
Mechanical and acoustic performance of compression-molded open-cell polypropylene foams
10
Mechanical and Acoustic Performance of Compression- Molded Open-Cell Polypropylene Foams Joe D. McRae, 1 Hani E. Naguib, 1 Noureddine Atalla 2 1 Department of Mechanical and Industrial Engineering, University of Toronto, Toronto, Canada 2 Groupe d’Acoustique et de Vibrations de l’Universite ´ de Sherbrooke, Canada Received 17 March 2009; accepted 11 October 2009 DOI 10.1002/app.31581 Published online 17 December 2009 in Wiley InterScience (www.interscience.wiley.com). ABSTRACT: Open-cell materials are lightweight and multifunctional capable of absorbing acoustic energy and supporting mechanical load. The acoustic and mechanical performance of open-cell materials can be optimized through processing. In this article, the relationships between processing parameters and acoustic and mechani- cal performance are shown for polypropylene (PP) foams. PP foam samples are fabricated using a combined com- pression molding and particulate leaching process. The results from a parametric study showed that both salt size and salt to polymer ratio affect the acoustic and mechani- cal performance of open-cell PP foams. As salt size increases, cell size increased and cell density decreased. The salt to polymer ratio had opposite affect on cell den- sity, and increasing the salt to polymer mass ratio increased the open-cell content. The airflow resistivity decreased significantly by increasing the cell size, which means that foam samples with smaller cell size have better sound absorption. When foam samples were thin, smaller cell sizes produced better sound absorption; however, as thickness of the sample increases, medium cell size offered the best acoustic performance. The compressive strength of the foams was increased by increasing the relative den- sity. Acoustic performance results from the parametric study were compared to the Johnson-Allard model with good agreement. Finally, optimal cellular morphologies for acoustic absorption and mechanical performance were identified. V C 2009 Wiley Periodicals, Inc. J Appl Polym Sci 116: 1106–1115, 2010 Key words: open-cell foam; polypropylene (PP); sound absorption; compression strength; computer modeling INTRODUCTION Compression molding has been widely used in the plastic industry to manufacture large parts such as automotive hoods, fenders, and spoilers. 1,2 The pro- cess is relatively inexpensive because of its simplic- ity and low waste. 3 The process is also capable of manufacturing large intricate parts with good sur- face finish. Compression molding has been used to create open-cell polymer foams by many researchers. Fos- sey et al. combined solvent blending and particulate leaching with compression molding to create poly- ethylene foams. 4 Here, the solvent blending was crit- ical to evenly disperse polyethylene throughout the salt particles. More recently, compression molding has been used to create open-cell bioscaffolds for tis- sue engineering. 5,6 Mooney and coworkers used a combined compression and gas foaming process to produce PLGA bioscaffolds. 5 In this process, sam- ples are saturated with gas in a foaming chamber. When the pressure is released, a thermal instability is created in the polymer matrix and cells nucleate as gas escapes. Mooney and coworkers has shown that using carbon dioxide instead of nitrogen creates foams with greater porosity. 7 In the noise control industry, three major methods are used to control unwanted noise: reducing sour- ces of noise and vibration, using barriers to prevent sound and vibration from entering a controlled space, and applying sound absorbing materials to dissipate unwanted sound energy. The materials investigated in this article fit into the third method, dissipating unwanted sound energy. It is critical that these materials have open-cell networks that are interconnected with the ambient environment to absorb sound energy. The acoustic performance of a material is meas- ured by determining the fraction of energy absorbed by a sample when a plane wave is incident on its surface. This measurement, which can be conducted Correspondence to: H. E. Naguib ([email protected]. ca). Contract grant sponsor: Networks of Centers of Excellence of Canada; contract grant number: AUTO21. Contract grant sponsors: Natural Science and Engineering Research Council of Canada (NSERC), Canada Research Chair (CRC), Canada Foundation of Innovation (CFI). Journal of Applied Polymer Science, Vol. 116, 1106–1115 (2010) V C 2009 Wiley Periodicals, Inc.
-
Upload
independent -
Category
Documents
-
view
5 -
download
0
Transcript of Mechanical and acoustic performance of compression-molded open-cell polypropylene foams

Mechanical and Acoustic Performance of Compression-Molded Open-Cell Polypropylene Foams
Joe D. McRae,1 Hani E. Naguib,1 Noureddine Atalla2
1Department of Mechanical and Industrial Engineering, University of Toronto, Toronto, Canada2Groupe d’Acoustique et de Vibrations de l’Universite de Sherbrooke, Canada
Received 17 March 2009; accepted 11 October 2009DOI 10.1002/app.31581Published online 17 December 2009 in Wiley InterScience (www.interscience.wiley.com).
ABSTRACT: Open-cell materials are lightweight andmultifunctional capable of absorbing acoustic energy andsupporting mechanical load. The acoustic and mechanicalperformance of open-cell materials can be optimizedthrough processing. In this article, the relationshipsbetween processing parameters and acoustic and mechani-cal performance are shown for polypropylene (PP) foams.PP foam samples are fabricated using a combined com-pression molding and particulate leaching process. Theresults from a parametric study showed that both salt sizeand salt to polymer ratio affect the acoustic and mechani-cal performance of open-cell PP foams. As salt sizeincreases, cell size increased and cell density decreased.The salt to polymer ratio had opposite affect on cell den-sity, and increasing the salt to polymer mass ratioincreased the open-cell content. The airflow resistivity
decreased significantly by increasing the cell size, whichmeans that foam samples with smaller cell size have bettersound absorption. When foam samples were thin, smallercell sizes produced better sound absorption; however, asthickness of the sample increases, medium cell size offeredthe best acoustic performance. The compressive strengthof the foams was increased by increasing the relative den-sity. Acoustic performance results from the parametricstudy were compared to the Johnson-Allard model withgood agreement. Finally, optimal cellular morphologies foracoustic absorption and mechanical performance wereidentified. VC 2009 Wiley Periodicals, Inc. J Appl Polym Sci 116:1106–1115, 2010
Key words: open-cell foam; polypropylene (PP); soundabsorption; compression strength; computer modeling
INTRODUCTION
Compression molding has been widely used in theplastic industry to manufacture large parts such asautomotive hoods, fenders, and spoilers.1,2 The pro-cess is relatively inexpensive because of its simplic-ity and low waste.3 The process is also capable ofmanufacturing large intricate parts with good sur-face finish.
Compression molding has been used to createopen-cell polymer foams by many researchers. Fos-sey et al. combined solvent blending and particulateleaching with compression molding to create poly-ethylene foams.4 Here, the solvent blending was crit-ical to evenly disperse polyethylene throughout the
salt particles. More recently, compression moldinghas been used to create open-cell bioscaffolds for tis-sue engineering.5,6 Mooney and coworkers used acombined compression and gas foaming process toproduce PLGA bioscaffolds.5 In this process, sam-ples are saturated with gas in a foaming chamber.When the pressure is released, a thermal instabilityis created in the polymer matrix and cells nucleateas gas escapes. Mooney and coworkers has shownthat using carbon dioxide instead of nitrogen createsfoams with greater porosity.7
In the noise control industry, three major methodsare used to control unwanted noise: reducing sour-ces of noise and vibration, using barriers to preventsound and vibration from entering a controlledspace, and applying sound absorbing materials todissipate unwanted sound energy. The materialsinvestigated in this article fit into the third method,dissipating unwanted sound energy. It is critical thatthese materials have open-cell networks that areinterconnected with the ambient environment toabsorb sound energy.The acoustic performance of a material is meas-
ured by determining the fraction of energy absorbedby a sample when a plane wave is incident on itssurface. This measurement, which can be conducted
Correspondence to: H. E. Naguib ([email protected]).
Contract grant sponsor: Networks of Centers ofExcellence of Canada; contract grant number: AUTO21.
Contract grant sponsors: Natural Science andEngineering Research Council of Canada (NSERC),Canada Research Chair (CRC), Canada Foundation ofInnovation (CFI).
Journal ofAppliedPolymerScience,Vol. 116, 1106–1115 (2010)VC 2009 Wiley Periodicals, Inc.

using an impedance tube, a plane wave is emittedfrom a loudspeaker and partially reflected by thesample to create a standing interference pattern inthe tube. Two microphones are used to measureminimum and maximum sound pressure levels ofthe standing interference pattern. These pressuresare used in
a ¼ 1� Pmax=Pmin � 1
Pmax=Pmin þ 1
� �2
(1)
to calculate the sound absorption coefficient a,where Pmax and Pmin are the maximum and mini-mum sound pressures.8 It is important to note thatthe sound absorption coefficient is not an intrinsicmaterial property because it depends on the thick-ness and supporting method of the sample.
Modeling the sound absorption of porous materi-als with complex cell morphology is difficult. In theliterature, three different approaches have beenused: empirical models, analytical models, and finiteelement simulations. Delany and Bazley used empir-ical relationships between flow resistivity, wavenumber, and characteristic impedance to developempirical model.9 Two analytical models have beendeveloped, the electro-acoustic analogy model andthe Johnson Allard (JA) model. Lu et al. developedthe electro-acoustic analogy model, where the acous-tic system is modeled as an equivalent electric cir-cuit of acoustic impedances.10 Allard and Daigledeveloped an analytical model to describe the prop-agation and absorption of sound waves in porousmedia.11 The JA model uses five macroscopic quanti-ties: open porosity (f), airflow resistivity (r), tortu-osity (a1), viscous and thermal characteristic lengths(K and K0) to find the effective density (q), and effec-tive bulk modulus (K) of the air fluid medium. Inthis model, the absorption coefficient (a) of the mate-rial is estimated as:
a ¼ 1� jRj2 (2)
where, R is the reflection coefficient. Finally, finiteelement methods have also been used to modelsound propagation in porous media. Recently, Atallaet al. have developed numerical models to representporoelastic materials, composite acoustic materials,and multilayer porous materials.12,13
From the study using open-celled aluminumfoam, it was investigated that the sound absorptioncapacity was improved by increasing the flow resist-ance and by using small pores and great foam thick-ness.14 A comparative study of the acoustic imped-ance, absorption coefficient, and reflection coefficientof several thermoplastic porous compounds was pre-sented by Soto et al.,15 where it was shown that con-trolling the mean pore size and the type of cellwould lead to an enhancement of the acoustic per-
formance of thermoplastics materials. Imai andAsano16 studied the effects of foam thickness, exis-tence of air layer behind foam, and foam profilingon acoustic absorption of polyester-based and poly-ether-based flexible polyurethane foams. The objec-tive of this article is to synthesize open-cell polypro-pylene (PP) foams using a compression molding andparticulate leaching process and to characterize thefoams. Through the use of particulate leaching tech-niques, the compression molding process is capableof fabricating open-cell foam materials. This methodhas not been used to create open-cell foams foracoustic applications. Hence, it is of great interest toinvestigate how processing affects open-cell foamsmade with this process. The relationships betweenprocessing parameters, cell morphology, acousticperformance, and mechanical properties will beexamined.
DESIGN, FABRICATION, ANDCHARACTERIZATION OF OPEN-CELL FOAM
Materials
The polymer selected to examine in this study ispolypropylene (PP). PP was selected because of theweight saving, the low cost, and the environmentalbenefits it can provide to the automotive indus-try.17,18 Specifically, the PP grade used in this studyis Microthene FP 800-00 powder supplied by Equi-star with density of 0.909 g/cm3 and vicat softeningand melting points of 150 and 163�C, respectively.The PP powder has a high melt flow index of 35 g/10 min measured in accordance with ASTM-D1238.19
PP powder is spherical and supplied with 5 to 50lm particles. Powder particles less than 106 lm indiameter were desired as they have better mechani-cal properties than foams made with larger par-ticles.20 Sodium chloride (NaCl) particles used in thesalt leaching process were supplied by Fisher Scien-tific. The salt was sieved into 106–250, 250–500, and500–850 lm particles.
Experimental setup
In this study, foam samples were produced usingthe process setup as shown in Figure 1. The batchsetup consisted of two compression molds, one toproduce acoustic samples and one to produce com-pression samples, a 24,000 lb Carver hydraulic presswith 0–350�C heated temperature controlled platens,salt leaching containers, and 1125�C Fisher Scientificisotemp muffle furnace.The compression molds were machined out of
6061 aluminum alloy. The acoustic sample mold pro-duced a foam sheet of 147 mm long � 48 mm wide� 6.4 mm thick. The sheets produced were cut into
COMPRESSION-MOLDED OPEN-CELL PP FOAMS 1107
Journal of Applied Polymer Science DOI 10.1002/app

four acoustic samples. The compression samplemold produced a 30 mm foam cube.
Fabrication procedure
The sample fabrication process can be divided intothree main steps: dry-blending salt and polymer,compression molding the sample, and salt leachingto create an open-cell material. Unless otherwisestated the procedure was performed at room tem-perature and atmospheric conditions.
The mass of salt and polymer required to makeeach sample can be calculated using the followingequations:
mPP ¼ Vgeometric � qNaCl � qPPqNaCl þ qPP � rs=p
(3)
mNaCl ¼Vgeometric � qNaCl � qPP
qNaCl þ qPP � rs=p
!� rs=p (4)
where rs/p is the salt to polymer mass ratio andVgeometric is the geometric volume of the sample. Inthis study, the polymer was mixed with salt at dif-ferent mass ratios and particle sizes by manuallyshaking a glass container of the mixture. Salt topolymer mass ratios of 4 : 1, 8 : 1, 12 : 1, and 16 : 1and sieved salt particles of 106–250, 250–500, 500–850 lm were used. The PP and salt blend was trans-ferred into a compression mold and heated at 180�Cfor 5 min on the compression press. The sample wasthen compressed at 7.5 MPa (1090 psi) for additional5 min. The die was cooled to room temperature in aFisher Scientific forma freezer at �35�C for 10 min.The molded samples were submerged in distilledwater to leach for 96 h. The water was changed forevery 24 h to avoid saturation. Finally, open-cellfoam samples were created after the samples weredried for 24 h at 60�C. Finished open-cell foam sam-ples fabricated with different salt sizes made for
compression and acoustic testing are shown inFigure 2.
Characterization
Cross-section micrographs of the polymer foamwere taken using a JOEL scanning electron micro-scope (JSM-6060). The cross-section images of foamswere analyzed with ImageJ, image processing soft-ware developed by the National Institute of Healthof USA, to determine average cell size and cell den-sity. Cell density, N, is calculated using:
N ¼ n
A
� �3=2q�1r (5)
where n is the number of cells in the cross sectionimage, A is the area of the image, and qr, is the rela-tive density.Relative density is the ratio of the density of the
foam, q*, to the density of the bulk material, q, asdefined below:
qr ¼q�
q(6)
Figure 1 Batch foaming process. [Color figure can beviewed in the online issue, which is available atwww.interscience.wiley.com].
Figure 2 Polypropylene open-cell foam samples for com-pression and acoustic testing, processed with different saltsizes.
1108 McRAE, NAGUIB, AND ATALLA
Journal of Applied Polymer Science DOI 10.1002/app

The mass, the thickness, the width, and the length offoam samples were measured to calculate the foamdensity. Thickness, width, and length measurementswere recorded as the average of three independentmeasurements. The mass of the samples was meas-ured with a Denver instrument model P-214 elec-tronic balance.
The open-cell content of a foam material is thepercentage of the material that is interconnectedwith the ambient environment. The open-cell con-tent was measured using UltraPync 1000 pycnom-eter by Quantachrome Instruments, which followsan American society for testing and materials(ASTM) standard, ASTM D6226.21 The pycnometerpressurizes the foam sample with nitrogen at 6psi and measures the closed-cell volume that can-not be penetrated by the pressurized nitrogen,Vclosed. The open-cell content, OV, is measuredusing:
OV ¼ 1� Vclosed
Vgeometric
� �� 100% (7)
The closed-cell volume percentage was also calcu-lated using the pyncnometer measurements:
CV ¼ 100%�OV � m
qPP � Vgeometric� 100% (8)
The static airflow resistivity is measured with an air-flow resistivity meter. The setup was built in accord-ance to the ASTM C522 standard.22 Using themeasured flow rate, U, and pressure difference, P,the airflow resistivity, r, can be calculated as shown:
r ¼ P� A
U � t(9)
The normal incident absorption coefficient, a, of thesamples was measured at the University of Sher-brooke with a B&K Type 4206 impedance tube inaccordance to ASTM 1050.23 The impedance tube di-ameter was 29 mm, dictating an allowable frequencyrange of 50–6400 Hz. During testing, samples werewrapped with Teflon tape to seal gaps between the
Figure 3 SEM images of cell morphology for different salt size and salt to polymer ratio.
COMPRESSION-MOLDED OPEN-CELL PP FOAMS 1109
Journal of Applied Polymer Science DOI 10.1002/app

sample holders and placed directly against a rigidimpervious wall.
Mechanical properties of the foam samples weremeasured using a Shimadzu AG-I 50kN mechanicaltester and an Instron 5548 500N micro tester. Thepolymer foam samples made with a 4 : 1 salt topolymer ratio were tested on the Shimadzu mechan-ical tester. The other polymer foam samples weretested on the Instron micro tester. Testing was donein accordance with ASTM D1621 with one deviation,and the values reported are for the average of threetests.24 During testing, all samples were preloadedto 10N, and the tests were conducted at a strain rateof 2.5 mm/min. The stress–strain curves were ana-lyzed to report Young’s modulus and yield stress.
RESULTS AND DISCUSSION
Effect of salt characteristics on cell morphology
Salt parameters were varied during open-cell foamprocessing to determine the effect of processing pa-rameters on cell morphology. Salt particle sizes of106–250, 250–500, 500–850 lm and salt to polymermass ratios of 4 : 1, 8 : 1, 12 : 1, and 16 : 1 wereused. Cell morphology of the resulting samples wasanalyzed using scanning electron microscopeimages.
Cells are formed during the foaming process,when space is vacated by leached salt particles.Hence, the cell size and shape must be closelyrelated to salt particles because both occupy thesame space. Figure 3 shows SEM images of sampleswith varied salt to polymer mass ratio and salt size.The images clearly show that as salt size increasesfrom 106–250 to 500–850 lm, the cell size increases.In Figure 4, the effect of increasing salt size is shownfor each salt to polymer mass ratio.
Cell density, a measure of the number of cells in agiven unit volume, was determined and is plottedagainst salt size in Figure 5. The cell densitydecreased with increasing salt size from 1.68 � 105
to 2.56 � 103 cells/cm3. The salt to polymer ratiohad a smaller and opposite affect on cell density; asthe salt to polymer ratio increased from 4 : 1 to16 : 1, the cell density increased 26% on average foreach salt size. These results were expected becausethe cell density is closely related to the number ofsalt particle in a given sample. As salt size in a sam-ple increases, the number of salt particles that canbe packed into a given volume will decrease, thusdecreasing the cell density. Increasing the salt topolymer mass ratio slightly increases the number ofsalt particles in a given sample, thus increasing thecell density.In this study, the relative density of a sample will
be proportional to bulk polymer mass because thevolume is held constant. Salt particle size does notaffect the relative density because it does not changethe mass of polymer in each sample; however, thesalt to polymer mass ratio, rs, is expected to beinversely proportional to relative density:
qr ¼1
rs(10)
Figure 4 Effect of salt size on cell size. Figure 5 Effect of salt size on cell density.
Figure 6 Effect of salt to polymer ratio on relativedensity.
1110 McRAE, NAGUIB, AND ATALLA
Journal of Applied Polymer Science DOI 10.1002/app

As salt to polymer mass ratio increases from 4 : 1 to16 : 1, the relative density decreases from 0.24 to0.08. This relationship is shown in Figure 6.
Effect of salt characteristics on open- andclosed-cell content
The open-cell content of foam is the percentage ofthe material that is interconnected with the ambientenvironment. Increasing the salt to polymer mass ra-tio from 4 : 1 to 16 : 1, increases the open-cell con-tent to 17%, from 74 to 91%, as shown in Figure 7.Although the open-cell content measurement is use-ful in predicting acoustic performance, it does notsuccinctly describe the effectiveness of the open-cellfoaming process. A better measurement to describethe performance of the foaming process is closed-cellcontent, which is the volume percentage of cells thatare closed. Figure 8 shows the closed-cell content offoams produced with different salt to polymerratios. The maximum closed-cell content for all sam-ples was 2.2%, indicating the open-cell foaming pro-cess is effective.
Effect of cell morphology on static airflowresistivity
Static airflow resistivity was measured on each sam-ple and effect of cell size is shown in Figure 9. Theairflow resistivity decreases significantly from 3 �105 to 2.5 � 104 N-s/m4 by increasing the cell sizefrom 106–250 to 250–500 lm. When increasing thecell size from 250–500 to 500–850 lm, the airflow re-sistivity decreased from 2.5 � 104 to 1.6 � 104 N-s/m4. This trend can be explained by Allard, he esti-mated that the airflow resistivity is inversely propor-tional to the square of cell radius for foams withspherical cells11:
r ¼ 8� l/� r2
(11)
where l is the dynamic viscosity of air.
Effect of cell morphology on sound absorption
In this study, 6.5 mm-disc samples were stacked to-gether to investigate how cell morphology affectssound absorption of samples with different thick-ness. Samples with thicknesses of 6.5, 13, and 26mm were examined in this study. Figure 10 showssound absorption coefficient frequency spectra for6.5, 13, and 26 mm samples produced with differentcell size and 0.14 relative density. Results for otherrelative densities were similar.The effect of thickness on sound absorption can be
determined by comparing the graphs of 6.5, 13, and26 mm sound absorption. As the thickness increases,the average sound absorption and the low frequencyabsorption of the sample both increase. This result isconsistent with research conducted on polyurethaneand aluminum open-cell foam.25,26 The reasonthicker foams have better sound absorption comesfrom the particle velocity theory described by Cox.27
The theory states that significant sound absorption
Figure 7 Effect of salt to polymer ratio on open-cellcontent.
Figure 8 Effect of salt to polymer ratio on closed-cellcontent.
Figure 9 Effect of cell size on airflow resistivity.
COMPRESSION-MOLDED OPEN-CELL PP FOAMS 1111
Journal of Applied Polymer Science DOI 10.1002/app

only occurs where particle velocity is high. Highparticle velocity will occur in foam farthest awayfrom the rigid wall boundary; hence, thicker samplesshould have better sound absorption.
The effect of cell size on sound absorption can bedetermined by comparing the curves on each indi-vidual graph in Figure 10. The 6 mm thick samplesare better sound absorbers when the cell size of thefoam is smaller. Samples produced with average cellsizes of 106–250, 250–500, and 500–850 lm had aver-age sound absorption coefficients of 0.57, 0.26, and0.18, respectively. Twelve millimetres thick samples
demonstrated the same trend, average cell sizes of106–250, 250–500, and 500–850 lm had averagesound absorption coefficients of 0.70, 0.67, and 0.54,respectively. The 25 mm samples with average cellsizes of 106–250, 250–500, and 500–850 lm had aver-age sound absorption coefficients of 0.71, 0.82, and0.70, respectively. A medium cell size, 250–500 lm,offers the best acoustic performance in the 26 mmsamples.
Figure 10 Effect of cell size on sound absorption fre-quency spectrums of (a) 6.5mm, (b) 13 mm, and (c) 26 mmsamples.
Figure 11 Effect of relative density on sound absorptionfrequency spectrums of (a) 6mm, (b) 13 mm, and (c) 25mm samples.
1112 McRAE, NAGUIB, AND ATALLA
Journal of Applied Polymer Science DOI 10.1002/app
When foam samples were thin, less than 26 mm,small cell sizes produced the best sound absorption.However, as thickness of the sample increased to 26mm, small cell sized samples had lower soundabsorption than the medium and large cell sizessamples. This change in performance can beexplained by the high airflow resistivity of the smallsamples. As the thickness of small cell sized samplesincreases, the difficulty for sound waves to travel inthe cell structure also increases. This increasereduces the amount of sound energy that is dissi-pated in the cell structure.
Figure 11 shows sound absorption coefficient fre-quency spectrums for 6.5, 13, and 26 mm samplesproduced with different relative density and 250–500lm cell size. Results for other cell sizes were similar.
The 6 mm thick samples are better sound absorb-ers when the relative density of the foam is higher.Samples produced with relative densities of 0.24,0.14, 0.10, and 0.08 had average sound absorptioncoefficients of 0.48, 0.26, 0.23, and 0.17, respectively.Twelve millimetres thick samples demonstrated thesame trend, samples with relative densities of 0.24,0.14, 0.10, and 0.08 had average sound absorptioncoefficients of 0.65, 0.67, 0.63, and 0.56. The 25 mmsamples with relative densities of 0.24, 0.14, 0.10,and 0.08 had average sound absorption coefficients
of 0.70, 0.82, 0.80, and 0.79. The 0.14 relative densityhas the best performance in 26 mm samples. The rel-ative density also affects the location of the maxi-mum sound absorption peak. As the relative densitydecreases, the peak shifts to higher frequencies.The effect of relative density can be explained by
examining the surface layer of the open-cell foams.As the relative density decreases, the amount of cellsper unit area on the surface increases. In thin sam-ples, this change reduces the airflow resistivity and,
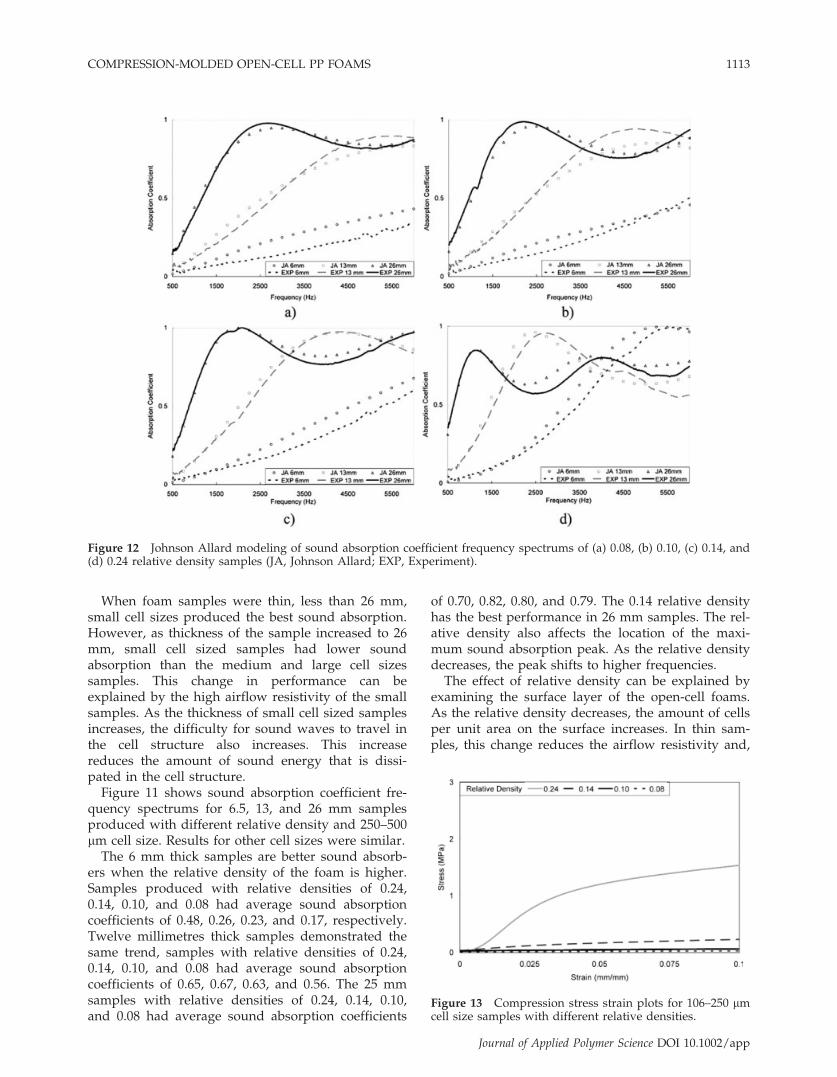
Figure 12 Johnson Allard modeling of sound absorption coefficient frequency spectrums of (a) 0.08, (b) 0.10, (c) 0.14, and(d) 0.24 relative density samples (JA, Johnson Allard; EXP, Experiment).
Figure 13 Compression stress strain plots for 106–250 lmcell size samples with different relative densities.
COMPRESSION-MOLDED OPEN-CELL PP FOAMS 1113
Journal of Applied Polymer Science DOI 10.1002/app
therefore, the absorption of sound energy in thesample. As the sample thickness increases, increas-ing the number of cell on the surface improvessound absorption, because less sound waves arebeing reflected back by solid material on the surfaceof the sample. This result is consistent with researchconducted on porous magnesium.28
Modeling of sound absorption
In this section, the PP open-cell foam results shownin this article are compared with the JA model dis-cussed earlier. The comparison will focus on themodels ability to predict sound absorption of sam-ples with different relative densities. Previousresearch conducted by Chu et al. shows the JAmodel accurately predicts sound absorption foropen-cell PP foams with different cell sizes.29
Five inputs are needed for the JA model: porosity,airflow resistivity, tortuosity, and viscous and ther-mal characteristic length. For this comparison, theporosity and airflow resistivity were measured ex-plicitly, and the remaining three parameters were
calculated using FoamX software. The softwareapplies and inverse algorithm to sound absorptionfrequency spectrum data to calculate tortuosity andviscous, and thermal characteristic length.The sound absorption behavior for samples with
relative density from 0.08 to 0.24 was modeled and
Figure 14 Compression stress strain plots for 250–500 lmcell size samples with different relative densities.
Figure 15 Compression stress strain plots for 500–850 lmcell size samples with different relative densities.
TABLE IMechanical Properties of Samples Produced with
Different Cell Size and Relative Density
Relativedensity
Cell size(lm)
Young’sModulus (MPa)
Yield stress(MPa)
0.24 106–250 41.7 0.87250–500 72.9 2.20500–850 72.6 1.87
0.14 106–250 5.0 0.11250–500 7.4 0.14500–850 8.9 0.21
0.10 106–250 0.5 0.04250–500 1.3 0.07500–850 2.6 0.05
0.08 106–250 0.3 0.01250–500 0.7 0.03500–850 1.1 0.03
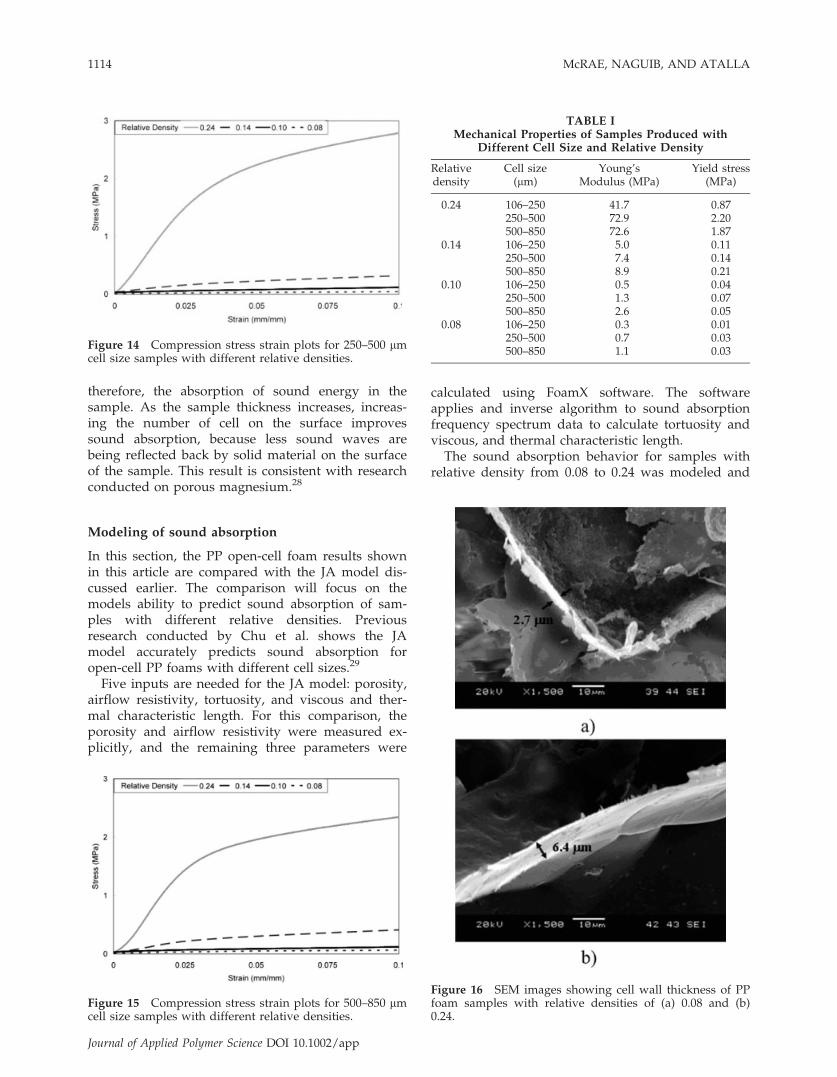
Figure 16 SEM images showing cell wall thickness of PPfoam samples with relative densities of (a) 0.08 and (b)0.24.
1114 McRAE, NAGUIB, AND ATALLA
Journal of Applied Polymer Science DOI 10.1002/app

the results are shown in Figure 12. The experimental(EXP) and JA model sound absorption frequencycurves shown in the figure have good agreement forall relative density and thicknesses. The average per-cent difference between experiment and the modelwas only 8% for average sound absorption. Theseresults show that the JA model is capable of predict-ing sound absorption of open-cell PP foams.
Effect of cell morphology on mechanical properties
Compression stress–strain curves for different rela-tive densities are shown below in Figures 13–15 for106–250, 250–500, and 500–850 lm cell sizes. The val-ues of Young’s modulus and yield stress for thesesamples are given in Table I.
The figures show that increasing the relative den-sity improve the compressive strength of the foams.Interpreting the results in Table I shows that increas-ing the relative density three times from 0.08 to 0.24results in an average 100 times increase in Young’smodulus and 75 times increase in yield stress. Thisexponential relationship is consistent with researchconducted by Ashby on cellular materials.30 Ashbyapplied elastic buckling theory to a 2D hexagonalunit cell and showed that relative density is themost important cellular parameter affecting mechan-ical properties. Relative density is the most impor-tant factor because it increases the mass of polymer,and therefore, the cell wall thickness increases, thuspreventing buckling and improving mechanicalproperties.
SEM images of sample wall thickness from 0.08 to0.24 relative density samples are shown in Figure 16.The SEM analysis clearly shows that the wall thick-ness of the 0.24 relative density sample is 3.7 lm(2.4 times) larger than the 0.08 relative densitysample.
CONCLUSIONS
Open-cell PP foams with relative densities between0.08 and 0.24 were produced using a compressionmolding/particulate leaching process. Good soundabsorption with average absorption coefficients of0.8 was achieved. Samples with relative densities of0.24 combine an average absorption coefficient of 0.7with great mechanical properties having a Young’smodulus of 72.9 MPa and a yield stress of 2.2 MPa.
Results from the parametric study have shownfoams made from small salt particles have smallercells, larger cell densities, and higher airflow resis-tivity. These foams also make better sound absorberswhere thin materials are required because as thick-ness increases they become too resistive and under-perform samples with larger cell sizes. They willalso have weaker mechanical properties because it is
difficult for the polymer particles to flow and sinterin a matrix of small salt particles.Foams made with lower salt to polymer ratio have
higher relative density and lower open-cell content.These samples will make better thin sound absorbersbecause they are more resistive. They will also havethe best mechanical properties because they havethicker cell walls.Good agreement was shown between EXP results
and the JA model for PP open-cell foams with rela-tive densities between 0.08 and 0.24.
References
1. Isayev, A. I. Injection and Compression Molding Fundamen-tals; Marcel Dekker Inc.: New York, 1987.
2. Vlachopoulos, J.; Strutt, D. Mater Sci Technol 2003, 19, 1161.3. Ebewele R. O. Polymer Science Technology; CRC Pr I Llc:
Boca Raton, Florida, 2000.4. Fossey, D. J.; Smith, C. H. J Cell Plast 1973, 9, 268.5. Harris, L. D.; Kim, D. S.; Mooney, D. J. J Biomed Mater Res
1998, 42, 396.6. Leung, L.; Chan, C.; Song, J.; Tam, B.; Naguib, H. E. J Cell
Plast 2008, 44, 189.7. Sheridan, M. H.; Shea, L. D.; Peters, M. C.; Mooney, D. J.
J Control Release 2000, 64, 91.8. Zwikker, C.; Kosten, C. W. Sound Absorbing Mater; Elsevier:
New York, 1949.9. Delany, M. E.; Bazley, E. N. App Acoust 1969, 13, 105.10. Lu, T. J.; Hess, A.; Ashby, M. F. J App Phys 1999, 85, 7528.11. Allard, J. F.; Daigle, G. J Acoust Soc Am 1994, 95, 2785.12. Atalla, N.; Sgard, F. J Sound Vib 2007, 303, 195.13. Atalla, N. Symposium on the Acoustics of Poro-Elastic Materi-
als (SAPEM, 2005), Lyon, France, December 7–9, 2005.14. Han, F.; Seiffert, G.; Zhao, Y.; Gibbs, B. J Phys D Appl Phys
2003, 36, 29415. Soto, P. F.; Herrfiez, M.; Gonzfilez, A.; de Saja, J. A. Polym
Test 1994, 13, 77.16. Imai, Y.; Asano, T. J Appl Polym Sci 1982, 27, 183.17. Liu, X.; Sun, Y. Hecheng Shuzhi Ji Suliao/China Syn Resin
Plast 2005, 22, 75.18. Kanari, N.; Pineau, J. L.; Shallari S. JOM 2003, 55, 15.19. ASTM D 1238, American Society for Testing and Materials:
Philadelphia, Pennsylvania, 2004.20. Riddle, K. W.; Mooney, D. J. J Biomater Sci Poly Ed, 2004, 15, 1561.21. ASTM D 6226, American Society for Testing and Materials:
Philadelphia, Pennsylvania, 1998.22. ASTM C 522, American Society for Testing and Materials:
Philadelphia, Pennsylvania, 1997.23. ASTM E 1050, American Society for Testing and Materials:
Philadelphia, Pennsylvania, 2007.24. ASTM D 1621, American Society for Testing and Materials:
Philadelphia, Pennsylvania, 2000.25. Tsay, H. S.; Yeh, F. H. J Cell Plast 2005, 41, 101.26. Hakamada, M.; Kuromura, T.; Chen, Y.; Kusuda, H.; Mabuchi,
M. Appl Phys Lett 2006, 88, 254106.27. Cox, T. J.; D’Antonio, P. Acous Absorbers and Diffusers:
Theory, Design, and Application; Spon Press: London,New York, 2004.
28. Xie, Z. K.; Ikeda, T.; Okuda, Y.; Nakajima, H. Mater Sci Forum2004, 449, 661.
29. Chu, R. K. M.; Naguib, H. E.; Atalla, N. SPE ANTEC Techni-cal Papers, Society of Plastics Engineers, Milwaukee, Wiscon-sin 2008.
30. Ashby, M. F.; Medalist, R. F. M. Metall Mater Trans A, 1983,14, 1755.
COMPRESSION-MOLDED OPEN-CELL PP FOAMS 1115
Journal of Applied Polymer Science DOI 10.1002/app