Temperature Dependence of Aliovalent-Vanadium Doping in LiFePO 4 Cathodes
Upload
independentCategory
view
1download
0
Microporous and Mesoporous Materials 142 (2011) 45–54
Contents lists available at ScienceDirect
Microporous and Mesoporous Materials
journal homepage: www.elsevier .com/locate /micromeso
Novel vanadium-containing mesocellular foams (V-MCF) obtainedby direct synthesis
Marco Piumetti a, Barbara Bonelli a,⇑, Pascale Massiani b, Yannick Millot b, Stanislaw Dzwigaj b,Lucia Gaberova b, Marco Armandi a, Edoardo Garrone a
a Department of Materials Science and Chemical Engineering, Politecnico di Torino and INSTM Unit – Torino Politecnico, Corso Duca degli Abruzzi 24, 10129 Turin, Italyb UPMC, Université Pierre et Marie Curie (Paris VI), CNRS-UMR 7197, Laboratoire de Réactivité de Surface, 4 place Jussieu, F-75005 Paris, France
a r t i c l e i n f o
Article history:Received 14 September 2010Received in revised form 4 November 2010Accepted 6 November 2010Available online 8 December 2010
Keywords:VanadiumMesocellular foamsIR spectroscopyNMR spectroscopyVanadium oxide catalysts
1387-1811/$ - see front matter � 2010 Elsevier Inc. Adoi:10.1016/j.micromeso.2010.11.010
⇑ Corresponding author. Tel.: +39 011 5644719; faxE-mail address: [email protected] (B. Bonel
a b s t r a c t
This work reports the preparation and characterization of novel V-containing mesocellular foams (MCF)obtained by direct synthesis: their physico-chemical properties were investigated by means of comple-mentary techniques and comparison was made with V-containing MCF prepared by (traditional) impreg-nation method, figuring out the main differences in both textural and surface features of the two types ofmaterials. Catalytic tests showed that V-MCF prepared by direct synthesis are more active towardsdichloromethane decomposition, due to the presence of isolated vanadium sites, as detected by meansof (complementary) spectroscopic techniques. Direct synthesis allows the formation of acidic VAOHgroups and favours the incorporation of highly reducible tetrahedral vanadium species that are well dis-persed inside silica walls. On the contrary, impregnation brings about an overall decrease of surfacehydroxyls and preferential formation of highly acidic sites, most probably related to extra-frameworkVOx species, that are reduced at a higher temperature than isolated vanadium sites.
� 2010 Elsevier Inc. All rights reserved.
1. Introduction
Ordered mesoporous materials with uniform and well-definedpores have been extensively studied since their discovery in theearly 90s [1–3] because of their potential applications in severalfields, like catalysis, adsorption, gas separation and storage, en-zyme immobilization, host–guest systems etc. [4–8].
Ordered mesoporosity silicas are commonly prepared by usingorganic templates as pore directing agents: among the differentkinds of mesoporous silicas, SBA-15 has many potential and actualapplications in virtue of its relatively large pores (5–30 nm indiameter), high specific surface area (600–1000 m2 g�1), thickwalls and good hydrothermal and thermal stability [9–13]. Thetwo-dimensional hexagonal system (P6mm) of SBA-15 is obtainedby using an amphiphilic tri-block copolymer (namely PluronicP123, EO20PO70EO20) as structure directing agent under strongacidic conditions. If micro-emulsions of tri-block copolymers areused as colloidal templates, siliceous mesocellular foams (MCF)may be prepared [14]: in such a case, a swelling agent is addedto the synthesis mixture, e.g. 1,3,5-trimethylbenzene (TMB) thatdissolves into the hydrophobic core of Pluronic P123 micelles, thusfavouring the formation of the three-dimensional MCF network,
ll rights reserved.
: +39 011 5644699.li).
characterized by uniform spherical cells (up to 50 nm in diameter)interconnected through small windows [14].
It has also been observed that a phase transition from highly or-dered SBA-15 P6mm hexagonal system to MCF system [15–17]may occur by adding TMB to Pluronic P123 copolymer (i.e. TMB/P123 mass ratio >0.3) [14].
Their three-dimensional porous network renders MCF valuablematerials in the field of heterogeneous catalysis, by facilitating thediffusion of both reactants and products, unlike other monodimen-sional mesoporous systems leading to severe mass transfer limita-tions (e.g. MCM-41) [18,19]. All this notwithstanding, only a fewpapers deal with the incorporation of catalytically active metalsin their framework by impregnation [20,21]. This work reports anew direct synthesis method for the preparation of MCF containinghighly dispersed vanadium species that are known to be effectivein many oxidation reactions, from oxidative dehydrogenation(ODH) of alkanes [22,23] to oxidation of volatile organic com-pounds (VOCs) [24–29], e.g. the decomposition of dichloromethane(CH2Cl2), the most stable chlorinated-alkane.
It must be pointed out that direct incorporation of vanadiuminto a silica matrix is feasible over a limited pH range (around3.0), since in such conditions mainly isolated tetrahedral V5+ and/or square pyramidal (VO2+) ions occur [30–32]. The main advan-tage of direct synthesis with respect to impregnation [33] is thepossibility to introduce vanadium inside silica walls and to obtainhighly dispersed and reactive sites. Gao et al. [30] previously

46 M. Piumetti et al. / Microporous and Mesoporous Materials 142 (2011) 45–54
observed that V-containing SBA-15 obtained by direct synthesis atpH = 3.0 exhibited highly dispersed vanadium species incorporatedinside silica walls, whereas at lower pH values (e.g. pH = 2.0) someextra-framework VOx species formed, as well. This is the first re-port on V-MCF materials prepared by direct synthesis.
All prepared samples were tested as catalysts for dichlorometh-ane decomposition, used as a probe reaction, and their physico-chemical properties were characterized by transmission electronmicroscopy, N2 sorption isotherms at �196 �C, H2-temperatureprogrammed reduction and several spectroscopic techniques, withthe aim to figure out the effects of different synthesis procedureson the: (i) textural properties of the materials; (ii) surface hydrox-yls population and surface hydration/dehydration behaviour; (iii)presence of different V-environments that could affect its reduc-tion behaviour, a parameter of vital importance for applicationsas redox catalysts.
2. Experimental section
2.1. Materials synthesis
Two Vx-MCF materials, x standing for the vanadium contentexpressed as wt.%, were prepared as follows: 4.0 g tri-block copoly-mer Pluronic P123 (EO20PO70EO20, Sigma–Aldrich) and 2.0 g 1,3,5-trimethylbenzene (TMB, ACS reagent 98%, Sigma–Aldrich) weredissolved in 30.0 mL bi-distilled water (Carlo Erba) and stirred atroom temperature for 5 h. Afterwards, 9.0 g tetraethylorthosilicate(TEOS, ACS reagent 98%, Sigma–Aldrich) and an appropriateamount of ammonium metavanadate (NH4VO3, ACS reagent 99%,Sigma–Aldrich) were added to the solution. 0.20 M HCl solution(obtained by diluting 37% HCl, Sigma–Aldrich) was then addeddrop-wise to the mixture until pH reached a value close to 3.0.After stirring at 40 �C for 24 h at constant pH, the solution wastransferred into a 150 mL Teflon autoclave and aged at 100 �C for24 h in order to increase both cells and windows size of the foam.
The obtained solid was filtered off, washed with bi-distilledwater and dried overnight at 100 �C under static conditions. Final-ly, the occluded organic phase was removed by 5 h calcination at600 �C in air. The two samples will be referred to as V2.5-MCFand V4.5-MCF, respectively.
A synthesis in more acidic conditions was attempted as well(pH < 2.0), but chemical analysis (EDS measurements, Table 1)showed the absence of vanadium in the final material, as reportedin literature [30].
A purely siliceous MCF was synthesized according to a literaturemethod [17] at a pH of about 2.0, with the aim to obtain a materialthat could be used both as reference blank sample and as supportof two samples obtained by wet impregnation, hereafter referredto as V2.5-MCF(i) and V4.5-MCF(i), respectively. Impregnated sam-ples were obtained by adding appropriate amounts of NH4VO3
solution to the MCF silica support and placing the mixture in a
Table 1Samples properties, as derived by both EDS analysis and N2 adsorption/desorption isother
Sample code Synthesis method V-contenta (wt.%) Sbet (m2 g�1)
V2.5-MCF Direct 2.6 925V4.5-MCF Direct 4.4 740V2.5-MCF(i) Impregnation 2.5 645V4.5-MCF(i) Impregnation 4.7 530MCF Ref. [17] – 685
a As measured by EDS analysis.b Vp total porous volume.c Vmicro = microporous volume, as measured according to the t-plot method.d Diameters of cells (Dc) and windows (Dw) as determined from adsorption and desor
rotary evaporator, in order to progressively evacuate water excess;the obtained solids were then calcined in oven at 600 �C for 5 h.
2.2. Materials characterization
Powders morphology was studied by transmission electronmicroscopy (TEM, JEM 2011 operating at 200 kV).
V-contents reported in Table 1 were determined by energy dis-persive X-ray spectroscopy (EDS) analysis onto 10–50 nm diameterspots (Oxford 7353 probe on a LEO 1450 VP microscope).
N2 adsorption/desorption isotherms were measured at �196 �Con ca. 30 mg samples previously outgassed at 150 �C for 5 h to re-move molecular water and other atmospheric contaminants(Quantachrome Autosorb 1). Specific surface area was calculatedaccording to the BET (Brunauer–Emmett–Teller) method and poressize distributions (PSDs) were evaluated according to the modifiedBroekhoff de Boer method, using the Hill’s approximation for theadsorbed layer thickness (BdB-FHH) [33].
For infra-red (IR) measurements, samples were studied either inpellets, obtained by mixing powders with optical grade KBr, orpressed into (thin) self-supporting wafers. The latter were pre-treated under high vacuum (residual pressure < 10�3 mbar) usinga standard vacuum frame, in a quartz cell equipped with KBr win-dows. Fourier transform-IR (FT-IR) spectra were collected at2 cm�1 resolution on a Bruker Equinox 55 FT-IR spectrophotome-ter, equipped with a MCT detector. To study hydroxyls population,wafers were outgassed for 1 h at 150, 300, and 500 �C and the cor-responding IR spectra were recorded at room temperature. Onsamples outgassed at 150 and 500 �C, CO adsorption was studiedat the nominal temperature of liquid nitrogen: IR spectra were re-corded after CO dosage (0.01–15.0 mbar equilibrium pressurerange) and after prolonged evacuation, to verify reversibility ofthe interaction.
Magic angle spinning (MAS) NMR spectra were registered on aBruker Avance spectrometer. 29Si MAS NMR and cross polarized(CP) 1HA29Si CP-MAS NMR spectra were recorded at 99.4 MHz into7 mm zirconia rotors spun at 5 kHz. 29Si MAS NMR spectra wereobtained using a 2.5 ls excitation pulse and a 10 s recycle delay.For CP-MAS experiments, the setting of Hartmann–Hahn condi-tions was made using 3-(trimethylsilyl)-1-propanosulfonic sodiumsalt: proton p/2 pulse duration, contact time and recycle delaywere 7 ls, 5 ms and 5 s, respectively. 1H and 51V MAS NMR spectrawere recorded in 4 mm zirconia rotors spun at 12 kHz. For 1H MASNMR spectra, a 90� pulse duration of 3.8 ls and a recycle delay of5 s were used; a special attention was made to carefully clean therotor with ethanol in order to avoid spurious proton signals. Theprobe signal was subtracted from the total free induction decay.51V MAS NMR spectra were acquired at 131.5 MHz with 0.5 s re-cycle delay and pulse duration of 3.7 ms. Chemical shifts weremeasured by making reference to (i) tetramethylsilane (TMS), forboth silicon and proton, and (ii) NH4VO3, for vanadium.
ms at �196 �C.
Vpb (cm3 g�1) Vmicro
c (cm3 g�1) Dcd (nm) Dw
d (nm)
1.00 0.17 16 60.87 0.13 16 61.75 0.06 23 121.63 0.05 23 122.10 0.08 25 13
ption branches of N2 isotherms (BdB-FHH method).

Fig. 1. TEM micrographs of samples: V2.5-MCF (a), V 4.5-MCF (b) and V2.5-MCF(i) (c).
M. Piumetti et al. / Microporous and Mesoporous Materials 142 (2011) 45–54 47
Micro-Raman spectra were collected at ambient conditions on aRenishaw Micro-Raman system, equipped with an Ar laser(k = 514.5 nm).
Diffuse reflectance (DR) UV–vis spectra were recorded on aCARY-500 UV–Vis-NIR spectrophotometer (Varian Instrument)equipped with an integrating sphere: ca. 200–300 mg powder sam-ples were studied both as such (after calcination and exposure toatmospheric moisture) and after outgassing for 2 h at 300 �C(dehydrated samples).
For H2-TPR (temperature programmed reduction) experiments,100 mg sample placed in a quartz micro-reactor was contactedwith reducing flowing gas (5% molar H2 in Ar, 40 ml min�1) andheated in the 20–1000 �C temperature range (heating rate:10 �C min�1), while recording H2 consumption by means of a ther-mal conductivity detector (TCD); a gas condenser operated at�196 �C and placed prior the TCD was used to remove the waterpossibly formed during reaction.
2.3. Catalytic activity tests
Catalytic tests were carried out inside a continuous quartztubular reactor (7 mm inner diameter) heated by an electric fur-nace [28]. Before each run, 70 mg catalyst was activated in air(flowing rate = 41 mL min�1) as temperature was increased up to500 �C (heating rate = 5�min�1) and kept at 500 �C for 1 h. Thegas flow was then switched from air to the reactive mixture (com-position: 1000 ppm CH2Cl2 in air; space velocity (volume of gas fedper volume of catalyst bed per hour, VVH): 21000 h�1) and cata-lytic activity was tested at 500, 450, 400, 350, 300, 250 and200 �C for 2 h at each temperature. The outlet gas compositionwas analyzed by means of an on-line gas chromatograph (PERI-CHROM, PR 2100) with two detection lines: the former, for analysisof organic products, was equipped with a capillary column and aflame ionization detector (FID); the latter, for COx detection, wasequipped with a succession of a Porapak-Q (for back-flush) and aMS-5A columns, and a thermal conductivity detector (TCD). Theflowing gas after reaction was passed through an HCl trap (zeolitebeads) in order to prevent corrosion of both the chromatographcolumn and the detector. The percentage of dichloromethane con-version was calculated as moles of CH2Cl2 converted over moles ofCH2Cl2 fed. The selectivity to each ith product was calculated as ra-tio between moles of ith species produced and moles of convertedCH2Cl2, normalized to the respective stoichiometric coefficients.
3. Results and discussion
3.1. Textural properties of the prepared materials
TEM images of both V2.5-MCF and V4.5-MCF samples (Fig. 1a andb, respectively.) show a disordered array of three-dimensionalmesoporous spherical cells (ca. 15–20 nm in diameter), typical ofMCF [17,34]. The measured cells sizes are in fair agreement withpores sizes determined from N2 isotherms (Table 1). The wallthickness, also estimated by TEM pictures, is ca. 5–8 nm, confirm-ing the presence of rather thick and robust framework walls, asreported previously [34].
With V4.5-MCF sample, onion-like structures are also observed(inset to Fig. 1b), due to the formation, often reported in MCFsilicas, of a multi-lamellar vesicles (MLV) phase: vesicles of about50–80 nm outer diameter and 20 nm inner diameter are seen, inagreement with the literature [15,35]. The occurrence of MLV inMCF silica is usually ascribed to an effect of the amount of swellingagent and/or of the aging temperature [15]: in this case, the presenceof vanadium in the synthesis mixture and its incorporation insidesilica matrix, with consequent modification of the final material,
have to be considered, as well. The modification of synthesis pHin order to allow vanadium incorporation is particularly important:a decrease of structural ordering with increasing synthesis pH wasalso observed with both MCF [36] and SBA-15 [30,37] materials.
V2.5-MCF(i) impregnated sample (Fig. 1c) has uniform cells withslightly larger diameters (20–25 nm) and shows the presence ofseveral VOx clusters (inset to Fig. 1c), confirming the fact thatimpregnation renders vanadium dispersion more difficult, evenat a low V-content.
Fig. 2 reports N2 isotherms at �196 �C: samples prepared by di-rect synthesis (Fig. 2a) show type IV isotherms with H2 hysteresisloops closing at about 0.45 P/P0, corresponding to the empting ofeither ‘‘ink-bottle’’ mesopores or ‘‘closed cell’’ foams intercon-nected by narrow windows [36]. The hysteresis loop broadnessmay also be due to the presence of both MCF and MLV, as evi-denced by TEM. By contrast, both impregnated samples (Fig. 2b)and MCF silica (inset) exhibit similar type IV isotherms, with nar-rower H1 hysteresis loops shifted at a higher relative pressure(0.60–0.90 P/P0), indicating the presence of larger and more or-dered pores with respect to Vx-MCF.
Data reported in Table 1 show that, with respect to impregna-tion, direct synthesis leads to: (i) significantly larger BET specificsurface areas (SBET); (ii) slightly lower total porous volume (Vp);(iii) smaller mesopores size (both Dc and Dw) and (iv) enhancedmicroporous volume (Vmicro). Such different textural properties be-tween samples obtained by direct synthesis and samples obtainedby impregnation are probably related to the fact that the directintroduction of vanadium into silica walls requires less acidic con-ditions with respect to MCF silica synthesis, that was carried out ata pH of about 2.0 [17]: the porous features of the final material def-initely depend on the synthesis pH. Concerning walls thickness, ithas been reported that introduction of vanadium inside silica wallsbrings about an increase of walls thickness of V-SBA-15 materialsprepared by direct synthesis [34]. In the present case, we have onlyTEM evidence that V-MCF prepared by direct synthesis haveslightly thicker walls than those obtained by impregnation ofMCF silica (prepared at a lower pH). Gao et al. [30] observed the in-crease of walls thickness in V-SBA-15 prepared by direct synthesisat increasing pH: this can be due to both a more efficient V incor-poration at higher pH values and a concomitant effect of pH on thekinetic of hydrolysis of the silica precursor and subsequent con-densation. Cui et al. [38] studied the synthesis of SBA-15 silica inthe pH range 2.0–5.0, showing that high pH values lead to rapidprecipitation of silica, high density of the precipitate and that wallsthickness increase with the increase in pH [38].
Additional information deriving from N2 physisorption may besummarized as follows: (i) V2.5-MCF has both larger SBET and Vp
than V4.5-MCF, probably because in the latter case the formationof MLV accompanies the introduction of vanadium in the silicawalls, and (ii) the smaller SBET and Vp values of impregnated

Fig. 2. (a) N2 adsorption/desorption isotherms at �196 �C measured on samplesV2.5-MCF (white symbols) and V4.5-MCF (black symbols); (b) N2 adsorption/desorption isotherms at �196 �C measured on samples V2.5-MCF(i) (white sym-bols), V4.5-MCF(i) (black symbols) and MCF silica (inset). All samples werepreviously outgassed at 150 �C for 5 h before measuring isotherms.
48 M. Piumetti et al. / Microporous and Mesoporous Materials 142 (2011) 45–54
samples may indicate the formation of extra-framework VOx spe-cies, partially occluding the overall accessible porosity, since the
MCF silica used as support exhibited larger values of both SBET
and Vp than impregnated samples.
3.2. Hydroxyls population as studied by both FT-IR and NMRspectroscopies
Fig. 3a–c report IR spectra in the 3800–3000 cm�1 range ofMCF silica, V2.5-MCF and V2.5-MCF(i) samples, respectively, out-gassed at 150, 300 and 500 �C; all IR spectra hereafter reportedwere normalized to samples unit specific weight, in order toallow comparison.
The IR spectrum of MCF silica outgassed at 150 �C (curve 1 inFig. 3a) shows a main band at 3745 cm�1, assigned to the stretch-ing mode of isolated silanols [39], and a broad absorption on thelower wavenumbers side, with two components at 3715 and3520 cm�1 due to terminal H-bonded silanols and silanols insidehydroxyls chains, respectively [28,40]. After outgassing at 300and 500 �C (curves 2 and 3, respectively) the latter two bands de-crease in intensity due to progressive surface de-hydroxylation[39] and 3745 cm�1 band becomes prominent.
The IR spectrum of V2.5-MCF sample outgassed at 150 �C (curve1 in Fig. 3b) is qualitatively similar to that of MCF silica: observedabsorption bands are due to (i) isolated silanols (3740 cm�1), (ii)terminal H-bonded silanols (3705 cm�1) and (iii) silanols insidechains (3530 cm�1). IR bands due to H-bonded hydroxyls (bothat 3705 and at 3530 cm�1) are more intense than in the spectrumof MCF silica, indicating that V2.5-MCF is a more hydrophilic mate-rial. Such a result can be related to the presence of more hydro-philic VAOH species at the surface: the VAOH stretching mode,absorbing at ca. 3660 cm�1 according to the literature, could notbe observed in the bare spectrum of V2.5-MCF sample because ofthe presence of abundant hydroxyls engaged in H-bonding[28,32]. As expected, H-bonded hydroxyls bands progressively de-crease in intensity after outgassing at 300 and 500 �C (curve 2 and3, respectively): curve 3 shows indeed the band of isolated silanols(3745 cm�1) only, in agreement with 1H NMR spectra discussedbelow.
IR spectra recorded with V2.5-MCF(i) sample (Fig. 3c) show thebands of both isolated silanols (3745–3739 cm�1) and H-bondedhydroxyls (components at 3715 and 3520 cm�1), the latter beingless intense than with V2.5-MCF: this is in agreement with boththe lower SBET of V2.5-MCF(i) and the presence of extra-frameworkVOx species (vide supra).
Fig. 4 shows 29Si MAS NMR spectra of samples V2.5-MCF (a) andV2.5-MCF(i) (b), respectively: with both samples a main resonanceis seen at about �111 ppm, indicating that Si is present mainly inSi(OSi)4 framework configuration [41]. A peak at �101 ppm is alsovisible, due to Si atoms in Si(OH)(OSi)3 environment, as seen fromthe strong peak increase when 1HA29Si cross polarization is ap-plied (spectra a’ and b’). Moreover, a weak CP-MAS NMR signalat �91 ppm is detected, revealing a small amount of Si atoms inSi(OH)2(OSi)2 environments, corresponding to the presence ofgeminal silanols that IR spectroscopy cannot easily distinguishfrom SiO-H species, both of them absorbing in the 3735–3750 cm�1 range.
1H MAS NMR spectrum of V2.5-MCF sample (Fig. 5a) exhibits avery intense peak at about 4.7 ppm, as usually observed for H-bonded silanol groups in zeolites with a high content of defectivehydroxyls, i.e. BEA and MFI [42–44]. After dehydrating 500 �C for3 h V2.5-MCF sample (curve b), the peak related to protons of H-bonded SiO-H groups disappeared with simultaneous appearanceof the peaks at 2.6 and 1.8 ppm corresponding to isolated and/orterminal SiO-H species (Fig. 5b). Such a result is in agreement withIR spectra discussed before, showing that H-bonded hydroxyls areremoved at high temperature by surface dehydration with forma-tion of (residual) isolated silanols. It indicates a preferential

Fig. 3. IR spectra, in the 3800–3000 cm�1 range of samples MCF (a), V2.5-MCF (b)and V2.5-MCF(i) (c) outgassed at 150, 300 and 500 �C (spectra No. 1, 2 and 3,respectively).
Fig. 4. 29Si MAS (a and b) and 1HA29Si CP MAS (a’ and b’) NMR spectra of samplesV2.5-MCF (a and a’) and V2.5-MCF(i) (b and b’).
Fig. 5. 1H MAS NMR spectra of samples V2.5-MCF (a), V2.5-MCF dehydrated at 500 �Cfor 3 h (b), V4.5-MCF (c) and V2.5-MCF(i) (d).
M. Piumetti et al. / Microporous and Mesoporous Materials 142 (2011) 45–54 49
de-hydroxylation of H-bonded SiO-H groups by heating V2.5-MCFsample, as extensively reported in the literature [28,29,45].
The 1H MAS NMR spectrum of V4.5-MCF (Fig. 5c) exhibits a veryintense peak at about 4.8 ppm due to protons of H-bonded SiO-Hgroups. The absence of the peak at 4.8 ppm in V2.5-MCF(i) sample(Fig. 5d) evidences the reaction of V precursor with H-bondedSiO-H groups upon impregnation of NH4VO3 on pure silica MCF.The 1H MAS NMR spectrum of V2.5-MCF(i) exhibits the main peakat around 3.8 ppm and a small peak at 2.2 ppm. The peak at3.8 ppm is still assigned to H-bonded SiO-H groups, but with muchlower intensity than that observed for V2.5-MCF. It shows that such
silanol groups are consumed upon impregnation of NH4VO3 pre-cursor on V2.5-MCF. The very small peak at 2.2 ppm (Fig. 5d) isprobably due to protons of isolated SiO-H present in V2.5-MCF(i)in very low content.
Although IR and NMR studies of hydroxyls species are in fairagreement, the presence of VAOH species deserves further investi-gation, as reported below.
3.3. IR characterization of surface acidic sites: adsorption of CO atnominal �196 �C
CO is widely used as a weak base to probe the presence of bothLewis and Brønsted acidic sites at the surface of several solids likeoxides, zeolites, etc. [46,47]. Being the interaction basically of an

50 M. Piumetti et al. / Microporous and Mesoporous Materials 142 (2011) 45–54
electrostatic nature, low temperatures are needed and thereforeadsorption is studied at the nominal temperature of liquidnitrogen.
Figs. 6 and 7 report difference spectra obtained after dosing CO(0.01–15.0 mbar equilibrium pressure range) on V2.5-MCF and V2.5-MCF(i) samples, respectively, outgassed at 150 �C (section a of thefigures) and 500 �C (section b of the figures). Difference spectrawere obtained by subtracting the corresponding spectra of baresamples reported in Fig. 3: negative and positive bands correspondto species either disappearing or forming upon interaction with CO,respectively. Similar results were obtained with the other samplesstudied, but will not be reported here for the sake of brevity.
After CO dosage on V2.5-MCF sample outgassed at 150 �C(Fig. 6a), three negative bands are observed in the OH stretchingregion (3800–3000 cm�1) at c.a. 3745, 3715 and 3665 cm�1, readilyassigned to (i) isolated silanols (3745 cm�1), (ii) terminal H-bonded silanols (3715 cm�1) and (iii) VAOH species (3665 cm�1)interacting with CO molecules.
When hydroxyls interact with CO by H-bonding, a red-shift ofthe corresponding OAH stretching band occurs, with formationof a new IR absorption band at lower wavenumbers: the observedshift (Dv) is a measure of hydroxyls acidity, in that the more acidicis the hydroxyls, the larger is the measured Dv [47]. In the presentcase, the following shifts were measured: (i) Dv = 3745 � 3655 =90 cm�1 for isolated silanols; (ii) Dv = 3715 � 3600 = 115 cm�1
for terminal silanols and (iii) Dv � 200 cm�1 for VAOH species.The latter species suffer a larger shift, due to their higher acidicstrength, whereas both isolated and terminal silanols suffer the
Fig. 6. IR difference spectra, in the 3800–3000 cm�1 region, recorded after dosingCO (equilibrium pressure in the 0.01–15 mbar range) at nominal�196 �C on sampleV2.5-MCF outgassed at 150 �C (a) and 500 �C (b). Insets: same difference spectra, inthe CO stretching region (2250–2050 cm�1).
Fig. 7. IR difference spectra, in the 3800–3000 cm�1 region, recorded after dosingCO (equilibrium pressure in the 0.01–15 mbar range) at nominal�196 �C on sampleV2.5-MCF(i) outgassed at 150 �C (a) and 500 �C (b). Insets: same difference spectra,in the CO stretching region (2250–2050 cm�1).
same shifts as those usually observed at the surface of amorphoussilicas. In the CO stretching region (inset to Fig. 6a), two bands format 2157 and 2138 cm�1, respectively assigned to (i) CO moleculesH-bonded to hydroxyls and (ii) liquid-like phase [47].
More acidic (both H-bonded silanols and VAOH species)hydroxyls are removed by dehydration at 500 �C as shown inFig. 6b, reporting difference spectra obtained after dosing CO onV2.5-MCF outgassed at 500 �C. In the OH stretching region, in fact,only the band of free silanols is seen to decrease upon interactionwith CO (Dv � 90 cm�1). In the CO stretching region (inset), a lessintense band due to CO absorbed on hydroxyls is observed(2157 cm�1), thus confirming that both terminal silanols andVAOH species were removed by outgassing. An additional weakband is seen at 2186 cm�1, readily assigned to CO interacting withfew un-coordinated V4+ species [46], formed after dehydration at500 �C, and acting as Lewis acidic sites. This latter result suggeststhat lattice tetrahedral V species may change their oxidation stateupon outgassing at a high temperature, as previously observedwith other V-silica systems [28,40–44,46–48].
CO dosage on sample V2.5-MCF(i) outgassed at 150 �C (Fig. 7a)brings about the following changes: both free (3740 cm�1) andH-bonded silanols (band at about 3710 cm�1) are red-shifted of100 and 114 cm�1, respectively, upon interaction with CO. As awhole, less intense bands are observed with respect to sampleV2.5-MCF, indicating that fewer hydroxyls are available at the
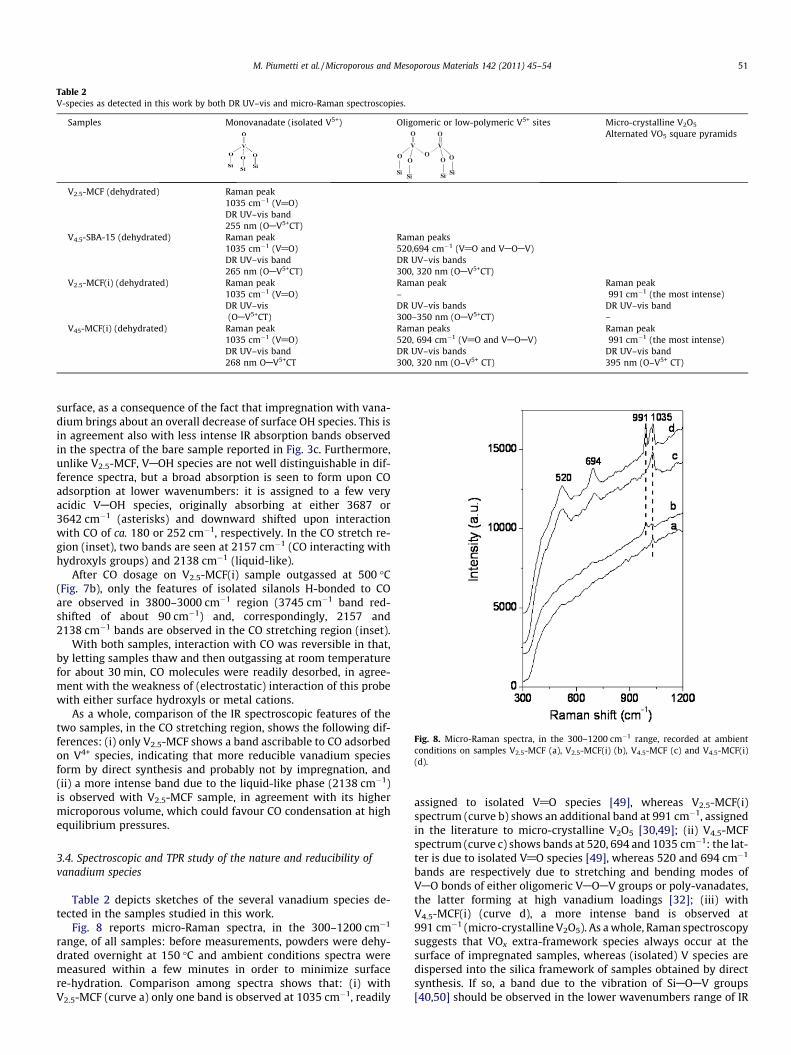
Table 2V-species as detected in this work by both DR UV–vis and micro-Raman spectroscopies.
Samples Monovanadate (isolated V5+) Oligomeric or low-polymeric V5+ sites Micro-crystalline V2O5
V
O
OO
V
O
O
Si Si
O
Si
O
Si
Alternated VO5 square pyramids
V2.5-MCF (dehydrated) Raman peak1035 cm�1 (V@O)DR UV–vis band255 nm (OAV5+CT)
V4.5-SBA-15 (dehydrated) Raman peak1035 cm�1 (V@O)
Raman peaks520,694 cm�1 (V@O and VAOAV)
DR UV–vis band265 nm (OAV5+CT)
DR UV–vis bands300, 320 nm (OAV5+CT)
V2.5-MCF(i) (dehydrated) Raman peak1035 cm�1 (V@O)
Raman peak–
Raman peak991 cm�1 (the most intense)
DR UV–vis(OAV5+CT)
DR UV–vis bands300–350 nm (OAV5+CT)
DR UV–vis band–
V45-MCF(i) (dehydrated) Raman peak1035 cm�1 (V@O)
Raman peaks520, 694 cm�1 (V@O and VAOAV)
Raman peak991 cm�1 (the most intense)
DR UV–vis band268 nm OAV5+CT
DR UV–vis bands300, 320 nm (O–V5+ CT)
DR UV–vis band395 nm (O–V5+ CT)
Fig. 8. Micro-Raman spectra, in the 300–1200 cm�1 range, recorded at ambientconditions on samples V2.5-MCF (a), V2.5-MCF(i) (b), V4.5-MCF (c) and V4.5-MCF(i)(d).
M. Piumetti et al. / Microporous and Mesoporous Materials 142 (2011) 45–54 51
surface, as a consequence of the fact that impregnation with vana-dium brings about an overall decrease of surface OH species. This isin agreement also with less intense IR absorption bands observedin the spectra of the bare sample reported in Fig. 3c. Furthermore,unlike V2.5-MCF, VAOH species are not well distinguishable in dif-ference spectra, but a broad absorption is seen to form upon COadsorption at lower wavenumbers: it is assigned to a few veryacidic VAOH species, originally absorbing at either 3687 or3642 cm�1 (asterisks) and downward shifted upon interactionwith CO of ca. 180 or 252 cm�1, respectively. In the CO stretch re-gion (inset), two bands are seen at 2157 cm�1 (CO interacting withhydroxyls groups) and 2138 cm�1 (liquid-like).
After CO dosage on V2.5-MCF(i) sample outgassed at 500 �C(Fig. 7b), only the features of isolated silanols H-bonded to COare observed in 3800–3000 cm�1 region (3745 cm�1 band red-shifted of about 90 cm�1) and, correspondingly, 2157 and2138 cm�1 bands are observed in the CO stretching region (inset).
With both samples, interaction with CO was reversible in that,by letting samples thaw and then outgassing at room temperaturefor about 30 min, CO molecules were readily desorbed, in agree-ment with the weakness of (electrostatic) interaction of this probewith either surface hydroxyls or metal cations.
As a whole, comparison of the IR spectroscopic features of thetwo samples, in the CO stretching region, shows the following dif-ferences: (i) only V2.5-MCF shows a band ascribable to CO adsorbedon V4+ species, indicating that more reducible vanadium speciesform by direct synthesis and probably not by impregnation, and(ii) a more intense band due to the liquid-like phase (2138 cm�1)is observed with V2.5-MCF sample, in agreement with its highermicroporous volume, which could favour CO condensation at highequilibrium pressures.
3.4. Spectroscopic and TPR study of the nature and reducibility ofvanadium species
Table 2 depicts sketches of the several vanadium species de-tected in the samples studied in this work.
Fig. 8 reports micro-Raman spectra, in the 300–1200 cm�1
range, of all samples: before measurements, powders were dehy-drated overnight at 150 �C and ambient conditions spectra weremeasured within a few minutes in order to minimize surfacere-hydration. Comparison among spectra shows that: (i) withV2.5-MCF (curve a) only one band is observed at 1035 cm�1, readily
assigned to isolated V@O species [49], whereas V2.5-MCF(i)spectrum (curve b) shows an additional band at 991 cm�1, assignedin the literature to micro-crystalline V2O5 [30,49]; (ii) V4.5-MCFspectrum (curve c) shows bands at 520, 694 and 1035 cm�1: the lat-ter is due to isolated V@O species [49], whereas 520 and 694 cm�1
bands are respectively due to stretching and bending modes ofVAO bonds of either oligomeric VAOAV groups or poly-vanadates,the latter forming at high vanadium loadings [32]; (iii) withV4.5-MCF(i) (curve d), a more intense band is observed at991 cm�1 (micro-crystalline V2O5). As a whole, Raman spectroscopysuggests that VOx extra-framework species always occur at thesurface of impregnated samples, whereas (isolated) V species aredispersed into the silica framework of samples obtained by directsynthesis. If so, a band due to the vibration of SiAOAV groups[40,50] should be observed in the lower wavenumbers range of IR

Fig. 9. IR spectra, in the 1500–600 cm�1 range, of samples MCF (dotted curve); V2.5-MCF (continuous curve) and V2.5-MCF(i) (bold curve) in KBr pellets.
Fig. 10. DR UV–vis spectra of samples V2.5-MCF (a), V2.5-MCF(i) (b), V4.5-MCF (c)and V4.5-MCF(i) (d), previously outgassed at 300 �C.
52 M. Piumetti et al. / Microporous and Mesoporous Materials 142 (2011) 45–54
spectra: Fig. 9 reports IR spectra (1500–600 cm�1) of KBr pellets of(i) MCF silica (dotted curve); (ii) V2.5-MCF sample and (iii) V2.5-MCF(i) sample (bold spectrum). The two band envelopes in the1300–1000 cm�1 range and 900–800 cm�1 range are assigned tothe asymmetric and symmetric stretching vibrations of SiAOASi(siloxane) groups of silica, respectively [30,49]. With V2.5-MCF sam-ple, another band is seen at 920 cm�1: a similar band, previously ob-served with both V-containing amorphous silica [40] and V-silicalite [50], was assigned to the vibration of SiO4 groups stronglypolarized by the presence of vanadium in the silica matrix. Interest-ingly, such a band is very weak with V2.5-MCF(i) (bold spectrum), inagreement with both previous literature reports on V-impregnatedsilica samples [40] and with V2.5-MCF(i) Raman spectrum thatshows the band of micro-crystalline vanadia at 991 cm�1. Such IRspectra further confirm that introduction of vanadium inside silicawalls may be obtained by direct synthesis. This should lead to differ-ent vanadium environments in samples prepared by different meth-od, as shown by DR UV–vis spectra discussed below.
Fig. 10 shows DR UV–vis spectra of powders outgassed at 300 �C:both V2.5-MCF and V2.5-MCF(i) samples (spectra a and b) show amain band at 255–260 nm, readily assigned to V5+AO charge-transfer (CT) transitions of isolated V5+ species in tetrahedralcoordination [24,35]. The slight shift in band position is probablydue to small differences in vanadium environments in samplesprepared with different methods. V2.5-MCF(i) spectrum shows anadditional shoulder at higher wavelengths (ca. 300–350 nm) dueto the contemporary presence of oligomeric V5+ species, as detectedby Raman spectroscopy [49,51]. At higher V-contents (V4.5-MCF andV4.5-MCF(i) samples, spectra c and d, respectively), the band due toV5+AO charge-transfer (CT) transitions is red-shifted, suggesting ahigher coordination number of V5+ species [31]; additional bandsat 300 and 320 nm confirm the presence of polymeric tetrahedralV5+ cations in both samples, due to a higher vanadium content[49,51]. V4.5-MCF(i) spectrum (curve d) exhibits also a bandat ca. 395 nm, assigned to octahedrally coordinated V5+ species[51], and probably due to the presence of extra-framework
micro-crystalline V2O5. Different vanadium species should havedifferent reduction behaviour, as shown by results of H2-TPRmeasurements reported in Fig. 11: samples prepared by direct syn-thesis (curves a and c) show only one maximum in the 560–570 �Crange, usually assigned to reduction of both isolated tetrahedralV@O species and low oligomeric VAOAV groups [51–53]. Withboth impregnated samples (curves b and d), reduction peaks areobserved at higher temperature (650–750 �C range) indicating thepresence of micro-crystalline V2O5 that is typically reduced above650 �C [54]. As a whole, H2-TPR profiles show the presence of morereducible and highly dispersed vanadium species in the silica wallsof V-MCF samples, whereas impregnation brings about thepreferential formation of micro-crystalline V2O5.
Fig. 12 reports 51V MAS NMR spectra of all V-MCF samples: V2.5-MCF and V4.5-MCF spectra confirm that vanadium occurs mainly astetrahedral V5+ species, the two peaks at c.a. �586 and �610 ppmindicating the probable presence of two kinds of V(V) ions, in linewith earlier data for various materials containing isolated V in dis-torted tetrahedral coordination [45,55–57].
In contrast, the 51V MAS NMR spectrum of V2.5-MCF(i) showsno signal ascribable to V(V). The absence of this signal is probablyrelated to the presence in this sample of important amounts ofparamagnetic V(IV) species, evidenced by ancillary EPR measure-ments (not reported for the sake of brevity). As a result of the pres-ence of V(IV) species, a strong interaction between electron andvanadium nucleus takes place, which can lead to strong broaden-ing and shifting of the 51V MAS NMR signal, as well as to amodification of the relaxation time of vanadium, as reportedearlier [58–60].
3.5. Catalyic activity in the decomposition of dichloromethane
Fig. 13 shows catalytic results of dichloromethane decomposi-tion under aerobic conditions in the 200–500 �C temperaturerange; both CH2Cl2 conversions and CO2 selectivities at 500 �C

Fig. 11. H2-TPR profiles of samples V2.5-MCF (a), V2.5-MCF(i) (b), V4.5-MCF (c) andV4.5-MCF(i) (d).
Fig. 12. 51V MAS NMR spectra recorded at room temperature of samples V2.5-MCF(a), V4.5-MCF (b) and V2.5-MCF(i) (c).
Fig. 13. Dichloromethane conversions under aerobic conditions as a function oftemperature over samples V2.5-MCF (j); V4.5-MCF (d); V2.5-MCF(i) (h) and V4.5-MCF(i) (s).
Table 3Dichloromethane conversion (%) and CO2 selectivity (%) measured with V2.5-MCF,V4.5-MCF, V2.5-MCF(i) and V4.5-MCF(i) catalysts at 500 �C (time on stream = 10 min).
Sample CH2Cl2 conversion (%) CO2 selectivity (%)a
V2.5-MCF 52 75V4.5-MCF 46 67V2.5-MCF(i) 23 45V4.5-MCF(i) 28 49
a CO2 was the only product measured with our experimental set up; the ‘‘missingproducts’’ could involve coke and/or adsorbed compounds.
M. Piumetti et al. / Microporous and Mesoporous Materials 142 (2011) 45–54 53
are reported in Table 3. Reference MCF silica was tested, as well,showing no conversion (not reported). As a whole, both materialsprepared by direct synthesis gave higher CH2Cl2 conversions inthe whole temperature range, reaching conversion values at500 �C that are approximately as twice as much those of impreg-nated samples. This result confirms the beneficial effect of havingdispersed (isolated or low polymeric) and highly reduciblevanadium species inside silica walls, as previously observed withV-SBA-15 systems prepared by direct synthesis [28,29]. Severaloxidation reactions are known to occur via a Mars-van Krevelenmechanism based on V5+ reduction and subsequent reoxidation;such a mechanism is favoured when vanadium species are well-dispersed in a hosting support and may readly change their oxida-tion state [28,29,40]. On the other hand, hydrophilic VAOH speciesat the surface of materials obtained by direct synthesis are know tobehave as Brønsted acidic sites [28,29,40,61] and could contributeto improve catalytic performances at low temperatures, sinceBrønsted acidic properties have been shown to play a role indichloromethane decomposition [28,29].
All prepared catalysts provided stable CH2Cl2 conversion in theconsidered temperature range (maximum reaction time tes-ted = 2.5 h) and values of both CH2Cl2 conversion and CO2 selectiv-ity were almost constant, in that after reaction catalysts werereactivated at 500 �C and several reaction-reactivation cycles wererepeated. Finally, by-products were mostly HCl, the most thermo-dynamically favored compound at high temperature, and, to aminor extent, Cl2 but only at low temperatures, in agreement withprevious studies [62].
4. Conclusions
V-containing MCF materials were obtained by direct synthesisby carefully controlling the pH during the synthesis, in order to al-low vanadium to enter silica walls. The so obtained V-MCF materialsare characterized by both higher specific surface area and micropo-rous volume than V-MCF(i) prepared by (traditional) impregnationof a MCF silica obtained according to literature method.
The introduction of vanadium into silica walls leads to a tex-tural modification of MCF, in that smaller cells and windows areobtained with respect to both reference MCF silica and impreg-nated V-MCF(i), and a modification of the surface properties takesplace, as well.
V-MCF materials prepared by direct synthesis shows indeed (i)a more hydrophilic surface with respect to V-MCF(i) samples

54 M. Piumetti et al. / Microporous and Mesoporous Materials 142 (2011) 45–54
prepared by impregnation; (ii) the presence of acidic functional-ities, namely VAOH species, behaving as Brønsted acidic sites,and V5+ species, acting as Lewis acidic sites. The latter, being highlyisolated inside silica framework, are more easily reducible thanvanadium sites obtained by impregnation, and are responsible ofhigher dichloromethane conversions at high temperature. At lowtemperatures, VAOH Brønsted acidic sites may contribute toimprove catalytic performances, as previously observed withV-SBA-15 materials prepared by direct synthesis.
Finally, the physico-chemical properties of such new materialscould be exploited for other catalytic applications, on behalf ofthe presence of highly dispersed and very active vanadium siteswithin MCF three-dimensional porous network, with the possibil-ity of overcoming the well-known problems of limited diffusion ofboth reactants and products, frequently observed with otherV-containing porous silicas.
Acknowledgments
ANR (Agence Nationale de la Recherche, France, ANR-07-BLAN-0265-02 (SAXO) project) and MIUR (Ministero dell’Istruzionedell’Università e della Ricerca, Italy, 2007498XRF_004 PRIN pro-ject) are acknowledged for financial support. The authors P.M.and L.G. warmly thank Sandra Casale from LRS for her contributionto TEM experiments.
References
[1] J.S. Beck, C.T.-W. Chu, I.D. Johnson, C.T. Kresge, M.E. Leonowicz, W.J. Roth, J.W.Vartuli, WO Patent 1991, 91/11390.
[2] J.S. Beck, J.C. Vartuli, W.J. Roth, M.E. Leonowicz, C.T. Kresge, K.D. Schmitt, C.T.-W. Chu, D.H. Olsen, E.W. Sheppard, S.B. McCullen, J.B. Higgins, J.L. Schlenker, J.Am. Chem. Soc. 114 (1992) 10834.
[3] C.T. Kresge, M.E. Leonowicz, W.J. Roth, J.C. Vartuli, J.S. Beck, Nature 359 (1992)710.
[4] X. Wang, C.C. Chen, S.Y. Chen, Y. Mou, S. Cheng, Appl. Catal. A 281 (2005) 47.[5] C.M. Crudden, M. Sateesh, M.R. Lewis, J. Am. Chem. Soc. 127 (2005) 10045.[6] S. Baskaran, J. Liu, K. Domansky, N. Kohler, X. Li, C. Coyle, G.E. Fryxell, S.
Thevuthasan, R.E. Williford, Adv. Mater. 12 (2000) 291.[7] Y. Wang, C.M. Yang, W. Schmidt, B. Spliethoff, E. Bill, F. Schüth, Adv. Mater. 17
(2005) 53.[8] P.D. Yang, G. Wirnsberger, H.C. Huang, S.R. Cordero, M.D. McGehee, B. Scott, T.
Deng, G.M. Whitesides, B.F. Chmelka, S.K. Buratto, G.D. Stucky, Science 287(2000) 465.
[9] D. Zhao, J. Feng, Q. Huo, N. Melosh, G.H. Fredrickson, B.F. Chmelka, G.D. Stucky,Science 179 (1998) 548.
[10] N.A. Melosh, P. Davidson, B.F. Chmelka, J. Am. Chem. Soc. 122 (2000) 823.[11] C.M. Yang, B. Zibrowius, W. Schmidt, F. Schuth, Chem. Mater. 16 (2004) 2918.[12] Y. Han, S.S. Lee, J.Y. Ying, Chem. Mater. 18 (2006) 643.[13] J. Fan, C. Yu, L. Wang, B. Tu, D. Zhao, Y. Sakamoto, O. Terasaki, J. Am. Chem. Soc.
123 (2001) 12113.[14] J.S. Lettow, Y.J. Han, P. Schmidt-Winkel, P. Yang, D. Zhao, G.D. Stucky, J.Y. Ying,
Langmuir 16 (2000) 8291.[15] M. Lezanska, J. Wloch, J. Niedojadlo, J. Kornatowski, Micropor. Mesopor. Mater.
111 (2008) 463.[16] P. Kustrowski, L. Chmielarz, R. Dziembaj, P. Cool, E.F. Vansant, J. Phys. Chem. B
109 (2005) 11552.[17] P. Schmidt-Winkel, W.W. Lukens, D. Zhao, P. Yang, B.F. Chmelka, G.D. Stucky, J.
Am. Chem. Soc. 121 (1999) 254.[18] D.T. On, S. Kaliaguine, J. Am. Chem. Soc. 125 (2003) 618.[19] Y.J. Han, J.T. Watson, G.D. Stucky, A. Butler, J. Mol. Catal. B 17 (2002) 1.
[20] P. Kustrowski, L. Chmielarz, R. Dziembaj, P. Cool, E.F. Vansant, J. Phys. Chem. B109 (2005) 11552.
[21] Y.-M. Liu, J. Xu, L.-C. Wang, Y. Cao, H.-Y. He, K.-N. Fan, Catal. Lett. 125 (2008)62.
[22] I. Muylaert, P. Van Der Voort, Phys. Chem. Chem. Phys. 11 (2009) 2826.[23] B.M. Weckhuysen, D.E. Keller, Catal. Today 78 (2003) 25.[24] J. Jones, J.R.H. Ross, Catal. Today 35 (1997) 97.[25] S. Krishnamoorthy, J.P. Baker, M.D. Amiridis, Catal. Today 40 (1998) 39.[26] R. Delaigle, D.P. Debecker, F. Bertinchamps, E.M. Gaigneaux, Top. Catal. 52
(2009) 501.[27] F. Bertinchamps, M. Treinen, P. Eloy, A.M. Dos Santos, M.M. Mestdagh, E.M.
Gaigneaux, Appl. Catal. B Environ. 70 (2007) 360.[28] M. Piumetti, B. Bonelli, M. Armandi, L. Gaberova, S. Casale, P. Massiani, E.
Garrone, Micropor. Mesopor. Mater. 133 (2010) 36.[29] M. Piumetti, B. Bonelli, P. Massiani, S. Dzwigaj, I. Rossetti, S. Casale, L.
Gaberova, M. Armandi, E. Garrone, Catal. Today, in press, <doi: 10.1616/j.cattod.2010.10.066>.
[30] F. Gao, Y. Zhang, H. Wan, Y. Kong, X. Wu, L. Dong, B. Li, Yi Chen, Micropor.Mesopor. Mater. 110 (2008) 508.
[31] S. Dzwigaj, M. Matsuoka, M. Anpo, M. Che, J. Phys. Chem. B 104 (2000) 6012.[32] Y.-M. Liu, W.-L. Feng, T.-C. Li, H.Y. He, W.-L. Dai, W. Huang, Y. Cao, K.-N. Fan, J.
Catal. 239 (2006) 125.[33] W.Jr. Lukens, P. Schmidt-Winkel, D. Zhao, J. Feng, G.D. Stucky, Langmuir 15
(1999) 5403.[34] P. Schmidt-Winkel, W.W. Lukens Jr., P. Yang, D.I. Margolese, J.S. Lettow, J.Y.
Ying, G.D. Stucky, Chem. Mater. 12 (2000) 686.[35] J. Sun, D. Ma, H. Zhang, C. Wang, X. Bao, D.S. Su, A. Klein-Hoffmann, G.
Weinberg, S. Mann, J. Mater. Chem. 16 (2006) 1507.[36] Y.-C. Hsu, Y.-H. Chang, C.-M. Yang, Adv. Funct. Mater. 18 (2008) 1799.[37] S.C. Hung, H.P. Lin, C.Y. Mou, Surf. Sci. Catal. 146 (2003) 105.[38] X. Cui, W.-C. Zin, W.-J. Cho, C.-S. Ha, Mater. Lett. 59 (2005) 2257.[39] B.A. Morrow, A.J. McFarlan, J. Phys. Chem. 96 (1992) 1395.[40] I. Rossetti, L. Fabbrini, N. Ballarini, F. Cavani, A. Cericola, B. Bonelli, M. Piumetti,
E. Garrone, H. Dyrbeck, E.A. Blekkan, L. Forni, J. Catal. 256 (2008) 45.[41] C.A. Fyfe, H. Strobl, G.T. Kkotailo, C.T. Pasztor, G.E. Barlow, S. Bradley, Zeolites 8
(1988) 2132.[42] C. Pazé, A. Zecchina, S. Spera, A. Cosma, E. Merlo, G. Spanò, G. Girotti, Phys.
Chem. Chem Phys. 1 (1999) 2627.[43] L.W. Beck, J.L. White, J.F. Haw, J. Am. Chem. Soc. 116 (1994) 9657.[44] A. Zecchina, S. Bordiga, G. Spoto, L. Marchese, G. Petrini, G. Leofanti, M.
Padovan, J. Phys. Chem. 96 (1992) 4991.[45] S. Dzwigaj, E.M. El Malki, M.J. Peltre, P. Massiani, A. Davidson, M. Che, Top.
Catal. 11/12 (2000) 379.[46] K.I. Hadjiivanov, G.N. Vayssilov, Adv. Catal. 47 (2002) 307.[47] A. Zecchina, C.O. Areán, Chem. Soc. Rev. 25 (1996) 187.[48] S. Dzwigaj, E. Ivanova, R. Kefirov, K. Hadjiivanov, F. Averseng, J.M. Raft, M. Che,
Catal. Today 142 (2009) 185.[49] S. Xie, E. Iglesia, A.T. Bell, J. Phys. Chem. B 105 (2001) 5144.[50] S. Dzwigaj, P. Massiani, A. Davidson, M. Che, J. Mol. Catal. A Chem. 155 (2000)
169.[51] L. Capek, R. Bulánek, J. Adam, L. Smoláková, H. Sheng-Yang, P. Cicmanec, Catal.
Today 141 (2009) 282.[52] V. Fornés, C. López, H.H. López, A. Martínez, Appl. Catal. A Gen. 249 (2003) 345.[53] F. Ying, J. Li, C. Huang, W. Weng, H. Wan, Catal. Lett. 115 (2007) 137.[54] E.P. Reddy, R.S. Varma, J. Catal. 221 (2004) 93.[55] J. Kornatowski, B. Wichterlova, M. Rozwadowski, W.H. Baur, Stud. Surf. Sci.
Catal. 84 (1994) 117.[56] B.I. Whittington, J.R. Anderson, J. Phys. Chem. 97 (1993) 1032.[57] B. Sulikowski, Z. Olejniczak, E. Wloch, J. Rakoczy, R.X. Valenzuela, V. Cortés
Corberan, Appl. Catal. A 232 (2002) 189.[58] O.B. Lapina, D.F. Khabibulin, A.A. Shubin, V.V. Terskikh, Prog. Nucl. Magn.
Reson. Spectrosc. 53 (2008) 128.[59] V.I. Bakhmutov, B.G. Shpeizer, A. Clearfield, Magn. Reson. Chem. 44 (2006) 861.[60] A. Tuel, L. Canesson, J.C. Volta, Colloids surf. A 158 (1999) 97.[61] I. Rossetti, L. Fabbrini, N. Ballarini, C. Oliva, F. Cavani, A. Cericola, B. Bonelli, M.
Piumetti, E. Garrone, H. Dyrbeck, E.A. Blekkan, L. Forni, Catal. Today 141 (2009)271.
[62] G. Ertl, H. Knözinger, F. Schüth, J. Weitkamp, Handbook of HeterogeneousCatalysis, 2nd Edition., Wiley, John & Sons, Incorporated, 2008. pp. 2397.
Copyright © 2022 FDOKUMEN