
Investigation of electrorefining of metallic alloy fuel onto solid Al cathodes

Temperature Dependence of Aliovalent-Vanadium Doping inLiFePO4 CathodesKatharine L. Harrison,† Craig A. Bridges,‡ Mariappan Parans Paranthaman,‡ Carlo U. Segre,∥
John Katsoudas,∥ Victor A. Maroni,⊥ Juan Carlos Idrobo,§ John B. Goodenough,†
and Arumugam Manthiram*,†
†Department of Mechanical Engineering, University of Texas at Austin, Austin, Texas 78712, United States‡Chemical Sciences Division and §Materials Science and Technology Division, Oak Ridge National Laboratory, Oak Ridge, Tennessee37831, United States∥Center for Synchrotron Research and Instrumentation, Physics Department & CSRRI, Illinois Institute of Technology, Chicago,Illinois 60616, United States⊥Argonne National Laboratory, Argonne, Illinois 60439, United States
*S Supporting Information
ABSTRACT: Vanadium-doped olivine LiFePO4 cathode materials have beensynthesized by a low-temperature microwave-assisted solvothermal (MW-ST)method at ≤300 °C. The samples have been extensively characterized by neutron/X-ray powder diffraction, infrared and Raman spectroscopy, elemental analysis,electron microscopy, and electrochemical techniques. The compositions of the as-synthesized materials were found to be LiFe1−3x/2Vx□x/2PO4 (0 ≤ x ≤ 0.2) with thepresence of a small number of lithium vacancies (□) charge-compensated by V4+,not Fe3+, leading to an average oxidation state of ∼3.2+ for vanadium. The vacancieson the Fe site likely provide an additional conduction pathway for Li+ ions totransfer between neighboring 1D conduction channels along the crystallographic baxis. Heating the pristine 15% V-doped sample in inert or reducing atmospheres ledto a loss of vanadium from the olivine lattice with the concomitant formation of aLi3V2(PO4)3 impurity phase; after phase segregation, a partially V-doped olivinephase remained. For comparison, V-doped samples were also synthesized byconventional ball milling and heating, but only ∼10% V could be accommodated in the olivine lattice in agreement with previousstudies. The higher degree of doping realized with the MW-ST samples demonstrates the temperature dependence of thealiovalent-vanadium doping in LiFePO4.
KEYWORDS: olivine cathodes, LiFePO4, vanadium doping, lithium-ion batteries, cathodes
■ INTRODUCTION
Conventionally, layered LiCoO2 and/or LiNi1/3Mn1/3Co1/3O2
have been used as cathode materials in lithium-ion batteries,but the transportation and grid energy-storage sectors requirenew cathode materials that are safer and less expensive.Polyanion cathodes such as Fe2(SO4)3 and Fe2(MoO4)3 werefirst pursued by Manthiram and Goodenough in the late1980s.1,2 It was recognized that the covalently bondedpolyanion groups lower the energy of redox couples throughthe inductive effect, which shifts the redox energy of coupleslike Fe2+/3+ into a useful range. Of particular interest is olivine-structured LiFePO4, which has generated significant interest inthe literature and in industry because of its high capacity andgood cycling performance.3−6 Additionally, it is thermallystable, environmentally benign, and inexpensive. However, thematerial suffers from poor electronic and ionic conductivities aswell as a power-limiting two-phase reaction during the charge−discharge process.7−10 To achieve high capacities, small
LiFePO4 particles must be synthesized, and the material mustbe coated with conducting materials.11−20
Improvements in the electrical conductivity throughaliovalent-cation doping have also been reported,21 but theseresults were later contested.22,23 Computational studies havesuggested that aliovalent doping is not energetically favorable;moreover, the unbreakable PO4
3− bonding prevents chargebalance by oxygen-vacancy formation.9,24 Despite these argu-ments, doping LiFePO4 with several different aliovalent cationsis often claimed, and many studies have reported higherelectronic conductivity and an increase in the FePO4/LiFePO4solid solution range for doped samples.25−36
Doping has been suggested to occur on the Li or Fe sites forseveral different aliovalent dopants.25−36 Of particular relevanceto this study is previous work pertaining to doping LiFePO4
Received: December 7, 2012Revised: February 7, 2013Published: February 7, 2013
Article
pubs.acs.org/cm
© 2013 American Chemical Society 768 dx.doi.org/10.1021/cm303932m | Chem. Mater. 2013, 25, 768−781

with vanadium, which has been shown to improve theelectrochemical performance and electronic conductivity.27−36
A recent computational study suggests that doping LiFePO4with V reduces the activation energy for Li-ion diffusion.37
Although there was initial disagreement regarding whether Vsubstituted on the anion or cation site, there is now generalagreement that V substitutes for Fe with the exception of onestudy that suggests that 1% doping can occur on the Lisite.28,32,36 There are also two studies that suggest that V couldnot be doped into the olivine lattice.38,39 Overall, while there isstill some disagreement in the literature regarding V doping,most studies report that ≤10% doping is possible and V existsas V3+ and/or V4+.We have recently reported the synthesis of cathodes with the
formula LiFe1−x(VO)xPO4 with 0 ≤ x ≤ 0.25 by a facile, lowtemperature microwave-assisted solvothermal (MW-ST) syn-thesis method.40 After investigating the structure andcompositions more thoroughly, we find that the formula isconsistent with LiFe1−3x/2Vx□x/2PO4 (where □ represents Fevacancies) rather than LiFe1−x(VO)xPO4, with evidence for asmall doping-dependent lithium deficiency (∼1−3%) andmixed-valent vanadium (V3+:V4+ = 4:1). The MW-STsynthesized LiFe0.775V0.15□0.075PO4 disproportionates on heat-ing to 725 °C to form Li3V2(PO4)3 and an olivine phase with alower V doping level than in the pristine MW-STLiFe0.775V0.15□0.075PO4; heating at 625 °C led to only a verysmall amount of impurity. For a comparison, we attempted toprepare 15% V-doped samples by conventional ball milling andheating, but by this approach we can accommodate only amaximum of ∼10% V in the olivine lattice. Although previousstudies have reported a maximum of 10% V doping,27−36 we areable to demonstrate at least 20% V in the olivine lattice due tothe low-temperature synthesis method employed, which canstabilize metastable phases.
■ EXPERIMENTAL SECTIONMicrowave Synthesis. The vanadium-doped samples were
prepared at ≤300 °C as described in more detail previously by amicrowave-assisted solvothermal (MW-ST) process. It involves amixing of iron acetate (STREM, 97%) and lithium hydroxidemonohydrate (Fisher, 98%) into a solution of phosphoric acid(Fisher, 85%) in tetraethylene glycol (Alfa Aesar, 99%) and thenadding vanadium triisopropoxide oxide (Alfa Aesar, 96%).40 Theprecursor solutions were prepared according to the formulasLiFe1−x(VO)xPO4 with 0 ≤ x ≤ 0.25, LiFe1−2xVx□xPO4 with 0 ≤ x≤ 0.15, and LiFe1−3x/2Vx□x/2PO4 with 0 ≤ x ≤ 0.15 in order to takeinto account different expectations for the vanadium oxidation stateand coordination environment. Fe3O4 forms as an impurity for thesamples prepared according to LiFe1−x(VO)xPO4 with 0 ≤ x ≤ 0.25,which can be subsequently removed by stirring the product solutionrepeatedly with a magnet.40
To determine the stability of the V-doped samples at elevatedtemperatures, the pristine MW-ST sample prepared according toLiFe0.775V0.15□0.075PO4 was ground and heated in flowing 5% H2−95%Ar and 100% Ar environments at various temperatures (525−725 °C)and for various times (6 and 15 h), similar to the conditions used inthe conventional high-temperature synthesis of undoped and V-dopedLiFePO4.
9,11−13,20−22,25−36 Due to the large amounts of materialneeded for all of the heating conditions, several batches of the pristinemicrowave-synthesized material were prepared. After checking XRDand ICP for consistency, the batches were mixed together, and thelarge mixture was used for all post-heating experiments to ensure thatthe pristine microwave-synthesized material was the same for each ofthe heating conditions. A similar protocol was used to prepare the 1 gbatches of powder for neutron diffraction experiments.
Conventional Synthesis. For direct solid-state synthesis ofLiFe0.775V0.15□0.075PO4, the vanadium precursor was first made bythe reaction
+ → + +V O 3H C O 2VOC O 3H O 2CO2 5 2 2 4 2 4 2 2 (1)
Water was evaporated while stirring the solution on a hot plate, andthe powder was dried in a vacuum oven at 100 °C. Inductively coupledplasma (ICP) analysis was used to determine the water content ofVOC2O4. Subsequently, the VOC2O4 was ball milled in acetone for 5days with stoichiometric amounts of iron oxalate (Fisher, 99%),ammonium dihydrogen phosphate (Fisher, 99%), and lithiumhyd ro x i d e monohyd r a t e (F i s h e r , 9 8%) t o p r ep a r eLiFe0.775V0.15□0.075PO4. The products were dried, ground, and heatedin flowing 5% H2−95% Ar or 100% Ar atmospheres for 3 h at 350 °Cfollowed by 6 h at temperatures ranging from 525 to 725 °C, which issimilar to known conventional synthesis methods for LiFePO4 and V-doped LiFePO4. Additionally, LiFePO4 was also made by ball millingand heating with stoichiometric amounts of precursors. A namingscheme is employed to refer to the pristine and subsequently heatedsamples, defined by “synthesis method−sample−furnace heatingatmosphere−furnace heating temperature−furnace heating time.” Forexample, MW-ST V-doped LiFePO4 that is then heated at 525 °C in5% H2 and 95% Ar for 6 h will be referred to as MW-LFVP-H2-525-6h.The corresponding conventionally prepared sample will be referred toas CONV-LFVP-H2-525-6h. LiFePO4 samples will be described with“LFP” rather than “LFVP”. The relevant samples will be latersummarized in Table 4. The samples referred to by this namingconvention were prepared by mixing precursors in the appropriateproportions to form LiFe0.775V0.15□0.075PO4.
For comparison, Li3V2(PO4)3 was prepared by a procedure similarto that for the conventionally prepared LiFe0.775V0.15□0.075PO4 samplesdescribed above, but with the appropriate stoichiometry forLi3V2(PO4)3. Finally, β-LiVOPO4 was prepared by a conventionalsol−gel method, as described elsewhere.40,41
Materials Characterization. Neutron powder diffraction (NPD)data were collected at 295 K on the HB2A beamline at the High FluxIsotope Reactor (HFIR) at Oak Ridge National Laboratory.Isotopically enriched lithium (7Li; scattering length of −2.22 fm)was used to remove uncertainties in the bound coherent neutronscattering length needed for Rietveld refinements of the neutrondiffraction data. Such uncertainties can exist due to variations in theisotopic composition of different lithium sources. The samplesconsisted of approximately 1 g of powder and were contained in 8-mm vanadium cans. Data were collected for each sample over tworanges, 10−130° 2θ and 33−153° 2θ, followed by merging of the datato produce a final file over the range of 10−153° 2θ with a step size of0.05° 2θ for refinement. Data were collected by alternating betweeneach range. With 2 h data collection time per range and collection ofmultiple data sets per sample, the total time of data collection was 12 hfor the 5% and 10% V-doped samples and 10 h for the 15% V-dopedsample. Data files containing the standard deviation (ESD) for eachpoint were used to ensure the appropriate calculation of errors duringRietveld refinement. The wavelength was selected using a Ge [115]monochromator, and the wavelength was determined to be 1.5395 Åby refinement against a silicon standard. NPD data were analyzed byRietveld refinement42 with GSAS/EXPGUI43,44 and Fullprof/WinPLOTR.45,46 X-ray powder diffraction (XRD) data were collectedwith a Rigaku Ultima IV instrument with Cu Kα radiation andanalyzed by Rietveld refinement with Fullprof/WinPLOTR.
X-ray absorption data were taken at the Fe and V K-edges intransmission at the MRCAT (Sector 10, Advanced Photon Source)bending magnet beamline at Argonne National Laboratory. Sampleswere prepared by grinding between 5 and 20 mg (depending on V andFe composition) of finely powdered specimens with boron nitride andpolyvinylpyrrolidone (PVP). The mixtures were then pressed into 7-mm-diameter pellets of less than 1 mm overall thickness. For LiFePO4samples, a 50/50 mix of (25 mg) boron nitride and (25 mg) PVP wasused for aiding easy sample release from the press and to bind a betterpellet (with 5 mg of sample). The X-ray energy was selected by a watercooled Si(111) monochromator with a 50% detuned second crystal for
Chemistry of Materials Article
dx.doi.org/10.1021/cm303932m | Chem. Mater. 2013, 25, 768−781769

the elimination of harmonics. Data were taken in transmission modewith metal (Fe and V) reference foil downstream of the sample. The20-cm-long ion chambers contained flowing gas mixtures tuned toobtain 10% absorption in Io and 80% absorption in It and Iref.X-ray absorption near edge spectroscopy (XANES) data were
processed with Athena47,48 by first aligning the reference spectra for alldata sets and then adjusting the normalization parameters so as to haveall spectra match before the edge and approximately 150 eV above theedge. Least-squares fitting was performed by Athena, with all fractionsconstrained to add up to 1 and requiring any energy shift to beidentical for all standards.The Raman measurements were made with a Renishaw inVia
Raman Microscope at Argonne National Laboratory equipped with aset of four lasers that provide excitation wavelengths at 785, 633, 514,442, and 325 nm. The samples (in powder form) were loaded into athreaded Teflon holder equipped with a rubber O-ring seal to preventcontact of the sample with ambient atmosphere. In this embodiment,the powder is pressed between a stainless backing disc and a BaF2window (10 mm in diameter and 2 mm thick). Raman spectra wererecorded through the BaF2 window with a 50-X focusing/collectionoptic with an NA of 0.5. The excitation laser was brought to a focus atthe sample/BaF2 interface, and the beam was spread to a circular areaapproximately 10 μm in diameter. The effective laser power densityused in these measurements did not exceed 1 mW/μm2.Scanning transmission electron microscopy (STEM) images were
obtained on a Hitachi S5500 SEM/STEM microscope with energydispersive spectroscopic (EDS) capability at the University of Texas atAustin. Fourier transform infrared (FTIR) spectra data were collectedwith a PerkinElmer BX FTIR spectrometer at the University of Texasat Austin. Pellets for FTIR analysis were prepared by grinding andpressing samples with dried KBr powder.To make electrodes, 75 wt % active material was ground with 12.5
wt % each conductive carbon and teflonated acetylene black (TAB).Composite electrodes were made by rolling the ground material intothin sheets and cutting out 0.64 cm2 circular disks with a punch. Eachelectrode contained ∼5 mg of active material. The electrodes weredried overnight in a vacuum oven at 115 °C. CR2032 coin cells werethen assembled in an Ar-filled glovebox with metallic lithium as theanode, Celgard polypropylene separator, and 1 M LiPF6 in 1:1 diethylcarbonate/ethylene carbonate as the electrolyte. A RadiometerAnalytical Voltalab PGZ402 potentiostat was used to collect cyclicvoltammetry (CV) data with a two-electrode coin cell assembly at arate of 0.1 mV/s. Coin cells were tested with an Arbin battery cycler,and first charge−discharge curves at a rate of C/10 are reported.
■ RESULTS AND DISCUSSION
Characterization of Pristine MW-ST V-Doped LiFePO4Samples. The present work clarifies and expands upon ourprevious report of V-doped LiFePO4 synthesized by the MW-ST method.40 Synthesis of ‘LiFe1−x(VO)xPO4’ (0 ≤ x ≤ 0.25)cathodes was initially reported since a vanadyl precursor wasused in the synthesis and FTIR spectra showed bands at thesame location as the VO bond in LiVOPO4.
40,49 We usesingle quotation marks around ‘LiFe1−x(VO)xPO4’ to indicatethat this was the intended composition in the sense thatp recur sor s were mixed in ra t ios accord ing to‘LiFe1−x(VO)xPO4.’ However, as was discussed in our previouswork and as we will briefly describe here,40 ‘LiFe1−x(VO)xPO4’is not the composition that actually formed. Electrochemicaldata for ‘LiFe1−x(VO)xPO4’ also showed activity in the samevoltage ranges as LiVOPO4, and XPS analysis was consistentwith an oxidation state of V4+.40 However, upon closerexamination of the olivine structure, we recognized that thehexagonal, close packed oxygen array prevents accommodationof large (VO)2+ ions in the octahedral sites due to sizeconstraints and the steric hindrance associated with adding anextra oxide ion into the lattice. Moreover, attempts to
synthesize ‘LiFe1−x(VO)xPO4’ resulted in Fe3O4 impurity,40
further suggesting that ‘LiFe1−x(VO)xPO4’ is not the correctformula and that iron vacancies are present in the structure. IfV4+ (rather than (VO)2+) substitution occurs in these samples,‘LiFe1−2xVx□xPO4’ should be the expected formula. Note that avanadyl bond could still occur from local V displacementtoward one of the oxide ions in the VO6 octahedra in a mannersimilar to that in LiVOPO4.
50
To examine whether ‘LiFe1−2xVx□xPO4’ (V4+) cathodesform, we mixed precursors stoichiometrically to obtain‘LiFe1−2xVx□xPO4’ with x = 0.05, 0.10, and 0.15 by ourp r e v i o u s l y d e s c r i b e d MW-ST me t hod . 4 0 Th e‘LiFe0.80V0.10□0.10PO4’ and ‘LiFe0.90V0.05□0.05PO4’ materialsformed phase-pure olivine samples according to XRD data,but attempts to prepare ‘LiFe0.70V0.15□0.15PO4’ resulted inLi3PO4 impurity (see Supporting Information Figure S1).Because this material was clearly deficient in Fe, the amount ofFe precursor was then increased with constant V:P:Li ratiosuntil the Li3PO4 impurity disappeared. A phase-pure sampleformed (with no Li3PO4 or Fe3O4) when the Fe/P ratio was∼0.78−0.79. Furthermore, ICP data, shown in Table 1, indicate
that a l l of the samples prepared according to‘LiFe1−2xVx□xPO4’ had higher iron contents than expectedfrom the precursor stoichiometry. These results suggest anoxidation state closer to V3+ than V4+; a V3+ oxidation stateimplies LiFe1−3x/2Vx□x/2PO4. We also found that if we washedthe samples with isopropyl alcohol (in addition to normalacetone washing), the lithium content found by ICP apparentlydecreased a few percent (although the decrease was withinerror of the ICP measurements), which may indicate slightlithium deficiency in the olivine structure. The lithiumhydroxide precursor is not very soluble in the synthesis solvent(TEG) at room temperature or in the acetone used to wash thesamples, although it has limited solubility in isopropyl alcohol.We also synthesized LiFePO4 with excess Li in the precursorsolution and the ICP data revealed excess Li in the product.Since LiFePO4 accommodates only one Li+, these resultsindicate that excess Li precursor does not wash out completelyin acetone after a reaction. Therefore, lithium deficiency in theV-doped samples with an acetone wash may not be adequatelydetected by elemental analysis.ICP (Table 1) data and synthesis results (Supporting
In fo rma t ion F igu re S1) sugge s t a fo rmu l a o fLiFe1−3x /2Vx□x /2PO4 (implying V3+) rather than‘LiFe1−2xVx□xPO4’ or ‘LiFe1−x(VO)xPO4’ (implying V4+).Again, we use single quotes around these two formulas to
Table 1. ICP Data of the V-Doped Samples PreparedAccording to ‘LiFe1−x(VO)xPO4’, ‘LiFe1‑2xVx□xPO4’, andLiFe1‑3x/2Vx□x/2PO4
intended sample impuritya Li/Pb Fe/Pb V/Pb
‘LiFe0.90V0.05□0.05PO4’ none 0.99 0.92 0.05‘LiFe0.80V0.10□0.10PO4’ none 1.00 0.83 0.10‘LiFe0.70V0.15□0.15PO4’ Li3PO4 1.00 0.74 0.15LiFe0.775V0.15□0.075PO4 none 1.00 0.79 0.14LiFe0.775V0.15□0.075PO4
c none 0.97 0.79 0.15‘LiFe0.85(VO)0.15PO4’ Fe3O4 (removed) 1.02 0.77 0.16‘LiFe0.75(VO)0.25PO4’ Fe3O4 (removed) 0.99 0.70 0.24
a“none” means no crystalline impurities were detected by XRD or bystirring with a magnet. bErrors in ICP ratios are estimated to bearound 2−3%. cWashed with isopropyl alcohol.
Chemistry of Materials Article
dx.doi.org/10.1021/cm303932m | Chem. Mater. 2013, 25, 768−781770

remind the reader that precursors were mixed in the ratioscorresponding to these formulas. However, the actual formulais LiFe1−3x/2Vx□x/2PO4. As shown in Table 1, mixingprecursors to form ‘LiFe1−x(VO)xPO4’ or LiFe1−3x/2Vx□x/2PO4essentially leads to the same product after the Fe3O4 impurity isremoved. Note that the Fe/P ratio for ‘LiFe0.70V0.15□0.15PO4’differs, due to the fact that the ICP ratios consist ofcontributions from both the olivine and Li3PO4 impurityphases and the Li3PO4 impurity cannot simply be removed asin the case of the Fe3O4 impurity. The formulaLiFe1−3x/2Vx□x/2PO4 implies V3+, which disagreed with ourprevious analysis of XPS data showing V peaks at locationssimilar to those in LiVOPO4,
40 indicating a V4+ oxidation state.A V3+ standard was not analyzed for comparison in ourprevious publication.40 New analysis revealed that we could notdistinguish between Li3V2(PO4)3 (V3+ standard) and β-LiVOPO4 (V4+ standard) with XPS. XPS analysis iscomplicated by many factors. It is a surface sensitive technique,and the charge compensation used during data collection forinsulating samples like LiFePO4 necessitates calibration of thedata to a common C or O peak location,51 which cancomplicate the analysis. We were unable to distinguish betweenour V3+ and V4+ standards with XPS regardless of whether wecalibrated the data to C 1s or O 1s peak locations. The splittingbetween V3+ and V4+ has been previously demonstrated to besmall (0.1−0.5 eV), and there is comparatively large variation inthe literature for the V 2p3/2 peak location for Li3V2(PO4)3(∼1.9 eV).51−54
To determine the oxidation state without the difficultiesassociated with XPS and to take advantage of bulk rather thansurface sensitivity, we collected XANES data (see SupportingInformation Figure S2) on samples prepared according to theformulas ‘LiFe1−x(VO)xPO4’ (x = 0.05, 0.10, 0.15),‘L iFe 1− 2 xV x□ xPO4 ’ (x = 0 .05 and 0 .10) , andLiFe1−3x/2Vx□x/2PO4 (x = 0.15). A subset of these samplesare compared to LiVOPO4 and Li3V2(PO4)3 standards inFigure 1. The standards show spectra consistent with theliterature.55 The pre-edge feature is indicative of VO6 distortionand arises because of the 1s → 3d transition for V which ispossible due to V 3d/V 4p and O 2p mixing. LiVOPO4 has amuch larger pre-edge peak than Li3V2(PO4)3 because the VObond in LiVOPO4 leads to a significant distortion, whereas
Li3V2(PO4)3 has much more symmetric octahedra. ForLi3V2(PO4)3, there is a double peak, which reflects thecrystal-field splitting of the V 3d orbitals into t2g and egsets.56−58 The V-doped LiFePO4 samples show larger pre-edge peaks than Li3V2(PO4)3, but smaller pre-edge peaks thanLiVOPO4, indicating that the VO6 octahedra are less distortedthan in LiVOPO4, but more distorted than in Li3V2(PO4)3. It isinteresting to note that there is a slight decrease in pre-edgeintensity with increasing V doping levels, which is consistentwith previous results on V-doped LiFePO4 samples.
28 The Voxidation state can be estimated by least-squares fitting of thestandards. The estimated V oxidation states for the samples arepresented in Supporting Information Table S1. The fit(detailed in Supporting Information Figure S2) suggests amixed oxidation state consisting of 77−88% V3+ and 12−23%V4+. Although this is only an estimate, the XANES (Figure 1and Supporting Information S2), ICP (Table 1), and synthesisresults (Supporting Information Figure S1) all suggest that theoxidation state of V is much closer to V3+ than V4+ or (VO)2+ aswas originally reported. The edge position of the V-dopedsample does not exactly match that of the V3+ standard andcorresponds to an estimated oxidation state of V3.2+. TheXANES data show that there is no systematic difference inoxidation state between the samples prepared according todifferent formulas, indicating a preferred stoichiometry nearLiFe1−3x/2Vx□x/2PO4, with Fe2+ and V3.2+. There is a Li3PO4impur i ty when mix ing precur sors accord ing to‘LiFe1−2xVx□xPO4’ and Fe3O4 forms when mixing precursorsaccording to ‘LiFe1−x(VO)xPO4’, reflecting the fact that theseare not the preferred stoichiometry.XANES data (Supporting Information Figure S3) were also
taken on the Fe edges and were compared to commercialFePO4·xH2O, MW-ST LiFePO4, and conventionally preparedLiFePO4. The edge positions and pre-edge regions for the V-doped samples and LiFePO4 (Fe2+ standards) are almostidentical and are distinctly different from the spectrum for theFePO4 (Fe3+) standard. The edge position shows no changefrom the LiFePO4 standards, and there is little change in thepre-edge feature, indicating that the FeO6 octahedra are notsignificantly changed by the V doping, in agreement with theliterature.28
In our initial publication on V-doped LiFePO4,40 we
discussed a shoulder in FTIR measurements around the samelocation as the VO bond in LiVOPO4. Since V3+ does notform a VO bond and because we have only a small amountof V4+ in the V-doped samples, it is unlikely that the FTIRshoulder around 900 cm−1 (discussed in more detail in ourprevious publication40) is indicative of VO. To betterunderstand the FTIR shoulder, we performed the Ramanspectroscopy measurements shown in Figure 2. Intensefluorescence obscured some details of the Raman spectralpatterns from the Fe-containing samples. Through the use oflow laser excitation power it was possible to avoid burning/decomposition of the samples, such that spectra were obtainedfor LiFePO4, 15% V-doped LiFePO4, and LiVOPO4. It is clearthat, unlike LiVOPO4, there is no peak around 882 cm−1
corresponding to a VO bond for the V-doped LiFePO4sample.49 Thus, the shoulder around 900 cm−1 seen in theFTIR patterns40 is not indicative of a VO bond in thesesamples.In our previous study,40 we presented lattice parameters
indicating that the unit-cell volume decreases with increasingdoping levels, which is consistent with the formation of cation
Figure 1. V edge XANES data of V-doped LiFePO4 samples andstandards, with the inset showing an expanded region of the V pre-edge. With the exception of the sample LiFe0.775V0.15□0.075PO4, theformulas for the V-doped LiFePO4 samples represent the intendedsample compositions, and the precursor ratios that were used forsynthesis, rather than the actual compositions.
Chemistry of Materials Article
dx.doi.org/10.1021/cm303932m | Chem. Mater. 2013, 25, 768−781771

vacancies to balance the higher charge from the V dopant. Toobtain more accurate values for the lattice parameters, a Siinternal standard was used and Rietveld refinement wasemployed. The lattice parameter values presented in Table 2confirm a decreasing unit-cell volume with increasing V doping.The occupancies of V and Fe were also estimated (Table 2).
Convergence could not be reached through attempts to restrainthe total cation charge to be equal to 3+ (to balance withPO4
3−). Since X-rays are not sensitive to Li, it would be difficultto determine the lithium content through the refinement usingXRD data, so the Li occupancy was assumed to be unity and allof the V was assumed to be on the Fe site. A restraint wasplaced such that the total charge on the iron site had to add upto 2+ (including Fe, V, and vacancies). The oxidation state of Vwas assumed to be 3.2+ for this analysis based on the averageoxidation state found from the XANES data. Although 3.2+ isonly an estimate for the V oxidation state, this assumption leadsto good agreement between the ICP data and the XRD-refinedV occupancies. However, if V3+ is assumed instead, the resultsare still reasonable within error. For example, structuralrefinement of the 15% V-doped structure assuming V3.2+
results in an occupancy of 0.149(11) and assuming V3+ resultsin an occupancy of 0.172(13). The error bars for these valuesoverlap. Attempts to add analogous restraints on the Li site ledto nonphysical results. More discussion regarding theassumptions made during the refinement is given in theSupporting Information.Rietveld refinement using the XRD data support V and Fe
occupancies similar to the expected values from ICP in thesehighly doped samples. However, the V occupancy of the 25%V-doped sample was found to be slightly lower than expected,indicating a solubility limit below 25% V from the 300 °Csynthesis.As neutron diffraction is sensitive to Fe and Li, but not V, it
can be used to estimate the Fe and Li occupancies. Neutron
diffraction was performed for the 5, 10, and 15% V-dopedsamples, and Table 3 shows a summary of the results. It shouldbe noted that the 25% V sample is difficult to synthesize inlarge amounts required for neutron diffraction due to the highpressure generated by the low-boiling-point V precursor used inthe MW-ST synthesis. Therefore, the 25% V-doped sample wasnot included in the neutron analysis.The lattice parameters found by neutron diffraction are
similar to those found from XRD, as is shown in Table 3. Fitsto the neutron data with no chemical constraints and the Voccupancy set at the nominal value are physically reasonable,with the implication that the occupancies are consistent withFe2+ and V3+ within error. A large Li displacement parameter(Uiso) may relate, in part, to static disorder, but it is difficult tomodel adequately by Rietveld refinement using the availabledata. Attempts to refine with the vanadium oxidation stateconstrained to V4+ produced unphysical results. It is also worthnoting that the neutron refinement results suggest a smallamount of Li deficiency in the samples with higher V dopinglevels, which is consistent with the presence of a small amountof V4+ to give charge balance on the Fe site (in agreement withXANES oxidation state analysis). A representative neutronrefinement fit is shown in Supporting Information Figure S7.It is also worth noting the possibility that the vacancies on
the Li site suggested by the NPD results for higher V dopinglevels could represent a small amount of doping on the Li site,given that NPD is not sensitive to V. Attempts to refine Fe onthe Li site resulted in ∼0% Fe occupancy within error for all Vdoping levels. While 1% V doping on the Li site has beenreported,36 it is unlikely that large amounts of V would bepresent on the Li site since our other experiments (ICP,synthesis results in Supporting Information Figure S1, andXRD refinement) all are consistent with Fe site doping. Also, Vdoping on the Li site is reported to cause an increase in unit cellvolume,36 while we observe a significant decrease in the unitcell volume with V doping. Our volume decrease is consistentwith the many studies also showing V doping on the Fe site.Furthermore, at the high doping levels presented in this work,there would be significant capacity loss if the majority of thedoping occurred on the Li site, which is not consistent with ourelectrochemical results. Therefore, we believe that the majorityof the doping occurs on the Fe site, but there is some evidencefrom the neutron diffraction data that suggests a small amountof V may be present on the Li site for the higher V-dopedsamples.Further insight into structure and oxidation state can be
provided by STEM and EELS, shown in SupportingInformation Figure S4. EELS data confirm an oxidation stateclose to V3+, as demonstrated by the vanadium L3/L2 ratio of1.61 ± 0.08.59 High-angle annular dark-field STEM imagesclearly show the presence of defects in the V-doped LiFePO4samples, which likely represent a small amount of Fe or V on
Figure 2. Raman spectra of LiFePO4, V-doped LiFePO4 preparedaccording to LiFe0.775V0.15□0.075PO4, and LiVOPO4.
Table 2. Rietveld Refinement Results Using the X-ray Diffraction Data of Undoped and V-Doped LiFePO4 (V-Doped SamplesPrepared According to LiFe1‑3x/2Vx□x/2PO4)
sample a (Å) b (Å) c (Å) V (Å3) Feocc Vocc χ2
LiFePO4 10.32093(20) 6.00127(12) 4.69262(9) 290.655(10) 1.555% V 10.31193(21) 5.99441(12) 4.69345(9) 290.121(10) 0.933(18) 0.042(11) 1.9210% V 10.30262(22) 5.98984(13) 4.69563(10) 289.772(11) 0.823(17) 0.111(11) 1.7015% V 10.27589(25) 5.97117(14) 4.69939(11) 288.350(12) 0.764(18) 0.149(11) 1.4025% V 10.24307(34) 5.95064(19) 4.70406(14) 286.726(16) 0.689(17) 0.195(11) 1.44
Chemistry of Materials Article
dx.doi.org/10.1021/cm303932m | Chem. Mater. 2013, 25, 768−781772

the Li site, though this may not be representative of the bulk.This possibility is discussed further in the SupportingInformation.Effect of Temperature on V-Doped LiFePO4 Samples.
Since we are able to incorporate at least 20% V into the olivinelattice while other studies have been limited to 10% orless,27−36 we investigated whether the high-doping levels aredue to the low-temperature MW-ST synthesis method.Accordingly, we prepared the 15% V sample by mixingp re cu r so r s i n the app rop r i a t e r a t i o s to fo rmLiFe0.775V0.15□0.075PO4, and we have heated it at 525, 625,
and 725 °C in Ar and 5% H2−95% Ar environments. Wecompare these results to V-doped LiFePO4 prepared byconventional ball milling and high-temperature heating.Samples are identified by the naming scheme given in theExperimental Section and summarized in Table 4.XRD patterns are shown in Figure 3 for the as-prepared
MW-LFP-unheated and MW-LFVP-unheated samples as wellas the MW-ST samples subsequently heated in 5% H2−95% Arat various temperatures. Results for the samples heated in Arand 5% H2−95% Ar were found to be very similar, so only thesamples heated in 5% H2−95% Ar are shown here. The XRD
Table 3. Rietveld Refinement Results for Samples Prepared According to ‘LiFe1−x(VO)xPO4’ Using Neutron Diffraction DataCollected at Room Temperaturea
samples [Li at (0,0,0)] samples (Li off-site)
5% V 10% V 15% V 5% V 10% V 15% V
a (Å) 10.3122(7) 10.2986(7) 10.2826(8) 10.3115(7) 10.2980(7) 10.2820(8)b (Å) 5.9963(4) 5.9840(4) 5.9714(5) 5.9959(4) 5.9838(4) 5.9712(4)c (Å) 4.6982(4) 4.7003(3) 4.7018(4) 4.6979(4) 4.7001(3) 4.7016(4)V (Å3) 290.51(6) 289.67(6) 288.70(7) 290.46(6) 289.63(6) 288.66(6)UisoLi 2.4(3) 2.4(3) 2.1(4) 1.0(3) 0.3(4) −0.6(4)b
Liocc 1.04(3) 0.98(3) 0.94(3) 1.04(3) 0.92(3) 0.92(3)c
Feocc 0.916(5) 0.855(5) 0.801(6) 0.923(5) 0.860(5) 0.808(6)Vocc 0.05 0.10 0.15 0.05 0.10 0.15Fen+ 1.97 2.01 2.01 1.96 2.02 2.02Vn+ 2.52 3.12 3.05 2.28 3.20 3.12χ2 2.24 2.98 3.43 2.17 2.92 3.30wRp 0.0334 0.0313 0.0374 0.0329 0.0309 0.0367
aFor the Fe oxidation state calculation, V3+ was assumed. For the V oxidation state calculation, Fe2+ was assumed. bThe Uiso values have beenmultiplied by 100, and have units of Å2. cFor the Li off-position refinements, the refined occupancy has been multiplied by a factor of 2 forcomparison with the refinements with Li at (0,0,0). The multiplicity of Li off-position is 8, rather than 4 at (0,0,0).
Table 4. Summary of As-Prepared and Post-Heated Samples of Undoped and V-Doped LiFePO4a
sample intended product synthesis method MW temp. MW time furnace temp. furnace time furnace atmosphere
MW-LFP-unheated LiFePO4 MW 300 °C 30 min N/A N/A N/AMW-LFPdef-unheated LiFe0.85PO4 MW 300 °C 30 min N/A N/A N/AMW-LFP-H2-725-6h LiFePO4 MW 300 °C 30 min 725 °C 6 h 5% H2
MW-LFVP-unheated LiFe0.775V0.15PO4 MW 300 °C 30 min N/A N/A N/AMW-LFVP-H2-525-6h LiFe0.775V0.15PO4 MW, heat 300 °C 30 min 525 °C 6 h 5% H2
MW-LFVP-H2-625-6h LiFe0.775V0.15PO4 MW, heat 300 °C 30 min 625 °C 6 h 5% H2
MW-LFVP-H2-725-6h LiFe0.775V0.15PO4 MW, heat 300 °C 30 min 725 °C 6 h 5% H2
MW-LFVP-Ar-525-6h LiFe0.775V0.15PO4 MW, heat 300 °C 30 min 525 °C 6 h ArMW-LFVP-Ar-625-6h LiFe0.775V0.15PO4 MW, heat 300 °C 30 min 625 °C 6 h ArMW-LFVP-Ar-725-6h LiFe0.775V0.15PO4 MW, heat 300 °C 30 min 725 °C 6 h ArMW-LFVP-Ar-525-15h LiFe0.775V0.15PO4 MW, heat 300 °C 30 min 525 °C 15 h ArMW-LFVP-Ar-625-15h LiFe0.775V0.15PO4 MW, heat 300 °C 30 min 625 °C 15 h ArMW-LFVP-Ar-725-15h LiFe0.775V0.15PO4 MW, heat 300 °C 30 min 725 °C 15 h ArCONV-LFP-Ar-725-6h LiFePO4 ball mill, heat N/A N/A 725 °C 6 h ArCONV-LFPdef-Ar-725-6h LiFe0.85PO4 ball mill, heat N/A N/A 725 °C 6 h ArCONV-LFP-H2-525-6h LiFePO4 ball mill, heat N/A N/A 525 °C 6 h ArCONV-LFP-H2-625-6h LiFePO4 ball mill, heat N/A N/A 625 °C 6 h ArCONV-LFP-H2-725-6h LiFePO4 ball mill, heat N/A N/A 725 °C 6 h ArCONV-LFVP-H2-525-6h LiFe0.775V0.15PO4 ball mill, heat N/A N/A 525 °C 6 h 5% H2
CONV-LFVP-H2-625-6h LiFe0.775V0.15PO4 ball mill, heat N/A N/A 625 °C 6 h 5% H2
CONV-LFVP-H2-725-6h LiFe0.775V0.15PO4 ball mill, heat N/A N/A 725 °C 6 h 5% H2
CONV-LFVP-Ar-525-6h LiFe0.775V0.15PO4 ball mill, heat N/A N/A 525 °C 6 h ArCONV-LFVP-Ar-625-6h LiFe0.775V0.15PO4 ball mill, heat N/A N/A 625 °C 6 h ArCONV-LFVP-Ar-725-6h LiFe0.775V0.15PO4 ball mill, heat N/A N/A 725 °C 6 h ArLi3V2(PO4)3 Li3V2(PO4)3 ball mill, heat N/A N/A 725 °C 6 h 5% H2
LiVOPO4 LiVOPO4 sol−gel, heat N/A N/A 500 °C 4 h AiraNote that all V-doped samples were prepared according to LiFe0.775V0.15□0.075PO4.
Chemistry of Materials Article
dx.doi.org/10.1021/cm303932m | Chem. Mater. 2013, 25, 768−781773

patterns for MW-LFVP-H2-525-6h and MW-LFVP-H2-625-6hclosely resemble that for MW-LFVP-unheated with no obviousimpurity phases. Closer inspection of the MW-LFVP-H2-625-6h sample (Supporting Information Figure S5) reveals a small
number of impurity peaks corresponding to monoclinicLi3V2(PO4)3. Conversely, the MW-LFVP-H2-725-6h samplehas obvious impurity peaks that can be identified easily asLi3V2(PO4)3. Several studies28−30,32,33,60 have shown that aLi3V2(PO4)3 impurity forms with high-temperature synthesiswhen substituting V into the olivine lattice at levels above 5−10%, so this result was anticipated.XRD patterns for the post-heated microwave-synthesized
samples can be compared to the LiFe0.775V0.15□0.075PO4samples synthesized by conventional ball milling and heating(CONV-LFVP in Figure 3). Li3V2(PO4)3 peaks are detectablein the samples at all three heating temperatures in contrast tothe MW-ST synthesized and heated samples which showedmajor impurity peaks at 725 °C and slight impurity peaks at625 °C. To eliminate any possibility that different heatingconditions were responsible for the difference in theLi3V2(PO4)3 formation, we heated the MW-ST sample andthe precursors for the conventionally doped samples in thesame tube furnace in adjacent crucibles. This result wasrepeatable, which confirms that the MW-ST synthesis providesa product with higher doping levels that is stable at elevatedtemperatures. If the V had not been present within the olivinelattice, the V should have formed Li3V2(PO4)3, as it did in theconventionally prepared samples. Even after 15 h of heating inAr, the microwave-synthesized LFVP sample showed a phase-pure pattern at 525 and 625 °C (Supporting InformationFigure S5).As shown in Tables 2 and 3, in addition to an increase in the
length of the c axis, there is a systematic decrease in unit-cellvolume (and a and b axes lengths) with increasing V doping.Therefore, an increase in unit-cell volume and decrease in c axislength are expected if heating results in V being leached out
Figure 3. XRD patterns of the as-prepared and post-heated samples ofundoped and V-doped LiFePO4 with an internal Si standard. Note thata l l V - dop ed s amp l e s we r e p r e p a r e d a c co r d i n g t oLiFe0.775V0.15□0.075PO4.
Table 5. Summary of Lattice Parameters of As-Prepared and Post-Heated Samples of Undoped and V-Doped LiFePO4 Obtainedby Rietveld Refinement Using XRD Dataa
sample a (Å) b (Å) c (Å) V (Å3) χ2
MW-LFP-unheated 10.32093(20) 6.00127(12) 4.69262(9) 290.655(10) 1.55MW-LFPdef-unheated 10.32392(14) 5.99971(8) 4.69249(6) 290.655(7) 2.66MW-LFP-H2-700-6h 10.32653(8) 6.00370(5) 4.69084(4) 290.820(4) 2.44MW-LFVP-unheated 10.27589(25) 5.97117(14) 4.69939(11) 288.350(12) 1.40MW-LFVP-H2-525-6h 10.28668(14) 5.97441(8) 4.69636(6) 288.623(7) 1.94MW-LFVP-H2-625-6h 10.29490(14) 5.98145(9) 4.69423(6) 289.063(7) 2.21MW-LFVP-H2-725-6h 10.31397(10) 5.99741(6) 4.69195(5) 290.230(5) 2.67MW-LFVP-Ar-525-6h 10.28145(15) 5.97428(9) 4.69722(7) 288.523(7) 1.88MW-LFVP-Ar-625-6h 10.28643(14) 5.97664(9) 4.69590(6) 288.696(7) 2.24MW-LFVP-Ar-725-6h 10.31407(10) 5.99812(6) 4.69239(5) 290.295(5) 2.52MW-LFVP-Ar-525-15h 10.28433(16) 5.97423(9) 4.69697(7) 288.586(8) 1.85MW-LFVP-Ar-625-15h 10.28678(14) 5.97686(8) 4.69540(6) 288.686(7) 2.11MW-LFVP-Ar-725-15h 10.31685(8) 6.00016(5) 4.69230(4) 290.466(4) 2.70CONV-LFVP-H2-525-6h 10.31085(30) 6.00156(16) 4.69548(13) 290.562(14) 1.68CONV-LFVP-H2-625-6h 10.30902(25) 5.99882(14) 4.69585(11) 290.400(12) 1.74CONV-LFVP-H2-725-6h 10.30636(21) 5.99633(12) 4.69407(10) 290.095(10) 2.54CONV-LFVP-Ar-525-6h 10.3097(3) 6.00242(17) 4.69601(14) 290.604(14) 1.84CONV-LFVP-Ar-625-6h 10.30809(27) 6.00045(15) 4.69596(12) 290.461(13) 1.85CONV-LFVP-Ar-725-6h 10.31044(20) 5.99990(12) 4.69530(9) 290.459(10) 1.95CONV-LFP-Ar-725-6h 10.32494(8) 6.00591(5) 4.69161(4) 290.930(4) 2.40CONV-LFPdef-Ar-725-6h 10.32681(11) 6.00602(6) 4.69043(5) 290.915(5) 3.64CONV-LFP-H2-525-6h 10.32535(15) 6.00610(9) 4.69367(7) 291.079(7) 1.80CONV-LFP-H2-625-6h 10.32441(13) 6.00614(7) 4.69241(6) 290.975(6) 1.95CONV-LFP-H2-725-6h 10.32507(9) 6.00606(5) 4.69162(4) 290.941(4) 2.27
aNote that all V-doped samples were prepared according to LiFe0.775V0.15□0.075PO4.
Chemistry of Materials Article
dx.doi.org/10.1021/cm303932m | Chem. Mater. 2013, 25, 768−781774

from the olivine lattice. Table 5 (and Supporting InformationFigure S6) shows that the MW-LFVP-H2-525-6h, MW-LFVP-Ar-525-6h, and MW-LFVP-Ar-525-15h samples have similarunit-cell volumes and all show an increase relative to thepristine MW-LFVP-unheated that cannot be accounted for bythe errors in refinement. At higher temperatures, there is asystematic increase in unit-cell volume with increasingtemperature, with the most significant increase in the unit-cellvolume present for the samples heated at 725 °C. In addition,there is a systematic decrease in the length of the c axis.However, the lattice parameters did not shift completely backto those for MW-LFP-unheated; a phase with ∼10% V dopingremains after segregation of the Li3V2(PO4)3 phase. The unitcell volumes for the conventionally heated samples are shownto be similar for all heating conditions, and the unit-cellvolumes are all lower than that for the conventional LiFePO4samples, indicating V doping. The unit-cell volumes are similarto those for the microwave-synthesized samples heated at 725°C and have a volume similar to our pristine MW-ST LiFePO4doped with ∼5% V (with no post-heating step).Since the precursors for these doped samples all have
deficient amounts of Fe relative to Li and P, we also synthesizedsamples with Fe deficiency, but without V, i.e., “LiFe0.85PO4” asthe intended formula, both conventionally and by the MW-STprocess. These samples are referred to as CONV-LFPdef-Ar-725-6h and MW-LFPdef-unheated, respectively, and the latticeparameters are shown in Table 5. In both cases, olivine andimpurity phases formed; the deficient iron samples have similarunit-cell volumes for the olivine phase as their stoichiometriccounterparts. This result shows that Fe vacancies do not occurin the MW-ST process described here without V doping, andthe lower unit cell volume of the doped samples are due to thepresence of V in the olivine lattice. It is worth noting that theMW-LFP-unheated sample (prepared at 300 °C) has a slightlylower unit-cell volume than the conventionally preparedLiFePO4 samples (prepared at 725 °C). However, uponheating in a 5% H2−95% Ar atmosphere, the lattice parametersare similar, as indicated in Table 5 by the MW-LFP-H2-725-6hsample. Because XANES data shows no evidence of Fe3+ in ourpristine MW-ST LiFePO4 samples (i.e., no shift in the edgeposition from the conventionally prepared LiFePO4), it isunclear why the lattice-parameter change occurs with heatingtemperature. Several studies have suggested an increase in unitcell volume with increasing heating temperature and/or particlesize.12,61−64 The change in unit cell volume with temperaturemay be due to defects in the material, as has been discussed inmore detail elsewhere for MW-ST LiFePO4 samples.61
To estimate the amount of vanadium remaining in the latticeafter heating, we refined the XRD patterns for V and Feoccupancies with a restraint that the total charge on the Fe sitemust be 2+ and assuming Fe2+ and V3+. The MW-LFVP-unheated sample was found to have a slightly higher oxidationstate for V, but the heated samples were assumed to consist ofV3+ since the conventional V-doped samples have Li3V2(PO4)3impurity, indicating V3+ is the stable oxidation state. Arepresentative refinement fit is shown in SupportingInformation Figure S7, where the refinement conditions arediscussed in more detail. As shown in Table 6, the samplesheated at 525 and 625 °C still have around 15% V doping, butthe samples heated at 725 °C lose V from the olivine latticeuntil doping levels of ∼10% or less are achieved.27−36 Tocorroborate these results, the amount of V remaining in thelattice was also estimated by assuming V loss from the olivine
phase forms Li3V2(PO4)3. This indirect analysis generallyproduced similar results (Table 6). The maximum V dopingdemonstrated in the olivine lattice is summarized as a functionof temperature in Figure 4 and compared to other studies. Theresults indicate the overall trend that the maximum achievabledoping levels before impurity formation decreases withincreasing temperature.To confirm the assumption made in the Rietveld analysis that
the monoclinic Li3M2(PO4)3 phase consists of M = V ratherthan M = Fe, STEM data were collected with elementalmapping analysis. Figure 5a shows a MW-LFVP-unheatednanorod and corresponding elemental dot maps for Fe, V, andP. It is clear that the V and Fe are evenly distributed along thenanorod imaged on the length scale of the image. Since themorphology of this sample includes nanorods as well as morespherical particles, we imaged a range of different particle sizesand shapes and were unable to find evidence of any V-rich orFe-poor regions. Figure 5b shows an STEM image of MW-LFVP-H2-725-6h with corresponding elemental dot maps. It is
Table 6. Fractional Occupancy and Phase Fraction Resultsfor As-Prepared and Post-Heated Samples of Undoped andV-Doped LiFePO4 from Rietveld Refinementa
sample Feocc Vocc
Vocc from %LVPb %LVP
MW-LFVP-unheated
0.764(18) 0.149(11)
MW-LFVP-H2-525-6h
0.765(14) 0.156(9)
MW-LFVP-H2-625-6h
0.798(14) 0.135(10)
MW-LFVP-H2-725-6h
0.875(14) 0.084(9) 0.0883(16) 9.50(33)
MW-LFVP-Ar-525-6h
0.777(13) 0.148(9)
MW-LFVP-Ar-625-6h
0.763(14) 0.158(10)
MW-LFVP-Ar-725-6h
0.878(14) 0.082(10) 0.0802(18) 10.61(36)
MW-LFVP-Ar-525-15h
0.767(14) 0.155(9)
MW-LFVP-Ar-625-15h
0.769(14) 0.154(9)
MW-LFVP-Ar-725-15h
0.895(15) 0.070(10) 0.0668(21) 12.39(41)
CONV-LFVP-H2-525-6h
0.843(35) 0.098(40) 0.1168(15) 5.36(31)
CONV-LFVP-H2-625-6h
0.839(17) 0.107(12) 0.1144(15) 5.72(30)
CONV-LFVP-H2-725-6h
0.805(19) 0.130(13) 0.0975(19) 8.24(39)
CONV-LFVP-Ar-525-6h
0.842(20) 0.105(13) 0.1175(14) 5.26(30)
CONV-LFVP-Ar-625-6h
0.824(18) 0.117(12) 0.1171(14) 5.33(29)
CONV-LFVP-Ar-725-6h
0.830(17) 0.113(11) 0.1035(17) 7.36(35)
aNote that all V-doped samples were prepared according toLiFe0.775V0.15□0.075PO4.
bErrors for “Vocc from %LVP” estimated bysequential perturbation because an iterative solution was required.“LVP” refers to Li3V2(PO4)3. Note that the site occupancies aspresented are double the value refined in Fullprof, such that a value of1 would indicate full occupancy. Fullprof defines site occupancy as thesite multiplicity divided by the multiplicity of the general position,necessitating the correction factor to get the occupancies on a scale of1. For the Li and Fe sites, full occupancy of the site is given as “0.5” inthe program.
Chemistry of Materials Article
dx.doi.org/10.1021/cm303932m | Chem. Mater. 2013, 25, 768−781775

clear that after post-heating there are V-rich and Fe-poorparticles present in this sample, indicating clear phaseseparation into a V-rich Li3M2(PO4)3 impurity with little Feincorporated. There is still a significant amount of V in the Fe-rich particle indicating it remains significantly doped, which
agrees with our refinement results. At lower heating temper-ature (MW-LFVP-H2-525-6h) we were unable to find any V-rich or Fe-poor particles. In the MW-ST LFVP samples, thesemicroscopy results corroborate the XRD results showing noimpurities for the MW-LFVP-H2-525-6h sample, whichillustrates that phase segregation to form Li3V2(PO4)3 occursat some point above 525 °C. Microscopy was not performedfor MW-LFVP-H2-625-6h, but XRD and electrochemicalresults (shown later) suggest that there is a smallLi3V2(PO4)3 impurity present in the MW-LFVP-H2-625-6hsample. In contrast, for conventionally prepared samplesCONV-LFVP-H2-525-6h and CONV-LFVP-H2-725-6h thereis clear evidence of phase segregation even at 525 °C (Figure6a,b). It is also worth noting that there is still a significant
amount of V in the Fe-rich particles at 725 °C. Clearly, for aninitial stoichiometry of >10% V the conventional synthesisproduces V-rich impurities at all synthesis temperatures, whilethe MW-ST samples show no XRD or microscopy evidence ofdecomposition until above at least 525 °C.In addition to diffraction and imaging techniques, FTIR
spectroscopy can also provide insight regarding the phasesformed upon heating the samples. Figure 7 shows FTIR spectrafor several samples. The FTIR spectrum for the MW-LFVP-unheated sample shares several features with the MW-LFP-unheated spectrum. As discussed in more detail in our previouspublication,40 a major distinction between the spectra for thedoped and undoped LiFePO4 samples prepared by MW-ST isthe shoulder at around 900 cm−1, which agrees with thepreviously documented position of the VO bond in
Figure 4. Maximum V doping as a function of synthesis/heatingtemperature. MW-ST V-doped LiFePO4 samples after heating arecompared to conventionally prepared V-doped LiFePO4 samples fromthis study (red triangles) and from literature (black symbols). Thelegends indicate the heating environment and heating time. Note thatthe V occupancies used here are “Vocc from %LVP” where applicable.The MW-ST data point is V occupancy value on the Fe site for the“25%” V-doped sample, which is the maximum V doping that has beendemonstrated. Note that all V-doped samples were prepared accordingto LiFe0.775V0.15□0.075PO4.
Figure 5. STEM images and corresponding elemental dot maps of (a)MW-LFVP-unheated and (b) MW-LFVP-H2-725-6h. Note that theMW-LFVP-H2-725-6h sample shown here is an older sample whichwas actually heated at 700 °C rather than 725 °C, but this is notexpected to affect the results.
Figure 6. STEM images and corresponding elemental dot maps of (a)CONV-LFVP-H2-525-6h and (b) CONV-LFVP-H2-725-6h. Note thatthe samples shown here are older samples which were actually heatedat 500 and 700 °C rather than 525 and 725 °C, respectively, but this isnot expected to affect the results.
Chemistry of Materials Article
dx.doi.org/10.1021/cm303932m | Chem. Mater. 2013, 25, 768−781776

LiVOPO449 outlined in a dashed-line pink box. Although the
VO bond peaks generally occur at higher wavenumbers, near1000 cm−1, there are many examples of vanadium-basedphosphates in the literature that exhibit VO bonds near 900cm−1, as is the case for LiVOPO4.
49,65−69 Reference spectrashow that this peak is not from remnant reaction solvent. TheMW-ST doped samples show a decreasing shoulder in thislocation with increasing heating temperature. Since Ramanspectroscopy showed no evidence of a vanadyl bond, this peakcannot correspond to VO. However, it remains a noteworthyfeature because it is present in the MW-ST doped samples, butnot in the MW-LFP-unheated sample or in the conventionallydoped samples. More data and discussion regarding the FTIR isgiven in Supporting Information Figure S8.The black dashed-line boxes in Figure 7 indicate another
feature related to PO bonds that changes with V doping. Thepeaks for the ν3 PO stretching modes70,71 around 1050,1100, and 1140 cm−1 are distinct for the MW-LFP-unheatedsample. Only the peak around 1050 cm−1 remains sharp for theMW-LFVP-unheated and MW-LFVP-H2-525-6h samples. Thepeak at 1140 cm−1 becomes visible for the MW-LFVP-H2-625-6h sample and is quite apparent for the MW-LFVP-H2-725-6hsample. The peak at around 1100 cm−1 appears more like ashoulder attached to the larger peak at around 1050 cm−1 forthe MW-LFVP-H2-725-6h sample rather than two distinctpeaks as are clear in the MW-LFP-unheated sample. The peakaround 1100 cm−1 is barely visible in the MW-LFVP samples atthe lower heating temperatures. The FTIR spectra for theconventionally prepared V-doped samples all appear similar tothe MW-LFVP-H2-725-6h sample, regardless of temperature. Inaddition, the spectra of the heated materials in some casescontain extra features around 1220 cm−1,72 outlined by a gray
dashed-line box, as expected for Li3V2(PO4)3. These featuresare not present in the pristine doped or undoped MW-STsamples, or the MW-LFVP-H2-525-6h and MW-LFVP-H2-625-6h samples. However, the features for Li3V2(PO4)3 are clearlypresent for the MW-LFVP-H2-725-6h and all of the conven-tionally heated samples. Similar IR spectra suggest the MW-STLFVP samples are similar chemically at 525 and 625 °C, while asignificant change in the spectrum is noted at 725 °C. This is inagreement with XRD results that also show little evidence forimpurities until 725 °C.
Electrochemical Characterization. Electrochemical datacan be instructive in terms of understanding redox couples andfor examining the presence of multiple phases. Figure 8 showsfirst charge−discharge curves for various samples in the voltagerange from 1.5 to 4.8 V. Although it is common to test LiFePO4
between the limits of 2.0 and 4.3 V (which we have shown inSupporting Information Figure S9 for reference), we chose to
Figure 7. FTIR absorbance spectra of the as-prepared and post-heatedsamples of undoped and V-doped LiFePO4, conventionally preparedV-doped LiFePO4, and reference samples. Arrows pointing up indicatethe presence of features of interest. Note that all V-doped sampleswere prepared according to LiFe0.775V0.15□0.075PO4.
Figure 8. First charge−discharge curves of the MW-ST LiFePO4,heated and unheated MW-ST V-doped LiFePO4 samples, andconventionally prepared V-doped LiFePO4 samples, as well asLi3V2(PO4)3 and LiVOPO4 for a comparison. Capacities in the 1.5−2.5 and 3.8−4.8 V regions are noted for each sample. Note that all V-doped samples were prepared according to LiFe0.775V0.15□0.075PO4.
Chemistry of Materials Article
dx.doi.org/10.1021/cm303932m | Chem. Mater. 2013, 25, 768−781777
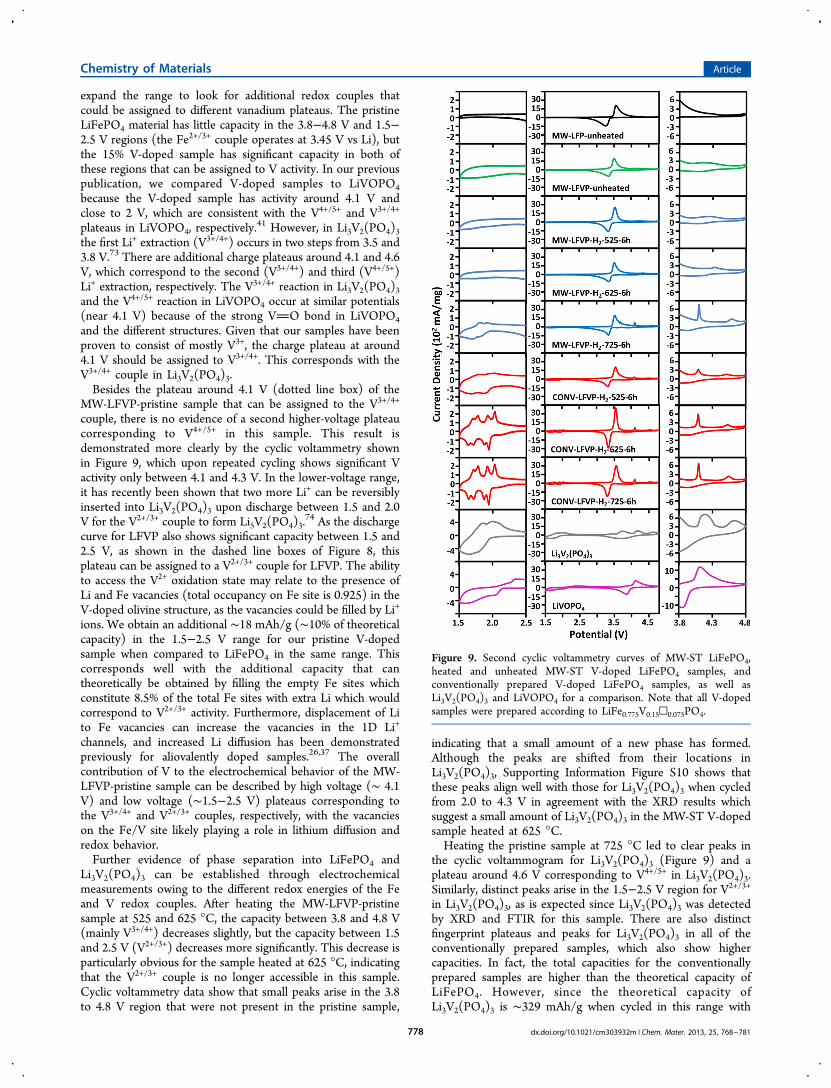
expand the range to look for additional redox couples thatcould be assigned to different vanadium plateaus. The pristineLiFePO4 material has little capacity in the 3.8−4.8 V and 1.5−2.5 V regions (the Fe2+/3+ couple operates at 3.45 V vs Li), butthe 15% V-doped sample has significant capacity in both ofthese regions that can be assigned to V activity. In our previouspublication, we compared V-doped samples to LiVOPO4because the V-doped sample has activity around 4.1 V andclose to 2 V, which are consistent with the V4+/5+ and V3+/4+
plateaus in LiVOPO4, respectively.41 However, in Li3V2(PO4)3
the first Li+ extraction (V3+/4+) occurs in two steps from 3.5 and3.8 V.73 There are additional charge plateaus around 4.1 and 4.6V, which correspond to the second (V3+/4+) and third (V4+/5+)Li+ extraction, respectively. The V3+/4+ reaction in Li3V2(PO4)3and the V4+/5+ reaction in LiVOPO4 occur at similar potentials(near 4.1 V) because of the strong VO bond in LiVOPO4and the different structures. Given that our samples have beenproven to consist of mostly V3+, the charge plateau at around4.1 V should be assigned to V3+/4+. This corresponds with theV3+/4+ couple in Li3V2(PO4)3.Besides the plateau around 4.1 V (dotted line box) of the
MW-LFVP-pristine sample that can be assigned to the V3+/4+
couple, there is no evidence of a second higher-voltage plateaucorresponding to V4+/5+ in this sample. This result isdemonstrated more clearly by the cyclic voltammetry shownin Figure 9, which upon repeated cycling shows significant Vactivity only between 4.1 and 4.3 V. In the lower-voltage range,it has recently been shown that two more Li+ can be reversiblyinserted into Li3V2(PO4)3 upon discharge between 1.5 and 2.0V for the V2+/3+ couple to form Li5V2(PO4)3.
74 As the dischargecurve for LFVP also shows significant capacity between 1.5 and2.5 V, as shown in the dashed line boxes of Figure 8, thisplateau can be assigned to a V2+/3+ couple for LFVP. The abilityto access the V2+ oxidation state may relate to the presence ofLi and Fe vacancies (total occupancy on Fe site is 0.925) in theV-doped olivine structure, as the vacancies could be filled by Li+
ions. We obtain an additional ∼18 mAh/g (∼10% of theoreticalcapacity) in the 1.5−2.5 V range for our pristine V-dopedsample when compared to LiFePO4 in the same range. Thiscorresponds well with the additional capacity that cantheoretically be obtained by filling the empty Fe sites whichconstitute 8.5% of the total Fe sites with extra Li which wouldcorrespond to V2+/3+ activity. Furthermore, displacement of Lito Fe vacancies can increase the vacancies in the 1D Li+
channels, and increased Li diffusion has been demonstratedpreviously for aliovalently doped samples.26,37 The overallcontribution of V to the electrochemical behavior of the MW-LFVP-pristine sample can be described by high voltage (∼ 4.1V) and low voltage (∼1.5−2.5 V) plateaus corresponding tothe V3+/4+ and V2+/3+ couples, respectively, with the vacancieson the Fe/V site likely playing a role in lithium diffusion andredox behavior.Further evidence of phase separation into LiFePO4 and
Li3V2(PO4)3 can be established through electrochemicalmeasurements owing to the different redox energies of the Feand V redox couples. After heating the MW-LFVP-pristinesample at 525 and 625 °C, the capacity between 3.8 and 4.8 V(mainly V3+/4+) decreases slightly, but the capacity between 1.5and 2.5 V (V2+/3+) decreases more significantly. This decrease isparticularly obvious for the sample heated at 625 °C, indicatingthat the V2+/3+ couple is no longer accessible in this sample.Cyclic voltammetry data show that small peaks arise in the 3.8to 4.8 V region that were not present in the pristine sample,
indicating that a small amount of a new phase has formed.Although the peaks are shifted from their locations inLi3V2(PO4)3, Supporting Information Figure S10 shows thatthese peaks align well with those for Li3V2(PO4)3 when cycledfrom 2.0 to 4.3 V in agreement with the XRD results whichsuggest a small amount of Li3V2(PO4)3 in the MW-ST V-dopedsample heated at 625 °C.Heating the pristine sample at 725 °C led to clear peaks in
the cyclic voltammogram for Li3V2(PO4)3 (Figure 9) and aplateau around 4.6 V corresponding to V4+/5+ in Li3V2(PO4)3.Similarly, distinct peaks arise in the 1.5−2.5 V region for V2+/3+
in Li3V2(PO4)3, as is expected since Li3V2(PO4)3 was detectedby XRD and FTIR for this sample. There are also distinctfingerprint plateaus and peaks for Li3V2(PO4)3 in all of theconventionally prepared samples, which also show highercapacities. In fact, the total capacities for the conventionallyprepared samples are higher than the theoretical capacity ofLiFePO4. However, since the theoretical capacity ofLi3V2(PO4)3 is ∼329 mAh/g when cycled in this range with
Figure 9. Second cyclic voltammetry curves of MW-ST LiFePO4,heated and unheated MW-ST V-doped LiFePO4 samples, andconventionally prepared V-doped LiFePO4 samples, as well asLi3V2(PO4)3 and LiVOPO4 for a comparison. Note that all V-dopedsamples were prepared according to LiFe0.775V0.15□0.075PO4.
Chemistry of Materials Article
dx.doi.org/10.1021/cm303932m | Chem. Mater. 2013, 25, 768−781778
5 Li+ inserted/extracted, even 5−10% Li3V2(PO4)3 impuritycan approximately account for the increased capacity. It alsomay be possible that some Li ions can be inserted intovacancies on the Fe site. The higher capacities shown for theconventionally prepared samples are associated with carboncoating from the organic oxalate precursors used in thesynthesis. The MW-ST samples are a light gray color with apink tint. Contrastingly, the conventional samples are all darkgray in color, consistent with carbon-coated samples.What Is the Impact of Vanadium Doping on the
Structure and Ionic Conduction Mechanism? Thisquestion is stimulated by the STEM images of SupportingInformation Figure S4 showing defects in the vicinity of the Lisite and the evidence for Li displacements in the NPDrefinement. What distinguishes vanadium oxides from othertransition-metal oxides, in addition to vanadyl VO formationwith formal valence V5+ or V4+, is the formation at temperaturesabove or near 300 K of V−V homopolar bonds across sharedoctahedral-site edges or faces.75−78 The possibility of V−Vbonding for V defects on the Li site leads to the question ofwhether V clustering may occur in LFVP. Any model of Vclustering must retain local charge neutrality and account forevidence of V displacements within the octahedral sites thatdecrease, on average, with larger V concentrations as issuggested by the decrease in XANES pre-edge peak intensitywith increasing doping levels. Although it is tempting tospeculate that V−V bonding may stabilize clusters of vanadium,our data provide no evidence that significant V−V bonds areformed. Rather, the data are more consistent with randomdoping of V on Fe sites, perhaps in small V−O−□−O−Fe orV−O−□−O−V clusters, in a nonequilibrium (metastable)low-temperature phase with Fe-site vacancies (□) compensat-ing for the larger formal valence states of the V atoms. Theapparent displacement of V from the center of symmetry of itsoctahedral site (evidenced by the XANES pre-edge feature)may be partly attributed to stronger bonding to an oxygenneighboring an Fe-site vacancy in V−O−□−O−V, Fe clusters,this displacement stabilizing V4+ in the presence of Fe2+, whichis generally not stable as demonstrated by FeVO3.
79 Thestructural flexibility provided by the Fe vacancies may thereforeallow the olivine structure to accommodate a small fraction ofV4+, and, additionally, allow the majority of V3+O6 octahedra tobecome more regular than the corresponding V4+O6 octahedra.This could account for the intensity decrease in the XANESpre-edge feature with increasing V doping.The incorporation of Fe-site vacancies appears to be critical
to the improved kinetics and cyclability (evident through cyclicvoltammetry and cycle data in our previous publication)40 of ametastable V-doped LiFePO4 phase. Facile Li+ transfer to theFe-site vacancies may retain Li+ mobility even in the presenceof some V or Fe on Li sites that would block Li+ motion,normally restricted to 1D channels along the crystallographic b-axis. There are six iron sites near each Li site with distancesranging from ∼3.3 to 3.7 Å. This distance is only slightly longerthan the ∼3.0 Å distance between Li sites along the [010]direction but significantly closer than the ∼4.7 Å distancebetween Li sites along the [001] direction, making the vacantFe sites a feasible route for Li ion migration. Moreover,improved electron conduction by Fe2+ + V4+ = Fe3+ + V3+
electron transfer must require only a small activation energygiven the observation73 of Fe3+ + V3+ in FeVO3.
■ CONCLUSIONSAlthough we originally reported ‘LiFe1−x(VO)xPO4’ by a low-temperature, microwave-assisted solvothermal process, we haveshown here that the resulting phases are consistent withLiFe1−3x/2Vx□x/2PO4 (x ≤ 0.2). The oxidation state of V wasfound consistently by XANES to be ∼ V3.2+ for different dopinglevels. Rietveld refinements of neutron and X-ray diffractiondata show clear evidence of Fe vacancies in these materials,with the XRD data confirming that at least 20% V can be dopedinto the Fe site. There is some evidence to support thepresence of a small fraction of vacancies on the Li site, orpossibly V doping, for higher doping levels. This finding is insharp contrast to other studies that employed a conventionalhigh-temperature synthetic approach and demonstrated amaximum V doping of 10% without the formation of impurityphases. By providing an additional pathway for ionicconduction, the vacancies induced by doping are expected toprovide an enhancement in the kinetics of Li-ion conduction.The stability of the samples has been examined by heating
the pristine microwave-synthesized 15% V-doped LiFePO4sample in 100% Ar or 5% H2−95% Ar at various temperaturesand times. Heating the samples led to the formation ofsignificant levels of Li3V2(PO4)3 impurities at 725 °C andpotentially a very small amount of impurity at 625 °C; thesamples heated at 525 °C exhibited no impurity in the XRDdata, but subtle changes were seen in the electrochemicalbehavior and FTIR spectra. STEM/EDS data showed noevidence of Li3V2(PO4)3 for the MW-ST sample heated at 525°C or the pristine sample. Contrastingly, attempts to synthesize15% V-doped LiFePO4 samples by a conventional methodresulted in significant impurities at all temperatures. Therefore,the pristine, microwave-synthesized V-doped LiFePO4 sampleswith >10% doping are metastable phases that are onlyaccessible at low temperatures and exhibit moderate stabilityup to 625 °C.
■ ASSOCIATED CONTENT*S Supporting InformationMore synthesis details, XANES, X-ray and neutron diffraction,STEM, EELS, FTIR, and electrochemical data are available.This material is available free of charge via the Internet athttp://pubs.acs.org.
■ AUTHOR INFORMATIONCorresponding Author*Phone: (512) 471-1791. Fax: 512-471-7681. E-mail: [email protected] authors declare no competing financial interest.
■ ACKNOWLEDGMENTSResearch was supported by the U.S. Department of Energy,Basic Energy Sciences, Materials Sciences and EngineeringDivision, at the University of Texas at Austin (under ContractDE-SC0005397) and at Oak Ridge National Laboratory. Wethank Clarina de la Cruz for assistance with collection ofneutron powder diffraction data at the High Flux IsotopeReactor (HFIR), which is sponsored by the Scientific UserFacilities Division, Office of Basic Energy Sciences, U.S.Department of Energy. Use of Raman instrumentation at theArgonne National Laboratory Center for Nanoscale Materialswas supported by the Office of Basic Energy Sciences, U.S.
Chemistry of Materials Article
dx.doi.org/10.1021/cm303932m | Chem. Mater. 2013, 25, 768−781779

Department of Energy. The work at the Argonne NationalLaboratory was performed under Contract DE-AC02-06CH11357 between UChicago Argonne, LLC, and theUSDOE. MRCAT operations are supported by the Departmentof Energy and the MRCAT member institutions. J.C.I.acknowledges support from Oak Ridge National Laboratory’sShared Research Equipment (ShaRE) User Facility, which issponsored by the Office of Basic Energy Sciences, U.S.Department of Energy.
■ REFERENCES(1) Manthiram, A.; Goodenough, J. B. J. Solid State Chem. 1987, 71,349.(2) Manthiram, A.; Goodenough, J. B. J. Power Sources 1989, 26, 403.(3) Padhi, A. K.; Nanjundasawamy, K. S.; Goodenough, J. B. J.Electrochem. Soc. 1997, 144 (4), 1188.(4) Yamada, A.; Hosoyo, M.; Chung, S.-C.; Kudo, Y.; Hinokuma, K.;Liu, K.-Y.; Nishi, Y. J. Power Sources 2003, 119−121, 232.(5) Li, Z.; Zhang, D.; Yang, F. J. J. Mater. Sci. 2009, 44, 2435.(6) Jugovic, D.; Uskokovic, D. J. Power Sources 2009, 190, 538.(7) Ellis, B.; Herle, P. S.; Rho, Y.-H.; Nazar, L. F.; Dunlap, R.; Perry,L. K.; Ryan, D. H. Faraday Discuss. 2007, 134, 119.(8) Ellis, B.; Perry, L. K.; Ryan, D. H.; Nazar, L. F. J. Am. Chem. Soc.2006, 128 (35), 11416.(9) Zaghib, K.; Mauger, A.; Goodenough, J. B.; Gendron, F.; Julien,C. M. Chem. Mater. 2007, 19, 2740.(10) Zhou, F. Phys. Rev. B 2004, 69, 201101-1.(11) Yamada, A.; Chung, S. C.; Hinokuma, K. J. Electrochem. Soc.2001, 148 (3), A224.(12) Ellis, B.; Kan, W. H.; Makahnouk, W. R. M.; Nazar, L. F. J.Mater. Chem. 2007, 17, 3248.(13) Wang, Y.; Wang, J.; Yang, J.; Nuli, Y. Adv. Funct. Mater. 2006,16, 2135.(14) Murugan, A. V.; Muraliganth, T.; Manthiram, A. J. Electrochem.Soc. 2009, 152 (2), A79.(15) Muraliganth, T.; Murugan, A. V.; Manthiram, A. J. J. Mater.Chem. 2008, 18, 5661.(16) Murugan, A. V.; Muraliganth, T.; Manthiram, A. J. Phys. Chem. C2008, 112 (37), 14665.(17) Murugan, A. V.; Muraliganth, T.; Manthiram, A. Electrochem.Commun. 2008, 10, 903.(18) Murugan, A. V.; Muraliganth, T.; Ferreira, P. J.; Manthiram, A.Inorg. Chem. 2009, 48 (3), 946.(19) Yoon, S.; Liao, C.; Sun, X. G.; Bridges, C. A.; Unocic, R. R.;Nanda, J.; Dai, S.; Paranthaman, M. P. J. Mater. Chem. 2012, 22, 4611.(20) Meethong, N.; Kao, Y.-H.; Tang, M.; Huang, H.-Y.; Carter, W.C.; Chiang, Y.-M. Chem. Mater. 2008, 20 (19), 6189.(21) Chung, S.-Y.; Bloking, J. T.; Chiang, Y.-M. Nat. Mater. 2002, 1,123.(22) Herle, P. S.; Ellis, B.; Coombs, N.; Nazar, L. F. Nat. Mater. 2004,3, 147.(23) Ravet, N.; Abouimrane, A.; Armand, M. Nat. Mater. 2003, 2,702.(24) Islam, M. S.; Driscoll, D. J.; Fisher, C. A. J.; Slater, P. R. Chem.Mater. 2005, 17, 5085.(25) Wagemaker, M.; Ellis, B. L.; Lutzenkirchen-Hecht, D.; Mulder,F. M.; Nazar, L. F. Chem. Mater. 2008, 20, 6313.(26) Meethong, N.; Kao, Y.-H.; Speakman, S. A.; Chiang, Y.-M. Adv.Funct. Mater. 2009, 19, 1060.(27) Sun, C. S.; Zhou, Z.; Xu, Z. G.; Wang, D. G.; Wei, J. P.; Bian, X.K.; Yan, J. J. Power Sources 2009, 193 (2), 841.(28) Omenya, F.; Chernova, N. A.; Upreti, S.; Zavalij, P. Y.; Nam, K.-W.; Yang, X.-Q.; Whittingham, M. S. Chem. Mater. 2011, 23 (21),4733.(29) Chen, X. J.; Cao, G. S.; Zhao, X. B.; Tu, J. P.; Zhu, T. J. J. AlloysCompd. 2008, 463, 385.
(30) Zhang, L.-L.; Liang, G.; Ignatov, A.; Croft, M. C.; Xiong, X.-Q.;Hung, I.-M. H.; Huang, Y.-H.; Hu, X.-L.; Zhang, W.-X.; Peng, Y.-L. J.Phys. Chem. C 2011, 115, 13520.(31) Wen, Y.; Zenga, L.; Tong, Z.; Nong, L.; Wei, W. J. Alloys Comp.2006, 416, 206.(32) Hong, J.; Wang, C. S.; Chen, X.; Upretim, S.; Whittingham, M.S. Electrochem. Solid State Lett. 2009, 12 (2), A33.(33) Ma, J.; Li, B.; Du, H.; Xu, C.; Kanga, F. J. Electrochem. Soc. 2011,158 (1), A26.(34) Yang, G.; Jiang, C.; He, X.; Ying, J.; Cai, F. Ionics 2012, 18, 59.(35) Hua, N.; Wanga, C.; Kang, X.; Wumair, T.; Han, Y. J. AlloysCompd. 2010, 503, 204.(36) Chiang, C.-Y.; Su, H.-C.; Wu, P.-J.; Liu, H.-J.; Hu, C.-W.;Sharma, N.; Peterson, V. K.; Hsieh, H.-W.; Lin, Y.-F.; Chou, W.-C.;Lee, C.-H.; Lee, J.-F.; Shew, B.-Y. J. Phys. Chem. C 2012, 116, 24424.(37) Lin, H.; Wen, Y.; Zhang, C.; Zhang, L.; Huang, Y.; Shan, B.;Chen, R. Solid State Commun. 2012, 152, 999.(38) Jin, Y.; Yanga, C. P.; Ruia, X. H.; Chengb, T.; Chena, C. H. J.Power Sources 2011, 196, 5623.(39) Zhao, T.; Xu, W.; Ye, Q.; Cheng, J.; Zhao, H.; Wu, Z.; Xiac, D.;Chu, W. J. Synchron Radiat. 2011, 17, 584.(40) Harrison, K. L.; Manthiram, A. Inorg. Chem. 2011, 50, 3613.(41) Ren, M. M.; Zhou, Z.; Su, L. W.; Gao, X. P. J. Power Sources2009, 189, 786.(42) Rietveld, H. M. J. Appl. Crystallogr. 1969, 2, 65.(43) Larson, A. C.; Von Dreele, R. B. GSAS, General StructureAnalysis System; Los Alamos National Laboratory: Los Alamos, NM,1994.(44) Toby, B. H. J. Appl. Cryst 2001, 34, 210.(45) Rodriguez-Carvaja, J. Physica 1993, 192B, 55.(46) Roisnel, T.; Rodriguez-Carvajal, J. Eur. Powder Diffr. 2001, 378−3, 118.(47) Ravel, B.; Newville, M. J. Synchrotron Radiat. 2005, 12, 537.(48) Newville, M. J. Synchrotron Radiat. 2001, 8, 322.(49) Baran, E. J.; Vassallo, M. B. J. Raman Spectrosc. 1994, 25, 203.(50) Lii, K. H.; Li, C. H.; Cheng, C. Y.; Wang, S. L. J. Solid StateChem. 1991, 95 (2), 352.(51) Silversmit, G.; Depla, D.; Poelman, H.; Marin, G. B.; De Gryse,R. J. Electron Spectrosc. Relat. Phenom. 2004, 135, 167.(52) Liu, H.; Cheng, C.; Huang, X.; Li, J. Electrochim. Acta 2010, 55,8461.(53) Huang, J. S.; Yang, L.; Liu, K. Y. Mater. Chem. Phys. 2011, 128(3), 470.(54) Ren, M.; Zhou, Z.; Li, Y.; Gao, X. P.; Yan, J. J. Power Sources2006, 162, 1357.(55) Allen, C. J.; Jia, Q.; Chinnasamy, C. N.; Mukerjee, S.; Abraham,K. M. J. Electrochem. Soc. 2011, 158 (12), A1250.(56) Kuo, H. T.; Bagkar, N. C.; Liu, R. S.; Shen, C. H.; Shy, D. S.;Xing, X. K.; Lee, J.-F.; Chen, J. M. J. Phys. Chem. B 2008, 112, 11250.(57) Wong, J.; Lytle, F. W.; Messmer, R. P.; Maylotte, D. H. Phys.Rev. B 1984, 30 (10), 5596.(58) Giorgetti, M.; Passerini, S.; Smyrl, W. H.; Mukerjee, S.; Yang, X.Q.; McBreen, J. J. Electrohchem. Soc. 1999, 146 (7), 2387.(59) Chi, M.; Mizoguchi, T.; Martin, L. W.; Bradley, J. P.; Ikeno, H.;Ramesh, R.; Tanaka, I.; Browning, N. J. Appl. Phys. 2011, 110, 046104-1.(60) Yang, M.-R.; Ke, W.-h.; Wu, S.-h. J. Power Sources 2007, 165,646.(61) Bridges, C. A.; Harrison, K. H.; Unocic, R.; Idrobo, J.-C.;Paranthaman, M. P.; Manthiram, A. J. Electrochem. Soc. 2013,submitted.(62) Jugovic, D.; Cvjeticanin, N.; Mitric, M.; Mentus, S. Mater. Sci.Forum 2007, 555, 225.(63) Arnold, G.; Garche, J.; Hemmer, R.; Strobele, S.; Vogler, C.;Wohlfahrt-Mehrens, M. J. Power Sources 2003, 119, 247.(64) Koleva, V.; Zhecheva, E.; Stoyanova, R. J. Alloys Compd. 2009,476, 950.(65) Yang, Y.; Fang, H.; Zheng, J.; Li, L.; Li, G.; Yan, G. Solid StateSci. 2008, 10, 1292.
Chemistry of Materials Article
dx.doi.org/10.1021/cm303932m | Chem. Mater. 2013, 25, 768−781780

(66) Wang, X.; Liu, L.; Jacobson, A. J. J. Am. Chem. Soc. 2002, 124,7812.(67) Sauvage, F.; Quarez, E.; Tarascon, J.-M.; Baudrin, E. Solid StateSci. 2006, 8, 1215.(68) De, S.; Dey, A.; De, S. K. J. Phys. Chem. Solids 2007, 68, 66.(69) Wang, L.; Yang, L.; Gong, L.; Jiang, X.; Yuan, K.; Hu, Z.Electrochim. Acta 2011, 56, 6906.(70) Salah, A. A.; Jozwiak, P.; Zaghib, K.; Garbarczyk, J.; Gendron, F.;Maugerd, A.; Julien, C. M. Spectrochim. Acta, Part A 2006, 65, 1007.(71) Burba, C. M.; Frech, R. J. Electrochem. Soc. 2004, 151 (7),A1032.(72) Fu, P.; Zhao, Y.; Dong, Y.; An, X.; Shen, G. Electrochim. Acta2006, 52, 1003.(73) Yang, G.; Liu, H.; Ji, H.; Chen, Z.; Jiang, X. Electrochim. Acta2010, 55, 2951.(74) Rui, X. H.; Yesibolati, N.; Chen, C. H. J. Power Sources 2011,196, 2279.(75) Goodenough, J. B. Annu. Rev. Mater. Sci. 1971, 1, 101.(76) Goodenough, J. B.; Dutta, G.; Manthiram, A. Phys. Rev. B 1991,43, 10170.(77) Manthiram, A.; Goodenough, J. B. Canadian J. Phys. 1987, 65,87.(78) Goodenough, J. B. J. Solid State Chem. 2011, 15, 285.(79) Cox, D. E.; Taxel, W. J.; Miller, R. C.; Shirane, G. J. Phys. Chem.Solids 1962, 23, 863.
Chemistry of Materials Article
dx.doi.org/10.1021/cm303932m | Chem. Mater. 2013, 25, 768−781781
Copyright © 2022 FDOKUMEN