Oxidations by the reagent «O 2 - H 2O 2 - vanadium complex - pyrazine-2-carboxylic acidå-8
Applied Catalysis A: General 255 (2003) 211–220
Role of vanadium in Ni:Al2O3 catalysts for carbondioxide reforming of methane
Antoninho Valentinia,∗, Neftalı Lenin Villarreal Carreñob,Luiz Fernando Dias Probsta, Paulo N. Lisboa-Filhoc, Wido H. Schreinerc,
Edson Roberto Leiteb, Elson Longoba Departamento de Qu´ımica, UFSC, CP-476, CEP 88040-900, Florianópolis, SC, Brazil
b CMDMC-LIEC, Depto de Qu´ımica, UFSCar, CP-676, CEP 13565-905, São Carlos, SP, Brazilc Departamento de F´ısica, UPPR, Curitiba, PR, Brazil
Received 2 April 2003; received in revised form 3 July 2003; accepted 9 July 2003
Abstract
The CO2 reforming of CH4 was performed over V-promoted Ni/Al2O3 catalysts similarly prepared by the polymericprecursor method. The H2 chemisorption, X-ray diffraction (XRD) and X-ray photoemission spectroscopy (XPS) analysesshow that a low V wt.% addition suppresses the NiAl2O4 formation. Moreover, the CHN results point out to a low carbondeposition and the surface area (BET) abruptly increases upon the addition of 0.8 wt.% V. On the other hand, the samplewith high V wt.% presented the highest carbon deposition, what was attributed to the CH4 decomposition increase promotedby the V.© 2003 Elsevier B.V. All rights reserved.
Keywords:Methane; CO2 reforming; V-promoted Ni/Al2O3; Coke deposition
1. Introduction
The continuously increasing world energy demandand the necessity to decrease the worldwide pollutionmakes hydrogen a very attractive energy source[1].The abundance of natural gas, which consists mostlyof methane, can provide an interesting source of en-ergy and chemicals.
The research interest in the catalytic reforming ofCH4 to produce synthesis gas, a mixture of CO and H2and a valuable industrial feedstock, has been increas-
∗ Corresponding author. Tel.:+55-48-3319966;fax: +55-48-3319711.E-mail addresses:[email protected] (A. Valentini),[email protected] (L.F.D. Probst).
ing [2]. The CO2 reforming of CH4 is an importantreaction, because it allows to convert this abundantmaterial efficiently into liquid fuels[3,4].
Numerous authors[5–12] have carried out the CO2reforming of CH4 on different catalysts, with emphasisto Ni supported on SiO2, Al2O3 and MgO. The majorproblem is the catalyst deactivation, induced by thecarbon deposition[4,5].
Noble metal catalysts supported on different carri-ers exhibit better activity and high stability[13], butthey are expensive. In spite of the carbon deposition,the Ni-based catalysts have high activity, stability andselectivity and are cheap. Therefore, the developmentof such catalysts is an attractive challenge[14].
It is well known that materials containing vanadiumare good catalysts for the oxidation reactions[15–17].
0926-860X/$ – see front matter © 2003 Elsevier B.V. All rights reserved.doi:10.1016/S0926-860X(03)00560-X
212 A. Valentini et al. / Applied Catalysis A: General 255 (2003) 211–220
However, only a limited amount of work has beendevoted to study the V action as a promoter of theCO2 reforming of CH4 [18].
The catalytic properties, the metal dispersion andthe structural features of supported species depend onthe support and on the method to process these ma-terials. Recently[19,20], our group described a newroute to synthesize nanometric Ni particles embeddedin a mesoporous silica material, with excellent poten-tial for catalytic applications. Mesoporous silica withsurface area in the range of 202–280 m2/g, with narrowpore size distribution and Ni nanoparticles (particlesin the range of 3–41 nm) were obtained in a direct pro-cess, i.e. in a single heat-treatment process. A differentapproach was adopted to process such a nanocompos-ite. This new approach is based on the formation ofa hybrid polymer with silicon, oxygen and carbon asmacromolecule chain components and nickel cationsarrested within the macromolecule structure and alsoon the control of the pyrolysis step. The general ideaof this method is to produce a metal oxide matrixwith metal nanoparticles well dispersed and embed-ded within it. In fact, this process is similar to thepolymeric precursor method or polymerizable com-plex method, largely employed to process nanostru-tured oxides and thin films[21].
In this work, we report the effect of V on Ni:Al2O3catalysts, similarly prepared by the polymeric precur-sor method. It is investigated the catalytic performanceand carbon deposition behavior in the CO2 reform-ing of CH4 under atmospheric pressure. The samplecharacterization was performed by means of X-raydiffraction (XRD), X-ray photoemission spectroscopy(XPS), differential scanning calorimetry (DSC), ther-mogravimetric analysis (TGA), H2 chemisorption andspecific surface area measurements (BET).
2. Experimental
2.1. Catalyst preparation
The Ni catalysts were synthesized by usingNi(NO3)2·6H2O, (99.9%, Fluka), citric acid monohy-drate (CA) (purity> 99%, Quimex), Al(NO3)3·9H2O(Riedel-de Haën) and NH4VO3 (Merck).
The 10-NiAlV(0.8) sample (where 10 and 0.8 rep-resent the Ni wt.% and the V wt.%, respectively) was
prepared as follows: CA (24.23 g) was dissolved in200 ml of ethanol at 50◦C. The Ni, Al and V salts(2.01, 25.98 and 0.08 g, respectively) were dissolvedin distilled water at 50◦C. Later the aqueous solutionswere added to the CA–ethanol solution and stirredduring 15 min., at 50◦C. A citric acid/metal ratio of1.5:1 (in mol) was used. The metal concentration isthe sum of Ni, Al and V. 36.3 g of ethylene glycol(EG) corresponding to mass ratio of 40:60 in relationto the citric acid was added to the solutions, to pro-mote the polymerization reaction. After polymeriza-tion at temperatures ranging from 90 to 120◦C for 3 hunder stirring, the solid resin was treated at 250◦Cfor 1 h, in an air atmosphere. The resulting precursorcompound was ground and treated at 350◦C for 1 hin air, then pyrolyzed for 1 h at 700◦C in a N2 atmo-sphere (flow rate of 1 cm3/min). Similar conditions ofsynthesis were used for preparing the polymeric pre-cursors that led to the formation of Ni:Al2O3, dopedwith V and undoped. A typical flowchart for the syn-thesis method is shown inFig. 1.
2.2. Chemical composition, phase evolution andtexture characterization
The Ni and V contents were determined by flameatomic absorption spectrophotometry (HITACHIZ8230), the crystal structure of the metal oxides wascharacterized by XRD (Model D-5000, Siemens,Karlsruhe, Germany), with Cu K� irradiation source(λ = 1.540 Å) and a graphite monochromator. Thepyrolysis step was followed by thermogravimetricanalysis (TG) and differential scanning calorime-try (model 409 Netzsch, Selb, Germany), using a5◦C/min heating rate under an air flow of 20 cm3/minand 10–15 mg of sample.
Specific surface area and pore volume of the cat-alysts were determined by N2 adsorption/desorptionisotherms, at liquid nitrogen temperature, it wasperformed by an Autosorb-1C (Quantachrome In-struments). A powder sample (40–50 mg, reducedat 650◦C in H2 flow) was outgassed at 300◦C for2 h before the area measurements. Using the sameequipment, the H2 chemisorption of the catalystswas performed at 27◦C after the reduction of thesample (0.5 g) in a flow of H2 (30 cc/min) at 650◦C(10◦C/min) for 1 h and evacuation for 1 h at the sametemperature. The amount of irreversible H2 uptake

A. Valentini et al. / Applied Catalysis A: General 255 (2003) 211–220 213
Citric acid (CA) dissolved in ethanol
Al, Ni and V dissolved in H2O
Metal-citrate complex
Ethylene glycol
Resin
1-Heating at 250ºC/1h in air 2- Heating at 350ºC/1h in air
Pyrolysis at 700ºC/1h in N2
Catalyst powders
Fig. 1. Flowchart for the synthesis of the catalysts.
was obtained from the difference between the totaladsorption of H2 on the catalyst and a second adsorp-tion series of H2 determined after evacuation of thecatalyst sample for 30 min at the same temperature(27◦C).
X-ray photoelectron spectroscopy analyses wereperformed using a commercial VG ESCA 3000 sys-tem operating at a pressure of 10−10 mbar. The spectrawere collected using Mg K� radiations in an overallresolution of about 0.8 eV. The concentrations of thesurface elements were calculated using the systemdatabase after subtracting the background counts. TheC 1s peak was used as standard for the calibration ofthe binding energies.
The catalyst powders were characterized by ele-mentary chemical analysis to determine the total cokecontent after the catalytic test (CHN analysis-FISONSEA 1108 CHNS-O).
2.3. Catalyst testing
The CO2 reforming of CH4 was carried out in atubular fixed-bed flow reactor made of a stainlesssteel tube of 9.5 mm i.d. The catalyst (0.050 g) was in
situ pretreated in a H2 stream at 650◦C (10◦C/min.)for 1 h. The reaction gas was composed of nitrogen,methane and carbon dioxide at the 5:1:1 ratio. Thetotal flow rate of reaction gas was 35 cm3/min. Thereactant and the product gases were analyzed with anon stream gas chromatograph (GC) SHIMADZU GC8A, equipped with a thermal conductivity detector(TCD), Porapak-Q and a 5A molecular sieve column(with Ar as the carrier gas). The N2 in the reaction gaswas used as diluent and an internal analysis standard.
3. Results and discussion
3.1. Chemical and texture characterization
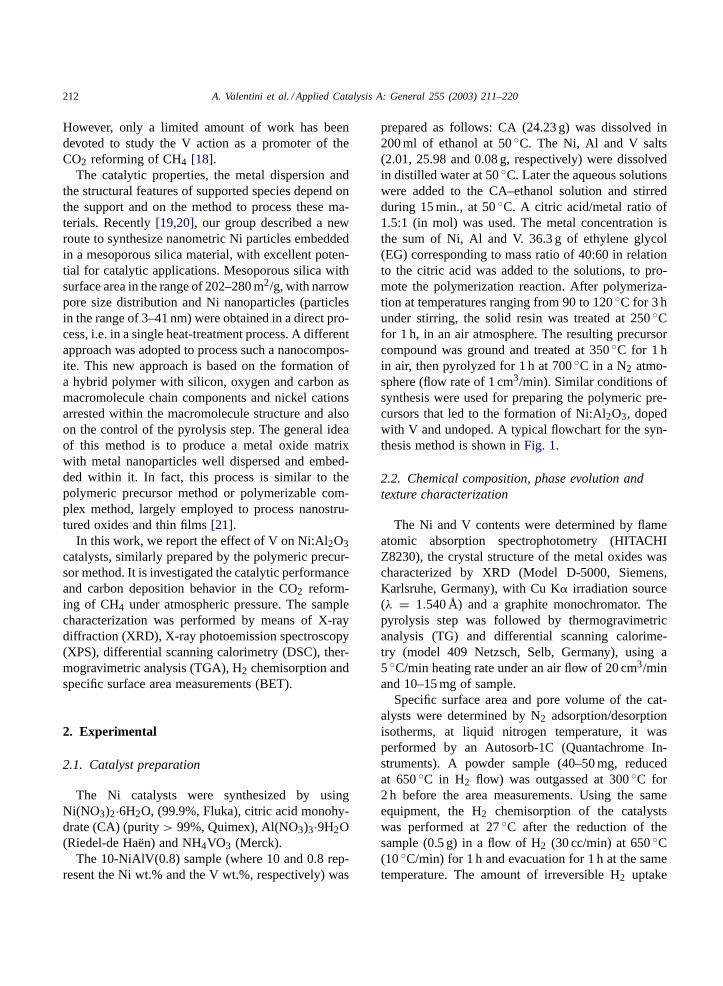
The results of chemical analysis, H2 chemisorptionand specific surface area for all the catalysts are sum-marized inTable 1. Fig. 2 presents the pore diameterdistribution for a series of samples, using the BJH des-orption method. It is observed that the vanadium ad-dition influences the textural properties. The 10-NiAlsample (without V) presented a low surface areaand a low pore volume. The 0.8 wt.% of V addition
214 A. Valentini et al. / Applied Catalysis A: General 255 (2003) 211–220
Table 1Chemical analysis and surface properties measured by H2 chemisorption and N2 physisorption of the fresh samples
Catalysts Metal (wt.%) H2 chemisorption N2 adsorption
Ni V � mol/g D (%) Sa (m2/g) Poreb (cc/g)
10-NiAl 10 0 – 11.39c – 1.33c 35 0.019910-NiAlV(0.8) 10 0.8 5.37d 14.87c 0.63d 1.74c 115 0.075810-NiAlV(2.3) 10 2.3 1.80d 17.63c 0.21d 2.10c 67 0.050910-NiAlV(3.7) 10 3.7 1.24d 5.05c 0.14d 0.59c 74 0.066622-NiAl 22 0 56.99d 113.50c 3.12d 5.59c 117 0.112122-NiAlV(8.5) 22 8.5 7.29d 20.60c 0.36d 1.02c 46 0.0344
D: metallic dispersion.a Surface area.b Pore volume atP/P0 = 0.6.c Based on total H2 adsorption at 27◦C.d Based on irreversible H2 adsorption at 27◦C.
provides a significant increase of the surface area andthe pore volume. On the other hand, with a furtherV increasing (2.3 and 3.7 wt.%), there is a decreasein the surface area and pore volume, seeTable 1and
Fig. 2. Pore size distribution of the samples, based on the BJHmethod.
Fig. 2a. In the samples with higher Ni wt.%, the use ofhigh V addition (8.5 wt.%) promoted a decrease in thesurface area and pore volume, and an increase in thepore diameter, as one can see inTable 1andFig. 2b.
Irreversible H2 chemisorption is indicated to deter-mine the metal dispersion. In the present work, thecalculation of the metal dispersion, based on the to-tal and irreversible H2 chemisorption, was done to getmore information about the support influence and theinterface properties.
The H2 chemisorption results for the 10-NiAl sam-ple did not present H2 irreversible with 650◦C of ac-tivation temperature. This suggests a lower rate of Nireduction at 650◦C, pointing out to the NiAl2O4 for-mation. These results are in agreement with measure-ments taken by X-ray photoemission experiments, asindicated inTable 2andFig. 3. Our results show that
850 860 870 880
10-NiAl
Mg Kα
10-NiAlV(3.7)
10-NiAlV(2.3)
10-NiAlV(0.8)
Inte
nsity
(a.
u.)
Binding energy (eV)
Fig. 3. The XPS results for the V-doped samples.
A. Valentini et al. / Applied Catalysis A: General 255 (2003) 211–220 215
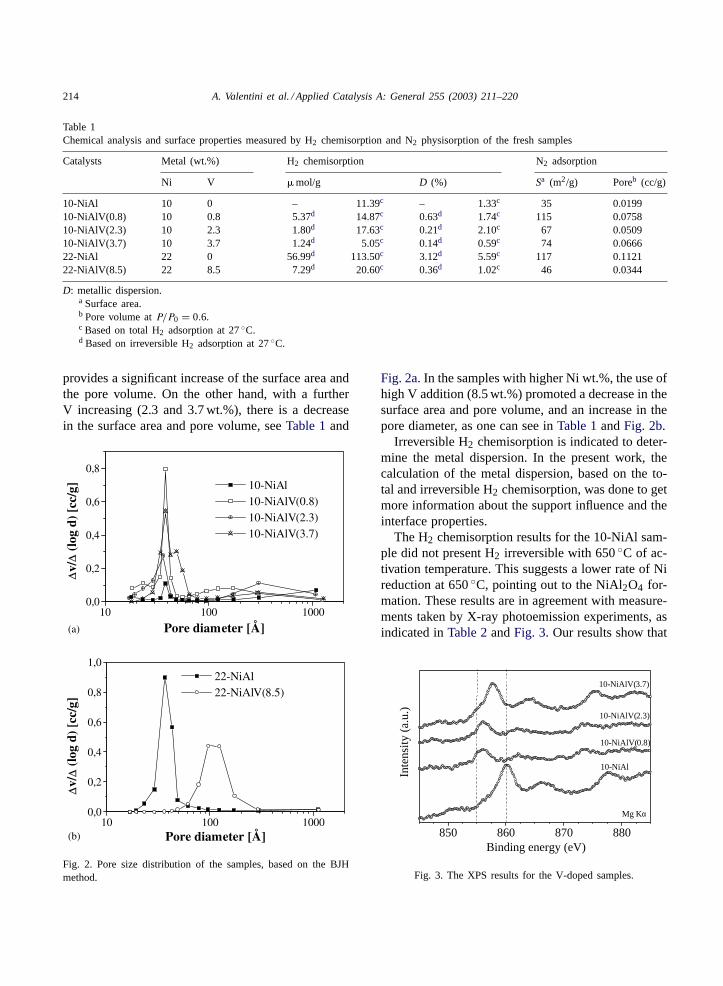
Table 2Chemical composition observed by XPS on the fresh catalyst surfaces and the elementary chemical analysis (CHN) of the catalysts afterCO2 reforming of CH4 at 625◦C
Catalysts Chemical concentration (%) on the catalyst surfacea Cokedeposition (g C/gcat)
Al Ni V
10-NiAl 0.80 99.20 – –10-NiAlV(0.8) 98.38 1.07 – 0.00810-NiAlV(2.3) 97.07 1.37 0.57 0.00610-NiAlV(3.7) 95.57 2.82 1.60 0.00922-NiAlV(8.5) 87.40 2.76 9.83 0.550 (0.145)b
22-NiAl – – – 0.080
a Considering Al, Ni and V only.b CH4/CO2 = 0.5.
the 10-NiAl sample presented a higher binding energy(Ni2+ 2p3/2), even higher than the spinel (NiAl2O4)phase values reported[22]. These reported[22] valuesare 857 eV for NiAl2O4 and 854 eV for NiO. In spiteof that, it is important to point out,Fig. 3, that thesamples containing V presented a lower binding en-ergy (856 eV), near the values for the NiO supportedon �-Al2O3 [23].
The high Ni atomic concentration (%) observed onthe surface of the 10-NiAl sample, measured by XPS(Table 2), can be related to the superficial spinel for-mation (NiAl2O4). Similar results were observed byPetti et al.[24], who reported a high Ni concentra-tion on the surface (by XPS) which corresponds tobetween five and seven times the bulk Ni concentra-tion. Lo Jacono et al.[25,26] reported the formationof a superficial (NiAl2O4) spinel, which was charac-terized by a distribution of nickel ions between tetra-hedral and octahedral sites. The authors also reportedthat the gaseous atmosphere used in the preparationprocess influenced this distribution.
3.2. Phase evolution characterization
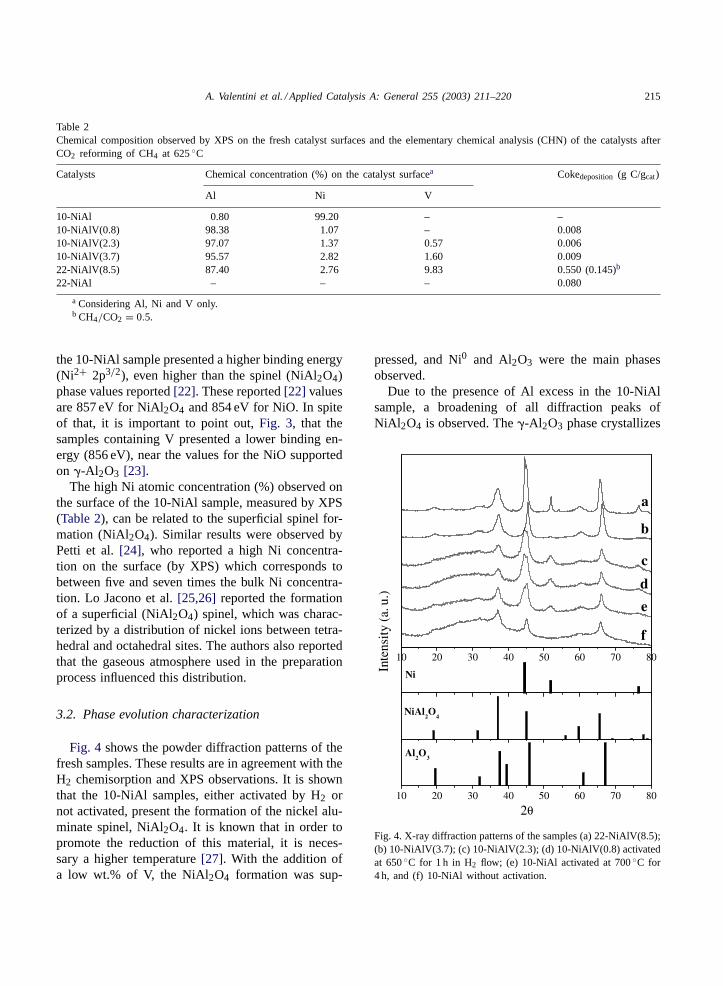
Fig. 4 shows the powder diffraction patterns of thefresh samples. These results are in agreement with theH2 chemisorption and XPS observations. It is shownthat the 10-NiAl samples, either activated by H2 ornot activated, present the formation of the nickel alu-minate spinel, NiAl2O4. It is known that in order topromote the reduction of this material, it is neces-sary a higher temperature[27]. With the addition ofa low wt.% of V, the NiAl2O4 formation was sup-
pressed, and Ni0 and Al2O3 were the main phasesobserved.
Due to the presence of Al excess in the 10-NiAlsample, a broadening of all diffraction peaks ofNiAl 2O4 is observed. The�-Al2O3 phase crystallizes
Fig. 4. X-ray diffraction patterns of the samples (a) 22-NiAlV(8.5);(b) 10-NiAlV(3.7); (c) 10-NiAlV(2.3); (d) 10-NiAlV(0.8) activatedat 650 ◦C for 1 h in H2 flow; (e) 10-NiAl activated at 700 ◦C for4 h, and (f) 10-NiAl without activation.
216 A. Valentini et al. / Applied Catalysis A: General 255 (2003) 211–220
in a spinel structure similar to the NiAl2O4 phase,which leads to the overlap of the principal diffractionpeaks. However, the difference in the intensity ofthe peaks point to the NiAl2O3 phase presence, whatcorroborates the H2 chemisorption results.
After activation at 700 ◦C for 4 h in a H2 stream, the10-NiAl sample presented the Ni0 phase, see X-raydiffraction patterns of Fig. 4.
With 0.8 wt.% of V addition (10-NiAlV(0.8) sam-ple) and the same preparation condition, the irre-versible H2 chemisorption was observed. This resultpoints out to the fact that Ni reduction is favoredby the V addition. On the other hand, with the Vincreasing to 2.3 and 3.7 wt.%, corresponding to10-NiAlV(2.3) and 10-NiAlV(3.7) samples, it wasobserved a drop in the exposed metallic surface area,by H2 chemisorption.
The vanadium doping effect for the samples(10-NiAlV(0.8), 10-NiAlV(2.3) and 10-NiAlV(3.7))was determined by XPS and can be observed inTable 2 and Fig. 3. They show the increasing of theNi 2p signal, as the concentration of vanadium in-creases. These results are not in agreement with thosefrom H2 chemisorption, but the effects of V on theH2 chemisorption (irreversible) should be considered.These results suggest that the V doping leads to theformation of new properties in the interface betweenNi an Al2O3.
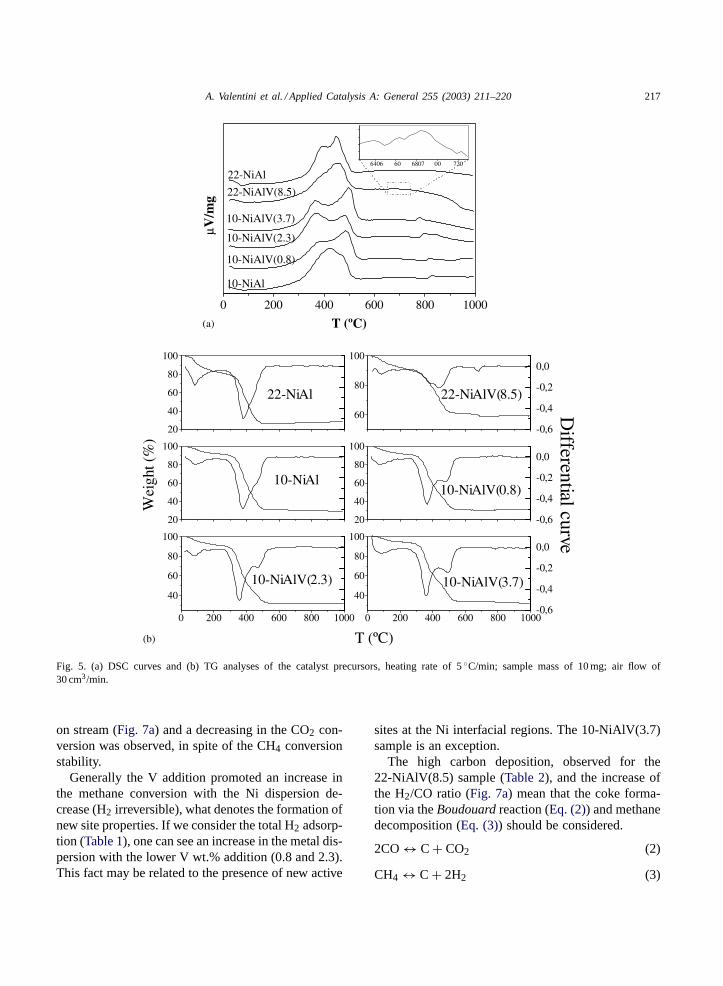
The thermal analyses are illustrated in Fig. 5. TheDSC curves for undoped and V-doped 22-NiAl and10-NiAl samples show two exothermic peaks, the firstsituated at ∼395 ◦C and the second one at ∼450 ◦C,whose relative proportion and temperature values aremodified with the V addition. A third peak is observedin the V-containing samples. In the samples with lowerNi wt.% content, a third peak placed at ∼800 ◦C isclearly shown. The 22-NiAlV(8.5) sample exhibits anexothermic peak at 690 ◦C (Fig. 5a inset).
The TG analyses of the samples are depictedin Fig. 5b. All of them show a great weight loss,∼40–60%, with main peaks in the differential weightloss curve. The 22-NiAl sample presented a peaklocated at 385 ◦C with a shoulder near 440 ◦C. Withthe V addition (22-NiAlV(8.5)), one can see that thefirst peak was less expressive than the peak placed at440 ◦C. In addition, a third peak, situated at 690 ◦C,which is correlated with the DSC curve, is alsoobserved. The samples with lower Ni content also
present two main peaks, the first situated at ∼360 ◦Cand the second one centered at 480 ◦C.
The first two peaks, in the DSC and DTG curves,have been attributed to the residual carbon elimina-tion (burning). In the DSC curves, an exothermic peakaround 800 ◦C is due to the formation of crystalline�-Al2O4 [28].
3.3. Carbon dioxide reforming of methane
The 10-NiAl sample did not produce any methaneconversion when activated at 650 ◦C/1 h, but at700 ◦C/4 h of activation it yielded a low methaneconversion (4% after 1 h). The results of XRD, XPS,the H2 chemisorption (at 650 ◦C activation) and ofthe N2 adsorption corroborate this fact, showing thepresence of NiAl2O4.
The catalytic methane conversion (%) is presentedin Fig. 6. With the higher Ni wt.% (22-NiAl) it waspossible to obtain metallic Ni at 650 ◦C of activationtemperature, with the consequent methane conversion(Fig. 6a). In spite of the lower Ni dispersion (%) andthe lower surface area presented by the 22-NiAlV(8.5)sample, a higher methane conversion was observed,however, the coke deposition was more meaningful(Table 2), promoting the reactor plugging due to theformation of large amounts of coke.
Fig. 6b shows that the catalytic methane conversionwas increased by the presence of V. On the other hand,the addition of a larger amount of V (3.7 wt.%) inhib-ited methane conversion. The lower CH4 conversionfor the 10-NiAlV(3.7) sample corroborates with theH2 chemisorption data.
Concerning the selectivity of the H2 and CO prod-ucts of the CO2 reforming of methane, it should be ex-pected a H2/CO ratio of 1. However, due to the reversewater-gas shift (RWGS) reaction (Eq. (1)), almost allcatalysts showed H2/CO ratio lower than 1 (Fig. 7).
CO2 + H2 ↔ CO + H2O (1)
The H2/CO ratio of the product gas was studied asa function of the time on stream. Fig. 7 shows that theH2/CO ratio was dependent of the amount of V. Thesamples with 10 wt.% of Ni presented a decrease inthe H2/CO ratio with the V wt.% increase. This showsthat the RWGS reaction is favored by the V addition(Fig. 7b). On the other hand, the 22-NiAlV(8.5) sam-ple presented an increase in the H2/CO ratio with time
A. Valentini et al. / Applied Catalysis A: General 255 (2003) 211–220 217
Fig. 5. (a) DSC curves and (b) TG analyses of the catalyst precursors, heating rate of 5 ◦C/min; sample mass of 10 mg; air flow of30 cm3/min.
on stream (Fig. 7a) and a decreasing in the CO2 con-version was observed, in spite of the CH4 conversionstability.
Generally the V addition promoted an increase inthe methane conversion with the Ni dispersion de-crease (H2 irreversible), what denotes the formation ofnew site properties. If we consider the total H2 adsorp-tion (Table 1), one can see an increase in the metal dis-persion with the lower V wt.% addition (0.8 and 2.3).This fact may be related to the presence of new active
sites at the Ni interfacial regions. The 10-NiAlV(3.7)sample is an exception.
The high carbon deposition, observed for the22-NiAlV(8.5) sample (Table 2), and the increase ofthe H2/CO ratio (Fig. 7a) mean that the coke forma-tion via the Boudouardreaction (Eq. (2)) and methanedecomposition (Eq. (3)) should be considered.
2CO ↔ C + CO2 (2)
CH4 ↔ C + 2H2 (3)

218 A. Valentini et al. / Applied Catalysis A: General 255 (2003) 211–220
0 2 4 6 8 1040
50
60
70
Time (h)
(a)
(b)
22-NiAl 22-NiAlV(8.5)
CH
4 con
vers
ion
(%)
0 2 4 6 8 1010
20
30
40
50
60 10-NiAlV(0.8) 10-NiAlV(2.3) 10-NiAlV(3.7)
Time (h)
Fig. 6. The effect of V concentration on the catalytic performance of the CO2/CH4 reaction at 625 ◦C and atmospheric pressure. (a) 22Ni wt.% and (b) 10 Ni wt.%. CH4/CO2 ratio of 1.
0 42 6 8 100,6
0,7
0,8
0,9
1,0
Time (h)
10-NiAlV(0.8) 10-NiAlV(2.3) 10-NiAlV(3.7)H2 /
CO
rat
io
0 42 6 8 100,8
1,0
1,2
1,4
Time (h)
22-NiAl 22-NiAlV(8.5)
(a)
(b)
Fig. 7. H2/CO ratio as a function of time on stream. (a) 22 Ni wt.% and (b) 10 Ni wt.%. CH4/CO2 ratio of the feed gas = 1.
A. Valentini et al. / Applied Catalysis A: General 255 (2003) 211–220 219
0 42 6 8 1020
30
40
50
60
70
80
90
100
22-NiAlV(8.5) (CH4/CO
2 = 0.5)
H2 / C
O ratio
CH4
CH
4 con
vers
ion
(%)
Time (h)
0,6
0,7
0,8
0,9
1,0
H2/CO
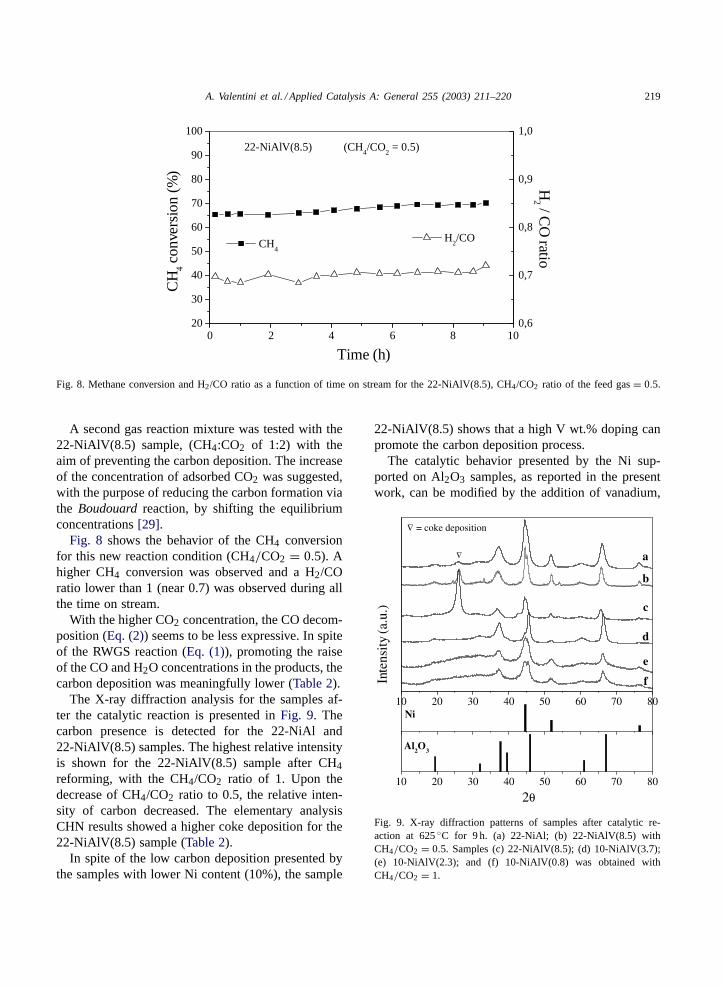
Fig. 8. Methane conversion and H2/CO ratio as a function of time on stream for the 22-NiAlV(8.5), CH4/CO2 ratio of the feed gas = 0.5.
A second gas reaction mixture was tested with the22-NiAlV(8.5) sample, (CH4:CO2 of 1:2) with theaim of preventing the carbon deposition. The increaseof the concentration of adsorbed CO2 was suggested,with the purpose of reducing the carbon formation viathe Boudouardreaction, by shifting the equilibriumconcentrations [29].
Fig. 8 shows the behavior of the CH4 conversionfor this new reaction condition (CH4/CO2 = 0.5). Ahigher CH4 conversion was observed and a H2/COratio lower than 1 (near 0.7) was observed during allthe time on stream.
With the higher CO2 concentration, the CO decom-position (Eq. (2)) seems to be less expressive. In spiteof the RWGS reaction (Eq. (1)), promoting the raiseof the CO and H2O concentrations in the products, thecarbon deposition was meaningfully lower (Table 2).
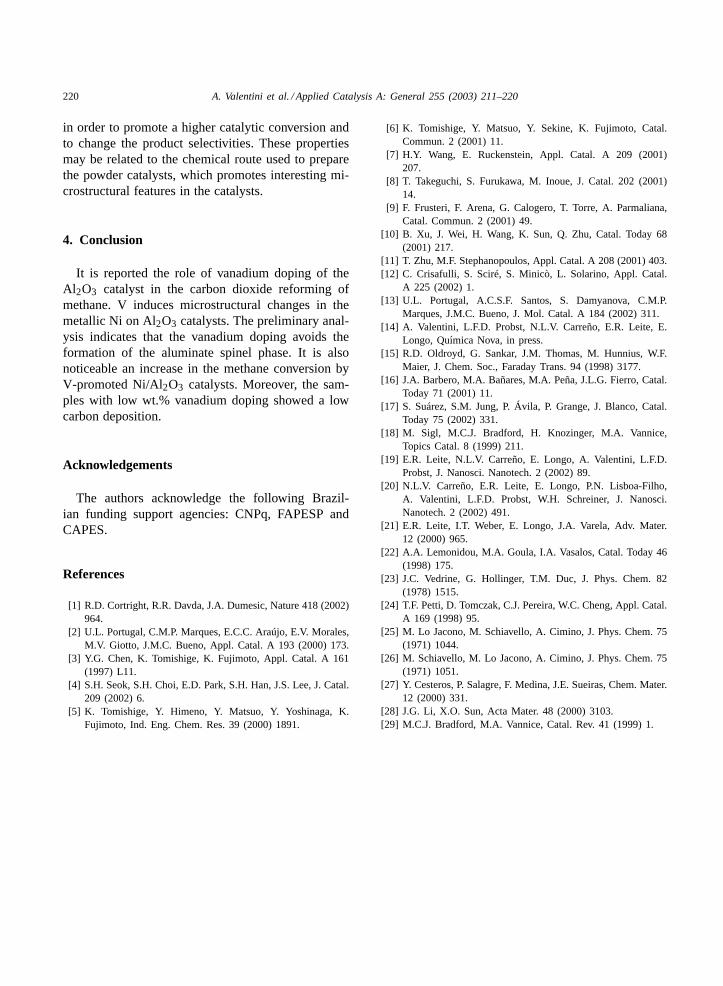
The X-ray diffraction analysis for the samples af-ter the catalytic reaction is presented in Fig. 9. Thecarbon presence is detected for the 22-NiAl and22-NiAlV(8.5) samples. The highest relative intensityis shown for the 22-NiAlV(8.5) sample after CH4reforming, with the CH4/CO2 ratio of 1. Upon thedecrease of CH4/CO2 ratio to 0.5, the relative inten-sity of carbon decreased. The elementary analysisCHN results showed a higher coke deposition for the22-NiAlV(8.5) sample (Table 2).
In spite of the low carbon deposition presented bythe samples with lower Ni content (10%), the sample
22-NiAlV(8.5) shows that a high V wt.% doping canpromote the carbon deposition process.
The catalytic behavior presented by the Ni sup-ported on Al2O3 samples, as reported in the presentwork, can be modified by the addition of vanadium,
Fig. 9. X-ray diffraction patterns of samples after catalytic re-action at 625 ◦C for 9 h. (a) 22-NiAl; (b) 22-NiAlV(8.5) withCH4/CO2 = 0.5. Samples (c) 22-NiAlV(8.5); (d) 10-NiAlV(3.7);(e) 10-NiAlV(2.3); and (f) 10-NiAlV(0.8) was obtained withCH4/CO2 = 1.
220 A. Valentini et al. / Applied Catalysis A: General 255 (2003) 211–220
in order to promote a higher catalytic conversion andto change the product selectivities. These propertiesmay be related to the chemical route used to preparethe powder catalysts, which promotes interesting mi-crostructural features in the catalysts.
4. Conclusion
It is reported the role of vanadium doping of theAl2O3 catalyst in the carbon dioxide reforming ofmethane. V induces microstructural changes in themetallic Ni on Al2O3 catalysts. The preliminary anal-ysis indicates that the vanadium doping avoids theformation of the aluminate spinel phase. It is alsonoticeable an increase in the methane conversion byV-promoted Ni/Al2O3 catalysts. Moreover, the sam-ples with low wt.% vanadium doping showed a lowcarbon deposition.
Acknowledgements
The authors acknowledge the following Brazil-ian funding support agencies: CNPq, FAPESP andCAPES.
References
[1] R.D. Cortright, R.R. Davda, J.A. Dumesic, Nature 418 (2002)964.
[2] U.L. Portugal, C.M.P. Marques, E.C.C. Araújo, E.V. Morales,M.V. Giotto, J.M.C. Bueno, Appl. Catal. A 193 (2000) 173.
[3] Y.G. Chen, K. Tomishige, K. Fujimoto, Appl. Catal. A 161(1997) L11.
[4] S.H. Seok, S.H. Choi, E.D. Park, S.H. Han, J.S. Lee, J. Catal.209 (2002) 6.
[5] K. Tomishige, Y. Himeno, Y. Matsuo, Y. Yoshinaga, K.Fujimoto, Ind. Eng. Chem. Res. 39 (2000) 1891.
[6] K. Tomishige, Y. Matsuo, Y. Sekine, K. Fujimoto, Catal.Commun. 2 (2001) 11.
[7] H.Y. Wang, E. Ruckenstein, Appl. Catal. A 209 (2001)207.
[8] T. Takeguchi, S. Furukawa, M. Inoue, J. Catal. 202 (2001)14.
[9] F. Frusteri, F. Arena, G. Calogero, T. Torre, A. Parmaliana,Catal. Commun. 2 (2001) 49.
[10] B. Xu, J. Wei, H. Wang, K. Sun, Q. Zhu, Catal. Today 68(2001) 217.
[11] T. Zhu, M.F. Stephanopoulos, Appl. Catal. A 208 (2001) 403.[12] C. Crisafulli, S. Sciré, S. Minicò, L. Solarino, Appl. Catal.
A 225 (2002) 1.[13] U.L. Portugal, A.C.S.F. Santos, S. Damyanova, C.M.P.
Marques, J.M.C. Bueno, J. Mol. Catal. A 184 (2002) 311.[14] A. Valentini, L.F.D. Probst, N.L.V. Carreño, E.R. Leite, E.
Longo, Quımica Nova, in press.[15] R.D. Oldroyd, G. Sankar, J.M. Thomas, M. Hunnius, W.F.
Maier, J. Chem. Soc., Faraday Trans. 94 (1998) 3177.[16] J.A. Barbero, M.A. Bañares, M.A. Peña, J.L.G. Fierro, Catal.
Today 71 (2001) 11.[17] S. Suárez, S.M. Jung, P. Ávila, P. Grange, J. Blanco, Catal.
Today 75 (2002) 331.[18] M. Sigl, M.C.J. Bradford, H. Knozinger, M.A. Vannice,
Topics Catal. 8 (1999) 211.[19] E.R. Leite, N.L.V. Carreño, E. Longo, A. Valentini, L.F.D.
Probst, J. Nanosci. Nanotech. 2 (2002) 89.[20] N.L.V. Carreño, E.R. Leite, E. Longo, P.N. Lisboa-Filho,
A. Valentini, L.F.D. Probst, W.H. Schreiner, J. Nanosci.Nanotech. 2 (2002) 491.
[21] E.R. Leite, I.T. Weber, E. Longo, J.A. Varela, Adv. Mater.12 (2000) 965.
[22] A.A. Lemonidou, M.A. Goula, I.A. Vasalos, Catal. Today 46(1998) 175.
[23] J.C. Vedrine, G. Hollinger, T.M. Duc, J. Phys. Chem. 82(1978) 1515.
[24] T.F. Petti, D. Tomczak, C.J. Pereira, W.C. Cheng, Appl. Catal.A 169 (1998) 95.
[25] M. Lo Jacono, M. Schiavello, A. Cimino, J. Phys. Chem. 75(1971) 1044.
[26] M. Schiavello, M. Lo Jacono, A. Cimino, J. Phys. Chem. 75(1971) 1051.
[27] Y. Cesteros, P. Salagre, F. Medina, J.E. Sueiras, Chem. Mater.12 (2000) 331.
[28] J.G. Li, X.O. Sun, Acta Mater. 48 (2000) 3103.[29] M.C.J. Bradford, M.A. Vannice, Catal. Rev. 41 (1999) 1.
Copyright © 2022 FDOKUMEN