Effect of Vanadium Catalysts on Hydrogen Evolution ... - MDPI
16
Citation: Orlowski, P.A.; Grochala, W. Effect of Vanadium Catalysts on Hydrogen Evolution from NaBH 4 . Solids 2022, 3, 295–310. https:// doi.org/10.3390/solids3020021 Academic Editors: Manickam Minakshi and Andrei Kovalevsky Received: 20 January 2022 Accepted: 16 May 2022 Published: 18 May 2022 Publisher’s Note: MDPI stays neutral with regard to jurisdictional claims in published maps and institutional affil- iations. Copyright: © 2022 by the authors. Licensee MDPI, Basel, Switzerland. This article is an open access article distributed under the terms and conditions of the Creative Commons Attribution (CC BY) license (https:// creativecommons.org/licenses/by/ 4.0/). Article Effect of Vanadium Catalysts on Hydrogen Evolution from NaBH 4 Piotr Antoni Orlowski 1,2, * and Wojciech Grochala 1, * 1 Centre of New Technologies, University of Warsaw, ˙ Zwirki i Wigury 93, 02-089 Warsaw, Poland 2 Faculty of Chemistry, University of Warsaw, Pasteura 1, 02-093 Warsaw, Poland * Correspondence: [email protected] (P.A.O.); [email protected] (W.G.) Abstract: NaBH 4 is a very cheap and hydrogen-rich material, as well as a potential hydrogen store. However, the high temperature of its thermal decomposition (above 530 ◦ C) renders it inapplicable in practical use. Here, we studied the effect of addition of diverse V-containing catalysts on thermal hydrogen desorption. It turns out that mechanochemical doping of NaBH 4 with vanadium metal, its oxides, or nanoparticles lowers the temperature of pyrolysis significantly. Notably, NaBH 4 milled for 3 h with 25 wt.% V 2 O 5 or VO 2 releases ca. 70% of stored hydrogen in the temperature range of ca. 370–450 ◦ C. On the other hand, precursors and solvents used to prepare rather uniform vanadium nanoparticles (~4 nm) suspended in THF or less uniform and larger ones (~15 nm) in o- difluorobenzene have adverse effect on the purity of hydrogen evolved. Keywords: sodium borohydride; vanadium; thermal decomposition; hydrogen storage materials; mechanochemical synthesis 1. Introduction Fossil fuels have been widely used as an energy source all over the world for centuries. Their intense usage has led to environmental pollution and climate change, and this has forced humanity to seek alternative, green energy sources and carriers. Hydrogen, next to none in its high gravimetric energy density, is a clean source of energy, with its combustion resulting only in water. This makes it a promising alternative to both fossil energy carriers and electric energy accumulators [1–5]. Sodium borohydride is one of the cheapest and most hydrogen-rich compounds known, having highly competitive volumetric hydrogen density [6]. Therefore, it is not surprising that much effort has been devoted to the possibility of using it as a hydrogen storage material. Hydrogen can be released from NaBH 4 either during its hydrolysis or upon thermal decomposition. Hydrolysis reactions in alkaline aqueous solutions take place at room temperature upon contact with a catalyst (so called Hydrogen-on-demand ® technology [7]). However, the reversibility of this process is poor, as it is associated with the necessity to recycle very stable oxoborates(III) back to BH 4 - species. On the other hand, the pyrolysis profile has a maximum desorption peak above 500 ◦ C[8] (values up to 534 ± 10 ◦ C at 1 bar of hydrogen [9] are given in the literature), which is quite high for mobile applications. Three main approaches taken to lower the decomposition temperature are catalytic enhancement of pyrolysis, tuning it via hydride mixing, and nanosizing of hydrogen-containing species [10–12]. Various dopants have been studied by numerous teams, and we can group them for convenience into four main categories (Tables 1–4): (I) first-period transition metal (TM) elements and their compounds, (II) second-period TM elements and their compounds, (III) lanthanides and their compounds, and (IV) other hydrides. Additionally, composites of NaBH 4 with diverse “inert” materials such as graphene and zeolites have been prepared, and their thermal profiles have been studied (Table 5). Last but not the least, attempts to prepare NaBH 4 nanoparticles to decrease the Solids 2022, 3, 295–310. https://doi.org/10.3390/solids3020021 https://www.mdpi.com/journal/solids
-
Upload
khangminh22 -
Category
Documents
-
view
0 -
download
0
Transcript of Effect of Vanadium Catalysts on Hydrogen Evolution ... - MDPI

Citation: Orłowski, P.A.; Grochala, W.
Effect of Vanadium Catalysts on
Hydrogen Evolution from NaBH4.
Solids 2022, 3, 295–310. https://
doi.org/10.3390/solids3020021
Academic Editors: Manickam
Minakshi and Andrei Kovalevsky
Received: 20 January 2022
Accepted: 16 May 2022
Published: 18 May 2022
Publisher’s Note: MDPI stays neutral
with regard to jurisdictional claims in
published maps and institutional affil-
iations.
Copyright: © 2022 by the authors.
Licensee MDPI, Basel, Switzerland.
This article is an open access article
distributed under the terms and
conditions of the Creative Commons
Attribution (CC BY) license (https://
creativecommons.org/licenses/by/
4.0/).
Article
Effect of Vanadium Catalysts on Hydrogen Evolutionfrom NaBH4
Piotr Antoni Orłowski 1,2,* and Wojciech Grochala 1,*
1 Centre of New Technologies, University of Warsaw, Zwirki i Wigury 93, 02-089 Warsaw, Poland2 Faculty of Chemistry, University of Warsaw, Pasteura 1, 02-093 Warsaw, Poland* Correspondence: [email protected] (P.A.O.); [email protected] (W.G.)
Abstract: NaBH4 is a very cheap and hydrogen-rich material, as well as a potential hydrogen store.However, the high temperature of its thermal decomposition (above 530 ◦C) renders it inapplicablein practical use. Here, we studied the effect of addition of diverse V-containing catalysts on thermalhydrogen desorption. It turns out that mechanochemical doping of NaBH4 with vanadium metal, itsoxides, or nanoparticles lowers the temperature of pyrolysis significantly. Notably, NaBH4 milledfor 3 h with 25 wt.% V2O5 or VO2 releases ca. 70% of stored hydrogen in the temperature rangeof ca. 370–450 ◦C. On the other hand, precursors and solvents used to prepare rather uniformvanadium nanoparticles (~4 nm) suspended in THF or less uniform and larger ones (~15 nm) in o-difluorobenzene have adverse effect on the purity of hydrogen evolved.
Keywords: sodium borohydride; vanadium; thermal decomposition; hydrogen storage materials;mechanochemical synthesis
1. Introduction
Fossil fuels have been widely used as an energy source all over the world for centuries.Their intense usage has led to environmental pollution and climate change, and this hasforced humanity to seek alternative, green energy sources and carriers. Hydrogen, next tonone in its high gravimetric energy density, is a clean source of energy, with its combustionresulting only in water. This makes it a promising alternative to both fossil energy carriersand electric energy accumulators [1–5].
Sodium borohydride is one of the cheapest and most hydrogen-rich compoundsknown, having highly competitive volumetric hydrogen density [6]. Therefore, it is notsurprising that much effort has been devoted to the possibility of using it as a hydrogenstorage material. Hydrogen can be released from NaBH4 either during its hydrolysis orupon thermal decomposition. Hydrolysis reactions in alkaline aqueous solutions takeplace at room temperature upon contact with a catalyst (so called Hydrogen-on-demand®
technology [7]). However, the reversibility of this process is poor, as it is associated withthe necessity to recycle very stable oxoborates(III) back to BH4
− species. On the otherhand, the pyrolysis profile has a maximum desorption peak above 500 ◦C [8] (values upto 534 ± 10 ◦C at 1 bar of hydrogen [9] are given in the literature), which is quite high formobile applications. Three main approaches taken to lower the decomposition temperatureare catalytic enhancement of pyrolysis, tuning it via hydride mixing, and nanosizing ofhydrogen-containing species [10–12]. Various dopants have been studied by numerousteams, and we can group them for convenience into four main categories (Tables 1–4):(I) first-period transition metal (TM) elements and their compounds, (II) second-periodTM elements and their compounds, (III) lanthanides and their compounds, and (IV) otherhydrides. Additionally, composites of NaBH4 with diverse “inert” materials such asgraphene and zeolites have been prepared, and their thermal profiles have been studied(Table 5). Last but not the least, attempts to prepare NaBH4 nanoparticles to decrease the
Solids 2022, 3, 295–310. https://doi.org/10.3390/solids3020021 https://www.mdpi.com/journal/solids

Solids 2022, 3 296
thermal decomposition temperature of the pristine material are gathered in the last group(Table 6).
Table 1. Influence of the first-period transition metal-based dopants on thermal decompositiontemperature of NaBH4 (5%mol doping if not specified differently).
Sc [13] Ti V Cr [13] Mn [13]
ScF3—501 ◦C
Nano—493 ◦C [14]TiF3—300 ◦C [15]
5%mol TiF3—~300 ◦C [16]TiF4—522 ◦C [13]
TiCl3 1:6—100 ◦C * [17]TiB2—503 ◦C [14]
TiSiO4—489 ◦C [14]
VF4—499 ◦C [13]NaBH4 + PrF3 + VF33:1:0.2—417 ◦C [18]V3B—478 ◦C [14]
CrF3—500 ◦C MnF3—483 ◦C
Fe [13] Co Ni Cu [13] Zn
FeF3—498 ◦C CoF3—501 ◦C [13]Co3B—480 ◦C [14]
Nano—483 ◦C [14]NiF2—452 ◦C [13]NiF2—453 ◦C [14]
wt.10% Ni onSi/Al2O3—449 ◦C [14]
NiCl2—460 ◦C [14]Ni3B—462 ◦C [14]
CuF2—476 ◦C ZnF2—504 ◦C [13]ZnF2 1:2—95 ◦C ** [19]
* polluted with B2H6 and diglyme; ** polluted with B2H6.
Table 2. Influence of the second-period transition metal-based dopants on thermal decompositiontemperature of NaBH4 (5%mol doping if not specified differently).
Y Zr Nb [13] Rh [14] Pd [14] Ag [13] Cd [13]
YF3—513 ◦C [13]YF3 3:1—423 ◦C [20]
ZrF4—503◦C [13]ZrCl4—503 ◦C [21]
NbF5:2%mol—442 ◦C
10%mol—379 ◦C15%mol—379 ◦C
Rh (5 wt.%) onAl2O3—476 ◦C Nano—420 ◦C AgF—498 ◦C CdF2—512 ◦C
(x)YF3 + (1 − x)GdF33:1 [22]:
x = 2/3—449 ◦Cx = 1/2—446 ◦Cx = 1/3—440 ◦C
Table 3. Influence of lanthanide series metal-based dopants on thermal decomposition temperatureof NaBH4 (5%mol doping if not specified differently).
La [23] Ce [13] Pr [18] Nd [24] Ho [25]
LaF3 3:1—396 ◦CLa 3:1—442 ◦C
CeF3—506 ◦CCeF4—502 ◦C PrF3 3:1—439 ◦C NdF3 3:1—413 ◦C HoF3 3:1—443 ◦C
Table 4. Influence of co-milling of other hydrogen-rich compounds with NaBH4 on its thermaldecomposition temperature (molar ratio was used if not described differently).
MH2 Mg2NiH4 [26] NaNH2 M(AlH4)x Li3AlH6 [27] MBH4
M = Mg:1:2—420 ◦C [28]1:2—490 ◦C [29]
1:2 with 5%mol of [30]:TiF3—~470 ◦CTiO2—~470 ◦C
Zr—~470 ◦CSi—~470 ◦C
BCC—~470 ◦C
M = Ca:1:6—390 ◦C [31]
5:4—~350 ◦C
1:1—330 ◦C * [32]
2:1 with Co–Ni–Bcatalyst [33]:
1 wt.%—~300 ◦C3 wt.%—~285 ◦C5 wt.%—285 ◦C
7 wt.%—~285 ◦C
M = Li:1:1 [16]:
No catalyst—446 ◦C5% TiF3—~300 ◦C
M = Ca:2NaAlH4 +
Ca(BH4)2 with 5wt.% TiF3 —400 ◦C
[34]
1:1 (1 h)—400 ◦C1:1 (24 h)—392 ◦C
1:2—430 ◦C1:3—430 ◦C
M = Li 0.38:0.62:pure—350 ◦C [35]
pure—~420 ◦C [36]60%vol in carbon
areogel—~333 ◦C [35]
M = K—~472 ◦C [37]
M = Mg—~205 ◦C [38]
M = Li, K, Mg, and Ca(equimolar)—~330 ◦C [39]
* polluted with ammonia.

Solids 2022, 3 297
Table 5. Thermal decomposition of NaBH4 in its composite materials (mass ratio was used if notdescribed differently).
Ionic Liquids [40] Carbon Carbon Based Zeolites [41] Ah-BN [42] NaBF4 ** [34]
1%mol solution in:bmimBr—~165 ◦C
bmimNTf2—104 ◦C
20% of scaffolds CMK-3—235 ◦C and 380 ◦C * [43]
~25% of HSAG-500 [44]:infiltrated—~270 ◦C
melted—~300 ◦Cmixed—~320 ◦C
45% fluorographite—141 ◦C [45]graphene:
10%—370 ◦C [46]?—426 ◦C [47]
MCM-22:1:1—490 ◦C1:2—503 ◦C1:3—507 ◦C1:4—508 ◦C
SAPO-34:1:1—483 ◦C1:2—491 ◦C1:3—493 ◦C1:4—495 ◦C
1:1—399 ◦C 1:10 mol—468 ◦C1:2 mol—305 ◦C
* polluted with ammonia; ** polluted with BF3 and B2H6.
Table 6. Influence of nanosizing of NaBH4 on its thermal decomposition temperature.
Solvented IonStabilization * [48]
Evaporation with 10%mol ofLigands or Solvents [49] Anti-Solvent Precipitation Milled LiBH4 + NaCl
LiCl—495 ◦CMgCl2—445 ◦C
NaI—485 ◦C
Hexyloamine—489 ◦Cdodecyloamine—476 ◦C
octodecyloamine—473 ◦Ctertabuthylamonium
bromide—464 and 482 ◦Ctetraoctylamoniumbromide—484 ◦C
tetradecyloamoniumbromide—~500 ◦Cdodecane—478 ◦C
dodecanothiol—464 ◦Ctri-decylic acid—~400 and 474 ◦C
tetrabutylphosphoniumbromide—471 ◦C
Bare—460 and 535 ◦C [50]Coated with:
Ni—418 ◦C [50]Co—350 ◦C [51]Cu—400 ◦C [51]Fe—380 ◦C [51]Sn—450 ◦C [51]
Graphene coated(ultrasonicated anddried)—400 ◦C [47]
Milled with graphenenanoflakes—~300 ◦C [52]Milled 1:10 mass with [53]:
graphite—109 ◦Cgraphene oxide—114 ◦C
carbon nanotubes—116 ◦C
* polluted with buthylamine.
Some of the most spectacular results achieved via doping with the first-period TMspecies (Table 1) were seen for zinc(II) fluoride and titanium(III) chloride, which evolvehydrogen around 95 and 100 ◦C, respectively. However, as typical for the rather low tem-perature of thermal decomposition, H2 gas is, in these cases, severely polluted with B2H6 orB2H6 and diglyme. For metals from the second TM period (Table 2), the lowest temperatureof thermal decomposition of 379 ◦C was achieved for 10%mol and 15%mol doping with NbF5.The third-period TM catalysts were also tested but the decrease in thermal decompositiontemperature was not impressive (TaCl5—460 ◦C and ReCl3—465 ◦C [14]). In lanthanideseries (Table 3), the best result was achieved for neodymium fluoride doping (413 ◦C).
Co-milling NaBH4 with other hydrogen storage materials (Table 4), particularly proticones, often leads to facile evolution of H2 from a composite system. As for NaBH4, particu-larly promising results were achieved for 5 wt.% Co-Ni-B doped 2NaNH2/NaBH4 mixture,milled in hexane environment, for which the temperature of pyrolysis with H2 evolutiondropped to a value as low as 285 ◦C. However, hydridic–protic stores rarely show sufficientreversibility [54,55].
If composites with diverse “inert” materials are considered (Table 5), substantial(45 wt.%) fluorographite addition resulted in the thermal decomposition point of 141 ◦C;an also interesting approach with the use of ionic liquid led to pure hydrogen desorptionstarting at 104 ◦C. Other composites usually yielded less appealing results.
The last group of proposed NaBH4 modifications involves either nanostructurizationor coating it with metal or graphene layers (Table 6) which could lead to a decompositiontemperature as low as 350 ◦C for NaBH4 nanoparticles coated with cobalt.

Solids 2022, 3 298
It may be seen from the literature screening that vanadium compounds have ratherseldom been used to modify the H2-release properties NaBH4, and only moderate resultswere achieved when using VF3, VF4, or V3B as catalysts. This is quite disappointing inview of the fact that, from 40 to 100 ◦C, the γ phase of vanadium(II) hydride is known toexist in equilibrium with hydrogen gas and its metallic β form [56]. This implies a ratherlow temperature of H2 release from VH2, especially in an H2-free atmosphere. Moreover,the process of H2 release from VH2 must have a rather low activation barrier, as it tendsto be fast. Consequently, vanadium metal or its compounds (reduced in situ to VNPs)could act as catalysts and destabilize [BH4]− anions present in NaBH4, thus decreasing thetemperature of thermal decomposition of this material and leading to facile H2 evolution atlow temperature. Therefore, in this study, we researched doping of sodium borohydridewith vanadium, vanadium oxides (V2O3, VO2, V2O5), or vanadium nanoparticles and theireffects on thermal stability of NaBH4 hydrogen storage material.
2. Experimental2.1. Materials
NaBH4 (≥98%), LiAlH4 2.0 M solution in THF and catalysts V2O5 (≥99.6%), VO2 (≥99%),and V2O3 (99.99%) were purchased from Sigma Aldrich (St. Louis, MO, USA). Ph4PCl(98%) used in Ph4PBH4 synthesis was delivered by abcr GmbH (Karlsruhe, Germany). Sol-vents dichloromethane (DCM) (≥99.8% ≤50 ppm H2O) and tetrahydrofuran (THF) (≥99.8%,≤50 ppm H2O) were purchased from ROTH (Karlsruhe, Germany), while o-difluorobenzene(o-DFB) (98%) was obtained from Fluorochem (Hadfield, UK). Before synthesis, DCM andTHF were dried with P2O5 and distilled; o-DFB was degassed using a Schlenk line and LN2.All solvents were then sealed in containers with 4 Å molecular sieves.
2.2. Equipment
A Vigor SG1200/750TS-F glovebox (Houston, TX, USA) was used for storing andpreparing the samples; all reactions were performed in an inert gas (Ar) atmosphere(<10 ppm O2, <0.05 ppm H2O) or using a Schlenk line. Mechanochemical doping wasconducted in a stainless-steel disc bowl using a Testchem vibration mill (1400 RPM). Sus-pensions of VNPs were firstly sonicated using Polsonic Sonic-6D in an ice-cooled water bath.Thermal decomposition analysis of the samples was investigated using a thermogravimeter(TGA) combined with differential scanning calorimeter (DSC) from Netzsch STA 409 PG(NETZSCH-Gerätebau GmbH, Selb, Germany) using Al2O3 crucibles. TGA/DSC chamberwas constantly purged at a constant Ar (99.9999%) flow rate of 80 mL·min−1. The evolvedgases were analyzed with a quadrupole mass spectrometer (MS) QMS 403 C (PfeifferVacuum, Aβlar, Germany), connected to the TGA/DSC device by a quartz capillary pre-heated to 200 ◦C to avoid condensation of low-boiling volatiles. Fourier-transform infraredspectroscopy (FTIR) of all solid products of doping was measured using a Vertex 80v FT-IRspectrometer (Bruker, Billerica, MA, USA). Anhydrous KBr was used as a pellet material.
2.3. Synthesis and Doping
Vanadium nanoparticles (VNPs) were synthesized via reduction of vanadium(III)compounds. The THF suspension was prepared using vanadium (III) chloride and LiAlH4solutions in THF. Then, 10 mL of a stoichiometric amount of reducer solution was addeddropwise to 30 mL of 0.05 M solution of VCl3 under intense stirring. In the case ofVNPs suspended in o-DFB, acetonitrile-coordinated vanadium(III) bis(tetra(nonafluoro-tert-butoxy)aluminate) monochloride (VCl(Al(OC(CF3)3)4)2·5ACN) was synthesized ac-cording to [57] and used as source of vanadium and tetraphenylphosphonium borohydride(Ph4PBH4) as a reducer and dissolved in o-DFB. Next, 20 mL of 0.015 M reducer solutionwas added dropwise to 20 mL of 0.005 M solution of vanadium salt, under intense stirring.Excess of the reducer was used to ensure complete reduction of vanadium cation. Bothsuspensions were stirred for 24 h before use and denoted in dependence of solvent usedas VNPsTHF and VNPsO-DFB. Attempts of purification by centrifuging brought no results

Solids 2022, 3 299
since VNPs could not be separated from their suspension that way and were used withoutfurther purification. The rationale behind the use of VNs is in their large specific area,which could imply fast and uniform catalysis of H2 evolution within the entire bulk of thehydrogen store.
Doping was carried out by mixing 5 or 25 wt.% of powder catalysts (V, V2O3, VO2,or V2O5) with NaBH4 and milling in 100 g batches for 5 or 30 min in milling periods of 1and 5 min respectively, altered with liquid nitrogen (LN2) cooling to avoid overheatingof samples. In addition, one V2O5 sample was also milled for 3 h in 20 min periods. Thesamples were then denoted using the Na:XY T pattern, where X stands for the catalyst used,Y is its wt.% amount, and T is the milling time; the samples were tested with TGA/DSCin 20–450 or 20–600 ◦C range with 5 K/min heating rate together with MS of evolvedgases and compared with milled pure NaBH4 as reference. For activation energy studies ofNa:V2O525%_180 min, three additional heating rates were used: 10, 1, and 0.5 K/min.
In the case of VNP doping (100 mg) of NaBH4, 2 or 10 mL of VNPsTHF or VNPsO-DFB,respectively, were added to the glass ampoule, which was firstly sonicated for 20 minin ice-cold bath, and then dried under a dynamic vacuum using a Schlenk line until thepressure dropped to 5 × 10⁻² mbar and for 30 min after. Samples were then transferred toa milling bowl, further milled for 30 min in the same way as powder-doped samples, anddenoted Na:VNPsTHF and Na:VNPsO-DFB, respectively.
3. Results3.1. Synthesis of VNPs
TEM analysis of synthesized VNPs (Figure 1) showed that nanoparticles prepared inTHF using LiAlH4 are smaller and more uniform than those synthesized in o-DFB.
Solids 2022, 2, FOR PEER REVIEW 6
Figure 1. TEM images of VNPs prepared in THF and o-DFB solutions.
The particle radius distribution based on several TEM images (Figure 2) was pre-pared in order to estimate size and standard deviation of their size. As calculated, mean sizes of VNPs were 14.86 ± 7.71 nm and 3.57 ± 0.93 nm for o-DFB and THF suspensions, respectively. The VNPsTHF size histogram could be described with a normal distribution, being more uniform in size and smaller than VNPsO-DFB which had various, aspherical shapes and a size histogram looking more like a lognormal distribution. Since LiAlH4 is a much stronger reducer than Ph4PBH4, vanadium is reduced more quickly; therefore, na-noparticles grow to a more uniform, smaller size. Unstirred VNPs are stable and stay sus-pended without any sign of agglomeration for months, despite no surfactant being used.
Figure 2. VNPs size distribution depending on route of synthesis.
3.2. Thermogravimetric and Spectroscopic Analysis of Doped Samples To screen the behavior of diverse V dopants, samples with 5 wt.% of catalyst milled
in five short periods of 1 min each were preliminarily studied. The TG–DSC profiles for these samples, as well as a reference sample of pristine NaBH4 (milled in a similar way), together with the ion current for diverse mass peaks in the MS of the evolved gas, are shown jointly in Figure 3. The picked masses in MS correspond to hydrogen, water, and diborane fragmentation patterns.
1 2 3 4 5 6 7 80
10
20
30
40
50
60
Cou
nt
Particle size [nm]
Mean size = 3.57 nmStd.Dev = 0.93 nm
THF
2 6 10 14 18 22 26 30 34 38 420
10
20
30
40
50
60
Cou
nt
Particle size [nm]
Mean size = 14.86 nmStd.Dev = 7.71 nm
o-DFB
Figure 1. TEM images of VNPs prepared in THF and o-DFB solutions.
The particle radius distribution based on several TEM images (Figure 2) was preparedin order to estimate size and standard deviation of their size. As calculated, mean sizesof VNPs were 14.86 ± 7.71 nm and 3.57 ± 0.93 nm for o-DFB and THF suspensions,respectively. The VNPsTHF size histogram could be described with a normal distribution,being more uniform in size and smaller than VNPsO-DFB which had various, asphericalshapes and a size histogram looking more like a lognormal distribution. Since LiAlH4is a much stronger reducer than Ph4PBH4, vanadium is reduced more quickly; therefore,nanoparticles grow to a more uniform, smaller size. Unstirred VNPs are stable and staysuspended without any sign of agglomeration for months, despite no surfactant being used.

Solids 2022, 3 300
Solids 2022, 2, FOR PEER REVIEW 6
Figure 1. TEM images of VNPs prepared in THF and o-DFB solutions.
The particle radius distribution based on several TEM images (Figure 2) was pre-pared in order to estimate size and standard deviation of their size. As calculated, mean sizes of VNPs were 14.86 ± 7.71 nm and 3.57 ± 0.93 nm for o-DFB and THF suspensions, respectively. The VNPsTHF size histogram could be described with a normal distribution, being more uniform in size and smaller than VNPsO-DFB which had various, aspherical shapes and a size histogram looking more like a lognormal distribution. Since LiAlH4 is a much stronger reducer than Ph4PBH4, vanadium is reduced more quickly; therefore, na-noparticles grow to a more uniform, smaller size. Unstirred VNPs are stable and stay sus-pended without any sign of agglomeration for months, despite no surfactant being used.
Figure 2. VNPs size distribution depending on route of synthesis.
3.2. Thermogravimetric and Spectroscopic Analysis of Doped Samples To screen the behavior of diverse V dopants, samples with 5 wt.% of catalyst milled
in five short periods of 1 min each were preliminarily studied. The TG–DSC profiles for these samples, as well as a reference sample of pristine NaBH4 (milled in a similar way), together with the ion current for diverse mass peaks in the MS of the evolved gas, are shown jointly in Figure 3. The picked masses in MS correspond to hydrogen, water, and diborane fragmentation patterns.
1 2 3 4 5 6 7 80
10
20
30
40
50
60
Cou
nt
Particle size [nm]
Mean size = 3.57 nmStd.Dev = 0.93 nm
THF
2 6 10 14 18 22 26 30 34 38 420
10
20
30
40
50
60
Cou
nt
Particle size [nm]
Mean size = 14.86 nmStd.Dev = 7.71 nm
o-DFB
Figure 2. VNPs size distribution depending on route of synthesis.
3.2. Thermogravimetric and Spectroscopic Analysis of Doped Samples
To screen the behavior of diverse V dopants, samples with 5 wt.% of catalyst milledin five short periods of 1 min each were preliminarily studied. The TG–DSC profiles forthese samples, as well as a reference sample of pristine NaBH4 (milled in a similar way),together with the ion current for diverse mass peaks in the MS of the evolved gas, areshown jointly in Figure 3. The picked masses in MS correspond to hydrogen, water, anddiborane fragmentation patterns.
There was a relatively minor effect of these short-milled dopants on the thermaldecomposition of NaBH4, with a noticeable effect seen only for VO2 (inflection of the TGcurve at 402 ◦C associated with mass loss of 0.6 wt.% up to 450 ◦C) and a more pronouncedone for V2O5 (clear mass decrease above 398 ◦C, associated with the total mass loss of1.0 wt.% up to 450 ◦C). At the same time, there was no visible decomposition in themilled pristine NaBH4 sample. MS clearly indicated that these events corresponded toendothermic H2 evolution but not associated with water or diborane.
It is worth mentioning that the small mass drift observable on a few TGA curvesis a phenomenon resulting from apparatus imperfection and cannot always be avoided(despite hours-long weight stabilization). However, the sudden mass drop resulting fromthe decomposition reaction can be clearly distinguished; thus, it does not result in datamisinterpretation in qualitative studies. Encouraged by this result, we further focusedon V2O5-doped samples. Another three samples with increased content of vanadiumpentoxide of 25 wt.% were prepared via 5, 30, and 180 min milling. As-obtained sampleswere inspected with FTIR, and the results were compared to those for pristine NaBH4 andV2O5 (Figure 4).
No change in wavenumber at peak or in the relative intensities of diverse absorptionbands characteristic for NaBH4 (2400, 2295, 2223, and 1120 cm−1) was observed upondoping with V2O5, independent of the milling time. However, bands at 1018, 838, 621,and 482 cm−1 which are characteristic for V2O5 clearly decreased their intensity when thesample was milled for 30 instead of 5 min, while the band at 514 cm−1 could be barelyseen in the 5 min milled sample. Noticeable shifts in the 838 and 621 cm−1 peaks couldbe observed as a function of milling time. When milled for 3 h, these bands disappearedalmost completely, and a few new bands could be described: a very weak band at 732 cm−1,two weak bands at 882 and 816 cm−1, a moderate band at 602 cm−1, and a very strongband at 436 cm−1 (off the scale), together with bands characteristic for water in the range of3000–3600 cm−1. This result indicates that V2O5 slowly reacted with milled borohydrideand underwent a progressive reduction, associated with the formation of unknown species.These bands did not originate from any known compound of vanadium, as revealed byour scrutiny. Simultaneously, X-ray diffraction patterns for the 3 h milled sample did notshow the presence of any new crystalline moiety. In each case, however, there remained a

Solids 2022, 3 301
substantial amount of bulk NaBH4 in these samples as evidenced by stable B–H stretchingand H–B–H bending regions, as also evidenced in X-ray diffraction patterns (not shown).
Solids 2022, 2, FOR PEER REVIEW 7
Figure 3. TGA/DSC + MS curves of pristine NaBH4 and NaBH4 doped for 5 min with 5 wt.% of catalyst. DCS and MS curves are stacked in each section with an offset applied for their better dis-tinction, but without distortion of the quantitative proportion between them. The fact that the TGA profiles are not flat for the doped samples may be associated with the absorption of a very small amount of moisture during milling; water vapor was then released during heating. Note that the TGA scale comprises 3 wt.% only; hence, the noise is more pronounced than in all forthcoming figures.
There was a relatively minor effect of these short-milled dopants on the thermal de-composition of NaBH4, with a noticeable effect seen only for VO2 (inflection of the TG curve at 402 °C associated with mass loss of 0.6 wt.% up to 450 °C) and a more pronounced one for V2O5 (clear mass decrease above 398 °C, associated with the total mass loss of 1.0 wt.% up to 450 °C). At the same time, there was no visible decomposition in the milled pristine NaBH4 sample. MS clearly indicated that these events corresponded to endother-mic H2 evolution but not associated with water or diborane.
Figure 3. TGA/DSC + MS curves of pristine NaBH4 and NaBH4 doped for 5 min with 5 wt.%of catalyst. DCS and MS curves are stacked in each section with an offset applied for their betterdistinction, but without distortion of the quantitative proportion between them. The fact that theTGA profiles are not flat for the doped samples may be associated with the absorption of a very smallamount of moisture during milling; water vapor was then released during heating. Note that the TGAscale comprises 3 wt.% only; hence, the noise is more pronounced than in all forthcoming figures.

Solids 2022, 3 302
Solids 2022, 2, FOR PEER REVIEW 8
It is worth mentioning that the small mass drift observable on a few TGA curves is a phenomenon resulting from apparatus imperfection and cannot always be avoided (de-spite hours-long weight stabilization). However, the sudden mass drop resulting from the decomposition reaction can be clearly distinguished; thus, it does not result in data mis-interpretation in qualitative studies. Encouraged by this result, we further focused on V2O5-doped samples. Another three samples with increased content of vanadium pentox-ide of 25 wt.% were prepared via 5, 30, and 180 min milling. As-obtained samples were inspected with FTIR, and the results were compared to those for pristine NaBH4 and V2O5 (Figure 4).
Figure 4. FTIR spectra of Na:V2O525%_5 min and Na:V2O525%_30 min in comparison to pure NaBH4 and V2O5. Spectra of NaBH4-containing species were normalized to the most intense peak originat-ing from B–H stretching. Spectra were shifted in vertical scale for clarity. Inset shows a blow-up of the 400–1000 cm–1 range.
No change in wavenumber at peak or in the relative intensities of diverse absorption bands characteristic for NaBH4 (2400, 2295, 2223, and 1120 cm−1) was observed upon dop-ing with V2O5, independent of the milling time. However, bands at 1018, 838, 621, and 482 cm−1 which are characteristic for V2O5 clearly decreased their intensity when the sample was milled for 30 instead of 5 min, while the band at 514 cm−1 could be barely seen in the 5 min milled sample. Noticeable shifts in the 838 and 621 cm−1 peaks could be observed as a function of milling time. When milled for 3 h, these bands disappeared almost com-pletely, and a few new bands could be described: a very weak band at 732 cm−1, two weak bands at 882 and 816 cm−1, a moderate band at 602 cm−1, and a very strong band at 436 cm−1 (off the scale), together with bands characteristic for water in the range of 3000–3600 cm−1. This result indicates that V2O5 slowly reacted with milled borohydride and under-went a progressive reduction, associated with the formation of unknown species. These bands did not originate from any known compound of vanadium, as revealed by our scrutiny. Simultaneously, X-ray diffraction patterns for the 3 h milled sample did not show the presence of any new crystalline moiety. In each case, however, there remained
Figure 4. FTIR spectra of Na:V2O525%_5 min and Na:V2O525%_30 min in comparison to pureNaBH4 and V2O5. Spectra of NaBH4-containing species were normalized to the most intense peakoriginating from B–H stretching. Spectra were shifted in vertical scale for clarity. Inset shows ablow-up of the 400–1000 cm−1 range.
All three samples were studied with TGA–DSC–MS, and the results were comparedto those for Na:V2O55%_5 min obtained with a very short milling time (5 min) and lowcatalyst load of 5 wt.% (Figure 5).
There was a clear effect of both catalyst load and milling time on the thermal de-composition of NaBH4/V2O5 conglomerates, as seen in TG–DSC–MS profiles. The weakeffect seen for the Na:V2O55%_5 min sample at 398 ◦C was enhanced and shifted to lowertemperature of 390 ◦C for the sample Na:V2O525%_5 min and further shifted to 383 ◦C forthe sample Na:V2O525%_30 min. The lowest onset of thermal decomposition was seen forthe 3 h milled sample (369 ◦C). All these events corresponded to the sharp and complexendothermic peaks of hydrogen desorption and were adjoined by sharp H2 release in thetemperature range of 380 to 410 ◦C as seen in the MS. Hydrogen was free from majorcontamination, as additionally evidenced by the MS.
The total mass loss between the onset of thermal decomposition and 450 ◦C was 4.0%,4.1%, and 5.4% for 25 wt.% doped samples milled for 5, 30, and 180 min, respectively(Figure 6). The latter value corresponds to ca. 70% of total hydrogen stored by the sample.Importantly, as indicated by MS, hydrogen was not contaminated by common impuritiessuch as B2H6, other boron hydrides, and water.
The onset of thermal decomposition for doped samples (368–388 ◦C) was quite low ascompared to the temperature of thermal decomposition for pristine NaBH4 and even to thatfor the best catalyzed samples described in the literature. Actually, only TiF3 was proven toprovide an even lower decomposition onset than catalysts studied here (300 ◦C) [15].

Solids 2022, 3 303
Solids 2022, 2, FOR PEER REVIEW 9
a substantial amount of bulk NaBH4 in these samples as evidenced by stable B–H stretch-ing and H–B–H bending regions, as also evidenced in X-ray diffraction patterns (not shown).
All three samples were studied with TGA–DSC–MS, and the results were compared to those for Na:V2O55%_5 min obtained with a very short milling time (5 min) and low catalyst load of 5 wt.% (Figure 5).
Figure 5. TGA/DSC + MS curves of Na:V2O55%_5 min, Na:V2O525%_5 min, Na:V2O525%_30 min, and Na:V2O525%_180 min samples. DCS and MS curves are stacked in each section with an offset for visual improvement, without proportion distortion.
There was a clear effect of both catalyst load and milling time on the thermal decom-position of NaBH4/V2O5 conglomerates, as seen in TG–DSC–MS profiles. The weak effect
Figure 5. TGA/DSC + MS curves of Na:V2O55%_5 min, Na:V2O525%_5 min, Na:V2O525%_30 min,and Na:V2O525%_180 min samples. DCS and MS curves are stacked in each section with an offset forvisual improvement, without proportion distortion.
The Kissinger method [58,59] was used to determine the activation energy of decom-position for NaV2O525%_180 min. Three additional experiments were conducted usingheating rates of 0.5, 1, and 10 K/min in addition to the default 5 K/min used before(Figure 7). The clearly observable intermediate decomposition step for 10 and 5 K/minheating rates could not be detected at lower heating rates due to its size compared toneighboring ones; thus, only the first and last (strong) peaks were taken into activationenergy calculations (Figure 8).

Solids 2022, 3 304
Solids 2022, 2, FOR PEER REVIEW 10
seen for the Na:V2O55%_5 min sample at 398 °C was enhanced and shifted to lower tem-perature of 390 °C for the sample Na:V2O525%_5 min and further shifted to 383 °C for the sample Na:V2O525%_30 min. The lowest onset of thermal decomposition was seen for the 3 h milled sample (369 °C). All these events corresponded to the sharp and complex en-dothermic peaks of hydrogen desorption and were adjoined by sharp H2 release in the temperature range of 380 to 410 °C as seen in the MS. Hydrogen was free from major contamination, as additionally evidenced by the MS.
The total mass loss between the onset of thermal decomposition and 450 °C was 4.0%, 4.1%, and 5.4% for 25 wt.% doped samples milled for 5, 30, and 180 min, respectively (Figure 6). The latter value corresponds to ca. 70% of total hydrogen stored by the sample. Importantly, as indicated by MS, hydrogen was not contaminated by common impurities such as B2H6, other boron hydrides, and water.
The onset of thermal decomposition for doped samples (368–388 °C) was quite low as compared to the temperature of thermal decomposition for pristine NaBH4 and even to that for the best catalyzed samples described in the literature. Actually, only TiF3 was proven to provide an even lower decomposition onset than catalysts studied here (300 °C)
[15].
Figure 6. Mass loss up to 450 °C observed for Na:V2O525%_5 min, Na:V2O525%_30 min and Na:V2O525%_180 min with respect to the milling time together with the onset of the thermal decom-position temperature.
The Kissinger method [58,59] was used to determine the activation energy of decom-position for NaV2O525%_180 min. Three additional experiments were conducted using heating rates of 0.5, 1, and 10 K/min in addition to the default 5 K/min used before (Figure 7). The clearly observable intermediate decomposition step for 10 and 5 K/min heating rates could not be detected at lower heating rates due to its size compared to neighboring
388.2
382.7
368.53.95
4.12
5.43
0 20 40 60 80 100 120 140 160 180
370
380
390
TGA onset TG loss to 450 oC
Milling time [min]
Tem
pera
ture
[o C]
4.0
4.5
5.0
5.5
TG
loss
[%]
Figure 6. Mass loss up to 450 ◦C observed for Na:V2O525%_5 min, Na:V2O525%_30 min andNa:V2O525%_180 min with respect to the milling time together with the onset of the thermal decom-position temperature.
Solids 2022, 2, FOR PEER REVIEW 11
ones; thus, only the first and last (strong) peaks were taken into activation energy calcu-lations (Figure 8).
Figure 7. DSC measurement for Na:V2O525%_180 min sample using four different heating rates. Values of peaks and onsets are marked with symbols; onset values are additionally described with their value in °C.
300 325 350 375 400 425 450
DSC
sig
nal
Temperature [°C]
0.5 K/min 1 K/min 5 K/min 10 K/min
335.6 345.7 368.5 377.6387.1
393.6
411.0
418.7
340.7
352.0
377.0
385.8426.0
419.4
409.5
400.7
exo↑
0.0022 0.0024 0.0026 0.0028 0.0030-13.0
-12.5
-12.0
-11.5
-11.0
-10.5
-10.0
-9.5
Plot Second PeakIntercept 37.78 ± 5.18Slope -20,282.61 ± 2,141.3Eₐ [kJ/mol] 168.64 ± 17.80R² 0.97819
First Onset First Peak Second Onset Second Peak
ln(β
T p-2
/K-1
min
-1)
Tp-1/K-1
Plot First OnsetIntercept 12.37 ± 0.71Slope -8,301.71 ± 253.02Eₐ [kJ/mol] 69.02 ± 2.10R² 0.99815
Plot First PeakIntercept 10.86 ± 1.02Slope -7,930.40 ± 370.42Eₐ [kJ/mol] 65.94 ± 3.08R² 0.99566
Plot Second OnsetIntercept 24.78 ± 0.35Slope -14,465.94 ± 142.27Eₐ [kJ/mol] 120.28 ± 1.18R² 0.99981
Figure 7. DSC measurement for Na:V2O525%_180 min sample using four different heating rates.Values of peaks and onsets are marked with symbols; onset values are additionally described withtheir value in ◦C.

Solids 2022, 3 305
Solids 2022, 2, FOR PEER REVIEW 11
ones; thus, only the first and last (strong) peaks were taken into activation energy calcu-lations (Figure 8).
Figure 7. DSC measurement for Na:V2O525%_180 min sample using four different heating rates. Values of peaks and onsets are marked with symbols; onset values are additionally described with their value in °C.
300 325 350 375 400 425 450
DSC
sig
nal
Temperature [°C]
0.5 K/min 1 K/min 5 K/min 10 K/min
335.6 345.7 368.5 377.6387.1
393.6
411.0
418.7
340.7
352.0
377.0
385.8426.0
419.4
409.5
400.7
exo↑
0.0022 0.0024 0.0026 0.0028 0.0030-13.0
-12.5
-12.0
-11.5
-11.0
-10.5
-10.0
-9.5
Plot Second PeakIntercept 37.78 ± 5.18Slope -20,282.61 ± 2,141.3Eₐ [kJ/mol] 168.64 ± 17.80R² 0.97819
First Onset First Peak Second Onset Second Peak
ln(β
T p-2
/K-1
min
-1)
Tp-1/K-1
Plot First OnsetIntercept 12.37 ± 0.71Slope -8,301.71 ± 253.02Eₐ [kJ/mol] 69.02 ± 2.10R² 0.99815
Plot First PeakIntercept 10.86 ± 1.02Slope -7,930.40 ± 370.42Eₐ [kJ/mol] 65.94 ± 3.08R² 0.99566
Plot Second OnsetIntercept 24.78 ± 0.35Slope -14,465.94 ± 142.27Eₐ [kJ/mol] 120.28 ± 1.18R² 0.99981
Figure 8. Kissinger plot of Na:V2O525%_180 min sample for first and last peaks of decomposition on-sets and maxima together with associated by color tables containing the activation energy calculatedand a description of fitted lines.
The activation energy of the first decomposition step for doped sample decreased dras-tically to 65.9 ± 3 kJ/mol (peak) or 69.0 ± 2 kJ/mol (onset) in comparison with 275 kJ/molfor pristine NaBH4 [21]. This implies a fourfold reduction of the activation energy; ourresult may also be compared to that of ZrCl4-doped NaBH4, which is characterized by an Eaof 180 kJ/mol [21]. On the other hand, the Ea value for the last decomposition step variedwhen calculated for onset or peak value (120.3 ± 1 and 169 ± 18 kJ/mol respectively);nevertheless, it was still remarkably smaller than the literature value for NaBH4. It isworth noticing, however, that the first decomposition step, characterized by very smallactivation energy, corresponded to the vast majority of hydrogen desorbed. Interestingly,the activation energies obtained for undoped but long-milled NaBH4 were as follows:143.0 ± 1.6 kJ/mol (first peak) and 70.0 ± 0.9 kJ/mol (second peak). Therefore, the reduc-tion in the activation barrier at the first stage of decomposition observed in V2O5-catalyzedsamples was partially due to nano-amorphization of NaBH4 and partially due to the pres-ence of a catalyst. On the other hand, the processes taking place at the second stage ofdecomposition were supposedly entirely different for the V2O5-free and V2O5-rich samples,as indicated by the counterintuitive behavior of the activation energies at that stage.
The fact that two main peaks were observed in the thermal profile means that twodifferent species were decomposing at each of these steps. We attempted to gain insightinto the nature of intermediate decomposing species and reaction products by performingadditional experiments. The initial surmise was that the last step of decomposition couldoriginate from the part of NaBH4 not in contact with catalyst, but where H2 release waseasier than for pristine NaBH4 due to pronounced milling and non-amorphization ofthe sample. Indeed, as already mentioned, milled NaBH4 showed two major distinctdecomposition steps, similarly to the catalyzed samples. However, none of those occurredat temperatures as low as 335–425 ◦C since the onset of thermal decomposition for milledNaBH4 was as high as 461 ◦C (not shown) and extended to over 600 ◦C (in agreement withliterature data). Additional X-ray diffraction experiments for samples heated up to diverse

Solids 2022, 3 306
temperatures failed to observe any crystalline species beyond traces of the bulk NaBH4.Moreover, while both thermal peaks coincided with H2 evolution, the evolved gas analysisfailed to detect any impurity species such as B2H6 and higher boron hydrides. Therefore,at the current stage, the genuine nature of a (probably in situ formed) catalyst and thatof the hydride intermediate undergoing the second stage of decomposition must remainan open question. We notice that the unequivocal detection of the catalyst nature is oftennontrivial, as documented by many cases including that of Ti species-catalyzed NaAlH4,which stands today as one of reference materials in hydrogen storage. One cannot excludeeven a scenario that the presence of V2O5 modifies the path of the decomposition reactionso substantially that sodium is no longer a volatile product of decomposition but remainsin the solid residue (e.g., as some sort of vanadate salt). All these issues go beyond thescope of the current preliminary work and remain to be thoroughly studied in the future.
Having achieved a marked reduction in the thermal decomposition temperature ofNaBH4 by the high load of V2O5 and a prolonged milling time, we applied the sameprocedure to the remaining vanadium oxides. The TG–DSC–MS profiles for all samples arejointly shown in Figure 9.
Solids 2022, 2, FOR PEER REVIEW 13
Figure 9. TGA/DSC + MS curves of pristine NaBH4 and sampled doped for 30 min with 25 wt.% of diverse vanadium catalysts. DCS and MS curves are stacked in each section with an offset for better distinction, without distortion of the quantitative proportions.
A substantial effect (and comparable to that for V2O5) on TG and DSC profiles can only be seen for VO2; here, the onset of thermal decomposition was around 377 °C, but the amount of hydrogen evolved up to 450 °C was smaller than that for the V2O5 additive. The effects seen for V2O3 and V were the least pronounced.
It is important to note that the total mass loss up to 600 °C in almost all samples exceeded the total H content of the samples. This is because sodium vapor is partly re-leased at high temperatures [17,50,60]. It is uncertain at this time what amount of sodium remained in the doped samples, as well as the chemical identity of the phase(s) containing this metal.
Having studied vanadium- and vanadium oxide-doped samples, our attention turned to vanadium nanoparticles. Samples doped with vanadium nanoparticles were denoted Na:VNPsTHF and Na:VNPsO- DFB, and they were studied with TGA–DSC–MS anal-ogously to previous samples (Figure 10). Reference curves for milled NaBH4 were added for comparison.
Figure 9. TGA/DSC + MS curves of pristine NaBH4 and sampled doped for 30 min with 25 wt.% ofdiverse vanadium catalysts. DCS and MS curves are stacked in each section with an offset for betterdistinction, without distortion of the quantitative proportions.

Solids 2022, 3 307
A substantial effect (and comparable to that for V2O5) on TG and DSC profiles canonly be seen for VO2; here, the onset of thermal decomposition was around 377 ◦C, butthe amount of hydrogen evolved up to 450 ◦C was smaller than that for the V2O5 additive.The effects seen for V2O3 and V were the least pronounced.
It is important to note that the total mass loss up to 600 ◦C in almost all samplesexceeded the total H content of the samples. This is because sodium vapor is partlyreleased at high temperatures [17,50,60]. It is uncertain at this time what amount of sodiumremained in the doped samples, as well as the chemical identity of the phase(s) containingthis metal.
Having studied vanadium- and vanadium oxide-doped samples, our attention turnedto vanadium nanoparticles. Samples doped with vanadium nanoparticles were denotedNa:VNPsTHF and Na:VNPsO- DFB, and they were studied with TGA–DSC–MS analo-gously to previous samples (Figure 10). Reference curves for milled NaBH4 were addedfor comparison.
Solids 2022, 2, FOR PEER REVIEW 14
Figure 10. TGA/DSC + MS curves of milled NaBH4 and both VNP-doped samples. DCS and MS curves are stacked in each section with an offset for better distinction, but without distortion of quantitative proportions. Values of m/z = 42 and 114 correspond to the THF and o-DFB MS main peaks, respectively.
Both VNP-doped samples seemingly released H2 at a lower temperature than the ref-erence sample, as can be judged from the MS profiles. However, the doped samples also released copious amounts of CO2, B2H6, and solvent residues (only in the case of Na:VNPsTHF) at even lower temperatures, as seen in the MS and TGA profiles. These con-taminations most probably came from byproducts of VNP synthesis and are certainly highly undesired for any practical application.
100 200 300 400 500 600
60
70
80
90
100
100 200 300 400 500 600
Mas
a [%
]
Temperatura [oC]
~86°C ~199°C~285°C ~447°C ~503°C
~412°Cm/z=42
NaBH4
Na:VNPsTHF
Na:VNPsO-DFB
DSC
sig
nal
exo↑
H2Ο↑
B2H6↑
Cos
ine
sim
ilarit
y
H2↑
CO2↑
m/z=114
Figure 10. TGA/DSC + MS curves of milled NaBH4 and both VNP-doped samples. DCS and MScurves are stacked in each section with an offset for better distinction, but without distortion ofquantitative proportions. Values of m/z = 42 and 114 correspond to the THF and o-DFB MS mainpeaks, respectively.
Solids 2022, 3 308
Both VNP-doped samples seemingly released H2 at a lower temperature than thereference sample, as can be judged from the MS profiles. However, the doped samplesalso released copious amounts of CO2, B2H6, and solvent residues (only in the case ofNa:VNPsTHF) at even lower temperatures, as seen in the MS and TGA profiles. Thesecontaminations most probably came from byproducts of VNP synthesis and are certainlyhighly undesired for any practical application.
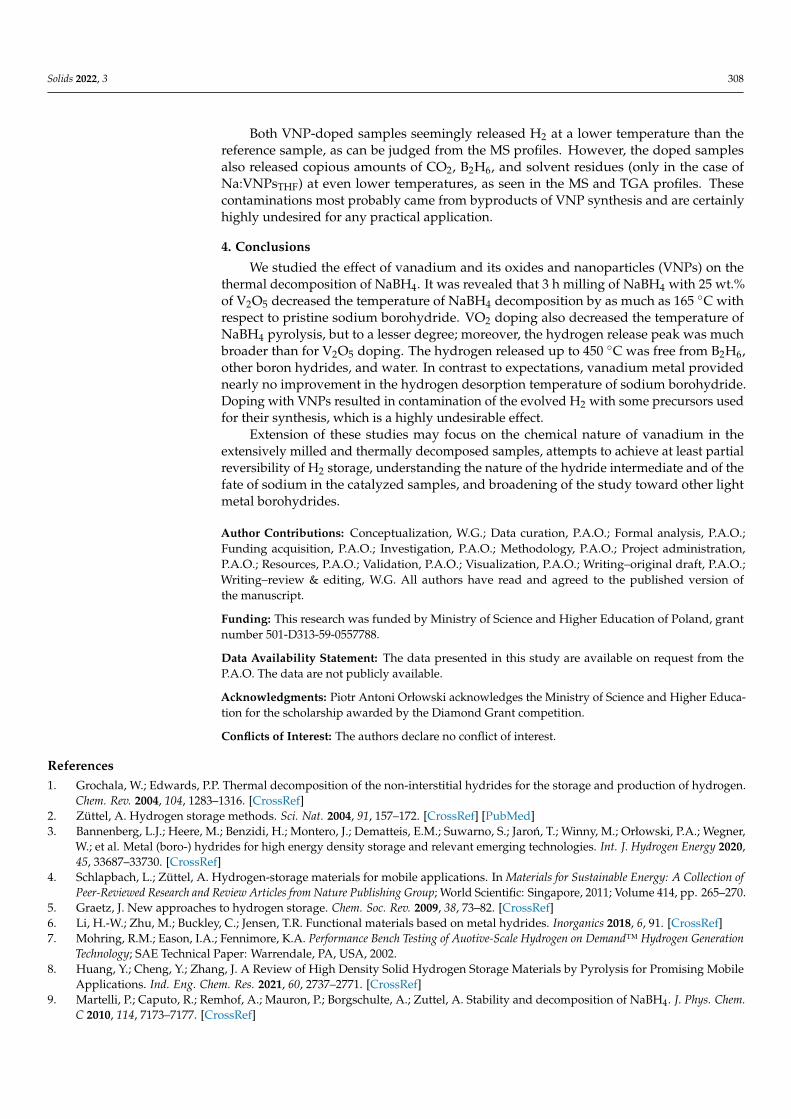
4. Conclusions
We studied the effect of vanadium and its oxides and nanoparticles (VNPs) on thethermal decomposition of NaBH4. It was revealed that 3 h milling of NaBH4 with 25 wt.%of V2O5 decreased the temperature of NaBH4 decomposition by as much as 165 ◦C withrespect to pristine sodium borohydride. VO2 doping also decreased the temperature ofNaBH4 pyrolysis, but to a lesser degree; moreover, the hydrogen release peak was muchbroader than for V2O5 doping. The hydrogen released up to 450 ◦C was free from B2H6,other boron hydrides, and water. In contrast to expectations, vanadium metal providednearly no improvement in the hydrogen desorption temperature of sodium borohydride.Doping with VNPs resulted in contamination of the evolved H2 with some precursors usedfor their synthesis, which is a highly undesirable effect.
Extension of these studies may focus on the chemical nature of vanadium in theextensively milled and thermally decomposed samples, attempts to achieve at least partialreversibility of H2 storage, understanding the nature of the hydride intermediate and of thefate of sodium in the catalyzed samples, and broadening of the study toward other lightmetal borohydrides.
Author Contributions: Conceptualization, W.G.; Data curation, P.A.O.; Formal analysis, P.A.O.;Funding acquisition, P.A.O.; Investigation, P.A.O.; Methodology, P.A.O.; Project administration,P.A.O.; Resources, P.A.O.; Validation, P.A.O.; Visualization, P.A.O.; Writing–original draft, P.A.O.;Writing–review & editing, W.G. All authors have read and agreed to the published version ofthe manuscript.
Funding: This research was funded by Ministry of Science and Higher Education of Poland, grantnumber 501-D313-59-0557788.
Data Availability Statement: The data presented in this study are available on request from theP.A.O. The data are not publicly available.
Acknowledgments: Piotr Antoni Orłowski acknowledges the Ministry of Science and Higher Educa-tion for the scholarship awarded by the Diamond Grant competition.
Conflicts of Interest: The authors declare no conflict of interest.
References1. Grochala, W.; Edwards, P.P. Thermal decomposition of the non-interstitial hydrides for the storage and production of hydrogen.
Chem. Rev. 2004, 104, 1283–1316. [CrossRef]2. Züttel, A. Hydrogen storage methods. Sci. Nat. 2004, 91, 157–172. [CrossRef] [PubMed]3. Bannenberg, L.J.; Heere, M.; Benzidi, H.; Montero, J.; Dematteis, E.M.; Suwarno, S.; Jaron, T.; Winny, M.; Orłowski, P.A.; Wegner,
W.; et al. Metal (boro-) hydrides for high energy density storage and relevant emerging technologies. Int. J. Hydrogen Energy 2020,45, 33687–33730. [CrossRef]
4. Schlapbach, L.; Züttel, A. Hydrogen-storage materials for mobile applications. In Materials for Sustainable Energy: A Collection ofPeer-Reviewed Research and Review Articles from Nature Publishing Group; World Scientific: Singapore, 2011; Volume 414, pp. 265–270.
5. Graetz, J. New approaches to hydrogen storage. Chem. Soc. Rev. 2009, 38, 73–82. [CrossRef]6. Li, H.-W.; Zhu, M.; Buckley, C.; Jensen, T.R. Functional materials based on metal hydrides. Inorganics 2018, 6, 91. [CrossRef]7. Mohring, R.M.; Eason, I.A.; Fennimore, K.A. Performance Bench Testing of Auotive-Scale Hydrogen on Demand™ Hydrogen Generation
Technology; SAE Technical Paper: Warrendale, PA, USA, 2002.8. Huang, Y.; Cheng, Y.; Zhang, J. A Review of High Density Solid Hydrogen Storage Materials by Pyrolysis for Promising Mobile
Applications. Ind. Eng. Chem. Res. 2021, 60, 2737–2771. [CrossRef]9. Martelli, P.; Caputo, R.; Remhof, A.; Mauron, P.; Borgschulte, A.; Zuttel, A. Stability and decomposition of NaBH4. J. Phys. Chem.
C 2010, 114, 7173–7177. [CrossRef]

Solids 2022, 3 309
10. Puszkiel, J.; Garroni, S.; Milanese, C.; Gennari, F.; Klassen, T.; Dornheim, M.; Pistidda, C. Tetrahydroborates: Development andpotential as hydrogen storage medium. Inorganics 2017, 5, 74. [CrossRef]
11. Milanese, C.; Jensen, T.R.; Hauback, B.C.; Pistidda, C.; Dornheim, M.; Yang, H.; Lombardo, L.; Zuettel, A.; Filinchuk, Y.; Ngene, P.;et al. Complex hydrides for energy storage. Int. J. Hydrogen Energy 2019, 44, 7860–7874. [CrossRef]
12. Andersson, J.; Grönkvist, S. Large-scale storage of hydrogen. Int. J. Hydrogen Energy 2019, 44, 11901–11919. [CrossRef]13. Llamas, J.I.; Kalantzopoulos, G.N.; Nordholm, K.; Hauback, B.C. Destabilization of NaBH4 by transition metal fluorides. Molecules
2020, 25, 780. [CrossRef]14. Humphries, T.D.; Kalantzopoulos, G.N.; Llamas-Jansa, I.; Olsen, J.E.; Hauback, B.C. Reversible hydrogenation studies of NaBH4
milled with Ni-containing additives. J. Phys. Chem. C 2013, 117, 6060–6065. [CrossRef]15. Mao, J.; Guo, Z.; Nevirkovets, I.P.; Liu, H.K.; Dou, S.X. Hydrogen de-/absorption improvement of NaBH4 catalyzed by titanium-
based additives. J. Phys. Chem. C 2012, 116, 1596–1604. [CrossRef]16. Mao, J.F.; Yu, X.B.; Guo, Z.P.; Poh, C.K.; Liu, H.K.; Wu, Z.; Ni, J. Improvement of the LiAlH4–NaBH4 system for reversible
hydrogen storage. J. Phys. Chem. C 2009, 113, 10813–10818. [CrossRef]17. Lai, Q.; Milanese, C.; Aguey-Zinsou, K.F. Stabilization of nanosized borohydrides for hydrogen storage: Suppressing the melting
with TiCl3 doping. ACS Appl. Energy Mater. 2018, 1, 421–430. [CrossRef]18. Chong, L.; Zou, J.; Zeng, X.; Ding, W. Reversible hydrogen sorption in NaBH4 at lower temperatures. J. Mater. Chem. A 2013, 1,
13510–13523. [CrossRef]19. Zhang, Z.G.; Wang, H.; Zhu, M. Hydrogen release from sodium borohydrides at low temperature by the addition of zinc fluoride.
Int. J. Hydrogen Energy 2011, 36, 8203–8208. [CrossRef]20. Zou, J.; Li, L.; Zeng, X.; Ding, W. Reversible hydrogen storage in a 3NaBH4/YF3 composite. Int. J. Hydrogen Energy 2012, 37,
17118–17125. [CrossRef]21. Kumar, S.; Jaina, J.; Miyaoka, H.; Ichikawa, T.; Kojima, Y. Study on the thermal decomposition of NaBH4 catalyzed by ZrCl4. Int.
J. Hydrogen. Energy 2017, 42, 22432–22437. [CrossRef]22. Huang, T.; Zou, J.; Zeng, X.; Wang, J.; Liu, H.; Ding, W. Reversible hydrogen sorption behaviors of the 3NaBH4-(x)YF3-(1-x)GdF3
system: The effect of double rare earth metal cations. Int. J. Hydrogen Energy 2019, 44, 4868–4877. [CrossRef]23. Chong, L.; Zou, J.; Zeng, X.; Ding, W. Effects of La fluoride and La hydride on the reversible hydrogen sorption behaviors of
NaBH4: A comparative study. J. Mater. Chem. A 2014, 2, 8557–8570. [CrossRef]24. Chong, L.; Zou, J.; Zeng, X.; Ding, W. Mechanisms of reversible hydrogen storage in NaBH4 through NdF3 addition. J. Mater.
Chem. A 2013, 1, 3983–3991. [CrossRef]25. Chong, L.; Zou, J.; Zeng, X.; Ding, W. Study on reversible hydrogen sorption behaviors of a 3NaBH4/HoF3 composite. Int. J.
Hydrogen Energy 2014, 39, 14275–14281. [CrossRef]26. Afonso, G.; Bonakdarpour, A.; Wilkinson, D.P. Hydrogen storage properties of the destabilized 4NaBH4/5Mg2NiH4 composite
system. J. Phys. Chem. C 2013, 117, 21105–21111. [CrossRef]27. Yahya, M.S.; Ali, N.A.; Sazelee, N.A.; Mustafa, N.S.; Yap, F.A.H.; Ismail, M. Intensive investigation on hydrogen storage properties
and reaction mechanism of the NaBH4-Li3AlH6 destabilized system. Int. J. Hydrogen Energy 2019, 44, 21965–21978. [CrossRef]28. Nwakwuo, C.C.; Pistidda, C.; Dornheim, M.; Hutchison, J.L.; Sykes, J.M. Microstructural study of hydrogen desorption in
2NaBH4+MgH2 reactive hydride composite. Int. J. Hydrogen Energy 2012, 37, 2382–2387. [CrossRef]29. Garroni, S.; Pistidda, C.; Brunelli, M.; Vaughan, G.B.M.; Surinach, S.; Baro, M.D. Hydrogen desorption mechanism of
2NaBH4+MgH2 composite prepared by high-energy ball milling. Scr. Mater. 2009, 60, 1129–1132. [CrossRef]30. Mao, J.F.; Yu, X.B.; Guo, Z.P.; Liu, H.K.; Wu, Z.; Ni, J. Enhanced hydrogen storage performances of NaBH4–MgH2 system. J. Alloys
Compd. 2009, 479, 619–623. [CrossRef]31. Mao, J.; Guo, Z.; Yu, X.; Liu, H. Improved hydrogen storage properties of NaBH4 destabilized by CaH2 and Ca(BH4)2. J. Phys.
Chem. C 2011, 115, 9283–9290. [CrossRef]32. Somer, M.; Acar, S.; Koz, C.; Kokal, I.; Höhn, P.; Cardoso-Gil, R.; Aydemir, U.; Akselrud, L. Alpha-and beta-Na2[BH4][NH2]: Two
modifications of a complex hydride in the system NaNH2–NaBH4; syntheses, crystal structures, thermal analyses, mass andvibrational spectra. J. Alloys Compd. 2010, 491, 98–105. [CrossRef]
33. Pei, Z.; Wu, C.; Bai, Y.; Liu, X.; Wu, F. NaNH2–NaBH4 hydrogen storage composite materials synthesized via liquid phaseball-milling: Influence of Co–Ni–B catalyst on the dehydrogenation performances. Int. J. Hydrogen Energy 2017, 42, 14725–14733.[CrossRef]
34. Mustafa, N.S.; Ismail, M. Significant effect of TiF3 on the performance of 2NaAlH4+ Ca(BH4)2 hydrogen storage properties. Int. J.Hydrogen Energy 2019, 44, 21979–21987. [CrossRef]
35. Javadian, P.; Sheppard, D.A.; Buckley, C.E.; Jensen, T.R. Hydrogen storage properties of nanoconfined LiBH4–NaBH4. Int. J.Hydrogen Energy 2015, 40, 14916–14924. [CrossRef]
36. Liu, Y.; Reed, D.; Paterakis, C.; Vasquez, L.C.; Baricco, M.; Book, D. Study of the decomposition of a 0.62LiBH4–0.38NaBH4mixture. Int. J. Hydrogen Energy 2017, 42, 22480–22488. [CrossRef]
37. Jensen, S.R.H.; Jepsen, L.H.; Skibsted, J.; Jensen, T.R. Phase Diagram for the NaBH4–KBH4 System and the Stability of aNa1–xKxBH4 Solid Solution. J. Phys. Chem. C 2015, 119, 27919–27929. [CrossRef]
38. Ley, M.B.; Roedern, E.; Thygesen, P.M.M.; Jensen, T.R. Melting behavior and thermolysis of NaBH4−Mg(BH4)2 andNaBH4−Ca(BH4)2 composites. Energies 2015, 8, 2701–2713. [CrossRef]

Solids 2022, 3 310
39. Dematteis, E.M.; Santoru, A.; Poletti, M.G.; Pistidda, C.; Klassen, T.; Dornheim, M.; Baricco, M. Phase stability and hydrogendesorption in a quinary equimolar mixture of light-metals borohydrides. Int. J. Hydrogen Energy 2018, 43, 16793–16803. [CrossRef]
40. Fu, H.; Wu, Y.; Chen, J.; Wang, X.; Zheng, J.; Li, X. Promoted hydrogen release from alkali metal borohydrides in ionic liquids.Inorg. Chem. Front. 2016, 3, 1137–1145. [CrossRef]
41. Xi, S.; Zhang, P.; Fu, Y.; Tome, K.C.; Zhang, T.; Zhou, S.; Guo, Y.; Yu, H. Hydrogen Release: Thermodynamic and kinetic studies ofNaBH4 activated by different zeolite nanoparticles. Energy Fuels 2020, 34, 10218–10224. [CrossRef]
42. Manoharan, K.; Palaniswamy, V.K.; Raman, K.; Sundaram, R. Investigation of solid state hydrogen storage performances ofnovel NaBH4/Ah-BN nanocomposite as hydrogen storage medium for fuel cell applications. J. Alloys Compd. 2021, 860, 158444.[CrossRef]
43. Ampoumogli, A.; Steriotis, T.; Trikalitis, P.; Giasafaki, D.; Bardaji, E.G.; Fichtner, M.; Charalambopoulou, G. Nanostructuredcomposites of mesoporous carbons and boranates as hydrogen storage materials. J. Alloys Compd. 2011, 509, S705–S708. [CrossRef]
44. Ngene, P.; van den Berg, R.; Verkuijlen, M.H.W.; de Jong, K.P.; de Jongh, P.E. Reversibility of the hydrogen desorption fromNaBH4 by confinement in nanoporous carbon. Energy Environ. Sci. 2011, 4, 4108–4115. [CrossRef]
45. Zhang, L.; Xiao, X.; Fan, X.; Li, S.; Ge, H.; Wang, Q.; Chen, L. Fast hydrogen release under moderate conditions from NaBH4destabilized by fluorographite. RSC Adv. 2014, 4, 2550–2556. [CrossRef]
46. Fang, Y.; Zhang, J.; Hua, M.Y.; Zhou, D.W. Modifying effects and mechanisms of graphene on dehydrogenation properties ofsodium borohydride. J. Mater. Sci. 2020, 55, 1959–1972. [CrossRef]
47. Chong, L.; Zeng, X.; Ding, W.; Liu, D.; Zou, J. NaBH4 in “graphene wrapper:” Significantly enhanced hydrogen storage capacityand regenerability through nanoencapsulation. Adv. Mater. 2015, 27, 5070–5074. [CrossRef]
48. Wang, T.; Aguey-Zinsou, K.F. “Surfactant-free” sodium borohydride nanoparticles with enhanced hydrogen desorption properties.ACS Appl. Energy Mater. 2020, 3, 9940–9949. [CrossRef]
49. Wang, T.; Aguey-Zinsou, K.F. Controlling the growth of NaBH4 nanoparticles for hydrogen storage. Int. J. Hydrogen Energy 2020,45, 2054–2067. [CrossRef]
50. Christian, M.L.; Aguey-Zinsou, K.F. Core–shell strategy leading to high reversible hydrogen storage capacity for NaBH4. ACSNano 2012, 6, 7739–7751. [CrossRef]
51. Christian, M.; Aguey-Zinsou, K.F. Synthesis of core-shell NaBH4@M (M = Co, Cu, Fe, Ni, Sn) nanoparticles leading to variousmorphologies and hydrogen storage properties. Chem. Comm. 2013, 49, 6794–6796. [CrossRef]
52. Li, Y.; Ding, X.; Zhang, Q. Self-printing on graphitic nanosheets with metal borohydride nanodots for hydrogen storage. Sci. Rep.2016, 6, 31144. [CrossRef]
53. Yang, H.; Lombardo, L.; Luo, W.; Kim, W.; Zuttel, A. Hydrogen storage properties of various carbon supported NaBH4 preparedvia metathesis. Int. J. Hydrogen Energy 2018, 43, 7108–7116. [CrossRef]
54. Maj, Ł.; Grochala, W. Theoretical design of catalysts for the heterolytic splitting of H2. Adv. Funct. Mater. 2006, 16, 2061–2076.[CrossRef]
55. Hamilton, C.W.; Baker, R.T.; Staubitz, A.; Manners, I. B-N compounds for chemical hydrogen storage. Chem. Soc. Rev. 2009, 38,279–293. [CrossRef] [PubMed]
56. Reilly, J.J.; Wiswall, R.H. Higher hydrides of vanadium and niobium. Inorg. Chem. 1970, 9, 1678–1682. [CrossRef]57. Koteras, K. Synteza i własciwosci fizykochemiczne nowych, wysoce reaktywnych soli wapnia, tytanu i wanadu z anionami słabo
koordynujacymi. Master’s Thesis, Warsaw University of Technology, Warsaw, Poland, 2018.58. Kissinger, H.E. Variation of peak temperature with heating rate in differential thermal analysis. J. Res. Natl. Bur. Stand. 1956, 57,
217–221. [CrossRef]59. Kissinger, H.E. Reaction kinetics in differential thermal analysis. Anal. Chem. 1957, 29, 1702–1706. [CrossRef]60. Wang, T.; Aguey-Zinsou, K.-F. Direct Synthesis of NaBH4 Nanoparticles from NaOCH3 for Hydrogen Storage. Energies 2019,
12, 4428. [CrossRef]