Misinterpretations in Evaluating Interactions of Vanadium ...
Upload
khangminh22Category
view
0download
0
Extraction of Vanadium from New Zealand
Titanomagnetite Sand and Vanadium Recovery
Concentrate.
By
Lachlan Gaudin
A thesis submitted for the degree of
Master of Science in Chemistry
Victoria University of Wellington
2022

i
Abstract
This study explores the extraction of the vanadium from titanomagnetite ironsand (IS) from the
West Coast of New Zealand, and a vanadium-rich concentrate (VRC) which is formed during the New
Zealand steel-making process from this titanomagnetite resource. This extraction first involved an HCl
leaching method, with acid concentrations ranging between 1M – 11.5M (concentrated) where the
amount of Fe, Ti and V leached/dissolved from the VRC and titanomagnetite materials was determined
with respect to leaching time. The concentrations of dissolved Fe, Ti and V in the leachates were
measured by ICP-MS, and the solid residues by X-ray fluorescence spectroscopy. The morphology,
chemical and individual component characterisation of the solid residues were carried out by X-ray
diffraction and scanning electron microscopy and associated energy dispersive elemental and mapping
analyses. The leaching results for the VRC showed no selective leaching of Fe, Ti, and V. The amount
of Fe, Ti, and V leached increased with increasing HCl concentrations, up to about 50 % of the amount
in the original VRC.
A different approach was then taken where the VRC material was roasted overnight at two
different temperatures (900 and 1200 °C) wherein the V and Mn formed a manganese vanadate phase
(Mn2V2O7) and the Fe and Ti formed pseudobrookite (Fe2TiO5) within the VRC. The Mn2V2O7 phase
was found to leach much more readily in HCl, while the pseudobrookite phase, which is comparatively
acid-resistant, did not leach to any extent. HCl leaching of the roasted VRC thus resulted in selective
dissolution of the V (86.89 % amount leached) from the Fe and Ti (~3 % amount leached). This provides
a potential new approach for extracting the vanadium from the VRC material.
In order to remove the small amount of Fe and Ti that did leach from the roasted VRC, an
attempt to precipitate the dissolved Ti and Fe from the leachate was made. The dissolved Ti was seeded
to promote hydrolysis and form TiO2, and the Fe was precipitated by increasing the pH to form an iron
hydroxide precipitate. ICP-MS analysis of the resulting filtrate showed a large decrease in the
concentrations of Fe, Ti, and V compared to the starting leachate, indicating that the V in solution was
removed alongside the Ti and Fe. This was likely caused by the V5+ forming V2O5 and/or being adsorbed
onto the surface of the iron hydroxide precipitate. This method to separate the residual dissolved Fe and
Ti in the roasted VRC leachate was deemed unsuitable for the extraction of vanadium.
The leaching experiments were repeated with the IS material, and again no selective leaching
of Fe, Ti and V was found. Approximately 73 % of these elements were leached. A portion of the IS
material was roasted (900 °C overnight) in an attempt to form an acid-soluble manganese vanadium
phase similar to the one formed in the VRC roast. Only a small amount of this phase could be identified
in the EDS and XRD analyses. HCl leaching of the roasted material similarly resulted in selective
dissolution of

ii
the V (29.26 % amount leached) from the Fe and Ti (~13 % amount leached), although total dissolution
for these elements was decreased after roasting.
This research has therefore shown that V can be selectively leached from the IS and VRC
materials, using a pre-roasting stage to form the manganese vanadate Mn2V2O7 phase which is more
readily soluble in HCl than the pseudobrookite Ti- and Fe- containing phase.

iii
Acknowledgements
I offer my sincere appreciation to Prof. Jim Johnston, who graciously accepted me as a master’s
student. It has been a pleasure working with you.
The whole of Jim’s research group has kept me well challenged and well entertained. I thank
them deeply. From those who endured the year with me, to those who I only briefly met, you have all
taught me the imperativeness of enjoying the company of your colleagues.

iv
Abbreviations
EDS – Energy Dispersive X-ray Spectroscopy
ICP-MS – Inductively Coupled Plasma Mass Spectrometry
LOI – loss on ignition
PES – Polyethersulfone
ppm – parts per million
ppb – parts per billion
ppt – parts per trillion
RFB – Redox Flow Battery
RPM – revolutions per minute
SEM – Scanning Electron Microscopy
TTM - Titanomagnetite
VRC – Vanadium Recovery Concentrate
VRU – Vanadium Recovery Unit
XRD – X-ray Powder Diffraction
XRF – X-ray Fluorescence

v
Table of Contents Introduction ............................................................................................................................................. 1
1.1 New Zealand Ironsand ............................................................................................................ 1
1.1.1 Ironsand Reserves in New Zealand ................................................................................. 1
1.1.2 Titanomagnetite .............................................................................................................. 2
1.2 NZ Steel .................................................................................................................................. 3
1.2.1 NZ Steel-making Process ................................................................................................ 3
1.2.2 Vanadium-rich Concentrate (VRC) ................................................................................ 4
1.3 Vanadium ................................................................................................................................ 5
1.3.1 Overview ......................................................................................................................... 5
1.3.2 Vanadium Uses ............................................................................................................... 5
1.3.3 Vanadium-manganese Chemistry ................................................................................... 7
1.4 Overview of Analytical Methods .......................................................................................... 10
1.4.1 Energy-dispersive X-ray Spectroscopy ......................................................................... 10
1.4.2 X-ray Powder Diffraction ............................................................................................. 11
1.4.3 X-ray Fluorescence ....................................................................................................... 11
1.4.4 Inductively Coupled Plasma Mass Spectrometry .......................................................... 12
1.5 Extraction of Vanadium ........................................................................................................ 12
1.5.1 Roasting ........................................................................................................................ 12
1.5.2 Leaching ........................................................................................................................ 14
1.5.3 Kinetics ......................................................................................................................... 14
1.5.4 Current Industry Methods ............................................................................................. 15
1.5.5 Solvent Extraction ......................................................................................................... 16
1.6 Overview of Project .............................................................................................................. 18
2 Experimental ................................................................................................................................. 19
2.1 Leaching ................................................................................................................................ 19
2.1.1 General Leaching Procedure ......................................................................................... 19
2.1.2 Leaching of Non-roasted Samples ................................................................................ 19
2.1.3 Leaching of Roasted Samples ....................................................................................... 20
2.1 Precipitation of Material from Filtrate .................................................................................. 21
2.2 Analysis and Characterisation ............................................................................................... 21
2.2.1 XRD .............................................................................................................................. 21
2.2.2 XRF ............................................................................................................................... 22
2.2.3 SEM/EDS ...................................................................................................................... 22
2.2.4 ICP-MS ......................................................................................................................... 22

vi
3 Results and Discussion.................................................................................................................. 23
3.1 Introduction ........................................................................................................................... 23
3.2 Vanadium Recovery Concentrate (VRC) .............................................................................. 23
3.2.1 Analysis of Starting Material ........................................................................................ 23
3.2.2 Leaching of Non-roasted Samples ................................................................................ 27
3.2.1 Titanium and Iron Precipitation from Leachate ............................................................ 41
3.2.2 Roasting of Samples ...................................................................................................... 42
3.2.3 Leaching of Roasted Sample ......................................................................................... 49
3.3 Ironsand (IS) ......................................................................................................................... 63
3.3.1 Analysis of Starting Material ........................................................................................ 63
3.3.2 Leaching of Non-roasted Samples ................................................................................ 65
3.3.3 Roasting of Samples ...................................................................................................... 78
3.3.4 Leaching of Roasted Sample ......................................................................................... 82
4 Conclusions ................................................................................................................................... 87
5 Future Directions .......................................................................................................................... 88
5.1 Further Separation of V......................................................................................................... 88
5.2 Combination with H2 Reduction ........................................................................................... 88
6 References ..................................................................................................................................... 89

1
Introduction
1.1 New Zealand Ironsand
1.1.1 Ironsand Reserves in New Zealand
Iron-containing mineral deposits, in the form of ironsand, can be found on a 480 km stretch of the
New Zealand (NZ) North Island’s western coastline (Figure 1.1).1 These beach and dune deposits are
the largest known reserve of ferrous ore located in the country, containing an estimated 322 million
tonnes of ore.2 Currently, mining of this ore takes place at a number of mines on the west coast, north
of Taranaki, and an estimated 1.8 million tonnes of this ore are recovered each year as of 2009.2 These
ironsand deposits have been determined to be of volcanic origin.3 Specifically, the mineral content of
the ironsand, as well as the dispersion of the minerals, points to the Mount Taranaki volcano as a major
factor in their creation. Offshore ironsand reserves are also known, but estimates of their size are
currently poor.4, 5
Figure 1.1. Map of the west coast of the North Island of NZ. Indicated (green to red) is the
concentration of offshore ironsand deposits. The inset (top left) is the region shown of the west coast.
Figure is sourced from Baker et.al.4
The iron in this sand exists mainly as a titanomagnetite ore (TTM), with the general structural
formula Fe3-xTixO4.6 The sand also contains amounts of Ilmenite (FeTiO3) and Magnetite (Fe3O4).
2 In
This content is unavailable. Please
consult the reference for further details.

2
a typical mining process, a TTM concentrate is produced via magnetic and gravity separation, which
enriches the iron content of the ore to ~70%.7, 8 This TTM concentrate is used primarily used for the
production of steel, and much of it is sent overseas for this purpose.9 The typical composition of NZ
ironsand concentrate is listed below (Table 1.)
Table 1.1 Typical composition of NZ ironsand.10
1.1.2 Titanomagnetite
The structure of the titanomagnetite mineral is of crucial consideration when attempting to further
the understanding of the acid leaching, and possible vanadium extraction from the TTM ore. For this
reason, a consideration of the TTM mineral follows.
The TTM ore is a member of the spinel group of minerals, with an inverse-spinel structure.11 The
spinel group contains many ferrites and other magnetic oxides, and is described by the formula AB2X4,
where A and B are metal ions occupying tetrahedral and octahedral sites, respectively, and X is an anion
(Figure 1.2).12, 13 An inverse-spinel contains a close-packed arrangement of the anions with the
tetrahedral A site ions substituted for half of the octahedral B site ions, which can be formulated as
B(AB)O4.14, 15 In the case of TTM, the regular inverse-spinel structure of magnetite, Fe3O4, has been
interpolated with a fraction of Ti4+ ions populating the B site.16 This can be understood as a magnetite
structure substituted in places with some fraction of the mineral Ulvöspinel (Fe2TiO4). This leads to the
general formula of TTM being Fe3-xTixO4 (where x is the parameter giving the fraction of Ulvöspinel
present in the structure). A standard unit cell for a spinel is shown below (Figure 1.2).
This content is unavailable. Please consult the reference for further
details.

3
Figure 1.2. a) Spinel crystal lattice of magnetite, showing atoms in a face-centred cubic structure, b)
a close-up of an Fe3+ ion occupying a tetrahedral A site, and an Fe2+ ion occupying a B site. In TTM,
some portion of the B ions is replaced by Ti4+.
It is expected that the small amount of vanadium impurity within NZ TTM ironsand is not present
as V2O5. It has been shown that the vanadium within the structure of TTM exists in a solid solution of
predominately V3+, substituting the octahedral B site ions.17-19 If this is the case, one expects to see little
difference in the acid leaching rate of vanadium and iron from TTM, and this appears to be the case (see
section 1.4). This is an important consideration, as it presents yet another research challenge: not only
is vanadium present in such small quantities, but it is locked within the ore structure, and selective
leaching may thus not be adequate for separation of the vanadium.
1.2 NZ Steel
1.2.1 NZ Steel-making Process
The ironsand used in this research is primarily used to produce steel, thus a brief overview of
the NZ steel-making process follows. The development of the NZ steel industry was fraught with
challenges, chief of them the fact that the ironsand feedstock contains other minerals, such as TiO2 and
SiO2. For instance, blast furnaces which were historically used for the smelting of iron ores were deemed
inadequate due to the build-up of titanium cyanonitride, TiCN. Early ore-processing plants turned to
direct reduction methods, using a reductant such as carbon, yet this method was more challenging, and
relied heavily on the skill of the iron-maker.20
Currently, the Waikato North Head mine employs four multi hearth furnaces for the drying of
the ore, and the driving off of unwanted impurities such as oils, tars and other hydrocarbons.21 The
ironsand is initially mixed with coal and a small amount of limestone (CaCO3), before being added to
This content is unavailable. Please consult the reference for further details.

4
the furnaces. Also employed are four reduction kilns, which turn the iron oxide into pig iron.22 The main
chemical reactions that take place in the kilns are
𝐶 + 𝑂2 → 𝐶𝑂2 (1.1)
𝐶𝑂2 + 𝐶 → 2𝐶𝑂 (1.2)
𝐹𝑒3𝑂4 + 𝐶𝑂 → 3𝐹𝑒𝑂 + 𝐶𝑂2 (1.3)
𝐹𝑒𝑂 + 𝐶𝑂 → 𝐹𝑒 + 𝐶𝑂2 (1.4)
𝐹𝑒3𝑂4 + 4𝐶 → 3𝐹𝑒 + 4𝐶𝑂 (1.5)
Reactions (1.1) and (1.2) work to convert any CO2 produced into CO gas as long as there is carbon
remaining, which can continue to participate in the reduction process.22 As per reactions (1.4) and (1.5),
the primary product that is removed from the kilns is iron metal, which contains carbon and multiple
impurities. This product is moved into smelters, where the iron is converted to its molten form. The
molten iron is then moved to the vanadium recovery unit (VRU), where the slag is separated from the
molten iron.23 The iron-making process then yields its final product, a liquid iron, which can be
transported to the steel-making plant.
1.2.2 Vanadium-rich Concentrate (VRC)
First commissioned in 1986, the VRU contains large metal containers, called ladles, into which the raw
molten iron from the smelters is pumped.23 The VRU is made economical by the fact that the presence
of impurities such as vanadium and manganese make other steel-making processes less cost-effective,
requiring larger amounts of reagents to process. Not only this, but vanadium is a very useful and costly
metal, for which special effort needs to be made in order to extract.24 In order to extract the metalloids,
oxidation is required, which can either be achieved at high temperatures (~1400 ℃) via use of a gaseous
O2 stream produced by an oxygen lance, or by the addition of solid millscale powder (a powder of mixed
iron oxides). The process takes advantage of the fact that vanadium is preferentially oxidised over the
iron and carbon.25 The oxidised vanadium and the other lower-density materials, such as Si and Ti
containing minerals, are allowed to form a slag on the top of the ladle, which can then be mechanically
scraped from the surface and collected.
The vanadium-rich slag that this process generates was tested during this research, thus the
expected qualities of this slag are discussed. The following equations represent the important oxidation
reactions for iron and vanadium, for both oxidation with O2 (1.6) and millscale (1.7).26 The presence of
millscale in such high heat also results in the production of oxygen indirectly, which can then perform the
required oxidation.

5
2𝐹𝑒 + 𝑂2 → 2𝐹𝑒𝑂 (1.6)
2𝑉 + 3𝐹𝑒𝑂 → 𝑉2𝑂3 + 3𝐹𝑒 (1.7)
2𝑉 + 𝐹𝑒2𝑂3 → 𝑉2𝑂3 + 3𝐹𝑒 (1.8)
From this, one can expect the vanadium present in the slag to be in the form of vanadium oxide,
V2O3. However, this is a simplified view, as multiple valences are available to many of the metals
contained within pig iron, and vanadium may exist instead as V2O5. Information on the composition of
this slag produced in NZ is not available, but similar steel production processes have produced
vanadium- rich slags with a vanadium concentration of 10-15%, some order of magnitude larger than that
contained within NZ TTM ironsand.26 This will provide a large benefit to the research proposed herein,
as the biggest challenge for extracting vanadium from TTM is the detection and chemical manipulation
of such small quantities. Any extraction method may first be applied to this vanadium-rich slag to
determine their efficacy more efficiently.
1.3 Vanadium
1.3.1 Overview
Vanadium, first discovered in 1801 by Spanish-Mexican scientist Manuel Del Rio, was named
after the Norse goddess of beauty Vanadis.27 This was not the name he gave it, however, as his discovery
was not recognised until 1831, when Swedish chemist Nils Sefström produced vanadium chlorides from
iron ores.28 Later, the English chemist Henry Roscoe first generated the metallic form of vanadium via
the reduction of vanadium dichloride.29
The element itself, atomic number 23, takes on a steel-grey appearance with a blueish tinge in
its metallic form.30 The element exhibits two isotopes, 51V and 50V, with the former at 99.75% abundance.
The metallic form is stable at temperatures below 250 ℃, and above this temperature oxidation takes
place readily.31 Other than its metallic V(0) oxidation state, vanadium displays compounds of oxidation
state II, III, IV, and V. The major commercial product of vanadium is the V(V) compound V2O5.32 It
occurs in the earth’s crust at an abundance of 150 g/t, and thus it is a more abundant metal than copper
and zinc.31
1.3.2 Vanadium Uses
The first application of vanadium was discovered in 1903, when the first vanadium-steel alloy
was manufactured.31 In later years, this alloy would go on to enable the revolution of many technologies.
A major example of this was in 1905, when automobile manufacturer Henry Ford recognised the
potential of the vanadium-alloyed steel for use in his Model N and S cars.33 The lighter and stronger

6
2
2
steel alloy was prime for use in areas such as the crankshaft and the axle, where a high-tensile strength
material is crucial. This was one of the factors that led the later model, the Model T, become such a
financial success, leading to the revolution of the automobile industry.34 The material went on to find
use in a wider range of areas, including machine gears, high-impact tools, and bicycle frames.31
Figure 1.3. Henry Ford standing by his Model T (left), spanners made from chrome-vanadium steel
alloy (right).
Other applications of vanadium do not derive from the metallic form of vanadium. In fact, the
many oxidation states which vanadium displays offers a unique set of properties that enable applications
such as catalysis and energy storage. In particular, the redox flow battery (RFB) is a forthcoming and
potentially ground-breaking technology for the storage of renewable energy.35 The vanadium RFB
operates with two electrolyte tanks, each containing a vanadium solution, each of which is fed through
a half cell of the battery, where the charging/discharging of the electrolyte takes place (Figure 1.4).36
Vanadium is well suited for use in RFB technology, due to its many oxidation states, lower levels of
gas evolution in quick charges, and good efficiency compared to other RFBs.37 The positive and
negative cell equations are
Positive cell reaction: 𝑉𝑂+ + 2𝐻+ + 𝑒− ⇌ 𝑉𝑂2+ + 𝐻2𝑂 (1.9)
Negative cell reaction: 𝑉2+ ⇌ 𝑉3+ + 𝑒− (1.10)
Overall cell reaction: 𝑉𝑂+ + 2𝐻+ + 𝑉2+ ⇌ 𝑉𝑂2+ + 𝐻2𝑂 + 𝑉3+ (1.11)
This content is unavailable. Please consult the reference for further details.

7
Figure 1.4. Schematic diagram of an RFB, showing the anodic electrolyte (blue) and the cathodic
electrolyte (red).
1.3.3 Vanadium-manganese Chemistry
Many studies have reported either the coextraction, or the solid-state combination of vanadium and
manganese in metallurgical contexts.38-40 For this reason, and for reasons which pertain to the results of
this thesis, a brief overview of the Mn-V literature is warranted. While not many studies have been
conducted into Mn-V systems, there are two categories which is considered: Mn-V alloys, and Mn-V
oxides. Further to this, a short exploration of Mn-V coextraction is presented in the roasting and solvent-
extraction sections of this thesis (Section 1.4.1 and 1.4.5, respectively)
A study by Smith and Carlson sought to elaborate on the Mn-V alloy system phase diagram
developed by Watersrat in 1962 (Figure 1.5).41 This diagram shows the phases for annealing a Mn-V
alloy at a range of temperatures and compositions. For the sake of this thesis, it is worth considering
what phases are likely to be present if a Mn-V phase were to be formed during the roasting of Ironsand
and VRC. From the XRF analysis of the VRC material, the ratio of Mn to V is 3:4 (or 43 %Mn). At this
molar ratio, there are two possible annealed phases available above 600 ℃. The first is a CsCl-like
phase, which is a primitive cubic lattice. (Figure 1.5.a) This phase is formed up to temperatures of
roughly 800 ℃, and above this, a body-centred-cubic structure is formed (Figure 1.5.b).
This content is unavailable. Please consult the reference for further details.

8
Figure 1.5. a) Composite phase diagram for the Mn-V alloy system. Sourced from Smith and
Carlson.41 b) Primitive cubic crystal structure. c) Body-centred cubic structure.
Like the Mn-V alloy system, not much is reported on Mn-V oxides, aside from their use in
advanced materials, which will not be covered herein.42, 43 Instead, the existence of the two most
researched Mn-V oxide materials is covered, MnV2O6 and Mn2V2O7. The first Mn-V oxide to be
considered, MnV2O6, has potential for application as a catalyst.44, 45 The structure of this oxide is a
brannerite-type structure (UTi2O6) (Figure 1.6) and can be formed under mild conditions from solutions
of ammonium vanadate, NH4VO3, and manganese nitrate, Mn(NO3)2.46, 47
This content is unavailable. Please consult the reference for further
details.

9
Figure 1.6. Brannerite structure of Mn2VO6. The unit cell for is indicated by black lines, and the
colours designate elements (red = O, grey = Mn, blue = V).
Mn2V2O7 is a paramagnetic oxide which crystallises in two phases (α and β) with a transition
between the two around room temperature (~296 K).48 Its α-phase is triclinic (Figure 1.7.a) whilst the
β-phase takes on a monoclinic distorted-honeycomb thortveitite structure ((Sc,Y)2Si2O7, Figure
1.7.b).49, 50 This material has also been studied for its potential in catalysis, particularly as it shows
promise for use as a light absorber.51 It can be grown at room temperature from a solution of MnCl2 and
VCl3.51 Some literature could be found for the existence of the Mn2V2O7 compound being generated via
the roasting of a vanadium-rich slag similar to the one studied in this thesis (see section 1.5.1).52 This
material is of particular interest to the results of this thesis, as evidence was found for the existence of
this material in the roasted VRC (see section 3.2.2)
Figure 1.7 a) Crystal structure of α-Mn2V2O7. b) Crystal structure of β-Mn2V2O7. The unit cell for
each is indicated by black lines, and the colours designate elements (red = O, grey = V, purple =
Mn).
This content is unavailable. Please consult the reference
for further details.
This content is unavailable. Please consult the reference for
further details.

10
1.4 Overview of Analytical Methods
Before going into the existing literature on vanadium extraction, it is necessary to explain the
relevant analytical methods employed in this research.
1.4.1 Energy-dispersive X-ray Spectroscopy
This technique is used to generate elemental data of a sample surface, by exploiting the unique
atomic structure of each element.53 A beam of electrons is generated, which ejects an inner-shell electron
via excitation (Figure 1.8). After ejection, an electron hole is formed in its place, which promotes the
relaxation of a higher-energy electron into the K shell. This relaxation results in the emission of a specific
frequency of energy (X-rays), which can be used to identify elements in the sample. Three main
transitions are used for this analysis. First are the Kα and Kβ transitions, which refer to transitions which
result at the K shell of the atom. Also detected is the Lα transition, which involves a relaxation from the
M to the L shell.
Figure 1.8. Cartoon representation of atomic transitions probed in EDS analysis.
The EDS setup consists of an electron source (emitter) and a collector, which are often paired with
an electron microscope in order to probe the elemental composition at a specific location. In this thesis,
EDS is used in two major ways. The first of which is the generation of elemental maps, giving insight
into the arrangement and distribution of mineral phases present in both the starting materials and the
acid-leaching residues. Coupled with this are EDS point analyses, where a single point is chosen, and
elemental data is collected with nanoscopic resolution. This enables semi-quantitative analysis of
individual mineral phases present in the solid materials.54
Some limitations are however present.54, 55 X-rays can only penetrate though several nanometres of
solid material, therefore only surface analysis can be done with this technique. This makes the technique
highly sensitive to surface contamination, as well as shielding effects due to topographical features.
Additionally, oxygen is known for being a challenge when trying to gather even semi-quantitative
This content is unavailable. Please consult the reference for
further details.

11
results from EDS, for many reasons.56 First is the oxidation of the material, primarily on the surface,
which will overinflate oxygen emission data compared to a bulk solid. Oxygen also suffers from being
a relatively small element, resulting in its small weight percentage of the sample, requiring higher
precision. A further issue surrounding oxygen EDS detection is that oxygen produces relatively soft X-
rays compared to the rest of the elements investigated in this thesis (O-Kα = 0.525 keV ), which EDS
detectors have historically been inefficient at measuring.
Finally, two of the elements of interest to this research, Ti and V, have overlapping emission
energies (Ti-Kβ = 4.93 keV, V-Kα = 4.95 keV).57 One has to rely upon the EDS analysis software to
deconvolute the overlapping data in order to produce reliable elemental maps.
1.4.2 X-ray Powder Diffraction
The EDS results, which provide elemental analysis of individual mineral phases, are paired with
X-ray Powder Diffraction (XRD). In the same way that visible light passed through a nanometre
diffraction grating will produce a diffraction pattern, the crystal lattice of a mineral phase can act as a
diffraction grating for X-rays.58, 59 This produces a unique set of diffraction patterns, which can be used
to identify crystalline phases. In order to achieve this, X-rays are generated in an X-ray tube, which are
then directed toward the sample, and any diffracted X-rays are measured with a detector. The detector
moves through the range of diffraction angles, and since the sample is a powder, and the phases are
randomly orientated, all diffractions should be collected. These diffraction patterns are then compared
to a reference library of diffraction patterns, in order to assign specific crystalline phases to the sample.
Some limitations are present for the analysis of the materials concerned in this thesis.60 First,
the samples considered herein are often heterogeneous samples, with many micro- and nano-sized
particulate phases to be identified. These can be hard to detect, if a dominant amount of another phase
is present. Another limitation is the amount of powder required; in this thesis, much of the solid material
was dissolved in concentrated HCl, thus a small amount of substance may be all that is left for XRD
analysis, which will lower the sensitivity of the measurement. Despite its limitations, XRD will pair
well with EDS for the identification of the phases present in the solid samples concerned in this thesis.
1.4.3 X-ray Fluorescence
Another analysis technique utilised in this thesis is X-ray Fluorescence (XRF). This is a powerful
method which can provide accurate elemental analysis of a sample.61 This technique also relies on the
same principles as EDS, but is highly quantitative, where EDS is not.62 A primary electron beam is
directed at a sample, generating inner electron holes which are filled with outer electrons, emitting
frequencies of energy specific to the atomic structure of that element. Since XRF is conducted with the
aid of certified standards, the elemental analysis can be calibrated, and precision in the ppm range is
often achieved. A typical presentation of the results for mineral samples includes the major elements
expressed in their oxide form after heating at 1000 °C.

12
In this thesis, XRF is a crucial component of the analysis of the starting materials, roasted
materials, and leaching residues. Compared with EDS, a quantitative result can be obtained, allowing
for the composition of these materials to be determined. This is essential for calculating certain values,
such as the percentage leaching of a particular element.
1.4.4 Inductively Coupled Plasma Mass Spectrometry
The final technique discussed is inductively coupled plasma mass spectrometry (ICP-MS). This is a
mass spectrometric technique, which enables the detection of the elemental composition of a sample to
a high degree of precision (up to the ppt range).63 In this technique, a liquid sample is converted into an
ultra-fine mist (nebulised) and introduced into an argon- plasma at extremely high temperature (6000 –
8000 K). This atomises and ionises the sample, preparing it for mass spectrometry. The atomised sample
is then passed into the mass spectrometer, where the species are separated and detected based on their
mass.
The aspects of ICP-MS that are of interest to this thesis are as follows. First, ICP-MS allows for the
analysis of solution samples. Experiments in this thesis involve acid-leaching, and both the solid residue
and the leachate will need to be analysed. ICP-MS analysis of the leachate will thus enable the
determination of relative leaching rates for each element. Furthermore, the sensitivity and precision of
ICP-MS analysis will lend itself well to this thesis, as the vanadium content of the TTM ironsand is so
low.
1.5 Extraction of Vanadium
1.5.1 Roasting
A potential pre-treatment process useful in this research is roasting of the TTM ore. Roasting is
a commonly employed treatment step in metallurgical processes, involving high-temperature treatment
of ore in a controlled atmosphere to encourage favourable reactions.64, 65 In the case of vanadium
extraction, one procedure currently employed is roasting of the TTM ore with a sodium salt, to generate
a water-soluble sodium metavanadate (NaVO3), which can be extracted with a water leaching step.66, 67
This, however, results in a low extraction ratio of vanadium (< 45% total extraction) as well as generation
of environmental pollution through the water leaching step.
A recent study by Zheng et. al. examined the additive-free roasting of titanomagnetite ore, in
the range of 800-1250 ℃, with a focus on the oxidative transformations of vanadium species.68 The
thermodynamic results showed that the oxidation of V3+ to V5+ would occur at temperatures exceeding
327 ℃, and the phases of the spinel structure which have vanadium present (vanadium-iron spinel
phase, FeV2O4) are oxidised more easily than magnetite (Fe3O4). In addition, liquids were generated
upon high-temperature roasting (including V2O5), and temperatures above 1200 ℃ should be avoided to
limit over-roasting. This study provides a justification for attempting a roasting step prior to acid-
leaching, since the vanadium-containing phases were more readily oxidised. However, due to the
potential environmental impact of high-temperature roasting procedures, direct acid leaching without

13
pre-roasting is a more attractive solution.
A 2017 study by Li et. al. sought to extract vanadium from a vanadium slag similar to the one
studied in this thesis.52 The slag was provided by Chengde Iron and Steel Group Co. in China, and the
elemental composition of this slag is presented below (Table 1.2). This study continued the additive-
free roasting pathway of vanadium extraction by roasting the slag in the 800 – 1000 ℃ range, followed
by leaching in ammonium carbonate, (NH4)2CO3. An investigation of the roasting process was
conducted, and the results showed that the oxidation of the vanadium spinel occurred in three steps.
Initially, the spinel phase was broken up, and a solid solution of Fe2O3·V2O3 is formed (Equation 1.12).
Following this, the solid solution was oxidised to form Fe2O3·V2O4 (Equation. 1.13), and some of the
V(IV) is reacted with basic oxides like MgO and MnO2 to form low-valence vanadates, such as Mg2VO4.
The final oxidation step resulted in the formation of the highest-valence vanadates, Mg2V2O7 and
Mn2V2O7 (Equation. 1.14). This Mn complex oxide was the material considered earlier in this thesis
(see section 1.3.3). The evidence for the formation of Mn2V2O7 was the presence of its characteristic
reflections in the XRD pattern of the roasted slag.
𝐹𝑒𝑉2𝑂4 + 𝑂2 → 𝐹𝑒2𝑂3 ∙ 𝑉2𝑂3 (1.12)
2𝐹𝑒2𝑂3 ∙ 𝑉2𝑂3 + 𝑂2 → 𝐹𝑒2𝑂3 ∙ 𝑉2𝑂4 (1.13)
𝐹𝑒2𝑂3 ∙ 𝑉2𝑂4 + 4𝑀𝑛𝑂 + 𝑂2 → 2𝑀𝑛2𝑉2𝑂7 + 2𝐹𝑒2𝑂3 (1.14)
Table 1.2. Elemental composition of vanadium slag used by Li et.al. determined by XRF. 52
A study, published in March 2020 by Wen et.al, sought to co-extract vanadium and manganese
from two sources simultaneously.40 A vanadium-rich slag was obtained from XiChang Steel Vanadium
Co. Ltd. in Sichuan and mixed with the manganese- rich mineral pyrolusite (elemental compositions in
Table 1.3). The motivation behind this study was the idea that, as the V3+ in the slag needs to be oxidised
to V5+to form Mn2V2O7 , while the Mn4+ in the pyrolusite needs to be reduced to Mn2+, the co-roasting
of a mixture of these two materials should facilitate the formation of the desired complex oxide. This is
akin to adding MnO2 as an additive to vanadium slag in order to facilitate the formation of Mn2V2O7.
This study continued with an acid leaching experiment, with H2SO4 used as the acidic extractant. A
reasonably good extraction result was
This content is unavailable. Please consult the reference for further details.

14
reported, with 93.86% of vanadium content extracted to a 91.98% purity. This study provides ample
evidence for the possibility of extracting vanadium from the VRC used in the thesis herein.
Table 1.3. Elemental composition of materials used by Wen et.al. determined by XRF.40
1.5.2 Leaching
An important initial consideration for this research is as follows: what happens when TTM is
dissolved in HCl? A study by Sedneva et. al. attempted to dissolved titaniferous magnetite with HCl
solutions, with acid concentrations between 15-25%.69 This was done to determine the recovery
efficiency of the metal components in the resulting leach solution. The main products from HCl
digestion were determined to be an HCl solution of FeCl2, which contained the majority of the vanadium
component (87-99%), and also a solid TiO2/SiO2 residue. Reductive HCl leaching (using Fe or Fe/HF as
the reductant) was determined to be more effective for the total recovery of the Fe and V components.
In this experiment, a precipitation of iron and vanadium was performed using aqueous ammonia. The
precipitation process for vanadium removal in this research resulted in a sorption of vanadium ions to
the freshly precipitated Fe(OH)3. Some enrichment of vanadium was observed via this method, which
varied as a function of pH, but only a low level of enrichment could be achieved, from 1.4% to 3.2%
vanadium content. For the herein proposed research, this method of vanadium enrichment is not
adequate due to its low level enrichment, and also has the implication that any method relying on the
removal of iron via precipitation of Fe(OH)3 will lead to unwanted partial V extraction.
1.5.3 Kinetics
A study by the co-supervisor of the proposed project, Chris Bumby, was conducted into the
kinetics of TTM ironsand HCl dissolution kinetics (Nusheh et.al).70 This study compared the component
leaching efficiencies over time across a range of factors, including HCl concentration, particle size, and
leaching temperature. The study showed that the dissolution kinetics can be described using the
shrinking core model (cube root model), as the rate-limiting step for dissolution is the surface chemical
reactions. The dissolution rate was shown to be strongly related to the acid strength, with very little
difference in the extraction ratios of Ti:V:Fe (Figure 1.9.). This supports the claim that the vanadium is
present as an impurity within the TTM structure, as it is co-extracted with Fe and Ti. This study also
examined the milled TTM ironsand using SEM and EDS mapping (Figure 1.9.a and b). As the source
of the ironsand used in the proposed project is the same, a brief review is necessary. The SEM images
This content is unavailable. Please consult the reference for further details.

15
show that the majority of the particles are featureless magnetite, and a small number of particles with
lamellae of titanohematite (TTH).
Figure 1.9. (Top) Chart from Nusheh et. al. showing leaching behaviour at a range of HCl
concentrations. (Bottom) a) TTM particle having undergone leaching in 6M HCl b) TTM particle with
Hematite lamellae having undergone leaching in 6M HCl.
1.5.4 Current Industry Methods
Whilst the early hydrometallurgical experiments in the proposed project will focus on the initial
dissolution of the ore in HCl, the focus of this research is to direct the development of a vanadium
separation method that can inform industry processes. To achieve this, a brief review of currently
employed industry methods as well as novel exploratory methods is necessary. The method which is
This content is unavailable. Please consult the reference for further details.

16
utilised in the NZ Steel-making process has already been covered earlier in this thesis (Section 1.2.2),
as this generates the VRC studied herein.
One recent industrial development in vanadium extraction and purification comes from the
Mount Peak Project (TNG Limited).71 Their proprietary process, named TIVAN, is a patented
hydrometallurgical treatment process, which can produce, three product streams (TiO2, Fe2O3, V2O5)
from magnetite.72 Limited information on the chemistry of this process is available. The magnetite ore
is initially leached with acid, which is followed by a selective solvent extraction process to extract the Ti,
Fe, and V as three separate products. The key to the success of the Mount Peak Project is the recovery
of vanadium via TIVAN, which provides further justification for the research proposed herein. To see
if a solvent extraction pathway is suitable for this thesis project, an investigation into current solvent
extraction research is warranted.
1.5.5 Solvent Extraction
Solvent extraction is a method which involves addition of a compatible solvent to a digested
ore, in order to selectively remove a target for purification.73 In the case of vanadium extraction, it is
important to know what form the vanadium is found in solution. A range of different species are
available to vanadium, depending on factors such as pH and chemical potential. In certain industry
processes, the TTM ore is roasted in the presence of sodium, forming a vanadate species that can be
extracted with water as the solvent.74 This method has been explored earlier in this thesis (Section 1.5.1),
along with the additive-free roasting method, followed by (NH4)2CO3 extraction.
Many solvent systems have also been attempted in laboratory settings, such as amine and
organophosphorus extractants, yet these have not adequately shown efficient selectivity of V over Fe
on their own, due to the complexity of the system (valances, redox effects, etc.).75-77 Some solvent
systems, including one studied by Tavakoli and Dreisinger, have shown separation of V4+ over Fe2+ via
extraction of VO2+, yet does not show suitable separation for any of the other oxidation states of the
metal ions.78 Dreisinger tested a range of organophosphorus extractants, including phosphinic and
phosphoric acids (Figure 1.10) on an acidic vanadium leachate. This study showed promise for the
extraction of vanadium, but not in the presence of iron ions. In particular, Cyanex 923 showed the best
selectivity of V(V) over Fe(III), and D2EHPA showed selectivity of V(IV) over Fe(II), but no extractant
was selective for V(V) over Fe(II), or for V(IV) over Fe(III). It should also be noted that these
extractions were performed in a sulphated media (i.e. mimicking an H2SO4 leachate), and thus the V
and Fe species in solution will differ for this thesis, which will utilise HCl. For this reason, if it is
decided that the herein research requires a solvent extraction experiment, a range of extractants will
need to be tested, rather than relying on this research by Tavakoli and Dreisinger.

17
Figure 1.10. Structures of organic extractants studied by Tavakoli and Dreisinger.
To round off the earlier exploration of Mn-V chemistry, a brief look is taken at the coextraction
of these elements using solvent extraction. A recent study has been published in this area by Liu et.al.,
who provides a novel method for coextracting Mn and V from high-manganese-containing
wastewater.38 Such wastewater is commonly produced via the vanadium extraction process from TTM
ores. Heavy metals (including Mn2+ and V5+) in the water make this an environmental pollutant, and thus
hard to reuse or discharge directly. In this study, a solvent-extraction process was developed, followed
by a precipitation step, in order to remove both the Mn and V from this waste. The solvent used in the
extraction process was D2EHPA, previously used above (Figure 1.10.). This extracted the V from the
wastewater, and the Mn along with it. Following this, Na2CO3 was added to precipitate the Mn as
MnCO3. This process was completed with 98.15% of vanadium extracted, to a purity of 98.60%. This
study reveals that, if a method of coextracting Mn and V from the VRC were to be developed, that a
highly pure product of V can be produced from this to a high degree of efficiency.

18
1.6 Overview of Project
This project seeks to explore potential methods of selectively extracting V first from VRC and
then from IS materials. This will be achieved by leaving other major elements (such as Fe and Ti)
behind, or by precipitation of these elements. Three treatments were applied to VRC during the
research conducted in this thesis. Procedures and findings from the VRC treatment were also applied
to ironsand:
1. Selective leaching of V was attempted for 120 min in HCl at a range of concentrations (2M
– 12M). This was conducted on both the IS and VRC materials. The leachate and solid
residues were analysed for their elemental and mineral compositions.
2. In another attempt, Ti and Fe were precipitated from a leachate generated in the leaching
experiments. Ti was hydrolysed from the leachate, and Fe was precipitated upon
manipulation of the pH.
3. The IS and VRC materials were roasted at 900 °C in air (3 hr), and the same HCl leaching
procedure was conducted on the resulting roasts with a 4M HCl concentration. The roasting
was conducted again on the VRC material at 1200 °C (overnight), and the roasts were
compared. Following this, the new roast was leached at a lower range of HCl concentrations
(1M – 3M)

19
2 Experimental
2.1 Leaching
2.1.1 General Leaching Procedure
All leaching experiments were conducted according to the following procedure, unless
otherwise specified. Where the term “conc. HCl” is used, this refers to a concentration of 11.5M. HCl
was added to a flask equipped with a stirrer, condenser, and thermocouple. The HCl was heated to 80
°C under stirring. The solid to be leached was added, and the experiment was left for 120 min under
constant temperature and stirring. Aliquots of ~2 mL were taken at fixed time intervals (2, 4, 6, 8, 10,
15, 20, 30, 45, 60, 90, and 120 min), and these were filtered with a syringe filter. The experiment was
removed from the heat, and the solid residue was filtered and washed with water (3 x 2 mL), before
being air dried. Leachate aliquots were submitted for ICP-MS analysis. The solid residue was analysed
via XRD XRF, and EDS.
Heating was supplied by a Labmaster Isopad LMUL/ER/500, and thermal regulation was
achieved by an Omron E5CSZ Temperature Controller. Stirring was achieved with a Heidolph RZR
overhead stirrer. Leachate aliquots were filtered, unless otherwise specified, through PES membrane
syringe filters of a 0.45 µm pore size. Where stated, samples were centrifuged with an Eppendorf
Centrifuge 5424.
2.1.2 Leaching of Non-roasted Samples
The first run of experiments was conducted with 20 g of material and 150 mL of HCl. The
leaching was conducted as per the general experimental procedure. For the conc. HCl attempts, syringe
filters were inadequate for filtering, due to breakdown of the PES membrane. Instead, the aliquots were
filtered through a glass wool plug in a Pasteur pipette. Upon addition of the solid material to the higher-
concentration (8M, conc.) HCl, over-heating of the reaction was observed up to 95 °C, before returning
to 80 °C over 6 – 10 min. The leachates for the VRC experiments ranged in colour from light green
(2M) to dark green (conc.). The leachates for the IS experiments ranged from pale yellow (2M) to dark
yellow (conc.). Over time, most filtrates accrued a small amount of white precipitate.

20
Table 2.1. Leaching experiments on non-roasted samples. Samples labelled a were filtered through
glass wool.
Material used
(mass used, g)
HCl Concentration
(mol L-1)
2
HCl Volume
(mL)
Remaining material
(wt%)
76.5
4 59 VRC (20)
8 53.5
conc. a 43 150
2 81.5
4 26.5 Ironsand (20)
8 3.5
conc. a 1.5
2.1.3 Leaching of Roasted Samples
Roasting of the IS and VRC samples was conducted in an induction furnace. Samples were left in
a roller mill with steel balls at 52 RPM overnight, prior to leaching experiments.
Table 2.2. Roasting experiments.
Sample Name Material Mass (g) Temperature (°C) Duration (hr)
IS-R Ironsand 30.1 900 3
VRC -R1 VRC 30.1 900 3
VRC-R2 VRC 59.8 1200 o/n
The roasted materials were leached as per the general experimental procedure. The leachates
for the VRC experiments ranged in colour from light green (2M) to dark green (conc.). The leachates
for the IS experiment were a dark yellow/gold colour. The leachates for the VRC experiments ranged
from pale yellow (1M) to yellow (4M).

21
Table 2.3. Leaching experiments of roasted samples.
Material used
(mass used, g)
HCl Concentration
(mol L-1)
HCl Volume
(mL)
Remaining
material (wt%)
IS-R (20) 4 150 58
VRC -R1 (20) 4 150 78.5
1 75 67
VRC-R2 (10) 2 75 70
3 75 62
2.1 Precipitation of Material from Filtrate
Seeding and precipitation of Ti was attempted with 100 mL of the filtrate resulting from the 8M
dissolution experiment. 100 mL of water was brought to a boil, and 1 mL of the filtrate was added to
this dropwise. This was left to boil until a cloudy suspension formed. The remaining filtrate was then
added, and left to boil for 3 hr, at which point it was taken off the heat and cooled. Then the mixture was
filtered, and the solid was resuspended in water. This new suspension was centrifuged at 4500 RPM for
30 min, and the resulting solid was separated from the pale blue supernatant. The recovered solid was
left in a vacuum desiccator overnight, resulting in a grey-white product. This product was then
characterised using XRD.
The supernatant above was then used to attempt a precipitation of the Fe. The pH of the supernatant
was slowly altered by dropwise addition of 2M NaOH, until a dark green precipitate had formed. A few
mL of pre-prepared flocculant (KW 10 HB) was then added, and this was centrifuged at 4500 RPM for
20 min. The dark solid was separated from the colourless supernatant and analysed using XRD. A small
amount of orange solid was found in the supernatant, and this was also centrifuged at 4500 RPM for 20
min and collected.
2.2 Analysis and Characterisation
2.2.1 XRD
XRD data was collected on a PANalytical X’Pert PRO, with a Cu K1 emitter. Data was
collected with a continuous scan in the 10° ≤ 2θ ≤ 80° range, with a fixed step size of 0.013°, and a step
time of 111 s. The XRD samples were loaded onto flat-plate spinner sample holders and measured using
a Bragg-Brentano geometry.

22
2.2.2 XRF
XRF data was collected by SpectraChem Analytical (Verum Group, Wellington, NZ). Samples
were oven dried at 110 °C before analysis. Two analyses were carried out, a loss-on-ignition analysis
using a furnace/gravimetric method up to 1000 °C, and a major oxide analysis using borate fusion/X-
ray fluorescence.
2.2.3 SEM/EDS
SEM/EDS data was collected on a JEOL JSM-6610LA system, with a JEOL EX-230**BU
EX37001 Energy Dispersive X-ray Analyser. Samples were analysed with a working distance of 1 mm
at 20 kV, with spot size SS60. Samples were affixed to stubs with carbon tape, and carbon-coated with
a Quorum Q150T E coater. The samples were coated with 2 pulses, at a current of 65 A and a pulse
time of 3 seconds. After coating, samples were stored under vacuum in a PELCO 2251 Vacuum
Desiccator.
2.2.4 ICP-MS
Concentration determinations were carried out using a ThermoFisher Element II sector field
ICP-MS. Leached aliquots were diluted using 3% HNO3 in a two-stage gravimetric dilution procedure,
to yield final solutions containing analytes of interest at the 0.5 to 20 ppb range. A suite of commercially
available certified reference materials (Inorganic Ventures, USA) for the elements Fe, Ti, and V, and
Mn were mixed and diluted to encompass similar concentrations to those expected in the diluted
leachates. The diluted leachates were then run against the calibration lines given by the gravimetrically
diluted reference standards for each element in order to calculate their concentrations in the diluted
samples. After subtraction of the procedural blank, a dilution factor was then applied to the
concentration determinations for the diluted samples in order to calculate the concentration in the
original undiluted leachate material.
Each analysis consisted of an initial three-minute wash cycle, with a 90 s sample uptake
followed by three minutes of analysis. The suite of elements was measured using a combination of
different instrument resolution modes in order to attenuate the dynamic range encountered within the
samples. This is particularly the case for Fe where the 98% beam attenuation afforded by the high-
resolution mode permitted collection of the large Fe ion beam alongside the small ion beams for other
elements measured at lower resolutions.

23
3 Results and Discussion
3.1 Introduction
In this section, the results of the VRC and IS leaching experiments are presented, alongside a
discussion of the main findings. This section is split into two parts, one for each of the materials studied.
The first material covered herein is the VRC, followed by the IS, as the VRC may act as a testing ground
for the potential vanadium extraction procedures, owing to its higher vanadium content. It should be
noted that the main mineral components of the VRC are different to the IS, as is explained further in this
section.
Initially, an analysis of the starting material was conducted, as this formed a basis for interpreting
the results of any leaching and roasting experiments. To achieve this, XRF was used to determine the
elemental composition, and XRD was used to determine the major mineral phases. To harmonise these
two sets of results, and to determine any phases which did not appear in the XRD, EDS was also
employed.
Following this, leaching data for the unroasted materials was analysed, and in the case of VRC, an
attempt at precipitating the Ti and Fe from the leachate was considered. For this, ICP-MS has been used
to determine the elemental composition of the leachate across the course of the leaching, and this has
been coupled with the XRF results of the starting materials to determine the leaching efficiencies of the
elements in question. XRD, XRF, and EDS were also used to analyse the solid residues remaining after
leaching. Following this, the roasting of the materials is covered, and special consideration is taken to
the effect of roasting on the leaching behaviour of the materials.
3.2 Vanadium Recovery Concentrate (VRC)
3.2.1 Analysis of Starting Material
Before analysing the leaching and roasting results, it is essential to have a sound understanding
of the starting materials. To begin, the XRF results are examined (Table 3.1). The main elemental
components are Fe, Mn, Ti, Si, and V. When compared to the composition of the IS (see section 1.1.1),
it should be noted that most of the Fe component has been removed. This is no surprise, as the VRC is
the side-product of iron smelting, and it is desirable that minimal Fe is withdrawn in the vanadium-
recovery process.

24
Table 3.1. XRF major oxide analysis results for VRC, and the VRC used by Li et. al.52 Values are
expressed as weight % on oven dried (110°C) basis. LOI = loss on ignition at 1000°C. Negative LOI
indicates positive mass gain due to oxidation. Values for SO3, P2O5 and K2O have been omitted due to
low value (<0.11). Dashes indicate values not reported.
Sample Fe2O3 MnO TiO2 CaO SiO2 Al2O3 MgO V2O5 LOI SUM
VRC 37.72 14.17 14.66 2.81 16.88 1.63 1.1 14.1 -6.7 96.56
VRC from
Li et. al.
An important consideration to make is how the composition of the VRC material compares to
that covered in the literature presented in the introduction. This is because VRC products will differ due
to the natural variation in ore compositions between locations. In particular, this study will make
comparisons to the Li et. al. research, where the slag was roasted and leached with a NH4CO3 solution
(see section 1.5.1).52 The compositions are somewhat comparable, with one major exception. The slag
that Li et. al. used had comparable wt% of Mn and Mg, whereas the VRC studied herein contained less
Mg, and markedly more Mn, than the Li et. al. slag. This is significant, as this study reported the
formation of two vanadium oxides upon roasting, Mg2V2O7 and Mn2V2O7. This leads to the assumption
that, if the roasting conditions from Li et. al. were to be replicated with our VRC, formation of the
Mn2V2O7 material should be expected, and formation of the Mg2V2O7 material should be less expected.
To determine how the elemental composition of the VRC is reflected in its major crystalline
phases, the XRD pattern was considered (Figure 3.1). The major phase of the material appears to be
Jacobsite, a Mn-containing spinel mineral, which accounts for the high Mn composition observed in the
XRF data. This phase, along with Ilmenite, also accounts for the Fe and Ti components, and the
Cristobalite phase accounts for most of the Si component. The shape of the background in the XRD
pattern indicated lower amounts of amorphous phases were present. The Olivine phase, judging by the
low Mg component of the material, was likely on the Fe-rich end of the Mg/Fe solid solution series (i.e.
Fayalite).
What remained unaccounted for was the high V component of the material, and the EDS results
were considered to determine whether it was found in the amorphous phase, or as a solid solution in the
titaniferous minerals. Furthermore, no Ca- or Al-containing minerals were present in the XRD pattern.
The later XRD analyses of the leaching residues revealed an Augite phase, a pyroxene mineral with the
general formula (Ca,Na)(Mg,Fe,Al,Ti)(Si,Al)2O6. This mineral was more resistive to the HCl leaching,
and consequently the Ca and Al components of the VRC can be attributed to this mineral. However,
corroboration with the EDS results was necessary to confirm this.
This content is unavailable. Please consult the reference for further details.

25
Figure 3.1. XRD pattern of VRC with major reflections labelled a) Jacobsite, MnFe2O4 b)
Cristobalite, SiO2 c) Ilmenite, FeTiO3 d) Olivine, MgFe(SiO4)
EDS maps were taken of the VRC material, and a representative section of the material, along
with EDS point analyses, is shown below (Figure 3.2). The EDS point analyses can be largely assigned
to the phases identified in the XRD, with a few exceptions. Notable exceptions are EDS points 5, 9, and
10, which contained large Mn, Fe, and Si components. These were assigned to the Rhodonite phase
(Mn,Fe,Mg,Ca)SiO3, which appeared in the XRD patterns of the leaching residues reported later in this
thesis. The SiO2 phase was not represented by any EDS point, but can be observed as red regions in the
colour map (Figure n, a). A Ti-rich phase with very little Fe was also observed (EDS point 4) and
assigned to a TiO2 phase. Small TiO2 particles appeared to be frequent in the VRC and its leaching
residues. As expected, the Olivine phase (EDS point 3) displayed a small Mg:Fe ratio (17.5:1.6 atomic%).
This could be due to a small Mg inclusion in a titaniferous particle, but as this EDS point contained no
Ti or V, it was most likely due to Olivine.
The most important takeaway from the EDS results is the location of the V component. Most
of the V component appeared to be locked up in a solid solution of the titaniferous minerals, as evidenced
by EDS points 2 and 6-9. However, one standout region of the EDS map (EDS point 1) contained an
overwhelming predominance of Mn and V, with little to no Fe or Ti observed. As this phase was not
present in the XRD, it was assumed that either the phase was not abundant enough to be identified in
the XRD, or this phase was amorphous. A particular quality of note is the ratio of Mn to V in this region.
The ratio was roughly 2:3 (Mn:V), and this fact became crucial in later sections in this thesis, where
this Mn-V region is revisited.

26
EDS
Point
EDS Data for Element
Assignment
Fe Ti V O Mn Si Mg
1 2.10 0.93 42.12 27.29 26.32 0.88 0.37 Manganese-vanadium phase
2 25.60 8.10 23.50 34.76 6.69 0.71 0.64 Vanadium-bearing Jacobsite
3 22.67 0.67 0.71 43.02 11.13 19.74 2.06 Olivine
4 7.48 32.05 13.42 36.73 7.24 1.87 1.22 TiO2
5 18.52 1.50 2.32 50.02 7.98 18.42 1.25 Iron-bearing Rhodonite
6 37.62 14.14 26.31 10.31 9.85 1.63 0.14 Vanadium-bearing Ilmenite
7 21.50 14.01 50.91 3.23 10.07 0.25 0.03 Vanadium-bearing Jacobsite
8 34.37 12.75 36.48 7.03 8.17 1.11 0.07 Vanadium-bearing Jacobsite
9 26.72 1.65 1.11 20.76 20.42 28.75 0.59 Iron-bearing Rhodonite
10 26.93 4.47 0.80 18.65 19.86 28.46 0.82 Iron-bearing Rhodonite
Figure 3.2. SEM maps of VRC. a) elemental colour map (red: Fe, green: Ti, blue: V) b) elemental
colour map (red: Si, green: Mn, blue: V) c) corresponding SEM image at x700 with EDS points
labelled. Table shows the mineral phases assigned to each EDS point, and the raw EDS data for each
of the major elements in atomic% (rescaled to 100 %).
Summary
The main component of the VRC was Jacobsite, a Mn-bearing titaniferous spinel. Other minor
components were Ilmenite, Cristobalite, Rhodonite, Olivine, and TiO2. The elemental composition of the
material showed similarities to VRC materials studied elsewhere, with the exception of the richness of Mn
in this VRC. Of particular note was the presence of a yet-unidentified Mn-V phase, with a ~2:3 (Mn:V)
atomic ratio. Apart from this phase, the overwhelming majority of the vanadium appeared to be found as a
solid solution in the Jacobsite and Ilmenite phases.

27
3.2.2 Leaching of Non-roasted Samples
Having analysed the starting material, one can consider the HCl leaching data. First it should
be noted that the liquid to solid ratio (7.5 ml/g) was chosen as a rough estimate of the amount required
to convert all the metal species into their highest oxidation-state chloride forms. After adding the solid
to the 80 °C HCl, aliquots of the leachate were taken at fixed intervals, and the ICP-MS results of these
aliquots are shown below (Figure 3.3). The values reported in the ICP-MS results were given as
concentrations, and these have been modified to show the amount leached as a molar percentage of the
element in the initial VRC material.
Figure 3.3. HCl Leaching of VRC over time, comparing the effect of HCl concentration. a) 2M
leaching b) 4M leaching c) 8M leaching d) conc. leaching. The % amount leached is the moles of
element leached compared to the moles of element in initial solid material.
There was no considerable difference in leaching rate for the three elements of interest across
the course of the experiment. Ti appeared to have slower leaching kinetics, which was likely because
Ilmenite and TiO2 are more resistive to HCl attack compared to Jacobsite. The leaching rate of Fe and V
at lower HCl concentrations differed, with Fe leaching faster than V. At higher concentrations this
reversed, with V leaching faster than Fe. The inconsistent leaching curve in the 8M experiment was
taken to be a result of anomalous values at 15, 20, and 30 min, as when these were omitted a smooth
curve similar to the other results was found. For all the higher concentration leaching experiments in this
thesis, addition of the solid material to the HCl resulted in an increase in temperature as the leaching

28
reactions are exothermic. This had the general effect of inflating the initial results, as the higher
temperature leachate raised the solubility of the metal ions.
The other main result from the leaching data was the total % amount (yield) leached as a function
of acid strength. At a 2M concentration, only a small amount (25.64 %) of the Fe, and even smaller
amounts of Ti and V, were leached (9.35 and 14.98 %, respectively). As the HCl concentration was
increased, the total amount leached increased to approximately half of the amount in the initial material.
These values are reported as leaching efficiencies in Table 3.2. The change in leaching efficiency as a
function of acid strength is exemplified in Figure 3.4. This figure shows clearly the reversal in the
comparative leaching rates of Fe and V. At lower concentrations, the Ilmenite appeared to be selectively
leached, leading to a higher amount of Fe in the leachate. At higher concentrations, this behaviour was
not as significant, as the acid strength was high enough to leach Ilmenite and spinel phases alike, leading
to a higher amount of V present in the leachate.
Table 3.2. Leaching efficiencies for Fe, Ti, and V in VRC leaching experiments. Values are the
maximum percentage amount leached from solid material.
Sample Fe Leaching
Efficiency (%)
Ti Leaching
Efficiency (%)
V Leaching
Efficiency (%)
VRC 2M Leach 25.64 9.35 14.98
VRC 4M Leach 39.46 18.95 27.46
VRC 8M Leach 44.19 29.61 49.41
VRC conc. Leach 51.01 47.25 58.88

29
Figure 3.4. Final extraction values at 120 min as a function of HCl concentration.
In order to fully understand the leaching process, careful analysis of the solid residue which
remains after leaching is warranted. Comparison of this data to the initial VRC material gave insight
into which phases were being leached, and which phases were resistant to HCl attack. The first data to
consider is the elemental data provided by XRF. This is compared to the starting material below (Table
3.3). Elements which became lower in weight % as the acid strength was increased were the elements
that were being leached most. These elements were Fe, Ti and V. These elements were most likely found
in the minerals which were not resistive to HCl attack, such as Jacobsite and Ilmenite. The elements
which increased in their weight % values are the elements which were comparatively not being leached.
These were Ca, Si, Al, and Mg. These elements were most likely found in phases which were resistive
to HCl attack, such as Rhodonite, Augite, and Cristobalite. Analysis of the XRD and EDS results for the
residue samples was required to confirm this. Mn appeared to maintain its weight % across the range of
experiments, and this was likely due to the fact that it was located in both an HCl soluble phase
(Jacobsite) and a more resistive phase (Rhodonite).

30
Table 3.3. XRF major oxide analysis results for VRC and leached VRC residues. Values are
expressed as weight % on oven dried (110°C) basis. LOI = loss on ignition at 1000°C. Negative LOI
indicates positive mass gain due to oxidation. Values for SO3, Na2O, K2O, and P2O5 have been
omitted due to low value (<0.13).
Sample Fe2O3 MnO TiO2 CaO SiO2 Al2O3 MgO V2O5 LOI SUM
VRC 37.72 14.17 14.66 2.81 16.88 1.63 1.1 14.1 -6.7 96.56
VRC 2M
Leaching Residue 32.21 13.71 16.6 2.73 19.14 1.59 0.99 14.88 -5.6 96.45
VRC 4M
Leaching Residue 24.3 13.57 18.95 3.55 26.36 1.66 1.05 10.73 -3.32 97.06
VRC 8M
Leaching Residue 22.9 13.19 17.13 3.74 30.3 1.78 1.08 8.8 -1.58 97.49
VRC conc.
Leaching Residue 20.96 13.99 12.52 4.44 37.96 1.89 1.22 6.39 -1.66 97.88
These results were corroborated by the ICP-MS leaching data, as the mol of any element in the
leachate and the mol of that element in the solid residue should total to the mol in the initial VRC
sample. This value was always comparable to the mol in the initial material; however, it was
consistently lower. This was due to material lost during the filtration process, and in handling of the
material post-experiment. This value was calculated for each experiment, and while not presented
herein, an example is as follows (from the 2M experiment).
n(V) in leachate (from ICP-MS) = 4.64 mmol
n(V) in residue (from XRF) = 25.03 mmol
total n(V) in leachate and residue = 29.67 mmol
n(V) in initial VRC material (from XRF) = 31.01 mmol
To continue the analysis of the residue samples, the XRD patterns and EDS data were
considered. These allowed the identification of the phases which remained after dissolution at different
acid strengths, and in turn revealed which phases had dissolved during the leaching experiments.
2M Leaching Residue
When compared to the XRD pattern of the initial VRC material, the reflections associated with
Ilmenite and Olivine peaks disappeared, due to their dissolution during the leaching experiment.
Rhodonite and Cristobalite reflections emerged, indicating that the major spinel phase became a much
less prevalent phase due to dissolution. This also indicated that the Cristobalite and Rhodonite phases

31
were more resistive to HCl leaching than the spinel phase. Another point of note is the assignment of
the spinel phase diffraction lines as Mn0.336Ti0.942Fe1.722O4, a spinel mineral closer to the Ti end of the
Mn/Ti spinel solid solution series. This was likely due to slight selective leaching of Mn-rich spinels.
The diffraction patterns of spinel minerals are, however, very similar, thus determination of the
composition of the spinel phase with XRD alone cannot be relied upon.
Figure 3.5. XRD pattern of VRC residue after leaching with 2M HCl, major reflections
labelled a) Titanomagnetite, Mn0.336Ti0.942Fe1.722O4 b) Rhodonite, MnSiO3 c) Cristobalite,
SiO2.
The EDS map of this residue material was considered and compared to the XRD. The main
phase identified was a TTM phase. The colour map of Mn (Figure 3.6.b, green), as well as EDS points
1, 4 and 5, indicate that the Mn was correlated with the TTM phase, confirming the XRD results. Of
particular interest are EDS points 4 and 5, where a large amount of V was found in the spinel phase,
indicating V-rich areas of TTM. EDS point 4 indicated the presence of TiO2 particles in the residue. The
colour map of Si indicated the presence of SiO2 particles, as well as a particular area of interest on the
righthand side of the colour map, where a network of SiO2 appeared to be cementing particles together
(Figure 3.6.b, red). A closer analysis of a particle (Figure 3.6.c, green box) is shown in Figure 3.7.

32
EDS Point EDS Data for Element Mineral Phase
Fe Ti V O Mn Si Mg
1 68.34 17.93 5.27 2.74 4.77 0.81 0.01 Mn-containing TTM
2 22.75 13.08 3.77 54.74 2.15 2.96 0.43 TTM
3 0.72 43.40 0.71 45.75 0.73 1.07 7.46 TiO2
4 29.22 9.72 24.69 27.68 5.47 2.64 0.47 V-rich Mn-containing TTM
5 27.48 10.79 35.92 13.77 10.37 1.17 0.35 V-rich Mn-containing TTM
Figure 3.6. SEM maps of VRC residue after leaching with 2M HCl. a) elemental colour map (red: Fe,
green: Ti, blue: V) b) elemental colour map (red: Si, green: Mn, blue: V) c) corresponding SEM
image at x300 with EDS points labelled. Table shows the mineral phases assigned to each EDS point,
and the raw EDS data for each of the major elements in atomic% (rescaled to 100 %).
This particle shows mainly the spinel phase, with Mn-rich, V-rich, and Ti-rich areas. At the
top-left section of the particle, a Ti-rich region was present, which appeared to be nested in an SiO2
network (EDS point 2). At the top-right section of the particle, the SiO2 network was most prominent,
and EDS point 3 indicated only the presence of Si, Fe, and O. This is likely due to a small region of
Ilmenite which remained after the leaching, surrounded by SiO2. The most interesting section of this map
is at the top-left, where a highly V-rich spinel phase was found (EDS point 1). All phases of spinel with
different amounts of Mn or V were assumed to have overlapping diffraction lines in the XRD pattern.

33
EDS Point EDS Data for Element Mineral Phase
Fe Ti V O Mn Si Mg
1 21.85 7.43 27.36 31.98 8.59 1.85 0.91 V-rich TTM
2 18.17 22.52 10.14 28.20 6.98 13.22 0.33 SiO2 and TTM
3 78.20 0.76 0.59 12.56 0.62 7.21 0.00 SiO2 and Iron
Figure 3.7. SEM maps of VRC residue after leaching with 2M HCl. a) elemental colour map (red: Fe,
green: Ti, blue: V) b) elemental colour map (red: Si, green: Mn, blue: V) c) corresponding SEM
image at x1900 with EDS points labelled. Table shows the mineral phases assigned to each EDS
point, and the raw EDS data for each of the major elements in atomic% (rescaled to 100 %).
4M Leaching Residue
The major reflections in the XRD pattern of the 4M leaching residue were still assigned to the
spinel phase pattern, but now the Rhodonite reflections were becoming much more prominent. This
indicated that the spinel phase was being dissolved in the leaching process. Still visible were the
Cristobalite reflections, and many other signals which could not be identified. It became more apparent
that amorphous material was present in the residue, due to the increasing size of the background hump.

34
Figure 3.8. XRD Pattern of VRC residue after leaching with 4M HCl, major reflections
labelled a) Titanomagnetite, Mn0.336Ti0.942Fe1.722O4 b) Rhodonite, MnSiO3 c) Cristobalite, SiO2.
The EDS maps of the 4M residue were similar to that of the 2M residue. EDS points 2-3
indicated the presence of the TTM spinel phase, including the V-rich TTM. EDS points 1-3 indicated the
presence of TiO2, Rhodonite, and SiO2. Qualitatively, it appeared that TiO2 and SiO2 phases were more
prominent in these maps compared to the 2M maps, based on the presence of Ti-rich regions (Figure
3.9.a, green) and Si-rich regions (Figure 3.9.b, red). This was expected, as the spinel phase dissolved in
the leaching process. A closer analysis of a particle (Figure 3.9.c, green box) is shown in Figure 3.10.

35
EDS Point EDS Data for Element Mineral Phase
Fe Ti V O Mn Si Mg
1 3.96 33.78 1.06 42.08 4.13 8.31 6.08 TiO2
2 16.19 32.49 3.42 20.50 10.87 15.60 0.13 TTM and Rhodonite
3 46.07 21.28 6.72 15.12 2.58 7.23 0.22 TTM and SiO2
4 24.48 10.82 25.48 30.52 6.31 2.04 0.21 V-rich TTM
Figure 3.9. SEM maps of VRC residue after leaching with 4M HCl. A) elemental colour map (red: Fe,
green: Ti, blue: V) b) elemental colour map (red: Si, green: Mn, blue: V) c) corresponding SEM
image at x250 with EDS points labelled. Table shows the mineral phases assigned to each EDS point,
and the raw EDS data for each of the major elements in atomic% (rescaled to 100 %).
This particle contained multiple mineral phases of interest. EDS point 1 contained a large
amount of V, Fe, and Ti, and was assigned as a V-rich TTM phase. These are the purple regions in the
colour map (Figure 3.10.a). EDS point 2 corresponded to the TiO2 phase, of which many particles are
visible in the colour map. EDS point 3 contained mostly Si and Mn and has been assigned as a Rhodonite
phase. EDS point 4 contains Si, Mn, Mg, Fe and Ca, and thus has been assigned as Augite. This phase
was not found in the XRD map of this residue but was a phase which appeared in later residues from
stronger acid leaching, thus was expected to be present in this residue as well. Finally, regions of SiO2
were identified in the colour map (Figure 3.10.b, red), and found to be present in EDS point 5.

36
EDS Point EDS Data for Element Mineral Phase
Fe Ti V O Mn Si Mg
1 14.77 12.53 40.73 17.25 10.55 3.94 0.23 V-rich TTM
2 2.91 31.89 2.53 52.62 1.08 8.95 0.03 TiO2
3 6.28 2.57 0.54 47.15 10.29 26.23 6.94 Rhodonite
4 16.22 6.13 1.51 25.53 24.30 24.49 1.82 Augite
5 5.45 12.47 1.30 59.77 5.79 14.74 0.47 TiO2 and SiO2
Figure 3.10. SEM maps of VRC residue after leaching with 4M HCl. a) elemental colour map (red:
Fe, green: Ti, blue: V) b) elemental colour map (red: Si, green: Mn, blue: V) c) corresponding SEM
image at x800 with EDS points labelled. Table shows the mineral phases assigned to each EDS point,
and the raw EDS data for each of the major elements in atomic% (rescaled to 100 %).
8M Leaching Residue
The next solid residue analysed was the 8M leaching residue. From this point, the XRD patterns
became more complex and harder to assign, as much of the spinel phase was dissolved. The TTM
diffraction lines in the XRD pattern are now minor reflections, indicating that much of the TTM had
been dissolved (Figure 3.11). In its place, the major phases identified in the XRD pattern were
Rhodonite and Cristobalite. This corroborated the XRF data for this residue (Table 3.3), as the Si
composition was much more dominant than in the initial VRC material. A new phase, Augite, became
visible in the XRD, owing to its higher composition in the residue as the spinel phase was leached. Finally,
the background hump of the XRD was much more pronounced, indicating a larger amount of amorphous
material compared to the previous residues.

37
Figure 3.11. XRD Pattern of VRC residue after leaching with 8M HCl, major reflections labelled a)
Rhodonite, MnSiO₃ b) Pseudobrookite, FeTi2O5 c) Titanomagnetite, Fe2TiO4 d) Augite,
(Ca,Na)(Mg,Fe,Al,Ti)(Si,Al)2O6 e) Cristobalite, SiO2.
In the EDS analysis of the residue, domains of the V-rich spinel phase were still visible (EDS
point 1), although its prevalence in the residue was much lower. Regions of TiO2 were much more
common (EDS point 2). EDS point 3 contained a considerable amount of Mn and Si, as well as the
expected amounts of Fe and Ti to identify this as the TTM phase. Thus, this point has been assigned to
both the Rhodonite phase and the TTM phase. EDS point 4 indicated the presence of SiO2, and this phase
was also more prevalent in the residue.

38
EDS
Point
EDS Data for Element
Mineral Phase
Fe Ti V O Mn Si Mg
1 21.75 12.69 27.80 26.34 9.39 1.63 0.41 V-rich TTM
2 5.87 52.27 10.28 29.05 0.72 1.74 0.05 TiO2
3 15.11 29.12 8.01 28.48 11.48 7.76 0.04 TTM/Pseudobrookite and Rhodonite
4 1.39 7.02 1.22 44.09 1.48 44.69 0.11 SiO2
Figure 3.12. SEM maps of VRC residue after leaching with 8M HCl. a) elemental colour map (red:
Fe, green: Ti, blue: V) b) elemental colour map (red: Si, green: Mn, blue: V) c) corresponding SEM
image at x1100 with EDS points labelled. Table shows the mineral phases assigned to each EDS
point, and the raw EDS data for each of the major elements in atomic% (rescaled to 100 %).
Conc. Leaching Residue
Again, it was much more difficult to assign phases to the XRD pattern, as many minor phases
resistant to HCl attack were left after dissolution of the majority of the titaniferous minerals.
Furthermore, the background hump of the pattern was much larger, owing to the higher composition of
amorphous material compared to the previous residues. The main phases were Cristobalite and TTM,
with Rhodonite and Augite also present. Additionally, a Pseudobrookite phase was identified in the
pattern. It may be the case that EDS points in previous residues labelled TTM were in fact
Pseudobrookite.

39
Figure 3.13. XRD Pattern of VRC residue after leaching with conc. HCl, major reflections labelled
a) Rhodonite, MnSiO₃ b) Pseudobrookite, FeTi2O5 c) Titanomagnetite, Fe2TiO4 d) Augite,
(Ca,Na)(Mg,Fe,Al,Ti)(Si,Al)2O6 e) Cristobalite, SiO2.
The EDS map of the residue still displayed V-rich spinel phases (EDS point 1). However, Si-
containing phases were much more dominant (Figure 3.14.b, red), as exemplified in EDS points 3 and 4.
EDS point 3 also indicated the presence of TiO2 in the large agglomeration of SiO2. The only other
phase identified in the EDS map was Rhodonite (EDS points 1 and 5). The results of the EDS mapping
agreed well with the XRF data for this sample, as the main component in the XRF data for this residue
was Si, followed by Fe, Ti, and Mn.

40
EDS Point EDS Data for Element Mineral Phase
Fe Ti V O Mn Si Ca Mg
1 22.82 5.77 0.66 20.71 15.37 29.43 4.86 0.37 Rhodonite
2 22.93 18.35 20.92 29.88 6.54 1.10 0.09 0.19 V-rich TTM
3 4.36 20.17 3.25 47.55 1.43 22.85 0.30 0.08 TiO2 and SiO2
4 1.97 5.27 1.43 47.56 0.93 42.59 0.19 0.06 SiO2
5 17.56 0.76 0.26 25.04 14.23 28.23 13.42 0.49 Rhodonite
Figure 3.14. SEM maps of VRC residue after leaching with conc. HCl. a) elemental colour map (red:
Fe, green: Ti, blue: V) b) elemental colour map (red: Si, green: Mn, blue: V) c) corresponding SEM
image at x300 with EDS points labelled. Table shows the mineral phases assigned to each EDS point,
and the raw EDS data for each of the major elements in atomic% (rescaled to 100 %).
Summary
Analysis of the leaching data revealed no major differences in leaching rates for the major metals
of concern in this thesis: Fe, Ti, and V. As the concentration of HCl was increased, a higher maximum %
amount extracted was observed, with the highest values being ~50 % in the conc. HCl experiments.
Analysis of the residues with EDS and XRF enabled determination of which phases were undergoing
dissolution, and which were resistive. The spinel phases (Jacobsite, TTM) were selectively leached over
the other phases, including TiO2, SiO2, Augite, and Rhodonite. Finally, the mol of any particular element
in the leachate (from ICP-MS) and the mol of the element in the residue (XRF) were comparable, but
consistently lower, than the mol in the initial VRC material. This was taken to be evidence that some
residue material was lost in the experimental procedure, most likely in the filtration step. These results
indicated no reliable way to separate Fe, Ti, and V using direct HCl leaching.

41
3.2.1 Titanium and Iron Precipitation from Leachate
Briefly, results from the Ti and Fe precipitation attempts are considered. The attempts were made
using the leachate from the 8M HCl leaching experiment above. TiO2 seeding yielded a white product,
which was analysed using XRD (Figure 3.15). Two phases were identified in the XRD pattern, with the
major phase being Rutile, and the minor phase Anatase. This demonstrated the successful precipitation
of Ti from the leachate.
Figure 3.15. XRD pattern of the first precipitated material, with major reflections labelled a) Rutile, TiO2
b) Anatase, TiO2.
The filtrate from the TiO2 seeding experiment was kept, and the pH of the filtrate was raised
with NaOH in order to precipitate Fe. This resulted in a black/green precipitate, which was flocculated.
Upon centrifugation and drying the precipitate transformed into an orange solid. This was then analysed
with XRD. As only a very small amount of this material could be recovered, this was analysed on an
amorphous silica stage, resulting in the large background hump seen in the XRD pattern (Figure 3.16).
The only phase identified from the XRD pattern was iron oxide-hydroxide. This proved that Fe was
successfully precipitated from the filtrate. The orange material, when desiccated, reverted to a black
solid. This was taken to be a transition between the polymorphs of iron oxide-hydroxide. The β-
polymorph (Akaganéite) was initially formed, and took on an orange colour. When this was dried in a
desiccator, it reverted to the black α-polymorph (Goethite).

42
Figure 3.16. XRD pattern of the second precipitated material, with major reflections labelled a)
iron oxide-hydroxide, FeO(OH).
As explained in the introduction of this thesis (see section 1.5.2), the prospect of precipitating
Fe to separate it from V, according to Sedneva et. al., faces the challenge of avoiding adsorption of the
positive V ions to the surface of the forming FeO(OH) particles. To see if this was the case in the above
attempts, the ICP-MS elemental results are compared before and after the precipitation (Table 3.4). The
Fe and Ti values were a fraction of what they were in the 8M HCl leachate, indicating good extraction of
these metals. However, the value for V in the final filtrate was miniscule, indicating that the V has been
coextracted with the Fe. This showed that Ti and Fe precipitation, as a method of isolating the V, was
not adequate.
Table 3.4. ICP-MS elemental results for Fe, Ti, and V before and after precipitation experiments.
Values are reported in mmol.
Sample 56Fe 47Ti 51V
VRC 8M Leachate 41.75 10.72 15.32
Filtrate after Ti and Fe
precipitation 0.73 2.45 x 10⁻⁵ 1.77 x 10⁻⁶
3.2.2 Roasting of Samples
For the VRC roasting experiments, two roasting conditions were investigated. The first one
covered in this section produced roasts by heating samples for 3 hr at 900 °C, and the other sample was
roasted overnight at 1200 °C.

43
Before investigating the XRD and EDS data for these roasts, the XRF is considered (Table 3.5).
There were minor differences present in the elemental compositions of both roasts, and it was not known
why this should be the case. It was assumed that these differences were due to compositional variation
in the VRC material. The LOI value for the roasts was positive, indicating loss of mass during the XRF
experiment, while the LOI value for the VRC was negative, indicating mass gained. This was because
elements in the VRC were oxidised, leading to mass gain, while the elements in the roasted materials were
already saturated, leading to no further gain by addition of oxygen.
Table 3.5. XRF major oxide analysis results for VRC and both VRC roasts. Values are expressed as
weight % on oven dried (110°C) basis. LOI = loss on ignition at 1000°C. Values for SO3, Na2O, P2O5,
and K2O have been omitted due to low value (<0.05).
Sample Fe2O3 MnO TiO2 CaO SiO2 Al2O3 MgO V2O5 LOI SUM
VRC 37.72 14.17 14.66 2.81 16.88 1.63 1.1 14.1 -6.7 96.56
VRC Roast
(3 hr, 900 °C) 40.74 12.06 12.91 2.4 13.99 1.74 1.25 11.95 0.21 97.39
VRC Roast
(overnight, 1200 °C) 35.55 13.22 13.79 2.53 15.68 1.71 1.07 13.01 0.22 96.91
3-hr Roast at 900 °C
The XRD and EDS for the 3-hr roast was first considered. The main phases present in the XRD
pattern are Hematite and Pseudobrookite (Figure 3.17). Phases in lower quantities that are present in
the pattern are Cristobalite, Rutile, manganese(III) oxide and Rutile. A set of reflections present at 27-
28° (Figure 3.17, right inset) mirrored reflections present in the Wen et. al. study (see section 1.5.1).
These reflections were due to a manganese vanadate phase Mn2V2O7, thus the reflections herein have
been identified as such. There was no indication of a spinel phase present in the material. This indicated
that the Fe and Ti content of the VRC, present as Jacobsite, Ilmenite, and TTM, were converted to
Hematite, Pseudobrookite, and Rutile. The Mn content of the VRC, present in the VRC as Jacobsite,
formed the manganese vanadate under roasting, and the rest partitioned as an Mn2O3 phase.

44
Figure 3.17. XRD Pattern of VRC after roasting at 900 ℃ for 3 hr, with major reflections labelled a)
Hematite, Fe2O3 b) Pseudobrookite, Ti1.10Fe1.90O5 c) Cristobalite, SiO2 d) Manganese Oxide, Mn2O3 e)
Rutile, TiO2 f) Manganese Vanadate, Mn2V2O7.
The EDS data was now consulted to corroborate the XRD results. The material appeared rife
with a phase which contained only V and Mn, in a 2:3 ratio (Mn:V) (EDS point 1). The vanadium present
in the colour map (Figure 3.18.a and b, blue) no longer appeared to be associated with the Fe and Ti, and
only seemed to be associated with the Mn. This was taken to be an indication that, during the roasting
process, the V and Mn partitioned from the Fe and Ti spinel phase and formed their own phase. This
phase was assigned as the manganese vanadate phase identified in the XRD pattern. From the XRD
pattern, the Fe and Ti which remained was in the formed Pseudobrookite.
An Fe- and Ti-containing phase was identified and assigned as Pseudobrookite (EDS point 2).
A phase containing only Fe was also identified (EDS point 3), which corresponded to the Hematite
phase present in the XRD pattern. Particles containing only Si were present in the colour map (Figure
3.18.b, red). EDS points were assigned to a predominantly manganese vanadate phase, with some SiO2
phase present. The final EDS point contained Fe and Ti, and thus was another Pseudobrookite particle.

45
EDS
Point
EDS Data for Element
Mineral Phase
Fe Ti V O Mn Si Ca Mg
1 4.30 1.93 42.17 13.88 30.16 1.40 6.04 0.13 Manganese vanadate
2 33.29 22.63 5.02 29.73 6.73 0.57 0.71 1.33 Pseudobrookite
3 47.87 4.06 0.72 43.09 0.69 0.38 0.04 3.16 Hematite
4 2.33 0.57 25.66 37.83 19.44 7.53 5.25 1.39 Manganese vanadate with SiO2
5 27.28 15.92 3.23 43.06 4.41 4.57 0.49 1.03 Pseudobrookite
Figure 3.18. SEM maps of VRC roast (3 hr, 900 ℃). a) elemental colour map (red: Fe, green: Ti,
blue: V) b) elemental colour map (red: Si, green: Mn, blue: V) c) corresponding SEM image at x2500
with EDS points labelled. Table shows the mineral phases assigned to each EDS point, and the raw
EDS data for each of the major elements in atomic% (rescaled to 100 %).
To further investigate the correlation of Mn with V in the 3-hr roasted sample, a range of EDS
points were taken, and their Mn and V values were plotted against each other (Figure 3.19, left). This
resulted in a high degree of correlation, with a ratio to 2:3 (slope = 0.71). This indicated that the V was
found almost entirely in the same phase as the Mn in the roasted sample. Furthermore, two distinct
groups can be identified in the chart, one with a high amount of both Mn and V, and one with low
amounts. This indicated that the Mn and V were found in distinct regions, separate from the other main
elements: Fe and Ti. Another point to note is that there was a larger amount of Mn than V in the areas
which contained little of each, indicated by the bump in Mn atomic % values near the bottom left of the
chart. This indicated that a small amount of Mn remained in the Fe and Ti phase, Pseudobrookite.
The same correlative analysis was performed for Fe and V and the opposite result was found.
An inverse correlation was found, indicating that the V and the Fe existed in separate phases. Again,
two distinct groupings were found in the data, representative of the Fe-rich/V-poor phase and the Fe-

46
poor/V-rich phase. These correlation plots, together with the EDS colour maps, showed a clear and
distinct redistribution of the Mn and V during the roasting process, separating them from the Fe and Ti
into their own phase.
Figure 3.19. Correlation data for EDS points showing Mn-V correlation (left) with a linear
regression (R2 = 0.99), and the Fe-V inverse correlation (right) with a polynomial fit (R2 = 0.83).
Overnight Roast at 1200 °C
Having analysed the 3-hr roast at 900 ℃, it was decided that the roast should be taken as far to
completion as possible in order to fully convert all V to the new Mn-V phase. To this end, a sample of
VRC was roasted overnight at 1200 ℃. The XRD pattern of this new roast material was taken and
compared to the 3-hr roast (Figure 3.20). All the major phases that were previously identified in the 3-
hr roast were also identified in the overnight roast. Importantly, the manganese vanadate phase was still
present, with reflections in the 25-29° range (Figure 3.20, labelled f).

47
Figure 3.20. XRD Pattern of VRC after roasting at 1200 ℃ overnight, with major reflections labelled
a) Hematite, Fe2O3 b) Pseudobrookite, Ti1.10Fe1.90O5 c) Cristobalite, SiO2 d) Manganese Oxide, Mn2O3
e) Rutile, TiO2 f) Manganese Vanadate, Mn2V2O7.
The EDS of the overnight roast is now considered. All the same phases appeared to be present
in the overnight roast as compared to the 3-hr roast. The Mn and V partitioned into their own phase,
leaving the Fe and Ti as Pseudobrookite and Hematite. The presence of manganese(III) oxide was also
found, and this was a phase identified in the XRD. This was identified based on the presence of Mn and
Fe in EDS point 6, with very little Ti and V to accompany it.

48
EDS Point EDS Data for Element Mineral Phase
Fe Ti V O Mn Si Mg
1 49.78 4.46 0.95 34.37 9.06 0.28 1.10 Hematite
2 5.26 2.52 46.00 10.50 33.72 1.78 0.21 Manganese vanadate
3 51.11 4.80 2.14 30.85 8.89 0.87 1.33 Hematite
4 48.95 27.07 4.54 11.07 7.15 0.63 0.58 Pseudobrookite
5 0.69 0.53 1.83 44.26 1.21 51.40 0.07 SiO2
6 63.63 5.91 2.44 14.51 12.53 0.40 0.58 Hematite and Mn2O3
Figure 3.21. SEM maps of VRC roast (overnight, 1200 ℃). a) elemental colour map (red: Fe, green:
Ti, blue: V) b) elemental colour map (red: Si, green: Mn, blue: V) c) corresponding SEM image at
x1500 with EDS points labelled. Table shows the mineral phases assigned to each EDS point, and the
raw EDS data for each of the major elements in atomic% (rescaled to 100 %).
Summary
Two sets of roasts were conducted, one at 900 ℃ for 3-hr, and the other at 1200 ℃ overnight.
No noticeable difference could be found in their XRD pattern, XRF data, or EDS maps. Comparison of
the XRF results with the initial unroasted material showed that the elements in the roasted material were
in a higher oxidation state. The main phases of the initial unroasted VRC, namely Jacobsite and Ilmenite,
were converted into Hematite, Pseudobrookite, Rutile and Mn2O3. The Cristobalite phase remained
unchanged in the roast, and no spinel phase was identified. Importantly, the existence of a manganese
vanadate was demonstrated, due to XRD reflections which conferred with Mn2V2O7 XRD reflections in
the literature. During the roasting process, V and Mn were partitioned from the Ti and Fe and formed
their own phase. This phase had a Mn:V ratio of approximately 2:3.

49
3.2.3 Leaching of Roasted Sample
Having roasted the VRC samples, HCl leaching studies were conducted. Initially, the 3-hr roast
was leached with just 4M HCl, in order to compare the leaching behaviour to the unroasted VRC.
Following this, the overnight roast was leached with a range of lower HCl concentrations, in order to
determine the effect of acid strength. This was considered appropriate as no significant difference
between the roasts was found in the previous chapter. In this section, the 3-hr roast is discussed first.
3-hr Roast Leaching at 4M HCl
The leaching results of the 3-hr VRC roast are shown below, with the unroasted results shown
as dashed lines for comparison (Figure 3.22). The obvious result was an increase in the % amount of V
leached over the course of the experiment. For the unroasted material, the % amount of V started at
approximately 7 %, and increased to ~30 % at the end of the experiment. In contrast, over 80 % of the V
in the roasted VRC material was leached in the first 2 min, and this peaked at close to 90 % after 6 min
of leaching time. This was due to the new manganese vanadate phase formed during roasting, which
appeared to be much less resistant to HCl attack compared to the spinel phase of the initial unroasted
material. This is the key finding of this thesis, as it provides a method of selectively extracting V from
the VRC material.
Furthermore, the leaching behaviour of Fe and Ti in the roasted VRC was remarkably different
to that in the unroasted VRC. The leaching behaviour of Fe and Ti in the unroasted VRC mimics the V
leaching, as all three were found in the same spinel phase. However, during the roasting, the Fe and Ti
from the Jacobsite and Ilmenite phases formed the new Pseudobrookite and Hematite phases, which
were more resistive to HCl leaching. This leads to the behaviour shown below, where less than 4 % of
the Fe and Ti was leached after roasting.

50
Figure 3.22. HCl Leaching of VRC over time, comparing the effect of roasting (3 hr, 900 °C) prior to
leaching. Unroasted comparison is 4M leaching of unroasted VRC. The % amount leached is the
moles of element leached compared to the moles of element in initial solid material.
The general result from the leaching experiment is exemplified below, where the leaching
efficiencies are compared (Table 3.6). The Fe and Ti leaching efficiencies drop from 39.46 % and 18.95
%, respectively, to below 4 %. The V leaching efficiency increases from 27.46 % for the unroasted
VRC, to 86.89 % after roasting. This result revealed a pathway for selective extraction of V from the Fe
and Ti. Yet, some Fe and Ti were leached along with the V, so some improvements are required. The
XRF results of the leaching residue were next considered, to determine which other elements were
leached in this process.
Table 3.6. Leaching efficiencies for Fe, Ti, and V in roasted VRC leaching experiment, compared to
unroasted. Values are the maximum percentage amount leached from solid material.
Sample Fe Leaching
Efficiency (%)
Ti Leaching
Efficiency (%)
V Leaching
Efficiency (%)
VRC 4M Leach 39.46 18.95 27.46
VRC Roast Leach
(3 hr, 900°C) 3.92 2.40 86.89

51
The XRF results for the roasted material and the leaching residue are shown below (Table 3.7).
The weight % of V2O5 in the analysis decreased from 11.95 to 2.07, indicating that almost all of the V
was leached from the roasted material. The other elements leached include Mn, Ca, and a small amount
of both Al and Mg. The leaching of Mn is expected in this experiment because the V, which is being
leached so successfully, is locked up with Mn in the manganese vanadate phase. The elements which
were not leached in the experiment were Fe, Ti, and Si.
Table 3.7. XRF major oxide analysis results for roasted VRC and its 4M HCl leaching residue. Values
are expressed as weight % on oven dried (110°C) basis. LOI = loss on ignition at 1000°C. Values for
SO3, Na2O, P2O5, and K2O have been omitted due to low value (<0.06).
Sample Fe2O3 MnO TiO2 CaO SiO2 Al2O3 MgO V2O5 LOI SUM
VRC Roast
(3 hr, 900 °C) 40.74 12.06 12.91 2.4 13.99 1.74 1.25 11.95 0.21 97.39
4M Leaching
residue 46.55 7.31 18.42 0.12 21.17 1.48 0.98 2.07 0.34 98.45
To corroborate the XRF analysis of the residue, the XRD and EDS results have been analysed.
The Pseudobrookite, Hematite, and SiO2 phases were still present in the XRD pattern of the leaching
residue (Figure 3.23). This was expected, from the lack of Fe and Ti in the leachate, as well as the presence
of Fe, Ti, and Si in the XRF results above. The only notable difference between this pattern and that of
the roasted starting material was the disappearance of the manganese vanadate reflections in the 25-29°
range. This not only demonstrated the dissolution of the Mn-V phase, but also supported the analysis of
these patterns in the roasted material.

52
Figure 3.23. XRD Pattern of residue after leaching roasted VRC (3 hr, 900 ℃) with 4M HCl, with
major reflections labelled a) Pseudobrookite, Ti1.10Fe1.90O5 b) Hematite, Fe2O3 c) Quartz, SiO2 d)
Cristobalite, SiO2.
The EDS maps of the leached residue indicated no regions of co-located V and Mn, and in fact
no regions of V were found separate from the Fe and Ti (Figure 3.24.a and b). The remaining V was
found only in the Pseudobrookite phase (EDS point 2), and the only other Fe-containing phase found
was Hematite (EDS point 3). The other phase of note was an SiO2 phase (EDS point 1). The colour
maps provided a key visual confirmation of the dissolution of the manganese vanadate phase. Whereas
in the roasted pre-leached material, where large regions of co-located V and Mn were found, no such
regions were visible in the leaching residue. This further confirmed the XRD reflections identified in
the 25- 29° range as a manganese vanadate and agreed perfectly with the ICP-MS results of the leachate.

53
EDS Point EDS Data for Element Mineral Phase
Fe Ti V O Mn Si
1 2.82 1.83 0.13 64.32 0.54 30.35 SiO2
2 36.87 23.41 3.87 27.93 5.40 2.53 Pseudobrookite
3 43.35 4.47 0.28 43.50 6.63 1.76 Hematite
Figure 3.24. SEM maps of residue after leaching VRC roast (3 hr, 900 ℃) with 4M HCl. a) elemental
colour map (red: Fe, green: Ti, blue: V) b) elemental colour map (red: Si, green: Mn, blue: V) c)
corresponding SEM image at x6000 with EDS points labelled. Table shows the mineral phases
assigned to each EDS point, and the raw EDS data for each of the major elements in atomic%
(rescaled to 100 %).
Overnight Roast at 1200 °C Leaching
To determine the effects of acid strength on the leaching behaviour of the roasted VRC, the
experiment was repeated with a range of HCl concentrations between 1M -3M. The material used for
these experiments was roasted overnight at 1200 °C. This was done under the expectation that a more
complete roast would enable all of the Mn and V to partition and form the manganese vanadate phase. The
results from the ICP-MS analysis of the leachates for each experiment are shown below (Figure 3.25).
The leaching results of the overnight roast mirrored the results of the 3-hr roast. The % amount
leached for V was much higher in all experiments, while the Fe and Ti leaching amounts were
considerably lower, as compared to the unroasted VRC. The 1M experiment leached a lower amount of
V (~ 50 %), as expected for a less concentrated acid leaching. After the leaching of V had stopped, the
amount in the leachate appeared to steadily drop, indicating precipitation may have been taking place.
The V % amount values for the 2M and 3M experiments were higher than that of the 1M experiment,
but confusingly the order was not what is expected. The 2M experiment appeared to have leached a
higher amount of V from the roasted sample, but it was not clear if this was a reliable result or due to

54
experimental error.
Figure 3.25. HCl Leaching of roasted VRC (overnight, 1200 °C) over time, comparing the effect of
HCl concentration. The % amount leached is the moles of element leached compared to the moles of
element in initial solid material.
The leaching efficiencies are shown below (Table 3.8) and these also reflect the results obtained
from the 3-hr roast experiment. Across the range of HCl concentrations, only a very minimal change
was observed in the total leaching amounts of Fe and Ti. The leaching efficiency for V jumped from
49.45 % in the 1M leachate, to values in the 70’s for 2M and 3M.

55
Table 3.8. Leaching efficiencies for Fe, Ti, and V in roasted VRC (overnight, 1200 °C) leaching
experiments, compared to unroasted. Values are the maximum percentage amount leached from solid
material.
Sample Fe Leaching
Efficiency (%)
Ti Leaching
Efficiency (%)
V Leaching
Efficiency (%)
VRC 4M Leach 39.46 18.95 27.46
VRC Roast 1M Leach 0.81 0.19 49.45
VRC Roast 2M Leach 1.64 0.45 77.76
VRC Roast 3M Leach 1.80 0.60 71.36
The analysis of the leaching residues follows, beginning with the XRF analysis. The elements
leached were Mn, Ca, V, and a small amount of Al and Mg. A small amount of the V component
remained in the VRC material after each of these leaching experiments. Leaching of the Mn was
expected, as the V was co-located with the Mn in the vanadate phase. Interestingly, the Mn weight %
values remained constant throughout the range of experiments and matched the value for the 4M
leaching experiment reported above (Table 3.9.). This due to the Mn found in the manganese(III) oxide
and titaniferous mineral phases. Once the amount in these was comparable to that remaining in the
vanadate phase, no large change in weight % was expected. The elements resistant to leaching were Fe,
Ti, and Si, which conferred well with the above results.
Table 3.9. XRF major oxide analysis results for roasted VRC (overnight, 1200 °C) and its 4M HCl
leaching residue. Values are expressed as weight % on oven dried (110°C) basis. LOI = loss on
ignition at 1000°C. Values for SO3, Na2O, P2O5, and K2O have been omitted due to low value (<0.06).
Sample Fe2O3 MnO TiO2 CaO SiO2 Al2O3 MgO V2O5 LOI SUM
VRC Roast
(overnight, 1200 °C) 35.55 13.22 13.79 2.53 15.68 1.71 1.07 13.01 0.22 96.91
1M Leaching residue 42.32 7.21 16.44 0.26 17.87 1.45 0.88 9.23 1.65 97.31
2M Leaching residue 45.69 7.52 17.77 0.14 18.99 1.54 0.92 4.54 0.97 98.08
3M Leaching residue 46.11 7.52 17.92 0.13 19.5 1.52 0.94 3.65 0.83 98.12

56
Overnight Roast at 1200 °C 1M Leaching Residue
To continue the analysis of the residues, the XRD pattern and EDS maps were compared for
each leaching experiment, beginning with the 1M experiment. The XRD pattern displayed the main
phases of the residue, including Hematite, Cristobalite, and Pseudobrookite, which matched
expectations given the XRF results above (Figure 3.26). Minor reflections for manganese(III) oxide
were also identified. Importantly, the pattern displayed none of the reflections in the 25-29° range,
mirroring the result found in the 4M experiment.
Figure 3.26. XRD Pattern of residue after leaching roasted VRC (overnight, 1200 ℃) with 1M HCl,
with major reflections labelled a) Hematite, Fe2O3 b) Cristobalite, SiO2 c) Pseudobrookite,
Ti1.10Fe1.90O5 d) Manganese Oxide, Mn2O3.
The EDS results for the 1M residue are considered. The three main phases identified in the XRD
pattern (Pseudobrookite, Hematite, and Cristobalite) were identified in the EDS map (Figure 3.27. EDS
points 1-3). By observing the EDS colour map, a network of a V-rich, Mn-containing phase was
identified, which appeared to cement several other particles together. This might be a vanadate phase,
but it should be noted that this phase was not identified in the XRD pattern for this residue. Furthermore,
no sign of this phase was present in the EDS analysis of the starting material. This might be due to
precipitation of the V during the leaching experiment; V5+ can precipitate as V2O5, and this might be the
material present in the EDS map.79 In order to confirm the nature of this phase, a higher magnification
image of the region in the green box (Figure 3.27.c) is presented below.

57
EDS Point EDS Data for Element Mineral Phase
Fe Ti V O Mn Si Mg
1 24.09 16.13 2.77 50.80 3.60 1.33 1.27 Pseudobrookite
2 47.66 4.99 1.69 36.10 7.13 1.44 0.99 Hematite
3 1.61 1.18 0.65 62.34 0.29 33.89 0.03 SiO2
Figure 3.27. SEM maps of residue after leaching VRC roast (overnight, 1200 ℃) with 1M HCl. a)
elemental colour map (red: Fe, green: Ti, blue: V) b) elemental colour map (red: Si, green: Mn, blue:
V) c) corresponding SEM image at x1700 with EDS points labelled. Table shows the mineral phases
assigned to each EDS point, and the raw EDS data for each of the major elements in atomic%
(rescaled to 100%).
From the colour maps below (Figure 3.28.a and b), it appeared that the vanadium was acting as
a cement to hold together multiple particles of Fe-, Ti-, Si-, and Mn-containing particles. None of the V
was co-located with the Mn in any meaningful way, thus the manganese vanadate phase appeared to
have been fully leached. It is unknown what this V-only phase is, but the best guess was a V2O5 phase,
due to the expected high oxidation state of V after roasting. For the sake of the EDS analysis, this is
assumed to be the present phase.
A collection of EDS points was taken across the collection of particles in the SEM image below
(Figure 3.28.c). EDS point 1 contained a predominant amount of Fe, with amounts of Mn and V. This
region was assigned as a Mn-rich Hematite within the V cementing phase. EDS point 2 contained
predominately Fe, with an amount of Mn present, so this was assigned as a Mn-rich Hematite. EDS point
3 contained Fe and Ti, and so deemed to be Pseudobrookite. Two regions were identified which
contained only Si and V (EDS points 4 and 6). This was assigned as SiO2 particles within the V
cementing phase. EDS point 5 contained Fe, V, Mn, and Si, and was identified as SiO2, with an
amount of Mn-rich Hematite, both stuck in the V cementing phase. EDS point 7 contained mostly Fe, Ti,

58
and V, and so was assigned as Pseudobrookite within the V phase. EDS point 8 contained only Si, and
so was assigned as an SiO2 particle. EDS point 9 contained a predominance of Fe, with an amount of
Mn, and so was identified as a Mn-rich hematite phase. The analysis of these points confirmed that the
Hematite contained an amount of the Mn content, agreeing with the earlier analysis of the XRF results
for the roasted leaching residues (i.e. why the weight % results for Mn stabilise).
EDS
Point
EDS Data for Element
Mineral Phase
Fe Ti V O Mn Si Mg
1 54.89 5.54 10.42 14.61 11.25 2.26 1.02 Mn-rich Hematite and vanadium
2 59.35 6.16 2.38 18.86 10.17 2.55 0.53 Mn-rich Hematite
3 34.69 22.59 4.45 28.25 5.73 3.65 0.64 Pseudobrookite
4 3.07 1.16 10.88 30.27 0.90 53.66 0.07 V2O5 and SiO2
5 15.38 3.89 16.44 13.89 7.88 42.35 0.16 Manganese vanadate and Hematite/SiO2
6 4.32 2.14 30.15 40.34 1.71 21.18 0.15 V2O5 and SiO2
7 17.10 11.55 26.78 30.30 3.78 10.04 0.45 Vanadium-rich Pseudobrookite
8 2.09 1.27 4.56 52.68 0.57 38.74 0.09 SiO2
9 55.28 5.51 9.00 17.37 9.06 2.71 1.07 Hematite and Manganese vanadate
Figure 3.28. SEM maps of residue after leaching VRC roast (overnight, 1200 ℃) with 1M HCl. a)
elemental colour map (red: Fe, green: Ti, blue: V) b) elemental colour map (red: Si, green: Mn, blue:
V) c) corresponding SEM image at x3300 with EDS points labelled. Table shows the mineral phases
assigned to each EDS point, and the raw EDS data for each of the major elements in atomic%
(rescaled to 100 %).

59
Overnight Roast at 1200 °C 2M Leaching Residue
Next considered was the 2M HCl leaching residue. The XRD pattern showed the 3 major phases
present in the 1M residue (Pseudobrookite, Hematite, and Cristobalite), with no indication of the
presence of manganese(III) oxide. Yet again, no reflections were found indicating the presence of any
manganese vanadate phase.
Figure 3.29. XRD Pattern of residue after leaching roasted VRC (overnight, 1200 ℃) with 2M HCl,
with major reflections labelled a) Cristobalite, SiO2 b) Hematite, Fe2O3 c) Pseudobrookite,
Ti1.10Fe1.90O5.
Analysis of the EDS results for the 2M leaching residue follows. From the colour map, it
appeared that a portion of the vanadium was present in the Pseudobrookite phase, and Mn was present in
the Hematite phase. EDS point 1 contained only V and O, and so likely was a particle of V2O5. EDS
point 2 contained mostly Fe, with amounts of Ti, V, and Mn. This point was assigned as both
Pseudobrookite and Hematite. EDS point 3 contained mainly Fe and Mn and was assigned to the Mn-
rich Hematite phase. EDS point 4 contained mainly Fe, Ti, and Si, and was assigned to the phases
Pseudobrookite and SiO2. Finally, EDS point 5 contained only Si, and was assigned to the SiO2 phase.

60
EDS Point EDS Data for Element Mineral Phase
Fe Ti V O Mn Si
1 5.77 4.15 32.06 48.35 1.93 7.74 Vanadium
2 56.54 17.47 6.46 6.09 9.72 3.73 V-containing
Pseudobrookite/Mn-rich Hematite
3 76.12 7.89 1.25 0.98 12.66 1.10 Mn-rich Hematite
4 21.77 8.78 1.01 29.68 3.48 35.27 Pseudobrookite and SiO2
5 1.11 0.68 0.30 43.38 0.23 54.31 SiO2
Figure 3.30. SEM maps of residue after leaching VRC roast (overnight, 1200 ℃) with 2M HCl. a)
elemental colour map (red: Fe, green: Ti, blue: V) b) elemental colour map (red: Si, green: Mn, blue:
V) c) corresponding SEM image at x2300 with EDS points labelled. Table shows the mineral phases
assigned to each EDS point, and the raw EDS data for each of the major elements in atomic%
(rescaled to 100%).
Overnight Roast at 1200 °C 3M Leaching Residue
Finally, the 3M leaching residue is analysed. The XRD pattern of the residue showed no
difference from the previous 2M residue, with the three main phases identified (Pseudobrookite,
Hematite, and Cristobalite)

61
Figure 3.31. XRD Pattern of residue after leaching roasted VRC (overnight, 1200 ℃) with 3M HCl,
with major peaks labelled a) Hematite, Fe2O3 b) Pseudobrookite, Ti1.10Fe1.90O5 c) Cristobalite, SiO2.
The EDS results for the 3M residue is considered next. Each of the three phases present in the
XRD could be identified. Two Hematite phases were identified, with one being particularly Mn-rich
(EDS points 1 and 3). A Pseudobrookite phase could be identified (EDS point 2), as well as a SiO2
phase (EDS point 4)

62
EDS Point EDS Data for Element Mineral Phase
Fe Ti V O Mn Si Mg
1 46.33 4.58 0.38 40.41 6.43 0.73 1.15 Hematite
2 28.38 22.67 1.03 39.30 5.80 1.51 1.29 Pseudobrookite
3 48.69 11.16 0.92 10.16 25.76 3.08 0.22 Mn-rich Hematite
4 1.59 0.63 0.07 61.93 0.28 35.47 0.03 SiO2
Figure 3.32. SEM maps of residue after leaching VRC roast (overnight, 1200 ℃) with 3M HCl. a)
elemental colour map (red: Fe, green: Ti, blue: V) b) elemental colour map (red: Si, green: Mn, blue:
V) c) corresponding SEM image at x2200 with EDS points labelled. Table shows the mineral phases
assigned to each EDS point, and the raw EDS data for each of the major elements in atomic%
(rescaled to 100%).
Summary
The main result, significant to the goal of this research, was the significant increase in the percentage
of extraction of V after roasting. Pre-roast, the 4M leaching efficiency for the extraction of V was 58.88
%, which increased to 86.89 % after the roasting step. Additionally, the leaching efficiencies of Fe and
Ti pre-roasting wass ~50 %, which decreased to less than 4 % after roasting. The cause for this was
identified to be new phases formed upon roasting, with V mostly partitioning to the HCl-susceptible
manganese vanadate phase, leaving Fe and Ti to form HCl-resistant Pseudobrookite and Hematite
phases. This was confirmed via analysis of the XRD and EDS of each of the leaching residues. After the
roast, the material was found to be rich in a Mn- and V- phase, which was not present in any of the
leaching residues. At 1M and 2M, small amounts of V-rich material was found to be located between
particles of the acid-resistant minerals, but as no Mn was co-located with this V, it was found to be a
different phase entirely, likely a vanadium oxide material. At all leaching concentrations, the predominant
phases

63
found concurred with the XRD, with only Hematite, Pseudobrookite, and Cristobalite present. Any
remaining V in the 3M and 4M experiments was found to be located in the Pseudobrookite phase.
Furthermore, effective and selective leaching occurred with 4M HCl at 80 °C, reducing the cost in
regards to acid consumed and equipment required compared to conc. HCl leaching. These results provide
a clear pathway for the selective extraction of V from the VRC material: roasting at ~1000 °C, followed
by leaching with HCl at a concentration around 4M. However, some amount of Ti and Fe was also
extracted, so further purification is required.
3.3 Ironsand (IS)
3.3.1 Analysis of Starting Material
The VRC was originally intended to be utilised as a sounding board for extraction procedures
that may be applied to the IS material, as the V content in the IS is much lower than that of the VRC.
To this end, the IS was leached under the same conditions as the VRC experiments above, followed by
a roasting procedure and leaching attempts of the roast. Before analysing these experiments, it is crucial
to have an in-depth understanding of the starting material. To achieve this, XRF, XRD, and EDS were
employed to determine the elemental composition of the material, as well as determine the mineral
phases these elements are found in. It is appropriate to re-state at the start of this section that, for the
sake of this research, IS refers to the fraction of natural ironsand which has had its Fe content amplified
using magnetic and gravity separation.
The XRF results of the IS material are first considered (Table 3.10). The major element present
is Fe, with Fe2O3 at 84.7 weight % in the analysis. The next largest components, in order of magnitude,
are Ti, Al, Mg, and Si. The element of interest to this research, V, was only present in a very small
quantity, with V2O5 at 0.58 weight % in the analysis. This poses a considerable challenge when trying
to apply the leaching methods attempted for the VRC. In order to determine which mineral phases these
elements exist in, the XRD and EDS results are next considered.
Table 3.10. XRF major oxide analysis results for IS. Values are expressed as weight % on oven dried
(110°C) basis. LOI = loss on ignition at 1000°C. Negative LOI indicates positive mass gain due to
oxidation. Values for SO3 and K2O have been omitted due to low value (<0.03).
Fe2O3 MnO TiO2 CaO P2O5 SiO2 Al2O3 MgO Na2O V2O5 LOI SUM
IS 84.7 0.73 7.8 0.4 0.1 1.61 3.89 2.68 0.1 0.58 -3.26 99.38
The XRD pattern displayed one major phase (Figure 3.33). This was identified as TTM, with the
formula Fe(Fe1.04Ti0.67)O4. From the literature presented in the introduction, this phase was expected to
contain the V (see section 1.1.2). The other phase present in the XRD was only detected in comparably

64
minor amounts, and this was identified as a titano-hematite with formula Ti0.14Fe1.86O3. Missing from
the XRD analysis are any phases containing the elements Si, Al, and Mg. The EDS was consulted, and
the XRD patterns of the HCl leaching residues are briefly invoked to reveal phases not yet present in the
current XRD.
Figure 3.33. XRD Pattern of IS with major peaks labelled a) Titanomagnetite, Fe(Fe1.04Ti0.67)O4 b)
Hematite, Ti0.14Fe1.86O3.
The EDS was next considered. Based on the colour maps, the overwhelmingly predominant
phase was the TTM phase, with varying amounts of Ti found within it (Figure 3.34.a) (EDS points 2
and 3). Regions appearing only in red in the top left colour map were Hematite, as these contained little
to no Ti (EDS point 4). No regions of V concentration were found in the colour maps either, but the V
that is present appeared to belong to the TTM phase (Figure 3.34.a). Some standout regions included
the region in the centre-top of the map (Figure 3.34.b, green), which appeared to contain only Si. This
was assigned to a SiO2 phase, supported by the revealing of SiO2 in the XRD patterns of the later IS
leaching residues from which TTM had been selectively leached. Another region of interest in the colour
map was the region at the top-left corresponding to a region of predominately Si and Ca (Figure 3.34.b,
cyan). This was assigned to an Augite phase, which appeared in the leaching residue XRD patterns. The
final region of interest was a Ca-rich phase at the bottom of the map (Figure 3.34.b, blue). This phase
could not be identified using the XRD patterns of the leaching residues, indicating that this phase is
leached. Thus, this remained an unidentified Ca-rich phase.

65
EDS Point EDS Data for Element Mineral Phase
Fe Ti V O Mn Si Ca
1 11.32 0.68 0.07 54.64 7.12 19.99 6.18 Augite
2 68.11 7.22 0.52 23.70 0.32 0.12 0.01 TTM
3 62.75 4.87 0.38 31.19 0.49 0.32 0.01 TTM
4 79.78 1.29 0.53 14.17 2.31 1.73 0.18 Hematite
Figure 3.34. SEM maps of IS. a) elemental colour map (red: Fe, green: Ti, blue: V) b) elemental
colour map (red: Fe, green: Si, blue: Ca) c) corresponding SEM image at x5000 with EDS points
labelled. Table shows the mineral phases assigned to each EDS point, and the raw EDS data for each
of the major elements (rescaled to 100 %).
Summary
The major component of the IS material was Fe. Minor components were Ti, Ca, Si, and Mg.
The V, of interest to this research, was present at a ~0.6 % weight percentage, which corroborated the
literature presented in the introduction to this thesis (see section 1.1.1). The predominant crystalline
phase in the material was TTM, with minor amounts of Hematite, SiO2, and Augite. A Ca-rich phase
could not be identified.
3.3.2 Leaching of Non-roasted Samples
Having analysed the starting material, one can consider the HCl leaching data. The procedure
for these leaches was the same as that for the VRC material above. After adding the solid to the 80 °C
HCl, aliquots of the leachate were taken at fixed intervals, and the ICP-MS results of these aliquots are
shown below (Figure 3.35.). The values reported in the ICP-MS results are given as concentrations, and
these have been modified to show the amount leached as a molar percentage of the element in the initial
VRC material.

66
No significant difference was found in the leaching rates for the three main elements of interest,
Fe, Ti, and V. As with the VRC leaching, Ti had a slower leaching rate than the other two, likely due
to the presence of TiO2 in the material, although this phase was not identified in the XRD. Another
result of interest to this research was the increased % amount leached for each element across the range
of HCl concentrations. As for the VRC leaching, this was expected, as a higher acid strength leached
more material across the timespan of the experiment. There were considerable differences in leaching
rates between the 2M, 4M, and 8M experiments, but little difference between the 8M and conc.
experiments. This indicated that at 8M, the maximum leaching amount appeared to have been reached
for HCl leaching at 80 °C.
Figure 3.35. HCl leaching of IS at 80 °C over the course of the experiment, comparing the effect of
HCl concentration. The % amount leached is the moles of element leached compared to the moles of
element in initial solid material.
The final standout result from the above leaching data was the anomalous Ti leaching amount
for the 4M experiment. The Ti amount in the leachate increased until 45 min, at which point it decreased.
The Ti likely existed in the leachate as TiOCl2, and this is known to hydrolyse and precipitate as TiO2.80
This resulted in the sudden reversal of the trend in the Ti % amount leached. This was further backed
up by the observation that a white precipitate was found in the leachate, as well as the presence of TiO2
in the EDS data for this leaching residue, which is soon considered in this section.
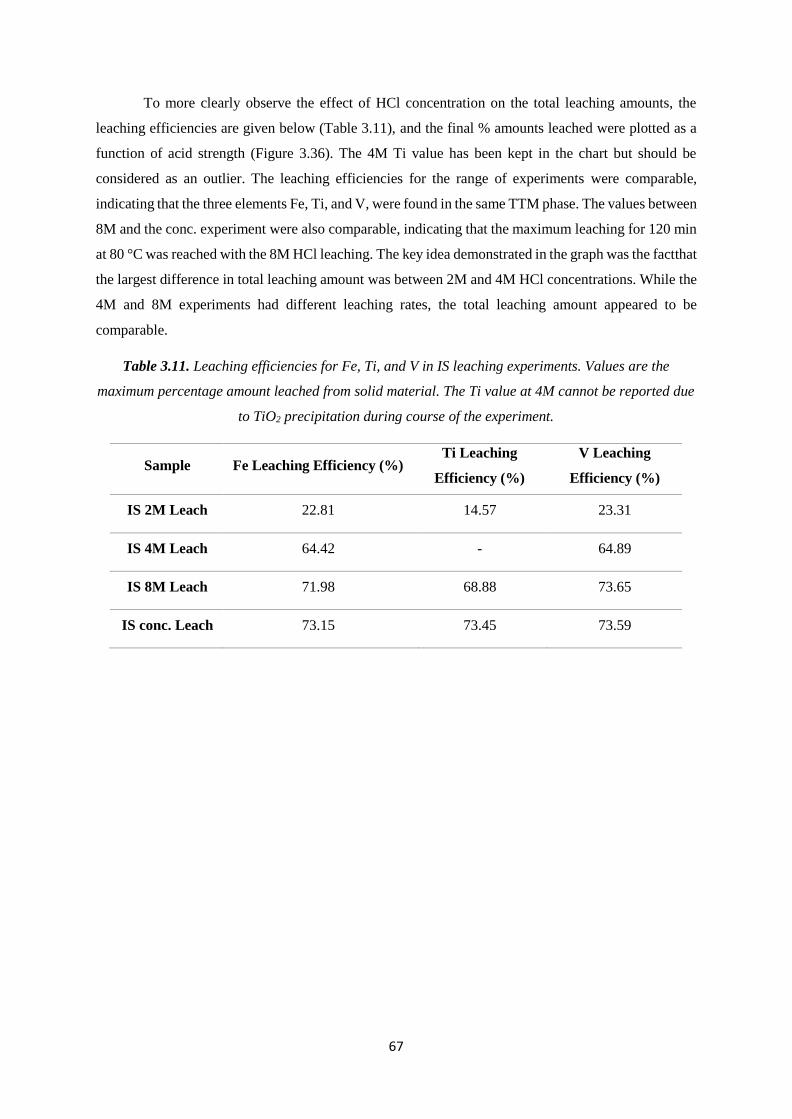
67
To more clearly observe the effect of HCl concentration on the total leaching amounts, the
leaching efficiencies are given below (Table 3.11), and the final % amounts leached were plotted as a
function of acid strength (Figure 3.36). The 4M Ti value has been kept in the chart but should be
considered as an outlier. The leaching efficiencies for the range of experiments were comparable,
indicating that the three elements Fe, Ti, and V, were found in the same TTM phase. The values between
8M and the conc. experiment were also comparable, indicating that the maximum leaching for 120 min
at 80 °C was reached with the 8M HCl leaching. The key idea demonstrated in the graph was the fact that
the largest difference in total leaching amount was between 2M and 4M HCl concentrations. While the
4M and 8M experiments had different leaching rates, the total leaching amount appeared to be
comparable.
Table 3.11. Leaching efficiencies for Fe, Ti, and V in IS leaching experiments. Values are the
maximum percentage amount leached from solid material. The Ti value at 4M cannot be reported due
to TiO2 precipitation during course of the experiment.
Sample Fe Leaching Efficiency (%) Ti Leaching
Efficiency (%)
V Leaching
Efficiency (%)
IS 2M Leach 22.81 14.57 23.31
IS 4M Leach 64.42 - 64.89
IS 8M Leach 71.98 68.88 73.65
IS conc. Leach 73.15 73.45 73.59

68
Figure 3.36. Final extraction values at 2 hr as a function of HCl concentration. Outlying Ti result at
4M was due to TiO2 precipitation during course of experiment.
To complete the analysis of the leaching experiments, the leaching residues were analysed. These
residues were first analysed by XRF to determine their elemental composition, and the results are shown
below (Table 3.12). The Fe component appeared to be almost entirely leached across the range of
experiments, with very little change observed in the 2M residue (84.7 to 83.80 weight %), and a
substantial change observed in the conc. residue (84.7 to 13.92 weight %). The other elements which
appeared to have been successfully leached across the range of experiments include Mn, Ti, and V. The
anomalous Ti result for the 4M leaching residue (22.87 weight %) is due to the aforementioned TiO2
precipitation. This also occurred in the 8M experiment, yet this is not evident in the ICP-MS analysis.
This was due to the TiO2 precipitation occurring after the final aliquot was taken from the leaching
experiment, and it appeared as a white precipitate in the 8M leachate.
The elements retained in the leaching residues included Ca, Si, Al, and Mg. These were likely
present in phases are resistant to HCl attack, such as SiO2 and Augite. The SiO2 weight percentage value
changed from 1.61 to 48.21 across the range of leaching experiments, which indicated a large portion
of the TTM was leached in the conc. HCl leaching experiment. This should be reflected in the XRD and
EDS analyses of the leaching residues.

69
Table 3.12. XRF major oxide analysis results for IS and leached IS residues. Values are expressed as
weight % on oven dried (110°C) basis. LOI = loss on ignition at 1000°C. Negative LOI indicates
positive mass gain due to oxidation. Values for SO3, Na2O, K2O, and P2O5 have been omitted due to
low value (<1.0). Total mass submitted for 8M and conc.
Sample Fe2O3 MnO TiO2 CaO SiO2 Al2O3 MgO V2O5 LOI SUM
IS 84.7 0.73 7.80 0.40 1.61 3.89 2.68 0.58 -3.70 99.38
2M Leaching
Residue 83.80 0.73 8.64 0.31 1.83 3.48 2.68 0.63 -2.90 99.4
4M Leaching
Residue 63.28 0.57 22.87 0.83 5.22 3.19 2.41 0.63 0.04 99.48
8M Leaching
Residue 21.00 0.72 17.95 5.08 37.54 6.66 5.54 0.29 2.31 98.52
Conc. Leaching
Residue 13.92 0.4 9.16 6.24 48.21 7.93 6.13 0.19 3.93 97.91
2M Leaching Residue
To continue the analysis of the leaching residues, the XRD and EDS results of the 2M residue
were considered. The titanomagnetite phase was still the only major phase identified in the XRD pattern
(Figure 3.37). The Hematite phase present in the IS starting material was no longer present, and in its
place, an iron oxide-hydroxide pattern was observed. This indicated that the Hematite had undergone
leaching, and an iron oxide-hydroxide phase had been produced. This iron oxide-hydroxide phase was
not likely to have been produced during the leaching, as the leaching occurred under acidic conditions.
Thus, this phase was likely produced post-experiment, as the material oxidised on standing. No phases
containing the other elements present in the IS material (Si, Ca, Mg) were identified in the XRD pattern.

70
Figure 3.37. XRD pattern of residue after leaching IS with 2M HCl, with major reflections
labelled a) Titanomagnetite, Fe(Fe1.04Ti0.67)O4 b) iron oxide-hydroxide,Fe1.9O2.7(OH)0.3.
To further analyse phases present in the 2M leaching residue, the EDS of this material was
considered (Figure 3.38). The colour maps indicated the predominance of Fe and Ti in the material, with
some particles containing Si and Ca. Two EDS points were taken of particles high in both Fe and Ti,
and assigned to the TTM phase (EDS points 1 and 4). By the colour maps, the amount of Ti in the TTM
particles varied greatly between TTM particles. Two EDS points were taken of particles containing
predominately Fe, and these were assigned to the iron oxide-hydroxide phase, in concordance with the
XRD results (EDS points 2 and 3). The V in this material appeared to be found mainly in the TTM phase,
as shown in the colour maps (Figure 3.38.a and b, blue).
The remaining EDS point contained amounts of Si and Ca, and was assigned to the Augite
phase, which was present in later leaching residues, as well as in the EDS analysis of the IS starting
material (EDS point 5). Regions containing only Si were present in the colour map (Figure 3.38.b, red),
and assigned to an SiO2 phase. Small regions containing only Ca were also noticed in the colour map
(Figure 3.38.b, green), and considered to be the same Ca-rich phase present in the IS starting material
which could not be identified.

71
EDS Point EDS Data for Element Mineral Phase
Fe Ti V O Mn Si Ca Mg
1 59.53 25.88 0.71 12.82 0.26 0.16 0.00 0.65 TTM
2 61.46 4.85 0.44 28.61 0.56 0.27 0.04 3.77 iron oxide-hydroxide
3 79.32 5.21 0.45 11.55 0.93 1.07 0.16 1.30 iron oxide-hydroxide
4 60.70 13.88 0.53 18.99 0.68 1.39 0.06 3.77 TTM
5 7.76 0.71 0.03 25.22 0.26 36.49 17.44 12.09 Augite
Figure 3.38. SEM maps of residue after leaching IS with 2M HCl. a) elemental colour map (red: Fe,
green: Ti, blue: V) b) elemental colour map (red: Si, green: Ca, blue: V) c) corresponding SEM
image at x1200 with EDS points labelled. Table shows the mineral phases assigned to each EDS
point, and the raw EDS data for each of the major elements in atomic% (rescaled to 100 %).
4M Leaching Residue
The XRD pattern of the 4M residue still displayed the TTM phase as the dominant crystalline
phase, and the iron oxide-hydroxide reflections appeared to have a greater relative height compared to
the 2M residue (Figure 3.39). The peak reflection height of the TTM phase (in counts) dropped from
~45,000 to ~13,000, indicating that this phase was less predominant in the material, due to being
leached. Still no evidence of the minor elements Si, Ca, and Mg, was found in the XRD pattern.

72
Figure 3.39. XRD pattern of residue after leaching IS with 4M HCl, with major reflections
labelled a) Titanomagnetite, Fe(Fe1.04Ti0.67)O4 b) iron oxide-hydroxide, Fe1.9O2.7(OH)0.3.
The EDS results for this phase indicated the presence of two main phases, a TTM phase and an
iron oxide-hydroxide phase (Figure 3.40.a, red and green). EDS points were taken for both the TTM
phase (EDS point 1) and for the iron oxide hydroxide phase (EDS point 3). For two of the TTM particles
analysed, small amounts of Si were also found (EDS points 4 and 6), indicating the presence of SiO2
deposits on the surface of the TTM particles. The V in this material appeared to be found mainly in the
TTM phase, as shown in the colour maps (Figure 3.40.a and b, blue).
Two other mineral phases were identified in the EDS results. The first as a Ca and Si containing
phase, found in all EDS maps of IS and its residues thus far. This was identified as Augite (EDS point 2).
The other phase was a Ti-containing phase with very little Fe present, indicating a TiO2 phase. No TiO2
phase has yet been identified in the XRD patterns of any IS or leaching residue material. This might be
due to precipitation of TiO2 occuring in this leaching experiment, and for the following 8M leaching
experiment. The TiO2 was precipitated as an amorphous hydrate, thus no TiO2 XRD pattern was
expected. The EDS colour map also indicated the presence of Ca-dominant phases, found in all IS
materials so far and not been identified yet (Figure 3.40.b, green).

73
EDS Point EDS Data for Element Mineral Phase
Fe Ti V O Mn Si Ca Mg
1 25.73 21.58 0.22 50.37 0.46 0.30 0.04 1.30 TTM
2 3.72 1.08 0.06 55.41 0.06 21.15 9.01 9.51 Augite
3 81.11 4.54 0.46 11.97 0.98 0.25 0.05 0.64 iron oxide-hydroxide
4 17.09 16.07 0.15 52.01 0.68 10.41 0.73 2.88 TTM with SiO2
5 12.44 26.39 0.54 53.61 0.14 5.43 0.54 0.90 TiO2 and TTM
6 21.35 8.14 0.34 55.23 0.07 12.08 1.71 1.08 TTM with SiO2
Figure 3.40. SEM maps of residue after leaching IS with 4M HCl. a) elemental colour map (red: Fe,
green: Ti, blue: V) b) elemental colour map (red: Si, green: Ca, blue: V) c) corresponding SEM
image at x1700 with EDS points labelled. Table shows the mineral phases assigned to each EDS
point, and the raw EDS data for each of the major elements in atomic% (rescaled to 100 %).
8M Leaching Residue
The XRD pattern of the 8M residue contained a large amorphous hump, indicative of the
presence of a significant amount of amorphous material. The background hump was subtracted from the
pattern for ease of analysis (Figure 3.41). The XRD pattern appeared much more complex compared to
the 2M and 4M residues, and the TTM phase was largely leached from the IS material, revealing the
minor, HCl resistant phases. As such, the XRD results for this material, as well as the following conc.
HCl leaching residue material, were likely to be more subject to false positives due to large number of
reflections present.
Reflections associated with TTM were still in the majority, and iron oxide-hydroxide remained
present in the XRD pattern. The main minor phase of interest was Augite, which was suggested as a
phase present in the IS and its leaching residues up to this point. This XRD provided the justification
for the earlier assignment of Augite in these materials. Another phase which appeared in the XRD pattern

74
was an Ilmenite phase, with the Fe substituted for a range of other metals.
Figure 3.41. XRD pattern of residue after leaching IS with 8M HCl, with major reflections labelled
a) Titanomagnetite, Fe(Fe1.04Ti0.67)O4 b) Augite, (Ca,Na)(Mg,Fe,Al,Ti)(Si,Al)2O6 c) iron oxide-
hydroxide, Fe1.9O2.7(OH)0.3. d) Ilmenite, FeTiO3.
To confirm the XRD analysis, the EDS is considered. The colour maps indicate a lower amount
of the two main phases (TTM and iron oxide-hydroxide) as compared to the 2M and 4M residues (Figure
3.42.a, red and green). The maps also indicated a higher presence of the Ca-containing Augite phase, as
compared to the previous residues (Figure 3.42.b, green). The Si colour map was lost during the analysis
of this data, but an EDS point was taken of a particle, confirming the presence of Si (EDS point 1). The
two phases previously identified in the 2M and 4M residues (TTM and iron oxide-hydroxide) were also
identified in the EDS map (EDS points 2 and 3). The two remaining EDS points contained mostly Si,
which indicated the presence of SiO2 particles (EDS points 4 and 5). There also appeared to be particles
containing mainly Mg present, but it was not known what these particles were (Figure 3.42.b, red). They
might be part of a Si-Mg phase, such as Enstatite (MgSiO3), but this could not be determined without
the Si EDS map.

75
EDS Point EDS Data for Element Mineral Phase
Fe Ti V O Mn Si Ca Mg
1 4.89 0.53 0.03 42.00 0.16 29.07 14.08 9.24 Augite
2 53.98 1.84 0.27 40.13 0.73 0.61 0.12 2.32 iron oxide-hydroxide
3 35.83 38.24 0.27 23.77 1.37 0.34 0.07 0.11 TTM
4 2.19 1.29 0.02 68.51 0.08 26.18 0.72 1.01 SiO2
5 1.70 1.61 0.00 60.79 0.05 33.12 1.88 0.85 SiO2
Figure 3.42. SEM maps of residue after leaching IS with 8M HCl. a) elemental colour map (red: Fe,
green: Ti, blue: V) b) elemental colour map (red: Mg, green: Ca, blue: V) c) corresponding SEM
image at x2200 with EDS points labelled. Table shows the mineral phases assigned to each EDS
point, and the raw EDS data for each of the major elements in atomic% (rescaled to 100 %).
Conc. Leaching Residue
Similar to the 8M residue, the XRD pattern of this residue contained a large amorphous hump,
indicating the presence of a significant amount of amorphous material, which has been subtracted as
background (Figure 3.43.). The main finding in the XRD analysis is the lack of reflections corresponding
to TTM or iron oxide-hydroxide. This indicated that at least the majority of these phases was leached
during the experiment. The main phases present in the pattern were Augite, as well as two newly found
phases, Cristobalite and Quartz. These are SiO2 minerals and were found in the EDS results for all
residues. Thus, this justified the earlier assignment of these phases.

76
Figure 3.43. XRD pattern of residue after leaching IS with conc. HCl, with major reflecctions
labelled a) Augite, (Ca,Na)(Mg,Fe,Al,Ti)(Si,Al)2O6 b) Cristobalite, SiO2 c) Quartz, SiO2
The EDS map of the conc. residue displayed some regions of Fe and Ti, indicating the presence
of TTM in the residue (EDS point 1). There also appeared to be large particles of Si and Ca mineral,
which were assigned as Augite (EDS point 3). Particles of SiO2 could also be identified in the residue
(EDS point 4). There were some small regions of the colour map which exhibited only the presence of
Ti, indicating that TiO2 was present in the material (Figure 3.44.a, green). The remainder of the V found
in the material appears to be found only in the remaining TTM phase (Figure 3.44.a and b, blue). There
were also fibres of glass wool (SiO2) present in the residue, which are likely artefacts from the sample
filtration through a glass wool plug (Figure 3.44.b, red, and EDS point 2). A closer analysis of a
particular particle was conducted at a higher magnification, shown in the green box below.

77
EDS Point EDS Data for Element Mineral Phase
Fe Ti V O Mn Si Ca Mg
1 74.11 7.30 0.54 14.76 0.54 1.12 0.07 1.56 TTM
2 5.38 3.24 0.00 56.63 0.00 32.44 1.25 1.07 SiO2
3 6.07 0.61 0.07 36.97 0.30 30.07 16.88 9.04 Augite
4 0.59 0.39 0.00 66.92 0.00 31.53 0.20 0.37 SiO2
Figure 3.44. SEM maps of residue after leaching IS with conc. HCl. a) elemental colour map (red:
Fe, green: Ti, blue: V) b) elemental colour map (red: Si, green: Ca, blue: V) c) corresponding SEM
image at x1900 with EDS points labelled. Table shows the mineral phases assigned to each EDS
point, and the raw EDS data for each of the major elements in atomic% (rescaled to 100 %).
Below is shown the higher magnification analysis of a particle. The particle appeared to be
comprised of several mineral phases held together by SiO2, based on the colour maps (Figure 3.45.a
and b). EDS point 1 showed a region of Si, Ca, and Mg rich mineral, which was assigned as an Augite
phase. EDS point 2 was mainly Fe-containing, and assigned as iron oxide-hydroxide. This phase was
not identified in the XRD but has precedent for existence due to its occurrence in the previous residues.
Its inclusion in the acid-resistant SiO2 phase shielded it from HCl attack. The central portion of this
particle contained regions high in Si, Ca, and Mg, and was assigned as Augite. These particles all
appeared to be cemented by a SiO2 phase, evidenced by EDS point 4.

78
EDS Point EDS Data for Element Mineral Phase
Fe Ti V O Mn Si Ca Mg
1 5.72 1.73 0.05 50.35 0.18 25.77 8.62 7.58 Augite
2 36.85 4.85 0.37 46.75 0.33 6.76 0.33 3.76 iron oxide-hydroxide
3 2.96 1.92 0.10 63.80 0.10 23.07 3.84 4.21 Augite
4 2.81 1.69 0.02 67.70 0.11 24.75 1.40 1.51 SiO2
Figure 3.45. SEM maps of residue after leaching IS with conc. HCl. a) elemental colour map (red:
Fe, green: Ti, blue: V) b) elemental colour map (red: Si, green: Ca, blue: V) c) corresponding SEM
image at x9000 with EDS points labelled. Table shows the mineral phases assigned to each EDS
point, and the raw EDS data for each of the major elements in atomic% (rescaled to 100 %).
Summary
The IS material was leached at a series of acid concentrations between 2M and conc. HCl. No
considerable difference was found in the leaching rate or amount for Fe, Ti, or V, indicating that these
were found in predominately the same phase, TTM. As the HCl concentration was increased, a higher
% amount of these elements was leached over 120 min, starting at ~20 % for the 2M experiment, and
peaking at ~70 % for the conc. experiment. In the 4M experiment, Ti precipitation was found to take
place. XRF, EDS, and XRD analysis of the leaching residues indicated that the TTM and Hematite
phases were leached, and an iron oxide-hydroxide phase was formed. The phases not leached were
Augite, Quartz, and Cristobalite.
3.3.3 Roasting of Samples
Since the roasting of the VRC resulted in such a significant increase in V leaching, and a similar
decrease in the leaching of both Fe and Ti, the same tactic was hypothesised to have a similar effect on
the IS. To this end, the IS was roasted at 900 ℃ for 3 hours in air. The XRF results of the IS roast are

79
shown below, compared to that of the unroasted IS material (Table 3.13). No large differences were
noticed in the XRF results, as expected for a roast. The LOI value has become positive, due to mass
being lost in the roasting process. This indicated the oxidation of the elements in the IS material during
roasting, as the unroasted IS took on oxygen during the XRF experiment, as demonstrated by the
negative LOI value.
Table 3.13. XRF major oxide analysis results for IS and IS roast (3 hr, 900 ℃). Values are expressed
as weight % on oven dried (110°C) basis. LOI = loss on ignition at 1000°C. Negative LOI indicates
positive mass gain due to oxidation. Values for SO3 and P2O5 have been omitted due to low value
(<0.1).
Sample Fe2O3 MnO TiO2 CaO SiO2 Al2O3 MgO V2O5 LOI SUM
IS 84.7 0.73 7.8 0.4 1.61 3.89 2.68 0.58 -3.26 99.38
IS Roast 82.43 0.71 7.87 0.04 1.66 3.2 2.66 0.45 0.39 99.49
The XRD pattern displayed one major sets of reflections, due to Hematite (Figure 3.46). This
indicated that the TTM converted into Hematite during the roasting process. The minor reflections in
the pattern were found to be due to Pseudobrookite. This agreed well with the roasting of the VRC
material, as Hematite and Pseudobrookite were found to be produced. No reflections indicated the
presence of Mn, Ca, Si, Al, Mg, or V, so the EDS of the roasted material must be considered in order
to locate these elements.

80
Figure 3.46. XRD pattern of the IS after roasting at 900 ℃ for 3 hr, with major reflections labelled
a) Hematite Fe2O3 b) Pseudobrookite Fe2TiO5.
The EDS results are shown below (Figure 3.47). The EDS colour map indicated that the major
phase was a Fe and Ti containing phase (Figure 3.47.a, red and green). A point analysis was conducted
on one of these particles, and it was assinged as a Ti-containing Hematite phase, as the Pseudobrookite
phase was minor in the XRD. There were also regions containing mostly Fe, due to particles of Hematite
(EDS point 2). Analysis of the colour maps indicated the presence of Si-rich regions (Figure 3.47.b,
green). Previously, the 8M and conc. HCl leaching residue analyses were used to determine the nature
of these phases. As no such leaching was conducted on this sample, one cannot say with confidence
what these regions were. Likewise, there appeared regions of a Ca-rich phase (Figure 3.47.b, blue), as
well as both Si and Ca containing phases (Figure 3.47.b, cyan).
Nevertheless, the most relevant result of this analyses was the presence of a V and Mn
containing phase (Figure 3.48.a, blue, and EDS point 3). This particle seemed reminiscent of the
manganese vanadate found in the VRC material, which was widespread in the VRC roast. The Mn:V
ratio in this particle was approximately 5:6, and while this was not the 2:3 ratio found in the VRC roast,
these values were comparable. For this reason, the particle was assigned as manganese vanadate.
Importantly, only one small particle of this phase was located in the EDS analysis of this material. A
higher magnification image of this region is presented in Figure 3.48.

81
EDS Point EDS Data for Element Mineral Phase
Fe Ti V O Mn Mg
1 46.26 5.11 0.47 44.71 0.44 3.02 Ti-containing Hematite
2 43.84 2.75 0.28 50.76 0.43 1.94 Hematite
3 11.23 1.63 14.41 59.09 12.04 1.60 Manganese vanadate
Figure 3.47. SEM maps of IS roast (3 hr, 900 ℃). a) elemental colour map (red: Fe, green: Ti, blue:
V) b) elemental colour map (red: Si, green: Ca, blue: V) c) corresponding SEM image at x4000 with
EDS points labelled. Table shows the mineral phases assigned to each EDS point, and the raw EDS
data for each of the major elements in atomic% (rescaled to 100 %).
The EDS image below shows a higher-magnification image of the V and Mn containing
particle. The Mn:V ratio of the particle in the EDS point spectrum was still approximately 5:6. A small
amount of Fe was also present in this analysis, but it is not known whether this was present in the
mineral phase of this particle, an exclusion on the surface of the particle, or if the EDS spot was
including a neighbouring particle. Additionally, the size of this particle was small, requiring a high-
magnification image to analyse, and in this case was approaching the focal limit of the EDS
instrumentation. Regardless, one should hope to see an increase in the leaching rate of V from the roasted
sample if this phase was present in the roast in any significant amount.

82
EDS Point EDS Data for Element Mineral Phase
Fe Ti V O Mn
1 11.27 1.50 14.38 61.08 11.77 Manganese vanadate
2 22.32 7.88 0.76 68.63 0.42 Pseudobrookite
3 33.13 3.33 0.25 62.99 0.30 Hematite
Figure 3.48. SEM maps of IS roast (3 hr, 900 ℃). a) elemental colour map (red: Fe, green: Ti, blue:
V) b) elemental colour map (red: Si, green: Ca, blue: V) c) corresponding SEM image at x9500 with
EDS points labelled. Table shows the mineral phases assigned to each EDS point, and the raw EDS
data for each of the major elements in atomic% (rescaled to 100 %).
3.3.4 Leaching of Roasted Sample
To determine the effect of roasting on the leaching behaviour of the IS, the material was leached
with 4M HCl (120 min, 80 ℃), and compared to the leaching of the unroasted material. The results are
shown below (Figure 3.49). It is worth restating that the Ti leaching results were due to TiO2
precipitation during the roasting experiment.
Generally, the leaching rate of each element (Fe, Ti, and V) decreased after the roasting
procedure. This was because roasting of the IS formed more HCl-resistant phases (Pseudobrookite). The
total % amount leached during the unroasted experiment was approximately 64 %, and this dropped to
approximately 10 % for Fe and Ti after roasting. The most important difference was the V leaching curve
after roasting. In the unroasted leaching, the V curve followed the Fe curve (no difference in leaching
rate), which indicated that the V was locked up in the ferrous mineral. After roasting the V curve did not
follow the Fe curve. In fact, the % amount extracted after roasting, while still much lower than the
unroasted leaching, was ~30 %, compared to the ~10 % result for Fe and Ti.

83
Figure 3.49. 4M HCl Leaching of roasted IS over time, compared to the 4M leaching of the unroasted
material. The % amount leached is the moles of element leached compared to the moles of element in
initial solid material.
While the V leaching curve didn’t follow the Fe curve, it did take on roughly the same slope after
the first few minutes. This was crucial, as it indicated that the V leached over the first few minutes was
not bound in the Fe mineral phase, which was further evidenced by the steeper incline in the first few
minutes. After this, the V was leached at the same rate as Fe, showing that this portion of V was found
in the ferrous mineral phase. During the analysis of the roasted IS material, a small amount of V and Mn
containing mineral was found and assigned as a manganese vanadate. It was the presence of this phase
which explained the above leaching results, as well as the shape and location of the leaching curve; one
should expect this phase to be leached quickly, as in the case of the VRC leaching experiments. One
should also expect to find V to still be present to some extent in the XRF results, and furthermore, one
should consider ways to optimise the partitioning of V from Fe in future roast experiments.
To complete the analysis of the roasting results, the leaching residue is considered. The XRF
results showed the selective leaching of V from the roasted material (Table 3.14), as this was one of the
only elements which decreased in weight % in the XRF results (along with Al). All other elements in
the residue were either equal in weight % to the roasted starting material, or greater, indicating less
leaching as compared to V. The value for Mn was equal to that of the roasted starting material, indicating
some amount of leaching.

84
Table 3.14. XRF major oxide analysis results for IS roast (3 hr, 900 ℃) and its 4M HCl leaching
residue. Values are expressed as weight % on oven dried (110°C) basis. LOI = loss on ignition at
1000°C. Values for SO3, Na2O, P2O5, and K2O have been omitted due to low value (<0.08).
Sample Fe2O3 MnO TiO2 CaO SiO2 Al2O3 MgO V2O5 LOI SUM
IS Roast 82.06 0.71 7.55 0.38 1.57 3.43 2.61 0.58 0.25 99.29
IS 4M
Leaching
Residue
82.43
0.71
7.87
0.04
1.66
3.2
2.66
0.45
0.39
99.49
To continue the analysis of the leaching residue, the XRD was analysed (Figure 3.50). There
appeared to be no difference between this pattern and that of the roasted IS starting material. The main
phase was still Hematite, and minor reflections for Pseudobrookite were found. Still no evidence for the
other minor elements were found in this pattern, so the EDS was considered.
Figure 3.50. XRD pattern of the residue after leaching of the roasted IS in 4M HCl, with major
reflections labelled a) Hematite, Fe2O3 b) Pseudobrookite, Fe2TiO5.
The EDS colour maps with corresponding SEM image is shown below (Figure 3.51). The
colour maps indicated the predominance of a Fe-containing phase, which was assigned to Hematite, as
per the XRD results. (Figure 3.51.a and b, red). Some regions of Fe and Ti phase were also present,
due to Pseudobrookite (Figure 3.51.a, red and green). Regions of Si-rich material were also found, which

85
were likely SiO2. No evidence of SiO2 was found in the XRD, so this assignment was unconfirmed. A
region of interest was found in the lower right portion of the SEM image, where multiple particles were
stuck together. A higher magnification analysis of this particle shown in the green box was conducted,
shown in Figure 3.52. below.
Figure 3.51. SEM maps of residue after leaching IS roast (3 hr, 900 ℃) with 4M HCl. a)
elemental colour map (red: Fe, green: Ti, blue: V) b) elemental colour map (red: Fe, green: Si, blue:
V) c) corresponding SEM image at x4000.
Two main phases were found to be present in the higher magnification EDS image. The first of
this was a Fe containing phase, assigned as Hematite (EDS point 1). The second was a Fe- and Ti-
containing phase, assigned as Pseudobrookite (EDS point 2). The cluster of particles were mostly
Hematite, with some Pseudobrookite near the top. No evidence of a Mn and V containing phase was
found in the EDS analysis of this material, and this was taken as an indication that any amount of this phase
present was leached during the experiment. Based on the EDS colour map, it appeared that the remaining
V found in the mineral was found within the Pseudobrookite phase.

86
EDS Point EDS Data for Element Mineral Phase
Fe Ti V O Mn
1 38.49 3.11 0.23 57.89 0.28 Hematite
2 24.68 9.05 0.36 65.49 0.43 Pseudobrookite
Figure 3.52. SEM maps of residue after leaching IS roast (3 hr, 900 ℃) with 4M HCl. a) elemental
colour map (red: Fe, green: Ti, blue: V) b) elemental colour map (red: Si, green: Ca, blue: V) c)
corresponding SEM image at x8500 with EDS points labelled. Table shows the mineral phases
assigned to each EDS point, and the raw EDS data for each of the major elements in atomic%
(rescaled to 100%).
Summary
The IS material was roasted, which formed a main phase of Hematite and a minor phase of
Pseudobrookite from the original TTM phase. A small particle of Mn- and V-rich mineral was found
and assigned to the same manganese vanadate phase formed in the VRC roast. This roasted IS material
was leached with 4M HCl, and it was found that the leaching rate and % amount leached for Fe, Ti, and V
decreased compared to the unroasted material, due to the formation of HCL-resistant phases during
roasting. Notably, the V % amount leached was higher than that for the other elements. For Fe and Ti,
the value dropped from ~64 % to ~10 %, whereas the relative value for V was ~30 %. This indicated
the selective leaching of V over Fe and Ti, and due to the shape of the leaching curve, it was found that
this was due to the formation of a new V phase which was highly sensitive to HCl. This was assumed
to be the manganese vanadate phase formed during roasting, and observed for the roasts of the VRC. In
future experiments, the formation of any vanadate phase should be encouraged by milling and prolonged
roasting

87
4 Conclusions
This study explored the potential for extracting V from two materials: VRC and IS. The extraction
was conducted with an HCl leach, for 120 min at 80 °C, and at a range of HCl concentrations.
The main component of the VRC was found to be Jacobsite. with minor components of
Ilmenite, Cristobalite, Rhodonite, Olivine, and TiO2. The elemental composition of the material showed
similarities with VRC materials studied elsewhere, with the exception of the richness of Mn in the VRC
investigated. Of particular note was the presence of a small amount of a Mn and V rich phase, which
was identified as a manganese vanadate, Mn2V2O7. The VRC material was leached at a range of HCl
concentrations, and no selective dissolution of V was observed. As the concentration of HCl was
increased, a higher degree of extraction was observed. The spinel phases (Jacobsite, TTM) were
selectively leached over the other phases, including TiO2, SiO2, Augite, and Rhodonite. In these results,
no way to separate the Fe, Ti, and V was found using direct HCl leaching. An attempt was made to
precipitate Fe and Ti while leaving V in solution, and this was found to be unsuitable for V extraction,
as the V co-precipitated.
Two sets of VRC roasts were produced, one at 900 ℃ for 3-hr, and the other at 1200 ℃
overnight. No noticeable difference could be found in their XRD pattern, XRF data, or EDS maps. The
main phases of the VRC were converted into Hematite, Pseudobrookite, Rutile and Mn2O3 upon
roasting. Importantly, the existence of a manganese vanadate, Mn2V2O7, was demonstrated. During the
roasting process, V and Mn partitioned from the Ti and Fe and formed this phase. The roasts were also
leached in HCl, and a dramatic increase in the extraction of V after roasting was observed, while the
relative extraction of Fe and Ti decreased. This was due to the formation of the acid-sensitive Mn2V2O7,
and the acid-resistant Pseudobrookite. These results provide a clear pathway for the selective extraction
of the V from the VRC material: roasting at ~1000 °C, followed by leaching with HCl at a concentration
around 4M. However, some amount of Ti and Fe was extracted also, so further purification is required.
The leaching and roasting experiments were repeated with the IS material. The composition of
this material was found to be mainly TTM, with minor amounts of Hematite, SiO2, and Augite. It was
found that the V was present in a very small relative amount in this material. The IS material was leached
in HCl, and no considerable difference was found in the leaching rate or amount for Fe, Ti, or V. This
indicated that there is no way to separate the V from the Fe and Ti by direct leaching. In the 4M
experiment, Ti precipitation was found to take place. The IS was roasted at 900 ℃ for 3 hours in air
forming Hematite and Pseudobrookite. A small particle of a manganese vanadate phase was also found.
Upon leaching, it was found that the % amount leached for Fe, Ti, and V had decreased. Significantly,
the percentage of V leached was higher than that for the other elements. This provided evidence of a
pathway fo V extraction from the original IS material.

88
5 Future Directions
Before moving the research in this thesis onto larger scale with the intention of testing these results
for industry, some important factors need to be considered. While this thesis provides a significant key
result (a method of selectively extracting the V from these materials) a few questions remain. First, it is
not known what species the Fe, Ti, and V are in solution after being leached from the solid material.
This can be further understood via solution-based analysis of the leachates, such as UV-vis
spectroscopy.
A high-resolution identification of the present phases and how they are arranged in the material can
be considered for future research in this area, to better understand the dissolution of the mineral phases,
and the formation of new phases. A better understanding of the mineral phases present in the material
will aid in the fine-tuning of any potential industrial processes based on these results.
5.1 Further Separation of V
In this research, the vanadium was successfully extracted from the VRC with a leaching efficiency
of 86.89 % after roasting at 900 °C for 3 hours. However, V was coextracted with a majority of the Mn
from the original material. In order to bring a product to market, it would be most efficient to produce
a pure single-element product, such as V2O5 or MnO2. To this end, a future research direction for this
thesis should be an attempt at separating the V and Mn from the leachate into their pure elemental
components.
Further to this, small amounts of Fe and Ti were also extracted during the HCl leaching process. A
line of future research should include the optimisation of the roasting and leaching procedures to
minimise this unwanted extraction. A post-leaching treatment of the leachate should also be considered
to purify the V from the Fe and Ti impurities.
5.2 Combination with H2 Reduction
As the NZ steel industry seeks to move away from coal as its main source of reductant, in order to
work toward the national goal of carbon net-neutrality by 2050, the capacity for H2 to replace coal with
another source of reduction is being extensively researched. This is a goal of the co-supervisor of this
thesis, Dr. Chris Bumby.81 In the H2 reduction process, the VRU process will still be applicable and will
generate a VRC slag. The results of this thesis should be replicated with this material, as it may contain
different phases or impurities which will need to be considered.

89
6 References
1. Christie, T.; Brathwaite, B. Mineral Commodity Report 15 — Iron; Institute of Geological and
Nuclear Sciences Ltd; 2006.
2. Orpin, A.; Bostock, H.; Nodder, S.; Barnes, P.; Lamarche, G. In Resource evaluation,
exploration and current prospecting interests of west coast ironsands, North Island, New Zealand,
2009.
3. Lawton, D. C.; Hochstein, M. P., Geophysical study of the Taharoa ironsand deposit, west
coast, North Island, New Zealand. New Zealand journal of geology and geophysics 1993, 36 (2), 141-
160.
4. Baker, E.; Gaill, F.; Karageorgis, A.; Lamarche, G.; Narayanaswamy, B.; Parr, J.;
Raharimananirina, C.; Santos, R.; Sharma, R., Chapter 23. Offshore Mining Industries. 2014; pp 1-25.
5. Carter, L., Ironsand in continental shelf sediments off western New Zealand—a synopsis. New
Zealand Journal of Geology and Geophysics 1980, 23 (4), 455-468.
6. Wang, Z.; Pinson, D.; Chew, S.; Rogers, H.; Monaghan, B. J.; Zhang, G., Interaction of New
Zealand Ironsand and Flux Materials. ISIJ international 2016, 56 (8), 1315-1324.
7. Martin, W. R. B., The iron and titanium ores of New Zealand: Occurrence, composition,
attempts to use and status today with special reference to ironsands. New Zealand engineering 1955, 10
(10), 317-336.
8. Thorp, D.; Cutten, C. W.; MacArthur, N. A.; Griffiths, S. J. Ironsand Concentration Processes
At New Zealand Steel Limited
9. Ingram, J.; La Roche, J., Steel from Ironsand. In Evolving Auckland, Wily Publications: 2011; pp
245-261.
10. Hogan, D.; Williamson, B., In New Zealand is different: chemical milestones in New Zealand
history, Clerestory: Christchurch, 1999; p 261.
11. Pearce, C. I.; Henderson, C. M. B.; Telling, N. D.; Pattrick, R. A. D.; Vaughan, D. J.; Charnock,
J. M.; Arenholz, E.; Tuna, F.; Coker, V. S.; Laan, G. v. d., Iron site occupancies in magnetite-ulvospinel
solid solution: A new approach using XMCD. The American mineralogist 2009. (LBNL-3328E;
Journal ID: ISSN 0003-004X; AMMIAY; TRN: US1004573), Medium: ED.
12. Beckett-Brown, C. E.; McDonald, A. M., The crystal-chemistry of Ni-bearing spinel-group
minerals; chemical, geological, and exploration implications. Canadian mineralogist 2018, 56 (1), 77-
94.
13. Lujan Ganuza, M.; Ferracutti, G.; Gargiulo, M. F.; Castro, S. M.; Bjerg, E.; Groller, E.;
Matkovic, K., The Spinel Explorer-Interactive Visual Analysis of Spinel Group Minerals. IEEE
transactions on visualization and computer graphics 2014, 20 (12), 1913-1922.
14. Xue, Z.; Shen, Y.; Chu, L.; Wang, Y.; Zhang, Y.; Sun, Z.; Wang, J.; Zeng, Y.; Li, P.; Zhu,
S., NaCl- induced nickel- cobalt inverse spinel structure for boosting hydrogen evolution from ethyl
acetate and water. Journal of materials chemistry. A, Materials for energy and sustainability 2019, 7

90
(4), 1700-1710.
15. Santos-Carballal, D.; Roldan, A.; Grau-Crespo, R.; de Leeuw, N. H., First-principles study of
the inversion thermodynamics and electronic structure of FeM2X4 (thio) spinels (M = Cr, Mn, Co, Ni;
X = O, S). 2015. Physical Review B 91 (19) , 195106.
16. Okube, M.; Oshiumi, T.; Nagase, T.; Miyawaki, R.; Yoshiasa, A.; Sasaki, S.; Sugiyama, K.,
Site occupancy of Fe 2+ , Fe 3+ and Ti 4+ in titanomagnetite determined by valence-difference contrast
in synchrotron X-ray resonant scattering. Journal of synchrotron radiation 2018, 25 (Pt 6), 1694.
17. Gilligan, R.; Nikoloski, A. N., The extraction of vanadium from titanomagnetites and other
sources. Minerals engineering 2020, 146, 106106.
18. Li, R.; Liu, T.; Zhang, Y.; Huang, J.; Xu, C., Efficient Extraction of Vanadium from Vanadium-
Titanium Magnetite Concentrate by Potassium Salt Roasting Additives. Minerals (Basel) 2018, 8 (1),
25.
19. Fischer, R. P., Vanadium resources in titaniferous magnetite deposits. U.S. Govt. Print. Off.:
Washington, 1975.
20. Sharp, R. M.; Cann, N. K.; McFadzean, D., NZ's Iron and Steel Industry - an Historical
Perspective. New Zealand engineering 1990, 45 (4), 9-15.
21. Ingram, J. H., Pioneering a Process (The Development of New Zealand Steel Limited's Unique
Iron/Steel Making Process). Institution of Engineers, Australia: Barton, ACT, 1988; pp i-xi.
22. Steel, N. THE IRONMAKING PROCESS. https://www.nzsteel.co.nz/new-zealand-steel/the-
story-of-steel/the-science-of-steel/the-ironmaking-process/. (accessed 2020-09-11).
23. Henley, R. G.; Chubb, T.; Graham, C., The Commissioning, Operation and Development of the
Vanadium Recovery Unit at NZ Steel. Chemical Engineering Group (New Zealand): Auckland, N.Z,
1990; pp 207-214.
24. Petranikova, M.; Tkaczyk, A. H.; Bartl, A.; Amato, A.; Lapkovskis, V.; Tunsu, C., Vanadium
sustainability in the context of innovative recycling and sourcing development. Waste management
2020, 113, 521-544.
25. Wanty, R. B.; Goldhaber, M. B., A method for the determination of vanadium and iron
oxidation states in naturally occurring oxides and silicates. Talanta 1985, 32 (5), 395-398.
26. Sweatman, W.; Wake, G.; Fullard, L.; Bruna, M., Recovering vanadium during the production
of steel from iron sand. ANZIAM Journal 2012, 53, 1.
27. Treviño, S.; Díaz, A.; Sánchez-Lara, E.; Sanchez-Gaytan, B. L.; Perez-Aguilar, J. M.;
González-Vergara, E., Vanadium in Biological Action: Chemical, Pharmacological Aspects, and
Metabolic Implications in Diabetes Mellitus. Biological Trace Element Research 2019, 188 (1), 68-98.
28. Langeslay, R. R.; Kaphan, D. M.; Marshall, C. L.; Stair, P. C.; Sattelberger, A. P.; Delferro, M.,
Catalytic Applications of Vanadium: A Mechanistic Perspective. Chemical reviews 2019, 119 (4), 2128-
2191.
29. Henry, E. R., Researches on Vanadium. Part II. Philosophical transactions of the Royal Society
91
of London 1869, 159, 679-692.
30. Pourret, O.; Dia, A., Vanadium. In Encyclopedia of Geochemistry; W. M. White. Ed; Springer,
2016;
31. Bauer, G.; Güther, V.; Hess, H.; Otto, A.; Roidl, O.; Roller, H.; Sattelberger, S.; Köther-
Becker, S.; Beyer, T., Vanadium and Vanadium Compounds. Ullmann's Encyclopedia of Industrial
Chemistry, 2017.
32. Costigan, M.; Cary, R.; Dobson, S.; World Health, O.; International Programme on Chemical,
S., Vanadium pentoxide and other inorganic vanadium compounds. World Health Organization:
Geneva, 2001.
33. Christopher, W. W., The Road to the Model T: Culture, Road Conditions, and Innovation at the
Dawn of the American Motor Age. Technology and culture 2007, 48 (3), 497-523.
34. Baker, M. J., Ford: how the model T revolutionised an industry. In The Business & Management
Collection, Henry Stewart Talks;. 2018; https://hstalks.com/bm/3728/ (accessed 2020-011-23)
35. Skyllas‐Kazacos, M.; Cao, L.; Kazacos, M.; Kausar, N.; Mousa, A., Vanadium Electrolyte
Studies for the Vanadium Redox Battery—A Review. ChemSusChem 2016, 9 (13), 1521-1543.
36. Choi, C.; Kim, S.; Kim, R.; Choi, Y.; Kim, S.; Jung, H.-y.; Yang, J. H.; Kim, H.-T., A review
of vanadium electrolytes for vanadium redox flow batteries. Renewable & sustainable energy reviews
2017, 69, 263-274.
37. Cunha, Á.; Martins, J.; Rodrigues, N.; Brito, F. P., Vanadium redox flow batteries: a technology
review. International Journal of Energy Research, 2015, 39 (7), 889-918.
38. Liu, Z.; Zhang, Y.; Dai, Z.; Huang, J.; Liu, C., Coextraction of vanadium and manganese from
high-manganese containing vanadium wastewater by a solvent extraction-precipitation process.
Frontiers of Chemical Science and Engineering 2020, 14 (5), 902-912.
39. Cai, Z.; Feng, Y.; Li, H.; Zhou, Y., Selective Separation and Extraction of Vanadium(IV) and
Manganese(II) from Co-leaching Solution of Roasted Stone Coal and Pyrolusite via Solvent Extraction.
Industrial & Engineering Chemistry Research 2013, 52 (38), 13768-13776.
40. Wen, J.; Jiang, T.; Sun, H.; Yu, T., Novel Understanding of Simultaneous Extraction of
Vanadium and Manganese from Vanadium Slag and Low-Grade Pyrolusite Based on Selective
Oxidation–Reduction Roasting. ACS Sustainable Chemistry & Engineering 2020, 8 (15), 5927-5936.
41. Smith, J. F.; Carlson, O. N., The Mn−V (Manganese-Vanadium) system. Journal of Phase
Equilibria 1982, 2 (4), 473-478.
42. Schwarz, B.; Forster, J.; Goetz, M. K.; Yücel, D.; Berger, C.; Jacob, T.; Streb, C., Back Cover:
Visible‐Light‐Driven Water Oxidation by a Molecular Manganese Vanadium Oxide Cluster (Angew.
Chem. Int. Ed. 21/2016). Angewandte Chemie (International ed.) 2016, 55 (21), 6344-6344.
43. Dobley, A.; Ngala, K.; Yang, S.; Zavalij, P. Y.; Whittingham, M. S., Manganese Vanadium
Oxide Nanotubes: Synthesis, Characterization, and Electrochemistry. Chemistry of Materials 2001, 13
(11), 4382-4386.

92
44. Abbood, H. A.; Abbood, H. A.; Ahmed, K. A. M.; Ahmed, K. A. M.; Ren, Y.; Ren, Y.; Huang,
K.; Huang, K., MnV2O6⋅V2O5 cross-like nanobelt arrays: synthesis, characterization and
photocatalytic properties. Applied Physics A 2013, 112 (4), 901-909.
45. Zoellner, B.; Gordon, E.; Maggard, P. A., A small bandgap semiconductor, p-type MnV2O6,
active for photocatalytic hydrogen and oxygen production. Dalton Transactions 2017, 46 (32), 10657-
10664.
46. Chuan-Cang, Z.; Fa-Min, L.; Peng, D.; Lu-Gang, C.; Wen-Wu, Z.; Huan, Z., Synthesis,
structure and antiferromagnetic behaviour of brannerite MnV2O6. Chinese physics B 2010, 19, 067503.
47. Viegas, J. s. I.; Moreira, R. L.; Dias, A., Polymorphism and Optical–Vibration Properties of
MnV2O6·nH2O (n = 0, 2, 4) Prepared by Microwave Irradiation. Crystal growth & design 2019, 19
(6), 3233-3243.
48. Liao, J. H.; Leroux, F.; Piffard, Y.; Guyomard, D.; Payen, C., Synthesis, Structures, Magnetic
Properties, and Phase Transition of Manganese(II) Divanadate: Mn2V2O7. Journal of Solid State
Chemistry 1996, 121 (1), 214-224.
49. Krasnenko, T. I.; Zhuravlev, N. A.; Rotermel, M. V., Stabilizing the triclinic structure of
Mn2V2O7 via isovalent cationic substitution. Bulletin of the Russian Academy of Sciences. Physics
2013, 77 (3), 246-248.
50. Knowles, K. M.; Vickers, M. E.; Sil, A.; Han, Y. H.; Jaffrenou, P., X‐ray powder diffraction
and electron diffraction studies of the thortveitite‐related L phase, (Zn,Mn)2V2O7. Acta
crystallographica. Section B, Structural science 2009, 65 (2), 160-166.
51. Yan, Q.; Li, G.; Newhouse, P. F.; Yu, J.; Persson, K. A.; Gregoire, J. M.; Neaton, J. B.,
Mn2V2O7: An Earth Abundant Light Absorber for Solar Water Splitting. Advanced energy materials
2015, 5 (8), 1401840.
52. Li, M.; Zheng, S.; Liu, B.; Wang, S.; Dreisinger, D. B.; Zhang, Y.; Du, H.; Zhang, Y., A Clean
and Efficient Method for Recovery of Vanadium from Vanadium Slag: Nonsalt Roasting and
Ammonium Carbonate Leaching Processes. Mineral processing and extractive metallurgy review 2017,
38 (4), 228-237.
53. Ellingham, S. T. D.; Thompson, T. J. U.; Islam, M., Scanning Electron Microscopy–Energy‐
Dispersive X‐Ray (SEM/EDX): A Rapid Diagnostic Tool to Aid the Identification of Burnt Bone and
Contested Cremains. Journal of forensic sciences 2018, 63 (2), 504-510.
54. Newbury, D. E.; Ritchie, N. W. M., Is Scanning Electron Microscopy/Energy Dispersive X‐ray
Spectrometry (SEM/EDS) Quantitative? Scanning 2013, 35 (3), 141-168.
55. Wolfgong, W. J., Chapter 14 - Chemical analysis techniques for failure analysis: Part 1,
common instrumental methods. Elsevier Ltd: 2016; pp 279-307.
56. Konopka, J. F., Quantitative Analysis of Oxygen in Metal Oxides with SEM/EDS by Direct
Measurement of all X-ray Peaks. 2012; Vol. 2012, pp V23C-2831.
57. Goldstein, J. I.; Newbury, D. E.; Michael, J. R.; Ritchie, N. W. M.; Scott, J. H. J.; Joy, D. C.,

93
Scanning Electron Microscopy and X-Ray Microanalysis. 4th ed. 2018. ed.; Springer New York: New
York, NY, 2018.
58. Chen, P., Table of key lines in x-ray powder diffraction patterns of minerals in clays and
associated rocks. Dept. of Natural Resources: Bloomington, Ind, 1977.
59. Shinoda, K.; Matsubara, E.; Waseda, Y., X-Ray Diffraction Crystallography: Introduction,
Examples and Solved Problems. 1. Aufl. ed.; Springer-Verlag: Berlin, Heidelberg, 2011.
60. Nijenhuis, J. t.; Gateshki, M.; Fransen, M. J., Eleventh European Powder Diffraction
Conference. In Possibilities and limitations of X-ray diffraction using high-energy X-rays on a
laboratory system, Oldenbourg Wissenschaftsverlag: 2015; pp 163-170.
61. Dzubay, T. G., X-ray fluorescence analysis of environmental samples. Ann Arbor Science
Publishers: Ann Arbor, Mich, 1977, 310, pp 324-325.
62. Margui, E.; Grieken, R. v., X-ray fluorescence spectrometry and related techniques : an
introduction. Momentum Press: New York, New York, 2013.
63. Thomas, R., Practical guide to ICP-MS a tutorial for beginners. 3rd ed. ed.; Taylor & Francis:
Boca Raton, 2013.
64. Kustel, G., Roasting of gold and silver ores : and the extraction of their respective metals
without quicksilver. New ed. ed.; A.J. Leary: San Francisco, 1880.
65. Ingraham, T. R.; Kerby, R., Roasting in extractive metallurgy a thermodynamic and kinetic
review. Canadian Metallurgical Quarterly 1967, 6 (2), 89-119.
66. Wen, J.; Jiang, T.; Xu, Y.; Cao, J.; Xue, X., Efficient extraction and separation of vanadium
and chromium in high chromium vanadium slag by sodium salt roasting-(NH4)2SO4 leaching. Journal
of industrial and engineering chemistry (Seoul, Korea) 2019, 71, 327-335.
67. Hebei Iron and Steel Co Ltd, Chengde Branch Applies for Patent on Method for Extracting
Vanadium from Vanadium Solution Through Vanadium Slag Sodium Salt Roasting Vanadium
Extraction Process. Global IP News. Chemical Patent News 2016.
68. Zheng, H.; Zhang, W.; Guo, Y.; Gao, Q.; Shen, F., Transformation of Vanadium-Bearing
Titanomagnetite Concentrate in Additive-Free Roasting and Alkaline-Pressure Leaching for Extracting
Vanadium (V). Minerals (Basel) 2019, 9 (3), 197.
69. Sedneva, T.; Lokshin, E.; Gromov, P.; Kopkova, E.; Shchelokova, E., Decomposing the
Titaniferous Magnetite Concentrate with Hydrochloric Acid. Theoretical Foundations of Chemical
Engineering 2011, 45, 753-763.
70. Zhang, A.; Monaghan, B.; Longbottom, R.; Nusheh, M.; Bumby, C., Reduction Kinetics of
Oxidized New Zealand Ironsand Pellets in H2 at Temperatures up to 1443 K. Metallurgical and
Materials Transactions B 2020, 51, 492-504.
71. Kasia, P., TIVAN extraction process underpins TNG project. Industrial Minerals 2013.
72. Ondrey, G., A new metals-recovery process moves to the pilot scale. Chemical engineering
2014, 121 (12), 12.
73. Wilson, A. M.; Bailey, P. J.; Tasker, P. A.; Turkington, J. R.; Grant, R. A.; Love, J. B., Solvent

94
extraction: the coordination chemistry behind extractive metallurgy. Chemical Society Reviews 2014, 43
(1), 123-134.
74. Yang, F.; Li, X.; Han, L.; Gao, F.; He, C.; Wei, Y., Solvent Extraction of Vanadium from
Sodium Carbonate–Sodium Bicarbonate Solution Using Aliquat-336. Mining, Metallurgy &
Exploration 2020, 37 (5), 1667-1672.
75. Liu, F.; Ning, P.-G.; Cao, H.-B.; Zhang, Y., Measurement and modeling for vanadium
extraction from the (NaVO3+H2SO4+H2O) system by primary amine N1923. The Journal of chemical
thermodynamics 2015, 80, 13-21.
76. Ye, G.; Hu, Y.; Tong, X.; Lu, L., Extraction of vanadium from direct acid leaching solution
of clay vanadium ore using solvent extraction with N235. Hydrometallurgy 2018, 177, 27-33.
77. Jiang, D.; Song, N.; Liao, S.; Lian, Y.; Ma, J.; Jia, Q., Study on the synergistic extraction of
vanadium by mixtures of acidic organophosphorus extractants and primary amine N1923. Separation
and purification technology 2015, 156, 835-840.
78. Tavakoli, M. R.; Dreisinger, D. B., Separation of vanadium from iron by solvent extraction
using acidic and neutral organophosporus extractants. Hydrometallurgy 2014, 141, 17-23.
79. Martins, A. H., Vanadium Precipitation From Sulfate Acid Solutions. Canadian metallurgical
quarterly 2000, 39 (1), 15-22.
80. Huang, Z., Hydrolysis of Titanic Acid in Hydrochloric Acid Solution for Synthesis of TiO2
Powder with Controlled Particle Size: Processes, Morphology, and Kinetics Study. M.S. Thesis,
University of Utah, Utah, USA, 2017.
81. Bumby, C., Hydrogen - an alternative reductant? https://stirringthepot.podbean.com/e/hydrogen-an-
alternative-reductant/ (accessed 20-11-21)
Copyright © 2022 FDOKUMEN