studies on the coordination chemistry of vanadium, barium
264
STUDIES ON THE COORDINATION CHEMISTRY OF VANADIUM, BARIUM AND COBALAMINS A dissertation submitted to Kent State University in partial fulfillment of the requirements for the degree of Doctor of Philosophy by Riya Mukherjee May, 2011
-
Upload
khangminh22 -
Category
Documents
-
view
0 -
download
0
Transcript of studies on the coordination chemistry of vanadium, barium
i
STUDIES ON THE COORDINATION CHEMISTRY OF VANADIUM, BARIUM
AND COBALAMINS
A dissertation submitted
to Kent State University in partial
fulfillment of the requirements for the
degree of Doctor of Philosophy
by
Riya Mukherjee
May, 2011

ii
Dissertation written by
Riya Mukherjee
B.Sc., University of Calcutta, Calcutta, India, 2000
M.Sc., University of Calcutta, Calcutta, India, 2002
Ph.D., Kent State University, 2011
Approved by
___________________________________ , Chair, Doctoral Dissertation Committee
Nicola E. Brasch, Ph.D.
___________________________________ , Advisor, Doctoral Dissertation Committee
Nicola E. Brasch, Ph.D.
___________________________________, Member, Doctoral Dissertation Committee
Scott D. Bunge, Ph.D.
___________________________________, Member, Doctoral Dissertation Committee
Derek S. Damron, Ph.D.
___________________________________, Member, Doctoral Dissertation Committee
Soumitra Basu, Ph.D.
___________________________________, Graduate Faculty Representative
John R. D. Stalvey, Ph.D.
Accepted by
_______________________________, Chair, Department of Chemistry & Biochemistry
Michael J. Tubergen, Ph.D.
___________________________________ , Dean, College of Arts and Sciences
John R. D. Stalvey, Ph.D.

iii
TABLE OF CONTENTS
LIST OF FIGURES……………………………………………………………………..X
LIST OF TABLES…………………………………………………………………..XVII
LIST OF SCHEMES……………………………………………………………….....XX
DEDICATION…………………………………………………………………...…..XXII
ACKNOWLEDGEMENTS………………………………………………………..XXIII
ABSTRACT……………………………………………………………………….....XXV
LIST OF PUBLICATIONS…………………………………………………..……..XXX
CHAPTER 1: INTRODUCTION AND BACKGROUND….………………………..1
1.1.Vitamin B12 (cobalamin)……………………………………………………………....1
1.1.1. B12−dependent enzyme reactions……………………………………………....1
1.1.2. Absorption, transport, cellular uptake and intracellular processing of
cobalamins……………………………………………………….......................4
1.1.3. Structure………………………………………………………………………..5
1.1.4. Oxidation states of the cobalt atom in cobalamins……………………………..7
1.1.5. Abiological syntheses of cobalamins…………………………………………...8
1.1.6. Characterization of cobalamins…………………………………………………9
1.1.6.1. X−ray crystallography……………………………………………………...9
1.1.6.2. Spectroscopic techniques………………………………………………….10
1.1.7. Non−enzymatic roles of cobalamins in alleviating chronic inflammation……13

iv
1.2. Vitamin B12−bioconjugates in targeted drug delivery………………………………14
1.3. Coordination chemistry of vanadium……………………………………………….16
1.3.1. Vanadium complexes formed in aqueous solution……………………………18
1.3.2. Vanadium in biology and medicine…………………………………………...20
CHAPTER 2: STRUCTURAL AND SPECTROSCOPIC EVIDENCE FOR THE
FORMATION OF POLYNUCLEAR V(III)/CARBOXYLATO
COMPLEXES IN AQUEOUS SOLUTION….………………………….22
2.1. Introduction…………………………………………………………………………22
2.2. Experimental………………………………………………………………………...24
2.2.1. Materials……………………………………………………………………….24
2.2.2. Instrumentation and Procedures…………………………………...…………..25
2.2.3. Preparation of V(III)/carboxylato solutions for NMR and
UV−visible spectrosopic measurements………………………………………26
2.2.4. PFG−NMR diffusion coefficient measurements……………………………...27
2.2.5. Syntheses of complexes [V3(3−O)(−OOCCH2Br)6(OH2)3]3+
(1)
and [V3(3−O)(−OOCCH2CH3)6(OH2)3]3+
(2) in aqueous solution………...27
2.2.6. X−ray crystallography experiment…………………………………………….28
2.3. Results and discussion……………………………………………………...………30
2.3.1. Syntheses and characterization of complexes 1 and 2 by
X-ray crystallography………………………………………………………….30
2.3.2. NMR spectroscopic studies on the formation of V(III)/carboxylato complexes
in aqueous solution………………………………………………………….....34
2.3.3. UV-visible spectroscopic studies on the formation of
V(III)/carboxylato complexes in aqueous solution……………………………44

v
2.4. Summary…………………………………………………………………………....48
CHAPTER 3: SELF−ASSEMBLY OF A NOVEL TWO−DIMENSIONAL
BARIUM/THIODIACETATE COORDINATION POLYMER IN
AQUEOUS SOLUTION……………………………………………....51
3.1 Introduction…………………………………………………………………………..51
3.2. Experimental………………………………………………………………………...52
3.2.1. Materials………………………………………………………………………..52
3.2.2. Instrumentation………………………………………………………………....53
3.2.3. Synthesis of {Ba[S(CH2COO)2(H2O)3]•2H2O}(1)………………………….....54
3.2.4. X−ray crystallography………………………………………………………….54
3.3. Results and discussion………………………………………………………………57
3.3.1. Synthesis and characterization of 1…………………………………………….57
3.3.2. Structural characterization of 1 by X−ray diffraction…………………………..61
3.4. Summary…………………………………………………………………………….66
CHAPTER 4: STUDIES ON VANADIUM−VITAMIN B12 BIOCONJUGATES
INCORPORATING A HYDROXYPYRIDINONE LINKER AS
POTENTIAL THERAPEUTICS FOR TREATING
DIABETES…………………………………………………………….68
4.1. Introduction………………………………………………………………………....68
4.2. Experimental………………………………………………………………………..71
4.2.1. Materials………………………………………………………………………71
4.2.2. Instrumentation………………………………………………………………..71
4.2.3. PFG−NMR diffusion coefficient measurement………………………………73

vi
4.2.4. Attempted separation of complexes 2 (VO2(OH/H)2L) and 3 (VO2L2) by
chromatography…………………………………………………………………73
4.2.5. In−vivo blood glucose lowering properties in the STZ−rat model for Type 1
diabetes…………………………………………………………………………..74
4.3. Results and discussion………………………………………………………………75
4.3.1. Characterization of complex 1 (3−(3−hydroxy−2−methyl−1H−pyridin−4−one)
propylcobalamin) by 1H NMR and UV-visible spectroscopy……………….....75
4.3.2 Systematic study of the binding of NaVO3 to 1 by NMR, UV-vis and FTIR
spectroscopy…………………………………………………………………….78
4.3.3. Measurements of the diffusion coefficients of complexes 2 and 3 by PFG NMR
experiments……………………………………………………………………..86
4.3.4 In vivo blood glucose−lowering properties complex 2 in the STZ−rat model for
Type 1 diabetes………………………………………………………………….88
4.4. Summary…………………………………………………………………….............90
CHAPTER 5: SYNTHESIS, SYNCHROTRON X−RAY DIFFRACTION AND
KINETIC STUDIES ON THE FORMATION AND
DECOMPOSITION OF A NOVEL THIOLATOCOBALAMIN OF
CAPTOPRIL…………………………………………………………..92
5.1. Introduction…………………………………………………………………………92
5.2. Experimental………………………………………………………………………...94
5.2.1. Materials………………………………………………………………………..94
5.2.2. Instrumentation………………………………………………………………...95
5.2.3. Synthesis of CapSCbl………………………..………………………………...96
5.2.4. Crystallization of CapSCbl…………………………………………………….97
5.2.5. X−ray diffraction studies on CapSCbl………………………………………....97

vii
5.2.6. Kinetic measurements on the formation of CapSCbl from aquacobalamin/
hydroxycobalamin and captopril……………………………………………....101
5.2.7. Kinetic measurements on the acid−catalyzed decomposition of CapSCbl…...102
5.3. Results and discussion……………………………………………………………..103
5.3.1. Synthesis and characterization of CapSCbl…………………………………...103
5.3.2. Evidence of cis−trans isomerization of the captopril ligand in CapSCbl by
1H NMR spectroscopy………………………………………………………...106
5.3.3. Further characterization of CapSCbl by X−ray crystallography……...……....111
5.3.3.1. Evidence for the cis−trans isomerization of the captopril ligand in
CapSCbl in the solid state…………………………………………….....114
5.3.3.2. Crystal packing in CapSCbl……………………………………………..115
5.3.4. Kinetic studies on the formation of CapSCbl…………………………………118
5.3.5. Kinetic studies on the acid−catalyzed decomposition of CapSCbl in aqueous
solution………………………………………………………………………...126
5.4. Summary…………………………………………………………………………...131
CHAPTER 6: KINETIC STUDIES ON THE REACTION OF COB(II)ALAMIN
WITH PEROXYNITRITE………………………………………….133
6.1. Introduction………………………………………………………………………...133
6.2. Experimental……………………………………………………………………….136
6.2.1. Materials………………………………………………………………………136
6.2.2. Instrumentation………………………………………………………………..136
6.2.3. Synthesis of Na+ONOO
−……………………………………………………...138
6.2.4. Synthesis of cob(II)alamin (Cbl(II))…………………………………………..139
viii
6.2.5. Solution preparation…………………………………………………………...139
6.2.6. Determination of the stoichiometry of the reaction between Cbl(II) and
ONOO(H)……………………………………………………………………..140
6.2.7. Kinetic measurements on the reaction of Cbl(II) with ONOO(H)……………140
6.2.8. Generation of the calibration curves for 3−nitrotyrosine and 3−hydroxytyrosine
................................................................................................................................141
6.2.9. Reaction of Cbl(II) with •NO2 ………………………………………………...141
6.3. Results and discussion……………………………………………………………..142
6.3.1. Determination of the acid dissociation constant and the rate constant for
spontaneous decomposition of ONOOH…………………………………….142
6.3.2. Determination of the molar extinction coefficients of Cbl(II)……………….144
6.3.3. Determination of the reaction stoichiometry………………………………...144
6.3.4. Kinetic studies on the reaction between Cbl(II) and ONOO(H)…………….149
6.3.5. Studies on the reaction between Cbl(II) and peroxynitrite in the presence of
tyrosine……………………………………………………………………….157
6.3.6. Attempt to determine the rate constant of the reaction between Cbl(II) and
•NO2 (g)……………………………………………………………………....164
6.4. Summary………………………………………………………………………….167
CHAPTER 7: KINETIC AND MECHANISTIC STUDIES ON THE REACTION
BETWEEN COB(I)ALAMIN AND PEROXYNITRITE………...169
7.1. Introduction………………………………………………………………………..169
7.2. Experimental……………………………………………………………………….170
7.2.1. Materials………………………………………………………………………170
7.2.2. Instrumentation………………………………………………………………..170

ix
7.2.3. Synthesis of cob(I)alamin (Cbl(I))…………………………………………….170
7.2.4. Preparation of solutions……………………………………………………….171
7.2.5. Determination of the stoichiometry of the reaction between Cbl(I) and
ONOO(H)……………………………………………………………………..172
7.2.6. Cbl(I) does not react with fully decomposed ONOO(H)……………………...172
7.2.7. Determining the amount of NH2OH formed in the Cbl(I) + ONOO− reaction..173
7.2.8. Oxidation of Cbl(I) by •NO2 (g) ………………………………………………174
7.3. Results and discussion……………………………………………………………..175
7.3.1. Kinetic studies on the reaction of Cbl(I) with ONOO(H)…………………….175
7.3.2. Stoichiometry of the reaction between Cbl(I) and ONOO(H)………………..183
7.4. Summary…………………………………………………………………………...188
CONCLUSIONS……………………………………………………………………....190
REFERENCES………………………………………………………………………..193

x
LIST OF FIGURES
CHAPTER 1: INTRODUCTION AND BACKGROUND
Figure 1.1. Structure of vitamin B12 derivatives………………………………………….2
Figure 1.2. Structure of vitamin B12 derivatives showing sites used for the conjugation
of therapeutics in vitamin B12 bioconjugates………………………………15
CHAPTER 2: STRUCTURAL AND SPECTROSCOPIC EVIDENCE FOR THE
FORMATION OF POLYNUCLEAR V(III)/CARBOXYLATO
COMPLEXES IN AQUEOUS SOLUTION
Figure 2.1. Thermal ellipsoid plot of [V3(3−O)(−OOCCH2Br)6(OH2)3]+ …………...31
Figure 2.2. Thermal ellipsoid plot of [V3(3−O)(−OOCCH2CH3)6(OH2)3]+………….31
Figure 2.3. 1H NMR spectra for equilibrated solution of VCl3 and 0.20 mol equiv.
free carboxylate……………………………………………………………..35
Figure 2.4. 1H NMR spectra for equilibrated solution of VCl3 and 20 mol equiv.
free carboxylate………………..………………………………..…………..37
Figure 2.5. Thermal ellipsoid plot of [V4(μ−OH)4(μ−OOCCH3)4(OH2)8]4+
…………...38
Figure 2.6. Plot of lne(I/I0) versus γ2G
2δ
2(Δ−δ/3) for the water signal in the PFG
NMR experiment for diffusion coefficient measurements……………….....40
Figure 2.7. Plot of lne(I/I0) versus γ2G
2δ
2(Δ−δ/3) for the signal for species B for the
V(III)/acetato system in the PFG NMR experiment for diffusion coefficient
measurements……………………………………………………………....41
Figure 2.8. Plot of lne(I/I0) versus γ2G
2δ
2(Δ−δ/3) for the signal for species B for the
V(III)/propionato system in the PFG NMR experiment for diffusion
coefficient measurements………………………………………………..….42
xi
Figure 2.9. UV-visible spectra for equilibrated solutions of VCl3 and 2.0 mol equiv.
free carboxylates…………………………………………………………….45
Figure 2.10. UV-visible spectra for equilibrated solutions of VCl3 and 20 mol equiv.
free carboxylates…………………………………………………………...47
CHAPTER 3: SELF−ASSEMBLY OF A NOVEL TWO−DIMENSIONAL
BARIUM/THIODIACETATE COORDINATION POLYMER IN
AQUEOUS SOLUTION
Figure 3.1. FTIR spectrum for {Ba[S(CH2COO)2(H2O)3]•2H2O}n (1)………………....59
Figure 3.2. Thermogram for 1 from the TGA experiment…….………………………...60
Figure 3.3. Thermal ellipsoid plot of the partial linkage motif in 1……………………..61
Figure 3.4. The coordination environment around each Ba2+
center in 1……………….62
Figure 3.5. Structure of 1 showing the Ba/tda network layer parallel to the bc plane…..64
Figure 3.6. View of the framework in 1 along the b axis……………………………….65
CHAPTER 4: STUDIES ON VANADIUM−VITAMIN B12 BIOCONJUGATES
INCORPORATING A HYDROXYPYRIDINONE LINKER AS
POTENTIAL THERAPEUTICS FOR TREATING DIABETES
Figure 4.1. Structure of 3−(3−hydroxy−2−methyl−1H−pyridin−4−one)propyl-
cobalamin (1) ………………………………………………………...76
Figure 4.2. Aromatic region of the 1H NMR spectrum of 1, pD 7.4 at 24 C………….77
Figure 4.3. UV-visible spectrum of 1, pD 7.4 at 24 C………………………………...78
Figure 4.4. Aromatic region of the 1H NMR spectrum of an equimolar solution of 1 and
NaVO3, pD 9.1 at 24 C……………………………………………………..79

xii
Figure 4.5. Aromatic region of the 1H NMR spectrum of 1 with 3.0 mole equiv. NaVO3,
pD 8.7 at 24 C…………………………………………………………80
Figure 4.6. Aromatic region of the 1H NMR spectrum of 1 with 0.20 mole equiv. NaVO3,
pD 8.9 at 24 C……………………………………………………………81
Figure 4.7. Aromatic region of the 1H NMR spectrum of 1 with 1.0 mole equiv. NaVO3,
pD 7.4 at 24 C………………………………..……………………………81
Figure 4.8. Aromatic region of the 1H NMR spectrum of 1 with 3.0 mole equiv. NaVO3,
pD 7.4 at 24 C……………………………………………………..………82
Figure 4.9. 51
V NMR spectrum of 1 with 1.0 mole equiv. NaVO3, pD 8.9 at 24 C……83
Figure 4.10. 51
V NMR spectrum of 1 with 3.0 mole equiv.NaVO3, pD 8.7 at 24 C…...83
Figure 4.11. IR spectra of 1 with increasing amounts of NaVO3, pH 8.7, 25 C…........85
Figure 4.12. Plot of lne(I/I0) versus γ2G
2δ
2(Δ−δ/3) corresponding to complex 2, pD 9.1
in the PFG NMR experiment for diffusion coefficient measurements….....87
Figure 4.13. Plot of lne(I/I0) versus γ2G
2δ
2(Δ−δ/3) corresponding to complex 3, pD 8.9
in the PFG NMR experiment for diffusion coefficient measurements……..87
Figure 4.14. Blood glucose levels for STZ-rats.………………………………………...89
CHAPTER 5: SYNTHESIS, SYNCHROTRON X−RAY DIFFRACTION AND
KINETIC STUDIES ON THE FORMATION AND
DECOMPOSITION OF A NOVEL THIOLATOCOBALAMIN OF
CAPTOPRIL
Figure 5.1. Structure of captopril………………………………………………………..93
Figure 5.2. UV-visible spectrum of CapSCbl………………………………………….104
Figure 5.3. ES-MS of CapSCbl in H2O………………………………………………..105
xiii
Figure 5.4. Aromatic region of the 1H NMR spectra of CapSCbl, pD 5.5 at 25 C…...107
Figure 5.5. Aromatic region of the 1H NMR spectra of CapSCbl in CD3OD………....109
Figure 5.6. Aromatic region of the 1H NMR spectra of CapSCbl in CD3OD + increasing
% of D2O…………………………………………………………………...110
Figure 5.7. Thermal ellipsoid plot of CapSCbl………………………………………...112
Figure 5.8. UV-visible spectra of H2OCbl+/HOCbl and 10 mole equiv. captopril,
pH 7.75 at 25 C……………………………………………………..…….118
Figure 5.9. Plot of kobs versus total captopril concentration for the formation of
CapSCbl from H2OCbl+ and captopril, pH 7.72 at 25 C………………….119
Figure 5.10. Plot of kobs versus total captopril concentration for the formation of
CapSCbl from H2OCbl+ and captopril at pH 4.50, 4.73, 5.10 and 5.60,
25 C………….………………………………………………………….120
Figure 5.11. Plot of kobs versus total captopril concentration for the formation of
CapSCbl from H2OCbl+ and captopril, pH 6.50, 7.04, 7.42 and 8.05 at
25 C…….………..………………………………………………………121
Figure 5.12. Plot of kobs versus total captopril concentration for the formation of
CapSCbl from H2OCbl+ and captopril, pH 8.52, 9.00 and 9.53 at
25 C ……………………………..............................................................122
Figure 5.13. Plot of absorbance versus wavelength for the conversion of CapSCbl to
Cbl(II), pH 9.00 under anaerobic conditions…………………………...123
Figure 5.14. Plot of kobs/[captopril]T versus pH for the formation of CapSCbl from
H2OCbl+/HOCbl and captopril…………………………………………124
Figure 5.15. Plot of absorbance with wavelength for the decomposition of CapSCbl at
pH 3.00 at 25 C…………………………………………………………126

xiv
Figure 5.16. Plot of absorbance versus time for the decomposition of CapSCbl at pH
2.90 at 25 C……………………………………………………………...127
Figure 5.17. Plot of kobs versus pH for the acid-catalyzed decomposition of CapSCbl
…………...………………………………………………………………..128
CHAPTER 6: KINETIC STUDIES ON THE REACTION OF COB(II)ALAMIN
WITH PEROXYNITRITE
Figure 6.1. Plot of absorbance versus time for the spontaneous decomposition of
ONOO(H) at pH 7.31 at 25 C………………………………………….…142
Figure 6.2. Plot of kobs vs. pH for the spontaneous decomposition of ONOO(H) at 25 C
………………………………………………………………......................143
Figure 6.3. Plot of absorbance versus Cbl(II) concentration at 475 and 537 nm……....144
Figure 6.4. UV-visible spectra for equilibrated anaerobic solutions of Cbl(II) with
0.21 – 0.51 mol equiv. of ONOO–, pH 12.3 at 25 C………………….….145
Figure 6.5. Aromatic region of the 1H NMR spectrum of the product of the reaction of
Cbl(II) and 0.55 mol equiv. of ONOO−, pD 13.2 at 24 C………………..147
Figure 6.6. UV-visible spectra for equilibrated anaerobic solutions of Cbl(II) with
0.22 – 0.55 mol equiv. of ONOO(H), pH 7.35 at 25 C……………..…….148
Figure 6.7. Aromatic region of the 1H NMR spectrum of the product of the reaction
of Cbl(II) and 0.55 mol equiv. of ONOO(H), pD 7.50 at 24 C………......149
Figure 6.8. Plot of absorbance versus wavelength for the reaction of Cbl(II) and
ONOO(H), pH 7.35 at 25 C……………………………………………..150
Figure 6.9. Plot of kobs versus [Cbl(II)]T for the reaction between Cbl(II) and ONOO(H),
pH 7.35 at 25 C…………………………………………………………..151

xv
Figure 6.10. Plot of absorbance versus time for the reaction of Cbl(II) with ONOO–,
pH 12.00 at 25 C…………………………………………………..…….152
Figure 6.11. Plot of kobs versus [Cbl(II)]T for the reaction between Cbl(II) and ONOO–,
pH 12.01 at 25 C…………………….…………………………………..153
Figure 6.12. Plot of kobs versus [ONOO–]T for the reaction between Cbl(II) and ONOO
–,
pH 12.01 at 25 C………………………………………………………..153
Figure 6.13. Plot of kobs versus [Cbl(II)]T for the reaction between Cbl(II) and
ONOO(H), pH 7.15, 8.20, 8.50, 9.50 and 11.10 at 25 C………………154
Figure 6.14. Plot of k versus pH for the reaction of Cbl(II) with ONOO(H) at 25 C...155
Figure 6.15. HPLC chromatogram for the reaction of Tyr and ONOO(H) at pH 7.4
± 0.1 at room temperature………………………………………..………158
Figure 6.16. Calibration curve for NO2–Tyr and HO–Tyr at pH 7.4 ± 0.1………….159
Figure 6.17. HPLC chromatogram for the reaction of Tyr and ONOO(H) in the
presence of Cbl(II) at pH 7.4 ±0.1 at room temperature………….……....160
Figure 6.18. UV-visible spectrum for the peak at 22.5 min in the HPLC
chromatogram……….……………………………………………………162
Figure 6.19. HPLC chromatogram of the product solution of the reaction of Cbl(II)
with NO2(g)…………….…………………………………………….…163
CHAPTER 7: KINETIC AND MECHANISTIC STUDIES ON THE REACTION
BETWEEN COB(I)ALAMIN AND PEROXYNITRITE
Figure 7.1. Plot of absorbance versus time for the reaction of Cbl(I) with ONOO(H)
at pH 9.24 at 25 C………………………………………………………...176
xvi
Figure 7.2. Plot of kobs versus [ONOO(H)]T the reaction of Cbl(I) with ONOO(H) at
pH 9.24 at 25 C………………………………….……………..………...177
Figure 7.3. Plot of kobs versus [ONOO(H)]T the reaction of Cbl(I) with ONOO(H) at
pH 8.42, 8.70, 10.42, 11.67 and 12.23 at 25 C……………..………..…...178
Figue 7.4. Plot of k versus pH for the reaction of Cbl(I) with ONOO(H) at 25 C.
Data are fitted assuming both ONOO- and ONOO(H) react with Cbl(I)…...179
Figure 7.5. Plot of k versus pH for the reaction of Cbl(I) with ONOO(H) at 25 C.
Data are fitted assuming only ONOO(H) reacts with Cbl(I)……………...180
Figure 7.6. UV-visible spectra for the reaction of Cbl(I) with ONOO– at pH 12.25 at
25 C, collected for 180 ms………………………………………………181
Figure 7.7. UV-visible spectra for the reaction of Cbl(I) with ONOO– at pH 12.30 at
25 C, collected for 6 s…………………………………………………….182
Figure 7.8. Plot of absorbance versus time at 475 nm for the data in Figure 7.7……...183
Figure 7.9. UV-visible spectra for equilibrated anaerobic solutions of Cbl(I) with 0 –
0.30 mole equiv. ONOO–, pH 12.25 at 25 C………….…………………184
Figure 7.10. Plot of absorbance at 489 nm versus [ONOO–]/[Cbl(I)]…………………185

xvii
LIST OF TABLES
CHAPTER 1: INTRODUCTION AND BACKGROUND
Table 1.1. pKbaseoff values for some XCbls……………………………………………..7
Table 1.2. 1H NMR chemical shifts in the aromatic region for some cobalamin
complexes………………………………………………………………….11
Table 1.3. UV-spectroscopic data for some cobalamin complexes……………………..12
CHAPTER 2: STRUCTURAL AND SPECTROSCOPIC EVIDENCE FOR THE
FORMATION OF POLYNUCLEAR V(III)/CARBOXYLATO
COMPLEXES IN AQUEOUS SOLUTION
Table 2.1. Crystal data and structure refinement parameters for complexes 1 and 2…...29
Table 2.2. Selected bond lengths and bond angles for complexes 1 – 6 ………………..33
Table 2.3. 1H NMR spectroscopy chemical shifts and relative intensity for equilibrated
solutions of VCl3 and CH3COOH…………………………………………..36
Table 2.4. 1H NMR spectroscopy chemical shifts and relative intensity for equilibrated
solutions of VCl3 and CH3CH2COOH……………………………...……..…36
CHAPTER 3: SELF−ASSEMBLY OF A NOVEL TWO−DIMENSIONAL
BARIUM/THIODIACETATE COORDINATION POLYMER IN
AQUEOUS SOLUTION
Table 3.1. Crystal data and structure refinement for {Ba[S(CH2COO)2(H2O)3]•2H2O}n
(1)……………………………………………...…55

xviii
Table 3.2. Selected bond lengths and bond angles for 1………………………………...56
Table 3.3. Wavenumbers and band assignments for the FTIR spectra of thiodiacetic
acid and its metal complexes…………………………………………………58
CHAPTER 5: SYNTHESIS, SYNCHROTRON X−RAY DIFFRACTION AND
KINETIC STUDIES ON THE FORMATION AND
DECOMPOSITION OF A NOVEL THIOLATOCOBALAMIN OF
CAPTOPRIL
Table 5.1. Crystal data and structure refinement parameters for CapSCbl–1 and
CapSCbl–2………………………………………………………………....100
Table 5.2. Comparison of the cobalt coordination sphere for thiolatocobalamins…….113
Table 5.3. Rate constants and pKa values for the decomposition of thiolatocobalamins
…………………………………………………………..………………….129
CHAPTER 6: KINETIC STUDIES ON THE REACTION OF COB(II)ALAMIN
WITH PEROXYNITRITE
Table 6.1. Determination of the stoichiometry of the reaction between Cbl(II) and
ONOO–
at pH 12.3…………………………………………………………146
Table 6.2. Determination of the stoichiometry of the reaction between Cbl(II) and
ONOO–
at pH 7.35…………………………………………………………148
Table 6.3. Yield of NO2–Tyr and HO–Tyr formed from the reaction of ONOO(H) with
Tyr, pH 7.4…………………………………………………………………159
Table 6.4. Comparison of the area of the peak at 22.5 min and the NO2Cbl peak at
varying [Cbl(II)]/[ONOO(H)] ratios……………………………………….162
Table 6.5. Scavenging of OH using D-mannitol …………………………………..….166
xix
CHAPTER 7: KINETIC AND MECHANISTIC STUDIES ON THE REACTION
BETWEEN COB(I)ALAMIN AND PEROXYNITRITE
Table 7.1. Determination of the stoichiometry of the reaction between Cbl(I) and ONOO–
at pH 12.25…………………………………………………………………..186
xx
LIST OF SCHEMES
CHAPTER 1: INTRODUCTION AND BACKGROUND
Scheme 1.1. Base–on/base–off equilibria for cobalamins……………………………….6
Scheme 1.2. Vanadate complexes formed in aqueous solutions ………………………..19
Scheme 1.3. Hydrolysis and aggregation of V(III) in aqueous solution………………...20
CHAPTER 3: SELF−ASSEMBLY OF A NOVEL TWO−DIMENSIONAL
BARIUM/THIODIACETATE COORDINATION POLYMER IN
AQUEOUS SOLUTION
Scheme 3.1. Modes of coordination of the tda ligand to the Ba2+
center in 1…………...63
CHAPTER 4: STUDIES ON VANADIUM−VITAMIN B12 BIOCONJUGATES
INCORPORATING A HYDROXYPYRIDINONE LINKER AS
POTENTIAL THERAPEUTICS FOR TREATING DIABETES
Scheme 4.1. Complexes formed upon the addition of NaVO3 to 1……………………...79
CHAPTER 5: SYNTHESIS, SYNCHROTRON X−RAY DIFFRACTION AND
KINETIC STUDIES ON THE FORMATION AND
DECOMPOSITION OF A NOVEL THIOLATOCOBALAMIN OF
CAPTOPRIL
Scheme 5.1. Cis–trans isomerization equilibrium for captopril in solution……………107
Scheme 5.2. Mechanism of the reaction of H2OCbl+/HOCbl with captopril to form
CapSCbl…………………………………………………………………..124
Scheme 5.3. Proposed reaction pathway for the acid-catalyzed decomposition of
CapSCbl……………………………………………………...…………...130
xxi
CHAPTER 6: KINETIC STUDIES ON THE REACTION OF COB(II)ALAMIN
WITH PEROXYNITRITE
Scheme 6.1. Decomposition pathways for ONOO(H)…………………………………133
Scheme 6.2. Proposed literature reaction for metal-catalyzed decomposition and
isomerization of ONOO(H)………………………………………………135
Scheme 6.3. Reaction pathway for spontaneous decomposition of ONOO(H)………..143
Scheme 6.4. Proposed mechanism for the reaction of Cbl(II) with ONOO(H)………..156
Scheme 6.5. Oxidation and nitration of Tyr by NO2 ………………………………….157
Scheme 6.6. Formation of NO2–Tyr from the reaction between Tyr and OH and
NO2……………………………………………………………………..165
CHAPTER 7: KINETIC AND MECHANISTIC STUDIES ON THE REACTION
BETWEEN COB(I)ALAMIN AND PEROXYNITRITE
Scheme 7.1. Possible pathway for the reaction between Cbl(I) and ONOO(H)……….188

xxii
DEDICATION
To My Family
xxiii
ACKNOWLEDGEMENTS
This dissertation would not have been possible without my advisor, Dr. Nicola E.
Brasch, who has been an excellent mentor with her continuous help, support, guidance
and feedback throughout the course of the work. I am grateful and sincerely thank her for
everything. I also express sincere gratitude for my Ph.D. committee members – Dr.
ScottD. Bunge, Dr. Soumitra Basu and Dr. Derek S. Damron, for their assistance in
finalizing the dissertation. I am grateful to Dr. Anatoly K. Khitrin for his assistance with
the NMR experiments in addition to his valuable help in early stages of this work as a
Ph.D.committee member. I would also like to thank Dr. Mahinda Gangoda (Kent State
University) for his valuable assistance. Special thanks go to Dr. Scott D. Bunge (Kent
State University), Dr. Christopher J. Ziegler (University of Akron), Dr. Clyde A. Smith
(Stanford Synchrotron Radiation Laboratory, Stanford University) and Dr. Andrew
McCaddon (Cardiff School of Medicine, Cardiff University, Heath Park, Cardiff, U.K.)
for their assistance with the X–ray crystallographic studies and/or for helpful suggestions
as co-authors of my publications. I would also like to thank Dr. John Stalvey for being
the Graduate Faculty Representative for my oral defense.
I would like to thank the former members of our research group, especially Brenda
A. Dougan, Dr. Michal A. Radomski, Dr. Edward Donnay and Dr. Edward
Suarez−Moreira, for their guidance during the early stages of my research. I would also

xxiv
like to thank Hanaa Hassanin, a former member of our group. Sincere thanks go to all the
present members of my research group, especially Harishchandra, Rohan, Noah, David
and Jeff for all their help. Special thanks to Noah and David for their assistance in proof–
reading this dissertation. I would also like to thank Ms. Arla Dee McPherson and Ms.
Erin Michael for all their assistance including the proof–reading this dissertation.
I owe my gratitude to my parents, Ma (Mrs. Maya Basu) and Baba (Mr. Tapan
Kumar Basu), for being the inspiration behind my work and for their continuous guidance
since the formative years of my education. In addition, I would like to thank my parents–
in law and other members of my family for their patience and support.
Last but most importantly, I would like to thank the person who stood beside me
and shared every moment of my ups and downs during all these years: my husband Dr.
Ritam Mukherjee. Ritam, you made my dream your own and with your unwavering love,
support and encouragement saw to it that it come true. I can’t thank you enough for being
there for me.
Riya Mukherjee,
May 2011, Kent, Ohio

xxv
ABSTRACT
Part 1 of this dissertation is concerned with structural and spectroscopic studies on
polynuclear V(III)/carboxylato complexes (Chapter 2) and a Ba(II)/thiodiacetato complex
(Chapter 3) formed in aqueous solution. The formation of vanadium(III) complexes with
nuclearity greater than two has been proposed by others in aqueous solution on the basis
of potentiometric, electrochemical, and/or UV−vis spectroscopy titration measurements.
However, prior to the studies reported in this dissertation, there was limited structural
evidence for these complexes. Upon the addition of 1−2 equiv of acetate, propionate,
chloroacetate, trifluoroacetate, or bromoacetate to an aqueous, acidic solution of
vanadium(III), trinuclear and/or tetranuclear complexes crystallized. The structures of
[V3(µ3−O)(µ−OOCCH2Br)6(OH2)3]CF3SO3•H2O (1) and [V3(µ3−O)(µ−OOCCH2CH3)6−
(OH2)3]Cl•2H2O (2) have been determined by X−ray diffraction. Importantly,
electrospray mass spectrometry and 1H NMR measurements suggest that formation of
these complexes is not purely a solid−state phenomenon, but the complexes are also
present in solution. For the vanadium(III)/acetato and vanadium(III)/propionato systems,
two paramagnetic 1H NMR signals corresponding to two distinct complexes (species A
and B) are observed in the 40−55 ppm region for 0.20 mol equiv of acetate or propionate,
at pD 3.44. No corresponding signals are observed for the vanadium(III)/bromoacetato
and vanadium(III)/chloroacetato systems under the same conditions or for the
xxvi
vanadium(III)/trifluoroacetato system using 19
F NMR spectroscopy. UV−vis
spectroscopic data suggest that species B are structurally analogous for the
vanadium(III)/acetato and vanadium(III)/propionato systems, whereas structurally
different complexes are the major species for the other systems. Diffusion coefficients of
species B for the vanadium(III)/acetato and vanadium(III)/propionato systems determined
by pulsed−field−gradient spin−echo NMR spectroscopy are (3.0 ± 0.1) × 10−6
and (3.23 ±
0.01) × 10−6
cm2
s−1
, respectively. These values are consistent with species B being
trinuclear, rather than tetranuclear, complexes.
In an attempt to synthesize a thiodiacetato complex of V(III), a novel
Ba(II)/thiodiacetato polymer {Ba[S(CH2COO)2(H2O)3]•2H2O}n, crystallized from an
aqueous solution containing V2(SO4)3, BaCO3, NaCO3 and thiodiacetate (tda) ligand.
Chapter 3 concerns the synthesis and characterization of the identical polymeric
thiodiacetate (tda) complex of Ba2+
, {Ba[S(CH2COO)2(H2O)3]•2H2O}n, by reacting
BaCl2 with tda in aqueous solution. The complex crystallizes in the monoclinic P21/c
space group with Z = 4 and the unit cell dimensions a = 13.069 A˚, b = 7.350 A˚ and c =
2.932 A˚. Ba2+
is ten−coordinate, ligated to four tda (O and S) and three aqua ligands.
Four distinct binding modes of tda to the Ba2+
center are observed. Each Ba2+
center is
coordinated via a tda ligand to four equivalent adjacent Ba2+
centers, creating an extended
2−D polymeric layered structure, with alternate interstitial layers of water. The complex
has also been characterized by elemental analysis, FT−IR spectroscopy, and
thermogravimetric analysis. 1H and
13C NMR spectroscopic data suggest that the
polymeric structure found in the solid state is not present in aqueous solution itself.

xxvii
Part 2 of this dissertation is concerned with cobalamin (= vitamin B12) chemistry.
In Chapters 4 and 5, the syntheses and characterization of novel bioconjugates of
vitamin B12 incorporating vanadate (Chapter 4) and captopril (Chapter 5) are
described. The development of vanadate (V(V)) and vanadyl (V(IV)) therapeutics as
oral insulin substitutes or for co−administration with insulin for treating diabetes is an
active research field. Vanadium complexes not only lower blood glucose levels, but
also reduce secondary complications associated with this disease. However, poor
intestinal absorption is a limiting factor for these complexes. By coordinating the
therapeutic to the upper (= β) axial site of cobalamin, the absorption and cellular
uptake of the therapeutic can be significantly enhanced. In Chapter 4 the solution
characterization of two B12 conjugates of vanadate, potentially orally active
therapeutics for the treatment of diabetes, are reported. V(V) is conjugated to the
Co(III) atom of vitamin B12 by a (3−hydroxy−2−methyl−1H−pyridin−4−one)propyl
linker. The conjugates are characterized by 1H and
51V NMR spectroscopy, mass
spectrometry, and FTIR spectroscopy. Diffusion coefficients determined using
pulsed−field−gradient spin−echo NMR spectroscopy methods support other
characterization data. Finally, the conjugates have been tested in the streptozotocin
(STZ) rat model for Type 1 diabetes, and show that the complexes are more effective
than vanadate alone at lowering blood glucose levels.
The orally administered therapeutic captopril is widely used for treating
hypertension, congestive heart failure, and cardiovascular disease. However, a number of
undesirable side effects are associated with high doses of captopril. Chapter 5 reports the
xxvii

xxviii
synthesis of captopril−cobalamin (CapSCbl), a novel vitamin B12 conjugate in which
captopril is bound via its sulfhydryl group at the β−axial site of the cobalamin moiety.
Characterization of CapSCbl by 1H NMR spectroscopy and X−ray diffraction shows that
CapSCbl exists in solution and the solid state as a mixture of two geometric isomers and
the formation of these isomers is solvent−dependent in solution. Kinetic studies on the
formation of CapSCbl from aquacobalamin and captopril are reported. The data fits a
model in which the thiol form (RSH, k1 = 40.9 ± 1.2 M−1
s−1
) and the thiolate form of
captopril (RS−, k2 = 660 ± 170 M
−1 s
−1) react rapidly with aquacobalamin. Kinetic studies
on the decomposition of CapSCbl show that the reaction is acid−catalyzed, and rapid for
pH < 3.
The last two chapters, Chapters 6 and 7 of this dissertation concern kinetic and
mechanistic studies on the reaction of peroxynitrite/peroxynitrous acid
(ONOO−/ONOOH) with the reduced forms of vitamin B12, cob(II)alamin (Chapter 6) and
cob(I)alamin (Chapter 7). Cob(I)alamin and cob(II)alamin are important intracellular
vitamin B12 species. ONOO−/ONOOH is implicated in multiple chronic inflammatory
and neurodegenerative diseases. Both mammalian B12−dependent enzymes are
inactivated under oxidative stress conditions. In Chapter 6, studies on the kinetics and
mechanism of the reaction between ONOO−/ONOOH and cob(II)alamin (Cbl(II)) using
stopped−flow spectroscopy show that ONOOH, not ONOO−, reacts directly with Cb(II)
to give cob(III)alamin and NO2, followed by a subsequent rapid reaction between
NO2
and a second molecule of Cbl(II) to primarily form nitrocobalamin. In support of this
mechanism a Cbl(II):ONOO(H) stoichiometry of 2:1 is observed at pH 7.35 and 12.0.
xxviii

xxix
The final major cob(III)alamin product observed (nitrocobalamin or hydroxycobalamin)
depends on the solution pH. Analysis of the reaction products in the presence of tyrosine,
which scavenges NO2 to form 5−nitrotyrosine, reveals that cob(II)alamin reacts with
NO2 faster than tyrosine itself. However, estimation of the rate constant of the reaction
between Cbl(II) and NO2 was not possible due to the presence of
OH, which also
contributes to nitrotyrosine formation.
Finally, Chapter 7 reports kinetic and mechanistic studies on the reaction of
cob(I)alamin (Cbl(I)) and ONOO−/ONOOH. Cbl(I) reacts rapidly with ONOOH and
ONOO−
with second−order rate constants of 1.6 × 10⁸ M
−1 s
−1 and 1.36 × 10
5 M
−1 s
−1,
respectively, 25 °C. A mechanism in which rate−determining 1e− oxidation of Cbl(I) by
ONOO(H) to yield Cbl(I) and NO2 followed by multiple fast steps leading ultimately to
the oxidation of 5Cbl(I) to 5Cbl(II) and the generation of N2 is proposed.
xxix

xxx
LIST OF PUBLICATIONS
Material contained in the following chapters of this dissertation has been published
elsewhere:
Chapter 2: Riya Mukherjee, Brenda A. Dougan, Fiona Fry, Scott D. Bunge, Christopher
Ziegler, Nicola E. Brasch, Inorg. Chem., 2007, 46, 1575-1585.
Chapter 3: Riya Mukherjee, Scott D. Bunge, Nicola E. Brasch, J. Coord. Chem., 2010,
63, 2821–2830.
Chapter 4: Riya Mukherjee, Edward G. Donnay, Michal A. Radomski, Catherine Miller,
Duane A. Redfern, Arne Gericke, Derek S. Damron and Nicola E. Brasch, Chem. Comm.,
2008, 3783–3785.
Chapter 5: Riya Mukherjee, Andrew McCaddon, Clyde A. Smith, and Nicola E.
Brasch, Inorg. Chem., 2009, 48, 9526–9534.
xxx
1
CHAPTER 1
INTRODUCTION AND BACKGROUND
1.1 VITAMIN B12 (COBALAMINS)
Vitamin B12 (cyanocobalamin, CNCbl, Figure 1.1, X = CN−) and its derivatives, also
known as cobalamins (Cbls), are essential nutrients in all living organisms. Higher
organisms including humans cannot synthesize vitamin B12 and must get their daily
supply (1–6 µg) from the diet, specifically from animal products [1]. In humans, the lack
of sufficient dietary intake, poor absorption or malfunctioning of enzymes involved in
B12 transport, intracellular uptake or intracellular B12 processing results in a deficiency of
vitamin B12 [2]. Pernicious anaemia (megaloblastic anaemia) is the most common
pathological condition that results from vitamin B12 deficiency [3]. Other important
clinical consequences of B12 deficiency are hyperhomocysteinemia, methylmalonic
acidemia and neurological disorders [4].
1.1.1 B12–DEPENDENT ENZYME REACTIONS
Cobalamins are important cofactors in several intracellular enzymatic reactions. In
mammals, two enzyme reactions require cobalamins as coenzymes. Methionine synthase
(MS) utilizes methylcobalamin (MeCbl, X = CH3, Figure 1.1) in an enzymatic

2
CH3
CONH2ONH
NNCH3
CH3
OP
O
H
CH3
O O–
O
OH
CH3N
NOH
CH3
N
CoIII
NCONH2
CH3
CONH2
CH3
H3CH3C
CONH2
CONH2
H
H
H
H
H
H
B2
B4
C10
B7R1
H2NOC
-axial site
X
-axial site
A B
CD
bc
d
ef
a
gCo
X
Bzm
or Co
X
N
pathway occurring in the cytosol, where MS transfers a methyl group from
methyltetrahydrofolate (MTHF) to homocysteine (Hcy) via cobalamin to generate
tetrahydrofolate (THF) and methionine [5].
Figure 1.1. Structure of vitamin B12 derivatives (cob(III)alamins, Cbl(III); X = Ado, Me,
H2O/HO, NO2, CN etc). A–D and a–g represent the conventional nomenclature for the
pyrrole rings and the amide side chains, respectively [6]. Ligand X is lost upon reduction
of Cbl(III) to pentacoordinate cob(II)alamin, Cbl(II). The bond to the Bzm at the α–axial
site is broken upon reduction of Cbl(II) to tetracoordinate cob(I)alamin, Cbl(I). Also
indicated on this figure are the protons that resonate in the aromatic region of the 1H
NMR spectrum, labelled B2, B4, B7, R1 and C10. Simplified representations of the
Cbl(III)s are given on the right hand side.

3
Elevated levels of Hcy (hyperhomocysteinemia) is a risk factor for cardiovascular
diseases [7] and neurological diseases [8-10]. Therefore, this reaction is important in
order to maintain normal levels of Hcy inside the cells and for methionine biosynthesis.
In mitochondria, L–methylmalonyl–CoA mutase (MMCM) catalyzes the reversible
isomerization of L–methylmalonyl–CoA to succinyl–CoA, an important substrate of the
Krebs cycle, and requires adenosylcobalamin (AdoCbl, X = 5’–deoxyadenosine or Ado,
Figure 1.1) as a coenzyme [6].
In addition to these two enzymes, cobalamins are the cofactors for several other
enzymes including eliminases, reductases and dehalogenases in lower organisms [6]. For
example, MeCbl participates in the enzymatic pathway of carbon dioxide fixation in
anaerobic acetogenic bacteria and methanogenic archaea. AdoCbl is the cofactor of class
II ribonucleotide reductases (RNR) that catalyze the reduction of ribonucleoside tri– or
diphosphates to 2’–deoxyribonucleoside tri– or diphosphates in bacteria. In anaerobic
suphidogenic bacteria, cobalamin–dependent dehalogenases reductively eliminate
chlorine from aliphatic and aromatic hydrocarbons [6]. All B12 metabolic pathways
involve the cleavage (homolytic or heterolytic) of the Co–C bond of MeCbl and AdoCbl.
Homolytic Co–C cleavage is favored over the heterolytic cleavage for AdoCbl–
dependent enzymes. However, both heterolytic and homolytic Co–C cleavage are
observed for MeCbl [11, 12]. The rate constant for Co–C bond homolysis in AdoCbl–
bound MMCM (k = 3.34 × 10³ s
–1 at 37 °C [13]) is ~12 orders of magnitude larger than
free AdoCbl (k = 8.9 × 10⁻⁹
s–1
at 37 °C [14]).

4
1.1.2 ABSORPTION, TRANSPORT, CELLULAR UPTAKE AND
INTRACELLULAR PROCESSING OF COBALAMINS
Recent developments on intracellular B12 trafficking have been reviewed by R.
Banerjee et al [5]. Cobalamins derived from the diet are transported to the cells by a
carrier system consisting of several proteins. First, cobalamin binds to haptocorrin (HC),
a salivary glycoprotein, which transports it to the duodenum through the stomach. In the
duodenum, pancreatic proteases release the vitamin which then binds to a second
glycoprotein carrier called intrinsic factor (IF). IF–bound–B12 complex is absorbed in the
intestine by the mucosal cells via endocytosis, mediated by the IF–receptor cubam [5].
Cubam is composed of two proteins–cubilin and amnionless [15]. IF is subsequently
degraded and the vitamin is released into the bloodstream, where it binds to another
transport protein, transcobalamin (TC, formally called TCII). HC is also found in the
bloodstream and ~80% of the cobalamin is bound to this transporter protein. TC–B12
complex binds to the transcobalamin receptor protein (TCR), and TCR–TC–B12 is
internalized into the lysosomes, where TC is degraded, TCR is recycled and vitamin B12
is released. HC serves as a reservoir for vitamin B12 and releases it under the conditions
of B12 deficiency. Vitamin B12 is transported from the lysosome to the cytoplasm by the
interaction of LMBD1 (a lysosomal membrane protein) and MMACHC (methylmalonic
aciduria type C and homocysteinuria) [16]. MMACHC is both a decyanase (removes the
CN– group from CNCbl [5]) and a dealkylase (removes the alkyl group in a glutathione
dependent process [16]).

5
In the cytoplasm, MMACHC catalyzes the removal of the upper (β) axial ligand of
the cobalamin forming cob(II)alamin. MS–bound cob(II)alamin is reduced to
cob(I)alamin by the action of methionine synthase reductase (MSR), which ultimately
yields MeCbl by methyl donation from S–adenosylmethionine. In mitochondria,
adenosyltransferase–bound cob(II)alamin is converted to AdoCbl by reductive
adenosylation via the reaction of cob(I)alamin with ATP [5, 6].
1.1.3 STRUCTURE
Cobalamins have one of the most complex and interesting structures of all vitamins
in nature [6]. Cob(III)alamins are hexacoordinate pseudo–octahedral complexes of
cobalt(III), with the four in–plane nitrogen atoms of the corrin ring occupying the four
equatorial binding sites. The corrin ring structurally resembles the porphyrin ring with
respect to the four in–plane nitrogen atoms. However, the corrin ligand also incorporates
a number of peripheral amide chains (a–g, Figure 1.1). Cobalamins belong to the family
of complexes known as corrinoids due to the presence of this corrin ring. The lower (= α)
axial site of cob(III)alamins is occupied by a 5,6–dimethylbenzimidazole (Bzm) ligand
via a Co–N bond. The ligand in the upper (= β) axial site can be a wide range of
molecules (Figure 1.1).
Cobalamins can be “base–on” or “base–off”, depending on whether or not the Bzm
nitrogen is coordinated at the α–axial site [6, 17]. Under neutral pH conditions, an
extremely small fraction of Cbl exists in the base–off form, Scheme 1.1a. Upon

6
Co
X
Bzm
+ H3O+Co
X
OH2+HBzm
Base-onBase-off
Kbase-off
(b)
Co
X
Bzm
+ H3O+Co
X
OH2Bzm
Base-onBase-off
KCo
+ H2O
(a)
acidifying aqueous solutions of cobalamins, the Bzm is protonated and displaced from
the α–axial site by solvent H2O, Scheme 1.1b.
Scheme 1.1. Base–on/base–off equilibria for Cbls (a) neutral pH (b) in acid.
The apparent pKa for this equilibrium, pKbase–off, depends on the electron donor
properties of the β–axial ligand (X) and varies from ~5 to –2, Table 1.1 [11], with higher
values for strong ζ donor ligands.
7
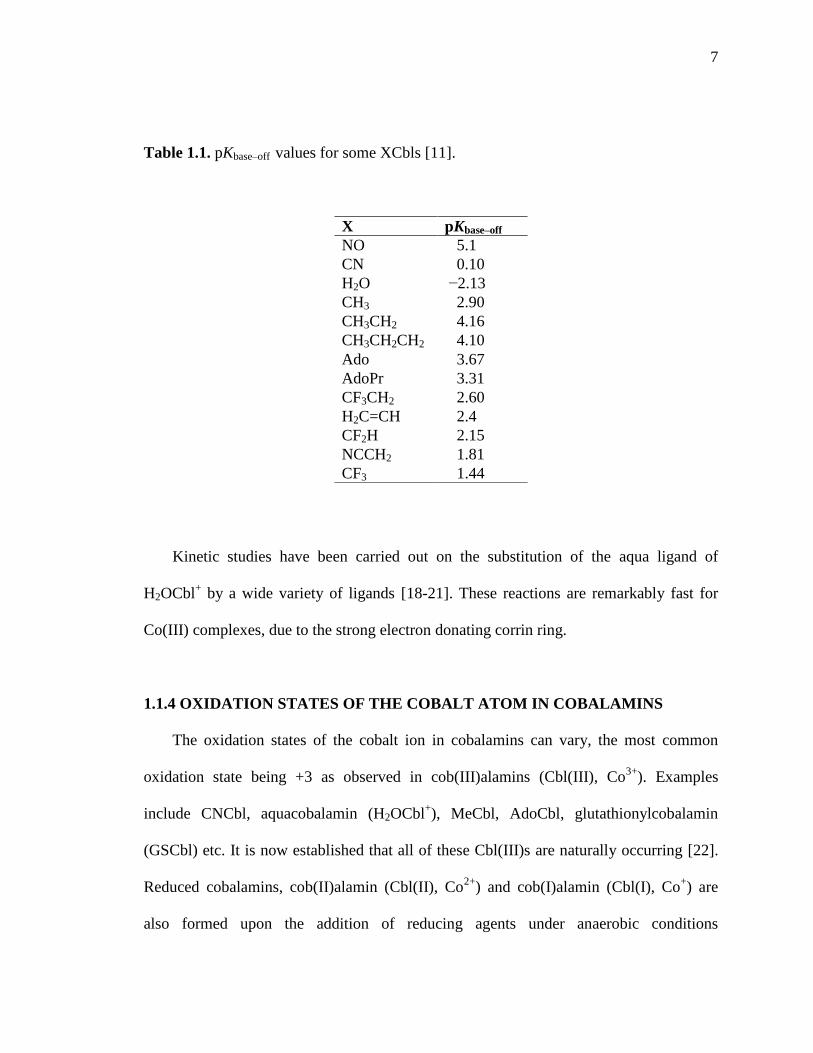
Table 1.1. pKbase–off values for some XCbls [11].
Kinetic studies have been carried out on the substitution of the aqua ligand of
H2OCbl+ by a wide variety of ligands [18-21]. These reactions are remarkably fast for
Co(III) complexes, due to the strong electron donating corrin ring.
1.1.4 OXIDATION STATES OF THE COBALT ATOM IN COBALAMINS
The oxidation states of the cobalt ion in cobalamins can vary, the most common
oxidation state being +3 as observed in cob(III)alamins (Cbl(III), Co3+
). Examples
include CNCbl, aquacobalamin (H2OCbl+), MeCbl, AdoCbl, glutathionylcobalamin
(GSCbl) etc. It is now established that all of these Cbl(III)s are naturally occurring [22].
Reduced cobalamins, cob(II)alamin (Cbl(II), Co2+
) and cob(I)alamin (Cbl(I), Co+) are
also formed upon the addition of reducing agents under anaerobic conditions
X pKbase–off
NO 5.1
CN 0.10
H2O −2.13
CH3 2.90
CH3CH2 4.16
CH3CH2CH2 4.10
Ado 3.67
AdoPr 3.31
CF3CH2 2.60
H2C=CH 2.4
CF2H 2.15
NCCH2 1.81
CF3 1.44

8
(E0(Cbl(III)/Cbl(II) = +0.23 V [23] and E
0(Cbl(II)/Cbl(I) = –0.61 V [23] versus SHE).
Cbl(II) is pentacoordinate, with the loss of the β–axial ligand upon reduction of Cbl(III)s.
Cbl(I) is tetracoordinate, with cleavage of the bond to the α–axial Bzm moiety occurring
in addition to the loss of the β–axial ligand upon reduction. All the three forms of
cobalamins (Cbl(III), Cbl(II) and Cbl(I)) exist inside cells. It is well established that
intracellular reductases are capable of reducing Cbl(III) to Cbl(II) [5]. Upon entering
cells, Cbl(III)s are reduced to Cbl(II) and ultimately to Cbl(I) prior to the biosynthesis of
MeCbl and AdoCbl [6]. Cbl(I) is also formed during the methyl group transfer from
MeCbl to THF in the catalytic cycle of methionine biosynthesis [5].
1.1.5 ABIOLOGICAL SYNTHESES OF COBALAMINS
The syntheses of a wide range of cob(III)alamins have been reported [24]. Vitamin
B12 or CNCbl, previously known as antipernicious anaemia factor, was first isolated from
liver and characterized by scientists at Merck, Sharp and Dohme, and later at Glaxo after
World War II [6]. In the 1960s, coenzyme B12 (AdoCbl) was discovered by Barker et al
[25]. Partial syntheses of AdoCbl and MeCbl were developed by Smith et al and
Bernhauer et al [25]. MeCbl was also subsequently identified in human serum [25]. Since
then, numerous cob(III)alamin complexes have been synthesized and characterized.
CNCbl is very stable with a strong Co–CN bond. Therefore, CNCbl is typically not used
as a precursor for the synthesis of other cob(III)alamins. On the other hand, the aqua
(H2O) ligand in commercially available aqua/hydroxycobalamin (H2OCbl+/HOCbl, pKa =
7.8 [21], X = H2O/OH, Figure 1.1) is very labile and can be easily substituted by a wide
9
range of stronger binding ligands. Thus, H2OCbl+ is typically used as the “starting
material” in the synthesis of vitamin B12 derivatives. Inorganic cobalamins (XCbl; X = an
inorganic ligand) are synthesized in high yield and purity by reacting ligand X with
H2OCbl+, in aqueous solution [26-28]. However, syntheses of alkylcobalamins (RCbl; R
= alkyl ligand) requires the reduction of H2OCbl+ (or CNCbl) to Cbl(I) prior to the
addition of alkyl halides (RX) under anaerobic conditions [24]. RCbls are sensitive to
light, whereas XCbls are not light–sensitive [6].
1.1.6 CHARACTERIZATION OF COBALAMINS
1.1.6.1 X–RAY CRYSTALLOGRAPHY
The elucidation of the X–ray crystal structure of CNCbl was first accomplished by
Dorothy Hodgkin in 1955 [29], for which she was awarded the Nobel Prize in Chemistry
in 1964. These studies revealed the unique but complex structure of vitamin B12
incorporating the tetrapyrrolic corrin ligand [29]. Since then, X–ray crystallography has
become a standard technique for the characterization of cobalamins in the solid state [30].
Accurate crystal structures of MeCbl and AdoCbl have recently been determined using
synchrotron radiation [31, 32]. Bond lengths and bond angles involving the four in–plane
Co–N and the Co–N(Bzm) bonds, the Co–X or Co–C bonds in XCbls and RCbls,
respectively, are of particular interest [26-28, 33-35]. The folding of the corrin ring,
commonly known as “corrin fold”, is also an important parameter to describe the
structure of the Cbls. It is defined as the angle between the two planes containing the four
10
in–plane nitrogen atoms and is a measure of the nonplanarity of the corrin ring, which is
always directed upward; that is toward the β–face [17]. Most Cbls can be assigned to one
of the three different packing types characterized by the ratios of the cell axis ratios c/a
and b/a [6, 30, 36-38]. This regularity in crystal packing are consistent with the
conformational rigidity of the B12 structure [17].
1.1.6.2 SPECTROSCOPIC TECHNIQUES
1H NMR spectroscopy is an important tool for the characterization of cobalamins in
solution. The 1H NMR spectra of cob(III)alamins displays five sharp peaks in the
aromatic region (5–8 ppm), in addition to potential signals from the β–axial ligand,
attributable to the three protons of the Bzm nucleotide (B2, B4, B7), one proton from the
corrin ring (C10) and a ribose proton (R1) as shown in Figure 1.1. The chemical shift
values of the five peaks in the aromatic region, are dependent on the nature of the β–axial
ligand, X (Table 1.2) [26, 28, 39].
UV–vis spectroscopy is also a useful characterization technique. Cobalamins are
intensely colored complexes. Strong peaks in the UV–vis spectra of cobalamins are
observed above 300 nm arising from spin–allowed π–π* transitions within the conjugated
double bonds of the corrin ring. Electronic d–d transitions are not observed [24]. The
most intense band observed in the 350–370 nm region (γ–band) is typically dependent on
the electronic donor properties of the β–axial ligand, X (Table 1.3). The Bzm moiety
present in the cobalamins absorbs in the 260–300 nm region [24]. Charge transfer bands
11
(LMCT) of lower intensities above 300 nm are observed for cobalamins with thiol
ligands [24] (Table 1.3).
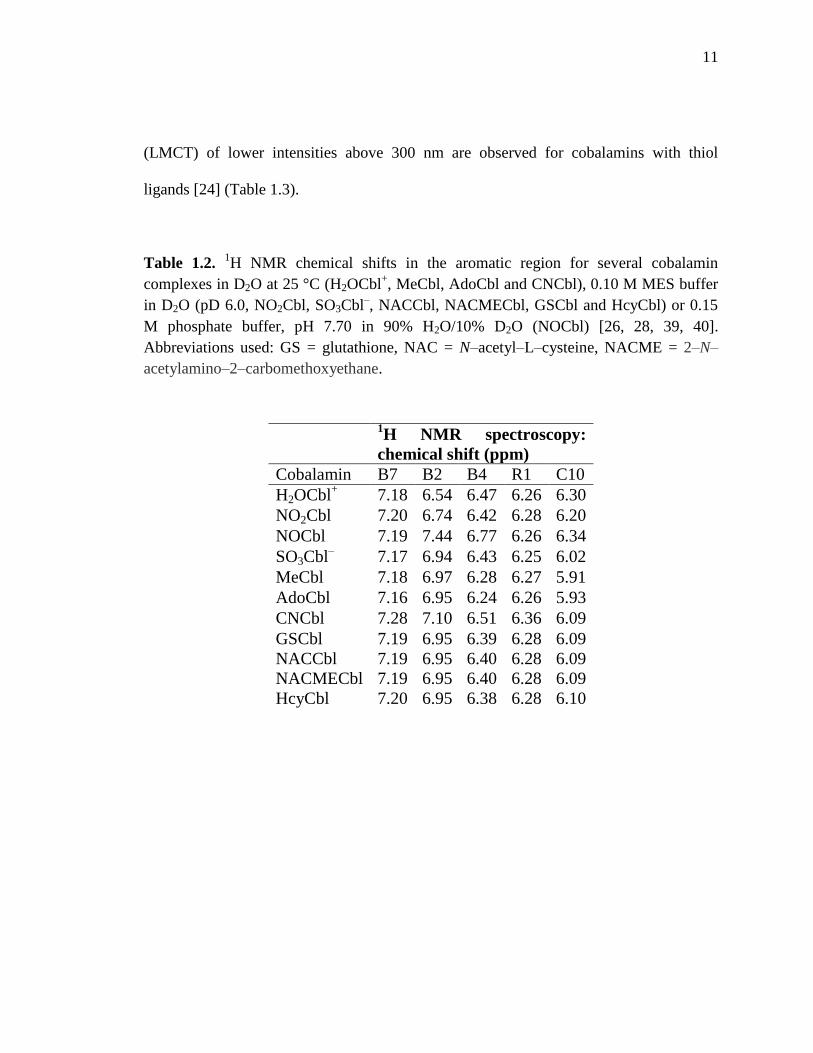
Table 1.2. 1H NMR chemical shifts in the aromatic region for several cobalamin
complexes in D2O at 25 °C (H2OCbl+, MeCbl, AdoCbl and CNCbl), 0.10 M MES buffer
in D2O (pD 6.0, NO2Cbl, SO3Cbl–, NACCbl, NACMECbl, GSCbl and HcyCbl) or 0.15
M phosphate buffer, pH 7.70 in 90% H2O/10% D2O (NOCbl) [26, 28, 39, 40].
Abbreviations used: GS = glutathione, NAC = N–acetyl–L–cysteine, NACME = 2–N–
acetylamino–2–carbomethoxyethane.
1H NMR spectroscopy:
chemical shift (ppm)
Cobalamin B7 B2 B4 R1 C10
H2OCbl+ 7.18 6.54 6.47 6.26 6.30
NO2Cbl 7.20 6.74 6.42 6.28 6.20
NOCbl 7.19 7.44 6.77 6.26 6.34
SO3Cbl– 7.17 6.94 6.43 6.25 6.02
MeCbl 7.18 6.97 6.28 6.27 5.91
AdoCbl 7.16 6.95 6.24 6.26 5.93
CNCbl 7.28 7.10 6.51 6.36 6.09
GSCbl 7.19 6.95 6.39 6.28 6.09
NACCbl 7.19 6.95 6.40 6.28 6.09
NACMECbl 7.19 6.95 6.40 6.28 6.09
HcyCbl 7.20 6.95 6.38 6.28 6.10

12
Table 1.3. UV–vis spectroscopic data for several cobalamin complexes at RT or at 25 °C
in 0.1 M MES buffer in D2O, pD 6.0 (NO2Cbl, SO3Cbl–, NACCbl, NACMECbl, GSCbl
and HcyCbl) or in H2O (H2OCbl+, CNCbl and MeCbl) or in 0.01 M phosphate buffer, pH
6.7 (AdoCbl) [26, 28, 41].
Electrospray mass spectrometry (ES–MS) is also a useful technique for the
characterization of cobalamins. It provides information regarding the existence and
fragmentation of cobalamins [26, 28]. Other useful spectroscopic techniques for
characterization of cobalamins include 13
C NMR and 31
P NMR spectroscopy [40]. An
array of 2–D NMR techniques such as TOCSY, ROESY, HSQC and HMBC are required
if a complete assignment of all 1H and
13C signals is desired [40, 42-45]. Fourier–
transform infrared spectroscopy (FTIR) [46] and X–ray atomic absorption spectroscopy
(XAS) [26] have also been used to characterize Cbls.
UV–vis
spectroscopy
Cobalamin λmax/nm
H2OCbl+ 349 411 525
CNCbl 278 361 551
MeCbl 340 377 528
AdoCbl 315 340 375 522
NO2Cbl 354 413 532
SO3Cbl– 312 365 418 517
GSCbl 333 372 428 534
NACCbl 333 372 428 534
NACMECbl 333 372 428 534
HcyCbl 333 372 428 534

13
1.1.7 NON–ENZYMATIC ROLES OF COBALAMINS IN ALLEVIATING
CHRONIC INFLAMMATION
Thus far, the main focus of research has been on the role of B12–dependent enzyme
reactions. However, a non–enzymatic role for Cbl in biology as a modulator of the
immune response has also been suggested. Specifically, Cbl regulates the production of
the pro–inflammatory cytokines TNF– and IL–6, epidermal growth factor and nerve
growth factor, and suppresses production of the inducible transcription factor NF–KB
[47-49]. Furthermore, Cbl therapy normalizes levels of TNF– and epidermal growth
factor in Cbl deficient patients [50].
Interestingly, Cbl supplementation is found to be beneficial for treating numerous
diseases associated with chronic inflammation, including sepsis, asthma, rheumatoid
arthritis, autism, Alzheimer’s disease, multiple sclerosis, viral based diseases including
AIDS, autoimmune diseases, stroke, chronic fatigue syndrome, eczema and migraines
[51-54]. All these diseases are associated with oxidative and nitrosative cellular stress.
Oxidative/nitrosative stress results from an imbalance between the generation of harmful
levels of Reactive Oxygen Species (ROS) and Reactive Nitrogen Species (RNS) (such as
the radical species nitric oxide (NO), superoxide (O2
), hydroxyl and nitrogen dioxide
(OH,
NO2), and peroxynitrite (ONOO(H)) and hydrogen peroxide (H2O2)) and the
ability of the biological system to degrade reactive intermediates or to repair the resulting
damage. These ROS/RNS species can irreversibly damage biomolecules including
proteins, lipids, nucleic acids and small molecules [55]. Antioxidant enzymes (superoxide

14
dismutase, catalase, glutathione peroxidase) and small molecules such as glutathione
(GSH) help to control ROS/RNS levels [55].
Our lab has hypothesized that the direct scavenging of ROS/RNS by Cbl is an
important mechanism by which Cbl modulates the immune response and is beneficial for
treating chronic inflammation. There is accumulating evidence for Cbl scavenging of
NO in biology. Cbl suppresses
NO–induced relaxation of smooth muscle [51, 56, 57],
NO–induced vasodilation [58] and
NO–mediated inhibition of cell proliferation [59]. In
addition, mammalian B12 dependent enzymes (MS and MMCM) are inhibited by NO
[60, 61] and Cbl reverses NO–induced neural tube defects [62]. The important
intracellular Cbl form, Cbl(II), reacts with NO to form NOCbl at a rate close to the rate
of diffusion [63]. Also, the binding constant of NO to Cbl(II) is very large (~1 × 10
8 M
–1
at 25° C) [64]. These chemical and biochemical data support the hypothesis that Cbl
scavenges excess NO in vivo. Recent studies also suggest that Cbl(II) is an efficient
intracellular scavenger of O2
[65]. The rate of the reaction between Cbl(II) and O2
is
extremely rapid (k ~ 7 × 10⁸ M
–1s
–1 [65]) and Cbl protects against O2
induced oxidative
stress in mammalian cells . The chemistry of the reactions of reduced cobalamins with
the potent RNS peroxynitrite is explored as part of this dissertation.
1.2 VITAMIN B12–BIOCONJUGATES IN TARGETED DRUG DELIVERY
After consumption, vitamin B12 is transported to the cell by a well established carrier
mechanism mediated by three transport proteins – HC, IF and TC (section 1.2.2.1) [5].
The efficient absorption, transport and cellular uptake mechanisms for cobalamins have
15
CH3
CONH2ONH
NNCH3
CH3
OP
O
H
CH3
O O–
O
OH
CH3N
NOH
CH3
N
CoIII
NCONH2
CH3
CONH2
CH3
H3CH3C
CONH2
CONH2
H
H
H
H
H
H
H2NOC
-axial site
X
d
b
c
e
5' - OH
2' - OH
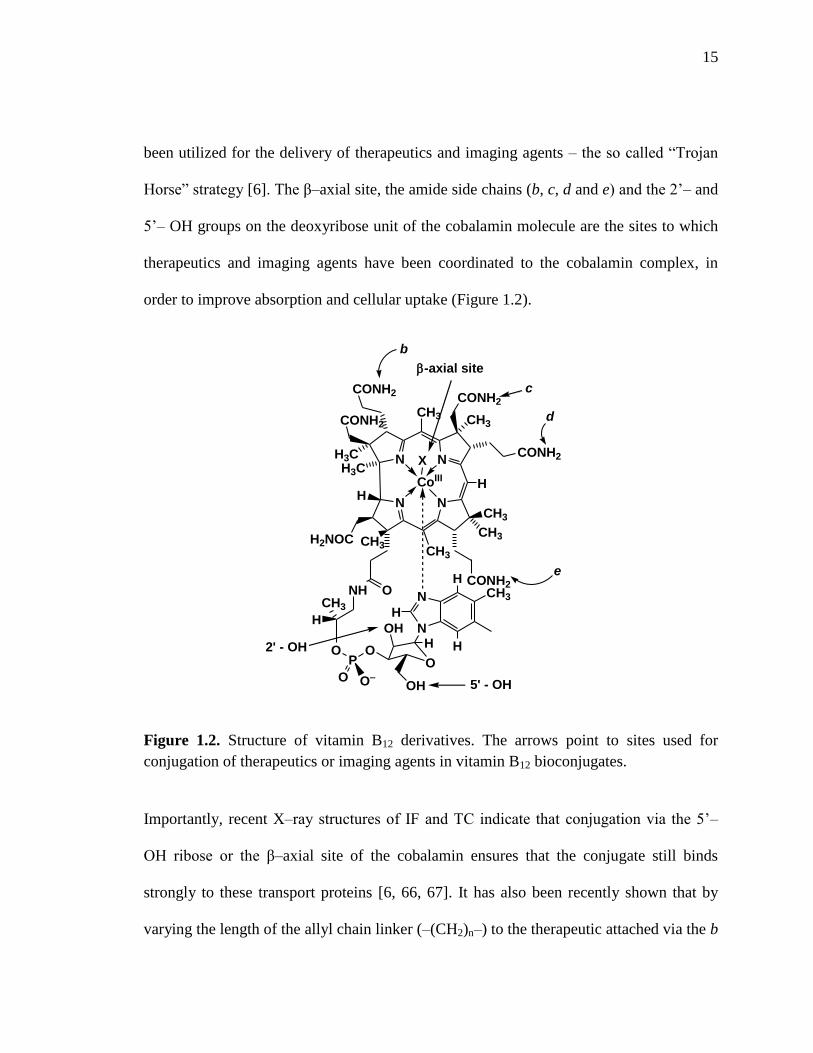
been utilized for the delivery of therapeutics and imaging agents – the so called “Trojan
Horse” strategy [6]. The β–axial site, the amide side chains (b, c, d and e) and the 2’– and
5’– OH groups on the deoxyribose unit of the cobalamin molecule are the sites to which
therapeutics and imaging agents have been coordinated to the cobalamin complex, in
order to improve absorption and cellular uptake (Figure 1.2).
Figure 1.2. Structure of vitamin B12 derivatives. The arrows point to sites used for
conjugation of therapeutics or imaging agents in vitamin B12 bioconjugates.
Importantly, recent X–ray structures of IF and TC indicate that conjugation via the 5’–
OH ribose or the β–axial site of the cobalamin ensures that the conjugate still binds
strongly to these transport proteins [6, 66, 67]. It has also been recently shown that by
varying the length of the allyl chain linker (–(CH2)n–) to the therapeutic attached via the b

16
amide side chains of the cobalamin, the binding of the B12 conjugate to HC versus TC
can be tuned, with preferential binding to HC using short linkers (–(CH2)n–, n < 4) [68].
Conjugates of vitamin B12 have been synthesized incorporating a range of anticancer
agents including Gd3+
[69], colchicines [70], nido–carborane [71] and platinum–based
therapeutics [72, 73]. Vitamin B12 is required in high concentrations at sites of rapid
cellular growth including tumors. Upregulation of TCR has also been observed for cancer
cells [74]. Higher organisms require vitamin B12 as an essential cofactor for the
methylation of uracil prior to DNA synthesis and replication [75]. Vitamin B12
bioconjugates incorporating insulin for use as oral therapeutics for the treatment of
diabetes have also been investigated [76-80]. Finally a conjugation to vitamin B12 has
been used for the delivery of imaging agents [71, 81, 82]. Examples include 99m
Tc, 131
I
and 111
In–labelled vitamin B12 bioconjugates [68, 83-85].
1.3 COORDINATION CHEMISTRY OF VANADIUM
Vanadium is a soft, silvery gray, ductile transition metal. The discovery of vanadium
was made by the Swedish chemist N.G. Sefström in 1831. He named the element
vanadium, due to the wide range of colors found in vanadium complexes, after Vanadis
(or Freya), the Scandinavian goddess of beauty and fertility [86, 87]. Vanadium ores are
rare. Examples of vanadium ores are patronite (VS4) and vanadinite (Pb5(VO4)3Cl) [87].
The main source of vanadium is titanomagnetite (contains 0.8% vanadium) [87]. Other
sources of vanadium are crude oil, oil shales and bituminous limestone [87].

17
In coordination complexes, vanadium exists in a wide variety of oxidation states,
from –1 through +5 [88]. The coordination number of vanadium in its complexes varies
from four to eight depending on the oxidation state of vanadium and the type of ligands.
Vanadium shows affinity for ligands (mono–, bi– or polydentate) with oxygen (alcohol,
esters, carboxylates, anhydrides etc.), nitrogen (amines, azides, amides), sulfur (thiols),
halide or phosphorus (phosphines) donor atoms and forms complexes with diverse
structures [88]. The ligands coordinated to vanadium are extremely labile for all
oxidation states of vanadium [89].
The coordination chemistry of vanadium(V) (V(V), vanadate) has been extensively
investigated. This can be attributed to the fact that V(V) complexes are stable in the
presence of air and that V(V) is diamagnetic. V(V) complexes are therefore readily
characterized by 51
V and 1H NMR spectroscopy in solution [88]. In the solid state, X–ray
diffraction and IR spectroscopy are useful characterization techniques for all vanadium
complexes. Electron paramagnetic resonance (EPR), electron nuclear double resonance
(ENDOR) and UV–visible spectroscopy are important tools to study the properties of
V(IV) complexes [88, 90]. Vanadyl complexes are slightly air sensitive (E0(V(V)/V(IV)
= +1.31 V versus SHE [91]), while vanadium complexes of oxidation number ≤ 3 are
typically extremely air–sensitive [88].
Compared to V(V) and V(IV), much less is known about vanadium(III) coordination
chemistry. Like V(IV), V(III) is paramagnetic, making its complexes generally unsuitable
for NMR spectroscopic measurements. EPR spectroscopy signals are also typically not
observed for V(III) complexes with lower than cubic symmetry using conventional EPR

18
spectrometers [92], since spin–orbit coupling results in a large zero–field splitting and
short spin–lattice (T1) relaxation times [93]. The coordination chemistry of oxidation
states <+3 has yet to be explored extensively. Complexes of vanadium(II) (V(II)) are
typically octahedral, however four or five–coordinate complexes have also been reported
[88]. The complexes of vanadium in oxidation states < +2 are typically organometallic
[88].
1.3.1 VANADIUM COMPLEXES FORMED IN AQUEOUS SOLUTION
In aqueous solution, the important oxidation states of vanadium are +3–+5. The
monomeric complexes formed in neutral aqueous solution are vanadate (H2VO4–/HVO4
2–,
pKa 7.91 [94]), vanadyl (([VIV
O(H2O)5]2+
/[VIV
O(OH)(H2O)4]+, pKa 5.9 [88]). V(III)
forms oligomeric complexes at neutral pH conditions [95]. However, numerous other
complexes are formed depending on the pH, vanadium concentration and ionic strength
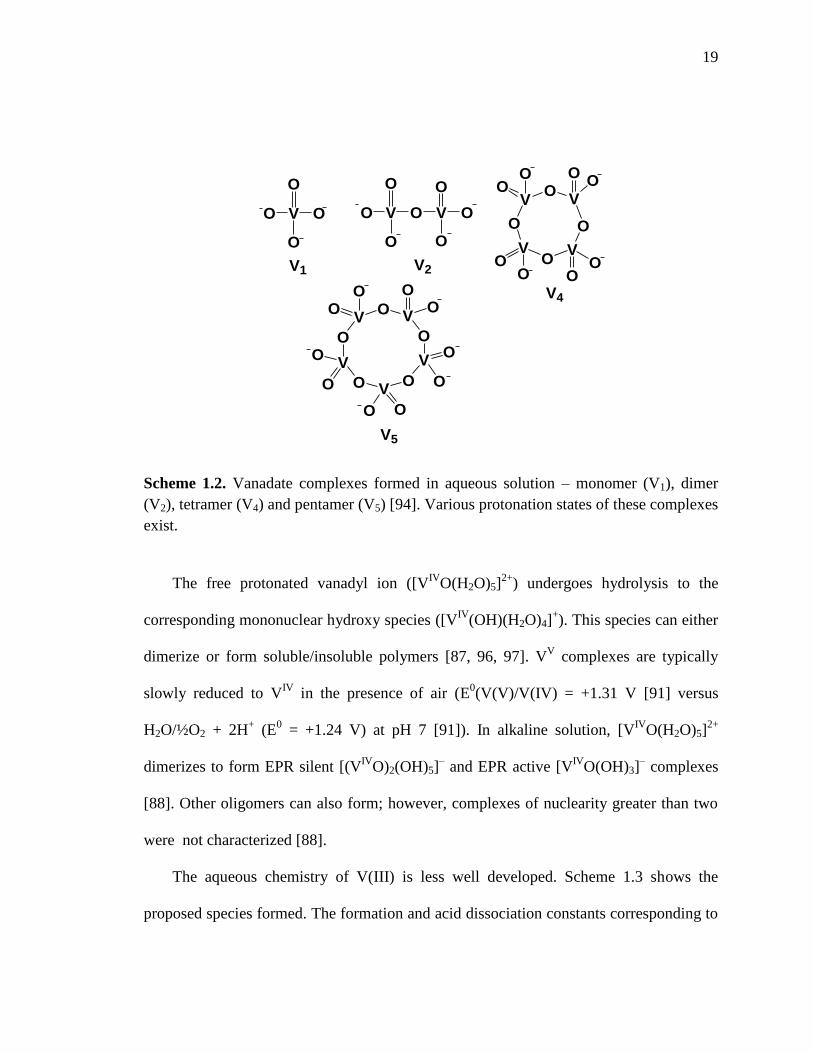
of the medium. To illustrate, H2VO4– (V1) ion can polymerize in neutral aqueous solution
to form di– (V2), tetra– (V4) and pentameric (V5) complexes (Scheme 1.2 [88, 94]). These
complexes can also exist in various protonated forms (H3V2O7–, H2V2O7
2–, HV2O7
3–,
V2O74–
, V4O124–
, HV4O135–
, V5O155–
), depending on the pH [94]. Tri− (V3) and
hexameric (V6) complexes may also be present in aqueous solution [91]. A vanadate
decamer (V10) is formed upon the addition of acid to vanadate solutions [94]. The
speciation of vanadates in aqueous solution has been studied in detail by 51
V NMR
spectroscopy [94] and formation and acid dissociation constants have been reported [87].
19
V
O
OO
O
V1
V
O
OO
O
V2
V
O
O
OO
VO
V
O
VO
V
O
O
O
O
O O
OO
V4
VOV
O O
O O
O
V
VO
V
O
O
O
O
O
O
O
O
V5
Scheme 1.2. Vanadate complexes formed in aqueous solution – monomer (V1), dimer
(V2), tetramer (V4) and pentamer (V5) [94]. Various protonation states of these complexes
exist.
The free protonated vanadyl ion ([VIV
O(H2O)5]2+
) undergoes hydrolysis to the
corresponding mononuclear hydroxy species ([VIV
(OH)(H2O)4]+). This species can either
dimerize or form soluble/insoluble polymers [87, 96, 97]. VV complexes are typically
slowly reduced to VIV
in the presence of air (E0(V(V)/V(IV) = +1.31 V [91] versus
H2O/½O2 + 2H+ (E
0 = +1.24 V) at pH 7 [91]). In alkaline solution, [V
IVO(H2O)5]
2+
dimerizes to form EPR silent [(VIV
O)2(OH)5]– and EPR active [V
IVO(OH)3]
– complexes
[88]. Other oligomers can also form; however, complexes of nuclearity greater than two
were not characterized [88].
The aqueous chemistry of V(III) is less well developed. Scheme 1.3 shows the
proposed species formed. The formation and acid dissociation constants corresponding to
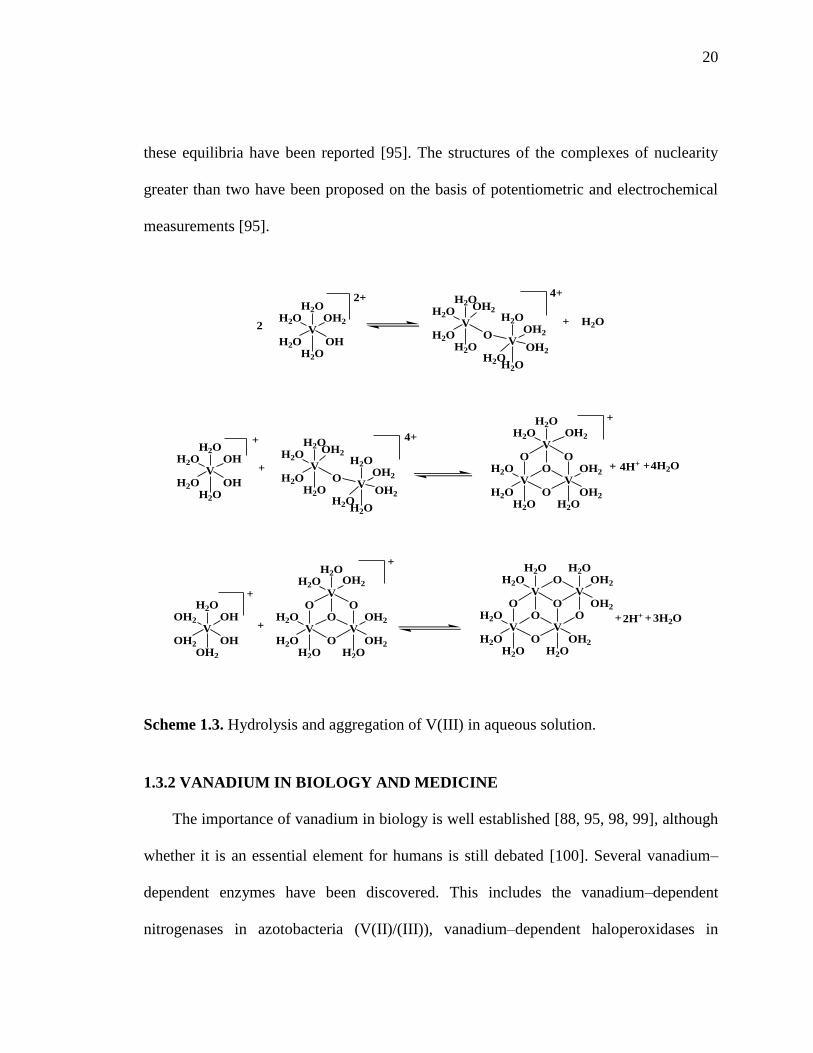
20
V
H2OOH2
OH
H2O
H2OH2O
V
H2OOH
OH
H2O
H2OH2O
V
H2OOH
OH
OH2
OH2
OH2
V
OV
O
VO
OO
VO
H2OOH2
OH2
H2OOH2H2O
H2O
H2OH2O
H2O
V
OV
O
VO
OH2O
H2O
H2OOH2
OH2
H2OOH2
H2OH2O
V
H2O
O
H2O
H2OH2O
2 + H2O
+ + 4H+ +4H2O
++2H+ +3H2O
OH2
V
H2O
H2O
OH2
OH2
+
4+
V
H2O
O
H2O
H2OH2O
OH2
V
H2O
H2O
OH2
OH2
4+
H2O
H2O
V
OV
O
VO
OH2O
H2O
H2OOH2
OH2
H2OOH2
H2OH2O
2+
+
+
+
these equilibria have been reported [95]. The structures of the complexes of nuclearity
greater than two have been proposed on the basis of potentiometric and electrochemical
measurements [95].
Scheme 1.3. Hydrolysis and aggregation of V(III) in aqueous solution.
1.3.2 VANADIUM IN BIOLOGY AND MEDICINE
The importance of vanadium in biology is well established [88, 95, 98, 99], although
whether it is an essential element for humans is still debated [100]. Several vanadium–
dependent enzymes have been discovered. This includes the vanadium–dependent
nitrogenases in azotobacteria (V(II)/(III)), vanadium–dependent haloperoxidases in

21
marine algae (V(V)), and amavadin in the mushroom Amanita muscaria (V(IV)). V(III)
has been found in the marine fanworm Pseudopotamilla occelata and V(III)/V(IV) in
some ascidian species [88, 95, 98, 99, 101, 102].
Due to the structural and electronic similarities with phosphate (PO43–
), H2VO4–
is
often referred to as a phosphate analogue [103-105]. Vanadate acts as an inhibitor of
phosphate–dependent enzymes by replacing the phosphate groups. Examples include the
inhibition of ATPases, phosphatases, kinases, lyases and synthases [106]. Vanadium
complexes exhibit insulin–enhancing properties and anti–tumor activity; hence,
utilization of vanadium complexes (V(III), V(IV) and V(V)) in the treatment of diabetes
and cancer are also active areas of research [107-114].

22
CHAPTER 2
STRUCTURAL AND SPECTROSCOPIC EVIDENCE FOR THE
FORMATION OF POLYNUCLEAR V(III)/CARBOXYLATO COMPLEXES IN
AQUEOUS SOLUTION
2.1 INTRODUCTION
The aqueous chemistry of vanadium(III) is less developed compared with
vanadium's higher oxidation states, (IV) and (V), mainly due to the more limited
instrumental tools available to study V(III) solution chemistry in addition to the
air−sensitivity of V(III) complexes. Formation of multinuclear (nuclearity > 2)
oxo/hydroxo−bridged V(III)(aq) complexes has been suggested based on potentiometric
and spectroscopic experiments [95]. It has also been suggested that oxo/hydroxo−bridged
multinuclear V(III) complexes are important in vanadium−accumulating ascidians, since
a number of metalloproteins exist with active sites involving oxo/hydroxo−bridged Fe or
Mn units [115]. However, there is extremely limited structural evidence for the existence
of V(III) complexes of nuclearity greater than two in aqueous solution – a single report of
a trinuclear V(III)/chloroacetato complex crystallized over two decades ago by two
independent groups [116, 117]).
23
A further reason for our interest in aqueous V(III)/carboxylato chemistry concerns
recent reports of polynuclear V(III) complexes isolated from organic solvents or neat
carboxylic acid solutions with interesting structures, spectroscopic properties and
magnetic properties [118-127]. Seven types of V(III)/carboxylato complexes isolated
from organic solvents or neat carboxylic acid solutions have been structurally
characterized: (i) monomeric carboxylato complexes [128-131], (ii) dimeric species,
bridged by one oxo (or hydroxo) group and two carboxylato ligands [122-124, 132-135],
or bridged by four carboxylato ligands [136, 137], (iii) complexes with a triangular
(3−oxo) V3 core with two −carboxylato ligands bridging the V centers (COO−
can be
replaced by RS−
or phosphate groups) [116, 117, 120, 125, 138-142], (iv) tetranuclear,
butterfly−type V(III) complexes, in which two of the V(III) centers are bound to a
μ3−oxo ligand, three μ−carboxylato ligands and a bidentate ligand (2,2'−bipyridine),
while the other two are bound to two μ3−oxo ligands and four μ−carboxylato ligands
[120, 121, 143], (v) cyclic V8 complexes bridged by −hydroxo, −carboxylato, and
−ethoxy ligands [125], (vi) a cyclic V10 complex bridged by −methoxide and
−acetato ligands [118] and (vii) an unusual capped cube structure with a Zn4V4O4 core
[126]. Recently, a new family of hexa− and trideca− oxo−bridged V(III)/phosphonates
have been structurally characterized and reported (Khanra, Shaw et al. 2010).
V(III)/carboxylato complexes also have interesting magnetic properties [120-124,
132-137, 143]. This includes switching from strong ferromagnetic coupling to
antiferromagnetic coupling upon protonation of the μ−oxo ligand of dimeric V(III)
complexes [122-124, 132], and exhibiting spin−frustration effects and/or single molecule

24
magnetic behavior [121, 143]. V(III)/carboxylato chemistry is also of interest in the
development of new microporous materials [144]. Finally, we note that since NMR and
EPR spectroscopies are generally unhelpful in studying V(III) speciation in solution, an
increasing number of potentiometric and UV−vis spectroscopic titration studies are being
performed to elucidate the species formed between V(III)(aq) and biologically relevant
ligands, and to determine the associated acid dissociation and stability constants [145-
148]. However, in order to obtain useful acid dissociation and stability constant data for
these complex systems from potentiometric and UV−vis spectroscopic data, there is an
urgent need for reliable structural models for multinuclear oxo and hydroxo V(III)
complexes formed in aqueous solution [145].
In this chapter, we report the structural and spectroscopic characterization of a series
of multinuclear V(III)/carboxylato complexes. Importantly, mass spectrometry and 1H
NMR spectroscopy measurements suggest that the integrity of these complexes is
retained in aqueous solution itself.
2.2 EXPERIMENTAL
2.2.1 MATERIALS
Anhydrous VCl3 (98%), NaOOCCH3 (99%) and CFCl3 (≥99%) were purchased from
Aldrich. Iminodiacetic acid (98%) and NaOOCCH2CH3 (99%) were obtained from Alfa
Aesar. NaOOCCH2Cl (98%), BrCH2COOH (99%), CF3COOH (99%), CF3SO3H (99%),
thiodiacetic acid (98%) and MES buffer (99%) were purchased from Acros organics.

25
HEPES (99.5%) was purchased from Sigma. All chemicals were used without further
purification. VCl3(THF)3 [149], V2(SO4)3 [150] and V(CF3SO3)3 [151] were prepared
according to published procedures. . Water was purified using a Barnstead Nanopure
Diamond water purification system or HPLC grade water was used.
2.2.2 INSTRUMENTATION AND PROCEDURES
All reactions were carried out under anaerobic conditions. Solutions were degassed
on a Schlenk line, using standard Schlenk techniques (using three freeze−pump−thaw
cycles and under argon), or by purging with argon for at least 12 hr. Air−free
manipulations were carried out in an MBRAUN Labmaster 130 (1250/78) glove box (<1
ppm O2), equipped with O2 and H2O sensors and a freezer.
pH measurements were carried out in the glove box at room temperature with an
Orion Model 710A pH meter equipped with a Wilmad 6030−02 pH electrode.
Alternatively a Corning Model 445 pH meter equipped with a Mettler−Toledo Inlab 423
electrode was used. Both electrodes were filled with 3 M KCl / saturated AgCl solution,
pH 7.0 and standardized with standard BDH buffer solutions at pH 4.01 and 6.98.
Solution pH was adjusted using conc. CF3SO3H or conc. NaOH solutions as necessary.
FT−IR spectra were recorded using a Bruker Tensor 27 Infrared spectrophotometer.
Samples were prepared inside the glove box by grinding with dry KBr using mortar and
pestle and crushed in a mechanical die press to form translucent pellets.
26
UV−Visible spectra were recorded using a Cary 5000 spectrophotometer operating with
WinUV Bio software (version 3.00), equipped with a thermostated (25.0 0.1 C) cuvette holder.
Air−free Schlenk cuvettes were used for air−free measurements.
Electrospray mass spectra (positive mode) were recorded using a BRUKER
Esquire~LC mass spectrometer.
All NMR spectra were recorded at 22 1 C using a Varian Unity/Inova 500 MHz
spectrometer equipped with a 5 mm probe. 1H NMR spectra were recorded using a 2 mm
diameter capillary of TSP (3−(trimethylsilyl)propionic−2,2,3,3−d4 acid, sodium salt) in
D2O as an external standard. 19
F NMR spectra were recorded using a 2 mm diameter
capillary of CFCl3 in CHCl3 as an external standard. NMR samples were prepared in the
glove box and the NMR tubes were fitted with septum caps.
2.2.3 PREPARATION OF V(III)/CARBOXYLATO SOLUTIONS FOR NMR AND
UV−VISIBLE SPECTROSCOPIC MEASUREMENTS
A series of solutions of VCl3 (0.0100 M) and CH3COO(H) (0.20−2.0 mole equiv.
free CH3COO−) in buffer, pD 3.44 0.02, were prepared in a glove box from anaerobic
stock solutions of VCl3 (0.0200 M) in 0.0500 M HEPES, CH3COO(H) in D2O
([CH3COOH]T = 2.00 M, [CH3COO−] = 0.118 M using pKa(CH3COOH) = 4.7) and
0.0500 M HEPES buffer solution (pD 3.50). The pH of the solutions were adjusted to pD
3.50 using 0.10 M MES buffer, pD ~ 6.3, since even dilute NaOH solutions result in
precipitation of insoluble polynuclear V(III) complexes. The pH dropped 0.06 units upon
mixing of the solutions. The solutions were left to equilibrate overnight. The purity of

27
commercially available VCl3 can vary; hence the concentration of the stock solutions of
VCl3 (calculated concentration = 0.0200 M based on mass of VCl3 weighed) was checked
by measuring the UV−visible spectrum of an aliquot of the solutions in 1.00 M HClO4,
and were found to be 0.0200 M within experimental error (0.198 and 0.0212 M,
respectively, for two separate solutions; 396 nm = 8.3 M−1
cm−1
and 588 nm = 5.8 M−1
cm−1
for [V(OH2)6]3+
in 1.0 M HClO4 [95]). Similar procedures were used to prepare the other
V(III)/carboxylate solutions for NMR and UV−Vis spectroscopy measurements.
2.2.4 PFG−NMR DIFFUSION COEFFICIENT MEASUREMENTS
The following parameters were used for the gradient−echo pulse sequence:
maximum field gradient amplitude, G = 20 Gauss cm−1
(H2O diffusion coefficient
experiment) or 40 Gauss cm−1
(V(III)/carboxylato diffusion coefficient experiments),
echo time 10 ms, and duration of the gradient pulses, δ = 1–5 ms.
2.2.5 SYNTHESES OF COMPLEXES 1 AND 2 IN AQUEOUS SOLUTION
[V3(3−O)(−OOCCH2Br)6(OH2)3]CF3SO3H2O (1): Solid bromoacetic acid (0.28
g, 2.0 mmol) was added to a solution of V(CF3SO3)3 (0.82 g, 1.7 mmol) in H2O (8 ml),
upon which the brown solution became green. The volume was reduced in vacuo until a
few dark green crystals appeared, suitable for X−ray diffraction studies. Several attempts
were made in subsequent identical syntheses to crystallize out more products for
elemental analysis measurements, without success.
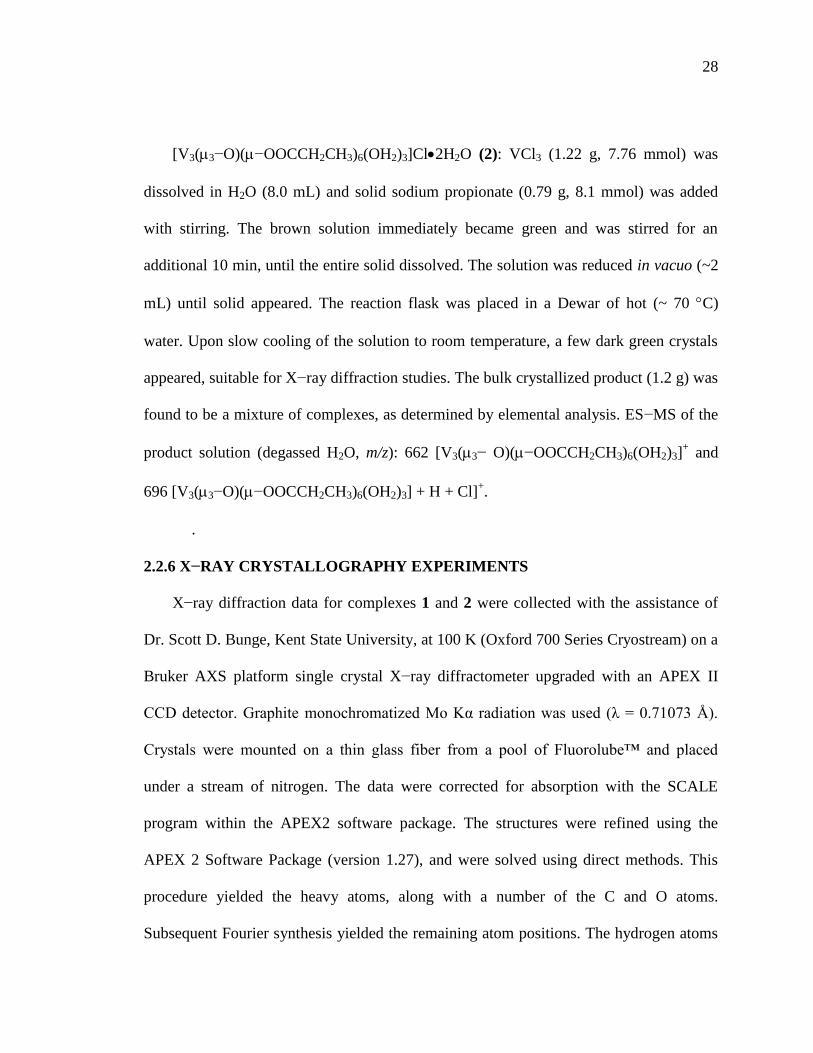
28
[V3(3−O)(−OOCCH2CH3)6(OH2)3]Cl2H2O (2): VCl3 (1.22 g, 7.76 mmol) was
dissolved in H2O (8.0 mL) and solid sodium propionate (0.79 g, 8.1 mmol) was added
with stirring. The brown solution immediately became green and was stirred for an
additional 10 min, until the entire solid dissolved. The solution was reduced in vacuo (~2
mL) until solid appeared. The reaction flask was placed in a Dewar of hot (~ 70 C)
water. Upon slow cooling of the solution to room temperature, a few dark green crystals
appeared, suitable for X−ray diffraction studies. The bulk crystallized product (1.2 g) was
found to be a mixture of complexes, as determined by elemental analysis. ES−MS of the
product solution (degassed H2O, m/z): 662 [V3(3− O)(−OOCCH2CH3)6(OH2)3]+ and
696 [V3(3−O)(−OOCCH2CH3)6(OH2)3] + H + Cl]+.
.
2.2.6 X−RAY CRYSTALLOGRAPHY EXPERIMENTS
X−ray diffraction data for complexes 1 and 2 were collected with the assistance of
Dr. Scott D. Bunge, Kent State University, at 100 K (Oxford 700 Series Cryostream) on a
Bruker AXS platform single crystal X−ray diffractometer upgraded with an APEX II
CCD detector. Graphite monochromatized Mo Kα radiation was used (λ = 0.71073 Å).
Crystals were mounted on a thin glass fiber from a pool of Fluorolube™ and placed
under a stream of nitrogen. The data were corrected for absorption with the SCALE
program within the APEX2 software package. The structures were refined using the
APEX 2 Software Package (version 1.27), and were solved using direct methods. This
procedure yielded the heavy atoms, along with a number of the C and O atoms.
Subsequent Fourier synthesis yielded the remaining atom positions. The hydrogen atoms

29
are fixed in positions of ideal geometry and refined within the XSHELL software. These
idealized hydrogen atoms had their isotropic temperature factors fixed at 1.2 or 1.5 times
the equivalent isotropic U of the C atoms to which they were bound. The final refinement
of each compound included anisotropic thermal parameters on all non−hydrogen atoms.
X−ray diffraction data for 1 and 2 are given in Table 2.1.
Table 2.1. Crystal data and structure refinement parameters for [V3(3−O)(−OOCR)3−
(OH2)6]XnH2O, R = CH2Br, X = CF3SO3, n = 1 (1); R = C2H5, X = Cl, n = 1 (2).
Parameters 1 2
Formula weight 1217.63 732.77
a/Å 13.699(4) 11.0342(18)
b/Å 14.218(4) 11.3901(19)
c/Å 18.674(6) 14.607(2)
/deg 67.527(3)
/deg 107.652(7) 70.775(3)
/deg 66.979(3)
V/Å 3
3466.0(18) 1526.0(4)
Crystal system Monoclinic Triclinic
Space group P2(1)/n P−1
Crystal size(mm3) 0.20×0.15×0.10 0.10×0.10×0.05
Z 4 2
T/K 100(2) 100(2)
Calculated density(Mg/m3) 2.333 1.595
R1, wR2 [I>2(I)] R1 = 0.0798
wR2 = 0.2252
R1 = 0.0386
wR2 = 0.0981
R1, wR2 (all data) R1 = 0.1081
wR2 = 0.2400
R1 = 0.0491
wR2 = 0.1084

30
2.3 RESULTS AND DISCUSSION
2.3.1 SYNTHESES AND CHARACTERIZATION OF [V3(3−O)(−OOCCH2Br)6−
(OH2)3]CF3SO3H2O (1) AND [V3(3−O)(−OOCCH2CH3)6(OH2)3]Cl2H2O (2) BY
X–RAY CRYSTALLOGRAPHY
Upon the addition of ~1.2 mole equiv. bromoacetic acid to an aqueous solution of
VCl3, deep green crystals of trinuclear [V3(3−O)(−OOCCH2Br)6(OH2)3]CF3SO3H2O
(1) were obtained. Thermal ellipsoid plots of the V3 cation are shown in Figure 2.1. The
cation of 1 consists of an essentially planar triangular V3 core of three equivalent V(III)
centers bridged to a central 3−oxo ligand, residing ~0.017 Å above the V3 plane. Each
V(III) is also bridged via two −bromoacetato ligands to an adjacent V(III) center, with
these ligands lying on opposite sides of the V(III)3(3− O) plane. The distorted octahedral
coordination is completed at each V center by a H2O ligand. The cation has virtual D3h
symmetry and the asymmetric unit consists of one cation, a triflate anion and one lattice
water molecule. Crystals of [V3(3−O)(−OOCCH2CH3)6(OH2)3]Cl2H2O (2), with a V3
cation structure analogous to that of 1 were obtained from a solution of VCl3 and ~1 mole
equiv. NaOOCC2H5. The asymmetric unit has one cation, one chloride and two water
molecules. The thermal ellipsoid plot of the V3 cation is shown in Figure 2.2.
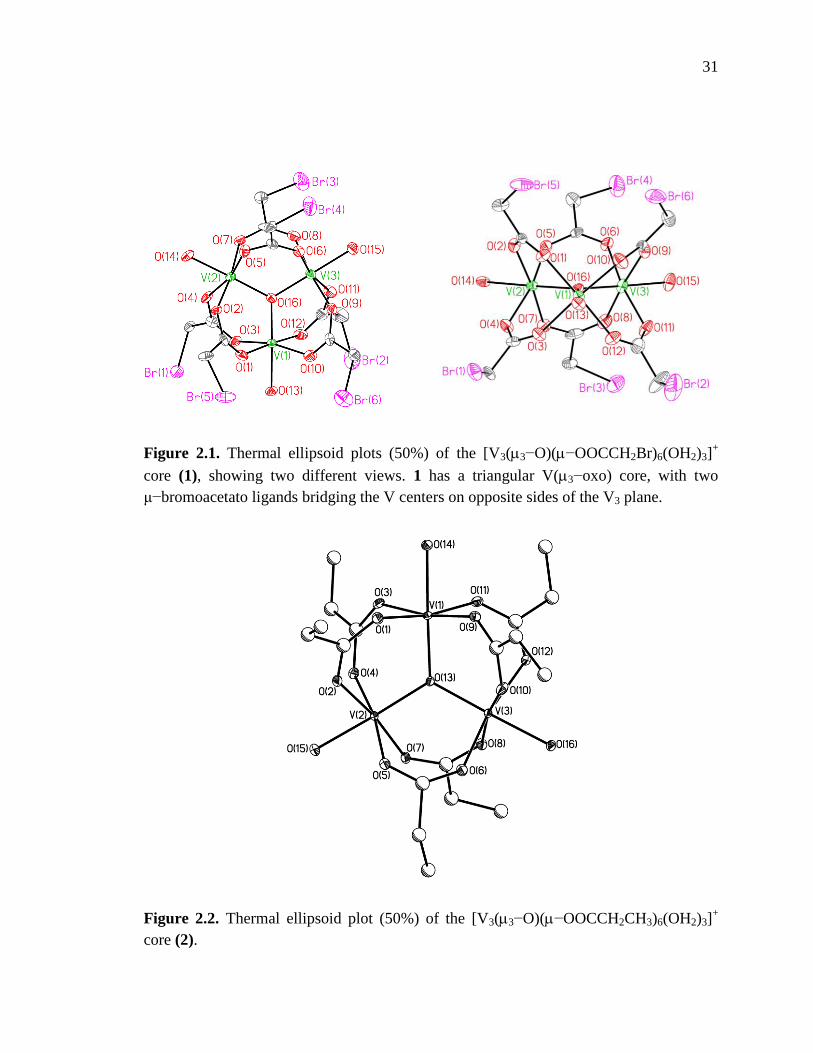
31
Figure 2.1. Thermal ellipsoid plots (50%) of the [V3(3−O)(−OOCCH2Br)6(OH2)3]+
core (1), showing two different views. 1 has a triangular V(3−oxo) core, with two
μ−bromoacetato ligands bridging the V centers on opposite sides of the V3 plane.
Figure 2.2. Thermal ellipsoid plot (50%) of the [V3(3−O)(−OOCCH2CH3)6(OH2)3]+
core (2).

32
The crystals of 1 and 2 were isostructural to the cations [V3(3−O)(−OOCCH3)6−
(OH2)3]+ (3) and [V3(3−O)(−OOCCH2Cl)3(OH2)6] CF3SO3H2O (4), crystallized by
Brenda Dougan in our group [152]. Complex 3 crystallized in space group P2(1)2(1)2
and the asymmetric unit is completed by a chloride anion and 3.5 water molecules.
Complex 4 crystallized in space group P2(1) and contains a triflate anion and one water
molecule. Two other V(III)/cholroacetato trimers, [V3(3−O)(−OCCH2Cl)6−
(OH2)3]SO3CF310.5H2O (5) [116] and [V3(3−O)(−OOCCH2Cl)6(OH2)3]ClO43H2O
(6) [117] have also previously been crystallized from aqueous solution. This structural
type is found for carboxylato complexes of other transition metals [140].
Important bond lengths and angles for 1–6 are given in Table 2.2. The V(III)−OH2
bond lengths in 1 and 2 (2.02−2.05 Å, Table 2.2) are within the range expected for V(III)
centers [153, 154]. The O−V−O bond lengths involving the O ligands of OH2 and
−carboxylato are consistent with distorted octahedral V(III) centers (85.0−94.7 for
cis−O−V−O and 166.7−175.7 for trans−O−V−O). The V−O bond lengths for the 3−O
(1.91−1.95 Å) are similar to other V(III)3(3−oxo) complexes crystallized from
non−aqueous solvents [116, 139]. The V−O bond lengths for the −carboxylato ligands
(1.99−2.05 Å) also occur within the expected range [116, 118, 121, 125, 139].

33
Table 2.2. Selected bond lengths and bond angles for [V3(3−O)(−OOCR)3−
(OH2)6]XnH2O, R = CH2Br, X = CF3SO3, n = 1 (1); R = C2H5, X = Cl, n = 2 (2); R =
CH3, X = Cl, n = 3.5 (3) [152]; R = CH2Cl, X = CF3SO3, n = 1 (4) [152]; R = CH2Cl, X =
CF3SO3, n = 10.5 (5) [116]; R = CH2Cl, X = ClO4, n = 3 (6) [117]. [a] V−(3−O), [b]
V−OC(CH3)O, [c] V−OH2, [d] V−(3−O)−V, [e] (3−O)−V−OC(CH3)O, [f]
O(CH3)CO−V−OC(CH3)O, [g] (3−O)−V−OH2
.
Repeated attempts to obtain a crystalline product with an elemental analysis
consistent with 2 failed, with the %Cl typically being twice that expected for 2,
suggesting that the bulk crystallized product contained trans−[V(OH2)4Cl2]Cl in addition
to 2. However, elemental analyses were reported for 4 [152, 155] and given the
similarities in the procedures used to synthesize 2 and 4 and the similarities in the bond
Parameters 1 2 3 4 5 6
V−Oa (Å) 1.910(7)−
1.948(7)
1.908(2)−
1.921(2)
1.920(2)−
1.928(2)
1.904(6)−
1.933(6)
1.909(4)−
1.943(3)
1.90(1)−
1.95(1)
V−Ob (Å) 1.991(8)−
2.043(8)
1.992(2)−
2.048(2)
2.002(2)−
2.051(2)
1.968(6)−
2.052(6)
2.000(5)−
2.025(4)
1.99(1)−
2.03(1)
V−Oc (Å) 2.016(8)−
2.052(9)
2.021(2)−
2.041(2)
1.997(2)−
2.018(2)
2.035(6)−
2.037(6)
2.023(3)−
2.054(3)
2.04(1)−
2.10(1)
trans−
V−O−Vd
(deg)
119.3(4)−
120.7(4)
119.74(11)−
120.37(11)
119.57(11)−
120.20(11)
119.4(3)−
120.6(3)
119.6(2)−
120.3(2)
119.5(5)−
120.8(5)
trans−
O−V−Oe
(deg)
− − 176.36(10)−
178.64(10)
− − −
cis−
O−V−Of
(deg)
85.0(3)−
94.7(3)
86.14(10)−
92.89(10)
82.44(10)−
93.20(12)
85.5(3)−
94.3(3)
87.04−
91.80
86.5(5)−
92.4(5)
trans−
O−V−Of
(deg)
166.7(3)−
175.7(3)
170.16(10)−
172.48(10)
167.62(11)−
175.54(10)
166.6(2)−
174.9(2)
167.54−
173.07
167.8(5)−
173.3(5)
trans−
O−V−Og
(deg)
178.3(3)−
179.0(3)
176.86(10)−
178.33(10)
92.21(9)−
97.83(10)
176.8(3)−
177.4(3)
176.7(1)−
179.7(2)
177.0(5)−
177.5(5)
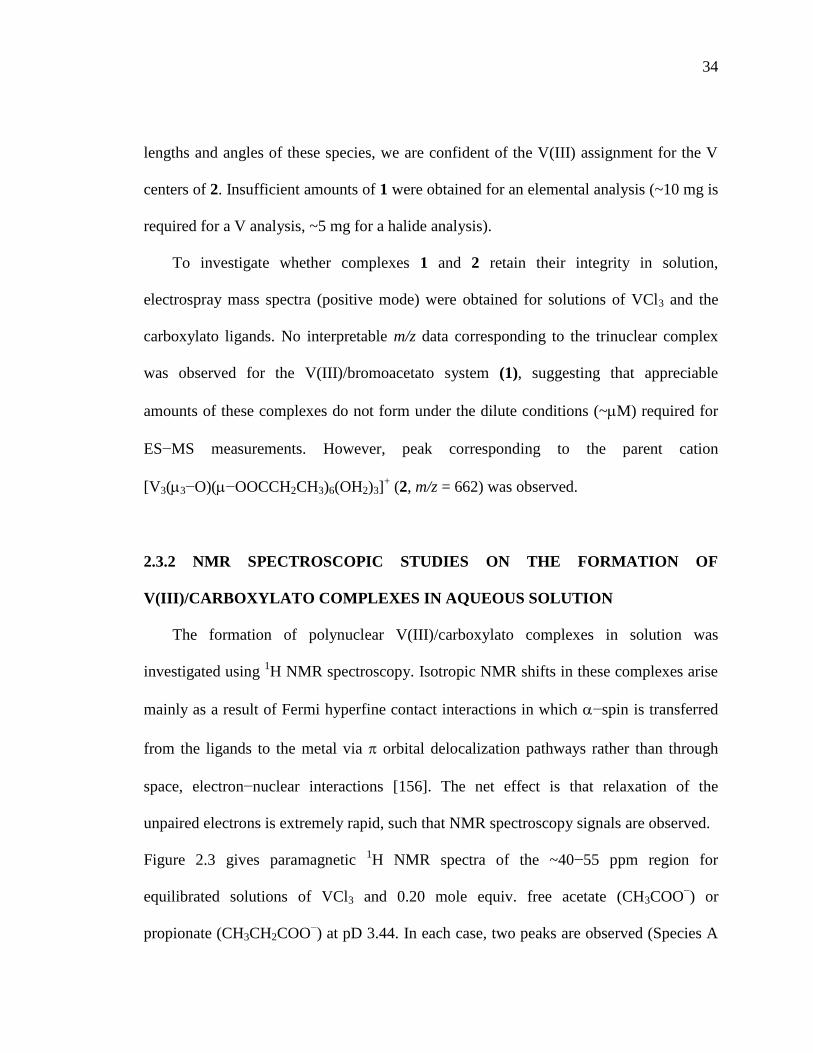
34
lengths and angles of these species, we are confident of the V(III) assignment for the V
centers of 2. Insufficient amounts of 1 were obtained for an elemental analysis (~10 mg is
required for a V analysis, ~5 mg for a halide analysis).
To investigate whether complexes 1 and 2 retain their integrity in solution,
electrospray mass spectra (positive mode) were obtained for solutions of VCl3 and the
carboxylato ligands. No interpretable m/z data corresponding to the trinuclear complex
was observed for the V(III)/bromoacetato system (1), suggesting that appreciable
amounts of these complexes do not form under the dilute conditions (~M) required for
ES−MS measurements. However, peak corresponding to the parent cation
[V3(3−O)(−OOCCH2CH3)6(OH2)3]+ (2, m/z = 662) was observed.
2.3.2 NMR SPECTROSCOPIC STUDIES ON THE FORMATION OF
V(III)/CARBOXYLATO COMPLEXES IN AQUEOUS SOLUTION
The formation of polynuclear V(III)/carboxylato complexes in solution was
investigated using 1H NMR spectroscopy. Isotropic NMR shifts in these complexes arise
mainly as a result of Fermi hyperfine contact interactions in which −spin is transferred
from the ligands to the metal via orbital delocalization pathways rather than through
space, electron−nuclear interactions [156]. The net effect is that relaxation of the
unpaired electrons is extremely rapid, such that NMR spectroscopy signals are observed.
Figure 2.3 gives paramagnetic 1H NMR spectra of the ~40−55 ppm region for
equilibrated solutions of VCl3 and 0.20 mole equiv. free acetate (CH3COO−) or
propionate (CH3CH2COO−) at pD 3.44. In each case, two peaks are observed (Species A
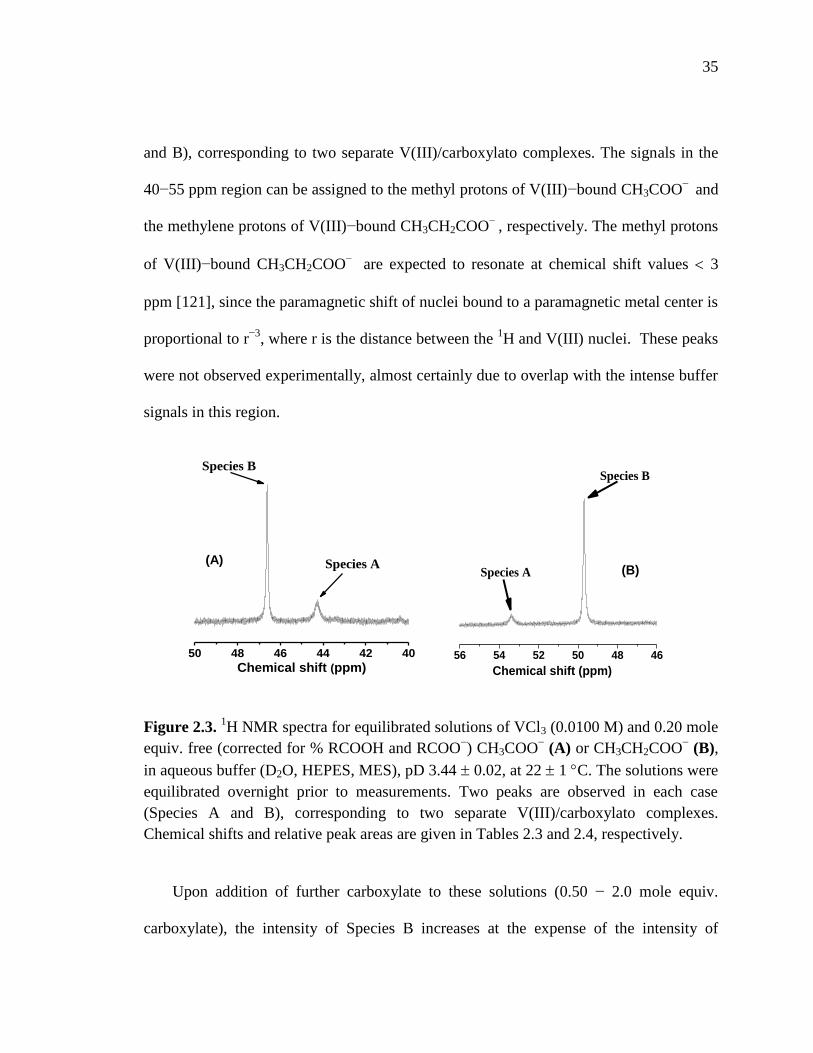
35
464850525456
Species A
Chemical shift (ppm)
Species B
(B)
50 48 46 44 42 40
Species A
Chemical shift (ppm)
Species B
(A)
and B), corresponding to two separate V(III)/carboxylato complexes. The signals in the
40−55 ppm region can be assigned to the methyl protons of V(III)−bound CH3COO−
and
the methylene protons of V(III)−bound CH3CH2COO−
, respectively. The methyl protons
of V(III)−bound CH3CH2COO−
are expected to resonate at chemical shift values 3
ppm [121], since the paramagnetic shift of nuclei bound to a paramagnetic metal center is
proportional to r−3
, where r is the distance between the 1H and V(III) nuclei. These peaks
were not observed experimentally, almost certainly due to overlap with the intense buffer
signals in this region.
Figure 2.3. 1H NMR spectra for equilibrated solutions of VCl3 (0.0100 M) and 0.20 mole
equiv. free (corrected for % RCOOH and RCOO−) CH3COO
− (A) or CH3CH2COO
− (B),
in aqueous buffer (D2O, HEPES, MES), pD 3.44 0.02, at 22 1 C. The solutions were
equilibrated overnight prior to measurements. Two peaks are observed in each case
(Species A and B), corresponding to two separate V(III)/carboxylato complexes.
Chemical shifts and relative peak areas are given in Tables 2.3 and 2.4, respectively.
Upon addition of further carboxylate to these solutions (0.50 − 2.0 mole equiv.
carboxylate), the intensity of Species B increases at the expense of the intensity of

36
Species A. Significant amounts of other species are not observed by 1H NMR
spectroscopy. The results are summarized in Tables 2.3 and 2.4. At 1.0 and 2.0 mole
equiv. carboxylate, only Species B is observed for both the V(III)/acetato and
V(III)/propionato systems.
Table 2.3. 1H NMR spectroscopy chemical shifts and relative intensities for equilibrated
solutions of VCl3 (0.0100 M) and CH3COO−/CH3COOH ([CH3COO
−] = 2.00 × 10
−3–
0.0200 M) in aqueous buffers (HEPES, MES), pD 3.44 ± 0.02 at 22 ± 1º C.
Table 2.4. 1H NMR spectroscopy chemical shifts and relative intensities for equilibrated
solutions of VCl3 (0.0100 M) and CH3CH2COO−/CH3CH2COOH ([CH3CH2COO
−] =
2.00 × 10⁻³
–0.0200 M) in aqueous buffers (HEPES, MES), pD 3.44 ± 0.02 at 22 ± 1º C.
Mole equiv. of
CH3COO−
added
Species A
(± 0.2 ppm)
Species B
(± 0.2 ppm)
Peak area of Species B
Peak area of Species A
0.20
44.3
46.6
4.1
0.50 44.1 46.5 13
1.0 − 46.6 −
2.0 − 46.6 −
Mole equiv.
of
CH3COO−
added
Species A
(±0.3
ppm)
Species B
(± 0.3 ppm)
Peak area of Species B
Peak area of Species A
0.20
53.4
49.7
9.1
0.50 53.4 49.7 41
1.0 − 49.8 −
2.0 − 50.0 −
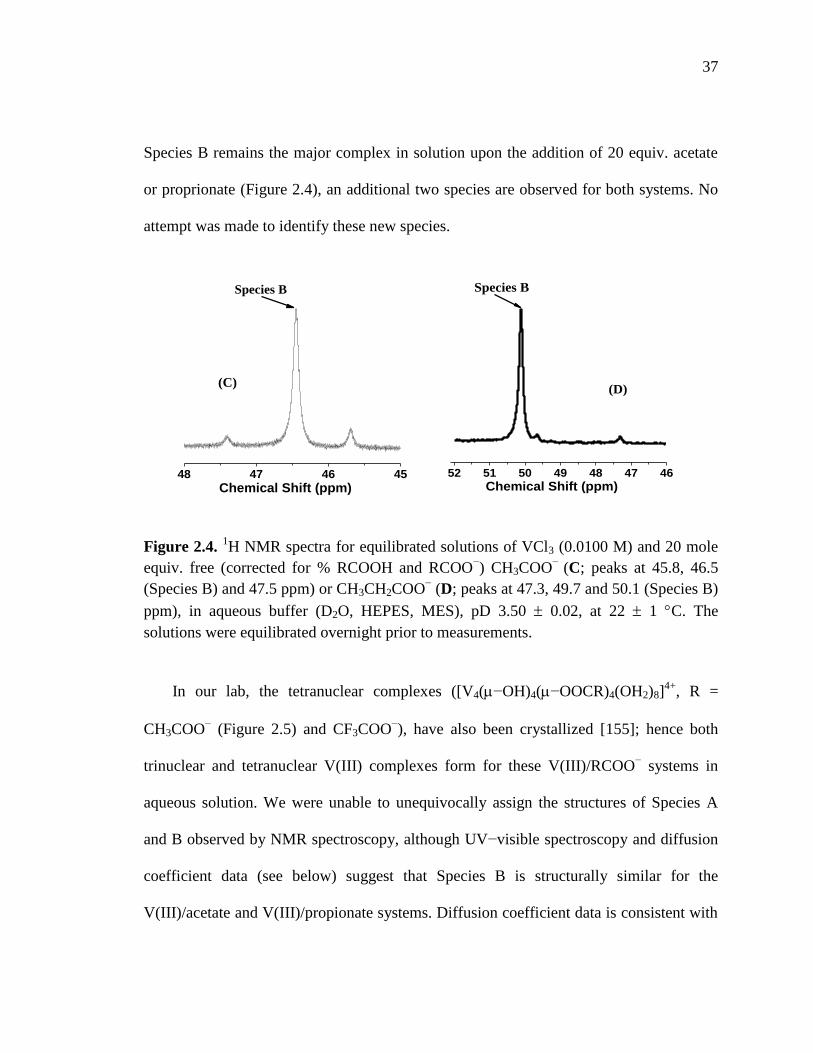
37
45464748
Chemical Shift (ppm)
Species B
(C)
46474849505152
Chemical Shift (ppm)
Species B
(D)
Species B remains the major complex in solution upon the addition of 20 equiv. acetate
or proprionate (Figure 2.4), an additional two species are observed for both systems. No
attempt was made to identify these new species.
Figure 2.4. 1H NMR spectra for equilibrated solutions of VCl3 (0.0100 M) and 20 mole
equiv. free (corrected for % RCOOH and RCOO−) CH3COO
− (C; peaks at 45.8, 46.5
(Species B) and 47.5 ppm) or CH3CH2COO− (D; peaks at 47.3, 49.7 and 50.1 (Species B)
ppm), in aqueous buffer (D2O, HEPES, MES), pD 3.50 0.02, at 22 1 C. The
solutions were equilibrated overnight prior to measurements.
In our lab, the tetranuclear complexes ([V4(−OH)4(−OOCR)4(OH2)8]4+
, R =
CH3COO− (Figure 2.5) and CF3COO
−), have also been crystallized [155]; hence both
trinuclear and tetranuclear V(III) complexes form for these V(III)/RCOO− systems in
aqueous solution. We were unable to unequivocally assign the structures of Species A
and B observed by NMR spectroscopy, although UV−visible spectroscopy and diffusion
coefficient data (see below) suggest that Species B is structurally similar for the
V(III)/acetate and V(III)/propionate systems. Diffusion coefficient data is consistent with
38
Species B being a trinuclear, rather than a tetranuclear complex (see below). If correct, it
is unusual that the order of the chemical shifts for Species A and B is reversed for the
V(III)/propionate system, suggesting that Species A are not necessarily isostructural for
the two systems.
Figure 2.5. Thermal ellipsoid plots (35%) of the [V4(μ−OH)4(μ−OOCCH3)4(OH2)8]4+
core showing two different views [155]. The four vanadium(III) atoms are bridged by one
μ−hydroxo ligand and one μ−acetato ligand. The remaining coordination sites are
occupied by water ligands.
1H NMR spectra were also recorded for the V(III)/chloroacetato (0.0100 M VCl3, pD
3.57 0.02) and V(III)/bromoacetato (0.0100 M VCl3, pD 3.52 0.02) systems. No
peaks were observed at chemical shift values > 5 ppm for 0.50, 1.0, 2.0 and 20 equiv.
carboxylate for the V(III)/bromoacetato system. For the V(III)/chloroacetato system, a
single, low intensity peak is observed at = 54.4 ppm for 20 equiv. chloroacetate; no
peaks were observed at 0.50, 1.0 or 2.0 equiv. chloroacetate. Peaks were not observed by

39
19F NMR spectroscopy for the V(III)/trifluoroacetato system at 0.50, 1.0, 2.0 and 20
equiv. CF3COO−
either (0.0100 M VCl3, pD 3.52 ± 0.02), apart from peaks
corresponding to free CF3COO− and CF3SO3
− (triflic acid was used to adjust the pD of
the solutions), suggesting that insignificant amounts of polynuclear complexes form
under these conditions.
DETERMINATION OF THE DIFFUSION COEFFICIENT FOR SPECIES B BY
PULSED–FIELD–GRADIENT SPIN–ECHO NMR SPECTROSCOPIC
MEASUREMENTS
Determination of diffusion coefficients for complexes in solution can provide
estimates of the molecular masses of these species, since diffusion coefficients primarily
depend upon the molecular mass and geometry of the complex. The pulsed–field–
gradient spin−echo NMR technique is a useful method to directly determine diffusion
coefficients [157-160]. This technique is mainly used for liquids, where the anisotropic
spin interactions are averaged by molecular motions and the NMR peaks are sharp. The
decay of the echo intensity in the Stejskal−Tanner experiment [157-160] is described by:
I = I0 exp{–(G)2 δ
2 (Δ–δ/3) D} (1)
where I is the echo intensity for the spectral peak of interest, I0 is the echo intensity at δ =
0, is the gyromagnetic ratio of the nuclei, G is the amplitude of the two gradient pulses,
δ is their duration, Δ is the interval between the gradient pulses, and D is the diffusion
coefficient. The experiment is performed at constant echo time Δ + δ by varying the
duration of the gradient pulses δ. From eq. (1), it can be shown that the plot of lne(I/I0)

40
0.0 8.0x10⁴
1.6x10⁵
2.4x10⁵
3.2x10⁵
-2.0
-1.5
-1.0
-0.5
0.0
G2()
lne
(I/I
0)
versus γ2G
2δ
2(Δ−δ/3) produces a straight line with slope −D. Hence, by simultaneously
varying Δ and δ and keeping the echo time constant, the diffusion coefficient for the
molecule with a specific NMR resonance peak can be directly determined.
Measurement of diffusion coefficients by PFG NMR experiments were performed
with the assistance of Dr. Anatoly Khitrin, Kent State University. In order to validate our
experimental design, we initially measured the diffusion coefficient for water. These
results are given in Figure 2.6. A value of (2.55 0.01) × 10−5
cm2 s
−1 was obtained,
which is in excellent agreement with a literature value of 2.6 × 10⁻⁵
cm2 s
−1 for free water
[160].
Figure 2.6. Plot of lne(I/I0) versus γ2G
2δ
2(Δ−δ/3) for the water signal for an equilibrated
solution of VCl3 (0.0100 M) and 2.0 mole equiv. free CH3CH2COO−, in aqueous buffer
(D2O, MES, HEPES), pD 3.44 ± 0.02, 22 1 C. The best fit of the data gives a straight
line with slope (= −diffusion coefficient) = (−2.55 ± 0.01) × 10−5
cm2 s
−1.
Accurate measurement of diffusion coefficients requires either sharp NMR peaks or
strong pulsed gradients. The line widths of Species A for the V(III)/acetato and
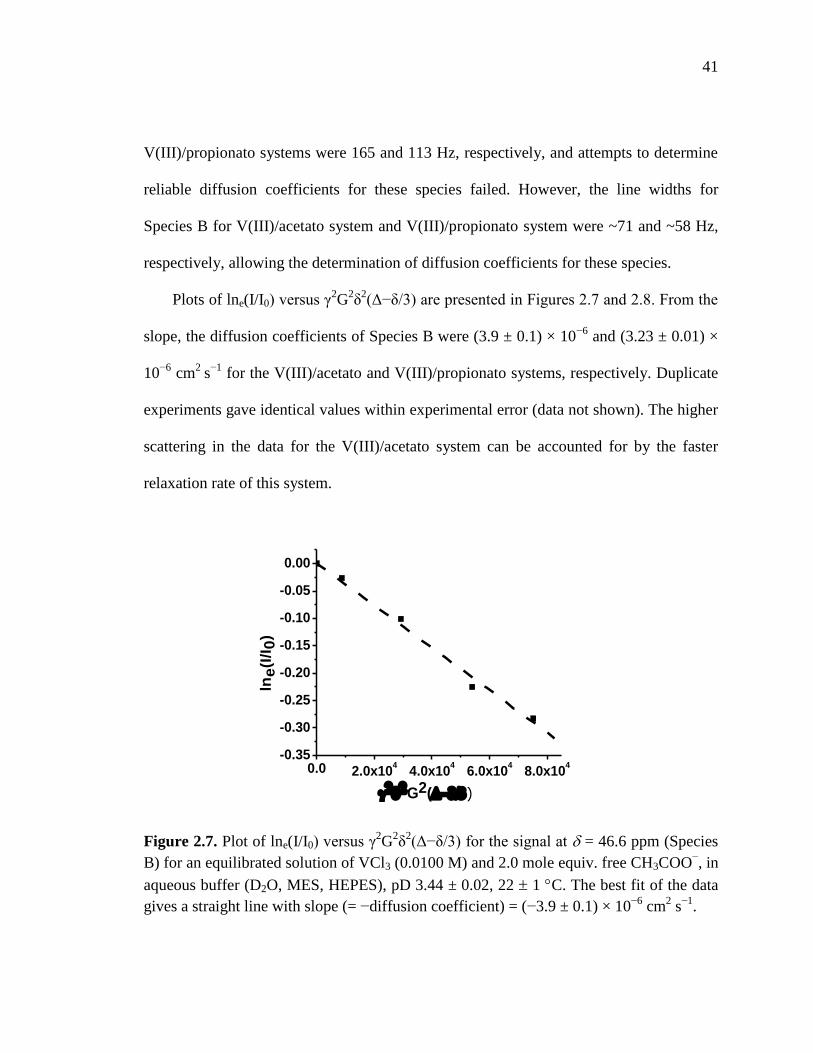
41
0.0 2.0x10⁴
4.0x10⁴
6.0x10⁴
8.0x10⁴
-0.35
-0.30
-0.25
-0.20
-0.15
-0.10
-0.05
0.00
lne
(I/I
0)
G2()
V(III)/propionato systems were 165 and 113 Hz, respectively, and attempts to determine
reliable diffusion coefficients for these species failed. However, the line widths for
Species B for V(III)/acetato system and V(III)/propionato system were ~71 and ~58 Hz,
respectively, allowing the determination of diffusion coefficients for these species.
Plots of lne(I/I0) versus γ2G
2δ
2(Δ−δ/3) are presented in Figures 2.7 and 2.8. From the
slope, the diffusion coefficients of Species B were (3.9 ± 0.1) × 10−6
and (3.23 ± 0.01) ×
10−6
cm2
s−1
for the V(III)/acetato and V(III)/propionato systems, respectively. Duplicate
experiments gave identical values within experimental error (data not shown). The higher
scattering in the data for the V(III)/acetato system can be accounted for by the faster
relaxation rate of this system.
Figure 2.7. Plot of lne(I/I0) versus γ2G
2δ
2(Δ−δ/3) for the signal at = 46.6 ppm (Species
B) for an equilibrated solution of VCl3 (0.0100 M) and 2.0 mole equiv. free CH3COO−, in
aqueous buffer (D2O, MES, HEPES), pD 3.44 ± 0.02, 22 1 C. The best fit of the data
gives a straight line with slope (= −diffusion coefficient) = (−3.9 ± 0.1) × 10−6
cm2 s
−1.

42
0 1x10⁵
2x10⁵
3x10⁵
-1.2
-1.0
-0.8
-0.6
-0.4
-0.2
0.0
G2()
lne
(I/I
0)
Figure 2.8. Plot of lne(I/I0) versus γ2G
2δ
2(Δ−δ/3) for the signal at = 49.7 ppm (Species
B) for an equilibrated solution of VCl3 (0.0100 M) and 2.0 mole equiv. free
CH3CH2COO−, in aqueous buffer (D2O, MES, HEPES), pD 3.44 ± 0.02, 22 1 C. The
best fit of the data gives a straight line with slope (= −diffusion coefficient) = (−3.23 ±
0.01) × 10−6
cm2 s
−1.
Since the diffusion coefficients of molecules decreases with increasing size or
molecular weight, assuming that Species B are structurally similar for the two systems,
one can approximate that
MP /MA = DA /DP (2)
where MA and MP are the molecular weights of Species B for the V(III)/acetato and
V(III)/propionato systems, respectively, and DA and DP are the corresponding diffusion
coefficients [157]. Assuming that Species B are the trimers for both systems
([V3(μ3−O)(μ−OOCR)6(OH2)3]+, R = CH3 and CH2CH3; MA = 577.1 and MP = 661.3,
respectively), then MP /MA = 1.15, which is close to the experimental ratio DA /DP =
1.19. Alternatively, if Species B are both the tetrameric species
43
2/12
i
i
i
ii
m
rm
([V4(μ−OH)4(μ−OOCR)4(OH2)8]4+
, R = CH3 and CH2CH3; MA = 652.1 and MP = 708.2,
respectively), MP /MA = 1.09, which deviates significantly from the experimental
observations. Hence the results of the diffusion cofficient experiments are most consistent
with Species B being the trinuclear, rather than the tetranuclear complexes.
The diffusion coefficient is also related to the hydrodynamic radius of the diffusing
object, which can be calculated using the Stokes–Einstein equation [159]
D = kBT/6πηRH (3)
where kB is the Boltzmann constant, T is temperature, η is the dynamic viscosity of the
solvent (= 0.89 × 10⁻²
g cm−1
s−1
for water [161]) and RH is the hydrodynamic radius. The
hydrodynamic radii of Species B were calculated for the V(III)/acetato (RH(A)) and
V(III)/proprionato (RH(P)) systems using eq. (3) and found to be 6.4 and 7.5 Å,
respectively. As expected, the hydrodynamic radius of Species B is larger for the
V(III)/proprionate system. For comparison purposes, the radii of gyration (RG) for the
[V3(3−O)(−OOCCH3)6(OH2)3]+ and [V3(3−O)(−OOCCH2CH3)6(OH2)3]
+ cores were
calculated from their crystal structure data using eq. 4 [162], assuming a spherical
motion, and were found to be 3.14 (RG(A)) and 3.50 (RG(P)) Å, respectively.
RH = (4)
For these calculations, the center of mass was taken as the 3−oxo atom and the H atom
contributions to the radius of gyration were assumed to be negligible. The hydrodynamic
radius is twice the radius of gyration. This can be attributed to the inclusion of solvent

44
molecules (H2O) in the hydrodynamic radii, whereas the radii of gyration are calculated
for the cationic core of the complexes only. There is, however, good agreement between
the ratio of the hydrodynamic radii for the two systems, RH(P)/RH(A) (= 1.2) with the ratio
of the radii of gyration, RG(P)/RG(A) (= 1.12), consistent with Species B being the trimeric
V(III)/carboxylato complexes. The ratio of RG(P)/RG(A) was also calculated assuming that
Species B is a tetramer for the V(III)/acetato system and a trimer for the
V(III)/proprionato system. The distances from the centroid of the tetramer were used to
calculate RG(A). In this case RG(P)/RG(A) = 0.97, which is significantly different from the
RH(P)/RH(A) ratio obtained from measurement of the diffusion coefficients of Species B
(1.2). It was not possible to calculate RG(P)/RG(A) assuming Species B were both tetramers
for the two systems, since crystals of the V4 tetramer of propionate were not obtained.
2.3.3 UV−VISIBLE SPECTROSCOPIC STUDIES ON THE FORMATION OF
V(III)/CARBOXYLATO COMPLEXES IN AQUEOUS SOLUTION
Figure 2.9a gives UV−visible spectra for solutions of VCl3 (0.0100 M) with 2.0
equiv. carboxylate, obtained under the same conditions as the 1H NMR spectroscopy
spectra (pD 3.5 0.1). The corresponding UV−visible spectrum of 0.0100 M VCl3 under
these conditions is given in Figure 2.10b, and is dominated by a peak at 421 ± 2 nm,
corresponding to the −oxo to V(III) charge transfer transition for the oxo−bridged V(III)
dimer.
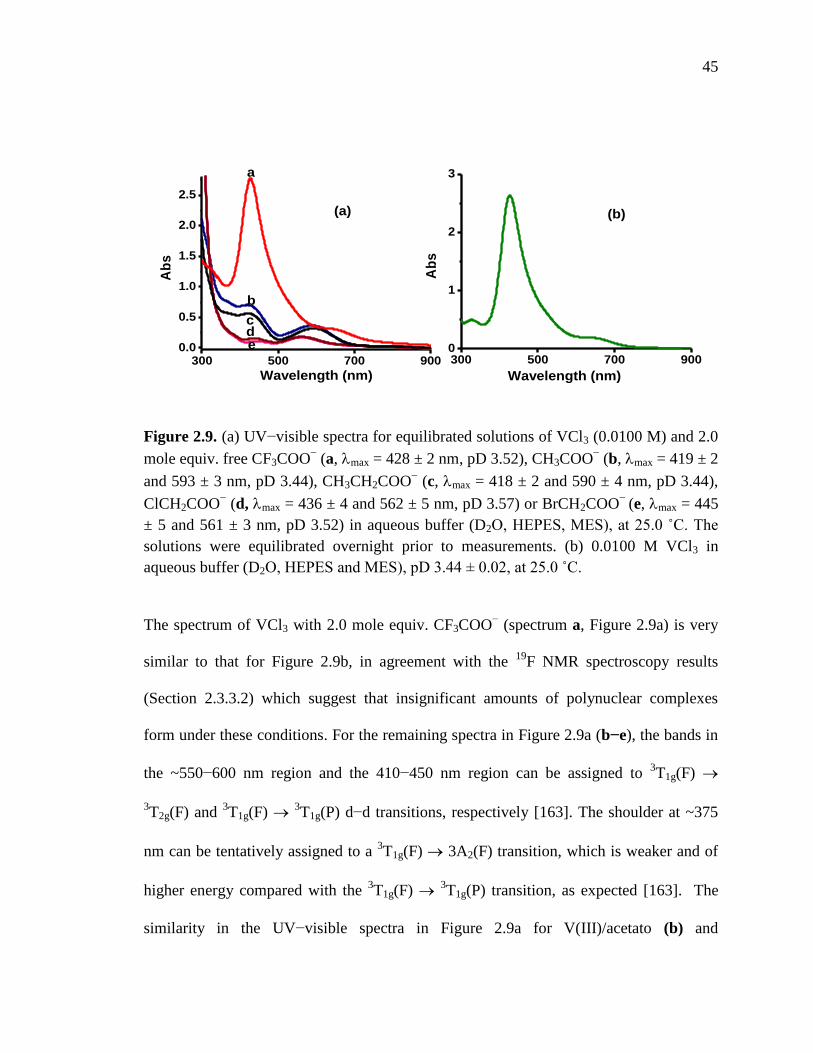
45
300 500 700 9000.0
0.5
1.0
1.5
2.0
2.5
Ab
s
Wavelength (nm)
a
b
cde
(a)
300 500 700 9000
1
2
3
Ab
s
Wavelength (nm)
(b)
Figure 2.9. (a) UV−visible spectra for equilibrated solutions of VCl3 (0.0100 M) and 2.0
mole equiv. free CF3COO− (a, max = 428 ± 2 nm, pD 3.52), CH3COO
− (b, max = 419 ± 2
and 593 ± 3 nm, pD 3.44), CH3CH2COO− (c, max = 418 ± 2 and 590 ± 4 nm, pD 3.44),
ClCH2COO− (d, max = 436 ± 4 and 562 ± 5 nm, pD 3.57) or BrCH2COO
− (e, max = 445
± 5 and 561 ± 3 nm, pD 3.52) in aqueous buffer (D2O, HEPES, MES), at 25.0 ˚C. The
solutions were equilibrated overnight prior to measurements. (b) 0.0100 M VCl3 in
aqueous buffer (D2O, HEPES and MES), pD 3.44 ± 0.02, at 25.0 ˚C.
The spectrum of VCl3 with 2.0 mole equiv. CF3COO− (spectrum a, Figure 2.9a) is very
similar to that for Figure 2.9b, in agreement with the 19
F NMR spectroscopy results
(Section 2.3.3.2) which suggest that insignificant amounts of polynuclear complexes
form under these conditions. For the remaining spectra in Figure 2.9a (b−e), the bands in
the ~550−600 nm region and the 410−450 nm region can be assigned to 3T1g(F)
3T2g(F) and
3T1g(F)
3T1g(P) d−d transitions, respectively [163]. The shoulder at ~375
nm can be tentatively assigned to a 3T1g(F) 3A2(F) transition, which is weaker and of
higher energy compared with the 3T1g(F)
3T1g(P) transition, as expected [163]. The
similarity in the UV−visible spectra in Figure 2.9a for V(III)/acetato (b) and
46
V(III)/propionato (c) systems, obtained under conditions where only one polynuclear
complex (Species B) is observed in the 1
H NMR spectrum (Figure 2.4), suggest that
Species B are structurally analogous for the two systems. UV−vis spectra for VCl3 with
2.0 mole equiv. ClCH2COO− (d) and BrCH2COO
− (e) are also shown in Figure 2.10a. As
expected on the basis of the absence of 1H NMR spectroscopy signals at > 5 ppm for
the latter two systems under these conditions, these spectra (d and e) differ significantly
from those observed for VCl3 and 2.0 mole equiv. acetate and propionate under the same
conditions. Furthermore, the band intensities in spectra d and e are significantly weaker
than those observed for the species giving rise to spectra b and c, suggesting that the
V(III) center is more centrosymmetric in the former systems. Given that oxo ligands are
strongly electronegative compared with other ligands, binding of one or more oxo ligands
to a V(III) center in an asymmetric geometry could explain the higher intensities of the
d−d transitions in spectra b and c. Since no signals are observed at chemical shift values
> 5 ppm for the V(III)/chloroacetato and V(III)/bromoacetato systems, and no additional
peaks were observed for the V(III)/trifluoroacetato system by 19
F NMR spectroscopy
(section 2.3.3.2), it is tempting to speculate that polynuclear V(III)/carboxylato
complexes are not formed in significant amounts under these conditions. However, we
cannot rationalize why this may be so. Since halogenated carboxylates are poorer
electron donors compared with acetate and propionate, the V(III) centers of complexes of
these ligands are better Lewis acids. Aqua ligands coordinated to the metal center would
therefore have a lower acid dissociation constant and therefore deprotonate more easily,
promoting the formation of oxo−bridged polynuclear complexes.
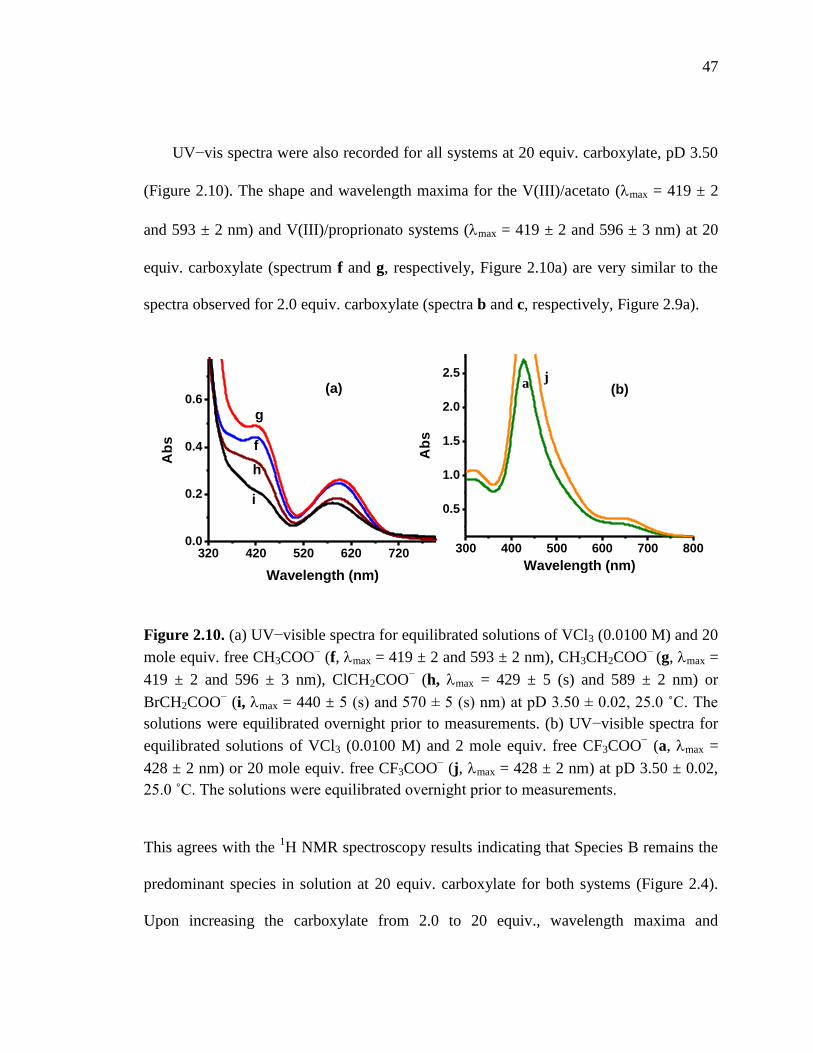
47
320 420 520 620 7200.0
0.2
0.4
0.6
i
h
f
Ab
s
Wavelength (nm)
g
(a)
300 400 500 600 700 800
0.5
1.0
1.5
2.0
2.5
Ab
s
Wavelength (nm)
a j(b)
UV−vis spectra were also recorded for all systems at 20 equiv. carboxylate, pD 3.50
(Figure 2.10). The shape and wavelength maxima for the V(III)/acetato (max = 419 ± 2
and 593 ± 2 nm) and V(III)/proprionato systems (max = 419 ± 2 and 596 ± 3 nm) at 20
equiv. carboxylate (spectrum f and g, respectively, Figure 2.10a) are very similar to the
spectra observed for 2.0 equiv. carboxylate (spectra b and c, respectively, Figure 2.9a).
Figure 2.10. (a) UV−visible spectra for equilibrated solutions of VCl3 (0.0100 M) and 20
mole equiv. free CH3COO− (f, max = 419 ± 2 and 593 ± 2 nm), CH3CH2COO
− (g, max =
419 ± 2 and 596 ± 3 nm), ClCH2COO− (h, max = 429 ± 5 (s) and 589 ± 2 nm) or
BrCH2COO− (i, max = 440 ± 5 (s) and 570 ± 5 (s) nm) at pD 3.50 ± 0.02, 25.0 ˚C. The
solutions were equilibrated overnight prior to measurements. (b) UV−visible spectra for
equilibrated solutions of VCl3 (0.0100 M) and 2 mole equiv. free CF3COO− (a, max =
428 ± 2 nm) or 20 mole equiv. free CF3COO− (j, max = 428 ± 2 nm) at pD 3.50 ± 0.02,
25.0 ˚C. The solutions were equilibrated overnight prior to measurements.
This agrees with the 1H NMR spectroscopy results indicating that Species B remains the
predominant species in solution at 20 equiv. carboxylate for both systems (Figure 2.4).
Upon increasing the carboxylate from 2.0 to 20 equiv., wavelength maxima and
48
intensities of the UV−vis spectra for the V(III)/chloroacetato (max = 429 ± 5 (s) and 589
± 2 nm, spectrum h, Figure 2.10a) and V(III)/bromoacetato (max = 440 ± 5 (s) and 570 ±
5 (s) nm, spectrum i, Figure 2.10a) systems significantly change towards parameters
expected if Species B or a structurally similar complex (or complexes) was now formed
for these systems. The largest changes are observed for the V(III)/chloroacetato system,
in line with the observation of a small signal at = 54.4 ppm under these conditions by
1H NMR spectroscopy. For the V(III)/trifluoroacetato system, increasing the carboxylate
from 2.0 to 20 equiv. resulted in a similar spectrum of higher intensity (spectrum j,
Figure 2.10b).
2.4 SUMMARY
Trinuclear complexes of vanadium(III) with bromoacetate and propionate of the
general structural type [V3(3−O)(−OOCR)6(OH2)3]+ have been crystallized from
aqueous solution and the crystal structures determined by X−ray diffraction. The
complexes display close structural similarities with isostructural acetato and
chloroacetato complexes of V(III) previously synthesized in our laboratory. Electrospray
mass spectrometry for the V(III)/propionato system gave peaks assignable to
[V3(3−O)(−OOCCH2CH3)6(OH2)3]+, which suggest that the complex is not only
formed in the solid state, but also retains its integrity in solution.
The tetranuclear complexes [V4(−OH)4(−OOCCF3)4(OH2)8]Cl4•7.5H2O,
[V4(−OH)4(−OOCCH3)4(OH2)8]Cl4•CH3COOH•12H2O and [V4(−OH)4−
(−OOCCH3)4(OH2)8]Cl4•3H2O have also been crystallized from aqueous solution and

49
structurally characterized by our group. A range of spectroscopic techniques were
employed to probe the formation of trinuclear and tetranuclear V(III)/carboxylato
complexes (acetate, propionate, bromoacetate, chloroacetate and trifluoroacetate) in
aqueous solution. 1H NMR spectra for solutions of VCl3 (0.010 M) with 0.20 mole equiv.
acetate or propionate (pD 3.44) showed two peaks at 44.3 and 46.6 ppm (acetate) or 53.4
and 49.7 ppm (propionate) assigned to Species A and Species B, respectively. At 1.0 and
2.0 mole equiv. of acetate or propionate, only Species B was observed. Species B was the
predominant complex in solution at 20 equiv. of carboxylate for both these systems. The
similarity of the UV−visible spectra for solutions of VCl3 and 2.0 mole equiv. acetate or
propionate under the same concentration and pH conditions suggests that Species B are
structurally analogous for these two systems. The diffusion coefficients for Species B for
both these systems were determined using pulsed–field–gradient spin–echo NMR
experiments. The diffusion coefficient and hydrodynamic radii are consistent with
Species B being the trinuclear complex.
1H NMR and UV−vis spectroscopic data for solutions of VCl3 with 0.2–2.0 mole
equiv. bromoacetate and chloroacetate ligands do not support the formation of trinuclear
or tetranuclear V(III)/carboxylato complexes (pD 3.5). However, the UV−vis spectrum
for a solution of VCl3 with 20 equiv. chloroacetate was significantly different, and a 1H
NMR spectrum showed a small peak at 54.4 ppm, suggesting that polynuclear complexes
are most likely formed at higher equiv. of carboxylate. Finally, 19
F NMR spectroscopy
measurements for solutions of VCl3 with trifluoroacetate (up to 20 equiv.) suggested that
polynuclear complexes were also not formed for this system.

50
To summarize, the formation of polynuclear complexes of V(III) with a series
carboxylate ligands have been studied by a range of spectroscopic techniques in aqueous
solution. Some of these complexes were characterized by X–ray diffraction. Mass
spectrometry and 1H NMR spectroscopic data showed that polynuclear
V(III)/carboxylato complexes are formed both in the solid state and in solution.
51
CHAPTER 3
SELF−ASSEMBLY OF A NOVEL TWO−DIMENSIONAL
BARIUM/THIODIACETATE COORDINATION POLYMER IN AQUEOUS
SOLUTION
3.1 INTRODUCTION
Barium is the fifth element in Group 2 in the periodic table, a soft silvery alkaline
earth metal. It is never found in nature in its elemental form due to its reactivity with air.
The most common naturally occurring minerals are the very insoluble barium sulfate,
BaSO4 (barite) and barium carbonate, BaCO3 (witherite) [164]. Barium's name originates
from Greek barys, meaning "heavy", describing the high density of some common
barium−containing ores [164].
There is currently considerable interest in the development of metal−organic−based
polymers, which have applications in catalysis, selective gas adsorption (O2, N2, H2 and
methane), as ion−selective sensors and materials with interesting magnetic properties
[165-167]. Di− and polycarboxylate ligands in particular have been shown to be useful
synthetic building blocks for metal/organic−based coordination polymers [166-168]. For
example, coordination polymers of transition, alkaline earth and lanthanide metals with
oxydiacetate (oda, O(CH3COO)22−
) and thiodiacetate (tda, S(CH3COO)22−
) spontaneously

52
self−assemble in aqueous solution [169-176]. Furthermore the aqua ligands of
Mn+
/X(CH3COO)2 coordination polymers (X = O or S) are labile, resulting in a rich
substitution chemistry [169, 170, 177].
Barium (Ba2+
) usually forms 8–12 coordinate complexes with O−, N− and P−donor
ligands. However, there are some examples of penta− and hexacoordinate Ba2+
complexes with polypeptides (N−donor), carboxylic acids (O−donor) and substituted
phosphido (P−donor) ligands [178]. Most of these complexes have layered structures
with more than one Ba2+
center bridged by ligands with O, N or P donor atoms [178,
179]. Recently the first oxydiacetate coordination polymers of Ba2+
were reported, with
9− and 10−coordinate Ba2+
centers [174].
This chapter describes the synthesis, structural and spectroscopic characterization of
a novel thiodiacetato complex of Ba2+
crystallized from aqueous solution, which forms a
two−dimensional polymeric structure. This complex first serendipitously crystallized
when attempting to crystallize a V(III) complex of tda.
3.2 EXPERIMENTAL
3.2.1 MATERIALS
Barium chloride (BaCl2, 99%) and thiodiacetic acid (tdaH2, 98%) were purchased
from Acros organics. All other materials were of AR grade and used without further
purification.

53
3.2.2 INSTRUMENTATION
All pH measurements were made at room temperature with an Orion Model 710A
pH meter equipped with Mettler−Toledo Inlab 423 or 421 electrodes. The electrode was
filled with 3 M KCl / saturated AgCl solution, pH 7.0. The electrodes were standardized
with standard BDH buffer solutions at pH 4.01 and 6.98. Solution pH was adjusted using
HCl or NaOH solutions as necessary.
1H NMR and
13C NMR spectra were recorded on a Bruker 400 MHz spectrometer
equipped with a 5 mm probe at room temperature (22 1 °C). Solutions were prepared
in D2O and TSP (3−(trimethylsilyl)propionic−2,2,3,3−d4 acid, sodium salt) was used as
an internal standard (1H NMR).
Elemental Analyses were carried out using a Leco CHNS–932 Elemental Analyzer
(C and H). The Ba analysis was carried out using an ICP−AAS instrument at the
Microanalytical Unit, Research School of Chemistry, Australian National University.
Thermogravimetric analysis (TGA) was performed on a TA Instruments Hi−Res TGA
2950 Thermogravimetric Analyzer, using a high resolution program, under a flow of
nitrogen gas at a heating rate of 5 °C/min in the temperature range of 21−1000 °C.
Electrospray mass spectra were recorded on a Thermo−Finnigan LCQDuo ion trap
mass spectrometer at the mass spectrometry facility in the Department of Chemistry,
Colorado State University.
FT−IR spectra were recorded using a Bruker Tensor 27 Infrared spectrophotometer.
Samples were prepared by grinding with KBr using a mortar and pestle and crushed in a
mechanical die press to form translucent pellets.
54
3.2.3 SYNTHESIS OF {Ba[S(CH2COO)2(H2O)3]•2H2O}n (1)
In the presence of air, thiodiacetic acid (tdaH2, 1.05 g, 6.99 mmol) was dissolved in
H2O (5.0 ml) and the pH was adjusted to 4.46 using 5 M NaOH. In a separate vial, BaCl2
(1.43 g, 6.87 mmol) was dissolved in 5.0 ml H2O (pH of the solution was 5.20). These
two solutions were slightly cooled by holding the vials under running tap water, and the
contents mixed in a beaker. After ~5 min white needle−like crystals appeared. The
crystals were filtered and dried under vacuum overnight. Yield: 1.32 g (54%). Elemental
Analysis: calcd. for Ba[S(CH2COO)2(H2O)3]•2H2O (%): C 12.8, H 3.76, Ba 36.6; found:
C 12.8, H 3.28, Ba 38.9. FT−IR (KBr, cm−1
): 3500−3100 (s, br), 2957 (w), 2922 (w),
1561 (vs), 1388 (vs), 1242 (s), 1223 (s), 1190 (w), 1155 (m), 946 (w), 872 (m), 805 (w),
780 (w), 687 (m, br), 605 (w, br), 566 (w), 447 (w). 1H NMR OF 1 (δ, ppm; pD 5.03,
D2O): 3.30 (CH2, s). 13
C NMR OF 1 (δ, ppm; pD 5.03, D2O): 37.0 (CH2, s) and 177.4
(COO, s). 1H NMR of tda (δ, ppm; pD 5.03, D2O): 3.31 (CH2, s).
13C NMR of tda (δ,
ppm; pD 5.03, D2O): 36.9 (CH2, s), 177.5 (COO, s).
3.2.4 X−RAY CRYSTALLOGRAPHY
X−ray crystallography was performed with the assistance of Dr. Scott D. Bunge at
Kent State University. Each crystal was mounted onto a thin glass fiber from a pool of
Fluorolube™ and immediately placing it under a liquid N2 cooled N2 stream, on a Bruker
AXS diffractometer. The radiation used was graphite monochromatized Mo Kα radiation
(λ = 0.7107 Å). The lattice parameters were optimized from a least−squares calculation
on carefully centered reflections. Lattice determination, data collection, structure

55
refinement, scaling, and data reduction were carried out using APEX2 version 1.0−27
software package. Each structure was solved using direct methods. This procedure
yielded Ba, along with a number of the S, O, and C atoms. Subsequent Fourier synthesis
yielded the remaining atom positions. The hydrogen atoms were fixed in positions of
ideal geometry and refined within the XSHELL software. These idealized hydrogen
atoms had their isotropic temperature factors fixed at 1.2 or 1.5 times the equivalent
isotropic U of the C atoms to which they were bonded. The final refinement of each
compound included anisotropic thermal parameters on all non−hydrogen atoms. Crystal
data and structure refinement parameters for 1 are listed in Table 3.1.
Table 3.1. Crystal data and structure refinement for {Ba[S(CH2COO)2(H2O)3]•2H2O}n.
Parameters 1
Empirical formula C4H14BaO9S
Formula Weight 375.55
Temperature (K) 100(2)
Wavelength (Mo Kα) (Å) 0.71073
Crystal System Monoclinic
Space group P21/c
Crystal dimensions (mm) 0.56 × 0.25 × 0.20
a (Å) 13.069(4)
b (Å) 7.350(2)
c (Å) 12.932(4)
α (°) 90.000
β (°) 115.368(5)
γ (°) 90.000
V (Å3) 1122.3(6)
Z 4
Dcalc (g cm−3
) 2.223
µ (mm−1
) 3.753
F (000) 728
Unique reflections, Rint, parameters 1990, 0.0203, 176
Maximum, minimum absorption correction 0.52, 0.23
R1a, wR2
b[F
2 > 2ζ(F
2)] 0.0141, 0.0360
Final Δρ (e Å−3
) 0.575, −0.656

56
Selected interatomic distances and bond angles are listed in Table 3.2.
Table 3.2. Selected bond lengths (Å) and bond angles (°) for
{Ba[S(CH2COO)2(H2O)3]•2H2O}n. Symmetry transformations used to generate
equivalent atoms: #1 x,y−1,z; #2 x,−y+1/2,z+1/2; #3 −x+2,y−1/2,−z+3/2; #4
−x+2,y+1/2,−z+3/2; #5 x,y+1,z ; #6 x,−y+1/2,z−1/2.
Ba(1)–O(1) 2.7502(16) O(4)−Ba(1)−O(5) 65.77(5)
Ba(1)–O(2) 2.7272(17) O(1)−Ba(1)−O(5) 68.10(4)
Ba(1)–O(1)#3 2.9349(16) O(6)−Ba(1)−O(5) 136.00(5)
Ba(1)–O(2)#3 2.8375(16) O(2)#1−Ba(1)− O(7) 90.90(5)
Ba(1)–O(4) 2.7490(18) O(4)−Ba(1)−O(7) 71.66(5)
Ba(1)–O(5) 2.8978(18) O(1)−Ba(1)−O(7) 113.55(5)
Ba(1)–O(6) 2.8361(17) O(6)−Ba(1)−O(7) 78.92(5)
Ba(1)–O(7) 3.026(2) O(5)−Ba(1)−O(7) 136.43(5)
Ba(1)–S(1) 3.6487(9) O(4)−Ba(1)−S(1) 54.60(3)
S(1)–C(2) 1.799(2) O(1)−Ba(1)−S(1) 54.24(4)
S(1)–C(3) 1.812(2) O(6)−Ba(1)−S(1) 73.52(4)
O(1)–C(1) 1.253(3) O(5)−Ba(1)−S(1) 99.92(4)
Ba(1)–Ba(1)#4 4.7357(11) O(7)−Ba(1)−S(1) 60.28(4)
O(2)#1−Ba(1)−O(4) 77.72(4) O(2)#1−Ba(1)− O(6) 145.60(5)
O(2)#1−Ba(1)− (1) 139.26(5) O(4)−Ba(1)−O(6) 127.84(5)
O(4)−Ba(1)−O(1) 79.86(4) O(2)#1−Ba(1)− O(5) 71.76(5)

57
3.3 RESULTS AND DISCUSSION
3.3.1 SYNTHESIS AND CHARACTERIZATION OF {Ba[S(CH2COO)2(H2O)3]−
•2H2O}n (1)
Upon the addition of 1.02 mole equiv. of tda to an aqueous solution of BaCl2,
colorless needle–like crystals of a novel polymeric complex {Ba[S(CH2COO)2−
(H2O)3]•2H2O}n (1) were obtained in ~54% yield. Complex 1 is soluble in warm water
and is stable in air. The experimentally determined percentages of C and H agree well
with the calculated values for 1. However, the experimentally determined % of S
(4.95%) is considerably lower than that expected for 1 (8.54%). It has previously been
reported for other metal/tda complexes that S can be released as gaseous SO2 prior to
analysis [180].
Complex 1 was further characterized by 1H and
13C NMR spectroscopy, mass
spectrometry, FT−IR and thermogravimetric analysis. Identical 1H NMR spectra were
obtained (D2O, pD 5.03) for 1 and free tda, suggesting that the self assembly of 1 is a
solid state phenomenon only (a singlet at 3.31 ± 0.01 ppm, CH2). The 13
C NMR spectra
for 1 and free tda were also identical under the same conditions (D2O, pD 5.03; 36.9 ±
0.1 (CH2, s) and 177.4 ± 0.1 ppm (COO, s)). No significant peaks were observed in the
ES−MS spectrum of 1.
There are numerous reports concerning the IR spectroscopy spectral assignments of
metal/tda complexes [169, 172, 173, 177, 180, 181]. In Table 3.3, the wavenumbers of
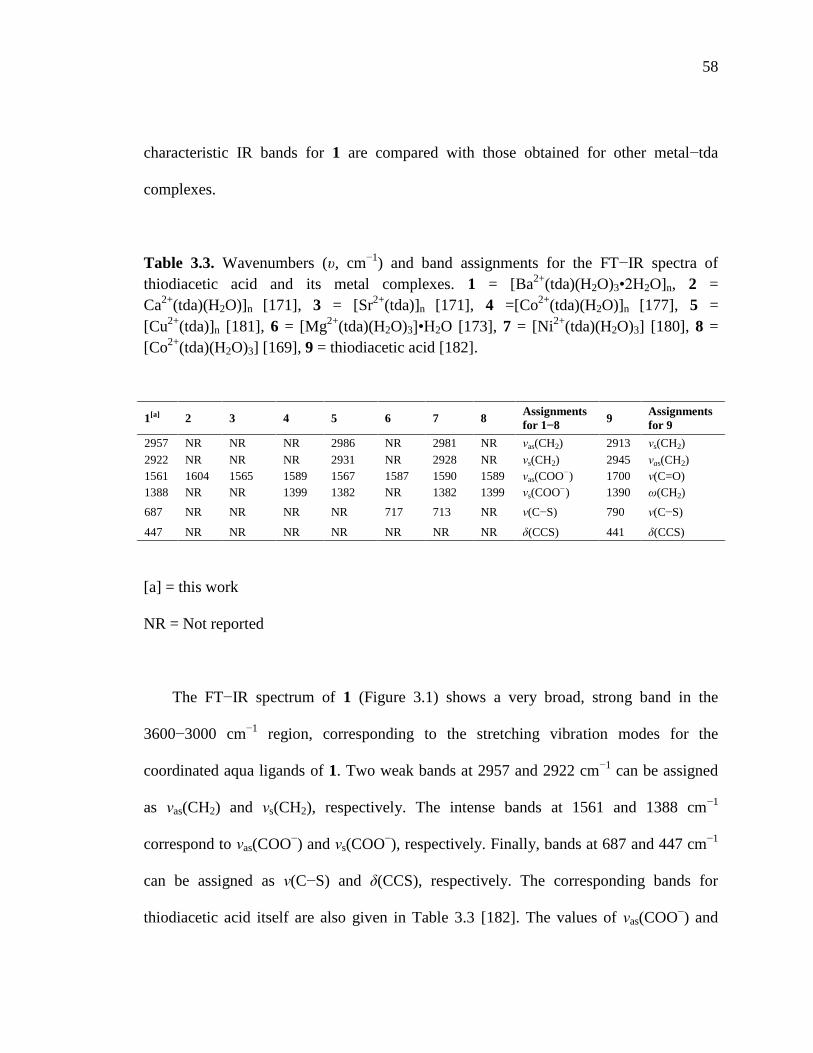
58
characteristic IR bands for 1 are compared with those obtained for other metal−tda
complexes.
Table 3.3. Wavenumbers (υ, cm−1
) and band assignments for the FT−IR spectra of
thiodiacetic acid and its metal complexes. 1 = [Ba2+
(tda)(H2O)3•2H2O]n, 2 =
Ca2+
(tda)(H2O)]n [171], 3 = [Sr2+
(tda)]n [171], 4 =[Co2+
(tda)(H2O)]n [177], 5 =
[Cu2+
(tda)]n [181], 6 = [Mg2+
(tda)(H2O)3]•H2O [173], 7 = [Ni2+
(tda)(H2O)3] [180], 8 =
[Co2+
(tda)(H2O)3] [169], 9 = thiodiacetic acid [182].
[a] = this work
NR = Not reported
The FT−IR spectrum of 1 (Figure 3.1) shows a very broad, strong band in the
3600−3000 cm−1
region, corresponding to the stretching vibration modes for the
coordinated aqua ligands of 1. Two weak bands at 2957 and 2922 cm−1
can be assigned
as νas(CH2) and νs(CH2), respectively. The intense bands at 1561 and 1388 cm−1
correspond to νas(COO−) and νs(COO
−), respectively. Finally, bands at 687 and 447 cm
−1
can be assigned as ν(C−S) and δ(CCS), respectively. The corresponding bands for
thiodiacetic acid itself are also given in Table 3.3 [182]. The values of νas(COO−) and
1[a] 2 3 4 5 6 7 8 Assignments
for 1−8 9
Assignments
for 9
2957 NR NR NR 2986 NR 2981 NR νas(CH2) 2913 νs(CH2)
2922 NR NR NR 2931 NR 2928 NR νs(CH2) 2945 νas(CH2)
1561 1604 1565 1589 1567 1587 1590 1589 νas(COO−) 1700 ν(C=O)
1388 NR NR 1399 1382 NR 1382 1399 νs(COO−) 1390 ω(CH2)
687 NR NR NR NR 717 713 NR ν(C−S) 790 ν(C−S)
447 NR NR NR NR NR NR NR δ(CCS) 441 δ(CCS)
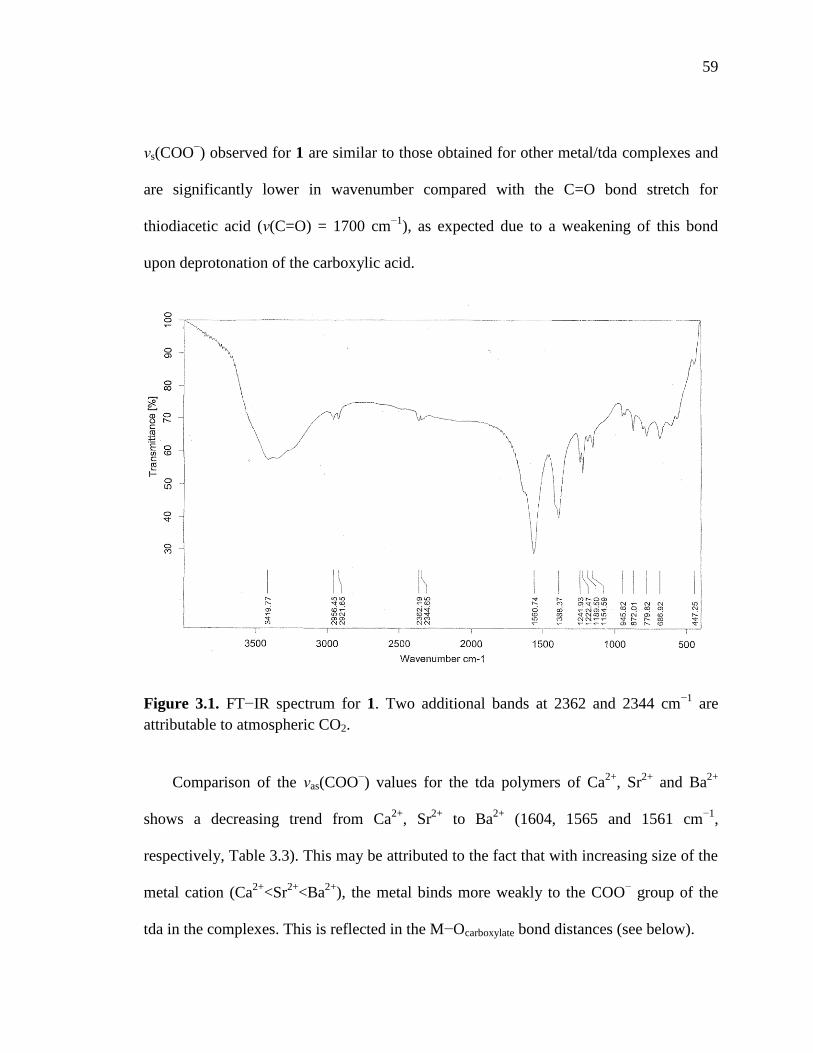
59
νs(COO−) observed for 1 are similar to those obtained for other metal/tda complexes and
are significantly lower in wavenumber compared with the C=O bond stretch for
thiodiacetic acid (ν(C=O) = 1700 cm−1
), as expected due to a weakening of this bond
upon deprotonation of the carboxylic acid.
Figure 3.1. FT−IR spectrum for 1. Two additional bands at 2362 and 2344 cm−1
are
attributable to atmospheric CO2.
Comparison of the νas(COO−) values for the tda polymers of Ca
2+, Sr
2+ and Ba
2+
shows a decreasing trend from Ca2+
, Sr2+
to Ba2+
(1604, 1565 and 1561 cm−1
,
respectively, Table 3.3). This may be attributed to the fact that with increasing size of the
metal cation (Ca2+
<Sr2+
<Ba2+
), the metal binds more weakly to the COO− group of the
tda in the complexes. This is reflected in the M−Ocarboxylate bond distances (see below).

60
The thermal decomposition of 1 under a flow of nitrogen was investigated by TGA
with the assistance of Ms. Joanna Gorka at Kent State University. The thermogram
(Figure 3.2) clearly shows that more than one species is lost in the first step (40–150 °C,
mass loss 16.36%). Loss of the two water molecules of crystallization of 1 corresponds to
a mass loss of 9.59%. Further experiments are required to unambiguously identify the
other species lost; however, the remaining mass loss can be attributed to CO (7.46%).
The mass loss in the second step (300–500 °C, 24.39%) can be assigned to the loss of
three bound water molecules (14.38%) and one CO2 (11.72%). Release of CO and CO2
has been previously observed for other metal–tda complexes [180, 181].
Figure 3.2. Thermogram for 1 from the TGA experiment.
0 200 400 600 800 100040
45
50
55
60
65
70
75
80
85
90
95
100
10.04%
2.415 mg
24.39%
5.868 mg
Weig
ht
(%)
Temperature (°C)
16.36%
3.937 mg
56.65°C
339.2°C
0.00
0.25
0.50
0.75
1.00
1.25
De
riv.
We
igh
t (%
/C)

61
3.3.2 STRUCTURAL CHARACTERIZATION OF 1 BY X−RAY DIFFRACTION
An X−ray structural determination on 1 was performed in collaboration with Dr.
Scott D. Bunge at Kent State University. The complex crystallized in the monoclinic
space group P21/c with four molecules per unit cell. The thermal ellipsoid plot of 1
(Figure 3.3) shows that each Ba2+
ion is indirectly coordinated to three adjacent Ba2+
centers through bridging thiodiacetate ligands (Ba(1)−Ba(1A) 4.736 Å, Ba(1)−Ba(1B)
6.474 Å and Ba (1)−Ba(1C) 7.350 Å). Similar Ba−Ba distances (4.374−7.034 Å) were
observed for a two−dimensional Ba2+
/oxydiacetate coordination polymer [Ba(oda)•H2O]n
[174].
Figure 3.3. Thermal ellipsoid plot (30%) of the partial linkage motif in
{Ba[S(CH2COO)2(H2O)3]•2H2O}n (1). H atoms are omitted for clarity.

62
The coordination environment around each Ba2+
center in 1 is identical and is illustrated
in Figure 3.4. Each Ba2+
is surrounded by ten donors: six carboxylate oxygen atoms from
four tda ligands, a tda sulfur atom and three oxygen atoms from water molecules. The
Ba2+
coordination geometry is distorted, rather than being an ordered polyhedral
geometry. Interestingly, in [Ba(oda)•H2O]n, each Ba2+
is instead 9−coordinate, with a
distorted monocapped square antiprismic geometry [174].
(a) (b)
Figure 3.4. (a) Ball and stick diagram of 1, showing the coordination environment
around each Ba2+
center. H atoms are omitted for clarity. (b) Schematic diagram of the
coordination environment around each Ba center.
The tda ligand has four modes of coordination (Modes I−IV, Scheme 3.1). In Mode I
tda binds via two oxygen atoms of the two carboxylates and the sulfur atom to the Ba2+
center. The Ba−S bond distance is 3.649 Å. This is ≥ 0.13 Å longer than the other
reported polymeric thioether complexes of Ba2+
(CSD: 3 hits) in which the Ba−S bond
tda = O
OS
O
Oor S OO
Ba
OO OH2
S
O
SO
O
H2O
OS
OO
O
O
OH2
O
O
SO
O

63
O
Ba
SO O
Ba
OHO
O
S
Ba
OO
O O
S
O
O
Ba Ba
Ba
O
O
S
O O
distances are in the 3.338–3.516 Å range [183-185], and significantly longer than the
monomeric thioether complexes of Ba2+
(CSD: 3 hits) in which the Ba−S bond distances
are in the 3.014–3.290 Å range [186-188]. The two Ba−Ocarboxylate bond distances in this
mode are identical (2.750 Å).
Mode I Mode II
Mode III Mode IV
Scheme 3.1. Modes of coordination of the tda ligand to the Ba2+
centers in 1.
In Mode II a single oxygen atom of the carboxylate group bridges two adjacent Ba atoms
in the same layer, with Ba−Ocarboxylate distances of 2.727 and 2.838 Å. In coordination
Mode III, a carboxylate group bridges two Ba2+
centers in adjacent layers with
Ba−Ocarboxylate bond distances of 2.749 and 2.752 Å. Finally, in Mode IV, a single oxygen
atom of the carboxylate group is coordinated to Ba2+
, with a Ba−Ocarboxylate bond distance
of 2.935 Å. The Ba−Ocarboxylate bond distances in [Ba(oda)•H2O]n are in the range
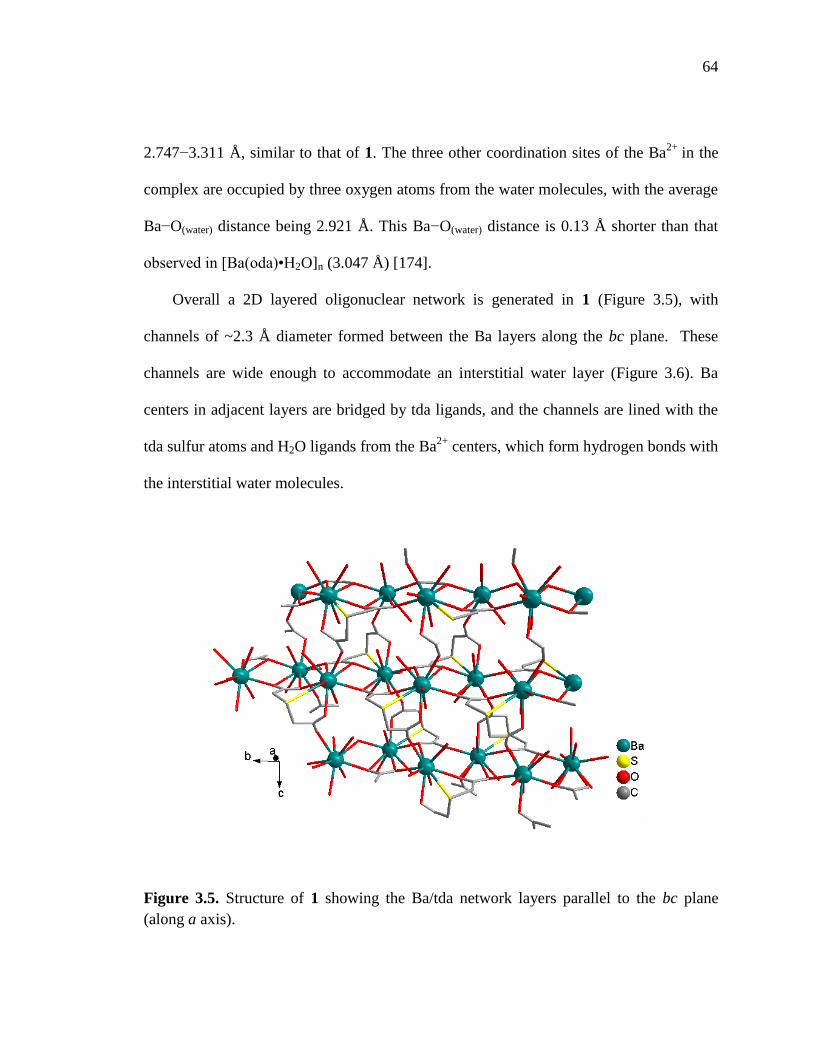
64
2.747−3.311 Å, similar to that of 1. The three other coordination sites of the Ba2+
in the
complex are occupied by three oxygen atoms from the water molecules, with the average
Ba−O(water) distance being 2.921 Å. This Ba−O(water) distance is 0.13 Å shorter than that
observed in [Ba(oda)•H2O]n (3.047 Å) [174].
Overall a 2D layered oligonuclear network is generated in 1 (Figure 3.5), with
channels of ~2.3 Å diameter formed between the Ba layers along the bc plane. These
channels are wide enough to accommodate an interstitial water layer (Figure 3.6). Ba
centers in adjacent layers are bridged by tda ligands, and the channels are lined with the
tda sulfur atoms and H2O ligands from the Ba2+
centers, which form hydrogen bonds with
the interstitial water molecules.
Figure 3.5. Structure of 1 showing the Ba/tda network layers parallel to the bc plane
(along a axis).

65
Figure 3.6. View of the framework in 1 along the b axis. The lattice water molecules are
shown inside the channels between the layers.
2D−coordination polymers of Ca2+
and Sr2+
incorporating the thiodiacetate ligand
have been reported with the formula [Ca2+
(tda)(H2O)]n and [Sr2+
(tda)]n, respectively
[171]. Interestingly, all four binding modes of the tda ligand observed in 1 are also found
in the Ca2+
complex. However, due to the smaller van der Waals radius of Ca2+
compared with Ba2+
, the Ca2+
center of [Ca2+
(tda)(H2O)]n is instead a distorted
dodecahedron, with 7 sites occupied by the 4 tda ligands (6 O and 1 S) and the remaining
site occupied by a water molecule. Unlike 1, the aqua ligand bridges Ca2+
centers in
adjacent layers, hence there are no channels formed between the layers wide enough to
accommodate a layer of solvent molecules (0.96 Å gap between the layers).

66
In [Sr2+
(tda)]n the Sr2+
center is 8−coordinate. Donor atoms from tda (O, S) occupy
the first coordination sphere of Sr2+
and additional binding modes of tda are also observed
not found in 1 nor [Ca2+
(tda)(H2O)]n. The Sr2+
centers in adjacent layers are bridged by
tda ligands and once again a solvent layer is not observed (0.77 Å channel between the
layers). The M2+
− S bond distances in the Ca2+
(3.079 Å) and Sr2+
(3.406 Å) polymers
are shorter than in 1 (3.649 Å), consistent with the larger size of Ba2+
compared to Ca2+
and Sr2+
. The M−Ocarboxylate bond distances in the latter two polymers are in the
2.391−2.575 Å range and are once again shorter than those observed in 1 (2.727−2.935
Å).
Finally, it should be noted that not all metal/tda complexes are polymeric. Indeed,
Mg, Co, Ni and Zn form monomeric tda complexes of the general formula
[Mn+
(tda)(H2O)3]•nH2O [169, 171, 173, 180, 189]. In these complexes the tda ligand
binds in the typical fac (O, O, S) coordination mode to the metal. The M−Ocarboxylate bond
distances in these complexes are in the range 2.040−2.060 Å and the M−S bond distances
are in the range of 2.415−2.729 Å, notably shorter than the M−Ocarboxylate and M−S bond
distances in 1 and in the polymeric [Ca2+
(tda)(H2O)]n and [Sr2+
(tda)]n.
3.4 SUMMARY
A novel 2−D coordination polymer of Ba2+
, {Ba[S(CH2COO)2(H2O)3]•2H2O}, has
been crystallized from aqueous solution in good yield. The complex has been
characterized by X−ray diffraction in addition to IR spectroscopy and TGA. The Ba2+
centers are 10−coordinate and are bridged by tda ligands. Four distinct binding modes of

67
the tda ligand were observed. Unlike [Ca2+
(tda)(H2O)]n, the larger radius of Ba2+
resulted
in the formation of a channel wide enough to accommodate H2O molecules between the
Ba2+
/tda layers. 1H and
13C NMR spectra of the complex and the free tda ligand were
identical, suggesting that the complex did not spontaneously form in aqueous solution
itself. The C=O stretching vibration of the tda ligand shifted to lower wavenumbers upon
binding to Ba2+
to form the complex. TGA analysis of the complex was consistent with
loss of gaseous species in addition to the two water molecules of crystallization upon
heating the complex.

68
CHAPTER 4
STUDIES ON VANADIUM−VITAMIN B12 BIOCONJUGATES
INCORPORATING A HYDROXYPYRIDINONE LINKER AS POTENTIAL
THERAPEUTICS FOR TREATING DIABETES
4.1 INTRODUCTION
Diabetes mellitus (DM) is a metabolic disease, characterized by an absolute or
relative lack of insulin (Type 1 DM) and/or insulin resistance (Type 2 DM), leading to
hyperglycemia [108, 190]. Insulin regulates carbohydrate and lipid metabolism. Serious
secondary complications of diabetes include gastrointestinal dysfunction, coronary artery
disease, peripheral arterial disease, diabetic nephropathy, neuropathy, and retinopathy
[191]. Administration of exogenous insulin by inhalation (intranasal and pulmonary) or
by subcutaneous injection is widely used for lowering blood glucose level in patients
with Type 1 and severe Type 2 DM [79, 192]. However, this can lead to undesirable
swings in blood glucose levels [193]. Type 1 and prolonged type 2 DM causes
autoimmune response-mediated destruction of the insulin-producing islet β-cells within
the endocrine tissue of Langerhans cells of the pancreas [190]. To maintain or restore a
critical mass of viable and functional β-cells in patients with type 1 diabetes, various
possibilities are currently being explored. These include stimulation of β-cell
regeneration/proliferation in vivo through hormone and growth factor treatment, in vivo

69
promotion of the transformation of adult pancreatic exocrine cells into β-cells, and
isolation and in vitro differentiation of pancreatic progenitors, embryonic stem cells
(ESCs), or extrapancreatic adult stem cells [190].
Mild to moderate Type 2 diabetes is typically controlled by administering oral
therapeutics such as metformin, glipizide, glimepiride and rosiglitazone [194]. There is
currently much interest in the development of vanadate (V(V)) and vanadyl (V(IV))
therapeutics as oral insulin substitutes or for co−administration with insulin [108, 195].
Vanadium complexes not only lower blood glucose levels, but also alleviate most of the
symptoms attributable to this disease [195, 196]. However, toxicity was a serious
problem in stage I clinical trials of inorganic vanadium salts [197]. Poor intestinal
absorption ( 5% [195]) necessitated large doses, resulting in gastrointestinal distress,
dehydration and weight loss. Tissue accumulation also occurs, the consequences of which
are under investigation [195, 197]. Over the last decade many V(IV) and V(V) complexes
with organic chelating ligands have therefore been evaluated in animal and cell models,
with the aim of improving absorption and tissue uptake [195, 198, 199]. This includes
porphyrin complexes [200], complexes incorporating established antioxidants and
hypoglycemic agents [196], and vanadium−containing capsules and hydrogels [201, 202].
The most promising vanadium complexes in terms of efficacy (dose related response) are
up to one order of magnitude better than inorganic vanadium salts [203, 204]. Indeed,
Phase IIa clinical trials were recently completed for a
bis(ethylmaltolato)oxovanadium(IV) (BEOV) complex and the absorption, distribution,
metabolism, and excretion of BEOV were studied in detail [205].

70
The delivery of therapeutics to the bloodstream in the pharmaceutically desired
amount via oral dosing is a challenge. Few drugs can survive the highly acidic
environment of the gastrointestinal tract unprotected [192]. Vitamin B12 has an
extremely effective uptake pathway mediated by three transport proteins (section
1.2.2), which makes it a good candidate to deliver drugs and therapeutics. Binding the
drug or imaging agent to the −axial site of the Cbl molecule has minimal effect on
the binding of Cbl to B12 transport proteins [206]. Another strategy is to coordinate
the drug or imaging agent via the 5’–OH ribose of the nucleotide. This strategy was
recently used to orally deliver insulin [79, 80]. Insulin was conjugated at the lysine 29
residue of the B strand to the ribose 5’−OH group of vitamin B12 via a 1,
1’−carbonyldiimidazole linker [79]. Conjugation of B12 to insulin did not significantly
affect recognition by the insulin receptor [80].
The binding of the ligand 3−hydroxy−1,2−dimethyl−1H−pyridin−4−one (dmpp)
to aqueous V(IV) and V(V) to form mono or bis dmpp complexes is well
characterized [207-214]. Two bidentate dmpp ligands bind strongly to V(IV) (log K1
= 12.18, log K2 = 10.65 [207]) and V(V) (log K1 = 10.48, log K2 = 5.25 [208, 209])
centers. V(V) complexes are reduced to V(IV) inside cells [215] and V(IV)(dmpp)2
has promising insulin−enhancing properties [211, 216]. 3−Hydroxy−4−pyridinones
have also been used in Fe and Al overload chelation therapy and for administering Ga
and In−based radiopharmaceuticals [210].
This chapter reports the synthesis and characterization of novel B12 conjugates of
vanadium, potentially orally active therapeutics for the treatment of diabetes.

71
3−Hydroxy−2−methyl−1−propyl−1H−pyridin−4−one was used to link the Cbl and
vanadium(V) center via the −axial site of Cbl. The blood glucose lowering ability of
the bioconjugates have also been investigated.
4.2 EXPERIMENTAL
4.2.1 MATERIALS
3−(3−Hydroxy−2−methyl−1H−pyridin−4−one)propylcobalamin (1) was kindly
provided by Michal A. Radomski and synthesized as reported elsewhere [217]. It was
used without further purification. All other chemicals were purchased from
Sigma−Aldrich, VWR or Fisher Scientific and were used as received. Water was purified
as described in section 2.2.2.
4.2.2 INSTRUMENTATION
1H NMR spectra were recorded on a Varian Inova 500 MHz or a Bruker Avance 400
MHz spectrometer equipped with a 5 mm probe. Typically the HDO peak was saturated;
saturation delays were 3−4 s. 51
V NMR spectra were recorded on the Bruker instrument
operating at 105.246 MHz with a pulse width of 8.25 µs, an acquisition time of 0.218 s,
and a delay time of 0.5 s. Solutions for NMR measurements were prepared in deuterated
solvents. All 1H NMR spectra were internally referenced to TMS (0 ppm) or TSP (0
ppm). 51
V NMR spectra were referenced using a sample of 0.0100 M NaVO3 in 2.0 M
NaOH (−541.2 ppm).
72
FTIR experiments were carried out by Dr. Duane A. Redfern in the laboratory of Dr.
Arne Gericke, Kent State University, using a Bruker Tensor 27 Infrared Spectrometer
(Billerica, MA) equipped with a narrow band MCT detector and a Bruker BioATRII
accessory unit. Interferograms were collected at 2 cm−1
resolution (1064 scans, 25 °C),
apodized with a Blackman−Harris function, and Fourier transformed with one level of
zero−filling to yield spectra encoded at 1 cm−1
intervals. The bare ATR crystal, cleaned
with H2O and dried using a cotton swap, was used as the background spectrum for all
experiments. Solutions for FTIR spectroscopy measurements on the binding of NaVO3 to
1 were prepared by the addition of 0.20, 0.50, 1.0, 2.0 or 3.0 mole equiv. of a stock
solution of NaVO3 (0.030 M, pH/pD 8.7) to a solution of 1 (0.0070 M, pH/pD 8.7). H2O
or D2O were used as the solvent. The final concentration of 1 was 0.0035 M in all cases.
A sample (14 µL) of each solution was placed on the crystal prior to recording the sample
spectrum. The individual spectra were smoothed using a Savitsky/Golay function with 13
smoothing points. A spectrum of H2O (or D2O) was also recorded and was subsequently
subtracted from each spectrum after smoothing. The H2O−subtracted spectra were fitted
with an exponential function to yield a flat baseline in the region of interest (~1500–1600
cm−1
), exported to Origin 7.0 software, and the spectra zeroed at either 1580 or 1610
cm−1
. All subtraction values were approximately 1.00 ± 0.02.
UV−vis spectroscopic instrumentation is described in section 2.2.2. pH
measurements and ESI−MS were recorded as described in section 3.2.2.

73
To prevent decomposition, the complex 1 was used under red light conditions and
stored in the absence of light. Removal of solvents was achieved by rotary evaporation
under reduced pressure (~5 mbar) and at temperatures < 35 oC.
4.2.3 PFG−NMR DIFFUSION COEFFICIENT MEASUREMENTS
The following parameters were used for the gradient−echo pulse sequence:
maximum field gradient amplitude G was varied (9.38–37.5 Gauss cm−1
), echo time 10
ms and duration of the gradient pulses, δ = 6 ms.
4.2.4 ATTEMPTED SEPARATION OF VO2(OH/H)2L (2) AND VO2L2 (3) BY
CHROMATOGRAPHY
(a) Amberlite XAD−2 column: Upon the addition of 3.0 equiv. NaVO3 to the Cbl
ligand (L, 1), the mono species 2 is the predominate species formed. Hence, a mixture of
2 and excess NaVO3 was prepared by reacting 1 (1.3 × 10⁻⁵
mol) with 3.0 mol equiv.
NaVO3 (3.9 × 10⁻⁵
mol) and the product mixture desalted (to remove remaining excess
vanadate), so as to obtain a pure sample of 2. An Amberlite XAD−2 column (15 × 5 cm)
was used and the product washed with water and eluted with 4:1 EtOH/H2O. The solvent
was evaporated from the eluted product by rotary evaporation at 35 ºC. The aromatic
region of the 1H NMR spectrum of the product dissolved in D2O showed peaks
corresponding to 1, 2 and 3 in the ratio 4:1:3; hence the desired pure 2 was not obtained.
(b) Semipreparative HPLC experiments were carried out using an Alltech Alltima
C18 column (5µm, 100 Å, 10 mm × 300 mm) with a flow rate of 3mL/min under acidic

74
and neutral conditions: (i) A mobile phase consisting of acetic acid in H2O (0.1% v/v),
pH = 3.5, A, and acetic acid in CH3CN (0.1% v/v), B, were used in the following method:
0−2 min, 83:17 A:B; 2−3 min, 83:17 to 77.5:22.5 A:B; 3−30 min, 77.5:22.5 A:B; 30−33
min 77.5:22.5 to 40:60 A:B; 33−35 min, 40:60 A:B; 35−36 min 40:60 to 83:17 A:B;
36−41 min, 83:17 A:B. All gradients were linear. A pure sample of the Cbl ligand, 1,
eluted at 11.2 min. A mixture of 2 and 3, prepared by mixing equimolar amounts of 1 and
NaVO3, eluted as a single, broad peak from 10−15 min (note that Cbl standards eluted at
well−separated times, each Cbl eluting within 1 min time period); hence the 2 and 3
could not be separated under these conditions. (ii) A mobile phase consisting of
phosphate buffer, pH = 7.4, A, and CH3CN (0.1% v/v), B, were used in the following
method: 0−2 min, 83:17 A:B; 2−3 min 83:17 to 80.3:19.7 A:B; 3−30 min, 80.3:19.7 A:B;
30−33 min 80.3:19.7 to 40:60 A:B; 33−35 min, 40:60 A:B; 35−36 min 40:60 to 83:17
A:B; 36−41 min, 83:17 A:B. All gradients were linear. A pure sample of the Cbl ligand,
1, eluted at 15.7 min. A mixture of 2 and 3, prepared from an equimolar solution of 1 and
NaVO3 (1.08 × 10⁻³
mol), eluted as an extremely broad peak from 16−19 min (the Cbl
standards eluted within 1 min); hence 2 and 3 could also not be separated under these
conditions.
4.2.5 IN VIVO BLOOD GLUCOSE−LOWERING PROPERTIES IN THE
STZ−RAT MODEL FOR TYPE 1 DIABETES
Investigation of the blood glucose−lowering ability of complex 1, NaVO3 and an
equimolar solution of 1 + NaVO3 were carried out in the STZ−rat model for Type 1

75
diabetes, with 3 rats in each group. The experiments were carried out and analyzed by Dr.
Derek S. Damron, Kent State University. Adult, male, Sprague−Dawley rats (6 weeks
old) were used for the study. Diabetes was induced by a single intraperitoneal injection
of streptozotocin (STZ, 55 mg/kg) on day 0. Animals were maintained with free access
to food and water following streptozotocin administration. Rats were administered a
single tail vein injection (pH 7.0, 70 l) of H2O, 5.0 × 10⁻⁷
mol 1 in H2O, 5.0 × 10⁻⁷
mol
NaVO3 in H2O, or an equimolar (5.0 × 10⁻⁷
mol) solution of 1 + NaVO3 in H2O on day 7,
directly after measuring their blood glucose levels. The blood from all rats was collected
from the tail vein (tail−nick procedure) and blood glucose levels were assessed using a
glucometer.
4.3 RESULTS AND DISCUSSION
4.3.1 CHARACTERIZATION OF 3−(3−HYDROXY−2−METHYL−1H−PYRID−
IN−4−ONE)PROPYLCOBALAMIN (1) BY 1H NMR AND UV− VISIBLE
SPECTROSCOPY
The alkylcobalamin 3−(3−hydroxy−2−methyl−1H−pyridin−4−one) propyl
cobalamin (1) (Figure 4.1) was provided by Michal A. Radomski. The synthesis is
reported elsewhere [217].

76
O O
Cbl
NaVO3
V
O
O
O
O
O
O
V
O
O
OH(H)
OH(H)
O
O
Cbl
Cbl Cbl
[VO2(OH(H))2L] 2- /-/ 0 [VO2L2]-
2 3
[L]
1
O O
Cbl
CH3
CONH2ONH
NNCH3
CH3
OP
O
H
CH3
O O–
O
OH
CH3
CH3N
NOH
CH3
N
Co+
NCONH2
CH3
CONH2
CH3
H3C
H3C
CONH2
CONH2
H
H
H
H
H
H
B2
B4
C10
B7R1
N
O
CH3
A5
A6
O
H2NOC
+
-axial
[L]
1
Figure 4.1. Structure of 3−(3−hydroxy−2−methyl−1H−pyridin−4−one)propylcobalamin
(1). A5 and A6 denotes the protons of the 3−hydroxy−2−methyl−1H−pyridin−4−one and
B2, B4, B7, R1 and C10 represent the protons of the vitamin B12 macrocycle resonating
in the aromatic region of the 1H NMR spectrum.
Figure 4.2 shows the aromatic region of the 1H NMR spectrum of 1. Seven
signals are observed in the aromatic region of the 1H NMR spectrum of 1 at 7.37(d),
7.18, 6.92, 6.36(d), 6.26(d), 6.23 and 6.00 ppm (pD 7.4), attributable to the A5 (7.37)
and A6 (6.36) protons of the hydroxypyridinone ring and the B2, B4, B7, R1 and C10
protons of the Cbl macrocycle (see Figure 4.1 for labeling).

77
6.006.256.506.757.007.257.50
Chemical Shift (ppm)
Figure 4.2. Aromatic region of the 1H NMR spectrum of 1 in aqueous buffer (D2O,
TES), pD 7.4 at 24 °C. Seven signals are observed at 7.37(d), 7.18, 6.92, 6.36(d), 6.26(d),
6.23 and 6.00 ppm.
Complex 1 was also characterized by electrospray mass spectrometry (+ve and −ve
modes). Peaks were observed at m/z = 1495.7 (calcd. for [1 + H]+, [C9H12O2N−Cbl + H]
+,
C71H101CoN14O16P = 1495.7); 1517.6 (calcd. for 1 + Na]+, C71H100CoN14O16P = 1517.7);
748.5 (calcd for [1 + 2H]2+
, C71H102CoN14O16P = 748.4); 759.5 (calcd. for [1 + H +
Na]2+
, C71H101CoN14O16PNa = 759.4); 770.4 (calcd. for [1 + 2Na]2+
,
C71H100CoN14O16PNa2 = 770.3) and 1529.7 (calcd for [1 + Cl]−, C71H100CoN14O16PCl =
1529.6).
The UV–vis spectrum of 1 is shown in Figure 4.3 (max = 319, 339 (shoulder),
377, 434 and 523 nm). The presence of the light−sensitive Co−C bond was confirmed
by exposing an aqueous solution of 1 to light. 1 decomposes cleanly to give
aquacobalamin (max at 350, 411 and 523 nm [41]), with isosbestic points at 332, 368,
457, 535 and 603 nm.
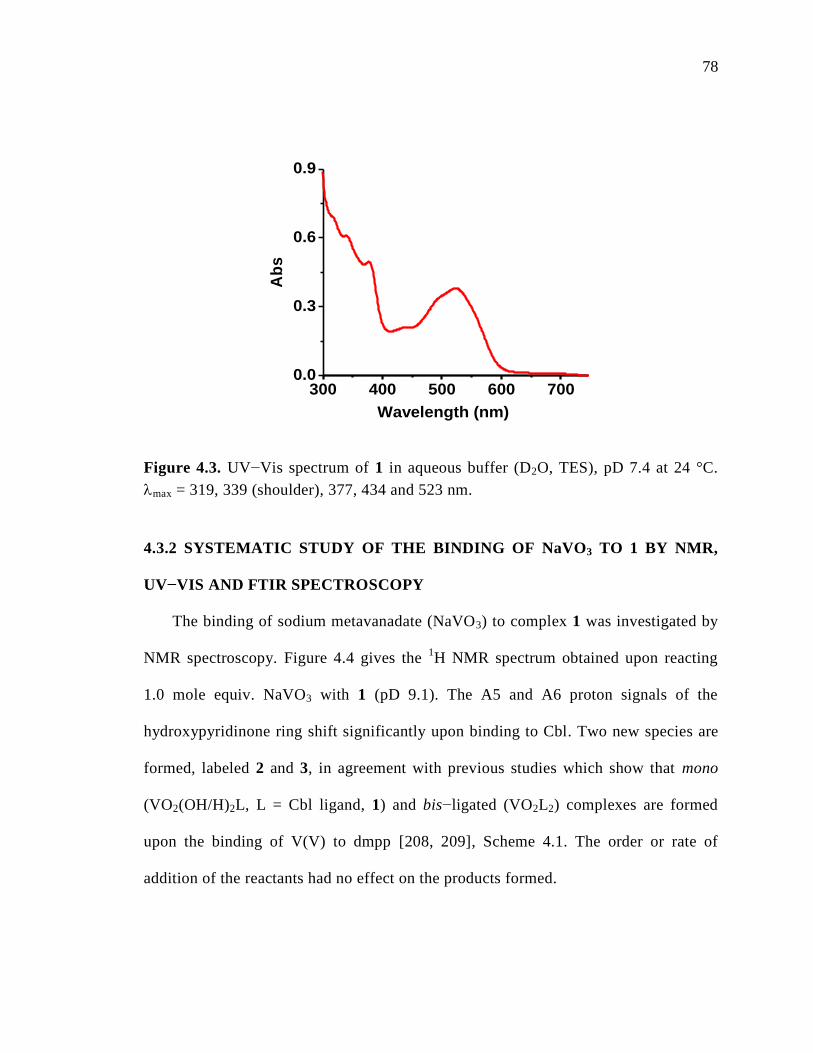
78
300 400 500 600 7000.0
0.3
0.6
0.9
Ab
s
Wavelength (nm)
Figure 4.3. UV−Vis spectrum of 1 in aqueous buffer (D2O, TES), pD 7.4 at 24 °C.
max = 319, 339 (shoulder), 377, 434 and 523 nm.
4.3.2 SYSTEMATIC STUDY OF THE BINDING OF NaVO3 TO 1 BY NMR,
UV−VIS AND FTIR SPECTROSCOPY
The binding of sodium metavanadate (NaVO3) to complex 1 was investigated by
NMR spectroscopy. Figure 4.4 gives the 1H NMR spectrum obtained upon reacting
1.0 mole equiv. NaVO3 with 1 (pD 9.1). The A5 and A6 proton signals of the
hydroxypyridinone ring shift significantly upon binding to Cbl. Two new species are
formed, labeled 2 and 3, in agreement with previous studies which show that mono
(VO2(OH/H)2L, L = Cbl ligand, 1) and bis−ligated (VO2L2) complexes are formed
upon the binding of V(V) to dmpp [208, 209], Scheme 4.1. The order or rate of
addition of the reactants had no effect on the products formed.
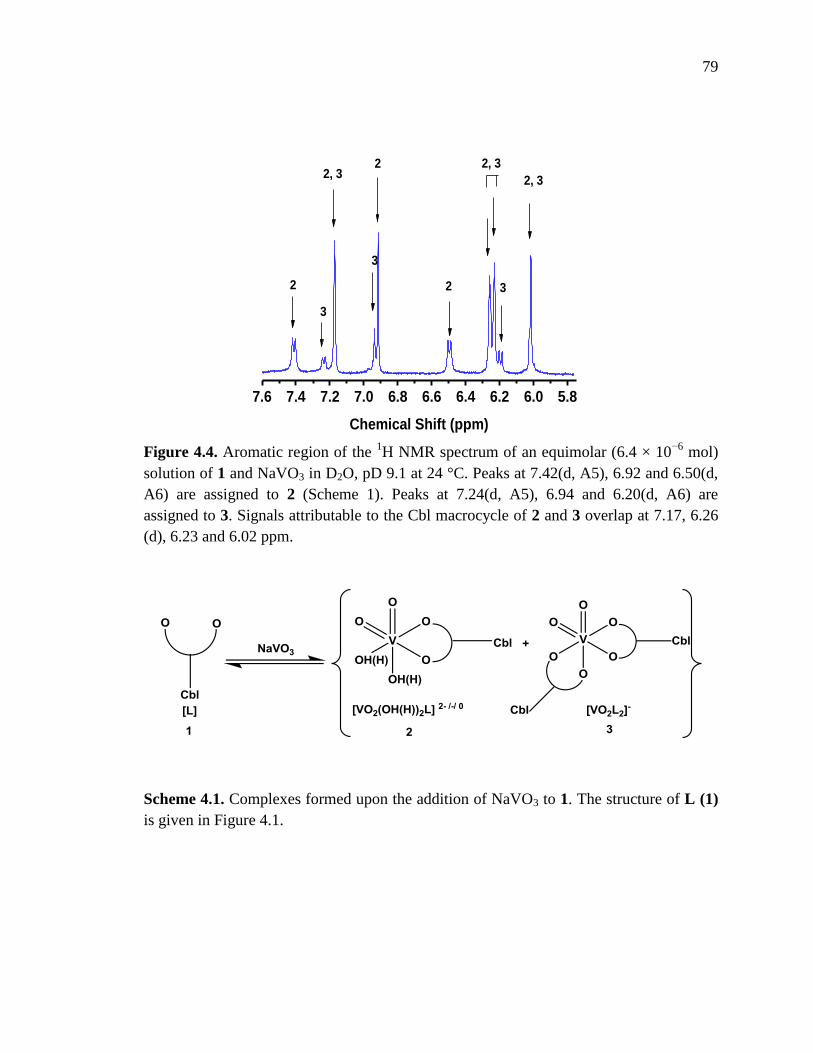
79
5.86.06.26.46.66.87.07.27.47.6
2, 3
3
2, 3
2
3
22, 3
3
Chemical Shift (ppm)
2
Figure 4.4. Aromatic region of the 1H NMR spectrum of an equimolar (6.4 × 10
−6 mol)
solution of 1 and NaVO3 in D2O, pD 9.1 at 24 °C. Peaks at 7.42(d, A5), 6.92 and 6.50(d,
A6) are assigned to 2 (Scheme 1). Peaks at 7.24(d, A5), 6.94 and 6.20(d, A6) are
assigned to 3. Signals attributable to the Cbl macrocycle of 2 and 3 overlap at 7.17, 6.26
(d), 6.23 and 6.02 ppm.
Scheme 4.1. Complexes formed upon the addition of NaVO3 to 1. The structure of L (1)
is given in Figure 4.1.
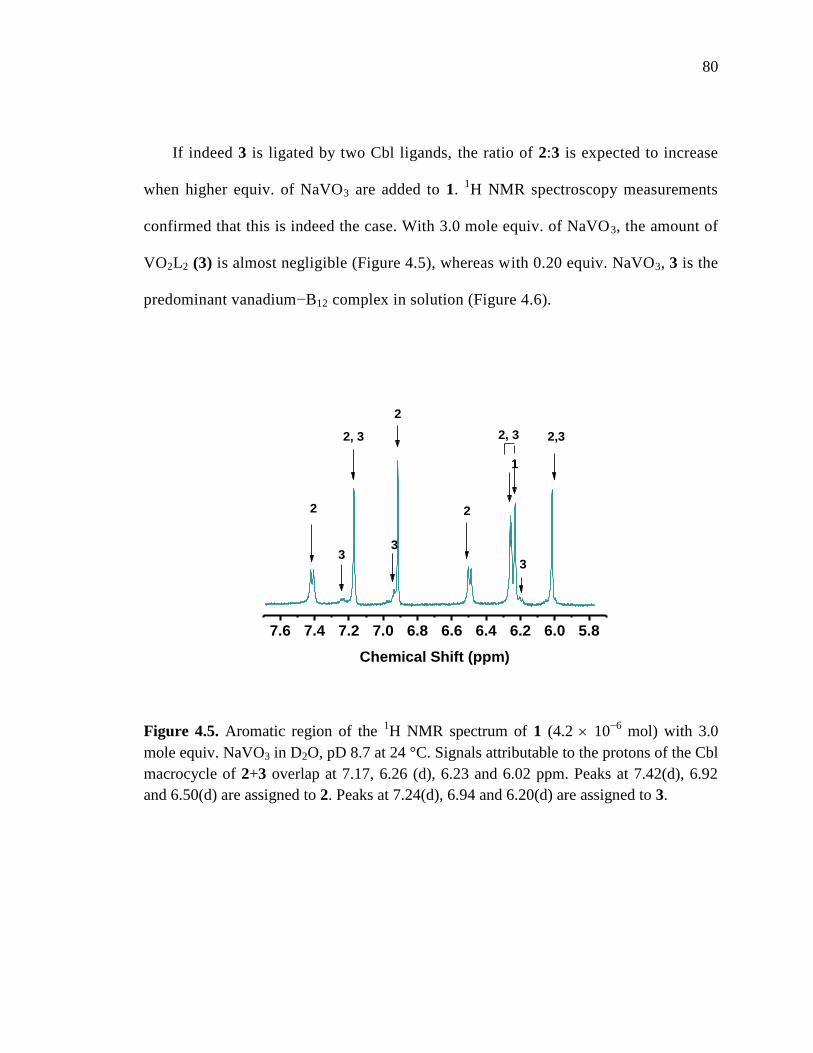
80
5.86.06.26.46.66.87.07.27.47.6
3
3
2,32, 3
1
2
2
2, 3
3
Chemical Shift (ppm)
2
If indeed 3 is ligated by two Cbl ligands, the ratio of 2:3 is expected to increase
when higher equiv. of NaVO3 are added to 1. 1H NMR spectroscopy measurements
confirmed that this is indeed the case. With 3.0 mole equiv. of NaVO3, the amount of
VO2L2 (3) is almost negligible (Figure 4.5), whereas with 0.20 equiv. NaVO3, 3 is the
predominant vanadium−B12 complex in solution (Figure 4.6).
Figure 4.5. Aromatic region of the 1H NMR spectrum of 1 (4.2 10
−6 mol) with 3.0
mole equiv. NaVO3 in D2O, pD 8.7 at 24 °C. Signals attributable to the protons of the Cbl
macrocycle of 2+3 overlap at 7.17, 6.26 (d), 6.23 and 6.02 ppm. Peaks at 7.42(d), 6.92
and 6.50(d) are assigned to 2. Peaks at 7.24(d), 6.94 and 6.20(d) are assigned to 3.
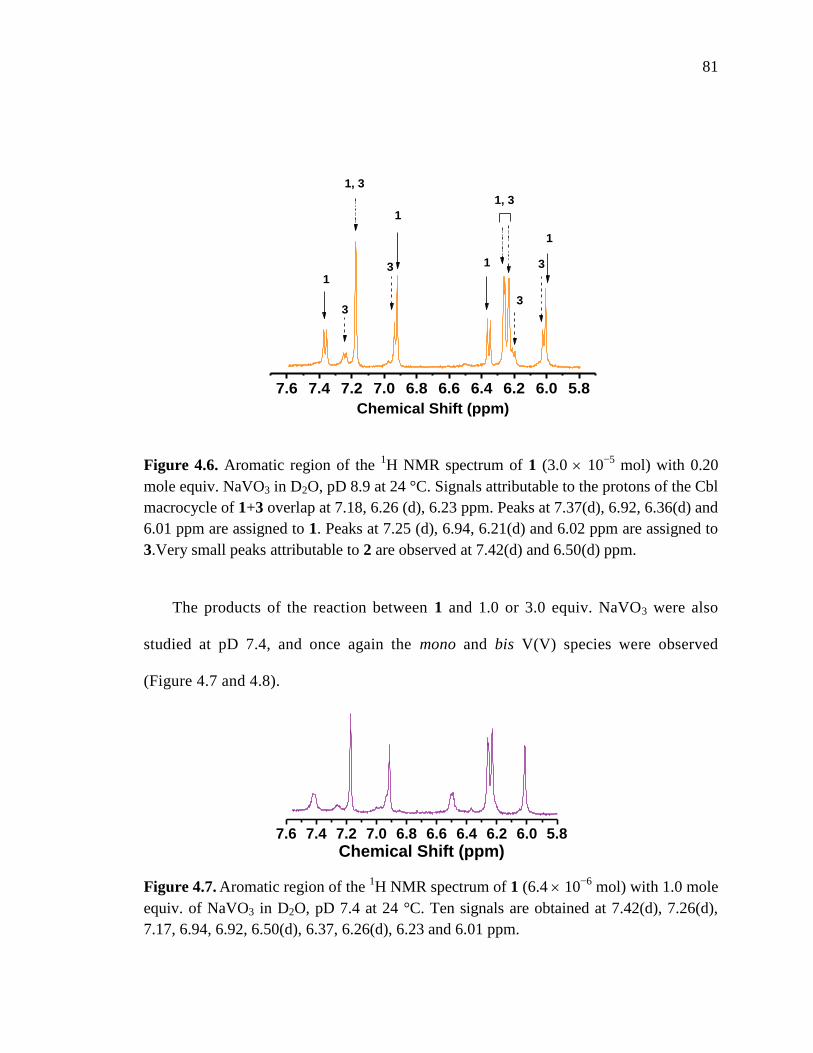
81
5.86.06.26.46.66.87.07.27.47.6
Chemical Shift (ppm)
1
3
1, 3
3
1
1
1, 3
3
3
1
7.6 7.4 7.2 7.0 6.8 6.6 6.4 6.2 6.0 5.8
Chemical Shift (ppm)
Figure 4.6. Aromatic region of the 1H NMR spectrum of 1 (3.0 10
−5 mol) with 0.20
mole equiv. NaVO3 in D2O, pD 8.9 at 24 °C. Signals attributable to the protons of the Cbl
macrocycle of 1+3 overlap at 7.18, 6.26 (d), 6.23 ppm. Peaks at 7.37(d), 6.92, 6.36(d) and
6.01 ppm are assigned to 1. Peaks at 7.25 (d), 6.94, 6.21(d) and 6.02 ppm are assigned to
3.Very small peaks attributable to 2 are observed at 7.42(d) and 6.50(d) ppm.
The products of the reaction between 1 and 1.0 or 3.0 equiv. NaVO3 were also
studied at pD 7.4, and once again the mono and bis V(V) species were observed
(Figure 4.7 and 4.8).
Figure 4.7. Aromatic region of the
1H NMR spectrum of 1 (6.4 10
−6 mol) with 1.0 mole
equiv. of NaVO3 in D2O, pD 7.4 at 24 °C. Ten signals are obtained at 7.42(d), 7.26(d),
7.17, 6.94, 6.92, 6.50(d), 6.37, 6.26(d), 6.23 and 6.01 ppm.

82
7.7 7.5 7.3 7.1 6.9 6.7 6.5 6.3 6.1 5.9Chemical Shift (ppm)
.
Figure 4.8. Aromatic region of the 1H NMR spectrum of 1 (7.8 10
−6 mol) with 3.0
mole equiv. of NaVO3 in D2O, pD 7.4 at 24 °C. Seven main peaks are obtained at
7.42(d), 7.17, 6.91, 6.50(d), 6.26(d), 6.23 and 6.01 ppm. Three peaks are found with very
small intensities at 7.26(d), 6.94 and 6.37 ppm.
Note, however, that under these pD conditions, the A5 and A6 proton signals of
the vanadium−bound complexes are broader. This can be attributed to partial
reduction of the V(V) to V(IV) by the ligand, which is more favorable at lower pH
conditions [208].
A new broad resonance was observed at −506 ppm in the 51
V NMR spectrum of 1
with 1.0 and 3.0 equiv. NaVO3 (Figures 4.9 and 4.10), which narrowed in line width
(from ~900 to 400 Hz) upon increasing the temperature from 24 to 65 C. A similar
broad resonance (−502 ppm, pH 7.5) was observed for VO2(OH/H)2(dmpp) [208].
Therefore, the peak at −506 ppm was attributed to complex 2.
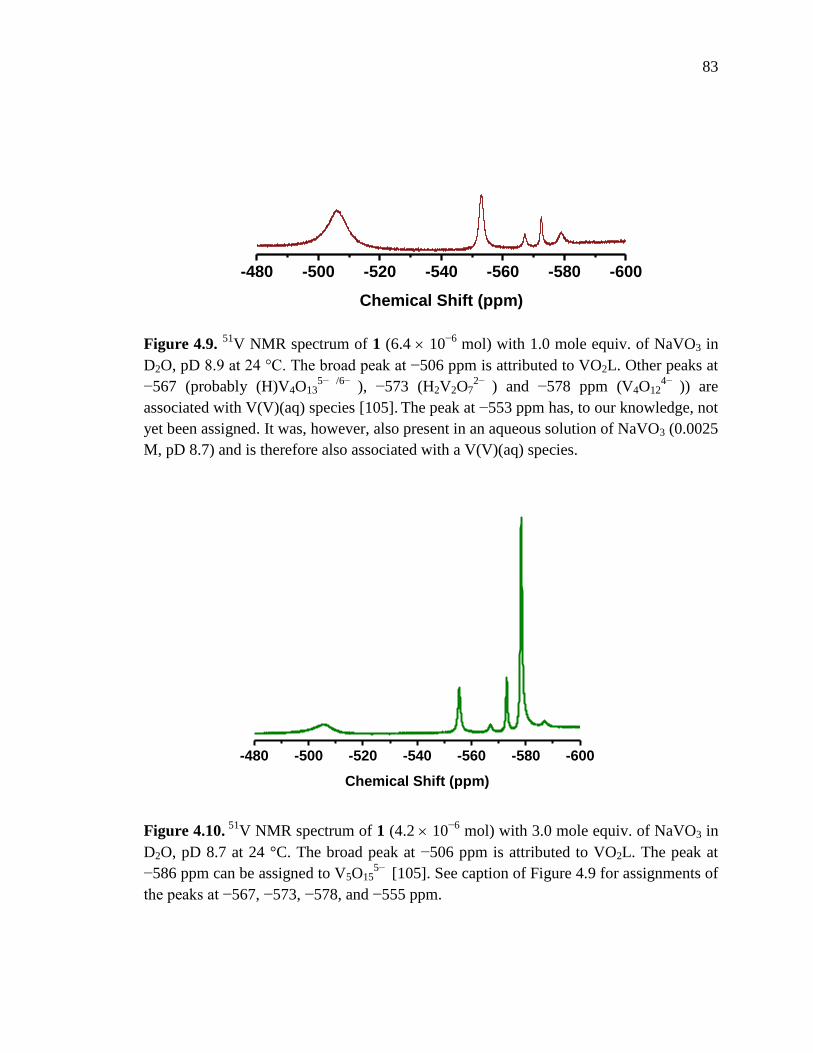
83
-480 -500 -520 -540 -560 -580 -600
Chemical Shift (ppm)
-600-580-560-540-520-500-480
Chemical Shift (ppm)
Figure 4.9. 51
V NMR spectrum of 1 (6.4 10−6
mol) with 1.0 mole equiv. of NaVO3 in
D2O, pD 8.9 at 24 °C. The broad peak at −506 ppm is attributed to VO2L. Other peaks at
−567 (probably (H)V4O135− /6−
), −573 (H2V2O72−
) and −578 ppm (V4O124−
)) are
associated with V(V)(aq) species [105]. The peak at −553 ppm has, to our knowledge, not
yet been assigned. It was, however, also present in an aqueous solution of NaVO3 (0.0025
M, pD 8.7) and is therefore also associated with a V(V)(aq) species.
Figure 4.10. 51
V NMR spectrum of 1 (4.2 10−6
mol) with 3.0 mole equiv. of NaVO3 in
D2O, pD 8.7 at 24 °C. The broad peak at −506 ppm is attributed to VO2L. The peak at
−586 ppm can be assigned to V5O155−
[105]. See caption of Figure 4.9 for assignments of
the peaks at −567, −573, −578, and −555 ppm.

84
A 51
V NMR spectrum was also recorded for 3 (1 + 0.20 equiv. NaVO3). A resonance
attributable to the V center of 3 was not observed even after collecting data for 24 hr (24
or 65 C). This can be rationalized given that 3 is more asymmetric and tumbles much
slower in solution compared with 2 due to its larger size, resulting in more efficient
quadrupolar relaxation and hence a larger line width [208]. It therefore seems likely that
this peak was too broad to be observed. Note that under these conditions (1 + 0.20 equiv.
NaVO3), a weak peak for 2 was observed, as expected, since a small amount of 2 was
observed by 1H NMR spectroscopy (Figure 4.6).
The binding of NaVO3 to 1 was also probed by UV−vis spectroscopy. However,
negligible spectral changes were observed by UV−vis spectroscopy upon the addition
of 0.2−3.0 equiv. NaVO3 to 1 (pH 7.4, 25 C). This is not unexpected, since −*
electronic transitions within the corrin ring dominate the UV−vis spectra of Cbls [24]
and the structural differences between 1−3 are far removed from the corrin ring (≥ 8
bond lengths away).
The binding of NaVO3 to 1 was studied by FTIR spectroscopy in H2O and D2O at
pH (pD) 8.7 ± 0.2. Vibrational modes corresponding to the C=O and C=C stretches of the
V(V) complexes of dmpp occur in the 1625−1450 cm−1
region in the solid state [213].
Upon the addition of increasing amounts (0.20−3.0 equiv.) of NaVO3 to 1, changes in the
1600−1500 cm−1
region of the IR spectrum were clearly observable (Figure 4.11). A
detailed analysis of the spectral changes was not possible due to the low signal−to−noise
ratio (1 has limited solubility in aqueous solution; the concentration of 1 used approached
its saturation limit) combined with significant overlap of the bands of interest with those

85
15501600
0.00
0.01
0.02
0.03
0.04
0.05
Arb
itra
ry u
nit
s (A
U)
Wavenumber (cm-1)
(1)
(2)
(3)
(4)
(5)
of the solvent. Analysis was further hampered by the fact that the normal modes of
vibrations of 1 are highly coupled and the expectation that the spectra contain
contributions from at least three components (1−3). However, the observed spectral
changes were consistent with the 1H NMR spectroscopy data.
Figure 4.11. Subtracted IR spectra (1600−1525 cm−1
region) after the addition of 0.20
(1), 0.50 (2), 1.0 (3) or 3.0 (4) equiv. of NaVO3 (0.030 M) to 1 (0.0035 M) in H2O, pH
8.7 ± 0.2, 25 °C. (5) corresponds to the spectrum of NaVO3 only under the same
conditions.
ES−MS (−ve mode) of a solution of 1 and 1.0 equiv. NaVO3 gave a peak with a
maximum intensity at 1593.4 attributable to a [VO2(OH)L]− adduct (peak splitting
pattern in excellent agreement with a simulation for C71H100CoN14O19PV, with a peak
maximum at 1593.6). However, ES−MS evidence for the formation of 3 could not be
obtained, presumably due to its size and hence lower volatility.

86
4.3.3 MEASUREMENTS OF THE DIFFUSION COEFFICIENTS OF 2 AND 3
BY PULSED FIELD GRADIENT SPIN ECHO NMR SPECTROSCOPY
Diffusion coefficients for 2 and 3 were determined with the assistance of Dr.
Anatoly Khitrin, Kent State University. Details of the experimental parameters and
techniques are given in section 4.2.3 and Chapter 2, repectively. To validate our
experimental design, the diffusion coefficient for water was initially measured (see
Section 2.3.2).
The diffusion coefiicient for complex 2 was determined from the peak resonating
at δ = 7.42 (d) in the 1H NMR spectrum of an equimolar solution of NaVO3 and 1 (4.2
× 10−6
mol) at pD 9.1 (24 °C). The corresponding plot of lne(I/I0) versus
[−(γG)2δ
2(Δ−δ/3)] is given in in Figure 4.12. From the slope of the plot, a diffusion
coefficient of (5.1 ± 0.3) × 10−6
cm2 s
−1 was obtained. Similar measurements were
carried out for complex 3 using the 1H NMR peak at δ = 7.24 (d) ppm for a solution
of 1 (3.0 10−5
mol) and 0.20 equiv. NaVO3. The corresponding plot of lne(I/I0)
versus [−(γG)2δ
2(Δ−δ/3)] is given in in Figure 4.13. From the slope of the plot, a
diffusion coefficient of (3.6 ± 0.1) × 10−6
cm2 s
−1 was obtained.

87
0 1x10⁵
2x10⁵
3x10⁵
-1.4
-1.2
-1.0
-0.8
-0.6
-0.4
-0.2
0.0
lne(I
/I0)
22G2(3)
0 1x10⁵
2x10⁵
3x10⁵
-1.0
-0.8
-0.6
-0.4
-0.2
0.0
lne(I
/I0)
22
G2
(-/3)
Figure 4.12. Plot of lne(I/I0) versus γ2G
2δ
2(Δ− δ/3) for the peak at 7.42 ppm
corresponding to complex 2 for an equimolar solution of 1 (4.2 × 10⁻⁶
mol) + NaVO3 in
D2O, pD 9.1 ± 0.02, 22 1 C. The best fit of the data gives a straight line with slope (=
−diffusion coefficient) = (5.1 ± 0.3) × 10−6
cm2 s
−1.
Figure 4.13. Plot of lne(I/I0) versus γ2G
2δ
2(Δ−δ/3) for the peak at 7.24 ppm
corresponding to complex 3 for a solution of 1 (3.0 10−5
mol) + 0.20 equiv. of NaVO3
in D2O, pD 8.9 ± 0.02, 22 1 C. The best fit of the data gives a straight line with slope
(= −diffusion coefficient) = (3.6 ± 0.1) × 10−6
cm2 s
−1.

88
The ratio of the molecular weights of complex 3 to 2 is 1.9, whereas the ratio of their
diffusion coefficients is 1.4. This difference can be rationalized by consideration of not
only the size but also the geometry of the hydrated complexes in solution, which also
plays a key role in determining the magnitude of the measured diffusion coefficient.
Since diffusion coefficients of molecules decrease with increasing size (molecular
weight, see section 2.3.2), it can be concluded that the molecular weight of 3 is clearly
much larger than 2.
Attempts to purify 2 and 3 were unsuccessful. Passing a solution of
predominately 2 (1 + 3.0 equiv. NaVO3) through an Amberlite XAD−2 column to
separate 2 from excess vanadate resulted in a mixture of 1−3 (see section 4.2.3). C18
reverse−phase HPLC has been routinely to separate Cbls [218]; however only a
single, broad product peak was observed in HPLC chromatograms of mixtures of 1−3
under either acidic or neutral isocratic conditions. On hindsight our failure to obtain
pure 2 and/or 3 using standard chromatography techniques is not unexpected, given
the considerable literature precedence for rapid exchange of ligands for V(V)
complexes [219].
4.3.4 IN VIVO BLOOD GLUCOSE−LOWERING PROPERTIES IN THE
STZ−RAT MODEL FOR TYPE I DIABETES
Experiments to determine the blood glucose−lowering ability of a single injection
of an equimolar 1 + NaVO3 solution (V/B12) versus NaVO3 (V) were carried out using
the streptozotocin (STZ) rat model for Type 1 diabetes, in the laboratory of Dr. Derek

89
0
50
100
150
200
250
300
350
400
450
500
0 7 8 9 10 14 16 21 30
Day
Blo
od
Glu
co
se
(m
g/d
l)
Ctrl
B12
V
V/B12
S. Damron, Department of Biological Sciences, Kent State University. Elevated blood
glucose levels were confirmed one week following intraperitonal injection of STZ (55
mg/kg; levels rose from 94 ± 7 (day 0) to 394 ± 11 mg/dl (day 7)), Figure 4.14.
Figure 4.14. Blood glucose levels for STZ−rats administered a single tail vein injection
(pH 7.0, 70 l) of H2O (= Control, Ctrl), 5.0 x 10⁻⁷
mol 1 in H2O (B12), 5.0 × 10⁻⁷
mol
NaVO3 in H2O (V), or an equimolar (5.0 × 10⁻⁷
mol) solution of 1 + NaVO3 in H2O
(V/B12) on day 7, directly after measuring their blood glucose levels. The rats were
injected with STZ (55 mg/kg) on day 0. The mean values represent independent
observations from 3 different animals in each group; errors are 1 standard deviation.
Importantly, from day 8 onwards, statistical analysis (student's t−test) showed
that the V/B12 conjugate mixture lowered glucose levels further than NaVO3 alone (p
0.05). Complex 1 did not significantly reduce blood glucose levels in the absence of
NaVO3.

90
4.4 SUMMARY
Two novel bioconjugates of vanadate were obtained upon the addition of vanadate to
the vitamin B12 complex 3−(3−hydroxy−2−methyl−1H−pyridin−4− one)propylcobalamin
(1). The oxygen atoms of the hydroxypyridinone ligand in 1 bind strongly to vanadate.
Several spectroscopic techniques were employed to investigate the structures of the
bioconjugates. The 1H NMR spectrum of a solution of 1 with 0.20 equiv. NaVO3 in
aqueous solution shows the existence of two complexes 2 and 3, the latter being the
major species. Upon increasing the concentration of NaVO3, 2 becomes the predominant
complex formed in solution. These observations are consistent with 2 and 3 being mono−
(VO2(H2O)2L) and bis–ligated (VO2L2) complexes, where L corresponds to the Cbl
complex 1. The 51
V NMR spectrum of 2 (1 + 1.0 or 3.0 equiv. NaVO3) and the ES–MS
of 2 (1 + 1.0 equiv. NaVO3) also support the assignment of 2 as VO2(H2O)2L. Changes
were observed in the FTIR spectra of solutions of 1 upon the addition of increasing
amounts of NaVO3; however, a detailed analysis was not possible due to the low signal
intensity. Diffusion coefficients of 2 and 3 were measured by pulsed−field gradient spin
echo NMR spectroscopy. The ratio of the diffusion coefficients suggested that complex 3
is of higher molecular weight than 2, which is once again consistent with 2 and 3 being
mono and bis–ligated complexes, respectively. Finally, it was shown that an equimolar
solution of 1 with NaVO3 (= mainly complex 2) lowers blood glucose levels in
STZ−induced diabetic rats. The extent of lowering of the blood glucose level was greater
than that achieved using NaVO3 alone. 1 did not lower the blood glucose level in the

91
absence of NaVO3. To our knowledge, these complexes are the first vanadium−vitamin
B12 bioconjugates developed with potential as insulin mimics.

92
CHAPTER 5
SYNTHESIS, SYNCHROTRON X−RAY DIFFRACTION AND KINETIC
STUDIES ON THE FORMATION AND DECOMPOSITION OF A NOVEL
THIOLATOCOBALAMIN OF CAPTOPRIL
5.1 INTRODUCTION
Angiotensin−converting enzyme (ACE, EC 3.4.15.1) is a zinc−containing dipeptidyl
carboxypeptidase [220, 221] on the lumenal surface of vascular endothelium and the
epithelial cells of several organs, including heart, lung and kidneys [222-224]. ACE
cleaves the carboxyl end of the inactive decapeptide angiotensin I (Ang I) to form
angiotensin II (Ang II) – a potent vasoconstrictor. ACE also cleaves and inactivates the
vasodilator bradykinin [225]. These actions result in raised blood pressure [221]. ACE
inhibitors are widely used to treat high blood pressure, congestive heart failure and
cardiovascular disease [226]. They can also attenuate endothelial dysfunction and reduce
organ damage including diabetes−associated kidney disease [226, 227].
Captopril (1−[(2S)−3−mercapto−2−methylpropionyl]−L−proline, Figure 5.1) is the
prototypic ACE inhibitor [220]. It inactivates ACE by binding via its sulphydryl group to
the zinc center [224]. Its effects are short−lived and several daily doses are required
[228]. Furthermore, common side effects include a dry cough [228], rash, and taste
disturbances which are attributed to the thiol group [229]. Administering captopril can
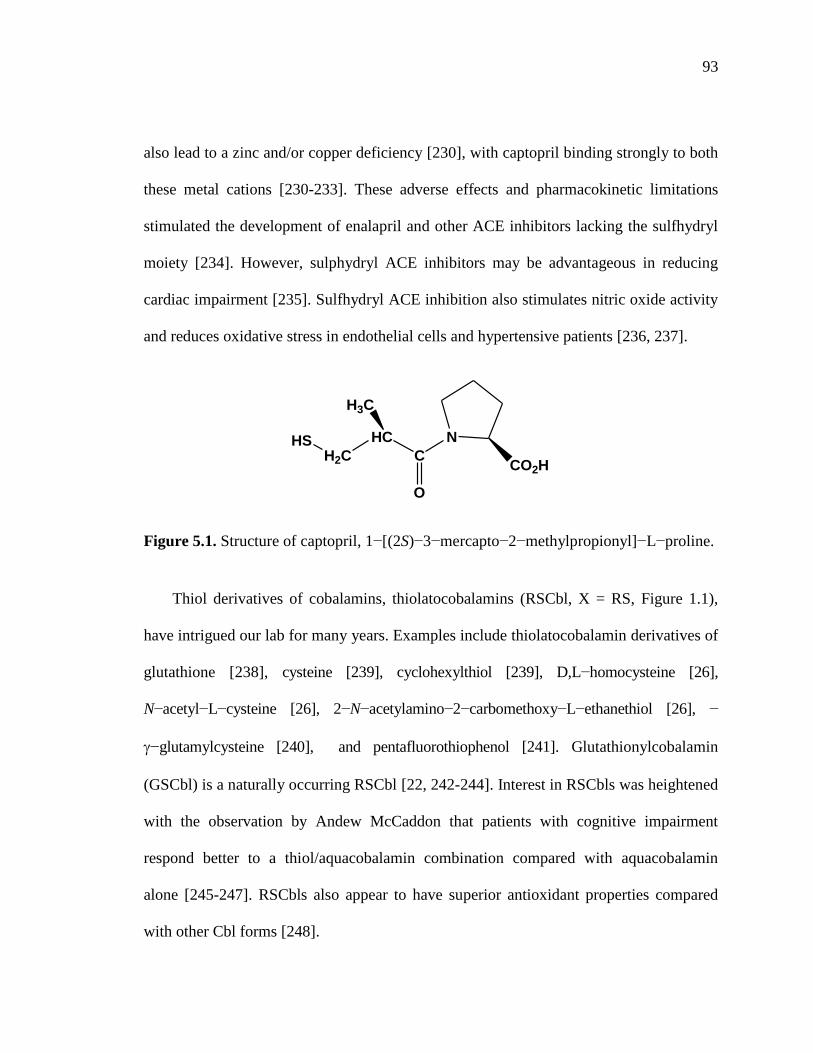
93
N
C
O
HC
CO2HH2C
HS
H3C
also lead to a zinc and/or copper deficiency [230], with captopril binding strongly to both
these metal cations [230-233]. These adverse effects and pharmacokinetic limitations
stimulated the development of enalapril and other ACE inhibitors lacking the sulfhydryl
moiety [234]. However, sulphydryl ACE inhibitors may be advantageous in reducing
cardiac impairment [235]. Sulfhydryl ACE inhibition also stimulates nitric oxide activity
and reduces oxidative stress in endothelial cells and hypertensive patients [236, 237].
Figure 5.1. Structure of captopril, 1−[(2S)−3−mercapto−2−methylpropionyl]−L−proline.
Thiol derivatives of cobalamins, thiolatocobalamins (RSCbl, X = RS, Figure 1.1),
have intrigued our lab for many years. Examples include thiolatocobalamin derivatives of
glutathione [238], cysteine [239], cyclohexylthiol [239], D,L−homocysteine [26],
N−acetyl−L−cysteine [26], 2−N−acetylamino−2−carbomethoxy−L−ethanethiol [26], −
−glutamylcysteine [240], and pentafluorothiophenol [241]. Glutathionylcobalamin
(GSCbl) is a naturally occurring RSCbl [22, 242-244]. Interest in RSCbls was heightened
with the observation by Andew McCaddon that patients with cognitive impairment
respond better to a thiol/aquacobalamin combination compared with aquacobalamin
alone [245-247]. RSCbls also appear to have superior antioxidant properties compared
with other Cbl forms [248].
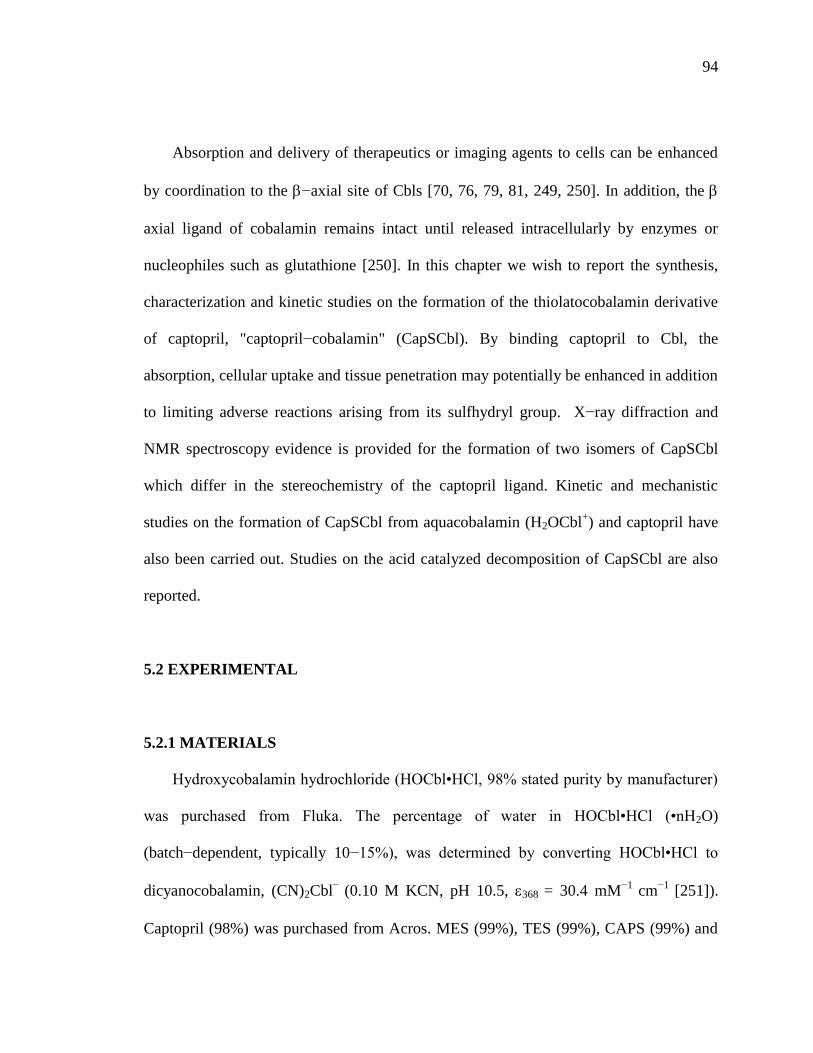
94
Absorption and delivery of therapeutics or imaging agents to cells can be enhanced
by coordination to the −axial site of Cbls [70, 76, 79, 81, 249, 250]. In addition, the
axial ligand of cobalamin remains intact until released intracellularly by enzymes or
nucleophiles such as glutathione [250]. In this chapter we wish to report the synthesis,
characterization and kinetic studies on the formation of the thiolatocobalamin derivative
of captopril, "captopril−cobalamin" (CapSCbl). By binding captopril to Cbl, the
absorption, cellular uptake and tissue penetration may potentially be enhanced in addition
to limiting adverse reactions arising from its sulfhydryl group. X−ray diffraction and
NMR spectroscopy evidence is provided for the formation of two isomers of CapSCbl
which differ in the stereochemistry of the captopril ligand. Kinetic and mechanistic
studies on the formation of CapSCbl from aquacobalamin (H2OCbl+) and captopril have
also been carried out. Studies on the acid catalyzed decomposition of CapSCbl are also
reported.
5.2 EXPERIMENTAL
5.2.1 MATERIALS
Hydroxycobalamin hydrochloride (HOCbl•HCl, 98% stated purity by manufacturer)
was purchased from Fluka. The percentage of water in HOCbl•HCl (•nH2O)
(batch−dependent, typically 10−15%), was determined by converting HOCbl•HCl to
dicyanocobalamin, (CN)2Cbl−
(0.10 M KCN, pH 10.5, 368 = 30.4 mM−1
cm−1
[251]).
Captopril (98%) was purchased from Acros. MES (99%), TES (99%), CAPS (99%) and

95
CHES (99.5%) buffers were from either Sigma or Acros. KNO3 (99%) and CH3COOH
(glacial, HPLC grade) was purchased from Acros and Fisher Scientific, respectively. All
the other reagents were purchased and used as described in the previous chapters.
5.2.2 INSTRUMENTATION
Rate data for rapid reactions were collected using an Applied Photophysics RX.2000
Rapid Mixing Stopped−Flow unit in conjunction with the Cary 5000 spectrophotometer
(25.0 0.1 C). Kinetic data analyses were carried out using the program Microcal
Origin version 7.5 or 8.0.
HPLC analyses were conducted on an Agilent 1100 series HPLC system equipped
with a degasser, quaternary pump and photodiode array detector (resolution of 2 nm)
using a semi−preparative Alltech Alltima C18 column (5 μm, 100 Å, 10 mm × 300 mm)
thermostatted to 25 °C with a flow rate of 3 ml/min. Product peaks were monitored at 254
and 350 nm. A mobile phase consisting of acetic acid in water (pH 3.5, 0.1% v/v), A, and
acetic acid in CH3CN (0.1% v/v), B, were used in the following method: 0–2 min,
isocratic elution of 95:5 A:B; 2–14 min, linear gradient to 85:15 A:B; 14–19 min, linear
gradient to 82:18 A:B; 19–32 min, linear gradient to 65:35 A:B, 32–33 min, linear
gradient to 40:60 A:B; and 33–35 min, linear gradient to 95:5 A:B. Under these
conditions, Cbls elute slowly, with the retention time of Cbl standards (CNCbl, MeCbl,
AdoCbl and H2OCbl+) varying from 21.7 min (H2OCbl
+) to 31.7 min (CH3Cbl).
All other instruments were used as described in section 3.2.2.
96
5.2.3 SYNTHESIS OF CapSCbl
A solution of captopril (347 l, 213 mM, 74 µmol, 1.2 mol equiv.) in H2O (pH
adjusted to 4.3) was added dropwise to a solution of HOCbl•HCl (96.8 mg, 62 µmol)
in H2O (1 ml, pH adjusted to 6.6) with stirring. The final pH of the reaction mixture
was 4.2. The reaction was allowed to proceed for 3 hr at 0 °C in the dark. The
product precipitated upon dripping into a chilled acetone solution (−20 °C), and was
filtered, washed with chilled acetone (50 ml, −20 °C), diethyl ether (10 ml, −20 °C)
and dried under vacuum (50 °C , 5 × 10⁻²
mbar) overnight. Yield: 86 mg (88%). 1H
NMR spectroscopy (D2O, δ ppm): major peaks at 7.19 (s, B7), 6.94 (s, B2), 6.40 (s,
B4), 6.28 (d, R1) and 6.09 (s, C10) ppm and minor peaks at 6.97 (s, B2) and 6.08 (s,
C10) ppm. The purity assessed by 1H NMR spectroscopy[39] was ~ 98%. UV−vis
spectroscopy: λmax = 333, 372, 428, 530 and 560 nm. ES−MS (m/z) : 1589.3 (calcd
for [CapSCbl + 2Na]+, C71H101CoN14Na2O17PS = 1589.6); 1567.3 (calcd for [CapSCbl
+ H + Na]+, C71H102CoN14NaO17PS = 1567.6); 1545.2 (calcd for [CapSCbl + 2H]
+,
C71H103CoN14O17PS = 1545.6); 1351.4 (calcd for [Cbl + Na]+, C62H88CoN13NaO14P
=1351.6); 806.3 (calcd for [CapSCbl + 3Na]2+
, C71H101CoN14Na3O17PS = 806.3);
795.2 (calcd for [CapSCbl + H + 2Na]2+
, C71H102CoN14Na2O17PS = 795.3); 784.2
(calcd for [CapSCbl + Na + 2H]2+
, C71H103CoN14NaO17PS = 784.3); 773.2 (calcd for
[CapSCbl + 3H]2+
, C71H104CoN14O17PS = 773.3); 687.3 (calcd for [Cbl + 2Na]2+
,
C62H88CoN13Na2O14P = 687.3); 665.2 (calcd for [Cbl + 2H]2+
, C62H90CoN13O14P =
665.5). FT−IR (KBr, cm−1
): The peak at 2567 cm−1
corresponding to the S−H
stretching vibration of captopril [252] disappeared upon binding to the cobalamin.

97
5.2.4 CRYSTALLIZATION OF CapSCbl
Two different types of CapSCbl (CapSCbl−1 and CapSCbl−2, respectively) were
crystallized from aqueous solutions. For CapSCbl−1, an aliquot of captopril solution
(460 mM, 20 l, 1.4 mole equiv.) was added to a solution of HOCbl•HCl (64 mM,
100 l). NaCl (15 mg) was added to this solution and the solution stirred until all the
NaCl was dissolved. The reaction mixture was kept in the dark and the solvent was
allowed to evaporate slowly. After a week, suitable crystals for X−ray diffraction
studies were obtained. When anaerobic conditions were used, the complex
crystallized in the CapSCbl−2 form. An aliquot of captopril (454 mM, 40 l, 2.5 mole
equiv.) was added to a solution of HOCbl•HCl (72 mM, 100 l) and NaCl (15 mg)
added with stirring. Crystals were obtained after a week upon slow evaporation of the
solvent.
5.2.5 X−RAY DIFFRACTION STUDIES ON CapSCbl
The X−ray diffraction data for the two crystals of CapSCbl were collected on
beamlines BL9−2 and BL11−1 and the structures were solved by Dr. Clyde A.Smith at
the Stanford Synchrotron Radiation Laboratory (SSRL), Stanford University. Crystals of
CapSCbl−1 and CapSCbl−2 were removed from the crystallization solution with nylon
loops mounted on copper CrystalCapS pins (Hampton Research), placed in paraffin oil
and flash frozen in liquid nitrogen. The CapSCbl−1 data were collected on a
MarMosaic−325 CCD detector using X−rays produced by a 16 pole wiggler insertion
device, with a wavelength of 0.85503 Å (14500 eV) from a liquid nitrogen cooled double

98
crystal monochromator. Two data sets were collected, both consisting of 90 1° images
with a crystal to detector distance of 95 mm and covering the same range of phi angle.
The first high resolution pass had an exposure time of 20 s and the second pass had an
exposure time of 3 s and a beam attenuation of 75%, in order to record the strong low
resolution reflections discarded from the first pass due to overloading of the CCD
detector. The data were processed with the program XDS [253] and scaled together with
the program XSCALE [253]. Bijvoet pairs were not merged and an absorption correction
was not applied. A total of 34803 reflections were measured to a nominal resolution of
0.84 Å, resulting in a final unique dataset of 12716 reflections with a merging R−factor
of 0.049.
The CapSCbl−2 data were collected at BL11−1 using a MarMosaic−325 CCD
detector. X−rays were produced by a 26 pole wiggler insertion device, with a
wavelength of 0.79987 Å (15500 eV) from a water cooled side scattering asymmetric
cut Si(111) single crystal monochromator. A single data set consisting of 180 1°
images was collected, with a crystal to detector distance of 95 mm and an exposure
time of 15 s. The data were processed with the program XDS [253] and scaled with
the program XSCALE [253]. A total of 102343 reflections were measured to
approximately 0.73 Å, giving 33693 unique reflections with a merging R−factor of
0.050.
The CapSCbl−1 structure was solved by Patterson methods as implemented in the
program SHELXS [254] to locate the cobalt, phosphorus and some of the corrin nitrogen
atoms. The remaining light atoms were located by difference Fourier synthesis using

99
SHELXS. The structure was refined by full matrix least−squares methods using the
program SHELXL [254]. All of the cobalamin non−hydrogen atoms were refined with
anisotropic thermal parameters and hydrogen atoms were added in idealized positions
and refined in riding positions. A correction for the anomalous scattering from cobalt at
14500 eV was applied during refinement. Additional difference electron density peaks
were modelled as water molecules. The captopril moiety appeared to have two distinct
conformations corresponding to the trans and cis conformations with respect to the amide
bond. Both conformations were modelled in the structure and the occupancies refined
with SHELXS. The atoms of the mercapto−2−methylpropionyl moiety (S70, C71, C72,
C74 and O75), along with the amide nitrogen of the proline moiety (N76), were all
refined in a single position with anisotropic thermal parameters, with the exception of
C73, and the remaining atom of the proline were refined isotropically in the cis and trans
configurations. When the two captopril configurations moieties were refined fully
anisotropically, these prolyl atoms proved to be highly anisotropic, with a tendency to
refine as non−positive definite. Because the entire captopril moiety could not be refined
anisotropically, this gave rise to a goodness of fit (GOF) greater than 2. The final
crystallographic R−factor, R1 was 0.1124 for 10382 reflections with Fo > 4ζF. Additional
data collection and refinement statistics are given in Table 5.1.

100
Table 5.1. Crystal data and structure refinement parameters for CapSCbl–1 and
CapSCbl–2.
The CapSCbl−2 structure was also solved by Patterson methods as implemented in
the program SHELXS [254] and refined with SHELXL [254]. A correction for the
anomalous scattering from cobalt at 15500 eV was applied during refinement. All
non−hydrogen atoms were refined with anisotropic thermal parameters, hydrogen atoms
were added in idealized positions and refined in riding positions and difference peaks
Parameter CapSCbl−1 CapSCbl−2
Empirical formula C71H101N15O17PCoS•14 H2O C71H101N15O17PCoS•12 H2O
FW / g mol−1
1811 1774
T / K 100 100
Wavelength / Å 0.85503 0.79987
Space group P212121 P212121
a / Å 16.05 16.05
b / Å 21.23 24.97
c / Å 24.70 63.96
V / Å3 8416.3(2) 25633.1(5)
Z 4 12
Absorption coefficient/mm−1
0.31 0.31
F(000) 3080 10872
Limiting indices −16≤ h ≤16, −24≤ k ≤24,
−28≤ l ≤28
−20< h ≤13, −33≤ k ≤29,
−84≤ l ≤70
Reflections collected/unique 34803 / 12716 102343/33693
Rmerge and Rsym 0.049, 0.043 0.050, 0.077
Refinement method Full−matrix least squares on F2 Full−matrix least squares on F
2
Data/restraints/parameters 10382 / 97 / 1063 25827 / 1969 / 3072
GOF on F2 2.139 1.588
Flack parameter 0.0684 NDa
R factors (F > 4ζ(F)) R1 = 0.1126, wR2 = 0.2981 R1 = 0.1445, wR2 = 0.3885
R factor (all data) R1 = 0.1281 R1 = 0.1628
Largest difference peak
and hole / e Å−3
+0.67 and −0.54 + 5.5 and −2.3

101
were modelled as water molecules. There are three independent captopril−cobalamin
molecules in the CapSCbl−2 asymmetric unit. Two of these molecules had the ligand in
the trans conformation and the third was in the cis conformation. Once all the atoms of
the cobalamin and the captopril had been added, residual peaks between 0.5 and 1.0 Å
from the Co, N, S and P atoms were observed in Fo−Fc electron density maps, appearing
as if there was a second captopril−cobalamin molecule “shadowing” the first. This
unaccounted for density resulted in a high crystallographic R−factor, and in an effort to
get a better fit to the experimental data, some of these residual peaks were modelled as
“alternates” of the real atom positions for the three cobalt atoms, the three sulphur atoms
and the three phosphorus atoms. This lowered the R−factor but gave rise to additional
residual peaks in these “shadow” structures. Since there was already a high quality
structure of the captopril−cobalamin complex obtained from the CapSCbl−1 crystal form,
it was decided to remove these “alternate” positions and leave the CapSCbl−2 structure in
its current state. The final crystallographic R−factor, R1 was 0.1445 for 25827 reflections
with Fo > 4ζF, and using data between 10.0 and 0.76 Å resolution. Additional data
collection and refinement statistics are given in Table 5.1.
5.2.6 KINETIC MEASUREMENTS ON THE FORMATION OF CapSCbl FROM
AQUACOBALAMIN/HYDROXYCOBALAMIN AND CAPTOPRIL
All solutions were prepared in 0.050 M buffer at a total ionic strength of 0.50 M
(KNO3). Captopril solutions were freshly prepared. The rates of reactions at pH 4.5 − 8.0
were determined under aerobic conditions using stopped−flow spectroscopy and were
102
independent of the wavelength at which they were measured. The rates of the reactions at
pH 8.5−9.5 were measured under anaerobic conditions using the Cary 5000
spectrophotometer and air−free cuvettes. Above pH 8.5, data were collected at an
isosbestic wavelength for the conversion of CapSCbl to cob(II)alamin (500 nm at pH 9.0;
494 nm at pH 9.5).
5.2.7 KINETIC MEASUREMENTS ON THE ACID CATALYZED
DECOMPOSITION OF CapSCbl
Solutions of pH < 1.5 were prepared by diluting a standardized HNO3 solution.
Solutions in the pH range 1.5−2.5 were prepared from aqueous HNO3 and the pH
adjusted using conc HNO3/NaOH in conjunction with a pH meter. For the pH 3.0, the
solutions were prepared in 0.050 M HEPES buffer (pKa1 = 3.05) and once again the pH
of the solutions adjusted as necessary. The total ionic strength was maintained at 0.50 M
(KNO3) for all solutions.
CapSCbl solutions (~0.01 M, in water) were used within 1 hr of preparation. The
rates of the reactions for the decomposition of CapSCbl was determined under pseudo
first−order conditions in excess [H+]. To a solution of a specific pH, a small aliquot of the
CapSCbl solution was added ([CapSCbl]final = 5.0 × 10⁻⁵
M) and the absorbance at 350
nm followed as a function of time in a Cary 5000 UV−Vis spectrophotometer.

103
5.3 RESULTS AND DISCUSSION
5.3.1 SYNTHESIS AND CHARACTERIZATION OF CapSCbl
CapSCbl was synthesized in high yield and purity by the addition of an aqueous
solution of captopril (1.2 mol equiv., pH 4.3) drop wise to an aqueous solution of
HOCbl•HCl (pH 6.6). The pH of the final product solution was 4.2. The procedure is
similar to that used for the syntheses of other thiolatocobalamins [26] but with minor
modifications. The pH of the final product solution plays a key role in the synthesis and
was kept in the range 3.5−4.5. Lowering or raising the pH beyond this range causes the
CapSCbl product to decompose to H2OCbl+ as determined by
1H NMR and UV−Vis
spectroscopy. The synthesis was also attempted in 0.10 M MES buffer at pH 6.0 (both the
HOCbl•HCl and captopril solutions adjusted to pH 6.0); however the final product
contained considerable H2OCbl+ in addition to the desired CapSCbl product.
UV−Vis wavelength maxima of cobalamins are dependent on the −axial ligand of
the Cbl [24]. CapSCbl has wavelength maxima (λmax = 333, 372, 428 and 534 nm, Figure
5.2) identical to other thiolatocobalamins (Table 1.3); hence captopril is coordinated to
Cbl via the S atom.

104
300 400 500 600 7000.0
0.2
0.4
0.6
0.8
Ab
s
Wavelength (nm)
Figure 5.2. UV−visible spectrum of CapSCbl (in H2O, pH 5.4, 25.0 ºC). Six peaks were
found at λmax = 289, 333, 372, 428, 534 and 560 nm.
CapSCbl was also characterized by ES−MS. Peaks with splitting in agreement with
computer simulated spectra were observed for [CapSCbl + 2H]+, [CapSCbl + H + Na]
+
and [CapSCbl + xH + yNa]2+
(x, y = 0, 1, 2 or 3; Experimental Section). Importantly, the
ES−MS spectrum of CapSCbl clearly shows that no additional Cbl species are present in
the product (Figure 5.3).
The FT−IR spectrum of captopril showed a peak at 2567 cm−1
corresponding to the
SH stretching vibration [252]. This peak disappeared upon the binding of captopril to
H2OCbl+, providing further support for captopril coordinating via the thiol S in CapSCbl.

105
Figure 5.3. ES−MS (+ve mode) of CapSCbl in H2O. Peak assignments are given in
section 5.2.3.
Given the potential interest in CapSCbl as a therapeutic, preliminary studies were
carried out to investigate its stability in solution. In air, CapSCbl decomposed slightly to
produce ~5% H2OCbl+ after 24 hr and ~9% H2OCbl
+ after 1 week (TES buffer, pD 7.4,
RT; 1H NMR spectroscopy experiment). Under slightly acidic, aerobic conditions,
decomposition of CapSCbl occurred more readily (~13% H2OCbl+ after 24 hr and ~18%
after 24 hr. Decomposition of CapSCbl was almost negligible under anaerobic conditions
106
at all these pH conditions; hence decomposition of CapSCbl in aerobic solution is a
consequence of the well established B12−catalyzed aerial oxidation of thiols [255-259].
5.3.2 EVIDENCE OF CIS−TRANS ISOMERIZATION OF THE CAPTOPRIL
LIGAND IN CapSCbl BY 1H NMR SPECTROSCOPY
1H NMR chemical shifts of Cbls in the aromatic region are also dependent on the
−axial ligand of Cbls [39]. The most interesting structural feature of the CapSCbl
complex first became apparent upon recording the 1H NMR spectrum of CapSCbl, Figure
5.4. Five major signals attributable to the B2, B4, B7 protons of the
α−5,6−dimethylbenzimidazole nucleotide, the C10 proton of the corrin ring and R1
proton of the ribose are observed at 6.94 (s), 6.40 (s), 7.19 (s), 6.09 (s) and 6.28 (d) ppm,
respectively. 1H NMR chemical shifts for other RSCbls are listed in Table 1.2. There is
excellent agreement between the chemical shifts of CapSCbl and other RSCbls.
However, unlike other RSCbls, CapSCbl also has two additional minor peaks (~18%) at
6.08 and 6.97 ppm, with peak integrals suggesting that CapSCbl exists in two isomeric
forms, since the sum of the peak integrals of the (6.08 + 6.09) and (6.94 + 6.97) peaks
equals that of the 6.28, 6.40 and 7.19 ppm peaks within experimental error (0.97, 1.00,
1.05, 1.02, 1.00, respectively).

107
NC
O
HC
HO2C
H2CHSN
C
O
HC
CO2HH2C
HS
H3C H3C
trans-captopril cis-captopril
Figure 5.4. Aromatic region of the 1H NMR spectrum of CapSCbl (25 1 ºC) in D2O,
pD 5.5, MES buffer. Five major peaks are at 7.19 (1H, s), 6.94 (1H, s), 6.40 (1H, s), 6.28
(1H, d) and 6.09 (1H, s) ppm, attributable to the B7, B2, B4, R1 and C10 protons (see
Figure 1.1 for the numbering scheme) respectively, of the Cbl macrocycle. Two minor
peaks are observed at 6.97 (s) and 6.08 (s) ppm.
The captopril ligand itself exists as cis and trans isomers in solution with respect to
the peptide bond involving the proline amide group (cis−captopril: trans−captopril ~
60:40, 25 C, pH 7.4, Scheme 5.1) [260-262].
Scheme 5.1. Cis−trans isomerization equilibrium for captopril in solution.
7.4 7.2 7.0 6.8 6.6 6.4 6.2 6.0Chemical Shift (ppm)
6.12 6.086.32 6.28 6.247.00 6.93
108
Captopril also exists as cis and trans isomers in the solid state [252], and ACE is
inhibited by the trans isomer only [252, 263, 264].
In order to provide further evidence for the cis−trans isomerization of the captopril
ligand in CapSCbl, the effects of temperature and pD on the 1H NMR spectrum of
CapSCbl were investigated. However, unlike captopril [260, 261], the relative amounts of
the two species remained unchanged with pD (pD 3.4, 7.4 and 9.4), and raising the
temperature to 75 C simply resulted in broadening of all resonances. Control
experiments showed that peak broadening is also observed in the NMR spectra of other
cobalamins (CNCbl and H2OCbl+, 25 versus 75 C). Attempts were also made to
separate the two stereoisomers by HPLC (section 5.2.2); however despite using mild
elution conditions to increase the retention time of cobalamins to promote separation, a
single peak was observed at 27.3 min with a UV−visible spectrum corresponding to
CapSCbl (λmax = 333 and 372 nm).
Importantly, the existence of cis and trans isomers for CapSCbl was confirmed
by X−ray diffraction studies and in the solid state at least, the trans isomer is the
major species (see section 5.3.3). In solution, the ratio of the two isomers was found
to be solvent dependent, as expected. Figure 5.5 gives the aromatic region of the 1H
NMR spectrum of CapSCbl in CD3OD.

109
Figure 5.5. Aromatic region of the 1H NMR spectrum of CapSCbl in CD3OD. Peaks
were observed at (7.14 + 7.15) (1H), (6.98 + 7.04) (1H), (6.46 + 6.49) (1H), (6.19)
(1H, d) and (6.053 + 6.050) ppm.
Nine peaks are observed at (6.053 + 6.050), 6.19 (d), (6.46 + 6.49), (6.98 + 7.04) and
(7.14 + 7.15) ppm, integrating as 0.96, 1.00, 1.05, 0.99 and 1.06 protons, respectively.
In CD3OD, the ratio of the two isomers (major: minor isomer) is ~ 57:43, not 82:18 as
observed in D2O (Figure 5.4). Upon taking an NMR sample of CapSCbl in CD3OD to
dryness and re−dissolving it in D2O, a 1H NMR spectrum was observed identical to
that obtained by directly dissolving the dry CapSCbl product in D2O. Similarly,
taking a sample of CapSCbl in D2O to dryness and re−dissolving it in CD3OD gave a
1H NMR spectrum identical to that observed in Figure 5.5. These experiments
demonstrate that the extra peaks observed in addition to the five expected for a
cobalamin are indeed a consequence of cis/trans isomerization, rather than
solvent−induced decomposition. Further evidence of the solvent dependent cis/trans
7.2 7.0 6.8 6.6 6.4 6.2 6.0Chemical shift (ppm)
6.23 6.167.2 7.1 6.06 6.04

110
isomerization was obtained by adding increasing amounts of D2O (up to 55% v/v) to a
sample of CapSCbl in CD3OD, which changed the ratio of the peaks in addition to the
chemical shifts in the aromatic region of the 1H NMR spectrum (Figure 5.6).
Figure 5.6. Aromatic region of the 1H NMR spectrum for CapSCbl in (a) CD3OD, (b)
CD3OD + 9% D2O (v/v), (c) CD3OD + 17% D2O, (d) CD3OD + 23% D2O (e) CD3OD +
29% D2O (f) CD3OD + 47% D2O and (g) CD3OD + 55% D2O. Spectrum a shows nine
peaks at (6.053 + 6.050) (s), 6.19 (d), (6.46 + 6.49) (s), (6.98 + 7.04) (s) and (7.14 + 7.15)
(s) ppm. Addition of increasing amounts of D2O results a progressive change in chemical
shifts. Spectrum g shows six peaks at 6.09 (s), 6.28 (d), 6.40 (s), (6.97 + 6.94) (s) and
7.19 (s) ppm, which resembles the spectrum of CapSCbl in pure D2O (Figure 2a). Three
small peaks at 6.52 (s), 6.46 (s) and 6.22(d) ppm, attributable to H2OCbl+, arise from
CD3OD−induced decomposition of CapSCbl over the time period of the experiment (~2
hr). The ratio of the peaks at 7.04 and 6.98 ppm changes as follows a. 57:43, b. 102:100,
c. 44:56, d. 39:61, e. 36:64, f. 32:68 and g. 25:75. The ratio of the peaks at 6.46 and 6.49
changes in a similar manner until a single peak is observed at 6.40 ppm.
6.6 6.4 7.1 7.0 6.9
7.2 6.8 6.4 6.0
Chemical Shift (ppm)
a
b
c
d
e
f
g
111
The final spectrum resembled the spectrum of CapSCbl in D2O only. Cis and trans
isomers with respect to the captopril ligand has also been demonstrated in silver
complexes of captopril using 1H and
13C NMR spectroscopy [265].
5.3.3 FURTHER CHARACTERIZATION OF CapSCbl BY X−RAY
CRYSTALLOGRAPHY
CapSCbl crystallizes in two orthorhombic crystal forms depending upon the
conditions during synthesis. The X−ray crystal structures of two crystals of CapSCbl
were solved by Dr. Clyde A. Smith at the SSRL, Stanford University. When the complex
is crystallized in the presence of air (CapSCbl−1), the crystals adopt the standard P212121
space group with one molecule per asymmetric unit (cell parameters a = 16.05, b = 21.23,
c = 24.70). Conversely, when the complex is crystallized in an inert atmosphere
(CapSCbl−2), the crystals have a larger P212121 unit cell (cell parameters, a = 16.05, b =
24.97, c = 63.96), with three molecules per asymmetric unit. To test the reproducibility
of these observations, multiple crystals of aerobic and anaerobic crystals from several
different preparations with varying mol equiv. of captopril were mounted, flash cooled
and their diffraction patterns measured. Without exception, the aerobic crystals always
gave the standard small orthorhombic CapSCbl−1 cell and the anaerobic crystals gave the
larger CapSCbl−2 cell. (Note that the CapSCbl−2 structure was observed with 1.4 equiv.
captopril under anaerobic conditions.) Analysis of the unit cell parameters shows that the
two cells are related, with the CapSCbl−2 unit cell being a subgroup of the more common

112
CapSCbl−1 cell (see discussion of crystal packing below). Figures 5.7a gives a thermal
ellipsoid plot of CapSCbl−1. The captopril molecule is shown in Figure 5.7b for clarity.
Figure 5.7. (a) Thermal ellipsoid plot (30%) of captopril−cobalamin. Only the cobalt
atom, some of the atoms of the captopril ligand and some of the corrin ring atoms have
been labeled for clarity and (b) close view of the captopril ligand showing complete atom
labeling.
The captopril ligand is bound to the cobalamin through the sulfur atom as expected,
with a Co−S bond distance of 2.282(3) Å. The Co−S and axial base Co−NB3 bond
distances are slightly, but significantly different (that is, not identical within experimental
error) from other thiolatocobalamin structures, Table 5.2.
(b) (a)

113
Table 5.2. Comparison of the Co coordination sphere for thiolatocobalamins:
−GluCysCbl [240], (NH2)2CSCbl [30], NACCbl [26] and GSCbl [35].
The four in−plane Co−N bond distances are very similar for all the thiolatocobalamins,
Table 5.2 [26, 30, 35, 240]. The cobalt ion of CapSCbl−1 sits in the plane of the four
corrin nitrogen atoms (the displacement = −0.027 Å). Comparison of the CapSCbl−1
structure with that of −GluCysCbl [240], GSCbl [35] and N−acetyl−L−cysteinylCbl
(NACCbl) [26] is interesting, in that whereas the upward corrin fold [255] in GSCbl was
found to be the largest yet observed in a cobalamin structure (24.7°), −GluCysCbl and
NACCbl also have large corrin folds (24.2° and 22°, respectively). The CapSCbl corrin
folds are much smaller (14.2° and 14.9°), and are similar to the value reported for
(NH2)2CSCbl (14.5°). This is intriguing in that the Co−S and Co−N bond lengths (Table
5.2) show very little variation between these three structures. In −GluCysCbl and
NACCbl, there are potential hydrogen bonding interactions between N40 and the
cysteinyl sulfur atoms, although in NACCbl, the C71−S70−N40 angle is only 93° and not
Co−S Co−NB3 Co−N21 Co−N22 Co−N23 Co−N24 corrin
fold(°)
CapSCbl− 1[a]
2.282(3) 2.106(5) 1.880(4) 1.906(4) 1.886(4) 1.893(3) 14.9
CapSCbl− 2[a,b]
2.261(4) 2.094(9) 1.879(9) 1.921(9) 1.913(8) 1.886(8) 14.2
NACCbl 2.250(2) 2.058(6) 1.878(5) 1.916(5) 1.929(5) 1.884(5) 22[c]
−GluCysCbl 2.267(2) 2.049(6) 1.885(5) 1.902(6) 1.914(6) 1.891(5) 24.2
(NH2)2CSCbl 2.300(2) 2.032(5) 1.884(5) 1.916(4) 1.926(5) 1.895(4) 14.5
GSCbl 2.295(1) 2.074(3) 1.883 1.914 1.911 1.887 24.7
[a] This work
[b] The average for the three independent CapSCbl molecules in the asymmetric
unit.
[c] This value was wrong in ref 26 and has been corrected in ref 35.

114
ideal for efficient hydrogen bond formation. It was suggested that this hydrogen bonding
interactions might contribute to the larger upward fold of the corrin ring [17, 266]. In
GSCbl there is a similar opportunity for hydrogen bonding, and the N40−S distance is
3.31 Å [35]. Hydrogen bonding interactions could also exist in CapSCbl−1, since the
orientation of the N40 and S70 atoms are close to optimal for hydrogen bonding, with a
C71−S70−N40 angle of about 115° and a N−S distance of 3.38 Å.
5.3.3.1 EVIDENCE FOR THE CIS−TRANS ISOMERIZATION OF THE
CAPTOPRIL LIGAND IN CapSCbl IN THE SOLID STATE
The most interesting observation was the presence of both the trans and cis
configurations of the captopril ligand in CapSCbl in the solid state. In the early stages of
refinement, the captopril ligand was built into the electron density in a trans
configuration about the C74−N76 bond. Residual peaks in the electron density indicated
the possibility of a lower occupancy cis configuration, and this alternate conformation
was also built in and refined. The trans configuration appears to be favored over the cis
in an almost 70:30 ratio, based on the refined occupancy factors. In the trans
configuration, the carboxylate moiety projects into the solvent channel and makes two
hydrogen bonding contacts with the O44 and N45 atoms of a neighboring cobalamin, and
a third interaction with a solvent molecule, whereas in the cis configuration, the
carboxylate functionality projects towards the ring−contracted side of the cobalamin
molecule. Interestingly, the electron density for the amide group on carbon C18 appears
to be disordered over two possible positions, one major conformation (about 80%) which
115
points away from the cis−captopril carboxylate (shown in Figure 5.7) and the other
weaker configuration pointing towards it. There would be a severe steric clash between
this second conformation and the carboxylate of the cis−captopril so presumably the
amide group can only adopt this conformation with the trans−captopril.
5.3.3.2 CRYSTAL PACKING IN CapSCbl
Crystal packing in cobalamins is typically analyzed by comparison of the ratios of
the c/a and b/a unit cell dimensions [6, 30, 37, 38]. CapSCbl−1 crystals are typical of
cluster I packing (c/a = 1.589, b/a = 1.323). In the CapSCbl−1 crystal, the individual
cobalamin molecules are oriented such that the plane of the corrin ring is roughly aligned
with the ab plane of the unit cell, approximately 18° off being truly parallel. When
viewed perpendicular to the bc plane, the neighboring cobalamin molecules are not
perfectly parallel with each other, giving rise to layers of zig−zagged planes, these planes
being roughly parallel to the b−axis. The separation between these layers along the
c−axis is 13 Å, with the layers separated by solvent molecules. The corrin rings in one
layer stack directly on top of a corrin ring two layers above or below, as a consequence of
the two−fold screw axis, with the corrin ring in the intervening layer displaced parallel to
the ab plane by approximately 4 Å. This type of structural pattern is typical for
cobalamins and has been described in detail in the literature [30]. As observed in other
cobalamin structures [30], when viewed down the c axis, long solvent−filled channels are
clearly evident, with smaller side pockets also filled with ordered water molecules
projecting off this main channel. The solvent structure has been modelled in CapSCbl−1

116
as 14 water molecules. The axial base and the captopril ligand extend into the solvent
layers.
The majority of the solvent molecules are hydrogen bonded directly to either oxygen
or a nitrogen atom on the cobalamin molecule. There are significant intermolecular
contacts in the crystal lattice, and although there are five direct nitrogen−oxygen
hydrogen bonds linking neighboring cobalamin molecules, the majority of the
interactions involve water−mediated hydrogen bonds. Similar H−bonded interactions
have been observed and described for several cobalamin molecules including AdoCbl
[30]. In particular, five water molecules in the side pocket of both the CapSCbl−1 and
CapSCbl−2 structures have an identical structural disposition to, and make the same
H−bonding interactions as, highly−conserved water molecules reported in other
cobalamin structures [30].
In the CapSCbl−2 structure, there are three cobalamin molecules in the asymmetric
unit and the crystal packing resembles that in the CapSCbl−1 crystals, in that they are
arranged in the same zig−zag pattern when viewed perpendicular to the bc plane,
although due to the switch of the b and c axes, the cobalamin planes are parallel to the
c−axis. Superposition of the CapSCbl−2 structure onto the CapSCbl−1 structure (based
upon one of the CapSCbl−2 molecules) shows that the other two molecules in the
CapSCbl−2 asymmetric unit are in similar but not quite identical positions to
symmetry−related molecules in the CapSCbl−1 unit cell. As mentioned above, one of the
cobalamin molecules has the captopril in a cis conformation where the carboxylate
moiety points down towards the cobalamin ring, making the β−side of the corrin ring

117
slightly more compact. This seems to facilitate the movement of a molecule in the plane
directly above in towards the first molecule by nearly 1 Å since the interaction between
the amide group on carbon C43 and the captopril carboxylate is lost. Conversely, because
the captopril carboxylate now clashes sterically with C54 and C60 (in the latter case the
amide group swings down below the corrin plane), the pyrrolidine ring has moved
upwards away from the corrin by about 1.5 Å in a direction towards another cobalamin
molecule in the plane above. As a consequence this molecule has moved away by
approximately 1 Å. The resultant effect seems to be an increase in the angular
displacement of the molecules in this plane; that is, the zig−zag nature of these planes is
expanded slightly. It is not possible at this stage to draw conclusions as to why this
expanded cell is favored over the more typical smaller cell under anaerobic conditions.
Clearly the small cell must be an energetically favored arrangement of cobalamin
molecules since it is observed in a large number of crystals of cobalamin complexed with
a multitude of ligands, some bulkier than captopril, including N−acetylcysteine [26] and
γ−glutamylcysteine [240]. Yet under anaerobic conditions the cobalamin molecules of
CapSCbl do not pack in quite the same manner and this leads to a switch to the larger unit
cell. However it cannot be simply a consequence of the lack of oxygen, since crystals of
the nitroxylcobalamin complex, grown under similar conditions, had the small unit cell
[27]. The presence of both cis and trans conformations of captopril could also potentially
explain these differences. Furthermore, two of the axes in the two crystal forms are
identical, with the new c−axis in CapSCbl−2 resulting from an approximate tripling of
the CapSCbl−1 b−axis.

118
350 400 450 500 550 600 6500.0
0.2
0.4
0.6
Ab
s
Wavelength (nm)
0 200 400 600
0.84
0.86
0.88
0.90
Ab
s
Time (s)
5.3.4 KINETIC STUDIES ON THE FORMATION OF CapSCbl
The kinetics of the reaction between aquacobalamin/hydroxycobalamin
(H2OCbl+/HOCbl) and captopril to form CapSCbl were studied as a function of captopril
concentration at pH 4.59.5 under pseudo first−order conditions ([captopril] ≥ 10 ×
[H2OCbl+/HOCbl]). Figure 5.8 gives UV−vis spectra recorded after the addition of 10
equiv. of captopril (5.00 × 10⁻⁴
M) to an aerobic solution of H2OCbl+/HOCbl (5.0 × 10
−5
M) at pH 7.75 (0.050 M HEPES buffer, I = 0.50 M (KNO3), 25.0 °C).
Figure 5.8. UV−vis spectra recorded after the addition of 10 equiv. captopril (5.00 × 10⁻⁴
M) to an aerobic solution of H2OCbl+/HOCbl (5.0 × 10
−5 M) at pH 7.75, 0.050 M HEPES
buffer (I = 0.50 M, KNO3), 25.0 °C. Inset: The best fit of absorbance data (obtained by
stopped−flow spectroscopy) at 350 nm versus time to a first−order rate equation, giving
kobs = (9.91 ± 0.62) × 10−3
s−1
(pH = 7.72, 0.050 M HEPES buffer, I = 0.50 M (KNO3)).
From this figure it can be seen that H2OCbl+/HOCbl is cleanly converted to CapSCbl
(max = 372, 430, 532 and 561 nm) with sharp isosbestic points at 340, 365, 449 and 540

119
0.000 0.002 0.0040.00
0.02
0.04
0.06
0.08
0.10
0.12
0.14
ko
bs
(s
-1)
[Captopril]T(M)
nm. The reaction was also followed by stopped−flow spectroscopy. The best fit of the
absorbance at 350 nm versus time to a first−order rate equation is shown in the inset to
Figure 5.8, and gives kobs = (9.91 ± 0.62) × 10−3
s−1
. Figure 5.9 summarizes the rate data
obtained at pH 7.72 (0.050 M HEPES buffer, I = 0.50 M (KNO3), 25.0 °C) as a function
of captopril concentration (5.00 × 10⁻⁴
–5.00 × 10⁻³
M). The data can be fitted to a
straight line passing through the origin which indicates that the reaction is irreversible.
From the slope of the line, kobs/[captopril]T was found to be 24.7 0.5 M−1
s−1
.
Figure 5.9. Plot of observed rate constant, kobs, versus total captopril concentration for
the reaction H2OCbl+/HOCbl + CapSH/CapS
− CapSCbl (+ H
+) at pH 7.72 (0.050 M
HEPES buffer, 25.0 °C, I = 0.50 M (KNO3)). Data have been fitted to a straight line
passing through origin, giving kobs/[captopril]T = 24.7 0.5 M−1
s−1
.
Similar plots for pH 4.50, 4.73, 5.10 and 5.60 and pH 6.50, 7.04, 7.42 and 8.05 are given
in Figure 5.10 and 5.11, respectively.
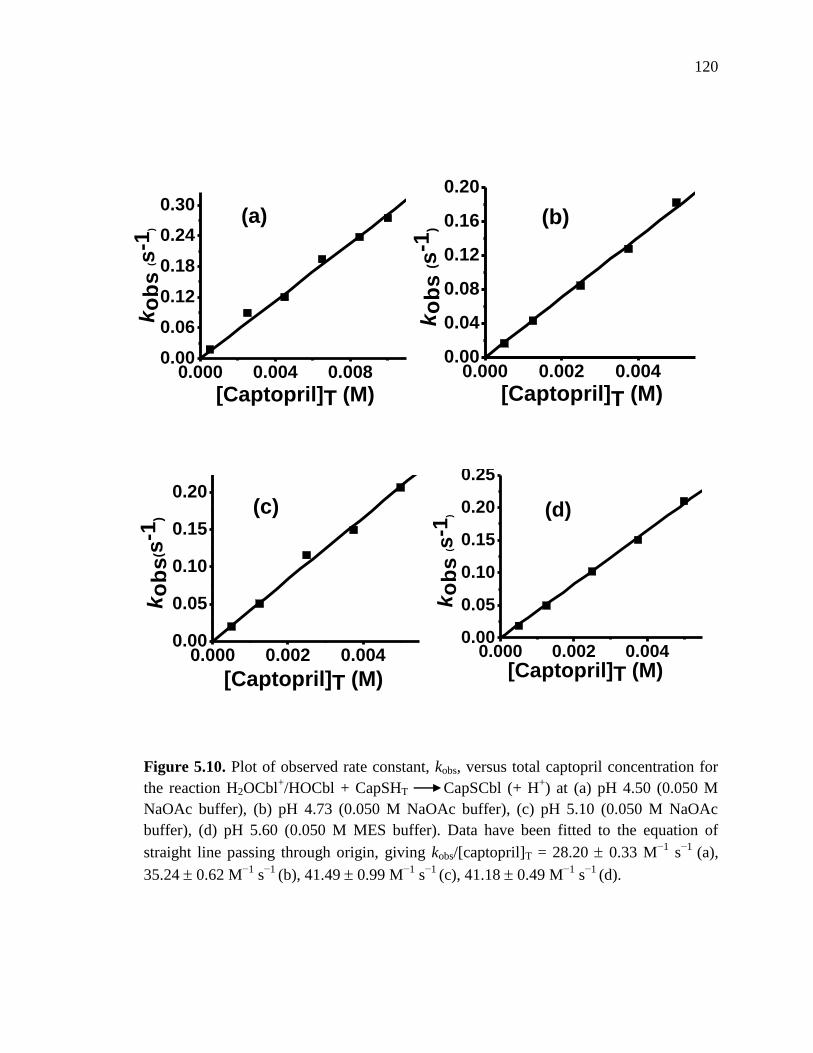
120
0.000 0.004 0.0080.00
0.06
0.12
0.18
0.24
0.30(a)
ko
bs
(s-1
)
[Captopril]T (M)0.000 0.002 0.004
0.00
0.04
0.08
0.12
0.16
0.20
ko
bs
(s
-1)
[Captopril]T (M)
(b)
0.000 0.002 0.0040.00
0.05
0.10
0.15
0.20
ko
bs
(s-1
)
[Captopril]T (M)
(c)
0.000 0.002 0.0040.00
0.05
0.10
0.15
0.20
0.25
ko
bs
(s-1
)
[Captopril]T (M)
(d)
Figure 5.10. Plot of observed rate constant, kobs, versus total captopril concentration for
the reaction H2OCbl+/HOCbl + CapSHT CapSCbl (+ H
+) at (a) pH 4.50 (0.050 M
NaOAc buffer), (b) pH 4.73 (0.050 M NaOAc buffer), (c) pH 5.10 (0.050 M NaOAc
buffer), (d) pH 5.60 (0.050 M MES buffer). Data have been fitted to the equation of
straight line passing through origin, giving kobs/[captopril]T = 28.20 0.33 M−1
s−1
(a),
35.24 0.62 M−1
s−1
(b), 41.49 0.99 M−1
s−1
(c), 41.18 0.49 M−1
s−1
(d).

121
0.000 0.002 0.0040.00
0.05
0.10
0.15
0.20k
ob
s (s
-1)
[Captopril]T (M)
(a)
0.000 0.002 0.0040.00
0.04
0.08
0.12
0.16
ko
bs
(s-1
)
[Captopril]T (M)
(b)
0.000 0.002 0.0040.00
0.04
0.08
0.12
ko
bs
(s-1
)
[Captopril]T (M)
(c)
0.000 0.002 0.0040.00
0.02
0.04
0.06
0.08
0.10
0.12
ko
bs
(s-1
)
[Captopril]T(M)
(d)
Figure 5.11. Plot of observed rate constant, kobs, versus total captopril concentration for
the reaction H2OCbl+/HOCbl + CapSHT CapSCbl (+ H
+) at (a) pH 6.50 (0.050 M
MES buffer), (b) pH 7.04 (0.050 M TES buffer), (c) pH 7.42 (0.050 M TES buffer), (d)
pH 8.05 (0.050 M TAPS buffer). Data have been fitted to the equation of straight line
passing through origin, giving kobs/[captopril]T = 41.59 0.19 M−1
s−1
(a), 33.38 0.69
M−1
s−1
(b), 26.70 0.22 M−1
s−1
(c), 20.75 0.60 M−1
s−1
(d).
Rate constants for the reaction between H2OCbl+/HOCbl and captopril to form
CapSCbl for pH 8.52, 9.00 and 9.53 (see Figure 5.12 for data) were determined under
anaerobic conditions. At pH 8.52 the reaction was monitored at 350 nm; however at
higher pH conditions the concentration of the thiolate (RS−) form of captopril becomes
significant. CapS− reduces CapSCbl to cob(II)alamin [21], which is oxidized back to
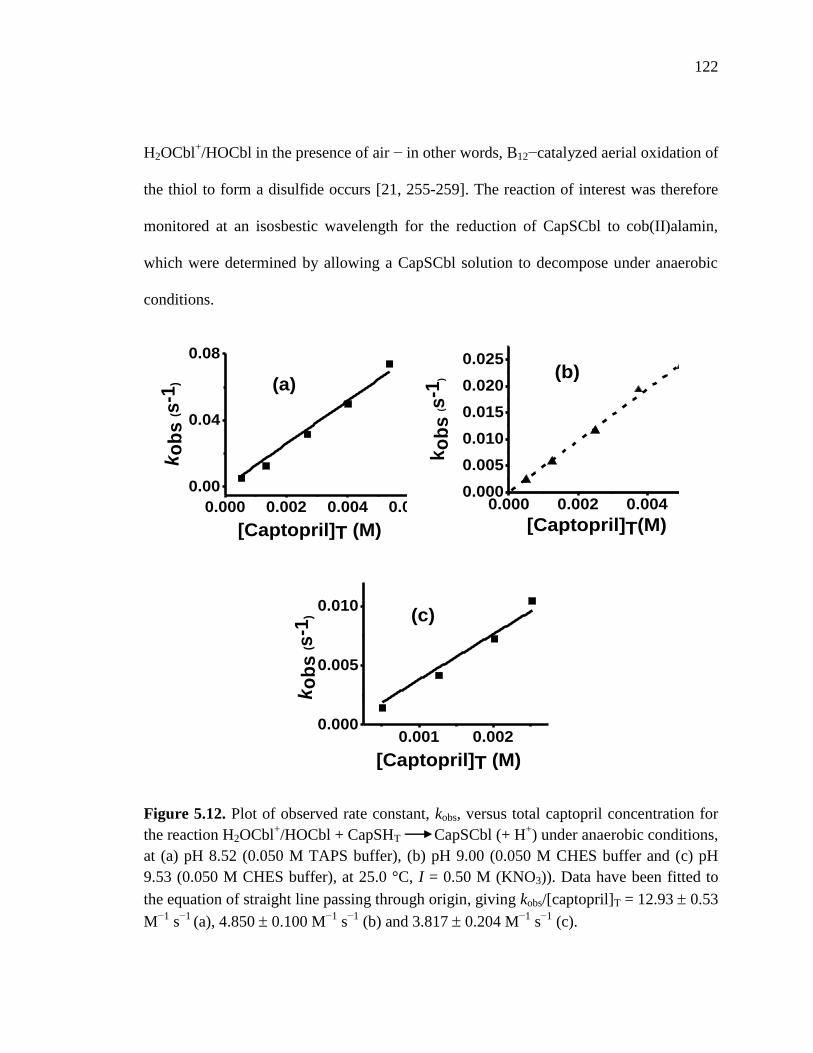
122
0.000 0.002 0.0040.000
0.005
0.010
0.015
0.020
0.025
ko
bs
(s-1
)
[Captopril]T(M)
(b)
0.000 0.002 0.004 0.006
0.00
0.04
0.08
ko
bs
(s-1
)
[Captopril]T (M)
(a)
0.001 0.0020.000
0.005
0.010
ko
bs
(s-1
)
[Captopril]T (M)
(c)
H2OCbl+/HOCbl in the presence of air − in other words, B12−catalyzed aerial oxidation of
the thiol to form a disulfide occurs [21, 255-259]. The reaction of interest was therefore
monitored at an isosbestic wavelength for the reduction of CapSCbl to cob(II)alamin,
which were determined by allowing a CapSCbl solution to decompose under anaerobic
conditions.
Figure 5.12. Plot of observed rate constant, kobs, versus total captopril concentration for
the reaction H2OCbl+/HOCbl + CapSHT CapSCbl (+ H
+) under anaerobic conditions,
at (a) pH 8.52 (0.050 M TAPS buffer), (b) pH 9.00 (0.050 M CHES buffer and (c) pH
9.53 (0.050 M CHES buffer), at 25.0 °C, I = 0.50 M (KNO3)). Data have been fitted to
the equation of straight line passing through origin, giving kobs/[captopril]T = 12.93 0.53
M−1
s−1
(a), 4.850 0.100 M−1
s−1
(b) and 3.817 0.204 M−1
s−1
(c).

123
400 500 600 700 8000.0
0.2
0.4
0.6
0.8
1.0
Ab
s
Wavelength (nm)
To illustrate, Figure 5.13 gives a plot of absorbance versus wavelength for the
decomposition of CapSCbl to Cbl(II) at pH 9.00. Isosbestic points were observed at 388,
500 and 602 nm. The formation of CapSCbl from H2OCbl+ and captopril was
subsequently followed at 500 nm. At pH 9.53, the formation of CapSCbl from H2OCbl+
and captopril was followed at 494 nm.
Figure 5.13. Plot of absorbance vs wavelength for the conversion of CapSCbl to Cbl(II)
under anaerobic conditions. CapSCbl was formed in solution by the addition of H2OCbl+
(7.58 × 10⁻⁵
M) to captopril (0.015 M) in 0.050 M CAPS buffer, pH 9.00. Spectral
changes correspond to the gradual conversion of CapSCbl (λmax = 372, 428, 534 and 560
nm) to Cbl(II) (λmax = 405 and 475 nm), with isosbestic points at 388, 500 and 602 nm.
Plots of kobs vs [captopril]T at pH 8.52 (a), 9.00 (b) and 9.52 (c) were once again linear
and passed through the origin (Figure 5.12). We were unable to collect any meaningful
data above pH 9.5, since the subsequent reduction of CapSCbl by the thiolate (RS–) form
of captopril to cob(II)alamin is considerably faster than the reaction of HOCbl with
captopril to form CapSCbl.

124
4 5 6 7 8 9 100
5
10
15
20
25
30
35
40
45
ko
bs
/[C
ap
top
ril]
T (
M-1
s-1
)
pH
Figure 5.14 summarizes the dependence of the second−order rate constant for the
formation of CapSCbl, kobs/[captopril]T, as a function of pH. It has been previously
established that only H2OCbl+ can undergo ligand substitution at the β−axial site, with
HOCbl being inert to substitution [19, 267, 268]. The proposed mechanism is given in
Scheme 5.2, in which H2OCbl+ reacts with the thiol (k1 pathway) or thiolate forms (k2
pathway) of captopril to form CapSCbl.
Figure 5.14. Plot of kobs/[captopril]T versus pH for the reaction of H2OCbl+/HOCbl with
captopril to form CapSCbl (0.050 M buffer, 25.0 °C, I = 0.50 M (KNO3)). Data in the pH
range 5.1–9.5 were fitted to eqtn (1), giving k1 = 40.9 ± 1.2 M−1
s−1
and k2 = 664 ± 174
M−1
s−1
.
Scheme 5.2. Mechanism of the reaction of H2OCbl+/HOCbl with captopril to form
CapSCbl.
Co
OH2
N
+ CapSH + H2O+ H+
Ka1
k1, -H+
CapS-
k2
Ka2 + H+
Co
N
Co
N
OH CapS

125
From Scheme 5.2 it can be shown that
kobs/[CapS]T = k1(fraction H2OCbl+)(fraction CapSH) + k2(fraction H2OCbl
+)(fraction
CapS−)
= (k1[H+]2 + k2Ka2[H
+])/(Ka1 + [H
+]2)(Ka2 + [H
+]) (1)
where Ka1 and Ka2 are the acid dissociation constants corresponding to the equilibria
shown in Scheme 5.2. The best fit of the data for pH 5.1 to eqtn(1) fixing pKa1 = 7.76,66
and pKa2 = 9.8 1, 51, 70, 71
gives k1 = 40.9 ± 1.2 M–1
s–1
and k2 = 664 ± 174 M–1
s–1
. The large
experimental error associated with k2 arises since this pathway becomes significant only
at values approaching pKa2 (= 9.8). We were unable to measure rate data for pH > 9.5.
The pKa of the –COOH group of captopril is 2.9–3.71, 51
and is probably responsible for
the decrease in the second−order rate constant, kobs/[captopril]T, in the pH 4.5−5 region. It
was not possible to obtain rate data at pH < 4.5 to probe this further, however, due to the
acid−catalyzed decomposition of CapSCbl.
Finally, detailed kinetic studies have been previously reported on the formation of
another thiolatocobalamin, GSCbl, from H2OCbl+/HOCbl and glutathione under the same
conditions as this study (25.0 C, I = 0.50 M (KNO3)) [21]. As for the
aquacobalamin/captopril system, kobs/[GSH]T decreases with increasing pH, since
H2OCbl+ (not HOCbl), reacts with glutathione. Analysis of the rate data for this system
was somewhat complicated by the fact that the pKa's for deprotonation of the amine and
thiol groups of glutathione overlap. The rate constant for the reaction of H2OCbl+ with

126
300 400 500 600 7000.0
0.3
0.6
0.9
Ab
s
Wavelength (nm)
the thiol (RSH) form of captopril or glutathione are similar (40.9 ± 1.2 and 18.5 M–1
s–1
,
respectively). A comparison of rate constants for reaction of H2OCbl+ with the thiolate
(RS–) forms of captopril or glutathione is less informative, due to large error in the former
value (664 ± 174 and 163 ± 8 M–1
s–1
, respectively) [21].
5.3.5 KINETIC STUDIES ON THE ACID CATALYZED DECOMPOSITION OF
CapSCbl IN AQUEOUS SOLUTION
Kinetic studies were carried out on the stability of CapSCbl in acidic solution. Figure
5.15 shows the UV−vis spectral changes observed upon adding an aliquot of CapSCbl
(5.0 × 10⁻⁵
M) in water to a pH 3.00 solution (0.050 M HEPES, I = 0.50 M (KNO3), 25
°C).
Figure 5.15. Plot of absorbance vs. wavelength for the decomposition of CapSCbl (5 ×
10-5
M) as a function of time at pH 3.00 (in 0.050 M HEPES, I = 0.5 M (KNO3)) at 25.0
ºC. Spectra were recorded every 0.5 min for 30 min. The downward pointing arrows
indicate the decay of CapSCbl peaks at 333 and 372 nm and the upward pointing arrows
indicate the formation of H2OCbl+ at 350 nm as a product of the decomposition.

127
0 500 1000 1500
0.85
0.90
0.95
1.00
1.05
1.10
Ab
s
Time (s)
The sharp isosbestic points at 336, 364, 448 and 535 nm are indicative of a single
reaction occurring, in which CapSCbl (max = 333, 372, 428 and 534 nm) is cleanly
converted to H2OCbl+ (max = 350, 411 and 525 nm [26]). The corresponding plot of
absorbance at 350 nm versus time is given in Figure 5.16. The data fits well to a
first−order rate equation, giving an observed rate constant, kobs, = 0.0034 s−1
. The rate
constant in the absence of HEPES buffer was very similar; hence specific acid catalysis
applies to this system. Kinetic data was collected in the pH range 0.58–2.90.
Measurements below pH 0.50 were not carried out, since this would increase the ionic
strength beyond 0.50 M.
Figure 5.16. Plot of absorbance vs. time for the decomposition of CapSCbl (5.50 × 10⁻⁵
M) at pH 2.90 (0.050 M HEPES, I = 0.50 M (KNO3)) at 25.0 ºC. Data were fitted to a
first−order rate equation, giving kobs = 0.0034 ± 0.0006 s−1
.
A plot of kobs versus pH for the decomposition of CapSCbl is given in Figure 5.17. It is
clear from the plot that the rate of the decomposition of CapSCbl increases with

128
0.5 1.0 1.5 2.0 2.5 3.00.00
0.02
0.04
0.06
0.08k
ob
s
pH
kobs =10-pH x k
10-pH + Ka(CapSCbl+H)
decreasing pH, reaching a limiting value at low pH; hence protonation occurs prior to
decomposition.
Figure 5.17. Plot of kobs versus pH for the H+−catalyzed decomposition of CapSCbl. The
data has been fitted to eqn (3) giving k = (10.2 ± 0.6) × 10−2
s−1
and pKa = 1.14 ± 0.08.
The experimental data was therefore fitted to the rate equation
(2)
Fitting the rate data to eqn (2) gives k = (10.2 ± 0.6) × 10−2
s−1
and pKa = 1.14 ± 0.08.
Values of k and pKa for GSCbl, NACCbl and HcyCbl determined in our lab are also
given in Table 5.3 for comparison purposes.
There are two possibilities regarding the likely site of protonation. In acidic solution,
Cbls protonate at the α−dimethylbenzimidazole’s imino N (α−DMB) to form “base−off”
Cbls, Scheme 1.1, with an associated apparent pKa, pKbase-off; hence one possibility is the

129
protonation at the α−DMB occurs. pKbase-off values for several Cbls with inorganic ligands
at the β–axial site are given in Table 1.1, with pKbase-off increasing with the ζ–donor
strength of the β–axial ligand [11]. Given that cyanide is a stronger ζ–donor ligand
compared with RS–, it is likely that pKbase–off < 0.1 for RSCbls, which is lower than the
experimental observed values of 1.14–1.41, Table 5.3.
Table 5.3. Rate constants (k) and pKa values for the decomposition of the
thiolatocobalamins GSCbl, NACCbl, HcyCbl [269] and CapSCbl (25.0 °C, I = 0.50 M
(KNO3)). pKa values for the sulfhydryl group of the thiols are also given: GSH [270],
NAC [271], Hcy [271] and CapSH [220].
Furthermore, if rapid protonation of the α–DMB of RSCbl occurs to form base−off
RSCbl−NH+ prior to rate−determining cleavage to ultimately give H2OCbl
+, this should
be reflected in the isosbestic wavelengths observed during the decomposition reaction
since large spectral shifts are observed for the base−on to base−off conversion of Cbls
[272]. However, the isosbestic wavelengths were unchanged as the pH decreased for each
system. It is therefore most likely that the sulfur of the thiol ligand itself is the site of
protonation, eqn (2). pKa(RSH) values for CapSH, GSH, Hcy and NAC are given in
Table 5.3. It is well established that the pKa of ligands drop several pH units upon
Compound 102k (s
−1) pKa (RSCbl) pKa (RSH)
GSCbl 3.24 0.14 1.31 0.07 9.28
NACCbl 4.54 0.21 1.31 0.09 9.55
HcyCbl 5.30 0.25 1.41 0.08 9.27
CapSCbl 10.2 0.57 1.14 0.08 9.80

130
Co
N
CapS
Co
N
CapSH
Co
N
H2O
+ CapSHKa(CapSHCbl)
H+k
binding to Cbl [21]. Furthermore, protonating the hydroxyl ligand of HOCbl to give
H2OCbl+
does not cause significant changes in the isosbestic wavelengths of the
HOCbl/GSCbl interconversion (344, 368, 457 and 551 nm, pH 9.67) versus the
H2OCbl+/GSCbl interconversion (341, 366, 460 and 548 nm, pH 1.36), and the same is
probably true for the protonation of the thiolato ligand of RSCbl, consistent with the
observation of insignificant changes in the isosbestic wavelengths despite rapid
protonation occurring prior to the rate determining step. The proposed reaction pathway
for acid–catalyzed decomposition of CapSCbl and other thiolatocobalamins is given in
Scheme 5.3.
Scheme 5.3. Proposed reaction pathway for the acid−catalyzed decomposition of
CapSCbl.
To summarize, the decomposition of CapSCbl to give aquacobalamin in acidic
solution has been investigated. Decomposition occurs at pH < 3 and is acid catalyzed. A
mechanism is proposed in which rapid protonation at the sulfur atom of the CapS− ligand
of CapSCbl occurs prior to rate−determining decomposition. Given that the pH of the
stomach is approximately 2 [273], it is clear that protection from this acidic environment
is necessary in order to prevent decomposition of orally ingested RSCbls. It is unclear to

131
us whether or not the binding of RSCbl to the B12 transport protein haptocrrin (HC) will
be sufficient to prevent RSCbl decomposition. The X−ray structure of Cbl−bound HC has
yet to be reported. Photolysis of the β−axial Co−C bond of alkylcobalamins is
considerably slower upon binding of the alkylcobalamin to B12 transport proteins [24],
and HC could also conceivably protect RSCbls from acid in the stomach.
5.4 SUMMARY
The reaction of aquacobalamin with the thiol ligand, captopril, results in the
formation of a novel thiolatocobalamin, captopril−cobalamin (CapSCbl), in high yield
(88%) and purity (98%). Two different types of CapSCbl crystals, CapSCbl−1 and
CapSCbl−2, were obtained, under aerobic and anaerobic conditions, respectively. Both
the complexes crystallize in the P212121 space group, as observed for other cobalamins.
The Co−S and Co−N bond distances were typical of thiolatocobalamins. However,
CapSCbl−1 contains one molecule per asymmetric unit, whereas CapSCbl−2 contains
three molecules per asymmetric unit. CapSCbl was also characterized by 1H NMR, UV-
vis and FTIR spectroscopy. 1H NMR spectroscopic data for CapSCbl showed that two
isomeric forms of the captopril ligand exist for CapSCbl in solution, with the isomer ratio
being solvent dependent. X−ray diffraction data confirmed this, and showed that at least
in the solid state, the trans isomer is preferentially formed. Kinetic studies on the
formation of captoprilcobalamin from H2OCbl+/HOCbl and captopril showed that both
the thiol and thiolate forms of captopril react with H2OCbl+, whereas HOCbl does not
react with captopril. Finally, kinetic studies showed that CapSCbl decomposes in acidic
132
solution (pH < 3). A reaction pathway is proposed in which rapid protonation of the
sulfur atom of CapSCbl is succeeded by rate−determining cleavage of the Co−S bond to
give aquacobalamin.

133
CHAPTER 6
KINETIC STUDIES ON THE REACTION OF COB(II)ALAMIN WITH
PEROXYNITRITE
6.1 INTRODUCTION
Peroxynitrite (peroxynitrite/peroxynitrous acid; ONOO–/ONOOH; pKa(ONOOH) = 6.8
[274-276]) is a potent reactive nitrogen species (RNS). It is a powerful oxidizing
(Eº(ONOO–, 2H
+/NO2, H2O) = 1.6 V, pH 7 [277]), nitrating and/or hydroxylating agent
[278, 279]. The anionic form, ONOO–, is stable in strongly basic solution [280], whereas
the acidic form, ONOOH spontaneously decomposes to NO2 and
OH (30% maximum
yield in the presence of an effective trap at pH 7.4) or isomerizes to nitrate, Scheme 6.1
[281, 282].
Scheme 6.1. Decomposition pathways for ONOOH. Rate constants have been reported
(k1 = 0.90 ± 0.05 s–1
, k2 = 0.35 ± 0.03 s–1
, k3 = 0.65 × 10⁸ M
–1 s
–1, k4 = 5.3 × 10
9 M
–1 s
–1,
in phosphate buffer, 25 °C [282]).
ONOOH
NO3 + H+
NO2 + OH
homolysis
isomerization
2 NO2 + H2O NO3 + NO2 + 2H+
NO2 + OH NO2 + OH
NO3 + H+ONOOHNet:
k1
k2
k3
k4

134
ONOO(H) formation is implicated in oxidative/nitrosative stress–initiated pathologies
including shock, chronic inflammation, chemical sensitivity, chronic fatigue syndrome,
vascular disease and neurodegeneration [279, 281, 283-285]. In vivo, ONOO(H) is
formed by the diffusion–controlled reaction of nitric oxide (NO) and superoxide (O2
–)
in a variety of cells including vascular endothelial cells, neurons and immune cells [55,
286-288]. Macrophages and neutrophils produce considerable concentrations of O2–
and
NO (and hence ONOO(H)) during the inflammation triggered 'oxidative burst' response
to invading pathogens [55, 286, 287]. O2–
is a byproduct of normal aerobic cellular
metabolism [287] and all three NOS synthase isoforms produce NO and O2
–
simultaneously ('NOS uncoupling') under certain conditions [278, 289].
ONOO(H) or its decomposition products react rapidly in vivo with numerous
species, including amino acids, nucleic bases, lipids, circulatory CO2 (to give 33% CO3–
+ NO2;
NO2 itself is a potent oxidizing and nitrating agent [290]), metal centers of
metalloproteins, thiols (proteins and low MW thiols) and antioxidants [278, 279].
Nitration of tyrosine residues of proteins occurs in many pathological conditions
associated with oxidative/nitrosative stress including cardiovascular and
neurodegenerative diseases [291]. Protein tyrosine nitration is therefore a widely used
biomarker for peroxynitrite formation [292, 293], although it should be noted that
peroxynitrite–independent mechanisms also exist for protein tyrosine nitration in vivo,
such as those mediated by myeloperoxidase [294]. Given the strong link between
peroxynitrite production and oxidative/nitrosative stress–associated pathologies, studies
on the reactions of biomolecules with peroxynitrite and the development of peroxynitrite

135
scavengers to attenuate peroxynitrite levels in vivo are active areas of research [281, 295].
Some of the most promising ONOO(H) scavengers include Mn or Fe porphyrins, which
catalyze the conversion of ONOO(H) to NO3– or NO2
– (2e
– reduction), Scheme 6.2 [281,
296-302].
Scheme 6.2. Proposed literature reactions for metal–catalyzed decomposition and
isomerization of ONOO(H).
Furthermore, catalysis can even occur in the absence of an added reducing agent in a few
special cases [281]. However, a few metalloporphyrins (e.g. Mn(III)TMPyP) actually
enhance the production of NO2, thus increasing the risk of cell death [303, 304].
Hemoglobin and myoglobin catalyze the conversion of ONOO(H) to NO3–
[305, 306].
Co(III) porphyrins also catalyze peroxynitrite decomposition (~102–10
3 M
–1 s
–1),
although the mechanism was not investigated [307].
Cobalamin deficiency is common in the elderly [2]. Upon entering cells
cob(III)alamins are reduced to cob(II)alamin prior to binding to the Cbl–dependent
enzymes [5]. Reduced Cbl cofactors are also involved in the methionine synthase and L–
methylmalonyl–CoA mutase enzyme cycles and are sensitive to oxidation, with both B12–
dependent enzymes being inactivated under oxidative stress conditions [308, 309]. It is
well established that Cbl(II) scavenges NO (Section 1.1.7). Recent studies in our

136
laboratory support Cbl(II) being an efficient intracellular scavenger of superoxide [65].
This led us to propose that Cbl(II) may scavenge other reactive species, explaining the
ability of Cbls to regulate the immune response and alleviate chronic inflammation
(Section 1.1.7).
This chapter presents kinetic and mechanistic studies on the reaction between
cob(II)alamin and peroxynitrite.
6.2 EXPERIMENTAL
6.2.1 MATERIALS
NaH2PO4, Na2HPO4, Na2B4O7•10H2O, NaBH4, NaNO2, H2O2, HClO4, HNO3, L–
tyrosine, D–mannitol (99%), Cu powder (40 micron, 99%) and NaOH were purchased
from either Fisher or Acros. 3–Nitro–L–tyrosine was obtained from MP Biomedicals,
LLC. 3–Hydroxytyrosine was obtained from Sigma. All other chemicals were purchased
as described in previous chapters. Chemicals were used without further purification.
6.2.2 INSTRUMENTATION
pH measurements were carried out as described in section 3.2.2. The electrodes were
standardized with standard buffer solutions at pH 2.02, 4.00, 6.98, 10.00 and 12.45.
Solution pH was adjusted using H3PO4 or NaOH solutions as necessary.
1H NMR spectroscopic measurements were performed as described in section 4.2.2.
Air–tight J–Young NMR tubes (Wilmad, 535–JY–7) were used for 1H NMR

137
measurements under anaerobic conditions. Reaction mixtures were left to equilibrate for
15 min prior to measurements.
UV–vis spectroscopic measurements were performed as described in section 2.2.2.
Anaerobic measurements were carried out in Schlenk cuvettes.
Kinetic data were collected under anaerobic conditions using an Applied
Photophysics SX20 stopped–flow instrument equipped with a photodiode array detector
at 25.0 0.2 C, operating with Pro–Data SX and Pro–Data Viewer software, using either
a 2 or 10 mm pathlength cell. The drive syringe and flow–through system was kept filled
with aqueous anaerobic Na2S2O4 (5 × 10⁻³
M) for at least 1 hr to remove O2 and the
system emptied and washed with anaerobic water immediately prior to use. A continuous
flow of nitrogen was used during measurements. Reactant solutions were introduced
using Hamilton gas–tight syringes (10 ml) fitted with a three way valve. Kinetic data
were fitted using the program Microcal Origin version 8.0.
HPLC analyses and purifications were carried out in an Agilent 1100 series HPLC
system equipped with a degasser, quaternary pump, autosampler and a photodiode array
detector (resolution of 2 nm), using an Alltech Alltima C18 semipreparative column (5
µm, 100 Å, 10 mm × 300 mm) at a flow rate of 1mL/min. Peaks were monitored at 220,
254, 280 and 350 nm. A mobile phase consisting of phosphate buffer (10.0 mM in H2O,
pH 3.52 ± 0.02), A, and CH3OH, B was used. Method: 0–2 min, 70:30 A:B (isocratic);
2–5 min, linear gradient to 60:40 A:B; 5–27 min, linear gradient to 55:45 A:B; 27–30
min, linear gradient to 70:30 A:B and 30–32 min, 70:30 A:B (isocratic).
138
Anaerobic manipulations were carried out using a glove box and Schlenk techniques
as described in section 2.2.2.
6.2.3 SYNTHESIS OF Na+ONOO
Na+ONOO
was synthesized in 40–50% yield under aerobic conditions by the rapid
mixing of 4.00 M NaOH with freshly prepared aqueous solutions of 0.525 M H2O2 in
0.510 M HClO4 and 0.500 M NaNO2 using a slightly modified literature procedure [310].
Three 60 ml BD syringes were filled with each of the three solutions which were rapidly
mixed through a custom made capillary T–tube connected by vinyl tubing incorporating
in–line mixers, using a Thermoscientific Orion M362 sage multi–syringe pump, at a flow
rate of 99.9 ml/min. The resulting bright yellow ONOO solution was collected at the end
of the capillary tube and stored in the freezer for several weeks. Prior to using an aliquot
(~10 ml) of the peroxynitrite solution, ~ 0.5 g MnO2 (5.75 × 10⁻³
mol) was added to
destroy the remaining small excess of H2O2 and the solution left uncapped until the
evolution of O2 ceased. The solution was filtered twice (Buchner funnel with filter paper)
and filtered through a micropore filter (0.45 micron) prior to degassing the solution.
(Control experiments showed that rate constants were unaffected if the MnO2 step was
left out; however this step was performed for all experiments.) The resulting stock
solution of ONOO– (~0.06–0.07 M) in 1.33 M NaOH unavoidably contained
approximately equal amounts of nitrite, determined using the Griess assay [311]. The
concentration of NO3– was negligible in freshly prepared stock ONOO
– solutions and
increased with time as ONOO– spontaneously decomposed.

139
6.2.4 SYNTHESIS OF COB(II)ALAMIN
Cbl(II) was prepared under anaerobic conditions using a published procedure.[312]
In a typical synthesis, an aliquot of an aqueous anaerobic solution of NaBH4 (0.128 ml,
0.264 M, 1.10 mol equiv.) was added drop wise to an aqueous anaerobic solution of
HOCbl•HCl (48 mg, 6.11 × 10⁻³
M). After 20 min, anaerobic acetone (0.150 ml) was
added to quench the excess NaBH4. Cbl(II) has distinctive peaks in the UV–vis spectrum
(max = 312, 405, 475 nm[24]). The concentration of the resulting Cbl(II) stock solution
was 5.13 × 10⁻³
M, as determined by converting the stock solution of Cbl(II) to
dicyanocobalamin, (CN)2Cbl−
(0.10 M KCN, pH 10.5, 368 = 30.4 mM–1
cm–1
) [251].
This solution was stored in the freezer inside the glove box and used within a week.
6.2.5 SOLUTION PREPARATION
Solutions of tyrosine (ε274 = 1400 M–1
cm–1
at pH 6.0 [313]), 3–nitrotyrosine (ε438 =
4200 M–1
cm–1
at pH 11.5 [314]), Cbl(II) (ε475 = 1.05 × 10⁴ M
–1cm
–1; see below) and
ONOO (ε302 = 1670 M
–1cm
–1 [315]) were standardized spectrophotometrically prior to
use. The peroxynitrite stock solution was diluted with 1.00 × 10⁻²
M NaOH, to prevent
spontaneous decomposition from occurring. Aliquots of peroxynitrite in NaOH(aq) were
added using microsyringes to buffered Cbl(II) and tyrosine solutions in vials closed with
septa while vortexing.
140
6.2.6 DETERMINATION OF THE STOICHIOMETRY OF THE REACTION
BETWEEN Cbl(II) AND ONOO(H)
Experiments were carried out under strictly anaerobic solutions. Cbl(II) solutions
were prepared in either 0.10 M phosphate buffer, pH 12.0, I = 0.40 M or 0.18 M
phosphate buffer, pH 7.35, I = 0.40 M. Solutions of ONOO were prepared by diluting
the stock ONOO solution with 1.00 × 10
–2 M NaOH.
Aliquots of ONOO (100–500 µl) were added to Cbl(II) in phosphate buffer (4.00 ml), in
the glove box, the mixtures equilibrated for 5 min and the increase in absorbance
measured at 537 nm. The absorbance change was compared with the absorbance change
upon aerial oxidation of the Cbl(II) solution to Cbl(III) (= HOCbl at pH 12.0 and NO2Cbl
at pH 7.35). In the latter case, after exposing Cbl(II) to air, the resulting H2OCbl+ was
converted to NO2Cbl by the addition of excess solid NaNO2.
6.2.7 KINETIC MEASUREMENTS ON THE REACTION OF Cbl(II) WITH
ONOO(H)
All solutions were prepared immediately before use. Cbl(II) solutions were prepared
in either anaerobic phosphate or borate/phosphate buffers (5.00 × 10⁻²
M borate) at a total
ionic strength of 0.40 M (Na2HPO4). The pH of the buffered solutions was ~0.4 units
lower than the desired final pH. ONOO
solutions were prepared from the stock ONOO
solution by dilution with 1.00 × 10⁻²
M NaOH. Kinetic data were collected under
pseudo–first order conditions and were independent of the wavelength at which they were

141
collected. The final solution pH was determined by measuring the pH of the solution in
the stopped syringe of the stopped–flow instrument.
6.2.8 GENERATION OF THE CALIBRATION CURVES FOR 3–
NITROTYROSINE AND 3–HYDROXYTYROSINE
Solutions of 3–nitrotyrosine (7.00 × 10⁻⁶
–2.50 × 10⁻⁴
M) and 3–hydroxytyrosine (2.5
× 10–5–
3 × 10⁻⁴
M) were prepared from stock solutions (5.00 × 10⁻⁴
M) in 0.400 M
phosphate buffer, pH 7.4 ± 0.1. The solutions were individually subjected to HPLC
analysis. From each of the HPLC chromatograms, the area of the peaks at 23.9 and 15.1
min corresponding to 3–nitrotyrosine and 3–hydroxytyrosine, respectively, were
determined at 280 nm and plotted against the number of moles of the compounds.
6.2.9 REACTION OF Cbl(II) WITH NO2
Cu powder (2.68 g) was transferred to a two necked flask fitted with a dropping
funnel containing conc. HNO3 and the second neck closed with a septum cap. A cannula
was inserted through the septum cap and the system flushed with argon. Conc. HNO3 (5
ml) was added drop wise to the Cu powder and the resulting brown NO2(g) transferred
via the cannula into an anaerobic Cbl(II) solution (1.5 × 10⁻²
M) in a septum–capped vial.
The product solution was subjected to HPLC analysis.

142
6.3 RESULTS AND DISCUSSION
6.3.1 DETERMINATION OF THE ACID DISSOCIATION CONSTANT AND
THE RATE CONSTANT FOR SPONTANEOUS DECOMPOSITION OF ONOOH
The spontaneous decomposition of ONOO(H) (5.00 × 10⁻⁵
M) was followed using
stopped–flow spectroscopy in the pH range 5.53–8.37 (25.0 °C, 0.08 M phosphate buffer)
at 302 nm. The phosphate concentration rather than the ionic strength was kept constant
since pKa(ONOOH) is dependent on the phosphate concentration [316]. A typical absorbance
vs. time trace for the decomposition of ONOO(H) at pH 7.31 is given in Figure 6.1. The
absorbance versus time traces fitted well to a single first–order rate equation under all
conditions. Figure 6.2 summarizes the dependence of kobs on pH for the decomposition of
ONOO(H).
Figure 6.1. Plot of absorbance at 302 nm versus time for the spontaneous decomposition
of ONOO(H) (5.00 × 10⁻⁵
M, pH 7.31, 25.0 C, 0.08 M phosphate buffer). The data have
been fitted to a first–order rate equation, giving kobs = 0.321 ± 0.002 s–1
.
0 2 4 6 8 10 12 140.00
0.02
0.04
0.06
0.08
Ab
s a
t 3
02
nm
Time (s)

143
5.5 6.0 6.5 7.0 7.5 8.0 8.50.0
0.2
0.4
0.6
0.8
1.0
1.2
ko
bs
(s
-1)
pH
ONOO- + H + ONOOH H+ + NO3-
kd
Ka
Figure 6.2. Plot of kobs versus pH for the spontaneous decomposition of ONOO(H) in
0.08 M phosphate buffer, 25.0 °C. Data were fitted to kobs = (kd[H+])/([H
+] +
Ka(ONOOH)), giving Ka = (1.34 ± 0.12) ×10–7
M or pKa = 6.87 ± 0.06 and kd = 1.23 ±
0.03 s–1
.
It is well established that ONOOH, not ONOO, undergoes spontaneous decomposition,
Scheme 6.3 [302, 317]. Fitting the data to kobs = (kd[H+]) / ([H
+] + Ka(ONOOH)) [302]
gave Ka(ONOOH) = (1.34 ± 0.12) × 10–7
M (pKa(ONOOH) = 6.87 ± 0.06) and kd = 1.23 ± 0.03
s–1
, which is in excellent agreement with values reported by others (kd = 1.25 s–1
,
pKa(ONOOH) = 6.8, in phosphate buffer, 25 °C [282]).
Scheme 6.3. Reaction pathway for spontaneous decomposition of ONOO(H).

144
6.0x10⁻⁵
8.0x10⁻⁵
1.0x10⁻⁴
0.20
0.24
0.28
0.32
0.36
Ab
s a
t 5
37
nm
[Cbl(II)](M)6.0x10
-58.0x10
-51.0x10
-40.6
0.7
0.8
0.9
1.0
1.1
Ab
s a
t 4
75
nm
[Cbl(II)] (M)
6.3.2 DETERMINATION OF THE MOLAR EXTINCTION COEFFICIENTS OF
Cbl(II)
Molar extinction coefficients for Cbl(II) under anaerobic conditions were determined
at 475 nm and 537 nm. Figure 6.3 gives the plot of absorbance vs concentration of Cbl(II)
at 475 and 537 nm. The data was fitted to the Beer–Lambert law and fitted a straight line
passing through origin. The extinction coefficients were found to be (1.05 ± 0.01) × 104
M–1
cm–1
at 475 nm and (3.55 ± 0.01) × 103 M
–1cm
–1 at 537 nm. The former value agrees
well with a literature value (= 1.1 × 10⁴ M
–1 cm
–1 [318]).
Figure 6.3. Plot of absorbance vs. Cbl(II) concentration at (a) 475 nm and (b) 537 nm.
The slopes of the plots are (1.05 ± 0.01) × 104 M
–1 (a) and (3.55 ± 0.01) × 10
3 M
–1 (b).
6.3.3 DETERMINATION OF THE REACTION STOICHIOMETRY
Experiments were carried out to determine the stoichiometry and the Cbl reaction
products of the reaction of Cbl(II) with ONOO(H). Since the spontaneous decomposition
of ONOO(H) is acid–catalyzed, the stoichiometry of the reaction was initially determined

145
400 500 600 700 8000.0
0.5
1.0
1.5
2.0
2.5
3.0
Ab
s
Wavelength (nm)
500 550 6000.0
0.5
1.0
1.5
cd
b
ef
Ab
s
Wavelength (nm)
a
at pH 12.3 – that is, under conditions where spontaneous decomposition of ONOO(H) is
negligible. Preliminary experiments showed that the reaction between Cbl(II) and
ONOO is completed in seconds. Figure 6.4 gives UV–vis spectra of equilibrated
anaerobic solutions of Cbl(II) (1.41 × 10⁻⁴
M, λmax = 312, 405 and 475 nm) with 0.21–
0.51 mol equiv. ONOO (25.0 °C, 0.10 M phosphate buffer, pH 12.3, I = 0.40 M). Cbl(II)
is cleanly converted to Cbl(III) (= hydroxycobalamin, HOCbl; λmax = 355, 410, 508 and
537 nm [26]), with isosbestic points at 339, 374, 493 and 577 nm.
Figure 6.4. UV–vis spectra for equilibrated anaerobic solutions of Cbl(II) (1.41 × 10⁻⁴
M) with 0, 0.21, 0.32, 0.43 and 0.51 mole equiv. ONOO¯ (traces a–e, shown more
closely in the inset) at pH 12.3 (25.0 C, 0.10 M phosphate buffer, I = 0.40 M). Cbl(II)
(λmax = 312, 405 and 475 nm) is converted to HOCbl (λmax = 355, 410, 508 and 537 nm)
with isosbestic points at 339, 374, 493 and 577 nm. Trace f (inset): UV–vis spectrum of
1.41 × 10⁻⁴
M HOCbl (in 0.10 M phosphate buffer, pH 12.3, I = 0.40 M).
Comparison of the observed absorbance change with that of pure HOCbl (1.41 ×
10−4
M, 0.10 M phosphate buffer, pH 12.3, I = 0.40 M) gave a Cbl(II):ONOO ratio of
2:1 (final column, Table 6.1).

146
Table 6.1. Determination of the stoichiometry of the reaction between Cbl(II) and
ONOO¯ at pH 12.3 (25.0 °C, 0.10 M phosphate buffer, I = 0.40 M). Absorbances were
measured at 537 nm. i = initial concentration.
All peroxynitrite solutions contain significant concentrations of NO2− (see section
6.2.3) and the UV–vis spectrum of HOCbl is very similar to that for nitrocobalamin,
NO2Cbl (λmax = 354, 413, 532 nm [26]). However each Cbl(III) complex has a unique set
of resonances in the aromatic region [39], and the 1H NMR spectrum of an equilibrated
solution of Cbl(II) (2.62 × 10⁻³
M) with 0.55 mole equiv. ONOO at pD 13.2 clearly
showed that HOCbl (δ 7.17(s), 6.73(s), 6.50(s), 6.24(d) and 6.07 (s) ppm[39], not
NO2Cbl (δ 7.20(s), 6.74(s), 6.42(s), 6.28(d) and 6.20(s) ppm [26]) is the Cbl(III) product
in strongly alkaline solution (Figure 6.5). Control experiments also showed that NO2Cbl
is decomposed to HOCbl in alkaline solution.
104[Cbl(II)]i
(M)
105[ONOO–]i
(M)
[ONOO–]i
/[Cbl(II)]i AbsCbl(II) AbsHOCbl Absobs
Fraction
of Cbl(II)
reacted[a]
Mol equiv.
ONOO–
required[b]
1.41 3.00 0.21 0.493 1.30 0.853 0.446 2.1
1.41 4.50 0.32 0.493 1.30 0.986 0.611 1.9
1.41 6.00 0.43 0.493 1.30 1.15 0.814 1.9
1.41 7.20 0.51 0.493 1.30 1.20 0.876 1.7
[a] Fraction of Cbl(II) reacted =AbsCbl(II) - Absobs
AbsCbl(II) - AbsCbl(III)
[b] Mol equiv. of ONOO- =Fraction of Cbl(II) reacted
[ONOO-]i / [Cbl(II)]i
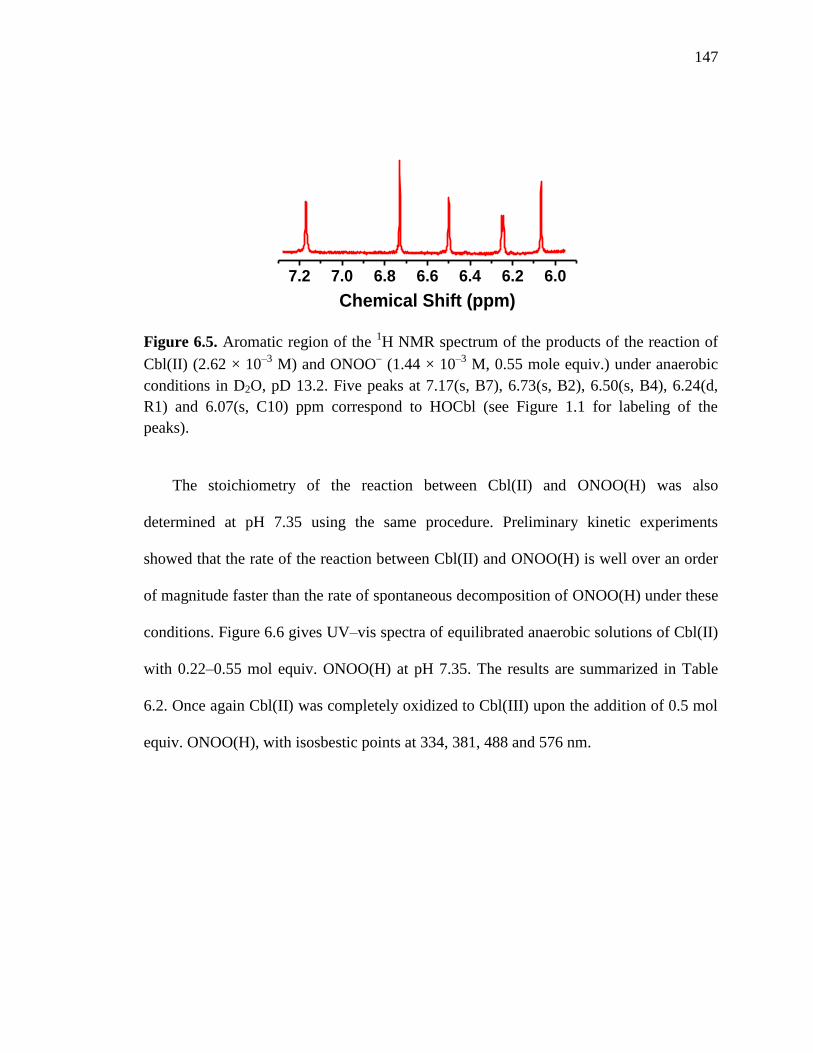
147
Figure 6.5. Aromatic region of the 1H NMR spectrum of the products of the reaction of
Cbl(II) (2.62 × 10⁻³
M) and ONOO (1.44 × 10
–3 M, 0.55 mole equiv.) under anaerobic
conditions in D2O, pD 13.2. Five peaks at 7.17(s, B7), 6.73(s, B2), 6.50(s, B4), 6.24(d,
R1) and 6.07(s, C10) ppm correspond to HOCbl (see Figure 1.1 for labeling of the
peaks).
The stoichiometry of the reaction between Cbl(II) and ONOO(H) was also
determined at pH 7.35 using the same procedure. Preliminary kinetic experiments
showed that the rate of the reaction between Cbl(II) and ONOO(H) is well over an order
of magnitude faster than the rate of spontaneous decomposition of ONOO(H) under these
conditions. Figure 6.6 gives UV–vis spectra of equilibrated anaerobic solutions of Cbl(II)
with 0.22–0.55 mol equiv. ONOO(H) at pH 7.35. The results are summarized in Table
6.2. Once again Cbl(II) was completely oxidized to Cbl(III) upon the addition of 0.5 mol
equiv. ONOO(H), with isosbestic points at 334, 381, 488 and 576 nm.
7.2 7.0 6.8 6.6 6.4 6.2 6.0
Chemical Shift (ppm)
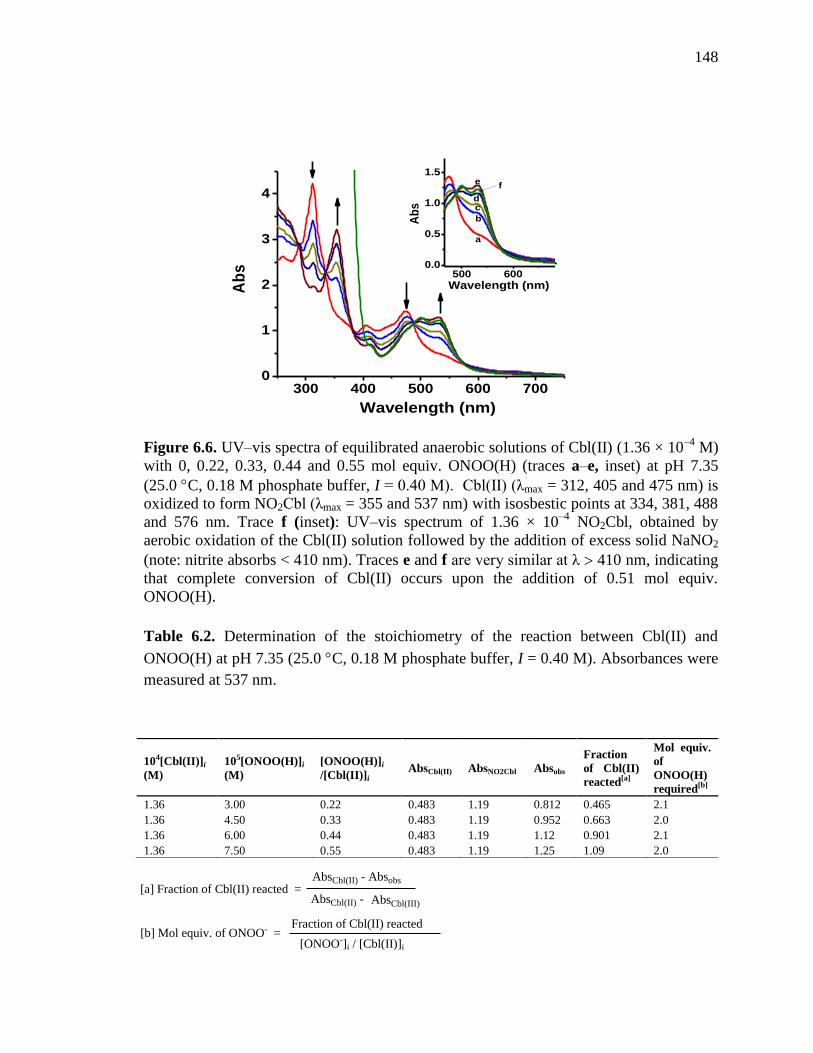
148
300 400 500 600 7000
1
2
3
4
Ab
s
Wavelength (nm)
500 600 7000.0
0.5
1.0
1.5
Ab
s
Wavelength (nm)
a
b
cd
ef
Figure 6.6. UV–vis spectra of equilibrated anaerobic solutions of Cbl(II) (1.36 × 10⁻⁴
M)
with 0, 0.22, 0.33, 0.44 and 0.55 mol equiv. ONOO(H) (traces a–e, inset) at pH 7.35
(25.0 C, 0.18 M phosphate buffer, I = 0.40 M). Cbl(II) (λmax = 312, 405 and 475 nm) is
oxidized to form NO2Cbl (λmax = 355 and 537 nm) with isosbestic points at 334, 381, 488
and 576 nm. Trace f (inset): UV–vis spectrum of 1.36 × 10⁻⁴
NO2Cbl, obtained by
aerobic oxidation of the Cbl(II) solution followed by the addition of excess solid NaNO2
(note: nitrite absorbs < 410 nm). Traces e and f are very similar at λ 410 nm, indicating
that complete conversion of Cbl(II) occurs upon the addition of 0.51 mol equiv.
ONOO(H).
Table 6.2. Determination of the stoichiometry of the reaction between Cbl(II) and
ONOO(H) at pH 7.35 (25.0 C, 0.18 M phosphate buffer, I = 0.40 M). Absorbances were
measured at 537 nm.
104[Cbl(II)]i
(M)
105[ONOO(H)]i
(M)
[ONOO(H)]i
/[Cbl(II)]i AbsCbl(II)
AbsNO2Cbl
Absobs
Fraction
of Cbl(II)
reacted[a]
Mol equiv.
of
ONOO(H)
required[b]
1.36 3.00 0.22 0.483 1.19 0.812 0.465 2.1
1.36 4.50 0.33 0.483 1.19 0.952 0.663 2.0
1.36 6.00 0.44 0.483 1.19 1.12 0.901 2.1
1.36 7.50 0.55 0.483 1.19 1.25 1.09 2.0
[a] Fraction of Cbl(II) reacted =AbsCbl(II) - Absobs
AbsCbl(II) - AbsCbl(III)
[b] Mol equiv. of ONOO- =Fraction of Cbl(II) reacted
[ONOO-]i / [Cbl(II)]i

149
7.2 7.0 6.8 6.6 6.4 6.2Chemical Shift (ppm)
Under these pH conditions the Cbl(III) product was shown to be NO2Cbl by 1H NMR
spectroscopy (Figure 6.7).
Figure 6.7. Cbl(II) (2.58 × 10⁻³
M) and ONOO(H) (1.42 × 10⁻³
M, 0.55 mole equiv.)
under anaerobic conditions in 0.50 M phosphate buffer in D2O, pD 7.50. Five peaks at
7.20(s, B7), 6.74(s, B2), 6.42(s, B4), 6.28(d, R1) and 6.20(s, C10) ppm correspond to
NO2Cbl (see Figure 1.1 for labeling of the peaks).
6.3.4 KINETIC STUDIES ON THE REACTION BETWEEN Cbl(II) AND
ONOO(H)
Kinetic studies on the reaction of Cbl(II) with ONOO(H) were carried out under
strictly anaerobic conditions under pseudo first–order conditions by stopped flow
spectroscopy. Experiments were carried out in phosphate and borate buffers at low buffer
concentrations, since the spontaneous decomposition of ONOO(H) is accelerated at high
buffer concentrations and the “biological buffers” (HEPES, MOPS etc) also significantly
accelerate the rate of spontaneous decomposition of ONOO(H) [316, 319]. Typical
experimental data are shown in Figure 6.8, which shows rapid spectral scans obtained
every 5.00 ms for the reaction between Cbl(II) (5.00 × 10⁻⁵
M) and ONOO(H) (1.00 ×
10–5
M) at pH 7.35 (25.0 °C, 0.09 M phosphate buffer, I = 0.20 M). Cbl(II) rather than
ONOO(H) was used in excess to minimize the concentration of NaOH added and hence
maintain the pH of the buffered solution (peroxynitrite is stabilized in the drive syringe of
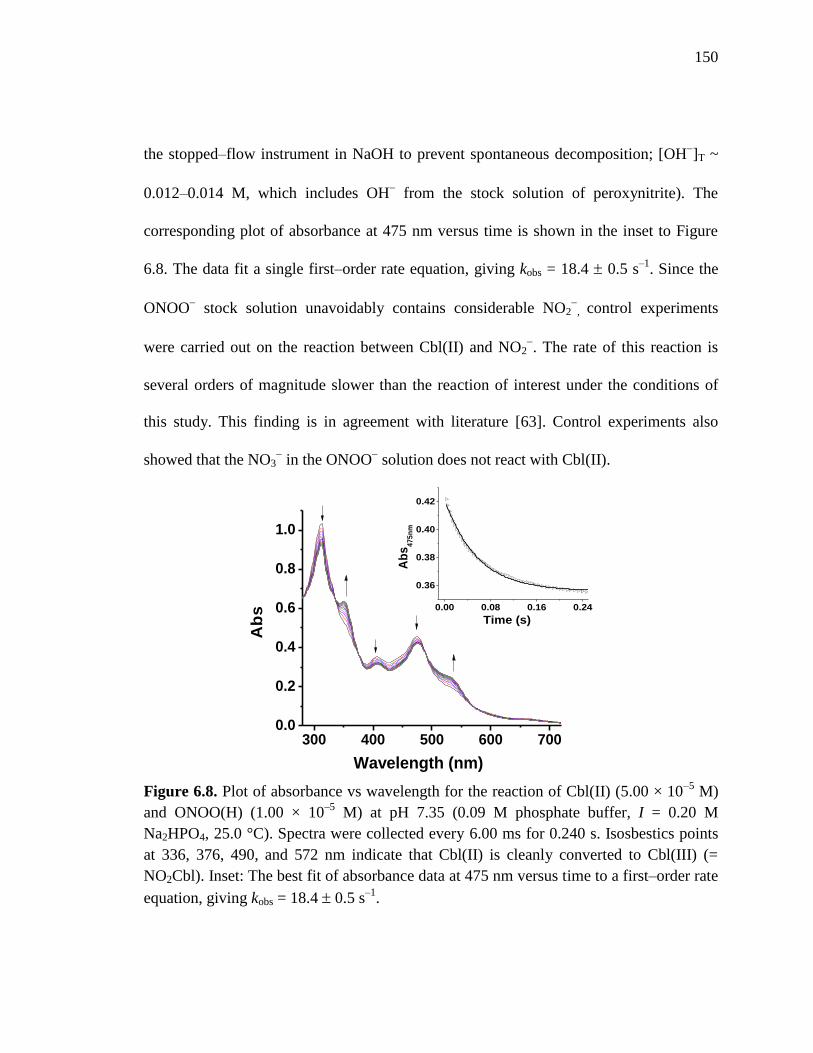
150
0.00 0.08 0.16 0.24
0.36
0.38
0.40
0.42
Ab
s4
75
nm
Time (s)
300 400 500 600 7000.0
0.2
0.4
0.6
0.8
1.0
Ab
s
Wavelength (nm)
the stopped–flow instrument in NaOH to prevent spontaneous decomposition; [OH]T ~
0.012–0.014 M, which includes OH from the stock solution of peroxynitrite). The
corresponding plot of absorbance at 475 nm versus time is shown in the inset to Figure
6.8. The data fit a single first–order rate equation, giving kobs = 18.4 0.5 s–1
. Since the
ONOO stock solution unavoidably contains considerable NO2
, control experiments
were carried out on the reaction between Cbl(II) and NO2. The rate of this reaction is
several orders of magnitude slower than the reaction of interest under the conditions of
this study. This finding is in agreement with literature [63]. Control experiments also
showed that the NO3 in the ONOO
solution does not react with Cbl(II).
Figure 6.8. Plot of absorbance vs wavelength for the reaction of Cbl(II) (5.00 × 10⁻⁵
M)
and ONOO(H) (1.00 × 10⁻⁵
M) at pH 7.35 (0.09 M phosphate buffer, I = 0.20 M
Na2HPO4, 25.0 °C). Spectra were collected every 6.00 ms for 0.240 s. Isosbestics points
at 336, 376, 490, and 572 nm indicate that Cbl(II) is cleanly converted to Cbl(III) (=
NO2Cbl). Inset: The best fit of absorbance data at 475 nm versus time to a first–order rate
equation, giving kobs = 18.4 0.5 s–1
.
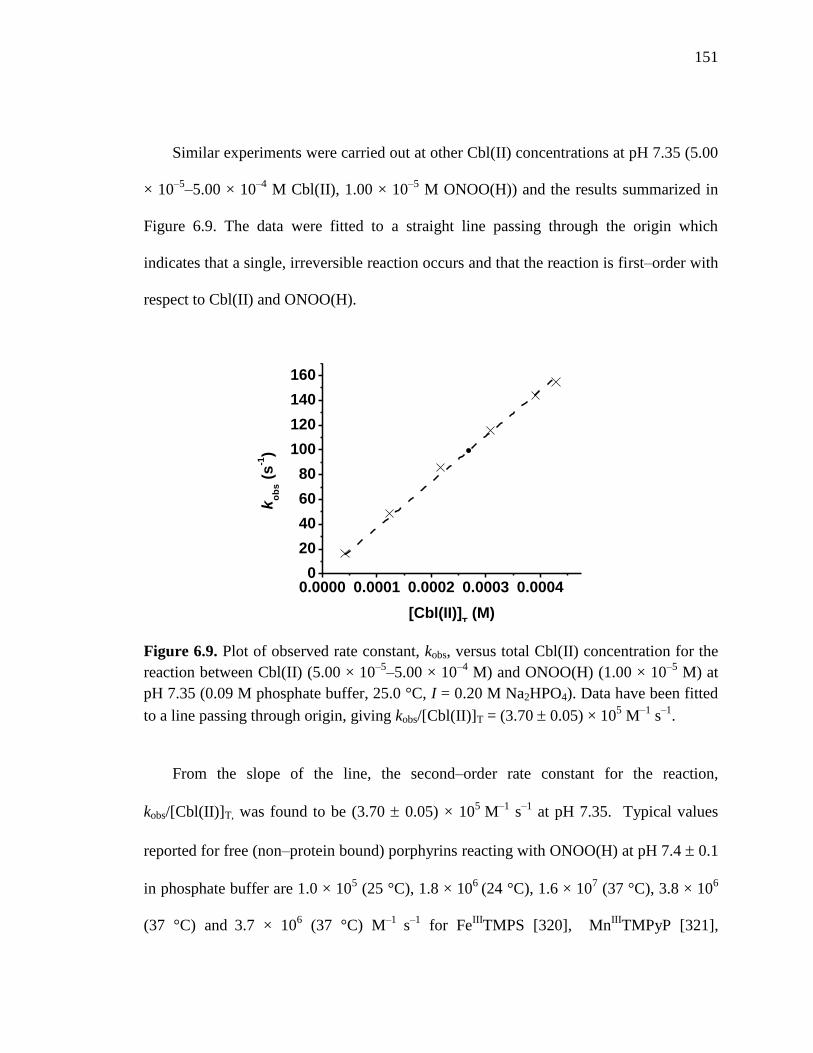
151
0.0000 0.0001 0.0002 0.0003 0.00040
20
40
60
80
100
120
140
160
ko
bs (
s-1)
[Cbl(II)]T (M)
Similar experiments were carried out at other Cbl(II) concentrations at pH 7.35 (5.00
× 10–5
–5.00 × 10⁻⁴
M Cbl(II), 1.00 × 10⁻⁵
M ONOO(H)) and the results summarized in
Figure 6.9. The data were fitted to a straight line passing through the origin which
indicates that a single, irreversible reaction occurs and that the reaction is first–order with
respect to Cbl(II) and ONOO(H).
Figure 6.9. Plot of observed rate constant, kobs, versus total Cbl(II) concentration for the
reaction between Cbl(II) (5.00 × 10⁻⁵
–5.00 × 10⁻⁴
M) and ONOO(H) (1.00 × 10⁻⁵
M) at
pH 7.35 (0.09 M phosphate buffer, 25.0 °C, I = 0.20 M Na2HPO4). Data have been fitted
to a line passing through origin, giving kobs/[Cbl(II)]T = (3.70 0.05) × 105 M
–1 s
–1.
From the slope of the line, the second–order rate constant for the reaction,
kobs/[Cbl(II)]T, was found to be (3.70 0.05) × 105
M–1
s–1
at pH 7.35. Typical values
reported for free (non–protein bound) porphyrins reacting with ONOO(H) at pH 7.4 0.1
in phosphate buffer are 1.0 × 10⁵ (25 °C), 1.8 × 10
6 (24 °C), 1.6 × 10
7 (37 °C), 3.8 × 10
6
(37 °C) and 3.7 × 10
6 (37 °C) M
–1 s
–1 for Fe
IIITMPS [320], Mn
IIITMPyP [321],

152
0.0 0.5 1.0 1.5 2.0 2.50.92
0.94
0.96
Ab
s a
t 4
75
nm
Time (s)
MnIII
TM–2–PyP, MnIII
TM–3–PyP and MnIII
TM–4–PyP [322], respectively. Protein–
bound porphyrins react slower with ONOO(H) at pH 7.4 0.1, phosphate buffer (8.8 ×
104
(pH 7.0, 20 °C), 5.4 × 10⁴
(20 °C), 1.7 × 10³ (37 °C) and 1.0 × 10
4 M
–1 s
–1
(temperature not given) for oxyhemoglobin [323], oxymyoglobin [323], methemoglobin
[304] and metmyoglobin [305], respectively.
Kinetic data were also collected at other pH values. Kinetic data for the reaction
between ONOO–
(5.00 × 10⁻⁵
M) and Cbl(II) (5.00 × 10⁻⁴
M) at the highest pH value
used in this study, pH 12.01, is shown in Figure 6.10, giving kobs = 2.21 0.12 s–1
.
Figure 6.10. Plot of absorbance at 475 nm versus time for the reaction of Cbl(II) (5.00 ×
10–5
M) with ONOO–
(5.00 × 10⁻⁴
M) at pH 12.01 (0.050 M phosphate buffer, I = 0.20
M). The data have been fitted to a first–order rate equation, giving kobs = 2.21 0.12 s–1
.
Rate data as a function of Cbl(II) concentration (5.00 × 10⁻⁵
–5.00 × 10⁻⁴
M, 1.00 ×
10–5
M ONOO–
), at pH 12.0 can again be fitted to a straight line passing through the
origin (Figure 6.11; kobs/[Cbl(II)]T = (4.75 0.12) × 103 M
–1 s
–1). Studying the reaction
with ONOO–
rather than Cbl(II) in excess at pH 12.00 ([ONOO−] ≥ 10 × [Cbl(II)]) gave

153
0.0000 0.0002 0.00040.0
0.5
1.0
1.5
2.0
2.5
ko
bs
(s
-1)
[Cbl(II)T] (M)
0.0005 0.0010 0.0015 0.0020 0.0025
2
4
6
8
10
12
ko
bs
(s
-1)
[ONOO-]T (M)
the same rate constant within experimental error limit (= (4.72 0.05) × 103 M
–1 s
–1;
Figure 6.12).
Figure 6.11. Plot of observed rate constant, kobs, versus total Cbl(II) concentration for the
reaction between Cbl(II) (5.00 × 10⁻⁵
–5.00 × 10⁻⁴
M) and ONOO–
(1.00 × 10⁻⁵
M) at pH
12.01 (0.05 M phosphate buffer, 25.0 °C, I = 0.20 M Na2HPO4). Data have been fitted to
a straight line passing throuh origin, giving a second–order rate constant, kobs/[Cbl(II)]T =
(4.75 0.12) × 103 M
–1 s
–1.
Figure 6.12. Plot of observed rate constant, kobs, versus total ONOO–
concentration for
the reaction between Cbl(II) (5.00 × 10⁻⁵
M) and ONOO–
(5.00 × 10⁻⁴
–2.50 × 10⁻³
M) at
pH 12.00 (0.05 M phosphate buffer, 25.0 °C, I = 0.20 M Na2HPO4). Data have been fitted
to a straight line passing through origin, giving second–order rate constant, kobs/[ONOO–
]T = (4.72 0.05) × 103 M
–1 s
–1.
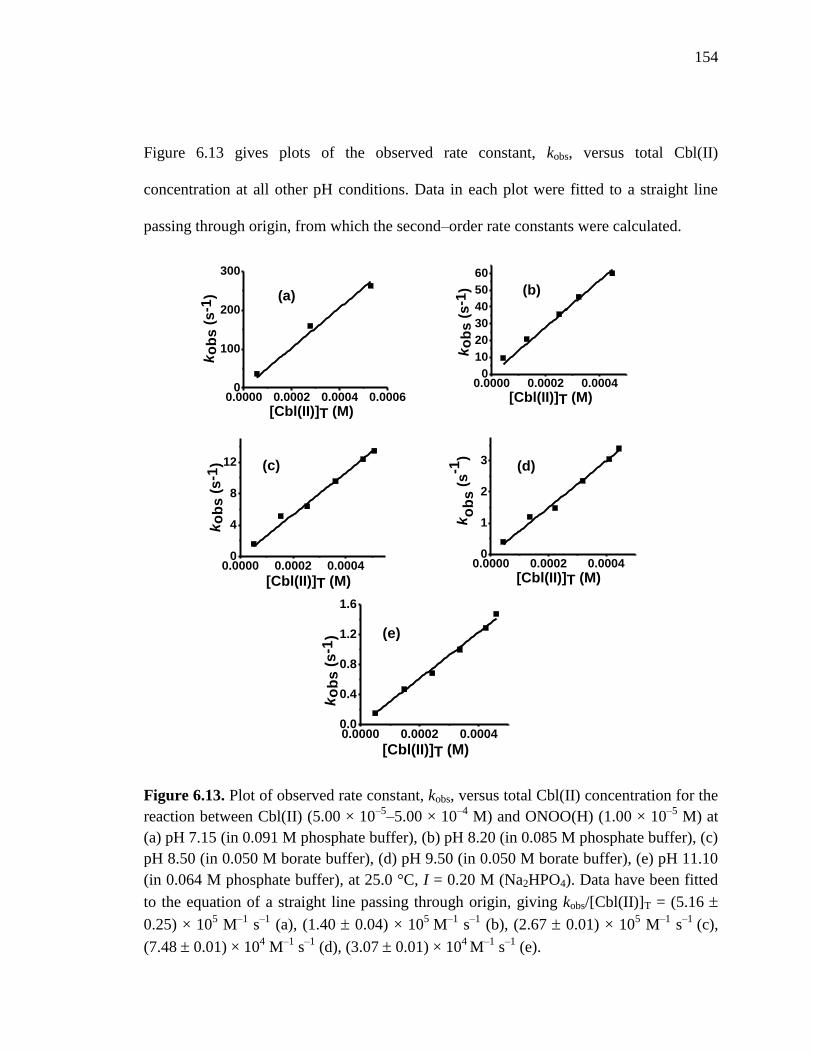
154
0.0000 0.0002 0.0004 0.00060
100
200
300
ko
bs
(s
-1)
[Cbl(II)]T (M)
(a)
0.0000 0.0002 0.00040
4
8
12
ko
bs
(s
-1)
[Cbl(II)]T (M)
(c)
0.0000 0.0002 0.00040
1
2
3k
ob
s (
s-1
)
[Cbl(II)]T (M)
(d)
0.0000 0.0002 0.00040.0
0.4
0.8
1.2
1.6
ko
bs
(s
-1)
[Cbl(II)]T (M)
(e)
0.0000 0.0002 0.00040
10
20
30
40
50
60
ko
bs
(s
-1)
[Cbl(II)]T (M)
(b)
Figure 6.13 gives plots of the observed rate constant, kobs, versus total Cbl(II)
concentration at all other pH conditions. Data in each plot were fitted to a straight line
passing through origin, from which the second–order rate constants were calculated.
Figure 6.13. Plot of observed rate constant, kobs, versus total Cbl(II) concentration for the
reaction between Cbl(II) (5.00 × 10⁻⁵
–5.00 × 10⁻⁴
M) and ONOO(H) (1.00 × 10⁻⁵
M) at
(a) pH 7.15 (in 0.091 M phosphate buffer), (b) pH 8.20 (in 0.085 M phosphate buffer), (c)
pH 8.50 (in 0.050 M borate buffer), (d) pH 9.50 (in 0.050 M borate buffer), (e) pH 11.10
(in 0.064 M phosphate buffer), at 25.0 °C, I = 0.20 M (Na2HPO4). Data have been fitted
to the equation of a straight line passing through origin, giving kobs/[Cbl(II)]T = (5.16
0.25) × 105 M
–1 s
–1 (a), (1.40 0.04) × 10
5 M
–1 s
–1 (b), (2.67 0.01) × 10
5 M
–1 s
–1 (c),
(7.48 0.01) × 104 M
–1 s
–1 (d), (3.07 0.01) × 10
4 M
–1 s
–1 (e).

155
7 8 9 10 11 12
0
1x10⁵
2x10⁵
3x10⁵
4x10⁵
5x10⁵
6x10⁵
k (
M-1
s-1
)
pH
Figure 6.14 summarizes the dependence of the second–order rate constant, kobs/[Cbl(II)]T,
for the reaction of Cbl(II) with ONOO(H) on pH. From Figure 6.14 it is clear the rate of
the reaction between Cbl(II) and ONOO(H) becomes slower with increasing pH,
becoming independent of pH above pH 9.5. This suggests that ONOOH, not ONOO–,
reacts with Cbl(II). It is well established that stronger oxidants are obtained upon
protonation of oxyanions, since the protonated oxyanion is more electron deficient [324].
Figure 6.14. Plot of k (= kobs/[Cbl(II)]T) versus pH for the reaction of Cbl(II) with
ONOO(H) (phosphate or borate buffer, 25.0 °C, I = 0.20 M (Na2HPO4)). Data were fitted
to eqn (1) in the text fixing Ka = 1.34 × 10⁻⁷
M, giving kCbl(II) = (1.53 0.07) ×106 M
–1s
–1.
Assuming that only ONOOH reacts with Cbl(II), the proposed mechanism is given in
Scheme 6.4, in which rate–determining oxidation of Cbl(II) by ONOOH to yield Cbl(III)
and NO2 is followed by the rapid reaction of
NO2 with a second molecule of Cbl(II) to
form NO2Cbl (Cbl(III)), consistent with the Cbl(II):ONOO(H) stoichiometry of 2:1.

156
Scheme 6.4. Proposed mechanism for the reaction of Cbl(II) with ONOO(H).
From Scheme 6.4 it can be shown that
kobs/[Cbl(II)]T = (kCbl(II) × [H+])/([H
+] + Ka(ONOOH)) (1)
pKa(ONOOH) was determined independently (= 6.87 ± 0.06, 0.08 M phosphate buffer, 25.0
C; details given in section 6.3.1). Fitting the data in Figure 6.14 to eqn (1) fixing
Ka(ONOOH) = 1.34 × 10⁻⁷
M gives kCbl(II) = (1.53 0.07) × 106 M
–1 s
–1. Of interest is the
observation that the rate of oxidation of a series of MnIII
porphyrins by ONOO(H)
increases with increasing pH in the pH range 5–8.5 (pKa 6.15), leading the authors to
propose that ONOO–, not ONOOH, is the oxidant [322]. A change in the Mn(III)
speciation with respect to pH (the redox potential of metal complexes which form
hydroxo complexes becomes more negative with increasing pH) was apparently not
responsible for the increase in the observed reaction rate with increasing pH [322, 325].

157
R
OH
R
O
R
OH
NO2NO2- NO2
Tyr TyrO NO2-Tyr
kTyr = 3.2 X 10⁵ M-1 s-1 kTyrO = 3.0 X 10⁹ M-1 s-1
NO2
6.3.5 STUDIES ON THE REACTION BETWEEN Cbl(II) AND PEROXYNITRITE
IN THE PRESENCE OF TYROSINE
The proposed mechanism for the reaction involves rate–determining 1e– oxidation of
Cbl(II) by ONOO(H) to give HOCbl and NO2, Scheme 6.4. In order to probe whether
NO2 is indeed a reaction intermediate, the reaction between Cbl(II) and peroxynitrite was
investigated in the presence of tyrosine (Tyr). It is well established that Tyr reacts rapidly
with NO2 obtained from the spontaneous homolytic decomposition of ONOOH to
ultimately form 3–nitrotyrosine (NO2–Tyr), Scheme 6.5.
Scheme 6.5. Oxidation and nitration of Tyr by NO2 [326]. R = H2CCH(NH3
+)CO2
–.
The products of the reaction between Tyr (6.00 × 10⁻³
M) and ONOO(H) (1.00 × 10–
3 M) were initially determined under anaerobic conditions in the absence of Cbl(II) (0.40
M phosphate buffer, room temperature, pH 7.4 ± 0.1). The HPLC chromatogram of the
product solution, Figure 6.15, shows peaks at 15.1 (3–hydroxytyrosine, HO–Tyr), 17.1
(Tyr) and 24.0 min (NO2–Tyr) (peaks were assigned by spiking with authentic samples).
HO–Tyr is a product of the reaction of Tyr with OH [327, 328], the latter species being
produced by the homolytic decomposition of ONOOH (Scheme 6.1).
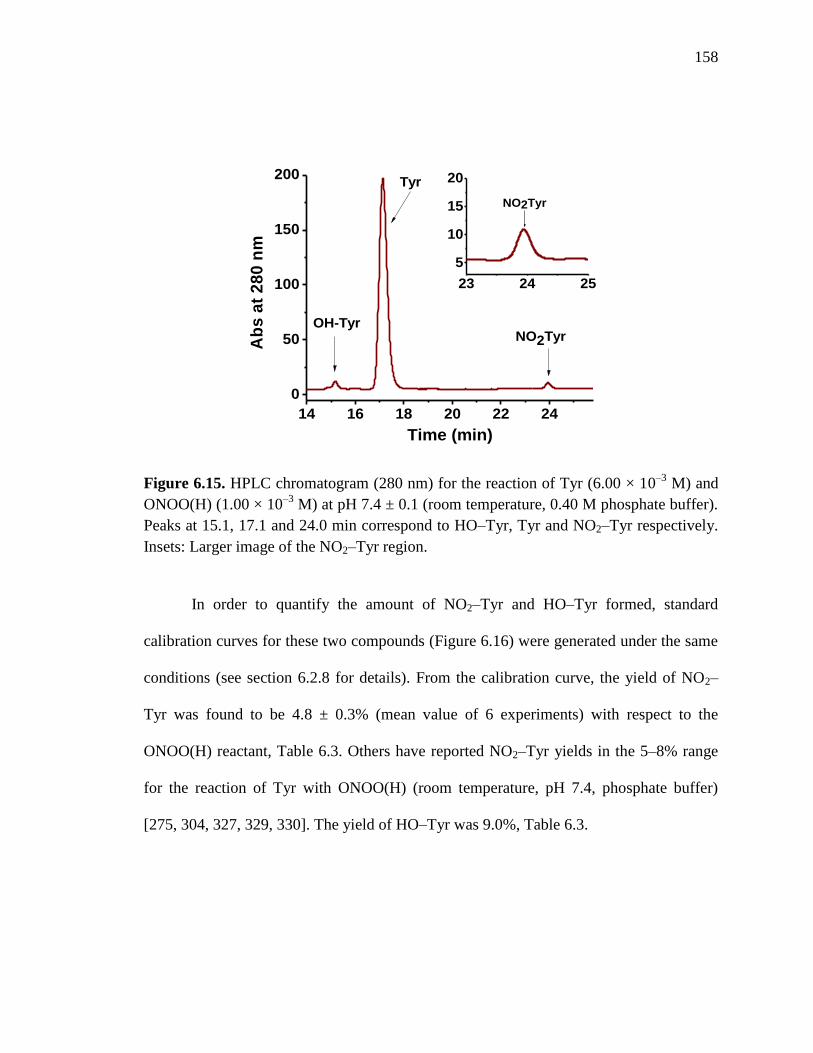
158
14 16 18 20 22 24
0
50
100
150
200
Ab
s a
t 2
80
nm
Time (min)
Tyr
NO2TyrOH-Tyr
23 24 25
5
10
15
20
NO2Tyr
Figure 6.15. HPLC chromatogram (280 nm) for the reaction of Tyr (6.00 × 10⁻³
M) and
ONOO(H) (1.00 × 10⁻³
M) at pH 7.4 ± 0.1 (room temperature, 0.40 M phosphate buffer).
Peaks at 15.1, 17.1 and 24.0 min correspond to HO–Tyr, Tyr and NO2–Tyr respectively.
Insets: Larger image of the NO2–Tyr region.
In order to quantify the amount of NO2–Tyr and HO–Tyr formed, standard
calibration curves for these two compounds (Figure 6.16) were generated under the same
conditions (see section 6.2.8 for details). From the calibration curve, the yield of NO2–
Tyr was found to be 4.8 ± 0.3% (mean value of 6 experiments) with respect to the
ONOO(H) reactant, Table 6.3. Others have reported NO2–Tyr yields in the 5–8% range
for the reaction of Tyr with ONOO(H) (room temperature, pH 7.4, phosphate buffer)
[275, 304, 327, 329, 330]. The yield of HO–Tyr was 9.0%, Table 6.3.

159
0.00 1.50x10⁻⁹
3.00x10⁻⁹
4.50x10⁻⁹
0
200
400
600
800
1000
1200
Are
a a
t 2
80
nm
No. of moles of NO2-Tyr
(a)
0.0 2.0x10⁻⁹
4.0x10⁻⁹
6.0x10⁻⁹
0
200
400
600
800
Are
a a
t 2
80
nm
No. of moles of OH-Tyr
(b)
Figure 6.16. (a) Calibration curve for NO2–Tyr in 0.40 M phosphate buffer, pH 7.4 ± 0.1.
The area of the peak observed at 24.0 min in the HPLC chromatogram was determined
for NO2–Tyr solutions at 280 nm. The best fit of the data to a line gives a slope of (2.38 ±
0.05)× 1011
, R2 = 0.998. (b) Calibration curve for HO–Tyr in 0.40 M phosphate buffer,
pH 7.4 ± 0.1. The area of the peak observed at 15.1 min in the HPLC chromatogram was
determined for HO–Tyr solutions at 280 nm. The best fit of the data to a line gives a
slope of (1.40 ± 0.04) × 1011
, R2 = 0.995.
Table 6.3. Yield of NO2–Tyr and HO–Tyr formed for the reaction of ONOO(H) (1.00 ×
10–3
M) with Tyr (6.00 × 10⁻³
M) in the presence of varying concentrations of Cbl(II)
(room temperature, pH 7.4 ± 0.1, 0.40 M phosphate buffer).
[Cbl(II)] (M) [Cbl(II)]/
[ONOO(H)]
Yield of NO2–Tyr
formed (%)
Yield of HO–Tyr
formed (%)
0 – 4.8 ± 0.3 9.0 ± 0.4
5.00 × 10⁻⁴
0.50 3.0 ± 0.4 5.9 ± 0.4
1.00 × 10⁻³
1.0 2.0 ± 0.3 1.9 ± 0.2
2.00 × 10⁻³
2.0 negligible negligible

160
10 15 20 25 30 35
0
100
200
300
400
Ab
s a
t 2
80
nm
Time (min)
Tyr
H2OCbl+
NO2-Tyr
NO2Cbl
HO-Tyr
20 22 24
10
20
30
Time (min)
H2OCbl+
NO2Tyr
The experiment was repeated in the presence of Cbl(II). Figure 6.17 gives a HPLC
chromatogram of the products of the reaction upon the addition of ONOO(H) (final
concentration 1.00 × 10⁻³
M) to a solution of Cbl(II) (5.00 × 10⁻⁴
M) and Tyr (6.00 × 10⁻³
M) at pH 7.4 ± 0.1 in 0.40 M phosphate buffer. Peaks were observed at 20.6 (H2OCbl+)
and 28.6 min (NO2Cbl) (confirmed by spiking with authentic samples of these
complexes), in addition to peaks from HO–Tyr, Tyr and NO2–Tyr.
Figure 6.17. HPLC chromatogram (280 nm) for the reaction of Tyr (6.00 × 10⁻³
M) and
ONOO(H) (1.00 × 10⁻³
M) in the presence of 5.00 × 10⁻⁴
M Cbl(II) at pH 7.4 ± 0.1 (room
temperature, 0.40 M phosphate buffer). Peaks at 15.1, 17.1, 20.6, 24.0 and 28.6 min
correspond to HO–Tyr, Tyr, H2OCbl+, NO2–Tyr and NO2Cbl, respectively. Insets: Larger
images of the NO2–Tyr region. The peak at 22.5 min is attributed to a second minor
corrinoid product of the reaction between Cbl(II) and NO2 .

161
Using the calibration curve for NO2–Tyr, the yield of NO2–Tyr was reduced from 4.8 to
3.0 ± 0.4% (mean value of 6 experiments) with respect to ONOO(H), Table 6.3.
Increasing the Cbl(II) concentration to 1.00 × 10⁻³
M while keeping everything else
constant results in a further decrease in the yield of NO2–Tyr to 2.0 ± 0.3 % (mean value
of 12 experiments), Table 6.3. Moreover, negligible NO2–Tyr was formed when the
Cbl(II) concentration was further increased to 2.00 × 10⁻³
M (ONOO(H) = 1.00 × 10⁻³
M,
Tyr = 6.00 × 10⁻³
M; 0.40 M phosphate buffer, pH 7.4 ± 0.1). Hence Cbl(II)
stoichiometrically scavenges NO2 in the presence of Tyr, preventing the formation of
NO2–Tyr. A similar trend was observed for HO–Tyr as the Cbl(II) concentration
increased, Table 6.3, with negligible HO–Tyr formed at the highest Cbl(II) concentration
(2.00 × 10⁻³
M).
One electron oxidation of the metal center by NO2 to form the corresponding
oxidized nitro complex has been reported previously for Fe(II) porphyrins [331].
Importantly, an additional product peak was observed at 22.5 min in the HPLC
chromatogram, Figure 6.17. In order to obtain further information on the product formed
with the HPLC peak at 22.5 min, the area of this peak was compared to that for NO2Cbl
at 280 nm for all the experiments. The results are given in Table 6.4, which shows that
the areas of the peak at 22.5 min and the NO2Cbl peak increase linearly with increasing
[Cbl(II)]/[ONOO(H)]. The ratio of the two peaks remain constant, last column, Table 6.4.
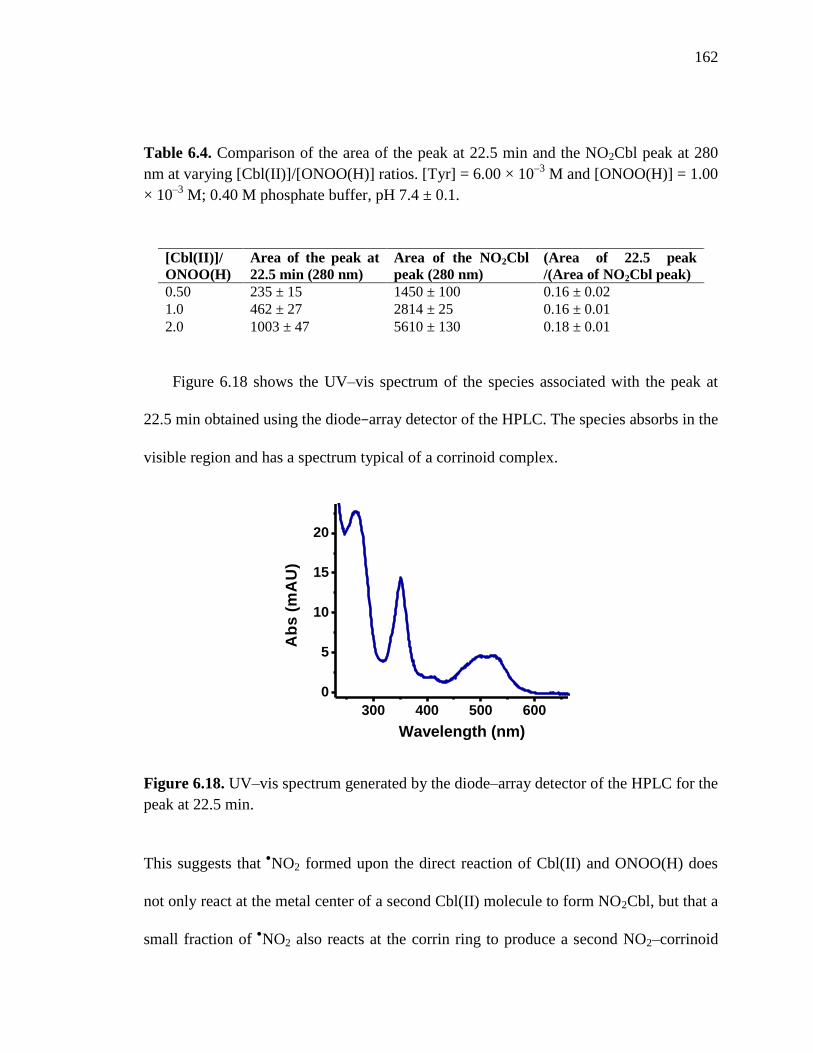
162
300 400 500 600 700
0
5
10
15
20
25
Ab
s (
mA
U)
Wavelength (nm)
Table 6.4. Comparison of the area of the peak at 22.5 min and the NO2Cbl peak at 280
nm at varying [Cbl(II)]/[ONOO(H)] ratios. [Tyr] = 6.00 × 10⁻³
M and [ONOO(H)] = 1.00
× 10–3
M; 0.40 M phosphate buffer, pH 7.4 ± 0.1.
Figure 6.18 shows the UV–vis spectrum of the species associated with the peak at
22.5 min obtained using the diode−array detector of the HPLC. The species absorbs in the
visible region and has a spectrum typical of a corrinoid complex.
Figure 6.18. UV–vis spectrum generated by the diode–array detector of the HPLC for the
peak at 22.5 min.
This suggests that NO2 formed upon the direct reaction of Cbl(II) and ONOO(H) does
not only react at the metal center of a second Cbl(II) molecule to form NO2Cbl, but that a
small fraction of NO2 also reacts at the corrin ring to produce a second NO2–corrinoid
[Cbl(II)]/
ONOO(H)
Area of the peak at
22.5 min (280 nm)
Area of the NO2Cbl
peak (280 nm)
(Area of 22.5 peak
/(Area of NO2Cbl peak)
0.50 235 ± 15 1450 ± 100 0.16 ± 0.02
1.0 462 ± 27 2814 ± 25 0.16 ± 0.01
2.0 1003 ± 47 5610 ± 130 0.18 ± 0.01

163
Cu(s) + 2HNO3 (conc.) Cu2+ + 2NO2(g) + H2O
10 15 20 25 300
200
400
600
800
1000
Ab
s a
t 2
80
nm
Time (min)
product. The complex was weakly absorbing. Addition of NO2 to a C=C unit of the
corrin ring reduces its conjugation, potentially leading to weaker –* transitions.
To probe this further, the HPLC chromatogram of the products of the direct reaction
between Cbl(II) and NO2 were examined.
NO2 was generated by reacting Cu with conc.
HNO3 (see Experimental Section for details) [325].
Figure 6.19 shows the HPLC chromatogram of the product solution formed from the
direct reaction of Cbl(II) with excess NO2. Two peaks were observed at 22.5 min and
27.8 min (NO2Cbl) in a ~0.07:1.00 ratio (280 nm), confirming that the peak at 22.5 min
arises from the reaction between Cbl(II) and NO2.
Figure 6.19. HPLC chromatogram of the product solution of the reaction of Cbl(II) with
authentic NO2 (g). Two major peaks were observed at 22.5 min and 27.8 min
corresponding to a putative nitro–corrinoid(III) species and NO2Cbl, respectively.

164
Multiple fractions of the species eluting at 22.5 min were pooled together, the pH
adjusted to 7.0, and the sample taken to dryness. The product was repeatedly dissolved in
EtOH, filtered to remove phosphate buffer (HPLC elutant) and evaporated to dryness.
The dry product had a faint pink color characteristic of a corrinoid complex.
Unfortunately the ES–MS of the product did not give any useful information.
To summarize, while NO2Cbl is the major species formed when Cbl(II) reacts with
NO2, small amounts of a second NO2–corrinoid(III) complex are produced, presumably
by attack of NO2 on the corrin ring itself. Others have reported
NO2 addition at the meso
(β–pyrolic) carbons of porphyrins [332].
6.3.6 ATTEMPT TO DETERMINE THE RATE CONSTANT OF THE
REACTION BETWEEN Cbl(II) AND NO2 (g)
Given that negligible NO2–Tyr is formed upon the stoichiometric addition (= 2.0
equiv.) of Cbl(II) to a solution of Tyr + ONOO(H), Table 6.3, this suggests that the rate
constant for the reaction between Cbl(II) and NO2 is considerably larger than that of the
reaction of Tyr with NO2, Scheme 6.5 [326]. Attempts were made to obtain an estimate
of this rate constant. NO2–Tyr can either be formed by the reaction of NO2 or
OH with
Tyr to form TyrO followed by the rapid reaction of a second
NO2 with TyrO
to give
NO2–Tyr [326, 328], or by the reaction of NO2 with Tyr followed by the rapid reaction
of this intermediate with OH [333], Scheme 6.6. It therefore occurred to us that by
scavenging OH, pathways involving
OH would be prevented so that NO2–Tyr

165
R
OH
R
O
R
OH
H
NO2
OH
NO2
NO2
NO2
NO2
OH
R
OH
NO2
R
O
Path A
Path B
Path C
formation would require NO2 exclusively, Scheme 6.5. The yield of NO2–Tyr in the
presence of Cbl(II) would therefore allow an estimation of the rate constant for the
reaction between Cbl(II) and NO2. Furthermore, the presence or absence of the HO–Tyr
product provides a convenient way to check the efficiency of the OH scavenger, since
HO–Tyr is a product of the reaction of Tyr with OH [327, 328] and should therefore not
be formed if the OH scavenger scavenges all
OH formed during the reaction.
Scheme 6.6. Formation of NO2–Tyr from the reaction between Tyr and OH and
NO2 by
pathways A [328], B [326] and C [333].
D–mannitol is an established OH scavenger [334]. To probe how efficiently D–mannitol
scavenges OH formed during the reaction of Tyr with ONOO(H), ONOO(H) (1.00 ×10
–3
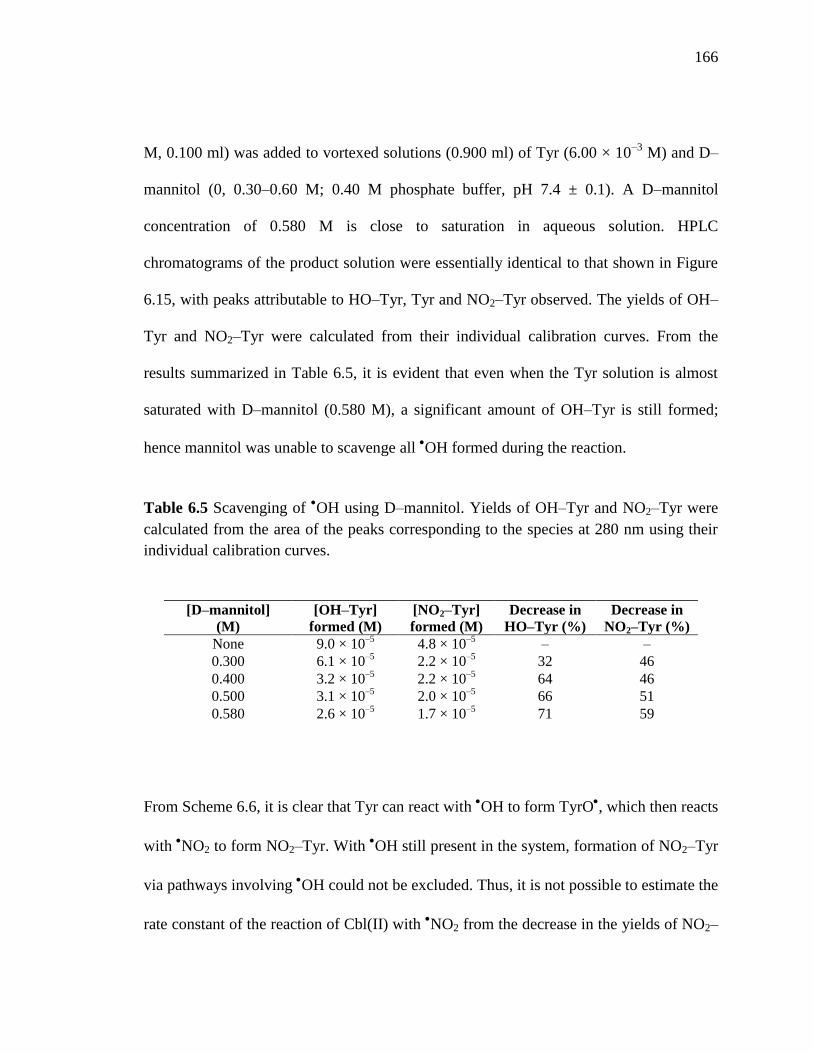
166
M, 0.100 ml) was added to vortexed solutions (0.900 ml) of Tyr (6.00 × 10⁻³
M) and D–
mannitol (0, 0.30–0.60 M; 0.40 M phosphate buffer, pH 7.4 ± 0.1). A D–mannitol
concentration of 0.580 M is close to saturation in aqueous solution. HPLC
chromatograms of the product solution were essentially identical to that shown in Figure
6.15, with peaks attributable to HO–Tyr, Tyr and NO2–Tyr observed. The yields of OH–
Tyr and NO2–Tyr were calculated from their individual calibration curves. From the
results summarized in Table 6.5, it is evident that even when the Tyr solution is almost
saturated with D–mannitol (0.580 M), a significant amount of OH–Tyr is still formed;
hence mannitol was unable to scavenge all OH formed during the reaction.
Table 6.5 Scavenging of OH using D–mannitol. Yields of OH–Tyr and NO2–Tyr were
calculated from the area of the peaks corresponding to the species at 280 nm using their
individual calibration curves.
From Scheme 6.6, it is clear that Tyr can react with OH to form TyrO
, which then reacts
with NO2 to form NO2–Tyr. With
OH still present in the system, formation of NO2–Tyr
via pathways involving OH could not be excluded. Thus, it is not possible to estimate the
rate constant of the reaction of Cbl(II) with NO2 from the decrease in the yields of NO2–
[D–mannitol]
(M)
[OH–Tyr]
formed (M)
[NO2–Tyr]
formed (M)
Decrease in
HO–Tyr (%)
Decrease in
NO2–Tyr (%)
None 9.0 × 10⁻⁵
4.8 × 10⁻⁵
– –
0.300 6.1 × 10⁻⁵
2.2 × 10⁻⁵
32 46
0.400 3.2 × 10⁻⁵
2.2 × 10⁻⁵
64 46
0.500 3.1 × 10⁻⁵
2.0 × 10⁻⁵
66 51
0.580 2.6 × 10⁻⁵
1.7 × 10⁻⁵
71 59
167
Tyr, since not all OH is scavenged. Finally, ethanol (54% v/v) was also tested for its
ability to scavenge OH in the presence of Tyr. However, the pH of the solution rose to
9.0 and the yield of OH–Tyr only dropped to ~54% of its original value.
To summarize, product studies on the reaction between Cbl(II) and ONOO(H) in the
presence of the efficient NO2 trap Tyr show that
NO2 reacts preferentially with Cbl(II)
rather than with Tyr, with stoichiometric scavenging of NO2 by Cbl(II). An estimate of
the rate constant of the Cbl(II) + NO2 reaction from the yield of NO2–Tyr formed was
not possible, since pathways leading to NO2–Tyr formation involving OH could not be
prevented.
6.4 SUMMARY
Kinetic studies on the reaction between Cbl(II) and peroxynitrous acid/peroxynitrite
have been carried out using stopped–flow spectroscopy. The rate of the reaction
increased with decreasing pH, indicating that only peroxynitrous acid (ONOOH), not
ONOO–, reacts with Cbl(II). This is not unexpected, given that ONOOH is a much
stronger oxidizing agent compared with ONOO–. The stoichiometry of the reaction was
found to be 2:1 (Cbl(II):ONOO(H)) at pH 12.3 and 7.35 by UV-vis titration experiments.
The Cbl(III) product was shown to be NO2Cbl at pD 7.5 and HOCbl at pD 13.2 by 1H
NMR spectroscopy. Based on the kinetic and stoichiometric results, a mechanism was
proposed in which Cbl(II) reacts with peroxynitrous acid to give Cbl(III) and NO2
followed by rapid scavenging of NO2 by a second molecule of Cbl(II) to form
predominately NO2Cbl and a second minor NO2–corrinoid product, which was also
168
formed when Cbl(II) was reacted directly with authentic NO2(g). This mechanism differs
from those previously proposed for the reactions between ONOO(H) and reduced
porphyrins. In order to provide evidence for NO2 being a reaction intermediate, the
products of the reaction between Cbl(II) and ONOO(H) were characterized by HPLC in
the presence of the efficient NO2 trapping agent, Tyr. Product studies instead revealed
stoichiometric scavenging of NO2 by Cbl(II) to form NO2Cbl and the minor NO2–
corrinoid complex, rather than trapping of NO2 by Tyr.
OH was produced as a
decomposition product of ONOO(H) (pH 7.4), which was supported by the observation
of OH–Tyr (maximum yield 9%) as a minor product. The rate constant for the reaction
between Cbl(II) and NO2 could not be estimated based on the yield of NO2–Tyr formed,
since pathways leading to NO2–Tyr formation involving OH could not be prevented,
even in the presence of the efficient OH scavengers D–mannitol and ethanol.
These studies show that Cbl(II) is rapidly oxidized by ONOO(H) to Cbl(III) (k =
3.70 × 10⁵
M–1
s–1
at physiological pH). Since both MMCM and MS are inactivated under
oxidative stress conditions [308, 309] and protein−bound Cbl is readily accessible to
small molecules [335], it is likely that enzyme−bound Cbl(II) is also rapidly oxidized to
inactive cob(III)alamins upon exposure to peroxynitrite or NO2 in addition to free
intracellular Cbl(II).

169
CHAPTER 7
KINETIC AND MECHANISTIC STUDIES ON THE REACTION
BETWEEN COB(I)ALAMIN AND PEROXYNITRITE
7.1 INTRODUCTION
There is currently much interest in the biochemical reactivity of
peroxynitrite/peroxynitrous acid (ONOO−/ONOOH), a strong oxidizing, hydroxylating
and/or nitrating agent formed by the diffusion controlled reaction of nitric oxide with
superoxide [276]. The reduced tetracoordinate vitamin B12 derivative cob(I)alamin
(Cbl(I)) is an extremely strong reducing agent (E0(Cbl(II)/Cbl(I) = −0.61 V vs. SHE
[336]). Cbl(I) is a key intermediate in the MeCbl–dependent methionine synthase (MS)
reaction, and undergoes oxidation to inactive Cbl(II) about once in every two thousand
turnovers [6]. Enzyme–bound Cbl(I) is also an intermediate in the biosynthesis of
AdoCbl and MeCbl.
There are surprisingly few reports of kinetic studies on the reactions of Cbl(I).
Studies on the oxidation of Cbl(I) to Cbl(II) by NO3−
in acidic solution have been
reported, in which NO3−
is reduced to NH4+ (8 e
− reduction) [337]. Kinetic studies on the
oxidation of Cbl(I) by N2O results in formation of Cbl(II) and N2 (2 e−
reaction) [338].
Given that both B12–dependent enzymes are inactivated under oxidative/nitrosative stress
conditions, the reactivity of Cbl(I) with reactive oxygen and nitrogen species is of special

170
interest. In this chapter, kinetic and mechanistic studies are reported on the reaction of
Cbl(I) with peroxynitrite.
7.2 EXPERIMENTAL
7.2.1 MATERIALS
TAPS (98%), CAPS (98%), CHES (99%), 8−quinolinol (98%), Na2CO3 (99%) and
NH2OH•HCl (98%) were purchased from either Fisher or Acros organics. All other
chemicals were purchased and used without further purification as described in Section
2.2.1.
7.2.2 INSTRUMENTATION
Kinetic data were collected under strictly anaerobic conditions at 25.0 0.2 C using
an Applied Photophysics SX20 stopped−flow instrument as detailed in Section 6.2.2 in
the sequential mixing mode. All other instruments were used as described in section
3.2.2.
7.2.3 SYNTHESIS OF COB(I)ALAMIN (Cbl(I))
Cbl(I) was prepared under anaerobic conditions using a published procedure [312].
In a typical synthesis, an aliquot of an aqueous anaerobic solution of NaBH4 (0.500 ml,
1.19 M, 6.00 mol equiv.) was added drop wise to an aqueous anaerobic solution of
HOCbl•HCl (155 mg, 9.84 × 10⁻⁵
mol in 12.0 ml H2O), to produce a deep charcoal
171
colored solution. After 20 min, acetone (0.50 ml) was added to quench the excess NaBH4.
Cbl(I) was characterized by UV−vis spectroscopy (max = 388, 463, 548 and 682 nm [41].
The concentration of resulting Cbl(I) stock solution was 6.92 × 10⁻³
M, as determined by
converting the stock solution of Cbl(I) to dicyanocobalamin, (CN)2Cbl−
(0.10 M KCN,
pH 10.5, 368 = 30.4 mM−1
cm−1
[251]). This solution was stored in the freezer inside the
glove box and used within a week.
Na+ONOO
− was synthesized and used as described in section 6.2.3.
7.2.4 PREPARATION OF SOLUTIONS
All solutions were prepared directly before use. Cbl(I) solutions were prepared in
anaerobic H2O. Phosphate (0.050 M), TAPS (0.050 M), CAPS (0.11 M) or CHES (0.070
M) buffers were used and a final total ionic strength of 0.200 M maintained (Na2HPO4).
ONOO−
solutions were prepared from the stock ONOO− solution by dilution with 1.00 ×
10−2
M NaOH. Reactant solutions were introduced into the stopped−flow apparatus using
the sequential mixing mode, using four Hamilton gas−tight syringes (10 ml), filled in the
glove box. The concentration of the Cbl(I) (in water) and the buffer reactant solutions
(phosphate, TAPS, CHES or CAPS) were four times higher than the final desired
concentrations and the ONOO− solution (in 0.01 M NaOH) was two times higher in
concentration. The sequential mixing sequence was as follows: the first drive pushes
Cbl(I) (syringe A) and the buffer solution (syringe B) into an aging loop. After a delay
time of 0.5 s, the second drive pushes the aged solution into the reaction chamber using
172
the flushing fluid (water, syringe F). The ONOO−
solution (syringe C) is also driven into
the reaction chamber by the second drive event.
Kinetic data were independent of the wavelength at which they were collected. The
final solution pH was determined by measuring the pH of the solution in the stopped
syringe. The range of pH values was 0.06 pH units.
7.2.5 DETERMINATION OF THE STOICHIOMETRY OF THE REACTION
BETWEEN Cbl(I) AND ONOO(H)
Experiments were carried out under strictly anaerobic conditions. Solutions of
ONOO−
were prepared by diluting the stock ONOO− solution with 1.00 × 10
−2 M NaOH.
Aliquots of ONOO− (240–720 µl) were added to a solution of Cbl(I) (2.07 × 10
−3 M,
0.386 ml) in phosphate buffer (0.100 M, pH 12.3, total volume of solution = 4.00 ml) in
the glove box. UV−vis spectra were immediately recorded in air−free Schlenk cuvettes
within 2–3 min of mixing the reagents. Stoichiometric experiments at pH 9.0 was
attempted, however, it was unsuccessful because at this pH NO2− and NO3
− present in the
ONOO(H) solution react at a significant rate with Cbl(I).
7.2.6 Cbl(I) DOES NOT REACT WITH FULLY DECOMPOSED ONOO(H)
An anaerobic solution of ONOO(H) (3.0 × 10⁻³
M) in water was allowed to
completely decompose overnight. The UV−vis spectrum was subsequently recorded
(absorbance at 302 nm ~0, indicating negligible ONOO(H) present). Cbl(I) (2.00 × 10⁻⁴
M, in 0.10 M phosphate buffer, pH 12.23) was then reacted with the decomposed
173
ONOO(H) solution (4.00 × 10⁻⁴
M, diluted using 0.01 M NaOH) in a Schlenk cuvette
and the UV−vis spectrum recorded periodically for 30 min. No significant spectral
change occurred during this time; hence there is no reaction between Cbl(I) and
decomposed ONOO(H).
7.2.7 DETERMINING THE AMOUNT OF NH2OH FORMED IN THE Cbl(I) +
ONOO− REACTION
A modified literature procedure was used to determine whether NH2OH is a reaction
product of the Cbl(I) + ONOO− reaction [339]. Three aerobic solutions were freshly
prepared for the assay. 8−Quinolinol (0.397 g, 0.274 M) was dissolved by stirring (~2
min) in absolute ethanol (10 ml). This concentration was found to be the optimum
concentration for the assay. A Na2CO3 solution (10.64 g, 1.01 M) was prepared in H2O.
Finally, a stock NH2OH•HCl solution (2.39 mg, 3.43 × 10⁻³
M) was prepared in H2O and
the pH adjusted to 4.5 using NaOH. Solutions of NH2OH at other concentrations were
prepared by dilution of the stock solution with H2O. Calibration standards were prepared
by the addition of a NH2OH solution (1.00 ml) of a specific concentration to 8−quinolinol
(1.00 ml, 0.247 M), followed by the addition of Na2CO3 (1.00 ml, 1.01 M). A solution of
intense green color formed within ~ 5 min and a UV−vis spectrum was recorded (ε710nm
of the indooxine product = 30000 M−1
cm−1
[340]). Note that the resulting absorbance
values at 710 nm were in excellent agreement with this literature value (e.g. for 2.00 ×
10−5
M NH2OH, Acalcd. = 0.600, Aexpt. = 0.597). Spectral scans of an indooxine product
solution showed that the maximum absorbance was achieved after 5 min and that there
174
was no further change in the absorbance at 710 nm within the next hr. Control
experiments showed that the assay cannot be performed under anaerobic conditions. The
assay, however, is unaffected by the presence of H2OCbl+ (5 × 10
−5 M; note that the
Cbl(II) reaction product is oxidized to H2OCbl+ under aerobic conditions), and the
presence of NO2− (~ 0.10 M) and NO3
− (~ 0.10 M) (Aexpt. = 0.608 in both cases, Acalcd. =
0.600).
The reaction product solution was freshly prepared under anaerobic conditions by the
addition of a ONOO− solution (0.348 ml, 4.31 × 10
−4 M; final conc. = 3.00 × 10
−5 M) to a
solution of Cbl(I) (1.96 ml, 4.84 × 10⁻⁴
M, final conc. = 1.90 × 10⁻⁴
M) in 0.01 M NaOH
(2.692 ml). In the presence of air, 8−quinolinol (1.00 ml, 0.247 M) was added to the
Cbl(I) + ONOO− product mixture (1.00 ml), followed by the addition of Na2CO3 (1.00
ml, 1.01 M). The UV−vis spectrum was recorded, and the absorbance at 710 nm
indicated that negligible NH2OH is formed. As a control, the product solution was also
spiked with NH2OH (final concentration = 2.99 × 10⁻⁵
M), and the assay repeated. In this
case the solution turned an intense green color associated with generation of indooxine
and the peak at 710 nm was observed at the expected intensity (for 2.99 × 10⁻⁵
M
NH2OH, Acalcd = 0.898; Aexpt. = 0.890).
7.2.8 OXIDATION OF Cbl(I) BY NO2 (g)
NO2 (g) was produced using an established procedure [325]. A few drops of
anaerobic conc. HNO3 was added by syringe to Cu powder in a Schlenk flask, under
argon. Brown NO2 (g) was formed immediately and filled the flask. This gas was

175
bubbled into an anaerobic aqueous solution of Cbl(I) (2.00 × 10⁻⁴
M) via a cannula. The
charcoal black color of the Cbl(I) solution immediately turned brown, indicating the
oxidation of Cbl(I) to Cbl(II). Cbl(II) was subsequently further oxidized to Cbl(III) over
the course of ~2 s. NO2 (g) therefore reacts very rapidly with Cbl(I) to form Cbl(II), the
latter complex reacting further with NO2 (g) to form Cbl(III).
7.3 RESULTS AND DISCUSSION
7.3.1 KINETIC STUDIES ON THE REACTION OF Cbl(I) WITH ONOO(H)
Kinetic studies on the reaction of Cbl(I) with ONOO(H) were carried out under
strictly anaerobic conditions using stopped−flow spectroscopy. Peroxynitrite (ONOO−) is
stable in strongly basic solution, whereas peroxynitrous acid, ONOOH, rapidly
spontaneously decomposes to NO2,
OH and nitrate [281, 282]. Sequential mixing and
low buffer concentrations were used to prevent the decomposition of the reagent
solutions prior to collecting kinetic data. Peroxynitrite solutions were prepared in 0.01 M
NaOH. A typical plot of absorbance at 388 nm versus time for the reaction of Cbl(I) (5.50
× 10−5
M) with ONOO(H) (7.15 × 10⁻⁵
M) at pH 9.24 is shown in Figure 7.1.

176
0.00 0.02 0.04 0.06 0.080.2
0.4
0.6
0.8
Ab
s3
88
nm
Time (s)
Figure 7.1. Plot of absorbance at 388 nm versus time for the reaction of Cbl(I) (5.50 ×
10−5
M) with ONOO(H) (7.15 × 10⁻⁵
M) at pH 9.24 (0.070 M CHES buffer, 25.0 °C, I =
0.20 M (Na2HPO4)). The data fits well to a first–order rate equation, giving kobs = 66.4
0.2 s−1
.
The color of the solution changed from charcoal (= Cbl(I)) to brown, consistent with
oxidation of Cbl(I) to Cbl(II) by ONOO(H). The data fits well to a single first−order rate
equation, giving an observed rate constant, kobs = 66.4 0.2 s−1
. Note that a
Cbl(I):ONOO(H) reaction stoichiometry of 5:1 (see section 7.3.2) allows the use of lower
concentrations of ONOO(H) whilst still maintaining pseudo first−order conditions with
respect to the ONOO(H) concentration. The spontaneous decomposition of ONOO(H) in
the buffer was always several orders of magnitude slower than the reaction between
Cbl(I) and ONOO(H) (e.g. at pH 9.2, kspont ~ 6 × 10⁻³
s−1
(Chapter 6)) under all
experimental conditions; hence ONOO(H), rather than its decomposition products, reacts
with Cbl(I).
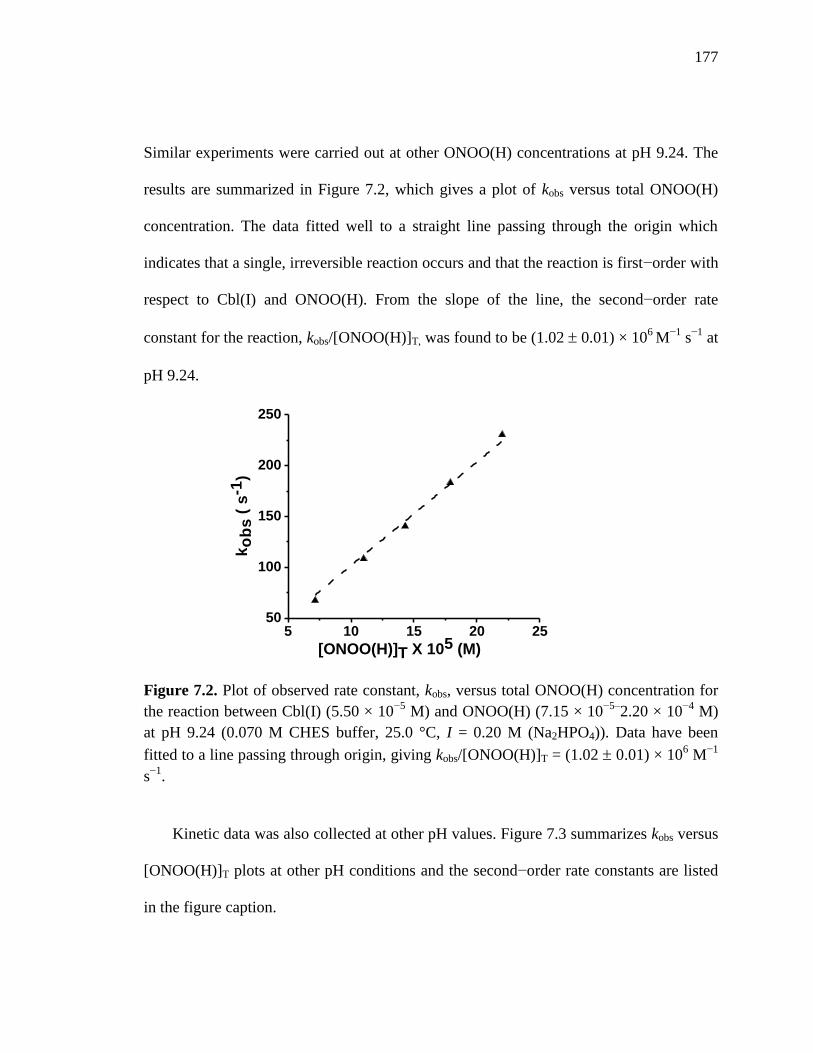
177
5 10 15 20 2550
100
150
200
250
ko
bs
( s
-1)
[ONOO(H)]T X 105 (M)
Similar experiments were carried out at other ONOO(H) concentrations at pH 9.24. The
results are summarized in Figure 7.2, which gives a plot of kobs versus total ONOO(H)
concentration. The data fitted well to a straight line passing through the origin which
indicates that a single, irreversible reaction occurs and that the reaction is first−order with
respect to Cbl(I) and ONOO(H). From the slope of the line, the second−order rate
constant for the reaction, kobs/[ONOO(H)]T, was found to be (1.02 0.01) × 106
M−1
s−1
at
pH 9.24.
Figure 7.2. Plot of observed rate constant, kobs, versus total ONOO(H) concentration for
the reaction between Cbl(I) (5.50 × 10⁻⁵
M) and ONOO(H) (7.15 × 10⁻⁵–
2.20 × 10⁻⁴
M)
at pH 9.24 (0.070 M CHES buffer, 25.0 °C, I = 0.20 M (Na2HPO4)). Data have been
fitted to a line passing through origin, giving kobs/[ONOO(H)]T = (1.02 0.01) × 106 M
−1
s−1
.
Kinetic data was also collected at other pH values. Figure 7.3 summarizes kobs versus
[ONOO(H)]T plots at other pH conditions and the second−order rate constants are listed
in the figure caption.

178
0.0 6.0x10⁻⁴
1.2x10⁻³
0
50
100
150
200
[ONOO(H)]T (M)
ko
bs
(s
-1)
(e)
7.0x10⁻⁵
1.4x10⁻⁴
2.1x10⁻⁴
200
400
600
800
1000
1200
ko
bs
(s
-1)
[ONOO(H)]T (M)
(a)
1.50x10⁻⁴
3.00x10⁻⁴
4.50x10⁻⁴
200
400
600
800
1000
1200
[ONOO(H)]T (M)
ko
bs
(s
-1) (b)
1.0x10⁻⁴
2.0x10⁻⁴
3.0x10⁻⁴
20
30
40
50
60
70
80
[ONOO(H)]T (M)
ko
bs
(s
-1) (c)
5.0x10⁻⁴
1.0x10⁻³
1.5x10⁻³
50
100
150
200
[ONOO(H)]T (M)
ko
bs
(s
-1) (d)
Figure 7.3. Plot of the observed rate constant, kobs, versus total ONOO(H) concentration
for the reaction between (a) Cbl(I) (5.50 × 10⁻⁵
M) and ONOO(H) at pH 8.42 in 0.05 M
TAPS buffer; (b) Cbl(I) (5.50 × 10⁻⁵
M) and ONOO(H) at pH 8.70 in 0.050 M TAPS
buffer; (c) Cbl(I) (5.50 × 10⁻⁵
M) and ONOO(H) at pH 10.42 in 0.11 M CAPS buffer; (d)
Cbl(I) (1.00 × 10⁻⁴
M) and ONOO− at pH 11.67 in 0.050 M phosphate buffer and (e)
Cbl(I) (1.00 × 10⁻⁴
M) and ONOO− at pH 12.23 in 0.050 M phosphate buffer. All
experiments were carried out at a total ionic strength of 0.20 M and 25.0 °C. Data are
fitted to a straight line passing through origin, giving second−order rate constants
kobs/[ONOO(H)]T = (4.89 0.27) × 106 M
−1 s
−1 (a), (2.57 0.11) × 10
6 M
−1 s
−1 (b), (3.01
0.07) × 105 M
−1 s
−1 (c), (1.32 0.02) × 10
6 M
−1 s
−1 (d) and (1.41 0.03) × 10
5 M
−1 s
−1
(e).

179
8 10 12
0
2
4
6
pH
1
0-6
k (
M-1
s-1
)
Figure 7.4 summarizes the dependence of the apparent second−order rate constant, k (=
kobs/[ONOO(H)]T), for the reaction of Cbl(I) with ONOO(H) as a function of pH. It is
clear from Figure 7.4 that the apparent rate constant increases with lowering the pH and
becomes pH independent at pH > 10.5. The reaction rate was too rapid to be determined
at pH 8.4 using our sequential mixing set up.
Figure 7.4. Plot of 10−6
k (= kobs/[ONOO(H)]T) versus pH for the reaction of Cbl(I) with
ONOO(H) (phosphate, TAPS, CAPS or CHES buffer, 25.0 °C, I = 0.20 M (Na2HPO4)).
Data is fitted to eqn (2) in the text fixing Ka = 1.34 × 10⁻⁷
M and kONOO− = 1.36 × 10⁵ M
−1
s−1
(mean value of k at pH 11.67 and 12.23), giving kONOOH = (1.60 0.03) × 108 M
−1 s
−1.
Assuming that both ONOOH and ONOO−
react with Cbl(I), the rate−determining
step can be expressed as
rate = kONOO−[Cbl(I)][ONOO−] + kONOOH[Cbl(I)][ONOOH] (1)
The data in Figure 7.4 can be fitted to the equation
kobs/[ONOO(H)]T = (kONOOH × [H+]) + (kONOO− × Ka(ONOOH)) / ([H
+] + Ka(ONOOH) ) (2)
pKa(ONOOH) was determined independently (= 6.87 ± 0.06, 0.08 M phosphate buffer, 25.0
C, section 6.3.1[341]). Fitting the data in Figure 7.4 to eqn (2), fixing Ka(ONOOH) = 1.34 ×

180
8 9 10 11 12 13
0
1x10⁶
2x10⁶
3x10⁶
4x10⁶
5x10⁶
k
(M-1s
-1)
pH
10−7
M and kONOO− = 1.36 × 10⁵ M
−1 s
−1 (mean value of k at pH 11.67 and 12.23) gives
kONOOH = (1.60 0.03) × 108 M
−1 s
−1. It is well established that stronger oxidants are
obtained upon protonation of oxyanions, since the protonated oxyanion is more electron
deficient [322, 325]. Using this model the apparent second−order rate constant (k) of the
reaction at pH 7.4 was calculated to be 3.6 × 10⁷ M
−1 s
−1. Second−order rate constants for
the reactions of the structurally related protein−free porphyrins with ONOO(H) at
physiological pH are typically one to two orders of magnitude smaller (1.0 × 10⁵ (25 °C),
1.8 × 10⁶
(24 °C), 1.6 × 10⁷ (37 °C), 3.8 × 10
6 (37 °C) and
3.7 × 10
6 (37 °C) M
−1 s
−1 for
FeIII
TMPS, MnIII
TMPyP, MnIII
TM−2−PyP, MnIII
TM−3−PyP and MnIII
TM−4−PyP,
respectively) [320-322]. Protein−bound porphyrins react slower (~103−10
4 M
−1 s
−1) with
ONOO(H) [304, 305, 323].
Alternatively, one can assume that only ONOOH reacts with Cbl(I), giving kONOOH
= (1.78 0.05) × 108 M
−1 s
−1; however the fit of the data to this model is significantly
worse, Figure 7.5.
Figure 7.5. Plot of k (= kobs/[ONOO(H)]T) versus pH for the reaction of Cbl(I) with
ONOO(H) (phosphate, TAPS, CAPS or CHES buffer, 25.0 °C, I = 0.20 M (Na2HPO4)).
Data is fitted to the equation kobs/[ONOO(H)]T = (kONOOH × [H+])/([H
+] + Ka(ONOOH))
fixing Ka = 1.34 × 10⁻⁷
M, giving kONOOH = (1.78 0.05) × 108 M
−1 s
−1.

181
400 6000.0
0.5
1.0
1.5
Ab
s
Wavelength (nm)
In order to identify the Cbl reaction product(s), complete UV−vis spectra for the
reaction of Cbl(I) with ONOO− were collected at pH 12.25 immediately (within 2−3 min)
after the addition of ONOO− to a Cbl(I) solution; that is, under pH conditions where the
reaction is the slowest. The data is shown in Figure 7.6, and confirms that Cbl(I) is
indeed oxidized to Cbl(II).
Figure 7.6. UV−vis spectra for the reaction of Cbl(I) (7.50 × 10⁻⁵
M) with ONOO− (9.60
× 10−5
M) at pH 12.25 (25.0 °C, 0.050 M phosphate buffer, I = 0.20 M (Na2HPO4)).
Spectra were collected every 10 ms for 145 ms. Cbl(I) (λmax = 388 and 463 nm [337]) is
converted to Cbl(II) (λmax = 312, 405 and 475 nm [41]), with isosbestic points at ~422
and 551 nm.
Independent kinetic experiments on the reaction between Cbl(II) and ONOO(H)
showed that Cbl(II) is also oxidized by peroxynitrite (described in detail in Chapter 6);
however the rate of the reaction between Cbl(II) and ONOO(H) to form Cbl(III) is
considerably slower than the rate of the reaction between Cbl(I) and ONOO(H). To
illustrate, k = (4.75 0.12) × 103 M
−1 s
−1 for the reaction between Cbl(II) and

182
300 400 500 600 7000.0
0.5
1.0
1.5
Ab
s
Wavelength / nm
a
b
c
300 400 500 600 7000.0
0.2
0.4
0.6
0.8
1.0
1.2
1.4
Ab
s
Wavelength (nm)
ONNO−(Chapter 6) versus (1.41 0.03) × 10
5 M
−1 s
−1 for the reaction between Cbl(I) and
ONOO−at pH 12.0, 0.05 M phosphate buffer, I = 0.20 M (Na2HPO4). To demonstrate that
the Cbl(II) + ONOO(H) reaction will also occur for our Cbl(I)/ONOO(H) system, the
reaction between Cbl(I) and ONOO(H) was followed for much longer times. Figure 7.7
shows UV−vis spectra collected for the reaction between Cbl(I) (7.50 × 10⁻⁵
M) and
ONOO− (9.60 × 10
−5 M) at pH 12.23 over a 6 s time interval. Cbl(I) (spectrum a, inset of
Figure 7.7) is first rapidly oxidized to Cbl(II) by ONOO−
(spectrum b, inset of Figure
7.7).
Figure 7.7. UV−vis spectra for the reaction of Cbl(I) (7.50 × 10⁻⁵
M) with ONOO− (9.60
× 10−5
M) at pH 12.30 (25.0 °C, 0.05 M phosphate buffer, I = 0.20 M (Na2HPO4)).
Spectra were collected every 12 ms upto 240 ms, then every 120 ms upto 840 ms and
then every 300ms upto 6s. Cbl(I) (Inset, spectrum a, λmax = 388 and 463 nm [337]) is
converted to Cbl(II) (spectrum b, Inset, λmax = 312, 405 and 475 nm [24]) within ~200
ms, with isosbestic points at 418 and 557 nm, in agreement with literature values [337].
Cbl(II) is subsequently oxidized to Cbl(III) (spectrum c, Inset) over the next ~5 s, with
isosbestic points at 489 and 577 nm [65].
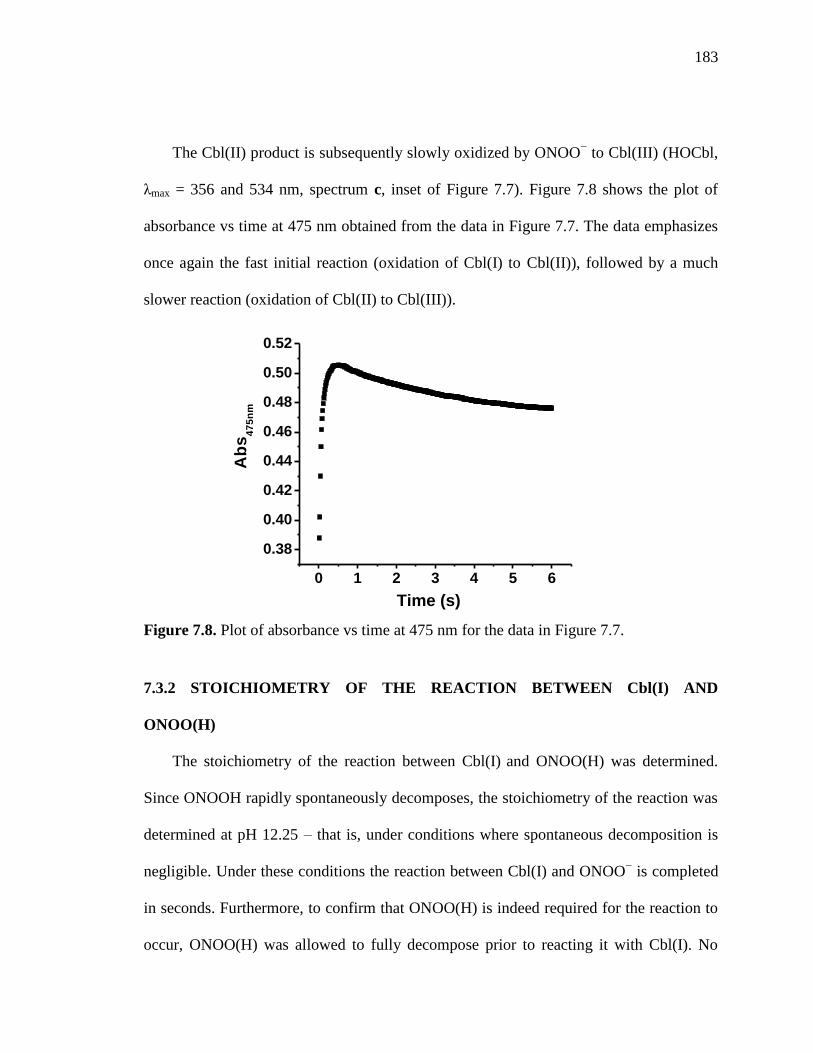
183
0 1 2 3 4 5 6
0.38
0.40
0.42
0.44
0.46
0.48
0.50
0.52
Ab
s4
75
nm
Time (s)
The Cbl(II) product is subsequently slowly oxidized by ONOO− to Cbl(III) (HOCbl,
λmax = 356 and 534 nm, spectrum c, inset of Figure 7.7). Figure 7.8 shows the plot of
absorbance vs time at 475 nm obtained from the data in Figure 7.7. The data emphasizes
once again the fast initial reaction (oxidation of Cbl(I) to Cbl(II)), followed by a much
slower reaction (oxidation of Cbl(II) to Cbl(III)).
Figure 7.8. Plot of absorbance vs time at 475 nm for the data in Figure 7.7.
7.3.2 STOICHIOMETRY OF THE REACTION BETWEEN Cbl(I) AND
ONOO(H)
The stoichiometry of the reaction between Cbl(I) and ONOO(H) was determined.
Since ONOOH rapidly spontaneously decomposes, the stoichiometry of the reaction was
determined at pH 12.25 – that is, under conditions where spontaneous decomposition is
negligible. Under these conditions the reaction between Cbl(I) and ONOO− is completed
in seconds. Furthermore, to confirm that ONOO(H) is indeed required for the reaction to
occur, ONOO(H) was allowed to fully decompose prior to reacting it with Cbl(I). No

184
450 600 7500
1
2
3
4
5
g
j
Ab
s
Wavelength (nm)
a
450 500 550 600
0.5
1.0
1.5
2.0g-j
fedcb
Ab
s
Wavelength (nm)
a
reaction was observed within the time frame of these experiments (see section 7.2.6 for
further details). Finally, the ONOO− stock solution unavoidably contains nitrite.
However, control experiments showed that the reaction of Cbl(I) with nitrite (or nitrate)
is several orders of magnitude slower than the Cbl(I)/ONOO(H) reaction and therefore
unimportant in the time frame of the stoichiometry experiments [341].
Figure 7.9 gives UV−vis spectra of equilibrated anaerobic solutions of Cbl(I) (λmax =
388, 463, 548 and 682 nm [337]) with ONOO− (0 − 0.30 mol equiv.) at pH 12.25.
Figure 7.9. UV−vis spectra for equilibrated anaerobic solutions of Cbl(I) (2.07 × 10⁻⁴
M) with 0, 0.05, 0.08, 0.10, 0.15, 0.18, 0.20, 0.25 and 0.30 mole equiv. ONOO− (traces
a−i) at pH 12.25 (25.0 C, 0.10 M phosphate buffer, I = 0.40 M). Trace j: UV−vis
spectrum of 2.00 × 10⁻⁴
M Cbl(II) under identical conditions (0.10 M phosphate buffer, I
= 0.40 M). Cbl(I) (λmax = 388, 463, 548 and 682 nm) is converted to Cbl(II) (λmax = 312,
405 and 475 nm) with isosbestic points at 417 and 542 nm. Inset: Trace a and trace g,
solid lines, superimposed with trace j (authentic Cbl(II)). Note that nitrite present in the
ONOO− solution absorbs at λ 400 nm.

185
0.0 0.1 0.2 0.3
0.6
0.8
1.0
1.2
1.4
1.6
Ab
s4
89
nm
[ONOO-]/[Cbl(I)]
A relatively high Cbl(I) concentration was used to maximize the stability of Cbl(I)
against oxidation to Cbl(II). Cbl(I) is cleanly converted to Cbl(II) (λmax = 312, 405, 475
nm), with isosbestic points at 417 and 542 nm, in agreement with literature values [337].
Figure 7.10 gives the corresponding plot of absorbance at 489 nm versus mole ratio of
ONOO− to Cbl(I) for the data shown in Figure 7.9. This wavelength (an isosbestic
wavelength for Cbl(II)/hydroxycobalamin [65]) was chosen to ensure no interference
from the subsequent Cbl(II) + peroxynitrite reaction, in which Cbl(II) is oxidized to
hydroxycobalamin. Figure 7.10 clearly shows that the reaction was complete upon the
addition of ~0.2 equiv. of ONOO−
to Cbl(I); that is, ONOO− acts as a 5 e
− oxidant in the
reaction of Cbl(I) with ONOO−.
Figure 7.10. Plot of absorbance at 489 nm versus [ONOO−]/[Cbl(I)] for the data shown
in Figure 7.9. The reaction is complete upon the addition of ~0.2 mol equiv. ONOO−.

186
As expected, a similar conclusion is reached by comparison of the observed absorbance
change for each experiment with the absorbance difference between Cbl(I) and authentic
Cbl(II), Table 7.1.
Table 7.1. Determination of the stoichiometry of the reaction between Cbl(I) and
ONOO− at pH 12.25 (25.0 C, 0.10 M phosphate buffer, I = 0.40 M). Absorbances were
measured at 489 nm.
In a 5 e− redox reaction peroxynitrite is oxidized to dinitrogen. The overall reaction is
therefore
5Cbl(I)− + 2(3) H2O + ONOO(H) 5Cbl(II) + ½ N2 + 5(6) OH
− (3)
Given that Cbl(I) is such a powerful reductant (E0(Cbl(II)/Cbl(I) =
−0.61 V with respect to SHE [336]), it is not surprising that a 5 e− redox reaction occurs
104[Cbl(I)]i
(M)
105[ONOO−]i
(M)
[ONOO−]i
/[Cbl(I)]i AbsCbl(I) AbsCbl(II) Absobs
Fraction
Cbl(I)
reacted[a]
Mol equiv.
ONOO−
required[b]
2.07 1.0 0.05 0.578 1.45 0.789 0.242 4.8
2.07 1.5 0.08 0.578 1.45 0.933 0.407 5.4
2.07 2.0 0.10 0.578 1.45 1.02 0.507 5.1
2.07 3.0 0.15 0.578 1.45 1.25 0.771 5.1
2.07 3.6 0.18 0.578 1.45 1.40 0.943 5.2
2.07 4.0 0.20 0.578 1.45 1.44 0.989 4.9
2.07 5.0 0.25 0.578 1.45 1.44 − −
2.07 6.0 0.30 0.578 1.45 1.48 − −
[a] Fraction of Cbl(I) reacted =AbsCbl(I) - Absobs
AbsCbl(I) - AbsCbl(II)
[b ]Mol equiv. of ONOO- =Fraction of Cbl(I) reacted
[ONOO-]i / [Cbl(I)]i
187
to ultimately produce the most thermodynamically stable product, N2 [324]. Control
experiments were also carried out which confirmed that a 6 e− reaction does not occur
(NH2OH would be formed; see Section 7.2.7). A 4 e− reduction of ONOO(H) to N2O can
also be ruled out since others have shown that N2O itself reacts rapidly with Cbl(I) to
yield Cbl(II) and N2 [338].
It is well established by others that peroxynitrite is a 1e− or 2 e
− oxidant [276, 281].
The proposed reaction pathways for the reaction between Cbl(I) and ONOO(H) are given
in Scheme 7.1(a). Rate−determining 1e− oxidation of Cbl(I) by ONOOH or ONOO
− to
give Cbl(II) and nitrogen dioxide (NO2) is succeeded by multiple fast steps (elementary
steps of molecularity greater than two are extremely rare), leading ultimately to the
oxidation of a further four Cbl(I) molecules to Cbl(II) and the formation of N2. Note that
like peroxynitrite, NO2 is a powerful oxidant (E
0(NO2, N2) = +1.36 V with respect to
SHE [341]). Control experiments also showed that Cbl(I) reacts instantly with NO2 (see
Section 7.2.8). A 2 e− pathway can be ruled out since the reaction between NO2
− and
Cbl(I) is negligible on the time scale of these experiments.[341] For a 2 e−
rate−determining step, Scheme 7.1(b), a Cbl(I):ONOO(H) reaction stoichiometry of 2:1
would be expected, which is not consistent with the experimentally observed
stoichiometry of 5:1.

188
Scheme 7.1. Possible pathways for the reaction between Cbl(I) and ONOO(H). A rate
constant for the reaction between Cbl(I) and HOCbl/H2OCbl+ to yield 2Cbl(II) has been
reported (k = 3.2 × 10⁷ M
−1 s
−1 ; pH independent [338]).
7.4 SUMMARY
Kinetic and mechanistic studies on the reaction between Cbl(I) and
peroxynitrite/peroxynitrous acid show that both ONOOH and ONOO− rapidly oxidize
Cbl(I) to Cbl(II), with the former species reacting much faster as expected (1.6 × 10⁸
versus 1.4 × 10⁵ M
−1 s
−1, respectively), since ONOOH is a much stronger oxidant. Under

189
physiological pH conditions, the observed rate constant was estimated to be 3.6 × 10⁷
M−1
s−1
. The reaction stoichiometry was determined by UV-vis spectroscopy titration
experiments and found to be 5:1 Cbl(I):ONOO(H). The proposed reaction pathway
involves rate−determining 1e− oxidation of Cbl(I) by ONOO(H) to yield Cbl(II) and
NO2 followed by multiple fast steps leading ultimately to the oxidation of 5 Cbl(I) to 5
Cbl(II) and the generation of N2.
Given the importance of the transient Cbl(I) intermediate in the methylation of
homocysteine to methionine catalyzed by methylcobalamin−dependent methionine
synthase [6], it is likely that this reaction is compromised by elevated peroxynitrite levels.
The production of the adenosylcobalamin and methylcobalamin cofactors for methionine
synthase and L−methylmalonyl−CoA mutase may also be affected, since cofactor
biosynthesis occurs via a cob(I)alamin intermediate [6]. Finally, note that although
peroxynitrite rapidly oxidizes the metal center of cob(I)alamin, the corrin moiety of the
cobalamin complex remains intact. This is important, given that others have reported
elevated levels of “cobalamin analogs” (the corrin moiety of cobalamin is modified) in
neurological diseases associated with oxidative stress [342].
190
CONCLUSIONS
The unifying theme of this dissertation is fundamental studies on the coordination
chemistry for a number of transition metal systems (vanadium(III), barium(II) and
cobalamins) in aqueous solution. Synthesis, characterization in the solid and solution
states by a wide range of techniques, and kinetic and mechanistic studies for some of
these systems has been carried out.
Chapter 2 reports X-ray diffraction, NMR and UV-vis spectroscopic studies for a
series of V(III)/carboxylato complexes. This research provides structural and
spectroscopic evidence for the spontaneous formation of trinuclear and tetranuclear
complexes of V(III) in aqueous solution. Prior to this study there was no structural
evidence for formation of V(III) complexes of nuclearity greater than two in aqueous
solution; namely only UV-vis titration, potentiometric and electrochemical titration data.
Future studies could include bulk syntheses of these complexes in a pure form and studies
on their magnetic properties. Syntheses of V(III)/carboxylato complexes in organic
solvents rather than in aqueous solution may assist in obtaining large amounts of pure
products, since V(III)/carboxylato complexes were found to be very soluble in aqueous
solution. Frequently inorganic salts co-crystallized with the desired product.
In Chapter 3 X-ray diffraction, NMR, IR and TGA studies of a novel
Ba(II)/thiodiacetato polymeric complex is reported. This structure is an important
addition to the scientific literature given that there are only a limited number of Ba(II)

191
complexes which have been structurally characterized. Ba(II) coordination chemistry is
intriguing, given that this large metal cation forms 8 – 12 coordinate complexes. Our
research opens the door for the synthesis and characterization of other complexes of
Ba(II) incorporating ligands with carboxylate and/or carboxylate plus thiol moieties.
Some of these complexes may have applications found with other metal – organic
framework structures, including selective gas adsorption, ion-selective sensors and
catalysis applications.
The remaining chapters of this dissertation concern cobalamin chemistry.
Chapters 4 and 5 focus on novel cobalamin bioconjugates of vanadate and captopril, with
medicinal applications. Vanadate complexes are of interest because of their potential in
treating diabetes. In Chapter 4 two novel vanadium(V) bioconjugates of vitamin B12 are
characterized by a wide range of techniques in solution and the blood glucose lowering
properties of the bioconjugates are studied in vivo, using the STZ-rat model for type 1
diabetes. Future studies could involve the synthesis of vanadium/B12 conjugates
incorporating other ligands which are known to chelate strongly to vanadate and studies
on the efficacy of these complexes using cell models for diabetes. In Chapter 5 the
synthesis, characterization and kinetic studies on the formation and decomposition of
captoprilcobalamin (CapSCbl) are reported. Captopril is widely used to treat
hypertension and cardiovascular disease; however high doses are required, with
undesirable side effects. Since binding drugs to the β-axial site of vitamin B12 is known to
enhance the uptake of the drug, it would be interesting to study whether this is also the
case for the captopril conjugate in animal models. Also, given that other

192
thiolatocobalamins have superior cellular antioxidant properties compared with the
currently available B12 pharmaceuticals, this biochemistry could also be explored.
The last two chapters of this thesis are concerned with kinetic and mechanistic
studies on the reactions of cob(II)alamin and cob(I)alamin with
peroxynitrite/peroxynitrous acid (ONOO−/ONOOH), potent reactive nitrogen species
associated with oxidative/nitrosative stress and chronic inflammation. Cob(II)alamin and
cob(I)alamin are important intracellular cobalamin forms. Cob(III)alamins are reduced to
cob(II)alamin immediately upon entering cells, and cob(I)alamin is a transient
intermediate of the reaction catalyzed by methionine synthase and an intracellular
biosynthetic precursor for formation of the two coenzyme forms of B12. Furthermore,
both mammalian B12-dependent enzyme reactions are known to be compromised under
oxidative/nitrosative stress conditions. Studies showed that peroxynitrous acid rapidly
oxidizes both Cbl(II) (to Cbl(III)’s) and Cbl(I) (to Cbl(II), which then reacts further with
ONOO(H)) under physiologically relevant pH conditions. Both reactions involve
multiple steps; however one limitation of kinetic studies is that mechanistic information
for the rate-determining step only is obtained. A •NO2 intermediate was proposed in both
reaction pathways. Future studies could involve directly studying the reaction of •NO2
(generated by pulse radiolysis), with Cbl(II) and Cbl(I), •NO2 also being a potent reactive
nitrogen species. Cell studies to probe the ability of Cbl to scavenge ONOO(H) are also
of interest.

193
REFERENCES
1. Stabler, S.P. and Allen, R.H. Vitamin B12 deficiency as a worldwide problem,
Annu. Rev. Nutr., 2004, 24, p. 299-326.
2. Green, R. and Miller, J.W. Vitamin B12 in Handbook of Vitamins (4th ed.), 2007,
p. 413-457.
3. O'Leary, F. and Samman, S. Vitamin B12 in health and disease, Nutrients, 2010, 2,
299-316.
4. Carmel, R. Cobalamin Deficiency, in Homocysteine in Health and Disease, (Eds.:
Jacobsen, D.W. and Carmel, R.), 2001, Cambridge University Press, Cambridge,
p. 289-305.
5. Banerjee, R., Gherasim, C. and Padovani, D. The tinker, tailor, soldier in
intracellular B12−trafficking, Curr. Opin. Chem. Biol., 2009, 13, 477-484.
6. Randaccio, L. et al. Vitamin B12: Unique Metalorganic Compounds and the Most
Complex Vitamins, Molecules, 2010, 15, 3228-3259.
7. McCully, K.S. Hyperhomocysteinemia and arteriosclerosis: historical
perspectives, Clin. Chem. Lab. Med., 2005, 43, 980-986.
8. Seshadri, S. et al. Plasma homocysteine as a risk factor for dementia and
Alzheimer's disease, N. Engl. J. Med., 2002, 346, 476-83.
9. Clarke, R. et al. Folate, vitamin B12, and serum total homocysteine levels in
confirmed Alzheimer disease, Arch. Neurol., 1998, 55, 1449-55.
194
10. McCaddon, A. et al. Total serum homocysteine in senile dementia of Alzheimer
type, Int. J. Geriatr. Psych., 1998, 13, 235-9.
11. Brown, K.L. Chemistry and enzymology of vitamin B12,Chem. Rev., 2005, 105,
2075-149.
12. Krautler, B. Organometallic Chemistry of B12 Coenzymes in Metal Ions in Life
Sciences (Eds. Sigel, H. and Sigel, A.), Vol. 6, 2009, Royal Society of Chemistry,
Cambridge, UK, p. 53-114.
13. Chowdhury, S. and Banerjee, R. Thermodynamic and Kinetic Characterization of
Co-C Bond Homolysis Catalyzed by Coenzyme B12-Dependent Methylmalonyl-
CoA Mutase, Biochemistry, 2000, 39, 7998-8006.
14. Finke, R.G. and Martin, B.D. Coenzyme AdoB12 vs AdoB12: Homolytic Co---C
cleavage following electron transfer: A rate enhancement ≥ 1012
, J. Inorg.
Biochem., 1990, 40, 19-22.
15. Pedersen, G.A. et al. AMN directs endocytosis of the intrinsic factor-vitamin B12
receptor cubam by engaging ARH or Dab2, Traffic, 2010, 11, 706-720.
16. Hannibal, L. et al. Processing of alkylcobalamins in mammalian cells: A role for
the MMACHC (cblC) gene product, Mol. Genet. Metab., 2009, 97, 260-266.
17. Banerjee, R. in Chemistry and Biochemistry of B12 (Ed. Banerjee, R.), 1999, John
Wiley & Sons Inc., New York, p. 32-34.
18. Marques, H.M., Brown, K.L. and Jacobsen, D.W. Kinetics and activation
parameters of the reaction of cyanide with free aquocobalamin and
195
aquocobalamin bound to a haptocorrin from chicken serum, J. Biol. Chem., 1988,
263, p. 12378-83.
19. Marques, H.M. Ligand substitution reactions of aquacobalamin: evidence for a
dissociative interchange mechanism, J. Chem. Soc., Dalton Trans., 1992, 2019-
2027.
20. Marques, H.M. Activation parameters for the reaction of aquocobalamin (vitamin
B12a) with small anionic and neutral ligands, J. Chem. Soc. Dalton Trans., 1991,
339-341.
21. Xia, L. et al. Studies on the formation of glutathionylcobalamin: any free
intracellular aquacobalamin is likely to be rapidly and irreversibly converted to
glutathionylcobalamin, Inorg. Chem., 2004, 43(21), 6848-57.
22. Hannibal, L. et al. Accurate assessment and identification of naturally occurring
cellular cobalamins, Clin. Chem. Lab. Med., 2008, 46, 1739-1746.
23. De, T.N.R., Lexa, D. and Saveant, J.M. Electrochemistry of vitamin B12. 4.
Kinetics and mechanisms in B12a-B12r oxido-reduction, J. Am. Chem. Soc., 1979,
101, 467-73.
24. Pratt, J.M. Inorganic Chemistry of Vitamin B12, 1972, Academic Press, New
York.
25. Krautler, B. Vitamin B12: chemistry and biochemistry, Biochem. Soc. Trans.,
2005, 33, 806-10.
26. Suarez-Moreira, E. et al. A simple, convenient method to synthesize cobalamins:
synthesis of homocysteinylcobalamin, N-acetylcysteinylcobalamin, 2-N-

196
acetylamino-2-carbomethoxyethanethiolatocobalamin, sulfitocobalamin and
nitrocobalamin, Dalton Trans., 2006, 44, 5269-77.
27. Hannibal, L. et al. Nitroxylcob(III)alamin: Synthesis and X-ray Structural
Characterization, Angew. Chem. Int. Ed., 2007, 46, 5140-5143.
28. Mukherjee, R. et al. Synthesis, synchrotron X-ray diffraction, and kinetic studies
on the formation of a novel thiolatocobalamin of captopril: evidence for cis-trans
isomerization in the beta-axial ligand, Inorg. Chem., 2009, 48, 9526-34.
29. Hodgkin, D.C. et al. Structure of vitamin B12, Nature, 1956, 178, 64-6.
30. Randaccio, L. et al. X-ray structural chemistry of cobalamins, Coord. Chem.
Rev., 2006, 250, 1332-1350.
31. Savage, H.F.J. et al. High-resolution neutron and x-ray refinement of vitamin B12
coenzyme, C72H100CoN18O17P.17H2O, Acta Crystallogr., Sect. B: Struct. Sci.,
1987, B43, 280-95.
32. Rossi, M. et al. The structure of a B12 coenzyme: methylcobalamin studies by x-
ray and NMR methods, J. Am. Chem. Soc., 1985, 107, 1729-38.
33. Hannibal, L. et al. X-ray structural characterization of imidazolylcobalamin and
histidinylcobalamin: cobalamin models for aquacobalamin bound to the B12
transporter protein transcobalamin, Inorg. Chem., 2007, 46, 3613-8.
34. Hannibal, L. et al. High Resolution Crystal Structure of the Methylcobalamin
Analogues Ethylcobalamin and Butylcobalamin by X-ray Synchrotron Diffraction,
Inorg. Chem., 2009, 48, 6615-6622.

197
35. Hannibal, L., Smith, C.A. and Jacobsen, D.W. The X-Ray Crystal Structure of
Glutathionylcobalamin Revealed, Inorg. Chem., 2010, 49, 9921-9927.
36. Randaccio, L. et al. Structural aspects of B12 chemistry and biochemistry: from
simple models to proteins, Trends Inorg. Chem., 2009, 11, 1-19.
37. Randaccio, L. et al. Crystal Chemistry of Cobalamins. Structural
Characterization of the Co-S Bond in Cobalamins, Inorg. Chem., 1999, 38, 4087-
4092.
38. Garau, G. et al. Crystal chemistry and binding of NO2, SCN and SeCN to Co in
cobalamins, Acta Crystallogr. B, 2003, 59, 51-9.
39. Brasch, N.E. and Finke, R. G. A simple, convenient and direct method for
assessing the purity of cobalamins, J. Inorg. Biochem., 1999, 73, 215.
40. Hassanin, H.A. et al. NMR spectroscopy and molecular modelling studies of
nitrosylcobalamin: further evidence that the deprotonated, base-off form is
important for nitrosylcobalamin in solution, Dalton Trans., 2009, 424-433.
41. Schneider, Z. in Comprehensive B12, 1987, Walter de Gruyter, Berlin, New York,
p. 56-77.
42. Brown, K.L., Marques, H.M. and Jacobsen, D.W. Heteronuclear NMR studies of
cobalamins. 31
P NMR observations of cobalamins bound to a haptocorrin from
chicken serum, J. Biol. Chem., 1988, 263, 1872-7.
43. Brown, K.L. et al. Heteronuclear NMR Studies of Cobalt Corrinoids. 18.
Correlation of Structure and Magnetic Resonance Parameters in Base-On
Cobalamins(1), Inorg. Chem., 1996, 35, 415-423.

198
44. Brown, K.L., Hakimi, J.M. and Jacobsen, D.W. Heteronuclear NMR studies of
cobalamins. 3. Phosphorus 31 NMR of aquocobalamin and various
organocobalamins, J. Am. Chem. Soc., 1984, 106, 7894-7899.
45. Brown, K.L. Heteronuclear NMR Studies of Cobalamins. 6. The Nucleotide Loop
pf Base-Off Cobalamins and the NAture of the Base-Off Species, J. Am. Chem.
Soc., 1987, 109, 2277-84.
46. Taraszka, K.S. et al. Identification of structural markers for vitamin B12 and other
corrinoid derivatives in solution using FTIR spectroscopy, Biochemistry, 1991,
30, 1222-7.
47. Scalabrino, G. et al. Increased spinal cord NGF levels in rats with cobalamin
(vitamin B12) deficiency, Neurosci. Lett., 2006, 396, 153-158.
48. Scalabrino, G. and Peracchi, M. New insights into the pathophysiology of
cobalamin deficiency, Trends Mol. Med., 2006, 12, 247-254.
49. Veber, D. et al. Indirect Down-Regulation of Nuclear NF-β Levels by Cobalamin
in the Spinal Chord and Liver of the Rat, J. Neurosci. Res., 2008, 86, 1380.
50. Scalabrino, G., Veber, D. and Mutti, E. Experimental and clinical evidence of the
role of cytokines and growth factors in the pathogenesis of acquired cobalamin-
deficient leukoneuropathy, Brain Res. Rev., 2008, 59, 42-54.
51. Greenberg, S.S. et al. Hydroxocobalamin (vitamin B12a) prevents and reverses
endotoxin-induced hypotension and mortality in rodents: role of nitric oxide, J.
Pharmacol. Exp. Ther., 1995, 273, 257-65.
199
52. Wheatley, C. A scarlet pimpernel for the resolution of inflammation? The role of
supra-therapeutic doses of cobalamin, in the treatment of systemic inflammatory
response syndrome (SIRS), sepsis, severe sepsis, and septic or traumatic shock,
Med. Hypotheses, 2006, 67, 124-142.
53. Wheatley, C. The return of the Scarlet Pimpernel: cobalamin in inflammation II -
cobalamins can both selectively promote all three nitric oxide synthases (NOS),
particularly iNOS and eNOS, and, as needed, selectively inhibit iNOS and nNOS,
J. Nutr. Environ. Med., 2007, 16, 181-211.
54. Crocket, J.A. Cyanocobalamin in asthma, Acta Allergol., 1957, 11, 261-8.
55. Valko, M. et al. Free radicals, metals and antioxidants in oxidative stress-induced
cancer, Chem-Biol. Interact., 2006, 160, 1-40.
56. Rand, M. J. and Li, C.G. Differential effects of hydroxocobalamin on relaxations
induced by nitrosothiols in rat aorta and anococcygeus muscle, Eur. J.
Pharmacol., 1993, 241, 249-54.
57. Schubert, R. et al. Nitric oxide donor sodium nitroprusside dilates rat small
arteries by activation of inward rectifier potassium channels, Hypertension, 2004,
43, 891-6.
58. Jiang, F., Li, C.G. and Rand, M. J. Effect of hydroxocobalamin on vasodilatations
to nitrergic transmitter, nitric oxide and endothelium-derived relaxing factor in
guinea-pig basilar artery, Eur. J. Pharmacol., 1997, 340, 181-6.
59. Brouwer, M. et al. Nitric oxide interactions with cobalamins: biochemical and
functional consequences, Blood, 1996, 88, 1857-64.
200
60. Danishpajooh, I.O. et al. Nitric oxide inhibits methionine synthase activity in vivo
and disrupts carbon flow through the folate pathway, J. Biol. Chem., 2001, 276,
27296-303.
61. Kambo, A. et al. Nitric oxide inhibits mammalian methylmalonyl-CoA mutase, J.
Biol. Chem., 2005, 280, 10073-82.
62. Weil, M. et al. Folic acid rescues nitric oxide-induced neural tube closure defects,
Cell Death Differ., 2004, 11, 361-3.
63. Wolak, M. et al. Kinetics and mechanism of the reversible binding of nitric oxide
to reduced cobalamin B12r (Cob(II)alamin), J. Am. Chem. Soc., 2001, 123, 9780-
91.
64. Zheng, D. and Birke, R. L. Spectroscopic evidence for nitric oxide binding with
cob(II)alamin, J. Am. Chem. Soc., 2001, 123, 4637-8.
65. Suarez-Moreira, E. et al. Vitamin B12 and Redox Homeostasis: Cob(II)alamin
Reacts with Superoxide at Rates Approaching Superoxide Dismutase (SOD), J.
Am. Chem. Soc., 2009, 131, 15078-15079.
66. Mathews, F.S. et al. Crystal structure of human intrinsic factor:cobalamin
complex at 2.6-Å resolution, Proc. Natl. Acad. Sci. U. S. A., 2007, 104, 17311-
17316.
67. Wuerges, J. et al. Structural basis for mammalian vitamin B12 transport by
transcobalamin, Proc. Natl. Acad. Sci. U. S. A., 2006, 103, 4386-4391.
68. Waibel, R. et al. New Derivatives of Vitamin B12 Show Preferential Targeting of
Tumors, Cancer Res., 2008, 68, 2904-2911.

201
69. Siega, P. et al. Release of Toxic Gd3+ Ions to Tumour Cells by Vitamin B12
Bioconjugates, Chem.--Eur. J., 2009, 15, 7980-7989.
70. Bagnato, J. D. et al. Synthesis and Characterization of a Cobalamin-Colchicine
Conjugate as a Novel Tumor-Targeted Cytotoxin, J. Org. Chem., 2004, 69, 8987-
8996.
71. Collins, D.A. and Hogenkamp, H.P.C. Cobalamin conjugates useful as imaging
agents and as antitumor agents, 2005, US patent appl. US20050004010.
72. Ruiz-Sanchez, P. et al. Vitamin B12 as a carrier for targeted platinum delivery: in
vitro cytotoxicity and mechanistic studies, J. Biol. Inorg. Chem., 2011, 16, 33-44.
73. Ruiz-Sanchez, P., et al. Syntheses and characterization of vitamin B12-Pt(II)
conjugates and their adenosylation in an enzymatic assay, J. Biol. Inorg. Chem.,
2008, 13, 335-347.
74. Seetharam, B. Upregulation of transcobalamin (TC) and its receptor in colonic
inflammation: effect of homocysteine, Am. J. Physiol. Gastrointest. Liver.
Physiol., 2007, 293, G918.
75. Wang, X., Wei, L. and Kotra, L.P. Cyanocobalamin (vitamin B12) conjugates with
enhanced solubility, Bioorg. Med. Chem., 2007, 15, 1780-1787.
76. Chalasani K. B. A novel vitamin B12-nanosphere conjugate carrier system for
peroral delivery of insulin, J. Control. Release, 2007, 117, 421.
77. Chalasani, K.B. et al. Carrier systems comprising vitamin B12-biodegradable
microparticulate conjugates for peroral delivery of drugs, peptides/proteins and
vaccines, 2002, US patent appl. US20020192235.

202
78. Chalasani, K.B. et al. Effective oral delivery of insulin in animal models using
vitamin B12-coated dextran nanoparticles, J. Control. Release, 2007, 122, 141-
150.
79. Petrus A. K. Vitamin B12 as a carrier for the oral delivery of insulin,
ChemMedChem, 2007, 2, 1717.
80. Petrus, A. K. et al. Exploring the implications of vitamin B12 conjugation to
insulin on insulin receptor binding, ChemMedChem, 2009, 4, 421-426.
81. Smeltzer, C.C. et al. Synthesis and Characterization of Fluorescent Cobalamin
(CobalaFluor) Derivatives for Imaging. Org. Lett., 2001, 3, 799-801.
82. Hogenkamp, H.P.C. et al. Synthesis and characterization of nido-carborane-
cobalamin conjugates, Nucl. Med. Biol., 2000, 27, 89-92.
83. Ruiz-Sanchez, P. et al. Iodination of cisplatin adduct of Vitamin B12 [{B12}-CN-
{cis-PtCl(NH3)2}]+, J. Organomet. Chem., 2007, 692, 1358-1362.
84. Collins, D.A. and Hogenkamp, H.P.C. Transcobalamin II receptor imaging via
radiolabeled diethylene-triaminepentaacetate cobalamin analogs, J. Nucl. Med.,
1997, 38, 717-23.
85. Hogenkamp, H.P.C. Labeled cobalamin derivatives, their preparation, and their
use in medical imaging, 2002, US patent appl. US20020049155.
86. Clark, R. J. H., in Comprehensive Inorganic Chemsitry (Eds. Bailar, J. J. C.,
Emeleus, H.J., Nyholm, R. and Trotman-Dickerson, A. F.), Vol. 3, 1973,
Perganon Press, Oxford, New York, Toronto, Sydney, p. 491.

203
87. Rehder, D. Inorganic Considerations on the Function of Vanadium in Biological
Systems in Metal Ions in Biological Systems (Eds. Sigel, H. and Sigel, A.), Vol.
31, 1995, Marcel Dekker, New York, p. 2.
88. Crans, D.C. and Smee, J.J. in Comprehensive Coordination Chemistry II (Eds.
McCleverty, J.A. and Meyer, T.J.), Vol. 4, 2004, Elsevier, London, New york. p.
175-240.
89. Basolo, F. Coordination Chemistry; the Chemistry of Metal Complexes, 1964, W.
A. Benjamin, New York.
90. Makinen, M. W. and Mustafi, D. The vanadyl ion: Molecular structure of
coordinating ligands by EPR and ENDOR spectroscopy in Metals Ions in
Biological Systems (Eds. Sigel, H. and Sigel, A.), Vol. 31, 1995, Marcel Dekker,
New York, p. 89.
91. Rehder, D. Inorganic Considerations on the Function of Vanadium in Biological
Systems in Metal Ions in Biological Systems (Eds. Sigel, H. and Sigel, A.), Vol.
31, 1995, Marcel Dekker, New York, p. 6.
92. Krzystek, J. et al. Pseudooctahedral Complexes of Vanadium(III): Electronic
Structure Investigation by Magnetic and Electronic Spectroscopy, Inorg. Chem.,
2004, 43, 5645-5658.
93. Drago, R.S. Physical Methods for Chemists (2nd ed.), 1992, Saunders College
Publishers, Forth Worth, USA, p578.
204
94. Crans, D.C. Interaction of Vanadates with Biogenic Ligands in Metal Ions in
Biological Systems (Eds. Sigel, H. and Sigel, A.), Vol. 31, 1995, Marcel Dekker,
Inc., New York, p. 147.
95. Meier, R. B., Mitzenheim, S. and Kanamori, K. Solution Properties of
Vanadium(III) with Regard to Biological Systems in Metal Ions in Biological
Systems (Eds. Sigel, H. and Sigel, A.), Vol. 31, 1995, Marcel Dekker, New York.
p. 46.
96. Francavilla, J. and Chasteen, N. D. Hydroxide effects on the electron
paramagnetic resonance spectrum of aqueous vanadyl(IV) ion. Inorg. Chem.,
1975, 14, 2860-2862.
97. Iannuzzi, M. M. and Rieger, P. H. Nature of vanadium(IV) in basic aqueous
solution. Inorg. Chem., 1975, 14, 2895-2899.
98. Crans, D.C. et al. The Chemistry and Biochemistry of Vanadium and the
Biological Activities Exerted by Vanadium Compounds, Chem. Rev., 2004, 104,
849-902.
99. Tracey, A.S. and Crans, D.C. Vanadium Compounds: Chemistry, Biochemistry,
and Therapeutic Applications, ACS Symp. Ser., 1998, 711, pp. 381.
100. Mukherjee, B. et al. Vanadium-an element of atypical biological significance.
Toxicol. Lett., 2004, 150, 135-143.
101. Coupe, E.E. et al. The dodecameric vanadium-dependent haloperoxidase from the
marine algae Corallina officinalis: Cloning, expression, and refolding of the
recombinant enzyme, Protein Expr. Purif., 2007, 52, 265-272.

205
102. Baran, E. J. Vanadium in plants, fungi, and bacteria: structural aspects and
functions, Adv. Plant Physiol., 2008. 10, p. 12.
103. Chasteen, N.D. Vanadium in Biological Systems. Physiology and Biochemistry,
1990, p. 225.
104. Chasteen, N.D. The biochemistry of vanadium, Struct. Bond., 1983, 53, 105.
105. Crans, D.C., Shin, P.K. and Armstrong, K.B. Application of NMR spectroscopy to
studies of aqueous coordination chemistry of vanadium(V) complexes, Adv.
Chem. Ser., 1995, 246, 303-28.
106. Stankiewicz, P.J and Crans, D. C. Inhibition of phosphate-metabolizing enzymes
by oxovanadium(V) complexes in Metal Ions in Biological Systems (Eds. Sigel, H.
and Sigel, A.), Vol. 31, 1995, Marcel Dekker, New York, p. 287.
107. Sakurai, H. Therapeutic potential of vanadium in treating diabetes mellitus, Clin.
Calcium, 2005, 15, 49-57.
108. Thompson, K.H. and Orvig, C. Vanadium compounds in the treatment of diabetes
in Metal Ions in Biological Systems, 2004, 41, 221-252.
109. Chen, F. et al. Cell apoptosis induced by carcinogenic metals, Mol. Cell.
Biochem., 2001, 222, 183-188.
110. Chatterjee, M. and Bishayee, A. Vanadium - a new tool for cancer prevention.
Adv. Environ. Sci. Tech., 1998, 31, 347-390.
111. Xie, M.-J. et al. Effect of the chloro-substitution on lowering diabetic
hyperglycemia of vanadium complexes with their permeability and cytotoxicity,
Eur. J. Med. Chem., 2010, 45, 6077-6084.

206
112. Smee, J.J. et al. Chloro-substituted dipicolinate vanadium complexes: Synthesis,
solution, solid-state, and insulin-enhancing properties, J. Inorg. Biochem., 2009,
103, 575-584.
113. D'Cruz, O.J. and Uckun, F. M. Metvan: a novel oxovanadium(IV) complex with
broad spectrum anticancer activity, Expert Opin. Invest., Drugs, 2002, 11, 1829-
1836.
114. Shabani, F. and Ghammamy, S. Synthesis, characterization and anti-tumour
activity of VOF3 and Cu (II) porphyrine complexes, Pharma Chem., 2009, 1, 124-
129.
115. Kanamori, K. Structures and properties of multinuclear vanadium(III) complexes:
seeking a clue to understand the role of vanadium(III) in ascidians, Coord. Chem.
Rev., 2003, 237, 147-161.
116. Cotton, F.A. et al. Four compounds containing oxo-centered trivanadium cores
surrounded by six µ, η2-carboxylato groups, Inorg. Chem., 1986. 25, 3505-12.
117. Glowiak, T., Kubiak, M. and Jezowska-Trzebiatowska, B. The crystal and
molecular structures of trinuclear vanadium and chromium complexes with
chloroacetic acid. [V3O(CH2ClOO)6(H2O)3]ClO4.3H2O and
[Cr3O(CH2ClCOO)6(H2O)3]NO3.3H2O, Bull. Acad. Pol. Sci., 1977, 25, 359-71.
118. Laye, R.H. et al. Solvothermal syntheses of high-nuclearity vanadium(III)
clusters, Chem.--Eur. J., 2003. 9, 6215-6220.
119. Ting, C. et al. Dimeric and Cyclotrimeric Piano-Stool Vanadium(III) Dihalides
with Unusual Differences in V-V Distance and Magnetochemistry. Syntheses,

207
Structures, and Reactivities of (h-C5Me4R)2V2(m-Br)4 and the Trivanadium
Cluster (h-C5Me4R)3V3(m-Cl)6, New Mid-Valent Organovanadium Synthons,
Organometallics, 1997, 16, 1816-1818.
120. Castro, S.L. et al. Structural, Spectroscopic, and Magnetochemical
Characterization of the Trinuclear Vanadium(III) Carboxylates
[V3O(O2CR)6L3](ClO4) (R = Various Groups; L = Pyridine, 4-Picoline, 3,5-
Lutidine), Inorg. Chem., 1996. 35, 4462-4468.
121. Castro, S.L. et al. Single-Molecule Magnets: Tetranuclear Vanadium(III)
Complexes with a Butterfly Structure and an S = 3 Ground State, J. Am. Chem.
Soc., 1998. 120, 2365-2375.
122. Bond, M.R. et al. Spectroscopic and Magnetostructural Correlations in Oxo-
Bridged Dinuclear Vanadium(III) Complexes of Potential Biological Significance,
Inorg. Chem., 1995, 34, 5857-69.
123. Carrano, C.J., Verastgue, R. and Bond, M. R. Structural and magnetic
consequences of protonation of the oxo bridge in
bis(hydridotripyrazolylborato)(.mu.-oxo)bis(.mu.-carboxylato)divanadium
complexes, Inorg. Chem., 1993, 32, 3589-90.
124. Knopp, P. and K. Wieghardt, Switching the mechanism of spin-exchange coupling
in (m-oxo)bis(m-carboxylato)divanadium(III) complexes by protonation of the
oxo bridge, Inorg. Chem., 1991, 30, 4061-6.
125. Kumagai, H. and Kitagawa, S. Synthesis and structure of novel vanadium(III)
compounds having a cyclic core, Chem. Lett., 1996, 471-472.
208
126. Cotton, F. A., Duraj, S. A. and Roth, W. J. An octanuclear basic benzoate
containing four vanadium(III) and four zinc(II) atoms:
[VZnO(O2CC6H5)3(THF)]4.2THF, Inorg. Chem., 1984, 23, 4042-5.
127. Khanra, S. et al. Families of Molecular Hexa- and Trideca-Metallic
Vanadium(III) Phosphonates, Materials, 2010, 3, 232-240.
128. Miyoshi, K., Wang, J. and Mizuta, T. An X-ray crystallographic study on the
molecular structures of seven-coordinate (ethylenediamine-N,N,N'-triacetato-N'-
acetic acid)(aqua)titanium(III) and -vanadium(III), [TiIII(H-edta)(H2O)].H2O
and [VIII
(Hedta)(H2O)].H2O, Inorg. Chim. Acta, 1995, 228, 165-72.
129. Kristine, F. J. and Shepherd, R. E. The monomer-dimer equilibriums of N-
hydroxyethylethylenediaminetriacetatovanadium(III) [V(HEDTA)], J. Am. Chem.
Soc., 1977, 99, 6562-70.
130. Grey, I. E. et al. Structure of trans-diaquabis(oxalato)vanadate(III) complexes:
A[V(C2O4)2(H2O)2].xH2O, A = Cs (x = 4) and A = CH3NH3 (x = 4.5), Acta
Crystallogr., 1985, C41, 681-3.
131. Fenn, R. H., Graham, A. J. Gillard, D. Structures of tris-oxalato-complexes of
trivalent metals, Nature, 1967, 213, 1012-13.
132. Wieghardt, K. et al. Spontaneous self-assembly of the {M2(m-O)(m-MeCO2)2}2+
core. Synthesis, structure, and properties of the binuclear vanadium(III) complex,
J. Chem. Soc., Chem. Comm., 1986, 1530-2.

209
133. Hotzelmann, R. et al. Spin exchange coupling in asymmetric heterodinuclear
complexes containing the µ-oxo-bis(µ-acetato)dimetal core, J. Am. Chem. Soc.,
1992, 114, 1681-96.
134. Knopp, P. et al. Syntheses, electrochemistry, and spectroscopic and magnetic
properties of new mononuclear and binuclear complexes of vanadium(III), -(IV,
and -(V) containing the tridentate macrocycle 1,4,7-trimethyl-1,4,7-
triazacyclononane (L). Crystal structures of [L2V2(acac)2(µ-O)]I2.2H2O,
[L2V2O4(µ-O)].14H2O, and [L2V2O2(OH)2(µ-O)](ClO4)2, Inorg. Chem., 1990, 29,
363-71.
135. Koeppen, M. et al. Syntheses and spectroscopic and magnetic properties of novel
binuclear vanadium(III)/(IV) complexes. Crystal structures of [L2V2(µ-O)( µ-
CH3CO2)2]I2.2H2O and [L2V2O2(µ-CH3CO2)2]I2 (L = 1,4,7-trimethyl-1,4,7-
triazacyclononane), Inorg. Chem., 1988, 27, 721-7.
136. McGregor, K. T., Kalinnikov, V. T. and Hatfield, W. E. Magnetic properties of
the dimeric vanadium(III) complexes tetra-m-carboxylatobis[p-
cyclopentadienylvanadium(III)], J. Organometal. Chem., 1975, 101, 321-30.
137. Larin, G.M. et al. Synthesis, molecular structure, and magnetic properties of p-
cyclopentadienylvanadium bis(trifluoroacetate) dimer, J. Organometal. Chem.,
1971, 27, 53-8.
138. Cotton, F.A., Lewis, G. E., Mott, G. N. New trinuclear, oxo-centred, basic
carboxylate compounds of transition metals. 2. Synthesis and X-ray structure of
210
V3(O)3(THF)(C6H5CO2)6, a compound with a deviant structure, Inorg. Chem.,
1982, 21, 3127-3130.
139. Cotton, F.A., Lewis, G. E., Mott, G. N. New trinuclear, oxo-centred, basic
carboxylate compounds of transition metals. 3. Syntheses and X-ray studies of the
trivanadium(III,III,III) and trivanadium(II,III,III) compounds [V3(µ3-
O)(CH3CO2)6(CH3COOH)2(THF)]+[VCl4(CH3COOH)2]
- and [V3(µ3-
O)(CF3CO2)6(THF)3 with "classical" triangular structures, Inorg. Chem., 1982,
21, 3316-3321.
140. Cannon, R. D. and White, R. P. Chemical and physical properties of triangular
bridged metal complexes, Prog. Inorg. Chem., 1988, 36,195-298.
141. Jezowska-Trzebiatowska, B. and Pajdowski, L. Polynuclear vanadium(III)
complexes. II. Structure of vanadium(III) complexes with monochloroacetic acid,
Roc. Chem., 1958, 32, 1061-72.
142. Allin, B. J. and Thornton, P. Basic vanadium(III) acetate. Magnetic properties of
a trinuclear cluster complex, Inorg. Nucl. Chem. Lett., 1973, 9, 449-52.
143. Castro, S.L. et al. Tetranuclear vanadium(III) carboxylate chemistry, and a new
example of a metal butterfly complex exhibiting spin frustration: structure and
properties of [V4O2(O2CEt)7(bpy)2](ClO4), J. Chem. Soc., Chem. Comm., 1995,
2517-18.
144. Barthelet, K. et al. Synthesis, structure determination and magnetic behaviour of
the first porous hybrid oxyfluorinated vanado(III)carboxylate: MIL-71 or
VIII
2(OH)2F2{O2C-C6H4-CO2}.H2O, J. Mat. Chem., 2003, 13, 2208-2212.

211
145. Buglyo, P., Nagy, E. M. and Sovago, I. Vanadium(III) binding strengths of small
biomolecules, Pure Appl. Chem., 2005, 77, 1583-1594.
146. Lubes, V. Vanadium(III) Complexes with Picolinic Acid and Dipicolinic Acid in
Aqueous Solution, J. Sol. Chem., 2005, 34, 899-915.
147. Bricual, J. et al. Vanadium(III) complexes in aqueous solution with the
dicarboxylic oxalic, malonic and succinic acids, J. Chil. Chem. Soc., 2004, 49,
285-288.
148. Osinska-Krolicka, I. et al. Vanadium(III) complexes with L-cysteine - stability,
speciation and the effect on actin in hepatoma Morris 5123 cells, J. Inorg.
Biochem., 2004, 98, 2087-2098.
149. Manzer, E. VCl3(C4H8O)3, Inorg. Synth., 1982, 21, 138.
150. R. T. Claunch, Jones, M. M. Vanadium(III) Sulphate. Inorganic Syntheses, 1963,
7, 92-94.
151. Hugi, A. D., Helm, L. and Merbach, A. E. High-pressure NMR kinetics. Part 24.
Water exchange on hexaaquavanadium(III): a variable-temperature and
variable-pressure oxygen-17 NMR study at 1.4 and 4.7 tesla, Helv. Chim. Acta,
1985, 68, 508-21.
152. Mukherjee, R. et al. Structural and spectroscopic evidence for the formation of
trinuclear and tetranuclear vanadium(III)/carboxylate complexes of acetate and
related derivatives in aqueous solution, Inorg. Chem., 2007, 46, 1575-85.

212
153. Cotton, F. A. et al. Precise structural chatacterizations of the
hexaaquovanadium(III) and diaquohydrogen ions. X-ray and neutron diffraction
studies of [V(H2O)6][H5O2](CF3SO3)4, J. Am. Chem. Soc., 1984, 106, 5319.
154. Kanamori, K. et al. Synthesis, structure, and magnetic property of a dinuclear
vanadium(III) complexes with N-hydroxyethyliminodiacetate, Bull. Chem. Soc.
Jap., 2001, 74, 2377-2378.
155. Fry, F. H. et al. Characterization of novel vanadium(III)/acetate clusters formed
in aqueous solution, Inorg. Chem., 2005, 44, 5197-9.
156. Horn, R. R. and Everett, G. W. Proton and deuteron nuclear magnetic resonance
isotope shifts in partially deuterated tris(2,4-pentanedionato)vanadium(III), J.
Am. Chem. Soc., 1971, 93, 7173-8.
157. Valentini, M., Pregosin, P. S. and Ruegger, H. Applications of Pulsed Field
Gradient Spin-Echo Measurements to the Determination of Molecular Diffusion
(and Thus Size) in Organometallic Chemistry, Organometallics, 2000, 19, 2551-
2555.
158. Kim, M. J., Cardwell, K. and Khitrin, A. K. Nuclear magnetic resonance study of
self-diffusion in liquid crystals, J. Chem. Phys., 2004, 120, 11327-11329.
159. Liger-Belair, G. et al. Diffusion Coefficient of CO2 Molecules as Determined by
13C NMR in Various Carbonated Beverages, J. Agr. Food Chem., 2003, 51, 7560-
7563.

213
160. Hong, Y. S. and Lee, C. H. Self-diffusion coefficient of water in tofu determined
by pulsed field gradient nuclear magnetic resonance, J. Agr. Food Chem., 2006,
54, 219-223.
161. Lide, D.R., CRC Handbook of Chemistry and Physics (73rd edition), 1992-1993,
CRC Press, Boca Raton, FL, p. 164.
162. McNaught, A. D. Compendium of Chemical Terminology, 1997, Blackwell
Science, Oxford, U.K., p. 338.
163. Lever, A.B.P. Inorganic Electronic Spectroscopy (2nd edition), Elsevier,
Amsterdam, 1984.
164. Stenger, R.D. in Comprehensive Inorganic Chemistry (Eds. Bailar, J. J. C.,
Emeleus, H. J., Nyholm, R. A. and Trotman-Dickerson, F.), Vol. 1, 1973,
Perganon Press, Oxford, New York, Toronto, Sydney, p. 593.
165. Kuppler, R. J. et al. Potential applications of metal-organic frameworks, Coord.
Chem. Rev., 2009, 253, 3042-3066.
166. Mori, W. et al. Molecular-level design of efficient microporous materials
containing metal carboxylates: inclusion complex formation with organic
polymer, gas-occlusion properties, and catalytic activities for hydrogenation of
olefins, Micro. Meso. Mat., 2004, 73, 31-46.
167. Lampeka, Y. D. and Tsymbal, L. V. Framework materials based on
azamacrocyclic complexes of transition metals and carboxylates, Theor. Exp.
Chem., 2004, 40, 345-371.
214
168. Ye, B.-H., Tong, M.-L. and Chen, X.-M. Metal-organic molecular architectures
with 2,2′-bipyridyl-like and carboxylate ligands, Coord. Chem. Rev.,
2005, 249, 545-565.
169. Grirrane, A. et al. Thiodiacetate cobalt(II) complexes: Synthesis, structure and
properties, Inorg. Chem. Comm., 2005, 8, 463-466.
170. Grirrane, A. et al. Supramolecular Interactions as Determining Factors of the
Geometry of Metallic Building Blocks: Tetracarboxylate Dimanganese Species,
Angew. Chem. Int. Ed., 2005, 44, 3429-3432.
171. Grirrane, A. et al. Structural diversity of thiodiacetate compounds of group II
metals: Synthesis and X-ray characterization of 2D coordination polymers of
calcium and strontium, Inorg. Chem. Comm., 2007, 10, 1125-1128.
172. Grirrane, A. et al. Novel results on thiodiacetate zinc(II) complexes: Synthesis and
structure of [Zn(tda)(phen)]2.5H2O, Inorg. Chem. Comm., 2006, 9,160-163.
173. Grirrane, A. et al. Magnesium dicarboxylates: First structurally characterized
oxydiacetate and thiodiacetate magnesium complexes, Inorg. Chem. Comm.,
2005, 8, 453-456.
174. Baggio, R. et al. Synthesis and structure of two polymeric barium oxydiacetates
[Ba(oda).H2O]nand [Ba(Hoda)2]n(H2oda: oxydiacetic acid), Inorg. Chim. Acta,
2004, 357, 2185-2190.
175. Baggio, R. et al. Synthesis and X-ray Structure of the Novel Polymeric
Lanthanum(III)-Oxydiacetate [La2(C4H4O5)3(H2O)3.5H2O]n, Inorg. Chem., 1996,
35, 2396-2399.

215
176. Kremer, C. et al. Lanthanide complexes with oda, ida, and nta: From discrete
coordination compounds to supramolecular assemblies, J. Mol. Str., 2008, 879,
130-149.
177. Grirrane, A. et al. Thiodiacetate and Oxydiacetate Cobalt Complexes: Synthesis,
Structure and Stereochemical Features, Eur. J. Inorg. Chem., 2007, 3543-3552.
178. McCleverty, J. A., Meyer, T. J. Comprehensive Coordination Chemistry, Vol. 3,
2004, Elsevier, New York, p. 22.
179. McCleverty, J. A., Meyer, T. J., Comprehensive Coordination Chemistry Vol. 3.
1987, Elsevier: New York, p. 7.
180. Alarcón-Payer, C. et al. Structural correlations in nickel(II)–thiodiacetato
complexes: molecular and crystal structures and properties of [Ni(tda)(H2O)3],
Inorg. Chem. Comm., 2004, 7, 1277-1280.
181. Alarcón-Payer, C. et al. Thiodiacetato-copper(II) chelates with or without N-
heterocyclic donor ligands: molecular and/or crystal structures of [Cu(tda)]n,
[Cu(tda)(Him)2(H2O)] and [Cu(tda)(5Mphen)].2H2O (Him=imidazole,
5Mphen=5-methyl-1,10-phenanthroline), Inorg. Chim. Acta, 2005. 358, 1918-
1926.
182. Ramsis, H., et al. Vibrational Study of Thiodiglycolic Acid and Potassium
Thiodiglycolate Salts, J. Raman Spectr., 1996. 27, 637-644.
183. Beck, J. and Y. Ben-Amer, Earth Alkaline Tetrathiosquarates. II. –
Syntheses and Crystal Structures of SrC4S4.;4H2O and Ba4K2(C4S4)5.16 H2O, Z.
Anorg. Allg. Chem., 2008, 634, 1522-1526.

216
184. Henke, K. and Atwood, D. A. Group 2 Complexes of 2,4,6-Trimercaptotriazine
(TMT), Inorg. Chem., 1998, 37, 224-227.
185. Rottgers, T. et al. Lamellar Copper(I) Thiocyanate-Based Coordination Polymers
containing the Alkali Cation ligating Thiacrown Ether 1,10-Dithia-18-crown-6,
Z. Anorg. Allg. Chem., 2001, 627, 1976-1982.
186. Weber, G. Versatility of the cyclic ligand 5,8,11-trioxa-2,14-dithia[15](2,6)-
pyridinophane: crystal and molecular structures of its complexes with barium
isothiocyanate and with copper(II) chloride, Inorg. Chim. Acta, 1982, 27.
187. Chadwick, S., Englich, U. and Ruhlandt-Senge, K. Formation of separated versus
contact ion triples in heavy alkaline-earth thiolates, Chem. Comm., 1998, 2149-
2150.
188. Ruhlandt-Senge, K. and Englich, U. Barium Thiolates and Selenolates: Syntheses
and Structural Principles, Chem.- Eur. J., 2000, 6, 4063-4070.
189. Drew, M.G.B. Crystal and molecular structure of
triaquazinc(<scp>II</scp>) thiodiglycolate monohydrate, J. Chem.
Soc., Dalton Trans., 1975, 144-148.
190. Faendrich, F. and Ungefroren, H. Customized cell-based treatment options to
combat autoimmunity and restore β-cell function in type 1 diabetes mellitus:
current protocols and future perspectives, Adv. Exp. Med. Biol., 2010. 654, 641-
665.
191. Fowler, M.J. Microvascular and Macrovascular Complications of Diabetes, Clin.
Diabetes, 2008, 26, 77-82.

217
192. Clardy, S.M. et al. Vitamin B12 in drug delivery: breaking through the barriers to
a B12 bioconjugate pharmaceutical, Expert Opin. Drug Delivery, 2010, 8, 127-
140.
193. Clark, T.A. and Pierce, G.N. Vanadium effects in diabetes, Prog. Exp. Cardiol.,
2003, 277-288.
194. Inzucchi, S.E. Oral antihyperglycemic therapy for type 2 diabetes. Scientific
review, J. Am. Med. Assoc., 2002, 287, 360-372.
195. Scior, T. et al. Are vanadium compounds drugable? Structures and effects of
antidiabetic vanadium compounds: A critical review, Mini-Rev. Med. Chem.,
2005, 5, 995-1008.
196. Thompson, K.H. et al. Comparison of anti-hyperglycemic effect amongst
vanadium, molybdenum and other metal maltol complexes, J. Inorg. Biochem.,
2004, 98, 683-690.
197. Domingo, J.L. Vanadium and tungsten derivatives as antidiabetic agents: A
review of their toxic effects, Biol. Trace Elem. Res., 2002, 88, 97-112.
198. Thompson K. H. et al. Preparation and characterization of vanadyl complexes
with bidentate maltol-type ligands; in vivo comparisons of anti-diabetic
therapeutic potential, J. Biol. Inorg. Chem., 2003, 8, 66-74.
199. Monga, V. et al. Vanadium Complexes with Mixed O,S Anionic Ligands Derived
from Maltol: Synthesis, Characterization, and Biological Studies, Inorg. Chem.,
2005, 44, 2678-2688.

218
200. Saha, T.K. et al. Oxovanadium(IV)-porphyrin complex as a potent insulin-
mimetic. treatment of experimental type 1 diabetic mice by the complex [meso-
tetrakis(4-sulfonatophenyl)porphyrinato]oxovanadate(IV)(4-), Bull. Chem. Soc.
Jap., 2006, 79, 1191-1200.
201. Sakurai, H., Fugono, J. and Yasui, H. Pharmacokinetic study and trial for
preparation of enteric-coated capsule containing insulinomimetic vanadyl
compounds: Implications for clinical use, Mini-Rev. Med. Chem., 2004, 4, 41-48.
202. Kofuji, K. et al. The controlled release of insulin-mimetic metal ions by the
multifunction of chitosan, J. Inorg. Biochem., 2005, 99, 1329-1334.
203. Majithiya, J.B. et al. Effect of bis[curcumino]oxovanadium complex on non-
diabetic and streptozotocin-induced diabetic rats, J. Trace Elem. Med. Biol.,
2005, 18, 211-217.
204. Yamaguchi, M. et al. Syntheses of vanadyl and zinc(II) complexes of 1-hydroxy-
4,5,6-substituted 2(1H)-pyrimidinones and their insulin-mimetic activities, J.
Inorg. Biochem., 2006, 100, 260-269.
205. Thompson, K.H. et al. Vanadium treatment of type 2 diabetes: A view to the
future, J. Inorg. Biochem., 2009, 103, 554-558.
206. Wuerges, J. et al. Structural basis for mammalian vitamin B12 transport by
transcobalamin, Proc. Natl. Acad. Sci. USA, 2006, 103, 4386-91.
207. Buglyo, P. et al. Interaction between the low molecular mass components of blood
serum and the VO(IV)-DHP system (DHP = 1,2-dimethyl-3-hydroxy-4(1H)-
pyridinone), J. Chem. Soc., Dalton Trans., 2002, 2275-2282.

219
208. Castro, M.M.C.A. et al. Study of the oxidation products of the VO(dmpp)2
complex in aqueous solution under aerobic conditions: comparison with the
vanadate-dmpp system, Inorg. Chim. Acta, 2003. 356, 142-154.
209. Castro, M.M.C.A. et al. Structural study of the interaction of vanadate with the
ligand 1,2-dimethyl-3-hydroxy-4-pyridinone (Hdmpp) in aqueous solution, J.
Inorg. Biochem., 2000, 80, 177-9.
210. Rangel, M. Pyridinone oxovanadium(IV) complexes: a new class of insulin
mimetic compounds, Trans. Met. Chem., 2001, 26, 219-223.
211. Rangel, M. et al. In vitro study of the insulin-like action of vanadyl-pyrone and -
pyridinone complexes with a VO(O4) coordination mode, J. Biol. Inorg. Chem.,
2001, 6, 128-132.
212. Burgess, J. et al. Synthesis and characterization of 3-hydroxy-4-pyridinone-
oxovanadium(IV) complexes, Polyhedron, 1996, 16, 789-794.
213. Avecilla, F., Geraldes, C.F.G.C. and Castro, M.M.C.A. A new trinuclear
oxovanadium(V) complex with DMPP ligands - synthesis and structural
characterization in the solid state and in aqueous solution, Eur. J. Inorg. Chem.,
2001, 3135-3142.
214. Taylor, P.D. Solution chemistry of vanadium(IV) and -(V) with the bidentate
ligand 1,2-dimethyl-3-hydroxy-4(1H)-pyridinone: relevance to the treatment of
diabetes, Chem. Comm., 1996, 405-6.

220
215. Thompson, K.H. et al. Complementary inhibition of synoviocyte, smooth muscle
cell or mouse lymphoma cell proliferation by a vanadyl curcumin complex
compared to curcumin alone, J. Inorg. Biochem., 2004, 98, 2063-2070.
216. Rehder, D. et al. In vitro study of the insulin-mimetic behaviour of vanadium(IV,
V) coordination compounds, J. Biol. Inorg. Chem., 2002, 7, 384-396.
217. Mukherjee, R. et al. Vandium-Vitamin B12 Bioconjugates as Potential
Therapeutics for treating Diabetes, Chem. Commun., 2008, 3783-3785.
218. Jacobsen, D.W., Green, R. and Brown, K.L. Analysis of cobalamin coenzymes
and other corrinoids by high-performance liquid chromatography, Methods
Enzymol., 1986, 123, 14-22.
219. Kustin, K., Toppen, D. L. Reduction of Vanadium(V) by L-ascorbic acid, Inorg.
Chem., 1973, 12, 1404.
220. Kadin, H. Captopril, in Analytical profile of Drug substances (Ed. K. Florey),
1982, Academic Press, New York, p. 79-137.
221. Erdos, E.G. FASEB J., 2006, 20, 1034-1038.
222. Ryan, J.W. Subcellular localization of pulmonary angiotensin-converting enzyme
(kininase II), Biochem. J., 1975, 146, 497.
223. Lavoie, J.L. and Sigmund, C.D. Minireview: Overview of the Renin-Angiotensin
System--An Endocrine and Paracrine System, Endocrinology, 2003, 144, 2179-
2183.
224. Williams, T.A. et al. A comparison of the zinc contents and substrate specificities
of the endothelial and testicular forms of porcine angiotensin converting enzyme

221
and the preparation of isoenzyme-specific antisera, Biochem. J., 1992, 288, 875-
881.
225. Ceconi, C. et al. Angiotensin-converting enzyme (ACE) inhibitors have different
selectivity for bradykinin binding sites of human somatic ACE, Eur. J. Pharmacol.,
2007, 577, 1.
226. Werner, C. et al. RAS blockade with ARB and ACE inhibitors: current perspective
on rationale and patient selection, Clin. Res. Cardiol., 2008, 97, 418.
227. Hanif, K. et al. Effect of 3-Thienylalanine-Ornithine-Proline, New Sulfur-
containing Angiotensin-converting Enzyme Inhibitor on Blood Pressure and
Oxidative Stress in Spontaneously Hypertensive Rats, J. Cardiovasc. Pharmacol.,
2009, 53, 145.
228. Richart, T., Staessen, J. A. and Birkenhager, W. H. Imidapril: Will Fewer Adverse
Events Translate into Better Long-Term Outcomes? Drugs, 2007, 67, 1379.
229. Havelka, J. Long-term experience with captopril in severe hypertension, Britt. J.
Clin. Pharmacol., 1982. 14, 71S.
230. Christie, G.L. et al. The binding of metal ions by captopril (SQ 14225). Part II.
Complexation of copper(II), Inorg. Chim. Acta, 1988, 151, 215-225.
231. Hughes, M.A., Smith, G.L. and Williams, D.R. The binding of metal ions by
captopril (SQ 14225). Part I. complexation of zinc(II), cadmium(II) and lead(II),
Inorg. Chim. Acta, 1985, 107, 247-252.
232. Torreggiani, A. A spectroscopic investigation of captopril and the Cu(II)-
captopril system, J. Mol. Str., 2001, 565, 347.

222
233. Atzei, D. et al. IR, NMR, XPS study of 1-(-3-mercapto-2-methylpropionyl)--
proline and its zinc complexes, Spectrochim. Acta, 1992. 48, 911-919.
234. Patchett, A. A. A new class of angiotensin-converting enzyme inhibitors, Nature,
1980, 288, 280.
235. Evangelista, S. Antioxidant and cardioprotective properties of the sulphydryl
angiotensin-converting enzyme inhibitor zofenopril, J. Int. Med. Res., 2005, 33,
42.
236. Zhang, X. et al. ACE Inhibitors Promote Nitric Oxide Accumulation to Modulate
Myocardial Oxygen Consumption, Circulation, 1997, 95, 176-182.
237. Pasini, A. F. et al. Effect of Sulfhydryl and non-Sulfhydryl Angiotensin-Converting
Enzyme Inhibitors on Endothelial Function in Essential Hypertensive Patients,
Am. J. Hyp., 2007, 20, 443.
238. Brasch, N.E. and Xia, L. Method of synthesis of b-thiolato cobalamin nucleoside
compounds, U.S. Patent Applic. 20040054128, 2004.
239. Brasch, N.E. Synthesis and characterization of isolable thiolatocobalamin
complexes relevant to coenzyme B12-dependent ribonucleoside triphosphate
reductase, J. Inorg. Biochem., 1999, 76, 197.
240. Suto, R.K. et al. Synthesis, Characterization, Solution Stability, and X-ray Crystal
Structure of the Thiolatocobalamin g-Glutamylcysteinylcobalamin, a Dipeptide
Analogue of Glutathionylcobalamin: Insights into the Enhanced Co-S Bond
Stability of the Natural Product Glutathionylcobalamin, Inorg. Chem., 2001, 40,
2686-2692.
223
241. Hsu, T.-L.C., Brasch, N.E. and Finke, R.G. The Second Isolable B12-Thiolate
Complex, (Pentafluorophenylthiolato)cobalamin: Synthesis and
Characterization, Inorg. Chem., 1998, 37, 5109-5116.
242. Pezacka, E., Green, R. and Jacobsen, D.W. Glutathionylcobalamin as an
intermediate in the formation of cobalamin coenzymes, Biochem. Biophys, Res.
Comm., 1990, 169, 443-50.
243. Pezacka, E.H., Green, R. and Jacobsen, D.W. Intracellular Cobalamin
Metabolism: A Thiol-Cobalamin Adduct as an Intermediate in Cobalamin
Coenzyme Formation, FASEB J., 1990, 4, A2126.
244. Jacobsen, D.W. et al. Glutathionylcobalamin (GS-Cbl) is found in cultured and
ascites leukemia L1210 cells, Fed. Proc., 1987, 46, 1005.
245. McCaddon, A. Wales patent appl., WO2002GB01843, 2002.
246. McCaddon, A., Davies, G. Int. J. Ger. Psych., 2005, 20, 998-1000.
247. McCaddon, A. Homocysteine and cognitive impairment; a case series in a
General Practice setting, Nutr. J., 2006, 5, 6.
248. Birch, C.S. et al. A novel role for vitamin B12: Cobalamins are intracellular
antioxidants in vitro, Free Rad. Biol. Med., 2009, 47, 184-188.
249. Mundwiler, S. et al. Cyanide-bridged vitamin B12-cisplatin conjugates, Chem.-
Eur. J., 2005, 11, 4089.
250. Hogenkemp, H.P.C. et al., in Chemistry and Biochemistry of B12 (Ed. Banerjee,
R.), 1999, Wiley, New York, p. 385.

224
251. Barker, H.A. et al. Isolation and properties of crystalline cobamide coenzymes
containing benzimidazole or 5, 6-dimethylbenzimidazole, J. Biol. Chem., 1960,
235, 480-8.
252. Wang, S.L. Solid-state trans-cis isomerization of captopril determined by thermal
Fourier transform infrared (FT-IR) microspectroscopy, J. Pharm. Sci., 2001, 90,
1034.
253. Kabsch, W. Automatic processing of rotation diffraction data from crystals of
initially unknown symmetry and cell constants, J. Appl. Cryst., 1993, 2, 795-800.
254. Sheldrick, G.M. SHELXL: high-resolution refinement, Methods Enzymol., 1997,
277, 319.
255. Jacobsen, D.W. The inhibition of corrinoid-catalyzed oxidation of
mercaptoethanol by methyl iodide: mechanistic implications, J. Inorg. Biochem.,
1993, 50, 47.
256. Peel, J.L. The Catalysis of the Auto-Oxidation of 2-Mercaptoethanol and Other
Thiols by Vitamin B12 Derivatives. Polarographic and Other Investigations,
Biochem. J., 1963, 88, 296-308.
257. Schrauzer, G.N. Electron transfer reactions catalyzed by vitamin B12 and related
compounds: the reduction of dyes and of riboflavin by thiols, Arch. Biochem.
Biophys., 1969, 30, 257.
258. Schrauzer, G.N. New developments in the field of vitamin B12: Reactions of the
cobalt atom in corrins and in vitamin B12 model compounds, Angew. Chem. Int.
Ed., 1976, 15, 417.
225
259. Jacobsen, D.W., Troxell, L.S. and Brown, K.L. Catalysis of Thiol oxidation by
Cobalamins and Cobinamides: Reaction Products and Kinetics, Biochemistry,
1984, 23, 2017-25.
260. Mariappan, S.V.S. and Rabenstein, D.L. Kinetics and thermodynamics of cis-
trans isomerization of captopril and related compounds, J. Org. Chem., 1992, 57,
6675-6678.
261. Rabenstein, D.L. and Isab, A.A. Conformational and acid-base equilibriums of
captopril in aqueous solution, Anal. Chem., 1982, 54, 526-529.
262. Nishikawa, T. HPLC profile of captopril disulfide that undergoes reversible cis-
trans conversion among three isomers, Anal. Sci., 2004, 20, 1395.
263. Hassall, C.H. et al. The design and synthesis of new triazolo, pyrazolo-, and
pyridazo-pyridazine derivatives as inhibitors of angiotensin converting enzyme, J.
Chem. Soc., Perkin Trans. 1, 1984, 155-164.
264. Thorsett, E.D. et al. Conformationally restricted inhibitors of angiotensin-
converting enzyme. Synthesis and computations, J. Med. Chem., 1986, 29, 251-
260.
265. Isab A. A. and Wazeer, M. I. M., Solid and solution NMR studies of the
complexation of Ag+ with the trans isomer of captopril: Biological activities of
this high blood pressure drug along with its Ag+ complex, Spectrochim. Acta,
2006, 65, 191.
266. Perlman, D. Microbial synthesis of cobamides, in Advances in Applied
Microbiology (Ed. Umbreit, W.W.), 1959, Academic Press, New York, p. 87.
226
267. Randall, W.C. and Alberty, R.A. Kinetics of Ligand Binding to Aquocobalamin*.
Biochemistry, 1967, 6, 1520-1525.
268. Marques, H.M. Compensation effects in ligand-substitution reactions of
aquacobalamin, S. Afr. J. Chem., 1991, 44, 114.
269. Schumacher L., Mukherjee, R. and Brasch, N. E. The acid-catalysed
decomposition of thiolatocobalamins, paper to be submitted, 2011.
270. Rabenstein, D.L. Nuclear magnetic resonance studies of the acid-base chemistry
of amino acids and peptides. I. Microscopic ionization constants of glutathione
and methylmercury-complexed glutathione, J. Am. Chem. Soc., 1973, 95, 2797-
2803.
271. Connett, P.H. and Wetterhahn, K.E. Reaction of chromium(VI) with thiols: pH
dependence of chromium(VI) thio ester formation, J. Am. Chem. Soc., 1986, 108,
1842-1847.
272. Chemaly, S.M. and Pratt, J.M. The chemistry of vitamin B12. Part 18. Nature of
the equilibria exhibited by organocobalamins, J. Chem. Soc., Dalton Trans.,
1980, 2267-2273.
273. Shun-xing, L., Nan-sheng, D. and Feng-ying, Z. Effect of digestive site acidity
and compatibility on the species, lipopily and bioavailability of iron, manganese
and zinc in Prunus persica Batsch and Carthamus tinctorus, Bioorg. Med. Chem.
Lett., 2004, 14, 505-510.
274. Koppenol, W.H. et al. Peroxynitrite, a cloaked oxidant formed by nitric oxide and
superoxide, Chem. Res. Toxicol., 1992, 5, 834-42.

227
275. Beckman, J.S. Oxidative Damage and Tyrosine Nitration from Peroxynitrite,
Chem. Res. Toxicol., 1996, 9, 836-844.
276. Ferrer-Sueta, G. and Radi, R. Chemical Biology of Peroxynitrite: Kinetics,
Diffusion, and Radicals, ACS Chem. Biol., 2009, 4, 161-177.
277. Koppenol, W.H. The basic chemistry of nitrogen monoxide and peroxynitrite.
Free Rad. Biol. Med., 1998, 25, 385-391.
278. Ducrocq, C. et al. Peroxynitrite. An endogenous oxidizing and nitrating agent,
Cell Mol. Life Sci., 1999, 55, 1068-1077.
279. Pacher, P., Beckman, J. S. and Liaudet, L. Nitric oxide and peroxynitrite in health
and disease, Physiol. Rev., 2007, 87, 315-424.
280. Al-Ajlouni, A. M. and Gould, E.S. Electron Transfer. 132. Oxidations with
Peroxynitrite, Inorg. Chem., 1996, 35, 7892-7896.
281. Szabo, C., Ischiropoulos, H. and Radi, R. Peroxynitrite: biochemistry,
pathophysiology and development of therapeutics, Nat. Rev. Drug Discov., 2007,
6, 662-680.
282. Goldstein, S. and Merényi, G. The Chemistry of Peroxynitrite: Implications for
Biological Activity, in Methods in Enzymology (Ed. K.P. Robert), 2008,
Academic Press, New York, p. 49-61.
283. Pall, M.L. Nitric oxide and the etiology of chronic fatigue syndrome: Giving
credit where credit is due, Med. Hypotheses, 2005, 65, 631-633.

228
284. Pall, M.L. and Satterlee, J.D. Elevated nitric oxide/peroxynitrite mechanism for
the common etiology of multiple chemical sensitivity, chronic fatigue syndrome,
and posttraumatic stress disorder, Ann. NY Acad. Sci., 2001, 933, 323-329.
285. Pall, M.L. Elevated, sustained peroxynitrite levels as the cause of chronic fatigue
syndrome, Med. Hypotheses, 2000, 54, 115-125.
286. Kissner, R. et al. Formation and Properties of Peroxynitrite as Studied by Laser
Flash Photolysis, High-Pressure Stopped-Flow Technique, and Pulse Radiolysis,
Chem. Res. Toxicol., 1997, 10, 1285-1292.
287. Radi, R. et al. Peroxynitrite oxidation of sulfhydryls. The cytotoxic potential of
superoxide and nitric oxide, J. Biol. Chem., 1991, 266, 4244-50.
288. Navarro-Antolin, J. et al. Superoxide limits cyclosporine-A-induced formation of
peroxynitrite in endothelial cells, Free Rad. Biol. Med., 2002, 32, 702-711.
289. Vasquez-Vivar, J. et al. Superoxide generation by endothelial nitric oxide
synthase: the influence of cofactors, Proc. Natl. Acad. Sci. USA, 1998, 95, 9220-
9225.
290. Ferrer-Sueta, G. et al. Reactions of Manganese Porphyrins with Peroxynitrite and
Carbonate Radical Anion, J. Biol. Chem. 2003, 278, 27432-27438.
291. Reiter, C. D., Teng, R. -J. and Beckman, J. S. Superoxide reacts with nitric oxide
to nitrate tyrosine at physiological pH via peroxynitrite, J. Biol. Chem., 2000,
275, 32460-32466.
292. Bian, K. et al. The nature of heme/iron-induced protein tyrosine nitration, Proc.
Natl. Acad. Sci. USA, 2003, 100, 5712-5717.

229
293. Ye, Y. et al. Prevention of Peroxynitrite-induced Apoptosis of Motor Neurons and
PC12 Cells by Tyrosine-containing Peptides, J. Biol. Chem., 2007, 282, 6324-
6337.
294. Malle, E. et al. Myeloperoxidase: a target for new drug development? Britt. J.
Pharm. 2007, 152, 838-854.
295. Crow, J.P. Peroxynitrite scavenging by metalloporphyrins and thiolates, Free
Rad. Biol. Med., 2000, 28, 1487-1494.
296. Groves, J.T. Peroxynitrite: reactive, invasive and enigmatic, Curr. Opin. Chem.
Biol., 1999, 3, 226-235.
297. Misko, T.P. et al. Characterization of the cytoprotective action of peroxynitrite
decomposition catalysts, J. Biol. Chem., 1998, 273, 15646-15653.
298. Shimanovich, R. et al. Mn(II)-Texaphyrin as a Catalyst for the Decomposition of
Peroxynitrite, J. Am. Chem. Soc., 2001, 123, 3613-3614.
299. Lee, J., Hunt, J.A. and Groves, J.T. Mechanisms of Iron Porphyrin Reactions with
Peroxynitrite, J. Am. Chem. Soc., 1998, 120, 7493-7501.
300. Lee, J., Hunt, J. A. and Groves, J. T. Manganese Porphyrins as Redox-Coupled
Peroxynitrite Reductases, J. Am. Chem. Soc., 1998, 120, 6053-6061.
301. Stern, M.K., Jensen, M.P. and Kramer, K. Peroxynitrite Decomposition Catalysts,
J. Am. Chem. Soc., 1996, 118, 8735-8736.
302. Jensen, M.P. and Riley, D.P. Peroxynitrite Decomposition Activity of Iron
Porphyrin Complexes, Inorg. Chem., 2002, 41, 4788-4797.

230
303. Groves, J. T. and Marla, S. S. Peroxynitrite-Induced DNA Strand Scission
Mediated by a Manganese Porphyrin, J. Am. Chem. Soc., 1995, 117, 9578-9.
304. Pietraforte, D. et al. Peroxynitrite-dependent modifications of tyrosine residues in
hemoglobin. Formation of tyrosyl radical(s) and 3-nitrotyrosine, Amino Acids,
2003, 25, 341-350.
305. Herold, S. and Shivashankar, K. Metmyoglobin and Methemoglobin Catalyze the
Isomerization of Peroxynitrite to Nitrate, Biochemistry, 2003, 42, 14036-14046.
306. Romero, N. et al. Reaction of Human Hemoglobin with Peroxynitrite, J. Biol.
Chem., 2003. 278(45): p. 44049-44057.
307. Zhang, W. et al. Catalysis of peroxynitrite decomposition by cobalt porphyrins,
Proc. Chin. Assoc. Sci. Tech., 2007, 3, 20-24.
308. Olteanu, H. and Banerjee, R. Redundancy in the pathway for redox regulation of
mammalian methionine synthase: reductive activation by the dual flavoprotein,
novel reductase 1, J. Biol. Chem., 2003, 278, 38310-4.
309. Padovani, D. and Banerjee, R. Assembly and protection of the radical enzyme,
methylmalonyl-CoA mutase, by its chaperone, Biochemistry, 2006, 45, 9300-6.
310. Saha, A. et al. Determination of Optimal Conditions for Synthesis of Peroxynitrite
by Mixing Acidified Hydrogen Peroxide with Nitrite, Free Rad. Biol. Med., 1998,
24, 653-659.
311. Griess, P. Bemerkungen zu der abhandlung der H. H. Weselsky und Benedikt
Uber einige azorverbindungen, Chem. Ber., 1879, 12, 426.

231
312. Brown, K.L. et al. Acid-base properties of a-ribazole and the thermodynamics of
dimethylbenzimidazole association in alkylcobalamins, Inorg. Chem., 1984, 23,
1463-71.
313. Wetlaufer, D. B., Edsall, J. T. and Hollingworth, B. R. Ultraviolet Difference
Spectra of Tyrosine Groups in Proteins and Amino Acids, J. Biol. Chem., 1958,
233, 1421-1428.
314. Ischiropoulos, H. et al. Peroxynitrite-mediated tyrosine nitration catalyzed by
superoxide dismutase, Arch. Biochem. and Biophys., 1992, 298, 431-437.
315. Hughes, M.N. and Nicklin, H.G. The chemistry of pernitrites. Part I. Kinetics of
decomposition of pernitrous acid, J. Chem. Soc. [A], 1968, 450-52.
316. Koppenol, W.H. The chemistry of peroxynitrite, a biological toxin, Quím. Nova,
1998, 21, 326-331.
317. Goldstein, S. and Czapski, G. Direct and Indirect Oxidations by Peroxynitrite.
Inorg. Chem., 1995, 34, 4041-8.
318. Espenson, J. H. and Gjerde, H. B. Single-electron reactions of vitamin B12s:
reduction of chromium(III) complexes, Inorg. Chem., 1980, 19, 3549-50.
319. Beckman, J.S. et al. Oxidative chemistry of peroxynitrite, in Methods in
Enzymology (Ed. Lester, P.), 1994, Academic Press, New York, p. 229-240.
320. Shimanovich, R. and Groves, J.T. Mechanisms of Peroxynitrite Decomposition
Catalyzed by FeTMPS, a Bioactive Sulfonated Iron Porphyrin, Arch. Biochem.
Biophys., 2001, 387, 307-317.

232
321. Marla, S.S., Lee, J. and Groves, J. T. Peroxynitrite rapidly permeates
phospholipid membranes, Proc. Natl. Acad. Sci. USA, 1997, 94, 14243-14248.
322. Ferrer-Sueta, G. et al. Catalytic Scavenging of Peroxynitrite by Isomeric Mn(III)
N-Methylpyridylporphyrins in the Presence of Reductants, Chem. Res. Toxicol.,
1999, 12, 442-449.
323. Exner, M. and Herold, S. Kinetic and Mechanistic Studies of the Peroxynitrite-
Mediated Oxidation of Oxymyoglobin and Oxyhemoglobin, Chem. Res. Toxicol.,
2000, 13, 287-293.
324. Shriver, D. and Atkins, P. Inorganic Chemistry (5th ed.), 2010, W. H. Freeman,
New York.
325. Holleman-Wiberg. The compounds of transition metals: a comparative review., in
Inorganic Chemistry (Ed. Wiberg, N.), 2001, Academic Press, New York, p.
1582-1587.
326. Prütz, W.A. et al. Reactions of nitrogen dioxide in aqueous model systems:
Oxidation of tyrosine units in peptides and proteins, Arch. Biochem. Biophys.,
1985, 243, 125-134.
327. Santos, C. X. C., Bonini, M.G. and Augusto, O. Role of the Carbonate Radical
Anion in Tyrosine Nitration and Hydroxylation by Peroxynitrite, Arch. Biochem.
Biophys., 2000, 377, 146-152.
328. Solar, S., Solar, W. and Getoff, N. Reactivity of hydroxyl with tyrosine in aqueous
solution studied by pulse radiolysis, J. Phys. Chem., 1984, 88, 2091-5.

233
329. Lymar, S. V., Jiang, Q. and Hurst, J. K. Mechanism of Carbon Dioxide-Catalyzed
Oxidation of Tyrosine by Peroxynitrite, Biochemistry, 1996, 35, 7855-7861.
330. Bartesaghi, S. et al. Mechanistic Studies of Peroxynitrite-Mediated Tyrosine
Nitration in Membranes Using the Hydrophobic Probe N-t-BOC-l-tyrosine tert-
Butyl Ester, Biochemistry, 2006, 45, 6813-6825.
331. Kurtikyan, T. S. and Ford, P. C. Reactions of Nitrogen Oxides with Heme Models:
Spectral Characterization of an Elusive Five-Coordinate Fe(porphyrin) Nitrito
Intermediate, Angew. Chem. Int. Ed., 2006, 45, 492-496.
332. Catalano, M.M. et al. Control of reactivity at the porphyrin periphery by metal
ion co-ordination: a general method for specific nitration at the [small beta]-
pyrrolic position of 5,10,15,20-tetra-arylporphyrins, J. Chem. Soc., Chem.
Comm., 1984(22): p. 1535-1536.
333. Gunaydin, H. and Houk, K. N. Mechanisms of Peroxynitrite-Mediated Nitration
of Tyrosine, Chem. Res. Toxicol., 2009, 22, 894-898.
334. Van der Vliet, A. et al. Aromatic hydroxylation and nitration of phenylalanine
and tyrosine by peroxynitrite. Evidence for hydroxyl radical production from
peroxynitrite, FEBS Lett., 1994, 339, 89-92.
335. Fedosov, S.N. et al. Conformational changes of transcobalamin induced by
aquocobalamin binding. Mechanism of substitution of the cobalt-coordinated
group in the bound ligand, J. Biol. Chem., 2000, 275, 11791-11798.

234
336. Banerjee, R.V. et al. Mechanism of reductive activation of cobalamin-dependent
methionine synthase: an electron paramagnetic resonance spectroelectrochemical
study, Biochemistry, 1990, 29, 1129-35.
337. Balasubramanian, P.N. and Gould, E. S. Electron transfer. 64. Reduction of
nitrate by vitamin B12s (cob(I)alamin), Inorg. Chem., 1983, 22, 2635-7.
338. Blackburn, R., Kyaw, M. and Swallow, A. J. Reaction of Cob(I)alamin with
nitrous oxide and Cob(III)alamin, J. Chem. Soc., Faraday Trans. 1, 1977, 73, 250-
255.
339. D.R. Arnelle and Stamler, J.S. in Methods in Nitric Oxide Research (Eds.
Stamler, J. S. and Arnelle, D.R.,1996, J. Wiley, New York, p. 546.
340. Palling, D. J. and Hollocher, T. C. Basis and optimization of the indooxine method
to determine oximes, Mikrochim. Acta, 1985, 137-144.
341. Maloy, J. T. in Standard Potentials in Aqueous Solution (1st ed.) (Eds. Parson, R.
Bard, A. J. and Jordan, J.), Marcel Dekker, New York, 1985, p. 127.
342. McCaddon, A. et al. Analogues, ageing and aberrant assimilation of vitamin B12
in Alzheimer's disease, Dement. Geriatr. Cogn. Disord., 2001, 12, 133-7.