Pyrolysis of waste polypropylene plastics for energy recovery
www.elsevier.com/locate/optmat
Optical Materials 29 (2007) 481–487
First synthesis of vanadium dioxide by ultrasonic nebula-spray pyrolysis
Bonex Wakufwa Mwakikunga a,*, Elias Sideras-Haddad a, Malik Maaza b
a School of Physics, University of the Witwatersrand, Private Bag X3, P.O. Wits, Johannesburg, Gauteng 2050, South Africab iThemba Labs, P.O. Box 722, Somerset West 7129, Cape Town, South Africa
Received 3 June 2005; accepted 12 October 2005Available online 19 January 2006
Abstract
Vanadium dioxide synthesis is a special problem from any precursor material due to the multi-valence nature of vanadium oxides andthe fact that, among these oxides, VO2 is one of the most unstable of them. Its synthesis therefore must be done under properly controlledconditions. This paper reports on the results of the production of the sub-micrometer structured VO2 thin films for the first time by theultrasonic nebula-spray pyrolysis from the precursor vanadium tri-chloride in an aqueous solution of 0.085 M ammonium meta-vana-date. The optimized flow rate of the argon carrier gas was 11 ml min�1 and VO2 was obtained at deposition temperature well above600 �C. Infrared switching confirms the VO2 transition temperature in the neighborhood of 60 �C for samples prepared under argonwhereas, those prepared under oxygen show a drastic shift in transition temperature to the neighborhood of room temperature (23 �C).� 2005 Elsevier B.V. All rights reserved.
PACS: 81.05.Z
Keywords: Vanadium dioxide; Ultrasonic spray pyrolysis; Raman; Transition; Thermo-chromism
1. Introduction
Thermo-chromic materials are characterized by a semi-conductor-to-metal transition occurring from a reversiblechange in their crystalline structure as a function of thetemperature. Along with a change in optical propertiesare also electronic transitions evidenced by a change inelectrical resistivity. This change has been observed in tran-sition-metal oxides [1,2] such as Ti2O3, Fe3O4, and Mo9O26
and in several magneli phases of vanadium oxide, VnO2n�1.Among them, VO2 has received the most attention becauseof the large reversible change of electric, magnetic and opti-cal properties at temperatures around 70�C [3].
During the semiconductor-to-metal transition, the opti-cal properties of vanadium dioxide are characterized by asharp decrease in optical transmission in the infrared spec-trum. This is coupled with an increase in its reflectivity.
0925-3467/$ - see front matter � 2005 Elsevier B.V. All rights reserved.
doi:10.1016/j.optmat.2005.10.007
* Corresponding author.E-mail address: [email protected] (B.W. Mwakikun-
ga).
Because of this anomalous behaviour, vanadium dioxidehas been presented as an attractive thin film material forelectrical or optical switches, optical storage, laser protec-tion, and solar energy control for windows in spacesatellites.
The transition temperature of vanadium dioxide of70 �C may be decreased by the addition of high-valent tran-sition metals such as niobium, molybdenum or tungsten.Trivalent cations (chromium and aluminium) increase thetransition temperature. The hysteresis profile associatedwith the transition depends on the microstructure and crys-tallinity of the sample.
Since the discovery of the VO2 semiconductor to metaltransition by Morin in 1959 [3] VO2 has been a subject ofnumerous experimental and theoretical studies. In thefirst-order [3] phase transition of VO2, the material under-goes a reversible change from a tetragonal rutile structurephase, space group P42/mnm with typical lattice constantsa = 4.5546 A and c = 2.8514 A, at higher temperature toa monoclinic structure, space group C2/m with lattice con-stants a = 12.09 A, b = 3.702A, 6.433 A and b = 106.6�,

Fig. 1. A diagrammatic layout of a typical set-up of the ultrasonic nebula-spray pyrolysis technique.
20 30 40 50 60 70 80
0
100
200
300
400
500
Window glass 700oCAr
PDF44-0253PDF44-0252PDF45-1074
V2O5(221)
VO2(100)
V2O5(026)
VO2(011)
VO2(110)
2θ
Inte
nsity
0
50
100
150
200
250
V2O5(026)
V2O5(035)V2O5
(240)(033)(241)
V2O5(100)
Corning 700oCH2 carrier
PDF45-1074
020406080
100120140160180200
AMV(020)(100) AMV
(002)
AMV(120)
AMV(021)
PDF09-0411Quartz 400oCArgonPrecursor= NH4VO3 (AMV)
Fig. 2. Typical X-ray spectra of VO2 under different synthesis conditions-carries gas type, carrier gas flow rate, substrate type, substratetemperature.
482 B.W. Mwakikunga et al. / Optical Materials 29 (2007) 481–487
below the phase transition temperature [4]. These structuralcharacteristics led Goodenough [5] to propose a model ofthe electronic structure based on the molecular field the-ory that has accounted for some properties of VO2 metallicand semiconducting phases [6]. This model has subse-quently undergone further improvements by incorporatingelectron–electron correlations [7] and electron–phononinteractions.
Because of the ability to change the transition tempera-ture by doping, Lee et al. [8] and more recently Jin et al. [9],suggested that tungsten doped vanadium dioxide can beused in energy efficient windows. These smart windows orelectro-chromic displays find special applications in thearchitectural, automotive and aerospace sectors [11].Roach [11] pointed out that, due to the changes in reflectiv-ity during the phase transition, VO2 films can be used as akind of optical disc medium and demonstrate holographicstorage. Bit recording on VO2 films using a near-infra-redlaser was demonstrated [12]; stability during long-termstorage and over 108 time cycles of write and erase wereachieved without degradation. Switching time of about30 ns and writing energy of the order of a few mJ/cm2 werereported [13]. Bit density has been estimated to be 350 bits/mm. Such low threshold recording energy and erase-re-write abilities encourage the use of VO2 films as a recordingmedium [14]. More recently, the use of VO2 thin films wassuggested in ultra-fast optical switching devices. The high-temperature metallic state attained in 5 ps by using femto-second laser excitation at 780 nm was reported [15]. Insummary, vanadium dioxide is an interesting candidatefor modern applications of active thin films in optical orelectric [16] switches.
VO2 has been prepared by vapour transport method[17], ion implantation [18], hydrothermal technique [19]for nano-wires and nano-belts; r.f. sputtering [20,21], solgel technique [22] and pulsed laser deposition [23] for thinfilms. In this article, synthesis for the first time of micro-structured thin films of VO2 by ultrasonic spray pyrolysisprocess is reported. The only work that precedes this workwas on V2O5 by spray pyrolysis by Bouzidi et al. [24]. V2O5
is the most stable of vanadium oxides and this is the initialcandidate that is present in most synthesis processing. Toobtain VO2, one of the most unstable oxides, controlledconditions are required. The present article reports on thework geared to obtaining VO2 with optimized conditionsin ultrasonic spray pyrolysis process.
2. Experimental
A precursor solution of ammonium meta-vanadatemixed with vanadium tri-chloride, NH4VO3 + VCl3 (codedAMVC) was prepared. The AMV was a whitish yellowishpowder with molecular weight of 116.98, density of2.326 g cm�3 and a melting temperature of 200 �C. Surfacetension of the precursor solution was measured using thecapillary rise method. A scoop weighing 6.1 g of AMVand was dissolved in 600 ml of distilled water and mixed
well using a magnetic stirrer on a hot plate at around70 �C for about 3 h. The so-made solution was then dec-anted into the container that was housing the ultrasonicnebulizer operating at a frequency of 1.7 MHz as illus-trated in the schematic diagram of Fig. 1. Substrate mate-

0 100 200 300 400 500 600 700 800
600
700
800
900
1000
1100
1200
1300
1400
1500
636
49627
6
184
107
67
V15 amorphous
0 200 400 600 800 1000 1200 1400
2000
4000
6000
8000
10000
12000
14000
16000
990
680
513
40128
0
193
140
93
V15 crystal
Ram
an in
tens
ity (
a.u.
)R
aman
inte
nsity
(a.
u.)
Wavenumber (cm-1)
Wavenumber (cm-1)
Fig. 3. Typical Raman spectra for crystalline islands (above) and the rest of the amorphous film of powder (below) of VO2.
Fig. 4. A typical scanning electron micrograph of the VO2 on a Corningglass substrate shows the morphology of the surface of these samples.
0.4 0.6 0.8 1.0 1.2 1.4 1.60
200
400
600
800
1000
1200
1400
1600
Gaussian centre 0.80673 μmwidth 0.010723 μm
Fre
quen
cy c
ount
Particle feret diameter (μm)
VO2A2 data Gaussian fit
Fig. 5. Size distribution of the VO2 image in Fig. 4 using Image ToolTM
reveals the grains are preferentially spherical with a modal diameter of800 nm.
B.W. Mwakikunga et al. / Optical Materials 29 (2007) 481–487 483
rials underwent the usual rigorous cleaning procedure ofdetergent–ultrasonic bath–alcohol–ultrasonic bath untilthe substrates qualified for deposition. Depositions weredone on quartz, borosilicate and Corning glass substrates,at furnace temperatures varied from 100 to 700 �C, at var-ious substrate positions in the furnace and using oxygen,argon and hydrogen for carrier gases at flow rates variedfrom 18 to 8 ml min�1. The optimum conditions forobtaining VO2 by ultrasonic spray pyrolysis were found
to be as follows: substrate temperature of 500–700 �C, car-rier gas type of argon, carrier gas flow rate of 11 ml min�1
and system pressure of 4–10 N cm�2 and substrates ofeither borosilicate window glass or Corning glass.
Structural studies of the as-deposited nano-particleswere done using a Powder X-ray Diffractometer with aCu Ka wavelength of 0.154184 nm; optical properties oftransmittance or absorbance were conducted using a Var-
484 B.W. Mwakikunga et al. / Optical Materials 29 (2007) 481–487
ian Cary UV–Vis–IR spectrophotometer in the wavelengthrange from 200 nm to 3000 nm. Morphology studies byscanning electron microscopy (SEM) were carried outusing a Jeol JSM-5600 SEM microscope. Because theSEM illuminates them with electrons, the samples alsohave to be made to conduct electricity. To improve the con-ductivity of the VO2, the samples were coated with a thinfilm of carbon. In order to unveil the phonon behaviourand the grain size distribution in the so-synthesized VO2,Raman spectroscopy was carried out using a Jobin-YvonT64000 Raman spectrograph with a 514.5 nm line froman argon ion laser.
3. Results and discussion
X-ray diffraction revealed very prominent peaks belong-ing to VO2 crystal faces such as (100), (110) and (011) in asample prepared on window glass at 700 �C as illustrated inFig. 2. This suggests that VO2 crystallites are randomlyordered rather than preferring some direction. Hydrogencarrier gas tends to bring other phases of VO2. In all casesin this group of samples, the presence of other phasesinhibits the manifestation of the VO2 properties hence theswitching factor so observed. In order to characterize themorphology of the particulates and crystallites on the so-obtained samples, the Scherrer equation was used to esti-mate the particulate sizes. �5.2186 nm as mean crystallitediameter was obtained.
Table 1An outline of previous and present findings of Raman phonon modes in VO2
Petrov et al. Shilbe Aronov et al.(100 K)
Srivastava andChase (300 K)
Vikhnin et(300 K)
142 – 149 – 149 – 144 –191 Ag 199 Ag 200 Ag 208 B1g 194 Ag221 Ag 225 Ag 226 Ag 236 226 Ag258 Ag 259 Bg 259 Ag 260 Ag
265 Bg308 Ag 313 Ag 313 Ag 311 Ag335 Ag 339 Bg 340 Ag 337 Ag392 Ag 392 Ag 392 Ag 389 Ag
395 Bg
444 Bg 436 Ag 450 E1g 438 Ag453 Bg489 Bg 493 Ag
497 Ag 503 Ag 501 Ag
594 Bg 595 Ag 594 Bg 595 Ag612 Ag 618 Ag 620 Ag 615 Ag
655 A1g 627 Ag670 Bg
830 Bg850 B2g
A number of authors have published their Raman studyfindings in various forms of VO2 whether crystalline, amor-phous or singe crystals. Raman intensities are much higherfrom single crystals. However, not much has been done onmicro- and nano-sized powders due to the weakness of theRaman signal from these samples. In the present work, aconsiderable amount of intensity of the incident laser beamhad to be set to get some Raman signal from the samples.At about 200· magnification, one could see that these VO2
samples were amorphous mixed with islands of single crys-tals. Fig. 3 illustrates the typical Raman spectra (top) fromthe islands of single crystals and (bottom) from the amor-phous nano-sized powder background. A scanning electronmicrograph of 5500· magnification of the same sample ispresented in Fig. 4. Image ToolTM image analysis softwarewas used to analyze the surface morphology of the SEMimages for a size distribution pattern of the grains andislands of single crystals on the thin films. The size distribu-tion chart given in Fig. 5 shows that the grains are uni-formly structured with almost all of them having aspherical ferret diameter of around 800 nm. Table 1 pre-sents the previous alongside the present findings on Ramanshifts and phonon frequencies in VO2. In this table it can beseen that, apart from the fact that the present resultsaccount for a wider range of Raman shift, the phononfrequencies agree very well with previous findings.
UV–Vis–IR transmittance spectroscopy is supposedlyuseful in revealing the switching properties of VO2 from
al. Pan et al.(300 K)
Present workV8 (300 K)
Present workV9 (300 K)
Present workV10 (300 K)
58 9367
119 104141 153 140
192 Ag 204 193225 Ag258 Bg265 Bg 264308 Ag 304 307 280339 Bg392 Ag395 Bg
424 413 401444 Bg 444453 Bg489 Bg 484503 Ag 504 501 513
564585 Ag 583618 Ag 612 613
627650 Bg 676 684
693 691825 Bg
995

16.616.716.8
2800nm 2500nm 2000nm
B.W. Mwakikunga et al. / Optical Materials 29 (2007) 481–487 485
the room temperature monoclinic structure to a tetragonalrutile-type structure at a temperature above 68 �C. Verysmall amount of switching was observed in samples pre-pared from a precursor of NH4VO3 with carrier gases ofargon or hydrogen or oxygen. The samples prepared usingNH4VO3 enriched with VCl3 had a remarkable switchingimprovement when transmittance was measured at differ-ent ambient temperatures. Typical switching under varyingambient temperature was observed by measuring transmit-tance at wavelengths in the range 200 nm to 3000 nm whenthe sample was being cooled (Fig. 6) and when it was beingheated (Fig. 7). The sample synthesized at 600 �C underargon shows a transition temperature around 65 �C and aswitching temperature resolution or a hysteresis width(HW) equal to 20 �C (as shown in the hysteresis plot inFig. 8) not only reveals the crystal quality but also signifiesthe broadening possibly due to particulate size. The switch-ing contrast is significantly reduced in the sample synthe-
0 500 1000 1500 2000 2500-2
0
2
4
6
8
10
12
14
23oC
90oC
Tra
nsm
ittan
ce %
Wavelength nm
%T90degC %T80 %T70 %T60 %T50 %T40 %T30 %T25 %T23
Fig. 6. Typical wavelength-related transmittance with varying ambienttemperature on the VO2 sample. This was a cooling cycle.
100oC
23oC
%T23degC %T25 %T30 %T40 %T50 %T60 %T70 %T80 %T90 %T100
0 500 1000 1500 2000 2500
Wavelength nm
-2
0
2
4
6
8
10
12
14
Tra
nsm
ittan
ce %
Fig. 7. Typical wavelength-related transmittance with varying ambienttemperature on the VO2 sample. This was a heating cycle.
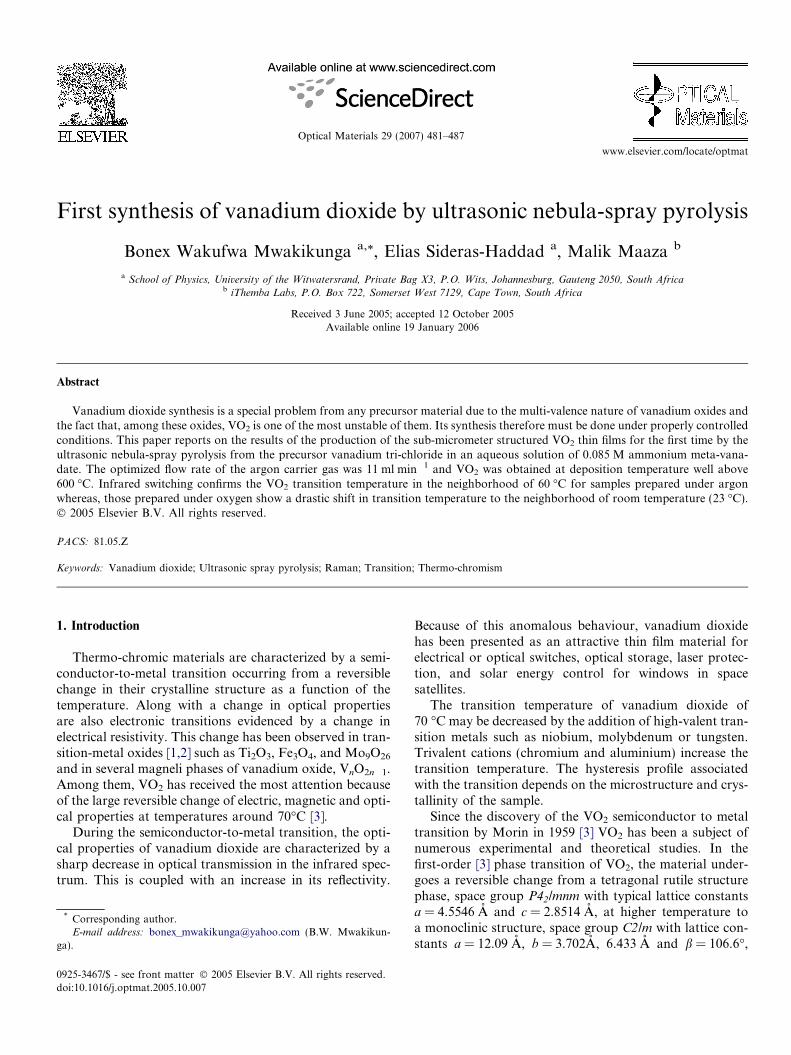
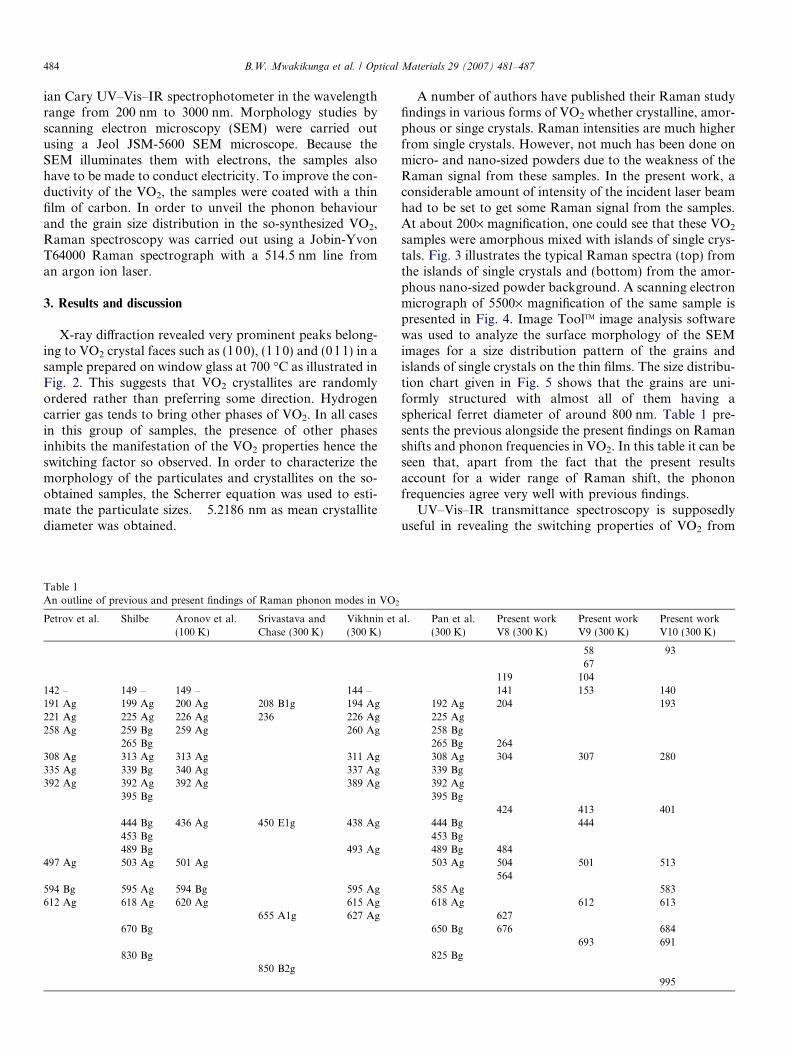
sized at 700 �C, shown in Fig. 9, as expected, where theparticulate size is supposedly larger than on the precedingsample. This sample shows an average resolution of about7 �C. One can also easily see the relationship betweenswitching factor of a sample and the temperature at whichit was synthesized. The sample prepared at 700 �C underthe carrier gas of oxygen showed a remarkable shift in tran-sition temperature to about 23 �C as presented in Fig. 10.This confirms the observation that changing the oxygento vanadium ratio sensitively affects the transition temper-ature of vanadium dioxide as shown in the plot given inFig. 11. This shows that impregnating VO2 with dopants
20 30 40 50 60 70 80 90 100 1108.0
8.5
9.0
9.5
10.0
10.5
11.0
11.5
12.0
12.5
13.0
13.5
Sample VCl700Ar
Tra
nsm
ittan
ce (
%)
Ambient temperature (oC)
2500nm 2000nm 1500nm
Fig. 9. Transmittance versus ambient temperature at different opticalwavelengths for a VO2 sample prepared at 700 �C in an argonenvironment.
20 40 60 80 100
14.915.015.115.215.315.415.515.615.715.815.916.016.116.216.316.416.5
Sample VCl600ArT
rans
mitt
ance
(%
)
Ambient temperature (oC)
1500nm
Fig. 8. Transmittance versus ambient temperature at different opticalwavelengths for a VO2 sample prepared at 600 �C in an argonenvironment.
0 20 40 60 80 100
6.5
7.0
7.5
8.0
8.5
9.0
9.5
10.0
10.5
11.0
11.5
Sample O211T700
Tra
nsm
ittan
ce (
%)
Ambient temperature (oC)
2500nm 2000nm 1500nm
Fig. 10. Transmittance versus ambient temperature at different opticalwavelengths for a VO2 sample prepared at 700 �C in an oxygenenvironment.
1.0 1.2 1.4 1.6 1.8 2.0 2.2
100
150
200
250
300
350
V6O
13V
5O
9
VO2
V2O
3
VOTra
nsiti
on te
mpe
ratu
re (
K)
Oxygen to Vanadium ratio
VnOn, VnO2n, VnO2n-1 VnO2n+1 data Gaussian fit
Fig. 11. Transition temperatures of a selected number of vanadium oxidephases as function of the oxygen to vanadium ratio. A Gaussian fit showsthe exclusivity of VO2 in comparison with the other phases.
486 B.W. Mwakikunga et al. / Optical Materials 29 (2007) 481–487
is not the only route to reducing the transition temperatureof VO2. In this case, the findings suggest that keeping theoxygen to vanadium ratio in the vicinity of 1.93 or 2.05should bring the transition temperature to room tempera-ture. In both routes, this reduction of the transition tem-perature apparently comes at the expense of the switchingquality and transmittance or reflectance contrast.
4. Conclusion
Vanadium dioxide is difficult to obtain because of itsinstability among the many phases of vanadium oxides.
This article has presented the synthesis of VO2 by ultra-sonic spray pyrolysis for the first time. A precursorsolution of ammonium meta-vanadate enriched with vana-dium tri-chloride was found to be one of the most suitablestarting solutions from which droplets were generated byan ultra-sonicator operated at 1.7 MHz. The optimumconditions for obtaining VO2 have been presented. X-raycharacterization shows VO2 crystals with randomizedrather than preferential ordering of the crystal faces.Raman spectra of the VO2 materials confirm the VO2
signatures obtained from previous studies. The size distri-bution by scanning electron microscopy shows prefer-entially spherical grains with modal ferret diameters ofaround 800 nm. Infrared switching confirms the VO2 tran-sition temperature in the neighborhood of 65 �C for sam-ples prepared under argon whereas those prepared underoxygen show a drastic shift in transition temperature tothe neighborhood of room temperature. In the latter case,transmittance contrast and, hence, switching quality isheavily hampered.
Acknowledgements
Sponsorship from the Japanese Government throughthe Joint Japan/World Bank Graduate ScholarshipProgramme (JJWBGSP), Washington, DC, USA ishighly appreciated. The support of the Schools of Physicsat the University of the Witwatersrand and the Univer-sity of Johannesburg in South Africa is also acknowl-edged.
References
[1] N.F. Mott, Rev. Modern Phys. 40 (4) (1968) 677.[2] D. Adler, Rev. Modern Phys. 40 (4) (1968) 714.[3] F.J. Morin, Phys. Rev. Lett. 3 (1959) 34.[4] Z. Iqbal, F.J. Owens (Eds.), Vibrational Spectroscopy of Phase
Transitions, Academic, Orlando, FL, 1984.[5] J.B. Goodenough, J. Solid State Chem. 3 (1971) 490.[6] S. Shin, S. Suga, M. Tanuguchi, M. Fijisawa, H. Kansaki,
A. Fujimori, H. Damon, Y. Ueda, K. Kosuge, S. Kachi, Phys. Rev.B41 (1990) 4993.
[7] D. Paquet, P. Leroux-Hugon, Phys. Rev. B22 (1980) 5284.[8] J.C. Lee, G.V. Jorgenson, R.J. Lin, Proc. SPIE 692 (1986) 2.[9] P. Jin, M. Tazawa, T. Miki, S. Tanemura, The 3rd IUMRS-ICAM,
Int. Conf. On Advanced Materials, 31 August–4 September 1993,Tokyo, Paper No. KP 57 in Ecomaterial session.
[11] S.M. Babulanam, T.S. Eriksson, G.A. Niklasson, C.G. Granqvist,Solar Energy Mater. 16 (5) (1987) 347;K. Kuwabara, S. Ichikawa, K. Sugiyama, J. Electrochem. Soc. 135(1988) 2432.
[11] W.R. Roach, Appl. Phys. Lett. 19 (1971) 453.[12] A.W. Smith, Appl. Phys. Lett. 23 (1973) 437.[13] D.D. Eden, Opt. Eng. 20 (1981) 337.[14] M. Fukuma, S. Zembutsu, S. Miyazawa, Appl. Opt. 22 (2) (1983) 265.[15] M.F. Becker, A.B. Buckman, R.M. Walser, T. Lepine, P. Georges,
A. Brun, Appl. Phys. Lett. 65 (12) (1994) 1507.[16] G. Guzman, F. Beteille, R. Morineau, J. Livage, J. Mater. Chem. 6
(1996) 505.[17] Beth S. Guiton, Qian Gu, Amy L. Prieto, Mark S. Gudiksen,
Hongkun Park, J. Am. Chem. Soc. 127 (2005) 498.

B.W. Mwakikunga et al. / Optical Materials 29 (2007) 481–487 487
[18] R. Lopez, L.A. Boatner, T.E. Haynes, L.C. Feldman, R. Hugland,J. Appl. Phys. 92 (2002) 4031.
[19] J. Liu, Y. Li, T. Wang, D. Yu, Angew. Chem. 116 (2004) 5158.[20] R.T. Kivaisi, M. Samiji, Solar Energy Mater. Solar Cells 57 (1999)
141.[21] E.E. Chain, J. Vac. Sci. Technol. A4 (1986) 432.
[22] An excellent article on VO2 as an infrared active coating by G.Guzman can be accessed from: <http://www.solgel.com/articles/August00/thermo/Guzman.htm>.
[23] D.H. Kim, H.S. Kwok, Appl. Phys. Lett. 65 (1994) 3188.[24] A. Bouizidi, N. Benramdane, A. Nakrela, C. Mathieu, B. Khelifa, R.
Desfeux, A. Da Costa, Mater. Sci. Eng. B95 (2002) 141.
Copyright © 2022 FDOKUMEN