Upgrading of Pyrolysis Oil - Kth Diva Portal Org
61
IN DEGREE PROJECT CHEMICAL SCIENCE AND ENGINEERING, SECOND CYCLE, 30 CREDITS , STOCKHOLM SWEDEN 2018 Upgrading of Pyrolysis Oil SURAPAT SOMSRI KTH ROYAL INSTITUTE OF TECHNOLOGY SCHOOL OF ENGINEERING SCIENCES IN CHEMISTRY, BIOTECHNOLOGY AND HEALTH
-
Upload
khangminh22 -
Category
Documents
-
view
2 -
download
0
Transcript of Upgrading of Pyrolysis Oil - Kth Diva Portal Org

IN DEGREE PROJECT CHEMICAL SCIENCE AND ENGINEERING,SECOND CYCLE, 30 CREDITS
, STOCKHOLM SWEDEN 2018
Upgrading of Pyrolysis Oil
SURAPAT SOMSRI
KTH ROYAL INSTITUTE OF TECHNOLOGYSCHOOL OF ENGINEERING SCIENCES IN CHEMISTRY, BIOTECHNOLOGY AND HEALTH

1
ACKNOWLEDGEMENTS
This study was completed in complementary to the requirements of the Master’s Program in
Chemical Engineering for Energy and Environment at KTH Royal Institute of Technology and
performed at the Process Technology Division at the Department of Chemical Engineering.
I would like to give special thanks to my supervisor and mentor Efthymios Kantarelis for his
relentless effort, understanding, and guidance. I thank my examiner Klas Engvall for his
invaluable assistance and the opportunity of working on this challenging project. I thank
Scandinavian Enviro Systems for making this project possible. I would also like to thank all my
colleagues from the Process Technology Division who helped my project to move on and for
creating a fun environment to work in.
Last but not least, I would like to thank my family and friends for their encouragement and
undying support. The people who have especially helped me to complete this journey are Ubol
Somsri, Anathea Cristea, Anna Basetti, Kusuma Wongmaha, Chulee Wangsirilert, and Jatesada
Borsub.

2
ABSTRACT
The annual increase in waste car tires in addition to the enormous amount at present poses a
major waste management problem as well as an environmental hazard. However, pyrolysis is
emerging as a solution for waste tire management and a viable technology for material recycling
and energy recovery that produces high energy liquid and gas products as well as char. The
pyrolysis oil that is produced from this technology has the potential to be used as vehicle fuel but
contains exceeding levels of sulfur and other impurities. This study investigates the upgrading
and desulfurization of waste tire pyrolysis oil by reactive adsorption using a molybdenum
modified zeolite and its desilicated form. The experiments were performed at 320 °C and a
LHSV of 45-50 h-1 for approximately 45 min, and revealed that both desilication and Mo-
modification resulted in the cracking of both gaseous and liquids compounds, reduction of TAN,
denitrogenation, and deoxygenation. Desilication increased desulfurization while Mo-
modification increased the EHI. The treatment was the most effective in the removal of oxygen,
followed by nitrogen and sulfur. In conclusion, the treatment process is promising as a method
for direct liquid upgrading but requires further research.

3
TABLE OF CONTENTS
ACKNOWLEDGEMENTS ............................................................................................................ 1
ABSTRACT .................................................................................................................................... 2
TABLE OF CONTENTS ................................................................................................................ 3
1 INTRODUCTION ....................................................................................................................... 5
1.1 Background ........................................................................................................................... 5
1.2 Aim ........................................................................................................................................ 6
2 STATE OF THE ART ................................................................................................................. 7
2.1 Introduction ........................................................................................................................... 7
2.2 Pyrolysis Technologies and Conditions ................................................................................ 8
2.2.1 Temperature and heating rate ......................................................................................... 8
2.2.2 Pressure .......................................................................................................................... 9
2.2.3 Reaction atmosphere .................................................................................................... 10
2.2.4 Residence time ............................................................................................................. 10
2.2.5 Reactors and pyrolysis methods ................................................................................... 10
2.3 Pyrolysis Oil ........................................................................................................................ 11
2.3.1 Composition ................................................................................................................. 11
2.3.2 Applications ................................................................................................................. 13
2.3.3 Problems ....................................................................................................................... 14
2.3.4 Characterization ........................................................................................................... 15
2.4 Upgrading ............................................................................................................................ 16
2.4.1 Catalytic upgrading ...................................................................................................... 17
2.4.2 Oxidative desulfurization ............................................................................................. 19
2.4.3 Hydrodesulfurization .................................................................................................... 19
2.4.4 Combinational techniques ............................................................................................ 20
2.4.5 Selection of desulfurization technique ......................................................................... 21

4
3 METHODOLOGY .................................................................................................................... 22
3.1 Materials .............................................................................................................................. 22
3.2 Preparation of Catalyst ........................................................................................................ 22
3.3 Preparation of Oil before Analysis ...................................................................................... 23
3.4 Experimental Setup ............................................................................................................. 25
3.5 Atomization Quality and Experimental Procedure ............................................................. 27
3.7 Analysis ............................................................................................................................... 30
3.7.1 Characterization of gas ................................................................................................. 30
3.7.2 Characterization of liquid ............................................................................................. 31
3.7.3 Characterization of catalyst .......................................................................................... 31
4 RESULTS AND DISCUSSION ............................................................................................... 31
4.1 Raw Oil ............................................................................................................................... 31
4.2 Mass Balance and CHNSO Balance ................................................................................... 33
4.3 Gas Formation ..................................................................................................................... 35
4.4 Thermodynamic Analysis ................................................................................................... 37
4.5 Physical Properties of Catalysts .......................................................................................... 38
4.6 Effects of Reactive Adsorption Tests on Catalysts ............................................................. 40
4.7 Liquid Analysis ................................................................................................................... 42
5 CONCLUSIONS ....................................................................................................................... 46
6 RECOMMENDATIONS AND FUTURE WORK ................................................................... 47
7 REFERENCES .......................................................................................................................... 48
APPENDICES: SUPPLEMENTARY INFORMATION ............................................................. 54
Appendix A: Mass Balance Closure ......................................................................................... 54
Appendix B: Gases and Their Volumes .................................................................................... 54
Appendix C: Thermodynamic Values ....................................................................................... 55
Appendix D: Peak Area of Liquid Compounds ........................................................................ 59

5
1 INTRODUCTION
1.1 Background
In 2015, the European Union (EU) alone produced 4.9 million tons of tires [1]. Based on
information from 2013, the EU has successfully achieved a 96 % environmentally viable
treatment rate. However, the remaining 4 % amasses to approximately 200,000 tons of tires per
year that remains to be managed and does not take into account existing used tires [2]. Since tires
are a combination of different materials, such as metal, rubbers, fabrics, and both organic and
inorganic components, they pose a great challenge for waste separation and management. The
main component of tires is rubber, which is a chemically cross-linked polymer that cannot be
remolded without major degradation and is difficult to be modified for other applications [3]. If
left untreated, these waste tires pose serious environmental problems such as soil contamination,
ground water leaching, mosquito breeding grounds, and tire fires, which are difficult to
extinguish once aflame [4], [5].
Among the different methods in handling waste tires, landfilling has been the most common.
However in 2003, the European Union Landfill Directive became a major driver for alternative
waste tire solutions and shifted tire disposal away from landfilling by banning the landfilling of
whole tires. Three main fields of alternative solutions as shown in Figure 1 have emerged in
response to the directive: recovery in civil engineering applications, material recycling, and
energy recovery. In civil engineering applications, the tires can be used for various purposes,
such as ocean wave barriers, road blocks, and retention basins. In material recycling, rubber and
steel wires in the tires are separated in steel works and foundries, and can be applied as re-
molded tools and synthetic floors. In the energy recovery route, tires are used as a fuel addition
or fuel substitute in urban heating, cement kilns, and power plants [6].

6
Figure 1: Alternative waste tire solutions
Among the different management methods, the energy recover route is particularly interesting.
The tires are combustible and provide high heating values with the appropriate technology [7].
They have similar calorific values to coal and crude oil with the extra benefit of lower sulfur
contents. In fact, one passenger car tire has a calorific value equivalent to 7.6 liters of oil and
replaces additional carbon dioxide emissions from fossil fuels [6]. On an estimate, replacing oil
with all of Europe’s tires can save more than 6 million barrels of oil [8]. Some energy recovery
technologies today are pyrolysis, incineration, co-combustion, and gasification. The most viable
means in terms of both material recycling and energy recovery is pyrolysis. This technology is
gaining global interest but further research is necessary to maximize its potential [5].
1.2 Aim
The aim of this study is to upgrade pyrolysis oil (i.e. reducing the content of sulfur, nitrogen, and
oxygen, and improving other properties) via mild treatment at gas phase as a direct treatment of
the pyrolysis oil vapors from the pyrolysis reactor. The selected treatment method is reactive
adsorptive desulfurization of the tire pyrolysis oil (TPO) using a molybdenum modified zeolite
and its desilicated form. The work is performed in collaboration with Scandinavian Enviro
Systems AB. The experimental setup is constructed using the facilities of the Department of
Chemical Engineering at the Process Technology Division at the School of Engineering Sciences
in Chemistry, Biotechnology and Health, KTH Royal Institute of Technology.
Civil Engineering
• Ocean wave barrier
• Road blocks
• Retention basin
Material Recycling
• Re-molded tools
• Synthetic floors
Energy Recovery
• Urban heating
• Cement kiln
• Power plant

7
2 STATE OF THE ART
2.1 Introduction
Pyrolysis is the thermal degradation of a material at elevated temperatures in an environment
devoid of oxygen, which can be created by filling the compartment with an inert gas. The
process causes organic compounds to decompose into simpler chemical compounds in the form
of solids, liquids, and gases. The final pyrolysis products are a result of the starting materials and
operating conditions. Thus, end-of-life tire management through this technology requires an
understanding of the basic tire components.
Tires are usually a composite of different rubbers, which constitute more than 60 % of the tire’s
composition. Some commonly used rubbers are natural rubber (polyisoprene), nitrile rubber,
chloroprene rubber, polybutadiene rubber, and styrene-butadiene copolymer. The tire rubber
composition is important to the pyrolysis conditions because each type of rubber has a
characteristic degradation temperature [9]. In addition to rubber, tires are composed of steel
wires, fabrics, extender oils, activating agents, zinc oxide, sulfur and carbon black [5], [7], [10].
Figure 2: Composition of tires [3]
After complete pyrolysis, three states of products can be found: gases, liquids, and solids. The
volatile organic material, which is mostly rubber, decomposes into low molecular weight vapors.
The nonvolatile organic and inorganic materials remain as char. The inorganic component,
58.8
27.7
9.6
3.9
Volatile Nonvolatile Steel Others

8
which is mainly steel wires, can then be separated [3]. The overall composition of a tire is shown
in Figure 2. The solid, liquid, and gas yields vary greatly depending on operating conditions and
environment. For example, Leung et al. achieved yields of 35-50 % for solids, 35-51 % for oil,
and 15-17 % for gas [11]. If a specific product is desired, the pyrolysis conditions can affect the
quality of the product as has been shown by Barbooti et al. where the carbon black differed in a
steam atmosphere as compared to an inert atmosphere [4].
2.2 Pyrolysis Technologies and Conditions
Pyrolysis is an endothermic reaction that is influenced by kinetic rate-controlled and transport
processes. Temperature and heating rate are key factors in endothermic reactions and are of
particular interest to the pyrolysis process. Secondly, transport factors relating to intraparticle,
particle-to-fluid, and interparticle transport processes must be considered [7]. These factors
include the pressure, type of carrier gas, gas flow rate, residence time, and particle size. Thirdly,
the result depends on the pyrolysis methods, catalysts, and raw materials used [11].
2.2.1 Temperature and heating rate
Temperature is one of the most important parameters and is the standard experimental variable.
Varying temperature tests from 300-900 °C on waste tires have provided a comprehensive
overview of rubber degradation as shown in Figure 3 [7]. Natural rubber decomposes at a lower
temperature of approximately 380 °C, styrene-butadiene rubber decomposes at a higher
temperature of approximately 450 °C, and butadiene rubber decomposes at a slightly higher
temperature of approximately 460 °C. A sample with a combination of the rubbers will possess
combined degradation properties of each rubber type [10].
In most cases, the optimal pyrolysis temperature at atmospheric pressure would appear to be 500
°C since complete pyrolysis conversion is achieved [9]. As the temperature in the reactor
increases, the sample undergoes different reactions. Primary pyrolysis reactions occur first at
temperatures between 250-520 °C [9]. In this range, the heavy carbonic compounds crack to
form hexamers and continue cracking to form dimers (dipentene) and monomers (isoprene). The
yields of liquid and solid products decrease as temperature increases. The liquid product (or oil)
in this range comprises more of free aliphatic compounds while the solid product is char. As oil
and char yields decrease, gas yields increase and the gases are mainly formed between 400-500
°C. This range is characterized by the formation of alkenes [3]. Between 450-475 °C, oil yields
reach a maximum and possess aliphatic-aromatic linked structures [4]. The gases at this range

9
have greater COx content which contributes to their lower gross calorific values (GCV) [3], [7].
At temperatures between 600-900 °C, secondary reactions or the major cracking of tar occurs
and expedites as the temperature increases [11]. As the temperature reaches 750-1000 °C,
pyrolytic carbon black gasifying reaction occurs simultaneously with CO2/H2O/O2 [9].
Figure 3: Effects of reaction temperature [9], [10]
The heating rate kinetically affects the pyrolysis complete time and the required pyrolysis
energy. Gonlalez et al. and Diez et al. have studied the effects of heating rates from 5-60 °C/min
and discovered that increasing the heating rate produced similar effects as to increasing the
temperature [7], [12].
Another factor that influences the thermal reactions is the particle size of the tires. The particle
size has a direct effect on the formation of temperature gradients in the particle which in turn
affects the product yields. However, it was determined that particle sizes below 5 mm have no
impact on the process rate since the reactions in the particles behave isothermally [7]. Particle
sizes larger than 5 mm result in a higher oil yield when heated to pyrolysis temperatures of 450-
460 °C [4].
2.2.2 Pressure
Pyrolysis is mostly studied at atmospheric pressure though different ranges affect the pyrolysis
reaction behavior [7]. Experiments conducted under vacuum conditions possessed limited
1
2
3
4
5
6
200 300 400 500 600 700 800 900 1000
Effe
cts
of
Rea
ctio
n T
emp
erat
ure
Temperature (°C)
Pyrolytic carbon black gasifying reaction occurs
Secondary post-cracking reaction occurs
Butadiene rubber decomposes
Styrene-butadiene rubber decomposes
Natural rubber decomposes
Primary pyrolysis reaction occurs

10
secondary reactions and shorter residence times of the volatile products in the reactor since the
vacuum facilitates outward diffusion from the tire particle’s pore [9]. Cases operated under high
pressures (3-13 MPa) exhibit greater carbon cracking and are based on traditional methods used
to process petroleum-derived feedstock [13].
2.2.3 Reaction atmosphere
The reaction atmosphere is conditioned into an oxygen-free environment by purging the reactor
with a carrier gas. The carrier gas is an inert gas, which is usually nitrogen but also helium and
argon [12], [14], [15]. If pyrolysis is performed in a non-inert atmosphere, additional reactions
can occur between the gas and solid particles. For instance, a carbon dioxide atmosphere shifts
sulfur compounds from the char to the pyrolysis gas [9]. Another example is steam [16]. Steam
results in a reaction atmosphere with higher pressure and lower pyrolytic temperature.
Additionally, pyrolytic char products from a steam environment will have a similar surface area
and porosity as that of activated carbon produced at high temperatures.
2.2.4 Residence time
The residence time determines the degree of secondary reactions. In combination with high
temperatures, long residence times offer conditions for extensive secondary reactions. As a
result, the yields of solid and liquid products will decrease while the yield of gas products will
increase [9]. Moreover, gases under long residence times contain more aromatic and polycyclic
compounds since gases, such as ethane, propene, and butadiene in the gaseous state will react to
form cyclic alkenes [10].
In addition to the reactor design, the factor that directly determines the residence time is the gas
flow rate. When there is a high flow rate, the residence time of gases and secondary pyrolysis
reactions are minimized [7].The gas flow rate additionally regulates the superficial velocity and
influences the heat and mass transfers, and the reaction and ratio of char and oil products [5].
2.2.5 Reactors and pyrolysis methods
Various types of reactors, pyrolysis methods, and scales have been developed and studied for
waste tire pyrolysis as shown in Table 1.

11
Table 1: Various pyrolysis reactors and methods
Reactor Author Reference
Unstirred autoclave Rodriguez et al. [3]
Fixed-bed reactor Diez et al. [12]
Rotary pilot reactor Diez et al. [12]
Fluidized bed reactor Conesa et al. [17]
Static batch reactor Williams et al. [18]
Continuous reactor Huayin Group [19]
Vortex reactor Martinez et al. [20]
Externally heated retort reactor Bouvier et al. [21]
Auger reactor Choi et al. [22]
Conical spouted bed reactor Hita et al. [23]
Plasma reactor Martinez et al. [24]
Vacuum pyrolysis Roy et al. [25]
Microwave pyrolysis Enval Limited [26]
Solar catalytic pyrolysis Zeaiter et al. [27]
2.3 Pyrolysis Oil
2.3.1 Composition
From a glance, pyrolytic oil contains two primary components. One of them is a heavy, tawny
brown liquid that clings to the surface and another consists of darker brown objects mixed with
char. Further analysis indicates that the liquid oil can be categorized as light oil (C3-8), diesel oil
(C8-18), fuel oil (C18-30), and residual oil (C30+) [5]. The oil includes a wide range of compounds,
including alkanes, alkenes, aromatic compounds, and hydroxyl compounds as shown in Figure 4
[7]. This result is in agreement with one of the tire’s main raw materials, i.e. styrene-butadiene
rubber, which has a repetitive a structure of aromatics and aliphatics [3]. Energy Pyrolysis Ltd.
reported an analysis assay report based on their oil product sample as shown in Table 2 [38].

12
Figure 4: Compounds in WTPO [7]
Table 2: Composition of waste tire pyrolysis from Energy Pyrolysis Ltd. [38]
Component Value
Arsenic 0.21 PPM
Cadmium 0.235 PPM
Chromium 0.244 PPM
Lead 0.209 PPM
Ash 7.1 %
Flash Point 40.1 /°C
Water content 1.5 %
Density 0.87 g/cm3
Oxide 6.1 %
Halogen 50.0 PPM
Sulfur 1.05 %
Kinematic Viscosity 26.0 /20 °C
Heat of Combustion 39.560 MJ/kg
Alkane
• Decane
• Undecane
• Dodecane
• Tridecane
• Octadecane
• Eicosane
Alkene
• Propylene
• Butadiene
• 1-Pentene
• 1,4-Pentadiene
• Isoprene
• Octene
Aromatic compounds
• Benzene
• Toluene
• Ethylbenzene
• (m-, p-, o-) Xylene
• Styrene
• Naphthalene
• Phenanthrene
• Anthracene
Hydroxyl compounds
• Phenol
• 3-Methylphenol
• 2-Ethyl-1-hexanol

13
2.3.2 Applications
Due to its composition and properties, waste tire pyrolysis oil (WTPO) is a potential source of
fuel and chemical feedstock as shown in Figure 5. Based on boiling points, the pyrolysis liquid
can be divided into three factions: light (45-205 °C), middle (205-300 °C), and heavy (>300 °C)
[39]. However, the fractions mix and are not distinctly separated. About 30 % of the pyrolytic
liquid has boiling points between 70-210 °C and is easily distillable while another 60 % has
boiling points between 150-370 °C. The former possesses properties similar to commercial petrol
while the latter is similar to diesel oil. The pyrolysis oils have a GCV of about 40 MJ/kg and can
be combusted directly or added to petroleum refinery feedstock with the added benefit of
reducing the carbon footprint [3], [38]. If combusted directly, businesses and applications from
ceramic factories, glass factories, electric power plants, steel refineries, and boilers can benefit
from the minimally processed pyrolytic oil.
Figure 5: Applications of waste tire pyrolysis products
Some manufacturers utilize pyrolysis to produce diesel oil that can power tractors, trucks, ships,
diesel oil generators, and power generators and have outputs of 92-95 % from the liquid [19],
[38]. According to various reports, TPO can be used in a blend or pure to some extent. Baskovic
et al. found that pure TPO can be injected into a modern turbocharged and intercooled diesel
engine while Islam et al. and Aydin and Ilkilic recommended blends with commercial diesel at
25 % and 75 %, respectively [36], [40]. Aside from blends with petroleum fuels, various works
Waste tire
Solid
Liquid
Fuel
Pure
Blend
Chemical
Limonene
Benzene
Toluene
Gas
14
have studied the co-pyrolysis of waste tire oil with other waste oils, lignite, and biomass such as
palm shells, canola oil, soapstock, and bamboo sawdust [14], [15], [33], [41].
In addition to the benefits as a fuel, pyrolysis oils they are a potential source of chemical
feedstock. They contain high concentrations of benzene, toluene, isoprene, styrene, xylene, and
limonene that have various uses in different industries [7]. The light aromatics and olefins such
as limonene in the oil have a very high value in the market and is used in a variety of different
applications, including industrial solvents, adhesives, pigments, and lemon fragrances [9], [42].
The chemical is most likely to have derived from isoprene or natural rubber but degrades above
temperatures of 500 °C into benzene, xylene, and styrene. Benzene is used in the production of
plastics and resins. Toluene is used in pesticide production and dyestuffs [39], [43].
2.3.3 Problems
TPO shows many potential qualities as a fuel alternative and have been tested for applications as
mentioned in the previous section. However, TPO has not become commercially widespread due
to several limitations including sulfur content, nitrogen content, oxygen content, flash point, and
moisture content as shown in Table 3. Since these factors harm the environment and equipment,
they have to be monitored and controlled. Some pyrolytic oils have a low sulfur content (~1.0
wt.%) but the level is several magnitudes above the 10 ppm sulfur limit for EU highway diesel
regulations [44]. Sulfur harms the environment as it is released as a vehicle emission and
becomes a major contributor to acid rain. The sulfur in pyrolysis oil can be found as
benzothiazole, dibenzothiophene, and its alkylated forms. The nitrogen content in TPO is slightly
higher than commercial diesel and is also found in the compound benzothiazole. Oxygen
contributes to the formation of CO2, SOx, and NOx and is found in hydroxyl compounds, such as
phenol, 3-methylphenol, and 2-ethyl-1-hexanol. Moisture in the oil causes uncontrollable
combustion that produces negative effects to the engine [15], [23].
In addition to challenges in terms of chemical composition, the liquid has higher viscosity, lower
flash point and lower cetane number than standard diesel. The high viscosity can cause
problems, such as carbonization, in the engine [45]. The lower flash point is caused by the high
amount of volatile hydrocarbons, aromatic compounds, and olefins from pyrolyzing rubber [23].
Lower cetane numbers than the standard (40-55) cause longer ignition times and higher fuel
consumption, which results in lower thermal efficiency and higher emissions. The lower cetane
numbers are due to the cycloalkanes and aromatic compounds in pyrolysis oil. Unprocessed TPO
also contains char particles and alkali metals that damage a car engine over time [9].

15
Table 3: Vehicle fuel properties of WTPO [9], [15], [31]
Properties Description TPO Diesel
Sulfur Contributes to SOx 1.12 wt.% [31] 0.16 wt.% [31]
Nitrogen Contributes to NOx 1.15 wt.% [31] 0.13 wt.% [31]
Oxygen Contributes to CO2,
SOx, and NOx
2.02 wt.% [31]
(In range of diesel)
Nil [31]
Moisture Leads to uncontrolled
engine combustion
0.30-4.60 wt.% [9] 0.02 wt.%a [15]
Density Affects uniform
distribution of fuel
during combustion
0.96 kg/L
at 15 °C [31]
0.82-0.86 kg/L
at 15 °C [31]
Viscosity Affects performance
at low temperatures
and atomization
16.39 cSt
at 40 °C [31]
2.00 cSt
at 40 °C [31]
Flash point Limits operating
temperature
50.00 °C [31] Above 55 °C [31]
Cetane
number
Affects thermal
efficiency
40-44 [9] 51 [38]
Higher heating
value
Affects performance
during combustion
42.00 MJ/kg
GCV [31]
44.00-46.00 MJ/kg
GCV [31]
a.. Converted from mg/kg
2.3.4 Characterization
The properties of pyrolysis oil mentioned in the previous section can be determined by several
well-established methods as seen in Table 4.

16
Table 4: Characterization technique of properties
Properties Measurement Technique Standard
Elemental composition CHNSO analyzer ASTM D5291,
ASTM D5373
Proximate analysis Thermogravimetric analysis ASTM D482,
ASTM D4530
Energy content
(GCV & HHV)
Bomb calorimeter ASTM D2015
Moisture content Karl Fischer titration ASTM D1533
Flash point Closed cup flash tester ASTM D92
Distillation properties Distillation test ASTM D86 - 17
Kinematic viscosity Viscometer ASTM D445
Corrosiveness Copper strip corrosion test ASTM D130
Total acid number Potentiometric titration ASTM D664
Specific gravity Gay-Lussac method ASTM D1298,
ASTM D1524
2.4 Upgrading
Upgrading of TPO differs from conventional petroleum-derived fuels due to the unique
properties of pyrolysis oil. As mentioned in the previous sections, factors that inhibit the
commercialization of TPO as a direct fuel alternative are moisture content, viscosity, cetane
number, flash point, and high levels of heteroatomic compounds, including sulfur, nitrogen, and
oxygen. There are many well-established methods that have been used to treat some of these
factors. For example, Na2CO3 treatment is used to increase the flash point while CaO and natural
zeolite treatment can decrease sulfur and nitrogen ratios [15]. However, the reduction of sulfur
levels to the stringent EU standard in new types of fuels poses a challenge for the industry and
lab-scale tests. Conventionally, hydrodesulfurization is used to remove organosulfur compounds
from petroleum-derived feedstock. However, the process requires high pressures (>2 MPa), large
feedstock volumes, and costly metal catalysts which all contribute to the method’s high
effectiveness and efficiency [46]. However, the TPO industry is in its early stages and cannot
compete with petroleum refineries in terms of technological capacity and cost of scale. Thus,
many methods have been developed to tailor to the needs of upgrading WTPO as shown in Table
5. Some include catalytic upgrading, oxidative desulfurization, hydrodesulfurization, and
physical methods.

17
Table 5: WTPO upgrade treatments
Treatment Author Reference
Oxidative desulfurization Ayanoglu and Yumrutas [15]
Hydrotreating-hydrocracking Hita et al. [23]
Hydrosulfuric acid treatment Islam and Nahian [40]
Photocatalytic oxidation Trongkaew et al. [46]
Vacuum distillation Roy et al. [47]
Ultrasound-assisted oxidation Chen et al. [48]
Methanol extraction Al-Lal et al. [49]
Adsorption Al-Lal et al. [49]
Supercritical water Isa et al. [50]
2.4.1 Catalytic upgrading
In early research on pyrolysis, catalysts were used to alter the ratio of solid, liquid, and gaseous
products obtained from the reaction. As more knowledge on pyrolysis was accumulated,
catalysts played a role in improving the quality of the pyrolysis products through increasing
valuable chemicals or decreasing impurities, such as sulfur. For example, calcium carbonate
(CaO) and natural zeolite (NZ) have been used to adsorb SO2 from heavy and light fractions of
pyrolytic oils [15]. A summary of the effects produced by different catalysts is listed in Table 6.

18
Table 6: Effects observed from different catalysts
Effect Catalyst Reference
Increased gas yield Y-zeolite (CBV-400) [28]
HZSM-5 [28], [29]
Increased aromatic
hydrocarbons
HY zeolite [29]
CaO [15]
Reduced aromatic
hydrocarbons
HZSM-5 [29]
5%Fe/HZSM-5 [30]
5%Fe/HBETA [30]
5%Fe/KL [30]
5%Fe/HMOR [30]
Pt/HMOR [31]
Pt/HBETA [31]
NiMoS/Al2O3 [32]
Increased aliphatic
hydrocarbons
CaO [15]
Co-Mo/Al2O3 [33]
SiO2 [34]
Reduced aliphatic
hydrocarbons
Al2O3 [34]
Reduce sulfur compounds NZ-1 [15]
CaO [15], [35], [36]
Ca(OH)2 [35], [36]
NaOH [35], [36]
5%Fe/HZSM-5 [30]
CoMo/c-Al2O3 [13]
NiMo/c-Al2O3 [13], [33]
NiMo/SiO2-Al2O3 [33]
NiMo/MCM-41 [33]
MgCl2 [37]

19
2.4.2 Oxidative desulfurization
The exceeding sulfur content of WTPO is one of the major obstacles to its potential as a fuel
substitute. One common method of desulfurization is oxidative desulfurization (ODS) where the
sulfur compound is oxidized into a form that is more easily removed. After treatment with an
oxidizing agent, usually hydrogen peroxide, other methods such as extraction and adsorption are
used. Table 7 shows studies that have applied extraction with H2O2 and C2H3N, and adsorption
using pyrolytic tire char with HNO3, HCl, HCOOH or H2O2 treatment [46], [48], [51].
Table 7: Oxidative desulfurization methods
ODS S content S removal T P Author
With TiO2 photocatalyst
and C2H3N extraction
0.84 wt.% to
0.47 wt.%
43.6 % 50 °C 0.1 MPa Trongkaew
et al. [46]
With phosphotungstic
acid containing solution,
assisted ultrasound,
C2H3N extraction, and
Al2O3 adsorption
0.88 wt.% to
0.28 wt.%
and then to
0.08 wt.%
89.0 % 88 °C 0.1 MPa Chen
et al. [48]
With assisted ultrasound
and H2O2 extraction
0.87 wt.% to
0.41 wt.%
53.0 % 70 °C 0.1 MPa Al-Lal
et al. [49]
Followed by HNO3
treated char adsorption
0.38 wt.% to
0.09 wt.%
75.2 % 60 °C 0.1 MPa Bunthid
et al. [51]
Followed by HCl treated
char adsorption
0.38 wt.% to
0.10 wt.%
73.0 % 60 °C 0.1 MPa Bunthid
et al. [51]
Followed by HCOOH
treated char adsorption
0.38 wt.% to
0.11 wt.%
72.3 % 60 °C 0.1 MPa Bunthid
et al. [51]
Followed by H2O2
treated char adsorption
0.38 wt.% to
0.10 wt.%
74.7 % 60 °C 0.1 MPa Bunthid
et al. [51]
2.4.3 Hydrodesulfurization
The most common industrial method of desulfurization is hydrodesulfurization. The method
hydrolyzes the oil under high pressure with hydrogen gas and accelerates the reaction with a
catalyst. However, hydrodesulfurization (HDS) is more effective at treating simple sulfur
compounds and is not as effective for large complex sulfur compounds, such as benzotheophene.

20
Frequently used catalysts contain nickel, cobalt, and molybdenum as well as platinum and
palladium as shown in Table 8 [13], [23], [52].
Table 8: Hydrodesulfurization methods
HDS S content S removal T P Author
NiMo/c-Al2O3 catalyst 1.15 wt.% to
0.14 wt.%
87.8 % 250 °C 2 MPa Jantaraksa
et al. [13]
CoMo/c-Al2O3 catalyst 1.15 wt.% to
0.24 wt.%
78.8 % 250 °C 2 MPa Jantaraksa
et al. [13]
Mo/c-Al2O3 catalyst 1.15 wt.% to
0.57 wt.%
50.4 % 250 °C 2 MPa Jantaraksa
et al. [13]
NiMo followed by
PtPd/SiO2-Al2O3
catalysts
1.18 wt.% to
0.20 wt.%
and then to
0.01 wt. %
99.2 % 375 °C,
500 °C
6.5 MPa Hita et al.
[23]
NiMo/Ac catalyst 0.83 wt.% to
0.57 wt.%
31.3 % 350 °C 7 MPa Ucar et al.
[52]
CoNi/Ac catalyst 0.83 wt.% to
0.68 wt.%
18.1 % 350 °C 7 MPa Ucar et al.
[52]
CoMo/Ac catalyst 0.83 wt.% to
0.64 wt.%
22.9 % 350 °C 7 MPa Ucar et al.
[52]
2.4.4 Combinational techniques
Different techniques continue to be studied involving both chemical and physical treatments to
complement one another and compensate for the drawbacks of each method. Table 9 shows
multistage treatments that model additional upgrading of TPO.

21
Table 9: Combinational desulfurization methods
Desulfurization S content S removal Author
3-Stage treatment:
removal of water, hydrosulfuric acid treatment,
and distillation
1.12 wt.% to
0.43 wt.%
61.6 % Islam and
Nahian [40]
3-Stage treatment:
removal of water, hydrosulfuric acid treatment,
and distillation
0.95 wt.% to
0.26 wt.%
72.6 % Murugan
et al. [45]
5-Stage treatment:
hydrosulfuric acid treatment, CaO adsorption,
distillation, oxidation, and washing
1.13 wt.% to
0.43 wt.%
61.9 % Dogan
et al. [53]
2.4.5 Selection of desulfurization technique
Since the aim of this study was to upgrade pyrolysis oil with direct mild treatment at gas phase,
techniques that do not accommodate the limitations of the experiment were excluded and a
suitable technique was be chosen based on previous research. Traditional ODS and HDS were
omitted due to the limited capability of ODS on gas phase treatment and the high pressure
requirement of HDS. However, the treated catalysts used in HDS (Table 8) are promising and are
prominent among other desulfurization catalysts (Table 6). The metals Ni, Mo, Co have been
studied in pairs either as NiMo, CoNi or CoMo, and Ni has been the catalyst of choice in
reactive adsorptive desulfurization [55]. However, Mo has not been studied individually even
though it showed potential in readily forming sulfides from the TPO [13]. Compared with other
catalysts, zeolites are commonly used in adsorptive desulfurization but face difficulty in
adsorbing large sulfur containing compounds due to steric hindrances in the compounds [56],
[57]. If the pores of the zeolite were to be enlarged through desilication, these large sulfur
compounds may be adsorbed with greater ease. The reaction temperature of the experiment was
based on the temperature of the modeled pyrolysis chamber and its low vapor concentration.
Therefore, the Mo modified zeolite and its desilicated form were chosen to be investigated for
the upgrading of TPO.

22
3 METHODOLOGY
3.1 Materials
The TPO was provided by Scandinavian Enviro Systems AB from the company’s tire recycling
plant in Åsensbruk, Sweden. The catalysts investigated in this experiment were zeolites and their
desilicated forms – HZSM5 and Mo/HZSM5. The parent catalyst was provided by Süd Chemie
(TZP-302) and modified. More information about the preparation can be found [54].The inert
material used for comparison between the catalysts was silica sand.
3.2 Preparation of Catalyst
The catalysts and inert material were prepared into particle sizes of 224-320 µm in diameter to
suit the ratio of particle size-to-reactor area. Each of the catalysts was compressed using a
pelletizer and crushed in a mortar. The crushed catalyst was then sieved using two sieving trays
of 224 µm and 320 µm. The pelletizing-to-sieving process was repeated until more than 2 g of
each catalyst was collected. Once the catalyst was collected, it was stored in a drying oven at 100
°C for 24 h to remove moisture and await usage. Before a catalyst was to be used in the
experiment, it had to be placed in a calcination oven at 500 °C for 3 h to eliminate any organic
compounds. For each experiment, 0.5 g of catalyst was used. Since the inert material was of a
significantly different density, 3.5 g of silica sand was used to achieve the corresponding liquid
hourly space velocity (LHSV) of the catalysts.
Figure 6: Catalysts and inert material. Zeolite HZSM5, desilicated zeolite (Ds-HZSM5), Mo-modified zeolite
(Mo/HZSM5), desilicated Mo-modified zeolite (Mo/Ds-HZSM5), and silica sand (left to right)

23
3.3 Preparation of Oil before Analysis
The raw TPO contained fine solid particles and miniscule heterogeneous droplets as shown in
Figure 7, and was delivered in a 1000 mL container. To prevent possible coking in the reactor
and clogging of the injection nozzle, the TPO was filtered by vacuum filtration with a Munktell
1F ash free filter paper as shown in Figure 8. The filtered oil was stored in a volumetric flask at
2-8 °C to prevent degradation. The used filter papers as shown in Figure 9 were placed in a
drying oven at 120 °C and weighed to observe the residual oil’s volatile behavior. The residual
oil on the filter paper completely evaporated after 3 days of drying.
Figure 7: Residues before vacuum filtration
Figure 8: Vacuum filtration setup

24
Figure 9: Used filter papers
Before the experiment, the oil was allowed to warm up to room temperature and agitated with a
magnetic stirrer for 1 h. In each experiment, 80 mL of the oil sample was used. Once the
homogenized oil was pipetted from the middle of the volumetric flask into a beaker, it was
covered with Parafilm and resumed agitation.
After the seventh successful run, the injection nozzle experienced frequent clogging. The TPO in
the volumetric flask had accumulated sediments at the bottom as shown in Figure 10 and had to
be vacuum filtered a second time before further experimental runs.
Figure 10: Residues before second filtration

25
3.4 Experimental Setup
Figure 11: Experimental setup. 1. TPO sample; 2. Magnetic stirrer; 3. TPO pump; 4. Primary N2 flow; 5. Secondary
N2 flow; 6. Gas-liquid mixing tee; 7. Injection nozzle; 8. Catalytic bed; 9. Furnace; 10. Thermocouples; 11. Primary
condenser; 12. Secondary condenser; 13. Tertiary condenser; 14. Quartz wool trap; 15. Iso-propanol bath; 16. Empty
gas washing bottle; 17. Water trap (P2O5); 18. MicroGC filter; 19. Vent; 20. MicroGC; 21. Computer
The experimental setup consisted of an 8 mm stainless steel reactor with a catalytic bed in the
center as illustrated in Figure 11. The oil sample (1) was placed on a magnetic stirrer (2) for
constant agitation and homogeneity of the oil. A pump (3) which was located next to the
magnetic stirrer drew oil from the beaker into the gas-liquid mixing tee (6) where nitrogen gas
was introduced. The top (primary) nitrogen flow (4) mixed with the oil in the mixing tee and
caused a spray to emerge from the 0.1 mm injection nozzle (7) within the reactor. Slightly below
the primary nitrogen inlet, a secondary nitrogen flow (5) was introduced into the reactor to
prevent any back flow of the spray up to the top. The nitrogen gas was supplied from the central
gas system of the laboratory and separated into two streams to be connected to separate nitrogen
flow controllers.
As the atomized oil was injected into the 8 mm stainless steel reactor, the oil was heated by the
surrounding 3-zone electrically heated furnace (9) and passed through a catalytic bed (8) which
was supported by metallic grids. Above and below the catalyst bed were two thermocouples (10)
that were placed to log the reactor temperatures (21). The vaporized oil that passed through the
catalyst bed would leave the reactor from the bottom and condense in the primary condenser (11)

26
which had cool water flowing through it. The condensed vapor was collected in the first two-
necked round-bottom flask – the primary receiver. The uncondensed vapor would pass through
the primary receiver to the secondary receiver and up the secondary condenser (12) and finally
into the tertiary receiver and then the tertiary condenser (13). All receivers were placed in a salt
water and ice bath.
Ideally after the tertiary condenser, all vaporized oil would have condensed and be collected in
the tertiary receiver. If not, the remaining vaporized oil would be stopped by the quartz wool trap
(14), the iso-propanol bath (15), and the empty gas washing bottle (16). The oil-free gas would
then pass through a water trap containing phosphorus pentoxide (17). Finally, a portion of gases
produced from the reactor could be pumped (18) into the microGC (20) for analysis of the gas
composition while the rest would be vented out (19). All gas analysis data was collected in the
laboratory’s computer (21). Figure 12 and Figure 13 show the actual experimental setup.
Figure 12: Experimental setup in the left fume hood

27
Figure 13: Experimental setup in the right fume hood
3.5 Atomization Quality and Experimental Procedure
The injection nozzle was carefully crafted and tested with different liquids to produce a uniform
atomization of the liquid and nitrogen gas mixture. Simultaneously, the chemical compatibility
of the pump tubing that would feed the liquid sample into the gas-liquid mixing tee was tested
with liquids possessing similar characteristics to the TPO and with the cleaning solvents.
The final testing liquid for atomization was tube condenser oil provided by Scandinavian Enviro
Systems AB from the company’s tire recycling plant in Åsensbruk, Sweden. The condenser oil
produced thin sprays and some mist as did distilled water which was the main testing liquid.
Methanol, acetone, and dichloromethane produced a fine mist when tested while rapeseed oil
methyl ester (RME) produced slightly larger mist particles. Figure 14 shows the setup for the
atomization test.
After preliminary tests, three methods were developed for cleaning the injection nozzle. The first
method was to disassemble the injection nozzle and compress dichloromethane through the
nozzle. The second method was used if the first method did not successfully clean the injection
nozzle and unclog it. The second method was to attach the injection nozzle to the pump and
immerse the injection nozzle under hot water while pumping hot water in and out of the tip until
the nozzle showed signs that water could pass through. If water could pass through the injection

28
nozzle, it was disassembled and acetone was compressed into the nozzle by hand. Under heavy
clogging of the injection nozzle, the third method was applied. In the third method, the injection
nozzle was attached to a gas tube and compressed air was fed into the tube. Then the exterior of
the nozzle from the tip until the middle of the rod was burned with a blow torch to combust
deposited organic compounds.
The pump tubing was provided by Labinett AB and made from polyvinyl chloride (PVC). The
tubing was compatible with condenser oil, RME, and water but would eventually fail from heavy
usage of the pump. The tubing had lower tolerance for acetone, methanol, and dichloromethane,
respectively. Usage with dichloromethane would cause the tubing to rupture within an hour of
usage. After tests with condenser oil, acetone was selected as the cleaning solvent for rinsing the
tube after experimental runs.
Figure 14: Atomization test setup
Each experimental run followed a procedure of different stages from preparation to product
collection. The process comprised of two preparation stages, initiation, monitoring, and
termination.
In the first stage of preparation, the TPO, the catalyst, and the microGC had to be prepared. The
TPO had to be removed from the refrigerator to reach room temperature and stirred with a
magnetic stirrer for 1 h to ensure homogeneity. Then 80 mL was drawn from the homogenized
oil in the storage flask using a volumetric pipette and transferred to a 100 mL beaker with a
29
magnetic stirrer in it for further agitation. The catalyst had to be removed from the oven and
placed in a desiccator for 30 minutes to cool down to room temperature with minimal exposure
to air. Then 0.5 g of the catalyst was measured and installed onto the catalytic bed within the
reactor. The microGC had to be purged with argon for 30 minutes to prevent detection of any
remaining gases.
In the second stage of preparation, the system had to be brought to a steady state. After the
reactor was installed in the furnace and the surrounding equipment and apparatuses were set up,
the system was filled with nitrogen gas from the secondary flow (~13.3 mL/min) and tested for
leaks. The 3-zone electrically heated furnace was set at the top, middle, and bottom so that it
produced a temperature profile with minimum temperature difference (±10 °C) between the top
and bottom of the catalytic bed. The reactor was heated for 3 h to allow the temperature in the
reactor to stabilize.
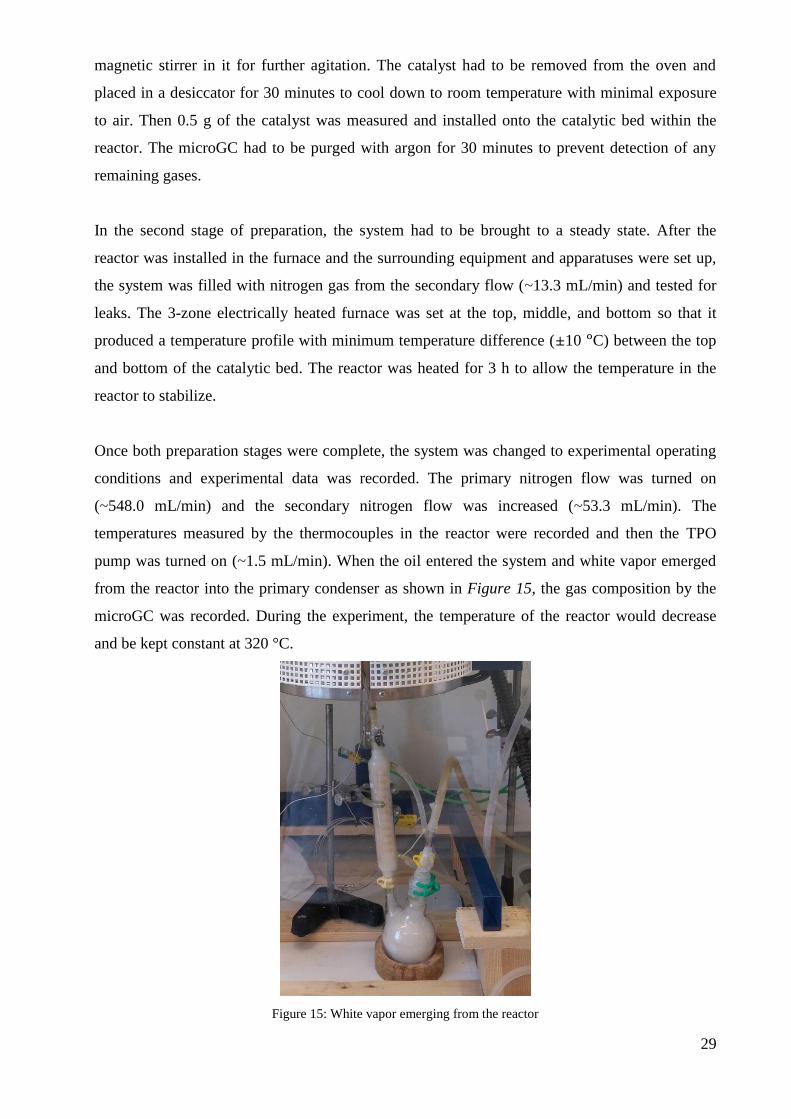
Once both preparation stages were complete, the system was changed to experimental operating
conditions and experimental data was recorded. The primary nitrogen flow was turned on
(~548.0 mL/min) and the secondary nitrogen flow was increased (~53.3 mL/min). The
temperatures measured by the thermocouples in the reactor were recorded and then the TPO
pump was turned on (~1.5 mL/min). When the oil entered the system and white vapor emerged
from the reactor into the primary condenser as shown in Figure 15, the gas composition by the
microGC was recorded. During the experiment, the temperature of the reactor would decrease
and be kept constant at 320 °C.
Figure 15: White vapor emerging from the reactor

30
In the final stage, the equipment was sequentially shut down and the products were collected.
When the sample oil had emptied, the furnace and pump were turned off. With no additional oil
injected into the reactor, the gases from the reaction would decrease and the percentage of
nitrogen would increase. Once only a nitrogen peak was observed in the microGC
measurements, the temperature recordings and microGC measurements were stopped. The
primary nitrogen flow was reduced and maintained while the reactor cooled down to below 200
°C to prevent clogging of the injection nozzle. When the reactor reached temperatures between
70 °C and 100 °C, the furnace was opened and the reactor was disassembled. The catalyst was
transferred to a beaker and placed in a desiccator until it cooled down to room temperature. Then
the product oil and catalyst, as well as all reactor parts and apparatuses relevant to the
gravimetric analysis, were weighed. Once all gravimetric measurements were complete, the
product oil and catalyst were stored and the equipment was cleaned.
Figure 16: Product oil in primary, secondary, and tertiary receivers (left to right)
3.7 Analysis
All analytically significant parts of the experimental setup were carefully noted for gravimetric
measurements before collection of the products and each experimental condition was carried out
in duplicates. The gas, liquid, and solid products were analyzed to completely assess the
performance and behavior of each experiment.
3.7.1 Characterization of gas
The non-condensable gases produced from the reactor were analyzed for their composition by a
Thermo C2V microGC. The values were then combined with results from the gravimetric

31
measurements to determine the total mass balance closure (MBC) and gas output to liquid input
ratio. Additionally, the data was used in complementary with the liquid analysis to compute the
CHNSO balance.
3.7.2 Characterization of liquid
The raw filtered TPO and the produced oils from each experiment were analyzed for their
density, total acid number (TAN), water content, ash content and carbon residue, chemical
composition, and CHNSO elemental composition. The densities of the oils were measured using
the Gay-Lussac method (ASTM D1298, ASTM D1524). The total acid number was measured
using potentiometric titration following ASTM D664. The water content was determined by Karl
Fisher titration following ASTM D1533. The ash content and carbon residue were analyzed by
NETZSCH STA 449 F3 Jupiter for thermogravimetric analysis (TGA) following ASTM D482
and ASTM D4530 respectively. The chemical composition was analyzed by Agilent 7890A GC
with 5977A MSD for gas chromatography-mass spectrometry (GC-MS). The CHNSO elemental
composition was analyzed by an external laboratory. The values from the CHNSO analysis were
used in complementary with results from the gas analysis to compute the CHNSO balance.
3.7.3 Characterization of catalyst
The sieved, unused catalysts were measured for their bulk density based on UOP294-14. Both
the unused and used catalysts were analyzed for their surface area and crystal structure. The
surface area was measured by means of Brunauer–Emmett–Teller (BET) analysis using N2
physisorption with Micromeritics ASAP 2000 analyzer. The crystal structure was measured with
X-ray diffraction (XRD) using a Siemens D5000 with CuKa radiation (λ=1,5408 nm) and 2θ
from 5-90°.
4 RESULTS AND DISCUSSION
4.1 Raw Oil
The characteristics of the spray are influenced by the surface tension of the injected liquid. A
liquid with higher surface tension will resist atomization. The surface tension values of the
testing liquids are presented in Table 10, except for RME and tube condenser oil since
information was not available. However, RME and tube condenser oil formed the largest
droplets in the atomization test. The atomization of water was visibly larger than

32
dichloromethane, methanol, and acetone which produced fine sprays since their surface tension
values were less than half of water.
Table 10: Surface energies of atomization test liquids
Test Liquid Surface Tension Reference
Water 71.97 mN/m at 25 °C [54]
Dichloromethane 28.20 mN/m at 25 °C [55]
Methanol 22.07 mN/m at 25 °C [56]
Acetone 26.20 mN/m at 0 °C
23.70 mN/m at 20 °C [57]
The filter papers from the vacuum filtration of raw pyrolysis oil were stored in a drying oven at
120 °C and periodically weighed. The mass of the oil residue on each of the 12 filter papers were
calculated by subtracting the premeasured mass of the filter paper and glass holder from the total
mass. Within the first 24 hours of drying, the average mass of the oil residues had decreased to
approximately 40 % of the original mass as observed in Figure 17. After the first week, the
average mass decreased to approximately 37 % of the original mass. The decrease suggests that
TPO comprises mainly of volatile compounds and should be stored in a sealed container at low
temperatures.
Figure 17: Volatility of TPO filter residue
0
10
20
30
40
50
60
70
80
90
100
0 1 2 3 4 5 6 7 8
Mas
s ra
tio
(%
)
Drying days

33
A sample of the raw TPO was kept for an aging test where it was placed at 80 °C for 24 h. The
conditions accelerated the age of the sample to 1 year of storage at ambient conditions and
yielded differences as shown in Table 11. Both TAN and water content increased after the aging
test, and coagulation of the oil became evident as seen in Figure 18.
Table 11: Aging test results
TAN
(mg KOH/g)
Water content
(wt.%)
Raw 15.0 11
Aged 16.0 16
Figure 18: Aging test on TPO
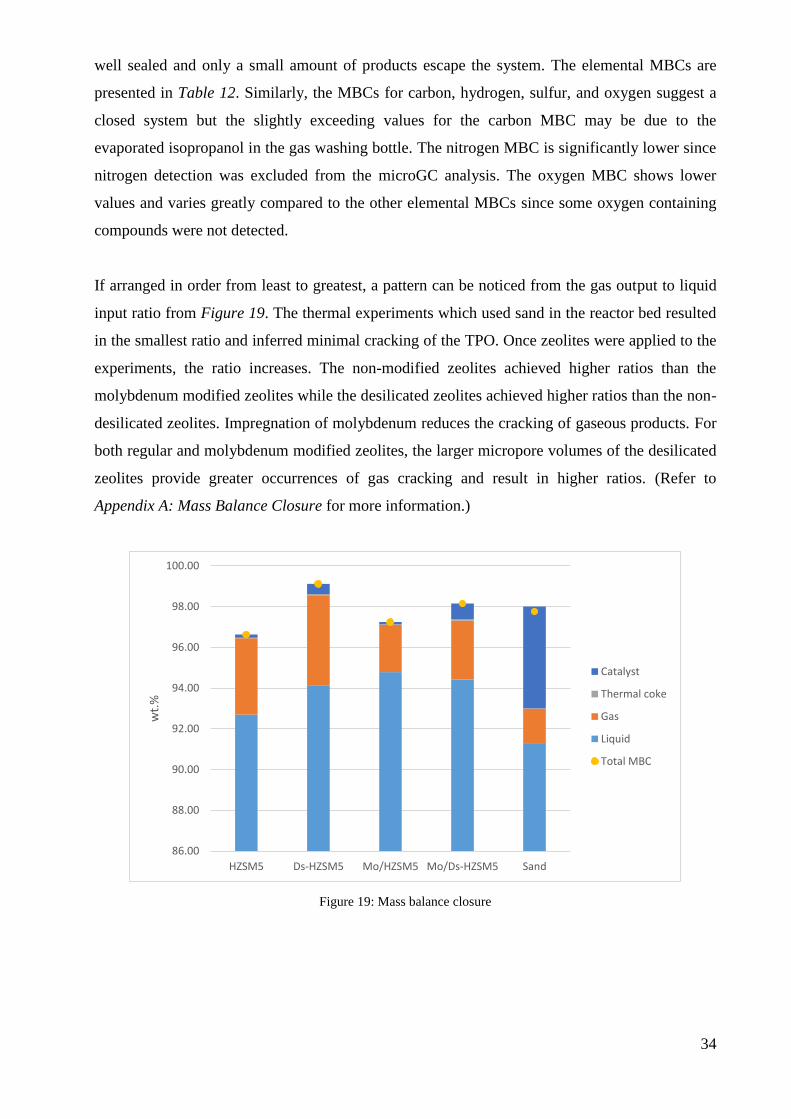
4.2 Mass Balance and CHNSO Balance
The measurements from the gravimetric analysis, gas characterization, and liquid
characterization were used to compute the total MBC, gas output to liquid input ratio, carbon
MBC, hydrogen MBC, and oxygen MBC. The total MBC from all 5 sets of catalytic experiments
were above 96 % as seen in Figure 19. The high percentage shows that the experimental setup is
34
well sealed and only a small amount of products escape the system. The elemental MBCs are
presented in Table 12. Similarly, the MBCs for carbon, hydrogen, sulfur, and oxygen suggest a
closed system but the slightly exceeding values for the carbon MBC may be due to the
evaporated isopropanol in the gas washing bottle. The nitrogen MBC is significantly lower since
nitrogen detection was excluded from the microGC analysis. The oxygen MBC shows lower
values and varies greatly compared to the other elemental MBCs since some oxygen containing
compounds were not detected.
If arranged in order from least to greatest, a pattern can be noticed from the gas output to liquid
input ratio from Figure 19. The thermal experiments which used sand in the reactor bed resulted
in the smallest ratio and inferred minimal cracking of the TPO. Once zeolites were applied to the
experiments, the ratio increases. The non-modified zeolites achieved higher ratios than the
molybdenum modified zeolites while the desilicated zeolites achieved higher ratios than the non-
desilicated zeolites. Impregnation of molybdenum reduces the cracking of gaseous products. For
both regular and molybdenum modified zeolites, the larger micropore volumes of the desilicated
zeolites provide greater occurrences of gas cracking and result in higher ratios. (Refer to
Appendix A: Mass Balance Closure for more information.)
Figure 19: Mass balance closure
86.00
88.00
90.00
92.00
94.00
96.00
98.00
100.00
HZSM5 Ds-HZSM5 Mo/HZSM5 Mo/Ds-HZSM5 Sand
wt.
%
Catalyst
Thermal coke
Gas
Liquid
Total MBC

35
Table 12: CHNSO balance
Carbon
MBC (%)
Hydrogen
MBC (%)
Nitrogen
MBC (%)
Sulfur
MBC (%)
Oxygen
MBC (%)
HZSM5 99.38
±3.29
96.32
±2.51
66.75
±1.17
89.71
±3.66
84.93
±3.86
Ds-HZSM5 101.96
±1.98
98.65
±0.86
67.33
±0.40
90.32
±3.80
84.26
±2.91
Mo/HZSM5 103.29
±3.01
99.26
±1.62
64.42
±2.88
91.68
±3.19
83.11
±0.00a
Mo/Ds-
HZSM5
103.39
±4.31
98.62
±1.40
40.79
±0.32
89.40
±3.84
94.01
±0.00a
Sand 103.93
±0.00
95.99
±0.00
80.04
±0.00
95.86
±0.00
59.23
±0.00
a. The values are based on only one measurement due to difficulties in H2O determination
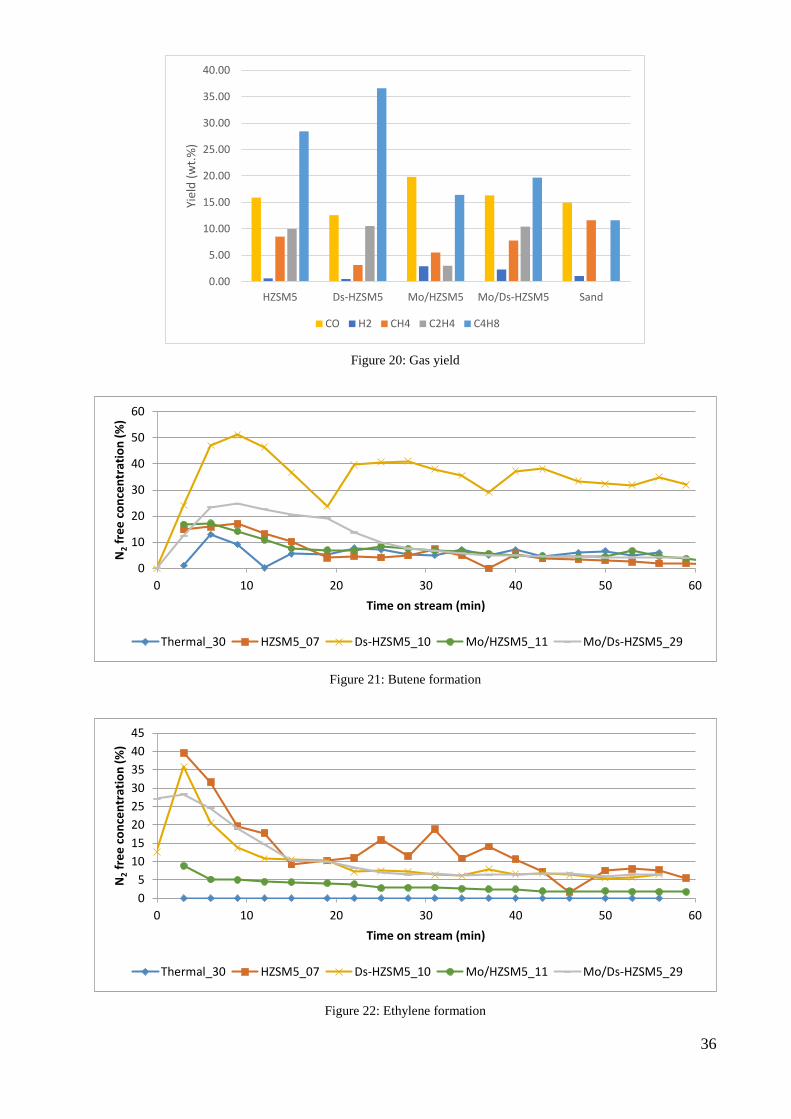
4.3 Gas Formation
Different gaseous compounds were detected using with the microGC. Figure 20 shows the yields
of carbon monoxide, hydrogen, methane, ethylene, and butene for each set of experiments.
Among the various gases, two are presented over time on stream. Butene and ethylene were
selected because the formation of these two gases indicates the cracking of heavy gaseous
compounds into lighter compounds. Figure 21 presents butene production while Figure 22
presents ethylene production. The two graphs show an increase in gas production in the
beginning and then a decrease until the amount of gas becomes stable. An explanation for the
decrease after the peak is that the catalyst loses its effectiveness after a duration in the
experimental run. However, a clear explanation to the order in butene and ethylene production
cannot be concluded. (Refer to Appendix B: Gases and Their Volumes for more information.)
36
Figure 20: Gas yield
Figure 21: Butene formation
Figure 22: Ethylene formation
0.00
5.00
10.00
15.00
20.00
25.00
30.00
35.00
40.00
HZSM5 Ds-HZSM5 Mo/HZSM5 Mo/Ds-HZSM5 Sand
Yiel
d (
wt.
%)
CO H2 CH4 C2H4 C4H8
0
10
20
30
40
50
60
0 10 20 30 40 50 60
N2
fre
e c
on
cen
trat
ion
(%
)
Time on stream (min)
Thermal_30 HZSM5_07 Ds-HZSM5_10 Mo/HZSM5_11 Mo/Ds-HZSM5_29
0
5
10
15
20
25
30
35
40
45
0 10 20 30 40 50 60
N2
fre
e c
on
cen
trat
ion
(%
)
Time on stream (min)
Thermal_30 HZSM5_07 Ds-HZSM5_10 Mo/HZSM5_11 Mo/Ds-HZSM5_29

37
4.4 Thermodynamic Analysis
Figure 23: Thermodynamic behavior of reactions
Reaction 1:
2 MoO2 + 5 CH4 ↔ Mo2C + CO + 10 H2
Reaction 2:
MoO2 + 2 H2 ↔ Mo + 2 H2O
Reaction 3:
MoO2 + 2 CO ↔ Mo + 2CO2
Reaction 4:
2 MoO2 + CO + 5 H2 ↔ Mo2C + 5 H2O
Reaction 5:
2 MoO2 + 6 CO ↔ Mo2C + 5 CO2
Reaction 6:
MoO2 + 2 H2S ↔ MoS2 + 2 H2O
-600
-500
-400
-300
-200
-100
0
100
200
300
400
250 350 450 550 650 750 850
ΔG
rxn
(KJ/
mo
l)
T (K)
R1
R2
R3
R4
R5
R6
R7
R8
R9
Operating temp

38
Reaction 7:
MoO2 + 3 C4H4S + 9 H2 ↔ MoS2 + H2S + 6 C2H4 + 2 H2O
Reaction 8:
MoO2 + 2 C4H4S + 12 H2 ↔ MoS2 + 8 CH4 + O2
Reaction 9:
MoO2 + 6 C4H4S + 18 H2 ↔ MoS2 + 4 H2S + 8 C3H6 + 2 H2O
The main objective of the study was to remove sulfur containing compounds from the WTPO.
Therefore, a suitable catalyst had to be selected to accompany the experiment. Among the
different catalysts considered, molybdenum modified zeolite was selected and modeled for
various possible reactions by their Gibbs free energy of reaction values over a range of
temperatures as shown in Figure 23. The likely form of molybdenum, i.e. molybdenum oxide
(MoO2), was modeled in reactions with Mo2C, CO, CH4, H2, H2S, C4H4S, and S. Reactions (R4-
R9) that equate to negative Gibbs free energy values are spontaneous and favored while
reactions (R1-R3) that equate to positive Gibbs free energy are nonspontaneous and not favored.
By impregnating molybdenum onto the catalyst, large sulfur containing compounds, i.e.
thiophene (C4H4S), would be converted into more easily removed forms such as hydrogen
sulfide (H2S) as predicted by R7 and R9. The calculated Gibbs free energy of the presented
possible reactions show support for the favored reactions of sulfur removal. Furthermore, the
catalysts show a low tendency for converting into molybdenum carbide (Mo2C), which would
inhibit the catalyst, at the operational temperature of 320 °C (or 593.15 K) as in R1 and R4.
(Refer to Appendix C: Thermodynamic Values for more information.)
4.5 Physical Properties of Catalysts
The bulk densities of the catalysts were similar in range but differed greatly for silica sand as
shown in Table 13. The bulk densities were used to determine the appropriate amount of
catalysts or inert material that was to be installed in the reactor bed. Based on the bulk densities,
0.5 g of zeolites and 3.5 g of silica sand were used to maintain the LHSV between 45-50 h-1.

39
Table 13: Bulk density of catalysts and inert material
Density [g/mL] Errora
HZSM5 0.1550 31.87 %
Ds-HZSM5 0.2535 6.85 %
Mo/HZSM5 0.2170 7.54 %
Mo/Ds-HZSM5 0.2277 3.76 %
Sand 1.4231 3.93 %
a. Coefficient of variation
The catalyst samples were further analyzed by N2 physisorption to collect data on their pore
surface areas, pore volumes, and average pore diameters as shown in Table 14. The results
revealed that desilication of both the non-modified and Mo-modified zeolites increased the BET
surface area (SBET), total pore volume (Vtot), and average pore diameter (davg), and decreased the
micropore surface area (Smicro) and micropore volume (Vmicro). These changes indicate larger
pores in the desilicated zeolites.
Table 14: Textural properties of the catalysts
SBET
[m2g-1]
Smicro
[m2g-1]a
Vmicro
[cm3g-1 STP]b
Vtot
[cm3g-1 STP]c
davg
[nm]
HZSM5 385.107 293.817 0.117 0.214 2.225
Ds-HZSM5 406.697 286.203 0.115 0.254 2.502
Mo/HZSM5 327.205 255.818 0.099 0.180 2.205
Mo/Ds-HZSM5 337.349 251.447 0.099 0.224 2.661
a. SBET-Sexternal
b. T-plot method
c. Single point at p/p0=0.995
Characterization of the catalysts by X-ray diffraction revealed that the catalysts retained their
general diffraction patterns after desilication as shown in Figure 24. The graph infers that the
crystal structure of the zeolites were not significantly altered by desilication and Mo-
modification.

40
Figure 24: X-Ray diffraction patterns of the catalysts
4.6 Effects of Reactive Adsorption Tests on Catalysts
The spent Mo-modified zeolites were analyzed for the formation of reactive compounds and
compared with fresh zeolites for any differences in X-ray diffraction patterns. Interpretations
from the EVA software and powder diffraction file reported possible formations of Mo2S, MoO2,
and MoO3 on the spent catalysts as shown in Figure 25 and Figure 27. Although the formation
of Mo2S is thermodynamically favored as previously mentioned, it was not detected upon
numerical comparison. Thus, the reaction may require a longer reaction time to form. The XRD
patterns of the fresh and spent catalysts differed in relative intensities of peaks and slight shifts
but showed no noticeable change except at one of the diffraction peaks. At 2θ of approximately
23° in both Mo/HZSM5 and Mo/Ds-HZSM5, the two peaks in the raw catalysts merge closer
into one peak in the spent catalysts as shown in Figure 26 and Figure 28. The behavior suggests
possible coke deposition in the pores.
0 10 20 30 40 50 60 70 80 90 100
Rel
ativ
e In
ten
sity
2θ (°)
HZSM5 Ds-HZSM5 Mo/HZSM5 Mo/Ds-HZSM5

41
Figure 25: X-Ray diffraction patterns of the Mo/HZSM5 catalyst before and after usage
Figure 26: Change in XRD peak of Mo/HZSM5 before and after usage
Figure 27: X-Ray diffraction patterns of Mo/Ds-HZSM5 before and after usage
0
0.2
0.4
0.6
0.8
1
0 10 20 30 40 50 60 70 80 90 100
Rel
ativ
e In
ten
sity
2θ (°)
Mo/HZSM5 spent Mo/HZSM5 MoS2 (00-037-1492)
MoO2 (00-032-0671) MoO3 (00-035-0609)
0
0.1
0.2
0.3
0.4
0.5
0.6
0.7
0.8
0.9
1
22.6 22.7 22.8 22.9 23 23.1 23.2 23.3 23.4 23.5 23.6
Rel
ativ
e In
ten
sity
2θ (°)
Mo/HZSM5 spent Mo/HZSM5
0
0.2
0.4
0.6
0.8
1
0 10 20 30 40 50 60 70 80 90 100
Rel
ativ
e In
ten
sity
2θ (°)
Mo/Ds-HZSM5 spent Mo/Ds-HZSM5 MoS2 (00-037-1492)
MoO2 (00-032-0671) MoO3 (00-035-0609)

42
Figure 28: Change in XRD peak of Mo/Ds-HZSM5 before and after usage
4.7 Liquid Analysis
Subjecting the TPO under the experiment lowered the liquids’ density or specific gravity (SG) as
shown in Table 15. Even under the non-catalytic condition that used silica sand as the inert
material, the specific gravity was decreased though not as much as in the liquids conducted with
catalysts. The specific gravity decreased due to cracking of heavy oil compounds into lighter
compounds by the heat and catalysts.
Additionally, the experiment decreased the micro carbon residue in the liquids. A reduction in
the micro carbon residue as compared to the raw TPO suggests that the treatment reduced the
coking tendency of the liquid when heated. The desilicated catalysts lowered the coking
tendency of the liquids more effectively than the non-desilicated catalysts. Figure 29 is an
example of the coking that occurs on the reactor wall and the injection nozzle.
0
0.1
0.2
0.3
0.4
0.5
0.6
0.7
0.8
0.9
1
22.6 22.7 22.8 22.9 23 23.1 23.2 23.3 23.4 23.5 23.6
Rel
ativ
e In
ten
sity
2θ (°)
Mo/Ds-HZSM5 spent Mo/Ds-HZSM5

43
Figure 29: Coking on reactor wall and injection nozzle
Also shown in Table 15, TAN was reduced due to the treatment. Again, the desilicated catalysts
revealed a greater reduction than the non-desilicated catalysts. This reduction in acidity is
beneficial if the liquid product were to be used in vehicles since highly acidic fuels will damage
the vehicle’s engine.
Table 15: Physical properties of liquids
SG 21C
Carbon residue (micro)
(wt.%)a
TAN
(mg KOH/g)
Raw 0.9581±0.0019 0.58 15.0
Non-catalytic 0.9554±0.0025 0.49 10.1±0.5
HZSM5 0.9552±0.0019 0.27 8.0±0.2
Ds-HZSM5 0.9524±0.0031 0.23 7.5±0.2
Mo/HZSM5 0.9504±6E-05 0.32 7.8±0.1
Mo/Ds-HZSM5 0.9521±0.0020 0.25 7.0±0.4
a. Ash free
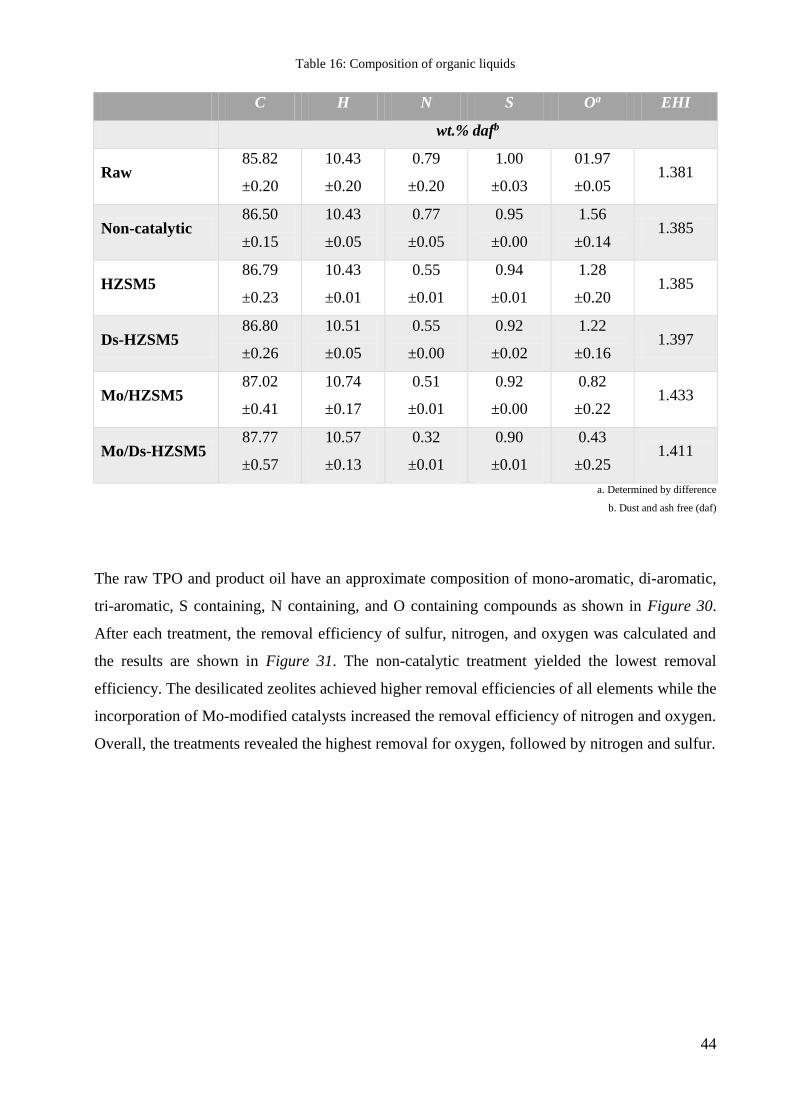
The elemental composition of the liquids is shown in Table 16. From the elemental composition
data, the effective hydrogen index (EHI) could be computed. EHI is “the "net" hydrogen-to-
carbon ratio of a pure or mixed heteroatom-containing feed, after debiting the feed’s hydrogen
content for complete conversion of heteroatoms to NH3, H2S, and H2O” [59]. The increased EHI
of the liquids after the treatment is a positive effect since a higher EHI value correlates to a lower
tendency for the liquid to form coke upon further catalytic treatment. Usage of Mo-modified
zeolites enhances this effect.
44
Table 16: Composition of organic liquids
C H N S Oa EHI
wt.% dafb
Raw 85.82
±0.20
10.43
±0.20
0.79
±0.20
1.00
±0.03
01.97
±0.05 1.381
Non-catalytic 86.50
±0.15
10.43
±0.05
0.77
±0.05
0.95
±0.00
1.56
±0.14 1.385
HZSM5 86.79
±0.23
10.43
±0.01
0.55
±0.01
0.94
±0.01
1.28
±0.20 1.385
Ds-HZSM5 86.80
±0.26
10.51
±0.05
0.55
±0.00
0.92
±0.02
1.22
±0.16 1.397
Mo/HZSM5 87.02
±0.41
10.74
±0.17
0.51
±0.01
0.92
±0.00
0.82
±0.22 1.433
Mo/Ds-HZSM5 87.77
±0.57
10.57
±0.13
0.32
±0.01
0.90
±0.01
0.43
±0.25 1.411
a. Determined by difference
b. Dust and ash free (daf)
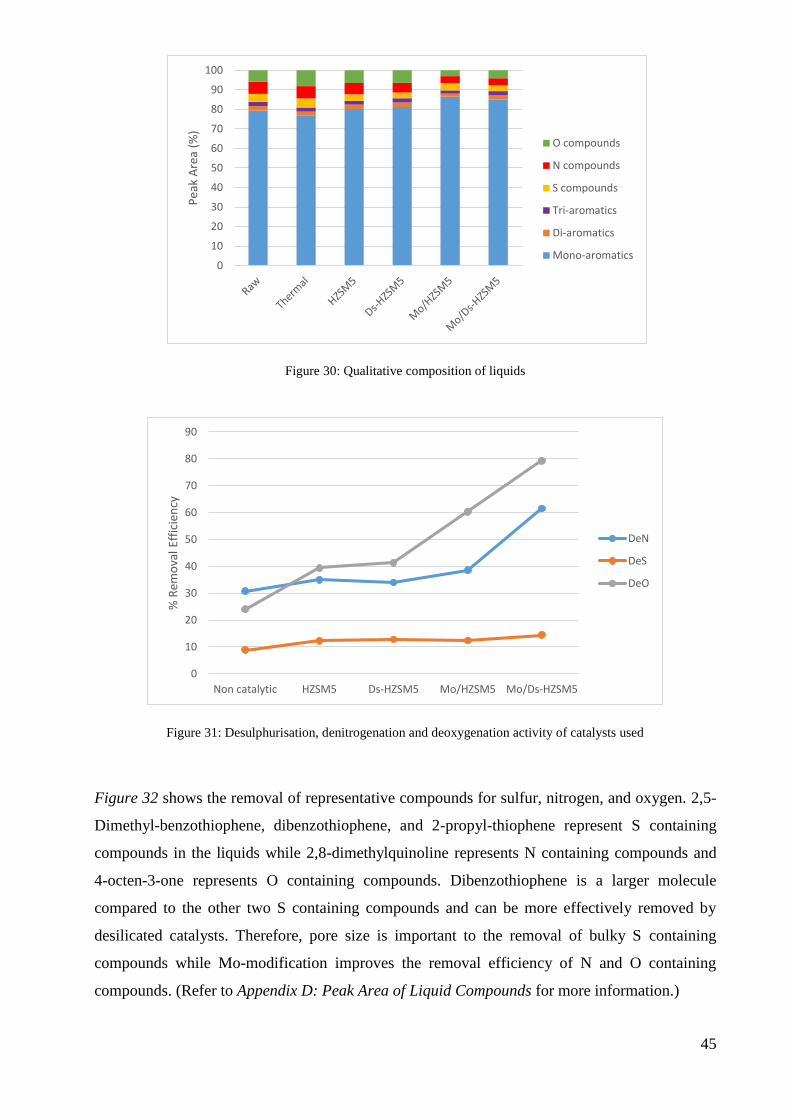
The raw TPO and product oil have an approximate composition of mono-aromatic, di-aromatic,
tri-aromatic, S containing, N containing, and O containing compounds as shown in Figure 30.
After each treatment, the removal efficiency of sulfur, nitrogen, and oxygen was calculated and
the results are shown in Figure 31. The non-catalytic treatment yielded the lowest removal
efficiency. The desilicated zeolites achieved higher removal efficiencies of all elements while the
incorporation of Mo-modified catalysts increased the removal efficiency of nitrogen and oxygen.
Overall, the treatments revealed the highest removal for oxygen, followed by nitrogen and sulfur.
45
Figure 30: Qualitative composition of liquids
Figure 31: Desulphurisation, denitrogenation and deoxygenation activity of catalysts used
Figure 32 shows the removal of representative compounds for sulfur, nitrogen, and oxygen. 2,5-
Dimethyl-benzothiophene, dibenzothiophene, and 2-propyl-thiophene represent S containing
compounds in the liquids while 2,8-dimethylquinoline represents N containing compounds and
4-octen-3-one represents O containing compounds. Dibenzothiophene is a larger molecule
compared to the other two S containing compounds and can be more effectively removed by
desilicated catalysts. Therefore, pore size is important to the removal of bulky S containing
compounds while Mo-modification improves the removal efficiency of N and O containing
compounds. (Refer to Appendix D: Peak Area of Liquid Compounds for more information.)
0
10
20
30
40
50
60
70
80
90
100
Pea
k A
rea
(%)
O compounds
N compounds
S compounds
Tri-aromatics
Di-aromatics
Mono-aromatics
0
10
20
30
40
50
60
70
80
90
Non catalytic HZSM5 Ds-HZSM5 Mo/HZSM5 Mo/Ds-HZSM5
% R
emo
val E
ffic
ien
cy
DeN
DeS
DeO

46
Figure 32: Removal efficiency of GC/MS detected sulfur, nitrogen and oxygen compounds
5 CONCLUSIONS
Upgrading of WTPO by reactive adsorption was investigated using Mo-modified zeolites and
their desilicated form. The operation parameters were set to a temperature of 320 °C, LHSV of
45-50 h-1, and operated for approximately 45 min. The treatments with non-catalytic and
catalytic bed materials resulted in the cracking of liquid compounds. Desilication of the zeolites
was applied to enlarge the pores of the catalysts and compared with the effects of molybdenum
modification. Both desilication and Mo-modification lowered the TAN and increased the
removal efficiencies of nitrogen and oxygen. Desilication played a major role in decreasing the
micro carbon residue and removal of sulfur while Mo-modification increased the EHI. The
treatments appeared to be most effective in the removal of oxygen, followed by nitrogen, and
lastly sulfur. In conclusion, reactive adsorption seems like a promising method for direct liquid
upgrading but further testing is needed.
0
10
20
30
40
50
60
70
80
90
100
Thermal HZSM5 Ds-HZSM5 Mo/HZSM5 Mo/Ds-HZSM5
Rem
ova
l Eff
icie
ncy
(%
)
Benzo[b]thiophene, 2,5-dimethyl- Dibenzothiophene
Thiophene, 2-propyl- 2,8-Dimethylquinoline
4-Octen-3-one
47
6 RECOMMENDATIONS AND FUTURE WORK
The study faced several obstacles regarding the experimental setup and analysis tools. The
alignment of the spray from the injection nozzle did not ensure uniform distribution onto the
catalytic bed and the catalysts in the bed would occasionally become loose and fall out from the
reactor. Thus, methods to precisely align the spray and secure the catalyst in the bed are
recommended. Detection and analysis of gaseous compounds using the microGC was greatly
affected by the non-constant sample flow and should be tuned for accuracy and ease of use.
Future work would involve a redesign of the experiment for direct treatment of pyrolysis
products, optimization of operating parameters, and characterization of spent catalysts. In
practice, desulfurization would be applied immediately after the pyrolysis of the waste car tires.
Therefore, the setup would receive pyrolysis vapors directly without reheating of the oil and it
would operate in the presence of various gases. This study experimented with only one
parameter set for temperature, space velocity, and reaction time. Optimization of these
parameters may yield different removal efficiencies and results. Lastly, there was no
characterization of the spent catalyst. Investigation of catalyst acidity and elemental composition
on the catalyst may provide a better understanding of the reaction mechanisms. Another
important factor for its application would be the catalysts’ coking tendency and deactivation
behavior as well as its regeneration.

48
7 REFERENCES
[1] European Tyre & Rubber Manufacturers' Association, "Statistics," 23 January 2017.
[Online]. Available: http://www.etrma.org/uploads/Modules/Documentsmanager/20161208-
--statistics-booklet-2016-final4.pdf. [Accessed 19 February 2017].
[2] E. Scott, "End-of-life Tyre Report 2015," European Tyre & Rubber Manufacturers'
Association, Brussels, 2015.
[3] I. d. M. Rodriguez, M. Laresgoiti, M. Cabrero, A. Torres, M. Chomon and B. Caballero,
"Pyrolysis of scrap tyres," Fuel Processing Technology, no. 72, pp. 9-22, 2001.
[4] M. M. Barbooti, T. J. Mohamed, A. A. Hussain and F. O. Abasa, "Optimization of pyrolysis
conditions of scrap tires under inert gas atmosphere," Journal of Analytical and Applied
Pyrolysis, vol. 72, pp. 165-170, 2004.
[5] Y.-M. Chang, "On pyrolysis of waste tire: degradation rate and product yields," Resources,
Conservation and Recycling, vol. 17, pp. 125-139, 1996.
[6] European Tyre & Rubber Manufacturers' Association, "End of Life Tyres," 2011. [Online].
Available: http://www.etrma.org/tyres/ELTs. [Accessed 13 February 2017].
[7] J. F. Gonzalez, J. M. Encinar, J. L. Canito and J. J. Rodrıguez, "Pyrolysis of automobile tyre
waste. Influence of operating variables and kinetics study," Journal of Analytical and
Applied Pyrolysis, Vols. 58-59, pp. 667-683, 2001.
[8] Recycling International, "Metso and PYReco plan pyrolysis venture," 2009. [Online].
Available: http://www.recyclinginternational.com/recycling-news/1713/plastic-and-
rubber/united-kingdom-finland/metso-and-pyreco-plan-pyrolysis-venture. [Accessed 21
February 2017].
[9] J. D. Martı´nez, N. Puy, R. Murillo, T. s. Garcı´a, M. V. Navarro and A. M. Mastral, "Waste
tyre pyrolysis – A review," Renewable and Sustainable Energy Reviews, vol. 23, pp. 179-
213, 2013.
[10] P. T. Williams and S. Besler, "Pyrolysis - thermogravimetric analysis of tyres and tyre
components," Fuel, vol. 74, no. 9, pp. 1-7, 1995.
[11] D. Leung, X. Yin, Z. Zhao, B. Xu and Y. Chen, "Pyrolysis of tire powder: influence of
operation variables on the composition and yields of gaseous product," Fuel Processing
Technology, vol. 79, pp. 141-155, 2002.

49
[12] C. Dıez, M. Sanchez, P. Haxaire, O. Martınez and A. Moran, "Pyrolysis of tyres: A
comparison of the results from a fixed-bed laboratory reactor and a pilot plant (rotatory
reactor)," Journal of Analytical and Applied Pyrolysis, vol. 74, pp. 254-258, 2005.
[13] N. Jantaraksa, P. Prasassarakich, P. Reubroycharoen and N. Hinchiranan, "Cleaner
alternative liquid fuels derived from the hydrodesulfurization of waste tire pyrolysis oil,"
Energy Conversion and Management, vol. 95, pp. 424-434, 2015.
[14] Y. Wang, L. Dai, L. Fan, D. Duan, Y. Liu, R. Ruan, Z. Yu, Y. Lui and L. Jiang,
"Microwave-assisted catalytic fast co-pyrolysis of bamboo sawdustand waste tire for bio-oil
production," Journal of Analytical and Applied Pyrolysis, vol. 123, pp. 224-228, 2017.
[15] A. Ayanog˘lu and R. Yumrutas, "Rotary kiln and batch pyrolysis of waste tire to produce
gasoline and diesel like fuels," Energy Conversion and Management, vol. 111, pp. 261-270,
2016.
[16] E. Muzenda, "A Comparative Review of Waste Tyre Pyrolysis, Gasification and
Liquefaction (PGL) Processes," in International Conference on Chemical Engineering &
Advanced Computational Technologies, Pretoria, 2014.
[17] J. A. Conesa, R. Font and A. Marcilla, "Gas from the pyrolysis of scrap tires in a fluidized
bed reactor," Energy & Fuels, vol. 10, pp. 134-140, 1996.
[18] P. T. Williams, S. Besler, D. T. Taylor and R. P. Bottrill, "The pyrolysis of automotive tire
waste," Journal of the Institute of Energy, vol. 68, pp. 11-21, 1995.
[19] Huayin Group, "Product List," 2013. [Online]. Available:
http://www.huayinenergy.com/products/. [Accessed 20 February 2017].
[20] D. Meier and O. Faix, "State of the art of applied fastp yrolysis of lignocellulosic materials -
a review," Bioresource Technology, vol. 68, no. 1, pp. 71-77, 1999.
[21] J. M. Bouvier, F. Charbel and M. Gelus, "Gas– solid pyrolysis of tire wastes kinetics and
material balances of batch pyrolysis of used tires," Resources and Conservation, vol. 15, pp.
205-214, 1987.
[22] G.-G. Choi, S.-J. Oh and J.-S. Kim, "Scrap tire pyrolysis using a new type two-stage
pyrolyzer: Effects of dolomite and olivine on producing a low-sulfur pyrolysis oil," Energy,
vol. 114, pp. 457-464, 2016.
[23] I. Hita, M. Arabiourrutia, M. Olazar, J. Bilbao, J. M. Arandes and P. Castaño,
"Opportunities and barriers for producing high quality fuels from the pyrolysis of scrap
tires," Renewable and Sustainable Energy Reviews, vol. 56, pp. 745-759, 2016.

50
[24] H. Huang and L. Tang, "Pyrolysis treatment of waste powder in a capacitively coupled RF
plasma reactor," Energy Conversion and Management, vol. 50, no. 3, pp. 611-617, 2009.
[25] C. Roy, B. Caumia and B. D. Caumia, "Recycling of scrap tires to oil and carbon black by
vacuum pyrolysis," Resource Conservation Recycling, vol. 4, pp. 203-213, 1990.
[26] University of Cambridge, "Where there’s muck there’s aluminium (if not brass)," 2014.
[Online]. Available: http://www.cam.ac.uk/research/features/where-theres-muck-theres-
aluminium-if-not-brass. [Accessed 22 February 2017].
[27] J. Zeaiter, M. N. Ahmad, D. Rooney, B. Samneh and E. Shammas, "Design of an automated
solar concentrator for the pyrolysis of scrap rubber," Energy Conversion and Management,
vol. 101, no. 1, pp. 118-125, 2015.
[28] Energy Pyrolysis Ltd., "Fuel Oil," 2017. [Online]. Available: http://www.energy-
pyrolysis.org/products/fuel-oil/. [Accessed 21 February 2017].
[29] A. Quek and R. Balasubramanian, "Liquefaction of waste tires by pyrolysis for oil and
chemicals — A review," Journal of Analytical and Applied Pyrolysis, vol. 101, pp. 1-16,
2013.
[30] H. Aydin and C. İlkılıç, "Optimization of fuel production from waste vehicle tires by
pyrolysis and resembling to diesel fuel by various desulfurization methods," Fuel, vol. 102,
pp. 605-612, 2012.
[31] M. N. Islam and M. R. Nahian, "Improvement of Waste Tire Pyrolysis Oil and Performance
Test with Diesel in CI Engine," Journal of Renewable Energy, vol. 2016, p. 8, 2016.
[32] Y. Han, F. Stankovikj and M. Garcia-Perez, "Co-hydrotreatment of tire pyrolysis oil and
vegetable oil for the production of transportation fuels," Fuel Processing Technology, vol.
159, pp. 328-339, 2017.
[33] L. Dai, L. Fan, D. Duan, R. Ruan, Y. Wang, Y. Lui, Y. Zhou, Y. Zhao and Z. Yu,
"Microwave-assisted catalytic fast co-pyrolysis of soapstock and wastetire for bio-oil
production," Journal of Analytical and Applied Pyrolysis, p. 6, 2017.
[34] M. Laresgoiti, I. de Marco, A. Torres, B. Caballero, M. A. Cabrero and M. Chomón,
"Chromatographic analysis of the gases obtained in tyre pyrolysis," Journal of Analytical
and Applied Pyrolysis, vol. 55, no. 1, pp. 43-54, 2000.
[35] B. Danon, P. van der Gryp, C. Schwarz and J. Görgens, "A review of dipentene (dl-
limonene) production from waste tire pyrolysis," Journal of Analytical and Applied
Pyrolysis, vol. 112, pp. 1-13, 2015.

51
[36] J. Miller, "EU: Fuels: Diesel and Gasoline," TransportPolicy.net, 30 June 2015. [Online].
Available: http://transportpolicy.net/index.php?title=EU:_Fuels:_Diesel_and_Gasoline.
[Accessed 19 April 2017].
[37] S. Murugan, M. Ramaswamy and G. Nagarajan, "Performance, emission and combustion
studies of a DI diesel engine using Distilled Tyre pyrolysis oil-diesel blends," Fuel
Processing Technology, vol. 89, pp. 152-159, 2008.
[38] TransportPolicy.net, "EU: FUELS: DIESEL AND GASOLINE," Boxcar Studio, 15
September 2012. [Online]. Available: https://www.transportpolicy.net/standard/eu-fuels-
diesel-and-gasoline/. [Accessed 9 February 2018].
[39] P. Trongkaew, T. Utistham, P. Reubroycharoen and N. Hinchiranan, "Photocatalytic
Desulfurization of Waste Tire Pyrolysis Oil," Energies, vol. 4, pp. 1880-1896, 2011.
[40] C. Roy, H. Darmstadt, B. Benallal and C. Amen-Chen, "Characterization of naphtha and
carbon black obtained by vacuum pyrolysis of polyisoprene rubber," Fuel Processing
Technology, vol. 50, pp. 87-103, 1997.
[41] T.-C. Chen, Y.-H. Shen, W.-J. Lee, C.-C. Lin and M.-W. Wan, "The study of ultrasound-
assisted oxidative desulfurization process applied to the utilization of pyrolysis oil from
waste tires," Journal of Cleaner Production, vol. 18, pp. 1850-1858, 2010.
[42] A.-M. Al-Lal, D. Bolonio, A. Llamas, M. Lapuerta and L. Canoira, "Desulfurization of
pyrolysis fuels obtained from waste: Lube oils, tires and plastics," Fuel, vol. 150, pp. 208-
216, 2015.
[43] K. M. Isa, C. E. Snape, C. Uguna, W. Meredith and H. Deng, "Pyrolysis oil upgrading in
high conversions using sub- and andsupercritical water above 400◦C," Journal of Analytical
and Applied Pyrolysis, vol. 119, pp. 180-188, 2016.
[44] P. T. Williams and A. J. Brindle, "Catalytic pyrolysis of tyres: influence of catalyst
temperature," Fuel, vol. 81, no. 18, pp. 2425-2434, 2002.
[45] M. Olazar, M. Arabiourrutia, G. López, R. Aguado and J. Bilbao, "Effect of acid catalysts
on scrap tyre pyrolysis under fast heating conditions," Journal of Analytical and Applied
Pyrolysis, vol. 82, no. 2, pp. 199-204, 2008.
[46] S. Muenpol and S. Jitkarnka, "Effects of Fe supported on zeolites on structures of
hydrocarboncompounds and petrochemicals in waste tire-derived pyrolysis oils," Journal of
Analytical and Applied Pyrolysis, vol. 117, pp. 147-156, 2016.

52
[47] N. A. Dũng, S. Wongkasemjit and S. Jitkarnka, "Effects of pyrolysis temperature and Pt-
loaded catalysts on polar-aromatic content in tire-derived oil," Applied Catalysis B:
Environmental, vol. 91, no. 1-2, pp. 300-307, 2009.
[48] P. Saeng-arayakul and S. Jitkarnka, "An attempt on using a regenerated commercial
NiMoS/Al2O 3 as a catalyst for waste tyre pyrolysis," Chemical Engineering Transactions,
vol. 35, pp. 1339-1344, 2013.
[49] J. Shah, M. R. Jan and F. Mabood, "Recovery of value-added products from the catalytic
pyrolysis of waste tyre," Energy Conversion and Management, vol. 50, no. 4, pp. 991-994,
2009.
[50] C. İlkılıç and H. Aydın, "Fuel production from waste vehicle tires by catalytic pyrolysis and
its application in a diesel engine," Fuel Processing Technology, vol. 92, no. 5, pp. 1129-
1135, 2011.
[51] A. H. Ahoor and N. Zandi-Atashbar, "Fuel production based on catalytic pyrolysis of waste
tires as an optimized model," Energy Conversion and Management, vol. 87, pp. 653-669,
2014.
[52] D. Bunthid, P. Prasassarakich and N. Hinchiranan, "Oxidative desulfurization of tire
pyrolysis naphtha in formic acid/H2O2/pyrolysis char system," Fuel, vol. 89, pp. 2617-
2622, 2010.
[53] S. Uçar, S. Karagöz, J. Yanik, M. Yuksel and M. Saglam, "Upgrading scrap tire derived oils
using activated carbon supported metal catalysts," Energy Sources, vol. 29, pp. 425-437,
2007.
[54] O. Doğan, M. B. Çelik and B. Özdalyan, "The effect of tire derived fuel/diesel fuel blends
utilization on diesel engine performance and emissions," Fuel, vol. 95, pp. 340-346, 2012.
[55] F. Ju, C. Liu, C. Meng, S. Gao and H. Ling, "Reactive Adsorption Desulfurization of
Hydrotreated Diesel over a Ni/ZnO–Al2O3–SiO2 Adsorbent," Energy and Fuels, vol. 201,
pp. 6057-6067, 2015.
[56] C. Song, "An overview of new approaches to deep desulfurization for ultra-clean gasoline,
diesel fuel and jet fuel," Catalysis Today, vol. 86, pp. 211-263, 2003.
[57] J. Groen, S. Abello, L. Villaescusa and J. Ramirez, "Mesoporous beta zeolite obtained by
desilication," Microporous and Mesoporous Materials, vol. 114, pp. 93-102, 2008.

53
[58] E. Kantarelis, R. Javed, S. Stefanidis, E. Pachatouridou, A. Psarras, K. Kalogiannis, E.
Iliopoulou and A. Lappas, "The application of hierarchical bi-functional ZSM5 based
catalysts to catalytic pyrolysis of biomass," in 3rd International Symposium on Catalysis for
Clean Energy and Sustainable Chemistry, Madrid, 2016.
[59] PubChem, "Compound Summary for CID 962: Water," 11 July 2017. [Online]. Available:
https://pubchem.ncbi.nlm.nih.gov/compound/962#section=Surface-Tension. [Accessed 15
January 2018].
[60] PubChem, "Compound Summary for CID 6344: Dichloromethane," 6 October 2016.
[Online]. Available: https://pubchem.ncbi.nlm.nih.gov/compound/6344#section=Surface-
Tension. [Accessed 15 January 2018].
[61] PubChem, "Compound Summary for CID 887: Methanol," 3 September 2017. [Online].
Available: https://pubchem.ncbi.nlm.nih.gov/compound/887#section=Surface-Tension.
[Accessed 15 January 2018].
[62] PubChem, "Compound Summary for CID 180: Acetone," 19 November 2017. [Online].
Available: https://pubchem.ncbi.nlm.nih.gov/compound/180#section=Surface-Tension.
[Accessed 15 January 2018].
[63] N. Y. Chen, D. E. Walsh and L. R. Koenig, "Fluidized-bed upgrading of wood pyrolysis
liquids and related compounds," Pyrolysis Oils from Biomass, pp. 277-288, 1988.

54
APPENDICES: SUPPLEMENTARY INFORMATION
Appendix A: Mass Balance Closure
% Catalyst
yield
Thermal
coke yield
Gas
yield
Liquid
yield
Total
MBC
HZSM5 0.16
±0.16
0.03
±0.01
3.74
±0.54
92.70
±1.82
96.63
±2.51
Ds-HZSM5 0.50
±1.10
0.06
±0.00
4.42
±0.03
94.14
±1.27
99.12
±1.20
Mo/HZSM5a 0.12
±0.00
0.02
±0.00
2.32
±0.00
94.78
±0.00
97.24
±0.00
Mo/Ds-
HZSM5
0.76
±0.13
0.08
±0.06
2.89
±0.84
94.42
±1.02
98.15
±0.00
Sanda 5.00
±0.00
0.02
±0.00
1.69
±0.00
91.30
±0.00
97.76
±0.00
a. The values are based on only one measurement due to difficulties in gravimetric measurements
Appendix B: Gases and Their Volumes
mL HZSM5 Ds-HZSM5 Mo/HZSM5 Mo/Ds-HZSM5 Sand
Run # 07 08 10 22 11 14 15 29 30
CO 428.47 323.41 301.74 410.82 336.31 295.70 439.39 162.08 159.39
CO2 563.17 523.13 628.31 695.32 570.89 490.59 589.29 362.53 411.72
H2 201.05 198.38 67.63 320.68 543.72 740.63 691.04 416.41 161.09
CH4 369.21 329.68 109.24 201.23 176.09 131.50 368.13 133.30 216.21
C2H4 288.61 186.70 187.86 405.00 52.51 43.12 239.87 125.66 0.00
C4H8 399.86 275.35 678.65 366.41 122.64 137.08 175.81 147.92 61.82

55
Appendix C: Thermodynamic Values
Thermodynamic values from Thermochemical Data of Elements and Compounds1
Mo (s) 298-2896 K
𝛥𝐻°(298 𝐾) = 0 𝐽𝑚𝑜𝑙−1 𝑆°(298 𝐾) = 28.6 𝐽𝑚𝑜𝑙−1𝐾−1
𝐶𝑝° = 29.73 − 5.7 ∗ 10−3 ∗ 𝑇 − 0.44 ∗ 106 ∗ 𝑇−2 + 4.67 ∗ 10−6 ∗ 𝑇2 𝐽𝑚𝑜𝑙−1𝐾−1
MoO2 (s) 298-2000 K
𝛥𝐻°(298 𝐾) = −587900 𝐽𝑚𝑜𝑙−1 𝑆°(298 𝐾) = 46.5 𝐽𝑚𝑜𝑙−1𝐾−1
𝐶𝑝° = 61.87 + 20.85 ∗ 10−3 ∗ 𝑇 − 1.08 ∗ 106 ∗ 𝑇−2 𝐽𝑚𝑜𝑙−1𝐾−1
MoS2 (s) 298-2023 K
𝛥𝐻°(298 𝐾) = −276100 𝐽𝑚𝑜𝑙−1 𝑆°(298 𝐾) = 62.6 𝐽𝑚𝑜𝑙−1𝐾−1
𝐶𝑝° = 71.69 + 7.45 ∗ 10−3 ∗ 𝑇 − 0.92 ∗ 106 ∗ 𝑇−2 𝐽𝑚𝑜𝑙−1𝐾−1
Mo2C (s) 298-1500 K
𝛥𝐻°(298 𝐾) = −49500 𝐽𝑚𝑜𝑙−1 𝑆°(298 𝐾) = 65.8 𝐽𝑚𝑜𝑙−1𝐾−1
𝐶𝑝° = 64.35 + 23.61 ∗ 10−3 ∗ 𝑇 − 0.95 ∗ 106 ∗ 𝑇−2 − 4.49 ∗ 10−6 ∗ 𝑇2 𝐽𝑚𝑜𝑙−1𝐾−1
1 M. Binnewies and E. Milke, Thermochemical Data of Elements and Compounds, Wienheim: Wiley-VCH Verlag
GmbH, 2002.

56
Thermodynamic values from DIPPR Project 8012
H2 (g) 250-1500 K
𝛥𝐻°(298 𝐾) = 0 𝐽𝑚𝑜𝑙−1 𝑆°(298 𝐾) = 130.571 𝐽𝑚𝑜𝑙−1𝐾−1
𝐶𝑝° = [27617 + 9560 ∗ (
2466𝑇
sinh (2466
𝑇 ))
2
+ 3760 ∗ (
567.6𝑇
cosh (567.6
𝑇 ))
2
] /1000 𝐽𝑚𝑜𝑙−1𝐾−1
H2O (g) 100-2273.15 K
𝛥𝐻°(298 𝐾) = −241818 𝐽𝑚𝑜𝑙−1 𝑆°(298 𝐾) = 188.825 𝐽𝑚𝑜𝑙−1𝐾−1
𝐶𝑝° = [33363 + 26790 ∗ (
2610.5𝑇
sinh (2610.5
𝑇 ))
2
+ 8896 ∗ (
1169𝑇
cosh (1169
𝑇 ))
2
]
/1000 𝐽𝑚𝑜𝑙−1𝐾−1
H2S (g) 100-1500 K
𝛥𝐻°(298 𝐾) = −20630 𝐽𝑚𝑜𝑙−1 𝑆°(298 𝐾) = 205.6 𝐽𝑚𝑜𝑙−1𝐾−1
𝐶𝑝° = [33288 + 26086 ∗ (
913.4𝑇
sinh (913.4
𝑇 ))
2
− 17979 ∗ (
949.4𝑇
cosh (949.4
𝑇 ))
2
]
/1000 𝐽𝑚𝑜𝑙−1𝐾−1
O2 (g) 50-1500 K
𝛥𝐻°(298 𝐾) = 0 𝐽𝑚𝑜𝑙−1 𝑆°(298 𝐾) = 205.147 𝐽𝑚𝑜𝑙−1𝐾−1
𝐶𝑝° = [29103 + 10040 ∗ (
2526.5𝑇
sinh (2526.5
𝑇 ))
2
+ 9356 ∗ (
1153.8𝑇
cosh (1153.8
𝑇 ))
2
]
/1000 𝐽𝑚𝑜𝑙−1𝐾−1
2 Design Institute for Physical Property Research/AIChE, "DIPPR Project 801 - Full Version," Design Institute for
Physical Property Research/AIChE, 1 December 2016. [Online]. Available:
https://app.knovel.com/hotlink/toc/id:kpDIPPRPF7/dippr-project-801-full/dippr-project-801-full. [Accessed 25
October 2017].

57
CO (g) 60-1500 K
𝛥𝐻°(298 𝐾) = −110530 𝐽𝑚𝑜𝑙−1 𝑆°(298 𝐾) = 197.556 𝐽𝑚𝑜𝑙−1𝐾−1
𝐶𝑝° = [29108 + 8773 ∗ (
3085.1𝑇
sinh (3085.1
𝑇 ))
2
+ 8455.3 ∗ (
1538.2𝑇
cosh (1538.2
𝑇 ))
2
]
/1000 𝐽𝑚𝑜𝑙−1𝐾−1
CO2 (g) 50-5000 K
𝛥𝐻°(298 𝐾) = −393510 𝐽𝑚𝑜𝑙−1 𝑆°(298 𝐾) = 213.677 𝐽𝑚𝑜𝑙−1𝐾−1
𝐶𝑝° = [29370 + 34540 ∗ (
1428𝑇
sinh (1428
𝑇 ))
2
+ 26400 ∗ (
588𝑇
cosh (588
𝑇 ))
2
]
/1000 𝐽𝑚𝑜𝑙−1𝐾−1
CH4 (g) 50-1500 K
𝛥𝐻°(298 𝐾) = −74520 𝐽𝑚𝑜𝑙−1 𝑆°(298 𝐾) = 186.27 𝐽𝑚𝑜𝑙−1𝐾−1
𝐶𝑝° = [33298 + 79933 ∗ (
2086.9𝑇
sinh (2086.9
𝑇 ))
2
+ 41602 ∗ (
991.96𝑇
cosh (991.96
𝑇 ))
2
]
/1000 𝐽𝑚𝑜𝑙−1𝐾−1
C2H4 (g) 60-1500 K
𝛥𝐻°(298 𝐾) = 52510 𝐽𝑚𝑜𝑙−1 𝑆°(298 𝐾) = 219.2 𝐽𝑚𝑜𝑙−1𝐾−1
𝐶𝑝° = [33380 + 94790 ∗ (
1596𝑇
sinh (1596
𝑇 ))
2
+ 55100 ∗ (
740.8𝑇
cosh (740.8
𝑇 ))
2
]
/1000 𝐽𝑚𝑜𝑙−1𝐾−1
C3H6 (g) 130-1500 K
𝛥𝐻°(298 𝐾) = 20230 𝐽𝑚𝑜𝑙−1 𝑆°(298 𝐾) = 267.0 𝐽𝑚𝑜𝑙−1𝐾−1
𝐶𝑝° = [43852 + 150600 ∗ (
1398.8𝑇
sinh (1398.8
𝑇 ))
2
+ 74754 ∗ (
616.46𝑇
cosh (616.46
𝑇 ))
2
]
/1000 𝐽𝑚𝑜𝑙−1𝐾−1

58
C4H4S (g) 298-1500 K
𝛥𝐻°(298 𝐾) = 115440 𝐽𝑚𝑜𝑙−1 𝑆°(298 𝐾) = 278.4 𝐽𝑚𝑜𝑙−1𝐾−1
𝐶𝑝° = [48694 + 123760 ∗ (
712.71𝑇
sinh (712.71
𝑇 ))
2
+ 47248 ∗ (
2484.2𝑇
cosh (2484.2
𝑇 ))
2
]
/1000 𝐽𝑚𝑜𝑙−1𝐾−1

59
Appendix D: Peak Area of Liquid Compounds
% Raw Sand HZSM5 Ds-
HZSM5
Mo/
HZSM5
Mo/Ds-
HZSM5
Run # - 30 08 10 11 29
Aromatics 83.82 80.99 84.36 85.71 89.75 89.35
Mono-aromatics 79.33 76.77 80.20 81.21 86.49 85.02
Benzene 0.99 0.82 0.85 0.83 1.17 0.86
Toluene 7.76 7.76 7.60 7.77 10.61 8.66
Ethylbenzene 5.03 4.73 4.80 4.85 6.07 5.31
o-Xylene 10.38 10.04 10.18 10.27 12.61 11.35
Styrene 1.57 1.56 1.59 1.61 1.89 1.66
p-Xylene 1.61 1.32 1.40 1.45 1.71 1.58
p-Cymene 18.63 17.10 18.55 18.80 17.50 18.95
d-Limonene 33.35 33.45 35.21 35.65 34.93 36.65
Di-aromatics 33.35 33.45 35.21 35.65 34.93 36.65
Napthalene 2.37 2.10 2.22 2.33 1.56 2.19
Tri-aromatics 2.37 2.10 2.22 2.33 1.56 2.19
Retene 2.12 2.11 1.94 2.17 1.70 2.14
S compounds 4.11 4.65 3.43 2.97 3.75 2.94
Benzo[b]thiophene,
2,5-dimethyl- 1.07 1.03 0.73 0.79 0.58 0.45
Dibenzothiophene 0.57 1.03 0.73 0.35 1.12 0.20
Thiophene,
2-propyl- 2.47 2.59 1.97 1.84 2.05 2.29
N compounds 6.30 6.28 5.73 4.88 3.49 3.61
2,8-
Dimethylquinoline 6.30 6.28 5.73 4.88 3.49 3.61
O compounds 5.77 8.07 6.48 6.44 3.01 4.11
4-Octen-3-one 5.77 8.07 6.48 6.44 3.01 4.11

www.kth.se