Greenfield FDI and Skill Upgrading
43
IIIS Discussion Paper No.395/ March 2012 Greenfield FDI and Skill Upgrading Ronald B. Davies, University College Dublin Rodolphe Desbordes University of Strathclyde March 20, 2012
Transcript of Greenfield FDI and Skill Upgrading

IIIS Discussion Paper
No.395/ March 2012
Greenfield FDI and Skill Upgrading
Ronald B. Davies, University College DublinRodolphe Desbordes University of Strathclyde
March 20, 2012

IIIS Discussion Paper No. 395
Greenfield FDI and Skill Upgrading Ronald B. Davies, University College Dublin Rodolphe Desbordes University of Strathclyde March 20, 2012
Disclaimer Any opinions expressed here are those of the author(s) and not those of the IIIS. All works posted here are owned and copyrighted by the author(s). Papers may only be downloaded for personal use only.

Greenfield FDI and Skill Upgrading∗
Ronald B. Davies†
(University College Dublin)
Rodolphe Desbordes‡
(University of Strathclyde)
March 20, 2012
AbstractGlobalisation is one of the primary accused culprits of growing income inequality in the de-
veloped world. In particular, outbound foreign direct investment (FDI) is often associated withgeneral “skill upgrading" in the home country, that is, a shift in relative labour demand from lowskilled workers towards more skilled workers. Nevertheless, the empirical evidence indicates thatsuch effects are small at best, especially in contrast to those for overall trade in intermediates(which includes both intra-firm trade and foreign outsourcing). In response, we utilise a propri-etary dataset on greenfield FDI. In contrast to M&A FDI, which can represent acquisition of newtechnologies or elimination of competitors, greenfield FDI may be more closely linked to skillupgrading, especially when its done to take advantage of international differences in factor prices.Given that our data delineate FDI by function as well as by destination country, we are able tocapture the different motives of FDI and to account for the fact that different functions in differentcountries may substitute for different skill levels at home. Using these data in conjunction withindustry-level data on seventeen developed home countries, we find that greenfield FDI resultsin polarised skill upgrading, i.e. an increase in the relative share of employment and compen-sation of the most skilled workers to the detriment of the medium skilled workers. This impactis strongest for support services (e.g. call centres), knowledge services (e.g. R&D), and retailFDI with little indication of an impact from FDI in other functions. Our estimates suggest thatthe change in the high skilled compensation share explained by support services is of the sameorder of magnitude as what is found in other studies for trade in services. Unlike those studies,however, we find that demand for medium skilled workers falls from outbound FDI whereas thatof the lowest skilled workers remains unchanged. Thus, in contrast to overall trade in serviceswhere globalisation leads to increased income inequality between the lowest skilled workers andother groups, increased outbound FDI leads to an increased gap between the most skilled and themoderately skilled workers. FDI then has parallels to the results from the labour literature estimat-ing the non-monotonic impacts on the demand for skills of computerisation and service offshoring.
Keywords: Greenfield FDI; Labour Demand; Skill Upgrading.
∗This paper is produced as part of the project "Globalisation, Investment and Services Trade (GIST) Marie Curie InitialTraining Network (ITN)" funded by the European Commission under its Seventh Framework Programme - Contract No.FP7-PEOPLE-ITN-2008-211429.
†School of Economics, University College Dublin, Newman Building (Room G215), Belfield, Dublin 4 Ireland. Email:[email protected]
‡Department of Economics, Sir William Duncan Building, University of Strathclyde, 130 Rottenrow, Glas-gow G4 0GE, Scotland, United Kingdom. Telephone/Fax number: (+44) (0)141 548 3961/4445. E-mail:[email protected]
1

1 Introduction
When a firm announces its intention to engage in outbound foreign direct investment (FDI), this is
almost invariably greeted with dismay by local workers out of the fear that this means a decline in
demand for their services. When FDI is horizontal and replaces home exports, absolute labour de-
mand for both skilled and unskilled labour at home may be reduced. When FDI is vertical, i.e. by
factor price differences, then only a part of the production process is shifted overseas. As a result,
some workers will lose out even as others gain.1 This latter possibility is particularly worrisome as
the increase in FDI observed over the last few decades has taken place during a period of increasing
income inequality. Despite such widely held concerns, the empirical evidence is fairly mixed. With
regards to total employment, depending on the study, outbound investment can actually increase par-
ent employment.2 Evidence of “skill upgrading" in the home country, that is, a shift in relative labour
demand from low skilled workers towards more skilled workers, is also ambiguous. Crino’s (2009)
survey indicates that FDI is only found significant in roughly half the firm-level studies, and the es-
timated impact is markedly smaller than the impact of overall trade in intermediate goods (including
both that within multinationals (MNEs) and foreign outsourcing). Furthermore, empirical studies fail
to find any impact at the industry-level, suggesting that the general skill upgrading observed within
the sectors of rich countries cannot be explained by the activities of MNEs (Navaretti and Venables,
2006).
This paper contributes to the debate on skill upgrading induced by the activities of multinational
enterprises by employing a new, proprietary measure of FDI activity. This measure covers outbound
greenfield capital investment in real projects.3 FDI can take place either through the construction of
a new overseas facility (greenfield FDI) or by the acquisition of an existing overseas facility (mergers
and acquisitions, M&A). This is an important distinction when anticipating domestic employment
effects because M&A activity can include several important changes to the economic environment
beyond the decision to do an activity overseas instead of at home. For example, M&A activity can
1See Markusen (1984) for seminal work on horizontal FDI and Helpman (1984) for that on vertical FDI. Navarettiand Venables (2006) provide an overview of the FDI literature, including that on skill upgrading. Grossman and Rossi-Hansberg (2008) and Rojas-Romagosa (2011) are recent theoretical treatments of trade in tasks.
2The literature estimating total labour demand includes Muendler and Becker (2010), Koenigs and Murphy (2006),Harrison and McMillan (2006), Becker, Ekholm, Jackle, and Muendler (2005), Hanson, Mateloni, and Slaughter (2003),Braconier and Ekholm (2000), Bruno and Falzoni (2003), Brainard and Riker (2001), Slaughter (1995). See Crino (2009)for a recent and excellent overview of the literature on the effect of FDI and imports on domestic labour markets.
3The bulk of the literature, including the present study, examines the impact of outbound FDI. The exceptions to thisare Heyman, Sjoholm, Tingvall (2011) and Heyman, Sjoholm, Tingvall (2007) who use Swedish employee-firm data toestimate the wage premium associated with working for a multinational. Of particular interest is the second of thesewhich finds that a Swedish employee working for a foreign-owned greenfield firm enjoys a higher wage premium thanone working for an affiliate that becomes foreign owned through an M&A.
2
represent the purchase of a new technology or the elimination of a foreign competitor.4 Greenfield
investment, on the other hand, embodies technology already available to the firm and does not mean
the elimination of an overseas competitor. As such, this measure is conceptually closer to the theoret-
ical notion of “jobs being sent overseas" and thus is potentially more tightly linked to skill upgrading,
especially when the FDI motive is unambiguously vertical. Therefore, our first contribution is to use
data specifically on greenfield FDI, avoiding this aggregation bias.
A second benefit of these new data is that they break down FDI into its primary function (such
as manufacturing, customer support, or R&D). Since different functions likely have different motives
and different skill intensities, allowing for these distinctions can give us more clear-cut results on
potential skill upgrading. As will be shown in our analysis, such disaggregation is crucial as it is only
some functions that influence home labour patterns.5 Thus, this decomposition along functional lines
represents our second contribution.
A third benefit of our data is its coverage of outbound investment from a broad group of countries
at the country-industry level. Hence, in contrast to other studies estimating the impact of FDI on
skill upgrading in a single home labour market, we are able to use labour market data from multiple
countries.6 Our third contribution is therefore to provide a much more general impact of outbound
FDI on OECD labour markets than previous research.
A fourth benefit of our database is that it allows us to investigate the impact of FDI according to its
destination. Previous work has emphasised the need to account for the destination of investment. In
particular, if investment in different locations represents the hiring of foreign workers with different
skill levels, theory suggests that this would have differential impacts on skill upgrading at home.7
Hence, our last contribution is to be consistent with the rest of the literature by looking at the different
impacts of geography-specific factor intensities at the country-industry level.
4Hansson, et al (2007) find that, for Swedish multinationals, technology and market acquisition are key factors influ-encing their decision to invest abroad.
5This relates to a small literature on how trade affects domestic workers according to the function the home workeris employed in. Becker, Eckholm, and Muendler (2009) use German micro data and find that imports tend to benefitworkers engaged in skill-intensive functions. Klein, Moser, and Urban (2010) use similar data and find that workers inskill-intensive functions also tend to benefit when their employer begins exporting. Kemeny and Rigby (2012) find asimilar result for US data, where increased imports benefit those in nonroutine tasks (which are arguably skilled workers).However, to our knowledge, no one has used information on overseas functions to explain domestic labour market shifts.
6Slaughter (2000) uses U.S. data, whereas Head and Ries (2002) use Japanese data and Hansson (2005) uses Swedishdata. Mariotti, Piscitello, and Elia (2010) and Castellani, Mariotti, and Piscitello (2006) use Italian data. The only papersto our knowledge estimating the impact of FDI on multiple home country labour markets are Becker, Ekholm, Jackle,and Muendler (2005), who use German and Swedish data, and Koenigs and Murphy (2006), who cover a set of Europeancountries. These studies, however, estimate total changes in home employment using firm level data, not skill upgrading.
7Typically, this breakdown is done by wage or income of the host. Hansson (2005) uses a breakdown depending onOECD membership. Koenigs and Murphy (2006) use regions within Europe (North, Central, or South). Harrison andMcMillan (2006) instead classify outbound investment as horizontal or vertical rather than relying on the assumption thathorizontal investment is in a high-income host and vertical is in a low-income host.
3

On the whole, we find the strongest impacts from FDI in support services (e.g. call centres and
marketing), with smaller effects in knowledge services (e.g. R&D) and retail. For these, we find a
general pattern wherein increased investment increases the relative demand for high skilled workers
relative to their medium skill counterparts that is borne out in both relative wage and employment
shares. Other functions, such as manufacturing or business services, have no significant impact.
Furthermore, these relative shifts are robust to delineating our data between the financial and business
services sectors as opposed to other sectors and to separating the host countries into two groups, one
developed and one developing. Nevertheless, in line with the existing literature on the effects of
globalisation on skill upgrading, the estimated magnitude of FDI’s absolute impact is small. Despite
this, it does explain a significant portion of the observed degree of skill upgrading. The observed
trends in support services explains 3-9% of the rise in the relative wages share of high skilled workers
and about 1-4% of the increase in their employment share, results comparable to the estimated impact
of the overall trade in intermediate services found by Crino (2012). However, contrary to that study,
we find that outbound support services FDI are likely to have strongly contributed to the stagnation
of the compensation and employment shares of medium-skilled workers and that there is no impact
from outbound FDI on the lowest skilled workers. Thus, in contrast to broad service offshoring,
greenfield FDI seems to create conflict primarily between the most skilled workers and the medium
skilled workers rather between those two groups and the lowest skilled workers. This finding echoes
the predictions of Levy and Murnane (2004) who argued that “computer substitution and outshouting
are affecting many of the same occupations”’ (p.21), i.e. those involving routine (expressible in rules)
tasks.
The paper proceeds as follows. In Section 2, we provide some stylised predictions about the
effects of FDI on skill upgrading in developed countries. Section 3 describes our empirical approach
and our data. Section 4 contains our results estimating the impact of FDI. Section 5 discusses the these
results further by comparing the estimated impacts to the actual changes in employment. Section 6
concludes.
2 Conceptual framework
As we will describe in the next section, data limitations on the rental price of capital and output prices
constrain us to estimate a short-run cost function, where capital and output are fixed factors and the
only variable factors are low-skilled (LS) workers, medium-skilled (MS) workers, and high-skilled
(HS) workers. This implies that our estimates will not capture any technical efficiency or scale effects4

resulting from an endogenous change of capital and/or output to outbound FDI. They will purely
reflect how outbound FDI influences relative labour demands, as measured by the share of a given
category of workers in total compensation or total employment.
Two conditions need to be met for outbound FDI to influence relative labour demands. The first
is that the skill-intensity of foreign and remaining domestic activities must differ. Second, FDI must
have some vertical features, meaning that the overseas activity substitutes for a given category of
workers at home because intra-firm imports replace them or because a certain group of workers are
complementary to the overseas activity.8 If these two criteria are not satisfied, relative labour demands
will remain unchanged (even though that may not be the case for absolute labour demands).
Thus, the impact of FDI on relative labour demands can be broken down according to the skill
intensity and verticality of the overseas activity. Figure 1 illustrates the expected effects of different
types of outbound FDI (horizontal vs. vertical) in different broad stages of the value chain (manu-
facturing vs. services) and different regional destinations (developing vs. developed countries) on
relative labour demands.
Pure horizontal FDI entails the replication abroad of the same activities as those performed do-
mestically. Given that the skill intensities of the domestic and foreign activities do not differ and no
trade in intermediate goods takes place, this will not influence the relative labour demands for high
skilled (HS), medium skilled (MS) or low skilled (LS) workers, as shown in Panel A. Thus, no skill
upgrading occurs.
Vertical FDI, on the other hand, is the geographical dispersion of the production stages according
to their factor intensities. When the overseas affiliate begins operations, this offshoring of a part of the
production process reduces the relative home demand for those workers used intensively in that stage
of production. Which workers those are depends on what type of activities are being sent overseas.
Panel B illustrates an example where the offshored activity is intensive in low skilled workers, as is
generally assumed for manufacturing offshored to developing countries. This change reduces home
demand for LS workers and, due to the reduction in unskilled labour costs, increases home demand
for HS and MS workers (as was observed in the 1980s and early 1990s in the developed countries).
Thus, this type of FDI results in generalised skill upgrading.
Panel C illustrates the offshoring of routine cognitive tasks (anecdotally to locations like India
or China), which can be easily codified and transmitted via-ICT, and which do not require physical8Vertical FDI can also replace home workers by reducing the need for intra-firm imports of final goods and services.
However, given that we assume that output in the home country is fixed in our discussion of the expected effects of FDIon relative labour demands, we solely describe vertical FDI here as involving intra-firm imports of intermediates, or, inthe branching FDI case, as exports of intermediate services which leave home production unchanged.
5
proximity (Levy and Murnane, 2004; Blinder, 2006). These services are usually performed by MS
workers and therefore the jobs they occupy are most at threat. In contrast to manufacturing offshoring
which has traditionally been associated with worsening wage and employment conditions for LS
workers, service offshoring is mainly believed to shift relative demand only among the skilled workers
as LS workers tend to perform non-tradable service jobs. Thus, this type of FDI works to the determent
of MS workers but the benefit of HS workers, resulting in polarised skill upgrading.
Finally, vertical FDI does not necessarily have to be located in a developing country. In fact, the
biggest exporters of services are developed countries (Jensen, 2011). From this perspective, vertical
services FDI in another, and potentially more skill-abundant, developed country may lead to the re-
location of highly-skilled domestic activities abroad. This possibility is described in Panel D, where
service offshoring to developed countries, like the United Kingdom or Japan, may induce a fall in the
relative demand for HS workers and a rise in the relative demand for MS and/or LS workers. Thus,
depending on whether the home labour demand rises for both MS and LS workers or just the former,
outsourcing to a developed country can result in either generalised or polarised skill downgrading.
[Figure 1 about here.]
Of course, our description of the effects of outbound FDI is extremely stylised. In particular, the
“pure" designation for horizontal FDI is critical. As discussed by Head and Ries (2002), there is a
distinction between pure horizontal FDI, which involves replication of all activities, and branching
FDI, which replicate production of final goods only while upstream skill-intensive activities remain
at home (this being the type of FDI discussed by Markusen, 1984). Because branching FDI still has
trade in skill intensive headquarter services, it can result in general or polarised skill upgrading as the
opening of a new plant abroad is complementary to the home employment of skilled workers. Nev-
ertheless, this indicates that in order to identify potential skill upgrading it is important to distinguish
between the differing functions of FDI as well as the host of the investment as these will allow us to
better control for the skill-intensity of the overseas activity.
3 The Empirical Model and Data
3.1 Empirical model
We follow the existing literature by estimating a set of relative labour demand equations in which
FDI serves as a demand shifter by affecting total costs. In this section, we provide a brief theoretical
derivation of our empirical specification.6

To arrive at the relative labour demand equations for our three worker types, high-skilled (HS),
medium-skilled (MS), and low-skilled (LS), we begin with a cost minimizing representative firm in
a particular country-industry-year (the subscripts for which are omitted for simplicity). This firm
minimizes the short-run cost function C(.) by choosing these inputs:
C(wHS,wMS,wLS, Y,K,Z) = min{wHSHS + wMSMS + wLSLS} (1)
such that output Y is achievable given its capital stock K:
Y = f (H,M,L,K,Z) (2)
where wi is the wage of worker type i and Z is a vector of shift factors that affect total costs
(including FDI).9 Applying Shepard’s Lemma to this cost function would result in a demand equation
for the variable input (i.e. labour type) i ∈ I = {HS,MS,LS}:
i = gi(wHS,wMS,wLS, Y,K, Z
)(3)
Note that in this, the firm is treating exogenous factors (including FDI), as parameters in its cost
minimization problem. Therefore, a change in FDI (or any other exogenous factor) will lead it to
re-optimize its employment choices. In order to arrive at a functional form for (3), we assume that the
cost function is translog:
lnC = α+∑i∈I
βi lnwi + βY lnY + βK lnK +∑z∈Z
βz ln z
+12
(∑i∈I
∑j∈I
βi,j lnwi lnwj + βY,Y (lnY )2 + βK,K (lnK)2 +∑z∈Z
∑k∈Z
βz,k ln z ln k
)+∑i∈I
βi,Y lnwi lnY +∑i∈I
βi,K lnwi lnK +∑i∈I
∑z∈Z
βi,z lnwi ln z
+βY,K lnY lnK +∑z∈Z
βY,z lnY ln z+∑z∈Z
βK,z lnK ln z
(4)
Linear price homogeneity and symmetry then imply that:
∑i∈i
βi = 1, (5)
9This approach has been employed by Morrison and Siegel (2001), Falk and Koebel (2001, 2002), Ekholm and Hakkala(2006), Hijzen et al. (2005), and Crino (2012) among others.
7

βi,j = βj,i for i = {HS,MS,LS} and j = {HS,MS,LS, Y,K, z} , (6)
and ∑i∈i
βi,j = 0 for j = {HS,MS,LS, Y,K, z} . (7)
As a result, applying Shepard’s lemma to (4), we get three compensation share functions, where
the share of labour type i in total labour compensation (si) is:10
Si = βi∑j∈I
βi,j lnwj + βi,Y lnY + βi,K lnK +∑z∈Z
βi,z ln z. (8)
Thus, if βi,FDI is positive, this means that an increase in FDI increases the share of total wages
spent on labour type i. As explained in the previous section, we expect that βi,FDI will depend on the
function offshored, the level of skills, and the destination of the FDI.
Applying the linear price homogeneity parameter restrictions to (8), we end up with two equations
to be estimated (one for the relative share of HS workers and one for the relative share of MS workers):
∆SHSsit = αHS
si + βHS1 ∆ln(
wHSit
wLSit
)eit + βHS2 ∆ln(
wMSit
wLSit
) + βHS3 ∆ln(Ksit) + βHS
4 ∆ln(Ysit) (9)
+βHS5 ∆ICTsit + βHS
6 ∆FDIfsit + THSt +∆ϵfsit
∆SMSsit = αMS
si + βMS1 ∆ln(
wHSit
wLSit
)sit + βMS2 ∆ln(
wMSit
wLSit
) + βMS3 ∆ln(Ksit) (10)
+βHS4 ∆ln(Ysit) + βMS
5 ∆ICTsit + βMS6 ∆FDIfsit + TMS
t +∆υfsit
where ∆ indicates that the variable has been first-differenced and ϵfsit and υfsit are error terms.
The z variables in equations (9) and (10) are FDI (FDI , distinguished by function) and computerisa-
tion (ICT ).
Our dependent variable ∆Ssit will be either the change in the share of a given category of workers
in total labour compensation or the change in the share of a given category of workers in total hours
worked in sector s of home country i at time t, using function of FDI f . We have data on three
categories of workers: HS, MS and LS. FDIfsit is our function-specific sectoral measure of FDI.
Our control variables are the ratios of the skill-specific hourly wages wsit, capital services Ksit, value
added Ysit, and computer intensity ICTsit.11 In addition αsi are sector-country fixed effects and Tt
10To recognize why this results in the compensation share rather than labour demand, it is helpful to recognize that weare taking the derivative of logged costs, which depends on logged wages, with respect to the non-logged wage.
11Berman et al. (1994) argue for not including relative wages in equations (9) and (10). Our results are robust to theomission of the wage terms.
8

are time fixed effects. Given the restrictions that we have imposed and the fact that our dependent
variables sum up to unity, we can retrieve the estimates of the parameters of the ∆SLSsit equation from
the estimated coefficients of equations (9) and (10). We do so through seemingly unrelated estimation
of both equations, with a variance-covariance matrix adjusted for clustering at the sector-country level.
We control for unobserved time-invariant factors which may have an impact on levels and changes
of our dependent variables by initially first-differencing our data and subsequently including sector-
country fixed effects. Given the short time-dimension of our panel (three years), this specification
allows us to control for most omitted variables (see Haskel et al. (2007) for a similar strategy). In
line with previous studies, we weigh all our regressions, including those underlying our descriptive
statistics, by the average sector share in total labour compensation across OECD countries. In that
way, by giving more weight to large sectors, we may obtain a more representative impact of outbound
FDI on the labour market of the home countries.12
3.2 Sectoral data
Data for our dependent and control variables come from the EU KLEMS database, which report at
the sector-level, for a large number of OECD countries over the 1970-2005 period, comparable data
on value added (Y), labour compensation (L), number of hours worked (H), capital compensation (K,
taken as a proxy for capital services), share of ICT capital in total capital compensation (ICT, taken
as proxy for technological change), and skill composition of the labour force.13 More precisely, the
shares of high skilled (HS), medium skilled (MS) and low skilled (LS) workers in total compensation
or in total hours worked is given. Typically, HS workers have a tertiary education, MS workers have
at most an upper secondary education and LS workers have stopped their education at the lower
secondary education level. After matching with our FDI database, we have data for 17 industries in
17 OECD countries over the 2002-2005 period, with an overall number of 852 observations.14 Table
1 gives the list of the sectors and their average share in total labour compensation in our data. On
average, these sectors represent 60% of total labour compensation in OECD countries.15
Table 2 provides some summary statistics about the evolution of compensation and employment
12Our results are qualitatively similar when our regressions are unweighted.13The database is available at http://www.euklems.net/. All nominal values have been expressed in US$
using the exchange rate reported in the Penn World Tables 7.2 (http://pwt.econ.upenn.edu/php_site/pwt_index.php) and deflated using the deflators reported in the EU KLEMS database.
14The countries are Australia, Austria, Belgium, Germany, Denmark, Spain, Finland, France, United Kingdom, Ireland,Italia, Japan, Luxembourg, Netherland, Portugal, Sweden and United States.
15Our results are robust to the inclusion of sectors for which we never observe in our FDI database an outboundinvestment.
9

shares during 2003-2005. We distinguish between Financial and Business Services (FBS) and non-
FBS sectors. The main reason motivating this distinction is that FBS sectors, which account for
about one-third of the overall labour compensation in our data, have been reported to be the heaviest
importers of services while they import little intermediate manufacturing goods (see Jensen (2011)
for the US and Winkler (2009) for Germany). On the other hand, the manufacturing industry in non-
FBS sectors, which account for another one-third of the overall labour compensation in our data (and
about one-half of overall labour compensation in non-FBS sectors), import both manufacturing and
services intermediate inputs. Hence, both groups of sectors may be exposed to offshoring but with
potentially different impacts on the labour market. For instance, we would expect MS workers to be
more harmed by service offshoring than by material offshoring in FBS sectors than in non-FBS
sectors, where both MS and LS workers may be affected.
[Table 1 about here.]
[Table 2 about here.]
Table 2 shows that FBS sectors are much more skill- and ICT-intensive than non-FBS sectors.
In both groups of sectors, the compensation and employment shares of HS workers have significantly
increased over time while those of MS and LS workers have stagnated or decreased. Furthermore, in
line with our previous argument, LS workers seem to have been more affected in non-FBS sectors
than in FBS sectors.16 Finally, it is interesting to notice that ICT intensity in both workers has
decreased or stagnated, which imply that increased computerisation is unlikely to explain the trends
we have just described.
3.3 Outward FDI data
Our FDI data on capital investment, originally available at the firm level, come from fDi Markets,
which is a commercial database tracking cross-border greenfield investment covering all sectors and
countries worldwide since 2003.17 This database has two unique features. First, it provides bilateral
panel FDI data with a wide coverage of countries and sectors, which allows us to match it with the
sectoral KLEMS database and distinguish investment by destination countries. Second, and crucially
16The trends are the same when we only consider manufacturing in non-FBS sectors.17It is notably the exclusive source of greenfield FDI data for the UNCTAD World Investment Report (e.g. UNCTAD,
2006). The limitations on the time dimension of these data set our time period. It is worth recognising that as these dataare at the individual investment level, they are perhaps more accurate than those recovered from balance of payment data.
10

for this paper, it also classifies projects by function. We aggregate eleven of these functions f into six
main groups:
1. BB Services [BS]: Business to Business professional services (ex: consultancy, marketing, legal,
financial services, recruitment).
2. Support Services [SS]: Customer Support Centres (ex: call centres); Sales; Marketing and Sup-
port Centres (ex: sales and support office); Shared Service Centre (ex: accounts processing,
HR/payroll processing, back-office activities).
3. Knowledge Services [KS]: Design, Development and Testing (ex:technology centres, applica-
tion centres, testing centres); Education and Training (ex: internal training centre); National or
Regional Headquarters; Research and Development.
4. Infrastructure Services [IS]: ICT Infrastructure (ex: broadband infrastructure, Internet data cen-
tres, data recovery centres); Logistic, Distribution and Transportation (logistics hub, distribution
centre).
5. Manufacturing Activities [MAN]: Production or processing of any good (ex: manufacturing
plant, processing plant, production facility).
6. Retail [RET]: Any retail operation (ex: opening of a store/agency).
Hence, our FDI figures correspond to the total value of the capital investments in new (greenfield)
projects made abroad in function f by MNEs headquartered in sector s of country i at time t.18
As illustrated in Figure 2, greenfield FDI is dominated by manufacturing, followed by retail and
information services. Further, it is worth noting that greenfield FDI, unlike M&A investment, is
concentrated in the developing countries. If this is more closely aligned to vertical motivations, this
then suggests that any skill upgrading effects may be more observable in these data than in aggregated
FDI data. Note that it is by definition a flow variable, i.e. the change in the stock from t − 1 to t,
therefore we do not first difference it because, following others, the stock of FDI activity would be
an element of z in (8). We deflate these values using the value added deflators reported in the EU
18Different studies measure FDI in different ways with the choice often decided by data availability. Several studies,including Braconier and Ekholm (2000), Becker, Ekholm, Jackle, and Muendler (2005), and Koenigs and Murphy (2006),use a function of the wages in the host country (or the average across hosts). Others, such as Head and Reis (2002),Hansson (2005), and Mariotti, Piscitello, and Elia (2010), use information on the number of overseas workers. Ourinvestment measure is closest to the use of capital stock (Slaughter, 2000) and the dummy variable for whether a firmengages in FDI or not (Castellani, Mariotti, and Piscitello, 2006).
11

KLEMS database and we normalise them by expressing them as a percentage of the last period’s
value added. In addition, we take the logs of these ratios to reduce the influence of outliers, adding
one prior to the transformation to deal with zero values. Our variable of interest is therefore equal to
ln(100 ∗ FDIfsitYsit−1
+ 1) and we use it as a proxy of the change in the global integration of sector s in
country i, such as ∆FDIfsit = ln(100 ∗ FDIfsitYsit−1
+ 1).
[Figure 2 about here.]
Table 3 gives some descriptive statistics, where we distinguish again between FBS and non-
FBS sectors. The average FDI intensity in non-FBS sectors is much larger than in FBS sectors,
partly due to the fact that the range of functions in non-FBS investment is much more restricted
than for FBS investment. By their very nature, FBS sectors tend to invest in business services (BS,
SS, KS) whereas non-FBS sectors, despite having a clear preference for (manufacturing) functions
related to the production, distribution and sale of goods (IS, MAN, RET), nevertheless invest in several
service functions. For instance, normalised FDI outflows in SS are greater in the manufacturing non-
FBS sectors than in FBS sectors. Finally, in both groups of sectors, greenfield investment has been
equally distributed between developed and developing countries.19 An exception are manufacturing
activities, which are predominantly located in developing countries, in line with their probable labour
cost advantage.
[Table 3 about here.]
In accord with our previous discussion, two conditions are required for outbound FDI to exert an
impact on relative labour demands (in the absence of a scale effect): the skill-intensity of foreign and
domestic activities must differ and the FDI must have vertical features. Under these conditions, FDI
will generally lead to a rise in intermediate material and service inputs which substitute for a given
category of workers. Functions BS, SS, KA and MAN are anecdotally the most likely to meet this
criteria. Among them, SS is the most promising. Its definition is tightly linked to the back and front
office services that are traditionally offshored and outbound FDI in this function is present across
sectors. On the other hand, the magnitude of FDI in BS, KA and MAN is more sector-specific and
their purpose may be to serve the local market of their host countries. For instance, the U.S. BEA
19We group the destination countries into developed or developing countries, based on the World Bankdefinition circa 2000. The income classification can be found at http://nyudri.org/resources/global-development-network-growth-database/
12

reports that in 2004, only 11% of the sales of the manufacturing majority-owned foreign affiliates of
U.S. MNEs were exported to their U.S. parents, compared with only 8% for MNEs in the finance
industry. Hence, we expect that the evidence for a short-run impact of outbound FDI on the labour
markets of OECD countries will be the strongest for the SS function and may be weak or non-existent
for the other functions.
4 Empirical results
4.1 Baseline results
We start the presentation of our results by investigating the effects of outbound FDI on the labour
market of home countries without distinguishing by destination countries. Results are given in Table
4. We observe that across functions, FDI in SS (Support Services), and to a much lesser extent FDI
in KA (Knowledge Services) and RET (Retail), appear to influence, statistically and economically,
relative labour demands. FDI in SS and KS tends to increase the relative demand for HS workers, to
decrease the relative demand for MS workers, and, to have little impact on LS workers. These effects
are consistent with greater imports of intermediate service inputs generated by FDI in SS and KS which
displace domestic production of these routine cognitive tasks previously done by MS workers in the
home country. The negative and statistically significant impact of FDI in RET on the compensation
share of MS workers could be explained by the need of fewer domestic MS managers when firms
invest in their own distribution networks instead of using the services of a local sales agent.
Table 5 shows that the labour demand shifts that we observe in Table 4 are not limited to changes
in compensation shares as employment shares also appear to be influenced by outbound FDI in SS
and KA. Furthermore, we now also find that FDI in BS (Business Services) tends to decrease the
employment share of MS workers while FDI in IS (Infrastructure Services) tends to have the reverse
effect, but with a negative impact on LS workers. FDI in these two functions may also partly result in
greater trade in intermediate services inputs, with different impacts on a given category of workers of
the home countries, depending on the skill-intensity of the activity offshored.
Overall, Tables 4 and 5 indicate that the substitution effect generated by outbound FDI always
plays against the non-HS workers, leaving HS workers unscathed or better off. In addition, Table
5 underlines that we do not only observe the impact of the threat of potential offshoring on wage
moderation, as proposed by Leamer (2007) or Blinder (2006, 2009) in terms of ‘job contestability’,
but also a real job displacement effect resulting from a shift in the skill-intensity of domestic activities.13

[Table 4 about here.]
[Table 5 about here.]
4.2 Distinction by sector of use
The descriptive statistics in the previous section indicate that the volume of FDI in some functions
heavily diverges between user industries. For instance, FDI in BS unsurprisingly tends to be done
by firms in the FBS sectors, while firms in non-FBS sectors invest much more in the MAN (Man-
ufacturing) and RET functions. Furthermore FBS sectors have a much higher skill-intensity than
non-FBS sectors. Finally, FBS sectors represent a large share of total activity, which may influence
our industry-weighted regressions. Hence, we now investigate whether the impact of outbound FDI
differs between these sectors. We do so by interacting our FDI measure with a FBS sector dummy
in Tables 6 and 7. Note that this is a comparison across workers in the two sectors, not differentiating
between the the sector of a firm undertaking the investment (something, unfortunately, our data do not
permit us to do). We also report our estimates when we omit the FBS sectors entirely, which leads
to a slightly different weighting of our regressions.
[Table 6 about here.]
[Table 7 about here.]
Table 6 and 7 suggest that our previous estimates suffered, in some cases, from an aggregation
bias, even though we frequently cannot reject the null hypothesis that the slopes are the same for
both sectors. While the results for the non-FBS sectors tend to conform to our previous results, we
sometimes find different impacts of outbound FDI in the FBS sectors. For instance, even though the
difference is not statistically significant, it appears that FDI in BS has little impact on workers in FBS
sectors, which are nonetheless heavy importers of these services. A possible explanation is that the
skill intensity of outbound FDI in this function by FBS sectors does not differ from the skill intensity
of domestic activities, leaving relative demands and relative wages unchanged. This might be the case
if these investments are driven by non-wage factors such as a relatively low foreign corporate tax rates
or laxer regulations. Alternatively, this lack of impact may find its roots in a predominantly horizontal
orientation of FDI in BS by FBS sectors. We also find that FDI in KS tends to have a negative impact
on HS workers in FBS sectors, possibly because less HS managers are needed when foreign regional14

headquarters are opened. On the other hand, we observe that FDI in the MAN and RET functions has
a positive impact on HS workers but a negative impact on MS and LS workers. However, given the
low level of FDI performed by these sectors in these functions, it is hard to draw any firm conclusions.
Finally, the effects of FDI in SS seem to be the same in both the FBS and non-FBS sectors. This
leads us to conclude that for both groups of sectors, it is the activities performed by MS in this function
which tend to be offshored. In addition, these results confirm the prevalent vertical orientation of FDI
in SS, whatever the sector observed.
4.3 Distinction by destination country
We have previously argued that two reasons may explain the absence of an impact of FDI on the
labour markets of the home countries: similar skill intensity or horizontal orientation. The second
reason seems particularly pertinent to explain why FDI in the MAN function, which we would expect
to increase a priori the trade in manufactured intermediate inputs, has not been found to influence
compensation and employment shares. FDI in the functions IS and RET is also potentially horizon-
tal. One way of investigating the validity of these assertions is to distinguish between FDI going to
developed countries and FDI going to developing countries. We expect FDI going to the latter group
of countries to have a stronger impact on compensation and employment shares as they should have
different relative skill endowments from our developed home countries, therefore attracting FDI in ac-
tivities that are relatively low-skill intensive relative to what remains in the home country. In addition,
the potentially smaller local markets tin these nations may limit market-seeking horizontal FDI.
This distinction by destination countries is carried out in Tables 8 to 10. The results often suggest
that FDI in most functions is indeed horizontal, as even FDI to developing countries does not seem
to have any impact on wages and employment shares. Indeed, even in Table 11, where we focus
on sectors in the manufacturing industry in an effort to minimise sectoral aggregation bias, we are
still unable to find any impact, including when looking at FDI in MAN to developing countries.
Despite this, as previously found, one discernible exception is FDI in SS which, for both developed
and developing hosts, results in polarising skill upgrading, with a slightly larger (but not statistically
significant) effect for developing hosts. This is consistent with a predominantly vertical orientation of
FDI in SS with plausibly a higher skill-intensity in developed countries. The bottom panels of Tables
9 and 10, where we only use the FBS sectors, finds similar results.
[Table 8 about here.]
[Table 9 about here.]15

[Table 10 about here.]
[Table 11 about here.]
4.4 Removing outliers
Besides weighting regressions by industry shares and distinguishing between broad sectors, another
way to get a typical impact of outbound FDI on relative labour demands is to remove the observations
that are not well described by a robust-to-outliers regression model, i.e. remove observations with an
absolute large (standardised) residual. Hence, we re-estimate our econometric model, still separating
FDI to developed countries from FDI to developing countries, without the outliers flagged by a robust
regression model (namely an S-estimator).20
Table 12 shows that our main results qualitatively hold, in the sense that only FDI in the SS
function seems to have an impact. However, the estimated coefficients are smaller and we now find
that only FDI to developed countries matter. There also seems to be a weak negative impact of FDI
in MAN to developing countries on the employment share of LS workers but the coefficient is small
and is not statistically significant at the conventional 5% level. Thus, for the developing countries, it
seems that the presence of a few unusual cases is driving the skill upgrading results found above.21
[Table 12 about here.]
4.5 Does the distinction by function matter?
We end this section by investigating whether distinguishing outbound FDI by function has been a
necessary exercise. To this end, we re-estimate our regressions using the normalised sum of FDI
in sector s of country i at time t as the variable of interest. Table 13 shows that if we did not have
information about the functions of FDI (as is true in other studies using industry-level data), we would
have concluded that investment abroad does not have any impact on relative labour demands in the
source countries. This highlights one of the advantages our our data.
[Table 13 about here.]20The S-estimator resists to a contamination of up-to 50% of outliers in the sample and is robust to outliers in both the
Y and X dimensions. See Verardi and Croux (2009) for an accessible introduction to robust (to outliers) regression.21Outward investment originating in Spain in the electrical and optical equipment industry is the main source of these
outliers, due to a combination of a large positive change in the share of HS workers with a large volume of investment indeveloping countries.
16

5 Illustrative quantification and Discussion
5.1 Illustrative quantification
We now provide an illustrative quantification of our results, with two immediate caveats. First we
will only focus on the impacts of FDI in SS as outbound FDI in other functions seemed to have little
statistical impacts on labour markets in OECD countries. In addition, up to a certain extent, this will
allow us to compare our results with those dealing with the impact of broad service offshoring. Sec-
ond, if some foreign investments have been primarily motivated by cost-minimising considerations,
we expect higher wages in the home country to be rapidly followed by an increase in FDI. From an
econometric perspective, this means that our fixed-effects estimators may suffer from a positive bias,
leading to an underestimation of the effects of outbound FDI on workers of the home countries.
Using the average changes in Tables 2 and 3 in conjunction with the estimates of column (2) in Ta-
ble 8, we calculate the contribution of outbound FDI in SS to the change in the wage and employment
shares of each group of workers. We express this contribution in absolute terms and as a share of the
overall change. In addition, we carry out the same exercise using the robust-to-outliers estimates of
column (2) in Table 12. Note that the lack of statistical significance of our estimated relative impacts
for MS workers come from the fact that in Table 2 we cannot reject that the average changes in com-
pensation and employment shares of MS workers are not different from zero. Furthermore, negative
explained shares mean that the signs of the estimates absolute impacts and of the observed absolute
changes differ.
Table 14 shows that the absolute economic effects (the odd-numbered columns) is not large. FDI
in SS has led to a 0.02-0.06 percentage points rise in the wage and employment shares of HS workers,
a fall of about 0.01-0.04 percentage points in the wage and employment shares of MS workers, and
a negligible impact on the wage and employment shares of LS workers. Comparing these absolute
changes to the observed changes results in shares of the changes that are slightly larger (the even-
numbered columns). For HS workers, FDI in SS can explain 3-10% of the time trends in wage and
employment shares. For MS workers, the large numbers indicate that it is likely that FDI in SS has
strongly contributed to the stagnation of their wage and employment shares over the observed period.
Finally, LS workers may have experienced at most a 1-2% fall in their wage and employment shares
due to FDI in SS. The estimated impact for HS workers is in line with those that Crino (2012) found
when investigating the impact of service offshoring on skill-specific compensation shares. However,
contrary to our results, that study finds an equivalent positive effect on MS workers and a larger
17

negative impact on LS workers. Thus, whereas he found evidence of general skill upgrading for total
services imports, we find that greenfield FDI results in polarising skill upgrading.
Overall, three remarks can be drawn from our results. First, previous studies of FDI where the ef-
fect is much smaller may well have been hampered by their inability to distinguish between greenfield
FDI and M&A FDI. Second, it appears critical to distinguish between different functions of overseas
investment since some functions are offshored to take advantage of vertical cost savings whereas oth-
ers appear prompted by horizontal motivations. Third, comparing our results to Crino’s, it suggests
that the relative skill intensity of offshored services may depend on whether those offshored activities
are done in-house through FDI or are outsourced.
[Table 14 about here.]
6 Conclusion
The goal of this paper was to contribute to the debate on offshoring and skill upgrading by using a
proprietary data set on greenfield FDI for a number of source countries. In contrast to M&A FDI,
these data are potentially more simply linked to the decision of whether to do activities locally or
overseas based on relative factor prices and therefore to the possibility of skill upgrading. In addition,
we are able to distinguish between the roles the overseas investment plays in the overall activities of
a multinational enterprise. This analysis results in several insights.
First, our empirical analysis demonstrates that it is extremely important not to treat outbound
FDI as a homogeneous bundle of foreign activities. Indeed, a failure to distinguish FDI by function
would have led us, like the other studies surveyed in Navaretti and Venables (2006), to conclude that
the foreign activities of MNEs cannot explain the average skill upgrading that has been observed
in OECD countries over the last decade. Once we do so, however, we do find that FDI in support
services and to a lesser extent in knowledge services and retail have contributed to skill upgrading.
In particular, the observed changes in support services FDI can explain up to 9.2% of the upgrade
in skill during our sample period. This is consistent with Levy and Murane (2004) who contend
that offshoring has the same polarisation effects as computerisation which, due to its skill-biased
nature, puts jobs occupied by medium skilled workers at the most risk. Indeed, we find that greater
FDI in support services, which has a strong parallel with the offshoring of services, increases the
relative labour demand for high skill workers, decreases the relative labour demand for medium skill
workers and has little impact on low skill workers. The lack of a consistent impact for FDI in other
18
functions suggests that they have little ‘vertical’ orientation or have similar skill-intensities as the
remaining activities performed in the source country. Somewhat surprisingly, this conclusion also
seems to hold for FDI in manufacturing activities. It is important to note, however, that we are only
looking at short-run contemporaneous impacts. Thus, we cannot reject the possibility that there is
additional skill upgrading over a longer time horizon. In addition, it is possible that the main labour
demand shifts related to the offshoring of manufacturing activities took place before our period of
investigation. Finally, it is worth repeating that we have only looked at relative labour demands,
holding output fixed. Hence, our results do not say anything about the impact of outbound FDI on
absolute employment levels or sectoral unemployment.
Second, just as it can be problematic to aggregate FDI with different functions, it is important to
distinguish between destinations. We find that it is mostly FDI in support services to both developed
and developing countries which generate shifts in relative labour demands, with a somewhat larger
effect in the former. While material offshoring has often been seen as making workers from rich
countries compete with workers from poor countries, service offshoring now appears to have shifted
the sphere of competition to workers from other rich countries. Our results lend further support to this
conjecture.
Nevertheless, as in other studies investigating the impact of global integration (be it through trade
or FDI) on the skill composition of labour demand, we find that the effects are small. Thus, although
the process of globalisation may have contributed to changes in relative labour demand (and thus
income inequality), its effects are by no means the driving force behind these changes. As such, calls
for protectionism to reduce inequality are potentially misguided.
References[1] Becker, S.O., K. Ekholm, R. Jackle, and M. Muendler (2005) “Location choice and employment
decisions: a comparison of German and Swedish multinationals," Review of World Economics,141(4): 693–731.
[2] Becker, S.O., K. Ekholm and M. Muendler (2009) “Offshoring and the Onshore Composition ofTasks and Skills," CEPR Discussion Paper 7391.
[3] Berman, E., J. Bound and Z. Griliches (1994) “Changes in the Demand for Skilled Labor withinU.S. Manufacturing: Evidence from the Annual Survey of Manufactures," uarterly Journal ofEconomics, 109(2): 367–397.
[4] Blinder, A. S. (2006) “Offshoring: The Next Industrial Revolution?” Foreign Affairs, 85(2):113–128.
19
[5] Blinder, A. S. (2009) “How Many U.S. Jobs Might Be Offshorable?” World Economics, 10(2):41–78.
[6] Braconier, H. and K. Ekholm (2000) “Swedish multinationals and competition from high andlow-wage locations," Review of International Economics, 8(3): 448–461.
[7] Brainard, L.S. and D.A. Riker (2001) “Are U.S. multinationals exporting U.S. jobs?" InD. Greenaway and D.R. Nelson (eds), Globalization and Labour Markets, Cheltenham andNorthampton: Elgar: 410–426.
[8] Bruno, G.S.F. and A.M. Falzoni (2003) “Multinational corporations, wages and employment:do adjustment costs matter?" Applied Economics, 35: 1277–1290.
[9] Castellani, D., I. Mariotti, and L. Piscitello (2006) “Outward investments and skill upgrading.Evidence from the Italian case," KITeS Working Papers 185, KITeS, Centre for Knowledge,Internationalization and Technology Studies, Universita’ Bocconi.
[10] Crinò, R. (2009) “Offshoring, Multinationals and Labour Market: A Review of the EmpiricalLiterature," Journal of Economic Surveys, 23(2): 197-249.
[11] Crinò, R. (2012) “Service Offshoring and the Skill Composition of Labor Demand," OxfordBulletin of Economics and Statistics, 74(1): 20-57.
[12] Ekholm, K. and K. Hakkala (2006) “The effect of offshoring on labor demand: evidence fromSweden," Working Paper 5648, Centre for Economic Policy Research, London.
[13] Falk, M. and B.M. Koebel (2001) “A dynamic heterogeneous labour demand model for Germanmanufacturing," Applied Economics, 33(3): 339–348.
[14] Grossman, Gene M. and E. Rossi-Hansberg (2008) “Trading Tasks: A Simple Theory of Off-shoring," American Economic Review, 98(5): 1978–1997.
[15] Helpman, E. (1984) “A simple theory of international trade with multinational corporations,"Journal of Political Economy, 92(3): 451–471.
[16] Hanson, G.H., R.J. Mataloni and M. J. Slaughter(2003) “Expansion abroad and the domesticoperations of U.S. multinational firms," Mimeo, Dartmouth College.
[17] Hansson, P. (2005) “Skill upgrading and production transfer within Swedish multinationals,"Scandinavian Journal of Economics, 107(4): 673–692.
[18] Hansson, P., P. Karpaty, M. Lindvert, L. Lundberg, A. Poldahl, and L. Yun (2007) “Svensktn¨aringsliv i en globaliserad v¨arld: Effekter av internationaliseringen pa produktivitet och sys-selsattning," Institutet for Tillvaxtpolitiska studier (ITPS), A2007:004. Stockholm, Sweden.
[19] Harrison, A.E. and M.S. McMillan (2006) “Outsourcing jobs? Multinationals and US employ-ment," Working Paper 12372, National Bureau of Economic Research, Cambridge, MA.
[20] Haskel, J.E., S.C. Pereira, and M.J. Slaughter (2007) “Does Inward Foreign Direct InvestmentBoost the Productivity of Domestic Firms?" The Review of Economics and Statistics, 89(3):pages 482-496.
[21] Head, K. and J. Ries (2002) “Offshore production and skill upgrading by Japanese manufactur-ing firms," Journal of International Economics, 58(1): 81–105.
20

[22] Helpman, E. (1984) “A simple theory of international trade with multinational corporations,"Journal of Political Economy, 92(3): 451–471.
[23] Heyman, F., F. Sjoholm, and P.G. Tingvall (2007) “Is There Really a Foreign Ownership WagePremium? Evidence from Matched Employer-Employee Data," Journal of International Eco-nomics, 73(2): 355–76
[24] Heyman, F., F. Sjoholm, and P.G. Tingvall (2011) “Multinationals, cross-border acquisitions andwage dispersion," Canadian Journal of Economics, 44(2): 627-650.
[25] Hijzen, A., H. Gorg, and R.C. Hine (2005) “International outsourcing and the skill structure oflabour demand in the United Kingdom," The Economic Journal, 115(506): 860–878.
[26] Jensen, J.B. (2011) Fear and Outsourcing: The Facts on Global Services Outsourcing, Instituteof International Economics Press.
[27] Kemeny, T. and D. Rigby, (2012) “Trading away what kinds of jobs? Globalization, trade andtasks in the US Economy," Review of World Economics, 148(1): 1-16.
[28] Klein, M.W., C. Moser and D.M. Urban, (2010) “The Contribution of Trade to Wage Inequality:The Role of Skill, Gender, and Nationality," NBER Working Papers 15985, National Bureau ofEconomic Research, Inc.
[29] Konings, J. and A.P. Murphy (2006) “Do multinational enterprises relocate employment to low-wage regions? Evidence from European multinationals," Review of World Economics, 142(2):267–286.
[30] Leamer, E. E. (2007) “A Flat World, a Level Playing Field, a Small World After All, or Noneof the Above? A Review of Thomas L Friedman’s The World is Flat," Journal of EconomicLiterature, 45(1): 83-126.
[31] Levy, F. and R.J. Murane (2004) The New Division of Labor: How Computers Are Creating theNext Job Market, Princeton University Press.
[32] Mariotti, S., L. Piscitello and S. Elia (2010) “Spatial agglomeration of multinational enterprises:the role of information externalities and knowledge spillovers," Journal of Economic Geography,10(4): 519-538.
[33] Markusen, J.R. (1984) “Multinationals, multi-plant economies, and the gains from trade," Jour-nal of International Economics, 16(3-4): 205-226.
[34] Morrison, C. and D. Siegel (2001) “The impacts of technology, trade and outsourcing on em-ployment and labor composition," Scandinavian Journal of Economics, 103(2): 241–264.
[35] Muendler, M. and S.O. Becker (2010) “Margins of Multinational Labor Substitution," AmericanEconomic Review, 100(5): 1999-2030.
[36] Navaretti, G.B. and A.J.Venables (2006) Multinational Firms in the World Economy, PrincetonUniversity Press.
[37] Rojas-Romagosa, H. (2011) “Wage inequality in trade-in-tasks models," CPB Discussion Paper196.
[38] Slaughter, M.J. (1995) “US Multinationals, Outsourcing, and American Wage Divergence,"NBER working paper no. 5253.
21

[39] Slaughter, M.J. (2000) “Production transfer within multinational enterprises and Americanwages," Journal of International Economics, 50(2): 449–472.
[40] Verardi, V. and C. Croux (2009) “Robust Regression in Stata," Stata Journal, 9(3): 439–453.
[41] Winkler, D. (2009) Services Offshoring and its Impact on the Labor Market: Theoretical In-sights, Empirical Evidence, and Economic Policy Recommendations for Germany, Physica-Verlag HD.
[42] UNCTAD (2006) World Investment Report: FDI from Developing and Transition Economies:Implications for Developments, New York and Geneva: United Nations.
22

List of Figures1 Expected effects of FDI on skill upgrading . . . . . . . . . . . . . . . . . . . . . . . 242 Greenfield FDI by Function and Destination . . . . . . . . . . . . . . . . . . . . . . 25
23

Figure 1: Expected effects of FDI on skill upgradingA: Pure Horizontal FDI
HS vs. LS MS vs. LS LS vs. HS and MS
B: Vertical Manufacturing FDI in Developing Country
C: Vertical Services FDI in Developing Country
D: Vertical Services FDI in Developed Country WHS/WLS
S
D’
EHS/ELS
D
WMS/WLS S
D’
EMS/ELS
D
WLS/WHMS S
D’
ELS/EHMS
D
WHL/WHMS S
D
ELS/EHMS
D’
WMS/WLS S
D
EMS/ELS
D’
WMS/WLS S
D
EMS/ELS
D’
WHS/WLS S
D
EHS/ELS
D’
WHS/WLS S
D
EHS/ELS
D’
WLS/WHMS S
D
ELS/EHMS
WLS/WHMS S
D
ELS/EHMS
WMS/WLS S
D
EMS/ELS
WHS/WLS S
D
EHS/ELS
Notes: W : wage, E: Employment. hs: highly-skilled, ms: medium-skilled, ls: low-skilled-skilled, mhs :medium- and high- skilled.
24

Figure 2: Greenfield FDI by Function and Destination
020
040
060
080
0V
alue
($
US
bill
ions
)
BS SS KS IS MAN RET
Cumulated FDI values (2003−2005)
ALL DVPING DVPED
25
List of Tables1 Sectors . . . . . . . . . . . . . . . . . . . . . . . . . . . . . . . . . . . . . . . . . . 272 Evolution of compensation and employment shares over 2003-2005 . . . . . . . . . 283 Outward FDI (2003-2005), by function and destination countries . . . . . . . . . . . 294 Impact of outbound FDI investment on compensation shares . . . . . . . . . . . . . 305 Impact of outbound FDI investment on employment shares . . . . . . . . . . . . . . 316 Is the impact in Financial and Business Services different? Wage shares. . . . . . . . 327 Is the impact in Financial and Business Services different? Employment shares. . . . 338 Impact of outbound FDI investment on compensation and employment shares, by
destination . . . . . . . . . . . . . . . . . . . . . . . . . . . . . . . . . . . . . . . . 349 Impact of outbound FDI investment on compensation shares, by destination and sector
of use . . . . . . . . . . . . . . . . . . . . . . . . . . . . . . . . . . . . . . . . . . 3510 Impact of outbound FDI investment on employment shares, by destination and sector
of use . . . . . . . . . . . . . . . . . . . . . . . . . . . . . . . . . . . . . . . . . . 3611 Impact of FDI in the manufacturing sector, by destination . . . . . . . . . . . . . . . 3712 Impact of outbound FDI investment on compensation and employment shares, with-
out outliers . . . . . . . . . . . . . . . . . . . . . . . . . . . . . . . . . . . . . . . 3813 Impact of aggregate outbound FDI on compensation and employment shares . . . . . 3914 Quantification of the impact of outbound FDI in SS on compensation and employment
shares . . . . . . . . . . . . . . . . . . . . . . . . . . . . . . . . . . . . . . . . . . 40
26

Table 1: Sectors
Average shareBroad ISIC sector Definition in total compensation
across OECD countries
15t16 Food, beverage and tobacco 317t19 Textiles, textile products, leather and footwear 120 Wood and products of wood and cork 121t22 Pulp, paper, paper products, printing and publishing 323t25 Chemical, rubber, plastics and fuel 426 Other non-metallic mineral products 127t28 Basic metals and fabricated metal products 429 Machinery [mac], nec 430t33 Electrical and optical equipment [eqpt] 1134t35 Transport equipment 452 Retail trade, except of motor vehicles and motorcycles 1060t63 Transport and storage 765t67 Financial intermediation 870 Real estate activities 371t74 Renting of mac&eqpt and other business activities 20H Hotels and restaurants 4N Health and social work 13
27
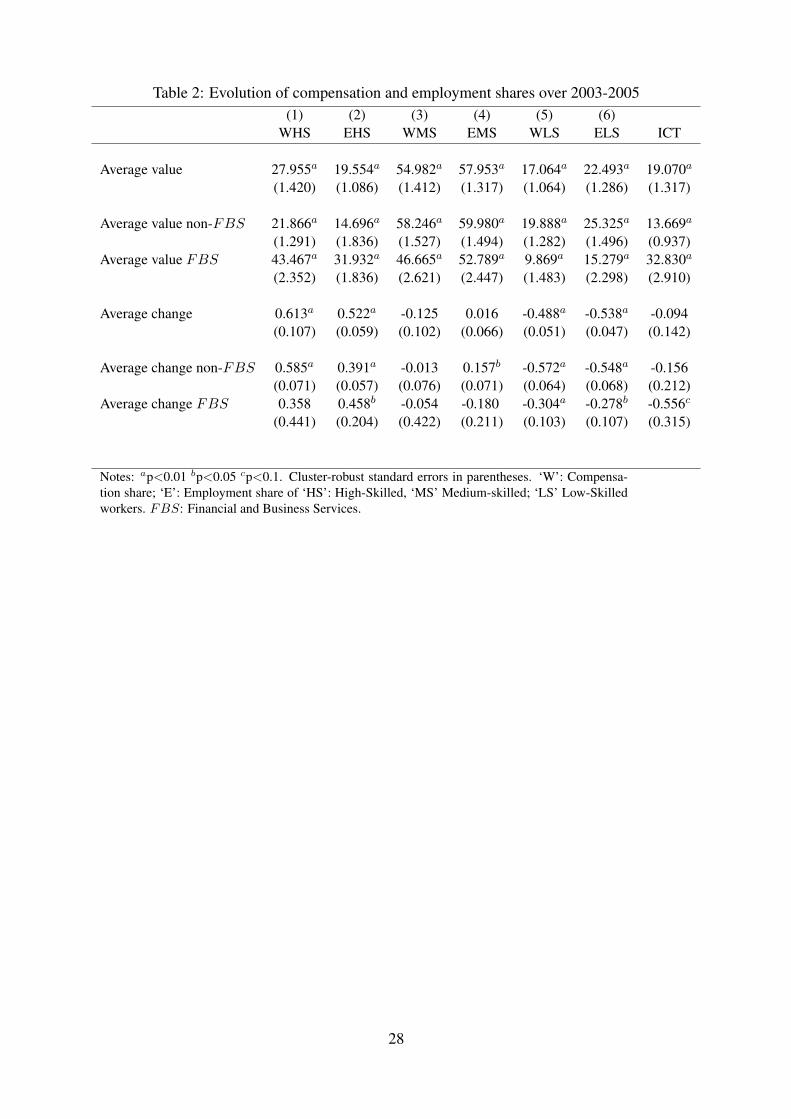
Table 2: Evolution of compensation and employment shares over 2003-2005(1) (2) (3) (4) (5) (6)
WHS EHS WMS EMS WLS ELS ICT
Average value 27.955a 19.554a 54.982a 57.953a 17.064a 22.493a 19.070a
(1.420) (1.086) (1.412) (1.317) (1.064) (1.286) (1.317)
Average value non-FBS 21.866a 14.696a 58.246a 59.980a 19.888a 25.325a 13.669a
(1.291) (1.836) (1.527) (1.494) (1.282) (1.496) (0.937)Average value FBS 43.467a 31.932a 46.665a 52.789a 9.869a 15.279a 32.830a
(2.352) (1.836) (2.621) (2.447) (1.483) (2.298) (2.910)
Average change 0.613a 0.522a -0.125 0.016 -0.488a -0.538a -0.094(0.107) (0.059) (0.102) (0.066) (0.051) (0.047) (0.142)
Average change non-FBS 0.585a 0.391a -0.013 0.157b -0.572a -0.548a -0.156(0.071) (0.057) (0.076) (0.071) (0.064) (0.068) (0.212)
Average change FBS 0.358 0.458b -0.054 -0.180 -0.304a -0.278b -0.556c
(0.441) (0.204) (0.422) (0.211) (0.103) (0.107) (0.315)
Notes: ap<0.01 bp<0.05 cp<0.1. Cluster-robust standard errors in parentheses. ‘W’: Compensa-tion share; ‘E’: Employment share of ‘HS’: High-Skilled, ‘MS’ Medium-skilled; ‘LS’ Low-Skilledworkers. FBS: Financial and Business Services.
28

Table 3: Outward FDI (2003-2005), by function and destination countriesBS CS HSA LOG MAN RET ALL(1) (2) (3) (4) (5) (6) (7)
AllAverage value 0.048a 0.061a 0.120a 0.254a 0.478a 0.140a 0.942a
(0.010) (0.009) (0.017) (0.038) (0.050) (0.029) (0.069)
Average value non-FBS 0.005a 0.057a 0.133a 0.330a 0.660a 0.194a 1.174a
(0.002) (0.012) (0.023) (0.050) (0.062) (0.039) (0.084)Average value MAN in non-FBS 0.009b 0.112a 0.257a 0.441a 1.264a 0.196a 1.753a
(0.004) (0.022) (0.039) (0.079) (0.080) (0.032) (0.088)Average value FBS 0.159a 0.070a 0.088a 0.061b 0.016a 0.004 0.349a
(0.036) (0.010) (0.018) (0.023) (0.005) (0.002) (0.047)
Developing worldAverage value 0.024a 0.032a 0.061a 0.162a 0.365a 0.081a 0.674a
(0.007) (0.007) (0.011) (0.029) (0.040) (0.021) (0.056)
Average value non-FBS 0.001a 0.031a 0.066a 0.216a 0.507a 0.112a 0.868a
(0.000) (0.009) (0.014) (0.039) (0.050) (0.028) (0.068)Average value MAN in non-FBS 0.002a 0.061a 0.132a 0.270a 0.989a 0.114a 1.330a
(0.001) (0.018) (0.026) (0.061) (0.068) (0.023) (0.079)Average value FBS 0.082a 0.033a 0.048a 0.024b 0.004c 0.001 0.179a
(0.026) (0.007) (0.012) (0.010) (0.002) (0.001) (0.031)
Developed worldAverage value 0.029a 0.031a 0.071a 0.126a 0.219a 0.090a 0.518a
(0.006) (0.005) (0.011) (0.025) (0.027) (0.023) (0.044)
Average value non-FBS 0.004b 0.028a 0.082a 0.161a 0.301a 0.125a 0.639a
(0.002) (0.006) (0.015) (0.033) (0.035) (0.031) (0.057)Average value MAN in non-FBS 0.007b 0.056a 0.157a 0.218a 0.573a 0.111a 0.954a
(0.003) (0.011) (0.026) (0.059) (0.055) (0.022) (0.071)Average value FBS 0.092a 0.039a 0.043a 0.037b 0.012b 0.003 0.210a
(0.019) (0.006) (0.010) (0.015) (0.005) (0.002) (0.030)
BS: Business services; SS: Support Services; KS: Knowledge Services; IS: InfrastructureServices; MAN : Manufacturing; RET : Retail. FBS: Financial and Business Services.
29

Table 4: Impact of outbound FDI investment on compensation sharesBS SS KS IS MAN RET
Impact on (1) (2) (3) (4) (5) (6)
All Sectors
High skilledFDI ratio 0.381 0.931a 0.173 -0.038 0.060 0.205
(0.895) (0.270) (0.200) (0.099) (0.091) (0.225)
ICT -0.015a -0.014a -0.015a -0.014a -0.015a -0.015a
(0.005) (0.005) (0.005) (0.005) (0.005) (0.005)
Medium skilledFDI ratio -0.615 -0.759a -0.280c 0.107 -0.026 -0.356c
(0.615) (0.222) (0.151) (0.081) (0.093) (0.199)
ICT 0.008b 0.008b 0.008b 0.007c 0.008b 0.008b
(0.004) (0.004) (0.004) (0.004) (0.004) (0.004)Low SkilledFDI ratio 0.234 -0.171b 0.107 -0.068 -0.033 0.151
(0.457) (0.085) (0.146) (0.066) (0.059) (0.149)
ICT 0.007c 0.007b 0.007c 0.007b 0.007b 0.007b
(0.003) (0.003) (0.003) (0.003) (0.003) (0.003)
Notes: ap<0.01 bp<0.05 cp<0.1. Cluster-robust standard errors in parentheses. BS: Businessservices; SS: Support Services; KS: Knowledge Services; IS: Infrastructure Services; MAN :Manufacturing; RET : Retail. FBS: Financial and Business Services. Control variables are in-cluded but not reported.
30

Table 5: Impact of outbound FDI investment on employment sharesBS SS KS IS MAN RET
Impact on (1) (2) (3) (4) (5) (6)
All Sectors
High skilledFDI ratio 0.302 0.654a 0.042 0.018 0.033 0.038
(0.857) (0.225) (0.146) (0.069) (0.069) (0.131)
ICT -0.013a -0.012a -0.013a -0.013a -0.013a -0.013a
(0.004) (0.004) (0.004) (0.004) (0.004) (0.004)
Medium skilledFDI ratio -0.867c -0.688a -0.319c 0.143c -0.008 -0.282
(0.515) (0.189) (0.170) (0.076) (0.088) (0.172)
ICT 0.005 0.004 0.005 0.004 0.005 0.005(0.004) (0.004) (0.004) (0.004) (0.004) (0.004)
Low SkilledFDI ratio 0.565 0.033 0.277 -0.161b -0.026 0.245
(0.698) (0.117) (0.173) (0.073) (0.067) (0.168)
ICT 0.008c 0.008c 0.008c 0.009b 0.008c 0.008c
(0.004) (0.004) (0.004) (0.004) (0.004) (0.004)
Notes: ap<0.01 bp<0.05 cp<0.1. Cluster-robust standard errors in parentheses. BS: Businessservices; SS: Support Services; KS: Knowledge Services; IS: Infrastructure Services; MAN :Manufacturing; RET : Retail. Control variables are included but not reported.
31

Table 6: Is the impact in Financial and Business Services different? Wage shares.BS SS KS IS MAN RET
Impact on (1) (2) (3) (4) (5) (6)
With FBS servicesHigh skillednon-FBS FDI 3.058c 0.918a 0.309c -0.050 0.030 0.169
(1.737) (0.274) (0.183) (0.098) (0.090) (0.222)X FIN/BUS source sector -3.136 0.358 -1.328c 1.213 8.413b 20.938a
(1.986) (2.282) (0.741) (1.849) (3.687) (6.386)
ICT -0.014a -0.014a -0.014b -0.020c -0.029a -0.015a
(0.005) (0.005) (0.006) (0.010) (0.009) (0.005)Medium skillednon-FBS FDI -3.052c -0.757a -0.315b 0.109 -0.011 -0.322c
(1.663) (0.227) (0.146) (0.080) (0.094) (0.195)X FIN/BUS source sector 2.854 -0.070 0.343 -0.259 -4.191 -19.412a
(1.774) (1.304) (0.748) (2.077) (2.708) (2.888)
ICT 0.008b 0.008b 0.008b 0.008 0.015b 0.008b
(0.004) (0.004) (0.004) (0.011) (0.006) (0.004)Low Skillednon-FBS FDI -0.007 -0.162b 0.007 -0.059 -0.018 0.154
(0.721) (0.080) (0.143) (0.065) (0.058) (0.150)X FIN/BUS source sector 0.282 -0.288 0.984b -0.955b -4.222a -1.526
(0.873) (1.464) (0.386) (0.473) (1.546) (3.672)
ICT 0.007c 0.007b 0.006c 0.012b 0.014a 0.007b
(0.003) (0.003) (0.004) (0.004) (0.004) (0.003)
Non-FBS sectors onlyHigh skillednon-FBS FDI 3.279b 0.914a 0.305 -0.056 0.017 0.189
(1.632) (0.273) (0.207) (0.096) (0.087) (0.214)
ICT -0.037c -0.039c -0.039c -0.037c -0.038 -0.040c
(0.022) (0.022) (0.022) (0.023) (0.023) (0.023)
Medium skillednon-FBS FDI -3.132b -0.736a -0.322c 0.115 -0.009 -0.307
(1.535) (0.226) (0.165) (0.084) (0.091) (0.187)
ICT -0.005 -0.003 -0.004 -0.006 -0.004 -0.002(0.024) (0.024) (0.024) (0.025) (0.025) (0.025)
Low skillednon-FBS FDI -0.147 -0.178b 0.017 -0.058 -0.007 0.118
(0.660) (0.081) (0.157) (0.066) (0.059) (0.144)
ICT 0.042a 0.043a 0.042a 0.043a 0.042a 0.041a
(0.011) (0.011) (0.011) (0.011) (0.011) (0.011)
Notes: ap<0.01 bp<0.05 cp<0.1. Cluster-robust standard errors in parentheses. BS: Businessservices; SS: Support Services; KS: Knowledge Services; IS: Infrastructure Services; MAN :Manufacturing; RET : Retail. FBS: Financial and Business Services. Control variables are in-cluded but not reported.
32
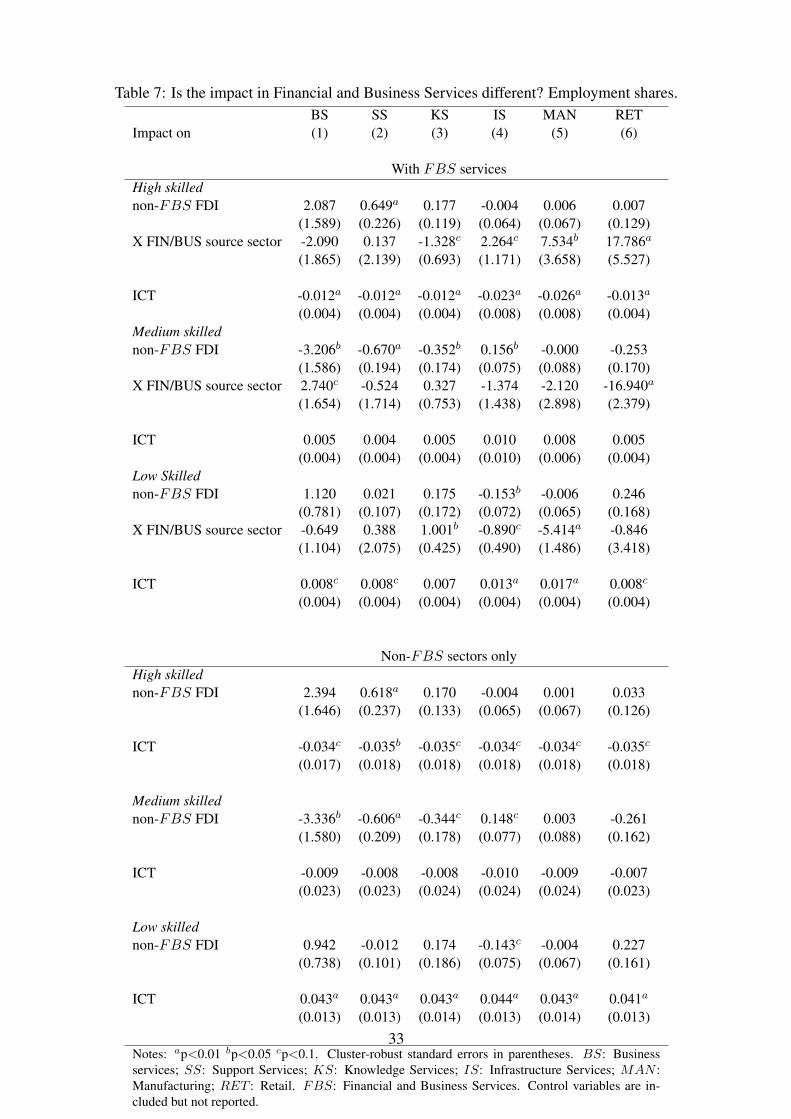
Table 7: Is the impact in Financial and Business Services different? Employment shares.BS SS KS IS MAN RET
Impact on (1) (2) (3) (4) (5) (6)
With FBS servicesHigh skillednon-FBS FDI 2.087 0.649a 0.177 -0.004 0.006 0.007
(1.589) (0.226) (0.119) (0.064) (0.067) (0.129)X FIN/BUS source sector -2.090 0.137 -1.328c 2.264c 7.534b 17.786a
(1.865) (2.139) (0.693) (1.171) (3.658) (5.527)
ICT -0.012a -0.012a -0.012a -0.023a -0.026a -0.013a
(0.004) (0.004) (0.004) (0.008) (0.008) (0.004)Medium skillednon-FBS FDI -3.206b -0.670a -0.352b 0.156b -0.000 -0.253
(1.586) (0.194) (0.174) (0.075) (0.088) (0.170)X FIN/BUS source sector 2.740c -0.524 0.327 -1.374 -2.120 -16.940a
(1.654) (1.714) (0.753) (1.438) (2.898) (2.379)
ICT 0.005 0.004 0.005 0.010 0.008 0.005(0.004) (0.004) (0.004) (0.010) (0.006) (0.004)
Low Skillednon-FBS FDI 1.120 0.021 0.175 -0.153b -0.006 0.246
(0.781) (0.107) (0.172) (0.072) (0.065) (0.168)X FIN/BUS source sector -0.649 0.388 1.001b -0.890c -5.414a -0.846
(1.104) (2.075) (0.425) (0.490) (1.486) (3.418)
ICT 0.008c 0.008c 0.007 0.013a 0.017a 0.008c
(0.004) (0.004) (0.004) (0.004) (0.004) (0.004)
Non-FBS sectors onlyHigh skillednon-FBS FDI 2.394 0.618a 0.170 -0.004 0.001 0.033
(1.646) (0.237) (0.133) (0.065) (0.067) (0.126)
ICT -0.034c -0.035b -0.035c -0.034c -0.034c -0.035c
(0.017) (0.018) (0.018) (0.018) (0.018) (0.018)
Medium skillednon-FBS FDI -3.336b -0.606a -0.344c 0.148c 0.003 -0.261
(1.580) (0.209) (0.178) (0.077) (0.088) (0.162)
ICT -0.009 -0.008 -0.008 -0.010 -0.009 -0.007(0.023) (0.023) (0.024) (0.024) (0.024) (0.023)
Low skillednon-FBS FDI 0.942 -0.012 0.174 -0.143c -0.004 0.227
(0.738) (0.101) (0.186) (0.075) (0.067) (0.161)
ICT 0.043a 0.043a 0.043a 0.044a 0.043a 0.041a
(0.013) (0.013) (0.014) (0.013) (0.014) (0.013)
Notes: ap<0.01 bp<0.05 cp<0.1. Cluster-robust standard errors in parentheses. BS: Businessservices; SS: Support Services; KS: Knowledge Services; IS: Infrastructure Services; MAN :Manufacturing; RET : Retail. FBS: Financial and Business Services. Control variables are in-cluded but not reported.
33
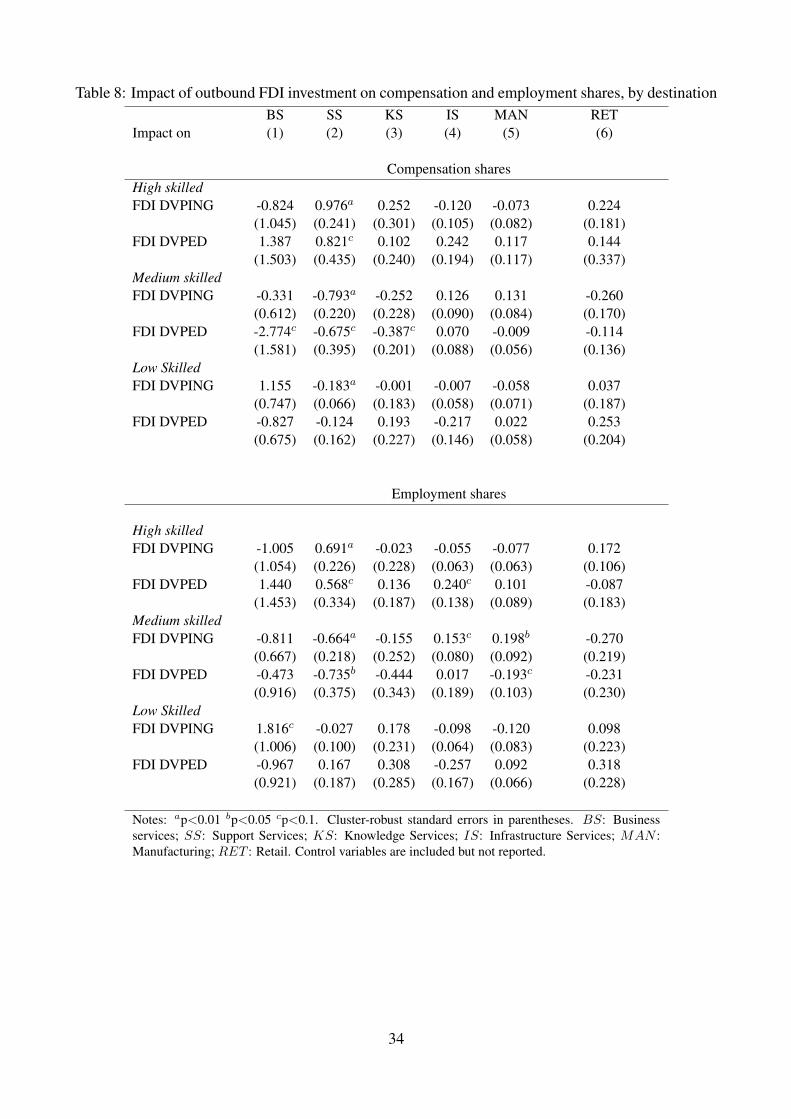
Table 8: Impact of outbound FDI investment on compensation and employment shares, by destinationBS SS KS IS MAN RET
Impact on (1) (2) (3) (4) (5) (6)
Compensation sharesHigh skilledFDI DVPING -0.824 0.976a 0.252 -0.120 -0.073 0.224
(1.045) (0.241) (0.301) (0.105) (0.082) (0.181)FDI DVPED 1.387 0.821c 0.102 0.242 0.117 0.144
(1.503) (0.435) (0.240) (0.194) (0.117) (0.337)Medium skilledFDI DVPING -0.331 -0.793a -0.252 0.126 0.131 -0.260
(0.612) (0.220) (0.228) (0.090) (0.084) (0.170)FDI DVPED -2.774c -0.675c -0.387c 0.070 -0.009 -0.114
(1.581) (0.395) (0.201) (0.088) (0.056) (0.136)Low SkilledFDI DVPING 1.155 -0.183a -0.001 -0.007 -0.058 0.037
(0.747) (0.066) (0.183) (0.058) (0.071) (0.187)FDI DVPED -0.827 -0.124 0.193 -0.217 0.022 0.253
(0.675) (0.162) (0.227) (0.146) (0.058) (0.204)
Employment shares
High skilledFDI DVPING -1.005 0.691a -0.023 -0.055 -0.077 0.172
(1.054) (0.226) (0.228) (0.063) (0.063) (0.106)FDI DVPED 1.440 0.568c 0.136 0.240c 0.101 -0.087
(1.453) (0.334) (0.187) (0.138) (0.089) (0.183)Medium skilledFDI DVPING -0.811 -0.664a -0.155 0.153c 0.198b -0.270
(0.667) (0.218) (0.252) (0.080) (0.092) (0.219)FDI DVPED -0.473 -0.735b -0.444 0.017 -0.193c -0.231
(0.916) (0.375) (0.343) (0.189) (0.103) (0.230)Low SkilledFDI DVPING 1.816c -0.027 0.178 -0.098 -0.120 0.098
(1.006) (0.100) (0.231) (0.064) (0.083) (0.223)FDI DVPED -0.967 0.167 0.308 -0.257 0.092 0.318
(0.921) (0.187) (0.285) (0.167) (0.066) (0.228)
Notes: ap<0.01 bp<0.05 cp<0.1. Cluster-robust standard errors in parentheses. BS: Businessservices; SS: Support Services; KS: Knowledge Services; IS: Infrastructure Services; MAN :Manufacturing; RET : Retail. Control variables are included but not reported.
34

Table 9: Impact of outbound FDI investment on compensation shares, by destination and sector of useBS SS KS IS MAN RET
Impact on (1) (2) (3) (4) (5) (6)
High skillednon-FBS FDI DVPING 9.484 1.021a 0.419 -0.120 -0.082 0.222
(5.982) (0.216) (0.279) (0.105) (0.083) (0.180)X FIN/BUS source sector DVPING -10.496c -1.669 -1.339b 0.904 28.021a 102.911a
(6.044) (1.957) (0.672) (1.959) (10.170) (27.619)
non-FBS FDI DVPED 2.370c 0.729c 0.161 0.214 0.083 0.094(1.344) (0.385) (0.237) (0.187) (0.113) (0.330)
X FIN/BUS source sector DVPED -1.333 6.053 -1.341 1.005 7.115c 19.320a
(2.352) (7.682) (1.872) (1.889) (3.982) (4.356)Medium skillednon-FBS FDI DVPING -9.201c -0.798a -0.314 0.119 0.135 -0.261
(5.348) (0.221) (0.241) (0.089) (0.085) (0.170)X FIN/BUS source sector DVPING 9.035c 0.223 0.483 0.637 -11.994c -68.267a
(5.395) (1.563) (0.616) (2.150) (7.199) (24.755)
non-FBS FDI DVPED -2.327b -0.679c -0.292 0.002 -0.122 -0.349(1.119) (0.353) (0.282) (0.166) (0.110) (0.266)
X FIN/BUS source sector DVPED 2.319 -1.195 0.047 -0.296 -3.609 -18.383a
(1.676) (5.010) (1.973) (2.071) (2.965) (1.739)Low Skillednon-FBS FDI DVPING -0.283 -0.224a -0.105 0.001 -0.053 0.038
1.818 0.054 0.171 0.058 0.070 0.186X FIN/BUS source sector DVPING 1.461 1.447 0.856a -1.541b -16.030a -34.640a
(1.927) (1.073) (0.288) (0.641) (6.012) (8.318)
non-FBS FDI DVPED -0.042 -0.050 0.131 -0.216 0.039 0.255(0.772) (0.132) (0.227) (0.154) (0.058) (0.203)
X FIN/BUS source sector DVPED -0.986 -4.858 1.294 -0.709 -3.506c -0.937(1.152) (4.351) (1.136) (0.507) (1.444) (2.834)
Non-FBS sectors only
High skillednon-FBS FDI DVPING 10.768 1.007a 0.356 -0.130 -0.071 0.274
(7.010) (0.215) (0.316) (0.102) (0.081) (0.170)non-FBS FDI DVPED 2.408c 0.722c 0.217 0.243 0.041 0.079
(1.234) (0.370) (0.259) (0.174) (0.119) (0.318)Medium skillednon-FBS FDI DVPING -9.121 -0.793a -0.335 0.118 0.114 -0.293c
(6.375) (0.206) (0.246) (0.093) (0.083) (0.175)non-FBS FDI DVPED -2.432b -0.625b -0.286 0.015 -0.096 -0.291
(0.996) (0.319) (0.285) (0.159) (0.110) (0.258)Low Skillednon-FBS FDI DVPING -1.647 -0.214a -0.022 0.012 -0.042 0.020
(1.849) (0.060) (0.174) (0.055) (0.070) (0.186)non-FBS FDI DVPED 0.025 -0.097 0.069 -0.258 0.055 0.212
(0.771) (0.129) (0.237) (0.161) (0.061) (0.195)
Notes: ap<0.01 bp<0.05 cp<0.1. Cluster-robust standard errors in parentheses. BS: Businessservices; SS: Support Services; KS: Knowledge Services; IS: Infrastructure Services; MAN :Manufacturing; RET : Retail. FBS: Financial and Business Services. Control variables are in-cluded but not reported.
35

Table 10: Impact of outbound FDI investment on employment shares, by destination and sector of useBS SS KS IS MAN RET
Impact on (1) (2) (3) (4) (5) (6)
With FBS servicesHigh skillednon-FBS FDI DVPING 9.796c 0.735a 0.121 -0.046 -0.086 0.171
(5.368) (0.198) (0.205) (0.061) (0.064) (0.106)X FIN/BUS source sector DVPING -10.995b -1.545 -1.174b 1.084 18.820 96.239a
(5.441) (1.885) (0.517) (1.595) (12.919) (24.201)
non-FBS FDI DVPED 1.258 0.495c 0.208 0.151 0.071 -0.129(1.034) (0.292) (0.180) (0.114) (0.085) (0.177)
X FIN/BUS source sector DVPED 0.145 4.918 -1.560 2.383b 6.758c 16.280a
(2.144) (7.125) (1.804) (1.027) (3.869) (3.571)Medium skillednon-FBS FDI DVPING -8.042 -0.618b -0.208 0.137c 0.200b -0.270
(5.371) (0.245) (0.270) (0.079) (0.092) (0.219)X FIN/BUS source sector DVPING 7.368 -1.254 0.403 0.326 2.384 -63.320a
(5.426) (2.253) (0.790) (1.774) (9.445) (23.189)
non-FBS FDI DVPED -2.605b -0.746b -0.440 0.103 -0.185c -0.190(1.138) (0.372) (0.354) (0.177) (0.102) (0.230)
X FIN/BUS source sector DVPED 2.768c 1.085 0.001 -1.673 -2.267 -16.035a
(1.618) (4.678) (1.804) (1.364) (2.968) (1.319)Low Skillednon-FBS FDI DVPING -1.754 -0.117 0.0862 -0.0912 -0.114 0.0996
(2.057) (0.084) (0.223) (0.064) (0.082) (0.222)X FIN/BUS source sector DVPING 3.627 2.799 0.771 -1.410b -21.200a -32.920a
(2.286) (2.097) (0.568) (0.586) (6.186) (6.434)
non-FBS FDI DVPED 1.347 0.251 0.232 -0.254 0.114c 0.319(0.881) (0.170) (0.288) (0.176) (0.066) (0.227)
X FIN/BUS source sector DVPED -2.914b -6.003 1.558 -0.710 -4.490a -0.244(1.382) (5.491) (1.044) (0.562) (1.201) (2.644)
Non-FBS sectors only
High skillednon-FBS FDI DVPING 12.028b 0.711a 0.051 -0.053 -0.073 0.174c
(5.987) (0.207) (0.232) (0.061) (0.063) (0.106)non-FBS FDI DVPED 1.271 0.434 0.261 0.186c 0.043 -0.075
(0.964) (0.283) (0.202) (0.109) (0.090) (0.178)Medium skillednon-FBS FDI DVPING -9.446 -0.608a -0.219 0.133 0.173c -0.262
(6.085) (0.233) (0.261) (0.083) (0.089) (0.214)non-FBS FDI DVPED -2.611b -0.584c -0.407 0.085 -0.151 -0.236
(1.019) (0.343) (0.334) (0.168) (0.099) (0.216)Low Skillednon-FBS FDI DVPING -2.582 -0.102 0.168 -0.080 -0.100 0.088
(2.132) (0.074) (0.203) (0.065) (0.083) (0.221)non-FBS FDI DVPED 1.340 0.150 0.145 -0.270 0.109 0.311
(0.838) (0.164) (0.291) (0.183) (0.067) (0.213)
Notes: ap<0.01 bp<0.05 cp<0.1. Cluster-robust standard errors in parentheses. BS: Businessservices; SS: Support Services; KS: Knowledge Services; IS: Infrastructure Services; MAN :Manufacturing; RET : Retail. FBS: Financial and Business Services. Control variables are in-cluded but not reported.
36

Table 11: Impact of FDI in the manufacturing sector, by destinationBS SS KS IS MAN RET
Impact on (1) (2) (3) (4) (5) (6)
Compensation sharesHigh skillednon-FBS FDI DVPING 3.149 0.967a 0.364 -0.156 -0.098 0.287
(7.008) (0.219) (0.292) (0.128) (0.093) (0.181)non-FBS FDI DVPED 2.726b 0.643c 0.224 0.390b -0.004 -0.290
(1.207) (0.340) (0.264) (0.175) (0.120) (0.322)Medium skillednon-FBS FDI DVPING -1.226 -0.829a -0.371 0.111 0.083 -0.304c
(6.229) (0.186) (0.229) (0.105) (0.083) (0.174)non-FBS FDI DVPED -2.608b -0.578c -0.124 -0.212 -0.077 0.053
(1.093) (0.311) (0.262) (0.157) (0.106) (0.239)Low Skillednon-FBS FDI DVPING -1.922 -0.138b 0.007 0.045 0.014 0.018
(2.784) (0.064) (0.130) (0.042) (0.053) (0.129)non-FBS FDI DVPED -0.117 -0.065 -0.100 -0.178 0.081 0.238
(0.539) (0.134) (0.217) (0.134) (0.057) (0.147)
Employment shares
High skillednon-FBS FDI DVPING 5.570 0.689a 0.040 -0.064 -0.088 0.155
(5.696) (0.209) (0.221) (0.072) (0.073) (0.119)non-FBS FDI DVPED 1.416 0.392 0.256 0.303b 0.008 -0.280
(1.051) (0.246) (0.215) (0.134) (0.093) (0.194)Medium skillednon-FBS FDI DVPING -1.664 -0.650a -0.239 0.103 0.108 -0.226
(5.042) (0.210) (0.238) (0.083) (0.082) (0.165)non-FBS FDI DVPED -2.516b -0.519 -0.216 -0.131 -0.138 -0.076
(1.035) (0.321) (0.290) (0.158) (0.100) (0.200)Low Skillednon-FBS FDI DVPING -3.905 -0.040 0.198 -0.039 -0.020 0.071
(3.216) (0.063) (0.150) (0.042) (0.062) (0.165)non-FBS FDI DVPED 1.100c 0.127 -0.0400 -0.172 0.130b 0.356b
(0.585) (0.195) (0.262) (0.163) (0.065) (0.140)
Notes: ap<0.01 bp<0.05 cp<0.1. Cluster-robust standard errors in parentheses. BS: Businessservices; SS: Support Services; KS: Knowledge Services; IS: Infrastructure Services; MAN :Manufacturing; RET : Retail. FBS: Financial and Business Services. Control variables are in-cluded but not reported.
37
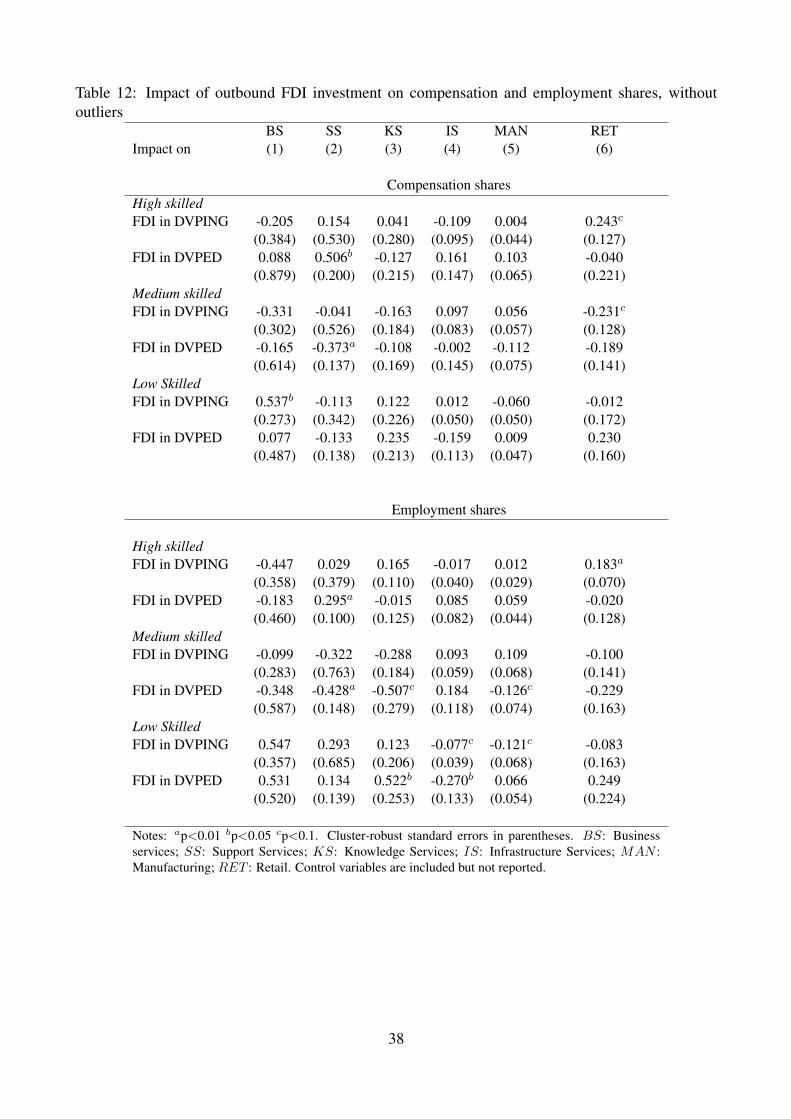
Table 12: Impact of outbound FDI investment on compensation and employment shares, withoutoutliers
BS SS KS IS MAN RETImpact on (1) (2) (3) (4) (5) (6)
Compensation sharesHigh skilledFDI in DVPING -0.205 0.154 0.041 -0.109 0.004 0.243c
(0.384) (0.530) (0.280) (0.095) (0.044) (0.127)FDI in DVPED 0.088 0.506b -0.127 0.161 0.103 -0.040
(0.879) (0.200) (0.215) (0.147) (0.065) (0.221)Medium skilledFDI in DVPING -0.331 -0.041 -0.163 0.097 0.056 -0.231c
(0.302) (0.526) (0.184) (0.083) (0.057) (0.128)FDI in DVPED -0.165 -0.373a -0.108 -0.002 -0.112 -0.189
(0.614) (0.137) (0.169) (0.145) (0.075) (0.141)Low SkilledFDI in DVPING 0.537b -0.113 0.122 0.012 -0.060 -0.012
(0.273) (0.342) (0.226) (0.050) (0.050) (0.172)FDI in DVPED 0.077 -0.133 0.235 -0.159 0.009 0.230
(0.487) (0.138) (0.213) (0.113) (0.047) (0.160)
Employment shares
High skilledFDI in DVPING -0.447 0.029 0.165 -0.017 0.012 0.183a
(0.358) (0.379) (0.110) (0.040) (0.029) (0.070)FDI in DVPED -0.183 0.295a -0.015 0.085 0.059 -0.020
(0.460) (0.100) (0.125) (0.082) (0.044) (0.128)Medium skilledFDI in DVPING -0.099 -0.322 -0.288 0.093 0.109 -0.100
(0.283) (0.763) (0.184) (0.059) (0.068) (0.141)FDI in DVPED -0.348 -0.428a -0.507c 0.184 -0.126c -0.229
(0.587) (0.148) (0.279) (0.118) (0.074) (0.163)Low SkilledFDI in DVPING 0.547 0.293 0.123 -0.077c -0.121c -0.083
(0.357) (0.685) (0.206) (0.039) (0.068) (0.163)FDI in DVPED 0.531 0.134 0.522b -0.270b 0.066 0.249
(0.520) (0.139) (0.253) (0.133) (0.054) (0.224)
Notes: ap<0.01 bp<0.05 cp<0.1. Cluster-robust standard errors in parentheses. BS: Businessservices; SS: Support Services; KS: Knowledge Services; IS: Infrastructure Services; MAN :Manufacturing; RET : Retail. Control variables are included but not reported.
38

Table 13: Impact of aggregate outbound FDI on compensation and employment shares
WHS EHS WMS EMS WLS ELS(1) (2) (3) (4) (5) (6)
All countries0.069 0.047 -0.074 -0.045 0.005 -0.001(0.075) (0.055) (0.072) (0.064) (0.048) (0.055)
Developing countries-0.039 -0.035 0.009 0.017 0.030 0.018(0.081) (0.064) (0.077) (0.075) (0.029) (0.037)
Developed countries-0.044 -0.008 0.006 -0.043 0.038 0.051(0.092) (0.067) (0.084) (0.071) (0.048) (0.359)
Notes: ap<0.01 bp<0.05 cp<0.1. Cluster-robust standard errors in parentheses. ‘W’: Compensa-tion share; ‘E’: Employment share of ‘HS’: High-Skilled, ‘MS’ Medium-skilled; ‘LS’ Low-Skilledworkers.
39

Tabl
e14
:Qua
ntifi
catio
nof
the
impa
ctof
outb
ound
FDIi
nSS
onco
mpe
nsat
ion
and
empl
oym
ents
hare
s
WH
SW
HS
EH
SE
HS
WM
SW
MS
EM
SE
MS
WL
SW
LS
EL
SE
LS
Abs
.Sh
are
(%)
Abs
.Sh
are
(%)
Abs
.Sh
are
(%)
Abs
.Sh
are
(%)
Abs
.Sh
are
(%)
Abs
.Sh
are
(%)
(1)
(2)
(3)
(4)
(5)
(6)
(7)
(8)
(9)
(10)
(11)
(12)
All
sam
ple
Con
trib
utio
n0.
057a
9.21
8a0.
040b
7.58
7b-0
.047
a37
.460
-0.0
44a
-271
.500
-0.0
10c
1.97
8c0.
004
-0.8
91to
aver
age
chan
ge(0
.019
)(3
.482
)(0
.016
)(3
.057
)(0
.017
)(3
3.40
0)(0
.016
)(1
097)
(0.0
06)
(1.1
95)
(0.0
07)
(1.4
27)
With
outo
utlie
rs
Con
trib
utio
n0.
017b
2.65
7b0.
010a
2.39
3a-0
.012
b11
.880
-0.0
14-1
1.13
0-0
.004
0.83
60.
004
-0.8
51to
aver
age
chan
ge(0
.007
)(1
.143
)(0
.003
)(0
.888
)(0
.005
)(1
2.67
0)(0
.006
)(7
.918
)(0
.004
)(0
.842
)(0
.005
)(0
.950
)
Not
es:ap<
0.01
bp<
0.05
cp<
0.1.
Clu
ster
-rob
usts
tand
ard
erro
rsin
pare
nthe
ses.
‘W’:
Com
pens
atio
nsh
are;
‘E’:
Em
ploy
men
tsha
reof
‘HS’
:H
igh-
Skill
ed,‘
MS’
Med
ium
-ski
lled;
‘LS’
Low
-Ski
lled
wor
kers
.
40

Institute for International Integration StudiesThe Sutherland Centre, Trinity College Dublin, Dublin 2, Ireland