Greenfield Investments and Acquisitions of Turkish ...
35
1 Greenfield Investments and Acquisitions of Turkish Multinationals: Trends, Motivations and Strategies Caner Bakir a and Nuran Acur b 1 a Koc University, Turkey b University of Strathclyde, UK & Ozyegin University, Turkey 1. Introduction Recently, Foreign Direct Investment (FDI) in Europe from emerging markets reached a record high in 2013 (Ernst and Young 2014: 6). Indeed, Emerging Market Multinationals (EMNCs) have started to play an increasingly important role in the economic globalisation processes (UNCTAD 2006). Unsurprisingly, explaining the rather sudden rise of EMNC investments in developed markets has become a major concern among policy makers and scholars over the last few years (Ramamurti and Singh 2009; Ramaurti 2009a,b; Cuervo- Cazurra and Ramamaurti 2014; Brennan 2011; Goldstein 2007; Khanna and Palepu 2006). Internationalisation of Turkish Multinational Corporations (TMNCs) is part of this economic globalisation process. According to UNCTAD (2015: 52), TMNC outward investments reached 6.7 billion US dollars in 2014, or increased by 89% compared to the previous year. In 10 years, from 2004 to 2013, TMNC greenfield investments increased over threefold from 2.2 billion US dollars to 6.9 billion US dollars (fDi intelligence database). During the same period, the top 62 TMNC acquisitions, whose value exceeded 10 million US dollars, increased over 17 times from 108 million US dollars to 1.8 billion US dollars (Thomson Reuters Mergers and Acquisitions database and Deloitte Turkish Outbound 1 Bakir gratefully acknowledges the support of The Scientific & Technological Research Council of Turkey (TÜBİTAK, 110K346 and Postdoctoral Fellowship for Research Abroad, TÜBİTAK 2219). This paper is also related to COST Action IS0905 The Emergence of Southern Multinationals and their Impact on Europe. Authors also thank Pinar Donmez, Mustafa Yagci, and Mina Kozluca for their assistance. This is an accepted Author Manuscript of the following book chapter: Bakir, C., & Acur, N. (2016). Greenfield investments and acquisitions of Turkish multinationals: trends, motivations and strategies. In L. Brennan, & C. Bakir (Eds.), Emerging Market Multinationals in Europe. (pp. 129-156). London: Routledge.
-
Upload
khangminh22 -
Category
Documents
-
view
4 -
download
0
Transcript of Greenfield Investments and Acquisitions of Turkish ...
1
Greenfield Investments and Acquisitions of Turkish
Multinationals: Trends, Motivations and Strategies
Caner Bakira and Nuran Acurb 1
aKoc University, Turkey
bUniversity of Strathclyde, UK & Ozyegin University, Turkey
1. Introduction
Recently, Foreign Direct Investment (FDI) in Europe from emerging markets reached a
record high in 2013 (Ernst and Young 2014: 6). Indeed, Emerging Market Multinationals
(EMNCs) have started to play an increasingly important role in the economic globalisation
processes (UNCTAD 2006). Unsurprisingly, explaining the rather sudden rise of EMNC
investments in developed markets has become a major concern among policy makers and
scholars over the last few years (Ramamurti and Singh 2009; Ramaurti 2009a,b; Cuervo-
Cazurra and Ramamaurti 2014; Brennan 2011; Goldstein 2007; Khanna and Palepu 2006).
Internationalisation of Turkish Multinational Corporations (TMNCs) is part of this
economic globalisation process. According to UNCTAD (2015: 52), TMNC outward
investments reached 6.7 billion US dollars in 2014, or increased by 89% compared to the
previous year. In 10 years, from 2004 to 2013, TMNC greenfield investments increased over
threefold from 2.2 billion US dollars to 6.9 billion US dollars (fDi intelligence database).
During the same period, the top 62 TMNC acquisitions, whose value exceeded 10
million US dollars, increased over 17 times from 108 million US dollars to 1.8 billion US
dollars (Thomson Reuters Mergers and Acquisitions database and Deloitte Turkish Outbound
1 Bakir gratefully acknowledges the support of The Scientific & Technological Research Council of Turkey
(TÜBİTAK, 110K346 and Postdoctoral Fellowship for Research Abroad, TÜBİTAK 2219). This paper is also
related to COST Action IS0905 The Emergence of Southern Multinationals and their Impact on Europe. Authors
also thank Pinar Donmez, Mustafa Yagci, and Mina Kozluca for their assistance.
This is an accepted Author Manuscript of the following book chapter: Bakir, C., & Acur, N. (2016). Greenfield
investments and acquisitions of Turkish multinationals: trends, motivations and strategies. In L. Brennan, & C. Bakir (Eds.),
Emerging Market Multinationals in Europe. (pp. 129-156). London: Routledge.
2
M&A Review 2012-2013). More significantly, over 95% of these investments are new
investments rather than an expansion of existing investments. Thus, it is legitimate to
investigate this new spectacular increase in TMNC investment activities. Further, several
Turkish firms have internationalised in aggressive and innovative ways, whilst competing with
established players. Some of the non-financial TMNCs are now among the world’s global
players in several industries, ranging from food (Yildiz Holding) to ferrocrome (Yildirim
Group), to tiles (Eczacibasi Yapi).
One area that has not received much attention in the past literature on EMNCs, however,
is the recent geographical and sectoral spread, motivations, and competitive advantages of
TMNCs; whether these investments represent theoretical and empirical challenges to existing
knowledge, or whether they can be explained within the existing theoretical frameworks that
have been used to explain developed country MNCs (see Bakir 2016).
This chapter offers answers to questions such as: Where do TMNCs go? What are their
Firm Specific Advantages (FSAs) and Country Specific Advantages (CSAs)? Why do they
internationalise? Are widely used frameworks in international business (IB) theory relevant to
explain TMNC behaviour? Are some of the largest TMNC acquisitions in EU motivated by
the global consolidator strategy? How do structural complementarities inform the outcome
of TMNC acquisitions?
This chapter finds that the largest TMNCs employ multiple strategies in developed and
developing country markets. 75% of TMNC greenfield FDI (or about 35 billion US dollars) is
directed towards transition and developing economies. TMNCs mainly exploit FSAs (dynamic
capabilities) obtained at home, such as managerial and market knowledge, expertise,
technology, local/regional brands and distribution channels, and expertise in operating in
relatively weak institutional environments in these economies. They also exploit traditional
locational advantages, or CSAs, such as economies of scale and leadership in home market,
3
geographical, cultural and institutional proximity. In contrast to greenfield investments, 50% of
their acquisitions (or 4.9 billion US dollars) are in developed countries, where they not only
exploit current FSAs obtained from home CSAs, but also aim to explore FSAs obtained from
host CSAs through their subsidiaries. In regards to motivations, TMNCs’ greenfield
investments are mainly motivated by market-seeking FDI, including access to host country
markets and neighbouring regions, efficiency-seeking FDI such as cost and tax advantages, and
resource-seeking FDI such as access to natural resources.
TMNCs’ acquisitions are mostly motivated by strategic asset-seeking FDI such as
access to global brands, international experience, knowledge, distribution networks, and
cutting-edge competitive technology. In doing so, they aim to increase their market share and
profitability at home and abroad. This chapter also highlights the global consolidator strategy
of some TMNCs and the significance of structural complementarities arising from the structural
context informing TMNC investment behaviour.
Data for this chapter come from the Financial Times Ltd fDi Intelligence (2003-2013)
and Thomson Reuters Mergers and Acquisitions Database (from 1 January 2000 to 30 January
2011) and Deloitte Turkish Outbound M&A Review 2012-2013. It also benefits from secondary
written sources. Acquisitions data focuses on transactions over 10 million US dollars by
TMNCs where at least 51% of ownership belongs to a Turkish owner.
The rest of this chapter is organised as follows. Section two offers a literature review.
Section three focuses on greenfield investment trends by TMNCs with special reference to
economic development of host countries, regional, country-based, and sectoral distribution of
the value of these investments. Section four does the same for outbound acquisitions. Section
five discusses the internationalisation strategies and motivations of some of the largest TMNCs,
and the role of structural complementarities in informing TMNC internationalisation strategy.
The conclusion summarizes the main findings.
4
2. Literature Review
Research and practice regarding the internationalisation of firms have been dominated
by the Eclectic paradigm (Dunning 1988), and FSAs and CSAs frameworks (Rugman and
Verbeke 1990). The Eclectic paradigm is based on Ownership, Location, and Internalisation
advantages (OLI framework). Ownership advantages such as technology, knowhow, and brand,
indicate who is going to produce abroad “and for that matter, other forms of international
activity” (Dunning, 1993: 142). These advantages are also labelled as FSAs. Locational factors
refers to home country resource endowments, such as natural resources, labour, market size,
and institutions that “influenc[e] where to produce” (Dunning, 1993: 143). These advantages
are also known as CSAs that “can be based on natural resource endowments (minerals, energy,
forests), market, labour force, and/or associated cultural factors” (Rugman 2009: 50).
Internalisation advantage “addresses the question of why firms engage in FDI rather than
license foreign firms to use their proprietary assets” (Dunning, 1993: 145). Here, ownership
advantages are exploited internally where such advantages are not sold to third parties through
contracts such as licensing and the establishment of joint ventures (i.e., MNCs do not sell their
FSAs to their rivals). OLI advantages are regarded as the necessary and sufficient conditions
for the internationalisation of MNCs (Hennart 2012: 169). It is widely held that developed
country multinationals mostly rely on the exploitation of their FSAs, such as technology,
knowhow, and brand, whilst developing country MNCs do not have strong FSAs, and they rely
heavily on CSAs, such as cheap labour, natural resources, and access to state funds (Rugman
2009). It is widely recognised that MNCs from developing countries have home CSAs, such as
cheap and skilled labour, scale advantages arising from strong demand in growing domestic
markets (Luo and Tung 2007), and they enjoy monopolistic power in home markets (Klein and
Wocke 2007). Several studies argued that EMNCs internationalise to gain FSAs in host
5
countries, rather than exploiting their existing FSAs obtained in home countries (Mathews
2002; Luo and Tung 2007; Ramamurti and Sigh 2009; Williamson et.al. 2013).
Recently, it has been argued that EMNCs have several FSAs obtained in home markets,
which are different than standard FSAs or ownership advantages of developed country MNCs.
As Ramamurti (2012: 42) rightly notes:
Among the ownership advantages attributed in the literature to EMNEs is their deep understanding of
customer needs in emerging markets, the ability to function in difficult business environments, their
ability to make products and services at ultra-low costs, their ability to develop “good enough” products
with the right feature-price mix for local customers, and so on.
Some of the EMNCs are “global consolidators,” who are the leaders in their home
markets and consolidate the industry globally by acquiring firms in developed countries
(Ramamurti and Sigh 2009). For example, in his analysis of Indian MNCs, Ramamurti (2013:
251) identifies “the global consolidator strategy [that] typically arises in industries that have
matured in developed countries but are booming in emerging markets – industries like
cement, steel, chemicals, white goods, automobiles, beverages and processed foods”. These
firms use the mix of FSA exploitation and FSA exploration for efficiency. Further, Ramamurti
and Sigh (2009: 141-142) note that
The distinguishing feature of the global consolidator …is that its competitive advantages can be leveraged
in both emerging economies and advanced countries, resulting in the potential for up-market exports and
FDI…[this is because] industry-specific factors – specifically, in the degree to which products and
production processes [that] can be standardized across countries, regardless of per-capita income, wages,
or cultural differences.
Has there been any TMNC that adopted the global consolidator strategy? This chapter also
aims to address this question with special reference to Yildiz Holding, the largest food
manufacturer and marketer in Turkey, which acquired top global brands such as the Belgium
chocolate maker, Godiva Chocolatier in 2007, and the top manufacturer and marketer of
biscuits in the UK, United Biscuits in 2014.
Past research has also shown that MNCs have four main motivations in
internationalisation (Dunning 1993; Narula and Dunning 2010). These are: 1) natural resource-
6
seeking to access host country resources; 2) market-seeking to access host country markets and
regions, to overcome trade-related and other restrictions, as well as to become closer to
customers; 3) efficiency-seeking to decrease costs and reconfigure supply chains; and 4)
strategic asset-seeking to acquire intangible assets such as knowhow and brand. The first three
motivations relate to the exploitation of FSAs obtained from home country CSAs, whilst the
last one relates to the exploration of FSAs obtained from host country CSAs.
More recently, for Rugman and Nguyen (2014: 56-57), “[n]ew internationalization
theory maintains that FSAs can be developed by both parent firms in the home countries and
foreign subsidiaries in the host countries. …What is missing from all the extant literature on
EMNCs is the interaction between foreign subsidiaries of EMNCs and the host CSAs.”
Accordingly this chapter considers FSAs obtained from both home and host CSAs.
More significantly, this chapter highlights some of the weaknesses in the IB theory,
namely the significance of the largely ignored structural context that informs investment
decisions and entry strategies of MNCs. It shows that structural complementarities (i.e.,
interdependence of structural influences on MNC behaviour) reinforce FSAs and/or CSAs
generating similar incentives that influence the internationalisation outcomes of MNCs (for a
detailed discussion on the structural complementarities in the context of bank behaviour, see
Bakir 2013; for the role of institutional complementarities on actor behaviour, see Campbell
2011 and Crouch 2010). In this context, the sociology and political economy literature may
offer new analytical insights highlighting the utility of introducing structural variables. In doing
so, we can further understand the timing and context of internationalisation of MNCs.
Following Sewell (1992:19) structures “are sets of mutually sustaining schemas and resources
that empower and constrain social action and that tend to be reproduced by that social action”.
Here, structures refer to broader material and ideational contexts within which institutions (i.e.,
formal and informal rules and norms that guide the behaviour of agents) and agents (e.g.,
7
individuals and organisations) are embedded. Structures, like institutions, inform the
internationalisation of MNCs. The examples include crises, wars, technical and technological
innovations, macroeconomic structures, market structures, currency structures, ideational
structures etc., that guide the behaviour of corporations
This nuanced view is important because it moves beyond conventional FSA and CSA
based analysis of firms’ internationalisation activities. For example, although MNCs’
internationalisation activity is informed by FSAs and CSAs, the realisation of investment may
require the existence of structural complementarities that reinforce a firm’s motivations and
strategies (If one wishes to race ahead, I summarise this point in section five below). These
complementarities may create structural-level enabling conditions for outward investment.
There are four main contributions of this chapter to these discussions on EMNCs. First,
there is an empirical gap in the past EMNC literature which ignored internationalisation of
TMNCs. This literature mostly focuses on MNCs from Brazil, Russia, India and China (here
after BRIC) (see for example, Ramamurti and Singh 2009; Guillén and García-Canal 2012;
Cuervo-Cazurra ve Ramamaurti 2014; Demirbağ and Yaprak, 2015). Second, it shows that
TMNCs have ownership advantages or FSAs which are different than developed country
MNCs. This finding is largely ignored in the previous research on TMNCs and some of the IB
perspectives on EMNCs which have focused on CSAs. Third, it also argues that “modern
international business theory [that has been developed to analyse Western MNCs], with its
distinctions between FSAs generated by home or host country recombinations” (Rugman and
Nguyen 2014: 76), is highly relevant in explaining some of the TMNC investments. In addition
to exploiting standard FSAs obtained from Turkey’s CSAs, such as economies of scale, and
low labour cost, TMNCs also explore ownership advantages and strategic assets (also known
as dynamic capabilities or FSAs) obtained from foreign MNCs and markets. Finally, it offers
8
examples of influence of largely ignored structural complementarities in informing the
outcomes of EMNCs’ internationalisation strategy.
This chapter also makes three main contributions to the previous literature on TMNCs
and outward Turkish FDI (see, for example, Akçaoğlu 2005; Erdilek 2003, 2007; Kaya and
Erden 2008; Kaya 2009). First, although TMNC internationalisation activities have exploded
over the last 10 years, our knowledge of outward TMNC investments is limited. Earlier studies
have mainly focused on the 1990s when EMNCs were relatively opaque in the global business
environment and the literature on EMNCs was underdeveloped. Second, the current study pays
special attention to the TMNC investments in advanced developed regions and countries, in
particular the European Union (EU), with special reference to some of the cutting edge
discussions in the newly emerging EMNC literature. Third, one of the unique contributions of
this chapter to the literature on TMNCs is its reliance on the analysis of private databases. The
previous studies have used publicly available aggregated data supplied by the Central Bank of
the Republic of Turkey, United Nations Conference on Trade and Development (UNCTAD) or
newspapers (bkz. Akçaoğlu 2005; Kayam and Hisarcıklılar 2009). The current chapter instead
uses private databases and firm-specific data which focus on the last decade rather than the
1990s. Thus this chapter offers discussions about individual TMNC advantages and motivations
in their recent integration with the economic globalisation process.
3. Greenfield Investments by Turkish MNCs
Table 9.1: Greenfield investments of non-financial TMNCs (2003-2013)
9
Year Number of
Investments
Number of
Investor
Companies
Total
Investment
Value (million
US dollars)
Average Value
of Capital
Investment by
Companies
(million US
dollars)
Total
Employment
Created
Average
Employment
Created by
Companies
2003 109 58 7,750 133.6 30,574 527
2004 66 48 2,374 49.5 10,450 218
2005 67 41 4,074 99.4 25,836 630
2006 51 37 1,941 52.5 14,520 392
2007 37 33 2,399 72.7 15,346 465
2008 64 52 4,464 85.8 16,649 320
2009 63 59 4,068 68.9 20,811 353
2010 100 67 3,852 57.5 21,689 324
2011 66 50 4,911 98.2 6,699 134
2012 86 59 4,155 70.4 12,797 217
2013 83 65 6,864 105.6 20,643 318
Total 792 438 46,852 81.28 196,014 354
Source: fDi Intelligence from the Financial Times Ltd. Author’s calculations.
Note:* Includes real sector firms and financial firms.
** Share of foreign MNCs operating in Turkey in total is negligible.
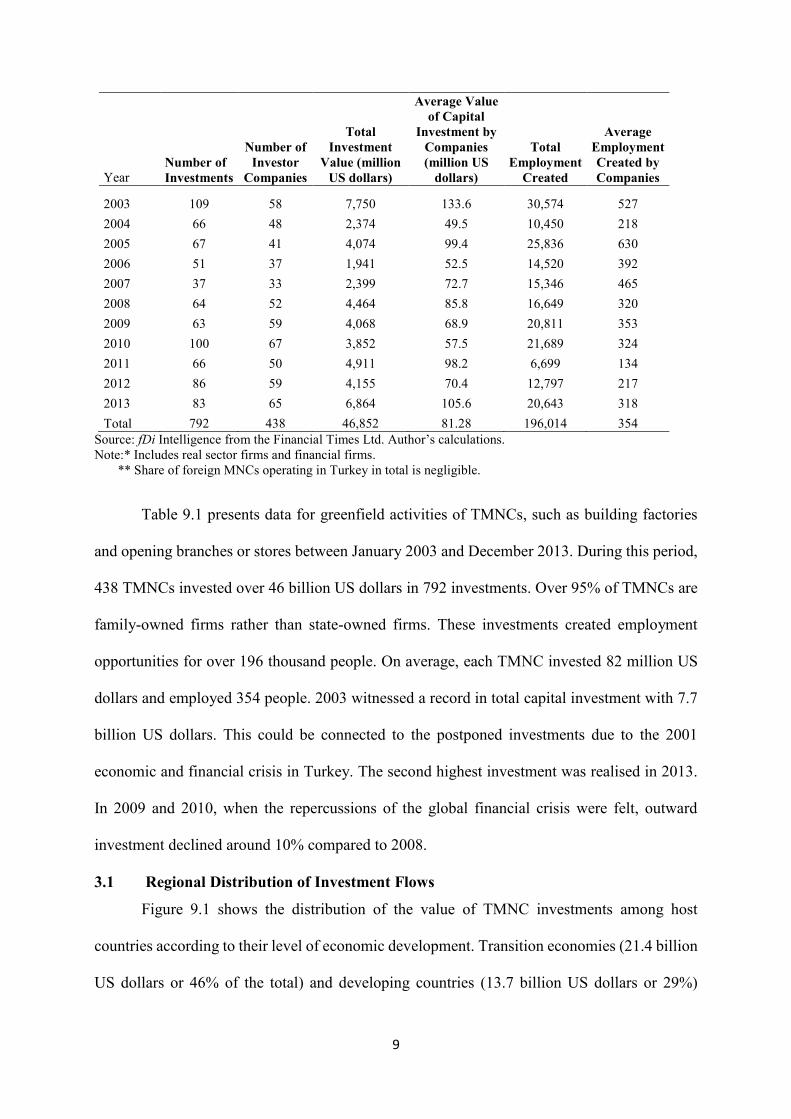
Table 9.1 presents data for greenfield activities of TMNCs, such as building factories
and opening branches or stores between January 2003 and December 2013. During this period,
438 TMNCs invested over 46 billion US dollars in 792 investments. Over 95% of TMNCs are
family-owned firms rather than state-owned firms. These investments created employment
opportunities for over 196 thousand people. On average, each TMNC invested 82 million US
dollars and employed 354 people. 2003 witnessed a record in total capital investment with 7.7
billion US dollars. This could be connected to the postponed investments due to the 2001
economic and financial crisis in Turkey. The second highest investment was realised in 2013.
In 2009 and 2010, when the repercussions of the global financial crisis were felt, outward
investment declined around 10% compared to 2008.
3.1 Regional Distribution of Investment Flows
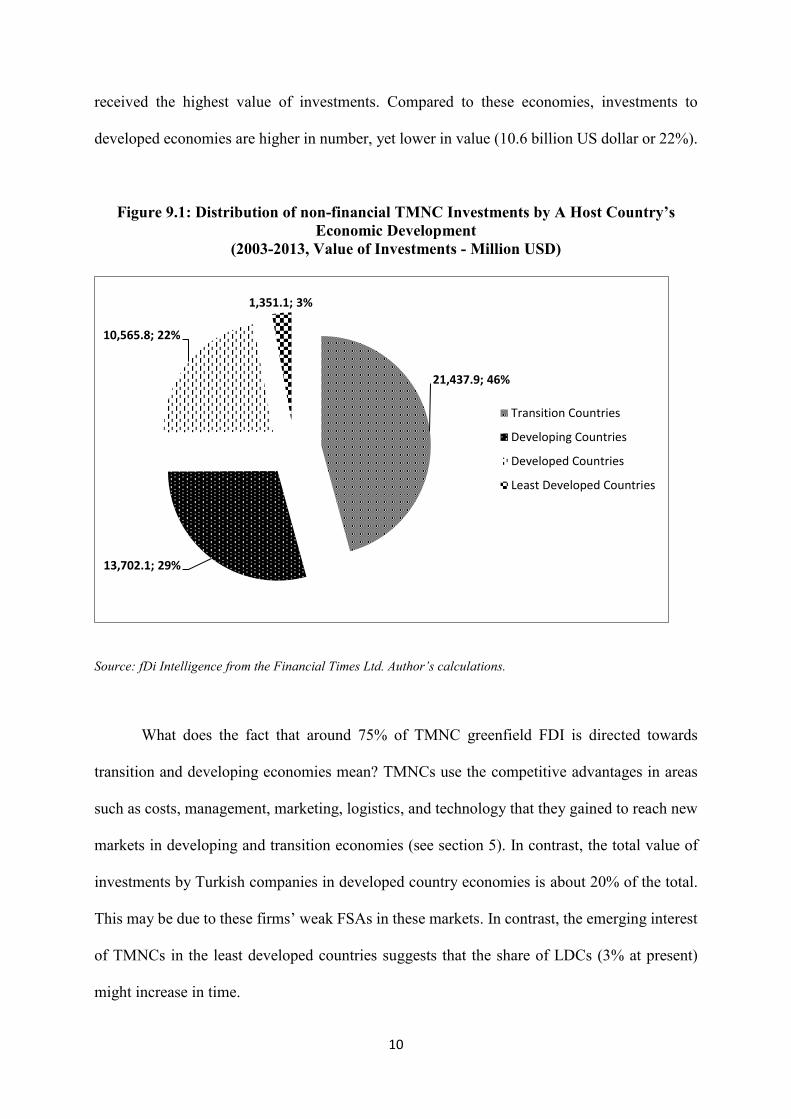
Figure 9.1 shows the distribution of the value of TMNC investments among host
countries according to their level of economic development. Transition economies (21.4 billion
US dollars or 46% of the total) and developing countries (13.7 billion US dollars or 29%)
10
received the highest value of investments. Compared to these economies, investments to
developed economies are higher in number, yet lower in value (10.6 billion US dollar or 22%).
Figure 9.1: Distribution of non-financial TMNC Investments by A Host Country’s
Economic Development
(2003-2013, Value of Investments - Million USD)
Source: fDi Intelligence from the Financial Times Ltd. Author’s calculations.
What does the fact that around 75% of TMNC greenfield FDI is directed towards
transition and developing economies mean? TMNCs use the competitive advantages in areas
such as costs, management, marketing, logistics, and technology that they gained to reach new
markets in developing and transition economies (see section 5). In contrast, the total value of
investments by Turkish companies in developed country economies is about 20% of the total.
This may be due to these firms’ weak FSAs in these markets. In contrast, the emerging interest
of TMNCs in the least developed countries suggests that the share of LDCs (3% at present)
might increase in time.
21,437.9; 46%
13,702.1; 29%
10,565.8; 22%
1,351.1; 3%
Transition Countries
Developing Countries
Developed Countries
Least Developed Countries
11
3.2 Geographical Distribution of Greenfield FDI
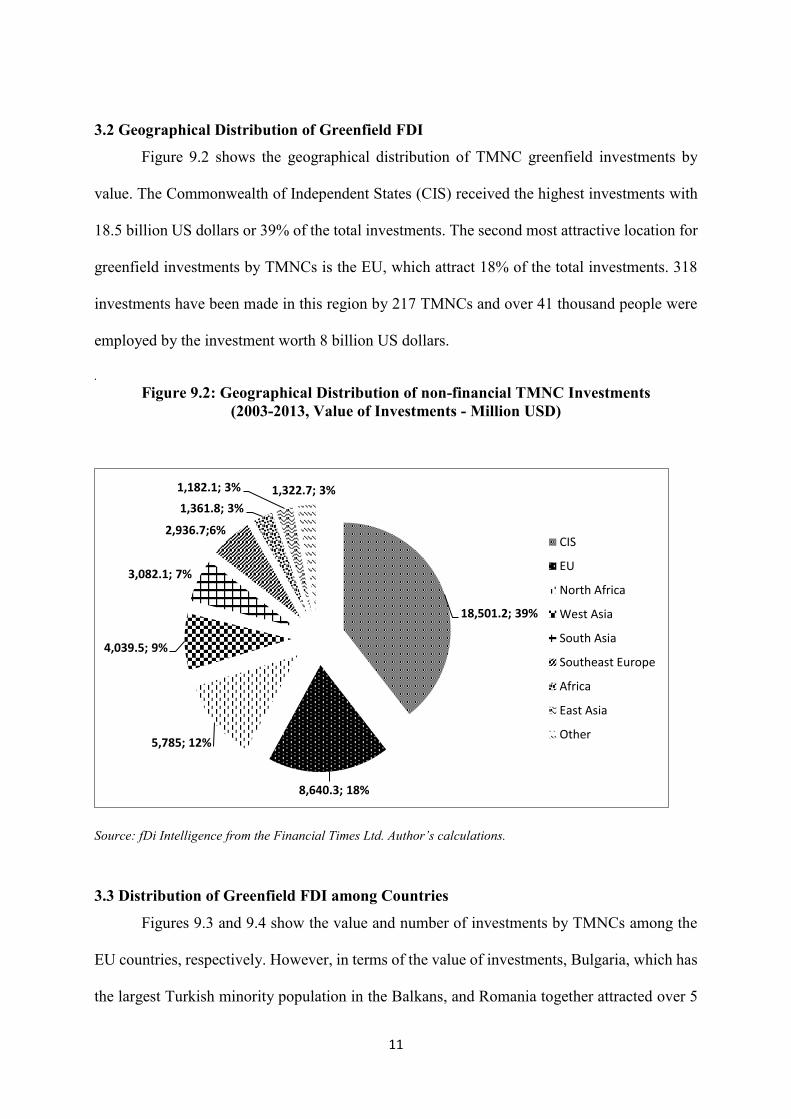
Figure 9.2 shows the geographical distribution of TMNC greenfield investments by
value. The Commonwealth of Independent States (CIS) received the highest investments with
18.5 billion US dollars or 39% of the total investments. The second most attractive location for
greenfield investments by TMNCs is the EU, which attract 18% of the total investments. 318
investments have been made in this region by 217 TMNCs and over 41 thousand people were
employed by the investment worth 8 billion US dollars.
. Figure 9.2: Geographical Distribution of non-financial TMNC Investments
(2003-2013, Value of Investments - Million USD)
Source: fDi Intelligence from the Financial Times Ltd. Author’s calculations.
3.3 Distribution of Greenfield FDI among Countries
Figures 9.3 and 9.4 show the value and number of investments by TMNCs among the
EU countries, respectively. However, in terms of the value of investments, Bulgaria, which has
the largest Turkish minority population in the Balkans, and Romania together attracted over 5
18,501.2; 39%
8,640.3; 18%
5,785; 12%
4,039.5; 9%
3,082.1; 7%
2,936.7;6%
1,361.8; 3%
1,182.1; 3% 1,322.7; 3%
CIS
EU
North Africa
West Asia
South Asia
Southeast Europe
Africa
East Asia
Other
12
billion US dollars, or about 60%. Germany, which hosts the largest Turkish population in
Europe, attracted the third largest TMNC greenfield investments in the EU (970 million US
dollars or 11%), and Romania received the highest employment and investment in value. They
are followed by Germany, France and Greece. Apparently, historical, cultural and geographic
proximity also informed TMNC internationalisation in these countries.
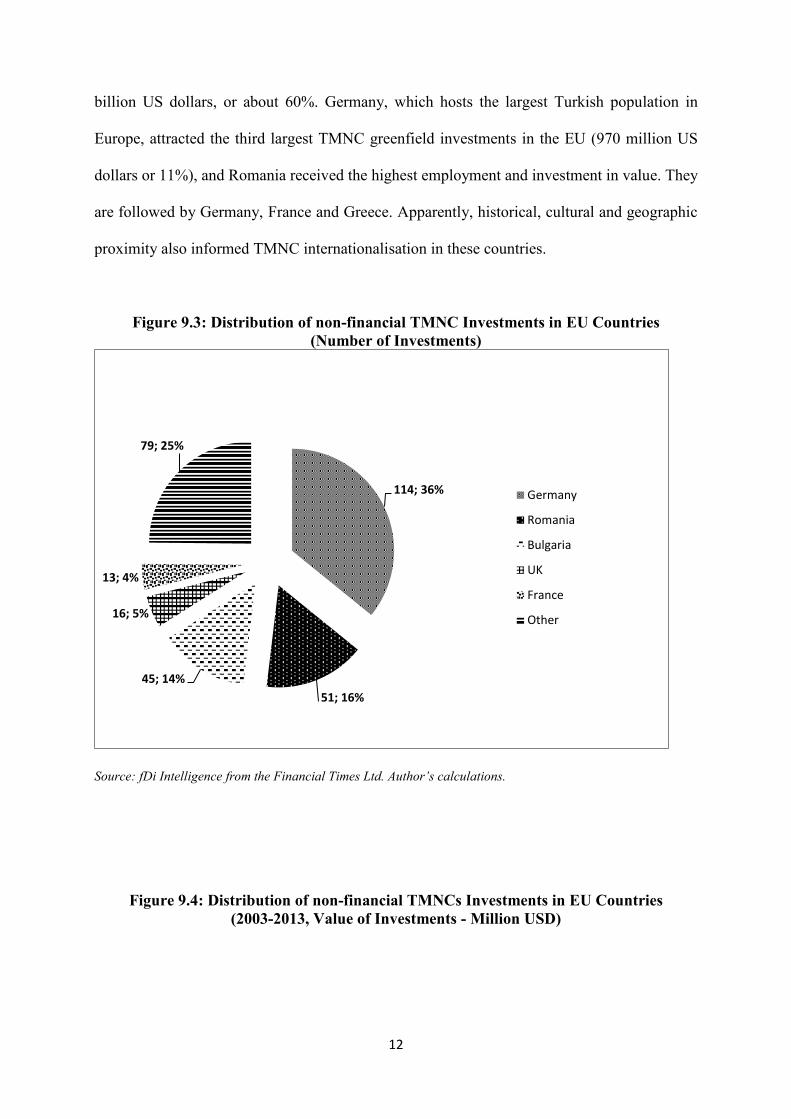
Figure 9.3: Distribution of non-financial TMNC Investments in EU Countries
(Number of Investments)
Source: fDi Intelligence from the Financial Times Ltd. Author’s calculations.
Figure 9.4: Distribution of non-financial TMNCs Investments in EU Countries
(2003-2013, Value of Investments - Million USD)
114; 36%
51; 16%
45; 14%
16; 5%
13; 4%
79; 25%
Germany
Romania
Bulgaria
UK
France
Other
13
Source: : fDi Intelligence from the Financial Times Ltd. Author’s calculations.
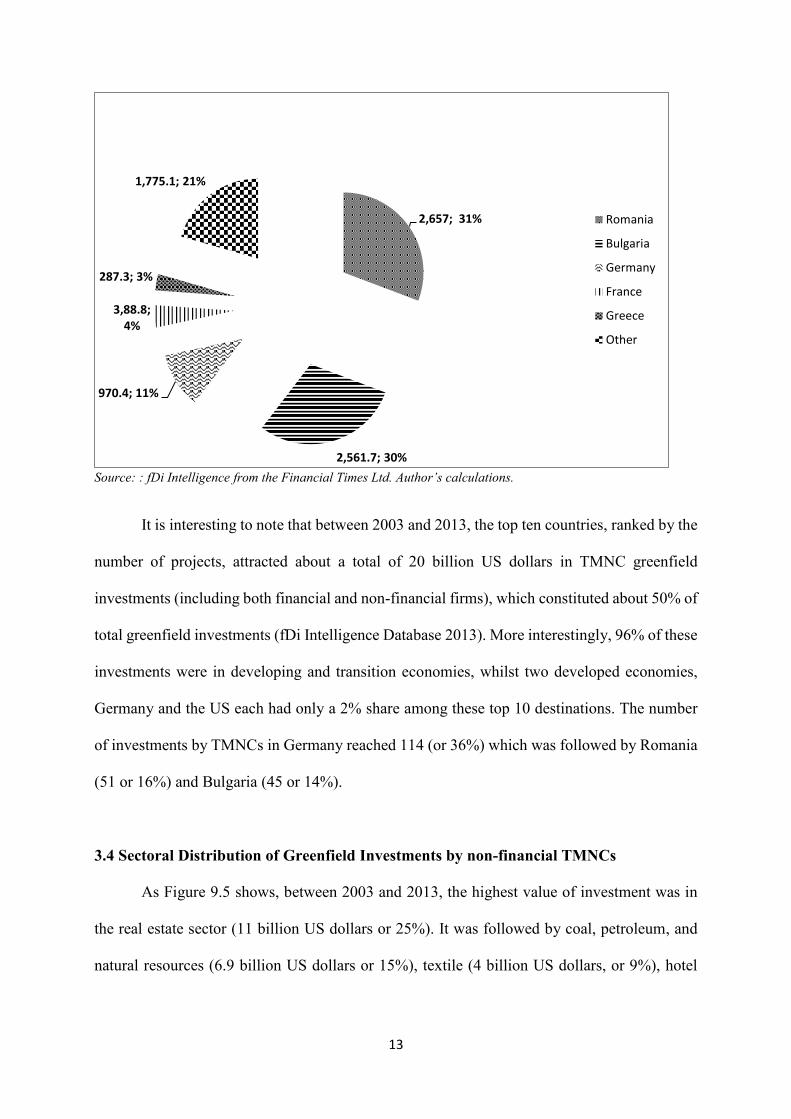
It is interesting to note that between 2003 and 2013, the top ten countries, ranked by the
number of projects, attracted about a total of 20 billion US dollars in TMNC greenfield
investments (including both financial and non-financial firms), which constituted about 50% of
total greenfield investments (fDi Intelligence Database 2013). More interestingly, 96% of these
investments were in developing and transition economies, whilst two developed economies,
Germany and the US each had only a 2% share among these top 10 destinations. The number
of investments by TMNCs in Germany reached 114 (or 36%) which was followed by Romania
(51 or 16%) and Bulgaria (45 or 14%).
3.4 Sectoral Distribution of Greenfield Investments by non-financial TMNCs
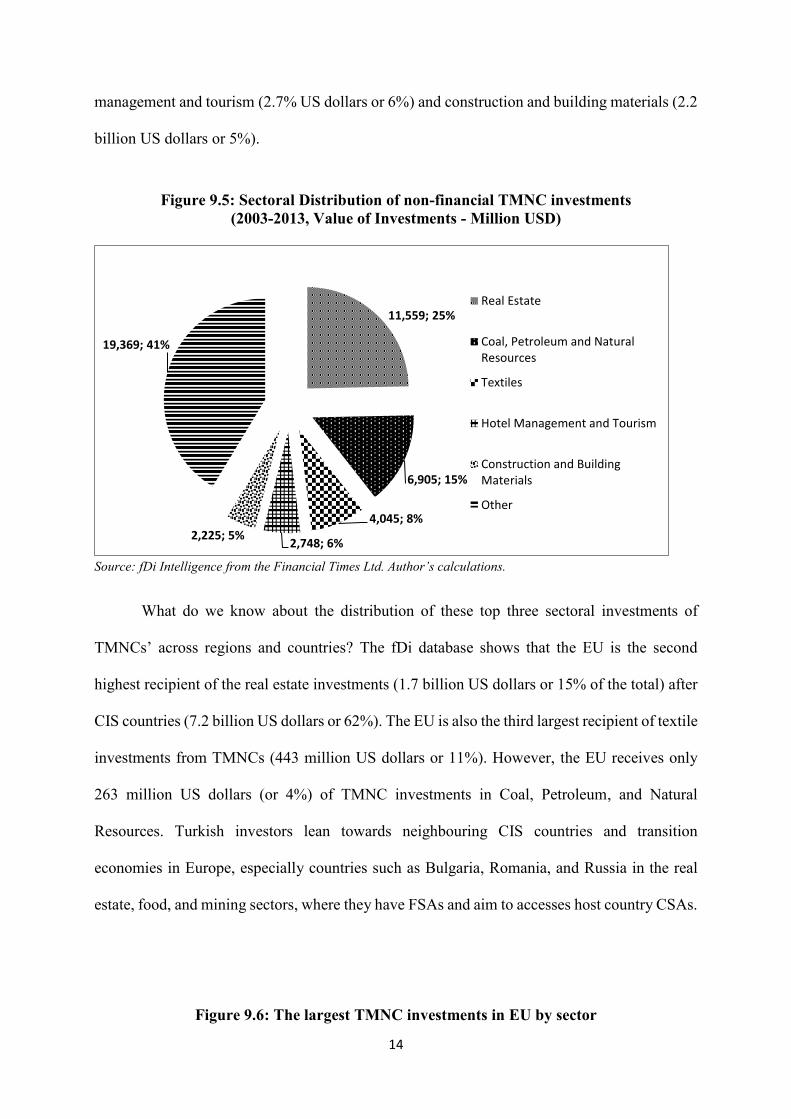
As Figure 9.5 shows, between 2003 and 2013, the highest value of investment was in
the real estate sector (11 billion US dollars or 25%). It was followed by coal, petroleum, and
natural resources (6.9 billion US dollars or 15%), textile (4 billion US dollars, or 9%), hotel
2,657; 31%
2,561.7; 30%
970.4; 11%
3,88.8; 4%
287.3; 3%
1,775.1; 21%
Romania
Bulgaria
Germany
France
Greece
Other
14
management and tourism (2.7% US dollars or 6%) and construction and building materials (2.2
billion US dollars or 5%).
Figure 9.5: Sectoral Distribution of non-financial TMNC investments
(2003-2013, Value of Investments - Million USD)
Source: fDi Intelligence from the Financial Times Ltd. Author’s calculations.
What do we know about the distribution of these top three sectoral investments of
TMNCs’ across regions and countries? The fDi database shows that the EU is the second
highest recipient of the real estate investments (1.7 billion US dollars or 15% of the total) after
CIS countries (7.2 billion US dollars or 62%). The EU is also the third largest recipient of textile
investments from TMNCs (443 million US dollars or 11%). However, the EU receives only
263 million US dollars (or 4%) of TMNC investments in Coal, Petroleum, and Natural
Resources. Turkish investors lean towards neighbouring CIS countries and transition
economies in Europe, especially countries such as Bulgaria, Romania, and Russia in the real
estate, food, and mining sectors, where they have FSAs and aim to accesses host country CSAs.
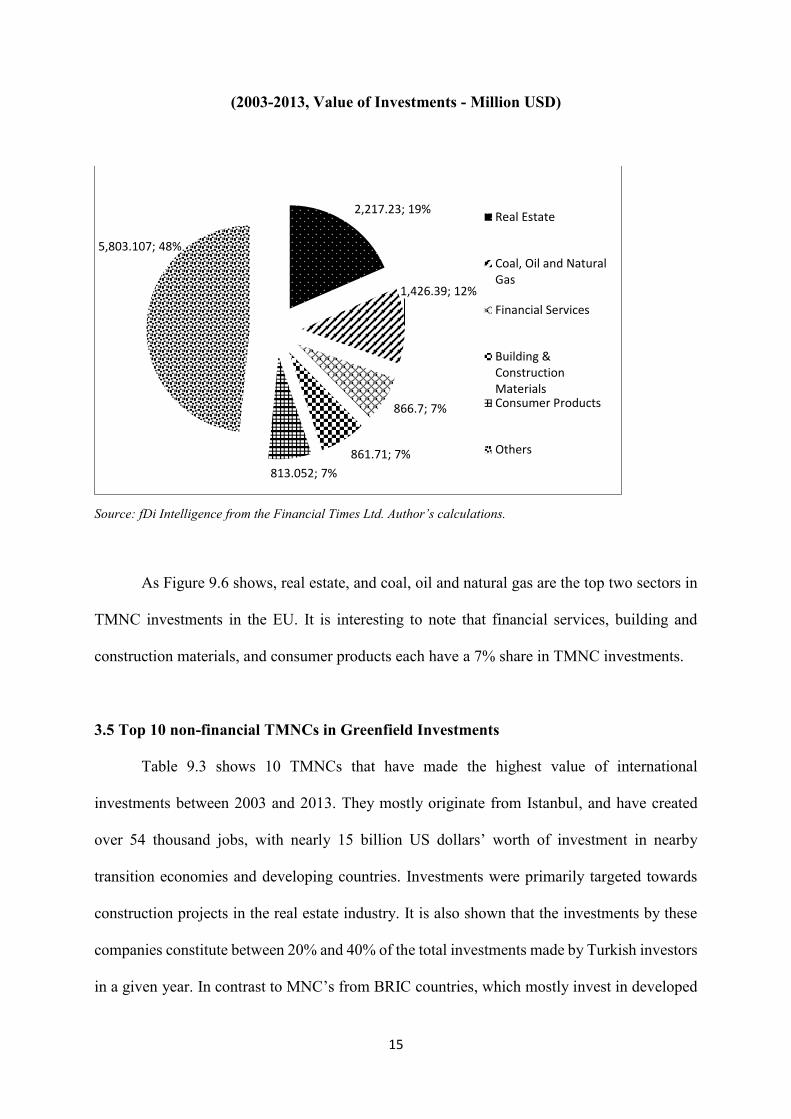
Figure 9.6: The largest TMNC investments in EU by sector
11,559; 25%
6,905; 15%
4,045; 8%
2,748; 6%2,225; 5%
19,369; 41%
Real Estate
Coal, Petroleum and NaturalResources
Textiles
Hotel Management and Tourism
Construction and BuildingMaterials
Other
15
(2003-2013, Value of Investments - Million USD)
Source: fDi Intelligence from the Financial Times Ltd. Author’s calculations.
As Figure 9.6 shows, real estate, and coal, oil and natural gas are the top two sectors in
TMNC investments in the EU. It is interesting to note that financial services, building and
construction materials, and consumer products each have a 7% share in TMNC investments.
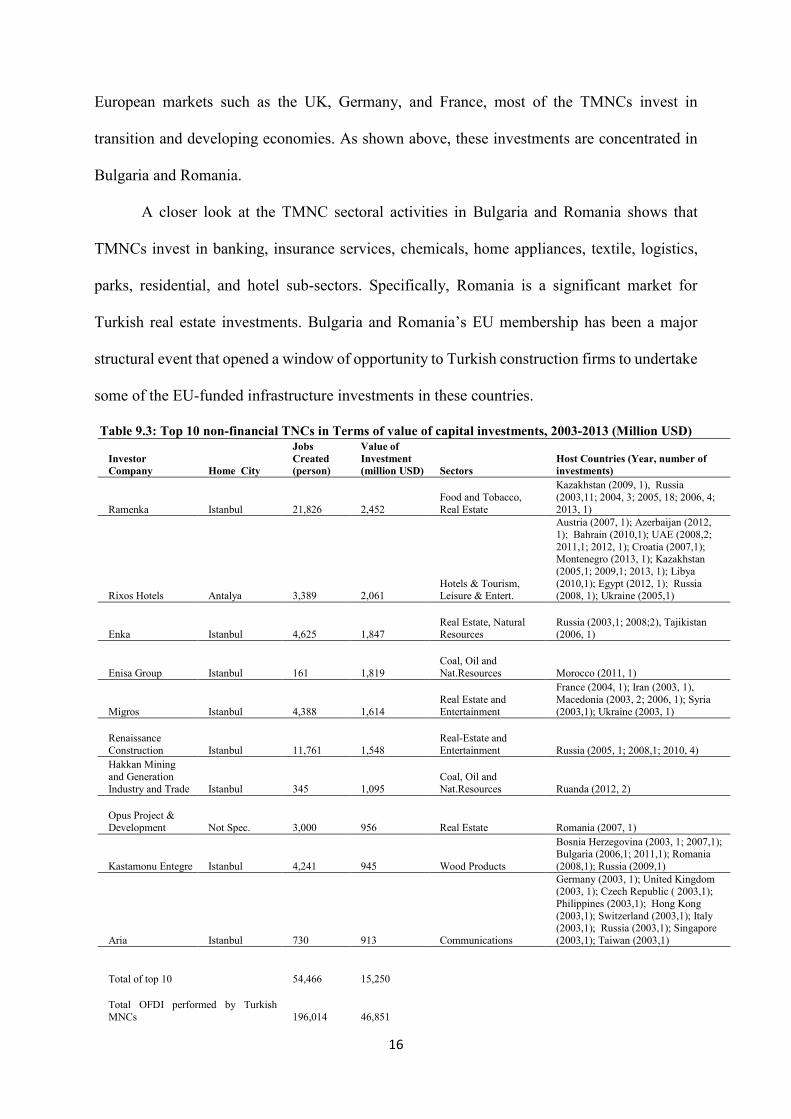
3.5 Top 10 non-financial TMNCs in Greenfield Investments
Table 9.3 shows 10 TMNCs that have made the highest value of international
investments between 2003 and 2013. They mostly originate from Istanbul, and have created
over 54 thousand jobs, with nearly 15 billion US dollars’ worth of investment in nearby
transition economies and developing countries. Investments were primarily targeted towards
construction projects in the real estate industry. It is also shown that the investments by these
companies constitute between 20% and 40% of the total investments made by Turkish investors
in a given year. In contrast to MNC’s from BRIC countries, which mostly invest in developed
2,217.23; 19%
1,426.39; 12%
866.7; 7%
861.71; 7%
813.052; 7%
5,803.107; 48%
Real Estate
Coal, Oil and NaturalGas
Financial Services
Building &ConstructionMaterialsConsumer Products
Others
16
European markets such as the UK, Germany, and France, most of the TMNCs invest in
transition and developing economies. As shown above, these investments are concentrated in
Bulgaria and Romania.
A closer look at the TMNC sectoral activities in Bulgaria and Romania shows that
TMNCs invest in banking, insurance services, chemicals, home appliances, textile, logistics,
parks, residential, and hotel sub-sectors. Specifically, Romania is a significant market for
Turkish real estate investments. Bulgaria and Romania’s EU membership has been a major
structural event that opened a window of opportunity to Turkish construction firms to undertake
some of the EU-funded infrastructure investments in these countries.
Table 9.3: Top 10 non-financial TNCs in Terms of value of capital investments, 2003-2013 (Million USD)
Investor
Company Home City
Jobs
Created
(person)
Value of
Investment
(million USD) Sectors
Host Countries (Year, number of
investments)
Ramenka Istanbul 21,826 2,452
Food and Tobacco,
Real Estate
Kazakhstan (2009, 1), Russia
(2003,11; 2004, 3; 2005, 18; 2006, 4;
2013, 1)
Rixos Hotels Antalya 3,389 2,061 Hotels & Tourism, Leisure & Entert.
Austria (2007, 1); Azerbaijan (2012,
1); Bahrain (2010,1); UAE (2008,2;
2011,1; 2012, 1); Croatia (2007,1); Montenegro (2013, 1); Kazakhstan
(2005,1; 2009,1; 2013, 1); Libya
(2010,1); Egypt (2012, 1); Russia (2008, 1); Ukraine (2005,1)
Enka Istanbul 4,625 1,847 Real Estate, Natural Resources
Russia (2003,1; 2008;2), Tajikistan (2006, 1)
Enisa Group Istanbul 161 1,819
Coal, Oil and
Nat.Resources Morocco (2011, 1)
Migros Istanbul 4,388 1,614
Real Estate and
Entertainment
France (2004, 1); Iran (2003, 1),
Macedonia (2003, 2; 2006, 1); Syria
(2003,1); Ukraine (2003, 1)
Renaissance
Construction Istanbul 11,761 1,548
Real-Estate and
Entertainment Russia (2005, 1; 2008,1; 2010, 4)
Hakkan Mining
and Generation
Industry and Trade Istanbul 345 1,095
Coal, Oil and
Nat.Resources Ruanda (2012, 2)
Opus Project &
Development Not Spec. 3,000 956 Real Estate Romania (2007, 1)
Kastamonu Entegre Istanbul 4,241 945 Wood Products
Bosnia Herzegovina (2003, 1; 2007,1); Bulgaria (2006,1; 2011,1); Romania
(2008,1); Russia (2009,1)
Aria Istanbul 730 913 Communications
Germany (2003, 1); United Kingdom (2003, 1); Czech Republic ( 2003,1);
Philippines (2003,1); Hong Kong
(2003,1); Switzerland (2003,1); Italy (2003,1); Russia (2003,1); Singapore
(2003,1); Taiwan (2003,1)
Total of top 10 54,466 15,250
Total OFDI performed by Turkish
MNCs 196,014 46,851
17
Percentage of top 10 companies in total 28% 33%
Source: fDi Intelligence from the Financial Times Ltd. Author’s calculations.
4. Acquisitions by TMNCs
Figure 9.7: Yearly Distribution of value and number of TMNC Acquisitions (2000-2013)
Sources: Thomson Reuters Mergers and Acquisitions Database and Deloitte Turkish Outbound M&A Review
2012-2013.
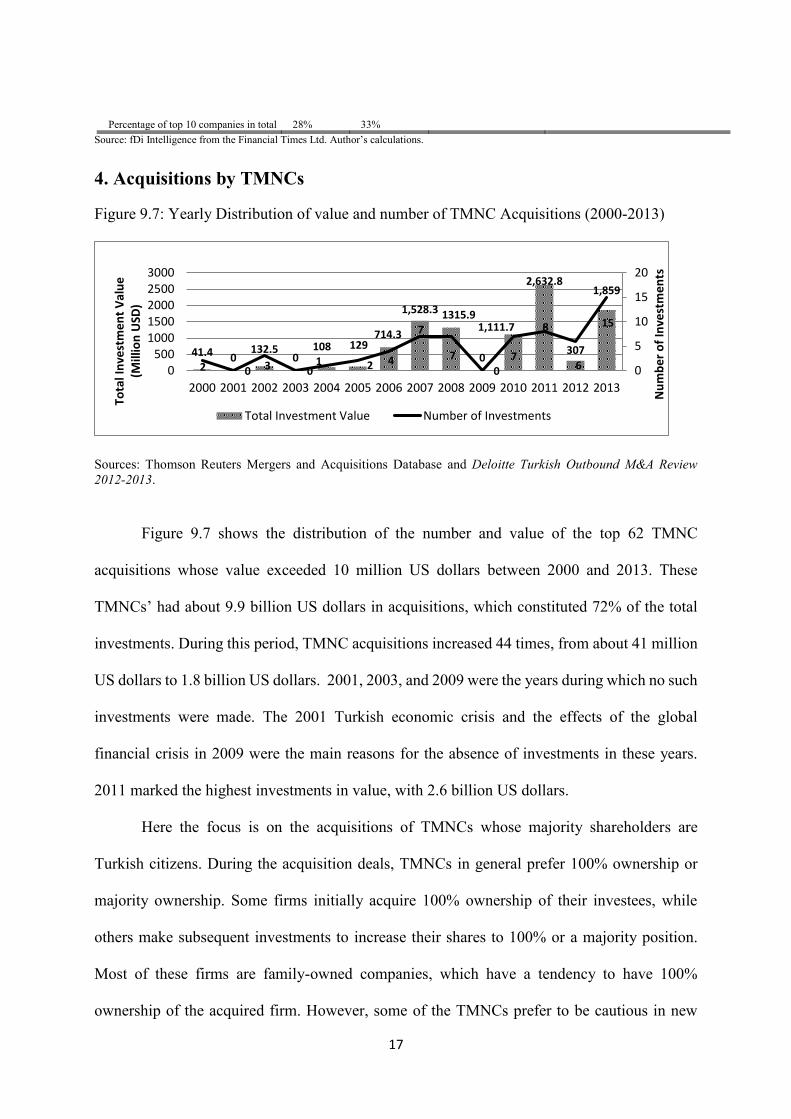
Figure 9.7 shows the distribution of the number and value of the top 62 TMNC
acquisitions whose value exceeded 10 million US dollars between 2000 and 2013. These
TMNCs’ had about 9.9 billion US dollars in acquisitions, which constituted 72% of the total
investments. During this period, TMNC acquisitions increased 44 times, from about 41 million
US dollars to 1.8 billion US dollars. 2001, 2003, and 2009 were the years during which no such
investments were made. The 2001 Turkish economic crisis and the effects of the global
financial crisis in 2009 were the main reasons for the absence of investments in these years.
2011 marked the highest investments in value, with 2.6 billion US dollars.
Here the focus is on the acquisitions of TMNCs whose majority shareholders are
Turkish citizens. During the acquisition deals, TMNCs in general prefer 100% ownership or
majority ownership. Some firms initially acquire 100% ownership of their investees, while
others make subsequent investments to increase their shares to 100% or a majority position.
Most of these firms are family-owned companies, which have a tendency to have 100%
ownership of the acquired firm. However, some of the TMNCs prefer to be cautious in new
41.4 0132.5
0108 129
714.3
1,528.3 1315.9
0
1,111.7
2,632.8
307
1,859
2 0 3 01 2 4
7
7
07
8
6
15
0
5
10
15
20
0500
10001500200025003000
2000 2001 2002 2003 2004 2005 2006 2007 2008 2009 2010 2011 2012 2013
Nu
mb
er
of
Inve
stm
en
ts
Tota
l In
vest
me
nt
Val
ue
(M
illio
n U
SD)
Total Investment Value Number of Investments
18
markets and engage in partnerships with local firms rather than outright ownership. There are
two main reasons: (1) This is because a partnership option is less costly in case the company
needs to exit the market; and/or (2) to overcome the liability of foreignness (i.e., additional
costs experienced abroad arising from, for example, limited local knowledge). Some TMNCs
that enter the new markets through partnerships make further investments for full ownership in
following years. Finally, it should be noted that most of these TMNCs are holding companies;
conglomerates operating in a wide range of sectors in Turkey. Holding company structure
enables TMNCs to reduce ‘transaction costs’ by creating internal markets inside the firm.
4.1 Geographical Distribution of Acquisitions by TMNCs
Figure 9.8: Distribution of the Value of the Mergers and Acquisitions among Economic
Regions (2000-2013, Value of Investments - Million USD)
Source: Thomson Reuters Mergers and Acquisitions Database and Deloitte Turkish Outbound M&A Review
2012-2013.
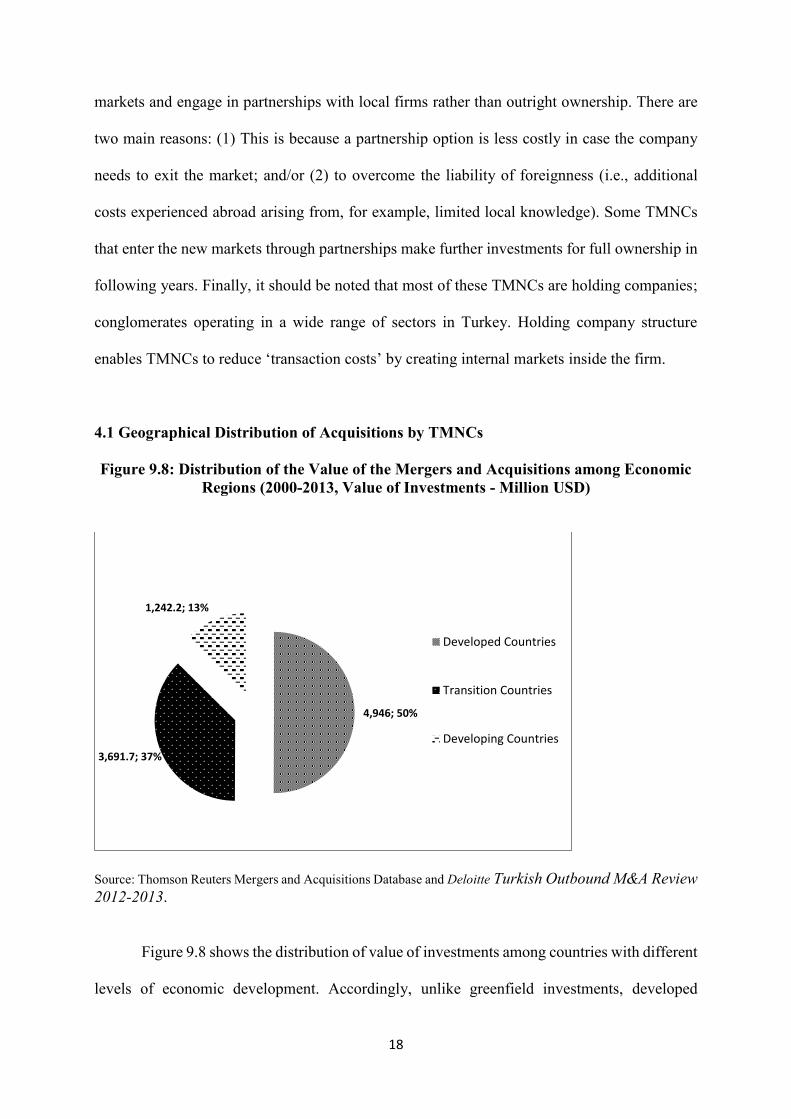
Figure 9.8 shows the distribution of value of investments among countries with different
levels of economic development. Accordingly, unlike greenfield investments, developed
4,946; 50%
3,691.7; 37%
1,242.2; 13%
Developed Countries
Transition Countries
Developing Countries
19
countries host half of the TMNC acquisitions (4.9 billion US dollars or 50%). They are followed
by developing countries (3.7 billion US dollars or 37%) and transition economies (1.2 billion
US dollars or 13%).
Figure 9.9: Geographical Distribution of the Value of the TMNC Acquisitions
(2000-2013, Value of Investments - Million USD)
Sources: Thomson Reuters Mergers and Acquisitions Database and Deloitte Turkish Outbound M&A Review
2012-2013.
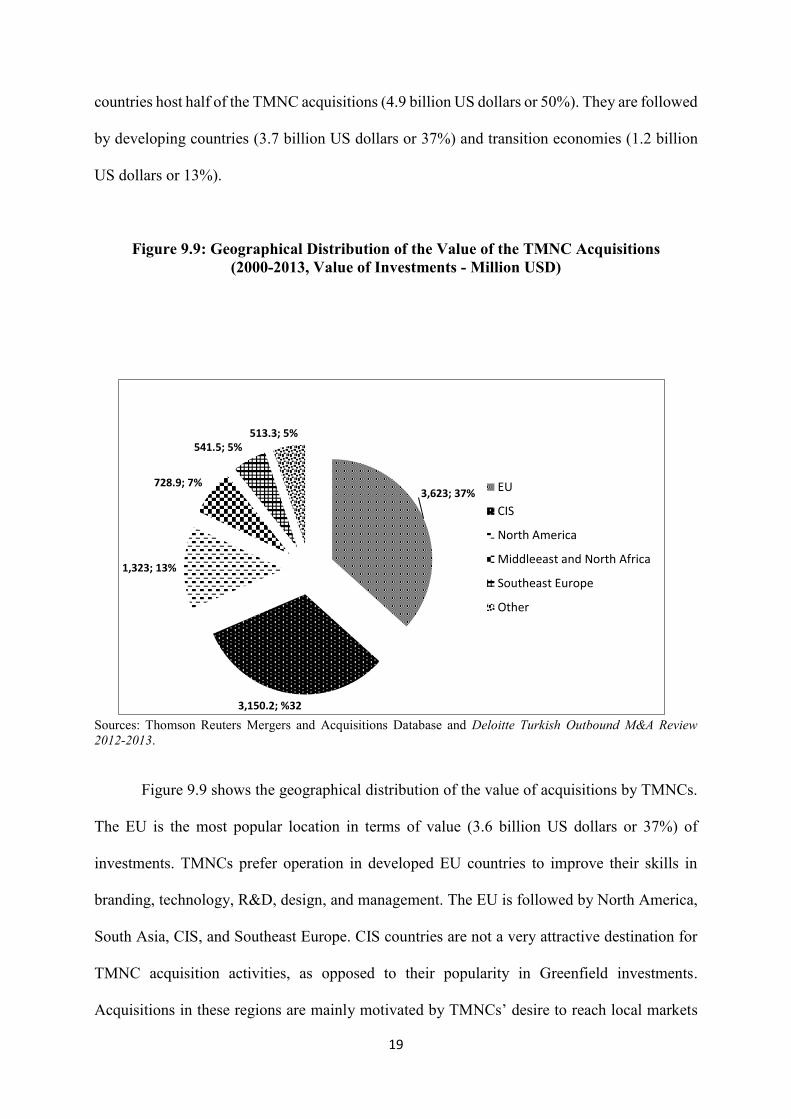
Figure 9.9 shows the geographical distribution of the value of acquisitions by TMNCs.
The EU is the most popular location in terms of value (3.6 billion US dollars or 37%) of
investments. TMNCs prefer operation in developed EU countries to improve their skills in
branding, technology, R&D, design, and management. The EU is followed by North America,
South Asia, CIS, and Southeast Europe. CIS countries are not a very attractive destination for
TMNC acquisition activities, as opposed to their popularity in Greenfield investments.
Acquisitions in these regions are mainly motivated by TMNCs’ desire to reach local markets
3,623; 37%
3,150.2; %32
1,323; 13%
728.9; 7%
541.5; 5%513.3; 5%
EU
CIS
North America
Middleeast and North Africa
Southeast Europe
Other
20
and raw materials, by using their firm-specific advantages such as managerial experience and
technology.
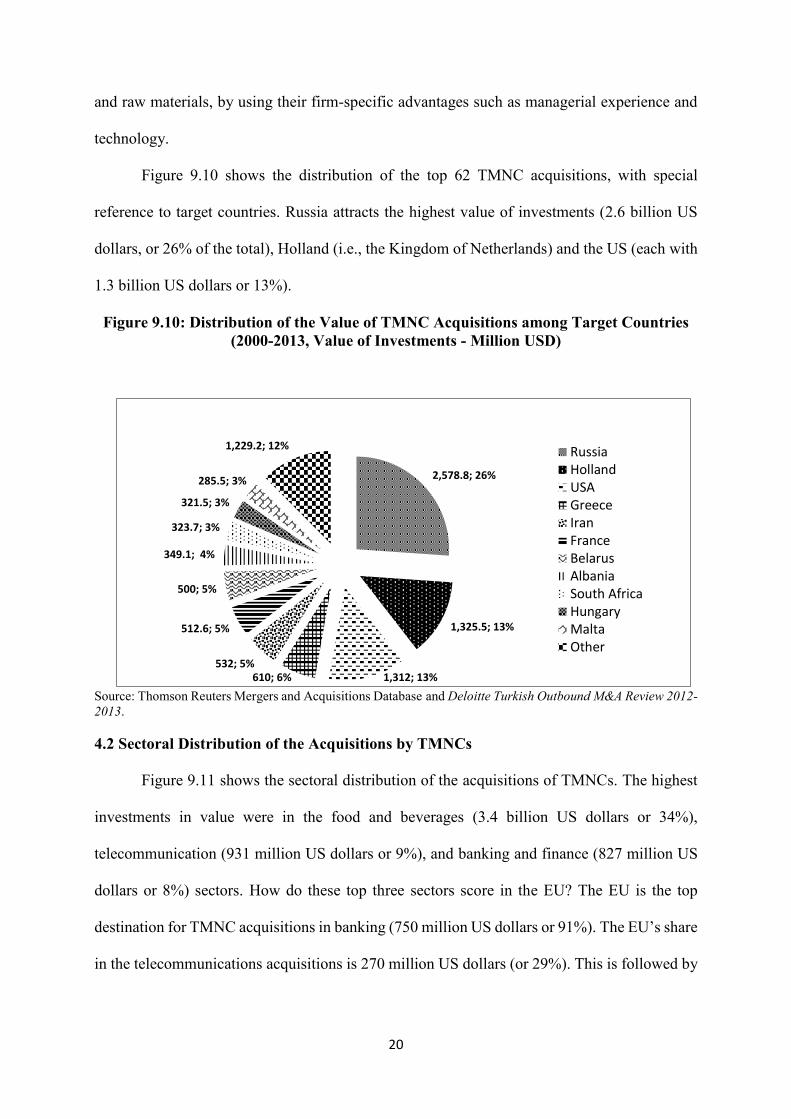
Figure 9.10 shows the distribution of the top 62 TMNC acquisitions, with special
reference to target countries. Russia attracts the highest value of investments (2.6 billion US
dollars, or 26% of the total), Holland (i.e., the Kingdom of Netherlands) and the US (each with
1.3 billion US dollars or 13%).
Figure 9.10: Distribution of the Value of TMNC Acquisitions among Target Countries
(2000-2013, Value of Investments - Million USD)
Source: Thomson Reuters Mergers and Acquisitions Database and Deloitte Turkish Outbound M&A Review 2012-
2013.
4.2 Sectoral Distribution of the Acquisitions by TMNCs
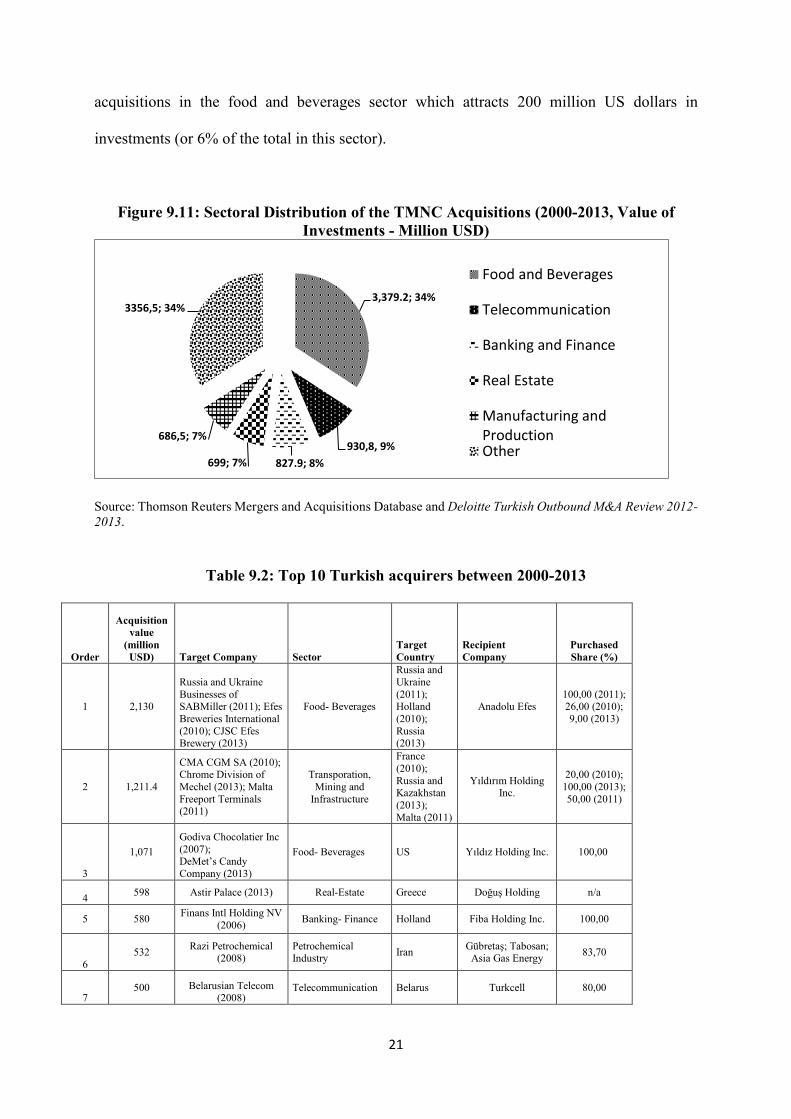
Figure 9.11 shows the sectoral distribution of the acquisitions of TMNCs. The highest
investments in value were in the food and beverages (3.4 billion US dollars or 34%),
telecommunication (931 million US dollars or 9%), and banking and finance (827 million US
dollars or 8%) sectors. How do these top three sectors score in the EU? The EU is the top
destination for TMNC acquisitions in banking (750 million US dollars or 91%). The EU’s share
in the telecommunications acquisitions is 270 million US dollars (or 29%). This is followed by
2,578.8; 26%
1,325.5; 13%
1,312; 13%610; 6%532; 5%
512.6; 5%
500; 5%
349.1; 4%
323.7; 3%
321.5; 3%
285.5; 3%
1,229.2; 12% RussiaHollandUSAGreeceIranFranceBelarusAlbaniaSouth AfricaHungaryMaltaOther
21
acquisitions in the food and beverages sector which attracts 200 million US dollars in
investments (or 6% of the total in this sector).
Figure 9.11: Sectoral Distribution of the TMNC Acquisitions (2000-2013, Value of
Investments - Million USD)
Source: Thomson Reuters Mergers and Acquisitions Database and Deloitte Turkish Outbound M&A Review 2012-
2013.
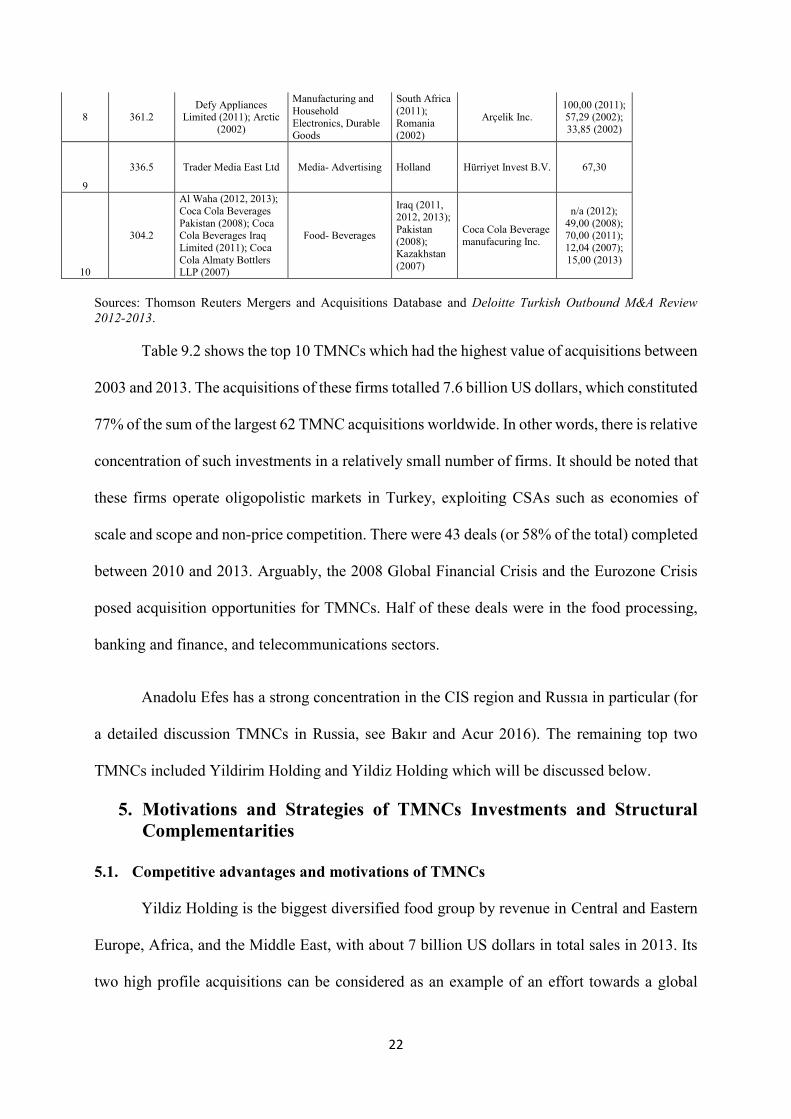
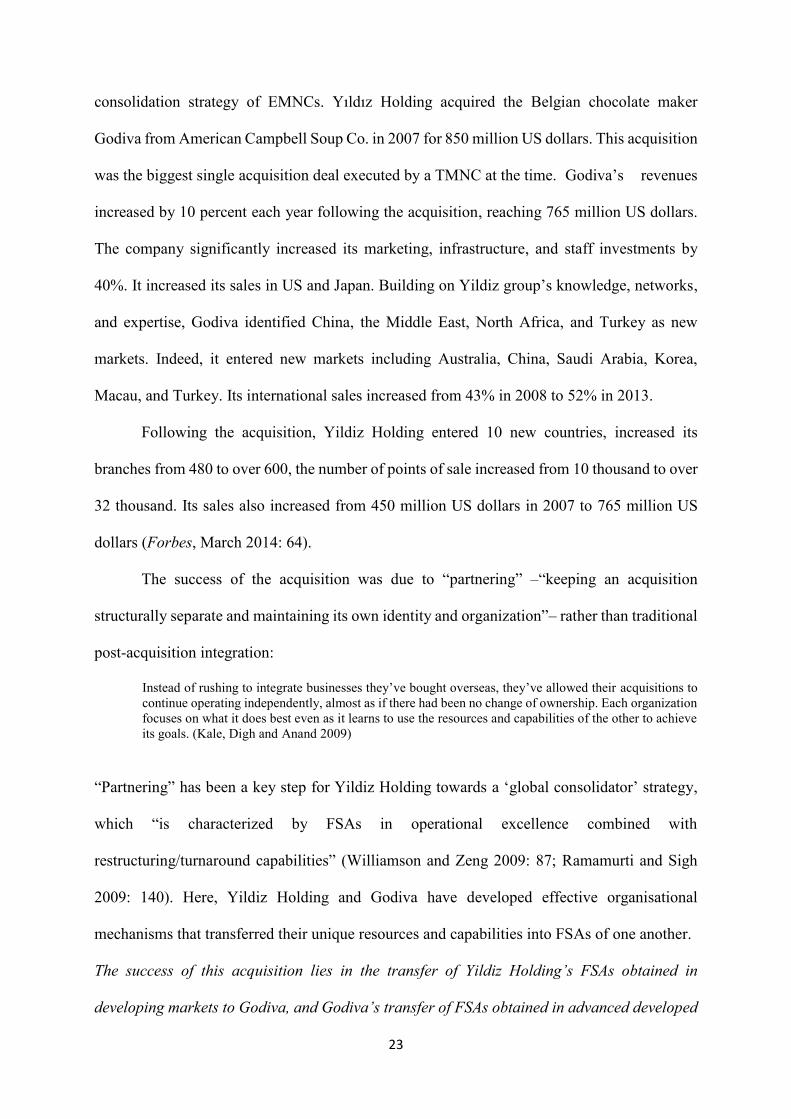
Table 9.2: Top 10 Turkish acquirers between 2000-2013
Order
Acquisition
value
(million
USD) Target Company Sector
Target
Country
Recipient
Company
Purchased
Share (%)
1 2,130
Russia and Ukraine
Businesses of SABMiller (2011); Efes
Breweries International
(2010); CJSC Efes Brewery (2013)
Food- Beverages
Russia and
Ukraine
(2011); Holland
(2010);
Russia (2013)
Anadolu Efes 100,00 (2011); 26,00 (2010);
9,00 (2013)
2 1,211.4
CMA CGM SA (2010); Chrome Division of
Mechel (2013); Malta
Freeport Terminals (2011)
Transporation,
Mining and
Infrastructure
France
(2010);
Russia and Kazakhstan
(2013);
Malta (2011)
Yıldırım Holding Inc.
20,00 (2010);
100,00 (2013);
50,00 (2011)
3
1,071
Godiva Chocolatier Inc
(2007); DeMet’s Candy
Company (2013)
Food- Beverages US Yıldız Holding Inc. 100,00
4 598 Astir Palace (2013) Real-Estate Greece Doğuş Holding n/a
5 580 Finans Intl Holding NV
(2006) Banking- Finance Holland Fiba Holding Inc. 100,00
6
532 Razi Petrochemical
(2008) Petrochemical Industry
Iran Gübretaş; Tabosan;
Asia Gas Energy 83,70
7 500 Belarusian Telecom
(2008) Telecommunication Belarus Turkcell 80,00
3,379.2; 34%
930,8, 9%
827.9; 8%699; 7%
686,5; 7%
3356,5; 34%
Food and Beverages
Telecommunication
Banking and Finance
Real Estate
Manufacturing andProductionOther
22
8 361.2 Defy Appliances
Limited (2011); Arctic
(2002)
Manufacturing and
Household
Electronics, Durable Goods
South Africa
(2011);
Romania (2002)
Arçelik Inc. 100,00 (2011); 57,29 (2002);
33,85 (2002)
9
336.5 Trader Media East Ltd Media- Advertising Holland Hürriyet Invest B.V. 67,30
10
304.2
Al Waha (2012, 2013);
Coca Cola Beverages
Pakistan (2008); Coca Cola Beverages Iraq
Limited (2011); Coca
Cola Almaty Bottlers LLP (2007)
Food- Beverages
Iraq (2011, 2012, 2013);
Pakistan
(2008); Kazakhstan
(2007)
Coca Cola Beverage
manufacuring Inc.
n/a (2012);
49,00 (2008); 70,00 (2011);
12,04 (2007);
15,00 (2013)
Sources: Thomson Reuters Mergers and Acquisitions Database and Deloitte Turkish Outbound M&A Review
2012-2013.
Table 9.2 shows the top 10 TMNCs which had the highest value of acquisitions between
2003 and 2013. The acquisitions of these firms totalled 7.6 billion US dollars, which constituted
77% of the sum of the largest 62 TMNC acquisitions worldwide. In other words, there is relative
concentration of such investments in a relatively small number of firms. It should be noted that
these firms operate oligopolistic markets in Turkey, exploiting CSAs such as economies of
scale and scope and non-price competition. There were 43 deals (or 58% of the total) completed
between 2010 and 2013. Arguably, the 2008 Global Financial Crisis and the Eurozone Crisis
posed acquisition opportunities for TMNCs. Half of these deals were in the food processing,
banking and finance, and telecommunications sectors.
Anadolu Efes has a strong concentration in the CIS region and Russıa in particular (for
a detailed discussion TMNCs in Russia, see Bakır and Acur 2016). The remaining top two
TMNCs included Yildirim Holding and Yildiz Holding which will be discussed below.
5. Motivations and Strategies of TMNCs Investments and Structural
Complementarities
5.1. Competitive advantages and motivations of TMNCs
Yildiz Holding is the biggest diversified food group by revenue in Central and Eastern
Europe, Africa, and the Middle East, with about 7 billion US dollars in total sales in 2013. Its
two high profile acquisitions can be considered as an example of an effort towards a global
23
consolidation strategy of EMNCs. Yıldız Holding acquired the Belgian chocolate maker
Godiva from American Campbell Soup Co. in 2007 for 850 million US dollars. This acquisition
was the biggest single acquisition deal executed by a TMNC at the time. Godiva’s revenues
increased by 10 percent each year following the acquisition, reaching 765 million US dollars.
The company significantly increased its marketing, infrastructure, and staff investments by
40%. It increased its sales in US and Japan. Building on Yildiz group’s knowledge, networks,
and expertise, Godiva identified China, the Middle East, North Africa, and Turkey as new
markets. Indeed, it entered new markets including Australia, China, Saudi Arabia, Korea,
Macau, and Turkey. Its international sales increased from 43% in 2008 to 52% in 2013.
Following the acquisition, Yildiz Holding entered 10 new countries, increased its
branches from 480 to over 600, the number of points of sale increased from 10 thousand to over
32 thousand. Its sales also increased from 450 million US dollars in 2007 to 765 million US
dollars (Forbes, March 2014: 64).
The success of the acquisition was due to “partnering” –“keeping an acquisition
structurally separate and maintaining its own identity and organization”– rather than traditional
post-acquisition integration:
Instead of rushing to integrate businesses they’ve bought overseas, they’ve allowed their acquisitions to
continue operating independently, almost as if there had been no change of ownership. Each organization
focuses on what it does best even as it learns to use the resources and capabilities of the other to achieve
its goals. (Kale, Digh and Anand 2009)
“Partnering” has been a key step for Yildiz Holding towards a ‘global consolidator’ strategy,
which “is characterized by FSAs in operational excellence combined with
restructuring/turnaround capabilities” (Williamson and Zeng 2009: 87; Ramamurti and Sigh
2009: 140). Here, Yildiz Holding and Godiva have developed effective organisational
mechanisms that transferred their unique resources and capabilities into FSAs of one another.
The success of this acquisition lies in the transfer of Yildiz Holding’s FSAs obtained in
developing markets to Godiva, and Godiva’s transfer of FSAs obtained in advanced developed
24
markets to Yildiz Holding. In the words of Yıldız Holding’s deputy chairman Ali Ülker “we
learnt how to do a global business. We had great benefits in the context of learning [following
the acquisition of Godiva]” (Harvard Business Review, November 2012). Godiva President and
Chief Executive Officer (CEO) Jim Goldman at the time referred to the transformation that
Godiva had undergone since it was acquired by Yıldız Holding in 2007. He highlighted
investments made in innovation in 2013 and noted that
I am certainly sure of the fact that Godiva reached success with the right partner. We came across the
strongest and newest marketing programs during the restructuring of the business and we expanded our
business to new destinations, such as China, which helped to increase the bulk of our sales as well as gain
experience (Cited in Today’s Zaman 20 December 2011).
This point adds a new dimension to the so-called new internationalisation theory that FSAs of
the parent company obtained at home can further FSAs of a subsidiary to operate in new
markets and benefit from structural complementarities that reinforce their internationalisation
strategies.
In other words, Yildiz Holding acquired unique resources and dynamic capabilities from
Godiva, such as a global brand, managerial and marketing skills, and knowledge and
experience. Godiva also acquired FSAs from Yildiz Holding, such as consumer insights,
operating in weak institutional environments, and access to cash. This argument – a mature
MNC (i.e., Godiva) acquires FSAs from an EMNC (i.e., Yildiz Holding) – challenges the
conventional wisdom that EMNCs
use international expansion as a springboard to acquire strategic resources and reduce their institutional
and market constraints at home. In so doing, they overcome their latecomer disadvantage in the global
stage via a series of aggressive, risk-taking measures by aggressively acquiring or buying critical assets
from mature MNEs to compensate for their competitive weaknesses. (Luo and Tung 2007: 481)
In fact, developed country MNCs as subsidiaries of EMNCs can acquire FSAs from their
parents.
Yildiz Holding took another major step towards its generic global consolidator strategy
when it bought United Biscuits in November 2014 from private equity owners Blackstone
Group and PAI Partners for about 2 billion pounds (3.2 billion US dollars). This made Yildiz
25
the world's third-biggest biscuit maker. In the words of CEO of Yildiz Holding, Murat Ulker:
“We want to grow United Biscuits to be a global player as part of Yildiz. This will include
enhancing its position in the UK, where Yildiz currently has minimal presence, so we will
continue to invest in the UK and Europe” (Cited in Financial Times 3 November 2014, my
italics).
TMNCs also explore FSAs in developed markets. For example, Turk Telekom acquired
100% ownership of Invitel International in 2010 and therefore owned “one of Central and South
eastern Europe’s leading independent wholesale data and capacity service providers that
operates in 16 European countries with its 27 thousand kilometres long optical fibre network”
(Anadolu News Agency, 18 May 2010). A statement by Turk Telekom asserted that the
investment in Austria aims at reaching the target company’s FSAs and increasing Turk
Telekom’s international competitiveness to allow it enter new markets:
It was stated that Turk Telekom, which has an important position in terms of geographical connections,
aims at improving this position by providing the access within Central and Eastern Europe and the access
to the Middle Eastern and Asian markets and the Western European and American markets with this
acquisition. Moreover, the statement also underscored that the acquisition will create synergy
opportunities between Invitel International and Turk Telekom. (Anadolu News Agency, 18 May 2010)
Similarly, Sabanci Holding, the second largest conglomerate in Turkey, sought access
to DuPont’s FSAs through acquisitions. DuPontSA, the largest Polyester manufacturer in
Europe, jointly established by Sabanci Holding and DuPont in 1996, is the leading producer of
its sector in Europe. The CEO Celal Metin from Sabancı Holding, which acquired the full
ownership of DuPontSA by an investment in 2005 in the US, stresses that they want to expand
their market share by obtaining technology and brands: “We foresee that DuPontSA will grow
profitably thanks to its high technology, world-renowned brands and 3.500 skilful employees
and the entire industry will benefit from its quality goods and services” (Star Gazetesi, 9
October 2004).
26
TMNCs also acquire firms with strong market penetration and exploit FSAs in emerging
European and CIS countries. For example, Hurriyet AS, a Turkish publishing company,
purchased Trader Media East Ltd. (TME) in 2007. Hurriyet is owned by Dogan Sirketler Grubu
Holding A.S., which is one of the largest conglomerates in Turkey with investments in media,
energy, manufacturing, and tourism. TME was one of the most important advertising agencies
in Russia, CIS, and Eastern Europe. TME employs approximately 1,900 people in eight
countries, namely Russia, Poland, Hungary, Croatia, Ukraine, Kazakhstan, Belarus and
Lithuania. Hurriyet Invest BV, Hurriyet’s subsidiary located in Holland, initiated this
investment which was motivated by Hurriyet’s desire to enter new markets in the online
advertisement business sector through incorporating TME’s knowledge, experience, and
specialisation in high growth markets in Russia and CIS countries. Hurriyet’s CEO Vuslat
Dogan Sabanci noted that:
We believe that the merger between Hurriyet and TME will create the biggest online advertisement
platform in the region. The acquisition will give Hurriyet better access to high-margin online advertising
and strengthen its presence in fast growing central and eastern European markets. (Anadolu Ajansi-
English News, 4 January 2007)
Indeed, a year later, it has been noted that Hurriyet increased its operating income by 90%
where 45% was derived from TME’s activities (Referans, 14 November 2008).
5.2 Structural Complementarities
Complex and interdependent interactions among context dependent structural and
institutional complementarities and agency-level enabling conditions affect firm behaviour
(Bakir, 2013). This section offers a brief assessment of interactions among structures and agents
informing the realisation of investments. This nuanced view offers a new insight to FSA and
CSA based analysis of firms’ internationalisation activities. Specifically, although firms may
be guided by FSAs and CSAs, the realisation of investment requires the existence of structural,
27
institutional, and agency-level complementarities that reinforce a firm’s motivations and
strategies.
The acquisition of Godiva by Yıldız Holding, owner of diversified food company Ulker
Group, in 2007 is an example demonstrating such interactions. A conventional IB explanation
would consider this acquisition as a reflection of both inward and outward internationalisation
strategy, which requires new brands, further management skills, technical know-how and
access to new markets.
However, the investment deal would not have taken place without two main structural
complementarities: the US sub-prime mortgage crisis and appreciation of the Turkish lira
against the US dollar. These two structural complementarities reinforced Yildiz Holding’s
acquisition of Godiva. In the words of Yildiz Holding’s CEO at the time:
Our biggest competitors were the financial investors and world’s giants in chocolate sector which acquire
valuable brands when they see it. …In those days [before the auction day], the deal price was expected to
be around 1.2-1.5 billion USD. There were two things that change the fate of this [acquisition] agreement.
First, financial investors withdrew from the scene due to the credit crisis originating in the US financial
markets. This was our biggest conjectural chance. [Second], depreciation of the US dollar against Turkish
lira has offered an advantage to us. (Anka, 28 December 2007, emphasis added)
In other words, the motivations and strategies of Yildiz Holding were not sufficient conditions
to deliver an investment deal unless they were backed by structural conditions. Thus,
appreciation of the effect of such structural variables on outward investment helps us to
understand when and why structural contexts complement FSAs and CSAs. One of the key
agency-level enabling conditions behind the acquisition was, in the words of Ulker Group’s
head of board of directors, Murat Ulker, “we had enough money” (Anka, 28 December 2007).
TMNCs also benefit from structural factors such as the economic recession in Europe
following the GFC and Euro crisis. These external shocks hit global trade, and thus firms
operating in the shipping business. For example, Yildirim Group, the world’s second largest
chrome producer and operator in coal and metal, production and sale of fertilizer, mining and
ferroalloys, shipping and ship buildings, and port management, bailed out heavily indebted
28
shipping giant CMA CGM by acquiring 20 percent of the French firm for 500 million US
dollars (380 million euros) in 2010. This was Yildirim’s largest investment in Europe. CMA
CGM was the world's third largest container operator and this acquisition contributed to
Yildirim Group’s horizontal integration strategy and profit. Yildirim has FSAs arising from its
diverse activities ranging from energy trading and port operations to ferroalloy production,
mining, and shipbuilding. Thus it was well positioned to control its supply chain. Therefore,
the key FSA related to the acquisition included market information and knowledge of trends in
the steel industry. In the words of Robert Yildirim, one of the owners and the Chairman of
Yildirim,
We supply the steel industry with raw materials so we know whether they are doing well or not, we see
their order books so when they are slowing down or going up, we are talking to them so then that affects
the shipping…If we sign a deal, we know what the market will be looking like two months ahead. So
when orders are cut that also affects shipping two months later, so we share this market information with
CMA CGM. So we are saying we see the market this way and how it affects shipping, we tell them [CMA
CGM] when to move their empty boxes - this is happening in the market, be careful, put your empty
container in position, the market is going up. (cited in Port Finance International, 25 April 2012)
Yildirim Holing also explored FSAs from the acquisition. In the words of the chairman, “We
can use the CMA CGM network to use the right people to reach the right people in other
businesses…We can use CMA CGM as a logistics partner, it is a win-win investment for both
parties, a perfect match” (ibid).
Further, structural complementarities such as the privatisation process also contributed
to the internationalisation of TMNCs along with institutional complementarities and agency-
level enabling conditions such as FSAs. Gübretaş acquired Razi Petrochemical Co through
Iran’s first privatisation opportunity activity. This investment was a reflection of the vision of
becoming a “globally branded pioneer in Turkey.” Since 2006, the firm has followed the
strategy of investing in countries with rich raw material resources. Gübretaş General Manager
Osman Balta says the company plans to rehabilitate the inactive parts of Razi Petrochemical
and increase the capacity utilization rate (Hazarworld, February 2013). In subsequent years,
Gubretas had further expansion of existing investments. Similarly, Sise Cam also acquired two
29
state-owned glass factories during the privatisation process in Bulgaria. For example, Sise Cam
had undertaken a joint acquisition with a Belgian company, Solvay Group, in 1997 to acquire
one of the largest glass producers ’de Sodi-Devnya with a 35 million US dollar investment.
Like Gubretas, this was followed by Sise Cam’s greenfield investments for the expansion of
glass production in the subsequent years. Similarly, Turk Telekomikasyon AS’s and Calik
Grubu’s investments in privatisation processes in Azerbaijan and Albania are examples of
investments based on such FSAs. Turk Telekominikasyon AS entered the Azeri market by
acquiring a mobile network operator with around 3 million subscribers. The company’s
partnerships in Georgia, Kazakhstan, and Moldova operate as the largest GSM companies in
their respective countries. These examples show that TMNCs exploit their firm-specific
managerial and technological advantages obtained in Turkey in less developed markets.
In sum, acquisitions by TMNCs in developed countries are motivated by inward
internationalisation strategies of reaching new markets through obtaining technology, market
information, and brands. Acquisitions in developing countries aim at accessing new markets
and lowering costs by using their firm-specific technological and managerial advantages.
5. Discussion and Conclusions
This chapter offered an analysis of the current trends, competitive advantages, and motivations
of TMNC investments in Europe with special reference to greenfield investments and
acquisitions. It focused on geographic and sectoral distribution of these investments with
particular emphasis on FSAs, CSAs, and structural complementarities. It examined the extent
to which key theoretical perspectives on the MNC internationalisation can explain outbound
investments from a developing economy like Turkey.
TMNCs have their Greenfield investments in neighbouring geographies, especially in
transition economies and developing countries. Only 22% of greenfield investments are located
30
in developed economies. There has been sectoral concentration in the construction sub-sector
of the real estate sector. Most of these investments are in Turkmenistan and Russia. Such
investments are mostly related to infrastructure investments (e.g., roads, tunnels, and bridges),
premises, airports, and hotels. TMNCs also have similar infrastructure investments in Bulgaria
and Romania. TMNCs’ greenfield investments are motivated by market-seeking (access to
domestic markets as well as access to EU markets via exports) and cost-seeking FDI (e.g., tax
advantages, access to raw materials and cheap labour) where these firms exploit their FSAs,
such as managerial and market knowledge, expertise, and technology. Key CSAs include
operating in oligopolistic industries, economies of scale and leadership in home market,
geographical, cultural, and institutional proximity.
In contrast to greenfield investments, most TMNCs’ acquisitions are in developed
countries (72% of total investments). The EU is the most preferred region for these firms.
Holland attracts the highest amount of investments in the EU. This is because it offers tax
advantages and has extensive bilateral investment treaties, therefore Turkish firms incorporated
in Holland (or subsidiaries of TMNCs) for fiscal considerations tend to use it as a home country
for investing in other countries. Half of the acquisitions in Holland are concentrated in the
manufacturing, banking and telecommunications sectors.
Although the main current theoretical lenses available in IB literature such as FSAs and
CSAs are widely used for developed country MNC internationalisation, they are also useful in
explaining the internationalisation behaviour of EMNCs, in particular TMNCs. Thus, this
chapter focuses on the FSAs of TMNCs obtained from both home CSAs and host CSAs in
understanding the motivations behind TMNC investments in Europe. It showed that some of
the largest TMNCs are guided by various complementary motivations, including the
exploitation and exploration of FSAs and CSAs in different times and contexts. They are also
31
successful in relying on both FSAs obtained in home markets and FSAs obtained from host
markets in their internationalisation activities.
TMNCs have inward and outward internationalisation strategies. In regard to inward
internationalisation, their key motivation has been to access brand, technology, market
knowledge, and managerial knowledge/expertise in developed markets. In doing so, TMNCs
aim to build or strengthen their competitive advantages. The acquisition of FSAs helps these
firms to access new markets. Thus, one of the main motivations has been to internalise
proprietary firm-specific assets. When TMNCs acquire firms in transition and developing
countries, they benefit from outward internationalisation to exploit their FSAs, such as
relatively advanced managerial knowledge and technology. However, it should be noted that
some of the TMNCs, such as Yildiz Holding and Yildirim Holding, have stakes in developed
country MNCs and they also exploit their FSAs and home country. These family-owned
diversified firms also utilise global consolidator strategies in their business activities.
It should also be noted that complementarities arising from structural contexts, such as
the appreciation of the Turkish lira against major currencies during the GFC and Euro crisis,
and financial difficulties of target companies in a crisis environment, have also contributed to
TMNCs’ acquisition activities. Finally, it would be interesting to investigate in detail whether
these deals make respective TMNCs formidable global competitors.
32
Bibliography
Akçaoğlu, E. (2005). Türk Şirketlerinin Dış Yatırımları: Saikler ve Stratejiler,
Türkiye Bankalar Birliği, Ankara.
Anadolu Ajansı. (2010). ‘Türk Telekom, Uluslararası Telekom Devini Satın Aldı’, May 18.
Anadolu Ajansi-English News. (2007). ‘Hurriyet to purchase trader media East’, January 2.
ANKA Haber Ajansı. (2007). ‘Godiva’yı almamızda kredi krizi ve değerli YTL önemli rol
oynadı’, December 28.
Brennan. L. ed. (2011). The Emergence of Southern Multinationals: Their Impact on
Europe, London/New York: Palgrave Macmillan.
Bakir. C. (2013). Bank Behaviour and Resilience: The Effect of Structures, Institutions and
Agents, Palgrave MacMillan.
Bakir. C. (2016). Turk Cok Uluslulari. Istanbul, Koc University Press. (forthcoming)
Bakir, C. and Acur, N. (2016). “Turkish Multinationals in Russia”, Liuhto, K., Sutyrin, S. ve
Blanchard, J. eds.Foreign direct investment to and from Russia: Recent trends and
international investment cooperation. London: Routledge (forthcoming).
Campbell, J. L. (2011). ‘The U.S. financial crisis: Lessons for theories of institutional
complementarity’. Socioeconomic Review, 9, 211-234.
Crouch, C. (2010). ‘Complementarity’, in Morgan, G., Campbell, J. L., Crouch, C.,
Pedersen, O. K. and Whitley, R. (eds), The Oxford Handbook of Comparative
Institutional Analysis. New York: Oxford University Press, 117–137.
Cuervo-Cazurra, A. and Ramamurti, R. (2014). Understanding Multinationals from emerging
markets. Cambridge, Cambridge University Press.
Demirbağ, M. and Yaprak, A. (eds). Handbook of Emerging Market Multinational
Corporations. Cheltenham: Edward Elgar.
Dunning JH. (1988). Explaining International Production. Unwin Hyman: London,
U.K.
Dunning, J.H. (1993). Multinational Enterprises and the Global Economy,
Addison Wesley, New York.
Erdilek, A. (2003). A Comparative Analysis of Inward and Outward FDI in
Turkey, Transnational Corporations, 12, 3, 79-105.
Erdilek, A. (2007). ‘Outward Foreign Direct Investment by Enterprises from
Turkey’, Global Players from Emerging Markets: Strengthening Enterprise
Competitiveness Through Outward Investment, UNCTAD; New York ve Cenevre. Pp.
147-162.
33
Ernst and Young. (2014). EY’s Attractiveness Survey Europe 2014: Back in the Game
Available at http://www.ey.com/Publication/vwLUAssets/EY-2014-European-
attractiveness-survey/$FILE/EY-2014-European-attractiveness-survey.pdf
Financial Times. (2014). ‘Blackstone and PAI seal sale of United Biscuits to Turkish group
Yildiz’, November, 3.
Forbes, 2014, ‘En Zenginler Listesi’ s.64
Goldstein, A. (2007), Multinational Companies from Emerging Economies,
London/New York: Palgrave Macmillan.
Harvard Business Review (2012). Istanbul, November
Guillén, M and García-Canal, E (2012). Emerging markets rule: Growth strategies of the new
global giants, McGraw-Hill, New York
Hazarworld. (2013). ‘Bölgenin Güçlü Oyuncusu Gübretaş’, Available at
http://www.hazarworld.com/201302/roportaj/bolgenin-guclu-oyuncusu-gubretas
Hennart, JF., (2012). ‘Emerging Market Multinationals and the Theory of the Multinational
Enterprise’, Global Strategy Journal, 2: 168–187.
Kale, Prashant. and Singh, Harbir. And Raman, P. Anand. (2009). ‘Don’t Integrate Your
Acquisitions, Partner with Them’. Harvard Business Review.
Kaya, H. (2009). ‘Unfavorable Business Environment and Foreign Direct Investment
Activities of Turkish Manufacturing Firm’, BDDK Bankacılık ve Finansal
Piyasalar, 3, 1, 101-118.
Kaya, H. and Erden, D. (2008). ‘Firm-specific Capabilities and Foreign Direct
Investment Activities of Turkish Manufacturing Firms: An Empirical Study’, Journal
of Management Development, 27, 7, 761-777.
Kayam, S. ve Hisarcıklılar, M. (2009). ‘Türkiye’den Çıkan Doğrudan Yatırımları Belirleyen
Etmenler: 1992-2005’, İşletme, İktisat ve Finans, 24, 280, 47-70.
Khanna T, Palepu K. (2006). ‘Emerging giants: building World class companies in
developing countries.’ Harvard Business Review 84(10): 60–69.
Klein, S. and Wocke, A. (2007). ‘Emerging Global Contenders: the South African
Experience’, Journal of International Management, 13(3), .319-337.
Luo Y, Tung RL. (2007). ‘International expansion of emerging market enterprises: a
springboard perspective’. Journal of International Business Studies 38(4): 481–498.
Mathews JA. (2002). Dragon Multinational: A New Model for Global Growth. Oxford
University Press: New York.
34
Narula,R. and Dunning, J.H., (2010). ‘Multinational enterprises, development and
globalization: some clarifications and a research agenda’. Oxford Development Studies,
38(3), pp. 263‐287.
Ramamurti, R. and Singh, J.V. (2009) Emerging Multinationals in Emerging
Markets, Cambridge University Press, Cambridge.
Ramamurti, R. (2009). ‘What have we learned about emerging market MNEs?’. In R.
Ramamurti & J. V.Singh (Eds.). Emerging multinationals from emerging markets.
Cambridge: Cambridge University Press.
Ramamurti, R. (2012). ‘What is really different about emerging market multinationals?’
Global Strategy Journal, 2: 41–47.
Ramamurti (2013). ‘Cross-border M&A and competitive advantage of Indian EMNEs’ in
Williamson, P., Ramamurti, R., Fleury, A. ve Fleury M.T.T. eds, The Competitive
Advantage of Emerging Market Multinationals, Cambridge University Press,
Cambridge. pp.239 259.
Rugman, A. M.(2009). ‘Theoretical Aspects of MNEs from Emerging Economies’,
Emerging Multinationals in Emerging Markets, ed. Ramamurti R. ve Singh
J.V., Cambridge University Press, pp.42-63.
Rugman, A.M. & Nguyen, Q.T.K. (2014). ‘Modern international business theory and
emerging economy MNCs’, in Alvaro Cuervo-Cazurra and Ravi Ramamurti
(eds), Understanding Multinationals from Emerging Markets, Cambridge University
Press, pp 53-80.
Rugman, A. M., & Verbeke, A. (1990). Global corporate strategy and trade policy. London:
Croom Helm.
Port Finance International. (2012). ‘Black Sea 2012 Special | Exclusive Interview with
Robert Yuksel Yildirim’. April 25. Available at
http://portfinanceinternational.com/features/item/ 157-pfi-black-sea-2012-special
exclusive-interview-with-robert-yuksel-yildirim
Sewell, W. H. 1992 ‘A Theory of Structure: Duality, Agency and Transformation.’ American
Journal of Sociology 98: 1–29
Star Gazetesi. 2004. ‘DuPont SA Sabancı’nın’, October 9.
Today’s Zaman, 2011. ‘Godiva CEO says company needed a Turkish partner to grow’,
December 20.
UNCTAD. (2006). World investment report 2006: FDI from developing and transition
economies: Implications for development. New York and Geneva: United Nations.
UNCTAD. (2015). World investment report 2015: Reforming International Investment
Governance. New York and Geneva: United Nations.

35
Williamson, P., Ramamurti, R., Fleury, A. ve Fleury M.T.T. (2013). The Competitive
Advantage of Emerging Market Multinationals, Cambridge University Press,
Cambridge.
Williamson P, Zeng M. (2009). ‘Chinese multinationals: emerging through new
Gateways’. In Emerging Multinationals in Emerging Markets, Ramamurti R, Singh JV
(eds). Cambridge University Press: Cambridge, U.K.; 81–109.