FDI Policies and Catching-Up - EconStor
44
Santos, Eleonora; Khan, Shahed Article — Manuscript Version (Preprint) FDI Policies and Catching-Up Journal of Applied Economic Sciences Suggested Citation: Santos, Eleonora; Khan, Shahed (2019) : FDI Policies and Catching-Up, Journal of Applied Economic Sciences, ISSN 2393-5162, Spiru Haret University, Craiova, Vol. XIII, Iss. 7(61), pp. 1821-1853, http://cesmaa.org/Docs/JAES-Winter_VolumeXIII_Issue7612018.pdf This Version is available at: http://hdl.handle.net/10419/193012 Standard-Nutzungsbedingungen: Die Dokumente auf EconStor dürfen zu eigenen wissenschaftlichen Zwecken und zum Privatgebrauch gespeichert und kopiert werden. Sie dürfen die Dokumente nicht für öffentliche oder kommerzielle Zwecke vervielfältigen, öffentlich ausstellen, öffentlich zugänglich machen, vertreiben oder anderweitig nutzen. Sofern die Verfasser die Dokumente unter Open-Content-Lizenzen (insbesondere CC-Lizenzen) zur Verfügung gestellt haben sollten, gelten abweichend von diesen Nutzungsbedingungen die in der dort genannten Lizenz gewährten Nutzungsrechte. Terms of use: Documents in EconStor may be saved and copied for your personal and scholarly purposes. You are not to copy documents for public or commercial purposes, to exhibit the documents publicly, to make them publicly available on the internet, or to distribute or otherwise use the documents in public. If the documents have been made available under an Open Content Licence (especially Creative Commons Licences), you may exercise further usage rights as specified in the indicated licence.
-
Upload
khangminh22 -
Category
Documents
-
view
1 -
download
0
Transcript of FDI Policies and Catching-Up - EconStor

Santos, Eleonora; Khan, Shahed
Article — Manuscript Version (Preprint)
FDI Policies and Catching-Up
Journal of Applied Economic Sciences
Suggested Citation: Santos, Eleonora; Khan, Shahed (2019) : FDI Policies and Catching-Up,Journal of Applied Economic Sciences, ISSN 2393-5162, Spiru Haret University, Craiova, Vol.XIII, Iss. 7(61), pp. 1821-1853,http://cesmaa.org/Docs/JAES-Winter_VolumeXIII_Issue7612018.pdf
This Version is available at:http://hdl.handle.net/10419/193012
Standard-Nutzungsbedingungen:
Die Dokumente auf EconStor dürfen zu eigenen wissenschaftlichenZwecken und zum Privatgebrauch gespeichert und kopiert werden.
Sie dürfen die Dokumente nicht für öffentliche oder kommerzielleZwecke vervielfältigen, öffentlich ausstellen, öffentlich zugänglichmachen, vertreiben oder anderweitig nutzen.
Sofern die Verfasser die Dokumente unter Open-Content-Lizenzen(insbesondere CC-Lizenzen) zur Verfügung gestellt haben sollten,gelten abweichend von diesen Nutzungsbedingungen die in der dortgenannten Lizenz gewährten Nutzungsrechte.
Terms of use:
Documents in EconStor may be saved and copied for yourpersonal and scholarly purposes.
You are not to copy documents for public or commercialpurposes, to exhibit the documents publicly, to make thempublicly available on the internet, or to distribute or otherwiseuse the documents in public.
If the documents have been made available under an OpenContent Licence (especially Creative Commons Licences), youmay exercise further usage rights as specified in the indicatedlicence.

1
FDI Policies and Catching-Up
Eleonora Santos1 & Shahed Khan2
1Centre for Business and Economics Research – CeBER. Faculty of Economics. University of Coimbra. Avenida Dias da Silva, 165. 3004-512
Coimbra, Portugal.
2Centre for Nuclear and Radiation Physics. Department of Physics. University of Surrey
Guildford. Surrey GU2 7XH. UK
ABSTRACT- The dynamic effects of Foreign Direct Investment in Portugal allowed for a structural shift in exports towards technology-intensive activities. However, since 2000, several factors, largely triggered by the global financial crisis, led to a drop in industrial output along with a reduction in FDI attraction. This paper assesses the efficacy of the Investment Promoting policies to stimulate innovation and promote the absorptive capacity at national level, by analysing the relationship between FDI inward flows and a set of innovation and absorptive capacity indicators. Results show that the gap between Portugal and the EU-28 average is far from being closed. Rather than being an automatic process triggered by foreign presence, we suggest that the convergence based on the productivity, can be assisted by a reinforcement of supply-side measures, and the coordination between the industrial policy and the instruments of the Investment Promotion Policy, in strategic industries.
Keywords: Industrial Policy, Productivity, Investment Promotion Policies, Innovation, Convergence, Technological Gap
JEL Codes: F15, F23, O11, O33, O40

2
1. INTRODUCTION
After World War II, the Portuguese economy started a process of industrialization, first based on an import substitution policy, which was followed in the 1960s by export promotion policies along with an increasing openness to international trade. Industrialization supported by public and private investments accelerated convergence to the technological frontier. In the 1960-1990 period, the second most important source of growth was the 'catching-up effect' (1.4%), followed by investment in physical capital (2.1%) [Pessoa, 1998]. Indeed, the increasing openness of the economy contributed to an increase in the productivity of manufacturing industries through access to up-to-date technology, disembodied technology and non-technological innovation, alongside with the movement of workers from agriculture to manufacturing industries. In this process of structural change in terms of production, employment and demand, many low-productivity activities were reduced or disappeared. In turn, the economies of scale, provided by output growth, encouraged technical progress. This effect, combined with an export-promotion policy allowed an average rate of growth of real GDP per capita of 4.31% over the period 1961-1989, the third highest recorded in OECD, after South Korea and Japan. However, its evolution was not constant over time. The economy grew more intensely in the 1960s (5.65%) than in the following decades (4.40% and 3.01%, respectively). In fact, as the country approached the technological frontier, because of economic integration in EFTA and the EEC, the relative contribution of the catching-up effect was diminishing. On average, the contribution of the TFP to the growth rate of GDP declined from 1.7% to 1.2% from the 1960’s to the 1980’s, dropped sharply to 0.2% in the 1990’s; and turned negative after 2000 (-1.2% for the first 10 years and -1% afterwards until 2015). In the 1990’s real GDP per capita grew on average at a lower rate of 3.19% (reporting a negative growth rate of -0.81 in 1993), and, after 2000, the scenario completely changed with average annual growth rates of 0.60% in 2000-2009 and -0.22% in 2010-2016. Simultaneously, China's entry into the World Trade Organisation in 2001, the increased foreign competition arising from the EU enlargements and the international financial crisis, slowed the pace of annual growth of real GDP per capita to 0.71% in the first ten years of the new millennium. Thus, the European integration of Portugal was marked by a gradual erosion of competitiveness of the economy and a worsening of the external accounts, due to several factors, namely, the successive increase in the labour cost; the resurgence of competition in the international markets; the expansion of domestic demand and a financing structure that favoured the public sector over the private sector; the high imported components and the low technological content of exports. Indeed, in 2001-2016, high tech exports accounted, on average, for only 5% of total exports.
Being a moderately innovative economy (Innovation Union Scoreboard, 2011), without the location advantages of the CEECs, the potential of convergence of the Portuguese economy, since 2005, was largely threatened by an average growth rate of Total Factor Productivity (TFP) of only 0.28% in 2005-2010. Indeed, in 2005-2014, GDP slumped into an average negative growth rate (-0.3%), with TFP accounting for -1.1% of this decline. Notwithstanding, historically the role of manufacturing labour productivity has been important. In 1986-2016, the productivity per worker is on average twice of that of services and three times higher than that in agriculture. In addition, in the last 30 years, Portugal has quadrupled the share of resource allocation to R&D activities, from 0.4% of GDP in 1986 to a maximum of 1.6%, in 2009. However, the effects of technological improvements on growth have not been translated into real convergence (measured by real GDP per capita) of Portugal towards the EU-28 level (Mateus, 2015). The difficulties in the convergence

3
process were evident in the evolution of net revenues from Community Structural Funds (CSF), which increased from 1% of GDP in 2007 to over 2% in 2013, while the average net revenues in the four "cohesion countries" remained around 0.5% of GDP.
It has been argued that the cause for non-convergence was the investment and the allocation of resources (labour) towards non-tradable services to the detriment of the manufacturing sector where the innovation indices are higher; as well as the implementation of structural reforms (OECD, 2013). The attempts to increase competitiveness based on wage flexibility instead of investment in new products and production processes contributed to revoke the potential positive effects from the R&D efforts. In addition, being a small open economy located on the European periphery, Portugal is vulnerable to external factors that undermine economic growth.
Historically, FDI has contributed significantly to economic growth, by strengthening the export capacity of domestic manufacturing firms. The share of foreign firms in Portuguese exports represented on average nearly 33% of total exports of the manufacturing sector in 1986-2016. However, the financial crisis caused a drop, not only in FDI flows but also in manufacturing output and employment in Europe, due to several external factors, and the Government incentives for innovation activities have been narrowed in most cases. Following the above summing-up about the main features of the Portuguese growth process under European integration, FDI inward flows seem to play an important role. Our main goal is to evaluate, under a policy perspective, whether FDI inward flows during the last 30 years of European integration have contributed to convergence through increased productivity in the Portuguese manufacturing sector. Accordingly, we analyse several innovation and absorptive capacity indicators, in order to evaluate the efficacy of FDI policies in promoting innovation and increasing the absorptive capacity.
In this framework, the European Commission (EC) plays an important role regarding the Government incentive system for innovation activities in Europe, with a view to improve the competitiveness of firms. The National Innovation System is the flow of technology and information among actors (people and institutions) that shape a Country’s innovative process. The linkages (i.e., the set of relationships between agents) can take the form of joint research, personnel exchanges, cross patenting, and purchase of equipment. Understanding these systems can assist policymakers developing approaches for enhancing innovative performance in the knowledge-based economies (OECD, 1997). Furthermore, the EC considers the manufacturing sector as a driver of economic recovery since it potentially generates high rates of innovation and drags capabilities to other sectors of the economy. In this context, industrial policy plays an important role by contributing to the achievement of higher levels of competitiveness through the increase of manufacturing productivity.
Hence, the purpose of this paper is to evaluate from a policy perspective, the impact of FDI inward flows on the TFP of the Portuguese manufacturing sector, through the encouragement of innovation and the increase of absorptive capacity; and thus, on the process of convergence vis-à-vis the EU-28 average.
The presence of the MNCs can provide, for example, technical support to local suppliers in order to improve the quality of inputs or to assist their suppliers in the introduction of innovations and new management techniques, among others (Lall, 1980). In other words, FDI can improve the innovative and the absorptive capacity of domestic manufacturing firms and, thus, it is a vehicle of technological change. Bearing this in mind, we analyse the evolution of FDI and several indicators related to the innovative capability and the absorptive

4
capacity; and we perform an analysis of the performance of the Portuguese economy regarding the achievement of goals to reduce the gap (technological plan) and to increase the innovative capability and the absorptive capacity (Europe 2020 strategy). The objective of this exercise is to provide some policy recommendations to boost productivity and prompt economic growth.
The paper is organized as follows. Section 2 describes the legal framework and the Public Investment Policy related to FDI in Portugal; Section 3 analyses the evolution of FDI inward flows in Portugal and the Manufacturing performance, as well as a set of indicators of technological change in order to assess the efficacy of FDI policies to promote innovation and its coordination with measures aiming to promote the absorptive capacity; In Section 4 we make some recommendations on the design and implementation of FDI policies in the Industrial context; finally, Section 5 concludes.
2. FDI POLICIES IN PORTUGAL
The economic benefits from attracting FDI are generally positive externalities to the host economy. The channels through which externalities operate are 1) technology transfer and know-how; 2) firm development and restructuring (in relation with privatizations); 3) integration in international trade; 4) enhanced competition; and 5) support for training human capital in the host country (Mercinger, 2003). In developed countries, the first two channels are generally considered the most important ones (OECD, 2002). Policies to attract foreign investors include low tax corporate rates, reducing bureaucracy, preferential tariff arrangements, stepped-up investment in infrastructure and education measures. Many of the tariff arrangements, infrastructure and education measures have been directed to priority economic sectors and regions (in connection with “special economic zones”, “export processing zones”, etc.). Other measures were aimed at the general strengthening of social capital through subsidies to the final investment. But these strategies cannot be classified as FDI incentives because they encourage private Investment in general, whereas FDI incentives target or give preferential treatment to foreign investors.
Legal Framework. Portugal's accession to the EC was the engine of change in existent foreign investment legislation from 24 August 1977. Indeed, the new legal mechanism was necessary to liberalize the transfer of private capital (in the form of FDI) from the EC countries and non-EU countries. Under the new regime, enshrined in the diplomas of July and August 1986, all economic sectors are open to private investment, regardless of their origin. The 1977 system, which followed the lengthy procedures, was replaced by a prior notification system based on the following characteristics. Before starting operations, the foreign investor should send the investment proposal to the competent national authority; within two months, the authority informs the applicant of its decision; failure to notify the applicant within that period gives the right to start operations immediately. This system was intended to create new jobs, attract foreign currency to reduce the Portuguese external indebtedness and to strengthen the regional development programs. These objectives were reinforced with entry into force in 1995, of the Foreign Investment Code, under which non-

5
resident firms can create and exercise any economic activity allowed to private sector.1 It also ensured non-discrimination between domestic and foreign investors. Investors could request state aid for an investment project under a general incentive scheme or under a special contractual regime of foreign investment, in case of involving a certain amount of capital expenditures. The Decree No. 2/96 of 16 May 1996, as amended by Decree No. 4/00 of 24 March 2000 establishes the procedures for submitting such a request; and Ordinance No. 865-A/ 2002 has established the minimum amount of capital associated with the eligible investment: EUR 25 million. Investment projects under this scheme could benefit from financial incentives under operational programs and special tax incentives (in accordance with the Tax Benefits -Article 49a and Decree-Law No. 409/99 of 15 October 1999). Law No. 44/2014, of 11 July, authorized the government to amend the Tax Benefits Statute and to adopt a new Tax Code of the investment that has adapted the European legislative framework for state aid for 2014-2020. This code aims to strengthen the tax-exempt investment schemes, about investments that aim to create or maintain jobs and which are in less-favoured regions. About the contractual tax benefits, the limit of corporate tax credit is extended as well as the credit increases for investments in regions with a per capita purchasing power significantly below the national average, which provide the creation or maintenance of employment or contribute to technological innovation or environmental protection. In November 2014, the Council of Ministers reviewed the contractual arrangements for investment, special procurement system (RCI) incentives applicable to large classifiable investment projects within the jurisdiction of the Portuguese Agency for Investment and Foreign Trade (henceforth AICEP). The RCI allows a special negotiation treatment for these projects and the contracting of a set of incentives. The nature, amount and conditions of the incentives- financial incentives, tax benefits and specific compensatory measures to mitigate the costs - are determined considering the economic impacts of the project, as well as the fulfilment of obligations by the sponsor and the contractually fixed economic targets, through a process led by AICEP mandated by the Government.
Public Investment Policy. According to Law 82-A/2014 which approved the major plan options for 2015, Portugal has implemented a program of structural reforms, aimed to reinforce the dynamism and flexibility of the economy, creating international competitive benefits and the sustainability of the public sector. To attract foreign investment, the areas of public intervention are based on the transparency of public finances, the flexibility of labour market, the speed of court proceedings and liberalization in product markets. In addition, measures have been taken to simplify administrative requirements, to restructure operations and to promote business and to strengthen the management and rationalization skills of bank funds directed to small and medium enterprises (SMEs). In October 2014, the EC approved the establishment of the Financial Development Institute which, as its counterparts in other European countries, channels the structural funds. This institution focus on three areas of intervention with the purpose of promoting economic growth and employment, supporting competitiveness and international presence; and contributing to sustainable development. In the field of innovation, measures were implemented to stimulate business innovation, strengthen the cooperation between firms and scientific and technological organizations and promote the inclusion of doctorates and masters in firms through financial incentives to SMEs. Aimed at creating a favourable environment for entrepreneurship, it was created the new special visa regime for knowledge intensive start-ups based in Portugal. Moreover, the incentives to promote business angels and venture
1 Decree-Law No. 321/95 of 28 November 1995

6
capital have been strengthened, with financial support mechanisms and corporate tax incentives for start-ups.
The Industrial Development Strategy for Growth and Employment and The Competitiveness Agenda for Trade, Services and Restaurants 2014-2020 were designed to jointly cover all sectors, create employment and growth opportunities. In this context, fiscal policy is a key instrument in supporting investment, promoting sustainable growth, creating employment and strengthening the capital structure of firms. In 2014, with the aim of turning competitive the country’s tax system, the government reformed the corporate Tax (IRC), which included a reduction of tax rates, and approved the new Investment Tax Code. To fight fraud and tax evasion, it was designed the Cash Value Added Tax system that allows the adjustment of loans overdue in more than 24 months from the date of maturity without prior judicial decision. Attention was also paid to the conventions to avoid double taxation, with other European countries, and the negotiations take place with about 40 countries. With the objective of creating a more favourable environment for investment, the government adopted a consolidation and revitalization of the business strategy based on: the simplification of administrative requirements for restructuring operations; development of business promotion actions; creation of business opportunity grants; mergers encouragement; enhance business management skills; and banking capitalization funds for SMEs.2 At the same time, the creation of a multi-annual training program for new exporters led to the signing of international protocols for the release of intermediated credit lines and guarantees for the financing needed to support the internationalization of SMEs. In the context of this paper it is assumed that the policies and instruments described have been, to some extent, successful in attracting FDI and, indirectly, increase the TFP of domestic manufacturing firms.3 Furthermore, international empirical studies provide evidence that FDI can improve the innovative capacity of the domestic firms. Though, the magnitude of the effect of FDI on innovation capacity may depend on the absorptive capacity of domestic firms (Fu, 2008).
3. FDI FLOWS TO MANUFACTURING, TECHNOLOGICAL CHANGE AND CONVERGENCE
For the follower economy, the process of catching-up with high-income economies consists in eliminating the productivity gap. Since the convergence process is partly driven by the convergence of TFP with the technological leader economy, identifying the drivers of productivity growth is crucial to understand the sources of the productivity gap.
FDI is believed to generate positive externalities in the form of knowledge spillovers to the domestic economy through, for instance, linkages with local suppliers and clients (backward and forward linkages), learning from nearby foreign firms and employee training programmes. In this context, the manufacturing sector, being a major producer of tradables, 2 Government provided funds aimed at the fulfillment of capital ratios by banks at a certain level of interest rate and with the guarantee that banks will lend at least part of these funds to SMEs. 3 Tavares-Lehman (2007) remarks that, although in recent years, Portuguese policy regarding FDI has evolved towards a more proactive and selective stance, the institutional agenda is not prone to maximize the potential benefits of existing investments and macro policies lack consistency. Also, Vinhas de Souza (1996) tested the effects of the regulatory structure upon the amount of the FDI flows to Portugal but the coefficients were not significant and the author could not find a clear sign of granger-causality between legal liberalization and tax policy and the size of the inflows, for 1985-1994. As a result, as Silva (1990) -notes, with the exception of some years in the 1980s, Portugal has never attracted a large amount of FDI flows.

7
is the main engine of economic growth due to its higher productivity and innovation indices (Andreoni and Gregory, 2013). Furthermore, technological linkages stemming from manufacturing industries are main vehicles of technological change (Jones and Olken, 2005; Rodrik, 2007 and Su and Yao, 2016).
An increased foreign presence within an industry is correlated with the TFP growth of domestic firms through increased speed of technology transfer. Table 1 shows some quantitative results regarding the effect of FDI in the TFP of the manufacturing firms in the host economy. For example, Keller and Yeaple (2009) estimate that, in 1987-1996, a 1% increase in the share of foreign-affiliates’ employment in total employment, increases TFP of manufacturing plants in the U.S. by 1.1%. For a panel of OECD Countries, including Portugal, Pessoa (2005) estimates that 1 % increase in FDI have an impact on the TFP of manufacturing firms of about 0.019% ‒ 0.023% in 1985-2002. Using plant level panel data for the UK, Haskel et al. (2007) find that a 1% increase in the share of MNCs in total employment raised the TFP of that industry by 0.05% in 1973-1992. Another study using panel data at firm-level (Fons-Rosen et al., 2013) analyses the impact of FDI in the TFP of manufacturing firms for a set of developed countries, including Portugal, and concludes that the impact is 0.007% in the 1999-2008 period. Finally, Santos & Khan (2018), using a dynamic panel data of manufacturing firms, for 1995-2007, estimate that 1% increase in the turnover of foreign firms raises the TFP in 0.42 percentage points.
Table 1. Impact of FDI on the TFP of manufacturing firms
FDI Measure TFP increase (%)
Keller & Yeaple, 2009
Share of foreign-affiliates’ employment 1.100
Pessoa, 2005* Net annual inflows 0.019 -0.023
Haskel et al., 2007
Share of foreign-affiliates’ employment 0.050
Fons Rosen et al., 2013*
Share of foreign capital of firms 0.008
Santos & Khan, 2018 Turnover 0.42
Notes- *Cross-section studies, including Portugal
FDI is one of the main potential sources of externalities to Portugal (EC, 2016). For example, in the period 1985-1995 there was a stronger contribution of TFP to economic growth, in part associated with FDI inflows financed by EU Structural Funds (Amador and Coimbra, 2007). Indeed, after 1988 there was a burst in FDI flows which increased the capital stock of about 4.2%, adding about 0.31% to GDP growth, per year (Mateus, 2006). Freitas and Mamede (2008) found that the share of foreign firms in 2005 was higher than average for products with “High” and “Very High” income content (56% and 43%, respectively); while Gonçalves and Martins (2016), using panel data for Portuguese manufacturing firms, for 2010-2014, found that exports prompted the TFP growth. Hence, the sustained growth of the economy will depend largely on the ability of economic agents to diversify financing sources, including by attracting FDI (Júlio et al., 2013). Hence, we assume that FDI inflows may be a channel of technological catching-up, and perform an analysis of correlation

8
between changes in FDI inward flows and in the manufacturing performance and in the aggregate productivity in order to provide a hint on the impact of FDI on the productivity and economic growth.4 Bearing this in mind, we start by analysing the evolution of FDI inflows and the manufacturing performance. Subsequently we analyse the evolution of a set of indicators related to the innovation system in the Portuguese economy. Finally we scrutinize the sources of the technological gap and the goals of the Technological Plan, which aim to narrow the gap. Our analysis on the dynamics of Portuguese innovation systems draw from Schumpeterian literature on innovation and economic growth. The importance of innovation capability for the economic growth arise from the idea-based new growth models (Romer, 1990; Furman et al., 2002); whereas the role of absorptive capacity for imitation-based catching-up is highlighted in the technology-gap models (Abramovitz, 1986; Verspagen, 1991; Godinho et al., 2006; Fagerberg and Srholec, 2008). This exercise aims to gauge whether convergence is being triggered.
FDI inward flows. Portugal's accession to the EEC has indirectly contributed to the boost of inflows of foreign capital, which in 1986 accounted for 15% of GDP and 3.3% of total world FDI. Nevertheless, in 1986, FDI inflows represented only 4% of GDP and 0.5% of global FDI; whereas in 2016 it represented only 1% of GDP. After 2008, FDI flows have stabilized around 1% of GDP. However, in the period 2011-2015 FDI flows increased to 2% of GDP, due to privatizations carried out in the context of the Economic and Financial Assistance Programme (EFAP). As for the evolution of FDI stocks, it confirms the increasingly importance of foreign subsidiaries in Portugal. In 2016, FDI stocks represented 28% of GDP, 3.5 times more than in 1986.
Table 2. Flows and stocks of FDI (% GDP), Portugal (1986-2016)
Year Flows Stocks Year Flows Stocks 1986 4 8 2002 1 19 1987 9 16 2003 3 22
1988 -2 12 2004 1 22
1989 7 18 2005 1 22
1990 2 17 2006 4 25
1991 2 17 2007 1 25
1992 1 17 2008 1 25
1993 1 18 2009 0 25
1994 1 17 2010 1 24
1995 0 16 2011 2 26
1996 1 16 2012 2 27
1997 1 16 2013 1 27
1998 2 16 2014 2 28
1999 1 16 2015 2 29
2000 3 18 2016 1 28
2001 3 19 Average 2 20
Source: author’s calculations based in UNCTAD.
4 Our analysis does not take into account technical transfer via FDI that occurs in Services sector.

9
Table 3 shows FDI inflows by EU Country. In 1993, Portugal was in the ninth position. However, the Country dropped to 15th position in 2013, being surpassed by Poland, Czech Republic and Hungary.

10
Table 3. FDI inflows (USD Million) to EU Countries (1986-2016) Country 1986 1987 1988 1989 1990 1991 1992 1993 1994 1995 1996 1997 1998 1999 2000 2001 Austria 4989 6648 6816 9208 10972 11511 12040 12106 14804 19720 19629 19522 23564 23471 30431 34329 Belgium -521090 -181084 -294553 97389 -138324 -227052 -206200 -204039 -82242 -18504 -18233 -17279 -20766 -20362 -23492 -26347 Bulgaria 1032 -2633 904 108 112 168 210 250 355 445 554 1059 1597 2184 2704 2945 Cyprus -1113 -1061 -999 -929 -802 -720 -613 -530 -454 -79 350 897 1242 2055 2910 3855 C.Repub 0 0 1291 1291 1363 1886 2889 3423 4547 7350 8572 9234 14375 17552 21644 27092 Denmark 4591 5629 5485 6905 9192 14712 14387 14618 18083 23801 22340 22268 35694 47643 73574 75438 Estonia 731 534 657 846 -603 14 96 258 473 674 825 1148 1822 2467 2645 3160 Finland 1680 2620 3040 3965 5132 4220 3689 4217 6714 8465 8797 9530 16455 18320 24273 24070 France 44465 49084 56287 69348 97814 110174 127883 135078 16344 19143 20015 19586 24621 24466 25977 29532Germany 49277 64714 61526 84218 111231 123992 119965 116134 13915 16591 16251 15883 20677 23525 27161 27215Greece 9071 10136 11632 13011 5681 6816 7960 8937 9918 10971 12029 13013 13084 15890 14113 13941 Hungary 10959 9786 9446 12942 570 2107 3424 5576 7087 11304 13282 17968 20733 23260 22870 27407 Ireland 36594 36917 37174 37367 37989 39351 40809 41887 42744 44187 46804 48940 62450 72815 12708 13405Italy 25554 31353 36884 49391 59998 61576 49963 53949 60376 65350 74640 85468 10882 10863 12117 11343Latvia 2298 722 1084 1778 343 145 176 221 436 615 936 1272 1558 1795 2084 2328 Lithuani -607 -657 -193 -784 -26 97 107 137 321 352 700 1041 1625 2063 2334 2665 Luxemb 56320 107627 -91839 10848 -27533 -64537 -82537 -107994 5423 18504 18233 17279 20766 20362 23492 26347 Malta 308 327 368 420 465 542 582 651 416 562 844 858 1174 1872 2385 2551 Netherla 33354 43449 42546 52052 68731 72475 74440 74478 93409 11604 12654 12219 16447 19222 24373 28288Poland 102732 39358 -1901 -37393 109 425 1370 2307 3789 7843 11463 14587 22461 26075 34227 41247 Portugal 4354 4870 5861 7670 10571 13020 14893 16427 17697 18982 21118 22392 30088 26910 32044 36023 Romania 0 0 0 0 0 44 122 215 402 821 1097 2417 4527 5671 6951 8339 Slovakia 17982 13295 -2394 189 282 363 463 642 897 1297 2046 2103 2920 3188 4746 5582 Slovenia 5804 3622 1636 1639 1643 1708 1819 1931 2048 2617 2730 2207 2777 2682 2893 2594 Spain 13436 22992 29578 41951 65916 79571 107840 100299 93148 10452 11976 10529 12605 12536 15634 17725Sweden 6013 9234 9907 10920 12636 18085 14057 13127 22650 31043 34835 41454 51002 73301 93995 91942 U.Kingd 76283 109352 129654 15020 203905 208346 172986 179233 18958 19977 22864 25295 33738 38514 43863 50668
Source: UNCTAD

11
Table 3. FDI inflows (USD Million) to EU Countries (1986-2016) (cont.)
Country 2002 2003 2004 2005 2006 2007 2008 2009 2010 2011 2012 2013 2014 2015 2016 Austria 43508 53844 62336 69454 84025 126895 145796 169124 160615 152768 164714 178825 176607 164785 107110 Belgium 229513 351499 466548 478183 633296 748110 854426 967601 873315 942817 512712 571776 476405 468710 421839 Bulgaria 4074 6371 10108 13851 22867 36508 27846 32829 31510 28179 29633 29855 29660 26375 17408 Cyprus 4912 6728 8594 8688 14577 18414 180043 186227 212576 182687 185190 177461 149440 138263 95401 C.Republic 38669 45287 57259 60662 79841 101074 113174 125827 128504 120569 136493 134085 121512 113057 83662 Denmark 82799 100191 116486 115953 135408 146632 103957 103197 96984 98406 98302 94482 97216 100858 73626 Estonia 4226 7002 10064 11290 12664 16594 15449 15841 15551 16350 18937 21202 19712 18914 14942 Finland 33987 50257 57376 54585 67991 85237 83534 85163 86698 89232 96641 88762 93901 92340 65561 France 385202 527624 641807 628075 771545 1026081 563005 648012 630710 698871 717328 796488 729147 772030 594463 Germany 297785 394513 512066 475996 578786 629711 789256 963511 955881 997727 1077019 1088690 1089569 1121289 818541 Greece 15561 22454 28482 29189 41288 52838 38119 42097 35026 29060 24765 25850 22534 17688 12205 Hungary 36224 48340 62585 61970 81586 97397 88054 98876 90845 85331 104017 108517 98885 92132 63571 Ireland 182897 222960 204819 163530 156593 187184 188290 250103 285575 290495 364607 392915 378202 435490 431135 Italy 130819 180891 220720 224079 294876 364839 327911 364427 328059 355127 375029 364959 346824 335335 224674 Latvia 2751 3277 4529 4929 7476 10493 11309 11629 10935 12111 13534 15956 14668 14549 9893 Lithuania 3981 4960 6389 8211 10996 14679 12949 13216 13271 14266 15966 17542 15619 14440 9242 Luxembourg 34972 41730 49733 43721 66658 30176 125128 172217 172257 225725 167222 91396 180434 205029 135319 Malta 2413 3281 4018 4315 6498 7457 117077 125193 129770 146146 165530 184584 173838 163522 112830 Netherlands 349969 426611 477219 451078 502226 673430 647414 646292 588078 610677 628187 770976 715706 707043 445437 Poland 48320 57877 86623 90711 124530 142110 148417 167399 187602 164424 198953 229167 205581 213071 144888 Portugal 44637 60585 66970 63339 87959 114192 105511 118299 114994 103761 114573 124623 118918 114220 62821 Romania 7846 12202 20486 25817 45452 60921 64759 69883 68093 69513 76329 82688 73086 69112 46996 Slovakia 8530 14576 20910 23656 38335 40702 50416 52537 50328 51980 55124 58021 52488 48163 34196 Slovenia 4112 6308 7590 7259 8924 10350 11966 11277 10667 11490 12203 12269 12299 11847 7700 Spain 257106 339652 395984 370943 441039 537455 588901 632246 628341 628950 644677 638982 591709 533306 383980 Sweden 119368 158884 196290 171768 226385 254459 278802 332150 347163 349058 373444 386105 311786 281876 205770 U.Kingdom 523320 606158 701913 850963 1133437 1347688 901515 1015805 1057188 1145720 1428059 1489940 1744230 1457408 932741
Source: UNCTAD

12
Indeed, with the acceleration of globalization that started in the new millennium, FDI flows targeting the Portuguese manufacturing sector became more volatile.
Figure 1. Net FDI flows to Manufacturing (USD million), Portugal (1986-2016)
Source: Author’s calculations based in OECD Stat.
Bearing this in mind, we analyse the joint evolution of FDI flows to the manufacturing sector and the factor contribution (%) to GVA increase in the manufacturing sector from 1986 to 2016, in search for a hint regarding the role of FDI to TFP increase in the manufacturing sector.
FDI and the Manufacturing performance. In what follows we analyse, on the one hand, the evolution of net FDI flows targeting the manufacturing sector in 1986-2016, and its performance regarding output, value added and productivity; and, on the other hand, the contribution of the subsidiaries in the manufacturing sector in Portugal, by technological groups, concerning high technology exports and growth accounting, in the same period. Through the joint analysis of Figures 2 and 3 on the evolution of net FDI flows targeting the manufacturing sector and the performance of this sector, we can observe a tendency in which the peaks of 1994, 2004, 2006 and 2012 correspond to years in which the contribution of manufacturing to employment was higher than the contributions to output, value added and productivity (or equal to the contribution to GDP in the years of 1994 and 2012). In the evolution of manufacturing sector from 1986 to 2016, we distinguish two phases. The first, from 1986 to 2004, is characterized by a decline in the share of output, TFP and GVA. After 2004, the 3 aggregates seem to have stabilized below 30%. In 2016, it is observed a small decline.

13
Figure 2. Manufacturing Performance (%), Portugal (1986-2016)
Notes: Labour productivity is the real GVA per hour worked Shareman denotes the share of manufacturing sector, gdp is gross domestic product, l is labour, lp is labour productivity, gva is gross value added and tfp is total factor productivity. Source: Total Economy Database. Groningen Growth and Development Centre.
In 1990 and 2013, the net flows to manufacturing were negative (i.e., foreign divestitures were higher than investments) yet we found that the contribution of manufacturing to the output was higher than the contribution to employment. This evolution cannot be dissociated from further European integration, especially with the adhesion to the euro and the privatization process. The appreciation of the national currency (escudo) before the adhesion and the setting of an excessively high irrevocable conversion rate between the escudo and the euro had a strong punitive effect, in a context where Portugal could no longer offset the losses in competitiveness via the devaluation of its currency (Mateus, 2015). Moreover, privatization heightened the deindustrialisation, as shown, for example, with the liquidation of heavy metallomechanics. These difficulties, combined with a sharp drop in interest rates tended to guide investment to the so-called non-tradable goods, housing, public works and consumption (Marques and Lynce, 2011).
We investigated the correlation between FDI flows targeting the manufacturing sector, and the manufacturing performance regarding output, employment, and labour productivity, as well as convergence (using the gap in labour productivity and the TFP vis-à-vis the EU-28 average), respectively. Regarding the manufacturing output, there is a positive but weak correlation in the current period. This correlation is negative but weak for the manufacturing output with one and two period lags.
Regarding employment, there is a positive but weak correlation in the current and lagged period, although the value of correlation is higher for employment with two-year lag. This may imply that it takes two years before the foreign projects begin to exert positive benefits regarding employment in the manufacturing sector.
Concerning labour productivity, there is a negative and strong correlation in the current period. This negative correlation is weak regarding labour productivity in lagged periods. As for convergence of productivity with the EU-28 average, there is a positive but weak

14
correlation with the gap of labour productivity. Because the gap is constructed as the ratio between labour productivity of EU28 countries and labour productivity in Portugal, a positive correlation implies that the larger the flows the larger the gap regarding labour productivity. Hence, in spite of FDI flows have a positive relation with employment in manufacturing, on the whole economy it appears that foreign firms contribute to deteriorate the labour productivity of domestic firms. One explanation is that may be the case that FDI causes a loss of market share to the domestic firms, via competition and these firms are forced to operate in an sub-optimum scale. As a result the labour productivity of domestic firms may decrease. However, there is a negative but weak correlation between FDI flows targeting the manufacturing sector and the gap of TFP (current period). In the same line of reasoning, because correlation is negative, it appears that FDI flows to manufacturing industries might help to close the gap regarding TFP. The EU countries have been experiencing a relative under-performance regarding productivity, when compared to the US. It has been highlighted that the causes were the slower adoption of new technologies compared to the US (Jorgenson and Stiroh 2000; O'Mahony and Vecchi 2005; Venturini 2009), and the insufficient level of skills and organizational changes. Indeed, investments in these two later assets may affect countries' absorptive capacity, i.e. their ability to take advantage of the international diffusion of technology (Foster-McGregor et al., 2013). Since the bulk of technological innovations is concentrated in few countries, the economies that are far from the technological frontier need to improve the absorptive capacity of their industries as a mean to enhance productivity growth. The evolution of labour productivity in the Portuguese manufacturing sector, measured by GVA per hour worked shows that the Portuguese manufacturing sector follows the trend of the EU-28 average, especially since the financial crisis in 2008. Over the period, the values are near zero. Table 4 shows the Growth Accounting analysis (GVA growth and contributions in volume).
Table 4. Share (%) of MNCs in Total Economy, Portugal (1986-2016)
Year No.Firms Employment
Value Added
Year No.Firms Employment
Value Added
1986 0.5 7.2 20.3 2002 0.1 2.7 8.1 1987 0.3 4.6 15.2 2003 0.2 4.5 17.6 1988 0.3 5.2 13.6 2004 0.2 4.4 14.5 1989 0.4 5.8 13.7 2005 0.3 5.1 16.4 1990 0.2 5.0 12.5 2006 0.4 5.4 16.5 1991 0.5 8.5 19.9 2007 0.4 5.7 17.0 1992 0.3 5.7 15.6 2008 0.4 6.9 17.5 1993 0.4 5.8 18.7 2009 0.4 6.9 17.6 1994 0.4 8.2 19.8 2010 0.4 7.2 18.4 1995 0.3 5.8 15.7 2011 0.5 7.3 18.7 1996 0.3 4.7 16.1 2012 0.5 7.2 18.6 1997 0.2 4.5 12.6 2013 0.4 7.5 18.8 1998 0.2 4.3 14.4 2014 0.3 5.1 11.8 1999 0.2 3.6 7.8 2015 0.3 4.6 10.6 2000 0.2 3.6 8.5 2016 0.1 2.7 8.1 2001 0.1 2.5 8.5 Average 0.3 5.4 14.9
Source- Author’s calculations based in UNCTAD

15
The contributions for GVA derive from labour (low, medium and high-skilled labour); capital (ICT and non-ICT) and the TFP.5 The values for 1996-2005 are obtained from EUKlems database (version of 2009 for Portugal) and the values for the remaining years were obtained by multiple imputation in Stata 13.0. The joint analysis of Table 5 and Figure 3 shows that, in the years that recorded peaks of net flows, capital contributions to manufacturing GVA were positive and in 2004, where there is an absolute maximum in regarding net flows, the contribution of TFP was also positive (0.1).6 It should be noted that in the cited years of maximum and minimum flows, the contribution of labour to the manufacturing GVA was negative.
Table 5. Growth Accounting in Manufacturing sector, Portugal (1986-2016)
Year Labour Capital TFP Year Labour Capital TFP 1986 -0,5 2,1 0,4 2002 -0,5 1,2 -1,7 1987 0,2 1,0 3,7 2003 -1,0 0,5 -0,5 1988 -1,4 -0,5 7,7 2004 -0,4 0,5 0,1 1989 -0,8 2,1 6,9 2005 0,2 0,5 -2,4 1990 -1,9 2,2 4,4 2006 -0,6 1,0 -1,8 1991 -3,3 1,7 7,9 2007 1,1 1,0 -2,0 1992 -0,8 1,0 -1,9 2008 -0,1 -0,2 -1,6 1993 -0,8 1,7 -2,7 2009 0,1 1,3 -3,9 1994 -0,6 0,6 -5,5 2010 0,2 0,6 -1,7 1995 -1,1 1,3 4,0 2011 2,9 0,3 -5,8 1996 0,8 0,5 6,1 2012 0,4 0,5 -3,4 1997 -2,4 1,3 6,8 2013 -0,9 1,2 -0,5 1998 -1,5 1,4 2,7 2014 1,7 0,8 -4,9 1999 1,5 1,9 -3,8 2015 -2,0 -0,6 7,6 2000 0,2 2,3 -0,2 2016 -0,4 0,3 3,3 2001 -1,5 2,2 0,5 Average -0.4 1.0 0.6
Note- values for 1986-1995 and 2006-2016 obtained by Multiple Imputation in Stata 13.0 Source: EUKlems database
Figure 3. Productivity gap between the average EU-28 Countries and Portugal (1986-2016)
Notes: Lp is calculated as GDP per hour worked, USD, constant prices, 2010 PPPs and TFP is TFP level at current PPPs (USA=1). Source: Author’s calculations based on OECD.Stat and Penn World Table, version 9.0
5 This distintion in capital aims to better gauge the impact of information and communication technologies (ICT) on growth. 6 The contribution is the factor share times the factor growth rate.

16
Concerning the closing of the technological gap, in 1994, the TFP in Portugal was higher than that of the EU-28 average, but in the remaining years, when there was a maximum in net FDI flows, the TFP level was equal to the UE-28 average. As for the labour productivity gap, it curiously narrowed both in 1990 and 2013 when net FDI flows were negative. This may imply that competition from foreign firms in the host economy caused a loss of domestic firms’ market shares. As they are compelled to operate in a sub-optimum scale there is a subsequent fall in their labour productivity.
Tables 6 and 7 concern the contribution of foreign firms in the manufacturing. On average, in the last 30 years of European integration, the subsidiaries represented only 0.3% of the firms but contributed to 15% of value added and 33% of exports, of which (at least) 14% concerns high-tech products (see Table 11). Therefore, in general, FDI in Portugal has contributed significantly to the structural change of exports, towards technology-intensive activities. Thus, the loss of FDI attractiveness seem to have a negative impact on the export performance of the country.
Table 6. Share (%) of MNCs exports in Total, Portugal (1986-2016)
Year MNCs exports in Manufacturing
% Total Year MNCs exports in Manufacturing
% Total
1986 1199 22 2002 6875 28 1987 1415 22 2003 6922 24 1988 1875 24 2004 9157 30 1989 2062 20 2005 12849 41 1990 4667 40 2006 8906 25 1991 3703 31 2007 17905 47 1992 5565 45 2008 9746 25 1993 1901 15 2009 13826 44 1994 2898 18 2010 16387 44 1995 3667 21 2011 17514 41 1996 6792 35 2012 20369 45 1997 6440 30 2013 11907 25 1998 4236 19 2014 25436 53 1999 5565 24 2015 17285 35 2000 11006 48 2016 25833 49
2001 10370 45 Average 33 Values in USD Million. Source: Author’s calculations based in World Bank (World Development Indicators) and Eurostat.

17
Table 7. Contribution (%) of foreign firms to high-tech exports, Portugal (1986-2016)
Year MNCs exports in
science based industries (% Manufacturing)
Year MNCs exports in
science based industries (% Manufacturing)
1986 11 2002 5 1987 10 2003 7 1988 8 2004 9 1989 7 2005 12 1990 28 2006 13 1991 16 2007 17 1992 34 2008 8 1993 8 2009 20 1994 8 2010 17 1995 5 2011 16 1996 23 2012 18 1997 14 2013 11 1998 7 2014 17 1999 15 2015 12 2000 19 2016 16
2001 14 Average 14 Source: Author's calculations based in World bank Database (World Development Indicators), OECD Stat and UNCTAD (2013, p.30).
Along the lines of the lower dynamism in promoting FDI, Portugal is the MS where foreign subsidiaries have less weight in employment and wealth creation. Tables 8a and 8b show the foreign firms’ performance regarding gross operating surplus and employment.

18
Table 8a. MNCs’ Performance (Gross Operating Surplus) by industry, Portugal (1986-2016)
Industry 1986 1987 1988 1989 1990 1991 1992 1993 1994 1995 1996 1997 1998 1999 2000
Food products 203 217 190 204 167 205 212 194 156 173 196 199 193 178 198 Beverages 66 49 83 35 35 90 46 47 71 73 76 66 43 69 43 Textiles 14 37 36 11 22 28 22 20 23 14 29 13 12 10 34 Wearing apparel 2 6 6 6 4 5 5 7 4 3 5 5 3 5 3 Leather products 14 19 28 22 33 11 16 14 13 24 44 10 28 16 13 Wood 89 102 115 55 55 114 25 101 75 25 45 22 94 33 95 Paper products 51 66 71 58 67 53 58 49 52 65 59 71 48 49 62 Printing 30 37 15 8 32 56 2 66 6 32 50 32 15 63 31 Chemicals 52 181 83 157 81 147 72 102 173 195 156 186 147 67 153 Pharmaceuticals 122 85 123 114 101 98 110 122 124 105 124 115 106 111 103 Rubber and plastics 240 334 196 305 242 250 283 229 217 207 283 273 251 315 219 Other non-metallic minerals 109 204 194 142 214 109 163 208 158 202 126 204 152 142 211 Basic metals 44 47 50 37 36 55 65 54 38 55 52 66 60 39 49 Fabricated metal products 52 66 68 60 53 59 50 70 70 64 39 56 68 68 66 Computer & electronics 52 53 33 61 49 62 65 76 52 49 73 58 55 68 38 Electrical equipment 90 87 102 58 54 96 98 50 64 70 83 99 120 62 57 Machinery& Equipment 69 102 67 53 65 102 73 104 63 77 58 47 63 105 80 Motor vehicles 362 300 252 317 183 168 273 245 330 245 175 283 322 239 366 Other transport equipment 76 56 58 112 18 14 26 83 22 101 73 25 11 96 150 Furniture 11 41 11 44 29 6 20 29 14 8 38 7 43 40 19 Other manufacturing 47 51 48 49 47 46 45 51 50 51 41 41 40 52 44 Repair and installation 28 24 23 29 28 24 23 25 26 22 22 30 21 26 29
Source: EUROSTAT, Foreign control of enterprises by economic activity

19
Table 8a. MNCs’ Performance (Gross Operating Surplus) by industry, Portugal (1986-2016) (cont.)
Industry 2001 2002 2003 2004 2005 2006 2007 2008 2009 2010 2011 2012 2013 2014 2015 2016
Food products 162 155 192 194 155 194 204 222 216 202 158 150 141 145 157 169 Beverages 33 95 43 92 94 62 57 97 104 97 91 63 69 88 33 73 Textiles 37 14 24 25 27 9 33 18 6 30 32 25 38 6 24 19 Wearing apparel 3 3 3 4 4 6 7 6 1 6 4 -2 5 7 5 5 Leather products 16 47 17 13 17 18 15 10 8 21 9 13 12 22 41 19 Wood 44 19 37 22 22 17 10 24 13 18 18 19 18 19 10 17 Paper products 72 60 49 60 59 61 56 56 61 76 61 58 64 72 75 65 Printing 37 11 39 12 46 4 4 6 4 2 1 1 0 2 11 18 Chemicals 157 126 159 164 129 110 128 196 140 188 179 51 70 103 159 155 Pharmaceuticals 108 88 86 116 115 85 106 106 124 89 84 94 88 104 107 115 Rubber and plastics 234 324 235 292 279 216 235 165 192 240 272 301 337 340 345 267 Other non-metallic minerals 156 103 182 160 214 150 209 135 103 132 114 92 102 214 106 191 Basic metals 61 61 48 36 41 69 54 35 -24 39 14 10 23 51 64 35 Fabricated metal products 43 55 43 58 49 64 49 69 64 71 38 40 47 62 69 52 Computer & electronics 60 68 38 34 61 59 34 57 54 84 81 62 64 64 40 38 Electrical equipment 68 108 71 121 64 59 106 173 157 165 143 97 106 103 104 108 Machinery& Equipment 92 50 87 65 106 71 42 112 36 63 54 71 56 66 72 98 Motor vehicles 143 221 328 191 303 132 192 284 245 362 394 329 328 366 332 139 Other transport equipment 85 39 114 157 124 2 71 102 149 10 -29 -99 -10 -12 99 155 Furniture 38 8 38 6 12 38 25 -6 2 9 6 4 24 27 38 44 Other manufacturing 48 48 49 40 43 40 42 35 39 41 52 45 46 44 50 51 Repair and installation 21 25 24 29 30 26 22 29 31 24 22 29 24 21 22 24

20
Table 8b. MNCs’ Performance (Number of Employees) by industry, Portugal (1986-2016) Industry 1986 1987 1988 1989 1990 1991 1992 1993 1994 1995 1996 1997 1998 1999 2000 Food products 4292 4410 6676 3369 5096 3317 5887 3196 2164 2742 4079 4322 8156 10903 3936 Beverages 6768 4597 1201 4149 1355 3408 3094 2456 3195 2439 3713 4016 2884 2704 1243 Textiles 5878 4776 3804 3488 4986 3569 6331 6886 5862 5412 3193 5574 7175 3382 2405 Wearing apparel 3528 3840 6602 2483 5408 4921 1517 591 2050 5756 2450 1619 475 5914 2390 Leather products 1495 8001 6608 8039 2736 4217 6469 7716 5737 4715 5994 6752 6832 5917 6011 Wood 1221 2434 6359 8064 3916 2440 3611 3398 4972 4686 5100 3544 4005 7692 6435 Paper products 4697 5733 2441 2234 3772 3606 3500 2964 4693 3976 7429 6434 7724 3658 2169 Printing 364 738 507 490 694 627 514 371 160 389 740 430 466 661 773 Chemicals 3133 8315 6367 4063 6143 7262 5620 4283 2705 645 2196 6682 2049 4874 4669 Pharmaceuticals 5664 3771 2828 3822 4432 2595 4139 3082 3120 2166 4372 7437 8300 9196 3310 Rubber and plastics 6219 4375 4729 5884 5205 3212 6744 6693 5841 5392 4624 2316 6595 5389 4056 Other non-metallic minerals 5296 5174 1800 1384 1705 1466 1753 5954 7657 2138 7310 8123 6190 3474 1790 Basic metals 1745 1546 7842 2125 3196 6565 4939 2023 3982 2708 4420 7103 1618 1950 5782 Fabricated metal products 9645 7270 6039 7843 4897 7610 7491 9938 8028 6413 5589 4007 4089 5031 6595 Computer & electronics 8021 8074 4779 8203 1757 5212 1543 3326 2760 3252 2262 7465 8184 6625 5704 Electrical equipment 4740 9474 8140 4484 2301 2452 3341 2733 3094 5220 8990 10210 6097 8444 5601 Machinery& Equipment 3563 3044 4794 4722 2392 7324 2050 1745 4473 4281 4872 4971 6185 7510 5684 Motor vehicles 10628 14484 13096 12780 13481 13114 9130 13874 17469 13931 16650 17240 16620 11786 17755 Other transport equipment 5517 7300 5173 7527 7092 7365 7327 4552 4697 3139 3916 5505 8658 5895 5655 Furniture 2027 4558 6612 3517 2933 1033 2276 2092 1556 2996 6941 8045 4314 5067 4287 Other manufacturing 5458 4252 3525 3535 2930 4386 3643 5170 4610 5713 6087 3282 1645 10206 2682 Repair and installation 4554 3174 6889 7009 5143 3159 4119 3770 5106 4531 5557 5601 3769 2082 2881

21
Table 8b. MNCs’ Performance (Number of Employees) by industry, Portugal (1986-2016) (cont.)
2001 2002 2003 2004 2005 2006 2007 2008 2009 2010 2011 2012 2013 2014 2015 2016 Food products 3932 4242 3076 7437 8680 6131 8795 9427 7124 8873 8999 8593 8394 9592 8718 5967 Beverages 2753 3878 2772 1270 2364 3453 3154 2684 2590 2395 2380 2302 1991 2265 3595 1260 Textiles 3810 4286 3921 1209 2098 7715 6519 4014 3592 3363 3197 2694 2772 2964 4030 3659 Wearing apparel 3684 4310 5868 3664 4927 5906 3880 4692 3737 3638 3534 3396 3410 3375 4906 4100 Leather products 4262 4806 3002 4468 6831 4327 6809 4963 4601 6759 3681 4102 4746 5262 5678 2270 Wood 5550 2332 3947 4351 4842 3618 2233 1369 1250 1241 1267 1219 1146 1405 1253 1731 Paper products 2797 2628 2743 2519 1040 3756 1320 2275 2206 2168 2064 2036 2180 2360 2763 1069 Printing 563 981 963 503 732 492 415 477 454 392 386 379 271 292 146 264 Chemicals 3801 7241 5754 4351 5711 6774 5237 5488 5094 5169 5092 4897 4556 4597 5049 4536 Pharmaceuticals 7050 4458 2876 2506 4651 3287 2158 2157 2432 2401 2416 2518 2339 2442 2940 2527 Rubber and plastics 6099 7548 5604 6543 6493 8424 8415 6055 5556 5751 6163 6179 6073 6437 3004 5221 Other non-metallic minerals 3734 3683 4192 5276 7446 6884 5863 6277 5811 5611 5448 5228 5329 6413 5588 7095 Basic metals 6599 7446 3448 3193 4307 4046 2498 2562 2271 2251 2307 2067 2154 2622 2313 1162 Fabricated metal products 7599 6617 8141 3441 6037 4575 3675 4698 4410 4420 4353 4248 4743 4988 2184 4410 Computer & electronics 4462 6953 6644 6000 5161 3039 3953 4763 5828 5978 5650 5502 5080 5288 6533 5075 Electrical equipment 4292 5594 3901 4293 9330 7949 6448 9149 8947 9145 9496 9444 9573 9430 8833 7025 Machinery& Equipment 7411 3073 4028 3477 6638 5002 6735 5902 3693 4080 4273 4909 4233 4458 7265 6589 Motor vehicles 11095 11380 12310 15769 11398 15029 22352 22874 19999 18831 19108 19163 19315 19591 18828 14371 Other transport equipment 4389 5589 9110 3312 7513 6053 5011 3620 6207 1492 3584 2643 1586 1610 1859 4483 Furniture 3121 2123 1035 2909 1360 2355 2407 1872 1502 2098 2110 2301 2247 2318 2229 2910 Other manufacturing 3986 2324 1814 3185 7246 6136 2860 2368 2531 2513 2717 2770 2737 2611 1769 1865 Repair and installation 6408 4712 7339 5897 3340 2036 2481 2676 2758 2743 2867 2746 2651 2747 3362 2910
Source: EUROSTAT, Foreign control of enterprises by economic activity .

22
Regarding the gross operating surplus, the importance of subsidiaries in 1986-2016 was greater in the motor vehicles industry, food products, rubber and plastics and chemicals, i.e., in scale intensive and science-based industries. The role of subsidiaries in creating employment was more relevant in the motor vehicles industry, food products and electrical equipment, rubber and plastics and other non-metallic minerals, again in scale intensive and science-based industries.
Figure 4. MNCs by technological groups, Portugal (1986-2016)
a b
c d Notes: Panel a- Number of firms (firm), panel b-Number of employees (employ), panel c- Value Added (va) and panel d- Exports (x). Sc denotes scale intensive industries; sci denotes science based industries; sd denotes supplier dominated industries and ss denotes specialized suppliers industries. Nominal values are in EUR Million. Source: Author’s calculations based in EUROSTAT- Foreign control of enterprises by economic activity (Portugal).
Scale intensive industries are major contributors to the number of firms and employment, with science-based industries being the group with fewer firms and the specialized
01
002
003
004
005
00N
umb
er o
f MN
Cs
19861988
19901992
19941996
19982000
20022004
20062008
20102012
20142016
Year
firmsc firmscifirmsd firmss
02
0000
400
006
0000
800
00M
NC
s' e
mp
loym
ent
19861988
19901992
19941996
19982000
20022004
20062008
20102012
20142016
Year
employsc employsciemploysd employss
02
000
400
06
000
800
0M
NC
s' V
alue
Ad
ded
19861988
19901992
19941996
19982000
20022004
20062008
20102012
20142016
Year
vasc vascivasd vass
01
0000
200
003
0000
400
00M
NC
s' E
xpo
rts
19861988
19901992
19941996
19982000
20022004
20062008
20102012
20142016
Year
xsc xscixsd xss

23
suppliers contributing less to employment (see Figure 4). The presence of foreign firms can trigger knowledge externalities to the manufacturing domestic firms, which are main vehicles of technological change due to their upstream and downstream linkages. Identifying the drivers of productive efficiency is crucial to understand the sources of the productivity gap. Thus, we will examine whether there was technological change in the Portuguese economy to assess the efficacy of public policies and instruments (financial incentives provided by the Structural Funds) in Portugal.
Technological Change. We analyse a dataset of indicators of technological change, in order to establish the correlation between its changes and the evolution of FDI inward flows. If the correlation is positive, it may indicate a positive impact of FDI on innovation and/or the absorptive capacity in the Portuguese economy. The construction of the dataset employs the method of multiple imputation.7 Specifically, we construct a dataset that contains no missing values. The dataset comprises 8 indicators measuring two important country-specific dimensions: innovation and technological capabilities, and absorptive capacity (see Table A1 in appendix A). The dataset that is obtained by estimating the missing values in the original data sources (Pordata and Ministry of Science) provides comprehensive statistical information for the period 1986-2016 (for a total of 31 observations). Our empirical analysis of this dataset shows its reliability and points out its usefulness for future time series studies of the Portuguese national innovation system. Historically, the first generation of innovation indicators focus on inputs such as R&D investment, education expenditure, capital expenditure, research personnel, university graduates, technological intensity, and the like. The second generation added input indicators by accounting for the intermediate outputs such as patents, scientific publications and new products and processes. The third generation draw attention to indicators and indexes based on surveys. Although some of the information collected is now qualitative, there is no question that a fourth generation of innovation indicators is required for sound policy implementation. Such indicators would account for Knowledge, Networks and Conditions for innovation. A multi-layered concept like knowledge, however, can only be captured by composite indicators that may include composite knowledge investment and performance indicators; networks should include contractual agreements (partnerships, intellectual property licensing) and informal collaboration and knowledge exchange (working relationships of individuals across organizations); finally, Conditions for innovation refers to systemic innovation measures that capture the context in which organizations form and match expectations and capabilities to innovate. Yet, so far, these 4th generation indicators remain ad hoc and are of limited analytical value. They can be improved only through a coordinated and internationally effort. Table 9 shows the most used innovation and absorptive capacity indicators. A major criticism of most absorptive capacity measures is that they were developed for large firms and are therefore totally inadequate for small firms. Since small firms do not always have a specific R&D department, it can be difficult to measure the resources allocated to research activities. Furthermore, as many small firms consider the patent process to be too expensive and time-consuming, the indicator of Patent registrations is also frequently inapplicable. Thus, the absence of a R&D department or a patent registration policy does not mean that
7 Multiple imputation is an iterative method to address missing data and fittingly reproduce the variance/covariance matrix one would have observed. In this process, the distribution of the observed data is used to estimate multiple values that reflect the uncertainty around the true value. These values are then used in an OLS model, and the results combined.

24
a firm does not acquire knowledge. Hence, the suitability and validity of proxy measures for absorptive capacity are highly empirically questionable.
Table 9. Most common innovation and absorptive capacity indicators
Measure Studies Main advantages Main drawbacks
Innovation indicators
Process innovations West et al. (2003) Reflects improvements in processes and methods
Focus solely on processes
Ratio of sales of new products to total sales
Czarnitzki & Kraft (2004)
Indicator of market success
Since it is a very broad indicator, it may reflect the impact of other factors besides innovation
Total R&D spending; Number of employees in R&D
García-Morales et al. (2008)
Easy to obtain Does not provide indication of innovation efficiency
Patents or patent applications
Jung et al. (2008) Measures technological progress
Nearly 95% of patents lack any market relevance and 99% fail to bring any profit to the firm (Stevens & Burley, 1997)
New products or product improvements; New markets entered
Elenkov & Manev (2009)
Indicator of radical innovation; reflects concrete implementation
Only about 60% of new products succeed
Ratio of sales of new products to R&D expenditures
Gumusluoglu & Ilsev (2009)
Indicator of R&D efficiency
Difficulty to establish a valid baseline
Patent citations Makri & Scandura (2010)
Measures importance of patents
Patents may be self-cited
R&D expenditures (% GDP); number of patent applications by residents; number of scientific publications.
Castelacci and Natera (2013)
Easy to obtain, measures technological progress
Does not indicate innovation efficiency; patents usually lack market relevance; publications may be self-cited
Source: adaptation based on Duchek (2013), Flatten et al. (2011), Jimenez-Barrionuevo et al. (2011) and Murovec and Prodan (2009).

25
Table 9. Most common innovation and absorptive capacity indicators (cont.) Absorptive Capacity indicators
Total Number of Publications based on dollars spent on research annually
Cockburn, Henderson [1998]
Generally accepted measure that can be used for international comparisons.
Data on patents are easily and internationally
available.
Purely quantitative measure. Data are not readily available.
International and sectoral differences in patenting behaviours.
There are differences in patenting between large and small firms.
Same weight is given to very important and less important patents.
Number of Patents Ahuja, Katila [2001]; George et
al. [2001]
Participation in life-long learning; Employment in medium/high-tech industries
Kutlača (2008) Employment in medium/high-tech industries is easy to obtain
Participation in life-long learning is difficult to obtain, due to incipient tracking down system. Systematized indicator for European Countries is recent. Employment in medium/high-tech industries have a limited explanatory power considering that there are several other sources of absorptive capacity.
GDP per capita, purchasing power parity; International Trade (Imports+ Exports % of GDP); Number of Total Graduates; Electric Power Consumption; Gini Index
Castelacci and Natera (2011)
Generally accepted measure that can be used for international comparisons. Data are easily and internationally
available.
GDP per capita is an average measure.
Source: adaptation based on Duchek (2013), Flatten et al. (2011), Jimenez-Barrionuevo et al. (2011) and Murovec and Prodan (2009).

26
After Castellacci and Natera (2013) we measure the dimension of the process of technological change, i.e. the dynamics of the Portuguese innovation system, through a set of indicators of innovative capability and absorptive capacity. Regarding innovative capability, the more domestic firms acquire and absorb new knowledge, the more innovation and competitive advantages they will obtain (Kim, 1998). Since absorptive capacity is a by-product of R&D (Cohen and Levinthal, 1990), innovative input is used as a measure of innovative capability, proxied by R&D expenditures as a percentage of GDP. The assimilation of new knowledge that may lead to the development of new products and processes; and/or the ability to reform the organizational routines, to apply knowledge can be measured by technological and scientific output, respectively proxied by the number of patent applications by residents and the number of scientific publications. As far as absorptive capacity is concerned, GDP per capita controls for the purchasing power of the domestic market. The income and the development level are likely to hustle output growth (Balasubramanyam et al., 1999) and are measured by GDP per capita, purchasing power parity. Indeed, assuming that the higher the GDP per capita, the greater the level of development, and the more education infrastructures. Cœteris paribus, the existence of universities and other educational institutions increases the absorptive capacity. Moreover, many empirical studies analyse the relationship between absorptive capacity and international technology transfer. These studies use international trade, as a measure of foreign technology, that can be proxied by Imports+ Exports as a percentage of GDP. Higher education increases the ability to utilize new knowledge. Thus, higher absorptive capacity will lead to high performance (Conlin, 2006). Accordingly, we use an indicator of human capital measured as the total number of graduates. Furthermore, the World bank (World Development Indicators Database) uses infrastructures as an indicator of penetration of older technologies. First rate infrastructures devoid of a sufficiently qualified labour force will be useless and vice versa (Abramovitz, 1989). Infraestructures can be measured by the electric power consumption.8 Because the acess to education requires income, income inequality reveals primarily as a social problem of unequal access to education, arising from inadequate access to resources (Ball 2004; Teese and Polesel, 2003). The income distribution can be associated with social cohesion and economic inequality (Alonso and Garcimartín 2011) and can be measured by the Gini Index. Starting with innovation, we analyse the R&D expenditure as a percentage of GDP in 1996-2016 (Figure 5).
8 Archibugi and Coco (2004) suggest another two indicators: internet and telephone penetration. According to the authors, Internet is a key infrastructure for business and as a mean of access to knowledge; while telephone mainlines connect customers’ equipment to the public switched telephone network allowing communications and exchange of knowledge. However we could not get values for internet prior to 2001. As regards telephone subscribers, we obtained data from world bank development indicators but it was not clear how many countries were included in the data, since the period 1986-2016 includes several EU enlargments. Hence we could not calculate the average value.

27
Figure 5. R&D Expenditure (% GDP), average EU-28 and Portugal (1986-2016)
Notes: rd denotes Research & Development expenditure; eu denotes European Union and pt denotes Portugal. Source: Worldbank database (World Development Indicators).
After joining the EEC, the weight of R&D in GDP, in Portugal, increased from 0.4% in 1986 to 0.8% in 2005. In 2009, this indicator rose to 1.6%, but became stable around 1.4% in 2012. This evolution allowed Portugal to converge with the EU. In fact, if in 1995 this indicator represented about a third of that for the EU average; in 2009, it reached the maximum of 82% of the EU average. However, after 2009, the economic conjuncture threatened the objective in line with the strategy Europe 2020 of increasing R&D spending to 2.7% of GDP. Currently, Portugal is one of the most lagging MS regarding innovation capability, especially concerning patent applications (Mateus, 2015). From 1986 to 2012, on average the number of registered triadic patents in Portugal represented only 1.3% of the EU-28 average.
Figure 6. Number of patents, average EU-28 and Portugal (1986-2016)
Notes: patenteu denotes patents in the European Union and patentpt denotes patents in Portugal. Source: PORDATA

28
Figure 7 shows the number of scientific publications in Web of Knowledge, concerning the EU-28 and Portugal over the period 1986-2016.9 The number of Portuguese scientific publications represented on average nearly 55% of that of EU-28 per year. The number of publications in Portugal was much more volatile in the period, with an average of 678 publications per year, than that of EU-28, with an average of 1195 publications/year.
Figure 7. Number of Publications (ISI -Web of Knowledge), average EU-28 and Portugal (1986-2016)
Source: OCEC, Ministry of Science and Higher Education
According to the European Commission (2013), R & D intensity in 2000 to 2011 was on average of -0.16% in Portugal, compared to 0.8% of the EU average. On the contrary, in terms of Excellence in S & T, in 2005-2010, Portugal had a better performance than the EU average (4.23% and 3.09%, respectively). Regarding Innovation and structural change, in 2010-2011, Portugal represented only 62% of the EU average, concerning the Index of economic impact of innovation (0.38% and 0.61%, respectively). Yet, in 2000-2010, the Portuguese performance regarding knowledge-intensity was well above that of the EU average (3.18% and 0.93%, respectively). Regarding the absorptive capacity indicators, we start with the Income and Development Level. The GDP per capita in Portugal represented 76% of the EU average both in 1986 and 2016. On average, the GDP per capita expressed in PPPs in Portugal was 79% of the EU28 average over the period 1986- 2016 (see Figure 8).
9 It is an integrated Web platform that provides information for research.

29
Figure 8. GDP per capita in pps, average EU-28 and Portugal (1986-2016)
Notes: eu denotes European Union and pt denotes Portugal. Source: PORDATA However, regarding this indicator, the distance between the EU-28 average and Portugal has increased when compared with the situation in late 1980s and early 1990’s, soon after the EEC accession. Turning to international trade, Figure 9 shows fluctuations in 1986-2016, with peaks in every 7-10 years’ periods, i.e. in 1990, 2000, 2008 and 2015.
Figure 9. Trade (% of GDP), average EU-28 and Portugal (1986-2016)
Notes: eu denotes European Union and pt denotes Portugal. Source: Worldbank database (World Development Indicators).
We can split the period under analysis in two subperiods: the first starting in 1986 until 2000, when the Portuguese economy showed a greater dynamic concerning international trade, as a share of GDP, than that of the EU-28 average; and after the year 2000, when the situation was reversed and Portugal became less dynamic regarding trade openness.
The analysis of Figure 10 shows that the number of total graduates (male and female) from 1986 to 2004 has been increasing in Portugal. However, the distance from the EU-

30
28 average remained stable. After 2004 the distance widened and, after 2013, we can observe a tendency of decrease regarding the number of graduates both in Portugal and the EU.
Figure 10. Total number of graduates, average EU-28 and Portugal (1986-2016)
Notes: eu denotes European Union and pt denotes Portugal. Source: PORDATA
The electricity consumption in Figure 11 shows an increase over the period, similar to the evolution in the remaining EU countries. However, the rate of growth has been higher in Portugal and, as a result, the distance has narrowed about one half, compared with the consumption in 1986.
Figure 11. Electric Power Consumption (kWwh per capita), average EU-28 and Portugal (1986-2016)
Notes: eu denotes European Union and pt denotes Portugal. Source: Worldbank database (World Development Indicators).
31
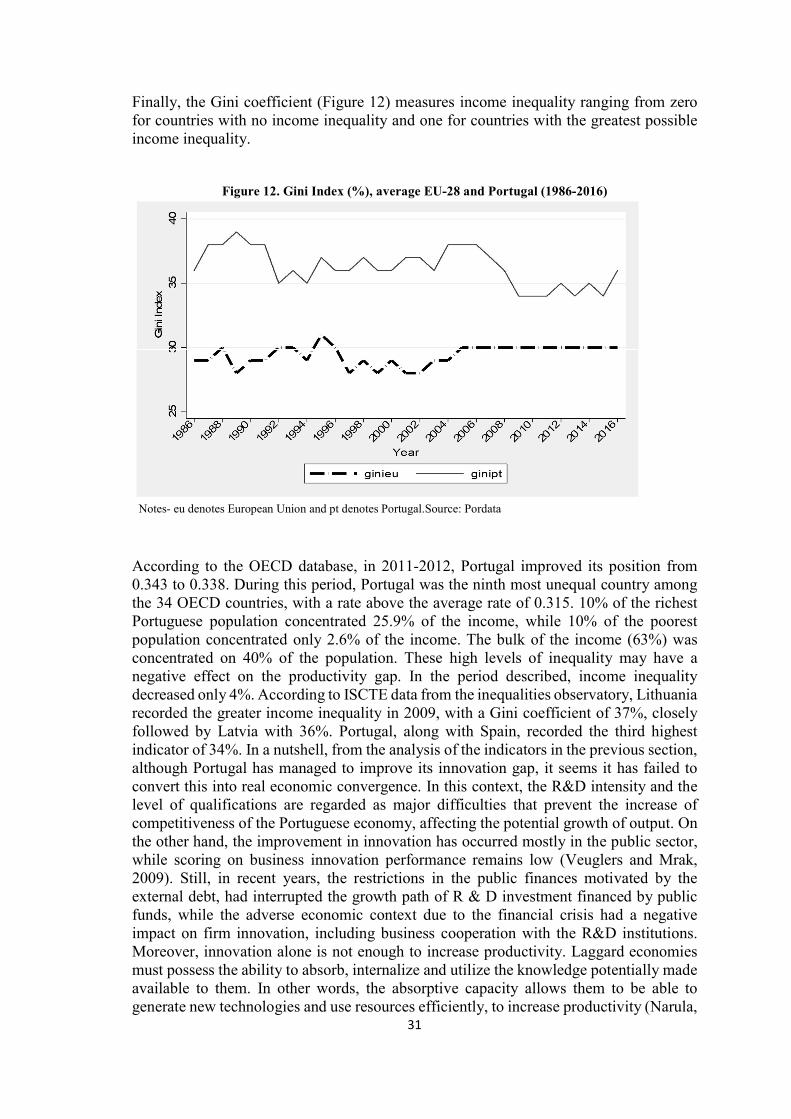
Finally, the Gini coefficient (Figure 12) measures income inequality ranging from zero for countries with no income inequality and one for countries with the greatest possible income inequality.
Figure 12. Gini Index (%), average EU-28 and Portugal (1986-2016)
Notes- eu denotes European Union and pt denotes Portugal.Source: Pordata
According to the OECD database, in 2011-2012, Portugal improved its position from 0.343 to 0.338. During this period, Portugal was the ninth most unequal country among the 34 OECD countries, with a rate above the average rate of 0.315. 10% of the richest Portuguese population concentrated 25.9% of the income, while 10% of the poorest population concentrated only 2.6% of the income. The bulk of the income (63%) was concentrated on 40% of the population. These high levels of inequality may have a negative effect on the productivity gap. In the period described, income inequality decreased only 4%. According to ISCTE data from the inequalities observatory, Lithuania recorded the greater income inequality in 2009, with a Gini coefficient of 37%, closely followed by Latvia with 36%. Portugal, along with Spain, recorded the third highest indicator of 34%. In a nutshell, from the analysis of the indicators in the previous section, although Portugal has managed to improve its innovation gap, it seems it has failed to convert this into real economic convergence. In this context, the R&D intensity and the level of qualifications are regarded as major difficulties that prevent the increase of competitiveness of the Portuguese economy, affecting the potential growth of output. On the other hand, the improvement in innovation has occurred mostly in the public sector, while scoring on business innovation performance remains low (Veuglers and Mrak, 2009). Still, in recent years, the restrictions in the public finances motivated by the external debt, had interrupted the growth path of R & D investment financed by public funds, while the adverse economic context due to the financial crisis had a negative impact on firm innovation, including business cooperation with the R&D institutions. Moreover, innovation alone is not enough to increase productivity. Laggard economies must possess the ability to absorb, internalize and utilize the knowledge potentially made available to them. In other words, the absorptive capacity allows them to be able to generate new technologies and use resources efficiently, to increase productivity (Narula,

32
2004). The indicators of absorptive capacity reflect in general an improvement in absolute terms. However, the distance between Portugal and the EU-28 average has widened, except in those indicators concerning infrastructures and inequality. In order to get some insights on the role of FDI flows to innovation and absorption capacity in Portugal and to the convergence of gross value added between Portugal and the European Union countries, we conducted a correlation test to verify the relationship degree between FDI inward flows and the Innovation system indicators as well as with the gap between the Portuguese gross value added towards European Union countries.10 The correlation coefficients are shown in Table 10.
Table 10. Correlations between FDI flows and Inovation system indicators and gap, 1986-2016 FDI R&D Pub. Patents GDPpc Trade Graduates Electric Gini Gap FDI 1.00 R&D 0.66* 1.00 Pub. 0.18 0.28 1.00 Patents 0.84* 0.71* 0.19 1.00 GDPpc 0.89* 0.48* 0.04 0.65* 1.00 Trade 0.76* 0.49* 0.18 0.67* 0.77* 1.00 Graduates 0.88* 0.50* 0.20 0.74* 0.83* 0.71* 1.00 Electric 0.89* 0.44* 0.05 0.65* 0.96* 0.69* 0.83* 1.00 Gini -0.56* -0.46* -0.16 -0.63* -0.47* -0.34 -0.60* -0.44* 1.00 Gap 0.37* -0.02 -0.08 0.06 0.53* 0.18 0.37* 0.66* -0.12 1.00
Note- * significant at 5% level. Pub denotes publications. Source: own calculations in Stata 13.0
The correlations between FDI inflows to Portugal and the innovation indicators are strong (coefficient>0.5), positive and significant (at 5% level), except for scientific publications. Regarding the absorptive capacity, all indicators are positively and strongly correlated with FDI inflows, except for Gini index, which shows a negative, strong a significant correlation (-0.5664). Since the higher the Gini index, the larger the inequality, it may be the case that FDI inflows have been contributing to reduce economic and social inequality in Portugal. Finally, the gap between Portugal and the European Union Countries is positively and significantly correlated with FDI inflows, GDP per capita, the number of graduates and the electric power consumption. Since the higher the value of the GAP indicator, the greater the convergence with the European Union Countries, the sign of correlations may indicate that FDI flows have been contributing to reduce the gap. Moreover the increasing number of graduates, increases the absorptive capacity of the Portuguese populations and this may have an impact on convergence of GVA towards the European Union Countries. Since the value of the coefficient is strong for the GDP per capita and the electric power consumption it may imply that those indicators may have a strong impact on reducing the gap. The statistical significance of correlation coefficients specify that all chosen indicators are valid for the analysis of the contribution of FDI inflows to innovation and absorptive capacity, except for scientific publications. Tables 11 and 12 show the goals of Technological plan and Portugal 2020, aiming to converge with the EU-28 average.
10 Data on Gross value added (current basic prices in millions of Euros) for Portugal and the aggregate European Union Countries comes from EUKlems database- November 2009 release, March 2011 update.

33
Table 11. Goals of Technological Plan, aiming to reduce the technological gap, 2005
Goal Human resources allocated to R&D and scientific publications in international journals
+50%
Number of PHDs in Portugal and abroad 1500
Private expenditure on R & D +300%
Public expenditure on R & D 1% of GDP (+200%)
Public R & D activities +1000 jobs
Number of registered patents +300%
Source: https://infoeuropa.eurocid.pt/files/database/000035001000036000/000035449.pdf, p.26
Table 12. Goals of Portugal 2020, aiming to converge with the EU-28 average, 2014-2020
Indicator Objective
Measure Goal (PT2020)
Innovative capability Reinforcement of R&D
and Innovation R&D (% GDP) 2.7%- 3.3%
Absorptive capacity
More and better education
% Population with higher
education or equivalent
(30-34 years old)
40.0%
Fight poverty and social
inequalities
People at risk of poverty
(compared to 2008) -200,000
Source: Adapted from http://ec.europa.eu/europe2020/pdf/nd/prgrep2013_portugal_pt.pdf, p.9
It has been argued that the difficulties in the convergence process are not related to factor intensity or technological progress but with the contribution of efficiency to TFP. Indeed, from 1986 to 1998, structural change was characterized by a transfer of labour from agriculture to services; while the weight of the manufacturing employment has remained broadly stable and output has declined. TFP can be expressed in terms of technology growth and efficiency. The former includes the effect of positive externalities which is a driver of economic growth. Amador and Coimbra (2007) show that, in 1995-2005, the contribution of efficiency was negative due to investment in real assets with low return, such as housing. Since many services are non-tradable, this resulted in lower productivity gains and lower the average contribution of TFP to economic growth to merely 0.2% in 1990-2000. Hence, the inclusion of both tradable and non-tradable sectors can hinder the analysis of structural change, as measured by the TFP performance. According to predictions of the EC (2016): “As economic conditions are expected to improve and investment to pick up, capital accumulation would eventually raise the growth potential. Prospects for labour force development are less optimistic.” (op. cit, p.8). In contrast, the TFP of the Portuguese economy is expected to improve slightly in the medium term. Nevertheless, the low average skill level of the labour force, although improving, and the low level of innovation may deter the growth of the TFP.
Being a small open economy located on the outskirts of Europe, Portugal is vulnerable to external factors that hamper economic growth. The competitiveness problems of the Portuguese economy were also reflected in the decrease of FDI flows. Yet, sectoral

34
empirical studies exist that, by estimating externalities from FDI via backward and forward linkages for the Portuguese manufacturing industry, allow to design FDI policies aimed at this specific industry. In this context, FDI policies may put forward suitable incentives to reach the FDI sectoral composition that enhances greater TFP growth for domestic firms, through externalities from FDI via backward and forward linkages.
4. POLICY RECOMMENDATIONS TO BOOST PRODUCTIVITY AND GROWTH
Based on previous sections, we make some recommendations on the design and implementation of FDI policies in articulation with industrial policy, i.e., according to the type of FDI externality, technological groups and/or specific manufacturing industries. One should notice that, a more comprehensive ex-ante evaluation of FDI policy would also apply to other sectors. In such scenario, we would most probably be led to a choice of a mix of FDI in manufacturing and services. However, this is beyond the scope of our research. These recommendations consider a logical framework for intervention to ensure causal linkages between, on the one hand, the specific goals and constraints associated with strengthening the articulation between FDI and Industrial policies, and, on the other hand, between the proposed policy measures/instruments and the expected results. Accordingly, in Table 13, the first policy component goals, determines the rest: constraints, policy measures/instruments, expected results and recommendations. The Policy goals are the increase of manufacturing competitiveness, the reduction of the technological gap, the convergence of productivity, the attraction of FDI and the promotion of economic growth and employment.
Regarding the manufacturing competitiveness, the main barriers to this goal are deindustrialization, international competition, and the highly fragmented value chains. Hence, measures targeting all industries should be taken, such as the promotion of entrepreneurship; access to credit and the strengthen of the intellectual property rights and the competition policy. FDI Policies need to tailor to the specific requirements of investors. If this is accomplished, it is expected that foreign firms, especially in scale-intensive industries in Portugal contribute to increase the turnover, employment, value added and gross operating surplus.

35
Table 13. Components of the Ex-Ante Evaluation of FDI and Industrial policies Policy
Goals Constraints Measures/Instruments Expected Results Recommendations Strengthen the manufacturing sector, consolidate poles of competitiveness, according to a specialization strategy
-Privatization has increased deindustrialization - Manufacturing is organized in highly fragmented value chains -Competition from emerging economies
-Horizontal measures (targeting all sectors) -Creation of an environment conducive to entrepreneurship - Promotion of businesses angels and venture capital -Flexibility of the labour market -Access to credit -Strengthen the internal market (intellectual property rights, competition policy, infrastructures, and standards)
-MNCs in scale-intensive industries may be the major contributors regarding turnover, employment, value added and gross operating surplus - Foreign firms may have a major role regarding Gross Operating Surplus in the automotive industry, rubber and plastics and non-metallic minerals - Subsidiaries may create a larger number of jobs in the automotive, food and electrical equipment industries.
-Policies need to tailor to the specific requirements of investors, and be difficult to replicate elsewhere -Industrial policy should contribute to: achieving higher levels of competitiveness through increased industrial productivity. Accordingly, it should: - Address systemic failures and attract FDI projects that lead to positive externalities -Conceal horizontal policies that support the manufacturing sector, with vertical policies targeting specific sectors
Reduce the technological gap
-Lack of fluidity in the technology transfer processes from universities and other R&D institutions to domestic firms - Low level of innovation capabilities of domestic firms - Government incentives for innovation have been reduced - Difficulty in adopting modern production techniques, organizational practices and in creating new products
Technological Plan: - Stimulate innovation - Enhance cooperation between firms and scientific and technological organizations -Inclusion of PhDs in domestic firms through financial incentives for SMEs -"Horizontal" emphasis on research strategies and the promotion of industry-wide innovation to increase productivity and economic growth
According to the technology-accumulation hypothesis, if the gap is too large, domestic firms do not possess the necessary "absorptive capacity" to incorporate the knowledge of foreign firms.
-Innovation facilitates structural change towards economic activities with high added value -Structural change via technological change. - The change of Portugal's specialization towards techno-low and capital-intensive products should continue.
Notes- Because the measure of technological gap is inverse, e., constructed as the ratio of labour productivity of domestic firms to foreign firms, the higher the value the greater the technological sophistication of domestic firms. Source-Author’s own elaboration

36
Table 13. Components of the Ex-Ante Evaluation of FDI and Industrial policies (cont.) Policy
Goals Constraints Measures/Instruments Expected Results
Recommendations
Real convergence of productivity
- Erosion of competitiveness and aggravation of external accounts - investment and allocation of resources (labour) for non-tradable services - Specialization in sectors of low technological intensity and weak capacity to generate knowledge adaptable to production needs - Low average labour qualification and low level of innovation can hinder TFP's growth
Focus on the manufacturing as a driver of economic recovery
Reduce the disparity in labour productivity in the Portuguese economy
The convergence process in Portugal must be assisted by a reinforcement of supply-side measures with an integrated industrial policy, favouring certain industries where there is evidence of positive externalities from FDI
Attract FDI and promote economic growth and employment
-Investment policy moving from national to European level -Stiff public budget -Limited scope of most FDI strategies through incentives - Difficulty of IPAs in identifying business opportunities for target firms
-Encourage FDI through incentives funded by Structural Funds -Special visa regime -Priority industries: heavy industry; traditional industries; and industries with comparative advantage (electrical equipment, computers and electronics). -Transparency of public finances - Promptness of judicial procedures - Liberalization of the product market -Improve regulation
Foreign presence may contribute to an increase of domestic firms’ TFP
FDI policy should: -Compare the benefits of attracting FDI projects with the costs in terms of the public budget - Align investor motivation with the country's development strategy - Protect and enable investment liberalization by removing obstructions (Particularly in the framework of mergers and repatriation of income) State aid rules need to: - Adopt a sectoral and multisector approach - Consider the economic impact of the project and the fulfilment of the contractual obligations; - Consider the tax laws of the country of origin and the agreements governing taxation between the two countries.
Notes- Because the measure of technological gap is inverse, e., constructed as the ratio of labour productivity of domestic firms to foreign firms, the higher the value the greater the technological sophistication of domestic firms. Source-Author’s own elaboration

37
Thus, policy recommendations include the promotion of structural change towards economic activities with high added value via technological change. However, the major obstacles regarding the reduction of technological gap are the lack of fluidity in the technology transfer from universities to firms, low level of innovation capabilities and the reduction of public incentives for innovation, since R&D activities are expensive and small firms may be discouraged to pursue innovation in the absence of some public funding. To accomplish this goal, measures should be taken to stimulate innovation and cooperation between firms and scientific organizations.
Concerning the barriers to the convergence of productivity, the main are the erosion of competitiveness, the allocation of resources to non-tradables, the specialization in sectors of low technological intensity and the low average of labour skills. Hence the focus on the manufacturing as a driver of economic recovery aims to reduce the disparity in labour productivity towards the EU-28 average. In order to close the gap, the convergence process must be assisted by a reinforcement of supply-side measures and simultaneously it must favour certain industries where there is evidence of positive externalities from FDI. Finally, barriers to attracting FDI and promote economic growth and employment are the fact that the Investment promoting policy is moving to European level and thus leaving the government with no autonomy to pursue such a FDI promoting policy prone to maximize externalities from FDI; the public budget constraints, the FDI strategies with narrow scope, and the difficulty of IPAs to identify business opportunities. Measures include Structural Funds, the special visa regime, the definition of priority industries and the improvement of the institutional environment. If authorities are successful in attracting the right kind of FDI projects, it is expected at the aggregate level, that an increase of one percent in turnover of foreign firms in downstream and upstream industries may contribute to an increase of domestic firms’ TFP of 0.0629 and 0.306 percentage points. This analysis seeks to contribute to the drawing up of a well-defined strategy. Thus, it is possible to state that the general objectives set out are in line with the major constraints posed by policies analysed here and thus constitute an appropriate starting point for further strategic specification. In this respect, the low levels of qualification of the population, the maladjustment of the articulation with the labour market; and the persistence of areas of inefficiency and the lack of innovation conform the main constraints. Finally, the system of goals and measures/instruments is articulated with the indicators of innovation and absorptive capacity. There are explicit synergies between specific objectives and measures/instruments. In this context, the selected indicators are generally relevant and their formulation clearly expresses the associated measurability dimension. The indicators use appropriate calculation methods and present realistic values against the objectives and resources.
Regarding Investment priorities, the Portuguese Investment Promotion Agency (AICEP) aims to attract foreign Investment focusing into three groups of priority industries: heavy industries that rely on domestic sources of raw materials (iron, copper, lead and zinc); traditional industries such as textiles to increase the competitiveness; and industries in which Portugal already has a comparative advantage (e.g. electrical equipment, electronic equipment and telecommunications).

38
Main Recommendations. It will be useful to highlight that the proposed intervention strategy concentrates preferentially its attention on the effort to achieve higher levels of competitiveness through increased industrial productivity. Attention has been drawn to strengthening structural change towards economic activities with high added value, since technological change appears to be the only route available to achieve economic growth. Thus, the design of public policies analysed here has a strong affiliation to the set of policy instruments established in the context of the Structural Funds. Therefore, FDI Policies need to be tailored to the specific requirements of investors (for example, in compliance with the tax laws of investor’s countries and the tax agreements between the two countries). Also, these policies should be difficult to replicate by other governments, in order that the host country will able to attract the desirable FDI projects. Examples of such measures are the creation of hubs of firms with high-skilled workforce and/or management expertise.
Regarding the Industrial Policy, in addition to the horizontal focus that support the whole manufacturing sector; it must also target the specific industries (vertical focus) where FDI generates positive externalities. Indeed, the quality and effectiveness of public policies analysed here, requires the assistance of supply-side measures with an integrated industrial policy, favouring scale intensive sectors, where there is evidence of positive externalities from FDI. Hence, FDI incentives should target that technological group instead of individual firms, after performing a balance between the benefits and costs (public budget) and aligning investors’ motivations with the country's development strategy.
5. CONCLUSION
Being a small and moderately innovative economy, without the locational advantages of the CEECs, the potential convergence of the Portuguese economy is threatened due to several factors that caused a fall not only in FDI flows, but also in production and employment, which were not fully compensated by government incentives for innovation activities, which in most cases were limited.
Based on the analysis of the Innovation System indicators, although Portugal has managed to improve its innovation activities, the distance between Portugal and the EU-28 average has increased, except for the indicators related to infrastructures and inequality, and the economy has not been able to converge with that average. According to the OECD Reports (Portugal), several weaknesses persist such as the scarcity of human capital and the difficulties to adopt more modern production techniques, organizational practices and new products. Thus, the main challenge for Portugal is to increase productivity on a sustained basis. The path of sustainable growth goes through a process of structural transformation via technological change. In this context, the manufacturing sector, being one of the main producers of tradable goods and higher rates of productivity and innovation is considered the main engine of economic growth. In addition, the numerous technological linkages within the manufacturing industries enable the technological change. In this context, FDI is considered the main vehicle of technology transfer, since it represents the greatest source of innovation, (Lim, 2001). A greater foreign presence within an industry is correlated with the growth of TFP of domestic firms by increasing the speed of technology transfer. Historically, FDI has contributed to the structural change of Portuguese exports to technology-intensive industrial activities.
The changes that recently occurred in industrial policy were accompanied by new strategies, such as the resumption of focus on productivity and merging with innovation

39
policy to support research and education. In this context, the European Commission (EC) plays an important role about the Government incentive system for innovation activities in Europe, with a view to improving the competitiveness of firms. Thus, aim of this paper is to evaluate the impact of FDI inflows to manufacturing TFP in Portugal and, therefore, on the process of convergence with the EU-28 average. This exercise can provide policy recommendations to boost productivity and stimulate growth. Though, with the acceleration of globalization that began in the new millennium, FDI inflows to the Portuguese manufacturing sector have become more volatile. Thus, we analysed the joint evolution of FDI inflows to the manufacturing sector and the factor contribution to the GVA increase in the manufacturing for 1986-2016, in search of a hint on the FDI impact on the manufacturing TFP. Our analysis has shown that FDI flows targeting this sector potentially help to narrow the gap with the TFP. However, in order to grow and converge, Portugal need a well-defined FDI policy that aligns investors' motives with the national development strategy; that uses the funds according to the objectives; that performs a continuous assessment to ensure its effectiveness; and makes the necessary corrections. On the other hand, the industrial policy must reconcile the horizontal focus that support the development of industry in general, with a vertical focus, i.e., on specific sectors. This is critical for attracting FDI projects that generate positive externalities for domestic firms. In this respect, the importance of subsidiaries in job creation in 1986-2016 was greater in scale-intensive industries and in science-based industries (e.g., automotive, food, rubber and plastics and chemicals). In order to boost productivity, an integrated industrial policy must be established, favouring scale-intensive sectors where there is evidence of positive externalities from FDI. In the past, economies of scale have encouraged technical progress in Portugal. Therefore, FDI incentives should be used to attract this technological group of industries, aligning investors' motives with the country's development strategy. In addition, the proposed intervention strategy should aim at reinforcing structural change towards high value-added economic activities, as technological change seems to be the only way available to achieve economic growth. In this context, clusters play an important role in improving the attractiveness of a region to FDI, providing local capacities that influence the location of economic activities. In our view, it is only under these conditions that Portugal can resume the path of convergence with the European Union countries.
References Abramovitz, M. Catching up, forging ahead, and falling behind. The Journal of Economic
History. 1986; 46(2), 385-406. Abramovitz, Moses (1989), Thinking about Growth, Cambridge, Cambridge University Press. Alonso, J. and Garcimartín, C. Criterios y factores de calidad institucional: un estudio empírico.
Revista de Economía Aplicada. 2011; 19(55):532. Amador , J. and Coimbra, C.. Characteristics of The Portuguese Economic Growth: What Has
Been Missing? Banco de Portugal Working Papers 8. 2007. Andreoni, A. and Gregory, M. Why and How Does Manufacturing still Matter: Old Rationales,
New Realities. Revue d'économie industrielle. 2013; 4(144): 1754. Archibugi, D. and Coco, A. A New Indicator of Technological Capabilities for Developed and
Developing Countries (ArCo). World development. 2004; 32.4: 629654. Balasubramanyam, V. N., Salisu, M., & Sapsford, D. Foreign direct investment as an engine of
growth. Journal of International Trade & Economic Development. 1999; 8(1), 27-40. Ball, S. Class Strategies and the Education Market: The middle classes and social advantage.
London: Routledge Falmer. 2004.

40
Castellacci, F. and Natera, J. 2013. The dynamics of national innovation systems: a panel cointegration analysis of the coevolution between innovative capability and absorptive capacity. Research Policy, Elsevier. 2013; 42(3): 579594.
Cockburn, I. and Henderson, R. Absorptive capacity, coauthoring behaviour, and the organization of research in drug discovery. Journal of Industrial Economics. 1998; 46(2): 157–182.
Cohen, W., & Levinthal, D. Absorptive capacity: A new perspective on learning and innovation. Administrative Science Quarterly. 1990; 35: 128 -152.
Colin, G. Absorptive capacity, knowledge management and innovation in entrepreneurial small firms. International Journal of Entrepreneurial Behaviour & Research. 2006; 12(6):345360.
Commission of the European Communities. Implementing the Community Lisbon Programme: A policy framework to strengthen EU manufacturingtowards amore integrated approach for industrial policy. COM (2005)0474. Bruxels. 2005 Available from: http://www.europarl.europa.eu/RegData/docs_autres_institutions/commission_europeenne/com/2005/0474/COM_COM(2005)0474_EN.pdf.
Conselho de Ministros. Plano Tecnológico. Uma estratégia de crescimento com base no Conhecimento, Tecnologia e Inovação. 2005. Available from https://infoeuropa.eurocid.pt/files/database/000035001/000035449.pdf
Czarnitzki, D. and Kraft, K. Firm leadership and innovative performance: Evidence from seven EU countries. Small Business Economics. 2004; 22:325–332.
Duchek, S. Capturing absorptive capacity: a critical review and future prospects. Schmalenbach Business Review. 2013; 65:312–329.
European Commission. State of the Industry, Sectoral overview and Implementation of the EU Industrial Policy. Communication from the Commission to the European Parliament, the Council, the European Economic and Social Committee and the Committee of the Regions: For a European industrial renaissance. Brussels. 2014.
European Commission. Country Report Portugal 2016 including an in Depth Review on the prevention and correction of macroeconomic imbalances. Brussels. 2016.
Elenkov, D. and Manev, I. Senior expatriates leadership’s effects on innovation and the role of cultural intelligence. Journal of World Business. 2009; 44:357–369.
Fagerberg, J., & Srholec, M. National innovation systems, capabilities and economic development. Research policy. 2008; 37(9), 1417-1435.
Flatten, T., Engelen, A., Shaker A. and Zahra, M. A measure of absorptive capacity: Scale development and validation. European Management Journal. 2011: 29 (2):98–116.
FonsRosen, C., Kalemli Ozcan, S., Sorensen, B., VillegasSanchez, C. and Volosovych, V. Quantifying Productivity Gains from Foreign Investment. NBER Working Paper 18920, 2013.
Foster-McGregor, N., & Stehrer, R. Value added content of trade: A comprehensive approach. Economics Letters. 2013; 120(2), 354-357
Freitas, M. and Mamede, R. The Role of Foreign Direct Investment in the Structural Transformation of Portuguese Exports between 1995 and 2005. Working paper ISCTE, Observatório do QREN, Dinâmia, 2008.
Fu, X. Foreign direct investment, absorptive capacity and regional innovation capabilities: evidence from China. Oxford Development Studies. 2008; 36(1), 89-110.
Furman, J. L., Porter, M. E., & Stern, S. The determinants of national innovative capacity. Research policy. 2002; 31(6), 899-933.
García Morales, V., Mathías Reche, F. and Hurtado Torres, N. Influence of transformational leadership on organizational innovation and performance depending on the level of organizational learning in the pharmaceutical sector. Journal of Organizational Change Management. 2008; 21:188–212.
George, G., Zahra, S., Wheatley, K. and Khan, R. The effects of alliance portfolio characteristics and absorptive capacity on performance. A study of biotechnology firms. The Journal of High Technology Management Research. 2001; 12: 205–226.

41
Global Value Chains Report. Challenges, opportunities, and implications for policy. OECD, WTO and World Bank Group. Report prepared for submission to the G20 Trade Ministers Meeting Sydney, Australia.2014.
Godinho, M.M., Mendonca, S.F., Pereira, T.S. Towards a Taxonomy of Innovation Systems”, mimeo, Universidade Tecnica de Lisboa. 2006.
Gonçalves, D. and Martins, A. The Determinants of TFP Growth in the Portuguese Manufacturing Sector. GEE Papers No. 62. 2016
Gumusluoglu, L. and Ilsev, A. Transformational leadership and organizational innovation: The roles of internal and external support for innovation. Journal of Product Innovation Management. 2009; 26:264–277.
Haskel, J., Pereira, S. and Slaughter, M. Does inward foreign direct investment boost the productivity of domestic firms. Review of Economics and Statistics. 2007; 89: 482496.
Innovation Union Scoreboard. The Innovation Union's Performance Scoreboard for Research and Innovation. 2011. Available from:http://www.proinnoeurope.eu/metrics.
Jimenez B. , Garcia Morales, L. and Molina, M. Validation of an instrument to measure absorptive capacity. Technovation. 2011; 31:190–202.
Jones, B. and Olken, B. Do Leaders Matter? National Leadership and Growth Since World War II. Quarterly Journal of Economics. 2005; 120: 835–864.
Jorgenson D. and Stiroh K. Raising the speed limit: U.S. economic growth in the information age. Brookings Pap Econ Act 1. 2000: 125–211.
Júlio, P. Pinheiro–Alves, R. and Tavares, J. Foreign direct investment and institutional reform: evidence and an application to Portugal. Portuguese Economic Journal, Springer. Instituto Superior de Economia e Gestao. 2013; 12(3): 215250.
Jung, D., Wu, A., and Chow, C. Towards understanding the direct and indirect effects of CEO’s transformational leadership on firm innovation. The Leadership Quarterly. 2008; 19:582–594.
Urata, S., & Kawai, H. (2000). The determinants of the location of foreign direct investment by Japanese small and medium-sized enterprises. Small Business Economics, 15(2), 79-103.
Keller, W., & Yeaple, S. R. Multinational enterprises, international trade, and productivity growth: firm-level evidence from the United States. The Review of Economics and Statistics. 2009; 91(4), 821-831.
Kim, L. Crisis construction and organizational learning. Organization Science. 1998; 9(4): 506–521.
Kutlača, D. Measurement of National Innovation Capacity: Indicators for Serbia”, 2nd PRIME Indicators Conference on STI Indicators for Policy, Addressing New Demands of Stakeholders, published on conference website: www.enideurope.org/conference.html , Oslo University College, May 2830, 2008.
Lall, S. (1980). Vertical inter‐firm linkages in LDCs: an empirical study. Oxford bulletin of Economics and Statistics, 42(3), 203-226.
Lim, E. Determinants of, and the Relation Between, Foreign Direct Investment and Growth: A Summary of the Recent Literature. Working Paper 01/175, International Monetary Fund, Washington D.C. 2001.
Makri, M. and Scandura, T. Exploring the effects of creative CEO leadership on innovation in hightechnology firms. The Leadership Quarterly. 2010; 21:75–88.
Marques, F. and Lynce, P. Industria e Politica Industrial em Portugal. Setores no âmbito da Fiequimetal. CGTPIN. Cord. João Silva. 2011. Available from: www.cgtp.pt/images/stories/imagens/2011/.../Ind_Pol_Industria_Portugal.
Mateus, A. Portugal’s convergence process: Lessons for accession countries. Living standards and the wealth of nations: Successes and failures in real convergence. Autoridade da Concorrência. 2006: 23150.
Mateus, A. Três décadas de Portugal Europeu. Fundação Francisco Manuel dos Santos. 2015. Mencinger, J. Does Foreign Direct Investment Always Enhance Economic Growth?” Kyklos.
2003; 56 (4): 491–508.

42
Murovec, N. and Prodan, I. Absorptive capacity, its determinants, and influence on innovation output: Crosscultural validation of the structural model. Technovation. 2009; 29: 859–872.
Narula, R. Understanding absorptive capacities in an “innovation System” context: consequences for economic and employment growth. Prepared for the ILO, background paper for the World Employment Report. MERIT – Maastricht Economic Research Institute on Innovation and Technology. 2004.
O’Mahony M. and Vecchi M. Quantifying the impact of ICT capital on output growth: a heterogeneous dynamic panel approach. Economica. 2005; 72: 615–633.
Observatório do QCA III. Quadro de Referência Estratégico Nacional: 20072013: Portugal. Ministério do Ambiente, do Ordenamento do Território e do Desenvolvimento. 2007.
OECD. National Innovation Systems. 1997. Available from: http://www.oecd.org/science/inno/2101733.pdf
OECD. Foreign Direct Investment for Development Maximising Benefits, Minimising Costs. Paris. 2002. Available from:
https://www.oecd.org/investment/investmentfordevelopment/1959815.pdf OECD. Science, Technology and Industry Outlook. 2012. Available from:
http://www.oecd.org/sti/stioutlook2012highlights.pdf . Pessoa, A. Catchup’ Tecnológico, Investimento e Convergência Real: Um Exercício de
Contabilidade do Crescimento Aplicado à Economia Portuguesa. Working Papers 83. Faculdade de Economia, Universidade do Porto. 1998.
Pessoa, A. Foreign direct investment and total factor productivity in OECD countries: evidence from aggregate data. Working Paper (FEP) Universidade do Porto. 2005; 79: 119.
Rodrik, D. One Economics, Many Recipes: Globalization, Institutions, and Economic Growth. Princeton, NJ: Princeton University Press. 2007.
Romer, P. Endogenous Technological Change. Journal of Political Economy, University of Chicago Press. 1990; 98(5): 71102.
Santos, E. & Khan, S., 2018. Technological Trajectories and FDI: Top Bananas and Underdogs, MPRA Paper 89620, University Library of Munich, Germany.
Silva J. Luso American economic relations and the Portuguese membership of the European Community, in Calvet de Magalhães J., de Vasconcelos A. and Silva J.R. (eds.) Portugal: an Atlantic paradox. Lisbon. Institute for Strategic and International Studies. 1990: 77139.
Su, D. and Yao, Y. Manufacturing as the Key Engine of Economic Growth for Middle Income Economies. ADBI Working Paper Series. 2016; 573.
TavaresLehman, A. Public policy, FDI attraction and Multinational Subsidiary Evolution: The Contrasting Cases of Ireland and Portugal in Multinationals on the Periphery, Benito, G. and Narula (eds), Palgrave Macmillan UK. 2007: 131157.
Teese, R. and Polesel, J. Undemocratic Schooling: Equity and Quality in Mass Secondary Education in Australia. Melbourne: Melbourne University Press. 2003.
Uppenberg, K. and Strauss, H. Innovation and productivity growth in the EU services sector. Luxembourg: European Investment Bank. 2010.
Venturini, F. The longrun impact of ICT. Empirical Economics. 2009; 37(3): 497515. Veugelers, R and Mrak, M. Catching-up Member States and the Knowledge Economy of the
European Union. Knowledge Economists Policy Brief. 2009; 5. Vinhas de Souza, L. Portugal's Legal Framework for Foreign Direct Investment 19431994:
Econometric Analysis and Causality Tests, in Foreign direct investment, East and West: The experiences of the Czech Republic, Hungary, Poland, Spain and Portugal. University of Lodz. 1996.
West, M., Borril, C., Dawson, J., Brodbeck, F., Shapiro, D. and Haward, B. Leadership clarity and team innovation in health care. The Leadership Quarterly. 2003; 14:393–410.

43
APPENDIX A
Table A1- Portuguese Innovative System Database: description and basic statistics, 1986-2016 Obs=31
Variable Description Unity Mean Std. Dev. Min Max Source
rdeu R&D expenditure EU-28 % GDP 1.81 0.11 1.63 2.02 PORDATA
rdpt R&D expenditure Portugal % GDP 0.94 0.38 0.40 1.58 PORDATA
patenteu Patents EU-28 Number 16,713.84 7,123.95 5,526.00 26,816.00 PORDATA
patentpt Patents Portugal Number 214.55 207.27 54.00 722.00 PORDATA
publeu Scientific publications EU-28 Number 1,195.06 156.07 933.00 1,526.37 OCES Ministry of Science publpt Scientific publications Portugal Number 677.54 353.58 33.00 1,336.00 OCES Ministry of Science gdpppseu GDP PPS EU-28 pps 20,070.03 6,208.78 10,183.00 33,582.00 PORDATA
gdpppspt GDP PPS Portugal pps 15,803.29 4,704.40 7,713.00 25,385.00 PORDATA
tradeeu (imports+exports) EU-28 % GDP 65.35 11.93 49.00 83.00 PORDATA
tradept (imports+exports) Portugal % GDP 65.22 7.03 54.01 79.90 PORDATA
graduateseu Graduates EU-28 Number 130,635.30 26,674.09 79,526.00 180,095.00 PORDATA
graduatespt Graduates Portugal Number 64,688.38 18,147.94 27,182.27 94,867.00 PORDATA
eleceu electric power consumption EU-28 Kwat 5,751.96 512.52 4,825.00 6,568.00 PORDATA
elecpt electric power consumption Portugal Kwat 3,839.40 1,053.64 1,974.54 5,342.17 PORDATA
ginieu Gini Index EU-28 Number 29.41 0.80 28.00 31.00 PORDATA
ginipt Gini Index Portugal Number 36.25 1.45 34.00 39.00 PORDATA
Source- Author’s own elaboration.