FDI IN INDIA
141
ECONOMICS ASSIGNMENT [FOREIGN DIRECT INVESTMENT (FDI) IN INDIA ] ECONOMICS ASSIGNMENT “FOREIGN DIRECT INVESTMENT (FDI) IN INDIA” BY: “GROUP 6” NAVNEET CHAUDHARY NIKESH BISWAL SAGAR SINGH Fazlani Altius Business School [Batch : 2013-2015] Page 1
Transcript of FDI IN INDIA

ECONOMICS ASSIGNMENT [FOREIGN DIRECT INVESTMENT (FDI) IN INDIA ]
ECONOMICS ASSIGNMENT“FOREIGN DIRECT INVESTMENT (FDI)
IN INDIA”
BY:“GROUP 6”
NAVNEET CHAUDHARY NIKESH BISWAL SAGAR SINGH
Fazlani Altius Business School [Batch : 2013-2015] Page 1

ECONOMICS ASSIGNMENT [FOREIGN DIRECT INVESTMENT (FDI) IN INDIA ]
MUTHU AYYANAR JAIRAJ VAIDYA
CONTENT:
PARTICULAR PAGE NO.
A. INTRODUCTION 4
B. FOREIGN DIRECT INVESTMENT (FDI) FLOWS TO INDIA 5
C. WHO CAN INVEST IN INDIA 6
D. ENTITIES FOR FDI 7
E. ENTRY ROUTES FOR FDI 8
F. GUIDELINES FOR CONSIDERATION OF FDI PROPOSALS BY FIPB 9
G. TREND IN FDI FLOWS 11
H. TRENDS IN FDI FLOWS TO INDIA 13
1. Cumulative FDI flows into India (2000-2013)14
2. Financial Year-Wise FDI inflow Data 20
I. STATEMENT ON COUNTRY-WISE FDI EQUITY INFLOWS 22
J. STATEMENT ON SECTOR-WISE FDI EQUITY INFLOWS 25
K. INDIAN ECONOMY1. Recent Trends in Indian Economy 27
Fazlani Altius Business School [Batch : 2013-2015] Page 2

ECONOMICS ASSIGNMENT [FOREIGN DIRECT INVESTMENT (FDI) IN INDIA ]
2. Growth in Gross Domestic Product 28
3. Economic Survey 2012-13 29
L. POTENTIAL FOR INVESTMENT IN INDIA 30
M. ADVANTAGE IN INDIA 321. Indian Economy 33
2. Agriculture Sector 33
3. Industry Sector 33
4. Services Sector 33
N. FDI POLICY FRAMEWORK
1. FDI Policy Framework in India 34
2. FDI Policy: The International Experience37
3. Cross-Country Comparison of FDI Policies – Where does India stand?41
O. FDI FLOWS TO INDIA IN RECENT PERIOD 44
P. APPROVAL FOR FDI IN LIMITED LIABILITY PARTNERSHIP FIRM 54
Q. SECTOR FOR FDI
1. FDI in Agriculture 55
2. FDI in Mining 57
3. FDI in Manufacturing 59
Fazlani Altius Business School [Batch : 2013-2015] Page 3
ECONOMICS ASSIGNMENT [FOREIGN DIRECT INVESTMENT (FDI) IN INDIA ]
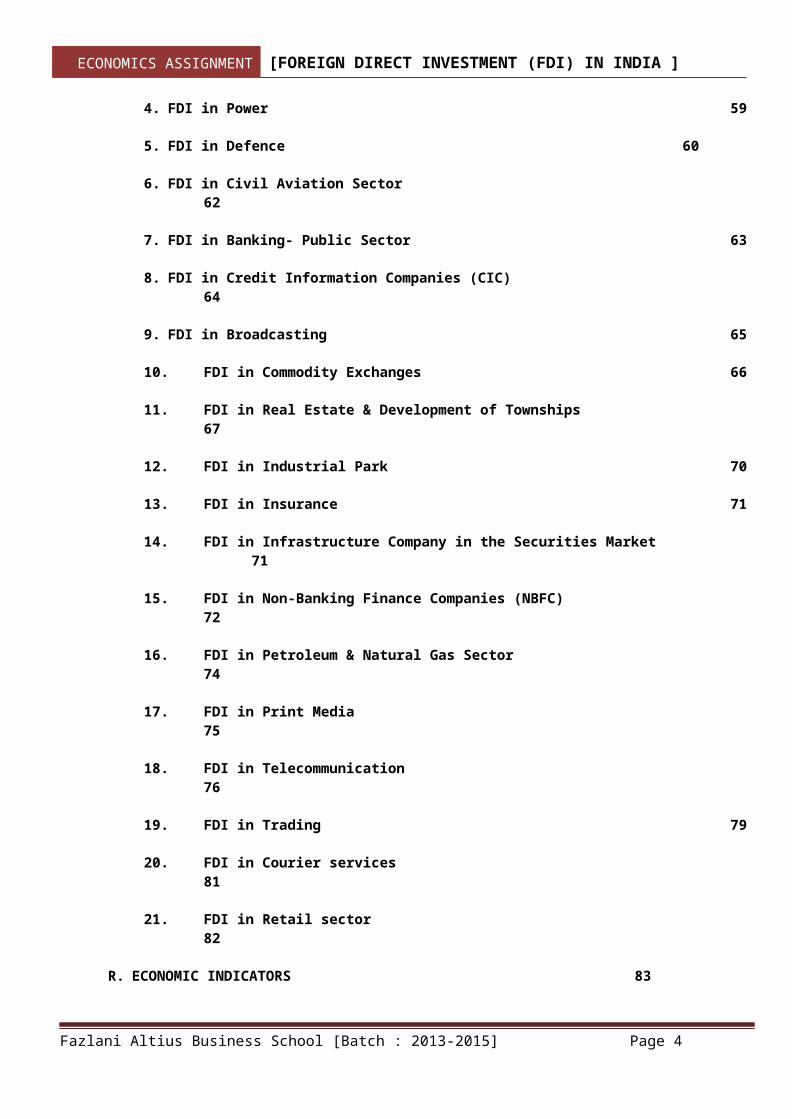
4. FDI in Power 59
5. FDI in Defence 60
6. FDI in Civil Aviation Sector62
7. FDI in Banking- Public Sector 63
8. FDI in Credit Information Companies (CIC)64
9. FDI in Broadcasting 65
10. FDI in Commodity Exchanges 66
11. FDI in Real Estate & Development of Townships67
12. FDI in Industrial Park 70
13. FDI in Insurance 71
14. FDI in Infrastructure Company in the Securities Market71
15. FDI in Non-Banking Finance Companies (NBFC)72
16. FDI in Petroleum & Natural Gas Sector74
17. FDI in Print Media75
18. FDI in Telecommunication76
19. FDI in Trading 79
20. FDI in Courier services81
21. FDI in Retail sector82
R. ECONOMIC INDICATORS 83
Fazlani Altius Business School [Batch : 2013-2015] Page 4

ECONOMICS ASSIGNMENT [FOREIGN DIRECT INVESTMENT (FDI) IN INDIA ]
S. TOP 10 FDI EQUITY INFLOW CASES 85
T. CONCLUSION 95
U. LIST OF INVESTMENT PROMOTION AGENCIES IN INDIA STATE-WISE 97
V. REFERENCES 106
A. INTRODUCTION
India has been ranked at the second place in global foreign directinvestments in 2010 and will continue to remain among the top fiveattractive destinations for international investors during 2010-12 period,according to United Nations Conference on Trade and Development (UNCTAD)in a report on world investment prospects titled, 'World InvestmentProspects Survey 2009-2012'.
The 2010 survey of the Japan Bank for International Cooperation releasedin December 2010, conducted among Japanese investors, continues to rankIndia as the second most promising country for overseas businessoperations.
Fazlani Altius Business School [Batch : 2013-2015] Page 5

ECONOMICS ASSIGNMENT [FOREIGN DIRECT INVESTMENT (FDI) IN INDIA ]
A report released in February 2010 by Leeds University Business School,commissioned by UK Trade & Investment (UKTI), ranks India among the topthree countries where British companies can do better business during2012-14.
According to Ernst and Young's 2010 European Attractiveness Survey, Indiais ranked as the 4th most attractive foreign direct investment (FDI)destination in 2010. However, it is ranked the 2nd most attractivedestination following China in the next three years.
Moreover, according to the Asian Investment Intentions survey released bythe Asia Pacific Foundation in Canada, more and more Canadian firms arenow focusing on India as an investment destination. From 8 per cent in2005, the percentage of Canadian companies showing interest in India hasgone up to 13.4 per cent in 2010.
India attracted FDI equity inflows of US$ 2,014 million in December 2010.The cumulative amount of FDI equity inflows from April 2000 to December2010 stood at US$ 186.79 billion, according to the data released by theDepartment of Industrial Policy and Promotion (DIPP).
The services sector comprising financial and non-financial servicesattracted 21 per cent of the total FDI equity inflow into India, with FDIworth US$ 2,853 million during April-December 2010, whiletelecommunications including radio paging, cellular mobile and basictelephone services attracted second largest amount of FDI worth US$ 1,327million during the same period. Automobile industry was the third highestsector attracting FDI worth US$ 1,066 million followed by power sectorwhich garnered US$ 1,028 million during the financial year April-December2010. The Housing and Real Estate sector received FDI worth US$ 1,024million.
During April-December 2010, Mauritius has led investors into India withUS$ 5,746 million worth of FDI comprising 42 per cent of the total FDIequity inflows into the country. The FDI equity inflows in Mauritius isfollowed by Singapore at US$ 1,449 million and the US with US$ 1,055million, according to data released by DIPP.
Fazlani Altius Business School [Batch : 2013-2015] Page 6

ECONOMICS ASSIGNMENT [FOREIGN DIRECT INVESTMENT (FDI) IN INDIA ]
B. FOREIGN DIRECT INVESTMENT (FDI) FLOWS TO INDIA
FDI inflows to India remained sluggish, when global FDI flows to EMEs hadrecovered in 2010-11, despite sound domestic economic performance ahead ofglobal recovery. The paper gathers evidence through a panel exercise thatactual FDI to India during the year 2010-11 fell short of its potentiallevel (reflecting underlying macroeconomic parameters) partly on accountof amplification of policy uncertainty as measured through Kauffmann’sIndex.
FDI inflows to India witnessed significant moderation in 2010-11 whileother EMEs in Asia and Latin America received large inflows. This hadraised concerns in the wake of widening current account deficit in Indiabeyond the perceived sustainable level of 3.0 per cent of GDP duringApril-December 2010. This also assumes significance as FDI is generallyknown to be the most stable component of capital flows needed to financethe current account deficit. Moreover, it adds to investible resources,provides access to advanced technologies, assists in gaining productionknow-how and promotes exports.
A perusal of India’s FDI policy vis-à-vis other major emerging marketeconomies (EMEs) reveals that though India’s approach towards foreigninvestment has been relatively conservative to begin with, itprogressively started catching up with the more liberalized policy stanceof other EMEs from the early 1990s onwards, inter alia in terms of wideraccess to different sectors of the economy, ease of starting business,repatriation of dividend and profits and relaxations regarding norms forowning equity. This progressive liberalization, coupled with considerableimprovement in terms of macroeconomic fundamentals, reflected in growingsize of FDI flows to the country that increased nearly 5 fold during firstdecade of the present millennium.
Though the liberal policy stance and strong economic fundamentals appearto have driven the steep rise in FDI flows in India over past one decadeand sustained their momentum even during the period of global economiccrisis (2008-09 and 2009-10),the subsequent moderation in investment flowsdespite faster recovery from the crisis period appears somewhatinexplicable. Survey of empirical literature and analysis presented in thepaper seems to suggest that these divergent trends in FDI flows could bethe result of certain institutional factors that dampened the investors‘sentiments despite continued strength of economic fundamentals. Findings
Fazlani Altius Business School [Batch : 2013-2015] Page 7

ECONOMICS ASSIGNMENT [FOREIGN DIRECT INVESTMENT (FDI) IN INDIA ]
of the panel exercise, examining FDI trends in 10 select EMEs over thelast 7 year period, suggest that apart from macro fundamentals,institutional factors such as time taken to meet various proceduralrequirements make significant impact on FDI inflows.
This paper has been organized as follows: Section 1 presents trends inglobal investment flows with particular focus on EMEs and India. Section 2traces the evolution of India’s FDI policy framework, followed by cross-country experience reflecting on India’s FDI policy vis-à-vis that ofselect EMEs. Section 3 deals with plausible explanations of relativeslowdown in FDI flows to India in 2010-11 and arrives at an econometricevidence using panel estimation. The last section presents theconclusions.
C. WHO CAN INVEST IN INDIA
1. A non-resident entity (other than a citizen of Pakistan or an entity incorporated in Pakistan) can invest in India, subject to the FDI Policy. A citizen of Bangladesh or an entity incorporated in Bangladesh can investin India under the FDI Policy, only under the Government route.
2. NRIs resident in Nepal and Bhutan as well as citizens of Nepal and Bhutan are permitted to invest in the capital of Indian companies on repatriationbasis, subject to the condition that the amount of consideration for such investment shall be paid only by way of inward remittance in free foreign exchange through normal banking channels.
3. OCBs have been derecognized as a class of Investors in India with effect from September 16, 2003. Erstwhile OCBs which are incorporated outside
Fazlani Altius Business School [Batch : 2013-2015] Page 8

ECONOMICS ASSIGNMENT [FOREIGN DIRECT INVESTMENT (FDI) IN INDIA ]
India and are not under the adverse notice of RBI can make fresh investments under FDI Policy as incorporated non-resident entities, with the prior approval of Government of India if the investment is through Government route; and with the prior approval of RBI if the investment is through Automatic route.
4. (i) An FII may invest in the capital of an Indian Company under the Portfolio Investment Scheme which limits the individual holding of an FII to 10% of the capital of the company and the aggregate limit forFII investment to 24% of the capital of the company. This aggregate limit of 24% can be increased to the sectorial cap/statutory ceiling, as applicable, by the Indian Company concerned by passing a resolution by its Board of Directors followed by passing of a special resolution to that effect by its General Body. The aggregate FII investment, in the FDI and Portfolio Investment Scheme, should be within the above caps.(ii) The Indian company which has issued shares to FIIs under the FDI Policy for which the payment has been received directly into company’s account should report these figures separately under item no. 5 of Form FC-GPR (Annex-1-A) (Post-issue pattern of shareholding) so that the details could be suitably reconciled for statistical/monitoring purposes.(iii) A daily statement in respect of all transactions (except derivativetrade) have to be submitted by the custodian bank in floppy / soft copy in the prescribed format directly toRBI to monitor the overall
ceiling/sectorial cap/statutory ceiling.
5. No person other than registered FII/NRI as per Schedules II and III of Foreign Exchange Management (Transfer or Issue of Security by a Person Resident Outside India) Regulations of FEMA 1999, can invest/trade in capital of Indian Companies in the Indian Stock Exchanges directly i.e. through brokers like a Person Resident in India.
6. A SEBI registered Foreign Venture Capital Investor (FVCI) may contribute up to 100% of the capital of an Indian Venture Capital Undertaking (IVCU) and may also set up a domestic asset management company to manage the fund. All such investments can be made under the automatic route in terms of Schedule 6 to Notification No. FEMA 20. A SEBI registered FVCI can alsoinvest in a domestic venture capital fund registered under the SEBI (Venture Capital Fund) Regulations, 1996. Such investments would also be subject to the extant FEMA regulations and extant FDI policy including sectorial caps, etc. SEBI registered FVCIs are also allowed to invest under the FDI Scheme, as non-resident entities, in other companies, subject to FDI Policy and FEMA regulations.
Fazlani Altius Business School [Batch : 2013-2015] Page 9

ECONOMICS ASSIGNMENT [FOREIGN DIRECT INVESTMENT (FDI) IN INDIA ]
D. ENTITIES FOR FDI
1. FDI in an Indian Company (i) Indian companies including those which are micro and smallenterprises (MSEs) can issue capital against FDI.
2. FDI in Partnership Firm / Proprietary Concern:
(i) A Non-Resident Indian (NRI) or a Person of Indian Origin (PIO) resident outside India can invest by way of contribution to the capital of a firm or a proprietary concern in India on non-
repatriation basis provided:(a) Amount is invested by inward remittance or out of
NRE/FCNR(B)/NRO account maintained with Authorized Dealers / Authorized banks. (b) The firm or proprietary concern is not engaged in any agricultural/plantation or real estate business or print media sector. (c) Amount invested shall not be eligible for repatriation outside India. (ii) Investments with repatriation benefits: NRIs/PIO may seek prior permission of Reserve Bank for investment in sole proprietorship concerns/partnership firms with repatriation benefits. The application will be decided in consultation with the Government of India. (iii) Investment by non-residents other than NRIs/PIO: A person resident outside India other than NRIs/PIO may make an application and seek prior approval of Reserve Bank for making
investment by way of contribution concern or any association of persons in India. The application will be decided in consultation with the Government of India. (iv) Restrictions: An NRI or PIO is not allowed to invest in a firm or proprietorship concern engaged in any and immovable property with a view to earning profit or earning income there from) or
engaged in Print Media.
3. FDI in Venture Capital Fund (VCF): FVCIs are allowed to invest in Indian Venture Capital Undertakings (IVCUs) /Venture Capital Funds (VCFs) /other companies, as stated in paragraph 3.1.6 of this Circular.If a domestic VCF is set up as a trust, a person resident outside India(non-resident entity/individual including an NRI) cannot invest in suchdomestic VCF under the automatic route of the FDI scheme and would be
Fazlani Altius Business School [Batch : 2013-2015] Page 10

ECONOMICS ASSIGNMENT [FOREIGN DIRECT INVESTMENT (FDI) IN INDIA ]
allowed subject to approval of the FIPB. However, if a domestic VCF is set-up as an incorporated company under the Companies Act, 1956, then aperson resident outside India (non-resident entity/individual includingan NRI) can invest in such domestic VCF under the automatic route of FDI Scheme, subject to the pricing guidelines, reporting requirements, mode of payment, minimum capitalization norms, etc.
4. FDI in Trusts: FDI in Trusts other than VCF is not permitted.
5. FDI in other Entities: FDI in resident entities other than those
mentioned above is not permitted.
E. ENTRY ROUTES FOR FDI
1. Investments can be made by non-residents in the equity shares/fully, compulsorily and Mandatorily convertible debentures/ fully, compulsorily and mandatorily convertible preference shares of an Indiancompany, through two routes:
(i) The Automatic Route: under the Automatic Route, the non-resident investor or the Indian company does not require any approval fromthe RBI or Government of India for the investment.
(ii) The Government Route: under the Government Route, prior approval of the Government of India through Foreign Investment Promotion Board (FIPB) is required. Proposals for foreign investment under Government route as laid down in the FDI policy from time to time, are considered by the Foreign Investment Promotion Board (FIPB) in Department of Economic Affairs (DEA), Ministry of Finance.
Fazlani Altius Business School [Batch : 2013-2015] Page 11

ECONOMICS ASSIGNMENT [FOREIGN DIRECT INVESTMENT (FDI) IN INDIA ]
F. GUIDELINES FOR CONSIDERATION OF FDI PROPOSALS BY FIPB:
The following guidelines are laid down to enable the FIPB to consider the proposals for FDI and formulate its recommendations.
1. All applications should be put up before the FIPB by its Secretariat within 15 days and it should be ensured that comments of the administrative ministries are placed before the Board either prior to/or in the meeting of the Board.
2. Proposals should be considered by the Board keeping in view the time frame of thirty (30) days for communicating Government decision.
Fazlani Altius Business School [Batch : 2013-2015] Page 12

ECONOMICS ASSIGNMENT [FOREIGN DIRECT INVESTMENT (FDI) IN INDIA ]
3. In cases in which either the proposal is not cleared or further information is required in order to obviate delays presentation by applicant in the meeting of the FIPB should be resorted to.
4. While considering cases and making recommendations, FIPB should keep inmind the sectorial requirements and the sectorial policies vis-à-vis the proposal (s).
5. FIPB would consider each proposal in its totality.
6. The Board should examine the following while considering proposals submitted to it forconsideration:(i) Whether the items of activity involve industrial licence or not and if so the considerations for grant of industrial licence must be gone into.(ii) Whether the proposal involves any export projection and ifso the items of export and the projected destinations.
(iii) Whether the proposal has any strategic or defence related considerations.
7. While considering proposals the following may be prioritized:(i) Items falling in infrastructure sector.
(ii) Items which have an export potential.
(iii) Items which have large scale employment potential and especially for rural people.(iv) Items which have a direct or backward linkage with agro business/farm sector.(v) Items which have greater social relevance such as hospitals, human resource development, life saving drugs and equipment.
(vi) Proposals which result in induction of technology or infusion of capital.
8. The following should be especially considered during the scrutiny and consideration ofproposals:(i) The extent of foreign equity proposed to be held (keeping in viewsectoral caps if any.(ii) Extent of equity from the point of view whether the proposed project would amount to a holding company/wholly owned subsidiary/a company with dominant foreign investment (i.e. 76% or more) joint venture.
Fazlani Altius Business School [Batch : 2013-2015] Page 13

ECONOMICS ASSIGNMENT [FOREIGN DIRECT INVESTMENT (FDI) IN INDIA ]
(iii) Whether the proposed foreign equity is for setting up a new project (joint venture or otherwise) or whether it is for enlargement of foreign/NRI equity or whether it is for fresh induction of foreign equity/NRI equity in an existing Indian company.
(iv) In the case of fresh induction offerings/NRI equity and/or in cases of enlargement of foreign/NRI equity, in existing Indian companies whether there is a resolution of the Board of Directors
supporting the said induction/enlargement of foreign/NRI equity and whether there is a shareholders agreement or not.
(v) In the case of induction of fresh equity in the existing Indian companies and/or enlargement of foreign equity in existing Indian companies, the reason why the proposal has been made and the modalityfor induction/enhancement (i.e. whether by increase of paid up capital/authorized capital, transfer of shares(hostile or otherwise) whether by rights issue, or by what modality.
(vi) Issue/transfer/pricing of shares will be as per SEBI/RBI guidelines.(vii) Whether the activity is an industrial or a service activity or a combination of both.(viii) Whether the items of activity involves any restriction by way of reservation for the Micro & Small Enterprises sector.
(ix) Whether there are any sectorial restrictions on the activity.
(x) Whether the proposal involves import of items which are either hazardous/banned or detrimental to environment (e.g. import of plastic scrap or recycled plastics).
9. No condition specific to the letter of approval issued to a non-resident investor would be changed or additional condition imposed subsequent to the issue of a letter of approval. This would not prohibit changes in general policies and, regulations applicable to theindustrial sector.
Fazlani Altius Business School [Batch : 2013-2015] Page 14

ECONOMICS ASSIGNMENT [FOREIGN DIRECT INVESTMENT (FDI) IN INDIA ]
G. TREND IN FDI FLOWS
Widening growth differential across economies and gradual opening up ofcapital accounts in the emerging world resulted in a steep rise in crossborder investment flows during the past two decades. This section brieflypresents the recent trends in global capital flows particularly toemerging economies including India.
1. Global Trends in FDI Inflows
During the period subsequent to dotcom burst, there has been anunprecedented rise in the cross-border flows and this exuberance wassustained until the occurrence of global financial crisis in the year2008-09. Between 2003 and 2007, global FDI flows grew nearly four -foldand flows to EMEs during this period, grew by about three-fold. Afterreaching a peak of US$ 2.1 trillion in 2007, global FDI flows witnessedsignificant moderation over the next two years to touch US$ 1.1 trillionin 2009, following the global financial crisis. On the other hand, FDIflows to developing countries increased from US$ 565 billion in 2007 toUS$ 630 billion in 2008 before moderating to US$ 478 billion in 2009.
Fazlani Altius Business School [Batch : 2013-2015] Page 15

ECONOMICS ASSIGNMENT [FOREIGN DIRECT INVESTMENT (FDI) IN INDIA ]
The decline in global FDI during 2009 was mainly attributed to subduedcross border merger and acquisition (M&A) activities and weaker returnprospects for foreign affiliates,which adversely impacted equityinvestments as well as reinvested earnings. According to UNCTAD, declinein M&A activities occurred as the turmoil in stock markets obscured theprice signals upon which M&As rely. There was a decline in the number ofgreen field investment cases as well, particularly those related tobusiness and financial services.
From an institutional perspective, FDI by private equity funds declined astheir fund raising dropped on the back of investors’ risk aversion and thecollapse of the leveraged buyout market in tune with the deterioration incredit market conditions. On the other hand, FDI from sovereign wealthfunds (SWFs) rose by 15 per cent in 2009. This was apparently due to therevised investment strategy of SWFs - who have been moving away frombanking and financial sector towards primary and manufacturing sector,which are less vulnerable to financial market developments as well asfocusing more on Asia.
As the world economic recovery continued to be uncertain and fragile,global FDI flows remained stagnant at US $ 1.1 trillion in 2010. Accordingto UNCTAD’s Global Investment Trends Monitor (released on January 17,2011), although global FDI flows at aggregate level remained stagnant,they showed an uneven pattern across regions – while it contracted furtherin advanced economies by about 7 per cent, FDI flows recovered by almost10 per cent in case of developing economies as a group driven by strongrebound in FDI flows in many countries of Latin America and Asia. Reboundin FDI flows to developing countries has been on the back of improvedcorporate profitability and some improvement in M&A activities withimproved valuations of assets in the stock markets and increased financialcapability of potential buyers.
Improved macroeconomic conditions, particularly in the emerging economies,which boosted corporate profits coupled with better stock marketvaluations and rising business confidence augured well for global FDIprospects. According to UNCTAD, these favourable developments may helptranslate MNC’s record level of cash holdings (estimated to be in therange of US$ 4-5 trillion among developed countries’ firms alone) into newinvestments during 2011. The share of developing countries, which nowconstitutes over 50 per cent in total FDI inflows, may increase further onthe back of strong growth prospects. However, currency volatility,sovereign debt problems and potential protectionist policies may pose somerisks to this positive outlook. Nonetheless, according to the Institute ofInternational Finance (January 2011), net FDI flows to EMEs was projectedto increase by over 11 per cent in 2011. FDI flows into select countriesare given in Table 1.
Fazlani Altius Business School [Batch : 2013-2015] Page 16

ECONOMICS ASSIGNMENT [FOREIGN DIRECT INVESTMENT (FDI) IN INDIA ]
Table 1 : Countries with Higher Estimated Level of FDIInflows than India in 2010Amount (US$ billion) Variation
(Percent)2007 2008 2009 2010
(Estimates)
2008
2009
2010(Estimat
es)World 2100
.01770.9
1114.2
1122.0 -15.
7
-37.
1
0.7
DevelopedEconomies
1444.1
1018.3
565.9
526.6 -29.
5
-44.
4
-6.9
UnitedStates
266.0
324.6
129.9
186.1 22.0
-60.
0
43.3
France 96.2 62.3 59.6 57.4 -35.
2
-4.3
-3.7
Belgium 118.4
110.0
33.8 50.5 -7.1
-69.
3
49.4
UnitedKingdom
186.4
91.5 45.7 46.2 -50.
9
-50.
1
1.1
Germany 76.5 24.4 35.6 34.4 -68.
1
45.9
-3.4
DevelopingEconomies
564.9
630.0
478.3
524.8 11.5
-24.
1
9.7
China 83.5 108.3
95.0 101.0 29.7
-12.
3
6.3
Hong Kong 54.3 59.6 48.4 62.6 9.8 -18.
8
29.3
Russian 55.1 75.5 38.7 39.7 37. - 2.6
Fazlani Altius Business School [Batch : 2013-2015] Page 17

ECONOMICS ASSIGNMENT [FOREIGN DIRECT INVESTMENT (FDI) IN INDIA ]
Federation 0 48.7
Singapore 35.8 10.9 16.8 37.4 69.6
54.1
122.6
Saudi Arabia 22.8 38.2 35.5 - 67.5
-7.1
-
Brazil 34.6 45.1 25.9 30.2 30.3
-42.
6
16.6
India 25.0 40.4 34.6 23.7 61.6
-14.
4
-31.5
Source: World Investment Report, 2010 and Global InvestmentTrends Monitor, UNCTAD.
H. TRENDS IN FDI FLOWS TO INDIA
With the tripling of the FDI flows to EMEs during the pre-crisis period ofthe 2000s, India also received large FDI inflows in line with its robustdomestic economic performance. The attractiveness of India as a preferredinvestment destination could be ascertained from the large increase in FDIinflows to India, which rose from around US$ 6 billion in 2001-02 toalmost US$ 38 billion in 2008-09. The significant increase in FDI inflowsto India reflected the impact of liberalisation of the economy since theearly 1990s as well as gradual opening up of the capital account. As partof the capital account liberalisation, FDI was gradually allowed in almostall sectors, except a few on grounds of strategic importance, subject tocompliance of sector specific rules and regulations. The large and stableFDI flows also increasingly financed the current account deficit over theperiod. During the recent global crisis, when there was a significantdeceleration in global FDI flows during 2009-10, the decline in FDI flows
Fazlani Altius Business School [Batch : 2013-2015] Page 18

ECONOMICS ASSIGNMENT [FOREIGN DIRECT INVESTMENT (FDI) IN INDIA ]
to India was relatively moderate reflecting robust equity flows on theback of strong rebound in domestic growth ahead of global recovery andsteady reinvested earnings (with a share of almost 25 per cent) reflectingbetter profitability of foreign companies in India. However, when therehad been some recovery in global FDI flows, especially driven by flows toAsian EMEs, during 2010-11, gross FDI equity inflows to India witnessedsignificant moderation. Gross equity FDI flows to India moderated to US$20.3 billion during 2010-11 from US$ 27.1 billion in the preceding year.
Table 2: Equity FDI Inflows to India(Percent)
Sectors 2006-07
2007-08
2008-09
2009-10
2010-11
Sectoral shares (Percent)Manufactures 17.6 19.2 21.0 22.9 32.1Services 56.9 41.2 45.1 32.8 30.1Construction, Real estateand mining
15.5 22.4 18.6 26.6 17.6
Others 9.9 17.2 15.2 17.7 20.1Total 100.
0100.
0100.
0100.
0100.0
Equity Inflows (US$ billion)Manufactures 1.6 3.7 4.8 5.1 4.8Services 5.3 8.0 10.2 7.4 4.5Construction, Real estateand mining
1.4 4.3 4.2 6.0 2.6
Others 0.9 3.3 3.4 4.0 3.0Total Equity FDI 9.3 19.4 22.7 22.5 14.9
From a sectoral perspective, FDI in India mainly flowed into servicessector (with an average share of 41 per cent in the past five years)followed by manufacturing (around 23 per cent) and mainly routed throughMauritius (with an average share of 43 per cent in the past five years)followed by Singapore (around 11 per cent). However, the share of servicesdeclined over the years from almost 57 per cent in 2006-07 to about 30 percent in 2010-11, while the shares of manufacturing, and ‘others’ largelycomprising ‘electricity and other power generation’ increased over thesame period (Table 2). Sectoral information on the recent trends in FDIflows to India show that the moderation in gross equity FDI flows during2010-11 has been mainly driven by sectors such as ‘construction, realestate and mining’ and services such as ‘business and financial services’.Manufacturing, which has been the largest recipient of FDI in India, hasalso witnessed some moderation (Table 2).
Fazlani Altius Business School [Batch : 2013-2015] Page 19

ECONOMICS ASSIGNMENT [FOREIGN DIRECT INVESTMENT (FDI) IN INDIA ]
I. CU M U L A T I V E FDI F LOW S IN T O IND I A (2 0 0 0 - 2 013 ) :
A. TOTAL FDI INFLOWS (from April, 2000 to March, 2013):
1. CUMULATIVE AMOUNT OF FDI INFLOWS(Equity inflows + ‘Re-invested earnings’ +‘Other capital’) *
-US$ 290,078million
2. CUMULATIVE AMOUNT OF FDI EQUITY INFLOWS(excluding, amount remitted through RBI’s-NRI
Rs. 896,38crore
US$ 193,282million
B. FDI INFLOWS DURING FINANCIAL YEAR 2012-13 (from April, 2012 to March, 2013):
1. TOTAL FDI INFLOWS INTO INDIA(Equity inflows + ‘Re-invested earnings’ + ‘Other capital’)(as per RBI’s Monthly bulletin dated:
- US$ 36,860million
2. FDI EQUITY INFLOWS Rs. 121,907crore
US$ 22,423million
C. FDI EQUITY INFLOWS (MONTH-WISE) DURING THE FINANCIAL YEAR 2012-13:
Financial Year 2012-13( April-March )
Amount of FDI Equity inflows(In Rs. Crore) (In US$ mn)
1 April, 2012 9,620 1,8572.
May, 2012 7,229 1,3273 June, 2012 6,971 1,2444 July, 2012 8,182 1,4755 August, 2012 12,578 2,2646 September, 2012 25,552 4,6797 October, 2012 10,295 1,9428 November, 2012 5,798 1,0589 December, 2012 6,012 1,1001 January, 2013 11,719 2,1571 February, 2013 9,654 1,7951 March, 2013 8,297 1,5252012-13 (up to March, 2013) # 121,907 22,4232011-12 (up to March, 2012) # 165,146 35,121
%age growth over last year ( - ) 28 % ( - ) 38 %
Fazlani Altius Business School [Batch : 2013-2015] Page 20

ECONOMICS ASSIGNMENT [FOREIGN DIRECT INVESTMENT (FDI) IN INDIA ]
D. FDI EQUITY INFLOWS (MONTH-WISE) DURING THE CALENDAR YEAR 2013:
Calendar Year 2013(Jan.-Dec.)
Amount of FDI Equity inflows(In Rs. Crore) (In US$ mn)
1. January, 2013 11,719 2,1572. February, 2013 9,654 1,7953. March, 2013 8,297 1,525Year 2013 (up to March, 2013) 29,670 5,477Year 2012 (up to March, 2012) 29,354 5,844%age growth over last year ( + ) 01 % ( - ) 06 %
N o te : Country & Sector specific analysis is available from the year 2000 onwards, as Company-wise details are provided by RBI from April, 2000 onwards only.* Data on „Re-invested earnings‟ & „Other capital‟, are the estimates on an average basis, based upon data for the previous two years, published by RBI in monthly bulletin dated: 10.12.2012.# Figures are provisional, subject to reconciliation with RBI, Mumbai.^ Inflows for the month of March, 2012 are as reported by RBI, consequent to the adjustment made in the figures of March, „11, August,‟11 and October, „11.
Fazlani Altius Business School [Batch : 2013-2015] Page 21

ECONOMICS ASSIGNMENT [FOREIGN DIRECT INVESTMENT (FDI) IN INDIA ]
E. SHARE OF TOP INVESTING COUNTRIES FDI EQUITY INFLOWS (Financial years):
Amount Rupees in crores(US$ in
million)
Ranks Country 2010-1 1 (April -March)
201 1 -1 2 ( April -March)
2012-1 3 (April –March)
C u m u lat i v e I n fl ows
(April ‟00– March’13)
%age tototal
Inflows (interms of US
1. MAURITIUS31,855(6,987)
46,710(9,942)
51,654(9,497)
341,125(73,666) 38 %
2. SINGAPORE7,730(1,705)
24,712(5,257)
12,594(2,308)
90,182(19,460) 10 %
3. U.K.12,235(2,711)
36,428(7,874)
5,797(1,080)
80,459(17,549) 9 %
4. JAPAN7,063(1,562)
14,089(2,972)
12,243(2,237)
70,094(14,550) 8 %
5. U.S.A.5,353(1,170)
5,347(1,115)
3,033(557)
50,923(11,121) 6 %
6. NETHERLANDS5,501(1,213)
6,698(1,409)
10,054(1,856)
42,378(8,965) 5 %
7. CYPRUS4,171(913)
7,722(1,587)
2,658(490)
32,328(6,889) 4 %
8. GERMANY908
(200)7,452(1,622)
4,684(860)
25,512(5,480) 3 %
9 FRANCE3,349(734)
3,110(663)
3,487(646)
16,865(3,573) 2 %
10. U.A.E.1,569(341)
1,728(353)
987(180)
11,307(2,422) 1 %
TOTAL FDI INFLOWSFROM
ALL COUNTRIES *
97,320(21,383)
165,146(35,121)
121,907(22,423)
896,913(193,403) -
*Includes inflows under NRI Schemes of RBI.
N o te : (i) Cumulative country-wise FDI equity inflows (from April, 2000 to March, 2013) are at – A nne x- „ A ‟
(ii) %age worked out in US$ terms & FDI inflows received through FIPB/SIA+ RBI‟s Automatic Route + acquisition of existing shares only.
Fazlani Altius Business School [Batch : 2013-2015] Page 22

ECONOMICS ASSIGNMENT [FOREIGN DIRECT INVESTMENT (FDI) IN INDIA ]
F. SECTORS ATTRACTING HIGHEST FDI EQUITY INFLOWS: Amount in Rs. crores (US$ in million)
Ranks Sector 2010-11 (April -March)
2011-12 ( April- March)
2012-13 (April –March)
C u m u lat i v e I n fl ows
(April ‟00–
% age tototal
Inflows(In1. SERVICES SECTOR ** 15,054
(3,296)24,656(5,216)
26,306(4,833)
172,275(37,235) 19 %
2. CONSTRUCTIONDEVELOPMENT:
TOWNSHIPS, HOUSING,BUILT-UP INFRASTRUCTURE
7,590(1,663)
15,236(3,141)
7,248(1,332)
101,049(22,080) 11 %
3. TELECOMMUNICATIONS(radio paging,
cellular mobile,basic telephone
7,542(1,665)
9,012(1,997)
1,654(304)
58,732(12,856)
7 %
4. COMPUTER SOFTWARE &HARDWARE
3,551(780)
3,804(796)
2,656(486)
52,774(11,691) 6 %
5. DRUGS & PHARMACEUTICALS 961(209)
14,605(3,232)
6,011(1,123)
48,880(10,318) 5 %
6. CHEMICALS (OTHER THANFERTILIZERS)
10,612(2,354)
18,422(4,041)
1,596(292)
40,496(8,881) 5 %
7. AUTOMOBILE INDUSTRY 5,864(1,299)
4,347(923)
8,384(1,537)
39,170(8,295) 4 %
8. POWER 5,796(1,272)
7,678(1,652)
2,923(536)
36,137(7,834) 4 %
9. METALLURGICALINDUSTRIES
5,023(1,098)
8,348(1,786)
7,878(1,466)
34,814(7,507)
4 %
10 HOTEL & TOURISM 1,405(308)
4,754(993)
17,777(3,259)
33,260(6,631) 3 %
N o te : (i) ** Services sector includes Financial, Banking, Insurance, Non-Financial / Business, Outsourcing, R&D, Courier, Tech.Testing and Analysis
(ii) Cumulative Sector- wise FDI equity inflows (from April, 2000 to March, 2013) are at - A nne x- „ B ‟ .
(iii) FDI Sectoral data has been revalidated / reconciled in line with the RBI, which reflects minor changes in the FDI figures (increase/decrease) as compared to the earlier published sectoral data.
Fazlani Altius Business School [Batch : 2013-2015] Page 23

ECONOMICS ASSIGNMENT [FOREIGN DIRECT INVESTMENT (FDI) IN INDIA ]
G. STATEMENT ON RBI’S REGIONAL OFFICES (WITH STATE COVERED) RECEIVED FDI EQUITY INFLOWS (from April, 2000 to March, 2013):
Amount Rupees in crores (US$ in million)
S.No.
RBI‟s -RegionalOffice
State covered 2010-1 1 (April
-March)
2011-1 2 ( April- March)
2012-13 (April –March)
C umu lat i v e I n fl ows
(April ‟00 –March’13)
%age tototal
Inflows(in terms
1 MUMBAI MAHARASHTRA,DADRA & NAGAR
HAVELI,DAMAN & DIU
27,669(6,097)
44,664(9,553)
47,359(8,716)
293,494(63,337)
33
2 NEW DELHI DELHI, PARTOF
UP AND
12,184(2,677)
37,403(7,983)
17,490(3,222)
168,581(36,294)
19
3 CHENNAI TAMIL NADU,PONDICHERRY
6,115(1,352)
6,711(1,422)
15,252(2,807)
52,810(11,081)
6
4 BANGALORE KARNATAKA 6,133(1,332)
7,235(1,533)
5,553(1,023)
49,445(10,784)
6
5 AHMEDABAD GUJARAT 3,294(724)
4,730(1,001)
2,676(493)
39,100(8,650)
4
6 HYDERABAD ANDHRAPRADESH
5,753(1,262)
4,039(848)
6,290(1,159)
36,891(7,968)
4
7 KOLKATA WEST BENGAL,SIKKIM,
ANDAMAN &NICOBARISLANDS
426(95)
1,817(394)
2,319(424)
10,504(2,306)
1
8 CHANDIGARH CHANDIGARH,PUNJAB,HARYANA,HIMACHALPRADESH
1,892(416)
624(130)
255(47)
5,564(1,201)
1
9 BHOPAL MADHYAPRADESH,
CHATTISGARH
2,093(451)
569(123)
1,208(220)
4,787(997)
0.5
10. KOCHI KERALA,LAKSHADWEEP
167(37)
2,274(471)
390(72)
4,321(911)
0.5
11 PANAJI GOA 1,376(302)
181(38)
47(9)
3,554(771)
0.4
12 JAIPUR RAJASTHAN 230(51)
161(33)
714(132)
3,325(685)
0.4
13 KANPUR UTTARPRADESH,
UTTRANCHAL
514(112)
635(140)
167(31)
1,614(347)
0.2
14 BHUBANESHWAR ORISSA 68(15)
125(28)
285(52)
1,617(341)
0.2
Fazlani Altius Business School [Batch : 2013-2015] Page 24
ECONOMICS ASSIGNMENT [FOREIGN DIRECT INVESTMENT (FDI) IN INDIA ]
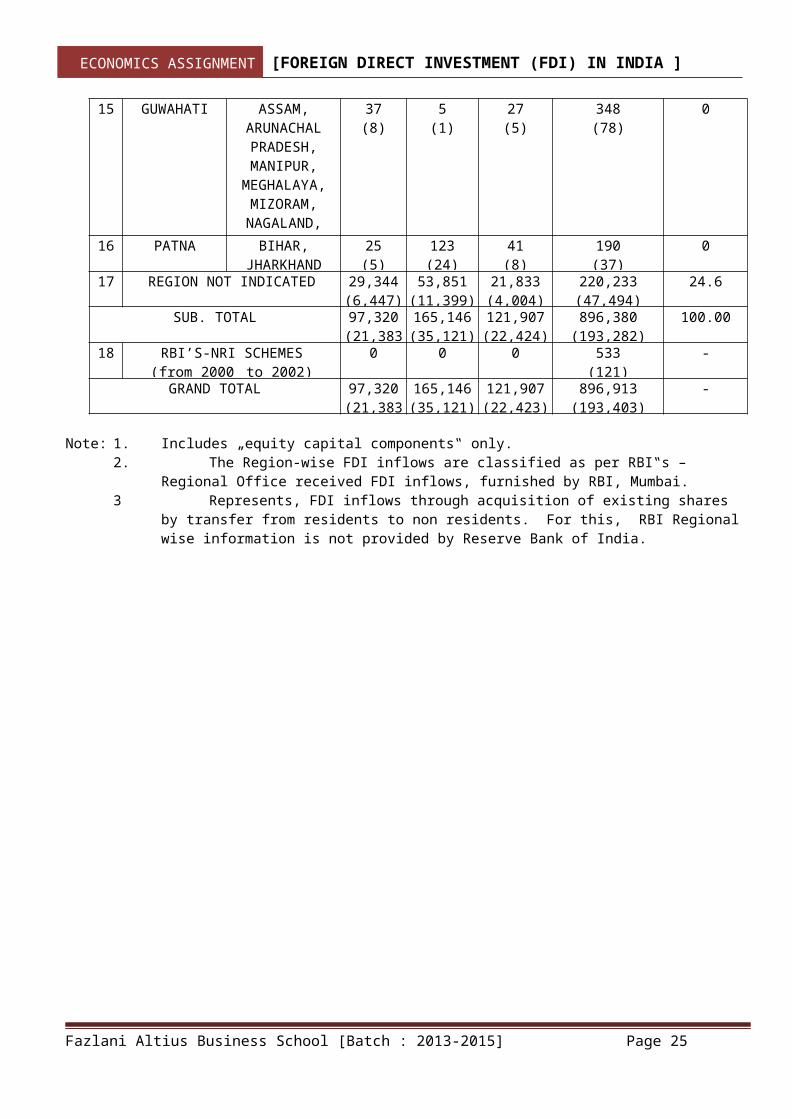
15 GUWAHATI ASSAM,ARUNACHALPRADESH,MANIPUR,
MEGHALAYA,MIZORAM,NAGALAND,TRIPURA
37(8)
5(1)
27(5)
348(78)
0
16 PATNA BIHAR,JHARKHAND
25(5)
123(24)
41(8)
190(37)
0
17 REGION NOT INDICATED 29,344(6,447)
53,851(11,399)
21,833(4,004)
220,233(47,494)
24.6
SUB. TOTAL 97,320(21,383
165,146(35,121)
121,907(22,424)
896,380(193,282)
100.00
18 RBI’S-NRI SCHEMES(from 2000 to 2002)
0 0 0 533(121)
-
GRAND TOTAL 97,320(21,383
165,146(35,121)
121,907(22,423)
896,913(193,403)
-
Note: 1. Includes „equity capital components‟ only.2. The Region-wise FDI inflows are classified as per RBI‟s –
Regional Office received FDI inflows, furnished by RBI, Mumbai.3 Represents, FDI inflows through acquisition of existing shares
by transfer from residents to non residents. For this, RBI Regional wise information is not provided by Reserve Bank of India.
Fazlani Altius Business School [Batch : 2013-2015] Page 25

Sr.No.
Financial Year(April-March)
FO R E I GN DIR E C T IN VE S T M E N T ( F DI ) I nv est m e n t
by F II ‟ s
ForeignInstitutiona l
InvestorsFund
Equity Re-investe
dearning
s+
Othercapita
l+
FDI FLOWS INTOINDIAFIPB
Route/RBI‟s
AutomaticRoute/
Acquisition Route
Equitycapital
ofunicorporated
bodies #
Tot a l F D I
F l ows
%agegrowthover
previousyear
(in US$FINANCIAL YEARS 2000-01 to 2012-13 (up to March, 2013)
1. 2000-01 2,339 61 1,350 279 4,029 - 1,8472. 2001-02 3,904 191 1,645 390 6,130 (+) 52 % 1,5053. 2002-03 2,574 190 1,833 438 5,035 (-) 18 % 3774. 2003-04 2,197 32 1,460 633 4,322 (-) 14 % 10,9185. 2004-05 3,250 528 1,904 369 6,051 (+) 40 % 8,6866. 2005-06 5,540 435 2,760 226 8,961 (+) 48 % 9,9267. 2006-07 15,585 896 5,828 517 22,826 (+) 146 3,2258. 2007-08 24,573 2,291 7,679 300 34,843 (+) 53 % 20,3289. 2008-09 31,364 702 9,030 777 41,873 (+) 20 % (-)10. 2009-10 (P) (+) 25,606 1,540 8,668 1,931 37,745 (-) 10 % 29,04811. 2010-11 (P) (+) 21,376 874 11,939 658 34,847 (-) 08 % 29,42212. 2011-12 (P) 34,833 1,022 8,206 2,495 46,556 (+) 34 % 16,81213. 2012-13 (P)
(up to March,21,825 1,059 11,025 2,951 36,860 - 27,583
CU M U L A T IVE T OT A L (from April, 2000 to
March’ 2013)
194,966 9,821 73,327 11,964 290,078 - 144,654
ECONOMICS ASSIGNMENT [FOREIGN DIRECT INVESTMENT (FDI) IN INDIA ]
II. FI N A N C I A L Y E A R -W I S E F DI INF LOW S D A T A :
A. AS PER INTERNATIONAL BEST PRACTICES:
(Data on FDI have been revised since 2000-01 with expended coverage to approach International Best Practices)
(Amount US$ million)
Source: (i) RBI‟s Bulletin May, 2013 dt. 13.05.2013 (Table No. 34 – FOREIGN INVESTMENT INFLOWS).(ii) Inflows under the acquisition of shares in March, 2011, August,
2011 & October, 2011, include net FDI on account of transfer of participating interest from Reliance Industries Ltd. to BP
Exploration (Alpha).(iii) RBI had included Swap of Shares of US$ 3.1 billion under equity
components during December 2006.(iv) Monthly data on components of FDI as per expended coverage are
not available. These data, therefore, are not comparable with FDI data for previous years.
(v) Figures updated by RBI up to March, 2013.
Fazlani Altius Business School [Batch : 2013-2015] Page 26

ECONOMICS ASSIGNMENT [FOREIGN DIRECT INVESTMENT (FDI) IN INDIA ]
„#‟ Figures for equity capital of unincorporated bodies for 2010-11 are estimates. (P) All figures are provisional“+” Data in respect of „Re-invested earnings‟ & „Other capital‟ for the years 2009- 10, 2010-11 & 2012-13 are estimated as average of previous two years.
B. DIPP’S – FINANCIAL YEAR-WISE FDI EQUITY INFLOWS: (As per DIPP’s FDI data base – equity capital components only):Sr.Nos
Financial Year(April – March)
Amount of FDI Inflows %age growthover
previousyear
(in terms ofUS $)
FINANCIAL YEARS 2000-01 to 2012-13(up to March, 2013)
In Rs crores In US$million
1. 2000-01 10,733 2,463 -2. 2001-02 18,654 4,065 ( + ) 65 %3. 2002-03 12,871 2,705 ( - ) 33 %4. 2003-04 10,064 2,188 ( - ) 19 %5. 2004-05 14,653 3,219 ( + ) 47 %6. 2005-06 24,584 5,540 ( + ) 72 %7. 2006-07 56,390 12,492 (+ )125 %8. 2007-08 98,642 24,575 ( + ) 97 %9. 2008-09 ‘*’ 142,829 31,396 ( + ) 28 %10. 2009-10 # 123,120 25,834 ( - ) 18 %11. 2010-11 # 97,320 21,383 ( - ) 17 %12. 2011-12 # ^ 165,146 35,121 (+) 64 %13. 2012-13 #
(from April, 2012 to March,121,907 22,423 -
CU M U L A T IV E T OT A L (from April, 2000 to March, 2013)
896,913 193,404 -
Note: (i) Including amount remitted through RBI‟s-NRI Schemes (2000-2002).(ii) FEDAI (Foreign Exchange Dealers Association of India)
conversion rate from rupees to US dollar applied, on the basis of monthly average rate provided by RBI (DEPR), Mumbai.
# Figures for the years 2009-10, 2010-11, 2011-12 & 2012-13 (from April, 2012 to August, 2012) are provisional subject to reconciliation with RBI.^ Inflows for the month of March, 2012 are as reported by RBI, consequentto the adjustment made in the figures of March, „11, August, ‟11 and October, „11.
Fazlani Altius Business School [Batch : 2013-2015] Page 27

ECONOMICS ASSIGNMENT [FOREIGN DIRECT INVESTMENT (FDI) IN INDIA ]
*‟ An additional amount of US$ 4,035 million pertaining to the year 2008-09, since reported by RBI, has been included in FDI data base from February, 2012.
Fazlani Altius Business School [Batch : 2013-2015] Page 28

ECONOMICS ASSIGNMENT [FOREIGN DIRECT INVESTMENT (FDI) IN INDIA ]
I. S T A T E M E NT O N C O UN T R Y -W I S E FDI E Q UI T Y INF LOW S A P R IL, 2 0 0 0 T O M A RC H , 2 0 1 3
Sr.
Country Amount of Foreign Direct %age with totalFDI Inflows (+)(In Rs crore) (In US$ million)
1 Mauritius 341,124.86 73,666.11 38.112 Singapore 90,182.32 19,460.35 10.073 United Kingdom 80,458.61 17,548.55 9.084 Japan 70,094.45 14,550.29 7.535 U.S.A 50,922.68 11,121.11 5.756 Netherlands 42,378.39 8,965.08 4.647 Cyprus 32,328.14 6,889.33 3.568 Germany 25,512.17 5,480.30 2.849 France 16,864.63 3,572.99 1.8510 UAE 11,307.02 2,422.47 1.2511 Switzerland 11,064.28 2,367.02 1.2212 Spain 6,960.69 1,463.19 0.7613 South Korea 5,821.17 1,231.55 0.6414 Italy 5,258.45 1,169.48 0.6115 Hong Kong 4,769.75 1,028.74 0.5316 Sweden 4,604.83 982.37 0.5117 Caymen Islands 3,755.52 877.74 0.4518 British Virginia 3,604.01 795.76 0.4119 Indonesia 2,825.48 610.30 0.3220 Poland 2,987.28 568.79 0.2921 Malaysia 2,730.13 549.45 0.2822 Australia 2,478.02 535.06 0.2823 The Bermudas 2,252.20 502.07 0.2624 Belgium 2,277.18 491.86 0.2525 Luxembourg 2,197.27 473.03 0.2426 Russia 2,236.55 468.17 0.2427 Canada 1,954.65 425.67 0.2228 Oman 1,622.44 352.02 0.1829 Denmark 1,645.73 342.61 0.1830 China 1,428.48 278.31 0.1431 Finland 1,301.95 273.89 0.1432 Austria 895.05 187.64 0.1033 Ireland 687.66 154.23 0.0834 Chile 654.72 141.07 0.0735 Morocco 649.65 136.99 0.0736 Norway 607.06 126.18 0.0737 South Africa 564.27 120.71 0.0638 Thailand 513.66 111.10 0.0639 British Isles 451.33 98.37 0.0540 West Indies 348.17 78.28 0.0441 Taiwan 306.60 65.70 0.0342 Mexico 345.83 64.97 0.03
Fazlani Altius Business School [Batch : 2013-2015]Page 29

ECONOMICS ASSIGNMENT [FOREIGN DIRECT INVESTMENT (FDI) IN INDIA ]
43 Turkey 279.53 59.66 0.0344 Israel 247.93 55.69 0.0345 St. Vincent 254.02 49.67 0.0346 Saudi Arabia 193.91 40.93 0.0247 Panama 185.36 40.61 0.0248 Korea(North) 187.15 36.94 0.0249 Saint Kitts & Nevis 147.88 33.53 0.0250 New Zealand 145.92 32.62 0.0251 Philippines 168.58 31.24 0.0252 Bahamas 141.68 30.74 0.0253 Sri Lanka 138.45 29.45 0.0254 Jordan 155.03 28.57 0.0155 Portugal 119.72 25.00 0.0156 Iceland 93.72 21.14 0.0157 Kenya 98.45 21.07 0.0158 Brazil 100.43 20.97 0.0159 Virgin Islands(US) 101.10 20.83 0.0160 Gibraltar 83.67 19.51 0.0161 Seychelles 86.99 18.24 0.0162 Kuwait 84.96 17.95 0.0163 Kazakhstan 81.11 17.42 0.0164 Czech Republic 74.81 17.36 0.0165 Bahrain 130.53 29.23 0.0166 Liberia 64.54 14.56 0.0167 Malta 58.39 12.78 0.0168 Channel Islands 57.20 12.71 0.0169 Belarus 49.93 12.17 0.0170 Nigeria 49.48 10.44 0.0171 Hungary 47.86 10.30 0.0172 Argentina 46.23 10.15 0.0173 Myanmar 35.75 8.96 0.0074 Isle of Man 38.09 8.49 0.0075 Slovenia 39.07 8.24 0.0076 Liechtenstein 29.90 6.43 0.0077 Belize 25.14 5.52 0.0078 Maldives 24.72 5.49 0.0079 Slovakia 22.62 5.22 0.0080 Rep. of Fiji Islands 22.30 5.07 0.0081 Romania 23.16 4.60 0.0082 Ghana 21.13 4.46 0.0083 Tunisia 19.84 4.31 0.0084 Guersney 23.27 4.20 0.0085 Greece 18.78 3.72 0.0086 Uruguay 16.06 3.63 0.0087 Scotland 13.51 2.99 0.0088 Qatar 14.23 2.84 0.0089 West Africa 12.31 2.47 0.0090 Nepal 9.12 1.93 0.0091 Yemen 7.74 1.87 0.00
Fazlani Altius Business School [Batch : 2013-2015]Page 30

ECONOMICS ASSIGNMENT [FOREIGN DIRECT INVESTMENT (FDI) IN INDIA ]
92 Monaco 7.49 1.52 0.0093 Egypt 7.30 1.43 0.0094 Tanzania 6.31 1.41 0.0095 Colombia 5.36 1.17 0.0096 Ukraine 5.06 1.12 0.0097 Uganda 5.06 1.10 0.0098 Cuba 4.73 1.04 0.0099 Guyana 4.60 1.00 0.0010 Vanuatu 4.41 0.94 0.0010 Bermuda 3.45 0.64 0.0010 Togolese Republic 3.08 0.60 0.0010 Congo (DR) 2.41 0.54 0.0010 Croatia 2.29 0.52 0.0010 Aruba 1.96 0.43 0.0010 Lebanon 1.87 0.39 0.0010 Bulgaria 1.69 0.36 0.0010 Estonia 1.31 0.30 0.0010 Anguilla 1.46 0.29 0.0011 Yugoslavia 1.13 0.24 0.0011 Vietnam 1.14 0.24 0.0011 Jamaica 1.00 0.22 0.0011 Iraq 0.85 0.19 0.0011 Zambia 0.67 0.15 0.0011 Iran 0.47 0.10 0.0011 Libya 0.28 0.07 0.0011 Latvia 0.27 0.06 0.0011 Mongolia 0.27 0.06 0.0011 Sudan 0.24 0.05 0.0012 Peru 0.20 0.04 0.0012 Bangladesh 0.16 0.03 0.0012 Afghanistan 0.12 0.03 0.0012 Botswana 0.13 0.02 0.0012 St. Lucia 0.06 0.01 0.0012 Georgia 0.02 0.00 0.0012 East Africa 0.02 0.00 0.0012 Bolivia 0.01 0.00 0.0012 Costa Rica 0.01 0.00 0.0012 Kyrgyzstan 0.01 0.00 0.0013 Trinidad & Tobago 0.01 0.00 0.0013 Cameroon 0.01 0.00 0.0013 Djibouti 0.00 0.00 0.0013 Venezuela 0.00 0.00 0.0013 Barbados 0.00 0.00 0.0013 Muscat 0.00 0.00 0.0013 FII's 0.25 0.06 0.0013 NRI ‘*’ 20,383.66 4,684.25 2.4213 Country Details Awaited 30,854.20 6,960.47 3.65
SUB.-TOTAL 896,379.66 193,281.91 100.0013 RBI’S- NRI SCHEMES 533.06 121.33 -
Fazlani Altius Business School [Batch : 2013-2015]Page 31

ECONOMICS ASSIGNMENT [FOREIGN DIRECT INVESTMENT (FDI) IN INDIA ]
GRAND TOTAL 896,912.72 193,403.24 -
J. S T A T E M E NT O N SE C T O R -W I S E FDI E Q UI T Y INF LOW S A P R IL, 2 0 0 0 T O M A RC H , 2 0 1 3
Sr.
Sector Amount of FDI Inflows %age withtotal(In Rs (In US$
1 SERVICES SECTOR(Fin., Banking, Insurance, NonFin/Business, Outsourcing, R&D,
Courier, Tech.
172,275.31
37,234.60 19.26
2 CONSTRUCTION DEVELOPMENT Townships,housing, built-up infrastructureand construction-development
101,049.13
22,080.20 11.42
3 TELECOMMUNICATIONS 58,732.23 12,856.06 6.654 COMPUTER SOFTWARE & HARDWARE 52,774.07 11,691.10 6.055 DRUGS & PHARMACEUTICALS 48,879.53 10,318.17 5.346 CHEMICALS
(OTHER THAN FERTILIZERS)40,495.55 8,880.83 4.59
7 AUTOMOBILE INDUSTRY 39,169.94 8,294.85 4.298 POWER 36,136.88 7,834.22 4.059 METALLURGICAL INDUSTRIES 34,814.13 7,507.07 3.8810 HOTEL & TOURISM 33,260.03 6,631.25 3.4311 PETROLEUM & NATURAL GAS 24,808.41 5,381.48 2.7812 TRADING 18,646.51 3,955.80 2.0513 INFORMATION & BROADCASTING
(INCLUDING PRINT MEDIA)15,495.69 3,284.21 1.70
14 ELECTRICAL EQUIPMENTS 14,668.58 3,182.70 1.6515 CEMENT AND GYPSUM PRODUCTS 11,779.04 2,626.43 1.3616 NON-CONVENTIONAL ENERGY 12,901.12 2,591.22 1.3417 MISCELLANEOUS MECHANICAL &
ENGINEERING INDUSTRIES10,522.52 2,318.71 1.20
18 INDUSTRIAL MACHINERY 11,017.51 2,302.14 1.1919 CONSULTANCY SERVICES 9,692.72 2,095.13 1.0820 CONSTRUCTION (INFRASTRUCTURE)
ACTIVITIES9,741.06 2,090.41 1.08
21 FOOD PROCESSING INDUSTRIES 8,681.38 1,811.06 0.9422 PORTS 6,717.38 1,635.08 0.8523 AGRICULTURE SERVICES 7,797.73 1,608.69 0.8324 HOSPITAL & DIAGNOSTIC CENTRES 7,437.93 1,597.33 0.8325 TEXTILES
(INCLUDING DYED,PRINTED)5,689.76 1,226.02 0.63
26 ELECTRONICS 5,466.74 1,198.22 0.6227 SEA TRANSPORT 5,492.51 1,194.50 0.6228 FERMENTATION INDUSTRIES 5,095.29 1,134.63 0.59
Fazlani Altius Business School [Batch : 2013-2015]Page 32

ECONOMICS ASSIGNMENT [FOREIGN DIRECT INVESTMENT (FDI) IN INDIA ]
29 RUBBER GOODS 5,824.46 1,134.44 0.5930 MINING 4,368.18 998.30 0.5231 PAPER AND PULP
(INCLUDING PAPER PRODUCTS)4,056.14 865.54 0.45
32 PRIME MOVER(OTHER THAN ELECTRICAL GENERATORS)
4,131.80 848.68 0.44
33 EDUCATION 3,332.97 684.35 0.3534 SOAPS, COSMETICS & TOILET
PREPARATIONS3,115.54 632.39 0.33
35 MACHINE TOOLS 2,967.09 622.99 0.3236 MEDICAL AND SURGICAL APPLIANCES 2,913.92 604.47 0.3137 CERAMICS 2,195.59 508.13 0.2638 AIR TRANSPORT (INCLUDING AIR
FREIGHT)2,022.00 449.26 0.23
39 DIAMOND,GOLD ORNAMENTS 1,810.74 390.76 0.2040 GLASS 1,942.21 389.07 0.2041 VEGETABLE OILS AND VANASPATI 1,893.72 384.94 0.2042 FERTILIZERS 1,425.53 297.90 0.1543 AGRICULTURAL MACHINERY 1,423.25 296.42 0.1544 PRINTING OF BOOKS
(INCLUDING LITHO PRINTING INDUSTRY)1,257.51 272.32 0.14
45 RAILWAY RELATED COMPONENTS 1,246.35 270.33 0.1446 COMMERCIAL, OFFICE & HOUSEHOLD
EQUIPMENTS1,181.76 254.83 0.13
47 EARTH-MOVING MACHINERY 769.05 174.95 0.0948 LEATHER,LEATHER GOODS AND PICKERS 527.88 107.43 0.0649 TEA AND COFFEE
(PROCESSING & WAREHOUSING COFFEE &RUBBER)
456.01 101.21 0.05
50 RETAIL TRADING (SINGLE BRAND) 459.55 95.36 0.05
51 SCIENTIFIC INSTRUMENTS 496.11 94.48 0.0552 TIMBER PRODUCTS 398.52 79.15 0.0453 PHOTOGRAPHIC RAW FILM AND PAPER 269.26 66.54 0.0354 INDUSTRIAL INSTRUMENTS 307.45 66.53 0.0355 BOILERS AND STEAM GENERATING PLANTS 305.75 61.83 0.03
56 SUGAR 242.32 51.82 0.0357 COAL PRODUCTION 103.11 24.78 0.0158 DYE-STUFFS 87.32 19.50 0.0159 GLUE AND GELATIN 70.56 14.55 0.0160 MATHEMATICAL,SURVEYING AND DRAWING
INSTRUMENTS39.80 7.98 0.00
61 DEFENCE INDUSTRIES 19.89 4.12 0.0062 COIR 10.37 2.17 0.0063 MISCELLANEOUS INDUSTRIES 35,469.28 7,843.68 4.10
SUB -TOTAL 896,379.6 193,283.31 10064 RBI’S- NRI SCHEMES (2000-2002) 533.06 121.33 -
GRAND TOTAL 896,912.73
193,404.64 -
Fazlani Altius Business School [Batch : 2013-2015]Page 33

ECONOMICS ASSIGNMENT [FOREIGN DIRECT INVESTMENT (FDI) IN INDIA ]
FDI inflows data re-classified, as per segregation of data from April 2000 onwards.
+‟ Percentage of inflows worked out in terms of US$ & the above amount of inflows received through FIPB/SIA route RBI‟s automatic route & acquisition of existing shares only.FDI Sectoral data has been revalidated / reconciled in line with the RBI, which reflects minor changes in the FDI figures (increase/decrease) as compared to the earlier published sectoral data.
K. INDIAN ECONOMY
I. Recent Trends in Indian Economy
1. The Indian economy has emerged with remarkable rapidity from the slowdown caused by the global economic crisis and emerged stronger in 2011.The Indian economy is estimated to grow at 8.6 per cent in 2010-11as compared to the growth rate of 8.0 per cent in 2009-10. The growth rate of 8.6 per cent in GDP during 2010-11 has been due to the robust growth rates of over 8 per cent in the sectors of manufacturing, construction, trade, hotels, transport and communication, financing, insurance, and, real estate and business services.
2. The agriculture, forestry and fishing sector is likely to show a growthof 5.4 per cent during 2010-11, as against the previous year's growth rate of 0.4 per cent. According to the Department of Agriculture and Cooperation (DAC) of Government of India, production of food grains andoilseeds is expected to grow by 6.5 per cent and 11.9 per cent, respectively, as compared to the previous agriculture year. The production of cotton and sugarcane is also expected to rise by 41.2 percent and 15.2 per cent, respectively, in 2010-11. Among the horticultural crops, production of fruits and vegetables is expected toincrease by 4.1 per cent and 3.8 per cent, respectively, during the year 2010-11.
3. The growth in mining and quarrying and manufacturing sectors during 2010-11 is expected to be 6.2 and 8.8 per cent respectively over previous year. According to the latest estimates available of the Indexof Industrial Production (IIP), mining and manufacturing registered growth rates of 8.0 per cent and 10.0 per cent respectively during April-November, 2010. The estimated growth rate for construction sectoris 8.0 per cent in 2010-11. The key indicators of construction sector, namely, cement production and steel consumption have registered growth rates of 4.4 per cent and 8.8 per cent, respectively during April-
Fazlani Altius Business School [Batch : 2013-2015]Page 34

ECONOMICS ASSIGNMENT [FOREIGN DIRECT INVESTMENT (FDI) IN INDIA ]
December, 2010.
4. The estimated growth in the trade, hotels, transport and communication sectors during 2010-11 is placed at 11.0 per cent, mainly on account ofgrowth of 14.9 per cent in passengers handled in civil aviation, 21.3 per cent in air cargo handled and 40.9 per cent in stock of telephone connections. The sales of commercial vehicles witnessed an increase of 34.1 per cent per cent in April-December, 2010. The financing, insurance, real estate and business services sectors are expected to show a growth rate of 10.6 per cent during 2010-11, on account of 14.0 per cent growth in aggregate deposits and 22.6 per cent growth in bank credit during April- November 2010 (against the respective growth ratesof 18.6 per cent and 10.1 per cent in the corresponding period of previous year). The growth rate of community, social and personal services during 2010-11 is estimated to be 5.7 per cent.
5. India's per capita income, often used to measure a country's standard of living, increased by 14.5 per cent during 2009-10 to US$ 1038.2 as compared to US$ 906.9 in 2008-09.
II. Growth in Gross Domestic Product
Annual growth by economic activity in Gross Domestic Product (GDP) for the year 2010-11, released by the Central Statistics office (CSO) of Government of India
S.No.
Industry GDP at FactorCost (2010-11)
Percentage change over previousyear
at 2004-05prices(US$
at currentprices (US$
at 2004-05
atcurrent
Fazlani Altius Business School [Batch : 2013-2015]Page 35

ECONOMICS ASSIGNMENT [FOREIGN DIRECT INVESTMENT (FDI) IN INDIA ]
billion) billion) prices prices1 Agriculture, forestry &
fishing152.42 295.25 5.4 23.2
2 Mining & quarrying 24.32 40.13 6.2 18.23 Manufacturing 170.87 228.09 8.8 14.54 Electricity, gas & water
supply20.49 22.15 5.1 8.6
5 Construction 84.57 129.21 8.0 17.06 Trade, hotels, transport
& communication291.36 379.65 11.0 16.7
7 Financing, insurance, real estate & business services
187.89 285.97 10.6 26.5
8 Community, social & personal services
141.87 216.87 5.7 11.3
Total GDP 1073.79 1597.49 8.6 18.3
Source: Central Statistics Office (CSO), Ministry of Statistics & Programme Implementation, Government of India
Fazlani Altius Business School [Batch : 2013-2015]Page 36

ECONOMICS ASSIGNMENT [FOREIGN DIRECT INVESTMENT (FDI) IN INDIA ]
III. Economic Survey 2012-13
According to the Economic Survey 2010-11, tabled in Parliament on February25, 2011 by the Union Finance Minister, Mr. Pranab Mukherjee, the economyis expected to grow at 8.6 per cent in 2010-11 and is expected to be around 9 per cent in the next fiscal year. The growth has been broad basedwith a rebound in the Agriculture sector which is expected to grow around 5.4 per cent. Manufacturing and Services sector have registered impressivegains. The Survey reports that the industrial output growth rate was 8.6 per cent while the manufacturing sector registered a growth rate of 9.1 per cent in 2010-11.
The main highlights of the survey are:
1. Economy expected to grow at 8.6 per cent in 2010-11 and 9 per cent in next fiscal.
2. Growth broad based with rebound in Agriculture, continued momentum in manufacturing and private services.
3. Fundamentals strong with savings and investments up, exports rising rapidly and inflation falling.
4. Agriculture likely to grow at 5.4 per cent in 2010-11.
5. Industrial output grows by 8.6 per cent.
6. Manufacturing sector registers 9.1 per cent growth.
7. Exports in April–December 2010 up by 29.5 per cent.
8. Imports in April–December 2010 up by 19 per cent.
9. Trade gap narrowed to US$ 82.01 billion in April-December 2010.
10. 59 per cent rise in Net Bank Credit.
11. Social programme spending stepped up by 5 percentage points of GDPover past 5 years.
Fazlani Altius Business School [Batch : 2013-2015]Page 37

ECONOMICS ASSIGNMENT [FOREIGN DIRECT INVESTMENT (FDI) IN INDIA ]
12. 9.7 per cent growth of GDP at market prices.
13. Production of food grains estimated at 232.1 million tonnes.
14. Forex Reserves estimated at US$ 297.3 billion.
15. Gross Fiscal Deficit stands at 4.8 per cent of GDP
L. POTENTIAL FOR INVESTMENT IN INDIA
1. India presents a vast potential for overseas investment and is activelyencouraging the entrance of foreign players into the market. India is also one of the few markets in the world, which offers high prospects for growth and earning potential in practically all areas of business.
2. India’s biotechnology sector is set to become a $10 billion industry by2015, CMD of Biocon Ltd, Kiran Mazumdar-Shaw said . She expects the industry to grow to $5 billion by next year. In 2008-09 it was $2.51 billion. “India’s biotechnology industry is at an inflexion point, and has attained a critical mass, Mazumdar-Shaw said. It now has a platformfrom where it can leapfrog and deliver exponential growth, she said. India is also becoming the vaccine capital.Clinical trials, agri-biotech and bio-fuels are becoming opportunities. There are a lot of growth drivers and trigger points which, she said, will deliver in the next five years.
3. With the launch of video telephony, by BSNL and Sai Info Systems (SIS),will boost demand for broadband connection, Sam Pitroda, advisor to Prime Minister on public information, infrastructure and innovations, expects the number to hit 100 million in next five years. "The service is expected to revolutionize the telecom sector and take it to the nextlevel. Globally with video phones have become an integral part of life.
Fazlani Altius Business School [Batch : 2013-2015]Page 38

ECONOMICS ASSIGNMENT [FOREIGN DIRECT INVESTMENT (FDI) IN INDIA ]
The service will be provided and marketed by SIS while the connectivityfor the service will be provided by BSNL. BSNL will also market it as another value added service to its large broadband customer base," saidVijay Mandora, director, SIS.
4. Tumbling voice tariffs contributing to the declining average revenue per user (ARPU) rates, will result in SMS volumes to reach 191.6 billion in India by 2013, predicts Gartner. By 2013, the country would have more than 750 million mobile connections; therefore the SMS usage per user would essentially drop. However, overall large base of mobile connections would support this SMS volume. Strong organic growth continues in Asia’s developing markets, with marginal subscribers turning to low-cost messaging as an entry-level service. In the mature markets of the Asia-Pacific region, SMS has seen sustained healthy growth as a result of steady price declines and increasingly generous SMS and data bundles," said Madhusudan Gupta, senior research analyst at Gartner. SMS contributes around 8% to value added services (VAS), which in turn contributes 10-12% of an operator’s revenue.
5. The Indian auto sector is likely to witness an overall growth of 10% - 12% in sales during 2010 and a faster recovery in expected in passengervehicle (PV) volumes of 12% - 14% compared with 5% - 6% for the commercial vehicle (CV) segment. The positive outlook for demand could result in a sharp increase in capex plans, which could offset the positive impact on credit profiles of higher volumes and lower inventories, said Fitch Ratings. The PV rebound has been supported by an improving liquidity scenario and restoration of consumer confidence;modest growth in industrial production, together with the government stimulus, has brought about stability in CV sales, though at lower levels than for PVs. Domestic CV sales grew by 22.3% during April-December 2009 compared with same period in 2008, building on the recovery in demand beginning Q4 09. However, growth trends have distinctly varied within the CV segment - depending on the tonnage capacity and end-use, as light commercial vehicles (LCVs) have been able to maintain their ground while medium and heavy commercial vehicles (M&HCVs) continued to face pressure due to the decline in industrial output. The M&HCV segment is now stabilizing with the higherindustrial production, while the LCV segment is showing a more rapid recovery. Fitch expects the full-year 2010 numbers to reveal moderate growth in the range of 5% - 6% for domestic sales, with the first few months being driven by regulatory guidelines.
Fazlani Altius Business School [Batch : 2013-2015]Page 39

ECONOMICS ASSIGNMENT [FOREIGN DIRECT INVESTMENT (FDI) IN INDIA ]
6. The Union food processing ministry has set a target of attracting investments to the tune of Rs 1 lakh crore in the sector by 2015.SubodhKant Sahai, Union food processing minister, said: “We are expecting investments of Rs 1 lakh crore in the next five years. We are planning to increase food processing to 20% of the total fruits and vegetable produced in the country. “According to him, food processing has grown by 10% in India while value-added products have grown by 10-15% in the last five years. We are looking at a growth of 35% in value-added production by 2015,” Sahai said.
7. The 234 million tonne per annum (mtpa) Indian cement industry, which witnessed a double digit dispatch growth in December 2009 and an overall growth thanks to infrastructure and real estate projects, is set to add 43.2 mtpa capacity during the next 15 months (January 2010 to March 2011).South India, which has already started feeling the heat of oversupply, will add the maximum capacity of 17.6 million tonne during that period. The next in line is the northern region, which willadd 9.6 mt. The western, central and eastern regions will add 9 mt, 3 mt and 4 mt, respectively. “The southern market with 18 players having capacity of 1mtpa or more is the most fragmented one in India. Capacities of three new players (Raghuram Cement, Jayajyothi and JSW Cement with more than 2 mtpa each) will stabilize in the next 6-9 months. With sharp price cuts, new producers may find it difficult to break even, and this would likely to prompt some consolidation. All thethree new producers are unlikely to participate in consolidation,” J Radhakrishnan, analyst with IIFL, said in his report.
8. The healthcare industry in the country, which comprises hospital and allied sectors, is projected to grow 23% per annum to touch $77-billionmark by 2012 from the current estimated size of $35 billion, according to a Yes Bank and Assocham report. The sector has registered a growth of 9.3% between 2000-2009, comparable to the sectorial growth rate of other emerging economies such as China, Brazil and Mexico. The growth in the sector would be driven by healthcare facilities, both private and public sector, medical diagnostic and pathlabs and the medical insurance sector. Of the sum, diagnostic and pathology services would account for $2.5 billion in 2012, more than double its estimated current size of $1billion. The growth in the segment is expected to be driven by consolidation in the industry and increasing insurance penetration among the country’s population. Healthcare facilities, inclusive of public and private hospitals, the core sector, around which the healthcare sector is centered, would continue to contribute over 70% of the total sector and touch a figure of $54.7 billion by
Fazlani Altius Business School [Batch : 2013-2015]Page 40

ECONOMICS ASSIGNMENT [FOREIGN DIRECT INVESTMENT (FDI) IN INDIA ]
2012.The medical insurance sector would account for another $ 3 billionin the next three years, up from the estimated current size of $1 billion.
9. Steve King, CEO of Zenith Optimedia Worldwide feels that new and emerging advertising markets like India and China will power the globalindustry’s recovery, on the back of positive signals from developed markets like US, Europe. “India, with an approximate 10% growth, will certainly be in the top ten advertising markets in absolute dollar terms by 2015,” he told. Zenith Optimedia, the world’s third largest media-buying agency and an enterprise under the Paris-based Publics Group is upbeat about India. It has brought fresh business worth $100 million in the country this year. India figures amongst Zenith Optimedia’s 20 largest markets globally, but over the past five years, it has been among the top three fastest growing ones. “Most of our markets are between 15 to 20 years old, so despite being here for only five years, this market has responded very well. Our focus here will beon winning local clients, apart from the international ones. By the next five years, we will have considerably closed the gap on the top two market leaders here,” King said.
M. ADVANTAGE IN INDIA
1. World's largest democracy with 1.2 billion people.
2. Stable political environment and responsive administrative set up.
3. Well established judiciary to enforce rule of law.
4. Land of abundant natural resources and diverse climatic conditions.
Fazlani Altius Business School [Batch : 2013-2015]Page 41

ECONOMICS ASSIGNMENT [FOREIGN DIRECT INVESTMENT (FDI) IN INDIA ]
5. Rapid economic growth: GDP to grow by 8.5% in 2010-11* and 9.0% in 2011-12.
6. India's growth will start to outpace China\'s within three to five years and hence will become the fastest large economy with 9-10% growth over the next 20-25 years (Morgan Stanley).
7. Investor friendly policies and incentive based schemes.
8. Second most attractive Foreign Direct Investment (FDI) location in the world: India received a total of US$ 25.9 billion of FDI in 2009-10.
9. Healthy macro-economic fundamentals: Investment rate is expected to be 37% in 2010-11 and 38.4% in 2011-12 while Domestic Savings rate is expected to be 34% in 2010-11 and 36% in 2011-12.
10. India's economy will grow fivefold in the next 20 years (McKinsey).
11. Cost competitiveness: low labour costs.
12. Total labour force of nearly 530 million.
13. Large pool of skilled manpower; strong knowledge base with significant English speaking population.
14. Young country with a median age of 30 years by 2025: India\'s economy will benefit from this "demographic dividend".
15. The proportion of population in the working age group (15-59 years) is likely to increase from approximately 58% in 2001 to more than 64% by 2021.
16. Huge untapped market potential.
17. The urban population of India will double from the 2001 census figure of 290m to approximately 590m by 2030 (McKinsey).
18. Progressive simplification and rationalization of direct and indirect tax structures.
19. Reduction in import tariffs.
20. Full current account convertibility.
Fazlani Altius Business School [Batch : 2013-2015]Page 42

ECONOMICS ASSIGNMENT [FOREIGN DIRECT INVESTMENT (FDI) IN INDIA ]
21. Compliance with WTO norms.
22. Robust banking and financial institutions.
"* India's financial year is from April to March. 2010-11 above means April 2010-March 2011."
I. Indian Economy
India has undergone a paradigm shift owing to its competitive stand in the world. The Indian economy is on a robust growth trajectory and boastsof a stable annual growth rate, rising foreign exchange reserves and booming capital markets among others.
Indian economy is estimated to grow at 8.6 percent in 2010-11 as comparedto the growth rate of 8.0 percent in 2009-10. These GDP figures are basedat factor cost at constant (2004-05) prices in the year 2010-11.The growth rate of 8.6 per cent in GDP during 2010-11 has been due to the robust growth rates of over 8 per cent in the sectors of manufacturing, construction, trade, hotels, transport and communication, financing, insurance, and, real estate and business services. Agriculture sector registered a growth rate of 5.4 percent in 2009-10. A growth rate of 18.3percent is estimated for GDP at current prices in the year 2010-11.
II. Agriculture Sector
The agriculture, forestry and fishing sector is likely to show a growth of 5.4 per cent in its GDP during 2010-11, as against the previous year’sgrowth rate of 0.4 per cent. The estimate of GDP from agriculture in 2010-11, according to the Department of Agriculture and Cooperation (DAC),production of food grains and oilseeds is expected to grow by 6.5 per cent and 11.9 per cent, respectively, as compared to the previous agriculture year. The production of cotton and sugarcane is also expectedto rise by 41.2 per cent and 15.2 per cent, respectively, in 2010-11. Among the horticultural crops, production of fruits and vegetables is expected to increase by 4.1 per cent and 3.8 per cent, respectively, during the year 2010-11.
III.Industry Sector
The growth in GDP for mining and quarrying and manufacturing sectors during 2010-11 is expected to be 6.2 and 8.8 percent respectively over previous year. According to the latest estimates available on the Index
Fazlani Altius Business School [Batch : 2013-2015]Page 43

ECONOMICS ASSIGNMENT [FOREIGN DIRECT INVESTMENT (FDI) IN INDIA ]
of Industrial Production (IIP), the index of mining and manufacturing registered growth rates of 8.0 per cent and 10.0 per cent during April-November, 2010. The estimated growth rate for construction sector is 8.0 percent in 2010-11. The key indicators of construction sector, namely, cement production and steel consumption have registered growth rates of 4.4 per cent and 8.8 per cent, respectively during April- December, 2010.
IV. Services Sector
The estimated growth in GDP for the trade, hotels, transport and communication sectors during 2010-11 is placed at 11.0 per cent, mainly on account of growth during April- November, 2010-11 of 14.9 per cent in passengers handled in civil aviation, 21.3 per cent in air cargo handled and 40.9 per cent in stock of telephone connections. The sales of commercial vehicles witnessed an increase of 34.1 per cent per cent in April-December, 2010. The financing, insurance, real estate and business services sector is expected to show a growth rate of 10.6 per cent during2010-11, on account of 14.0 per cent growth in aggregate deposits and 22.6 per cent growth in bank credit during April- November 2010 (against the respective growth rates of 18.6 per cent and 10.1 per cent in the corresponding period of previous year). The growth rate of community, social and personal services during 2010-11 is estimated to be 5.7 per cent.
N. FDI POLICY FRAMEWORK
Policy regime is one of the key factors driving investment flows to acountry. Apart from underlying macro fundamentals, ability of a nation toattract foreign investment essentially depends upon its policy regime -whether it promotes or restrains the foreign investment flows. Thissection undertakes a review of India’s FDI policy framework and makes acomparison of India’s policy vis-à-vis that of select EMEs.
1. FDI Policy Framework in India
There has been a sea change in India’s approach to foreign investmentfrom the early 1990s when it began structural economic reformsencompassing almost all the sectors of the economy.
Fazlani Altius Business School [Batch : 2013-2015]Page 44
ECONOMICS ASSIGNMENT [FOREIGN DIRECT INVESTMENT (FDI) IN INDIA ]
Pre-Liberalization Period
Historically, India had followed an extremely cautious and selectiveapproach while formulating FDI policy in view of the dominance of‘import-substitution strategy’ of industrialization. With the objectiveof becoming ‘self-reliant’, there was a dual nature of policy intention –FDI through foreign collaboration was welcomed in the areas of hightechnology and high priorities to build national capability anddiscouraged in low technology areas to protect and nurture domesticindustries. The regulatory framework was consolidated through theenactment of Foreign Exchange Regulation Act (FERA), 1973 wherein foreignequity holding in a joint venture was allowed only up to 40 per cent.Subsequently, various exemptions were extended to foreign companiesengaged in export oriented businesses and high technology and highpriority areas including allowing equity holdings of over 40 per cent.Moreover, drawing from successes of other country experiences in Asia,Government not only established special economic zones (SEZs) but alsodesigned liberal policy and provided incentives for promoting FDI inthese zones with a view to promote exports. As India continued to behighly protective, these measures did not add substantially to exportcompetitiveness. Recognising these limitations, partial liberalisation inthe trade and investment policy was introduced in the 1980s with theobjective of enhancing export competitiveness, modernisation andmarketing of exports through Trans-national Corporations (TNCs). Theannouncements of Industrial Policy (1980 and 1982) and Technology Policy(1983) provided for a liberal attitude towards foreign investments interms of changes in policy directions. The policy was characterized byde-licensing of some of the industrial rules and promotion of Indianmanufacturing exports as well as emphasizing on modernization ofindustries through liberalized imports of capital goods and technology.This was supported by trade liberalization measures in the form of tariffreduction and shifting of large number of items from import licensing toOpen General Licensing (OGL).
Post-Liberalization Period
A major shift occurred when India embarked upon economic liberalizationand reforms program in 1991 aiming to raise its growth potential andintegrating with the world economy. Industrial policy reforms graduallyremoved restrictions on investment projects and business expansion on theone hand and allowed increased access to foreign technology and fundingon the other. A series of measures that were directed towardsliberalizing foreign investment included:
(i) Introduction of dual route of approval of FDI – RBI’s automaticroute and Government’s approval (SIA/FIPB) route,
Fazlani Altius Business School [Batch : 2013-2015]Page 45

ECONOMICS ASSIGNMENT [FOREIGN DIRECT INVESTMENT (FDI) IN INDIA ]
(ii) Automatic permission for technology agreements in high priorityindustries and removal of restriction of FDI in low technologyareas as well as liberalization of technology imports,
(iii) Permission to Non-resident Indians (NRIs) and OverseasCorporate Bodies (OCBs) to invest up to 100 per cent in highpriorities sectors,
(iv) Hike in the foreign equity participation limits to 51 per centfor existing companies and liberalization of the use of foreign‘brands name’ and
(v) Signing the Convention of Multilateral Investment GuaranteeAgency (MIGA) for protection of foreign investments. Theseefforts were boosted by the enactment of Foreign ExchangeManagement Act (FEMA), 1999 [that replaced the Foreign ExchangeRegulation Act (FERA), 1973] which was less stringent. Thisalong with the sequential financial sector reforms paved wayfor greater capital account liberalization in India.
Investment proposals falling under the automatic route and mattersrelated to FEMA are dealt with by RBI, while the Government handlesinvestment through approval route and issues that relate to FDI policyper se through its three institutions, viz., the Foreign InvestmentPromotion Board (FIPB), the Secretariat for Industrial Assistance (SIA)and the Foreign Investment Implementation Authority (FIIA).
FDI under the automatic route does not require any prior approval eitherby the Government or the Reserve Bank. The investors are only required tonotify the concerned regional office of the RBI within 30 days of receiptof inward remittances and file the required documents with that officewithin 30 days of issuance of shares to foreign investors. Under theapproval route, the proposals are considered in a time-bound andtransparent manner by the FIPB. Approvals of composite proposalsinvolving foreign investment/ foreign technical collaboration are alsogranted on the recommendations of the FIPB. Current FDI policy in termsof sector specific limits has been summarized in Table 3 below:
Table 3: Sector Specific Limits of Foreign Investment in IndiaSector FDI Cap/Equity Entry
RouteOther
ConditionsA. Agriculture1. Floriculture, Horticulture, Development of Seeds, Animal Husbandry, Pisciculture,
100%
Automatic
Fazlani Altius Business School [Batch : 2013-2015]Page 46

ECONOMICS ASSIGNMENT [FOREIGN DIRECT INVESTMENT (FDI) IN INDIA ]
Aquaculture, Cultivation of vegetables & mushrooms and services related to agro and allied sectors.2. Tea sector, includingplantation
100% FIPB
(FDI is not allowed in any other agricultural sector /activity)B. Industry1. Mining covering exploration and mining of diamonds & precious stones; gold, silver and minerals.
100%
Automatic
2. Coal and lignite mining forcaptive consumption by powerprojects, and iron & steel,cement production.
100% Automatic
3. Mining and mineral separationof titanium bearing minerals
100% FIPB
C. Manufacturing1. Alcohol- Distillation & Brewing
100%Automatic
2. Coffee & Rubber processing &Warehousing.
100% Automatic
3. Defence production 26% FIPB4. Hazardous chemicals and isocyanates
100% Automatic
5. Industrial explosives -Manufacture
100% Automatic
6. Drugs and Pharmaceuticals 100% Automatic7. Power includinggeneration (except Atomicenergy); transmission,distribution and power trading.
100% Automatic
(FDI is not permitted for generation, transmission & distribution of electricityproduced in atomic power plant/atomic energy since private investment in this activity is prohibited and reserved for public sector.)D.Services1. Civil aviation (Greenfieldprojects and Existing projects)
100% Automatic
2. Asset Reconstructioncompanies
49% FIPB
3. Banking (private) sector 74% (FDI+FII).FII not to exceed 49%
Automatic
4. NBFCs : underwriting, s.t.minimum
Fazlani Altius Business School [Batch : 2013-2015]Page 47

ECONOMICS ASSIGNMENT [FOREIGN DIRECT INVESTMENT (FDI) IN INDIA ]
portfolio management services, investment advisory services, financial consultancy, stock broking, asset management, venture capital, custodian, factoring, leasing and finance, housing finance, forex broking, etc.
100% Automatic capitalization norms
5. Broadcasting a. FM Radio b. Cable network; c. Direct to home; d. Hardware facilities such as up-linking, HUB. e. Up-linking a news and currentaffairs TV Channel
20% 49% (FDI+FII) 100%
FIPB
6. Commodity Exchanges 49% (FDI+FII) (FDI 26 % FII 23%)
FIPB
7. Insurance 26% Automatic Clearance from IRDA
8. Petroleum and natural gas : a. Refining
49% (PSUs). 100% (Pvt. Companies)
FIPB (for PSUs). Automatic (Pvt.)
9. Print Media a. Publishing of newspaper and periodicals dealing with news and current affairs b. Publishing of scientific magazines / speciality journals/periodicals
26% 100%
FIPB FIPB
S.t.guidelines by Ministry of Information & broadcasting
10. Telecommunications a. Basic and cellular, unified access services, national / international long-distance, V-SAT, public mobile radio trunkedservices (PMRTS), global mobile personal communication services (GMPCS) and others.
74% (including FDI, FII, NRI, FCCBs, ADRs/GDRs, convertible preference shares, etc.
Automatic up to 49% and FIPB beyond 49%.
Sectors where FDI is Banned1. Retail Trading (except single brand product retailing);2. Atomic Energy;3. Lottery Business including Government / private lottery, online lotteries etc; 4. Gambling and Betting including casinos etc.; 5. Business of chit fund;
Fazlani Altius Business School [Batch : 2013-2015]Page 48

ECONOMICS ASSIGNMENT [FOREIGN DIRECT INVESTMENT (FDI) IN INDIA ]
6. Nidhi Company;7. Trading in Transferable Development Rights (TDRs); 8. Activities/sector not opened to private sector investment; 9. Agriculture (excluding Floriculture, Horticulture, Development of seeds,Animal Husbandry, Pisciculture and cultivation of vegetables, mushrooms etc. under controlled conditions and services related to agro andallied sectors) and Plantations (Other than Tea Plantations); 10. Real estate business, or construction of farm houses;11. Manufacturing of Cigars, cheroots, cigarillos and cigarettes, of tobacco or of tobacco or of tobacco substitutes.
2. FDI Policy: The International Experience
Foreign direct investment is treated as an important mechanism forchannelizing transfer of capital and technology and thus perceived to bea potent factor in promoting economic growth in the host countries.Moreover, multinational corporations consider FDI as an important meansto reorganise their production activities across borders in accordancewith their corporate strategies and the competitive advantage of hostcountries. These considerations have been the key motivating elements inthe evolution and attitude of EMEs towards investment flows from abroadin the past few decades particularly since the eighties. This sectionreviews the FDI policies of select countries to gather some perspectiveas to ‘where does India stand’ at the current juncture to draw policyimperatives for FDI policy in India.
China
Encouragement to FDI has been an integral part of the China’s economicreform process. It has gradually opened up its economy for foreignbusinesses and has attracted large amount of direct foreign investment.
Government policies were characterised by setting new regulations topermit joint ventures using foreign capital and setting up SpecialEconomic Zones (SEZs) and Open Cities.The concept of SEZs was extendedto fourteen more coastal cities in 1984.Favorable regulations andprovisions were used to encourage FDI inflow, especially export-oriented joint ventures and joint ventures using advanced technologiesin 1986.
Foreign joint ventures were provided with preferential tax treatment,the freedom to import inputs such as materials and equipment, the rightto retain and swap foreign exchange with each other, and simplerlicensing procedures in 1986. Additional tax benefits were offered toexport-oriented joint ventures and those employing advanced technology.
Fazlani Altius Business School [Batch : 2013-2015]Page 49
ECONOMICS ASSIGNMENT [FOREIGN DIRECT INVESTMENT (FDI) IN INDIA ]
Priority was given to FDI in the agriculture, energy, transportation,telecommunications, basic raw materials, and high-technologyindustries, and FDI projects which could take advantage of the richnatural resources and relatively low labour costs in the central andnorthwest regions.
China’s policies toward FDI have experienced roughly three stages:gradual and limited opening, active promoting through preferentialtreatment, and promoting FDI in accordance with domestic industrialobjectives. These changes in policy priorities inevitably affected thepattern of FDI inflows in China.
Chile
In Chile, policy framework for foreign investment, embodied in theconstitution and in the Foreign Investment Statute, is quite stable andtransparent and has been the most important factor in facilitatingforeign direct investment. Under this framework, an investor signs alegal contract with the state for the implementation of an individualproject and in return receives a number of specific guarantees andrights.
Foreign investors in Chile can own up to 100 per cent of a Chileanbased company, and there is no time limit on property rights. They alsohave access to all productive activities and sectors of the economy,except for a few restrictions in areas that include coastal trade, airtransport and the mass media.
Chile attracted investment in mining, services, electricity, gas andwater industries and manufacturing.
Investors are guaranteed the right to repatriate capital one year afterits entry and to remit profits at any time.
Although Chile’s constitution is based on the principle of non-discrimination, some tax advantages are extended to foreign investorssuch as invariability of income tax regime, invariability of indirecttaxes, and special policy regime for large projects.
Fazlani Altius Business School [Batch : 2013-2015]Page 50
ECONOMICS ASSIGNMENT [FOREIGN DIRECT INVESTMENT (FDI) IN INDIA ]
Malaysia
The Malaysian FDI regime is tightly regulated in that all foreignmanufacturing activity must be licensed regardless of the nature oftheir business.
Until 1998, foreign equity share limits were made conditional onperformance and conditions set forth by the industrial policy of thetime.
In the past, the size of foreign equity share allowed for investment inthe manufacturing sector hinged on the share of the products exportedin order to support the country's export-oriented industrial policy.
FDI projects that export at least 80 per cent of production orproduction involving advanced technology are promoted by the state andno equity conditions are imposed. Following the crisis in 1997-98, therestriction was abolished as the country was in need of FDI.
Korea
The Korean government maintained distinctive foreign investmentpolicies giving preference to loans over direct investment tosupplement its low level of domestic savings during the early stage ofindustrialisation. Korea’s heavy reliance on foreign borrowing tofinance its investment requirements is in sharp contrast to othercountries.
The Korean Government had emphasised the need to enhance absorptivecapacity as well as the indigenisation of foreign technologythrough reverse engineering at the outset of industrialisation whilerestricting both FDI and foreign licensing. This facilitated Koreanfirms to assimilate imported technology, which eventually led toemergence of global brands like Samsung, Hyundai, and LG.
The Korean government pursued liberalised FDI policy regime in theaftermath of the Asian financial crisis in 1997-98 to fulfil theconditionality of the International Monetary Fund (IMF) in exchange forstandby credit.
Several new institutions came into being in Korea immediately after thecrisis. Invest Korea is Korea’s national investment promotion agencymandated to offer one-stop service as a means of attracting foreigndirect investment, while the Office of the Investment Ombudsman wasestablished to provide investment after-care services to foreign-
Fazlani Altius Business School [Batch : 2013-2015]Page 51

ECONOMICS ASSIGNMENT [FOREIGN DIRECT INVESTMENT (FDI) IN INDIA ]
invested companies in Korea. These are affiliated to the Korea TradeInvestment Promotion Agency.
Korea enacted a new foreign investment promotion act in 1998 to provideforeign investors incentives which include tax exemptions andreductions, financial support for employment and training, cash grantsfor R&D projects, and exemptions or reductions of leasing costs forland for factory and business operations for a specified period.
One of the central reasons for the delays in the construction processin Korea is said to be the lengthy environmental and cultural duediligence on proposed industrial park sites. (OECD, 2008).
Thailand
Thailand followed a traditional import-substitution strategy, imposingtariffs on imports, particularly on finished products in the 1960s. Therole of state enterprises was greatly reduced from the 1950s andinvestment in infrastructure was raised. Attention was given tonurturing the institutional system necessary for industrialdevelopment. Major policy shift towards export promotion took place byearly 1970s due to balance of payments problems since most ofcomponents, raw materials, and machinery to support the productionprocess, had to be imported.
On the FDI front, in 1977 a new Investment Promotion Law was passedwhich provided the Board of Investment (BOI) with more power to provideincentives to priority areas and remove obstacles faced by privateinvestors (Table 4). After the East Asian financial crisis, the Thaigovernment has taken a very favourable approach towards FDI with anumber of initiatives to develop the industrial base and exports andprogressive liberalisation of laws and regulations constraining foreignownership in specified economic activities.
The Alien Business Law, which was enacted in 1972 and restrictedmajority foreign ownership in certain activities, was amended in 1999.The new law relaxed limits on foreign participation in several
Fazlani Altius Business School [Batch : 2013-2015]Page 52

ECONOMICS ASSIGNMENT [FOREIGN DIRECT INVESTMENT (FDI) IN INDIA ]
professions such as law, accounting, advertising and most types ofconstruction, which have been moved from a completely prohibited listto the less restrictive list of businesses.
To sum up, the spectacular performance of China in attracting large amountof FDI could be attributed to its proactive FDI policy comprising settingup of SEZs particularly exports catering to the international market,focus on infrastructure and comparative advantage owing to the low labourcosts. A comparison of the FDI policies pursued by select emergingeconomies, set out above, suggests that policies although broadly commonin terms of objective, regulatory framework and focus on technologicalupgradation and export promotion, the use of incentive structure andrestrictions on certain sectors, has varied across countries. While Chinaand Korea extend explicit tax incentives to foreign investors, othercountries focus on stability and transparency of tax laws. Similarly,while all the countries promote investment in manufacturing and servicessector, China stands out with its relaxation for agriculture sector aswell. It is, however, apparent that though policies across countries varyin specifics, there is a common element of incentivisation of foreigninvestment (Table 4).
Table 4: FDI Policy and Institutional Framework in Select CountriesYearof
Libera
lisation
Objective Incentives PrioritySectors
Uniquefeatures
China 1979 Transformation oftraditionalagriculture, promotionofindustrialization,infrastructure andexportpromotion.
Foreign joint ventureswere provided withpreferential taxtreatment. Additionaltax benefits to export-oriented joint venturesand those employingadvanced technology.Privileged access wasprovided to supplies ofwater, electricity andtransportation (payingthe same price as state-owned enterprises) andto interest-free RMBloans.
Agriculture,energy,transportation,telecommunications, basicraw materials,and high-technologyindustries.
Settingup ofSpecialEconomicZones
Chile 1974 Technologytransfer,export
Invariability of taxregime intended toprovide a stable tax
All productiveactivities andsectors of the
Does notuse taxincentive
Fazlani Altius Business School [Batch : 2013-2015]Page 53

ECONOMICS ASSIGNMENT [FOREIGN DIRECT INVESTMENT (FDI) IN INDIA ]
promotionand greaterdomesticcompetition.
horizon. economy,except for afewrestrictionsin areas thatincludecoastal trade, airtransport andthe massmedia.
s toattractforeigninvestment.
Korea 1998 Promotionofabsorptivecapacityandindigenization offoreigntechnologythroughreverseengineeringat theoutset ofindustrializationwhilerestrictingboth FDIand foreignlicensing.
Businesses located inForeign Investment Zoneenjoy full exemption ofcorporate income tax forfive years from the yearin which the initialprofit is made and 50percent reduction forthe subsequent twoyears. High-tech foreigninvestments in the FreeEconomic Zones areeligible for the fullexemption three yearsand 50 percent for thefollowing two years.Cash grants to high-techgreen field investmentand R&D investmentsubject to thegovernment approval.
Manufacturingand services
Loan-basedborrowingto anFDI-baseddevelopmentstrategytilllate1990s.
Malaysia
1980s Exportpromotion
No specific taxincentives.
Manufacturingand services.
MalaysianIndustrialDevelopmentAuthoritywasrecognised to beone oftheeffectiveagenciesin theAsian
Fazlani Altius Business School [Batch : 2013-2015]Page 54

ECONOMICS ASSIGNMENT [FOREIGN DIRECT INVESTMENT (FDI) IN INDIA ]
regionThailand
1977 Technologytransferand exportpromotion
No specific taxincentives. The ThaiBoard of Investment hascarried out activitiesunder the three broadcategories to promoteFDI. 1. Image building todemonstrate how the hostcountry is anappropriate location forFDI. 2. Investment generationby targeting investorsthrough variousactivities. 3. Servicing investors
Manufacturingand services
-
3. Cross-Country Comparison of FDI Policies – Where does India stand?
A true comparison of the policies could be attempted if the variedpolicies across countries could be reduced to a common comparable indexor a measure. Therefore, with a view to examine and analyse ‘where doesIndia stand’ vis-a-vis other countries at the current juncture in terms
Fazlani Altius Business School [Batch : 2013-2015]Page 55

ECONOMICS ASSIGNMENT [FOREIGN DIRECT INVESTMENT (FDI) IN INDIA ]
of FDI policy framework, the present section draws largely from theresults of a survey of 87 economies undertaken by the World Bank in 2009and published in its latest publication titled ‘Investing AcrossBorders’.
The survey has considered four indicators, viz., ‘Investing acrossBorders’, ‘Starting a Foreign Business’, ‘Accessing Industrial Land’, and‘Arbitrating Commercial Disputes’ to provide assessment about FDI climatein a particular country. Investing across Borders indicator measures thedegree to which domestic laws allow foreign companies to establish oracquire local firms. Starting foreign business indicator record the time,procedures, and regulations involved in establishing a local subsidiaryof a foreign company. Accessing industrial land indicator evaluates legaloptions for foreign companies seeking to lease or buy land in a hosteconomy, the availability of information about land plots, and the stepsinvolved in leasing land. Arbitrating commercial disputes indicatorassesses the strength of legal frameworks for alternative disputeresolution, rules for arbitration, and the extent to which the judiciarysupports and facilitates arbitration. India’s relative position in termsof these four parameters vis-à-vis major 15 emerging economies, whichcompete with India in attracting foreign investment, is set out in Tables5A and 5B.
Following key observations could be made from this comparison:
A comparative analysis among the select countries reveals thatcountries such as Argentina, Brazil, Chile and the Russian Federationhave sectoral caps higher than those of India implying that their FDIpolicy is more liberal.
The sectoral caps are lower in China than in India in most of thesectors barring agriculture and forestry and insurance. A noteworthyaspect is that China permits 100 per cent FDI in agriculture whilecompletely prohibits FDI in media. In India, on the other hand, foreignownership is allowed up to 100 per cent in sectors like ‘mining, oiland gas’, electricity and ‘healthcare and waste management’.
India positioned well vis-a-vis comparable counterparts in the selectcountries in terms of the indicator ‘starting a foreign business’. In2009, starting a foreign business took around 46 days with 16procedures in India as compared with 99 days with 18 procedures inChina and 166 days with 17 procedures in Brazil (Table 5 B).
In terms of another key indicator, viz., ‘accessing industrial land’India’s position is mixed. While the ranking in terms of indices basedon lease rights and ownership rights is quite high, the time to leaseprivate and public land is one of the highest among select countries at
Fazlani Altius Business School [Batch : 2013-2015]Page 56

ECONOMICS ASSIGNMENT [FOREIGN DIRECT INVESTMENT (FDI) IN INDIA ]
90 days and 295 days, respectively. In China, it takes 59 days to leaseprivate land and 129 days to lease public land. This also has importantbearing on the investment decisions by foreign companies.
In terms of the indicator ‘arbitrating commercial disputes’ India is onpar with Brazil and the Russian Federation. Although, the strength oflaws index is fairly good, the extent of judicial assistance index ismoderate.
Table 5A: Investing Across Borders – Sector wise Caps – 2009Country Min
ing,
oil
and
gas
Agricultureand forestry
Light
manufact
uring
Telecommunications
Electricity
Banking
Insurance
Transportation
Media Construction
,tourism andretail
Health
care andwastemanagement
Argentina
100 100 100 100 100 100 100 79.6 30 100 100
Brazil 100 100 100 100 100 100 100 68 30 100 50Chile 100 100 100 100 100 100 100 100 100 100 100China 75 100 75 49 85.4 62.5 50 49 0 83.3 85India 100 50 81.5 74 100 87 26 59.6 63 83.7 100Indonesia
97.5
72 68.8 57 95 99 80 49 5 85 82.5
Korea, 100 100 100 49 85.4 100 100 79.6 39.5 100 100Malaysia
70 85 100 39.5 30 49 49 100 65 90 65
Mexico 50 49 100 74.5 0 100 49 54.4 24.5 100 100Philippines
40 40 75 40 65.7 60 100 40 0 100 100
Russian 100 100 100 100 100 100 49 79.6 75 100 100South 74 100 100 70 100 100 100 100 60 100 100
Fazlani Altius Business School [Batch : 2013-2015]Page 57

ECONOMICS ASSIGNMENT [FOREIGN DIRECT INVESTMENT (FDI) IN INDIA ]
Thailand
49 49 87.3 49 49 49 49 49 27.5 66 49
Table 5B: Investing Across Borders – Key Indicators 2009Countr
yStarting aForeignBusiness
Accessing Industrial Land Arbitrating CommercialDisputes
Time (days)
Procedures
(number)
Easeof
establishment
index (0=
Strengthof
leaseright
sindex
(0 =min,
Strengthof
ownershiprights
index
(0 =
Accesstolandinformation
index
Availability oflandinformation
Timetoleasepriv
ate
lan
Timetoleasepublic lan
Strengthoflawsindex(0=
Ease ofprocessindex(0
Extent of
judicialassistanceindex (0
Fazlani Altius Business School [Batch : 2013-2015]Page 58

ECONOMICS ASSIGNMENT [FOREIGN DIRECT INVESTMENT (FDI) IN INDIA ]
min,
100=
max)
100 =max)
min,100 =max)
(0 =min,
100= max)
index (0=
min,
100= max)
d(days)
d(days)
min,100=max)
=min,
100
=max)
=min,
100=
max)
Argentina
50 18 65 79.3 100 44.4 85 48 112 63.5
72.2
55.1
Brazil 166 17 62.5 85.7 100 33.3 75 66 180 84.9
45.7
57.2
Chile 29 11 63.2 85.7 100 33.3 80 23 93 94.9
62.8
74.8
China 99 18 63.7 96.4 n/a 50 52.5 59 129 94.9
76.1
60.2
India 46 16 76.3 92.9 87.5 15.8 85 90 295 88.5
67.6
53.4
Indonesia
86 12 52.6 78.6 n/a 21.4 85 35 81 95.4
81.8
41.3
Korea, 17 11 71.1 85.7 100 68.4 70 10 53 94.9
81.9
70.2
Malaysia
14 11 60.5 78.5 87.5 23.1 85 96 355 94.9
81.8
66.7
Mexico 31 11 65.8 81.3 100 33.3 90 83 151 79.1
84.7
52.7
Philippines
80 17 57.9 68.8 n/a 23.5 87.5 16 n/a 95.4
87 33.7
Russian
31 10 68.4 85.7 100 44.4 90 62 231 71.6
76.1
76.6
South 65 8 - 84.5 100 47.4 85 42 304 82.4
79 94.5
Thailand
34 9 60.5 80.7 62.5 27.8 70 30 128 84.9
81.8
40.8
Thus, a review of FDI policies in India and across major EMEs suggeststhat though India’s policy stance in terms of access to differentsectors of the economy, repatriation of dividend and norms for owningequity are comparable to that of other EMEs, policy in terms ofqualitative parameters such as ‘time to lease private land’, ‘access toland information’ and ‘Extent of Judicial assistance’ are relativelymore conservative. Since time taken to set up a project adds to thecost and affect competitiveness, an otherwise fairly liberal policyregime may turn out to be less competitive or economically unviableowing to procedural delays. Thus, latter may affect the cross border
Fazlani Altius Business School [Batch : 2013-2015]Page 59

ECONOMICS ASSIGNMENT [FOREIGN DIRECT INVESTMENT (FDI) IN INDIA ]
flow of investible funds. But an assessment of precise impact of thesequalitative parameters on the flow of FDI is an empirical question. Thefollowing section makes an attempt to quantify the impact of variousfactors that govern the flow of FDI in India.
O. FDI FLOWS TO INDIA IN RECENT PERIOD
Distinct slowdown despite strong fundamentals – Plausible Explanations
As stated above, global FDI flows moderated significantly since theeruption of global financial crisis in 2008, albeit with an unevenpattern across regions and countries. Though initially developingcountries showed some resilience, crisis eventually spread through thetrade, financial and confidence channels and FDI flows declined in boththe advanced and developing economies during 2009. Subsequently, whileFDI flows to advanced countries continued to decline, FDI flows to manyof the Latin American and Asian countries witnessed strong reboundduring 2010 on the back of improved corporate profitability and someimprovement in M&A activities.
FDI flows to India also moderated during 2009 but unlike trends inother EMEs, flows continued to be sluggish during 2010 despite strongdomestic growth ahead of global recovery. This raised concerns forpolicy makers in India against the backdrop of expansion in the currentaccount deficit.
Table 6: FDI Inflows in Select EMEs(US$ billion)
Argentina
Brazil
Chile India
Indonesia
Mexico SouthAfrica
Thailand
2007 6.5 34.6 12.5 25.5 6.9 29.1 5.7 11.32008 9.7 45.1 15.2 43.4 9.3 24.9 9.6 8.5
(50.2) (30.3)
(21.1)
(70.3)
(34.5) -(14.3)
(68.1) -(24.7)
2009 4.0 25.9 12.7 35.6 4.9 14.5 5.4 5.0-(92.0) -
(14.3)
-(39.9
)
-(49.
4)
-(85.9) -(200.8
)
-(92.1)
-(120.2
)
Fazlani Altius Business School [Batch : 2013-2015]Page 60

ECONOMICS ASSIGNMENT [FOREIGN DIRECT INVESTMENT (FDI) IN INDIA ]
Q1-10 1.9 5.5 5.5 6.1 2.9 4.8 0.4 1.5Q2-10 0.0 6.6 2.5 6.0 3.3 7.6 0.4 2.0Q3-10 1.9 10.5 5.3 6.7 3.4 2.4 0.1 1.5Q4-10 0.9 25.9 1.9 5.3 3.7 2.8 - 0.72010 4.7 48.5 15.2 24.1 13.3 17.6 0.9 5.7
(17.5) (87.3)
(19.7)
-(32.
3)
(171.4) (21.4) -(80.4)
(14.0)
Note: Figures in brackets relate to percentage variation over thecorresponding period of the previous year.Source: IMF, BOP Statistics.
An analysis of trends in FDI flows during 2010 reveal that among theEMEs, countries such as Indonesia, Thailand, Brazil, Argentina, Chileand Mexico registered increases in the range of 14-171 per cent during2010 over 2009 (Table 6). In contrast, FDI inflows to India declined by32 per cent, year-on-year, during 2010. This moderation in FDI inflowswarrants a deeper examination of the causal factors from a cross-country perspective.
An analysis of key macroeconomic indicators in the select EMEs revealsthat India’s macroeconomic performance compares with other EMEs whichreceived higher FDI inflows during 2010 (Charts 1 & 2 ).
Fazlani Altius Business School [Batch : 2013-2015]Page 61

ECONOMICS ASSIGNMENT [FOREIGN DIRECT INVESTMENT (FDI) IN INDIA ]
For instance, the GDP growth of India improved during 2010 as was thecase with the select EMEs. The current account balance as percent ofGDP deteriorated across the select EMEs, except Argentina. However,inflation in India was generally higher (remaining at double digits fora long period) than other select EMEs (except Argentina).
Fazlani Altius Business School [Batch : 2013-2015]Page 62

ECONOMICS ASSIGNMENT [FOREIGN DIRECT INVESTMENT (FDI) IN INDIA ]
Thus, without any significant deterioration in Indian macroeconomicperformance compared to the select EMEs during 2010, the moderation inFDI inflows to India points towards the probable role of institutionalfactors that might have discouraged FDI inflows.
1. FDI slowdown – Explanations Offered
In the recent past, various economists, policymakers, academicians andcorporate researchers suggested that India’s regulatory policies in termsof procedural delays, complex rules and regulations related to landacquisition, legal requirements and environmental obligations might haveplayed a role in holding the investors back from investing into India.The uncertainty created by the actions taken by policy makers might haveled to unfriendly business environment in India. In this context, some ofthe statements and observations made in various reports are detailedbelow:
“Infrastructure projects in India carry significant risks associated withmeeting government regulation, environment norms and legal requirements;inadequate user charges; and execution and construction risks” (CRISILReport, January 2011).
“Procedural delays are bothering nearly all of the respondents withalmost 93 percent of the respondents indicating this issue to be ‘quiteto very serious’. The time consuming systems and procedures to becomplied with, the bureaucratic layers to be dealt with and the multiplebodies from which clearances are to be obtained- all add up substantially
Fazlani Altius Business School [Batch : 2013-2015]Page 63

ECONOMICS ASSIGNMENT [FOREIGN DIRECT INVESTMENT (FDI) IN INDIA ]
to the transaction cost involved and take up a lot of management timethus making it an issue of serious concern for the investors” (FDI Surveyby FICCI, December 2010).
Identification of ‘environment clearances, land acquisition andrehabilitation’ as the key issues that delayed large investment projectsin the steel industry (Kotak Institutional Equities Research, October,2010).
“The Posco project (still in the pipeline) involves wider issues: Rs.52,000 crore in foreign direct investments that will be seen as a testcase for India’s ability to accommodate big-ticket capital from abroad.The mining project by Vedanta in the same state (Orissa) has already beenstalled on environment grounds” (The Telegraph newspaper statement,October 19, 2010).
“When hard choices need to be made about large projects that areconsidered central to economic growth but are detrimental to theenvironment. Let us all accept the reality that there is undoubtedly atrade-off between growth and environment”(EPW, October 16, 2010).
“Apart from hundreds of industry projects, he (environment Minister) hasheld up construction of a second airport in the commercial hub of Mumbaiand dozens of road and dam projects await clearance” (China Daily,November 6, 2010).
To ascertain these assertions which seek to imply that probablyrelatively more restrictive policy environment in India vis-à-vis othercountries might have caused sluggishness in FDI flows, following sectionundertakes an econometric exercise using data of select EMEs.
2. Reasons for FDI slowdown – An Econometric Evidence
The review of theoretical and select empirical literature reveals thatFDI flows are driven by both pull and push factors. While pull factorsthat reflect the macroeconomic parameters could be influenced by thepolicies followed by the host country, push factors essentially representglobal economic situation and remain beyond the control of economiesreceiving these flows (Box I).
Box IForeign Investment Flows – Theoretical Underpinnings
The research on this subject has so far been largely devoted to factorsdetermining the FDI and policy formulations in response to those factors.Until 1960s, FDI was modelled as a part of neoclassical capital theoryand the basic motive behind the movement of this capital into a host
Fazlani Altius Business School [Batch : 2013-2015]Page 64
ECONOMICS ASSIGNMENT [FOREIGN DIRECT INVESTMENT (FDI) IN INDIA ]
country was search for higher rate of returns. Over the period, withgrowing realisation the motives for capital movement have been far morediverse than mere search for higher returns, there has been a plethora oftheoretical and empirical research directed towards identifying factorsdetermining different types of capital flows. It was the insight of Hymer(1960) who by differentiating direct investment from portfolio investmentcreated basis for studies on factors determining the FDI flows. Hymerhighlighted certain facts and evidences2 on the basis of which heconcluded that the nature of the direct and portfolio investment differsand therefore same theories cannot be applied to both types ofinvestment. The key feature that Hymer identified for motivation of FDIwas the level of control which a firm of home country gets through directinvestment in host country. He also stressed upon market imperfectionssuch as the ownership of knowledge not known to rivals, existence ofdifferentiated products giving profit advantage to a firm investingabroad, problems related to licensing the product, etc., for supportingFDI decisions. However, the literature argues that his theory over-emphasised the role of structural market failure and ignored thetransaction cost side of market failure (Dunning and Rugman, 1985).Moreover, his theory did not explain the locational and dynamic aspect ofFDI.
Later, Caves (1971) expanded upon Hymer’s theory of direct investment andembedded it in the industrial organisation literature. By differentiatinghorizontal and vertical FDI, he identified factors such as possession ofsuperior knowledge or information, motives to avoid uncertainty in amarket characterized by a few suppliers and objective of creating entrybarriers, etc., as being responsible for rising FDI flows. With therising presence of multinational enterprises in the global economy, theview on FDI was expanded with the internationalization theories of FDIthat stressed on transaction costs (Dunning and Rugman, 1985; Horaguchinad Toyne, 1990). The internationalisation theory of FDI identifiedaccumulation and internalisation of knowledge as the motivation for FDI,which bypasses intermediate product markets in knowledge (Tolentino,2001).
The theorists such as Horst (1972), who stressed upon locationaldeterminants of FDI, identified prevalence of natural resources as animportant factor for FDI inflow. Wheeler and Mody (1992) identifiedergodic and non-ergodic systems that determine the location of FDI. Theergodic system focussed on classical variables such as geographical
Fazlani Altius Business School [Batch : 2013-2015]Page 65

ECONOMICS ASSIGNMENT [FOREIGN DIRECT INVESTMENT (FDI) IN INDIA ]
features, labor costs, transport costs and market size as factorsdetermining the FDI flows. Various empirical studies still rely on thesevariables to determine potential for FDI flows. The non-ergodic systemfocussed on externalities that emerge from investment in firmsexperiencing agglomeration economies, in other words, indicating theclustering effects of FDI. The studies such as Venables (1996), Potter etal (2002) explained spatial patterns of FDI in terms of these factors.
The research work of Dunning (1973, 1981) provided a comprehensiveanalysis of FDI based on ownership, location and the internationalisation(OLI) paradigm. His eclectic theory of FDI highlighted various benefitsemerging from FDI: the ownership-specific advantages which compriseaccess to spare capacity, economies of joint supply, greater access tomarkets and knowledge, diversification of risk, technology andtrademarks, firm size; the location-specific advantages consisting ofdistribution of inputs and markets, costs of labor, materials andtransport costs, government intervention and policies, commercial andlegal infrastructure, etc.; internalisation-specific advantages coveringreduction in search, negotiation and monitoring costs, tariff avoidance,etc. The critics of eclectic theory of FDI have regarded it as a taxomonyrather than a theory of FDI (Ietto-Gillies, 1992) as it covered a rangeof theories and employs a large number of variables. It has also beencriticised for reformulation over time to incorporate new ideas and toreflect contemporary trends in FDI. The prior version of his theoryignored the role of strategy in determining the FDI flows. The role ofstrategic motivations, which was first analysed by Knickerbocker (1973),were extended by Acocella (1992). As per these strategic theories, thereasons behind strategic alliances included economies of scale, thereduction of risk and access to knowledge and expertise (Inkpen, 2001).The strategic alliances highlight the motivation for mergers andacquisitions taking place in the current era of M&A boom.
All these theories mainly explain the supply side of FDI that creates apush to FDI for flowing out of the home economy. Broadly, these factorsand motives comprise profit expansion through knowledge advantage, lowercost advantage, greater market access, gains from scale economies,strategic motives such as acquiring input supplies or creating worldwidenear to monopoly powers, locational advantages, reduction in risk andagglomeration gains.
A vast literature on demand side factors that pull FDI into a hosteconomy is also available. The studies such as World Bank (1995),Blomstrom and Kokko (1998), Markusen and Venables (1999), highlight gainsfrom FDI in the form of competition and efficiency effects, spillovereffects, effects of backward and forward linkages, technological effects,accumulation of knowledge capital, stable flow of funds with no debt-servicing obligation attached, greater external market discipline on
Fazlani Altius Business School [Batch : 2013-2015]Page 66
ECONOMICS ASSIGNMENT [FOREIGN DIRECT INVESTMENT (FDI) IN INDIA ]
macroeconomic policy, broadening and deepening of national capitalmarkets, etc. for the host country. These theoretical studies have givena lot of space for empirical research on factors determining the inflowand outflow of FDI and the role played by policy initiatives undertakenon the part of host countries to attract FDI. The country specificstudies have analysed the role of regulatory regime of the host countryin attracting FDI. These studies have focussed on timing, activities ofsupervisory authorities and content of external and internal regulatorymeasures.
A lot of literature highlighting the role played by policy environmentdiscusses the issues of creating investor friendly environment for FDI.As per Oxelheim (1993), in attracting inward investment during the periodof transition from a national market to an integrated part of the globalmarket, governments can influence the relative cost of capital by usingan adequate mix of interventions. Policymakers may affect the corporatedecision about where to locate a production facility by managing a set ofinternational relative prices: exchange rates, relative inflation andinterest rates. In general, they can create investment incentives orbusiness opportunities by creating deviations from the internationalpurchasing power parity and the international Fisher effect. Additionalbusiness incentives controlled by policymakers are relative taxes andrelative political risk. This study has argued that appropriate policiesappear to be a necessary precondition for attracting FDI.
The UNCTC (1991) has provided seven policy instruments used to attractFDI: ownership policies, tax and subsidy measures, policies concerningconvertibility of foreign exchange and remittance of earnings, pricecontrol measures, performance requirements, sector-specific limitationsand incentives and miscellaneous entry and procedural rules that areassumed to impose a considerable cost on a potential FDI. A World Bankreport on indicators of FDI regulation (2010) has found that restrictiveand obsolete laws and regulations impede FDI, red tape and poorimplementation of laws creates further barriers to FDI, good regulationsand efficient processes matter for FDI and effective institutions help infostering FDI. Thus, the report highlights the importance of regulatoryframework.
Data and Methodology
The paper attempts a panel exercise for the select major emerging marketeconomies to ascertain determinants of FDI flows. The data set comprisesobservations for the period from 2003-04 to 2009-10 for 10 major emergingeconomies, viz., Argentina, Brazil, Chile, India, Malaysia, Mexico,Philippines, Russia, South Africa and Thailand. To ensure the
Fazlani Altius Business School [Batch : 2013-2015]Page 67
ECONOMICS ASSIGNMENT [FOREIGN DIRECT INVESTMENT (FDI) IN INDIA ]
comparability entire dataset has been sourced from the Global DevelopmentFinance, published by the World Bank. FDI flows have been measured as FDIinflows to GDP ratio which has been regressed over a range of explanatoryvariables. Drawing from the literature review presented above, some ofthe variables that have been chosen and could be significant indetermining the FDI flows comprise: market size, openness, currencyvaluation, growth prospects, macroeconomic sustainability, regulatoryregime and proportion of global FDI received by emerging economies.
Market size: Larger market size is expected to attract more FDI as itprovides greater potential for demand and lower production costs throughscale economies. Market size has been proxied by GDP in purchasing powerparity (PPP) terms.
Openness: Impact of openness or liberalised trade is somewhat ambiguousand depends on relative strength of two effects. First, economy withtrade barriers is expected to attract more horizontal FDI so thatproduction sites could be built within the national boundaries of thoserestricted economies. Second, increasing openness attracts vertical FDIflows in search of cheap intermediate and capital goods (Resmini, 2000).Also, openness in trade is correlated with economic liberalisation policyof an economy that may sound favorable to investors. Openness has beenproxied by sum of current receipts and payments to GDP ratio.
Macroeconomic stability - Lower inflation rate and stable exchange rateare expected to attract greater FDI by mitigating uncertainty risk. Ithas been proxied by inflation and exchange rate volatility.
Exchange rate valuation - Froot and Stein (1991) have evidently foundthat a weaker host country currency tends to increase inward FDI asdepreciation makes host country assets less expensive relative to assetsin the home country which may act as an attraction for vertical FDI. Onthe other hand, a stronger real exchange rate might be expected tostrengthen the incentive of foreign companies to produce domesticallythereby attract more horizontal FDI. However, the second hypothesis doesnot appear to have attracted much support in the empirical literature(Walsh and Yu, 2010). It has been measured by value of US dollar in termsof respective domestic currencies.
Clustering effects: A larger stock of FDI is regarded as a signal of abenign business climate for foreign investors and thus may attract moreFDI. Moreover, by clustering with other firms, new investors benefit frompositive spillovers from existing investors in the host country. Thestudies of Wheeler and Mody (1992), Barrel and Pain (1999) and Campos andKinoshida (2003) have found empirical evidence of agglomeration effects.It has been proxied by the stock of FDI.
Fazlani Altius Business School [Batch : 2013-2015]Page 68

ECONOMICS ASSIGNMENT [FOREIGN DIRECT INVESTMENT (FDI) IN INDIA ]
Institutions and Governance - Institutional and Governance quality hasbeen identified as a likely determinant of FDI, particularly for lessdeveloped countries, for a variety of reasons. First, good governance isassociated with higher economic growth, which should attract more FDIinflows. Second, poor institutions that enable corruption tend to add toinvestment costs and reduce profits. Third, the high sunk cost of FDImakes investors highly sensitive to uncertainty, including the politicaluncertainty that arises from poor institutions (Walsh and Yu, 2010).Institutional framework and governance has been captured by ‘GovernmentEffectiveness’ Index (Kaufmann Index). It captures “perceptions of thequality of public services, the quality of the civil service and thedegree of its independence from political pressures, the quality ofpolicy formulation and implementation, and the credibility of thegovernment's commitment to such policies”. Score is assigned on the scaleof -2.5 to 2.5. Higher score means Government procedures are moreefficient.
Macro Economic Sustainability could be a key factor in attracting foreigninvestment. If government finances and external sector are consideredsustainable, foreign investor feel assured of the safety of itsinvestments. Sustainability has been captured through two variables.Fiscal sustainability has been captured by GFD to GDP ratio and externalsector sustainability has been captured by net IIP to GDP ratio.
Apart from these pull factors, push factors such as global economicenvironment and policy stance of the developed world may be criticalfactors in determining the FDI flows. For instance, higher globalliquidity would cause larger flow of resources to EMEs searching forhigher returns. It could be proxied by the FDI to EMEs.
Limitations of the data
Inferences drawn in the study should however be seen in the light offollowing data limitations:
The study is based on the macro level data and may not capture strictlythe firm specific characteristics in the determination of FDI.
Dataset for each variable have been sourced from a single source toensure comparability. Since international agencies may make suitable
Fazlani Altius Business School [Batch : 2013-2015]Page 69

ECONOMICS ASSIGNMENT [FOREIGN DIRECT INVESTMENT (FDI) IN INDIA ]
adjustments for the sake of comparability, data for an individualcountry may marginally vary from the country’s own datasets.
The sectoral caps for India, as provided by the World Bank in itssurvey ‘Investing across Borders’, in respect of agriculture, banking,media, ‘construction, tourism and single brand retail’ are apparentlyat variance with extant guidelines. This is because the average capswere reported for the respective sectors in its publication and thesame have been reproduced in the study.
Fixed effect model4 of the following form was estimated for a group ofemerging economies, where fy (i, t) is the FDI to GDP ratio of anindividual economy i in the year t, and x (i, t) is the vector ofexplanatory variables.
y(i,t) = a1 d1(i,t) + a2 d2(i,t) + ... + b¢x(i,t) + e(i,t)= a(i) + b¢x(i,t) + e(i,t),
where the a(i)s are individual specific constants, and the d(i)s are groupspecific dummy variables which equal 1 only when j = i.
Panel has been estimated for the period 2000-01 to 2010-11 for 10 countries.
Results
The estimated equation is shown below, with t-statistics shown in parentheses:
Fazlani Altius Business School [Batch : 2013-2015]Page 70
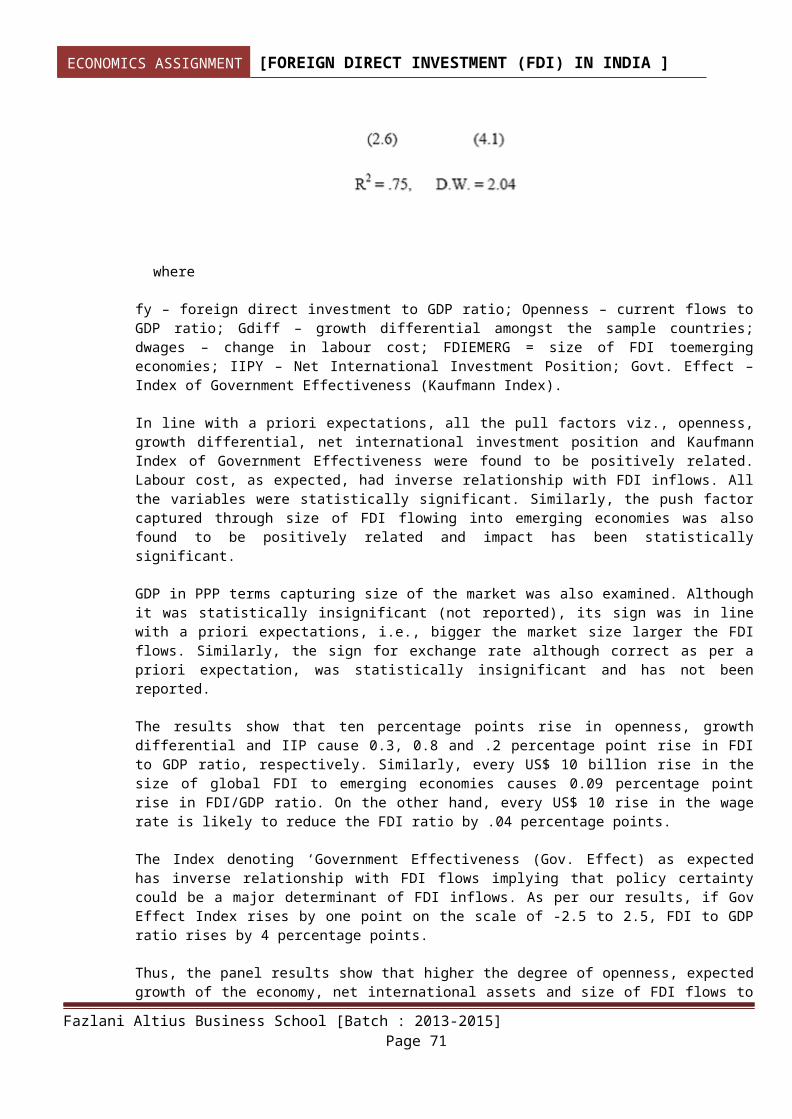
ECONOMICS ASSIGNMENT [FOREIGN DIRECT INVESTMENT (FDI) IN INDIA ]
where
fy – foreign direct investment to GDP ratio; Openness – current flows toGDP ratio; Gdiff – growth differential amongst the sample countries;dwages – change in labour cost; FDIEMERG = size of FDI toemergingeconomies; IIPY – Net International Investment Position; Govt. Effect –Index of Government Effectiveness (Kaufmann Index).
In line with a priori expectations, all the pull factors viz., openness,growth differential, net international investment position and KaufmannIndex of Government Effectiveness were found to be positively related.Labour cost, as expected, had inverse relationship with FDI inflows. Allthe variables were statistically significant. Similarly, the push factorcaptured through size of FDI flowing into emerging economies was alsofound to be positively related and impact has been statisticallysignificant.
GDP in PPP terms capturing size of the market was also examined. Althoughit was statistically insignificant (not reported), its sign was in linewith a priori expectations, i.e., bigger the market size larger the FDIflows. Similarly, the sign for exchange rate although correct as per apriori expectation, was statistically insignificant and has not beenreported.
The results show that ten percentage points rise in openness, growthdifferential and IIP cause 0.3, 0.8 and .2 percentage point rise in FDIto GDP ratio, respectively. Similarly, every US$ 10 billion rise in thesize of global FDI to emerging economies causes 0.09 percentage pointrise in FDI/GDP ratio. On the other hand, every US$ 10 rise in the wagerate is likely to reduce the FDI ratio by .04 percentage points.
The Index denoting ‘Government Effectiveness (Gov. Effect) as expectedhas inverse relationship with FDI flows implying that policy certaintycould be a major determinant of FDI inflows. As per our results, if GovEffect Index rises by one point on the scale of -2.5 to 2.5, FDI to GDPratio rises by 4 percentage points.
Thus, the panel results show that higher the degree of openness, expectedgrowth of the economy, net international assets and size of FDI flows to
Fazlani Altius Business School [Batch : 2013-2015]Page 71

ECONOMICS ASSIGNMENT [FOREIGN DIRECT INVESTMENT (FDI) IN INDIA ]
EMEs, larger the size of FDI that flows to the country. Similarly, higherthe certainty of implementation of efficient and quality policies, higherwould be the flow of FDI. On the other hand, higher labour cost is likelyto discourage the flow of FDI to the country.
What caused dip in FDI flows to India during 2010-11?
Our empirical exercise portrays a range of factors that significantlyimpact the size of FDI flows. With a view to segregate the impact of non-economic factors including government policy, a contra factual scenariois generated for the year 2010-11 by updating values for all theexplanatory variables except for the Kaufmann Index. Estimated potentialand actual FDI levels are presented in the Chart 3 and contra factualscenario that assumes no deterioration in government effectiveness indexhas been presented in Chart 3a.
Fazlani Altius Business School [Batch : 2013-2015]Page 72

ECONOMICS ASSIGNMENT [FOREIGN DIRECT INVESTMENT (FDI) IN INDIA ]
It could be observed from Chart 3 that actual FDI to India closely trackedthe potential FDI path. The potential FDI level is the estimated levelthat should occur given the trends in underlying fundamentals. In the year2010-11, the actual FDI flows at 1.5 per cent of GDP are marginally lowerthan the estimated level of 1.8 per cent of GDP. Chart 3a, presents acontra-factual scenario where potential level of FDI flows for the year2010-11 is worked out by updating values of all the variables except‘Govt. Effect’. The latter is retained at preceding year’s level. In couldbe observed that in case of contra-factual scenario, in the year 2010-11,gap between potential and actual level of FDI increased by more than 25per cent. Since, the contra factual estimated for 2010-11 updated value ofall other variables except Govt. Effect, the larger gap between potentialand the actual in the year could be attributed to index of GovernmentEffectiveness7.
In other words, contra factual estimate of FDI for the year 2010-11incorporates impact of all the economic variables, viz., growthdifferential, openness, net IIP, labour cost and size of ‘FDI to allemerging economies’ whereas it keeps qualitative variable ‘Govt. Effect’unaltered. Keeping ‘Govt. Effect’ unaltered means that had there been noamplification in policy uncertainty over the preceding year’s level, FDIinflows to India would have been more than 35 per cent higher than thatwas actually received.
Thus, empirical results corroborate our assertion made in the analyticspresented above that the qualitative factors play an important role inattracting FDI flows, and slowdown in FDI flows in the absence of any
Fazlani Altius Business School [Batch : 2013-2015]Page 73

ECONOMICS ASSIGNMENT [FOREIGN DIRECT INVESTMENT (FDI) IN INDIA ]
deterioration in the macro economic variables could probably be on accountof such qualitative factors.
P. APPROVAL FOR FDI IN LIMITED LIABILITY PARTNERSHIP FIRM
The Cabinet Committee on Economic Affairs approved the proposal to amend the policy on allowing Foreign Direct Investment (FDI) in Limited Liability Partnership (LLP) firms on 11 may 2011. The FDI in LLPs will be implemented in a calibrated manner, beginning with the ‘open’ sectors where monitoring is not required, subject to the following conditions:
Fazlani Altius Business School [Batch : 2013-2015]Page 74

ECONOMICS ASSIGNMENT [FOREIGN DIRECT INVESTMENT (FDI) IN INDIA ]
a) LLPs with FDI will be allowed, through the Government approval route, in those sectors/activities where 100% FDI is allowed, through the automatic route and there are no FDI-linked performance related conditions.
b) LLPs with FDI will not be allowed to operate in agricultural/plantationactivity, print media or real estate business.
c) LLPs with FDI will not be eligible to make any downstream investments.
There are also further following conditions relating to funding, ownershipand management of LLPS:
I. Funding of LLPs:
(a) An Indian company, having FDI, will be permitted to make downstream investment in LLPs only if both the company, as well as the LLP are operating in sectors where 100% FDI is allowed, through
the automatic route and there are no FDI-linked performance related conditions.
(b) Foreign Capital participation in the capital structure of the LLPswill be allowed only by way of cash considerations, received by inward remittance, through normal banking channels, or by debit to
NRE/FCNR account of the person concerned, maintained with an authorizeddealer/authorized bank.
(c) Foreign Institutional Investors (Flls) and Foreign Venture CapitalInvestors (FVCIs) will not be permitted to invest in LLPs. LLPs will also not be permitted to avail External Commercial Borrowings
(ECBs.)
II. Ownership and management of LLPs:
For the purpose of determination of the designated partners in respect of LLPs with FDI, the term "resident in India" would have the meaning, as defined for "person resident in India", under Section 2(v) (i) (A) & (B) of the Foreign Exchange Management Act, 1999.
Fazlani Altius Business School [Batch : 2013-2015]Page 75

ECONOMICS ASSIGNMENT [FOREIGN DIRECT INVESTMENT (FDI) IN INDIA ]
Q. SECTORS FOR FDI :
1. FDI in Agriculture
1. Agriculture & Animal Husbandry
(a) Floriculture, Horticulture, and 100% Automatic Cultivation of Vegetables & Mushrooms under controlled conditions(b) Development and production of Seeds and planting material;(c) Animal Husbandry (including of breeding of dogs), Pisciculture, Aquaculture under controlled conditions(d) Services related to agro and allied sectors
Other conditions:
For companies dealing with development of transgenic seeds/vegetables, thefollowing conditions apply:
(i) When dealing with genetically modified seeds or planting material the company shall comply with safety requirements in accordance withlaws enacted under the Environment (Protection) Act on the genetically modified organisms.
(ii) Any import of genetically modified materials if required shall be subject to the conditions laid down vide Notifications issued under Foreign Trade (Development and Regulation) Act, 1992.
(iii) The company shall comply with any other Law, Regulation or Policy governing genetically modified material in force fromtime to time.(iv) Undertaking of business activities involving the use of genetically engineered cells and material shall be subject to the receipt of approvals from Genetic Engineering Approval
Committee (GEAC) and Review Committee on Genetic Manipulation (RCGM).(v) Import of materials shall be in accordance with National Seeds Policy.(vi) The term “under controlled conditions” covers the following:
Fazlani Altius Business School [Batch : 2013-2015]Page 76

ECONOMICS ASSIGNMENT [FOREIGN DIRECT INVESTMENT (FDI) IN INDIA ]
‘Cultivation under controlled conditions’ for the categories of Floriculture, Horticulture, Cultivation of vegetables and Mushrooms is the practice of cultivation wherein rainfall, temperature, solar radiation, air humidity and culture medium are controlled artificially.Control in these parameters may be effected through protected cultivation under green houses, net houses, poly houses or any other improved infrastructure facilities where microclimatic conditions are regulated anthropogenically.
In case of Animal Husbandry, scope of the term ‘under controlled conditions’ includes – • Rearing of animals under intensive farming systems with stall-feeding. Intensive farming system will require climate systems (ventilation, temperature/humidity management), health care andnutrition, herd registering/pedigree recording, use of machinery, wastemanagement systems.
• Poultry breeding farms and hatcheries where microclimate is controlled through advanced technologies like incubators, ventilation systems etc.
In the case of pisciculture and aquaculture, ‘under controlled conditions’ includes –• Aquariums
• Hatcheries where eggs are artificially fertilized and fry are hatched and incubated in an enclosed environment with artificial climate control. 2 Tea Plantation 1 Tea sector including tea plantations.
Note: Besides the above, FDI is not allowed in any other plantation
Other conditions:
(i) Compulsory divestment of 26% equity of the company in favour of anIndian partner/Indian public within a period of 5 years.
(ii) Prior approval of the State Government concerned in case of any future land use change.
Fazlani Altius Business School [Batch : 2013-2015]Page 77

ECONOMICS ASSIGNMENT [FOREIGN DIRECT INVESTMENT (FDI) IN INDIA ]
2. FDI in Mining
1. Mining and Exploration of metal and non-metal ores including diamond, gold, silver and precious ores but excluding titanium bearing minerals and its ores; subject to the Mines and Minerals (Development & Regulation) Act, 1957.
2. Coal and Lignite:(1) Coal & Lignite mining for captive consumption by power projects, iro& steel and cement units and other eligible activities permitted under and subject to the provisions of Coal Mines
(Nationalization) Act, 1973 (2) Setting up coal processing plants like washeries subject to the
Fazlani Altius Business School [Batch : 2013-2015]Page 78

ECONOMICS ASSIGNMENT [FOREIGN DIRECT INVESTMENT (FDI) IN INDIA ]
condition that the company shall not do coal mining and shall not sell washed coal or sized coal from its coal processing plants in
the open market and shall supply the washed or sized coal to thoseparties who are supplying raw coal to coal processing plants for washing or sizing.
3. Mining and mineral separation of titanium bearing minerals and ores, its value addition and integrated activities. Mining and mineral separation of titanium bearing minerals & ores, its value addition and integrated activities subject to sectorial regulations and the Mines and Minerals (Development and Regulation Act 1957)
Other conditions:
India has large reserves of beach sand minerals in the coastal stretches around the country. Titanium bearing minerals viz. Limonite, rutile and leucoxene, and Zirconium bearing minerals including zircon are some of the beach sand minerals which have been classified as “prescribed substances” under the Atomic Energy Act, 1962. Under the Industrial Policy Statement 1991, mining and production of minerals classified as “prescribed substances” and specified in the Schedule to the Atomic Energy (Control of Production and Use) Order, 1953 were included in the list of industries reserved for the public sector. VideResolution No. 8/1(1)/97-PSU/1422 dated 6th October 1998 issued by the Department of Atomic Energy laying down the policy for exploitation of beach sand minerals, private participation including Foreign Direct Investment (FDI), was permitted in mining and production of Titanium ores (Limonite, Rutile and Leucoxene) and Zirconium minerals (Zircon). Vide Notification No. S.O.61(E) dated 18.1.2006, the Department of Atomic Energy re-notified the list of “prescribed substances” under theAtomic Energy Act 1962. Titanium bearing ores and concentrates (Limonite, Rutile and Leucoxene) and Zirconium, its alloys and compounds and minerals/concentrates including Zircon, were removed fromthe list of “prescribed substances”.
(i) FDI for separation of titanium bearing minerals & ores will be subject to the following additional conditions viz.:
(A) Value addition facilities are set up within India along with transfer of technology.
(B)Disposal of tailings during the mineral separation shall be
carried out in accordance with regulations framed by the Atomic Energy Regulatory Board such as Atomic Energy (Radiation Protection) Rules, 2004 and the Atomic Energy (Safe Disposalof Radioactive Wastes) Rules, 1987.
(ii) FDI will not be allowed in mining of “prescribed substances” listed in the Notification No. S.O 61(E) dated 18.1.2006
Fazlani Altius Business School [Batch : 2013-2015]Page 79
ECONOMICS ASSIGNMENT [FOREIGN DIRECT INVESTMENT (FDI) IN INDIA ]
issued by the Department of Atomic Energy.
Clarification: (1) For titanium bearing ores such as Limonite, Leucoxene
and Rutile, manufacture of titanium dioxide pigment and titanium sponge constitutes value addition. Limonite canbe processed to produce 'Synthetic Rutile or Titanium Slag as an intermediate value added product.
(2) The objective is to ensure that the raw material available in the country is utilized for
setting up downstream industries and the technology available internationally is available for setting up such industries within the country. Thus, if with the
technology transfer, the objective of the FDI Policy can be achieved, the conditions prescribed at (i) (A) above shall be deemed to be fulfilled.
Fazlani Altius Business School [Batch : 2013-2015]Page 80

ECONOMICS ASSIGNMENT [FOREIGN DIRECT INVESTMENT (FDI) IN INDIA ]
3. FDI in Manufacturing
Manufacture of items reserved for production in Micro and Small Enterprises (MSEs).
FDI in MSEs will be subject to the sectorial caps, entry routes and other relevant sectorial regulations. Any industrial undertaking which is not a Micro or Small Scale Enterprise, but manufactures items reserved for the MSE sector would require Government route where foreign investment is more than 24% in the capital. Such an undertakingwould also require an Industrial License under the Industries (Development & Regulation) Act 1951, for such manufacture. The issue ofIndustrial License is subject to a few general conditions and the specific condition that the Industrial Undertaking shall undertake to export a minimum of 50% of the new or additional annual production of the MSE reserved items to be achieved within a maximum period of three years. The export obligation would be applicable from the date of commencement of commercial production and in accordance with the provisions of section 11 of the Industries (Development & Regulation) Act 1951.
Fazlani Altius Business School [Batch : 2013-2015]Page 81

ECONOMICS ASSIGNMENT [FOREIGN DIRECT INVESTMENT (FDI) IN INDIA ]
4. FDI in Power
Electric Generation, Transmission, Distribution and Trading
1. Generation and transmission of electric energy produced in - hydroelectric, coal/lignite based thermal, oil based thermal and gas based thermal power plants.
2. Non-Conventional Energy Generation and Distribution.
3. Distribution of electric energy to households, industrial, commercial and other users and
4. Power Trading
Note: All the above would be subject to the provisions of the Electricity Act 2003.
5. FDI in Defence
1. Defence Industry subject to Industrial license under the Industries (Development & Regulation) Act 1951.
2. Other conditions:(i) Licence applications will be considered and licences given by the Department of Industrial Policy & Promotion, Ministry of Commerce & Industry, in consultation with Ministry of Defence.
(ii) The applicant should be an Indian company / partnership firm.
(iii) The management of the applicant company / partnership should be inFazlani Altius Business School [Batch : 2013-2015]
Page 82

ECONOMICS ASSIGNMENT [FOREIGN DIRECT INVESTMENT (FDI) IN INDIA ]
Indian hands with majority representation on the Board as well as the Chief Executives of the company / partnership firm being resident Indians.(iv) Full particulars of the Directors and the Chief Executives should be furnished along with the applications.
(v) The Government reserves the right to verify the antecedents of theforeign collaborators and domestic promoters including their financial standing and credentials in the world market.
Preference would be given to original equipment manufacturers or design establishments, and companies having a good track record of past supplies to Armed Forces, Space and Atomic energy sections and having an established R & D base.
(vi) There would be no minimum capitalization for the FDI. A proper assessment, however, needs to be done by the management of the applicant company depending upon the product and the
technology. The licensing authority would satisfy itself about theadequacy of the net worth of the non-resident investor taking into account the category of weapons and equipment that are proposed to be manufactured.
(vii) There would be a three-year lock-in period for transfer of equity from one non-resident investor to another non-resident investor (including NRIs & erstwhile OCBs with 60% or
more NRI stake) and such transfer would be subject to prior approval of the FIPB and the Government.
(viii) The Ministry of Defence is not in a position to give purchase guarantee for products to be manufactured. However, theplanned acquisition programme for such equipment and overall
requirements would be made available to the extent possible.
(ix) The capacity norms for production will be provided in the licencebased on the application as well as the recommendations of the Ministryof Defence, which will look into existing capacities of similar and allied products.(x) Import of equipment for pre-production activity including development of prototype by the applicant company would be permitted.
(xi) Adequate safety and security procedures would need to be put in place by the licensee once the licence is granted and productioncommences. These would be subject to verification by authorized Government agencies.
Fazlani Altius Business School [Batch : 2013-2015]Page 83

ECONOMICS ASSIGNMENT [FOREIGN DIRECT INVESTMENT (FDI) IN INDIA ]
(xii) The standards and testing procedures for equipment to be produced under licence from foreign collaborators or from indigenous R & D will have to be provided by the licensee to theGovernment nominated quality assurance agency under appropriate confidentiality clause. The nominated quality assurance agency would inspect the finished product and would conduct surveillanceand audit of the Quality Assurance Procedures of the licensee. Self-
certification would be permitted by the Ministry of Defence on case to case basis, which may involve either individual items, or group of items manufactured by the licensee. Such
permission would be for a fixed period and subject to renewals.
(xiii) Purchase preference and price preference may be given to thePublic Sector organizations as per guidelines of the Department of Public Enterprises.(xiv) Arms and ammunition produced by the private manufacturers will be primarily sold to the Ministry of Defence. These items may also be sold to other Government entities under the
control of the Ministry of Home Affairs and State Governments withthe prior approval of the Ministry of Defence. No such item should besold within the country to any other person or entity. The export of manufactured items would be subject to policy and guidelines as applicable to Ordnance Factoriesand Defence Public Sector Undertakings. Non-lethal items would be permitted for sale to persons / entities other than the Central of State Governments
with the prior approval of the Ministry of Defence. Licensee wouldalso need to institute a verifiable system of removal of all goods out of their factories. Violation of these provisions maylead to cancellation of the licence.
(xv) Government decision on applications to FIPB for FDI in defence industry sector will be normally communicated within a time frame of 10 weeks from the date of acknowledgement.
Fazlani Altius Business School [Batch : 2013-2015]Page 84

ECONOMICS ASSIGNMENT [FOREIGN DIRECT INVESTMENT (FDI) IN INDIA ]
6. FDI in Civil Aviation Sector
1. The Civil Aviation sector includes Airports, Scheduled and Non-Scheduled domestic passenger airlines, Helicopter services / Seaplane services, Ground Handling Services, Maintenance and Repair organizations; Flying training institutes; and Technical training institutions.
For the purposes of the Civil Aviation sector:
(i) “Airport” means a landing and taking off area for aircrafts, usually with runways and aircraft maintenance and passenger facilities and includes aerodrome as defined in clause (2) of
section 2 of the Aircraft Act, 1934.
(ii) "Aerodrome" means any definite or limited ground or water area intended to be used, either wholly or in part, for the landing ordeparture of aircraft, and includes all buildings, sheds,
vessels, piers and other structures thereon or pertaining thereto.
(iii) "Air transport service" means a service for the transport by air of persons, mails or any other thing, animate or inanimate, for any kind of remuneration whatsoever, whether such service consistsof a single flight or series of flights
Fazlani Altius Business School [Batch : 2013-2015]Page 85

ECONOMICS ASSIGNMENT [FOREIGN DIRECT INVESTMENT (FDI) IN INDIA ]
(iv) "Air Transport Undertaking" means an undertaking whose business includes the carriage by air of passengers or cargo for hire or reward.
(v) "Aircraft component" means any part, the soundness and correct functioning of which, when fitted to an aircraft, is essential to the continued airworthiness or safety of the aircraft and
includes any item of equipment.
(vi) "Helicopter" means a heavier-than -air aircraft supported in flight by the reactions of the air on one or more power driven rotors on substantially vertical axis.
(vii) "Scheduled air transport service", means an air transport service undertaken between the same two or more places and operatedaccording to a published time table or with flights so regular
or frequent that they constitute a recognizably systematic series,each flight being open to use by members of the public.
(viii) “Non-Scheduled Air Transport service” means any service which is not a scheduled air transport service and will include Cargo airlines.
(ix) “Cargo” airlines would mean such airlines which meet the conditions as given in the Civil Aviation Requirements issued bythe Ministry of Civil Aviation.
(x) "Seaplane" means an aeroplane capable normally of taking off from and alighting solely on water.
(xi) “Ground Handling” means (i) ramp handling , (ii) traffic handling both of which shall include the activities as specified by the Ministryof Civil Aviation through the Aeronautical Information Circulars from time to time, and (iii) any other activity specified by the Central Government to be a part of either ramp handling or traffic handling.
2. Policy for FDI in Civil Aviation sector
The policy for FDI in the Civil Aviation Sector would be subject to theAircraft Rules, 1934 as amended from time to time, Civil Aviation Requirements, and Aeronautical Information Circulars as notified by theMinistry of Civil Aviation.
Fazlani Altius Business School [Batch : 2013-2015]Page 86

ECONOMICS ASSIGNMENT [FOREIGN DIRECT INVESTMENT (FDI) IN INDIA ]
(i) Airports:
(a) Greenfield projects (b) Existing projects
(ii) Air Transport Services:
(a) Air Transport Services would include Domestic Scheduled Passenger Airlines; Non- Scheduled Air Transport Services, helicopter and seaplane services.
(b) No foreign airlines would be allowed to participate directly or indirectlyin the equity of an Air Transport Undertaking engaged in operating Scheduled and Non-Scheduled Air Transport Services except Cargo airlines.
(c) Foreign airlines are allowed to participate in the equity of companies operating Cargo airlines, helicopter and seaplane services.
(1) Scheduled Air Transport Service/ Domestic Scheduled Passenger Airline. (2)
Non-Scheduled Air Transport Service.(3) Helicopter services/seaplane services requiring DGCA
approval
(iii) Other services under Civil Aviation sector:
(1) Ground Handling Services subject to sectorial regulations and security clearance. (2) Maintenance and Repair organizations; flying training institutes; and technical
training Institutions
7. FDI in Banking- Public Sector
Banking- Public Sector subject to Banking Companies (Acquisition & Transfer of Undertakings) Acts1970/80. This ceiling (20%) is also 20% (FDI and Portfolio Investment) applicable to the State Bank of India and its associate Banks.
Fazlani Altius Business School [Batch : 2013-2015]Page 87

ECONOMICS ASSIGNMENT [FOREIGN DIRECT INVESTMENT (FDI) IN INDIA ]
8. FDI in Credit Information Companies (CIC)
Credit Information Companies 49% (FDI & FII) Government
(1) Foreign investment in Credit Information Companies is subject to the Credit Information Companies (Regulation) Act, 2005.
(2) Foreign investment is permitted under the Government route, subject to regulatory clearance from RBI.
(3) Investment by a registered FII under the Portfolio Investment Scheme would be permitted up to 24% only in the CICs listed at the Stock Exchanges, within the overall limit of 49% for foreign
investment.
(4) Such FII investment would be permitted subject to the conditions that:
(a) No single entity should directly or indirectly hold more than 10% equity.
(b) Any acquisition in excess of 1% will have to be reported to RBI as a mandatoryrequirement.
(c) FIIs investing in CICs shall not seek a representation on the Board of Directors based upon their shareholding.
Fazlani Altius Business School [Batch : 2013-2015]Page 88

ECONOMICS ASSIGNMENT [FOREIGN DIRECT INVESTMENT (FDI) IN INDIA ]
9. FDI in Broadcasting
1. Terrestrial Broadcasting FM (FM Radio) subject to such terms and conditions as specified from time to time by Ministry of Information and Broadcasting for grant of permission for setting up of FM Radio Stations 20% (FDI, NRI & PIO investments and Portfolio investment)
2. Cable Network subject to Cable Television Network Rules, 1994 and otherconditions as specified from time to time by Ministry of Information and Broadcasting 49% (FDI, NRI &PIO investments and portfolio investment)
3. Direct –to-Home subject to such guidelines/terms and conditions as specified from time to time by Ministry of Information and Broadcasting49% (FDI, NRI & PIO investments and portfolio investment) Within this limit, FDI component not to exceed 20%
4. Headend-In-The-Sky (HITS) Broadcasting Service refers to the multichannel downlinking and distribution of television programme in CBand or Ku Band wherein all the pay channels are downlinked at a central facility (Hub/teleport) and again uplinked to a satellite afterencryption of channel. At the cable headend these encrypted pay channels are downlinked using a single satellite antenna, transmodulated and sent to the subscribers by using a land based transmission system comprising of infrastructure of cable/optical fibres network.
(i) FDI limit in (HITS) Broadcasting Service is subject to such guidelines/terms and conditions as specified from time to time
Fazlani Altius Business School [Batch : 2013-2015]Page 89
ECONOMICS ASSIGNMENT [FOREIGN DIRECT INVESTMENT (FDI) IN INDIA ]
by Ministry of Information and Broadcasting. 74% (total direct and indirect foreign investment including portfolio and FDI)
Automatic upto 49% Government route beyond 49% and up to74%.
5. Setting up hardware facilities such as up-linking, HUB etc.
(1) Setting up of Up-linking HUB/ Teleports 49% (FDI & FII).
(2) Up-linking a Non-News & Current Affairs TV Channel .
(3) Up-linking a News & Current Affairs TV Channel subject to the condition that the portfolio investment from FII/ NRI shall not be “persons acting in concert” with FDI investors, as
defined in the SEBI(Substantial Acquisition of Shares and Takeovers) Regulations, 1997.
10. FDI in Commodity Exchanges
1. Futures trading in commodities are regulated under the Forward Contracts (Regulation) Act, 1952. Commodity Exchanges, like Stock Exchanges, are infrastructure companies in the commodity futures market. With a view to infuse globally acceptable best practices, modern management skills and latesttechnology, it was decided to allow foreign investment in Commodity Exchanges.
Fazlani Altius Business School [Batch : 2013-2015]Page 90

ECONOMICS ASSIGNMENT [FOREIGN DIRECT INVESTMENT (FDI) IN INDIA ]
2. For the purposes of this chapter:(i) “Commodity Exchange” is a recognized association under the provisions of the Forward Contracts (Regulation) Act, 1952, as amended from time to time, to provide exchange platform for trading in forward contracts in commodities.(ii) “Recognized association” means an association to which recognitionfor the time being has been granted by the Central Government under Section 6 of the Forward Contracts
(Regulation) Act, 1952.(iii) “Association” means any body of individuals, whether incorporated or not, constituted for the purposes of regulating andcontrolling the business of the sale or purchase of any goods and
commodity derivative.(iv) “Forward contract” means a contract for the delivery of goods andwhich is not a ready delivery contract.(v) “Commodity derivative” means-
• A contract for delivery of goods, which is not aready delivery contract.
Or
• A contract for differenceswhich derives its value from prices or indices of prices of
such underlying goods or activities, services, rights, interests and events, as may be notified in consultation with the Forward Markets Commission by the Central Government, but does not include securities.
Fazlani Altius Business School [Batch : 2013-2015]Page 91

ECONOMICS ASSIGNMENT [FOREIGN DIRECT INVESTMENT (FDI) IN INDIA ]
11. FDI in Real Estate & Development of Townships
The real estate sector in India is of great importance. According to the report of the Technical Group on Estimation of Housing Shortage, an estimated shortage of 26.53 million houses during the Eleventh Five Year Plan (2007-12) provides a big investment opportunity.
According to a report ‘Emerging trends in Real Estate in Asia Pacific 2011', released by PricewaterhouseCoopers (PwC) and Urban Land Institute (ULI), India is the most viable investment destination in real estate. Thereport, which provides an outlook on Asia-Pacific real estate investment and development trends, points out that India, in particular Mumbai and Delhi, are good real estate investment options for 2011. Residential properties maintain their growth momentum and hence are viewed as more promising than other sectors. ULI is a global non-profit education and research institute.
Further, real estate companies are coming up with various residential and commercial projects to fulfill the demand for residential and office properties in Tier-II and Tier-III cities. For instance, Ansal Properties has several residential projects in cities such as Jodhpur, Ajmer, Jaipur,Panipat, Kundli and Agra. Omaxe has also planned around 40 residential andintegrated township projects in Tier-II and Tier-III cities, majority of them being in Uttar Pradesh, Punjab, Madhya Pradesh, Rajasthan and Haryana. The growth in real estate in Tier-II and Tier-III cities is mainly due to increase in demand for organized realty and availability of land at affordable prices in these cities.
According to the data released by the Department of Industrial Policy and Promotion (DIPP), housing and real estate sector including cineplex, multiplex, integrated townships and commercial complexes etc, attracted a cumulative foreign direct investment (FDI) worth US$ 9,405 million from April 2000 to January 2011 wherein the sector witnessed FDI amounting US$ 1,048 million during April-January 2010-11.
New Projects
• Private equity fund IL&FS Investment Managers (IIML) is estimated to have invested US$ 300 million in real estate and urban infrastructure projects in 2010.
Fazlani Altius Business School [Batch : 2013-2015]Page 92

ECONOMICS ASSIGNMENT [FOREIGN DIRECT INVESTMENT (FDI) IN INDIA ]
• Close to Nalagarh in Solan district, Dabhota is set to be the latest industrial area to be developed by the Himachal Pradesh government, say officials. The state government has already issued a
notification and asked the state land acquisition officials to acquire 2,020 bighas of land at Baghota to be developed into industrial plots.
• Ramky Estates and Farms Limited, the real estate arm of the Ramky Group, is contemplating to enter Indian market by July 2011. Thecompany is evaluating on land acquisitions in Kolkata and
Bhubaneswar.
• Chennai-based VGN Developers Pvt Ltd has entered into a joint venture with private equity firm Pragnya Fund to initiate a new residential project with an investment of US$ 20.06 million in the city.
• Ascendas has entered into an agreement with a Japanese consortium of Mizuho Corporate Bank (MCB) and JGC Corporation to develop integrated townships in India, according to a press release
from Ascendas. The integrated township is likely to be in Chennai, which has attracted investment by a number of companies from Japan. Ascendas of Singapore will be the master developer.
• Godrej Group's real estate company, Godrej Properties and Frontier HomeDevelopers, has launched a residential project in Gurgaon with joint venture partner M/s. Frontier Home Developers Pvt. Ltd. This is a debut residential project in the national capital region (NCR) for Godrej Properties.
• Shristi Infrastructure Development Corporation will invest US$ 444.7 million over the next three years in seven small cities in West Bengal, Tripura and Rajasthan. The money would be used to build
integrated townships, healthcare facilities, hospitality and sports facilities, retail malls, logistics hubs and commercial and residential complexes.
• Realty major Ansal Properties & Infrastructure Ltd plans to invest about US$ 330.8 million over the next three years on expansion of its existing integrated townships and to develop a group housing
Fazlani Altius Business School [Batch : 2013-2015]Page 93

ECONOMICS ASSIGNMENT [FOREIGN DIRECT INVESTMENT (FDI) IN INDIA ]
project in Haryana.
• Vision India Real Estate, a closely-held business group in the US, is investing US$ 5 million in Gem Group's upcoming residential project in Chennai. This will be the first joint development project for theUS company that is proposing to invest US$ 100 to US$ 200 million over thenext three years on projects, especially in the logistics arena.
• Realty major Embassy Property Developments has entered into a joint venture with MK Land Holding, a Malaysian company that specializes in pre-fabricated affordable housing, to build projects
in the affordable housing segment. The proposed project entails an investment of over US$ 1.2 billion.
• Thai real estate developer Pruksa Global plans to invest US$ 218 million in projects in India and launched its first residential project in the country at Bangalore in October 2010.
• The International Finance Corporation (IFC) is in talks with several real estate developers to create large affordable housing projects in India. For FY-09 and FY-10 (fiscal year ending June 30), IFC's
highest exposure has been in India. Out of the US$ 3.5 billion that IFC has committed in India, US$ 2.5-2.6 billion have been disbursed. IFC will continue to invest roughly US$ 1 billion in India every year for the next two or three years.
• Townships, housing, built-up infrastructure and construction & development projects (which would include, but not be restricted to, housing, commercial premises, hotels, resorts, hospitals, educational
institutions, recreational facilities, city and regional level infrastructure)
Investment to be made will be subject to the following conditions:
1. Minimum area to be developed under each project would be as under:
(i) In case of development of serviced housing plots, a minimum land area of 10 hectares
(ii) In case of construction-development projects, a minimum built-up area of 50,000 sq.mts
(iii) In case of a combination project, any one of theabove two conditions would suffice
Fazlani Altius Business School [Batch : 2013-2015]Page 94

ECONOMICS ASSIGNMENT [FOREIGN DIRECT INVESTMENT (FDI) IN INDIA ]
2. Minimum capitalization of US$10 million for wholly owned subsidiaries and US$ 5 million for joint ventures with Indian partners. The funds would have to be brought in within six months ofcommencement of business of the Company.
3. Original investment cannot be repatriated before a period of three years from completion of minimum capitalization. Original investmentmeans the entire amount brought in as FDI. The lock-in period of three years will be applied from the date of receipt of each installment/tranche of FDI or from the date of completion of minimumcapitalization, whichever is later. However,the investor may be permitted to exit earlier with prior approval ofthe Government through the FIPB.
4. At least 50% of the project must be developed within a period of five years from the date of obtaining all statutory clearances. The investor/investee company would not be permitted to sell undevelopedplots. For the purpose of these guidelines, “undeveloped plots” willmean where roads, water supply, street lighting, drainage, sewerage,and other conveniences, as applicableunder prescribed regulations, have not been made available. It will be necessary that the investor provides this infrastructure and obtains the completion certificate from the concerned local body/service agency before he would be allowed to dispose of serviced housing plots.
5. The project shall conform to the norms and standards, including landuse requirements and provision of community amenities and common facilities, as laid down in the applicable building control regulations, bye-laws, rules, and other regulations of the State Government / Municipal/Local Body concerned.
6. The investor/investee company shall be responsible for obtaining allnecessary approvals, including those of the building/layout plans, developing internal and peripheral areas and other infrastructure facilities, payment of development, external development and other charges and complying with all other requirements as prescribed under applicable rules/bye-laws/regulationsof the State Government/ Municipal/Local Body concerned.
Fazlani Altius Business School [Batch : 2013-2015]Page 95

ECONOMICS ASSIGNMENT [FOREIGN DIRECT INVESTMENT (FDI) IN INDIA ]
7. The State Government/ Municipal/ Local Body concerned, which approves the building / development plans, would monitor compliance of the above conditions by the developer.Note:(i) The conditions at (1) to (4) above would not apply to Hotels& Tourism, Hospitals and SEZ’s.
(ii) For investment by NRIs, the conditions at (1) to (4) above would not apply.(iii) 100% FDI is allowed under the automatic route in development of Special Economic Zones (SEZ) without the conditionalities at (1) to (4) above. This will be subject to the provisions of Special Economic Zones Act 2005 and the SEZ Policy of the Department of Commerce.(iv) FDI is not allowed in Real Estate Business.
12. FDI in Industrial Park
1. Industrial parks both setting up and already established Industrial Parks:(i) “Industrial Park” is a project in which quality infrastructure in the form of plots of developed land or built up space or a combination with common facilities, is developed and made
available to all the allottee units for the purposes of industrialactivity.(ii) “Infrastructure” refers to facilities required for functioning of units located in the Industrial Park and includes roads (including approach roads), water supply and sewerage, common effluenttreatment facility, telecom network, generation and distribution of
Fazlani Altius Business School [Batch : 2013-2015]Page 96

ECONOMICS ASSIGNMENT [FOREIGN DIRECT INVESTMENT (FDI) IN INDIA ]
power, air conditioning.
(iii) “Common Facilities” refer to the facilities available for all the units located in the industrial park, and include facilities of power, roads (including approach roads), water supply and
sewerage, common effluent treatment, common testing, telecomservices, air conditioning, common facility buildings, industrialcanteens, convention/conference halls, parking, travel desks, security service, first aid center, ambulance and other safety services, training facilities and such other facilities meant for common use of the units located in the Industrial Park.(iv) “Allocable area” in the Industrial Park means-
(a) In the case of plots of developed land- thenet site area available for allocation to the units, excluding the area for common facilities.
(b) In the case of built up space- the floor area and built up space utilized for providing common facilities.
(c) In the case of a combination of developed land and built-up space the net site and
floor area available for allocation to the units excluding the site area and built up space utilized for providing common facilities.
(v) “Industrial Activity” means manufacturing, electricity, gas and water supply, post and telecommunications, software publishing, consultancy and supply, data processing, database
activities and distribution of electronic content, other computer related activities, Research and experimental development onnatural sciences and engineering, Business and
management consultancy activities and Architectural, engineering and other technical activities.
2. FDI in Industrial Parks would not be subject to the conditionality applicable for construction development projects etc. spelt out in Paraabove, provided the Industrial Parks meet with the under-mentioned conditions:(i) It would comprise of a minimum of 10 units and no single unit shall occupy more than 50% of the allocable area.
(ii) The minimum percentage of the area to be allocated for industrial activity shall not be less than 66% of the total allocable area.
Fazlani Altius Business School [Batch : 2013-2015]Page 97

ECONOMICS ASSIGNMENT [FOREIGN DIRECT INVESTMENT (FDI) IN INDIA ]
13. FDI in Insurance
(1) FDI in the Insurance sector, as prescribed in the Insurance Act, 1999, is allowed under the automatic route.
(2) This will be subject to the condition that Companies bringing in FDI shall obtain necessary license from the Insurance Regulatory & Development Authority for undertaking insurance activities.
14. FDI in Infrastructure Company in the Securities Market
Infrastructure companies in Securities Markets, namely, stock exchanges, depositories and clearing corporations, in compliance with SEBI Regulations 49% (FDI & FII) [FDI limit of 26 per cent and an FII limit of 23 per cent of the paid-up capital]
Other Conditions:
• FII can invest only through purchases in the secondary market.
Fazlani Altius Business School [Batch : 2013-2015]Page 98

ECONOMICS ASSIGNMENT [FOREIGN DIRECT INVESTMENT (FDI) IN INDIA ]
15. FDI in Non-Banking Finance Companies (NBFC)
1. Foreign investment in NBFC is allowed under the automatic route inonly the following activities:(i) Merchant Banking(ii) Under Writing(iii) Portfolio Management Services(iv) Investment Advisory Services(v) Financial Consultancy(vi) Stock Broking(vii) Asset Management(viii) Venture Capital(ix) Custodian Services(x) Factoring(xi) Credit Rating Agencies(xii) Leasing & Finance(xiii) Housing Finance(xiv) Forex Broking(xv) Credit Card Business(xvi) Money Changing Business(xvii) Micro Credit(xviii) Rural Credit
2. Other Conditions:
(1) Investment would be subject to the following minimum capitalization norms:
(i) US $0.5 million for foreign capital upto 51% to be brought up front.
(ii) US $ 5 million for foreign capital more than 51% and upto 75% to be
Fazlani Altius Business School [Batch : 2013-2015]Page 99

ECONOMICS ASSIGNMENT [FOREIGN DIRECT INVESTMENT (FDI) IN INDIA ]
brought up front.
(iii) US $ 50 million for foreign capital more than 75% out of which US$ 7.5 million to be brought up front and the balance in 24 months.
(iv) 100% foreign owned NBFCs with a minimum capitalization of US$ 50
million can set up step down subsidiaries for specific NBFC activities, without any restriction on the number of operating subsidiaries and without bringing in additional capital.
(v) Joint Venture operating NBFCs that have 75% or less than 75%foreign investment can also set up subsidiaries for undertaking other NBFC activities, subject to the
subsidiaries also complying with the applicable minimum capitalization norm mentioned in (i), (ii) and (iii) above and (vi) below.
(vi) Non- Fund based activities : US $0.5 million to be brought upfront for all permitted non-fund based NBFCs irrespective of the level of foreign investment subject to the
following condition:It would not be permissible for such a company to set up any
subsidiary for any other activity, nor it can participate in any equity of an NBFC holding/operating company.
Note: The following activities would be classified as Non-Fund Based activities:
(a) Investment Advisory Services (b) Financial Consultancy (c) Forex Broking (d) Money Changing Business
(e) Credit Rating Agencies
(vii) This will be subject to compliance with the guidelinesof RBI.
Note: Credit Card business includes issuance, sales, marketing & design of various
Fazlani Altius Business School [Batch : 2013-2015]Page 100

ECONOMICS ASSIGNMENT [FOREIGN DIRECT INVESTMENT (FDI) IN INDIA ]
payment products such as credit cards, charge cards, debit cards, stored value cards, smart card, value added cards etc.
3. The NBFC will have to comply with the guidelines of the relevant regulators, as applicable.
16. FDI in Petroleum & Natural Gas Sector
Fazlani Altius Business School [Batch : 2013-2015]Page 101

ECONOMICS ASSIGNMENT [FOREIGN DIRECT INVESTMENT (FDI) IN INDIA ]
1. Exploration activities of oil and natural gas fields, infrastructure related to marketing of petroleum products and natural gas, marketing of natural gas and petroleum products, petroleum product pipelines, natural gas/pipelines, LNG Regasification infrastructure, market study and formulation and Petroleum refining in the private sector, subject to the existing sectoral policy and regulatory framework in the oil marketing sector and the policy of the Government on private participation in exploration of oil and the discovered fields of national oil companies.
2. Petroleum refining by the Public Sector Undertakings (PSU), without anydisinvestment or dilution of domestic equity in the existing PSUs. 49% Government.
Fazlani Altius Business School [Batch : 2013-2015]Page 102

ECONOMICS ASSIGNMENT [FOREIGN DIRECT INVESTMENT (FDI) IN INDIA ]
17. FDI in Print Media
1. Publishing of Newspaper and periodicals dealing with news and current affairs 26% (FDI and investment by NRIs/PIOs/FII)
2. Publication of Indian editions of foreign magazines dealing with news and current affairs26% (FDI and investment by NRIs/PIOs/FII)
Other Conditions:
(i) ‘Magazine’, for the purpose of these guidelines, will be defined as a periodical publication, brought out on non-daily basis,containing public news or comments on public news.(ii) Foreign investment would also be subject to the Guidelines for Publication of Indian editions of foreign magazines dealing with news and current affairs issued by the Ministry of
Information & Broadcasting on 4.12.2008.
3. Publishing/printing of Scientific and Technical Magazines/specialty journals/ periodicals, subject to compliance with the legal framework as applicable and guidelines issued in this regard from time to time byMinistry of Information and Broadcasting.
4. Publication of facsimile edition of foreign newspapers.
Other Conditions:
(i) FDI should be made by the owner of the original foreign newspaperswhose facsimile edition is proposed to be brought out in India.
(ii) Publication of facsimile edition of foreign newspapers can be undertaken only by an entity incorporated or registered in India under the provisions of the Companies Act, 1956.(iii) Publication of facsimile edition of foreign newspaper would also be subject to the Guidelines for publication of newspapers and periodicals dealing with news and current affairs and publication of
facsimile edition of foreign newspapers issued by Ministry of
Fazlani Altius Business School [Batch : 2013-2015]Page 103

ECONOMICS ASSIGNMENT [FOREIGN DIRECT INVESTMENT (FDI) IN INDIA ]
Information & Broadcasting on 31.3.2006, as amended from timeto time.
18. FDI in Telecommunication
Investment caps and other conditions for specified services are given below. However, licensing and security requirements notified by the Department of Telecommunications will need to be complied with for all services. Telecom services 74% Automatic up to 49% Government route beyond49% and up to 74%.Other conditions:
1. General Conditions:
(i) This is applicable in case of Basic, Cellular, Unified Access Services, National/ International Long Distance, V-Sat, Public Mobile Radio Trunked Services (PMRTS), Global Mobile PersonalCommunications Services (GMPCS) and other value added Services.
(ii) Both direct and indirect foreign investment in the licensee company shall be counted for the purpose of FDI ceiling. ForeignInvestment shall include investment by Foreign Institutional
Investors (FIIs), Non-resident Indians (NRIs), Foreign Currency Convertible Bonds (FCCBs), American Depository Receipts (ADRs), Global Depository Receipts (GDRs) and convertible preference shares held by foreign Entity. In any case, the `Indian’ shareholding will not be less than 26 percent.
Fazlani Altius Business School [Batch : 2013-2015]Page 104

ECONOMICS ASSIGNMENT [FOREIGN DIRECT INVESTMENT (FDI) IN INDIA ]
(iii) FDI in the licensee company/Indian promoters/investment companies including their holding companies shall require approval of the Foreign Investment Promotion Board (FIPB) if it has a bearing on the Overall ceiling of 74 percent. While approving the investment proposals, FIPB shall take note that investment is not coming from countries of concern and/or unfriendly entities.
(iv) The investment approval by FIPB shall envisage the conditionality that Company would adhere to licence Agreement.
(v) FDI shall be subject to laws of India and not the laws of the foreign country/countries.
2. Security Conditions:
(i) The Chief Officer In-charge of technical network operations and the Chief Security Officer should be a resident Indian citizen.
(ii) Details of infrastructure/network diagram (technical details of the network) could be provided on a need basis only to telecom equipment suppliers/manufacturers and the affiliate/parents of thelicensee company. Clearance from the licensor (Department of Telecommunications) would be required if such information is tobe provided to anybody else.(iii) For security reasons, domestic traffic of such entities as may be identified /specified by the licensor shall not be hauled/routed to any place outside India.
(iv) The licensee company shall take adequate and timely measures to ensure that the information transacted through a network by the subscribers is secure and protected. (v) The officers/officials of the licensee companies dealing with the lawful interception of messages will be resident Indian citizens.(vi) The majority Directors on the Board of the company shall be Indian
citizens.
(vii) The positions of the Chairman, Managing Director, Chief Executive Officer (CEO) and/or Chief Financial Officer (CFO), if held by foreign nationals, would require to be security
vetted by Ministry of Home Affairs (MHA). Security vetting shall be required periodically on yearly basis. In case something adverse is found during the security vetting, the direction of MHA shall be binding on the licensee.
Fazlani Altius Business School [Batch : 2013-2015]Page 105

ECONOMICS ASSIGNMENT [FOREIGN DIRECT INVESTMENT (FDI) IN INDIA ]
(viii) The Company shall not transfer the following to any person/place outside India:-
(a) Any accounting informationrelating to subscriber (except for international
roaming/billing) (Note: it does not restrict a statutorily required disclosure of financial nature).
(b) User information (except pertaining to foreign subscribers using Indian Operator’s
network while roaming).
(ix) The Company must provide traceable identity of their subscribers. However, in case of providing service to roaming subscriber of foreign Companies, the Indian Company shall endeavour to obtain traceable identity of roaming subscribers from the foreign company as a
part of its roaming agreement.
(x) On request of the licensor or any other agency authorised by the licensor, the telecom service provider should be able to provide the geographical location of any subscriber (BTS location)
at a given point of time.
(xi) The Remote Access (RA) to Network would be provided only to approved location(s) abroad through approved location(s) in India. The approval for location(s) would be given by the Licensor(DOT) in consultation with the Ministry of Home Affairs.
(xii) Under no circumstances, should any RA to the suppliers/manufacturers and affiliate(s) be enabled to access Lawful Interception System(LIS), Lawful Interception Monitoring(LIM),
Call contents of the traffic and any such sensitive sector/data, which the licensor may notify from time to time.
(xiii) The licensee company is not allowed to use remote access facility for monitoring of content.
(xiv) Suitable technical device should be made available at Indianend to the designated security agency /licensor in which a mirror image of the remote access information is available on line formonitoring purposes.
(xv) Complete audit trail of the remote access activities pertaining tothe network operated in India should be maintained for a period of six months and provided on request to the licensor or any other agency authorised by the licensor.
Fazlani Altius Business School [Batch : 2013-2015]Page 106

ECONOMICS ASSIGNMENT [FOREIGN DIRECT INVESTMENT (FDI) IN INDIA ]
(xvi) The telecom service providers should ensure that necessary provision (hardware/software) is available in their equipment for doing the Lawful interception and monitoring from a centralized location.
(xvii) The telecom service providers should familiarize/train Vigilance Technical Monitoring (VTM)/security agency officers/officials in respect of relevant operations/features of their
systems.
(xviii) It shall be open to the licensor to restrict the Licensee Company from operating in any sensitive area from the National Security angle.(xix) In order to maintain the privacy of voice and data, monitoring shall only be upon authorisation by the UnionHome Secretary or Home Secretaries of the States/Union
Territories.
(xx) For monitoring traffic, the licensee company shall provide access of their network and other facilities as well as to books of accounts to the security agencies.(xxi) The aforesaid Security Conditions shall be applicable to allthe licensee companies operating telecom services covered under this circular irrespective of the level of FDI.(xxii) Other Service Providers (OSPs), providing services like CallCentres, Business Process Outsourcing (BPO), tele-marketing, tele-education, etc, and are registered with DoT as OSP. Such OSPs operate the service using the telecom infrastructure provided by licensed telecom service providers and 100% FDI is permitted for OSPs. As the security conditions are applicable to all licensedtelecom service providers, the security conditions mentioned above
shall not be separately enforced on OSPs.
3. The above General Conditions and Security Conditions shall also be applicable to the companies operating telecom service(s) with the FDI cap of
4. All the telecom service providers shall submit a compliance report on the aforesaid conditions to the licensor on 1st day of July and Januaryon six monthly basis.
Fazlani Altius Business School [Batch : 2013-2015]Page 107
ECONOMICS ASSIGNMENT [FOREIGN DIRECT INVESTMENT (FDI) IN INDIA ]
19. FDI in Trading
1. Cash & Carry Wholesale Trading/ Wholesale Trading (including sourcing from MSEs)Definition: Cash & Carry Wholesale trading/Wholesale trading, would mean sale of goods/merchandise to retailers, industrial, commercial, institutional or other professional business users or to other wholesalers and related subordinated service providers. Wholesale trading would, accordingly, be sales for the purpose of trade, businessand profession, as opposed to sales for the purpose of personal consumption. The yardstick to determine whether the sale is wholesale or not would be the type of customers to whom the sale is made and not the size and volume of sales. Wholesale trading would include resale, processing and thereafter sale, bulk imports with ex-port/ex-bonded warehouse business sales and B2B e-Commerce.
Guidelines for Cash & Carry Wholesale Trading/Wholesale Trading (WT):
(a) For undertaking WT, requisite licenses/registration/ permits, as
Fazlani Altius Business School [Batch : 2013-2015]Page 108

ECONOMICS ASSIGNMENT [FOREIGN DIRECT INVESTMENT (FDI) IN INDIA ]
specified under the relevant Acts/Regulations/Rules/Orders of the State Government/Government Body/Government
Authority/Local Self-Government Body under that State Government should be obtained.
(b) Except in case of sales to Government, sales made by the wholesaler would be considered as ‘cash & carry wholesale trading/wholesale trading’ with valid business customers, only when
WT are made to the following entities:
(I) Entities holding sales tax/ VAT registration/service tax/excise duty registration.
(II) Entitiesholding trade licenses i.e. a license/registration certificate/membership certificate/registration under Shops and Establishment Act, issued by a Government
Authority/ Government Body/ Local Self-Government Authority, reflecting that the entity/person holding the license/ registration certificate/ membership certificate, as thecase may be, is itself/ himself/herself engaged in a business involving
commercial activity.
(III) Entities holding permits/license etc.for undertaking retail trade (like the bazari and similar license for hawkers) from Government Authorities/Local Self Government
Bodies.
(IV) Institutions having certificate of incorporationor registration as a society or registration as public trust for their self-consumption.
Note: An Entity to whom WT is made, may fulfill any one of The 4 conditions.
( c) Full records indicating all the details of such sales like name ofentity, kind of entity, registration/license/permit etc. number, amount of sale etc. should be maintained on a day to
day basis.
(d) WT of goods would be permitted among companies of the same group. However, such WT to group companies taken together should not exceed25% of the total turnover of the wholesale venture.
(e) WT can be undertaken as per normal business practice, including extending credit facilities subject to applicable regulations.
Fazlani Altius Business School [Batch : 2013-2015]Page 109
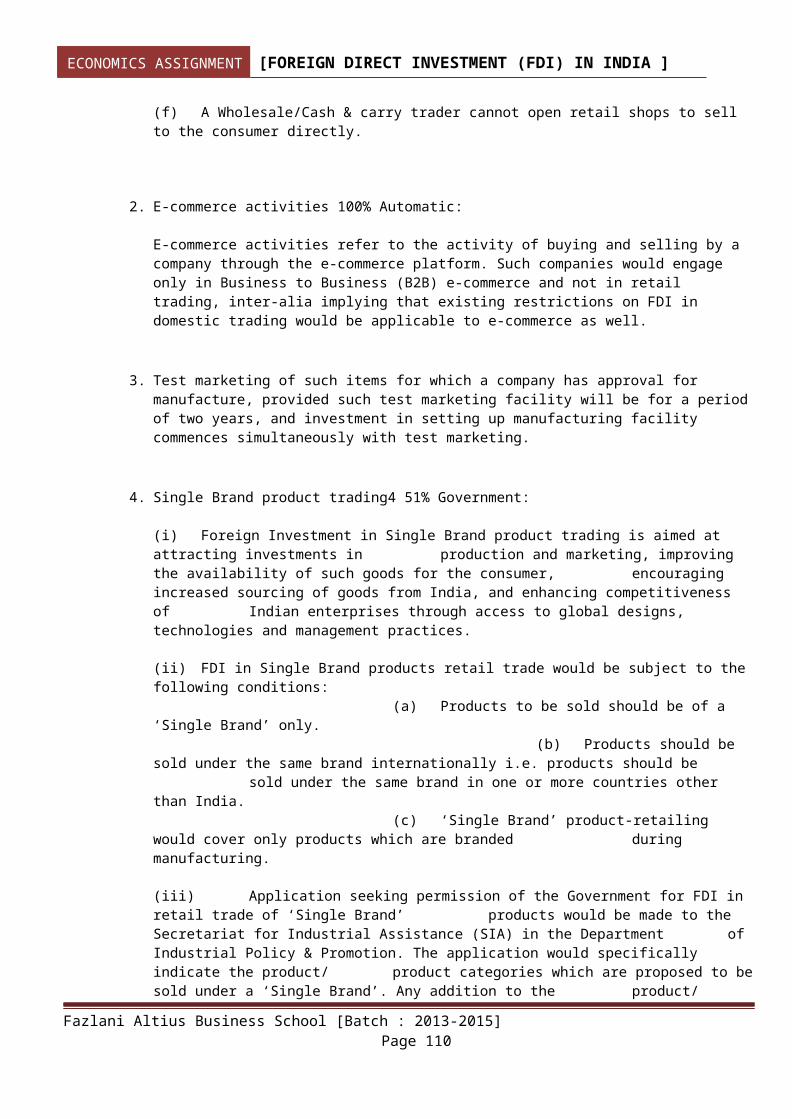
ECONOMICS ASSIGNMENT [FOREIGN DIRECT INVESTMENT (FDI) IN INDIA ]
(f) A Wholesale/Cash & carry trader cannot open retail shops to sell to the consumer directly.
2. E-commerce activities 100% Automatic:
E-commerce activities refer to the activity of buying and selling by a company through the e-commerce platform. Such companies would engage only in Business to Business (B2B) e-commerce and not in retail trading, inter-alia implying that existing restrictions on FDI in domestic trading would be applicable to e-commerce as well.
3. Test marketing of such items for which a company has approval for manufacture, provided such test marketing facility will be for a periodof two years, and investment in setting up manufacturing facility commences simultaneously with test marketing.
4. Single Brand product trading4 51% Government:
(i) Foreign Investment in Single Brand product trading is aimed at attracting investments in production and marketing, improving the availability of such goods for the consumer, encouraging increased sourcing of goods from India, and enhancing competitiveness of Indian enterprises through access to global designs, technologies and management practices.
(ii) FDI in Single Brand products retail trade would be subject to the following conditions:
(a) Products to be sold should be of a ‘Single Brand’ only.
(b) Products should be sold under the same brand internationally i.e. products should be
sold under the same brand in one or more countries other than India.
(c) ‘Single Brand’ product-retailing would cover only products which are branded during manufacturing.
(iii) Application seeking permission of the Government for FDI in retail trade of ‘Single Brand’ products would be made to the Secretariat for Industrial Assistance (SIA) in the Department of Industrial Policy & Promotion. The application would specifically indicate the product/ product categories which are proposed to besold under a ‘Single Brand’. Any addition to the product/
Fazlani Altius Business School [Batch : 2013-2015]Page 110

ECONOMICS ASSIGNMENT [FOREIGN DIRECT INVESTMENT (FDI) IN INDIA ]
product categories to be sold under ‘Single Brand’ would require a fresh approval of the Government.
(iv) Applications would be processed in the Department of Industrial Policy & Promotion, to determine whether the products proposed to be sold satisfy the notified guidelines, before
being considered by the FIPB for Government approval.
20. FDI in Courier services
Courier services for carrying packages, parcels and other items which do not come within the ambit of the Indian Post Office Act, 1898.
1. 100% FDI is allowed under the Government route.
2. This will be subject to existing Law. i.e Indian Post Office Act 1898 and exclusion of activity relating to the distribution of letters.
Note : Minimum capitalization includes share premium received along with the face value of the share, only when it is received by the company upon issue of the shares to the non-resident investor. Amount paid by the transferee during post-issue transfer of sharesbeyond the issue price of the share, cannot be taken into account while calculating minimum capitalization requirement.
Fazlani Altius Business School [Batch : 2013-2015]Page 111

ECONOMICS ASSIGNMENT [FOREIGN DIRECT INVESTMENT (FDI) IN INDIA ]
21. FDI in the Retail sector:
Retailing is one of the world’s largest private industries.Liberalizations in FDI have caused a massive restructuring in retailindustry. The benefit of FDI in retail industry superimposes its costfactors. Opening the retail industry to FDI will bring forth benefits interms of advance employment, organized retail stores, availability ofquality products at a better and cheaper price. It enables a country’sproduct or service to enter into the global market.
Cheaper production facilities: FDI will ensure better operations in
production cycle and distribution. Due to economies of operation,production facilities will be available at a cheaper rate thereby
Fazlani Altius Business School [Batch : 2013-2015]Page 112

ECONOMICS ASSIGNMENT [FOREIGN DIRECT INVESTMENT (FDI) IN INDIA ]
resulting in availability of variety products to the ultimate consumersat a reasonable and lesser price.
Availability of new technology:FDI enables transfer of skills and
technology from overseas and develops the infrastructure of the domestic country. Greater managerial talent inflow from other countriesis made possible. Domestic consumers will benefit getting great varietyand quality products at all price points.
Long term cash liquidity:FDI will provide necessary capital for
setting up organized retail chain stores. It is a long term investment because unlike equity capital, the physical capital invested in the domestic company is not easily liquidated.
Lead driver for the country’s economic growth:FDI would create a competition
among the global investors, which would ultimately ensure better and lower prices thus benefiting people in all sections of the society. There would be an increase in the market growth and expansion. It will increase retail employment and suppress untrained manpower and lack of experience. It will ensure better managerial techniques and success. Higher wages will be paid by the international companies. Urban consumers will be exposed to international lifestyles.
R. ECONOMIC INDICATORS
MARKETS LAST PREVIOUS AVERAGE TREND UNIT REFERENCE
Fazlani Altius Business School [Batch : 2013-2015]Page 113
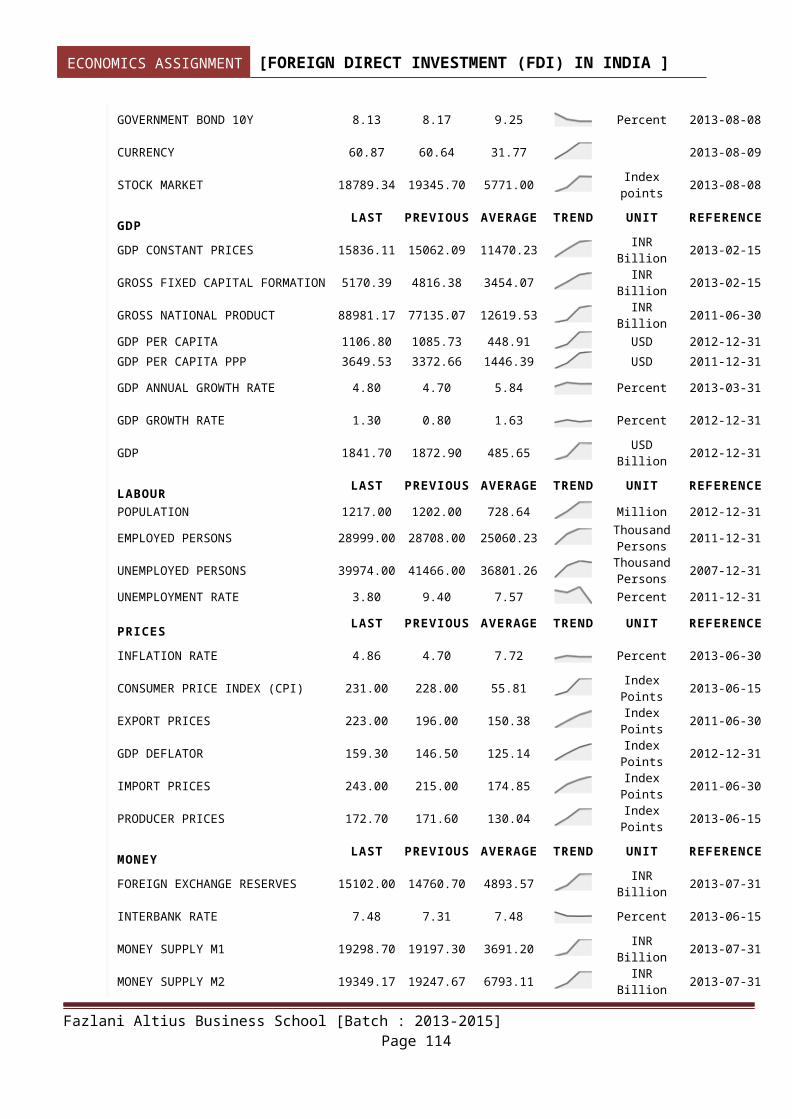
ECONOMICS ASSIGNMENT [FOREIGN DIRECT INVESTMENT (FDI) IN INDIA ]
GOVERNMENT BOND 10Y 8.13 8.17 9.25 Percent 2013-08-08
CURRENCY 60.87 60.64 31.77 2013-08-09
STOCK MARKET 18789.34 19345.70 5771.00 Indexpoints 2013-08-08
GDP LAST PREVIOUS AVERAGE TREND UNIT REFERENCE
GDP CONSTANT PRICES 15836.11 15062.09 11470.23 INRBillion 2013-02-15
GROSS FIXED CAPITAL FORMATION 5170.39 4816.38 3454.07 INRBillion 2013-02-15
GROSS NATIONAL PRODUCT 88981.17 77135.07 12619.53 INRBillion 2011-06-30
GDP PER CAPITA 1106.80 1085.73 448.91 USD 2012-12-31GDP PER CAPITA PPP 3649.53 3372.66 1446.39 USD 2011-12-31
GDP ANNUAL GROWTH RATE 4.80 4.70 5.84 Percent 2013-03-31
GDP GROWTH RATE 1.30 0.80 1.63 Percent 2012-12-31
GDP 1841.70 1872.90 485.65 USDBillion 2012-12-31
LABOUR LAST PREVIOUS AVERAGE TREND UNIT REFERENCE
POPULATION 1217.00 1202.00 728.64 Million 2012-12-31
EMPLOYED PERSONS 28999.00 28708.00 25060.23 ThousandPersons 2011-12-31
UNEMPLOYED PERSONS 39974.00 41466.00 36801.26 ThousandPersons 2007-12-31
UNEMPLOYMENT RATE 3.80 9.40 7.57 Percent 2011-12-31
PRICES LAST PREVIOUS AVERAGE TREND UNIT REFERENCE
INFLATION RATE 4.86 4.70 7.72 Percent 2013-06-30
CONSUMER PRICE INDEX (CPI) 231.00 228.00 55.81 IndexPoints 2013-06-15
EXPORT PRICES 223.00 196.00 150.38 IndexPoints 2011-06-30
GDP DEFLATOR 159.30 146.50 125.14 IndexPoints 2012-12-31
IMPORT PRICES 243.00 215.00 174.85 IndexPoints 2011-06-30
PRODUCER PRICES 172.70 171.60 130.04 IndexPoints 2013-06-15
MONEY LAST PREVIOUS AVERAGE TREND UNIT REFERENCE
FOREIGN EXCHANGE RESERVES 15102.00 14760.70 4893.57 INRBillion 2013-07-31
INTERBANK RATE 7.48 7.31 7.48 Percent 2013-06-15
MONEY SUPPLY M1 19298.70 19197.30 3691.20 INRBillion 2013-07-31
MONEY SUPPLY M2 19349.17 19247.67 6793.11 INRBillion 2013-07-31
Fazlani Altius Business School [Batch : 2013-2015]Page 114

ECONOMICS ASSIGNMENT [FOREIGN DIRECT INVESTMENT (FDI) IN INDIA ]
MONEY SUPPLY M3 87567.88 85930.00 13850.82 INRBillion 2013-07-31
INTEREST RATE 7.25 7.25 6.57 Percent 2013-07-30
TRADE LAST PREVIOUS AVERAGE TREND UNIT REFERENCE
CURRENT ACCOUNT -18.10 -32.63 -1.51 USDBillion 2013-03-31
CURRENT ACCOUNT TO GDP -4.80 -4.20 -1.45 Percent 2012-12-31
EXTERNAL DEBT 345819.00 305931.00 140319.65 USD
Million 2012-12-31
FOREIGN DIRECT INVESTMENT 1954.00 2802.00 923.56 USDMillion 2013-05-15
REMITTANCES 7845.07 8173.09 7657.98 USDMillion 2013-02-15
TERMS OF TRADE 113.00 91.00 90.00 IndexPoints 2011-06-30
BALANCE OF TRADE -715.31 -1108.12 -120.37 INRBillion 2013-06-15
EXPORTS 1389.02 1348.08 246.34 INRBillion 2013-06-15
IMPORTS 2104.33 2456.19 368.19 INRBillion 2013-06-15
GOVERNMENT LAST PREVIOUS AVERAGE TREND UNIT REFERENCE
GOVERNMENT DEBT TO GDP 67.57 68.05 74.56 Percent 2012-12-31
GOVERNMENT BUDGET VALUE -2628.23 -1806.91 -1237.76 INRBillion 2013-06-30
GOVERNMENT EXTERNAL DEBT 345819.00 305931.00 140319.65 USD
Million 2012-12-31
GOVERNMENT SPENDING 1773.81 1821.98 1262.77 INRBillion 2013-02-15
CREDIT RATING 47.12
GOVERNMENT BUDGET -4.80 -5.80 -3.84 Percent of 2012-12-31
Fazlani Altius Business School [Batch : 2013-2015]Page 115

ECONOMICS ASSIGNMENT [FOREIGN DIRECT INVESTMENT (FDI) IN INDIA ]
GDP
BUSINESS LAST PREVIOUS AVERAGE TREND UNIT REFERENCE
CAR REGISTRATIONS 205381.00 208507.00 87168.33 Cars 2013-05-15
CHANGES IN INVENTORIES 597.31 556.98 375.11 INRBillion 2013-02-15
INDUSTRIAL PRODUCTION -1.60 2.00 7.03 Percent 2013-05-31
BUSINESS CONFIDENCE 51.20 51.30 60.14 2013-06-30
CONSUMER LAST PREVIOUS AVERAGE TREND UNIT REFERENCE
BANK LENDING RATE 10.25 10.25 14.17 Percent 2013-07-15
CONSUMER SPENDING 8668.54 9255.44 6712.74 INRBillion 2013-02-15
DISPOSABLE PERSONAL INCOME 71640930.00
60158160.00
10220093.02
INRMillion 2011-06-30
PERSONAL SAVINGS 20037.20 18329.01 2778.25 INRBillion 2012-06-29
CONSUMER CONFIDENCE 118.00 120.00 118.88 2013-06-30
S. T O P 10 FD I E Q U I T Y IN F L O W C ASE S FR O M A P RI L 2 0 00 T O J A NU A R Y 20 1 1
Country: Mauritius
Sr.No
Name ofIndianCompany
FDIRoute
Name ofForeign
Collaborator
RBIRegionalOffice
Item ofManufacture
Amount of FDIInflows
Fazlani Altius Business School [Batch : 2013-2015]Page 116

ECONOMICS ASSIGNMENT [FOREIGN DIRECT INVESTMENT (FDI) IN INDIA ]
(In Rscrore)
(InUS$
1 IDEA CELLURLTD
RBI TMIMAURITIUS
LTD
AHMEDABAD TELEPHONECOMMUNICATION
SERVICES
7,294.48
1,600.95
2 I FLIEXSOLUTIONS
LTD
RBI ORACLEGLOBAL( MAURITIUS) LTD
REGION NOTINDICATED
SOFTWAREDEVELOPMENT.
4,805.58
1,083.99
3 INDIA DEBTMANAGEMENT
LTD
RBI MAURITIUSDEBT
MANAGEMENTLTD
MUMBAI COMMERCIALLOAN COMPANIES
ACTIVITIES
3,800.00
956.39
4 BHAIKINFOTEL P.
LTD.
FIPB VODAFONEMAURITIUS
LTD.
NEW DELHI TELEPHONECOMMUNICATION
SERVICES
3,268.12
801.37
5 ETISALAT DBTELECOM P.
LTD
RBI ETISALATMAURITIUS
LTD.
MUMBAI TELEPHONECOMMUNICATIO N
SERVICES
3,228.45
667.93
6 HOUSINGDEVELOPMENT FINANCE
CORPN. LTD.
RBI CMP ASIALTD.
MUMBAI HOUSINGFINANCE
COMPANIES
2,638.25
653.74
7 I FLEXSOLUTIONS
LTD
FIPB ORACLEGLOBAL
MAURITIUSLTD
REGION NOTINDICATED
IT TOFINIANCIALSERVICEINDUSTRY
2,578.88
563.94
8 DSP MERRILLLYNCH LTD.
RBI MERRILLLYNCH
(MAURITIUS) LTD.
REGION NOTINDICATED
FINANCIALSERVICESPROVIDER
2,230.02
483.55
9 DABHOLPOWER
COMPANY LTD
FIPB NA MUMBAI NA 2,160.35
450.07
10 ADITYABIRLATELECOMLTD.
FIPB P S ASIAHOLDING
INVESTMENT(MAURITIUS)
MUMBAI TELEPHONECOMMUNICATION
SERVICES
2,098.25
419.13
Grand Total 34,102.3 6
7,681.06
Fazlani Altius Business School [Batch : 2013-2015]Page 117

ECONOMICS ASSIGNMENT [FOREIGN DIRECT INVESTMENT (FDI) IN INDIA ]
Country: Singapore
Sr.No
Name ofIndianCompany
FDIRoute
Name ofForeign
Collaborator
RBIRegionalOffice
Item ofManufacture
Amount of FDIInflows
(In Rscrore)
(InUS$
1 RELOGISTICSINFRASTRUCTURE P. LTD.
RBI BIOMETRIXMARKETING P.
LTD.
MUMBAI BOTTLING OFNATURAL GAS OR
LIQUIFIEDPETROLEUM GAS
1,851.91
458.89
2 DLF ASSETSLTD
RBI DALSINGAPOREINVESTMENTSPTE LTD
NEW DELHI CONSTRUCTION 1,794.59
387.37
3 AAA GLOBALVENTURESPVT LTD
RBI BARCLAYSBANK PLC
MUMBAI FINANCIALLEASINGCOMPANIES
ACTIVITIES.
1,711.24
368.35
4 ESSELMINING
INDUSTRIESLTD.
RBI SURYA ABHAINVESTEMENT
PTE.
KOLKATA MINING OF IRONORE
1,496.00
378.62
5 LPCUBESYSTEMS (I)P. LTD.
RBI VIDHYAJAYARAMAN
CHENNAI DATAPROCESSINGSOFTWARE
DEVELOPMENTAND COMPUTERCONSULTANCYSERVICES
1,406.25
328.27
6 HINDUSTANCOCO- COLAHOLDINGSPVT LTD
FIPB HINDUSTANCOCA- COLAOVERSEASHOLDING PT
MUMBAI INVESTMENTRESEARCH ANDCOUNSELLINGACTIVITIES
1,334.18
273.21
7 HINDUSTANCOCO- COLAHOLDINGSPVT LTD
FIPB HINDUSTANCOCA- COLAOVERSEAS
HOLDING PTE
MUMBAI INVESTMENTRESEARCH ANDCOUNSELLINGACTIVITIES
1,334.18
273.21
8 HINDUSTANCOCO- COLAHOLDINGSPVT LTD
FIPB BHARAT COCO-COLA
OVERSEASHOLDINGS PVT
LTD
MUMBAI INVESTMENTRESEARCH
COUNSELLINGACTIVITIES
1,170.32
239.65
9 RELIANCEGAS
TRANSPORTATION INFRAS.
RBI BIO METRIXMARKETING P.
LTD.
MUMBAI GENERATION OFGAS IN GAS-
WROKS
875.60 222.01
10 RELIANCEPORTS ANDTERMINALS
LTD.
RBI BIOMETRIXMARKETINGPVT.LTD.
AHMEDABAD OTHERBUSSINESS
SERVICES NOTELSEWHERE
CLASSIFIED ORINCLUDED.
830.33 205.75
Grand Total 13,804.60
3,135.34
Fazlani Altius Business School [Batch : 2013-2015]Page 118
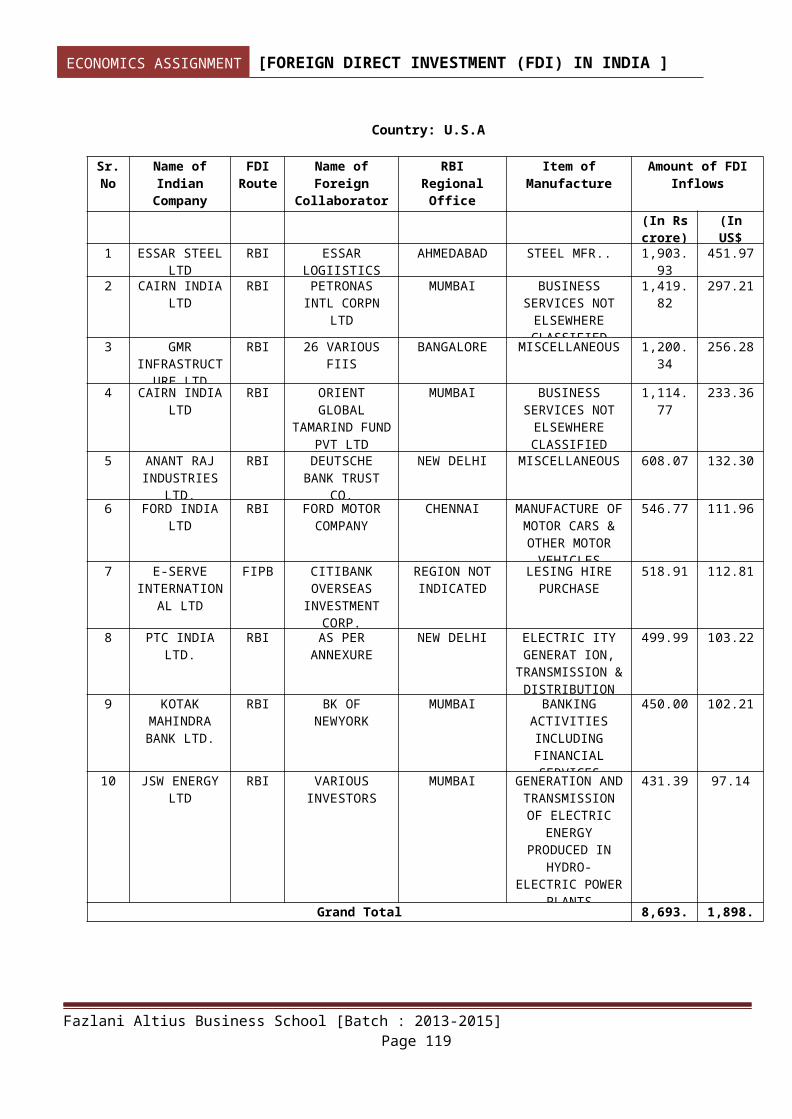
ECONOMICS ASSIGNMENT [FOREIGN DIRECT INVESTMENT (FDI) IN INDIA ]
Country: U.S.A
Sr.No
Name ofIndianCompany
FDIRoute
Name ofForeign
Collaborator
RBIRegionalOffice
Item ofManufacture
Amount of FDIInflows
(In Rscrore)
(InUS$
1 ESSAR STEELLTD
RBI ESSARLOGIISTICS
AHMEDABAD STEEL MFR.. 1,903.93
451.97
2 CAIRN INDIALTD
RBI PETRONASINTL CORPN
LTD
MUMBAI BUSINESSSERVICES NOTELSEWHERECLASSIFIED
1,419.82
297.21
3 GMRINFRASTRUCT
URE LTD
RBI 26 VARIOUSFIIS
BANGALORE MISCELLANEOUS 1,200.34
256.28
4 CAIRN INDIALTD
RBI ORIENTGLOBAL
TAMARIND FUNDPVT LTD
MUMBAI BUSINESSSERVICES NOTELSEWHERECLASSIFIED
1,114.77
233.36
5 ANANT RAJINDUSTRIES
LTD.
RBI DEUTSCHEBANK TRUST
CO.
NEW DELHI MISCELLANEOUS 608.07 132.30
6 FORD INDIALTD
RBI FORD MOTORCOMPANY
CHENNAI MANUFACTURE OFMOTOR CARS &OTHER MOTORVEHICLES
546.77 111.96
7 E-SERVEINTERNATION
AL LTD
FIPB CITIBANKOVERSEASINVESTMENT
CORP.
REGION NOTINDICATED
LESING HIREPURCHASE
518.91 112.81
8 PTC INDIALTD.
RBI AS PERANNEXURE
NEW DELHI ELECTRIC ITYGENERAT ION,
TRANSMISSION &DISTRIBUTION
499.99 103.22
9 KOTAKMAHINDRABANK LTD.
RBI BK OFNEWYORK
MUMBAI BANKINGACTIVITIESINCLUDINGFINANCIALSERVICES
450.00 102.21
10 JSW ENERGYLTD
RBI VARIOUSINVESTORS
MUMBAI GENERATION ANDTRANSMISSIONOF ELECTRIC
ENERGYPRODUCED IN
HYDRO-ELECTRIC POWER
PLANTS
431.39 97.14
Grand Total 8,693.98
1,898.46
Fazlani Altius Business School [Batch : 2013-2015]Page 119
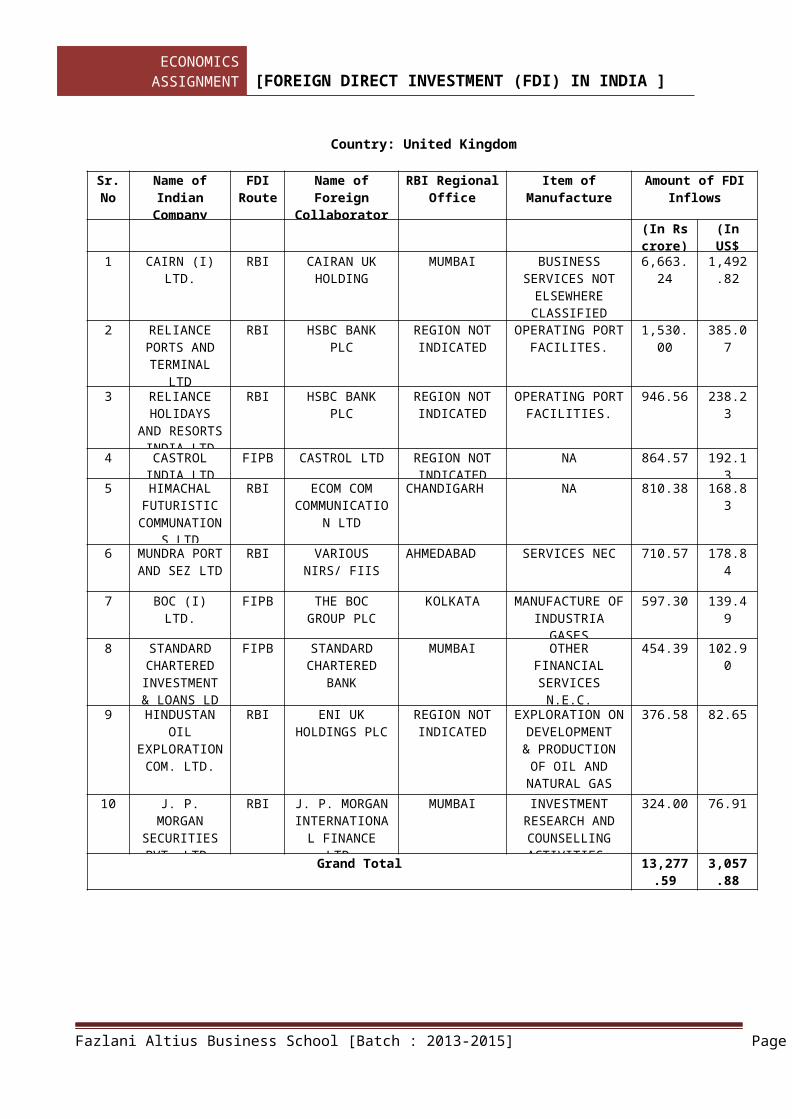
ECONOMICSASSIGNMENT [FOREIGN DIRECT INVESTMENT (FDI) IN INDIA ]
Country: United Kingdom
Sr.No
Name ofIndianCompany
FDIRoute
Name ofForeign
Collaborator
RBI RegionalOffice
Item ofManufacture
Amount of FDIInflows
(In Rscrore)
(InUS$
1 CAIRN (I)LTD.
RBI CAIRAN UKHOLDING
MUMBAI BUSINESSSERVICES NOTELSEWHERECLASSIFIED
6,663.24
1,492.82
2 RELIANCEPORTS ANDTERMINAL
LTD
RBI HSBC BANKPLC
REGION NOTINDICATED
OPERATING PORTFACILITES.
1,530.00
385.07
3 RELIANCEHOLIDAYS
AND RESORTSINDIA LTD
RBI HSBC BANKPLC
REGION NOTINDICATED
OPERATING PORTFACILITIES.
946.56 238.23
4 CASTROLINDIA LTD
FIPB CASTROL LTD REGION NOTINDICATED
NA 864.57 192.13
5 HIMACHALFUTURISTICCOMMUNATION
S LTD
RBI ECOM COMCOMMUNICATIO
N LTD
CHANDIGARH NA 810.38 168.83
6 MUNDRA PORTAND SEZ LTD
RBI VARIOUSNIRS/ FIIS
AHMEDABAD SERVICES NEC 710.57 178.84
7 BOC (I)LTD.
FIPB THE BOCGROUP PLC
KOLKATA MANUFACTURE OFINDUSTRIAGASES
597.30 139.49
8 STANDARDCHARTEREDINVESTMENT& LOANS LD
FIPB STANDARDCHARTERED
BANK
MUMBAI OTHERFINANCIALSERVICESN.E.C.
454.39 102.90
9 HINDUSTANOIL
EXPLORATIONCOM. LTD.
RBI ENI UKHOLDINGS PLC
REGION NOTINDICATED
EXPLORATION ONDEVELOPMENT& PRODUCTIONOF OIL ANDNATURAL GAS
376.58 82.65
10 J. P.MORGAN
SECURITIESPVT. LTD.
RBI J. P. MORGANINTERNATIONAL FINANCE
LTD.
MUMBAI INVESTMENTRESEARCH ANDCOUNSELLINGACTIVITIES.
324.00 76.91
Grand Total 13,277.59
3,057.88
Fazlani Altius Business School [Batch : 2013-2015] Page

ECONOMICS ASSIGNMENT [FOREIGN DIRECT INVESTMENT (FDI) IN INDIA ]
Country: Netherlands
Sr.No.
Name ofIndianCompany
FDIRoute
Name ofForeign
Collaborator
RBI RegionalOffice
Item ofManufacture
Amount of FDIInflows
(In Rscrore)
(InUS$
millio1 EMAAR MGF
LAND PVT.LTD.
RBI HORIZONINDIA B.V.
NEW DELHI CONSTRUCTIONOF RESIDENTIAL
BUILDINGS
1,109.90
281.44
2 NISSANMOTOR INDIAPVT LTD
RBI NISSAN INTLHOLDING BV
CHENNAI MANUFACTURE OFMOTOR CARS &OTHER MOTORVEHICLES
1,025.80
230.98
3 DIGITALGLOBAL SOFT
LTD
FIPB HEWLETTPACKARD
LEIDEN B.V.
REGION NOTINDICATED
COMPUTERSOFTWARE
950.52 206.64
4 EMAAR MGFLAND P.LTD.
RBI HORIZON (I)BV
NEW DELHI DEVELOPING ANDSUBDIVIDINGREAL ESTATEINTO LOTS
682.05 150.01
5 BILTGRAPHICPAPER
PRODUCTSLTD.
RBI BALLAPURPAPER HOLDING
BV
REGION NOTINDICATED
MANUFACTURERSAND DEALERS OF
PULP PAPERBOARDS
637.94 148.57
6 SAB MILLERINDIA LTD
FIPB NEW DELHI BREWERIES 597.36 129.86
7 M/S MY HOMEINDUSTRIES
LTD.
RBI CRH INDIAINVESTMENTS
BV
HYDERABAD MANUFACTURE OFCEMENT IN THE
FORM OFCLINKERS
517.36 120.77
8 SKOLBREWERIES
LTD.
RBI SABMILLERASIA B.V.
MUMBAI MANUFACTURE OFBEER
489.11 114.22
9 SESA GOALTD.
RBI STICHINGPENSIONFON
DS ABP
PANAJI BASIC METALS &ALLOYS
INDUSTRIES
480.00 104.78
10 VOLKSWAG ENGROUP SALESINDIA PVT
LTD
RBI VOLKSWAGO NAG
MUMBAI MANUFACTURE OFMOTOR VEHICLES
FOR THETRANSPORT OF
GOODS,MANUFACTURE MOTORVEHICLE
418.17 91.78
Grand Total 6,908.21
1,579.05
Fazlani Altius Business School [Batch : 2013-2015]Page 121

ECONOMICS ASSIGNMENT [FOREIGN DIRECT INVESTMENT (FDI) IN INDIA ]
Country: Japan
Sr.No.
Name ofIndianCompany
FDIRoute
Name ofForeign
Collaborator
RBIRegionalOffice
Item ofManufacture
Amount of FDIInflows
(In Rscrore)
(InUS$
1 ANCHORELECTRICALS
PVT LTD
FIPB MATSUSHITAELECTRICWORKS LTD
REGION NOTINDICATED
ELECTRICALPRODUCTS.
1,440.83
341.85
2 KOTAKMAHINDRABANK LTD
RBI SUMITOMITSUIBANKING
CORPORATION
MUMBAI BANKINGACTIVITIESINCLUDINGFINANCIALSERVICES
1,366.12
303.47
3 TELCOCONSTRUCTION EQUIPMENT
CO LTD
RBI HITACHICONSTRUCTION MACHINERY
CO LTD
REGION NOTINDICATED
MFGCONSTRUCTIONEQUIPMENT
1,159.50
260.56
4 MARUTIUDYOG LTD
FIPB SUZUKI MOTORCO. LTD.
NEW DELHI NA 1,000.00
208.33
5 TATATELESERVICE
S
RBI NTT DOCOMOINC
REGION NOTINDICATED
TELECOMMUNICATION SERVICES
567.75 110.83
6 TATATELESERVICE
S
RBI NTT DOCOMOINC
REGION NOTINDICATED
TELECOMMUNICATION S SERVICES
465.14 92.91
7 ANCHORELECTRICALSPVT. LTD.
RBI PANASONICELECTRICWORKS CO
LTD.
REGION NOTINDICATED
MANUFACTURING& MARKETING OF
ELECTRICAL
460.90 98.65
8 RENAULTNISSAN
AUTOMOTIVEINDIA PVT
LTD.
RBI NISSAN MOTORCOMPANY LTD.
CHENNAI MANUFACTURE OFMOTOR CARS &OTHER MOTORVEHICLES
450.00 99.65
9 ANCHORELECTRICALSPVT. LTD.
RBI MATSUSHITAELECTRICAL
MUMBAI WHOLESALETRADE INELECTRICAL
MACHINERY ANDEQUIPMENT
425.67 104.28
10 ESCORTYAMAHA
MOTOR LTD.
FIPB YAMAHA MOTORLTD
NEW DELHI NA 400.00 88.89
Grand Total 7,735.91
1,709.42
Fazlani Altius Business School [Batch : 2013-2015] Page

ECONOMICS ASSIGNMENT [FOREIGN DIRECT INVESTMENT (FDI) IN INDIA ]
Country: Cyprus
Sr.No.
Name ofIndian
FDIRoute
Name ofForeign
RBIRegional
Item ofManufacture
Amount of FDIInflows
(In Rscrore)
(InUS$
1 TATACAPITALLTD.
RBI TRAVORTOHOLDINGSLTD.
MUMBAI FINANCIALLEASINGCOMPANIESACTIVITIES
1,417.59
291.35
2 NATIONALSTOCK
EXCHANGE OFINDIA LTD
FIPB GA GLOBALINVESTMENTS
LTD
REGION NOTINDICATED
STOCKEXCHANGE.
1,086.75
257.84
3 MAHINDRA &MAHINDRALTD.
RBI GOLBOOTHOLDINGSLTD.
MUMBAI MANUFACTURE OFMOTOR CARS &OTHER MOTORVEHICLES
700.00 153.86
4 MAHINDRA &MAHINDRALTD.
RBI GOLBOOTHOLDINGSLTD.
MUMBAI MOTOR CARS &OTHER MOTORVEHICLES
700.00 142.86
5 D.B.REALITY PVT
LTD
RBI WALKINSONINVESTMENTS
LTD
MUMBAI PURCHASE,SALE,LETTING ANDOPERATING OFREAL ESTATE-RESIDENTIALAND NON-
RESIDENTIAL
525.00 112.37
6 MAX INDIALTD
FIPB XENOK LTD CHANDIGARH` OTHERMANUFACTURINGINDUSTRIES
521.93 112.08
7 KARANJATERMINAL
& LOGISTICSPVT LTD
RBI KARANJATERMINAL &LOGISTICSCYPRUS LTD
MUMBAI CARGO HANDLINGINCIDENTAL TOLAND TRANSPORT
465.12 102.46
8 SWETAESTATES PVT
LTD
RBI PROCTUSSALTD
NEW DELHI REAL ESTATEACTIVITIES
434.99 86.89
9 DYNAMIXBALWAS
INFRASTRUCTURE PVT.LTD.
RBI GREET HAMINVESTMENTS
LTD.
MUMBAI CONSTRUCTION 387.69 83.14
10 ESSARSHIPPINGPORTS
&LOGISTICSLTD.
RBI ESSARSHIPPING
& LOGISTICSLTD.
REGION NOTINDICATED
SHIPPING &LOGISTICSSERVICEPROVIDER
249.36 55.39
Grand Total 6,488.43
1,398.25
Fazlani Altius Business School [Batch : 2013-2015] Page123

ECONOMICS ASSIGNMENT [FOREIGN DIRECT INVESTMENT (FDI) IN INDIA ]
Country: Germany
Sr.No.
Name ofIndianCompany
FDIRoute
Name ofForeign
Collaborator
RBIRegionalOffice
Item ofManufacture
Amount of FDIInflows
(In Rscrore)
(InUS$
1 MICRO INKSLTD
FIPB MHM HOLDINGGMBH
REGION NOTINDICATED
MFG PRINTINGINKS/ PKG
INKD, RESINS,ENAMELSADHESIVES
847.82 190.95
2 APOLLOENERGY P.
LTD.
RBI DKY INILHEALTHHOLDING
NEW DELHI MANUFACTUREOF POWER
CAPACITORS
736.72 151.80
3 BAJAJALLIANZELIC LTD.
RBI ALLIEANZ SE MUMBAI INSURANCECARRIERS,
LIFE
509.88 118.75
4 METRO CASH& CARRY (I)P. LTD.
FIPB METRO CASH &CARRY
INTERNATIONALGMBH
BANGALORE TRADING 381.16 89.01
5 BAJAJALLIANZELIC LTD.
RBI ALLIAZ SE MUMBAI INSURANCECARRIERS,
LIFE
302.72 74.23
6 INDIAN OILTANKINGLTD.
FIPB OIL TANKINGINDIA GMBH
MUMBAI CONSTRUCTIONAND
MAINTENANCENOT ELSEWHERECLASSIFIED
285.71 66.54
7 JOHN DEERE(I) P. LTD.
RBI DEEREE ANDCO.
MUMBAI INTERNETSERVICES
221.16 54.80
8 SAINTGOBAIN
FIPB CHENNAI NA 210.00 43.75
9 LANXESSINDIA PVT
LTD
RBI LANXESSDEUTSCHLAND
GMBH
MUMBAI MANUFACTUREOF CHEMICALPRODUCTS
206.31 44.16
10 BOMBAYSTOCK
EXCHANGE
FIPB DEUTCHBOARSE A.G.
MUMBAI SECURITIESDEALING
ACTIVITES
200.78 49.24
Grand Total 3,902.26
883.23
Fazlani Altius Business School [Batch : 2013-2015] Page124

ECONOMICS ASSIGNMENT [FOREIGN DIRECT INVESTMENT (FDI) IN INDIA ]
Country: France
Sr.No.
Name ofIndianCompany
FDIRoute
Name ofForeign
Collaborator
RBIRegionalOffice
Item ofManufacture
Amount of FDIInflows
(In Rscrore)
(InUS$
1 BHARATHICEMENT
CORPORATIONLTD.
RBI PARFICIM HYDERABAD MANUFACTUREOF CEMENT,
LIME &PLASTER
1,466.00
324.65
2 SREIINTERNATIONAL FINANCE
LTD .
RBI BNP PARIBASLEASING GROUP
(BPLG)
KOLKATA OTHERFINANCIALSERVICESN.E.C.
775.00 183.98
3 BHARATHICEMENT CORP
LTD
RBI PARFICIM SAS REGION NOTINDICATED
MFG OF CEMENT 499.72 106.69
4 LAFARAGEAGGREGATES& CONCE(I)
RBI FINANCIERELAFARGE
MUMBAI SERVICES NEC 380.00 77.55
5 ZUARICEMENT LTD.
RBI NA CHENNAI NA 295.00 65.56
6 BILAGINDUSTRIESPVT LTD
FIPB AVENTISCROPSCIENCE
SA
REGION NOTINDICATED
NA 243.23 50.67
7 LAFARGEINDIA
HOLDINGPVT. LTD.
FIPB NA MUMBAI NA 208.98 48.60
8 SCHNEIDERELECTRICINDIA PVT
LTD
RBI SCHNEIDERELCTRIC
INDUSTRIESSAS
NEW DELHI MANUFACTUREOF MACHINERYAND EQUIPMENTOTHER THANTRANSPORTEQUIPMENT
195.32 40.29
9 GEOJITFINANCIALSERVICESLTD.
RBI BNP PARIBASSA
KOCHI SECURITIESDEALING
ACTIVITIES
183.86 38.49
10 MAHINDRARENAULT
PVT. LTD.
RBI RENAULT SAS MUMBAI MANUFACTUREOF MOTOR CARS
174.90 37.97
Grand Total 4,422.00
974.44
Fazlani Altius Business School [Batch : 2013-2015] Page 125

ECONOMICS ASSIGNMENT [FOREIGN DIRECT INVESTMENT (FDI) IN INDIA ]
Country: UAE
Sr.No.
Name ofIndian
FDIRoute
Name ofForeign
RBIRegional
Item ofManufacture
Amount of FDIInflows
(In Rscrore)
(InUS$
1 ADANI POWERLTD.
RBI VARIOUS NIRS AHMEDABAD GENERATION &TRANSMISSIONOF ELECTRIC
ENERGY
1,181.80
243.98
2 INDIA BULLSFINANCIALSERVICESPVT LTD
RBI CROWNCAPITAL LTD
NEW DELHI DATAPROCESSING,SOFTWARE
DEVELOPMENT &COMPUTER
CONSULTANCY
302.33 67.41
3 IL & FSTRANSPORTAT
IONNETWORKS
LTD.
RBI VARIOUSINVESTORS
MUMBAI OTHER SERVICESINCIDENTAL TO
TRANSPORTN.E.C.
232.59 49.66
4 BHARTHOTELS LTD.
RBI DUBAIVENTURES LTD
NEW DELHI HOTELS,ROOMING
HOUSES, CAMPS& OTHERLODGINGPLACES.
164.00 38.93
5 DB REALITYPVT LTD
RBI VARIOUS MUMBAI PURCHASE,SALE,LETTING ANDOPERATING OFREAL ESTATE
153.95 33.06
6 ANRAKALUMINIUM
LTD.
RBI RAKINVESTMENTAUTHORITY
HYDERABAD ALUMINIUMMANUFACTURING
143.77 30.87
7 CONVERGEMCOMMUNICATION (INDIA)
RBI AXIOMTELECOM LLC
MUMBAI WHOLESALETRADE NOTELSEWHERE
140.00 34.98
8 SPICEJETLTD
RBI ISTITHMAIPISC
NEW DELHI AIR TRANSPORTCARRIERS
137.76 32.68
9 INFRASTRUCTURE LEASING& FINANCIAL
SEV.
RBI ABU DHABIINVESTMENTAUTHORITY.
REGION NOTINDICATED
FINANCIALSERVCIES,
ASSET FINANCE&
INFRASTRUCTURE
126.01 28.23
10 BALAJITELEFILM
LTD.
RBI ASIANBROADCASTING
FZ-LLC
MUMBAI VEDIOPARLOURS,ELECTRONIC
GAMES
123.25 29.26
Grand Total 2,705.46
589.06
Fazlani Altius Business School [Batch : 2013-2015] Page 126

ECONOMICS ASSIGNMENT [FOREIGN DIRECT INVESTMENT (FDI) IN INDIA ]
T. CONCLUSION
An analysis of the recent trends in FDI flows at the global level as wellas across regions/countries suggests that India has generally attractedhigher FDI flows in line with its robust domestic economic performance andgradual liberalisation of the FDI policy as part of the cautious capitalaccount liberalisation process. Even during the recent global crisis, FDIinflows to India did not show as much moderation as was the case at theglobal level as well as in other EMEs. However, when the global FDI flowsto EMEs recovered during 2010-11, FDI flows to India remained sluggishdespite relatively better domestic economic performance ahead of globalrecovery. This has raised questions especially in the backdrop of thewidening of the current account deficit beyond the sustainable level ofabout 3 per cent.
In order to analyse the factors behind such moderation, an empiricalexercise was undertaken which did suggest the role of institutionalfactors (Government’s to implement quality policy regime) in causing theslowdown in FDI inflows to India despite robustness of macroeconomicvariables.
A panel exercise for 10 major EMEs showed that FDI is significantlyinfluenced by openness, growth prospects, macroeconomic sustainability(International Investment Position), labour cost and policy environment.
A comparison of actual FDI flows to India vis-à-vis the potential levelworked out on the basis of underlying macroeconomic fundamentals showedthat actual FDI which has generally tracked the potential level till 2009-10, fell short of its potential by about 25 per cent during 2010-11.Further, counter factual scenario attempted to segregate economic and non-economic factors seemed to suggest that this large divergence betweenactual and potential during 2010-11 was partly on account of rise inpolicy uncertainty .
Apart from the role of institutional factors, as compared to other EMEs,there are also certain sectors including agriculture where FDI is notallowed, while the sectoral caps in some sectors such as insurance andmedia are relatively low compared to the global patterns. In this context,it may be noted that the caps and restrictions are based on domesticconsiderations and there is no uniform standards that fits all countries.However, as the economy integrates further with the global economy and
Fazlani Altius Business School [Batch : 2013-2015] Page 127
ECONOMICS ASSIGNMENT [FOREIGN DIRECT INVESTMENT (FDI) IN INDIA ]
domestic economic and political conditions permit, there may be a need torelook at the sectoral caps (especially in insurance) and restrictions onFDI flows (especially in multi-brand retail). Further, given theinternational experience, it is argued that FDI in retail would help inreaping the benefits of organised supply chains and reduction in wastagein terms of better prices to both farmers and consumers. The mainapprehensions in India, however, are that FDI in retail would expose thedomestic retailers – especially the small family managed outlets - tounfair competition and thereby eventually leading to large-scale exit ofdomestic retailers and hence significant job losses. A balanced andobjective view needs to be taken in this regard. Another important sectoris the generation, transmission and distribution of electricity producedin atomic power, where FDI is not permitted at present, may merit arevisit. In this context, it may be noted that electricity distributionservices is a preferred sector for FDI. According to UNCTAD four out oftop ten cross-border deals during 2009 were in this segment, which led toincrease in FDI in this sector even in the face of decline in overall FDI.Similarly, the demands for raising the present FDI limits of 26 per centin the insurance sector may be reviewed taking into account the changingdemographic patterns as well as the role of insurance companies insupplying the required long term finance in the economy.
Against this backdrop, it is pertinent to highlight the number of measuresannounced by the Government of India on April 1, 2011 to furtherliberalise the FDI policy to promote FDI inflows to India. These measures,inter alia included (i) allowing issuance of equity shares against non-cash transactions such as import of capital goods under the approvalroute, (ii) removal of the condition of prior approval in case of existingjoint ventures/technical collaborations in the ‘same field’, (iii)providing the flexibility to companies to prescribe a conversion formulasubject to FEMA/SEBI guidelines instead of specifying the price ofconvertible instruments upfront, (iv) simplifying the procedures forclassification of companies into two categories – ‘companies owned orcontrolled by foreign investors’ and ‘companies owned and controlled byIndian residents’ and (v) allowing FDI in the development and productionof seeds and planting material without the stipulation of ‘undercontrolled conditions’. These measures are expected to boost India’s image
Fazlani Altius Business School [Batch : 2013-2015] Page 128

ECONOMICS ASSIGNMENT [FOREIGN DIRECT INVESTMENT (FDI) IN INDIA ]
as a preferred investment destination and attract FDI inflows to India inthe near future.
Fazlani Altius Business School [Batch : 2013-2015] Page 129

ECONOMICS ASSIGNMENT [FOREIGN DIRECT INVESTMENT (FDI) IN INDIA ]
U. LIST OF INVESTMENT PROMOTION AGENCIES IN INDIA STATE-WISE
Andaman & Nicobar(UT)
Andaman & Nicobar Islands Integrated Development Corporation Ltd (ANIIDCO)Vikas BhawanA & N Islands
Port Blair - 744101Tel: + 91 3192 232666Fax: + 91 3192 235098
Website: http://www.aniidco.nic.inEmail: [email protected]
Andhra Pradesh
Andhra Pradesh Industrial Development Corporation LimitedParishrama Bhavan,
5-9-58/B,Fateh Maidan RoadPost Box No.1049
Hyderabad - 500 004Tel: + 91 40 23235253-56
Fax: + 91 40 23235516, 23236756Website: http://www.apidc.org
Email: [email protected]
Arunachal Pradesh
Arunachal Pradesh Industrial Development and Financial Corporation LimitedC Sector
Near Petrol PumpItanagar - 791 111
Tel: + 91 360 2212672, 2212673Fax: + 91 360 2212672
Email: [email protected]
Assam
Assam Industrial Development Corporation LtdRGB Road
Guwahati - 781 024Tel: + 91 361 22003999Fax: + 91 361 2202017
Email: [email protected]
Fazlani Altius Business School [Batch : 2013-2015] Page 130

ECONOMICS ASSIGNMENT [FOREIGN DIRECT INVESTMENT (FDI) IN INDIA ]
Bihar
Bihar State Credit and Investment Corporation Ltd (BICICO)4th Floor, Indira Bhawan,Ram Charitra Singh Path
P.B. No. 204 GPOPatna - 800 001
Tel: + 91 612 228552, 232277Fax: + 91 612 234298
Website: http://www.bicico.comEmail: [email protected]
Chandigarh(UT)
Chandigarh Industrial and Tourism Development Corporation Ltd (CITCO)SCO 121-122Sector 17-B,Chandigarh
Tel: + 91 172 2704761, 2704356Fax: + 91 172-2705288
Website: http://www.citco.nic.inEmail: [email protected]
Chhattisgarh
Chhattisgarh State Industrial Development Corporation LtdB-4, M.R ColonySailendra Nagar
RaipurTel: + 91 771 2429024, 5055888
Fax: + 91 771 2429025Website: http://www.csidcindia.com
Email: [email protected]
Dadra & Nagar Haveli(UT)
Omnibus Industrial Development Corporation of Daman & Diu and Dadra & Nagar HaveliLtd
Paryatan Bhavan,
Fazlani Altius Business School [Batch : 2013-2015] Page 131

ECONOMICS ASSIGNMENT [FOREIGN DIRECT INVESTMENT (FDI) IN INDIA ]
Nani Daman - 396210Tel: + 91 260 2250743, 2250421, 2250903
Fax: + 91 260 2250328Website: http://www.oidc.nic.in/Email: [email protected]
Daman & Diu(UT)
Omnibus Industrial Development Corporation of Daman & Diu and Dadra & Nagar HaveliLtd
Paryatan Bhavan,Nani Daman - 396210
Tel: + 91 260 2250743, 2250421, 2250903Fax: + 91 260 2250328
Website: http://www.oidc.nic.in/Email: [email protected]
Delhi
Delhi State Industrial Development Corporation (DSIDC)N Block Bombay Life Building
Connaught CircusDelhi 110 001
Tel: + 91 11 23312013Fax: + 91 11 23315067
Website: http://www.dsidc.orgEmail: [email protected]
Goa
Goa Industrial Development Corporation (GIDC)Patto, Next to Passport Office
Panaji, Goa 403 001Tel: + 91 832 2437470 to 73
Fax: + 91 832 2228012
Fazlani Altius Business School [Batch : 2013-2015] Page 132

ECONOMICS ASSIGNMENT [FOREIGN DIRECT INVESTMENT (FDI) IN INDIA ]
Website: http://www.goaidc.comEmail: [email protected]
Gujarat
Gujarat Industrial Development Corporation (GIDC)Block # 4, 2nd Floor
Udyog Bhavn, Sector 11Gandhinagar - 382 017
Tel: + 91 79 23225811, 23225805, 23225816Fax: + 91 79 23221191, 23225815Website: http://www.gidc.gov.in
Email: [email protected]
Haryana
Haryana State Industrial Development Corporation (HSIDC)Plot No.13-14,
Institutional Area, Sector 6Panchkula-134109
Tel: + 91 172 2590481-83Fax: + 91 172 2590474
Website: http://www.hsiidc.org/abouthsidc.htmEmail: [email protected]
Himachal Pradesh
The Himachal Pradesh State Industrial Development Corporation (HPSIDC)New Himrus Building
Circular RoadShimla-171001
Tel: + 91 177 2624751, 2624752, 2624754, 2625422Fax: + 91 177 2624278
Website: http://hpsidc.nic.in/Email: [email protected]
Fazlani Altius Business School [Batch : 2013-2015] Page 133
ECONOMICS ASSIGNMENT [FOREIGN DIRECT INVESTMENT (FDI) IN INDIA ]
Jammu & Kashmir
J&K State Industrial Development Corporation Ltd (SIDCO)Srinagar SIDCO Office
Drabu House, Ram Bagh, Srinagar, J&K - 190001
Jammu SIDCO Office
Shere Kashmir Bhavan, Vir Marg, Jammu - 180001
Tel: + 91 194 430036Fax: + 91 194 430036
Jharkhand
Directorate of IndustryNepal House, 3rd Floor
Doranda, RanchiTel: + 91 651 2491844Fax: + 91 651 2491884
Email: [email protected]
Karnataka
Karnataka State Industrial Investment & Development Corporation Limited (KSIIDC)MSIL House No 36Cunningham Road
Bangalore - 560 052Tel: + 91 80 2258131Fax: + 91 80 2255740
Website: http://www.ksiidc.comEmail: [email protected]
Kerala
Kerala Industrial Infrastructure Development Corporation (KINFRA)
Fazlani Altius Business School [Batch : 2013-2015] Page 134

ECONOMICS ASSIGNMENT [FOREIGN DIRECT INVESTMENT (FDI) IN INDIA ]
TC 31/2312 , KINFRA HouseSasthamangalam
Trivandrum - 695 010Tel: + 91 471 2726585Fax: + 91 471 2724773
Website: http://www.kinfra.comEmail: [email protected]
Lakshadweep(UT)
Department of IndustriesUT of Lakshadweep,Kavaratti - 682 555Tel: + 91 4896 262325Fax: + 91 4896 263132
Website: http://www.lakshadweep.nic.in/depts/industries/home.htmEmail: [email protected]
Madhya Pradesh
Madhya Pradesh State Industrial Development Corporation Ltd (MPSIDC)AVN Towers, 192 Zone-1
M.P NagarBhopal - 462011
Tel: + 91 755 5270370/246/247Fax: + 91 755 5270280, 5203106Website: http://www.mpsidc.orgEmail: [email protected]
Maharashtra
Maharashtra Industrial Development Corporation Ltd (MIDC)Udyog Sarathi
Mahakali Caves Road, Andheri (E),Mumbai - 400 093
Tel: + 91 22 26870052 / 54 / 73, 26870800Fax: + 91 22 26871587
Website: http://www.midcindia.org/Email: [email protected]
Fazlani Altius Business School [Batch : 2013-2015] Page 135

ECONOMICS ASSIGNMENT [FOREIGN DIRECT INVESTMENT (FDI) IN INDIA ]
Manipur
Manipur Industrial Development Corporation LtdIndustrial EstateTakyelpat, P.B 46Imphal - 795001
Tel: + 91 385 2223624, 2221967
Meghalaya
Meghalaya Industrial Development Corporation Ltd"Kismat", Upland Road
LaitumkhrahShillong - 793 001
Tel: + 91 364 224965, 224763, 226941, 226893Fax: + 91 91 364 224763
Website: http://www.meghalaya.nic.in/MIDC/midc.htmEmail: [email protected]
Mizoram
Zoram Industrial Development CorporationM.G Road
Upper KhatlaAizawal 796001
Tel: + 91 389 2323217, 2326240Email: [email protected]
Nagaland
Nagaland Industrial Development Corporation (NIDC)IDC HouseP.B No 5
Dimapur 797 112Tel: + 91 3862 226473Fax: + 91 3862 226473
Orissa
Fazlani Altius Business School [Batch : 2013-2015] Page 136

ECONOMICS ASSIGNMENT [FOREIGN DIRECT INVESTMENT (FDI) IN INDIA ]
Orissa Industrial Infrastructure Development Corporation Ltd.IDCO Tower, JanpathBhubaneswar - 751007
Tel: + 91 674 2540820, 2542784Fax: + 91 2542956
Website: www.idcoindia.com/Email: [email protected]
Pondicherry(UT)
Pondicherry Industrial Promotion Development and Investment Corporation LtdPost Box. No. 190
60, Romain Rolland StreetPondicherry - 605 001
Tel: + 91 413 2334606, 2335116, 2334361, 2336842Fax: + 91 413 336842
Website: http://www.pipdic.comEmail: [email protected]
Punjab
The Punjab State Industrial Development Corporation LtdUdyog Bhawan
18, Himalaya MargSector - 17Chandigarh
Tel:+ 91 172 2702881-84, 2702791Fax:+ 91 172 2704145
Website: http://www.punjabgovt.nic.in/Industry/ind552.htmEmail: [email protected]
Rajasthan
Rajasthan State Industrial Development & Investment Corporation LtdUdyog BhawanTilak Marg
Jaipur - 302005Tel:+ 91 141 5113201, 2227751
Fax:+ 91 141 5104804Website: http://www.riico.co.in
Email: [email protected]
Fazlani Altius Business School [Batch : 2013-2015] Page 137

ECONOMICS ASSIGNMENT [FOREIGN DIRECT INVESTMENT (FDI) IN INDIA ]
Sikkim
Sikkim Industrial Development & Investment Corporation Limited (SIDICO)Tashiling Secretariat
Gangtok - 737103Tel:+ 91 3592 202530Fax:+ 91 3592 202851
Website: http://www.sikkiminfo.net/sidico/
Tamil Nadu
Tamil Nadu Industrial Development Corporation Ltd (TIDCO)19-A, Rukmani Lakshmipathy Salai
EgmoreChennai - 600008
Tel:+ 91 44 28554421Fax:+ 91 44 28553729
Website: http://www.tidco.comEmail: [email protected]
Tripura
Tripura Industrial Development Corporation Ltd (TIDC)Gorkha basti Office Complex
PO: KunjabanAgartala - 799006
Tel:+ 91 381 220342Website: http://www.tripura.nic.in/tidc/
Uttar Pradesh
Uttar Pradesh State Industrial Development CorporationUPSIDC Complex, A-1/4 Lakhanpur
KanpurTel:+ 91 512 2582851, 2582852, 2582853
Fax:+ 91-512-2580797
Fazlani Altius Business School [Batch : 2013-2015] Page 138

ECONOMICS ASSIGNMENT [FOREIGN DIRECT INVESTMENT (FDI) IN INDIA ]
Website: http://www.upsidc.comEmail: [email protected]
Uttarakhand
State Infrastructure & Industrial Development Corporation of Uttarakhand Ltd.2, New Cantt RoadDehradun 248001
Tel:+ 91 135 2743292/97, 2743838Fax:+ 91 135 2743288
Website: http://usidcl.gov.in/Email: [email protected]
West Bengal
West Bengal Industrial Development Corporation (WBIDC)5, Council Street House
Kolkata 700001Tel:+ 91 33 22435343Fax:+ 91 33 22483747
Website: http://www.wbidc.comEmail: [email protected]
Fazlani Altius Business School [Batch : 2013-2015] Page 139

ECONOMICS ASSIGNMENT [FOREIGN DIRECT INVESTMENT (FDI) IN INDIA ]
V. REFERENCES:
http://fdiindia.in/
http://dipp.nic.in/English/Publications/FDI_Statistics/FDI_Statistics.aspx
http://www.rbi.org.in/scripts/NotificationUser.aspx?Id=8209&Mode=0
http://www.rbi.org.in/scripts/BS_ViewMasCirculardetails.aspx?id=8104
http://www.allbankingsolutions.com/Banking-Tutor/FDI-in-India.htm
http://fdiindia.in/list-of-investment-promotion-agencies-in-india-state-wise.php
http://www.rbi.org.in/scripts/BS_ViewMasterCirculardetails.aspx
http://www.ibef.org/india-at-a-glance/foreign-direct-investment.aspx
http://www.ijmrbs.com/ijmrbsadmin/upload/IJMRBS_515da52cd191a.pdf
http://astrology.sify.com/astronews/foreign-investment-india-2013/
Fazlani Altius Business School [Batch : 2013-2015] Page 140

ECONOMICS ASSIGNMENT [FOREIGN DIRECT INVESTMENT (FDI) IN INDIA ]
http://ftbsitessvr01.ft.com/forms/fDi/report2013/files/The_fDi_Report_2013.pdf
http://accman.in/images/feb13/Dharwal%20M.pdf
https://www.kpmg.com/IN/en/services/Tax/FlashNews/LiberalisationofForeignDirectInvestmentPolicy-2013.pdf
http://almtlegal.com/articles-pdf/Newsflash%20on%20FDI%20policy%202013.pdf
**************************************
Fazlani Altius Business School [Batch : 2013-2015] Page 141