
FDI in Chinese Cities: Spillovers and Impact on Growth
37
No 2006 – 22 December FDI in Chinese Cities: Spillovers and Impact on Growth _____________ Nicole Madariaga & Sandra Poncet
-
Upload
independent -
Category
Documents
-
view
1 -
download
0
Transcript of FDI in Chinese Cities: Spillovers and Impact on Growth
No 2006 – 22December
FDI in Chinese Cities:Spillovers and Impact on Growth
_____________
Nicole Madariaga & Sandra Poncet

FDI in Chinese cities: spillovers and impact ongrowth
Nicole MadariagaSandra Poncet
No 2006 – 22December

FDI in Chinese cities: spillovers and impact on growth
Contents1 Introduction 8
2 FDI impact and spillovers in China 102.1 FDI trends and policies . . . . . . . . . . . . . . . . . . . . . . . . . . . . 102.2 FDI impact and spillover channels . . . . . . . . . . . . . . . . . . . . . . 102.3 Evidence on spillovers in China . . . . . . . . . . . . . . . . . . . . . . . 13
3 Spatial dependence in China: data and empirical method 143.1 Data . . . . . . . . . . . . . . . . . . . . . . . . . . . . . . . . . . . . . . 143.2 The Model . . . . . . . . . . . . . . . . . . . . . . . . . . . . . . . . . . . 153.3 Econometric issues and estimation techniques . . . . . . . . . . . . . . . . 16
4 Empirical estimation results 194.1 Validity Tests . . . . . . . . . . . . . . . . . . . . . . . . . . . . . . . . . 194.2 Results . . . . . . . . . . . . . . . . . . . . . . . . . . . . . . . . . . . . . 19
5 Conclusion 22
6 References 25
3

CEPII, Working Paper No 2006-22.
FDI IN CHINESE CITIES: SPILLOVERS AND IMPACT ON GROWTH1
SUMMARY
This paper provides a case study of whether foreign direct investment (FDI) promotes eco-nomic growth when accounting for spatial dependence. We rely on data at the sub-nationallevel across cities within China to estimate a dynamic panel growth equation taking intoaccount the issue of spatial dependence. We explicitly consider the fact that Chinese citiescan take advantage not only of local FDI but also of FDI flows into surrounding locations.We determine whether FDI positive impact on economic growth is characterized by a sub-stitution or a complementary pattern across Chinese cities, i.e. whether economic growth isfostered by FDI received locally as well as FDI received in surrounding localities.In line with the claim made by multilateral development agencies that FDI brings consider-able benefits, many developing and transition economies placed attracting FDI high on theirreform agenda. Policy leaders expected FDI inflows to bring technology transfer, manage-ment know-how, and export marketing access, thus encouraging increased productivity andcompetitiveness of domestic industries. Attracting FDI became a priority for countries withthe aim of closing the technology gap with high-income countries.However, empirical studies have so far produced inconclusive results regarding spillovers.Indeed the difficulties associated with disentangling different effects at play and data limita-tions have prevented researchers from providing conclusive evidence of positive externalitiesresulting from FDI.An important empirical literature exists on openness to trade, or to FDI, and economicgrowth. This literature has been criticized for having failed to consider the possible reversecausation between openness and growth. Another possible shortcoming of these studiesis that differing cross-country changes in legal systems and other institutions could impactgrowth in addition to FDI, thus their effects may be incorrectly attributed to FDI. Finally,the analyses traditionally assume each region to be an isolated entity. The role of spatialdependence is completely neglected even though it is an important force in the process ofconvergence and ignoring it could result in serious misspecification. Past research on the im-pact of FDI on economic growth ignores these potential problems and, as a result, previouslymeasured parameter estimates and statistical inferences are questionable.The current paper aims at exploring regional variations within a single country (China), mit-igating the common shortcomings of the literature. Notably, the omitted variable problem islimited as the legal system and other institutions are much more similar within a single coun-try. A per capita income growth model is estimated, relying on dynamic panel GeneralizedMethod of Moments estimations that control for endogeneity, variable omission and spatialdependence problems. The question is whether FDI inflows in one locality promote growthin this locality and/or in the surrounding localities.Our results show that spatial relationships between Chinese cities matter significantly. Esti-mates suggest that economic growth responds positively to FDI received locally as well as inproximate cities. We find that a one standard deviation increase in the local FDI rate raisesincome per capita in the same proportion than a one standard deviation increase in the FDIrate in the surrounding localities, i.e. by around 5%. Moreover, we also find evidence ofa positive and significant impact of the level of income per capita in surrounding areas oncities’ own income per capita. A one standard deviation increase in real GDP per capita inthe surroundings could increase local income by around 10%.
1We would like to thank two anonymous referees for their comments. We are also grateful to AgnèsBénassy-Quéré for her corrections and suggestions.
4

FDI in Chinese cities: spillovers and impact on growth
ABSTRACT
We study the impact of FDI on growth performance. We rely on a data set of Chinese citiesbetween 1990 and 2002 to investigate the effects of FDI in the traditional growth regressionframework using the GMM estimator for dynamic panels. Our growth model incorporatesan explicit consideration of spatial dependence effects in the form of spatially lagged incomeand FDI. Our results reveal that Chinese cities take advantage not only of FDI flows receivedlocally but also of FDI flows received by their neighbors.
JEL classification: E1, O1, O5, R1.Keywords: Growth, Regional convergence, Economic geography, Foreign Direct Invest-ment, China.
5

CEPII, Working Paper No 2006-22.
L’INVESTISSEMENT DIRECT À L’ÉTRANGER EN CHINE: EXTERNALITÉS ET IMPACTSUR LA CROISSANCE.
RÉSUMÉ
Nous étudions l’impact des investissements directs étrangers (IDE) sur la croissance écono-mique en Chine en tenant compte des effets de la dépendance spatiale. Nous avons recoursà une base de données infranationales à l’intérieur de la Chine pour estimer une équation decroissance en panel dynamique. Nous prenons explicitement en compte le fait que les villeschinoises peuvent tirer profit non seulement des IDE reçus localement mais aussi de ceuxreçus dans les localités environnantes. Nous déterminons si les IDE sont caractérisés par unerelation de complémentarité ou de substitution entre les villes chinoises.
En lien avec les avantages attendus des IDE, de nombreux pays en développement et entransition ont cherché à favoriser l’implantation d’investisseurs étrangers. Les gouverne-ments attendent des IDE qu’ils apportent des transferts de technologie, une amélioration dela gestion et du marketing et ainsi qu’ils encouragent les gains de productivité et de compéti-tivité des industries nationales. L’attraction des IDE est devenue une priorité pour les paysdésireux de rattraper l’avance technologique des pays développés.
Les études empiriques s’intéressant au lien entre IDE et croissance ont pourtant souventobtenu des résultats non concluants. Les difficultés associées à la distinction entre les dif-férents effets en jeu ainsi que le manque de données ont limité la capacité des chercheursà fonder un consensus sur l’existence d’externalités positives des IDE. Une littérature em-pirique importante existe sur les liens entre ouverture commerciale, IDE et croissance écono-mique. Cette littérature a néanmoins été critiquée pour sa non prise en compte de la possiblecausalité inverse entre l’ouverture et la croissance. Une autre limite de ces études est quel’hétérogénéité en termes de systèmes légaux et autres institutions pourrait avoir un effet àla fois sur les IDE et sur la croissance, ce dernier pouvant être incorrectement attribué auxIDE. Enfin, ces études considèrent traditionnellement chaque région ou pays comme une en-tité isolée. Le rôle de la dépendance spatiale est ainsi ignoré alors qu’il constitue une forceimportante du processus de convergence et que sa non prise en compte produit un problèmede spécification.
Cette étude explore les variations régionales à l’intérieur d’un pays unique (la Chine). Unmodèle de croissance du revenu par tête est estimé par la méthode des moments généralisésen panel dynamique qui résout les problèmes d’endogéneité, d’omission de variables et dedépendance spatiale.
Nos résultats indiquent que les relations spatiales entre les villes chinoises comptent. Lesestimations suggèrent que la croissance économique des villes répond positivement aux IDEreçus localement ainsi qu’à ceux obtenus par les villes environnantes.
6

FDI in Chinese cities: spillovers and impact on growth
RÉSUMÉ COURT
Cette étude réexamine la question de l’impact des IDE sur la performance de croissance.Nous exploitons une base de données de villes chinoises entre 1990 et 2002 pour étudierles effets des IDE dans le cadre traditionnel de régression de la croissance en utilisantl’estimateur GMM pour les panels dynamiques. Notre modèle de croissance incorpore deseffets de dépendance spatiale sous la forme de termes de revenu et d’IDE spatialement dé-calés. Nos résultats revèlent que les villes chinoises tirent profit non seulement de leur propreouverture aux IDE mais également des flux d’IDE reçus par leurs voisins.
Classification JEL : E1, O1, O5, R1.Mots Clefs : Croissance, Convergence Régionale, Economie géographique, InvestissementsDirects Etrangers, Chine.
7

CEPII, Working Paper No 2006-22.
FDI IN CHINESE CITIES: SPILLOVERS AND IMPACT ONGROWTH
Nicole MADARIAGA 2
Sandra PONCET3
1 Introduction
This paper provides a case study of whether foreign direct investment (FDI) pro-motes economic growth. We rely on data at the sub-national level across cities withinChina to estimate a dynamic panel growth equation taking into account the issue ofspatial dependence. We explicitly consider the fact that Chinese cities can take ad-vantage not only of local FDI but also of FDI flows into surrounding locations. Wedetermine whether FDI is characterized by a substitution or a complementary patternacross Chinese cities.In line with the claim made by multilateral development agencies that FDI bringsconsiderable benefits, many developing and transition economies have placed at-tracting FDI high on their reform agenda. Policy leaders expect FDI inflows to bringtechnology transfers, management know-how, and export marketing access, thus en-couraging increased productivity and competitiveness of domestic industries. At-tracting FDI has become a priority for developing countries with the aim of closingthe technology gap with high-income countries.However, empirical studies have so far produced inconclusive results regarding spill-overs (Agenor, 2003). Rodrik (1999) is often quoted on this issue: “today’s policyliterature is filled with extravagant claims about positive spillovers from FDI, but thehard evidence is sobering” (p. 37). Indeed the difficulties associated with disentan-gling different effects at play and data limitations have prevented researchers fromproviding conclusive evidence of positive externalities resulting from FDI (JavorcikSmarzynska, 2004).An extensive empirical literature exists on the impact of openness to trade or to FDIon economic growth. Most of these analyses are based on cross-country regressions(Agosin and Mayer, 2000; Bosworth and Collins, 2000; Carkovic and Levine, 2002;Edison et al., 2002). This literature has been criticized by Rodriguez and Rodrik(2001) for failing to consider the possible reverse causation from growth to open-ness. Another possible shortcoming of these studies is that differing cross-countrychanges in legal systems and other institutions could impact growth in addition toFDI inflows, thus their effects may be incorrectly attributed to FDI. Finally, the anal-yses traditionally assume each region to be an isolated entity. The role of spatial
2 Panthéon-Sorbonne-Economie, Université Paris 1, CNRS.3 Corresponding author: Panthéon-Sorbonne-Economie and Paris School of Economics, Université
Paris 1, CNRS and CEPII.
8

FDI in Chinese cities: spillovers and impact on growth
dependence4 is completely neglected even though it is an important force in the pro-cess of convergence (Rey and Montouri, 1999) and ignoring it could result in seriousmisspecification (Abreu et al., 2005). Past research on the impact of FDI on eco-nomic growth ignores these potential problems and, as a result, previously measuredparameter estimates and statistical inferences are questionable.
The current paper aims at exploring regional variations within a single country (China),mitigating the common shortcomings of the literature. Notably, the omitted variableproblem is limited as the legal system and other institutions are much more similarwithin a single country. Furthermore, institutions changes follow a similar patternacross the country5. A per capita income growth model is estimated, relying ondynamic panel Generalized Method of Moments estimations that control for endo-geneity, variable omission and spatial dependence problems.
We choose China as the focus of our study since from being an economy with vir-tually no foreign investment in the late 1970s, China has become the largest recip-ient of FDI among developing countries and, for many years, has been the secondlargest FDI recipient in the world after the United States. FDI inflows explodedfrom US$2.3 billion over the 1984-89 period to US$50 billion in 2003 (Tseng andZebregs, 2002).
We wonder whether FDI inflows in one locality promotes growth locally, whetherit occurs at the expense of economic growth in surrounding localities, or whetherlocalities benefit from higher income around them.
Our results show that spatial relationships between Chinese cities matter signifi-cantly. Estimates suggest that economic growth responds positively to FDI receivedlocally as well as in proximate cities. We find that a one standard deviation (sevenpercentage points) increase in the local FDI rate raises income per capita in the sameproportion as a one standard deviation (four percentage points) increase in the ag-gregate FDI rate in the surrounding localities, i.e. by around five per cent. Moreover,we also find evidence of a positive and significant impact of the level of incomeper capita in surrounding areas on cities’ own income per capita. A one standarddeviation (fifty per cent) increase in real GDP per capita in the surroundings couldincrease local income per capita by around ten per cent. As such, our results showthat spatial relationships between Chinese cities matter significantly.
This paper proceeds as follows: Section 2 presents the main features of FDI in Chinaand discusses its impact. Section 3 analyzes the data and develops the empiricalstrategy used to investigate the impact of FDI on economic growth in China whileaccounting for spatial interdependence. Section 4 discusses the results obtained ona panel of 180 Chinese cities over four sub-periods between 1990 and 2002 period.Section 5 concludes.
4Spatial dependence, for example in terms of income, refers to the correlation of incomes acrossspace. Income in one location may be correlated with that of neighboring localities.
5Differences in reform pace across China will be accounted for through locality and time fixedeffects.
9

CEPII, Working Paper No 2006-22.
2 FDI impact and spillovers in China
2.1 FDI trends and policies
Since economic reforms launching in 1979, China has received a large part of inter-national direct investment flows.6 China moved from restrictive to permissive poli-cies in the early 1980s, then to policies encouraging FDI in general in the mid-1980sto policies encouraging more high-tech and more capital intensive FDI projects inthe mid-1990s (Fung et al., 2004). During the permissive period, the Chinese gov-ernment established four Special Economic Zones (SEZs) in Guangdong and Fujianprovinces and offered special incentive policies for FDI in these SEZs. While FDI in-flows were highly concentrated within these provinces, the amounts remained ratherlimited (Cheung and Lin, 2004). After 1984, Hainan Island and fourteen coastalcities across ten provinces were opened, and FDI levels really started to take off.The realized value of inward FDI to China reached US$3.49 billion in 1990. Thiskind of preferential regimes policies resulted in an overwhelming concentration ofFDI in the east. The expected spillover effects from coastal to inland provincesfailed to materialize. In reaction to the widening regional gap, more broadly-basedeconomic reforms and open door policies were pushed forward in the 1990s. In thespring of 1992, Deng Xiaoping adopted a new approach which turned away fromspecial regimes toward more nation-wide implementation of open policies for FDIinflows. New policies and regulations encouraging FDI inflows were implementedand produced remarkable results. Since 1992 inward FDI in China has acceleratedand reached the peak level of US$45.5 billion in 1998. After a drop due to theAsian crisis, FDI inflows into China surged again, so that by 2003 China receivedmore than US$50 billion in FDI, surpassing the United States to become the world’slargest single recipient of FDI (Forbes, 2005). China’s entry to the WTO in 2001 islikely to deepen China’s integration in the international segmentation of productionprocesses and as such should reinforce the FDI attractiveness position of China.
2.2 FDI impact and spillover channels
Because of its unique nature and its importance, the economic literature and researchattributes significant economic effects to FDI. A recent IMF study estimates that FDIhas increased China’s annual potential growth rate by about 3 percent- with about80 percent of the benefits coming from increased productivity (Tseng and Zebregs,2002).
6For an in depth presentation of FDI trends in China, refer to OECD (2000).
10

FDI in Chinese cities: spillovers and impact on growth
2.2.1 Direct Impact of FDI
FDI has played a major role in transforming the Chinese economy. Several directeffects of FDI are usually mentioned in the literature.7 Evidently, FDI brings aboutcapital. A sufficient amount of capital has been necessary to build-up China’s econ-omy and FDI has made a substantial contribution to this. The ratio of FDI to GDProse to 15 per cent of domestic gross investment in 1994, stayed around 13 per centup to 1998 and stabilised around 11 per cent in the late 1990s. However as stressedby OECD (2005), FDI has not been necessary to counter insufficient domestic sa-ving. Indeed, the current account (which measures the difference between domesticsaving and investment) has been in surplus for all but one year since 1991. Rather,the role of foreign companies has been to use management skills and technology,together with local labour, to increase exports and improve the overall productivityof the economy.OECD (2000) notes that the creation of employment opportunities -either directly orindirectly- has been one of the most prominent impacts of FDI on the Chinese econ-omy. The report evaluates that foreign firms employed around 20 million workers(3% of China’s total employment) at the end of the 1990s.FDI has been at the core of China’s foreign trade expansion. It has furthermore beena decisive factor in China’s involvement in the international segmentation of the pro-duction process. OECD (2000) emphasizes the role of foreign investment enterprises(FIEs) in the modification of China’s industrial structure, the diversification of labourintensive products exports and the strengthening of China’s competitive position inrapidly expanding markets.An important specificity of FIEs is that while investment in Chinese firms is mostlydevoted to the expansion of production capacities, FDI incorporates much moreequipment and technology knowledge. This is consistent with findings of greaterallocative and technical efficiency in labour utilisation in production in FDI firmscompared to domestic firms. FIEs have improved the overall efficiency with whichresources are used. Their efficiency can be judged from the level of their over-all productivity, which was over 90% greater than that of directly controlled statecompanies (OECD, 2005). An important difference in industrial structure betweenFIEs and domestic firms is that FIEs are relatively more concentrated in the newlydeveloping and fast growing industries such as electronics and telecommunicationsequipment. By contrast, domestic firms are more present in the conventional basiccapital intensive and large scale industries.As emphasized by Fung et al. (2004), there are also concerns that FDI may bringabout detrimental effects. Some claim that foreign companies can crowd the accessto credit of domestic firms (Harrison and McMillan, 2003). FDI can also have anegative impact on the local economy by substituting for domestic savings or leading
7It is clearly beyond the scope of the present paper to review the vast literature on the FDI-growthrelationship and the determinants of FDI. The interested reader should refer to de Mello (1997 and1999) for a comprehensive survey of the nexus between FDI and growth as well as for further evidenceon the FDI-growth relationship.
11

CEPII, Working Paper No 2006-22.
to balance-of-payment deficits as a result of rising equity repayment obligations.
2.2.2 Spillover channels
Several channels of spillovers are identified in the literature (see Görg and Green-away (2004) for a complete description of these channels):8
- The imitation of new products and process brought in by foreign firms is aclassic transmission mechanism through reverse engineering. Its importanceis tied to product/process complexity. Hence, imitation may improve localtechnology and result in a spillover enhancing productivity of local firms.
- Competition may generate spillovers (Glass and Saggi, 2001). Incoming MNEsare expected to foster competition. This new competition compels them toadapt their technology and production processes. By reducing X-inefficiency,greater competition improves productivity.
- Exports spillovers are an additional source of productivity gain. Domesticfirms learn from multinationals to implement an exporting strategy (Görg andGreenaway, 2004; Aitken et al., 1997). Exporting involves fixed costs in theform of establishing distribution networks, creating transport infrastructure,learning about consumer tastes, etc... Collaboration and imitation generateproductivity gains and may help local firms to penetrate new markets.
- Spillovers may take place vertically through the acquisition of human capitalfrom foreign firms. MNEs transfer their know-how or enhance staff trainingby two means. First, MNEs demand relatively skilled labor in the host coun-try. Hence they invest in technological know-how transfer or staff training.As a result, labor turnover from MNEs to local firms can generate produc-tivity improvement by means of complementary workers or by stealing theirskilled workers. Several studies argue that this is the most important channelfor spillovers (Fosfuri et al., 2001). Second, FIEs can increase demand forinputs produced by local upstream suppliers and thereby transfer technologyand management practices to local firms (Rodriguez-Clare, 1996; JavorcikSmarzynska, 2004). These vertical spillovers may constrain local suppliers toimprove their innovation capability in order to keep or gain new clients.
The geographic proximity is of crucial importance for the process linking knowledgespillovers to innovative activity (Audretsch, 1998). For instance, the closer a localfirm is located to FIEs, the more likely and the more frequently their employees in-teract with each other, and the more frequently labor moves between these two firms.This spatial link may also be important for vertical spillovers between firms and their
8However, these transmission channels are constrained by the technology gap between local andforeign firms (Javorcik Smarzynska, 2002; Blömstrom, Globerman and Kokko, 1999). The scope ofpositive FDI spillovers is all the greater the smaller the technology gap between foreign and local firms.
12

FDI in Chinese cities: spillovers and impact on growth
local suppliers, which often are located close to one another. It is furthermore wellrecognized that geographic proximity facilitates flows of knowledge. The probabilitythat knowledge flows from one agent to another decreases with geographic distance.As a result, high productivity locations as well as low productivity areas tend to begeographically clustered, thus creating strong spatial links or dependence betweenlocations (Anselin, 2001).These spillovers, whether they are due to the mobility of goods, workers and cap-ital or to spatial externalities, induce a particular organization of economic activityin space. As expressed in Tobler’s (1979) first law of geography, “everything is re-lated to everything else, but near things are more related than distant things” (p.236).Many studies show the importance of spatial patterns (Fingleton, 1999; Rey andMontouri, 1999). These spatial aspects are especially important to account for sinceignoring them could result in serious misspecification (Abreu et al., 2005).
2.3 Evidence on spillovers in China
Empirical evidence is still limited on FDI spillovers in China, but generally confirmsthat there are positive FDI spillovers (Tong and Hu, 2003; Hu and Jefferson, 2001).There is evidence of positive intra- and inter-industry productivity spillovers withinregions in the Chinese manufacturing sector (Wei and Liu, 2006) as well as a positiveeffect of FDI on the number of domestic patent applications in China (Cheung andLin, 2004). However, Hale and Long (2006) show that FDI has different spillovereffects on different firms. Estimating production functions, Hale and Long (2006)find that the presence of foreign firms in China is positively associated with theperformance of private firms but has no or negative effect on the performance ofstate owned enterprises. In particular, domestic firms with higher absorptive capacity(higher initial total factor productivity) experience positive spillovers while thosewith low initial total factor productivity have negative spillovers. Buckley, Clegg andWang (2002) find positive spillovers only for collectively owned firms while Hu andJefferson (2002) evidence that, for China’s textile industry, FDI presence depressesproductivity of state-owned enterprises but not of domestic firms in general.While the above-mentioned papers suggest spillover effects from FDI, to our knowl-edge, only three papers use spatial econometric techniques to examine FDI activityalthough ignoring them could result in serious misspecification. They focus on FDImotivations and the geographic pattern of FDI location while correcting for third-country effects (Blonigen et al., 2004; Egger et al., 2006). Coughlin and Segev(2000) explain US FDI across Chinese provinces while accounting for the positivespatial correlation between local FDI and that received in alternative regions. Theseauthors argue that it accounts for agglomeration economies. To our knowledge,no empirical work has directly tested the presence of FDI spillovers on economicgrowth between Chinese cities applying appropriate econometric techniques.Labor and goods mobility constitute two straightforward channels through whichspillovers from FDI would occur between cities. The labor mobility mechanism,through the movement of skilled workers from foreign firms to domestic firms, helps
13

CEPII, Working Paper No 2006-22.
transfering advanced technology and management skills. Djankov and Hoekman(2000) and Görg and Strobl (2005) present evidence demonstrating the existence oflabor mobility effect in the Czech republic and Ghana, respectively. In the case ofChina, Hale and Long (2006) find empirical evidence that the labor market chan-nel facilitates FDI spillovers in Chinese cities. Labor migration (intra- and inter-province) in China is becoming one of the most obvious and influential social fac-tors which is profoundly changing the current system and the society as a whole.Between 1990 and 1995, 13 million people (out of a recorded total of 33 millionof migrants) engaged in a urban-urban migration either within the same province(9.6 million) or between two separate provinces (2.2 million)(Poncet, 2005). Thesefigures grew even further in the last decade. It is very likely that these massivemigratory flows between cities fostered the exchange of skills and technology. Inter-city exchanges of goods provide an additional mean of embedded technology trans-mission. Reform advances especially in terms of output rationalization and priceliberalization have prompted further integration of domestic markets and intensifiedalready intense trade flows within China (Naughton, 2003).
3 Spatial dependence in China: data and empirical method
3.1 Data
The data set comes mainly from two sources: (1) Urban Statistical Yearbook, variousissues, published by China’s State Statistical Bureau, and (2) Fifty Years of the Citiesin New China: 1949-1998, also published by the State Statistical Bureau.Our data set covers 180 cities spread over the entire territory except for the provincesof Qinghai and Tibet. In order to explain the data set clearly, it is useful to providea brief description of the Chinese administrative structure (see Figure A-1 in Ap-pendix). The entire country is divided into 27 provinces plus four province-status“super-cities” – Beijing, Chongqing, Shanghai and Tianjin.9 In each province (orsupercity), the population is further divided into prefecture level cities and lowerlevel cities and rural counties. Our data set consists of information on the urban partof those prefecture level cities.10 In the rest of this paper, the term “city” is used torefer to the urban area under the jurisdiction of either prefecture-level cities or supercities.Table A-1 in the appendix A lists the various cities by province covered by the dataset. Figures A-2 and A-3 (in Appendix A) show the geographic pattern in 2002 of
9The official term for super-cities is “directly administered cities”, meaning that the city officialsreport directly to the central government just as the officials in other provinces. Since 1997, Chongqinghas become the fourth “super-city”. Note that the data set does not include Hong Kong SAR, MacauSAR and Taiwan Province of China.
10In other words, the data does not cover the rural counties that are attached to these cities. Sinceone can expect spillovers to be a more likely urban phenomenon due to greater agglomeration, moredeveloped infrastructure and denser interaction between non agricultural activities, our study may over-estimate the impact of FDI on growth.
14

FDI in Chinese cities: spillovers and impact on growth
the ratio of FDI inflows to GDP and of GDP per capita, respectively. The fewernumber of cities at the prefecture level in the western part of China is evident. Thewestern part of China is clearly under-represented since it includes fewer prefecture-level cities. As an illustration, in the Xinjiang province, only two cities in 2002 havethis level of power, against 12 in the Hubei province. Moreover these cities are morerecent and are thus characterized by a greater amount of missing observations. How-ever, cities, regardless of where they are located (with the exception of a few locatedin Guangdong province), appear to share comparable level of GDP per capita. Theaverage GDP per capita in current terms in 2002 is 18,177 yuans. Heterogeneity isgreater across cities in terms of the FDI to GDP ratio. Greater values are observedin provinces that contained the original four special economic zones (Guangdongand Fujian), with significant FDI flows going also to Beijing and Shanghai. Thisdistribution is in line with original policies but also with efforts made since 1992 toease foreign investment restrictions and attract FDI to other parts of the country (seeSection 2). Numerous cities in the interior provinces are shown to have a ratio ofFDI over GDP above three per cent.
3.2 The Model
Our study of the impact of FDI on economic performance relies on a traditionalcross-country empirical framework. Regressions are made using a data set of 180cities between 1990 and 2002. We estimate the autoregressive form of the augmentedSolow growth model as proposed by Mankiw et al. (1992) and add the inward FDIrate in order to determine its influence on growth. Our strategy follows Easterly andLevine (1998)’s strategy.
ln yi,t = α0 ln yi,t−T + α1 ln sKit + α2 ln sHit + α3 ln(nit + g + δ) (1)
+α4 lnFDIit + ηi + γt + εit
where the dependent variable, yi,t, is the per capita real GDP in city i at time t.Explanatory variables are measured as an average over the period between t andt − T : yi,t−T is the lagged dependent variable T years ago. The saving rate, sK ,is proxied by the ratio of fixed investment to GDP while the rate of investment inhuman-capital-enhancing activities, sH , is measured by the share of the populationstudying at the university level. The third term corresponds to nit, the average pop-ulation growth rate over the period, plus 0.05 (see Mankiw et al., 1992), where 0.05represents the sum of a common exogenous rate of technical change (g) and a com-mon depreciation rate (δ). We test for the impact of FDI on economic performancebased on the city’s ratio of FDI over GDP (FDIit).The disturbance term consists of an unobservable city fixed effect that is constantover time ηi, an unobserved period effect that is common across cities γt and a com-ponent that varies across both cities and periods which we assume to be uncorrelatedover time εit.
15

CEPII, Working Paper No 2006-22.
3.3 Econometric issues and estimation techniques
Equation (1) confronts us with five econometric problems. First, some of the indica-tors may be measured with error. Second, the introduction of the lagged dependentvariable together with city fixed effects renders the OLS estimator biased and incon-sistent, as the lagged dependent variable is correlated with the error term even inthe absence of serial correlation between εit. The third difficulty is that of omittedvariables. Differences in economic growth across China reflect a variety of factorsother than factor accumulation and FDI. To the extent that these factors are corre-lated with FDI, the significance of FDI in the growth regression in which they areomitted may simply reflect FDI serving as a proxy for other policies and institutionsthat are conducive to growth. The fourth concern arises from the fact that most ofthe explanatory variables may be endogenous with respect to economic growth. No-tably, localities may choose to liberalize and reduce impediments to financial flowswhen growth performance is good. Finally, the equation ignores the role of spatialdependence even though ignoring it could result in serious misspecification (Abreuet al., 2005).
3.3.1 Spatial dependence
Spatial dependence can take two forms.11 The first form is spatial autocorrelation,which describes how a city’s income per capita can be affected by a shock to incomeper capita in surrounding cities: shocks in neighboring localities are correlated andso is the error term. If the spatial autocorrelation is erroneously ignored, standardstatistical inferences are invalid; however, the parameter estimates are unbiased. Thesecond form, of particular interest in testing the theories of economic growth (Bloni-gen et al., 2004), is a spatial lag model. In the spatial lag form, spatial dependenceis captured by a term that is similar to a lagged dependent variable and thus is of-ten referred to as spatial autoregression. Using standard notation, such a regressionmodel can be expressed as: y = ρWy + βX + ε, where y is a n element vector ofobservations on the dependent variable, W is a n × n spatial weighting matrix, X isa n × k matrix of k exogenous variables, β is a k element vector of coefficients, ρis the spatial autoregressive coefficient that is assumed to lie between -l and +1, andε is an n element vector of error terms. The coefficient ρ measures how neighboringobservations affect the dependent variable.Ignoring a spatial autoregressive term means that a significant explanatory variablehas been omitted. The consequence is that the estimates of β are biased and allstatistical inferences are invalid.
3.3.2 Spatial dependence diagnostic
The robust Lagrange Multiplier tests for spatial dependence hint at spatial depen-dence at a very high probability level. The tests reported in table B-1 (in the Ap-
11See Anselin and Bera (1998) for an excellent introduction to spatial econometrics.
16
FDI in Chinese cities: spillovers and impact on growth
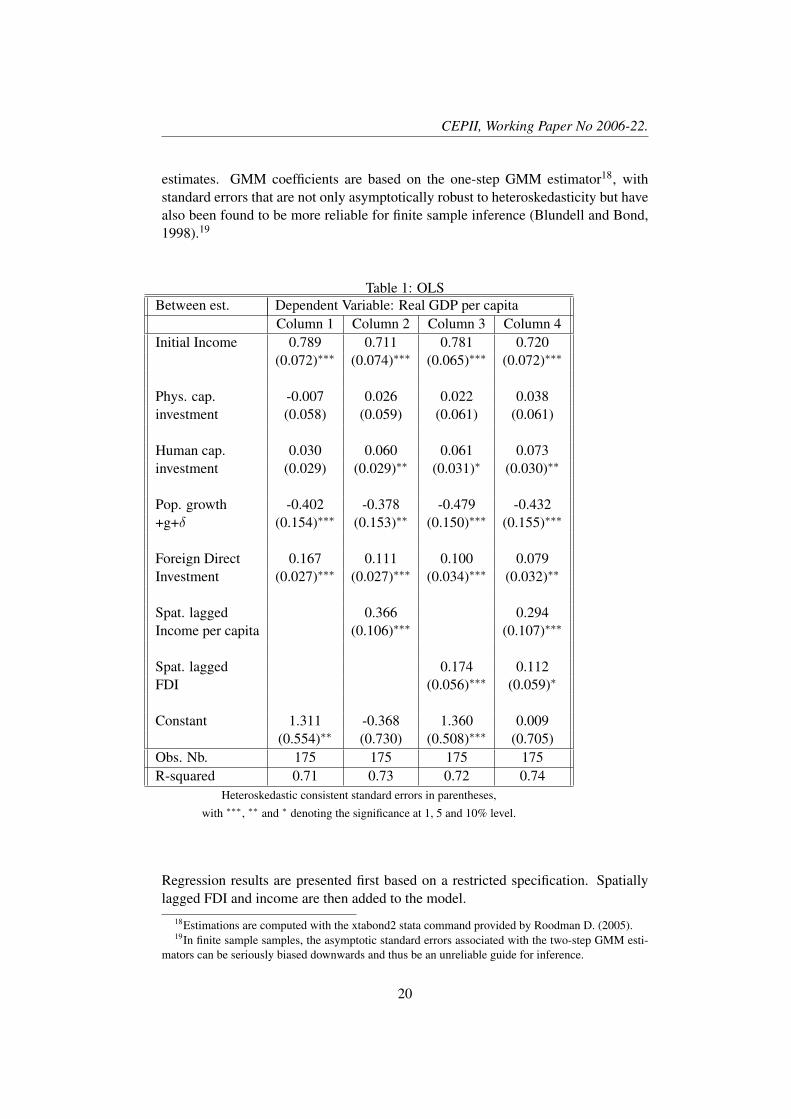
pendix B) fail to reject the null hypothesis of no error autocorrelation while they donot reject the presence of a spatial autoregressive pattern at the one per cent confi-dence level. We therefore proceed with the spatial lag model. The construction ofthe model relies on the weight matrix W , of major importance since it defines howspace is accounted for. The construction of our weight matrix is discussed in theAppendix C. We verified that our results were robust to the use of alternative weightmatrices.12
We further rely on the Moran’s I test (Moran, 1950) to check the presence of spatialdependence for all explanatory variables separately. This test is the most generallyused to detect spatial interdependence patterns (Anselin, 2001). Significant presenceof spatial dependence was found for the FDI to GDP ratio and for the income percapita. No spatial dependence was detected for the other right-hand side variables(investment in human and physical capital and population growth).13 We thereforeaugment Equation (1) to include spatial lags of FDI and per capita income. Ourmodel therefore explicitly accounts for deterministic sources of third-city effects forincome and FDI. These effects enter as spatially weighted averages of these regres-sors. Weights, as discussed above, are based on distances between cities i and j:
ln yi,t = α0 ln yi,t−T + α1 ln sKit + α2 ln sHit + α3 ln(nit + g + δ) (2)
+α4 lnFDIit + α5 lnWyit + α6 lnWFDIit + ηi + γt + εit
The last two control variables, lnWyit and lnWFDIit are defined in line with ourefforts to account for spatial dependence within China. We introduce the spatiallylagged14 dependent variable (income per capita) and the spatially lagged FDI ratewhich are computed and based on the exogenous spatial weight matrix W .15
The estimation of Equation (2) will determine whether income per capita in a givencity is directly affected by income and FDI in surrounding regions. Results will shedlight on the substitution or complementarity patterns of FDI and income as well astheir strength through the estimated spatial lag coefficient.
12As robustness checks, we used different cut-off points for spillovers such as the median distancein the sample, which is traditionally used in the literature. Results, available upon request, remainvirtually unchanged.
13This lack of spatial dependence may in part relate to the poor quality of the data notably onschooling rate or physical investment. Notably, these indicators do not take into account the qualityaspect.
14The spatial lag of a variable X for a given locality i corresponds to the sum of spatially weightedvalues of X for surrounding locations. They are computed as spatially lagged WXi =
Pj 6=i(Xjwij),
with wij being the spatial weights defined by W . The spatially-weighted variable has the simpleinterpretation of a proximity-weighted average of the variable in alternative cities.
15Spatial lags for all other explanatory variables of the model, such as physical and human capitalinvestment and population growth, are not included since tests based on the Moran I statistics rejectedthe presence of spatial dependence for these indicators. As a cautionary procedure, we neverthelessintroduced them in the regression. We find not only that they failed to be significant both individuallyand jointly but also that their introduction induces a decrease in the sample size because of numerousmissing values. As a consequence, we only report results with spatially lagged FDI and income.
17

CEPII, Working Paper No 2006-22.
Our results will be informative in terms of convergence and growth as well as interms of economic geography forces at play. We will observe the nature of incomeconvergence processes once spatial effects are controlled for. From the economicgeography perspective, our results will show how the growth rate of per capita GDPin a city is affected by that of neighboring cities. As far as the impact of FDI ongrowth is concerned, we will obtain estimates of both the direct effect and the indirecteffect on the growth rate, through the inclusion of the local and the spatially laggedFDI to GDP ratio, respectively.
3.3.3 Empirical strategy
As underlined by Abreu et al. (2005), including a spatially lagged dependent variablecauses a simultaneity problem, which in spatial econometrics is typically solvedby estimating a reduced form of the model using Maximum Likelihood or as inEasterly and Levine (1998) by instrumenting the spatial lag. Elhorst (2005) proposesa first-differenced model to eliminate fixed-effects and then derives an unconditionallikelihood function. He claims this method is superior to the Generalized Method ofMoments (GMM) estimator. However, if other explanatory variables than the seriallylagged variable are endogenous, which is very likely in our case, no instrumentaltreatment is implemented to control for this econometric problem. In this situation,the GMM appears to be the best estimator as it corrects for the potential endogeneityof all explanatory variables16. We adopt the Generalized Method of Moments, whichis the prominent way to address the problems of estimating growth regressions andrely on the system GMM estimator as proposed by Arellano and Bover (1995) andBlundell and Bond (1998) to overcome the problem of weak instruments observedin first-difference GMM17.The basic idea of system GMM is to estimate Equation (2) as a system of two equa-tions, one in first differences and the other one in levels. Lagged first-differencesand lagged levels are used as instruments for equations in levels and for equationsin first-differences, respectively. The use of instrumental variables allows consistentestimation of the parameters even in the presence of measurement error and endoge-nous right-hand side variables (such as investment, schooling rates and openness toFDI in our economic growth framework).Caselli et al. (1996) and Bond et al. (2001) establish a bound for the autoregressiveparameter in growth models analysis. Observed biases in the OLS and within esti-mators in growth models are used as references to define upper and lower boundsfor the autoregressive parameter. As Hsiao (1986) shows, omitting unobserved timeinvariant cities effects in a dynamic panel data model causes OLS estimates to beinconsistent and biased upward. This is due to the positive correlation between thelagged dependent variable and the permanent cities fixed-effect. The Within esti-
16Another drawback of the Maximum Likelihood method is that it does not control for the presenceof measurement errors.
17Refer to Bond et al. (2001), Badinger et al. (2004) and Weeks and Yudong (2003) among othersfor a good discussion of this issue.
18

FDI in Chinese cities: spillovers and impact on growth
mator, however, which takes into account the unobserved location specific effects,produces on the opposite, a downward bias with the extent of attenuation increasingwhen exogenous covariates are added (Nickell, 1981).
4 Empirical estimation results
4.1 Validity Tests
The consistency of the system GMM estimator depends on whether lagged and first-differenced values of the explanatory variables are valid instruments in the growthregression. We address this issue by considering two specification tests.The overall validity of the instruments can be tested using the standard Hansen testof over-identifying restrictions. It analyzes the sample analog of the moment condi-tions used in the estimation process. The figures reported in the result tables for theHansen test are the Chi2 values for the null hypothesis of a valid specification.We also report tests for first-order and second-order serial correlation in the first-differenced residuals. If the disturbances εit are not serially correlated, there shouldbe evidence of a significant negative first-order serial correlation in differenced resid-uals and no evidence of second-order serial correlation in the first-differenced resid-uals. Significant second-order serial correlation of the first-differenced residual in-dicates that the original error term is serially correlated and thus that the instrumentsare misspecified. Alternatively, if the test fails to reject the null hypothesis of nosecond order serial correlation, we conclude that εit is serially uncorrelated and themoment conditions are well specified.The Sargan test of overidentifying restrictions does not indicate a serious problemwith the validity of the instruments. Failure to reject the null hypothesis of no secondorder serial correlation attested by the test statistics insignificance provides furthersupport to the model.
4.2 Results
Results are displayed in Tables 1 and 2. We check the robustness of our results byproceeding successively to cross-section, pooling, (fixed effects) panel and GMMestimations. Table 1 reports OLS regressions in cross-section of average real GDPper capita growth over the period from 1990 to 2002. Average real per capita in-come is regressed on lagged income, population growth, physical and human capitalinvestment and on FDI rate. Spatially lagged FDI and income are then added tothe benchmark specification. Our results show that FDI has a beneficial impact oneconomic growth. The positive and significant impacts of spatially lagged FDI andincome per capita provide initial evidence of the spatial complementarity of FDI andincome benefits in China. The remainder of the analysis relies on the breakdown ofour twelve year sample between 1990 and 2002 into four sub-periods of three years.Table 2 yields initial results based on the pooled observations. The middle panelreports Within regressions while the right hand side panel provides system GMM
19
CEPII, Working Paper No 2006-22.
estimates. GMM coefficients are based on the one-step GMM estimator18, withstandard errors that are not only asymptotically robust to heteroskedasticity but havealso been found to be more reliable for finite sample inference (Blundell and Bond,1998).19
Table 1: OLSBetween est. Dependent Variable: Real GDP per capita
Column 1 Column 2 Column 3 Column 4Initial Income 0.789 0.711 0.781 0.720
(0.072)∗∗∗ (0.074)∗∗∗ (0.065)∗∗∗ (0.072)∗∗∗
Phys. cap. -0.007 0.026 0.022 0.038investment (0.058) (0.059) (0.061) (0.061)
Human cap. 0.030 0.060 0.061 0.073investment (0.029) (0.029)∗∗ (0.031)∗ (0.030)∗∗
Pop. growth -0.402 -0.378 -0.479 -0.432+g+δ (0.154)∗∗∗ (0.153)∗∗ (0.150)∗∗∗ (0.155)∗∗∗
Foreign Direct 0.167 0.111 0.100 0.079Investment (0.027)∗∗∗ (0.027)∗∗∗ (0.034)∗∗∗ (0.032)∗∗
Spat. lagged 0.366 0.294Income per capita (0.106)∗∗∗ (0.107)∗∗∗
Spat. lagged 0.174 0.112FDI (0.056)∗∗∗ (0.059)∗
Constant 1.311 -0.368 1.360 0.009(0.554)∗∗ (0.730) (0.508)∗∗∗ (0.705)
Obs. Nb. 175 175 175 175R-squared 0.71 0.73 0.72 0.74
Heteroskedastic consistent standard errors in parentheses,
with ∗∗∗, ∗∗ and ∗ denoting the significance at 1, 5 and 10% level.
Regression results are presented first based on a restricted specification. Spatiallylagged FDI and income are then added to the model.
18Estimations are computed with the xtabond2 stata command provided by Roodman D. (2005).19In finite sample samples, the asymptotic standard errors associated with the two-step GMM esti-
mators can be seriously biased downwards and thus be an unreliable guide for inference.
20

FDI in Chinese cities: spillovers and impact on growth
As expected, the proxy for investment in education enters positively and significantlyin all regressions except in the first column of Table 1. Consistent with theory, popu-lation growth is generally associated with lower per capita GDP growth. The proxyfor physical investment fails to enter significantly with the exception of the GMMspecifications. The lack of significance of the proxy of fixed capital investment isdeceptive but is not inconsistent with other studies (Boyreau-Debray, 2003). How-ever, estimated parameters become positive and significant once the GMM estimatoris used. The results therefore suggest that the initial lacking significance of capitalinvestment is due to econometric problems such as endogeneity and measurementerrors that are controlled for when GMM estimators are used.Results of the traditional augmented Solow model are robust to the introduction ofinter-city heterogeneity in terms of FDI inflows. The FDI to GDP ratio appearsto be a positive and significant determinant of per capita GDP in all specifications.As widely recognized in the empirical literature on China’s growth (Démurger andBerthélemy, 2000), higher FDI rates promote Chinese cities’ growth. Note that thestrength of FDI impact on growth is slightly reinforced when the GMM estimatorcontrols for endogeneity and other econometric problems. Our results underline thatthe larger a city’s FDI to GDP ratio, the greater its economic growth.The system GMM estimator is expected to address the inconsistency of both OLSand Within estimators due to endogeneity. As explained above, pooled and Withinestimator results provide the upper and lower bounds for the autoregressive param-eter as recommended by Bond et al. (2001). As argued by Hsiao (1986), OLSyields an upward bias while the Within estimator produces a downward bias (Nick-ell, 1981). While OLS values are around 0.92, they drop sharply to values of around0.17 when the Within estimator is used. As expected, the autoregressive coefficientsestimated based on GMM fall between these bounds: they lie close to 0.80. Relyingon these results and on validity tests, we consider system GMM estimates as ourpreferred specification.We now shed light on estimates of spatially lagged variables. The introduction ofspatially lagged indicators of per capita income and FDI ratio confirms that incomeper capita and FDI to GDP ratio in a given city relate positively to that in surround-ing cities. The coefficient estimates for spatially lagged variables are positive andsignificant when endogeneity problems are controlled for by the system GMM esti-mator. The spatial autoregressive parameter lies between -1 and + 1, as assumed inthe spatial lag model discussed in Section 3. A positive coefficient is coherent witha complementarity pattern while a negative one would support a substitution rela-tion between local and neighboring income. All estimators clearly provide evidencein favor of spreading effects both in terms of FDI and income per capita. Hence,our results signal the importance of including spatially lagged variables in growthestimations.We can note that the coefficient on the lagged GDP per capita decreases when spa-tially lagged variables are accounted for. These findings support the idea that con-trolling for spatial interdependence in terms of income and FDI produces a fasterestimated speed of convergence. Therefore, they support an underestimation bias
21

CEPII, Working Paper No 2006-22.
when spatial relations due to geographic proximity are not accounted for. The speedof convergence rises from 0.7 per cent per annum in Column 7 to more than eight percent in Column 11 when spatially lagged variables are both included (four per centwhen only spatial FDI variable is introduced). These estimates yield a higher speedof convergence than those of Weeks and Yudong (2003) study on China’s growth forthe 1978-1997 period. They found a maximum convergence speed equal to 2.5 percent using first-difference and system GMM estimators without spatial dimension.The positive and significant coefficient on the spatially lagged FDI points out thatcities benefit from the FDI flows received by neighboring cities. We also find thatFDI rate coefficients remain significant confirming the importance of local as wellas proximate FDI flows. Our results therefore suggest intensive positive spatialspillover effects of FDI inflows on economic growth. In other words, higher FDI-induced income in a given location does not appear to occur at the expense of sur-rounding cities.Table B-4 in Appendix B computes the average impact on the explained variablefrom a one standard deviation increase in the various explanatory variables. Mini-mum and maximum values of the coefficients are taken from GMM estimations. Wefind the impact of an increase in the level of income per capita in surrounding areasto be almost twice that of FDI since our results indicate that a one standard deviation(fifty percent) increase in aggregate real GDP per capita in the surroundings couldincrease local income by around ten per cent. Our point estimates suggest that a onestandard deviation (seven percentage points) increase in the local FDI rate increasesincome per capita in the same proportion as a one standard deviation (four percent-age points) increase in the aggregate FDI rate in the surrounding localities, i.e. byaround five per cent. Our results thus provide some evidence of spatial dependencein terms of economic development as shown by the positive and significant impactof the spatial lag of per capita income. They are in line with positive and significantwealth spillovers in China. The strength of complementarity patterns brought to lightby the positive and large coefficient of the spatial variable gives good reason to thinkthat wealth of the richest cities will ultimately benefit not only surrounding but alsomore distant cities. Our results indicate that a policy of promoting FDI can be jus-tified since they highlight inter-city spillover effects of FDI presence in addition todirect positive effect on local income per capita.
5 Conclusion
This study reconsiders the question of the impact of FDI on China’s recent growthexperience from a spatial econometric perspective. Our analysis covers 180 Chinesecities over the period 1990-2002. While the growth literature has largely treatedthe endogeneity problem of dynamic panels thanks to GMM estimator, it has neveraddressed the joint problem of endogeneity and omitted variable bias due to spatialdependence between cities.We estimate a per capita income convergence model that incorporates an explicit
22

FDI in Chinese cities: spillovers and impact on growth
consideration of these spatial dependence effects. We include spatially lagged lev-els of FDI and per capita GDP since we have significantly detected the presence ofspatial dependence in these two variables. We verify the robustness of our results aswe rely successively on cross-section, pooling, panel and GMM estimations. More-over, incorporating spatial effects into our dynamic panel data estimation signifi-cantly raises the speed of convergence in comparison with findings of the literatureon China’s growth. Our empirical approach significantly corrects upwards the esti-mated annual β-convergence speed upwards from two to eight per cent per annum.It is also revealed that Chinese cities take advantage not only of their own FDI in-flows but also of FDI flows received by their neighboring cities. They further benefitfrom income per capita spillover effects, evidencing a spatial dependence in terms ofeconomic development. We find that a one standard deviation increase in the localFDI rate raises income per capita in the same proportion as a one standard deviationincrease in the FDI rate in the surrounding localities, i.e. by around five per cent.We also find evidence of a positive and significant impact of the level of income percapita in surrounding areas on cities’ own income per capita. As a consequence, wecan conclude that a policy of promoting FDI can be justified since Chinese citiesappear to benefit from FDI flowing locally and in the surroundings.
23

CEPII, Working Paper No 2006-22.
Tabl
e2:
Est
imat
ions
pool
ing,
pane
land
GM
MPo
olin
gW
ithin
Syst
emG
MM
12
34
56
78
910
11In
itial
0.94
0.91
0.91
0.18
0.17
0.17
0.97
0.87
0.78
0.86
80.
787
inco
me
(0.0
2)∗∗∗
(0.0
2)∗∗∗
(0.0
3)∗∗∗
(0.0
5)∗∗∗
(0.0
6)∗∗∗
(0.0
6)∗∗∗
(0.0
6)∗∗∗
(0.0
4)∗∗∗
(0.0
6)∗∗∗
(0.0
4)∗∗∗
(0.0
5)∗∗∗
Phys
.-0
.01
0.01
0.01
-0.0
6-0
.07
-0.0
70.
120.
070.
200.
070.
12ca
p.in
.(0
.01)
(0.0
1)(0
.01)
(0.0
6)(0
.06)
(0.0
6)(0
.06)∗
(0.0
3)∗∗
(0.0
6)∗∗∗
(0.0
3)∗
(0.0
4)∗∗∗
Hum
an0.
020.
030.
030.
130.
130.
130.
090.
050.
070.
060.
04ca
p.in
v.(0
.01)∗
(0.0
1)∗∗∗
(0.0
1)∗∗∗
(0.0
2)∗∗∗
(0.0
3)∗∗∗
(0.0
3)∗∗∗
(0.0
5)∗
(0.0
3)∗
(0.0
3)∗∗
(0.0
2)∗∗
(0.0
2)∗
Pop
-0.0
9-0
.09
-0.0
8-0
.02
-0.0
3-0
.03
-0.2
4-0
.20
-0.2
0-0
.18
-0.1
3+g
+δ(0
.03)∗∗∗
(0.0
2)∗∗∗
(0.0
2)∗∗∗
(0.0
2)(0
.02)
(0.0
2)(0
.04)∗∗∗
(0.0
4)∗∗∗
(0.0
3)∗∗∗
(0.0
3)∗∗∗
(0.0
6)∗∗
FDI
0.04
0.03
0.02
0.01
0.02
0.02
0.05
0.03
0.02
0.02
(0.0
1)∗∗∗
(0.0
1)∗∗
(0.0
1)∗∗
(0.0
1)∗∗
(0.0
1)∗∗
(0.0
1)∗∗
(0.0
3)∗∗
(0.0
1)∗
(0.0
1)∗
(0.0
1)∗
Spat
.lag
.0.
150.
150.
580.
580.
620.
21In
com
e(0
.03)∗∗∗
(0.0
3)∗∗∗
(0.1
0)∗∗∗
(0.1
0)∗∗∗
(0.0
9)∗∗∗
(0.1
0)∗∗
Spat
.lag
.-0
.02
-0.0
10.
063
0.11
)FD
I(0
.02)
(0.0
3)(0
.04)∗
(0.0
4)∗∗
Con
s.0.
38-0
.13
-0.4
83.
280.
650.
63-1
.13
-0.0
6-3
.22
0.13
-0.3
5(0
.12)∗∗∗
(0.1
5)∗
(0.2
1)∗∗
(0.4
1)∗∗∗
(0.6
4)(0
.57)
(0.4
3)∗∗∗
(0.3
8)(0
.54)∗∗∗
(0.3
1)(0
.59)
Han
sen
12.2
840
.01
21.8
051
.00
38.8
2A
R(1
)-5
.67∗∗∗
-5.2
5∗∗∗
-5.3
0∗∗∗
-5.1
9∗∗∗
-5.3
5∗∗∗
AR
(2)
-1.0
8-1
.01
-1.4
7-1
.42
-1.4
5O
bs.
709
709
709
709
709
709
704
704
704
704
704
R2
0.91
0.91
0.91
0.96
0.96
0.96
Het
eros
keda
stic
cons
iste
ntst
anda
rder
rors
inpa
rent
hese
s,w
ith∗∗∗,∗
∗an
d∗
deno
ting
the
sign
ifica
nce
at1,
5an
d10
%le
vel.
24

FDI in Chinese cities: spillovers and impact on growth
6 ReferencesAbreu M, De Groot H. L. F. and R. J. G. M. Florax (2005), ‘Space and Growth: A Survey
of Empirical Evidence and Methods’, Région et Développement 21, 13-44.
Agenor P. R. (2003), ‘Benefits and Costs of International Financial Integration: Theory andFacts’, The World Economy, 26, 8, 1089-1118.
Agosin M. R. and R. Mayer (2000), Foreign Investment in Developing Countries: Does itGrow in Domestic Investment?, UN Conference on Trade and Development, Discus-sion paper 146.
Aitken B., Hanson G. H. and A. E. Harrison (1997), ‘Spillovers, Foreign Investment andExport Behavior’, Journal of International economics, 43, 103-132.
Aitken B. and A. E. Harrison (1999), Do Domestic Firms Benefit from Direct ForeignInvestment? Evidence from Venezuela. American Economic Review, 90, 3, 605-618.
Anselin L. (2001), Spatial Econometrics. In A companion to theoretical econometrics,Baltagi B (ed). Oxford: Basil Blackwell.
Anselin L. and A. Bera (1998), Spatial Dependence in Linear Regression Models with anIntroduction to Spatial Econometrics. In Handbook of Applied Economic Statistics,Ullah A, Giles DEA (eds). Berlin: Springer-Verlag.
Anselin L. (1995), ‘Local Indicators of Spatial Association: LISA’, Geographical Analysis,27, 2, 93-115.
Arellano M. and S. Bond (1991), ‘Some Tests of Specification for Panel Data: MonteCarlo Evidence and an Application to Employment Equations’, Review of EconomicStudies, 58, 277-297.
Arellano M. and S. Bover (1995), ‘Another Look at Instrumental Variable Estimation ofError-component Models’, Journal of Econometrics, 68, 29-52.
Audretsch D. B. (1998) ‘Agglomeration and the Location of Innovative Activity’, OxfordReview of Economic Policy 14, 2, 18-29.
Badinger H., Müller W. and G. Tondl (2004), ‘Regional Convergence in the EuropeanUnion (1985-1999): A Spatial Dynamic Panel Analysis’, Regional Studies, 38, 241-53.
Baumont C., Ertur C. and J. Le Gallo (2000), ‘Geographic Spillover and Growth: A Spa-tial Econometric Analysis for European Regions’, LATEC - Document de travail,Economie 2000-07.
Blonigen B. A., Davies R. B., Waddell G. R. and H. Naughton (2004), ‘FDI in Space:Spatial Autoregressive Relationships in Foreign Direct Investment’, NBER WorkingPaper 10939.
Blundell R. and S. Bond (1998), ‘Initial Conditions and Moment Restrictions in DynamicPanel Data Models’, Journal of Econometrics, 87, 1, 115-143.
Bond S., Hoeffler A. and J. Temple (2001), ‘GMM estimation of empirical growth models’CEPR discussion paper n. 3048.
Bosworth B.P. and S. M. Collins (2000), ‘Capital Flows to Developing Economies: Im-plications for Saving and Investment’, Brookings Papers on Economic Activity, 1,143-80.
25

CEPII, Working Paper No 2006-22.
Boyreau-Debray G. (2003), ‘Financial Intermediation and Growth: Chinese Style’, WorldBank Policy Research Working Paper Series, 3027.
Buckley P.J, Clegg J. and C. Wang (2002), ‘The Impact of Inward FDI on Performanceof Chinese Manufacturing Firms’, Journal of International Business Studies, 33, 4,637-655.
Carkovic M. and R. Levine (2002), ‘Does Foreign Direct Investment Accelerate EconomicGrowth’ mimeo, University of Minnesota.
Caselli F., Esquivel G. and F. Lefort (1996), ‘Reopening the Convergence Debate: A NewLook at Cross-Country Growth Empirics’ Journal of Economic Growth, 1, 363-389.
Cheung K. and P. Lin (2004), ‘Spillover effects of FDI on innovation in China: Evidencefrom the provincial data’, China Economic Review, 15, 25-44.
Coughlin C. C. and E. Segev (2000), ‘Foreign Direct Investment in China: A Spatial Econo-metric Study’, The World Economy, 23, 1, 1-23.
Dall’erba S. and J. Le Gallo (2003), ‘Regional Convergence And The Impact Of Euro-pean Structural Funds Over 1989-1999: A Spatial Econometric Analysis’, EconomicsWorking Paper Archive at WUSTL. Urban/Regional 0310005.
de Mello, L. (1997), ‘Foreign Direct Investment in Developing Countries and Growth: ASelective Survey’, Journal of Development Studies, 34, 1, 1–34.
de Mello, L. (1999), ‘Foreign Direct Investment Led Growth: Evidence from Time-seriesand Panel Data’, Oxford Economic Papers, 51, 133–51.
Démurger S. and J. C. Berthélemy (2000), ‘Foreign direct investment and economic growth:theory and application to China’, Review of Development Economics 4, 2, 140-155.
Easterly W. and R. Levine (1998), ‘Troubles with the Neighbours: Africa’s Problem,Africa’s Opportunity’, Journal of African Economies, 7, 120-142.
Edison H. J., Levine R., Ricci L. and T. Slok (2002), ‘International Financial Integrationand Economic Growth’, Journal of International Money and Finance, 21, 749-76.
Egger P., Baltagi, B. and M. Pfaffermayr, 2006, Estimating Models of Complex FDI: AreThere Third-Country Effects?, Journal of Econometrics, 2006, in press.
Elhorst J. P. (2005), ‘Unconditional Maximum Likelihood Estimation of dynamic modelsfor spatial models’, Geographical Analysis, 37, 1, 85-106.
Fingleton B. 1999. Estimates of Time to Economic Convergence: An Analysis of Regionsof the European Union. International Regional Science Review 22(1): 5-34.
Forbes K. J. (2005), ‘Capital Controls : Mud in the Wheels of Market Efficiency’, CatoJournal, 25, 1, 153-166.
Fosfuri A., Motta M. and T. Ronde (2001), ‘Foreign Direct Investment and SpilloversThrough Workers’ Mobility’, Journal of International Economics, 53, 205-222.
Fung K.C., Iizaka H. and S.Y. Tong (2004), ‘FDI in China: Policy, recent Trend and Im-pact’, Global Economic Review, 32, 2, 99-130.
Glass A. and K. Saggi (2001), ‘Multinational Firms and Technology Transfer’, World BankPolicy research Working Paper, 2067.
26

FDI in Chinese cities: spillovers and impact on growth
Greenaway D. and H. Görg (2004), ‘Much Ado About Nothing? Do Domestic Firms ReallyBenefit from Foreign Direct Investment?’, World Bank Research Observer, 19, 171-197.
Harrison A. and M. McMillan (2003), ‘Does direct foreign investment affect domestic firmcredit constraints’, Journal of International Economics, 61, 1, 73-100.
Hale G. and C. Long (2006), ‘FDI Spillovers and Firm Ownership in China: Labor Mar-kets and Backward Linkages’, Federal Reserve Bank of San Francisco working paperseries, 2006-25.
Hsiao C. (1986), Analysis of Panel Data. Econometric Society Monographs. CambridgeUniversity Press.
Hu A. and G. Jefferson (2001), ‘FDI, Technological Innovation and Spillover: Evidencefrom Large and Medium Size Chinese Enterprises’, Mimeo, Brandeis University:Waltham MA.
Hu A. and G. Jefferson (2002), ‘FDI Impact and Spillover: Evidence from China’s Elec-tronic and Textile Industries’, The World Economy, 25, 1063-1076.
Javorcik Smarzynska B. (2004), ‘Does Foreign Direct Investment Increase the Productivityof Domestic Firms? In Search of Spillovers through Backward Linkages’, AmericanEconomic Review 94, 3, 605-627.
Javorcnik Smarzynska, B. (2002), ‘Spillovers of foreign direct investment through back-ward linkages: Does technological gap matter?’ World Bank Working paper.
Keller W. (2002), ‘Geographic Localization of International Technology Diffusion’, Amer-ican Economic Review, 92, 120-142.
Le Gallo J. (2004), ‘Space-Time Analysis of GDP Disparities among European Regions:A Markov Chains Approach’, International Regional Science Review,27, 138-163.
Mankiw N. G., D. Romer and D. N. Weil (1992), ‘A Contribution to the Empirics of Eco-nomic Growth’, The Quarterly Journal of Economics, 107, 2, 407-437.
Moran P. A. P. (1950), ‘Notes on continuous stochastic phenomena’, Biometrika, 37, 17-23.
Naughton B. (2003), How much can regional integration do to unify China’s markets?, inNicholas Hope, Dennis T. Yang and Mu Yang Li (eds.), How far across the river?Chinese Policy Reform at the Millenium, Stanford: Stanford University Press, 204-232.
Nickell S. (1981), ‘Biases in dynamic models with fixed effects’, Econometrica, 49, 6,14171426.
OECD (2005), China, OECD economic surveys.
OECD (2000), ‘Main Determinants and Impacts of Foreign Direct Investment on China’sEconomy’, Working Papers on International Investment, 4.
Poncet S. (2005), ‘Country people moving to the cities: the migratory dynamic’, ChinaPerspectives, 67, 11-22.
Rey S. J. and B. D. Montouri (1999), ‘U.S. Regional Income Convergence: A SpatialEconometric Perspective’, Regional Studies, 33, 145-156.
27

CEPII, Working Paper No 2006-22.
Rey S. J. (2001), ‘Spatial Empirics for Economic Growth and Convergence’, GeographicalAnalysis, 33, 195-214.
Rodriguez F. and Rodrik D. (2001), Trade Policy and Economic Growth: A Sceptic’s Guideto Cross-National Literature, in National Bureau for Economic Research Macro An-nual 2000, Bernanke B. and K. Rogoff (eds), Cambridge: Massachusetts Institute forTechnology Press.
Rodriguez-Clare A. (1996), ‘Multinationals, Linkages and Development’, American Eco-nomic Review, 86 ,4 , 852-873.
Rodrik D. (1999), ‘The New Global Economy and the Developing Countries: MakingOpenness Work’, Overseas Development Council Policy Essay, 24, Washington, DC:Johns Hopkins University Press for the Overseas Development Council.
Roodman D. (2005), xtabond2: Stata module to extend xtabond dynamic panel data esti-mator, Center for Global Development, Washington.
State Statistical Bureau, various years, China Statistical Yearbook, Beijing.
State Statistical Bureau (1999), Comprehensive statistical data and materials on 50 yearsof new China, Beijing.
Tobler W. R. (1970), ‘A Computer movie simulating urban growth in the Detroit Region’,Economic Geography, 46, 234-240.
Tong J.Y. and A.Y. Hu. (2003), ‘Foreign Investment and Technology Transfer: A SimpleModel’, European Economic Review, 36, 1, 137-155.
Tseng W. and H. Zebregs (2002), ‘Foreign Direct Investment in China: Some Lessons forOther Countries’, IMF Policy Discussion Paper, 02/3.
Upton G. J. G. and B. Fingleton (1985), Spatial Data Analysis by Example, Volume 1,Wiley, Chichester.
Weeks M. and Yudong Y. (2003), ‘Provincial Conditional Income Convergence in China,1953-1997: A Panel Data Approach’, Econometric Reviews, 22, 1, 59-77.
Wei Y. and X. Liu (2006), ‘Productivity spillovers from R&D, exports and FDI in China’smanufacturing sector’, Journal of International Business Studies, 37, 4, 544-557.
28

FDI in Chinese cities: spillovers and impact on growth
APPENDIX A
Figure 1: Administrative Structure in China
Provinces (27)
Prefecture level cities
Super Cities (4)
Central government
Prefectures
Rural counties
Rural counties
Urban areas
Rural counties
Low level cities
Urban areas
Our data set
29

CEPII, Working Paper No 2006-22.
liste.pdf
30

FDI in Chinese cities: spillovers and impact on growth
2 and 3.pdf 2 and 3.pdf
31

CEPII, Working Paper No 2006-22.
APPENDIX B
Table B-1: Spatial dependance diagnosticsTest Statistic p-valueSpatial error:Moran’s I 2.748 0.006Lagrange multiplier 5.339 0.021Robust Lagrange multiplier 0.138 0.710Spatial lag:Lagrange multiplier 11.731 0.001Robust Lagrange multiplier 6.530 0.011
Table B-2: Summary statisticsVariable Mean Standard deviation Minimum MaximumIncome per capita 81.55 70.92 6.99 972.57FDI over GDP 0.05 0.07 0.00 0.62Human capital investment 0.02 0.02 0.00 0.10Spat. lag. per cap. Income 81.43 37.40 18.67 276.48Spat. lag. FDI/ GDP 0.05 0.04 0.00 0.30Population growth+g+δ 0.03 0.04 -0.03 0.29
Table B-3: Correlation matrixInc. per Initial inc. Human cap FDI Phys. cap. Pop Spat. lag.capita per cap. inv GDP inv. growth FDI
Initial Income 0.94* 1Hum. cap. inv. 0.44* 0.45* 1FDI over GDP 0.44* 0.27* 0.22* 1Phys. cap. inv. 0.39* 0.47* 0.32* -0.12* 1Pop. +g+δ 0.19* 0.29* 0.17* 0.17* 0.01 1Spat. lagged FDI 0.41* 0.19* -0.04 0.66* -0.26* 0.17* 1Spat. lagged Inc. 0.65* 0.59* 0.21* 0.50* 0.52* 0.11* 0.63*
32

FDI in Chinese cities: spillovers and impact on growth
Table B-4: Impact of one standard deviation increaseover mean of explanatory variables on income per capita statisticsVariable Minimum MaximumFDI over GDP 3.0% 7.2%Human capital investment 3.9% 8.5%Spatially lagged Income per capita 9.6% 28.5%Spatially lagged FDI over GDP 5.3% 9.1%
33

CEPII, Working Paper No 2006-22.
APPENDIX C: Spatial weight matrixThe spatial weight matrix is used to evaluate the covariance of characteristics across loca-tions. It contains information about the relative dependence between the cities in our sample.We assume that the intensity of the relation between cities depends on the distance betweenthem. The literature suggests various alternative weighting methods. The most widely usedmethods rely on contiguity and distance between localities, but differ in the functional formused. As recommended by Anselin and Bera (1998) and Keller (2002), the elements of thematrix have to be exogenous20, otherwise the empirical model becomes highly non-linear.We choose a spatial weighting matrix W that depends exclusively on the geographical dis-tance dij between cities i and j since the exogeneity of distance is absolutely unambiguous.Distance-based weights are defined as follows:w∗
ij = 0, if i = j
w∗ij = 1/d2
ij , if dij ≤ 1624w∗
ij = 0, if dij > 1624and wij = w∗
ij/∑
j w∗ij
where w∗ij is an element of the unstandardized weight matrix and wij is an element of the
standardized weight matrix. dij is the distance in kilometers between cities i and j. Thedistance 1624 km is the cut-off parameter above which interactions are assumed to be neg-ligible. This distance has been chosen so that each city interacts with at least one otherChinese city. This cut-off parameter is important since there must be a limit to the range ofspatial dependence allowed by the spatial weights matrix (Abreu et al., 2005). This is dueto the asymptotical feature required to obtain consistent estimates for the parameters of themodel. We use the inverse squared distance in order to reflect a gravity relation. The matrixis row-standardized so that each row sums to one and each weight may be interpreted as theprovince’s share in the total spatial effect of the country.
20This condition is a prerequisite for the introduction of spatial econometrics.
34

CEPII, Working Paper No 2006-22
35
LIST OF WORKING PAPERS RELEASED BY CEPII1
No Title Authors
2006-21 Taux d'intérêt et marchés boursiers : une analyseempirique de l'intégration financière internationale
V. Borgy & V. Mignon
2006-20 World Consistent Equilibrium Exchange Rates A. Bénassy-Quéré,A. Lahrèche-Révil
& V. Mignon
2006-19 Institutions and Bilateral Asset Holdings V. Salins& A. Bénassy-Quéré
2006-18 Vertical Production Networks: Evidence from France M. Fouquin,L. Nayman
& L. Wagner
2006-17 Import Prices, Variety and the Extensive Margin ofTrade
G. Gaulier & I. Méjean
2006-16 The Long Term Growth Prospects of the WorldEconomy: Horizon 2050
S. Poncet
2006-15 Economic Integration in Asia: Bilateral Free TradeAgreements Versus Asian Single Market
M. H. Bchir& M. Fouquin
2006-14 Foreign Direct Investment in China: Reward orRemedy?
O. Havrylchyk& S. Poncet
2006-13 Short-Term Fiscal Spillovers in a Monetary Union A. Bénassy-Quéré
2006-12 Can Firms’ Location Decisions Counteract theBalassa-Samuelson Effect?
I. Méjean
2006-11 Who’s Afraid of Tax Competition? Harmless TaxCompetition from the New European Member States
A. Lahrèche-Révil
2006-10 A Quantitative Assessment of the Outcome of theDoha Development Agenda
Y. Decreux& L. Fontagné
2006-09 Disparities in Pension Financing in Europe: Economicand Financial Consequences
J. Château& X. Chojnicki
1 Working papers are circulated free of charge as far as stocks are available; thank you to send your request
to CEPII, Sylvie Hurion, 9, rue Georges-Pitard, 75015 Paris, or by fax : (33) 01 53 68 55 04 or by [email protected]. Also available on: \\www.cepii.fr. Working papers with * are out of print. They cannevertheless be consulted and downloaded from this website.
1 Les documents de travail sont diffusés gratuitement sur demande dans la mesure des stocks disponibles.
Merci d’adresser votre demande au CEPII, Sylvie Hurion, 9, rue Georges-Pitard, 75015 Paris, ou parfax : (33) 01 53 68 55 04 ou par e-mail [email protected]. Egalement disponibles sur : \\www.cepii.fr.Les documents de travail comportant * sont épuisés. Ils sont toutefois consultable sur le web CEPII.

FDI in Chinese Cities: Spillovers and Impact on Growth
36
2006-08 Base de données CHELEM-BAL du CEPII H. Boumellassa& D. Ünal-Kesenci
2006-07 Deindustrialisation and the Fear of Relocations in theIndustry
H. Boulhol& L. Fontagné
2006-06 A Dynamic Perspective for the Reform of the Stabilityand Gowth Pact
C. Deubner
2006-05 China’s Emergence and the Reorganisation of TradeFlows in Asia
G. Gaulier, F. Lemoine& D. Ünal-Kesenci
2006-04 Who Pays China's Bank Restructuring Bill? G. Ma
2006-03 Structural Determinants of the Exchange-Rate Pass-Through
G. Gaulier,A. Lahrèche-Révil
& I. Méjean
2006-02 Exchange-Rate Pass-Through at the Product Level G. Gaulier,A. Lahrèche-Révil
& I. Méjean
2006-01 Je t'aime, moi non plus : Bilateral Opinions andInternational Trade
A.C. Disdier& T. Mayer
2005-23 World Trade Competitiveness: A DisaggregatedView by Shift-Share Analysis
A. Cheptea, G. Gaulier& S. Zignago
2005-22 Chômage et réformes du marché du travail au Japon E. Dourille-Feer
2005-21 Profitability of Foreign and Domestic Banks inCentral and Eastern Europe: Does the Mode of EntryMatter?
O. Havrylchyk &E. Jurzyk
2005-20 ECB Governance in an Enlarged Eurozone A. Bénassy-Quéré &E. Turkisch
2005-19 What Are EU Trade Preferences Worth for Sub-Saharan Africa and Other Developing Countries?
F. Candau & S. Jean
2005-18 Binding Overhang and Tariff-Cutting Formulas M.H. Bchir, S. Jean &D. Laborde
2005-17 International Trade and Income Distribution:Reconsidering the Evidence
I. Bensidoun, S. Jean &A. Sztulman
2005-16 China and the Relationship between the Oil Price andthe Dollar
A. Bénassy-Quéré,V. Mignon & A. Penot
2005-15 Consequences of Alternative Formulas forAgricultural Tariff Cuts
S. Jean, D. Laborde &W. Martin

CEPIIDOCUMENTS DE TRAVAIL / WORKING PAPERS
Si vous souhaitez recevoir des Documents de travail,merci de remplir le coupon-réponse ci-joint et de le retourner à :
Should you wish to receive copies of the CEPII’s Working papers,just fill the reply card and return it to:
Sylvie HURION – PublicationsCEPII – 9, rue Georges-Pitard – 75740 Paris – Fax : (33) 1.53.68.55.04
M./Mme / Mr./Mrs ..................................................................................................................
Nom-Prénom / Name-First name .............................................................................................
Titre / Title ...............................................................................................................................
Service / Department................................................................................................................
Organisme / Organisation ........................................................................................................
Adresse / Address.....................................................................................................................
Ville & CP / City & post code..................................................................................................Pays / Country.............................................................. Tél......................................................Your e-mail ..............................................................................................................................
Désire recevoir les Document de travail du CEPII n° :
Wish to receive the CEPII’s Working Papers No:..................................................................
..................................................................................................................................................
..................................................................................................................................................
..................................................................................................................................................
..................................................................................................................................................
..................................................................................................................................................
..................................................................................................................................................
..................................................................................................................................................
..................................................................................................................................................
Souhaite être placé sur la liste de diffusion permanente (pour les bibliothèques)Wish to be placed on the standing mailing list (for Libraries).