Do institutions matter for FDI? A comparative analysis for the MENA countries
Upload
khangminh22Category
view
3download
0
PART 1
TRADE, FDI and ODA
15

China’s Trade and FDI to MRB Countries:
An Advocacy Document
Xingmin Yin
INTRODUCTION
The Mekong River Basin (MRB) covers five countries: Cambodia, Lao PDR,
Myanmar, Thailand, Vietnam, plus China’s Yuan Province.i The population in this region
stood at 247 million persons at end-2006. For a long time, four of the five countries (i.e.,
excluding Thailand) insisted on implementing the inward-looking development agenda.
However, the shift from inward-looking to outward-oriented policy in the MRB countries
was driven by the success of China’s open-door policy that was initiated in 1978. A
development-oriented strategy that is widely accepted and appreciated by these countries
would create employment opportunities and promote high economic growth for the MRB
countries. After a decade of putting liberal national and international trade regimes in
place, the MRB countries have succeeded to reap the benefits of trade liberalization,
achieved economic growth and increased the income of the population.
Within the framework of liberalization, increases in regional trade and foreign direct
investment (FDI) are potentially vital in promoting this region’s economic growth.
Examining this possibility requires an appreciation both of the kinds of trade and FDI that
MRB countries engage in and of the way these activities have changed over time. The
16

FDI is distinct from other capital flows in that it primarily reflects managerial rather than
portfolio behavior. Trade and FDI can be related to one another through the globalization
of the production-chain network both for labor-intensive and technology-intensive
industries. As the MRB countries integrate into the world economy, they typically
become increasingly involved with global pattern of production. In addition, some FDIs
can generate exports when the foreign-funded enterprises engage in building local export
capacities.
This study is based on documentation as well as analysis of perceptions on current
and future trade and investment relationships between China and the MRB countries. We
need to understand the nature and dynamics involved in trade and FDI for MRB countries,
which had experienced high economic growth over the past 10 years.
Against this backdrop, this paper aims to assess the economic implications of the
China-MRB countries’ trade and capital investment experience and to draw some lessons
for both sides from the economic perspectives. . Section 2 provides a brief review of the
basic facts and economic performance of the MRB countries. Section 3 examines the
evolution of the China-MRB countries’ trade expansion. Section 4 provides a detailed
analysis of trade composition between China and the MRB countries over the period
2001-2006. Section 5 derives lessons from the direct investment and discusses ways to
strengthen economic links between China and MRB countries based on the change of
comparative advantages. Section 6 provides the concluding remarks.
1. FACTS ON MACROECONOMIC PERFORMANCE
Is it possible to broadly conceptualize the development stage and economic
17

dynamics within the MRB countries by taking into consideration the new economic
relations between China and the MRB region? The following facts will help identify the
answer to this question and provide a number of suggestions that will be further discussed
in the succeeding sections of this paper.
For the past three decades, the world economy had been primarily focused on ways
to accelerate the growth rate of national incomes. Table 1 presents data on the MRB
countries and China’s economic performance. All data in this table come from The World
Development Indicators published by the World Bank, and the China Statistical Yearbook
published by China State Statistical Bureau.
The Gross Domestic Product (GDP) per capita is often used as a summary index of
the relative economic well-being of people in different nations. Purchasing power parities
(PPP) use a common set of international prices for all goods and services produced. More
precisely, GDP per-capita calculations measured in PPP international dollars would be
another indicator of economic development level. For the countries in this study, the
figures are: Thailand, 8,700; China, 6,100; Vietnam, 2,900; Cambodia and Lao PDR,
2,100; and Myanmar, 1,200. Column 5 and 6 in Table 1 compare the exchange rate and
PPP per-capita for six nations. The income gap between different nations is often
regarded as the real stage of economic development, which shows that more income
means more wealth for people. Between 1978 and 2007, China had a rapid rate of
economic development. Its real growth rate in GDP per capita was 8.5 percent per year. In
2005, China’s Gross National Income (GNI) per capita was US$1,740, which classifies
the nation as a low middle-income country. Low-income countries are those with a
per-capita income of less than US$735 while middle-income countries are those with a
18

per-capita income of more than US$735 but less than US$9,076 in 2002. Clearly,
Cambodia, Lao PDR, Myanmar, and Vietnam are low-income countries per the World
Bank’s classification, and China and Thailand belong to the middle-income countries.
Table 1. Overview of MRB countries’ population and income in comparison with China
Country
2005
Surface Area
2005
Population
1997
GNI
2007
GDP
2008
PPP
1000 sp. km millions US$ billion p.c US$ billion p.c p.c
Cambodia 181 14 3.2 300 8.69 606 2100
Lao PDR 237 6 1.9 400 4.11 669 210
0
Myanmar 677 51 .. .. 13.48 234 1200
Thailand 513 64 165.8 2740 245.35 3732 8700
Vietnam 332 83 24.0 310 70.94 829 2900
China 9634 1321 1055.4 860 3419.25 2580 6100 Note: GNI: Gross National Income. PPP is the abbreviation of purchasing power parity. And p.c. stands for US$ per capita. Sources: The World Bank, World Development Indicators, Washington DC., 1999, pp.26-28; 2008, pp.14-16; 2008 China Statistical Yearbook.
However, it must be pointed out that the big income difference between the coastal
areas and inland provinces exists in China due to the country’s size and diversity. For
instance, GDP per capita in 2008 for Shanghai was US$10,530 and US$6,078 for
Zhejiang province, but only US$1,800 for Yunnan province, which has wide border
connections with the MRB countries.
Table 1 above provides some basic macroeconomic and structural facts associated
with the MBR countries. It is necessary to mention the growth rates, calculated from
constant price GDP data in local currency, of the MRB countries. In 2000-2008, most of
the MRB countries have substantial high economic growth (e.g., Cambodia and Vietnam)
19

while some struggled with their erratic growth performance (e.g., Myanmar and
Thailand). Here, we see diverse income growth among the MRB countries. Vietnam and
Cambodia succeeded in more than doubling their income, while Myanmar’s income
remains very low in comparison with its neighboring countries.
At present, all MRB countries have undertaken various trade policy reforms and are
considering international trade as a principal means for accelerating growth and
promoting their economic development.
2. TRADE DEVELOPMENT BETWEEN CHINA AND MRB COUNTRIES
The trade regimes in MRB countries registered a major shift in the mid-1990s,
where a moderate liberalization was initiated. However, by the early 21st century, a
large-scale liberalization program was implemented. Since then, governments have
continued with their commitments toward more liberal trade regimes. These
liberalization programs have led to a remarkable decline in quantity restrictions:
Specifically, they have opened up trade of many restricted items, significantly
rationalized lessened import tariffs, and liberalized foreign exchange regimes. Another
important trade reform was the introduction of generous promotional measures for
exports.
Looking beyond aggregate trends, we need to examine the trade development
between China and the MRB countries, and their performance in terms of trade balance.
Before we proceed, however, let us have a cursory theoretical exposition on the value of
international trade to developing economies.
20

2.1. A cursory theoretical exposition
International trade must be understood in a much broader perspective than simply
the inter-country flow of commodities. By opening their economies and societies to world
trade and by looking outward, developing countries invite not only the international
transfer of goods and capital but also the developmental influences of the transfer of
production technologies, consumption patterns and organizational arrangements.
It is well known that the gains from trade exposition are rooted in the theory of
comparative advantage, per the Heckscher-Ohlin-Samuelson theory. A liberal trade
strategy is beneficial to developing countries because it would bring efficiency in
resource allocation, eliminate directly unproductive profit-seeking and rent-seeking
activities, encourage foreign investment, and stimulate dynamic positive effects on the
domestic economy. The proponents of trade as an engine of growth also recognize the
benefits of a larger international market, which enable the industry to gain scale effects
through large-scale production, to achieve higher export productivity as a result of
international competitive pressures, and to exploit different forms of externalities. ii In
addition, better access to imports makes new inputs, new technologies and ideas, and new
management techniques available to local producers.
The dynamic gains from trade are also one of the central features of the “new”
growth theories, often known as the “endogenous” growth theories.iii In the traditional
neoclassical growth model, there is no connection between openness and economic
growth as it regards the exogenously determined technology as the sole determinant of
per-capita income growth. In contrast, the endogenous growth theory allows a conceptual
21

framework for the analysis of the relationship between trade policies and economic
growth. New models consistent with the endogenous theory establish the relationship
between trade and growth through several channels. Clearly, through liberalized import
regimes, a country can procure improved technology and advanced capital goods
essential for improved productivity and higher production. In addition, trade is believed
to result in technological spillovers. Thus, more open countries have a greater capacity to
absorb the technological advancement of the world. iv
2.2. An overview of trade development
China’s integration into the world economy is one of the most important
developments affecting the structure and evolution of the global trading system. Over the
past three decades, China’s economy has grown at nearly 10 percent per year, driven
primarily by the expansion of a modern, export-oriented industrial sector.
China is now the third largest economy in the world and the second largest in exports
(behind Germany). Its exports have grown even more rapidly than its economy, at rates
nearly 20 percent per year over the last decade. In 2007, merchandise exports reached
about US$1.16 trillion, which is more than four times prior to China’s entry into the
World Trade Organisation (WTO) in 2000. This trend continued in 2008: The exports of
goods had grown by 17.5 percent (US$1.43 trillion). Such improvement in export
performance was accompanied by a dramatic change in labor productivity even in the
face of the currency appreciation in 2005-2008, which had greatly influenced the
competitiveness of China’s exports. Aggregate export statistics show that the momentum
of export performance has been sustained by manufactured goods, particularly machinery
22

products, in the past 10 years.
A. Reduction of Tariffs
Trade liberalization actually laid the solid foundation for manufactured exports of
developing countries. The share of manufactures in merchandise exports in 2005 was
over 70 percent for most countries in the region, except for Vietnam (with 53%). The
manufacturing share of imports accounted for 70 percent in the same year, which implies
that the final demand outside this region is driving the region’s exports.
Yet, import taxes and transport costs are by no means the only barriers to
international trade. So, reductions in tariffs (and extensive use of duty drawbacks) and
improvements in the transportation infrastructure in the Mekong River Basin
region—such as the completion of the highway from Kunming to Bangkok in March
2008—have certainly played a key role in the expansion of trade among these countries.
Table 2. Low protections in manufactured products: imported-weighted average tariffs (%)
Tariffs
Cambodia n.a. 14.6 (2001) 13.8 (2005)
China 36.5 (1992) 14.7 (1998) 4.5 (2006)
Lao PDR n.a 8.9 (2000) 8.0 (2006)
Myanmar n.a 4.7 (2001) 3.7 (2006)
Thailand 35.7 (1989) 15.7 (1995) 5.8 (2006)
Vietnam 13.0 (1994) 14.9 (1999) 12.8 (2006)
Low income n.a n.a 12.1 (2006)
Middle income n.a n.a 5.0 (2006)
High income n.a n.a 1.8 (2006) Notes: n.a. is not available. Sources: The World Bank, World Development Indicators, 2001, pp.336-338; 2007, pp.336-338; 2008, pp.340-342.
23

Table 2 summarizes the reform experiences of MRB countries in terms of their tariff
profiles at the time the reforms were undertaken and post-reforms. China and Thailand
had the highest average tariffs in the late 1980s. By the late 1990s to early 21st century,
high tariffs in these countries had already been slashed dramatically. According to the
data available for the most recent years, Cambodia and Vietnam had the highest average
tariff rates of 13.8 percent and 12.8 percent in 2005-2006, followed by Lao PDR with 8.0
percent rates respectively. In contrast, Myanmar was reported to have the lowest
comparable rate (3.7%) among the MRB countries. Furthermore, China’s
imported-weighted average tariffs in manufactured goods have been reduced to 4.5
percent, slightly lower than that of Thailand.
B. Recent Trade Development between China and MRB Countries
Asia has been China’s biggest trading partner for many years. China-MRBC trade
totaled US$40.09 billion and US$53.03billion in 2006 and 2007, respectively. The
MRBC share in China’s Asian merchandise trade has been continuously on the rise,
increasing from 3.65 percent in 2000 to 4.47 percent in 2007. China and the MRB
countries have enjoyed a long-standing good relationship based on geographic and
cultural linkages. The governments have worked to broaden and deepen the bilateral
cooperation via agreements that cover a broad range of concerns including economic,
trade, investment, culture, education, and training.
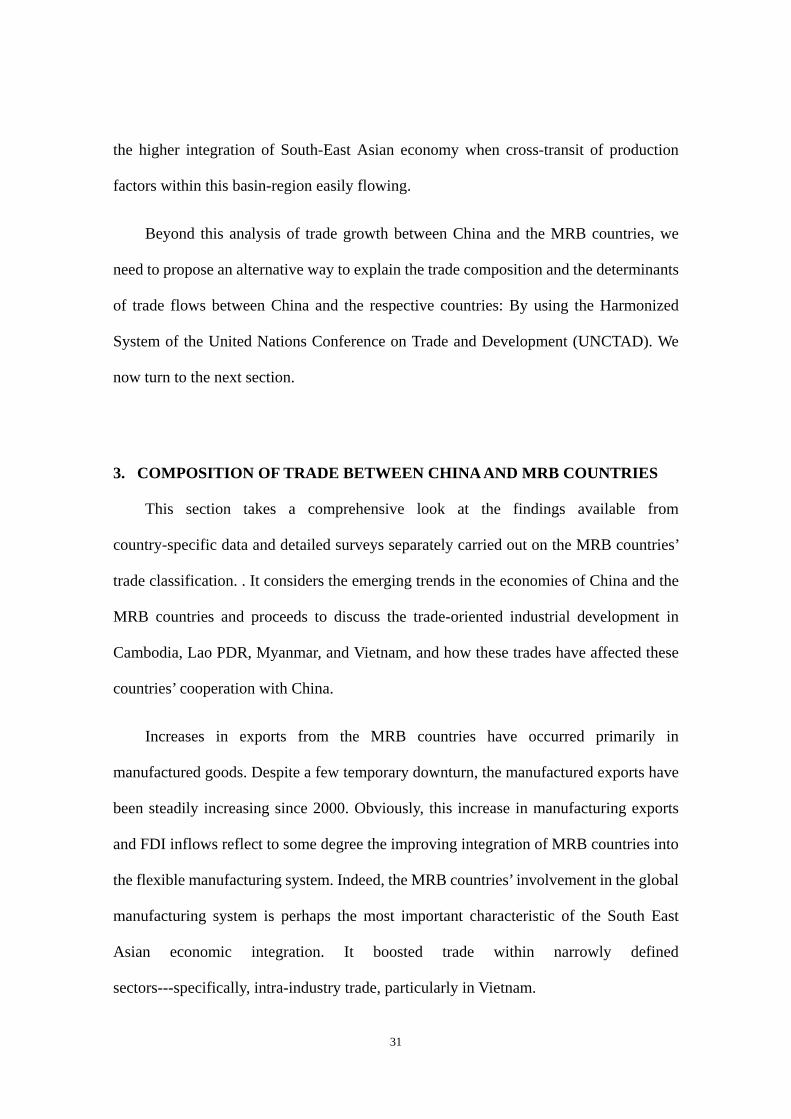
Table 3 shows that, during 2000-2007, international trade between China and
24
MRBC grew 4.5 times (from US$3.35 billion to US$18.39 billion). The MRBC exports
to China increased nearly 2.34 times, while imports from China rose 5.56 times. Data
clearly show that the growth of China’s exports to the MRB countries substantially
increased from 2003 to 2007.
Traditionally, geography affects trade flows among developing countries, according
to Sachs (2001), “since sea-navigable regions are generally richer than landlocked
regions, regions that are both temperate and easily accessible to sea-based trade almost
everywhere have achieved a very high measure of economic development.” v
Geographical patterns may explain and define inequalities among the MRB countries: A
glance at the Mekong River Basin economy points to developing, landlocked Lao PDR as
loosely integrated to international trade, as can be seen in Table 4. The export-to-GDP
ratio for Lao PDR is 22 percent, while it is higher for non-landlocked countries such as
Cambodia, whose ratio is 47 percent in 2007.
Table 3. China-MRBC trade development 2000-2007 (US$ million)
Year Total Trade Exports to MRBC Imports from MRBC
Balance Value % change Value % change Value % change
2000 3352.06 - 2232.18 - 1119.88 - 1112.30
2001 3749.02 10.95 2561.82 14.77 1187.20 6.01 1374.62
2002 4465.98 19.12 3179.00 24.09 1286.98 8.41 1892.02
2003 6149.28 37.69 4485.85 41.11 1663.43 29.25 2822.42
2004 8482.64 37.95 5751.12 28.21 2731.52 64.21 3019.60
2005 10098.25 19.05 7218.16 25.51 2880.90 5.44 4338.07
2006 12360.76 22.41 9267.26 28.39 2823.50 -1.96 6443.76
2007 18393.30 48.80 14651.90 58.10 3741.40 32.51 10910.50 Notes: % change from previous year. Sources: China Statistical Yearbook, various issues. WTO: 2007 International Trade Statistics.
25

However, as the Lao PDR economy began to open up to global trade, and its
land-locked location---and more generally, its geography---will have no straight-forward
impact on trade. Rather, the impact on trade will henceforth be defined by a combination
of geography and other development-related determinants such as the trade integration
with open economies among neighboring countries. A case in point is the trade growth in
relation to Lao PDR’s liberalization policy in the past 20 years. The exports of Lao PDR
to China was only US$9.56 million in 1999 but substantially increased to US$85.96
million by 2007, while the imports from China experienced tremendous growth, from
US$22.16 million to US$177.94 million. These results show the strong ties in China-Lao
PDR’s trade development over the period 1999-2007.
C. Balance of Trade
A critical dimension of the MRBC merchandise trade balance--the excess or deficit
in the value of its exports relative to its imports---relates to the commodity composition of
that trade. The past decade has seen considerable expansion in exports of manufactured
goods. This progress has, as noted, been largely concentrated in Cambodia and Vietnam.
However, Lao PDR and Myanmar remain to keep their predominant exports of primary
products. The structure of China’s exports has been changing as well: Exports have been
moving away from clothing, footwear, and other light manufacturing goods, and toward a
wide range of technological industries.
26

Table 4. Trade growth between China and MRB countries (US$ million)
Country 2000 2001 2002 2003 2004 2005 2006 2007 2000-07
Cambodia
Exports 164.06 205.61 251.56 294.65 451.77 536.03 697.76 882.93 3484.4
Imports 59.49 34.80 24.55 26.00 29.93 27.31 35.09 51.07 288.2
Balance 104.57 170.81 227.01 268.65 421.84 508.72 662.67 831.86 3196.1
Lao PDR
Exports 34.42 54.41 54.31 98.24 100.88 103.38 168.72 177.94 792.3
Imports 6.42 7.46 9.65 11.20 12.65 25.55 49.65 85.92 208.5
Balance 28.00 46.95 44.66 87.04 88.23 77.83 119.07 92.02 583.8
Myanmar
Exports 496.44 497.35 724.75 910.22 938.44 934.85 1207.4 1699.7 7409.2
Imports 124.82 134.19 136.89 169.52 206.94 274.40 252.65 378.14 1677.6
Balance 371.62 363.16 587.86 740.70 731.50 660.45 954.77 1321.6 5731.6
Thailand
Exports 2243.25 2337.45 2957.35 3827.91 5801.58 7819.30 9764.06 11973.4 46724.3
Imports 4380.79 4712.85 5599.60 8826.84 11540.5 13991.9 17962.4 22664.7 89670.6
Balance -2137.5 -2375.4 -2642.3 -4998.9 -5738.9 -6172.6 -8198.3 -10691 -42955
Vietnam
Exports 1537.26 1804.45 2148.38 3182.74 4260.03 5643.90 7463.36 11891.3 77931.4
Imports 929.15 1010.75 1115.89 1456.71 2481.99 2552.84 2486.08 3226.28 15259.7
Balance 608.11 793.70 1032.49 1726.03 1778.04 3091.06 4977.28 8665.02 62671.7
Sources: China Statistical Yearbook, various issues.
A different picture for the balance of trade between China and the MRB countries
has emerged. The major reason for China’s strong trade is its high level of manufacturing
capacity in exports. Actually, the balance of trade reflects a national industrial
competitiveness. The export commodities where China is specializing are products with
increasing returns-to-scale and high skill intensity. As the trade in machinery in China
27

increased, products made in China are shifting to more sophisticated machinery and away
from mass-manufactured, low-technology goods. Although much of this production
involves the assembly of high-technology products using low-skill workers, there has
been true improvement in China’s technological production capacity. The study on a
revealed comparative advantage (RCA) among developing East Asian economies shows
that China is not only gaining competitiveness in high-technology products; it is also
becoming more competitive in a broader range of machinery products.vi Machinery has
become an important trade commodity for China. In the past decade, this commodity
group has turned into the most important driver for exports.
On the other hand, the balance of trade has been heavily in Thailand’s favor for
many years. Thailand’s exports to China have continuously shown a huge surplus every
year, reaching US$42.95 billion within the sample period.
In sum, China’s trade deficit has accumulated to US$11.04 billion over the period
2000-2007. The evolution of its export commodities has a direct impact on these
respective trade partner/countries.
2.3. Trade partnership between China and MRB countries
This study estimates China’s share in the MRBC trade, since we are assessing the
ability of the MRBC industries to penetrate the world market or increase their export
capacity to other countries. To complete this analysis, we also consider two additional
factors: export and import diversification/concentration, which would be most
appropriate for identifying the real situation of China and MRB countries’ trade
28

partnership. The share of MRB countries’ major trade partners is indicated in Table 5 for
the year of 2007, for which latest data are available.
Table 5. MRB countries’ top four trade partners in 2007
Export Partners Import Partners
Cambodia US (58.1%), Germany (7.3%),
UK (5.2%), Canada (4.6%)
Thailand (23.1%), Vietnam (16.9%),
China (15.0%), Hong Kong (10.4%)
Lao PDR Thailand (32.7%), China (15.9%)
Vietnam (14.3%), South Korea (4.9%)
Thailand (68.5%), China (9.3%),
Vietnam (5.5%)
Myanmar Thailand (44.3%), India (14.5%),
China (7.1%), Japan (5.7%)
China (33.7%), Thailand (19.1%),
Singapore (15.5%), South Korea (5.8%)
Thailand US (12.6%), Japan (11.9%),
China (9.7%), Singapore (6.3%)
Japan (20.3%), China (11.6%),
US (6.8%), Malaysia (6.2%)
Vietnam US (20.8%), Japan (12.5%),
Australia (7.3%), China (6.9%)
China (19.9%), Singapore (12.1%),
Taiwan (11.0%), Japan (9.9%) Sources: Author’s calculation from various sources.
We analyze the impact of export concentration of MRB countries on the low level of
trade observed among them. Indeed, if these countries export only agricultural goods and
raw materials dedicated to developed countries, their bilateral trade will obviously be low.
To assess such effect, to Table 5 shows that the major destination of Cambodia’s exports
are the developed countries such as the United States (58.1%), Germany (7.3%), the
United Kingdom (5.2%), and Canada (4.6%). For Vietnam’s export destinations, the
United States and Japan accounted for 20.8 percent and 12.5 percent, respectively.
Indeed, for Lao PDR and Myanmar, their export destinations suggest that
neighboring countries have higher trade concentration. For instance, Thailand has been
the major export market of Lao PDR (32.7%) and Myanmar (44.3%) in 2007, while
China accounted for 15.97 percent and 7.1 percent, respectively.
29

Generally, China has been one of the top four trading partners for all MRBC exports
and imports in the year of 2007, except for Cambodia’s exports. Major import partners for
Vietnam are China (19.9%), Singapore (12.1%), Taiwan (11.0%) and Japan (9.9%).
China accounted for 33.7 percent of Myanmar’s total imports, while has only 19.1
percent and 15.5 percent for Thailand and Singapore’s, respectively. In comparison,
Japan exported less products to this region except for Thailand, where Japan was the top
import partner, accounting for 20.3 percent of Thailand’s total imports. Geographically,
China has border linkages with Vietnam, Lao PDR, and Myanmar. This fact, as show by
Table 5, proves thus that the geographical proximity has paved a way for the regional
trade integration between Thailand and the MRB countries but with the exception of
Vietnam, which already has a special trade preference with economies outside of the
Mekong Basin River region.
2.4. Impact of regional trade integration
The potential for further expanding these trade links is apparent if we consider the
strong demand from China’s economic development. In addition, both China and the
MRB countries wish to enhance economic cooperation and integration level by
expanding trade relationships. Its long experience in intra-regional cooperation makes
MRBC a good case study when considering issues related to trade growth among
neighboring countries. In the last decade, the economic situation faced by the MRB
countries encouraged them to reinforce their solidarity via deeper economic integration.vii
From the above discussion, two types of advantages seem to affect these countries’
trade performance: One is due to their location in an industrializing area, and one is due to
30
the higher integration of South-East Asian economy when cross-transit of production
factors within this basin-region easily flowing.
Beyond this analysis of trade growth between China and the MRB countries, we
need to propose an alternative way to explain the trade composition and the determinants
of trade flows between China and the respective countries: By using the Harmonized
System of the United Nations Conference on Trade and Development (UNCTAD). We
now turn to the next section.
3. COMPOSITION OF TRADE BETWEEN CHINA AND MRB COUNTRIES
This section takes a comprehensive look at the findings available from
country-specific data and detailed surveys separately carried out on the MRB countries’
trade classification. . It considers the emerging trends in the economies of China and the
MRB countries and proceeds to discuss the trade-oriented industrial development in
Cambodia, Lao PDR, Myanmar, and Vietnam, and how these trades have affected these
countries’ cooperation with China.
Increases in exports from the MRB countries have occurred primarily in
manufactured goods. Despite a few temporary downturn, the manufactured exports have
been steadily increasing since 2000. Obviously, this increase in manufacturing exports
and FDI inflows reflect to some degree the improving integration of MRB countries into
the flexible manufacturing system. Indeed, the MRB countries’ involvement in the global
manufacturing system is perhaps the most important characteristic of the South East
Asian economic integration. It boosted trade within narrowly defined
sectors---specifically, intra-industry trade, particularly in Vietnam.
31

3.1. Data explanation
The dataset used in this section is drawn from two different sources. The first one,
used in most part of the trade structure analysis, is drawn from the United Nations
Commodity Trade Statistics Database (UN Comtrade). The second dataset, used only to
estimate trade volume between China and the MRB countries, is drawn from the China’s
State Statistical Yearbook. This dataset comprises country-level trade flows based on
bilateral trading activities.
Given these restrictions on the trade information of MRB countries, some of the
calculations presented here may differ slightly from that of the World Development
Indicators. However, the difference is minimal.
3.2. An evolution of China’s export composition
We start by providing some facts about the structural change of China’s exports at
the sector level between 2000 and 2007. Table 6 below shows the value of trade in 2007,
which makes up around 90 percent of China’s total exports of manufactured goods.
It should be pointed out that China’s export of electronics and machinery has
changed significantly from one belonging to the low value-added, labor-intensive
category to one characterized as using intermediate technology, over the period of
2002-2007. The same story applies to the export of miscellaneous manufactures. China
has continued to decrease its share in exports throughout the same period, although it did
not have an absolute decline in export volume.
32

There is a high level of concentration of exports. The top two sectors alone
(machinery and textiles industries) accounted for 54.65 percent in 2000 and 60.08 percent
in 2007 of the total, respectively. When we expand the coverage to the top five sectors,
nearly 80 percent of the value of exports was composed of manufactured goods in 2007.
Majority of these top sectors comprised technology-intensive contents, although these
were also importing for local processing and assembling production in such industries.
The largest manufacturing sector is machinery, which accounted for around 50 percent of
the total manufacturing exports. Textiles comprised 14 percent of total exports, while
base metals and their products accounted for nearly 10 percent in 2007.
Table 6. China: export composition, 2000-2007 (US$ million)
2000 2007
HS Section Trade Value Share (%) Trade Value Share (%)
Chemicals and related products 11639 5.20 51085 4.42
Plastics and rubber 7949 3.55 36513 3.16
Leather and fur products 7505 3.35 16364 1.42
Wood and wood products 2680 1.20 11390 0.99
Paper and related products 1852 0.83 9193 0.80
Textile and related products 49379 22.07 165802 14.34
Footwear 11958 5.35 30579 2.65
Ceramic glass 4047 1.81 18295 1.58
Base metals 16609 7.42 115530 9.99
Machinery and electric equipment 72885 32.58 528815 45.74
Vehicles 9379 4.20 54977 4.76
Optical and precision instruments 8536 3.82 40729 3.52
Sub-total 204436 91.37 1079272 93.34
Total manufactured goods 223734 100.00 1156267 100.00 Note: HS: The Harmonized System. Sources: China Statistical Yearbook, 2001, 588-590; 2008, 712-716.
Meanwhile, exports of traditional labor-intensive manufactured products accounted
33

for a small share of total exports: For example, there is footwear with 2.65 percent; and
leather and fur products, with 1.42 percent of China’s total exports in 2007.
China is the world leader and largest exporter in the textile and garment sectors.
China’s export accounted for more than 25 percent and 21 percent of total world exports
of textiles in 2006 and 2007, respectively; and 33.4 percent of the clothing sector in
2007.viii In addition, China’s steel products accounted for 10.9 percent of the global
exports in 2007, as compared with Japan’s (7.3%) and Russia’s (4.7%).ix
China also leads as a world exporter of other commodities such as
telecommunications equipment, cell phones, etc. Interestingly, for its largest sector,
machinery and electric equipment, China is becoming a large player in the world market
based on 2007 data. For instance, the telecommunications equipment and integrated
circuits and electronic components accounted for 26.1 percent and 8.5 percent of the total
world exports in 2007.
The productivity growth as well as the global economic boom in semiconductors,
cell phones, computers, telecommunication equipment, and steel industries both helped
China’s export growth. Of course, the growing machinery categories in China include a
disproportionate share of assembly and relatively simple products such as personal
computers as well as parts, rather than highly sophisticated complex capital goods. Some
of these exports represent a shift of production from East Asian countries, especially
Japan and South Korea, where costs have been rising. For instance, over the period
2003-2007, the trade deficits for China-Japan and China-South Korea was US$107.96
billion and US$192.01 billion, respectively. China is not yet as technologically advanced
as Japan or South Korea.
34

The above findings show that the ongoing changes in the export structure reflect the
changes of China’s comparative advantage from textiles and garments sector to
machinery and electronics industries. Such have clear impact on the trade composition
between China and the MRB countries in the past few years.
3.3. A survey of MRB countries’ trade features with China
The rapid expansion of external trade and FDI plays a part in the economic
development in the Mekong River Basin region. Through external trade and FDI, MRB
economies have obtained technology and management know-how from foreign countries,
thereby improving production and technological capability.
Productivity increases can occur because of imports as well as exports. In this case,
the process is typically related to the imports of new machinery featuring more advanced
technologies than the machinery to be replaced. For export activities to support economic
growth in a sustained manner, it helps if those activities lend themselves to technological
upgrade and associated learning processes. For example, when Lao PDR and Myanmar
liberalized their trading regimes, firms imported more physical capital (machines) to
increase their export capability. There is some evidence, therefore, that international trade
can promote productivity in a country, and it is possible that increases can, in turn, hike
the income of people.
Generally, items exported by the MRB countries are almost all low-technology,
labor-intensive manufacturing industries such as textiles and garments, footwear, leather
products, processed foods, and minerals. The share of sophisticated manufacturing
35

products remains negligible. However, there have been dramatic changes in trade patterns
over the years for Cambodia and Vietnam.
Manufacturing exports are increasingly important for the MRB countries, although
agricultural exports remain relatively important for Myanmar and Lao PDR than for
Cambodia and Vietnam. For Cambodia and Vietnam, the growth of exports of textiles and
clothing, particularly under the Multi-fiber Arrangement (MFT) quotas, has been a
contributing factor to the rising export ratio, but only Vietnam has witnessed a diversified
export structure.
Although the general information on bilateral trade between China and MRB
countries is provided in Section 3, we should further analyze the changes of trade
composition through per-country studies. We turn to the description of these trade
compositions in the following section.
A. Cambodia
Trade policy in Cambodia has undergone a remarkable change during the last
decades. Obviously, Cambodia has moved toward bilateral, regional and multilateral
arrangements, and trade openness. Its membership in the ASEAN in 1999 and the WTO
in 2004 clearly marked a deepened integration into the regional and global trading system.
The export/GDP ratio was 47 percent in 2007, reflecting the liberalized character of
Cambodia’s external sector.
Under the ASEAN-China Free Trade Area’s Early Harvest Scheme signed in July
2003, China granted Cambodia, effective from January 1, 2004, a special preferential
36

37
tariff (SPT) treatment for 297 agricultural products at zero tariff rates. Cambodia
requested that China treat an additional 439 Cambodian commodities exported to China
with a special preferential tariff (SPT) at zero tariff rates.
Table 7 also shows the percentage of exports/imports between China and Cambodia
for the 10 sections over the period 2000-2006. In fact, a significant portion of exports
from China to Cambodia consists of manufactured goods On the other hand, majority of
Cambodia’s exports to China is composed of primary products and crude materials. The
exports of Cambodia manufactured goods to China have also been increasing since 2000.
Surprisingly, China’s exports to Cambodia increased substantially from US$164.06
million in 2000 to US$882.93 million in 2007. The share of manufactured goods
(classified chiefly by material) for export surged to 72.19 percent in 2006, from 68.27
percent in 2001 (from US$ 140.41 million to US$503.73 million). Besides, the share of
machinery slightly increased---from 14.68 percent to 15.5 percent (from US$30.19
million to US$108.15 million). Aside from these two kinds of manufactured goods, China
exports food, beverage, tobacco, mineral fuels, chemical and related products, although
all comprise a small share of total exports. For the sample period 2001-2006, China’s
manufactured goods accounted for 95.37 percent of Cambodia’s total imports.
China’s imports from Cambodia decreased from US$59.49 million in 2000 to
US$51.07 million. re The share of crude materials, China’s main import in 2006, and
inedible goods rose from 23.71 percent in 2001 to 61.54 percent in 2006 (from US$8.25
million to US$21.60 million), while the share of manufactured goods decreased from
72.90 percent to 31.18 percent (from US$25.37 million to US$10.94 million).

Table 7. China’s trade composition with MRB countries
Trade Classification Exports to MRB Countries (Share of Exports) Imports from MRB Countries (Share of Imports)
Cambodia Lao Myanmar Thailand Cambodia Lao Myanmar Thailand
FOOD AND LIVE ANIMALS 2.18% 0.53% 3.50% 3.36% 3.71% 8.67% 8.37% 6.42%
BEVERAGES AND TOBACCO 1.60% 1.04% 2.56% 0.14% 0.00% 0.00% n.a. 0.01%
CRUDE MATERIALS, INEDIBLE, EXCEPT FUELS 0.12% 0.40% 0.58% 1.36% 42.54% 78.33% 85.36% 10.04%
MINERAL FUELS, AND RELATED MATERIALS 0.61% 0.28% 7.12% 1.02% n.a. 0.20% 0.07% 6.30%
ANIMAL AND VEGETABLE OILS, FATS AND WAXES 0.00% 0.00% 0.01% 0.03% 0.09% n.a. 0.00% 0.07%
CHEMICALS AND RELATED PRODUCTS 2.36% 2.08% 8.16% 11.21% 1.13% 0.68% 0.71% 15.79%
MANUFACTURED GOODS CLASSIFIED BY MATERIAL 74.01% 13.30% 35.81% 26.46% 47.21% 9.34% 4.43% 8.98%
MACHINERY AND TRANSPORT EQUIPMENT 12.94% 72.85% 35.72% 48.67% 0.17% 0.04% 0.51% 50.12%
MISCELLANEOUS MANUFACTURED ARTICLES 6.06% 6.92% 5.06% 7.34% 3.87% 2.11% 0.52% 2.24%
Other COMMODITIES AND TRANSACTIONS 0.12% 2.59% 1.49% 0.41% 1.28% 0.64% 0.01% 0.02%
Total 100.00% 100.00% 100.00% 100.00% 100.00% 100.00% 100.00% 100.00%
Sources: UN Comtrade.
38

B. Lao PDR
In Lao PDR, the transition from a centralized, planned economy to an open,
liberalized, market-oriented system was launched in 1986. This led to a strong revival of
economic growth, rapid increase in employment, and a boom in exports. The Lao
economy is dominated by subsistence agriculture, with a low level of industrialization.
The agricultural sector employs over 80 percent of the population, and contributes 39
percent to the GDP in 2008. The industry has gradually increased its share (34.3%) of the
GDP, with key economic activity focused on electricity production, handicrafts,
foodstuffs, chemical production, and mining.
Since 2000, China-Lao PDR trade volume has increased each year by an average of
25 percent; and the trade deficit for Lao PDR has been going up annually by an average of
15 percent. The volume of exports has increased substantially from US$6.42 million in
2000 to US$85.92 million in 2007, a 12-times jump within the eight-year period. During
the same period, Lao PDR has been increasingly diversifying its export structure, and
improving the quality of exported products to China. While crude materials such as food,
wood and wood products, and mining products are still important items for exports, their
share in total exports to China declined from 95.5 percent in 2001 to 88.92 percent in
2006. Meanwhile, the share of manufactured products increased substantially from 1.72
percent to 8.75 percent for the same period, except for chemical and related products.
The nation’s top three sectors are machinery (72.85%), manufactured goods
39

classified chiefly by materials (13.30%) and miscellaneous manufactured articles
(6.92%). All these accounted for 93.07 percent of Lao PDR’s total imports from China
over the same period. The share of machinery related to China’s direct investment
projects has increased from 66.11 percent in 2001 to 80.26 percent in 2006, and the share
of garment raw materials and miscellaneous manufactured articles has dramatically
decreased from 27.25 percent to 14.95 percent. Furthermore, there was a continuous
increase in import of machinery from China from 2001 to 2006 while the import of
garment raw materials started to decrease from US$15.96 million in 2004 to US$13.82
million in 2006.
As can be seen from the data provided above, there is an absolutely high level of
trade dynamics between China and Lao PDR. In another words, the import of machinery
accounted for the dominant portion of Lao’s total imports from China while crude
materials and inedible goods accounted for 78.33 percent of Lao PDR’s total exports to
China. All other major export commodities from Lao PDR such as tobacco, timber, sawn
wood, pressed wood, rattan, forest products, and minerals came from natural resources.
This indicates that Lao PDR manufacturing capacity has not yet been developed.
C. Myanmar
The detailed information on the composition and dynamics of trade between China
and Myanmar is in Table 7. China’s basket of exports to Myanmar for the period of
40

2001-2006 includes items such as chemical products (US$425.45 million), manufactured
goods classified chiefly by materials (US$1866.73 million), and machinery (US$1861.85
million). These three sectors become China’s main exports to Myanmar, accounting for
around 80 percent over the period 2000-2006.
Data show that Myanmar has been in a large trade deficit over the last seven years.
Myanmar exports to China have been largely dominated by raw materials, which
accounted for 85.36 percent of total exports to China; and food and live animals, which is
8.37 percent of the exports over the same period. In fact, majority of Myanmar exports
either are derived from natural resources or are agricultural goods, which is indicative of
its less developed economy. On the other hand, with Myanmar’s increasing acceptance of
China’s low-priced manufactured goods, further rapid growth in China’s exports to
Myanmar is expected.
In sum, China’s exports to Myanmar in all categories have increased, while
Myanmar’s exports to China have remained constant. In comparison with the evolution of
Cambodia’s export composition (i.e., where Cambodia’s export of manufactured goods to
China has been increasing), Myanmar should boost its industrialization process and
increase its manufacturing production’s capacity.
D. Vietnam
In the past 20 years, Vietnam recorded impressive achievements in terms of GDP
41

growth, foreign trade expansion, and FDI inflows. It undertook several measures to open
the economy and integrate it into the global economy. The measures have contributed to
improving transparency, expanding market access for all importers and exporters, as well
as increasing competition among various kinds of firms. Vietnam joined the ASEAN in
1995 and became a member of the WTO in December 2005. Indeed, it has regained the
growth momentum for the last few years, with average annual growth rate of over 7.5
percent for the period 2000-2007.
During the said period, foreign trade between China and Vietnam grew five times
(from US$2.47 billion to US$15.12 billion), in which exports to Vietnam increased 6.74
times while imports from Vietnam rose 2.47 times. Table 7 provides the breakdown of
major commodities between China and Vietnam with their percentage share.
Major items exported by Vietnam to China are raw materials such as food and live
animals (8.10%), crude materials and inedible goods (12.21%), mineral fuels, lubricants
and related materials (61.37%) in the period 2001-2006, totaling 81.68 percent. Thus,
majority of the export products are agricultural and commodity-based, although
chemicals and related products accounted for 3.19 percent of the total exports to China.
On the other, the share of exported manufactured products substantially increased from
8.46 percent in 2001 to 27.49 percent in 2006 (from US$ 85.58 million to US$ 683.35
million). By 2006, the share of Vietnam’s machinery to China had increased to 8.71
percent (from 2.04% in 2001) of total export turnover.
42

Meanwhile, China’s exports to Vietnam are mainly mineral fuels, chemical products,
machinery, and manufactured goods such as textiles and apparel products. The largest
products are manufactured goods classified chiefly by materials, which accounted for
around 34 percent of China’s total exports to Vietnam. This is followed by machinery,
with 25 percent; and chemicals and related products, with 14 percent of total exports.
3.4. A view from the role of industrial capacity to trade composition
The patterns-of-development analysis on structural change focuses on the sequential
process through which the economic, industrial, and institutional structure of a
developing economy is transformed over time to permit new industries to replace
traditional agriculture as the engine of economic growth.x
Almost of all the MRB countries are agrarian in their economic, social and cultural
outlook. Agriculture, both subsistence and commercial, is the principal economic activity
in terms of the occupational distribution of the labor force, if not in terms of proportionate
combinations to the GDP. It is in the relative importance of both industry and service
sectors that we find the difference among the MRB countries. Thailand, having a long
history of industrialization and generally higher levels of national income than that of
Cambodia, Lao PDR, Myanmar, and Vietnam, possesses more advanced industrial
sectors. Over the last two decades, countries such as Cambodia and Vietnam greatly
accelerated the growth of their manufacturing output and rapidly became
43

newly-industrializing countries.
In terms of sheer size, China has one of the largest manufacturing sectors in the
world. For instance, its volume of value-added output quadrupled, from US$238 billion
in 2000 to US$1233 billion in 2007. Furthermore, the number of motor vehicles
manufactured grew from 2.07 million units in 2002 to 10 million units in 2008. China has
substantially increased its industrial capacity over the last three decades.
Table 8 provides information on the distribution of labor force and GDP in three
sectors: agriculture, industry, and service in five countries. The contrasts among the
industrial structures of these countries are striking, especially in terms of the relative
importance of agriculture.
44

Table 8. Industrial structure in China and MRB countries
Agriculture Industry Service
GDP (2008)
Cambodia 31.9 26.0 43.0
Lao PDR 19.2 34.3 26.6
Thailand 11.4 44.5 44.1
Vietnam 19.0 42.7 38.4
China (2007) 11.3 48.6 40.1
Labor (2005)
Cambodia 75.0 n.a n.a
Lao PDR 80.0 20.0 Including in industry
Thailand 42.6 20.2 37.1
Vietnam 55.6 18.9 25.5
China (2007) 40.8 26.8 32.4
Sources: Author’s collection from various sources.
a. Majority of the labor force in the MRB countries lives and works in rural areas.
Over 75 percent are rural based for Cambodia and Lao PDR, compared to less than
41 percent in China and 43 percent in Thailand. Agriculture accounts for 55 percent
of Vietnam’s labor force.
b. Agriculture contributes more than 30 percent of the GDP of Cambodia and Lao PDR
but only around 11 percent of both China and Thailand.
c. Industry provides the most important contribution to the economic growth of
45

developed countries as well as those newly-industrializing nations. Obviously, the
proportion of industry to GDP for China is 48.6 percent, higher than any
corresponding regional partners among the MRB countries (Vietnam, 42.7%; Lao
PDR, 34.3%; and Cambodia, 26%). Meanwhile, the labor force in industry accounts
for 26.8 percent of China’s total labor. This figure is significantly higher level than
that of Thailand and Vietnam.
Because of the dramatic growth in China’s industrial capacity over the past 30 years,
the division of labor within China would be different from that of its MRB trade partners.
The proportion of its labor force in agricultural activities has gradually declined from 70
percent in 1978 to 40 percent in 2008, a drop of 30 percentage points. There has been a
corresponding shift of the labor force away from rural, agriculture, and related
nonagricultural activities and toward urban-oriented manufacturing and service pursuits.
This rapid structural change has a very positive impact on China’s industrial
capacity in the world markets. Therefore, for the same significant industrial structural
change to also take place in the MRB countries, determining how to enhance their
manufacturing sectors’ capacity should be at the top of its list of economic development
strategies.
Table 8 shows the relative comparative advantages for China and the MRB countries
in the early 21st century. The discussion earlier on the composition of trade between China
and the MRB countries provides some insight into the changing role of China in the
regional economy. Export’s composition reflects the traditional hierarchy: (a) It starts
46

with raw materials and foodstuffs representative of the lowest income countries; (b) This
then evolves into a rise in the manufactured mass-produced products; and (c) Finally,
there is a shift to technology and capital goods as the economy’s production matures.
Within the MRB countries, China is the region’s dominant exporter. It is reasonable to
forecast that the MRB countries will follow this industrial development and trade patterns
to increase their manufacturing export capabilities in the coming years.
3.5. Critical comments on China’s trade composition with MRB countries
The industry-specific estimation provided interesting additional results, two of
which are most appealing. First, industrial capacities seem to matter in the
nonagricultural raw materials-and-machinery trade between China and the MRB
countries. China’s comparative advantage seems to be moving into the machinery and
capital-goods industries, which constitute a large proportion of exports to the MRB
countries that are at a lower industrialization stage than China. Thus, this kind of trade
pattern will continue for a couple of years. Second, it appears that the textile and clothing
industry involved in the intraregional trade faces a strong border connection that is
revealing an escalated trade integration process between China and the MRB countries,
particularly for Vietnam in the last few years.
In the Mekong River Basin region, industrialization tends to go hand in hand with an
expansion in the labor-intensive industries as it moves into the global production chain.
47

The fact that China is at a level in the technological stage where its products exhibit
increasing returns-to-scale (such as machinery, automobile, electronics, and its parts and
components) has exacerbated the degree of specialization within global production
networks. Over time, these MRB countries have become more specialized in producing
components and other intermediate inputs for firms in Cambodia and Vietnam,
suggesting that economic integration is an important contributor to the region’s
development. China has created a supply of labor-intensive intermediate inputs sufficient
to push a wave of industrialization in this region, except for Thailand, in terms of the type
of manufacturing activities these countries perform.
China imports a significant part of raw materials and industrial components needed
in the production of its manufactured goods. As China’s per-capita income continues to
grow, it needs more food and agricultural products. The MRB countries can take
advantage of having a preferential access to the Chinese market by supplying China with
rice, sugar, tropical fruits, natural rubber, pulses, and vegetable oils where they have a
competitive advantage. Furthermore, if the composition of MRBC exports is changing
toward goods of relatively higher productivity, namely, from natural resource products to
manufactured goods, then one could expect an increase in the volume of exports to China.
4. CHINA’S FDI IN MRB COUNTRIES
Foreign direct investment (FDI) is the acquisition of shares by a firm in a
48

foreign-based enterprise that exceeds a threshold of 10 percent, implying managerial
participation in the foreign enterprise. The FDI is one means of effecting services trade,
but is also important in the production of merchandise. Under the right condition, FDI can
generate direct and indirect increases in employment, promote competition, improve the
training of host-country workers, and transfer technology from one country to another. xi
A large number of empirical studies on the role of FDI in host countries suggest that FDI
is an important source of capital, complements domestic private investment, is usually
associated with new job opportunities and enhancement of technology transfer, and
boosts overall economic growth in host countries.xii Much of FDI contributes in this way.
4.1. New development of China’s outward direct investment (ODI)
The FDI began to pour China after 1992, and annual inflows have been over US$50
billion since 2002. Inflows were around US$70 billion in 2006 and 2007, respectively, by
far the largest of any developing countries. In 2007, inflows to China reached an
estimated US$83.52 billion, which represented 4.56 percent of the world’s FDI flows,
and 16.71 percent of developing country’s FDI flows. The stock of FDI up to 2007 in
China was US$327.09 billion and accounted for 2.15 percent of the world FDI flows and
7.7 percent of developing country’s FDI flows.xiii
China is not just a magnet for FDI but is increasingly also a source of FDI. Although
China’s Outward Direct Investment (ODI) is still small in absolute terms, especially when
49

compared to the huge inward flow, its overseas enterprises have been quietly gaining
importance as new sources of international capital. As China’s economy continues to
grow and becomes a capital-surplus economy, its policies encourage the capital outflow
to overseas. China’s ODI, excluding the financial sector, reached US$24.84 billion in
2007, up 55 percent over 2006. It now represents the fourth largest outflow from
developing and transitioning countries. China’s stock of ODI in other countries was at
US$101 billion in 2007,xiv which accounted for 2.95 percent of China’s GDP.
The launch of the “Going Global” strategy, which intends to promote the
international operation of capable Chinese firms with a view to improving resource
allocation and enhancing international competitiveness, was formally adopted in 2000.xv
The main activities attracting Chinese investment are commercial supporting, trade, and
mining (21.16%, 24.92%, and 15.33%, respectively, of total ODI in 2007). In recent years,
ODI in manufacturing has grown especially fast. In 2003, for example, it accounted for
21.86 percent of total ODI.
4.2. China’s ODI flows to MRB countries
Since the late 1990s, FDI has emerged as the most important foreign resource flow
for the MRB countries as a whole, surpassing foreign aid or official development
assistance (ODA) by increasing amounts. Despite some volatility for Lao PDR in 2001
and Myanmar in 2002, the long-term growth and volume of these flows has been
50

remarkable, inspiring much comment on the possibility of private capital replacing aid.
Data demonstrate an unprecedented record of FDI inflows in the MRB countries. These
new inflows are related to the increased manufacturing exports of East Asia, because FDI
has been these MRB countries’ integration vehicle into the global manufacturing system.
It is important to further study these countries because of their share of FDI flows and
their strong growth over the sample period.
At this point, it makes sense to briefly discuss the data collection issue. Although
great strides have been made to improve the foreign investment data in this region, it is
still difficult to get an accurate and up-to-date profile on FDI activities between China and
the MRB countries. There are three sources of data on China’s ODI flows to the MRB
countries: There is the China Statistical Yearbook, published by China State Statistical
Bureau annually, which provides the amount and sector distribution of ODI from 2004.
This is our major data source for China’s ODI. The second source is UN Comtrade, which
is largely the source of the breakdown of China’s investment in the MRB countries.
However, this dataset shows that more FDI flows to the MRB countries in comparison
with UNCTAD database, our third source of FDI data. The data limitations make it quite
difficult to get anything more than a broad impression of FDI patterns between China and
the MRB countries in the past few years.
A. China’s FDI in Asia and MRB Countries in General
51

Note that Table 9 shows data different from that of the UNCTAD database.
According to a Chinese official, Asia accounted for 54.57 percent of China’s ODI flows
in 2004, but dropped to 35.68 percent and 43.46 percent in 2005 and 2006, respectively,
and grew back to 62.6 percent in 2007. The UNCTAD data show that the amount of
China’s outward FDI was US$21,160 million in 2006 and US$22,469 million in 2007.xvi
Table 9. China’s outward direct investment (ODI), 2004-2007 (US$ million)
Net-ODI ODI in Asia Asia’s Ratio to Total ODI (%)
2004 5497.99 3000.27 54.57
2005 12261.17 4374.64 35.68
2006 17633.97 7663.25 43.46
2007 26506.09 16593.15 62.60 Sources: 2008 China Statistical Yearbook.
The trends in the share of FDI in the GDP of MRB countries are shown in column 3
of Table 10. Among the five countries, both Thailand and Vietnam performed extremely
well in attracting foreign investment. Vietnam has been widely recognized for its success
in attracting FDI. Since 2002, FDI inflow in Vietnam has surpassed that of Thailand.
Table 9 provides the ODI data from the 2008 China’s Statistical Yearbook and shows
that Asia is the most important destination for China’s ODI over the period 2004-2007,
52

accounting for around two-thirds in 2007. As a matter of fact, the increase of China’s ODI
in Asia has been systematically rising from US$3.0 billion in 2004 to US$16.59 billion in
2007.
Column 3 in Table 10 reveals that following the gradual liberalization of foreign
direct investment in MRB countries, the FDI in these countries is now sizeable. They
have, in fact, been one of the major recipients of China’s FDI in South-East Asia since
2003.
By examining the annual distribution of China’s FDI in this region, we realized that
China’s contribution was very small: Only 2.69 percent of Vietnam’s total FDI inflows
and 5.41 percent of Myanmar’s FDI inflows over this period came from China.
Table 10. FDI inflows and China’s share of total FDI in MRB countries
(US$ million)
Country Period Value in US$ China’s FDI China/TotalCountry /China’s
FDI in MRBC
Cambodia 2000-06 4871.87 1397.99 28.70% 32.34%
Lao PDR 2001-06 5490.27 705.40 12.85% 15.29%
Myanmar 2000-07 7449.62 443.52 5.95% 9.99%
Thailand 2000-08 52311.40 253.40 0.48% /
Vietnam 2002-07 166331.65 4480.93 2.69% 42.37%
Notes: MRBC/China’s FDI ratio refers to the proportion of respected country’s FDI flows from China among MRB countries over the period 2000-2007. Sources: UN Comtrade.
53

During the global economic boom, China’s investment in the MRB countries
increased rather than decreased: from US$1.02 billion in 2005 to US$2.07 billion in 2006.
Meanwhile, China’s ODI flow into Myanmar and Vietnam in 2007 significantly
increased to US$281.22 million and US$1744.03 million, respectively. Table 10 shows
Vietnam as the country to attract China’s biggest FDI, accounting for 42.37 percent of
China’s total FDI in this region. Vietnam is then followed in rank by Cambodia, which
garnered 32.34 percent over the same period.
B. Features of China’s FDI Distribution among MRB Countries
To understand the role of capital flows in the economies of MRB countries as well as
their implication on trade growth, we need to look at the recent figures. We noted the
volatile nature of FDI relative to trade.
Table 11 provides detailed information on China’s FDI flows to the MRB countries
in recent years. Some features of China’s capital flows in the Mekong River Basin region
are based on country studies over the last few years.
54

Table 11. Distribution of China’s FDI in MRB countries
Value FDI from China
Year US$ million US$ million Ratio to total
Cambodia
2003 275.71 33.05 11.99
2004 262.14 83.13 31.71
2005 1041.84 451.96 43.38
2006 2633.00 763.00 28.99
Total 4212.69 1331.14 31.60
Lao PDR
2003 465.99 119.86 25.72
2004 533.15 28.20 5.29
2005 1245.31 58.12 4.67
2006 2699.69 423.23 15.68
Total 4944.14 629.41 12.73
Myanmar
2004 91.17 2.82 3.09
2005 158.28 126.55 79.95
2006 6065.68 0.70 /
2007 752.70 281.22 37.36
Total 7607.83 411.29 5.41
Thailand
2003 5165.00 23.79 0.46
2004 4956.00 / /
2005 6503.11 11.49 0.18
2006 10479.02 49.85 0.48
2007 10199.02 73.65 0.72
Total 37302.15 108.93 0.29
Vietnam
2002 7357.67 334.80 4.55
2003 9262.64 584.44 6.31
2004 11820.24 440.94 3.73
2005 24814.86 496.57 2.00
2006 37215.90 880.55 2.37
2007 75860.34 1744.03 2.30
Total 166331.65 4480.93 2.69Sources: Data from UN Comtrade.
55

China’s ODI to the MRB countries has substantially increased since 2002. As earlier
mentioned, both Cambodia and Vietnam out of the five countries also performed
extremely well in attracting China’s foreign direct investment. Estimates from the
recently released data clearly suggest that China’s FDI to Vietnam rose from US$334.80
million in 2002 to US$1,744.03 million in 2007. Between 2002 and 2007, China’s FDI to
Vietnam exceeded US$4.48 billion, of which more than four-fifth entered the country
after 2005, particularly in 2007. This has been recently attributed to the number of
reforms undertaken by Vietnam in recent years. Other points noted here are:
a. Cambodia. Data from UN Comtrade show that the direct investment from
China to Cambodia amounted to US$763 million in 2007, and that China’s investment
accumulated to US$4.87 billion for the period of 2000-2006. Cambodia’s share of
China’s total capital outflow is negligible, while China’s share of Cambodian capital
inflow is at 28.7 percent. Table 11 also shows the share of China’s investment out of
Cambodia total FDI as 43.38 percent in 2005 and 28.99 percent in 2006. This indicates a
continuous flow of China’s capital into Cambodia due to the efforts made by the
Cambodian and Chinese governments through bilateral and regional arrangements.
The destination of China’s outward FDI in South-East Asia seems to shift to the
Mekong region, particularly Cambodia, in an effort to explore low labor cost for the
garments industry. The comparative advantages of both countries are complementary due
to the quick appreciation of Chinese currency and the rise of Chinese labor cost in the past
four years. A recent study by Kum Kim and Seng Sovirak on opportunities and conditions
56

of investment in Cambodia’s garments industryxvii shows that Cambodia possesses
strengths such as access to the dynamic ASEAN market as well as preferential access to
the European Union, the United States, and other developed regions because of it’s Less
Developed Country (LDC) status, in comparison with Chinese firms.
b. Lao PDR. The Foreign Investment law of Lao PDR promulgated in 1988 seeks to
encourage foreign investment as a means to facilitate economic development. In 2003,
the amount of foreign direct investment was US$466 million, of which China invested
US$119.86 million, accounting for 25.72 percent of the total FDI in Lao PDR. The value
of FDI increased more than four times from 2003 to 2006, while China’s FDI flows
increased only 2.5 times over the same period. Traditionally, China has been interested in
participating in pre-exploration or mining of materials in Lao PDR.
c. Myanmar. China has been a big investor in Myanmar in the past years.
Investment from China to Myanmar amounted to US$443.52 million over the period
2000-2007. China’s share in Myanmar’s total capital inflow is less than 6 percent.
However, in 2005 and 2006, China’s share in Myanmar’s capital inflow was 79.95
percent and 37.36 percent, respectively. Except for 2006, China has been the largest
foreign direct capital provider to Myanmar since 2000. Among the MRB countries,
Myanmar, together with Lao PDR and Vietnam, has border connectivity to China. The
capital flow to Myanmar is expected to increase beyond the current levels just because of
the geographical conditions and cultural similarities between the countries.
57
d. Vietnam The Foreign Investment Law of Vietnam, promulgated in 1987, was the
first law designed to promote the development of a market-oriented economy, and
marked the very beginning of the country’s open-door policy. As part of the
decentralization process, more autonomy was given to provinces to make decisions on
foreign investment. Therefore, local authorities competed to attract foreign investment
and increase jobs for local people, which resulted in a significant improvement in
Vietnam’s investment environment.
Vietnam is active as an FDI recipient, attracting US$15.38 billion over the period of
2002-2007---a feat more than that of Cambodia, Lao PDR, and Myanmar. Obviously, the
bulk of the Mekong region’s FDI goes to Vietnam, which in fact has been a big FDI
winner among the MRB countries in the last few years. In 2007, the FDI inflow into
Vietnam was US$75.86 billion, in comparison with US$10.20 billion for Thailand and
US$752.7 million for Myanmar.
East Asia is the most important source of FDI in Vietnam. The country attracted a
quite large amount of FDI from Singapore, South Korea, and Japan. Since 2002, China’s
direct investment inflows into Vietnam seem to have increased from US$334.80 million
in 2002 to US$1.74 billion in 2007. China ranked sixth among Vietnam’s FDI providers,
following right behind Japan.
China’s investment in Vietnam has kept growing, with total invested capital of
US$4.48 billion in 2002-2007. Table 11 shows that the share of China’s FDI was only
58

2.37 percent and 2.30 percent of Vietnam’s total FDI in 2006 and 2007. Japan’s, on the
hand, was 11.16 percent in 2006 and 5.48 percent in 2007, respectively.
e. Thailand China’s FDI flows in the Mekong region is highly concentrated, with
Thailand slightly involved as a FDI recipient. The share of FDI from China accounted for
only 0.72 percent of Thailand’s total FDI in 2007, a figure so negligible.
It might appear that Vietnam’s FDI activity is working at a tangent to other elements
of the economic reform process. Yet, experience shows us that FDI policies should not
operate independently, but rather work in conjunction with other policies to create a
country’s investment environment.
By 2007, the impact of China’s capital flows to MRB countries seems to be
dependent upon the respective country or year. Therefore, at the same time, our results
clearly suggest the need for individual industry studies on the FDI-specific structure. This
remains an important challenge for future research.
4.3. Areas of China’s FDI to MRB countries
At present, direct investment from China tends to favor access to markets, natural
resources, and low labor-cost industries, which are abundant in the MRB countries. It is
quite clear that the MRB countries have a wage advantage relative to China in terms of
GDP per capita over the past few years. Overall, the trade pattern between China and the
59

MRB countries is also quite consistent with their relative factor endowments.
On one end, China’s wages are extremely low by East Asian standards. The annual
manufacturing earning of a Chinese worker was only US$1,923 in 2005. On the other
hand, China’s wages in dollar terms have been increasing rapidly. In fact, in some parts of
China where exports originate (such as Shanghai and Zhejiang province), wages are
higher than those in Thailand. In recent years, wages have been rapidly rising from
US$1,923 in 2005 to US$3,251 in 2007, jumping nearly 70 percent within two years. In
this regard, Cambodia, Lao PDR, Myanmar, and Vietnam have lower wages than these in
China’s coastal regions. The wage differentials that favor production in the MRB
countries (Cambodia and Vietnam) and the good impact of trade liberalization partly
explain the recent upsurge in MRBC exports. The relocation of clothing plants from
China to the MRB countries contributed to the growth in Cambodia and Vietnam imports
of textiles and related materials from China. Therefore, the MRB countries’ garment
industry can extend their production and exports to the global market. In addition,
Cambodia and Vietnam’s exported footwear has been enjoying an increasing competitive
advantage through the displacement of footwear exports partly from China.
Looking ahead, all these also reveal areas of opportunities for Chinese investors
such as in commercial agriculture and agro-processing, garments and other light
manufacturing; and infrastructure development and labor-skill training in the
manufacturing sector.
60

4.4. Prospects of China’s FDI flows to MRB countries
The large inflow of FDI, which is responsible for much of the export flow and
reflects the favorable economies of export production in MRB countries. The shift of
MRBC production from agriculture to manufactured goods with labor cost content proves
the power of comparative advantage among these four countries. It also reflects a
collaborative relationship with China, whose cost structure has outgrown the simpler
labor-intensive goods that supported earlier phases of China’s industrialization.
Obviously, China’s current strength in export markets results in improved
production, and the coming adjustments in production and trade would be consistent with
the gradual change of comparative advantage. If the MRB countries’ manufacturing base
and skill would be significantly improved, the pattern of trade will favor the MRB
countries, particularly in labor-intensive industries. Japan’s investment in China shows
the positive linkages between FDI and export growth. Indeed, China has recently become
an engine of intraregional trade growth for the Asian region and is one of the major export
markets for countries such as Japan and South Korea. By 2002, China had displaced the
United States as Japan’s largest source of inputs and received the bulk of Japanese FDI
among the regional economies. From 2002 to 2007, the amount of Japan’s FDI flows to
China was US$29.41 billion, accounting for 8.06 percent of China’s total FDI inflows.
The trade deficit between China and Japan reached US$ 112.99 billion over this period,
which was much larger than China’s FDI inflows from Japan. This FDI-trade linkage
seems to be happening in the MRB countries as well.
61

China’s FDI flows into the MRB countries shows that foreign direct investment has
been critical in improving this subregion’s ability to produce goods for the world market.
Foreign investors not only provide capital; in most cases, they are responsible for
technical and managerial skills and often provide foreign markets as well.
Foreign-funded firms integrate their local operations into a value chain that extends into
the world economy. This mechanism is also working well in FDI-backed MRB countries
in the past decade.
Table 12. China’s FDI and ODI performance, 2000-2007 (US$ million)
1990-2000 2004 2005 2006 2007
Inward FDI 30104 60630 72406 72715 83521
Outward FDI 2195 5498 12261 21160 22469
Out/Inward FDI (%) 7.29 9.07 16.93 29.10 26.90
Source: www.unctad.org/wir.
As far as outward investment is concerned, China has become a capital-surplus
country and its overseas investment has grown apace. An alternative way to evaluate the
development of ODI is to see them as a ratio of inward FDI inflows to China. Table 12
shows a substantially increasing outward/inward FDI ratio from 9.07 percent in 2004 to
29.1 percent in 2006, although it slightly declined to 26.9 percent in 2007. China’s
outward FDI played a considerably bigger role in world inward FDI: From only 0.77
percent of world FDI inflows in 2004, the contribution rose to 1.23 percent in 2007.
62

China has considerable trade surpluses up to this day. By end-2008, Chinese
official foreign exchange (FX) reserves alone exceeded US$ 1.95 trillion. The ODI may
increasingly become an alternative vehicle to establish the supply chain for overseas
markets. China’s ODI is now globally diversified and involved in a wide variety of
sectors, including banking, manufacturing, and natural resource exploitation. As part of
such a strategy, Chinese firms are also buying local distribution networks.
It appears that FDI from China into the MRB countries is still small in terms of total
FDI inflows. However, the prospects for growth in China’s FDI in MRB countries are
bright. A simple indicator of the existing potential is the comparison of China’s GDP per
capita with that of the MRB countries and the difference in their industrial structures.
These indicators show how the shift of labor-intensive production toward low-wage
destinations in neighboring MRB countries is largely desired.
5. CONCLUDING REMARKS
This study discusses the emerging trend of China’s trades and FDIs to the Mekong
River Basin countries over the past decade. China is now highly involved in this
subregional economic integration following her accession to the WTO in 2001.
The main findings from this documentary survey on new development of trade and
FDI flows are as follows:
First, China and MRB countries have had a long-standing good relationship based
63

on geographical and political connections. The MRBC’s share in China’s Asian
merchandise trade has been continuously on the rise, increasing from 3.65 percent in
2000 to 4.47 percent in 2007. International trade between China and the MRB countries
grew 4.5 times, where MRBC exports to China increased 2.34 times while imports from
China rose 5.56 times. Therefore, the balance of trade has been heavily in China’s favor
for many years. This phenomenon largely reflects the difference in the countries
industrial structures. Results indicate that this trade pattern between China and MRB
countries would continue if MRB countries cannot enhance their industrial capacity
within a short period.
Second, as far as trade composition is concerned, machinery has become an
important trade commodity for China since the early 21st century. This commodity group
has become the most important driver for China’s exports to the global developing
markets as well as to the MRB region in the past few years. On the other side, majority of
MRBC’s exports to China comprise primary goods and raw materials although exports of
manufactured goods have been increasing since 2000. As mentioned above, the trade
composition vividly mirrors the division of labor and both sides’ current stage of
industrial development. It is reasonably estimated, at the rate the industrialization in their
economies is going, that the MRB countries will expand their manufacturing abilities and
gradually increase the proportion of manufactured goods exported to China. This
evidence provides a new interpretation of how the dynamic change of MRBC industrial
power plays a role in their export competitiveness, particularly to China. So,
understanding the direction of trade composition and industrial transition is crucial when
64

formulating policies.
Third, China is not just a magnet for FDI, but increasingly also a source of FDI.
Using data on China’s FDI flows to MRBC from 2002 to 2007, this study analyzes the
impact of China’s FDI on total FDI inflows in the Mekong River Basin region. Actually,
China’s direct investment in MRB countries increased rather than decreased over an
eight-year period. Among the five MRB countries, Cambodia and Vietnam performed
extremely well in attracting China’s FDI. It is quite clear that the MRB countries have a
labor-cost advantage relative to China in term of income per capita; thus, more of China’s
FDI will be flowing into this region in the coming years.
Overall, we find that the Mekong River Basin’s regional integration has been
deepening in respect of trade and capital flows under the new wave of globalization. The
recent economic development in all MRB countries in the last eight years suggests that
the impact of China’s trade and FDI flows to this region is positive, but not as strong as
currently expected.
65

ENDNOTES
i This region is called another name: The Greater Mekong Sub-Region (GMS), which is proposed by
Asian Development Bank in 1992. ii Krueger, A.O. (1998), “Why Trade Liberalization is Good for Growth”, Economic Journal, 108,
450(September), 1513-22. iii The endogenous growth theories are pioneered by Rome and Lucas. Rome, P. (1986), “Increasing
Returns and Long Run Growth,” Journal of Political Economy, 94, 5(October), 1002-37. Lucas, R.
(1988), “On the Mechanics of Economic Development”, Journal of Monetary Economics, 22, 1(July),
3-42. iv Grossman, Gene M., and Elhanan Helpman, (1991), Innovation and Growth in the Global Economy,
Cambridge: MIT Press. Barro, Robert J., and Xavier Sala-i-Martin, (1995), eds. Economic Growth.
New York: McGraw Hill. v Sachs, J. (2001), “Tropical underdevelopment”, NBER Working Paper, no.8119. vi Mona Hadded, “ASEAN-China Free Trade Area: A Bane or Boon for ASEAN Countries?” The World
Economy, vol.28, No.2, February 2005. vii Jose L. Tongzon, “ASEAN-China Free Trade Area: A Bane or Boon for ASEAN Countries”, The World
Economy, vol.28, no.2 (February 2005), 191-210. viii WTO, 2008 International Trade Statistics, 104-114. ix WTO, 2008 International Trade Statistics, 73. x Michael P. Todaro, Economic Development, sixth ed., Addison Wesley Longman Limited, 1997, p.8. xi Ian Goldin and Kenneth Reinert, Globalization for Development, A Publication of the World Bank and
Palgrave Macmillan, 2007, p.80. xii The vast literature on the FDI-growth relationship and determinants of FDI, see Abdur Chowdhury and
George Mavrotas, “FDI and Growth: What Causes What?” The World Economy, vol.29, no.1, January
2006, pp.9-19. Henrik Hansen and John xiii UNCTAD, World Investment Report 2008: Transnational Corporations and the Infrastructure
Challenge, Country Fact Sheet: China. xiv 2008 China Statistical Yearbook, p.737. xv UNCTAD, World Investment Report 2006. FDI from Developing and Transition Economies:
Implications for Development, New York and Geneva: United Nations, p.210. xvi UNCTAD, World Investment Report 2008: Transnational Corporations and the Infrastructure
Challenge, Country Fact Sheet: China. xvii Kum Kim and Seng Sovirak, “Garment Exports: The case of Cambodia,” Dialogue and Cooperation.
FES Occasional Papers, vol. 15, 2006.
66

REFERENCES
A.O. Krueger (1998) “Why Trade Liberalization is Good for Growth.” Economic
Journal 108:1513-22.
Abdur Chowdhury and George Mavrotas(2006) “FDI and Growth: What Causes
What?” The World Economy 29, no.1:9-19.
China Statistical Bureau: China State Statistical Yearbook, various issues.
Gene M. Grossman and Elhanan Helpman (1991) Innovation and Growth in the Global
Economy. Cambridge, MIT Press.
Henrik Hansen and John Rand(2006) “On the Causal Links between FDI and Growth in
Developing Countries.” The World Economy 29, no.1:21-41.
Ian Goldin and Kenneth Reinert(2007) Globalization for Development. A Publication of
the World Bank and Palgrave Macmillan.
J. Sachs (2001) “Tropical underdevelopment.” NBER Working Paper no.8119.
Jose L. Tongzon (2005) “ASEAN-China Free Trade Area: A Bane or Boon for ASEAN
Countries.” The World Economy 28, no.2:191-210.
Kum Kim and Seng Sovirak (2006) “Garment Exports: The Case of Cambodia.” FES
Occasional papers vol. 15: Dialogue and Cooperation.
Michael P. Todaro(1997) Economic Development. Addison Wesley Longman Limited.
Mona Hadded(2005) “ASEAN-China Free Trade Area: A Bane or Boon for ASEAN
Countries?” The World Economy 28, no.2.
P. Rome and Robert Lucas (1986) “Increasing Returns and Long Run Growth.” Journal
of Political Economy 94, no.5:1002-37.
R. Lucas (1988) “On the Mechanics of Economic Development.” Journal of Monetary
Economics 22, no.1:3-42.
Robert J. Barro and Xavier Sala-i-Martin (1995) Economic Growth. New York,
McGraw Hill.
UNCTAD (2006) World Investment Report: FDI from Developing and Transition
Economies: Implications for Development. Geneva and New York: United Nations.
67

UNCTAD (2008) World Investment Report: Transnational Corporations and the
Infrastructure Challenge. Geneva and New York: United Nations.
WTO (2008) International Trade Statistics. Geneva.
68
Copyright © 2022 FDOKUMEN