Pyrolysis of biomass - USN Open Archive
81
www.usn.no Faculty of Technology, Natural sciences and Maritime Sciences Campus Porsgrunn FMH606 Master's Thesis 2021 Process Technology Pyrolysis of biomass Ahmad Dawod
-
Upload
khangminh22 -
Category
Documents
-
view
4 -
download
0
Transcript of Pyrolysis of biomass - USN Open Archive
www.usn.no
Faculty of Technology, Natural sciences and Maritime Sciences Campus Porsgrunn
FMH606 Master's Thesis 2021
Process Technology
Pyrolysis of biomass
Ahmad Dawod

www.usn.no
The University of South-Eastern Norway takes no responsibility for the results and
conclusions in this student report.
Course: FMH606 Master's Thesis, 2021
Title: Pyrolysis of biomass
Number of pages: 81
Keywords: Pyrolysis, Wood pellets, Operational conditions, Computational Particle Fluid
Dynamic (CPFD), Biomass air gasification
Student: Ahmad Dawod
Supervisor: Britt M. E. Moldestad
Hildegunn H. Haugen
Janitha Bandara
Availability: Open

www.usn.no
The University of South-Eastern Norway takes no responsibility for the results and
conclusions in this student report.
Summary:
Pyrolysis of biomass is considered to be a green technology since it has no impacts or
emissions to the environment. Pyrolysis of biomass is the initial stage in the gasification
process and is defined as the thermal decomposition of biomass into valuable products
such as char, tar, and gas. In this study, a pyrolysis reactor was designed and constructed,
and experimental tests were performed to study the pyrolysis products, especially the gas
compositions. An extensive literature study has been carried out on the pyrolysis of
biomass along with the effects of different operational conditions on the product yields.
Further, computational particle fluid dynamic (CPFD) simulations were performed to
study the composition of the synthesis gas obtained from the gasification of wood pellets.
The pyrolysis experiment was performed using wood pellets as the feedstock and the
reactor temperature was set to 500°C. The product yields were found to be 29.24%, 22.48%,
and 48.28% for char, tar, and gas, respectively. The char yield was within the range compared to
the literature, while the tar yield was lower, and the gas yield was significantly higher. The
deviation is mainly due to experimental uncertainty, where condensable tar escaped with the gas.
Gas samples were further analyzed by a gas chromatograph (GC) and the average gas
compositions were 62.02%, 6.73%, and 33.15% for cumulative CH4 and CO, H2, and CO2,
respectively. The results agreed well with the results from the literature, especially for H2 and CO2.
A CPFD model was created using the Barracuda Virtual Reactor 17.4.1 software. Three simulation
cases were created by varying the reactor temperature and pyrolysis gas compositions. The effect
of the pyrolysis step was found to be significant, especially on the production of CO, H2, and CH4.
This is mainly because 85 wt.% of the synthesis gas was produced during the pyrolysis stage.
Comparing the simulation results with the experimental results showed a good agreement on
predicting CH4 and H2 while overestimation of CO2 and underestimation of CO was observed.
This might be due to errors in the pyrolysis gas composition or high rates in the water-gas-shift
reaction.
The effects of temperature on the synthesis gas composition were further investigated. Increasing
the temperature increased the concentration of CO and H2 by 2.4% and 1.6% respectively, while
decreased the concentration of CO2 and CH4 by 1.3% and 0.5%, respectively. The result trends
show a good agreement with other experiments from the literature, except the trend of CH4. This
might be due to the neglect of the tar composition in the volatiles.

Preface
4
Preface This thesis was completed in the spring semester of 2021 as a fulfillment of a partial
requirement to achieve a master’s degree in Process Technology at the University of South-
Eastern Norway.
I would like to thank my supervisors Britt M. E. Moldestad, Janitha Bandara, and Hildegunn
H. Haugen for their guidance, support, and help through this project.
Porsgrunn, 2021
Ahmad Dawod

Contents
5
Contents Preface ................................................................................................................... 4
Contents ................................................................................................................. 5
List of figures ........................................................................................................ 7
List of tables .......................................................................................................... 9
Nomenclature ...................................................................................................... 10
1 Introduction ..................................................................................................... 12
1.1 Background ........................................................................................................................... 12 1.2 Waste treatment methods and resources .......................................................................... 13 1.3 Objectives of the thesis ....................................................................................................... 15
2 Pyrolysis of biomass ...................................................................................... 16
2.1 Biomass resources ............................................................................................................... 16 2.1.1 Ultimate and proximate analysis of biomass ............................................................. 17
2.2 Principles of pyrolysis.......................................................................................................... 17 2.2.1 Pyrolysis oil ................................................................................................................... 20 2.2.2 Pyrolysis biochar .......................................................................................................... 21 2.2.3 Pyrolysis gases ............................................................................................................. 22
2.3 Effect of operational conditions on biomass pyrolysis products ................................... 26 2.3.1 Pyrolysis temperature .................................................................................................. 26 2.3.2 Heating rate.................................................................................................................... 28 2.3.3 Particle size.................................................................................................................... 29 2.3.4 Pretreatment of biomass .............................................................................................. 30
2.4 Pyrolysis reactor ................................................................................................................... 31
3 Gasification of biomass .................................................................................. 33
3.1 Principles of biomass gasification ...................................................................................... 33 3.2 Fluidized bed gasification reactor ....................................................................................... 34 3.3 Simulation of biomass gasification .................................................................................... 35
4 Pyrolysis experiments .................................................................................... 36
4.1 Pyrolysis feedstock .............................................................................................................. 36 4.2 Experimental set-up.............................................................................................................. 37 4.3 Experimental procedure ....................................................................................................... 39
5 CPFD simulation of biomass gasification ..................................................... 41
5.1 Mesh and geometry .............................................................................................................. 41 5.2 Initial and boundary conditions .......................................................................................... 42 5.3 Input data ............................................................................................................................... 43 5.4 Simulation procedure ........................................................................................................... 45
6 Results and Discussion .................................................................................. 47
6.1 Pyrolysis experiments .......................................................................................................... 47 6.2 CPFD model ........................................................................................................................... 51
6.2.1 Case-A ............................................................................................................................ 51 6.2.2 Case-B ............................................................................................................................ 53 6.2.3 Case-C ............................................................................................................................ 54 6.2.4 Comparison ................................................................................................................... 55
6.3 Further work .......................................................................................................................... 59

Contents
6
7 Conclusion ...................................................................................................... 61
References ........................................................................................................... 63
Appendices .......................................................................................................... 69

List of figures
7
List of figures Figure 1.1 Waste hierarchy [4]. ............................................................................................... 12
Figure 1.2 Waste treatment methods and their products [16] .................................................. 14
Figure 1.3 Pyrolysis, gasification and incineration [14]. ......................................................... 14
Figure 2.1 Thermal decomposition of biomass (wood) and the products at different
temperatures [27]. .................................................................................................................... 18
Figure 2.2 Product yield from pyrolysis of biomass as a function of temperature [32]. ......... 19
Figure 2.3 Two-step reaction scheme proposed by Koufopanos et al. [33]. ........................... 19
Figure 2.4 Pyrolysis gas composition from pyrolysis of (a) nonhybrid grass composts and (b)
hybrid grass composts at temperature 700°C, conducted by Adela et al. [51]. ....................... 24
Figure 2.5 Release of gases (vol.%) during pyrolysis of wood as a function of temperature
[22]. .......................................................................................................................................... 27
Figure 2.6 Char and gas yield from pyrolysis of grape bagasse as a function of temperature
reported from Encinar et al. [22].............................................................................................. 27
Figure 2.7 Effect of temperature on char yield [52]. ............................................................... 28
Figure 2.8 Effect of temperature on liquid yield [52]. ............................................................ 28
Figure 2.9 Product yield from pyrolysis of sawdust as a function of heating rate, at a pyrolysis
temperature of 500°C, reported from Harding et al. [53]. ....................................................... 29
Figure 2.10 Product yield from pyrolysis of bamboo as a function of heating rate, at a
temperature of 700°C, reported from Chen et al. [54]. ............................................................ 29
Figure 2.11 Effect of particle size on liquid yield, reported from Zama et al. [55]. ................ 30
Figure 2.12 Effect of particle size on char yield, reported from Zaman et al. [55]. ................ 30
Figure 2.13 Heat transfer methods in pyrolysis reactors [6]. ................................................... 31
Figure 3.1 Main conversion processes in biomass gasification [58]. ...................................... 33
Figure 3.2 Scheme of fluidized bed gasification reactors: (a) bubbling and (b) circulating
fluidized bed [19]. .................................................................................................................... 34
Figure 4.1 Wood pellets as received. ....................................................................................... 36
Figure 4.2 Pyrolysis reactor design. ......................................................................................... 37
Figure 4.3 Front view of constructed reactor. .......................................................................... 37
Figure 4.4 Schematic diagram of the biomass pyrolysis process. ........................................... 38
Figure 4.5 SRI 8610C gas chromatograph. .............................................................................. 39
Figure 4.6 Water-cooled condenser. ........................................................................................ 39
Figure 4.7 Material balance. .................................................................................................... 40
Figure 5.1 Simulation set-up: (a) Meshed geometry (b) Initial bed material and geometry
dimensions (c) Transient data points. ...................................................................................... 42

List of figures
8
Figure 5.2 Boundary conditions: (a) Flow boundaries (b) Thermal boundary. ....................... 43
Figure 5.3 Reaction rates for the gasification reactions. .......................................................... 45
Figure 6.1 Tar and char produced from pyrolysis of wood pellets at 500°C. .......................... 47
Figure 6.2 Product yields from pyrolysis of wood pellets at 500°C. ....................................... 48
Figure 6.3 Comparison between experimental results and literature results at 500°C. ........... 48
Figure 6.4 Gas analysis from the GC after 9 minutes of pyrolysis. ......................................... 49
Figure 6.5 Gas volume fractions from the GC after 9 minutes of pyrolysis. ........................... 49
Figure 6.6 Product gas production with time at 500°C. ........................................................... 50
Figure 6.7 Average product gas composition obtained from experiment and literature at
500°C. ...................................................................................................................................... 51
Figure 6.8 Case-A: Outlet mass fraction variation with time. ................................................. 52
Figure 6.9 Reactor conditions (a) Fluid temperature [K] (b) Particle temperature (c) Particle’s
volume fraction. ....................................................................................................................... 53
Figure 6.10 Case-B: Outlet mass fraction variation with time. ............................................... 54
Figure 6.11 Case-C: Outlet mass fraction variation with time. ............................................... 54
Figure 6.12 Molar compositions of the gas species monitored at the reactor outlet for (a)
Case-A (b) Case-B (c) Case-C. ................................................................................................ 55
Figure 6.13 Case-A: Input pyrolysis gas composition compared to synthesis gas composition.
.................................................................................................................................................. 56
Figure 6.14 Case-B: Input pyrolysis gas composition compared to synthesis gas composition.
.................................................................................................................................................. 56
Figure 6.15 Average product gas composition from the three cases compared to the
experimental results. ................................................................................................................ 58
Figure 6.16 Product gas molar fraction for Case-A and Case-B at different temperatures. .... 59

List of tables
9
List of tables Table 2.1 Different resources of biomass [19] [12]. ................................................................ 16
Table 2.2 Product yields from pyrolysis of biomass [22]. ....................................................... 17
Table 2.3 Comparison between bio-oil produced from pyrolysis of wood and heavy fuel oil
[6] [35] [13].............................................................................................................................. 21
Table 2.4 Product yields and gas compositions from pyrolysis of wood, wood pellets, and
straw, with the temperature range of 400-900°C [36] [37]. ..................................................... 25
Table 2.5 Typical feedstock requirements, operational conditions, and product yield of
different modes of pyrolysis (dry-wood basis) [23] [13] [19]. ................................................ 26
Table 2.6 Characteristics and status of common pyrolysis reactor units [6]. .......................... 32
Table 4.1 Ultimate and proximate analysis of wood pellets. ................................................... 36
Table 5.1 Biomass particle properties, inlet flows, and simulation parameters used in the
simulation. ................................................................................................................................ 44
Table 5.2 Input data for the simulation cases. ......................................................................... 46
Table 6.1 Average gas composition (mole basis) from the simulated cases and experiment. . 57

Nomenclature
10
Nomenclature Abbreviations Explanations
CAD Computer-Aided Design
CFD Computational Fluid Dynamic
CFX Computational Fluid dynamics program
CPFD Computational Particle Fluid Dynamic
FID Flame Ionization Detector
GC Gas Chromatograph
HHV Higher Heating Value
IPA Isopropyl Alcohol
LHV Lower Heating Value
MP-PIC Multiphase Particle-In-Cell
MSW Municipal Solid Waste
TCD Thermal Conductivity Detector
USN University of South-Eastern Norway
VR Virtual Reactor
Chemical compound Explanations
C Carbon
C2H2 Acetylene
C2H4 Ethylene
C2H6 Ethane
C6H6 Benzene
CH4 Methane
CO Carbon monoxide

Nomenclature
11
CO2 Carbon dioxide
H2 Hydrogen
H2O Water
He Helium
N2 Nitrogen
O2 Oxygen
SiO2 Sand
Symbol Explanations SI Unit
k1, k2, and k3 Rate constants [s-1]
MC Mass of char [kg]
mC1 Mass concentration of primary char [kg/m2]
mC2 Mass concentration of secondary char [kg/m2]
MG Mass of gas [kg]
mG1 Mass concentration of primary gas [kg/m2]
mG2 Mass concentration of secondary gas [kg/m2]
MT Mass of tar [kg]
mW Mass concentration of wood [kg/m2]
PH Acidity or basicity of a solution [-]
t Time [s]
Δ𝐻 Heat of formation [kJ/mol]
𝛿 Yield ratio [-]

1 Introduction
12
1 Introduction This chapter covers the background and the objectives of the thesis, along with different
methods for waste treatment.
1.1 Background
Waste generation has increased greatly around the planet in ongoing many years, and there are
no signs of its decline. The world generates 2.01 billion tons of municipal solid waste (MSW)
every year [1]. According to the World Bank estimation, the overall waste generation will
increase by around 70% to 3.4 billion tons by 2050. This is due to various components, such
as population growth, urbanization, economic development, and customer shopping habits [2].
At least 33% of the generated waste worldwide is not managed in an environmentally safe way
and instead dumped or openly burned [1].
The 2008 EU Waste Framework Directive introduced a waste hierarchy, which sets out the
basic concepts and definitions related to waste management. The waste hierarchy illustrated in
Figure 1.1 lists prevention at the top (most preferable) to reuse, recycling, energy recovery to
the least favored option disposal of waste at the bottom [3].
Figure 1.1 Waste hierarchy [4].
CO2 and other greenhouse gas emissions into the atmosphere contribute to climate change,
especially global warming. The concerns about global warming and declining petroleum
resources have prompted a move towards renewable energy resources [5]. Biomass is one of
the potential feedstocks that satisfies the environmental issues and considered as one of the
most important resources in near future [6]. Biomass is defined as any organic non-fossil
material and formed by or from living organisms [7]. Compared to other renewable energy
sources such as solar, wind, and hydropower, biomass can be converted directly into valuable
fuels rather than just generating electricity [5]. Wood-based biomass is one of the most
commonly used green energy sources that can be utilized in producing valuable products [8].

1 Introduction
13
Forrest and manufacturing processes wastes are the major sources of wood-based biomass.
Around 50% of the wood is processed to timber or other valuable products, while the rest
becomes wastes [9].
Several technologies and techniques within waste management have been utilized, whereas
some are still under development. The goals are to improve health and protect the environment,
and conservation of resources such as material, energy, and space [10]. Treatment techniques
are selected and utilized based on the form, composition, and amount of biomass [11]. Thermal
treatment processes including combustion, gasification, and pyrolysis, are utilized to convert
biomass into valuable products [12].
Pyrolysis of biomass is one of the thermal treatment technologies that break biomass into bio-
oil, solid biochar, and gases. Pyrolysis is defined as a process for breaking down the biomass
by heating to high temperatures in the absence of oxygen [7]. Bio-oil from pyrolysis is gaining
increasing interest due to easier storage and transportation at a lower cost than solid biomass,
which can be used as a substitute combustion fuel for power generation and transportation [13].
Biochar can be used for different industrial uses such as solid fuel in boilers and the production
of activated carbon. Finally, the gas produced from the pyrolysis of biomass can be used as
fuel for industrial combustion or to supply the energy required for the pyrolysis process [12].
1.2 Waste treatment methods and resources
The hierarchy of waste management and the idea of integrated waste management have
contributed to the development of waste treatments and disposal technologies, instead of
focusing on landfill and incineration methods. The developed treatment technologies have
minimal environmental impact and energy recovery with low pollution. Among such
technologies are pyrolysis, gasification, combined pyrolysis-gasification, composting, and
anaerobic digestion, as illustrated in Figure 1.2 [14]. These technologies convert solid waste
into valuable products, chemicals, and fuels. Typical solid waste streams are MSW such as
Food, wood, paper, plastics, waste tires, etc. The main products and chemical yields generated
from waste treatment facilities include [15]:
1) Liquid fuels such as oil, biodiesel, and ethanol.
2) Electricity, heat, and steam from combustible gases such as methane.
3) Chemicals and consumer products from syngas.
4) Activated carbon.
1 Introduction
14
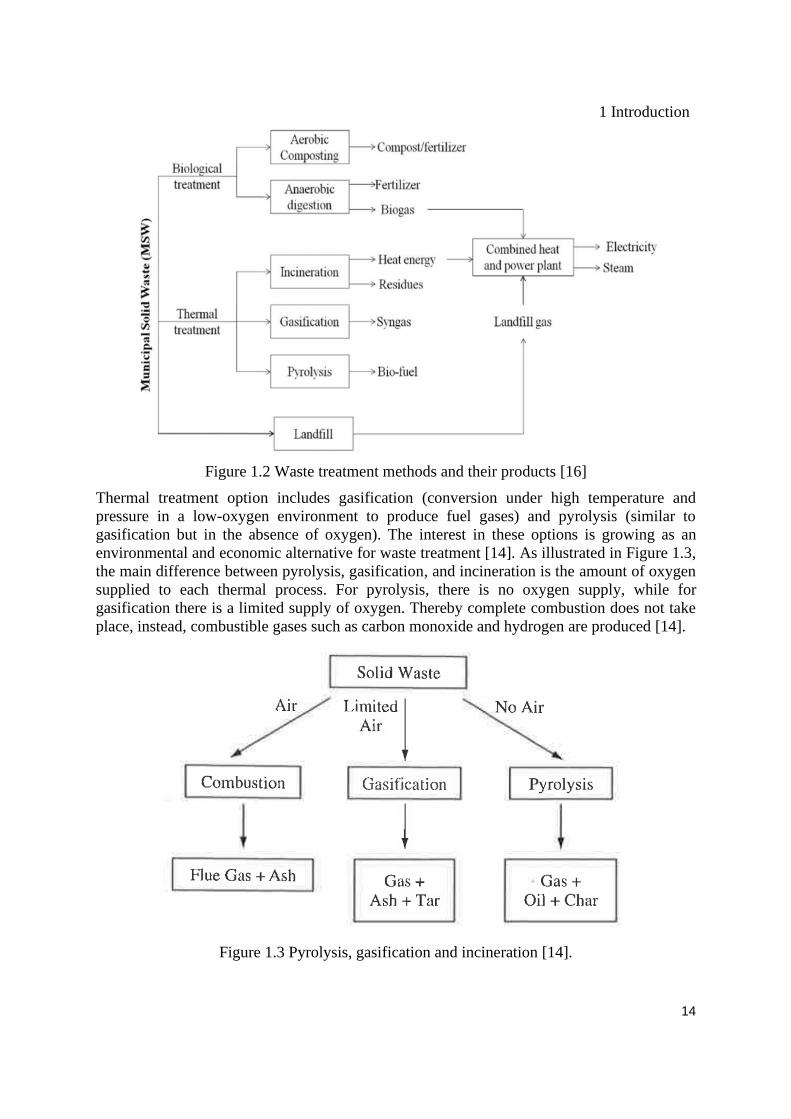
Figure 1.2 Waste treatment methods and their products [16]
Thermal treatment option includes gasification (conversion under high temperature and
pressure in a low-oxygen environment to produce fuel gases) and pyrolysis (similar to
gasification but in the absence of oxygen). The interest in these options is growing as an
environmental and economic alternative for waste treatment [14]. As illustrated in Figure 1.3,
the main difference between pyrolysis, gasification, and incineration is the amount of oxygen
supplied to each thermal process. For pyrolysis, there is no oxygen supply, while for
gasification there is a limited supply of oxygen. Thereby complete combustion does not take
place, instead, combustible gases such as carbon monoxide and hydrogen are produced [14].
Figure 1.3 Pyrolysis, gasification and incineration [14].

1 Introduction
15
Biological treatment processes such as aerobic composting and anaerobic digestion are also
alternative options for the treatment of waste. Biological treatment proceeds at lower
temperatures and lower reaction rates than other thermal conversion processes [15]. Aerobic
composting is the biological degradation of biodegradable organic waste such as garden and
food waste. Composing is a relatively fast method of biodegradation, usually taking between
4-6 weeks to produce a stabilized product. Anaerobic degradation is also an option for the
treatment of MSW and other wastes such as sewage sludge, agricultural waste, and animal
manure. This method generates the same gases as in landfill sites, gases such as carbon dioxide
and methane, but in a controlled, closed environment. whereas the generated gas can be used
directly as fuel or converted to a higher quality gaseous fuel or chemical feedstock. Moreover,
it is possible to use the residual as a soil conditioner [14] [17].
1.3 Objectives of the thesis
The pyrolysis of biomass into valuable resources is gaining great interest as a feasible and
environmentally friendly option for waste treatment. The product yield from pyrolysis of
biomass includes biochar, bio-oil, and gases. How much of each product is produced is
dependent on the biomass composition and the process conditions. The overall aim is to design
and construct a pyrolysis reactor and perform experimental tests to study the product
composition of the biomass pyrolysis as a function of biomass type and operational conditions,
especially the temperature. Another goal is to simulate a fluidized bed gasification reactor using
a computational particle fluid dynamic (CPFD), using actual experimental data from pyrolysis
as an input. Task description in detail is attached in Appendix A.
2 Pyrolysis of biomass
16
2 Pyrolysis of biomass This chapter describes the chemical and physical aspects of the pyrolysis mechanism, along
with the effects of different operational conditions on the pyrolysis product yields. An overview
of biomass resources and pyrolysis reactor design are introduced.
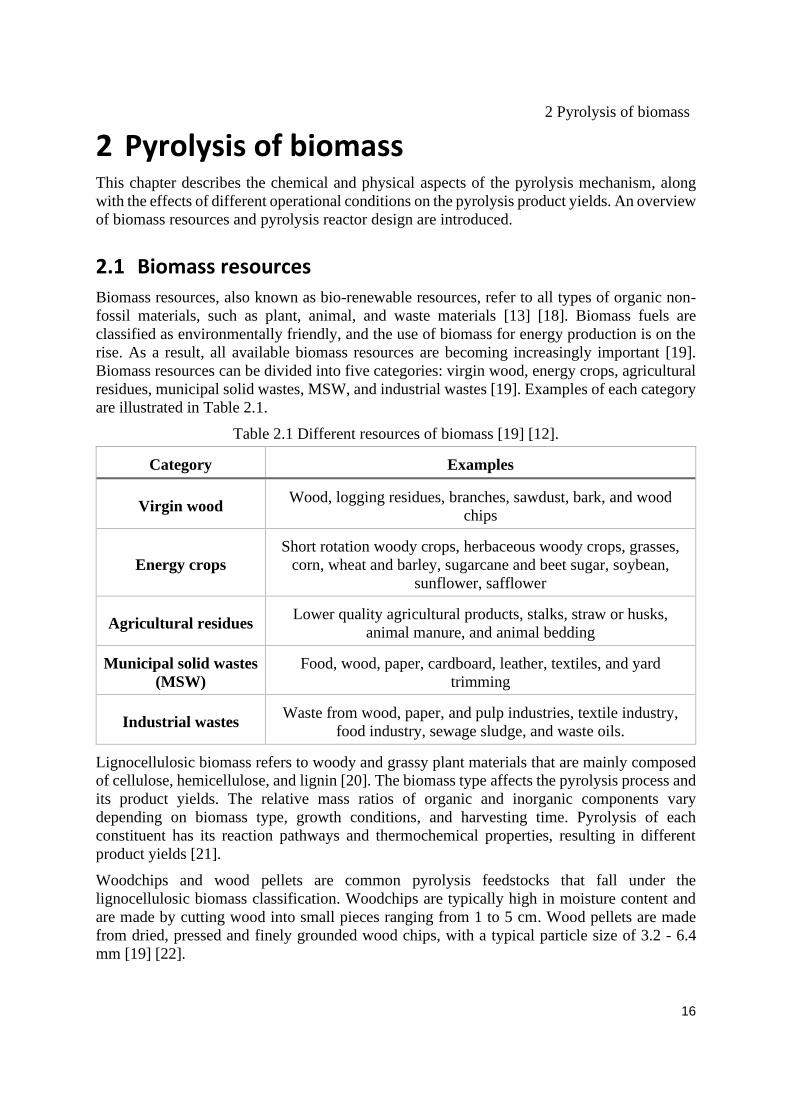
2.1 Biomass resources
Biomass resources, also known as bio-renewable resources, refer to all types of organic non-
fossil materials, such as plant, animal, and waste materials [13] [18]. Biomass fuels are
classified as environmentally friendly, and the use of biomass for energy production is on the
rise. As a result, all available biomass resources are becoming increasingly important [19].
Biomass resources can be divided into five categories: virgin wood, energy crops, agricultural
residues, municipal solid wastes, MSW, and industrial wastes [19]. Examples of each category
are illustrated in Table 2.1.
Table 2.1 Different resources of biomass [19] [12].
Category Examples
Virgin wood Wood, logging residues, branches, sawdust, bark, and wood
chips
Energy crops
Short rotation woody crops, herbaceous woody crops, grasses,
corn, wheat and barley, sugarcane and beet sugar, soybean,
sunflower, safflower
Agricultural residues Lower quality agricultural products, stalks, straw or husks,
animal manure, and animal bedding
Municipal solid wastes
(MSW)
Food, wood, paper, cardboard, leather, textiles, and yard
trimming
Industrial wastes Waste from wood, paper, and pulp industries, textile industry,
food industry, sewage sludge, and waste oils.
Lignocellulosic biomass refers to woody and grassy plant materials that are mainly composed
of cellulose, hemicellulose, and lignin [20]. The biomass type affects the pyrolysis process and
its product yields. The relative mass ratios of organic and inorganic components vary
depending on biomass type, growth conditions, and harvesting time. Pyrolysis of each
constituent has its reaction pathways and thermochemical properties, resulting in different
product yields [21].
Woodchips and wood pellets are common pyrolysis feedstocks that fall under the
lignocellulosic biomass classification. Woodchips are typically high in moisture content and
are made by cutting wood into small pieces ranging from 1 to 5 cm. Wood pellets are made
from dried, pressed and finely grounded wood chips, with a typical particle size of 3.2 - 6.4
mm [19] [22].

2 Pyrolysis of biomass
17
There are other biomass feedstocks such as macroalgae and seaweed that are not sufficiently
explored for pyrolysis. Macroalgae is a fast-growing marine organism classified as non-
lignocellulosic biomass. Macroalgae contain low levels of cellulose and lignin and are instead
composed of elastic polysaccharides (laminarin, carrageenan, agarose, and alginic acid) and
free sugars (mannitol and fucoses). As a result, macroalgae could be a possible option for
pyrolysis with an available biomass supply across the world [23] [24].
2.1.1 Ultimate and proximate analysis of biomass
The chemical composition of the biomass has a major impact on the chemistry of pyrolysis
[25]. The ultimate analysis evaluates the mass percentages of individual elements within
biomass such as Carbon, hydrogen, nitrogen, and oxygen [26]. The proximate analysis gives
the gross components of the biomass such as moisture, volatile matter, ash, and fixed carbon.
The proximate analysis gives a good idea of the percentages of the main pyrolysis product
yields [25]. The volatile matter of biomass is the condensable vapors and non-condensable
gases emitted when biomass is heated [22]. Fixed carbon represents the amount of solid carbon
that remains in the char after pyrolysis, and ash is the inorganic solid residue that remains after
complete combustion of the biomass [22] [26].
2.2 Principles of pyrolysis
Pyrolysis is defined as the thermal degradation of biomass in the absence of oxygen and the
presence of nitrogen [14]. The term derives from two Greek words: pyro, meaning fire, and
lysis, meaning disintegration into integral parts [27]. Pyrolysis is typically performed at low
temperatures ranging between 400-800°C compared to 800-1000°C for gasification [14]. The
pyrolysis process is endothermic, which means that it needs a heat supply to the reactor [28].
The product yield from pyrolysis of biomass is classified into three types, presented in Table
2.2:
Table 2.2 Product yields from pyrolysis of biomass [22].
Phase Products
Solid Biochar or carbon
Liquids Tars or bio-oil, heavier hydrocarbons, and water
Gases mainly CO2, CO, CH4, H2, H2O, and other lighter
hydrocarbons such as C2H2, C2H4, C2H6, C6H6
Reaction (2.1) is a generic reaction that can be used to describe the pyrolysis process and its
products(2.1) [22]:
C𝑛H𝑚O𝑝( biomass ) ⟶ heat
∑
liquid
C𝑥H𝑦O𝑧 + ∑
gas
C𝑎H𝑏O𝑐 + H2O + 𝐶 (char) (2.1)
2 Pyrolysis of biomass
18
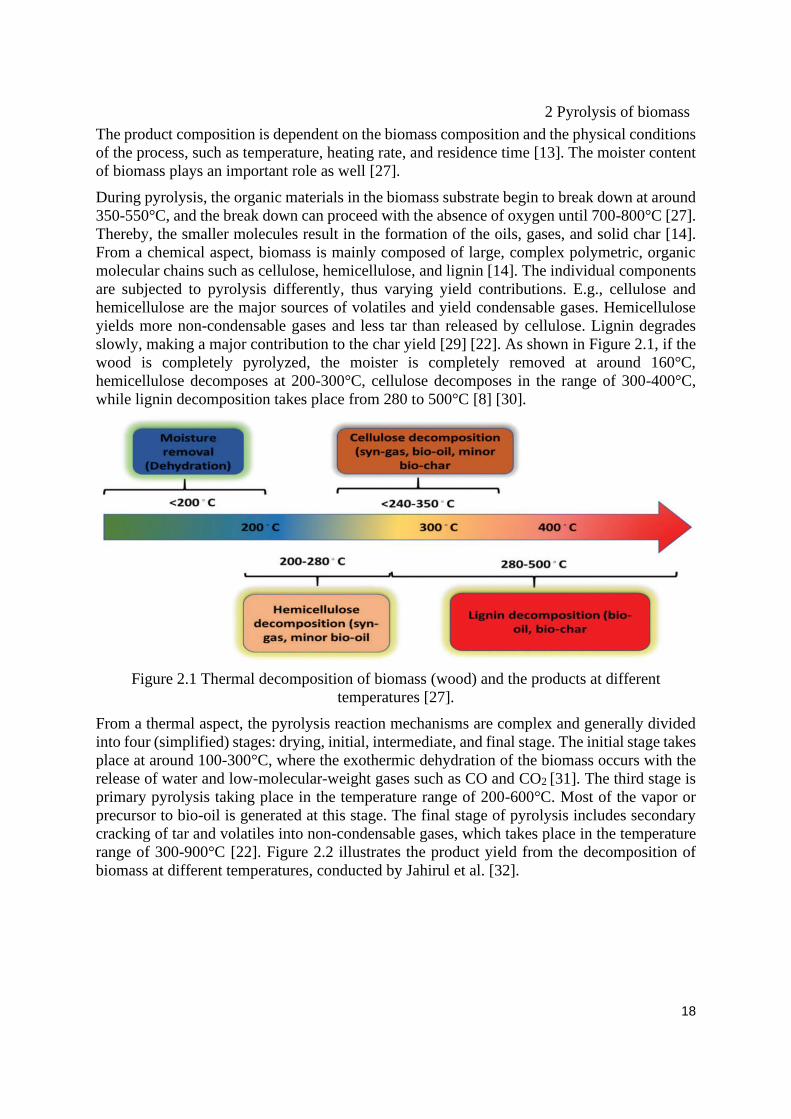
The product composition is dependent on the biomass composition and the physical conditions
of the process, such as temperature, heating rate, and residence time [13]. The moister content
of biomass plays an important role as well [27].
During pyrolysis, the organic materials in the biomass substrate begin to break down at around
350-550°C, and the break down can proceed with the absence of oxygen until 700-800°C [27].
Thereby, the smaller molecules result in the formation of the oils, gases, and solid char [14].
From a chemical aspect, biomass is mainly composed of large, complex polymetric, organic
molecular chains such as cellulose, hemicellulose, and lignin [14]. The individual components
are subjected to pyrolysis differently, thus varying yield contributions. E.g., cellulose and
hemicellulose are the major sources of volatiles and yield condensable gases. Hemicellulose
yields more non-condensable gases and less tar than released by cellulose. Lignin degrades
slowly, making a major contribution to the char yield [29] [22]. As shown in Figure 2.1, if the
wood is completely pyrolyzed, the moister is completely removed at around 160°C,
hemicellulose decomposes at 200-300°C, cellulose decomposes in the range of 300-400°C,
while lignin decomposition takes place from 280 to 500°C [8] [30].
Figure 2.1 Thermal decomposition of biomass (wood) and the products at different
temperatures [27].
From a thermal aspect, the pyrolysis reaction mechanisms are complex and generally divided
into four (simplified) stages: drying, initial, intermediate, and final stage. The initial stage takes
place at around 100-300°C, where the exothermic dehydration of the biomass occurs with the
release of water and low-molecular-weight gases such as CO and CO2 [31]. The third stage is
primary pyrolysis taking place in the temperature range of 200-600°C. Most of the vapor or
precursor to bio-oil is generated at this stage. The final stage of pyrolysis includes secondary
cracking of tar and volatiles into non-condensable gases, which takes place in the temperature
range of 300-900°C [22]. Figure 2.2 illustrates the product yield from the decomposition of
biomass at different temperatures, conducted by Jahirul et al. [32].

2 Pyrolysis of biomass
19
Figure 2.2 Product yield from pyrolysis of biomass as a function of temperature [32].
The actual reaction scheme for wood pyrolysis is extremely complex due to the formation of
hundreds of intermediate products. Cellulose is the major component of wood and pyrolyzes
over a wide range of temperatures. Thereby, several researchers have been studying cellulose
pyrolysis in detail [25], Koufopanos et al. [33] proposed a pyrolysis scheme reaction model
illustrated in Figure 2.3.
Figure 2.3 Two-step reaction scheme proposed by Koufopanos et al. [33].
This mechanism indicates that biomass decomposes via two parallel reactions to produce
volatiles and char. The primary products may further react with char to produce additional
volatiles and char with different compositions [34]. The kinetic equations for the scheme
mechanism expressed in Figure 2.3 are introduced as follows [25]: Equation (2.2) represents
the rate of change in the wood weight fraction. Further, the equations (2.3) and (2.5) are the
rate of change in the weight fractions of gases. Finally, equations (2.4) and (2.6) are the rate of
change in the char weight fractions.
𝑑𝑚𝑊
𝑑𝑡= −𝑘1𝑚𝑊
𝑛1 − 𝑘2𝑚𝑊𝑛1 (2.2)

2 Pyrolysis of biomass
20
𝑑𝑚𝐺1
𝑑𝑡= 𝑘1𝑚𝑊
𝑛1 − 𝑘2 𝑚𝐺1𝑛2 𝑚𝐶1
𝑛3 (2.3)
𝑑𝑚𝐶1
𝑑𝑡= 𝑘2𝑚𝑊
𝑛1 − 𝑘3 𝑚𝐺1𝑛2 𝑚𝐶1
𝑛3 (2.4)
𝑑𝑚𝐺2
𝑑𝑡= 𝑘3 𝑚𝐺1
𝑛2 𝑚𝐶1𝑛3 (2.5)
𝑑𝑚𝐶2
𝑑𝑡= 𝛿 𝑘3 𝑚𝐺1
𝑛2 𝑚𝐶1𝑛3 (2.6)
Where mW is the mass concentration of wood, mG1 and mG2 are the mass concentrations of
primary and secondary gas. mC1 and mC2 are the mass concentrations of primary and secondary
char where n1, n2, and n3 are the orders of the three reactions. k1, k2, and k3 are the rate constants,
t is the time, and 𝛿 is the yield ratio of secondary char to gas [25] [34].
2.2.1 Pyrolysis oil
The liquid or bio-oil produced from the pyrolysis of biomass is a dark brown, smoky smell and
a free-flowing organic liquid mixture [31]. Bio-oil is produced by simultaneous
depolymerization and fragmentation of cellulose, hemicellulose, and lignin [22]. Bio-oil is
mainly composed of oxygen-containing organic compounds resulting in high thermal
instability and low heating values [6]. Bio-oil generally contains a great amount of water (15 –
30 wt%) and hundreds of different organic compounds such as acids, alcohols, phenols, sugars,
alkenes, nitrogen, oxygen, and solid particles [6] [21]. The high water content in bio-oil lowers
the heating values and makes the phase separation more difficult [27]. Table 2.3 presents
typical properties of pyrolysis bio-oil compared to heavy fuel oil.
2 Pyrolysis of biomass
21
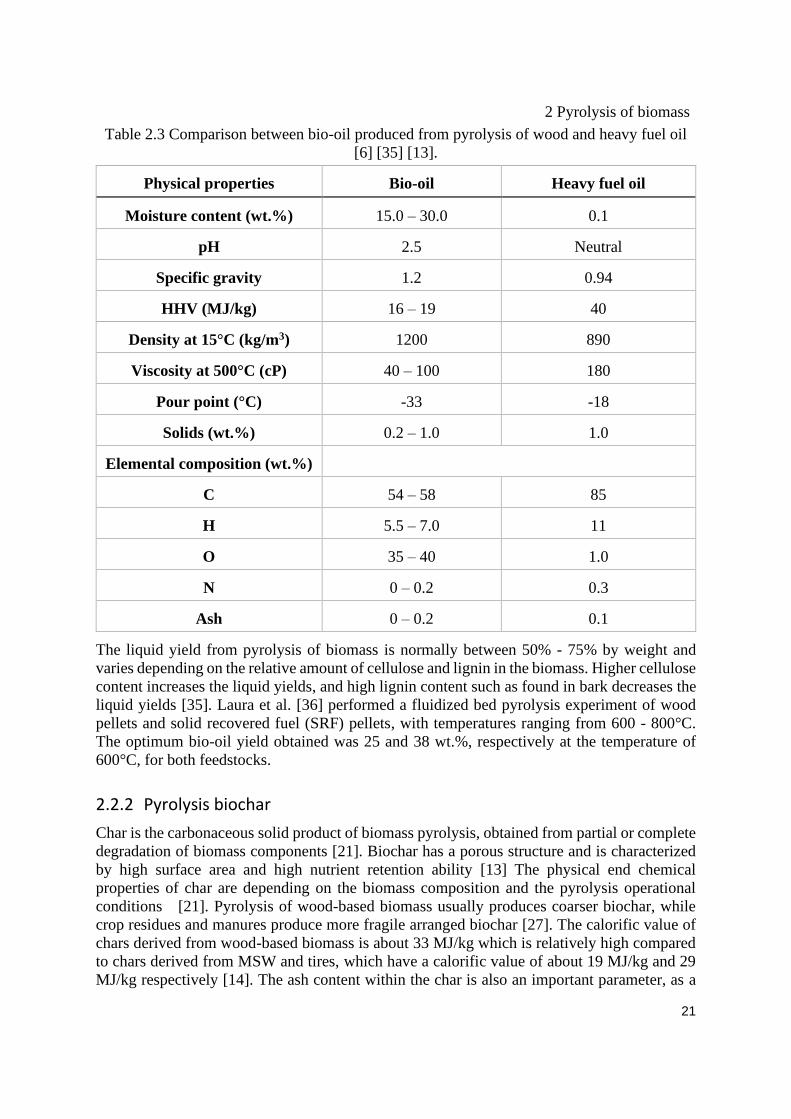
Table 2.3 Comparison between bio-oil produced from pyrolysis of wood and heavy fuel oil
[6] [35] [13].
Physical properties Bio-oil Heavy fuel oil
Moisture content (wt.%) 15.0 – 30.0 0.1
pH 2.5 Neutral
Specific gravity 1.2 0.94
HHV (MJ/kg) 16 – 19 40
Density at 15°C (kg/m3) 1200 890
Viscosity at 500°C (cP) 40 – 100 180
Pour point (°C) -33 -18
Solids (wt.%) 0.2 – 1.0 1.0
Elemental composition (wt.%)
C 54 – 58 85
H 5.5 – 7.0 11
O 35 – 40 1.0
N 0 – 0.2 0.3
Ash 0 – 0.2 0.1
The liquid yield from pyrolysis of biomass is normally between 50% - 75% by weight and
varies depending on the relative amount of cellulose and lignin in the biomass. Higher cellulose
content increases the liquid yields, and high lignin content such as found in bark decreases the
liquid yields [35]. Laura et al. [36] performed a fluidized bed pyrolysis experiment of wood
pellets and solid recovered fuel (SRF) pellets, with temperatures ranging from 600 - 800°C.
The optimum bio-oil yield obtained was 25 and 38 wt.%, respectively at the temperature of
600°C, for both feedstocks.
2.2.2 Pyrolysis biochar
Char is the carbonaceous solid product of biomass pyrolysis, obtained from partial or complete
degradation of biomass components [21]. Biochar has a porous structure and is characterized
by high surface area and high nutrient retention ability [13] The physical end chemical
properties of char are depending on the biomass composition and the pyrolysis operational
conditions [21]. Pyrolysis of wood-based biomass usually produces coarser biochar, while
crop residues and manures produce more fragile arranged biochar [27]. The calorific value of
chars derived from wood-based biomass is about 33 MJ/kg which is relatively high compared
to chars derived from MSW and tires, which have a calorific value of about 19 MJ/kg and 29
MJ/kg respectively [14]. The ash content within the char is also an important parameter, as a

2 Pyrolysis of biomass
22
higher ash content reduces the heating value of the char as a fuel. Wood-based biochar has very
low ash content, typically less than 2% [14].
Usually, pyrolysis of biomass yields 25 – 35% biochar at a temperature between 350°C and
500°C [19]. The elemental composition of biochar is mainly carbon ranging from 53 % to 96
% by weight and can contain oxygen and hydrogen as well [22] [6]. Fagbemi et al. [37]
conducted a pyrolysis experiment on wood material with a temperature range of 400 to 900°C.
The char yield decreased with increasing temperature. The maximum char yield was 31%
achieved at the temperature of 400°C. the HHVs of the char produced were in the range of 33-
34 MJ/kg.
Biochar contains a variety of plant nutrients such as magnesium, sulfur, sodium, and
manganese, making it useful as a soil enhancement. The nutrient content in biochar can be
improved by increasing the pyrolysis temperature. In addition, biochar can be used for co-firing
in power stations and can help to reduce ambient carbon emissions by soil carbon sequestration
[21].
2.2.3 Pyrolysis gases
Non-condensable pyrolysis gases are produced from the primary decomposition of biomass
and secondary cracking of vapors at higher temperatures. Thus, the total product yield of gas
is a mixture of primary and secondary gases [22]. As the temperature increases, secondary
reactions such as decarboxylation, deoxygenation, dehydrogenation, and cracking take place
which further increases the pyrolysis gas yield [27]. The pyrolysis product gas has typically a
lower heating value (LHV) in the range of 11-20 MJ/Nm3, depending on the composition [21].
The non-condensable gas mixture contains CO2, CO, H2, and light-hydrocarbons such as CH4,
C2H4, C2H6 [38]. The decomposition and reforming of carbonyl and carboxyl groups are the
primary sources of CO2 and CO [6]. The lighter hydrocarbons are formed due to the
restructuring and breaking of heavier hydrocarbons and tar in the vapor stage [27]. H2 is
produced from the reforming and decomposition of hydrocarbons at higher temperatures [39].
The major reactions for the formation and consumption of CO2, CO, H2, and C2H6 during
pyrolysis of biomass includes the following reactions [40]:
The water-gas reaction (2.7) is an important reaction, describing the reaction of C and H2O
released from biomass to produce H2 and CO. The reaction is endothermic and requires heat to
proceed in its forward direction [41].
C + H2O ↔ CO + H2 Δ𝐻 = +131 kJ/mol (2.7)
The Boudouard reaction (2.8) where solid carbon (char) reacts with CO2 to form CO, is the
main reaction for reducing CO2 emissions [42]. The reaction is highly endothermic and
thermodynamically favorable at temperatures above 700°C [43]. The CO generated from the
Boudouard reaction offers a chemical pathway to produce H2 by the water gas shift reaction
(2.12) [42].
CO2 + C ↔ 2CO Δ𝐻 = +172 kJ/mol (2.8)
The dry reforming of methane reaction (2.9) introduces the reaction between CO2 and CH4 to
produce CO and H2. The reaction is favored at higher temperatures above 650°C and typically

2 Pyrolysis of biomass
23
occurs simultaneously with the reverse water gas shift reaction (2.12) [44]. The dry reforming
of methane has been widely studied due to its ability on greenhouse gas reduction and biogas
production [45].
CO2 + CH4 ↔ 2CO + 2H2 Δ𝐻 = +247 kJ/mol (2.9)
The steam methane reforming reaction (2.10) involves the reaction of CH4 and H2O to form
CO and H2. Steam methane reforming of natural gas is the main commercial process for H2
production and usually proceeds in the presence of a catalyst such as nickel or rhodium. The
reaction is strongly endothermic and usually takes place at high temperatures [46].
CH4 + H2O ↔ CO + 3H2 Δ𝐻 = +206 kJ/mol (2.10)
Methanation or hydro-gasification reaction (2.11) involves the reaction of C with H2 producing
CH4. The reaction is relatively slow and favored at higher pressures [19].
C + 2H2 ↔ CH4 Δ𝐻 = −75 kJ/mol (2.11)
The water-gas shift reaction (2.12) provides the reaction of CO with steam producing CO2 and
H2. The reaction is moderately exothermic, reversible, thermodynamically favorable at low
temperatures 210 - 450°C, and unaffected by pressure changes [47] [48]. The water-gas shift
reaction is usually catalyzed by a variety of metallic-based catalysts [49]. The reaction is
commonly used in industrial processes such as Hydrogen and ammonia production
technologies [50].
CO + H2O ↔ CO2 + H2 Δ𝐻 = −41 kJ/mol (2.12)
The gas composition from pyrolysis of biomass is influenced by several factors, including
reactor type, heating rate, residence time, reaction medium, biomass particle size, and
temperature. The pyrolysis temperature is the most influential factor in most cases [36].
Biomass compositions are also critical in defining the product gas composition, where lignin
is the main source for the formation of H2 and CH4, hemicellulose contributes to the highest
CO2 emission, and cellulose is responsible for the highest CO emission [51]. Several studies
have been conducted to investigate the gas composition from pyrolysis of different biomass
feedstocks. Adela et al. [51] studied the gas composition of nine hybrid and nonhybrid grass
composts. The gas composition was determined at 700°C. The results are shown in Figure 2.4.
The mixture of clover composts (MC) gave the highest H2 yield (62.17 vol%) and lowest CO
and CH4 formation (12.74 vol%) and (5.10 vol%) respectively [51].

2 Pyrolysis of biomass
24
Figure 2.4 Pyrolysis gas composition from pyrolysis of (a) nonhybrid grass composts and (b)
hybrid grass composts at temperature 700°C, conducted by Adela et al. [51].
Laura et al. and Fagbemi et al [36] [37] studied the effect of pyrolysis temperature on the
product gas yields and gas composition. Some results from these experiments are shown in
Table 2.4.

2 Pyrolysis of biomass
25
Table 2.4 Product yields and gas compositions from pyrolysis of wood, wood pellets, and
straw, with the temperature range of 400-900°C [36] [37].
Product yield (wt.%) Gas composition (vol.%)
Feedstock Temperature
(°C)
Tar Char Gas CO CO2 H2 CH4 C2Hx
Wood 400 21 33 19 34.2 51.9 1.3 9.3 3.3
500 33 25 15 39.7 36.6 7.6 12.8 3.3
600 30 23 21 42.5 23.0 10.8 16.5 7.2
700 19 22 34 44.3 16.7 15.5 16.1 7.4
800 12 21 45 50.2 9.1 20.8 14.2 5.8
900 9 22 48 53.5 5.0 25.3 12.1 4.1
Wood
pellets
600 28 22 50 47 15 14.5 16 7.5
700 16 19 65 43 18 17 16 6
800 5 18 77 37 21 23 14 5
Straw 700 15 33 34 41 15.8 19.2 15.3 8.7
800 10 31 43 48.1 8.4 23.4 13.7 6.5
900 7 30 51 53.3 4.5 24.6 12.1 5.5
As shown in Table 2.4, and by comparing the gas product yields and gas compositions from
pyrolysis of wood, wood pellets, and straw, wood pellets resulted in the highest gas product
yield (77wt.%) achieved at 800°C. All cases show an increase in gas product yield and H2
production as the temperature increases. Pyrolysis of wood pellets and straw gave the highest
H2 formations of 23% and 23.4% by volume respectively, achieved at 800°C. The CH4
production was highest at approximately 700°C and declined afterward in all three cases.

2 Pyrolysis of biomass
26
2.3 Effect of operational conditions on biomass pyrolysis products
Depending on the operational conditions, mainly temperature and heating rate, pyrolysis is
categorized as slow, intermediate, fast, and flash pyrolysis. Slow pyrolysis is defined as a
carbonization process operating at low heating rates, long residence time, and low
temperatures. The main product from this process is charcoal [27] [30]. Intermediate pyrolysis
is characterized by a lower heating rate compared to fast pyrolysis. Accordingly, less tar is
generated due to more controlled chemical reactions take place [19]. Fast or flash pyrolysis is
characterized by high heating rates and high temperatures, where the main goal is to maximize
the production of liquid or bio-oil [12]. Table 2.5 summarizes the impact of operational
conditions on the product yield from different modes of pyrolysis of wood.
Table 2.5 Typical feedstock requirements, operational conditions, and product yield of
different modes of pyrolysis (dry-wood basis) [23] [13] [19].
Feedstock Operational conditions Product yield
Particle
size
Temperature
(°C)
Heating
rate
°C/min
Residence
time
Solid
(%)
Liquid
(%)
Gas
(%)
Slow
pyrolysis
Moderate-
large 300-500 <10
Minutes to
days 35 30 35
Intermediate
pyrolysis
Small-
large 400-500 300 Minutes 25 50 25
Fast
pyrolysis
Small (<1
mm) 400-650 1-1000 0.5-5 s 12 75 13
Flash
pyrolysis
105-250
µm 650-1300 >1000 <1 s <20 <70 <20
2.3.1 Pyrolysis temperature
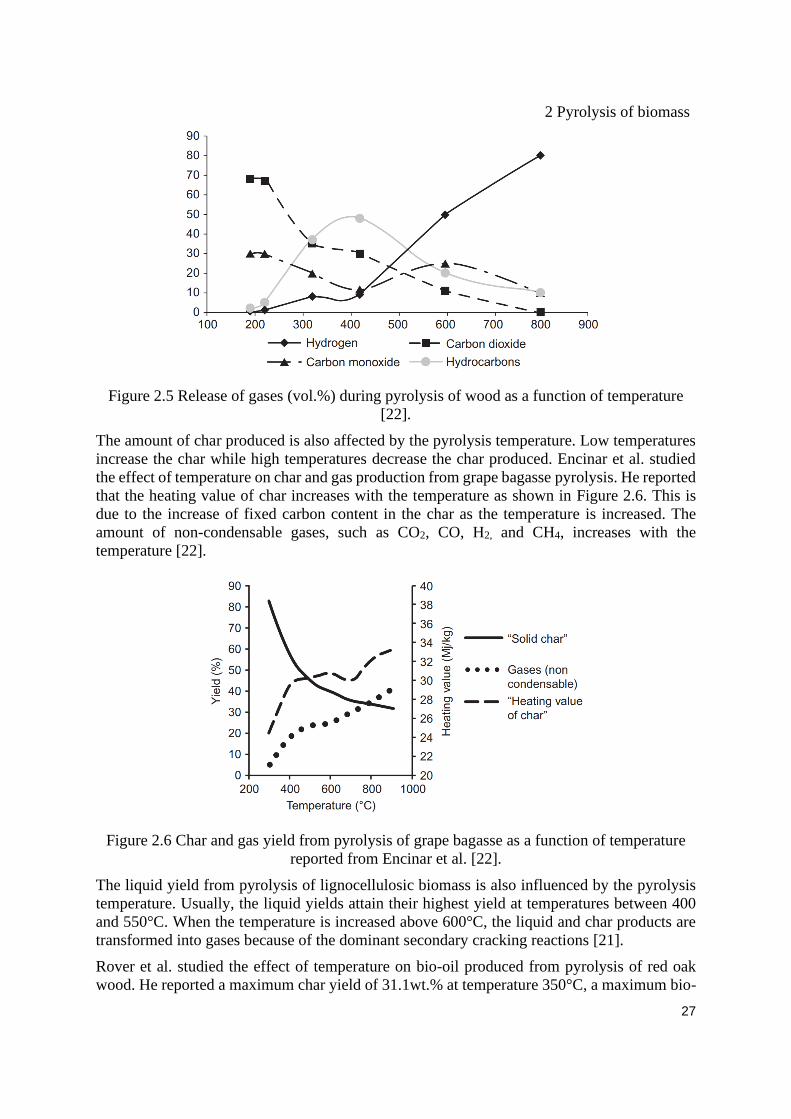
The pyrolysis temperature has a significant effect on the product distribution and properties.
The gas components released during the pyrolysis of biomass vary with different temperatures.
Figure 2.5 shows the behavior of different gas components released from the pyrolysis of wood
as a function of temperature [22].
2 Pyrolysis of biomass
27
Figure 2.5 Release of gases (vol.%) during pyrolysis of wood as a function of temperature
[22].
The amount of char produced is also affected by the pyrolysis temperature. Low temperatures
increase the char while high temperatures decrease the char produced. Encinar et al. studied
the effect of temperature on char and gas production from grape bagasse pyrolysis. He reported
that the heating value of char increases with the temperature as shown in Figure 2.6. This is
due to the increase of fixed carbon content in the char as the temperature is increased. The
amount of non-condensable gases, such as CO2, CO, H2, and CH4, increases with the
temperature [22].
Figure 2.6 Char and gas yield from pyrolysis of grape bagasse as a function of temperature
reported from Encinar et al. [22].
The liquid yield from pyrolysis of lignocellulosic biomass is also influenced by the pyrolysis
temperature. Usually, the liquid yields attain their highest yield at temperatures between 400
and 550°C. When the temperature is increased above 600°C, the liquid and char products are
transformed into gases because of the dominant secondary cracking reactions [21].
Rover et al. studied the effect of temperature on bio-oil produced from pyrolysis of red oak
wood. He reported a maximum char yield of 31.1wt.% at temperature 350°C, a maximum bio-

2 Pyrolysis of biomass
28
oil yield of 66.7wt% at 400°C, and the highest non-condensable gas yield of 26.3wt.% at 550°C
[6]. Demirbas (2007) studied the effect of temperature on the yield of char and liquid from
pyrolysis of hazelnut shell, beechwood, spruce wood, and organics of MSW. He reported that
char yield decreases as the temperature increases. The HHV of char from biomass samples
increases as the pyrolysis temperature increases. The highest liquid yields from the biomass
samples were achieved at temperatures ranging between 380°C and 530°C. The experimental
results conducted by Demirabs (2007) are illustrated in Figure 2.7 and Figure 2.8 [52].
Figure 2.7 Effect of temperature on char
yield [52].
Figure 2.8 Effect of temperature on liquid
yield [52].
2.3.2 Heating rate
The heating rate of biomass pyrolysis has a fundamental influence on the product yield and
composition. At fast heating rates, biomass is subjected to quick fragmentation, resulting in
more gases and lower char yield. Fast heating rates also improve bio-oil production because
mass and heat transfer is increased, and secondary reactions have less time to occur.
Accordingly, slow heating rates produce more char [22] [21]. In addition, high heating rates
contribute to increasing the yield of CO and CO2, decrease the water content in the liquid
product and reduce the pore volume in the char [6].
The operational conditions, including the heating rate, can be modified to satisfy the
requirements of the desired end products. To maximize char production, slow heating rate and
low final temperature are recommended. For maximation of the liquid yield, a high heating
rate, moderate final temperature (450-600°C), and a short gas residence time are preferred. To
maximize the gas yield, moderate to slow heating rate, high temperature (700-900°C), and a
long gas residence time is required [52] [22].
Harding et al. [53] studied the effect of heating rate for the pyrolysis of sawdust on the liquid
yield. They observed that the oil yield increased by increasing the heating rate. As shown in
Figure 2.9, the bio-oil increases significantly when the heating rate is increased from 500 to
700 °C/min, whereas there is no marked change of oil yield when the heating rate is increased
from 700 to 1000 °C/min.

2 Pyrolysis of biomass
29
Figure 2.9 Product yield from pyrolysis of sawdust as a function of heating rate, at a pyrolysis
temperature of 500°C, reported from Harding et al. [53].
Chen et al. [54] performed slow pyrolysis experiments of bamboo biomass and investigated
the effect of heating rate on the pyrolysis product yield. An increase in the heating rate resulted
in to decrease in the char and bio-oil yield and an increase in the gas yield, as illustrated in
Figure 2.10.
Figure 2.10 Product yield from pyrolysis of bamboo as a function of heating rate, at a
temperature of 700°C, reported from Chen et al. [54].
2.3.3 Particle size
The pyrolysis product yield can be influenced by the particle size and shape of the biomass due
to its impact on the heating rate. In finer biomass particles, the condensable gases have an easier
path to escape before secondary cracking occurs. As a result, the liquid yield increases. In
contrast, larger biomass particles contribute to increasing the char yield [22]. Smaller particles,

2 Pyrolysis of biomass
30
in general, enable heat and mass transfer to obtain uniform temperatures within the biomass
particles during pyrolysis. The liquid production is improved by minimizing the secondary
vapor cracking [21].
Zaman et al. [55] studied the effect of particle size of palm kernel shell on pyrolysis product
yield. They used a series of particle sizes ranging between 0.35 and 2 mm and pyrolysis
temperature ranging between 380 and 600°C. As shown in Figure 2.11 and Figure 2.12, the
highest liquid yield was obtained at a particle size of 0.35 mm and temperature 450°C. The
highest char yield was obtained from the largest particle size (1-2 mm).
2.3.4 Pretreatment of biomass
Biomass feedstock usually needs pretreatment before pyrolysis. The purpose of the
pretreatment is to enhance the pyrolysis efficiency and improve the desired product yields.
Pretreatment technologies include milling/grinding, torrefaction, drying and
densification/pelletization [22] [21]. Milling or grinding biomass into smaller particles is a
common procedure due to easier feeding into the reactors and improve pyrolysis efficiency.
Drying of biomass before pyrolysis increases the energy efficiency of the process [21]. Because
a kilogram of water in biomass needs 2.26 MJ to vaporize and therefore, high moisture content
results in a substantial energy loss [31]. Lignocellulosic biomass such as wood usually has a
moisture content of 30 to 60% and can be as high as 90% for some types of biomass [22]. For
the pyrolysis process, drying of biomass to a moisture content of 10-15% is usually required
[31]. Some research reported the effect of dried biomass on product yields. It improves the
quality of generated syngas by lowering the CO2 content and increasing the H2 and CH2
contents. Others also verified a lower liquid yield generated from pyrolysis of dried biomass
[21].
Densification or pelletization of biomass by applying mechanical force produces biomass
pellets which usually take the shape of small cylinders. Densified biomass is characterized by
easier handling, reduces storage and transportation costs, high volumetric energy density, lower
moisture contents, and higher bio-oil yields from pyrolysis [31] [21] [6].
Figure 2.11 Effect of particle size on liquid yield,
reported from Zama et al. [55].
Figure 2.12 Effect of particle size on char yield,
reported from Zaman et al. [55].
2 Pyrolysis of biomass
31
2.4 Pyrolysis reactor
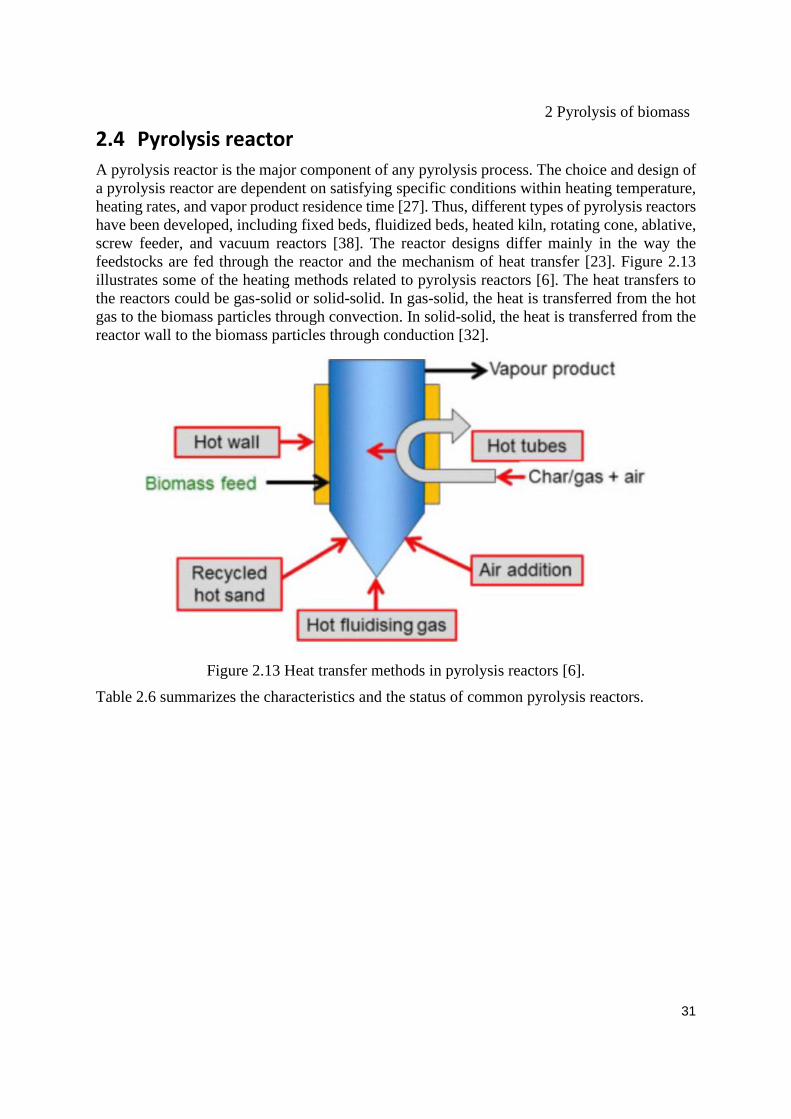
A pyrolysis reactor is the major component of any pyrolysis process. The choice and design of
a pyrolysis reactor are dependent on satisfying specific conditions within heating temperature,
heating rates, and vapor product residence time [27]. Thus, different types of pyrolysis reactors
have been developed, including fixed beds, fluidized beds, heated kiln, rotating cone, ablative,
screw feeder, and vacuum reactors [38]. The reactor designs differ mainly in the way the
feedstocks are fed through the reactor and the mechanism of heat transfer [23]. Figure 2.13
illustrates some of the heating methods related to pyrolysis reactors [6]. The heat transfers to
the reactors could be gas-solid or solid-solid. In gas-solid, the heat is transferred from the hot
gas to the biomass particles through convection. In solid-solid, the heat is transferred from the
reactor wall to the biomass particles through conduction [32].
Figure 2.13 Heat transfer methods in pyrolysis reactors [6].
Table 2.6 summarizes the characteristics and the status of common pyrolysis reactors.

2 Pyrolysis of biomass
32
Table 2.6 Characteristics and status of common pyrolysis reactor units [6].
Reactor
type Status
Bio-oil
yield
(wt.%)
Complexity
Feed
size
specific
ation
Inert
gas
need
Specific
reactor
size
Scale-
up
Gas
quality
Fluidized
bed Commercial 75 Medium High High Medium Easy Low
CFB and
transported
bed
Commercial 75 High High High Medium Easy Low
Rotating
cone
Demonstrati
on 70 High High Low Small Medium High
Entrained
bed Laboratory 60 Medium High High Medium Easy Low
Ablative Laboratory 75 High Low Low Small Hard High
Screw or
auger Pilot 60 Medium Medium Low Small Medium High
Vacuum None 60 High Low Low Large Hard Mediu
m

3 Gasification of biomass
33
3 Gasification of biomass There are three types of reactors or gasifiers used for biomass gasification: fixed or moving
bed, fluidized bed, and entrained flow gasifiers. They differ mainly in their flow conditions,
gas-sild contact mode, and residence time of biomass inside the reactors [56] [57].
This chapter includes the basic principles of biomass gasification. Among the gasification
reactor types, fluidized bed gasification reactor will only be discussed in this chapter due to its
relation to the study. A literature study on the simulation of the biomass gasification process is
also introduced.
3.1 Principles of biomass gasification
Biomass gasification processes, in contrast to pyrolysis, tend to maximize the conversion of
biomass feedstock into valuable gases [19]. The product gas mixture is called synthesis gas or
syngas, which consists of CO2, CO, CH4, H2, H2O, and small amounts of light and heavier
hydrocarbons [56]. In addition, and contrast to pyrolysis, gasification requires a gasifying
medium such as steam, air, or oxygen to rearrange the molecular structure of the biomass to
produce gases [22]. Biomass particles undergo a chain of conversion processes, which includes
drying, pyrolysis, combustion, and char gasification [58] [22]. Figure 3.1 illustrates the main
conversion steps that occur during biomass gasification.
Figure 3.1 Main conversion processes in biomass gasification [58].
Typical reactions involved in the biomass gasification process are the oxidation reactions
presented by partial oxidation reaction (3.1), oxidation of carbon reaction (3.2), hydrogen
combustion reaction (3.3), and carbon monoxide combustion (3.4) in addition to the previously
mentioned reactions listed from (2.7) to (2.12) in chapter 2.2.3 [51] [22].
2C + O2 ↔ 2CO Δ𝐻 = −222 kJ/mol (3.1)
3 Gasification of biomass
34
C + O2 ↔ CO2 Δ𝐻 = −394 kJ/mol (3.2)
H2 + 1/2O2 ↔ H2O Δ𝐻 = −242 kJ/mol (3.3)
CO + 1/2O2 → CO2 Δ𝐻 = −283 kJ/mol (3.4)
These oxidation reactions are exothermic. The main product of the oxidation step is the thermal
energy needed for the gasification process, while the gas produced is a mixture of CO, CO2, and H2O [56].
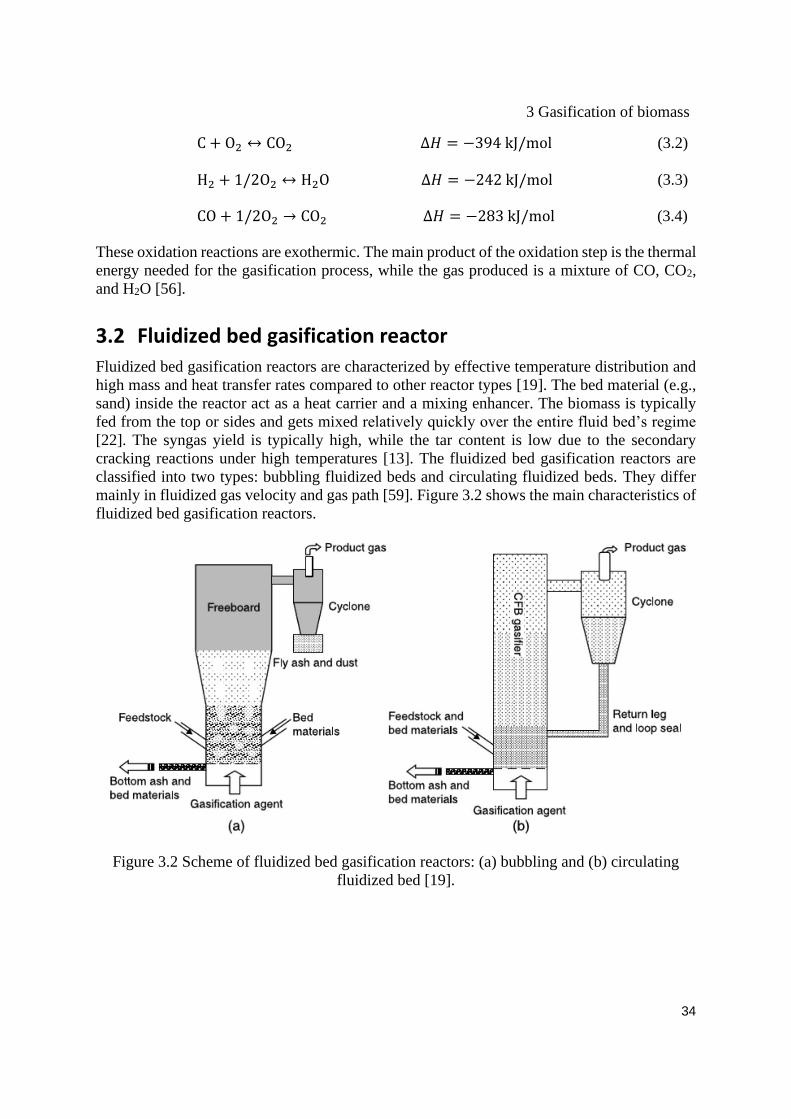
3.2 Fluidized bed gasification reactor
Fluidized bed gasification reactors are characterized by effective temperature distribution and
high mass and heat transfer rates compared to other reactor types [19]. The bed material (e.g.,
sand) inside the reactor act as a heat carrier and a mixing enhancer. The biomass is typically
fed from the top or sides and gets mixed relatively quickly over the entire fluid bed’s regime
[22]. The syngas yield is typically high, while the tar content is low due to the secondary
cracking reactions under high temperatures [13]. The fluidized bed gasification reactors are
classified into two types: bubbling fluidized beds and circulating fluidized beds. They differ
mainly in fluidized gas velocity and gas path [59]. Figure 3.2 shows the main characteristics of
fluidized bed gasification reactors.
Figure 3.2 Scheme of fluidized bed gasification reactors: (a) bubbling and (b) circulating
fluidized bed [19].

3 Gasification of biomass
35
3.3 Simulation of biomass gasification
Process simulation is a useful method for simulating flows in complicated systems such as
chemical reactors. In general, process simulation provides information about how an existing
system will respond when the operational conditions are varied [60].
Many simulation software and models used for the simulation of biomass gasification
processes have been developed. Aspen Plus is a popular software for simulating coal
conversion and has been used for simulating biomass gasification processes. The software
includes an extensive library of physical property models and unit operation models, as well as
quick and accurate process simulation functions, and an advanced measurement method [61].
Niko et al. developed a model for biomass gasification in an atmospheric fluidized bed gasifier
using the Aspen Plus simulator. The model was used to predict performance such as product
gas composition of a laboratory scale biomass gasifier. The model gave reasonable results
compared to the experimental results [62].
Computational fluid dynamics (CFD) software and models are commonly used for the
simulation of biomass gasification processes. Among such software are Ansys Fluent, Ansys
CFX, OpenFoam, and Barracuda (CPFD) software. CFD software is characterized by giving
the ability to study the flow behavior inside the reactor and testing the flow and fluid effects
on surfaces [63]. In general, all CFD models for multiphase flow can be divided into two
categories: Eulerian-Eulerian and Eulerian-Lagrangian approaches. Both particle and fluid
phases are treated as interpenetrating continua in the Eulerian-Eulerian approach. This solution
has been used to simulate the fluidization processes for many years, as it can estimate and
predict the microscopic characteristics of a process with remarkably low computational cost.
The Eulerian-Eulerian method has difficulty modeling flows with a variety of particle types
and sizes, this is due unrecognition of the discrete character of the particle phase. These
difficulties can be avoided by using the Eulerian-Lagrangian method. The Eulerian-Lagrangian
model treats the gas as continuous and particle as discrete phase [64]. This model uses the
Navier Stokes equations with an appropriate averaging method to model the fluid phase [65].
The Eulerian-Lagrangian approach works effectively for both dune and dense multiphase
flows. However, the computation time grows in proportion to the number of parcels simulated.
This means, the denser the flow is, the longer it takes to compute. The disadvantage of using
this model is the high computational costs. This is mainly because a high number of parcels is
needed for the statistical mean values of the dispersed phase. The grid generation for complex
geometries requires the usage of the multiblock concept. As a result, every new parcel
placement needs a long and complex search method, which is highly time-consuming [66].
The Computational Fluid Particle Dynamic (CPFD) method for solving particle-laden fluid
flows is used in Barracuda Virtual Reactor (VR) software. Barracuda VR is specialized CFD
software that is commonly used for simulation and analysis of fluidized bed reactors and other
gas-solid processes [67]. The software can predict performance when changing the unit
operational conditions, geometry, inlets and outlets, flow rates, and particle properties [60].
The Barracuda VR software uses the multiphase particle-in-cell (MP-PIC) model. This
numerical approach solves the fluid phase with the Eulerian computational grid and models the
solid phase with Lagrangian computational particles [68]. A given number of particles having
the same properties are expressed by parcels to minimize the computational costs [60]. The
present thesis uses Barracuda VR software for the simulation of the biomass gasification
process.

4 Pyrolysis experiments
36
4 Pyrolysis experiments The pyrolysis experiments were performed at the University of South-Eastern Norway,
department Porsgrunn. The overall aim is to build and construct the pyrolysis reactor unit and
perform pyrolysis experiments. Furthermore, study the pyrolysis product yields and the product
gas compositions. This chapter presents the pyrolysis experimental setup and procedure along
with feedstock analyses.
4.1 Pyrolysis feedstock
Wood pellets manufactured by Felleskjøpet were used as the feedstock for the pyrolysis
experiments. The pellets consist of 100% wood having a diameter of 6 mm and a length range
between 5 – 30 mm. Figure 4.1 shows the size distribution of the wood pellets.
Figure 4.1 Wood pellets as received.
The higher heating value (HHV), ultimate and proximate analysis presented in Table 4.1 were
carried out by Eurofins Environmental Testing Norway AS, using the following standard test
methods: Solid recovered fuels method SS-EN 15407 for determination of carbon, nitrogen,
and hydrogen contents, SS-EN ISO 18123 for the volatile matter, EN-ISO 18122 for the ash,
and SS-EN 15400 for the higher heating values. The fixed carbon content was calculated by
difference. The analyses received from the source are attached in Appendix B.
Table 4.1 Ultimate and proximate analysis of wood pellets.
a = dry basis, b = ash-free, c = by difference, d = as received
Ultimate analysis (wt.%)a,b Proximate analysis (wt.%)a
Biomass C H N O𝑐 S Moistured Volatile
matter a Asha Fixed
carbona,c
HHV
(MJ/kg)
Wood
pellets 51.3 6.1 0.1 42 0.01 7.9 83.9 0.55 15.55 18.774

4 Pyrolysis experiments
37
4.2 Experimental set-up
A tubular reactor is designed and constructed to perform a set of pyrolysis experiments. Figure
4.2 and Figure 4.3 show the designed and constructed pyrolysis reactor. The reactor is
cylindrical shaped made of steel with a diameter of 50 mm and length of 200 mm. The reactor
consists of two sections, section A and B. Section A is fixed inside the furnace and has three
inlets and outlets, one for biomass feeding, one for nitrogen flushing, and one for product gas
outlet. Section B is made of aluminum and used as a biomass feeder, which is tightly inserted
into section A through the wall gasket.
Figure 4.2 Pyrolysis reactor design.
Figure 4.3 Front view of constructed reactor.
The constructed reactor is inserted horizontally into a muffle furnace of type Nabertherm model
L15/11/B410 programmer and chimney, having a maximum allowable temperature of 1100°C.
The furnace temperature is shown on the integrated display and can be adjusted to the desired
temperature. Figure 4.4 illustrates a schematic diagram of the pyrolysis process.

4 Pyrolysis experiments
38
Figure 4.4 Schematic diagram of the biomass pyrolysis process.
The schematic diagram is drawn using the SolidWorks software. Nitrogen is used as a carrier
gas to avoid any oxygen to flow into the system. The nitrogen flow is supplied from a gas
cylinder, controlled by a gas cylinder, and measured with a rotameter. The reactor is connected
to a water-cooled condenser to collect the condensable vapors. Pyrolysis liquid yield is
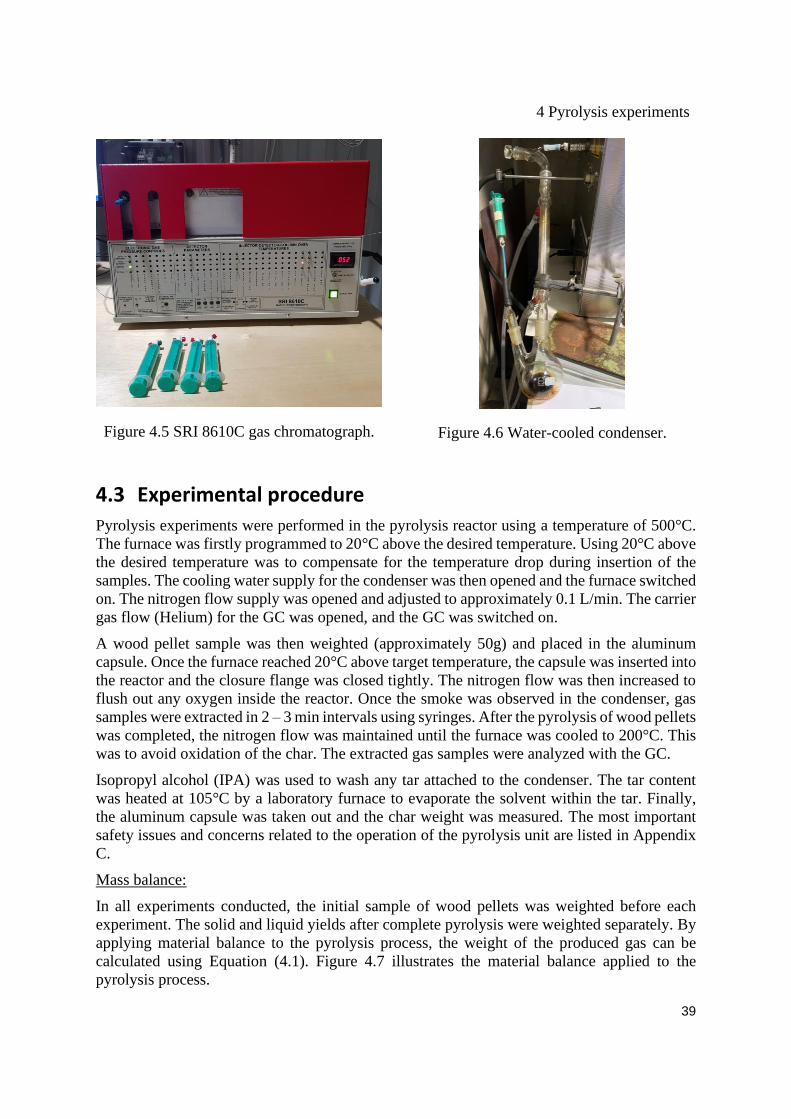
collected in a bio-oil collector. A gas chromatograph (GC) SRI 8610C using helium as a carrier
gas, is used to determine the gas composition fraction (O2, N2, CH4, CO2, and CO). The GC is
located in the experimental facility and uses a thermal conductivity detector (TCD). Helium
does not measure H2 accurately at lower concentrations. This is mainly because helium and H2
have a close relation in weight. Therefore, the H2 composition was calculated by difference.
Gas-tight syringes with shut-off valves were used for gas sampling. Figure 4.5 and Figure 4.6
show the gas chromatograph (GC) and the water-cooled condenser used for experiments.
4 Pyrolysis experiments
39
Figure 4.5 SRI 8610C gas chromatograph.
Figure 4.6 Water-cooled condenser.
4.3 Experimental procedure
Pyrolysis experiments were performed in the pyrolysis reactor using a temperature of 500°C.
The furnace was firstly programmed to 20°C above the desired temperature. Using 20°C above
the desired temperature was to compensate for the temperature drop during insertion of the
samples. The cooling water supply for the condenser was then opened and the furnace switched
on. The nitrogen flow supply was opened and adjusted to approximately 0.1 L/min. The carrier
gas flow (Helium) for the GC was opened, and the GC was switched on.
A wood pellet sample was then weighted (approximately 50g) and placed in the aluminum
capsule. Once the furnace reached 20°C above target temperature, the capsule was inserted into
the reactor and the closure flange was closed tightly. The nitrogen flow was then increased to
flush out any oxygen inside the reactor. Once the smoke was observed in the condenser, gas
samples were extracted in 2 – 3 min intervals using syringes. After the pyrolysis of wood pellets
was completed, the nitrogen flow was maintained until the furnace was cooled to 200°C. This
was to avoid oxidation of the char. The extracted gas samples were analyzed with the GC.
Isopropyl alcohol (IPA) was used to wash any tar attached to the condenser. The tar content
was heated at 105°C by a laboratory furnace to evaporate the solvent within the tar. Finally,
the aluminum capsule was taken out and the char weight was measured. The most important
safety issues and concerns related to the operation of the pyrolysis unit are listed in Appendix
C.
Mass balance:
In all experiments conducted, the initial sample of wood pellets was weighted before each
experiment. The solid and liquid yields after complete pyrolysis were weighted separately. By
applying material balance to the pyrolysis process, the weight of the produced gas can be
calculated using Equation (4.1). Figure 4.7 illustrates the material balance applied to the
pyrolysis process.

4 Pyrolysis experiments
40
Figure 4.7 Material balance.
𝑀𝑎𝑠𝑠 𝑜𝑓 𝑡ℎ𝑒 𝑔𝑎𝑠 (M𝐺) = MB − (MC + MT) (4.1)
The mass fractions of the product yields are calculated using equations (4.2) and (4.3).
Liquid yield = MT
M𝐵× 100 (4.2)
gas yield =M𝐺
M𝐵 × 100 (4.3)

5 CPFD simulation of biomass gasification
41
5 CPFD simulation of biomass gasification Computational particle fluid dynamic (CPFD) software was used to simulate the biomass
gasification reactor. The Barracuda Virtual reactor (VR) version 17.4.1 software simulates
multiphase hydrodynamics, heat balance, and chemical reactions of fluid-particle systems in
three dimensions. The Lagrange approach is used for the particle phase, and the Eulerian
approach is used for the gas phase. Pyrolysis data obtained from different studies were used as
an input for the simulation.
The aim was to study the composition of the synthesis gas obtained from gasification of wood
pellets and compare them with the experimental results performed at USN and conducted by
(Bandara, 2021, P.44) [65]. Further, to study the effect of pyrolysis gas composition and reactor
temperature on the synthesis gas composition. This chapter discusses the simulation setup and
procedure used in Barracuda software to establish the simulation model.
5.1 Mesh and geometry
For simulation of the biomass gasification reactor, a geometry with 8.83 cm square cross-
section and 100 cm height was created. The geometry can be constructed using software that
handles CAD geometries such as AutoCAD and SolidWorks. Afterward, the geometry was
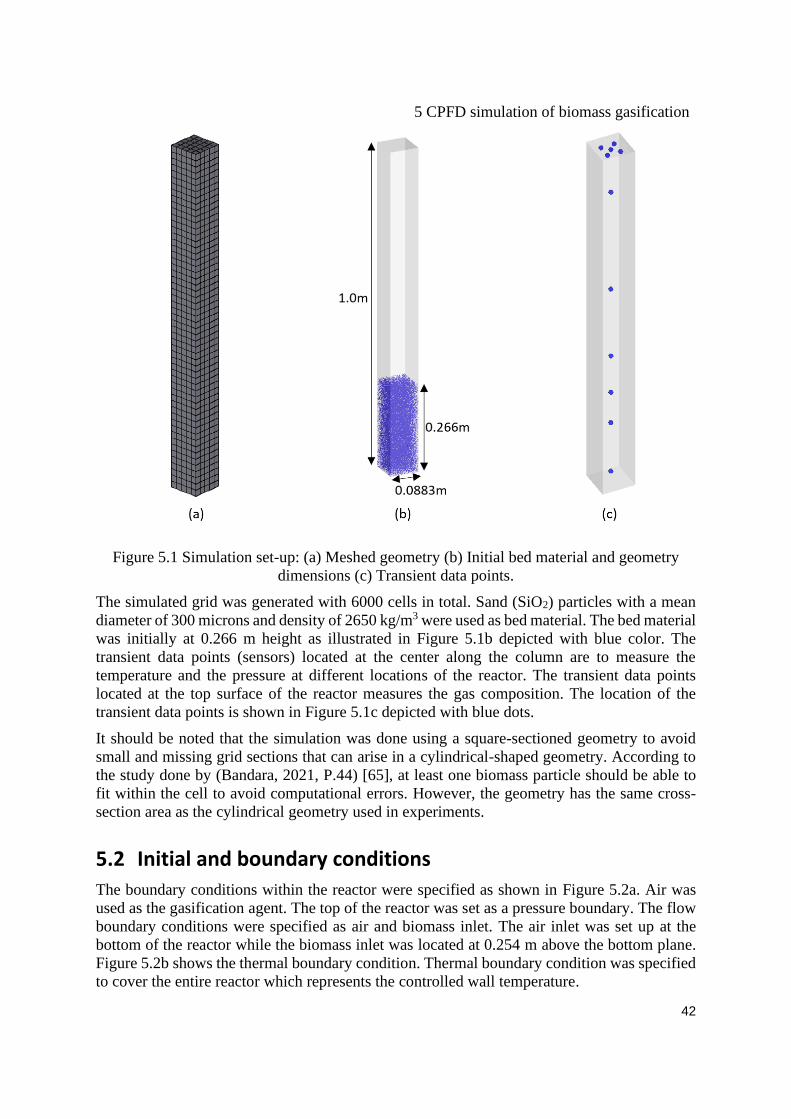
imported to Barracuda as a .STL file and meshed. Figure 5.1 shows the meshed geometry
(Grid), the initial bed material and dimension of the geometry, and the locations of transient
data points.
5 CPFD simulation of biomass gasification
42
Figure 5.1 Simulation set-up: (a) Meshed geometry (b) Initial bed material and geometry
dimensions (c) Transient data points.
The simulated grid was generated with 6000 cells in total. Sand (SiO2) particles with a mean
diameter of 300 microns and density of 2650 kg/m3 were used as bed material. The bed material
was initially at 0.266 m height as illustrated in Figure 5.1b depicted with blue color. The
transient data points (sensors) located at the center along the column are to measure the
temperature and the pressure at different locations of the reactor. The transient data points
located at the top surface of the reactor measures the gas composition. The location of the
transient data points is shown in Figure 5.1c depicted with blue dots.
It should be noted that the simulation was done using a square-sectioned geometry to avoid
small and missing grid sections that can arise in a cylindrical-shaped geometry. According to
the study done by (Bandara, 2021, P.44) [65], at least one biomass particle should be able to
fit within the cell to avoid computational errors. However, the geometry has the same cross-
section area as the cylindrical geometry used in experiments.
5.2 Initial and boundary conditions
The boundary conditions within the reactor were specified as shown in Figure 5.2a. Air was
used as the gasification agent. The top of the reactor was set as a pressure boundary. The flow
boundary conditions were specified as air and biomass inlet. The air inlet was set up at the
bottom of the reactor while the biomass inlet was located at 0.254 m above the bottom plane.
Figure 5.2b shows the thermal boundary condition. Thermal boundary condition was specified
to cover the entire reactor which represents the controlled wall temperature.

5 CPFD simulation of biomass gasification
43
Figure 5.2 Boundary conditions: (a) Flow boundaries (b) Thermal boundary.
The initial conditions for the gasification reactor were also defined. The reactor was initially
filled with pure nitrogen at 1 atm and the temperature was varied according to the simulated
case. The bed material is initially 100% sand (SiO2) with a particle volume fraction of 0.6. The
starting temperature was specified to be similar to the target operational temperature for all
simulated cases.
5.3 Input data
There are several drag models available in Barracuda. Wen-Yu/Ergun was adopted for the
simulation because prior simulations done at USN used the Wen-Yu/Ergun drag model and the
results showed a good match to the experimental data [69]. Table 2.1 shows the specified
biomass properties, inlet flows, and simulation parameters used in the simulation.
5 CPFD simulation of biomass gasification
44
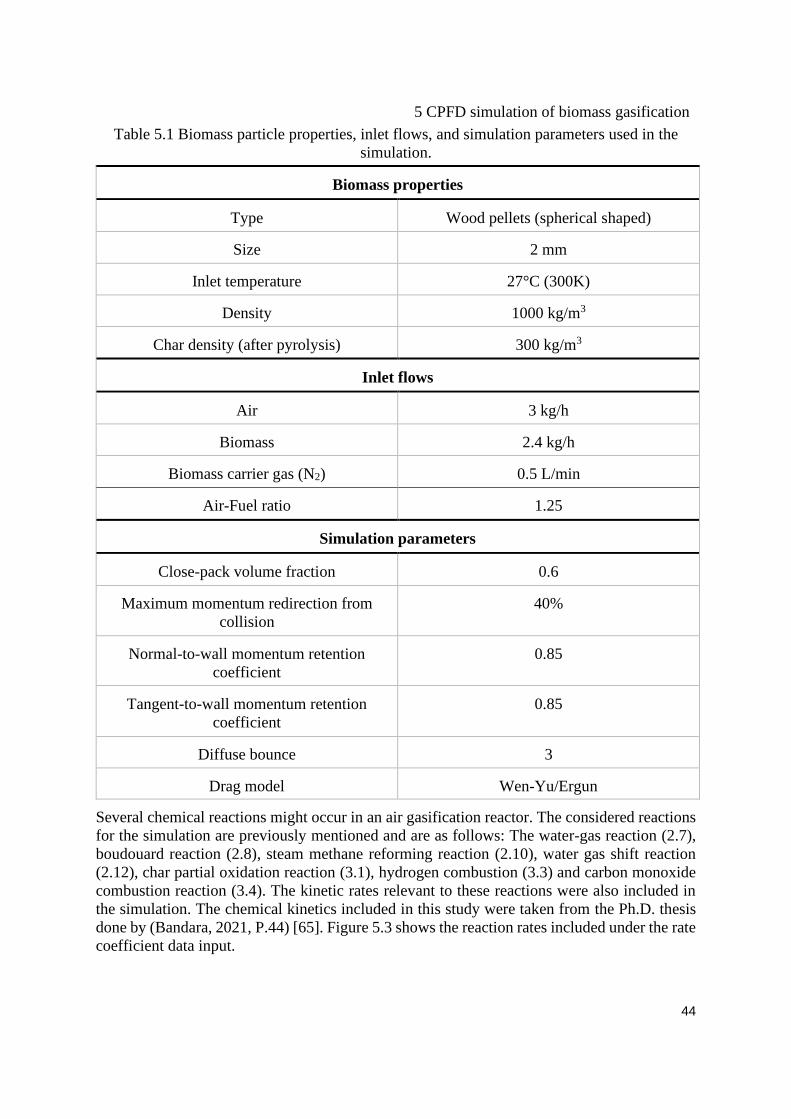
Table 5.1 Biomass particle properties, inlet flows, and simulation parameters used in the
simulation.
Biomass properties
Type Wood pellets (spherical shaped)
Size 2 mm
Inlet temperature 27°C (300K)
Density 1000 kg/m3
Char density (after pyrolysis) 300 kg/m3
Inlet flows
Air 3 kg/h
Biomass 2.4 kg/h
Biomass carrier gas (N2) 0.5 L/min
Air-Fuel ratio 1.25
Simulation parameters
Close-pack volume fraction 0.6
Maximum momentum redirection from
collision
40%
Normal-to-wall momentum retention
coefficient
0.85
Tangent-to-wall momentum retention
coefficient
0.85
Diffuse bounce 3
Drag model Wen-Yu/Ergun
Several chemical reactions might occur in an air gasification reactor. The considered reactions
for the simulation are previously mentioned and are as follows: The water-gas reaction (2.7),
boudouard reaction (2.8), steam methane reforming reaction (2.10), water gas shift reaction
(2.12), char partial oxidation reaction (3.1), hydrogen combustion (3.3) and carbon monoxide
combustion reaction (3.4). The kinetic rates relevant to these reactions were also included in
the simulation. The chemical kinetics included in this study were taken from the Ph.D. thesis
done by (Bandara, 2021, P.44) [65]. Figure 5.3 shows the reaction rates included under the rate
coefficient data input.

5 CPFD simulation of biomass gasification
45
Figure 5.3 Reaction rates for the gasification reactions.
5.4 Simulation procedure
The simulated biomass was wood pellets. To define the wood pellets in the simulation software,
the fraction of the volatiles and solid must be clarified. From the proximate analysis Table 4.1,
wood pellets are broken into 83.9 wt.% volatiles, 15.55 wt.% fixed carbon, 0.55 wt.% ash, and
7.9 wt.% moisture in the pyrolysis stage. The amount of ash is very small; thus, the ash content
was neglected. The moisture content was included in the volatile phase. Biomass char is
considered to consist of pure carbon.
Experimental data conducted from other studies were used and fitted into the Barracuda
simulation software. The product gas composition from pyrolysis of wood pellets, conducted
from other studies, is listed in Table 2.4. Product gas composition includes CO, CO2, H2, CH4,
and H2O gases. The Barracuda software requires to specify the volatiles in mass percentages.
Therefore, the volume percentage of the gases was converted into a mass percentage using
equation (5.1). The ideal gas assumption was adopted. Thereby, the molar fraction is the same
as the volume fraction.
𝑀𝑎𝑠𝑠 𝑓𝑟𝑎𝑐𝑡𝑖𝑜𝑛 =𝑉𝑜𝑙𝑢𝑚𝑒 𝑓𝑟𝑎𝑐𝑡𝑖𝑜𝑛 ∗ 𝑀𝑜𝑙𝑒𝑐𝑢𝑙𝑎𝑟 𝑤𝑒𝑖𝑔ℎ𝑡
𝑇𝑜𝑡𝑎𝑙 𝑤𝑒𝑖𝑔ℎ𝑡 (5.1)
Three simulation cases were established by changing the reactor temperature and fitting the
pyrolysis gas compositions according to data from the literature. The specific data for each case
are tabulated in Table 5.2.
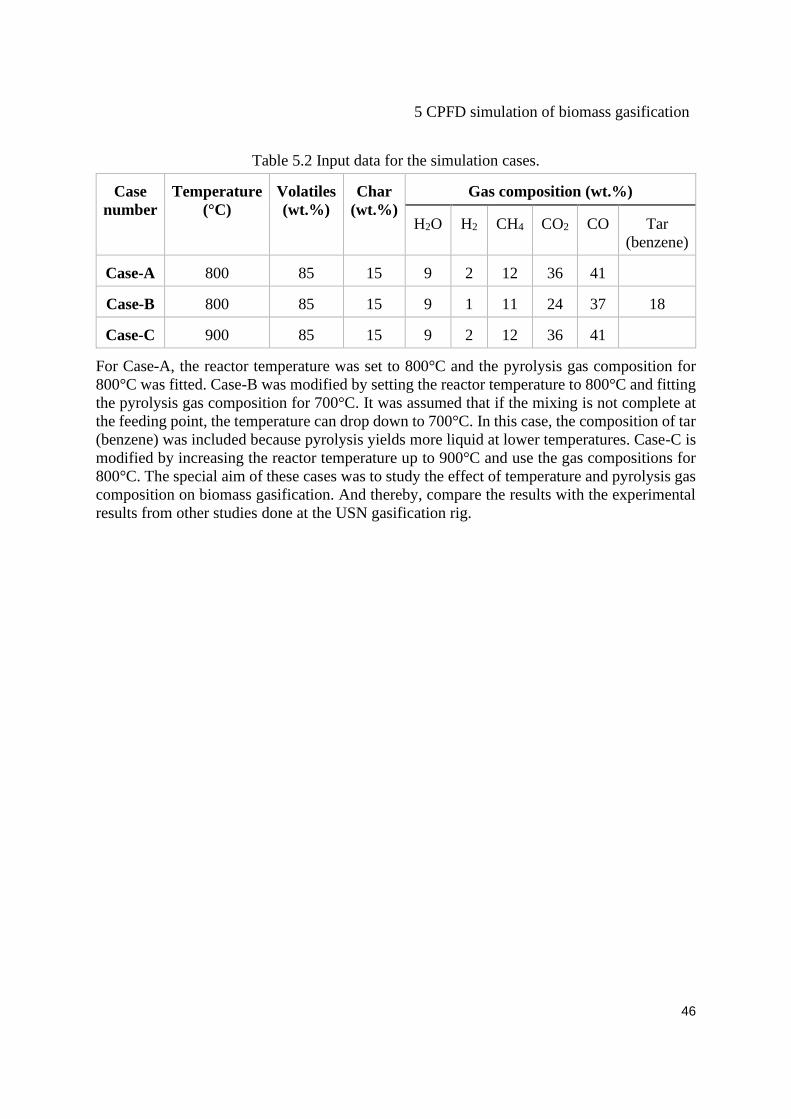
5 CPFD simulation of biomass gasification
46
Table 5.2 Input data for the simulation cases.
Case
number
Temperature
(°C)
Volatiles
(wt.%)
Char
(wt.%)
Gas composition (wt.%)
H2O H2 CH4 CO2 CO Tar
(benzene)
Case-A 800 85 15 9 2 12 36 41
Case-B 800 85 15 9 1 11 24 37 18
Case-C 900 85 15 9 2 12 36 41
For Case-A, the reactor temperature was set to 800°C and the pyrolysis gas composition for
800°C was fitted. Case-B was modified by setting the reactor temperature to 800°C and fitting
the pyrolysis gas composition for 700°C. It was assumed that if the mixing is not complete at
the feeding point, the temperature can drop down to 700°C. In this case, the composition of tar
(benzene) was included because pyrolysis yields more liquid at lower temperatures. Case-C is
modified by increasing the reactor temperature up to 900°C and use the gas compositions for
800°C. The special aim of these cases was to study the effect of temperature and pyrolysis gas
composition on biomass gasification. And thereby, compare the results with the experimental
results from other studies done at the USN gasification rig.

6 Results and Discussion
47
6 Results and Discussion This chapter presents the results obtained from pyrolysis of wood pellets experiments, along
with a discussion of the results. The results were further compared to other pyrolysis
experiments obtained from the literature. Similarly, the results from the three simulated cases
are presented and compared with experimental data.
6.1 Pyrolysis experiments
The pyrolysis experimental rig is a newly built unit, hence there were some modifications and
operational problems during the experiments. Due to technical reasons, it was only possible to
get good results from only one of the pyrolysis experiments. Among the operational problems
experienced during this study are the leakages from closing flanges. Whereas the gas could not
pass through the solvent in the impingements bottles due to the pressure. However, this
problem was solved by replacing the impingement bottles with a water-cooled condenser.
The pyrolysis experiment was performed with a reactor temperature of 500°C and the initial
sample of wood pellets was weighted to 37.8g. It took approximately 9 minutes to complete
the pyrolysis. The char and tar products were weighed, and the product gas percentage was
calculated by material balance using Equation (4.1), (4.2), and (4.3). The tar produced has a
dark brown appearance. Figure 6.1 shows the end-products obtained from pyrolysis of wood
pellets at 500°C.
Figure 6.1 Tar and char produced from pyrolysis of wood pellets at 500°C.
Figure 6.2 shows the product yields obtained from pyrolysis of wood pellets at 500°C. The
char, tar, and gas fractions were measured to be 29.2%, 22.5%, and 48.3% by weight,
respectively. There is a possibility of escaping some non-condensed tar with the gas. Therefore,
the actual tar content may be a little bit higher, and the gas content may be lower.

6 Results and Discussion
48
Figure 6.2 Product yields from pyrolysis of wood pellets at 500°C.
There were no studies found on pyrolysis of wood pellets at 500°C. Therefore, it was decided
to compare the results with the pyrolysis experiments performed for wood listed in Table 2.4.
This is to compare the trend of the product yields and study the validity of the pyrolysis
experiment. As both wood pellets and wood are lignocellulosic biomass, the same product
trends are expected. Figure 6.3 shows the product yields from the pyrolysis experiment of wood
pellets compared to product yields from pyrolysis of wood obtained from the literature. The
trend of char yield agreed well with the literature, while the experimental tar yield was lower,
and the experimental gas yield was significantly higher. The high gas yield and low tar yield
in the experiment might be due to escaping of non-condensed tar with the gas.
Nevertheless, it is expected that pyrolysis of wood pellets will produce less tar than wood. This
is because wood pellets have less moisture content compared to wood and according to the
literature, less moisture content in the biomass contributes to fewer tar yields.
Figure 6.3 Comparison between experimental results and literature results at 500°C.

6 Results and Discussion
49
Once the smoke was observed in the condenser, the gas samples were extracted in 1-2 minutes
intervals using syringes. Figure 6.4 and Figure 6.5 show the results for the gas compositions
analyzed by the gas chromatographer (GC), measured after 9 minutes of pyrolysis. The rest of
the results and graphs obtained from the GC after 2, 4, 7, and 8 minutes of pyrolysis are attached
in Appendix D.
The cumulative value of the gas compositions was above 100%, as shown in Figure 6.5. This
might be due to other gas components that are not calibrated such as Ethane and hydrogen.
Usually, the composition of H2 is calculated by difference. However, as the gas composition
obtained from the GC analysis was above 100%, it was not possible to calculate it.
Furthermore, the GC could not differentiate between CO and CH4 in different peaks. From
experience, this is mainly due to high concentrations of CO and CH4. As shown in Figure 6.4,
the GC measured the two gases as CH4 and in other cases as CO. However, it was observed a
shoulder in the analysis, where it starts to differentiate but suddenly decreases. This means that
both gases are presented in the product gas. The N2 presence in the analysis is due to N2 flushing
inside the reactor during the operation.
Figure 6.4 Gas analysis from the GC after 9 minutes of pyrolysis.
Figure 6.5 Gas volume fractions from the GC after 9 minutes of pyrolysis.
Due to the mentioned issues, the sum of CO and CH4 were introduced together. The
concentration of H2 was determined by difference for the case of 2 minutes, as it was the only
case with cumulative gas composition below 100%. Figure 6.6 indicates the evolution of the
product gas with time at pyrolysis temperature of 500°C. The H2 concentration was only
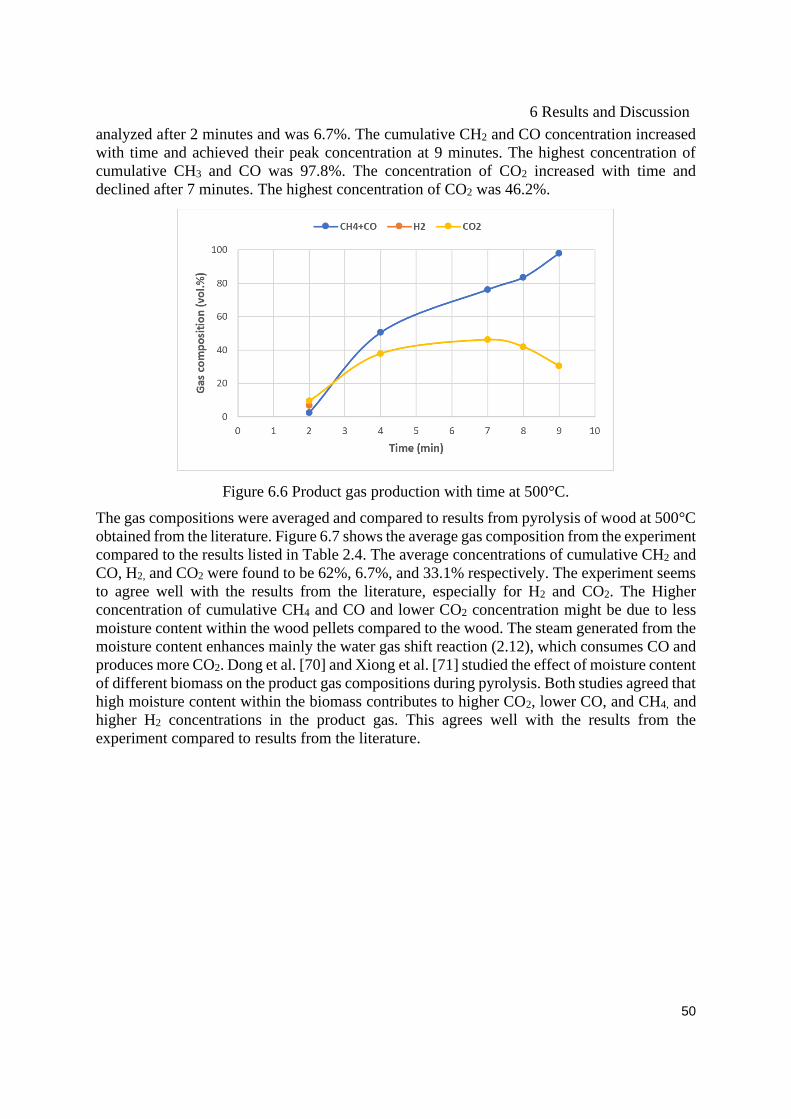
6 Results and Discussion
50
analyzed after 2 minutes and was 6.7%. The cumulative CH2 and CO concentration increased
with time and achieved their peak concentration at 9 minutes. The highest concentration of
cumulative CH3 and CO was 97.8%. The concentration of CO2 increased with time and
declined after 7 minutes. The highest concentration of CO2 was 46.2%.
Figure 6.6 Product gas production with time at 500°C.
The gas compositions were averaged and compared to results from pyrolysis of wood at 500°C
obtained from the literature. Figure 6.7 shows the average gas composition from the experiment
compared to the results listed in Table 2.4. The average concentrations of cumulative CH2 and
CO, H2, and CO2 were found to be 62%, 6.7%, and 33.1% respectively. The experiment seems
to agree well with the results from the literature, especially for H2 and CO2. The Higher
concentration of cumulative CH4 and CO and lower CO2 concentration might be due to less
moisture content within the wood pellets compared to the wood. The steam generated from the
moisture content enhances mainly the water gas shift reaction (2.12), which consumes CO and
produces more CO2. Dong et al. [70] and Xiong et al. [71] studied the effect of moisture content
of different biomass on the product gas compositions during pyrolysis. Both studies agreed that
high moisture content within the biomass contributes to higher CO2, lower CO, and CH4, and
higher H2 concentrations in the product gas. This agrees well with the results from the
experiment compared to results from the literature.

6 Results and Discussion
51
Figure 6.7 Average product gas composition obtained from experiment and literature at
500°C.
However, other factors might have contributed to the variations between experimental and
literature results. The type of wood and wood pellets were not identified, whereas different
wood types have different biochemical compositions. Uncertainty during the experiment, gas
leakages, sampling issues, higher density for the wood pellets might have also influenced the
product yields.
6.2 CPFD model
This chapter includes the results of the three simulated cases created for biomass gasification
reactor. The influence of the pyrolysis gas composition and reactor temperature on the
synthesis gas composition are presented and discussed. The synthesis gas compositions from
the simulation were further compared with the experimental data obtained from other studies.
The total simulation time for each case was set to 200 seconds with a time step of 0.001
seconds. The gas compositions measured by the transient data points were averaged for the last
simulated 100 seconds.
6.2.1 Case-A
Case-A was modified by setting the reactor temperature to 800°C using the pyrolysis gas
composition for 800°C. Figure 6.8 shows the mass fraction of product species at the reactor
outlet plotted after 100s of simulated time. The average mass fraction of CO was 10.4%, CO2
was 39.4%, CH4 was 4.2% and H2 was 1.1%.

6 Results and Discussion
52
Figure 6.8 Case-A: Outlet mass fraction variation with time.
Figure 6.9 shows an outline of the (a) fluid temperature (b) particle temperature and (c) particle
volume fraction along the bed, plotted at 200s. These parameters were only studied for this
case. As there are no significant changes within temperature, and the air flow was kept constant,
the same behavior for the other cases is assumed. As shown in Figure 6.9, fluid and particle
temperatures are above 800°C (1073K), which is the desired temperature. This indicates that
the gasification reactions are continuously maintained. From Figure 6.9c, the particles seem to
be well mixed, which is good in terms of temperature distribution. The air flow might be a little
bit high, but as long the particles remain within the bed it is accepted. However, limited air
flows can reduce the generation of combustible gases such as CO, H2, and CH4.

6 Results and Discussion
53
Figure 6.9 Reactor conditions (a) Fluid temperature [K] (b) Particle temperature (c) Particle’s
volume fraction.
6.2.2 Case-B
In Case-B, the reactor temperature was kept at 800°C and the pyrolysis gas composition for
700°C was fitted. Figure 6.10 shows the mass fraction of product species at the reactor outlet
plotted after 100s of simulated time. The average mass fraction of CO was 13.2%, CO2 was
32.4%, CH4 was 4.1% and H2 was 0.9%. As the pyrolysis gas composition for 700°C was fitted
in this case, more tar will be produced. Thereby, the tar composition was modified within the
volatiles and the tar reactions were included in the simulation.
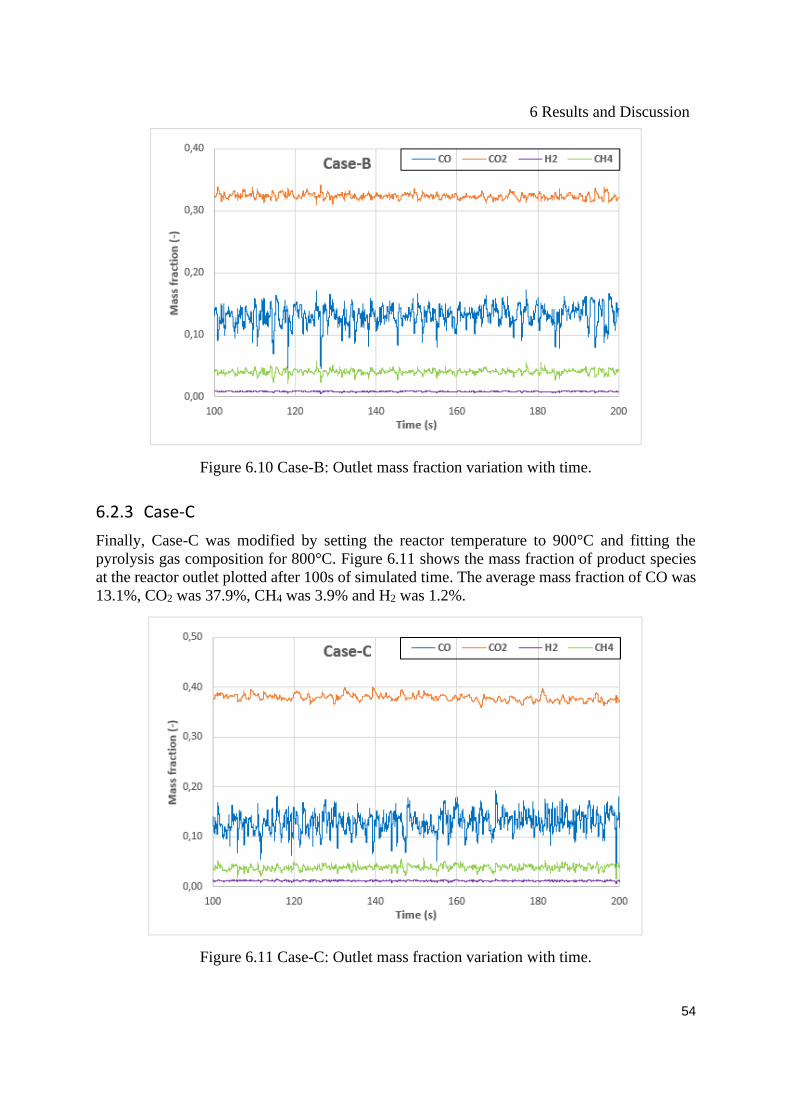
6 Results and Discussion
54
Figure 6.10 Case-B: Outlet mass fraction variation with time.
6.2.3 Case-C
Finally, Case-C was modified by setting the reactor temperature to 900°C and fitting the
pyrolysis gas composition for 800°C. Figure 6.11 shows the mass fraction of product species
at the reactor outlet plotted after 100s of simulated time. The average mass fraction of CO was
13.1%, CO2 was 37.9%, CH4 was 3.9% and H2 was 1.2%.
Figure 6.11 Case-C: Outlet mass fraction variation with time.

6 Results and Discussion
55
6.2.4 Comparison
From Figure 6.8, Figure 6.10, and Figure 6.11, the calculated product mass fractions are
showing a noisy and unsteady behavior, whereas the steady-state is never reached. This is due
to the unsteady characteristics of the fluidized bed, where different chemical and physical
transformations taking place. However, it was noticed from the plots that the average mass
fractions were stable over time.
The average gas composition from the three cases was converted into a molar basis and is
presented in Figure 6.12 and Table 6.1. The percentage of other gases includes N2, O2, and
H2O. In addition to these gases, benzene is only included in Case-B. In all cases, N2 contributed
to the highest molar concentration and ranged between 41.5% and 43.5% of the total volume
composition. This is reasonable, as nitrogen is an inert gas and does not react with other gases.
The molar concentration of O2 were monitored to be very close to zero. This is mainly due to
the occurrence of oxidation reactions. The H2O molar concentration were measured to be 2.5%,
1.6%, and 1.2% for Case-A, B, and C, respectively. The lower percentage of H2O produced in
Case-C is mainly due to the increase of temperature to 900°C. Where higher temperatures
enhance the water gas reaction (2.7) to proceed forward. Which in term produces more H2. In
all cases, the molar concentration of CO2 was highest, and then comes H2 and CO, respectively.
The lowest produced gas component was CH4.
Figure 6.12 Molar compositions of the gas species monitored at the reactor outlet for (a)
Case-A (b) Case-B (c) Case-C.
Case-A and Case-B were simulated for the same reactor temperature but different pyrolysis
gas compositions, therefore, the results from the two cases are compared with the input
pyrolysis gas composition to study the effect of the pyrolysis step. Figure 6.13 and Figure 6.14
show the input pyrolysis gas compositions for Case-A and B respectively, compared to the
synthesis gas compositions.
The molar concentration of CO2 increased slightly by 3% and 2.6% in the synthesis gas for
Case-A and B, respectively. In the contrast, the CO concentration decreased significantly by
27% and 29.9% in the synthesis gas for Case-A and B, respectively. The concentration of CH4
decreased by 6.9% and 7.1% in the synthesis gas for Case-A and B, respectively. The
concentration of H2 decreased by 8.2% and 4.7% in the synthesis gas for Case-A and B,
respectively.

6 Results and Discussion
56
The increase of CO2 is mainly due to the oxidation reactions in the gasifier. The consumption
of CO is mainly due to enhance of the CO combustion reaction (3.4) and water gas shift reaction
(2.12), where both reactions produce more CO2. Consumption of methane is mainly due to
steam methane reforming reaction (2.10), which in term produces more CO.
It was observed that higher concentrations of the combustible gases including CH2, CO, and
H2 released in the pyrolysis stage contributed to higher concentrations of these gases in the
synthesis gas. This means that the pyrolysis stage is critical in deciding how much CH4, CO,
and H2 will be produced in the synthesis gas.
From Figure 6.13, Figure 6.14 and according to the mentioned arguments, the pyrolysis gas
composition seems to have a significant effect on the synthesis gas compositions, especially on
the production of the combustible gases. This is mainly because 85% by weight of the synthesis
gas was produced during the pyrolysis of biomass step.
Figure 6.13 Case-A: Input pyrolysis gas composition compared to synthesis gas composition.
Figure 6.14 Case-B: Input pyrolysis gas composition compared to synthesis gas composition.

6 Results and Discussion
57
Table 6.1 shows the average gas composition from the simulation of the three cases and
experimental results. Figure 6.15 shows a plot of the average gas compositions from the
simulation of Case-A and B compared with the experimental results. It should be noted that
only Case-A and B are comparable with the experimental results, as they have the same reactor
temperature. Comparing Case-A and Case-B with the experimental results, both cases gave a
good agreement with experimental results in the case of CH4 and H2. Case-B gave a closer
prediction on CO2 and CO, which is not as expected because Case-B uses the pyrolysis gas
composition for 700°C. This might be due to the tar that was defined in Case-B. However, in
both cases, the concentration of CO2 was overestimated, the concentration of CO was
underestimated while the concentration of CH4 was slightly overestimated.
The overestimation of CO2 and underestimation of CO might be due to some errors in the
pyrolysis gas composition or high rates in the water-gas-shift reaction (2.12) where CO is
consumed, and more CO2 is produced. However, there can also be some experimental
uncertainties in measuring the gas composition, related to the GC measurements and during
sampling. In the experiment, the biomass feeding was not continuous in contrast to simulation.
As the pyrolysis gas composition highly affects the final syngas composition, discontinuous
feeding might cause alterations in the actual measured value. In the simulation, it is possible to
take a wide range of measurements while in experiments is limited.
However, the deviation between experiment and simulation cannot be avoided. This is mainly
because the reaction network is decreased, devolatilization is simplified and the tar generation
is minimized or ignored.
Table 6.1 Average gas composition (mole basis) from the simulated cases and experiment.
Case-A Case-B Case-C Experiment
CO2 24.1 20.6 22.82 14
CH4 7 7.1 6.5 4
CO 10 13.1 12.4 19
H2 14.8 12.3 16.4 17

6 Results and Discussion
58
Figure 6.15 Average product gas composition from the three cases compared to the
experimental results.
Case-A and C are both compared with each other to study the effect of temperature in synthesis
gas composition. As both cases are defined with the same pyrolysis gas composition but
different temperatures. Figure 6.16 shows product gas composition from Case-A and Case-B
with varying the reactor temperature. Increasing the temperature from 800°C to 900°C,
increased the concentration of CO and H2 while decreased the concentration of CO2 and CH4.
The CO concentration increased from 10% to 12.4%, CO2 concentration decreased from 24.1%
to 22.8%, CH4 concentration decreased slightly from 7% to 6.5% and H2 concentration
increased from 14.8% to 16.4%. This is mainly due to the reactions that are enhanced with
increasing temperature including, char partial oxidation reaction (3.1), water gas shift reaction
(2.12), and the Boudouard reaction (2.8). Higher temperature enhances the tar cracking
reactions, resulting in a higher concentration of H2 and CO. Further, the reactor temperature
has a significant effect on the pyrolysis product yields, especially the gas. Therefore, increasing
the reactor temperature contributes to higher gas composition and lower tar yields. However,
the trends show a good agreement with literature and other experiments except for the trend of
CH4. This might be due to the neglect of the tar composition in the volatiles.
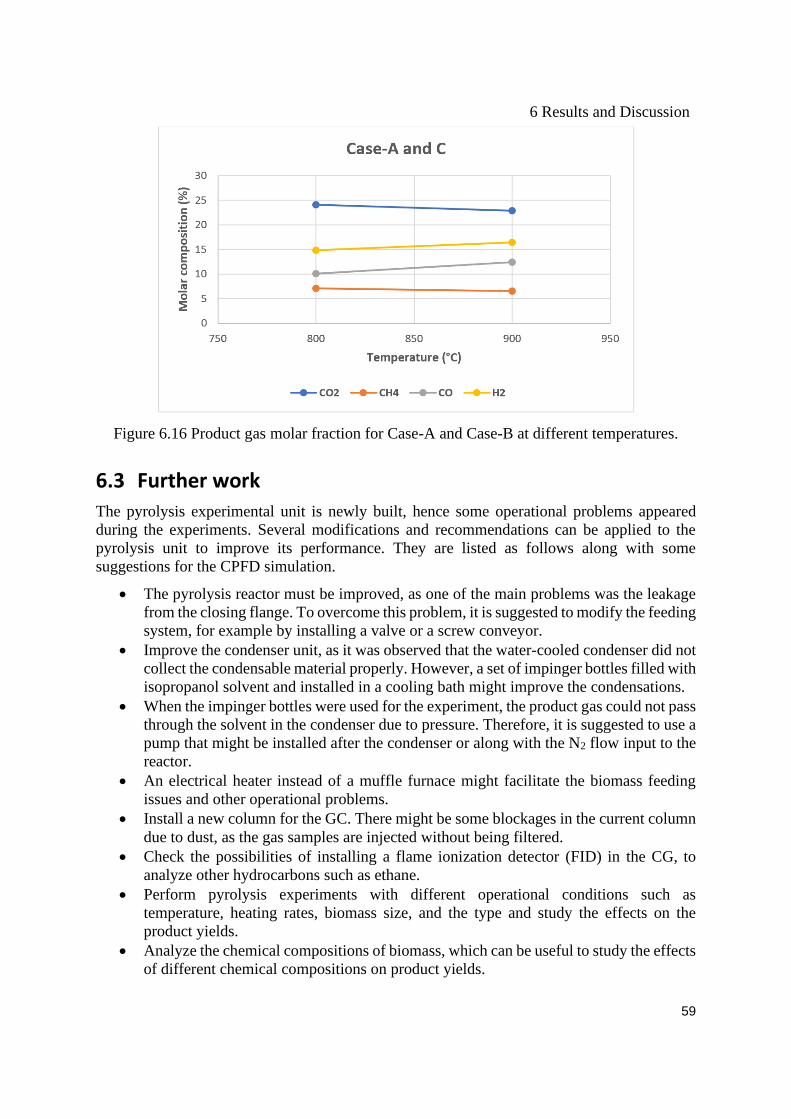
6 Results and Discussion
59
Figure 6.16 Product gas molar fraction for Case-A and Case-B at different temperatures.
6.3 Further work
The pyrolysis experimental unit is newly built, hence some operational problems appeared
during the experiments. Several modifications and recommendations can be applied to the
pyrolysis unit to improve its performance. They are listed as follows along with some
suggestions for the CPFD simulation.
• The pyrolysis reactor must be improved, as one of the main problems was the leakage
from the closing flange. To overcome this problem, it is suggested to modify the feeding
system, for example by installing a valve or a screw conveyor.
• Improve the condenser unit, as it was observed that the water-cooled condenser did not
collect the condensable material properly. However, a set of impinger bottles filled with
isopropanol solvent and installed in a cooling bath might improve the condensations.
• When the impinger bottles were used for the experiment, the product gas could not pass
through the solvent in the condenser due to pressure. Therefore, it is suggested to use a
pump that might be installed after the condenser or along with the N2 flow input to the
reactor.
• An electrical heater instead of a muffle furnace might facilitate the biomass feeding
issues and other operational problems.
• Install a new column for the GC. There might be some blockages in the current column
due to dust, as the gas samples are injected without being filtered.
• Check the possibilities of installing a flame ionization detector (FID) in the CG, to
analyze other hydrocarbons such as ethane.
• Perform pyrolysis experiments with different operational conditions such as
temperature, heating rates, biomass size, and the type and study the effects on the
product yields.
• Analyze the chemical compositions of biomass, which can be useful to study the effects
of different chemical compositions on product yields.

6 Results and Discussion
60
• Include the formation and decomposition of tar in the CPFD simulations. Neglection of
this parameter might give errors in the results.

7 Conclusion
61
7 Conclusion The overall aim of this thesis was to design and construct a pyrolysis reactor and perform
experimental tests to study the product composition as a function of biomass type and
operational conditions, especially the temperature. An extensive literature study has been
carried out on the pyrolysis of biomass along with the effects of different operational conditions
on the product yields. Another aim was to simulate a fluidized bed gasification reactor using
actual experimental data from pyrolysis as input and study the effect of the pyrolysis step on
the synthesis gas.
A pyrolysis reactor was designed and constructed, and the pyrolysis experiments were carried
out using a muffle furnace. Due to technical reasons, only one experiment with good results
was successful. The pyrolysis experimental unit includes, muffle furnace, reactor, water-cooled
condenser, nitrogen supply, rotameter, and a gas chromatographer (GC) used to analyze the
product gas. The experiment was performed using wood pellets as the feedstock and the reactor
temperature was set to 500°C. The product yields were found to be 29.2%, 22.5%, and 48.3%
for char, tar, and gas, respectively. There were no studies found on pyrolysis of wood pellets
at 500°C and therefore, the results were further compared to pyrolysis of wood experiment
obtained from the literature. The char yield was within the range compared to the literature,
while the tar yield was lower, and the gas yield was significantly higher. The high gas yield
and low tar yield in the experimental results are mainly due to escaping of some of the
condensable tar with the gas. The average product gas compositions were found to be 62%,
6.7%, and 33.1% for cumulative CH4 and CO, H2, and CO2, respectively. The experimental gas
composition seems to agree well with the results from the literature, especially for H2 and CO2.
Computational particle fluid dynamic (CPFD) simulations were carried out to study the
composition of the synthesis gas obtained from the air gasification of wood pellets. The model
was developed in Barracuda and uses a three-dimensional multiphase particle-in-cell approach.
The gasification reactions and reaction rates were defined in the chemistry module. A geometry
with 8.83 cm square cross-section and 100 cm height was created. The fractions of the volatiles
and the solid from pyrolysis of wood pellets obtained from the literature were used as inputs.
Three simulation cases were created by varying the temperature and the pyrolysis gas
compositions.
In all cases, the production of CO2 was highest, and then comes H2, CO, and CH4, respectively.
The effect of the pyrolysis step on synthesis gas composition was found to be significant,
especially on the production of CO, H2, and CH4. This is mainly due to the 85% by weight of
the synthesis gas was produced during the pyrolysis of biomass step.
Comparing Case-A and B with experimental data showed a good agreement on predicting CH4
and H2 while overestimation of CO2 and underestimation of CO were observed. The deviation
of CO2 and CO might be due to errors in the pyrolysis gas composition or high rates in water-
gas shift reaction. Including the decomposition of tar in the simulation seems to give better
prediction performance, especially on predicting CO2 and CO.
The effect of temperature was established by comparing Case-A and C, where the temperature
was varied from 800°C up to 900°C. Increasing the temperature increased the concentration of
CO and H2 by 2.4% and 1.6% respectively and decreased the concentration of CO2 and CH4
by 1.3% and 0.5% respectively. The trends showed a good agreement with other experiments

7 Conclusion
62
from the literature, except the trend of CH4. This might be due to the neglect of the tar
compositions in the volatiles.

References
63
References
[1] S. Kaza, L. Yaw, P. Bhada-Tata og F. V. Woerden, What a Waste, Washington:
Inernational Bank for Reconstruction and development, 2018.
[2] C. Ellis, «World Bank: Global waste eneration could increase by 70% by 2050,»
Industy Dive, 2018.
[3] European Commission , «Directive 2008/98/EC on waste (Waste Framework
Directive),» European Commission website, [Internett]. Available:
https://ec.europa.eu/environment/waste/framework/. [Funnet 06 02 2021].
[4] I. Barret, «Waste Hierarchy,» European Parliamentary Research Service Blog, 16 03
2016. [Internett]. Available: https://epthinktank.eu/2017/05/29/circular-economy-
package-four-legislative-proposals-on-waste-eu-legislation-in-
progress/waste_hierarchy/. [Funnet 06 02 2021].
[5] J. S. Tumuluru, «Biomass Compositional Analysis for Conversion to Renewable Fuels
and Chemicals,» i Biomass Volume Estimation nad Valorization for energy, Idaho,
Intechopen, 2017.
[6] X. Hu og M. Gholizadeh, «Biomass pyrolysis: A review of the process development
and challenges from initial researches up to the commercialisation stage,» Energy
Chemistry, vol. 39, pp. 109-143, 2019.
[7] UngEnergi, «Pyrolyse,» UngEnergi, 13 09 2019. [Internett]. Available:
https://ungenergi.no/energikilder/bioenergi/pyrolyse/. [Funnet 26 03 2021].
[8] A. Demirbas, «Pyrolysis of Biomass for Fuels and Chemicals,» Energy Sources, vol.
31, nr. 12, pp. 1028-1037, 2009.
[9] M. Taherzdeh, K. Bolton, J. Wong og A. Pandey, Sustainable Resource Recovery and
Zero Waste Approaches, St. Louis: Elsevier, 2019.
[10] P. H. Bunner og H. Rechberger, «Waste Mabagement,» Elsevier, vol. 37, nr. Waste to
Energy processes and Technologies, pp. 3-12, 2015.
[11] R. Leblanc, «Waste Treatment and Disposal Methods,» Thebalancesmb, 09 05 2019.
[Internett]. Available: https://www.thebalancesmb.com/waste-treatment-and-disposal-
methods-2878113. [Funnet 01 02 2021].
[12] H. B. Goyal, D. Seal og R. C. Saxena, «Bio-fuel from thermochemical conversion of
renewable resources: A review,» Elsevier, vol. 12, nr. 2, pp. 504-517, 2008.
[13] Z. Luo og J. Zhou, «Thermal Conversion of Biomass,» i Handbook of Climate Change
Mitigation, New York, Springer, 2012, pp. 1001-1042.
References
64
[14] P. T. Williams, Waste Treatment and Disposal, 2nd red., Chichester: John Wiley and
Sons, Ltd, 2005.
[15] B. Barrows, «What are "Conversion Technologies",» Oregon Department of
Environmental Quality, Oregon, 2011.
[16] M. Faizal, Y. H. Wardah, M. A. Husna og Y. H. Tan, «Energy,economic and
environmental impact of watse to energy in Malaysia,» Journal of Mechanical
Engineering Research and Developments, vol. 41, nr. 3, pp. 97-101, 2018.
[17] L. Castrillon, Y. Fernandez-Nava, M. Ulmanu, I. Anger og E. Maranon, «Waste
Management,» Elsevier, vol. 30, nr. 2, pp. 228-235, 2010.
[18] Alternativ Energy Tutorials, «Biomass Resources,» Alternativ Energy Tutorials, 03
2015. [Internett]. Available: https://www.alternative-energy-
tutorials.com/biomass/biomass-resources.html. [Funnet 03 2021].
[19] L. Rosendahl, Biomass Combustion Science, Technology and Engineering, Sawston:
Woodhead Publishing Limited, 2013.
[20] T. Govil, J. Wang, D. Samanta, A. David, A. Tripathi, S. Rauniyar, D. R. Salem og R.
K. Sani, «Lignocellulosic feedstock: A review of a sustainable platform for cleaner
production of nature's plastics,» Journal of Cleaner Production, vol. 270, 2020.
[21] T. Kan, V. Strezov og T. J. Evans, «Lignocellulosic biomass pyrolysis: A review of
product properties and effect of pyrloysis parameters,» Renewable and Sustainable
Energy Reviews, vol. 57, pp. 1126-1140, 2016.
[22] P. Basu, Biomass Gasification, Pyrolysis and Torrefaction, 2nd red., London: Elsevier,
2013.
[23] S. L. Suib, New and Future Developments in Catalysis, Connecticut: Elsevier, 2013.
[24] K. Kositkanawuth, M. L. Sattler og B. Dennis, «Pyrolysis of Macroalgae and
Polysytrene:A Review,» Current Sustainable/Renewable Energy Reports, vol. 1, pp.
121-128, 2014.
[25] S. Sinha, A. Jhalani, M. R. Ravi og A. Ray, «Modeling of pyrolysis wood: A review,»
Department of Mechanical Engineering, Indian Institute of Technology, New Delhi,
2000.
[26] P. Tanger, J. L. Field, C. E. Jahn, M. W. Defoort og J. E. Leach, «Biomass for
thermochemical conversion: target and chalenges,» frontiers in plant scince, Hazen,
2013.
[27] C. Z. Zaman, K. Pal, W. A. Yehye, S. Sagadevan, S. T. Shah, G. Abimbola, E.
Marliana, R. F. Rafique og R. B. Johan, Pyrolysis: a sustainable way to generate
energy from waste, Cairo: IntechOpen, 2017.

References
65
[28] J. F. Puna og M. T. Santos, «Thermal Conversion Technologies for Solid Wastes: A
New Way to Produce Sustainable Energy,» i Waste Management, Intch open acces
journals, 2014, pp. 132-147.
[29] S. Wang, G. Dai, H. Yang og Z. Luo, «Lignocellulosic biomass pyrolysis mechanism:
A state-of-the-art review,» i Progress in Energy and Combustion Science, Wuhan,
Elsevier, 2017, pp. 33-86.
[30] A. Gabra, «Biomass Conversion Technologies for Bioenergy Generation: An
Introduction,» Intechopen, Katsina, 2020.
[31] C. R. Lohri, S. Diener, I. Zabaleta, A. Mertenat og C. Zurbrugg, «Treatment
technologies for urban solid biowaste to create value products: A review with focus on
low- and middle-income settings,» Reviews in Environmental Science and
Bio/Technology, vol. 16, pp. 81-130, 2017.
[32] M. I. Jahirul, M. G. Rasul, A. A. Chawdhury og N. Ashwath, «Biofuels Production
through Biomass Pyrolysis - A Technological Review,» Energies, vol. 5, pp. 4952-
5001, 2012.
[33] D. Mallick, P. Mahanta og V. Moholkar, «Co-gasification of coal and biomass blends:
Chemistry and engineering,» Fuel, vol. 207, pp. 106-128, 2017.
[34] M. Balat, «Mechanisms of Thermochemical Biomass Conversion Processes. Part 1:
Reactions of Pyrolysis,» Energy Sources, vol. 30, nr. 7, pp. 620-635, 2008.
[35] D. Mohan, C. U. Pittman og P. H. Steele, «Pyrolysis of Wood/Biomass for Bio-oil: A
Critical Review,» Energy&Fuels, vol. 20, nr. 3, pp. 848-889, 2006.
[36] L. Santamaria, M. Beirow, F. Mangold, G. Lopez, M. Olazar, M. Schmid, Z. Li og G.
Scheffknecht, «Influence of temperature on products from fluidized bed pyrolysis of
wood and solid recovered fuel,» Fuel, vol. 283, 2021.
[37] L. Fagbemi, L. Khezami og R. Capart, «Pyrolysis products from different biomasses:
application to the thermal cracking of tar,» Applied Energy, vol. 69, nr. 4, pp. 293-306,
2001.
[38] A. K. Hossain og P. A. Davis, «Pyrolysis liquids and gases as alternative fuels in
internal combustion engines - A review,» Renewable and Sustainable Energy Reviews,
vol. 21, pp. 165-189, 2013.
[39] P. Abhijeet, G. Swagathnath, S. Rangabhashiyam, M. Asok Rajkumar og P.
Balasubramanian, «Prediction of pyrolytic composition and yield for various grass
biomass feedstocks,» Biomass Conversion and Biorefinery, vol. 10, pp. 663-674, 2020.
[40] R. A. Moghadam, S. Yusup, W. Azlina, S. Nehzati og A. Tavasoli, «Investigation on
syngas production via biomas conversion through the integration of pyrolysis and air-
steam gasification process,» Energy Conversion and Management, vol. 87, pp. 670-
675, 2014.

References
66
[41] J. G. Speight, Heavy Oil Recovery and Upgrading, Laramie: Elsevier, 2019.
[42] P. Lahijani, Z. A. Zainal, M. Mohammadi og A. R. Mohamed, «Conversion of the
greenhouse gas CO2 to the fuel gas CO via the Boudourad reaction: A review,»
Renewable and Sustainable Energy Reviews, vol. 41, pp. 615-642, 2015.
[43] D. Choi, J. I. Oh, J. Lee, E. E. Kown og K. Baek, «Compostional modification of
products from Co-Pyrolysis of chicken manure and biomass by shifting carbon
distribution from pyrolytic oil to syngas using CO2,» Energy, vol. 153, pp. 530-538,
2018.
[44] N. Laosiripojana og S. Assabumrungrat, «Catalytic dry reforming of methane over
high surface area ceria,» Applied Catalysis B: Environmental, vol. 60, nr. 1-2, pp. 107-
116, 2005.
[45] M. Usman, W. W. Daud og H. F. Abbas, «Dry reforming of methane: Influence of
process parameters - A review,» Renewable and Sustainable Energy Reviews, vol. 45,
pp. 710-744, 2015.
[46] M. Mbodji, J. M. Commenge, L. Falk, D. D. Marco, F. Rossingol, L. Prost, S.
Valentin, R. Joly og P. Del-Gallo, «Steam reforming reaction process intensification
by using a millistructed reactor: Experimental setup and model validation for global
kinetic reaction rate estimation,» Chemical Engineering Journal, Vol. %1 av %2207-
208, pp. 871-884, 2012.
[47] C. Wheeler, A. Jhalani, E. J. Klein, S. Tummala og L. D. Schmidt, «The water-gas-
shift reaction at short contact times,» Journal of Catalysis, vol. 223, nr. 1, pp. 191-199,
2004.
[48] F. Mashkani og M. Razaei, «Simplified direct pyrolysis method for preparation of
nanocrystalline iron based catalysts for H2 purificationvia high temperature water gas
shift reaction,» Chemical Engineering Researsch and Design, vol. 95, pp. 288-297,
2015.
[49] J. G. Speight, «Gasification reaction kinetics for synthetic liquid fuel production,» i
Gasification for Synthetic Fuel Production, Laramie, Elsevier , 2015, pp. 103-117.
[50] F. Meshkani og M. Razaei, «High temperature water gas shift reaction over promoted
iron based catalysts prepared by pyrolysis method,» International Journal of Hydrogen
Energy, vol. 39, nr. 29, pp. 16318-16328, 2014.
[51] A. Hlavsova, A. Carsaro, H. Raclavska, D. Jachelkova, H. Skrobankova og J.
Frydrych, «Syngas production from pyrolysis of nine composts obtained from
nonhybrid and hybrid Perennial grasses,» The Scientific World Journal, vol. 2014, p.
11, 2014.
[52] A. Demirbas, «Effect of Temperature on Pyrolysis Products from Biomass,» Energy
Sources, vol. 29, nr. 4, pp. 329-336, 2007.
References
67
[53] E. Salehi, J. Abedi og T. Harding, «Bio-oil from Sawdust: Pyrolysis of Sawdust in a
Fixed-Bed System,» Energy & Fuels, vol. 23, nr. 7, pp. 3767-3772, 2009.
[54] D. Chen, J. Zhou og Q. Zhang, «Effect of heating rate on slow pyrolysis behavior,
kinetic parameters and product properties of moso bamboo,» Bioresource Technology,
vol. 169, pp. 313-319, 2014.
[55] K. K. Zaman, V. Balasundram, N. Ibrahim, M. D. Muhaimin, R. M. Kasmani, M. K.
Abd Hamid og H. Hasbullah, «Effect of Particle Size and Temperature on Pyrolysis of
Paalm Kernel Shell,» International Journal of Engineering & Technology, vol. 7, nr.
4.35, pp. 118-124, 2018.
[56] A. Monilo, S. Chianese og D. Musmarra, «Biomass gasification technology: The state
of the art overview,» Journal of Energy Chemistry, vol. 25, nr. 1, pp. 10-25, 2016.
[57] J.-P. Badeau og A. Levi, Biomass Gasification: Chemistry, Process and Aplications,
New York: Nova Science Publishers, 2009.
[58] K. Sun, «Optimization of biomass gasification reactor using Aspen Plus,» Telemark
University College, Nøtterøy, 2014.
[59] A. Gomez-Barea og B. Leckner, «Modeling of biomass gasification in fluidized bed,»
Progress in Energy and Combustion Science, vol. 36, nr. 4, pp. 444-509, 2010.
[60] CPFD Software, «Complements Other Tools,» 2021. [Internett]. Available:
https://cpfd-software.com/technology/complements-other-tools/.
[61] K. Sun, «Optimization of biomass gasification reactor using Aspen Plus,» Telemark
University College, Porsgrunn, 2014.
[62] M. B. Nikoo og N. Mahinpey, «Simulation of biomass gasification in fluidized bed
reactor using ASPEN PLUS,» Biomass and Bioenergy, vol. 32, nr. 12, pp. 1245-1254,
2008.
[63] Technology Evaluation Centers, «The Computational Fluid Dynamics (CFD)
Software,» TEC, 2021. [Internett]. Available:
https://www3.technologyevaluation.com/c/computational-fluid-dynamics-
cfd#:~:text=Computational%20fluid%20dynamics%20(CFD)%20software%20brings
%20the%20testing%20of%20flow,of%20safety%20and%20structural%20integrity..
[Funnet 2021].
[64] X. Ku, T. Li og T. Løvås, «CFD-DEM simulation of biomass gasification with steam
in a fluidized bed reactor,» Chemical Engineering Science, vol. 122, pp. 270-283,
2015.
[65] J. Bandara, «Simulation and parameter optimization of fluidized-bed and biomass
gasification,» Univercity of South-Eastern Norway, Porsgrunn, 2021.
References
68
[66] M. Chrigui, «Eulerian-Lagrangian Approach for Modeling and Simulation of
Turbulent Reactive Multi-Phase Flows under Gas Turbine Combutor Conditions,»
Technische Univeritat Darmstadt, Darmstadt, 2005.
[67] «CPFD Software Realeases Barracuda Virtual Reactor 17.4,» CPFD Software LLC, 26
03 2019. [Internett]. Available: https://cpfd-software.com/news/cpfd-software-
releases-barracuda-virtual-reactor-17.4. [Funnet 03 05 2021].
[68] C. K. Perera, «Optimization of biomass gasification reactor,» Telemark Univercity
College, Porsgrunn, 2013.
[69] R. Jaiswal, «Computational modeling and experimental studies on fluidized bed
regimes,» University of South-Eastern Norway, Porsgrunn, 2018.
[70] J. Dong, Y. Chi, Y. Tang, N. Ni, A. Nzihou, E. W. Hortala og Q. Huang, «Effect of
operating parameters and moisture content on Municipal solid waste pyrolysis and
gasification,» Energy and fuels, vol. 30, nr. 5, pp. 2994-4001, 2016.
[71] S. Xiong, J. Zhuo, B. Zhang og Q. Yao, «Effect of moisrure content on the
characterization of products from the pyrolysis of sewage sludge,» Analytical and
Applied Pyrolysis, vol. 104, pp. 632-639, 2013.
[72] BioEnergy Consult, «Biomass As Renewable Energy Resource,» Bioenergy Consult,
08 25 2020. [Internett]. Available: https://www.bioenergyconsult.com/biomass-
resources/. [Funnet 03 03 2021].
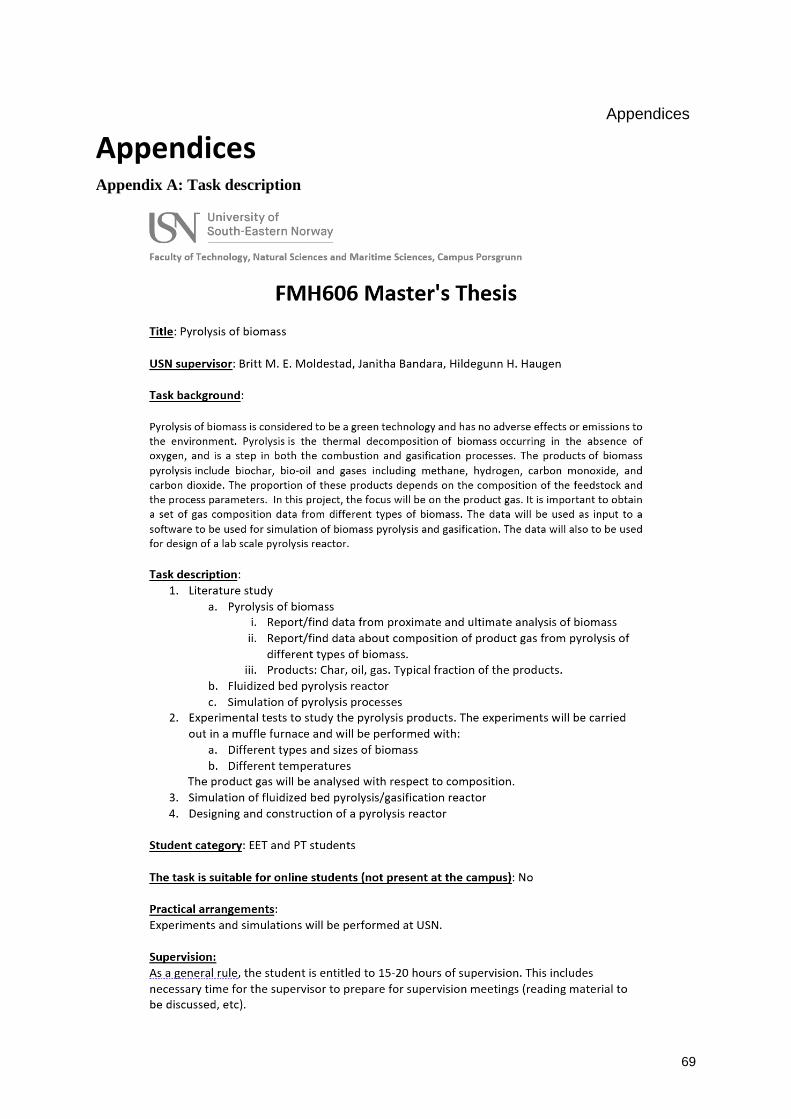
Appendices
69
Appendices Appendix A: Task description
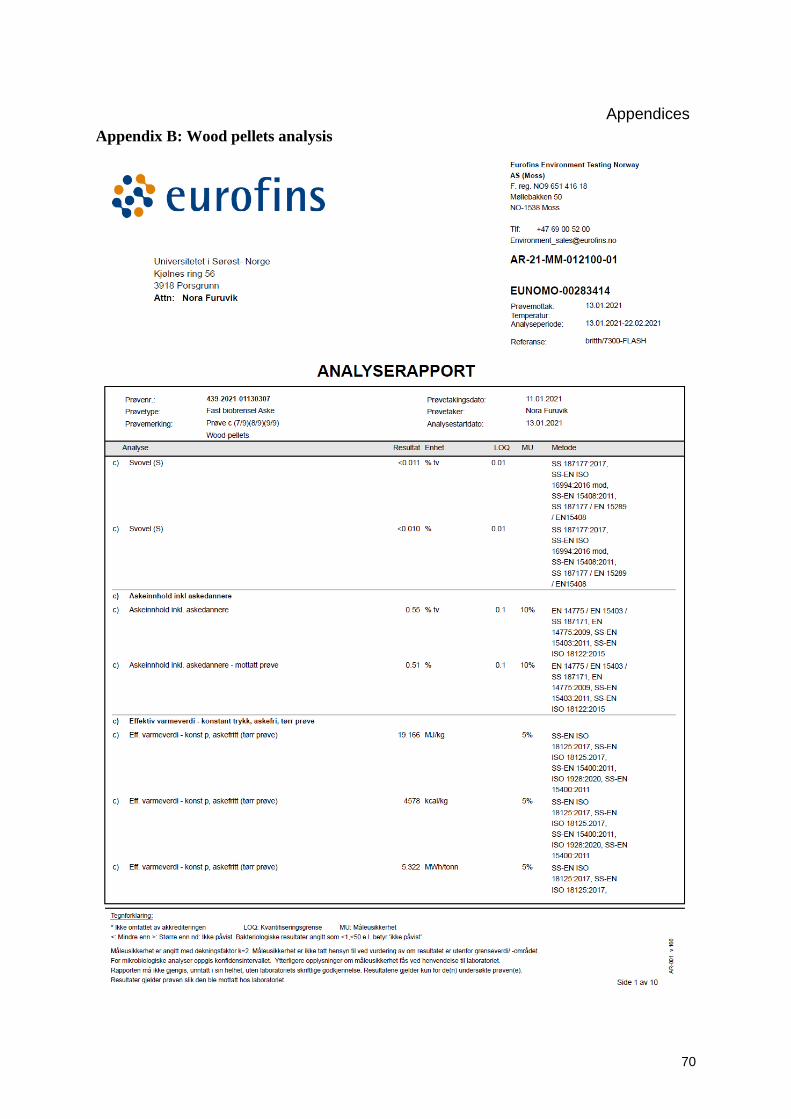
Appendices
70
Appendix B: Wood pellets analysis

Appendices
71

Appendices
72
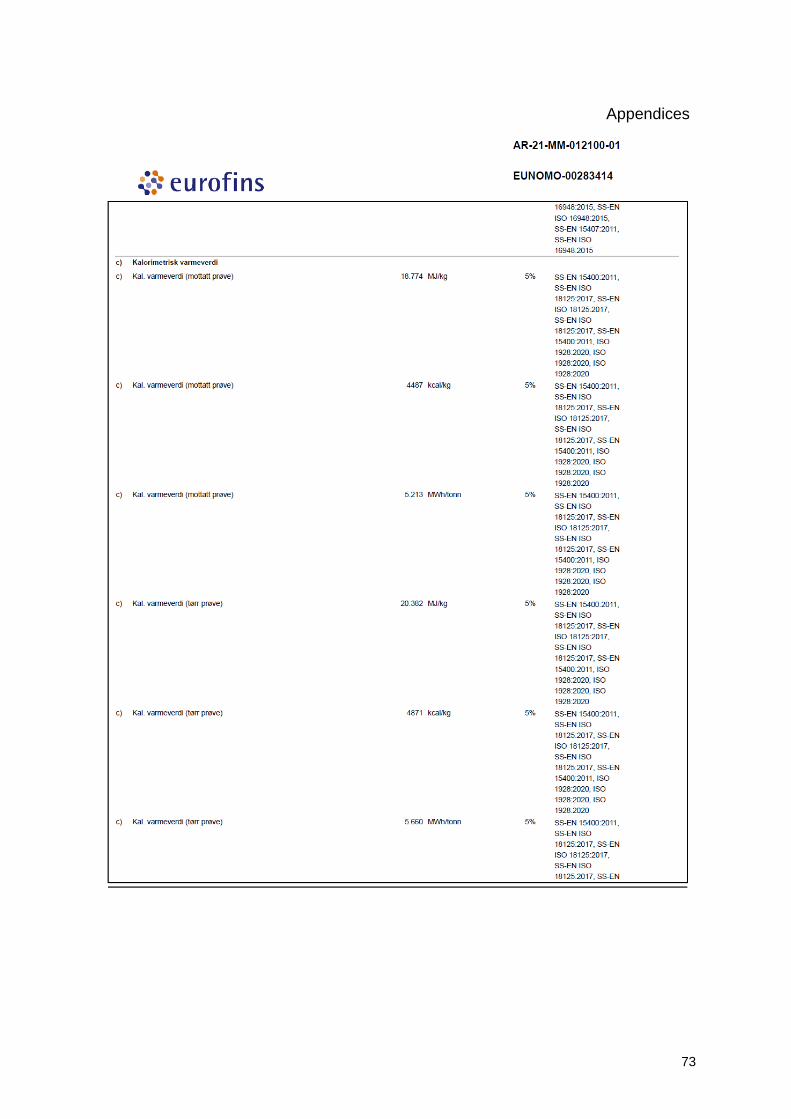
Appendices
73

Appendices
74

Appendices
75

Appendices
76

Appendices
77
Appendix C: Safety issues and concerns for pyrolysis experiments
This is a newly built pyrolysis unit and therefore, there was operation problems. It is important
to follow the safety issues listed below:
• The biomass sample is introduced to a heated oven. Therefore, it is necessary to have
extra concerns. Temperature resistant gloves should be wore always.
• The pyrolysis unit was place inside the chimney so that any leakage will encounter with
the user.
• Use maximum 50 grams of sample for the experiments that it will not generate large
amounts of gases at once.
• Always check the nitrogen pressure and make sure that the nitrogen flow in the reactor
is at least at 0.1 L/min.
• Fully tight all the bolts at the closure flange.
• Make sure that all the attachments from the reactor out to the condenser are properly
fixed.
• Any leakage can be observed by gas coming out the furnace door or two exits from the
furnace back.
• If any leakage is observed, do not open the furnace door, and wait until the pyrolysis is
completed (can be observed when there is not any smoke inside the condenser).
• The furnace must be cooled down to at least 200 ºC before leaving the unit.
• Make sure that the chimney fan is working.

Appendices
78
Appendix D: Gas chromatograph analysis
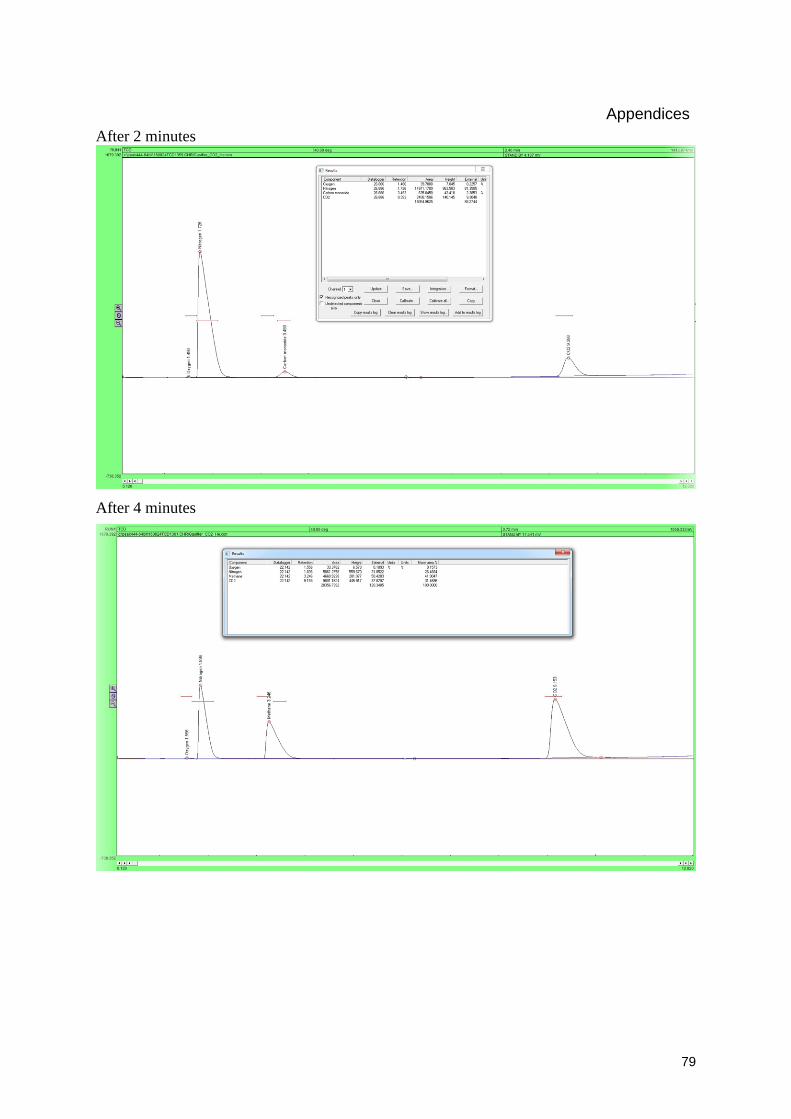
Appendices
79
After 2 minutes
After 4 minutes

Appendices
80
After 7 minutes
After 8 minutes

Appendices
81
After 9 minutes