Bio-oil production by pyrolysis of biomass coupled with a ...
207
HAL Id: tel-02096666 https://tel.archives-ouvertes.fr/tel-02096666 Submitted on 11 Apr 2019 HAL is a multi-disciplinary open access archive for the deposit and dissemination of sci- entific research documents, whether they are pub- lished or not. The documents may come from teaching and research institutions in France or abroad, or from public or private research centers. L’archive ouverte pluridisciplinaire HAL, est destinée au dépôt et à la diffusion de documents scientifiques de niveau recherche, publiés ou non, émanant des établissements d’enseignement et de recherche français ou étrangers, des laboratoires publics ou privés. Bio-oil production by pyrolysis of biomass coupled with a catalytic de-oxygenation treatment Chikirsha Chetna Devi Mohabeer To cite this version: Chikirsha Chetna Devi Mohabeer. Bio-oil production by pyrolysis of biomass coupled with a catalytic de-oxygenation treatment. Catalysis. Normandie Université, 2018. English. NNT : 2018NORMIR22. tel-02096666
-
Upload
khangminh22 -
Category
Documents
-
view
0 -
download
0
Transcript of Bio-oil production by pyrolysis of biomass coupled with a ...

HAL Id: tel-02096666https://tel.archives-ouvertes.fr/tel-02096666
Submitted on 11 Apr 2019
HAL is a multi-disciplinary open accessarchive for the deposit and dissemination of sci-entific research documents, whether they are pub-lished or not. The documents may come fromteaching and research institutions in France orabroad, or from public or private research centers.
L’archive ouverte pluridisciplinaire HAL, estdestinée au dépôt et à la diffusion de documentsscientifiques de niveau recherche, publiés ou non,émanant des établissements d’enseignement et derecherche français ou étrangers, des laboratoirespublics ou privés.
Bio-oil production by pyrolysis of biomass coupled witha catalytic de-oxygenation treatment
Chikirsha Chetna Devi Mohabeer
To cite this version:Chikirsha Chetna Devi Mohabeer. Bio-oil production by pyrolysis of biomass coupled with a catalyticde-oxygenation treatment. Catalysis. Normandie Université, 2018. English. �NNT : 2018NORMIR22�.�tel-02096666�

THESE
Pour obtenir le diplôme de doctorat
Spécialité Génie des Procédés
Préparée au sein de « l’Institut National des Sciences Appliquées de Rouen Normandie »
Bio-oil production by pyrolysis of biomass coupled with a catalytic
de-oxygenation treatment
Présentée et soutenue par
Chikirsha Chetna Devi MOHABEER
Thèse dirigée par Bechara TAOUK et co-encadrée par Lokmane ABDELOUAHED, Laboratoire de
Sécurité des Procédés Chimiques - LSPC
Thèse soutenue publiquement le 04 décembre 2018
devant le jury composé de
Mme. Claire COURSON MCF HDR, Université de Strasbourg Rapporteure
M. Aissa OULD DRIS Professeur des Universités, Université de Compiègne Rapporteur
Mme. Nadège CHARON Ingénieure Docteure HDR, IFP Energies Nouvelles, Solaize Examinatrice
M. François LAPICQUE Directeur de Recherche, CNRS, ENSIC, Nancy Examinateur
M. Lokmane ABDELOUAHED MCF, INSA Rouen Normandie Co-Encadrant de thèse
M. Bechara TAOUK Professeur des Universités, INSA Rouen Normandie Directeur de thèse

Acknowledgements
I first wish to express my heartfelt thanks to Bechara, my thesis director, for having welcomed me in
the lab and for having trusted in me during these past three years. You have always been there for a
quick discussion, a quick word and lengthier ones whenever needed. Your calm demeanour and
unflinching interest in the work being performed have always been an enormous encouragement to
me. I am grateful for having had the opportunity to learn from you as part of this work. Thank you!
Secondly, Lokmane, thank you so much for these past years! It has not been easy to start from
scratch and set up everything that has been done so far, but we have and it would not have been
possible without you. You have been the pivot in leading this thesis to completion and I am deeply
grateful for your presence, your help and all the exchanges we have had over the last three years.
I wish to acknowledge and thank the regional council of Normandie and the European regional
development fund (ERDF) for having funded this research work under the banner of the Bio-Engine
project. I also wish to thank Dr. Claire Courson and Prof. Aissa Ould Dris for having graciously
accepted to be the rapporteurs for this PhD thesis. Furthermore, Dr. François Lapicque and Dr.
Nadège Charon beget my warm gratitude for having accepted and taken the time to be part of my
thesis jury.
To all the people who are always behind the scenes, but who are part of the force behind the motor
having driven this work forward: Bruno (my superhero!), Sylvie, Christine, Sarah, Raphaël, Jean-
Pierre, Jeremy, Isabelle, Maria, Axelle, Giovanna, Murielle and Fatimah, thank you all! I want to
include thanks to Edmond Abi-Aad and Lucette Tidahy for having welcomed me at the UCEIV and
helped with the catalyst characterisation analysis. Also, special thanks to Stéphane Marcotte, I learnt
so much from your participation in this project. It made the work richer than it would otherwise have
been. To Emmanuelle, who solved almost all the glitches during my analytical work, and who has
been there for me always, from the very beginning of this work, you have no idea how much our
time together has meant to me. Thank you!
I want to acknowledge all my colleagues who have been part of this journey with me and have been
pillars of strength for me; all the permanent staff from LSPC, thank you for your input during the
course of my work! I also wish to thank all the interns and students who worked on this project
alongside me; Antoinette, Rania, Cléante, Grégory, you have been a big help! To my fellow PhD
colleagues, I want to say that you all made my days brighter (and my evenings less lonely) by being
there. Thank you! A special word to Luis, thanks for understanding my weirdness and for being weird

alongside me, and thank you for having shared part of the burden of a new subject with me. Your
help has been priceless! A very special thought goes out to Cai, who has made a special place for
herself in my heart and whom I thank for being unapologetically herself! These three years have
been filled with laughter and incredible experiences by your side; I shall forever be grateful to have
known you.
I also want to thank all my friends who have been unequivocally there for me since my days in
Mauritius and Paris: Sooreea, Ashvin, Ratnesh, Drashya, Linda and Raka, thanks for all the smiles and
tears we have shared! To Norman, thank you for having been by my side relentlessly during all the
ups and down of these past three years! And last, but never least, I wish to thank my darling family,
my mum, my dad and my brother, for having had my back at the best and the worst of times. I love
you, forever and always!

Table of contents
Acknowledgements .................................................................................................................................. i
List of abbreviations ................................................................................................................................. i
Symbols .................................................................................................................................................... i
Abstract ....................................................................................................................................................ii
Résumé .................................................................................................................................................... iii
General Introduction ............................................................................................................................... 1
References ............................................................................................................................................... 3
1. Literature review ............................................................................................................................. 4
1.1 Introduction ............................................................................................................................. 4
1.2 Definition of biomass .............................................................................................................. 4
1.3 Composition of lignocellulosic biomass .................................................................................. 4
1.3.1 Cellulose .......................................................................................................................... 5
1.3.2 Hemicellulose .................................................................................................................. 6
1.3.3 Lignin ............................................................................................................................... 6
1.3.4 Minerals ........................................................................................................................... 8
1.3.5 Extractives ....................................................................................................................... 8
1.4 Conversion of biomass ............................................................................................................ 8
1.4.1 Biomass conversion pathways ........................................................................................ 8
1.4.2 Categorisation of fuels .................................................................................................... 9
1.5 Pyrolysis of biomass .............................................................................................................. 10
1.5.1 Reactors utilised for biomass pyrolysis ......................................................................... 12
1.5.2 Pyrolysis of woody biomass........................................................................................... 17
1.6 Catalytic pyrolysis of biomass ............................................................................................... 26
1.6.1 De-oxygenation: catalysts used and process ................................................................ 26
1.7 De-activation of catalysts in catalytic pyrolysis ..................................................................... 34
1.7.1 Causes of catalyst de-activation .................................................................................... 34

1.7.2 Case studies of catalyst de-activation ........................................................................... 36
1.8 Conclusion ............................................................................................................................. 37
1.9 References ............................................................................................................................. 38
2. Comparative analysis of pyrolytic liquid and gas products of beech wood, flax shives and woody
pseudo-components ............................................................................................................................. 55
2.1 Introduction ........................................................................................................................... 55
2.2 Experimental section ............................................................................................................. 55
2.2.1 Materials used ............................................................................................................... 55
2.2.2 Elemental analysis ......................................................................................................... 56
2.2.3 Pyrolysis experimental Setup ........................................................................................ 56
2.2.4 GC-MS analysis .............................................................................................................. 57
2.2.5 GC-FID analysis .............................................................................................................. 58
2.2.6 GC analysis of non-condensable gases .......................................................................... 58
2.2.7 Principal Component Analysis (PCA) ............................................................................. 58
2.3 Results and discussion ........................................................................................................... 59
2.3.1 Identification and quantification of bio-oil components .............................................. 59
2.3.2 Pyrolysis of flax shives and beech wood ....................................................................... 60
2.3.3 Pyrolysis of woody biomass components ..................................................................... 62
2.3.4 Effect of pyrolysis temperature on liquid product distribution .................................... 64
2.3.5 Correlations between the different chemical families present .................................... 69
2.3.6 Oxygen content of pyrolytic oils .................................................................................... 69
2.3.7 Non-condensable gases analysis ................................................................................... 70
2.3.8 Solid residue analysis ..................................................................................................... 72
2.4 Conclusion ............................................................................................................................. 72
2.5 References ............................................................................................................................. 72
3. Production of liquid bio-fuel from catalytic de-oxygenation: pyrolysis of beech wood and flax
shives ..................................................................................................................................................... 75
3.1 Introduction ........................................................................................................................... 75

3.2 Experimental section ............................................................................................................. 75
3.2.1 Materials used ............................................................................................................... 75
3.2.2 Catalysts preparation and characterisation .................................................................. 75
3.2.3 Pyrolysis experimental setup ........................................................................................ 77
3.2.4 Bio-oil and non-condensable gases analysis ................................................................. 78
3.2.5 Karl Fischer (KF) titration method ................................................................................. 78
3.2.6 Principal component analysis (PCA) .............................................................................. 78
3.3 Results and discussion ........................................................................................................... 78
3.3.1 Defining the pyrolytic temperature............................................................................... 78
3.3.2 Catalyst characterisation results ................................................................................... 79
3.3.3 Effect of quantity of catalyst used ................................................................................. 82
3.3.4 Performance of catalysts in terms of de-oxygenation activity ...................................... 83
3.3.5 Effect of catalytic treatment on pyrolytic products distribution .................................. 85
3.3.6 PCA results ..................................................................................................................... 96
3.4 Conclusion ............................................................................................................................. 99
3.5 References ............................................................................................................................. 99
4. Investigating catalytic de-oxygenation of bio-oil from cellulose, xylan and lignin pyrolysis using
HZSM-5 and Fe-HZSM-5 ...................................................................................................................... 103
4.1 Introduction ......................................................................................................................... 103
4.2 Experimental section ........................................................................................................... 103
4.3 Results and discussion ......................................................................................................... 103
4.3.1 Effect of catalyst use on pyrolytic product distributions of woody biomass components
………………………………………………………………………………………………………………………………..103
4.3.2 Effect of catalyst use on bio-oil and non-condensable gas composition .................... 105
4.3.3 Further discussion ....................................................................................................... 111
4.4 Conclusion ........................................................................................................................... 114
4.5 References ........................................................................................................................... 115

5. Investigating pyrolysis of biomass in a drop tube reactor with and without catalytic treatment
……………………………………………………………………………………………………………………………………………….117
5.1 Introduction ......................................................................................................................... 117
5.2 Experimental section ........................................................................................................... 117
5.2.1 Materials used and layout of experimental setup ...................................................... 117
5.2.2 Analytical tools and methods ...................................................................................... 120
5.3 Results and discussion ......................................................................................................... 120
5.3.1 Pyrolysis without catalytic treatment ......................................................................... 120
5.3.2 Pyrolysis with catalytic treatment ............................................................................... 130
5.4 Conclusion ........................................................................................................................... 139
5.5 References ........................................................................................................................... 140
Conclusion and perspectives ............................................................................................................... 143
A. Annex A ....................................................................................................................................... 148
B. Annex B ........................................................................................................................................ 163
C. Annex C ........................................................................................................................................ 168
D. Annex D ....................................................................................................................................... 170

Table of Figures
Figure 1: World energy mix as of end of 2017 (Adapted from BP Global, 2018) .................................... 1
Figure 2: Aim and proceeding of research work ..................................................................................... 2
Figure 1.1: Biomass composition (Adapted from Hao and Loqué (2017)) .............................................. 5
Figure 1.2: Cellulose structure (Université de Waikato, 2015) ............................................................... 5
Figure 1.3: Principal polysaccharides in hemicellulose (INP Toulouse, 2005) ........................................ 6
Figure 1.4: Monomers of lignin (Prat, 2012) ........................................................................................... 7
Figure 1.5: Inter-unit linkages in lignin, (a) β-O-'4 bonds and, (b) condensed linkages (Adapted from
Méchin, 2015) ......................................................................................................................................... 7
Figure 1.6: Biomass transformation pathways (Adapted from EUBIA (2007)) ....................................... 9
Figure 1.7: Categorisation of liquid bio-fuels (Adapted from energypedia.info, 2016) ........................ 10
Figure 1.8: Utilisation chain of pyrolysis products (Adapted from ADEME (2001)) .............................. 11
Figure 1.9: Pyrolysis processes classification (Adapted from Deglise (2007)) ...................................... 12
Figure 1.10: Schematics of some fast pyrolysis reactors (a) Ablative, (b) Conical spouted bed, (c)
Rotating cone, (d) Auger, (e) Bubbling fluidised bed and (f) Circulating fluidised bed reactors (Amutio
et al., 2013; Dutton, 2018; IEA Bioenergy, 2018; Ronsse, 2016) .......................................................... 13
Figure 1.11: Simplified schematic of DTR (Adapted from Lu et al. (2010)) ........................................... 16
Figure 1.12: Representation of the pyrolysis process (Adapted from Guedes et al. (2018)) ................ 18
Figure 1.13: TGA of fast pyrolysis of biomass components (Jin et al., 2013) ........................................ 22
Figure 1.14: Broido-Shafizadeh model for biomass pyrolysis (Shafizadeh, 1982) ................................ 24
Figure 1.15: Model used by Park et al. (2009) ...................................................................................... 25
Figure 1.16: De-oxygenation principle .................................................................................................. 26
Figure 1.17: Representative catalytic upgrading reactions (Mortensen et al., 2011)........................... 27
Figure 1.18: Representation of HZSM-5 catalyst (Structure adapted from Teng et al. (2009)) ............ 31
Figure 1.19: Representation of Fe-HZSM-5 catalyst.............................................................................. 32
Figure 1.21: Literature results for oxygen content in bio-oils from CFP with HZSM-5 (Mukarakate et
al., 2014) ................................................................................................................................................ 35
Figure 1.22: Change in physical aspect of catalyst before and after catalytic pyrolysis (Adapted from
Rostami et al., 2015)) ............................................................................................................................ 37
Figure 2.1: First layout of tubular reactor ............................................................................................. 57
Figure 2.2: GC-MS spectrum of beech wood pyrolytic oil obtained at 500 °C ...................................... 59
Figure 2.3: Quantification of chemical families (mol. %) in pyrolytic bio-oils for beech wood and flax
shives at 500 °C ..................................................................................................................................... 61
Figure 2.4: (a) Score plot of samples, (b) Loading plot of variables ...................................................... 65

Figure 2.5: Effect of the pyrolysis temperature on the carboxylic acid content of biomass bio-oils .... 66
Figure 2.6: Effect of the pyrolysis temperature on the carboxylic acid content of pseudo-component
bio-oils ................................................................................................................................................... 67
Figure 2.7: Effect of the pyrolysis temperature on the phenol content of bio-oils .............................. 68
Figure 2.8: Effect of the pyrolysis temperature on the carbohydrate content of bio-oils .................... 69
Figure 2.9: NCG composition (vol. %) obtained at 500 °C ..................................................................... 71
Figure 2.10: Evolution of NCG composition (vol. %) with pyrolysis temperature ................................. 71
Figure 3.1: Second layout of pyrolysis reactor ...................................................................................... 78
Figure 3.2: Mass balances for flax shives pyrolysis at different pyrolytic temperatures ...................... 79
Figure 3.3: N2 adsorption/desorption isotherms of catalysts and supports: (a) HZSM-5, (b) Fe-HZSM-5,
(c) H-Y and (d) γ-alumina ....................................................................................................................... 80
Figure 3.4: IR spectra of catalysts at 300 °C .......................................................................................... 81
Figure 3.5: Oxygen and phenolics content of bio-oil samples obtained with and without catalytic
treatment (for pyrolysis of flax shives at 500 °C with Fe-HZSM-5) ....................................................... 83
Figure 3.6: Oxygen content of bio-oil samples obtained with and without catalytic treatment .......... 84
Figure 3.7: Liquid product distributions for (a) beech wood and (b) flax shives with and without
catalytic treatment ................................................................................................................................ 85
Figure 3.8: Effect of catalysts on (a) carboxylic acids, (b) phenols and (c) ketones .............................. 93
Figure 3.9: Effect on catalysts on aromatic compounds ....................................................................... 94
Figure 3.10: Evolution of CO, CO2, H2 and CH4 with and without catalytic treatment for (a) beech
wood and (b) flax shives ........................................................................................................................ 95
Figure 3.11: PCA of (a) bio-oil sample, and (b) non-condensable gas sample, of flax shives ............... 97
Figure 4.1: Effect of catalyst use on pyrolytic product distribution (a) for cellulose, (b) for xylan, and
(c) for lignin ......................................................................................................................................... 104
Figure 4.2: Bio-oil oxygen content (mol. %) ........................................................................................ 105
Figure 4.3: Evolution of percentages (mol. %) of major chemical families in bio-oils with and without
catalytic treatment .............................................................................................................................. 109
Figure 4.4: Evolution of percentages (vol. %) of major non-condensable gas components with and
without catalytic treatment ................................................................................................................ 112
Figure 4.5: Conversion mechanism of the major chemical family in cellulose with (a) HZSM-5 and (b)
Fe-HZSM-5 ........................................................................................................................................... 113
Figure 4.6: Conversion mechanism of the major chemical family in xylan with (a) HZSM-5 and (b) Fe-
HZSM-5 ................................................................................................................................................ 114
Figure 4.7: Conversion mechanism of the major chemical family in lignin with (a) HZSM-5 and (b) Fe-
HZSM-5 ................................................................................................................................................ 114

Figure 5.1: DTR layout ......................................................................................................................... 118
Figure 5.2: Mass balances of experiments performed without catalyst use ...................................... 121
Figure 5.3: Degree of biomass conversion (TGA) at different DTR temperatures under 500 mL/min N2
............................................................................................................................................................. 122
Figure 5.4: Liquid product compositions obtained for pyrolysis of beech wood at 500 °C in DTR ..... 123
Figure 5.5: Gas product compositions obtained for pyrolysis of beech wood at 500 °C in DTR ......... 124
Figure 5.6: Composition of beech wood bio-oils obtained at 500 °C and 500 mL/min N2 in DTR (τ: 9.27
min) and semi-continuous reactor (τ: 11 min) (mol. %) ...................................................................... 125
Figure 5.7: Evolutions of major bio-oilcomponentswithincreasingDTRtemperature(τ:9.27min) 126
Figure 5.8: PCA of beech wood bio-oil samples in DTR at 500 mL/min N2 without catalyst .............. 127
Figure 5.9: Composition of beech wood NCG obtained at 500 °C in DTR and semi-continuous reactor
(vol. %) ................................................................................................................................................. 127
Figure 5.10: Evolution of NCG components with DTR temperature under 500 mL/min N2 ............... 128
Figure 5.11: Water content (wt. %) of bio-oils obtained from each experimental run ...................... 129
Figure 5.12: Oxygen content (mol. %) of bio-oils obtained from all experimental runs ..................... 130
Figure 5.13:Catalytic effect on pyrolytic product distribution ............................................................ 131
Figure 5.14: Liquid product composition at t = 10 min in DTR and catalytic fixed bed reactor
temperature 500 °C vs. semi-continuous reactor 500 °C with HZSM-5 .............................................. 132
Figure 5.15: Evolution of mass flow rate (g/min) and percentage (mol. %) of carboxylic acids at t = 10
min at different catalytic fixed bed reactor temperatures ................................................................. 133
Figure 5.16: Effect of catalyst de-activation on bio-oil obtained during pyrolysis reaction ............... 135
Figure 5.17: Evolution of carboxylic acids in liquid product (g/min) in time with different fixed bed
reactor temperatures .......................................................................................................................... 136
Figure 5.18: Evolution of NCG composition (vol. %) in time at 500 °C (fixed bed reactor) vs. no catalyst
............................................................................................................................................................. 137
Figure 3: Setup layout for catalytic de-oxygenation of model molecules ........................................... 145
Figure 4: Schematic of dual fluidised and entrained bed reactor ....................................................... 147
Figure A.1: Effect of the pyrolysis temperature on the ester content of bio-oils ............................... 153
Figure A.2: Effect of the pyrolysis temperature on the ketone content of bio-oils ............................ 153
Figure A.3: Effect of the pyrolysis temperature on the alkane content of bio-oils ............................. 153
Figure A.4: Effect of the pyrolysis temperature on the aromatics content of bio-oils ....................... 154
Figure A.5: Effect of the pyrolysis temperature on the alcohol content of bio-oils............................ 154
Figure A.6: Effect of the pyrolysis temperature on the aldehyde content of bio-oils ........................ 154
Figure A.7: Effect of the pyrolysis temperature on the amide content of bio-oils ............................. 155
Figure A.8: Effect of the pyrolysis temperature on the furan content of bio-oils............................... 155

Figure A.9: Effect of the pyrolysis temperature on the guaiacol content of bio-oils .......................... 155
Figure B.1: IR spectra of catalysts at 100 °C ........................................................................................ 163
Figure B.2: IR spectra of catalysts at 150 °C ........................................................................................ 164
Figure B.3: IR spectra of catalysts at 200 °C ........................................................................................ 164
Figure B.4: IR spectra of catalysts at 400 °C ........................................................................................ 165
Figure B.5: PCA of (a) bio-oil sample, and (b) non-condensable gas sample, of beech wood ............ 167
Figure D.1: Calibration curve for screw conveyor ............................................................................... 170
Figure D.2: Dimensions of cyclones ..................................................................................................... 171
Figure D.3 (a)-(l): Evolution of chemical families in bio-oil samples obtained under different nitrogen
flow rates with DTR temperature ........................................................................................................ 175
Figure D.4: Evolution of NCG components with DTR temperature under 1000 mL/min N2 ............... 176
Figure D.5: Evolution of NCG components with DTR temperature under 2000 mL/min N2 ............... 176
Figure D.6: PCA of beech wood bio-oil samples in DTR with HZSM-5 at different fixed bed reactor
temperatures ....................................................................................................................................... 179
Figure D.7: Evolution of phenols in liquid product (g/min) in time with different fixed bed reactor
temperatures ....................................................................................................................................... 180
Figure D.8: Evolution of alcohols in liquid product (g/min) in time with different fixed bed reactor
temperatures ....................................................................................................................................... 180
Figure D.9: Evolution of NCG composition (vol. %) in time at 450 °C (fixed bed reactor) vs. no catalyst
............................................................................................................................................................. 181
Figure D.10: Evolution of NCG composition (vol. %) in time at 425 °C (fixed bed reactor) vs. no
catalyst ................................................................................................................................................ 181

Table of tables
Table 1.1: Fractions of cellulose, hemicellulose and lignin in biomass (McKendry, 2002) ..................... 5
Table 1.2: Summary of some different pyrolysis process technologies (Bridgwater, 1999) and
technology statuses of pyrolysis reactors ............................................................................................. 14
Table 1.3: Summary of bio-oil composition (Adapted from Diebold (1997); Mullen and Boateng
(2008); Pittman et al. (2012)) ................................................................................................................ 19
Table 1.4: Summary of important CFP researches done in literature ................................................... 28
Table 2.1: Elemental analysis of biomass and biomass components used ........................................... 56
Table 2.2: Proximate analysis (dry basis) of different raw materials based on TGA experiments (wt. %)
............................................................................................................................................................... 56
Table 2.3: Calibration information of major chemical groups in bio-oil ............................................... 60
Table 2.4: Percentages of chemical families (mol. %) present in biomass components pyrolysed at 500
°C ........................................................................................................................................................... 62
Table 3.1: Specific surface areas and specific pore volumes of catalysts used ..................................... 80
Table 3.2: Parameters for experimental runs concerning effect of catalyst-to-biomass ratio used .... 82
Table 3.3 : Water content of bio-oil samples ........................................................................................ 86
Table 3.4: Percentages (mol. %) of chemical families present in bio-oil samples with and without
catalytic treatment ................................................................................................................................ 87
Table 3.5: Percentages (vol. %) of gaseous components present in non-condensable gas samples with
and without catalytic treatment ........................................................................................................... 88
Table 3.6: Conversion and production rates of chemical families present in bio-oil samples obtained
with and without catalyst use ............................................................................................................... 90
Table 3.7: Conversion and production rates of non-condensable gas (NCG) components obtained
with and without catalyst use ............................................................................................................... 91
Table 4.1: Composition (mol. %) of chemical families present in bio-oils .......................................... 106
Table 4.2: Composition (vol. %) of components present in non-condensable gases ......................... 107
Table 4.3: Conversion and production rates of chemical families present in bio-oils ........................ 108
Table 4.4: Conversion rates of non-condensable gas components .................................................... 109
Table 5.1: Temperatures used at different parts of experimental setup ........................................... 119
Table 5.2: List of pyrolysis experiments without catalyst use ............................................................. 121
Table 5.3: Experimental runs involving use of catalyst ....................................................................... 131
Table 5.4: Conversion and production rates of chemical families present in upgraded bio-oils at a
catalytic fixed bed reactor temperature of 500 °C .............................................................................. 134

Table 5.5: Conversion and production rates of NCG components at a catalytic fixed bed reactor
temperature of 500 °C ......................................................................................................................... 138
Table A.1: Detailed list of minerals in raw materials used .................................................................. 149
Table A.2 (a), (b), (c), (d): Most abundant compound in pyrolytic oils at 450°C, 500°C, 550°C and
600°C ................................................................................................................................................... 150
Table A.3: Percentages of chemical groups present in bio-oils recovered ......................................... 152
Table A.4: Molecules present in bio-oils and their chemical family ................................................... 156
Table A.5 (a), (b), (c), (d) and (e): Correlations existing between chemical groups in pyrolytic oils of (a)
beech wood, (b) flax shives, (c) cellulose, (d) xylan and (e) lignin ...................................................... 159
Table A.6: Summary of non-condensable gas compositions for all experimental runs ...................... 162
Table B.1: Evolution of percentage of chemical families present in bio-oil from flax shives samples
with different catalyst-to-biomass ratios ............................................................................................ 165
Table C.1: Water content of bio-oil samples ....................................................................................... 168
Table C.2: Model molecules found in bio-oil samples ........................................................................ 169
Table D.1: Percentages (mol. %) of chemical families in obtained bio-oil samples ............................ 172
Table D.2: NCG compositions (vol. %) obtained for all experimental runs ......................................... 173
Table D.3 : Bio-oil compositions (mol. %) obtained during course of reaction at different catalytic
fixed bed reactor temperatures with and without HZSM-5................................................................ 177
Table D.4: Conversion and production rates of chemical families present in upgraded bio-oils at 450
°C ......................................................................................................................................................... 178
Table D.5: Conversion and production rates of chemical families present in upgraded bio-oils at 425
°C ......................................................................................................................................................... 178
Table D.6: Conversion and production rates of NCG components at a catalytic fixed bed reactor
temperature of 450 °C ......................................................................................................................... 182
Table D.7: Conversion and production rates of NCG components at a catalytic fixed bed reactor
temperature of 425 °C ......................................................................................................................... 182

i
List of abbreviations
ACP: Analyse de composantes principales
BW: Beech wood
C2: C2H2, C2H4 and C2H6 gases
C3: C3H4, C3H6 and C3H8 gases
DTR: Drop tube reactor
FCC: Fluidised catalytic cracking
FS: Flax shives
GC-MS: Gas chromatography-mass spectrometry
GC-FID: Gas chromatography-flame ionisation detection
GC-TCD: Gas chromatography-thermal conductivity detection
HDO: Hydro de-oxygenation
IRTF: Infrarouge à transformée de Fourier
mol. %: percentage, on molar basis
NCG: Non-condensable gases
PCA: Principal component analysis
TGA: Thermogravimetric analysis
vol. %: percentage, on volume basis
WHSV: Weight hourly space velocity
wt. %: percentage, on mass basis
Symbols Ø: Diameter
L: Length
R: Correlation between two values (-1≤R≤1)
r2:Pearson’scorrelationcoefficient(0≤r2 ≤1)
τ:Gasresidencetime

ii
Abstract
Depleting sources of fossil fuels and harmful consequences of greenhouse gas emissions on the
environment have heightened the necessity of renewable energy resources. Among the different
existing sources, biomass presents a considerable potential. This research work aimed at
investigating the pyrolysis of flax shives and beech wood residues, which are biomass residues
commonly found in the Normandy region, so as to produce and upgrade a bio-oil capable of being
used as a bio-fuel in combustion engines. The objective of this thesis was thus to provide a detailed
characterisation of the products obtained from the pyrolysis of the two chosen biomasses and their
pure components (cellulose, hemicellulose and lignin) in a semi-continuous system. A catalytic de-
oxygenation treatment was then employed to upgrade the properties of the bio-oils obtained. The
catalysts used were zeolite-based (HZSM-5 and H-Y), the latter zeolites modified by iron and metals
(Pt and CoMo) supported on alumina. It was observed that, in a semi-continuous setup, pyrolysis at
500 °C under 500 mL/min of nitrogen, followed by a catalytic de-oxygenation using Fe-HZSM-5 as
catalyst, gave the best results in terms of bio-oil yield and de-oxygenation degree.
The effect, on the pyrolysis products, of changing the pyrolysis reactor technology to a continuous
drop-tube reactor was also investigated. This reactor was similarly coupled with a catalytic de-
oxygenation treatment step occurring in a separate fixed bed reactor. It was found that despite a
change in reactor technology, the optimal operational conditions remained the same, although a
non-negligible difference was noticed with respect to the de-oxygenation degree. This difference was
attributed to the effect of contact time. Finally, the efficiency of the catalyst used during the
continuous pyrolysis was monitored in time. It was seen that over time, the catalyst presented a
diminishing activity, indicating the presence of a de-activation phenomenon.
Keywords: Pyrolysis; biomass; catalytic de-oxygenation; Fe-HZSM-5; HZSM-5; drop-tube reactor; bio-
oil.

iii
Résumé
L’épuisementdessourcesd’énergiefossileetlesconséquencesnocivesdesgazàeffetdeserresur
l’environnement ont accru la nécessité de l’utilisation des énergies renouvelables. Parmi les
différentes sources, la biomasse possède un potentiel considérable. Ce projet de recherche vise à
étudier la pyrolyse des anas de lin et du bois de hêtre, des biomasses qui se retrouvent
communément dans la région Normandie, afin de produire et d’améliorer une bio-huile capable
d’êtreutiliséecommebio-carburant dans les moteurs à combustion. L’objetdecettethèseestdonc
de fournir une caractérisation détaillée des produits de la pyrolyse des deux biomasses choisies et de
leurs constituants purs(lacellulose,l’hémicellulose et la lignine) dans une installation semi-continue.
Un traitement catalytique de désoxygénation a ensuite été employé pour améliorer les propriétés
des bio-huiles obtenues. Les catalyseurs utilisés sont à base de zéolithes (HZSM-5 et H-Y), des mêmes
zéolithes modifiées au fer et de métaux (Pt, CoMo) supportés sur alumine. Nous avons constaté que,
dans une installation semi-continue,unepyrolyseà500 °C, sous500mL/mind’azote, suivied’une
désoxygénation catalytique en utilisant Fe-HZSM-5 comme catalyseur, donnait les meilleurs résultats
en termes de rendement en bio-huiles et de taux de désoxygénation.
L’effet d’unchangementdetechnologiede réacteur de pyrolyse en utilisant un réacteur continu à
chute sur les produits de la pyrolyse a aussi été examiné. Ce réacteur a également été couplé à une
étape de traitement catalytique de désoxygénation dans un réacteur à lit fixe indépendant. Il a été
aperçu qu’en dépit d’un changement de technologie de réacteur, les conditions opératoires
optimales restaient les mêmes avec cependant, une différence non négligeable au niveau du taux de
désoxygénation. Cette différence a été attribuée à l’effet du temps de contact. Finalement,
l’efficacité du catalyseur utilisé lors de la pyrolyse en continu a été suivie dans le temps. Il a été
constatéqu’aucoursdutemps,lecatalyseurdémontraituneactivitédécroissante,indiquantqu’un
phénomène de désactivation était présent.
Mots clés : Pyrolyse ; biomasse ; désoxygénation catalytique ; Fe-HZSM-5 ; HZSM-5 ; réacteur à
chute ; bio-huile.

GENERAL INTRODUCTION

1
General Introduction
Energy has always been considered to be the cornerstone of economic and social development for
anycountry.However,theworld’senergymarketsrelyheavilyonthefossil-derived fuels, as shown
in Figure 1. The reserves of these fuels are finite and rapidly depleting (Agbontalor, 2007). Given the
limited availability of fossil fuels and the growing awareness of the detrimental environmental
consequences resulting from greenhouse gas emissions, the importance of renewable energy
resources in developed and developing countries has been reinforced. In this regard, agricultural
residues in the form of biomass can play a significant role in biomass energy generation (Oladeji and
Enweremadu, 2013).
Figure 1: World energy mix as of end of 2017 (Adapted from BP Global, 2018)
Biomass is constituted of three main polymers, which are cellulose, hemicellulose and lignin. The
thermochemical transformation of biomass includes a number of possible processes to produce from
the initial biomass feedstock useful fuels and chemicals. Some examples of such conversion
processes are thermochemical processes like combustion, carbonisation, gasification or pyrolysis,
which are more convenient for solid residues. Then, there exist bio-chemical processes such as
methanisation, mostly advised for fermentable organic matter (ADEREE, 2014). Biomass pyrolysis is a
promising process, in which an organic material is rapidly heated in a controlled environment and in
the absence of oxygen to produce mostly a liquid product: the bio-oil. The latter is essentially
composed of oxygenated compounds and can be used directly to generate heat or be further
upgraded to a fossil fuel substitute with improved properties.

2
This work has been funded by the regional council of Normandie and the European regional
development fund (ERDF) under the banner of the Bio-Engine project. The main aim of this work was
to firstly provide a detailed characterisation of the products obtained from the pyrolysis of biomass
residues and pure woody biomass components, and the upgrading of the properties of the bio-oil
obtained through catalytic de-oxygenation, as illustrated in Figure 2. Also, the effect on the pyrolytic
products of changing the process from a semi-continuous one to a continuous one was investigated,
again coupled with a catalytic de-oxygenation treatment and finally, the performance of the catalyst
during the course of the continuous reaction was monitored.
Figure 2: Aim and proceeding of research work
Thesis structure
The following part details the content of the different chapters included in this research work:
Chapter 1 presents a brief literature review of the different aspects pertinent to biomass pyrolysis
and catalytic pyrolysis of biomass. The various technologies included in biomass transformation are
presented. Then, the biomass pyrolysis process is detailed and a comprehensive review of catalytic
pyrolysis of biomass is given. Finally, a brief survey on the de-activation of catalysts during catalytic
pyrolysis is presented.
In Chapter 2, beech wood, flax shives and the three biomass components: cellulose, hemicellulose
and lignin, were pyrolysed at 450, 500, 550 and 600 °C in a semi-continuous reactor under the same
operating conditions. The liquid bio-oil samples recovered in each case were analysed through gas
chromatography-mass spectrometry (GC-MS) and gas chromatography-flame ionisation detection
(GC-FID) to identify and quantify the different molecules present. The molecules were then grouped
into different chemical families, each having the same main functional group. As for the non-
condensable gases, they were analysed by GC-FID and GC-thermal conductivity detection (TCD).
Then, principal component analysis (PCA) was used to visualise the global trend of the data.

3
Chapter 3 presents a detailed analysis of the catalytic de-oxygenation of the liquid and gaseous
pyrolytic products of the same two biomasses as above, using different catalysts (commercial HZSM-
5 and H-Y, and lab-synthesised Fe-HZSM-5, Fe-H-Y, Pt/Al2O3 and CoMo/Al2O3). The experiments were
all conducted in the same reactor as above at 500 °C and under 500 mL/min N2. The catalysts were
characterised by using several techniques such as BET specific surface area, BJH pore size distribution
and FT-IR.
The purpose of Chapter 4 is to investigate the pyrolysis of the three principal components of biomass
(cellulose, hemicellulose and lignin) using the two most efficient catalysts as found in Chapter 3
(HZSM-5 and its iron-modification, Fe-HZSM-5) so as to propose transformation schemes for the
different de-oxygenation reactions occurring through the use of these catalysts. The effects of the
two catalysts studied have been investigated by examining the composition of the bio-oils and non-
condensable gases produced.
Finally, Chapter 5 presents a continuous setup for the pyrolysis reaction: the drop tube reactor (DTR).
This reactor was connected to a fixed bed catalytic reactor so as to study the effect of this kind of
setup on the pyrolytic products as a comparison to the semi-continuous system and also, attempt to
monitor the de-activation of the catalyst. The pyrolysis of beech wood without the use of catalysts
was investigated by varying the DTR reactor temperature (500, 550 and 600 °C) and the gas
residence time by varying the nitrogen flow rate (500, 1000 and 2000 mL/min). Then, the catalyst
was placed in the fixed bed reactor, the temperature of which was varied (425, 450 and 500 °C). The
liquid and gaseous products formed were collected periodically in time and analysed so as to
examine the de-activation of the catalyst.
References
(1). ADEREE, 2014. Biomasse - Les filières de valorisation [WWW Document]. Agence Natl. Pour
Dév. Energ. Renouvelables Effic. Energétique ADEREE. URL
http://www.amee.ma/index.php?option=com_content&view=category&id=44&Itemid=365&l
ang=en (accessed 5.3.18).
(2). Agbontalor, E.A., 2007. Overview of various biomass energy conversion routes. Am.-Eurasian J.
Agric. Environ. Sci. 2, 662–671.
(3). BP Global, 2018. BP Statistical Review of World Energy.
(4). Oladeji, J.T., Enweremadu, C.C., 2013. A predictive model for the determination of some
densification characteristics of corncob briquettes 9.

CHAPTER 1:
LITERATURE REVIEW

Chapter 1
4
1. Literature review
1.1 Introduction
This chapter presents a brief literature review of the different aspects pertinent to biomass pyrolysis
and catalytic pyrolysis of biomass. The term “biomass” is firstly defined an overview of the
composition of biomass is given; the various technologies included in biomass transformation are
then presented. Afterwards, the biomass pyrolysis process is detailed and a comprehensive review of
catalytic pyrolysis of biomass is given. Finally, a brief survey on the de-activation of catalysts during
catalytic pyrolysis is presented.
1.2 Definition of biomass
Theterm“biomass” isusedtodescribeanymaterial frombiologicalorigin,suchasplantmaterials
(Crocker, 2010). This term can also be applied to organic waste originating from agriculture and
forestry, like wood and vegetal matter. It represents furthermore municipal or industrial organic
waste, mud from treatment plants or even biogas produced during fermentation of waste, all of
which can be used as heat or electricity sources. Biomass thus encompasses all the sources of energy
originating from the degradation of organic matter (Lambert and Rohfritsch, 2013).
However,adivergencedoesexist inpeople’smindstoday; somedonot considerbiomass tobea
renewable source of energy. This reasoning treads along the following path: if the wood which has to
be utilised as a source of biomass is harvested in line with its production, this wood is considered as a
renewable energy source. But, in most cases, wood is over-exploited. Whole forests are destroyed so
that wood can be used as energy source. In these cases, the biomass cannot be called a renewable
source as it gets depleted more rapidly than it is produced (Bichat and Mathis, 2013; Dufour, 2016;
François et al., 2018).
Biomass is typically categorised into two types (Lambert and Rohfritsch, 2013):
1) Dry biomass: various ligneous waste; includes lignocellulosic biomass,
2) Wet biomass: agricultural or food waste; can be transformed into energy or manure.
1.3 Composition of lignocellulosic biomass
Biomass, either from forestry or agriculture, is always constituted of three main polymers, which are
cellulose, hemicellulose and lignin. The composition has been illustrated in Figure 1.1. The typical
values have been listed in Table 1.1.

Chapter 1
5
Table 1.1: Fractions of cellulose, hemicellulose and lignin in biomass (McKendry, 2002)
Biomass Cellulose (wt. %) Hemicellulose (wt. %) Lignin (wt. %)
Hardwood 45-50 20-25 20-25
Softwood 35-50 25-30 27-30
Figure 1.1: Biomass composition (Adapted from Hao and Loqué (2017))
1.3.1 Cellulose
Firstly, cellulose is known to be a linear polymer having a high molar mass and having cellobiose as
monomer.Cellobiose ismadeupof twoglucoseunits linkedbyaβ-glucosidic bond. A network of
intra- and inter-molecular hydrogen bonds links the cellulose molecules to one another and this
phenomenon gives rise to fibrils. Cellulose is partially crystallised and represents about 40 to 50 % of
the dry weight of wood (Jamart et al., 2015). The structure is depicted in Figure 1.2.
Figure 1.2: Cellulose structure (Université de Waikato, 2015)

Chapter 1
6
1.3.2 Hemicellulose
The second major component of lignocellulosic biomass is hemicellulose. It represents about 20-40 %
of the biomass weight. It constitutes a group of complex polysaccharides recognisable by their
solubility in alkaline solutions and their insolubility in water (Wertz, 2011). Hemicellulose chains
generally comprise of D-glucose, D-mannose, D-galactose, D-xylose, L-arabinose and small quantities
of L-rhamnose, 4-O-methyl-D-glucorinic acid and D-galactoronic acid (Navi and Heger, 2005). The
principal polysaccharides of the hemicellulose structure have been represented in Figure 1.3.
Figure 1.3: Principal polysaccharides in hemicellulose (INP Toulouse, 2005)
1.3.3 Lignin
Lignin, which is the third major component of lignocellulosique biomass, is a tri-dimensional polymer
made up of phenylpropanes. It is non-fermentable, insoluble and hydrophobic and it gives rise to a
physical barrier that limits accessibility to cellulose. It represents around 20-30 % of the dry wood
(Broust et al., 2008; Jamart et al., 2015). Lignin does not possess a unique structure; its structure is
dependent upon its environment and the physical and chemical conditions of the biomass. However,
it is known to consist of at least three monomers: coumaryl alcohol, coniferyl alcohol and sinapyl
alcohol, as illustrated in Figure 1.4.

Chapter 1
7
Figure 1.4: Monomers of lignin (Prat, 2012)
Lignin units are interlinked by carbon-carbon bonds or by ether bonds. The latter represent more
than two-thirds of the bonds within ligneous structure. As every unit can be linked to its neighbour
by a single, double or triple bond, lignin is known as a crosslinked polymer. The most frequent bonds
encountered in native lignin are ether bonds, named β-O-4’.Apartfromthelatterbonds,whichbring
along a certain liability, there exist resistant inter-unit bonds, known as condensed linkages. They
consist of 4-O-5’,5-5’andβ-5’bonds (Jouanin, 2006; Liitiä et al., 2002). The afore-discussed bonds
are represented in Figure 1.5.
Figure 1.5: Inter-unit linkages in lignin, (a) β-O-'4 bonds and, (b) condensed linkages (Adapted from Méchin,
2015)
The three afore-mentioned polymers (cellulose, hemicellulose and lignin) have long been studied
separately to try and gauge the behaviour of biomass in different thermochemical processes,
including pyrolysis (Beis et al., 2010; Carrier et al., 2017; Collard and Blin, 2014; de Wild et al., 2009;
Lin et al., 2009; Patwardhan et al., 2011a; Stefanidis et al., 2014). However, it has been demonstrated
that just studying the polymers, or pseudo-components, separately does not reflect the actual

Chapter 1
8
behaviour of the biomass. Indeed, when the three polymers are intertwined together in the biomass
matrix, there exist some physico-chemical interactions between them that should also be taken into
consideration. These interactions demand energy to be undone and so, influence the behaviour of
the biomass as a whole (Mohabeer et al., 2017).
1.3.4 Minerals
In addition to the three major components of lignocellulosic biomass, the latter is also comprised of
mineral matter and extractives. The mineral composition varies according to the type of biomass.
These substances are generally found in the ash content after the processing of the biomass, or
sometimes in chemical groups such as amides found in the bio-oil collected from the pyrolysed
biomass (Mohabeer et al., 2017). The minerals essentially include calcium (Ca), silicon (Si), potassium
(K) and phosphorus (P) (Llorente and García, 2006). The typical mineral content for wood as biomass
is around 4 wt. % (Vassilev et al., 2010).
1.3.5 Extractives
Extractives involve material derived from living cells of wood, and generally represent 4-20 % of the
dry mass of wood. The composition of extractives is generally very varied; the content and
composition are dependent upon the species (Badea et al., 2008). The following can be
distinguished:
1) Waxes and fats present in wood in the form of fatty acids linked to glycerol, and
2) Terpenes (complex molecules which are the source of odours and which possess antiseptic
properties) (Stevanovic, 2007).
1.4 Conversion of biomass
1.4.1 Biomass conversion pathways
Biomass can be converted through the following methods (ADEREE, 2014):
1) Thermochemical processes: more convenient for solid residues, examples are combustion,
carbonisation, gasification or pyrolysis.
2) Bio-chemical processes: advised for fermentable organic matter such as very humid organic
waste, household waste, manure; an example is methanisation. The process consists of an
enzymatic degradation of the organic fraction by micro-organisms.
Figure 1.6 depicts the different biomass transformation pathways, from raw material to finished
products, as seen in literature.

Chapter 1
9
Figure 1.6: Biomass transformation pathways (Adapted from EUBIA (2007))
1.4.2 Categorisation of fuels
Typically, bio-fuels are classified as being first-generation, or second-generations ones (EUBIA, 2007).
The simplest way to utilise raw, unconverted biomass (like harvest, industrial or household residues)
is essentially as fuel in an open fire to produce heat for cooking or warming water or air in residential
areas. This utilisation of biomass comprises of first-generation bio-fuels.
On the other hand, with emerging new technologies dating back a few years, biomass can directly or
indirectly be converted into solid, liquid or gaseous fuels. Consequently, it can be claimed that
second-generation bio-fuels are thus modified first-generation bio-fuels (EUBIA, 2007). However, the
handling of solid biomass remains a daunting task and it is not very practical as well because the
energy density is quite low. Hence, methods to convert solid biomass into liquid bio-fuels have been
developed; these liquid bio-fuels are easier to store and transport (Haykırı-Açma, 2003). Now, the
liquid bio-fuels themselves can be categorised into first-, second- and third-generation ones,
depending on the raw material and the transformation technique used. This is illustrated in Figure
1.7.

Chapter 1
10
These liquid bio-fuels present an alternative to the liquid fuels derived from fossil sources such as
diesel. The liquid bio-fuels can normally be utilised in an equivalent manner as the fossil-based ones
in order to produce electricity, in the transport sector or even to in combustion engines. This is the
main reason why they have aroused much interest during recent years.
Figure 1.7: Categorisation of liquid bio-fuels (Adapted from energypedia.info, 2016)
1.5 Pyrolysis of biomass
Theterm“pyrolysis”comesfromitsetymologicalsense,“pyro”(fire)and“lysis”(cut).Theprocessis
considered to be the primary decomposition process of biomass. It produces non-condensable gases,
condensable vapours and a solid, in variable proportions depending on the operating conditions and
the raw material used. The final products obtained may be valorised as shown in Figure 1.8.

Chapter 1
11
Figure 1.8: Utilisation chain of pyrolysis products (Adapted from ADEME (2001))
Pyrolysis can mostly be classified into three types (Dhyani and Bhaskar, 2018):
1) Classical or slow pyrolysis: this technique is one of the oldest used for the treatment of
biomass into charcoal. Low heating rates (0.1 to 2 °C/min) have been reported for this
technique.
2) Intermediate pyrolysis: this technology is usually carried out in the 300-500 °C temperature
range. More controlled chemical reactions take place; reaction conditions and parameters can
be more optimised. Process still aims at optimising liquid production.
3) Fast pyrolysis: this process aims at producing a high yield of liquid by carefully controlling
process parameters. The purpose is to prevent further cracking of pyrolysis products into non-
condensable compounds. Temperatures used fluctuate around 450-600 °C and short residence
times (< 2 s) are typically used.
The above-mentioned classification can be illustrated in a diagram as illustrated in Figure 1.9. It
should be noted that the heat flux density depends on the type of reactor and is equal to the
external heat transfer coefficient (W/m2.K) multiplied by the difference in temperature between the
heat source in the reactor and the surf ace of the particle (Dufour, 2016). One observation stemming
from the figure below was that not a lot of difference was found between fast and intermediate
pyrolysis in terms of product distribution in literature (Bajus, 2010; Mohabeer et al., 2017); both
classes of pyrolysis have as aim a maximum production of liquid as end product.

Chapter 1
12
Figure 1.9: Pyrolysis processes classification (Adapted from Deglise (2007))
1.5.1 Reactors utilised for biomass pyrolysis
As there have been hundreds of technologies used for this process (Rousset, 2014), this part will only
present the most commonly-used types of reactors in pyrolysis technologies aiming at maximising
liquid fuel production. There are five main types of reactors utilised for the afore-mentioned process:
ablative, conical spouted bed, rotating cone, Auger and fluidised bed reactors (bubbling and
circulating) (Garcia-Nunez et al., 2017; Jiang et al., 2015; Ronsse, 2016). Their schematics have been
presented in Figure 1.10, while Table 1.2 illustrates the comparison between the different pyrolysis
process technologies, the different reactors, their technologies and their status as of 2017.

Chapter 1
13
Figure 1.10: Schematics of some fast pyrolysis reactors (a) Ablative, (b) Conical spouted bed, (c) Rotating
cone, (d) Auger, (e) Bubbling fluidised bed and (f) Circulating fluidised bed reactors (Amutio et al., 2013;
Dutton, 2018; IEA Bioenergy, 2018; Ronsse, 2016)

Chapter 1
14
Table 1.2: Summary of some different pyrolysis process technologies (Bridgwater, 1999) and technology statuses of pyrolysis reactors
Type of reactor (Temperature ranges used)
Company (Country) (Technology status)
Features References
Ablative (500-700 °C)
Pytec (Germany) (Demonstration)
- Possibility of large particle sizes - High mechanical char abrasion from biomass - Compact design - Problematic heat supply - Heat transfer gas not required - Carrier has not always a necessity
(Bridgwater, 2012)
Conical spouted bed
(350-700 °C)
Ikerlan (Spain) (Pilot plant)
- Construction and design simplicity - Low charge loss - Vigorous contact between particles - High heat and mass transfer rate between phases - Versatility in the gas flux - Low residence time of gas - Ease of the operation in a continuous regime with
solids
(Arabiourrutia et al., 2017;
Bridgwater, 2012; Schulzke et al.,
2016)
Rotating cone (300-600 °C)
BTG-BTL (The Netherlands) (Commercial)
- Low wear of equipment - Complex process - Can only be performed at small scale - Can only deal with small particle sizes
(Bridgwater, 2012; BTG, 2015; Rasul and Jahirul, 2012)
Auger (400-600 °C)
BioGreen Spirajoule (France), Genesis Industries (USA), BioMaCon GmbH (Germany), Karr Group
(USA), Polvax (Ukraine), Pro-Natura (France) (Commercial)
Bioliq (Germany), Energy Farmers (Australia),
ABRITech (Canada), Renewable Oil International LLC (USA)
(Demonstration)
- Compact process - No carrier gas required - Requires lower process temperatures - Moving parts typically found in hot zones - Heat transfer only suitable for small scale
(Bridgwater, 2012; FAO, 2006; Garcia-Nunez et al., 2017; Jahanshahi et al., 2015; Rasul and
Jahirul, 2012; Siemons and
Baaijens, 2013)

Chapter 1
15
Fraunhofer UMSICHT and Susteen Technologies (Germany), Alternative Energy Solutions Ltd. (New
Zealand), Renewable Oil Int. (USA) (Pilot plant)
Bubbling fluidised bed
(500-800 °C)
Anellotech (USA), Valmet-Fortum (Finland), Agritherm (Canada), RTI (USA), Avello Bioenergy (USA), Bioware (Brazil), Biomass Engineering Ltd. (Belgium & UK), Nettenergy BV (The Netherlands)
(Commercial/Demonstration)
- High heat transfer rates - Heat supplied to fluidising gas, or bed, directly - Limited char abrasion - Very good solid mixing - Particle size limit (< 2 mm) - Simple reactor configuration
(Bridgwater, 2012; Garcia-Nunez et
al., 2017; Meier et al., 2013)
Circulating fluidised bed
(450-800 °C)
Ensyn (USA), Envergent technologies (USA), Metso (Finland), Inaeris Technologies (USA)
(Commercial/ Demonstration)
- High heat transfer rates - High char abrasion from biomass and char erosion,
leading to high char content in products - Char/solid heat carrier separation required - Solid recycle required, leading to increased
complexity of system - Maximum particle sizes up to 6 mm - Possible liquid cracking by hot solids - Possible catalytic activity from hot char - Greater reactor wear probable
(Bridgwater, 2012; Garcia-Nunez et al., 2017; Meier and Faix, 1999)

Chapter 1
16
The reactors listed above include those that perform at a semi-industrial or industrial scale. However,
according to Lam et al. (2016), most of the studies on biomass pyrolysis at laboratory scale are
conducted on batch reactors. The advantages are that better process simplicity is offered, no high-
pressure pump or compressor is needed, it can cater for all types of biomass and lastly, no complex
separation means needs to be applied to obtain the resulting bio-char. On the other hand, the
extended reaction, heating and cooling times, inconsistency of products and difficulty of large-scale
production have pushed researches towards semi-continuous and continuous processes (Qureshi et
al., 2018).
Studies having been made at laboratory-scale on biomass pyrolysis are geared towards a better
understanding of the process. The next step is to scale-up the process for a semi-industrial, or
industrial, application. The following part deals with previous studies having been performed on
laboratory-scale continuous reactors for the pyrolysis of biomass. One of the most common
technologies used is the drop tube reactor (DTR), also known as the entrained flow reactor or the
free fall reactor; a simplified schematic of this reactor has been presented in Figure 1.11.
Figure 1.11: Simplified schematic of DTR (Adapted from Lu et al. (2010))
Guizani et al. (2017) worked on an entrained-flow reactor by varying process parameters for biomass
pyrolysis: temperature (450-600 °C), particle size (370-640 µm) and gas residence time (12.6-20.6 s).
They found higher temperatures, as well as higher particle sizes, tended to decrease bio-oil yield. Out
of the varied process parameters, they observed that reactor temperature and particle size had a
great impact on the product distribution while not majorly affecting bio-oil properties like acidity.
Ouazki et al. (2016) presented a comparative study of direct and staged pyrolysis of softwood and
hardwood for the production of bio-oil with the aim to enhance the selective production of high

Chapter 1
17
added value molecules. The experiments were conducted in a fixed bed reactor under nitrogen flow
rate. It was found that the overall yields of bio-oil obtained by staged pyrolysis were lower than
those obtained by direct pyrolysis for both biomasses. In the first stage, the produced bio-oil was rich
in phenolic and furan derivatives and the gaseous fraction was rich in CO2. In the second one, the rest
of the bio-oil was produced and the gas produced contained mainly CO and CO2. In the last stage,
only a production of CO, CO2 and CH4 was observed.
Punsuwan and Tangsathitkulchai (2014) studied the biomass of palm shell, palm kernel and cassava
pulp residue in a laboratory free-fall reactor. They analysed the effects of pyrolysis temperature (250-
1050 °C) and particle size (0.18-1.55 mm). They found that a higher temperature and smaller particle
size increased gas yield but decreased char yield. Another observation was that in the gas
composition, CO was the major component. Tchapda and Pisupati (2015), on their part, did some
research on the characterisation of an entrained-flow reactor for the pyrolysis of coal and biomass at
high temperatures. They have conducted modelling and experiments at three different
temperatures: 1300, 1400 and 1500 °C. They found that fuel conversion rates of biomass at those
temperatures tended to be higher than coal (maximum values of 90.5 % for biomass and 64.0 % for
coal at 1500 °C). As temperature increased, they noted a reduction in tar formation and an increase
in CO production. The calculated the average particle residence time in the reactor was 0.4 s for coal
and 0.5 s for biomass.
Another interesting study on this topic is that of Sun et al. (2010). They performed experiments on
the flash pyrolysis of rice husk and sawdust in an entrained flow reactor with the temperature range
of 700-1000 °C. Their results have shown that the temperature has a great impact on the reaction;
along with a temperature increase, gas yield experienced a boost while char and liquid yields
diminished. They observed that at lower temperatures, the boost in gas formation could be
attributed to the increase of CO and CH4 formation and that at higher temperatures to CO2 and H2
production.
1.5.2 Pyrolysis of woody biomass
1.5.2.1 Woody biomass pyrolysis
Through the thermal depolymerisation and degradation of celluloses, hemicelluloses and lignins,
liquid and gaseous products as well as a solid residue of char are formed (Demirbaş,2000). During
the actual process of biomass pyrolysis, various physical and chemical processes occur, including
heating up of biomass, moisture evaporation and transportation, reaction kinetics involving the
conversion of biomass to tar, char and gases, heat and mass transfer, pressure build-up within the
porous medium of the solid, convective and diffusive gas phase flow, variation of thermo-physical

Chapter 1
18
properties with temperature and change in particle size (Ibrahim et al., 2012). While there are
several factors that influence the product distribution of biomass pyrolysis, the distribution of the
final products are generally of the following order (ADEME, 2001), on mass basis:
1) 40-65 % of condensable vapours
2) 10-20 % of char
3) 5-25 % of non-condensable gases
4) 10-20 % of water
A simplified representation of the pyrolysis process, complete with all the factors susceptible to
influence the process and products, has been illustrated in Figure 1.12.
Figure 1.12: Representation of the pyrolysis process (Adapted from Guedes et al. (2018))
Pyrolysis of woody biomass aimed at optimising liquid product yield has been vastly studied in
literature (Bridgwater, 2012, 1999; Cuevas et al., 1995; Jahirul et al., 2012; Jiang et al., 2015; Kohler,
2009; Lehto et al., 2014; Qureshi et al., 2018; Radlein and Quignard, 2013). The different samples of
bio-oil collected and presented in literature possess a wide array of compositions given the various
operating conditions and kinds of biomass that were used to obtain them. Table 1.3 details the
typical chemical families present in pyrolysis oils as presented in literature, along with some major
model molecules present in each family. Concerning the non-condensable gases composition,
according to Yamamiya et al. (2003), it is the following: 5 % H2, 26 % CH4, 28 % CO and 40 % CO2.
Following this table, some findings concerning experiments with varying pyrolysis temperature and
power density will be discussed.

Chapter 1
19
Table 1.3: Summary of bio-oil composition (Adapted from Diebold (1997); Mullen and Boateng (2008); Pittman et al. (2012))
Chemical family
Percentage present in bio-
oil Model molecules
Chemical family
Percentage present in bio-
oil Model molecules
Acids 1.7-26.4 wt. %
Acetic acid
Alcohols 2.4-8.8 wt. %
Methanol
Propanoic acid
Ethanol
2-Butenic (Crotonic) acid
2-Propene-1-ol
Benzoic acid
Ethylene glycol
Esters 1.1-9.2 wt. %
Methyl acetate
Ketones 5.1-13.2 wt. %
Acetone
Methyl crotonate
2-Pentanone
Methyl n-butyrate
2,3-Pentenedione
Valerolactone
Dimethylcyclopentanone

Chapter 1
20
Aldehydes 8.3-18.3 wt. %
Formaldehyde
Guaiacols 2.2-15.1 wt. %
2-Methoxy phenol
Acetaldehyde
4-Ethyl guaiacol
2-Butenal
Eugenol
Ethanedial
Sugars 5.4-13.4 wt. %
Levoglucosan
Phenols 2.9-13.3 wt. %
Phenol
1,6-Anhydroglucofuranose
2-Methyl phenol
Furans 1.6-25.8 wt. %
Furan
2,3-Dimethyl phenol
2-Methyl furan
2-Ethyl phenol
Dimethyl furan

Chapter 1
21
Kosanićet al. (2014) have studied the pyrolysis of a woody biomass mixture (equal fractions of oak,
beech, fir, cherry, walnut and linden wood chips) in a fixed bed reactor. They used 10 g of biomass
having a particle diameter of 5-10 mm, which were heated in the range of 240 – 650 °C. Their results
indicated that heating rate has an important effect on the yields of pyrolytic gas and char; higher
pyrolysis temperatures and heating rates favoured higher yields of pyrolytic gas and caused a
decrease in char yield.Keleşet al. (2011) have investigated the fast pyrolysis of hazelnut cupula in a
fixed-bed reactor by varying pyrolysis temperature from 400 to 700 °C, sweeping gas flow rate and
particle size. They have found that they obtained a maximum oil yield using a temperature of 600 °C
and a carrier gas flow rate of 200 mL/min; they also noted uniform heating of particles for sizes
ranging from 0.150 mm to 0.425 mm. However, they did not perform any further analysis on the
liquid and gas products formed.
Bajus (2010) examined the pyrolysis of beech wood in a batch reactor specifically at temperatures
ranging from 350 to 450 °C. He found that the pyrolysis resulted on average in 25.1 wt. % of gas, 44.3
wt. % of liquids and 30.6 wt. % of carbon solid residues. The gaseous products consisted mainly of
carbon dioxide and carbon monoxide whilst the liquid products of acetic acid, formic acid, furfural,
lactic acid and levoglucosan. Demirbas (2007) investigated the influence of temperature on the
pyrolysis of hazelnut shell, olive husk, beech and spruce wood samples in a fixed-bed tubular reactor
by varying the temperature from 350 to 525 °C. He found that a large fraction of the oil produced
was made up of phenols; the water content typically fluctuated around 15-30 wt. % of the oil mass.
He also noted that the bio-oil formed at 500 °C contained high concentrations of acetic acid, 1-
hydroxy-2-butanone, 1-hydroxy-2-propanone, methanol, 2,6-dimethoxyphenol, 4-methyl-2,6-
dimethoxyphenol and 2-cyclopenten-1-one. He concluded by stating that if wood were completely
pyrolysed, the resulting products would be what would have been formed from the pyrolysis of the
three major components (cellulose, hemicellulose and lignin) separately.
1.5.2.2 Pyrolysis of cellulose, hemicellulose and lignin
As mentioned before, biomass is made up of a mix of structural constituents (cellulose,
hemicellulose, lignin, minerals and extractives); each of these components pyrolysis at different rates
and by different pathways and mechanisms. Therefore, the studies focused on the individual
components of biomass (cellulose, hemicellulose and lignin) are crucial; the basic knowledge of the
role and behaviour of these three components during pyrolysis is important for the understanding
and control of the overall biomass pyrolysis process.
It has been shown that the activation energy increases along with the degree of conversion of
biomass during the course of the reaction as carbon becomes less reactive and starts forming stable
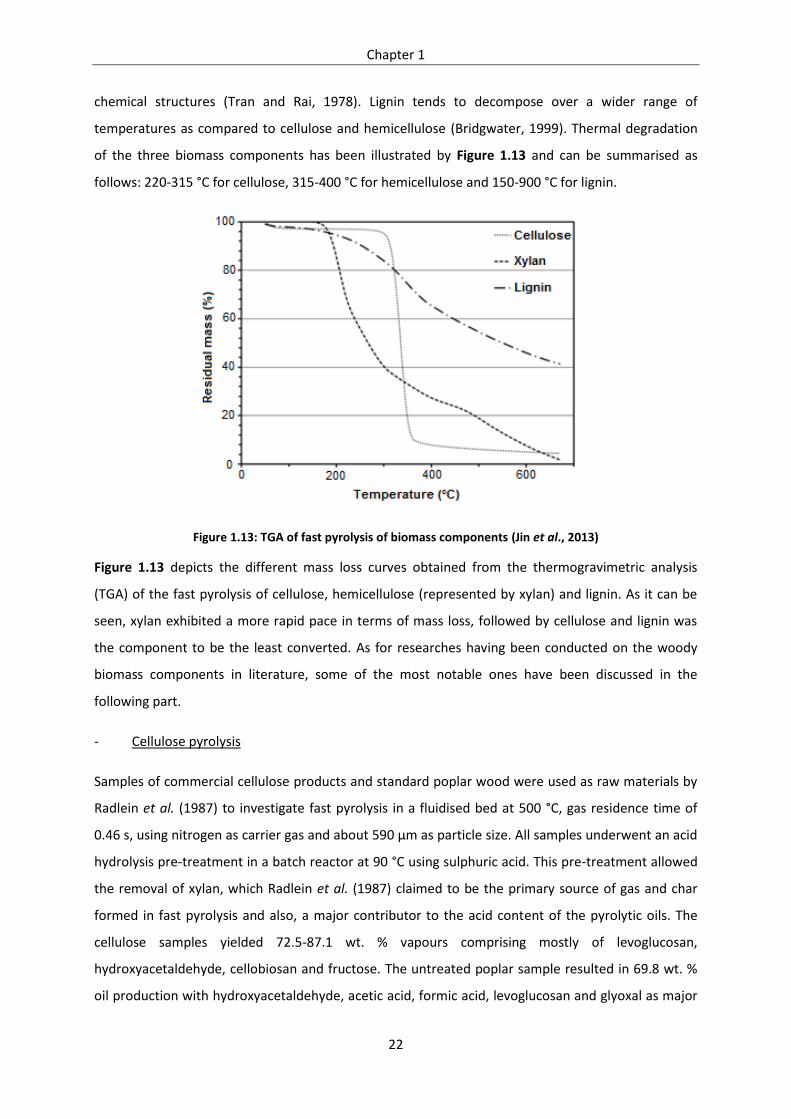
Chapter 1
22
chemical structures (Tran and Rai, 1978). Lignin tends to decompose over a wider range of
temperatures as compared to cellulose and hemicellulose (Bridgwater, 1999). Thermal degradation
of the three biomass components has been illustrated by Figure 1.13 and can be summarised as
follows: 220-315 °C for cellulose, 315-400 °C for hemicellulose and 150-900 °C for lignin.
Figure 1.13: TGA of fast pyrolysis of biomass components (Jin et al., 2013)
Figure 1.13 depicts the different mass loss curves obtained from the thermogravimetric analysis
(TGA) of the fast pyrolysis of cellulose, hemicellulose (represented by xylan) and lignin. As it can be
seen, xylan exhibited a more rapid pace in terms of mass loss, followed by cellulose and lignin was
the component to be the least converted. As for researches having been conducted on the woody
biomass components in literature, some of the most notable ones have been discussed in the
following part.
- Cellulose pyrolysis
Samples of commercial cellulose products and standard poplar wood were used as raw materials by
Radlein et al. (1987) to investigate fast pyrolysis in a fluidised bed at 500 °C, gas residence time of
0.46 s, using nitrogen as carrier gas and about 590 µm as particle size. All samples underwent an acid
hydrolysis pre-treatment in a batch reactor at 90 °C using sulphuric acid. This pre-treatment allowed
the removal of xylan, which Radlein et al. (1987) claimed to be the primary source of gas and char
formed in fast pyrolysis and also, a major contributor to the acid content of the pyrolytic oils. The
cellulose samples yielded 72.5-87.1 wt. % vapours comprising mostly of levoglucosan,
hydroxyacetaldehyde, cellobiosan and fructose. The untreated poplar sample resulted in 69.8 wt. %
oil production with hydroxyacetaldehyde, acetic acid, formic acid, levoglucosan and glyoxal as major

Chapter 1
23
compounds present. These findings were further corroborated by Nieva et al. (2014), who conducted
pyrolysis experiments in a tubular reactor at temperatures of 250 to 400 °C under a nitrogen flow
rate of 0.1 L/s; their vapour residence time was found to be less than 0.1 s. They found that the
effective transformation of microcrystalline cellulose started at temperatures higher than 200 °C and
that its fast pyrolysis at temperatures exceeding 300 °C yielded mainly levoglucosan. However, apart
from the latter and other anhydro sugars, they also detected the presence of aromatic hydrocarbons
like xylene and ethylbenzene and different furan derivatives.
- Hemicellulose pyrolysis
Yang et al. (2006) have studied the pyrolytic behaviour of commercially-available xylan, as a proxy for
hemicellulose, by using a thermogravimetric analyser (TGA) and differential scanning calorimetry
(DSC). The temperature programme they used has been detailed in their paper. They have found that
xylan decomposition occurred mainly between 220-315 °C, with maximum weight loss occurring at
260 °C. They also identified a char yield of about 22 wt. % from the pyrolysis of xylan. Patwardhan et
al. (2011a) investigated the product distribution of the fast pyrolysis of hemicellulose isolated from
switchgrass in a quartz micro furnace reactor at 500 °C. They obtained a chromatogram from the
analysis of the oils produced. Six major compounds were detected: acetaldehyde, formic acid,
hydroxyacetone, acetic acid, 2-furaldehyde and isomers of dianhydro xylose. They have also found
that the pyrolysis of hemicellulose resulted in a large formation of CO2.
- Lignin pyrolysis
de Wild et al. (2009) have reported pyrolysis oil yields of up to 21 % for the fast pyrolysis of two
different lignin feedstock, an Alcell lignin and a soda pulping lignin, in a continuously-fed bubbling
fluidised bed reactor at 400 °C. Beis et al. (2010) have studied three different types of lignin: two
Kraft lignins and an organosolv lignin using a fluidised bed reactor. Modest oil yields, ranging from
16-22 % were obtained at a process temperature of 550 °C and reactor gas residence times of the
order of 1-2 s. Patwardhan et al. (Patwardhan et al., 2011b), using the same setup as mentioned
above for the hemicellulose pyrolysis, have found that lignin pyrolysis resulted primarily in the
formation of monomeric phenolic compound, with phenol, 4-vinyl phenol, 2-methoxy-4-vinyl phenol,
and 2,6-dimethoxy phenol as the major products. They also noted that temperature impacted the
pyrolysis product distribution significantly as the yield of alkylated phenols increased with
temperature while that of methoxylated phenols decreased. Additionally, it was seen that char yield
decreased linearly with temperature while the yields of gaseous and low molecular weight products
increased.

Chapter 1
24
1.5.2.3 Pyrolysis mechanism and modelling
Studies focusing on the kinetics of pyrolysis for converting biomass into bio-fuel are essential in order
to understand both the mechanism of the reaction and the kinetics parameters. There have been
several studies that have been reported on biomass pyrolysis models (Bech et al., 2009; Di Blasi,
2008; Dupont et al., 2009; Haseli et al., 2011; Kaushal et al., 2010; Park et al., 2009; Radmanesh et
al., 2006; E. Ranzi et al., 2008).
Detailed models are available in literature for biomass pyrolysis; they are mostly based on coupled
time-dependent conservation equations including kinetics of biomass decomposition. The most
frequently applied model is a one-step global model, and is also one of the simplest models; it
considers the conversion of biomass into char and volatiles and has been proposed by Galgano and
Di Blasi (2003). Another well-known decomposition scheme is the Broido-Shafizadeh model
(Shafizadeh, 1982), which assumes the formation of an intermediate liquid compound (ILC), which is
followed by two competing reactions: one where tar is produced, and the other where char and light
gases are formed. This model has been illustrated in Figure 1.14.
Figure 1.14: Broido-Shafizadeh model for biomass pyrolysis (Shafizadeh, 1982)
Chan et al. (1985), on their part, used a pyrolysis model involving three primary reactions and one
secondary reaction; the products of the secondary tar reaction are divided into light gases and
aromatics. The weightage of the two products depend on the boundary conditions. The kinetics data
were obtained from pine wood. In the model developed by Koufopanos et al. (1991), biomass
undergoes a primary reaction to decompose into volatiles and gases (reaction 1) and char (reaction
2). The primary products then participate in the secondary reaction to give rise to more volatiles,
gases and char, all having different compositions (reaction 3). This model has been used by Babu and
Chaurasia (2004) and Sadhukhan et al. (2009).
E. Ranzi et al. (2008) proposed a model of biomass pyrolysis based on conventional multistep de-
volatilisation models of the three main biomass components (cellulose, hemicellulose, and lignin)
and which predicted the yields and lumped composition of gas, tar, and solid residues. Kinetic
models of the different steps of solid fuel volatilisation and secondary gas phase reactions were

Chapter 1
25
developed and validated through comparison with experimental data. Park et al. (2009) built a model
consisting of three endothermic parallel reactions producing tar, char and an intermediate solid,
followed by an exothermic decomposition of the said solid into char and also, an exothermic
conversion of tar to char and gas, as illustrated in Figure 1.15. The proposed model showed good
agreement with the experimental results they obtained.
Figure 1.15: Model used by Park et al. (2009)
Guizani et al. (2017) a 1-D model developed in FORTRAN language (GASPAR) which took into account
particle heating, particle drying, pyrolysis reaction, gas phase reactions and char gasification. Gas and
tar reactions in the gas phases were modelled using the CHEMKIN tool. They found that the model
gave worthy information about the pyrolysis reaction in a drop-tube reactor and can be used for the
design of pilot and industrial-scale entrained flow reactors.
Punsuwan and Tangsathitkulchai (2014) developed a pyrolysis model based on solving the two-
parallel reaction kinetics model and equation of particle motion; the model was found to give very
accurate char yield prediction. Post-experimental modelling was done by Tchapda and Pisupati
(2015) with the aid of the CFD package ANSYS-Fluent. The model showed some particle and gas
recirculation at the inlet of the reactor, and also helped in describing the hydrodynamics and heat
transfer profile in the reactor. Sun et al. (2010) adopted a first order kinetic model of thermal
decomposition. Then, they carried out numerical simulations using Fluent. The output of the model
and simulations were found to be very close to the experimental results found.
Finally, Abdelouahed et al. (2017) investigated the devolatilisation behaviour of two biomasses
(beech wood and flax shives) and their main constituents (cellulose, hemicellulose and lignin) in an
inert atmosphere by thermogravimetric analysis. They discussed the different methods for
determining the kinetic parameters (activation energy and pre-exponential factor) of biomass (beech
wood and flax shives) pyrolysis, based on the Kissinger method, isoconversional methods (Kissinger–
Akahira–Sunose and Friedman) and based models (non-linear least square minimization and
optimization by genetic algorithm). This paper showed that kinetic parameters were very sensitive to

Chapter 1
26
the methods used. The comparison of results showed a large difference for the same experimental
results even for the pure biomass pseudo-components. Based on results, they claimed that the
Kissinger method remained the best one for the determination of kinetic parameters as it took into
account the biomass structure effect and the mineral content.
1.6 Catalytic pyrolysis of biomass
Untreated bio-oil is usually considered a low-grade liquid fuel because it is highly oxygenated, very
acidic and corrosive, chemically and thermally unstable and immiscible with petroleum fuels (Adjaye
and Bakhshi, 1995; Guo et al., 2009). The oxygen present in bio-oilisthereasonbehindthelatter’s
high functionality. Having a high functionality decreases the stability of oils and results in
polymerisation. These characteristics present a very difficult challenge for it to be used as a
substitute for conventional fuels. So as to improve the quality and use of the woody biomass bio-oils,
many authors have studied different methods to enhance their properties. One such method is the
upgrading of bio-oils through the removal of oxygen (de-oxygenation) using different catalysts. The
principle behind de-oxygenation has been represented by a simplified illustration (Figure 1.16). It
should be noted that de-oxygenation predominantly involves three reaction classes: dehydration,
decarbonylation and decarboxylation, that is, the removal of the -OH, -COOH and –C=O functionality
groups (Gunawardena and Fernando, 2013).
Figure 1.16: De-oxygenation principle
1.6.1 De-oxygenation: catalysts used and process
De-oxygenation via catalytic treatment is a very promising route for lignocellulosic biomass to
produce chemicals and fuels compatible with the current petrochemical structure. Catalysts can be

Chapter 1
27
mixed either directly with the biomass feedstock in the reactor or used in contact with the hot
vapour after the reaction, called in-situ and ex-situ catalytic pyrolysis, respectively (Yildiz et al., 2016).
Adding catalysts to the pyrolysis system tends to enhance reactions like dehydration, cracking,
decarbonylation, decarboxylation, and if hydrogen is present, hydrocracking, hydro de-oxygenation
and hydrogenation (Dickerson and Soria, 2013), as represented in Figure 1.17.
Figure 1.17: Representative catalytic upgrading reactions (Mortensen et al., 2011)
Catalysts used in the catalytic pyrolysis of biomass can be categorised into several groups: soluble
inorganics, metal oxides, microporous materials, mesoporous materials and supported metal
catalysts (Liu et al., 2014). Table 1.4 presents a summary of the numerous CFP (catalytic fast
pyrolysis) researches done in literature that are relevant to our study purposes, and some of the
most noteworthy works have been further detailed afterwards in this chapter. There have been
several research works done on the catalytic pyrolysis of pyrolytic oils previously recovered (Adjaye
and Bakhshi, 1995; Payormhorm et al., 2013; Vitolo et al., 1999; Zhao et al., 2015). As this is not the
purpose of our study, they have not been included in the following table.
As can be seen from the various data presented in Table 1.4, zeolite-based catalysts presented the
best efficiency and performance when it came to the upgrading of the produced bio-oil. Metal-
modified zeolites presented high selectivity for aromatic compounds and low ones for phenolics,
while metal-modified alumina-supported catalysts had good efficiencies in acid removal and high
selectivity for carbonyl compounds. These observations have thus helped gear our research towards
the use of these catalysts.

Chapter 1
28
Table 1.4: Summary of important CFP researches done in literature
* WHSV: Weight hourly space velocity
Feed
Reaction conditions Results
Ref. Catalyst used
Reactor
used
Temperature
(°C)
WHSV (g feed/g cat.h)
or biomass:catalyst
ratio
Bio-oil
yield
(wt. %)
Product quality and oxygen
content, if applicable
Waste
wood
shavings
HZSM-5
Fluidised
bed 500-550
1.05-1.14 g biomass/g
cat. h
28.8 Good aromatics yield (15.9 wt. %) (Williams
and Horne,
1995)
Na-ZSM-5 24.3 Higher aromatics yield (21.3 wt. %)
Y-zeolite 28.6 Average aromatics yield (14.0 wt. %)
Activated alumina 31.2 Lowest aromatics yield (8.0 wt. %)
Radiata pine
sawdust
HZSM-5 Bubbling
fluidised
bed
475-625
4 g biomass/g cat. h 43.7
Formation of mainly aromatic
hydrocarbons (Only aromatics
listed) (Park et al.,
2006, 2007) HY 8 g biomass/g cat. h 45.7 Almost no formation of aromatics
Ga/HZSM-5 4 g biomass/g cat. h 51.3 Higher selectivity for aromatics (as
compared to HZSM-5)
Radiata pine
sawdust
HZSM-5
Fixed bed 500 10:1
46.6 Reduction of non-phenolic
oxygenates
(Park et al.,
2010)
MMZHZSM-5
(mesoporous
material from
HZSM-5)
50.6 No change in phenols; reduction in
other oxygenates

Chapter 1
29
MFI zeolite 45.9
High aromatics yield; reduction in
non-phenolic oxygenates and in
phenols
1 % Ga/MFI
Higher aromatics yield; reduction in
non-phenolic oxygenates and in
phenols
5 % Ga/MFI Similar to HZSM-5; less efficient that
1 % Ga/MFI
Pine
sawdust
H-β
Dual
fluidised
bed
450 8.33:1
37.8
β-zeolite was the most performant
at de-oxygenation, followed by Y
and ferrierite zeolites
(Aho et al.,
2010)
Fe-H-β 37.0
H-Y 39.7
Fe-H-Y 34.3
H-Ferrierite 43.8
Fe- H-Ferrierite 44.5
Pine wood ZSM-5 Fluidised
bed 450-600 0.35 g biomass/g cat. h Increase in selectivity of aromatics
(Zhang et
al., 2012)
Jatropha
wastes HZSM-5 Fixed-bed 550 2:1 4.1-8.7
Conversion of 76.7-91.6 % found;
production of mainly aromatics
(Murata et
al., 2012)
Pine wood Na2CO3/Al2O3 Fixed-bed 500 0.5:1 - 2:1 9
Complete removal of acids and high
carbonyl content in bio-oil; O: 12.3
wt. %
(Nguyen et
al., 2013)
Particle HZSM-5 Batch 500 10:1 42.54 Reduction in oxygenates and (Choi et al.,
Chapter 1
30
board increase in aromatics and phenolics 2013)
Ga/HZSM-5 46.27
Larger reduction in oxygenates and
higher increase in aromatics
(compared to HZSM-5); lower
phenolics content
H-β 44.60 Similar to HZSM-5, but less
performant
Oak wood
cylinder
particles
HZSM-5 Micro
fluidised
bed
500 0.85:1
8.3-10.1
High selectivity in mono aromatic
compounds (4.4 wt. %); Co2:CO =
0.5
(Jia et al.,
2017)
Desilicated HZSM-5
Higher selectivity in mono aromatic
compounds (6.2 wt. %); Co2:CO =
0.5
HZSM-5
Fixed bed
High selectivity in mono aromatic
compounds (4.1 wt. %), but not as
performant as in fluidised bed
Desilicated HZSM-5
Higher selectivity in mono aromatic
compounds compared to parent
zeolite (5.1 wt. %), but not as
performant as in fluidised bed

Chapter 1
31
1.6.1.1 Catalytic pyrolysis of woody biomass
- Zeolite-based catalysts
A representation of the HZSM-5 catalyst is given in Figure 1.18, and that of Fe-HZSM-5 in Figure 1.19.
Guda and Toghiani (2015) worked with pinewood in a packed bed reactor to study the effects of acid
catalysts on the products of pyrolysis; they used an Auger reactor at a temperature of 450 °C with
nitrogen as carrier gas, testing beta zeolite supported on alumina (Al2O3), Si/Al catalyst, H-Y and
HZSM-5. Their results affirmed that Si/Al catalyst and beta zeolite contributed to the increase of
liquid product while HZSM-5 and H-Y led to the formation of aromatic hydrocarbons and a higher gas
percentage. They also found that the use of HZSM-5 could reduce an oxygen content of 46.4 wt. % to
one of 30 wt. %, classifying this catalyst as one of the most effective ones for de-oxygenation. Other
authors have had the same opinion about the performance of this catalyst (French and Czernik, 2010;
Gayubo et al., 2004a; Guda and Toghiani, 2015; Gunawardena and Fernando, 2013).
Figure 1.18: Representation of HZSM-5 catalyst (Structure adapted from Teng et al. (2009))
Upgrading bio-oil via the use of zeolites implicates passing the pyrolysis vapours through a
microporous structure to convert part of these vapours into desired aromatic compounds and
olefins, while the other part is converted into non-condensable gases and coke. The advantage of this
process is that high hydrogen pressure is not required (Cheng et al., 2012). Furthermore, literature
data prove that using metal-impregnated zeolite materials present many advantages (Arenamnart
and Trakarnpruk, 2006; Cheng et al., 2012; Gunawardena and Fernando, 2013). For instance, through
a study led by Arenamnart and Trakarnpruk (2006) on using metal-impregnated catalysts to convert
ethanol to ethylene, it was found that a metal-modified support would lower coke formation as
water produces would get adsorbed on the catalyst surface and cause light alkenes to convert less
into high molecular weight compounds. French and Czernik (2010) led a study that concluded that
metal-modified zeolites possessing reduced acidity could enhance the yield of hydrocarbons and
high-value chemicals like phenols while producing less coke than the commercial zeolite itself.

Chapter 1
32
Among the various metals used, iron proves to be active, quite popular as it is highly abundant, has
low toxicity and is cheap (Li et al., 2016).
For instance, Mullen and Boateng (2015) investigated the production of aromatic compounds from
catalytic pyrolysis of biomass and some biomass components using Fe-modified HZSM-5; the
experiments were conducted in a pyroprobe reactor. They found that an iron loading of 1.4 wt. %
produced the largest increase in production of aromatic hydrocarbons from cellulose, hemicellulose
and lignin. For the biomass studied, switchgrass, Fe-HZSM-5 loaded with iron at 1.4 wt. % Fe
produced a similar carbon yield of aromatics as the standard HZSM-5 but higher loadings of Fe
decreased the yield. Sun et al. (2016) compared the catalytic fast pyrolysis of biomass to aromatic
hydrocarbons over ZSM-5 and Fe/ZSM-5 catalysts in a µ-reactor. They found that the Fe/ZSM-5
catalyst demonstrated better activity in the conversion of oxygenates and formation of mono-cyclic
aromatic hydrocarbons (MAHs) than the ZSM-5 catalyst.
Figure 1.19: Representation of Fe-HZSM-5 catalyst
- Metal-based catalysts
Now, metal-based catalysts are more commonly used in hydro-desulphurisation (HDS) and hydro-
de-oxygenation (HDO) with high hydrogen pressure (Mortensen et al., 2011), but some authors have
made use of these catalysts under other conditions such as a non-sulphated atmosphere, at
atmospheric pressure and without hydrogen to study the catalytic de-oxygenation of bio-oil
(Mortensen et al., 2011; Payormhorm et al., 2013; Zhang et al., 2013).

Chapter 1
33
One example is the following: AteşandIşıkdağ(2009) investigated the influence of temperature and
the alumina catalyst on the pyrolysis of corncob in a fixed bed reactor in the range of 300-800 °C. 10
g of 0.65 mm corncob particles were thus pyrolysed in a 250 mL reactor. The carrier gas name and
flow rate were not specified (AteşandIşıkdağ,2008). The results indicated that a maximum oil yield
of 22.2 % was obtained at a moderate temperature of 600 °C. The oil yield reduced when the
temperature increased from 600 to 800 °C, whereas the gas yield increased. They also observed that
aliphatics were obtained in larger quantities in catalytic experiments as compared to those carried
out non-catalytically, at every temperature. The total amount of phenolic compounds decreased and
the amount of single-ring or more than single ring aromatic compounds (PAHs) increased at high
pyrolysis temperatures in the experiments without catalyst or at moderate pyrolysis temperatures
with a catalyst.
1.6.1.2 Catalytic pyrolysis of woody biomass components
Concerning the catalytic pyrolysis of the woody biomass components, firstly, Zhou et al. (2011) have
studied the catalytic pyrolysis of cellulose with different zeolite in a TG-FTIR setup. They have found
that HZSM-5 was the most efficient catalyst in terms of de-oxygenation degree as it improved the
conversion of oxygenated families like esters, aldehydes and acids. About the same observations
were made by Lei et al. (2018). Then, Guo et al. (2011) investigated the catalytic pyrolysis of xylan-
based hemicellulose in a TG-FTIR setup using different zeolites. They found that all of the zeolites had
a significant effect on the de-oxygenation of xylan, and that HZSM-5, along with having good de-
oxygenation efficiency, catalysed the degradation of char residues. Zhu et al. (2010), on their part,
found that metal-modified HZSM-5 was even more efficient than the parent zeolite concerning de-
oxygenation activity. Lignin de-oxygenation was examined by Zhan et al. (2017) in a micro pyrolysis
reactor using an array of catalysts. They found that HZSM-5 was the most efficient catalyst in forming
aromatics; the highest yield obtained was at 600°C, the highest temperature they used.
1.6.1.3 Conversion schemes of model molecules from woody biomass
Now, concerning the pyrolytic conversion schemes of chemical families involved in catalytic pyrolysis,
several studies tackling one or arbitrary compounds have indeed been reported in literature
(Danuthai et al., 2009; Derouane et al., 1978; Zhang et al., 2011, 2016). To report on some of the
relevant data previously published in literature, Gayubo et al. (2004a) investigated on the pyrolytic
conversion of alcohols and phenols using HZSM-5. They found that the dehydration process gave rise
to propene from alcohols, which later produced hydrocarbons. They also noted a very low
conversion rate of phenols. Guaiacols were found to form aromatics by decarboxylation, along with a
carbonaceous material deposited within the catalyst matrix. In another study (Gayubo et al., 2004b),
it was observed that aldehydes converted to C6+ olefins, albeit with a low conversion rate; ketones

Chapter 1
34
produced alkenes via dehydration followed by decarboxylation and decarbonylation; acids and
esters, having the same reactivity, gave rise to ketones, which later decomposed as mentioned
above. Finally, they found that levoglucosan formed furans, which degraded further to give
aromatics, olefins, CO, CO2, water and coke.
1.7 De-activation of catalysts in catalytic pyrolysis
As it is, catalytic upgrading is touted to be a promising method to convert the bio-oil into fuels and
chemicals of higher quality. However, many challenges must still be addressed. For instance, better,
more performant catalysts may be part of the solution, but, most catalytic materials are currently
quite expensive and easily de-activated. Understanding the reaction mechanism leading to this de-
activation can be of crucial importance to understand how to manage the catalyst lifetime and
improve the overall process. Some catalyst de-activation models have indeed been presented in
literature (Cerqueira et al., 2008; Meng et al., 2007), but the data remains limited.
A study conducted by Hua et al. (2011) showed that due to the microporous structure of typical
zeolites, bulky reactants and intermediates have poor access to the active sites found in the pores
and end up blocking the channels, thereby causing the de-activation of catalysts. This fact has been
further corroborated by Guisnet et al. (2009), who claimed that the build-up of these bulky
carbonaceous intermediates and by-products are referred to as coke, which either cover the external
sites, or are trapped inside the pores. As it has been afore-mentioned, there are no current
economical methods to remove coke and regenerate fresh zeolites at industrial scale. As an
endeavour to go forward in this direction, this part of the study will present case studies in order to
better comprehend catalyst de-activation in the conversion of biomass to hydrocarbons.
1.7.1 Causes of catalyst de-activation
Based on researches previously conducted in literature, several causes of de-activation for catalysts
have been listed: catalyst acidity (Paasikallio et al., 2014; Zhu et al., 2010), catalyst topology and
biomass-to-catalyst ratio used (Mukarakate et al., 2014; Zhu et al., 2010). A very explicit review on
this topic has been published by Cerqueira et al. (2008).
- Acidity
The effects of acidity have been shown to be a combination of the concentration and strength of the
active acid sites and the proximity of these sites to one another. Greater acid strength and higher
concentration of acid sites have been proved to accelerate the de-activation of catalysts (Guisnet et
al., 2009; Paasikallio et al., 2014). The different reasons given have been firstly, that stronger acidity
resulted in a faster reaction, leading up to a faster consumption of coke pre-cursors and thus

Chapter 1
35
speeding up the coking rate and secondly, that larger densities of acid sites led to more successive
reaction steps, causing an increased potential to form condensation and ultimately, a faster rate of
formation of coke (Xu et al., 2016).
- Topology
The pore size of HZSM-5 catalysts are generally of the order of 5 Å (Corma, 2003). Therefore, heavy
primary vapours with sizes larger than 5 Å which cannot enter the pores would need to undergo
catalytic cracking on the macrosurface to form light species, hence blocking the entrance of the
pores (Mukarakate et al., 2014).
- Biomass-to-catalyst ratio
The next cause is the biomass-to-catalyst ratio (for discontinuous reactions) or space velocity (for
continuous reactions) used for the study. Several parametric studies in literature have varied
reaction conditions so as to better understand coking and yields from upgrading pyrolysis vapours
with HZSM-5. Mukarakate et al. (2014) have summarised the findings of these reports into a graph
and this graph has been illustrated in Figure 1.21.
Figure 1.20: Literature results for oxygen content in bio-oils from CFP with HZSM-5 (Mukarakate et al., 2014)
It should be noted that the numbers 1-6 on the figure correspond to the following research works: 1 -
Czernik (2013), 2 - Williams and Nugranad (2000), 3 - Horne and Williams (1996), 4 - Agblevor et al.

Chapter 1
36
(2010), 5 - Zacher et al. (2014) and 6 - Stefanidis et al. (2011). From these results, it was suggested
that fresh catalyst initially produces very low yields of essentially oxygen-free hydrocarbons, but, as
the amount of biomass is increased, the catalyst becomes de-activated and oxygenated products
break through, increasing liquid yield and the oxygen content of the oil. Also, from the plot, it
appears that for biomass-to-catalyst ratios exceeding 3 or 4, the catalyst is completely de-activated.
1.7.2 Case studies of catalyst de-activation
Many studies have been conducted on the effect and de-activation of zeolites during the methanol-
to-olefins (MTO) or methanol-to-hydrocarbons (MTH) process (Biddy et al., 2013a, 2013b; Hemelsoet
et al., 2013; Ilias and Bhan, 2013; Olsbye et al., 2012). These findings are relevant to our studies as
Mukarakate et al. (2015) demonstrated in their study, from the examination of intermediates and
their reactions, the mechanisms of MTO/MTH process are similar to those for the catalytic
conversion of biomass over zeolites. So, in the light of the previous statement, Schulz (2010) found
that the de-activation of HZSM-5 in the MTH reaction was mainly due to the formation of
ethyltrimethylbenzene and isopropyl-dimethylbenzene through the alkylation with ethane and
propene at low temperatures (270-300 °C) using capillary gas chromatography.
Mukarakate et al. (2014) studied the conversion of pine pyrolysis vapours over fixed beds of HZSM-5
catalyst as a function of the de-activation of the catalyst in a batch horizontal quartz annular flow
tube reactor coupled with an molecular beam-mass spectrometer (MBMS). Quartz boats, each
containing 50 mg samples of biomass, were introduced into the inner tube at 500 °C under a 0.2
L/min He flow rate. The WHSV they used approximated 3.6 h-1 (1.0 g of catalyst used for 50 boats of
biomass). They found that the complete de-activation of the catalyst occurred at a biomass-to-
catalyst ratio of about 3. They also observed the formation of an array of phenol- and cresol-
containing products before complete de-activation of the catalyst. They claim that these products
were likely to be intermediates or side products released due to excess build-up of these compounds
on the catalyst. Their conclusion was that de-activation seemed to take place primarily because of
the build-up of coke on the exterior surface of the catalyst particles, which eventually resulted in the
capping of micropores. These results were further corroborated by Ibarra et al. (2016). Figure 1.22
depicts the change in the physical aspect of the catalysts before and after the catalytic pyrolysis
reaction.

Chapter 1
37
Figure 1.21: Change in physical aspect of catalyst before and after catalytic pyrolysis (Adapted from Rostami et al., 2015))
Paasikallio et al. (2014) have studied the product quality and catalyst de-activation in a four-day run
using pine saw dust as feed and HZSM-5 as catalyst. The pyrolysis experiments were carried out using
a 20 kg.h−1 Process Development Unit (PDU) which employed a circulating fluidised bed reactor. The
feedstock was fed into the reactor using a screw feeder. The initial amount of catalyst in the system
was 120 litres, which corresponded to approximately 94 kilograms. The catalyst to biomass ratio, i.e.
the ratio of the hourly catalyst circulation rate and biomass feeding rate, was approximately 7:1 on a
weight basis. The pyrolysis temperature used was 520 °C and the fluidisation velocity in the reactor
was approximately 4 m/s. They found that the properties of the catalyst changed considerably during
the initial pre-pyrolysis heating period and during the four-day run, though, to a lesser extent; this
change could be due to both to thermal stress and the biomass feedstock. They also observed that
the deposition of alkali metals on the surface of the catalyst increase with increasing time on stream
and this directly impacted the acidity of the catalyst, causing it to reduce. Along with these changes,
they noted that the oil produced displayed a quite stable composition during the four-day run.
1.8 Conclusion
This literature review has provided knowledge on the state-of-the-art technologies and know-how in
the biomass pyrolysis and catalytic pyrolysis fields. It could be seen that parameters affecting the
Chapter 1
38
pyrolysis reaction (namely, temperature, particle size distribution and vapour residence time) have
vastly been examined in the studies presented. A wide array of catalysts (microporous, mesoporous
and macroporous) has also been investigated for the catalytic pyrolysis of woody biomass, as
presented. However, firstly, there still is lacking data concerning the pyrolysis of woody biomass and
its biomass components as conducted in one single setup, under the exact same operational
conditions in order to better understand biomass pyrolysis mechanisms and the provenance of
chemical families present in the bio-oil. Then, even though the continuous catalytic pyrolysis of
woody biomass has indeed been well-examined in previous studies, some knowledge concerning the
de-activation of the catalyst during the course of the reaction and its effect on the product
distribution is still missing. This research work endeavours into filling in those gaps left in literature.
1.9 References
(1). Abdelouahed, L., Leveneur, S., Vernieres-Hassimi, L., Balland, L., Taouk, B., 2017. Comparative
investigation for the determination of kinetic parameters for biomass pyrolysis by
thermogravimetric analysis. J. Therm. Anal. Calorim. 129, 1201–1213.
https://doi.org/10.1007/s10973-017-6212-9
(2). ADEME, 2001. Pyrolyse et gazéification de la biomasse pour la production d’électricité -
Procédés et acteurs.
(3). ADEREE, 2014. Biomasse - Les filières de valorisation [WWW Document]. Agence Natl. Pour
Dév. Energ. Renouvelables Effic. Energétique ADEREE. URL
http://www.amee.ma/index.php?option=com_content&view=category&id=44&Itemid=365&l
ang=en (accessed 5.3.18).
(4). Adjaye, J.D., Bakhshi, N.N., 1995. Production of hydrocarbons by catalytic upgrading of a fast
pyrolysis bio-oil. Part I: Conversion over various catalysts. Fuel Process. Technol. 45, 161–183.
https://doi.org/10.1016/0378-3820(95)00034-5
(5). Agblevor, F.A., Beis, S., Mante, O., Abdoulmoumine, N., 2010. Fractional Catalytic Pyrolysis of
Hybrid Poplar Wood. Ind. Eng. Chem. Res. 49, 3533–3538. https://doi.org/10.1021/ie901629r
(6). Aho, A., Kumar, N., Lashkul, A.V., Eränen, K., Ziolek, M., Decyk, P., Salmi, T., Holmbom, B.,
Hupa, M., Murzin, D.Y., 2010. Catalytic upgrading of woody biomass derived pyrolysis vapours
over iron modified zeolites in a dual-fluidized bed reactor. Fuel 89, 1992–2000.
https://doi.org/10.1016/j.fuel.2010.02.009

Chapter 1
39
(7). Amutio, M., Lopez, G., Alvarez, J., Moreira, R., Duarte, G., Nunes, J., Olazar, M., Bilbao, J., 2013.
Flash pyrolysis of forestry residues from the Portuguese Central Inland Region within the
framework of the BioREFINA-Ter project. Bioresour. Technol. 129, 512–518.
https://doi.org/10.1016/j.biortech.2012.11.114
(8). Arabiourrutia, M., Elordi, G., Olazar, M., Bilbao, J., 2017. Pyrolysis of Polyolefins in a Conical
Spouted Bed Reactor: A Way to Obtain Valuable Products, in: Samer, M. (Ed.), Pyrolysis.
InTech. https://doi.org/10.5772/67706
(9). Arenamnart, S., Trakarnpruk, W., 2006. Ethanol conversion to ethylene using metal-mordenite
catalysts. Int. J. Appl. Sci. Eng. 4, 21–32.
(10). Ateş, F., Işıkdağ,M.A., 2009. Influence of temperature and alumina catalyst on pyrolysis of
corncob. Fuel 88, 1991–1997. https://doi.org/10.1016/j.fuel.2009.03.008
(11). Ateş, F., Işıkdağ, M.A., 2008. Evaluation of the Role of the Pyrolysis Temperature in Straw
Biomass Samples and Characterization of the Oils by GC/MS. Energy Fuels 22, 1936–1943.
https://doi.org/10.1021/ef7006276
(12). Babu, B.V., Chaurasia, A.S., 2004. Heat transfer and kinetics in the pyrolysis of shrinking
biomass particle. Chem. Eng. Sci. 59, 1999–2012. https://doi.org/10.1016/j.ces.2004.01.050
(13). Badea, A., Gheorghe, C., Marculescu, C., Apostol, T., 2008. L’influencedespropriétésphysiques
du bois et des paramètres du processus sur les produits de pyrolyse. UPB Sci Bull, C 70, 8.
(14). Bajus, M., 2010. Pyrolysis of woody material. Pet. Coal 52, 207–214.
(15). Bech, N., Larsen, M.B., Jensen, P.A., Dam-Johansen, K., 2009. Modelling solid-convective flash
pyrolysis of straw and wood in the Pyrolysis Centrifuge Reactor. Biomass Bioenergy 33, 999–
1011. https://doi.org/10.1016/j.biombioe.2009.03.009
(16). Beis, S.H., Mukkamala, S., Hill, N., Joseph, J., Baker, C., Jensen, B., Stemmler, E.A., Wheeler,
M.C., Frederick, B.G., van Heiningen, A., Berg, A.G., DeSisto, W.J., 2010. Fast pyrolysis of
lignins. BioResources 5, 1408–1424.
(17). Bichat,H.,Mathis,P.,2013.Labiomasse,énergied’avenir ?Quaeéditions,Versailles.
(18). Biddy, M., Dutta, A., Jones, S., Meyer, A., 2013a. Ex-Situ Catalytic Fast Pyrolysis Technology
Pathway (Rapport Technique). NREL, USA.

Chapter 1
40
(19). Biddy, M., Dutta, A., Jones, S., Meyer, A., 2013b. In-Situ Catalytic Fast Pyrolysis Technology
Pathway (Rapport Technique). NREL, USA.
(20). Bridgwater, A.V., 2012. Review of fast pyrolysis of biomass and product upgrading. Biomass
Bioenergy, Overcoming Barriers to Bioenergy: Outcomes of the Bioenergy Network of
Excellence 2003 – 2009 38, 68–94. https://doi.org/10.1016/j.biombioe.2011.01.048
(21). Bridgwater, A.V., 1999. Principles and practice of biomass fast pyrolysis processes for liquids. J.
Anal. Appl. Pyrolysis 51, 3–22. https://doi.org/10.1016/S0165-2370(99)00005-4
(22). Broust, F., Girard, P., Van der Steene, L., 2008. Biocarburants de Seconde Generation. Ed.
Techniques Ingénieur, Paris, France.
(23). BTG, 2015. Empyro - energy & materials from pyrolysis [WWW Document]. Empyro - Energy
Mater. Pyrolysis. URL http://empyroproject.eu/ (accessed 8.6.18).
(24). Carrier, M., Windt, M., Ziegler, B., Appelt, J., Saake, B., Meier, D., Bridgwater, A., 2017.
Quantitative Insights into the Fast Pyrolysis of Extracted Cellulose, Hemicelluloses, and Lignin.
ChemSusChem 10, 3212–3224. https://doi.org/10.1002/cssc.201700984
(25). Cerqueira, H.S., Caeiro, G., Costa, L., Ramôa Ribeiro, F., 2008. Deactivation of FCC catalysts. J.
Mol. Catal. Chem. 292, 1–13. https://doi.org/10.1016/j.molcata.2008.06.014
(26). Chan, W.-C.R., Kelbon, M., Krieger, B.B., 1985. Modelling and experimental verification of
physical and chemical processes during pyrolysis of a large biomass particle. Fuel 64, 1505–
1513. https://doi.org/10.1016/0016-2361(85)90364-3
(27). Cheng, Y.-T., Jae, J., Shi, J., Fan, W., Huber, G.W., 2012. Production of Renewable Aromatic
Compounds by Catalytic Fast Pyrolysis of Lignocellulosic Biomass with Bifunctional Ga/ZSM-5
Catalysts. Angew. Chem. 124, 1416–1419. https://doi.org/10.1002/ange.201107390
(28). Choi, S.J., Park, S.H., Jeon, J.-K., Lee, I.G., Ryu, C., Suh, D.J., Park, Y.-K., 2013. Catalytic
conversion of particle board over microporous catalysts. Renew. Energy, AFORE 2011(Asia-
Pacific Forum of Renewable Energy 2011) 54, 105–110.
https://doi.org/10.1016/j.renene.2012.08.050
(29). Collard, F.-X., Blin, J., 2014. A review on pyrolysis of biomass constituents: Mechanisms and
composition of the products obtained from the conversion of cellulose, hemicelluloses and
lignin. Renew. Sustain. Energy Rev. 38, 594–608. https://doi.org/10.1016/j.rser.2014.06.013

Chapter 1
41
(30). Corma, A., 2003. State of the art and future challenges of zeolites as catalysts. J. Catal., 40th
Anniversary Commemorative Issue 216, 298–312. https://doi.org/10.1016/S0021-
9517(02)00132-X
(31). Crocker, M., 2010. Thermochemical Conversion of Biomass to Liquid Fuels and Chemicals.
Royal Society of Chemistry.
(32). Cuevas, A., Reinoso, C., Scott, D.S., 1995. Pyrolysis oil production and its perspectives,
Proceeding of power production from biomass II. Espoo: VTT.
(33). Czernik, S., 2013. Catalytic Pyrolysis of Biomass, in: Lee, J.W. (Ed.), Advanced Biofuels and
Bioproducts. Springer New York, New York, NY, pp. 119–127. https://doi.org/10.1007/978-1-
4614-3348-4_9
(34). Danuthai, T., Jongpatiwut, S., Rirksomboon, T., Osuwan, S., Resasco, D.E., 2009. Conversion of
methylesters to hydrocarbons over an H-ZSM5 zeolite catalyst. Appl. Catal. Gen. 361, 99–105.
https://doi.org/10.1016/j.apcata.2009.04.001
(35). de Wild, P., Van der Laan, R., Kloekhorst, A., Heeres, E., 2009. Lignin valorisation for chemicals
and (transportation) fuels via (catalytic) pyrolysis and hydrodeoxygenation. Environ. Prog.
Sustain. Energy 28, 461–469. https://doi.org/10.1002/ep.10391
(36). Deglise, X., 2007. La gazéification thermochimique: histoire et développement de la recherche
39.
(37). Demirbas, A., 2007. The influence of temperature on the yields of compounds existing in bio-
oils obtained from biomass samples via pyrolysis. Fuel Process. Technol. 88, 591–597.
https://doi.org/10.1016/j.fuproc.2007.01.010
(38). Demirbaş, A., 2000.Mechanisms of liquefaction and pyrolysis reactions of biomass. Energy
Convers. Manag. 41, 633–646. https://doi.org/10.1016/S0196-8904(99)00130-2
(39). Derouane, E.G., Nagy, J.B., Dejaifve, P., van Hooff, J.H.C., Spekman, B.P., Védrine, J.C.,
Naccache, C., 1978. Elucidation of the mechanism of conversion of methanol and ethanol to
hydrocarbons on a new type of synthetic zeolite. J. Catal. 53, 40–55.
https://doi.org/10.1016/0021-9517(78)90006-4
(40). Dhyani, V., Bhaskar, T., 2018. A comprehensive review on the pyrolysis of lignocellulosic
biomass. Renew. Energy, 1st International Conference on Bioresource Technology for

Chapter 1
42
Bioenergy, Bioproducts & Environmental Sustainability 129, 695–716.
https://doi.org/10.1016/j.renene.2017.04.035
(41). Di Blasi, C., 2008. Modeling chemical and physical processes of wood and biomass pyrolysis.
Prog. Energy Combust. Sci. 34, 47–90. https://doi.org/10.1016/j.pecs.2006.12.001
(42). Dickerson, T., Soria, J., 2013. Catalytic Fast Pyrolysis: A Review. Energies 6, 514–538.
https://doi.org/10.3390/en6010514
(43). Diebold, J.P., 1997. A Review of the Toxicity of Biomass Pyrolysis Liquids Formed at Low
Temperatures (No. NREL/TP-430-22739). National Renewable Energy Laboratory (NREL).
(44). Dufour, A., 2016. Thermochemical Conversion of Biomass for the Production of Energy and
Chemicals, Focus Series. ed. Alain Dollet, Great Britain.
(45). Dupont, C., Li, C., Cances, J., Commandre, J.M., Cuoci, A., Pierucci, S., Ranzi, E., 2009. Biomass
pyrolysis: kinetic modelling and experimental validation under high temperature and flash
heating rate conditions. J. Anal. Appl. Pyrolysis 85, 260–267.
(46). Dutton, J.E., 2018. Biomass pyrolysis [WWW Document]. PennState Coll. Earth Miner. Sci. URL
https://www.e-education.psu.edu/egee439/node/537 (accessed 8.6.18).
(47). energypedia.info, 2016. Biofuels [WWW Document]. energypedia.info. URL
https://energypedia.info/wiki/Biofuels#Classification_of_Biofuel_Sources (accessed 5.3.18).
(48). EUBIA, 2007. Conversion routes to Bioenergy. Eur. Biomass Ind. Assoc. EUBIA.
(49). FAO, 2006. Development of a sustainable charcoal industry (Croatia).
(50). François, J., Fortin, M., Patisson, F., Mauviel, G., Feidt, M., Rogaume, C., Rogaume, Y., Mirgaux,
O., Dufour, A., 2018. LCA from Biomass Powerplants: from Soil to Electricity. 3rd Int. Exergy
Life Cycle Assess. Sustain. Workshop Symp. ELCAS-3.
(51). French, R., Czernik, S., 2010. Catalytic pyrolysis of biomass for biofuels production. Fuel
Process. Technol. 91, 25–32. https://doi.org/10.1016/j.fuproc.2009.08.011
(52). Galgano, A., Di Blasi, C., 2003. Modeling wood degradation by the unreacted-core-shrinking
approximation. Ind. Eng. Chem. Res. 42, 2101–2111.

Chapter 1
43
(53). Garcia-Nunez, J.A., Pelaez-Samaniego, M.R., Garcia-Perez, M.E., Fonts, I., Abrego, J.,
Westerhof, R.J.M., Garcia-Perez, M., 2017. Historical Developments of Pyrolysis Reactors: A
Review. Energy Fuels 31, 5751–5775. https://doi.org/10.1021/acs.energyfuels.7b00641
(54). Gayubo, A.G., Aguayo, A.T., Atutxa, A., Aguado, R., Bilbao, J., 2004a. Transformation of
Oxygenate Components of Biomass Pyrolysis Oil on a HZSM-5 Zeolite. I. Alcohols and Phenols.
Ind. Eng. Chem. Res. 43, 2610–2618. https://doi.org/10.1021/ie030791o
(55). Gayubo, A.G., Aguayo, A.T., Atutxa, A., Aguado, R., Olazar, M., Bilbao, J., 2004b.
Transformation of Oxygenate Components of Biomass Pyrolysis Oil on a HZSM-5 Zeolite. II.
Aldehydes, Ketones, and Acids. Ind. Eng. Chem. Res. 43, 2619–2626.
https://doi.org/10.1021/ie030792g
(56). Guda, V.K., Toghiani, H., 2015. Catalytic upgrading of pinewood fast pyrolysis vapors using an
integrated Auger–packed bed reactor system: Effects of acid catalysts on yields and
distribution of pyrolysis products. J. For. Prod. Ind. 4, 33–43.
(57). Guedes, R.E., Luna, A.S., Torres, A.R., 2018. Operating parameters for bio-oil production in
biomass pyrolysis: A review. J. Anal. Appl. Pyrolysis 129, 134–149.
https://doi.org/10.1016/j.jaap.2017.11.019
(58). Guisnet, M., Costa, L., Ribeiro, F.R., 2009. Prevention of zeolite deactivation by coking. J. Mol.
Catal. Chem., In memory of Eric Derouane 305, 69–83.
https://doi.org/10.1016/j.molcata.2008.11.012
(59). Guizani, C., Valin, S., Billaud, J., Peyrot, M., Salvador, S., 2017. Biomass fast pyrolysis in a drop
tube reactor for bio oil production: Experiments and modeling. Fuel 207, 71–84.
https://doi.org/10.1016/j.fuel.2017.06.068
(60). Gunawardena, D.A., Fernando, S.D., 2013. Methods and Applications of Deoxygenation for the
Conversion of Biomass to Petrochemical Products. https://doi.org/10.5772/53983
(61). Guo, X., Wang, S., Zhou, Y., Luo, Z., 2011. Catalytic pyrolysis of xylan-based hemicellulose over
zeolites, in: ResearchGate. Presented at the 6th IASME/WSEAS international conference on
Energy & environment.
(62). Guo, Z., Wang, S., Zhu, Y., Luo, Z., Cen, K., 2009. Separation of acid compounds for refining
biomass pyrolysis oil. J. Fuel Chem. Technol. 37, 49–52. https://doi.org/10.1016/S1872-
5813(09)60010-4

Chapter 1
44
(63). Hao, Z., Loqué, D., 2017. PlantCellWalls: ImprovedResources forBiofuelsandValue‐Added
Products through Genetic Engineering, in: ELS. American Cancer Society, pp. 1–10.
https://doi.org/10.1002/9780470015902.a0001684.pub2
(64). Haseli, Y., van Oijen, J.A., de Goey, L.P.H., 2011. Modeling biomass particle pyrolysis with
temperature-dependent heat of reactions. J. Anal. Appl. Pyrolysis 90, 140–154.
https://doi.org/10.1016/j.jaap.2010.11.006
(65). Haykırı-Açma, H., 2003. Combustion characteristics of different biomass materials. Energy
Convers. Manag. 44, 155–162. https://doi.org/10.1016/S0196-8904(01)00200-X
(66). Hemelsoet, K., Van der Mynsbrugge, J., De Wispelaere, K., Waroquier, M., Van Speybroeck, V.,
2013. Unraveling the reaction mechanisms governing methanol-to-olefins catalysis by theory
and experiment. Chemphyschem Eur. J. Chem. Phys. Phys. Chem. 14, 1526–1545.
https://doi.org/10.1002/cphc.201201023
(67). Horne, P.A., Williams, P.T., 1996. Upgrading of biomass-derived pyrolytic vapours over zeolite
ZSM-5 catalyst: effect of catalyst dilution on product yields. Fuel 75, 1043–1050.
https://doi.org/10.1016/0016-2361(96)00082-8
(68). Hua, Z.L., Zhou, J., Shi, J.L., 2011. Recent advances in hierarchically structured zeolites:
synthesis and material performances. Chem. Commun. 47, 10536–10547.
https://doi.org/10.1039/C1CC10261C
(69). Ibarra, Á., Veloso, A., Bilbao, J., Arandes, J.M., Castaño, P., 2016. Dual coke deactivation
pathways during the catalytic cracking of raw bio-oil and vacuum gasoil in FCC conditions.
Appl. Catal. B Environ. 182, 336–346. https://doi.org/10.1016/j.apcatb.2015.09.044
(70). Ibrahim, N.B., Dam-Johansen, K., Jensen, P.A., 2012. Bio-oil from flash pyrolysis of agricultural
residues (Chemical Engineering). Technical University of Denmark, Kgs.Lyngby.
(71). IEA Bioenergy, 2018. Pyrolysis Reactors [WWW Document]. IEA Bioenergy. URL
http://task34.ieabioenergy.com/pyrolysis-reactors/ (accessed 8.6.18).
(72). Ilias, S., Bhan, A., 2013. Mechanism of the Catalytic Conversion of Methanol to Hydrocarbons.
ACS Catal. 3, 18–31. https://doi.org/10.1021/cs3006583
(73). INP Toulouse, 2005. Généralités sur le papier [WWW Document]. INP Toulouse. URL
http://hmf.enseeiht.fr/travaux/CD0506/bei/bei_ere/2/html/Binome1/projet/general_fichiers/
p_gen.htm (accessed 9.1.16).

Chapter 1
45
(74). Jahanshahi, S., Mathieson, J.G., Somerville, M.A., Haque, N., Norgate, T.E., Deev, A., Pan, Y.,
Xie, D., Ridgeway, P., Zulli, P., 2015. Development of Low-Emission Integrated Steelmaking
Process. J. Sustain. Metall. 1, 94–114. https://doi.org/10.1007/s40831-015-0008-6
(75). Jahirul, M.I., Rasul, M.G., Chowdhury, A.A., Ashwath, N., 2012. Biofuels Production through
Biomass Pyrolysis —A Technological Review. Energies 5, 4952–5001.
https://doi.org/10.3390/en5124952
(76). Jamart, B., Bodiguel, J., Brosse, N., 2015. Les cours de Paul Arnaud - Chimie organique, 19th ed.
Dunod, Paris, France.
(77). Jia, L., Raad, M., Hamieh, S., Toufaily, J., Hamieh, T., Bettahar, M., Mauviel, G., Tarrighi, M.,
Pinard, L., Dufour, A., 2017. Catalytic fast pyrolysis of biomass: superior selectivity of
hierarchical zeolite to aromatics. Green Chem. https://doi.org/10.1039/C7GC02309J
(78). Jiang, J., Xu, J., Song, Z., 2015. Review of the direct thermochemical conversion of
lignocellulosic biomass for liquid fuels. Front. Agric. Sci. Eng. 2, 13. https://doi.org/10.15302/J-
FASE-2015050
(79). Jin, W., Singh, K., Zondlo, J., 2013. Pyrolysis Kinetics of Physical Components of Wood and
Wood-Polymers Using Isoconversion Method. Agriculture 3, 12–32.
https://doi.org/10.3390/agriculture3010012
(80). Jouanin, L., 2006. Modification des lignines en vue d’améliorer les produits végétaux :
Exemples chez le maïs et le peuplier. Sélectionneur Fr. 57, 25–28.
(81). Kaushal, P., Abedi, J., Mahinpey, N., 2010. A comprehensive mathematical model for biomass
gasification in a bubbling fluidized bed reactor. Fuel 89, 3650–3661.
https://doi.org/10.1016/j.fuel.2010.07.036
(82). Keleş, S., Kaygusuz, K.,Akgün,M.,2011.PyrolysisofWoodyBiomass for SustainableBio-oil.
Energy Sources Part Recovery Util. Environ. Eff. 33, 879–889.
https://doi.org/10.1080/15567030903330652
(83). Kohler, S., 2009. Pyrolyse rapide de biomasses et de leurs constituants. Application à
l’établissementdeloisprévisionnelles.Vandoeuvre-les-Nancy, INPL.
(84). Kosanić, T.R., Ćeranić, M.B., Đurić, S.N., Grković, V.R., Milotić, M.M., Brankov, S.D., 2014.
Experimental investigation of pyrolysis process of woody biomass mixture. J. Therm. Sci. 23,
290–296. https://doi.org/10.1007/s11630-014-0709-3

Chapter 1
46
(85). Koufopanos, C.A., Papayannakos, N., Maschio, G., Lucchesi, A., 1991. Modelling of the pyrolysis
of biomass particles. Studies on kinetics, thermal and heat transfer effects. Can. J. Chem. Eng.
69, 907–915. https://doi.org/10.1002/cjce.5450690413
(86). Lam, S.S., Liew, R.K., Jusoh, A., Chong, C.T., Ani, F.N., Chase, H.A., 2016. Progress in waste oil to
sustainable energy, with emphasis on pyrolysis techniques. Renew. Sustain. Energy Rev. 53,
741–753. https://doi.org/10.1016/j.rser.2015.09.005
(87). Lambert, F.M., Rohfritsch, S., 2013. Rapport d’information sur la biomasse. Assemblée
nationale.
(88). Lehto, J., Oasmaa, A., Solantausta, Y., Kytö, M., Chiaramonti, D., 2014. Review of fuel oil quality
and combustion of fast pyrolysis bio-oils from lignocellulosic biomass. Appl. Energy 116, 178–
190. https://doi.org/10.1016/j.apenergy.2013.11.040
(89). Lei, X., Bi, Y., Zhou, W., Chen, H., Hu, J., 2018. Catalytic Fast Pyrolysis of Cellulose by Integrating
Dispersed Nickel Catalyst with HZSM-5 Zeolite. IOP Conf. Ser. Earth Environ. Sci. 108, 022017.
https://doi.org/10.1088/1755-1315/108/2/022017
(90). Li, P., Li, D., Yang, H., Wang, X., Chen, H., 2016. Effects of Fe-, Zr-, and Co-Modified Zeolites and
Pretreatments on Catalytic Upgrading of Biomass Fast Pyrolysis Vapors. Energy Fuels 30, 3004–
3013. https://doi.org/10.1021/acs.energyfuels.5b02894
(91). Liitiä, T., Maunu, S.L., Sipilä, J., Hortling, B., 2002. Application of Solid-State 13C NMR
Spectroscopy and Dipolar DephasingTechnique to Determine the Extent of Condensation
inTechnical Lignins. Solid State Nucl. Magn. Reson. 51.
(92). Lin, Y.-C., Cho, J., Tompsett, G.A., Westmoreland, P.R., Huber, G.W., 2009. Kinetics and
Mechanism of Cellulose Pyrolysis. J. Phys. Chem. C 113, 20097–20107.
https://doi.org/10.1021/jp906702p
(93). Liu, C., Wang, H., Karim, A.M., Sun, J., Wang, Y., 2014. Catalytic fast pyrolysis of lignocellulosic
biomass. Chem. Soc. Rev. 43, 7594–7623. https://doi.org/10.1039/C3CS60414D
(94). Llorente, M.J.F., García, J.E.C., 2006. Concentration of elements in woody and herbaceous
biomass as a function of the dry ashing temperature. Fuel 85, 1273–1279.
https://doi.org/10.1016/j.fuel.2005.11.007

Chapter 1
47
(95). Lu, Q., Zhang, Z.-F., Dong, C.-Q., Zhu, X.-F., 2010. Catalytic Upgrading of Biomass Fast Pyrolysis
Vapors with Nano Metal Oxides: An Analytical Py-GC/MS Study. Energies 3, 1805–1820.
https://doi.org/10.3390/en3111805
(96). McKendry, P., 2002. Energy production from biomass (part 1): overview of biomass. Bioresour.
Technol., Reviews Issue 83, 37–46. https://doi.org/10.1016/S0960-8524(01)00118-3
(97). Méchin, V., 2015. Les lignines et leur organisation au sein des parois végétales - Apports de la
plante modèle Maïs [WWW Document]. INRA Grignon. URL http://www7.inra.fr/gdr-
biopolymeres/pointpdf/pdfdraveil/MechinValerie.pdf (accessed 9.1.16).
(98). Meier, D., Faix, O., 1999. State of the art of applied fast pyrolysis of lignocellulosic materials —
a review. Bioresour. Technol., Bioprocessing and Characterization of Lignocellulosics 68, 71–77.
https://doi.org/10.1016/S0960-8524(98)00086-8
(99). Meier, D., van de Beld, B., Bridgwater, A.V., Elliott, D.C., Oasmaa, A., Preto, F., 2013. State-of-
the-art of fast pyrolysis in IEA bioenergy member countries. Renew. Sustain. Energy Rev. 20,
619–641. https://doi.org/10.1016/j.rser.2012.11.061
(100). Meng, X., Xu, C., Gao, J., 2007. Coking behavior and catalyst deactivation for catalytic pyrolysis
of heavy oil. Fuel 86, 1720–1726. https://doi.org/10.1016/j.fuel.2006.12.023
(101). Mohabeer, C., Abdelouahed, L., Marcotte, S., Taouk, B., 2017. Comparative analysis of
pyrolytic liquid products of beech wood, flax shives and woody biomass components. J. Anal.
Appl. Pyrolysis 127, 269–277. https://doi.org/10.1016/j.jaap.2017.07.025
(102). Mortensen, P.M., Grunwaldt, J.-D., Jensen, P.A., Knudsen, K.G., Jensen, A.D., 2011. A review of
catalytic upgrading of bio-oil to engine fuels. Appl. Catal. Gen. 407, 1–19.
https://doi.org/10.1016/j.apcata.2011.08.046
(103). Mukarakate, C., McBrayer, J.D., Evans, T.J., Budhi, S., Robichaud, D.J., Iisa, K., Dam, J. ten,
Watson, M.J., Baldwin, R.M., Nimlos, M.R., 2015. Catalytic fast pyrolysis of biomass: the
reactions of water and aromatic intermediates produces phenols. Green Chem. 17, 4217–
4227. https://doi.org/10.1039/C5GC00805K
(104). Mukarakate, C., Zhang, X., R Stanton, A., J Robichaud, D., N Ciesielski, P., Malhotra, K.,
Donohoe, B., Gjersing, E., J Evans, R., S Heroux, D., Richards, R., Iisa, K., Nimlos, M., 2014. Real-
time monitoring of the deactivation of HZSM-5 during upgrading of pine pyrolysis vapors.
Green Chem 16. https://doi.org/10.1039/c3gc42065e

Chapter 1
48
(105). Mullen, C.A., Boateng, A.A., 2015. Production of Aromatic Hydrocarbons via Catalytic Pyrolysis
of Biomass over Fe-Modified HZSM-5 Zeolites. ACS Sustain. Chem. Eng. 3, 1623–1631.
https://doi.org/10.1021/acssuschemeng.5b00335
(106). Mullen, C.A., Boateng, A.A., 2008. Chemical Composition of Bio-oils Produced by Fast Pyrolysis
of Two Energy Crops. Energy Fuels 22, 2104–2109. https://doi.org/10.1021/ef700776w
(107). Murata, K., Liu, Y., Inaba, M., Takahara, I., 2012. Catalytic fast pyrolysis of jatropha wastes. J.
Anal. Appl. Pyrolysis 94, 75–82. https://doi.org/10.1016/j.jaap.2011.11.008
(108). Navi, P., Heger, F., 2005. Comportement thermo-hydromécanique du bois : Applications
technologiques et dans les structures. PPUR, Lausanne.
(109). Nguyen, T.S., Zabeti, M., Lefferts, L., Brem, G., Seshan, K., 2013. Conversion of lignocellulosic
biomass to green fuel oil over sodium based catalysts. Bioresour. Technol. 142, 353–360.
https://doi.org/10.1016/j.biortech.2013.05.023
(110). Nieva, M.L., Volpe, M.A., Moyano, E.L., 2014. Catalytic and catalytic free process for cellulose
conversion: fast pyrolysis and microwave induced pyrolysis studies. Cellulose 22, 215–228.
https://doi.org/10.1007/s10570-014-0484-z
(111). Olsbye, U., Svelle, S., Bjørgen, M., Beato, P., Janssens, T.V.W., Joensen, F., Bordiga, S., Lillerud,
K.P., 2012. Conversion of Methanol to Hydrocarbons: How Zeolite Cavity and Pore Size
Controls Product Selectivity. Angew. Chem. Int. Ed. 51, 5810–5831.
https://doi.org/10.1002/anie.201103657
(112). Ouarzki, I., Hazi, M., Luart, D., Len, C., Ould-Dris, A., 2016. Comparison of direct and staged
pyrolysis of the ligno-cellulosic biomass with the aim of the production of high added value
chemicals from bio-oil 15.
(113). Paasikallio, V., Lindfors, C., Kuoppala, E., Solantausta, Y., Oasmaa, A., Lehto, J., Lehtonen, J.,
2014. Product quality and catalyst deactivation in a four day catalytic fast pyrolysis production
run. Green Chem. 16, 3549. https://doi.org/10.1039/c4gc00571f
(114). Park, H.J., Dong, J.-I., Jeon, J.-K., Yoo, K.-S., Yim, J.-H., Sohn, J.M., Park, Y.-K., 2007. Conversion
of the Pyrolytic Vapor of Radiata Pine over Zeolites. J. Ind. Eng. Chem. 13, 182–189.
(115). Park, H.J., Heo, H.S., Jeon, J.-K., Kim, J., Ryoo, R., Jeong, K.-E., Park, Y.-K., 2010. Highly valuable
chemicals production from catalytic upgrading of radiata pine sawdust-derived pyrolytic

Chapter 1
49
vapors over mesoporous MFI zeolites. Appl. Catal. B Environ. 95, 365–373.
https://doi.org/10.1016/j.apcatb.2010.01.015
(116). Park, H.J., Park, Y.-K., Dong, J.-I., Kim, J.-S., Jeon, J.-K., Kim, S.-S., Kim, J., Song, B., Park, J., Lee,
K.-J., 2009. Pyrolysis characteristics of Oriental white oak: Kinetic study and fast pyrolysis in a
fluidized bed with an improved reaction system. Fuel Process. Technol. 90, 186–195.
https://doi.org/10.1016/j.fuproc.2008.08.017
(117). Park, H.J., Park, Y.-K., Kim, J.-S., Jeon, J.-K., Yoo, K.-S., Yim, J.-H., Jung, J., Sohn, J.M., 2006. Bio-
oil upgrading over Ga modified zeolites in a bubbling fluidized bed reactor, in: Rhee, H.-K.,
Nam, I.-S., Park, J.M. (Eds.), Studies in Surface Science and Catalysis, New Developments and
Application in Chemical Reaction Engineering. Elsevier, pp. 553–556.
https://doi.org/10.1016/S0167-2991(06)81656-3
(118). Patwardhan, P.R., Brown, R.C., Shanks, B.H., 2011a. Product distribution from the fast pyrolysis
of hemicellulose. ChemSusChem 4, 636–643.
(119). Patwardhan, P.R., Brown, R.C., Shanks, B.H., 2011b. Understanding the Fast Pyrolysis of Lignin.
ChemSusChem 4, 1629–1636. https://doi.org/10.1002/cssc.201100133
(120). Payormhorm, J., Kangvansaichol, K., Reubroycharoen, P., Kuchonthara, P., Hinchiranan, N.,
2013. Pt/Al2O3-catalytic deoxygenation for upgrading of Leucaena leucocephala-pyrolysis oil.
Bioresour. Technol. 139, 128–135. https://doi.org/10.1016/j.biortech.2013.04.023
(121). Pittman, C.U., Mohan, D., Eseyin, A., Li, Q., Ingram, L., Hassan, E.-B.M., Mitchell, B., Guo, H.,
Steele, P.H., 2012. Characterization of Bio-oils Produced from Fast Pyrolysis of Corn Stalks in an
Auger Reactor. Energy Fuels 26, 3816–3825. https://doi.org/10.1021/ef3003922
(122). Prat, R., 2012. Constitution chimique du bois [WWW Document]. Univ. Pierre Marie Curie. URL
http://www.snv.jussieu.fr/bmedia/bois/bois_chimie.htm (accessed 9.1.16).
(123). Punsuwan, N., Tangsathitkulchai, C., 2014. Product Characterization and Kinetics of Biomass
Pyrolysis in a Three-Zone Free-Fall Reactor [WWW Document]. Int. J. Chem. Eng.
https://doi.org/10.1155/2014/986719
(124). Qureshi, K.M., Kay Lup, A.N., Khan, S., Abnisa, F., Wan Daud, W.M.A., 2018. A technical review
on semi-continuous and continuous pyrolysis process of biomass to bio-oil. J. Anal. Appl.
Pyrolysis. https://doi.org/10.1016/j.jaap.2018.02.010

Chapter 1
50
(125). Radlein, D., Piskorz, J., Grinshpun, A., Scott, D.S., 1987. Fast pyrolysis of pre-treated wood and
cellulose. Am Chem Soc Div Fuel Chem 32, 29.
(126). Radlein, D., Quignard, A., 2013. A short historical review of fast pyrolysis of biomass. Oil Gas
Sci. Technol. - Rev IFP Energ. Nouv. 68, 765–783.
(127). Radmanesh, R., Courbariaux, Y., Chaouki, J., Guy, C., 2006. A unified lumped approach in
kinetic modeling of biomass pyrolysis. Fuel 85, 1211–1220.
https://doi.org/10.1016/j.fuel.2005.11.021
(128). Ranzi, E., Cuoci, A., Faravelli, I., Frassoldati, A., Migliavacca, G., Pierucci, S., Sommariva, S.,
2008. Chemical Kinetics of Biomass Pyrolysis. Energy Fuels 22, 4292–4300.
(129). Ranzi, Eliseo, Cuoci, A., Faravelli, T., Frassoldati, A., Migliavacca, G., Pierucci, S., Sommariva, S.,
2008. Chemical Kinetics of Biomass Pyrolysis. Energy Fuels 22, 4292–4300.
https://doi.org/10.1021/ef800551t
(130). Rasul, M.G., Jahirul, M.I., 2012. Recent Developments in Biomass Pyrolysis for Bio-Fuel
Production: Its Potential for Commercial Applications. Recent Res. Environ. Geol. Sci. 10.
(131). Ronsse, F., 2016. Biochar Production, in: Bruckman, V.J., Apaydin Varol, E., Uzun, B.B., Liu, J.
(Eds.), Biochar. Cambridge University Press, Cambridge, pp. 199–226.
https://doi.org/10.1017/9781316337974.011
(132). Rostami, R.B., Ghavipour, M., Di, Z., Wang, Y., Behbahani, R.M., 2015. Study of coke deposition
phenomena on the SAPO_34 catalyst and its effects on light olefin selectivity during the
methanol to olefin reaction. RSC Adv. 5, 81965–81980. https://doi.org/10.1039/C5RA11288E
(133). Rousset, P., 2014. From biomass to fuel, power and chemicals Brazilian charcoal-based pig
iron.
(134). Sadhukhan, A.K., Gupta, P., Saha, R.K., 2009. Modelling of pyrolysis of large wood particles.
Bioresour. Technol. 100, 3134–3139. https://doi.org/10.1016/j.biortech.2009.01.007
(135). Schulz,H.,2010.“Coking”ofzeolitesduringmethanolconversion:Basicreactions of the MTO-,
MTP- and MTG processes. Catal. Today, Eleventh International Symposium on Catalyst
Deactivation , Delft(The Netherlands,) October 25-28, 2009. 154, 183–194.
https://doi.org/10.1016/j.cattod.2010.05.012

Chapter 1
51
(136). Schulzke, T., Conrad, S., Westermeyer, J., 2016. Fractionation of flash pyrolysis condensates by
staged condensation. Biomass Bioenergy 95, 287–295.
https://doi.org/10.1016/j.biombioe.2016.05.022
(137). Shafizadeh, F., 1982. Introduction to pyrolysis of biomass. J. Anal. Appl. Pyrolysis 3, 283–305.
https://doi.org/10.1016/0165-2370(82)80017-X
(138). Siemons, R.V., Baaijens, L., 2013. An Innovative Carbonisation Retort: Technology and
Environmental Impact. Tepmotechnika 38, 131–138.
(139). Stefanidis, S.D., Kalogiannis, K.G., Iliopoulou, E.F., Lappas, A.A., Pilavachi, P.A., 2011. In-situ
upgrading of biomass pyrolysis vapors: catalyst screening on a fixed bed reactor. Bioresour.
Technol. 102, 8261–8267. https://doi.org/10.1016/j.biortech.2011.06.032
(140). Stefanidis, S.D., Kalogiannis, K.G., Iliopoulou, E.F., Michailof, C.M., Pilavachi, P.A., Lappas, A.A.,
2014. A study of lignocellulosic biomass pyrolysis via the pyrolysis of cellulose, hemicellulose
and lignin. J. Anal. Appl. Pyrolysis 105, 143–150. https://doi.org/10.1016/j.jaap.2013.10.013
(141). Stevanovic, T., 2007. Le monde merveilleux des extractibles du bois.
(142). Sun, L., Zhang, X., Chen, L., Zhao, B., Yang, S., Xie, X., 2016. Comparision of catalytic fast
pyrolysis of biomass to aromatic hydrocarbons over ZSM-5 and Fe/ZSM-5 catalysts. J. Anal.
Appl. Pyrolysis 121, 342–346. https://doi.org/10.1016/j.jaap.2016.08.015
(143). Sun, S., Tian, H., Zhao, Y., Sun, R., Zhou, H., 2010. Experimental and numerical study of biomass
flash pyrolysis in an entrained flow reactor. Bioresour. Technol. 101, 3678–3684.
https://doi.org/10.1016/j.biortech.2009.12.092
(144). Tchapda, A.H., Pisupati, S.V., 2015. Characterization of an entrained flow reactor for pyrolysis
of coal and biomass at higher temperatures. Fuel 156, 254–266.
https://doi.org/10.1016/j.fuel.2015.04.015
(145). Teng, C.Y., Hua, K., Fong, Y., Ting, S., Piao, S., Fong, M.K., Lien, A., Tzeng, M., Seng, B., 2009.
REMOVAL OF VOLATILE ORGANIC COMPOUND (VOC) FROM AIR USING ZEOLITE BASED
ADSORPTION-CATALYTIC COMBUSTION SYSTEM WONG CHENG TENG UNIVERSITI SAINS
MALAYSIA 2007 REMOVAL OF VOLATILE ORGANIC COMPOUND (VOC) FROM AIR USING
ZEOLITE BASED ADSORPTION-CATALYTIC COMBUSTION SYSTEM by WONG.
(146). Tran, D.Q., Rai, C., 1978. A kinetic model for pyrolysis of Douglas fir bark. Fuel 57, 293–298.
https://doi.org/10.1016/0016-2361(78)90007-8

Chapter 1
52
(147). Université de Waikato, 2015. Structure de la cellulose [WWW Document]. Plant Struct. Funct.
URL http://sci.waikato.ac.nz/farm/content/plantstructure.html (accessed 9.1.16).
(148). Vassilev, S.V., Baxter, D., Andersen, L.K., Vassileva, C.G., 2010. An overview of the chemical
composition of biomass. Fuel 89, 913–933. https://doi.org/10.1016/j.fuel.2009.10.022
(149). Vitolo, S., Seggiani, M., Frediani, P., Ambrosini, G., Politi, L., 1999. Catalytic upgrading of
pyrolytic oils to fuel over different zeolites. Fuel 78, 1147–1159.
https://doi.org/10.1016/S0016-2361(99)00045-9
(150). Wertz, J.L., 2011. Les hémicelluloses.
(151). Williams, P.T., Horne, P.A., 1995. The influence of catalyst regeneration on the composition of
zeolite-upgraded biomass pyrolysis oils. Fuel 74, 1839–1851. https://doi.org/10.1016/0016-
2361(95)80017-C
(152). Williams, P.T., Nugranad, N., 2000. Comparison of products from the pyrolysis and catalytic
pyrolysis of rice husks. Energy 25, 493–513. https://doi.org/10.1016/S0360-5442(00)00009-8
(153). Xu, M., Mukarakate, C., Robichaud, D.J., Nimlos, M.R., Richards, R.M., Trewyn, B.G., 2016.
Elucidating Zeolite Deactivation Mechanisms During Biomass Catalytic Fast Pyrolysis from
Model Reactions and Zeolite Syntheses. Top. Catal. 59, 73–85.
https://doi.org/10.1007/s11244-015-0507-5
(154). Yamamiya, T., Ota, M., Mozammel, H.M., Murakami, K., 2003. Pyrolysis Characteristics of
Biomass Resources, in: Energy Conversion and Resources: Fuels and Combustion Technology,
Energy, Nuclear Engineering, and Solar Engineering. Presented at the ASME 2003 International
Mechanical Engineering Congress and Exposition, ASME, Washington, DC, USA, pp. 149–156.
https://doi.org/10.1115/IMECE2003-41355
(155). Yang, H., Yan, R., Chen, H., Zheng, C., Lee, D.H., Liang, D.T., 2006. In-Depth Investigation of
Biomass Pyrolysis Based on Three Major Components: Hemicellulose, Cellulose and Lignin.
Energy Fuels 20, 388–393. https://doi.org/10.1021/ef0580117
(156). Yildiz, G., Ronsse, F., Duren, R. van, Prins, W., 2016. Challenges in the design and operation of
processes for catalytic fast pyrolysis of woody biomass. Renew. Sustain. Energy Rev. 57, 1596–
1610. https://doi.org/10.1016/j.rser.2015.12.202

Chapter 1
53
(157). Zacher, A.H., Elliott, D.C., Olarte, M.V., Santosa, D.M., Preto, F., Iisa, K., 2014. Pyrolysis of
Woody Residue Feedstocks: Upgrading of Bio-oils from Mountain-Pine-Beetle-Killed Trees and
Hog Fuel. Energy Fuels 28, 7510–7516. https://doi.org/10.1021/ef5017945
(158). Zhan, S., Chenguang, W., Kang, B., Xinghua, Z., Chiling, Y., Renjie, D., Longlong, M., Changle, P.,
1. Bioenergy and Environment Science & Technology Laboratory, College of Engineering, China
Agricultural University, Beijing 100083, China, 2. Key Laboratory of Renewable Energy,
Guangzhou Institute of Energy Conversion, Chinese Academy of Sciences, Guangzhou 510640,
China, 3. Key Laboratory of Clean Production and Utilization of Renewable Energy, Ministry of
Agriculture, Beijing 100083, China, 4. School of Chemical Engineering and Energy, Zhengzhou
University, Zhengzhou 450001, China, 5. State Key Laboratory of Organic Geochemistry,
Guangzhou Institute of Geochemistry, Chinese Academy of Sciences, Guangzhou 510640,
China, 6. National Center for International Research of BioEnergy Science and Technology,
Ministry of Science and Technology, Beijing 100083, China, 7. Department of Vehicle
Engineering, College of Engineering, China Agricultural University, Beijing 100083, China, 2017.
Py-GC/MS study of lignin pyrolysis and effect of catalysts on product distribution. Int. J. Agric.
Biol. Eng. 10, 214–225. https://doi.org/10.25165/j.ijabe.20171005.2852
(159). Zhang, H., Carlson, T.R., Xiao, R., Huber, G.W., 2012. Catalytic fast pyrolysis of wood and
alcohol mixtures in a fluidized bed reactor. Green Chem. 14, 98–110.
https://doi.org/10.1039/C1GC15619E
(160). Zhang, H., Cheng, Y.-T., Vispute, T.P., Xiao, R., Huber, G.W., 2011. Catalytic conversion of
biomass-derived feedstocks into olefins and aromatics with ZSM-5: the hydrogen to carbon
effective ratio. Energy Environ. Sci. 4, 2297. https://doi.org/10.1039/c1ee01230d
(161). Zhang, H., Xiao, R., Jin, B., Xiao, G., Chen, R., 2013. Biomass catalytic pyrolysis to produce
olefins and aromatics with a physically mixed catalyst. Bioresour. Technol. 140, 256–262.
https://doi.org/10.1016/j.biortech.2013.04.094
(162). Zhang, J., Wang, K., Nolte, M.W., Choi, Y.S., Brown, R.C., Shanks, B.H., 2016. Catalytic
Deoxygenation of Bio-Oil Model Compounds over Acid–Base Bifunctional Catalysts. ACS Catal.
6, 2608–2621. https://doi.org/10.1021/acscatal.6b00245
(163). Zhao, X., Wei, L., Cheng, S., Cao, Y., Julson, J., Gu, Z., 2015. Catalytic cracking of carinata oil for
hydrocarbon biofuel over fresh and regenerated Zn/Na-ZSM-5. Appl. Catal. Gen. 507, 44–55.
https://doi.org/10.1016/j.apcata.2015.09.031

Chapter 1
54
(164). Zhou, Y., Wang, S., Guo, X., Fang, M., Luo, Z., 2011. Catalytic pyrolysis of cellulose with zeolites,
in: 2011 World Congress on Sustainable Technologies (WCST). Presented at the 2011 World
Congress on Sustainable Technologies (WCST), pp. 163–166.
(165). Zhu, X., Lu, Q., Li, W., Zhang, D., 2010. Fast and catalytic pyrolysis of xylan: Effects of
temperature and M/HZSM-5 (M = Fe, Zn) catalysts on pyrolytic products. Front. Energy Power
Eng. China 4, 424–429. https://doi.org/10.1007/s11708-010-0015-z

CHAPTER 2:
COMPARATIVE ANALYSIS OF
PYROLYTIC LIQUID AND GAS
PRODUCTS OF BEECH WOOD, FLAX
SHIVES AND WOODY PSEUDO-
COMPONENTS

Chapter 2
55
2. Comparative analysis of pyrolytic liquid and gas products of beech wood,
flax shives and woody pseudo-components
2.1 Introduction
During the course of this study, beech wood, flax shives and the three biomass components:
cellulose, hemicellulose and lignin, were pyrolysed at 450, 500, 550 and 600 °C. The liquid bio-oil
samples recovered in each case were analysed through gas chromatography-mass spectrometry (GC-
MS) and gas chromatography-flame ionisation detection (GC-FID) to identify and quantify the
different molecules present; the non-condensable gas was analysed by GC-FID and GC-thermal
conductivity detection (TCD). Then, principal component analysis (PCA) was used to visualise the
global trend of the data. A part of this study has been published as an article in the Journal of
Analytical and Applied Pyrolysis (Mohabeer et al., 2017). However, it should be noted that when the
article was mainly focused on the liquid product analysis. The non-condensable gases (NCG) analysis
part (section 2.3.5) has been added to this chapter as complementary results.
2.2 Experimental section
2.2.1 Materials used
Table 2.1 illustrates the elemental analysis of all the raw materials used as feed for this study. The
beech wood (BW) used for this study was provided by ETS Lignex Company and its average particle
sizewasof400µm. Flax shives (FS), providedby “LaCoopérativeTerrede Lin”,were groundand
sieved at our laboratory. The average particle size ranges between 600 µm and 1 mm. The bio-
polymers used were utilised in their pure form: microcrystalline cellulose, obtained from Merck (Ref.
1.02330.0500-500G), had a density of 1.5 g/cm3 at 20 °C while xylan, which was used as proxy for
hemicellulose as the latter is not commercialised in its original form, was of corn stover origin. The
xylan was purchased from Tokyo Chemical Company Co. Ltd. (Ref: X0078-100G). Finally, the lignin
used was in its alkaline form and had low sulphur content. It was obtained from Sigma-Aldrich (Ref:
471003-100G). It should be noted that all three biomass components were in powder form and
possessed sizes less than 50 µm. A detailed mineral analysis was conducted on samples of the
different raw materials used for this study. The complete results can be found in Annex A (Table
A.1).
Table 2.2 presents the proximate analysis of different raw materials based on thermogravimetric
measurements according to García et al. (2015).

Chapter 2
56
Table 2.1: Elemental analysis of biomass and biomass components used
Biomass/Biomass Component
used
Elemental analysis (wt. %)
Carbon Hydrogen Nitrogen Oxygen
FS 45.70 5.77 0.41 48.12
BW 47.38 6.11 <0.01 46.51
Cellulose 41.74 6.08 <0.01 52.18
Xylan 41.47 6.48 <0.01 52.05
Lignin 57.04 4.76 <0.01 38.21
Table 2.2: Proximate analysis (dry basis) of different raw materials based on TGA experiments (wt. %)
Volatile matter Fixed carbon Ash
FS 75.47 21.77 2.76
BW 80.15 18.93 0.92
Cellulose 96.26 3.74 < 0.01
Hemicellulose 80.18 19.58 0.25
Lignin 68.42 24.86 6.72
2.2.2 Elemental analysis
The total C, H and N were measured on sub-samples using a CHN elemental analyser Flash 2000
(Thermofisher Scientific). Mineral content of feed material was determined by performing
microwave assisted wet digestion followed by ICP-OES analysis using an ICAP 6300, Thermofisher
Scientific machine, and the results have been presented in Annex A.
2.2.3 Pyrolysis experimental Setup
Pyrolysis runs were performed in a semi-continuous experimental set up. It comprised of a quartz
reactor (Ø = 90mm,L=970mm)placedhorizontallyinatubularfurnace.Astainlesssteel“spoon”
could be inserted at one end of the reactor and the other end was connected to a condenser and a
cold bath to recover the bio-oils formed from the condensation of vapours. A flowmeter, placed near
the mouth of the reactor, allowed the regulation of the flow of nitrogen, used as carrier gas. The
furnace used was from Carbolite, and had a maximum temperature of 1200 °C and a maximum
power of 2340 W. The cold bath and the refrigerant were both kept at a constant temperature of -5
°C. Figure 2.1 illustrates the layout of the reactor used.

Chapter 2
57
Figure 2.1: First layout of tubular reactor
The pyrolysis experiments were conducted at temperatures of 450 °C, 500 °C, 550 °C and 600 °C for
each raw material used. For one specific test, the reactor was fed with a flow rate of 500 mL/min of
nitrogen to create an inert atmosphere. The gas residence time in the reactor was estimated to be
about 11 minutes. About 3 g of raw materials were placed onto the spoon, which was kept near the
mouth of the reactor. The furnace was set to the temperature required with a heating rate of 40
°C/min. The setup was then allowed to stabilise for two hours before insertion of the spoon in the
midst of the reactor for 5 minutes, during which the raw material was pyrolysed. The heat was then
turned off and the setup allowed to cool down to temperatures below 150 °C so as to permit the
collection of the solid char without it burning at the contact of air. After cooling, the oil was
recovered by using acetone with 99.98 % purity, with a known added amount of nonane, as internal
standard and the non-condensable gases were collected in a sampling bag for further analysis.
2.2.4 GC-MS analysis
The analysis of the recovered bio-oil was performed using a gas chromatograph-mass spectrometer
instrument GC-MS (Varian 3900-Saturn 2100T). The column was a VF-1701ms (Agilent) (60 m × 0.25
mm × 0.25 µm film thickness). The temperature programme used was the same as Charon et al.
(2015). The oven was held at 45 °C for 4 minutes then heated to 280 °C with a heating rate of 4 °C
and held for 20 minutes. The carrier gas was helium with a constant flow of 1 mL/min. 1 µL of the
bio-oil sample diluted in pure acetone was directly injected into the heated split injector (split ratio
30:1) at 250 °C. The MS electron ionization energy was 70 eV. The detection was performed in full
scan mode. The analysed components were identified with Varian WS (WorskStation) and NIST 2002
software by comparing the mass spectrum obtained to mass spectra from the NIST library. Kovats

Chapter 2
58
retention indices of the identified peaks were then calculated and compared to reference values for
confirmation of their identity.
2.2.5 GC-FID analysis
Once the identity of the peaks was confirmed, a flame ionisation detector (FID), GC-FID Scion 456-GC
Bruker instrument, was used to quantify the components. The column used was the same as the one
used for the GC-MS; the temperature programme was also the same except that the final
temperature was 240 °C instead of 280 °C. These compounds were then grouped into chemical
“families”,eachhavingthesamemainfunctionalgroup.Apurereferencecompoundforeachfamily
was used for calibration of all peaks of the corresponding family. Standard solutions of each of these
reference compounds were prepared by dissolving them acetone. Five-point straight line calibration
curves (with R2>0.99) were established for these pure compounds, using nonane as the internal
standard.
2.2.6 GC analysis of non-condensable gases
The analysis of the non-condensable gases was performed with a gas chromatograph instrument
from Perkin Elmer, Clarus 580, equipped with two detectors, a FID and a thermal conductivity
detector (TCD). The instrument also comprised of a Shincarbon St 100 120 column, a methaniser and
a hydrogen generator. The oven was regulated from 100-200 °C. The carrier gas was argon. The TCD
was used to determine the components such as H2 and N2. The FID detected the carbonated
components, except for CO and CO2, which were detected with the help of the methaniser.
2.2.7 Principal Component Analysis (PCA)
PCA is a multivariate technique used in data processing usually presented in a table containing
variables and observations; it is a graphical representation of a cloud of points initially drawn in a
multidimensional space. PCA has the goal to detect the existence of similarities or inter-correlation
between variables, based on the treatment of observations. PCA is represented by only one
orthogonal variable called “principal components”, F1 and F2. In order to facilitate the analysis of the
existence of any correlation between each of two variables separately, a projection of this cloud in an
orthogonal space (F1 and F2) is created, as previously specified. Often, these two axes have no
physical meaning, however, they ensure the maximum recovery of information from the projection
of the cloud of points. Obviously, a bad projection of a variable on this new space may not be
representative, and therefore, the information about this variable is deformed. The conclusions
drawn in this case may not have a physical meaning (Boukaous et al., 2018). The different chemical
groups identified in the pyrolytic oils were set as variables, while the various bio-oils recovered for
the different experiments were the samples. The R software (R: A Language and Environment for

Chapter 2
59
Statistical Computing, 2014) was used in this study for the analysis and evaluation of data. A detailed
introduction and application of PCA to multivariate data can be found in Esbensen et al. (2002).
2.3 Results and discussion
2.3.1 Identification and quantification of bio-oil components
The first step in the analysis of the bio-oils was performed by GC-MS (see Figure 2.2 for typical mass
spectrum). After identification of individual peaks using, a total of 255 compounds were identified.
Figure 2.2: GC-MS spectrum of beech wood pyrolytic oil obtained at 500 °C
After identification of each peak, the quantification of each individual compound was performed. For
this purpose, all the compounds were grouped into 12 major chemical families. A reference
compound was chosen in each family for calibration. These reference compounds along with their
corresponding retention times and the chemical group they represent are listed in Table 2.3, as well
as the most abundant compound present for each family, on average. The detailed representation of
the most abundant molecule present per family per bio-oil produced can be found in Annex A (Table
A.2 (a), (b), (c) and (d)). It has been seen from the r2 values obtained for all the calibration lines that
the latter had near-perfect linearity (R2>0.99). This enhanced the reliability of the quantification

Chapter 2
60
method used. In each of the 12 chemical families, the calibration curve of the reference compound
was used for the quantification. However, to take into account the structural difference that could
lead to the variation of the response factor from the reference compound, the relative response
factors were corrected using the ECN method (Scanlon and Willis, 1985).
Table 2.3: Calibration information of major chemical groups in bio-oil
Retention time
(min)
Reference
Compound for
calibration
Chemical group Most abundant compound in oil
6.38 Furan Furans Furan, 2,3,5-
trimethyl- C7H10O
10.90 Acetic acid Carboxylic acids Acetic acid C2H4O2
18.14 Allyl butyrate Esters 2-Propanol, 1,1-
dimethoxy-, acetate C7H14O4
21.40 2-Cyclopenten-1-
one, 2-methyl Ketones Levoglucosenone C6H6O3
28.02 Furfural Aldehydes Furfural C5H4O2
28.66 Phenol Phenols Phenol, 2,4,5-
trimethyl- C9H12O
30.43 Dodecene Aromatics Cyclopentene, 1-(1-
methylethyl)- C8H14
34.88 p-Cresol Alcohols 2-Furanmethanol C5H6O2
39.29 Tetradecane Alkanes Nonane, 4-ethyl-5-
methyl- C12H26
41.72 4-Methylcatechol Guaiacols 4-Ethyl guaiacol C9H12O2
42.66 Benzamide Amides Butyramide, 2,2,3,3-
tetramethyl- C8H17NO
49.49 Levoglucosan Carbohydrates Levoglucosan C6H10O5
2.3.2 Pyrolysis of flax shives and beech wood
For the various families to be more visually representative, pie charts were built for each
temperature and biomass used. Figure 2.3 is an example of the chemical families present in pyrolytic
oils of beech wood and flax shives obtained at 500 °C. Similar diagrams were built for each bio-oil
produced; the results obtained have been tabulated and can be found in Annex A (Table A.3).

Chapter 2
61
Furthermore, Table A.4 in Annex A lists the different families present in the bio-oils and the major
identified molecules belonging to each of them.
Figure 2.3: Quantification of chemical families (mol. %) in pyrolytic bio-oils for beech wood and flax shives at 500 °C
Bajus (2010) claimed in his studies that the major liquid products obtained from the pyrolysis of
beech wood were acetic acid, formic acid, lactic acid and levoglucosan. The percentages obtained
during the course of this study corroborated that finding. A percentage of 35 mol. % of carboxylic
acids has been obtained for the pyrolysis of beech wood at 500 °C, clearly demonstrating that acids
were the most prominent products present in the pyrolytic bio-oil obtained. However, carbohydrates
were not the second most abundant product, phenols were. This can be explained in that while
levoglucosan remained one of the major liquid products detected, the phenolic compounds, when
cumulated, presented a higher percentage. The same explanation holds for esters and ketones. As
for aromatic compounds, which are the ones most interesting in bio-oil to be used as bio-fuel, it
could be observed that this setup did not produce much (1 mol. % for beech wood). This fact shows
the importance of upgrading the oil so as to enhance the production of these compounds.
Concerning the behaviour of the pyrolytic oils of flax shives obtained under the same conditions, it
can be seen that the distribution followed a similar pattern with respect to the major chemical
families present. Carboxylic acids were still the majority proportion present, despite having a lower
percentage (28 mol. % vs. 35 mol. %). But, differences were observed for minor compounds; no
guaiacols and no alkanes were present in the pyrolytic oils of flax shives. This observation confirms
the fact that there indeed exist differences between beech wood and flax shives. The difference

Chapter 2
62
might be due to the different harvesting process or the fundamental structure of the biomasses.
Elemental analysis performed on flax shives presented a significant content of mineral materials (see
Annex A for detailed values). Some of these minerals could possess catalytic properties (Yan et al.,
2016).
2.3.3 Pyrolysis of woody biomass components
During the course of these studies, pure samples of the three components making up biomass:
cellulose, hemicellulose and lignin, were also pyrolysed under the same conditions as the two
biomasses. The quantification of the chemical families in the respective obtained oils is given in Table
2.4. It should be noted that alkanes have not been included in this table as they have not been
detected in this bio-oil samples. This quantification can give a clear idea of the provenance of the
compounds present in the pyrolytic bio-oils of the biomasses. For comparison purposes, it was
considered that beech wood comprised of 41.7 % cellulose, 37.1 % hemicellulose and 18.9 % lignin
(Gucho et al., 2015) on a dry basis, with the remaining 2.3 % were made up of ash and minerals and
that flax shives were made up of 46.0 % of cellulose, 26.2 % of hemicellulose, 23.1 % of lignin and the
remaining 4.70 % were considered to be ash and minerals (Sharma, 1989).Also, the “theoretical”
percentages of each chemical family at 500°C, assuming that the biomass was only made up of the
three biomass components, have been included in Table 2.4. The following equation was used to
calculate the two last columns:
Theoretical average = 100
100
100
.,3.,2.,1
grpchem
ligningrpchem
osehemicellulgrpchem
cellulose yx
yx
yx
Where x = percentage of pseudo-component; x cellulose = percentage of cellulose and,
y = percentage of chemical group in pseudo-component; y1, alcohols = percentage of alcohols in cellulose.
For instance, for alcohols for beech wood, the calculation would be:
Theroretical average, alcohols, for BW =
0
100
18.9 6.13
100
37.1 4.90
100
41.7
Table 2.4: Percentages of chemical families (mol. %) present in biomass components pyrolysed at 500 °C
Chemical
families
Pseudo-components (mol. % present) Theoretical average (mol. %)
Cellulose Xylan
(Hemicellulose) Lignin Beech wood Flax shives

Chapter 2
63
Alcohols 4.90 6.13 - 4.42 3.86
Aldehydes 3.37 16.55 - 7.72 5.89
Alkenes 1.01 1.22 - 0.89 0.78
Amides 1.23 2.24 - 1.38 1.15
Carboxylic
acids 7.14 22.33 - 11.53 9.13
Esters 7.38 10.40 - 7.10 6.12
Furans 5.17 4.19 - 3.80 3.48
Guaiacols - 0.81 - 0.31 0.21
Ketones 11.30 12.53 33.98 16.15 16.33
Phenols 21.21 8.39 66.02 25.01 27.21
Sugars 37.29 15.21 - 21.69 21.14
Globally, it can be seen that the compounds issued from the three pseudo-components were the
same as those from the biomasses, except for alkanes. The latter was detected in the beech wood
and flax shives pyrolytic oils, albeit being present in less than 1 mol. %. This can be explained once
more by the effect of minerals.
From the percentages in Table 2.4, it was obvious that the great majority of carbohydrates came
from cellulose while most of the carboxylic acids from xylan. If the biomass were considered to be
made up of only the three pure pseudo-components, the estimated percentage of carboxylic acids
present in beech wood would have been 11.53 mol. %. However, it was seen that amount actually
present was 35 mol. %. The same observation can be made for most of the other chemical families:
the calculated values were always less than the values obtained. The exceptions were aldehydes,
ketones, phenols and carbohydrates. One way these disparities may be accounted for is by the
physico-chemical interactions between the pseudo-components present in the biomass and also, by
the presence of various minerals and impurities in the biomass. These minerals have catalytic
properties (Liu et al., 2014) and can lead the biomass to behave in an unpredicted manner. Also, the
different samples of biomass components used during the course of this study have been extracted
from a wide array of sources using different extraction methods. For instance, the lignin used was in
its alkaline form. Therefore, the divergence in percentages obtained may have arisen from the fact

Chapter 2
64
that the pseudo-components samples used and the actual components of the biomass used have
different structures and exhibit different behaviours (Jiang et al., 2010). The latter point can also
consider the physical interactions of the biomass components when intertwined in the biomasses.
The breakdown of these interactions may also inhibit the pyrolysis reaction. Furthermore, it should
not be forgotten that while the decomposition temperatures of cellulose and hemicellulose are
relatively low (220-315 °C for cellulose and 315-400 °C for hemicellulose), those of lignin are quite
high (150-900 °C) (Yang et al., 2007). This might be a contributor to the unanticipated percentages
obtained.
2.3.4 Effect of pyrolysis temperature on liquid product distribution
The effect of temperature could also be seen on the percentages of the chemical families present in
the bio-oils produced at different temperatures. PCA was employed to study the correlations and
differences between the bio-oil content from different biomass sources and pyrolysis temperatures.
The first two principal components described 51.5 % and 18.8 % of the variability observed in bio-oils
produced at different experimental pyrolytic temperatures. These percentages were obtained from
thecalculationofthestandarddeviationofthevariables,viathe‘R’software. However, it should be
noted that the accuracy of the analytical setup being of 1 %, all the concentrations that were less
than 1 % have been neglected so as to have a proper representation of the spread of the data.
Comparing the two plots in Figure 2.4 helped identify the different covariations between the oils and
the different groups present in them. For instance, the presence of well-separated sub-groups in
Figure 2.4 (b) shows that the elements of each of these sub-groups behaved in a similar manner as
the other elements in the sub-group. Hence, it can be said that the pyrolytic behaviour of the beech
wood and flax shives samples at the different temperatures resembled one another. However, the
pyrolytic behaviour of each pseudo-component was distinctly different from one another and from
that of the biomasses. The fact that two points (8 and 16) did not follow the same trend as the rest of
the points showed that the pyrolytic behaviour of the raw materials at 600 °C was different from the
rest.
From the loading plot (Figure 2.4 (b)), the variables which most affect the components 1 and 2 can
be deduced. These variables, known as “important variables” were carboxylic acids, esters and
phenols. This comes as no surprise as these chemical groups were the ones mostly present in the
pyrolytic oils. Usually, samples lying on the same side of the axes are positively correlated and vice-
versa. Hence, it can also be witnessed from Figures 2.4 (a) and (b) that samples 1 to 8, i.e. the
biomass samples were all positively correlated; they covaried in the same manner. Another
observation is that pyrolytic runs done at higher temperatures were negatively correlated along
component 2 in terms of carbohydrates, furans and carboxylic acids. This could be a proof that higher

Chapter 2
65
temperatures cracked large molecules like carbohydrates and furans to favour the formation of
carboxylic acid molecules, hence accounting for the lower percentages of carbohydrates and furans
and higher percentages of acidic molecules at 600 °C.
Figure 2.4: (a) Score plot of samples, (b) Loading plot of variables
A final observation that can be noted concerns the lignin sub-group. As mentioned earlier, lignin
tended to exhibit a different behaviour relative to the biomass samples and the other biomass
components. The fact that the samples of lignin pyrolytic oils were found apart from the others is a
further confirmation of its odd behaviour. The reasons accounting for this behaviour have already
been discussed previously.
2.3.4.1 Effect of pyrolytic temperature on chemical families present in bio-oils
In order to delve deeper into the relationship of the various specific chemical groups and the
pyrolytic temperature, different graphs were built to observe and analyse patterns. Figure 2.5 shows
the variation of the percentage of carboxylic acids present in pyrolytic oils of beech wood and flax
shives at the different temperatures studied.
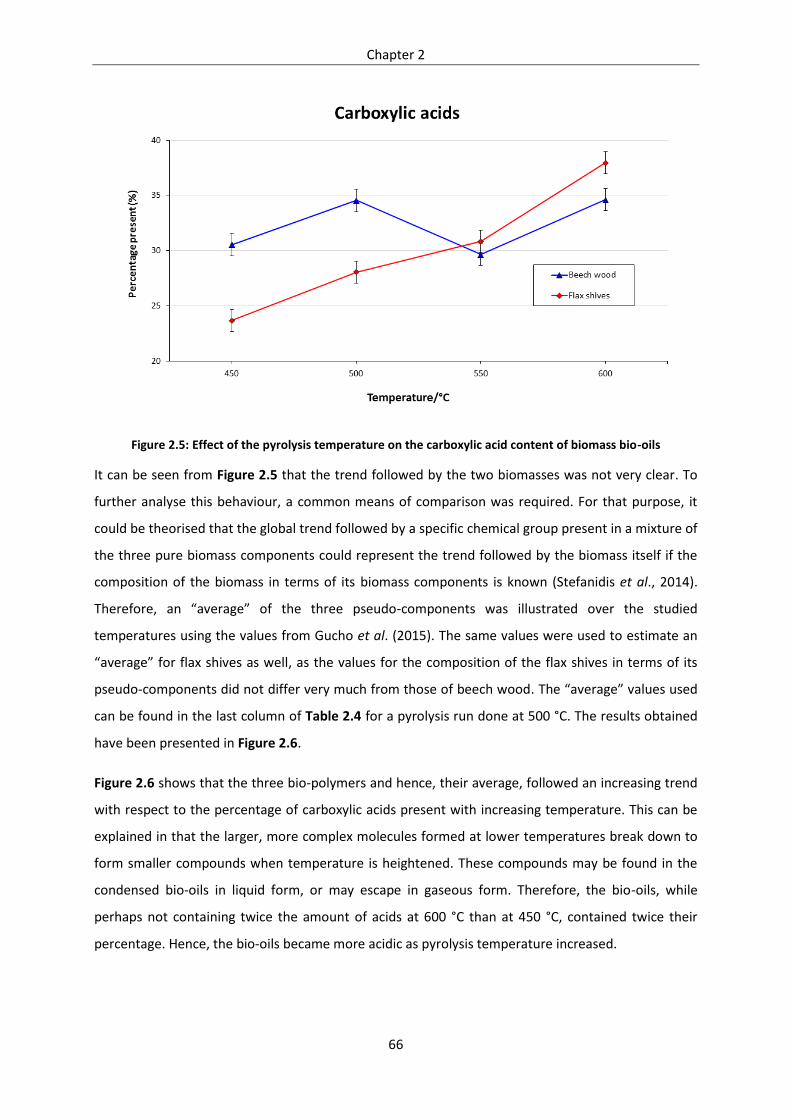
Chapter 2
66
Figure 2.5: Effect of the pyrolysis temperature on the carboxylic acid content of biomass bio-oils
It can be seen from Figure 2.5 that the trend followed by the two biomasses was not very clear. To
further analyse this behaviour, a common means of comparison was required. For that purpose, it
could be theorised that the global trend followed by a specific chemical group present in a mixture of
the three pure biomass components could represent the trend followed by the biomass itself if the
composition of the biomass in terms of its biomass components is known (Stefanidis et al., 2014).
Therefore, an “average” of the three pseudo-components was illustrated over the studied
temperatures using the values from Gucho et al. (2015). The same values were used to estimate an
“average”forflaxshivesaswell, as the values for the composition of the flax shives in terms of its
pseudo-components did not differ very much from those of beech wood.The“average”valuesused
can be found in the last column of Table 2.4 for a pyrolysis run done at 500 °C. The results obtained
have been presented in Figure 2.6.
Figure 2.6 shows that the three bio-polymers and hence, their average, followed an increasing trend
with respect to the percentage of carboxylic acids present with increasing temperature. This can be
explained in that the larger, more complex molecules formed at lower temperatures break down to
form smaller compounds when temperature is heightened. These compounds may be found in the
condensed bio-oils in liquid form, or may escape in gaseous form. Therefore, the bio-oils, while
perhaps not containing twice the amount of acids at 600 °C than at 450 °C, contained twice their
percentage. Hence, the bio-oils became more acidic as pyrolysis temperature increased.

Chapter 2
67
Figure 2.6: Effect of the pyrolysis temperature on the carboxylic acid content of pseudo-component bio-oils
From the comparison of the Figures 2.5 and 2.6, it can be seen that although not down to the last
detail, the curve representing the trend followed by flax shives pyrolytic oils was similar to the one
representing the average trend of the three pseudo-components. The beech wood pyrolytic oils
curve, however, experienced a drop at the 550 °C mark. This abnormality could not be theorised
based on the current analyses performed. A further analysis was conducted using some of the other
major chemical families in the oils. Figures about the effect of the pyrolysis temperature on the
remaining chemical families can be found in Annex A (Figures A.1-A.9).
From the trends for phenols, esters, ketones and carbohydrates for the biomasses, it can be seen
that flax shives and beech wood pyrolytic oils did not exhibit the exact same behaviour. In contrast to
what was seen in Figure 2.5, the 550 °C point for beech wood did not behave in an abnormal manner
relative to the trend shown by the average of the three biomass components. However, the
behaviour of the pyrolytic oils of both biomasses followed about the same trend as that of the
average of the biomass components for phenols, esters, ketones and carbohydrates.

Chapter 2
68
Figure 2.7: Effect of the pyrolysis temperature on the phenol content of bio-oils
Furthermore, the percentage of phenolic compounds, which were the second most abundant
chemical family present, in the pyrolytic oils have been presented in Figure 2.7. It can be seen that
the global trend of phenols present over increasing temperature was an increasing one. The
exception was with cellulose and flax shives; as the temperature increased to 600 °C, the curve for
both cellulose and flax shives sloped downwards. If the average of the three biomass components is
considered, it could be said that the percentage of phenols present over the range of temperatures
fluctuated around 20-30 % of the mass of the pyrolytic oils. However, in the case of the two
biomasses studied, phenols were present in the order of 10-20 % for beech wood bio-oils and 20-30
% for flax shives bio-oils. The curves in Figure 2.7 show that the major percentage of phenols came
from the lignin fraction of the biomass. As lignin has a larger span of degradation temperatures than
the temperatures used in this study (Quan et al., 2016), it could be that the lignin fraction did not
degrade fully in order to give the same amount of phenolic compounds for the pyrolysis of beech
wood and flax shives. This could be due the effect of minerals on the pyrolysis products. The same
behaviour can be noted with respect to esters and ketones in (as can be seen from Figures A.1 and
A.2 from Annex A), and this behaviour can be explained in the same manner as for phenols.
As for carbohydrates, it can be seen from Figure 2.8 that the majority came from the degradation of
the cellulosic portion of the biomasses, and that as temperature increased, the mass fraction of
carbohydrates correspondingly decreased as the complex carbohydrate molecules cracked to give
smaller, lighter molecules. The variation of the remaining chemical families followed about the same
trend of that of the average of the three biomass components, with some exceptions: alkanes and
guaiacols. The afore-mentioned two groups of chemical compounds represented less than 1 % of the
mass of the pyrolytic oils. As these percentages were less than the error margin of the apparatus
used to quantify the oils, they have not been retained. It can thus be inferred that the amount of
alkanes and guaiacols comprised in the bio-oils were negligible.

Chapter 2
69
Figure 2.8: Effect of the pyrolysis temperature on the carbohydrate content of bio-oils
2.3.5 Correlations between the different chemical families present
Correlations between different variables from a set of samples were assessed. The table regrouping
the detailed R value (Pearson) can be found in Annex A (Table A.5 (a), (b), (c), (d) and (e)).
Globally, carbohydrates present in all pyrolytic oils, except that of cellulose and lignin, showed the
strongest negative correlation with temperature (R= -0.78 to -0.99) while carboxylic acids showed the
strongest positive relationship (R= 0.36 to 0.98). This follows the explanation that higher
temperatures cracked larger molecules of carbohydrates and favoured the formation of acidic
molecules. To further deepen this analysis, the correlation between carboxylic acids and
carbohydrates was investigated. For the individual biomass bio-oils, beech wood bio-oil showed a
negative correlation between acids and carbohydrates (R= -0.42) as well as bio-oil from flax shives
(R= -0.89). To explain this trend, xylan bio-oil showed a negative correlation between carbohydrates
and acids (R= -0.94) while cellulose exhibited no correlation at all (R= 0.04). It can thus be said that it
was carbohydrates originating from the hemicellulosic fraction of the biomass that got converted to
acids when hemicellulose was degraded at high temperatures. Another important negative
correlation was observed between phenols and carbohydrates (R= -0.92) for beech wood, and
between ketones and acids for flax shives (R= -0.93). Both correlations are mirrored by xylan,
demonstrating that it was again the hemicellulosic fraction that contributed to this phenomenon.
2.3.6 Oxygen content of pyrolytic oils
A major challenge of the usage of bio-oils in various applications remains their relatively high oxygen
content. The oxygen content can be determined by the quantification of compounds in the oils and
was found to fluctuate around 33 mol. %, for the range 500-550 °C, which is coherent with respect to
what has been reported in literature (Lehto et al., 2013). This value is very high compared to the
oxygen quotient of heavy oil, 1 % (Xiu and Shahbazi, 2012). It should however be noted that the
oxygen coming from the biomass humidity has not been included in the total oxygen percentage;

Chapter 2
70
only the oxygen derived from the molecules in the bio-oil have contributed to this percentage.
Contrary to what can be believed, even if a particular group of compounds possesses only one
oxygen atom, it can contribute more in the overall oxygen content of the oils if its presence is more
significant than another group which contains six atoms. For instance, for the pyrolysis of beech
wood at 500 °C, 41 mol. % of the oxygen of the bio-oil produced came from carboxylic acids while
only 14 mol. % came from carbohydrates, despite the fact that only two atoms of oxygen were
involved in the first case while six were involved in the second one. However, if the percentage of
acids is taken into account, it can be seen that there was around five times more acids than
carbohydrates. Hence, the oxygen atoms linked to the acidic molecules impact the oil more than
those bonded to the carbohydrate molecules.
From the various pyrolysis experiments conducted, it was noted that the major portion of oxygen
came from the carboxylic acids, followed by the esters, carbohydrates and ketones. Hence, these are
the chemical groups deemed problematic to the usage of bio-oil as an efficient bio-fuel.
2.3.7 Non-condensable gases analysis
The same analysis as for liquid composition was made for the non-condensable gas composition. The
non-condensable gases (NCG) are the fraction of pyrolysis products recuperated after the
condensation of bio-oil vapours. They are typically made up of CO, CO2, CH4 and H2. In this case, C2H2,
C2H4 and C2H6 (represented as ‘C2’) and C3H4, C3H6 and C3H8 (represented as ‘C3’) have also been
quantified. Figure 2.9 represents the different gas product distributions obtained for each feed
material at 500 °C. The results obtained have been tabulated and presented in Annex A, Table A.6.
It can be seen that all the feed materials, except lignin, follow approximately the same trend: the
major NCG component was CO, followed by CO2. Lignin’sdifferentbehaviourcan be explained by the
difference in its structure as compared to those of the two other biomass components (Patwardhan,
2010). It is therefore, not the same linkages that break when lignin is converted, giving rise to more
CO2 than CO. Apart from this observation, the rest of the feed materials tended to have about the
same product distribution, prompting the supposition that the pyrolytic behaviour of biomass was
more mirrored in the pyrolytic behaviours of cellulose and xylan.

Chapter 2
71
Figure 2.9: NCG composition (vol. %) obtained at 500 °C
Now, Figure 2.10 depicts the evolution of NCG composition for all feed materials with increasing
pyrolysis temperature. For the flax shives NCG evolution, it can be seen that as the pyrolysis
temperature rose, the percentage of CO2 diminished while those of the rest of the components
increased. The same trends were seen again for all the feed materials, apart from lignin, which as
stated previously, behaved differently.
Figure 2.10: Evolution of NCG composition (vol. %) with pyrolysis temperature

Chapter 2
72
2.3.8 Solid residue analysis
Concerning the evolution of the solid residue (char) with increasing pyrolysis temperature, it was
noted that the char left behind decreased in mass as pyrolysis temperature increased. This
observation is on the same line than the previous ones: increasing the pyrolysis temperature
privileged cracking reactions, and thus, gas formation, causing a decrease in liquid and solid product
formation.
2.4 Conclusion
This part of the study examined the pyrolytic behaviour of flax shives relative to beech wood, a
biomass commonly used in literature and the three pseudo-components that make up biomass:
cellulose, hemicellulose and lignin. It was found that, albeit not to the dot, the pyrolytic behaviour of
flax shives matched that of beech wood and also had a trend reflected by an average of the three
pseudo-components built on a composition of beech wood found in literature. However, after
deeper analysis of the data, it was seen that it was not totally correct to infer that the pyrolytic
behaviour of the biomass was the same as that of the theoretical average built. This might be due to
physical interactions between the different parts and also probably, the mineral content of the
biomass. Furthermore, the results showed that the pyrolytic temperature had a significant effect on
the liquid and solid products recovered from the pyrolysis reactions of each raw material. Acidic
content increased with temperature, as opposed to carbohydrate content. It was also seen that the
evolution of the chemical groups with temperature between the different chemical groups present in
the bio-oils followed mostly the same degradation trend as that of the hemicellulosic part of the
biomass. Now, the main problem remained the rather elevated oxygen content of the pyrolytic oils.
In order for this oil to be exploitable as a bio-fuel, a means to enhance its properties needs to be
found.
2.5 References
(1). Bajus, M., 2010. Pyrolysis of woody material. Pet. Coal 52, 207–214.
(2). Boukaous, N., Abdelouahed, L., Chikhi, M., Meniai, A.-H., Mohabeer, C., Bechara, T., Boukaous,
N., Abdelouahed, L., Chikhi, M., Meniai, A.-H., Mohabeer, C., Bechara, T., 2018. Combustion of
Flax Shives, Beech Wood, Pure Woody Pseudo-Components and Their Chars: A Thermal and
Kinetic Study. Energies 11, 2146. https://doi.org/10.3390/en11082146
(3). Charon, N., Ponthus, J., Espinat, D., Broust, F., Volle, G., Valette, J., Meier, D., 2015. Multi-
technique characterization of fast pyrolysis oils. J. Anal. Appl. Pyrolysis 116, 18–26.
https://doi.org/10.1016/j.jaap.2015.10.012

Chapter 2
73
(4). Esbensen, K.H., Guyot, D., Westad, F., Houmoller, L.P., 2002. Multivariate Data Analysis: In
Practice :anIntroductiontoMultivariateDataAnalysis and Experimental Design. Multivariate
Data Analysis.
(5). García, J.R., Bertero, M., Falco, M., Sedran, U., 2015. Catalytic cracking of bio-oils improved by
the formation of mesopores by means of Y zeolite desilication. Appl. Catal. Gen. 503, 1–8.
https://doi.org/10.1016/j.apcata.2014.11.005
(6). Gucho, E.M., Shahzad, K., Bramer, E.A., Akhtar, N.A., Brem, G., 2015. Experimental Study on
Dry Torrefaction of Beech Wood and Miscanthus. Energies 8, 3903–3923.
https://doi.org/10.3390/en8053903
(7). Jiang, G., Nowakowski, D.J., Bridgwater, A.V., 2010. A systematic study of the kinetics of lignin
pyrolysis. Thermochim. Acta 498, 61–66. https://doi.org/10.1016/j.tca.2009.10.003
(8). Lehto, J., Oasmaa, A., Solantausta, Y., 2013. Fuel oil quality and combustion of fast pyrolysis
bio-oils.
(9). Liu, C., Wang, H., Karim, A.M., Sun, J., Wang, Y., 2014. Catalytic fast pyrolysis of lignocellulosic
biomass. Chem. Soc. Rev. 43, 7594–7623. https://doi.org/10.1039/C3CS60414D
(10). Mohabeer, C., Abdelouahed, L., Marcotte, S., Taouk, B., 2017. Comparative analysis of
pyrolytic liquid products of beech wood, flax shives and woody biomass components. J. Anal.
Appl. Pyrolysis 127, 269–277. https://doi.org/10.1016/j.jaap.2017.07.025
(11). Patwardhan, P., 2010. Understanding the product distribution from biomass fast pyrolysis.
Grad. Theses Diss.
(12). Quan, C., Gao, N., Song, Q., 2016. Pyrolysis of biomass components in a TGA and a fixed-bed
reactor: Thermochemical behaviors, kinetics, and product characterization. J. Anal. Appl.
Pyrolysis 121, 84–92. https://doi.org/10.1016/j.jaap.2016.07.005
(13). R: A Language and Environment for Statistical Computing, 2014. . Vienna, Austria.
(14). Scanlon, J.T., Willis, D.E., 1985. Calculation of Flame Ionization Detector Relative Response
Factors Using the Effective Carbon Number Concept. J. Chromatogr. Sci. 23, 333–340.
https://doi.org/10.1093/chromsci/23.8.333

Chapter 2
74
(15). Sharma, H.S.S., 1989. Thermogravimetric analysis of flax shives degraded by pleurotus
ostreatus and ceraceomyces sublaevis. Thermochim. Acta 138, 347–357.
https://doi.org/10.1016/0040-6031(89)87271-5
(16). Stefanidis, S.D., Kalogiannis, K.G., Iliopoulou, E.F., Michailof, C.M., Pilavachi, P.A., Lappas, A.A.,
2014. A study of lignocellulosic biomass pyrolysis via the pyrolysis of cellulose, hemicellulose
and lignin. J. Anal. Appl. Pyrolysis 105, 143–150. https://doi.org/10.1016/j.jaap.2013.10.013
(17). Xiu, S., Shahbazi, A., 2012. Bio-oil production and upgrading research: A review. Renew.
Sustain. Energy Rev. 16, 4406–4414. https://doi.org/10.1016/j.rser.2012.04.028
(18). Yan, L.-J., Bai, Y.-H., Kong, X.-J., Li, F., 2016. Effects of alkali and alkaline earth metals on the
formation of light aromatic hydrocarbons during coal pyrolysis. J. Anal. Appl. Pyrolysis 122,
169–174. https://doi.org/10.1016/j.jaap.2016.10.001
(19). Yang, H., Yan, R., Chen, H., Lee, D.H., Zheng, C., 2007. Characteristics of hemicellulose, cellulose
and lignin pyrolysis. Fuel 86, 1781–1788. https://doi.org/10.1016/j.fuel.2006.12.013

CHAPTER 3:
PRODUCTION OF LIQUID BIO-FUEL
FROM CATALYTIC DE-OXYGENATION:
PYROLYSIS OF BEECH WOOD AND FLAX
SHIVES

Chapter 3
75
3. Production of liquid bio-fuel from catalytic de-oxygenation: pyrolysis of
beech wood and flax shives
3.1 Introduction
This study presents a detailed analysis of the catalytic de-oxygenation of the liquid and gaseous
pyrolytic products of two biomasses (beech wood and flax shives) using different catalysts
(commercial HZSM-5 and H-Y, and lab-synthesised Fe-HZSM-5, Fe-H-Y, Pt/Al2O3 and CoMo/Al2O3)
based on their proven de-oxygenation performance in literature. The experiments were all
conducted in a semi-batch reactor under the same operating conditions for all feed materials. BET
specific surface area, BJH pore size distribution and FT-IR technologies have been used to
characterise the catalysts, while gas chromatography-mass spectrometry (GC-MS), flame ionisation
detection (GC-FID) and thermal conductivity detection (GC-TCD) were used to examine the liquid and
gaseous pyrolytic products. PCA was applied at the end to have an overall view of the behaviour of
the pyrolytic products obtained with and without catalyst use and the various correlations existing
among them. This part of the study has been submitted for publication to the Journal of Fuel
Chemistry and Technology.
3.2 Experimental section
3.2.1 Materials used
The biomasses (beech wood and flax shives) and woody biomass components (cellulose, xylan and
lignin) used for this part of the study have already been presented and detailed (Refer to Chapter 2,
section 2.2.1).
3.2.2 Catalysts preparation and characterisation
3.2.2.1 Preparation of catalysts
3.2.2.1.1 HZSM-5
The catalyst [hydrophobic HZSM-5 catalyst in its proton form (H+)] was acquired from ACS materials
in the form of pellets (Ø = 3 mm, L = 30 mm). The SiO2/Al2O3 ratio was 38, the specific surface area
about 250 g/m2 and the pore size about 5 Å. The catalyst was triturated and sieved between 1.2
and 1.0 mm. The apparent porosity of this catalyst was between 0.60 and 0.62 (The calculation
method used for the apparent porosity has been described in Annex B). The catalyst was calcined at
550 °C during 4 hours, with a heating rate of 2 °C/min (Aho et al., 2010) at atmospheric pressure in
air, before use.

Chapter 3
76
3.2.2.1.2 H-Y
The H-Y catalyst [4587 Zeolite Y, Hydrogen] was obtained from Alfa Aesar in powder form and had a
SiO2/Al2O3 ratio of 60 and a specific surface area of 720 g/m2. In order to avoid blockage and any
other disadvantage that may be caused by using powders with low particle size, the catalyst was
wetted in deionized water and dried overnight in an oven at a temperature of 105 °C. The dried and
compacted catalyst was then triturated and had an apparent porosity of 0.77. Before use, the
catalyst was calcined at a temperature of 550 °C using the same procedure as described for HZSM-5.
3.2.2.1.3 Fe-HZSM-5 and Fe-H-Y
The previously mentioned zeolites, HZSM-5 and H-Y, were used for the synthesis of the Fe-modified
catalysts. An iron nitrate salt, ferric (III) nitrate 9-hydrate (Fe(NO3)3.9H2O), was purchased from
PanReac AppliChem. For each 10 g of catalyst (HZSM-5 or HY), 4.04 g of the iron nitrate salt were
diluted in 100 mL of deionized water (Aho et al., 2010) so as to reach a content of 1.4 wt. % (Mullen
and Boateng, 2015). Both catalysts were imbued by the ferric dilution, agitated and heated at 80 °C
for 10 minutes. The catalysts were then dried overnight in an oven at 105 °C. The dried catalysts
were afterwards introduced in the tubular furnace to be calcined at a temperature of 550 °C, as
described above. These catalysts are considered to be bifunctional ones. The apparent porosity was
0.61 and 0.78 for Fe-HZSM-5 and Fe-H-Y, respectively.
3.2.2.1.4 Pt/Al2O3
Tetraamine platinum (II) nitrate (Pt(NH3)4(NO3)2), containing 1.32 % of platinum was acquired from
Alfa Aesar in powder form, using gamma-alumina(γ-Al2O3, 99.97%) as support having an apparent
porosity of 0.83. For 0.3 g of platinum solution, 10 g of alumina support were required so as to reach
a Pt content of 1.32 wt. % (Payormhorm et al., 2013). The platinum solution and alumina were then
added to 20 mL of deionized water and heated at 80 °C for 10 minutes. Following this, the platinum-
alumina catalyst was dried and calcined with the same procedure for the afore-mentioned catalysts.
In order to reduce the catalyst, it needed to be introduced in the tubular furnace and heated with a
rate of 5 °C/min up to 500 °C during 2.5 hours with a gas flow of 500 mL/min of 90 % N2 and 10 % H2.
3.2.2.1.5 CoMo/ Al2O3
The bi-metallic catalyst mixture of cobalt and molybdenum was prepared using an atomic relation of
Co:Mo 4:1; for 1 g of cobalt (II) nitrate hexahydrate 98%, 0.81 g of ammonium molybdate
terahydrate 99 % and 33.33 g of support were needed (Dumeignil et al., 2005). The support used was
γ-Al2O3, 99.97%. The same impregnation, drying, calcination and reduction methods were employed
as for the previous catalyst (Pt/Al2O3). The cobalt and molybdenum salts were both purchased from
Sigma Aldrich.

Chapter 3
77
3.2.2.2 Catalyst characterisation methods
All the catalyst characterisation work was done at the “Unité de Chimie Environnementale et
Interactions sur le vivant” (UCEIV) laboratory, at the “Universitédu LittoralCôtéd’Opale” (ULCO),
located in Dunkirk, France.
3.2.2.2.1 Specific surface area and pore size
BET surface area was measured by nitrogen adsorption at -196 °C in a Quanta Sorb Junior apparatus
(Ankerschmidt). Before analysis, the samples were degassed for 30 min at 200 °C. Each measurement
was repeated three times and an average value was taken.
Nitrogen adsorption-desorption isotherms were obtained on a Micromeritics TRISTAR 3000 analyser
at -196 °C over a wide relative pressure range, from 0.01 to 0.995. The samples were degassed under
vacuum for several hours before nitrogen adsorption measurements. The pore diameter and the
pore size distribution were determined by the Barret–Joyner–Halenda (BJH) method using the
adsorption branch of isotherms.
3.2.2.2.2 Surface acidity
The acidity of the catalysts was measured by infrared spectroscopy of adsorbed pyridine. It has been
demonstrated in literature that pyridine is the probe molecule of choice to examine the acidity of
zeolites as used in biomass pyrolysis applications (Deka, 1998). To investigate the nature of acid sites
and bonding of ions on the surface of catalysts, FT-IR (Spectrum BX, Perkin-Elmer) spectra were
obtained in the range of 600-4000 cm-1. The samples for acidity measurement were prepared in
powder form, then saturated with small amount of pyridine, and degassed at 100 °C for one hour.
The FT-IR spectra in absorbance mode after the pyridine treatment were subtracted with those of
the untreated catalysts to obtain the peaks only due to pyridine–acid site interactions (Topaloǧlu
YazıcıandBilgiç,2010).
3.2.3 Pyrolysis experimental setup
The pyrolysis runs were done in a semi-continuous experimental set up. It comprised of a quartz
reactor with a special configuration, as illustrated in Figure 3.1. The total length of the reactor was
1050 mm. The reactor included two zones: a pyrolysis zone and a catalysis zone, as it has been shown
in literature that such a configuration enhances the liquid yield (Li et al., 2008). Both the pyrolysis
zone and the catalysis zone were placed horizontally in a tubular furnace. The same carrier gas and
other experimental configuration were used as for the sole pyrolysis experimental runs (Refer to
Chapter 2, section 2.2.3). The differences were that first, the cooling temperature used was -10 °C so
as to enhance the condensing efficiency of the setup. Then, the pyrolysis experiments were only
conducted at a temperature of 500 °C for each raw material used.

Chapter 3
78
Figure 3.1: Second layout of pyrolysis reactor
For the experiences comprising the catalysts, a catalyst-to-biomass ratio of about 4:1 was used. After
pyrolysis, the oil was recovered by using acetone with 99.98% purity, with a known added amount of
nonane, used as internal standard while the non-condensable gases produced were captured using
sampling bags for further analysis.
3.2.4 Bio-oil and non-condensable gases analysis
The techniques used for the liquid and gas product analysis (GC-MS and GC-FID/TCD) have already
been detailed previously (See Chapter 2, section 2.2.4, 2.2.5 and 2.2.6).
3.2.5 Karl Fischer (KF) titration method
The volumetric KF titrations were performed with a Metrohm 870 KF TitrinoPlus apparatus. An
aqualine sodium tartrate solution was used as titrating agent, along with Hydranal Composite 5 and
Hydranal Methanol Rapid as working media. The sample weight used was in the range of 0.17-0.20 g.
3.2.6 Principal component analysis (PCA)
This statistical has already been introduced in Chapter 2 (Refer to section 2.2.6).
3.3 Results and discussion
3.3.1 Defining the pyrolytic temperature
The pyrolytic temperature chosen for this study was 500 °C. This was based on a series of pyrolytic
runs at 450, 500, 550 and 600 °C under the same operating conditions. Based on the reproducibility
of the experiments, a percentage error of 1 % was found. Figure 3.2 demonstrates the different
N2
Tubular Furnace
Condenser-1Refrigerant in
Refrigerant out
(To evacuation)
Cold Bath Flask
Condenser-2
(To Sample bag)
Filter
1050 mm
290 mm 760 mm
56 mm
26 mm
Catalyst

Chapter 3
79
values obtained for the mass balances of the various runs for flax shives (all above 95 %), brought to
100 %. Beech wood followed a similar trend, despite the two biomasses having been harvested in a
different way and flax shives possessing more mineral content. As it can be seen, the maximum yield
of bio-oil was obtained at 500 °C (58.18 wt. %). 500 °C was hence chosen as the operating
temperature for the experimental runs done throughout this study.
Figure 3.2: Mass balances for flax shives pyrolysis at different pyrolytic temperatures
3.3.2 Catalyst characterisation results
- BET surface area and porosity
The values obtained for the specific surface area of the catalysts used have been listed in Table 3. It
can be seen that the BET surface area decreased after the metal modifications. This observation can
be attributed to the fact that metal species were deposited on the catalyst surface during the
impregnation. In the case of the supported catalysts on alumina, the decrease was more pronounced
because the surface area of γ-alumina was lower than that of the zeolites and therefore, the
dispersion was probably lower.
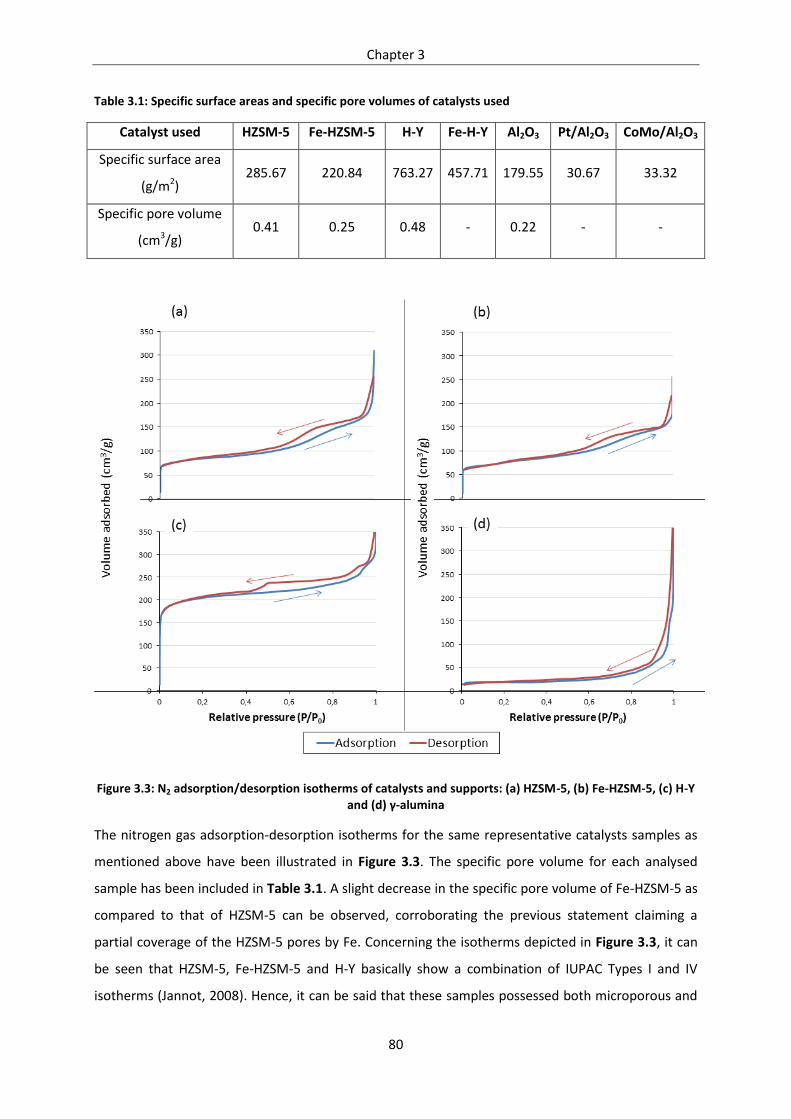
Chapter 3
80
Table 3.1: Specific surface areas and specific pore volumes of catalysts used
Catalyst used HZSM-5 Fe-HZSM-5 H-Y Fe-H-Y Al2O3 Pt/Al2O3 CoMo/Al2O3
Specific surface area
(g/m2) 285.67 220.84 763.27 457.71 179.55 30.67 33.32
Specific pore volume
(cm3/g) 0.41 0.25 0.48 - 0.22 - -
Figure 3.3: N2 adsorption/desorption isotherms of catalysts and supports: (a) HZSM-5, (b) Fe-HZSM-5, (c) H-Y and (d) γ-alumina
The nitrogen gas adsorption-desorption isotherms for the same representative catalysts samples as
mentioned above have been illustrated in Figure 3.3. The specific pore volume for each analysed
sample has been included in Table 3.1. A slight decrease in the specific pore volume of Fe-HZSM-5 as
compared to that of HZSM-5 can be observed, corroborating the previous statement claiming a
partial coverage of the HZSM-5 pores by Fe. Concerning the isotherms depicted in Figure 3.3, it can
be seen that HZSM-5, Fe-HZSM-5 and H-Y basically show a combination of IUPAC Types I and IV
isotherms (Jannot, 2008). Hence, it can be said that these samples possessed both microporous and

Chapter 3
81
mesoporousstructures.γ-Alumina displayed a slightly different isotherm than the others (closer to
IUPACTypeIII);thismaybeduetothesmallersurfaceareaofγ-alumina relative to the zeolite-based
catalysts, which translated to a lower pore volume (0.22 cm3/g).
- FT-IR acidity analysis
For the acidity characterisation, after pyridine adsorption, the stepwise desorption of the catalysts
used was performed at 100, 150, 200, 300 and 400 °C. Figure 3.4 represents the spectra obtained for
the Fourier transform infrared (FT-IR) at 300 °C of the catalysts samples used in this study. The
spectra at all temperatures exhibited the same tendency; the figures can be found in Annex B
(Figures B.1 to B.4).
Figure 3.4: IR spectra of catalysts at 300 °C
Catalysts are known to possess two kinds of acid sites. Firstly, for those in the H-form, the hydroxyl
groups linking Si and Al atoms are said to have strong Brønsted acid properties. Then, Lewis acid sites
are usually associated with extra-framework Al and O species (Ward, 1970). Concerning the IR
spectra obtained for the catalyst supports (HZSM-5, H-Yandγ-alumina), the presence of bands at
1436 and 1580 cm-1, characteristic of Brønsted acid sites, as well as bands at 1482 and 1596 cm-1,

Chapter 3
82
representing Lewis acid sites, were noted. The principal effect of the metal modification on the
supports can be observed as a decrease in the acid bands; however, only those present at 1482 and
1596 cm-1 have been completely reduced, providing evidence that the Lewis acid sites were occupied
by metal ions. These same observations were previously reported by Lobree et al. (1999), validating
the metal impregnation.
3.3.3 Effect of quantity of catalyst used
Several studies investigating the effect of using different catalyst loadings (catalyst-to-biomass ratios)
have been published in literature (Naqvi et al., 2015; Payormhorm et al., 2013; Puértolas et al.,
2016). The reason behind this is that for heterogeneous catalytic systems, the contact time between
the catalyst and biomass, or vapour, is an important parameter (Garcia et al., 1998). Therefore, in the
course of this study, we have studied the effect of catalyst loading on the composition of the bio-oil.
The experiment done with Fe-HZSM-5 will be taken as case in point; the parameters have been listed
in Table 3.2. It should be noted that the nitrogen flow rate used was 500 mL/min and the apparent
porosity of Fe-HZSM-5 was 0.61. The equation used to calculate the contact time was the following:
Contact time = Volume of catalytic bed × (1 − apparent porosity)
Nitrogen flow rate
Table 3.2: Parameters for experimental runs concerning effect of catalyst-to-biomass ratio used
Mass of Fe-
HZSM-5 used (g)
Height of Fe-
HZSM-5 bed (cm)
Volume of
catalytic bed
(cm3)
Catalyst-to-
biomass ratio
used
Contact time (s)
6 2.5 26.55 2:1 1.94
12 5.0 53.09 4:1 3.89
28 10.0 106.19 9:1 7.77
Firstly, it was observed that by changing the contact time from 1.94 s to 3.89 s, the bio-oil was de-
oxygenated by a large margin: from 34.33 mol. % to 23.84 mol. % and 17.31 mol. %, respectively (as
shown in Figure 3.5). On the other hand, utilising a contact time of 7.77 s did further de-oxygenate
the bio-oil produced, but not by a significant amount, causing the oxygen content to drop only to
16.18 mol. %.
As for the evolution of the different chemical families present in the bio-oil samples with the
different catalyst loadings, it was seen that the use of higher amounts of catalyst caused the liquid
products to decrease and boosted the gaseous products, which is in line with previous studies (Imran
et al., 2016) and acts as proof that de-oxygenation was indeed taking place. Another major

Chapter 3
83
observation was that the phenolic content increased to reach a maximum at the catalyst-to-biomass
ratio of 4:1, while that of other oxygenates decreased (see Figure 3.5). What can be gleaned from
this is that using higher catalyst loadings may continually lower the bio-oil oxygen content; however,
for catalyst-to-biomass ratios of more than 4:1, any further improvement remained negligible. More
details on the different percentages of the chemical families have been given in Annex B (Table B.1).
Figure 3.5: Oxygen and phenolics content of bio-oil samples obtained with and without catalytic treatment (for pyrolysis of flax shives at 500 °C with Fe-HZSM-5)
3.3.4 Performance of catalysts in terms of de-oxygenation activity
It should be noted that the presence of oxygen in biomass-derived oil is the primary reason why the
latter is highly functionalised. This elevated functionality diminishes the stability of the bio-oils and
commonly results in polymerisation (Gunawardena and Fernando, 2013). A direct consequence is the
increase in viscosity of bio-oils with time, low pH values and low heating values (Naqvi et al., 2015;
Yoo et al., 2016). Hence, removal of oxygen (de-oxygenation) of these bio-oils prior to their use is of
paramount importance. This is the reason why out of all the catalysts studied during this work, the
one which caused the most important drop in oxygen content was considered the most performant
one. Figure 3.6 illustrates the different percentages of oxygen obtained for beech wood and flax
shive bio-oils with and without catalytic treatment. It should be noted that the oxygen content
denoted here was the one calculated only from the chemical molecules present in the bio-oils.
Further calculations have been presented in Annex B.

Chapter 3
84
Figure 3.6: Oxygen content of bio-oil samples obtained with and without catalytic treatment
From Figure 3.6, it is quite apparent that the most efficient catalyst was the Fe-HZSM-5, reducing the
bio-oil content from 33.82 mol. % to 17.50 mol. % for beech wood and 34.76 mol. % to 17.31 mol. %
for flax shives. HZSM-5, which was long touted as being the most performant catalyst for de-
oxygenation (Gunawardena and Fernando, 2013), presented the second best efficiency, bringing the
oxygen level for beech wood down to 18.40 mol. % and to 18.42 mol. % for flax shives. The catalysts
that followed in terms of de-oxygenation efficiency were Fe-H-Y and H-Y. It can be claimed that the
addition of Fe on the zeolite matrices considerably improved their de-oxygenation efficiency.
However, the γ-alumina-supported catalysts did not have a very significant impact on the oxygen
content of the bio-oils. Despite the fact that some researchers reported successful de-oxygenation
through the sole use of these catalysts (Wang et al., 2008), our results remained nonetheless
coherent with what has been presented by the majority of authors (Garcia et al., 1998; Mortensen et
al., 2011; Mullen and Boateng, 2008; Zhang et al., 2016; Zheng et al., 2016): these catalysts are
better used in hydro de-oxygenation (HDO) processes, where, in the presence of a high pressure of
hydrogen, they are more efficient.

Chapter 3
85
3.3.5 Effect of catalytic treatment on pyrolytic products distribution
Judging the performance of the catalysts based on the oxygen content of the bio-oils gives an idea of
their efficiency. However, no knowledge can be garnered concerning the effect that the catalyst
utilisation has on the different pyrolytic products. Figure 3.7 shows the different product (liquid,
char, gas) distributions obtained for beech wood and flax shives at 500 °C with and without catalytic
treatment, brought to 100 %. Furthermore, the effect of these different catalysts on the bio-oil and
non-condensable gas compositions was also investigated during the course of this study. The results
gathered concerning the chemical families present in the pyrolytic bio-oils and the non-condensable
gas components from beech wood and flax shives obtained at 500°C with and without any catalytic
treatment have been presented in Tables 3.4 and 3.5.
Figure 3.7: Liquid product distributions for (a) beech wood and (b) flax shives with and without catalytic treatment
From Figure 3.7, it can first be noted that the addition of catalysts inhibited liquid formation while
boosting gas production, pointing to the fact that de-oxygenation (removal of CO, CO2 and H2O) was
indeed taking place. As for the solid fraction, it could be observed that it was not significantly
impacted. Then, it can be seen that in the oils obtained without any catalytic treatment, the major
chemical family present was carboxylic acids, with 36.36 mol. % in the case of beech wood and 37.26
mol. % in that of flax shives. The most significant families following acids were phenols and ketones.
It is also worth noting that these were the families contributing most in terms of oxygen content. As
for the non-condensable gases, CO2 and CO were the major components for beech wood and flax
shives, respectively. Also, the water content of the different bio-oils has been presented in Table 3.3.
It was observed that HZSM-5 tended to favour the production of water, hence the dehydration

Chapter 3
86
reaction, as compared to its iron-modified counterpart. The same observation can be made for H-Y
as compared to Fe-H-Y. As for the metal-based catalysts, CoMo/Al2O3 showed a preference towards
the dehydration reaction relative to Pt/Al2O3. The production of water from the metal-based
catalysts may arise from hydro de-oxygenation (HDO) as well; the presence of H2 gas may prompt the
metal-based catalysts to undergo HDO and give birth to some water formation.
Table 3.3 : Water content of bio-oil samples
Biomass Catalyst used Water content (wt. %) Standard error (%)
Beech wood
No catalyst 2.39 0.14
HZSM-5 6.06 0.06
Fe-HZSM-5 5.45 0.10
H-Y 3.81 0.05
Fe-H-Y 2.63 0.26
Pt/Al2O3 3.33 0.01
CoMo/Al2O3 4.65 0.33
Flax shives
No catalyst 1.23 0.04
HZSM-5 5.45 0.23
Fe-HZSM-5 5.08 0.07
H-Y 3.92 0.08
Fe-H-Y 2.73 0.18
Pt/Al2O3 1.86 0.01
CoMo/Al2O3 3.76 0.29

Chapter 3
87
Table 3.4: Percentages (mol. %) of chemical families present in bio-oil samples with and without catalytic treatment
mol. %
Beech wood bio-oils Flax shive bio-oils
No
catalyst
HZSM-
5
Fe-
HZSM-5 H-Y Fe-H-Y Pt/Al2O3
CoMo/
Al2O3
No
catalyst
HZSM-
5
Fe-
HZSM-
5
H-Y Fe-H-Y Pt/
Al2O3
CoMo/
Al2O3
Carboxylic
acids 36.36 7.50 - 19.83 13.99 23.52 35.31 37.26 - - 30.78 7.83 33.62 36.25
Alkanes 0.85 - - - - 2.91 2.19 2.01 - - - - 2.51 1.38
Aromatics 4.83 13.28 8.97 8.07 4.89 7.77 5.18 4.54 12.15 10.51 7.11 5.26 5.19 4.13
Alcohols 7.36 7.47 5.09 8.61 5.83 12.28 8.88 11.02 9.27 5.79 9.25 5.37 13.52 7.29
Aldehydes 3.62 1.75 1.04 1.87 1.31 4.29 1.81 3.33 0.57 0.82 1.46 2.44 1.84 0.43
Amides 3.92 3.82 - 5.30 2.27 2.36 1.25 3.48 3.22 1.36 3.74 2.24 2.09 0.50
Ketones 10.26 6.21 7.30 5.29 3.79 9.69 10.37 8.53 5.35 9.04 3.84 3.52 15.26 14.53
Esters 9.58 5.42 - 11.41 3.53 10.83 5.17 10.85 1.49 - 11.35 1.89 6.55 3.87
Furans 2.16 4.56 3.99 3.08 2.74 1.03 2.19 0.76 3.04 5.64 2.65 2.54 1.18 1.89
Guaiacols 1.34 3.06 2.07 4.10 1.44 0.91 0.88 1.30 1.05 1.66 3.21 1.39 - 1.06
Phenols 14.46 46.92 71.53 32.43 60.22 16.96 22.05 12.92 63.86 65.18 26.62 67.54 12.54 23.86
Carbohydrates 5.26 - - - - 7.45 4.72 3.99 - - - - 5.70 4.80

Chapter 3
88
Table 3.5: Percentages (vol. %) of gaseous components present in non-condensable gas samples with and without catalytic treatment
vol. %
Beech wood non-condensable gases Flax shive non-condensable gases
No
catalyst
HZSM-
5
Fe-
HZSM-5 H-Y Fe-H-Y Pt/Al2O3 CoMo/Al2O3
No
catalyst
HZSM-
5
Fe-
HZSM-
5
H-Y Fe-H-Y Pt/Al2O3 CoMo/Al2O3
H2 1.04 0.93 15.28 1.13 10.10 36.23 6.97 1.30 1.35 13.77 1.42 10.03 31.91 6.91
CO 44.61 49.60 28.61 52.38 35.52 24.67 42.22 35.39 42.34 25.83 42.87 28.38 25.41 33.46
CO2 39.99 32.36 38.61 28.67 34.46 29.73 37.08 50.18 35.79 43.41 38.79 41.59 32.10 44.91
CH4 11.38 5.26 6.18 11.87 14.78 8.49 11.04 10.51 7.29 6.31 11.50 14.17 8.34 10.24
C2H4 1.64 6.66 5.10 3.04 2.31 0.39 1.47 1.40 6.81 4.92 2.86 2.13 0.66 1.43
C2H6 1.13 0.46 1.46 1.09 0.94 0.48 0.83 1.20 0.85 0.65 1.40 1.11 0.66 1.05
C3H6 - 4.73 4.74 1.81 1.88 - 0.04 - 5.56 4.81 0.64 1.80 0.64 1.36

Chapter 3
89
The effects of the different catalysts with respect to the various chemical groups present in the bio-
oil samples and the gaseous components in the non-condensable gas samples recovered have been
presented in terms of conversion and production percentages in Tables 3.6 and 3.7. The different
conversion and production rates of the various chemical families present in the bio-oil samples and
those of the non-condensable gas components have been calculated from the following formula:
%100
0
10
A
AA
Ax
xxx
Where Ax is the conversion rate of family A,
0Ax is the no. of moles of A obtained without de-oxygenation, and
1Ax is the no. of moles of A obtained after de-oxygenation.
It should be noted that a negative sign in front of a values indicates a reduction and a positive sign
indicates an increase, or a production. The “production”markingmeans that the chemical family, or
non-condensable gas component, was produced because of the catalytic treatment when it was not
present in the original, non-catalytic, product. Another important point is that the conversion rates
presented do not take into account the water content of the bio-oil, which was already subtracted from
the beginning of the calculations..
It was seen that the results obtained with both biomasses yielded approximately the same trend,
showing that they both reacted in the same manner despite having been collected differently. The
zeolites mostly impacted the carboxylic acids, with different degrees of effectiveness; the HZSM-5-based
catalysts were the most efficient ones in reducing the acids (-100 % for HZSM-5 and Fe-HZSM-5 for the
flax shive bio-oils), as compared to the H-Y-based catalysts (-55 % and -83 % for H-Y and Fe-H-Y,
respectively, for the flax shive bio-oils). As for the metal-based catalysts, CoMo/Al2O3 was more efficient
than Pt/ Al2O3 in reducing acids (-67 % for CoMo/ Al2O3 vs. -53 % for Pt/ Al2O3 for flax shive bio-oils).
However, the degree of effectiveness was very low in contrast to the zeolite-based catalysts.

Chapter 3
90
Table 3.6: Conversion and production rates of chemical families present in bio-oil samples obtained with and without catalyst use
Chemical families
Conversion(“-”sign)andproduction(“+”sign)rate(%)
Beech wood bio-oil Flax shive bio-oil
HZSM-5 Fe-HZSM-5 H-Y Fe-H-Y Pt/Al2O3 CoMo/Al2O3 HZSM-5 Fe-HZSM-5 H-Y Fe-H-Y Pt/Al2O3 CoMo/Al2O3
Carboxylic acids -84 -100 -69 -84 -53 -60 -100 -100 -55 -83 -53 -67
Alkanes -100 -100 -100 -100 +37 +223 -100 -100 -100 -100 +40 +291
Aromatics +372 +23 +159 +4 +217 +74 +133 +30 +60 +11 +122 +27
Alcohols -27 -83 -39 -70 +11 +48 N.C. -70 +1 -61 +37 +83
Aldehydes -65 -93 -73 -86 -20 -93 -80 -86 -47 -41 -38 +113
Amides -71 -100 -48 -95 -46 -29 -67 -95 -39 -89 -67 -98
Ketones -45 -78 -66 -82 -33 -65 -15 -31 -38 -62 +128 +60
Esters -61 -100 -40 -86 -31 -4 -83 -100 -46 -85 -29 +19
Furans +322 +27 +107 +35 -11 -329 +374 +324 +319 +168 +73 +734
Guaiacols +82 -58 +76 -55 -50 +168 -3 -27 +199 -14 -100 +289
Phenols +267 +92 +65 +151 +4 -24 +766 +305 +257 +505 +56 N.C.
Carbohydrates -100 -100 -100 -100 -20 -92 -100 -100 -100 -100 -41 -46
* N.C.: No Change (same as amount present in non-catalytic sample).

Chapter 3
91
Table 3.7: Conversion and production rates of non-condensable gas (NCG) components obtained with and without catalyst use
NCG components
Conversion (“-”sign)andproduction (“+”sign)rate (%)
Beech wood NCG Flax shives NCG
HZSM-5 Fe-HZSM-5 H-Y Fe-H-Y Pt/Al2O3 CoMo/Al2O3 HZSM-5 Fe-HZSM-5 H-Y Fe-H-Y Pt/Al2O3 CoMo/Al2O3
H2 +67 +4511 +116 +2565 +13960 +1173 +101 +2774 +79 +1837 +8199 +886
CO +109 +101 +132 +118 +123 +79 +131 +97 +98 +101 +142 +75
CO2 +52 +202 +42 +136 +199 +76 +38 +134 +26 +107 +116 +65
CH4 -13 +70 +106 +256 +200 +84 +34 +62 +79 +237 +168 +80
C2H2 -100 -100 -100 -100 -100 -100 N.C. N.C. N.C. Prod. N.C. Prod.
C2H4 +662 +874 +266 +286 -4 +70 +839 +849 +234 +280 +59 +88
C2H6 -23 +307 +92 +129 +71 +40 +37 +46 +90 +132 +85 +63
C3H4 Prod. N.C. Prod. Prod. Prod. Prod. -17 -19 +254 +2 +2 +121
C3H6 Prod. Prod. Prod. Prod. N.C. Prod. Prod. Prod. Prod. Prod. Prod. Prod.
C3H8 N.C. N.C. N.C. N.C. N.C. Prod. N.C. Prod. Prod. Prod. Prod. Prod.
* Prod.: Production (produced because of the catalytic treatment, not present in non-catalytic sample),
N.C.: No Change (same as amount present in non-catalytic sample).

Chapter 3
92
3.3.5.1 Effect of catalytic treatment on liquid product of biomass pyrolysis
Now, to better understand the effect of catalytic treatment on the liquid product, the results
obtained for each bio-oil has been analysed. Firstly, from Figure 3.7, it can be seen that for all the
experimental runs, the liquid product was the most significant one present. This result is logical given
the experimental conditions utilised and is in line with several other researches presented in
literature (Gayubo et al., 2004; Guo et al., 2009; Imran et al., 2016; Wang et al., 2008; Yang et al.,
2014). Similarly, from the same figure, it was observed that the use of any of the catalysts impeded
the liquid yield and boosted the gas yield. This observation holds true in that the presence of the
catalysts induced conversion of oxygenated molecules in order to form gaseous products (CO, CO2
and so on) and water. This fact is proof that de-oxygenation was indeed taking place. However, this
conversion causes the loss of some carbon atoms, albeit along with oxygen ones, to the gaseous
components (CO, CO2 and so on).
The effect of each catalyst on the carboxylic acid, phenol and ketone families was investigated as
they were the chemical groups representing the most important proportions in the bio-oil samples
obtained. The resulting graphs have been illustrated in Figure 3.8. Concerning carboxylic acids, the
trend touched upon earlier has been illustrated in Figure 3.8 (a). As carboxylic acids are the group
influencing most of the bio-oil’s characteristics andbehaviour (Guo et al., 2009; Mohabeer et al.,
2017), the efficiency of acid removal is a very important parameter to study. As can be seen from
Figure 3.8 (a), the efficiency of HZSM-5-based zeolites in reducing the carboxylic acid group was very
apparent, while the γ-alumina-supported catalysts did not have much of an impact on the acid
content. What can also be observed concerning the zeolites is that the addition of Fe caused the
efficiency of the catalysts to reduce acids to increase; the conversion rate increased from -84 % for
HZSM-5 to -100 % for Fe-HZSM-5 and from -69 % for H-Y to -84 % for its iron-modified version, both
in the case of beech wood bio-oil samples. The same trend was observed for the flax shive bio-oils. It
can thus be said that the addition of Fe on zeolite supports favoured the occurrence of the
decarboxylation reaction, and thus the production of CO2.
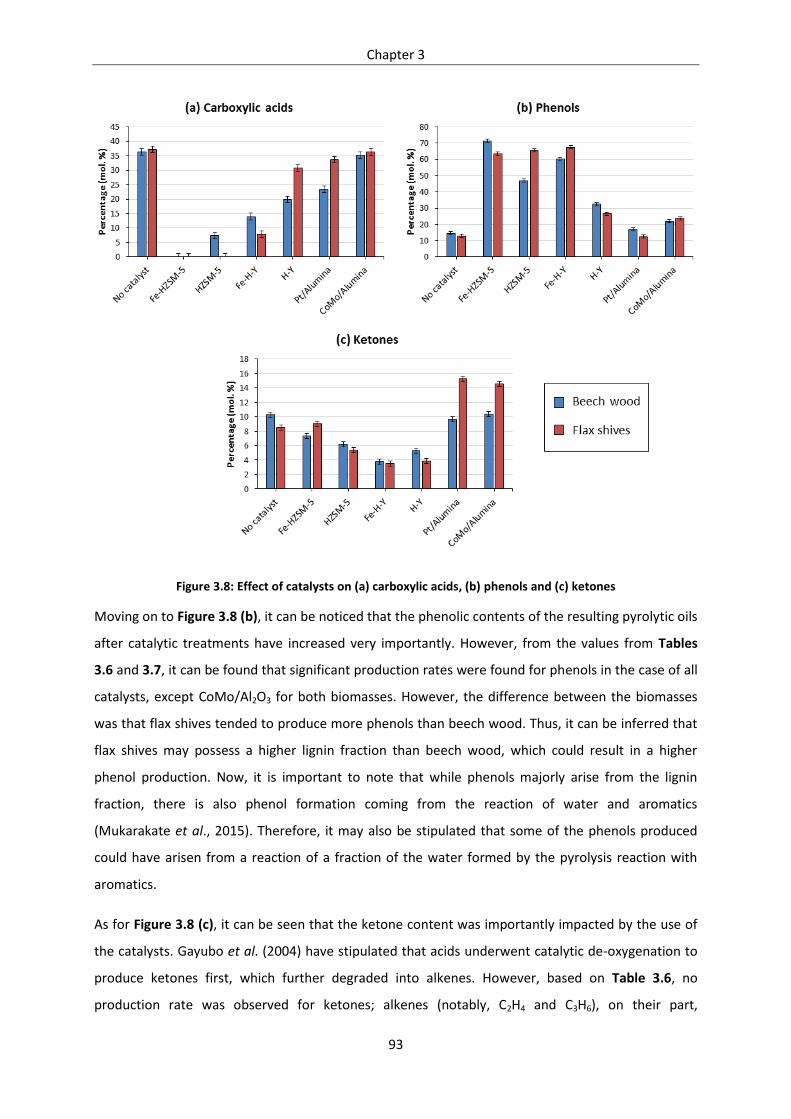
Chapter 3
93
Figure 3.8: Effect of catalysts on (a) carboxylic acids, (b) phenols and (c) ketones
Moving on to Figure 3.8 (b), it can be noticed that the phenolic contents of the resulting pyrolytic oils
after catalytic treatments have increased very importantly. However, from the values from Tables
3.6 and 3.7, it can be found that significant production rates were found for phenols in the case of all
catalysts, except CoMo/Al2O3 for both biomasses. However, the difference between the biomasses
was that flax shives tended to produce more phenols than beech wood. Thus, it can be inferred that
flax shives may possess a higher lignin fraction than beech wood, which could result in a higher
phenol production. Now, it is important to note that while phenols majorly arise from the lignin
fraction, there is also phenol formation coming from the reaction of water and aromatics
(Mukarakate et al., 2015). Therefore, it may also be stipulated that some of the phenols produced
could have arisen from a reaction of a fraction of the water formed by the pyrolysis reaction with
aromatics.
As for Figure 3.8 (c), it can be seen that the ketone content was importantly impacted by the use of
the catalysts. Gayubo et al. (2004) have stipulated that acids underwent catalytic de-oxygenation to
produce ketones first, which further degraded into alkenes. However, based on Table 3.6, no
production rate was observed for ketones; alkenes (notably, C2H4 and C3H6), on their part,

Chapter 3
94
experienced mostly production rates. It can thus be said that, during this study, ketones as
intermediates were not observed, contrary to Gayubo et al. (2004). Also, another observation is that
H-Y-basedcatalystsseemedtobemoreefficient inconvertingketones.Theγ-Al2O3-based catalysts
were the least efficient in converting ketones, and their use even resulted in ketone formation in the
case of flax shives.
Figure 3.9 illustrates the evolution of aromatic compound formation from the use of the catalysts for
the catalytic de-oxygenation of beech wood and flax shive bio-oils. Formation of aromatics is an
important factor to consider when speaking of the upgrading of bio-oils as these are the most
interesting bio-oil components. Figure 3.9 shows that the aromatics percentage in the upgraded bio-
oils increased with the use of all catalysts for both biomasses. These findings are in line with previous
works presented in literature (Chantal et al., 1984; Cheng et al., 2012; Dickerson and Soria, 2013;
French and Czernik, 2010; Jia et al., 2017). However, the interesting point here was that the
percentages obtained did not reflect the true happenings of the reaction. In Table 3.6, the
production and conversion rates of the different chemical families were calculated and presented. It
was thus observed that HZSM-5 had a higher aromatics production rate than Fe-HZSM-5, as did H-Y
relative to its iron-modified counterpart. For the metal-based catalysts, Pt/Al2O3 was more efficient
than CoMo/Al2O3 in producing aromatics. Based on these observations, it can be stated that the
addition of a metal on the original catalyst support inhibited the formation of aromatic compounds in
the enhanced bio-oil.
Figure 3.9: Effect on catalysts on aromatic compounds

Chapter 3
95
3.3.5.2 Effect of catalytic treatment on gaseous product of biomass pyrolysis
Almost all the gases analysed demonstrated production rates (as shown by Table 3.7). Figure 3.10
shows the evolution of CO, CO2, H2 and CH4, the major gas components present in the non-
condensable gases.
Figure 3.10: Evolution of CO, CO2, H2 and CH4 with and without catalytic treatment for (a) beech wood and (b) flax shives
It can be observed that CH4 demonstrated a rather constant trend in the case of the two biomasses
and with the use of all catalysts. Secondly, a notable difference between CO and CO2 can be seen;
non-condensable gases obtained without any catalytic treatment yielded more CO than CO2 in the
case of beech wood, while the inverse was detected for flax shives. The emission of these two gases
has been associated with hemicellulose and cellulose decomposition (Yang et al., 2007);
hemicellulose, possessing a higher carboxyl content, was said to emit more CO2, while cellulose
produced more CO due to thermal cracking of carbonyl groups. Therefore, based on the previous
statement, it can be claimed that the major gas contribution was made by the hemicellulosic fraction
for flax shives and by cellulose for beech wood. Another observation is that for the use of the same
catalyst on the two different biomasses, the same de-oxygenation routes were privileged. For
instance, the use of HZSM-5 and H-Y privileged the decarbonylation route (production of CO): +109 %
CO vs. +52 % CO2 for HZSM-5 and +132 % CO vs. +42 % for H-Y in the case of beech wood. The same
trend could be observed in the case of flax shives. Then, it was also observed that the addition of Fe
to the zeolite catalysts changed the de-oxygenation path favoured. Fe-HZSM-5 and Fe-H-Y tended to
privilege the decarboxylation pathway (production of CO2): +202 % CO2 vs. +101 % CO for Fe-HZSM-5
and +136 % CO2 vs. +118 % CO for Fe-H-Y, both in the case of beech wood, and again, the same trend
was noted in the flax shives case.

Chapter 3
96
Concerning H2, an opposite trend to that of CO can be noted. This is interesting as this opposite trend
can be related to the reverse water-gas shift reaction. However, it can be stipulated that if it were
the latter reaction causing this opposing relationship, the percentage of CO2 would have known a
similar trend as that of H2, and no specific similarities could be seen here. This observation can be
explained by the fact that it was not only the water-gas shift reaction at play in this case, the reaction
also depended on the reactivity of the catalyst (Naqvi et al., 2015). Hence, the production of CO2
from the decarboxylation of various chemical families can be said not to have been constant. Also,
the maximum amount of H2 collected involved the use of Pt/Al2O3, followed by Fe-HZSM-5 and Fe-H-
Y. Now, to the extent of our knowledge, not much research has been done on the gases emitted
during the catalytic de-oxygenation of biomass pyrolytic vapours using Pt/Al2O3, but, it has been
shown that metals supported on catalysts tend to induce hydrogenation/dehydrogenation reactions
(Rogers and Zheng, 2016). Therefore, it can be claimed that the presence of Pt and Fe on the
catalysts’surfacecauseddehydrogenation,emittingmoreH2 gas than the other catalysts.
3.3.6 PCA results
PCA is a very interesting statistical tool to use because it helps present a global view of the
performance of the catalysts used. In this study, it was employed especially to study the different
correlations and covariations that existed among the chemical families present in the bio-oil samples
and the gas components present in the non-condensable gas fraction obtained with and without
catalytic treatment. All in all, PCA synthetises the different observations obtained and helps in
noticing similar trends that different catalysts may have on the families present in the bio-oil and on
the gas components. The different plots obtained from running a PCA for the flax shives bio-oil and
non-condensable product samples can be found in Figure 3.11 (those concerning beech wood are
found in Annex B, Figure B.5).

Chapter 3
97
Figure 3.11: PCA of (a) bio-oil sample, and (b) non-condensable gas sample, of flax shives
3.3.6.1 PCA of bio-oil samples obtained from biomass pyrolysis
From loading plots (Figures 3.11 (a) (ii) and B.5 (a) (ii)), the behaviour of the different variables may
be examined. The elements which find themselves to be close together on the plot are said to exhibit
the same type of behaviour (Esbensen et al., 2002). Hence, it follows that the catalytic behaviour of
the two biomasses were noted to be approximately the same as, in both cases, the sub-groups
formed were similar. The bio-oil sample obtained with no catalytic treatment found itself on the
same side to the samples obtained with CoMo/Al2O3 and Pt/Al2O3. As mentioned earlier, these were
the two least efficient catalysts; thus, the oils they produced approached the most the non-catalytic
oil. This PCA enabled us to witness this behaviour without need of any further calculations. The same

Chapter 3
98
can be witnessed for the Fe-HZSM-5, HZSM-5 and Fe-H-Y, the three most efficient catalysts; they
were completely opposite to the non-catalytic oil.
As for the score plots presented in Figures 3.11 (a) (i) and B.5 (a) (i), the different branches represent
the variables (Esbensen et al., 2002), which here, were the different chemical families present in the
bio-oilsamples.Firstly,whatcanbegleanedfromthesefiguresarethe“important”variables,thatis,
variables that have a significant bearing on the behaviour of the bio-oils. These are the variables that
travel the most along the axes, especially the horizontal axis, as the latter represents 55.27 % of the
scattering for flax shives and 59.43 % for beech wood. So, for flax shives, the important variables
were carboxylic acids, phenols, alcohols and aromatics, while, for beech wood, they were carboxylic
acids, carbohydrates, furans and phenols. Also, when branches are found on directly opposite sides
of the axes, it is said that they present directly opposing correlations (Esbensen et al., 2002). For
instance, in the case of flax shives, carboxylic acids and phenols were found on opposing sides.
Hence, it can be said that they were negatively correlated with each other; when one was produced,
the other was reduced. This observation was proved by the fact that r = -0.95 for these two families.
Another important observation that can be made from comparing the two plots is the major
chemical family present in each bio-oil sample. The position of the branch in the loading plot
corresponding to the position of the element in the score plot secures this information (Esbensen et
al., 2002). For example, by comparing Figures 3.11 (a) (i) and (ii), it can be claimed that phenols,
aromatics and furans were the major families present in the oils obtained from flax shives involving
the use of HZSM-5 and Fe-HZSM-5.
3.3.6.2 PCA of gaseous components of non-condensable gas fraction
The same analysis procedure was applied for the non-condensable gas components for each
pyrolysis run (Figures 3.11 (b) and B.5 (b)). Again, beech wood and flax shives displayed
approximately the same catalytic behaviour according to their score plots. From the different loading
plots, it was hard to establish which of the different gas components obtained the important ones
were. As it can be seen, some of the branches presented a short magnitude; this means that the PCA
was not able to draw a solid conclusion concerning these variables. Hence, more in-depth analysis of
these variables is required. As for the comparison of the two plots for each sample, the use of Pt/
Al2O3 was associated with a high amount of H2. All these observations have been proven true by
previous analyses.
From these observations and analyses, it was determined that PCA can present itself to be a valuable
tool in obtaining a global view of the different behaviours of pyrolytic products and/or different

Chapter 3
99
catalysts tested in the installation without further analysis or calculations. More in-depth analysis can
thus follow the PCA to corroborate or dispute the drawn conclusions.
3.4 Conclusion
A detailed analysis of the liquid and gaseous pyrolytic products of catalytic de-oxygenation of two
biomasses (beech wood and flax shives) using different catalysts (HZSM-5, Fe-HZSM-5, H-Y, Fe-H-Y,
Pt/Al2O3 and CoMo/Al2O3) was presented through this study. The different pathways and reactions
through which aromatic compounds were produced from the catalytic de-oxygenation of flax shives
as compared to a conventional lignocellulosic biomass, beech wood, were also examined. Fe-HZSM-5
was deemed to be the most efficient of the catalysts utilised as it helped reach the lowest oxygen
contents in both bio-oils. The second best was HZSM-5. Secondly, it was found that HZSM-5 and H-Y
tended to privilege the decarbonylation route (production of CO), whilst their iron-modified
counterparts favoured the decarboxylation one (production of CO2) for both biomasses. Then, it was
found that the major bio-oil components (carboxylic acids) underwent almost complete conversion
under catalytic treatment to produce mostly unoxygenated aromatic compounds, phenols and gases
like CO and CO2. Phenols were seen to be the family most significantly formed from the actions of all
catalysts. Also, PCA was deemed to be a very interesting tool to be used before going into detailed
analysis so as to get an overall idea of the different behaviours, correlations and covariations existing
among various products collected from a wide array of experiments. Finally, it was also concluded
that at higher catalyst-to-biomass ratios of 4:1, de-oxygenation efficiency did not experience any
further significant improvement.
As for the upcoming study: the study of the catalytic de-oxygenation of the woody biomass
components, only the two most performant catalysts have been taken into account and have been
used during the course of the experiments.
3.5 References
(1). Aho, A., Kumar, N., Lashkul, A.V., Eränen, K., Ziolek, M., Decyk, P., Salmi, T., Holmbom, B.,
Hupa, M., Murzin, D.Y., 2010. Catalytic upgrading of woody biomass derived pyrolysis vapours
over iron modified zeolites in a dual-fluidized bed reactor. Fuel 89, 1992–2000.
https://doi.org/10.1016/j.fuel.2010.02.009
(2). Chantal, P., Kaliaguine, S., Grandmaison, J.L., Mahay, A., 1984. Production of hydrocarbons
from aspen poplar pyrolytic oils over H-ZSM5. Appl. Catal. 10, 317–332.
https://doi.org/10.1016/0166-9834(84)80127-X

Chapter 3
100
(3). Cheng, Y.-T., Jae, J., Shi, J., Fan, W., Huber, G.W., 2012. Production of Renewable Aromatic
Compounds by Catalytic Fast Pyrolysis of Lignocellulosic Biomass with Bifunctional Ga/ZSM-5
Catalysts. Angew. Chem. 124, 1416–1419. https://doi.org/10.1002/ange.201107390
(4). Deka, R.C., 1998. Acidity in zeolites and their characterization by different spectroscopic
methods. Indian J. Chem. Technol. 5, 109–123.
(5). Dickerson, T., Soria, J., 2013. Catalytic Fast Pyrolysis: A Review. Energies 6, 514–538.
https://doi.org/10.3390/en6010514
(6). Dumeignil, F., Sato, K., Imamura, M., Matsubayashi, N., Payen, E., Shimada, H., 2005.
Characterization and hydrodesulfurization activity of CoMo catalysts supported on sol–gel
prepared Al2O3. Appl. Catal. Gen. 287, 135–145. https://doi.org/10.1016/j.apcata.2005.03.034
(7). Esbensen, K.H., Guyot, D., Westad, F., Houmoller, L.P., 2002. Multivariate Data Analysis: In
Practice :anIntroductiontoMultivariateDataAnalysisandExperimentalDesign.Multivariate
Data Analysis.
(8). French, R., Czernik, S., 2010. Catalytic pyrolysis of biomass for biofuels production. Fuel
Process. Technol. 91, 25–32. https://doi.org/10.1016/j.fuproc.2009.08.011
(9). Garcia, L., Salvador, M.L., Arauzo, J., Bilbao, R., 1998. Influence of catalyst weight/biomass flow
rate ratio on gas production in the catalytic pyrolysis of pine sawdust at low temperatures. Ind.
Eng. Chem. Res. 37, 3812–3819.
(10). Gayubo, A.G., Aguayo, A.T., Atutxa, A., Aguado, R., Olazar, M., Bilbao, J., 2004. Transformation
of Oxygenate Components of Biomass Pyrolysis Oil on a HZSM-5 Zeolite. II. Aldehydes,
Ketones, and Acids. Ind. Eng. Chem. Res. 43, 2619–2626. https://doi.org/10.1021/ie030792g
(11). Gunawardena, D.A., Fernando, S.D., 2013. Methods and Applications of Deoxygenation for the
Conversion of Biomass to Petrochemical Products. https://doi.org/10.5772/53983
(12). Guo, Z., Wang, S., Zhu, Y., Luo, Z., Cen, K., 2009. Separation of acid compounds for refining
biomass pyrolysis oil. J. Fuel Chem. Technol. 37, 49–52. https://doi.org/10.1016/S1872-
5813(09)60010-4
(13). Imran, A.A., Bramer, E.A., Seshan, K., Brem, G., 2016. Catalytic Flash Pyrolysis of Biomass Using
Different Types of Zeolite and Online Vapor Fractionation. Energies 9, 187.
https://doi.org/10.3390/en9030187

Chapter 3
101
(14). Jannot, Y., 2008. Isothermes de sorption: Modèles et détermination.
(15). Jia, L., Raad, M., Hamieh, S., Toufaily, J., Hamieh, T., Bettahar, M., Mauviel, G., Tarrighi, M.,
Pinard, L., Dufour, A., 2017. Catalytic fast pyrolysis of biomass: superior selectivity of
hierarchical zeolite to aromatics. Green Chem. https://doi.org/10.1039/C7GC02309J
(16). Li, H., Yan, Y., Ren, Z., 2008. Online upgrading of organic vapors from the fast pyrolysis of
biomass. J. Fuel Chem. Technol. 36, 666–671. https://doi.org/10.1016/S1872-5813(09)60002-5
(17). Lobree, L.J., Hwang, I.-C., Reimer, J.A., Bell, A.T., 1999. Investigations of the State of Fe in H–
ZSM-5. J. Catal. 186, 242–253. https://doi.org/10.1006/jcat.1999.2548
(18). Mohabeer, C., Abdelouahed, L., Marcotte, S., Taouk, B., 2017. Comparative analysis of
pyrolytic liquid products of beech wood, flax shives and woody biomass components. J. Anal.
Appl. Pyrolysis 127, 269–277. https://doi.org/10.1016/j.jaap.2017.07.025
(19). Mortensen, P.M., Grunwaldt, J.-D., Jensen, P.A., Knudsen, K.G., Jensen, A.D., 2011. A review of
catalytic upgrading of bio-oil to engine fuels. Appl. Catal. Gen. 407, 1–19.
https://doi.org/10.1016/j.apcata.2011.08.046
(20). Mukarakate, C., McBrayer, J.D., Evans, T.J., Budhi, S., Robichaud, D.J., Iisa, K., Dam, J. ten,
Watson, M.J., Baldwin, R.M., Nimlos, M.R., 2015. Catalytic fast pyrolysis of biomass: the
reactions of water and aromatic intermediates produces phenols. Green Chem. 17, 4217–
4227. https://doi.org/10.1039/C5GC00805K
(21). Mullen, C.A., Boateng, A.A., 2015. Production of Aromatic Hydrocarbons via Catalytic Pyrolysis
of Biomass over Fe-Modified HZSM-5 Zeolites. ACS Sustain. Chem. Eng. 3, 1623–1631.
https://doi.org/10.1021/acssuschemeng.5b00335
(22). Mullen, C.A., Boateng, A.A., 2008. Chemical Composition of Bio-oils Produced by Fast Pyrolysis
of Two Energy Crops. Energy Fuels 22, 2104–2109. https://doi.org/10.1021/ef700776w
(23). Naqvi, S.R., Uemura, Y., Yusup, S., Sugiur, Y., Nishiyama, N., Naqvi, M., 2015. The Role of
Zeolite Structure and Acidity in Catalytic Deoxygenation of Biomass Pyrolysis Vapors. Energy
Procedia, Clean, Efficient and Affordable Energy for a Sustainable Future: The 7th International
Conference on Applied Energy (ICAE2015) 75, 793–800.
https://doi.org/10.1016/j.egypro.2015.07.126

Chapter 3
102
(24). Payormhorm, J., Kangvansaichol, K., Reubroycharoen, P., Kuchonthara, P., Hinchiranan, N.,
2013. Pt/Al2O3-catalytic deoxygenation for upgrading of Leucaena leucocephala-pyrolysis oil.
Bioresour. Technol. 139, 128–135. https://doi.org/10.1016/j.biortech.2013.04.023
(25). Puértolas, B., Keller, T.C., Mitchell, S., Pérez-Ramírez, J., 2016. Deoxygenation of bio-oil over
solid base catalysts: From model to realistic feeds. Appl. Catal. B Environ. 184, 77–86.
https://doi.org/10.1016/j.apcatb.2015.11.017
(26). Rogers, K.A., Zheng, Y., 2016. Selective Deoxygenation of Biomass-Derived Bio-oils within
Hydrogen-Modest Environments: A Review and New Insights. ChemSusChem 9, 1750–1772.
https://doi.org/10.1002/cssc.201600144
(27). TopaloǧluYazıcı,D.,Bilgiç,C.,2010.Determiningthesurfaceacidic properties of solid catalysts
by amine titration using Hammett indicators and FTIR-pyridine adsorption methods. Surf.
Interface Anal. 42, 959–962. https://doi.org/10.1002/sia.3474
(28). Wang, C., Hao, Q., Lu, D., Jia, Q., Li, G., Xu, B., 2008. Production of Light Aromatic
Hydrocarbons from Biomass by Catalytic Pyrolysis. Chin. J. Catal. 29, 907–912.
https://doi.org/10.1016/S1872-2067(08)60073-X
(29). Ward, J.W., 1970. Thermal decomposition of ammonium Y zeolite. J. Catal. 18, 348–351.
https://doi.org/10.1016/0021-9517(70)90331-3
(30). Yang, H., Yan, R., Chen, H., Lee, D.H., Zheng, C., 2007. Characteristics of hemicellulose, cellulose
and lignin pyrolysis. Fuel 86, 1781–1788. https://doi.org/10.1016/j.fuel.2006.12.013
(31). Yang, H., Yao, J., Chen, G., Ma, W., Yan, B., Qi, Y., 2014. Overview of Upgrading of Pyrolysis Oil
of Biomass. Energy Procedia, International Conference on Applied Energy, ICAE2014 61, 1306–
1309. https://doi.org/10.1016/j.egypro.2014.11.1087
(32). Yoo, M.L., Park, Y.H., Park, Y.-K., Park, S.H., 2016. Catalytic Pyrolysis of Wild Reed over a
Zeolite-Based Waste Catalyst. Energies 9, 201. https://doi.org/10.3390/en9030201
(33). Zhang, J., Wang, K., Nolte, M.W., Choi, Y.S., Brown, R.C., Shanks, B.H., 2016. Catalytic
Deoxygenation of Bio-Oil Model Compounds over Acid–Base Bifunctional Catalysts. ACS Catal.
6, 2608–2621. https://doi.org/10.1021/acscatal.6b00245
(34). Zheng, A., Jiang, L., Zhao, Z., Huang, Z., Zhao, K., Wei, G., Li, H., 2016. Catalytic fast pyrolysis of
lignocellulosic biomass for aromatic production: chemistry, catalyst and process. Wiley
Interdiscip. Rev. Energy Environ. n/a-n/a. https://doi.org/10.1002/wene.234

CHAPTER 4:
INVESTIGATING CATALYTIC DE-
OXYGENATION OF BIO-OIL FROM
CELLULOSE, XYLAN AND LIGNIN
PYROLYSIS USING HZSM-5 AND FE-
HZSM-5

Chapter 4
103
4. Investigating catalytic de-oxygenation of bio-oil from cellulose, xylan and
lignin pyrolysis using HZSM-5 and Fe-HZSM-5
4.1 Introduction
The purpose of this part of the study is to investigate the pyrolysis of the three principal components
of biomass (cellulose, hemicellulose and lignin) using the two most efficient catalysts (HZSM-5 and its
iron-modification, Fe-HZSM-5) so as to propose transformation schemes for the different de-
oxygenation reactions occurring through the use of these catalysts. BET specific surface area, BJH
pore size distribution and FT-IR technologies have been used to characterise the catalysts. The
effects of the two catalysts studied have been investigated by examining the composition of the bio-
oils and non-condensable gases produced. This part has been presented in the PYRO2018 conference
held in June 2018 in Kyoto and has been accepted as article in the Journal of Analytical and Applied
Pyrolysis (November 2018).
4.2 Experimental section
All the materials, experimental and analytical setups and tools used for this part of the study have
been detailed previously (Refer to Chapter 3, section 3.2). The only difference is the catalysts used;
out of the six studied in Chapter 3, the two best, Fe-HZSM-5 and HZSM-5, were chosen for this
particular part of the research work.
4.3 Results and discussion
4.3.1 Effect of catalyst use on pyrolytic product distributions of woody biomass
components
The pyrolysis of the three biomass components at 500°C with and without any catalytic treatment
yielded different product distributions. It should be noted that values exceeding 95 % were obtained
for all mass balances conducted, and all were brought to 100 %. The results obtained have been
illustrated in Figure 4.1, from which it can clearly be seen that the most significant amount of bio-oil
came from the pyrolysis of xylan and cellulose, with 79 wt. % and 77 wt. %, respectively. The largest
quantity of non-condensable gases was produced by cellulose pyrolysis (about 12 wt. %), while that
of lignin yielded more char than any other component, approximately 57 wt. %. Now, even though
xylan seemed to give rise to more liquid than the other two biomass components, it should be noted
that cellulose is present in a higher fraction in biomass; hence, it can be said that cellulose
contributed most in liquid and gas production. These experiments provided the product distribution

Chapter 4
104
of the pyrolysis of the three biomass components as conducted in a semi-batch reactor, under the
same operational conditions; and this provided the base of our study.
Figure 4.1: Effect of catalyst use on pyrolytic product distribution (a) for cellulose, (b) for xylan, and (c) for lignin
The use of catalysts had a significant impact on the product distribution of the biomass components.
Concerning cellulose and xylan, the use of the zeolites boosted gas production, while impeding that
of bio-oil. Also, as can be seen from Figure 4.2, the oxygen content of the bio-oils (oxygen present in
humidity notwithstanding) was quite impacted by the use of the catalysts. This result seems to
indicate that certain oxygenated compounds present in the pyrolytic vapours were de-oxygenated in
the presence of the catalysts to form more gaseous (CO, CO2 and H2) and water molecules. The only
exception was the lignin bio-oil, where the difference in oxygen content was insignificant. This may
be explained by the fact that the major part of lignin (57 wt. %) remained unconverted, and so, no
important change was observed. Also, a table listing the water content of the different bio-oils can
be found in Annex C (Table C.1). It could be seen that HZSM-5 tended to favour the formation of
water, and hence, the dehydration reaction, for all the biomass components as compared to the
iron-modified catalyst.

Chapter 4
105
Figure 4.2: Bio-oil oxygen content (mol. %)
4.3.2 Effect of catalyst use on bio-oil and non-condensable gas composition
The percentages of the different chemical families present in the bio-oils recovered and those of the
various components present in the non-condensable gases are listed in Tables 4.1 and 4.2. It is
clearly shown by the results obtained that without any catalytic treatment, the major part of
carboxylic acids present in the bio-oils came from xylan and lignin (24.68 mol. % and 14.01 mol. %,
respectively) while the bio-oil from cellulose mainly comprised of carbohydrates (42.84 mol. %).
Concerning the effect of catalyst use on the oxygen content of the bio-oil, Figure 4.2 showed that Fe-
HZSM-5 and HZSM-5 had about the same efficiency in terms of de-oxygenation; the use of both
catalysts reduced the oxygen content of cellulose and xylan quite significantly.

Chapter 4
106
Table 4.1: Composition (mol. %) of chemical families present in bio-oils
Chemical
groups in
bio-oil
mol. %
Cellulose Xylan Lignin
No catalyst HZSM-5 Fe-HZSM-5 No catalyst HZSM-5 Fe-HZSM-5 No catalyst HZSM-5 Fe-HZSM-5
Carboxylic
acids 7.04 - 2.12 24.68 2.31 - 14.01 - -
Alkanes 0.60 0.53 - 7.39 - - 9.68 14.61 100
Aromatics 4.76 26.62 23.18 3.58 16.08 15.08 10.00 - -
Alcohols 8.44 22.35 10.09 17.13 6.77 8.18 - - -
Aldehydes 5.58 1.21 1.81 3.46 2.06 0.77 - - -
Amides 2.93 2.02 1.54 8.43 1.10 1.82 5.84 15.09 -
Ketones 11.19 4.74 9.61 10.61 9.57 10.82 6.07 9.12 -
Esters 4.46 1.73 1.50 8.54 0.63 3.12 - - -
Furans 0.56 2.76 4.64 2.27 4.17 5.58 - - -
Guaiacols - - - 1.19 2.12 1.56 6.75 26.05 -
Phenols 11.63 38.05 45.51 9.91 55.19 53.07 47.66 35.13 -
Carbohydra-
tes 42.84 - - 2.82 - - - - -

Chapter 4
107
Table 4.2: Composition (vol. %) of components present in non-condensable gases
Non-
condensable
gases
components
vol. %
Cellulose Xylan (hemicellulose) Lignin
No catalyst HZSM-5 Fe-HZSM-5 No catalyst HZSM-5 Fe-HZSM-5 No catalyst HZSM-5 Fe-HZSM-5
H2 1.60 1.38 17.61 1.60 0.90 13.92 15.56 15.67 7.99
CO 54.80 61.43 38.68 46.59 60.16 40.00 9.54 11.39 7.85
CO2 34.27 23.66 33.63 43.78 24.98 34.49 59.97 58.67 64.35
CH4 3.67 2.74 2.45 5.37 2.47 2.83 11.35 12.27 18.36
C2H4 2.59 6.20 4.45 1.42 6.29 4.84 0.34 0.99 0.75
C2H6 0.66 0.38 0.27 0.99 0.40 0.34 3.23 0.82 0.70
C3H6 1.79 4.21 2.90 - 4.79 3.57 - 0.04 -

Chapter 4
108
An interesting point is that even though the same catalysts were used with respect to the three
biomass components, not the same families were impacted. For instance, de-oxygenation efficiency
notwithstanding, in the case of cellulose pyrolysis, the use of both catalysts resulted in reducing the
carbohydrates percentage. On the other hand, for xylan, the use of the catalysts brought down the
carboxylic acids percentage. The same phenomenon was noted with lignin, where the catalyst
activityaffectedthephenolspercentage.Thisobservationledtotheconclusionthata“competition”
existed within the chemical families present; the catalysts mainly targeted the group present in a
higher percentage in the bio-oil.
To better compare the different results obtained when utilising the catalysts, the conversion and
production rates of the different chemical families in the bio-oils, and those of the non-condensable
gas components were used as reference. The calculations done to obtain these values have been
presented in Annex B. These values have been tabulated in Tables 4.3 and 4.4. Also, Figure 4.3
illustrates the evolution of the percentages of the major chemical families for each bio-oil sample
with and without catalyst use. It can be seen (from Figure 4.3) that the above-mentioned observation
holds true: the evolution of the same chemical group varied for each biomass component.
Table 4.3: Conversion and production rates of chemical families present in bio-oils
Chemical
families
Conversion rate (-%) and production rate (+%)
Cellulose +
HZSM-5
Cellulose +
Fe-HZSM-5
Xylan +
HZSM-5
Xylan + Fe-
HZSM-5
Lignin +
HZSM-5
Lignin + Fe-
HZSM-5
Carboxylic
acids -100 -90 -95 -100 -100 -100
Alkanes -43 -100 -100 -100 -3 -9
Aromatics +257 +61 +130 +5 -100 -100
Alcohols +69 -61 -80 -88 No change No change
Aldehydes -86 -89 -70 -94 No change No change
Amides -56 -83 -93 -95 +67 -100
Ketones -73 -72 -54 -75 -3 -100
Esters -75 -89 -96 -91 No change No change
Furans +215 +174 -6 -39 No change No change
Guaiacols No change No change -9 -67 +149 -100
Phenols +109 +29 +185 +34 -52 -100
Carbohydrates -100 -100 -100 -100 No change No change
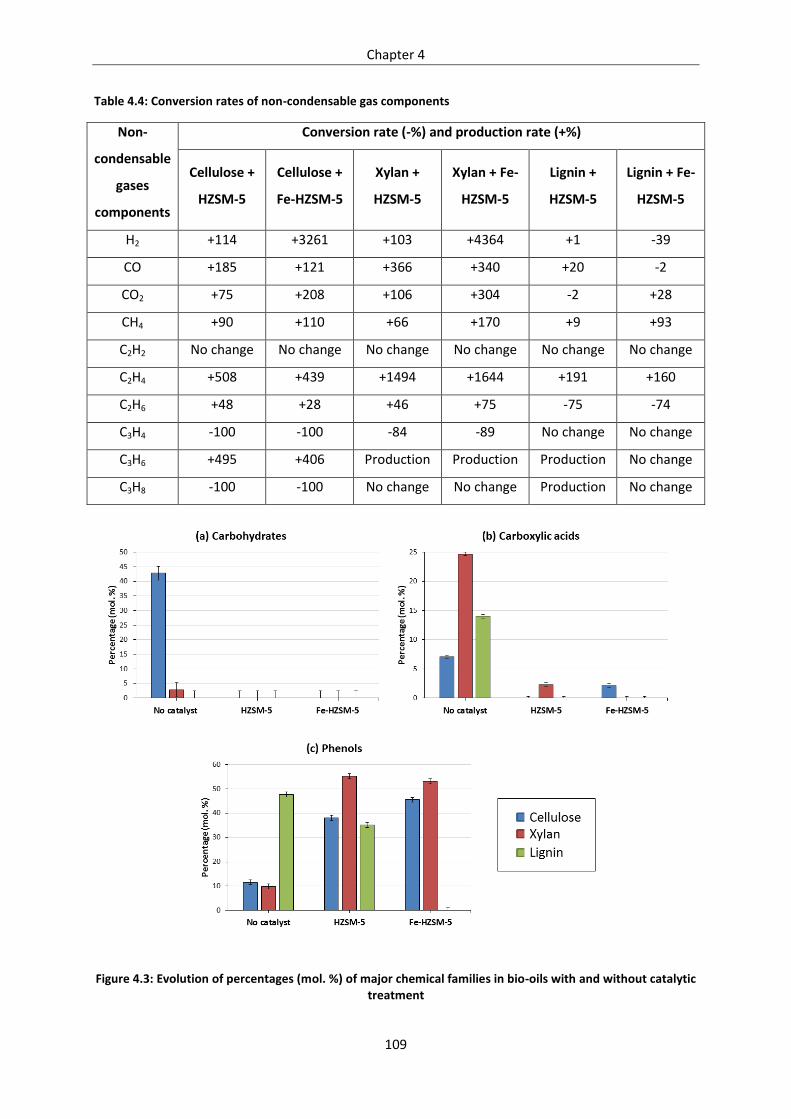
Chapter 4
109
Table 4.4: Conversion rates of non-condensable gas components
Non-
condensable
gases
components
Conversion rate (-%) and production rate (+%)
Cellulose +
HZSM-5
Cellulose +
Fe-HZSM-5
Xylan +
HZSM-5
Xylan + Fe-
HZSM-5
Lignin +
HZSM-5
Lignin + Fe-
HZSM-5
H2 +114 +3261 +103 +4364 +1 -39
CO +185 +121 +366 +340 +20 -2
CO2 +75 +208 +106 +304 -2 +28
CH4 +90 +110 +66 +170 +9 +93
C2H2 No change No change No change No change No change No change
C2H4 +508 +439 +1494 +1644 +191 +160
C2H6 +48 +28 +46 +75 -75 -74
C3H4 -100 -100 -84 -89 No change No change
C3H6 +495 +406 Production Production Production No change
C3H8 -100 -100 No change No change Production No change
Figure 4.3: Evolution of percentages (mol. %) of major chemical families in bio-oils with and without catalytic treatment

Chapter 4
110
Now, Mullen and Boateng (2015) presented the possibility that phenol formation was inhibited by
the addition of Fe on an HZSM-5 support; this statement can be confirmed by our observations. From
Tables 4.3 and 4.4, it can be observed that HZSM-5 had a more pronounced selectivity towards
phenol production as compared to Fe-HZSM-5 (HZSM-5: +109 % for cellulose and +185 % for xylan vs.
Fe-HZSM-5: +29 % for cellulose and +34 % for xylan). Another observation that was noted was that
the addition of Fe suppressed the formation of aromatics; HZSM-5 had a higher production rate than
its iron-modification when it came to aromatics (122 % more for cellulose and 119 % more for xylan).
4.3.2.1 Effect of catalyst on products of cellulose pyrolysis
If the results obtained for cellulose are examined, it can be seen that there was a complete reduction
of carbohydrates with both HZSM-5 (-100 %) and Fe-HZSM-5 (-100 %). However, it could be seen that
the use of HZSM-5 resulted in a high production of aromatics (+257 %), but also some oxygenated
chemical families like furans and phenols; meanwhile, the use of Fe-HZSM-5 did lead to the
formation of phenols and furans, but, the percentages produced were much lower, while the
aromatics formation was less significant (+61 %). This difference is explained when the conversion
rates of the gaseous components are analysed: the production rates of H2 and CO2 were noticeably
higher with Fe-HZSM-5 than with HZSM-5. These observations can prompt the supposition that the
use of Fe-HZSM-5 favoured the production of gas molecules over other oxygenated liquid
components and water molecules.
4.3.2.2 Effect of catalyst on products of xylan pyrolysis
There were a few noticeable differences between the data obtained for the pyrolysis of xylan
without and with catalytic treatment and those for cellulose. These differences are logical and can be
explained by the different structures of cellulose and xylan (Patwardhan, 2010). An important
observation is that while almost carbohydrates were converted by the use of catalysts for cellulose,
for xylan, the carboxylic acid group was the one targeted by the catalysts. Almost complete reduction
was achieved by using both catalysts (-95 % with HZSM-5 and -100 % with Fe-HZSM-5). Now, the
difference in product distribution when utilising the two catalysts could be seen in the products
formed by the catalytic activity: for HZSM-5, the end product was mainly phenols and aromatics, with
a less significant formation of gas molecules like CO and C2H4, while for the iron-modified catalyst,
only an important production of the gas molecules H2, CO, CO2 and C2H4 was observed, strengthening
the previously-drawn observation about the catalytic activity of Fe-HZSM-5, and contradicting the
findings of Zhu et al. (2010).

Chapter 4
111
4.3.2.3 Effect of catalyst on products of lignin pyrolysis
The behaviour of lignin was completely different from those of cellulose and xylan. Again, this
observation can be explained by the differences in the structures of the three biomass components
(Patwardhan, 2010). However, in this case, there was absolutely no correlation in the catalytic
behaviour. Phenols were found to be the major family present in the lignin bio-oil and they were
indeed impacted by the use of the catalysts (-52 % for HZSM-5 and -100 % for Fe-HZSM-5); however,
it should be noted that a very low liquid yield was obtained from lignin (57 wt. % was recovered as
solid residue). The commercial lignin used in this study was chosen based on its frequent use in
literature (Abdelouahed et al., 2017; Choi and Meier, 2013; Farag et al., 2016; Maldhure and Ekhe,
2013; Zhou et al., 2015). It should however not be forgotten that the extraction method used to
separate lignin from a biomass, the interactive forces that exist between the three biomass
components when they are intertwined and the presence of minerals influence greatly the behaviour
of the said lignin. Hence, the chosen lignin for this research might not be representative of the
behaviour of actual lignin as present in biomass.
4.3.3 Further discussion
Concerning the evolution of non-condensable gas molecules, an interesting observation was made
pertaining to the CO and CO2 emitted with the use of the catalysts. The gas percentages have been
illustrated in Figure 4.4. However, the percentages themselves can be misleading for, from Table 4.4,
it can be seen that while the use of HZSM-5 did boost the production of CO for all three biomass
components (+185 %, +366 % and +20 % for cellulose, xylan and lignin, respectively), that of Fe-
HZSM-5 privileged the production of CO2 (+208 %, +304 % and +28 % for cellulose, xylan and lignin,
respectively). From these observations, it can be inferred that the use of HZSM-5 privileged the
decarbonylation route over decarboxylation one, while the opposite can be said for Fe-HZSM-5.

Chapter 4
112
Figure 4.4: Evolution of percentages (vol. %) of major non-condensable gas components with and without catalytic treatment
Comparing the different production and conversion rates investigated during the course of the study
enabled the proposal of the conversion schemes for different chemical families. The proposals put
forwardareillustratedinthispart.“Modelmolecules”,that is, the most abundant molecule present
in each family, were taken to represent each chemical group; a detailed list of these molecules can
be found in Annex C (Table C.2). Conversion schemes have only been proposed for the major
chemical families in each bio-oil sample from three biomass components.
- Cellulose
In the case of cellulose, the major family were carbohydrates and the main compound found was
levoglucosan. The conversion schemes obtained when using HZSM-5 and its iron-modification have
been illustrated in Figure 4.5 (a) and (b). From the latter figures, it can be seen that the common
molecule formed following the activities of both catalysts is a furan. This observation is coherent in
the light of studies led by Mullen and Boateng (2015): levoglucosan underwent dehydration to form
furans, then through decarboxylation to produce aromatics, olefins, CO, CO2, water and coke.
However, from our results, it was apparent that decarbonylation, not decarboxylation, was
predominant in the HZSM-5 activity (formation of CO), while decarboxylation was predominant in
that of Fe-HZSM-5 (production of CO2). Another difference noted was the production of hydrogen

Chapter 4
113
gas; the utilisation of the iron-modified zeolite seemed to enhance significantly the production of
hydrogen in the non-condensable gases.
Figure 4.5: Conversion mechanism of the major chemical family in cellulose with (a) HZSM-5 and (b) Fe-HZSM-5
- Xylan
In the same manner as above, the schemes for the conversion reactions of carboxylic acids with
HZSM-5 and Fe-HZSM-5 have been shown in Figure 4.6 (a) and (b). From the results obtained, it can
be inferred by the processes of dehydration, decarbonylation and decarboxylation did take place
(formation of water, CO and CO2). However, Gayubo et al. (2004) have stipulated that acids
underwent catalytic de-oxygenation to produce ketones first, which further degraded into alkenes.
Our observations did not corroborate this statement as our results showed that along with alkenes
(C3H6), other products like unoxygenated aromatics, phenols and other light gases were also formed.
This alternate observation can be explained by the difference in vapour residence time; Gayubo et al.
(2004) having used a residence time shorter than the one used in this study. Hence, no intermediate
products (ketones, in this case) were seen during our experiments.

Chapter 4
114
Figure 4.6: Conversion mechanism of the major chemical family in xylan with (a) HZSM-5 and (b) Fe-HZSM-5
- Lignin
Finally, the transformation scheme for the conversion of the major constituents of lignin (phenols)
has been presented in Figure 4.7 (a) and (b). From the latter figure, it can be seen that the difference
between the two catalysts was the same as in the previous instances (transformation schemes for
cellulose and xylan); HZSM-5 favoured decarbonylation and formation of guaiacols while the iron-
modified HZSM-5 gave rise to decarboxylation.
Figure 4.7: Conversion mechanism of the major chemical family in lignin with (a) HZSM-5 and (b) Fe-HZSM-5
4.4 Conclusion
This study aimed at presenting a detailed analysis of the liquid and gaseous pyrolytic products of the
three principal components of biomass (cellulose, hemicellulose and lignin) using the two most
efficient catalysts found in the previous chapter: HZSM-5 and its iron-modification, Fe-HZSM-5 (See
Chapter 3) in the same experimental setup and under the same operating conditions. The goal was to

Chapter 4
115
be able to present transformation schemes for the catalytic de-oxygenation of the biomass
components and thus determine the provenance of aromatic compounds in the liquid product so as
to get a better idea of the composition of bio-oil to be used as a bio-fuel. It was firstly found that a
“competition”aroseduetothepresenceofacatalyst;ratherthanonesinglechemicalfamilybeing
targeted, the family which was present in majority was the one converted by the catalyst. Secondly,
it was found that HZSM-5 tended to privilege the decarbonylation route (production of CO), whilst
Fe-HZSM-5 favoured the decarboxylation one (production of CO2) for the same feed. It was also seen
that cellulose contributed most in terms of liquid and gas molecules, while lignin gave rise to mostly
solid particles. This can prompt the supposition that a pre-treatment aiming at getting rid of the
lignin fraction may enhance the quality of the final products formed, and may also increase the
catalyst lifetime. Finally, from the transformation schemes, it was seen that even though both
catalysts boosted the aromatics production, HZSM-5 produced more aromatics than its iron-
modification. It was also observed that HZSM-5 formed more phenols, and hence, more coke, than
Fe-HZSM-5.
4.5 References
(1). Abdelouahed, L., Leveneur, S., Vernieres-Hassimi, L., Balland, L., Taouk, B., 2017. Comparative
investigation for the determination of kinetic parameters for biomass pyrolysis by
thermogravimetric analysis. J. Therm. Anal. Calorim. 129, 1201–1213.
https://doi.org/10.1007/s10973-017-6212-9
(2). Choi, H.S., Meier, D., 2013. Fast pyrolysis of Kraft lignin—Vapor cracking over various fixed-bed
catalysts. J. Anal. Appl. Pyrolysis 100, 207–212. https://doi.org/10.1016/j.jaap.2012.12.025
(3). Farag, S., Mudraboyina, B.P., Jessop, P.G., Chaouki, J., 2016. Impact of the heating mechanism
on the yield and composition of bio-oil from pyrolysis of kraft lignin. Biomass Bioenergy 95,
344–353. https://doi.org/10.1016/j.biombioe.2016.07.005
(4). Gayubo, A.G., Aguayo, A.T., Atutxa, A., Aguado, R., Olazar, M., Bilbao, J., 2004. Transformation
of Oxygenate Components of Biomass Pyrolysis Oil on a HZSM-5 Zeolite. II. Aldehydes,
Ketones, and Acids. Ind. Eng. Chem. Res. 43, 2619–2626. https://doi.org/10.1021/ie030792g
(5). Maldhure, A.V., Ekhe, J.D., 2013. Pyrolysis of purified kraft lignin in the presence of AlCl3 and
ZnCl2. J. Environ. Chem. Eng. 1, 844–849. https://doi.org/10.1016/j.jece.2013.07.026
(6). Mullen, C.A., Boateng, A.A., 2015. Production of Aromatic Hydrocarbons via Catalytic Pyrolysis
of Biomass over Fe-Modified HZSM-5 Zeolites. ACS Sustain. Chem. Eng. 3, 1623–1631.
https://doi.org/10.1021/acssuschemeng.5b00335
(7). Patwardhan, P., 2010. Understanding the product distribution from biomass fast pyrolysis.
Grad. Theses Diss.
Chapter 4
116
(8). Zhou, H., Long, Y., Meng, A., Chen, S., Li, Q., Zhang, Y., 2015. A novel method for kinetics
analysis of pyrolysis of hemicellulose, cellulose, and lignin in TGA and macro-TGA. RSC Adv. 5,
26509–26516. https://doi.org/10.1039/C5RA02715B
(9). Zhu, X., Lu, Q., Li, W., Zhang, D., 2010. Fast and catalytic pyrolysis of xylan: Effects of
temperature and M/HZSM-5 (M = Fe, Zn) catalysts on pyrolytic products. Front. Energy Power
Eng. China 4, 424–429. https://doi.org/10.1007/s11708-010-0015-z

CHAPTER 5:
INVESTIGATING PYROLYSIS OF
BIOMASS IN A DROP TUBE REACTOR
WITH AND WITHOUT CATALYTIC
TREATMENT

Chapter 5
117
5. Investigating pyrolysis of biomass in a drop tube reactor with and
without catalytic treatment
5.1 Introduction
This part presents a continuous setup for the pyrolysis reaction: the drop tube reactor (DTR), also
known as the entrained flow reactor or the free fall reactor. This reactor was connected to a fixed
bed catalytic reactor so as to study the effect of this kind of setup on the pyrolytic products as a
comparison to the semi-continuous system and also, attempt to monitor the de-activation of the
catalyst. Firstly, the pyrolysis of beech wood without the use of catalysts was investigated by varying
the DTR reactor temperature (500, 550 and 600 °C) and the gas residence time by varying the
nitrogen flow rate (500, 1000 and 2000 mL/min). The liquid, gas and solid products were analysed by:
GC-MS and Karl Fischer titration for liquids and GC-FID/TCD for liquids and gas and
thermogravimetric analysis (TGA) for solids. Then, 1.48 g of catalyst was placed in the fixed bed
reactor, the temperature of which was varied (425, 450 and 500 °C). The liquid and gaseous products
formed were collected periodically in time and analysed so as to examine the de-activation of the
catalyst.
5.2 Experimental section
5.2.1 Materials used and layout of experimental setup
All the materials used throughout this study, that is, the biomass (beech wood) and the catalyst
(HZSM-5), have already been presented and detailed (Refer to Chapter 3, section 3.2). The
characterisation methods for the catalysts were also the same.
The experimental runs were performed in a continuous drop tube reactor coupled with a catalytic
fixed bed reactor, as is illustrated by Figure 5.1. Quite similarly to the setup used in the semi-
continuous experiments, this setup also possessed two reactors: a pyrolysis and a catalysis one. The
use of such a configuration has been proven to enhance liquid yield, which is the main focus of this
study (Li et al., 2008). However, the difference with the semi-continuous setup was that in this case,
the two zones were independently controlled. This meant that the pyrolysis reaction could occur at a
different temperature from the de-oxygenation reaction. This kind of setup also allows following the
catalytic de-activation and coke formation occurring only because of the pyrolytic vapours.

Chapter 5
118
Figure 5.1: DTR layout
- Biomass and carrier gas feeding systems
A screw conveyor (GLD 77.0, Tremie 5L from Gericke) was used to feed biomass into the reactor
through the top of the DTR. Information on the calibration of the conveyor has been detailed in
Annex D.
- DTR
The DTR was 2.37 m high and had 0.053 m as internal diameter. The heated length of the pyrolysis
zone was 2 m high, with the same internal diameter. Two electrical resistances were placed around a
stainless steel tube to ensure the heating at any desired temperature, and the whole installation was
insulated using a silica coat (thickness = 10 cm).
- Char collection and separation
A char collector was placed at the bottom of the DTR to gather the solid residues of the biomass
pyrolysis. The collector was 0.016 m high and has an external diameter of 0.017 m. It was heated to a

Chapter 5
119
temperature of 300 °C by a custom-madeheatingshell (purchasedfrom“Jeannot”) toensurethat
the pyrolytic vapours penetrating it did not condense. However, some of the fine char particles
tended to get entrained by the gas/vapour flow and escaped the char collector. In order to separate
these particles from the gaseous flux, two cyclones were placed at the vapour exit of the DTR. The
two cycloneswere identical anddesignedwith the helpof the “Cyclone Software”program; their
efficiency was about 85 %. The dimensions of the cyclones have been illustrated in Annex D, Figure
D.2.
- Fixed bed reactor
A stainless steel fixed bed reactor having an internal diameter of 0.0131 m was located at the exit of
the second cyclone. A bed of catalyst was then placed inside the reactor. It should be noted that the
whole system (except the catalytic fixed bed reactor, which was regulated independently) was kept
at a temperature of 300 °C to prevent the condensation of the pyrolysis vapours.
- Liquid and gas product collection
The vapours coming through at the exit of the fixed bed reactor were condensed to be recovered as
a bio-oil. The cooling system consisted of a condenser and a flask held in a cold bath, all maintained
at -10 °C. The flask possessed an exit at its top, which permitted the escape of the non-condensable
fraction of the reaction products. This fraction, the non-condensable gases, consisting of CO, CO2,
CH4, H2, C2 hydrocarbons and C3 hydrocarbons, were then sent on to the analytical setup to be
analysed. A 45 µm paper filter was placed at the mouth of the analytical equipment to ensure the
blockage of particles which could damage the apparatus.
5.2.1.1 Experimental procedure
The whole experimental setup was heated upstream to the cooling system to avoid the condensation
of the pyrolytic vapours, as mentioned earlier. The different temperatures used throughout the
experimental setup have been listed in Table 5.1.
Table 5.1: Temperatures used at different parts of experimental setup
DTR Fixed bed reactor Cyclones Char collector Cooling system
Temperature (°C) 500-600 300-500 300 300 -10
For the experiments without any catalyst use, the pyrolysis experiments were performed by varying
the DTR temperature (500, 550 and 600 °C) and the nitrogen flow rate (500, 1000 and 2000 mL/min).
The insulation of the whole setup, apart from the DTR itself, was ensured by rock wool. For each
experiment, the DTR was fed with 2 g/min of biomass. The DTR was set to the desired temperature,

Chapter 5
120
the nitrogen flow was measured at the exit to ensure no leakages and the setup was then left to
stabilise for two hours. After this period, the biomass was fed and the reaction allowed to take place
for 60 minutes. It was seen that the steady state was only reached after about 20 minutes. After the
experiment, the same procedure used for the semi-continuous setup was used: the heat was turned
off and the setup allowed to cool down to temperatures below 150 °C so as to permit the collection
of the solid char without it burning at the contact of air. After cooling, the oil was recovered by using
acetone with 99.98% purity, with a known added amount of nonane, as internal standard.
Concerning the experiments involving the presence of a catalyst, a bed of 2 cm high (1.48 g) of
catalyst was placed in the fixed bed reactor. The catalyst bed was held in place by thin layers of
quartz wool placed at its top and bottom. The same experimental procedure as described above was
used for these experiments. The only difference was that the bio-oil was collected and the non-
condensable gases were analysed at 10 minutes intervals so as to monitor any variation in their
composition with time.
5.2.2 Analytical tools and methods
Along with the various analytical tools and methods described previously: GC-MS, GC-FID, GC-
FID/TCD, Karl Fischer titration and PCA (See Chapter 2, section 2.2.4, 2.2.5, 2.2.6 and Chapter 3,
section 3.2.4.1 and 3.2.5), this study made use of another method that will be further developed in
this part.
5.2.2.1 Thermogravimetric analysis (TGA)
Char sample collected at the end of each experiment was analysed by TGA (TA Instrument Explorer
Q600) so as to determine the degree of conversion of the biomass. A 5 to 10 mg sample was placed
in a ceramic crucible under a 50 mL/min nitrogen flow. The char sample was then heated up to 800
°C with a heating rate of 15 °C/min, and finally, was held at constant temperature during 15 minutes.
5.3 Results and discussion
5.3.1 Pyrolysis without catalytic treatment
The pyrolysis of beech wood in the DTR was investigated by varying the DTR temperature (500, 550
and 600 °C) and the residence time of the pyrolysis vapours (by using 500, 1000 and 2000 mL/min N2
as carrier gas). In this case, the whole setup downstream of the DTR was maintained at 300 °C
(including the fixed bed reactor). The different experiments conducted have been listed in Table 5.2.
It should be noted that the vapour residence time has been calculated based on the nitrogen flow
rate.

Chapter 5
121
Table 5.2: List of pyrolysis experiments without catalyst use
DTR temperature (°C) Nitrogen flow rate (mL/min)* Vapour residence time (min)
500 500 9.27
500 1000 4.63
500 2000 2.32
550 500 9.27
550 1000 4.63
550 2000 2.32
600 500 9.27
600 1000 4.63
600 2000 2.32
*Measured at room temperature and pressure
5.3.1.1 Effect on pyrolysis product distribution
As mentioned earlier, different parameters were varied during the course of this study. Figure 5.2
demonstrates the different values obtained for the mass balances of the various experimental runs.
It should be noted that values of more than 85 % were found experimentally. The gap in the values
can be explained by the fact that even if every effort was made to recover all of the liquid produced,
there still was a fraction that remained on the walls of the DTR installation and was lost. Hence, the
mass balances were completed to 100 % with respect to the liquid fraction.
Figure 5.2: Mass balances of experiments performed without catalyst use

Chapter 5
122
What can be observed from the previous figure is that firstly, the lowest temperature (500 °C)
corresponded to the highest amount of char produced (between 13 and 18 wt. %) and the lowest
amount of non-condensable gases formed (between 28 to 30 wt. %). In contrast to the former
observations, 600 °C, the highest temperature tested produced the lowest amount of char (around 9
to 10 wt. %) and the highest amount of non-condensable gases (49-55 wt. %). Now, the results
obtained for the degree of conversion of the biomass by TGA under a nitrogen flow rate of 500
mL/min have been illustrated in Figure 5.3.
Figure 5.3: Degree of biomass conversion (TGA) at different DTR temperatures under 500 mL/min N2
It can be seen from the above figure that the evolution of the char percentage and that of the degree
of conversion tended to follow opposite trends, as did the evolution of the bio-oil percentage and
that of the gas percentage. Hence, it can be claimed that the higher the temperature, the higher the
gas production, and the lower the liquid formation. This observation is logical in that at higher
temperatures, cracking reactions are favoured (Fan et al., 2014), and so, the larger liquid molecules
are broken down to form smaller gaseous ones. This also corroborates our previous observations
(Mohabeer et al., 2017).
It was also seen that the experiment at 500 °C under 500 mL/min N2 yielded the highest amount of
bio-oil (58.8 wt. %). These conditions were also the ones resulting in the highest liquid product yield
in the semi-continuous setup (see Chapter 2). Hence, these operating conditions were adopted for
the whole series of experiments involving catalyst use undertaken in this part of the study.

Chapter 5
123
5.3.1.2 Effect of gas residence time on pyrolytic liquid and gas products
- Liquid product composition
As mentioned earlier, the carrier gas (N2) flow rate was varied from 500 to 2000 mL/min. This
variation induced a difference in the gas residence time in the DTR. The ensuing residence times have
been listed in Table 5.2. The different liquid product compositions obtained for the pyrolysis of beech
wood at 500 °C in the DTR have been illustrated in Figure 5.4. Those obtained for the experiments
conducted at other temperatures have been tabulated in Table D.1, found in Annex D.
Figure 5.4: Liquid product compositions obtained for pyrolysis of beech wood at 500 °C in DTR
Here, as can be seen, the product compositions have not altered much even though the vapour
residence times have more than halved (9.27 min to 4.63 min to 2.32 min). Some further calculations
were performed to get an idea about the happenings during the reaction. These calculations can be
found in Annex D. It was seen from these calculations that the biomass particle residence time in the
reactor was 2.20 s, which was much lower than the gas residence time, as specified above. This
observation meant that the limiting parameter, that is, the parameter that controlled the formation
of products and the dynamics of the reaction, was the biomass particle residence time, and not the
gas residence time. This points to the fact that even if the carrier gas flow rate is increased, hence
reducing vapour residence time, no significant change will be brought to the liquid product
distribution as long as the pyrolysis reaction takes place in the same pyrolysis regime, that is, where
the biomass particle residence time is shorter than the gas residence time. This observation has also
been verified by Guizani et al. (2017), Jahirul et al. (2012)and Ellens (2009).

Chapter 5
124
- Gas product composition
NCG gas analysis was also performed while the N2 flow rate was varied. Figure 5.5 represents the
different NCG compositions obtained at 500, 1000 and 2000 mL/min N2 at 500 °C, while those
obtained at the higher temperatures have been summarised in Table D.2 (Annex D).
Figure 5.5: Gas product compositions obtained for pyrolysis of beech wood at 500 °C in DTR
From the above figure, the same observation as for the liquid product composition can be made:
increasing the carrier gas flow rate did not impact significantly the NCG composition. Hence, the
same deduction can be made in this case: if the pyrolysis regime is not changed, even though the
vapour residence time changes, the gas product distribution is not importantly altered.
5.3.1.3 Effect of DTR temperature on pyrolytic liquid and gas products
- Liquid product composition
For the various families to be more visually representative, pie charts were built for each
temperature and nitrogen flow rate used. Figure 5.6 is an example of the chemical families present in
pyrolytic oil of beech wood obtained at 500 °C under 500 mL/min N2 in the DTR, as compared to the
bio-oil obtained under the same conditions in the semi-continuous setup used in Chapter 2. Similar
diagrams were built for each bio-oil produced; the results obtained have been tabulated and can be
found in Annex D (Table D.1).
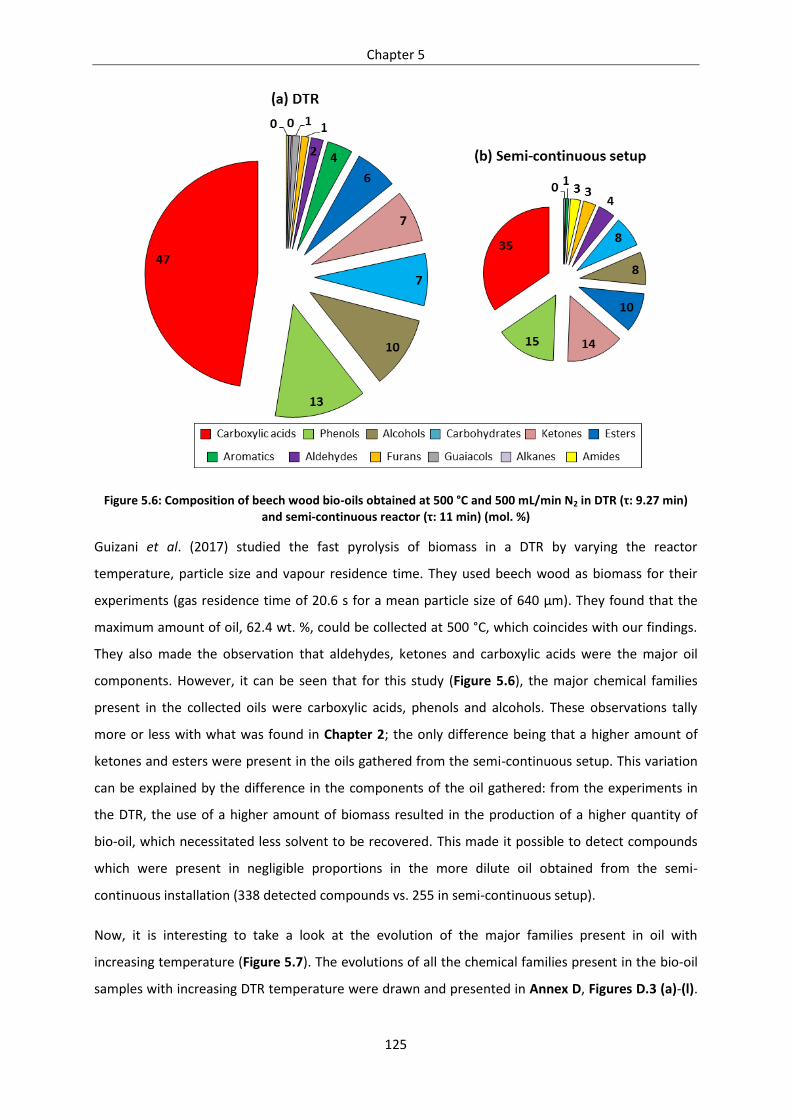
Chapter 5
125
Figure 5.6: Composition of beech wood bio-oils obtained at 500 °C and 500 mL/min N2 in DTR (τ: 9.27 min) and semi-continuous reactor (τ: 11 min) (mol. %)
Guizani et al. (2017) studied the fast pyrolysis of biomass in a DTR by varying the reactor
temperature, particle size and vapour residence time. They used beech wood as biomass for their
experiments (gas residence time of 20.6 s for a mean particle size of 640 µm). They found that the
maximum amount of oil, 62.4 wt. %, could be collected at 500 °C, which coincides with our findings.
They also made the observation that aldehydes, ketones and carboxylic acids were the major oil
components. However, it can be seen that for this study (Figure 5.6), the major chemical families
present in the collected oils were carboxylic acids, phenols and alcohols. These observations tally
more or less with what was found in Chapter 2; the only difference being that a higher amount of
ketones and esters were present in the oils gathered from the semi-continuous setup. This variation
can be explained by the difference in the components of the oil gathered: from the experiments in
the DTR, the use of a higher amount of biomass resulted in the production of a higher quantity of
bio-oil, which necessitated less solvent to be recovered. This made it possible to detect compounds
which were present in negligible proportions in the more dilute oil obtained from the semi-
continuous installation (338 detected compounds vs. 255 in semi-continuous setup).
Now, it is interesting to take a look at the evolution of the major families present in oil with
increasing temperature (Figure 5.7). The evolutions of all the chemical families present in the bio-oil
samples with increasing DTR temperature were drawn and presented in Annex D, Figures D.3 (a)-(l).

Chapter 5
126
It can be seen from Figure 5.7 that both the percentages of carboxylic acids and alcohols tended to
decrease with increasing temperatures, while phenols demonstrated the opposite trend. This is not
quite similar with what was found by using the semi-continuous setup (Refer to Figures 2.5, 2.7 and
A.6).
Figure 5.7: Evolutions of major bio-oil components with increasing DTR temperature (τ:9.27min)
The decrease in carboxylic acid percentages coincided with a sharp increase in the phenols
percentage. As mentioned earlier (See Chapter 3, section 3.3.6.1), carboxylic acids and phenols
shared a negatively correlated tendency; that is, when one experienced an increase, the other
experienced a decrease. This phenomenon is well-demonstrated in the above figure. Now, the
difference with the results obtained from the first configuration of the semi-continuous setup can be
explained again by the fact that more molecules were detected this time around, but also by the
varying conditions of the two reactors. This fact demonstrates the subsequent differences that may
be experienced when changing a reaction from lab to pilot scale, but also when changing the
reaction technology from discontinuous to continuous.
Now, the PCA of the bio-oils produced at 500 mL/min N2 at different temperatures has been
illustrated in Figure 5.8. The major observation was that aromatics displayed a negative correlation
to almost all the “important” variables present in the bio-oils (carboxylic acids, ketones,
carbohydrates, alcohols and esters). This means that a decrease in those oxygenated families
engendered an increase in the formation of aromatic compounds, which are essential to the
composition of a performant bio-fuel.

Chapter 5
127
Figure 5.8: PCA of beech wood bio-oil samples in DTR at 500 mL/min N2 without catalyst
- Gas product composition
The same analysis as for liquid composition was made for the non-condensable gas composition.
Non-condensable gases (NCG) are mostly composed of CO, CO2, CH4 and H2. In this case, C2H2, C2H4
and C2H6 (represented as ‘C2’) and C3H4, C3H6 and C3H8 (represented as ‘C3’) have also been
quantified. Figure 5.9 depicts the gas product distribution obtained for a sample at 500 °C under 500
mL/min in the DTR, as compared to that obtained under the same experimental conditions in the
semi-continuous reactor. Similar diagrams depicting the NCG compositions obtained by varying the
reaction conditions were drawn and the results have been listed in Table D.2, found in Annex D.
Figure 5.9: Composition of beech wood NCG obtained at 500 °C in DTR and semi-continuous reactor (vol. %)

Chapter 5
128
Firstly, it can be seen that the species present in majority was CO (58 vol. %). This results tallies with
the findings of Guizani et al. (2017) (58.4 vol. %), and was not very far from what was found when the
semi-continuous setup was used. However, the gas product distribution itself altered slightly when
the DTR was used: a higher amount of each gas fraction was detected. This may have had to do with
the fact that, as with the liquid fraction, a larger amount of beech wood was fed in the DTR as
compared to the semi-continuous setup and this resulted in a higher quantity of NCG being formed,
making it easier to detect smaller gas molecules as they are less diluted in the carrier gas. Also, if the
evolution of each NCG component at 500 mL/min N2 gas flow were analysed with mounting reactor
temperature, the graph depicted by Figure 5.10 would be obtained. The evolutions obtained with
other flow rates have been represented in Annex D, Figures D.4 and D.5.
Figure 5.10: Evolution of NCG components with DTR temperature under 500 mL/min N2
The evolutions of the NCG composition at different DTR temperatures remained quite feeble: a peak
of CO was noticed at 550 °C while CO2 percentage tended to decrease with increasing pyrolysis
temperature. All other gas components, excluding C3, experienced an increase in percentage as the
reactor temperature increased. The general trend of an increase in CO and a decrease in CO2 with
mounting reaction temperature, observed with the discontinuous setup (see Annex A, Figure A.11)
was somewhat altered through the use of the DTR. Here, while CO2 did experience a reduction in its
percentage, the CO percentage remained quite stable. However, when the quantitative values are
glanced at, it could be observed that the CO volume did experience an increase, corroborating the

Chapter 5
129
previous theory that heightening the reaction temperature favoured cracking reactions and hence,
the generation of gas molecules.
5.3.1.4 Water content of liquid products
The water content for each experiment was obtained by the Karl Fischer volumetric titration. The
results have been detailed in Figure 5.11. It can be seen that an increase in DTR temperature caused
the water content to increase (maximum water content: 48 wt. % at 600 °C under 1000 mL/min N2),
which coincided with the decrease in certain chemical families like alcohols, carbohydrates and
carboxylic acids. Similar observations have been noted by Lehto et al. (2013). Hence, it can be
stipulated that increasing the reaction temperature favoured the dehydration reaction of the afore-
mentioned chemical groups.
Figure 5.11: Water content (wt. %) of bio-oils obtained from each experimental run
5.3.1.5 Oxygen content of liquid products
The major challenge to bio-oil use remains their elevated oxygen content, which renders them highly
functionalised (Adjaye and Bakhshi, 1995). This high functionality is the cause behind the elevated
viscosity, high acidity, low calorific value and instability of the bio-oils. Hence, getting an idea of the
oxygen content coming from the bio-oil components (oxygen from humidity not included) is essential
to understanding the behaviour of the oil and to finding a way to enhance their properties. Figure
5.12 depicts the evolution of the oxygen content of the bio-oils obtained at different temperatures of
the DTR under various N2 flow rates.

Chapter 5
130
Figure 5.12: Oxygen content (mol. %) of bio-oils obtained from all experimental runs
It can be seen that the oxygen content deceased with mounting DTR temperature. This observation
goes along the fact that higher reaction temperatures tend to privilege cracking reactions, and hence,
smaller, gas molecules formation. Therefore, at higher temperatures, less liquid is recovered and
some of the oxygen atoms have escaped in the gas fraction. However, the overall oxygen content of
the bio-oils remain quite elevated (29-40 mol. %) as compared to that of fossil-derived fuels (~1 %)
(Xiu and Shahbazi, 2012). This brings us to the importance of upgrading the bio-oil so as to improve
its properties as a potential liquid bio-fuel.
5.3.2 Pyrolysis with catalytic treatment
The aim of this part of the research is to study the catalytic activity of HZSM-5 and Fe-HZSM-5 and
eventually, their de-activation during the course of the de-oxygenation of the bio-oils formed in the
DTR. In order to do so, as illustrated in Figure 5.1, a fixed bed catalytic reactor was placed at the exit
of the DTR. A catalyst mass of 1.48 g, corresponding to a catalyst bed volume of 2.70 mL, was used
foralltheexperiments.Thecatalysts’apparent porosity was 0.61. The contact time was estimated to
be 0.20 s between the gas and the catalyst bed. The temperature of the fixed bed reactor was varied
(425, 450 and 500 °C) so as to study the effect on the pyrolytic products. It should be noted that
before conducting these experiments, experiments without any catalyst use were performed by
varying the temperature of the empty fixed bed reactor so as to get matching bench references.
These experiments have thus been listed in Table 5.3. The DTR temperature and the carrier gas flow
rate were fixed at 500 °C and 500 mL/min, respectively, because these conditions ensured the
maximum bio-oil yield.

Chapter 5
131
Table 5.3: Experimental runs involving use of catalyst
DTR temperature (°C) N2 flow rate used
(mL/min)
Catalytic fixed bed
reactor temperature
(°C)
Catalyst used
500 500
400 -
425 -
500 -
400 HZSM-5
425 HZSM-5
500 HZSM-5
5.3.2.1 Effect of catalyst use on pyrolysis product distribution
It has already been shown (Refer to Chapter 3, section 3.3.5) that the presence of a catalyst boosted
NCG formation and inhibited liquid formation as the de-oxygenation process took place. Figure 5.13
confirms these findings, even though the reaction took place in the DTR (a percentage error of ~1 %
was found). The product distributions presented in Figure 5.13 were those recovered from t = 0 min
until the end of the reaction. It can also be noticed that even at a temperature of 425 °C, the HZSM-5
catalyst was performant and efficient in de-oxygenating the pyrolytic vapours.
Figure 5.13:Catalytic effect on pyrolytic product distribution

Chapter 5
132
5.3.2.2 Effect of varying fixed bed reactor temperature on pyrolytic liquid and gas products
- Liquid product composition
As was seen earlier (see Chapter 3, section 3.3.5.1), catalyst use impacted significantly the pyrolytic
liquid product distribution in the semi-continuous reactor. Now, in the DTR, the de-oxygenation
reaction takes place continually. The main aims of the experiments about to be presented were to
investigate the catalytic performance in the continuous regime, the effect of the bed temperature on
the products formed and the stability of the catalyst in time during the course of the reaction as it
was observed in literature that the catalyst, after some time of use, starts losing some of its activity
and starts to de-activate (Cerqueira et al., 2008; Mukarakate et al., 2014; Paasikallio et al., 2014;
Vitolo et al., 2001). This de-activation usually affects the pyrolytic product distribution and in the
semi-continuous reactor, very obvious changes were observed in the percentages of the various
chemical groups present in the upgraded bio-oils (see Chapter 3).
1) Investigating catalytic performance during continuous pyrolysis and effect of catalytic fixed
bed reactor temperature on products formed
So as to get an appropriate visual representation of the liquid product composition in the DTR, pie
charts were drawn. Figure 5.14 illustrates the liquid product distribution obtained for an
experimental run at 500 °C DTR temperature, 500 mL/min N2 and 500 °C catalytic fixed bed reactor
temperature at reaction time, t = 10 min, as compared to the results obtained in the semi-continuous
reactor (see Chapter 3). The various compositions obtained have been listed in Annex D, in Table
D.3.
Figure 5.14: Liquid product composition at t = 10 min in DTR and catalytic fixed bed reactor temperature 500 °C vs. semi-continuous reactor 500 °C with HZSM-5

Chapter 5
133
It can be seen that the liquid product distribution differed quite fundamentally. Primarily, the acid
percentage did not decrease as dramatically as it did in the semi-continuous reactor (55 mol. % vs. 8
mol. %). Among the several reasons behind this observation stands the fact that in the semi-
continuous reactor, a contact time of about 3.89 s was found between the gas and the catalyst,
whereas in the catalytic fixed bed reactor, the contact time was about 0.20 s. The high efficiency of
the catalyst in the semi-continuous reactor is thus explained. The low percentage of phenols as
compared to the semi-continuous reactor can also be explained by the fact that there was a lower
amount of catalyst present, and so, a lower production of phenols. It could nonetheless be noted
that certain highly oxygenated families like carbohydrates did indeed diminish due to the presence of
the catalyst, proving that the catalyst did contribute in the de-oxygenation of the bio-oil produced.
- Analysis of carboxylic acids evolution with rising catalytic fixed bed reactor temperature
Figure 5.15 depicts the percentage (mol. %) of the carboxylic acids as obtained in the bio-oils
collected at different catalytic fixed bed reactor temperatures, along with the mass flow rate (g/min)
of the carboxylic acids at t = 10 min for different catalytic fixed bed reactor temperatures.
Figure 5.15: Evolution of mass flow rate (g/min) and percentage (mol. %) of carboxylic acids at t = 10 min at different catalytic fixed bed reactor temperatures
Several observations can be made from the above figure. Firstly, some similarities were found in the
evolution trend in mass flow rate and percentages for the experiments done while using HZSM-5;
both series showed a decrease in carboxylic acids as catalytic fixed bed reactor temperature
increased. This is in line with what was seen in Figure 5.13. Indeed, with increasing catalytic reactor
temperature, less liquid was recovered. Hence, it can be said that increasing the catalytic reactor

Chapter 5
134
temperature boosted the catalytic activity, enhancing the different de-oxygenation reactions,
including decarboxylation, which resulted in a lower amount of carboxylic acids being present in the
collected bio-oil. However, one main difference was concerning the experiments done without the
use of catalysts: the mass flow rates showed a decrease with increasing catalytic temperature, while
the percentages demonstrated an increase. The decreasing trend appeared to be more coherent
according to the reasons stated previously. Several articles in literature base their results on the
percentage of chemical families present in bio-oils (Choi et al., 2013; Murata et al., 2012; Park et al.,
2006, 2007); this method of comparison may give rise to misleading conclusions if other, deeper
analyses are not conducted.
Now, as mentioned earlier, in order to better comprehend the impact of catalyst use on the liquid
product, bio-oil samples were recovered intermittently and analysed to get an idea of their
composition. Then, conversion and production rates, as previously explained (see Chapter 3, section
3.3.5), were calculated for each chemical family found in the oils. Table 5.4 details the values
obtained for the bio-oil recovered at a catalytic fixed bed reactor temperature of 500 °C. Those
obtained for the 450 and 425 °C temperatures have been listed in Annex D, in Tables D.4 and D.5.
Table 5.4: Conversion and production rates of chemical families present in upgraded bio-oils at a catalytic fixed bed reactor temperature of 500 °C
Chemical
families
Conversion(“-”sign)andproduction(“+”sign)rate(%)
t = 10 min t = 20 min t = 35 min t = 60 min t = 120 min
Carboxylic acids -96 -88 -69 -69 -49
Alkanes -97 -88 -68 -74 -55
Aromatics -98 -92 -81 -83 -77
Alcohols -97 -89 -75 -77 -61
Aldehydes -96 -82 -53 -54 -22
Amides -97 -91 -71 -71 -25
Ketones -95 -85 -66 -67 -49
Esters -91 -73 -49 -52 -61
Furans -82 -64 -8 -19 -2
Guaiacols -97 -85 -55 -50 -2
Phenols -97 -90 -71 -76 -59
Carbohydrates -99 -95 -87 -87 -79
Several deductions can be made following these tables. Firstly, it was seen that for all temperatures,
the trend was the same: the conversion rate for almost all families became less important in time.

Chapter 5
135
This is proof that the catalyst did indeed lose its activity during the course of the reaction, and so,
became less efficient. However, another difference that was noticed was the fact that according to
the fixed bed reactor temperature, the efficiency of the catalyst experienced a change. As it can be
seen from comparing the values for all temperatures, the higher the fixed bed reactor temperature
was, the more performant was the catalyst in converting the chemical families. For instance, if
carboxylic acids are considered, the de-oxygenation at 500 °C ensured a first conversion at -96 %,
that at 450 °C, one at -88 % and that at 425 °C, one at -85 %. It can hence be stipulated that de-
oxygenation at 500 °C is more successful than at lower temperatures. This fact has been further
corroborated by PCA (Annex D, Figure D.6): the experiments performed at 450 and 425 °C are
gathered close together in a sub-group; it means that they present the same behaviour as one
another (Esbensen et al., 2002). Meanwhile, the samples collected for the experiment at 500 °C
presented a distinct sub-group, presenting a different behaviour than the others.
2) Stability of catalyst during continuous pyrolysis reaction
As mentioned earlier, when the catalyst has been in continual use during a continuous pyrolysis
reaction for some time, it starts to display a decrease in activity. Figure 5.16 represents the effect of
catalyst de-activation on the collected bio-oil in time during the course of catalytic pyrolysis of
biomass.
Figure 5.16: Effect of catalyst de-activation on bio-oil obtained during pyrolysis reaction
Studying this de-activation and its impacts on the product distribution is of utmost importance to
fully comprehend the reaction in its entirety. For this, the chemical family mostly present in the bio-
oil obtained without the use of the catalyst and that impacted most on the behaviour of the bio-oil
(Guo et al., 2009; Mohabeer et al., 2017), that is, carboxylic acids, was taken as case in point. Figure

Chapter 5
136
5.17 represents the evolution of the mass flow rate of the carboxylic acids (g/min) during the course
of the catalytic pyrolysis reaction at different catalytic fixed bed reactor temperatures. Only the first
three bio-oil recoveries are presented (t = 10, 20 and 35 min). The figures for phenols and alcohols
have been illustrated in Annex D, in Figures D.7 and D.8.
Figure 5.17: Evolution of carboxylic acids in liquid product (g/min) in time with different fixed bed reactor temperatures
Firstly, the same behaviour as discussed above was noted: the mass flow rate of the carboxylic acids
demonstrated a steady decrease as the catalytic fixed bed reactor temperature increased. Secondly,
as it may be observed, the mass flow rate of the carboxylic acids also showed a steady increase
during the course of the reaction, at all catalytic fixed bed temperatures (for instance, at t = 10 min,
6.13 g/min vs. t = 35 min, 9.20 g/min with no catalyst). However, the mass flow rates remained less
than that obtained for the non-catalytic bio-oil. This proved that even at 425 °C, the catalyst did
display de-oxygenation performance. Now, the increase in mass flow of carboxylic acids during the
course of the reaction was proof that the catalytic activity tended to decrease as the reaction
continued on in time.

Chapter 5
137
- Gas product composition
NCG samples were recovered intermittently as well, at the same times as bio-oil sample recoveries,
and the same kind of analyses as for the bio-oil samples were performed on them. Figure 5.18
depicts the gas product distribution obtained for a sample at a fixed bed reactor temperature of 500
°C under 500 mL/min with the use of HZSM-5, as compared to that obtained under the same
experimental conditions without the use of any catalyst. Similar figures have been drawn for the
other catalytic reaction temperatures and have illustrated in Annex D, Figures D.9 and D.10.
Figure 5.18: Evolution of NCG composition (vol. %) in time at 500 °C (fixed bed reactor) vs. no catalyst
It was firstly seen that the evolutions for reactions at fixed bed reactor temperatures 500, 450 and
425 °C follow the same trend. Here, the focus is on the one at 500 °C. As it can be observed, the
composition of the NCG did not undergo a drastic change during the first four analyses (60 minutes
reaction time), as compared to the reaction without catalyst. A real change was noticed at the fifth
analysis (t = 120 min), where the CO and CH4 percentages dropped and the CO2, C2 and C3 ones
experienced an increase. These observations primarily call out the fact that the catalyst had not been
completely de-activated after 120 minutes of reactions. Then, as the percentages stood after two
hours of reaction, it could be said that the decarboxylation reaction (production of CO2) was being
privileged in time relative to the decarbonylation one (formation of CO). Also, according to Gayubo et

Chapter 5
138
al. (2004), carboxylic acids underwent decarboxylation under the action of HZSM-5 to give rise to
ketones as intermediates and to alkenes as end products. Hence, the increase in C2 and C3 could be
related to the de-oxygenation of carboxylic acids.
However, as it has been mentioned earlier, percentages give an idea of the evolution of the
composition; the actual change can be more accurately monitored through the conversion and
production rates of the components. Table 5.5 lists the values obtained for the NCG components at a
catalytic fixed bed reactor temperature of 500 °C. Those obtained for the 450 and 425 °C
temperatures have been listed in Annex D, in Tables D.6 and D.7.
Table 5.5: Conversion and production rates of NCG components at a catalytic fixed bed reactor temperature of 500 °C
NCG
components
Conversion(“-”sign)andproduction(“+”sign)rate(%)
t = 10 min t = 20 min t = 35 min t = 60 min t = 120 min
H2 -82 -30 159 239 3316
CO -84 -35 140 219 2938
CH4 -84 -33 147 215 2434
CO2 -85 -37 173 402 3351
C2H2 -89 -66 31 -12 903
C2H4 -83 -40 109 225 1643
C2H6 -81 -16 229 433 3254
C3H4 -95 -84 -39 -21 652
C3H6 -75 -19 193 538 2452
C3H8 -80 -30 159 502 2442
The values listed in Table 5.5 further confirm what has been stated previously: the catalyst was not
completely de-activated after 120 minutes of reaction. Actually, even if a decrease in the CO
percentage at t = 120 min was noticed, the fact that CO underwent a production rate at that point
belies the fact that decarboxylation was privileged over decarbonylation. As it is, both reactions were
occurring at the same time as both CO and CO2 were experienced very significant production rates.
However, the values obtained for the NCG components did not reflect the same trend as that
demonstrated for chemical families in the liquid product. In the latter case, the conversion rate
tended to decrease, showing a decreasing activity of the catalyst; here, the production rates of the
NCG components all increased. With the present setup, it is difficult to draw a proper conclusion on
this part as, from t = 120 min onwards, severe clogging problems were experienced within the

Chapter 5
139
experimental installation. It was theorised that the coke formed on the surface of the catalyst bed
and solid particles deposited on the catalyst surface caused a severe pressure drop, which gave rise
to a pressure build-up inside the setup. It subsequently caused an important drop in the gas flow at
the exit of the installation. This phenomenon happened for every reaction repeatedly.
5.3.2.3 Experiments with catalyst treatment: use of Fe-HZSM-5
The same series of experiments was also conducted with Fe-HZSM-5, deemed to be the most
efficient of the catalysts tested (see Chapter 3, section 3.4). The phenomenon that was observed at
two hours of reaction time with HZSM-5 was seen within 10 minutes of reaction with Fe-HZSM-5. The
sudden drop in the gas flow rate at the exit of the installation was experienced at the very start of
the reaction. This observation confirms the fact that Fe-HZSM-5 did de-oxygenate the bio-oils more
efficiently than HZSM-5. However, it also shows that a fixed bed reactor setup might not be the best
alternative to test the de-activation of a catalyst during long reaction times.
5.4 Conclusion
This study presented the pyrolysis liquid and gas results obtained for a continuous pyrolysis reaction
in a DTR, with and without catalyst use. The aim was firstly to establish a comparison between a
semi-continuous and a continuous pyrolysis reaction and the eventual similarities and differences
that could be obtained. Then, for the reactions involving catalyst use, the goal was to study the effect
of this kind of setup on the pyrolytic products as a comparison to the semi-continuous system and
also, attempt to monitor the de-activation of the catalyst by analysing the evolution of the
composition of the liquid and gaseous products formed, periodically. DTR temperature and gas
residence time were primarily varied to examine the pyrolytic products. It was found that despite not
using the same installation, the reaction parameters yielding the maximum bio-oil yield without the
use of catalysts were the same: 500 °C under 500 mL/min N2 (~58 wt. % in both cases). Also, while
varying the temperature impacted significantly on the product distribution (higher temperatures
yielded higher gas products and a more acidic oil), varying the gas residence time did not quite alter
the product distribution as it was found that the pyrolysis was still taking place within the
intermediate regime, and that the reaction was governed by the biomass particle residence time.
Finally, many non-compliant observations were obtained between the semi-continuous and the
continuous setups. This fact highlighted the heightened error margin present for using results
obtained in a semi-continuous or discontinuous setup to globally model pyrolysis as a continuous
reaction. Concerning the reactions involving catalyst use, a glance at the conversion and production
rates of the chemical families present in the liquid product showed that HZSM-5 lost its de-
oxygenation efficiency steadily over time as the conversion rates of the families decreased. However,

Chapter 5
140
with the present setup, it is difficult to draw a proper conclusion on this part as, from t = 120 min
onwards, severe clogging problems were experienced within the experimental installation.
5.5 References
(1). Adjaye, J.D., Bakhshi, N.N., 1995. Production of hydrocarbons by catalytic upgrading of
a fast pyrolysis bio-oil. Part I: Conversion over various catalysts. Fuel Process. Technol.
45, 161–183. https://doi.org/10.1016/0378-3820(95)00034-5
(2). Cerqueira, H.S., Caeiro, G., Costa, L., Ramôa Ribeiro, F., 2008. Deactivation of FCC
catalysts. J. Mol. Catal. Chem. 292, 1–13.
https://doi.org/10.1016/j.molcata.2008.06.014
(3). Choi, S.J., Park, S.H., Jeon, J.-K., Lee, I.G., Ryu, C., Suh, D.J., Park, Y.-K., 2013. Catalytic
conversion of particle board over microporous catalysts. Renew. Energy, AFORE
2011(Asia-Pacific Forum of Renewable Energy 2011) 54, 105–110.
https://doi.org/10.1016/j.renene.2012.08.050
(4). Ellens, C., 2009. Design, optimization and evaluation of a free-fall biomass fast
pyrolysis reactor and its products. Grad. Theses Diss.
(5). Esbensen, K.H., Guyot, D., Westad, F., Houmoller, L.P., 2002. Multivariate Data
Analysis: InPractice :an Introduction toMultivariateDataAnalysisandExperimental
Design. Multivariate Data Analysis.
(6). Fan, Y., Cai, Y., Li, X., Yu, N., Yin, H., 2014. Catalytic upgrading of pyrolytic vapors from
the vacuum pyrolysis of rape straw over nanocrystalline HZSM-5 zeolite in a two-stage
fixed-bed reactor. J. Anal. Appl. Pyrolysis 108, 185–195.
https://doi.org/10.1016/j.jaap.2014.05.001
(7). Gayubo, A.G., Aguayo, A.T., Atutxa, A., Aguado, R., Olazar, M., Bilbao, J., 2004.
Transformation of Oxygenate Components of Biomass Pyrolysis Oil on a HZSM-5
Zeolite. II. Aldehydes, Ketones, and Acids. Ind. Eng. Chem. Res. 43, 2619–2626.
https://doi.org/10.1021/ie030792g

Chapter 5
141
(8). Guizani, C., Valin, S., Billaud, J., Peyrot, M., Salvador, S., 2017. Biomass fast pyrolysis in
a drop tube reactor for bio oil production: Experiments and modeling. Fuel 207, 71–84.
https://doi.org/10.1016/j.fuel.2017.06.068
(9). Guo, Z., Wang, S., Zhu, Y., Luo, Z., Cen, K., 2009. Separation of acid compounds for
refining biomass pyrolysis oil. J. Fuel Chem. Technol. 37, 49–52.
https://doi.org/10.1016/S1872-5813(09)60010-4
(10). Jahirul, M.I., Rasul, M.G., Chowdhury, A.A., Ashwath, N., 2012. Biofuels Production
through Biomass Pyrolysis —A Technological Review. Energies 5, 4952–5001.
https://doi.org/10.3390/en5124952
(11). Lehto, J., Oasmaa, A., Solantausta, Y., 2013. Fuel oil quality and combustion of fast
pyrolysis bio-oils.
(12). Li, H., Yan, Y., Ren, Z., 2008. Online upgrading of organic vapors from the fast pyrolysis
of biomass. J. Fuel Chem. Technol. 36, 666–671. https://doi.org/10.1016/S1872-
5813(09)60002-5
(13). Mohabeer, C., Abdelouahed, L., Marcotte, S., Taouk, B., 2017. Comparative analysis of
pyrolytic liquid products of beech wood, flax shives and woody biomass components. J.
Anal. Appl. Pyrolysis 127, 269–277. https://doi.org/10.1016/j.jaap.2017.07.025
(14). Mukarakate, C., Zhang, X., R Stanton, A., J Robichaud, D., N Ciesielski, P., Malhotra, K.,
Donohoe, B., Gjersing, E., J Evans, R., S Heroux, D., Richards, R., Iisa, K., Nimlos, M.,
2014. Real-time monitoring of the deactivation of HZSM-5 during upgrading of pine
pyrolysis vapors. Green Chem 16. https://doi.org/10.1039/c3gc42065e
(15). Murata, K., Liu, Y., Inaba, M., Takahara, I., 2012. Catalytic fast pyrolysis of jatropha
wastes. J. Anal. Appl. Pyrolysis 94, 75–82. https://doi.org/10.1016/j.jaap.2011.11.008
(16). Paasikallio, V., Lindfors, C., Kuoppala, E., Solantausta, Y., Oasmaa, A., Lehto, J.,
Lehtonen, J., 2014. Product quality and catalyst deactivation in a four day catalytic fast
pyrolysis production run. Green Chem. 16, 3549. https://doi.org/10.1039/c4gc00571f

Chapter 5
142
(17). Park, H.J., Dong, J.-I., Jeon, J.-K., Yoo, K.-S., Yim, J.-H., Sohn, J.M., Park, Y.-K., 2007.
Conversion of the Pyrolytic Vapor of Radiata Pine over Zeolites. J. Ind. Eng. Chem. 13,
182–189.
(18). Park, H.J., Park, Y.-K., Kim, J.-S., Jeon, J.-K., Yoo, K.-S., Yim, J.-H., Jung, J., Sohn, J.M.,
2006. Bio-oil upgrading over Ga modified zeolites in a bubbling fluidized bed reactor,
in: Rhee, H.-K., Nam, I.-S., Park, J.M. (Eds.), Studies in Surface Science and Catalysis,
New Developments and Application in Chemical Reaction Engineering. Elsevier, pp.
553–556. https://doi.org/10.1016/S0167-2991(06)81656-3
(19). Vitolo, S., Bresci, B., Seggiani, M., Gallo, M.G., 2001. Catalytic upgrading of pyrolytic
oils over HZSM-5 zeolite: behaviour of the catalyst when used in repeated upgrading–
regenerating cycles. Fuel 80, 17–26. https://doi.org/10.1016/S0016-2361(00)00063-6
(20). Xiu, S., Shahbazi, A., 2012. Bio-oil production and upgrading research: A review.
Renew. Sustain. Energy Rev. 16, 4406–4414.
https://doi.org/10.1016/j.rser.2012.04.028

CONCLUSION AND PERSPECTIVES

Conclusion and perspectives
143
Conclusion and perspectives
- Conclusion
The main aim of this work was to provide a detailed characterisation of the pyrolysis products
obtained from biomass residues and pure woody biomass components, with and without the use of
various catalysts in order to better understand the provenance of each family in the bio-oil. Then, the
effect of scaling up the process (from semi-continuous process to continuous process in drop-tube
reactor) on the pyrolytic products was studied, again with and without the use of catalysts to finally
gauge the performance of the catalyst during the course of the continuous reaction.
Firstly, the pyrolytic behaviour of flax shives relative to beech wood and the three woody biomass
components (cellulose, hemicellulose and lignin) at different pyrolysis temperatures was studied
successfully in a semi-continuous reactor. It was found that the two biomasses exhibited
approximately the same behaviour. However, their behaviours as compared to that of a theoretical
average of the biomass components were different; mostly due to physical interactions between the
different components in the biomass and also, the mineral content of the latter. Because the main
problem concerning the utilisation of the bio-oil remained the relatively elevated oxygen content,
the catalytic de-oxygenation of the bio-oil was studied.
A detailed analysis of the liquid and gaseous pyrolytic products of catalytic de-oxygenation of two
biomasses (beech wood and flax shives) using different catalysts (HZSM-5, Fe-HZSM-5, H-Y, Fe-H-Y,
Pt/Al2O3 and CoMo/Al2O3) was presented. The results showed:
The different pathways and reactions through which aromatic compounds were produced
from the catalytic de-oxygenation of flax shives as compared to a conventional lignocellulosic
biomass, beech wood.
Fe-HZSM-5 was deemed to be the most efficient of the catalysts utilised as it helped reach the
lowest oxygen contents in both bio-oils.
At higher catalyst-to-biomass ratios of 4:1, de-oxygenation efficiency did not experience any
further significant improvement.
HZSM-5 and H-Y tended to privilege the decarbonylation route (production of CO), whilst their
iron-modified counterparts favoured the decarboxylation one (production of CO2) for both
biomasses.
The metal-based catalysts were seen to exhibit the least efficient performance in terms of de-
oxygenation, but showed relatively high H2 and H2O productions, prompting the supposition

Conclusion and perspectives
144
that the presence of H2 gas may prompt the metal-based catalysts to undergo HDO and give
birth to some water formation.
The third part of the study followed the second in that a detailed analysis of the liquid and gaseous
pyrolytic products of the three principal components of biomass (cellulose, hemicellulose and lignin)
using the two most efficient catalysts found in the previous chapter: HZSM-5 and its iron-
modification, Fe-HZSM-5 in the same experimental setup and under the same operating conditions
was presented. It was observed that:
Similarly to the reaction with the biomasses, HZSM-5 tended to privilege the decarbonylation
route (production of CO), whilst Fe-HZSM-5 favoured the decarboxylation one (production of
CO2) for the same feed.
From the transformation schemes, it was seen that even though both catalysts boosted the
aromatics production, HZSM-5 produced more aromatics than its iron-modification. It was also
observed that HZSM-5 formed more phenols, and hence, more coke, than Fe-HZSM-5.
Finally, the last part of this study tackled a change in technology: pyrolysis in a continuous, drop-tube
reactor. DTR temperature and gas residence time were primarily varied to examine the pyrolytic
products. It was found that:
Despite not using the same installation, the reaction parameters yielding the maximum bio-oil
yield without the use of catalysts were the same in the semi-continuous and continuous
processes.
While varying the temperature impacted significantly on the product distribution (higher
temperatures yielded higher gas products and a more acidic oil), varying the gas residence
time did not quite alter the product distribution as pyrolysis was still taking place within the
intermediate regime.
A heightened error margin was present for using results obtained in a semi-continuous or
discontinuous setup to globally model pyrolysis as a continuous reaction as various results
obtained present non-compliances.
Concerning the reactions involving catalyst use:
The conversion and production rates of the chemical families present in the liquid and gaseous
products showed that the HZSM-5 lost partially its efficiency as a catalyst over time.

Conclusion and perspectives
145
- Perspectives
While the previous sub-part of this chapter has provided an overview of the work previously
conducted and the various results obtained, some recommendations of future works will be
proposed henceforth.
1) Understanding the catalytic de-oxygenation mechanisms of model molecules from each
chemical family present in the pyrolytic bio-oils.
While some work has been conducted on the overall catalytic de-oxygenation of the pyrolytic bio-
oils, it can be very interesting to deepen the analysis by studying the effect of the catalyst by feeding
model molecules to the reactor and analysing the obtained products. This could help polish the
understanding of de-oxygenation reaction mechanisms. The setup to be used for this part of the
study has already been put into place during this PhD thesis and some trials have been performed.
However, during the trials, a fixed bed catalytic reactor was used. As a result, severe blockages,
clogging and gas returns were experienced. It can hence be claimed that a fluidised bed catalytic
reactor might provide a more functional alternative to this setup, as shown in Figure 3. This research
work will be undertaken as a continuum to this thesis.
Figure 3: Setup layout for catalytic de-oxygenation of model molecules

Conclusion and perspectives
146
2) Setting up a model for biomass pyrolysis in the drop tube reactor (DTR).
As mentioned in Chapter 5, pyrolysis temperature and gas residence time have been varied for the
experiments conducted in the DTR. Indeed, it was seen that varying gas residence times in the range
studied did not bring forth very significant changes in the pyrolytic product distributions obtained.
Therefore, it would be interesting to undertake this part of the study again, by varying the gas
residence times in a larger range, or by diminishing the biomass feed rate so that the reaction is no
longer governed by this parameter, in order to build a model for the pyrolysis reaction occurring in
the DTR. This model should thus take into account the kinetics of the reaction, heat transfer and the
physical forces acting on the biomass particle. Hence, along with the various analyses done, a model
comprising the conversion degree of the biomass particle as it falls down the DTR could be obtained.
This model, coupled with the prevision of the pyrolytic products obtained at one specific conversion
degree, could help guide researchers to know what heated length of reactor they would need for
them to attain the product composition they require.
3) Investigation of catalyst de-oxygenation and regeneration during continuous catalytic
pyrolysis.
Again, as was seen earlier, in Chapter 5, some work was conducted on the continuous catalytic
pyrolysis of biomass in the DTR. However, the reaction time was limited to approximately two hours
as beyond this reaction time, severe clogging and gas return problems were encountered. Indeed,
during catalytic de-oxygenation reactions occurring in the catalyst bed, an increase in pressure inside
the DTR, and also, a notable drop in the gas flow at the exit of the experimental setup were noticed.
This problem could again be taken care of by replacing the fixed bed catalytic reactor by a fluidised
bed one. The latter could provide longer reaction times during which, by applying the same
experimental protocol as described in Chapter 5, catalyst de-activation could be further investigated
and a mechanism for this reaction could subsequently be proposed, tested and proven.
Then, as an endeavour to remedy to catalytic de-activation, continuous regeneration of the catalyst
could be undertaken. The fluidised catalytic cracking (FCC) technology already known, tested and
utilised in the petroleum industry, it would be practical to adapt this technology in the biomass
valorisation sector. In this light, a model of a dual fluidised and entrained bed reactor was made, as
represented in Figure 4. The purpose of this dual bed reactor is to perform continuous catalytic
pyrolysis coupled with the regeneration of partially or completely de-activated catalyst
simultaneously.

Conclusion and perspectives
147
Figure 4: Schematic of dual fluidised and entrained bed reactor
As of now, only trial tests at ambient temperature have been performed on this model in order to
find the most practical configuration and also, the different parameters needed for the functioning of
the dual fluidised bed. The ultimate goal, however, is to set up the same reactor made of stainless
steel to affix it to the exit of the DTR, instead of the fixed bed reactor.

ANNEXES

Annex A
148
A. Annex A
This part shows the different tables and graphs that are related to the different results discussed in
the text, but could not be included.
Table A.1 shows the detailed quantification of mineral elements found through inductively coupled
plasma-optical emission spectrometry (ICP-OES), in the different biomass samples.
Table A.2 (a), (b), (c) and (d) showthedifferent“modelmolecules”foundforthevarious chemical
groups present in the bio-oils recovered at the four pyrolytic temperatures studied.
Table A.3 synthesises the percentages (in mol. %) of the different chemical groups present in the five
different raw materials studied at the four pyrolytic temperatures of 450°C, 500°C, 550°C and 600°C.

Annex A
149
Table A.1: Detailed list of minerals in raw materials used
Mass (mg/kg of raw material)
Beech wood Flax shives Cellulose Xylan Lignin
Ag <2 3 <2 <2 <2
Al 211 335 <5 <5 58
Ba 12 7 0.4 <0.2 2
Be <0.05 <0.05 <0.05 <0.05 <0.05
Bi 2 3 2 3 2
Ca 1770 2911 <2 7 126
Cd 0.1 0.2 <0.05 <0.05 0.09
Co <0.8 <0.8 <0.8 <0.8 <0.8
Cr 2 6 2 2 2
Cu 1 14 <0.5 <0.5 0.5
Fe 84 994 11 13 52
Ga <0.5 0.5 <0.5 <0.5 <0.5
In <5 <5 <5 <5 <5
K 1054 4501 <20 <20 2226
Li <1 <1 <1 <1 <1
Mg 291 1410 4 6 152
Mn 103 69 0.3 0.3 31
Mo 1 0.6 0.2 0.3 1
Na 47 295 27 77 >500
Ni 1 3 0.6 <0.2 0.4
Pb <1 2 <1 <1 <1
Rb 5 <4 <4 <4 10
Sr 2 6 <0.2 <0.2 <0.2
Tl <1 <1 <1 <1 <1
V <0.5 2 <0.5 <0.5 37
Zn 6 115 1 1 6

Annex A
150
Table A.2 (a), (b), (c), (d): Most abundant compound in pyrolytic oils at 450°C, 500°C, 550°C and 600°C
Pyrolyt-
ic temp.
Raw
material
used
Chemical groups present in bio-oils
Carboxy-
lic acids Alkanes
Aromat-
ics Alcohols
Aldehy-
des Amides Ketones Esters Furans
Guaiaco-
ls Phenols
Carboh-
ydrates
450 °C
Beech
wood
C2H4O2
C8H14 C6H6O3
C5H4O2
C8H17NO
C14H18O8
C7H14O4
C7H12O C8H12O2
C10H14O
C6H10O5 Flax
shives C9H12O2 C11H12O C9H8O2 C9H12O2
Cellulos
e C5H4O2 C8H16O3
C5H10O4 C7H12O C8H10O2 C9H12O
Xylan C8H12O3 C4H4O2 C9H12O2 C6H6O C7H14O7
Lignin C8H16O3
Pyrolyt-
ic temp.
Raw
material
used
Chemical groups present in bio-oils
Carboxy-
lic acids Alkanes
Aromat-
ics Alcohols
Aldehy-
des Amides Ketones Esters Furans
Guaiaco-
ls Phenols
Carboh-
ydrates
500 °C
Beech
wood
C2H4O2
C12H26
C8H14
C5H6O2
C5H4O2 C8H17NO
C5H6O2
C7H14O4
C8H8O
C8H10O
C6H10O5 Flax
shives
C6H6O3 C6H6O3 C7H10O C10H14O
Cellulos
e C4H10O C6H16O3
C5H10O4 C7H12O C9H12O
Xylan C7H12O C9H12O2 C6H6O
C7H14O7
Lignin C8H16O3
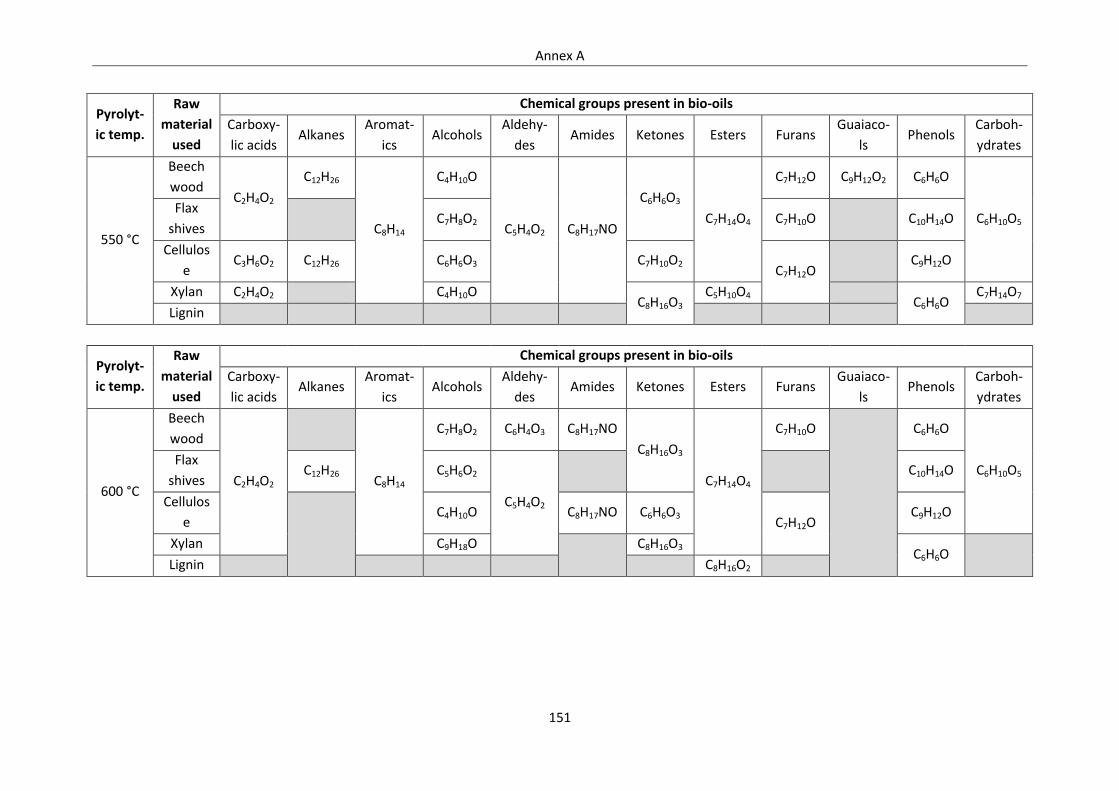
Annex A
151
Pyrolyt-
ic temp.
Raw
material
used
Chemical groups present in bio-oils
Carboxy-
lic acids Alkanes
Aromat-
ics Alcohols
Aldehy-
des Amides Ketones Esters Furans
Guaiaco-
ls Phenols
Carboh-
ydrates
550 °C
Beech
wood C2H4O2
C12H26
C8H14
C4H10O
C5H4O2 C8H17NO
C6H6O3
C7H14O4
C7H12O C9H12O2 C6H6O
C6H10O5 Flax
shives C7H8O2 C7H10O C10H14O
Cellulos
e C3H6O2 C12H26 C6H6O3 C7H10O2
C7H12O C9H12O
Xylan C2H4O2 C4H10O C8H16O3
C5H10O4 C6H6O
C7H14O7
Lignin
Pyrolyt-
ic temp.
Raw
material
used
Chemical groups present in bio-oils
Carboxy-
lic acids Alkanes
Aromat-
ics Alcohols
Aldehy-
des Amides Ketones Esters Furans
Guaiaco-
ls Phenols
Carboh-
ydrates
600 °C
Beech
wood
C2H4O2
C8H14
C7H8O2 C6H4O3 C8H17NO
C8H16O3
C7H14O4
C7H10O
C6H6O
C6H10O5 Flax
shives C12H26 C5H6O2
C5H4O2
C10H14O
Cellulos
e
C4H10O C8H17NO C6H6O3 C7H12O
C9H12O
Xylan C9H18O
C8H16O3 C6H6O
Lignin C8H16O2

Annex A
152
Table A.3: Percentages of chemical groups present in bio-oils recovered
Biomass/
Pseudo-
componen-
ts used
Temperatu-
re
/°C
Chemical families present (mol. %)
Alcohols Aldehydes Alkanes Aromat-
ics Amides
Carboxylic
acids Esters Furans Guaiacols Ketones Phenols
Carbohyd-
rates
Beech
wood
450 8.04 3.90 - 1.58 2.79 30.55 14.73 2.94 1.43 12.99 12.09 8.95
500 8.07 4.21 0.39 0.69 2.51 34.54 9.77 3.12 - 14.23 14.86 7.61
550 9.84 2.30 0.43 1.23 2.44 29.64 13.78 2.09 0.72 10.91 20.53 6.09
600 7.65 3.01 - 1.89 1.43 34.61 14.2 2.36 - 10.19 21.16 3.49
Flax shives
450 7.49 4.33 - 2.16 2.15 23.66 12.74 2.92 0.79 12.87 21.92 8.99
500 8.19 4.57 - 1.97 2.88 28.07 14.26 1.19 - 11.86 20.51 6.50
550 6.28 3.86 - 1.99 2.18 30.83 12.22 1.83 - 11.91 26.37 2.51
600 8.04 1.56 0.91 0.66 - 37.95 20.95 - - 6.87 20.89 2.17
Cellulose
450 6.52 4.72 - 1.41 0.92 6.83 7.08 5.04 0.49 15.38 23.95 27.66
500 4.90 3.37 - 1.01 1.23 7.14 7.38 5.17 - 11.30 21.21 37.29
550 3.90 3.08 0.40 1.01 0.49 6.36 6.24 4.00 - 9.40 13.18 51.95
600 4.26 2.40 - 1.21 1.08 9.12 12.43 3.82 - 9.76 12.44 43.48
Xylan
450 6.25 22.13 - 1.26 1.84 16.31 8.99 3.59 0.65 18.15 6.77 14.05
500 6.13 16.55 - 1.22 2.24 22.33 10.40 4.19 0.81 12.53 8.39 15.21
550 4.52 21.86 - 1.25 2.67 25.76 11.41 5.09 - 10.09 9.39 7.97
600 2.15 19.08 - 0.91 - 41.81 10.04 2.61 - 8.09 15.32 -
Lignin
450 - - - - - - - - - 46.28 53.72 -
500 - - - - - - - - - 33.98 66.02 -
550 - - - - - - - - - 31.61 68.39 -
600 - - - - - - 10.49 - - - 89.51 -

Annex A
153
The following figures (Figures A.1-A.9) represent the variation of esters, ketones, carbohydrates,
alkanes, aromatics, alcohols, aldehydes, amides, furans and guaiacols with the pyrolytic
temperatures studied. This part is complementary to Figures 1-6 presented previously, in the text.
Figure A.1: Effect of the pyrolysis temperature on the ester content of bio-oils
Figure A.2: Effect of the pyrolysis temperature on the ketone content of bio-oils
Figure A.3: Effect of the pyrolysis temperature on the alkane content of bio-oils

Annex A
154
Figure A.4: Effect of the pyrolysis temperature on the aromatics content of bio-oils
Figure A.5: Effect of the pyrolysis temperature on the alcohol content of bio-oils
Figure A.6: Effect of the pyrolysis temperature on the aldehyde content of bio-oils

Annex A
155
Figure A.7: Effect of the pyrolysis temperature on the amide content of bio-oils
Figure A.8: Effect of the pyrolysis temperature on the furan content of bio-oils
Figure A.9: Effect of the pyrolysis temperature on the guaiacol content of bio-oils
Table A.4 represents the different chemical families and the major molecules identified in the bio-
oils that belong to each of them.

Annex A
156
Table A.4: Molecules present in bio-oils and their chemical family
Chemical family Molecules Identified
Alcohols
1-Hexanol, 4-methyl-
2-Propanol, 2-methyl-
1-Butanol, 4-butoxy-
5-Hexen-3-ol, 2,2,4-trimethyl-
2-Furanmethanol
1-Heptanol, 6-methyl-
Maltol
Thymol
Resorcinol
3-Methylcatechol
1,4-Benzenediol, 2,6-dimethyl-
Aldehydes
3-Furaldehyde
Furfural
2-Furancarboxaldehyde, 5-methyl-
Benzaldehyde, 2-hydroxy-6-methyl-
Benzaldehyde, 2-methyl-
Cinnamaldehyde, (E)-
Alkanes Nonane, 4-ethyl-5-methyl-
Decane
Aromatics
1,5-Heptadiene, 3-methyl-
Cyclopentene, 1-(1-methylethyl)-
Naphthalene, 1,2-dihydro-4-methyl-
Amides Butyramide, 2,2,3,3-tetramethyl-
2-Butynamide, N-methyl-
Carboxylic acids
Acetic acid
Propanoic acid
2-Butenoic acid, 2-methyl-
2-Pentenoic acid, 4-hydroxy-
Nonanoic acid

Annex A
157
Benzoic acid, 3,4-dimethyl-
Esters
1,2,3-Propanetriol, monoacetate
Butanoic acid, pentyl ester
Propane-1,1-diol diacetate
Methyl 2-furoate
Benzoic acid, 3,4-dihydroxy-, methyl ester
Methylparaben
Furans
2,2'-Bifuran
Benzofuran, 2,3-dihydro-
Furan, 2-(2-propenyl)-
2-(1-Cyclopentenyl)furan
Guaiacols
3-Methoxy-5-methylphenol
4-Ethyl guaiacol
Phenol, 2-methoxy-6-(1-propenyl)-
Ketones
3-Penten-2-one, (E)-
3-Hexen-2-one
Cyclopentanone
2(5H)-Furanone
2-Cyclopenten-1-one
2-Pentanone, 4-hydroxy-4-methyl-
2-Cyclopenten-1-one, 2,3-dimethyl-
2-Cyclopenten-1-one, 3-methyl-
Cycloheptanone
Ethanone, 1-(4-methylphenyl)-
Phenols
Phenol, 3-methyl-
Phenol, 4-methyl-
Phenol, 3-ethyl-5-methyl-
Phenol, 3,5-dimethyl-
Phenol, 2,4,5-trimethyl-
Phenol, 2-ethyl-4,5-dimethyl-
Phenol, 2,3,5,6-tetramethyl-
Carbohydrates 1,4:3,6-Dianhydro-α-β-glucopyranose
2,3-Anhydro-β-galactosan

Annex A
158
β-Glycero-γ-gluco-heptose
Levoglucosan
Table A.5 (a), (b), (c), (d) and (e) represent the different correlations between the various chemical
groups present in the different samples of bio-oils recovered from the five raw materials used in this
study. The closer the values are to +1, the stronger the correlation is between the two chemical
groups. Also, the positive sign shows a direct relation between the two groups. It means that when
one group increases, the other increases as well. The opposite holds true; a negative correlation
demonstrates an opposing trend between two chemical groups. Again, as the values are closer to -1,
the correlations become stronger.

Annex A
159
Table A.5 (a), (b), (c), (d) and (e): Correlations existing between chemical groups in pyrolytic oils of (a) beech wood, (b) flax shives, (c) cellulose, (d) xylan and (e) lignin
Beechwood
Temperature Acids Aromatics Alcohols Aldehydes Amides Ketones Esters Furans Phenols Carbohydrates
Temperature 1
Acids 0,36 1
Aromatics 0,37 -0,08 1
Alcohols 0,08 -0,74 -0,29 1
Aldehydes -0,68 0,44 -0,37 -0,68 1
Amides -0,90 -0,59 -0,56 0,35 0,39 1
Ketones -0,81 0,14 -0,73 -0,24 0,87 0,72 1
Esters 0,14 -0,54 0,88 0,10 -0,52 -0,19 -0,68 1
Furans -0,74 0,36 -0,45 -0,60 0,99 0,48 0,92 -0,54 1
Phenols 0,96 0,12 0,31 0,34 -0,84 -0,76 -0,86 0,20 -0,88 1
Carbohydrates -0,99 -0,42 -0,48 0,06 0,62 0,96 0,82 -0,21 0,69 -0,92 1
Flax shives
Temperature Acids Aromatics Alcohols Aldehydes Amides Ketones Esters Furans Phenols Carbohydrates
Temperature 1
Acids 0,98 1
Aromatics -0,83 -0,92 1
Alcohols -0,04 0,13 -0,41 1
Aldehydes -0,84 -0,91 0,97 -0,21 1
Amides -0,74 -0,82 0,94 -0,21 0,98 1
Ketones -0,85 -0,93 0,99 -0,39 0,97 0,92 1
Esters 0,72 0,84 -0,98 0,58 -0,91 -0,88 -0,97 1
Furans -0,86 -0,91 0,87 -0,45 0,77 0,65 0,89 -0,87 1
Phenols 0,13 -0,04 0,35 -0,99 0,17 0,20 0,33 -0,54 0,35 1
Carbohydrates -0,96 -0,89 0,65 0,29 0,70 0,58 0,68 -0,50 0,72 -0,39 1

Annex A
160
Cellulose
Temperature Acids Aromatics Alcohols Aldehydes Amides Ketones Esters Furans Phenols Carbohydrates
Temperature 1
Acids 0,65 1
Aromatics -0,40 0,20 1
Alcohols -0,87 -0,23 0,79 1
Aldehydes -0,96 -0,61 0,59 0,91 1
Amides -0,11 0,55 0,14 0,29 -0,03 1
Ketones -0,88 -0,30 0,78 0,99 0,94 0,21 1
Esters 0,69 0,99 0,22 -0,26 -0,62 0,47 -0,32 1
Furans -0,90 -0,45 0,19 0,75 0,75 0,47 0,73 -0,52 1
Phenols -0,95 -0,42 0,44 0,90 0,88 0,40 0,89 -0,48 0,96 1
Carbohydrates 0,78 0,04 -0,73 -0,96 -0,79 -0,55 -0,93 0,08 -0,79 -0,90 1
Xylan
Temperature Acids Aromatics Alcohols Aldehydes Amides Ketones Esters Furans Phenols Carbohydrates
Temperature 1
Acids 0,95 1
Aromatics -0,79 -0,94 1
Alcohols -0,94 -0,97 0,90 1
Aldehydes -0,19 -0,27 0,31 0,03 1
Amides -0,56 -0,79 0,95 0,76 0,19 1
Ketones -0,97 -0,87 0,66 0,82 0,33 0,39 1
Esters 0,54 0,25 0,08 -0,24 -0,11 0,39 -0,69 1
Furans -0,25 -0,55 0,79 0,50 0,21 0,94 0,08 0,67 1
Phenols 0,92 0,99 -0,96 -0,97 -0,25 -0,83 -0,8 0,18 -0,61 1
Carbohydrates -0,91 -0,94 0,87 0,99 -0,08 0,75 0,78 -0,22 0,49 -0,94 1

Annex A
161
Lignin
Temperature Acids Aromatics Alcohols Aldehydes Amides Ketones Esters Furans Phenols Carbohydrates
Temperature 1
Acids - 1
Aromatics - - 1
Alcohols - - - 1
Aldehydes - - - - 1
Amides - - - - - 1
Ketones -0,92 - - - - - 1
Esters 0,77 - - - - - -0,95 1
Furans - - - - - - - - 1
Phenols 0,95 - - - - - -0,99 0,90 - 1
Carbohydrates - - - - - - - - - - 1
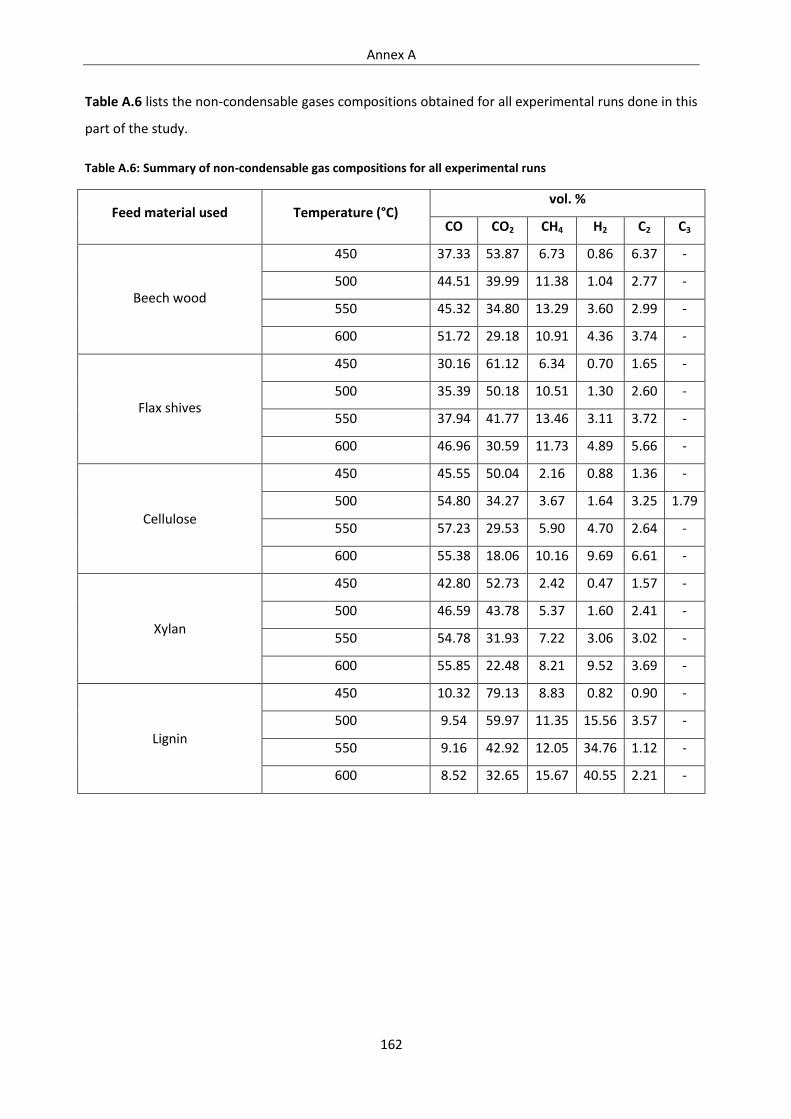
Annex A
162
Table A.6 lists the non-condensable gases compositions obtained for all experimental runs done in this
part of the study.
Table A.6: Summary of non-condensable gas compositions for all experimental runs
Feed material used Temperature (°C) vol. %
CO CO2 CH4 H2 C2 C3
Beech wood
450 37.33 53.87 6.73 0.86 6.37 -
500 44.51 39.99 11.38 1.04 2.77 -
550 45.32 34.80 13.29 3.60 2.99 -
600 51.72 29.18 10.91 4.36 3.74 -
Flax shives
450 30.16 61.12 6.34 0.70 1.65 -
500 35.39 50.18 10.51 1.30 2.60 -
550 37.94 41.77 13.46 3.11 3.72 -
600 46.96 30.59 11.73 4.89 5.66 -
Cellulose
450 45.55 50.04 2.16 0.88 1.36 -
500 54.80 34.27 3.67 1.64 3.25 1.79
550 57.23 29.53 5.90 4.70 2.64 -
600 55.38 18.06 10.16 9.69 6.61 -
Xylan
450 42.80 52.73 2.42 0.47 1.57 -
500 46.59 43.78 5.37 1.60 2.41 -
550 54.78 31.93 7.22 3.06 3.02 -
600 55.85 22.48 8.21 9.52 3.69 -
Lignin
450 10.32 79.13 8.83 0.82 0.90 -
500 9.54 59.97 11.35 15.56 3.57 -
550 9.16 42.92 12.05 34.76 1.12 -
600 8.52 32.65 15.67 40.55 2.21 -

Annex B
163
B. Annex B
The apparent porosity of the various catalysts was measured by first putting a known volume of
catalyst (Vcatalyst) in a graduated measuring cylinder and filling the cylinder with acetone to the same
level of the catalyst. The mass of the acetone bottle was measured before and after its use. Hence,
the volume of acetone used was known (Vacetone). The difference in volumes of the acetone and the
catalyst thus gave the volume of the pores of the catalyst (Vpores). The apparent porosity is the
percentage of the ratio of the volume of the pores to the exterior volume (initial catalyst volume), as
shown in the equation below.
Apparent porosity = (Vacetone − Vcatalyst
Vcatalyst) × 100 % = (
Vpores
Vcatalyst) × 100 %
Figures B.1 to B.4 represent the spectra obtained for the Fourier transform infrared (FT-IR) at
different temperatures (100, 150, 200 and 400 °C) of the catalysts samples used in this study.
Figure B.1: IR spectra of catalysts at 100 °C

Annex B
164
Figure B.2: IR spectra of catalysts at 150 °C
Figure B.3: IR spectra of catalysts at 200 °C

Annex B
165
Figure B.4: IR spectra of catalysts at 400 °C
Table B.1 lists the evolution of the percentage of the different chemical families present in the bio-oil
sample from flax shives with different catalyst-to-biomass ratios.
Table B.1: Evolution of percentage of chemical families present in bio-oil from flax shives samples with different catalyst-to-biomass ratios
Chemical family present in
bio-oil
Bio-oil samples (mol. %)
Catalyst : biomass ratio
0 2 4 9
Carboxylic acids 34.41 18.79 - -
Alkanes 1.86 1.29 - -
Aromatics 4.95 6.00 10.30 17.00
Alcohols 10.18 5.82 - -
Aldehydes 3.07 1.78 3.26 7.36
Amides 15.13 - - -

Annex B
166
Ketones 6.93 11.73 12.44 20.96
Esters 9.57 4.03 - -
Furans 0.70 1.74 - -
Guaiacols 1.20 2.18 13.26 10.72
Phenols 8.31 46.65 60.74 43.96
Carbohydrates 3.68 - - -
For the determination of the oxygen percentage (mol. %), the following calculations were performed:
For a molecule A, having molecular formula CxHyOz, the theoretical oxygen fraction is:
16 z 1 y 12 x
16 z
= foxygen
From the GC-FID calibration, the molar concentration of the molecule A ([A]) is obtained, and thus,
the molar percentage of oxygen is found from the following equation:
Oxygen percentage (mol. %) = % 100 A oxygen f
The following figure, Figure B.5, is complementary to Figure 3.11 shown in Chapter 3. It represents
the different plots obtained from running a PCA for beech wood bio-oil and non-condensable
product samples.

Annex B
167
Figure B.5: PCA of (a) bio-oil sample, and (b) non-condensable gas sample, of beech wood

Annex C
168
C. Annex C
The water content of the bio-oils has been evaluated by using the Karl Fischer method. These values
(in wt. %), with their associated standard errors (%), have been listed in Table C.1.
Table C.1: Water content of bio-oil samples
Biomass component Catalyst used Water content (wt. %) Standard error (%)
Cellulose
No catalyst 1.97 0.09
HZSM-5 6.43 0.11
Fe-HZSM-5 5.42 0.26
Xylan
No catalyst 2.96 0.04
HZSM-5 9.13 0.21
Fe-HZSM-5 2.86 0.08
Lignin
No catalyst 3.19 0.24
HZSM-5 7.78 0.02
Fe-HZSM-5 3.61 0.19
Table C.2 represents the model molecules of each chemical family present in the bio-oil samples
studied.
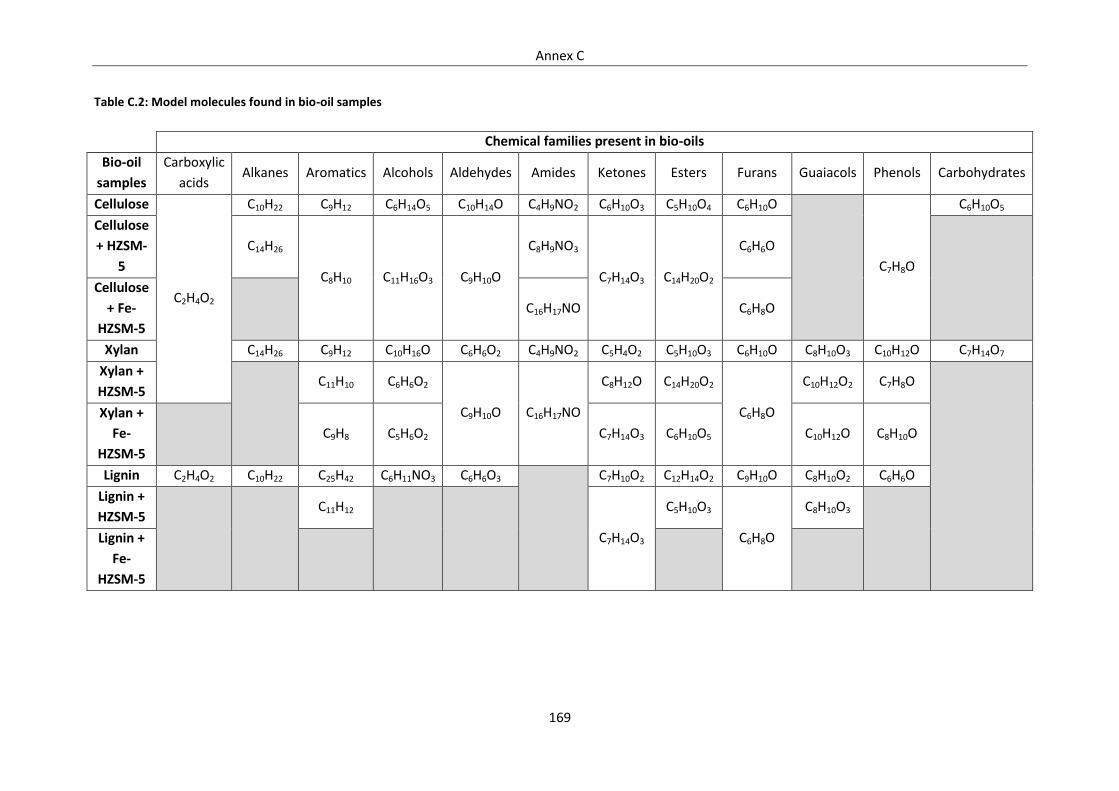
Annex C
169
Table C.2: Model molecules found in bio-oil samples
Chemical families present in bio-oils
Bio-oil
samples
Carboxylic
acids Alkanes Aromatics Alcohols Aldehydes Amides Ketones Esters Furans Guaiacols Phenols Carbohydrates
Cellulose
C2H4O2
C10H22 C9H12 C6H14O5 C10H14O C4H9NO2 C6H10O3 C5H10O4 C6H10O
C7H8O
C6H10O5
Cellulose
+ HZSM-
5
C14H26
C8H10 C11H16O3 C9H10O
C8H9NO3
C7H14O3 C14H20O2
C6H6O
Cellulose
+ Fe-
HZSM-5
C16H17NO C6H8O
Xylan C14H26 C9H12 C10H16O C6H6O2 C4H9NO2 C5H4O2 C5H10O3 C6H10O C8H10O3 C10H12O C7H14O7
Xylan +
HZSM-5
C11H10 C6H6O2
C9H10O C16H17NO
C8H12O C14H20O2
C6H8O
C10H12O2 C7H8O
Xylan +
Fe-
HZSM-5
C9H8 C5H6O2 C7H14O3 C6H10O5 C10H12O C8H10O
Lignin C2H4O2 C10H22 C25H42 C6H11NO3 C6H6O3
C7H10O2 C12H14O2 C9H10O C8H10O2 C6H6O
Lignin +
HZSM-5
C11H12
C7H14O3
C5H10O3
C6H8O
C8H10O3
Lignin +
Fe-
HZSM-5

Annex D
170
D. Annex D
Calibration of the conveyor was performed by varying the frequency on the control board and
measuring the mass of biomass gathered for a given time. Figure D.1 shows the calibration curve
obtained. Concerning the carrier gas, nitrogen was introduced at the top of the DTR and in the screw
conveyor reservoir to ensure an inert atmosphere. Both these flow rates were regulated using flow
controllers.
Figure D.1: Calibration curve for screw conveyor
The following figure illustrates the dimensions of the cyclones used for solid particles separation
fromthegaseousflux,asobtainedfromthe“CycloneSoftware”.

Annex D
171
Figure D.2: Dimensions of cyclones
Table D.1 synthesises the percentages (in mol. %) of the different chemical groups present in the
different experimental runs performed at the pyrolytic temperatures of 500, 550 and 600°C under
the N2 flow rates of 500, 1000 and 2000 mL/min.

Annex D
172
Table D.1: Percentages (mol. %) of chemical families in obtained bio-oil samples
Experiment
conditions
Chemical families present (mol. %)
Carboxylic
acids Alkanes Aromatics Alcohols Aldehydes Amides Ketones Esters Furans Guaiacols Phenols Carbohydrates
500 °C
500 mL/min N2 47.44 0.36 3.64 10.38 1.74 0.25 7.45 6.10 1.04 1.02 13.12 7.45
500 °C
1000 mL/min N2 43.88 1.00 3.65 9.18 1.94 0.26 7.38 6.48 0.97 1.26 15.55 8.46
500 °C
2000 mL/min N2 45.75 0.53 5.09 5.67 1.49 1.01 8.35 5.99 2.13 3.15 16.03 4.81
550 °C
500 mL/min N2 46.91 0.55 2.95 4.04 1.75 0.90 5.94 5.00 1.02 1.05 26.33 3.57
550 °C
1000 mL/min N2 46.34 0.29 2.60 7.92 1.40 0.72 7.24 3.28 1.00 1.04 24.88 3.29
550 °C
2000 mL/min N2 47.90 1.59 3.63 5.76 1.66 0.15 6.56 3.88 0.98 1.07 23.74 3.08
600 °C
500 mL/min N2 39.04 0.33 4.90 2.97 1.76 2.08 4.75 5.21 0.71 0.98 35.9 1.38
600 °C
1000 mL/min N2 38.35 0.21 2.80 3.60 1.31 1.98 4.78 8.59 1.26 1.21 34.71 1.21
600 °C
2000 mL/min N2 39.75 0.34 3.50 3.37 1.69 2.53 5.66 4.37 0.82 1.18 35.09 1.69
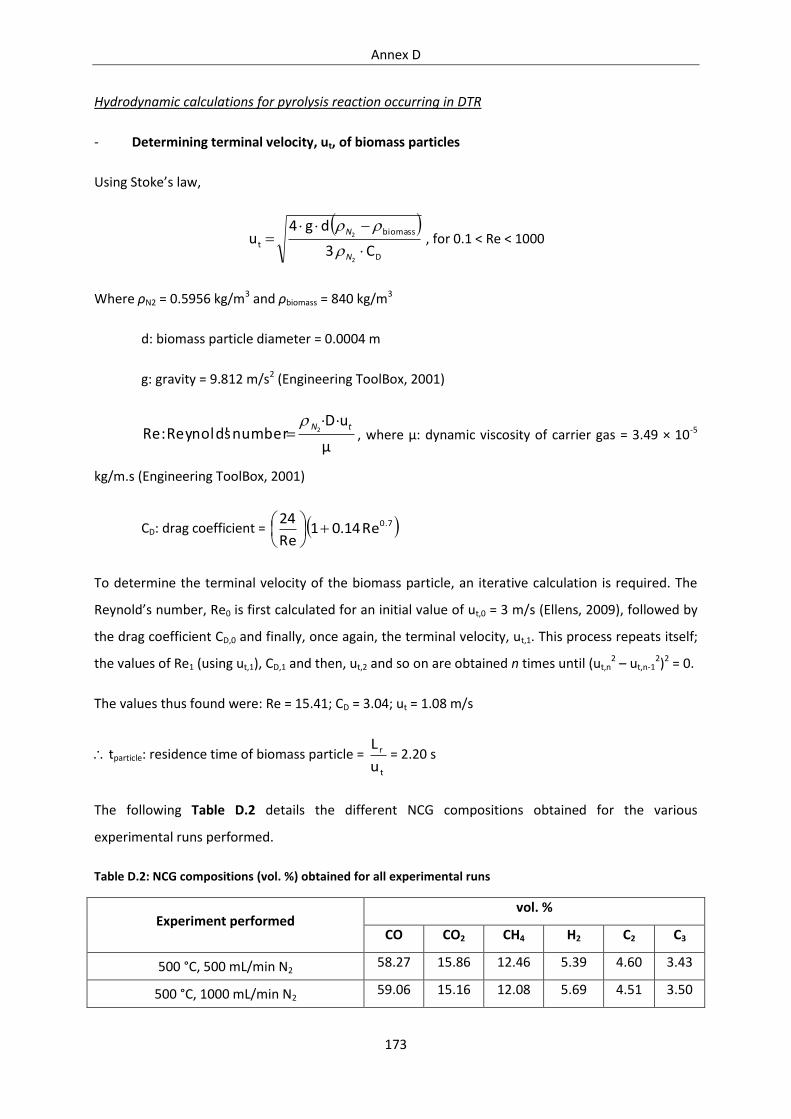
Annex D
173
Hydrodynamic calculations for pyrolysis reaction occurring in DTR
- Determining terminal velocity, ut, of biomass particles
UsingStoke’slaw,
D
biomass
tC 3
d g 4 u
2
2
N
N
, for 0.1 < Re < 1000
Where ρN2 = 0.5956 kg/m3 and ρbiomass = 840 kg/m3
d: biomass particle diameter = 0.0004 m
g: gravity = 9.812 m/s2 (Engineering ToolBox, 2001)
µ
uD number sReynold' :Re 2 tN
, where µ: dynamic viscosity of carrier gas = 3.49 × 10⁻⁵
kg/m.s (Engineering ToolBox, 2001)
CD: drag coefficient = 0.7Re 0.14 1 Re
24
To determine the terminal velocity of the biomass particle, an iterative calculation is required. The
Reynold’snumber,Re0 is first calculated for an initial value of ut,0 = 3 m/s (Ellens, 2009), followed by
the drag coefficient CD,0 and finally, once again, the terminal velocity, ut,1. This process repeats itself;
the values of Re1 (using ut,1), CD,1 and then, ut,2 and so on are obtained n times until (ut,n2 – ut,n-1
2)2 = 0.
The values thus found were: Re = 15.41; CD = 3.04; ut = 1.08 m/s
tparticle: residence time of biomass particle = t
r
u
L= 2.20 s
The following Table D.2 details the different NCG compositions obtained for the various
experimental runs performed.
Table D.2: NCG compositions (vol. %) obtained for all experimental runs
Experiment performed vol. %
CO CO2 CH4 H2 C2 C3
500 °C, 500 mL/min N2 58.27 15.86 12.46 5.39 4.60 3.43
500 °C, 1000 mL/min N2 59.06 15.16 12.08 5.69 4.51 3.50

Annex D
174
500 °C, 2000 mL/min N2 59.80 15.53 11.86 5.23 4.42 3.15
550 °C, 500 mL/min N2 59.38 10.54 13.68 7.98 5.41 3.00
550 °C, 1000 mL/min N2 60.08 10.47 13.27 7.84 5.30 3.04
550 °C, 2000 mL/min N2 60.46 10.44 12.69 7.95 5.19 3.28
600 °C, 500 mL/min N2 56.32 9.70 15.64 10.14 6.00 2.19
600 °C, 1000 mL/min N2 56.60 9.59 15.11 10.41 5.93 2.36
600 °C, 2000 mL/min N2 56.44 9.56 14.56 11.17 5.79 2.48
Figures D.3 (a)-(l) illustrate the evolution of the different chemical families present in the bio-oil
samples obtained under different nitrogen flow rates with increasing DTR temperature.

Annex D
175
Figure D.3 (a)-(l): Evolution of chemical families in bio-oil samples obtained under different nitrogen flow rates with DTR temperature
Figures D.4 and D.5 depict the evolutions of the non-condensable gas compositions obtained with
increasing DTR temperature under different gas flow rates, except that obtained with 500 mL/min
N2, as it was presented in the main text.

Annex D
176
Figure D.4: Evolution of NCG components with DTR temperature under 1000 mL/min N2
Figure D.5: Evolution of NCG components with DTR temperature under 2000 mL/min N2
Table D.3 summarises the different bio-oil compositions obtained in time with the use of HZSM-5 at
different catalytic fixed bed reactor temperatures.

Annex D
177
Table D.3 : Bio-oil compositions (mol. %) obtained during course of reaction at different catalytic fixed bed reactor temperatures with and without HZSM-5
Bio-oil composition (mol. %)
Fixed bed reactor
temperature
No catalyst
(300 °C) 425 °C 450 °C 500 °C
Time in reaction
(min) - 10 20 35 60 120 10 20 35 60 120 10 20 35 60 120
Carboxylic acids 47.44 60.83 61.11 61.66 55.01 55.28 50.57 56.94 59.11 62.56 53.30 48.10 54.73 52.37 53.45 58.25
Alkanes 0.36 1.47 1.42 1.34 1.55 1.18 1.59 1.72 1.69 1.90 2.70 - 0.28 0.38 0.38 0.35
Aromatics 3.64 2.54 2.13 1.92 2.10 1.85 3.27 2.82 2.67 2.14 2.97 3.68 2.53 2.73 2.59 2.03
Alcohols 10.38 6.78 4.89 5.39 5.18 5.56 7.07 5.89 5.32 4.65 5.68 4.51 3.77 4.91 4.37 4.39
Aldehydes 1.74 1.43 1.54 1.71 1.86 1.85 2.54 2.23 2.17 2.39 2.40 2.60 1.29 2.09 2.16 2.33
Amides 0.25 0.57 1.22 0.66 1.21 0.68 0.62 0.44 0.38 0.30 0.47 0.75 0.51 0.56 0.69 1.18
Ketones 7.45 7.28 6.81 6.57 8.37 7.64 12.64 11.92 10.17 6.43 8.25 10.81 9.39 9.27 8.47 8.09
Esters 6.10 5.83 4.92 4.86 8.50 7.11 4.20 4.13 4.31 6.81 6.48 12.39 8.25 8.30 6.27 3.11
Furans 1.04 2.21 2.35 1.95 1.23 1.06 1.46 1.53 1.57 1.10 1.32 3.66 3.87 2.62 2.62 1.81
Guaiacols 1.02 1.31 1.55 1.75 2.20 2.71 1.30 1.27 1.46 1.52 2.02 - 0.66 1.31 1.54 2.19
Phenols 13.12 9.18 10.79 10.46 10.39 12.68 14.06 10.21 9.79 8.66 12.06 13.50 14.22 14.01 15.88 14.59
Carbohydrates 7.45 0.57 1.28 1.73 2.39 2.39 0.68 0.91 1.35 1.54 2.35 - 0.50 1.44 1.58 1.68

Annex D
178
The following tables (Tables D.4 and D.5) list the conversion (-) and production (+) rates of the
different chemical families obtained in the presence of a catalyst, in time. The calculations used to
get these values have been detailed in Chapter 3.
Table D.4: Conversion and production rates of chemical families present in upgraded bio-oils at 450 °C
Chemical
families
Conversion(“-”sign)andproduction(“+”sign)rate(%)
t = 10 min t = 20 min t = 35 min t = 60 min t = 120 min
Carboxylic acids -88 -79 -63 -51 -12
Alkanes -74 -56 -25 6 219
Aromatics -92 -89 -82 -82 -48
Alcohols -92 -89 -83 -81 -52
Aldehydes -84 -78 -63 -49 9
Amides -91 -90 -86 -86 -54
Ketones -84 -77 -66 -73 -27
Esters -93 -89 -81 -61 -22
Furans -85 -76 -58 -63 -5
Guaiacols -87 -80 -60 -47 48
Phenols -91 -90 -83 -81 -43
Carbohydrates -98 -97 -91 -87 -59
Table D.5: Conversion and production rates of chemical families present in upgraded bio-oils at 425 °C
Chemical
families
Conversion(“-”sign)andproduction(“+”sign)rate(%)
t = 10 min t = 20 min t = 35 min t = 60 min t = 120 min
Carboxylic acids -85 -53 -43 -35 -23
Alkanes -85 -55 -50 -26 -33
Aromatics -92 -78 -76 -67 -65
Alcohols -92 -82 -76 -70 -62
Aldehydes -91 -70 -61 -45 -36
Amides -92 -46 -65 -17 -45
Ketones -89 -69 -64 -42 -37
Esters -92 -78 -74 -43 -43
Furans -75 -15 -16 -32 -31
Guaiacols -87 -52 -36 3 50
Phenols -94 -76 -73 -65 -50

Annex D
179
Carbohydrates -99 -93 -89 -80 -76
Figure D.6 illustrates the PCA of the bio-oil samples obtained with the use of HZSM-5 at different
fixed bed reactor temperatures.
Figure D.6: PCA of beech wood bio-oil samples in DTR with HZSM-5 at different fixed bed reactor temperatures
Figures D.7 and D.8 depict the different mass flow rates obtained for the two families following
carboxylic acids in percentage present (phenols and alcohols) during the reaction at different
catalytic fixed bed reactor temperatures.

Annex D
180
Figure D.7: Evolution of phenols in liquid product (g/min) in time with different fixed bed reactor temperatures
Figure D.8: Evolution of alcohols in liquid product (g/min) in time with different fixed bed reactor temperatures

Annex D
181
The evolution in time (vol. %) of the NCG composition for experiments conducted at fixed bed
reactor temperatures of 450 °C and 425 °C have been illustrated in Figures D.9 and D.10. These
percentages have been pitted against those obtained for the same reactions without catalyst use.
Figure D.9: Evolution of NCG composition (vol. %) in time at 450 °C (fixed bed reactor) vs. no catalyst
Figure D.10: Evolution of NCG composition (vol. %) in time at 425 °C (fixed bed reactor) vs. no catalyst

Annex D
182
Tables D.6 and D.7 list the conversion and production percentages obtained for the NCG
components at a catalytic fixed bed reactor temperatures of 450 and 425 °C.
Table D.6: Conversion and production rates of NCG components at a catalytic fixed bed reactor temperature of 450 °C
NCG
components
Conversion(“-”sign)andproduction(“+”sign)rate(%)
1st analysis 2nd analysis 3rd analysis 4th analysis 5th analysis
H2 -78 -37 139 394 2445
CO -79 -40 116 330 2089
CH4 -80 -40 121 329 2093
CO2 -81 -45 133 473 3204
C2H2 -84 -60 23 111 726
C2H4 -79 -46 84 236 1561
C2H6 -80 -26 196 485 3033
C3H4 -93 -79 -38 11 495
C3H6 -75 -35 125 316 1981
C3H8 -79 -36 111 287 1632
Table D.7: Conversion and production rates of NCG components at a catalytic fixed bed reactor temperature of 425 °C
NCG
components
Conversion(“-”sign)andproduction(“+”sign)rate(%)
1st analysis 2nd analysis 3rd analysis 4th analysis 5th analysis
H2 -68 70 175 673 1477
CO -70 53 139 579 1346
CH4 -71 56 140 569 1291
CO2 -71 55 193 863 2644
C2H2 -77 -3 45 266 425
C2H4 -72 31 92 425 936
C2H6 -70 97 219 803 1872
C3H4 -94 -100 -100 206 233
C3H6 -73 50 167 511 1157
C3H8 -58 25 111 485 922