Influence of citrate buffer and flash heating in enhancing the ...
J. Anal. Appl. Pyrolysis 85 (2009) 260–267
Contents lists available at ScienceDirect
Journal of Analytical and Applied Pyrolysis
journal homepage: www.e lsev ier .com/ locate / jaap
Biomass pyrolysis: Kinetic modelling and experimental validation under hightemperature and flash heating rate conditions
Capucine Dupont a,*, Li Chen a, Julien Cances a, Jean-Michel Commandre b, Alberto Cuoci c,Sauro Pierucci c, Eliseo Ranzi c
a CEA, 17 rue des Martyrs, 38054 Grenoble cedex 09, Franceb RAPSODEE, UMR-CNRS 2392, Ecole des Mines d’Albi-Carmaux, 81013 Albi CT cedex 9, Francec CMIC Politecnico di Milano, Piazza Leonardo da Vinci, 32, 20133 Milano, Italy
A R T I C L E I N F O
Article history:
Received 30 June 2008
Received in revised form 18 November 2008
Accepted 19 November 2008
Available online 3 December 2008
Keywords:
Biomass
Pyrolysis
Modelling
Devolatilization
Gas phase kinetics
Entrained flow reactor
A B S T R A C T
This work analyzes and discusses the general features of biomass pyrolysis, both on the basis of a new set
of experiments and by using a detailed kinetic model of biomass devolatilization that includes also
successive gas phase reactions of the released species and is therefore able to predict the main gases
composition. Experiments are performed in a lab-scale Entrained Flow Reactor (EFR) to investigate
biomass pyrolysis under high temperatures (1073–1273 K) and high heating fluxes (10–100 kW m�2).
The influence of particle dimensions and temperature has been tested versus solid residence time in the
reactor. The particle size appeared as the most crucial parameter. The pyrolysis of 0.4 mm particles is
nearly finished under this range of temperatures after a reactor length of 0.3 m, with more than 75 wt% of
gas release, whereas the conversion is still under evolution until the end of the reactor for larger particles
up to 1.1 mm, due to internal heat transfer limitations. The preliminary comparisons between the model
and the experimental data are encouraging and show the ability of this model to contribute to a better
design and understanding of biomass pyrolysis process under severe conditions of temperature and
heating fluxes typically found in industrial gasifiers.
� 2008 Elsevier B.V. All rights reserved.
1. Introduction
Biomass is a renewable, CO2-neutral energy resource, widelyavailable and increasingly used as an alternative to fossil fuel forenergy supply. The thermal conversion of biomass to produce fuelgas (mainly CO and H2) via gasification, of which pyrolysis is thefirst step, is considered as a very promising process. It is wellknown that biomass pyrolysis is a complex process that involvesmass and heat transfer phenomena as well as chemical reactions.Furthermore, the chemical reactions during pyrolysis can befocused on three different aspects:
� B
01
do
iomass devolatilization: i.e. the decomposition of the solid intopermanent gases, condensable vapours (tars) and solid residue(char);
� S econdary gas phase reactions of the released gas and tar species; � H eterogeneous reactions between solid and gas.The way these reactions occur, and therefore the final productyield, is strongly related to operating conditions and possible heat
* Corresponding author.
E-mail address: [email protected] (C. Dupont).
65-2370/$ – see front matter � 2008 Elsevier B.V. All rights reserved.
i:10.1016/j.jaap.2008.11.034
and mass transfer resistances. Several researchers have studied theintrinsic kinetic of biomass devolatilization with small particles(�100 mm). Network biomass devolatilization models describeaccurately the chemistry of the devolatilization process [1]. The FG(functional group)-Biomass model [1–3], the Bio-Flashchain model[4], and the bio-CPD (chemical percolation devolatilization) model[5,6] are examples of these network models. They assume that thebiomass macromolecule is constituted of different lumped groups,and the macromolecular fuel structure changes during thedevolatilization process to produce gas, tar, and char. Thesemodels, initially developed for coal devolatilization, have beenrecently extended to biomasses, but their availability andvalidation are still limited. Research efforts have also been devotedto the pyrolysis of large (said as ‘‘thermally thick’’) biomassparticles [7–10] in order to study the influence of heat and masstransfer limitations and the evolution of solid physical properties.Usually the chemistry of biomass devolatilization is roughlysacrificed. As clearly stated by Di Blasi [11], as well as by Janse et al.in modelling the flash pyrolysis of a single wood particle [12], theaccurate knowledge of the reaction kinetics appears to be a crucialparameter for a reliable modelling of the pyrolysis process.
Besides, the main conclusion of a recent literature review onthe modelling of biomass pyrolysis [13,14] underlines that theavailable knowledge on kinetics and transport phenomena has
Nomenclature
A reactor cross-section [m2]
C species concentration [mol m�3 s�1]
CP specific heat [J kg�1 K�1]
dP particle diameter [m]
f friction factor
g gravity [m s�2]
h species enthalpy [J kg�1]
J particle mass flux [kg s�1]
K global mass exchange coefficient [m s�1]
m mass of particle sector [kg]
m total mass flow rate of particles [kg s�1]
mP particle mass [kg]
M species molecular weight [kg kmol�1]
NC number of species
NR number of reactions
NS number of particle sectors
q heat flux from particle to gas phase [J s�1]
r reaction rate [kmol m�3 s�1]
S external surface of particle sector [m2]
t time [s]
U global thermal exchange coefficient [W m�2 K�1]
v velocity [m s�1]
V volume of spherical sector [m3]
W gas phase mass flow rate [kg s�1]
z reactor axial coordinate [m]
Greek lettersa thermal diffusivity [m2 s�1]
G mass diffusivity [m2 s�1]
DH reaction heat [J mol�1 s�1]
e porosity
h total concentration of solid particles [#/m�3]
l thermal conductivity [J m�1 s�1 K�1]
j radial coordinate [m]
r density [kg m�3]
y stoichiometric coefficient
C. Dupont et al. / J. Anal. Appl. Pyrolysis 85 (2009) 260–267 261
not been integrated properly for reactor design. Accuratemeasurements are difficult, mass balance closures are seldomgood enough to determine the trends of the product yields as afunction of temperature and biomass particle size. Unfortu-nately, it appears that the reaction kinetics reported until nowcannot be used to predict the product distribution with enoughaccuracy. These conclusions emphasize the value of newexperimental measurements and new research activity on thesetopics.
In the present study, a lab-scale Entrained Flow Reactor (EFR)has been used to study experimentally the pyrolysis behaviour ofbiomass particles under severe conditions, namely high tem-peratures (1050–1250 K) and high heating fluxes (10–100 kW m�2). Then the experimental results are used to furthercompare with the prediction of a semi global kinetic model ofbiomass pyrolysis in order to test its predicting ability under EFRconditions. The model [15] includes a description of the chemistryof biomass devolatilization and a detailed scheme of successivegas phase reactions, which is able to predict not only the totalyields of gas, tar, and char, but also the yields of individual speciesreleased in gas phase.
2. Experimental work
2.1. Experimental facility
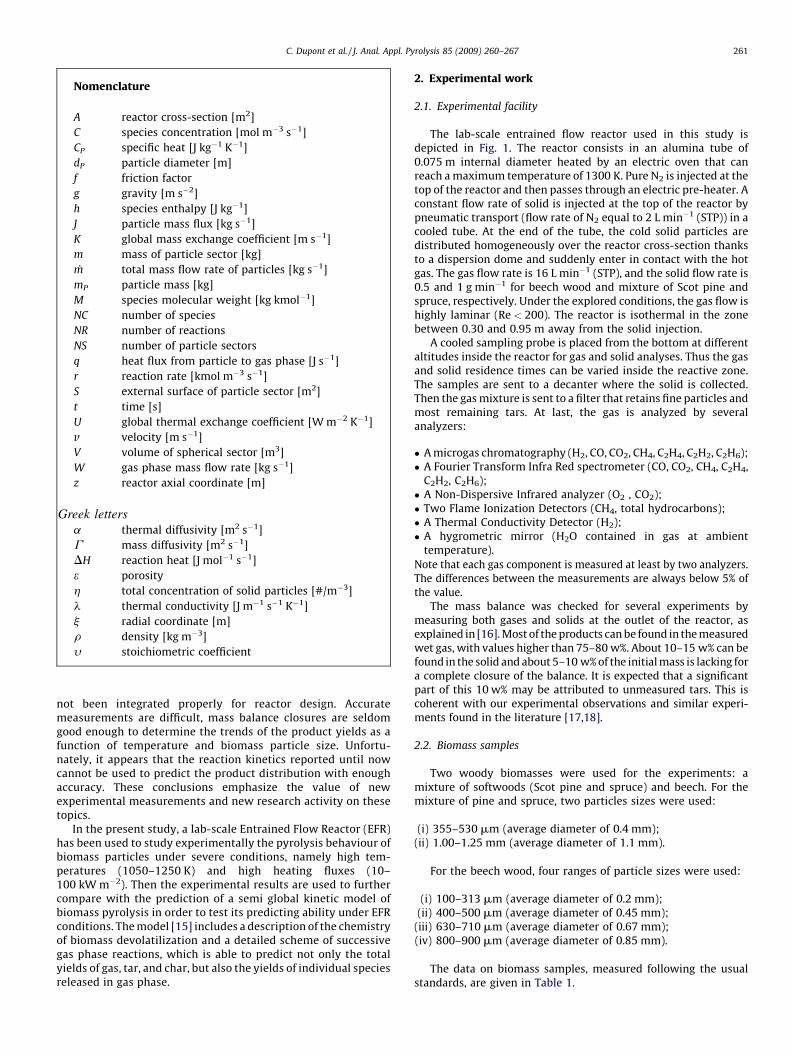
The lab-scale entrained flow reactor used in this study isdepicted in Fig. 1. The reactor consists in an alumina tube of0.075 m internal diameter heated by an electric oven that canreach a maximum temperature of 1300 K. Pure N2 is injected at thetop of the reactor and then passes through an electric pre-heater. Aconstant flow rate of solid is injected at the top of the reactor bypneumatic transport (flow rate of N2 equal to 2 L min�1 (STP)) in acooled tube. At the end of the tube, the cold solid particles aredistributed homogeneously over the reactor cross-section thanksto a dispersion dome and suddenly enter in contact with the hotgas. The gas flow rate is 16 L min�1 (STP), and the solid flow rate is0.5 and 1 g min�1 for beech wood and mixture of Scot pine andspruce, respectively. Under the explored conditions, the gas flow ishighly laminar (Re < 200). The reactor is isothermal in the zonebetween 0.30 and 0.95 m away from the solid injection.
A cooled sampling probe is placed from the bottom at differentaltitudes inside the reactor for gas and solid analyses. Thus the gasand solid residence times can be varied inside the reactive zone.The samples are sent to a decanter where the solid is collected.Then the gas mixture is sent to a filter that retains fine particles andmost remaining tars. At last, the gas is analyzed by severalanalyzers:
� A
microgas chromatography (H2, CO, CO2, CH4, C2H4, C2H2, C2H6); � A Fourier Transform Infra Red spectrometer (CO, CO2, CH4, C2H4,C2H2, C2H6);
� A Non-Dispersive Infrared analyzer (O2 , CO2); � T wo Flame Ionization Detectors (CH4, total hydrocarbons); � A Thermal Conductivity Detector (H2); � A hygrometric mirror (H2O contained in gas at ambienttemperature).
Note that each gas component is measured at least by two analyzers.The differences between the measurements are always below 5% ofthe value.
The mass balance was checked for several experiments bymeasuring both gases and solids at the outlet of the reactor, asexplained in [16]. Most of the products can be found in the measuredwet gas, with values higher than 75–80 w%. About 10–15 w% can befound in the solid and about 5–10 w% of the initial mass is lacking fora complete closure of the balance. It is expected that a significantpart of this 10 w% may be attributed to unmeasured tars. This iscoherent with our experimental observations and similar experi-ments found in the literature [17,18].
2.2. Biomass samples
Two woody biomasses were used for the experiments: amixture of softwoods (Scot pine and spruce) and beech. For themixture of pine and spruce, two particles sizes were used:
(i) 3
55–530 mm (average diameter of 0.4 mm); (ii) 1 .00–1.25 mm (average diameter of 1.1 mm).For the beech wood, four ranges of particle sizes were used:
(i) 1
00–313 mm (average diameter of 0.2 mm); (ii) 4 00–500 mm (average diameter of 0.45 mm);(iii) 6
30–710 mm (average diameter of 0.67 mm); (iv) 8 00–900 mm (average diameter of 0.85 mm).The data on biomass samples, measured following the usualstandards, are given in Table 1.
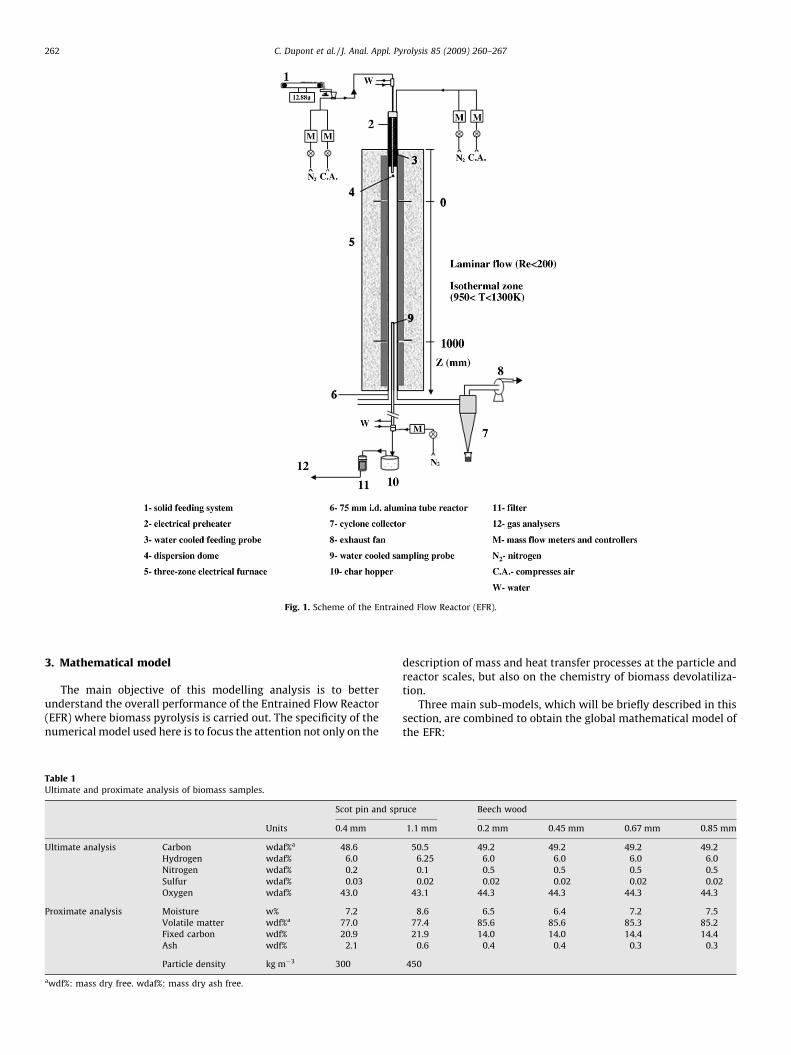
Fig. 1. Scheme of the Entrained Flow Reactor (EFR).
C. Dupont et al. / J. Anal. Appl. Pyrolysis 85 (2009) 260–267262
3. Mathematical model
The main objective of this modelling analysis is to betterunderstand the overall performance of the Entrained Flow Reactor(EFR) where biomass pyrolysis is carried out. The specificity of thenumerical model used here is to focus the attention not only on the
Table 1Ultimate and proximate analysis of biomass samples.
Scot pin and spr
Units 0.4 mm
Ultimate analysis Carbon wdaf%a 48.6
Hydrogen wdaf% 6.0
Nitrogen wdaf% 0.2
Sulfur wdaf% 0.03
Oxygen wdaf% 43.0
Proximate analysis Moisture w% 7.2
Volatile matter wdf%a 77.0
Fixed carbon wdf% 20.9
Ash wdf% 2.1
Particle density kg m�3 300
awdf%: mass dry free. wdaf%: mass dry ash free.
description of mass and heat transfer processes at the particle andreactor scales, but also on the chemistry of biomass devolatiliza-tion.
Three main sub-models, which will be briefly described in thissection, are combined to obtain the global mathematical model ofthe EFR:
uce Beech wood
1.1 mm 0.2 mm 0.45 mm 0.67 mm 0.85 mm
50.5 49.2 49.2 49.2 49.2
6.25 6.0 6.0 6.0 6.0
0.1 0.5 0.5 0.5 0.5
0.02 0.02 0.02 0.02 0.02
43.1 44.3 44.3 44.3 44.3
8.6 6.5 6.4 7.2 7.5
77.4 85.6 85.6 85.3 85.2
21.9 14.0 14.0 14.4 14.4
0.6 0.4 0.4 0.3 0.3
450
C. Dupont et al. / J. Anal. Appl. Pyrolysis 85 (2009) 260–267 263
1. T
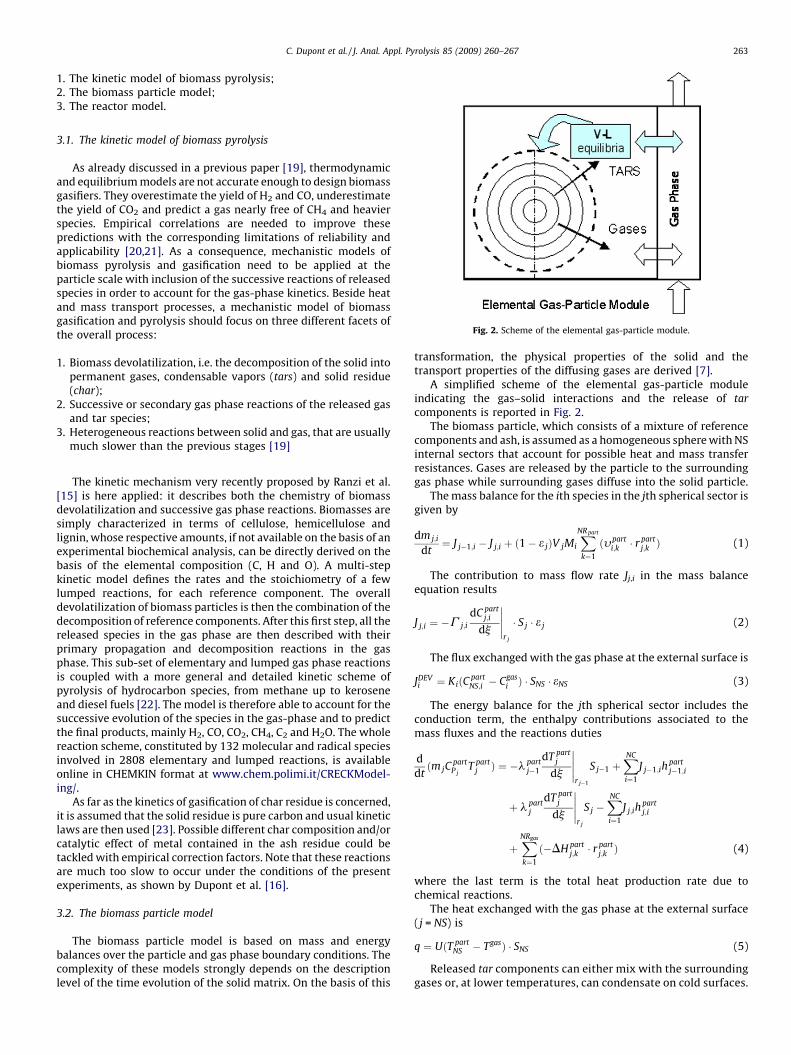
he kinetic model of biomass pyrolysis; 2. T he biomass particle model; 3. TFig. 2. Scheme of the elemental gas-particle module.
he reactor model.
3.1. The kinetic model of biomass pyrolysis
As already discussed in a previous paper [19], thermodynamicand equilibrium models are not accurate enough to design biomassgasifiers. They overestimate the yield of H2 and CO, underestimatethe yield of CO2 and predict a gas nearly free of CH4 and heavierspecies. Empirical correlations are needed to improve thesepredictions with the corresponding limitations of reliability andapplicability [20,21]. As a consequence, mechanistic models ofbiomass pyrolysis and gasification need to be applied at theparticle scale with inclusion of the successive reactions of releasedspecies in order to account for the gas-phase kinetics. Beside heatand mass transport processes, a mechanistic model of biomassgasification and pyrolysis should focus on three different facets ofthe overall process:
1. B
iomass devolatilization, i.e. the decomposition of the solid intopermanent gases, condensable vapors (tars) and solid residue(char);2. S
uccessive or secondary gas phase reactions of the released gasand tar species;3. H
eterogeneous reactions between solid and gas, that are usuallymuch slower than the previous stages [19]The kinetic mechanism very recently proposed by Ranzi et al.[15] is here applied: it describes both the chemistry of biomassdevolatilization and successive gas phase reactions. Biomasses aresimply characterized in terms of cellulose, hemicellulose andlignin, whose respective amounts, if not available on the basis of anexperimental biochemical analysis, can be directly derived on thebasis of the elemental composition (C, H and O). A multi-stepkinetic model defines the rates and the stoichiometry of a fewlumped reactions, for each reference component. The overalldevolatilization of biomass particles is then the combination of thedecomposition of reference components. After this first step, all thereleased species in the gas phase are then described with theirprimary propagation and decomposition reactions in the gasphase. This sub-set of elementary and lumped gas phase reactionsis coupled with a more general and detailed kinetic scheme ofpyrolysis of hydrocarbon species, from methane up to keroseneand diesel fuels [22]. The model is therefore able to account for thesuccessive evolution of the species in the gas-phase and to predictthe final products, mainly H2, CO, CO2, CH4, C2 and H2O. The wholereaction scheme, constituted by 132 molecular and radical speciesinvolved in 2808 elementary and lumped reactions, is availableonline in CHEMKIN format at www.chem.polimi.it/CRECKModel-ing/.
As far as the kinetics of gasification of char residue is concerned,it is assumed that the solid residue is pure carbon and usual kineticlaws are then used [23]. Possible different char composition and/orcatalytic effect of metal contained in the ash residue could betackled with empirical correction factors. Note that these reactionsare much too slow to occur under the conditions of the presentexperiments, as shown by Dupont et al. [16].
3.2. The biomass particle model
The biomass particle model is based on mass and energybalances over the particle and gas phase boundary conditions. Thecomplexity of these models strongly depends on the descriptionlevel of the time evolution of the solid matrix. On the basis of this
transformation, the physical properties of the solid and thetransport properties of the diffusing gases are derived [7].
A simplified scheme of the elemental gas-particle moduleindicating the gas–solid interactions and the release of tar
components is reported in Fig. 2.The biomass particle, which consists of a mixture of reference
components and ash, is assumed as a homogeneous sphere with NSinternal sectors that account for possible heat and mass transferresistances. Gases are released by the particle to the surroundinggas phase while surrounding gases diffuse into the solid particle.
The mass balance for the ith species in the jth spherical sector isgiven by
dm j;i
dt¼ J j�1;i � J j;i þ ð1� e jÞV jMi
XNR part
k¼1
ðyparti;k � r part
j;k Þ (1)
The contribution to mass flow rate Jj,i in the mass balanceequation results
J j;i ¼ �G j;i
dC partj;i
dj
�����r j
� S j � e j (2)
The flux exchanged with the gas phase at the external surface is
JDEVi ¼ KiðC part
NS;i � Cgasi Þ � SNS � eNS (3)
The energy balance for the jth spherical sector includes theconduction term, the enthalpy contributions associated to themass fluxes and the reactions duties
d
dtðm jC
partP j
T partj Þ ¼ �l part
j�1
dT partj
dj
�����r j�1
S j�1 þXNC
i¼1
J j�1;ihpartj�1;i
þ l partj
dT partj
dj
�����r j
S j �XNC
i¼1
J j;ihpartj;i
þXNRgas
k¼1
ð�DH partj;k � r
partj;k Þ (4)
where the last term is the total heat production rate due tochemical reactions.
The heat exchanged with the gas phase at the external surface(j = NS) is
q ¼ UðT partNS � TgasÞ � SNS (5)
Released tar components can either mix with the surroundinggases or, at lower temperatures, can condensate on cold surfaces.
C. Dupont et al. / J. Anal. Appl. Pyrolysis 85 (2009) 260–267264
Gas phase is considered as a perfectly stirred reactor inside thecell module. Convective fluxes or flow rates entering and exitingthe module are allowed, both for gas and solid phase. Thiselemental module is flexible and suitable for simulating differentprocess alternatives, such as fixed or moving bed gasifiers andcombustors, updraft or downdraft configurations and also theentrained flow reactor. The C++ BzzDAE solver is used tonumerically handle this mathematical model [24,25]. Physicaland mathematical details on the overall complexity of thisproblem are given elsewhere [26].
3.3. Mathematical model of the lab-scale entrained flow reactor
Here is briefly described the way how the particle model isapplied to the Entrained Flow Reactor. The emphasis is mainly puton the characterization along the reactor of two crucial para-meters:
� T
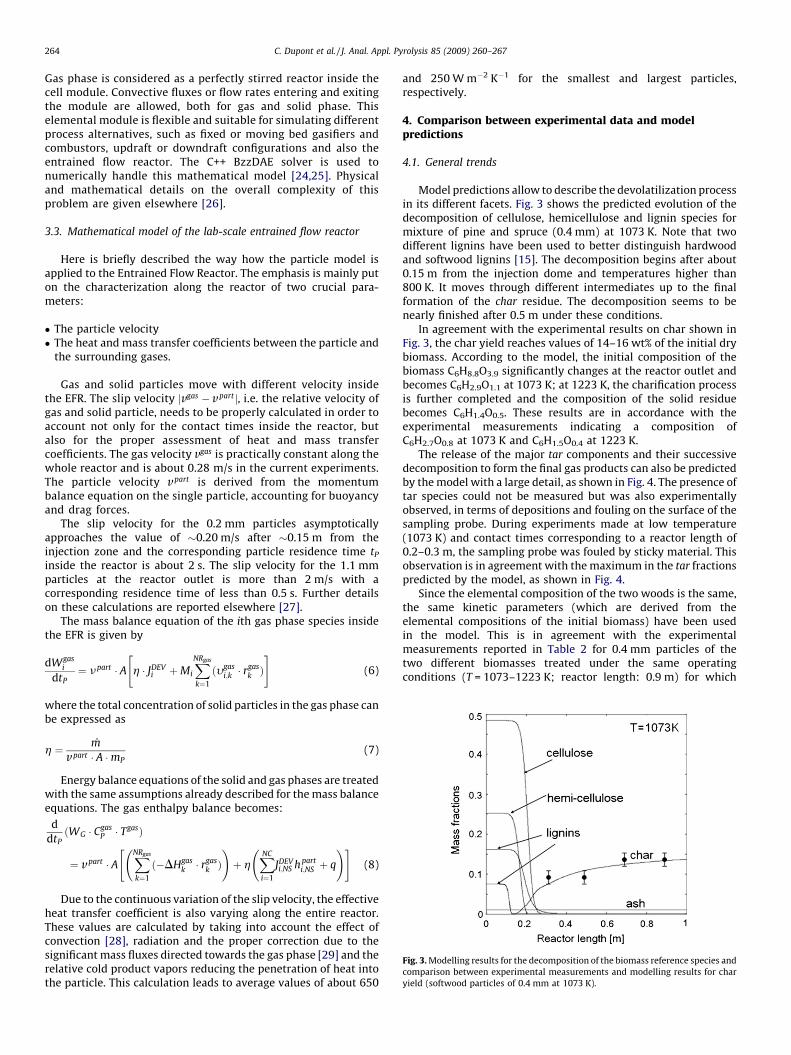
he particle velocity � TFig. 3. Modelling results for the decomposition of the biomass reference species and
comparison between experimental measurements and modelling results for char
yield (softwood particles of 0.4 mm at 1073 K).
he heat and mass transfer coefficients between the particle andthe surrounding gases.
Gas and solid particles move with different velocity insidethe EFR. The slip velocity jvgas � v partj, i.e. the relative velocity ofgas and solid particle, needs to be properly calculated in order toaccount not only for the contact times inside the reactor, butalso for the proper assessment of heat and mass transfercoefficients. The gas velocity vgas is practically constant along thewhole reactor and is about 0.28 m/s in the current experiments.The particle velocity v part is derived from the momentumbalance equation on the single particle, accounting for buoyancyand drag forces.
The slip velocity for the 0.2 mm particles asymptoticallyapproaches the value of �0.20 m/s after �0.15 m from theinjection zone and the corresponding particle residence time tP
inside the reactor is about 2 s. The slip velocity for the 1.1 mmparticles at the reactor outlet is more than 2 m/s with acorresponding residence time of less than 0.5 s. Further detailson these calculations are reported elsewhere [27].
The mass balance equation of the ith gas phase species insidethe EFR is given by
dWgasi
dtP¼ npart � A h � JDEV
i þMi
XNRgas
k¼1
ðygasi;k � r
gask Þ
" #(6)
where the total concentration of solid particles in the gas phase canbe expressed as
h ¼ m
v part � A �mP(7)
Energy balance equations of the solid and gas phases are treatedwith the same assumptions already described for the mass balanceequations. The gas enthalpy balance becomes:
d
dtPðWG � Cgas
P � TgasÞ
¼ v part � AXNRgas
k¼1
ð�DHgask � rgas
k Þ !
þ hXNC
i¼1
JDEVi;NS h part
i;NS þ q
!" #(8)
Due to the continuous variation of the slip velocity, the effectiveheat transfer coefficient is also varying along the entire reactor.These values are calculated by taking into account the effect ofconvection [28], radiation and the proper correction due to thesignificant mass fluxes directed towards the gas phase [29] and therelative cold product vapors reducing the penetration of heat intothe particle. This calculation leads to average values of about 650
and 250 W m�2 K�1 for the smallest and largest particles,respectively.
4. Comparison between experimental data and modelpredictions
4.1. General trends
Model predictions allow to describe the devolatilization processin its different facets. Fig. 3 shows the predicted evolution of thedecomposition of cellulose, hemicellulose and lignin species formixture of pine and spruce (0.4 mm) at 1073 K. Note that twodifferent lignins have been used to better distinguish hardwoodand softwood lignins [15]. The decomposition begins after about0.15 m from the injection dome and temperatures higher than800 K. It moves through different intermediates up to the finalformation of the char residue. The decomposition seems to benearly finished after 0.5 m under these conditions.
In agreement with the experimental results on char shown inFig. 3, the char yield reaches values of 14–16 wt% of the initial drybiomass. According to the model, the initial composition of thebiomass C6H8.8O3.9 significantly changes at the reactor outlet andbecomes C6H2.9O1.1 at 1073 K; at 1223 K, the charification processis further completed and the composition of the solid residuebecomes C6H1.4O0.5. These results are in accordance with theexperimental measurements indicating a composition ofC6H2.7O0.8 at 1073 K and C6H1.5O0.4 at 1223 K.
The release of the major tar components and their successivedecomposition to form the final gas products can also be predictedby the model with a large detail, as shown in Fig. 4. The presence oftar species could not be measured but was also experimentallyobserved, in terms of depositions and fouling on the surface of thesampling probe. During experiments made at low temperature(1073 K) and contact times corresponding to a reactor length of0.2–0.3 m, the sampling probe was fouled by sticky material. Thisobservation is in agreement with the maximum in the tar fractionspredicted by the model, as shown in Fig. 4.
Since the elemental composition of the two woods is the same,the same kinetic parameters (which are derived from theelemental compositions of the initial biomass) have been usedin the model. This is in agreement with the experimentalmeasurements reported in Table 2 for 0.4 mm particles of thetwo different biomasses treated under the same operatingconditions (T = 1073–1223 K; reactor length: 0.9 m) for which
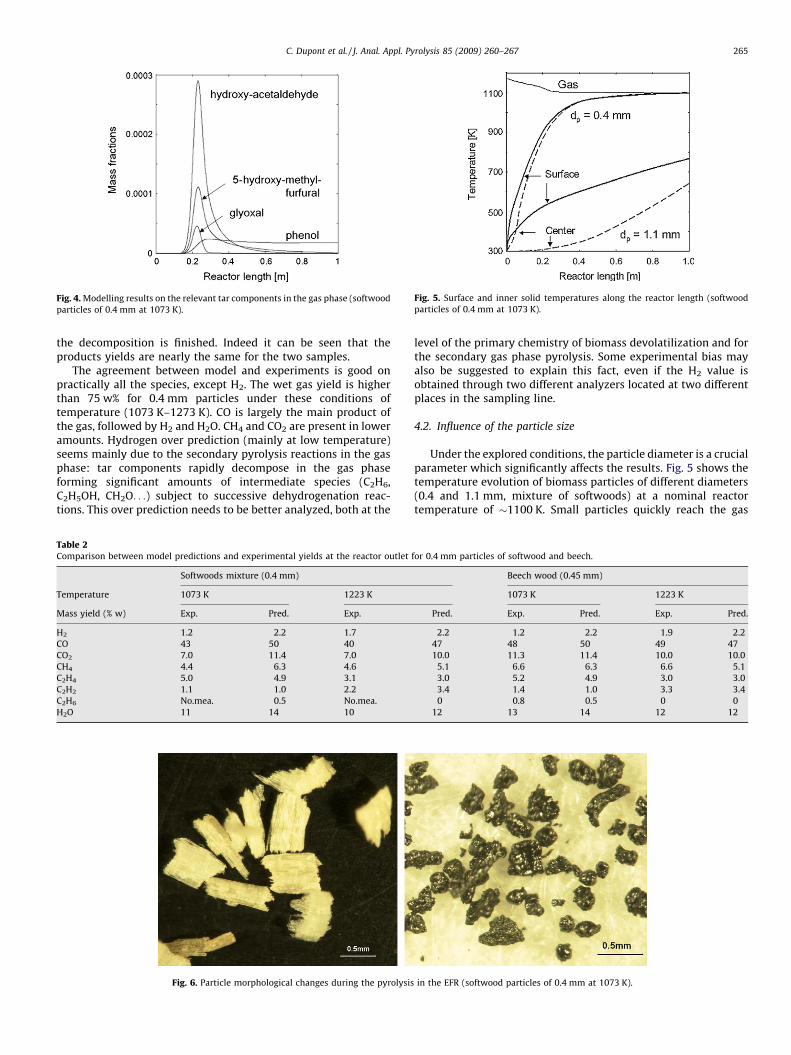
Fig. 4. Modelling results on the relevant tar components in the gas phase (softwood
particles of 0.4 mm at 1073 K).
Fig. 5. Surface and inner solid temperatures along the reactor length (softwood
particles of 0.4 mm at 1073 K).
C. Dupont et al. / J. Anal. Appl. Pyrolysis 85 (2009) 260–267 265
the decomposition is finished. Indeed it can be seen that theproducts yields are nearly the same for the two samples.
The agreement between model and experiments is good onpractically all the species, except H2. The wet gas yield is higherthan 75 w% for 0.4 mm particles under these conditions oftemperature (1073 K–1273 K). CO is largely the main product ofthe gas, followed by H2 and H2O. CH4 and CO2 are present in loweramounts. Hydrogen over prediction (mainly at low temperature)seems mainly due to the secondary pyrolysis reactions in the gasphase: tar components rapidly decompose in the gas phaseforming significant amounts of intermediate species (C2H6,C2H5OH, CH2O. . .) subject to successive dehydrogenation reac-tions. This over prediction needs to be better analyzed, both at the
Table 2Comparison between model predictions and experimental yields at the reactor outlet
Softwoods mixture (0.4 mm)
Temperature 1073 K 1223 K
Mass yield (% w) Exp. Pred. Exp.
H2 1.2 2.2 1.7
CO 43 50 40
CO2 7.0 11.4 7.0
CH4 4.4 6.3 4.6
C2H4 5.0 4.9 3.1
C2H2 1.1 1.0 2.2
C2H6 No.mea. 0.5 No.mea.
H2O 11 14 10
Fig. 6. Particle morphological changes during the pyrolysis
level of the primary chemistry of biomass devolatilization and forthe secondary gas phase pyrolysis. Some experimental bias mayalso be suggested to explain this fact, even if the H2 value isobtained through two different analyzers located at two differentplaces in the sampling line.
4.2. Influence of the particle size
Under the explored conditions, the particle diameter is a crucialparameter which significantly affects the results. Fig. 5 shows thetemperature evolution of biomass particles of different diameters(0.4 and 1.1 mm, mixture of softwoods) at a nominal reactortemperature of �1100 K. Small particles quickly reach the gas
for 0.4 mm particles of softwood and beech.
Beech wood (0.45 mm)
1073 K 1223 K
Pred. Exp. Pred. Exp. Pred.
2.2 1.2 2.2 1.9 2.2
47 48 50 49 47
10.0 11.3 11.4 10.0 10.0
5.1 6.6 6.3 6.6 5.1
3.0 5.2 4.9 3.0 3.0
3.4 1.4 1.0 3.3 3.4
0 0.8 0.5 0 0
12 13 14 12 12
in the EFR (softwood particles of 0.4 mm at 1073 K).
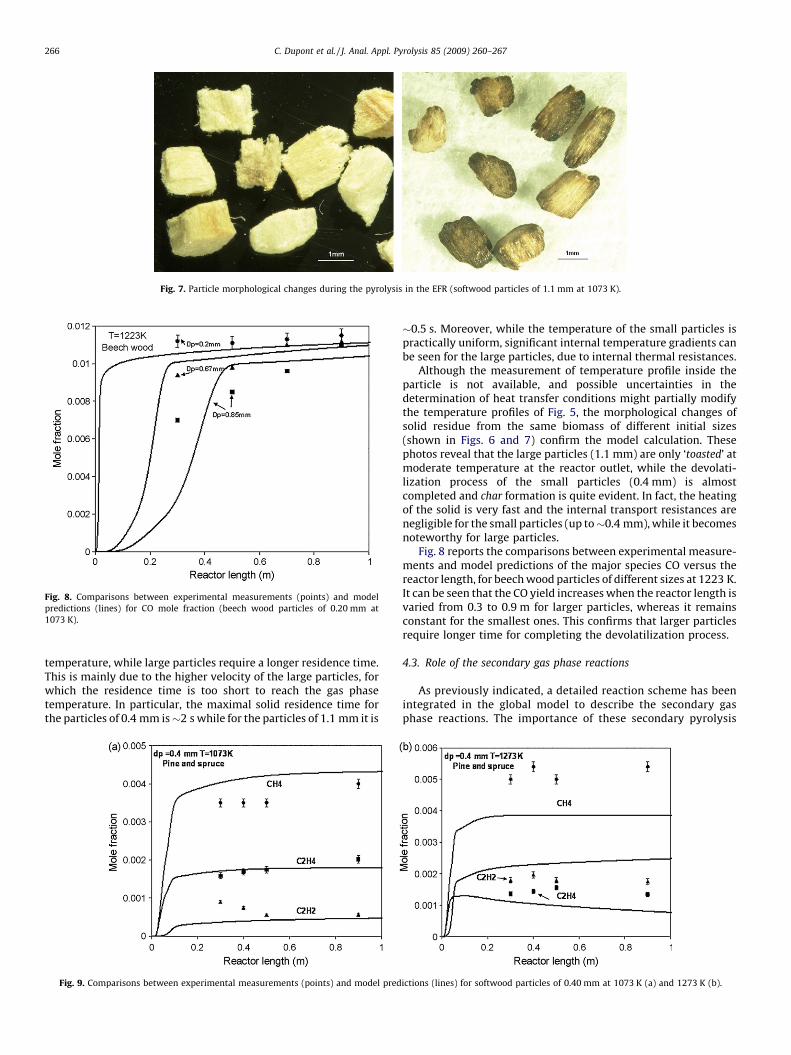
Fig. 7. Particle morphological changes during the pyrolysis in the EFR (softwood particles of 1.1 mm at 1073 K).
Fig. 8. Comparisons between experimental measurements (points) and model
predictions (lines) for CO mole fraction (beech wood particles of 0.20 mm at
1073 K).
C. Dupont et al. / J. Anal. Appl. Pyrolysis 85 (2009) 260–267266
temperature, while large particles require a longer residence time.This is mainly due to the higher velocity of the large particles, forwhich the residence time is too short to reach the gas phasetemperature. In particular, the maximal solid residence time forthe particles of 0.4 mm is�2 s while for the particles of 1.1 mm it is
Fig. 9. Comparisons between experimental measurements (points) and model pred
�0.5 s. Moreover, while the temperature of the small particles ispractically uniform, significant internal temperature gradients canbe seen for the large particles, due to internal thermal resistances.
Although the measurement of temperature profile inside theparticle is not available, and possible uncertainties in thedetermination of heat transfer conditions might partially modifythe temperature profiles of Fig. 5, the morphological changes ofsolid residue from the same biomass of different initial sizes(shown in Figs. 6 and 7) confirm the model calculation. Thesephotos reveal that the large particles (1.1 mm) are only ‘toasted’ atmoderate temperature at the reactor outlet, while the devolati-lization process of the small particles (0.4 mm) is almostcompleted and char formation is quite evident. In fact, the heatingof the solid is very fast and the internal transport resistances arenegligible for the small particles (up to�0.4 mm), while it becomesnoteworthy for large particles.
Fig. 8 reports the comparisons between experimental measure-ments and model predictions of the major species CO versus thereactor length, for beech wood particles of different sizes at 1223 K.It can be seen that the CO yield increases when the reactor length isvaried from 0.3 to 0.9 m for larger particles, whereas it remainsconstant for the smallest ones. This confirms that larger particlesrequire longer time for completing the devolatilization process.
4.3. Role of the secondary gas phase reactions
As previously indicated, a detailed reaction scheme has beenintegrated in the global model to describe the secondary gasphase reactions. The importance of these secondary pyrolysis
ictions (lines) for softwood particles of 0.40 mm at 1073 K (a) and 1273 K (b).
C. Dupont et al. / J. Anal. Appl. Pyrolysis 85 (2009) 260–267 267
reactions is confirmed by the experimental observations. Forexample, C2H2 is only the product of the secondary phasedehydrogenation of C2H4, and it is favoured by high temperatures[16]. Table 2 and Fig. 9 show that in accordance with theexperimental results, model properly predicts this differenttrend of C2H4 and C2H2: C2H2 is more abundant than C2H4 at hightemperature, while the reverse behaviour is predicted andexperimentally measured at 1073 K.
5. Conclusions
Experiments have been performed at high temperatures(1073–1273 K) and high heating fluxes (10–100 kW m�2) in alab-scale entrained flow reactor with different wood particles ofdifferent sizes. These results have been used to further validate adetailed kinetic model of biomass pyrolysis. The comparisonsbetween experimental results and model prediction show thatthe main experimental trends are well-reproduced by the model.The crucial influence of the particle size can be seen under thetested operating conditions. For small particles (dp up to 0.4 mm),the decomposition of the biomass components is almostcompleted after a reactor length of 0.3 m and leads to total gasyields higher than 75 wt% and a char yield of about 10–15 wt% atthe reactor outlet. The major gas component is largely CO,followed by H2. CH4 and CO2 are present in smaller amounts. Thereis a clear effect of temperature on the C2 species behaviour. Forlarge particles (0.4 mm < dp < 1.1 mm), the decomposition is stillunder evolution between 0.3 and 0.9 m of reactor length, due tointernal heat transfer limitations. These first results andcomparisons are encouraging, since the specific fitting for theseexperiments has been limited. The results prove the real potentialof this modelling tool to predict the main product yields and tobetter understand the complex chemical and physical transfor-mations occurring during biomass pyrolysis inside industrialreactors. For a more complete validation of the model, newexperiments are planned in the next future with a more completeproduct analysis including heavier hydrocarbons, such asbenzene.
Acknowledgements
The authors acknowledge the fruitful and continuous discus-sions with Tiziano Faravelli and Alessio Frassoldati. The authorsalso acknowledge the useful comments and suggestions of thereferees.
References
[1] W. De Jong, G. Di Nola, B.C.H. Venneker, H. Spliethoff, M.A. Wojtowicz, Fuel 86(2007) 2367–2376.
[2] Y.G. Chen, S. Charpenay, A. Jensen, M.A. Serio, M.A. Wojtowicz, A.C.S. Fuel Chem.Div. Preprints, 1997, 1.
[3] Y.G. Chen, S. Charpenay, A. Jensen, M.A. Wojtowicz, M.A. Serio, Modeling ofBiomass Pyrolysis Kinetics, in: Proceedings of the Twenty-Seventh Symposium(International) on Combustion, 1998.
[4] S. Niksa, Predicting the Rapid Devolatilization of Diverse Forms of Biomass withBio-FLASHCHAIN, in: Proceedings of the Combustion Institute, 2000.
[5] C.D. Sheng, J.L.T. Azevedo, Modeling biomass devolatilization using the chemicalpercolation devolatilization model for the main components, in: Proceedings ofthe Combustion Institute, 2002, p. 29.
[6] H.R. Pond, T.H. Fletcher, L.L. Baxter, Prediction of tar and light gas during pyrolysisof black liquor and biomass, in: Proceedings of the Third Annual Joint Meeting ofthe U.S. Sections of the Combustion Institute, Chicago, 2003.
[7] W.C.R. Chan, M. Kelbon, B.B. Krieger, Fuel 64 (1985) 1505–1513.[8] M.G. Gronli, A theoretical and experimental study of the thermal degradation of
biomass, Faculty of Mechanical Engineering, The Norwegian University of Scienceand Technology, 1996.
[9] H. Lu, Experimental and Modeling Investigations of Biomass Particle Combustion,Department Chemical Engineering, Brigham Young University, 2006.
[10] M. Bellais, Modelling of the pyrolysis of large wood particles, in: in Department ofChemical Engineering and Technology, Royal Institute of Technology, Stockholm,2007.
[11] C. Di Blasi, Progress in Energy and Combustion Science 34 (2008) 47–90.[12] A.M.C. Janse, R.W.J. Werterhout, et al. ‘‘Modelling of Flash Pyrolysis of a Single
Wood Particle.’’ Chemical Engineering and Processing, 39 (2000) 239–252.[13] S.R.A. Kersten, et al., Interpretation of biomass gasification by ‘‘quasi’’-equilibrium
models, in: Proceedings of the 12th European Conference on Biomass for Energy,Industry and Climate Protection, Amsterdam, 2002.
[14] X. Wang, S.R.A. Kersten, W. Prins, W.P.M. van Swaaij, Ind. Eng. Chem. Res. 44(2005) 8786–8795.
[15] E. Ranzi, A. Cuoci, T. Faravelli, A. Frassoldati, G. Migliavacca, S. Pierucci, S.Sommariva, Energy Fuels (2008), doi:10.1021/ef800551t.
[16] J.M. Commandre, P. Gauthier, G. Boissonnet, S. Salvador, D. Schweich, Fuel 87(2008) 1155–1164.
[17] R. Zanzi, K. Sjostrom, E. Bjornbom, Fuel 75 (1996) 545–550.[18] S. Li, S. Xu, S. Liu, C. Yang, Q. Lu, Fuel Proc. Technol. 85 (2004) 1201–1211.[19] C. Dupont, G. Boissonnet, J.-M. Seiler, P. Gauthier, D. Schweich, Fuel 86 (2007) 32–
40.[20] S.R.A. Kersten, et al., Interpretation of biomass by quasi-equilibrium models, in:
Proceedings of the Twelfth European Conference on Biomass for Energy, Industryand Climate Protection, Amsterdam, The Netherlands, 2002.
[21] X.T. Li, J.R. Grace, C.J. Lim, A.P. Watkinson, H.P. Chen, J.R. Kim, Biomass Bioenergy26 (2004) 171–193.
[22] E. Ranzi, M. Dente, A. Goldaniga, G. Bozzano, T. Faravelli, Prog. Energy Combust.Sci. 27 (2001) 99–139.
[23] C. Branca, C. Di Blasi, H. Horacek, Ind. Eng. Chem. Res. 41 (2002) 2107–2114.[24] G. Buzzi-Ferraris, D. Manca, Comput. Chem. Eng. 22 (1998) 1595–1621.[25] G. Buzzi-Ferraris, Numerical Libraries in C++. 2007. Available from: http://
www.chem.polimi.it/homes/gbuzzi.[26] S. Pierucci, E. Ranzi, ESCAPE 18 Comput. Aided Process Eng. 25 (2008) 901–906.[27] C. Dupont, Vapogazeification de la biomasse: contribution a l’etude de la phe-
nomenologie entre 800 et 1000C. 2006, Universite Claude Bernard, Lyon 1, Lyon.[28] W.E. Ranz, W.R. Marshall, Chem. Eng. Prog. 48 (1952) 141–146, 173-180.[29] R.B. Bird, W.E. Stewart, E.N. Lightfoot, Transport Phenomena, 2nd ed., Wiley, New
York, 2002.
Copyright © 2022 FDOKUMEN