
Anchor Handling Tug Supply - USN Open Archive
68
Running head: AHTS, IS THERE A CORRELATION BETWEEN FUEL CONSUMPTION AND RATE LEVELS? Anchor Handling Tug Supply Is there a correlation between fuel consumption and rate levels? Candidate name: Thomas Nordvik Strande University of South-Eastern Norway Faculty of Technology, Natural Sciences and Maritime Sciences MASTER THESIS May 2018
-
Upload
khangminh22 -
Category
Documents
-
view
0 -
download
0
Transcript of Anchor Handling Tug Supply - USN Open Archive

Running head: AHTS, IS THERE A CORRELATION BETWEEN FUEL
CONSUMPTION AND RATE LEVELS?
Anchor Handling Tug Supply Is there a correlation between fuel consumption and rate levels?
Candidate name: Thomas Nordvik Strande
University of South-Eastern Norway Faculty of Technology, Natural Sciences and Maritime Sciences
MASTER THESIS
May 2018
AHTS, IS THERE A CORRELATION BETWEEN FUEL CONSUMPTION AND
RATE LEVELS?
2
Abstract
The last four years have seen offshore vessel owners struggle with declining
utilization and revenues from their fleet. Reducing the cost of operation have been the focus
for survival, second only to securing capital expenditure runway. Where other offshore
segments have seen a clear favouritism from oil companies, hiring and advocating for vessels
with more fuel and cost-efficient profiles, the powerful and complex AHTS vessels have been
lacking a similar seen focus. This thesis has studied the variance between consumption and
rate levels for the large sized AHTS vessels. Through statistical analysis and regressions, it
sought to determine a correlation between consumption profile and rate levels earned, both
from an overall perspective, and during power distribution favouring either buyer or seller, in
geographical specified areas of operation. Interviews with eight relevant industry
professionals were in addition conducted, to strengthen the quantitative results together with
evaluating and connecting relevant literature on the subject. The overall results found that the
fuel consumption has played a diminutive part in determining rate levels for these vessels.
Indications where found supporting a positive correlation between less fuel consuming
vessels and rates, when buyer’s bargaining power was strong. For the area specific research,
the South American and Australian covered areas reflected to be the regions with the
strongest consumption focus and rate correlation. Respondents were found to diverge in their
expressed views, with oil companies more inclined to support a fuel efficient AHTS’s
positive influence on rates, while owners expressed little confidence in consumption
significantly affecting rates.

AHTS, IS THERE A CORRELATION BETWEEN FUEL CONSUMPTION AND
RATE LEVELS?
3
Acknowledgments
First, I would like to show my gratitude and thank my supervisor, Marius Imset.
Thank you for the guidance and helping me stay on point. The narrowing down of topic and
research questions, along with the demand for theoretical connections, contributed to elevate
this thesis. Secondly, I would like to thank the supportive and knowledge-sharing employees
at Arctic Offshore, who have aided me along the process with both insightful views and
access to data. A huge thank you also goes out to the interview participants, for taking the
time out of their demanding everyday schedules and helping me make this research more
solid.
Finally, I want to acknowledge my patient and supportive wife, who has endured
some moody nights and weekends.

AHTS, IS THERE A CORRELATION BETWEEN FUEL CONSUMPTION AND
RATE LEVELS?
4
Table of Contents
ABSTRACT ............................................................................................................... 2
ACKNOWLEDGMENTS .......................................................................................... 3
ABBREVIATIONS ..................................................................................................... 7
1. INTRODUCTION................................................................................................ 8
1.1 BACKGROUND ..................................................................................................... 8
1.2 PURPOSE AND RESEARCH PROBLEM .................................................................. 10
2. LITERATURE REVIEW ................................................................................ 11
2.1 THE AHTS SEGMENT AND ITS DYNAMICS ......................................................... 11
2.2 CHARTER CONTRACTS IN THE AHTS SEGMENT ................................................ 11
2.3 THE AHTS MARKET AND GEOGRAPHICAL AREAS OF OPERATION ................... 12
2.4 THE RATE DETERMINATIONS OFFSHORE ............................................................ 14
2.5 THE FUEL CONSUMPTION FOR AHTS ................................................................ 16
2.6 PROPULSION SYSTEMS AND DEVELOPMENTS IN AHTS ..................................... 21
2.7 INVESTMENT THEORY FOR PROJECTS................................................................ 24
2.8 COMPETITIVE FORCES ....................................................................................... 25
2.9 REFINED RESEARCH QUESTIONS AND HYPOTHESES ........................................... 25
3. METHODOLOGY ............................................................................................ 28
3.1 RESEARCH STRATEGY AND DESIGN ................................................................... 28
3.2 QUANTITATIVE RESEARCH ................................................................................ 28
3.2.1 Data Collection ........................................................................................ 30
3.2.2 Population and Sample ............................................................................ 30
3.2.3 Data editing .......................................................................................... 31
3.2.4 One-way ANOVA ..................................................................................... 32
3.2.5 Multiple linear regression........................................................................ 32
3.3 AREA SPECIFIC ANALYSIS.................................................................................. 34
3.4 QUALITATIVE RESEARCH .................................................................................. 34
3.4.1 Data Collection and Approval of Research ............................................. 35
3.4.2 Objects of interest .................................................................................... 36

AHTS, IS THERE A CORRELATION BETWEEN FUEL CONSUMPTION AND
RATE LEVELS?
5
3.4.3 Participants .............................................................................................. 36
3.4.4 Interview method ...................................................................................... 37
3.4.5 Interview Guide ........................................................................................ 38
4. RESULTS .......................................................................................................... 39
4.1 DESCRIPTIVE RESULTS ...................................................................................... 39
4.2 RESULTS FROM THE ONE-WAY ANOVA ANALYSIS .......................................... 41
4.3 RESULTS FROM MULTIPLE REGRESSION ANALYSIS ............................................ 42
4.4 RESULTS FROM AREA SPECIFIC MULTIPLE REGRESSION ANALYSIS .................... 44
4.5 RESULTS FROM INTERVIEWS ............................................................................. 47
5. DISCUSSION ..................................................................................................... 52
5.1 VARIATIONS IN RATE LEVELS FOR AHTS VESSELS ........................................... 52
5.2 CORRELATIONS BETWEEN CONSUMPTION AND RATE LEVELS FOR AHTS .......... 53
5.3 MAIN GEOGRAPHICAL AREAS OF OPERATIONS AND THEIR VARIANCE ............... 55
5.3.1 Northwest Europe .................................................................................... 55
5.3.2 South & Central American....................................................................... 55
5.3.3 Australia, New Zealand and Southeast Asia ............................................ 56
5.3.4 Mediterranean and West Africa ............................................................... 56
5.3.5 Gulf of Mexico, US and Canadian ........................................................... 56
5.3.6 Other Areas .............................................................................................. 57
6. CONCLUSION ................................................................................................. 59
REFERENCES ......................................................................................................... 61
APPENDICES ........................................................................................................... 65

AHTS, IS THERE A CORRELATION BETWEEN FUEL CONSUMPTION AND
RATE LEVELS?
6
List of Figures
Figure 1 AHTS Main Geographical Areas of Operation, Daleel, (2017) .................... 13
Figure 2 Distribution for Time & FOC (Internal Class society survey, 2012) ............ 20
Figure 3 Myklebust & Aadnanes (2011). ..................................................................... 21
Figure 4 Porter, M. E. (2008). The five forces that shape strategy .............................. 25
Figure 5 Conceptual model for 2.9.1 ........................................................................... 27
Figure 6 Conceptual model for 2.9.2.1-2 ..................................................................... 27
Figure 7 Conceptual model for 2.9.3 ........................................................................... 27
List of Tables
Table 1 Abbreviations .................................................................................................... 7
Table 2 AHTS specifications researched to correlate with charter rates ..................... 15
Table 3 Fuel consumption theory & calculations ........................................................ 18
Table 4 Consumption variables effecting vessels performance ................................... 19
Table 5 Overview of most recent AHTS orders and deliveries ................................... 23
Table 6 Variables and definitions ................................................................................ 26
Table 7 Research Question and Hypotheses ................................................................ 26
Table 8 Interview Guide with purpose & connection .................................................. 38

AHTS, IS THERE A CORRELATION BETWEEN FUEL CONSUMPTION AND
RATE LEVELS?
7
Abbreviations
AHTS – Anchor handling tug supply vessel
PSV – Platform Supply Vessel
OSV – Offshore Support Vessel
DW – Deadweight tonnage
GT – Gross tonnage
E&P – Exploration and Production
LNG – Liquified Natural Gas
FOC- Fuel Oil Consumption
IOC – International Oil & Gas Company
DP - Dynamic Positioning
DE – Diesel Electric Propulsion System
DM – Diesel Mechanic Propulsion System
Hybrid – Combined DE and DM systems
NPV – Net Present Value
PBP – Payback Period
IV- Independent Variable
DV- Dependent Variable
Table 1 Abbreviations

AHTS, IS THERE A CORRELATION BETWEEN FUEL CONSUMPTION AND
RATE LEVELS?
8
1. Introduction
Described below are the developments that motivated me to conduct research within
the field of consumption and rates in the AHTS segment. The introduction sheds light on the
purpose of the thesis along with the research questions raised and sought answered.
1.1 Background
The AHTS vessels plays a crucial part in the offshore oil and gas industry. Together
with other vessel segments, they deliver a key service to oil companies in exploration for and
production of oil and gas. As Leffler, Pattarozzi & Sterling, (2011) describe, the AHTS
vessels are typically used to tow oilrigs from A to B, assist in the anchor placement and
securing rigs at various wells to be drilled. The vessels can also supply the oilrigs and
offshore installations with containers and bulk-cargo. However, the anchor handling and
towing capabilities are what makes these vessels unique. These features nevertheless, come at
a price, as the vessels are highly complex and expensive to both build and operate, Myklebust
& Aadnanes (2011). One significant cost of operating AHTS vessels are the fuel cost. The
unique abilities to tow objects and conduct anchor handling, demand large power outputs,
which results in high fuel consumption.
Tvedte & Sterud, (2016) points out that the oil companies chartering the vessels at
agreed upon rates are also typically responsible for covering the fuel costs. The shipowners
on the other hand are responsible for acquiring and operating the vessels. They decide on the
design and propulsion-configuration when building new vessels or buying second hand
assets, all of which affects the consumption of the vessel.
Fuel consumption within the AHTS segment varies and in the last decade new and
modern designs are proving superior with regards to consumption. Innovative and modern

AHTS, IS THERE A CORRELATION BETWEEN FUEL CONSUMPTION AND
RATE LEVELS?
9
tonnage is more expensive to acquire for the owners, so the question becomes; does it make
economic sense to invest in vessels with efficient consumption profiles, from an owner’s
point of view? And is there empirical evidence supporting incentives for this from the
charterers?
Research conducted by Lindstad, Eskeland & Rialland (2016) has shown that the
related segment of platform supply vessels (PSVs), has experienced a higher pace when
turning their attention towards fuel consumption and alternative fuels, including LNG and
battery supplements. Their study makes claim for a possible payback period (PBP) of 5 years,
for a battery instalment on a new-built PSV. The related PSV segment has also seen clear
signs from charterers, that reducing consumption is valued. Oil major Statoil’s, (2017), recent
proclamation for more fuel efficiency in the offshore sector, supports the timing and
relevance of this thesis, as the overall literature and research on the AHTS segment is slim.
AHTS’ are more complex and fuel consuming than the related PSVs, especially in
their operational modes of towing and anchor handling. I argue however, that many
similarities in operational modes justifies more research on this specific segment, to optimize
the efficiency and reduce fuel and cost, as seen in the related offshore support vessel (OSV)
segments.
Studies show variations in the fuel consumption within the AHTS fleet, Myklebust &
Aadnanes (2011). So, are the vessels with the optimal fuel consumption profile the ones
being hired in today’s challenging market? Are they receiving a “premium” rate, and is there
evidence of variations in rates for these vessels compared to less fuel-efficient ones? These
are some of the research questions this thesis will attempt to answer, in hopes that industry

AHTS, IS THERE A CORRELATION BETWEEN FUEL CONSUMPTION AND
RATE LEVELS?
10
players can acquire insight to further conduct research studies’, and use as guidance when
ordering, chartering and operating AHTS vessels in the future.
The above combined with firmer global seaborne emission legislation and upcoming
mandatory consumption registration, IMO, (2016), strengthen my argument for further
research on the correlation between fuel consumption and rate levels in the AHTS segment.
1.2 Purpose and research problem
The purpose of this thesis has been to investigate if there is evidence for a correlation
between fuel consumption and rates earned by the AHTS vessels. I wished to establish if less
fuel consumption resulted in a rate premium, and if this was something that occurred on an
unremitting regularity, or if it was dependent on the market’s power distribution as well. This
thesis also sought to research if the conceivable correlation varied across geographical areas
of operations, as these vessels work worldwide under various oil companies and
governmental legislations.
Research conducted on the different propulsion systems available have shown
variations in consumption and these differences had a central place when investigating a
possible correlation between consumption and rates, for the large type AHTS vessels. The
argumentation for the choice will be described in depth, but originates from the complexity
and variations of the operational modes and consumption profile for the AHTS.
Through empirical research this thesis attempted to answer the research question: “Is
there a correlation between fuel consumption and rate levels with regards to Anchor
Handling Tug Supply vessels?”

AHTS, IS THERE A CORRELATION BETWEEN FUEL CONSUMPTION AND
RATE LEVELS?
11
2. Literature review
2.1 The AHTS segment and its dynamics
The literature on the collective OSV sector and more specifically the AHTS segment
and its dynamics, is a field with little standardized curriculum. Although the sector is over
fifty years old, we still see a superior focus on conventional shipping segments like deep-sea
bulk and tank freight. Various textbooks such as; Leffler, Pattarozzi & Sterling (2011) guide
on the basics of the offshore industry, but little is written on the correlation between
specifications of the vessels and their utilization and rates. Reasons for the lack of literature
and research could be, as argued by Stopford (2009), the relative small size that the segment
adds up to in terms of gross tonnage. These vessels are not transporting goods from port to
port and labelled by way of weight capacity, as is the case in deep-sea shipping. The offshore
sector is more complex in terms of work scopes, which makes studying the AHTS segment
more challenging, compared to the more traditional shipping sectors.
The AHTS segment varies between smaller less powerful vessels, operating in more
shallow-water areas, to the large type AHTS vessels, able to deliver services in deep-sea
areas. Break horse power (BHP) and bollard pull (BP) capacity are found to be the most
commonly used features to divide the segment on and approximately 15,000 Bhp / 140t BP
and upwards are considered as large type AHTS. The latter is the population this thesis seeks
to research.
2.2 Charter contracts in the AHTS segment
Charter contracts for AHTS vessels are usually divided between spot and long-term
charters. Where the spot charter period normally refers to commitments for a period less than

AHTS, IS THERE A CORRELATION BETWEEN FUEL CONSUMPTION AND
RATE LEVELS?
12
a month. Oil companies typically use these spot charters when they need vessels for one
specific rig-move or towing job.
The long-term charter periods can vary from more than a month to multiple year
commitments. Long-term charters are utilized by oil companies to secure access to certain
type vessels for longer periods. Both charter contracts are awarded or fixed after a tendering
process. On occasion the contracts can be awarded ahead of commencement, however the
trend shown in the data demonstrate a clear tendency of contracts being fixed close to the
actual date of instigation, particularly for spot charter fixtures.
2.3 The AHTS Market and Geographical Areas of Operation
The AHTS sector represents a part of the supply side, selling their services to the
buying oil and gas companies, putting forth the demand. Economical market theory applies to
sea trade as well, and as stated by Y. H. V. Lun., et al. (2010), price will favour seller if the
demand outweighs the supply, and support buyer when the opposite is true.
In recent years the latter have been most accurate, as worldwide oversupply of AHTS
vessels have seen chartering rates plumage. This is no unprecedented occurrence, as
prescribed by Daleel, (2017), the offshore market mirrors that of the deep-sea shipping trade
in being highly cyclical. While deep-sea shipping is global in its essence, the AHTS segment
diverge to a degree.
Since the core business model is supporting oil and gas exploration and production
(E&P), the AHTS vessels operate in such areas around the globe that have the demand for
said service and support. The largest and most significant offshore E&P areas are displayed
below:

AHTS, IS THERE A CORRELATION BETWEEN FUEL CONSUMPTION AND
RATE LEVELS?
13
Figure 1 AHTS Main Geographical Areas of Operation, Daleel, (2017)
We find the main geographical areas for larger AHTS vessels around the deep-water
and ultradeep water E&P shelfs in; the Northwest Europe (NWE), Gulf of Mexico (GOM),
West Africa (WA), Americas, Brazil, Southeast Asia (SE Asia) and Australian waters, Sakar
& Hwa, (2017).
These areas follow the same basic market principals and historical statistics show that
declining oil prices and investments from the oil majors, affects all areas negatively. The
downward spiral is felt with utilization and rates reduced for the owners. The maturity level
of the areas does however wary, and younger deep-sea areas found in Brazil, Australia, and
WA, have historically seen an un-synced pace of decline compared to GOM and NWE. This
has generally led to owners deploying their vessels to said areas, resulting in oversupply and
lower rates over time, Sakar & Hwa, (2017), OECD, (2014).
The NWE area is unique with regards to its spot market and transparency, making it
much more predictable as to preferences from the chartering side. Other areas for the large

AHTS, IS THERE A CORRELATION BETWEEN FUEL CONSUMPTION AND
RATE LEVELS?
14
AHTS, have seen less uniform vessels operating, and preferences including propulsion
system and overall consumption weighing is thought to be more uncertain.
Few AHTS specific studies can be found on areas outside NWE, but in researching
more broadly when observing for correlations between consumption and rates, the
expectation is that this thesis will be able to confirm or reject correlations between the
variables in all areas of operations.
2.4 The rate determinations offshore
The correlation between specifications of OSVs and market appeal has seen some
more attention of late, both within the PSV and AHTS segments. Dahle & Kvalsvik, (2016)
investigates the microeconomic factors that ship-specifics gives in terms of charter and rates.
They also explore if energy efficiency pays off by means of contracts. In their findings, they
highlight that “standardized vessels” in both the PSV and AHTS segments has been shown to
be preferred. For energy efficient AHTS, they argue that the market has become more
sensitive to the issue, specifically for longer charter contracts awarded AHTS vessels in the
NWE area. They further state that both environmental legislation and the charter dominant
role in the supply chain, may impact further developments in this segment.
Grøvdal & Tomren, (2016)’s OSV lay-up research, comes at this from a different
angle. Their thesis uses logistic regression to argue for the significant link between the AHTS
specific bollard pull (BP) capacity and the lay-up decision by owners.
An equivalent research done by Tvedte & Sterud, (2016), look at obtaining contracts
for OSV’s. For the AHTS segment, that research makes claims to the diversification between
spot/long-term chartering and the vessel specifications. Elaborating on the importance of
technical specifications to be able to win contracts.

AHTS, IS THERE A CORRELATION BETWEEN FUEL CONSUMPTION AND
RATE LEVELS?
15
Bjørkelund, (2014) thesis on pricing in offshore shipping markets, suggest a two-
regime mean reverting jump diffusion model with seasonality, to better understand the spot
rate dynamics in the North Sea market.
The above-mentioned research’s denominator is the influence OSV vessel’s specifics
have on charterer appeal, disclosed through utilization, lay-up decision and rate levels. The
only AHTS specific research found, Dahle & Kvalsvik, (2016), disclosed a handful of
specifications to have a significant effect on the rate levels:
AHTS specifications
researched to correlate
with charter rates
Correlation Comments / indicating Geographical
Area
Bollard pull Sig. positive Larger BP cap. earns higher rates NEW
Break horsepower Argued to reflect that of BP NEW
Deadweight t Sig. positive Larger cargo cap. In DWT earns
higher rates
NEW
DP configuration Sig. positive DP class 2 vsl. earn higher rates NEW
Age Sig. Negative Higher aged vsl. earn lower rates NEW
Duration of charter Sig. Negative Longer charter periods earn lower
rates
NEW
Average monthly rate Sig. positive Monthly rates reflected market and
removes spikes and troughs
NEW
Areas of operation Not found other areas researched than
NWE
Fuel consumption Various results
dependent on
represented
consumption
variable and
calculations.
Signs of FEI (bhp) variable showing a
penalty for AHTS with higher relative
consumption.
Negative corr. in long term charters,
positive in shorter charter periods.
NEW
Table 2 AHTS specifications researched to correlate with charter rates
The findings regarding consumption and rates are described as insignificant in all but
one consumption variable. The consumption findings encounter some issues that arguably

AHTS, IS THERE A CORRELATION BETWEEN FUEL CONSUMPTION AND
RATE LEVELS?
16
originates with the data and method used for analysing the various vessels consumptions. The
research finds the modified Fuel Efficiency Index (FEI) variable to show significance,
however, this method has certain limitations. The adaption of research from conventional
shipping and geographical narrowing on the NWE area, will be sought further explained and
countered in the following sections.
2.5 The fuel consumption for AHTS
Fuel consumption theory and calculations in shipping are dependent on the
displacement of the vessel and speed to power ratio. Assmann, Andersson & Eskeland,
(2015), utilizes the commonly agreed upon equation for fuel consumption in their research
regarding very large crude carriers (VLCC):
F - Fuel Consumption
V - Vessel speed
Vd – Vessel design speed
Fd - Fuel consumption at design speed Vd
ε - Fuel consumption exponent (depends on vessel type)
∇ - Displacement of a ship
∇d -Displacement at design draught

AHTS, IS THERE A CORRELATION BETWEEN FUEL CONSUMPTION AND
RATE LEVELS?
17
The above outlined equations show the fuel consumption as dependent on vessel
speed, displacement, their design calculations, and a fuel consumption exponent, varying
amongst vessel segments.
Another equation utilized in researching consumption and variations in efficiency
towards rates, is the fuel efficiency index equation developed by Adland et al. ,(2017).
The FEI index was originally employed in analyses conducted for researching the dry-
bulk market and the probable premium obtained with improved fuel efficiency. In later
researches, it has been used in research conducted on AHTS specifics and its influence vis-à-
vis rate levels. When applied to researching the AHTS segment, neither the fuel consumption
equation nor the FEI equation can account for the various operation modes, typical for
ordinary AHTS operations.
When a cargo vessel transports goods from A to B, there are some key aspects that
effects the fuel consumption of the vessel. Bialystocki & Konovessis, (2016) state that in
addition to the traditionally used power to speed curve for optimal consumption during
transit; draft, displacement, external conditions (waves, wind, and currents), and the design of
the hull also affect the consumption. Since the core operational modes in the deep-sea
segment are few, (in port loading/offloading, transit fully-loaded, transit in ballast condition,
manoeuvring and waiting at anchor), and most of the operational time is spent in transit,
monitoring and data collection is mainly focused on the latter mode.

AHTS, IS THERE A CORRELATION BETWEEN FUEL CONSUMPTION AND
RATE LEVELS?
18
The deep-sea theories and calculation methods as viewed below, encounter some
limitations when adapting them to the offshore segment, as the AHTS vessels endures a
wider spread over additional modes of operation.
Fuel consumption theory &
calculations
Equations Research by
Dependent on vessel speed,
displacement, their design
calculations, and a fuel
consumption exponent,
varying amongst shipping
segments.
Assmann, Andersson &
Eskeland, (2015)
Fuel efficiency index (FEI)
Uses DWT (Cargo shipped
in tons instead of vessels
displacement. A commonly
used index to research
connections between
consumptions and rates.
Modified with bhp in lower
equation.
Adland et al. ,(2017)
Dahle & Kvalsvik,
(2016)
Difference from average
fleet (DAF)
DAF = (Consumption-Average fleet
consumption) x bunkers price
Dahle & Kvalsvik,
(2016)
Divided on propulsion type Diesel mechanical system analysed
for correlation with rate levels
Dahle & Kvalsvik,
(2016)
Table 3 Fuel consumption theory & calculations
The preliminary research on the AHTS segment reflects that traditional deep-sea
consumption definitions and calculation of variables, viewed in table 3, only to some degree
corresponds. Essential differences should be noted, as the following table shows, some key
modes are not represented for the compared vessel segments:

AHTS, IS THERE A CORRELATION BETWEEN FUEL CONSUMPTION AND
RATE LEVELS?
19
Variables effecting vessels consumption performance Deep-sea AHTS
Power-speed ratio x x
DWT, Displacement and draft x x
Engines & Generators; type & configuration x x
Hull, shape and smoothness x x
Operational modes
Transit A-B, loaded condition x x
Transit A-B, ballast condition x x
In Port Loading/Unloading x x
At anchor (Awaiting quay or charter) x x
DP
Mod
e Supply x
Waiting on platform or weather x
Standby x
Towing x
Anchor Handling x
External forces (Wind, waves & Currents) x x
Operational Management (decentralized). Company guidelines,
routing etc.
x x
Operational Management (local). Onboard planning and
optimization from crew;
Including trim of vessel, route planning, speed and engine
optimizations towards logistic schedule etc.
x x
Table 4 Consumption variables effecting vessels performance
The crucial part of station keeping using Dynamic Positioning (DP), is one variable
that separates the segments. Lindstad, Eskeland & Rialland (2016), argues that for the AHTS
vessels, DP mode is often a requirement, when entering the rig or platforms 500-meter safety
zone. The system maintains a set position at high accuracy and is engineered around a
philosophy of redundancy. This means backup systems and power sources, which in turn
means potentially higher consumption, as two or more engines / generators are operating on
what is conceivably far from optimal power outputs.

AHTS, IS THERE A CORRELATION BETWEEN FUEL CONSUMPTION AND
RATE LEVELS?
20
Myklebust, (2011) support this, and makes claim for its significance, stating in his
comparison study that close to 50 % of the time was spent in DP / Standby mode. He goes on
to describe that during the crucial operations of anchor handling or towing, the AHTS can use
large power outputs over shorter periods of time, illustrating the vast differences between
modes, these vessels can encounter. A study conducted on a AHTS mode and consumption
spread, conducted by a classification society in 2012, were as viewed in figure 2. The internal
study on 66 vessels from various owners found that over 30% of the time and 29% of the
consumption were during DP Mode. The specified modes and fuel oil consumption (FOC) in
said modes, are what’s separating this segment from more conventional consumption theory.
Time spent in different modes vary with scope of work, area of operation and external
forces like weather. A case study by Myklebust, (2011) on a 200t BP AHTS, figure 3. Shows
time spent in different modes, and how the difference in consumption for the diesel-mechanic
and diesel-electric propulsion systems vary. The variation in consumption between
propulsion systems will be utilized when dividing the vessels consumption profile in coming
research, as they arguably offer a more precise segregation than conventional consumption
theory, and lay the foundation for a more segment specific research of the AHTS vessels.
Figure 2 Distribution for Time & FOC (Internal Class society survey, 2012)

AHTS, IS THERE A CORRELATION BETWEEN FUEL CONSUMPTION AND
RATE LEVELS?
21
2.6 Propulsion systems and developments in AHTS
Myklebust & Aadnanes (2011) explain that a potential reduction in consumption of
16.8% is credible to favour a DE propulsion system, given figure 3’s used spread over modes,
during a year in operation. They also state that in certain modes demanding higher power
outputs, the DM systems are superior to the DE ones. Wartsila (2015), also support this and
state that the optimal fuel consumption profile available today is gained with a Hybrid
system. For the large type AHTS’s, the hybrid system incorporates the advantages from both
DE and DM systems and can be optimized according to each mode. Still maintaining high
capabilities needed for anchor handling and towing scopes.
Figure 3 Myklebust & Aadnanes (2011).
AHTS, IS THERE A CORRELATION BETWEEN FUEL CONSUMPTION AND
RATE LEVELS?
22
In the coming research, the different consumption profiles obtained through DE and
hybrid engine configurations versus the more traditional DM, will be used as independent
variables, when researching if there is a correlation between consumption and rates. The
argument supporting this variable selection is split between the unprecise methods of analysis
adapted from deep-sea theory and the current lack of precise consumption data from the
AHTS vessels, reflecting their spread over operational modes.
Up until the mid-1990ies, the majority of OSVs’ were using diesel mechanical
propulsion systems. Rapidly, the PSV segment started adapting the DE solution, and today
the clear majority of PSVs are configurated with this type of setup.
Some of the first AHTS vessels with DE and later Hybrid arrangement were built
from around 2005, and this segment has also seen a percentage gain away from pure DM.
Though not to the same extent as the PSV segment, as bollard pull demands, which are
technically favoured in DM configurations, have surpassed the overall benefits and
consumption gains from configurating with pure DE, Myklebust & Aadnanes (2011).
The current OSV market recession is well in to its consecutive forth year, and few
orders for new AHTS vessels were found placed prior to 2014. The perceiving cases prior to
the collapse can be viewed to support a hypothesis in ways of HB system preference. The
latest major order came in October 2014, when the large Danish OSV owner, Maersk Supply
Service inked a deal for six hybrid AHTS vessels, from the Norwegian yard Kleven, Offshore
Energy Daily, (2014).
Most recent orders of AHTS vessels as viewed below, supports the argument for
assumed movement away from DM.

AHTS, IS THERE A CORRELATION BETWEEN FUEL CONSUMPTION AND
RATE LEVELS?
23
Table 5 Overview of most recent AHTS orders and deliveries
Recent years orders and delivery’s show owners’ slight lean towards Hybrid solutions,
with 15 HB systems under construction or delivered since 2015. 14 of the more traditional
DM configuration can be seen in the same period, while only 3 diesel electric system were
found to have been ordered, with two of these cancelled by buyers, prior to completion.
The trend in ordering more hybrid propulsion systems supported an initial hypothesis
favouring a negative correlation between rates earned and AHTS vessels with DM systems. It
also perceived the possibility of detecting a significant positive correlation between hybrid
and diesel electric systems and rate levels, as a negative or non-existent correlation, could be
argued to make diminutive economic sense, as the next section will highlight.
Vessel Name Status
Propulsion
System DWT BP BHP
Delive
red Design
Maersk AHTS SALT 200 TBN06 Under Construction HB 4,500 230 23,000 2019 SALT 200
CBO AHTS OCEANA 05 Under Construction DM 3,000 200 16,316 2018 Haryard 843
CBO Iguacu In Service DM 3,000 200 16,316 2018 Haryard 843
ECO Ice Class AHTS TBN01 Newbuild Cancelled DE 5,000 180 27,520 na
ECO Ice Class AHTS TBN02 Newbuild Cancelled DE 5,000 180 25,000 na
Island Victory Under Construction HB 8,000 400 26,000 2018 UT 797 CX
Maersk AHTS SALT 200 TBN04 Under Construction HB 4,500 230 23,000 2018 SALT 200
Maersk AHTS SALT 200 TBN05 Under Construction HB 4,500 230 23,000 2018 SALT 200
Maersk Mover In Service HB 4,500 230 23,000 2018 SALT 200
Sayan Prince Under Construction DM 4,000 220 21,700 2018 MOSS 919
Varada AHTS H842 TBN03 Under Construction DM 3,000 200 16,092 2018 Havyard 842
Varada AHTS H842 TBN04 Under Construction DM 3,000 200 16,092 2018 Havyard 842
Varada AHTS H842 TBN05 Under Construction DM 3,000 200 16,092 2018 Havyard 842
Varada Grace Under Construction DM 3,000 200 16,092 2018 Havyard 842
Varada Shark Under Construction DM 3,000 200 16,092 2018 Havyard 842
Bram Force In Service HB 4,891 260 27,360 2017 na
Bram Power In Service HB 4,917 260 27,256 2017 na
CBO Bossa Nova In Service DM 3,000 200 16,316 2017 Havyard 843
Maersk Mariner In Service HB 4,500 252 24,018 2017 SALT 200
Maersk Master In Service HB 4,500 252 23,000 2017 SALT 200
Bourbon Arctic In Service HB 4,000 280 26,000 2016 VARD 2 12 Arctic
Skandi Paraty In Service DM 4,200 250 23,112 2016 STX AH11
Boa Jarl In Service HB 4,250 285 27,000 2015 VS491CD
Bram Titan In Service HB 4,742 310 23,392 2015 na
Go Perseus In Service HB 4,500 250 24,000 2015 VS491CD
Hai Yang Shi You 684 In Service DM 3,293 190 15,000 2015 na
Hai Yang Shi You 685 In Service DM 3,293 190 15,000 2015 na
Maersk Cutter In Service DE 4,000 180 15,000 2015 VS482
Pacific Centurion In Service DM 3,600 200 16,100 2015 UT786CD
Skandi Angra In Service HB 4,299 250 19,646 2015 STX AH11

AHTS, IS THERE A CORRELATION BETWEEN FUEL CONSUMPTION AND
RATE LEVELS?
24
2.7 Investment Theory for Projects
Berk & DeMarzo, (2014) supports an initially higher project investment, given that
the net present value (NPV) exceeds an initially cheaper project. The NPV calculation
requires a certain amount of knowledge and credible assumptions, to be able to be viable. In
short, the calculations seek to show the relationship between the cash outflows and the cash
inflows of a given investment project, and uses compounded interest rate to illustrate what
NPV an investment is expected to create.
A similar more simplistic investment appraisal, often used to support a preliminary
project or configuration investment, is known as the payback period (PBP). Berk &
DeMarzo, (2014) argues that the NPV method is preferred for accuracy, but state that a PBP
calculation can be used as decent guidance at an initial decision stage. The PBP method is
often used in both shipping and offshore circles, due to its simplicity and suitability for the
volatile business models. The PBP shows the time it will take for an initial cash outflow to be
repaid, without considering the time value of money and interest rate. Both methods are
based on the principle of obtaining the highest possible value when deciding amongst
different investments.
Keeping in mind the initial higher cost for selecting DE or HB as appose to a DM
configuration, one could argue, based on these theories that the owners expect higher
revenues (rates) for the DE or HB vessels, as this configuration is proving to be increasingly
preferred, shown through historically placed orders.

AHTS, IS THERE A CORRELATION BETWEEN FUEL CONSUMPTION AND
RATE LEVELS?
25
2.8 Competitive Forces
According to Porter, M. E. (2008)’s Five Competitive Forces, applied to analyse
markets and business strategies, the bargaining power rests with buyer or seller dependent on
various factors. Olesen, (2016) Points to the supplier’s strength to be dominant when demand
is high and there is no substitute for the product or service provided. A strong group of
suppliers can then charge high prices despite limited quality and services, since the buyer’s
position is weak. A contrary scenario will see buyers position strengthened, as the oversupply
would lead them to force down prices and request more for less, in terms of quality and
performance.
Viewed through the lenses of the upstream offshore E&P chain, the supply/demand
and power ratio theories could be adapted, and help reject or confirm the hypotheses put forth
in the coming section.
2.9 Refined research questions and hypotheses
To answer the research questions in table 7, I utilized the three different propulsion
systems available for the AHTS’s, searching for a correlation between consumption and the
dependent variable, daily rate. The independent control variable, average monthly rate, was
added to divide the market, and test for correlations in both sellers and buyers’ market.
Figure 4 Porter, M. E. (2008). The five forces that shape strategy

AHTS, IS THERE A CORRELATION BETWEEN FUEL CONSUMPTION AND
RATE LEVELS?
26
Table 6 Variables and definitions
The variables listed in table 6 were used to analyse and answer 2.9.1, 2.9.2.1, 2.9.2.2
and within each of the main areas isolated, for research question 2.9.3.
No Research question Market Area H
B
D
E
D
M
Hypotheses
2.9
.1
Are there variations in rate
levels earned for AHTS’s
with different
consumption systems?
Overall All x
+
x
+
x
-
Yes, superior consumption systems in
AHTS vessels are believed to earn an
average higher rate. Also, a variance
between the three is believed to exist
2.9
.2.1
Is there a positive
correlation between
consumption-efficient
AHTS’s and rate levels?
Strong
seller
power
All - -
+
No, DM systems are believed to have
a positive correlation with rates, when
sellers power is strong, and buyer lack
options. HB and DE predicted to show
negative or no correlation with rates.
2.9
.2.2
Strong
buyer
power
All + + s
-
Yes, HB and DE systems are believed
to have a positive correlation with
rates, when buyer power is strong, and
options are vast. DM systems believed
to correlate negatively.
2.9
.3
Are the stated research
questions in 2.9.2.1-2 true
for all main areas of
operations?
Both
Indiv
idual
ly x x x Various levels of maturity and
development might separate areas
with regards to propulsion system and
rate correlation. I lean towards the
research showing variations between
areas.
Table 7 Research Question and Hypotheses
Dependent Variable Unit Type Interpretation
Daily rate USD /d Numeric Continuous
Independent Variable
Hybrid Propulsion System Categorical Dummy variable created to analyse variable in
the methods conducted
Diesel Electric System Categorical Dummy variable created to analyse variable in
the methods conducted
Diesel Mechanic System Categorical Dummy variable created to analyse variable in
the methods conducted
Average monthly rate USD/d Numeric Continuous. Monthly avg. day-rate (manually
calculated) to reflect a buyers’ market.

AHTS, IS THERE A CORRELATION BETWEEN FUEL CONSUMPTION AND
RATE LEVELS?
27
Figure 5 Conceptual model for 2.9.1
Figure 6 Conceptual model for 2.9.2.1-2
Figure 7 Conceptual model for 2.9.3
Hybrid
system
Diesel
Electric
+
Correlation
w/ Rate
-
Strong
Seller
Power
2.9.2.1
Overall
Market
2.9.1
NWE
S&C Am.
Med/WA
Gom,US,Can
Other
Strong
Buyer
Power
2.9.2.2
Diesel
Electric
Diesel
Electric
Hybrid
system
Hybrid
system
Diesel
Mechanic
Diesel
Mechanic
Diesel
Mechanic
Strong
Buyer
Power
+
Correlation
w/ Rate
-
+
Correlation
w/ Rate
-
Aus/Nz/SEA
Strong
Seller
Power

AHTS, IS THERE A CORRELATION BETWEEN FUEL CONSUMPTION AND
RATE LEVELS?
28
3. Methodology
3.1 Research strategy and design
The research strategy is an overall approach to how the research is intended to be
examined, and set out to explain what type of tools the researcher will apply to obtain validity
for the probable answers and assumptions. A research design can be viewed as a bridge
connecting research questions with data, showing their relationship in depth and the process
used to answer the question(s). Frankfort-Nachmias & Nachmias, (2008).
This thesis has its basis in research and results from a combination of qualitative and
quantitative data collection. The quantitative data gathered assisted in building empirical
evidence, supporting, or rejecting a correlation between consumption and rates. The
qualitative interviews strengthen the research and helped produce a contemporary
understanding of the underlying variables, from key industry-player’s perspective. The
decision to use a mixed method approach originated from the complexity of the business and
the lack of easily accessible data, concerning fuel consumption and rates.
From an early stage of the process, it was evident that a combination of quantitative
and qualitative methods would suit the task and have the potential of gaining the most useful
result. This methodology chapter describes the methods used, first through a wide-ranging
interpretation, followed by a thesis attentive description.
3.2 Quantitative research
Quantitative research uses objective measurement of extensive data sets collected, to
attempt explaining a phenomenon. Mathematical, statistical, and numerical tools are utilized
to produce empirical evidence from the data sets, which in turn give potential for
generalization. Typical forms of data collection can be questionnaire’s or secondary data

AHTS, IS THERE A CORRELATION BETWEEN FUEL CONSUMPTION AND
RATE LEVELS?
29
from previous conducted studies. The goal of the research is often to be able to gain support
for a relationship between one dependent and one or more independent variables. Creswell &
Creswell (2018).
Strengths of quantitative approaches as argued by USC, (2018), includes the ability to
take on broader studies and enhancing the generalization of the results, objectively and
accurate. They go on to state that such methods can be replicable and earn the study more
validity. Other pros include utilizing computerized tools, cover larger data amounts and avoid
bias from interacting directly with subjects. The negative characteristics can entail a lack of
circumstantial elements, little flexibility, diminutive knowledge of surrounding variables and
a large error risk, if the population and sample data is incorrect.
A research covering an entire population is challenging, so a common approach is to
select a representative sample of the population and thus provide supportive evidence from
the sample researched. One important feature for this type of study is the correct selection
and collection of sample data. As an example, investigating and analysing a parameter, such
as consumption data gathered from 500 random vessels (sample), does not automatically
provide any consistent empirical resilience, if the researchers objective is to collect and
process data reflecting vessels defined as AHTS (population).
This thesis used a deductive research approach in attempting to reject or confirm the
stated hypotheses in section 2.9, through the quantitative data analysis and qualitative
interviews with key individuals. The quantitative data was used in a one-way ANOVA
analysis to examine the difference in average mean between the three propulsion systems on
the dependent variable.

AHTS, IS THERE A CORRELATION BETWEEN FUEL CONSUMPTION AND
RATE LEVELS?
30
To detect magnitude and direction of correlation, a multiple linear regression analysis
was conducted. For answering 2.9.2.1, a model with the three independent variables for
propulsion systems were tested against the dependent variable, rate.
Researching if the market-power affected the outcome, and answering 2.9.2.2, the
independent variable, avg. monthly rate was added to the model. I defined this variable as a
moderator for the market, rejecting single high and low rates and reflecting a more balanced
market climate, argued to favour the buyer side. The background for the method choice stems
from similar theses referred to in the literature review, researching vessel specifics and there
influence on the rate earned, for PSVs and AHTS vessels.
3.2.1 Data Collection
The data set used in the analysis were collected as second-hand data from an oil and
gas consultant and analysis firm, IHS Markit. Access to the database was provided for a
period by the collaborating brokerage company. IHS provides a wide range of analysis and
expert consultation to oil and gas companies and brokerage firms. The IHS Petrodata
Marinebase was used to collect data concerning the vessels specifications and the contracts
fixed for each vessel, from 2006 until 2018.
3.2.2 Population and Sample
The thesis researched large type AHTS vessels, able to conduct services in deep-sea
areas. Accordingly, the break horsepower limit was set to 15,000 Bhp in the search. The total
number of vessels with this specification were defined as the large AHTS population. To
research the data in the SPSS program, some data editing and cleaning was required. The
following section describes how the process accumulated in to the end set for analysis of
retained samples.

AHTS, IS THERE A CORRELATION BETWEEN FUEL CONSUMPTION AND
RATE LEVELS?
31
3.2.3 Data editing
On the 14th of March 2018 a total of 14359 samples were found and downloaded
from IHS Petrodata. Unfortunately, not all contract rates were given, so an initial 3627
fixtures were deleted from the data set, as other sources for rates, proved challenging to
acquire. The removal of unidentified contracts samples was not ideal for the accuracy of the
research. However, samples deprived of rates were evenly spread over the period researched,
and amongst the different types of propulsion systems, resulting in an insignificant effect for
the end result. Contract rates are sensitive information to each involved member of the cycle,
and hence not always made available or public.
The period chosen for the research was set to cover contracts between Jan 2006 and
Feb 2018. The selection was based on the absence of DE and HB vessels of size, found to be
delivered prior to 2006.
In all 2472 samples were deleted from the dataset for reasons related to the fixture
dates falling outside the period set. This left a total of 8260 samples for analysis in the SPSS
software program.
Columns containing irrelevant data for the analysis were deleted prior to entry; client,
manager, class etc. Although the data set was extensive, some specifications and figures were
absent, and needed to be supplemented from other sources. Predominantly shipowner’s
homepage and vessel specification sheets were used to fill in missing data. To maintain
certainty in the matching of data and vessels, the ship specific IMO number was used. The
IMO number follows the vessel its entire life, and does not vary if sold, converted, or
changed in any way.

AHTS, IS THERE A CORRELATION BETWEEN FUEL CONSUMPTION AND
RATE LEVELS?
32
The main independent variables for the correlation test, the propulsion systems,
needed to be acquired from vessel specific sheets. 323 fixture dates were absent in the data
set, and subsequently set manually to the same date as when the contract started.
3.2.4 One-way ANOVA
To research for a significant difference in average mean rate between the diverse
propulsion systems, and answer research questions 2.9.1, a one-way ANOVA analysis was
conducted. It was deemed crucial to establish significant variance between the propulsion
systems and rate levels, to justifying further research.
Martin & Bridgmon, (2012), explain how the one-way ANOVA analysis can be used
to research variance between and within categorical groups as the independent variables on a
continuous dependent variable.
This method was predicted to reveal differences in average mean rates for the various
propulsion systems, and support further analysis if found to be of significance. It was not
predicted to help foresee variance between areas or buyer and seller power.
To be able to conduct a one-way ANOVA test in the SPSS software, the propulsion
systems were edited and labelled numeric values 1, 2 and 3 for the DM, DE, and Hybrid
systems. The daily rate was set as the dependent variable.
3.2.5 Multiple linear regression
Multiple regression analysis can be used to evaluate the extent that two or more
independent variables (IV) relate to a continuous dependent variable (DV), Martin &
Bridgmon, (2012). The multiple linear regression equation;
Ŷ= b0 + b1X1 + b2X2 +...+bpXp

AHTS, IS THERE A CORRELATION BETWEEN FUEL CONSUMPTION AND
RATE LEVELS?
33
Sees Ŷ as the predicted value of the dependent variable. X1 through Xp are p mutually
exclusive independent variables, b0 is the value of Y when all independent variables,
X1 through Xp are equal to zero, and b1 through bp are the estimated regression coefficients.
The regression coefficients represent the change in Y relative to a one-unit change in the
independent variable. In a multiple regression, b1 can be interpreted as the change in Y
relative to a one-unit change in X1, holding all other independent variables constant.
Statistical tests can be performed to assess whether each regression coefficient is
significantly different from zero. Multiple regression analysis can also be used to measure
whether confounding exists, since the analysis allows for estimating the relationship between
an IV and the result, all other variables constant. This allows for a possible control for added
variables, encompassed in the model. Boston University, (2013).
Cohen, J. et al, (2003) describes the method of labelling categorical variables in to
dummies, coded with 0 and 1’s. This method of using dummies in a regression allows for two
categorical variables to be compared to a constant (third categorical), on the dependent
variable.
A multiple linear regression analysis was applied to measure the effects the IV had on
the DV, and how the correlation varied in a buyer or sellers’ market. The regression model
was first set to research 2.9.2.1, investigating for a correlation between propulsion systems
and rate levels in an unlevered market. For the second model the market variable, average
monthly rate was added, in an attempt for confirming the hypothesis stated in 2.9.2.2

AHTS, IS THERE A CORRELATION BETWEEN FUEL CONSUMPTION AND
RATE LEVELS?
34
3.3 Area specific analysis
For the research of 2.9.3, the multiple linear regression methods stated above, were
conducted on the five segregated areas of interest. In the isolated analysis of the geographical
areas, the decision was taken to compound closely connected areas to get sufficient
frequencies and research the data at an elevated level. The areas were set to;
• NWE (Northwest Europe)
• S&C Am (South America and Central America)
• Aus/NZ & SE Asia (Australia, New Zealand and South-East Asia)
• MED/WA (Mediterranean, Black Sea and West Africa
• GOM, US, CAN (Gulf of Mexico, US areas and Canada)
• Others (All other; Far East, Indian Ocean, Middle East and Russian Arctic)
3.4 Qualitative research
The qualitative research approaches can in general be described to research more in
depth within a topic. The QUAL methods can detect more of the underlying causes for the
associations researched and help reject or confirm developed hypotheses. A common method
of qualitative research, is the interview method. Conducted in various structurally forms,
personal interviews with participants can produce otherwise overlooked data, and function as
an elastic approach to answering a research problem. Welch et al, (2002).
For this thesis to gain sufficient data support and confirm or reject the hypotheses in
table 7, it was deemed crucial to acquire first hand data. In hopes that such data would help
explain the complexity of the business and support the QUAN data findings. Where the
second-hand data analysis exploited the numbers, the interviews with top level individuals,

AHTS, IS THERE A CORRELATION BETWEEN FUEL CONSUMPTION AND
RATE LEVELS?
35
defined as “elite informants”, Welch et al, (2002), collected first hand data, not easily
extracted otherwise.
Initially one can argue that the main strengths of interviews are the collecting of
supplementary information, however there are other benefits as argued by Frankfort-
Nachmias & Nachmias, (2008). The flexibility in structure and process, more control over the
data gathered and prone to high response rate. Disadvantages are described to include
relatively high cost to conduct the research, bias exposure, and the lack of anonymity.
Response and availability of elite informants could prove more challenging, as these
individuals often have tight schedules and are engaged with running their businesses, Welch
et al, (2002).
3.4.1 Data Collection and Approval of Research
To balance cost and time, the decision was made to conduct the interviews via mail
and telephone correspondence. As stated by Keats, (2000), this can assist in lowering the cost
and time consumed, but runs the risk of missing face to face interactions, and the non-verbal
communication expressed by interview objects.
The questions and research methods were registered with the Norwegian Centre for
Research Data (NSD) and given approval. Gathering of consent and conducting the
interviews then followed. To be able acquire candid feedback and data material from the
participants, I choose to analyse and present the data confidentially. This opened for more
sensitive data being shared, as the questions sought answered could be argued to have
negative impact on the persons and companies participating.
The depth of the elaborations was given priority over the openness regarding each
object, as previous conducted research has utilized said method, it supported the decision for

AHTS, IS THERE A CORRELATION BETWEEN FUEL CONSUMPTION AND
RATE LEVELS?
36
this thesis as well. This resulted in a presentation of participants though segment affiliation
and main area of operations, instead of full name of person and company.
3.4.2 Objects of interest
To be able to gain as much relevant and geographically spread data, corresponding
with the correlation analysis conducted, the decision was taken to interview key individuals at
the highest levels of influence. The interview objects were sought gathered from the
significant areas of operation, described in section 2.3. Preliminary research and literature on
the segment suggested that the main decisionmakers would include lead chartering personnel
from the oil and gas companies, vessel owners and their chartering departments, and offshore
brokers, argued to possess market information and situational awareness.
The decision was also made to reach out to designers and yards, designing and
building the vessels being researched. Their expertise was thought to assist in supporting or
rejecting the hypothesis stated in table 7, as these institutions enjoy hands on experience with
the types of vessels being ordered and built.
3.4.3 Participants
Initially a total of twenty-three companies and persons were approached in order to
get a sufficient participation volume, able to represent the various sides of the business, and
the geographical diversified areas. Out of the initial twenty-three, thirteen did not respond,
despite numerous attempts to establish contact. Two responded, but declined to participate,
not viewing their companies as relevant for the research. This left a total of eight respondents
willing to contribute in the study.

AHTS, IS THERE A CORRELATION BETWEEN FUEL CONSUMPTION AND
RATE LEVELS?
37
Keats, (2000), claims non-respondents have various reasons for not partaking in
research regarding their business of operation. Lack of time, overall willingness, belief in the
relevance or unwillingness to share, may be possible reasons for avoiding participation. To
counter the likelihood of non-respondents, initial distribution to a larger number of objects
was carried out. The goal was at least one relevant company or person from each part of the
industry and geographical area. A weakness in the interview method origin from lack of
response, as the research sufferers both in terms of less data, but also grasping the type off
data lost and the underlying reasons. The diverse types of respondents obtained are argued to
diminish some of this negative effect.
3.4.4 Interview method
To be able to obtain qualitative data seeking to reject or confirm my initial hypothesis
in table 7, a deductive approach through semi structured interviews, with open ended
questions was utilized. The questions were focused on gaining background information to
strengthen and explain the tendencies and correlations. The interviews were conducted
through telephone and mail correspondence, and sorted by question and participant. Each
answer was analysed and compared amongst respondents. By following the theory of Bogdan
& Biklen, (1992), the main goal was to try and detect patterns and regularities in the
responses, able to assist in confirming or rejecting the hypothesises in table 7.
The first question in the interview guide was edited and used to reference segment
affiliation and main geographical area of operation. The last question in the interview guide
was cut due to this question having more of a logistical purpose. In the interview analysis
found in the result section, edits were made to revealing names to harmonize with the
anonymity of each participant.

AHTS, IS THERE A CORRELATION BETWEEN FUEL CONSUMPTION AND
RATE LEVELS?
38
3.4.5 Interview Guide
The letter of information distributed along with the consent form can be view in the
appendices of the thesis. The open-ended questions asked were as viewed below. The section
with reference to each question was not initially distributed, but was added to display
connections to the research questions and hypothesis in table 7.
Interview Guide – Questions with regards to large AHTS
vessels (140BP<, 15.000 BHP < )
Purpose and
connection
Please state your job title. -
1 In your opinion, what are the main elements driving forth less fuel
consuming vessels?
Background
data
2 Do you think that the AHTS segment has seen focus on fuel
consumption in the past?
2.9.1-2.9.3
3 To what extent do you think the rate obtained by a AHTS is
dependent on its fuel consumption?
2.9.1-2.9.3
4 Has there been any change in the correlation between fuel
consumption and rates earned by AHTS in the past three decades?
2.9.1-2.9.3
5 In your opinion, how has the cyclic market for AHTS influenced
the fuel consumption correlation to rates earned?
2.9.2.1-2.9.2.2
6 Do you believe that fuel consumption will have a significant
influence on AHTS rates going forward?
Expectations
7 Would you say that your answers reflect the global AHTS industry?
If no, what geographical variations do you see with regards to the
connection between consumptions and rates?
2.9.3
8 Apart from what we have discussed so far, is there anything
relevant to the topic you would like to add?
Additional data
• Could I contact you by e-mail or telephone if further questions or
clarifications are needed?
-
Table 8 Interview Guide with purpose & connection

AHTS, IS THERE A CORRELATION BETWEEN FUEL CONSUMPTION AND
RATE LEVELS?
39
4. Results
This section discloses the results of the different analysis’s and the answers received
from the semi-structured, open-ended interviews conducted.
4.1 Descriptive results
Dependent Variable; as expected, a significant range was found between the lowest
and highest rates earned. This aligned with the conjecture that the market varies over the
period researched.
Independent variables; The average monthly rates mirrors some of the same trends
found in the daily rates, however the minimum average rate was approximately three times
the day rate minimum.
The preliminary research conducted on propulsion systems was to a large degree
confirmed in the frequency overview displayed below. Diesel mechanical propulsion systems
accounted for 63.8 percent of the samples while hybrid systems made up approximately half
of that, with 35 percent. One surprising discovery was made with regards to the diesel electric
systems and its spread. Only one vessel could be found to have DE propulsion system within

AHTS, IS THERE A CORRELATION BETWEEN FUEL CONSUMPTION AND
RATE LEVELS?
40
this segment and given size of larger than 15,000 bhp, however the vessel had numerous
contract fixtures, and added up to a total of 1.2 percent of the data set.
The frequency found from the areas of interest were as displayed below. For the areas
of operation, the data supported main areas defined for these types of vessels. As seen, the
predominant fixtures were in the Northwest Europe area. This may be explained by the high
frequency of shorter “spot” contracts, not seen to the same extent in other areas, where longer
contracts are more common.

AHTS, IS THERE A CORRELATION BETWEEN FUEL CONSUMPTION AND
RATE LEVELS?
41
4.2 Results from the One-way ANOVA analysis
The ANOVA descriptive above, show the mean freight rate in USD/d for each
propulsion system over the period. The highest average mean, 50.383 was earned by vessels
with DM systems, while the HB systems followed with 46.938. At the low end of the scale I
found the DE systems with 32.018 in average mean.
Since the sample sizes varied significantly between the groups, along with a violation
of the Levene test for homogeneity, the below shown model’s significance was less reliable.
To confirm significance when analysing variations in means between the groups, a
Welch test was conducted.

AHTS, IS THERE A CORRELATION BETWEEN FUEL CONSUMPTION AND
RATE LEVELS?
42
The significance of the welch test combined with a Games-Howell (equal variance not
assumed) Post Hoc Multiple Comparison test, gave the following significant comparisons of
average means between groups.
The AHTS vessels with DM systems were seen to have earned a significant higher
average mean rate, compared to both DE and Hybrid systems. For the HB systems, I found
the average mean rate to be significantly higher than that of the DE systems. As much as
14.920 separated the latter in HB systems favour.
4.3 Results from multiple regression analysis

AHTS, IS THERE A CORRELATION BETWEEN FUEL CONSUMPTION AND
RATE LEVELS?
43
From the multiple regression analysis, the adjusted R squared in model one, indicated
that as little as .2 percent of the variance in freight rate could be explained by the propulsion
system variables. When adding the average monthly rate variable in model two, the
explanation strength of the model increased to 50,4 percent.
Looking exclusively at the unstandardized coefficients B in model one, the DE
systems indicated to have had a negative rate of 14.879 on average compared to the constant
Hybrid, on the dependent variable. The DM systems to the contrary, exhibited an average
positive rate of 3.486 compared to the Hybrid, on the dependent variable.
After adding the additional independent variable, average rate monthly in model two,
the DE systems indicated to have had a negative rate of 16.770 on average compared to the
constant Hybrid, on the dependent variable. The DM systems displayed to have had an
average negative rate of 11.969 compared to the Hybrid, on the dependent variable.

AHTS, IS THERE A CORRELATION BETWEEN FUEL CONSUMPTION AND
RATE LEVELS?
44
4.4 Results from area specific multiple regression analysis
In the area specific research, analysing each area independently, the following model
summary results were as displayed.
The NWE area results showed similar regression outcomes as the overall analysis.
DM systems were indicated to have had a positive correlation compared to HB systems in
model one, with the opposite being true in model two. All results were found to be
significant, however the adjusted R squared in model one indicated as little as a .3 %
explanatory effect on the DV.
Area Model R R Square Adjusted R Square Std. Error of the Estimate Durbin-Watson
1 .059a 0.004 0.003 49475.035
2 .733b 0.538 0.538 33693.450 0.777
1 .415a 0.172 0.167 12314.175
2 .420b 0.176 0.167 12316.196 1.537
1 .124a 0.015 0.010 13472.087
2 .185b 0.034 0.025 13375.626 0.985
1 .087a 0.008 -0.018 17176.377
2 .586b 0.343 0.318 14062.081 1.582
1 .085a 0.007 -0.022 48246.305
2 .130b 0.017 -0.043 48733.105 1.421
1 .462a 0.213 0.195 20134.997
2 .553b 0.306 0.273 19135.759 1.754
GOM / US / CAN
Other
Model Summaryc
NWE
South & Central America
AUS / NZ Southeast
Asia
MED / WA
c. Dependent Variable: Freight Rate USD pr/d
Standardized
Coefficients
B Std. Error Beta Lower Bound Upper Bound Tolerance VIF
(Constant) 46803.767 926.915 50.494 0.000 44986.762 48620.771
DE -14744.981 5082.963 -0.033 -2.901 0.004 -24708.967 -4780.995 0.979 1.021
DM 4532.200 1171.237 0.044 3.870 0.000 2236.259 6828.142 0.979 1.021
(Constant) 3610.427 779.424 4.632 0.000 2082.545 5138.308
DE -16043.913 3461.623 -0.036 -4.635 0.000 -22829.633 -9258.193 0.979 1.021
DM -12275.535 817.235 -0.120 -15.021 0.000 -13877.537 -10673.534 0.933 1.072
Avg Rate
monthly
1.100 0.012 0.749 94.474 0.000 1.078 1.123 0.952 1.051
Coefficientsa
Model
NW
E
1
2
Unstandardized
Coefficients
t Sig.
95.0% Confidence Interval for
B
Collinearity
Statistics

AHTS, IS THERE A CORRELATION BETWEEN FUEL CONSUMPTION AND
RATE LEVELS?
45
For the South & Central American region, the data showed zero DE systems during
the period researched. With regards to the models, both indicated to explain 16.7% of the
variance in the DV. Both models resulted in a negative correlation for the DM systems versus
the HB, on the DV. It was also detected that the avg. rate variable was found to be
insignificant. Indicating a model failure for model two in this area.
Australia, New Zealand and Southeast Asia displayed similar lack of DE systems
during the period. Both models revealed a low 1.0 and 2.5 % adjusted R squared. DM
systems were indicated to earn a lower rate compared to HB, however the regression in
model one was not found to be significant, under the 95% confidence level set. In the second
model the DM systems were indicated to earn a negative rate of 5.763 compared to the
constant HB on the DV.
Standardized
Coefficients
B Std. Error Beta Lower Bound Upper Bound Tolerance VIF
(Constant) 62141.400 3179.506 19.544 0.000 55864.735 68418.065
DM -19712.285 3328.859 -0.415 -5.922 0.000 -26283.787 -13140.782 1.000 1.000
(Constant) 63126.240 3337.578 18.914 0.000 56537.243 69715.237
DM -19174.165 3375.132 -0.403 -5.681 0.000 -25837.300 -12511.030 0.973 1.028
Avg Rate
monthly
-0.034 0.035 -0.069 -0.972 0.333 -0.103 0.035 0.973 1.028
Sig.
95.0% Confidence Interval for
B
Collinearity
Statistics
Coefficientsa
Model
So
uth
Am
.
Ce
ntr
al A
m
1
2
Unstandardized
Coefficients
t
Standardized
Coefficients
B Std. Error Beta Lower Bound Upper Bound Tolerance VIF
(Constant) 42138.542 2749.978 15.323 0.000 36716.034 47561.049
DM -5173.246 2928.537 -0.124 -1.766 0.079 -10947.842 601.351 1.000 1.000
(Constant) 39589.828 3019.275 13.112 0.000 33636.131 45543.526
DM -5762.926 2922.824 -0.138 -1.972 0.050 -11526.431 0.578 0.990 1.011
Avg Rate
monthly
0.061 0.031 0.138 1.977 0.049 0.000 0.121 0.990 1.011
Coefficientsa
Model
Unstandardized
Coefficients
t Sig.
95.0% Confidence Interval for
B
Collinearity
Statistics
Au
s/N
Z &
SE
Asia
1
2
AHTS, IS THERE A CORRELATION BETWEEN FUEL CONSUMPTION AND
RATE LEVELS?
46
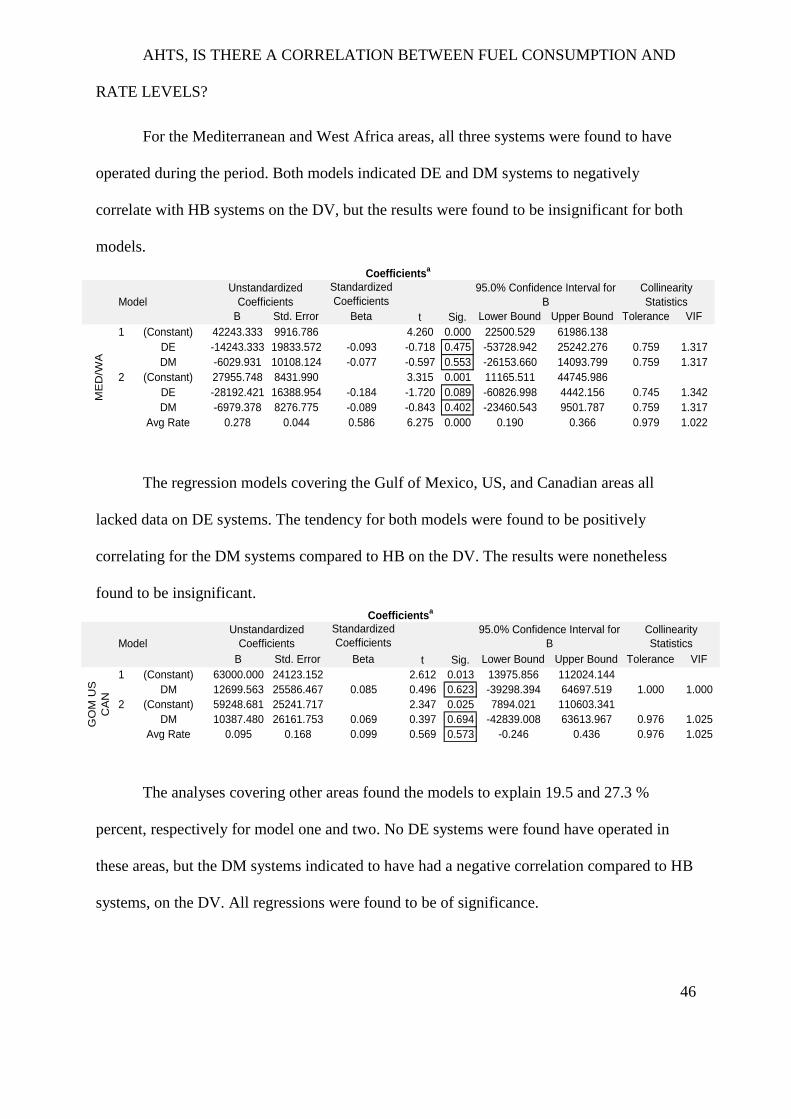
For the Mediterranean and West Africa areas, all three systems were found to have
operated during the period. Both models indicated DE and DM systems to negatively
correlate with HB systems on the DV, but the results were found to be insignificant for both
models.
The regression models covering the Gulf of Mexico, US, and Canadian areas all
lacked data on DE systems. The tendency for both models were found to be positively
correlating for the DM systems compared to HB on the DV. The results were nonetheless
found to be insignificant.
The analyses covering other areas found the models to explain 19.5 and 27.3 %
percent, respectively for model one and two. No DE systems were found have operated in
these areas, but the DM systems indicated to have had a negative correlation compared to HB
systems, on the DV. All regressions were found to be of significance.
Standardized
Coefficients
B Std. Error Beta Lower Bound Upper Bound Tolerance VIF
(Constant) 42243.333 9916.786 4.260 0.000 22500.529 61986.138
DE -14243.333 19833.572 -0.093 -0.718 0.475 -53728.942 25242.276 0.759 1.317
DM -6029.931 10108.124 -0.077 -0.597 0.553 -26153.660 14093.799 0.759 1.317
(Constant) 27955.748 8431.990 3.315 0.001 11165.511 44745.986
DE -28192.421 16388.954 -0.184 -1.720 0.089 -60826.998 4442.156 0.745 1.342
DM -6979.378 8276.775 -0.089 -0.843 0.402 -23460.543 9501.787 0.759 1.317
Avg Rate
monthly
0.278 0.044 0.586 6.275 0.000 0.190 0.366 0.979 1.022
Coefficientsa
Model
Unstandardized
Coefficients
t Sig.
95.0% Confidence Interval for
B
Collinearity
Statistics
ME
D/W
A
1
2
Standardized
Coefficients
B Std. Error Beta Lower Bound Upper Bound Tolerance VIF
(Constant) 63000.000 24123.152 2.612 0.013 13975.856 112024.144
DM 12699.563 25586.467 0.085 0.496 0.623 -39298.394 64697.519 1.000 1.000
(Constant) 59248.681 25241.717 2.347 0.025 7894.021 110603.341
DM 10387.480 26161.753 0.069 0.397 0.694 -42839.008 63613.967 0.976 1.025
Avg Rate
monthly
0.095 0.168 0.099 0.569 0.573 -0.246 0.436 0.976 1.025
Coefficientsa
Model
Unstandardized
Coefficients
t Sig.
95.0% Confidence Interval for
B
Collinearity
Statistics
GO
M U
S
CA
N
1
2

AHTS, IS THERE A CORRELATION BETWEEN FUEL CONSUMPTION AND
RATE LEVELS?
47
4.5 Results from Interviews
A total of eight respondents participated in answering the open-ended questions from
the interview guide. Below are the coded data displayed in table form, with analysis
displayed for the respond to each separately asked question, additional data, and main
extracted points.
1.In your opinion, what are the main elements driving forth less fuel consuming vessels?
Essence from the answers obtained Additional data Main extractions
There seems to be consensus among
the respondents, that the main driver
for less fuel consuming vessels have
been the cost aspect, including
abilities to lower operational costs by
reducing fuel. In addition, two other
points were raised;
The market downturn and cost focus
seen across the up-stream logistics.
Environmental issues hereunder
emission, stricter legislation, and
public opinions. Viewed to be of a
secondary nature.
Technological evolution for
more efficient consumption
believed to have gained
momentum
Optimization of equipment
and crew awareness of
importance
Change in party covering
fuel costs predicted to
possibly affect FOC focus
Attractiveness for buyers
• Cost
• Environment
• Market
Standardized
Coefficients
B Std. Error Beta Lower Bound Upper Bound Tolerance VIF
(Constant) 66892.800 9004.644 7.429 0.000 48733.204 85052.396
DM -32592.425 9550.868 -0.462 -3.413 0.001 -51853.585 -13331.265 1.000 1.000
(Constant) 57689.483 9398.882 6.138 0.000 38721.770 76657.195
DM -33682.750 9088.557 -0.477 -3.706 0.001 -52024.200 -15341.299 0.997 1.003
Avg Rate
monthly
0.258 0.109 0.305 2.368 0.023 0.038 0.477 0.997 1.003
Coefficientsa
Model
Unstandardized
Coefficients
t Sig.
95.0% Confidence Interval for
B
Collinearity
Statistics
Oth
er
Are
as
1
2

AHTS, IS THERE A CORRELATION BETWEEN FUEL CONSUMPTION AND
RATE LEVELS?
48
2. Do you think that the AHTS segment has seen focus on fuel consumption in the past?
Essence from the answers obtained Additional data Main extractions
There was perceived to be an
orientation towards a higher focus on
FOC during recent years. However,
the majority view capabilities and
configurations for executing the
required scope of work, as the primary
focus for charters hiring the vessels.
Total cost was described as more
valued and fixated on. Higher rates
could easier be defended when fuel
and total cost were lower.
Consumption efficiency seemed to
have gained more traction after latest
downturn in the market.
Proven technological
consumption -reducing
innovations implemented in
similar segments, have not
yet been implemented in
AHTS vessels.
Higher fuel prices
mentioned to have had an
impact, strengthening the
focus.
• Last decade
+ / -
experienced
a higher
focus on
consumption
• Capabilities
such as BP
and Bhp
more
significant
3. To what extent do you think the rate obtained by a AHTS is dependent on its fuel
consumption?
Essence from the answers obtained Additional data Main extractions
Conflicting responses were detected
for this question. Vessel owners
operating in the NWE area,
predominantly expressed little faith in
rates being dependent on consumption.
However, voices were heard
supporting consumption superior
vessels, all other specifications
aligned.
Interview objects from the oil
companies expressed a larger
weighting for consumption profiles
influencing rates
GOM area explained to notice growing
focus on consumption in the tendering
process for vessels.
Perceived to vary dependent
on the market and
buyer/seller power.
Length of contracts deemed
to affect to what extent the
FOC is weighted. Stronger
positive correlation for fuel-
efficient vessels on long
term contracts.
Less important in a spot
market with uniform
vessels.
Track-record of vessel and
crew competence valued.
• Less overall,
supply and
demand
main driver
• Significant
driver in the
tendering
process of
late.
• Difference
in views
between
buyer/seller

AHTS, IS THERE A CORRELATION BETWEEN FUEL CONSUMPTION AND
RATE LEVELS?
49
4. Has there been any change in the correlation between fuel consumption and rates earned
by AHTS in the past three decades?
Essence from the answers obtained Additional data Main extractions
There was detected variance in what
degree participants viewed the
change in correlation between
consumption and rates.
Mainly responds favoured a stronger
positive correlation, for the last
decade. Less fuel-efficient vessels
were seen to have lowered their rates
to equal that of the total cost for
IOCs, competing with more
technologically advanced vessels
with DE/HB configurations
contrasting DM-AHTSs.
Rates again argued to predominantly
depend on balance between supply
and demand and to a lesser extent the
fuel consumption. However, “one
might be able to get slightly better
paid/ be a preferred candidate for the
IOCs if a more fuel-efficient
performance can be proven, all other
capabilities uniform”, stated two of
the owners.
Little impacted in the GOM area
until recent. Some higher fuel
consuming vessels have seen rates
lowered by Pemex. In very rare
instances a low fuel consuming
vessel has created a bonus to
shipowners.
Oil companies started to
implement fuel penalty
clauses in contracts. This
has been a relatively new
thing.
The PSV market differs
from the AHTS market,
where we have seen a
transfer from conventional
fuel driven vessels leaning
more towards battery/LNG
vessels (mainly in the
North Sea). This has been
achieved by upgrading
existing PSV tonnage.
• Stronger
positive
correlation
between less
FOC vessels
and rates,
during last
decade
• Seller/buyer’s
power and
supply/demand
thought to be
of far greater
significance
• Total cost for
IOCs getting
more attention

AHTS, IS THERE A CORRELATION BETWEEN FUEL CONSUMPTION AND
RATE LEVELS?
50
5. In your opinion, how has the cyclic market for AHTS influenced the fuel consumption
correlation to rates earned
Essence from the answers obtained Additional data Main extractions
Lack of assurance in the answers were
detected. Some responders had no
opinion on the subject.
Owners convinced that prior markets
fluctuations had seen little influenced
on the FOC and rate correlation.
Balance between seller and buyer, and
the supply/demand environment
believed to have weighed heavier.
IOCs and brokers were less opposed,
and expressed belief in the fuel-
efficient vessels being more prone to
win contracts and earn higher rates in a
buyer’s markets
.
• Split views
among seller
and buyer
• Seller argue
little
influence
• Buyer
claims a
stronger
effect in
competitive
markets
6. Do you believe that fuel consumption will have a significant influence on AHTS rates
going forward?
Essence from the answers obtained Additional data Main extractions
Similar spread detected as in the
answers for question 5. However,
respondents expressed more confident
from both stands.
Owners for the most part believed
future rates would have little
dependence on the FOC profile
IOCs, brokers and builders on the
other hand, uttered faith in the fuel-
efficient vessels being more prone to
win contracts and earn higher rates
going forward
Existing fleet viewed as
having similar engine set-up
in NWE, by owners
Type of AHTS required for
the operations, capacities,
and specification to show
stronger effect on rates.
The industry downturn
believed to have compelled
vessel owners to scrap
AHTS vessels due to their
design inherent lack of
efficiency.
• Sellers not
convinced
FOC will
move rates
• Buyer side
more
positive to
FOC
affecting
rates in the
future

AHTS, IS THERE A CORRELATION BETWEEN FUEL CONSUMPTION AND
RATE LEVELS?
51
7. Would you say that your answers reflect the global AHTS industry? If no, what
geographical variations do you see with regards to the connection between consumptions
and rates?
Essence from the answers obtained Additional data Main extractions
Participants were understood to be
quite consistent in their view, that the
consumption focus and correlating
exposure onto rate levels were present
in all geographical areas. The NWE
area was particularly believed to enjoy
a higher focus of late.
Brazil was highlighted by several
objects, as an area with stricter
consumption attention form charterers.
Including FOC in the tendering
process and contract.
GOM area believed to catch up to
other areas in terms of FOC focus
Many IOCs operate
worldwide and are
perceived to maintain a
uniform FOC policy,
regardless of area of
operation.
Fuel consumption penalty
clauses in contracts so to
penalize owners not
delivering according to
contractual agreements
regarding FOC, more and
more common in Brazil.
• Answers
mainly
reflecting
worldwide
operations
• Brazil a
stricter area
with regards
to FOC
• GOM
staring to
catch up
8. Apart from what we have discussed so far, is there anything relevant to the topic you
would like to add?
Essence from the answers obtained Additional data Main extractions
Little additional thoughts and insights
were shared by participants at this
concluding question. One of the
interviewees shared some
supplementary data and notions.
Advocated for
technologically advanced
vessels able to perform rig
moves quicker
The day rate of rigs far
outweighs vessels.
Consumption efficient
vessels believed to be
favoured by charters
Owners ability to show
savings believed to be of
importance.

AHTS, IS THERE A CORRELATION BETWEEN FUEL CONSUMPTION AND
RATE LEVELS?
52
5. Discussion
For the discussion section the goal was to collaborate the findings from both the
QUAN and QANT methods. Elaborate on similarities and conflicting findings, while
critically evaluating each of the research questions and the results’ relevance.
5.1 Variations in rate levels for AHTS vessels
From an early stage of the thesis process it was evident that scarce literature and
research could be found on the subject; consumption and rates in the AHTS segment. This
both encouraged me to focus on the area, but simultaneously made the task more challenging.
An overall limitation became the lack of literature and research to support and compare my
methods and results. As such, the quantitative methods were particularly prone to limitations.
From the one-way ANOVA, results indicated a variance between the different
propulsion systems available for the large AHTS vessels. On average the DM systems were
found to earn a higher rate compared to the two systems, argued to have a better FOC profile
by Myklebust & Aadnanes, (2011). This was contrary to my initial hypothesis stated in 2.9.1.
The analysis although significant, had some limitations with respect to the outcome.
Looking specifically at the DE vessel from the research, the vessel fitted in to the category
prescribed, however it’s lower bhp and bollard pull capacity, diverged compared to many of
the DM and HB vessels. Dahle & Kvalsvik, (2016) findings on the specifics influencing rates
for AHTS vessels supported a positive correlation between the two capacities and rate levels,
making this research less reliable as not all other vessel variables were constant.
The second-hand data set used in the research, along with my interpretation and
investigation in to the vessels specification sheets should be addressed. For the second-hand
data I was prone to trust the given information, it would however be naïve to think that errors
AHTS, IS THERE A CORRELATION BETWEEN FUEL CONSUMPTION AND
RATE LEVELS?
53
could not occur in such a vast data set. Rate levels and consumption profile are sensitive data
for buyer and seller, possibly resulting in inaccurate and approximate information.
The participants from the QUAL interviews did support a noticeable difference in
consumption profiles of the vessels in question. Although they predominantly credited
abilities to conduct the scope of work in a safe and efficient manner, as prime correlating
factors with rate levels. This notion corresponded with the test for variance in means between
systems, as the DM and HB systems enjoyed a more similar rate on average and encompasses
more uniform spec characters.
5.2 Correlations between consumption and rate levels for AHTS
From the overall regression results I detected a low indication of .2 percent of the rate
levels to be explained by the different propulsion systems and consumption profile. The low
explanatory effect of consumption on rate levels could be seen in parallel with the
insignificant findings using various consumption variables by Dahle & Kvalsvik, (2016). It
may also reveal the difficulty in proving such correlation with the propulsion systems as
variables, or simply make claim for a diminutive correlation.
The first model in the analysis including that of a sellers’ market, detected a negative
correlation between both HB and DE systems, while the DM systems indicated a positive
correlation with rate levels. This supported a confirmation of the hypothesis 2.9.2.1. The
findings should be viewed in parallel with owners participating in the interviews, and their
claim for little overall correlation between consumption and rates for AHTS vessels.
The introduction of the moderator variable, avg. monthly rate in model two, sought to
research a market climate more in favour of buyers’. Post adding this variable the explanatory
effect of the model rose to an indicated 50,4 percent. The results revealed a change in the

AHTS, IS THERE A CORRELATION BETWEEN FUEL CONSUMPTION AND
RATE LEVELS?
54
correlation, showing the HB systems to have a positive correlation with rate levels. The result
partially confirmed my hypothesis in 2.9.2.2 regarding the HB system, while the premise for
a similar correlation with DE systems were rejected.
The participating IOCs confidence in efficient FOC being of importance and
correlating with rates, supports this result. Although model two to some degree implicated a
more buyer oriented market, the method and variable choice had its limitations.
Foremost the Durbin-Watson test indicated a positive autocorrelation between the IV
avg. rate and the DV. The variable avg. rate was arguably removing the peaks in the rates
earned, however this could be viewed as inadequate to explain the entire representation of the
market climate. Additional variables and models would conceivably have given a more
precise picture of the period researched, determining buyer or seller power. Total utilization
of the vessels, oil prices and investment levels in the E&P business were in retrospect viewed
to possibly have added more certainty and segregation between the two distinct powers’.
Responses from the interviews suggested that a difference in correlation between FOC
and rates would depend on length of charter, long-term or spot. Dividing on charter type was
supported by Tvedte & Sterud, (2016) research, and could have assisted in giving this thesis
more precise results. The lack of spot fixtures in other areas outside the NWE region, along
with access to more exact figures from long term contracts, was given weight when choosing
to research the two charter types combined.

AHTS, IS THERE A CORRELATION BETWEEN FUEL CONSUMPTION AND
RATE LEVELS?
55
5.3 Main geographical areas of operations and their variance
For the area specific research, results were exposed to the similar mentioned model
limitations, discussed in the previous section. Some perceived variance between areas were
however detected, supporting my hypothesis in 2.9.3.
5.3.1 Northwest Europe
The NWE area results indicated a support for DM systems having a positive
correlation compared to HB systems in the model favouring seller, with the opposite being
true in model two, supporting buyer. All results were found to be significant, however the
explanatory effect was close to zero, supporting a low or insignificant FOC correlation with
rates. This was also addressed to be the case by the owners operating in the region, from the
interviews. It’s worth noticing that conflicting feedback from the interviews were detected, as
participants also uttered belief in a stronger FOC focus and correlation to rates in more recent
years for this region.
5.3.2 South & Central American
For the South & Central American region, only DM and HB systems were found to
have operated. Both models indicated to explain some 16.7% of the variance found in the
rates and both showed a negative correlation for the DM versus the HB systems. Although
the avg. rate variable was found to be insignificant in model two, the trend and support for
more FOC focus and rate relevance in this area gained specific support from the interviewees,
with one owner stating “Brazil differs slightly from the other regions in terms of actually
having to include vessels fuel consumption figures as part of the contract. In Brazil, when the
IOCs are evaluating offers, the fuel consumption will play a significant part in their
evaluation. If a vessel consumes more than what is included in the contract, the Owners will
need to compensate the Charterer for such excess fuel consumed»

AHTS, IS THERE A CORRELATION BETWEEN FUEL CONSUMPTION AND
RATE LEVELS?
56
5.3.3 Australia, New Zealand and Southeast Asia
AUS, NZ and SE. Asia also showed lack of pure DE systems during the period. 1.0
and 2.5% adjusted R squared for the regressions, indicated a week explanatory effect. For
model one it indicated little correlation between propulsion system and rates and for the
second model it indicated that the avg. rate monthly was poorly reflecting the market for this
region. DM systems were indicated to earn a lower rate compared to HB’s in a sellers’
market, however this regression was not found to be significant. In the model reflecting
stronger buyer power, the DM systems were indicated to earn lower rates compared to the
HB systems. While this model can be rightfully critiqued, the tendency noticed aligns with
respondents from this area, with one local IOC representative stating; “Vessel operators
have...adjusted vessels with a heavy fuel burn to become more competitive when
tendering…instead of being muscled out by larger or more technologically advanced vessels
that have a lower burnt rate, ie a diesel electric AHTS as opposed to a direct shaft driven
AHTS.”
5.3.4 Mediterranean and West Africa
For the MED and WA areas, all three systems were found to have operated during the
period. Both models indicated DE and DM systems to negatively correlate with HB systems,
but results were found to be insignificant for both models. Lack of substantial QUAN data
samples along with no specific mentioning from respondents regarding this area, made a
conclusion difficult to draw.
5.3.5 Gulf of Mexico, US and Canadian
The regression models covering the GOM, US and CAN areas all lacked data on DE
systems and overall these areas were found to have the lowest number of samples, with only
36. The low sample size and non-significant models, rejected any considerable weighing

AHTS, IS THERE A CORRELATION BETWEEN FUEL CONSUMPTION AND
RATE LEVELS?
57
from the QUAN methods, pointing to a positive correlation for the DM systems compared to
HB with rates.
The QUAL interviews gave an area specific insight from one owner stating; “Lower
fuel consumption has not impacted the profits of Mexican shipowners, however, with higher
fuel consuming vessels, rates have been lowered by Pemex and decreasing profits for owners.
In very rare instances in the past, a low fuel consuming vessel has created a bonus to
shipowners.” … I do think that lower fuel consumption can justify higher rates to owners.
This we see already in the recent contracts we have obtained with Pemex”, supporting a
momentum for less FOC correlating positively with rates, in recent years. It should be noted
that the answer outlined came from an owner with primarily other vessel types within the
offshore segment.
5.3.6 Other Areas
The analyses covering other areas found the models to explain 21.3 and 30.6 percent,
respectively for model one and two. All regressions were found to be of significance, less no
DE systems were found to have operated in these areas. The DM systems indicated to have
had a negative correlation compared to HB systems, indicating a preference and positive
correlation between the latter and rates. The result could to a degree be explained by the trend
seen in recent years, with high-end HB vessels being chartered out from the North Sea market
to work in Russian waters, an area which fell under “other”.

AHTS, IS THERE A CORRELATION BETWEEN FUEL CONSUMPTION AND
RATE LEVELS?
58
Participants from the QUAL methods were thought to represent a broad spectre of the
AHTS business cycle. It should however be emphasised that it would have been more ideal to
have additional respondents. Specifically, IOCs and owners from all geographical areas and
their shared experience, could have elevated the thesis and strengthen the results. A total
coverage was not accomplished due to the absents of responds from certain targeted
candidates and the limited time and resources of the student during the research period.

AHTS, IS THERE A CORRELATION BETWEEN FUEL CONSUMPTION AND
RATE LEVELS?
59
6. Conclusion
This research has sought to explain the relationship between fuel oil consumption and
rates earned, for the large AHTS vessels. It has made attempts to explain how this segment
differs from other shipping and offshore markets, with arguments for the insufficient and
unsuitable adoption of said segments consumption variables, when researching the AHTS
vessels.
The thesis introduced a method for studying consumption correlations with rates,
based on utilizing the vessels different propulsion systems as variables. Additionally, it used
interviews with key individuals to strengthen the quantitative results. The study found overall
indications for variations in rates earned pendent consumption profile. It also found that
different power distributions between buyer and seller, conceivably impacted the correlation.
Lastly the research detected inclinations for variations between different areas of operations,
with regards to consumption and rate correlation.
The overall research indicated different propulsion systems on average earned
significantly different rates, answering my initial research question from 2.9.1. Diesel
mechanical systems proved superior to that of the hybrid systems, with pure diesel electric
earning the lowest of the three. To what extent other variables affected this result was
challenging to read from the One-way ANOVA. However, it did stimulate a precedence to
further research the possible correlation between consumption and rates.
In answering research questions, 2.9.2.1 and 2.9.2.2, the regression models combined
with the respondent’s views, indicated that consumption have played a diminutive part in
determining rate levels for these vessels. On average, superior propulsion systems were found

AHTS, IS THERE A CORRELATION BETWEEN FUEL CONSUMPTION AND
RATE LEVELS?
60
to have earned less than that of the traditional diesel mechanical systems in periods sought
reflecting a strong seller power climate, including peak rates over the period.
The reversed state, researching a market with strong buyer power, resulted in a
differing outcome. Under this scenario the model indicated a positive correlation between the
consumption-superior hybrid systems and the rates earned. Both models were viewed to have
shortcomings and the explanatory effect found, was small. The interviews did however
support the indications found in both models, giving the results more leverage for a claim
regarding consumption influencing rates, in a buyers’ market.
For the area specific research this thesis could show variations between areas and
consumption-rate correlations. For the NWE region, the results aligned with that of the
overall regression. In South & Central Am. the tendencies were found to support HB systems
positive correlation with rates, with AUS, NZ & SE. Asia seeing similar inclinations.
MED/WA and US/CAN/GOM gave insignificant results from the models. The latter
got support from a local shipowner, stating a rise in correlation; consumption-rates, while the
MED/WA regions could not be determined either way due to diminutive data reliability.
Further research is recommended to strengthen and explain the correlating trends
indicated in this study. The deviating views on consumption importance between owners and
IOCs, could be an interesting angel to trail. The approaching IMO requirement for mandatory
consumption registration will perceivably generate more accurate consumption data for the
AHTS, and assist in building more precise models for the future. The area specific research
could possibly benefit from case studies for each segregated area, determining more clearly a
possible variance and FOC-Rate correlation.

AHTS, IS THERE A CORRELATION BETWEEN FUEL CONSUMPTION AND
RATE LEVELS?
61
References
Adland, R., Alger, H., Banyte, J. and Jia, H. (2017). Does fuel efficiency pay?
Empirical evidence from the drybulk timecharter market revisited. Transportation Research
Part A, 95, 1-12.
Assmann, L., Andersson, J., & Eskeland, G. (2015). Missing in Action? Speed
optimization and slow steaming in maritime shipping.
Berk, J. & DeMarzo, P. (2014) Corporate Finance 3rd Edition (p 59-91)
Bjørkelund, A. (2014). Pricing in Offshore Shipping Markets: A Two-Regime Mean
Reverting Jump Diffusion Model with Seasonality.
Bogdan, R. C., & Biklen, S. K. (1992). Qualitative Research for Education: An
Introduction to Theory and Methods. Boston
Boston University, (2013) Multivariable Methods Retrieved 30/04/18 from:
http://sphweb.bumc.bu.edu/otlt/MPH
Modules/BS/BS704_Multivariable/BS704_Multivariable7.html
Creswell, J.W. and Creswell, J.D. (2018) Research Design, Qualitative, Quantitative
and Mixed Methods Approaches 5th ed (p 1-22)
Cohen, J. et al, (2003) Applied Multiple Regression/Correlation Analysis for the
Behavioral Sciences 3rd ed. Ch. 8.
Daleel, (2017). Oil and gas supply chain portal, AHTS. Retrieved 10/03/18 from:
http://www.scmdaleel.com/category/anchor-handling-tug-supply-ahts/171
Dahle, A. and Kvalsvik, J. (2016). Freight rate determinants in the offshore market,
Does energy efficiency pay?

AHTS, IS THERE A CORRELATION BETWEEN FUEL CONSUMPTION AND
RATE LEVELS?
62
Draffin, N. Bankes-Hughes, L. and Cutler, A. (2012)
Introduction to Bunkering
Frankfort-Nachmias, C. and Nachmias, D. (2008) Research Methods In The Social
Sciences 7th ed. (p 88-95, 160-202, )
Grøvdal, L. and Tomren, M. (2016) The lay-up decision in practice: how offshore
supply shipowners respond to lower demand
IMO, (2016) Organization agrees mandatory system for collecting ships’ fuel
consumption data Retrieved 14/01/18 from:
http://www.imo.org/en/MediaCentre/PressBriefings/Pages/11-data-collection-.aspx
Keats, D.M, (2000) Interviewing: A Practical Guide for Students and Professionals
(p 4-13)
Leffler, W. ,Pattarozzi, R. and Sterling, G. (2011) Deepwater Petroleum Exploration
& Production : A Nontechnical Guide (p 313-332)
Lindstad, H.E. , Eskeland G.S. and Rialland A. (2016) Batteries in Offshore Support
vessels -Pollution, climate impact and economics
Martin, W.E & Bridgmon, K.D. (2012) Quantitative and Statistical Research
Methods: From Hypothesis to Results
Myklebust, T.A (2011) Achieving fuel savings for anchor handling tug
supply vessels through electric propulsion
Myklebust, T.A & Aadnanes, A.K. (2011). Parallel hybrid propulsion for AHTS
A compromise between performance, energy efficiency, and investment

AHTS, IS THERE A CORRELATION BETWEEN FUEL CONSUMPTION AND
RATE LEVELS?
63
OECD, (2015) Shipbuilding and the Offshore Industry Retrieved 10/03/18 from:
https://www.oecd.org/officialdocuments/publicdisplaydocumentpdf/?cote=C/WP6(2015)5/FI
NAL&docLanguage=En
Offshore Energy Daily, (2014) Kleven to build six Salt AHTS for Maersk
Retrieved 03/03/18 from: https://www.offshoreenergytoday.com/kleven-to-build-six-
salt-ahts-for-maersk/
Olesen, T.R., (2016) Offshore supply industry dynamics
Retrieved 05/03/18 from: https://www.cbs.dk/files/cbs.dk/mapping_report_d2_offshore.pdf
Porter, M. E. (2008). The five competitive forces that shape strategy. Harvard
Business Review, 86(1), January, 57-71.
Plomaritou, E. & Papadopoulos, A, (2017) Shipbroking and chartering practice, 8th
ed.
Sakar, S. & Hwa, H.P. (2017) DBS Group Research, Industry Outlook Offshore
Support Vessels
Seatrade, (2016) Low recycling value means OSV scrapping is not happening
Retrieved 22/1/18 from: http://www.seatrade-maritime.com/news/asia/low-recycling-value-
means-osv-scrapping-is-not-happening.html
Statoil, (2017) Statoil turns to battery power for term fleet Retrieved 22/8/17 from:
https://www.seabrokers.no/wp-content/uploads/Seabreeze-June-2.pdf
Stopford, M. (2009) Maritime Economics 3rd edition (p 633, 234-235,)
Tvedte, M. and Sterud, A. (2016) Obtaining contracts in the North Sea OSV market.

AHTS, IS THERE A CORRELATION BETWEEN FUEL CONSUMPTION AND
RATE LEVELS?
64
USC (2008) Organizing Your Social Sciences Research Paper: Quantitative Methods
Retrieved 24/2/18 from: http://libguides.usc.edu/writingguide/quantitative
Wartsila (2015), WSD 4628 AHTS Specification Sheet
Retrieved 22/4/18 from: https://cdn.wartsila.com/docs/default-source/product-
files/sd/offshore/ahts/datasheet-ship-design-offshore-ahts-wsd-4826.pdf?sfvrsn=9fbcf145_15
Welch, C., Marschan-Piekkari, R., Penttinen, H., & Tahvanainen, M. (2002).
Corporate elites as informants in qualitative international business research. International
Business Review
Y. H. V. Lun, K. H. Lai, , and T. C. E. Cheng , (2010) Shipping and Logistics
Management

AHTS, IS THERE A CORRELATION BETWEEN FUEL CONSUMPTION AND
RATE LEVELS?
65
Appendices
Appendix 1: Interview Guide
- Please state your job title.
- In your opinion, what are the main elements driving forth less fuel consuming
vessels?
- Do you think that the AHTS segment has seen focus on fuel consumption in the past?
- To what extent do you think the rate obtained by a AHTS is dependent on its fuel
consumption?
- Has there been any change in the correlation between fuel consumption and rates
earned by AHTS in the past three decades?
- In your opinion, how has the cyclic market for AHTS influenced the fuel consumption
correlation to rates earned?
- Do you believe that fuel consumption will have a significant influence on AHTS rates
going forward?
- Would you say that your answers reflect the global AHTS industry? If no, what
geographical variations do you see with regards to the connection between
consumptions and rates?
- Apart from what we have discussed so far, is there anything relevant to the topic you
would like to add?
- Could I contact you by e-mail or telephone if further questions or clarifications are
needed?

AHTS, IS THERE A CORRELATION BETWEEN FUEL CONSUMPTION AND
RATE LEVELS?
66
Appendix 2: Project Approval, NSD

AHTS, IS THERE A CORRELATION BETWEEN FUEL CONSUMPTION AND
RATE LEVELS?
67

AHTS, IS THERE A CORRELATION BETWEEN FUEL CONSUMPTION AND
RATE LEVELS?
68
Appendix 3: Project Participation Form
Request for participation in research project "The AHTS, is there a correlation between fuel consumption and rate- level"
Background and Purpose
The AHTS vessels have a larger fuel requirement when conduction certain operations in
comparison to the PSV vessels (in which we have seen higher focus on fuel consumption in
recent years). Since its common for the charterer to pay for fuel for both these vessel types, I
want to research if there is any correlation between the vessels fuel consumption and the vessels
rate levels.
My master thesis at the University College of Southeast Norway, will through empirical research
try to obtain evidence and answer the following questions:
- Are the vessels with the best fuel consumption profile the only ones being hired in today’s tough
market? Are they getting a better rate (premium)?
- Is there historical evidence of variations in rates of these vessels compared to less fuel-efficient
ones?
You have been selected to participate in this project based on your key industry position and your
respectable knowledge of the offshore business.
What does participation in the project imply?
If participating in the project, I will do a personal interview with you, either face-to-face, by
telephone, or email. The questions will be on the topics of AHTS vessels fuel consumption and
possible correlations with rate levels and aspects that are likely to shed light on this. My goal is to
get your reflections on the subject. The interview could be audio recorded. If it is, the recordings
will be deleted at the end of the project.
What will happen to the information about you?
All personal information will be treated confidentially. Only student and supervisor
will have access to personal data, and these will be encrypted. Participants in the project will not
be recognized in the publication.
The project is scheduled to end on the 15th. of May 2018. All information will then be
anonymized.
Voluntary participation
It is voluntary to participate in the project, and you can at any time choose to withdraw your
consent without stating any reason. If you decide to withdraw, all your personal data will be made
anonymous.
If you would like to participate or have any questions regarding the study, please contact Student
Thomas Strande by telephone; (removed in appendix), or email: (removed in appendix) or
Supervisor Marius Imset by telephone; (removed in appendix), or email: (removed in appendix)
The study has been notified to the Data Protection Official for Research, NSD - Norwegian
Centre for Research Data.