Characterization of Various Fast-Pyrolysis Bio-Oils by NMR Spectroscopy †
Upload
independentCategory
view
4download
0
lable at ScienceDirect
Polymer Degradation and Stability 100 (2014) 1e9
Contents lists avai
Polymer Degradation and Stability
journal homepage: www.elsevier .com/locate /polydegstab
Pyrolysis behaviors of various biomasses
Elena P�arp�arit�a a, Mihai Brebu a, Md. Azhar Uddin b, Jale Yanik c, Cornelia Vasile a,*
a “Petru Poni” Institute of Macromolecular Chemistry of Romanian Academy, Department of Physical Chemistry of Polymers, 41A Grigore Ghica Voda Alley,700487 Iasi, RomaniabDepartment of Materials and Energy Science, Graduate School of Environmental Science, Okayama University, 3-1-1 Tsushima Naka, Kita-ku, Okayama700-8530, Japanc Ege University, Faculty of Science, Department of Chemistry, 35100 Izmir, Turkey
a r t i c l e i n f o
Article history:Received 18 October 2013Received in revised form29 December 2013Accepted 6 January 2014Available online 16 January 2014
Keywords:BiomassDecompositionThermogravimetryPyrolysis
* Corresponding author. Tel.: þ40 232217454; fax:E-mail address: [email protected] (C. Vasile).
0141-3910/$ e see front matter � 2014 Elsevier Ltd.http://dx.doi.org/10.1016/j.polymdegradstab.2014.01.0
a b s t r a c t
Thermal behavior of different types of biomass, namely forestry e Eucalyptus globulus sawdust, Norwayspruce (Picea abies) thermo mechanical pulp; agricultural e energy grass, Brassica rapa, and by-productse pine cones, grape seeds, was evaluated by thermogravimetry and by analytical pyrolysis. The liquidproducts from pyrolysis were analyzed by gas chromatography coupled with mass selective detector,Fourier transform infrared spectroscopy and by nuclear magnetic resonance spectroscopy. The elementalanalysis and the calorific values of the pyrolysis residues were investigated. It has been established thatthe pyrolysis products consisted mainly of carboxylic acids, ketones, furans, phenols, guaiacols, catechols,and their derivatives, resulting from the degradation of the main structural components of biomass. Thedistribution of compounds in oils was strongly depended on biomass source, differences in the pyrolysisbehavior among the biomass samples being found.
� 2014 Elsevier Ltd. All rights reserved.
1. Introduction
Most of the world’s energy resources are based on non-renew-able and depleting fossil fuels. This has resulted in increasingworldwide interest in exploring alternative and renewable fuels,out of long e term economic, environmental and national securityconcerns [1]. Biomass is an extremely abundant resource which isproduced in agriculture and forestry or could also be collected aswaste residue. It is renewable and environmentally friendly and canbe converted into biofuels, as an efficient alternative for fossil fuels[2].
Conventionally, most of the solid biomass heating fuels(woodchips, wood pellets, and cordwood) come from the forestproducts industry. Over the past 15 years, however, growing thecrops and perennial grasses (such as Switchgrass, Miscanthus, andReed Canarygrass) specifically for energy has gained widespreadappeal and present exciting new renewable energy options.Perennial grasses can also be pressed into pellets, briquettes, andcubes and used as heating fuel by replacing or complementing thefuels made from wood [3].
Considerable efforts have been made to convert wood biomassinto liquid fuels and chemicals, since the oil crisis in mid 1970s [4].
þ40 232211299.
All rights reserved.05
Replacing fossil fuels with wood fuels to generate usable energytypically reduces net CO2 atmospheric emission levels by over 90%.The principal sources of biomass for thermal conversion are: wood(from forestry residues, from primary processing, e.g. saw milling,from secondary processing, e.g. furniture, panel, paperboard,joinery manufacture and construction), waste streams (industrial,commercial, demolition and domestic) and also annual fiber crops.Virtually any form of biomass could be considered for pyrolysis.
Pyrolysis products of biomass could be used as an energy sourceor as feedstock for chemicals production. Most of the works havebeen performed on wood materials because of its consistency andcomparability between tests [5].
Generally, it was supposed that the thermal conversion pro-cesses are somehow insensitive to type, form, and shape of thematerials, being able to convert the biomass into stable, storable,and transportable physical and chemical forms that can be used forhigher efficiency energy conversion processes developed for liquidpetroleum, coal, and natural gas.
However, it is well known that the fast and slow pyrolysis ofbiomass produces markedly different products depending onthermal conversion process characteristics (heating rate, temper-atures, residence times, diluent gas composition), and feedstockcharacteristics (particle size, density, moisture, composition). Towhat extent the internal geometry of the wood influences the ratesof heat and mass transfer, and thus the composition of the reactionproduct, is largely unknown. Of particular importance it is the
E. P�arp�arit�a et al. / Polymer Degradation and Stability 100 (2014) 1e92
ability to predict the relative proportions of char, tar, and gas (andof components therein) that result from a biomass thermal con-version process and given feedstock [6]. Analytical pyrolysis tech-niques coupled with gas chromatography and mass spectrometrycan be easily used as characterization methods in order to obtainmolecular information about hemicelluloses, cellulose, and lignin.GC e MS analysis provides more information on the distribution ofpyrolytic products, due to good chromatographic separation [7,8].For a better understanding of the pyrolysis process, many re-searchers studied thermal decomposition of biomass by thermog-ravimetric analysis [9].
In this paper the thermal behavior of different biomasses(forestry, agricultural and by-products) was studied by thermog-ravimetry and analytical pyrolysis. The yields of biochar, bio-oil,and gases are given. Further, a detailed investigation of the bio-oils and chars was made.
2. Materials and methods
2.1. Materials
The biomass samples studied in this work are as follows:Eucalyptus globulus sawdust and Norway spruce (Picea abies)
thermo mechanical pulp (as forestry biomass) provided by ÅboAkademi Process Chemistry Centre, Laboratory of Wood and PaperChemistry, Finland, collected during summer and characterized byOhra-aho et al. [10].
Energy grass collected during summer from Hungarian lands,called also “Szarvase I Industrial Grass”, and detailed characterizedby Lele et al. [11,12].
Brassica rapa as dried plant collected during fall from Moldaviaregion, Romania (as agricultural biomass).
Pine cones (Pinus pinea L.), obtained from forest in Izmir area,milled and sieved to a particle size of less than 1 mm then dried inair for several days.
Grape seeds supplied by Bozacada, Turkey, as dried residue fromthe juice extraction process of a wine industry (as biomass by-products).
The biomass samples were dried at 80 �C for 24 h, then groundin a Retsch PM 200 planetary ball mill for powdering. The obtainedpowder was sieved, and the particles with the maximum fractionsize of 160 mm were retained for further analysis. The biomasssamples used in this study were denoted as: Eucalyptus globulussawdust (EG), Norway spruce (NS), energy grass (EnG), Brassicarapa (BR), pine cones (PC), grape seeds (GS). Characteristics ofbiomass samples are given in Table 1.
The biomass samples differed mainly by the content of carbo-hydrates, which varied from 60 to 70 wt % for EG, NS and GS to 40e44 wt % for EnG and BR and to 32e37 wt% for PC. The ash content isvery low, of less than 1 wt% for EG, NS and PC, while for BR is about
Table 1Characteristics of biomass samples.
Samples Moistured Extractivesa,d Carbohydratesb,d Ligninc,d Ashd
EG 7.0 1.1e3.0 57.1e70.6 24.5e27.6 0.5NS 6.6 1.0 60.6e69.0 27.6e29.4 0.4EnG 5.7e7.7 16.3 44.4 24.1 4.5BR 6.6 5.9 40.3 17.9 7.5PC 9.6 4.8 37.6e32.7 24.9 0.9GS 8.1 0.7 62.4e70.3 24.9 3.3
a Total amount of extractives determined by extraction in different solvents [13].b Total amounts determined by high-performance anion exchange chromatog-
raphy with pulsed amperometric detection (HPAEC e PAD) [14].c Total amount of lignin (ASL þ AIL) [15].d wt% of dry matter.
7.5 wt%. The lignin content varies between 24.9 and 29.4 wt % in allbiomasses, except BR, which has 17.9 wt% lignin content. The ex-tractives content has the highest value in EnG, followed by BR, PC,EG, NS, and GS, respectively.
2.2. Methods
2.2.1. Elemental analysisElemental analysis (C, H, N) of biomass samples and pyrolysis
residues was determined by using a Perkin Elmer ElementalAnalyzer 2400II with routine analytical uncertainty better than�5% of the measured value.
2.2.2. Biomass thermal degradationThermogravimetry: Thermal behavior of biomass was studied
thermogravimetrically with a TGA e 40S Shimadu thermogravi-metric analyzer. About 10 mg of samples were heated at a rate of10 �C min�1, up to 850 �C in an open Al2O3 crucible, under200 mL min�1 nitrogen flow. The correction for the TG data wasdone using a blank experiment with no sample placed in thecrucible.
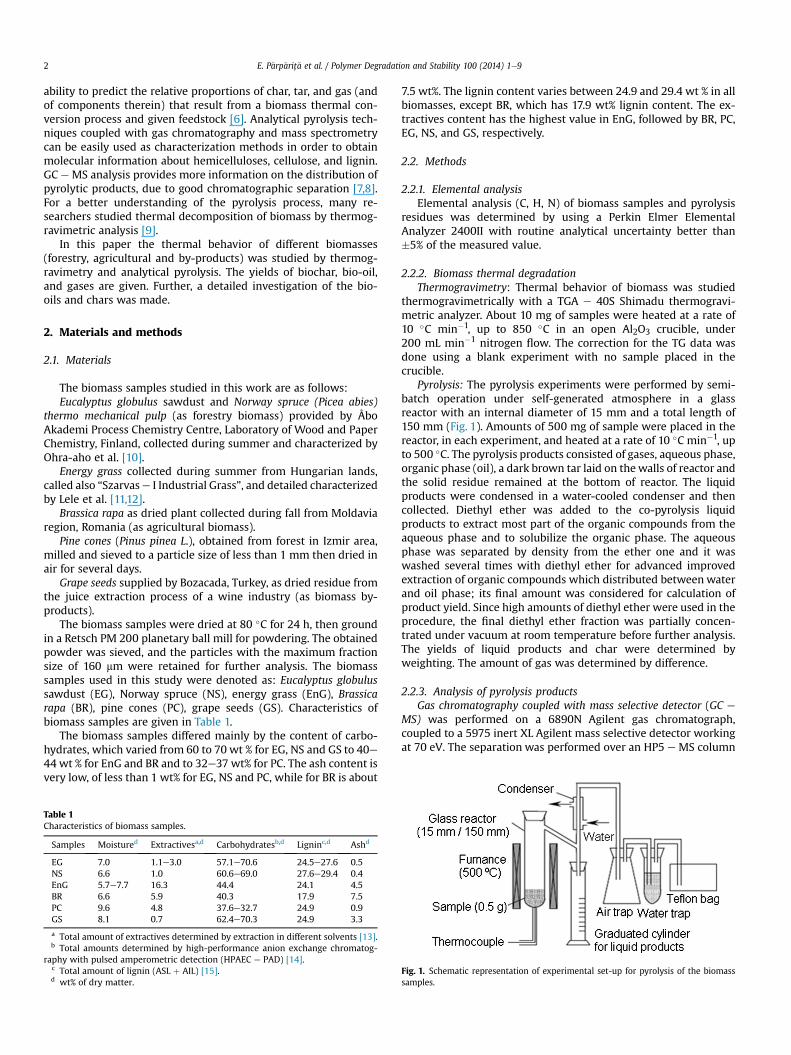
Pyrolysis: The pyrolysis experiments were performed by semi-batch operation under self-generated atmosphere in a glassreactor with an internal diameter of 15 mm and a total length of150 mm (Fig. 1). Amounts of 500 mg of sample were placed in thereactor, in each experiment, and heated at a rate of 10 �C min�1, upto 500 �C. The pyrolysis products consisted of gases, aqueous phase,organic phase (oil), a dark brown tar laid on the walls of reactor andthe solid residue remained at the bottom of reactor. The liquidproducts were condensed in a water-cooled condenser and thencollected. Diethyl ether was added to the co-pyrolysis liquidproducts to extract most part of the organic compounds from theaqueous phase and to solubilize the organic phase. The aqueousphase was separated by density from the ether one and it waswashed several times with diethyl ether for advanced improvedextraction of organic compounds which distributed between waterand oil phase; its final amount was considered for calculation ofproduct yield. Since high amounts of diethyl ether were used in theprocedure, the final diethyl ether fraction was partially concen-trated under vacuum at room temperature before further analysis.The yields of liquid products and char were determined byweighting. The amount of gas was determined by difference.
2.2.3. Analysis of pyrolysis productsGas chromatography coupled with mass selective detector (GC e
MS) was performed on a 6890N Agilent gas chromatograph,coupled to a 5975 inert XL Agilent mass selective detector workingat 70 eV. The separation was performed over an HP5 e MS column
Fig. 1. Schematic representation of experimental set-up for pyrolysis of the biomasssamples.

E. P�arp�arit�a et al. / Polymer Degradation and Stability 100 (2014) 1e9 3
(30 m � 0.25 mm � 0.25 mm) coated with (5% e Phenyl) e meth-ylpolysiloxane. The following parameters were used: injector e
temperature of 230 �C, split ratio of 10:1, volume of injected sampleof 0.2 ml; He flow rate e 1 mL min�1; temperature program e starttemperature of 40 �C that was hold for 2 min, then heated up to300 �C at a heating rate of 10 �Cmin�1, where it was maintained foranother 7 min. Identification of compounds was performed ac-cording to the NIST database library and a minimum 70% acceptablematch.
Fourier transform infrared (FT e IR) spectra were recorded on aSpectrum 100 Perkin Elmer spectrophotometer, with a resolutionof 4 cm�1. In order to obtain the spectra a very thin layer of pyrolysisoil was deposited on KBr tablets. The pyrolysis residue was used aspowder in KBr tablets.
Nuclear Magnetic Resonance (NMR). The 1H NMR spectra of py-rolysis oils were recorded with a Bruker Avance DRX 400 spec-trometer, using CDCl3 as solvent.
Calorimetric determinations. The calorific value of the residuewas determined using a Berthlot VEB (AB) calorimetric bombPotsdam e Bahelsberg. The temperature difference was measuredusing a Beckman thermometer with precision of �0.01 �C. Cali-bration was done by the combustion of the benzoic acid(DcHo298 ¼ 3.2257 106 J mol�1).
3. Results and discussion
3.1. Elemental analysis
The concentration in the C, H, O, and N of the biomass samples isshown in Table 2.
The elemental analysis confirmed that biomass is primarilycomposed of C, O, and H and only trace amounts of N, excepting GS.The concentration of carbon was between 44 and 53 wt%, thelowest value being observed for BR and the highest one for GS. Thehydrogen content was of about 5.8 wt% for EG, EnG and BR, lowervalue being observed for PC and higher (of 6.3 wt%) for NS and GS.At the same time, no trace of N was observed for forestry biomass,while for the other biomasses (the agricultural and by-products) Nwas between 0.3 and 2 wt%.
3.2. Thermal behavior of biomass
Thermal analysis is a useful method for studying thermal sta-bility of wooden materials, in order to understand the pyrolyticprocess of wood [16]. It is also used for biomass characterization[17].
The thermal behavior of the different types of biomassmentioned above was determined by thermogravimetry (TG)which measure the mass loss of the sample with increasing tem-perature, as shown in Fig. 2a. All biomass samples show a smallmass loss before 100 �C, which can be attributed to the removal ofhumidity. The rate of mass loss gradually increased above 200 �Cand a distinct mass loss step appeared between 250 and 400 �C
Table 2Elemental analysis of the biomass samples.
Sample C (wt%) H (wt%) N (wt%) O (wt%)a
EG 46.8 5.8 e 47.4NS 47.7 6.4 e 46.0EnG 44.9 5.9 0.7 48.5BR 44.1 5.8 0.3 49.9PC 46.9 5.1 0.3 47.6GS 53.4 6.3 2.0 38.2
a Calculated by difference.
with a mass loss of about 65 wt % e Table 3. The forestry biomassshowed the highest mass loss while the biomass by-products hadthe lowest one.
The DTG curves (Fig. 2b) allow a comparison of the thermalstability among the biomass samples. The degradation profile ofbiomass sample is a two step process.
The first decomposition step is observed as a shoulder in the279e312 �C temperature range and could be attributed todecomposition of hemicelluloses and partially to decomposition ofcellulose and lignin. Because the decomposition ranges of hemi-celluloses and cellulose partially overlap, hemicelluloses decom-position usually appears as a more or less pronounced “shoulder”instead of a well-defined peak [18].
The second degradation step, with a temperature for themaximum decomposition rate above 350 �C, can be attributed tothe degradation of cellulose, but can be also associated with thepyrolytic degradation of lignin, starting with fragmentation of theinter-unit linkages [19]. Table 3 shows the temperature range forthe main decomposition step of studied biomass samples.
From Table 3 it can be observed that the biomass by-products(pine cones, grape seeds) start to degrade at lower temperaturescompared with agricultural (energy grass, B. rapa) and forestry (E.globulus, Norway spruce) biomass. This may be due to a higherconcentration of low molecular compounds from extractives (oilsand resins) and hemicelluloses in GS and PC, which are less stableand start to degrade faster. The EG exhibit the most prominentshoulder at 294 �C, while for the NS this shoulder is very weak(with a temperature for the maximum decomposition at 312 �C),mostly due to the lower content of hemicellulose which wereremoved partially during the thermo mechanical pulping process.In the case of EnG and BR, the shoulder is also less pronounced,indicating a smaller amount of hemicelluloses in their structure.
The temperature for the maximum decomposition rate is alsostrongly dependent on the biomass type, the EnG decomposing atlower temperature (around 320 �C) compared with the other bio-masses. The EnG also has the lowest mass loss. This behavior mightbe associated with the highest content of extractives in its structureand the low content of carbohydrates (Table 1). Extractives arecompounds with low molecular mass, which are removed fromsamples at lower temperatures due to their higher volatility. Thehighest temperature (of 365 �C) was observed for NS sample, due toa greater amount of cellulose.
A long tail of mass loss was observed above 400 �C for all bio-masses e Fig 2a. The degradation continued up to 800 �C, but therate of reaction was minimal, due to advanced charring processes.In case of EnG, BR, PC and specially GS the main decompositionpeak was broad. This broadening can be due to the overlappingdecomposition processes of wood extractives, hemicellulose, cel-lulose, and lignin Ref. [20].
From the DTG curves of the biomass samples, it was observedthat the degradation was significant up to 450 �C. Therefore, theprocess temperature for bio-oil productionwould be at about 450e500 �C in order to attain the maximum degradation and volatili-zation of biomass samples.
3.3. Biomass pyrolysis behavior
3.3.1. Pyrolysis yieldIt is known that the pyrolysis yield depends on many factors
such as temperature, particle size, heating rate and type of biomass.The products of biomass pyrolysis include biochar, bio-oil, andgases, such as methane, hydrogen, carbon monoxide and carbondioxide [21].
Depending on the heating program and the final temperature,pyrolysis yields mainly biochar below 450 �C when the heating rate

Fig. 2. TG (a)/DTG (b) curves for the studied biomass samples.
E. P�arp�arit�a et al. / Polymer Degradation and Stability 100 (2014) 1e94
is low, and mainly gases above 800 �C, for rapid heating [21]. Atintermediate temperatures and under relatively high heating rates,the main product is bio-oil. The pyrolysis process is very dependenton the moisture content of the biomass, and 5e10 wt % humiditywater is generally considered acceptable for the pyrolysis processtechnologies currently in use [22]. For all the particles to reach thedesired temperatures in a short residence time, they need to besize-reduced before being used for pyrolysis. In this study, theparticle size was relatively constant at about 160 mm. The productyield of the biomass pyrolysis is given in Fig. 3.
The pyrolysis of the biomass gives polar oxygenated compoundscoming from its hemicellulose, cellulose, and lignin components,which are distributed between oil and aqueous phase.
The percentage of the product yields of the biomass pyrolysiswere of about 15e25 wt% gases, 15e30 wt% aqueous phase, 6e28 wt% oil, 1.5e7 wt% tar and 30e40 wt% residue e Fig. 3. Allproducts showed high variations among studied samples. BR andPC pyrolysis gave low amount of tar, while GS gave similar amountsof tar and oil. EG produced the highest amount of tar, PC leave thehighest amount of residue (50 wt%), while EG and NS recorded thelowest ones. The highest amount of oil was obtained for the BR,followed by EG and NS; the lowest amount of oil being obtained forPC.
The gaseous products are evolved in similar amounts from EG,NS and GS biomasses, while for the PC the amount of gas wassmaller e Fig. 3.
Table 3Temperatures and mass loss of the main decomposition step for studied biomasssamples.
Sample Ti(�C) Tsh(�C) Tm(�C) Tf(�C) Dw (%)
EG 204 294 355 392 77NS 212 312 365 397 73EnG 189 279 320 390 66BR 193 309 351 419 67PC 164 327 357 401 57GS 169 307 350 511 62
Ti e temperature for the onset of mass loss, Tsh e temperature of the shoulder in theDTG curves, Tme temperature corresponding to themaximum rate of mass loss, Tfetemperature for the end of mass loss, Dwemass loss at the end of degradation step.
3.3.2. Characterization of the pyrolysis productsAs has beenmentioned, awide range of feedstock is available for
pyrolysis/gasification, which varies from clean biomass to wastecontaining different amounts of ash, alkaline metals, and emissionprecursors, such as nitrogen, chlorine, and sulfur. Primary pyrolysisproducts of biomass are vapors and aerosols from decomposition ofhemicelluloses, cellulose, and lignin. Liquid collection requirescooling and agglomeration or coalescence of aerosols. Heavierfractions may deposit on pipes leading to their blockage, while thechar acts as a vapor cracking catalyst so rapid and effective removalis essential [23].
3.3.2.1. Oil fraction. Bio-oil is a dark brown liquid, which iscomprised of many oxygenated organic chemicals. Bio-oil is notsuitable for direct use in standard internal combustion engines, butis particularly attractive for co-firing, because it can bemore readilyhandled and burned than solid fuels and is cheaper to transport andstore. In addition, bio-oil could also be an important source for awide range of organic compounds and specialty chemicals.
The composition of the bio-oils obtained from pyrolysis of bio-masses used in this study was characterized by FT e IR spectros-copy. Fourier transform infrared spectroscopy is often used tocharacterize bio-oils derived from the pyrolysis of biomass [24].
Fig. 3. The product yields of the biomass pyrolysis.

Fig. 4. FT e IR spectra of bio e oil obtained from pyrolysis of biomass samples in two spectral regions (a) 3750e2750 cm�1 and (b) 1900e550 cm�1.
E. P�arp�arit�a et al. / Polymer Degradation and Stability 100 (2014) 1e9 5
Details of the FT e IR spectra of the samples under study areplotted in Fig. 4 and the assignment of the bands is presented inTable 4.
In the 3750e2750 cm�1 region (Fig. 4a), the spectra of thebiomass samples showawide band at about 3400 cm�1, assigned toOeH stretching vibrations. A mixture of different hydrogen bondsis considered to cause the broadening of the OH band in the IRspectra [25], this indicating the presence of phenolic and alcoholiccompounds [26]. There are variations in this band position for thestudied samples. Thus, this band appears at 3402 cm�1 for EG andat 3400 cm�1 for NS and GS, and is shifted to higher wavenumberfor BR (at 3433 cm�1) and to lower wavenumber in case of EnG andPC biomass (3383 and 3385 cm�1, respectively). In addition, theintensity of these bands varies in the studied series, therefore, thehighest amount of hydroxyl groups in the bio-oil fraction could beobtained for the BR and EnG biomasses, while the lowest amountfor the GS.
The changes in the intensity, width, or maximum shifting of theIR bands are due to different amounts of compounds in pyrolysisbio-oils, coming from the variation in the main biomass compo-nents (extractives, carbohydrates, and lignin).
The CeH stretching vibrations between 3020 and 2750 cm�1
with three maxima, indicate the presence of methyl and methylenegroups of alkanes and alkenes in pyrolysis oils the highest amountof these compounds being observed for the PC and GS biomasses.
The spectra of the bio-oils are very complex in the “fingerprint”region (1900e550 cm�1), consisting in many overlapped bands,assigned to different stretching and deformation vibrations of thefunctional groups in the compounds resulted from pyrolysis(Fig. 4b). The bands with the maximum at about 1710 and1640 cm�1 assigned to C]O (carbonyl) stretching vibrations indi-cate the possible presence of aldehydes, ketones, carboxylic acids oresters compounds.
The absorbance bands at 1604 and 1515 cm�1 represent the C]C stretching vibrations indicative of the aromatic groups. Here thehighest amount of these groups was evidenced for the oils of theEG, EnG and PC samples. The bands at 1464 and 1433 cm�1 areassigned to CH3 asymmetric stretching and CH2 scissoring vibra-tions. Absorption bands with the maximum at 1380 and 1361 cm�1
could be due to symmetrical methyl bending vibrations and in-dicates the carbonyl components (e.g., esters, carboxylic acids,
ketones, aldehydes). The bands with maximum at 1265, 1237 and1219 cm�1 are assigned to CeO stretching. The bands at 1157, 1035,971 and 806 cm�1 are assigned to characteristic CeOeC, CeO, CeC,CeH deformation and stretching vibrations. The highest amount ofthese groups was observed in the oil from EG.
The EG pyrolysis oil appears to have higher amount of aromaticcomponents as shown by the bands at 1611, 1514 and 1214 cm�1,while for the others, the pyrolysis oil contain more aliphaticcompounds.
The region between 900 and 700 cm�l can bemainly assigned toaromatic CeH out of plane bending vibrations. The high intensity ofthese bands indicates that the aromatic hydrogen is located in ar-omatic rings with high degree of substitution. Aromatic com-pounds with three adjacent hydrogen atoms such as syringol and2,6-dimethylphenol show absorption bands between 810 and750 cm�l [27]. Fig. 4b shows absorption bands at 752 cm�l, indi-cating the presence of such compounds. Aromatic rings with twoadjacent or isolated hydrogen atoms give bands from 800 to900 cm�l. Aromatic compounds such as 2-methoxy-4-ethylphenol(808e816 cm�l), 2-methoxy-4-(2-propenyl) phenol (817e802 cm�l)), 2,6-dimethoxy-4-(2-propenyl) phenol (827e802 cm�l),and 2,6-dimethoxy-4-methylphenol (818e794 cm�l) absorb in thisrange [28]. The observed bands at 806 cm�l (Fig. 4b) mainlyrepresent these types of substitution patterns in the samples. Thehighest concentration of these compounds may be found in the oilsobtained from EG, EnG and PC biomasses. This results are sup-ported by the GC e MS data presented below.
Proton nuclear magnetic resonance (1H NMR) can provide in-formation about the proportions of protons in aromatic, saturatedand unsaturated structures in pyrolysis oils from biomass samples[31]. The proton NMR spectra of bio-oils are shown in Fig. 5 and thepercentage of different types of hydrogen in biomass pyrolysis oilsaccording to chemical shifts are presented in Table 5.
From the 1H NMR spectra it is evident that there are some dif-ferences in the overall composition of the bio-oils from thedifferent biomasses.
The 1H NMR results showed that the first region of the spectrafrom 0.9 to 3 ppm, represent protons in aliphatic structures. There-fore, bio-oils from EnG, BR, and PC have high levels of protons in thisspectra region, but bio-oil fromGSwas themost rich in these protons.The EG and NS bio-oils have low amount of protons in this chemical

Fig. 5. 1H NMR spectra oil obtained from pyrolysis of biomass samples.
Table 4Characteristic bands and their assignment [29,30].
Sample Band assignment
EG NS EnG BR PC GS
3402 3400 3383 3433 3385 3400 OeH stretching vibration inphenolic and aliphaticcompounds
2963 2962 2963 2978 2960 2956 Asymmetric CH3 stretchingvibration
2936 2928 2929 2930 2927 2923 Asymmetric CH2 and CHstretching vibration
2876 2873 2873 2874 2868 e Symmetric CH3 stretchingvibration
e 2857 2857 e 2859 2853 Symmetric CH2 stretchingvibration
1712 1710 1709 1715 1703 1710 C]O stretching vibration inunconjugated ketone,carbonyl and ester groups
e e e 1646 e 1630 C]O stretching vibration ofPh-(C]O)e groups
1611 1599 1604 e 1604 1604 Aromatic C]C skeletalvibration
1514 1515 1514 1515 1514 1512 Aromatic C]C skeletalvibration
1463 1464 1462 1458 1462 1462 Asymmetric CH3 stretchingvibration, CH2 scissoringvibration
1433 1433 e e e e CH2 scissoring vibratione 1400 1402 1404 CeH bending vibratione 1383 1379 1384 1380 1380 CeH bending vibration1361 1364 1363 e 1365 e CeH bending vibration1261 1262 1262 1265 1261 1261 CeO stretching vibration1237 1234 e 1245 e e CeO stretching vibration of
PheOeC groups1214 1207 1219 e 1209 1205 CeO stretching vibration1156 1153 1157 1153 1156 e Asymmetric CeOeC
stretching vibration1110 1111 e 1107 1103 e CeOeH deformation
vibratione 1096 1097 1080 e 1093 CeO deformation vibration1034 1033 1035 1022 1034 1043 CeO and CeC stretching
vibration of >CHeOHand eCH2OH groups
969 971 971 971 968 969 CeO and CeC stretchingvibration of >CHeOHand eCH2OH groups
803 804 806 e 806 806 Aromatic CeH out of planebending vibration
751 751 752 752 751 748 Aromatic CeH out of planebending vibration
Table 5Percentage of hydrogen types, divided into 4 main regions, based on 1H NMRanalysis of biomass pyrolysis oil according to chemical shifts [31].
Chemicalshifts (ppm)
EG NS EnG BR PC GS Proton assignment
0.9e3 49.7 52.9 59.6 67.8 67.1 79.6 Methyl, methyleneprotons in aliphaticstructures
3.5e5.5 29.5 24.3 17.9 12.9 10.6 8.1 Ethers, cyclic andlinear olefins
6.5e8.5 19.8 21.7 21.9 18.6 21.7 12.2 Heteroaromatics9e10 1.0 1.0 0.6 0.6 0.5 e Aldehydes, carboxylic
acids
GC e MS.
E. P�arp�arit�a et al. / Polymer Degradation and Stability 100 (2014) 1e96
shift range. The next region, from 3.5 to 5.5 ppm, represents protonsin olefin and ether compounds. These compounds, were found inhigher amounts in bio-oils fromEG, NS and decreased to bio-oil fromGS. The region of the spectra from 6.5 to 8.5 ppm represents protonsin heteroaromatics containing O andN. In this spectra region, all bio-oils have approximately the same levels of heteroaromatic protons,exception being bio-oil from GS, which accounts the least amount ofthese protons. At the same time, signals corresponding to hydrogenbondedoxygenatedcompoundssuchasaldehydesorcarboxylic acidswere observed in the 9e10 ppm range [31].
The composition of the bio-oil obtained from the pyrolysis ofbiomass is very complex, as shown by the chromatograms in Fig. 6.Some differences could be observed between chromatograms; thesimplest ones are those of the oils resulted from the pyrolysis of EGand EnGwhile those fromNS and BR contain a high number of highmolecular weight compounds and that from GS contains mainlycompounds in the middle range of retention times. This means, theGS pyrolysis oil contains compounds with a narrower distributionin respect to the other ones as concerning the carbon number(retention times).
The distribution of compounds in the pyrolysis oils wasdescribed by the NPe gram curves (NP stands for normal paraffins)e Fig. 7 e drawn based on the GC e MS chromatograms. Thesecurves show the total peak area of all compounds having theretention time in the range of two successive normal paraffinsversus the corresponding carbon number of the normal paraffinfrom the upper limit of the range [32].
Each pyrolysis oil has a particular NP e gram (Fig. 7). Mostcompounds (about 70e80% from the total peak area of the chro-matograms) were distributed in the range of nC6 to nC15, howeverheavier compoundswere found as a tail up to nC25. In the case of EGand EnG oils, a sharp peak at nC7can be observed. This is mainly dueto the presence of the 5-methyl-2-furancarboxyaldehyde. Thepeaks at nC9 aremainly due to presence of the 2-methyl phenol and3-methyl phenol.
Large peaks distributed in the nC6 e nC15 range of the NP e
grams are observed for EnG and BR. A reason could be that thesesamples gave a higher quantity of light compounds compared with

Fig. 6. GC e MS chromatograms of the diethyl ether extracted organic compoundsfrom condensable fraction.
Table 6The main compounds of the pyrolysis oil obtained from biomass samples.
Compound Rt (min) Area (%)
EG NS EnG BR PC GS
Acids 19.93 9.31 18.95 2.56 4.19 2.01Acetic acid 2.89 18.72 8.62 16.50 2.20 3.80 1.92Propanoic acid 3.673 0.82 0.33 0.05 1.66 0.29 0.09Butanoic acid 4.929 0.19 0.21 0.79 0.15 0.10 e
Crotonic acid 5.614 0.20 0.15 e 0.16 e e
Aldehydes 8.12 3.24 4.05 2.35 2.20 0.50Propanal 4.573 0.44 e e e e e
Furfural 5.514 7.68 3.24 4.05 2.35 2.20 0.50Non-aromatic ketones 3.48 3.57 6.69 1.61 1.73 e
Furans 4.24 5.21 6.04 3.45 2.09 3.043-Furaldehyde 5.127 0.19 0.38 0.18 0.19 0.13 e
2-Furanmethanol 5.891 1.70 2.37 4.40 2.49 0.32 0.531-(2-Furanyl)ethanone 6.871 0.29 0.40 0.52 0.41 0.22 e
5-Methyl-2(5H)-furanone
7.414 0.07 e e e e e
5-Methyl-2-furancarboxaldehyde
7.798 1.33 1.39 0.43 0.36 0.93 0.17
2-Pentyl-furan 8.260 e e e e e 1.332-Acetyl-5-methylfuran 9.058 0.08 e e e 0.07 e
7-Methylbenzofuran 10.151 0.18 0.54 0.28 e 0.22 e
2-Methylbenzofuran 10.231 0.10 0.13 0.23 e 0.20 1.01Phenols 2.91 7.53 7.43 4.16 5.36 9.85Phenol 8.099 0.12 1.40 2.61 0.77 1.56 2.172-Methylphenol 9.328 0.57 1.18 1.26 0.70 0.07 1.783-Methylphenol 9.670 0.90 1.94 2.01 1.25 1.94 2.522,6-Dimethylphenol 10.189 0.29 0.65 0.27 0.36 0.19 e
2-Ethylphenol 10.677 e 0.31 0.86 0.16 0.19 2.243,5-Dimethylphenol 11.127 0.48 1.52 e 0.43 0.74 e
2,3-Dimethylphenol 11.276 0.19 0.42 0.23 0.26 0.49 0.812,3,6-Trimethylphenol 11.684 0.36 0.11 0.19 0.23 0.18 0.33Guaiacols 4.86 7.72 3.78 5 5.64 4.74
E. P�arp�arit�a et al. / Polymer Degradation and Stability 100 (2014) 1e9 7
the other samples. The bio-oil fromGS showed an NPe gramwith asingle peak with maximum at nC11.
The main compounds of the pyrolysis oils identified by GC e
MSD are listed in Table 6.The pyrolysis products consisted mainly in carboxylic acids,
ketones, furans, phenols, guaiacols, catechols, and their derivatives,resulting from the degradation of the main structural components
Fig. 7. The distribution of compounds in the pyrolysis oil obtained by biomass versusthe carbon number.
Guaiacol 9.920 0.72 2.42 1.44 1.43 1.83 3.694-Methylguaiacol 11.525 0.80 2.20 0.52 0.67 1.65 2.074-Ethylguaiacol 12.781 0.60 1.47 0.83 0.88 1.04 1.42Syringol 13.797 2.38 e 0.59 1.38 e 0.21Eugenol 13.871 e 0.61 e 0.32 0.44 e
Vanillin 14.480 0.16 0.62 0.16 0.32 0.28 e
5-(1-Propenyl)guaiacol 14.546 0.20 0.40 0.24 e 0.40 0.35Catechols 3.49 3.97 1.46 2.89 3.84 0.25Catechol 11.588 1.07 1.71 0.73 1.19 1.63 e
3-Methylcatechol 12.508 0.62 0.69 0.24 e 0.45 e
3-Methoxycatechol 12.563 1.02 e 0.15 0.90 e e
Hydroquinone 12.723 0.14 0.06 e e 0.12 e
4-Methylcatechol 12.923 0.41 1.27 0.22 0.42 1.45 e
3,5-Dihydroxytoluene 13.688 0.23 0.24 0.12 0.38 0.19 0.25Total area (%) 47.35 40.55 49.4 22.02 25.05 20.39
of the biomass. Acetic acid and furfural occurred in higher amountsin EG, NS and EnG and decreased by 6e8 times in the case of the oilsfrom BR and GS.
Phenols were found in higher amounts in bio-oils from EnG, BRand from GS. Catechols are found in larger amount in bio-oils fromEG, NS and PC. These compounds come from the degradation oflignin component of biomass [33].
Pyrolysis liquids can be obtained with a yield of about 70%(based on dry biomass). Many biomass pyrolysis processes convert55e65% of dry biomass to inexpensive pyrolysis oils. These inex-pensive oils, rich in phenolic fractions, acids, and furans derivativescan act as feedstock for further upgrading or can be used in manyapplications such as boilers, furnaces, engines, and turbines forelectricity generation [34].
It was found by Demirbas [35] that compared with the bio-oilsfrom wood, the bio-oils from microalgae have lower contents ofoxygen, higher heating values, lower viscosity, and lower density.Its utilization as fuel or as a source of chemical feedstock requiressome form of upgrading to improve storage stability and heatingvalue. Heavier, higher molecular weight products like polycyclicaromatics also need hydrocracking, with at least partial ring
Fig. 8. FT e IR spectra of residue obtained from pyrolysis of biomass samples, in two
E. P�arp�arit�a et al. / Polymer Degradation and Stability 100 (2014) 1e98
saturation prior to cracking. Tar from wood is a very complexmixture, its composition varying with the type of wood andmethod of preparation. The main constituents are pyrocatechol,phenol, guaiacol, creosol, methyl-creosol, pyrrole, toluene, xylene,naphthalene, and other hydrocarbons [36].
In pyrolysis reactions, methanol arises from the breakdown ofmethyl esters and/or ethers from the decomposition of pectin-likeplant materials [37,38]. Methanol also arises from the methoxylgroups of the uronic acid. The acetic acid, formed in the thermaldecomposition of all three main components of biomass, comesfrom the elimination of acetyl groups originally linked to the xyloseunits, while furfural is formed by dehydration of the xylose units.Quantitatively, 1-hydroxy-2-propanone and 1-hydroxy-2-butanone are present in high concentrations in the liquid prod-ucts. These two alcohols are partly esterified by the acetic acid.Other compounds are formic and propionic acids, 1-hydroxy-2-propanone, 1-hydroxy-2-butanone and 2-furfuraldeyde. In addi-tion to water, other low-molecular weight polar compound such ashydroxyacetaldehyde, acting also as solvent, is present.
spectral regions (a) 3710e2750 cm�l and (b) 1780e450 cm�l
3.3.2.2. Residue fraction. The growing concerns about climatechange have brought biochar into greater attention. Biochar can beused as a soil amendment to improve the plant growth yield and toenhance soil fertility. It can store the CO2 in the soil, leading toreduction in greenhouse gas (GHG) emission. In addition to itspotential for carbon sequestration, biochar has several other ad-vantages; it can increase water retention and the available nutri-ents for plant growth so reducing the amount of fertilizer bypreventing the leaching of nutrients out of the soil. Biochar reducemethane and nitrous oxide emissions from soil, therefore furtherreducing GHG emission. Biochar could be also used in many ap-plications as a replacement for other biomass energy systems.
The composition and quantity of combustion residue are theprimary factors determining whether or not a feedstock can beburned effectively in a particular appliance. Alkali metals, in com-binationwith silica and sulfur, are primarily responsible for meltingor sintering at relatively low temperatures. This undesirable pro-cess is facilitated by the presence of chlorine. The typical range inconcentration (on a dry matter basis) of these critical componentsin grasses is as follows: silica (1e4%), alkali metals (0.2e2.0%),chlorine (0.01e0.5%), and sulfur (0.07e0.15%).
The elemental composition and calorific values of the pyrolysisresidues of the studied biomass samples are given in Table 7.
It should be noted that residue composition is a characteristic ofeach group of biomass. EG and NS residues contain high amount ofcarbon and hydrogen, while biomass from BR and EnG leavedresidues which contain the lowest amount of carbon and hydrogen.Calorific values are almost similar and are in the range for goodsolid biomass energy source.
The FT e IR spectra of the residues (Fig. 8) proved the fact thatcarbonization is not complete at the pyrolysis temperature used inthis case. The residues still contain various functionalities mainly inthe “fingerprint” region (1780e450 cm�l) specific for each pyro-lyzed biomass.
Table 7Elemental analysis and calorific value of the residue from biomass samples.
Sample C (%) H (%) N (%) Cl (%) Calorific value (MJ/kg)
EG 82.6 5.1 2.2 0.97 35.1NS 83.5 3.3 0.1 e 30.6EnG 60.7 3.1 1.1 1.1 32.0BR 61.3 2.2 0.1 0.3 27.2PC 78.5 3.0 0.4 1.1 30.5GS 78.0 4.1 2.1 0.6 28.5
All samples showed a broad band with a maximum at about3430 cm�l and a shoulder at about 3150 cm�l assigned to differentOH stretching vibrations, indicating the presence of oxygen con-taining compounds. The bands at 2920 and 2850 cm�l, observed inall samples, were associated with methyl and methylene groupsstretching vibration. In the fingerprint region, the bands at 1580and 870 cm�l are assigned to aromatic C e C and aromatic C e H,respectively [27]. This band is more pronounced for EG, NS, EnG,and PC bio-chars and has lower intensity in the case of BR and GSbio-chars. The band at 1400 cm�l is assigned to C e H deformation.The remaining multiple bands in the range between 1400 and1100 cm�l, observed in all samples, are likely due to the aromaticring group frequencies. Olefinic C e H stretching vibration takesplace between 750 and 650 cm�l.
4. Conclusions
The thermal degradation of different types of biomass, namelyforestry e E. globulus sawdust, Norway spruce (P. abies) thermomechanical pulp; agricultural e energy grass, B. rapa, and by-products e pine cones, grape seeds, were investigated by ther-mogravimetric and analytical pyrolysis methods.
Pyrolysis can be used to differentiate various kinds of biomass.Differences in the pyrolysis behavior among the biomass sampleswere found. Pyrolysis of biomass gave polar oxygenated compoundscoming from carbohydrates and lignin components, these com-pounds being distributed between oil and aqueous phase. A widevariety of functional groups (i.e. acids, aldehydes, ketones, carbohy-drates, furans, aromatics) are present in the bio-oils. Forestry biomass(EG and NS) gives a higher amount of carboxylic acids, ketones, andfurans and a lower amount of phenols than agricultural biomass (Engand BR). The distribution of the compounds in the oils strongly de-pends on biomass source. Pyrolysis oils could be used as fuels or asraw materials to obtain resins, fertilizers, fine chemicals, etc. Inaddition, the calorific values for the studied bio-chars are almostsimilar and are in the limits for good solid biomass energy source.
Acknowledgments
The authors are grateful for the support received Marie CurieFP7 program, grant PIRSES GA e 2009 e 247550 BIOFUEL. Drd.Mihaela Balan is acknowledged for the assistance in the 1H NMRspectra interpretation.

E. P�arp�arit�a et al. / Polymer Degradation and Stability 100 (2014) 1e9 9
References
[1] Mosier N, Wyman C, Dale B, Elander R, Lee YY, Holtzapple M, et al. Features ofpromising technologies for pretreatment of lignocellulosic biomass. BioresourTechnol 2005;96(6):673e86.
[2] Wyman CE. Biomass ethanol: technical progress, opportunities, and com-mercial challenges. Annu Rev Energy Environ 1999;24:189e226.
[3] BERC-Biomass Energy Resources Center. Grass energy: basics of production,processing and combustion of grasses for energy. Available from: http://www.biomasscenter.org/resources/fact-sheets/grass-energy.html.
[4] Lowenstein MZ, editor. Energy applications of biomass. England: Elsevierapplied science publishers LTD; 2005.
[5] Grause G, Bruekens A, Sakata Y, Okuwaki A, Yoshioka T. Feedstock recycling ofwaste polymeric material. J Mater Cycles Waste Manag 2011;13(4):265e82.
[6] Brebu M, Ucar S, Vasile C, Yanik J. Co-pyrolysis of pine cone with syntheticpolymers. Fuel 2010;89(8):1911e8.
[7] Balabanovich AI, Luda MP, Operti L. GC/MS identification of pyrolysis productsfrom fire-retardant brominated epoxy resin. J Fire Sci 2005;23(3):227e45.
[8] Czégény Z, Jakab E, Blazsó M. Pyrolysis of wood, cellulose, lignin-brominatedepoxy oligomer flame retardant mixtures. J Anal Appl Pyrol 2012;103:52e9.
[9] Müller-Hagedorn M, Bockhorn H, Krebs L, Müller U. A comparative kineticstudy on the pyrolysis of three different wood species. J Anal Appl Pyrol2003;68-69:231e49.
[10] Ohra-aho T, Argyropoulos DS, Evtuguin DT. Characterization of lignin inSpruce TMP, eucalyptus chips and kraft pulp by analytical pyrolysis-GC/MS.In: 9th European Workshop for Lignocellulosics & Pulp, Vienna Austria,August 27th e 31st 2006.
[11] Vig A, Lele I, Lele M, Janowsk Z, Janowszky J. http://web.abo.fi/fak/tkf/spk/costfp0901/Espoo_2012/Vig.pdf. (last view 2013.10.18).
[12] Janowszky Z, Janowszky J, Lele I, Lele M, Nagy HJ, Rusznak I, et al. New annualHungarian plants (industrial grasses) as raw materials in the pulp and paperindustry. Papíripar 2012;56(4):3e7.
[13] Willfor S. Summary of results of WG3 on the joint analysis effort of eucalyptand spruce samples. In: Proceedings of the COST E41 meeting, Progress of the“COST Action E41 Joint Analysis effort” on Wood and Fiber Characterisation2006.
[14] Puls J. Summary of WG2 results. In: Proceedings of the COST E41 meeting,Progress of the “COST Action E41 Joint Analysis effort” on Wood and FiberCharacterisation 2006.
[15] de Jong E. Compositional characterisation of wood and pulps: summary WG1.In: Proceedings of the COST E41 meeting, Progress of the “COST Action E41Joint Analysis effort” on Wood and Fiber Characterisation 2006.
[16] Gunnar Grønli M, Varhegyi Gabor, Di Blasi Colomba. Thermogravimetricanalysis and devolatilization kinetics of Wood. Ind Eng Chem Res2002;41(17):4201e8.
[17] Abdullah SS, Yusup S, Ahmad MM, Ramli A, Ismail L. Thermogravimetry studyon pyrolysis of various lignocellulosic biomass for potential hydrogen pro-duction. Int J Chem Biol Eng 2010;3(3):137e41.
[18] Popescu C-M, Spiridon I, Tibirna CM, Vasile C. A thermogravimetric study ofstructural changes of lime wood (Tilia cordata Mill.) induced by exposure to
simulated accelerated UV/Vis-light. J Photochem Photobiol A Chem2011;217(1):207e12.
[19] Popescu C-M, Manoliu A, Lisa G, Gradinariu P, Vasile C. Thermal behavior ofbiodegraded lime wood. Carbohydr Res 2010;345(9):1149e55.
[20] Shebani AN, van Reenen AJ, Meincken M. The effect of wood extractives onthe thermal stability of different wood species. Thermochim Acta2008;471(1e2):43e50.
[21] Bridgwater AV. Review of fast pyrolysis of biomass and product upgrading.Biomass Bioenerg 2012;38:68e94.
[22] Ringer M, Putsche V, Scahill J. Large-scale pyrolysis oil production: a tech-nology assessment and economic analysis. November 2006 Available from:http://www.nrel.gov/docs/fy07osti/37779.pdf (last view 2013.10.18).
[23] Demirbas A. Mechanisms of liquefaction and pyrolysis reactions of biomass.Energy Convers Manage 2000;41(6):633e46.
[24] LuR, ShengG-P,HuY-Y, Zheng P, JiangH, TangY, et al. Fractional characterizationof a bio-oil derived from rice husk. Biomass Bioenergy 2011;35(1):671e8.
[25] Popescu M-C, Popescu C-M, Lisa G, Sakata Y. Evaluation of morphological andchemical aspects of different wood species by spectroscopy and thermalmethods. J Mol Struct 2011;988(1e3):65e72.
[26] Onay O, Kockar OM. Pyrolysis of rapeseed in a free fall reactor for productionof bio-oil. Fuel 2006;85(12e13):1921e8.
[27] Uzun BB, Apaydin-Varol E, Ates F, Özbay N, Pütün AE. Synthetic fuel pro-duction from tea waste: characterisation of bio-oil and bio-char. Fuel2010;89(1):176e84.
[28] Guillen MD, Manzanos MJ, Zabala L. Study of a commercial liquid smokeflavoring by means of gas chromatography/mass spectrometry and Fouriertransform infrared spectroscopy. J Agric Food Chem 1995;43(2):463e8.
[29] Popescu C-M, Popescu M-C, Vasile C. Characterization of fungal degraded limewood by FT-IR and 2D IR correlation spectroscopy. Microchem J 2010;95(2):377e87.
[30] Scholze B, Meier D. Characterization of the water-insoluble fraction frompyrolysis oil (pyrolytic lignin). Part I. PY-GC/MS, FTIR, and functional groups.J Anal Appl Pyrol 2001;60(1):41e54.
[31] Mullen CA, Strahan GD, Boateng AA. Characterization of various fast-pyrolysisbio-oils by NMR spectroscopy. Energ Fuels 2009;23(5):2707e18.
[32] Pindoria RV, Lim JY, Hawkes JE, Lazaro MJ, Herod AA, Kandiyoti R. Structuralcharacterization of biomass pyrolysis tars/oils from eucalyptus wood waste:effect of H2 pressure and sample configuration. Fuel 1997;76(11):1013e23.
[33] Brebu M, Spiridon I. Co-pyrolysis of LignoBoost� lignin with synthetic poly-mers. Polym Degrad Stabil 2012;97(11):2104e9.
[34] Mohan D, Pittman Jr CU, Steele PH. Pyrolysis of Wood/Biomass for bio-oil: acritical review. Energy Fuels 2006;20(3):848e89.
[35] Demirbas A, Demirbas MF. Importance of algae oil as a source of biodiesel.Energy Convers Manage 2011;52(1):163e70.
[36] Demirbas A. Biomass resource facilities and biomass conversion processing forfuels and chemicals. Energy Convers Manage 2001;42(11):1357e78.
[37] Vasile C, Brebu M. Thermal valorisation of biomass and of synthetic polymerwaste. Upgrading of pyrolysis oils. Cell Chem Technol 2006;40(7):489e512.
[38] Zhang Q, Chang J, Wang T, Xu Y. Review of biomass pyrolysis oil propertiesand upgrading research. Energy Convers Manage 2007;48(1):87e92.
Copyright © 2022 FDOKUMEN