Agro-Commodity Global Value Chains and Upgrading
213
Agro-Commodity Global Value Chains and Upgrading: The Case of Malaysian Palm Oil Yee Siong Tong Queens’ College University of Cambridge This dissertation is submitted for the degree of Doctor of Philosophy August 2018
-
Upload
khangminh22 -
Category
Documents
-
view
4 -
download
0
Transcript of Agro-Commodity Global Value Chains and Upgrading

Agro-Commodity Global Value Chains
and Upgrading:
The Case of Malaysian Palm Oil
Yee Siong Tong
Queens’ College
University of Cambridge
This dissertation is submitted for the degree of Doctor of Philosophy
August 2018

i
Agro-Commodity Global Value Chains and Upgrading: The Case of Malaysian Palm Oil
Yee Siong Tong
Summary
This dissertation consists of three closely related essays on upgrading in agro-commodity value
chains, which is an important issue for many developing countries that produce and export
commodities in mostly unprocessed form. The essays are based on fieldwork in Malaysia and
focus on its palm oil, which is the world’s largest oils and fats product by production and export
volumes.
The first essay examines the suitability of vertical specialisation for participation and upgrading
in agro-commodity value chains based on the case of Malaysian palm oil. It uses data from
interviews, site visits, and industry and economic statistics to analyse upgrading at the sector
and firm levels. The essay suggests that upgrading is prone to sectoral linkage development
and vertical integration at local lead firms. The development is driven by production
characteristics, sectoral dynamics, eco-historical settings that are unique to agro-commodity
value chains, as well as firm motives seeking resources, markets, efficiency gains, and strategic
assets.
The second essay studies Malaysia’s industrial policy for its palm oil sector through three
distinct stages of development. The findings show that resource-based industrialisation (RBI)
requires selective state intervention targeting macroeconomic conditions, infrastructure,
business climate, and human capital. The Malaysian experience also highlights the importance
of local firms in driving RBI investments, contrary to the emphasis in the literature which either
overplays the importance of foreign linkages or dismisses nationality of firms as a non-factor for
industrialisation.
The third essay investigates economic and social outcomes from upgrading in the Malaysian
palm oil sector using gross value added data. It shows that economic upgrading can but does
not automatically lead to social upgrading. The essay finds that economic upgrading in value
chains improves income of groups of individuals at different rates depending on their position in
the value chains. Skills and productivity performance provide only partial explanation for the
uneven social outcomes; the differences in institutional arrangements and political
representation accorded to the groups are likely to be important factors as well.

ii
For Ho-Yan and Our Parents

iii
Acknowledgements
My sincere gratitude goes to my advisor Peter Nolan for his continuous support of my doctoral
study and research, and for his patience, motivation, mentoring and immense knowledge. His
guidance helped me in all the time of research and writing of this dissertation.
I would also like to acknowledge the generous financial support from the Gates Cambridge
Trust, as well as institutional support from the Centre of Development Studies and Queens’
College at the University of Cambridge. I would like to thank Élise Lapaire, Doreen Woolfrey,
Nathalie Henry and Emma Cantu for their help. I thank Vasiliki Mavroeidi, Albert Hoon Park,
Terry van Gevelt, and my colleagues and friends at the Centre of Development Studies for the
stimulating discussions, the exchange of ideas, the sharing of knowledge and all the fun we had
in the last four years. The camaraderie forged was truly one of the greatest experiences in the
PhD journey.
I place on record my appreciation for the invaluable help I received for my fieldwork in Malaysia
from a number of individuals. Among them are Kalyana Sundram, Normala Majid, Yusof Basiron,
Norihan Husain and N. Balu at the Malaysian Palm Oil Council; M. Nagarajan at the Ministry of
Plantation Industries and Commodities; Choo Yuen May at the Malaysian Palm Oil Board; Lee
Yeow Chor at IOI Group; Lee Hau Hian at KLK, Tan Siok Choo at United Malacca; Mohd Haris
Mohd Arshad at Sime Darby Plantation; Edward Clayton at PwC's Strategy&; Khor Yu Leng at
LMC International; and others who wish to remain anonymous. I am indebted to Raphael
Kaplinsky, David Croft, Jonathan Smales, Neil Lacroix, Julia Tijaja, Gary Gereffi and Patrick
Low for our discussions that helped me think through my research during the early stage.
I am grateful for the feedback provided by the anonymous reviewers as well as Guy Robinson at
Land Use Policy. I would also like to thank my examiners, Ha-Joon Chang and Christopher
Cramer, for their extremely insightful comments.
I give special thanks to Ho-Yan Chan and our parents for their unceasing, unconditional and
tireless support throughout the writing of this dissertation and in life. Without them the
completion of this study would not have been possible.

iv
Contents
List of Tables ............................................................................................................................. vi
List of Figures ........................................................................................................................... viii
List of Abbreviations .................................................................................................................. ix
1 Resources, Industrialisation and Globalisation .................................................................... 1
1.1 Resources and Industrialisation .................................................................................... 2
1.2 Globalisation and Global Value Chains ........................................................................ 8
1.3 Malaysian Palm Oil in the World Oils and Fats Market ............................................... 16
1.4 Malaysian Palm Oil in the National Development Context .......................................... 22
1.5 Institutional Framework of the Malaysian Palm Oil Sector .......................................... 30
1.6 Structure of the Dissertation ....................................................................................... 37
2 Vertical Specialisation or Linkage Development in Agro-Commodity Value Chain Upgrading?
Evidence from the Malaysian Palm Oil Sector .......................................................................... 39
2.1 Introduction ................................................................................................................ 39
2.2 Vertical Specialisation and Value Chain Taxonomy .................................................... 40
2.3 Methods and Data ...................................................................................................... 43
2.4 Sectoral Upgrading ..................................................................................................... 43
2.5 Firm Upgrading .......................................................................................................... 59
2.6 Conclusion ................................................................................................................. 72
3 The Role of Ownership and Firm Innovation in Resource-Based Industrialisation: The
Malaysian Experience .............................................................................................................. 74
3.1 Introduction ................................................................................................................ 74
3.2 Industrialisation and Intervention ................................................................................ 75
3.3 Methods and Data ...................................................................................................... 78
3.4 Industrial Policy in Three Stages ................................................................................ 79
3.5 Firm Ownership .......................................................................................................... 90
3.6 Firm Innovation ........................................................................................................ 101
3.7 Conclusion ............................................................................................................... 106
4 Economic Upgrading for Whom? Distribution of Gains from Development of the Malaysian
Palm Oil Sector ...................................................................................................................... 109

v
4.1 Introduction .............................................................................................................. 109
4.2 Economic and Social Upgrading ............................................................................... 110
4.3 Methods and Data .................................................................................................... 113
4.4 Findings ................................................................................................................... 115
4.5 Discussion ................................................................................................................ 126
4.6 Conclusion ............................................................................................................... 134
5 Falling Behind, Keeping Up or Catching Up? ................................................................... 136
5.1 Upgrading in the Age of GVCs ................................................................................. 137
5.2 Conclusion ............................................................................................................... 141
Annexes ................................................................................................................................. 145
Annex 1: Semi-Structured Interview Questions ................................................................... 145
Annex 2: Explanatory Notes for Industry Reclassification and Aggregation ........................ 146
Annex 3: Products and Processes in Palm Oil Value Chains .............................................. 153
Annex 4: Explanatory Notes for Linkage Analysis ............................................................... 156
Annex 5: Backward and Forward Linkages and Coefficients of Variation of 36 Industries in
Malaysia, 1991-2010 .......................................................................................................... 158
Annex 6: Explanatory Notes for Derivation of Net Foreign Exchange Earnings................... 162
Annex 7: Market Capitalisation and Substantial Shareholders of 20 Largest Palm-Based
Firms, 2014/2015 ................................................................................................................ 163
Annex 8: A Brief History and Milestones of 20 Largest Palm-Based Firms ......................... 165
Annex 9: Palm Oil Industries with Corresponding Activity and Commodity Codes .............. 174
References ............................................................................................................................. 178

vi
List of Tables
Table 1.1. Characteristics, determinants and implications of governance for upgrading. .......... 13
Table 1.2. World production of major oils and fats, 1980-2014. ................................................ 17
Table 1.3. World exports of major oils and fats, 1980-2014. ..................................................... 17
Table 1.4. Major world palm oil producers, 1980-2014. ............................................................ 20
Table 1.5. Major world palm oil exporters, 1980-2014. ............................................................. 21
Table 1.6. Market share of Malaysian and Indonesian palm oil in key export markets, 2010 and
2014. ........................................................................................................................................ 21
Table 1.7. Output of 36 industries at basic prices, 1991-2010. ................................................. 23
Table 1.8. Ten major export products by export value, 2008-2015. .......................................... 24
Table 1.9. Indicators of openness of selected Asian economies. .............................................. 25
Table 1.10. Gross national income per capita of high growth economies. ................................. 25
Table 1.11. Policy concerns and directions for the palm oil sector, 1960s-2010s. ..................... 29
Table 1.12. Main actors in the palm oil sector. .......................................................................... 31
Table 1.13. Roles of the state as exercised through its formal institutional channels. ............... 34
Table 2.1. Products and segments in simplified palm oil value chains. ..................................... 44
Table 2.2. Malaysian PPO in the world PPO and processed oils market, 1971-1995................ 48
Table 2.3. Power and Sensitivity of Dispersion Indices for 36 industries, 1991-2010. ............... 50
Table 2.4. Net foreign exchange earnings of major exporting industries, 1991-2010. ............... 52
Table 2.5. Agricultural and manufacturing value added, 1995-2010. ........................................ 54
Table 2.6. 20 largest palm-based firms: Plantation hectarage, yield, revenue and ownership,
2014/2015. ............................................................................................................................... 59
Table 2.7. 20 largest palm-based firms: Level of vertical integration, 2014/2015. ..................... 61
Table 2.8. Key oleochemicals firms. ......................................................................................... 66
Table 2.9. Estimates of gross profit margins for selected palm oil products, 2014. ................... 68
Table 2.10. Transnational operations of integrated firms. ......................................................... 70
Table 3.1. Taxonomy of industrial policy ................................................................................... 79
Table 3.2. Selected policy measures during the factor-driven stage. ........................................ 81
Table 3.3. Selected policy measures during the investment-driven stage. ................................ 83
Table 3.4. Selected policy measures in transition to the innovation-driven stage. ..................... 89
Table 3.5. Statutory charges on the palm oil sector. ................................................................. 90
Table 3.6. Number and geographical distribution of firms in global palm oil value chains. ........ 91
Table 3.7. Position of local firms in global palm oil value chains. .............................................. 92
Table 3.8. Manufacturing and services investments in the palm oil sector, 2007-2015. ............ 97
Table 3.9. Import tariffs on crude and processed palm oil in selected advanced economies. .... 99
Table 3.10. R&D focus areas, objectives and outputs of MPOB. ............................................ 102
Table 3.11. Percentage of manufacturing firms engaged in innovation activities, 2011. .......... 104

vii
Table 3.12. Factors hampering innovation activities. .............................................................. 106
Table 4.1. Annual percentage change of gross value added, profits and employees’
compensation for palm oil industries (2000 prices), 2000-2010. ............................................. 116
Table 4.2. Number of workers in selected palm oil activities, 2008. ........................................ 123
Table 4.3. Job titles and skill classification in selected palm oil activities, 2008. ..................... 123
Table 4.4. Distribution of oil palm plantation workers by work category and nationality, 2008. 125
Table 4.5. Nationality of foreign workers in oil palm plantations, 2008. ................................... 125
Table 4.6. Common abusive practices against foreign workers. ............................................. 129
Table 5.1. The world’s largest agribusiness TNCs by foreign assets and sales, 2007. ........... 138
Table 5.2. Population and GDP in current prices at market exchange rates in developing
countries and the world, 1970-2010. ....................................................................................... 143
Table 5.3. GDP per capita in current prices at market exchange rates in developing world as
proportion of GDP per capita in industrialised countries, 1970-2010. ...................................... 143
Table 5.4. GDP and GDP per capita in current prices at purchasing power parity rates in the
world, developing countries and industrialised countries, 1980-2010. ..................................... 144

viii
List of Figures
Figure 1.1. Simplified production linkages in agriculture, agro-industry and agribusiness. .......... 7
Figure 1.2. The ‘make or buy, and where’ of production. .......................................................... 10
Figure 1.3. Major world producers, exporters and importers of oils and fats, 2014. .................. 19
Figure 1.4. Gross domestic product by economic activity at current prices, 1965-2010. ........... 22
Figure 1.5. Agricultural land under major crops, 1980-2013. ..................................................... 28
Figure 1.6. Palm plantation hectarage by producer type, 1980-2014. ....................................... 31
Figure 2.1. CPO and CPKO yields, 1975-2014. ........................................................................ 45
Figure 2.2. Palm oil and palm-based product exports, 1960-2014. ........................................... 48
Figure 2.3. Malaysia within global palm oil value chains. .......................................................... 72
Figure 4.1. Economic and social outcomes in GVCs. ............................................................. 111
Figure 4.2. GVA as a percentage of output (GVA share) in palm oil industries, 2000-2010. ... 117
Figure 4.3. Capital shares in palm oil industries, 2000-2010. .................................................. 119
Figure 4.4. Labour shares in palm oil industries, 2000-2010. .................................................. 119
Figure 4.5. Percentage point change of GVA and labour shares in palm oil industries, 2000-
2010. ...................................................................................................................................... 121
Figure 4.6. Poverty rate by ethnic groups, 1970-2012. ........................................................... 127
Figure 4.7. Population and poverty rate, 1970-2012. .............................................................. 127

ix
List of Abbreviations
ADM Archer Daniels Midland
BPA Bilateral payment arrangement
CPKO Crude palm kernel oil
CPO Crude palm oil
CPOPC Council of Palm Oil Producer Countries
CSPO Certified sustainable palm oil
DOA Department of Agriculture
DOS Department of Statistics
ECR Export credit refinancing
EOI Export-oriented industrialisation
EPF Employees Provident Fund
EPU Economic Planning Unit
ETP Economic Transformation Programme
EU European Union
FAO Food and Agriculture Organisation of the United Nations
FCPO Crude Palm Oil Futures
FDI Foreign direct investment
Felcra Federal Land Consolidation and Rehabilitation Authority
Felda Federal Land Development Authority
FFB Fresh fruit bunches
FGV Felda Global Ventures
G2G Government-to-government
GAP Good Agriculture Practice
GATT General Agreement on Tariffs and Trade
GDP Gross domestic product
GNI Gross national income
GRI Government research institute
GSP Generalised System of Preferences
GVA Gross value added
GVC Global value chain
IMP Industrial Master Plan
ISI Import substitution industrialisation
KPF Felda Investment Cooperative (Koperasi Permodalan Felda Malaysia)
KWAP Retirement Fund Incorporated (Kumpulan Wang Persaraan)
LTAT Armed Forces Fund Board (Lembaga Tabung Angkatan Tentera)
LTH Pilgrims Fund Board (Lembaga Tabung Haji)
M&As Mergers and acquisitions
MARDI Malaysian Agricultural Research and Development Institute
MATRADE Malaysia External Trade Development Corporation
x
MIDA Malaysian Industrial Development Authority
MIMOS Malaysian Institute of Microelectronic Systems
MITI Ministry of International Trade and Industry
MOF Ministry of Finance
MPIC Ministry of Plantation Industries and Commodities
MPOB Malaysian Palm Oil Board
MPOC Malaysian Palm Oil Council
MYR Malaysian Ringgit
NEP New Economic Policy
OBM Original brand manufacturing
ODI Outward direct investment
ODM Original design manufacturing
OECD Organisation for Economic Cooperation and Development
OEM Original equipment manufacturing
OPGL Oil Palm Genetics Laboratory
OPP Outline Perspective Plan
PKC Palm kernel cake
PNB National Equity Corporation (Permodalan Nasional Bhd)
POCPA Palm Oil Credit and Payment Arrangement
PORIM Palm Oil Research Institute of Malaysia
PORLA Palm Oil Registration and Licensing Authority
PPKO Processed palm kernel oil
PPO Processed palm oil
PPP Purchasing power parity
R&D Research and development
RBD Refined, bleached, deodorised
RBI Resource-based industrialisation
RISDA Rubber Industry Smallholder Development Authority
RSPO Roundtable on Sustainable Palm Oil
SAP Structural adjustment programme
SME Small and medium sized enterprise
SPOC Sustainable Palm Oil Cluster
TNC Transnational corporation
UMNO United Malays National Organisation
UNCTAD United Nations Conference on Trade and Development
UNDP United Nations Development Programme
UNESCO United Nations Educational, Scientific and Cultural Organisation
UPM Universiti Putra Malaysia
WTO World Trade Organisation
WWF World Wide Fund for Nature

1
1 Resources, Industrialisation and Globalisation
Interest in agriculture and agribusiness tends to ebb and flow over time. Before the publication
of World Development Report 2008: Agriculture for Development, the last report by the World
Bank that focused on agriculture was published in 1982. Throughout the decades of the 1980s
and 1990s, agriculture was considered a sunset industry. Since the turn of the millennium,
agriculture and agribusiness have received revived interest on account of several developments,
including the more immediate commodity booms and food price crises.
The resurgence of agriculture as a development agenda in part reflects its relevance to key
aspects of development ranging from structural transformation, employment, poverty reduction,
rural development, food security and nutrition intake (see, for example, Ghatak and Ingersent
(1984); Ishikawa (1978); Johnston and Mellor (1961); Southworth and Johnston (1967); Timmer
(1991)). Historically, countries that modernised their agriculture and built agro-industries out of it
performed better on the Human Development Index than those who did not (Wilkinson & Rocha,
2009).
It is also fuelled by a new understanding of the sector’s production linkages to manufacturing
and services that are effected through evolving supply chains, which are increasingly
characterised by groups of firms undertaking geographically dispersed activities in vertically
fragmented yet functionally coordinated production networks (Abonyi, 2005; Dicken, 2011). The
organising framework known as global value chains (GVCs) has spread to wide-ranging
industries such as garments, automobiles/ automotive parts, consumer electronics,
telecommunications and even services (UNCTAD, 2002, 2013).
Improving the terms of participation in agro-commodity value chains through upgrading will
benefit developing countries. Most of these countries still derive substantial export incomes from
commodities. In addition, three out of every four persons in developing countries live in rural
areas and rely on agriculture for livelihood (UNCTAD, 2015; World Bank, 2007). The impetus for
upgrading is even greater for economies with lower income levels: of the 49 Sub Saharan
African economies, 11 rely on a single commodity for 50% of their export earnings and nearly
three-quarters rely on three commodities for half or more of export earnings (Taylor, 2016). The
dissertation is based on research and analysis from the perspective of developing countries and
their firms, using the case of the Malaysian palm oil sector from the 1960s to the present.

2
1.1 Resources and Industrialisation
Industrialisation refers to the sustained structural transformation of a traditional economy into a
modern economy, in which manufacturing plays a significant role in total activity (Szirmai,
Naude and Alcorta, 2013; Weiss, 2011). Economic growth increases national income and
wealth, and industrialisation is an important growth engine. Manufacturing is recognised for
having higher productivity level and growth potential as well as offering greater linkage
possibilities to other parts of the economy than agriculture and services. Manufacturing also
offers the greatest potential for expansion via exports since goods are highly tradeable (Weiss
and Jalilian 2016). Economic gains from industrialisation and growth are important for – though
by no means an automatic process – reducing poverty, solving social problems, and improving
the well-being of the population. Clear evidence exists for a strong positive connection between
industrialisation and human development measured along the dimensions of poverty/ equality,
education and health (see, for example, Upadhyaya and Kepllinger, 2014).
The exact threshold at which an economy is said to have industrialised is open to debate but
most agree that economies broadly share some economic characteristics before and after
industrialisation. Economies before industrialisation typically have low output per head, a fairly
large agricultural sector, and rely more on unskilled labour in production. Industrialised
economies have higher outputs on increased efficiency and productivity per head, a relatively
large manufacturing sector, and use new technology and more capital in production. Beyond
these common traits, the paths to industrialisation show considerable divergences, depending
on countries’ initial conditions and the era during which industrialisation took place (Pollard
1990).
Britain is recognised as the first country that successfully industrialised in the mid-18th century
beginning with specialisation, division of labour, and innovations in cotton textiles. Technical
progress characterised by the improvement of the Newcomen steam engine took place over the
next several decades. Firm profits were reinvested, while machines were incorporated into
production on a wide scale. In the early 19th century, European industrial followers similarly
concentrated on productive investment but relied more on banks and focused on different
products (coal mining and textiles for Belgium; fine silk, embroidery and watch-making for
Switzerland; and luxury goods requiring artisanal skills for France). The US followed a radically
different path towards industrialisation by focusing on primary exports (World Bank, 1987;
Szirmai, Naude and Alcorta, 2013; Weiss, 2011). From the late 19th century, the latecomers –
Germany, Russia and Japan – industrialised by making use of the modern technologies
developed in the leading industrial economies in what Gerschenkron (1979) refers to as the

3
“advantages of backwardness”. In Japan – and later in Korea and Taiwan in the 20th century –
the government invested in infrastructure and industries. Japan and Korea also created large
conglomerate national firms in strategic sectors to drive industrial development; while Taiwan
relied more on the small and medium-scale private sector. Industrialisation subsided since the
beginning of the 20th century and resumed unevenly post-war. East Asia rapidly industrialised
while Latin America and Sub-Saharan Africa showed little change or even signs of
deindustrialisation.
Clearly, the state played a more active role in late industrialisation than in early industrialisation.
However, the debate on industrial strategy for the contemporary world remains unresolved.
Disagreements exist in relation to several aspects: 1) the treatment of foreign trade (‘open’
versus ‘closed’ trade policy, particularly the use of import taxes and trade restrictions to protect
domestic industry); 2) the degree to which foreign investment should be relied upon for
technology and funding for industrial projects (‘dependent’ versus ‘independent’ policies); 3) the
relative role attributed to the market or state planning in industrial development (price
mechanisms to allocate resources between firms, versus the use of price and non-price controls
to influence resources allocation); and 4) the extent to which technology used should reflect a
country’s comparative advantage and/ or be created indigenously (Weiss 2002, 2011).
While industrialisation rightly concentrates on the augmentation of manufacturing base, it was
often misinterpreted to mean that non-manufacturing sectors are unimportant. This reflects a
poor understanding of production linkages between manufacturing industries and non-
manufacturing activities. With the notable exception of RBI, the development literature is replete
with misgivings about the role of natural and agricultural resources in industrial development, on
account of at least six strands of argument. First, resource-based activities benefit foreign
capital, with minimal spillovers to those in the immediate vicinity of the activities (the enclave
theory) (Singer, 1950; Humphreys et al., 2007; McMillan & Rodrik, 2011). Second, real
exchange-rate appreciation and domestic inflation reduce competitiveness of manufactured
exports, investments in non-resource export sectors and long-term growth (the ‘Dutch Disease’)
(Corden & Neary, 1982; Gylfason et al., 1999; Sachs & Warner, 2001). Third, resource-
abundant countries’ dependence on commodity exports constrains the incentive for industrial
development, as was the case with Canada (where the ‘Staples Trap’ theory was developed)
(Watkins, 1963; Innis, 1933; North, 1955). Fourth, decreasing relative prices of commodities to
manufactured goods and slow rate of technical progress in the primary sector cause developing
countries to lag behind the industrialised world (the Prebisch-Singer hypothesis) (Prebisch,
1950; Singer, 1950). Fifth, a common misinterpretation of structural change that agriculture is
unimportant, since the share of manufacturing in output and labour force rises as the

4
agricultural share declines during economic growth (Kuznets, 1966; Timmer, 1991; Kaldor, 1967;
Chenery et al., 1986). Lastly, potential gains from resource abundance are offset by social
conflict, violence, institutional weaknesses, rent-seeking and corruption (Easterly & Levine,
1997; Tornell & Lane, 1999; Mehlum et al., 2006).
Agriculture or Agribusiness? The Missing Production Linkages
The debate on whether resource-intensive sectors can provide a base for industrial
development concerns two dimensions: the potential of production linkages, and the
technological and knowledge content in these linkages.
Empirical inquiry into linkage effects of resource-intensive sectors, typically by applying input-
output analysis to specific locations and ventures, has produced mixed results. Stilwell et al.
(2000) estimate that linkages between mining and the rest of the economy are minimal in South
Africa. San Cristóbal and Biezma (2006) find that only three subsectors in EU mining and
quarrying are key sectors in that they are more stimulated by overall industry growth and have
greater impacts in terms of investment expenditures on the national economy than other sectors.
Other studies suggest that linkage effects in resource-intensive sectors are not inherently and
can in fact be substantial. Alrawashdeh and Thyabat (2012) show that mining has a strong
forward and backward linkage to the Jordanian economy, and that five sub-sectors are
considered as key sectors. Morris et al. (2012) show that in a number of cases in Sub-Saharan
countries, backward and forward linkages – and even lateral linkages (segments within a value
chain that feed into other value chains, e.g. logging equipment originally designed for the timber
sector being modified for use in sugarcane production) – have developed in varying degrees
around diverse mining and agricultural industries.1
The second aspect of the resource debate is the technological and knowledge intensity in the
production linkages. Resource-intensive sectors are seen as unable to provide firms in
developing countries with technologies and knowledge, either foreign or indigenous, to innovate
and industrialise. For example, the widely used Pavitt’s taxonomy of sectors characterises
agriculture and traditional sectors (resource-intensive sectors presumably included) as supplier-
1 For example, Gabon’s timber industry has evolved beyond logging and integrated processing
functions to make higher value-added sawn wood, veneer sheets and plywood. Zambia’s copper mining
has expanded downstream into manufacturing of semi-frabricates (albeit undertaken by a US processing
conglomerate and a Chinese state-owned enterprise), with substantial backward linkages in the form of
many local suppliers for mining activities.

5
dominated, and having a low intensity of technology driven by large suppliers of machinery,
materials and inputs (Pavitt, 1990).
However, as with supposedly weak linkage effects, technological backwardness in activities
based on resources is not a given. As Lederman and Maloney (2006) put it:
It is each country’s choice either to exploit their natural resources with outdated
technologies or enclave production systems, or to invest in related skills in transfer,
adaptation, and creation of more productive technologies and in the setting of
adequate institutions for the efficient and sustainable use of natural resources and
of the public revenues associated with oil and mineral activities. When natural
resource-rich societies take appropriate complementary policies, they indeed
become very rich and grow fast; when they don’t, they can certainly waste the
great development opportunities that nature holds out for them. It is perplexing that
modern agriculture, forestry, and fisheries based on transgenetics and
biotechnology, as well as modern oil and mineral exploration and production based
on major scientific and technological advances in geology and other earth sciences
are still routinely classified as ‘low-technology’ activities by most of our fellow
economists.
Empirically, Martin and Mitra (2001) use a panel data set for 50 countries over the 1967-1992
period and find that at all levels of development, technical progress as measured by total factor
productivity grew 50% faster in agriculture than in manufacturing, suggesting rapid
dissemination of innovations. Kuramoto and Sagasti (2006) find that the gold mining industry in
Peru innovated in bioremediation technologies with applications outside mining for any pollution
that is generated by industrial, agriculture or waste management activities.
Agriculture has distinct common technological and socio-economic characteristics, even though
agricultural production is highly heterogeneous and varies by produce and location (Colman &
Young, 1989; Corsi, 2002; Cramer et al., 2001; Fox & Johnson, 1970). Technologically, (1)
agriculture has a tight link to land, which is a scarce and non-producible factor; (2) it involves a
lengthy production process that has low reversibility; (3) its production remains an intensely
local process, bound to specific climatic and soil conditions; (4) it is grounded in biophysical
processes and is more susceptible than other sectors to biological cycles and natural factors,
both of which have difficult to control; and (5) due to the perishable nature of certain agricultural
produce, there is also a greater emphasis on freshness and agility in the logistics system.
Several implications arise. First, agriculture has a high degree of asset fixity, where farmers find

6
it difficult to dispose of their capital equipment in the event of downsizing or closure. In the event
of asset disposal, asset values are quite low relative to their purchases price so farmer end up
owing more on purchase loans than assets are worth in the used equipment markets. Second,
agriculture has a high degree of seasonality. Regular changes recur throughout the year,
resulting in unevenness in resource requirements as well as output flows. Third, standardisation
is relatively difficult in agricultural product. Fourth, risks and uncertainty are inherent and more
difficult to control for in the production stages.
In most countries, the majority of agricultural output volume and workforce composition involves
small, family-operated farms due to the lack of economies of scale and lower supervision costs
of waged labour. These farming households are common in rural or suburban areas, providing a
historical link between agriculture and rural development (Ellis & Biggs, 2001). The coexistence
of informal and formal sectors is notable. In agricultural production for most countries, large-
scale, industrial firms’ involvement is relatively less than what is observed in other sectors,
although this is fast changing. This culminates in relatively less market concentration and power
in agricultural production for large-scale, industrial firms, which are nonetheless more
concentrated outside direct agricultural production and have a stronger presence in the post-
harvest food and non-food processing and marketing segments. As a consequence, agricultural
production is usually highly fragmented and many costs are implicit, as with the case of family
labour. Individual farmers have little market power, and are exposed to high risks of income
fluctuations arising from volatile agro-commodity prices. The key factors used for agricultural
production – labour, land, and water – are also less mobile (than factors used in industrial
production), making any adjustment for other productive purposes within farm sectors slow.
With economic development, the share of agriculture as a percentage of a country’s gross
domestic product (GDP) tends to decline (Chenery & Syrquin, 1975; Kuznets, 1971). This is
based on Engel’s Law that the proportion of income spent on food tends to fall even if actual
spending on food increases in absolute terms (Timmer, Falcon, & Pearson, 1983).
Notwithstanding varied income elasticities for different food types,2 as income expands,
consumer demand for food rises at a slower pace than demand for manufactured consumer
2 Inferior goods such as potatoes have a negative income elasticity, meaning an increase in
income will lead to a fall in the demand because consumers switch to better substitutes. Normal goods
such as animal protein are associated with positive income elasticity, where an increase in income will
lead to a rise in demand. A normal good is considered a necessity good if its income elasticity of demand
is less than 1, and a luxury or superior good if is income elasticity of demand is greater than 1. Sticky
goods have a zero income elasticity of demand because an increase in income is not associated with any
change in its demand.

7
goods and later on, services. This results in structural transformation of economies, where an
expansion of the industrial/ manufacturing sector alongside national income growth is observed
along an inverted U-shaped curve, before the share of industry, too, declines, giving way to the
growing services sector. This often masks the continued importance of agriculture to economic
development. An extended definition of agriculture to focus on agribusiness highlights the
importance of production linkages along agro-commodity value chains and their full potential for
industrialisation and economic growth (Figure 1.1).
Agriculture
Agro-industry
Agribusiness
Value Chain Links
Inputs Production Trading Handling,
packing, and storage
Processing Distribution and
marketing
Function
Produce and distribute the goods and services that producers buy as part of their business activities
Produce raw food, fiber and other agricultural products
Trade agricultural products and coordinate production and delivery at times
Provide services to preserve, store and transport agricultural products
Convert raw agricultural products into intermediate and finished products (food and non-food)
Distribute food and non-food products to the final consumer when and where the consumer wants it
Figure 1.1. Simplified production linkages in agriculture, agro-industry and agribusiness.
Agriculture is systematic primary production of plants and animals for use as food, feed, fibre,
fuel, and other outputs. Agro-industry describes a subset of manufacturing industries where
value is added to agricultural raw materials through processing and handling operations (Da
Silva & Baker, 2009). Agribusiness includes but extends beyond the farm gate to cover a range
of pre- and post-harvest activities involved in the production, transformation, preservation and
preparation of agricultural production for intermediary or final consumption (Henson & Cranfield,
2009). Such differences are not merely a terminology issue. For instance, agriculture is one of
the smallest sectors in the US, producing 2% of national output and directly employing 3% of
the employed labour force. Once agricultural input industries, services, processing and
marketing, wholesale and retail establishments are taken into consideration, the agribusiness
complex employs nearly 21.6 million jobs or 15.8% of total employment in the United States,
and accounts for 14% of the nation’s GDP (Cramer et al., 2001). The case for agribusiness
development is even more pressing for developing countries because their food system,
including the production of primary goods and commodities, marketing and retailing, would
account for more than 50% of their GDP (Jaffee et al., 2003). This ratio may be understated
given the prevalence of the informal sector in these countries.
Historically, resource-abundant economies of new Western European settlement and of Latin
America expanded rapidly at the end of the 19th century; and resource-rich countries grew faster

8
from 1913 to 1950 than the then-industrialised countries (Auty, 1998; Maddison, 1995). Using
estimation techniques different from those of Sachs and Warner (2001), Lederman and Maloney
(2006) find that natural resource abundance appears to be even positively related to countries’
economic growth between 1975 and 1999 and that export revenue concentration, rather than
natural resources, reduces growth.
In the US, collective learning as well as returns on large-scale investments in exploration,
transportation, geological knowledge and mining-related technologies turned the country into a
leader in production of a wide range of minerals (Wright & Czelusta, 2004). Similarly, once
suppliers of simple intermediate products to more advanced economies in Western Europe,
Sweden and Finland upgraded the technological level of their raw material-based industries
(timber and iron ore) and use them as a foundation for diversification into machinery,
engineering products, transport equipment, and various types of services since around the
middle of the 19th century (Blomström & Kokko, 2003). In the two Nordic economies, industries
based on domestic raw materials still account for a significant share of manufacturing activity
(the forest and metal industries together employ one-fifth of Sweden’s industrial labour and
supply about a quarter of total Swedish exports – in Finland, the corresponding shares are even
higher). This implies that raw material based production is not merely a temporary stage in
economic development but can instead be a sustainable element of an advanced industrial
structure. Importantly, the rapid change in industrial structure in both Sweden and Finland
occurred since the early 1990s, when they developed information and communications
technology and other knowledge-intensive manufacturing and services. At present,
industrialised countries process 98% of their agricultural products with a value added of US$185
per tonne and minimal post-harvest losses; compared with 38% processed, US$38 in value
added and 40% losses for developing countries (UNIDO, 2009).
1.2 Globalisation and Global Value Chains
Industrialisation has always been shaped by the wider external economic environment in which
the process takes place. One distinct feature that differentiates the current era of
industrialisation compared with its predecessors is international fragmentation of production
across firms and borders, often referred to GVCs.
The previous dominant paradigm for industrial organisation was the modern corporation, based
on the multidivisional and multinational enterprises that emerged in the US between the 1840s
and 1920s. A modern corporation is posited to accumulate more upstream and downstream
functions formerly mediated by the market within the boundaries of the firm (leading to

9
decreased variable costs and increased fixed costs), giving rise to vertical integration. Chandler
(2002, 2003) argues that given their hierarchical internal organisation and large size, such
corporations enjoy lower transaction costs because of routinised intra-firm interactions; higher
accuracy of price and supply information; and better coordination of inputs and outputs, leading
to more efficient utilisation of productive apparatuses and increased throughput. The thinking
was influenced by the transaction cost approach pioneered by Coase (1937). While market and
price mechanisms work well between firms, economic relationships between autonomous actors
incur costs in search and information; bargaining; as well as policing and enforcement. Firms
thus exist not because markets fail to produce the efficient outcomes but because in some
cases, transactions operate more efficiently inside the firm. Williamson (1975, 1981) challenges
Coase’s view that the market is always efficient. “Opportunism” among contracting parties leads
to uncertainty, complexity, bounded rationality, incomplete contracts and hold-up problem.
These problems incur transaction costs (i.e. the costs of developing and monitoring exchange
contracts) and lead to market inefficiency. Firms thus exist as hierarchies that exercise power
over economic actors to mitigate transaction costs (conceptualised differently from Coase’s
version) and opportunistic behaviour.
Since the late 1970s, firms in advanced economies evolved in a way that defies Chandler’s
logic. During the global business revolution, aided by trade liberalisation and technological
advances, firms from the Global North redefined their core competencies and became vertically
specialised, shedding the activities and functions in the value chains that they can purchase
from others, leading to an increase in vertical trade (Nolan, 2001; Nolan et al, 2008; Feenstra,
1998). Almost 60% of global trade at present is in intermediates, which are goods used as
inputs in a further production process. The import content of exports was 20% in 1990, rose to
40% in 2010 and is expected to rise to around 60% by 2030 (Lamy, 2013).
As large firms from advanced economies consolidated their core business and improved their
market position through massive mergers and acquisitions (M&As), they grew in size. Their
influence and power also increased as the extent of conscious coordination and planning
surrounding the value chains increased in a wide range of industries, and led to the emergence
of core “systems integrator firms” and “external firms” with which they have no equity links
(Nolan, 1999, 2001).3 Functional integration of internationally dispersed activities across
3 Similarly, Ruigrok and van Tulder (1995) describe the new form of organisation that arises from
international business restructuring as an “industrial complex”, which they see as a bargaining arena
involving internal and external actors. The primary internal actors are the core firm, “which is the spider in
the industrial web and which is best positioned to manage the dependencies in the industrial complex”,
and the supplying firms, workers and dealers. The external actors include governments and financiers.

10
multiple firms, with powerful transnational corporations (TNCs) occupying the commanding
heights of various value chains for coordination purposes, differentiates the latest wave of
‘globalisation’ from the previous ones which reflected simple geographic spread of economic
activities across national boundaries (Dicken, 2011). This gives rise to the concept of GVC,
represented by the greyed quadrant in Figure 1.2, and has become a rich site for GVC research.
Location (Spatial)
Local International/ Offshoring
Organisation (Functional)
Within Firm (Hierarchical)
Domestic, in-house supply
Onshoring (production at domestic locations with cheaper costs)
Domestic direct investment
Vertical/ horizontal integration
International insourcing (activities contracted to foreign subsidiaries/ affiliates)
Foreign direct investment
Vertical/ horizontal integration
Outside Firm/ Outsourcing (Arms-length and quasi-hierarchical)
Domestic outsourcing
Vertical/ horizontal specialisation
International outsourcing (activities contracted to ‘independent’ third parties abroad
Vertical/ horizontal specialisation
Figure 1.2. The ‘make or buy, and where’ of production.
While fragmentation of production is not without limits and is more applicable to some industries
than others (De Backer & Miroudot, 2012), the production process is increasingly getting sliced
up into smaller segments in a complex way previously not possible. The emergence of GVCs
has made production more services-intensive. However, because services inputs do not break
down easily into the existing product classification and nomenclature systems, the role of
services is often underestimated and poorly understood even as efforts to improve analytical
and statistical measures of services have begun to intensify (Low, 2013).4
GVC as a form of industrial organisation has fuelled concern but also cautious optimism about
benefits of GVC participation. Latecomer firms from developing countries are faced with two
competitive disadvantages: they are dislocated from the main international sources of
technology and R&D, and they are dislocated from the mainstream international markets that
they wish to supply to (Hobday, 1995). Through GVCs, they can have better access to
international product and input markets as well as technologies and knowledge, and acquire
4 Low (2013) notes that the share of cross-border services transactions in international trade was
estimated at just over one fifth of total trade in 2012 but the recent OECD/WTO work on measuring trade
in terms of the value-added to products by different countries along supply chains, rather than in gross
terms, has yielded a dramatically different picture. In 2008, for example, the share of commercial services
in world trade was estimated at 23% in gross terms and 45% in value-added terms.

11
new capabilities to be more efficient and productive. However, power and capability asymmetry
within actively managed value chains also complicates performance and prospects of a great
number of developing-country firms which are connected to lead firms through multi-tiered
supplier networks.
Upgrading
Understandably, upgrading has been an important issue in GVC research and policy. In a
narrow sense, upgrading means acquiring the skills, competences and supporting services to
raise productivity and to capture higher value-added. More broadly, upgrading is about actively
and purposefully changing the way firms are linked to GVCs.
Sources of capabilities for upgrading have been extensively explored in the GVC literature and
elsewhere, with some overlaps. The first approach highlights the importance of development
agencies and donors as well as non-governmental organisations. These entities have been
especially important in agribusiness value chains, where the agencies and organisations
typically target smallholder farmers and small agro-enterprises through measures such as rural
infrastructure development, agricultural extension services, training and technical support
(Jaffee et al., 2003). The second is the theory of agglomeration in the Marshallian sense in
economic geography and business studies. It addresses domestic transfers and linkages within
clusters or industrial districts made up of a critical mass of firms performing interconnected
activities. Firms reap collective efficiency through external economies of scale and joint actions
(Krugman & Venables, 1995; Markusen, 1996; Porter, 1996). The third is innovation systems in
which generation, application and diffusion of knowledge occur through interactions between
private and public institutions and actors within sectoral, regional or national settings (Freeman,
1995; Lundvall, 2012; Nelson, 1994). Firms, personnel and industry groups are important
network elements; as are public institutions (e.g. universities and research laboratories) and
state policies (e.g. training, funding and technical assistance).
For the GVC framework, foreign linkages in export-oriented value chains can be an important
source of capabilities for upgrading. This is a marked departure from the early view inspired by
dependency theory that developing countries will be harmed by their reliance on foreign direct
investment, which may involve significant equity stake (with ownership control or effective
management decision power in foreign enterprises) or non-equity forms of cross-border

12
investment modalities (licensing, leasing, franchising, start-up and international production
sharing agreements).5
Some consensus has emerged more recently around a more benign view that FDI can be an
important bundle of resources and assets for capital accumulation and productivity gains. The
resources are: 1) more stable financial capital (FDI inflows are less footloose than initially
thought because they are for long-term projects, unlike short-term portfolio investments for fast
returns); 2) modern technologies that may otherwise be unavailable without FDI; 3) access to
export markets (which allows technological learning, realisation of scale economies, competitive
stimulus and market intelligence); and 4) transfer and spillover of skills, organisational practices
and management techniques (UNCTAD, 1999). Such benefits are not without a caveat. The
UNCTAD report, led by Sanjaya Lall, cautions that simply opening up to FDI was not the best
policy stance since some investments “may lead to static gains, but not necessarily to dynamic
ones” and therefore “do not substitute for domestic effort” (ibid).
Within GVCs, local firms may learn from foreign lead firms through two main channels: active
transfers and ‘unintended’ knowledge leakage (Fu et al., 2011; Saliola & Zanfei, 2009).
Upgrading effects are most significant for local firms new to global markets (Dolan & Humphrey,
2000; Gereffi, 1999; Keesing & Lall, 1992). But upgrading is not a given. The extent of active
support for upgrading by the lead firm or the global buyer is closely linked to how a value chain
is governed, namely how parameters for the processes are established, monitored and
enforced. Upgrading targeted by local firms may in fact be hindered were it to encroach on the
global buyers’ or lead firms’ core competence (Humphrey & Schmitz, 2002; Schmitz &
Knorringa, 2000). Studies have attempted to map the characteristics and determinants of
governance and how different types of governance, in turn, affect upgrading possibilities (Table
1.1. See, for example, Gereffi et al., (2005); Milberg (2004); Pietrobelli and Rabellotti (2011)).
As governance moves towards hierarchical control, the level and impact of active support from
lead firms increases, especially in product and process upgrading. In comparison, support for
5 In world systems theory best associated with Wallerstein (2011), TNCs as agents of core
economies draw upon resources from semi-peripheral and peripheral economies, leaving the latter in a
perpetual state of under-development. Rather than contribute to local financial capital, TNCs extract
financial capital out of host countries through transfer pricing and profit repatriation (Moran, 1998; Fry,
1983). FDI can serve as the vehicle through which TNCs dominate host countries’ markets, create
technology dependence and stifle local competition (Evans, 1979). Additionally, footloose FDI increases
the power of TNCs vis-à-vis host country governments and leads to interference in local politics and
policy (Apter, 1976; Fry, 1983).

13
functional upgrading is negative or at best neutral across all governance patterns. Functional
upgrading is still possible but only if lead firms decide to vacate certain spaces, and if the
suppliers demonstrate their capabilities and can make the required investments. For lead firms,
governance is necessary for managing various risks inherent in value chain production (supplier
failure, performance, conformance and price risks). Hence governance evolves as risk profiles
change.
Although lead firms often hold considerable power over other firms in the value chains,
governance is not a one-way, top-down interaction. It is inaccurate to assume that suppliers
have no leverage for bargaining in their interactions with lead firms. First, switching costs for
lead firms are potentially high, especially if there is a limited pool of alternative suppliers.
Second, the very basic function of a value chain is to ensure the smooth running of repetitive
linkage interactions and to enable risk-sharing among firms. It is therefore in the mutual interest
of firms to maintain their relationships, even as they continuously find ways to avoid over-
dependence on each other. Third, the specification and enforcement of parameters incur costs
from monitoring, inspection and control. Parameters concern what is to be produced (product
standards), how it is to be produced (process standards), at what price it is to be produced
(cost), and how much is to be produced and delivered by when (delivery and logistics)
(Humphrey and Schmitz, 2001). Trust and reliability can minimise enforcement costs.
Table 1.1. Characteristics, determinants and implications of governance for upgrading.
Arms’ length relationships (Market transactions)
Quasi-hierarchical modes (Modular, Relational, Captive)
Hierarchy/ intra-firm trade (Foreign direct investment)
Characteristics
Degree of explicit coordination and power asymmetry
Low Moderate to high High
Type of goods flow
Inter-firm trade Inter-firm trade Intra-firm trade
Product characteristic
Low design and specification requirement
Standard, non-differentiated
Non-durables
Low technological requirement
High design and process specification
Non-durables
High technological and design requirement
Quality-based differentiation
Durables
Industry example
Natural resource-based (sugar, tobacco, wine, fruits, vegetables, minerals)
Specialised products and traditional manufacturing (textile, garments, footwear, chemicals, basic equipment)
Complex products (automobile and auto components, aircraft, consumer electronics)
Typical lead firm/ buyer type
Volume traders/ processors
Retailers
Brand owners
Retailers
Producers (makers)
Typical supplier location
Low-income developing countries
Low- and middle-income developing countries
Middle-income developing countries and high-income developed countries

14
Determinants
Complexity of transactions
Low Moderate to high High
Ability to codify transactions
High Moderate to high Low
Capabilities in the supply base
High Moderate Low
Appropriability of knowledge
Low Low Medium to high
Barriers to entry Low to high (land use can be politically sensitive)
Low High
Implications for Upgrading
Active buyer-supplier transfer of technology
Unlikely Likely Necessary
Suppliers’ learning mechanisms
Knowledge spillovers
Imitation
Knowledge embodied in standards, codes and technical definitions
Face-to-face interactions with buyers
Deliberate transfers of technology confined to a narrow range of tasks (e.g. assembly)
Imitation
Turnover of skilled managers and workers
Training
Knowledge spillovers
Buyers’ impact on suppliers’ upgrading
Positive (but passive) on product and process upgrading
Neutral to negative on functional upgrading
Positive (active) on product and process upgrading
Often negative on functional upgrading
Neutral to positive on product and process upgrading
Neutral to negative on functional upgrading
Source: Adapted from Gereffi et al. (2005); Kaplinsky (2005); Milberg (2004); Pietrobelli and Rabellotti (2006, 2011).
Upgrading in Agro-Commodity Value Chains
The international operating environment for agro-commodity value chains has changed with
significant shifts in national agricultural policy (Barrett, 2012; Barrett et al., 2010). Since the
1980s, the international debt crisis triggered unprecedented macroeconomic reform under
structural adjustment programmes (SAPs), typically by reducing fiscal and balance-of-payment
deficits and divesting state enterprises to the private sector in line with the free market paradigm.
As a result, statist control of agriculture collapsed. Subsidies and non-subsidy support on
stapled food, agricultural credit, and fertiliser were scaled back as donor and government
support retreated. The 1990s saw donor efforts further redirected from agricultural development
to emergency relief for internal conflicts as the Cold War ended. The Uruguay Round of General
Agreement on Tariffs and Trade (GATT) led to commitments to remove nontariff barriers to
trade and to reduce tariff barriers and agricultural subsidisation. New trade agreements and the
creation of the World Trade Organisation (WTO) ushered in an era where developing countries
will be dealing with a much more open world trading regime (Staatz & Eicher, 1998).
15
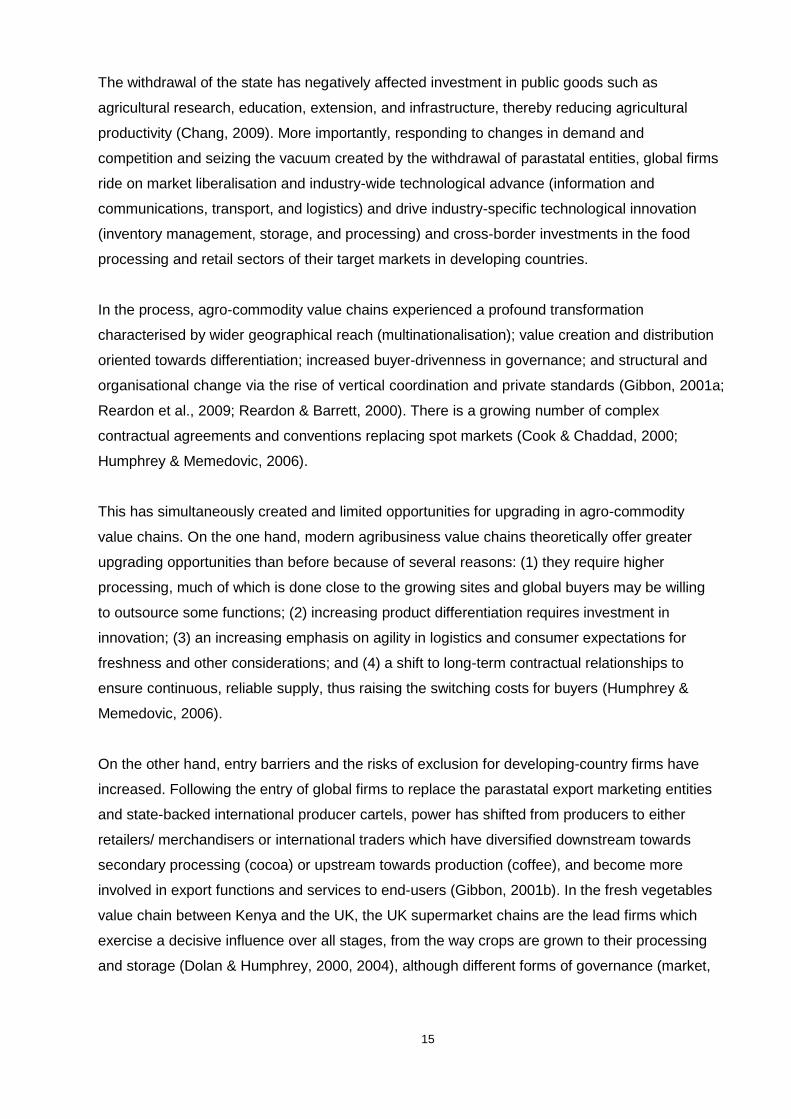
The withdrawal of the state has negatively affected investment in public goods such as
agricultural research, education, extension, and infrastructure, thereby reducing agricultural
productivity (Chang, 2009). More importantly, responding to changes in demand and
competition and seizing the vacuum created by the withdrawal of parastatal entities, global firms
ride on market liberalisation and industry-wide technological advance (information and
communications, transport, and logistics) and drive industry-specific technological innovation
(inventory management, storage, and processing) and cross-border investments in the food
processing and retail sectors of their target markets in developing countries.
In the process, agro-commodity value chains experienced a profound transformation
characterised by wider geographical reach (multinationalisation); value creation and distribution
oriented towards differentiation; increased buyer-drivenness in governance; and structural and
organisational change via the rise of vertical coordination and private standards (Gibbon, 2001a;
Reardon et al., 2009; Reardon & Barrett, 2000). There is a growing number of complex
contractual agreements and conventions replacing spot markets (Cook & Chaddad, 2000;
Humphrey & Memedovic, 2006).
This has simultaneously created and limited opportunities for upgrading in agro-commodity
value chains. On the one hand, modern agribusiness value chains theoretically offer greater
upgrading opportunities than before because of several reasons: (1) they require higher
processing, much of which is done close to the growing sites and global buyers may be willing
to outsource some functions; (2) increasing product differentiation requires investment in
innovation; (3) an increasing emphasis on agility in logistics and consumer expectations for
freshness and other considerations; and (4) a shift to long-term contractual relationships to
ensure continuous, reliable supply, thus raising the switching costs for buyers (Humphrey &
Memedovic, 2006).
On the other hand, entry barriers and the risks of exclusion for developing-country firms have
increased. Following the entry of global firms to replace the parastatal export marketing entities
and state-backed international producer cartels, power has shifted from producers to either
retailers/ merchandisers or international traders which have diversified downstream towards
secondary processing (cocoa) or upstream towards production (coffee), and become more
involved in export functions and services to end-users (Gibbon, 2001b). In the fresh vegetables
value chain between Kenya and the UK, the UK supermarket chains are the lead firms which
exercise a decisive influence over all stages, from the way crops are grown to their processing
and storage (Dolan & Humphrey, 2000, 2004), although different forms of governance (market,

16
modular, relational, captive, and hierarchy) can exist between firms at different stages along the
value chain, and evolve over time.6
1.3 Malaysian Palm Oil in the World Oils and Fats Market
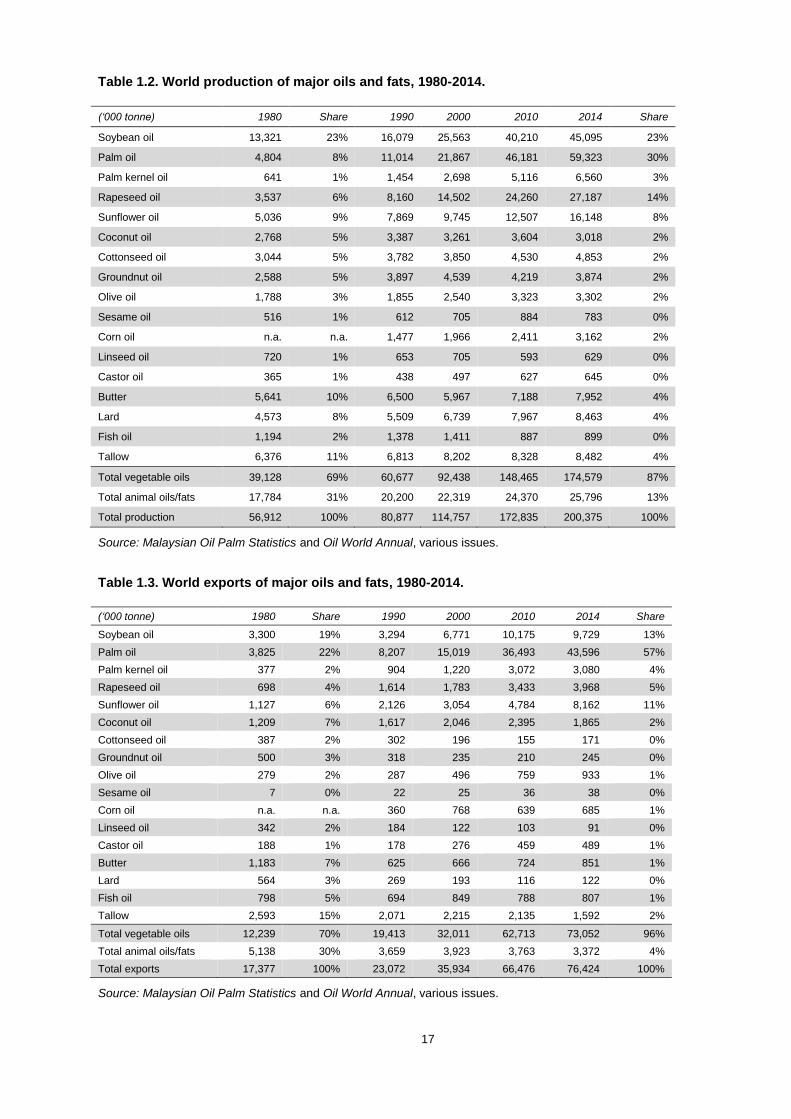
Globally, there are 17 major oils and fats of plant and animal origin. In total, over 200 million
tonnes of these oils and fats are produced annually, of which 76 million tonnes are exported.
The share of vegetable oils, extracted from the crushing of oilseeds and oil crops, has increased
in relation to animal fats, with the former accounting for 87% of world production and 96% of
world exports in 2014 (compared with 69% and 70% in 1980) (Table 1.2). Four vegetable oils --
palm, soybean, rapeseed and sunflower oils – dominate the world market for oils and fats,
accounting for 75% of world production and 86% of world exports in 2014 (Table 1.3). In the
past decades, production of oilseeds and oil crops rose to provide for higher consumption of oils
and fats and continuously growing demand for protein meals, both of which were primarily
attributed to growing populations and rising incomes in developing countries. Increased
production has also been driven by a shift in consumer preferences for vegetable oils and more
recently, by the use of biofuels. In the coming decade to 2025, demand for vegetable oils is
expected to slow due to a reduced growth in per capita food use in developing countries (at
1.5% per annum compared to 3.0% in 2006-2015) and only slight increases in biodiesel
production from vegetable oils as biodiesel mandates have been gradually fulfilled in developed
economies (OECD & FAO, 2016).
6 For example, during the early stage of the value chain throughout the 1990s, as the supermarkets
bypassed the wholesale markets and relinquished some functions and services related to value chain
management to a limited number of UK importers in a relational form. During the 2000s, with the
introduction of category management, each product category saw the consolidation of the value chain,
and had a large part of its management transferred to a ‘category captain’, which is typically a leading
importer with the capacity to coordinate suppliers from a number of other importers. This results in shift to
modular governance between the supermarkets and the importers.
17
Table 1.2. World production of major oils and fats, 1980-2014.
(‘000 tonne) 1980 Share 1990 2000 2010 2014 Share
Soybean oil 13,321 23% 16,079 25,563 40,210 45,095 23%
Palm oil 4,804 8% 11,014 21,867 46,181 59,323 30%
Palm kernel oil 641 1% 1,454 2,698 5,116 6,560 3%
Rapeseed oil 3,537 6% 8,160 14,502 24,260 27,187 14%
Sunflower oil 5,036 9% 7,869 9,745 12,507 16,148 8%
Coconut oil 2,768 5% 3,387 3,261 3,604 3,018 2%
Cottonseed oil 3,044 5% 3,782 3,850 4,530 4,853 2%
Groundnut oil 2,588 5% 3,897 4,539 4,219 3,874 2%
Olive oil 1,788 3% 1,855 2,540 3,323 3,302 2%
Sesame oil 516 1% 612 705 884 783 0%
Corn oil n.a. n.a. 1,477 1,966 2,411 3,162 2%
Linseed oil 720 1% 653 705 593 629 0%
Castor oil 365 1% 438 497 627 645 0%
Butter 5,641 10% 6,500 5,967 7,188 7,952 4%
Lard 4,573 8% 5,509 6,739 7,967 8,463 4%
Fish oil 1,194 2% 1,378 1,411 887 899 0%
Tallow 6,376 11% 6,813 8,202 8,328 8,482 4%
Total vegetable oils 39,128 69% 60,677 92,438 148,465 174,579 87%
Total animal oils/fats 17,784 31% 20,200 22,319 24,370 25,796 13%
Total production 56,912 100% 80,877 114,757 172,835 200,375 100%
Source: Malaysian Oil Palm Statistics and Oil World Annual, various issues.
Table 1.3. World exports of major oils and fats, 1980-2014.
(‘000 tonne) 1980 Share 1990 2000 2010 2014 Share
Soybean oil 3,300 19% 3,294 6,771 10,175 9,729 13%
Palm oil 3,825 22% 8,207 15,019 36,493 43,596 57%
Palm kernel oil 377 2% 904 1,220 3,072 3,080 4%
Rapeseed oil 698 4% 1,614 1,783 3,433 3,968 5%
Sunflower oil 1,127 6% 2,126 3,054 4,784 8,162 11%
Coconut oil 1,209 7% 1,617 2,046 2,395 1,865 2%
Cottonseed oil 387 2% 302 196 155 171 0%
Groundnut oil 500 3% 318 235 210 245 0%
Olive oil 279 2% 287 496 759 933 1%
Sesame oil 7 0% 22 25 36 38 0%
Corn oil n.a. n.a. 360 768 639 685 1%
Linseed oil 342 2% 184 122 103 91 0%
Castor oil 188 1% 178 276 459 489 1%
Butter 1,183 7% 625 666 724 851 1%
Lard 564 3% 269 193 116 122 0%
Fish oil 798 5% 694 849 788 807 1%
Tallow 2,593 15% 2,071 2,215 2,135 1,592 2%
Total vegetable oils 12,239 70% 19,413 32,011 62,713 73,052 96%
Total animal oils/fats 5,138 30% 3,659 3,923 3,763 3,372 4%
Total exports 17,377 100% 23,072 35,934 66,476 76,424 100%
Source: Malaysian Oil Palm Statistics and Oil World Annual, various issues.

18
The five largest oils and fats producers through the noughties have been Indonesia (palm oil),
China (soybean, cottonseed, peanut oils), the EU (rapeseed, sunflower oils), Malaysia (palm oil)
and the US (soybean, cottonseed, sunflower oils) (Figure 1.3). Most countries in the world –
including three of the five largest producers (China, the EU, and the US) – have net deficits in
oils and fats which are met through imports. At present, only three countries are able to supply
large volumes of oils on international markets: Indonesia, Malaysia, and Argentina (soybean oil)
(Wong et al., 2012). The five largest importers of oils and fats since 2000 have been India, the
EU, China, the US, and Pakistan.
Indonesia, 18%
China, 13%
EU, 12%
Malaysia, 11%
US, 9%Commonwealth Independent States, 6%
India, 5%
Brazil, 5%
Argentina, 4%
Canada, 2% RoW, 16%
Producers' total: 200.00 million tonnes
Indonesia, 32%
Malaysia, 25%
Commonwealth Independent States, 10%
Argentina, 6%
EU, 3%
Canada, 4%
US, 3%
Brazil, 2%
Phillipines, 1%
New Zealand, 1%
RoW, 13%
Exporters' total: 76.7 million tonnes

19
Figure 1.3. Major world producers, exporters and importers of oils and fats, 2014.
Source: Malaysian Oil Palm Statistics and Oil World Annual, 2014.
Historically, soybean oil was the largest vegetable oil by production volume, until it was
overtaken by palm oil around 2005. In terms of export volume, palm oil has been the largest
since at least 1980. Palm oil became the market leader because of its productivity, reliability in
supply, cost of production and technical attributes.
The commercial oil palm is a perennial tree crop (Elaeis guineensis Jacq.) indigenous to West
Africa. It grows optimally in areas between 7 degrees north and south from the Equator due to
their climate and soil conditions (Moll, 1987). Among oilseeds and oil crops, oil palm has the
highest oil yield (but a relatively low meal yield) – it produces approximately 10 times more oil
than soybean and seven times more than rapeseed on a per hectare basis. In 2012, palm and
palm kernel oil contributed to over a third of global vegetable oils production while oil palm
utilised only 4% of total land used for oilseeds and oil crops. Oil palm is a perennial crop. Once
it matures, an oil palm tree will be in production for 25 years. This makes it more difficult to
adjust planting and production of oil palm in response to market conditions and prices,
compared with annual crops (soybean, rapeseed and sunflower). However, palm oil supply is
relatively predictable in the long term, and enjoys a cost advantage over oilseeds that need to
be planted every year. In addition, palm oil and its by-products are versatile. They can be used
as it is, or in fractionated forms for a wide range of food and non-food (fibre, fuel, and feed)
purposes.7 It is estimated that 71% of palm oil is used for food applications, followed by energy
(17%), chemicals (8%) and other uses (4%) (MPOC, 2014).
7 Palm oil has good oxidative stability and interesterification significantly modifies its crystallisation
behaviour. It is also known as a good industrial frying medium because of its relatively low
polyunsaturation and its low slip melting point (Nambiappan, 2013).
India, 16%
EU, 14%
China, 12%
US, 6%
Pakistan, 3% Commonwealth Independent States, 2%Turkey, 2%
Malaysia, 2%
Mexico, 2%
South Korea, 1%
RoW, 40%
Importers' total: 76.3 million tonnes

20
Up to World War II, the global palm oil industry was centred on Nigeria and Democratic
Republic of the Congo. Production was mainly for domestic consumption while the surplus was
exported to Europe and the US for use as soaps, candles and resins. Ensuing political
upheavals damaged the industry while increased local consumption left little palm oil for exports
(Corley & Tinker, 2016). Within Asia, oil palm was first introduced to the Dutch East Indies (now
Indonesia) and later to British Malaya (now Peninsular Malaysia) in the 19th century, as an
ornamental plant. Commercial plantings began under colonial rule in the 1910s, but were
disrupted by World War II (Moll, 1987).
Malaysia overtook Nigeria as the world’s largest palm oil producer in 1966. The country held on
to that position until losing it in 2006 to Indonesia whose rapid ascent in global palm oil is fairly
recent. Malaysia also lost its position as the world’s largest palm oil exporter to Indonesia in
2012. In 2014, Malaysia accounted for 33% of world palm oil production and 40% of world
exports, compared to Indonesia’s 52% and 51%, respectively. Other major exporters and
producers are Thailand, Papua New Guinea, Guatemala and Honduras (Table 1.4 and Table
1.5). Indonesia and Malaysia export most of their palm oil (88% for Malaysia and 72% for
Indonesia).
Table 1.4. Major world palm oil producers, 1980-2014.
Country (‘000 tonne) 1980 Share 1990 2000 2010 2014 Share
Indonesia 691 14% 2,413 7,050 22,400 30,800 52%
Malaysia 2,573 54% 6,091 10,842 16,994 19,667 33%
Thailand n.a. n.a. 226 525 1,360 1,930 3%
Colombia 74 2% 226 524 753 1,120 2%
Nigeria 433 9% 580 740 885 1,010 2%
Papua New Guinea 32 1% 145 336 488 530 1%
Ecuador n.a. n.a. 120 218 380 515 1%
Honduras n.a. n.a. n.a. 101 275 450 1%
Cote d’Ivoire n.a. n.a. 270 278 345 420 1%
Guatemala n.a. n.a. n.a. 65 182 420 1%
Brazil n.a. n.a. n.a. 108 250 370 1%
Costa Rica n.a. n.a. n.a. 137 227 210 0%
Venezuela n.a. n.a. n.a. 70 75 52 0%
Rest of the World 1,001 21% 943 873 1,567 1,829 3%
Total 4,804 100% 11,014 21,867 46,181 59,323 100%
Source: Malaysian Oil Palm Statistics and Oil World Annual, various issues.

21
Table 1.5. Major world palm oil exporters, 1980-2014.
Country (‘000 tonne) 1980 Share 1990 2000 2010 2014 Share
Indonesia 503 13% 1,163 4,139 16,450 22,080 51%
Malaysia 2,284 60% 5,727 9,081 16,664 17,306 40%
Thailand n.a. n.a. n.a. n.a. 133 290 1%
Papua New Guinea 36 1% 143 336 486 525 1%
Guatemala n.a. n.a. n.a. n.a. 154 390 1%
Honduras n.a. n.a. n.a. n.a. 156 318 1%
Cote d’Ivoire n.a. n.a. 156 72 201 261 1%
Colombia n.a. n.a. n.a. 97 90 230 1%
Rest of the World * 1,002 26% 1,018 1,294 2,159 2,196 5%
Total 3,825 100% 8,207 15,019 36,493 43,596 100%
* Includes re-exporters such as Hong Kong and Singapore.
Source: Malaysian Oil Palm Statistics and Oil World Annual, various issues.
In contrast to its early Europe-centric trade, palm oil is imported by over 150 countries at
present. The five largest importers in 2014 were India (18%), the European Union (17%), China
(13%), Pakistan (5%) and the US (3%). Between 2010 and 2014, the market share of Malaysian
palm oil significantly declined in seven out of its 10 traditional markets. Four experienced a
simultaneous decrease in market share and export volume: China, Pakistan, the US and Turkey.
The other three recorded a decline in market share despite a slight increase in export volume:
the EU, Egypt and Myanmar. In comparison, Indonesia gained in both market share and
absolute export volume in all these markets (Table 1.6).
Table 1.6. Market share of Malaysian and Indonesian palm oil in key export markets, 2010 and 2014.
Market (‘000 tonne)*
Malaysia Indonesia
2010 Share 2014 Share 2010 Share 2014 Share
China 3,455 59% 2,971 53% 2,332 40% 2,649 47%
EU 2,045 35% 2,079 28% 3,083 53% 4,061 55%
Pakistan 2,009 96% 846 35% 89 4% 1,585 65%
India 1,190 18% 3,073 39% 5,435 82% 4,758 60%
US 886 94% 751 63% 49 5% 420 35%
Turkey 264 64% 205 35% 146 36% 388 65%
Egypt 347 43% 350 40% 453 57% 530 60%
Vietnam 344 65% 593 87% 181 34% 76 11%
Bangladesh 184 17% 299 24% 880 83% 947 76%
Myanmar 178 48% 208 34% 145 39% 404 66%
* Crude and processed palm oil only.
Source: Malaysian Palm Oil Board.

22
1.4 Malaysian Palm Oil in the National Development Context
Malaysia came into being in 1963 as a federation comprising Peninsular Malaysia (Malaya),
Singapore, Sabah and Sarawak (Singapore left the federation two years later). Malaya was the
world’s largest producer of rubber and tin during British colonial rule, and continued to be so
when it became independent in 1957. For the next two decades, the economy specialised in the
primary sectors and relied heavily on primary commodity exports, much like many other new
nation states that were formed during that period. Since the late 1970s, however, Malaysia
diversified its economic and export structure into the secondary and tertiary sectors through
promotion of industrialisation. Between 1965 and 2010, the share of agriculture shrank from
almost a third to a tenth of the economy, while that of manufacturing more than doubled to
about a quarter (Figure 1.4).
Figure 1.4. Gross domestic product by economic activity at current prices, 1965-2010.
Source: Malaysia Statistical Handbook, various issues.
An analysis of Malaysia’s input-output tables for 1991, 2000, 2005 and 2010 reveals specific
industry changes within the economy-wide structural change (the basis for aggregating and
reclassifying the industries into 36 industries is explained in Annex 1). Measured by output at
basic prices, within the primary sector, crude oil and natural gas (1) has been the single largest
industry, accounting for approximately 5% of total output since 1991 (Table 1.7). Oil palm (2)
has been the second largest industry, with its share of total output rising from 1.7% to 2.9%
between 1991 and 2010.
Within the secondary sector, electric appliances and electronic components (21) is the largest
industry. However, its share of total output declined from 12.1% to 9.6%. Oils and fats (9)
1965 1970 1975 1980 1985 1990 1995 2000 2005 2010
Tertiary (Services) 49.1% 43.4% 51.3% 47.4% 49.0% 50.4% 56.6% 53.1% 49.7% 55.1%
Secondary (Manufacturing) 10.4% 13.9% 16.4% 19.6% 19.7% 24.2% 26.4% 30.9% 29.6% 23.7%
Primary (Mining) 9.0% 13.7% 4.6% 10.1% 10.5% 11.8% 6.2% 10.6% 14.4% 11.0%
Primary (Agriculture) 31.5% 29.0% 27.7% 22.9% 20.8% 15.2% 12.9% 8.6% 8.4% 10.2%
0%
10%
20%
30%
40%
50%
60%
70%
80%
90%
100%

23
remains the second largest industry, with a significantly bigger share at 6.4% of total output in
2010 compared with 3.9% in 1991. The other major secondary industries are refined petroleum
products (15) and chemical and pharmaceutical products (16). Within the tertiary sector,
wholesale and retail trade (27) has been the largest industry, with a 9.6% of total output in 2010
(8.9% in 1991). This is followed by finance and insurance (30) and transport and
communications (29). The share of finance and insurance (30) more than doubled between
1991 and 2010.
Table 1.7. Output of 36 industries at basic prices, 1991-2010.
Industry (% of total output) Industry code
% of total output
1991 2000 2005 2010
Primary sector
Rubber 1 1.0% 0.2% 0.4% 0.5%
Oil palm 2 1.7% 1.2% 1.4% 2.9%
Agriculture 3 1.6% 0.8% 0.5% 0.5%
Livestock and fishing 4 2.0% 1.3% 0.9% 1.2%
Forestry and logging 5 2.3% 1.6% 0.6% 1.1%
Crude oil and natural gas 6 4.5% 4.9% 5.7% 4.7%
Other mining and quarrying 7 0.5% 0.3% 0.3% 0.5%
Secondary sector
Food, beverage and tobacco 8 3.7% 2.5% 2.6% 2.6%
Oils and fats 9 3.9% 3.1% 3.4% 6.4%
Textiles and leather 10 1.2% 1.0% 0.6% 0.3%
Apparels and footwear 11 1.1% 1.0% 0.4% 0.3%
Wood products 12 2.1% 1.4% 1.0% 0.9%
Paper products and furniture 13 0.9% 1.5% 1.6% 1.1%
Printing and publishing 14 0.7% 0.5% 0.4% 0.3%
Refined petroleum products 15 1.6% 3.6% 5.3% 5.0%
Chemicals and pharmaceuticals 16 2.8% 3.0% 4.5% 3.7%
Processed rubber products 17 2.0% 1.2% 1.3% 1.5%
Plastics and non-metallic mineral products 18 2.2% 2.6% 2.4% 2.3%
Metal products 19 3.5% 2.9% 4.2% 3.4%
Machinery 20 1.9% 9.8% 7.0% 2.7%
Electronic components and electrical appliances
21 12.1% 17.6% 16.6% 9.6%
Precision equipment 22 0.5% 0.6% 1.0% 0.4%
Motor vehicles and transport equipment 23 3.6% 2.0% 3.2% 2.4%
Recycling and other manufacturing 24 0.5% 0.5% 0.5% 0.6%
Tertiary sector
Electricity, gas and water 25 1.8% 2.1% 2.2% 2.3%
Construction 26 8.1% 5.0% 3.8% 4.4%
Wholesale and retail 27 8.9% 6.0% 4.8% 9.6%
Hotels and restaurants 28 2.3% 2.4% 1.7% 2.3%
Transport and communications 29 5.6% 5.9% 7.4% 6.9%
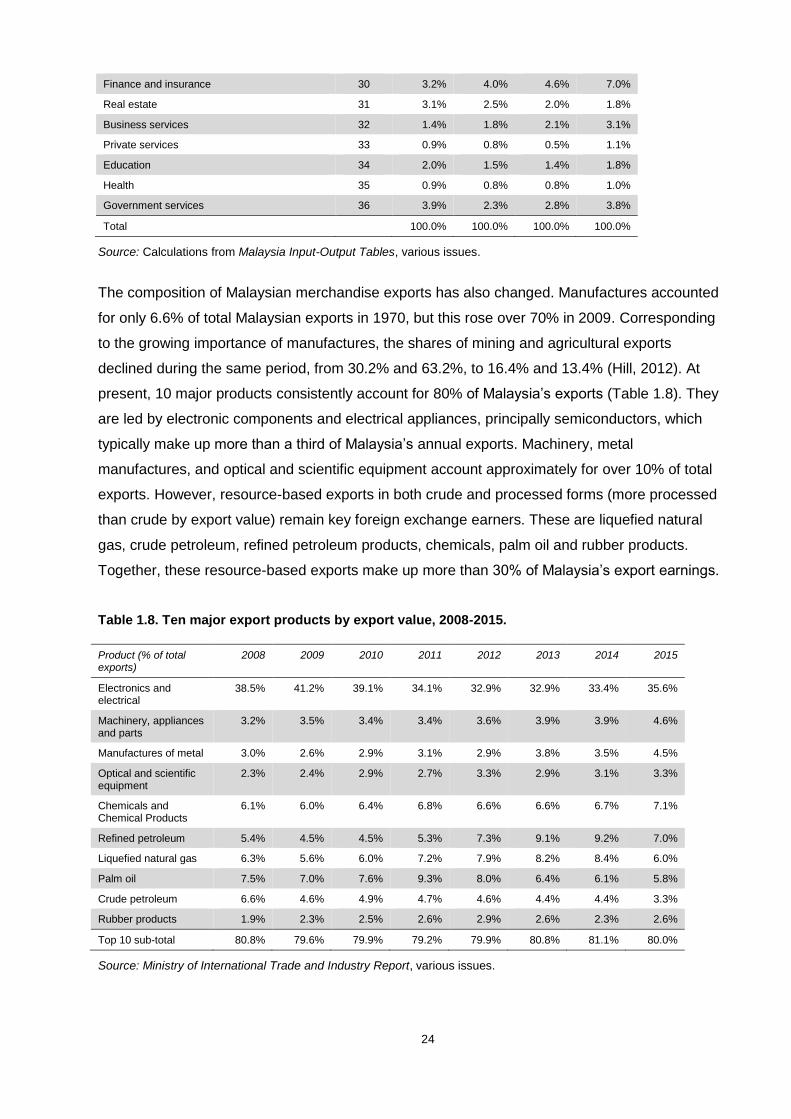
24
Finance and insurance 30 3.2% 4.0% 4.6% 7.0%
Real estate 31 3.1% 2.5% 2.0% 1.8%
Business services 32 1.4% 1.8% 2.1% 3.1%
Private services 33 0.9% 0.8% 0.5% 1.1%
Education 34 2.0% 1.5% 1.4% 1.8%
Health 35 0.9% 0.8% 0.8% 1.0%
Government services 36 3.9% 2.3% 2.8% 3.8%
Total 100.0% 100.0% 100.0% 100.0%
Source: Calculations from Malaysia Input-Output Tables, various issues.
The composition of Malaysian merchandise exports has also changed. Manufactures accounted
for only 6.6% of total Malaysian exports in 1970, but this rose over 70% in 2009. Corresponding
to the growing importance of manufactures, the shares of mining and agricultural exports
declined during the same period, from 30.2% and 63.2%, to 16.4% and 13.4% (Hill, 2012). At
present, 10 major products consistently account for 80% of Malaysia’s exports (Table 1.8). They
are led by electronic components and electrical appliances, principally semiconductors, which
typically make up more than a third of Malaysia’s annual exports. Machinery, metal
manufactures, and optical and scientific equipment account approximately for over 10% of total
exports. However, resource-based exports in both crude and processed forms (more processed
than crude by export value) remain key foreign exchange earners. These are liquefied natural
gas, crude petroleum, refined petroleum products, chemicals, palm oil and rubber products.
Together, these resource-based exports make up more than 30% of Malaysia’s export earnings.
Table 1.8. Ten major export products by export value, 2008-2015.
Product (% of total exports)
2008 2009 2010 2011 2012 2013 2014 2015
Electronics and electrical
38.5% 41.2% 39.1% 34.1% 32.9% 32.9% 33.4% 35.6%
Machinery, appliances and parts
3.2% 3.5% 3.4% 3.4% 3.6% 3.9% 3.9% 4.6%
Manufactures of metal 3.0% 2.6% 2.9% 3.1% 2.9% 3.8% 3.5% 4.5%
Optical and scientific equipment
2.3% 2.4% 2.9% 2.7% 3.3% 2.9% 3.1% 3.3%
Chemicals and Chemical Products
6.1% 6.0% 6.4% 6.8% 6.6% 6.6% 6.7% 7.1%
Refined petroleum 5.4% 4.5% 4.5% 5.3% 7.3% 9.1% 9.2% 7.0%
Liquefied natural gas 6.3% 5.6% 6.0% 7.2% 7.9% 8.2% 8.4% 6.0%
Palm oil 7.5% 7.0% 7.6% 9.3% 8.0% 6.4% 6.1% 5.8%
Crude petroleum 6.6% 4.6% 4.9% 4.7% 4.6% 4.4% 4.4% 3.3%
Rubber products 1.9% 2.3% 2.5% 2.6% 2.9% 2.6% 2.3% 2.6%
Top 10 sub-total 80.8% 79.6% 79.9% 79.2% 79.9% 80.8% 81.1% 80.0%
Source: Ministry of International Trade and Industry Report, various issues.

25
As one of the most open economies in the developing world, Malaysia has exploited the world
economy and market. This openness is particularly visible in merchandise trade, labour and
foreign direct investment (FDI). By the common indicators of openness, Malaysia is more open
than China, South Korea and Thailand on trade policy and FDI, though it is not in the same
league as Singapore (Hill, 2012) (Table 1.9). Malaysia’s trade regime has featured low average
tariffs, low dispersion of tariffs and limited resort to non-tariff barriers (with some historical
exceptions in heavy industries such as automobiles which were characterised by strong
presence of state owned interests), while its investment regime has been open to FDI in export-
oriented manufactures with easy rules for profit repatriation and few restrictions.
Table 1.9. Indicators of openness of selected Asian economies.
Malaysia China South Korea Singapore Thailand
Trade/GDP, 2008 212% 63% 107% 450% 150%
Average tariff, 2000-2004
7.6% 12.8% 9.1 0.2% 8.9%
FDI stock/GDP, 2008 38.0% 10.8% 10.2 136% 34.2%
Source: Hill (2012).
Structural transformation and openness contributed to strong growth in Malaysia. The
Commission on Growth and Development identifies Malaysia as one of the only 13 economies
in the world to have sustained growth of more than 7% for over 25 years since World War II
(Commission on Growth and Development, 2008) (Table 1.10). Of the 13 economies, only six
went on to achieve high income economy status based on the World Bank’s classification
(defined as those with a gross national income (GNI) per capita of US$12,476 or more in 2016).
The six are Hong Kong, Japan, Malta, Singapore, South Korea and Taiwan – of which all but
one are in East Asia. That few managed to make the transition from middle to high income
illustrates the difficulty of the process.
Table 1.10. Gross national income per capita of high growth economies.
Economy High growth period (7% or more per annum)
GNI per capita at the start of high growth period (US$)
GNI per capita in 2015 (US$)
Bostwana 1960-2005 210 6,460
Brazil 1950-1980 960 9,850
China 1961-2005 105 7,930
Hong Kong 1960-1997 3,100 41,000
Indonesia 1966-1997 200 3,440
Japan 1950-1983 3,500 38,840
Malaysia 1967-1997 790 10,570
Malta 1963-1994 1,100 23,930

26
Oman 1960-1999 950 16,910
Singapore 1967-2002 2,200 52,090
South Korea 1960-2001 1,100 27,450
Taiwan 1965-2002 1,500 22,267
Thailand 1960-1997 330 2,400
Source: World Bank.
Malaysia has been an upper middle income economy since 1992. Its high growth rates were
disrupted by the 1997 Asian financial crisis; post-crisis growth momentum slowed to an average
of 4.7% per annum between 2000 and 2016. In the aftermath of the 2007-2009 global financial
crisis, Malaysia has been in search of a ‘new economic model’, both as a short-term rebalancing
exercise and as a long-term agenda for structural change to avoid the so-called ‘middle income
trap’ (NEAC, 2010; Hill, 2012). The evolution of the Malaysian palm oil sector is in many ways a
microcosm that captures both achievements and challenges of the country’s development.
Malaysia biogeographically transplanted three major crops from other parts of the world during
colonial rule and became a leading world player in each of them (Wong, 2011). The crops were
rubber from Brazil, cocoa from South America, and oil palm from West Africa. The planting of
rubber was fuelled by the development of the auto industry in the 1950s coupled with the
Korean War. However, synthetic alternatives caused the collapse of rubber prices in the 1960s
and threatened the Malaya economy which relied on a single crop. The need for crop
diversification became a major concern to the local coalition government led by the Alliance
Party (later expanded and renamed as the National Front or Barisan Nasional) which had just
taken over the economy from the British administrators. There were two other major structural
issues: high rural unemployment and legions of landless peasant farmers. The social-political
dimension of these issues was pressing. Peasant farmers and unemployed rural folk were
predominantly the majority native ethnic group, the Malays.8 Economically, the Malays had the
highest poverty incidence and lagged behind others, especially the Chinese migrants who had
chosen to settle permanently in Malaya and become its citizens.
Both the government and the industry thus recognised the opportunities for a large-scale switch
to oil palm, whose planting was disrupted by the World War II years, in fulfilment of clear
8 In 2013, the Malays make up 49.7% of Malaysia’s population of 30.2 million. This is followed by
the Chinese (21.7%), various native peoples in Sabah and Sarawak (11.7%), the Indians (6.5%), and
others (0.9%). Non-citizens make up the remaining 9.6% (DOSM, 2015). The Malays and the natives of
Sabah and Sarawak are accorded a ‘special position’ in the Federal Constitution, which provides for
quotas in civil service admission, public scholarships and public education. The Malays and the natives
are collectively referred to as the Bumiputeras, which literally means ‘sons of the oil’.

27
political and economic objectives. High yield characteristics of oil palm, Malaysia’s agro-climatic
suitability for the crop and the country’s relatively good physical infrastructure for exports
inherited from the colonial era were among the opportunities identified. As part of its crop
diversification and poverty eradication measures, the government expanded oil palm cultivation
on a large scale through state-sponsored land settlement schemes specifically targeted at the
Malays in order to increase palm oil production. The Federal Land Development Authority
(Felda) is the most important actor. It resettled landless peasant farmers to primary forest and
unused land for oil palm cultivation. This move mirrored the earlier experience of land reform in
countries such as the US and Sweden, in which unused public land was given away or sold at
subsidised prices to settlers for land quality improvement (Chang, 2009).
Examples of successful land reforms that have effectively improved the poor people’s
accessibility to land and wellbeing in developing countries are very few, and Felda stands out as
a rare example. The success of the Felda scheme can be explained by the sharing and
devolution of powers and responsibilities in decision-making process, underpinned by an
element of inclusiveness and involvement or integration of settler community, as well as political
will to support pro-poor land governance reforms in long-term national development planning
agenda (Barau and Said 2016). In return, Felda settlers have by and large voted for the United
Malays National Organisation (Umno), the lynchpin Malay party in the ruling coalition, in general
elections. At present, 54 representing a quarter of the 222 parliamentary seats are dominated
by Felda settlers (Barrock & Tay, 2017). Their political power is enhanced by ‘rural weightage’ in
Malaysian electoral constituency system, which favours rural voters over urban voters by
making rural constituencies significantly smaller by voters’ number than urban constituencies.
Felda areas consistently overlap with electoral constituencies won by Umno (Khor, 2015;
Mohamad, 2015). The Umno-dominated ruling coalition now stands as the longest-serving
government in the world (Welsh, 2015).
It was within this context that oil palm became Malaysia’s dominant crop. Total land use for all
crops increased by 66% between 1980 and 2013, driven mostly by oil palm plantations which
rose by 411% to 5.2 million hectares. By 2013, oil palm took up 73% of total crop land,
compared with 24% in 1980 (Figure 1.5). Land use change for oil palm cultivation was likely
linked to decreasing land use by other crops and conversion of logged-over forest (Wicke et al.,
2011).9 Land scarcity in Peninsular Malaysia drove expansion to Sabah from the 1970s and
Sarawak from the late 1980s. Growth in palm plantation hectarage has slowed since the 2000s.
9 Indonesia’s forest covered land decreased by 40 million hectares (a 30% reduction in forest land)
between 1975 and 2005. Its agricultural land increased from 38 million hectares to 48 million hectares,

28
Figure 1.5. Agricultural land under major crops, 1980-2013.
Source: Statistics on Commodities, various issues.
The agenda to uplift the Malays’ socio-economic status gained further prominence in national
policymaking the 1970s. In the aftermath of inter-ethnic clashes rooted in class divides and
economic disparities, the New Economic Policy (NEP) was introduced to eliminate ethnic
identification by economic function and to eradicate poverty. Affirmative action or positive
discrimination permeated Malaysia’s economic and industrial policies at all levels. When
Malaysia embarked on nationalisation of ‘strategic sectors’ (the plantation, petroleum and
banking industries) in the 1970s, state investment vehicles and trust agencies such as National
Equity Corporation (Permodalan Nasional Bhd or PNB by its Malay acronym) and National
Corporation (Perbadanan Nasional Bhd or Pernas by its Malay acronym) with mandates to
increase corporate wealth on behalf of the Bumiputeras were used (Searle, 1999).10 The
half of which was driven by expansion in palm oil plantations. Malaysia’s forest cover decreased by 5
million hectares during the same period (a 20% reduction in forest land) but the annual rate of forest
cover loss since the 1980s has slowed down to between 0.01% and 1% (Wicke et al., 2011).
10 This was in line with widespread decolonisation efforts during the 1960-1976 period in which host
governments increasingly assumed control over their natural resources, including land, making it more
difficult for foreign investors to become involved in the production of agricultural goods directly.
Agriculture was second, after banking and insurance, among activities affected by a wave of
nationalisations of foreign enterprises in developing countries, with 272 cases of expropriations
1980 1986 1990 1995 2000 2005 2010 2013
Sugarcane 12,705 33,318 21,574 22,050 21,380 14,235 4,540 4,519
Tea 2,428 3,206 3,270 2,946 3,524 1,961 2,459 2,711
Coffee 10,882 15,919 17,795 11,525 12,260 8,557 5,098 5,667
Rice 716,873 627,500 680,647 672,787 698,707 666,766 677,884 688,207
Tobacco 13,243 15,822 10,168 10,525 15,764 8,520 3,698 538
Pineapple 10,729 10,495 9,076 7,895 15,720 14,884 15,456 13,162
Pepper 13,295 6,120 11,408 9,837 13,414 12,722 14,174 15,130
Coconut 354,500 280,500 313,589 273,519 158,592 121,011 105,659 98,533
Cacao 138,302 322,334 393,465 190,127 75,766 33,994 20,083 13,728
Oil Palm 1,023,306 1,599,311 2,029,464 2,540,087 3,376,664 4,051,374 4,853,766 5,229,739
Rubber 1,999,300 1,905,606 1,836,600 1,679,000 1,430,700 1,271,300 1,020,400 1,057,271
-
1,000,000
2,000,000
3,000,000
4,000,000
5,000,000
6,000,000
7,000,000
8,000,000

29
government promoted the appointment of Bumiputera managers on estates through Felda while
private plantations, too, “bent to government pressure” by doing the same, resulting in a gradual
fall in the number of non-Bumiputera managers (Rasiah, 2006).
However, the actual extent to which the NEP was implemented in the palm oil sector remains
unclear and debatable, as is its effect on industrial development. For instance, in the late 1970s,
incentives to promote palm oil refining and fractionation which were open to all previously were
limited only to firms owned in part by Bumiputeras but these incentives were scrapped soon
after. The application of Bumiputera ownership conditions on firms depending on their export-
orientation also remained largely arbitrary (Rasiah, 2006). Lee (2007) suggests that
‘ethnicisation’ of Malaysia’s industrial policy compromised industrial development with the exit of
non-Bumiputera capital, which had the potential to strengthen Malaysia’s technological
capabilities and industrial base. But he cautions that criticism of the redistribution regime should
be “tempered with acknowledgement of more harmful eventualities that could have transpired”.
Notwithstanding possible contradictions and complementarities between the goals of pro-
Bumiputera redistribution and industrial development, techno-economic and marketing concerns
have largely dominated policy directions for the palm oil sector throughout the last several
decades (Table 1.11). Malaysia became a leading producer and exporter in the world oils and
fats market, one of the few niche areas in which the country can be considered a global leader.
In recent years, Malaysia has to deal with declining competitiveness (stagnating productivity,
rising production costs, and scarcity of suitable land for oil palm cultivation) in an environment
characterised by new entrants and increased socio-environmental expectations of palm oil
importing countries.
Table 1.11. Policy concerns and directions for the palm oil sector, 1960s-2010s.
Period Concern Identified Policy Direction
1960s Collapse of rubber prices
Unused land
High rural unemployment
Small farmers’ inability to switch crops
Ethnic tensions rooted in class divides
Increase in palm oil production
Integration of small farmers and unemployed rural population
1970s Small domestic market for ISI
Reliance on agriculture and mining
Single product for palm oil exports
Plantation sector dominated by foreign interests
Promotion of exports
Promotion of refineries (forward linkages)
Nationalisation of plantation ownership and control
(compared to 349 cases in banking and insurance) out of an overall total of 1,369 nationalisations. In
South and East Asia, nearly half of all expropriations took place in agriculture (UNCTC, 1978).

30
1980s Refining overcapacity and inefficiency
Anti-palm oil campaign on health and nutrition grounds
Export markets concentrated in Europe
Promotion of basic oleochemicals and specialty fats (forward linkages)
Market promotion for palm oil products
Rationalisation of refining sector
1990s Insufficient feedstock
Labour and land shortage
Rising costs of production
Heavily imported inputs, equipment and machinery
Inadequate infrastructure in East Malaysia
Internationalisation of upstream production
Promotion of byproducts from biomass (forward and lateral linkages)
Promotion of pre-upstream activities (backward linkages)
Infrastructure improvement in Sabah and Sarawak
2000s Rising competition from Indonesia and others
Dependence on foreign labour
Increased pressure for sustainability (private standards)
Growers’ productivity gaps
Internationalisation of downstream presence
Promotion of specialty products (e.g. phytonutrients and biofuel)
Maintaining and widening market access through PTAs
Promotion of mechanisation
2010s Declining competitiveness
Loss of GSP status with EU
Slower demand growth
Shift towards 2-tiered market (certified versus non-certified)
Innovation for increasing product and business competitiveness
Bilateral cooperation with Indonesia
Promotion of domestic consumption
Continuous inclusion and productivity improvement of small firms and smallholders
1.5 Institutional Framework of the Malaysian Palm Oil Sector
At present oil palm is cultivated by three types of producers: plantation firms, organised
smallholders (typically with four to seven hectares, organised through government schemes),
and independent smallholders (with 40.5 hectares or less, not part of government schemes).
Palm hectarage under government schemes has stagnated from the 1990s. Except for Felda,
government schemes have become less important. The share for independent smallholders,
numbering over 175,000, doubled between 1980 and 2014. Industrial-scale plantation firms
have always been dominant in the production system as a colonial legacy. Their share, in the
form of over 4,450 plantation estates, increased from 52% to 62% (Figure 1.6).

31
Figure 1.6. Palm plantation hectarage by producer type, 1980-2014.
Source: Malaysian Oil Palm Statistics, various issues.
Little has been written about how key industry actors are organised and linked in the institutional
framework through which the actors interact and the role of the state is exercised. Fold (1994,
1998) and Fold and Whitfield (2012) focus on regulation, which is only one of the many
important ways through which industrial policy is pursued in the Malaysian palm oil sector.
Within the production systems, actors within the Malaysian palm oil sector are commonly
differentiated by the function they perform within the value chains (Table 1.12). For instance,
upstream producers are those who grow oil palm for its fruits. They include plantation firms,
government schemes through which smallholders are organised, and the so-called independent
smallholders who fall outside the schemes. Midstream and downstream processors extract
crude palm oil and palm kernel oil from palm fruits, which are then refined and processed for
various products.
Table 1.12. Main actors in the palm oil sector.
Type Key Actors Representation on the Board of MPOB
Upstream producers
Federal Land Development Authority (Felda)
Plantation firms
Smallholders (organised and independent)
Direct
Indirect through MPOA, MEOA, SOPPOA, EMPA
Indirect through Felda (organised) and NASH (independent)
Midstream & downstream processors
Millers
Crushers
Refiners
Oleochemical producers
Specialty fats producers
Biodiesel producers
Indirect through POMA
Indirect through PORAM
Indirect through PORAM
Indirect through MOMG
Indirect through PORAM
0
500,000
1,000,000
1,500,000
2,000,000
2,500,000
3,000,000
3,500,000
4,000,000
4,500,000
5,000,000
5,500,000
1980 1985 1990 1995 2000 2005 2010
Hectares
Private Estates Independent Smallholders Government Estates

32
Government agencies
Ministry of Plantation Industries and Commodities (MPIC)
Malaysian Palm Oil Board (MPOB)
Malaysian Palm Oil Council (MPOC)
Malaysian Industrial Development Authority (MIDA)
Ministry of International Trade and Industry (MITI)
Ministry of Finance (MOF)
State Governments of Sabah and Sarawak
Direct
Direct
Direct
Direct
Direct
Industry groups & associations
Roundtable on Sustainable Palm Oil (RSPO)
Malaysian Palm Oil Association (MPOA)
Malaysian Estate Owners Association (MEOA)
National Organisation of Smallholders (NASH)
Palm Oil Millers Association (POMA)
Palm Oil Refineries Association of Malaysia (PORAM)
Malaysian Oleochemical Manufacturers Group (MOMG)
Sarawak Oil Palm Plantation Owners Association (SOPPOA)
East Malaysia Planters Association (EMPA)
Malaysian Biodiesel Association (MBA)
Direct
Direct
Direct
Direct
Direct
Direct
Direct
Direct
Input & equipment suppliers
Seed providers
Fertiliser producers
Agrochemical producers
Equipment and machinery makers
Manufacturers & retailers
Manufacturers of food and non-food consumer goods
Retailers
Traders Traders and exporters of palm oil, palm-based products
Importers and distributors of inputs, machinery and parts
Dealers of palm fruits
Transport & logistics operators
Warehousing and storage providers
Shipping lines
Land freight operators (truck)
Financiers Commercial and development banks
Investors
Brokers
Research institutions
Public universities
Private research laboratories and firms
Stakeholder groups
Civil society organisations
Labour unions and smallholder cooperatives
The upstream producers and the midstream and downstream producers share several common
characteristics: 1) a long history of existence; 2) well organised through a range of industry
associations (or through government schemes in the case of smallholders); 3) have substantial
business interests and operations domestically; and 4) locally owned. Some firms perform a
range of functions (being more vertically integrated than others); they usually hold membership
in more than one industry association. The non-producer and non-processor actors are less
organised and have low formal representation. The reasons for this vary. In trading for instance,
the larger plantation firms are already performing trading functions for inputs (for own use and
external sales) and for palm oil products in export markets, and their representation exists
through other industry association. The remaining, so-called independent traders are far less
integrated (with limited production assets) and many in number. They also vary in size and in

33
scope of products and markets, although most can be characterised as locally owned small and
medium sized enterprises (SMEs).
Others choose to organise themselves on an industry-wide basis, instead of by functions within
the value chains. These include three important actors: suppliers of inputs (e.g. agrochemicals,
fertilisers, equipment and machinery; manufacturers who are industrial users of palm-based
derivatives for making food and non-food finished products; and retailers who carry such
consumer products. They exist mostly as locally incorporated subsidiaries of foreign lead firms,
and have limited operations in Malaysia (often in corporate, marketing and distribution functions
since production facilities could be located elsewhere based on their global strategy). Many of
them are part of the Roundtable on Sustainable Palm Oil (RSPO), a not-for-profit private-led
initiative that was created to address rising sustainability concerns in palm oil value chains.11
RSPO has developed a certification system for sustainable palm oil based on a set of socio-
environmental criteria. It now has 2,500 members worldwide representing different segments of
the value chains (upstream producers, midstream and downstream processors, consumer
goods manufacturers, retailers, banks/ investors and socio-environmental non-governmental
organisations).
The state is typically associated with the role of regulation through institutions such as
government agencies. In practice, however, the state exercises multiple roles for industrial
development through different institutional channels (Table 1.13).12 The roles are: (1) regulator/
promoter, by setting tariffs and production levels for certain activities, and by providing
promotion and marketing services; (2) producer, by participating directly in economic activity; (3)
consumer, by ensuring a market for products and services through procurement programmes;
(4) financier, by influencing credit markets and promoting financial resources for industrial
activities and projects; and (5) innovator, by undertaking R&D for improving technologies and
processes. Strong informal relationships exist among state institutions, firms and individuals.
They are likely important channels but are outside the ambit of this study. Conflicts between the
multiple roles and institutions arise from time to time, for instance when state-owned producers
11 RSPO was established in 2004 with its secretariat based in Kuala Lumpur. The 10 founding
members included World Wide Fund for Nature (WWF), major consumer goods manufacturers and
retailers (Unilever (Netherlands-UK), Migros (Switzerland), AarhusKarlshamn (Sweden-Denmark), The
Body Shop (UK)) as well as oil palm growers and processors.
12 This follows the approach by Peres and Primi (2009) which divides state interventions in support
of industrial development by different roles. However, they have identified only four: regulator, producer,
consumer and financial agent and investor. In the case of Malaysia’s palm oil industry, the state’s role as
a consumer is somewhat limited since the bulk of the products are for exports.

34
are perceived to be receiving preferential treatment in regulation, financing and other forms of
assistance.
Table 1.13. Roles of the state as exercised through its formal institutional channels.
Channel Regulator/ Promoter
Producer Consumer Financier Innovator
Government agencies & public/ quasi-public institutions
MITI, MOF, MPIC, MPOB, MPOC
MPOB, development finance institutions
MPOB, public universities, research institutes
State-owned plantation firms
Sime Darby, Felda Global Ventures, Boustead Plantations, TH Plantations
Sime Darby, Felda Global Ventures, Boustead Plantations, TH Plantations
Sime Darby, Felda Global Ventures
Government smallholder schemes
Felda, Federal Land Consolidation and Rehabilitation Authority (Felcra), Rubber Industry Smallholder Development Authority (Risda)
The first formal institutional channel is government agencies and public or quasi-public
institutions. The palm oil sector is regulated by a host of federal and state government agencies
with different functions and mandates at the macroeconomic, sectoral and industry levels.13
Other public inst itutions exist for roles beyond regulation. Research institutes such as the
Malaysian Agricultural Research and Development Institute (MARDI) and public universities
such as Universiti Pertanian Malaysia or Agriculture University of Malaysia (UPM by its Malay
name), which has since been renamed Universiti Putra Malaysia) serve the role as innovator by
working closely with the private sector. Development finance institutions serve the role as
13 At the macroeconomic management level, Malaysia has a three-tiered planning process covering
the long- (10 years and above), medium- (5 years), and short-term (annual) planning horizons (EPU,
2004). Past long-term plans include Vision 2020 (1991-2020); Outline Perspective Plans (OPPs) (1997-
1990, 1991-2000, and 2001-2010). They spell out the broad strategies and goals. The last OPP ended in
2010 which some see as an implicit acknowledgement of increased difficulty for long-term planning in a
rapidly changing economic environment. Medium-term Malaysia Plans are formulated by the Economic
Planning Unit (EPU) within the Prime Minister’s Department to operationalise the OPPs and its successor,
ETP. Growth targets and public sector allocations are provided to help the private sector determine their
investments. The country is now in its 11th Malaysia Plan covering the 2016-2010 period. Short-term
planning is done through annual budgets.

35
financier. One particularly important institution is Bank Industri & Teknologi Malaysia which
provides financing for industrialisation and export-oriented industries (Gustafsson, 2007).
The palm oil sector is one of the few in Malaysia with an ‘industry steward’ in the form of the
Malaysian Palm Oil Board (MPOB), which straddles the roles of regulator, innovator and
financier. It is a statutory body under the Ministry of Plantation Industries and Commodities
(MPIC), which is responsible for development of commodities and commercial agriculture.
MPOB was established in 2000 by merging the Palm Oil Registration and Licensing Authority
(PORLA) and the Palm Oil Research Institute of Malaysia (PORIM). PORLA was inaugurated in
1977 to regulate, coordinate and promote all activities within the palm oil sector through
registration, licensing and enforcement, and industry dialogues. For instance, the replanting
subsidy scheme (which helps smallholders and estates replace mature, less productive palm
trees) has been implemented in consultation with the private sector to coincide with periods of
glut and low prices to also reduce supply (Rasiah, 2006). When local firms became more
internationalised, the ban on exports of planting materials was relaxed to benefit Malaysian-
owned plantations abroad while duty-free crude palm oil export rights were granted to local firms
with refineries abroad. PORIM was established in 1979 with the objectives of conducting R&D
(Moll, 1987).14 MPOB has absorbed these functions and more importantly, retained its
predecessors’ historical characteristics of having members of both the government and industry
within the organisation (while top management and internal divisions are made up of civil
servants).
The board of MPOB, sitting at the apex of the organisation’s governance structure, has
permanent representation from selected government agencies and industry associations
representing different producer groups (Table 1.12). The composition is indicative of the level of
importance assigned to different actors from the government’s perspective. A glaring exclusion
is the RSPO, although it has been a regular participant at government dialogue and
engagement sessions with the private sector. The challenge for public-private collaboration is
whether it can embrace civil society organisations and evolve into a more inclusive multi-
stakeholder partnership.
A quasi-public institution that is closely linked to the MPOB is the Malaysian Palm Oil Council
(MPOC). It was first set up as a private firm in 1990 (as the Malaysian Palm Oil Promotion
Council) to undertake public relations and market promotion of palm oil in the export markets, by
14 PORIM was set up with after strong industry lobby from oil palm growers, with support from
MARDI and UPM to take over R&D function from MARDI’s oil palm branch (Rasiah, 2006). For a history
of PORIM, see (Global South-South Development Academy, 2001).

36
organising trade missions and exhibitions as well as distributing information on nutritional
aspects of palm oil (Simeh & Tengku Ahmad, 2001).
At the ministry level, the key ones other than MPIC are the Ministry of International Trade and
Industry (MITI) and the Ministry of Finance (MOF). MITI is the principal ministry charged with a
general oversight of industrial development in primary through tertiary sectors (agriculture,
manufacturing and services). The ministry’s Industrial Master Plans (IMPs) outlines sectoral
strategies as well as the priority areas of activities within key industries in each sector as
targeted by the government. Currently, the third IMP, covering the 2006-2020 period, is in
operation.
In addition, MITI, through its Malaysian Industrial Development Authority (MIDA), assists foreign
and local companies with their investment in the manufacturing and services sectors and
implementation of their investment projects. Another MITI agency, the Malaysia External Trade
Development Corporation (MATRADE), promotes Malaysia’s export of manufactured, semi-
manufactured goods and professional services. MOF provides the necessary fiscal incentives
and expenditure allocations that support industrial development, in addition to handling tax
administration through the Customs Department and the Inland Revenue Board.
The second institutional channel is government schemes which organise smallholders and
serve mainly the role of producer. Together, these schemes hold about a quarter of total oil
palm hectarage in Malaysia. Among them, Felda has the largest oil palm hectarage in the
country (13% of total national hectarage in 2014). Since 1990, Felda ceased settler intake due
to high programme costs and labour shortages. It undertook corporation of management, and
took on a profit-making dimension in addition to its original objectives (Fold, 2000; Khor,
Saravanamuttu, & Augustin, 2015). Other government schemes include the Federal Land
Consolidation and Rehabilitation Authority (Felcra), Rubber Industry Smallholder Development
Authority (RISDA) and much smaller schemes at the state level.
The third channel is plantation firms in which the state is a substantial or majority shareholder.
Of the 20 largest plantation firms in Malaysia by palm hectarage, seven are majority owned by
state capital through various investment vehicles such as PNB, Felda, Pilgrims Fund Board
(LTH), Retirement Fund Incorporated (KWAP), Armed Forces Fund Board (LTAT) and
Employees Provident Fund (EPF). These firms include Felda Global Ventures, Sime Darby,
Boustead Plantations, TH Plantations, IJM Plantations, Kulim (Malaysia) and TDM.
Even in other plantation firms that are majority owned by private capital, state capital is
prevalent, often holding substantial shareholdings exceeding 5%. The prevalence of state
37
capital follows nationalisation of plantation interests dating back to the 1970s. Malaysia then
had become a significant producer and exporter of crude PO, but production and exports were
largely controlled by a small number of primarily British firms (Pletcher, 1990; Searle, 1999).
The government required foreign owned plantation firms to spin off their Malaysian holdings as
subsidiaries domiciled in Malaysia and used PNB, the government’s principal Bumiputera trust
agency, to purchase majority ownership in these subsidiaries on the stock market (Pletcher,
1990; Rock & Sheridan, 2007). The process was largely achieved through negotiation but at
times became hostile, as seen in the ‘dawn raid’ by PNB to gain control of Guthrie Corporation
in 1981 (Yacob & White, 2010). Guthrie was the leading plantation firm in Malaysia which was
under British ownership and which was listed on the London Stock Exchange then. It was
subsequently merged with Sime Darby. Through nationalisation, Malaysia was able to inherit
sector-specific knowledge from the firms. Some state-owned firms play the role as innovator
either through in-house R&D or when they commercialise technologies jointly developed by
MPOB, public universities and research institutes. They also serve as consumers of raw
materials, mostly palm fruits and crude palm oil, for production of processed products.
1.6 Structure of the Dissertation
Given the scope of the issues at stake, tensions between the breadth and depth of research
were real. Finding the best fit requires judgements which are not necessarily agreeable to all.
This dissertation opts for the three- essay format. What it lacks in depth in some parts, it is
hoped that the dissertation more than makes up for it by producing a more holistic picture of the
key economic, policy and social questions associated with agro-commodity value chain
upgrading – which are often explored in isolation from each other. Section 1 provides contextual
and background information to the approaches and findings of the three essays. The three
essays appear in Sections 2 through 4. The last section integrates the issues from the essays
and discusses the implications of issues and trends in agro-commodity value chain upgrading
for development.
The first essay examines the fundamental question of whether upgrading in agro-commodity
value chains differs from the trajectory of vertical specialisation as espoused by researchers and
practitioners and if so, how and why. The case study points to linkage development in the
Malaysian palm oil sector due to a combination of state policies and firm-specific actions since
the 1970s. With newly attained midstream and downstream capabilities, the sector began to
produce and export higher value added goods and services. Sectoral linkage development
accelerated when a handful of local lead firms became increasingly vertically integrated and
internationalised. The trajectory can be explained by the unique production characteristics,

38
sectoral dynamics and historical settings of agro-commodity value chains. The findings suggest
that vertical specialisation is less applicable across all GVC types than thought, and that
development policy and research should delve more into hindrances to linkage development in
similar additive value chains.
The second essay systematically studies Malaysia’s industrial policy for its palm oil sector
through three distinct stages of development. While policies that seek to improve
macroeconomic conditions, infrastructure, business climate and human capital are important for
resource-based industrialisation (RBI), the more targeted and aggressive measures (such as
alteration of internal terms of trade against traditional primary imports and export facilitation) are
critical, though their importance gradually declines over time. The Malaysian experience also
shows that local instead of foreign firms drove the initial phase of RBI. The limited evidence
suggests that nationality of firms remains relevant for RBI due to local specificity and trade
distortions in relation to resources as well as embeddedness of local firms. Public action matters
for indigenous innovation efforts. As RBI advances to a more mature phase, industrial policy
must evolve from direct provision of innovation services to linking the various actors within the
sector and inducing commensurable private investment in innovation.
The third essay investigates economic and social outcomes from upgrading in Malaysia’s palm
oil sector since 2000. Measured by changes in the labour shares for the industries within the
sector, social upgrading is detected in most cases between 2000 and 2010, even in the
scenario of economic downgrading in which gross value added (GVA) as a share of output
declined. High returns accruing to capital owners (including smallholders) and skilled labour
held steady and even improved in at least half the industries. In contrast, the wages and work
conditions for low-skilled labour, concentrated in primary production and made up
overwhelmingly of migrant workers, showed slower progress. Such differences partly reflect the
actors’ position and the skill content of their work in the value chain. They also reflect the lack of
political representation and institutional arrangements affecting labour rights and bargaining
power for migrant workers. It demonstrates that economic upgrading does not automatically
lead to social upgrading for all, and that a rethinking on who constitutes the vulnerable groups
along the value chain is needed in view of new production realities.

39
2 Vertical Specialisation or Linkage Development in Agro-
Commodity Value Chain Upgrading? Evidence from the
Malaysian Palm Oil Sector
2.1 Introduction
In recent times, global value chain (GVC) as a new form of industrial organisation has fuelled
cautious optimism regarding developing countries’ position in the global economy. As
production becomes fragmented, aided by technological innovations and trade liberalisation, a
country is posited as being involved in a specific stage of production using imported inputs
before passing the good, be it intermediate or final, onto another (Hummels et al., 2001). A
country upgrades thereon by graduating to another stage of production offering better returns.
Variations of the notion of vertical specialisation have since been adopted by and promulgated
in the international policy and development discourse.
Surprisingly, the proposition tends to treat all GVCs as the same and does not consider the
possibility that vertical specialisation may be unsuited for all value chain types, be it as a
strategy for insertion or upgrading. This essay (Essay 1) assesses development of the
Malaysian palm oil sector from the 1970s to the present to test the validity of vertical
specialisation in agro-commodity value chains. It finds little evidence for strict vertical
specialisation in the case of Malaysian palm oil, which is often cited as a relatively successful
example of industrial upgrading (See, for example, Chandra (2006); Global South-South
Development Academy (2001); UNECA (2016)). Instead, it shows that linkage development at
the sectoral level and vertical integration at the firm level through a combination of state policies
and firm actions have driven the sector’s development. The evidence is analysed for drawing
out unique production characteristics, sectoral dynamics and historical settings of agro-
commodity value chains that explain their upgrading trajectories. A better understanding of
these factors is important for developing countries, especially least developed countries (LDCs),
which are deeply embedded in agro-commodity value chains and derive over 60% of their total
goods export earnings from commodities (UNCTAD, 2015).
Section 2.2 reviews the concepts of upgrading. It highlights that vertical specialisation leading to
upgrading in agro-commodity value chains remains speculative, and indicates a need to
differentiate between resource-based and non-resource-based manufactured goods in existing
value chain taxonomy. Section 2.3 explains the methods and data for the case study, which
relies not only on industry database and existing research, but also on interviews with firm and

40
government representatives as well as site visits. Section 2.4 presents a picture of sectoral
upgrading characterised by productivity gains, emergence of new industries and products,
increased linkage effects and improved manufacturing value added. It analyses the
considerations that drive linkage development. Section 2.5 examines firm-level upgrading to
explain the rise of vertical integration and internationalisation of local lead firms. Despite the
benefits associated with linkage development, few processing activities are based in developing
countries. The last section concludes the essay with both theoretical and practical implications
for research and policy.
2.2 Vertical Specialisation and Value Chain Taxonomy
Links of value chains are “repositories for rents” arising from unequal access to resources and
from differential productivity of factors, including knowledge and skills (Kaplinsky, 2000).
Economic upgrading – commonly referred to as ‘moving up the value chain’ – is defined as
“development of capabilities in targeted areas of value accretion, in order to maintain or
increase incomes in the face of rising competitive pressures” (Humphrey & Schmitz, 2002;
Kaplinsky, 2005). Numerous case studies have focused on restructuring of international
production networks by lead firms, as well as the extent, nature and determinants of upgrading
in products including toys, garments, beverages, computers and automobiles (see, for example,
Gereffi (1999); Kishimoto (2003); Nolan (1999); Ruigrok & van Tulder (1995); Sturgeon et al.
(2008)).
Five types of upgrading – product, process, functional, channel and intersectoral – have been
identified (Humphrey & Schmitz, 2002; Frederick & Staritz, 2012). Process upgrading improves
efficiency through reorganised production systems or better technology. Product upgrading
shifts production to more sophisticated product lines with increased unit values. Functional
upgrading focuses on acquisition of new functions to increase the skill content of activities.
Channel upgrading involves diversification to new buyers or geographic and product markets.
Intersectoral upgrading signifies a move into a different value chain, using old and new
competences.
The GVC literature offers little answer on the permutation of upgrading types and how the
combination shapes upgrading trajectories over time for a country’s economic activity and the
firms within. Some seminal works from the economic geography and international trade streams
provide useful conceptualisation (as well as measurement) of fragmentation of production and
vertical specialisation (See, for example, Helpman and Krugman (1985); Feenstra (1998);
Baldone et al. (2001); Jones and Kierzkowski (2005)). Arndt and Kierzkowski (2001) stress that

41
“the international division of labour now matches factor intensities of components with factor
abundance of locations”. Hummels et al. (2001) argue that global production has become “a
vertical trading chain that stretches many countries, with each country specialising in particular
stages of a good’s production sequence”. Vertical specialisation can thus be described as a
phenomenon where firms slice up production and divide it across different locations abroad
(offshoring), with or without ownership links. Parts and components or intermediate goods cross
borders to be transformed into final products and more elaborate intermediate goods going back
to the same country or ending up in other countries.
Gereffi (1999) remains one of the few that explicitly incorporates vertical specialisation into long-
term upgrading trajectories. From the 1960s through the 1990s, East Asian firms progressed
from low-cost, labour-intensive assembly through original equipment manufacturing (OEM) and
original design manufacturing (ODM) before finally reaching original brand manufacturing
(OBM). Later, the firms offshored manufacturing while retaining and deepening skill-intensive
functions such as trading and logistics. The trajectory can be described as successive vertical
specialisation, or one form of vertical specialisation after another.
A familiar refrain in international development these days is that countries should target specific
functions and activities in which they have a comparative advantage within a GVC rather than
an entire sector. Once inserted into the value chains, they can deepen their capabilities, achieve
specialisation and derive benefits from scale. With accumulated capabilities, countries can
migrate to processes, products or functions with higher domestic value added, and develop new
specialisation. This kind of discourse is encapsulated in a joint statement by the Organisation
for Economic Cooperation and Development, World Trade Organisation and United Nations
Conference on Trade and Development:
In a world of GVCs… [governments] can nevertheless encourage firms to join
an existing global value chain, which may have low entry barriers and enable
firms to realise export success relatively quickly and at low cost. …rather than
being obliged to develop vertically integrated industries (producing both
intermediates and final products), firms can become export-competitive by
specialising in specific activities and tasks (emphasis added). For example,
China specialised in the assembly of final products in the electronics industry
and has become the largest exporter of ICT products; other countries
specialised in the assembly of intermediates (e.g. sub-systems for motor
vehicles in Mexico), the production of parts and components, or ICT services,
e.g. India (OECD, WTO, & UNCTAD, 2013).

42
Such characterisation of upgrading escalates the unit of analysis from firms to countries. It also
overlooks the fact that the logic of successive vertical specialisation was derived largely from
evidence in GVCs for non-resource-based manufactured goods. The prevailing taxonomy of
value chains revolves around two dimensions: the type of the ‘driver’ (buyer-driven versus
producer-driven) and the governance patterns (arms-length, quasi-hierarchical and intra-firm)
(Gereffi, 1994; Gereffi et al., 2005). The taxonomy is useful for highlighting the dynamics
between lead firms and their suppliers in upgrading considerations. Yet, it does not consider the
inherent sectoral and production differences across value chains.
Kaplinsky and Morris (2015) argue that, beyond the conventional taxonomy, value chains can
be distinguished between those that are “vertically specialised” and “additive” in nature. In
vertically specialised chains, production activities can be undertaken in parallel and processing
loss or degradation is minimal, thus increasing possibilities for the various stages of production
to be “sliced up” and dispersed geographically. In contrast, additive chains involve sequentially
adding value to raw inputs (which make up a large proportion of total value of the final product).
Coupled with potentially large processing losses, this feature makes fragmentation and parallel
execution of production less feasible (Kaplinsky & Morris, 2015). While GVCs for manufacturing
and services become increasingly vertically specialised, resource-based sectors tend to
dominate additive chains. The implication is that, while successive vertical specialisation is
appropriate for upgrading in vertical specialised chains, it is likely that additive chains require a
different upgrading pathway.
Sectoral linkage development occurs when investment is made in input-supplying activities
(backward linkages) or in output-using activities (forward linkages) (Hirschman, 2013). It may
take place within a single firm or across multiple firms within the sector. When linkage
development takes place intra-firm – a firm expanding its business into different stages along
the value chain – it becomes vertical integration. Vertical integration reduces contracting friction
from a transaction cost perspective, and may provide scale and scope economies while
extending market power (Coase, 1937; Stigler, 1951; Williamson, 1971). Hirschman who coined
the concept of linkages argues that it is difficult to establish backward and forward linkage
industries around agricultural and industrial raw materials (Hirschman, 2013).15
15 Hirschman’s original reasoning was that food production is consumed and agricultural
commodities are exported with minimal processing. He later revised his position to suggest that the
limited linkages effects are due to a high degree of technological “strangeness” or “alienness” of the new
economic activities in relation to the ongoing ones (primary industries are unfamiliar with technology used
in input and processing industries). When processing industries are established around growing sites, the

43
2.3 Methods and Data
This essay employs a case study design suited to the purpose of GVC research. The GVC
framework takes an industry-centric view that highlights the linkages between firms and other
economic actors from the local to the global levels of analysis (CGCC, n.d.). The case study
uses a mixed-methods approach, combining descriptive statistics on sectoral and firm
performance with the reporting of primary research in the form of notes from interviews with 25
firm and non-firm actors related to the Malaysian palm oil industry. Data analysis was performed
on two levels (sectoral and firm) and is presented as such. The sectoral data were obtained
mainly from the annual Malaysian Oil Palm Statistics (from 1980) published by the Malaysian
Palm Oil Board (MPOB), and Oil World Annual (from 1987) produced by the Hamburg-based
ISTA Mielke GmbH. Malaysia’s input-output tables were used for calculating changes in linkage
effects that have occurred in Malaysia’s palm oil sector. The data on firms were compiled from
annual reports published for financial years 2014/2015 by 20 firms with the largest reported
palm plantation hectarages, of which all but two are public listed companies in Malaysia.
Semi-structured interviews were subsequently conducted to explore the key issues raised in the
descriptive statistics. Confidentiality was granted to ensure that the subjects were at ease with
expressing their opinions. A total of 25 interviewees were interviewed in the states of Selangor,
Johore and Pahang in Peninsular Malaysia between March and August 2015. They comprised
12 senior executives overseeing strategy and management at their firms, seven government
officials with regulatory and planning responsibilities, and six industry analysts and trade
association officials. Two firm interviews were accompanied by field visits to oil palm cultivation
and processing sites. Purposive sampling was used in that the interview subjects were chosen
‘with purpose’ for their relevant experience and opinions. The list of interviewees was
constructed based on discussion with key informants in government and industry. The criteria
for selecting the interviewees were that they were practitioners, experts or regulators who had
industry and policy experience and knowledge; that they were willing to answer a list of
preliminary questions (Annex 1); and that they were available for further interviews in person.
2.4 Sectoral Upgrading
With an economic life of about 25 years, oil palm trees produce fig-sized fruits in bunches
weighing 20 to 30 kilogrammes. Three main products are derived from processing of the fruits:
existence of forward linkages has depended more on compelling technical characteristics of the product
than on entrepreneurial choice (Hirschman, 2013).

44
palm oil from the mesocarp; palm kernel oil from the kernel; and residual kernel cake from
milling and crushing. Over 70% of palm oil is used for edible purposes given its flexible
attributes suitable for food applications. Palm kernel oil, a heavily saturated lauric oil, is mostly
used for non-edible uses. Both palm oil and palm kernel oil can be processed into liquid olein
and solid stearin fractions, which can be further processed into a range of products. The
residual cake is used as animal feed, paper and fertiliser.16 Table 2.1 shows the key products
and segments in the simplified palm oil value chains. A detailed schematic with product listing
and explanation on the main processes can be found in Annex 2.
Table 2.1. Products and segments in simplified palm oil value chains.
Stage Key segment Segment description Product
Upstream Input supply Produce and distribute goods that planters use for their production activities
Machinery/ equipment
Agrochemicals
Fertilisers
Seeds and planting materials
Plantation Grow and harvest fresh fruit bunches (FFBs)
FFBs
Milling & crushing (primary processing)
Process FFBs into crude palm oil (CPO) and crude palm palm kernel oil (CPKO)
CPO CPKO
Waste and Residue Management
Convert biomass wastes and residues from primary processing into further uses (e.g. animal feed and energy generation)
Palm kernel cake (PKC)
Empty fruit bunches
Palm kernel shell
Palm oil mill effluent
Midstream Trading Trade palm oil and palm-based products from CPO, CPKO, PKC onwards on domestic and international markets
Services
Transport & logistics
Coordinate transportation, storage and delivery of traded goods
Services
Basic refining (secondary processing)
Refine and fractionate crude products into a wide range of basic processed palm oil (PPO) and processed palm kernel oil (PPKO) products
Main PPOs: refined, bleached, deodorised (RBD) palm oil; RBD palm olein; RBD palm stearin
Main PPKOs: RBD palm kernel oil; RBD palm kernel olein; RBD palm kernel stearin
Palm fatty acid distillates and palm kernel fatty acid distillates (by-products from refining processes)
16 The processing of 70 tonnes of FFB produces 15 tonnes of CPO, 2 tonnes of CPKO and 4
tonnes of palm kernel shell. The biomass from processing includes 50 tonnes of palm oil mill effluent, 9
tonnes of fibre, 15 tonnes of empty fruit bunches, 13 tonnes of frond and 8 tonnes of trunk (Hassan &
Abd-Aziz, 2012).

45
Downstream Further refining (secondary processing)
Further process PPO and PPKO into intermediate or finished products
Edible oils
Specialty fats
Oleochemicals
Biofuel
Phytonutrients
Food & non-food manufacturing
Produce consumer goods using palm oil derivatives as functional ingredients or processing aids
Food products
Personal and household care products
Distribution & retail Sales of goods for household consumption
Source: Interviews, various publications.
Various upgrading types were present at the sectoral level. As a result of process upgrading,
yields for crude palm oil (CPO) and crude palm kernel oil (CPKO), measured as tonnes of CPO
and CPKO per hectare per year respectively, almost doubled between 1975 and 2014 (Figure
2.1). The improved CPO yield, from 1.96 to 3.65 tonnes, reflects improvements in production
efficiency (larger quantity of fruits), processing efficiency (higher oil extraction out of fruits), and
the quality of inputs (better seeds). The improved CPKO yield, from 0.17 to 0.40 tonnes,
indicates better recovery rates of palm kernel from the milling of palm fruits as well as greater
processing efficiency.
Figure 2.1. CPO and CPKO yields, 1975-2014.
Source: Malaysia Economic Statistics Time Series, 2015.
The improved seeds in the form of the high-yield Tenera variety also reflected product
upgrading. They emerged from intensified selection and breeding efforts by both private and
public entities in the 1960s (Corley & Tinker, 2016). The seeds’ strategic importance to industry
-
0.50
1.00
1.50
2.00
2.50
3.00
3.50
4.00
4.50
CPO Yield (Tonnes/ Hectare) CPKO Yield (Tonnes/ Hectare)
46
competitiveness is attested by a government ban on seed exports since the early 1970s. The
ban was only relaxed in 2013 to allow seeds exports to overseas plantations that are more than
70% owned by Malaysian interest.
Functional upgrading was most evident in the emergence of palm oil refining and downstream
activities. Initially, Malaysia had only one single palm oil product for exports: CPO. In situ
production of CPO close to plantations is always a necessity. Once harvested, palm fruits must
be milled within 24 hours to avoid fruit bruising which affects palm oil quality. Most mills are
hence located adjacent to plantations and owned by plantation operators. Only two foreign-
owned refineries existed in Malaysia to cater for domestic market in the 1960s (Martin, 2003).
Earlier, groups of oil palm growers had attempted to establish cooperatively owned refining
plants and to coordinate marketing and shipment. Large plantation firms, which were controlled
mostly by British, refused to take part and led to failure of the initiative. According to one major
industry figure, the firms “neither wanted nor dared to offend Unilever, by far their largest
customer, who at that time was opposed to the establishment of an independent refining
industry in Malaysia” (Fold, 1998).
In arguing against the establishment of refining plans in Malaysia, palm oil buyers used the
comparative advantage argument that processing was capital-intensive but Malaysia had an
abundance of labour, and that Malaysia had neither the indigenous technological and marketing
capabilities nor the facilities and procedures for handling and shipping. There were also
concerns with product quality deterioration during shipping (Gopal, 2001). The one major
deterrent was likely to be cascaded tariff structures in industrialised economies which accorded
heavy effective protection to domestic processing industries (Athukorala, 1998; Helleiner,
1973).17
From the early 1970s, the Malaysian government nationalised plantation interests through
negotiated transfers and hostile takeovers (Pletcher, 1990; Rock & Sheridan, 2007; Yacob &
17 That tariffs and other trade barriers in major markets tend to escalate with the level of a product’s
processing is not disputed. What is less clear-cut is whether tariffs are the main reason working against
the efforts of commodity-dependent countries to increase domestic processing. One should take into
account of the Generalised System of Preferences (GSP) and the Lome IV Convention preferences
received by some developing countries (including the least developed countries), as Safadi and Yeats
(1994) did with their study on commodity exports from Sub-Saharan Africa. Other constraints include high
capital and skill requirements, transport costs that escalate with processing, and high entry barriers
associated with the market power of a few large oligopolistic firms (World Bank, 1996).
47
White, 2010). It also introduced a number of horizontal and sectoral policy measures including: i)
higher export duties on raw materials (through a graduated system that awards duty exemption
to processed products based on their degree of processing); ii) incentives (mostly tax measures)
for investment and export promotion; and iii) export credit financing and insurance (Gopal, 2001;
Gustafsson, 2007; Jomo et al., 2003).
Public research institutes were created to intensify research and development in areas such as
agronomics, processing, and downstream products. Technologies were developed in
collaboration with private firms for commercialisation. Among this was a continuous sterile
process in milling that reduced setup costs by 15% and the number of operators required by
more than a third. Tools and machinery for harvesting palm fruits, infield transportation of palm
fruits, and collection and separation of loose fruits were created to increase mechanisation
(MPOB, 2010b). This led to the emergence of a great number of small and medium-sized
enterprises producing and distributing equipment and parts in the input segment (fertilisers,
agrochemicals and heavy machinery such as tractors remain largely imported).
The policy measures were not without problems, which were most visible in relation to trade
measures. The export duty structure increased domestic supply and widened world and
domestic CPO price differentials, enabling refiners and processors to make profit at the expense
of plantation firms.18 Price distortions attracted massive investment into the refining sector and
introduced competition that led to the use of new technologies and more efficient production
methods. But it also created an overcapacity that continues to this day. The trade measures
also led to the ‘Singapore cocktail’ throughout the 1980s, in which palm oil products were
exported in the processed form to benefit from Malaysian tax exemption, only to be blended
again in Singapore and sold as CPO to international markets to avoid higher import tariffs on
processed products (Moll, 1987; Rossell, 2001). The rampant practice created potential
reputational risk for Malaysian exporters because while the reconstituted CPO was known as
Malaysian palm oil to global buyers, they could not guarantee its quality (USITC, 2003, 1987).
This has not been fully resolved, given Singapore’s role as an important transhipment port.
However, the problem is believed to have largely dissipated since the 1990s, as buyers knew
their suppliers better and used only those that they trusted.
18 Using gross margins of domestic versus European processors from 1980 to 1994 for dynamic
competitiveness analysis, Gopal (2001) estimates that Malaysian refiners were uncompetitive and
enjoyed excess profit due to policies in the 1980s but became just as competitive as their European
counterparts by the 1990s.

48
Notwithstanding the unintended consequences of those policy measures, their introduction
through the 1970s is widely recognised as a turning point that set off midstream and
downstream industries for Malaysian palm oil. Prior to 1974, Malaysia was refining and
fractionating about 90,000 tonnes of CPO, or less than 10% of the country’s total CPO
production. Malaysia began to export different types of processed palm oil (PPO) in 1975. By
the early 1980s, PPO overtook CPO as the main palm oil export product. Of Malaysia’s total
palm oil and palm-based product exports, the share of crude products (CPO and CPKO) was
reduced to a fifth in 2014, from 100% in the 1960s (Figure 2.2). The share of processed
products (PPO and processed palm kernel oil or PPKO) meanwhile grew to over half of total
palm oil export volume from virtually nothing. Malaysia’s market share in the global PPO market
grew from 2% in 1971 to reach a record high of 78% in 1982, before moderating to 54% in 1995.
The gains were made at the expense of mostly processors based in the EU (Table 2.2.
Malaysian PPO in the world PPO and processed oils market, 1971-1995.Table 2.2). Increased
PPO supply from Malaysia also helped cement the position of palm oil in as a key oils and fats
product, with PPO accounting for 15% of world processed oils in 1995 compared with a 3%
global share in 1971.
Figure 2.2. Palm oil and palm-based product exports, 1960-2014.
Source: Malaysian Oil Palm Statistics, various issues.
Table 2.2. Malaysian PPO in the world PPO and processed oils market, 1971-1995.
0
2,500,000
5,000,000
7,500,000
10,000,000
12,500,000
15,000,000
17,500,000
20,000,000
22,500,000
25,000,000
27,500,000
1960 1965 1970 1975 1980 1985 1990 1995 2000 2005 2010
Tonne
CPO CPKO PPO PPKO PKC Oleochemicals Finished Products Other Products Biodiesel

49
('000 tonne) 1971 1975 1980 1985 1990 1995
Malaysia 26 265 2,432 3,681 6,476 7,788
European Union 645 741 585 477 959 1,080
Rest of the world 546 985 432 1,224 1,669 3,327
World PPO total 1,217 1,991 3,449 5,382 9,104 12,195
World processed oils total 37,954 40,598 50,498 60,593 72,859 83,544
World PPO as % of world processed oils
3.2% 4.9% 6.8% 8.9% 12.5% 14.6%
Source: Adapted from Gopal (2001).
Development of processed and downstream products continued, most significantly with the
creation of the oleochemicals industry, driven partly by foreign direct investment (FDI) since the
1980s. As of 2014, Malaysia accounted for 20% of global basic oleochemicals production,
making it the world’s largest producer (MIDA, 2015). The government has since targeted refined
oleochemicals, production of biofuel by blending palm oil with fossil fuel, and commercial energy
generation from palm biomass. Higher-value oleochemicals and other finished products, which
emerged only from the 1980s, contributed to 13% of total export volume but 20% of total export
value. Coinciding with greater product profile that could cater to different uses, Malaysia
undertook channel upgrading. It expanded exports into new markets in populous emerging
economies instead of serving only traditional markets in Europe.
Linkage Effects and Value Added
By applying linkage analysis to 36 industries in Malaysia between 1991 and 2010 (see notes in
Annex 1), the study confirms the presence of ‘key industries’ within the palm oil sector, defined
as those with strong backward and forward linkages. The explanation notes for calculating the
linkage effects using the Sensitivity of Dispersion and the Power of Dispersion Indices, and their
coefficients of variation are provided in Annex 3. The complete results are ranked and
presented in Annex 4. Annex 5 explains the derivation of net foreign exchange earnings from
the exports of goods and services for various industries.
Briefly, the Power of Dispersion Index measures total backward linkage of an industry. An
industry has significant backward linkages (greater than 1) when its production of output
requires substantial intermediate inputs from other industries. The Sensitivity of Dispersion
Index measures total forward linkage of an industry. An industry has significant forward linkages
(greater than 1) when it supplies significant amounts of outputs to other industries in their
production. Key industries are those with strong backward and forward linkages. The
coefficients of variation measure the extent to which the linkage effects are spread over all
industries.

50
With regards to backward linkages, the primary industries generally have weak linkages (below
1) for all periods considered (Table 2.3). The use of inputs from others is low because these
industries make direct substantial use of natural resources in their production. The exception
here is livestock and fishing (4), mainly because of its extensive use of inputs such as animal
feeds. The tertiary industries, too, have moderate backward linkages. Construction (26) and
hotels and restaurants (28) consistently have strong demand for inputs. However, their relatively
high backward coefficients of variation suggest that they draw upon a narrow range of
industries.19
Table 2.3. Power and Sensitivity of Dispersion Indices for 36 industries, 1991-2010.
Industry Code 1991 2000 2005 2010
Backward Forward Backward Forward Backward Forward Backward Forward
Rubber 1 0.747 0.976 0.728 0.784 0.754 0.587 0.888 0.636
Oil palm 2 0.742 1.052 0.859 1.080 0.826 1.027 0.761 1.148
Agriculture 3 0.842 0.880 0.846 0.859 0.884 0.769 0.718 0.654
Livestock and fishing
4 1.254 0.997 1.303 0.986 0.967 0.920 1.044 0.684
Forestry and logging
5 0.754 1.094 0.797 1.196 0.684 0.822 1.217 1.460
Crude oil and natural gas
6 0.744 1.516 0.720 1.281 0.706 1.421 0.684 1.329
Other mining and quarrying
7 0.969 0.782 0.958 0.742 1.086 0.615 0.763 0.742
Food, beverage and tobacco
8 1.221 1.158 1.197 1.168 1.099 0.932 1.063 0.893
Oils and fats 9 1.790 1.309 1.956 1.528 1.483 1.160 1.527 1.271
Textiles and leather
10 0.961 0.860 1.050 0.880 1.101 0.832 1.052 0.721
Apparels and footwear
11 0.895 0.710 1.048 0.741 0.946 0.573 0.922 0.625
Wood products 12 1.305 0.846 1.231 0.804 1.056 0.695 1.439 0.806
Paper products and furniture
13 1.069 0.894 1.094 1.035 1.086 0.954 1.198 0.793
Printing and publishing
14 0.917 0.863 1.073 0.762 0.992 0.714 0.993 0.687
Refined petroleum products
15 1.323 1.075 1.064 1.467 1.124 1.994 0.988 1.367
Chemicals and pharmaceuticals
16 0.985 1.114 1.183 1.310 1.069 1.235 1.119 1.533
Processed rubber products
17 1.218 0.788 1.125 0.861 1.366 1.142 1.403 1.033
Plastics and non-metallic mineral products
18 1.070 1.064 1.032 1.050 1.044 1.001 1.155 1.018
Metal products 19 1.099 1.187 0.990 1.188 1.070 1.266 1.008 1.252
Machinery 20 0.978 0.795 0.815 0.862 0.834 0.885 0.823 0.692
19 In the case of construction, its strongest backward linkages are with plastics and non-metallic
products as well as metal products (both of which are key construction materials). For hotels and
restaurants, the strongest linkage is with oils and fats, which supplies cooking fats for food preparation.

51
Electric appliances and electronic components
21 0.906 1.065 0.864 0.969 0.973 1.432 0.778 0.676
Precision equipment
22 0.976 0.688 0.914 0.700 0.900 0.650 0.856 0.609
Motor vehicles and transport equipment
23 0.960 0.974 1.036 0.949 1.048 0.818 1.014 0.806
Recycling and other manufacturing
24 0.934 0.754 1.048 0.757 0.795 0.698 0.899 0.677
Electricity, gas and water
25 1.002 1.164 0.932 1.344 1.103 1.175 0.901 1.312
Construction 26 1.092 0.924 1.089 0.865 1.040 1.039 1.133 0.862
Wholesale and retail
27 0.908 2.225 0.818 1.965 0.805 1.591 0.908 2.174
Hotels and restaurants
28 1.189 0.904 1.156 0.927 1.149 0.793 1.158 0.759
Transport and communications
29 0.988 1.511 0.983 1.439 1.178 1.968 1.104 1.824
Finance and insurance
30 0.899 0.907 0.826 0.799 1.034 1.658 1.063 2.271
Real estate 31 0.747 0.983 0.789 0.904 0.872 0.871 0.920 0.873
Business services
32 0.948 1.114 0.886 1.020 0.795 0.936 0.955 1.368
Private services 33 0.842 0.738 1.003 0.740 1.208 0.913 0.979 0.665
Education 34 0.804 0.684 0.795 0.667 0.820 0.560 0.735 0.597
Health 35 0.894 0.679 0.845 0.666 1.060 0.710 0.902 0.602
Government services
36 1.028 0.726 0.947 0.703 1.041 0.645 0.932 0.581
Note: Shaded area denotes key industry for the year.
Source: Calculations from Malaysia Input-Output Tables, various issues.
In contrast, the industries in the secondary sector, especially resource-based manufacturing
industries, have strong backward linkages (exceeding 1). In most years, resource-based
manufacturing industries dominate the top five industries in terms of backward linkage strength.
The exact industries vary from year to year but they typically include food, beverage and
tobacco (8), oils and fats (9), wood products (12), paper products and furniture (13), refined
petroleum products (15), chemicals and pharmaceuticals (16), and processed rubber products
(17). The prominence of these industries points to the high use of local inputs in the form of raw
materials such as petroleum, oil palm, timber and rubber. Three non-resource-based
manufacturing industries – machinery (20), electric appliances and electronic components (21),
and precision equipment (22) – have backward linkages below 1 for all years. This is due to
their high import requirements for production.
Oil and fats (9) consistently ranks first with the highest backward linkage among all 36 industries
for the periods under study, although the linkage has weakened slightly between 1991 and 2010.
Its high backward linkage is accompanied by a relatively low backward coefficient of variation.

52
This means oils and fats (9) is a significant absorber of intermediate inputs provided by a
relatively broad range of other industries. As expected, oil and fats (9) has the highest linkage
with oil palm (2) whose outputs are the main inputs for milling, crushing and refining industries.
The backward linkage of chemicals and pharmaceuticals (16) further strengthened between
1991 and 2010. Chemicals and pharmaceuticals (16) has the highest linkage with oils and fats
(9). A key product group for chemical and pharmaceuticals (16) is oleochemicals made with
palm oil derivatives supplied by oils and fats (the other key product group is petrochemicals
made with petroleum derivatives).
The strength of backward linkages for secondary industries can be further understood by their
net foreign exchange earnings. Net foreign exchange earnings represent foreign earnings
accruing to an industry or an economy with full consideration of its import requirement. The
higher an industry’s net foreign exchange earnings are as a share of its export earnings, the
lower is its import requirement and the greater amount of local inputs goes into production of the
industry’s output. Net foreign exchange earnings for the major Malaysian exporting industries
are shown in Table 2.4. For all the periods under study, resource-based manufacturing
industries generally have a higher-than-average ratio of net foreign exchange earnings to export
earnings, implying that they have relatively low import requirements than non-resource-based
manufacturing industries. This should not be taken to mean that high local content is
necessarily the appropriate goal for all industries, or that resource-based manufacturing is
‘superior’ to non-resource-based manufacturing. Rather, it indicates that where primary
resources are available locally, there is a greater scope for capturing more gains from these
primary industries through linkage development. Furthermore, high local content does not equal
exclusive use of local content in production. Imports are inevitable even for resource-based
manufactures and should be facilitated especially the inputs are not available locally.
Table 2.4. Net foreign exchange earnings of major exporting industries, 1991-2010.
(% of export earnings) Code 1991 2000 2005 2010
Crude oil and natural gas 6 95.36% 87.26% 92.71% 89.72%
Oils and fats 9 89.94% 89.90% 87.24% 92.96%
Refined petroleum products 15 76.97% 47.70% 32.26% 68.98%
Chemicals and pharmaceuticals 16 50.90% 62.03% 61.61% 52.93%
Processed rubber products 17 87.11% 71.65% 63.66% 54.16%
Metal products 19 40.88% 10.34% 26.45% 20.00%
Machinery 20 46.20% 31.03% 47.71% 46.73%
Electric appliances and electronic components 21 37.57% 36.02% 36.39% 46.01%
Precision equipment 22 39.41% 50.41% 45.97% 43.37%
Share of total export earnings (36 industries)
62.63% 47.87% 54.93% 60.09%
Source: Calculations from Malaysia Input-Output Tables, various issues.

53
As for forward linkages, most primary industries demonstrate strong linkages (exceeding 1). It
indicates that they are significant suppliers of inputs for use by other industries in their
production. Four out of seven industries have seen their forward linkages increase between
1991 and 2000. Among them is oil palm (2), which ranks first among all 36 industries in terms of
forward linkage strength in all years but one.
The secondary industries’ forward linkages are less pronounced than their backward linkages.
This is because many products are for final consumption (such as food, beverage, tobacco,
apparels and footwear) with some exceptions. These include oils and fats (9); refined petroleum
products (15); plastics and non-metallic mineral products (18); and metal products (19). For
these industries, however, their forward linkages tend to fluctuate depending on demand and
production in other industries.
Historically, oils and fats (9) has extremely strong forward linkage with chemicals and
pharmaceuticals (16), wholesale and retail (27), and hotels and restaurants (28). This translates
into a high forward coefficient of variation. In 2010, the forward linkage for oils and fats (9)
dropped to slightly below 1. This possibly indicates an increase in the amount of outputs from
oils and fats (9) being exported, instead of being used for further domestic value adding. It partly
reflected the move to retain market share in the face of increasing competition from Indonesia.
But it also signalled a new business reality for major Malaysian-owned firm which had acquired
refining and manufacturing operations in key markets such as Europe and China. The exports
of less processed oils and fats were necessary to provide them with feedstocks. For chemicals
and pharmaceuticals (16), its forward linkage has strengthened between 1991 and 2010,
indicating increased supply of its outputs as inputs for other industries’ production.
The previously moderate forward linkages for industries in the tertiary sector have strengthened
in general. Since 2005, industries with forward linkages exceeding 1 include utilities (25),
transport and communications (29), finance and insurance (30), and business services (32).
Furthermore, they have relatively low forward coefficients of variation, indicating their nature as
providers of services to a broad range of industries.
In the spirit of Rasmussen (1957) and Boucher (1976), the Malaysian economy had seven ‘key
industries’ in 1991, 2000 and 2010. In 2005, it had 11 ‘key industries’. In most of the periods
under study, oils and fats (9) as well as chemicals and pharmaceuticals (16) – both of which
represent industries which are secondary in nature extending from oil palm (2) – feature among
the key industries. The high Power of Sensitivity and Dispersion of Sensitivity Indices for the two
industries indicate that they have greater linkages than the average of all industries. Chemicals

54
and pharmaceuticals (16) saw its indices strengthen between 1991 and 2005, providing further
evidence of downstream linkage development.
Strong linkage development in the Malaysian palm oil sector contributed significantly to the
country’s value added performance. Malaysia’s manufacturing value added grew twice as fast
as its agricultural value added between 1995 and 2010 (Table 2.5). Palm oil was instrumental
not just for driving agricultural value added growth (compared with other crops). Among
manufactured goods, oils and fats (almost entirely palm oil) was the second fastest growing
segment after industrial chemicals (of which palm oil is a key input, as is petroleum). Oil and fats
was also an important contributor to value added in absolute terms.
Table 2.5. Agricultural and manufacturing value added, 1995-2010.
Commodity % of total value added in 1987 prices Average annual growth rate
1995 2000 2005 2010*
Industrial commodities 68.5% 59.1% 61.5% 56.4% 1.9%
Oil palm 24.7% 31.4% 36.7% 36.6% 5.9%
Forestry and logging 24.2% 16.4% 14.0% 10.0% -2.7%
Rubber 12.4% 10.0% 10.5% 9.3% 1.2%
Cocoa 7.2% 1.3% 0.4% 0.5% -13.5%
Food commodities 31.5% 40.9% 38.5% 43.6% 5.5%
Fisheries 11.5% 13.4% 11.1% 14.1% 4.6%
Livestock 5.6% 8.1% 9.7% 9.0% 6.6%
Paddy (rice) 3.0% 3.2% 2.9% 3.6% 4.4%
Other agriculture 11.4% 16.2% 14.8% 16.9% 6.0%
Total agricultural value added
100.0% 100.0% 100.0% 100.0% 3.2%
Industry % of total value added in 1987 prices Average annual growth rate
1995 2000 2005 2010*
Resource-based 48.3% 41.9% 43.7% 42.3% 5.4%
Agro-based 24.7% 20.2% 20.5% 19.5% 4.7%
Oils and fats 2.7% 3.8% 4.4% 4.9% 10.8%
Other food processing, beverages & tobacco
7.8% 6.0% 5.8% 5.6% 4.0%
Wood products including furniture
6.7% 4.4% 3.6% 3.3% 1.5%
Paper & paper products, printing and publishing
4.2% 3.4% 3.2% 2.9% 3.7%
Rubber processing & products
3.4% 2.7% 3.5% 2.8% 5.0%
Non-agro-based 23.6% 21.7% 23.1% 22.8% 6.1%
Industrial chemicals including fertilisers & plastic products
5.7% 10.1% G 12.6% 12.1%

55
Petroleum products including crude oil refineries & coal
11.3% 6.7% 6.4% 6.6% 2.6%
Non-metallic mineral products
6.6% 5.0% 4.5% 3.6% 2.2%
Non-resource-based 49.4% 56.3% 54.2% 55.4% 7.2%
Textiles, wearing, apparel & leather
5.1% 3.5% 2.2% 1.8% -0.9%
Basic metal industry industry
1.1% 0.9% 0.8% 0.7% 3.5%
Metal products 3.4% 4.3% 4.9% 5.8% 10.1%
Manufacture of machinery except electrical
5.9% 4.6% 4.2% 3.1% 1.8%
Electronics 22.8% 29.5% 28.0% 29.4% 8.2%
Electrical machinery 1.8% 2.6% 1.2% 1.0% 2.2%
Transport equipment 9.2% 11.0% 12.9% 13.7% 9.2%
Others 2.3% 1.7% 2.1% 2.2% 6.0%
Total manufacturing value added
100.0% 100.0% 100.0% 100.0% 6.3%
* Estimates.
Source: Eighth and Ninth Malaysia Plans.
The Drive for Linkage Development
Interviewees for the study acknowledged that Malaysia’s palm oil sector benefited from an
existing base of large-scale industrial agriculture dating back to the colonial era. Heavy British
investments in rubber plantations and tin mines turned British Malaya into a specialised
economy and one of the most profitable colonies. In the 1950s, European firms controlled 60%
of British Malaya’s tin output and 93% of its plantation hectarage (Gomez & Jomo, 1999).
Foreign control persisted post-independence (British Malaya became independent in 1957, and
merged with Sabah, Sarawak and Singapore to form the Federation of Malaysia in 1963). In
1974, the 3 largest firms of British agency house origin (Sime Darby, Guthrie and Harrisons &
Crosfield) controlled 30% of plantation hectarage in Malaysia (Searle, 1999). With waves of
nationalisation, the Malaysian interests inherited expertise, knowledge and network resources
that were useful for driving subsequent expansion. This feature affirms path dependence and is
not one that can be easily replicated. It also points to the usefulness of prior manufacturing
experience in industrial development. As Amsden (2001) notes, Malayan manufacturing activity
existed in food processing, textiles and machinery under British colonialism and émigré Chinese.
By the 1950s, local producers were already exporting to South East Asia.
Notwithstanding the prewar manufacturing experience, there was a broad consensus among
the interviewees that linkage development specifically in the oil palm sector was made possible
by conscious state and firm efforts. This started with a deliberate increase in upstream oil palm

56
production at the onset. While palm oil has unique product attributes that it suitable for versatile
applications – a key advantage over its competitors – it is first and foremost a highly
substitutable bulk commodity. As with most bulk commodities, supply availability and reliability
are important for palm oil to compete with other established oils and fats.
In addition, for successful development of downstream industries, achieving scale economies in
upstream production was critical for ensuring an adequate, consistent feedstock volume. This
was because Malaysia could rely only on a single feedstock, unlike incumbent European
refiners who had a choice of abundant feedstocks given the region’s position as the leading
destination market.
Yet, the palm oil sector did not concentrate solely on its traditional activity of growing oil palm
and providing crude products, as advocates of vertical specialisation would dictate. Neither did it
abandon oil palm cultivation when it moved into other areas and activities along the palm oil
value chain. Rather, oil palm cultivation, an essentially upstream activity, was used as the
foundation for developing linkages. As reasonably demonstrated by the case of the Malaysian
palm oil sector, linkage development is desirable and feasible when it comes to upgrading in
GVCs for agricultural commodities, but must first overcome the barriers and constraints
(domestic, external, natural, and artificial) that could prevent linkage development. Several
reasons account for the desirability and feasibility of linkage development in agro-commodity
value chains.
First, agro-commodity GVCs bear certain unique production characteristics that differentiate
them from value chains for regular manufactures (there is even heterogeneity among those).
Primary agriculture has relatively high location specificity that is tied to unalterable natural
factors such as land and agro-climatic conditions. Because agricultural commodities are subject
to decay and spoilage, they generally require at least some degree of post-harvest preparation,
transformation, preservation or handling close to growing sites to ensure quality (freshness and
agility) and safety for intermediate use and final consumption. Due to the ‘bulkiness’ (high
weight-to-value ratio) of agricultural commodities and transport costs, adjacent processing is
often an economically sound decision.
The potential volume loss in processing and transportation is also high, making it less likely for
value-adding activities to be more dispersed geographically than necessary. For example, when
soybean and sunflower oil is processed through continuous production without interruption, the
processing loss is 5.5%. The processing loss increases to 6.2% with batch production, in which
the oil is created state by stage over a series of workstations. Palm oil has a processing loss of

57
1.1%, which contributes to its cost advantage (Nambiappan, 2013). Losses also unavoidably
occur during the transportation of bulk cargo, both dry and liquid. Relatedly, the process of
adding value in agro-commodity value chains involves working on the primary input through a
series of consecutive stages (as long as the primary input remains a key part of the product).
This contradicts what is observed about vertically specialised chains which are generally found
among manufactured goods (especially the complex ones), thus affirming the point about the
difficulty with parallel execution in additive chains made by (Kaplinsky & Morris, 2015).
Moreover, upgrading types are often intertwined in agro-commodity production. For example,
the introduction of new processes often generates new categories of products (such as organics
and ‘sustainable’ products) (Ponte & Ewert, 2009). Scope economies is relatively limited within
primary production, especially for bulk commodities. Therefore product upgrading will ultimately
require more differentiation by degree of processing and value-adding. This necessitates
acquisition of secondary capabilities in processing and manufacturing that were not already in
place, which by definition is functional upgrading.
Second, the sectoral dynamics of agro-commodity GVCs are such that their prices are cyclically
prone to booms and busts as well as external shocks. Compared with manufactured goods,
significant time lags exist between production decisions and realisation of outputs in GVCs for
agro-commodities. Risk and uncertainty also emanate from biological cycles and other
uncontrollable factors. Supply adjustment in response to sudden changes in demand and
external volatility is therefore complicated. Furthermore, with increased financialisation of the
commodity markets and rising popularity of commodity futures as an asset class, the price of an
individual commodity is no longer determined solely by supply and demand (Tang & Xiong,
2012).20
For producers of agricultural commodities, processed products can be a hedge against volatile
commodity prices. Processed products are not immune to price fluctuations but their quantum of
price decline (especially for specialty products) is less than that of raw commodities during a
commodity down cycle. Additionally, lower feedstock prices reduce production costs of
processed products (feedstock is usually the largest cost component) and mitigate the negative
earnings impact. A similar observation was made in the oil and gas sector during the 2015 price
20 The total value of various commodity index-related instruments purchased by institutional
investors increased from an estimated US$15 billion in 2003 to at least US$200 billion in mid-2008. Price
comovements between various commodities have increased after 2004, reflecting the aggregate risk
appetite for financial assets and the investment behaviour of diversified commodity index investors (Tang
& Xiong, 2012).

58
downswing. Executives of major oil and gas firms acknowledged that integrated firms (those
which combined upstream activities of finding and developing oilfields with downstream
functions of refining crude and selling petroleum products) produced better returns than those
which focused only on upstream business (Stacey & Crooks, 2016).21
Third, one cannot overlook the historical settings of agro-commodity GVCs in discussions about
the appropriate GVC strategy. Vertical specialisation is positioned not just as an upgrading
strategy (in the sense of how countries and firms can improve their participation in GVCs post-
GVC integration); it has also marketed as an entry strategy for developing countries to insert
themselves into international production networks in the first place. However, most developing
countries are already deeply integrated into GVCs for agricultural commodities and mineral
resources as a legacy of colonial rule to supply goods to the growing populations and industries
of their home countries (Clarke et al., 2013; Jones & Khanna, 2006; Thomas, 1999; Wilkins,
2001). Primary products such as minerals, fuel and agricultural produce are important in the
export structure of developing countries, with very few, if any, processing activities (UNCTAD,
2009). The relevant strategy for developing countries is thus to ensure continuous participation
in such GVCs and to make the most out of their inherent position in production and trade of raw
materials.
Fourth, given land use constraints, specialisation in upstream production is also not desirable
from an ecological perspective (due to sustainability pressure that is caused by increased land
use), nor is it viable from an economic viewpoint. Arable land and water are critical inputs for
agro-commodity production but their supply is finite. Because of this, expansion in upstream
production will run into limits even with technological change, productivity gains and, in a more
extreme scenario, displacement of other crops by monoculture – as seen in the case of
Malaysia’s oil palm. For reasons related to agro-commodity production characteristics and
sectoral dynamics, it is equally unlikely that developing countries can specialise in midstream
and downstream activities without some kind of position in upstream production (unless
upstream supplies are readily available, within reach and are not too costly in terms of
transportation and processing loss).
21 Another benefit, as Rex Tillerson, then chief executive of ExxonMobil puts it, is that vertical
integration “captures the highest value for every molecule that flows through our facilities” (Stacey &
Crooks, 2016).

59
2.5 Firm Upgrading
Malaysia’s palm oil sector revolves around the plantation firms, of which the 20 largest by palm
plantation hectarage are listed in Table 2.6. They accounted for over two million hectares or
40% of total palm plantation hectarage in Malaysia in 2014, and held an additional 850,000
hectares outside Malaysia. These firms derive a significant portion of their revenue and profit
from palm-based business. Except for Tradewinds Plantation (headquartered in Malaysia but
not listed) and Wilmar International (headquartered and listed in Singapore) 22, all are
headquartered and listed in Malaysia.
Table 2.6. 20 largest palm-based firms: Plantation hectarage, yield, revenue and ownership, 2014/2015.
Firm Palm
plantation hectarage
Outside Malaysia
CPO yield Palm-based revenue Ownership/ control type
Million US$ Of total revenue
1 Felda Group 750,093 7.5% 3.98 3,413 81.5% State
2 Sime Darby 605,046 49.0% 4.4 2,628 23.5% State
3 Wilmar International 238,287 76.0% N.A. 26,824 62.3% Local private
4 Kuala Lumpur Kepong 207,622 56.2% 4.9 3,383 96.8% Local private
5 IOI Corporation 178,768 11.3% 5.2 2,949 99.2% Local private
6 Tradewinds Plantation 132,940 N.A. N.A. 307 42.9% Local private
7 Genting Plantations 119,900 50.6% 5.1 325 77.4% Local private
8 Boustead Plantations 65,680 0.0% 3.9 157 99.8% State
9 Sarawak Oil Palms 63,377 0.0% 4.2 735 99.9% Local private
10 TH Plantations 60,417 0.0% 4.2 125 99.8% State
11 IJM Plantations 58,900 57.2% 5.3 171 100.0% State
12 Rimbunan Sawit 57,182 0.0% N.A. 61 99.0% Local private
13 TSH Resources 53,200 67.3% N.A. 243 88.5% Local private
14 Kulim (Malaysia) 47,194 0.2% 4.6 196 69.9% State
15 TDM 45,389 29.3% 3.2 67 67.9% State
16 United Plantations 45,095 21.2% 5.25 257 99.8% Foreign private
17 Hap Seng Plantations 35,538 0.0% 5.0 127 100.0% Local private
18 Sarawak Plantation 33,367 0.0% 2.4 99 99.6% Local private
19 BLD Plantation 27,600 0.0% N.A. 399 100.0% Local private
20 United Malacca 22,411 0.0% 4.1 55 100.0% Foreign private
Source: Annual reports, 2014/2015 (2012 for Tradewinds Plantation).
22 Wilmar International completed a merger with the Malaysian-controlled PPB Oil Palms in 2007.
The exercise saw the family of Robert Kuok Hock Nien, a Malaysian of Chinese descent, emerge as the
largest shareholder of Wilmar International. Kuok who currently owns a third of Wilmar International has
been named regularly by Forbes magazine as South East Asia’s richest man. Tradewinds was originally a
vehicle set up by state-owned National Corporation (Perbadanan Nasional Bhd or Pernas) to acquire
foreign-owned plantation, mining and property interests. In the late 1990s, it was sold to Syed Mokhtar Al-
Bukhary, known to be the richest Malay businessman, which was later merged with a competitor and
taken private.

60
Thirteen out of the 20 firms are controlled by private local and foreign capital. However, state
capital is more prevalent than it appears. Statutory bodies and government investment arms
have substantial shareholdings exceeding 5% in all private controlled firms except the
Singapore-listed Wilmar International, which is out of reach for Malaysian state capital that is
accustomed to investing domestically for reasons related to risk appetite and investment
capability. Information on market capitalisation and substantial shareholders of the 20 firms is in
Annex 6.
Five firms have existed since before World War II and have decades of experience in plantation
operations. The five firms are Sime Darby, Kuala Lumpur Kepong, Kulim (Malaysia), United
Plantations and United Malacca. Sime Darby is the product of merger of three stated-owned
companies (Sime Darby, Guthrie and Golden Hope) in 2007. Sime Darby, Kuala Lumpur
Kepong, Guthrie, Golden Hope and Kulim (Malaysia) were originally British-owned firms. The
other 15 firms emerged mostly in the 1970s through establishment of new plantations and
swaps or acquisitions of existing plantations, just as oil palm became lucrative. A brief history of
the plantation firms is in Annex 7.
The conventional wisdom is that industrial-scale plantation is more productive than smallholders
due to the latter’s poor management skills and lack of scale. Smallholders produce 1.8 tonnes
of CPO per hectare per year, about a third of plantation firms’ yield of 5.3 tonnes (NEAC,
2010)23. However, data on the 20 largest firms suggest that significant variance exists within
industrial-scale plantation too. While most recorded CPO yields above the 2014 national
average of 3.65 tonnes, only five (controlled by local private capital) managed to produce five
tonnes and above. One firm achieved a yield as low as 2.42 tonnes. The two firms with the
largest palm plantation hectarage – Felda and Sime Darby (both state-owned) – reported yields
closer to four tonnes.
All 20 firms include plantation and milling or crushing operations as part of their business. Only
six have derived a substantial share of their palm-based revenues from beyond palm fruits and
CPO sales, signifying the vertically integrated nature of their business. In addition, a high
proportion of their revenues comes from international sales, indicating their ability as tier-1
suppliers to sell straight to global buyers (Table 2.7).
23 In FFB yield terms, oil palm smallholders are estimated to produce 10 tonnes of FFB per hectare
per year, 15 tonnes short of the 25 tonnes produced by plantation firms. In oil extraction rate terms
(reflecting quality of fruits and speed of harvest and collection), smallholders’ FFB produces CPO that is
18% of the weight of the fruits, compared to plantation firms’ 21%.

61
Table 2.7. 20 largest palm-based firms: Level of vertical integration, 2014/2015.
Firm Non-upstream
revenue Activity in value chain segment (through subsidiaries, joint ventures or associates)
Million US$
Of palm-based total
Input supply
Plantation Milling & crushing
Biomass energy
Export trading
Transport & logistics
Refining Edible oils
Specialty fats
Oleo- chemicals
Biodiesel Marketing/distribution
R&D Technical/ advisory services
1 Felda Group 2,101 61.6%
2 Sime Darby N.A. N.A.
3 Wilmar International
26,753 99.7%
4 Kuala Lumpur Kepong
1,597 47.2%
5 IOI Corporation
2,902 98.4%
6 Tradewinds Plantation
N.A. N.A.
7 Genting Plantations
26 8.0%
8 Boustead Plantations
0 0.0%
9 Sarawak Oil Palms
0 0.0%
10 TH Plantations 0 0.0%
11 IJM Plantations
0 0.1%
12 Rimbunan Sawit
0 0.1%
13 TSH Resources
1 0.3%
14 Kulim (Malaysia)
0 0.0%
15 TDM 0 0.0%
16 United Plantations
160 62.4%
17 Hap Seng Plantations
0 0.0%
18 Sarawak Plantation
0 0.0%
19 BLD Plantation
0 0.0%
20 United Malacca
0 0.0%
Source: Interviews, annual reports, company websites.

62
All six firms had served as suppliers to foreign buyers for much of their operating history.
Previously, the intermediary buyers were processors and traders concentrated in Europe.
Leveraging on the processing function, the six firms have taken on the trading function and now
supply diverse products directly to end-buyers further down the value chain, namely lead firms
in food and non-food manufacturing including, but not limited to, Mars (US), Nestlé (Switzerland),
Cadbury (UK), Kraft Foods (US), Kellogg’s (US), Ferrero (Italy), Hershey (US), Unilever (UK-
Netherlands), Procter & Gamble (US), Colgate-Palmolive (US), Johnson & Johnson (US) and
L’Occitane (France).
The six firms are Felda (through Felda Global Ventures), Sime Darby, Wilmar International,
Kuala Lumpur Kepong, IOI Corporation and United Plantations. The degree of vertical
integration varies for the six firms, with some much stronger than others in midstream and
downstream segments. Nonetheless, their wider product and service profiles, capabilities
beyond upstream production, and ability to supply to global markets reflect a mix of process,
product, functional and channel upgrading in varying degrees that suited each firm’s strategic
motives.
− Felda is the world’s largest CPO producer, with an annual output of 3.1 million tonnes or
over 5% of the world total. But it also has a strong presence in manufactured fats as well
as bulk installations and storage. Some 40% of Malaysia’s palm oil products for exports
passes through Felda’s bulk facilities.
− Sime Darby is the world’s largest producer of certified sustainable palm oil (CSPO) with
an annual output of 2.4 million tonnes that accounts for 22% of the global CSPO total.
Almost all of Sime Darby’s plantations and mills are certified by the Roundtable on
Sustainable Palm Oil (RSPO) which sets the widely used standards for environmental and
social sustainability in palm oil supply chains. Sime Darby is also involved in
manufacturing, marketing and distribution of oils and fats, oleochemicals and biodiesel.
− Wilmar International’s particular strength is in processing and trading of palm oil from
external sources. It merchandises some 24.6 million tonnes of palm and palm kernel oil,
accounting for almost 40% of global palm oil trade. It is also the world’s largest producer
of branded consumer pack cooking oils, with a dominant market share in Indonesia and
China. Unlike the other five firms that specialise on only palm oil, Wilmar International also
ventures into other oilseeds, grains and sugar as well. It owns a fleet of liquid bulk vessels
and dry vessels that partly meet its own shipping requirements.

63
− Kuala Lumpur Kepong has diversified into resource-based manufacturing since the 1990s.
It focuses on basic oleochemicals such as fatty acids, glycerine, fatty alcohols and esters.
In recent years, it has also ventured further downstream into specialty products such as
soap and detergent intermediates, biodiesel and surfactants. Kuala Lumpur Kepong
ventured into branding and retailing of body and home care products when it acquired
Crabtree & Evelyn in 2009 before disposing it in 2012 to focus on its plantation and
oleochemical business which offered significant higher returns.
− IOI Corporation has consistently ranked among the most productive plantation firms in
Malaysia, with its two dedicated research and biotechnology centres focusing on best
agronomic practices and high-yield planting materials. Its oleochemicals business is
mainly in the manufacturing and sales of fatty acids, glycerine, soap noodles and fatty
esters. It also supplies specialty oils and fats that are required for food processing
applications.
− United Plantations is controlled by a Danish family and makes and distributes cooking oils,
edible oils, specialty fats and soap products. United Plantations was the first among
Malaysia-based plantation firms to invest in domestic palm oil refining (in as early as
1971). It sells the bulk of its products through a long-standing working relationship to
AarhusKarlshamn AB (AAK) and remains a niche supplier of specialty oils and fats. The
Swedish-Danish owned AAK is the world’s largest supplier of speciality and semi-specialty
oils and fats (with a market share of over 50% in China alone).
The six firms’ ability to take on processing, marketing and trading functions is not an
insignificant achievement given that such functions in many agro-commodity chains are
dominated by international trading houses who can procure continuously specific volumes and
quality mixes, which “no individual supplier or country-specific association of suppliers has the
capacity to perform” (Gibbon, 2001b). Entry barriers to the trading function are particularly high:
a deep pocket for working capital (necessary because of the high volumes traded); knowledge
of markets for trade-related services like logistics, storage, processing, insurance and financial
services; the ability to command a broad coverage of supply sources across commodities; and
intangibles like reputation (ibid). The ABCD quartet of companies – Archer Daniels Midland
(ADM) (US), Bunge (US), Cargill (US), and Luis Dreyfus (Netherlands) – account for between
75% and 90% of the global grain trade, and collectively made US$350 billion in revenue before
commodity prices fell since 2014 (Lawrence, 2011; Meyer, 2013; Schneyer, 2011).
64
Wilmar International has been able to swiftly expand its trading function to account for over 40%
of global palm oil, largely because it recognised the importance of strategic alliances very early
on. Wilmar International entered into processing joint ventures with ADM in China since the
early 2000s. When Wilmar International undertook the merger exercise in 2006, ADM
transferred its holdings in the joint ventures in exchange for shares in Wilmar International. ADM
became the second largest shareholder and has been steadily increasing its shareholdings in
Wilmar International since. For ADM, investing in Wilmar represented an opportunity to gain a
foothold in palm oil processing and trading business, in addition to its own premier position in
the processing and trade of soybeans, corn and wheat. For Wilmar International, the move
deepened its strategic alliance with ADM to expand its global footprint and to further diversify its
processing business to other oilseeds and grains. Wilmar International is at present the largest
crusher of soybean and producer of soybean oil and soybean meal in China, and has expanded
its marketing and sales partnerships with ADM to multiple locations in Europe.
For the other 14 firms, signs of upgrading are unclear. They remain focused on upstream
production and act as tier-2 suppliers to either the integrated firms or independent refiners and
dealers. Their products are limited to palm fruits and crude products, mainly CPO. Given that
their sales are for domestic markets, these tier-2 suppliers tend to have a high concentration of
large buyers. It is common for many of these firms to derive more than 75% of their revenues (in
one extreme case, up to 95%) from two to three customers. By comparison, the integrated firms
have a much less concentrated customer base (no single customer accounts for more than 10%
of revenue). This partly reflects large volume effects but is mainly due to the integrated firms’
ability to export to foreign lead firms. Because the integrated firms could obtain supplies
internally and from a wide pool of smaller plantation firms and growers, they did not play a role
in technology diffusion (with the exception of Felda, due to the explicit mandate to assist the
smallholders organised under its scheme).
Many plantations firms, including the integrated firms, pursued cross-border horizontal
integration in upstream oil palm cultivation beginning in the early 1990s. Labour and land
shortages had pushed up production costs in Malaysia, driving local capital to Indonesia for
expansion given its geographical and cultural proximity.24 Consequently, Malaysian interests
24 In the 1980s, Indonesia’s policy objective was to replace Malaysia as the world’s largest palm oil
producer. Previously state-run plantations and extensive new concessions were privatised and awarded
to large Indonesian firms. The Indonesian government also opened the sector to foreign investors but
reversed the policy when foreign interest was deemed to have become too dominant (McCarthy & Cramb,
2009). After the Asian Financial Crisis, when Indonesia reopened its markets to FDI, Malaysian and
Singaporean interests re-entered Indonesia and took over plantations from large indebted Indonesian

65
control 25% to 50% of Indonesia’s oil palm plantations (Adnan, 2009; Pemandu, 2010; Varkkey,
2016). Upstream expansion has since spread further afield. Most of the 20 largest firms own
plantations outside Malaysia, of which 86% is in Indonesia, 10% in Oceania and Asia (Papua
New Guinea, Solomon Islands, Cambodia, the Philippines) and 4% in Africa (Liberia, Republic
of Congo, Uganda).
What separates the integrated firms from their peers is that they did not strive for scale
economies through upstream horizontal integration per se. They also widened their product and
service offerings for greater scope economies. This was achieved by expanding into refining
and downstream production, and by acquiring capabilities in marketing, logistics and other new
functions.
Convergence of Linkage Development and Vertical Integration
Notwithstanding the prominence of the integrated firms at present, they were not the pioneers
which initiated linkage development. Linkage development in Malaysia’s palm oil sector took off
with non-plantation firms making initial investments in the nascent domestic refining industry.
These were mainly local investors with trading experience and background, plus some overseas
refiners and manufacturers which used palm oil for their operations. Because their feedstock
supply base was external, they were known as independent refiners.
In theory, linkage development at the sectoral level may involve multiple firms instead of taking
place within a single firm. This was at least true during the initial phase with the establishment of
the refining industry. However, once the integrated firms (which focused on plantation business
up until then) entered the refining and processing space from the 1980s, they achieved a
dominant position swiftly and altered the industry structure. It marked the beginning of a
convergence between sectoral linkage development and firm-level vertical integration. The
integrated firms not only processed palm oil from their own production but also sourced
aggressively for primary and crude products from tier-2 suppliers, dealers and sometimes
smallholders. This intensified competition for feedstock among independent refiners. While
efficiency and competitiveness improved at the sectoral level, the outcome is different for firms.
The surviving independent refiners and processors grew extremely competitive and efficient to
be among the market and technology leaders; others suspend operations when CPO supplies
firms (Varkkey, 2016). Policy reversal may yet happen again, with Indonesia seeking to limit foreign
ownership in natural resource sectors, including plantations (Taylor & Supriatna, 2014).

66
become tight or exit the market altogether. Independent refiners have since become much less
important than before, and process a far smaller volume than the integrated firms.
When targeting the oleochemicals industry in the 1980s, the Malaysian government in its first
10-year Industrial Master Plan (1986-1995) noted that the key strategy to develop the
downstream palm oil segments was to “encourage foreign investment in the oleochemicals
industry. This is necessary because 90% of the market is in the developed countries and these
markets are held by a few large international producers, and therefore their participation is
highly desirable” (UNIDO & Malaysia, 1985). The focus to attract FDI was a recognition that
foreign proprietary technology played a more important role in driving the oleochemicals
industry than the basic refining industry largely because the technology for the former was less
‘off-the-shelf’ and because tacit knowledge transfer was required.
Notably, the development of the oleochemicals industry was spurred by entry and investment of
Japanese in joint ventures with local firms. Many key oleochemicals firms in Malaysia remain
JVs involve foreign partners (Table 2.8). These foreign partners are mostly manufacturers of
palm oil derivatives as functional ingredients or processing aids (for use in manufacturing of
food and non-food consumer goods). The joint ventures were not necessarily indicative of their
willingness to outsource the processing functions. Rather, with the refining industry having been
established, it became strategically important for the oleochemicals firms to have a presence in
Malaysia’s palm oil sector. Foreign oleochemicals firms previously worked closely with refiners
and processors located outside Malaysia. As local firms took on processing and refining
functions, the foreign oleochemicals firms needed to form partnerships with these entities
instead. Strategic partnerships with local and foreign firms often came with licensing
agreements and these were important for transfers of production technology and knowledge
which local firms would otherwise have difficulties accessing. Technology transfers took place at
the management level, since co-ownership made it more likely to have Malaysian nationals in
managerial positions.
Table 2.8. Key oleochemicals firms.
Name Ownership Type Owner(s)
Emery Oleochemicals (M)
JV with foreign partner(s)
Sime Darby (50%), PTT Global Chemical (Thailand) (50%)
Fatty Chemical (M) JV with foreign partner(s)
Kao Corporation (Japan) (70%), IOI Corporation (30%)
FPG Oleochemicals JV with foreign partner(s)
Felda (50%), Procter & Gamble (US) (50%)

67
Iffco (M) Foreign IFFCO (UAE) (100%)
IOI Acidchem Local IOI Corporation (100%)
Natural Oleochemicals Local Wilmar International (91%), National Land Finance Co-operative Society (9%)
Pacific Oleochemicals Foreign Lam Soon (Singapore) (100%)
Palm-Oleo JV with foreign partner(s)
Kuala Lumpur Kepong (80%), Mitsui & Co., Miyoshi Oil & Fat Co., Asahi Denka Kyogo K.K. (Japan, 20% in total)
Southern Acids (M) Local Various, principally Southern Palm Industries (31%) and Pilgrims Fund Board (13%)
Source: Malaysian Oleochemical Manufacturers Group.
In contrast, retailers are not actively involved in coordination and production aspects of global
palm oil value chains. This is because palm oil is used in a small quantity in a wide range of
products and has low visibility to most consumers for a long time. Palm oil rarely appears as a
final consumer product in most markets, except in some developing countries where palm oil is
a common edible fat in daily home use. Due to intensified campaigns against palm oil, retailers’
reputational risk of being associated with products containing palm oil has increased. But
retailers source a huge number of product lines and lack specialist knowledge of palm oil
products and processes to coordinate upgrading effectively.
Interviews with firms suggest that two reasons may explain why most plantation firms opted out
of vertical integration despite its potential benefits. First, firm-level upgrading presupposes the
presence of entrepreneurial drive and strategic intent, which is not always the case. Many
plantation firms remained reluctant to adopt more sophisticated business models, which require
new capabilities and higher risk exposure.
Second, a more consolidated industry structure further downstream has narrowed the window
for vertical integration for other plantation firms. Refining margins were high through the 1980s
due to price distortions created by policies. Intense competition due to the rise of the integrated
firms led to feedstock shortage and overcapacity, resulting in a collapse in refining margins. On
a per tonne basis, gross profits are the highest in the upstream segment, the lowest midstream,
and moderately high downstream (
Table 2.9). Given the margin differentials across the value chain, plantation firms see no
incentive to venture into refining, which is a crucial first step for vertical integration. This is
further complicated by the high investment and technical requirements for higher-margin
products further downstream.

68
Table 2.9. Estimates of gross profit margins for selected palm oil products, 2014.
MYR per tonne FFB (Plantation)*
CPO (Local delivered) (Milling)
RBD PO (FOB) (Refining)
Fatty Acids (FOB) (Manufacturing)
Cocoa Butter Equivalents (FOB) (Manufacturing)
Price 480 2,384 2,502 3,877 6,722
Gross margin 240–432 238–358 50–75 310–582 672–1,070
Gross margin (%) 50–90% 10–15% 2–3% 8–15% 10–16%
* Assumes 20% oil extraction rate.
Source: Interviews.
Historically, the integrated firms were in a better position to pursue vertical integration. Even
before vertical integration, these were local lead firms which had a first-mover advantage in
upstream production and were already in possession of some of the largest and oldest oil palm
plantations in the country. This advantage manifests in many forms. For one, it provides the
firms with ample internal feedstock, which makes production planning easier. Internal feedstock
proves useful for mitigating supply risk, improving quality assurance, and reducing the need to
compete for raw materials on the open market.
Given linkage development in the processing industries, the palm oil sector requires more inputs
and skills that are supplied locally. This offers opportunities for development of domestic
capabilities for future upgrading. The immediate prospects for firm collaboration and learning,
however, are not distributed evenly among local firms. They tend to favour larger firms. To the
extent that economies of scale are obtainable, foreign firms often seek out low-cost producers
and processors, which typically have large-scale operations and are in position to ensure
continuous, large-volume supply. For the foreign firms, working with a small number of large
suppliers lowers the costs for coordination as well as ensuring consistent quality (Humphrey &
Memedovic, 2006; Reardon et al., 2009). Incidentally, the pressure from the foreign firms to
meet performance standards and capability requirements has often been the greatest for local
lead firms that qualified as tier-1 suppliers.
With operations dating back to as early as the turn of the 20th century, the integrated firms had
extensive experience of working as tier-1 suppliers to global buyers and export markets as
explained. During the establishment of the refining industry, global buyers did not provide as
much active technical or financial support for vertical integration as they did later on with the
development of the oleochemicals industry. Nonetheless, the foreign linkages were useful
network and knowledge resources for identification and assimilation of new technology, which
were mostly embodied capital goods originating from the advanced economies.

69
The foreign linkages also stimulated local lead firms’ adoption of international quality standards
and practices as well as imitation of foreign lead firms’ management and marketing techniques
and strategies (much of this was unintended knowledge leakage rather than active knowledge
transfer). Employment of skilled and managerial workforce, both local and expatriate, further
enhanced competitiveness and innovativeness at local lead firms.
Internationalisation
For the integrated firms (except United Plantations), vertical integration led to cross-border
horizontal integration once again, this time in the midstream and downstream segments. Given
that these segments are mostly located in industrialised economies, this wave of cross-border
horizontal integration was characterised by mergers and acquisitions, joint ventures and
greenfield investments beyond developing countries. As Indonesia overtook Malaysia as the
leading producer of palm oil, internationalisation strategy became important for maintaining
growth momentum of Malaysians firms which were driven by four motives: resource seeking,
market seeking, efficiency seeking, and strategic asset or capability seeking (Md Nor, 2012).
Resource-seeking motives arise from the need to invest abroad to acquire specific resources at
a lower cost than could be obtained or inadequate in the home country to support
industrialisation. These usually include physical resources such as minerals, raw materials and
land in the case of resource-intensive industries, as well as supplies of low-cost labour in the
case of manufacturing of labour-intensive intermediate or final products. Firms also invest in a
particular country or region to supply goods and services to the adjacent markets, either to
protect existing markets or to exploit new markets. In addition, internationalisation allows firms
to benefit from economies of scale and scope and risk diversification from the common
governance of their activities, thus providing for efficiency gains. Strategic asset-seeking
motives lead firms to acquire the assets of foreign corporations as a way to enhance their
international competitiveness (Dunning & Lundan, 2008).
The investment development path theory, which states that the extent and nature of outward
direct investment (ODI) changes with increasing economic development, explains how the
different motives come into play (Dunning & Lundan, 2008; Dunning & Narula, 1996). The early
forms of internationalisation of business and overseas direct investment (ODI) are usually
inspired by resource-seeking motives motivated by the search for raw materials and primary
products. This pattern follows the previous resource-based investments of the UK, Europe, the
US and more recently Japan to drive domestic industrial development. The investments tend to
be limited to specific locations with short physical distance, and a particular type of activity

70
initially. As countries develop, their ODI evolves towards more complex forms of investments
associated with expanding geographic distribution, in order to serve the complex motives.
Since the 2000s, the integrated firms have followed their strategies of moving further
downstream. This coincided with a time when European firms began to intensify disposal of
oleochemicals and processing assets having gradually lost their competitiveness to Malaysian
firms. As part of Unilever’s rationalisation exercise to divest non-core business in 2002, it sold
Unimills BV in the Netherlands (then the second largest refinery in Europe specialising in
margarine) to Golden Hope, which was later merged with Sime Darby. A year later, IOI
Corporation acquired Unilever’s oils and fats division, Loders Croklaan BV, a leading specialty
fats manufacturer with facilities in the Netherlands, the US, Canada and Egypt, for US$220
million. It remains the largest strategic asset acquisition by a Malaysian palm oil firm to date (Md
Nor, 2012). In 2006, Kuala Lumpur Kepong acquired Dr W Kolb Holding, a specialty fats
manufacturer based in Germany for US$107 million. In recent years, Kuala Lumpur Kepong has
also been acquiring various oleochemicals assets from Croda, a British specialty chemicals firm.
Md Nor (2012) estimates that the integrated firms collectively spent more than US$600 million to
acquire foreign assets between 1994 and 2010, of which almost 95% was spent in developed
countries. The five firms have since established themselves as homegrown TNCs with
substantial international sales, assets and vertically integrated operations across multiple
countries (Table 2.10), unlike their peers with regionalised operations only in plantation
business.
Table 2.10. Transnational operations of integrated firms.
Firm Transnational presence
Felda Operations in 13 countries.
Estates in Malaysia and Indonesia.
71 mills, 5 crushing plants, 7 refineries, 4 bulk installations and 1 oleochemical plant (through JV) in Malaysia.
8 refining and processing facilities (mostly through JB) in China, Pakistan, Indonesia, Thailand, Turkey,US and Canada.
Distribution and sales offices in the Philippines, Cambodia, Myanmar, France and Spain.
Sime Darby Operations in 20 countries.
Over 200 estates in Malaysia, Indonesia, Liberia, Papua New Guinea and Solomon Islands.
Refineries and marketing offices in Malaysia, Indonesia, Singapore, Thailand, Vietnam, China, South Africa, Germany, Netherlands, US, India, UK, Brazil, South Korea, Japan, and Solomon Islands.
Wilmar International
Operations in over 50 countries.
Estates in Indonesia, Malaysia and Africa.

71
210 refineries and manufacturing plants (oleochemicals, specialty fats and biodiesel) in Indonesia, Malaysia, India, China, Bangladesh, Vietnam, Europe, Russia, Ukraine, Africa and others.
Distribution offices in over 50 countries.
Kuala Lumpur Kepong
Estates in Malaysia, Indonesia and Liberia.
Refineries and manufacturing facilities (oleochemicals) in Malaysia, China and Europe.
IOI Corporation
Operations in 14 countries.
90 estates and 15 mills in Malaysia and Indonesia.
11 manufacturing (oleochemicals and specialty oils and fats) facilities in US, Canada, Netherlands, China and Malaysia.
Regional sales and procurement office in the US, Brazil, the Netherlands, Italy, Poland, Russia, Ireland, Egypt, Ghana, Burkina Faso, Indonesia, China and Malaysia.
Source: Annual reports.
Felda is the least internationalised and vertically integrated among the five firms, going by its
portion of palm-based revenue derived from non-upstream segments, foreign revenue and
foreign assets. In recent years, it has been playing catch up with its peers. One major move
made by Felda was to acquire a 37% stake in Indonesia’s PT Eagle High Plantations Tbk, a
subsidiary of the Rajawali Group. The US$500 million acquisition gives Felda access to more
than 320,000 hectares of plantation landbank in Indonesia (New Straits Times, 2016). The
acquisition is possibly more for seeking resources than strategic assets or capability. However,
Felda has been making efforts in that direction starting with asset purchase from Twin River
Technologies, a US-based specialty fats and products manufacturer, in 2007.
Size growth for the integrated firms through vertical integration and internationalisation also
reflects the ‘cascade effects’ in global business (Nolan et al., 2008). As northern lead firms
pursued mergers in their core businesses and de-mergers in their non-core businesses,
consolidation and concentration became a norm in a wide range of industries since the 1980s
(Nolan, 2001). Agribusiness industries have been among the most takeover-intensive industries;
the aggregate value of global food industry M&As for example doubled to over US$200 billion in
2007 from 2005 (Dicken, 2011). In the process, intense pressures developed for local lead firms
(tier-1 suppliers) to northern lead firms to merge as well as acquire and develop leading global
positions. The pressure of consolidation, in turn, may well be transmitted to their tier-2 supplier
networks and beyond. Concentration has indeed increased at multiple points in agro-commodity
value chains, including in the case of the Malaysian palm oil.
Overall, the Malaysian palm oil sector experienced linkage development (though more forward
than backward). The country is now present within midstream and downstream segments of the
global palm oil value chain in which it previously had little or no presence (Figure 2.3). The

72
representation is through a number of SMEs specialising in different segments across the value
chain, and a handful of local lead firms that are vertically integrated.
Figure 2.3. Malaysia within global palm oil value chains.
2.6 Conclusion
From a concentration on oil palm cultivation, Malaysia’s palm oil value chain developed strong
linkages into downstream manufacturing of various processed products and oleochemicals (for
use in production of food and non-food consumer goods), R&D, and marketing and trading; and
moderate linkages into input supplies (mostly seeds). Downstream activities became key
industries with strong backward and forward linkages, and contributed to growth in
manufacturing value added, industrialisation, and foreign exchange earnings. The drive for
linkage development could be explained by ‘additive’ production processes which are prone to
processing losses and difficult to execute in parallel; the quest for higher value added and less
price volatility; and eco-historical settings in which countries’ are already ‘specialised’ primary
producers but further expansion is limited by available of land and water. Sectoral linkage
development accelerated when it converged with vertical integration at local lead firms with
substantial upstream assets, which assumed more functions along the value chain. Cross-
border horizontal integration (upstream business in developing countries, downstream in
industrialised economies) was pursued concurrently in search of resources, markets, efficiency
gains and strategic assets. The local lead firms have since become home-grown TNCs in their
own right.
This essay has demonstrated that upgrading in agro-commodity GVCs will require linkage
development at the sectoral level and possibly vertical integration at some firms. The logic is
Segments
Domestic
scope of activities
National border
International
scope of activities
Brand name/ international supermarket and retaill chains (foreign TNCs)
Marketing & Distribution
Food & Non-Food Manufacturing
Further ProcessingTrading & LogisticsBasic & Intermediate
ProcessingPlantation/ Farming
Input Supply & Seed Propagation
Producers ofagrochemicals,
fertilisers, heavy
equipment and agricultural implements
(foreign TNCs)
Producers and distributors of
equipment and parts (mostly local SMEs)
Smallholders (organised and independent)
Plantation firms (mostly local)
Independentmills/
crushers (mix of local and
foreign)
Independentrefiners (mix of local and
foreign)
Commodity trading houses (foreign TNCs)
Traders and transport services
providers (mostly local
SMEs)
Brokers (mostly local)
Bulk installations (Mix of local and
foreign)
Shipping operators (foreign
TNCs)
Local manufacturers of palm derivatives
Brand name manufacturers of food and non-food products(foreign TNCs)
Integrated firms (homegrown TNCs)
Local manufacturers of food and non-
food products
Local supermarket and retail chains
Foreign-based manufacturers of palm derivattives
Foreign-based processors

73
likely to be just as applicable to value chains for mineral or hard commodities which share
‘additive’ production characteristics and similar sectoral and price dynamics. The principal
implication is that vertical specialisation as the upgrading high road is less generalisable than
previously thought, and must not be over-extended across value chain types. For a start, a
distinction should be made between resource-based manufactured goods and non-resource-
based manufactured goods. Vertical specialisation may be suited for the latter, especially where
production of components and intermediate goods can be more easily divided and executed in
parallel before final assembly, as seen in the case of automobiles and consumer electronics.
Incidentally, even for non-resourced-based manufactured goods, fragmentation is not without
limits. Firms decrease marginal costs of production through offshoring but incur higher fixed and
variable costs that correspond to all the service links needed to maintain the production. There
is therefore an optimal level of fragmentation; some value chains have in fact consolidated
instead of expanding continuously following the global financial crisis (De Backer & Miroudot,
2012).
From this, a more sober approach to vertical specialisation is needed in policy and research on
GVCs. There is likely little disagreement over the broad importance of policy measures such as
the development of transportation infrastructure for trade facilitation, or investment in human
capital; they are important for both scenarios of linkage development and vertical specialisation.
However, significant differences exist elsewhere. The type of policy advice and technical
expertise typically provided to developing countries – for instance, to continuously lower tariffs
on imported inputs on the assumption that it will automatically induce manufacturing investment
and help developing countries specialise and achieve scale quickly – affects allocation of
financial resources and other assistance from international organisations ranging from
multilateral development banks to aid agencies. At best, it does not help with the much-needed
upgrading in agro-commodity value chains. At worst, it diverts resources away from tackling
obstacles to upgrading in these value chains, including agricultural tariffs which are several
times the level of those in manufacturing, common in industrialised economies, and distort
international agricultural trade and production (Josling, 2013).
Despite the potential benefits associated with linkage development, very few resource-rich
developing countries have successfully made the transition to more linkage development and
greater processing (Hausmann et al., 2008). Further research will be needed to identify the type
and nature of internal and external barriers (technological, economic, policy, market) that
explain this phenomenon, and how international organisations can help developing countries,
especially the LDCs, to overcome the barriers.

74
3 The Role of Ownership and Firm Innovation in Resource-
Based Industrialisation: The Malaysian Experience
3.1 Introduction
Industrial activities have a critical role in economic growth.25 The importance of manufacturing,
particularly at relatively low income per capita levels, has been established in the work of
(Kaldor, 1966, 1967). However, countries seldom leapfrog into manufacturing. With a
chequered track record, resource-based industrialisation (RBI) is accepted as a viable albeit
difficult industrial strategy. RBI is often associated with industrial policy which can mean
different things but at the minimum implies government intervention or ‘non-neutrality’ in the
economy that affects industry (Naudé, 2010). Most countries have de facto industrial policy and
will continue to do so; even in the US, the state has been extremely proactive in developing and
commercialising new technologies from the Internet to Apple products (Mazzucato, 2014; Peres
& Primi, 2009).
Industrial policy is thus not a question of if, but how. This essay (Essay 2) examines the
evolution of Malaysian industrial policy for the country’s palm oil sector through three broad
stages of development. It aims to distil practical considerations for improving policy efficacy and
minimising the policy learning costs and risks in RBI. The key policy measures, in the form of
either market-based intervention or public inputs for factor and product markets, as well as their
notable outcomes during each stage of development are identified. From this, the essay
highlights two critical factors which arguably enabled RBI in Malaysia’s palm oil sector and
continue to shape its present-day development. Local firms played an equally, if not more,
important role as foreign firms; while public action in research and development led to swift
diffusion of technology and knowledge. Further interpretation and analysis of the evidence
brings to the fore the nationality of firm ownership and the sources of indigenous innovation
efforts as issues that warrant more explicit attention in policy-making.
The essay is organised as follows. Section 3.2 situates the research within a theoretical
framework that connects RBI and industrial policy through their common focus on increasing
linkage effects and technology intensity for higher productivity and value added. Section 3.3
explains the methods and data, as well as the taxonomy of industrial policy for analysing the
25 Following the general practice in the economics literature, the term industry refers to
manufacturing while ‘industrial’ is taken to denote ‘manufacturing-related’.

75
policy measures in the Malaysian palm oil sector. Section 3.4 maps the key measures and
analyses their outcomes. Section 3.5 examines the role of firm ownership in the Malaysian
experience, and revisits the theoretical reasoning which appropriately attached much
importance to this issue but is largely ignored these days. Section 3.6 traces indigenous
innovation efforts to public action and offers some insights into its usefulness for driving RBI
historically and its inadequacies during the later stage of RBI. The final section summarises the
main findings and discusses their implications.
3.2 Industrialisation and Intervention
Industries are important due to higher productivity (in terms of output per worker) in
manufacturing than in agriculture or services, superior technical change and learning effects,
and greater scope for specialisation and externalities (Thirlwall, 2015; Weiss & Jalilian, 2016).
The case for industrial development is further reinforced by some stylised facts: rapidly growing
countries since the Second World War (the European periphery from the 1950s, and East Asia
since the 1960s) are those with large manufacturing industries; and growth accelerations are
associated with structural changes in the direction of manufacturing (Rodrik, 2007).
A misreading of these facts has often inadvertently led to dismissal of natural and agricultural
resources as unimportant or worse, a curse for growth. One reason the contribution of mining
and agriculture to the economy is understated is that their value added is only considered in
relation to production of crops and livestock and extraction of minerals. All forms of off-farm and
off-site processing and further value adding, as is the production of inputs and equipment, are
captured in the manufacturing sector. However, once the interdependence and linkages
between economic sectors are fully considered, a country’s resources can be “augmented
through material growth (in the sense of machinery and industry) and intellectual capital (skills,
learning and knowledge accumulation)” (Sampath, 2014). It usually involves processing and
beneficiation of natural and agricultural resources (Auty, 1986). RBI can therefore be
understood as a strategy to establish industrial activities within and from the primary commodity
sector, in order to improve productivity and value added in the economy.
Industrial strategy is typically differentiated by market orientation. The inward-looking import
substitution industrialisation (ISI) seeks to produce imported goods through protection of
domestic markets and strong public sector involvement (in infrastructure investment and export
promotion). In the outward-looking export-oriented industrialisation (EOI), firms and
governments promote exports and production of goods that are demanded in international
markets. However, Nixson (2005, 2016) argues a rigid dichotomy presents a false conflict

76
between ISI and EOI. While the transition from ISI to EOI is most difficult, some economies
historically successfully used the capabilities gained during the ISI period to develop export
capabilities.26
Another way to conceptualise an industrial strategy is to simply consider what countries can
produce, and what it takes for them to make a breakthrough into international production and
trade. Broadly, there are four product categories of manufactures, with different potential for
technology diffusion (ranging from widely available and/or easily absorbed on an end, to internal
or proprietary to transnational corporations or TNCs and/or difficult to absorb on the other end)
and factor intensities (natural resources, labour, capital and skills) (Athukorala, 1998; Helleiner,
1973, 1995).
Category 1 is resource-based manufacturing which involves further local processing of materials
previously exported in raw state. Local raw materials (natural and agricultural resources) usually
make up the bulk of value of processed materials. The technology is often widely diffused and
accessible. Category 2 is light consumer goods such as clothing, toys, shoes and foodstuff. The
technology used is extremely widely diffused and available, and has intensive use of low-skilled
labour. Category 3 is production and assembly of components and intermediate goods within
vertically tightly coordinated production systems. The technology used is mostly proprietary and
internal to TNCs but has intensive use of low-skilled labour. Category 4 is technologically
advanced, differentiated final products such as motor vehicles, radios, televisions, computers
and phones. Technology for these goods originates almost exclusively from advanced
economies. When setting up production facilities, firms consider labour cost to be less important
than availability of high-quality operator and technical skills (Athukorala, 1998).
Light manufactured goods (Category 2) and low- to medium-technology component production
and assembly (Category 3) were the most promising areas when present-day newly
industrialised economies pursued EOI in the 1960s. As production activities became
fragmented, the labour-intensive activities were shifted to low-wage locations to the extent that
these activities could be separated from other stages of production (Krugman, 1995). Both
categories are generally more import intensive (especially in Category 3). The use of local
inputs is extremely limited because substitution of inputs with locally produced inputs of
26 Furthermore, the shift away from ISI was not always an autonomous policy choice in response to
the ‘failures’ of ISI, but was imposed as part macroeconomic and industrial restructuring requirements
under structural adjustment programmes. These reforms – by reducing inflation, liberalising trade,
privatising state-owned companies, and deregulating markets – ended ISI policies in Latin America,
Eastern Europe and Sub-Saharan Africa (Noorbakhsh & Paloni, 1999).

77
secondary quality may lead to significant market losses, and corrective costs for defects are
prohibitive (Keesing & Lall, 1992).27
With oil windfalls derived from high commodity prices in the 1970s, many resource-abundant
developing countries pursued RBI (Category 2) more actively for domestic physical and human
capital accumulation (Stauffer, 1988). Potential benefits include economic diversification into
manufacturing, reducing dependence on primary commodities, and capturing a higher share of
value added from production to raise export revenues (Radetzki, 1977; Roemer, 1979; Auty,
1986, 2001). Yeats (1991) analyses 48 commodities for the 1965-1987 period and finds that
processed goods have greater price stability than their primary equivalent in two-thirds of the
cases, with long-term price increases detected in half the cases.
Early RBI efforts have produced mixed results (Jomo & Rock, 1998; Auty, 1986; Morris et al.,
2012; Paz, 2014; Wall, 1987). Three problems were common: overambitious strategy design,
inefficient implementation, and inadequate markets. Many RBI projects came under strain
during commodity price downswings as fixed capital charges for new projects could not be met.
Some favoured scale economies as rapidly as possible but output surplus could not be
absorbed domestically and internationally. Resource rents were sometimes consumed rather
than reinvested in productivity enhancing investments (Walker, 2001).
Success with RBI is positively correlated to a country’s size (in population, GDP or area terms)
and bargaining power. Large countries have more opportunity for procuring local content, are
able to absorb a significant portion of new production, and have greater leverage on TNCs in
technical, financial and marketing negotiations (Auty, 1986). Additionally, the economic impact
of resource processing projects will be muted in a large economy, lessening inflationary ripple
effects from resource-based sectors to non-resource-based ones. Citing Bostwana’s joint
venture with De Beers’ for global supply of rough diamonds, Kaplan (2016) posits that to the
extent that a country has a near monopoly over a resource that cannot be obtained elsewhere,
it will have considerable bargaining power as to further usage of that resource.
Notwithstanding the advantages that come with natural endowments, their realisation depends
on each country’s choice on how to capitalise on them. Exploitation of resources and
geographical conditions inevitably concerns industrial policy. Critics argue that government
27 Limits to the use of local inputs (even if they meet quality requirements) can also be due to the
nature of global strategies of TNCs and international buying groups. The input structure and
specifications of production are usually determined by such lead firms, and they may insist on specific
sources of inputs.

78
failure is just as prevalent as market failure because government does not possess perfect
information to make good decisions. Government intervention may also create rents that lead to
rent-seeking, corruption and investment decisions that distort efficient allocation of resources.
To its proponents, industrial policy is justified when activities or sectors have large opportunities
for productivity-enhancing collective action and competitiveness on world markets (See, for,
example, (Chang, 1996, 2011, 1999; Stiglitz et al., 2013; Cimoli et al., 2009; Hausmann &
Rodrik, 2003; Rodrik, 2004, 2008; Harrison & Rodríguez-Clare, 2009). Based on the logic of
“wrong prices, right direction”, future benefits will exceed the present costs of protection or
distortion (Amsden, 1989; Amsden & Chu, 2003).
To be sure, the private sector is the main economic actor and structural change occurs largely
through firm actions in market conditions. However, it is not helpful to stress either the state or
the market to the exclusion of the other (Nolan, 1993, 1995; Chan & Clark, 1994). While the
state cannot create and sustain industrial productivity and economic competitiveness by fiat, it
can play a role to “try to anticipate structural change, facilitating it by removing obstacles and
correcting for market failures” (Syrquin, 2008). Counterfactuals and difficulties in isolating
specific interventions of interest introduce ambiguity in empirical tests of the impact of industrial
policy, but the fact that South Korea and Taiwan had an active policy and grew rapidly suggests
an association (Weiss, 2016). More recently, studies have focused on the features and content
of ‘functional’ industrial policy (Evans, 1995; Rodrik, 2004; Hausmann & Rodrik, 2006).
3.3 Methods and Data
Case studies have long been used in a variety of disciplines for detailed contextual analysis of
real-life phenomenon or events and conditions and their relationships (Yin, 2009). This essay
presents evidence about the relevance and ‘content’ of industrial policy in Malaysia’s palm oil
sector in several ways that differentiate it from previous studies. First, much research on public
interventions in Malaysia’s palm oil sector has covered the period from the 1960s through the
1980s (Pletcher, 1990; Lall, 1995; Gopal, 2001; Jomo et al., 2003; Rasiah, 2006). The essay
includes the more recent phase through the 2010s to provide an up-to-date analysis. Second,
such endeavour will benefit from an analytical framework grounded in a systematic taxonomy of
policy measures, which are linked to stages of development to account for change in policy
measures.
Notwithstanding a lack of consensus over what counts as industrial policy and what does not,
efforts have been made to classify and conceptualise industrial policy, for example by policy
domain or by level of sector specificity (non-targeted/ horizontal and targeted/ vertical) (Pack &

79
Saggi, 2006; Peres & Primi, 2009; Warwick, 2013). Two issues arise from this. One, without
some kind of delimitation, industrial policy analysis potentially includes everything from
monetary to environmental policy. Furthermore, even policies that are ostensibly ‘purely’
horizontal may have non-neutral effects (Warwick, 2013). As such, this essay adopts a narrower
definition of industrial policy by Weiss (2015) as initiatives which have a direct impact on
manufacturing and which fall under the bureaucratic purview of ministries of industry and sector.
Guided by the definition, Weiss’ taxonomy distinguishes policy measures by market areas for
intervention (product versus factor markets) and policy mechanisms (market- versus non-
market-based means) (Table 3.1).
Table 3.1. Taxonomy of industrial policy
Areas in which incentives are shifted and support is provided
Means through which incentives are shifted and support is provided
1. Product market
2. Capital market
3. Land market
4. Labour market
5. Technology
1. Market-based interventions
- Operate through pricing links
- Impact costs, prices and taxes
- E.g. subsidies, taxes, import tariffs
2. Public inputs and non-market-based interventions
- Goods or services which firms cannot provide or secure adequately
- Usually cannot be marketed or involve significant external benefits
- E.g. R&D, training, procurement policy, national champions, nationalisation
Source: Based on Weiss (2015).
Interviews were the main method for data collection. A total of 25 semi-structured, face-to-face
interviews were conducted with senior-level firm executives (12), government officials (7) and
analysts and industry group officials (6). The interviews took place between March and August
2015. Industry-level data was sourced from official publications produced by, among others, the
Malaysian Palm Oil Board (MPOB), Malaysian Industrial Development Authority (MIDA),
Ministry of International Trade and Industry (MITI), and Department of Statistics Malaysia
(DOSM). Firm-level data was extracted from Palm Oil Directory and Malaysia Agribusiness
Directory. These are business directories for trade purposes, with basic company information
such as address, line of business, product offerings, and contact details. Other data sources
include annual reports for 2014 and 2015, government reports, and academic publications.
3.4 Industrial Policy in Three Stages
Early development of Malaysia’s palm oil sector is well documented (See, for example, (Martin,
2003, 2006; Yaacob, 2011; Corley & Tinker, 2016; Henson, 2012). The World Economic

80
Forum’s Global Competitiveness Index since 2007 has adapted (Porter, 1990) theory of
competitive advantage and stages of development. In the factor-driven stage, countries
compete based on their factor endowments – primarily unskilled labour and natural resources.
In the investment-driven stage, efficiency in producing standard products and services becomes
the dominant source of competitive advantage. Economies concentrate on manufacturing and
on outsourced service exports. In the innovation-driven stage, countries can produce innovative
products and services at the global technology frontier using the most advanced methods. Firms
based in these economies compete using unique strategies that are global in scope, and invest
strongly in advanced skills, technology and innovative capacity (Schwab et al., 2006).
Malaysia’s palm oil sector underwent the factor-driven stage from the early 1960s through mid-
1970s. This period was characterised by a rapid increase in oil palm cultivation by making use
of abundant land (either new or existing agricultural land grown with other crops) and unskilled
labour (mainly peasant farmers organised into smallholder schemes). The investment-driven
stage from the late 1970s through mid-2000s saw rapid linkage development into new areas of
manufacturing and services. Scale expansion and efficiency drive allowed major improvements
in productivity, while internationalisation of operations was sought. The ongoing transition to the
innovation-driven phase started from mid-2000s onward.
Factor-Driven Stage, Early 1960s through Mid-1970s
During this stage, industrial policy was targeted at increasing oil palm cultivation, a labour- and
land-intensive activity (Table 3.2). Public inputs in land and capital markets and technology
were channelled through Felda and other government schemes with funding from the World
Bank. Felda settlers numbered 11,577 in 1967 and grew to reach 106,510, located mostly in
Peninsular Malaysia, by 1987 (Lee & Bahrin, 2006). Typically, each settler’s household was
allocated a 4-hectare plot of land and received the land title over time under a loan repayment
scheme. A package approach was taken in which settlers were provided with skill training and
technical assistance through agricultural extension services, in addition to housing,
complementary facilities and social services (Khor et al., 2015).

81
Table 3.2. Selected policy measures during the factor-driven stage.
Period 1960s 1970s
Market-Based Interventions
Product Market
Refiners given ‘pioneer status’ and corporate tax exemptions on profits
Exporters of processed PO and PKO given tax reliefs on income
Export duty on all palm oil exports, with exemption for processed PO exports
Graduated export duty, export surcharge and windfall based on CPO prices for price stabilisation
Differentiated rates of export duty exemptions for processed PO based on degree of processing
Tax reliefs for further downstream processing (instead of basic refining)
Tax reliefs for export insurance premiums and marketing expenses abroad (advertising, market research, offices and warehouses)
Capital Market
Loan guarantees and preferential rates for investments in PO processing at commercial and development banks
Public Inputs
Product Market
Export credit financing with preferential rates for shipments of PO
Export credit insurance for exporters
Financial and technical assistance for smallholders to switch crops
Land Market
Provision of unused land for peasant farmers under state smallholder schemes
Acquisition of foreign interests in plantation
Capital Market
Upgrading/ construction of ports and bulk installations to handle processed PO exports
Investments in transport networks from mills and refineries to bulk installations
Labour Market
Training and social services for peasant farmers Specialised education institutes to produce agro-industrial engineers and agribusiness graduates
Technology Agricultural extension for peasant farmers
Agricultural research focusing on breed selection
Ban on exports of seeds
Research on agronomics and field production and processing technologies
Introduction of standards for indigenous and imported technologies
To deal with product market constraints, market-based interventions were used to increase the
relative profitability of processing activities vis-à-vis trade in raw materials. The Investment
Incentives Act of 1968 was the most relevant in analysing development of the palm oil refining
industry in Malaysia. Under the Act, ‘pioneer status’ was granted to industrial activities that had
not been undertaken in Malaysia but were beneficial for economic development (Gopal, 2001).
Refiners that qualified for ‘pioneer status’ enjoyed generous tax incentives, including
exemptions from corporate tax on profits (40% then) for two years and subject to extension.
Firms without the ‘pioneer status’ could obtain tax credits ranging from 25% to 100% of capital
expenditure on taxable income.
In addition, export duty was introduced for all palm oil products, but export duty exemption was
granted for processed PO exports. The duty structure was later modified into a graduated

82
system in which duty payable gradually decreased with an increase in the number of processing
stages (Gopal, 2001). The duty structure involved no government subsidy, as it made it possible
for refiners and processors to make profit at the expense of crude palm oil producers (plantation
firms). Loans and guarantees were also provided by development finance institutions for
investments in new production facilities.
Amid a search for new export markets to absorb the palm oil products, export facilitation was
done through both market-based interventions and public inputs. Exporters were given loans,
export insurance and guarantees under the Export Credit Refinancing (ECR) scheme. Under
the ECR scheme, exporters were offered short-term loans at below market rates for pre-
shipment expenses and post-shipment credit extended to overseas buyers by commercial
banks, which obtained the necessary funds from development finance institutions such as the
Export-Import Bank of Malaysia (Gustafsson, 2007). Tax reliefs were also provided to firms for
export insurance premiums and marketing expenses incurred abroad for advertising, market
research, warehousing and keeping offices.
In anticipation of skills needed for agricultural modernisation and RBI, the College of Agriculture
Malaysia was merged with the Faculty of Agriculture, University of Malaya (both were
established during the British colonial era) to form the Agriculture University of Malaysia or UPM.
The purpose was to produce graduates in the areas of agricultural sciences and economics,
agro-industrial engineering, and agribusiness management. On the R&D front, the Department
of Agriculture (DOA), together with the Oil Palm Genetics Laboratory (OPGL) formed by private
plantation firms, formed an exchange programme in plant breeding with West African
economies from which the commercial oil palm originated. Much was this was built on British
Malayan agricultural policies and institutions that were originally intended for rubber plantings.
Investment-Driven Stage, Late 1970s through Mid-2000s
The investment-driven phase started since the late 1970s with increased capital investments in
refining and manufacturing of higher value added products using crude palm oil. Building on
existing activities in oil palm cultivation, IP measures focused on acquisition, mastery and
diffusion of technologies available on global markets (Table 3.3). Various investment incentives
and export duty structure attracted mostly local firms with manufacturing and trading
background to venture into palm oil refining.
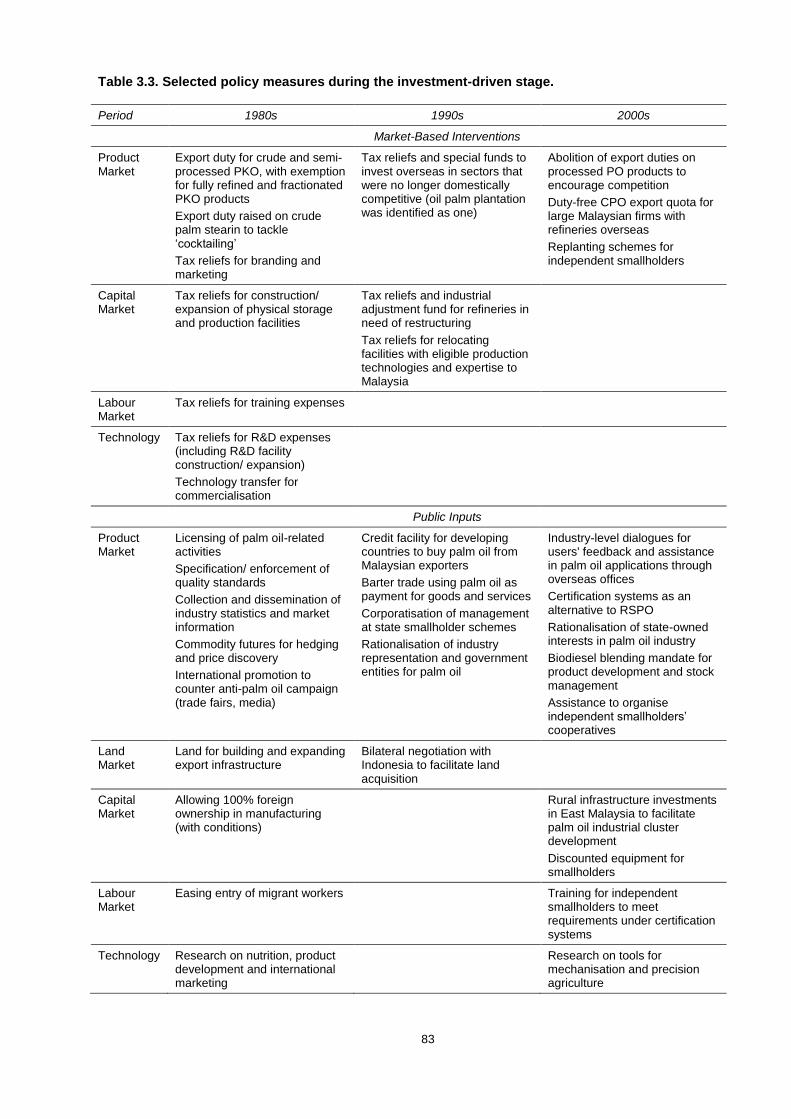
83
Table 3.3. Selected policy measures during the investment-driven stage.
Period 1980s 1990s 2000s
Market-Based Interventions
Product Market
Export duty for crude and semi-processed PKO, with exemption for fully refined and fractionated PKO products
Export duty raised on crude palm stearin to tackle ‘cocktailing’
Tax reliefs for branding and marketing
Tax reliefs and special funds to invest overseas in sectors that were no longer domestically competitive (oil palm plantation was identified as one)
Abolition of export duties on processed PO products to encourage competition
Duty-free CPO export quota for large Malaysian firms with refineries overseas
Replanting schemes for independent smallholders
Capital Market
Tax reliefs for construction/ expansion of physical storage and production facilities
Tax reliefs and industrial adjustment fund for refineries in need of restructuring
Tax reliefs for relocating facilities with eligible production technologies and expertise to Malaysia
Labour Market
Tax reliefs for training expenses
Technology Tax reliefs for R&D expenses (including R&D facility construction/ expansion)
Technology transfer for commercialisation
Public Inputs
Product Market
Licensing of palm oil-related activities
Specification/ enforcement of quality standards
Collection and dissemination of industry statistics and market information
Commodity futures for hedging and price discovery
International promotion to counter anti-palm oil campaign (trade fairs, media)
Credit facility for developing countries to buy palm oil from Malaysian exporters
Barter trade using palm oil as payment for goods and services
Corporatisation of management at state smallholder schemes
Rationalisation of industry representation and government entities for palm oil
Industry-level dialogues for users' feedback and assistance in palm oil applications through overseas offices
Certification systems as an alternative to RSPO
Rationalisation of state-owned interests in palm oil industry
Biodiesel blending mandate for product development and stock management
Assistance to organise independent smallholders’ cooperatives
Land Market
Land for building and expanding export infrastructure
Bilateral negotiation with Indonesia to facilitate land acquisition
Capital Market
Allowing 100% foreign ownership in manufacturing (with conditions)
Rural infrastructure investments in East Malaysia to facilitate palm oil industrial cluster development
Discounted equipment for smallholders
Labour Market
Easing entry of migrant workers Training for independent smallholders to meet requirements under certification systems
Technology Research on nutrition, product development and international marketing
Research on tools for mechanisation and precision agriculture

84
Price distortions led to overcapacity in the palm oil refining segment. Throughout the 1980s,
generous incentives were withdrawn and industrial adjustment funds were provided for
rationalisation in the segment. Market-based interventions began to target oleochemicals. The
main feedstock for oleochemicals is crude palm kernel oil (which is extracted from the kernel as
opposed to crude palm oil which is milled from the flesh). An export duty for crude and semi-
processed palm kernel oil was introduced. Exemptions were accorded to fully refined and
fractionated palm kernel oil products (oleochemicals), akin to the preferential treatment granted
to processed palm oil earlier.
Compared with palm oil refining, the technology for oleochemicals production was not as readily
available on the markets, and marketing experience for the products was more limited among
local firms. At the same time, Malaysia recorded massive current account and fiscal deficits as a
result of commodity shocks and huge public expenditure in development of heavy industries. To
attract FDI, the manufacturing licensing regime in Malaysia shifted to a more liberalised
investment environment. The increased emphasis was on industrial development and economic
growth, instead of inter-ethnic redistribution (Lee, 2007). The Investment Coordination Act of
1975, enacted originally to increase Bumiputera involvement at the enterprise level, was
amended to ease restrictions on foreign ownership, equity requirements and employment of
expatriates. The Promotion of Investment Act of 1986 further strengthened incentives to foreign
investors. Tax reliefs were provided for expenses incurred in a number of areas, including
marketing, construction and expansion of eligible production facilities, training and R&D.
Public inputs during this period focused on functioning of product markets and R&D. Through
licensing and regulation of all activities in the palm oil sector, PORLA collects vital industry
statistics and market information on production, stock, prices and trade. The various statistics
and information are disseminated on a daily, quarterly and annual basis to monitor industry
performance and to help producers make decisions. PORLA also specifies and enforces
product standards for quality control. Enforcement is conducted through regular inspection, spot
checks, routine sampling and testing at the point of export. Meanwhile, PORIM was made the
principal R&D agency for undertaking research in a variety of areas. Initially, it focused on
agronomics, mainly in the areas of improving the quality of planting and breeding materials. For
instance, traditional palms grew too tall and made harvesting difficult. PORIM developed a dwarf
oil palm breed (PS1) with slower height increment and longer economic lifespan. To date,
PORIM has developed a total of 13 breed varieties, with different characteristics such as higher
unsaturated oil content (PS2), higher kernel content (PS3), thinner shell (thus more flesh for
higher oil content) (PS5), larger fruits (PS6), higher vitamin E content (PS8) and longer stalk

85
(PS10) (MPOB, 2010a). These breeds were adopted by and leased to plantation firms for seed
production.
PORIM expanded its research into new areas such as field production techniques, chemistry of
extraction, processing technologies, end-use of oil, development of new products and uses from
various parts of oil palm including the biomass from processing (most notably biodiesel). During
the 1980s, when palm and coconut oils emerged to threaten the dominance of soybean oil in
international markets, the American soybean industry launched campaigns against the so-called
‘unhealthy tropical grease’ and lobbied for legislation against imports (Nordin et al., 2010).
PORIM, together with local and foreign research institutes, increased its research on the
nutritional aspects of palm oil, and has released much scientific evidence that palm oil is a
satisfactory dietary source of fats. MPOC was soon established to promote palm oil
internationally through means such as trade fairs, marketing events and industry publications. It
now has regional offices in major oils and fats markets such as the US, Europe (Belgium),
Pakistan, India and China where industry engagement events are held to gather industry
feedback, promote business networking and assist in palm oil application.
One important development was the establishment of the Kuala Lumpur Commodity Exchange
(now Malaysia Derivatives Exchange) in 1980. Since the 1950s, raw palm oil was sold through a
pooling arrangement (the Malayan Palm Oil Pool) that was managed by the London-based Joint
Selling Committee. The committee was controlled by large plantation firms owned by British
interest and was responsible for quoting prices and approving sales for all contracts. This
presented difficulty for crude palm oil producers who wanted to venture into refining as they had
to sell and buy back their palm oil from the pool, before they could use it as raw materials for
processing (Martin, 2006). A founding member of the pool (United Plantations) eventually
exercised its right to dissolve the pool to facilitate its establishment of refineries in Malaysia for
supplying to Asian markets. With the dissolution of the pool, the centre of sales negotiations
began to shift to Kuala Lumpur (ibid). Commodity futures for palm oil, rubber and tin were
introduced for hedging, competitive trading, and better pricing of commodities produced in the
country. The Crude Palm Oil Futures (FCPO) has since become the global price benchmark for
the palm oil sector (the other futures ceased trading due to lack of industry interest).
As local labour entered the emerging manufacturing and services sectors and urbanisation
accelerated, labour shortages in rural plantations were resolved with increased imports of
migrant workers since the early 1980s. By 1984, the Ministry of Human Resources estimated
that above 500,000 migrant workers, mostly in plantations and construction, were present in the

86
national labour force of 5.9 million. The policy continued well into the 1990s, with more migrant
labour being used to meet general labour shortages in manufacturing and services sectors.
From the 1990s, measures were taken to encourage state- and private-owned firms to venture
abroad, especially to neighbouring developing countries (Carney & Dieleman, 2011; Goh &
Wong, 2011). This was to foster the creation of successful Malaysian multinationals or ‘national
champions’ that could occupy strategic positions within regional and global production networks
(Goh & Wong, 2011). Tax reliefs and special funds were provided to assist firms invest
overseas in industries that were longer domestically competitive (oil palm plantation was
identified was one such industry). This included a tax abatement on income earned abroad and
a tax deduction for ‘pre-operating expenses’ (Carney & Dieleman, 2011; Rasiah et al., 2010; Zin,
1999).
For the palm oil sector, internationalisation of plantations was not facilitated through market-
based interventions alone, but also through public inputs in the form of government-to-
government (G2G) arrangements due to the unprecedented size of land that was involved
(Varkkey, 2016). The government introduced an explicit policy to promote outward FDI and had
negotiated investment guarantees with 64 countries in the 1990s (Rasiah et al., 2010). For
example, as part of an Indonesian-Malaysian bilateral investment treaty in 1997, the Indonesian
government pledged to specially allocate 1.5 million hectares of land to Malaysian developers
for oil palm development (Casson, 2002). Investments abroad were not limited to plantations.
Some of the largest plantation firms which had established domestic presence in processed and
manufactured palm oil products also began to invest abroad (especially Europe, China and
India) in the midstream and downstream segments. In addition to tax reliefs extended to firms
investing abroad, further tax reliefs were introduced to encourage firms that have invested
abroad to relocate some of high-tech production facilities and technologies to Malaysia.
Export facilitation in the 1990s also saw increased state involvement through bilateral payment
arrangements (BPAs). BPAs promote trade by minimising foreign exchange reserve constraints
and converting trade-related commercial risk into sovereign risk, with central banks or monetary
authorities guaranteeing payments in domestic currencies to their respective exporters. One key
BPA was the Palm Oil Credit & Payment Arrangement (POCPA), which provides a two-year
credit facility for countries to buy palm oil from Malaysian exporters. It has been extensively
used since its inception in 1992; an estimated 5% of Malaysia’s palm oil exports fell under
POCPA in 2000 (Gustafsson, 2007). Malaysia also pursued barter trade at the highest political
level with countries such as Russia, China and India, using palm oil as payment for their goods
and services. The public-private coordination mechanism strengthened throughout the 1990s.

87
Rationalisation occurred among government agencies (merger of PORLA and PORIM into
MPOB, and restructuring of MPOPC into MPOC) and industry associations (MPOA was the
product of merger involving four major plantations associations then).
Since the 2000s, with a well-established refining industry, there has been relaxation of export
restrictions on raw materials trade. Duty exemptions were extended to all processed palm oil
products, after which the differentiated export duties were abolished altogether to encourage
competition. The government also rationalised its direct economic interests in the palm oil sector
by merging several of the state-owned plantation firms (Sime Darby, Guthrie and Golden Hope)
into one of the world’s largest plantation firms, and by restructuring its main smallholder scheme
(Felda). As of 2015, the enlarged Sime Darby produces about 4% of the world's CPO output
annually, operates on a land bank of 1 million hectares across 5 countries, and has midstream
and downstream operations in 17 countries. Felda’s assets and businesses were also
restructured continuously following corporatisation of management since the 1990s, culminating
in the listing of Felda Global Ventures (FGV) in 2012 on Malaysia’s stock exchange. FGV now
holds Felda’s key processing and logistics assets.
MPOB also introduced a certification system based on codes of practices for keg segments
within the palm oil sector, namely nurseries; estates and smallholdings; mills; crushers;
refineries; handling, transport and storage; and bulking installations. The move can be
interpreted as an attempt by public governance to regain some ground lost to emerging private
governance (RSPO). Since its introduction in 2004, the private-led RSPO achieved remarkable
industry acceptance within a short span of time. RSPO-certified palm oil now accounts for 18%
of global palm oil. Implementing RSPO principles and criteria, however, is costly and
burdensome to small firms and smallholders. MPOB’s certification was to present a credible and
most-effective alternative to ensure that small firms and smallholders are not excluded when the
markets shift towards certified sustainable palm oil.
To address productivity gaps between organised and independent smallholders and between
small firms and large-scale plantation firms, various programmes were introduced. For instance,
the Sustainable Palm Oil Cluster (SPOC) programme was to organise independent smallholders
into groups by region. These groups were given training by MPOB’s extension officers to meet
its Certification of Good Agricultural Practice (GAP) and codes of practice. Assistance was
provided to help independent smallholders organise cooperatives as a means to lower
production costs through bulk purchase of inputs and services. Subsidies for replanting to
remove unproductive trees and discounted equipment were also provided. To reduce
dependency on fossil fuels and to stabilise palm oil prices, the government announced a

88
mandate to blend diesel with 5% palm methyl ester (B5) for domestic consumption (gradually
raised to 10%). The biodiesel technology was developed and tested by MPOB over two
decades before it was transferred to private firms.
Transition to Innovation-Driven Stage, Mid-2000s Onward
Despite decades of relatively successful RBI, Malaysia appears not to have built sufficient
barriers to entry. Its model could be copied with relative ease. Indonesia overtook Malaysia as
the largest producer and exporter of palm oil, although it must be noted that Malaysian firms
through their outward investments have been heavily involved in Indonesia’s rapid ascent in
global palm oil. As supplies steadily rose while demand growth slowed in the oils and fats
markets (especially since 2014, prompting some to suggest the decade-long commodity boom
might have come to an end), the competitiveness of Malaysian palm oil has come under
immense pressure.
Since Malaysia and Indonesia are close competitors in the same market, a change in policy in
one country affects the other. Understandably, Malaysia’s policy stance becomes increasingly
reactionary to Indonesia’s actions (Table 3.4). For example, after Indonesia introduced the
Indonesian Sustainable Palm Oil standards in 2011, Malaysia introduced the Malaysian
Sustainable Palm Oil standards several years later. Indonesia has since October 2011
drastically widened the gap between the export taxes for CPO and PPO (similar to the move
taken by Malaysia decades ago) to encourage more downstream investments and production.
In response, to defend its market share, Malaysia lowered its CPO export duty in 2013 for the
first time since it was introduced in the 1970s, and reduced or eliminated export duties for other
processed products to make Malaysian palm oil exports more competitive.
Malaysia also shifted to closer bilateral cooperation with Indonesia in production and stock
management, harmonisation of standards, and development of framework for sustainable
production. It has since signed a charter with Indonesia to establish the Council of Palm Oil
Producer Countries (CPOPC) with the aims to “control the global CPO supply, stabilise prices,
promote sustainable practices in the palm oil sector, and enhance the welfare of oil palm
smallholders” (Indonesia Investments, 2015).

89
Table 3.4. Selected policy measures in transition to the innovation-driven stage.
Period 2010s
Market-Based Interventions
Product Market
Revised CPO export duty (first time since 1970s) and abolition of CPO export quota to mimic Indonesia’s policy
Replanting schemes expanded to plantations (for production management and yield improvement)
Labour Market
Minimum wage
Increased levies for hiring foreign workers
Public Inputs
Product Market
Introduction of Malaysian Sustainable Palm Oil (MSPO) standards
Establishment of Council of Palm Oil Producer Countries (CPOPC) with Jakarta
Higher biodiesel blending mandate to increase domestic consumption
Regulatory review to reduce business costs in palm oil sector
Technology Relaxation of ban on seed exports to facilitate Malaysian firms’ expansion overseas
Increased domestic consumption through a higher blending mandate for biodiesel is another
key policy measure. To reduce reliance on foreign labour and to encourage mechanisation, a
minimum wage was introduced in 2012 across sectors, and was raised again in 2016.
Employment of foreign workers was made less attractive through more stringent conditions and
higher levies on procedures. A regulatory review was conducted by the Malaysian Productivity
Corporation (MPC), a MITI agency that is responsible for productivity improvement, to eliminate
unnecessary regulatory burdens adding to business costs in the palm oil sector (MPC, 2014).
Plantation firms have long claimed that the palm oil sector is among the most taxed in Malaysia,
with some suggesting that they pay various statutory charges amounting to 40% of profits (Ooi,
2016; Adnan, 2010) (Table 3.5).

90
Table 3.5. Statutory charges on the palm oil sector.
Charge Rate
Corporate tax 26%
Goods and Services Tax 6%
Windfall Profit Tax 3% on palm oil prices above 2,500 MYR per tonne in Peninsular Malaysia
1.5% on palm oil prices above 3,000 MYR per tonne in Sabah and Sarawak
CPO Export Duty 4.5% to 8.5% of CPO prices
State Sales Tax (for Sabah and Sarawak)
7.5% in Sabah and 2.5-5% sales tax in Sarawak when CPO prices exceed 1,000 MYR per tonne
Cess to MPOB 13 MYR per tonne of CPO (inclusive of 2 MYR to MPOC for promotion)
Cess for Price Stablisation Fund
2 MYR per tonne of CPO per tonne
Cess for Cooking Oil Subsidy Scheme
5% when CPO prices exceed 1,700 MYR
Agricultural Tools & Machinery
Import duties
Foreign Workers’ Recruitment (per Worker)
Levy of 590 MYR
Processing fee of 125 MYR
Work permit fee of 50 MYR
Mandatory health screening fee of 180 MYR (male) and 190 MYR (female)
Security deposit of 250 MYR
Visa payment of 70 MYR
Compensation insurance of 100 MYR
Source: Ooi (2016), Hanim (2010), Royal Malaysian Customs Department.
3.5 Firm Ownership
At first glance, Malaysia as a country has a strong presence across the palm oil value chains,
given that many firms catering to different segments (irrespective of nationality of ownership)
are present in the country – indicating business activity there (Table 3.6). Developing countries
are dominant in plantation and primary processing, accounting for virtually for all the firms that
exist in those segments. Firms with registered addresses in Malaysia account for a third of the
developing country total. This is not unexpected, given the country’s established position as an
important source of palm oil. Malaysia accounts for 33% of world production and 40% of world
exports in 2014. Developing countries are also dominant in refining and secondary processing
segments, with a share of over two thirds of firms. Firms located in Malaysia alone account for
more than half of the developing country total. Of various input supply and trading firms listed,
more than half of them are in developing countries, with Malaysia having the lion’s share. In
downstream segments such as food ingredients and products, consumer goods, retail and
financing that the geographical concentration of firms shifts to advanced economies.

91
Table 3.6. Number and geographical distribution of firms in global palm oil value chains.
Segment Number of firms
Geographical distribution of firms
Advanced economies
Developing economies
Malaysia
Input supply
Agrochemicals - - - 39
Machinery/ equipment 273 96 177 62
Fertilisers 33 1 32 23
Seeds & planting materials
26 3 23
11
Plantation & primary processing
Plantation 1,044 14 1,030 300
Milling 98 4 94 58
Crushing 50 0 50 46
Refining & secondary processing
Basic refined products 125 7 118 43
Animal feed 17 1 16 12
Biodiesel 256 128 128 76
Cooking oil 202 52 150 80
Margarine & shortening 73 20 53 28
Specialty fats 116 33 83 30
Oleochemicals 154 44 110 66
Specialty chemicals 51 25 26 6
Food & non-food manufacturing
Food ingredients/ products
455 393 62 10
Consumer goods 367 320 47 12
Trading, distribution & retail
Traders 1,435 563 872 224
Brokers 113 41 72 40
Shipping/ logistics 131 57 74 52
Retailers 30 30 0 0
Other services
Financing 47 31 16 10
Inspection/ certification 56 23 33 15
Consulting 119 51 68 26
Source: Palm Oil Directory 2014, Malaysia Agribusiness Directory 2003-2014, RSPO Annual Communications of
Progress 2014.
A more complex picture emerges when one considers who the firms in the country are, and how
they are embedded in each segment of the value chain in terms of their capability, geographical
scope of business activity, and market reach. Capability and power asymmetry between foreign
and local firms becomes apparent, as does Malaysia’s reliance on foreign capital goods imports.

92
Despite substantial local firm presence in input segments (agrochemicals, fertilisers, and
machinery and equipment), most of the input supplies can in fact be traced to foreign lead firms,
whose locally incorporated subsidiaries are deeply embedded though less visible in the palm oil
value chains. Depending on the type of inputs, these subsidiaries (which are essentially foreign
firms whose decisions are determined by a central corporate structure located elsewhere based
on global strategy and considerations) sometimes perform local processing of imported inputs
sourced from production facilities located elsewhere owned by parent or affiliate firms, before
distributing them to domestic and other export/ re-export markets in the region. In comparison,
the bona fide local firms have limited manufacturing and marketing capability, serve as
distributors of these inputs for only domestic markets, and are much smaller in size (Table 3.7).
Table 3.7. Position of local firms in global palm oil value chains.
Segment Capability & Role Location of Activity
Market Presence of Local Lead Firms
Input supply
Agrochemicals Importers and distributors of agrochemicals supplied by foreign firms e.g. BASF, Syngenta, Bayer, DuPont and Dow Chemical
Malaysia Domestic No
Machinery/ equipment
Importers and distributors of heavy equipment, agricultural implements and spare parts from foreign firms e.g. Caterpillar, Kubota, Komatsu, Case New Holland
Malaysia Domestic No
Fertilisers Importers of straight fertilisers from foreign firms e.g. Yara, Behn Meyer, Agricultural Chemicals and All Cosmos for mixing and distribution
Malaysia Domestic No
Seeds & planting materials
Producers of planting materials Malaysia Domestic, limited export
Yes
Plantation & primary processing
Plantation Producers of palm fruits for own or external processing facilities
Malaysia, international (mostly Indonesia)
Domestic Yes
Milling Producers of crude palm oil Malaysia, international (mostly Indonesia)
Domestic, export
Yes
Crushing Producers of crude palm kernel oil Malaysia, international (mostly Indonesia)
Domestic, export
Yes
Refining & secondary processing
Basic refined products
Producers of refined products e.g. RBD palm oil, palm kernel oil, palm olein and palm stearin
Malaysia, international (various, including Europe, China, India)
Domestic, export
Yes

93
Animal feed Producers of palm kernel cake and pellet
Malaysia Domestic, export
No
Biodiesel Producers of biodiesel Malaysia Domestic, export
No
Cooking oil Producers of cooking oil Malaysia, international
Domestic, export
Yes
Margarine & shortening
Producers of margarine and shortening
Malaysia, international
Domestic, export
No
Specialty fats Producers of specialty fats Malaysia, international
Domestic, export
Yes
Oleochemicals Producers of basic oleochemicals Malaysia, international
Domestic, export
Yes
Specialty chemicals
Producers of function-specific chemicals for industrial sectors e.g. automobile and textile
International Domestic, export
No
Food & non-food manufacturing
Food ingredients/ products
Manufacturers of compound food ingredients and finished food products
Malaysia Domestic No
Consumer goods Manufacturers of consumer goods e.g. personal care, cosmetics, household products
Malaysia Domestic No
Trading, distribution & retail
Traders Arrangers for transfers of physical quantities of palm oil products
Malaysia, international
Domestic, export
Yes
Brokers Agents dealing with futures contracts
Malaysia Domestic, export
No
Shipping/ logistics
Agents for foreign operators of tanker vessels that ship palm oil products internationally e.g. Maersk, d’Amico, Stolt-Nielsen and Nova Carriers
Malaysia Domestic No
Retailers Retailers of food and non-food products
Malaysia Domestic No
Other services
Financing Financiers and investors for plantation and other production/ processing facilities
Malaysia Domestic No
Inspection/ certification
Providers of testing, inspection and certification services
Malaysia Domestic No
Consulting Providers of plantation management, consulting and advisory services
Malaysia Domestic No
Source: Interviews.
Malaysia was a net importer of agrochemicals (herbicides, insecticides and fungicides) in four
out of five years from 2009 through 2013 (Lee et al., 2013). The trade flows and the resultant
balance of trade reflected largely decisions made by foreign lead firms such as BASF
(Germany), Syngenta (Switzerland), Bayer (Germany), DuPont (US) and Dow Chemical (US)
based on their global and regional production and marketing strategy. For example, Malaysia’s

94
herbicides imports totalled 89.5 million MYR in 2012, of which half was from Germany.
Malaysia’s herbicides exports/ re-exports stood at 214.3 million MYR during the same year, of
which a third went to China. Similarly, for insecticides, 70% of Malaysia’s imports came from
Indonesia, China and India while more than half of the exports went to Indonesia, a
neighbouring country which has in recent years been the growth centre for oil palm plantations.
In fertilisers, Malaysia has been a net importer (ibid). Trade deficit in fertilisers grew by 140% to
3.6 billion MYR between 2005 and 2012.
For agro-processing machinery and agricultural production machinery, imports ranging from
parts to presses used to extract water and oil out of solid fraction to complex monitoring and
control systems for automation grew 56% to 635.74 million MYR between 2008 and 2012.
Imports of agricultural production machinery have also been on the rise due to increased
agricultural mechanisation. For example, imports of agricultural tractors grew 44% to 255.3
million MYR between 2009 and 2012, of which over a quarter came from Japan (Komatsu
(Japan) and Tata Hitachi (India-Japan) are among the world’s top five manufacturers of heavy
equipment for mining, construction and agriculture), followed by Brazil and China which have
gained on lower priced units in recent years.
The lower-priced units from China are made by Chinese manufacturers such as YTO (the
largest manufacturer of tractors in China, part of China National Machinery Industry Corporation
or Sinomach). Imports from China also include more expensive, higher-end models from
Caterpillar (US), the world’s largest machinery manufacturer which had amassed over 30 years
of experience, more than 20,000 employees, and dozens of manufacturing facilities in China
(Baldwin & Ruwitch, 2014). Other significant sources of agricultural tractors are Italy, South
Korea and Turkey. Imports of bulldozers, motor graders, road rollers and shovel loaders – of
which a significant proportion is used for agriculture-related activities such as construction of
plantation roads and terraces – increased by 181% to 1.9 billion MYR between 2009 and 2012.
Domination by foreign firms is not limited to the input segments; it can also be seen in the food
and non-food consumer goods manufacturing as well as retail segments going by different
indicators. For instance, of the 711 consumer goods manufacturers registered with the
Roundtable on Sustainable Palm Oil (RSPO), over 90% are firms which are headquartered in or
originated from European countries (led by Germany, France, the Netherlands, and the UK) and
the US. Of the 63 retailers registered with the RSPO, none of them is from the developing world.
This concurs with an annual report tracking global retailing powers. Of the 250 largest retail
chains in the world in 2015, 35% (88) are based in the US, followed by 34% (85) in Europe and

95
12% (30) in Japan. The retail chains from the triad together account for 87% (US$3.75 trillion) of
US$4.31 trillion generated in sales revenue by all 250 retail chains (Deloitte, 2017).
In services-oriented segments, capability and power asymmetry between local and foreign firms
in trading, brokering and to a lesser extent, financing is less obvious. Local firms have more
substantial presence alongside their foreign counterparts in trading (through in-house trading
arms or independent trading firms), brokering (brokerage firms attached to domestic financial
institutions), and financing (though limited to domestic and regional transactions). However, in
the shipping segment, local firms serve mostly as agents for foreign firms that own and operate
tanker vessels that ship palm oil products internationally. The government has singled out sea
freight charges as the largest component which has contributed to persistent deficits in the
service account of Malaysia’s balance of payments (MITI, 2006). A small number of firms exist
to undertake shipbuilding and repairing services but their ownership is unclear. In any case,
these firms are likely to be less important for the palm oil value chains since they focus more on
commercial vessels, small ferries, tugboats, cruisers and patrol boats (ibid).
Across the palm oil value chains, upstream segments related to plantation, primary processing,
refining and secondary processing are the only ones in which local firms clearly demonstrate
substantial production capability, a wide geographical coverage of business operations, and
international market reach. Arguments about the efficacy of industrial policy can be made both
ways: that industrial policy is relevant (Malaysia will likely still be producing and exporting crude
palm oil products without industrial policy) or that industrial policy is a lot more difficult than
thought (Malaysia has not been able to make a break into segments that are dominated by
foreign lead firms at the commanding heights even with industrial policy). There is validity in
both arguments given the different assumptions and expectations one may have about
industrial policy.
Interestingly, the more recent industrial policy discussion in the GVC literature often omits the
issue of firm ownership altogether or mentions it in passing without making a case for or against
it.28 Morris et al. (2012) go one step further to suggest that local ownership is a “subsidiary
priority of an indigenisation policy”, which should focus on deepening of domestic value added
through local content policy. The impression given is that industrial development can be driven
by either local or foreign firms. This was not the case with the Malaysian palm oil sector.
28 For example, Gereffi (1999) observes in passing that the bulk of exports in East Asian newly
industrialised economies, except for Singapore, are produced by locally owned firms, be it industrial
conglomerates in South Korea or densely networked SMEs in Hong Kong and Taiwan. The observation,
however, is for descriptive purposes and not for further analysis.

96
In the late 1960s, FDI inflows into palm oil refining were muted despite the generous incentives
offered and the introduction of the export duty on crude palm oil which increased costs for
overseas refineries. Foreign firms, which owned refineries mostly in Europe, remained unwilling
to invest in refining in Malaysia. In contrast, local firms were more willing to invest in palm oil
refining. It was local firms in the form of investors with manufacturing or trading background
which first took advantage of the opportunity and invested in the segment. Over time, the
plantations firms, which by now were controlled by local capital (state and private) post-
nationalisation, followed suit. The firms had sizable internal feedstock and did not have to
compete for raw materials on the open market. They also had greater financial and non-
financial resources (especially experience and network in marketing) at their disposal. Soon
they established themselves as the dominant actors within the refining segment.
Unsurprisingly, FDI accounted for less than a fifth of ownership in palm oil refineries in Malaysia
in 1987. Most of the FDI did not come from the Global North (with the exception of Japan); it
originated from India, Singapore and Hong Kong (Jomo et al., 2003). Cargill (US), the world’s
largest privately held firm and a key commodity trading firm specialising in trade, purchase and
distribution of grain and other agro-commodities, did not get into palm oil refining in Malaysia
until it acquired two operating refineries in as late as 1991.
Once the refining and processing segment had been established, international processors and
industrial users of palm oil realised the need to have a domestic stake in Malaysia’s palm oil
sector. When Malaysia targeted further downstream development into oleochemicals in the
1980s, foreign firms had become more receptive to the incentives offered and invested in joint
ventures with local firms, mainly major locally owned plantation firms which had by now
integrated vertically into refining and secondary processing activities. These local firms also
expanded scale horizontally through local and overseas investments, and evolved into TNCs.
Recent investment patterns in the palm oil sector affirm local firms’ continuous importance in
driving future industrial development. Between 2007 and 2015, domestic investments have
been at least as important as foreign investments. In most years, domestic investments exceed
foreign investments by far (Table 3.8). In two segments which are mature and well-established –
palm oil and palm kernel oil refining as well oleochemicals – domestic and foreign investments
alternately assumed the leading role. However, for palm biomass products and palm biomass
energy generation, domestic investments led foreign investment by large margins in all years.
Both are relatively new segments with small shares of total palm oil product sales but have been
high on the government’s list of targeted areas. Annually, the oil palm industry produces over 30

97
million tonnes of biomass (oil palm fronds, trunks, empty fruit bunches, kernel shells, mesocarp
fibre and palm oil mill effluent). The new segments seek to turn biomass into value added
products (e.g. materials for wood-based and pulp and paper industries) and energy generation
(e.g. biogas recovered from palm oil mill effluent for combustion in gas turbine).
Table 3.8. Manufacturing and services investments in the palm oil sector, 2007-2015.
MYR Million 2007 % 2009 % 2011 % 2013 % 2015 %
Palm oil & palm kernel oil
Domestic 535 81% 335 32% 19 2% 1,300 82% 268 49%
Foreign 124 19% 702 68% 1,100 98% 285 18% 276 51%
Total 658 1,037 1,119 1,585 544
Oleochemicals Domestic 360 38% 74 48% 1,100 79% 333 69% 249 38%
Foreign 595 62% 81 52% 301 21% 149 31% 413 62%
Total 956 155 1,401 482 663
Palm biomass products
Domestic 120 76% 285 86% 321 81% 55 100% 249 63%
Foreign 39 24% 45 14% 75 19% 0 0% 148 37%
Total 159 330 397 55 397
Palm biomass energy generation
Domestic 1,300 84% 85 77% 69 93% 254 98% 533 98%
Foreign 246 16% 25 23% 5 7% 6 2% 11 2%
Total 1,546 110 74 260 544
All Domestic 2,315 70% 779 48% 1,509 50% 1,942 82% 1,299 61%
Foreign 1,004 30% 853 52% 1,482 50% 440 18% 848 39%
Total 3,319 1,632 2,990 2,382 2,148
Source: Malaysian Industrial Development Authority.
Due to a history of substantial local firm involvement, Lall (1995) notes that resource-based
products are an exception with high domestic private capital participation in Malaysia’s export
structure. Most of the country’s manufactured exports are typically dominated by foreign TNCs
(accounting for over three quarters of total value of manufactured exports in 1990) and have low
local content, few high value added and technologically demanding tasks, and weak linkages
with the domestic economy.29
The Malaysian experience suggests that industrial policy for linkage development into the
refining and secondary processing segments would not have been effective without substantial
local firm participation. As Cramer (1999) observes, RBI requires a supportive political economy:
“if the capitalist class is too weak, or if sections of it (especially foreign capital) are too strong in
relation to others or to the state… no amount of initiatives to reduce transaction costs, or to
reduce production costs, is likely to be effective”. Having capable local firms is thus not merely a
29 Lall describes these as “worrisome features” but acknowledges that they nonetheless contribute
to Malaysia’s relative export success.

98
desirable outcome but can in fact be a necessary means to drive industrial development in RBI.
This is because FDI is of relatively limited relevance due to several reasons.
First, resources are location-specific yet these locations may not fit with foreign lead firms’
investment and business strategy (Athukorala, 1998). Second, some processing activities are
characterised by high physical and/or human-capital intensity and may not be suitable for
locating in a low-income country. FDI considerations often depend on the absorptive capacity of
the recipient economy. Local production takes place only when the basic skills needed for
production relocation and further training are present in the host country for foreign investors to
sustain production activities thereafter. This leads to the idea of a ‘development threshold’ for
FDI (Borensztein et al., 1998). In the case of Malaysian palm oil refining, foreign firms indeed
argued in the 1970s that Malaysia did not have a comparative advantage for capital-intensive
processing, which included a lack of human capital (in addition to the lack of transportation,
handling and shipping facilities and procedures for exports of processed palm oil products)
(Gopal, 2001). Third, a major deterrent for foreign firms to invest in developing countries’ RBI is
cascaded tariff structures in industrialised economies which provide heavy effective protection
to domestic processing industries (Helleiner, 1973; Athukorala, 1998; Gopal, 2001). In the case
of palm oil, Takase (1990) and Gopal (2001) show that tariff escalation between edible crude
and processed products under the General Agreement on Tariffs and Trade’s Most Favoured
Nation status was widespread throughout the 1970s in two key markets for Malaysian palm oil:
Canada and the European Economic Community (EEC, which precedes the EU).
Some EEC countries provided preferential concessions in the form of the Generalised System
of Preferences (GSP), which were subsequently expanded to the EU level, for which both
Malaysia and Indonesia were eligible. However, tariff escalation remained an issue (the
effective rates of protection are higher than suggested by the nominal tariff rates) which drove
Malaysia to diversify its export markets (
Table 3.9). As Malaysia became an upper middle income economy, its eligibility for lower levies
under the EU’s GSP scheme expired in January 2014. A leading industry figure had warned that
without the GSP and a Malaysia-EU free trade agreement, the tax rate on some Malaysian
oleochemicals heading for the EU will be between 4% and 6%, putting in “another nail in the
coffin” of the local palm industry sector (Oxford Business Group, 2014).30
30 Negotiations for an FTA with the EU were launched in Brussels in late 2010. After seven rounds,
negotiations were put on hold in April 2012 at Malaysia's request. A stocktaking exercise is being finalised
to assess the prospect to resume negotiations.

99
Table 3.9. Import tariffs on crude and processed palm oil in selected advanced economies.
CPO PPO Difference
EEC edible and technical use (Pre-Kennedy Round, 1967 and before)
9% 15% 6%
EEC edible and technical use (Post-Kennedy Round, 1967-1980)
4–9% 8–14% 4–5%
EEC edible and technical use (Post-Tokyo Round, 1980-1990)
4–6% 8–14% 4–8%
EEC edible and technical use (GSP, Post-Tokyo Round, 1980-1990)
2.5–4% 8–12% 5.5–8%
Canada (MFN, 1968-1983) 10% 17.5% 7.5%
Canada (GSP, 1968-1983) 0% 12.5% 12.5%
Source: Gopal (2001).
Beyond reasons related specifically with the RBI scenario, local firms also offer advantages for
industrial development in the more general situation. Deeply embedded in the local business
environment compared with foreign firms, local firms know their way around domestic
institutional setting, infrastructure, suppliers and customers. Importantly, they are the ones that
exploit a developing country’s high risk opportunities not due to nationalistic sentiments but
because, quite simply, “they have no other choice but to invest locally” (Amsden, 2009).
Local and foreign firms also behave differently with regards to profit reinvestment. Amsden
(2009) argues that in the mining industry, foreign firms tend to repatriate profits or reinvest them
in the same industry elsewhere, with few local jobs or skill formation. Meanwhile local firms
invest a greater share of profits in diversifying locally, potentially creating new industries and
activities with more jobs and skills established. Foreign lead firms also tend to use less local
content than their local firms, especially in Category 3 and 4 products (component production
and assembly as well as advanced technology final products). This is because foreign lead
firms are likely to import inputs with large scale economies from a single source outside the
country. The process of initial outsourcing to seek the lowest cost supplier extends in requiring
the supplier to locate proximate to the factory. This ‘follower supply chain’ strategy was initiated
in the automobile industry and has spread to other manufacturing sectors (Barnes & Kaplinsky,
2000).
Furthermore, when foreign firms set up production facilities through subsidiaries in developing
countries, these are usually for mature products which are made through routinised,
standardised functions, and which compete on the basis of cost (Vernon, 1966). The tacit
knowledge, top managers and engineers and the prized high value added functions are usually
retained at home within corporate headquarters in the Global North. This leads to international

100
division of labour in which some countries are locked in lower value added products and
functions, with little chances to attain capabilities in higher value added ones which are rich in
technology, knowledge and skills. Amsden and Tschang (2003) find that the R&D conducted in
Singapore’s hard disk drive industry, dominated virtually by foreign lead firms, was applied
research at most (higher than pure science and basic research, but lower than exploratory and
advanced development research). In contrast, a comparison of R&D in subsidiaries of five
foreign lead firms and five local firms in South Korea’s telecommunications industry finds that
the local firms did more diversified R&D with the potential of generating frontier technology than
their foreign counterparts (Amsden, 2009). This has upgrading implications for developing
countries.
While local firms are important for RBI, the configuration of local capital plays a role too. Cramer
(2003) cautions that if a resource-based sector was organised purely around large private
concerns, the attraction of short-term profit from exports of raw materials may hamper effective
linkage development. That Malaysia’s state capital was involved heavily alongside domestic
private capital in local firms was important for driving vertical integration at the key firms, for
minimising tensions between producers and processors over relative economic returns, and for
overcoming resistance by interest groups. In particular, the unresolved tensions between
producers and processors can hamper development of domestic processing, as seen in the
case of Sri Lankan tea. To produce value added tea blends for exports, local processors need
to add cheap filler teas (those that do not possess significant flavour or colour attributes) to
locally grown quality tea to increase the bulkiness of the final blends without significantly
affecting the quality while keeping cost at a minimum (Ganewatta et al., 2006). The filler teas
are not readily available locally, largely due to agro-ecological factors, and their imports are
regulated tightly to protect domestic producers (who grow quality tea).
Critically related to the development of local firms is their size. With increasing consolidation in
global industries, the asymmetry in market structure has become more entrenched. Foreign
lead firms have further strengthened their oligopsony position in value chains, outsourced low
value added or non-core activities, and stoked competition among a wide supplier base for cost
efficiency and flexibility simultaneously (Milberg & Winkler, 2013). This strengthens foreign lead
firms’ leverage over local firms from developing countries, and perpetuates profit accrual to
foreign lead firms. One possible strategy to address this asymmetry is by creating a small
number of large local firms or ‘national champions’ similar to Japan’s kereitsu and South
Korea’s chaebol, in order to accelerate industrial upgrading. Although it may be unrealistic to
expect the national champions to fully compete with foreign lead firms from the Global North in
the latest epoch of globalisation (Nolan, 2014a), not having any large local firms will conceivably
101
undermine a country’s bargaining position and long-term capability for technological learning
and industrial upgrading.
3.6 Firm Innovation
Globalisation allows transmission of technological and knowledge at a much faster pace in the
past. However, such opportunities must be exploited through developing countries’ “deliberate
effort to absorb innovation through endogenous learning” (Archibugi & Pietrobelli, 2003).
Deliberate indigenous efforts include government policies that promote selected FDI and
collaborations between foreign lead firms and local firms, industrial clusters that facilitate
exchanges among firms, and business innovation systems at a sectoral, regional or national
level in which private actors and public institutions interact to improve generation, application
and absorption of technology and knowledge (Freeman, 1995; Lundvall, 2012; Nelson, 1994;
Malerba et al., 2016).
Compared with its other key export-oriented sector, electrical and electronics (specialising in
semiconductor assembly operations), Malaysia’s palm oil sector is less dominated by foreign
firms and sees high participation by local, especially private, firms. Except for joint ventures
most notable in oleochemicals, most local firms generally engage local lead firms or in some
cases, foreign buyers through arms’ length relationships. Such relationships are not uncommon
for resource-based value chains.
The degree of coordination for meeting private and public standards has been on the rise in
agro-commodity value chains but it is relatively less than what is observed in value chains for
specialised and complex manufactured goods. The relatively loose governance (which is closer
to arms-length trade as opposed to tight coordination and control by lead firms) in resource-
based value chains reflects lower complexity and high codifiability of transactions, high supplier
capability, and low appropriability of technology (in the sense that lead firms find it difficult to
retain the value added of proprietary technology and knowledge that they provide) (Milberg,
2004; Pietrobelli & Rabellotti, 2006, 2011). Consequently, active transfers of technology and
knowledge by local or foreign lead firms are limited.
For these reasons, public institutions (DOA, MARDI and universities) have historically played a
vital role in driving innovation and learning in the Malaysian palm oil sector, the most important
of which has been MPOB (previously PORIM before merger). Of 43 government research
institutes (GRIs) in Malaysia, MPOB was the largest spender on R&D in 2004, with an outlay of
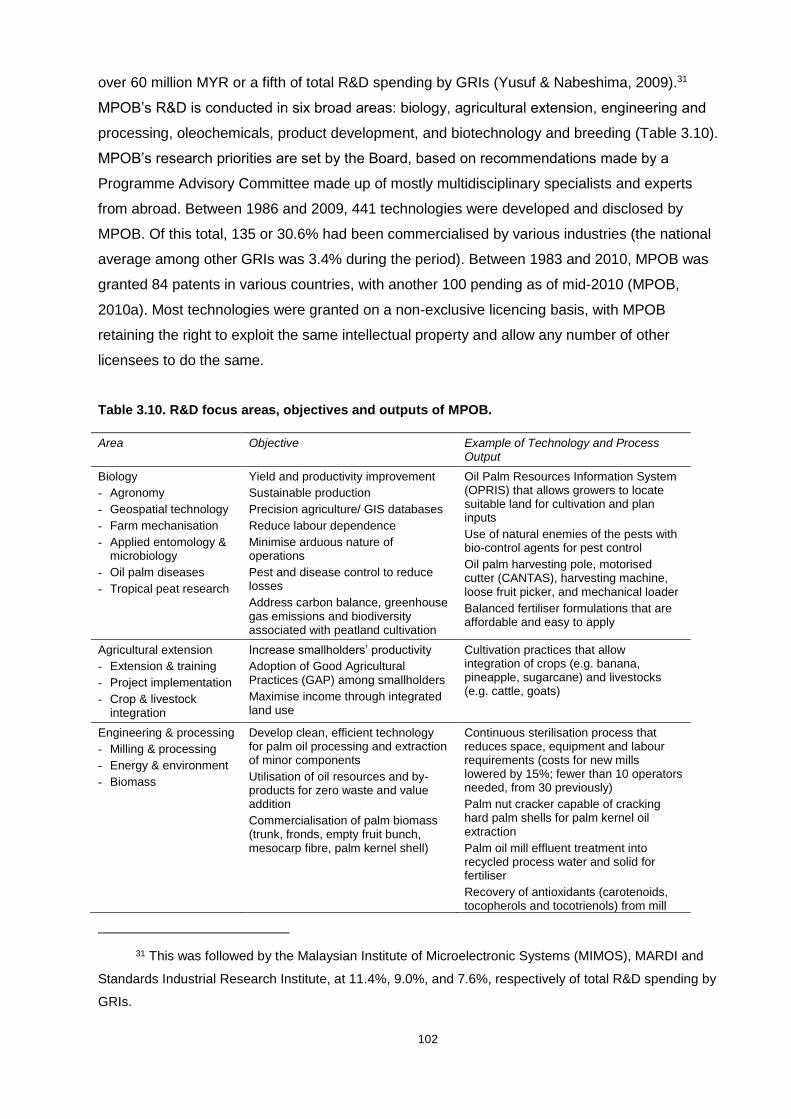
102
over 60 million MYR or a fifth of total R&D spending by GRIs (Yusuf & Nabeshima, 2009).31
MPOB’s R&D is conducted in six broad areas: biology, agricultural extension, engineering and
processing, oleochemicals, product development, and biotechnology and breeding (Table 3.10).
MPOB’s research priorities are set by the Board, based on recommendations made by a
Programme Advisory Committee made up of mostly multidisciplinary specialists and experts
from abroad. Between 1986 and 2009, 441 technologies were developed and disclosed by
MPOB. Of this total, 135 or 30.6% had been commercialised by various industries (the national
average among other GRIs was 3.4% during the period). Between 1983 and 2010, MPOB was
granted 84 patents in various countries, with another 100 pending as of mid-2010 (MPOB,
2010a). Most technologies were granted on a non-exclusive licencing basis, with MPOB
retaining the right to exploit the same intellectual property and allow any number of other
licensees to do the same.
Table 3.10. R&D focus areas, objectives and outputs of MPOB.
Area Objective Example of Technology and Process Output
Biology
- Agronomy
- Geospatial technology
- Farm mechanisation
- Applied entomology & microbiology
- Oil palm diseases
- Tropical peat research
Yield and productivity improvement
Sustainable production
Precision agriculture/ GIS databases
Reduce labour dependence
Minimise arduous nature of operations
Pest and disease control to reduce losses
Address carbon balance, greenhouse gas emissions and biodiversity associated with peatland cultivation
Oil Palm Resources Information System (OPRIS) that allows growers to locate suitable land for cultivation and plan inputs
Use of natural enemies of the pests with bio-control agents for pest control
Oil palm harvesting pole, motorised cutter (CANTAS), harvesting machine, loose fruit picker, and mechanical loader
Balanced fertiliser formulations that are affordable and easy to apply
Agricultural extension
- Extension & training
- Project implementation
- Crop & livestock integration
Increase smallholders’ productivity
Adoption of Good Agricultural Practices (GAP) among smallholders
Maximise income through integrated land use
Cultivation practices that allow integration of crops (e.g. banana, pineapple, sugarcane) and livestocks (e.g. cattle, goats)
Engineering & processing
- Milling & processing
- Energy & environment
- Biomass
Develop clean, efficient technology for palm oil processing and extraction of minor components
Utilisation of oil resources and by-products for zero waste and value addition
Commercialisation of palm biomass (trunk, fronds, empty fruit bunch, mesocarp fibre, palm kernel shell)
Continuous sterilisation process that reduces space, equipment and labour requirements (costs for new mills lowered by 15%; fewer than 10 operators needed, from 30 previously)
Palm nut cracker capable of cracking hard palm shells for palm kernel oil extraction
Palm oil mill effluent treatment into recycled process water and solid for fertiliser
Recovery of antioxidants (carotenoids, tocopherols and tocotrienols) from mill
31 This was followed by the Malaysian Institute of Microelectronic Systems (MIMOS), MARDI and
Standards Industrial Research Institute, at 11.4%, 9.0%, and 7.6%, respectively of total R&D spending by
GRIs.

103
by-products
Oleochemicals
- Polymer & composite products
- Specialty & industrial chemicals
- Product specifications
- Consumer products
Increase non-food applications of palm oil and palm oil products
Provide pilot plant facilities for industry and SMEs
Add value to palm-based basic oleochemicals
Discovery of a natural palm-based surfactant (alpha sulphonated methyl ester) as an alternative to petrochemicals-based surfactants
Food-grade grease to lubricate food processing machines (instead of petroleum-based grease that may cause food contamination)
Palm biodiesel (known as Envo Diesel) as renewable energy
Product development
- Food technology & nutrition
- Food safety & code of practices
- Technical & commercial information for palm oil users
Find new uses for palm oil products
Promote utilisation and acceptance of palm oil for food and non-food applications
Nutrition trials and research findings on palm oil
Trans fats free formulation (Smart Balance which blends several oils) for use in margarines and shortenings
High-fibre chocolate formulation which substitutes cocoa fat with palm derivatives
Specialty animal fat replacer (SAFaR)
Biotechnology & breeding
- Breeding & tissue culture
- Genomics & genetic engineering
- Bioinformatics
Improve oil palm planting materials
Develop bioinformatics data storage and analysis
Develop genomic tools to improve breeding
Planting materials with higher oil yield, higher value-added oil content, and specific physical features for ease of harvesting
Largest oil palm germplasm collection in the world
Source: Malaysian Palm Oil Board, Interviews.
MPOB’s R&D activities, as well as it licensing and regulatory activities, are funded by budgetary
allocations from the government and an industry cess. In recent years, MPOB’s funding is
believed to be derived almost entirely from cess revenues (cess is a tax that is earmarked for a
specific purpose and its origin can be traced to British colonial rule), estimated at 220 million
MYR in 2008 (Adebowale & Egbetokun, 2012; Adnan, 2008). The industry cess collected by
MPOB amounts to 13 MYR per tonne of crude palm oil (less than 1% of 2014 average crude
palm oil prices for local delivery, at 2,384 MYR per tonne) from palm oil producers. Out of every
13 MYR, 2 MYR is allocated for MPOC’s promotion and marketing activities.
Interviewees noted that the MPOB model was effective for high diffusion of technologies and
knowledge, consistent with studies suggesting that public R&D is best targeted at technologies
that are far from being commercial (Ek & Söderholm, 2010). This was especially relevant during
the factor-driven and early investment-driven phases. As public R&D and funding lower
investment costs through scale effects, the government expectation was that private
investments will be catalysed and ‘crowded in’ over time (Qiu et al., 2014). Yet, there was no
clear evidence of an increase of private R&D investments in Malaysia’s palm oil sector. Of the
20 largest plantation firms, only nine (FGV, Sime Darby, Wilmar International, Kuala Lumpur
Kepong, IOI, Genting Plantations, Boustead Plantations, Sarawak Oil Palms, and Kulim
(Malaysia)) reported some kind of R&D activity internally. Although the firms’ annual reports do

104
not provide much detail on such activities, interviewees suggested that most of the R&D
remains directed at agronomy and plantation operations (in other words, more upstream
oriented).
The limited evidence of R&D activities within plantation firms appears broadly consistent with
the findings of more recent studies that attempt to measure technology and innovation
performance using Oslo Manual (OECD & Statistical Office of the European Communities,
2005), the widely used international guidelines for collection and use of innovation data. In a
pilot cross-national study by (UNESCO, 2012), 42.5% of Malaysian manufacturing firms were
engaged in R&D domestically and 15.8% in R&D abroad (Table 3.11). Similarly, Lim and
Nagaraj (2011) find that 41.6% of Malaysian manufacturing firms had generated innovations or
had ongoing innovation activities. Most of the innovator firms were more likely to be of a larger
size, export-oriented, in sectors a higher level of technological intensity, and at least partially
owned by foreign interests.
Table 3.11. Percentage of manufacturing firms engaged in innovation activities, 2011.
% Domestic R&D
Overseas R&D
Acquisition of machinery, equipment and software
Acquisition of other external knowledge
Training Market introduction of innovations
Other preparations
Euro-27 max 81.3 54.8 98.8 53.1 96.4 48.4 88.1
China 63.3 22.1 66.0 28.1 71.5 60.6 36.9
South Africa 54.1 22.4 71.2 24.8 69.6 42.6 47.7
Israel 48.9 32.2 85.1 12.9 52.6 59.1 n.a.
Indonesia 48.3 5.2 39.3 21.6 37.0 85.4 77.5
Malaysia 42.5 15.8 64.9 29.8 50.2 32.0 n.a.
Ghana 42.1 14.0 80.7 15.8 86.0 71.9 45.6
Egypt 41.3 5.5 74.3 11.0 56.9 19.3 35.8
Colombia 26.8 8.9 85.8 7.2 19.8 26.6 n.a.
Russia 18.9 20.0 64.0 12.7 18.3 9.6 n.a.
Uruguay 11.1 1.2 20.3 4.4 15.1 n.a. n.a.
Brazil 4.7 1.9 34.1 4.8 26.5 14.7 16.7
Source: UNESCO (2011).
It is unlikely that public R&D has crowded out private R&D. Neither can private R&D substitute
fully for public R&D in Malaysia’s palm oil sector. After all, both public and private sources for
R&D investment play different but complementary roles. For a successful transition to the
innovation-driven phase, firms cannot rely solely on MPOB for R&D and innovation functions,
given contradictions between the fundamental nature of public R&D and the specific needs of
firms. By its very nature, MPOB’s R&D must be made as accessible and generic for all as

105
possible. This explains why most of the technologies and knowledge developed by MPOB
related to agronomic practices as well as products and processes. In practice, larger firms will
likely benefit more from these technologies and knowledge given their greater access to
financial and non-financial resources compared with smaller firms. However, MPOB’s
technologies and knowledge are at least theoretically available to any firm if there are no real-
life obstacles hampering adoption. In contrast to the factor-driven phase, during the innovation-
driven phase, firms need to create and sustain higher value added and profits accruing from
niche, proprietary technology and knowledge which will differentiate them from competitors.
The transition to the innovation-driven phase is fraught with challenges especially for agro-
commodities. Widely accepted as a strategy to secure price premiums, product differentiation
commonly involves product branding supported by extensive marketing and advertising efforts.
However, product differentiation – based on either functional (taste, quality standards, and
usage) or emotional benefits (provenance, social responsibility, and exclusivity) – is difficult for
bulk commodities, which are highly substitutable and reliant on price competition (Saccomandi,
1998). Furthermore, production differentiation must be persuasively conveyed through branding
– a specialist field that requires expert understanding of consumers, markets, channels and
products (Docherty, 2012). In many cases, price premiums at the farm and basic processing
levels remain stagnant in relation to the extra costs that are incurred by producers (be it growers
or processors) as a way to differentiate their products.
The implication is that past policy measures for promoting innovation in the Malaysian palm oil
sector – either firms’ acquisition of existing technology and knowledge through the use of tax
incentives, as well as creation and diffusion of technology and knowledge by MPOB – are no
longer adequate. Innovation among local firms must evolve beyond product and process
innovation to include firm-initiated and firm-specific organisational and marketing innovation.
Organisational innovation requires implementation of a new organisational method in the firm’s
business practices, workplace organisation or external relations. Marketing innovation is
implementation of a new marketing method involving significant changes in product design or
packaging, product placement, product promotion or pricing (OECD & Statistical Office of the
European Communities, 2005).
Firms may not undertake innovation for a variety of obstacles, some of which are
complementary to each other (such as costs and risks) (Mohnen & Röller, 2005) (Table 3.12). In
the case of Malaysian manufacturing firms, Lim and Nagaraj (2011) find that high costs,
economic risks, lack of skilled labour, and lack of finance stand out as the most important
obstacles for firms that innovate and firms that do not innovate. However, there are two

106
differences in the way obstacles are experienced by innovating and non-innovating firms. One,
firms which are on the innovation path, even larger ones with greater resources to support
innovation, are more likely to report obstacles than non-innovating firms because they have a
better understanding of the problems after engaging in innovation activities. Two, risks and
financing are bigger obstacles to non-innovating firms than innovating firms but cost and labour
problems are equally important to both firm types.
Table 3.12. Factors hampering innovation activities.
Cost and Economic Factors Knowledge Factors Market Factors
Lack of funds within firm
Lack of external funding (venture capital, public funding)
High innovation costs
Excessed perceived risks
Lack of qualified personnel
Lack of information on technology
Lack of information on markets
Difficulty in finding cooperation partners for innovation
Market dominated by established firms
Uncertain demand for innovative goods or services
Innovation is easy to imitate
Source: Adapted from OECD and Statistical Office of the European Communities (2005).
3.7 Conclusion
RBI requires selective government intervention. There is no single set of policy measures that
guarantee success of RBI given different product and industry contexts. Nonetheless, common
RBI policies will likely promote scale and efficiency to increase production of raw materials,
ensure availability of feedstock for processing, adjust relative profitability of processing to
primary production, facilitate exports and market diversification, and encourage technology and
knowledge transfers. The policy emphasis gradually shifts from scale expansion to efficiency
gains to innovation, and the declining relevance of policies to change internal terms of trade
against traditional primary exports.
The limited evidence from Malaysian palm oil indicates that foreign firms are less inclined to
invest in downstream processing at least during the early stages of RBI due to locational
specificity of resources, domestic factor endowments, and trade distortions in resources which
do not match their strategy and economic considerations. This potentially renders policies to
attract FDI for RBI less effective than anticipated. Conversely, local firms may have a crucial
role to play when it comes to investing in RBI. They have knowledge about the domestic
business environment and a potentially bigger risk appetite due to practical constraints arising
from their lack of ability to invest elsewhere. Public investments in R&D and innovation, usually
financed by taxes on production and exports, are equally crucial for technology and knowledge

107
diffusion. Long-term indigenous innovation efforts however will require commensurable private
investments to stay ahead of the competition.
The essay suggests the need to further clarify the role of foreign linkages for RBI in industrial
policy research. Foreign linkages, with or without equity links, can be important sources of
technology and capital for developing countries. Numerous examples show that these linkages
in agro-commodity value chains can under specific circumstances deliver benefits in the form of
better inputs and products, and more efficient processes (most visibly in logistics for harvesting,
collecting, preserving and transporting the produce). However, these foreign linkages have
been more established in primary production – either through FDI (operations via affiliates and
subsidiaries in developing countries) or coordination (global buyers who set, monitor and
enforce key parameters for the value chain processes) – than in downstream development. The
essay also affirms the importance of public actions to accelerate R&D and innovation in agro-
commodity value chains as identified in the GVC literature. The challenge is to create a more
balanced innovation system that reflects efforts by all stakeholder groups including private firms,
instead of one that relies overwhelmingly on public efforts.
Several policy implications arise, starting with a review of the bias towards FDI in domestic
policies and institutions in developing countries. Many governments in developing countries did
impose restrictions on foreign TNCs throughout the 1960s and 1970s to protect and give
preferential treatment to local businesses. In the decades that followed, to attract foreign
investment, governments offered foreign firms significant regulatory advantages – as perceived
by the firms themselves32 – over domestic firms in areas such as taxes and subsidies, business
licensing, labour laws, foreign currency and exchange policies. These concessions were made
to compensate for defects in the domestic investment climate and have the effect of
discriminating against local firms (Collier & Dollar, 2002). Correcting the FDI bias does not entail
cushioning local firms from foreign competition and compensating them for inefficiency; it is
about creating an environment in which firms, foreign or local, can be competitive. In addition, in
line with what advanced economies do, more active financial support to support firm-level
innovation, including state funding for private R&D as well as credit for higher-risk innovation
activities, must now be considered. To provide business with the required human and physical
capital in their R&D and innovation undertakings, more public investments can be directed to
32 Huang (2005) uses the data from the 2000 World Business Environment Survey (WBES) of over
10,000 firms across 81 countries and finds evidence that foreign firms’ regulatory advantages are
especially substantial where domestic firms are politically weak and where countries are corrupt.

108
general education, tertiary education in applied science-based subjects, and knowledge-based
infrastructure and assets.

109
4 Economic Upgrading for Whom? Distribution of Gains from
Development of the Malaysian Palm Oil Sector
4.1 Introduction
Industrial or economic upgrading in global value chains (GVCs) is crucial for national
development. With industrial upgrading, a country achieves economic growth and increases its
wealth and income, which translate into more resources for reducing poverty and solving other
social problems. Given the increasingly globalised and coordinated capitalist environment in
which production and trade occur – simultaneously expanding and limiting one’s prospects for
upgrading – much GVC research understandably focuses on how economic upgrading at the
levels of country, sector or firm along a given value chain can best be achieved. However,
history offers examples in which economic growth was not always followed by commensurable
progress in human development.
The question who benefits from economic upgrading has received relatively little attention but is
highly relevant (Bair, 2005; Rammohan & Sundaresan, 2003). This essay (Essay 3) attempts to
link economic to social and development outcomes by investigating their progress made in key
primary through tertiary industries within Malaysia’s palm oil sector. Evidence suggests broad
economic and social upgrading has been achieved across most industries, contributing to
remarkable gains as reflected in national economic development and poverty eradication. Social
upgrading is detected even in industries which can be categorised as having experienced
economic downgrading. Individuals receive unequal amounts of benefits depending on where
they are in the value chains. Migrant workers who account for 60% of the workforce make far
less headway in wage and work conditions compared to others. The differences are normally
attributed to the skill requirements of jobs and individuals’ productivity levels. While skills are
important, there is no evidence to suggest the migrant workers are less productive than others.
The institutional arrangements and political representation that they enjoy (or lack thereof) are
likely to be just as important in predicting and explaining their treatment vis-à-vis other groups.
Section 4.2 reviews the conceptual and measurement issues for economic and social outcomes
in GVCs and discusses selected works in the area. Section 4.3 identifies 12 key industries
within the Malaysian palm oil sector and explains the measurement of their economic and social
outcomes using gross value added (GVA) data from 2000 to 2010. Section 4.4 presents the
findings on how GVA in gross terms and as a share of output has evolved during the period as
well as the evolving distribution of GVA between labour and capital. It analyses the distribution
trends by linking them to the industries’ occupational structure and employee profile. This is

110
followed by a discussion on the findings in Section 4.5, which seeks to provide some factors
which possibly explain the findings in addition to the normal skill- and productivity-centric
explanations. Section 4.6 concludes the essay with a summary of findings and briefly outlines
the implications arising from these findings.
4.2 Economic and Social Upgrading
Asking who gets what in value chains is important for shedding light on “the winners and losers
in the globalisation process, how and why the gains from globalisation are spread, and how the
number of gainers can be increased” (Gereffi et al., 2001). The GVC literature first identified five
types of economic upgrading – product, process, functional, channel and intersectoral
(Humphrey & Schmitz, 2002; Frederick & Staritz, 2012). However, as Bair (2005) points out,
upgrading in this sense has two limitations that need further work due to its firm-level orientation.
The first is the unclear aggregative effect of firm upgrading as in how the process of upgrading
at firm level adds up to the implications for the larger units that are traditionally regarded as the
containers for development, such as the national or regional economy (ibid). The second is the
need to specify who benefits from economic upgrading. Process upgrading in the direction of
manufacturing automation illustrates this point: it may result in higher value-added for the firm
but may displace lower-skilled workers, temporarily or otherwise.
The first issue is not fully resolved, though some recent work attempts to be more careful with
the levels of analysis and makes a distinction between a firm’s insertion into a specific value
chain and a country’s incorporation into the global economy. The second issue is being
addressed as more work emerges to demonstrate that economic upgrading does not equal or
automatically lead to social upgrading. This was observed, for example, in the case of coffee
and banana, where increased value added did not translate into better farm-gate prices for
producers. Rather, profits and oligopoly rents appear to gravitate to points of concentration
dominated by developed-country firms in the input-output structure, as seen in a number of
cases ranging from coffee and bananas (Milberg, 2004; Fitter & Kaplinsky, 2001; Vorley & Fox,
2004; Robinson, 2009).
Theoretically, four combinations of economic and social outcomes are possible (Figure 4.1)
(Milberg & Winkler, 2011). The high-road growth scenario is one in which both economic and
social upgrading are present. The high-road decline scenario occurs when social upgrading is
present despite economic upgrading. The low-road growth scenario is one where economic
upgrading is accompanied by social downgrading. The worst scenario, described as the low-
road decline, occurs when both economic and social dimensions are worse off than before.

111
Social Realm
Upgrading Downgrading
Economic Realm
Upgrading High-road growth Low-road growth
Downgrading High-road decline Low-road decline
Source: Milberg and Winkler (2011).
Figure 4.1. Economic and social outcomes in GVCs.
Social upgrading captures gains in living standards and conditions of employment over time,
and does not involve any explicit assessment of environmental impact. Barrientos et al. (2011)
argue that social upgrading is affected by the type of work performed and the status of workers
– with non-regular workers performing low-skilled, labour-intensive work being most vulnerable
to the risks of social downgrading. In operational terms, the measurement of economic and
social upgrading is complicated by a wide variety of variables across levels of analysis (See
Milberg and Winkler (2011) for an illustrative list of possible measures). Like economic
upgrading, social upgrading comes with a choice of measures for aspects including wages,
consumption, working conditions, workers’ rights, gender equality and job security. Case studies
present a mixed picture. For example, a review of GVCs in horticulture, garments and textiles
finds contradictory evidence following their insertion into the global economy: modest income
gains and job creation, accompanied by little improvement or deterioration in employment
stability, income security and work conditions (Nadvi, 2004).
Pay remains the most basic representation of social upgrading. One reasonable measure of pay
is the labour share or the fraction of production income accruing to labour – wages and salaries
before taxes, plus employers’ social contributions (Lübker, 2007). While movements in the
labour share must not be interpreted as changes in real wages (Bentolila & Saint-Paul, 2003),
the usual explanation for changes in the two is marginal labour productivity. The neoclassical
theory based on the tradition of marginalist analysis sees wages as being determined by labour
demand emanating from profit-maximising firms based on their calculation of the marginal
revenue generated by labour. Wages therefore increase in tandem with rises in the marginal
productivity of labour, assuming labour supply and product market conditions or prices remain
constant (Milberg & Winkler, 2011). However, the link between labour productivity and wage
growth remains debatable. In nine advanced Group of 20 economies including the US,
Germany, and Japan, labour shares declined while real average wage growth lagged behind
labour productivity growth since 1999, even when different deflators are used or when total
compensation (instead of the narrower concept of wages) is used (ILO, 2015; ILO & OECD,
2015).

112
Considerable alternative effort has been made to explain wage and labour share trends. These
include technological change, globalisation, financialisation, unemployment levels, and
institutional factors. Because growth in labour productivity is not caused solely by improved
labour skills and knowledge, some see capital-augmenting technical change and capital
deepening as accounting for at least part of the decline in the labour share (Bentolila & Saint-
Paul, 2003; Driver & Muñoz-Bugarin, 2010).
Incidentally, capital intensity is one reason that RBI may be limited in terms of social upgrading:
processing industries and supporting services developed around primary production typically
have small direct employment generation effects (Walker, 2001).33 Similarly, Owens & Wood
(1997) argue that while primary processing or RBI (apart from its need for more local raw
materials) is fundamentally similar to other sorts of manufacturing in that they all depend on the
skills of a country’s workforce, the main difference is that primary processing is less labour-
intensive than narrowly defined manufacturing. When jobs are created in RBI, they have higher
skill and knowledge requirements and often favour semi-skilled and skilled labour instead of
unskilled labour. This leads to their conclusion that “exporting processed primary products is
thus likely to yield fewer of the distributional and social gains that East Asia reaped from
massive expansion of manufacturing employment” (ibid).
Others find wage-moderating effects from the integration of labour-abundant countries into the
global economy and increased levels of offshoring (or ‘threat effects’ even without actual
changes in production locations) (Burke & Epstein, 2001; ILO, 2008). Under pressure to deliver
shareholder value, firms divest non-core, typically labour-intensive activities and increase
financial profits (instead of profits from productive investments) (Bell & Van Reenen, 2013; Weil,
2014). Additionally, high employment exerts downward pressure on wages while the level of
unemployment benefits affects the level of pay deemed acceptable to workers (OECD, 2012).
In the institutionalist approach, wages are understood as a function of the bargaining power of
labour versus management within a specific institutional context shaped by, among others,
labour market regulations, the extent of public ownership, and the size of the welfare state. In
particular, union density (the number of trade union members as percentage of total employees
or as a percentage of total employment), bargaining rights, and minimum wage legislation have
33 While direct employment spin-offs are limited, (Walker, 2001) cautions that RBI can still stimulate
the development of additional industries, services and supporting firms within the vicinity of the main
industry, enlarging the employment base and job opportunities in the local economy.

113
been found be significant in determining wage outcomes (Berg & Kucera, 2008; Howell, 2004;
ILO & OECD, 2015; Milberg & Winkler, 2011).
More recently, the rise of industrial agriculture and agro-industrialisation has led to a growing
schism between industrial agriculture and smallholder-based agriculture, and concerns that
smallholders may get marginalised if not excluded because they lack the means to adjust to
new production realities. The common challenges identified include high transaction costs,
insufficient to financial and knowledge resources, and increasingly demanding standards and
performance requirements (Ashley & Maxwell, 2001; Dolan & Humphrey, 2000; Gibbon & Ponte,
2005). Despite higher entry barriers, some studies suggest that for those who successfully
gained access to the value chains, net earnings on a per hectare or per kilogramme basis has
improved, compared with those who stay in the traditional channels (see, for example,
(Natawidjaja et al., 2007; Hernández et al., 2007; Falkowski et al., 2008; Berdegue et al., 2008).
In the Tanzanian and Kenyan cut flower industries, trade unions and labour groups used private
social standards to enhance union organisation, and to perform a watchdog function by
threatening non-compliant business with exposure in consumer markets (Riisgaard, 2009).
In comparison, there has been a dearth of research that systematically studies downstream
segments beyond primary production as well as waged workers along the value chains.
Enlarging the scope of inquiry to incorporate these dimensions is important. There has been a
massive movement of people across borders – instead of internal migration – to fill jobs in
agriculture and its downstream sectors in most industrial countries and in many middle-income
developing countries, leading to estimates of migrant workers contributing up to 80% of the
agricultural labour force in some countries and regions (Martin, 2016; IUF, 2008). This trend is
likely to affect developing countries as well when they industrialise and exhaust unlimited
supplies of labour domestically.
4.3 Methods and Data
The key data used in this essay are the three input-output (I-O) tables compiled by the
Department of Statistics Malaysia for 2000, 2005 and 2010. Breakdown of gross value added
(GVA) by labour and capital shares was introduced since 2000. The original I-O tables were
compiled using different classification systems to cope with emergence of new products and
new industries that produce them. The palm oil sector is disaggregated into 12 industries that
span across primary, secondary and tertiary industries, based on their national activity and
commodity codes. The way in which these industries relate to specific palm oil-related activities

114
can be found in Annex 8. Additionally, the tables, expressed in basic prices in local currency for
the year, were adjusted to 2010 prices.
Additional data on employment statistics and occupational structure were extracted from official
reports and industry publications. The sources are as so identified in the rest of the essay.
Anonymous, semi-structured interviews with a total of 15 interviewees (12 senior-level firm
executives, 7 government officials, and 6 analysts/ industry group officials) were conducted in
Malaysia between March and August 2015. The interviews, together with documentary analysis
of mainly policy documents and media reports, enhanced quantitative analyses.
Value added measures value created by production. Once the amount of value added
appropriated by government in the form of other taxes on production is subtracted from value
added and the value of subsidies is added, the compensation of labour and capital is revealed
(United Nations, European Commission, International Monetary Fund, Organisation for
Economic Co-operation and Development, & World Bank, 2009). For this essay, GVA is output
valued at basic prices less intermediate consumption valued at purchasers’ prices. It has three
components:34
GVA at basic prices = Employees’ compensation + Gross operating surplus +
Taxes less subsidies on production
Employees’ compensation as return to labour of the households can be divided into wages and
salaries payable in cash or in kind, and the value of social contributions payable by employers.
Gross operating surplus in the context of national accounts represents the excess amount of
money generated by firms’ operations after paying labour input costs. It is effectively profits as
return to capital of corporations. Gross operating surplus has two components: consumption of
fixed capital and net operating surplus. Taxes less subsidies (if any) represent the share of GVA
going to government for its services. Labour, capital and government shares total 100% of GVA.
Labour and capital shares are of relevant interest for analysis of functional distribution of income.
Factor shares need to be interpreted with caution due to well-recognised measurement issues.
While national income accounting has become more standardised, it remains difficult to
34 Purchasers’ price is the price at which a product is sold in the market. Producers’ price is
purchasers’ price, less wholesale and retail margins, transport charges and value added tax not
deductible by the purchaser. Basic price is producers’ price, plus subsidies on the product, less taxes on
the product excluding invoiced value added tax. Using an income approach, GDP at current prices is the
sum of GVA at basic prices and taxes on products (United Nations, European Commission, International
Monetary Fund, Organisation for Economic Co-operation and Development, & World Bank, 2009).

115
disaggregate national income into functional components in determining the factor shares (for
example, entrepreneurs’ income is not solely profits but also embodies wages) (Gollin, 2008). In
addition, labour share tends to be understated, especially in developing economies, because
income from self-employment is recorded as capital income (Guerriero, 2012; ILO & OECD,
2015).
Labour share is unadjusted in this essay and is likely be a lower estimate of the true share of
labour income. That mixed income as a category does not exist in the I-O tables informs the
choice of non-adjustment. Nonetheless, non-adjustment does not affect trends of factor shares
(Guerriero, 2012; ILO, 2010). Furthermore, the usefulness of labour shares is widely accepted
because they are one of the few available sources of data on income distribution, and because
most individuals subsist on wage income (Gollin, 2008).
For the purpose of this study, economic upgrading occurs when three conditions are met: (a)
GVA in gross terms (at 2000 prices) increases; (b) gross operating surplus in gross terms (at
2000 prices) increases; and (c) GVA as a percentage of output increases. This is especially
important for trend analysis. After all, the absolute value of GVA could rise over time on
increased output but may in fact be declining relative to the output increase. GVA expressed as
a share of output over time provides a consistent way of tracking whether the same amount of
production contributes to value added accretion, which signifies economic upgrading. Social
upgrading occurs when two conditions are satisfied: (d) employees’ compensation in gross
terms (at 2000 prices) increases; and (e) employees’ compensation as a percentage of GVA
(labour share, unadjusted) increases. In other words, employees’ compensation must not only
increase in gross terms but also as a share of GVA before it can be considered as proof of
social upgrading.
4.4 Findings
GVA, Profits and Employees’ Compensation
GVA and two of its components – gross operating surplus and employees’ compensation –
increased between 2000 and 2010 for the entire economy and the palm oil sector. Mostly
importantly, all industries within the palm oil sector experienced increases in gross terms (at
constant prices) in GVA, gross operating surplus and employees’ compensation, thus meeting
partial requirements for economic and social upgrading by satisfying conditions (a), (b) and (d).
Despite internal variations, the palm oil sector as a whole consistently outperformed the entire
economy in GVA, profits and employees’ compensation growth in percentage terms. GVA at
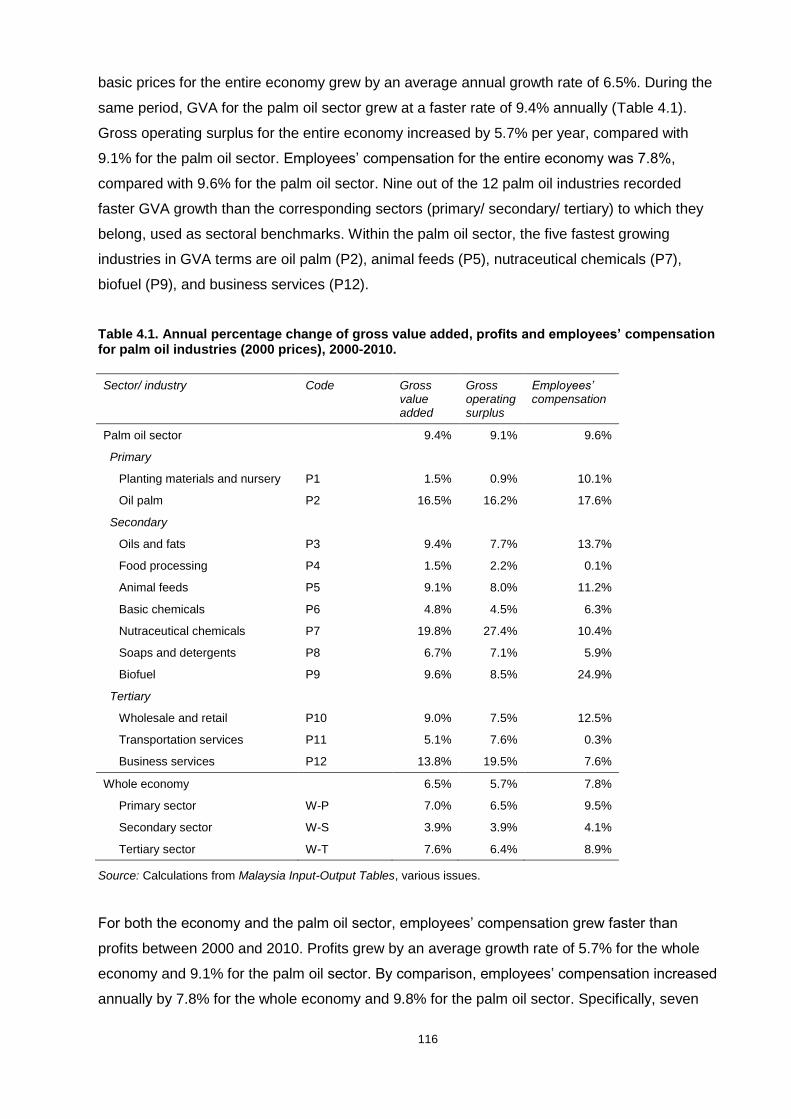
116
basic prices for the entire economy grew by an average annual growth rate of 6.5%. During the
same period, GVA for the palm oil sector grew at a faster rate of 9.4% annually (Table 4.1).
Gross operating surplus for the entire economy increased by 5.7% per year, compared with
9.1% for the palm oil sector. Employees’ compensation for the entire economy was 7.8%,
compared with 9.6% for the palm oil sector. Nine out of the 12 palm oil industries recorded
faster GVA growth than the corresponding sectors (primary/ secondary/ tertiary) to which they
belong, used as sectoral benchmarks. Within the palm oil sector, the five fastest growing
industries in GVA terms are oil palm (P2), animal feeds (P5), nutraceutical chemicals (P7),
biofuel (P9), and business services (P12).
Table 4.1. Annual percentage change of gross value added, profits and employees’ compensation for palm oil industries (2000 prices), 2000-2010.
Sector/ industry Code Gross value added
Gross operating surplus
Employees’ compensation
Palm oil sector 9.4% 9.1% 9.6%
Primary
Planting materials and nursery P1 1.5% 0.9% 10.1%
Oil palm P2 16.5% 16.2% 17.6%
Secondary
Oils and fats P3 9.4% 7.7% 13.7%
Food processing P4 1.5% 2.2% 0.1%
Animal feeds P5 9.1% 8.0% 11.2%
Basic chemicals P6 4.8% 4.5% 6.3%
Nutraceutical chemicals P7 19.8% 27.4% 10.4%
Soaps and detergents P8 6.7% 7.1% 5.9%
Biofuel P9 9.6% 8.5% 24.9%
Tertiary
Wholesale and retail P10 9.0% 7.5% 12.5%
Transportation services P11 5.1% 7.6% 0.3%
Business services P12 13.8% 19.5% 7.6%
Whole economy 6.5% 5.7% 7.8%
Primary sector W-P 7.0% 6.5% 9.5%
Secondary sector W-S 3.9% 3.9% 4.1%
Tertiary sector W-T 7.6% 6.4% 8.9%
Source: Calculations from Malaysia Input-Output Tables, various issues.
For both the economy and the palm oil sector, employees’ compensation grew faster than
profits between 2000 and 2010. Profits grew by an average growth rate of 5.7% for the whole
economy and 9.1% for the palm oil sector. By comparison, employees’ compensation increased
annually by 7.8% for the whole economy and 9.8% for the palm oil sector. Specifically, seven

117
out of 12 industries within the palm oil sector saw their employees’ compensation grow faster
than their profits. They are planting materials and nursery (P1), oil palm (P2), oils and fats (P3),
animal feeds (P5), basic chemicals (P6), biofuel (P9), and wholesale and retail (P10).
GVA, Capital and Labour Shares
The average GVA share for the whole economy in 2000, 2005 and 2010 was slightly below 40%.
Across the entire economy, the primary sector has the highest GVA share (generally above
70%), followed by the tertiary sector (approximately 50%) and the secondary sector
(approximately 20%) (Figure 4.2). The relatively high GVA shares for the primary and tertiary
sectors reflect their lower requirement for intermediate consumption than manufacturing.
Intermediate consumption for manufacturing is typically high because it represents not only the
basic materials, components and semi-finished goods going into the product, but also electricity,
cost of rents, insurances, accounting, legal and other services used in the production of goods.
Seven out of 12 industries within the palm oil sector experienced increases in their GVA shares,
thus satisfying condition (c) to be considered having experienced economic upgrading (since
conditions (a) and (b) are already satisfied). They are planting materials (P1), oil palm (P2), food
processing (P4), animal feeds (P5), nutraceutical chemicals (P7), soaps and detergents (P8),
and business services (P12).
Figure 4.2. GVA as a percentage of output (GVA share) in palm oil industries, 2000-2010.
Source: Calculations from Malaysia Input-Output Tables, various issues.
Within the palm oil sector, the GVA shares for the two primary industries – planting materials
and nursery (P1) and oil palm (P2) – appear broadly in line with their economy-wide sectoral
0%
10%
20%
30%
40%
50%
60%
70%
80%
90%
2000 Level 2010 Level

118
benchmark. Among the secondary industries within the palm oil sector, variations are more
pronounced. Oils and fats (P3) had an unusually low GVA share at below 10% on average. This
is likely related to the history of industry development. An export duty structure favouring
exports of processed palm oil was introduced in the 1970s. It subsequently attracted massive
investments and helped establish the local refining industry. However, it also created
overcapacity in refining that lasted through the 1990s and drove down processing margins due
to intense completion among refiners. The newer secondary industries within the palm oil sector
had GVA shares which were higher than the economy-wide sectoral benchmark. These
included basic chemicals (P6), nutraceutical chemicals (P7), soaps and detergents (P8) and
biofuel (P9).
Gross operating surplus or profits was the largest component of GVA. During the periods for
which data are available, on average, for every 100 MYR created in GVA for the entire economy,
70 MYR accrued to profits. For the entire economy, the primary sector had the highest capital
share, at just below 90%. This was followed by the secondary sector (slightly above 70%) and
the tertiary sector (at approximately 60%) (Figure 4.3). Employees’ compensation was the
second largest component of GVA.35 For 2000, 2005 and 2010, on average, for every 100 MYR
created in GVA for the whole economy, 30 MYR goes to employees’ compensation. Labour
shares mirror capital shares in that their sum amounts to almost 100%, since taxes less
subsidies on production collected by the government have been negligible. As such, mirroring
the trends in capital shares, the tertiary sector had the highest labour share at approximately
40%, followed by the secondary sector (slightly below 30%) and the primary sector (just above
10%) (Figure 4.4).
35 Taxes on production less subsidies as the third component of GVA was not available in
Malaysia’s I-O Tables until 2010. In the data published for that year, taxes less subsidies accounted for a
mere 1.2% of GVA.

119
Figure 4.3. Capital shares in palm oil industries, 2000-2010.
Source: Calculations from Malaysia Input-Output Tables, various issues.
Figure 4.4. Labour shares in palm oil industries, 2000-2010.
Source: Calculations from Malaysia Input-Output Tables, various issues.
The exceptionally high capital share or low labour share for the primary sector was likely due to
substantial existence of small farmers who are considered self-employed and not employees.
Their incomes were treated as gross operating surplus in Malaysia’s national accounts, which
do not provide for mixed income. Mixed income is a concept similar to gross operating surplus
but is used for unincorporated firms (such as small family businesses or self-employed people)
because it is difficult to distinguish between remuneration for the work carried out by the owner
0%
10%
20%
30%
40%
50%
60%
70%
80%
90%
100%
2000 Level 2010 Level
0%
10%
20%
30%
40%
50%
60%
70%
2000 Level 2010 Level

120
(or by family members) and entrepreneurial profit of the owner. Within the palm oil sector, the
labour shares for the two primary industries – planting materials and nursery (P1) and oil palm
(P2) – were close to 20% in 2010. This suggests that both industries, particularly oil palm (P2),
use more hired labour than their peers in the primary sector. Except for basic chemicals (P6)
and biofuel (P7), all secondary industries within the palm oil sector had labour shares that were
broadly in line with or higher than their economy-wide sectoral benchmarks. While resource-
based manufacturing activities may have minimal employment effects as suggested in the
literature (in that that they do not create as many jobs), their labour shares seem at least
comparable to those of regular manufacturing activities.
For the tertiary industries within the palm oil sector, wholesale and retail (P10) and
transportation and storage (P11) had lower labour shares than their sectoral benchmark. The
reasons differ for the two industries. For the former, the reason is possibly a large proportion of
self-employed people, similar to what is observed in the primary sector. These self-employed
people include traders, dealers and distributors of various inputs (machinery, fertilisers and
agrochemicals) and palm products. For transportation and storage (P11), it is due to heavy use
of capital such as vehicles, material handling equipment, information and communication
technology, and storage facilities. By contrast, business services (P12) had a higher labour
share than the sectoral benchmark. This was likely due to better pay for knowledge-intensive
jobs associated with professions in legal services, accounting, technical and engineering
advisory, and R&D. All in all, seven out of 12 industries within the palm oil sector experienced
increases in their labour shares, thus satisfying condition (e) to be considered having
experienced social upgrading (since condition (d) has been satisfied). The seven are planting
materials and nursery (P1), oil pam (P2), oils and fats (P3), animal feeds (P5), basic chemicals
(P6), biofuel (P9), and wholesale and retail (P10).
Taking GVA and labour share changes into account, the 12 palm oil industries are distributed
over a four-way classification to illustrate their social and economic outcomes (Figure 4.5). An
increase in the labour share means rising cost of production to business, which erodes its
profitability and potentially its competitiveness too. Nevertheless, from the labour perspective,
an increase in the labour share signifies social upgrading in that income distribution improves
favouring wage earners. An increase in the GVA share indicates a shift to higher value added
relative to output as a result of productivity gains (be it labour, capital or total factor productivity).
Between the optimal and worst combinations (economic with social upgrading versus economic
and social downgrading), it is also possible that economic upgrading is accompanied by social
downgrading, or that social upgrading occurs despite economic downgrading.

121
Figure 4.5. Percentage point change of GVA and labour shares in palm oil industries, 2000-2010.
Source: Calculations from Malaysia Input-Output Tables, various issues.
Notably, the entire economy underwent economic and social upgrading simultaneously between
2000 and 2010. The GVA share was fairly stable and increased by 0.3 percentage points,
providing evidence of modest economic upgrading. The economy-wide GVA share advanced by
a modest 0.3 percentage points. Compared with GVA share, labour share changes were more
pronounced. Between 2000 and 2010, the labour share for the economy increased by 3.6
percentage points. The labour share for the tertiary sector grew the most, by almost 5
percentage points to more than 40%. The labour shares for the primary and secondary sectors
increased by 2.4 and 0.4 percentage points respectively. In other words, the economy as a
whole as well as its sectoral components experienced social upgrading when measured by
labour share changes.
For the 12 industries within the palm oil sector, three experienced an increase in their GVA and
labour shares, indicating high-road growth characterised by both economic and social
upgrading. The three are planting materials and nursery (P1) and oil palm (P2), and animal
feeds (P5). Of the three, planting materials and nursery (P1) gained the most in GVA and labour
Planting materials and nursery (P1)
Oil palm (P2)
Oils and fats (P3)
Food processing (P4)
Animal feeds (P5)
Basic chemicals (P6)
Nutraceutical chemicals (P7)
Soaps and detergents (P8)
Biofuel (P9)
Wholesale and retail (P10)
Transportation and storage (P11)
Business services (P12)
Whole Economy
W-P
W-S
W-T
-20%
-15%
-10%
-5%
0%
5%
10%
15%
-35% -30% -25% -20% -15% -10% -5% 0% 5% 10% 15% 20%
Ch
an
ge
in
GV
A S
ha
re o
f O
utp
ut
Change in Labour Share of GVA
Higher GVA share of output, with lower labour share (low-road growth)
Higher GVA share of output and labour share (high-road growth)
Lower GVA share of output and labour share (low-road decline)
Lower GVA share of output, with higher labour share (high-road decline)

122
shares in percentage point terms and by far outperformed even the primary sector benchmark.
The GVA share for oil palm (2) increased in tandem with the commodity boom throughout the
2000s. Yet, its labour share growth was muted between 2000 and 2010. It was less than that of
the economy-wide primary sector, and slower than even palm oil secondary industries whose
GVA shares actually declined (in other words, economic downgrading).
In comparison, four industries experienced a decrease in their GVA shares but an increase in
their labour shares, indicating low-road growth that is characterised by social upgrading with
economic downgrading. Remarkably, most of these four industries experienced the worst
declines in GVA shares compared to all 12 industries. Wholesale and retail (P10) was the most
affected, recording a drop by 17.3 percentage points between 2000 and 2010. The next two
industries that fell by the most were oils and fats (P3) and basic chemicals (P6), both of which
have a longer history of establishment than other palm oil secondary industries. The GVA share
for basic chemicals (P6) fell by 9.4 percentage points to 20.9%. The GVA share for oils and fats
(P3) was already low relative to other palm oil secondary industries. It further declined by 3.4
percentage points to 6.1%. Yet, in terms of labour share growth, all three outperformed their
respective sectoral benchmarks. However, all had relatively low average labour shares against
their respective sectoral benchmarks historically.
Four industries recorded an increase in their GVA shares but a decrease in their labour shares,
signalling low-road decline or economic upgrading with social downgrading. The four are food
processing (P4), nutraceutical chemicals (P7), soaps and detergents (P8), and business
services (P12). All had relatively high average labour shares against their respective sectoral
benchmarks historically. Their increased GVA shares and decreased labour shares suggests
that there could be capital deepening in the industries. Transportation and storage (P11) was
the only among the 12 industries that experienced a decrease in both GVA and labour shares,
pointing to high-road decline characterised by simultaneous social and economic downgrading.
Productivity growth in transportation and storage (P11) slowed drastically from 2008 and did not
recover until after 2010, coinciding with the trough of the global economic crisis then.
Occupational Structure and Employee Profile
The labour share for oil palm plantations (oil palm (P2)) is of particular interest within the palm
oil sector for several reasons. First, oil palm plantations are the ‘progenitor’ that spawns the
other industries which either use its inputs or supply to its production. They are concentrated in
rural areas, where the incidence of poverty is usually the highest. Oil palm cultivation is thus an
important source of income for rural populations and a useful tool for poverty reduction.

123
Additionally, it is extremely labour intensive especially in field maintenance and harvesting.36
Some 35% of production cost in oil palm plantation is attributed to labour, which was the second
largest cost component after fertiliser (39%) (MPOB, 2010c). More importantly, oil palm
plantation has the highest number of workers, accounting for above 82% of workers employed
in the palm oil sector, while refining, processing and other downstream activities account for
18% of the jobs within the palm oil sector (Table 4.2). Based on the type of job titles available
and their skill classifications, oil palm plantations have mostly unskilled to semi-skilled positions
requiring certificate qualifications and below, whereas refining and R&D activities have more
skilled than unskilled and semi-skilled positions (Table 4.3).
Table 4.2. Number of workers in selected palm oil activities, 2008.
Activity Number %
Oil Palm Plantation (Primary) 500,817 82.1%
Milling (Secondary) 45,375 7.4%
Refining (Secondary) 6,860 1.1%
Crushing (Secondary) 956 0.2%
Oleochemicals (Secondary) 3,690 0.6%
Bulking Installations (Tertiary) 673 0.1%
Palm Fruit Dealers (Tertiary) 19,690 3.2%
Seed and Seedling Dealers (Tertiary) 26,100 4.3%
Palm Oil Dealers (Tertiary) 5,973 1.0%
Total 610,134 100.0%
Source: Malaysian Palm Oil Board.
Table 4.3. Job titles and skill classification in selected palm oil activities, 2008.
Activity Skilled (Diploma and Above)
Unskilled/ Semi-Skilled (Certificate and Below)
Total
Plantation 6 14 20
Milling 7 8 15
Refining 28 12 40
Research and Development
5 0 5
Source: Ministry of Human Resources.
36 Field maintenance includes weeding, water management, pruning, pest and disease
management and manuring. The common harvesting method involves the use of a chisel or sickle to cut
fresh fruit bunches off the top of palm trees that grow up to 30 feet. It is tedious and requires much time
and care.

124
Despite a high labour requirement by oil palm plantations, the majority of workers are not local.
The official definition of ‘foreign worker’ is a non-Malaysian citizen who is unskilled or semi-
skilled, working in Malaysia using the Temporary Employment Visit Pass issued by the
Immigration Department. Highly skilled workers and those with specialised expertise are
officially classified as ‘expatriates’. As oil palm plantation area expanded rapidly from 54,638
hectares in 1960 to over 1 million hectares in 1980 and as the economy embarked on broad-
based industrialisation, the industry was faced decreasing labour supply and rising labour costs.
The common prescription would be to gradually raise labour productivity and reduce labour
requirements through mechanisation and retraining of workers. However, the oil palm plantation
industry complained of ‘labour shortage’, taken to mean that it could not secure labour at the
prevailing wages and work conditions. The construction industry made a similar complaint. The
use of illegal foreign workers became widespread. Although unemployment was above 8% in
the 1980s, the government eventually legalised the use of foreign workers for oil palm plantation,
construction, and domestic help. This was extended to cover more industries over the years,
including export-oriented manufacturing industries and food and beverage industries.
The number of documented foreign workers increased from about 380,346 in 1990 to over 2.1
million in 2014 (excluding another 1.3 million undocumented migrant workers), accounting for
almost 15% of total labour force of 14 million. About 44% of migrant workers in Malaysia work in
low-skilled occupations – often in work environments deemed ‘dirty, dangerous and difficult’ (3D
jobs) (World Bank, 2015). Foreign workers remain concentrated in plantation and construction
industries, and certain types of manufacturing. Of the 500,817 workers in oil palm plantations as
of 2008, about three-quarters were foreign workers (Table 4.4). Some 80% of the production
jobs, which require either primary or no formal education, were held by foreign workers.
Meanwhile local workers dominated the management and administration positions and
accounted for over 90% of the jobs. Indonesians made up over 90% of the foreign workers
holding production jobs in oil palm plantations (Table 4.5). Bangladeshis were the second
largest nationality group (4%).

125
Table 4.4. Distribution of oil palm plantation workers by work category and nationality, 2008.
Work Category Local Foreign Total % of Foreign Workers
Field Production 92,247 365,770 458,017 79.9%
Harvesting mandora 6,629 4,656 11,285 41.3%
General mandora 28,079 15,493 43,572 35.6%
Harvester 9,677 176,795 186,472 94.8%
FFB Collector 3,221 29,142 32,363 90.0%
Loose Fruit Collector 1,646 12,389 14,035 88.3%
Field Workers 26,290 91,814 118,104 77.7%
Other General Workers 16,705 35,481 52,186 68.0%
Management and Administration 39,495 3,305 42,800 7.7%
Executive 14,450 815 15,265 5.3%
Staff 25,045 2,490 27,535 9.0%
Total 131,742 369,075 500,817 73.7%
Source: Malaysian Palm Oil Board.
Table 4.5. Nationality of foreign workers in oil palm plantations, 2008.
Nationality (%) Mandore Harvester Fruit collector
General workers
Office workers
Total
Indonesia 92.4 93.8 91.7 86.0 89.7 90.2
Bangladesh 0.6 1.7 4.0 6.5 0.1 3.9
Philippines 3.0 1.3 1.3 2.0 10.2 1.7
India 0.2 0.8 0.7 2.0 0.0 1.3
Thailand 0.1 0.2 0.4 0.1 0.0 0.2
Nepal 0.7 0.1 0.1 0.2 0.0 0.2
Myanmar 0.0 0.0 0.1 0.1 0.0 0.0
Others 3.1 2.3 1.6 3.0 0.0 2.5
Source: Malaysian Palm Oil Board.
A dualistic structure appears to have emerged in the palm oil sector. The plantation (upstream)
segment accounts for over 80% of total jobs in the sector and remains labour intensive. Over
70% of the workers are foreign workers who have relatively low education attainment levels
(primary or no formal education), while the level of mechanisation and automation in their daily
work is relatively low. The downstream segment (e.g. refining, processing, others) makes up
slightly less than a fifth of total jobs in the sector and has become increasingly capital intensive.
Over 90% of the workers are local workers with relatively high education attainment levels
(secondary education and above), while the level of mechanisation and automation is high.
The upstream employment and technological characteristics have been a major debate in
recent years, mostly surrounding the causes and effects of such characteristics. Some hold the
126
view that indiscriminate government policy to allow the influx of foreign workers has enabled
plantation operators to continue with their existing production mode and cost structure. The
availability of foreign workers is said to dampen wage growth for local workers and slow down
the pace of farm mechanisation and automation.
Others, however, see labour intensity as a persistent characteristic of the upstream segment.
They point to the improved labour to land ratio, widely used as a performance indicator for oil
palm plantations, from 1:4 (meaning one worker to service four hectares of land) in the 1980s to
1:9 in the early 2010s as proof of mechanisation and automation in the plantations. However,
they caution that the anatomy of oil palm severely limits the scope for further mechanisation and
automation in plantations, especially in harvesting. Furthermore, they argue that demand for
labour in the plantations cannot be fully met by local labour supplies. Improvements in wages
and work conditions would not attract local workers in sufficient numbers, because local workers
will always be reluctant to work in oil palm plantations due to distance from urban centres,
regimented lifestyle in plantations, and rising levels of education.
The government has enacted measures to reduce the reliance on foreign workers and to
encourage farm mechanisation and modernisation. It remains to be seen if the measures
produce results as intended. Mechanisation may reduce labour requirement but will not entirely
change labour use in the foreseeable future. Major progress has been made in the areas of in-
field fruit collection, fertiliser application, and mainline transport but mechanised harvesting has
been attempted without success. It is likely that the dualistic structure within the palm oil sector
will persist in the medium term.
4.5 Discussion
The bulk of the capital share accrues to industrial-scale plantation firms, the biggest of which
are controlled by state and private local capital. Such firms held over 60% of oil palm plantation
hectarage, compared to 14% held by independent smallholders and 24% held by government
smallholder schemes. The state collects revenues from the palm oil sector through various
taxes and cesses, as well as through massive dividend payment from its shareholdings in
plantation firms. Varkkey (2016) describes the palm oil sector as an “easily accessible strategy
to obtain rents (from natural resources)” that allows ruling elites to “enrich themselves and inner
circle” and to “appease the masses through large-scale distribution policies”. Khor et al. (2015)
argue that state and private local capital did not just profit from the operations of oil palm
plantations; they also benefited substantially from timber logging during the initial phase up to
the 1980s, when oil palm plantations encroached on primary and secondary forest land.

127
Notwithstanding these strictures, the palm oil sector is generally regarded as a vehicle through
which relatively sound social policies were pursued. The rural development schemes associated
with the palm oil sector were by far the most effective in reducing rural poverty given their large
scope (Zin, 2014). This had the effect of reducing the poverty rate among the Bumiputeras from
64.8% in 1970 to 2.2% in 2012 and narrowed the gaps between the Bumiputeras and other
ethnic groups in Malaysia (Figure 4.6). Lifting the Bumiputeras out of poverty had a remarkable
impact on Malaysia’s poverty rate. From 49.3% in 1970, it fell to 1.7% in 2012 despite the
tripling of population, placing Malaysia among Asian countries with the lowest poverty rates
(Figure 4.7). The United Nations Development Programme ranks Malaysia 59th on its 2016
Human Development Index and designates it as a country with ‘high human development’. The
lack of data on independent smallholders does not allow an analysis of the change in their
welfare and income. However, it is likely that they have benefited from recent government
efforts to assist all smallholders, and not just smallholders organised through various
government schemes.
Figure 4.6. Poverty rate by ethnic groups, 1970-2012.
Source: Economic Planning Unit.
Figure 4.7. Population and poverty rate, 1970-2012.
Source: Economic Planning Unit.
64.8
23.0
5.3 2.2
26.0
5.40.6 0.3
39.2
7.62.5 1.8
0.0
10.0
20.0
30.0
40.0
50.0
60.0
70.0
1970 1989 2009 2012
Bumiputera Chinese Indian
10.9
19.1
24.7
29.2
49.3
12.4
6.01.7 0
10
20
30
40
50
60
0
5
10
15
20
25
30
35
1970 1992 2002 2012
Population (Million) (RHS) Poverty Rate (%) (LHS)
128
The palm oil sector’s contribution to poverty reduction and social development is likely to have
spread beyond its national border through remittances sent home by migrant workers. Malaysia
had the 26th highest stock of immigrants and was ranked 16th among top remittance-sending
countries in 2013 (Ratha et al., 2016). Total remittance was US$8.1 billion in 2014, the second
highest in Asia Pacific after South Korea’s US$9.5 billion.
The findings in this paper however suggest more complex contours in which different
stakeholder groups appear to have benefited in varying degrees from the development of
Malaysian palm oil sector. Labour share expands when wage growth outpaces growth in labour
productivity. The labour share for plantation workers grew at the slowest pace among seven
industries whose labour shares expanded during the 2000-2010 period. This means wage
growth for plantation workers relative to growth in their labour productivity was not as fast as
that of workers in the other downstream industries.
Slower growth in labour share is not on its own an issue for concern; it is possible that labour
productivity for plantation workers simply lagged that of other workers. While the lack of data on
detailed employee numbers does not allow a cross-industry and cross-year comparison, one
indicator suggests the former’s labour productivity growth could be at least comparable to that of
the latter. Between 2000 and 2010, the CPO extracted from per tonne of FFB rose consistently
from 0.175 to 0.194 tonnes. Among the most important factors affecting the extraction rates are
the ripeness of the fruits harvested, and the ability to collect the harvested fruits for timely
delivery to processing sites – both of which are tasks performed by plantations workers. What is
of further concern is the historically low labour share in oil palm plantations, which account for
over 80% of workers in the palm oil sector, compared with other industries. The low and slow-
growing labour share of plantations workers can be explained by weak institutional
arrangements and the lack of political representation to protect their rights vis-à-vis workers in
downstream industries.
Institutional Arrangements
Workers’ welfare and well-being in Malaysia are stipulated and protected by law. Briefly, the
Employment Act 1955 establishes the minimum legal terms and conditions of employment in
Peninsular Malaysia, such as rest days, annual leave, sick leave, holidays, maternity allowance,
conditions for dismissal, and termination benefits.37 The Industrial Relations Act 1967 provides
37 Sabah and Sarawak have their own labour ordinances providing for slightly varied terms and
conditions.

129
for conclusion of collective agreements between employers and trade unions to guide the
minimum terms of individual employment contracts. The Workers’ Minimum Standards of
Housing and Amenities Act 1990 prescribes the minimum standards of housing and various
health and social amenities for workers and their dependants. Both local and foreign workers
generally enjoy the same terms, except in specific instances such as redundancy where foreign
workers will be terminated first. Foreign workers are also excluded from the Employees’
Provident Fund Act 1991 and the Employees’ Social Security Act 1969. The former mandates
compulsory savings for retirement in old age, while the latter provides social security in the
event of injury and death.
In practice, the provisions and enforcement of labour laws are inherently discriminatory and
biased against migrant workers, which lead to many abusive practices against them (Table 4.6).
For instance, great disparities exist in occupational safety and health. Protection of injured
workers and their dependants comes under the Social Security Organisation (SOCSO) scheme
under the Employees’ Social Security Act 1969, and the compulsory insurance scheme under
the Workmen’s Compensation Act 1952. The SOCSO however is limited to local workers while
migrant workers enjoy significantly lower benefits and compensation under the Workmen’s
Compensation Act 1952.
Table 4.6. Common abusive practices against foreign workers.
− Absence of employment contracts or contracts that are not honoured, given that the terms and conditions become less favourable compared to those that were agreed upon before their departure from their homeland.
− Outsourcing system that denies workers the benefits of collective bargaining agreements, given that the terms are agreed upon between recruitment agents and employers.
− Non-payment of wages and unfair dismissal.
− Wrongful deduction of wages to cover the cost of the work permits (though it is mandatory for employers to bear the cost).
− Substandard living conditions and lack of workplace protection against industrial injuries.
− Passports withheld by employers and recruiting agents, leaving them vulnerable to arrest, ill-treatment and extortion by police.
− Some outsourcing companies recruit, transport and receive workers through fraud and deception (e.g. jobs that do not exist; different economic sectors; different destination of work) mainly to exploit them, resulting in migrant workers becoming victims of trafficking in persons. The Malaysian border police and immigration authorities are said to be directly involved in trafficking.
Source: Adapted from Devadason and Chan (2014).
Foreign workers in general also have weak union rights. Foreign workers were previously
barred from joining unions on the basis that they were in the country for a temporary period, and
that existing labour laws were adequate to safeguard workers’ rights. In 2001, the government
amended the labour laws to allow foreign workers to become ordinary union members with
130
voting rights who are nonetheless not eligible to be union office bearers. The effects of such
legislative changes on workers’ rights and union memberships are unclear. Civil rights groups
and trade unions assert that foreign workers are continuously subject to pressure from their
employers and the immigration authorities to not join unions.
Cvil rights groups and trade unions have long contended that plantation workers’ rights was a
low policy priority to the government, even before the labour force became dominated by foreign
nationals. Historically, plantation workers were mostly of Southern Indian origin. Tin mining and
monocropping in the form of rubber plantations were the twin pillars of the British Malayan
economy. Unable to attract local Malays to work in rubber plantations, European planters turned
to indentured migrant labour from India (Kaur, 2014b). Indian labour mobility was confined to
the plantation industry, first rubber and then oil palm, which contributed to their marginalisation
in Malaysia’s subsequent economic development. Plantation workers have been represented by
the National Union of Plantation Workers, which was established in 1954 by merging various
smaller trade unions then. Yet, it was not until 2001 that they received monthly wages by law.
Before then, the government often resorted to the twin arguments of ‘twilight industry’ and
domination by foreign workers as reasons that monthly wages for plantation workers were
irrelevant (Ramasamy, 2001).
Another issue that complicates foreign workers’ union rights is the legal ambiguity as to who
their employers are. Foreign workers must first be employees at their workplaces before they
can join unions (where unions exist) and enjoy common workers’ rights such as inclusion under
collective bargaining agreements. Yet, the exercise of such rights has been undermined by the
rise of third-party ‘labour outsourcing agents’ or ‘labour contractors’ since 2007. Under labour
contracting arrangements, firms engage labour contractors for labour supply and pay the
contractors, not the workers. While the firms are in charge of control and supervision of the
workers, the workers are not legally their employees. At the same time, because labour
contractors are registered formally as recruitment agencies for foreign workers, they also do not
consider the workers to be their employees.
The government institutionalised labour outsourcing in its amendment to the Employment Act in
2012. The practice of labour contracting proves more contentious than workforce casualisation,
another trend that is becoming common. Casual or contract workers at least have clearly
defined employers, despite not having permanent employment. With labour contracting, there
have been cases where foreign workers were paid below minimum wage, cheated out of
months of salary, and had their passports unlawfully detained by the contractors (thus limiting

131
their mobility) (Hodal & Kelly, 2016; Pattisson, 2016).38 Foreign workers who entered the
country illegally through human smuggling suffered the harshest abuses. Many supposedly
ended up working in oil palm plantations (Al-Mahmood, 2015). The US State Department
previously consistently placed Malaysia at the lowest rank of Tier 3 in its annual Trafficking in
Persons Report, with oil palm plantation cited as an industry plagued by “bonded or forced
labour”. Malaysia was later elevated to Tier 2 at a time when the US had concluded the 12-
country Trans-Pacific Partnership Agreement negotiations with Malaysia but was barred from
signing a free trade pact with a Tier 3 country (ibid).
Even when employed legally and directly by plantation firms, foreign workers are exposed to
poor working and living conditions. Smaller plantations had a higher tendency than large
plantations to not pay foreign workers with minimum wage and provide them with proper
facilities. There were other less tangible forms of circumstances that increased possibilities of
abuse. For instance, being foreign nationals and given the remote location of plantations, the
workers had to rely on their mandores and managers for supplies in day-to-day sustenance. In
addition, Malaysia’s use of a state-sponsored paramilitary group known as the People’s
Volunteers Corp (RELA for its Malay acronym) to check travel documents and immigration
permits of foreigners has led to allegations of extortion and theft against foreign workers (Burton,
2007).
Since 2013, Malaysia’s has introduced the Minimum Wage Order to set minimum wage for all
industries. It was set initially at 900 MYR for Peninsular Malaysia and 800 MYR for Sabah and
Sarawak, and revised to 1,000 MYR and 920 MYR respectively since mid-2016. The
government positioned the initiative as critical for improving the skills, productivity and economic
conditions of the labour force. Given the government’s mixed track record with enforcement,
there is much scepticism with regards to the effect of the new minimum wage rule on the labour
share for oil palm plantation workers, especially the foreign workers.
In the context of oil palm plantations, the policy imperative behind minimum wage is more
rooted in strategic concerns about labour shortage than improvement in social conditions. The
number of Indonesian workers who are prepared to work in Malaysian oil palm plantations is
38 The claim was made by a group of Nepalese workers who were among those provided by a
labour contractor to the operations of McDonald’s (the US fast food conglomerate) in Malaysia. The
workers claimed they were deceived about their wages and were charged additional fees upon arrival in
Malaysia, in addition to experiencing late salary payment. McDonald’s had earlier ended the contract with
the labour contractor in question after it became aware that the services provided “were not in compliance
with our standards”.

132
said to be declining in recent years (Chow, 2017). This is due to the weakening of Malaysia’s
currency against the Indonesian rupiah, and increased demand for labour in Indonesia as new
plantations open there. As labour costs rose in Indonesia and wage differentials between the
two countries narrow, Indonesians may prefer seek jobs elsewhere or remain in their own
country, driven by non-income-based considerations such as not having to relocate or be
separated from family. Success in sourcing for labour from other countries is not guaranteed
and will not resolve the risk associated with high labour requirement. In recent years, labour
shortages have caused losses amounting to 15% of ripe fruits in oil palm plantations due to
insufficient numbers of harvesters (MPOB, 2010c).
Political Representation
The absence of political representation for migrant workers further undermines their social
upgrading prospects. Foreign workers are employed for a period of 10 years for all permissible
sectors and they may not marry nor bring their family members into Malaysia. This places them
outside political life and keeps them voiceless and passive.
To fully appreciate the importance of political representation and power, the development
concerning the historically vulnerable group, the smallholders, is instructive. The smallholders
are legally not workers and therefore the above-mentioned laws and regulations governing
workers’ rights do not apply to them. Yet, this does seem to affect their welfare since
smallholder inclusion has been a high government priority due to the alignment of Malay poverty
with Malay political power (Lim, 2011). In 1957, over 70% of the population of the subsistence
sector was Malay. For the 1955 and 1959 general elections, as the allocation of Parliamentary
seats was weighted in favour of the rural areas, the Malays formed the majority of the seats and
wielded the political power to demand institutional arrangements and programmes for
agricultural and rural development (McGee, 1962; Lim, 2011).
Seen in this light, the economic significance of oil palm plantations for Malaysia only partly
explains government assistance to smallholders. Electoral politics and social stability have been
important calculations for government policy too. Since its inception, Felda’s participation has
been limited to Malays, the largest ethnicity group accounting for slightly above half of
Malaysia’s population. Felda areas, at over 850,000 hectares, account for 9% of Malaysia’s 13
million registered voters (Khor et al., 2015). Studies have shown that Felda settlers constitute a
‘vote bank’ for Umno, the leading party within the ruling coalition. It is estimated that of the
180,000 independent smallholders, at least three quarters are Malays. Almost a third of the
independent smallholders are concentrated in the state of Johore in southern Peninsular

133
Malaysia, the founding place of Umno where the party has won every past general election with
a comfortable two-thirds majority.
The most notable government assistance targeting the Malays was the Federal Land
Development Authority (Felda), which was set up in 1956. Landless peasants were given land
plots to work on, in addition to being provided with complementary housing and recreational
facilities and social services (piped water, electricity and access roads) as part of a package
deal. Smallholders were provided with income until the trees began to produce an income.
Felda would purchase and process the oil palm produce from it settlers. Subsidised credit and
other essential farm inputs as well as extension services were provided to reduce real costs of
production (Zin, 2014).
Settler intake ceased in 1990 due to high programme costs. But by then, it was widely
recognised as a success story for rural land development (Khor et al., 2015; Pletcher, 1990).
The current number of settler families, who became known as ‘organised smallholders’, stands
in excess of 110,000. Felda settlers received not only incomes for their produce, but also
secondary income in the form of investment returns from their cooperative entity, Koperasi
Permodalan Felda (KPF). Smallholders’ cash income fluctuates depending on palm oil prices
and is estimated to range between 1,200 to 3,000 MYR during the past decade (compared to a
monthly cash income of 500 to 650 MYR for plantation workers, excluding housing and utilities)
(Choo, 2013; Khor et al., 2015).
The independent smallholders, defined as those who are self-financed and manage their own
plantation land (of less than 40.5 hectares) outside state-sponsored smallholder schemes, have
also received increasing government subsidies and assistance. For instance, the Oil Palm
Replanting and New Planting Scheme offered subsidies up to 9,000 MYR per hectare for some
36,000 hectares held by independent smallholders since 2012. They were also given huge
discounts on equipment such as mechanical harvesting poles.
Signs are emerging that past policies favouring the Felda settlers are coming under financial
pressure. Historically, Felda settlers derived 20 to 30% of their monthly income from their
investments in KPF, whose key assets included a 51% stake in of Felda’s milling, transportation
and other downstream business. The investment returns per year averaged 14% over a 30-year
period. However, in 2012 KPF sold off the stake to Felda Global Ventures (FGV) in exchange
for cash and shares in FGV, which was preparing for a listing on Malaysia’s stock exchange.
The exercise was expected to subject FGV to market disciplines, as an indirect way to
strengthen Felda’s commercial viability and overall efficiency. It was also expected to raise

134
working capital for Felda/ FGV’s expansion. The disposal of key assets by KPF significantly
affects its future investment returns as downstream income increasingly accrues to FGV (Khor
et al., 2015). This has led to concerns over the dilution of socio-political agenda of Felda by
commercial considerations.
However, given Felda settlers’ considerable influence and power in electoral politics, the
government will continuously find new ways to accommodate their needs. Since the early 2000s,
the National Felda Settlers’ Children Society (Persatuan Anak Peneroka Felda Kebangsaan or
Anak) representing the second and third generations of Felda settlers have protested that they
have little economic opportunity (given that government land schemes are located far away from
urban growth centres) and limited social mobility compared with the previous generation. In
response, the government has introduced new education programmes (training and
scholarships for certificate and diploma levels), entrepreneurship loans and incentives, and new
housing projects catering to the children of first-generation settlers (Salih et al., 2014).
The lack of political representation for foreign workers has been at times addressed by their
national governments at the bilateral level, with limited impact. In 2009, amid cases of torture
and deaths at the hands of employers, the Indonesian government intervened with a
moratorium on the recruitment of Indonesian workers for work in Malaysia (Kaur, 2014a).
However, this was only limited to domestic workers. The ban was lifted in late 2011 after an
agreement was reached between Indonesia and Malaysia to provide a day off to the workers,
allow them to keep their passports, and receive salaries in their bank accounts. For foreign
workers in the plantation sector, their governments make intermittent threats to stop sending
their workers to Malaysia but there has been no reliable evidence that they were carried out.
4.6 Conclusion
Development of Malaysia’s palm oil sector is a relatively successful example of economic
upgrading. Between 2000 and 2010, most industries with the palm oil sector recorded higher
GVA in gross terms and as a share of their respective output. Economic upgrading was
accompanied by increased employment in higher value activities in the modern sectors, and
improved income for domestic and migrant workers. Social upgrading, defined as higher
employees’ compensation in gross terms and as a share of GVA, is observed in most of the
industries. However, the benefits were unevenly spread across groups. Capital owners
(including smallholders) in the labour-intensive plantation industry, as well as skilled labour in
capital-intensive processing and services industries enjoyed relatively higher shares of GVA.
These held steady or continued to grow. The labour share for migrant workers who account for

135
60% of the sector’s total workforce and perform low-skilled jobs in primary production, was
historically low and only grew marginally, with no evidence to suggest that their productivity
growth was slower than that of their local semi-skilled or skilled counterparts in secondary
industries. Weak institutional arrangements and political representation did little to help improve
their share of income.
The essay provides further evidence to existing work which shows that economic and social
outcomes do not perform in a synchronised manner. With resource-based industrialisation,
economic upgrading can be achieved in agro-commodity chains. It creates fewer jobs and tends
to favour semi-skilled and skilled labour as predicted. Much attention has been rightly accorded
in the literature to smallholders’ welfare given that they form the structural backbone of the rural
economy, with extensive linkages with rural farm and non-farm sectors. However, the impact of
value chain development on migrant workers as a subject receives much less attention in GVC
research. As reflected in this essay, migrant workers encounter much difficulty because they
lack power to engage in political action, and are excluded from rights and entitlements
associated with citizenship and residency. It demonstrates a potential area for future GVC
research because of its direct relevance to social outcome. GVCs do not always bring about
benefits but may in fact produce and reproduce the chronic conditions that worsen the
vulnerability and disposability of the marginal workforce (Phillips, 2016). However, one must
avoid assumptions that migrant workers lack agency to respond to their conditions through
participation and action. Much work is needed in this area.
Migrant workers will form an increasingly important part of the labour force in various value
chains. On the demand side, an industrialising society will eventually exhaust its unlimited pool
of labour supplies and will have to rely on migrant workers to fill slots vacated by domestic
population. On the supply side, migration has been on the rise as people seek better
opportunities outside their countries of birth. One area of potential concern is that international
migration is driven more by South-South migration (38% of the total migrant stock in 2013) than
other types of migration (Ratha et al., 2016), and that many developing countries have weaker
institutions and policies for ensuring labour rights. There have also been concerns that rules
associated with labour and other social standards in developed-country markets may be used
as non-tariff barriers that are more restrictive than necessary to achieve intended goals.
Discussion of decent work and rights for migrant workers is highly politicised and proves difficult
even in advanced economies. Nonetheless, it must be addressed if social upgrading potential of
GVCs is to be more equitably and sustainably realised.

136
5 Falling Behind, Keeping Up or Catching Up?
Development of the Malaysian palm oil sector shows that agro-commodity value chain
upgrading can be achieved by building forward and backward linkages around a country’s initial
position in production of primary resources. While the scope for linkage development is
determined by a number of factors and varies across countries and products, the development
experience of the Malaysian palm oil sector certainly does not conform neatly to vertical
specialisation or concentration in upstream production. Linkage development and resource-
based industrialisation (RBI) require an appreciation of agriculture from value chain and
agribusiness perspectives. They must form part of a broad economic diversification strategy
which combines effective state policies and firm-specific actions, and uses resource rents for
making productivity-enhancing investments rather than consumption. It entails preparedness to
accept short-run welfare losses, and the ability to find markets to absorb increased supplies.
A reversal of policy biases against agriculture will be welcome. Heavy taxation on agriculture
relative to other sectors in developing countries as well as protection measures of the advanced
economies stand out among such discrimination. However, removing the constraints is
insufficient. The case of Malaysian palm oil highlights the necessity of selective, active
intervention for linkage development as well as the salience of some common functional policy
features. These include trade measures, indigenous innovation and physical infrastructure.
Other desirable features are continuous public-private coordination, in which government can
elicit information from the private sector about constraints and opportunities to minimise
mistakes, as well as transparent tracking of industry performance and dissemination of such
information. The tricky part is to avoid using intervention to compensate for inefficiency and
allowing low-productivity firms to become entrenched lobby interests, complicating future policy
change. Policy design should also incorporate distributional considerations to better align
economic and social upgrading.
Some cautionary notes are as follows. First, agricultural commodities have different agro-
ecological and production requirements as well as initial cultivation and land use histories.
Country differences also exist in contextual determinants of linkage development, including
government capabilities and nationality and nature of ownership. Second, most of the upgrading
as described in the case study occurred at a time when chain governance was loose and buyer-
drivenness was relatively low. Much has since changed with procurement system modernisation
characterised by a shift from spot market relations to the use of vertical coordination
mechanisms such as explicit or implicit contracts (Reardon & Barrett, 2000; Reardon et al.,

137
2009). Entry barriers and conditions for continuous participation for suppliers have indeed
increased.
Third, the policy space for linkage development has shrunk considerably since the 1990s with
rules introduced by the World Trade Organisation, international financial institutions and
preferential trade agreements (DiCaprio & Gallagher, 2006). Developing countries are likely to
continue to work around and circumvent restrictions imposed by trade rules and free trade
agreements. The constraints become real when one WTO member successfully mounts a legal
challenge against another for the use of a particular policy. Nonetheless, the possibility of a
legal challenge on its own introduces uncertainty, which bears a cost (Low & Tijaja, 2014).
Lastly, the “full flowering of global oligopolistic capitalism” over the recent decades has made it
more difficult for developing country firms to become globally competitive ‘national champion’
firms with leading technologies and brands that could drive national development (Nolan,
2014a). In sector after sector, the number of lead firms shrunk while the degree of global
industrial concentration increased greatly. The most visible part consists of the well-known firms
with superior technologies and powerful brands. In 2007/2008, the world’s top 1,400 firms (the
G1400) invested a total of US$545 billion in R&D. The top 100 firms, all from the high income
countries, account for 60% cent of the total R&D spending of the G1400, while the bottom 100
firms account for less than 1% of the total. In other words, around 100 or so firms in a small
number of high-technology industries sit at the centre of technical progress in the era of
globalisation (ibid).
5.1 Upgrading in the Age of GVCs
By the early 2000s, within the high value-added, high technology and strongly branded
segments of global markets, which serve mainly the middle and upper income earners who
control the bulk of the world’s purchasing power, a veritable ‘law’ had come into play: a handful
of giant firms, the ‘systems integrators’, occupied upwards of 50% of the whole global market
(Nolan, 2014b). The pressure for consolidation and concentration is transmitted from the global
lead firms is subsequently transmitted down to their suppliers in different tiers in what Nolan et
al. (2008) describes as ‘cascade effects’. These dynamics are indeed visible in the agribusiness
sector. The case of Malaysian palm oil highlights that while upgrading is possible up to an
extent, the challenge for developing-country firms to catch up with immensely powerful TNCs is
in the GVC era of economic globalisation is more daunting as ever. After decades of work,
seven Malaysian-controlled firms featured among UNCTAD’s lists of the world’s largest
agribusiness TNCs by foreign assets and sales in 2007 (Table 5.1).
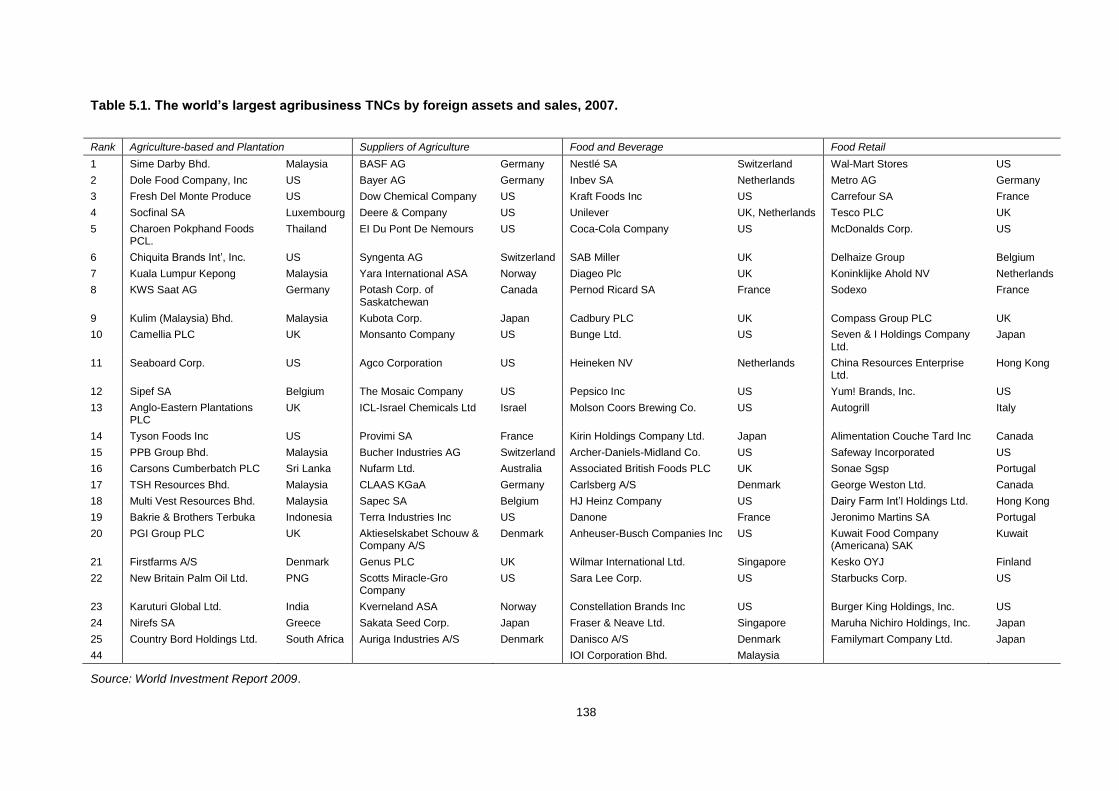
138
Table 5.1. The world’s largest agribusiness TNCs by foreign assets and sales, 2007.
Rank Agriculture-based and Plantation Suppliers of Agriculture Food and Beverage Food Retail
1 Sime Darby Bhd. Malaysia BASF AG Germany Nestlé SA Switzerland Wal-Mart Stores US
2 Dole Food Company, Inc US Bayer AG Germany Inbev SA Netherlands Metro AG Germany
3 Fresh Del Monte Produce US Dow Chemical Company US Kraft Foods Inc US Carrefour SA France
4 Socfinal SA Luxembourg Deere & Company US Unilever UK, Netherlands Tesco PLC UK
5 Charoen Pokphand Foods PCL.
Thailand EI Du Pont De Nemours US Coca-Cola Company US McDonalds Corp. US
6 Chiquita Brands Int’, Inc. US Syngenta AG Switzerland SAB Miller UK Delhaize Group Belgium
7 Kuala Lumpur Kepong Malaysia Yara International ASA Norway Diageo Plc UK Koninklijke Ahold NV Netherlands
8 KWS Saat AG Germany Potash Corp. of Saskatchewan
Canada Pernod Ricard SA France Sodexo France
9 Kulim (Malaysia) Bhd. Malaysia Kubota Corp. Japan Cadbury PLC UK Compass Group PLC UK
10 Camellia PLC UK Monsanto Company US Bunge Ltd. US Seven & I Holdings Company Ltd.
Japan
11 Seaboard Corp. US Agco Corporation US Heineken NV Netherlands China Resources Enterprise Ltd.
Hong Kong
12 Sipef SA Belgium The Mosaic Company US Pepsico Inc US Yum! Brands, Inc. US
13 Anglo-Eastern Plantations PLC
UK ICL-Israel Chemicals Ltd Israel Molson Coors Brewing Co. US Autogrill Italy
14 Tyson Foods Inc US Provimi SA France Kirin Holdings Company Ltd. Japan Alimentation Couche Tard Inc Canada
15 PPB Group Bhd. Malaysia Bucher Industries AG Switzerland Archer-Daniels-Midland Co. US Safeway Incorporated US
16 Carsons Cumberbatch PLC Sri Lanka Nufarm Ltd. Australia Associated British Foods PLC UK Sonae Sgsp Portugal
17 TSH Resources Bhd. Malaysia CLAAS KGaA Germany Carlsberg A/S Denmark George Weston Ltd. Canada
18 Multi Vest Resources Bhd. Malaysia Sapec SA Belgium HJ Heinz Company US Dairy Farm Int’l Holdings Ltd. Hong Kong
19 Bakrie & Brothers Terbuka Indonesia Terra Industries Inc US Danone France Jeronimo Martins SA Portugal
20 PGI Group PLC UK Aktieselskabet Schouw & Company A/S
Denmark Anheuser-Busch Companies Inc US Kuwait Food Company (Americana) SAK
Kuwait
21 Firstfarms A/S Denmark Genus PLC UK Wilmar International Ltd. Singapore Kesko OYJ Finland
22 New Britain Palm Oil Ltd. PNG Scotts Miracle-Gro Company
US Sara Lee Corp. US Starbucks Corp. US
23 Karuturi Global Ltd. India Kverneland ASA Norway Constellation Brands Inc US Burger King Holdings, Inc. US
24 Nirefs SA Greece Sakata Seed Corp. Japan Fraser & Neave Ltd. Singapore Maruha Nichiro Holdings, Inc. Japan
25 Country Bord Holdings Ltd. South Africa Auriga Industries A/S Denmark Danisco A/S Denmark Familymart Company Ltd. Japan
44 IOI Corporation Bhd. Malaysia
Source: World Investment Report 2009.

139
The seven firms are present mostly in the plantation segment, despite having expanded into the
processing segment. In general, developing country firms are absent in most other segments
such as agricultural input supply, food and beverage, and food retail. These segments are
characterised by ownership of created assets such as brands, superior technologies, logistics
expertise, marketing capabilities and intellectual property which allow firms to compete
dynamically with others. Because the segments are highly profitable and offer potentially higher
value added, they have turned into increasingly oligopolistic and concentrated markets through
rapid consolidation. Dominance by far larger and far more established brand-name TNCs from
the advanced economies in these segments has become entrenched. These firms are deeply
nested within economies worldwide, including those of developing countries. In contrast, firms
from the Global South – even the best performing ones – hold little assets in advanced
economies, derive much less revenues from international sales, and have earnings that pale in
comparison to their counterparts from high income economies. Nolan (2012) sums up this
relationship between firms from the developing and developed world in each other’s economy
as “I have you within me but you do not have me within you”.
Driven by increased financialisation of large firms, a commodity boom and rising food prices,
agribusiness industries were among the most takeover-intensive industries over the past
decade (Dicken, 2011). In 2007, the aggregate value of global food industry M&As was
approximately US$200 billion, double the amount in 2005. The consolidation in the agribusiness
sector mirrors the global M&A trend in all sectors, which recorded US$4.48 trillion in total value
in 2007, representing a 27% rise from US$2.7 trillion in 2005 (ETC Group, 2008). In some
instances, the M&As in agribusiness industries involved not only horizontal integration but also
vertical integration. For example, many large agrochemical chemicals branched out into plant
biotechnology and the seed business, heralding a move towards unprecedented convergence
between agricultural input segments (UNCTAD, 2006). Rapid consolidation further enhances
concentration in various agribusiness industries.39 A study based on 2006-2007 revenue figures
of agribusiness makes the following observations (ETC Group, 2008):
39 Concentration refers to the extent to which a market is dominated by a limited number of firms.
Determination of precise market size and structure for the overall industry are difficult, complicated by
availability issues regarding firm data. Two common measures for concentration are the Herfindahl index
which is calculated as the sum of the squares of the individual market shares of all known players and the
N-firm concentration ratio which expresses the combined market share of the N largest firms in a
particular industry as a percentage (Law, 2009; Black et al, 2009). The limited empirical work measuring
and analysing the increase of concentration in agribusiness is typically based on estimates.
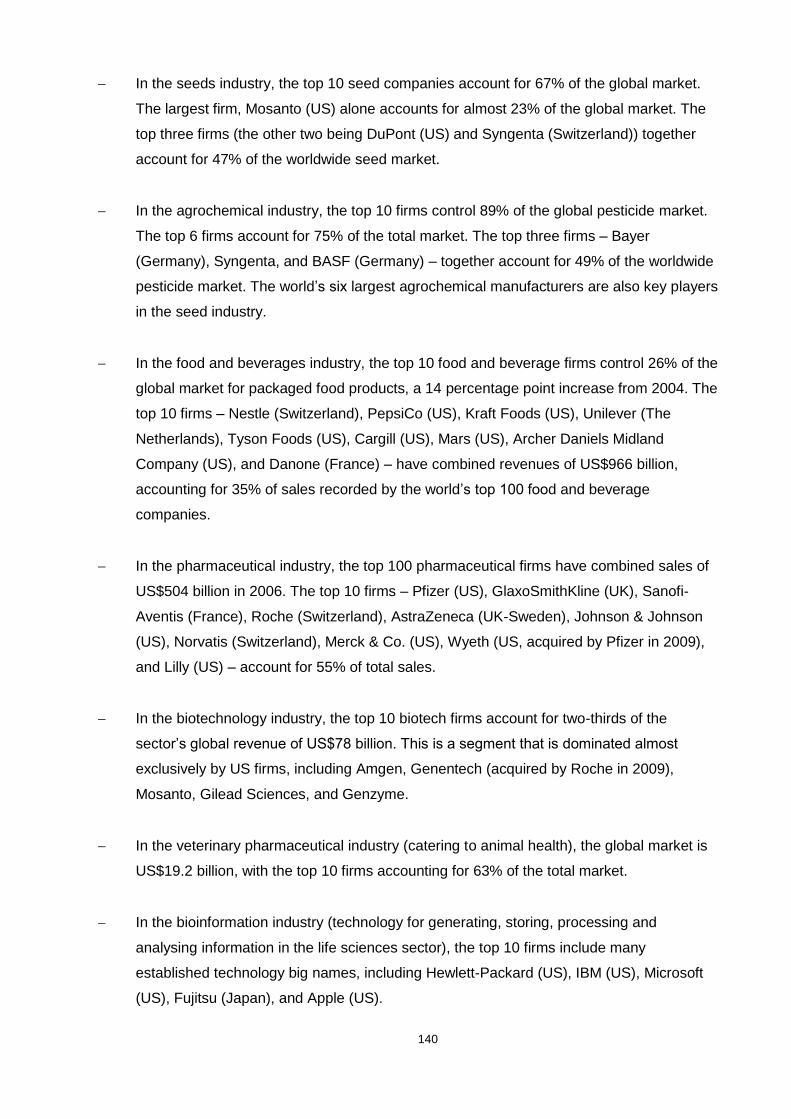
140
− In the seeds industry, the top 10 seed companies account for 67% of the global market.
The largest firm, Mosanto (US) alone accounts for almost 23% of the global market. The
top three firms (the other two being DuPont (US) and Syngenta (Switzerland)) together
account for 47% of the worldwide seed market.
− In the agrochemical industry, the top 10 firms control 89% of the global pesticide market.
The top 6 firms account for 75% of the total market. The top three firms – Bayer
(Germany), Syngenta, and BASF (Germany) – together account for 49% of the worldwide
pesticide market. The world’s six largest agrochemical manufacturers are also key players
in the seed industry.
− In the food and beverages industry, the top 10 food and beverage firms control 26% of the
global market for packaged food products, a 14 percentage point increase from 2004. The
top 10 firms – Nestle (Switzerland), PepsiCo (US), Kraft Foods (US), Unilever (The
Netherlands), Tyson Foods (US), Cargill (US), Mars (US), Archer Daniels Midland
Company (US), and Danone (France) – have combined revenues of US$966 billion,
accounting for 35% of sales recorded by the world’s top 100 food and beverage
companies.
− In the pharmaceutical industry, the top 100 pharmaceutical firms have combined sales of
US$504 billion in 2006. The top 10 firms – Pfizer (US), GlaxoSmithKline (UK), Sanofi-
Aventis (France), Roche (Switzerland), AstraZeneca (UK-Sweden), Johnson & Johnson
(US), Norvatis (Switzerland), Merck & Co. (US), Wyeth (US, acquired by Pfizer in 2009),
and Lilly (US) – account for 55% of total sales.
− In the biotechnology industry, the top 10 biotech firms account for two-thirds of the
sector’s global revenue of US$78 billion. This is a segment that is dominated almost
exclusively by US firms, including Amgen, Genentech (acquired by Roche in 2009),
Mosanto, Gilead Sciences, and Genzyme.
− In the veterinary pharmaceutical industry (catering to animal health), the global market is
US$19.2 billion, with the top 10 firms accounting for 63% of the total market.
− In the bioinformation industry (technology for generating, storing, processing and
analysing information in the life sciences sector), the top 10 firms include many
established technology big names, including Hewlett-Packard (US), IBM (US), Microsoft
(US), Fujitsu (Japan), and Apple (US).
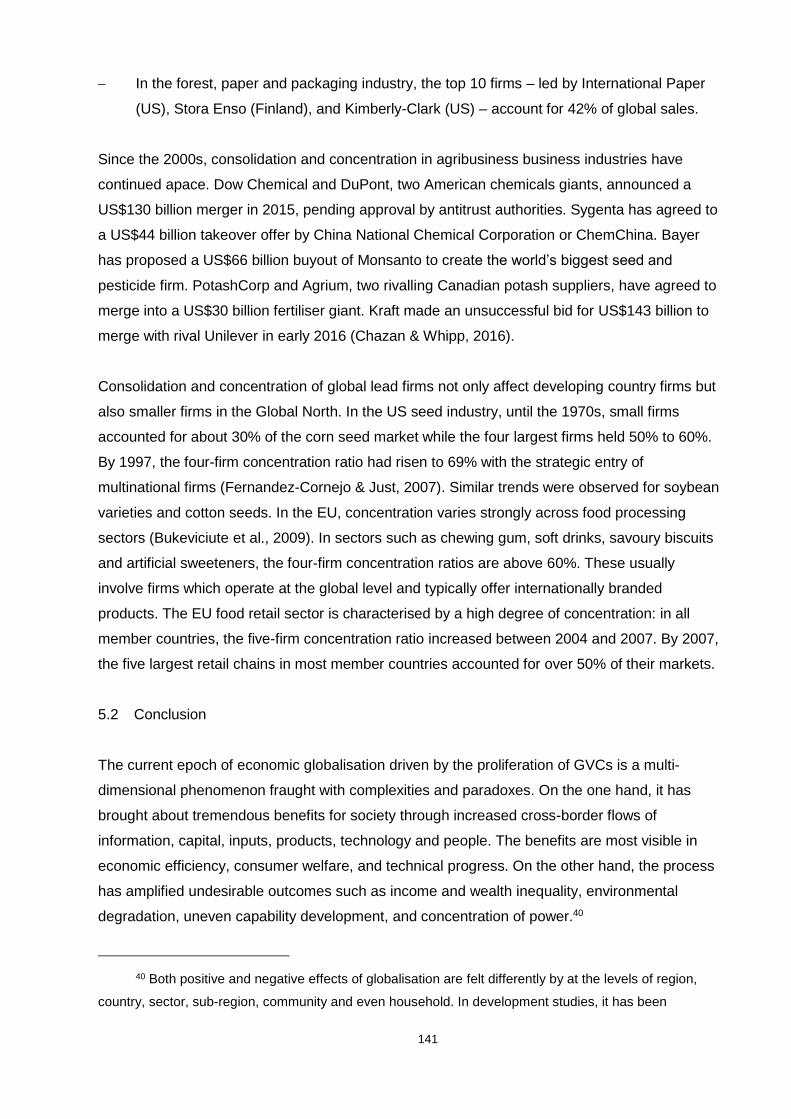
141
− In the forest, paper and packaging industry, the top 10 firms – led by International Paper
(US), Stora Enso (Finland), and Kimberly-Clark (US) – account for 42% of global sales.
Since the 2000s, consolidation and concentration in agribusiness business industries have
continued apace. Dow Chemical and DuPont, two American chemicals giants, announced a
US$130 billion merger in 2015, pending approval by antitrust authorities. Sygenta has agreed to
a US$44 billion takeover offer by China National Chemical Corporation or ChemChina. Bayer
has proposed a US$66 billion buyout of Monsanto to create the world’s biggest seed and
pesticide firm. PotashCorp and Agrium, two rivalling Canadian potash suppliers, have agreed to
merge into a US$30 billion fertiliser giant. Kraft made an unsuccessful bid for US$143 billion to
merge with rival Unilever in early 2016 (Chazan & Whipp, 2016).
Consolidation and concentration of global lead firms not only affect developing country firms but
also smaller firms in the Global North. In the US seed industry, until the 1970s, small firms
accounted for about 30% of the corn seed market while the four largest firms held 50% to 60%.
By 1997, the four-firm concentration ratio had risen to 69% with the strategic entry of
multinational firms (Fernandez-Cornejo & Just, 2007). Similar trends were observed for soybean
varieties and cotton seeds. In the EU, concentration varies strongly across food processing
sectors (Bukeviciute et al., 2009). In sectors such as chewing gum, soft drinks, savoury biscuits
and artificial sweeteners, the four-firm concentration ratios are above 60%. These usually
involve firms which operate at the global level and typically offer internationally branded
products. The EU food retail sector is characterised by a high degree of concentration: in all
member countries, the five-firm concentration ratio increased between 2004 and 2007. By 2007,
the five largest retail chains in most member countries accounted for over 50% of their markets.
5.2 Conclusion
The current epoch of economic globalisation driven by the proliferation of GVCs is a multi-
dimensional phenomenon fraught with complexities and paradoxes. On the one hand, it has
brought about tremendous benefits for society through increased cross-border flows of
information, capital, inputs, products, technology and people. The benefits are most visible in
economic efficiency, consumer welfare, and technical progress. On the other hand, the process
has amplified undesirable outcomes such as income and wealth inequality, environmental
degradation, uneven capability development, and concentration of power.40
40 Both positive and negative effects of globalisation are felt differently by at the levels of region,
country, sector, sub-region, community and even household. In development studies, it has been

142
It begs the larger question to what extent developing countries and their firms can ‘develop’ and
improve their living standards in the current epoch of economic globalisation. The more
optimistic analysis from the modernisation, late industrialisation, neoclassical and comparative
institutional schools has predicted convergence and catch-up (see, for example, Solow (1956);
Rostow (1960); Kerr et al. (1960); Gerschenkron (1979); Wade (1990); Amsden (1989); Balassa
et al. (1986); Sachs (1994); Dore (1990)). Broadly, the convergence hypothesis suggests that
developing countries can grow faster than developed countries and narrow their gaps in living
standards. Variables including prices, production structures, and consumptions patterns can be
used but per capita income, productivity, and wages are most commonly used measures. The
stronger variant known as unconditional convergence predicts that follower countries catch up
by bringing into production a large backlog of unexploited technology and will reach similar
income levels (van Ark & Timmer, 2003). The weaker version of conditional convergence
predicts that countries converge to their own steady states but that these steady states can
differ between countries controlling for differences in parameters such as savings rates and
population growth. The experience of developing countries in the world economy from 1970 to
2010 does not validate the hypothesis and suggests instead that convergence and divergence
are often simultaneous (Nayyar, 2013).
Developing Asia achieved the fastest growth rates and increased its share of the world GDP in
current prices at market exchange rates from less than a tenth to more than a fifth. Latin
America’s share increased slightly, while Africa’s share actually decreased (Table 5.2). In terms
of GDP per capita, developing Asia had the highest growth rate, Latin America was in the
middle, and Africa had the lowest growth rate. A comparison of developing countries and
regions and the industrialised is telling of how big the gap is between them for catch-up to take
place. In 2010, developing countries accounted for 82% of the world population but only 32% of
the world GDP. The GDP per capita in developing countries, at US$3,715, was less than a tenth
of that of industrialised countries (US$39,723) (Table 5.3). On a purchasing power parity (PPP)
basis, developing countries get a much higher weight in the world GDP, accounting for over half
in 2010. The GDP per capita gaps between developing countries and industrialised countries
are modestly reduced but remain exceptionally large (Table 5.4).41
recognised that there is no clear-cut distinction between ‘developed’ and ‘developing’ parts of the world –
pockets of low levels of development exist in the richest countries, just as there are pockets of high levels
of development in the poorest countries (Hodder, 2005). However, characteristics of a country still apply
to a large proportion of its population and it is therefore still relevant and useful to consider development
in country terms.
41 Aggregate economic data across countries are converted using either market exchange or PPP
rates, each with its own advantages and disadvantages. Used in international flows and transactions,

143
Table 5.2. Population and GDP in current prices at market exchange rates in developing countries and the world, 1970-2010.
Year World population (billion)
Developing countries population (billion)
Developing countries population as a percentage of world population
World GDP (US$ billion)
Developing countries GDP (US$ billion)
GDP as a percentage of world GDP
Developing countries
Asia Africa Latin America
1970 3.7 2.7 72.8% 3,283 549 16.7% 8.7% 2.7% 5.3%
1975 4.1 3.0 74.3% 6,410 1,228 19.2% 9.9% 3.2% 6.0%
1980 4.5 3.4 75.7% 11,865 2,540 21.4% 11.3% 3.7% 6.3%
1985 4.9 3.7 77.0% 12,993 2,552 19.6% 10.9% 3.0% 5.7%
1990 5.3 4.1 78.3% 22,206 3,851 17.3% 10.0% 2.2% 5.0%
1995 5.7 4.5 79.4% 29,928 5,896 19.7% 11.8% 1.8% 6.1%
2000 6.1 4.9 80.5% 32,244 6,973 21.6% 13.1% 1.8% 6.6%
2005 6.6 5.3 81.3% 45,722 10,789 23.6% 15.5% 2.2% 5.9%
2010 6.9 5.7 82.1% 63,151 20,362 32.2% 21.8% 2.6% 7.8%
Source: Nayyar (2013).
Table 5.3. GDP per capita in current prices at market exchange rates in developing world as proportion of GDP per capita in industrialised countries, 1970-2010.
Year Developing countries GDP per capita (US$)
Industrialised countries GDP per capita (US$)
GDP per capita as a percentage of that of industrialised countries
Developing countries
Asia Africa Latin America
1970 209 2,873 7.3% 5.1% 8.4% 21.2%
1975 416 5,387 7.7% 5.3% 9.0% 22.3%
1980 772 9,710 8.0% 5.7% 9.3% 21.6%
1985 697 10,761 6.5% 4.9% 6.6% 17.2%
1990 947 19,303 4.9% 3.9% 4.0% 13.2%
1995 1,324 24,898 5.3% 4.4% 3.0% 15.4%
2000 1,444 25,711 5.6% 4.7% 2.9% 16.0%
2005 2,081 33,977 6.1% 5.6% 3.2% 14.4%
2010 3,715 39,723 9.4% 8.9% 4.2% 21.5%
Source: Nayyar (2013).
market exchange rates are highly relevant for internationally traded goods. But PPP rates are derived a
wider basket that considers non-traded goods and services as well, which tend to be cheaper in low-
income and high-income countries. PPP rates are thus sometimes regarded as a better measure of
overall well-being and purchasing power of consumers in developing countries (Callen, 2007).

144
Table 5.4. GDP and GDP per capita in current prices at purchasing power parity rates in the world, developing countries and industrialised countries, 1980-2010.
Year World GDP (billion international dollar)
Developing countries GDP (billion international dollar)
Developing countries GDP as a percentage of world GDP
Industrialiased countries GDP per capita (international dollar)
Developing countries GDP per capita (international dollar)
GDP per capita as a percentage of that of industrialised countries
Developing Countries
Asia Africa Latin America
1980 13,140 4,783 36.4% 10,158 1,544 15.2% 5.5% 11.5% 45.1%
1985 19,227 6,879 35.8% 14,540 2,005 13.8% 6.2% 9.7% 38.0%
1990 27,208 9,867 36.3% 19,751 2,525 12.8% 6.8% 8.6% 32.3%
1995 38,096 15,938 41.8% 23,639 3,488 14.8% 8.8% 7.3% 32.7%
2000 49,837 21,409 43.0% 29,413 4,257 14.5% 9.5% 6.5% 30.6%
2005 67,699 31,998 47.3% 35,810 5,915 16.5% 12.0% 7.0% 30.1%
2010 89,269 47,907 53.7% 40,245 8,294 20.6% 17.2% 8.0% 33.5%
Source: International Monetary Fund.
Despite its rapid growth within a remarkably short period of time, Asia’s GDP per capita in 2010
was just 9% of that of industrialised countries. China, the star performer among developing
countries, offers interesting lessons. For all its significant economic achievements and having
been the world’s second largest economy since 2011, China is far from having caught up with
the high-income economies. It is still a developing country of a low level of income per person.
Furthermore, it cannot be assumed that China will grow indefinitely at its current high speed and
make the transition to a high income economy (Nolan, 2012).
This is not to suggest that developing countries should or will not try to achieve growth and
upgrading using a range of old and new solutions in a GVC world. After all, earlier experiences
of “catching up” also took place despite global constraints. The barriers to industrialisation
created by GVCs are not totally impenetrable albeit difficult. The case of Malaysian palm oil
illustrates both the possibilities and severe challenges of upgrading in GVCs. Even if catch up
remains an elusive goal, developing countries should – and most certainly will – try to achieve
growth to at least keep up and not fall behind further in economic globalisation. At the same
time, developing countries will do well to bear in mind that development is not a materialistic
process towards a uniform ‘ideal’ state of being the same for all, and that they will have to find
their own meaning and purpose for development.

145
Annexes
Annex 1: Semi-Structured Interview Questions
1. What are the benefits and disadvantages of vertical integration? What are the benefits and
disadvantages of vertical specialisation? Which is more suitable for agricultural commodity
producing firms, and why?
2. Upstream horizontal integration (acquisition of existing plantations and establishing new
plantations) seems to be the ‘starting point’ for firms that wish to vertically integrate (more
products and functions across the value chains). Is ample feedstock (CPO) internally is
the single most important factor for firms to integrate vertically?
3. Without government policy, how likely was it that upstream and downstream activities
could have emerged on their own? Did the investors (both foreign and local) have the
incentives to do it?
4. Many plantation firms lack the ability to sell directly to the world (a low proportion of
revenue from overseas customers) and have a concentration of revenue among a handful
of major local customers.
i. Does this suggest that they are contented with serving as tier-1 suppliers (selling
upstream products) to large integrated firms?
ii. In spite of the benefits associated with vertical integration, why won’t these firms
integrate and develop a fuller of capabilities (profitability reasons, difficulties in
vertical integration, other factors for consideration)?
5. Upgrading necessitates a substantial degree of internationalisation as it gets further
downstream, closer to foreign markets where the consumers are actually based. What are
the difficulties in internationalisation for developing-country firms?
6. Does government policy have a role in facilitating the internationalisation process?

146
Annex 2: Explanatory Notes for Industry Reclassification and Aggregation
The four original input-output tables used in this dissertation were compiled by the Department of Statistics Malaysia using different industry
classification systems. The 1991 Absorption Matrix of Domestic Production at Basic Values (Activity by Activity) (Table 16) was for 92 industries
classified using the Malaysia Industrial Classification (MIC) 1972, which was based on the United Nations System of National Accounts (SNA) 1968.
The number of industries increased to 94 in the 2000 Absorption Matrix of Domestic Production at Basic Prices (Activity by Activity) (Table 16),
based on the Malaysia Standard Industrial Classification (MSIC) 2000 which was modelled after the UN SNA 1993. Taking into consideration of
International Standard Industrial Classification of All Economic Activities (ISIC) Revision 3, the 2005 Absorption Matrix of Domestic Production at
Basic Prices (Activity by Activity) (Table 22) further revised the number of industries to 120 although it was still based on the MSIC 2000. The 2010
Absorption Matrix of Domestic Production at Basic Prices (Activity by Activity) (Table 10) was compiled using the new MSIC 2008, reflecting ISIC
Revision 4. The number of industries increased to 124. To ensure consistency for cross-year comparison, the industries in each of the tables were
reclassified and aggregated into 36 by referencing the national activity and commodity codes used for the respective years.
.
Sector No. Reclassified Industry
No. 1991 Activity (MIC 1972) (92 industries)
No. 2000 Activity (MSIC 2000) (94 industries)
No. 2005 Activity (MSIC 2000) (120 industries)
No. 2010 Activity (MSIC 2008) (124 industries)
Agriculture, Fishery & Forestry
1 Rubber 2 Rubber planting 2 Rubber planting 5 Rubber 5 Rubber
2 Oil Palm 3 Oil palm estates 3 Oil palm estates 6 Oil palm 6 Oil palm
3 Agriculture 1 Agriculture, other 1 Agriculture, other 1 Paddy 1 Paddy
4 Coconut 4 Coconut 2 Food crops 2 Food crops
5 Tea estates 5 Tea estates 3 Vegetables 3 Vegetables
4 Fruits 4 Fruits
7 Flower plants 7 Flower plants
8 Other agriculture 8 Other agriculture
4 Livestock and Fishing
6 Livestock breeding etc. 6 Livestock breeding etc. 9 Poultry farming 9 Poultry farming
8 Fishing 8 Fishing 10 Other livestock 10 Other livestock
12 Fishing 12 Fishing

147
5 Forestry and Logging
7 Forestry and logging 7 Forestry and logging 11 Forestry and logging 11 Forestry and logging
Mining & Quarrying
6 Crude Oil and Natural Gas
9 Crude petrol, natural gas and coal
9 Crude petrol, natural gas and coal
13 Crude oil and natural gas 13 Crude oil and natural gas
7 Other Mining and Quarrying
10 Metal ore mining 10 Metal ore mining 14 Metal ore mining 14 Metal ore mining
11 Stone, clay and sand quarrying
11 Stone, clay and sand quarrying 15 Stone, clay and sand quarrying 15 Stone, clay and sand quarrying
16 Other mining and quarrying 16 Other mining and quarrying
Manufacturing 8 Food, Beverage and Tobacco
12 Meat and meat production 12 Meat and meat production 17 Meat and meat production 17 Meat and meat production
13 Dairy production 13 Dairy production 18 Preservation of seafood 18 Preservation of seafood
14 Preservation of fruits and vegetables
14 Preservation of fruits and vegetables
19 Preservation of fruits and vegetables
19 Preservation of fruits and vegetables
15 Preservation of seafood 15 Preservation of seafood 20 Dairy production 20 Dairy production
17 Grain mills 17 Grain mills 22 Grain mills 22 Grain mills
18 Bakeries 18 Bakeries 23 Bakery products 23 Bakery products
19 Manufacture of confectionery 19 Manufacture of confectionery 24 Confectionery 24 Confectionery
20 Manufacture of ice 20 Manufacture of ice 25 Other food processing 25 Other food processing
21 Manufacture of other foods 21 Manufacture of other foods 26 Animal feeds 26 Animal feeds
22 Manufacture of animal feeds 22 Manufacture of animal feeds 27 Wine and spirit 27 Wine and spirit
23 Production of wine and spirits 23 Production of wine and spirits 28 Soft drink 28 Soft drink
24 Production of beer and soft drinks
24 Production of soft drinks 29 Tobacco products 29 Tobacco products
25 Manufacture of tobacco 25 Manufacture of tobacco
9 Oils and Fats 16 Manufacture of oils and fats 16 Manufacture of oils and fats 21 Oils and fats 21 Oils and fats
10 Textiles and Leather
26 Manufacture of yarns and cloth
26 Manufacture of yarns and cloth 30 Yarn and cloth 30 Yarn and cloth
27 Manufacture of knitted fabrics 27 Manufacture of knitted fabrics 31 Finishing of textiles 31 Finishing of textiles
28 Manufacture of other textiles 28 Manufacture of other textiles 32 Other textiles 32 Other textiles
30 Leather industries 30 Leather industries 34 Leather industries 34 Leather industries
11 Apparels and Footwear
29 Manufacture of wearing apparels
29 Manufacture of wearing apparels 33 Wearing apparels 33 Wearing apparels
31 Manufacture of footwear 31 Manufacture of footwear 35 Footwear 35 Footwear
12 Wood Products 32 Sawmills 32 Sawmills 36 Sawmilling and planning of 36 Sawmilling and planning of wood

148
wood
33 Manufacture of other wooden products
33 Manufacture of other wooden products
37 Veneer sheets, plywood, laminated board, particle board and other panels and boards
37 Veneer sheets, plywood, laminated board, particle board and other panels and boards
38 Builders' carpentry and joinery 38 Builders' carpentry and joinery
39 Wooden and cane containers 39 Wooden and cane containers
40 Other wood products 40 Other wood products
13 Paper Products and Furniture
34 Manufacture of furniture and fixtures
34 Manufacture of furniture and fixtures
41 Paper and paper products and furniture
41 Paper and paper products and furniture
35 Paper and board industries 35 Paper and board industries
14 Printing and Publishing
36 Printing 36 Printing 42 Publishing 42 Publishing
43 Printing 43 Printing
15 Refined Petroleum Products
42 Petrol and coal industries 42 Petrol and coal industries 44 Petroleum refinery 44 Petroleum refinery
16 Chemicals and Pharmaceuticals
37 Manufacture of industrial chemical
37 Manufacture of industrial chemical
45 Basic chemicals 45 Basic chemicals
38 Manufacture of paints and lacquers
38 Manufacture of paints and lacquers
46 Fertilisers 46 Fertilisers
39 Manufacture of drugs and medicines
39 Manufacture of drugs and medicines
47 Paints and varnishes 47 Paints and varnishes
40 Manufacture of soap etc. 40 Manufacture of soap etc. 48 Pharmaceuticals, medicinal chemicals and botanical products
48 Pharmaceuticals, medicinal chemicals and botanical products
41 Other chemical industries 41 Other chemical industries 49 Soap and detergents, perfumes, cleaning & toilet preparations
49 Soap and detergents, perfumes, cleaning & toilet preparations
50 Other chemicals products 50 Other chemicals products
17 Processed Rubber Products
43 Rubber processing 43 Rubber processing 51 Tyres 51 Tyres
44 Rubber industries 44 Rubber industries 52 Rubber processing 52 Rubber processing
53 Rubber gloves 53 Rubber gloves
54 Rubber products 54 Rubber products
18 Plastics and Non-Metallic Mineral Products
45 Manufacture of plastic products
45 Manufacture of plastic products 55 Plastics Products 55 Plastics Products
46 China and glass industries 46 China and glass industries 56 Sheet glass and glass products 56 Sheet glass and glass products
47 Manufacture of clay products 47 Manufacture of clay products 57 Clay and ceramic 57 Clay and ceramic

149
48 Manufacture of cement etc. 48 Manufacture of cement etc. 58 Cement, lime and plaster 58 Cement, lime and plaster
49 Other non-metallic manufacture
49 Other non-metallic manufacture 59 Concrete and other non-metallic mineral products
59 Concrete and other non-metallic mineral products
19 Metal Products 50 Iron and steel industries 50 Iron and steel industries 60 Iron and steel products 60 Iron and steel products
51 Manufacture of non-ferrous metals
51 Manufacture of non-ferrous metals
61 Basic precious and non-ferrous metals
61 Basic precious and non-ferrous metals
52 Manufacture of metal furniture and fixture
52 Manufacture of other fabricated metal and fixture
62 Casting of metals 62 Casting of metals
53 Structural metal industries 53 Structural metal industries 63 Structural metal products 63 Structural metal products
54 Other metal industries 54 Other metal industries 64 Other fabricated metal products 64 Other fabricated metal products
20 Machinery 55 Manufacture of industrial machinery
55 Manufacture of industrial machinery
65 Industrial machinery 65 Industrial machinery
56 Manufacture of household machinery
56 Manufacture of household machinery
66 General purpose machinery 66 General purpose machinery
67 Special purpose machinery 67 Special purpose machinery
69 Office, accounting and computing machinery
69 Office, accounting and computing machinery
21 Electric Appliances and Electronic Components
57 Manufacture of radio, television etc.
57 Manufacture of radio, television etc.
68 Domestic appliances 68 Domestic appliances
58 Manufacture of electric appliances etc.
58 Manufacture of electric appliances etc.
70 Electrical machinery and apparatus
70 Electrical machinery and apparatus
59 Manufacture of other electrical machinery
59 Manufacture of other electrical machinery
71 Other electrical machinery 71 Other electrical machinery
72 Insulated wires and cables 72 Insulated wires and cables
73 Electric lamps and lighting equipment
73 Electric lamps and lighting equipment
74 Semi-conductor devices, electronic valves, tubes and printed circuit boards
74 Semi-conductor devices, electronic valves, tubes and printed circuit boards
75 Television and radio receivers and transmitters, sound or video recording or reproducing apparatus and associated goods
75 Television and radio receivers and transmitters, sound or video recording or reproducing apparatus and associated goods
22 Precision Equipment
64 Manufacture of instruments and clocks
64 Manufacture of instruments and clocks
76 Medical and surgical equipment and orthopaedic appliances
76 Medical and surgical equipment and orthopaedic appliances
77 Instruments and appliances for measuring, checking, testing, navigating and other purposes; manufacture of industrial
77 Instruments and appliances for measuring, checking, testing, navigating and other purposes; manufacture of industrial process

150
process control equipment control equipment
78 Optical instruments and photographic equipment
78 Optical instruments and photographic equipment
79 Watches and clocks 79 Watches and clocks
23 Motor Vehicles and Transport Equipment
60 Ship and boat building 60 Ship and boat building 80 Motor vehicles 80 Motor vehicles
61 Manufacture of motor vehicles 61 Manufacture of motor vehicles 81 Motorcycles 81 Motorcycles
62 Manufacture of cycles and motorcycles
62 Manufacture of cycles and motorcycles
82 Building and repairing of ships and boats; manufacture of bicycles and invalid carriages
82 Building and repairing of ships and boats; manufacture of bicycles and invalid carriages
63 Manufacture of other transport equipment
63 Manufacture of other transport equipment
83 Other transport equipment 83 Other transport equipment
24 Recycling and Other Manufacturing
65 Other manufacturing 65 Other manufacturing 84 Other manufacturing 84 Other manufacturing
89 Recycling 85 Recycling 85 Recycling
Services 25 Electricity, Gas and Water
66 Electricity and gas 66 Electricity and gas 86 Electricity and gas 86 Electricity and gas
67 Waterworks 67 Waterworks 87 Waterworks 87 Waterworks
88 Sewerage, waste collection and remediation activities
26 Construction 68 Building and construction 68 Building and construction 88 Residential 89 Residential
89 Non residential 90 Non residential
90 Civil engineering 91 Civil engineering
91 Special trade works 92 Special trade works
27 Wholesale and Retail
69 Wholesale and retail trade 69 Wholesale and retail trade 92 Wholesale and retail trade and motor vehicle
93 Wholesale and retail trade and motor vehicle
85 Repair of motor cycles 87 Repair of motor cycles
86 Other repair 88 Other repair
28 Hotels and Restaurants
70 Hotels and restaurants 70 Hotels and restaurants 93 Accommodation 94 Accommodation
94 Restaurants 95 Restaurants
29 Transport and Communications
71 Transport 71 Transport 95 Land transport 96 Land transport
72 Communication 72 Communication 96 Water transport 97 Water transport
97 Air transport 98 Air transport
98 Other transport services 99 Other transport services

151
99 Port and airport operation services
100 Port and airport operation services
100 Highway, bridge and tunnel operation services
101 Highway, bridge and tunnel operation services
101 Communication 102 Communications
103 Publishing activity
104 Telecommunications
105 Cinema, video and television activity
30 Finance and Insurance
73 Banks 73 Banks 102 Banks 107 Banks
74 Other financial institutions 74 Other financial institutions 103 Financial institutions 108 Financial institutions
75 Insurance 75 Insurance 104 Insurance 109 Insurance
105 Other financial institutions 110 Other financial institutions
31 Real Estate 76 Real estate 76 Real estate 106 Real estate 111 Real estate
77 Ownership of dwellings 77 Ownership of dwellings 107 Ownership of dwellings 112 Ownership of dwellings
32 Business Services 78 Business services 78 Business services 108 Rental and leasing 106 ICT and computer services
109 Computer services 113 Rental and leasing
110 Research and development 114 Research and development
111 Professional 115 Professional
112 Business services 116 Business services
33 Private Services 81 Private non-profit institutions 83 Private non-profit institutions 118 Non-profit private institutions 122 Non-profit private institutions
82 Entertainment 84 Entertainment 119 Amusement and recreational services
123 Amusement and recreational services
83 Radio and TV broadcasting 85 Radio and TV broadcasting 120 Other private services 124 Other private services
84 Recreation 86 Recreation
87 Laundry and cleaning 90 Other private services
88 Other private services
34 Education 79 Education 79 Education - private 114 Education 118 Education
80 Education - public
35 Health 80 Health 81 Health - private 115 Health 119 Health
82 Health - public

152
36 Government Services
89 Public administration 91 Public administration 113 Public administration 117 Public administration
90 Public order 92 Public order 116 Defence and public order 120 Defence and public order
91 Defence 93 Defence 117 Other public administration 121 Other public administration
92 Other public administration 94 Other public administration

153
Annex 3: Products and Processes in Palm Oil Value Chains
INPUT SUPPLY
Machinery/ Equipment Agrochemicals Fertilisers Seeds and Planting Materials
PLANTATION (FARMING) Site Preparation, Nursery and Planting SERVICES
Weeding
Fertiliser Application
Pruning Industry
Upkeep of Roads, Bridges, Paths Associations
Harvesting and Collection
Government
Fresh Fruits Bunches (FFB)
Financing
Sterilisation
BIOMASS WASTE MANAGEMENT PRIMARY PROCESSING (MILLING) Threshing and Stripping of Fruitlets Depericarping (Nut/ PRIMARY PROCESSING (CRUSHING) Trading
Oil Extraction (Screw Press) Fibre Separation)
Empty Fruit Nut Drying Brokering
On-Site Energy Demand Bunches Crude Oil Nut Cracking Palm Kernel Pressing (Extraction)
Biogas Capture Palm Kernel Winnowing (Dry/ Shipping
Other Uses Being Researched Shell Wet Separation)
Palm Oil Mill Clarification and Purification Kernel Drying Logistics/
Effluent Transportation
Crude Palm Oil (CPO) Crude Palm Kernel Oil (CPKO) Palm Kernel Cake
Legal Services
SECONDARY PROCESSING (REFINING INTO EDIBLE OILS AND INTERMEDIATE GOODS) Information and
Communication
Distillation Physical Fractionation Chemical Physical Distillation Technology
(By-Product) Refining Refining Refining (By-Product)
Landscaping
Neutralised, Palm Kernel Fatty
EDIBLE OILS & SPECIALTY FATS Crude Palm Bleached, Soapstock Acid Distillates Laboratory
Stearin Deodorised Testing/ Research
(NBD) Palm Oil
Fractionation Fractionation Inspection/
Fractionation Certification
Extraction
NBD Palm Olein NBD Palm Stearin Surveying
Tocols/ Splitting (Hydrolisis) Environmental
Vitamin E Second Fractionation Second Fractionation OLEOCHEMICALS Conservation
Esterification Feedstock (Tocotrienols, Blending Fatty Acids Glycerine
Transesterification Tocopherols) Packaging Interesterification Further processed Feedstock Equipment
Purification Carotenoids Double Fractionated Palm Blending Double Mid Stearin Blending Amination Neutralisation Esterification mainly for specialty Maintenace/
(Carotenes, RBD Palm Olein Midfraction Packaging Stearin Distillation fats Repair
Lycopene) Margarine Hydrogenation Interesterified Amines Soap Noodles Methyl Ester
Polyphenols Shortening Palm Olein Alcohol Removal Glycerol Training
(Phenolic Vanaspati Hydrogenated Packaging Blending Amidation Hydrogenation Neutralisation
Biodiesel Acids, (Vegetable Double Olein Cooking/ Soup Dry Cocoa Butter Similar characteristics Consulting/
Flavonoids) Ghee) Frying Fats Confectionery/ Mixes Equivalent Shortening Fatty Amides Fatty Alcohol Biodiesel and uses to PFAD Advisory
Squalene Frying Fats Confectionery Cooking/ Frying Fats Cocoa Butter Shortening Biscuit Filling Cake Dry Hard Stock Margarine Lubricant
Lecithin Ice Cream Mix Fillings Salad Oil Equivalent Margarine Fats Mixes for Margarine Vanaspati Additives Surfactants Humectants Conference
and Events
Market Research
Animal Feed Nutraceuticals Compound Food Ingredients Consumer Goods Food Uses Animal Feed
Laundry Soap Functional Foods Food Products Non-Food Products Technical Uses
(eg. shampoo, detergent, fabric softeners, (eg. pharmaceutical formulations, cosmetic
PRODUCTION OF FINAL GOODS USING PALM OIL DERIVATIVES AS FUNCTIONAL INGREDIENTS OR PROCESSING AIDS (INDUSTRIAL USERS) sanitising agents, corrosion inhibitors) applications, explosives, anti freeze)
DISTRIBUTION OF FINAL GOODS TO WHOLESALERS AND RETAILERS
HOUSEHOLD CONSUMPTION
Products
Malaysia's Main Export Products
Source: Interviews, based on MPOB materials
PH
YTO
NU
TRIE
NTS
BIO
FUEL
Olein
RBD Palm Olein RBD Palm Stearin
Palm Fatty Acid
Distillates
Refined, Bleached,
Deodorised (RBD) Palm Oil
RBD Palm Kernel Olein
DO
WN
STREA
M
RBD Palm Kernel Stearin
Press Cake
Crude Palm RBD Palm Kernel Oil
UP
STREA
MM
IDSTR
EAM
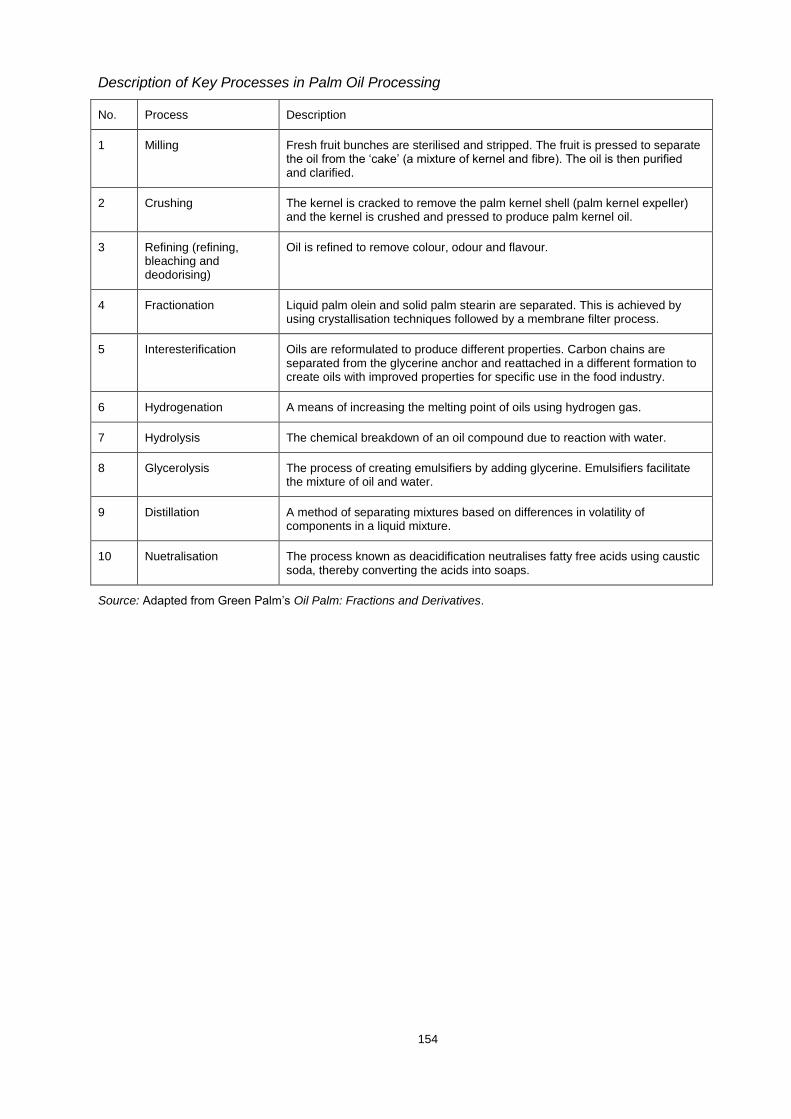
154
Description of Key Processes in Palm Oil Processing
No. Process Description
1 Milling Fresh fruit bunches are sterilised and stripped. The fruit is pressed to separate the oil from the ‘cake’ (a mixture of kernel and fibre). The oil is then purified and clarified.
2 Crushing The kernel is cracked to remove the palm kernel shell (palm kernel expeller) and the kernel is crushed and pressed to produce palm kernel oil.
3 Refining (refining, bleaching and deodorising)
Oil is refined to remove colour, odour and flavour.
4 Fractionation Liquid palm olein and solid palm stearin are separated. This is achieved by using crystallisation techniques followed by a membrane filter process.
5 Interesterification Oils are reformulated to produce different properties. Carbon chains are separated from the glycerine anchor and reattached in a different formation to create oils with improved properties for specific use in the food industry.
6 Hydrogenation A means of increasing the melting point of oils using hydrogen gas.
7 Hydrolysis The chemical breakdown of an oil compound due to reaction with water.
8 Glycerolysis The process of creating emulsifiers by adding glycerine. Emulsifiers facilitate the mixture of oil and water.
9 Distillation A method of separating mixtures based on differences in volatility of components in a liquid mixture.
10 Nuetralisation The process known as deacidification neutralises fatty free acids using caustic soda, thereby converting the acids into soaps.
Source: Adapted from Green Palm’s Oil Palm: Fractions and Derivatives.

155
Malaysian Palm Oil and Palm-Based Product Profile, 2014
Palm Oil Products
1. Crude palm oil
2. Crude palm olein
3. Crude palm stearin
4. Bleached palm oil
5. Bleached palm olein
6. Bleached palm stearin
7. Cooking oil/ double olein
8. Double fractionated RBD palm
olein/ superolein
9. Double fractionated RBD palm
stearin
10. Double fractionated palm olein
11. Hydrogenated palm fatty acid
distillate
12. Hydrogenated palm oil
13. Hydrogenated palm olein
14. Hydrogenated palm stearin
15. HB palm stearin
16. HRBD double fractionated olein
17. HRBD stearin flakes
18. Interesterified palm oil
19. Interesterified palm stearin
20. Interesterified palm olein
21. Interesterified mixed
palm/vegetable oil
22. Interesterified mixed palm/ palm
kernel oil based
23. NB palm olein
24. NBD palm oil
25. NBD palm olein
26. NBD palm stearin
27. Neutralised palm oil
28. Neutralised palm olein
29. NB interesterified olein
30. NB interesterified stearin
31. Nutrolein
32. Palm acid oil
33. Palm fatty acid distillate
34. Palm-mid fraction
35. RB palm olein
36. RBD blended palm oil
37. RBD hydrogenated palm oil
38. RBD hydrogenated palm olein
39. RBD hydrogenated palm stearin
40. RBD palm oil
41. RBD palm olein
42. RBD palm stearin
43. Refined palm oil
44. Refined palm olein
45. Refined palm stearin
46. Refined hydrogenated palm
stearin
47. Stabilised palm oil
48. Vegetable oil
Palm Kernel Products
49. CPKO
50. Crude palm kernel olein
51. Crude palm kernel stearin
52. Double fractionated RBD palm
kernel olein
53. Double fractionated RBD palm
kernel stearin
54. Hydrogenated palm kernel oil
55. Hydrogenated palm kernel olein
56. Hydrogenated palm kernel
stearin
57. Interestified palm kernel oil
58. N palm kernel olein
59. N palm kernel stearin
60. NB palm kernel olein
61. NB palm kernel stearin
62. NBD palm kernel oil
63. NBD palm kernel olein
64. NBD palm kernel stearin
65. Palm kernel acid oil
66. Palm kernel fatty acid distillate
67. RBD palm kernel oil
68. RBD palm kernel olein
69. RBD palm kernel stearin
70. RBDH palm kernel oil
71. RBDH palm kernel olein
72. RBDH palm kernel stearin
73. Refined palm kernel oil
Palm Kernel Cake Products
74. Palm kernel expeller
75. Palm kernel pellets
Oleochemicals
76. Stearic acid
77. Lauric acid
78. Myristic acid
79. Oleic acid
80. Palmitic acid
81. Other fatty acids
82. Fatty alcohol
83. Methylester
84. Glycerine
85. Soap noodles
Finished Products
86. Shortening
87. Vegetable ghee/ vanaspati
88. Vegetable/ dough fats
89. Cocoa-butter substitutes/
equivalents/ replacer
90. Margarine
91. Soap
92. Red olein
93. Prayer oil
94. Hydrogenated vegetable oil
95. Blended vegetable oils
96. Biodiesel
Finished Products
97. Residue oil/ scavenger oil
98. Mixed acid oil
99. Industrial grade palm oil
100. Sludge oil
101. Palm fatty acid residue
102. Palm kernel shell
103. High free fatty acid oil
104. Lauric fatty acid distillate
105. Methyl ester residue
106. Mixed vegetable acid oil
107. Palm kernel oil residue
108. Oil palm fibre
109. Stearin wax
110. Volatiles
111. Pitch oil

156
Annex 4: Explanatory Notes for Linkage Analysis
Input-output analysis developed by Wassily Leontief in the 1930s has been widely used to
assess structural changes and interdependence of sectors and industries in an economy. This
analytical framework has its limitations due to well-recognised assumptions about homogeneity
of output, zero substitution between inputs, fixed proportion between inputs and outputs,
constant returns to scale, and exogeneity of primary inputs and final demand components.
Nonetheless, it has significant advantages and provides valuable information for socio-
economic analysis.
In this framework, production by an industry has two kinds of economic effects on other
industries (See (Miller & Blair, 2009) for a detailed discussion on I-O analysis). If industry j
increases its output, there will be increased demand from industry j on the industries whose
goods are used as inputs to production in j. This demand relationship is termed backward
linkage. If industry i increased its output, there will be increased supply from industry i for the
industries which use product i in their production. This supply relationship is termed forward
linkage.
Total backward linkage measures both direct and indirect effects of one monetary unit change
in the final demand for each industry (as consumer) on total output of all industries (including
itself, as suppliers). It is the sum of the elements in the jth column of the Leontief inverse matrix
and can be defined as:
𝐵𝐿𝑗 = ∑ 𝑏𝑖𝑗
𝑛
𝑖=1
(1)
where 𝐵𝐿
𝑗 is the backward linkage of industry j and 𝑏𝑖𝑗 is the Leontief inverse matrix in an
economy with n industries.
Total forward linkage measures both direct and indirect effects of one monetary unit change in
output of each industry (as supplier) on total output of all industries (as consumers) that depend
on the industry’s output for production. It is the sum of the elements in the ith column of the
Ghosh inverse matrix and can be defined as:
𝐹𝐿𝑖 = ∑ 𝑏𝑖𝑗∗
𝑛
𝑗=1
(2)
where 𝐹𝐿𝑖 is the forward linkage of industry I and 𝑏𝑖𝑗
∗ is the Ghosh inverse matrix.

157
Both linkages are then calculated in normalised form (against the global average) for expression
as indices (Rasmussen, 1957). The index for total backward linkage, known as the Power of
Dispersion Index, is defined as:
𝑈𝑗 =
𝐵𝐿𝑗
1𝑛
∑ 𝐵𝐿𝑗
𝑛𝑗=1
= ∑ 𝑏𝑖𝑗
𝑛𝑖=1
1𝑛
∑ 𝑏𝑖𝑗𝑛𝑖=1 ∑ 𝑏𝑖𝑗
𝑛𝑗=1
(3)
while the parallel for total forward linkage, known as the Sensitivity of Dispersion Index, is
𝑈𝑖 = 𝐹𝐿𝑖
1𝑛
∑ 𝐹𝐿𝑖𝑛𝑖=1
= ∑ 𝑏𝑖𝑗
∗𝑛𝑗=1
1𝑛
∑ 𝑏𝑖𝑗∗𝑛
𝑗=1 ∑ 𝑏𝑖𝑗∗𝑛
𝑖=1
(4)
Industries can be classified as (1) not strongly connected to other industries (both linkage
measures less than 1); (2) strongly connected to other industries (both linkage measures
greater than 1); (3) dependent on interindustry supply (only backward linkage greater than 1);
and (4) dependent on interindustry demand (only forward linkage greater than 1) (Miller & Blair,
2009). This allows identification of ‘key industries’ (with both backward and forward linkages
greater than 1). Coefficients of variation further provide a sense of whether the linkage effects
are narrowly or widely spread over all industries (Boucher, 1976). The backward coefficient of
variation of industry j is
𝑉𝑗 =
√ 1𝑛 − 1
∑ (𝑏𝑖𝑗 − 1𝑛
∑ 𝑏𝑖𝑗𝑛𝑖=1 )2 𝑛
𝑖=1
1𝑛 ∑ 𝑏𝑖𝑗
𝑛𝑖=1
(5)
and the forward coefficient of variation for industry i is
𝑉𝑖 = √ 1
𝑛 − 1∑ (𝑏𝑖𝑗
∗ − 1𝑛 ∑ 𝑏𝑖𝑗
∗𝑛𝑗=1 )2 𝑛
𝑗=1
1𝑛 ∑ 𝑏𝑖𝑗
∗𝑛𝑗=1
(6)
A relatively high 𝑉
𝑗 shows that industry j draws heavily on a small number of industries while a
low 𝑉𝑗 means that it draws more evenly from the other industries. A high 𝑉𝑖 means that a small
number of industries draw heavily on industry I while a low 𝑉𝑖 means that the other industries
draw evenly on industry i.

158
Annex 5: Backward and Forward Linkages and Coefficients of Variation of 36 Industries in Malaysia, 1991-2010
Industry Code 1991 2000
Backward Linkage
Rank Forward Linkage
Rank Backward Coefficient
Rank Forward Coefficient
Rank Backward Linkage
Rank Forward Linkage
Rank Backward Coefficient
Rank Forward Coefficient
Rank
Rubber 1 0.747 33 1.259 6 5.332 4 3.890 27 0.728 35 1.314 5 5.438 2 3.821 29
Oil palm 2 0.742 36 1.457 1 5.372 2 4.009 24 0.859 26 1.659 1 4.614 14 3.792 30
Agriculture 3 0.842 29 0.995 17 4.810 9 3.994 25 0.846 27 1.090 12 5.048 5 3.930 28
Livestock and fishing 4 1.254 4 1.052 14 3.832 30 4.356 17 1.303 2 1.091 10 3.764 32 4.338 18
Forestry and logging 5 0.754 32 1.024 15 5.295 5 4.067 21 0.797 32 1.198 7 5.101 4 3.522 33
Crude oil and natural gas 6 0.744 35 1.007 16 5.429 1 3.902 26 0.720 36 0.990 17 5.579 1 4.026 26
Other mining and quarrying 7 0.969 18 1.380 4 4.182 24 3.123 33 0.958 20 1.446 2 4.183 20 3.221 34
Food, beverage and tobacco
8 1.221 5 0.954 20 3.678 33 4.531 16 1.197 4 1.044 14 3.829 33 4.304 19
Oils and fats 9 1.790 1 1.222 8 4.167 25 5.664 5 1.956 1 1.436 3 4.106 26 5.293 10
Textiles and leather 10 0.961 19 0.837 26 4.757 11 5.228 10 1.050 12 0.901 24 4.160 21 4.732 14
Apparels and footwear 11 0.895 27 0.699 32 4.650 13 5.688 4 1.048 13 0.751 28 4.082 27 5.497 7
Wood products 12 1.305 3 0.854 24 3.643 35 4.896 13 1.231 3 0.868 26 3.687 34 4.669 15
Paper products and furniture
13 1.069 11 1.142 11 4.087 27 3.646 29 1.094 8 1.033 15 4.073 28 4.164 21
Printing and publishing 14 0.917 23 1.408 3 4.471 17 2.809 35 1.073 10 0.977 18 3.866 29 4.069 24
Refined petroleum products
15 1.323 2 1.247 7 3.822 31 3.232 32 1.064 11 1.143 9 4.218 22 3.585 32
Chemicals and pharmaceuticals
16 0.985 15 0.980 18 4.370 19 4.171 18 1.183 5 1.090 11 3.920 30 4.099 23
Processed rubber products 17 1.218 6 0.784 28 3.748 32 5.277 8 1.125 7 0.900 25 4.233 23 5.095 12
Plastics and non-metallic mineral products
18 1.070 10 1.217 9 4.080 28 3.586 30 1.032 16 1.030 16 4.239 24 4.182 20
Metal products 19 1.099 8 1.167 10 4.452 18 4.047 22 0.990 18 1.171 8 4.745 11 3.941 27
Machinery 20 0.978 16 0.805 27 4.332 22 4.996 12 0.815 31 0.700 33 4.961 6 5.577 6

159
Electric appliances and electronic components
21 0.906 25 0.776 30 4.876 8 5.428 7 0.864 25 0.725 30 4.906 9 5.665 4
Precision equipment 22 0.976 17 0.668 34 4.207 23 5.853 1 0.914 23 0.714 32 4.518 16 5.610 5
Motor vehicles and transport equipment
23 0.960 20 0.921 22 4.781 10 4.757 15 1.036 15 0.964 21 4.738 12 4.933 13
Recycling and other manufacturing
24 0.934 22 0.959 19 4.367 20 4.025 23 1.048 14 0.951 22 3.944 31 4.162 22
Electricity, gas and water 25 1.002 13 1.359 5 4.144 26 2.897 34 0.932 22 1.401 4 4.498 17 2.859 36
Construction 26 1.092 9 0.726 31 3.675 34 5.276 9 1.089 9 0.719 31 3.673 35 5.369 9
Wholesale and retail 27 0.908 24 1.098 12 4.521 14 3.562 31 0.818 30 1.262 6 4.899 10 3.115 35
Hotels and restaurants 28 1.189 7 0.920 23 3.394 36 4.145 19 1.156 6 0.966 20 3.516 36 4.039 25
Transport and communications
29 0.988 14 1.087 13 4.493 15 3.883 28 0.983 19 0.976 19 4.472 18 4.343 17
Finance and insurance 30 0.899 26 0.847 25 4.709 12 4.764 14 0.826 29 0.736 29 5.010 7 5.441 8
Real estate 31 0.747 34 0.935 21 5.365 3 4.082 20 0.789 34 0.905 23 5.395 3 4.539 16
Business services 32 0.948 21 1.433 2 4.353 21 2.724 36 0.886 24 1.086 13 4.635 15 3.632 31
Private services 33 0.842 30 0.777 29 4.956 6 5.119 11 1.003 17 0.781 27 4.200 25 5.250 11
Education 34 0.804 31 0.663 36 4.945 7 5.748 3 0.795 33 0.649 36 4.964 8 5.905 1
Health 35 0.894 28 0.664 35 4.479 16 5.782 2 0.845 28 0.654 35 4.673 13 5.870 2
Government services 36 1.028 12 0.677 33 3.869 29 5.640 6 0.947 21 0.681 34 4.253 19 5.763 3

160
Industry Code 2005 2010
Backward Linkage
Rank Forward Linkage
Rank Backward Coefficient
Rank Forward Coefficient
Rank Backward Linkage
Rank Forward Linkage
Rank Backward Coefficient
Rank Forward Coefficient
Rank
Rubber 1 0.754 34 0.767 29 4.283 8 4.152 15 0.888 28 0.767 28 4.025 15 4.521 14
Oil palm 2 0.826 29 1.590 1 4.309 7 3.481 24 0.761 33 1.527 2 4.580 5 3.643 24
Agriculture 3 0.884 26 1.211 6 4.256 9 3.290 29 0.718 35 0.886 22 4.874 2 4.018 18
Livestock and fishing 4 0.967 23 1.150 12 4.119 14 3.419 27 1.044 14 0.769 27 3.509 31 4.590 13
Forestry and logging 5 0.684 36 1.230 5 4.720 1 2.902 33 1.217 4 1.578 1 4.123 13 3.245 32
Crude oil and natural gas 6 0.706 35 1.051 16 4.696 2 3.275 31 0.684 36 1.138 10 5.175 1 3.369 30
Other mining and quarrying 7 1.086 11 1.197 7 3.022 36 2.778 36 0.763 32 1.487 4 4.547 6 2.524 35
Food, beverage and tobacco
8 1.099 9 0.838 27 3.621 27 4.646 10 1.063 12 0.814 26 3.837 25 4.893 8
Oils and fats 9 1.483 1 1.108 14 3.674 24 4.587 11 1.527 1 0.998 19 3.535 30 4.884 9
Textiles and leather 10 1.101 8 0.951 21 3.652 25 4.143 16 1.052 13 0.827 24 3.596 28 4.424 15
Apparels and footwear 11 0.946 24 0.710 33 3.463 33 4.487 12 0.922 22 0.741 30 3.880 23 4.681 12
Wood products 12 1.056 15 0.841 26 3.515 31 4.196 14 1.439 2 1.006 16 3.019 36 3.820 20
Paper products and furniture
13 1.086 10 1.008 19 3.899 20 4.109 17 1.198 5 0.926 21 3.187 35 3.966 19
Printing and publishing 14 0.992 21 1.008 20 3.876 21 3.713 22 0.993 17 1.522 3 3.538 29 2.438 36
Refined petroleum products
15 1.124 6 1.286 4 3.535 30 2.845 35 0.988 18 1.002 17 3.980 17 3.422 29
Chemicals and pharmaceuticals
16 1.069 13 0.939 22 3.478 32 3.835 19 1.119 9 1.118 11 3.807 26 3.674 23
Processed rubber products 17 1.366 2 1.290 3 4.202 11 4.337 13 1.403 3 1.096 13 3.977 18 4.937 7
Plastics and non-metallic mineral products
18 1.044 17 1.088 15 3.615 28 3.444 26 1.155 7 1.187 8 3.453 32 3.353 31
Metal products 19 1.070 12 1.111 13 4.129 13 3.899 18 1.008 16 1.175 9 4.341 9 3.637 25
Machinery 20 0.834 28 0.681 34 4.085 15 4.868 6 0.823 30 0.661 32 4.305 11 5.216 5
Electric appliances and electronic components
21 0.973 22 0.783 28 4.174 12 5.078 4 0.778 31 1.052 14 4.508 7 4.102 17
Precision equipment 22 0.900 25 0.755 31 4.026 17 4.705 9 0.856 29 0.654 34 4.109 14 5.238 4

161
Motor vehicles and transport equipment
23 1.048 16 0.765 30 3.588 29 4.782 8 1.014 15 0.833 23 3.964 19 4.688 11
Recycling and other manufacturing
24 0.795 33 1.165 11 4.313 6 2.990 32 0.899 27 0.986 20 3.881 22 3.427 28
Electricity, gas and water 25 1.103 7 1.172 9 3.683 23 3.284 30 0.901 26 1.350 6 4.489 8 2.877 34
Construction 26 1.040 19 0.871 24 3.154 35 3.696 23 1.133 8 0.760 29 3.318 33 4.775 10
Wholesale and retail 27 0.805 31 1.174 8 4.214 10 2.878 34 0.908 24 0.999 18 4.019 16 3.551 27
Hotels and restaurants 28 1.149 5 0.844 25 3.627 26 4.805 7 1.158 6 0.824 25 3.244 34 4.369 16
Transport and communications
29 1.178 4 1.168 10 3.853 22 3.742 21 1.104 10 1.118 12 3.897 21 3.702 22
Finance and insurance 30 1.034 20 1.346 2 4.563 3 3.462 25 1.063 11 1.362 5 4.716 4 3.555 26
Real estate 31 0.872 27 0.909 23 4.072 16 3.798 20 0.920 23 1.022 15 4.338 10 3.751 21
Business services 32 0.795 32 1.041 18 4.438 4 3.292 28 0.955 20 1.326 7 4.281 12 3.005 33
Private services 33 1.208 3 1.043 17 4.327 5 4.891 5 0.979 19 0.687 31 3.914 20 5.402 3
Education 34 0.820 30 0.556 36 3.979 18 5.763 1 0.735 34 0.581 35 4.834 3 5.966 2
Health 35 1.060 14 0.715 32 3.926 19 5.725 2 0.902 25 0.657 33 3.875 24 5.125 6
Government services 36 1.041 18 0.638 35 3.202 34 5.109 3 0.932 21 0.562 36 3.696 27 5.992 1
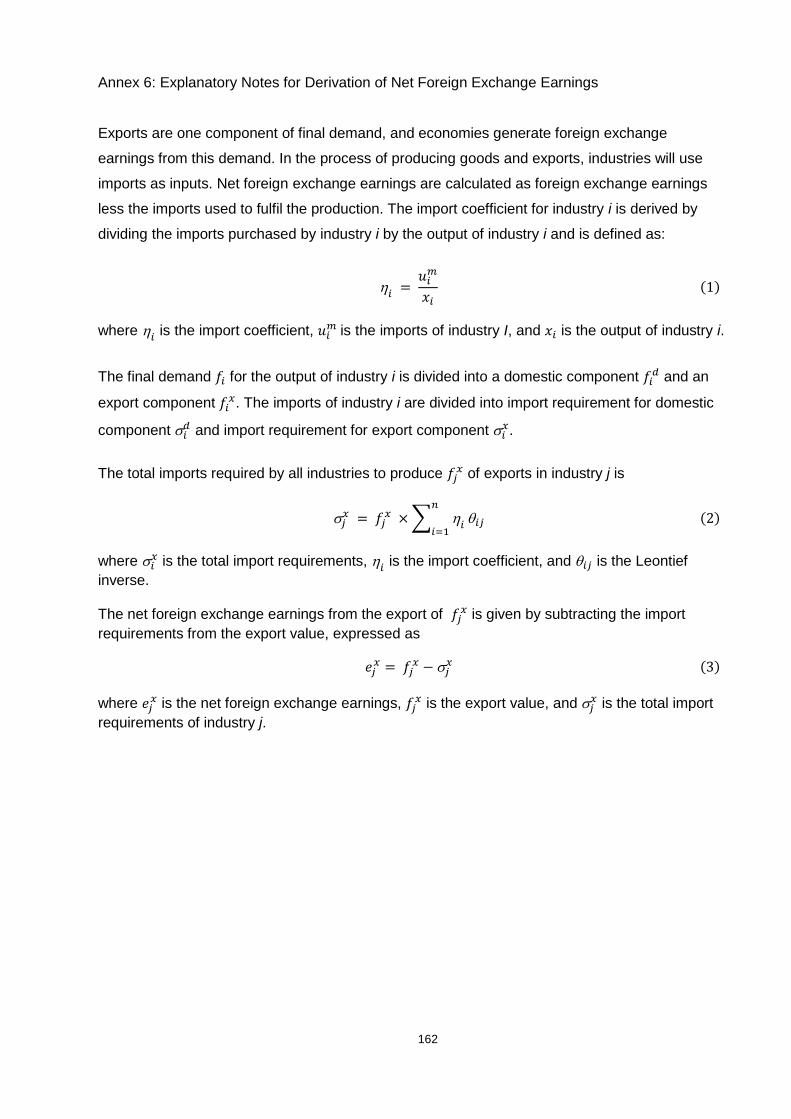
162
Annex 6: Explanatory Notes for Derivation of Net Foreign Exchange Earnings
Exports are one component of final demand, and economies generate foreign exchange
earnings from this demand. In the process of producing goods and exports, industries will use
imports as inputs. Net foreign exchange earnings are calculated as foreign exchange earnings
less the imports used to fulfil the production. The import coefficient for industry i is derived by
dividing the imports purchased by industry i by the output of industry i and is defined as:
𝑖 = 𝑢𝑖
𝑚
𝑥𝑖 (1)
where 𝑖 is the import coefficient, 𝑢𝑖
𝑚 is the imports of industry I, and 𝑥𝑖 is the output of industry i.
The final demand 𝑓𝑖 for the output of industry i is divided into a domestic component 𝑓𝑖𝑑 and an
export component 𝑓𝑖𝑥. The imports of industry i are divided into import requirement for domestic
component 𝑖𝑑 and import requirement for export component 𝑖
𝑥.
The total imports required by all industries to produce 𝑓𝑗
𝑥 of exports in industry j is
𝑗𝑥 = 𝑓𝑗
𝑥 × ∑ 𝑖
𝑛
𝑖=1𝑖𝑗 (2)
where 𝑖
𝑥 is the total import requirements, 𝑖 is the import coefficient, and 𝑖𝑗 is the Leontief
inverse. The net foreign exchange earnings from the export of 𝑓𝑗
𝑥 is given by subtracting the import
requirements from the export value, expressed as
𝑒𝑗𝑥 = 𝑓𝑗
𝑥 − 𝑗𝑥 (3)
where 𝑒𝑗
𝑥 is the net foreign exchange earnings, 𝑓𝑗𝑥 is the export value, and 𝑗
𝑥 is the total import
requirements of industry j.

163
Annex 7: Market Capitalisation and Substantial Shareholders of 20 Largest Palm-Based Firms,
2014/2015
Firm Market
Capitalisation (Million US$) 3
Substantial Shareholder(s) 4
1 Federal Land Development Authority (Felda) Group 1
1,597 Felda * 33.7%
National Equity Corporation (PNB) 3 1.6%
Pilgrims Fund Board (LTH) * 7.8%
Koperasi Permodalan Felda Malaysia Bhd (KPF) 5.8%
Retirement Fund Incorporated (KWAP) * 5.6%
Employees Provident Fund (EPF) * 5.3%
Pahang State Government 5.0%
2 Sime Darby 12,320 National Equity Corporation (PNB) 5 54.1%
EPF 13.1%
3 Wilmar International 13,675 Robert Kuok Hock Nien 6 32.4%
Archer Daniels Midland Company (AMD) 7 18.1%
Kuok Khoon Hong 8 12.0%
Martua Sitorus 9 8.0%
4 Kuala Lumpur Kepong 6,236 Lee Oi Hian and Lee Hau Hian 10 46.6%
EPF 13.2%
PNB 11.9%
5 IOI Corporation 7,216 Lee Shin Cheng 11 46.8%
EPF 9.4%
PNB 9.2%
6 Tradewinds Plantation 2 N.A. Syed Mokhtar Al-Bukhary N.A.
Others N.A.
7 Genting Plantations 2,099 Lim Kok Thay 12 53.6%
EPF 14.6%
KWAP 5.0%
8 Boustead Plantations 610 Armed Forces Fund Board (LTAT) * 69.4%
LTH 5.0%
9 Sarawak Oil Palms 493 Ling Chiong Ho 13 35.8%
Pelita Holdings Sdn Bhd ^ 20.4%
State Financial Secretary of Sarawak 7.9%
10 TH Plantations 262 LTH 71.8%
EPF 7.3%
11 IJM Plantations 800 IJM Corporation Bhd 14 55.2%
EPF 11.8%
12 Rimbunan Sawit 189 Tiong Hiew King 15 54.9%
State Financial Secretary of Sarawak 5.4%
13 TSH Resources 675 Kelvin Tan Aik Pen 12.1%
Tunas Lestari Sdn Bhd 6.4%
Embun Yakin Sdn Bhd 5.6%
14 Kulim (Malaysia) 1,270 Johor Corporation ^ 62.7%
KWAP 6.8%
Waqaf An-Nur Corporation Bhd ^ 5.2%
15 TDM 264 Terengganu Incorporated Sdn Bhd ^ 47.4%
Terengganu State Economic Development Corporation ^ 13.3%
KWAP 7.8%
16 United Plantations 1,349 The Bek-Nielsen family 16 48.7%
EPF 14.3%
Perak State Agricultural Development Corporation ^ 6.3%
17 Hap Seng Plantations Holdings
491 Lau Cho Kun 17 52.8%
Innoprise Corporation Sdn Bhd ^ 15.0%
EPF 7.6%
LTH 5.6%
18 Sarawak Plantation 152 Abdul Hamed Sepawi 30.5%
State Financial Secretary of Sarawak 25.5%
LTH 6.7%

164
Mohamad Bolhair Reduan 6.7%
19 BLD Plantation 220 Henry Lau Lee Kong 18 39.2%
Wan Abdillah Wan Hamid 18.3%
20 United Malacca 323 Aberdeen Asset Management Plc 15.1%
Oversea-Chinese Banking Corporation (OCBC) Ltd 19 14.2%
Hongkong and Shanghai Banking Corporation (HSBC) Ltd 8.6%
EPF 5.7%
Lee Foundation 5.0%
* Federal-level statutory bodies
^ State-level statutory bodies/ government investment arms
1 Felda Group comprises the corporate entities and smallhoders' schemes launched by Felda, a statutory body under the Prime Minister's Department. Data are for Felda Global Ventures (FGV) Bhd, which is 34% owned by Felda.
2 Based on 31 December 2015 closing price on stock exchanges and central bank annual average exchange rates (1 USD to 3.9073 MYR and 1.3749 SGD).
3 Data obtained from its last annual report for 2012 before the listed company was taken private the following year.
4 For cumulative direct and indirect shareholding that is 5% or more.
5 Directly through PNB and indirectly through PNB's wholly owned unit trust, AmanahRaya Trustees Bhd.
6 Indirectly through the Kuok Group of companies, namely Kuok Brothers Sdn Bhd (which controls PPB Group Bhd), Kerry Group Ltd and Kuok (Singapore) Ltd.
7 Indirectly through Archer Daniels Midland Asia-Pacific Ltd, ADM Ag Holding Ltd and Global Cocoa Holdings Ltd.
8 Directly held by Kuok and indirectly through a range of investment companies controlled by Kuok.
9 Directly held by Sitorus, or indirectly through a range of investment companies controlled by Sitorus.
10 Directly held by Lee and his immediate family members, and indirectly through Vertical Capacity Sdn Bhd, which is wholly owned by family-controlled Progressive Holdings Sdn Bhd.
11 Directly held by the Lee brothers, and indirectly through Batu Kawan Bhd, which is controlled by the brothers' jointly-owned company, Wan Hin Investments Sdn Bhd.
12 Directly held by Lim, or indirectly through Genting Bhd, which is controlled by the family-owned Kien Huat Realty Sdn Bhd and Kien Huat International Ltd and which serves as the investment holding company for the Genting Group.
13 Directly held by Ling, or indirectly through Shin Yang Plantation Sdn Bhdh, which is a subsidiary of the Shing Yang Group of which Ling is the founding chairman.
14 A construction and property development firm that is controlled by EPF (13.1%), PNB's Amanah Trustees Bhd (8%) and Lembaga Tabung Haji (5.3%).
15 Directly held by Tiong, or indirectly through a list of companies in which Tiong has substantial interests, mainly Tiong Toh Siong Holdings Sdn Bhd, Pemandangan Jauh Plantation Sdn Bhd and Rimbunan Hijau Southeast Asia Sdn Bhd.
16 Directly held by the Bek-Nielsen family members, or indirectly through the family-owned Maximum Vista Sdn Bhd and United International Enterprises Ltd.
17 Indirectly though Hap Seng Consolidated Bhd, which is 74.07% owned by Lau Cho Kun through Gek Poh (Holdings) Sdn Bhd and Lei Shing Hong Investment Ltd.
18 Indirectly through BLD Holdings Sdn Bhd of which Lau is the chairman and other companies in which he has substantial interests.
19 Indirectly through Great Eastern Life Assurance (Malaysia) Bhd, which is wholly owned by Great Eastern Holdings Ltd (GEH) whose parent is Singapore-based OCBC.
Source: Annual reports 2014/ 2015, company websites.
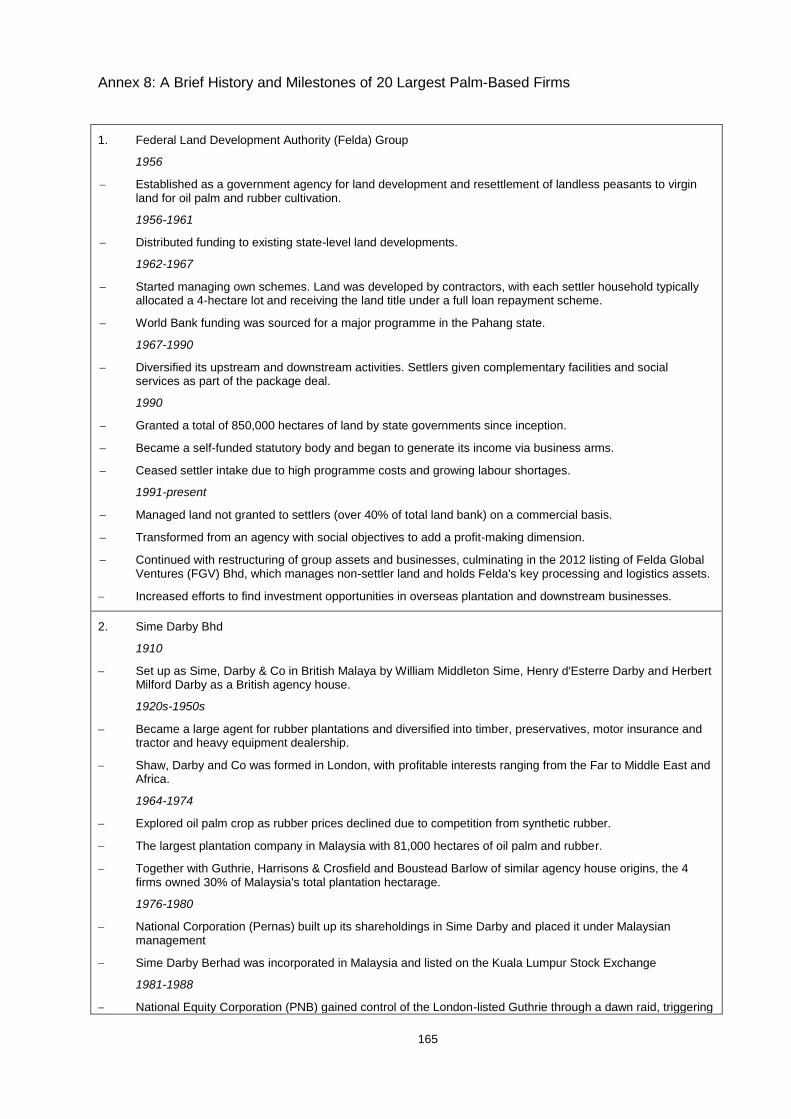
165
Annex 8: A Brief History and Milestones of 20 Largest Palm-Based Firms
1. Federal Land Development Authority (Felda) Group
1956
− Established as a government agency for land development and resettlement of landless peasants to virgin land for oil palm and rubber cultivation.
1956-1961
− Distributed funding to existing state-level land developments.
1962-1967
− Started managing own schemes. Land was developed by contractors, with each settler household typically allocated a 4-hectare lot and receiving the land title under a full loan repayment scheme.
− World Bank funding was sourced for a major programme in the Pahang state.
1967-1990
− Diversified its upstream and downstream activities. Settlers given complementary facilities and social services as part of the package deal.
1990
− Granted a total of 850,000 hectares of land by state governments since inception.
− Became a self-funded statutory body and began to generate its income via business arms.
− Ceased settler intake due to high programme costs and growing labour shortages.
1991-present
− Managed land not granted to settlers (over 40% of total land bank) on a commercial basis.
− Transformed from an agency with social objectives to add a profit-making dimension.
− Continued with restructuring of group assets and businesses, culminating in the 2012 listing of Felda Global Ventures (FGV) Bhd, which manages non-settler land and holds Felda's key processing and logistics assets.
− Increased efforts to find investment opportunities in overseas plantation and downstream businesses.
2. Sime Darby Bhd
1910
− Set up as Sime, Darby & Co in British Malaya by William Middleton Sime, Henry d'Esterre Darby and Herbert Milford Darby as a British agency house.
1920s-1950s
− Became a large agent for rubber plantations and diversified into timber, preservatives, motor insurance and tractor and heavy equipment dealership.
− Shaw, Darby and Co was formed in London, with profitable interests ranging from the Far to Middle East and Africa.
1964-1974
− Explored oil palm crop as rubber prices declined due to competition from synthetic rubber.
− The largest plantation company in Malaysia with 81,000 hectares of oil palm and rubber.
− Together with Guthrie, Harrisons & Crosfield and Boustead Barlow of similar agency house origins, the 4 firms owned 30% of Malaysia's total plantation hectarage.
1976-1980
− National Corporation (Pernas) built up its shareholdings in Sime Darby and placed it under Malaysian management
− Sime Darby Berhad was incorporated in Malaysia and listed on the Kuala Lumpur Stock Exchange
1981-1988
− National Equity Corporation (PNB) gained control of the London-listed Guthrie through a dawn raid, triggering

166
a series of ownership transfers among foreign-ocontrolled plantation firms.
− Harrisons & Crosfields sold its plantation business (later renamed as Golden Hope) to PNB.
1990s-2000s
− Diversified into healthcare, manufacturing, automotive dealership and real estate.
2007
− Merged with Golden Hope and Guthrie - two other plantation companies under PNB's control - to form the world's largest oil palm plantation company.
2008-Present
− Obtained concession rights to 220,000 hectares of land and commenced large-scale plantation in Liberia.
− Acquired NBPOL and its 135,000 hectares in Papua New Guinea, bringing land bank to almost 1 million hectares in 5 countries.
3. Wilmar International Ltd
1991
− Founded as Wilmar Holdings Pte Ltd, a palm oil trading company headquartered in Singapore, by Kuok Khoon Hong and Martua Sitorus
− Acquired a land bank of approximately 7,100 hectares for oil palm cultivation in Western Sumatra, Indonesia, followed by crushing plants and refineries in Sumatra and Riau.
1995-1999
− Purchased first liquid bulk vessel to provide logistics and transportation support to business operations.
− Expanded refinery operations into Malaysia.
− Entered the Indian market through Wilmar Adani Limited, a joint venture with the Adani Group of India.
2000-2005
− Began developing and marketing own brand of Sania edible oil consumer pack in Indonesia.
− Acquired a controlling interest in Indonesia-listed PT Cahaya Kalbar Tbk, a producer of specialty oils and fats.
2006-2007
− Expanded oil palm plantation hectarage aggressively through acquisition of plantation companies and land bank in Indonesia.
− Renamed Wilmar International Ltd and listed on the Singapore Exchange via a reverse takeover.
− Underwent a major capacity expansion drive in refining, crushing, milling and compound fertiliser manufacturing plant.
− Completed a merger exercise with the Kuok Group and Archer Daniels Midland (ADM) contributing their businesses in palm plantation, edible oils, oilseeds and grains businesses in Malaysia and China, respectively, to Wilmar International in exchange for shares.
− Formed a joint venture with Olam International Ltd and SIFCA Group to target palm oil, natural rubber, sugar and other plantation crops in Africa.
2010-Present
− Acquired Sucrogen Limited (now Wilmar Sugar Australia Ltd), the largest raw sugar producer and refiner in Australia, and PT Jawamanis Rafinasi, a leading sugar refinery in Indonesia.
− Further expanded into the sugar business through the acquisition of PT Duta Sugar International in Indonesia and Proserpine Mill in Australia.
− Expanded in Ghana through the acquisition of Ghana-listed Benso Oil Palm Plantations Ltd.
− Established a joint venture with Kellogg Company for the manufacture, sale and distribution of breakfast cereals and savoury snacks in China.
− Acquired approximately 30,000 hectares of land in Nigeria for oil palm plantations.
− Acquisition of 35% equity interest in Estate Management Services Pte Ltd, which manages estates and plantation property in Sri Lanka.
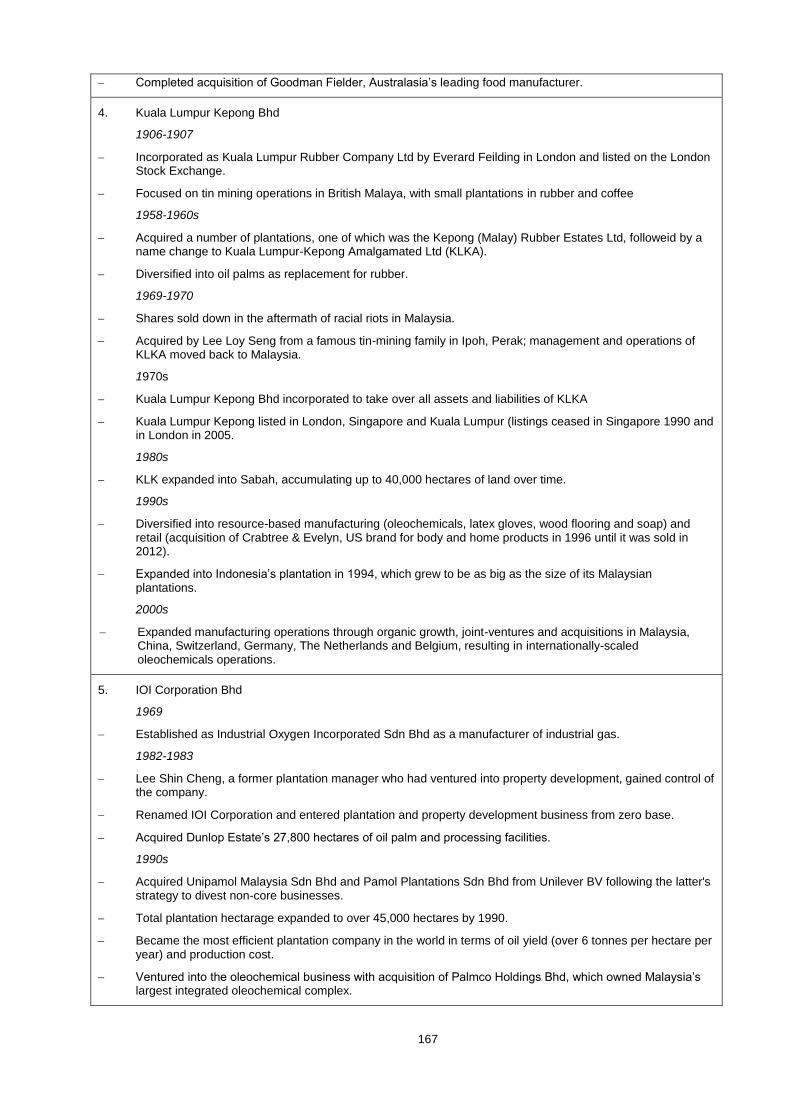
167
− Completed acquisition of Goodman Fielder, Australasia’s leading food manufacturer.
4. Kuala Lumpur Kepong Bhd
1906-1907
− Incorporated as Kuala Lumpur Rubber Company Ltd by Everard Feilding in London and listed on the London Stock Exchange.
− Focused on tin mining operations in British Malaya, with small plantations in rubber and coffee
1958-1960s
− Acquired a number of plantations, one of which was the Kepong (Malay) Rubber Estates Ltd, followeid by a name change to Kuala Lumpur-Kepong Amalgamated Ltd (KLKA).
− Diversified into oil palms as replacement for rubber.
1969-1970
− Shares sold down in the aftermath of racial riots in Malaysia.
− Acquired by Lee Loy Seng from a famous tin-mining family in Ipoh, Perak; management and operations of KLKA moved back to Malaysia.
1970s
− Kuala Lumpur Kepong Bhd incorporated to take over all assets and liabilities of KLKA
− Kuala Lumpur Kepong listed in London, Singapore and Kuala Lumpur (listings ceased in Singapore 1990 and in London in 2005.
1980s
− KLK expanded into Sabah, accumulating up to 40,000 hectares of land over time.
1990s
− Diversified into resource-based manufacturing (oleochemicals, latex gloves, wood flooring and soap) and retail (acquisition of Crabtree & Evelyn, US brand for body and home products in 1996 until it was sold in 2012).
− Expanded into Indonesia’s plantation in 1994, which grew to be as big as the size of its Malaysian plantations.
2000s
− Expanded manufacturing operations through organic growth, joint-ventures and acquisitions in Malaysia, China, Switzerland, Germany, The Netherlands and Belgium, resulting in internationally-scaled oleochemicals operations.
5. IOI Corporation Bhd
1969
− Established as Industrial Oxygen Incorporated Sdn Bhd as a manufacturer of industrial gas.
1982-1983
− Lee Shin Cheng, a former plantation manager who had ventured into property development, gained control of the company.
− Renamed IOI Corporation and entered plantation and property development business from zero base.
− Acquired Dunlop Estate’s 27,800 hectares of oil palm and processing facilities.
1990s
− Acquired Unipamol Malaysia Sdn Bhd and Pamol Plantations Sdn Bhd from Unilever BV following the latter's strategy to divest non-core businesses.
− Total plantation hectarage expanded to over 45,000 hectares by 1990.
− Became the most efficient plantation company in the world in terms of oil yield (over 6 tonnes per hectare per year) and production cost.
− Ventured into the oleochemical business with acquisition of Palmco Holdings Bhd, which owned Malaysia’s largest integrated oleochemical complex.
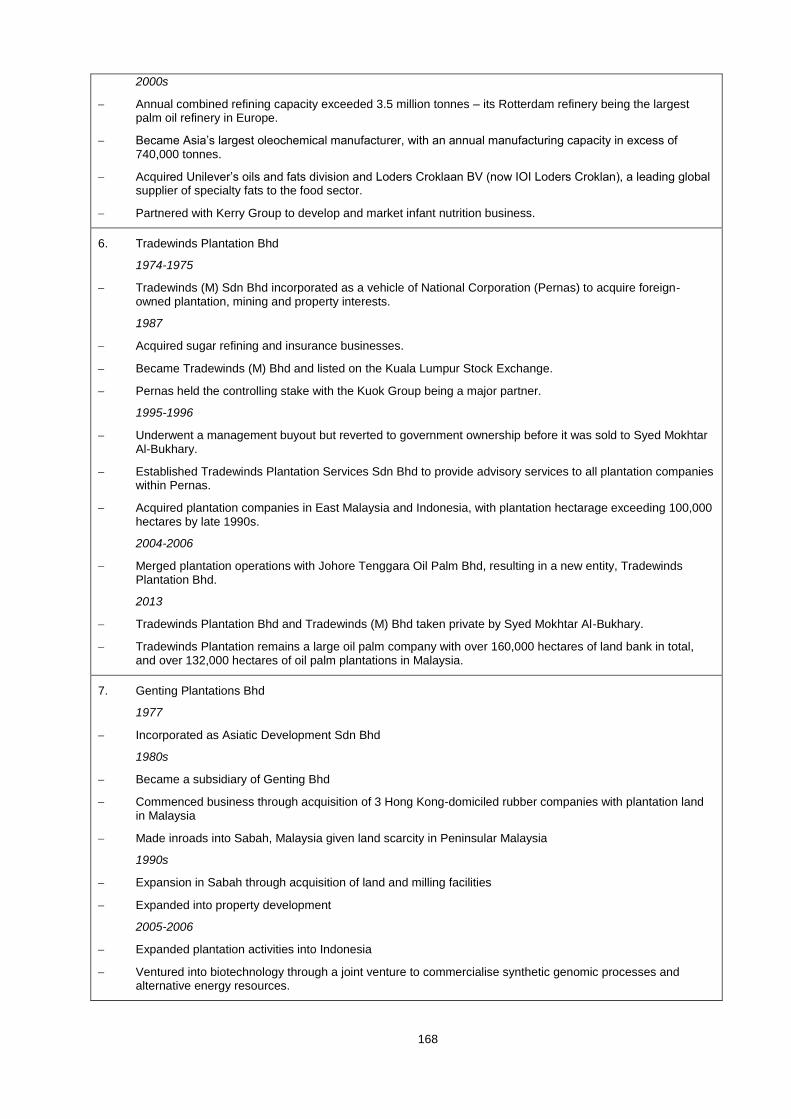
168
2000s
− Annual combined refining capacity exceeded 3.5 million tonnes – its Rotterdam refinery being the largest palm oil refinery in Europe.
− Became Asia’s largest oleochemical manufacturer, with an annual manufacturing capacity in excess of 740,000 tonnes.
− Acquired Unilever’s oils and fats division and Loders Croklaan BV (now IOI Loders Croklan), a leading global supplier of specialty fats to the food sector.
− Partnered with Kerry Group to develop and market infant nutrition business.
6. Tradewinds Plantation Bhd
1974-1975
− Tradewinds (M) Sdn Bhd incorporated as a vehicle of National Corporation (Pernas) to acquire foreign-owned plantation, mining and property interests.
1987
− Acquired sugar refining and insurance businesses.
− Became Tradewinds (M) Bhd and listed on the Kuala Lumpur Stock Exchange.
− Pernas held the controlling stake with the Kuok Group being a major partner.
1995-1996
− Underwent a management buyout but reverted to government ownership before it was sold to Syed Mokhtar Al-Bukhary.
− Established Tradewinds Plantation Services Sdn Bhd to provide advisory services to all plantation companies within Pernas.
− Acquired plantation companies in East Malaysia and Indonesia, with plantation hectarage exceeding 100,000 hectares by late 1990s.
2004-2006
− Merged plantation operations with Johore Tenggara Oil Palm Bhd, resulting in a new entity, Tradewinds Plantation Bhd.
2013
− Tradewinds Plantation Bhd and Tradewinds (M) Bhd taken private by Syed Mokhtar Al-Bukhary.
− Tradewinds Plantation remains a large oil palm company with over 160,000 hectares of land bank in total, and over 132,000 hectares of oil palm plantations in Malaysia.
7. Genting Plantations Bhd
1977
− Incorporated as Asiatic Development Sdn Bhd
1980s
− Became a subsidiary of Genting Bhd
− Commenced business through acquisition of 3 Hong Kong-domiciled rubber companies with plantation land in Malaysia
− Made inroads into Sabah, Malaysia given land scarcity in Peninsular Malaysia
1990s
− Expansion in Sabah through acquisition of land and milling facilities
− Expanded into property development
2005-2006
− Expanded plantation activities into Indonesia
− Ventured into biotechnology through a joint venture to commercialise synthetic genomic processes and alternative energy resources.

169
8. Boustead Plantations Bhd
1946
− Incorporated as Kuala Sidim Rubber Company Ltd.
1960s
− Converted rubber crops into oil palm.
1969
− Barlow Boustead Estates Agency (BBEA) Ltd of British agency house origin assumed control.
1970s
− Listed in Singapore and Kuala Lumpur.
− Expanded into agricultural research and advisory services.
1980s
− Local shareholders including the Armed Forces Fund Board (LTAT), Pilgrims Fund Board (LTH) and Felda acquired the interest held by the Barlow family in BBEA.
− Shares in BBEA transferred to Boustead Holdings, now controlled by LTAT.
1990s
− Delisted from the Singapore Stock Exchange.
− Became the vehicle for Boustead Holdings’ plantations interest.
− Expanded direct ownership of plantation land, focusing on Sarawak, Malaysia and Sumatra, Indonesia.
2000s
− Name changed to Boustead Plantations Bhd following a restructuring and relisting exercise.
9. Sarawak Oil Palms Bhd
1968-1969
− Sarawak Oil Palms Sdn Bhd incorporated as a joint venture between the UK’s Commonwealth Development Corporation (CDC) and Sarawak State Government to pioneer commercial oil palm plantation in Sarawak.
1990-1991
− Conversion to Sarawak Oil Palms Bhd and listed in Kuala Lumpur.
− Shin Yang Group, one of the major companies with significant timber concessions in Sarawak, acquired CDC’s remaining stake in Sarawak Oil Palms, with Sarawak State Government continuing its involvement thtorugh Pelita Holdings Sdn Bhd.
1990s
− Expansion of plantation land in Sarawak.
2000s
− Ventured into edible oils business.
− Expansion of plantation land in Sarawak through agreements with Sarawak Economic Development Corporation and Shin Yang Group.
2012-Present
− Ventured into refining, consumer cooking oil and property development business.
10. TH Plantations Bhd
1972
− Incorporated as Perbadanan Ladang-Ladang Tabung Haji Sdn Bhd (Pilgrims Fund Board Plantations
Corporation).
1990s
− Expanded plantations to Sarawak.

170
− Acquired land through strategic ventures with state and government agencies.
1997
− Name changed to TH Plantations Sdn Bhd.
2005
− Name changed to TH Plantations Bhd and listed in Kuala Lumpur.
2014
− Acquired plantations in Kalimantan Timur, Indonesia, marking TH Plantations’ first foray overseas.
11. IJM Plantations Bhd
1985
− IJM Corporation Bhd, a construction firm, ventured into oil palm cultivation in Sabah, Malaysia
1993
− Commissioned the first palm oil mill
2002-2003
− Built jetty and bulking facilities in Sabah
− Ventured into crushing business
− Listed in Kuala Lumpur
2007
− Expanded into Indonesia through acquisition of plantations.
12. Rimbunan Sawit Bhd
1993
− Rimbunan Hijau, a Sarawak-based company controlled by Tiong Hiew King with significant timber concessions in the state, ventured into oil palm plantation amid depleting timber resources and increasing profitability of oil palm
− Timrest Sdn Bhd incorporated as the oil palm subsidiary
1990s-2000s
− Rapid expansion through acquisition of existing plantations and setting up of new plantations
2005-2006
− Oil palm business unde Rimbunan Hijau consolidated under Rimbunan Sawit Sdn Bhd
− Rimbunan Sawit became a public limited company and listed in Kuala Lumpur
− Continuous expansion of plantations in Sarawak.
13. TSH Resources Bhd
1979-1985
− Set up by Tan Sook Hong as a company to engage in marketing and distribution of cocoa beans sourced from suppliers in Sabah, Malaysia.
1994
− Listed in Kuala Lumpur as a cocoa manufacturing and processing company.
1995
− Diversified into manufacture and trading of downstream timber products.
1997-2001
− Ventured into oil palm plantations and milling in Sabah, Malaysia.
− Awarded a forestation licence by the Sabah State Government to manage 123,000 hectares of forest reserve for 100 years.
− Subsidiary involved in biomass power generation, TSH Bio-Energy Sdn Bhd, signed a power purchase

171
agreement to supply electricity to Sabah Electricity Sdn Bhd.
2002-Present
− Expansion into plantations and milling in West Sumatera and Kalimantan, Indonesia.
14. Kulim (Malaysia) Bhd
1933-1940s
− Kulim Rubber Plantation Ltd (KRPL) incorporated in the UK.
− Commenced operations with rubber plantation in Johore, Malaysia.
1970s
− Name changed to Kulim Group Ltd (KGL) and listed in London.
− Expanded from business in Malaysia to include property development in the UK, hotels in the Carribean and a rubber plantation in Nigeria.
1975-1976
− Kulim (Malaysia) Bhd incorporated and listed in Kuala Lumpur.
− Johor State Economic Development Corporation (now Johor Corporation) became a controlling shareholder of Kulim.
− KGL ceased listing in London and transferred to Kulim its assets and liabilities.
1980s
− Expanded oil palm and rubber plantations in Malaysia.
− Disposed of property business overseas.
1990s
− Expanded into rubber-based manufacturing and oleochemicals
− Expanded regionally with acquisition of New Britain Palm Oil Limited (NBPOL) in Papua New Guinea.
− Ventured into plantations in Indonesia.
2005-2007
− Diversified into fast food business through acquisition of the franchise operator of Kentucky Fried Chicken and Pizza Hut in Malaysia.
− Exited from property business in Malaysia and from plantation operations in Indonesia.
2011-Present
− Re-entered into plantations in Indonesia.
− Ventured into oil and gas exploration and production in Indonesia.
− Sold NBPOL to Sime Darby.
15. TDM Bhd
1965
− TDM Bhd incorporated to cultivate and manage oil palm plantations leased from the Terengganu State Economic Development Corporation.
1970
− Listed in Kuala Lumpur
1990s
− Diversified into healthcare, poultry, fast food, transportation, hotel and property businesses.
2000s
− Consolidated businesses into plantations and healthcare services, divesting others.
− Expanded into plantations in Indonesia.
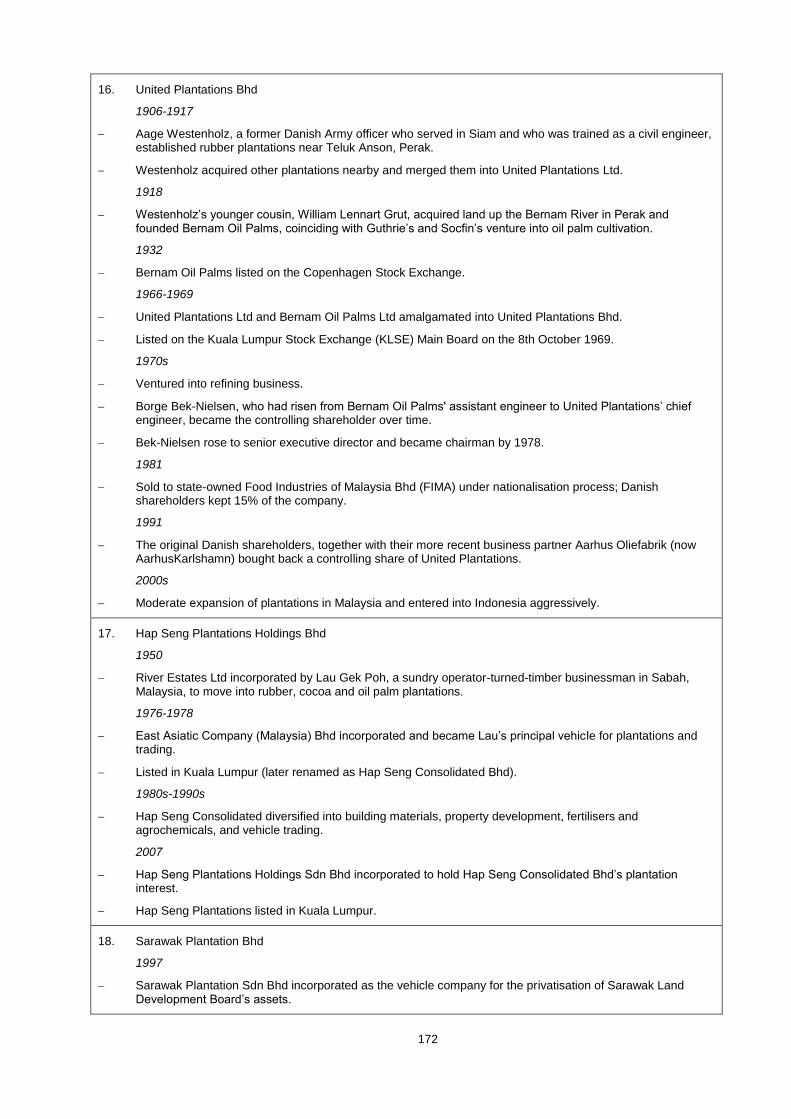
172
16. United Plantations Bhd
1906-1917
− Aage Westenholz, a former Danish Army officer who served in Siam and who was trained as a civil engineer, established rubber plantations near Teluk Anson, Perak.
− Westenholz acquired other plantations nearby and merged them into United Plantations Ltd.
1918
− Westenholz’s younger cousin, William Lennart Grut, acquired land up the Bernam River in Perak and founded Bernam Oil Palms, coinciding with Guthrie’s and Socfin’s venture into oil palm cultivation.
1932
− Bernam Oil Palms listed on the Copenhagen Stock Exchange.
1966-1969
− United Plantations Ltd and Bernam Oil Palms Ltd amalgamated into United Plantations Bhd.
− Listed on the Kuala Lumpur Stock Exchange (KLSE) Main Board on the 8th October 1969.
1970s
− Ventured into refining business.
− Borge Bek-Nielsen, who had risen from Bernam Oil Palms' assistant engineer to United Plantations’ chief engineer, became the controlling shareholder over time.
− Bek-Nielsen rose to senior executive director and became chairman by 1978.
1981
− Sold to state-owned Food Industries of Malaysia Bhd (FIMA) under nationalisation process; Danish shareholders kept 15% of the company.
1991
− The original Danish shareholders, together with their more recent business partner Aarhus Oliefabrik (now AarhusKarlshamn) bought back a controlling share of United Plantations.
2000s
− Moderate expansion of plantations in Malaysia and entered into Indonesia aggressively.
17. Hap Seng Plantations Holdings Bhd
1950
− River Estates Ltd incorporated by Lau Gek Poh, a sundry operator-turned-timber businessman in Sabah, Malaysia, to move into rubber, cocoa and oil palm plantations.
1976-1978
− East Asiatic Company (Malaysia) Bhd incorporated and became Lau’s principal vehicle for plantations and trading.
− Listed in Kuala Lumpur (later renamed as Hap Seng Consolidated Bhd).
1980s-1990s
− Hap Seng Consolidated diversified into building materials, property development, fertilisers and agrochemicals, and vehicle trading.
2007
− Hap Seng Plantations Holdings Sdn Bhd incorporated to hold Hap Seng Consolidated Bhd’s plantation interest.
− Hap Seng Plantations listed in Kuala Lumpur.
18. Sarawak Plantation Bhd
1997
− Sarawak Plantation Sdn Bhd incorporated as the vehicle company for the privatisation of Sarawak Land Development Board’s assets.

173
− The Sarawak State Government received shares in Sarawak Plantation in return.
− Commenced operations in the same year.
2000s
− Listed in Kuala Lumpur.
− Ventured into seed production business.
− Expansion of plantations in Sarawak, Malaysia, some of them on Native Customary Rights land that belongs to the indigenous people.
19. BLD Plantation Bhd
1975
− Bintulu Lumber Development Sdn Bhd incorporated as part of the KTS Group of companies to undertake timber logging business in Sarawak, Malaysia.
1987
− Bintulu Lumber Development diversified into oil palm plantation on logged-over land amid depleted timber resources and rising profitability of oil palm.
1996-1999
− Oil palm plantation became the principal activity of Bintulu Lumber Development.
− Bintulu Lumber Development’s timber licence for 1975-1999 period expired, to be renewed on an annual basis.
− Ventured into milling.
2000-2003
− Acquired existing plantation companies with land bank for future expansion.
− BLD Plantation Bhd incorporated to hold selected KTS’s oil palm-based businesses in plantation, milling and crushing.
− BLD Plantation listed in Kuala Lumpur.
20. United Malacca Bhd
1910
− United Malacca Rubber Estates Ltd founded by Tan Cheng Lock.
1966
− Diversified into oil palm cultivation; old rubber trees replaced with oil palm.
1990s
− Expanded plantations activities to Sabah, Malaysia.
2001
− Renamed United Malacca Bhd.
2015
− Expanded into plantations in Indonesia through an acquisition that doubled United Malacca’s total plantation land bank.
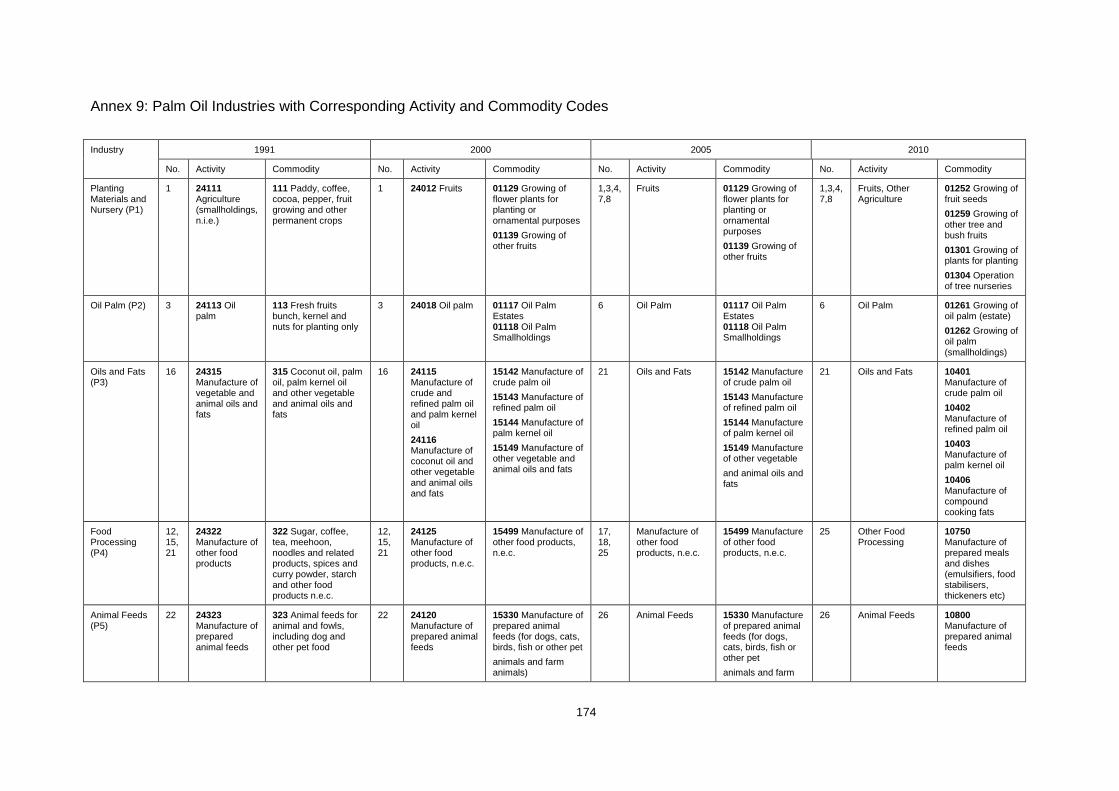
174
Annex 9: Palm Oil Industries with Corresponding Activity and Commodity Codes
Industry 1991 2000 2005 2010
No. Activity Commodity No. Activity Commodity No. Activity Commodity No. Activity Commodity
Planting Materials and Nursery (P1)
1 24111 Agriculture (smallholdings, n.i.e.)
111 Paddy, coffee, cocoa, pepper, fruit growing and other permanent crops
1 24012 Fruits 01129 Growing of flower plants for planting or ornamental purposes
01139 Growing of other fruits
1,3,4,7,8
Fruits 01129 Growing of flower plants for planting or ornamental purposes
01139 Growing of other fruits
1,3,4,7,8
Fruits, Other Agriculture
01252 Growing of fruit seeds
01259 Growing of other tree and bush fruits
01301 Growing of plants for planting
01304 Operation of tree nurseries
Oil Palm (P2) 3 24113 Oil palm
113 Fresh fruits bunch, kernel and nuts for planting only
3 24018 Oil palm 01117 Oil Palm Estates 01118 Oil Palm Smallholdings
6 Oil Palm 01117 Oil Palm Estates 01118 Oil Palm Smallholdings
6 Oil Palm 01261 Growing of oil palm (estate)
01262 Growing of oil palm (smallholdings)
Oils and Fats (P3)
16 24315 Manufacture of vegetable and animal oils and fats
315 Coconut oil, palm oil, palm kernel oil and other vegetable and animal oils and fats
16 24115 Manufacture of crude and refined palm oil and palm kernel oil
24116 Manufacture of coconut oil and other vegetable and animal oils and fats
15142 Manufacture of crude palm oil
15143 Manufacture of refined palm oil
15144 Manufacture of palm kernel oil
15149 Manufacture of other vegetable and animal oils and fats
21 Oils and Fats 15142 Manufacture of crude palm oil
15143 Manufacture of refined palm oil
15144 Manufacture of palm kernel oil
15149 Manufacture of other vegetable
and animal oils and fats
21 Oils and Fats 10401 Manufacture of crude palm oil
10402 Manufacture of refined palm oil
10403 Manufacture of palm kernel oil
10406 Manufacture of compound cooking fats
Food Processing (P4)
12, 15, 21
24322 Manufacture of other food products
322 Sugar, coffee, tea, meehoon, noodles and related products, spices and curry powder, starch and other food products n.e.c.
12, 15, 21
24125 Manufacture of other food products, n.e.c.
15499 Manufacture of other food products, n.e.c.
17, 18, 25
Manufacture of other food products, n.e.c.
15499 Manufacture of other food products, n.e.c.
25 Other Food Processing
10750 Manufacture of prepared meals and dishes (emulsifiers, food stabilisers, thickeners etc)
Animal Feeds (P5)
22 24323 Manufacture of prepared animal feeds
323 Animal feeds for animal and fowls, including dog and other pet food
22 24120 Manufacture of prepared animal feeds
15330 Manufacture of prepared animal feeds (for dogs, cats, birds, fish or other pet
animals and farm animals)
26 Animal Feeds 15330 Manufacture of prepared animal feeds (for dogs, cats, birds, fish or other pet
animals and farm
26 Animal Feeds 10800 Manufacture of prepared animal feeds

175
animals)
Basic Chemicals (P6)
37, 41
24351 Manufacture of basic industrial chemicals
24355 Manufacture of chemical products n.e.c.
351 Industrial chemicals, fertilizers and pesticides, synthetic resins, plastic materials and man-made fibers except glass
355 Chemical products n.e.c.
37, 41
24147 Manufacture of basic chemicals, except fertilizers and nitrogen compounds
24155 Manufacture of other chemical products, n.e.c.
24119 Manufacture of other basic industrial chemicals except fertilizers and nitrogen compounds (includes alcohols and colouring matter of vegetable origin)
24290 Manufacture of other chemical products n.e.c e.g. lubricating oil
additives)
24210 Manufacture of pesticides and other agrochemical products
45, 46, 50
Basic and Other Chemicals
24119 Manufacture of other basic industrial chemicals except fertilizers and nitrogen compounds (includes alcohols and colouring matter of vegetable origin)
24290 Manufacture of other chemical
products n.e.c e.g. lubricating oil additives)
24210 Manufacture of pesticides and other agrochemical
products
45, 46, 50
Basic and Other Chemicals
20112 Manufacture of basic organic chemicals
20119 manufacture of other basic chemicals n.e.c.
20299 Manufacture of other chemical products n.e.c.
Nutraceutical Chemicals (P7)
39 24353 Manufacture of drugs and medicines
353 Drugs and medicines
39 24153 Manufacture of pharmaceuticals, medicinal chemicals and botanical products
24230 Manufacture of pharmaceuticals, medicinal chemicals and botanical products
48 Pharmaceuticals, Medicinal Chemicals and Botanical Products
24230 Manufacture of pharmaceuticals, medicinal chemicals and botanical products
48 Pharmaceuticals, Medicinal Chemicals and Botanical Products
21001 Manufacture of medicinal active substances to be used for their pharmacological properties in the manufacture of medicaments
21009 Manufacture of other pharmaceuticals, medicinal chemical and botanical products n.e.c.
Soaps and Detergents (P8)
40 24354 Manufacture of soap and cleaning preparations, perfumes, cosmetic, etc.
354 Soap and cleaning preparations, perfumes, cosmetic and other toilet preparations
40 24154 Manufacture of soap and detergents, perfumes, cleaning and toilet preparations
24240 Manufacture of soap and detergents, cleaning and polishing preparations, perfumes and toilet preparations (includes crude glycerol)
49 Soaps, Detergents, Perfumes, Cleaning and Toilet Preparations
24240 Manufacture of soap and detergents, cleaning and polishing preparations, perfumes and toilet
preparations (includes crude glycerol)
49 Soaps, Detergents, Perfumes, Cleaning and Toilet Preparations
20231 Manufacture of soap and detergents, cleaning and polishing preparations
20232 Manufacture of perfumes and toilet preparations

176
Biofuel (P9) 42 24356 Petroleum refiners. Manufacture of miscellaneous products of petroleum and coal
356 Petroleum refineries products such as petrol, kerosene and other miscellaneous products of petroleum and coal
42 24146 Manufacture of coke oven, refined petroleum products and nuclear fuel
23200 Manufacture of refined petroleum products
44 Petroleum Refinery
23200 Manufacture of refined petroleum products
44 Petroleum Refinery
19202 Manufacture of bio-diesel products
Wholesale and Retail (P10)
69 24431 Wholesale and retail trade
431 Wholesale and retail trade margins
69 24404 Wholesale trade and commission trade, except of motor vehicles
and motorcycles
51212 Wholesale of palm oil
92 Wholesale and Retail Trade and Motor Vehicle
51212 Wholesale of palm oil
93 Wholesale and Retail Trade
46202 Wholesale of palm oil
Transportation Services (P11)
71 24445 Services allied to transport
441, 442, 443 & 444 Transport margins
445 Services allied to transport such as storage and warehousing
71 24638 Activities of other transport agencies
63020 Storage and warehousing service (includes warehousing of furniture, automobiles, lumber, gas and oil, chemicals, textiles, food and agricultural products, etc. as well as storage of goods in foreign trade zone)
63039 Other supporting transport services n.e.c.
63091 Activities of freight forwarding / forwarding agencies
63092 Activities of shipping agencies
63099 Activities of other transport agencies n.e.c.
95, 96, 97, 98, 99, 100
Transportation services
63020 Storage and warehousing service (includes warehousing of furniture, automobiles, lumber, gas and oil, chemicals, textiles, food and agricultural products, etc. as well as storage of goods in foreign trade zone)
63039 Other supporting transport services n.e.c.
63091 Activities of freight forwarding / forwarding agencies
63092 Activities of shipping agencies
63099 Activities of other transport agencies n.e.c.
96, 97, 98, 99, 100, 101
Transportation Services
52100 Warehousing and Storage Services
52211 Operation of terminal facilities
52219 Other service activities incidental to land transportation n.e.c.
52291 Forwarding of freight
52292 Brokerage for ship and aircraft space
52299 Other transportation support activities n.e.c.
Business Services (P12)
78 24480 Business services
480 Legal services, accounting, auditing and book-keeping services, data processing and tabulating services, engineering, architecture and
78 24721 Computer and related activities
24731 Research and development
72100 Hardware consultancy
72200 Software consultancy and supply
73101, 73102, 73104,
108, 109, 110, 111, 112
Business Services
72100 Hardware consultancy
72200 Software consultancy and supply
73101, 73102, 73104, 73105, 73109 Research
106, 113, 114, 115, 116
Business Services
62010, 62021, 62022, 62091 , 62099 Computer programming activities, consultancy, facilities management

177
technical services, advertising services, machinery and equipment rental and leasing and other business services n.e.c.
24741 Legal activities
24743 Market research, business and management consultancy activities
24744 Architectural, engineering and other technical activities
73105, 73109 Research and developmental services on physical sciences, chemistry and biology, agricultural sciences, medical sciences and pharmacy
74110 Legal service
74212 Engineering consultancy services (includes engineering and technical activities related to chemical engineering, mechanical, industrial and systems engineering, sanitary and pollution control engineering etc.
74220 Technical testing and analysis
and developmental services on physical sciences, chemistry and biology, agricultural sciences, medical sciences and pharmacy
74110 Legal service
74212 Engineering consultancy services (includes engineering and technical activities related to chemical engineering, mechanical, industrial and systems engineering, sanitary and pollution control engineering etc.
74220 Technical testing and analysis
activities, ICT security
63111, 63112, 63120 Data processing, hosting and related activities
72101, 72102, 72103, 72104, 72105, 72106, 72109 Research and development on natural sciences and engineering
69100, 69200 Legal and accounting activities
71101, 71102, 71103, 71109, 71200 Architecture and engineering activities, technical testing and analysis

178
References
Abonyi, G. (2005). Integrating SMEs into Global and Regional Value Chains: Implications for
Subregional Cooperation in the Greater Mekong Sub Region. Bangkok: United Nations
Economic and Social Commission for Asia and the Pacific.
Adebowale, B. A., & Egbetokun, A. (2012). Learning Innovation and Technological Performance
in the Nigerian and Malaysian Oil Palm Sector. In W. Siyanbola, A. Egbetokun, B. A.
Adebowale, & O. Olamade (Eds.), Innovation Systems and Capabilities in Developing
Regions: Concepts, Issues and Cases. London: Gower.
Adnan, H. (2008, December 24). Oil Palm Planters May Get Cess Respite from Government.
The Star.
Adnan, H. (2009, February 27). Indonesia Still on Radar of Malaysian Planters. The Star.
Adnan, H. (2010, January 11). Planters Seek Review of Tax, Cess and Levy. The Star.
Al-Mahmood, S. Z. (2015, July 26). Palm-Oil Migrant Workers Tell of Abuses on Malaysian
Plantations. Wall Street Journal.
Alrawashdeh, R., & Thyabat, S. A. (2012). Mining in Jordan: Challenges and Prospects.
International Journal of Mining and Mineral Engineering, 4(2), 116.
Amsden, A. H. (1989). Asia’s Next Giant: South Korea and Late Industrialization. New York:
Oxford University Press.
Amsden, A. H. (2001). The Rise of “the Rest”: Challenges to the West from Late-Industrialising
Economies. New York: Oxford University Press.
Amsden, A. H. (2009). Nationality of Firm Ownership in Developing Countries: Who Should
‘Crowd Out’ Whom in Imperfect Markets? In G. Dosi, J. E. Stiglitz, & M. Cimoli (Eds.),
Industrial Policy and Development: The Political Economy of Capabilities Accumulation.
Abingdon: Oxford University Press.
Amsden, A. H., & Chu, W. (2003). Beyond Late Development: Taiwan’s Upgrading Policies.
Cambridge, Mass: MIT Press.
Amsden, A. H., & Tschang, F. T. (2003). A New Approach to Assessing the Technological
Complexity of Different Categories of R&D (with Examples from Singapore). Research
Policy, 32(4), 553–572.
Apter, D. E. (1976). Charters, Cartels and Multinationals - Some Colonial and Imperial
Questions. In D. E. Apter & L. W. Goodman (Eds.), The Multinational Corporation and
Social Change. New York: Praeger.
Archibugi, D., & Pietrobelli, C. (2003). The Globalisation of Technology and Its Implications for
Developing Countries. Technological Forecasting and Social Change, 70(9), 861–883.

179
Arndt, S. W., & Kierzkowski, H. (2001). Introduction. In S. W. Arndt & H. Kierzkowski (Eds.),
Fragmentation: New Production Patterns in the World Economy. New York: Oxford
University Press.
Ashley, C., & Maxwell, S. (2001). Rethinking Rural Development. Development Policy Review,
19(4), 395–425.
Athukorala, P. (1998). Trade Policy Issues in Asian Development. London: Routledge.
Auty, R. M. (1986). Resource-based Industrialisation and Country Size: Venezuela and Trinidad
and Tobago. Geoforum, 17(3), 325–338.
Auty, R. M. (1998). Resource Abundance and Economic Development: Improving the
Performance of Resource-Rich Countries. Helsinki: UNU World Institute for
Development Economis Research.
Auty, R. M. (Ed.). (2001). Resource Abundance and Economic Development. Oxford; New York:
Oxford University Press.
Bair, J. (2005). Global Capitalism and Commodity Chains: Looking Back, Going Forward.
Competition & Change, 9(2), 153–180.
Balassa, B., Bueno, G. M., Kuczynski, P.-P., & Simonsen, M. H. (1986). Toward Renewed
Economic Growth in Latin America. Washington, DC: Institute for International
Economics.
Baldone, S., Sdogati, F., & Tajoli, L. (2001). Patterns and Determinants of International
Fragmentation of Production: Evidence from Outward Processing Trade Between the EU
and Central Eastern European Countries. Weltwirtschaftliches Archiv, 137(1), 80–104.
Baldwin, C., & Ruwitch, J. (2014, January 23). How Caterpillar Got Bulldozed in China. Reuters.
Barau, A. & Said, I. (2016). From Goodwill to Good Deals: Felda Land Resettlement Scheme
and the Ascendancy of the Landless Poor in Malaysia. Land Use Policy, Volume 54, July,
423–431.
Barnes, J., & Kaplinsky, R. (2000). Globalization and the Death of the Local Firm? The
Automobile Components Sector in South Africa. Regional Studies, 34(9), 797–812.
Barrett, C. B. (2012). The Economics of Agricultural Development: An Overview. In Agricultural
Development Volume I: Agricultural Development and Economic Growth. London:
Routledge.
Barrett, C. B., Carter, M. R., & Timmer, C. P. (2010). A Century-Long Perspective on
Agricultural Development. American Journal of Agricultural Economics, 92(2), 447–468.
Barrientos, S., Gereffi, G., & Rossi, A. (2011). Economic and Social Upgrading in Global
Production Networks: A New Paradigm for a Changing World. International Labour
Review, 150(3–4), 319–340.

180
Barrock, J., & Tay, C. (2017, February 4). Fixing an Ailing Felda. The Edge Weekly.
Bell, B. D., & Van Reenen, J. (2013). Extreme Wage Inequality: Pay at the Very Top. The
American Economic Review, 103(3), 153–157.
Bentolila, S., & Saint-Paul, G. (2003). Explaining Movements in the Labor Share. The B.E.
Journal of Macroeconomics, 3(1).
Berdegue, J., Hernandez, R., & Reardon, T. (2008). Modern Market Channels and Strawberry
Farmers in Michoacán, México. In Selected Poster for AAEA Annual Meeting.
Berg, J., & Kucera, D. (2008). In Defence of Labour Market Institutions: Cultivating Justice in the
Developing World. Springer.
Blomström, M., & Kokko, A. (2003). From Natural Resources to High-Tech Production: The
Evolution of Industrial Competitiveness in Sweden and Finland (CEPR Discussion Paper
No. 3804). London: Centre for Economic Policy Research.
Borensztein, E., De Gregorio, J., & Lee, J.-W. (1998). How Does Foreign Direct Investment
Affect Economic Growth? Journal of International Economics, 45(1), 115–135.
Boucher, M. (1976). Some Further Results on the Linkage Hypothesis. The Quarterly Journal of
Economics, 90(2), 313.
Bukeviciute, L., Dierx, A., & Ilzkovitz, F. (2009). The Functioning of the Food Supply Chain and
Its Effect on Food Prices in the European Union. Brussels: European Commission,
Directorate-General for Economic and Financial Affairs, Publications.
Burke, J., & Epstein, G. (2001). Threat Effects and the Internationalization of Production
(Working Paper Series). Amherst: University of Massachusetts Amherst Political
Economy Research Institute.
Burton, J. (2007, August 7). Rights Groups Hit at Malaysia Crackdown on Illegal Workers.
Financial Times.
Callen, T. (2007, March). Back to Basics - PPP Versus the Market: Which Weight Matters?
Finance and Development, 44(1).
Carney, M., & Dieleman, M. (2011). Indonesia’s Missing Multinationals: Business Groups and
Outward Direct Investment. Bulletin of Indonesian Economic Studies, 47(1), 105–126.
Casson, A. (2002). The Political Economy of Indonesia’s Oil Palm Subsector. Center for
International Forestry Research.
Centre on Globalization, Governance & Competitiveness, University of Duke. (n.d.). Global
Value Chains & Development. Retrieved 25 July 2016, from
http://www.cggc.duke.edu/projects/gvc.php
Chan, S., & Clark, C. (1994). Economic Development in Taiwan: Escaping the State—Market
Dichotomy. Environment and Planning C: Government and Policy, 12(2), 127–143.

181
Chandler, A. D. (2002). The Visible Hand: The Managerial Revolution in American Business (16.
print). Cambridge, Massachusetts: Harvard University Press.
Chandler, A. D. (2003). Strategy and Structure: Chapters in the History of the American
Industrial Enterprise (repr). Washington: Beard Books.
Chandra, V. (Ed.). (2006). Technology, Adaptation, and Exports: How Some Developing
Countries Got It Right. The World Bank.
Chang, H.-J. (1996). The Political Economy of Industrial Policy. Basingstoke: Macmillan.
Chang, H.-J. (1999). The Economic Theory of the Developmental State. In M. J.-E. Woo-
Cumings (Ed.), The Developmental State. Ithaca: Cornell University Press.
Chang, H.-J. (2009). Rethinking Public Policy in Agriculture: Lessons from Distant and Recent
History. Rome: Food and Agriculture Organisation of the United Nations.
Chang, H.-J. (2011). Industrial Policy: Can We Go Beyond an Unproductive Confrontation? In J.
Y. Lin & B. Pleskovic (Eds.), Annual World Bank Conference on Development
Economics 2010, Global: Lessons from East Asia and the Global Financial Crisis.
Washington, DC: World Bank.
Chazan, G., & Whipp, L. (2016, September 6). Farmers Sound Alarm Over Mega Deals.
Financial Times.
Chenery, H. B., Robinson, S., & Syrquin, M. (1986). Industrialization and Growth: A
Comparative Study. New York: Published for the World Bank [by] Oxford University
Press.
Chenery, H. B., & Syrquin, M. (1975). Patterns of Development, 1950-1970. London: Oxford
University Press.
Choo, Y. M. (2013). Sustainability of Palm Oil. In MPOB (Ed.), Selected Readings on Palm Oil
and Its Uses. Kajang: Malaysian Palm Oil Board.
Chow, E. (2017, April 7). Malaysia Palm Planters Face Labor Shortage as Indonesia Workers
Stay Away. Reuters.
Cimoli, M., Dosi, G., Nelson, R., & Stiglitz, J. E. (2009). Institutions and Policies Shaping
Industrial Development: An Introductory Note. In M. Cimoli, G. Dosi, & J. E. Stiglitz
(Eds.), Industrial Policy and Development: The Political Economy of Capabilities
Accumulation. Oxford University Press.
Clarke, C. G., Dickenson, J. P., Gould, W. T. S., Mather, S., Prothero, R. M., Siddle, D. J., …
Thomas-Hope, E. (2013). A Geography of the Third World (2nd ed.). Abingdon:
Routledge.
Coase, R. H. (1937). The Nature of the Firm. Economica, 4(16), 386–405.

182
Collier, P., & Dollar, D. (2002). Globalization, Growth, and Poverty: Building an Inclusive World
Economy. Washington, DC; New York: World Bank; Oxford University Press.
Colman, D., & Young, T. (1989). Principles of Agricultural Economics: Markets and Prices in
Less Developed Countries. Cambridge: Cambridge University Press.
Commission on Growth and Development (Ed.). (2008). The Growth Report: Strategies for
Sustained Growth and Inclusive Development. Washington DC: World Bank.
Cook, M. L., & Chaddad, F. R. (2000). Agroindustrialization of the Global Agrifood Economy:
Bridging Development Economics and Agribusiness Research. Agricultural Economics,
23(3), 207–218.
Corden, W. M., & Neary, J. P. (1982). Booming Sector and De-Industrialisation in a Small Open
Economy. The Economic Journal, 92(368), 825.
Corley, R. H. V., & Tinker, P. B. H. (2016). The Oil Palm (5th ed.). West Sussex: Wiley-
Blackwell.
Corsi, A. (2002). Notes of the Course in Agricultural Economics. FAO-Italian Government
Cooperative Program: Assistance in Capacity Building through Enhancing Operation of
the National Agricultural Policy Centre, Syria.
Cramer, C. (1999). Can Africa Industrialize by Processing Primary Commodities? The Case of
Mozambican Cashew Nuts. World Development, 27(7), 1247–1266.
Cramer, C. (2003, February). Should Developing Country Industrialisation Policies Encourage
Processing of Primary Commodities? The Courier (ACP-EU), (196), 30–32.
Cramer, G. L., Jensen, C. W., & Southgate, D. D. (2001). Agricultural Economics and
Agribusiness (8th ed). New York: John Wiley.
Da Silva, C. A., & Baker, D. (2009). Introduction. In C. A. Da Silva, D. Baker, A. Shepherd, C.
Jenane, & S. Miranda-da-Cruz (Eds.), Agro-Industries for Development. Wallingford:
Food and Agriculture Organisation of the United Nations and United Nations Industrial
Development Organisation.
De Backer, K., & Miroudot, S. (2012). Mapping Global Value Chains. Paris: Organisation for
Economic Co-operation and Development.
Deloitte. (2017). Global Powers of Retailing 2017: The Art and Science of Customers. London:
Deloitte Touche Tohmatsu.
Devadason, E. S., & Chan, W. M. (2014). Policies and Laws Regulating Migrant Workers in
Malaysia: A Critical Appraisal. Journal of Contemporary Asia, 44(1), 19–35.
DiCaprio, A., & Gallagher, K. P. (2006). The WTO and the Shrinking of Development Space:
How Big is the Bite? The Journal of World Investment & Trade, 7(5), 781–803.

183
Dicken, P. (2011). Global Shift: Mapping the Changing Contours of the World Economy (6th ed.).
New York: Guilford Press.
Docherty, C. (2012). Branding Agricultural Commodities: The Development Case for Adding
Value Through Branding. London: International Institute for Environment and
Development.
Dolan, C., & Humphrey, J. (2000). Governance and Trade in Fresh Vegetables: Impact of UK
Supermarkets on the African Horticulture Industry. The Journal of Development Studies,
37(2), 147–176.
Dolan, C., & Humphrey, J. (2004). Changing Governance Patterns in the Trade in Fresh
Vegetables between Africa and the United Kingdom. Environment and Planning A, 36(3),
491–509.
Dore, R. P. (1990). British Factory, Japanese Factory: The Origins of National Diversity in
Industrial Relations. University of California Press.
DOSM. (2015). Malaysia Statistical Handbook 2015. Putrajaya: Department of Statistics
Malaysia.
Driver, C., & Muñoz-Bugarin, J. (2010). Capital Investment and Unemployment in Europe:
Neutrality or Not? Journal of Macroeconomics, 32(1), 492–496.
Dunning, J. H., & Lundan, S. M. (2008). Multinational Enterprises and the Global Economy (2nd
ed). Cheltenham, UK; Northampton, MA: Edward Elgar.
Dunning, J. H., & Narula, R. (1996). The Investment Development Path Revisited: Some
Emerging Issues. In J. H. Dunning & R. Narula (Eds.), Foreign Direct Investment and
Governments: Catalysts for Economic Restructuring. London: Routledge.
Easterly, W., & Levine, R. (1997). Africa’s Growth Tragedy: Policies and Ethnic Divisions. The
Quarterly Journal of Economics, 112(4), 1203–1250.
Ek, K., & Söderholm, P. (2010). Technology Learning in the Presence of Public R&D: The Case
of European Wind Power. Ecological Economics, 69(12), 2356–2362.
Ellis, F., & Biggs, S. (2001). Evolving Themes in Rural Development 1950s-2000s.
Development Policy Review, 19(4), 437–448.
EPU. (2004). Development Planning in Malaysia (2nd ed.). Putrajaya: Economic Planning Unit,
Prime Minister’s Department.
ETC Group. (2008). Who Owns Nature? Corporate Power and the Final Frontier in the
Commodification of Life. Ottawa: ETC Group.
Evans, P. (1979). Dependent Development the Alliance of Multinational, State, and Local
Capital in Brazil. Princeton: Princeton University Press.

184
Evans, P. (1995). Embedded Autonomy: States and Industrial Transformation. Princeton, NJ:
Princeton Univ. Press.
Falkowski, J., Malak-Rawlikowska, A., & Milczarek-Andrzejewska, D. (2008). Dairy Supply
Chain Restructuring and Its Impact on Farmers’ Revenues in Poland. In 12th Congress
of the European Association of Agricultural Economists–EAAE.
Feenstra, R. C. (1998). Integration of Trade and Disintegration of Production in the Global
Economy. Journal of Economic Perspectives, 12(4), 31–50.
Fernandez-Cornejo, J., & Just, R. E. (2007). Researchability of Modern Agricultural Input
Markets and Growing Concentration. American Journal of Agricultural Economics, 89(5),
1269–1275.
Fitter, R., & Kaplinsky, R. (2001). Who Gains from Product Rents as the Coffee Market
Becomes More Differentiated? A Value-chain Analysis. IDS Bulletin, 32(3), 69–82.
Fold, N. (1994). Industrial Organization and Sectoral Linkages: A Study of the Malaysian Palm
Oil Industry. Geografisk Tidsskrift, 94.
Fold, N. (1998). State Regulation of Agro-industries in Developing Countries. Governance
Systems in the Vegetable Oil Industry of Malaysia and Zimbabwe. Geoforum, 29(4),
393–412.
Fold, N. (2000). Oiling the Palms: Restructuring of Settlement Schemes in Malaysia and the
New International Trade Regulations. World Development, 28(3), 473–486.
Fold, N., & Whitfield, L. (2012). Developing a Palm Oil Sector: The Experiences of Malaysia and
Ghana Compared (DIIS Working Paper No. 2012:08). Copenhagen: Danish Institute for
International Studies (DIIS).
Fox, K. A., & Johnson, D. (1970). Readings in the Economics of Agriculture. London: Allen &
Unwin.
Frederick, S., & Staritz, C. (2012). Developments in the Global Apparel Industry after the MFA
Phaseout. In G. Lopez-Acevedo & R. Robertson (Eds.), Sewing Success? Employment,
Wages, and Poverty Following the End of the Multi-Fibre Arrangement. Washington DC:
World Bank.
Freeman, C. (1995). The ‘National System of Innovation’ in Historical Perspective. Cambridge
Journal of Economics, 19(1), 5–24.
Fry, E. H. (1983). The Politics of International Investment. New York: McGraw-Hill.
Fu, X., Pietrobelli, C., & Soete, L. (2011). The Role of Foreign Technology and Indigenous
Innovation in the Emerging Economies: Technological Change and Catching-up. World
Development, 39(7), 1204–1212.

185
Ganewatta, G., Waschik, R., Jayasuriya, S., & Edwards, G. (2006). Impact of Protection on
Domestic Processing of Primary Commodities for Export Markets: An Example from the
Sri Lankan Tea Industry. South Asia Economic Journal, 7(1), 1–18.
Gereffi, G. (1994). The Organisation of Buyer-Driven Global Commodity Chains: How U.S.
Retailers Shape Overseas Production Networks. In G. Gereffi & M. Korzeniewicz (Eds.),
Commodity Chains and Global Capitalism (pp. 95–122). Westport: Greenwood Press.
Gereffi, G. (1999). International Trade and Industrial Upgrading in the Apparel Commodity
Chain. Journal of International Economics, 48(1), 37–70.
Gereffi, G., Humphrey, J., Kaplinsky, R., & Sturgeon, T. (2001). Introduction: Globalisation,
Value Chains and Development. IDS Bulletin, 32(3), 1–8.
Gereffi, G., Humphrey, J., & Sturgeon, T. (2005). The Governance of Global Value Chains.
Review of International Political Economy, 12(1), 78–104.
Gerschenkron, A. (1979). Economic Backwardness in Historical Perspective: A Book of Essays.
Cambridge, Massachusetts: Belknap Pr.
Ghatak, S., & Ingersent, K. A. (1984). Agriculture and Economic Development. Baltimore: Johns
Hopkins University Press.
Gibbon, P. (2001a). Agro-Commodity Chains: An Introduction. IDS Bulletin, 32(3), 60–68.
Gibbon, P. (2001b). Upgrading Primary Production: A Global Commodity Chain Approach.
World Development, 29(2), 345–363.
Gibbon, P., & Ponte, S. (2005). Trading Down: Africa, Value Chains, and the Global Economy.
Philadelphia: Temple University Press.
Global South-South Development Academy. (2001). Oil Palm R&D. In Examples of Successful
Initiatives in Agriculture and Rural Development in the South (Vol. 5). Rome: FAO
Special Unit for Technical Cooperation among Developing Countries.
Goh, S. K., & Wong, K. N. (2011). Malaysia’s Outward FDI: The Effects of Market Size and
Government Policy. Journal of Policy Modeling, 33(3), 497–510.
Gollin, D. (2008). Labour’s Share of Income. In S. N. Durlauf & L. E. Blume (Eds.), The New
Palgrave Dictionary of Economics (2nd ed., pp. 836–839). Basingstoke: Nature
Publishing Group.
Gomez, E. T., & Jomo, K. S. (1999). Malaysia’s Political Economy: Politics, Patronage and
Profits. Cambridge: Cambridge University Press.
Gopal, J. (2001, January). The Development of Malaysia’s Palm Oil Refining Industry:
Obstacles, Policy and Performance. Imperial College London, London.
Guerriero, M. (2012). The Labour Share of Income Around the World. Evidence from a Panel
Dataset. Development Economics and Public Policy Working Paper, 32, 2012.

186
Gustafsson, F. (2007). Malaysian Industrial Policy, 1986-2002. In K. S. Jomo (Ed.), Malaysian
Industrial Policy. Singapore: NUS Press.
Gylfason, T., Herbertsson, T. T., & Zoega, G. (1999). A Mixed Blessing: Natural Resources and
Economic Growth. Macroeconomic Dynamics, 3(02), 204–225.
Harrison, A., & Rodríguez-Clare, A. (2009). Trade, Foreign Investment, and Industrial Policy for
Developing Countries. National Bureau of Economic Research.
Hassan, M. A., & Abd-Aziz, S. (2012). Waste and Environmental Management in the Malaysian
Palm Oil Industry. In O. M. Lai, C. P. Tan, & C. C. Akoh (Eds.), Palm Oil: Production,
Processing, Characterization, and Uses. Urbana: AOCS Press.
Hausmann, R., Klinger, B., & Lawrence, R. (2008). Examining Beneficiation. Harvard Kennedy
School Faculty Research Working Papers Series, (RWP08-030).
Hausmann, R., & Rodrik, D. (2003). Economic Development as Self-Discovery. Journal of
Development Economics, 72(2), 603–633.
Hausmann, R., & Rodrik, D. (2006). Doomed to Choose: Industrial Policy as Predicament.
Cambridge, Massachusetts.
Helleiner, G. K. (1973). Manufactured Exports from Less-Developed Countries and Multinational
Firms. The Economic Journal, 83(329), 21–47.
Helleiner, G. K. (Ed.). (1995). Manufacturing for Export in the Developing World: Problems and
Possibilities. London; New York: Routledge.
Helpman, E., & Krugman, P. R. (1985). Market Structure and Foreign Trade: Increasing Returns,
Imperfect Competition, and the International Economy. Cambridge, Massachusetts: MIT
Press.
Henson, I. E. (2012). A Brief History of the Oil Palm. In O. M. Lai, C. P. Tan, & C. C. Akoh (Eds.),
Palm Oil: Production, Processing, Characterization, and Uses. Urbana: AOCS Press.
Henson, S., & Cranfield, J. (2009). Building the Political Case for Agro-Industries and
Agribusiness in Developing Countries. In C. A. Da Silva, D. Baker, A. Shepherd, C.
Jenane, & S. Miranda-da-Cruz (Eds.), Agro-Industries for Development. Wallingford:
Food and Agriculture Organisation of the United Nations and United Nations Industrial
Development Organisation.
Hernández, R., Reardon, T., & Berdegué, J. (2007). Supermarkets, Wholesalers, and Tomato
Growers in Guatemala. Agricultural Economics, 36(3), 281–290.
Hill, H. (2012). Malaysian Economic Development: Looking Backward and Forward. In H. Hill, T.
Siew Yean, & R. H. M. Zin (Eds.), Malaysia’s Development Challenges: Graduating from
the Middle. Abingdon: Routledge.

187
Hirschman, A. O. (2013). A Generalized Linkage Approach to Development, with Special
Reference to Staples. In J. Adelman (Ed.), The Essential Hirschman. Woodstock:
Princeton University Press.
Hobday, M. (1995). East Asian Latecomer Firms: Learning the Technology of Electronics. World
Development, 23(7), 1171–1193.
Hodal, K., & Kelly, A. (2016, November 21). Malaysia: Forced Labour Casts Dark Shadow Over
Electronics Industry. The Guardian.
Hodder, R. (2005). Development Geography. London: Routledge.
Howell, D. (Ed.). (2004). Fighting Unemployment: The Limits of Free Market Orthodoxy. Oxford,
New York: Oxford University Press.
Huang, Y. (2005). Are Foreign Firms Privileged by Their Host Governments? Evidence from the
2000 World Business Environment Survey.
Hummels, D., Ishii, J., & Yi, K.-M. (2001). The Nature and Growth of Vertical Specialization in
World Trade. Journal of International Economics, 54(1), 75–96.
Humphrey, J., & Memedovic, O. (2006). Global Value Chains in the Agrifood Sector. Vienna:
UNIDO.
Humphrey, J., & Schmitz, H. (2001). Governance in Global Value Chains. IDS Bulletin Vol. 32
No. 3, 19–29.
Humphrey, J., & Schmitz, H. (2002). How Does Insertion in Global Value Chains Affect
Upgrading in Industrial Clusters? Regional Studies, 36(9), 1017–1027.
Humphreys, M., Sachs, J., & Stiglitz, J. E. (2007). Escaping the Resource Curse. Columbia
University Press.
ILO. (2008). Global Wage Report 2008/2009: Minimum Wages and Collective Bargaining -
Towards Policy Coherence. Geneva: International Labour Organisation.
ILO (Ed.). (2010). Global Wage Report, 2010/2011: Wage Policies in Times of Crisis. Geneva;
New Delhi: International Labour Office; Academic Foundation.
ILO. (2015). Global Wage Report 2014/2015: Wages and Income Inequality. Geneva:
International Labour Organisation.
ILO, & OECD. (2015). The Labour Share in G20 Economies. Geneva; Paris: Organisation for
Economic Co-operation and Development; International Labour Organisation.
Indonesia Investments. (2015, November 21). Indonesia & Malaysia Set up the Council of Palm
Oil Producer Countries.
Innis, H. A. (1933). Problems of Staple Production in Canada. Ryerson Press.
188
Ishikawa, S. (1978). Labour Absorption in Asian Agriculture: An ‘Issues’ Paper. Geneva:
International Labour Office (ILO) Asian Regional Team for Employment Promotion
(ARTEP).
IUF. (2008). Workers and Unions on the Move: Organising and Defending Migrant Workers in
Agriculture and Allied Sectors. Geneva: International Union of Food, Agricultural, Hotel,
Restaurant, Catering, Tobacco and Allied Workers’ Associations.
Jaffee, S., Kopicki, R., Labaste, P., & Christie, I. (2003). Modernizing Africa’s Agro-Food
Systems: Analytical Framework and Implications for Operations (Africa Region Working
Paper Series No. 44). Washington DC: World Bank.
Johnston, B. F., & Mellor, J. W. (1961). The Role of Agriculture in Economic Development. The
American Economic Review, 51(4), 566–593.
Jomo, K. S., Rasiah, R., Alavi, R., & Gopal, J. (2003). Industrial Policy and the Emergence of
Internationally Competitive Manufacturing Firms in Malaysia. In K. S. Jomo (Ed.),
Manufacturing Competitiveness in Asia: How Internationally Competitive National Firms
and Industries Developed in East Asia. London: RoutledgeCurzon.
Jomo, K. S., & Rock, M. (1998). Economic Diversification and Primary Commodity Processing in
the Second-Tier South-East Asian Newly Industrializing Countries. UNCTAD.
Jones, G., & Khanna, T. (2006). Bringing History (back) into International Business. Journal of
International Business Studies, 37(4), 453–468.
Jones, R. W., & Kierzkowski, H. (2005). International Fragmentation and the New Economic
Geography. The North American Journal of Economics and Finance, 16(1), 1–10.
Josling, T. (2013). Protection, Subsidies, and Agricultural Trade. In A. Lukauskas, R. M. Stern,
& G. Zanini (Eds.), Handbook of Trade Policy for Development. Oxford: Oxford
University Press.
Kaldor, N. (1966). Causes of the Slow Rate of Economic Growth of the United Kingdom: An
Inaugural Lecture. London: Cambridge University Press.
Kaldor, N. (1967). Strategic Factors in Economic Development. Ithaca: New York State School
of Industrial and Labor Relations, Cornell University.
Kaplan, D. E. (2016). Linkage Dynamics and Natural Resources: Diversification and Catch-Up.
In P. G. Sampath & B. Oyelaran-Oyeyinka (Eds.), Sustainable Industrialization in Africa:
Toward a New Development Agenda. London: Palgrave Macmillan UK.
Kaplinsky, R. (2000). Globalisation and Unequalisation: What Can Be Learned from Value
Chain Analysis. Journal of Development Studies, 73(2), 117–146.
Kaplinsky, R. (2005). Globalization, Poverty and Inequality: Between a Rock and a Hard Place.
Cambridge: Polity Press.

189
Kaplinsky, R., & Morris, M. (2015). Thinning and Thickening: Productive Sector Policies in The
Era of Global Value Chains. The European Journal of Development Research.
Kaur, A. (2014a). Managing Labour Migration in Malaysia: Guest Worker Programs and the
Regularisation of Irregular Labour Migrants as a Policy Instrument. Asian Studies
Review, 38(3), 345–366.
Kaur, A. (2014b). Plantation Systems, Labour Regimes and the State in Malaysia, 1900-2012:
Plantation, Labour and the State in Malaysia, 1900-2012. Journal of Agrarian Change,
14(2), 190–213.
Keesing, D. B., & Lall, S. (1992). Marketing Manufactured Exports from Developing Countries:
Learning Sequences and Public Support. In G. K. Helleiner (Ed.), Trade Policy,
Industrialisation and Development. Oxford University Press.
Kerr, C., Dunlop, J., Harbinson, F., & Myers, C. (1960). Industrialism and Industrial Man: The
Problems of Labor and Management in Economic Growth. Cambridge, Massachusetts:
Harvard University Press.
Khor, Y. L. (2015). The Political Economy of FELDA Seats: UMNO’s Malay Rural Fortress in
GE13. In J. Saravanamuttu, H. G. Lee, & M. N. Mohamed Osman (Eds.), Coalitions in
Collision: Malaysia’s 13th General Elections. Singapore: Institute of Southeast Asian
Studies and Strategic Information and Research Development Centre.
Khor, Y. L., Saravanamuttu, J., & Augustin, D. (2015). The Felda Case Study. Oxford: LMC
International.
Kishimoto, C. (2003). Upgrading in the Taiwanese Computer Cluster: Transformation of Its
Production and Knowledge Systems (IDS Working Paper No. 186). Sussex: Institute of
Development Studies.
Krugman, P. (1995). Growing World Trade: Causes and Consequences. Brookings Papers on
Economic Activity, 1995(1), 327–377.
Krugman, P., & Venables, A. J. (1995). The Seamless World: A Spatial Model of International
Specialization (Working Paper No. 5220). Cambridge, MA: National Bureau of Economic
Research.
Kuramoto, J., & Sagasti, F. (2006). Innovation in Resource-Based Technology Clusters:
Investigating the Lateral Migration Thesis – Cleaning Pollution: From Mining to
Environmental Remediation. Cape Town: Human Sciences Research Council.
Kuznets, S. S. (1966). Modern Economic Growth: Rate, Structure, and Spread. Yale University
Press.
Kuznets, S. S. (1971). Economic Growth of Nations: Total Output and Production Structure.
Cambridge, Massachusetts: Harvard University Press.

190
Lall, S. (1995). Malaysia: Industrial success and the role of the government. Journal of
International Development, 7(5), 759–773.
Lamy, P. (2013). The Geneva Consensus: Making Trade Work for All. Cambridge: Cambridge
University Press.
Lawrence, F. (2011, June 2). The Global Food Crisis: ABCD of Food – How the Multinationals
Dominate Trade. The Guardian.
Lederman, D., & Maloney, W. F. (Eds.). (2006). Natural Resources, Neither Curse nor Destiny.
The World Bank.
Lee, B. T., & Bahrin, S. (2006). Felda’s Fifty Years: Land Pioneers to Investors. Kuala Lumpur:
Felda.
Lee, H.-A. (2007). Industrial Policy and Inter-Ethnic Redistribution in Malaysia: Industrial
Development and Equity Ownership, 1975-97. In K. S. Jomo (Ed.), Malaysian Industrial
Policy. Singapore: National University Press.
Lee, L. F., Lim, M. P. S., & Koh, P. B. (2013). Malaysia Agribusiness Directory 2013-2014.
Petaling Jaya: Agribusiness Publishing.
Lim, D. (2011). Economic Development: A Historical Survey. In ISIS (Ed.), Malaysia: Policies
and Issues in Economic Development. Kuala Lumpur: Institute of Strategic and
International Studies.
Lim, E. S., & Nagaraj, S. (2011). Impediments to Innovation: Evidence from Malaysian
Manufacturing Firms. Asia Pacific Business Review, 17(2), 209–223.
Low, P. (2013). The Role of Services in Global Value Chains. Hong Kong: Fung Global Institute.
Low, P., & Tijaja, J. (2014). Effective Industrial Policies and Global Value Chains. In R. Baldwin,
M. Kawai, & G. Wignaraja (Eds.), A World Trade Organization for the 21st Century: The
Asian Perspective. Cheltenham: Edward Elgar.
Lübker, M. (2007). Labour Shares. Geneva: International Labour Office.
Lundvall, B. A. (Ed.). (2012). National Systems of Innovation: Toward a Theory of Innovation
and Interactive Learning. London: Anthem Press.
Maddison, A. (1995). Explaining the Economic Performance of Nations: Essays in Time and
Space. Aldershot: E. Elgar.
Malerba, F., Nelson, R. R., Orsenigo, L., & Winter, S. G. (2016). Innovation and the Evolution of
Industries: History-Friendly Models. Cambridge: Cambridge University Press.
Markusen, A. (1996). Sticky Places in Slippery Space: A Typology of Industrial Districts.
Economic Geography, 72(3), 293.

191
Martin, P. L. (2016). Migrant Workers in Commercial Agriculture. Geneva: International Labour
Organisation.
Martin, S. M. (2003). The UP Saga. Copenhagen: Nordic Institute of Asian Studies Press.
Martin, S. M. (2006). An Edible Oil for the World: Malaysian and Indonesian Competition in the
Palm Oil Trade, 1945–2000. In A. J. H. Latham & H. Kawakatsu (Eds.), Intra-Asian
Trade and the World Market. London; New York: Routledge.
Martin, W., & Mitra, D. (2001). Productivity Growth and Convergence in Agriculture versus
Manufacturing*. Economic Development and Cultural Change, 49(2), 403–422.
Mazzucato, M. (2014). The Entrepreneurial State: Debunking Public Vs. Private Sector Myths
(Revised edition). London; New York: Anthem Press.
McCarthy, J. F., & Cramb, R. A. (2009). Policy Narratives, Landholder Engagement, and Oil
Palm Expansion on the Malaysian and Indonesian Frontiers. The Geographical Journal,
175(2), 112–123.
McGee, T. (1962). The Malayan Elections of 1959: A Study of Electoral Geography. Malayan
Journal of Tropical Geography, 16.
McMillan, M. S., & Rodrik, D. (2011). Globalization, Structural Change and Productivity Growth.
Cambridge, Massachusetts: National Bureau of Economic Research.
Md Nor, A. (2012). Internationalisation of Malaysian Palm Oil-Based Multinationals. Oil Palm
Industry Economic Journal, 12(1).
Mehlum, H., Moene, K., & Torvik, R. (2006). Institutions and the Resource Curse. The
Economic Journal, 116(508), 1–20.
Meyer, G. (2013, September 13). Bunge, Cargill, Dreyfus and Adm Face New Challenges.
Financial Times.
MIDA. (2015). Malaysia Investment Performance Report 2014. Kuala Lumpur: Malaysian
Investment Development Authority.
Milberg, W. S. (2004). The Changing Structure of Trade Linked to Global Production Systems:
What Are the Policy Implications? International Labour Review, 143(1–2), 45–90.
Milberg, W. S., & Winkler, D. (2011). Economic and Social Upgrading in Global Production
Networks: Problems of Theory and Measurement. International Labour Review, 150(3–
4), 341–365.
Milberg, W. S., & Winkler, D. (2013). Outsourcing Economics: Global Value Chains in Capitalist
Development. Cambridge; New York: Cambridge University Press.
Miller, R. E., & Blair, P. D. (2009). Input-Output Analysis: Foundations and Extensions.
Cambridge University Press.

192
MITI. (2006). Third Industrial Master Plan (IMP3) 2006-2020. Kuala Lumpur: Ministry of
International Trade and Industry.
Mohamad, M. (2015). Fragmented but Captured: Malay Voters and the FELDA Factor in GE13.
In J. Saravanamuttu, H. G. Lee, & M. N. Mohamed Osman (Eds.), Coalitions in Collision:
Malaysia’s 13th General Elections. Singapore: Institute of Southeast Asian Studies and
Strategic Information and Research Development Centre.
Mohnen, P., & Röller, L.-H. (2005). Complementarities in Innovation Policy. European Economic
Review, 49(6), 1431–1450.
Moll, H. A. J. (1987). The Economics of Oil Palm. Wageningen: Centre for Agricultural
Publishing and Documentation.
Moran, T. H. (1998). Foreign Direct Investment and Development: The New Policy Agenda for
Developing Countries and Economies in Transition. Washington, DC: Institute for
International Economics.
Morris, M., Kaplinsky, R., & Kaplan, D. E. (2012). ‘One Thing Leads to Another’—Commodities,
Linkages and Industrial Development. Resources Policy, 37(4), 408–416.
MPC. (2014). Reducing Unnecessary Regulatory Burdens on Business: Growing Oil Palm.
Petaling Jaya: Malaysia Productivity Corporation.
MPOB. (2010a). Going for Liquid Gold: The Achievements of the Malaysian Palm Oil Board.
Kuala Lumpur: Malaysian Palm Oil Board.
MPOB. (2010b). Innovations in Oil Palm Mechanisation: Tools of Achievement. Kajang:
Malaysian Palm Oil Board.
MPOB. (2010c). Proceedings of the Palm Industry Labour: Issues, Performance and
Sustainability (PILIPS) Workshop. Bandar Baru Bangi: Malaysian Palm Oil Board.
MPOC. (2014). Grown by the People for the People. Kuala Lumpur: Malaysian Palm Oil Council.
Nadvi, K. (2004). Globalisation and Poverty: How Can Global Value Chain Research Inform the
Policy Debate? IDS Bulletin, 35(1), 20–30.
Nambiappan, B. (2013). Techno Economic Advantages of Palm Oil Usage. In MPOB (Ed.),
Selected Readings on Palm Oil and Its Uses. Kajang: Malaysian Palm Oil Board.
Natawidjaja, R., Reardon, T., & Shetty, S. (2007). Horticultural Producers and Supermarket
Development in Indonesia. Washington, DC: World Bank.
Naudé, W. (2010). Industrial Policy: Old and New Issues. Helsinki: WIDER.
Nayyar, D. (2013). Catch up: Developing Countries in the World Economy (First edition). Oxford:
Oxford University Press.

193
NEAC. (2010). New Economic Model for Malaysia Part 1: Strategic Policy Directions. Putrajaya:
National Economic Advisory Council.
Nelson, R. R. (1994). The Co-evolution of Technology, Industrial Structure, and Supporting
Institutions. Industrial and Corporate Change, 3(1), 47–63.
New Straits Times. (2016, December 24). Felda buys 37pc stake in Eagle High. New Straits
Times.
Nixson, F. (2005). Reflections on Industrialisation Strategies and Experiences in Sub-Saharan
Africa. In M. Tribe, J. Thoburn, & R. Palmer-Jones (Eds.), Development Economics and
Social Justice: Essays in Honour of Ian Livingstone. Aldershot: Ashgate.
Nixson, F. (2016). Import Substituting Industrialisation (ISI): Can or Should We Divorce
Industrialisation and Trade Strategies? In J. Weiss & M. Tribe (Eds.), Routledge
Handbook of Industry and Development. Abingdon: Routledge.
Nolan, P. H. (1993). State and Market in the Chinese Economy: Essays on Controversial Issues.
Springer.
Nolan, P. H. (1995). China’s Rise, Russia’s Fall: Politics, Economics and Planning in the
Transition from Stalinism. Springer.
Nolan, P. H. (1999). Coca-Cola and the Global Business Revolution: A Study with Special
Reference to the EU. Cambridge: Judge Business School.
Nolan, P. H. (2001a). China and the Global Business Revolution. Basingstoke: Palgrave.
Nolan, P. H. (2001b). China and the Global Economy: National Champions, Industrial Policy
and the Big Business Revolution. Basingstoke: Palgrave Macmillan.
Nolan, P. H. (2012). Is China Buying the World? Cambridge: Polity Press.
Nolan, P. H. (2014a). Chinese Firms, Global Firms: Industrial Policy in the Age of Globalization.
Abingdon: Routledge.
Nolan, P. H. (2014b). Globalisation and Industrial Policy: The Case of China. The World
Economy, 37(6), 747–764.
Nolan, P. H., Zhang, J., & Liu, C. (2008). The Global Business Revolution, the Cascade Effect,
and the Challenge for Firms from Developing Countries. Cambridge Journal of
Economics, 32(1), 29–47.
Noorbakhsh, F., & Paloni, A. (1999). Structural Adjustment Programs and Industry in Sub-
Saharan Africa: Restructuring or De-Industrialization? The Journal of Developing Areas,
33(4), 549–580.
Nordin, A. B. A., Simeh, M. A., Mahidin, M. R., & Mohd Shariff, F. (2010, June). Impact of
Labelling on Palm Oil in the US Market. Palm Oil Developments, 52.

194
North, D. C. (1955). Location Theory and Regional Economic Growth. The Journal of Political
Economy, 243–258.
OECD. (2012). OECD Employment Outlook 2012. Paris: Organisation for Economic
Cooperation and Development.
OECD, & FAO. (2016). OECD-FAO Agricultural Outlook 2016-2025. Paris; London:
Organisation for Economic Cooperation Development; Food and Agricultural
organisation of the United Nations.
OECD, & Statistical Office of the European Communities (Eds.). (2005). Oslo Manual:
Guidelines for Collecting and Interpreting Innovation Data (3rd ed). Paris: Organisation
for Economic Co-operation and Development; Statistical Office of the European
Communities.
OECD, WTO, & UNCTAD. (2013). Implications of Global Value Chains for Trade, Investment,
Development and Jobs. Paris, Geneva: Organisation for Economic Co-operation and
Development, World Trade Organisation, and United Nations Conference on Trade and
Development.
Ooi, T. C. (2016, January 27). Groups Seek Authorities’ Help to Reduce Costs. New Straits
Times.
Owens, T., & Wood, A. (1997). Export-Oriented Industrialization Through Primary Processing?
World Development, 25(9), 1453–1470.
Oxford Business Group. (2014). The Report: Malaysia 2014. London: Oxford Business Group.
Pack, H., & Saggi, K. (2006). The Case for Industrial Policy: A Critical Survey (Vol. 3839).
Washington, DC: World Bank.
Pattisson, P. (2016, November 28). Workers for McDonald’s in Malaysia Say They Were Victims
of Labour Exploitation. The Guardian.
Pavitt, K. (1990). Sectoral Patterns of Technical Change: Towards a Taxonomy and a Theory.
The Economics of Innovation, 249–79.
Paz, M. J. (2014). Oil and Development in Brazil: Between an Extractive and an Industrialization
Strategy. Energy Policy, 73, 501–511.
Pemandu. (2010). Economic Transformation Programme: A Roadmap for Malaysia. Putrajaya:
Performance Management & Delivery Unit.
Peres, W., & Primi, A. (2009). Theory and Practice of Industrial Policy: Evidence from the Latin
American Experience, 187.
Phillips, N. (2016). Labour in Global Production: Reflections on Coxian Insights in a World of
Global Value Chains. Globalizations, 13(5), 594–607.

195
Pietrobelli, C., & Rabellotti, R. (Eds.). (2006). Upgrading to Compete: Global Value Chains,
Clusters, and Smes in Latin America. Washington, DC: Inter-American Development
Bank and David Rockefeller Center for Latin American Studies.
Pietrobelli, C., & Rabellotti, R. (2011). Global Value Chains Meet Innovation Systems: Are There
Learning Opportunities for Developing Countries? World Development, 39(7), 1261–
1269.
Pletcher, J. (1990). Public Interventions in Agricultural Markets in Malaysia: Rice and Palm Oil.
Modern Asian Studies, 24(2), 323–340.
Pollard, S. (1990). Typology of Industrialisation Processes in the Nineteenth Century. Chur:
Harwood Academic Publishers.
Ponte, S., & Ewert, J. (2009). Which Way Is ‘Up’ in Upgrading? Trajectories of Change in the
Value Chain for South African Wine. World Development, 37(10), 1637–1650.
Porter, M. E. (1990). The Competitive Advantage of Nations. New York: Free Press.
Porter, M. E. (1996). Competitive Advantage, Agglomeration Economies, and Regional Policy.
International Regional Science Review, 19(1–2), 85–90.
Prebisch, R. (1950). The Economic Development of Latin America and Its Principal Problems.
New York: United Nations Department of Economic Affairs.
Qiu, L., Chen, Z.-Y., Lu, D.-Y., Hu, H., & Wang, Y.-T. (2014). Public Funding and Private
Investment for R&d: A Survey in China’s Pharmaceutical Industry. Health Research
Policy and Systems, 12(1), 27.
Radetzki, M. (1977). Where Should Developing Countries’ Minerals Be Processed? The
Country View Versus the Multinational Company View. World Development, 5(4), 325–
334.
Ramasamy, P. (2001, January 5). Labouring over Wage Issues. The Sun.
Rammohan, K. T., & Sundaresan, R. (2003). Socially Embedding the Commodity Chain: An
Exercise in Relation to Coir Yarn Spinning in Southern India. World Development, 31(5),
903–923.
Rasiah, R. (2006). Explaining Malaysia’s Export Expansion in Palm Oil and Related Products. In
V. Chandra (Ed.), Technology, Adaptation, and Exports: How Some Developing
Countries Got It Right. Washington, DC: World Bank.
Rasiah, R., Gammeltoft, P., & Jiang, Y. (2010). Home Government Policies for Outward FDI
from Emerging Economies: Lessons from Asia. International Journal of Emerging
Markets, 5(3/4), 333–357.
Rasmussen, P. N. (1957). Studies in Inter-Sectoral Relations. Amsterdam: North-Holland.

196
Ratha, D., Eigen-Zucchi, C., & Plaza, S. (2016). Migration and Remittances Factbook 2016.
Washington, DC: World Bank.
Reardon, T., & Barrett, C. B. (2000). Agroindustrialization, Globalization, and International
Development: An Overview of Issues, Patterns, and Determinants. Agricultural
Economics, 23(3), 195–205.
Reardon, T., Barrett, C. B., Berdegué, J. A., & Swinnen, J. F. M. (2009). Agrifood Industry
Transformation and Small Farmers in Developing Countries. World Development, 37(11),
1717–1727.
Riisgaard, L. (2009). Global Value Chains, Labor Organization and Private Social Standards:
Lessons from East African Cut Flower Industries. World Development, 37(2), 326–340.
Robinson, P. K. (2009). Responsible Retailing: Regulating Fair and Ethical Trade. Journal of
International Development, 21(7), 1015–1026.
Rock, M. T., & Sheridan, M. (2007). The Political Economy of Industrial Policy in Malaysia. In K.
S. Jomo (Ed.), Malaysian Industrial Policy (pp. 179–221). Singapore: NUS Presss.
Rodrik, D. (2004). Industrial Policy for the Twenty-First Century.
Rodrik, D. (2007). Industrial Development: Some Stylized Facts and Policy Directions. In UN
Department of Economic and Social Affairs & UN Commission of Sustainable
Development\ (Eds.), Industrial Development for the 21st Century: Sustainable
Development Perspectives (pp. 7–28). New York: United Nations Department of
Economic and Social Affairs.
Rodrik, D. (2008). Normalizing Industrial Policy. International Bank for Reconstruction and
Development/The World Bank.
Roemer, M. (1979). Resource-based Industrialization in the Developing Countries: A Survey.
Journal of Development Economics, 6(2), 163–202.
Rossell, J. B. (2001). Frying: Improving Quality. Cambridge: Woodhead Publishing.
Rostow, W. W. (1960). The Stages of Economic Growth: A Non-Communist Manifesto.
Cambridge: Cambridge University Press.
Ruigrok, W., & van Tulder, R. (1995). The Logic of International Restructuring. London:
Routledge.
Saccomandi, V. (1998). Agricultural Market Economics: A Neo-Institutional Analysis of the
Exchange, Circulation, and Distribution of Agricultural Products. Assen: Van Gorcum.
Sachs, J. (1994). Poland’s Jump to the Market Economy. Cambridge, Massachusetts: MIT
Press.
Sachs, J., & Warner, A. M. (2001). Natural Resources and Economic Development: The Curse
of Natural Resources. European Economic Review, 45(4), 827–838.

197
Safadi, R., & Yeats, A. (1994). The Escalation of Asian Trade Barriers. Asian Economic Journal,
8(2), 147–180.
Salih, K., Lee, H.-A., & Khalid, M. A. (2014). Malaysia Human Development Report 2013:
Redesigning an Inclusive Future. Kuala Lumpur: United Nations Development
Programme.
Saliola, F., & Zanfei, A. (2009). Multinational Firms, Global Value Chains and the Organization
of Knowledge Transfer. Research Policy, 38(2), 369–381.
Sampath, P. G. (2014). Industrial Development for Africa: Trade, Technology and the Role of
the State. African Journal of Science, Technology, Innovation and Development, 6(5),
439–453.
San Cristóbal, J. R., & Biezma, M. V. (2006). The Mining Industry in the European Union:
Analysis of Inter-Industry Linkages Using Input–Output Analysis. Resources Policy,
31(1), 1–6.
Schneyer, J. (2011, October 28). Commodity Traders: The Trillion Dollar Club. Reuters.
Schwab, K., Porter, M. E., López-Claros, A., & Sala-i-Martin, X. (2006). The Global
Competitiveness Report 2006-2007. London: Palgrave Macmillan UK.
Searle, P. (1999). The Riddle of Malaysian Capitalism: Rent-Seekers or Real Capitalists?
Honolulu: Asian Studies Association of Australia in association with Allen & Unwin and
University of Hawai’i Press.
Simeh, M. A., & Tengku Ahmad, T. M. A. (2001). The Case Study on the Malaysian Palm Oil. In
Regional Workshop on commodity export diversification and poverty reduction in South
and South-East Asia, Bangkok (pp. 3–5).
Singer, H. W. (1950). The Distribution of Gains Between Investing and Borrowing Countries.
The American Economic Review, 40(2), 473–485.
Solow, R. M. (1956). A Contribution to the Theory of Economic Growth. The Quarterly Journal of
Economics, 70(1), 65–94.
Southworth, H. M., & Johnston, B. F. (Eds.). (1967). Agricultural Development and Economic
Growth. Ithaca: Cornell University Press.
Staatz, J. M., & Eicher, C. K. (1998). Agricultural Development Ideas in Historical Perspective.
In J. M. Staatz & C. K. Eicher (Eds.), International Agricultural Development. Baltimore:
Johns Hopkins University Press.
Stacey, K., & Crooks, E. (2016, June 12). Oil Majors Find Virtue in Integration. Financial Times.
Stauffer, T. R. (1988). Oil Rich: Spend or Save? How Oil Countries Handled the Windfall. In
Wealth Management: A Comparison of the Alaska Permanent Fund and Other Oil-
Generated Savings Accounts Around the World. Alaska Permanent Fund.

198
Stigler, G. J. (1951). The Division of Labor is Limited by the Extent of the Market. The Journal of
Political Economy, 185–193.
Stiglitz, J. E., Lin, J. Y., & Monga, C. (2013). The Rejuvenation of Industrial Policy. In The
Industrial Policy Revolution I (pp. 1–15). Springer.
Stilwell, L. C., Minnitt, R. C. A., Monson, T. D., & Kuhn, G. (2000). An Input–Output Analysis of
the Impact of Mining on the South African Economy. Resources Policy, 26(1), 17–30.
Sturgeon, T., Van Biesebroeck, J., & Gereffi, G. (2008). Value Chains, Networks and Clusters:
Reframing the Global Automotive Industry. Journal of Economic Geography, 8(3), 297–
321.
Syrquin, M. (2008). Structural Change and Development. In A. K. Dutt & J. Ros (Eds.),
International Handbook of Development Economics. Cheltenham, UK; Northampton,
Mass: Edward Elgar.
Szirmai, A., Naude, W. and Alcorta, L. ( 2013). Pathways to Industrialisation in the Twenty-First
Century: New Challenges and Emerging Paradigms. Oxford: Oxford University Press.
Takase, T. (1990). Trade Barriers on Tropical Vegetable Oils. Bandar Baru Bangi: Palm Oil
Research Institute of Malaysia.
Tang, K., & Xiong, W. (2012). Index Investment and the Financialization of Commodities.
Financial Analysts Journal, 68(5), 54–74.
Taylor, I. (2016). Dependency Redux: Why Africa Is Not Rising. Review of African Political
Economy, 43(147), 8–25.
Taylor, M., & Supriatna, Y. (2014, August 15). Indonesia Lawmakers Draft Bill to Slash Foreign
Ownership of Plantations. Reuters.
Thirlwall, A. P. (2015). A Plain Man’s Guide to Kaldor’s Growth Laws. In A. P. Thirlwall, Essays
on Keynesian and Kaldorian Economics (pp. 326–338). London: Palgrave Macmillan UK.
Thomas, H. (1999). The Slave Trade: The Story of the Atlantic Slave Trade: 1440-1870 (1 ed).
New York: Simon & Schuster.
Timmer, C. P. (Ed.). (1991). Agriculture and the State: Growth, Employment, and Poverty in
Developing Countries. Ithaca: Cornell University Press.
Timmer, C. P., Falcon, W. P., & Pearson, S. R. (1983). Food Policy Analysis. Baltimore: Johns
Hopkins University Press.
Tornell, A., & Lane, P. R. (1999). The Voracity Effect. American Economic Review, 22–46.
Upadhyaya, S., & Kepllinger, D. (2014). How Industrial Development Matters to the Well-Being
of the Population: Some Statistical Evidence. Vienna: UNIDO Working Paper 04/2014.

199
UNCTAD. (1999). World Investment Report 1999: Foreign Direct Investment and the Challenge
of Development. New York: United Nations Conference on Trade and Development.
UNCTAD. (2002). World Investment Report 2002: Transnational Corporations and Export
Competitiveness. New York: United Nations Conference on Trade and Development.
UNCTAD. (2006). Tracking the Trend Towards Market Concentration: The Case of the
Agricultural Input Industry. Geneva: United Nations Conference on Trade and
Development.
UNCTAD. (2009). World Investment Report 2009: Transnational Corporations, Agricultural
Production and Development. Geneva: United Nations Conference on Trade and
Development.
UNCTAD. (2013). World Investment Report 2013: Global Value Chains: Investment and Trade
for Development. Geneva: United Nations Conference on Trade and Development.
UNCTAD. (2015). State of Commodity Dependence 2014. Geneva: United Nations Conference
on Trade and Development.
UNCTC. (1978). Transnational Corporations in World Development: A Re-Examination. New
York: United Nations Centre on Transnational Corporations.
UNECA. (2016). Transformative Industrial Policy for Africa. Addis Ababa: United Nations
Economic Commission for Africa.
UNESCO. (2012). Results of the 2011 UIS Pilot Data Collection of Innovation Statistics. Quebec:
United Nations Educational, Scientific and Cultural Organization Institute for Statistics.
UNIDO. (2009). Agro-Value Chain Analysis and Development: The UNIDO Approach. Vienna:
United Nations Industrial Development Organisation.
UNIDO, & Malaysia. (1985). Medium and Long Term Industrial Master Plan Malaysia 1986-1995:
Executive Highlights. Kuala Lumpur: Government of Malaysia and United Nations
Industrial Development Organisation.
United Nations, European Commission, International Monetary Fund, Organisation for
Economic Co-operation and Development, & World Bank (Eds.). (2009). System of
National Accounts 2008. New York: United Nations.
USITC. (1987). US Global Competitiveness: Oilseeds and Oilseed Products (USITC
Publication). Washington, DC: US International Trade Commission.
USITC. (2003). Industry & Trade Summary: Oilseeds. Washington, DC: US International Trade
Commission.
van Ark, B., & Timmer, M. (2003). Economic Convergence and Divergence. In J. Mokyr (Ed.),
The Oxford Encyclopedia of Economic History. Oxford: Oxford University Press.

200
Varkkey, H. (2016). The Haze Problem in Southeast Asia: Palm Oil and Patronage. Abingdon:
Routledge.
Vernon, R. (1966). International Investment and International Trade in the Product Cycle. The
Quarterly Journal of Economics, 190–207.
Vorley, B., & Fox, T. (2004). Global Food Chains: Constraints and Opportunities for
Smallholders. Paris: Organisation for Economic Cooperation and Development.
Wade, R. (1990). Governing the Market: Economic Theory and the Role of Government in East
Asian Industrialization. Princeton: Princeton University Press.
Walker, M. (2001). Resource-Based Industrialisation Strategies: A Comparative Analysis of the
South African and International Experience. South African Geographical Journal, 83(2),
93–104.
Wall, D. (1987). Processing Primary Products: A Review of Some Case Studies. Foreign Trade
Review, 22(1), 60–82.
Wallerstein, I. (2011). Capitalist Agriculture and the Origins of the European World-Economy in
the Sixteenth Century: With a New Prologue. Berkeley: University of California Press.
Warwick, K. (2013). Beyond Industrial Policy: Emerging Issues and New Trends (OECD
Science, Technology and Industry Policy Papers No. 2).
Watkins, M. H. (1963). A Staple Theory of Economic Growth. The Canadian Journal of
Economics and Political Science, 29(2), 141.
Weil, D. (2014). The Fissured Workplace: Why Work Became So Bad for So Many and What
Can Be Done to Improve It. Harvard University Press.
Weiss, J. (2002). Industrialisation and Globalisation: Theory and Evidence from Developing
Countries. Abingdon: Routledge.
Weiss, J. (2011). The Economics of Industrialisation. Abingdon: Routledge.
Weiss, J. (2015). Taxonomy of Industrial Policy (Working Paper No. 08). Vienna: United Nations
Industrial Development Organisation.
Weiss, J. (2016). Industrial Policy: Back on the Agenda. In J. Weiss & M. Tribe (Eds.),
Routledge Handbook of Industry and Development. Abingdon: Routledge.
Weiss, J., & Jalilian, H. (2016). Manufacturing as an Engine of Growth. In J. Weiss & M. Tribe
(Eds.), Routledge Handbook of Industry and Development. Abingdon: Routledge.
Welsh, B. (2015). Elections in Malaysia: Voting Behaviour and Electoral Integrity. In M. L. Weiss
(Ed.), Routledge Handbook of Contemporary Malaysia. London: Routledge.
Wicke, B., Sikkema, R., Dornburg, V., & Faaij, A. (2011). Exploring Land Use Changes and the
Role of Palm Oil Production in Indonesia and Malaysia. Land Use Policy, 28(1), 193–206.

201
Wilkins, M. (2001). The History of Multinational Enterprise. In A. M. Rugman & T. L. Brewer
(Eds.), Oxford Handbook of International Business. Abingdon: Oxford University Press.
Wilkinson, J., & Rocha, R. (2009). Agro-Industry Trends, Patterns and Development Impacts. In
C. A. Da Silva, D. Baker, A. Shepherd, C. Jenane, & S. Miranda-da-Cruz (Eds.), Agro-
Industries for Development. Wallingford: FAO and UNIDO.
Williamson, O. E. (1971). The Vertical Integration of Production: Market Failure Considerations.
The American Economic Review, 61(2), 112–123.
Wong, K. K. S., Shamsudin, M. N., & Abdel Hameed, A. A. (2012). The Economics of Malaysian
Palm Oil Production, Marketing, and Utilization. In O. M. Lai, C. P. Tan, & C. C. Akoh
(Eds.), Palm Oil: Production, Processing, Characterization, and Uses. Urbana: AOCS
Press.
Wong, L. C. Y. (2011). Agriculture. In ISIS (Ed.), Malaysia: Policies and Issues in Economic
Development (p. 26). Kuala Lumpur: Institute of Strategic and International Studies.
World Bank. (1987) World Development Report 1987: Industrialisation and Foreign Trade.
Washington DC: World Bank.
World Bank. (1996). Global Economic Prospects and the Developing Countries 1996: Effects of
Globalization on Developing Countries. Washington, DC: World Bank.
World Bank. (2007). World Development Report 2008: Agriculture for Development. Washington
DC: World Bank.
World Bank. (2015). Malaysia - Economic Monitor: Immigrant Labor (No. 102131) (pp. 1–89).
The World Bank.
Wright, G., & Czelusta, J. (2004). Why Economies Slow: The Myth of the Resource Curse.
Challenge, 47(2), 6–38.
Yaacob, M. R. (2011). The Development of the Malaysian Palm Oil Industry and the
Environment: Prior, Early Independent and Contemporary Periods. Kuala Lumpur:
Universiti Malaysia Kelantan.
Yacob, S., & White, N. J. (2010). The ‘Unfinished Business’ of Malaysia’s Decolonisation: The
Origins of the Guthrie ‘Dawn Raid’. Modern Asian Studies, 44(05), 919–960.
Yeats, A. J. (1991). Do Natural Resource-Based Industrialization Strategies Convey Important
(unrecognized) Price Benefits for Commodity-Exporting Developing Countries? (Vol.
580). World Bank Publications.
Yin, R. K. (2009). Case Study Research: Design and Methods (4th ed.). Thousand Oaks: Sage.
Yusuf, S., & Nabeshima, K. (2009). Tiger Economies Under Threat: A Comparative Analysis of
Malaysia’s Industrial Prospects and Policy Options. Washington, DC: The World Bank.
202
Zin, R. H. M. (1999). Malaysian Reverse Investments: Trends and Strategies. Asia Pacific
Journal of Management, 16(3), 469–496.
Zin, R. H. M. (2014). Malaysian Development Experience: Lessons for Developing Countries.
Institutions and Economies (Formerly Known as International Journal of Institutions and
Economies), 6(1), 17–56.