COMMODITY INSIGHTS YEARBOOK 2021 1 - NISM
152
COMMODITY INSIGHTS YEARBOOK 2021 1
-
Upload
khangminh22 -
Category
Documents
-
view
0 -
download
0
Transcript of COMMODITY INSIGHTS YEARBOOK 2021 1 - NISM

COMMODITY INSIGHTS YEARBOOK 2021
1
� � � � � � � � � � � � �

Disclaimer: The Commodity Insights Yearbook is being made available for the limited purpose of creating awareness about commodity derivatives and related markets and is provided on as available basis. This publication contains information sourced from third party sources/ market sources on best effort basis. The user of the information assumes the entire risk of the use of information provided in this publication at their sole discretion. Every effort has been made to ensure accuracy and reliability of the information to the best of endeavors, however, NISM or MCX or any of their employees or the MCX IPF Trust/ Trustees make no warranty or representation as to the accuracy, completeness or reliability of any of the information contained herein and expressly disclaims any and all liability whatsoever to any person for any damage or loss of any nature arising out of use or as a result of reliance, any error, misrepresentations or omissions of any of the information provided herein.
The content, opinions and views expressed by the authors of the articles are those of only the authors and do not necessarily reflect those of NISM or MCX/ MCX IPF or the organizations/companies/institutions the authors bear allegiance to. Any act of plagiarism, factual error, omission or misrepresentation carried in any article vests solely with the relevant author and not to NISM, MCX/ MCX-IPF or any of their employees/ Trustees. Notwithstanding the content carried in any part of the Yearbook, NISM, MCX/ MCX-IPF does not provide or endorse any forward-looking statement or a price view. The information contained in this document is not intended to provide any professional counsel or investment advice and should not be used as such.
All rights reserved. No part of this publication may be reproduced, stored in a retrieval system or transmitted in any form, or by any means – electronic, photocopying, recording, scanning, or otherwise – without explicit prior permission of NISM or MCX.

COMMODITY INSIGHTS YEARBOOK 2021
3


COMMODITY INSIGHTS YEARBOOK 2021
5


CONTENTS
Foreword Preface
I. IndIan CommodIty derIvatIves markets 05
II. emergIng trends - speCIal FoCus: Base metals 07
theme note: trading in Base metals – progress and perspectives
1. Copper: a barometer of global economy setting its foothold in India 12 - Hanish Kumar Sinha
2. Industrial metals as economy builders – contribution, indicators of economy growth 18 – Sandeep Daga
3. Financialization of metals using warehouse receipt financing 22 - Viral Shah
4. Investment strategies for base metal futures and options 26 - Kishore Narne
5. Index based investments – a case for base metal index 30 – Ramesh Varakhedkar
6. Challenges in ensuring quality standards in storage and delivery of base metals 34 - Pranav Jhawar
7. developing domestic pricing and quality standards – Challenges and way forward 38 – Arunava Bandyopadhyay, Nilotpal Sarma, Prabina Rajib
III statIstICs 43
1. key economic Indicators 45
2. non-agricultural commodities 61
• PreciousMetals–Gold&Silver 63
• BaseMetals–Aluminium,Copper,Lead,Nickel&Zinc 77
• EnergyCommodities–CrudeOil&NaturalGas 101
3. agricultural commodities 115
• Cotton 117
• Oilseedscomplex–CPO&CastorSeed 123
• Spices–Cardamom&MenthaOil 131
• Rubber 137
(Electronic copy of the yearbook is also available at https://www.mcxindia.com/education-training/publications/commodity-insightsyearbook)


1

COMMODITY INSIGHTS YEARBOOK 2021
2
Intentionally kept blank
33

COMMODITY INSIGHTS YEARBOOK 2021
4
Intentionally kept blank

COMMODITY INSIGHTS YEARBOOK 2021
5
Indian Commodity Derivatives Market – Widening Scope
Indian commodity derivatives market has remained on a steady growth path during the last year or so, despite the frequent disruptions from the Covid-19 pandemic and the resultant lockdowns. Notwithstanding the uncertainty resulting from the emerging new variants of Covid-19 and the operational constraints from lockdowns, India’s commodity derivatives market has remained resilient and expanded its scope with successful launch of new products, backed by supportive regulatory and robust trading systems. Rapid vaccination drives have helped in containing the spread of the pandemic, helping in lifting lockdowns and returning to normalcy in economic activities across the country.
Global economic recovery, though stillperceived to be uneven, has provided the necessary boost for trade in commodities, particularly those in the energy and industrial metals segments, during the last one year, owing to rise in demand across the globe. According to the World Bank’s Commodity Markets Outlook October 2021, the prices ofenergy, especially natural gas and base metals, have witnessed a significant increase in 2021 compared to that in the previous year.
Indian commodity markets also witnessed a surge in energy and base metal prices as the global volatility trends percolated to domestic markets. Consequently, trade volumes in energy and base metals derivative segments increased as stakeholders in these commodities sought to hedge their risk exposure using derivatives traded on domestic exchanges.
Widening ScopeIndian commodity derivatives market has witnessed successful launch of new products in the last one year or so, prominent among these being futures on commodity indices. MCX has recently introduced futures onMCX ENERGDEXon October 7, 2021 after successfullaunch of futures contracts on MCX BULLDEXandMCXMETLDEXin2020.
Trade volumes in the Indian commodity derivatives market continued to be impressive in the last one year or so. In the futures segment, the Indian commodity market registered a moderate fall of about 6% in trading activity due to Covid-19 during FY 2020-21 to Rs.83.5 lakh crore total value traded across all exchanges, including the futures on commodity indices, from Rs.89.3 lakh crore during FY 2019-20. The average daily turnover (ADT) of commodity futures declined by about 5% to Rs.32,909 crore from Rs.34,491 crore
during the corresponding two years. Despite the recurrence of pandemic in the current financial year, commodity futures trade across all exchanges registered an ADT of Rs. 29,021 crore in the first half of the current financial year, FY 2021-22.
Trading in options contracts registered a robust growth of about 197% to Rs.8.7 lakh crore notational trade value(including both options on futures and options in goods) in FY 2021-21 over Rs. 2.9 lakh crore in the previous year. Further extending the strong growth trends in the first five months of the current financial year, trading in options posted about 90% increase in terms of ADT to Rs 6474 crore from about Rs.3400 crore during the corresponding months of the last financial year due to sharp increase in trading of energy options. Commodity segment-wise share of notional traded value of options contracts is presented in Table 1.
1,97
0 6,95
2 11,9
77
13,3
75
17,0
42 25
,458
38,9
22
58,4
71
55,8
91
32,7
25
24,1
90
26,0
05
24,9
65
23,6
58
28,0
03
34,4
91
32,9
09
29,0
21
-
10,000
20,000
30,000
40,000
50,000
60,000
70,000
2004
-05
2005
-06
2006
-07
2007
-08
2008
-09
2009
-10
2010
-11
2011
-12
2012
-13
2013
-14
2014
-15
2015
-16
2016
-17
2017
-18
2018
-19
2019
-20
2020
-21
2021
-22H
1
Average Daily Turnover of Indian Commodity Futures Market (Rs. crore)
Source: SEBI, FMC, respective Exchanges
Levy of CTT July 2013

COMMODITY INSIGHTS YEARBOOK 2021
6
Major Regulatory and Policy Developments Policy and regulatory enablements continue to drive the growth of India’s commodity derivatives market. Some of such recent enablements include the following:
Setting up of Bullion Exchange The Union Budget 2021-22 proposed to designate SEBI as the regulator for domestic gold exchanges (outside IFSC), following which SEBI circulated a consultative paper on proposed frameworkforGoldExchangeinIndiaanddraft SEBI (Vault Managers) Regulations, 2021 inviting comments from public in May 2021. Subsequently, the SEBI Board has cleared the framework for setting of gold exchange in September 2021. A gold spot exchange can complement the derivatives market for this metal and facilitate the comprehensive development of the domestic gold market. Besides, a bullion exchange is being set up at the International Financial Service Centre (IFSC)atGIFTCity,Gujaratandapilotrunhas been conducted on August 18, 2021.
Strengthening of warehousing and regulationThe government has announced the strengthening of the Warehousing Development and Regulatory Authority (WDRA) to set up a commodity market ecosystem arrangement including vaulting, assaying, logistics etc., in addition to warehousing. This step will help in developing the commodity market ecosystem in terms of quality standards and warehouse-based financing, in turn further deepening the country’s commodity markets.
Developing domestic physical market standards To develop domestic physical market standardization practices by bringing the local stakeholders of the respective commodity value chain into the Exchange’s delivery mechanism, detailed guidelines on ‘MCX Good Delivery
Norms for BIS-Standard Gold/Silver’have been prescribed to facilitate the entry of local refiners into the Exchange’s delivery process. Following this, qualified Indian refiners have been empaneled for delivery as per the specified guidelines and these local refiners have started delivery of locally refined gold on the Exchange platform. Similar indigenization of quality standards is being attempted for Base Metals too, so that local metal manufacturers can be brought into the ambit of Exchange delivery process.
Way ForwardIndian commodity derivatives market has been on a firm growth path with efficient trading systems and resilient operational mechanisms, supported by a vigilant regulatory and policy environment. There has been constant efforts by the regulator and the exchanges to expand the product base and eligible participant categories, so as to adequately fulfill the hedging as well as investment requirements of market participants, while ensuring adequate liquidity. In this regard, the following steps in terms of expanding the participation base in the commodity derivatives market may be needed to boost liquidity and facilitate reaching out to a wider stakeholder base.
permitting participation of banks: Banks can act as aggregators representing the interests of farmers and other small stakeholders, who are unable to access commodity derivatives markets due to lack of awareness, technical know-how, small quantum of crop output etc. Further, banks can handhold the small and medium enterprises to hedge against adverse price movements by providing them tailor-made OTC derivative products,thereby giving stability to their profit margins. In addition, banks will be able to cover their exposure to commodity risk, while enhancing the market liquidity. Thus, permitting participation of banks can not only enhance liquidity but also help in the overall development of
commodity derivatives markets through various catalytic roles.
participation of pension funds and insurance companies: Insurance companies and pension funds, which prefer to invest in long maturity instruments, can potentially enhance the liquidity of commodity derivatives in the far month contracts thereby facilitating participation of hedgers in the markets, while providing their constituents the diversification benefits of investing in commodities.
expansion of eligible foreign entities: Foreign entities are another category of participants whose presence can enrich the market. Foreign hedgers, also termed as Eligible Foreign Entities (EFEs), are already allowed in the market, but the norms for their participation may need to be further liberalized to encourage their entry and participation. Moreover, the market may be opened up to all types of foreign entities, including foreign investors like FPIs. Participation of foreign institutions is likely to contribute to higher quality of information flow into the price discovery process, thereby adding to the knowledge base of commodity ecosystem and buildup of technical expertise for better risk management using commodity derivatives.
Given the rapid and transformationaldevelopments witnessed in the Indian commodity derivatives market, this market is possibly undergoing a historic watershed moment currently. As the Indian economy looks towards a faster growth in the post-Covid era, it is essential to envision a vibrant commodity derivatives market, setting up global standards, facilitating better integration between spot and futures market, offering efficient derivative instruments with high liquidity and reaching out to diversified market participants of the commodity ecosystem. It is in realizing this vision that the Indian commodity derivatives market would not just realize its true potential, but also play its rightful supportive role for the Indian economy.
Table 1: Trends in notional trade value of options contracts (Rs. crore)
Bullion share (%) metals share (%) energy share (%) agri share (%)
2018-19 135700 75 6493 3.58 38752 21 174 0.10
2019-20 164655 56 2263 0.78 124825 43 42 0.01
2020-21 819018 94 89 0.01 47892 6 33 0.00
2021-22# 423188 61 99 0.01 275870 39 54 0.01
# April-August 2021 Source: SEBI Monthly Bulletin, Handbook of Statistics

COMMODITY INSIGHTS YEARBOOK 2021
77
EMERGING TRENDS
Special Focus: Base Metals

COMMODITY INSIGHTS YEARBOOK 2021
8
Intentionally kept blank
8

COMMODITY INSIGHTS YEARBOOK 2021
9
Trading in Base Metals – Progress and Perspectives
Base metals are considered as the building blocks of any economy with their critical role in construction, infrastructure and various other industries like automobiles, electricity, etc. For instance, copper is essential for wiring in residential and commercial structures with medium-voltage distribution and low-voltage connections, while aluminium is preferred for overhead power transmission lines. Most common and largely used base metals include copper, aluminum, lead, nickel, tin, and zinc. Among the base metals, copper is most extensively used metal with wide applications ranging from electric applications to telecommunications and transport. As a result, the rise in demand for base metals is considered as an indicator for economic health and development of a country.
While the role of base metals as economy builders has been well known for centuries, their importance as investment choice has gained significantly in the recent times across the world. Base metals have become an important asset for portfolio diversification apart from precious metals. Various avenues for investment in base metals include futures, options, exchange traded funds (ETFs), index funds, index futures, etc.
Globally,LondonMetalExchange(LME)is the oldest exchange traded platform with its inception in 1877 providingvarious types of derivative contracts for trading in base metals to fulfil both risk management and investment functions apart from providing global benchmark reference prices as well as quality standards for base metals. Similarly, the CME Group and the Shanghai Futures
0
2000
4000
6000
8000
10000
12000
2006
2007
2008
2009
2010
2011
2012
2013
2014
2015
2016
2017
2018
2019
2020
2021
Chart 1: Average Daily Turnover in Base Metal Futures on MCX ( Rs crore)
Exchange (SHFE) in China established in 1990 have also proven to be catalysts in the development of base metals ecosystem in their respective markets, while providing benchmark references for the international markets. Thus, commodity exchanges, while providing efficient trading platform for derivative instruments in base metals, have not only facilitated the transparent price discovery and efficient risk management for the stakeholders and market participants, but also ensured the overall development of entire base metals ecosystem.
Indian base metals markets are witnessing a similar trend as the commodity exchanges have established transparent trading mechanisms accompanied by efficient physical delivery and settlement processes fulfilling the hedging needs of various stakeholders of base metal value chain while providing investment opportunities.
Source: MCX
Investment in base metals in India become popular only recently with start of online futures trading in base metals on domestic exchange in the mid-2000s. Base metal futures, while providing effective price risk management cover to the hedgers, have also become important asset for investors to diversify their investment portfolios with their strong linkages to major sectors of economy. Trading volumes in base metal futures have gained momentum till 2012 but lost significantly from mid-2013 following the levy of Commodity Transaction Tax (CTT), though the volumes have recovered in the subsequent years. Trends in average daily turnover (ADT) in base metal futures during the past one and half decade or so presented in Chart 1.
Apart from futures, options contracts on a few base metal futures (futures of Copper and Zinc) as underlying werealso introduced for trading in Mid-2018.
Trends in monthly notional trade value of options on futures are presented in Chart 2.

COMMODITY INSIGHTS YEARBOOK 2021
10
In addition, following regulatory clearance, futures contracts on a base metal index, MCX METLDEX, werelaunched successfully inOctober2020.Trading in METLDEX futures has beenpicking up steadily as indicated by the monthly trade value presented in Chart 3. Base metal index futures are perceived to provide a very good investment option for investors as the performance of the index represents the collective performance of all the metal constituents. Further, with their relatively small trade size, index futures provides an excellent investment tool to the small market participants.
0
200
400
600
800
1,000
1,200M
ay-1
8Ju
l-18
Sep-
18N
ov-1
8Ja
n-19
Mar
-19
May
-19
Jul-1
9Se
p-19
Nov
-19
Jan-
20M
ar-2
0M
ay-2
0Ju
l-20
Sep-
20N
ov-2
0Ja
n-21
Mar
-21
May
-21
Jul-2
1Se
p-21
Chart 2: Options on Futures Monthly Notional Trade Value (Rs. crore)
Developing domestic price benchmarks and quality standards has been the focus for the recent regulatory policies and the persistent efforts by the exchanges. Towards this, the settlement type of base metal futures contracts has been changed in recent years and these contracts are now all settled based on the domestic market prices with compulsory delivery. In addition, domestic exchanges are engaging in developing Indian quality standards for various metals and the recognition of their acceptance for good delivery deliver through exchange-accredited warehouses.
While base metals are crucial contributors in the growth of the economy, the presence of an efficient base metals ecosystem becomes essential to ensure not only transparent trading in base metals, but also to facilitate hedging and price risk management for all the stakeholders in the value chain and associated industries. In this regard, the presence of an efficient metals warehousing and related infrastructure is crucial for the development of base metals ecosystem, as they connect the physical markets with financial markets ensuring a seamless delivery processes. Besides, trading of base metals requires financing support in the entire production and logistics process, and given the large demand for financing support, base metals manufacturers and traders often get operationally constrained. Under such situation, providing financial support through warehouse receipt financing can help the stakeholders of base metal value chain by availing credit facilities from financial institutions. As the regulation of base metals warehousing is expected to come under the purview of the Warehousing Development and Regulatory Authority (WDRA) soon, the electronic negotiable warehouse receipts (eNWRs), issued against base metals deposited in the regulated warehouses, can be expected to link warehousing to formal finance channels to a much greater degree than is happening now.
The 2021 edition of the Commodity Insights Yearbook is dedicated to Base Metals. The special articles presented in the Emerging Issues section of this year’s Yearbook provide intricate discussions on some of the issues and perspectives relevant to this commodity segment, while highlighting and elaborating the contemporary issues concerning various stakeholders of base metal value chain, as well as market participants.
Source: MCX
0
500
1000
1500
2000
2500
3000
3500
4000
Chart 3 MCXMETLDEX Futures Monthly Trade Value (Rs. crore)
Source: MCX

COMMODITY INSIGHTS YEARBOOK 2021
11
Intentionally kept blank
11

12
Copper: A Barometer of Global Economy Setting its Foothold in India
Dr. Hanish Kumar SinhaProfessor of Practice, National Institute of Securities Markets (NISM)

COMMODITY INSIGHTS YEARBOOK 2021
13
Armed with a Ph.D. Degree in Agricultural Economics from Banaras Hindu University, Dr. Hanish Kumar Sinha has over 20 years of working experience in the field of Agriculture and Agri-Warehousing. He is a Certified Sigma Six Black Belt and successful Business Analyst. Currently he is associated with National Institute of Securities Markets - An Educational Initiative by SEBI as Professor of Practice.
Prior to NISM, Dr. Sinha was associated with National Bulk Handling Corporation where he was leading the Commodity Research Team and was involved in the role of commodity valuation, risk management and business advisory. He was also associated with National Collateral Management Services Limited (NCML) where he brought out several issues of India Commodity Year Book - 2011, 2012, 2013 & 2014. He has made notable contributions across print and electronic media as “Commodity Expert” and has shared valuable insights with regards to commodities market on various business channels and print media.
He has authored two Books:
l Copper : The True Fighter - Secrets Down the Memory Lane (IsBn: 9781636068084)
l Understanding Indian Commodity Market - An Overview of Operation, Regulation and Approach to Price Trend Analysis (IsBn: 9788175110502)
Copper is the third-most-consumed industrial metal behind iron and aluminium and is one of the oldest metals known to humanity, which was discovered and first used around 10,000 years ago for coinage and jewelry making. In terms of its property which makes it valuable for modern industrial usage, copper is second only to silver when it comes to the value of thermal and electrical conductivity. Copper is also widely used to make alloys by combining it with other metals to provide economic and usage value. Since it is a good conductor of electricity and is ductile, it acted as a significant vehicle for the industrial revolution. The major industrial uses of copper are wiring, piping, electrical products, building construction, infrastructure, power generation and transportation. With the renewed focus on green energy, the demand for copper has been expected by various experts to be robust and keeps the supplies under pressure.
Copper supply scenarioAs per the International Copper Study Group&U.S. Geological Survey, globalproduction of copper is dominated by Latin American Countries followed byChina, Australia, and the U.S. Chinese domestic production constitutes almost 12 per cent of international mined copper tonnage, behind Chile (the global leader at 25 per cent) and slightly ahead of the U.S. (about 5 per cent) (Table 1). Over the years, themine production remained stagnant at around 20.5 million M.T. (Table 2). With the current rate of mine production, the strategic reserve of copper is likely to last for another 40 years if no new
exploration of mines takes place, which calls for increased investment in finding the new exploration sites of copper mines the new explorations.
The year 2020-21 has experienced some stress amidst the closure of mines on the back of the COVID pandemic.The supply of copper from the mines has always been a concern for the last few years, as shown in Figure 1. Chile’s copper output decreased 1 per cent in 2020, whereas production in Peru fell 12.5 per cent. The unrelenting nature of the pandemic remains a persistent threat to copper miners. The danger of
COVID-19innationsinSouthAmericaislikely to hamper the exports of copper concentrate into the global market. World refined copper balance in the first ten months of 2020 indicates an apparent deficit of about 480 thousand tons due to strong Chinese demand. Chinese usage increased by 14 per cent, offsetting usage declines in other regions of the world. Apart from the mine supplies, recycled copper plays an integral part in the copper economy since today’s primary copper is tomorrow’s recycled material.
table 1. Country wise mine production & strategic reserves
rank CountryWorld mine
production (000 mt)% share in
Worldstrategic reserves
(000 mt)1 Chile 5223 25.38 2000002 China 2454 11.93 260003 Peru 1837 8.93 870004 Australia 1402 6.81 870005 Russian Federation 1354 6.58 610006 United States 1068 5.19 510007 Canada 886 4.31 190008 Zambia 790 3.84 170009 Poland 655 3.18 23000
10 Kazakhstan 650 3.16 2000011 Others 4257 20.69 220000
GrandTotal 20,577 100.00 811000Source: International Copper Study Group & U.S. Geological Survey, 2020
table 2. World refined Copper usage and supply trends
particulars 2018 2019 2020 2021 (Jan - apr)
World Mine Production 20579 20571 20577 6811
World Mine Capacity 24063 24164 24765 8443
Mine Capacity Utilization (% ) 86 85 83 81
Primary Refined Production 20040 20012 20579 6878
Secondary Refined Production 4035 4028 3875 1300
World Refined Production 24075 24041 24454 8178Source: International Copper Study Group (ICSG) April, 2021

COMMODITY INSIGHTS YEARBOOK 2021
14
Copper demand scenarioCurrent supply and demand conditions favour market conditions to remain tighter. Physical inventory levels are nearing record lows (with the LondonMetals Exchange’s current copper inventory level near 15-year lows), indicating that any new consumption would have to be supported by additional refined copper production. The demand side has been more robust, driven by government stimulus spending centred on infrastructure, particularly China, the world’s largest copper consumer. As the world shifts towards clean energy solutions, it will likely add to the demand-side pressures.
Its industrial utilization has always led to the demand for copper, the trend of which is shown in Figure 3. Due to their durability, machinability, and ability to be cast with high precision and tolerances, copper and copper‐based products are used to manufacture computers, electrical appliances, wires, air conditioners, cookware, and brassware. The massive expansion plan of $600 billion in transportation infrastructure, including$174billion inelectric vehicles and $115 in bridges, roads, and highways in the United States, is likely to add to demand-side pressures as the funding results in the implementation of the policy vision.
In the rest of the world, the demand side is equally strong, driven by government stimulus spending centred on infrastructure, particularly in China, the world’s largest copper consumer. The world’s largest consumer of copper has recently unveiled its 14th Five-Year Plan, highly supportive of more robust copper demand. In particular, the plan’s focus on rural revitalization, decarbonization, and pledges to advance infrastructure construction, transportation, power, green energy, digital development, and technological innovation set a strong demand trend for Copper in China.Ontheotherhand,itislikelytobe challenged by limited mine supplies, shipping delays, especially from Chile, and China’s unofficial ban on Australian concentrate imports.
Overall, pending recovery and thegrowth momentum in green investing are likely to keep the copper markets see the demand pressures overwhelming the available supplies maintaining the volatility in prices. The shift in the preference from the conventional vehicle to Electric vehicles is expected to boost the demand for copper by
Figure 1. Trend in Copper Concentrates Production
Figure 2. Trend in Refined Copper Production
Source: International Copper Study Group (ICSG), 2020
Figure 3. Global Trend in Production and Consumption of CopperFigure 3. Global Trend in Production and Consumption of Copper
13000
15000
17000
19000
21000
23000
25000
2000
2001
2002
2003
2004
2005
2006
2007
2008
2009
2010
2011
2012
2013
2014
2015
2016
2017
2018
2019/p
Mine Production Refined Production Refined Usage
Source: U.S. Geological Survey, 2020
Unlike other commodities such as energy or food, copper is not “consumed”. Copper scrap comprises either metal discarded in semis fabrication or finished product manufacturing processes (“new
scrap”) or end‐of‐life products (“old scrap”). Refined copper production attributable to recycled scrap feed is classified as “secondary copper production”. (Figure 2)

COMMODITY INSIGHTS YEARBOOK 2021
15
about four-folds, as per various research reports. Copper supplies are expected to grow at least 5 per cent to meet growing demand from the automotive and renewables sectors. The challenge will be to get the copper ore, concentrate supplies, and steady copper prices to support the growth momentum. Moreover, the cost of electric vehicles remains out of many consumers’ reach. It is likely to remain so unless National governments undertake efforts to make them more accessible to keep up the replacement rate of the existing vehicles running on heavily polluting internal combustion engines.
As seen above, the demand for copper
in the world’s major derivative markets such as the London Metal Exchange,Chicago Mercantile Exchange, Shanghai Futures Exchange and Multi Commodity Exchange of India as well.
Price risk management The role of the commodity exchange has historically been to facilitate and make transparent the process of settling prices and at the same time provide an opportunity for the value chain players to manage their margins and keep their business healthy. In these exchanges, prices are settled by the continuous auction mechanism, reflecting the market’s perception of the impact of
Warehousing Finally, a robust and credible warehousing infrastructure is a sine qua non for an effective Commodity Derivatives Market that can instill confidence amongst the market participants and other stakeholders. Unlike the global exchanges, the Indian Copper market is not adequately supported by well-developed forward curves and regulated warehouses. It was overwhelmed by producer warehouses that are too few and concentrated mainly near the major production/consumption centres. Currently, the Warehousing Development and Regulatory Authority (WDRA) does not accredit warehouses for non-agricultural commodities. A network of regulated warehouses following standardized and scientific storage norms well-accepted governance norms backed with adequate financial safeguard mechanisms would instill greater confidence amongst value chain participants in using their facilities. It is in this regard, stakeholders would have to note that each storage facility of accredited warehouse service provider (WSP) meant for storing Base Metals/Industrial Metals has been mandated to have a fully fenced perimeter/ boundary, ensure the stored copper is prevented from distortion, corrosion, scaling and rusting, and appropriately packed. On the other hand, the WSP,its promoters and key management personnel have been mandated to be ‘fit and proper’ to carry out the business of warehousing and should have a professional management team to oversee its functioning and operations.
To efficiently manage the warehouse, the clearing corporation (CC) of the exchange has been mandated to ensure that the WSP ideally owns the warehouse or has a direct lease with the owners for at least three years. SEBI has proposed a robust framework for warehouse companies and other allied service providers engaged in non-agricultural goods to improve the delivery and settlement mechanism. Under the proposed norms for warehousing of non-agricultural commodities, there should be a tripartite agreement amongst the stock exchange, the clearing corporation and the WSP. Further, the CC has been mandated to ensure that the WSP for precious metals, eligible for accreditation, has a good facility and infrastructure for handling and storing commodities properly.
Figure 4. Price Trend of Copper in MCX, LME & COMEXFigure 4. Price Trend of Copper in MCX, LME & COMEX
0
100
200
300
400
500
600
700
800
900
7500
9500
11500
13500
15500
17500
19500
21500
1-4
-16
3-2
-16
5-3
-16
6-3
0-1
68
-30
-16
10
-26
-16
12
-22
-16
2-2
3-1
74
-25
-17
6-2
3-1
78
-22
-17
10
-19
-17
12
-15
-17
2-1
6-1
84
-18
-18
6-1
8-1
88
-14
-18
10
-15
-18
12
-11
-18
2-1
1-1
94
-9-1
96
-12
-19
8-8
-19
10
-8-1
91
2-4
-19
1-3
1-2
03
-30
-20
6-3
-20
7-3
0-2
09
-28
-20
11
-25
-20
1-2
7-2
13
-25
-21
5-2
6-2
1
LME MCX COMEX
Source: https://in.investing.com (July 2021)
has been strong enough, but the producers need additional support for pricing their products.
On the other hand, the green plan isalso seemingly adding to the cost of the miners as the social and corporate governance (ESG)-centric investorspressure miners to raise the standard of operations and reduce emissions. The copper industry is also subject to increasing scrutiny from regulators and policymakers, who aim to reduce the health and environmental risks associated with the extraction and processing of copper concentrates. Higher standards will result in a higher supply cost; tighter ecological regulations could also render artisanal and small-scale mining uneconomical. It could dampen investment potential in the mining and processing industry, slowing future capacity growth further and keeping the markets volatile in the times to come while squeezing the players in the value chain out of the market. To help them manage their output or raw material prices and hence their business margins, the futures on refined copper are traded
supply and demand of a commodity at any time on a given day when the market is trading.OntheLMEplatform,copperis traded in 25 ton lots and quoted in U.S.dollarsperton;onCOMEXplatform,copper is traded in lots of 25,000 pounds and quoted in U.S. cents per pound; and on the SHFE, Copper is traded in lots of 5 tons, and prices are quoted in Renminbi per ton. These exchanges also provide for the trading of futures and options contracts meeting the needs of stakeholders with different risk-taking abilities. These allow producers and consumers to fix a price in the future, thus providing a hedge against price variations. The MCX is the primary exchange supporting the copper trade in India. Copper prices on MCX have about 82percentcorrelationwithLMEprices,whereas its correlation with COMEXis about 93 per cent, the comparative trend of which is shown in Figure 4. The existence of futures contracts also allowed benchmarking of its prices for the entire ecosystem. As these contracts are settled by way of delivery, exchanges also provide warehousing facilities that can enable the same.

COMMODITY INSIGHTS YEARBOOK 2021
16
Moreover, the present system of Negotiable Warehouse Receipts (NWRs)/electronic-NWRs (e-NWRs) for agri-commodities can be extended to non-agricultural commodities with certain modifications and longer validity to ascertain increased confidence of the industry stakeholders. Wider adoption of these norms and the coming into being of the correct type of intermediaries who can time the market based on price expectations and robust commodity price research would help develop forward curves and price guidance for the exchange-
traded futures markets. Thanks to the regulatory reforms initiated in the markets for non-agricultural commodity futures, today we have benchmark price for copper and other base metals, providing guidance for the production and sales decisions of the ecosystem players.
Conclusion In order to make hedging efficient it is necessary that India has a well-developed forward curve in the physical markets on the back of a robust warehousing mechanism assisted
by the warehouse receipt financing mechanism making non-agricultural commodities including copper good collateral to lend against. This will lead to development of depth and breadth in the long-dated contracts setting up India pricing benchmark for copper backed by a robust and transparent warehousing ecosystem integrated with efficient institutional finance.
(The views expressed are of the author and do not necessarily reflect the official policy or position of National Institute of Securities Markets)

COMMODITY INSIGHTS YEARBOOK 2021
17
Intentionally kept blank
17

18
Industrial Metals as Economy Builders – An Indian Perspective
Sandeep DagaRegsus Consulting Private Limited

COMMODITY INSIGHTS YEARBOOK 2021
19
In 23 years of his professional career, Sandeep has seen currency and commodity price risk management in three roles viz: as a banker, from corporate front-office hedging desk and as a consultant.
Sandeep had worked with Aditya Birla Group (Hindalco) in Mumbai and Standard Bank Plc in London. He is currently acting as risk management consultant through his company Regsus Consulting Private Limited.
Established in 2009, Regsus is a risk management consulting advisory company with focus on hedging commodities at overseas exchanges. It helps setting up businesses for commodity hedging, auditing risk management setup, conducting training etc. Regsus, through its app, Metal Intelligence Centre (MIC), provides news, research, data and analysis on base metals. The app is used by several corporate houses in India.
Sandeep was awarded with SME leaders award 2018 by Institute of Chartered Accountants of India in the category of Best Commodity Price Risk Management.
Sandeep is a qualified as Chartered Financial Analyst, from Institute of Chartered Financial Analyst of India (ICFAI). He qualified as Certified Treasury Manager, with All India First Rank. He completed Chartered Accountancy in 1996 with All India 13th Rank. He is a cost and works accountant as well
The development of a country is a toilsome task. Crafting country’s growth trajectory requires a long-term vision and also consistent efforts with careful execution, spanning over many decades. The task becomes even more challenging for a country as diversified as India.
Growingisbeautifulandis(possibly)themedicine to all economic evils. But the quality and sustainability of growth is what matters in the long-run. This brings up the importance of infrastructure and metals.
Growth cyclesGrowthcyclescantaketwoforms.
First is repeating cyclical growth that typically lastsfor5-7years.Thistypeofgrowth cycle is quite linked with interest rate cycle and inflation, that move up and down over period, and is also influenced by growth in other countries.
On the other hand, structural growth,that could last for several decades, brings a lasting change and prosperity to a country. It reshapes the landscape of domestic industries. It turns villages into towns, towns into cities, reduces poverty rates and enhances per capita income of the countrymen. Such strong momentum of growth is seen once in many generations and sometimes once in many centuries.
Most often, infrastructure development sits at the core of structural growth. A gradual, but consistent efforts, towards building up the basic framework of roadways, railways, airways, waterways, electricity, internet, education, sanitation, healthcare etc create capacities (for businesses to grow), large scale jobs (for individuals) and opportunities (for start-ups) in an economy.
Looking backHistory tells us that the golden era of economic development in a country or region has been closely associated with a strong industrial boom. And, in all these cases, infrastructure development has preceded or coincided with the growth period.
The defining period of growth in Europe (1700-1800),US(1900’s),Korea(1970’s),Japan(1970-80),SouthEastAsian“Tigereconomies” e.g. Malaysia, Indonesia (1990s) and China (2000’s) tell the tales of how structural growth redefined the landscape of respective countries.
A massive scale of construction, that was undertaken in these economies, had set the stage for them to grow at a “never before, never again” rate. Infrastructure investments seeded scale and productivity growth that helped domestic industry to become and stay globally competitive.
India is walking the same road and therefore its growth story isn’t (and won’t be) any different.
Industrial metals as growth catalystIndustrial metals are the building blocks of infrastructure developments. Metals are key to making everything from houses to electric cars, roads to bridges and ports to cities. Due to their widespread use, growth rate of their consumption symbolises the pace of economic growth in a country, especially in case of developing countries like India.
History is full of examples of strong metal consumption growth marking the best years of economic growth of a country.
Base metals consumption was growing in China was 15-20% per annum (pa)
in its peak growth years between 2002 and 2011. Its steel consumption grew by 14% pa in the same period. Country’s GDPgrowthratepeakedat15% in thesame period.
Similarly, Japanese steel consumption grew by 9% in the heady years of its growth in the 1970s. US and Europetoo saw similar pattern of metal consumption growth closely associating withtheirGDPgrowth.
Further, we gather from history that it is not only the demand for metals thatfuelstheGDPgrowth,itisalsothebuild-up of metal supply chain in the country that brings the change. The past tells us that the region that sees an explosive growth in demand for metals also becomes the largest creator of new supplies.
Between 2002 and 2012, when China was undergoing period of strong growth – led by infrastructure investments - nearly 90% of incremental growth in global base metal demand came from this country. Interestingly, nearly 85% of the new capacity of smelters and refineries globally too, in that period, came from this country.
A similar pattern was seen in Europe, US and Japan in their respective periods of strong industrial growth. Most of the large industrial metal and metal product producers of this region, who are well-known today, had begun business in those boom years.
The Indian growth trajectoryThere is no doubt that Indian economic growth story is and will continue to be closely linked with its scale of infrastructure spending. The comparative data suggest that we are just about getting started and have miles to go.

COMMODITY INSIGHTS YEARBOOK 2021
20
India deserves but is starved of world quality infrastructure. Although a lot has been done in electrification, construction of roads, rail network, airports and internet connectivity, a lot remains to be done over the coming years.
Similar to the growth model seen elsewhere, government spending needs to continue to lead the way in India as well. Typically, private sectors hesitate from committing money in long-term asset like infrastructure.
Every year the general budget of the country commits a large sum of money for infrastructure investments. Yet, for bringing a structural growth outburst, that the country needs, it needs to scale and speed up the spending plans, and also make them intensive and extensive.
The “never before, never after” moment of India growth is yet to arrive. However, this needs a well-laid out 10-20 years large infrastructure spending programme. For this purpose, India needs money.
Where are the funds?Europe, Japan, Korea and China, got their capital from several decades of current account surplus. US got it from low interest rates and its affordability to finance its budget deficit through quantitative easing.
India is a current account deficit country and could remain so. Yet, it can emulate Japanese, Korean or Chinese model. For this purpose, it needs to tweak its growth model to turn into an export-oriented nation. This could augur well in the current times when China is turning inward.
For this purpose, India needs to have a targeted approach. It should identify the industry segments and product-lines which have potential to reach global scale and quality standards. Thereafter, fiscal policies can be fine-tuned to encourage entrepreneurial participation.
Alternatively, the country may have to find other ways to fund its infrastructural spending ambitions. Given that theseinvestments are long-term and low-yielding in nature, following funding solutions can be explored:
1. India has quite low direct-to-indirect tax ratio. For a country to grow, this needs to change. The tax-payer base of the direct taxes and their compliance should be enhanced.
2. The country can set up a separate Special Purpose Vehicle (SPV) that could own new (or selected) infrastructure investments in the country. Global and domesticfunds can be invited into invest in the the SPV. Tax breaks and sovereign guarantee can be added as sweeteners. Zero to negativeyields in the West and attractive opportunity to participate in the long-term growth story of India could lure foreign fund houses. Also, insurance and pension fund houses of the country, who have long-term investible money, may find this as an attractive investment idea.
3. The country can borrow on the back of collateralised securitisation of future revenues from toll-taxes, port charges, airport taxes etc. This can either be on portfolio basis or for individual projects.
4. Use of foreign exchange reserve for infrastructure investments has been debated several times in the past. This deserves a serious debate and experimental beginning.
5. The country can also undertake focussed Quantitative Easing (QE) for buying back bonds specifically issued for funding infrastructure investments. Such QE will avoid crowding out regular borrowings and will thus keep yields stable.
Moreover, the government can frame direct/indirect tax breaks and subvention schemes to invite private sector to invest in low-break infrastructure investments.
Self-dependency in mining is crucialMerely creating demand for metals won’t be sufficient for India’s growth model. The country would also need to
proactively build a home-grown supply-chains of metals and metal products. In absence of this, the rise in import of metals, to feed the growing demand, could expand an already worrying current account deficit and thus become a drag on the economy.
India was known as “golden bird” of natural resources. The English, during their rule, exploited our resources to the best of their ability. However, unfortunately, we neither explored nor invested in our mines enough.
Except the mineral deposits explored till early 1990s, no new significant deposit of base, precious or minor metals has been found or put on the geological map of the country. This needs to change. For India to become self-dependent on its metal needs, the country needs to invest more in mining exploration and extraction. The latest technologies and innovations should be used to map the geological ore deposits of the country. Even if we start now, it could take several years and decades before we start reaping the benefits.
We can learn from US history in this regard.
The oil crisis of 1930s seeded the need for US country to become self-dependent. The geologists of the country worked for several decades to find a solution to this and eventually zeroed on shale oil and gas. Investments and production grew rapidly over the last decade.
Today, nearly 36% of US oil comes from shale oil industry. Also, US has become a net exporter of oil products.
Is Indian metal industry prepared?We can now examine if the Indian metal industry is ready for the next wave of demand growth.
India is world’s 2nd largest producer
-
100
200
300
400
500
600
700
India China US Japan Germany
Per capita consumption of industrial metals (kgs)
Source: ICSG, ILZSG, IAI, WSA, MIC

COMMODITY INSIGHTS YEARBOOK 2021
21
countries in this regard who have a time-tested formal ecosystem.
India has recently announced modular implementation of vehicle scrappage policy. This marks a good beginning. Overtime,thecountryneedstoexpandthe scope of the policy to include recycling for all metals, generated from scrapping of consumer or industrial goods.
Moving up the value chainThe growth of a country is not reflected merely in the intensity of its metal consumption but also in the structure of its domesticmetal industry. Over timea country should moves up the value ladder by increasing the proportion of value-added products.
Under ‘Make in India’ initiative, the country aims to increase the manufacturing share of GDP to 25%by the end of 2025. Moreover, under “Atmanirbhar Bharat Abhiyan”, the country wants to substitute imports with locally sourced material. Under this initiative, the government has announced Production LinkedIncentive (PLI) scheme for13 industrialsectors. This is designed to strengthen manufacturing and export capacities.
In order to feed its future demand for metal products, the country needs to expandPLIschemestoseveralofthosemetal products that the country imports on net basis currently or would turn into a net importer of due to capacity expansionsunderexistingPLI schemesfor user sectors e.g. automotive components or durable goods.
Conclusion Metal intensive structural growth, which is driven by a large-scale infrastructure investment, brings generational change in a country. Similar to other nations, who walked through this path in the earlier years, India too has started its journey. However, the country needs funds and also a right policy framework to stimulate both, demand and supply. The current times are apt for India to take some calculated risk to bring “never before, never again” period in its growth trajectory which the country very well deserves.
of steel and aluminium. Also, most often, India is a net exporter of these metals. The country owns a large pool of high-quality ores, used for producing these metals. Moreover, India is also amongst the lowest cost producers of steel and aluminium. Indian producers have state of the art production facilities and decades of experience in operating and expanding capacities, if needed. Accordingly, scaling up Indian Aluminium and Steel capacities, to match the new demand, may not be a constraint.
On the other hand, India has a largeindustry of Lead recyclers. Althoughthe industry is fragmented with a few large players and a large number of small- scale recyclers, the country has experience and capacity to step up recycling to match future needs. The industry, however, needs to consolidate in hands of responsible corporate houses who take environmental protection seriously. Government’s interventionwill be needed in this regard. Moreover, Vedanta’s Hindustan Zinc Limited hasa large deposit of high-quality ores of Leadthatmighthelpfeedingourfutureneeds for the metal.
However, the story of copper is different.
After closure of Vedanta’s smelter in 2018, India has become a net importer of copper. Moreover, the largest producer of the metal in the country, Hindalco Industries Limited, importsmost of the raw material of its needs. Further,HindustanCopperLimited,theonly integrated producer of copper, has very low scale of operation. In effect, India is dependent on imports, directly or indirectly, for most its Copper needs. Given the importance of thered-metal in the industrial growth and infrastructure build-up in an economy, Indian dependency on imports does not augur well.
Over the coming years, the Indiangovernment, in collaboration with interested corporate houses, should invest in copper mines and smelters overseas. This is particularly important for two reasons.
First, Copper ores are projected to be in surplus till 2024 but could turn into
deficit from 2025 onwards as GreenEnergy (e.g. Electric Vehicles, Solar Power, Hydro Power, EV charging infrastructure etc) related demand gets critical mass. India should act proactively.
Also, with Chinese consumption growth slowing down to low single digit, the country is stepping back from new investments in metals and mines. This is good time for India to step-up efforts to grab a share of overseas resources.
Similar to Copper, India is dependent on imported Nickel as well. This can be changed.
Nickel production, through Nickel Pig Iron (NPI) route has revolutionised the industry in the last decade. Metal, produced through this route, is not only used in the stainless-steel industry but is now acceptable to the Electric Vehicle industry (in China) as well. Currently, Indonesia specialises output of NPI Nickel. India, which is rich in laterite ores, should explore for availability of NPI ores in the country and encourage setting up of domestic smelters for this purpose.
Need for an organised recycling industryIndia is a large importer of metal scrap. As the country grows, its demand for recyclable scrap too would keep growing over time. Before it is too late, the country needs to take policy steps to streamline this sector.
India has a thriving recycling industry, spread all over the country. However, a good part of it is unorganised and fragmented into lakhs of small-scale industries that have little concern for environment and product quality. Also, scrap collection, warehousing and sorting, which are labour intensive processes, are generally handled by the informal sector.
The country should encourage large players to participate in the recycling industry while complying with regulations. Metal recycling only reduces the overall cost of metal production in a country but also brings the environmental sustainability.
We can learn a lot from the Western

22
Financialization of Metals Using Warehouse Receipt Financing
Viral ShahEVP, IIFL Wealth Management

COMMODITY INSIGHTS YEARBOOK 2021
23
Commodity derivatives market in India is unique in many ways. It possibly has the higher percentage of delivery compared to the open interest (OI) in many ofthe agri and non-agri commodities. It also has monthly settlement contracts through a compulsory delivery mechanism which stretches for 5 days. Hence, with 4 sets of commodities trades i.e. bullions, metals, agri (edible & nonedible products) & softs – youhave pretty much a delivery happening almost every day in the exchange ecosystem. The growth of the delivery-based ecosystem and the acceptance of the “good delivery” standard of the exchange has resulted in increased participation of many hedgers, traders, consumers and producers in the exchange traded commodity markets.
Globally, banks are very vital to thecommodities trade since the entire supply chain - from the origination to processing to transportation to consumption requires some sort of financing arrangement either in terms of working capital or for holding inventory. More so, if the commodity is hedged using the OTC or exchange tradedcontracts – it may result in lower interest rates for the borrower since the bank may consider the loan to be safer since
- The hedged position would result in lower chance of loss due to massive price swings since the derivative position would be opposite of physical
- If the transaction is routed through the clearing corporation of the exchange – then there is no counter party risk since the exchange / clearing corporation would settle the trades
For high value commodities like industrial metals – nonferrous metals like Copper, Aluminium, Nickle, Lead,ZincandTin–financingbecomesevenmore important. In the modern era of a global supply chain, many commodities from their ores to raw materials to semi-finished & finished products areconstantly moving from one location to another and large companies use commodities as a conduit for structured trade finance. One of these very
financing arrangements is what we call as Warehouse Receipt Financing.
LME experience LondonMetal Exchange–Thepremierexchange for metals trading worldwide has brands and delivery centres spread across the world. Producers, traders and consumers all participate on the platform for price risk management as well as to honour the derivatives contract through physical delivery. But it is very difficult for us to assume that all their economic interest would be matched at all times – i.e. the producers wanting to deposit 50000 MT of Aluminium will find a buyer to take physical delivery during the same settlement period with the matched requirement. Many a times, supply exceeds demand and vice versa. Hence, we need more set of participants to provide equilibrium to the market and these set of participants needs banks as well as other financial institutions to provide financing against the deliveries that are deposited in the exchange accredited warehouses or the deliveries that are likely to be tendered during the settlement period. Without financing, it would be difficult for producers and consumers alike to pump in so much capital to hold commodities for a period of 30 days to 3yearsintheexchangeecosystem.LMEhas an efficient system of warrant-based financing, which has some of the largest global banks providing this facility.
Delivery Based Contracts for Base Metals and Need for Finance MCX started off with delivery-based contracts for base metals in March 2019. Since base metals till then were an INR equivalent contract of the overseas exchanges, the physical settlement mechanism opened a new business model, where in an India price now started getting quoted. The India prices didincorporatetheLMEpricesbutalsostarted to reflect the current demand supply scenario for a particular base metal in the country. Hence, even if a particular commodity globally was in a backwardation due to supply shortage, excess inventories in India could make the forward curve flat or in a lower backwardation compared
to the international markets. For the first time, Indian LME approved brandproducers were able to tender material to the Indian exchanges and get a better realization with lower counterparty risk as well as buyers could convert their long futures position into physical delivery.
The last 24 months have thrown some interesting numbers in the delivery based base metals contracts
- The Indian markets oscillate between premium to discount to the global exchanges. But have now gained acceptance of the MCX delivery standard in base metals
- The warehouse ecosystem has now beentestedduringCOVIDtimesandthe exchanges have created a robust framework of warehousing across 3 stated and will be expanding to 2 more in the next 2 months
- Some primary producers have started depositing LME approvedmaterial. Domestic refiners may also get permission to start depositing India standard of quality specifications
- The most active participants in the delivery process are the traders who represent both buyers and sellers on the exchange
- Churn of deliveries is very high due to non-availability of credit
- Consumers not too keen to participate, since if long derivative position results in physical delivery, they will need to make payment on T+1 basis
- GST on metals is the highestamongst all commodities @ 18%. Hence, a huge working capital is required for participants wanting to use the convenience of the exchange delivery process
- After hitting a high of 25000MT of inventory, there has been a significant dip in the stocks available for deposit in the MCX accredited warehouses
It is in this context that the next level of market development will need the “Warehouse Receipt Financing”
Viral Shah, EVP IIFL Wealth Management, has been part of the exchange traded commodities ecosystem since its inception. An alumnus from JBIMS, with specialization in Finance, he started off his career with Refco broking for some of the largest corporate clients in the onshore & offshore exchanges for commodities & FX. In his current role at IIFL Wealth, he is integrating the asset classes of commodities & FX within the wealth management set up – a first in India.

COMMODITY INSIGHTS YEARBOOK 2021
24
for increasing the throughput of deliveries on the exchange platform.
The following issues summarize the need of a robust warehouse receipt financing
- The current settlement cycle of the exchange is for futures contracts to be converted into physical during the last 5 working days of every calendar month. Hence, a producer / trader, wanting to deposit the material, needs to wait between 2 days to 25 days to realize the purchase / sale value
- Total cash flows that get blocked are as under
o Margin for derivative position ~ 10%
o Inventory Value / Principal ~ 100%
o GST on the inventory value ~18%
o MTM variance to be paid in cash ~ 5%
o Total ~ 133% of the commodity value is blocked till the expiry of the contract.
- Hence producers / importers need to have a financing arrangement which provide them relief from the 133% cash flows and allow them to generate additional turnover from the same capital
- Consumers too need to furnish similar cash flows in a very short period of time since they can be tendered delivery on any of the last 5 working days and hence need to arrange for funds on T+1 basis as per the current settlement cycle initiated by the regulator
- In the absence of proper financing arrangements, the numbers of participants and throughput will always be restricted
Financialization of Metals Metals financing is a tricky affair due
cyclical nature of the business, higher ticket size, hugeGST relatedpaymentsand also the safeguard measure to ensure the quality & quantity of thematerial. MCX, through the last 2 years has successfully demonstrated that it is possible to reduce the risk for all stakeholders through the various checks &balancestomitigatesuchrisk.
they now have a tripartite agreement through which the clearing corporation of the exchange, the financier and the warehouse service provider will be able to create lien on the warehousing receipts (Comris Credits), which are issued by the exchange accredited warehouses and shown as depository receipts in the clients demat holding. since all the concerned participants are linked through the exchanges portal, in theory it should allow for a seamless loan origination against the ComrIs credits once banks and other non-banking financial institutions can start lending against such credits or fund the consumers in case their futures contracts get converted into physical deliveries.
Challenges and way forwardHowever, certain challenges remain!
- In the current scheme of things, the financier still does not have a first loss charge on the material should an event like fire, theft, flood take place
- The business risk of double financing on the same cargo is not mitigated tillonesecuresanNOCfromallotherlenders
Having said that, there is still a huge business case for all stake holders – banks, NBFC, clients, WSP’s and exchanges to work towards removing these obstacles due to the following
- Commodity financing from banks especially metals is still above 12% per annum in most cases, whereas the rates for financing are
low for many other agricultural commodities as well as other asset classes
- Lower limit for inventory-basedfinancing
- End to end financing will allow for increase in throughput for all stakeholders
- Ability to hold the cargo for more time in the exchange accredited warehouses for a longer duration
- Lowering cost for clients if morebanks / NBFC’s start financing operations due to higher pool of capital being available
- In thepost COVID scenario –manyclients are looking for solutions to improve domestic procurement &and have a favourable outlook to the exchange delivery mechanism. With financing available at an attractive rate, they may increase their participation on the exchange platform for delivery
- India is one of the largest producers of Zinc & Aluminium as well as aconsumer for other base metals. Hence, both set of participants can be tapped for such financing arrangements
- Lower interest rates can also drivecash&carryarbitrageopportunitiesand further create “REPO” likefinancingfrombanks&NBFCs.
In it is this context that we see the current clarification from RBI, which allows banks to provide finance against warehouse receipts for non-agri, as extremely favourable. Banks are the most important pool of liquidity to take the commodity markets to the next level of growth. The market is also ripe for innovation from the new age tech enabled NBFCs, who are providing SME & MSMEs with liquidity and financingoptions to look at the warehouse receipt financing business. The financialisation of the metals market is about to the take off in a big way.

COMMODITY INSIGHTS YEARBOOK 2021
25
Intertionally Kept blank
Intentionally kept blank
25

COMMODITY INSIGHTS YEARBOOK 2021
26
Investment Strategies for Base Metal Futures and Options
Kishore NarneDirector, Motilal Oswal FinancialServices Ltd.
26

COMMODITY INSIGHTS YEARBOOK 2021
27
Kishore Narne is Director at Motilal Oswal Financial Services Ltd. (MOFSL) and has been associated with MOFSL since last Nine years leading their Commodity and Currency business. He holds a Masters’ Degree in Financial Management and has over two decades of experience of working in international and domestic Commodities as well as Currency markets.
He has been the winner of “India’s Best market analyst - Commodities” in 2011 and, “India’s Best market analyst – Forex” for MOSL in 2014 from Zee Business, “market excellence award – Bullion” from Zee Business in 2016 and “Commodity Broker of the year 2016-17” from MCX as well as “Best Brokerage House – West 2017-18 and 18-19” from MCX. He is regular on various business channels and forums as well as writes for many newspapers. He is also strategic advisor for some of the largest corporates in India and abroad.
We Indians love our Gold and Silver,and they both have dominated the investment landscape for centuries in a country where people didn’t had access to organized banking or financial markets and even when they did, lack of education in financial instruments continued to push them towardsGoldas primary instrument to save and invest their wealth. The concept of investing in commodities itself originates from the very purpose of owning the natural resources which are scarce and create value of utility. Investing in commodities is always a tactical opportunity rather than an asset class for wealth creation, so one should always have commodities in their portfolios and the weightage and the basket may keep changing depending on changes in various underlying factors.
While precious metals tend to get the most attention from investors, investing in base metals can also be a lucrative endeavour for those interested in natural resource commodities. These are more abundantly found in the nature than precious metals, so base metals fetch much lower prices. Base metals have myriad commercial and industrial purposes, with Copper, Nickel, Zinc,LeadandAluminiumbeingsomeofthemost common base metals.
Base metals as a tactical investmentFor investors, who are interested in using a portfolio of industrial metals as a tactical investment, it is useful to understand their return characteristics under different macroeconomic scenarios. When we try to correlate the returns in base metals to other assets the correlations of largest magnitude are with the Dollar Index (-33%) and industrial production (47%). The high correlation betweenmetals and industrial production is not surprising. Industrial metals, as their name suggests, are used in production, and should therefore be expected to be sensitive to economic activity. The negative correlation with the Dollar index suggests that metals retain
their positive return characteristics during periods of US Dollar decline. Finally, metals have a moderately positive correlation with unexpected inflation (22%) and inflation (13%). Thus, a broadly diversified commodity portfolio, of metals, unlike equities, tend to generate positive returns when inflation is high.
Basis as a driver of industrial metals returns One of the very important conceptsany commodity investor must know is the “Basis”. The basis is the difference between the spot price of a commodity and a futures contract that expires one or more months later. The basis is also called as premium / discount in general market terms. In the case the futures prices are trading higher than the spot price then it is called “Contango or Negative Basis” and vice versa is called “Backwardation or Positive Basis”. These two terms play an extraordinary role in assessing inventory situation in base metals and can be used as a price-based proxy for inventories, a positive basis (Backwardation) indicates lower inventories, and a negative basis (Contango) indicates higher inventories. In other terms, an expanding positive basis (Backwardation) indicates depleting inventories in other words increased consumption or decreased production, which is causing spot prices to move up, given other factors remain constant this is a bullish signal. An expanding negative basis (Contango) also means rising inventories, which may be caused by depleting demand or increasing production either way it should cause spot prices to drop and increase the contango, which means negative for prices in near term. Further, it also can be said that commodity futures earn a higher risk premium when inventories are lower than normal, but the risk is lower when the inventories are higher than usual. It is easy to manage abundance but certainly difficult to manage shortages in commodities.
Pandemic and Base Metal MarketsEver since the pandemic began, metals have been up for a frenzy, initially the prices crashed by around 20%, which was followed by liquidity enhancement as well as fiscal support measures taken up by various central banks and federal governments of many countries, which amounted close to around $10 trillion worth of additional spending and another $6.1 trillion worth of liquidity injections or purchase of debt etc. This has triggered mother of all rallies in industrial commodities, and base metals rallied anywhere between 40-100% from lows of March 2020.
Inventories Vs Price Risk
As the number of people vaccinated rise slowly, many countries started to open their economies and the demand cycle is set to pick up. With the latest push on infrastructure building in US, Electric Vehicle (EV) boom across the world, metals occupy the central focus in this recovery.
Investing in base metals: CopperCopper is perhaps the best-known base metal, and it’s not hard to see why. This industrial metal has a wide range of applications and is used in everything from wiring and plumbing to coinage and electronics. Indeed, copper is so widely used that it’s considered a valuable indicator for the health of the global economy — earning the red metal the moniker “Dr. Copper.”
Over the past few years, the price

COMMODITY INSIGHTS YEARBOOK 2021
28
of copper has faced highs and lows considering trade tensions between China and the US, along with supply concerns and now the Pandemic. Copper is largely a long-cycle commodity, which takes around 2-3 years to extend an existing mine and as-long-as 8 years to establish a new Greenfield project. This long lead timefor copper, combined with the mining sectors under investments towards new capex, thanks to sluggish prices for first half of the decade between 2010 - 2020, left the copper market in a lurch to secure the necessary supply to meet demand in the second half. Which means, copper prices must rise now to incentivise enough supply to solve prospective deficits, or risk chronic scarcity pricing in the coming years.
Copper has always been an integral part of the green transition and the recent efforts from global economies, central banks and targeted stimulus has opened the supply-gap and necessitated a rise in copper price. This is not new to the world of commodities, we see this often in agri-commodities and about a decade back we saw a similar condition in nickel that led to prices shooting off the roof and jumping 5 folds in few months, which was later followed by the required supply innovation.
At the start of 2021, “commodities super cycle” was the new buzz word with metals having all the spotlight led by the ever-growing green demand was at the heart of the metal’s price rally. Estimates suggest that in aggregate ‘green’ copper amounted to 1 million ton (Mt) in 2020, just 3% of total global copper. However, there is likely to be a rapid acceleration in green demand growth from here rising to 2.6 Mt by 2025 or 9% total global demand and is likely to increase incrementally further over the next 5 years. Over the next few years, EVs,
5G technology, wind and solar powerinfrastructure is likely to be the key incremental drivers for copper. Amidst all these, we believe that EV demand is likely to be the most salient one, and the source of demand that is most likely to face volatile revisions to adoption rates, based on consumer demand trends.
Tightness in copper mine supply is starting to ease, and treatment charges (TC/RC) are rising as a result. The second half of this year will see key projects such as Grasberg in Indonesia andKamoa in Congo ramping up, adding to other projects which are already in the pipeline. While TC/RCs have risen to around $45 a ton in July from historically low levels of just over $20 a ton in April, today’s charges still compare to more than $70 a ton in June last year andspikes as high as $130 in 2010s.
How exchange copper inventories move from here is also worth keeping an eye on, given the still-low levels. To control rising commodity prices, China announced that it would release reserves of key metals, including copper. Couple of rounds of sales has been done by the Chinese SRB, but the quantum was very small and has done little to pressurize the market. Details about sales further ahead have not yet been released, and further pronouncements may still unsettle the market.
Chinese reserve releases are not likely to be very large and are temporary in nature, the fundamentals of a tight physical market and a terrific demand outlook are being weighted more heavily. However, since the metal is widely used, higher prices are calling for substitution and rallies could be in check. Investors should focus on short term tactical moves rather than long term in copper and should keep tighter stops to protect from volatility in the second half of 2021.
Investing in base metals: NickelBHPGrouphadplannedtoexitthenickelbusiness to focus on other commodities as nickel was not a very profitable venture and had put its Nickel West unit in Australia up for sale in 2014. Today the focus on nickel represents a sharp turnaround from less than a decade ago as the company has identified the metal as one of its priorities “future facing” commodities as they shift away from fossil fuels. This shows how the story of nickel changed in the last 5 years.
Nickel is one base metal that investors may want to consider. It is essential in the world today with EV technology taking the centre stage of automobile market, nickel is increasingly getting investor attention. Nickel is taking centre stage in the mining industry’s push into the booming battery metal space. A key component in lithium-ion batteries, which has garnered eyeballs of a lot of mining giants and corporates who are now looking to invest in nickel mining related activities. The Tesla Boss – Elon Musk has also been gung-ho about this sector and the metal anticipating higher demand over the next few years and citing slim supply pipeline for the exponentially rising demand. Nickel basically packs more energy into batteries and allows producers to reduce use of cobalt, which is more expensive and has a less transparent supply chain.
Plans by China’s Tsingshan Holding Group to make battery-grade metalfrom materials previously reserved only for stainless steel have sparked fears of a market flood. However, it’s not an environment friendly process and will not go down well with the ESG eco-conscious automakers. On the otherhand, China is racing fast to increase its presence in the Nickel Pig Iron (NPI) market and higher prices makes it more viable for Chinese players to go all in. This will help the premium quality nickel sulphate (class 1) to be diverted to battery making and NPI could be used to manufacture medium grade stainless steel.
Driven by huge capacities commissioned by Chinese companies, Indonesia is about to overtake India as the second largest stainless-steel producer in the world in 2021. Stainless steel capacity of 5.5 million tons is ready in Indonesia. On the other hand, theChinese government has withdrawn export tax rebate in May 2021, which will restrict the export of stainless steel from China. As a result, exports from
75
95
115
135
155
175
Jan
-20
Feb
-20
Mar
-20
Ap
r-2
0
May
-20
Jun
-20
Jul-
20
Au
g-2
0
Sep
-20
Oct
-20
No
v-2
0
Dec
-20
Jan
-21
Feb
-21
Mar
-21
Ap
r-2
1
May
-21
Jun
-21
Jul-
21
Au
g-2
1
Sep
-21
Base Metals performace since FY2020
Copper Lead Zinc Aluminium Nickel

COMMODITY INSIGHTS YEARBOOK 2021
29
China may come down, while exports from the same Chinese companies in Indonesia will rise significantly. Indonesia, which presently ranks fourth in global stainless-steel production, will produce 4.2 million tonnes this year, up 75%year-on-year.
The electrification of vehicles will continue to have a positive impact on nickel usage using nickel sulphate in batteries. New NPI projects in Indonesia ramped up strongly in 2020 and 2021. High pressure acid leaching (HPAL)projects being developed in Indonesia and other parts of the world will have a positive impact on mine output and should result in increased supplies. World primary nickel production was 2.49 Mt in 2020 and is forecasted to
-80
-60
-40
-20
0
20
40
Oct
-20
De
c-2
0
Feb
-21
Ap
r-2
1
Jun
-21
Au
g-2
1
Oct
-21
Nickel Cash-3M Spread($)
Source: Reuters
Positive Bias
Negative Bias
reach 2.72 Mt in 2021, whereas Nickelusage was 2.39 Mt in 2020 and is forecastsanincreaseto2.67Mtin2021.Which means, the market surplus of 108 thousand tons (kt) in 2020 is expected to fall to 45 kt in 2021. This shift in demand supply balance is also reflecting in the change of basis from a Negative Basis towards Positive Basis Spread in the last one year.
As the world recovers from Covid, the Nickel demand for 2022 and 2023 is likely to come from EV and Stainless-steel not only from China but also from rest of Asia and Europe. Supply side is concentrated in the hands of Indonesia and Philippines and some NPI production coming out of China. Crude stainless-steel production in China is
likely to remain higher on a year-on-year basis, and Indonesian stainless-steel mills are ramping up towards capacity. Tsingshan’s announcement that it would convert Nickel pig iron into nickel matte to serve the battery sector, has been an overhang and if that happens, it could change the whole dynamics of the markets from a near deficit market in 2022 and 2023 to a well-supplied one. Until that the market is well poised for a continuation of the price rally well in to 2022.
Investing in base metals: METLDEXOne of the challenges as an investorwho is looking for tactical opportunities in base metal complex is that, though all the metals are predominantly driven by global economic outlook, but each metal may have very different fundamentals of demand and supply providing them short term price direction, so identifying the right metal at the right time becomes a nightmare. To avoid this problem, it is always to choose the basket approach of an Index. The recently launchedMCXMETLDEXgivesthat flexibility to not choose individual metals but invest in the entire segment and still get to participate in short-term or long-term opportunities presented. The Index approach smoothens the volatility and gives more predictability of returns at the same time the contracts being cash settled makes it ideal for investors, who are looking to participate in long term trends without worrying about the physical deliveries.
Source: Reuters

30
Index Based Investments - A Case for Base Metals Index
Ramesh VarakhedkarHead, Commodities and CurrenciesICICI Securities Ltd.

COMMODITY INSIGHTS YEARBOOK 2021
31
Mr. Ramesh Varakhedkar is presently heading the commodity and currencies vertical at ICICI Securities Ltd. He brings with him an immense experience of over two decades across banks, exchange, and broking industry.
He has strong domain knowledge about Commodities & Currencies traded in India along with rules and regulations of exchange and regulator. He is also a member of Product Advisory Committee (PAC) for Index Derivatives at Multi Commodity Exchange of India Ltd.
Prior to ICICI Securities, he had worked with Karvy Stock Broking Ltd, MCX Stock Exchange Ltd. and Citibank N.A. Mr. Varakhedkar is trained in management through the Accelerated General Management Program from IIM-Ahmadabad and MDP Program -Executive Program in Applied Finance from IIM-Kolkata.
IntroductionA market index is an investment portfolio that reflects a portion of the financial market. The prices of the underlying holdings are used to calculate the index value. Market-cap weighting, revenue weighting, float weighting, and fundamental weighting are all used to calculate the values of several indices. An approach of modifying the individual impact of elements in an index is to weight them.
Market indices indicate a diverse range of investment holdings. Individual index construction methodologies differ, however virtually all calculations are based on weighted average mathematics. Indexes are used as benchmarks to measure market sector change and performance. Indexes are used as a foundation for portfolio or passive index investment by investors.
Indexes serve as benchmark comparisons for a variety of purposes across the financial markets as a notional portfolio of securities. The Dow Jones IndustrialAverage, S&P500, andNasdaq Composite are three popular U.S. indexes. The 30 largest stocks in the United States by market size, the 500 largest stocks, and all stocks on the Nasdaq exchange are included in these three indexes, respectively. These benchmarks can be a decent indication of the whole U.S. stock market because they comprise some of the most important U.S. stocks.
Indices are best investment options for investors as these products will perform collectively of individual constituents within it. Indices are the best investment tools for all types of market participants.
Some of the most popular commodity indices in the world are Bloomberg Commodity Index, Thomson Reuters CRB Commodity Index, Rogers International Commodity Index, Dow Jones Commodity Index etc. The indices
were absent in the Indian commodities market albeit many commodities available for trading across the globe. After taking the regulation of commodity market from the erstwhile Forward Markets Commission, the Securities and Exchange Board of India (SEBI) made a series of initiatives and introduction of trading in commodities indices was among those initiatives.
According to the rules and regulations framed by the regulator for launching commodity indices, MCX launched futures contracts on sectoral bullion index named as BULLDEX and ametalindexnamedasMETLDEX.
Advantages of investing in index DerivativesCommodity Indices solve most of the challenges faced by commodity traders who trade in single commodity.
(a) Whose positions and margins are concentrated in a single commodity, to trade one lot of copper or nickel margin requirement is
approximately Rs. 2 lakh. Similarly, margin requirement for lead, zinc and aluminium is approximately Rs 1 lakh per lot, for gold 1 kg or silver 30 kg contract margin requirement is approximately Rs. 5 lakh and Rs. 2.5 lakh, respectively.
(b) All these bullion and base metal contracts are compulsory delivery contracts. It means, one has to square off his / her positions before they move into staggered delivery period.
Global PerspectiveLMEX is the metal sectoral indexavailable for trading on London MetalExchange and this index is constituent of aluminium, copper, lead, zinc, nickel and tin.Asondate,theLMEispublishingtheindex values based on the calculation adopted while framing the index and trading is suspended inLMEXeffectivefrom 4th November 2019 because of no tradesintheLMEXfuturescontractsfornumber of years.
42.80%
31.20%
14.80%
8.20% 2.00% 1.00%
Chart 1: Composition of LMEX
Aluminium Copper Zinc Lead Nickel Tin

COMMODITY INSIGHTS YEARBOOK 2021
32
Indian perspective
The liquid base metal futures contracts traded on the MCX, namely futures of aluminium, copper, lead, nickel, and zinc,areincludedintheMCXMETLDEX,which is one of the sectoral indices. The Index is a useful tool for investors, who want to manage their base metals assets, and it’s great for benchmarking and trading because it’s an excess returns index. Because it is a broad-based index that includes essential industrial metals, the index also serves as a barometer of the industrial sector’s fundamentals and performance, notably in the metals-using manufacturing sector. Furthermore, because it is a broad index, it is less affected by macroeconomic events affecting a single commodities market or sector.
Long-term investors can benefit fromexposure to the base metals industry as a whole by investing in the MCX METLDEX. With solid returns and lowvolatility over time, as well as minimal correlation with equities and fixed income assets, the Index can be utilised to create a potent portfolio diversifier. Furthermore, when compared to single commodity exposures, diversification may lessen volatility.
Individual investors, professional traders, and financial institutions such as hedge funds and mutual funds can use the MCX METLDEX as a referencebenchmark for their base metals and related asset class investments, or as the basis for investment products that provide direct exposure to Indian base metals.
Benefits of metldeX
1. portfolio diversification: There are different asset classes available for investors to invest such as stocks, commodities, currencies and bonds. It is always advisable to diversify the investment to get maximum benefits as all these asset classes are independent of each in their performance. Since MCX METLDEXis an index consisting of all base metals traded on exchange, this index gives options for index based traders to invest in commodities also. Since there are metal company indexes available for trading, hence, METLDEX to be considered alongwith trading in NSE Metal Index.
2. risk diversification: Rather than investing in a single or multiple metals, investors can opt for investing inMETLDEX,whichconsistsofallthe
2000
2500
3000
3500
4000
4500
5000
Jul-
18
Sep
-18
No
v-1
8
Jan
-19
Mar
-19
May
-19
Jul-
19
Sep
-19
No
v-1
9
Jan
-20
Mar
-20
May
-20
Jul-
20
Sep
-20
No
v-2
0
Jan
-21
Mar
-21
May
-21
Jul-
21
Chart 2: LME Metal Index
12.00%
35.00%
16.00%
5.00% 32.00%
Chart 3: Composition of MCX METLDEX (for the year 2021)
Aluminium Copper Zinc Lead Nickel
8000
9000
10000
11000
12000
13000
14000
15000
16000
17000
Dec
-19
Jan
-20
Feb
-20
Mar
-20
Ap
r-2
0
May
-20
Jun
-20
Jul-
20
Au
g-2
0
Sep
-20
Oct
-20
No
v-2
0
Dec
-20
Jan
-21
Feb
-21
Mar
-21
Ap
r-2
1
May
-21
Jun
-21
Jul-
21
Chart 4: Trends in MCX METLDEX
metals available for trading on an exchange platform wherein all the metals are included into the index in a calculated weights. With investing in METLDEX, one can diversify therisk of investing in single or multiple metals.
3. Cash settlement: Unlike individual metals, which are delivery based contracts,METLDEXisacashsettledcontract making it a hassle free investment tool for various market
participants. Investors need not worry of their investment turning into delivery towards the end of the expiry period. This is the best part among commodity investment where all the commodities are categorized under compulsory delivery contracts except crude oil and natural gas.
4. tender period & delivery margins are not applicable: Since the METLDEXcontractsarecashsettled

COMMODITY INSIGHTS YEARBOOK 2021
33
contracts, hence, the investors need not to think about tender period and delivery margin.
5. Benchmark for manufacturing sector: Some of the manufacturing companies use two or more metals in their process making it somehow difficult for them to make a proper risk management strategy. All the metals individually perform based on their fundamentals as the usages of these metals are different in different sectors. Therefore, with an index available for trading, these manufacturing firms can benchmark their raw material requirements.
6. asset allocation & optimization: Asset allocation is one of the important elements while making an investment in any asset class. Each investor always wants to get maximum benefit and minimum loss on his/her investment therefore many investors take advice from experts for asset allocation. The task of asset allocation is somewhat reduced by investing in indexes and for traders who want to trade in metals, METLDEX is the mostappropriate tool as the asset allocation between five base metals is already done by the exchange.
7. Investment in multiple commodities through single contract: Since indices consist of many constituents and the price movement in individual constituents is reflected in a weight assigned indices making it easy for investors to make hassle free investment into multiple commodities through a single instrument.
8. trading strategies: METLDEXgives an option to investors and other market participants to take advantage of overall price movement of index constituent commodities rather than investing in single or multiple base metals. One more advantage of METLDEXis it is a cash settled contract unlike base metal futures contracts which are compulsory delivery contracts as well as the margin is very small compared to individual commodities. If the investor carries bullish outlook in 3 base metals and bearish outlook in 2 commodities, the best investment strategy would be to buyMETLDEX and sell those
2 commodity futures where the investor is having a bearish outlook. Further, the options are available in copper and zinc, which can also be combined in formulating an investment strategy.
9. arbitrage opportunities:METLDEXalso gives arbitrage opportunities andtraderscansetupALGOtradingstrategies between METLDEXand composition of underlying commodities. With participation of theseALGOplayers, themarketwillalso get good liquidity and depth in both METLDEX and underlyingcommodities.
Comparison between NSE Metal Index and MCX METLDEXNSE Metal Index and MCX METLDEXcarry a strong relation of 0.94 therefore market participants can take arbitrage trading opportunities in both these indices. The following graph shows how both these indices move in tandem with each other. Since metal company’s performance is dependent largely on price of the metal itself, hence, the METLDEX making the most powerfulhedging tool for traders investing in NSE Metal Index.
ChallengesAs mentioned above, there are various commodity indices available across the globe but these indices are used for reference purpose and not for the trading purpose. In the stock and currencies, we have active tradable indices such as Dow Jones Industrial Average, Nasdaq, S & P 500, SENSEX,NIFTY and dollar index. The index in commodities has a mile to go to get
attraction from investors groups. There is a need to popularize the METLDEXamongst the retail market participants as this group does not have smaller products like mini base metal contracts.
It’s been a year since the launch of METLDEX, but currently only currentmonth contracts are liquid, which poses a challenge for Institutional players to trade in these indices as they look forward to long dated contracts.
Conclusion and suggestionsOn the prima facie, commodity indextrading in general and MCX METLDEXin particular looks attractive as an investment tool for retail as well as corporate and institutional participants. However, it lacks awareness amongst the investors as the fundamentals of each metal vary from each other making it difficult for investors to assess the impact of certain events in a particular commodity on the overall index. For example, Copper is largely impacted by economic growth in the United States and China and their consumption pattern as well as mining related news while nickel is impacted by price movement in stainless steel and iron ore futures as well as mining policies in producing nations.
2,000
3,000
4,000
5,000
6,000
7,000
12,000
13,000
14,000
15,000
16,000
17,000
Chart 5: Trends in NSE Metal Index and MCX METLDEX
MCX METLDEX NSE Metal
TomaketheMETLDEXmoreattractivetoinvestors, series of awareness programs are to be conducted in regional languages. It has always been demand from institutional participants to make long dated contracts liquid, hence, there is a need to do the same. Also launch of options on liquid metal index futures contract will help traders to trade with different strategies, as they do in NIFTY and BANK NIFTY.

34
Challenges in Ensuring Quality Standards in Storage & Delivery of Industrial Metals
Mr. Pranav JhawarPromoter – Samaira Group

COMMODITY INSIGHTS YEARBOOK 2021
35
Mr. Jhawar is a qualified professional having Master Degree in Industrial Engineering and Business Management from USA.
He is the Promoter and Key executive of the Samaira Group, genesis of which goes beyond 200 years. Group focused on value addition in agricultural related pre and post-harvest commodity business (farm to port) in India including Warehousing, Food Processing and Packaging.
Mr. Jhawar having extensive experience & expertise in the field of Agri-Commodity Procurement, Warehousing & Logistics, Food Processing & Packaging, Agricultural Machinery & Financing. Under his Visionary leadership, group companies performing key role in commodity exchange based agri, non-agri and Metal Warehousing Business in the country.
His main objective is to lead the Group by diversifying the group activities and establishing new business association.
IntroductionMetals futures contracts in India started more than a decade back with domestic commodity exchanges rolling out base metals contracts on copper, zinc, aluminium, nickel, lead, etc. All these contracts were a derivative of the international traded contracts &the currency conversion. The contracts were not settled by compulsory delivery and resulted in participation only from a select few hedgers over the last decade. More so, the primary producers of these metals preferred to hedge in the overseas exchanges due to better liquidity&contractdesign.
The Indian traders and research houses wouldforageslookattheLondonMetalExchange (LME) stocks and recentlythe SHFE stocks to see the built up of inventory. The big trends in market (2011-12 to 2015-16) could be observed withtheLMEstock(which ismeasuredin millions of tones for all commodities put together) rising and then falling as producers started to curtail production resulting in more drawdown of the inventory.
All this while, the Indian market participants were paying a premium / discount to the LME rates quoted inthe market to adjust for the demand / supply in the country. Earlier, after expiry of future contract, settlement was done through seller’s option/ intention matching mechanism.
From March 2019, Multi Commodity Exchange Of India Limited startedcompulsory delivery based contract in 5 industrial metals (aluminum, zinc, nickel, and lead & copper). During theinitial period, the Exchange started withonewarehouseserviceprovider&one warehouse, with a small capacity of around 2500 MT at only one delivery center in Bhiwandi, which has gradually increased year on year to 30000 MT into three warehouse service providers and multiple locations like Raipur Delhi, Chennai, and Kolkata also added. Since
inception of delivery based contracts on exchange platform, more than 2,50,000 MT metal is handled, stored and delivered satisfactorily by the warehousing ecosystem.
Some of the salient points are as follows:• Deposits include LME Brandmetals
being imported from Russia, Malaysia, Indonesia, Korea, Japan as well as domestic producers
• Economic value of deliveriesis touching USD 25-30 million approximately in each settlement.
• Primary producers have startedparticipating and selling material through the exchange platform.
• Financial market participants likeMutual Funds/ Portfolio Managers havestartedparticipatingforcash&carry arbitrage.
• Endusershavestartedparticipatingto buy LME brand metals fromexchange ecosystem. As they have price discovery and ease of lifting in smaller denomination which starts as low from 1MT.
Above are Impressive statistics for an ecosystem that started off only in March 2019 and has as little as 2.5 years of history. The contracts are in a state of constant improvement with regulator’s constant supervision. Recently, the regulator has changed the settlement mechanism from 1 day Expiry to a staggered 5 day expiry. Market is still adjusting to the regulatory changes and business dynamics of incorporating the exchange ecosystem in their day to day operations.
WHAT EXCHANGE DERIVATIVE PLATFORM HAS DONE TO ECO SYSTEMDelivery based contract resulted in following benefits:-
1. After Inception of compulsory psychical delivery in base metals (aluminum, zinc, nickel, lead &
copper) psychical premium discount totheLMEPricesarebeingcapturedin landed price calculation.
2. After expiry of the futures contract month all open positions gets converted into compulsory delivery due to which realistic price conversion between spot and futures market, which results in better transparency and enhanced confidence in all the stakeholders.
3. Before inception of compulsory delivery based contract on exchange platform, participants took physical delivery from dealer or manufacturer. They used to get better price based on larger volumes. Now on exchange platform all the participants receive the goods on same price.
4. Indian Price discovery was also poor before the out-set of Physical Delivery.
5. All the materials deposited on exchange platform got converted in electronic form. This enables buyers/sellers to see quality and quantity of material in real time basis.
6. All value chain participants i.e. importer, exporter, producers, processors, consumer, dealer, distributors, end user etc., across country gets the deliverable contract based on their needs.
7. Hedgers use exchange platform tomitigate their risk.
In delivery based contract, entities like SEBI, Multi Commodity Exchange OfIndia Limited oversees and regulateall transactions. Now SEBI imposed Financial Security Deposit (FSD) i.e. 0.5% of commodity value to all warehouses. This is one of the regulatory changes in India. This has increased confidence in depositors/holders for the safety of commodity. Warehousing Development and Regulatory Authority (WDRA) is going to take base metal warehouses under their warehousing guidelines in coming few months. After this, eNWR

COMMODITY INSIGHTS YEARBOOK 2021
36
(Electronic Negotiable Warehouse Receipt) will be issued against all deposited materials in WDRA warehouses. Depositors/holders of the commodity will get easily finance from Financial Institutions by submitting their eNWR. This will create more volumes and liquidity in markets.
Challenges Faced by the Warehouses in Storage and DeliveryLooking at above it is clear a lot isaccomplished in a small time and this is the tip of the iceberg. Future policy changes and regulatory reforms with inception of WDRA challenges are aplenty for WSPs (Warehouse Service Providers), which in turn will bring a lot of opportunity of new business with continuous improvement in warehouse management practices.
Warehouses are approved by completing an onboarding process executed by the Exchange. This process includes review and approval of required documentation as well as an onsite inspection of the facility. As an Exchange-approved warehouse, the facility must comply with various requirements and obligations as prescribed by the rules and regulations of the Exchange.
Four areas of big challenge and large importance are as follows:
1. Quality Standard & Quantity
Only LME approved brands (includingIndian producer’s brands approved by LME) of aluminum ingots/coppercathodes/lead ingots/nickel cathodes/zinc ingots as per the list specified by LME at the time of deposit will beaccepted for deposit by the depositor/seller.
Detailed quality standards required of each five base metals deliverable on MCX are in the contract Specs of each base metals on MCX website.
The warehouse service provider receives the above five base metals in their warehouse only on the basis of the documents i.e. copy of certificate of analysis (COA) of the producerscontaining details like brand name of associated lots, producers name, batch no. and certificate date, packing list, certificate of origin and any of custom clearance documents in case of imported goods.
ensuring timeliness: Time is the essence in case of base metals as the market prices keep on changing daily.
So the lead time of delivery and also the lead time for conversion to electronic receipt is the key for timely pay in and pay out.
Challenges with delivery quantity size: Conversion from bulk quantity to smaller volumes is also a big challenge for the WSPs the deposit mostly comes in 25MT to 40MT containers and since increase in hedgers, who are not the actual end user they tender the goods on the exchange for which the delivery is allocated to more and more actual consumer. With ease of lifting in small lots, the delivery size is mostly in smaller volumes then deposit volumes.
delivery allocation: Since delivery allocation isnotbasedonFIFOorLIFObasis, it is allocated randomly. This is the biggest logistical challenge for the warehouses as a set pattern of delivery cannot be followed and delivery has to be done by breaking the stacks many times from the bottom of the stack. There are many instances, wherein a person has to lift 10MT and the delivery lots allocated are stored at the bottom of ten different racks.
Major challenge on the exchange is to ensure the correct quality and quantity is delivered as the person depositing the goods and lifting the goods are not same as in case of the regular warehousing practice. So it is of key importance to keep tight controls and checks to get the delivery correct every single time.
2. Finance & Pricing Currently only a few big finance houses are participating on the exchange platform. With more people becoming aware of the hedging opportunities, financial institutions have started funding on the base metals deposited on exchange. This needs to be recognized on larger scale to give benefit to larger stakeholders.
With mutual funds also now getting into commodities, it is expected that metals futures will attract a lot of attraction from investors as it constantly gives the opportunity of arbitrage. This will increase the bar and throw a new challenge to the WSPs for the following reasons:
• As thepaceofdepositwill increaserapidly and from one shift, the need might arise to work in multiple shifts for the warehousing staff to satisfy the clients and their needs.
• The current charges are based ondaily basis for the depositor/holder of the goods, which gives them
a better arbitrage opportunity as against cross hedging, which is done largely in the market by many participants taking a warehouse by themselves for a longer tenure or on yearly basis, which increases the fixed cost for them due to lower occupancy ratio.
• With no minimum or any volumecommitment from the ecosystem, pressure is added on the WSP for maintaining the pricing to break even as the churn ratio is very high and average occupancy of a base metal lot is as low as 15 days to a high of 45 days.
3. Policy & InsuranceWDRA, which was only operating in agri and agro commodities, will now expand its purview to metals as well. WDRA will bring fresh change in industry. eNWR will be generated against all deposited materials. Depositors/holders will get an opportunity to avail funding from financial institutions against deposit of their respective eNWR. This will attract more participation on exchange platform and strength Indian economy.
need for development of domestic quality standards: In addition to LMEstandards, authorities like WDRA in India needs to recognize more to cover the Indian conditions in dealing base metals thereby facilitating development of domestic quality standards.
Concentration of manufacturing in few companies: It can be seen that the manufacturing in India is controlled by a few key players only. Lack of qualitymanufacturing capability and awareness in manufacturers and importers is the reason for few manufacturers producing LME standards products and these areonly registeredwith LME.They controlthe supply and the market today, which is open only for larger buyers and distributors, resulting in smaller player and SME manufacturer paying a higher price for a smaller lot size.
Benefits of participation on exchanges:Onexchangeplatform,notonly a smaller/SME manufacturer can buy smaller lots, he can also phase it out monthly as per his requirement with assurance of quality to be delivered to him by warehouses at the fair market price. With time other producers shall get awareness and also be equipped for manufacturing LME standard productsandfacilitatethemtoregisterwithLME.This will help in achieving larger market participation and increase reach to global standard in India.

COMMODITY INSIGHTS YEARBOOK 2021
37
Warehousing regulation: WDRA may be expected to focus in the direction of retail and SME/MSME as per GOIguidelines. Warehousing compliance requirements are also increasing on an ongoing basis to ensure complete satisfaction of the clients.
Insurance: With time the insurance requirements has increased to give complete security for participants. This has also added more pricing burden on the WSPs than a regular warehouse insurance as the premium prices have increased multifold. Insurance needs to be continuously enhanced based on the peak daily stock which is fine with the deposit increasing. But, the occupancy ratio of the lot being as low as 15 days to 45 days in the warehouses, the ratio of average stock to peak stock for one insurance cycle is 1:20. This implies that a significant premium paid remains unutilized.
Thus, steps such as bringing base metals under WDRA purview and participation of mutual funds might lead to reducing such ratio, which can also lead to rationalization of warehousing costs.
4. Regulatory policy & financial security depositSEBI is clear that the retail participation shall be increased on exchange platform. With delivery lot of base metals of 1 to 5 MT, warehouse faces challenge while delivering small quantity, as random allocation of delivery consumes more time, labor, energy, resource and supervision.
As per new SEBI Circular dated April 16, 2021, (FSD will be applicable in case of base/industrial metals) the WSP shall furnish refundable FSD for all goods on incremental basis in addition to the security deposit as presented in table below.
FSD in base/industrial metals is a new change. This will provide more confidence to depositors/holders. On the other hand, this will increasethe cost of warehousing. Under such scenario, increase in participation on the exchange platform might lead to cost of warehousing being in control.
Concluding RemarksChurn ratio will increase when large
manufacturer open a separate window for exchange delivery along with their dealers and distributors, currently their distributors are delivering goods and this is causing internal policy confusion of area encroachment amongst their ecosystem. Further, small manufacturers will take more delivery position from the exchange, increasing the open interest.
More delivery centers at consumption centers to be opened in places like Jaipur, Delhi NCR etc., will bring more ease of doing logistics business.
For a contract which covers all the major risk for Indian metal participants -LMEPrices+Premium/DiscountstoLME prices + USDINR prices + Duty,can attract a substantial interest from all segments. Exchanges may launch full conversion contract with LME,after taking due approval from SEBI.
The next couple of years will showcase as to whether the base metal contracts can truly change the way India trades metals as deliveries could pick up in a major way for commodities like lead, nickel and copper. However, as they say, “Well Begun is half done”.
type of goods value of goods stored minimum Fsd
Agricultural/ Agri-Processed
Upto Rs. 250 Crores 2% of the aggregate Value of Stored Commodities
Between Rs. 250 Crores and Rs. 500 Crores
Rs. 5 Crores + 3% of aggregate value of stored commodities exceeding Rs. 250 Crores
Above Rs. 500 Crores Rs. 12.5 Crores + 4% of the aggregate value of stored commodities exceeding Rs. 500 Crores
Base/Industrial Metals NA 0.5 % of the aggregate value of stored commodities

38
Developing Indian Pricing Benchmarks for Base Metals – Will it Remain a Pipe Dream?
Arunava Bandyopadhyay
Research Scholar,
Nilotpal SarmaResearch Scholar,
Dr. Prabina Rajib, FRM
Professor (Finance and Accounting),
Vinod Gupta School of Management, Indian Institute of Technology Kharagpur

COMMODITY INSIGHTS YEARBOOK 2021
39
Mr. Arunava Bandyopadhyay is a research scholar at the Vinod Gupta School of Management, Indian Institute of Technology, Kharagpur, India. His research interest lies in price discovery and risk management in commodity markets. His PhD thesis work focusses on financialization of commodity markets and its impact on efficiency of futures market. His co-authored work has been featured in journals like Mineral Economics and Journal of Agribusiness in Developing and Emerging Economies. He has 7 years of corporate experience in various MNC’s in execution of turnkey projects of the base metals industry as a Project Manager.
Nilotpal Sarma is a research scholar in Vinod Gupta School of Management (VGSOM), Indian Institute of Technology Kharagpur and he is a UGC NET/JRF qualified scholar. His research interests are Financial Institutions and markets, Financial and Commodity Derivatives and Risk management. Prior to joining as a full time PhD scholar in VGSOM IIT Kharagpur, he has completed his B.Com honors with a Gold Medal from Tezpur University, Assam and then completed his Masters of Commerce from University of Delhi with specialising in Finance and International Business. He has also worked as a TA for a NPTEL course “Commodity Derivatives and Risk Management”. He is currently working in the area of commodity derivative markets.
Dr. Prabina Rajib is Professor of Finance and Accounting at Vinod Gupta School of Management (VGSOM), Indian Institute of Technology Kharagpur, West Bengal. She has more than a decade of academic experience and has presented and published many papers in national and international journals and conferences. She has handled the responsibility of Dean of VGSOM. Her teaching & research interests include Financial Accounting, Corporate Finance, Financial Markets, Risk Management using Financial & Commodity Derivatives. She has offered NPTEL online certification course on Commodity Derivatives and Risk Management that covers almost the entire spectrum of commodities traded in the Indian commodity market, including agricultural commodities, crude oil, base metal, precious metal, and electricity. She has authored two books i.e., 1) Commodity Derivatives & Risk Management, 2) Stock Exchanges, Investments & Derivatives: Straight Answer to 250 Nagging Questions. She was also a Fulbright scholar at Purdue University, USA.
Commodity derivatives markets perform two important functions i.e., price discovery and price risk management. These markets provide a platform to commodity producers, consumers and other value chain partners (VCPs) to hedge price risk by offering various types of derivatives contracts such as futures, options and spread contracts. In addition, speculators such as hedge funds, proprietary trading firms, commodity mutual funds, ETFs and retail investors also trade in these contracts purely for earning risk premium for assuming the risk of price volatility on behalf of hedgers. The interplay among different types of hedgers and speculators increases the liquidity (measured through trading volume and open interest) makes the market efficient. In an efficient market, futures price correctly reflects the expected spot price leading to better price discovery.
Requirement of different trading horizons by hedgers and speculators also reflects in the maturity profile of futures contracts. For example, the hedging duration of commodity producers’ and consumers’ is normally longer as compared to that of retail traders. Commodity hedge funds normally take directional view and by investing in relatively longer maturity contracts, thereby avoid the costs associated with frequent roll overs. Besides adding liquidity, participation by different categories of investors positively influences the maturity profile of commodity futures, leading to a long-dated commodity forward curve.
Global scenarioOnce a derivatives market has goodliquidity, it attracts more traders, thus fulfilling the aphorism “liquidity begets liquidity”. Another upside to a liquid commodity market is the easier acceptance of traded futures price as a reference price by a wide array of producers, consumers and VCPs. For example, globally LME (London MetalExchange) prices have become the reference price for all major players in base metals. Major companies in metal, mining,smelting&refiningandtradersuse LME price by either quoting apremiumoverordiscounttoLMEpricesto negotiate physical deals. In fact, buyers and sellers startwith LMEpriceas the reference price and negotiate the premium/discount based on delivery location, quality, grade and impurities. LME attracts market participants fromall over the world, resulting in good liquidity, leading toLMEbecoming thede facto global price setter in the base metal category.
Setbacks in the development of domestic derivatives marketsIndian commodity exchanges commenced derivatives trading in 2003, however, the performance of commodity derivatives in general and base metal commodities in particular haveremainedratherlackluster.Openinterest and trading volumes have remained low and India remains a price taker for almost all commodities including base metal commodities. Several research studies have identified factors which are negatively impacting liquidity in these exchanges. Two of the most important factors highlighted in
these studies are the imposition of CTT (commodity transaction tax) and the present restriction prohibiting Indian banks to trade in commodity derivatives.
Implications of Ctt : Many researchers have cited that the imposition of CTT has the most detrimental effect on Indian commodity derivatives market. Commodity derivatives market in general faced various kinds of headwinds, but as CTT was imposed on non-agricultural commodities including base metals, liquidity in these commodity groups declined the most.Sinha&Mathur(2015)comparedthe trading volume one year before and after the imposition of CTT and reported about 40% decline in trading volumes for Aluminium, Copper, Zinc,Lead,CrudeOilandNaturalGas.Sehgal& Agarwal (2019) reported that CTTimposition contributed to decline in trading volume and destroyed the parity of the Indian commodity futures market with the international markets as CTT isabsentonCOMEX,LME,NYMEX,etc.In addition, they also found that due to imposition of CTT, Indian government is losing an annual net tax revenue worth ofINR30billion.Ghosh&DSouza(2021)analyzed data from 2006 to 2019 for five non-agricultural commodities i.e., Aluminium,Copper,Crudeoil,Gold,andSilver. They found that the efficacy of price discovery was eroded in the case ofCopper,GoldandSilver in thepost-CTT era and hedging efficiency declined forCrudeoil,GoldandSilver.Theyalsofound that due to CTT trading volumes declined, leading to decline in overall tax revenue and succinctly summarized “these trends amount to a decline in the overall market”. Though not

COMMODITY INSIGHTS YEARBOOK 2021
40
highlighted much in research studies, another peculiar aspect CTT is that, it is only applied to sell side and makes the market lopsided as it deters traders to take short positions.
lack of participation from banks: Even after 18 years since Indian commodity derivatives exchanges have come into existence, Indian banks are not allowed to trade in commodity derivatives even though banks provide working capital loan against agri-commodity inventory. Widening the ambit, only recently, RBI has permitted Indian banks1 to extend loans against warehouse receipts for non-agricultural commodities available in warehouses of domestic exchanges. But permission to Indian banks to take counterparty positions in bi-lateral commodity hedging or to trade in exchange traded derivative contracts remains elusive. In fact, all over the world, banks take counterparty positions to commodity hedgers. By doing so, banks effectively become market maker as they assume price risk between the arrival of sellers and buyers leading to accumulation of inventory with banks. For example, during 2008-09 recession, even with reduced production, global aluminium industry faced excess supply as demand fell precipitously accompanied by significant decline in aluminium price2. At that point in time, banks started procuring aluminum from their client companies and stored these inbondedLMEwarehouses.Thisshiftedprice risk from the aluminum producers to banks. Considering the fact that aluminum producers did not want to (or could not) hold inventory beyond a couple of months, without the presence of banks, these companies would have been forced to close their production facilities leading to a larger societal cost of job loss and the attendant cost of reopening these units at a later point in time. In fact, around of middle of 2010, when aluminum demand and prices peaked up, these banks sold the aluminum inventory which also helped in stabilizing the price.
Lack of bank participation in India hasnot only hamstrung the commodity derivatives market growth but has several other untended consequences
whose impact is difficult to assess. All over the world, banks take counterparty positions to meet their client’s commodity risk hedging needs. Unlike exchanges, banks do not charge MTM on daily basis and being tailor-made contracts, even at times banks give/take delivery of non-standard goods at the preferred location of their clients. In fact, to satisfy the hedging needs of their clients, globally, banks have become active players in physical commodity market. In turn, to cover their exposure to commodity price risk, banks also directly take position in exchange traded contracts which adds to the much needed liquidly to the commodity derivatives market. Table 1 gives a snapshot of banks’ open position in copper futures at CME. The role of banks in offering customized derivatives contracts to their clients cannot be emphasized enough. For example, on August 17th 2021, Coal India Ltd. (CIL)announced that it has lost INR 700crore for the Apr-June 2021 quarter as diesel price increasedby 35%.CIL alsoannounced that it intends to pass on this loss to its customers by increasing the price of coal. If Indian banks were allowed to offer derivatives contracts, itwould have been possible for CIL tohedge diesel price risk and not transfer the higher cost to its customers. The above discussion makes a strong case for doing away with CTT and allowing Indian banks to participate in Indian commodity derivatives market.
Way forward In addition to addressing the above two setbacks, policy and regulatory support in developing Indian commodity derivatives market needs further discussion. Shanghai Futures Exchange (SHFE) started nearly the same time as the Indian commodity exchanges and offers predominantly metal derivatives contracts. It has emerged as a leading player in the global platform due to the sheer volume of contracts traded. Though China’s strong production capacity and consumption needs in base metals have supported the growth of SHFE, but a large part of the success of SHFE can be attributed to the regulatory support it received from the Chinese government
Some of the favorable policy initiatives that have supported SHFE are listed below:
• Restricting traders’ access tointernational commodity exchanges: Except for a few large state-owned companies, all other companies in the base metals space are mandated to hedge only in domestic exchanges.
• Financial incentives to brokers:Chinese commodity exchanges are state owned and are not-for-profit companies. These exchanges incentivize brokers to bring more participants to the market. Financial incentive motivates brokers to not only bring more traders3 to the derivatives platform but also to undertake market development exercises and to educate investors.
• Lowertransactioncost:Theaveragetransaction costs are substantially lower in China. As per CPAI (Commodity Participants Association in India), the cost of executing a transaction in India in various asset classes is 4 to 19 times4 the cost of executing a comparable transaction in the US, China and Singapore due to myriad taxes and levies such as STT (securities transaction tax), CTT, GST,stampduty,exchangecharges,and capital gain tax.
• Infrastructure development: Ascommodity contracts are physically settled, China has done significant investment in developing required warehouse infrastructure. For base metals, China now has 98 warehouses5 distributed at various strategic locations. With the availability of a large number of warehouses, the inconvenience and cost associated with delivering/receiving delivery in a far off location has reduced significantly, helping to attract hedgers. To attract base metal players from other countries, China is planning to open warehouses in other countries as well, which also fits to the Chinese “One Belt OneRoad” policy.
• Opening up of Chinese commodityexchanges to foreign participants:
1 Financing of non-agricultural commodities lying in domestic Exchange warehouse https://www.mcxindia.com/docs/default-source/circulars/english/2021/july/circular-411---202130c0354757fb64e3bdfdff00007acb35.pdf?s-fvrsn=803b5191_0
2 Alumnium prices (per Ton) was around USD 3065 on January 2 2008, while the same was USD 1316 by January 1 2009. 3 Ofcoursethereisadownsidetosuchanincentivemechanism.Itleadstosignificantincreaseinspeculativetraders’participationincommoditiesderiva-
tives market. In fact, recently Chinese regulators have initiated a slew of measures to restrict speculative trading in domestic exchanges.4 CPAI urges government to address high cost of trading in Indian markets:
https://timesofindia.indiatimes.com/business/india-business/cpai-urges-government-to-address-high-cost-of-trading-in-indian-markets/article-show/73704106.cms
5 Out of the 98 warehouses, there are 21 warehouses for copper, 29 warehouses for aluminum, 18 for zinc, 16 for nickel, and 4 warehouses for tin.

COMMODITY INSIGHTS YEARBOOK 2021
41
China has progressively allowed foreign participants to trade derivatives in its domestic exchanges. In a phased manner China has allowed foreign participants to trade in non-agri commodity derivatives followed by agri-commodities. In fact, targeting only foreign participants, China has created an international exchange i.e., Shanghai International Energy Exchanges (INE) which offers RNB denominated contracts on commodities such as crude oil and bonded copper. Interestingly, RNB denominated Crude oil contract is now being considered as the benchmark for the Asia-Pacific region and is emerging as an alternative to the two main global oil markers i.e, NYMEX WTI and Intercontinental Exchange’s Brent.
Drawing on the Chinese experience, strong regulatory and government support are needed for Indian commodity exchanges to thrive. In addition to government support, commodity exchanges also need to put significant effort on investors’ education, introducing domestic brands, rationalizing taxation issues, developing base metal spot exchange and warehouse development to make their presence felt in global arena. Some of the initiatives that the Indian commodity exchanges may consider are the following:
• Investor’s education: Low tradingvolume in base metal commodity derivatives in India is largely due to the structural issues of low domestic consumption. For example, India’s per capita copper consumption is around 0.5 kg while the same is 5.4Kg for China. Similarly per capita aluminum consumption in India is 2.5 kg which is significantly lower than per capita global average of 11kg. In addition, like any country, nature of primary base metal industry is oligopolistic in India i.e. industry is dominated by small number of large producers. Almost all of these Indian companies have significant export presence and use LME price as areference for pricing their products. These companies prefer to hedge in LME due to availability of liquidlong-dated forward curve. This make it difficult, if not impossible
for Indian commodity exchanges to attract these large base metal producers to their platform. Instead, Indian commodity exchanges can focus on VCPs and educate them to use exchange traded derivatives for mitigating price risk. Similarly exchanges can reach out to asset management companies to encourage them to start multi‐asset mutual funds with commodity as an asset class. Commodity exchanges can also reach out to portfolio managers and family offices for investing in commodities. In India, there are about 45 family offices with billions of dollars of asset under management. Their foray into commodity space has been limited to investment on gold and there is a huge potential for these family offices to invest in base metals.
• Development of domestic brands:Currently in the Indian commodity market, all base metal futures contracts require LME approvedbrands to be delivered. Even though futures contract specifications mention “any other producer brands as approved by exchanges from time to time”, there has not been much progress in this regard.6 Indian commodity exchange can target Indian companies who may be producing base metals which are in linewithLMEstandardsbutarenotpart of LME approved brand list7 to create “LME equivalent brands”.Even though creating necessary infrastructure to test and assay brands as“LME equivalent” may becostly and time consuming, but such initiatives will go a long way to attract hedgers. In addition to the “primary” base metal contracts currently offered by Indian exchanges, they can introduce new contracts on base metal “products” which are also BIS certified.8 For example, copper cathode contract is a primary base metal contract, while a contract with “copper wire” as underlying would be a base metal “product” contract. As the number of VCPs for a base metal product contract is much larger than that for primary base metal contract, exchanges will have a larger potential hedger base.
Just to give a perspective, in India, there are about 6-7 primary copperproducers (with only 2 featuring in LME approved brand list) whilethere are about 30-35 copper wire manufacturers and about 400 copper wire wholesalers and exporters. Hence offering contracts on copper wire will attract wider set of companies to the exchange platform than offering only copper cathode contracts. Also, as India mandates companies to produce products as per BIS certification, an ecosystem for BIS certification is already available which exchanges can leverage. Hence, offering BIS certified base metal “product” contracts will go long way in attracting more traders to the exchange platform which may pave the path for setting a reference price for these base metal products in India.
• Rationalization of GST and IGST:Indian exchanges are adding new warehouses9 and will continue to do so to achieve national acceptance of it prices. While this is a welcome step, theproblemofGST credit fortransactions across multiple states is creating difficulty for participants. Not all exchange participants have GST registrations in multiplestates. More importantly, fungibility between SGST and IGST is a stickyissue as surplus SGST cannot beoffset with IGST as of now. Hence,Indian exchanges need to work with the Indian tax authority to resolve this issue.
• Development of organized spotexchanges: India does not have a spot market for base metals. An active spot market is a precursor to a vibrant derivativesmarkets. In fact, LMEhasbecome world’s leading base metal market as it not only offers derivatives contractsbut italsooffersLMECashcontracts. Realizing the need for an organized spot exchange, National Stock Exchange Limited (NSEL)started its operation in 2008 with the explicit objective of facilitating online spot trading of commodities. Notwithstanding the Rs. 5300 crore debacle associated with NSEL, therelevance of spot exchange can never be stressed enough. In fact,
6 As a comparison, at SHFE, for copper, there are 28 domestic brands along with 30 overseas brands, while for aluminum there are about 39 domestic brandsand3overseasbrands.Thisgoesontoindicatethesignificant
7 Though there are about 25 Indian companies producing Primary Aluminium, products from only 4 Indian companies are part of LME approved brand list. List of LME approved brands https://www.lme.com/en-GB/Trading/Brands/Approved-brands
8 RecentlyNCDEXhasintroducedMildSteelIngotsandBilletcontractsconfirmingtoBISstandards.9 During last couple of years, MCX and NCDEX have created new base metal warehouses in locations like Raipur, Chennai, Kolkata and Ghaziabad.

COMMODITY INSIGHTS YEARBOOK 2021
42
References:
1. Sinha P. and K. Mathur (2015), Impact of Commodities Transaction Tax on Indian Commodity Futures, https://mpra.ub.uni-muenchen.de/63677/1/MPRA_paper_63677.pdf
2. Sehgal S and Agarwal T(2019), Impact of Commodity Transaction Tax on Market Liquidity, Volatility, and Government Revenues: An Empirical Study for India, Vikalpa: The Journal of Decision Makers, https://doi.org/10.1177/0256090919826316
3. NilanjanGhoshandRenitaD’Souza(2021),“InvestigatingtheImpactofCommodityTransactionTaxonIndia’sCommodityDerivativesMarkets,”ORFOccasional Paper No. 313, May 2021, Observer Research Foundation. https://www.researchgate.net/profile/Nilanjan-GhoshPhd/publication/352644107_Investigating_the_Impact_of_Commodity_Transaction_Tax_on_India’s_Commodity_Derivatives_Markets/links/60d1bfcc299bf1cd71e9d835/Investigating-the-Impact-of-Commodity-Transaction-Tax-on-Indias-Commodity-Derivatives-Markets.pdf
4. Why banks need to participate in commodity derivative market https://www.mcxindia.com/docs/default-source/education-training/occasional-papers/banks_participation.pdf?sfvrsn=2
5. The role of Banks in Physical commodities, https://www.sifma.org/wp-content/uploads/2017/05/study-the-role-of-banks-in-physical-commodities.pdf
Table A: Bank Count, Long/Short Position in Near-month Copper Futures at CMEBank Count long Futures (oI) % sHort Futures (oI) % open Interest
Aug-21 14 14,891 7.1 550 0.3 2,11,071
Jul-21 16 16,645 8.2 984 0.5 2,02,781
Jun-21 15 15,069 6.5 879 0.4 2,32,824
May-21 15 15,363 5.9 1,290 0.5 2,59,609
Apr-21 14 14,333 5.9 1,111 0.5 2,43,342
Mar-21 14 15,898 6.3 1,768 0.7 2,51,989
Feb-21 14 13,422 5.2 1,762 0.7 2,57,036
Jan-21 18 15,236 5.9 918 0.4 2,56,942
Dec-20 16 16,256 6.8 1,136 0.5 2,40,738
Nov-20 15 15,008 6.4 139 0.1 2,33,351
Oct-20 15 16,006 7 881 0.4 2,28,717
Sep-20 14 13,654 5.9 2,497 1.1 2,33,226
Aug-20 14 12,161 5.2 1,728 0.7 2,32,022
Jul-20 14 12,824 6.2 1,910 0.9 2,06,843
Jun-20 13 12,134 6.7 74 0 1,82,043
May-20 14 12,265 7.5 735 0.5 1,62,899
Apr-20 14 12,901 7 1,205 0.6 1,85,408
Mar-20 13 14,948 6.2 1,812 0.7 2,42,931
Feb-20 18 16,870 6.4 828 0.3 2,64,032
Jan-20 15 16,331 6 1,310 0.5 2,70,889
Dec-19 16 15,289 7.1 786 0.4 2,15,424
Nov-19 18 16,500 6.9 2,951 1.2 2,39,147
Oct-19 14 14,481 6 1,496 0.6 2,42,951
Sep-19 14 14,208 5.5 1,008 0.4 2,60,040
Aug-19 15 16,600 5.5 2,260 0.7 3,03,764
Date Source: Bloomberg
IndianGas Exchange (IGX) is an aptexample of the benefit of developing an organized spot exchange. Indian commodity exchanges should work towards creating a spot exchange for both in “primary” and BIS certified “products” category. In addition, the spot exchange can offer a trading platform for base metal warehouse receipts as well as customized auction platform to satisfy specific quality, quantity and delivery location needs of Indian base metal players.
To summarize, in the base metal category, Indian exchanges are facing formidable competition not only from established players like LMEand CME but also from relatively new exchanges such as SGX and SHFE.Indian government must do away with CTT and allow Indian banks to offer derivatives contracts to satisfy the varied hedging needs of their clients as well as allow banks to trade in commodity derivatives exchanges. Similarly a lot needs to be done by
the exchanges in terms of educating value chain partners, creating an organized spot exchange for base metal commodities and introducing new base metal product contracts for which a large VCP base already exists in India. Unless concrete measures are taken to attract traders to these exchanges, the dream of becoming a price setter will remain a pipe dream for Indian commodity exchanges!!

COMMODITY INSIGHTS YEARBOOK 2021
43
Intertionally Kept blank
43
STATISTICS

COMMODITY INSIGHTS YEARBOOK 2021
44
Intentionally kept blank
44

COMMODITY INSIGHTS YEARBOOK 2021
45
Key econoMIcIndIcatorS
STATISTICS
45

COMMODITY INSIGHTS YEARBOOK 2021
46
key eConomIC IndICatorsIndicator unit 2016-17 2017-18 2018-19 2019-20 2020-21 (p)national Income aggregatesGrossDomesticProduct(currentmarketprices) base = 2011-12
Rs. Crore 15391669 17090042 18886957 20351013 19745670
GrowthRate % 11.8 11.0 10.5 7.8 -3GrossDomesticProduct(costantmarketprices) base = 2011-12
Rs. Crore 12308193 13144582 14003316 14569268 13512740
GrowthRate % 8.3 6.8 6.5 4.0 -7.3GrossFixedCapitalFormation(%toGDP) % 28.2 28.2 29.2 28.8 27.1Per Capita Net National Income (at current prices)
Rs 103870 115224 125883 134186 128829
outputFoodgrains Mn tonnes 275.1 285.0 285.2 295.7 308.7Index of Industrial Production (growth) % 4.6 4.4 3.8 -0.8 -8.4ElectricityGeneration(growth) % 5.8 5.4 5.2 1.0 -0.5Prices TrendsInflation WPI % 1.7 3.0 4.3 1.7 1.3Inflation CPI % 4.5 3.6 3.4 4.8 5.5external sectorExportGrowth(USD) % change 5.2 10.3 9.1 -5.0 -7.1ImportGrowth(USD) % change -1.0 19.5 10.3 -7.6 -17.1CurrentAccountBalance(CAB)/GDP % -0.6 -1.9 -2.0 -0.9 0.9Foreign Exchange Reserves USD Billion 370 425 413 478 579money and CreditBroad Money (M3) % change 10.1 9.2 10.5 8.9 12.2Scheduled Commercial Bank Credit Rs Billion 78415 86254 97717 103709 109495(Growth%) % change 8.2 10.0 13.3 6.1 5.6Fiscal Indicators (Centre)GrossFiscalDeficit %ofGDP 3.5 3.5 3.4 4.6 9.5Revenue Deficit %ofGDP 2.1 2.6 2.4 3.3 7.5Primary Deficit %ofGDP 0.4 0.4 0.4 1.6 5.9P: Provisional EstimatesNote: Data updated till September 30, 2021Source: Central Statistical Organisation (CSO), Reserve Bank of India (RBI), Ministry of Agriculture, GoI, Economic Survey, India Budget
groWtH trends In seCtoral gross value added and gdp at 2011-12 prICes (%)Industry 2016-17 2017-18 2018-19 2019-20 2020-21(p)Agriculture,forestry&fishing 6.8 6.6 2.6 4.3 3.6Mining&quarrying 9.8 -5.6 0.3 -2.5 -8.5Manufacturing 7.9 7.5 5.3 -2.4 -7.2Electricity,gas,watersupply&otherutilityservices 10.0 10.6 8.0 2.1 1.9Construction 5.9 5.2 6.3 1.0 -8.6Trade, hotels, transport, communication and services related to broadcasting
7.7 10.3 7.1 6.4 -18.2
Financial,realestate&professionalservices 8.6 1.8 7.2 7.3 -1.5Public Administration, defence and other services 9.3 8.3 7.4 8.3 -4.6GVAatbasicprices 8.0 6.2 5.9 4.1 -6.2GDPatMarketPrices 8.3 6.8 6.5 4.0 -7.3P: Provisional EstimatesNote: Data updated till Septmeber 30, 2021Source: Central Statistical Organisation (CSO)
econoMIcIndIcatorS

COMMODITY INSIGHTS YEARBOOK 2021
47
money supply (rs. BIllIon)
Indicator 2016-17 2017-18 2018-19 2019-20 2020-21
Currency with the public 12641 17597 20522 23497 27518
Deposit Money of the Public 14178 15076 16581 17762 20425
M1 26820 32673 37103 41259 47943
PostOfficeSavingsDeposits 921 1028 1406 1418 1700
M2 27740 33701 37117 42677 49643
Time Deposits with Banks 101100 106953 117206 126740 140503
M3 127919 139626 154309 167999 188446
TotalPostOfficeDeposits 2562 2881 3673 4092 5095
M4 130481 142507 154345 172092 193541Source: Reserve Bank of India (RBI)
econoMIcIndIcatorS
ForeIgn eXCHange reserves (In BIllIon)
end of Financial year 2016-17 2017-18 2018-19 2019-20 2020-21
Foreign Currency Assets (Rupees) 22449 25976 26656 33338 39010
(US Dollar) 346 399 385 442 538
Gold (Rupees) 1288 1397 1596 2305 2531
(US Dollar) 20 21 23 31 35
Reserve Tranch Position (Rupees) 151 135 207 270 357
(US Dollar) 2.3 2.1 3.0 3.6 4.9
SDRs (Rupees) 94 100 101 108 108
(US Dollar) 1.4 1.5 1.5 1.4 1.5
Total (Rupees) 23982 27609 28559 36022 42007
(US Dollar) 370 425 413 478 579Source: RBI
key Components oF IndIa’s eXternal seCtor (usd mIllIon)2016-17 2017-18 2018-19 2019-20 2020-21
I. Merchandise - A) Exports, f.o.b. 280138 308970 337237 320431 296300I. Merchandise - B) Imports, c.i.f. 392580 469006 517519 477937 398452I. Trade balance (A-B) -112442 -160036 -180283 -157506 -102152II. Invisibles, net 98026 111319 123026 132850 126065III. Current account (I+II) -14417 -48717 -57256 -24656 23912IV. Capital account (A to F) 35967 92292 53917 84154 63374A) Foreign Investment 49981 61595 42898 56558 93653B) External assistance, net 2186 3013 3487 3856 11211C) Commercial borrowings, net -7590 -799 9769 21680 240D) Rupee debt service -99 -75 -31 -69 -64E) NRI deposits, net -12367 9676 10387 8627 7364F)Othercapital 3857 18881 -12592 -6498 -49030V.Overallbalance(III+IV) 21550 43574 -3339 59498 87286Source: RBI

COMMODITY INSIGHTS YEARBOOK 2021
48
WHolesale prICe IndeX (Base = 2011-12)- annual average InFlatIon rates (%)
description Weight 2016-17 2017-18 2018-19 2019-20 2020-21
all Commodities 100.0 1.7 3.0 4.3 1.7 1.3
primary articles 22.6 3.5 1.3 2.8 6.8 1.7
Food Articles 15.3 4.0 2.1 0.3 8.4 3.1
Non-Food Articles 4.1 3.4 -2.1 2.9 4.5 1.4
Minerals 0.8 7.1 8.3 11.4 13.2 6.7
CrudePetroleum&NaturalGas 2.4 -4.6 -0.1 26.6 -7.7 -17.5
Crude Petroleum 1.9 4.8 1.9 29.7 -12.7 -15.8
NaturalGas 0.5 -21.2 -5.3 18.6 6.6 -21.5
Fuel & power 13.2 -0.2 8.1 11.6 -1.8 -8.0
MineralOils 7.9 -0.8 12.6 17.2 -4.6 -14.2
manufactured products 64.2 1.4 2.8 3.6 0.3 2.7Source: Estimated from the Indices published on www.eaindustry.nic.in
Consumer prICe IndeX (Base=2012) - annual average InFlatIon rates (%)
description Weight 2016-17 2017-18 2018-19 2019-20 2020-21
Rural 100.0 5.0 3.6 3.0 4.3 4.6
Urban 100.0 4.0 3.6 3.9 5.4 6.5
Combined 100.0 4.5 3.6 3.4 4.8 5.5Source: Estimated from the Indices published by CSO
IndeX oF IndustrIal produCtIon (Base=2011-12) - annual groWtH rates (%)
description Weights 2016-17 2017-18 2018-19 2019-20 2020-21
Mining 14.4 5.3 2.3 2.9 1.6 -7.8
Manufacturing 77.6 4.4 4.6 3.9 -1.4 -9.6
Electricity 8.0 5.8 5.4 5.2 1.0 -0.5
General 100.0 4.6 4.4 3.8 -0.8 -8.4
use-based Category
Primary goods 34.0 4.9 3.7 3.5 0.7 -7.0
Capital goods 8.2 3.2 4.0 2.7 -13.9 -18.6
Intermediate goods 17.2 3.3 2.3 0.9 9.1 -9.4
Infrastructure/ construction goods 12.3 3.9 5.6 7.3 -3.6 -8.7
Consumer durables 12.8 2.9 0.8 5.5 -8.7 -15.0
Consumer non-durables 15.3 7.9 10.6 4.0 -0.1 -2.2Source: CSO
econoMIcIndIcatorS

COMMODITY INSIGHTS YEARBOOK 2021
49
econoMIcIndIcatorS
sCHeduled CommerCIal Banks CredIt outstandIng (rs Crore)
Bank credit growth (%) Food credit growth (%) non-food credit growth (%)
Apr-15 6575199 9.3 87126 -6.0 6488073 9.6
May-15 6606344 9.3 116538 0.0 6489806 9.5
Jun-15 6630624 8.8 111435 -2.6 6519189 9.0
Jul-15 6627976 8.9 108566 -3.5 6519410 9.2
Aug-15 6638819 9.1 102682 -4.7 6536137 9.3
Sep-15 6685892 9.3 102739 -2.2 6583153 9.5
Oct-15 6794626 8.8 102449 -6.0 6692177 9.1
Nov-15 6839154 9.3 108926 1.3 6730228 9.5
Dec-15 6988249 10.6 111005 2.5 6877244 10.7
Jan-16 7055477 10.9 102187 -0.8 6953290 11.1
Feb-16 7144778 11.2 107782 8.1 7036996 11.2
Mar-16 7249615 10.9 105253 11.5 7144362 10.9
Apr-16 7232295 10.0 104069 19.4 7128226 9.9
May-16 7226441 9.4 110661 -5.0 7115780 9.6
Jun-16 7227960 9.0 100382 -9.9 7127578 9.3
Jul-16 7240548 9.2 105460 -2.9 7135088 9.4
Aug-16 7247719 9.2 103516 0.8 7144203 9.3
Sep-16 7494868 12.1 85462 -16.8 7409406 12.6
Oct-16 7384414 8.7 102228 -0.2 7282186 8.8
Nov-16 7261754 6.2 91780 -15.7 7169974 6.5
Dec-16 7317391 4.7 105064 -5.4 7212327 4.9
Jan-17 7389528 4.7 104013 1.8 7285515 4.8
Feb-17 7458850 4.4 105541 -2.1 7353309 4.5
Mar-17 7841466 8.2 53927 -48.8 7787539 9.0
Apr-17 7582391 4.8 55681 -46.5 7526710 5.6
May-17 7569458 4.7 60701 -45.1 7508757 5.5
Jun-17 7819807 8.2 50890 -49.3 7768917 9.0
Jul-17 7670219 5.9 54721 -48.1 7615498 6.7
Aug-17 7691194 6.1 47943 -53.7 7643251 7.0
Sep-17 7983438 6.5 46368 -45.7 7937070 7.1
Oct-17 7884645 6.8 62225 -39.1 7822420 7.4
Nov-17 7934715 9.3 74375 -19.0 7860340 9.6
Dec-17 8179460 11.8 58458 -44.4 8121002 12.6
Jan-18 8147189 10.3 54429 -47.7 8092760 11.1
Feb-18 8237448 10.4 45817 -56.6 8191631 11.4
Mar-18 8625425 10.0 41989 -22.1 8583436 10.2
Apr-18 8517625 12.3 52035 -6.5 8465590 12.5
May-18 8537655 12.8 52910 -12.8 8484745 13.0
Jun-18 8672807 10.9 59300 16.5 8613507 10.9
Jul-18 8616227 12.3 50876 -7.0 8565351 12.5
Aug-18 8780753 14.2 48854 1.9 8731899 14.2
Sep-18 8981664 12.5 47663 2.8 8934001 12.6

COMMODITY INSIGHTS YEARBOOK 2021
50
econoMIcIndIcatorS
sCHeduled CommerCIal Banks CredIt outstandIng (rs Crore)
Bank credit growth (%) Food credit growth (%) non-food credit growth (%)
Oct-18 9033975 14.6 55034 -11.6 8978941 14.8
Nov-18 9221898 16.2 79830 7.3 9142068 16.3
Dec-18 9319765 13.9 75685 29.5 9244080 13.8
Jan-19 9351201 14.8 68791 26.4 9282410 14.7
Feb-19 9449740 14.7 59314 29.5 9390426 14.6
Mar-19 9771722 13.3 41610 -0.9 9730112 13.4
Apr-19 9620945 13.0 43161 -17.1 9577784 13.1
May-19 9621545 12.7 65722 24.2 9555823 12.6
Jun-19 9648768 12.0 71419 14.2 9577349 12.0
Jul-19 9658378 12.2 66001 30.3 9592377 12.1
Aug-19 9680153 10.2 62392 27.7 9617761 10.1
Sep-19 9768854 8.8 60085 26.1 9708769 8.7
Oct-19 9840562 8.9 69778 26.8 9770784 8.8
Nov-19 9860303 8.0 91304 26.3 9768999 7.8
Dec-19 9947444 7.1 85143 10.1 9862301 7.1
Jan-20 10105176 8.3 78899 11.2 10026277 8.3
Feb-20 10104866 7.0 65596 6.2 10039270 7.0
Mar-20 10370861 6.1 51763 24.4 10319098 6.1
Apr-20 10273416 6.8 52643 22.0 10220773 6.7
May-20 10222753 6.2 79416 20.8 10143337 6.1
Jun-20 10245677 6.2 89288 25.0 10156389 6.0
Jul-20 10282057 6.5 79287 20.1 10202770 6.4
Aug-20 10216158 5.5 65941 5.7 10150217 5.5
Sep-20 10271581 5.1 66426 10.6 10205155 5.1
Oct-20 10338868 5.1 66659 -4.5 10272209 5.1
Nov-20 10434880 5.8 88956 -2.6 10345924 5.9
Dec-20 10547037 6.0 93152 9.4 10453885 6.0
Jan-21 10703752 5.9 87109 10.4 10616643 5.9
Feb-21 10774742 6.6 75205 14.6 10699537 6.6
Mar-21 10949509 5.6 61254 18.3 10888255 5.5As on the last reporting Friday of the corresponding monthSource: Database on Indian Economy, RBI

COMMODITY INSIGHTS YEARBOOK 2021
51
all IndIa IndeX numBers oF area and produCtIon oF prInCIpal Crops (Base : trIennIum endIng 2007-08= 100)Crop Weight 2010-11 2011-12 2012-13 2013-14 2014-15 2015-16 2016-17 2017-18 2018-19 2019-20*
all India Index numbers of area of principal Crops
Foodgrains 51 104 104 102 106 105 104 109 107 106 109
Cereals 42 102 103 102 104 106 103 105 102 101 105
Pulses 9 116 108 104 113 104 109 130 132 128 126
Non Foodgrains 49 114 116 116 119 119 120 116 118 119 121
Oilseeds 13 101 98 98 104 94 95 97 91 93 101
Cotton 4 124 134 132 132 141 135 119 139 140 147
All Crops 100 109 110 109 112 112 112 113 113 112 115
all India Index numbers of production of principal Crops
Foodgrains 51 114 120 119 123 116 116 131 137 134 140
Cereals 42 111 119 117 121 115 116 124 127 129 134
Pulses 9 129 122 129 136 122 117 166 182 159 164
Non Foodgrains 49 128 130 129 136 132 126 135 142 140 145
Oilseeds 13 117 107 107 119 100 93 111 115 112 122
Cotton 4 148 158 153 161 156 134 146 147 126 159
All Crops 100 121 125 124 130 124 121 133 139 137 142* Agricultural Crops as per 4th Advance Estimates and Horticultural Crops as per 3rd Advance EstimatesSource: Economic Survey 2020-21
econoMIcIndIcatorS
all IndIa produCtIon estImates For FoodgraIns (mIllIon tonnes)
Crop season 2016-17 2017-18 2018-19 2019-20 2020-21#
Rice Kharif 96.3 97.1 102.0 102.3 104.4Rabi 13.4 15.6 14.4 16.6 17.9Total 109.7 112.8 116.5 118.9 122.3
Wheat Rabi 98.5 99.9 103.6 107.9 109.5Maize Kharif 18.9 20.1 19.4 19.4 21.4
Rabi 7.0 8.6 8.3 9.3 10.1Total 25.9 28.8 27.7 28.8 31.5
Barley Rabi 1.8 1.8 1.6 1.7 1.7Coarse Cereals Kharif 32.4 34.0 31.4 33.6 36.5
Rabi 11.3 12.9 11.7 14.1 14.7Total 43.8 47.0 43.1 47.8 51.2
Cereals Kharif 128.7 131.2 133.4 135.9 140.9Rabi 123.2 128.4 129.7 128.6 142.1Total 252.0 259.6 263.1 274.5 282.9
Tur (Arhar) Kharif 4.9 4.3 3.3 3.9 4.3Gram Rabi 9.4 11.4 9.9 11.1 12.0Pulses Kharif 9.6 9.3 8.1 7.9 8.7
Rabi 13.6 16.1 14.0 15.1 17.0Total 23.1 25.4 22.1 23.0 25.7
Foodgrains Kharif 138.3 140.5 141.5 143.8 149.6Rabi 136.8 144.6 143.7 153.7 159.1Total 275.1 285.0 285.2 297.5 308.7
Source: Ministry of agriculture, GoI # Fourth Advance Estimates

COMMODITY INSIGHTS YEARBOOK 2021
52
all IndIa produCtIon estImates For oIlseeds and CommerCIal Crops (lakH tonnes)Crop season 2016-17 2017-18 2018-19 2019-20 2020-21#Groundnut Kharif 60.5 76.0 53.9 83.9 85.56
Rabi 14.1 16.6 13.4 15.6 16.53Total 74.6 92.5 67.3 99.5 102.1
Castorseed Kharif 13.8 15.7 12.0 18.4 15.61Sesamum Kharif 7.5 7.6 6.9 6.6 8.11Nigerseed Kharif 0.9 0.7 0.5 0.4 0.39Soyabean Kharif 131.6 109.3 132.7 112.3 128.97Sunflower Kharif 1.1 0.9 0.9 0.9 0.77
Rabi 1.4 1.4 1.3 1.2 1.53Total 2.5 2.2 2.2 2.1 2.3
Rapeseed&Mustard Rabi 79.2 84.3 92.6 91.2 101.12Linseed Rabi 1.8 1.7 1.0 1.2 1.12Safflower Rabi 0.9 0.6 0.3 0.4 0.39TotalOilseeds Kharif 215.3 210.1 206.8 222.5 240.32
Rabi 97.5 104.5 108.5 109.7 120.69Total 312.8 314.6 315.2 332.2 261.01
Sugarcane Total 3060.7 3799.1 4054.2 3705.0 3993.53Cotton@ Total 325.8 328.1 280.4 360.7 353.84@ Thousand bales of 170 kgs each. | # Fourth Advance Estimates
Source: Ministry of agriculture, GoI
ConversIon FaCtors BetWeen Important prImary and seCondary agrICultural CommodItIesCommodity Conversion FactorCotton
Cotton lint production 1/3 of Kapas Production Cotton seed production 2/3 of Kapas Production
2TimesofCottonLintProductionrapseed and mustard
Oiltoseedscrushed 33 Per cent Cake to seeds crushed 67Percent
CastorseedOiltoseedscrushed 37Percent Cake to seeds crushed 63 Per cent
soyabean seedOiltosoyabeanseedcrushed 18 Per cent Meal to soyabean seed crushed 73Percent Hull from soyabean seed crushed 8 Per cent Wastage from soyabean seed crushed 1 Per cent
sugarGurfromcanecrushed 11.20 Per cent to 11.50 Per cent Crystal sugar from gur refined (gur refineries) 62.5 Per cent Crystal sugar from cane Crushed (cane factories) 10.20 Per cent Khandasari sugar (Sulpher and Non-sulpher) 46 Per cent from standard gur refined Molasses from cane crushed 4.0 Per cent to 4.5 Per cent Cane - trash from cane harvested 8.0 Per cent to 12.0 Per cent
Source: Department of Agriculture and Cooperation
econoMIcIndIcatorS

COMMODITY INSIGHTS YEARBOOK 2021
53
econoMIcIndIcatorS
all-IndIa land use pattern (000 HeCtares)
2013-14 2014-15 2015-16 2016-17 2017-18
Geogra-phicalArea 328726 328726 328726 328726 328726
Reported area for land utilisation statistics 307797 307781 307752 308316 307768
Forests 71828 71756 71866 72020 72047
Net area Sown 141426 140128 139506 139415 139181
Total Cropped Area 200951 198378 197054 200203 199988
Cultivated land 155582 155219 154916 154502 153991
Net Irrigated Area 68117 68384 67300 68649 69478
GrossIrrigatedArea 95759 96754 96782 98148 100084
PercentageofGrossIrrigatedAreatoCroppedArea 48 49 49 49 50
Cropping Intensity (%) 142 142 141 144 144Source: Department of Agriculture, GoI | * Provisional
Crop groWtH Calendar (IndIa)Crop Jan Feb mar apr may Jun Jul aug sep oct nov decWheatRiceCornChanaTurGuarseedSugarcanePotato (Northern India)MenthaCottonTurmericChilliesJeeraSoyRapeseedCoffeeCardamomRubber
sowing growth HarvestingSource: www.agmarknet.nic.in, Spices Board of India, Coffee Board of India

COMMODITY INSIGHTS YEARBOOK 2021
54
econoMIcIndIcatorS
state-WIse land use pattern (000 HeCtares)state 2013-14 2014-15 2015-16 2016-17 2017-18andHra pradesHGeogra-phicalArea 16020 16276 16297 16297 16297Reported area for land utilisation statistics 16020 16276 16297 16297 16297Forests 3493 3663 3688 3688 3688Net area Sown 6448 6236 6209 6077 6048Total Cropped Area 8128 7690 7532 7418 7445Cultivated land 7536 7638 7619 7573 7490Net Irrigated Area 3014 2927 2743 3358 3285GrossIrrigatedArea 4095 3886 3547 3836 3715PercentageofGrossIrrigatedAreatoCroppedArea 50 51 47 48 50Cropping Intensity (%) 126 123 121 122 123telangana (formed in 2013-14)Geogra-phicalArea 11487 11231 11210 11210 11210Reported area for land utilisation statistics 11484 11208 11208 11208 11208Forests 2743 2540 2540 2698 2698Net area Sown 4961 4377 4175 4774 4898Total Cropped Area 6288 5315 4893 5970 6059Cultivated land 5921 5777 5753 5789 5814Net Irrigated Area 2289 1726 1486 2158 2324GrossIrrigatedArea 3164 2529 2028 3008 3172PercentageofGrossIrrigatedAreatoCroppedArea 50 48 41 50 52Cropping Intensity (%) 127 121 117 125 124assamGeogra-phicalArea 7844 7844 7844 7844 7844Reported area for land utilisation statistics 7844 7844 7844 7844 7844Forests 1853 1853 1853 1853 1853Net area Sown 2820 2827 2801 2774 2723Total Cropped Area 4100 4083 4060 4087 4045Cultivated land 2906 2915 2896 2879 2829Net Irrigated Area 303 296 297 362 357GrossIrrigatedArea 375 374 388 465 483PercentageofGrossIrrigatedAreatoCroppedArea 9 9 10 11 12Cropping Intensity (%) 145 144 145 147 149BIHarGeogra-phicalArea 9416 9416 9416 9416 9416Reported area for land utilisation statistics 9360 9360 9360 9360 9360Forests 622 622 622 622 622Net area Sown 5252 5278 5205 5293 5242Total Cropped Area 7580 7673 7572 7654 7525Cultivated land 6166 6167 6166 6161 6161Net Irrigated Area 2933 2987 2958 3101 3105GrossIrrigatedArea 5145 5268 5247 5341 5414PercentageofGrossIrrigatedAreatoCroppedArea 68 69 69 70 72Cropping Intensity (%) 144 145 145 145 144

COMMODITY INSIGHTS YEARBOOK 2021
55
econoMIcIndIcatorS
state-WIse land use pattern (000 HeCtares)state 2013-14 2014-15 2015-16 2016-17 2017-18CHHattIsgarHGeogra-phicalArea 13519 13519 13519 13519 13519Reported area for land utilisation statistics 13790 13790 13790 13790 13790Forests 6331 6316 6314 6317 6314Net area Sown 4686 4681 4651 4664 4653Total Cropped Area 5698 5728 5640 5673 5540Cultivated land 4946 4948 4932 4937 4943Net Irrigated Area 1462 1468 1476 1486 1506GrossIrrigatedArea 1751 1787 1753 1846 1838PercentageofGrossIrrigatedAreatoCroppedArea 31 31 31 33 33Cropping Intensity (%) 122 122 121 122 119guJarat Geogra-phicalArea 19602 19602 19602 19602 19602Reported area for land utilisation statistics 19069 19069 19069 19069 19069Forests 1834 1834 1834 1834 1834Net area Sown 10302 10302 10302 10302 10302Total Cropped Area 12487 12773 11522 11994 12220Cultivated land 10681 10681 10681 10681 10681Net Irrigated Area 4233 4233 4233 4233 4233GrossIrrigatedArea 5939 6014 6037 5917 6278PercentageofGrossIrrigatedAreatoCroppedArea 48 47 52 49 51Cropping Intensity (%) 121 124 112 116 119HaryanaGeogra-phicalArea 4421 4421 4421 4421 4421Reported area for land utilisation statistics 4371 4371 4371 4371 4371Forests 39 38 41 40 36Net area Sown 3497 3522 3522 3499 3517Total Cropped Area 6471 6536 6510 6452 6549Cultivated land 3598 3608 3615 3609 3628Net Irrigated Area 2931 2974 2956 3146 3261GrossIrrigatedArea 5708 5824 5948 5831 5993PercentageofGrossIrrigatedAreatoCroppedArea 88 89 91 90 92Cropping Intensity (%) 185 186 185 184 186HImaCHal pradesHGeogra-phicalArea 5567 5567 5567 5567 5567Reported area for land utilisation statistics 4576 4577 4577 4578 4577Forests 1126 1127 1127 1125 1124Net area Sown 549 548 551 548 543Total Cropped Area 940 918 933 959 917Cultivated land 606 603 605 603 608Net Irrigated Area 114 117 120 114 110GrossIrrigatedArea 197 190 206 226 203PercentageofGrossIrrigatedAreatoCroppedArea 21 21 22 24 22Cropping Intensity (%) 171 167 169 175 169
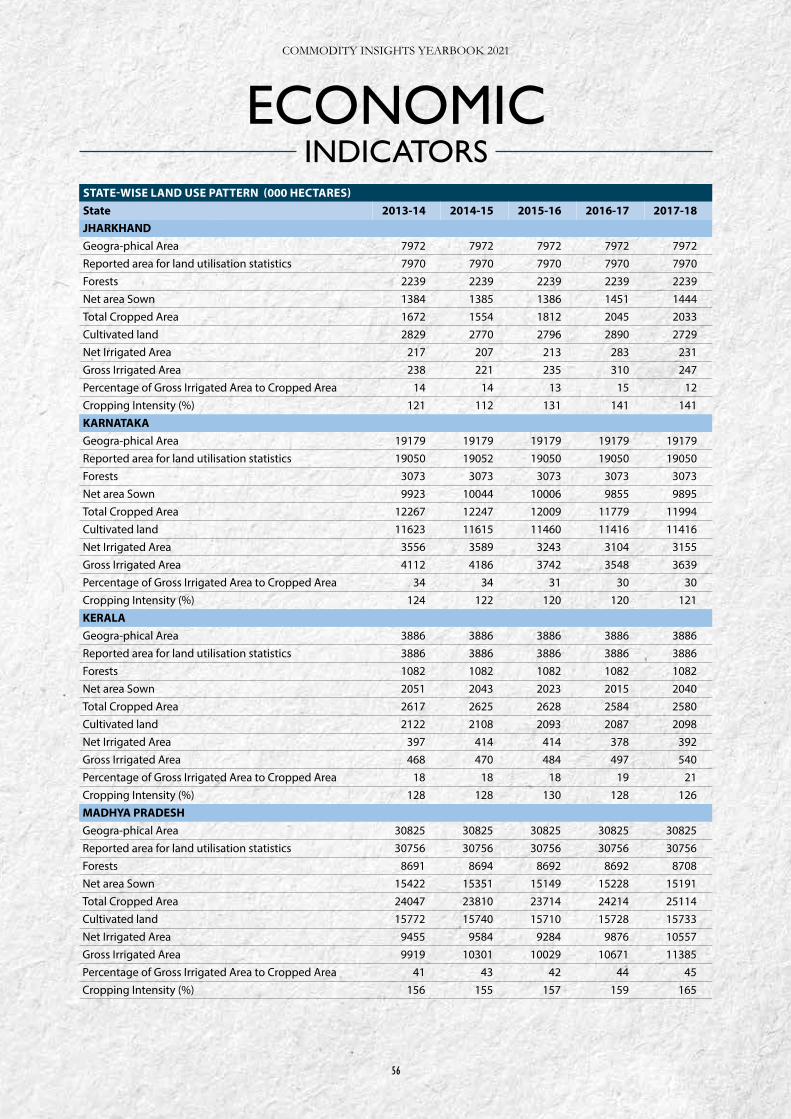
COMMODITY INSIGHTS YEARBOOK 2021
56
econoMIcIndIcatorS
state-WIse land use pattern (000 HeCtares)state 2013-14 2014-15 2015-16 2016-17 2017-18JHarkHandGeogra-phicalArea 7972 7972 7972 7972 7972Reported area for land utilisation statistics 7970 7970 7970 7970 7970Forests 2239 2239 2239 2239 2239Net area Sown 1384 1385 1386 1451 1444Total Cropped Area 1672 1554 1812 2045 2033Cultivated land 2829 2770 2796 2890 2729Net Irrigated Area 217 207 213 283 231GrossIrrigatedArea 238 221 235 310 247PercentageofGrossIrrigatedAreatoCroppedArea 14 14 13 15 12Cropping Intensity (%) 121 112 131 141 141karnatakaGeogra-phicalArea 19179 19179 19179 19179 19179Reported area for land utilisation statistics 19050 19052 19050 19050 19050Forests 3073 3073 3073 3073 3073Net area Sown 9923 10044 10006 9855 9895Total Cropped Area 12267 12247 12009 11779 11994Cultivated land 11623 11615 11460 11416 11416Net Irrigated Area 3556 3589 3243 3104 3155GrossIrrigatedArea 4112 4186 3742 3548 3639PercentageofGrossIrrigatedAreatoCroppedArea 34 34 31 30 30Cropping Intensity (%) 124 122 120 120 121keralaGeogra-phicalArea 3886 3886 3886 3886 3886Reported area for land utilisation statistics 3886 3886 3886 3886 3886Forests 1082 1082 1082 1082 1082Net area Sown 2051 2043 2023 2015 2040Total Cropped Area 2617 2625 2628 2584 2580Cultivated land 2122 2108 2093 2087 2098Net Irrigated Area 397 414 414 378 392GrossIrrigatedArea 468 470 484 497 540PercentageofGrossIrrigatedAreatoCroppedArea 18 18 18 19 21Cropping Intensity (%) 128 128 130 128 126madHya pradesHGeogra-phicalArea 30825 30825 30825 30825 30825Reported area for land utilisation statistics 30756 30756 30756 30756 30756Forests 8691 8694 8692 8692 8708Net area Sown 15422 15351 15149 15228 15191Total Cropped Area 24047 23810 23714 24214 25114Cultivated land 15772 15740 15710 15728 15733Net Irrigated Area 9455 9584 9284 9876 10557GrossIrrigatedArea 9919 10301 10029 10671 11385PercentageofGrossIrrigatedAreatoCroppedArea 41 43 42 44 45Cropping Intensity (%) 156 155 157 159 165

COMMODITY INSIGHTS YEARBOOK 2021
57
econoMIcIndIcatorS
state-WIse land use pattern (000 HeCtares)state 2013-14 2014-15 2015-16 2016-17 2017-18maHarasHtraGeogra-phicalArea 30771 30771 30771 30771 30771Reported area for land utilisation statistics 30758 30758 30758 30759 30742Forests 5206 5201 5195 5195 5220Net area Sown 17368 17345 17192 16910 16943Total Cropped Area 23328 23474 23467 23947 23109Cultivated land 18769 18744 18669 18312 18309Net Irrigated Area 3248 3244 3215 3163 3169GrossIrrigatedArea 4556 4564 4736 4663 4692PercentageofGrossIrrigatedAreatoCroppedArea 20 19 20 19 20Cropping Intensity (%) 134 135 137 142 136odIsHaGeogra-phicalArea 15571 15571 15571 15571 15571Reported area for land utilisation statistics 15467 15518 15426 15944 15424Forests 5814* 5814* 5814* 5814* 5814*Net area Sown 4495 4474 4198 4099 3863Total Cropped Area 5168 5173 4803 4884 4502Cultivated land 5372 5392 5226 5184 5079Net Irrigated Area 1245 1259 1230 1122 970GrossIrrigatedArea 1505 1485 1434 1309 1151PercentageofGrossIrrigatedAreatoCroppedArea 29 29 30 27 26Cropping Intensity (%) 115 116 114 119 117punJaBGeogra-phicalArea 5036 5036 5036 5036 5036Reported area for land utilisation statistics 5033 5033 5033 5033 5033Forests 258 256 256 255 253Net area Sown 4145 4119 4137 4130 4124Total Cropped Area 7848 7857 7872 7804 7779Cultivated land 4200 4202 4214 4208 4209Net Irrigated Area 4143 4118 4137 4128 4122GrossIrrigatedArea 7732 7757 7765 7714 7661PercentageofGrossIrrigatedAreatoCroppedArea 99 99 99 99 98Cropping Intensity (%) 189 191 190 189 189raJastHanGeogra-phicalArea 34224 34224 34224 34224 34224Reported area for land utilisation statistics 34267 34267 34267 34279 34287Forests 2758 2740 2752 2753 2756Net area Sown 18268 17521 18024 18169 17903Total Cropped Area 26120 24235 25014 26036 25069Cultivated land 19671 19377 19622 19659 19645Net Irrigated Area 7650 7882 7938 8257 7985GrossIrrigatedArea 9865 10171 10562 10724 10604PercentageofGrossIrrigatedAreatoCroppedArea 38 42 42 41 42Cropping Intensity (%) 143 138 139 143 140

COMMODITY INSIGHTS YEARBOOK 2021
58
state-WIse land use pattern (000 HeCtares)state 2013-14 2014-15 2015-16 2016-17 2017-18tamIl naduGeogra-phicalArea 13006 13006 13006 13006 13006Reported area for land utilisation statistics 13033 13033 13033 13033 13033Forests 2125 2125 2157 2157 2157Net area Sown 4714 4819 4833 4347 4639Total Cropped Area 5897 5995 6074 5129 5730Cultivated land 5829 5817 5822 5708 5630Net Irrigated Area 2679 2726 2833 2385 2627GrossIrrigatedArea 3311 3394 3575 2845 3278PercentageofGrossIrrigatedAreatoCroppedArea 56 57 59 55 57Cropping Intensity (%) 125 124 126 118 124uttarakHandGeogra-phicalArea 5348 5348 5348 5348 5348Reported area for land utilisation statistics 5992 5993 5993 5993 6005Forests 3800 3800 3800 3800 3812Net area Sown 701 700 698 691 673Total Cropped Area 1099 1097 1083 1082 1060Cultivated land 758 757 756 752 746Net Irrigated Area 328 330 330 329 329GrossIrrigatedArea 544 542 541 542 543PercentageofGrossIrrigatedAreatoCroppedArea 49 49 50 50 51Cropping Intensity (%) 157 157 155 157 157uttar pradesHGeogra-phicalArea 24093 24093 24093 24093 24093Reported area for land utilisation statistics 24170 24170 24170 24170 24170Forests 1658 1659 1666 1666 1671Net area Sown 16546 16598 16469 16564 16542Total Cropped Area 25896 26147 26203 26949 26864Cultivated land 17681 17720 17630 17654 17602Net Irrigated Area 14027 14389 14231 14337 14332GrossIrrigatedArea 20403 20965 20882 21633 21596PercentageofGrossIrrigatedAreatoCroppedArea 79 80 80 80 80Cropping Intensity (%) 157 158 159 163 162West BengalGeogra-phicalArea 8875 8875 8875 8875 8875Reported area for land utilisation statistics 8684 8683 8684 8684 8684Forests 1174 1173 1174 1175 1175Net area Sown 5234 5238 5243 5246 5247Total Cropped Area 9618 9690 9881 9618 9945Cultivated land 5583 5577 5571 5559 5555Net Irrigated Area 3099 3102 3105 3106 3107GrossIrrigatedArea 5661 5700 6486 6317 6481PercentageofGrossIrrigatedAreatoCroppedArea 59 59 64 66 65Cropping Intensity (%) 184 185 188 183 190Source: Department of Agriculture, GoI | * Provisional
econoMIcIndIcatorS

COMMODITY INSIGHTS YEARBOOK 2021
59
econoMIcIndIcatorS
perFormanCe oF soutH-West monsoon In IndIa number of meteorological sub-divisions @ percentage of districts
with normal/ excess rainfall
actual rainfall as % of normal rainfall (all
India)excess/normal
rainfalldeficient/scanty
rainfall2012 23 13 58 922013 30 6 72 1062014 24 12 55 882015 19 17 51 862016 27 9 68 972017 30 6 66 952018 24 12 62 912019 31 5 77 1102020 31 5 75 109
@ Total number of Meteorological sub-divisions was 35 upto 2001. From 2002 onwards, the numberof meteorological sub-divisions is 36.Excess:+20%ormoreofLongPeriodAverageRainfallNormal:Between+19%and-19%ofLongPeriodAverageRainfallDeficient:Between-20%and-59%ofLongPeriodAverageRainfall
Scanty:Between-60%and-99%ofLongPeriodAverageRainfallSource: Directorate of Economics and Statistics, DAC & FW
FloW oF InstItutIonal CredIt to agrICulture seCtor (rs Crore)particulars/agency 2015-16 2016-17 2017-18 2018-19 2019-20I. production (st) CreditCo-operative Banks 143803 131880 138348 142750 148287RRBs 101579 105001 119546 125654 138069Commercial Banks 419930 452576 497078 483805 538795Sub Total 665312 689457 754972 752209 825151II. mt/lt CreditCo-operative Banks 9492 10878 12041 9591 9080RRBs 17681 18215 21413 24013 27257Commercial Banks 223024 347205 380077 471017 531241Sub Total 250197 376298 413531 504620 567579total Credit (st + mt/lt)Co-operative Banks 153295 142758 150389 152340 157367RRBs 119260 123216 140959 149667 165326Commercial Banks 642954 799781 877155 954823 1070036GrandTotal 915509 1065755 1168503 1256830 1392729Source: Agricultural Sttisitcs at a Glance 2019, Ministry of Agriculture, GoI

COMMODITY INSIGHTS YEARBOOK 2021
60
econoMIcIndIcatorS
state-WIse storage CapaCIty (In lakH metrIC tonnes)
2015-16 2016-17 2017-18 2018-19 2019-20
Bihar 15.1 15.56 25.81 22.1 17.9
Odisha 11.63 13.57 12.1 13.15 13.39
West Bengal 16.72 18.64 18.67 19.44 3.9
Jharkhand 2.53 2.91 3.68 5.51 0.23
Assam 6.29 3.98 4.68 3.98 4.18
Delhi 3.67 3.67 3.67 3.67 3.67
Haryana 116.11 101.73 99.17 112.2 131.44
Himachal Pradesh 0.49 0.35 0.51 0.53 0.72
Jammu&Kashmir 2.49 2.59 2.79 2.46 2.6
Punjab 252.56 250.13 201.43 234.3 234.27
Rajasthan 23.24 21.42 19.9 27.83 19.26
Uttar Pradesh 64.43 58.28 58.72 62.38 54.17
Uttarakhand 3.8 0.21 3.93 2.94 2.47
Andhra Pradesh 24.02 28.71 26.8 25.48 22.87
Telangana 20.88 17.52 27.37 33.42 28.85
Kerala 5.89 5.55 7.17 7.62 5.63
Karnataka 29.62 13.87 11.56 12.49 10.87
Tamil 16.99 26.97 43.17 31.31 28.96
Gujarat 9.26 8.82 9.28 10.71 7.11
Maharashtra 31.55 31.98 34.19 38.3 20.49
Madhya Pradesh 129.66 124.29 210.73 157.8 92.96
Chhattisgarh 24.98 19 15.04 24.9 27.02
All India 814.84 775.38 843.03 855.68 755.94Note: Storage capacity pertains to FCI, CWC and SWC. It includes Owned and Hired, Covered and Cap Storage
Source: Agricultural Sttisitcs at a Glance 2019, Ministry of Agriculture, GoI

COMMODITY INSIGHTS YEARBOOK 2021
61
non - aGrIcULtUraLcoMModItIeS
STATISTICS
PrecIoUS MetaLSGold&Silver
BASEMETALSAluminium,Copper,Lead,
Nickel&Zinc
ENERGYCOMMODITIESCrudeOil&NaturalGas
61

COMMODITY INSIGHTS YEARBOOK 2021
62
Intentionally kept blank
62

COMMODITY INSIGHTS YEARBOOK 2021
63
PRECIOUS METALS
63

COMMODITY INSIGHTS YEARBOOK 2021
64
In India, apart from investment purposes, gold and silver have cultural, auspicious and sentimental values attached to them. Hence, most of the Indian households buy physical form of gold and silver as symbols of prosperity. They never like to part with gold and silver under normal circumstances and pass on to next generations. As a result, India has been one of the largest consuming countries of gold and silver. Since domestic production of these metals has been negligible compared to the demand for consumption, India has been largely depending on imports to meet the domestic demand and became one of the major importing countries in the world.
Among all, gold is the most sought after precious metal globally, since ancient times owing to its rarity, easy minting, smelting and fabrication, resistance to corrosion (nobility) and distinctive colour. Gold is used as asset, coins & currency and jewellery. It is alsoknown to have been used in medicines in the recorded history. The world gold standard, fixing of world’s major currencies to gold atasetpriceperounce,wasabandonedin1976afterfollowingfor about 100 years. Jewellery accounts for nearly half of total gold demand, followed by private investment and official purposes such as reserves.
Major mine producing countries of gold in the world include China, Australia, Russia, United States, Peru and South Africa. India and China account for over 50% of global gold demand for gold in therecentyearsaccordingtothelatestreportbytheWGC.Therehas been a distinct geographic shift in gold demand from western countries to eastern countries during the last two decades or so.
Silver is the second most important and widely traded precious metal. Similar to gold, silver is also utilized in a number of applications ranging from coins, ornaments, silverware to industrial applications and pharmaceuticals. Silver fabrication accounts for about 55% of total silver utilization in the world followed by jewellery, coins & bars and silverware accountingfor 20%, 20% and 5% respectively. Major countries in silver mine production include Mexico, Peru, China, Chile and Russia. India is now one of the top three importing countries in the world.
Goldandsilver,apartfromtradinginwidespreadphysicalmarkets,are also traded extensively in derivatives markets all over the world and in India in order to hedge against price risk. Prices fixed bytheLondonBullionMarketAssociation(LBMA)arewidelyusedbenchmark references for gold and silver globally. Comex is the major international benchmark for derivatives trading in gold and silver. Futures contracts of gold, silver and diamond are available for trading on Indian commodity exchanges. Further, first ever optionscontractsinIndiawerelaunchedforgoldinOctober2017and for silver in May 2018. Further expanding the product base, options in goods with physical commodity as the underlying were launched in Bullion by BSE, NSE and MCX in June and July 2020, while options in goods for chana, soybean, guarseed and guargum were launched on NCDEX in September 2020. The first index futures in India, on MCX Bulldex was successfully launched on August 24, 2020 on MCX trading platform.
Precious metals, particularly gold and silver, need no introduction and have been well sought after metals to possess since ancient times. Investing in precious metals such as gold and silver, also known as bullion, has widely been practiced historically in India as well as in other countries. Precious metals are also used as coins and currencies. central banks even now hold large quantities of gold as part of their reserves all over the world.
PrecIoUS MetaLS

COMMODITY INSIGHTS YEARBOOK 2021
65
gold Fundamentals (tonnes)2016 2017 2018 2019 2020
global supply
Mine production 3459 3492 3554 3532 3401
Net producer hedging 38 -26 -12 6 -65
Recycled gold 1249 1128 1147 1282 1297
Total supply 4746 4594 4689 4820 4633
global demand
Jewellery 2104 2241 2248 2123 1412
Technology 323 333 335 326 302
Electronics 256 266 268 262 248
OtherIndustrialuse 50 51 51 50 42
Dentistry 18 16 15 14 12
Investment 1614 1315 1160 1269 1773
Total bar and coin demand 1073 1044 1090 871 896
Physical Bar demand 797 780 775 581 529
OfficialCoin 208 188 242 224 298
Medals/Imitation Coin 68 76 73 66 69
ETFs&similarproducts 541 272 70 398 877
Centralbanks&otherinst. 395 379 657 668 273
Golddemand 4436 4268 4400 4386 3760
Indian scenario
Total Supply 641 976 853 777 449
Net bullion imports 551 879 756 647 344
Scrap 80 88 87 120 96
Domestic other sources# 10 9 11 11 9
Demand 666 771 760 690 446
Bar and coins 162 169 162 146 130
Jewellery demand 505 602 598 545 316# local mine production, recovery from imported copper concentrates and disinvestmentSource: World Gold Council, GFMS, US Geological Survey
GoLdFUndaMentaLS
65

COMMODITY INSIGHTS YEARBOOK 2021
66
gold Fundamentals (tonnes)2016 2017 2018 2019 2020*
major producing countries (mine production)
China 453 426 401 380 380
Australia 290 301 315 325 320
Russia 253 270 311 305 300
United States 222 237 226 200 190
South Africa 145 137 117 105 90
Canada 165 164 183 175 170
World 3110 3230 3300 3300 3200
major Consuming Countries
China 929 972 994 849 615
India 666 771 760 690 446
United States 210 159 154 151 185
Germany 121 117 107 100 172
Turkey 70 94 74 90 147
World 3177 3285 3339 2994 2308
Jewellery demand from major countries
China 645 665 686 638 416
India 505 602 598 545 316
United States 119 124 128 131 118
Russian Federation 38 40 43 44 33
Saudi Arabia 49 44 39 38 25
World 2104 2241 2248 2123 1412
reserves (gold) of central governement
United States 8133 8133 8133 8133 8,133
Germany 3378 3372 3367 3366 3,362
Italy 2452 2452 2452 2452 2,452
France 2436 2436 2436 2436 2,436
China 1843 1843 1927 1948 1,948
India 558 558 600 635 677
World 33293 33735 32640 32833 35395Source: World Gold Council, USGS Mineral Commodity Surveys; *Estimated
GoLdFUndaMentaLS
66

COMMODITY INSIGHTS YEARBOOK 2021
67
maJor Import sourCes and eXport destInatIons oF gold# (usd BIllIon)2016 2017 2018 2019 2020
Country value Country value Country value Country value Country value
major Importing Countries
Switzerland 82.9 Switzerland 69.8 Switzerland 63.3United Kingdom
70.8United Kingdom
88.3
China 64.0 India 36.2 India 31.8 Switzerland 60.6 Switzerland 87.9
United Kingdom
58.0 United Kingdom 34.5 UAE 27.7 India 31.2 USA 34.7
UAE 32.2China, Hong Kong SAR
29.4United Kingdom
25.6China, Hong Kong SAR
14.0 Turkey 25.2
Hong Kong SAR
29.5 Turkey 16.6China, Hong Kong SAR
23.6 Turkey 11.3 India 21.9
major exporting Countries
Switzerland 82.3 Switzerland 67.9 Switzerland 64.0 Switzerland 61.9 Switzerland 71.6
Hong Kong SAR
54.1China, Hong Kong SAR
52.2China, Hong Kong SAR
37.2China, Hong Kong SAR
25.2China, Hong Kong SAR
41.3
USA 17.7 USA 19.8United Kingdom
31.8 United Kingdom
23.3United Kingdom
21.4
UAE 16.5 United Kingdom 17.0 USA 20.3 USA 17.2 USA 20.6
United Kingdom
15.7 Canada 13.2United Arab Emirates
15.7 Australia 16.2 Australia 17.6
major Importing sources for India (usd million)
Switzerland 15371.6 Switzerland 17162.2 Switzerland 15221.4 Switzerland 14,466.94 Switzerland 16275.8
UAE 3256.6 UAE 3535.7 Ghana 3018.0 UAE 2,706.52 UAE 4194.9
Ghana 1759.0 Ghana 2392.3 UAE 2508.2 Peru 1,423.66 South Africa 2549.4
U S A 1422.7 U S A 2099.9 Peru 2207.4 South Africa 1,367.01 Peru 1499.1
Peru 585.4 Peru 1775.3 U S A 2126.7 U S A 1,365.26 Guinea 1431.7
major exporting destinations of India (usd million)
UAE 5397.45 UAE 1499.9 Singapore 20.5 Switzerland 55.86 Switzerland 192.92
USA 0.01 Turkey 0.04 Guinea 0.18 South Africa 18.63 Turkey 63.13
- - - - UK 0.04 UAE 6.22 Guinea 0.52
- - - - Germany 0.03 Hong Kong 0.01 UAE 0.43
- - - UAE 0.01 - - Hong Kong 0.16# includes gold unwrought, semi-manufactured, powder form (HS Code 7108)Source: UN Comtrade Database, Export-Import databank of India
GoLdFUndaMentaLS
67

COMMODITY INSIGHTS YEARBOOK 2021
68
gloBal eConomIC parameters ImpaCtIng prICes ( %)
2016 2017 2018 2019 2020
real gdp growth
China 6.8 6.9 6.8 5.9 2.3
Euro area 1.9 2.5 1.9 1.3 -6.7
India (fiscal year) 8.3 6.8 6.5 4.0 -7.3
Japan 0.5 2.2 0.3 0.3 -4.8
United Kingdom 1.7 1.7 1.3 1.4 -9.8
United States 1.7 2.3 3.0 2.2 -3.5
Consumer price Inflation
China 2.0 1.6 2.1 2.9 2.4
Euro area 0.2 1.4 1.7 1.4 0.3
India (fiscal year) 4.5 3.6 3.4 4.8 6.1
Japan -0.1 0.5 1.0 0.5 0.0
United Kingdom 1.0 2.6 2.3 1.7 1.0
United States 1.3 2.1 2.4 1.8 1.2
Industrial output growth
China 6.0 5.9 5.8 4.9 2.6
Euro area 2.7 3.1 2.0 -0.2 -7.6
India (fiscal year) 4.6 4.4 3.8 -0.8 -8.4
Japan 0.0 3.1 1.1 -3.0 -10.4
United Kingdom 2.0 3.2 0.2 -0.2 -10.8
United States -2.2 1.3 3.2 -0.8 -7.2
Interest rates (end of period)
China (loan prime rate) 4.35 4.35 4.35 4.15 3.85
India (repo rate ) 6.25 6.25 6.50 5.15 4.00
Japan (basic loan/discount rate) 0.30 0.30 0.30 0.30 0.30
United Kingdom 0.25 0.50 0.75 0.75 0.10
United States (Fed Funds rate) 0.54 1.30 2.27 1.55 0.09
equity Index (end of year)
US (Dow Jones Industrial Average) 19763 24719 23327 28538 30607
India (BSE-Sensex) 26626 34057 36068 41254 47751Source: Data releases of World Bank, Statistical departments of respective countries, BSE, NYSE
GoLdFUndaMentaLS
68

COMMODITY INSIGHTS YEARBOOK 2021
69
COMMODITY INSIGHTS YEARBOOK 2021
China 27%
India 19%
United States 8% Germany
8%
Turkey 6%
Others 32%
Gold Consumption 2020
Source: World Gold Council (WGC)
China 12%
Australia 10%
Russia 9%
United States 6%
South Africa 3%
Canada 5%
Others 55%
Gold Mine Production 2020
Source: USGS Mineral Commodity Summaries
69

COMMODITY INSIGHTS YEARBOOK 2021
70
COMMODITY INSIGHTS YEARBOOK 2021
1000
1200
1400
1600
1800
2000
0.0
0.5
1.0
1.5
2.0
2.5
Jan-
12Ju
l-12
Jan-
13Ju
l-13
Jan-
14Ju
l-14
Jan-
15Ju
l-15
Jan-
16Ju
l-16
Jan-
17Ju
l-17
Jan-
18Ju
l-18
Jan-
19Ju
l-19
Jan-
20Ju
l-20
Jan-
21
Go
ld P
rice
USD
/Tro
y O
un
ce
Inte
rest
rat
es
%
Gold Prices and US Interest Rates
Gold Price 3M Treasury rates
Source: WGC and Federal Reserve Bank of St Louis
12000
17000
22000
27000
32000
37000
1000
1200
1400
1600
1800
2000
2200
No
v-1
5
Feb
-16
May
-16
Au
g-1
6
No
v-1
6
Feb
-17
May
-17
Au
g-1
7
No
v-1
7
Feb
-18
May
-18
Au
g-1
8
No
v-1
8
Feb
-19
May
-19
Au
g-1
9
No
v-1
9
Feb
-20
May
-20
Au
g-2
0
No
v-2
0
Feb
-21
DJI
A (n
um
be
r)
Go
ld P
rice
USD
/Tro
y O
un
ce Gold Prices and Equity Trends
Gold price DJIASource: WGC and S & P Dow Jones Indices
100102104106108110112114116118
1000
1200
1400
1600
1800
2000
2200
No
v-1
5
Mar
-16
Jul-
16
No
v-1
6
Mar
-17
Jul-
17
No
v-1
7
Mar
-18
Jul-
18
No
v-1
8
Mar
-19
Jul-
19
No
v-1
9
Mar
-20
Jul-
20
No
v-2
0
Mar
-21
Do
llar
Ind
ex
(nu
mb
er)
Go
ld P
rice
USD
/Tro
y O
un
ce
Gold Prices and Dollar Index
Gold price Dollar IndexSource: WGC and Federal Reserve Bank of St. Louis
70
COMMODITY INSIGHTS YEARBOOK 2021

COMMODITY INSIGHTS YEARBOOK 2021
71
sIlver Fundamentals (tonnes)
World scenario 2016 2017 2018 2019 2020
GlobalSupply 33124 32089 31643 31685 30365
Mine Production 27975 26839 26387 25916 24399
Recycling 5116 5218 5218 5304 5665
Net Hedging Supply - - - 434 264
GlobalDemand 31016 30046 30785 30960 27872
Industrial Demand 15287 16134 15968 16007 15142
of which Photovoltaic 2915 3166 2877 3069 3142
Photography 1174 1092 1051 1018 859
Jewelry 5859 6074 6283 6229 4622
Silverware 1677 1853 2101 1931 1014
Net Physical Investment 6645 4858 5152 5776 6236
Market Balance 2108 2044 858 725 2493
Change in ETP Holdings 1676 223 -666 2590 10299
Indian scenario
Total Supply 3335 5748 7740 6328 3205
Mine Production 436 526 658 633 671
Recycling of Scrap 106 112 124 129 316
Imports 2793 5110 6958 5566 2218
Silver Fabrication: 5081 5327 6864 3466 -
CoinsAndMedalsIncludingTheUseOfScrap 220 257 328 351 161
Physical Investment 1136 1259 1680 1757 269
Industrial Applications 1122 1166 1256 1181 -
Brazing Alloys And Solders 67 69 71 68 54
Jewelry And Silverware 2738 3231 3698 3430 1801
Jewelry 1677 1995 2256 2148 1260
Silverware 1061 1236 1442 1282 541
Source: World Silver Survey 2021
SILVerFUndaMentaLS
71

COMMODITY INSIGHTS YEARBOOK 2021
72
sIlver Fundamentals (tonnes)
2016 2017 2018 2019 2020
major producing Countries (mine poduction)
Mexico 5421 5815 6049 5840 5541
Peru 4757 4840 4575 4221 3411
China 3754 3601 3422 3444 3377
Russia 1450 1305 1341 1391 1323
Chile 1448 1257 1243 1189 1474
Bolivia 1353 1196 1192 1153 930
World 27975 26839 26387 25916 24399
major countries with Industrial demand
China 3265 3650 3774 3773 3466
United States 3718 3864 3942 3825 3925
Japan 3255 3381 2911 3081 3107
Germany 906 935 969 963 908
South Korea 561 593 595 571 541
World 15287 16134 15968 16007 15142Source: World Silver Survey 2021
SILVerFUndaMentaLS
72

COMMODITY INSIGHTS YEARBOOK 2021
73
maJor Import sourCes and eXport destInatIons oF sIlver# (usd BIllIon)
2016 2017 2018 2019 2020-21
Country values Country values Country values Country values Country values
major Importing Countries
USA 4.38 USA 3.65 India 3.85 USA 3.21 USA 5.91
United Kingdom
2.44 India 2.99 USA 3.34 India 2.94United Kingdom
2.74
India 1.82United Kingdom
2.83United Kingdom
2.03United Kingdom
2.06 Canada 2.65
Canada 1.26 Japan 1.17 Japan 1.13China, Hong Kong SAR
1.04China, Hong Kong SAR
1.37
Japan 1.04China, Hong Kong SAR
0.91China, Hong Kong SAR
0.92 Japan 0.93 Japan 1.25
major exporting Countries
Mexico 1.89China, Hong Kong SAR
3.12China, Hong Kong SAR
2.19 Mexico 1.84United Kingdom
3.75
Rep. of Korea 1.67 Mexico 1.98 Mexico 1.77China, Hong Kong SAR
1.57China, Hong Kong SAR
3.02
Canada 1.64 Germany 1.48 UK 1.45 Germany 1.29 China 2.47
1.52 Japan 1.44 USA 1.31 Rep. of Korea 1.28 Mexico 2.09
Japan 1.44 Rep. of Korea 1.37 Rep. of Korea 1.28 Japan 1.20 Germany 1.99
major Importing sources for India (usd million)
2015-16 2016-17 2017-18 2018-19 2019-20
HONGKONG 479 HONGKONG 1395 U K 1064 HONGKONG 901.92 HONGKONG 334.38
CHINA P RP 441 U K 554 HONGKONG 970 U K 488.96 U K 113.35
KOREARP 192 RUSSIA 400 RUSSIA 325 U S A 195.19 RUSSIA 74.01
RUSSIA 172 CHINA P RP 326 CHINA P RP 322 RUSSIA 181.04 AUSTRALIA 63.59
U K 112 SINGAPORE 88 USA 302SWITZER-LAND
174.56 CHINA P RP 51.76
major exporting destinations of India (usd million)
U S A 4.9 U S A 3.9 USA 4.3 U S A 3.3 U K 399.4
UAE 3.1U ARAB EMTS
2.0U ARAB EMTS
2.9U ARAB EMTS
2.0 CANADA 24.9
MEXICO 0.5 CANADA 0.6 IRAN 1.1 GERMANY 1.0 AUSTRALIA 15.1
CANADA 0.4 GERMANY 0.5 GERMANY 0.9 CANADA 0.5 U S A 13.4
PHILIPPINES 0.3 IRAN 0.4 CANADA 0.6 IRAN 0.5U ARAB EMTS
6.1
# includes Silver, unwrought or semi-manufactured, silver powder (HS Code - 7106)Source: UN Comtrade Database, Export-Import databank of India
SILVerFUndaMentaLS
73

COMMODITY INSIGHTS YEARBOOK 2021
74
gloBal eConomIC parameters ImpaCtIng prICes ( %)
2016 2017 2018 2019 2020
real gdp growth
China 6.8 6.9 6.8 5.9 2.3
Euro area 1.9 2.5 1.9 1.3 -6.7
India (fiscal year) 8.3 6.8 6.5 4.0 -7.3
Japan 0.5 2.2 0.3 0.3 -4.8
United Kingdom 1.7 1.7 1.3 1.4 -9.8
United States 1.7 2.3 3.0 2.2 -3.5
Consumer price Inflation
China 2.0 1.6 2.1 2.9 2.4
Euro area 0.2 1.4 1.7 1.4 0.3
India (fiscal year) 4.5 3.6 3.4 4.8 6.1
Japan -0.1 0.5 1.0 0.5 0.0
United Kingdom 1.0 2.6 2.3 1.7 1.0
United States 1.3 2.1 2.4 1.8 1.2
Industrial output growth
China 6.0 5.9 5.8 4.9 2.6
Euro area 2.7 3.1 2.0 -0.2 -7.6
India (fiscal year) 4.6 4.4 3.8 -0.8 -8.4
Japan 0.0 3.1 1.1 -3.0 -10.4
United Kingdom 2.0 3.2 0.2 -0.2 -10.8
United States -2.2 1.3 3.2 -0.8 -7.2
Interest rates (end of period)
China (loan prime rate) 4.35 4.35 4.35 4.15 3.85
India (repo rate ) 6.25 6.25 6.50 5.15 4.00
Japan (basic loan/discount rate) 0.30 0.30 0.30 0.30 0.30
United Kingdom 0.25 0.50 0.75 0.75 0.10
United States (Fed Funds rate) 0.54 1.30 2.27 1.55 0.09
equity Index (end of year)
US (Dow Jones Industrial Average) 19763 24719 23327 28538 30607
India (BSE-Sensex) 26626 34057 36068 41254 47751Source: Data releases of World Bank, Central banks and statistical departments of respective countries, BSE, NYSE
SILVerFUndaMentaLS
74

COMMODITY INSIGHTS YEARBOOK 2021
75
China 13% United States
15%
Japan 11%
Germany 3%
South Korea 2%
Others 56%
Silver Consumption 2020
Source: World Silver Survey 2021
Mexico 23%
Peru 14%
China 14%
Russia 5%
Chile 6%
Bolivia 4%
Others 34%
Silver Mine Production 2020
Source: World Silver Survey 2021
75
COMMODITY INSIGHTS YEARBOOK 2021

COMMODITY INSIGHTS YEARBOOK 2021
76
0.00
0.50
1.00
1.50
2.00
2.50
3.00
30000
35000
40000
45000
50000
55000
60000
65000
70000
75000
Ap
r-1
6
Au
g-1
6
Dec
-16
Ap
r-1
7
Au
g-1
7
Dec
-17
Ap
r-1
8
Au
g-1
8
Dec
-18
Ap
r-1
9
Au
g-1
9
Dec
-19
Ap
r-2
0
Au
g-2
0
Dec
-20
Ap
r-2
1
US
3M
Tre
asu
ry r
ate
s %
Silv
er
Pri
ces
Rs/
Kg
Trends in Silver Prices vs US 3M Treasury rates
Silver price US 3M Treasury rates
Source: MCX and Fed Reserve of St Luis
76
COMMODITY INSIGHTS YEARBOOK 2021

COMMODITY INSIGHTS YEARBOOK 2021
77
BASEMETALS
77

COMMODITY INSIGHTS YEARBOOK 2021
78
Although there are numerous base metals, most widely used and traded are aluminium, copper, zinc, lead, nickel and tin. China and USA are major producers and consumers of majority of the base metals. China alone accounts for about half of global base metals consumption. While China is self-reliant in zinc and aluminium, it relies heavily on imports in case of copper. India is net importer of almost all the base metals to meet domestic consumption demand.
Aluminium is the most widely used non-ferrous metal and is the third most common metal on earth. It is used in industries like transportation, packaging, cookware, construction, electrical applications, electronic appliances etc., China alone accounts for more than 50% of world’s production as well as consumption of aluminium. Russia, Canada, India and Australia are other important producers of aluminium.
Copper is one of the metals used since ancient times. It is a good conductor of heat & electricity, corrosion resistant andantimicrobial. It is widely used in industrial applications as power cables, telecommunication cables, railways, cathodes etc. Copper is majorly produced in Chile, Peru, China and Australia. India is net importer of copper.
Zincandleadmineralsareknowntocoexistinvaryingconcentrationsintheearth’scrust.Zincisthefourthmostcommonmetalinuse,afteriron,aluminium,andcopper.Zincislargelyusedforgalvanizingirontoprotectagainstcorrosion.Zincisalsousedtoproducediecastings, which are used extensively by the automotive, electrical, andhardwareindustries.Lead,ontheotherhand,istoxicmetalwithhigh density. It is extensively used in acid batteries and also used as protection against radiation. Lead being toxic metal requiresspecial measures in its recycling and waste management and is regulated by pollution control boards and ministry of environment. Chinaisthelargestproducerandconsumerofzincandlead.Otherimportant producers are Korea, India, Canada and Japan.
Nickel is known to be the fifth most common element in the earth’s crust, most of which is inaccessible. It is widely used in the manufacturing of stainless and other alloys that are corrosion resistant. Alloy of nickel and copper are extensively used in pipes in desalination plants. China is the largest producer and consumer of nickel in the world. India completely depends on imports to meet all domestic consumption requirements.
Prices of base metals, apart from demand and supply, are largely influenced by a number of factors such as indicators of housing and auto sector performance in major countries, mining activity related policy®ulatorydevelopmentsinthemajorproducingcountries,inventorylevelsetc.LondonMetalExchange(LME)pricesarewidelyacknowledged benchmark reference prices for base metals all over the world and India. In India, futures contracts in metals are available for aluminium, copper, zinc, lead, nickel and brass, an alloy of copper and zinc. Further, options contracts on copper and zinc futures are also available from May 2018. During 2019, all base metal futures contracts traded on domestic exchanges have become compulsory delivery contracts. Following the permission from SEBI, index based futures contracts on MCX Metldex were launched on October19,2020forthebenefitofbothinvestorsandhedgersfortheir respective purposes.
Base metals are common, less expensive industrial non-ferrous metals. Metals and metal alloys possess high structural strength per unit of mass, which makes them useful for carrying large loads or resisting impact damage. Metal alloys can be engineered to have high resistance to shear, torque and deformation. Strength and resilience have led to their frequent use in high-rise building & bridge construction, vehicles, tools, pipes, non-illuminated signs, railroad tracks and numerous other appliances.
BaSe MetaLS

COMMODITY INSIGHTS YEARBOOK 2021
79
alumInIum Fundamentals
2016 2017 2018 2019 2020*
World sCenarIo (000 tonnes)
Primary Aluminium Production 59890 63404 64336 63697 65884
Production capacity 75500 77800 77000 77900 77900
Primary Aluminium Consumption 60922 68700 60524 62270 64806
Source: USGS, World Aluminium (International Aluminium Institute), *Estimated
IndIan sCenarIo 2016-17 2017-18 2018-19 2019-20 2020-21
Production 1746 1843 3694 3656 2987#
Imports 1751 1958 2318 2152 2060
Exports 1547 2012 2338 2371 2736
Source : Ministry of Mines; Ministry of Commerce & Industry; #April 2020 to January 2021
maJor produCers oF prImary alumInum (000 tonnes)
2016 2017 2018 2019 2020
World 58900 59400 63600 63200 65200
China 31900 32300 35800 35000 37000
Russia 3560 2600 3630 3640 3600
Canada 3210 3210 2920 2850 3100
India 2720 3270 3680 3640 3600
UAE 2500 2600 2640 2600 2600
Source: USGS Mineral Commodity Summaries; *Estimated
aLUMInIUMFUndaMentaLS
79

COMMODITY INSIGHTS YEARBOOK 2021
80
maJor ImportIng and eXportIng CountrIes
2016 2017 2018 2019 2020
major Importing Countries (usd billion)
USA 18.7 23.4 24.2 22.3 19.1
Germany 14.9 18.7 19.9 17.5 15.2
Japan 6.9 8.3 9.3 8.0 6.5
France 6.3 6.9 7.5 7.2 6.1
China 5.9 6.6 9.1 0.9 8.1
Total 128.7 154.9 177.0 159.8 152.1
major exporting Countries (usd billion)
China 21.2 22.6 27.1 26.1 24.6
Germany 14.6 16.4 17.8 16.6 14.8
USA 12.2 11.6 12.6 10.9 9.4
Canada 8.1 9.8 10.0 8.3 8.4
Russian Federation 6.0 6.7 6.3 5.8 -
Total 137.6 150.9 159.9 135.1 145.8Source: UN Comtrade Database (HS code 76)
aLUMInIUMFUndaMentaLS
80

COMMODITY INSIGHTS YEARBOOK 2021
81
aLUMInIUMFUndaMentaLS
maJor Import sourCes and eXport destInatIons For IndIa (value In rs. lakH)
2016-17 2017-18 2018-19 2019-20 2020-21
Country value Country value Country value Country value Country value
Imports sources (Hs code 76)
China P Rp 443900 China P Rp 486724 China P Rp 824469 China P Rp 675919 China P Rp 543077
UAE 236775 UAE 257929 UAE 321908 Malaysia 257768 U S A 369188
Malaysia 172921 Malaysia 257258 Malaysia 338881 UAE 204995 UAE 250329
U K 164351 U K 225441 U K 239174 U K 184375 Malaysia 194152
Saudi Arab 136060 Saudi Arab 190530 Saudi Arab 181058 U S A 364701 U K 166479
Total 2332595 Total 2915466 Total 3816626 Total 3109455 Total 2991264
exports destinations (Hs code 76)
Korea Rp 497888 Malaysia 499803 Malaysia 643985 Malaysia 905728 Malaysia 908805
U S A 234609 Korea Rp 492737 Korea Rp 366779 Korea Rp 652530 Korea Rp 799037
Malaysia 180283 U S A 438677 U S A 547956 U S A 451083 U S A 375104
Mexico 110017 Turkey 164259 Turkey 324902 Taiwan 99672 China P Rp 298626
Italy 108546 Italy 127193 Italy 176105 Japan 96383 Taiwan 160794
Total 2161505 Total 3078767 Total 3987562 Total 3610345 Total 4277560Source: Export-Import Data Bank, Ministry of Commerce, GoI
81

COMMODITY INSIGHTS YEARBOOK 2021
82
gloBal eConomIC parameters ImpaCtIng prICes ( %)
2016 2017 2018 2019 2020
real gdp growth
China 6.8 6.9 6.8 5.9 2.3
Euro area 1.9 2.5 1.9 1.3 -6.7
India (fiscal year) 8.3 6.8 6.5 4.0 -7.3
Japan 0.5 2.2 0.3 0.3 -4.8
United Kingdom 1.7 1.7 1.3 1.4 -9.8
United States 1.7 2.3 3.0 2.2 -3.5
Consumer price Inflation
China 2.0 1.6 2.1 2.9 2.4
Euro area 0.2 1.4 1.7 1.4 0.3
India (fiscal year) 4.5 3.6 3.4 4.8 6.1
Japan -0.1 0.5 1.0 0.5 0.0
United Kingdom 1.0 2.6 2.3 1.7 1.0
United States 1.3 2.1 2.4 1.8 1.2
Industrial output growth
China 6.0 5.9 5.8 4.9 2.6
Euro area 2.7 3.1 2.0 -0.2 -7.6
India (fiscal year) 4.6 4.4 3.8 -0.8 -8.4
Japan 0.0 3.1 1.1 -3.0 -10.4
United Kingdom 2.0 3.2 0.2 -0.2 -10.8
United States -2.2 1.3 3.2 -0.8 -7.2
Interest rates (end of period)
China (loan prime rate) 4.35 4.35 4.35 4.15 3.85
India (repo rate ) 6.25 6.25 6.50 5.15 4.00
Japan (basic loan/discount rate) 0.30 0.30 0.30 0.30 0.30
United Kingdom 0.25 0.50 0.75 0.75 0.10
United States (Fed Funds rate) 0.54 1.30 2.27 1.55 0.09
equity Index (end of year)
US (Dow Jones Industrial Average) 19763 24719 23327 28538 30607
India (BSE-Sensex) 26626 34057 36068 41254 47751Source: Data releases of World Bank, Central banks and statistical departments of respective countries, BSE, NYSE
aLUMInIUMFUndaMentaLS

COMMODITY INSIGHTS YEARBOOK 2021
83
-20
-15
-10
-5
0
5
10
90
110
130
150
170
190
Mar
-15
Jul-1
5N
ov-1
5M
ar-1
6Ju
l-16
Nov
-16
Mar
-17
Jul-1
7N
ov-1
7M
ar-1
8Ju
l-18
Nov
-18
Mar
-19
Jul-1
9N
ov-1
9M
ar-2
0Ju
l-20
Nov
-20
Mar
-21
Indu
stry
Gro
wth
(%)
Alum
iniu
m P
rice
Rs/k
g
Aluminium Prices and US Industry Growth (%)
ALUMINIUM US Industry Growth (Y-o-Y)
Source: MCX and Federal Reserve Bank of St. Louis
China 57%
Russia 5%
Canada 5%
India 6%
UAE 4%
Others 23%
Aluminium Production 2020
Source: USGS Mineral Commodity Summaries
83
COMMODITY INSIGHTS YEARBOOK 2021

COMMODITY INSIGHTS YEARBOOK 2021
84
coPPerFUndaMentaLS
Copper Fundamentals (000 tonnes)
particular 2016 2017 2018 2019 2020
World scenario
Mine Production 20386 20067 20579 20571 20575
Mine Capacity 23481 24003 24063 24164 24764
Capacity Utilization (%) 87 84 85 85 83
Primary Refined Production 19490 19494 20040 19999 20579
Secondary Refined Production 3866 4063 4035 4028 3875
World Refined Production 23357 23557 24075 24027 24454
World Refinery Capacity 26853 27804 28234 29044 29945
Refineries Capacity Utilization (%) 87 85 85 83 82
World Refined Usage 23512 23705 24484 24429 24987
World Refined Stocks 1365 1375 1227 1215 1234Source: International Copper Study Group
particular 2016-17 2017-18 2018-19 2019-20 2020-21
Indian scenario
Production 796 848 737 408 547#
Import 507 553 680 897 745
Export 453 511 135 141 210Source : Ministry of Mines; Ministry of Commerce & Industry; #April 2020 to January 2021
Country/ region 2016 2017 2018 2019 2020*
major Countries in mine production
Chile 5550 5500 5830 5790 5700
Peru 2350 2450 2440 2460 2200
China 1900 1710 1600 1680 1700
United States 1430 1260 1220 1260 1200
Australia 948 860 950 934 870
World 20100 20000 21000 20400 20000Sources: USGS Mineral Commodity Summaries;
*Estimated
84

COMMODITY INSIGHTS YEARBOOK 2021
85
coPPerFUndaMentaLS
maJor ImportIng and eXportIng CountrIesCountry 2016 2017 2018 2019 2020major Importers (usd billion)China 33.3 41.3 12.9 1.5 48.5Germany 8.6 10.9 12.2 10.5 10.0USA 7.5 10.1 11.0 9.6 9.1Italy 5.6 7.1 7.5 6.7 6.2Rep. of Korea 5.1 5.7 5.8 5.3 5.1major exporters (usd billion)Chile 15.1 17.8 18.1 15.2 NAGermany 10.2 12.4 13.3 11.6 11.6USA 6.3 7.4 8.4 7.3 6.5Japan 6.4 7.2 8.5 7.6 9.4China 5.8 6.5 1.5 1.7 6.2Source: UN Comtrade Database
maJor Import sourCes and eXport destInatIons For IndIa (rs. lakH)2016-17 2017-18 2018-19 2019-20 2020-21
Country value Country value Country value Country value Country valueImports in the form of Copper and articles thereof (HS code 74)Zambia 447472 Zambia 572723 Zambia 292572 Japan 597507 Japan 733147UAE 332247 UAE 355308 UAE 519575 Zambia 511242 South Africa 373709Malaysia 255380 Malaysia 351595 Malaysia 420853 UAE 468286 UAE 320358Vietnam Soc Rep 141149 Vietnam Soc Rep 273920 Vietnam Soc Rep 341436 Malaysia 383755 Tanzania Rep. 300013China P Rp 116773 Japan 154882 Japan 346939 Vietnam Soc Rep 316325 Vietnam Soc Rep 205801Total 2270885 Total 2905824 Total 3687262 Total 3610182 Total 3414992
Imports in the form of Copper ores and concentrates (Hs code 2603)Chile 611465 Chile 1121320 Chile 540907 Chile 561274 Chile 290650Indonesia 408341 Indonesia 466638 Indonesia 272587 Peru 87489 Indonesia 213914Australia 238010 Peru 341719 Peru 103367 Australia 61708 Malaysia 39747Peru 232468 Brazil 244172 Saudi Arabia 42072 Indonesia 49327 Canada 29697Brazil 83902 Australia 219451 Australia 202495 Saudi Arabia 31423 Saudi Arabia 16671Total 1829870 Total 2783448 Total 1214620 Total 866752 Total 590716
exports in the form of Copper and articles thereof (Hs code 74)China P Rp 475039 China P Rp 998370 China P Rp 172555 China P Rp 189360 China P Rp 576371UAE 206508 UAE 219200 UAE 35561 U S A 110999 U S A 121645Singapore 196648 Malaysia 180523 U S A 107230 UAE 32717 UAE 26811Taiwan 193581 Qatar 133798 Qatar 44899 U K 20476 Saudi Arabia 22364Malaysia 190242 Korea Rp 124050 TAIWAN 27208 Saudi Arabia 18553 Korea RP 21862Total 1766826 Total 2203405 Total 700303 Total 606005 Total 1020865Source: Export-Import Data Bank, Ministry of Commerce, GoI
85

COMMODITY INSIGHTS YEARBOOK 2021
86
coPPerFUndaMentaLS
gloBal eConomIC parameters ImpaCtIng prICes ( %)2016 2017 2018 2019 2020
real gdp growth
China 6.8 6.9 6.8 5.9 2.3
Euro area 1.9 2.5 1.9 1.3 -6.7
India (fiscal year) 8.3 6.8 6.5 4.0 -7.3
Japan 0.5 2.2 0.3 0.3 -4.8
United Kingdom 1.7 1.7 1.3 1.4 -9.8
United States 1.7 2.3 3.0 2.2 -3.5
Consumer price Inflation
China 2.0 1.6 2.1 2.9 2.4
Euro area 0.2 1.4 1.7 1.4 0.3
India (fiscal year) 4.5 3.6 3.4 4.8 6.1
Japan -0.1 0.5 1.0 0.5 0.0
United Kingdom 1.0 2.6 2.3 1.7 1.0
United States 1.3 2.1 2.4 1.8 1.2
Industrial output growth
China 6.0 5.9 5.8 4.9 2.6
Euro area 2.7 3.1 2.0 -0.2 -7.6
India (fiscal year) 4.6 4.4 3.8 -0.8 -8.4
Japan 0.0 3.1 1.1 -3.0 -10.4
United Kingdom 2.0 3.2 0.2 -0.2 -10.8
United States -2.2 1.3 3.2 -0.8 -7.2
Interest rates (end of period)
China (loan prime rate) 4.35 4.35 4.35 4.15 3.85
India (repo rate ) 6.25 6.25 6.50 5.15 4.00
Japan (basic loan/discount rate) 0.30 0.30 0.30 0.30 0.30
United Kingdom 0.25 0.50 0.75 0.75 0.10
United States (Fed Funds rate) 0.54 1.30 2.27 1.55 0.09
equity Index (end of year)
US (Dow Jones Industrial Average) 19763 24719 23327 28538 30607
India (BSE-Sensex) 26626 34057 36068 41254 47751
Source: Data releases of World Bank, Central banks and statistical departments of respective countries, BSE, NYSE
86

COMMODITY INSIGHTS YEARBOOK 2021
87
-20
-15
-10
-5
0
5
10
250
350
450
550
650
750
May
-15
Sep
-15
Jan
-16
May
-16
Sep
-16
Jan
-17
May
-17
Sep
-17
Jan
-18
May
-18
Sep
-18
Jan
-19
May
-19
Sep
-19
Jan
-20
May
-20
Sep
-20
Jan
-21
Ind
ust
ry g
row
th (
%)
Co
pp
er
Pri
ce R
s/kg
Copper Prices and US Industry Growth (%)
Copper Price US Industry Growth (Y-o-Y)
Source: MCX and Federal Reserve Bank of St. Louis
Chile 28%
Peru 11%
China 9%
United States 6%
Australia 4%
Others 42%
Copper Mine Production 2020
Source: USGS Mineral Commodity Summaries
87
COMMODITY INSIGHTS YEARBOOK 2021

COMMODITY INSIGHTS YEARBOOK 2021
88
LeadFUndaMentaLS
lead Fundamentals (000 tonnes)
World scenario 2016 2017 2018 2019 2020
Mine production 4689 4713 4625 4720 4400
Metal Production 11576 11945 12241 12253 11748
Metal Usage 11538 12094 12287 12222 11593
Source: International Lead and Zinc Study Group, USGS
Indian scenario 2016-17 2017-18 2018-19 2019-20 2020-21
Production 139 168 198 181 171#
Import 307 352 360 349 315
Export 181 160 177 175 177
Sources: Indian Bureau of Mines, Ministry of Commerce & Industry, GoI; # April 2020 to Jan 2021
major Countries in mine production 2016 2017 2018 2019 2020*
China 2340 2150 2100 2000 1900
Australia 453 459 450 509 480
US 346 310 260 274 290
Peru 314 307 300 308 240
Mexico 232 243 240 259 240
Source: USGS Mineral Commodity Summaries; *Estimated
88

COMMODITY INSIGHTS YEARBOOK 2021
89
LeadFUndaMentaLS
maJor ImportIng and eXportIng CountrIesmajor Importers (usd million) 2016 2017 2018 2019 2020USA 1116 1558 1347 1081 778India 564 744 860 664 620United Kingdom 411 584 465 457 386Germany 343 554 595 521 432Czech Republic 314 407 415 353 290Total 6726 7822 8021 7001 6179major exporters (usd million)Australia 874 951 812 576 676Rep. of Korea 778 848 878 775 669Canada 560 637 607 553 372United Kingdom 522 618 598 520 493Germany 358 510 512 387 346Total 6711 7966 8047 6547 5374Source: UN Comrade Database
maJor Import sourCes and eXport destInatIons For IndIa (rs. lakH)
2016-17 2017-18 2018-19 2019-20 2020-21
Country value Country value Country value Country value Country value
Imports in the form of lead and articles thereof (Hs code 78)
Korea Rp 91839 Korea Rp 105845 Korea Rp 128815 Korea Rp 109140 Korea Rp 100478
Australia 63806 Australia 77803 Australia 77644 Malaysia 46734 U S A 41260
UAE 41680 Vietnam Soc Rep 46834 USA 42200 U S A 42466 UAE 39530
Vietnam Soc Rep 27923 UAE 43105 UAE 46327 U K 42324 Australia 35976
U K 25252 Malaysia 38265 U K 42795 UAE 38845 Malaysia 29253
Total 400656 Total 525037 Total 547549 Total 499234 Total 458828
Imports in the form of lead ores and Concentrates (Hs Code 2607)
Turkey 2102 UAE 344 UAE 411 UAE 567 Turkey 1462
UAE 440 Saudi Arabia 215 Tanzania Republic 139 Mozambique 417 UAE 1014
South Africa 125 Turkey 197 Nigeria 74 Morocco 237 Morocco 200
Morocco 108 Yemen Republic 149 Canada 77 South Africa 103 Mozambique 162
Yemen Republic 102 Sudan 140 Morocco 69 Nigeria 82 Sudan 124
Total 3187 Total 1494 Total 855 Total 1667 Total 3251
exports in the form of lead and articles thereof (Hs code 78)
U S A 69248 Korea Rp 71195 Korea Rp 110801 Korea Rp 79406 Korea Rp 98032
Korea Rp 26888 U S A 68563 Thailand 28485 Vietnam 43107 Thailand 26456
Taiwan 16681 Bangladesh Pr 21679 Turkey 17607 Thailand 38215 Vietnam 24303
UAE 14180 Vietnam Soc Rep 19576 Vietnam Soc Rep 34251 UAE 17984 Taiwan 20317
Vietnam Soc Rep 6615 Taiwan 15716 UAE 15304 Bangladesh 17374 Bangladesh 19884
Total 159479 Total 255722 Total 281998 Total 264225 Total 258455Source: Export-Import Data Bank, Ministry of Commerce, GoI
89

COMMODITY INSIGHTS YEARBOOK 2021
90
LeadFUndaMentaLS
gloBal eConomIC parameters ImpaCtIng prICes ( %)
2016 2017 2018 2019 2020
real gdp growth
China 6.8 6.9 6.8 5.9 2.3
Euro area 1.9 2.5 1.9 1.3 -6.7
India (fiscal year) 8.3 6.8 6.5 4.0 -7.3
Japan 0.5 2.2 0.3 0.3 -4.8
United Kingdom 1.7 1.7 1.3 1.4 -9.8
United States 1.7 2.3 3.0 2.2 -3.5
Consumer price Inflation
China 2.0 1.6 2.1 2.9 2.4
Euro area 0.2 1.4 1.7 1.4 0.3
India (fiscal year) 4.5 3.6 3.4 4.8 6.1
Japan -0.1 0.5 1.0 0.5 0.0
United Kingdom 1.0 2.6 2.3 1.7 1.0
United States 1.3 2.1 2.4 1.8 1.2
Industrial output growth
China 6.0 5.9 5.8 4.9 2.6
Euro area 2.7 3.1 2.0 -0.2 -7.6
India (fiscal year) 4.6 4.4 3.8 -0.8 -8.4
Japan 0.0 3.1 1.1 -3.0 -10.4
United Kingdom 2.0 3.2 0.2 -0.2 -10.8
United States -2.2 1.3 3.2 -0.8 -7.2
Interest rates (end of period)
China (loan prime rate) 4.35 4.35 4.35 4.15 3.85
India (repo rate ) 6.25 6.25 6.50 5.15 4.00
Japan (basic loan/discount rate) 0.30 0.30 0.30 0.30 0.30
United Kingdom 0.25 0.50 0.75 0.75 0.10
United States (Fed Funds rate) 0.54 1.30 2.27 1.55 0.09
equity Index (end of year)
US (Dow Jones Industrial Average) 19763 24719 23327 28538 30607
India (BSE-Sensex) 26626 34057 36068 41254 47751Source: Data releases of World Bank, Central banks and statistical departments of respective countries, BSE, NYSE
90

COMMODITY INSIGHTS YEARBOOK 2021
91
-20
-15
-10
-5
0
5
10
100110120130140150160170180
May
-15
Oct
-15
Mar
-16
Aug-
16
Jan-
17
Jun-
17
Nov
-17
Apr-
18
Sep-
18
Feb-
19
Jul-1
9
Dec-
19
May
-20
Oct
-20
Mar
-21
Indu
stry
gro
wth
(%)
LEad
Pric
es R
s/kg
Lead Prices and US Industry Growth (%)
Lead Price US Industry Growth (Y-o-Y)Source: MCX and Federal Reserve Bank of St. Louis
China 43%
Australia 11%
US 7%
Peru 6%
Mexico 5%
Others 28%
Lead Mine Production 2020
Source: USGS Mineral Commodity Summaries
91
COMMODITY INSIGHTS YEARBOOK 2021

COMMODITY INSIGHTS YEARBOOK 2021
92
nIcKeLFUndaMentaLS
nICkel Fundamentals (000 tonnes)
2016 2017 2018 2019 2020
World scenario
Mine Production 2090 2160 2400 2610 2500
Refined Production 1989 2076 2182 2382 2436
Refined consumption 2033 2192 2328 2403 2586Sources: USGS Mineral Commodity Summaries; International Nickel Study Group
2016-17 2017-18 2018-19 2019-20 2020-21
Indian scenario
Production 0 0 0 0 0
Import 122 157 154 48 57
Export 1 1 1 16 3Sources: Indian Bureau of Mines, Ministry of Commerce & industry, GoI
major countries in mine production
World 2090 2160 2400 2610 2500
Indonesia 199 345 606 853 760
Philippines 347 366 345 323 320
New Caledonia 207 215 216 208 200
Canada 236 214 176 181 150
Australia 204 179 170 159 170Sources: USGS Mineral Commodity Summaries; *Estimated
92

COMMODITY INSIGHTS YEARBOOK 2021
93
nIcKeLFUndaMentaLS
maJor Import sourCes and eXport destInatIons In tHe World (value In usd mIlllIon)
2016 2017 2018 2019 2020
Country value Country value Country value Country value Country value
major Importers
China 4957 China 4643 USA 2952 USA 2929 Canada 2777
USA 1973 USA 2420 Japan 2892 Japan 2769 USA 2216
Japan 1746 Japan 2050 Germany 1900 Germany 1867 Germany 1479
Germany 1149 Germany 1454 Norway 1839 Norway 1744 Norway 1253
UK 1005 Norway 1255 UK 1513 United Kingdom 1521 United Kingdom 1100
Total 19436 Total 20942 Total 22478 Total 22442 Total 17862
major exporters
Canada 3111 Canada 2841 Canada 3160 USA 3119 China 4218
Russia 2019 Russia 2058 Russia 2605 Canada 2981 Japan 2411
USA 1881 USA 2006 USA 2759 Russian Federation 2975 USA 2383
UK 1083 UK 1209 Malaysia 1422 Germany 1571 Norway 1966
Germany 958 Germany 1202 Germany 1502 United Kingdom 1401 Germany 1543
Total 16404 Total 17534 Total 22374 Total 22726 Total 24061
Source: UN Comtrade Database (Nickel and articles thereof)
major Import sources and export destinations for India (value in rs. lakh)
2016-17 2017-18 2018-19 2019-20 2020-21
Country value Country value Country value Country value Country value
Imports in the form of nickel and articles thereof (Hs code 75)
Russia 46998 Australia 75284 Norway 55312 Japan 66600 Japan 73873
Norway 42043 Norway 57670 South Africa 47111 Norway 60319 Norway 69355
Australia 39850 Russia 39585 Netherlands 43434 China 55974 USA 43029
Canada 33257 South Africa 30426 UK 39342 USA 49642 China 38501
South Africa 27681 Canada 28109 USA 34423 South Africa 39725 Canada 35104
Total 370808 Total 407789 Total 516808 Total 554943 Total 551262
exporters in the form of nickel and articles thereof (Hs code 75)
China 25239 China 3560 USA 6361 China 27315 China 7323
UAE 5301 USA 3411 Korea Rp 5002 UK 4142 USA 3830
Malaysia 5158 UK 2396 Saudi Arabia 4888 USA 3895 Mexico 3309
Korea Rp 4814 Singapore 2260 UK 4553 Saudi Arabia 3400 Turkry 3080
Taiwan 4388 Saudi Arabia 2350 China 2980 Mexico 2648 Netherlands 2729
Total 61197 Total 27319 Total 46488 Total 65325 Total 41490
Source: Export-Import Data Bank, Ministry of Commerce, GoI
93

COMMODITY INSIGHTS YEARBOOK 2021
94
nIcKeLFUndaMentaLS
gloBal eConomIC parameters ImpaCtIng prICes ( %)
2016 2017 2018 2019 2020
real gdp growth
China 6.8 6.9 6.8 5.9 2.3
Euro area 1.9 2.5 1.9 1.3 -6.7
India (fiscal year) 8.3 6.8 6.5 4.0 -7.3
Japan 0.5 2.2 0.3 0.3 -4.8
United Kingdom 1.7 1.7 1.3 1.4 -9.8
United States 1.7 2.3 3.0 2.2 -3.5
Consumer price Inflation
China 2.0 1.6 2.1 2.9 2.4
Euro area 0.2 1.4 1.7 1.4 0.3
India (fiscal year) 4.5 3.6 3.4 4.8 6.1
Japan -0.1 0.5 1.0 0.5 0.0
United Kingdom 1.0 2.6 2.3 1.7 1.0
United States 1.3 2.1 2.4 1.8 1.2
Industrial output growth
China 6.0 5.9 5.8 4.9 2.6
Euro area 2.7 3.1 2.0 -0.2 -7.6
India (fiscal year) 4.6 4.4 3.8 -0.8 -8.4
Japan 0.0 3.1 1.1 -3.0 -10.4
United Kingdom 2.0 3.2 0.2 -0.2 -10.8
United States -2.2 1.3 3.2 -0.8 -7.2
Interest rates (end of period)
China (loan prime rate) 4.35 4.35 4.35 4.15 3.85
India (repo rate ) 6.25 6.25 6.50 5.15 4.00
Japan (basic loan/discount rate) 0.30 0.30 0.30 0.30 0.30
United Kingdom 0.25 0.50 0.75 0.75 0.10
United States (Fed Funds rate) 0.54 1.30 2.27 1.55 0.09
equity Index (end of year)
US (Dow Jones Industrial Average) 19763 24719 23327 28538 30607
India (BSE-Sensex) 26626 34057 36068 41254 47751Source: Data releases of World Bank, Central banks and statistical departments of respective countries, BSE, NYSE
94

COMMODITY INSIGHTS YEARBOOK 2021
95
-19
-14
-9
-4
1
6
500
700
900
1100
1300
1500
May
-15
Oct
-15
Mar
-16
Aug-
16
Jan-
17
Jun-
17
Nov
-17
Apr-
18
Sep-
18
Feb-
19
Jul-1
9
Dec-
19
May
-20
Oct
-20
Mar
-21
Indu
stry
gro
wth
(%)
Nic
el P
rice
Rs/k
g
Nickel Prices and US Industry Growth (%)
NICKEL US Industry Growth (Y-o-Y)
Source: MCX and Federal Reserve Bank of St. Louis
Indonesia 30%
Philippines 13%
New Caledonia 8%
Canada 6%
Australia 7%
Others 36%
Nickel Mine Production 2020
Sources: USGS Mineral Commodity Summaries
95
COMMODITY INSIGHTS YEARBOOK 2021

COMMODITY INSIGHTS YEARBOOK 2021
96
ZIncFUndaMentaLS
ZInC Fundamentals (‘000 tonnes)2016 2017 2018 2019 2020
World scenarioMine Production 12668 12681 12810 12856 12237Metal Production 13560 13486 13101 13480 13700Consumption 13670 13944 13663 13737 13199Source: International Lead and Zinc Study Group, USGS
Indian scenario 2016-17 2017-18 2018-19 2019-20 2020-21Production 671 791 696 688 586#Import 310 273 278 250 189Export 229 287 196 213 300Sources: Indian Bureau of Mines, Ministry of Commerce & Industry, GoI; # April 2020- Jan 2021
Country 2016 2017 2018 2019 2020major Countries in mine production World 12600 12500 12500 12700 12000China 4800 4400 4170 4210 4200Peru 1330 1470 1470 1400 1200Australia 965 842 1110 1330 1400United States 805 774 824 753 670Mexico 670 674 691 677 600India 682 833 750 720 720Source: USGS Mineral Commodity Summaries; ILZSG; *Estimated
major Importing Countries (usd million)Country 2016 2017 2018 2019 2020USA 1820 2234 2599 2416 2193Germany 1307 1855 1929 1595 1321China 1171 2497 246 209 1992Belgium 852 1175 1084 870 504India 700 721 863 681 444Total 11934 17002 16920 14742 14909major exporting Countries (usd million)Rep. of Korea 1301 1654 1879 1534 1478Canada 1203 1401 1847 1567 1290Belgium 1019 1342 1928 1286 413Spain 814 1261 1253 1493 988Australia 804 1283 1268 1013 964Total 11595 17505 18918 16398 12985Source: UN Comrade Database
96

COMMODITY INSIGHTS YEARBOOK 2021
97
ZIncFUndaMentaLS
maJor Import sourCes and eXport destInatIons For IndIa (rs. lakH)
2016-17 2017-18 2018-19 2019-20 2020-21
Country value Country value Country value Country value Country value
Imports in the form of Zinc and articles thereof (Hs code 79)
Korea Rp 225823 Korea Rp 278600 Korea Rp 253652 Korea Rp 218095 Korea Rp 169887
UAE 40164 UAE 51826 UAE 50990 Japan 49079 Japan 62978
Spain 19305 U S A 22880 U S A 32006 U S A 30409 U S A 14728
Malaysia 18692 Australia 20354 Australia 27153 UAE 25461 UAE 14638
U S A 17870 Netherlands 11082 Japna 24023 Italy 11686 Italy 6933
exports in the form of Zinc and articles thereof (Hs code 79)
Malaysia 96594 China 186148 Korea Rp 91163 Korea Rp 66701 Malaysia 158805
Korea South
62736 Korea South 104413 Taiwan 54310 Taiwan 63817 Singapore 132960
Taiwan 42420 Malaysia 78025 China 38190 China 58700 Taiwan 56844
China 31469 Taiwan 36554 UAE 36458 Singapore 48074 Korea Rp 36194
UAE 19318 UAE 31016 Nepal 35056 Nepal 31845 Thailand 28327
Total 410946 Total 616799 Total 418999 Total 403729 Total 551040
Sources: Ministry of Commerce & Industry, GoI
97

COMMODITY INSIGHTS YEARBOOK 2021
98
ZIncFUndaMentaLS
gloBal eConomIC parameters ImpaCtIng prICes ( %)
2016 2017 2018 2019 2020
real gdp growth
China 6.8 6.9 6.8 5.9 2.3
Euro area 1.9 2.5 1.9 1.3 -6.7
India (fiscal year) 8.3 6.8 6.5 4.0 -7.3
Japan 0.5 2.2 0.3 0.3 -4.8
United Kingdom 1.7 1.7 1.3 1.4 -9.8
United States 1.7 2.3 3.0 2.2 -3.5
Consumer price Inflation
China 2.0 1.6 2.1 2.9 2.4
Euro area 0.2 1.4 1.7 1.4 0.3
India (fiscal year) 4.5 3.6 3.4 4.8 6.1
Japan -0.1 0.5 1.0 0.5 0.0
United Kingdom 1.0 2.6 2.3 1.7 1.0
United States 1.3 2.1 2.4 1.8 1.2
Industrial output growth
China 6.0 5.9 5.8 4.9 2.6
Euro area 2.7 3.1 2.0 -0.2 -7.6
India (fiscal year) 4.6 4.4 3.8 -0.8 -8.4
Japan 0.0 3.1 1.1 -3.0 -10.4
United Kingdom 2.0 3.2 0.2 -0.2 -10.8
United States -2.2 1.3 3.2 -0.8 -7.2
Interest rates (end of period)
China (loan prime rate) 4.35 4.35 4.35 4.15 3.85
India (repo rate ) 6.25 6.25 6.50 5.15 4.00
Japan (basic loan/discount rate) 0.30 0.30 0.30 0.30 0.30
United Kingdom 0.25 0.50 0.75 0.75 0.10
United States (Fed Funds rate) 0.54 1.30 2.27 1.55 0.09
equity Index (end of year)
US (Dow Jones Industrial Average) 19763 24719 23327 28538 30607
India (BSE-Sensex) 26626 34057 36068 41254 47751Source: Data releases of World Bank, Central banks and statistical departments of respective countries, BSE, NYSE
98

COMMODITY INSIGHTS YEARBOOK 2021
99
China 35%
Peru 10%
Australia 12%
United States 5%
Mexico 5%
India 6%
Others 27%
Zinc Mine Production 2020
Source: USGS Mineral Commodity Summaries
-20
-15
-10
-5
0
5
10
100
120
140
160
180
200
220
240
May
-15
Sep-
15Ja
n-16
May
-16
Sep-
16Ja
n-17
May
-17
Sep-
17Ja
n-18
May
-18
Sep-
18Ja
n-19
May
-19
Sep-
19Ja
n-20
May
-20
Sep-
20Ja
n-21
Indu
stry
gro
wth
(%)
Zinc
Pric
es R
s/kg
Zinc Prices and US Industry Growth (%)
Zinc Price US Industry Growth (Y-o-Y)
Source: Websites of LME and Federal Reserve Bank of St. Louis
99
COMMODITY INSIGHTS YEARBOOK 2021

COMMODITY INSIGHTS YEARBOOK 2021
100
Intentionally kept blank
100
COMMODITY INSIGHTS YEARBOOK 2021

COMMODITY INSIGHTS YEARBOOK 2021
101
ENERGYCOMMODITIES
101

COMMODITY INSIGHTS YEARBOOK 2021
102
Crude oil is the most widely used non-renewable energy in the production of a number of fuel and non-fuel products such as fuel oilslikepetrolorgasoline,LPG,paraffinwax,tar,petroleumcoke,petro-chemicals etc., The petroleum industry generally classifies crude oil based on its geographic location of production (West Texas Intermediate, Brent, or Oman), its Sulphur content anddensity in terms of American Petroleum Institute (API) gravity as referred by the petroleum industry.
Crude oil is the most traded energy commodity in the world as its production is concentrated in few countries while it is utilized extensively all over the world. Major producing countries include US, Saudi Arabia, Russia, Iran and Iraq. India relies heavily on import of crude oil to meet its steadily growing domestic consumption demand.
Natural gas is the cleanest source of energy generated from fossil fuels containing mostly methane, emits greenhouse gases to an extent of 40% of that emitted by coal and 25% of that emitted by petroleum oil. Hence, as a less polluting alternative fuel energy source, it is replacing petroleum oil in transportation sector in the form of compressed natural gas across the world. It is widely used for electricity generation, cooking, heating, running automobiles and major feedstock for fertilizers. Natural gas production is largely concentrated in US, Russia, Iran, Qatar and Canada. India’s domestic consumption demand for natural gas is met through domestic production to an extent of about 60% and the rest of it is metfromimportsintheformofliquefiednaturalgas(LNG)largelyfrom Qatar.
Prices of energy products, particularly crude oil and natural gas, have been highly sensitive to geo-political tensions owing to their wide spread demand and limited sources of supply. In order to hedge against the price volatilities, futures contracts in crude oil and natural gas are available for trading in India. Crude oil and natural gas futures on New York Mercantile Exchange (NYMEX) are considered as global benchmarks. In India, futures contracts in crude oil and natural gas are offered on domestic commodity derivatives exchanges to hedge against the price risk arising from adverse price movements. Further, options contracts on crude oil futures are also made available from May 2018.
Crude oil prices are largely influenced by the expectations on the demand from major consuming countries, decisions related toproductionannouncedby theOrganizationof thePetroleumExportingCountries (OPEC), crudeoilproductionand inventoryposition in US, economic growth conditions in major consuming countries,crudeoilinventoriesinOPECandnon-OPECcountries,weather conditions in major producing and consuming countries, supply of shale etc. In addition, geopolitical tensions that may disrupt production and supply influences crude oil prices.
Natural gas prices in international markets are influenced by the weather conditions in US, petroleum prices, demand for heating or cooling in US, economic growth conditions, and supply &storage levels. Apart from futures, options contracts on crude oil futures are also available from May 2018. Further, the index futures onMCXENERGDEXarealsosuccessfullylaunchedonOctober7,2021 on MCX trading platform.
energy products, generated from either renewable or non-renewable sources, have become an essential part of our life to carry out any activity from simple cooking to run businesses, manufacturing, transportation etc. Major non-renewable energy sources include coal, crude oil, natural gas and nuclear fuel. at present, crude oil provides for nearly 40% of world energy requirements, primarily in the form of fueling automobiles for transportation.
enerGy coMModItIeS

COMMODITY INSIGHTS YEARBOOK 2021
103
crUde oILFUndaMentaLS
Crude oIl Fundamentals (000 Barrels/day )
2016 2017 2018 2019 2020
World scenario
OilProduction 91989 92568 94852 94961 88391
ProvenOilReserves(‘000mnbarrels) 1690 1728 1736 1735 1732
OilConsumption 94381 96099 97265 97598 88477
Refinery Capacity 98420 98696 100125 101748 101947
Refinery Throughput 80641 82152 83063 82954 75512
World Trade 66526 69814 70111 70404 65061
opeC
OilProduction 37799 37615 37357 35464 31116
ProvenOilReserves(‘000mnbarrels) 1189 1215 1214 1216 1216
oeCd
OilProduction 24019 24828 27258 28992 28216
ProvenOilReserves(‘000mnbarrels) 245 257 264 261 260
OilConsumption 45426 45916 46372 46056 40282
Refinery Capacity 44869 44700 45193 45541 44804
Refinery Throughput 38279 39096 38905 38478 33449
Indian scenario
OilProduction 874 885 869 830 771
ProvenOilReserves(‘000mnbarrels) 4.7 4.5 4.5 4.7 4.5
Refinery Capacity 4620 4699 4972 4994 5018
Refinery Throughput 4930 5010 5154 5119 4493
CrudeOilImports 4945 4920 5196 5394 5030
OilConsumption 4544 4724 4974 5148 4669Source: BP Statistical Review 2020, Ministry of Petroleum & Natural Gas, EIA
103

COMMODITY INSIGHTS YEARBOOK 2021
104
crUde oILFUndaMentaLS
Crude oIl Fundamentals (000 Barrels/day)
Country 2016 2017 2018 2019 2020
major producing Countries
US 12361 13154 15334 17072 16476
Saudi Arabia 12406 11892 12261 11832 11039
Russian Federation 11342 11374 11562 11679 10667
Iran 4578 4854 4608 3399 3084
Iraq 4423 4538 4632 4779 4114
World 91989 92568 94852 94961 88391
major Consuming Countries
US 18622 18878 19447 19475 17178
China 12499 13137 13576 14005 14225
India 4544 4724 4974 5148 4669
Japan 3988 3953 3824 3689 3268
Saudi Arabia 3865 3799 3617 3635 3544
World 94381 96099 97265 97598 88477
major Importing Countries
Europe 14354 14700 14151 14866 12611
US 10056 10148 9943 9142 7863
China 9214 10241 11028 11826 12865
India 4945 4920 5196 5394 5030
Japan 4180 4142 3940 3780 3310
World 66526 69814 70111 70404 65061
major exporting Countries
Middle East (ex Saudi Arabia) 15321 16255 16154 14921 13915
Russia 8814 8992 8117 8380 7433
Saudi Arabia 8606 8404 8581 8474 8027
Asia Pacific (ex Japan) 7356 7811 7731 7992 7399
US 5078 5888 7041 8095 8117
World 66526 69814 70111 70404 65061
major sources of Imports for India (million tonnes)
Middle East 136 134 147 133 130
West Africa 29 26 28 30 21
South&CentralAmerica 28 25 23 19 16
OtherAsiaPacific 7 6 5 5 4
Mexico 6 7 9 10 8
World 212 211 227 222 204Source: BP Statistical Review 2020
104

COMMODITY INSIGHTS YEARBOOK 2021
105
crUde oILFUndaMentaLS
gloBal eConomIC parameters ImpaCtIng prICes ( %)
2016 2017 2018 2019 2020
real gdp growth
China 6.8 6.9 6.8 5.9 2.3
Euro area 1.9 2.5 1.9 1.3 -6.7
India (fiscal year) 8.3 6.8 6.5 4.0 -7.3
Japan 0.5 2.2 0.3 0.3 -4.8
United Kingdom 1.7 1.7 1.3 1.4 -9.8
United States 1.7 2.3 3.0 2.2 -3.5
Consumer price Inflation
China 2.0 1.6 2.1 2.9 2.4
Euro area 0.2 1.4 1.7 1.4 0.3
India (fiscal year) 4.5 3.6 3.4 4.8 6.1
Japan -0.1 0.5 1.0 0.5 0.0
United Kingdom 1.0 2.6 2.3 1.7 1.0
United States 1.3 2.1 2.4 1.8 1.2
Industrial output growth
China 6.0 5.9 5.8 4.9 2.6
Euro area 2.7 3.1 2.0 -0.2 -7.6
India (fiscal year) 4.6 4.4 3.8 -0.8 -8.4
Japan 0.0 3.1 1.1 -3.0 -10.4
United Kingdom 2.0 3.2 0.2 -0.2 -10.8
United States -2.2 1.3 3.2 -0.8 -7.2
Interest rates (end of period)
China (loan prime rate) 4.35 4.35 4.35 4.15 3.85
India (repo rate ) 6.25 6.25 6.50 5.15 4.00
Japan (basic loan/discount rate) 0.30 0.30 0.30 0.30 0.30
United Kingdom 0.25 0.50 0.75 0.75 0.10
United States (Fed Funds rate) 0.54 1.30 2.27 1.55 0.09
equity Index (end of year)
US (Dow Jones Industrial Average) 19763 24719 23327 28538 30607
India (BSE-Sensex) 26626 34057 36068 41254 47751Source: Data releases of World Bank, Central banks and statistical departments of respective countries, BSE, NYSE
105

COMMODITY INSIGHTS YEARBOOK 2021
106
US 19%
Saudi Arabia 12%
Russian Federation
12% Iran 3%
Iraq 5%
Others 49%
Crude Oil Production 2020
Source: BP Statistical Review
US 19%
China 16%
India 5%
Japan 4%
Saudi Arabia 4%
Others 52%
Crude Oil Consumption 2020
Source: BP Statistical Review
106
COMMODITY INSIGHTS YEARBOOK 2021

COMMODITY INSIGHTS YEARBOOK 2021
107
1400
1500
1600
1700
1800
1900
2000
2100
2200
-10
10
30
50
70
90
110
130
150
Feb-
14
Jul-1
4
Dec-
14
May
-15
Oct
-15
Mar
-16
Aug-
16
Jan-
17
Jun-
17
Nov
-17
Apr-
18
Sep-
18
Feb-
19
Jul-1
9
Dec-
19
May
-20
Oct
-20
Mar
-21 U
S Cr
ude
oil s
ocks
in m
illio
n ba
rrel
s
Crud
e oi
l pric
e in
USD
/bar
rel
Crude Oil Prices and Inventory
Crude oil stocks Cushing WTI Prices Europe Brent Prices
Source: Energy Information Administration, US
107
COMMODITY INSIGHTS YEARBOOK 2021

COMMODITY INSIGHTS YEARBOOK 2021
108
natUraL GaSFUndaMentaLS
natural gas Fundamentals (BIllIon CuBIC metre)
particulars 2016 2017 2018 2019 2020
World scenario
Natural gas production 3552 3676 3853 3976 3854
Natural gas consumption 3559 3654 3838 3904 3823
Natural gas trade (export/import) - pipeline 480 510 508 499 756
Naturalgastrade(export/import)-LNG 358 393 431 484 488
Proven gas reserves 186574 195790 197080 198756 188074
Provengasreserves-OECD 16405 19761 20056 20092 20280
OECDnaturalgasprodution 1297 1331 1431 1511 1478
OECDnaturalgasconsumption 1658 1679 1764 1800 1758
Indian scenario
Proven gas reserves 1181 1241 1289 1329 1320
Natural gas production 27 28 27 27 24
Natural gas consumption 51 54 58 59 60
Naturalgas(LNG)imports 24 26 31 33 36
Source: BP Statistical Review 2020, Ministry of Petroleum & Natural Gas
108

COMMODITY INSIGHTS YEARBOOK 2021
109
natUraL GaSFUndaMentaLS
natural gas Fundamentals (BIllIon CuBIC metre)Country 2016 2017 2018 2019 2020major producing CountriesUS 727 746 841 930 915Russian Federation 589 636 669 679 638Iran 199 214 232 241 251Qatar 175 170 169 172 171Canada 172 174 177 169 165Total 3552 3676 3853 3976 3854major Consuming CountriesUS 749 740 822 849 832Russian Federation 421 431 454 444 411China 209 241 284 308 331Iran 196 205 220 223 233Japan 116 117 116 108 104Total 3559 3654 3838 3904 3823major Importing Countries (pipeline)Germany 99 95 101 110 102US 82 81 77 73 68Italy 59 54 56 54 51Mexico 38 42 46 51 54China 38 39 48 48 45major Importing Countries (lng)Japan 114 114 113 105 102South Korea 46 51 60 56 55China 37 53 73 85 94Spain 14 17 15 22 21United Kingdom 11 7 7 17 19major exporting Countries (pipeline)Russian Federation 191 215 223 217 198Norway 110 109 114 109 107Canada 82 81 77 73 68US 60 66 68 75 76Netherlands 52 43 32 38 28major exporting Countries (lng)Qatar 107 104 105 106 106Australia 60 77 92 105 106 US 4 17 29 47 61Russia 15 15 25 39 40Malaysia 34 36 33 35 33Source: BP Statistical Review 2020
109

COMMODITY INSIGHTS YEARBOOK 2021
110
natUraL GaSFUndaMentaLS
maJor produCIng states In IndIa (In mIllIon standard CuBIC metre)
state 2016-17 2017-18 2018-19 2019-20 2020-21
A.Onshore 9858 9904 10756 10549 10243
Assam&ArunachalPradesh 3155 3249 3317 3187 3051
Gujarat 1580 1607 1402 1342 1138
Tripura 1430 1440 1554 1473 1634
Rajasthan 1277 1442 1483 1883 2040
Tamil Nadu 983 1207 1208 1097 911
Andhra Pradesh 868 959 1082 912 827
West Bengal (CBM) 555 531 350 306 307
Madhya Pradesh(CBM) 6 200 357 345 334
Jharkhand (CBM) 3 4 4 5 2
B. offshore
MumbaiHigh+EasternOffshore 16883 17791 19044 18576 17086
Private / JVCs 5155 6338 3075 2059 1343
C.Total(A&B) 31897 32649 32875 31184 28672Source: Petroleum Policy and Analysis Cell (PPAC) Ministry of Petroleum and Natural Gas
Country 2016 2017 2018 2019 2020
major sources of Import for India (billion cubic metres)
Qatar 14 13.2 14.8 13.2 14.1
Nigeria 2.7 3.6 4.0 3.6 4.0
UAE 0.7 0.5 0.5 3.6 4.8
Australia 1.2 2.5 2.0 1.4 1.4
Total 22.5 25.7 30.6 32.9 35.8Source: BP Statistical Review 2020
110

COMMODITY INSIGHTS YEARBOOK 2021
111
natUraL GaSFUndaMentaLS
gloBal eConomIC parameters ImpaCtIng prICes ( %)
2016 2017 2018 2019 2020
real gdp growth
China 6.8 6.9 6.8 5.9 2.3
Euro area 1.9 2.5 1.9 1.3 -6.7
India (fiscal year) 8.3 6.8 6.5 4.0 -7.3
Japan 0.5 2.2 0.3 0.3 -4.8
United Kingdom 1.7 1.7 1.3 1.4 -9.8
United States 1.7 2.3 3.0 2.2 -3.5
Consumer price Inflation
China 2.0 1.6 2.1 2.9 2.4
Euro area 0.2 1.4 1.7 1.4 0.3
India (fiscal year) 4.5 3.6 3.4 4.8 6.1
Japan -0.1 0.5 1.0 0.5 0.0
United Kingdom 1.0 2.6 2.3 1.7 1.0
United States 1.3 2.1 2.4 1.8 1.2
Industrial output growth
China 6.0 5.9 5.8 4.9 2.6
Euro area 2.7 3.1 2.0 -0.2 -7.6
India (fiscal year) 4.6 4.4 3.8 -0.8 -8.4
Japan 0.0 3.1 1.1 -3.0 -10.4
United Kingdom 2.0 3.2 0.2 -0.2 -10.8
United States -2.2 1.3 3.2 -0.8 -7.2
Interest rates (end of period)
China (loan prime rate) 4.35 4.35 4.35 4.15 3.85
India (repo rate ) 6.25 6.25 6.50 5.15 4.00
Japan (basic loan/discount rate) 0.30 0.30 0.30 0.30 0.30
United Kingdom 0.25 0.50 0.75 0.75 0.10
United States (Fed Funds rate) 0.54 1.30 2.27 1.55 0.09
equity Index (end of year)
US (Dow Jones Industrial Average) 19763 24719 23327 28538 30607
India (BSE-Sensex) 26626 34057 36068 41254 47751Source: Data releases of World Bank, Central banks and statistical departments of respective countries, BSE, NYSE
111

COMMODITY INSIGHTS YEARBOOK 2021
112
US 24%
Russian Federation
17% Iran 7%
Qatar 4%
Canada 4%
Others 44%
Natural Gas Production in 2020
Source: BP Statistical Review 2020
US 22%
Russian Federation
11%
China 8%
Iran 6% Japan
3%
Others 50%
Natural Gas Consumption in 2020
Source: BP Statistical Review 2020
112
COMMODITY INSIGHTS YEARBOOK 2021

COMMODITY INSIGHTS YEARBOOK 2021
113
1.5
2.5
3.5
4.5
5.5
6.5
700
1200
1700
2200
2700
3200
3700
Mar
-14
Oct
-14
May
-15
Dec-
15
Jul-1
6
Feb-
17
Sep-
17
Apr-
18
Nov
-18
Jun-
19
Jan-
20
Aug-
20
Mar
-21
Pric
e in
USD
/ Mill
ion
Btu
Stor
age
in B
illio
n Cu
bic
Feet
US Natural Gas Storage Levels and Prices
Storage NG PriceSource: Energy Information Administration, US
113
COMMODITY INSIGHTS YEARBOOK 2021

COMMODITY INSIGHTS YEARBOOK 2021
114
Intentionally kept blank
114
COMMODITY INSIGHTS YEARBOOK 2021

COMMODITY INSIGHTS YEARBOOK 2021
115
aGrIcULtUraLcoMModItIeS
STATISTICS
cotton
oILSeedS coMPLeXcPo & castor Seed
SPIceScardamom, Mentha oil, rubber
115

COMMODITY INSIGHTS YEARBOOK 2021
116
Intentionally kept blank
116
COMMODITY INSIGHTS YEARBOOK 2021

COMMODITY INSIGHTS YEARBOOK 2021
117
COTTON
117

COMMODITY INSIGHTS YEARBOOK 2021
118
Although cotton is reportedly cultivated in more than 100 countries accounting for about 2.5% of the world’s cultivated land, top five countries account for nearly 80% of total world cotton production. Further, cotton is a largely traded agricultural commodity, with over 150 countries involved in exporting or importing cotton. Cotton has been cultivated in India since ancient times and is known to have originated from the Indian sub-continent. Studies have indicated that India was the original habitat for the old world cotton. It is cultivated in tropical and sub-tropical climate.
India has regained its positon of one of the largest producers in the world during the last decade owing to a significant rise in yields and thereby raising production levels in the country. India is now the largest producer and the second largest consumer and exporter of cotton in the world. Other major countriesproducing cotton include China, US, Pakistan and Brazil. In India, cotton production is distributed across a number of states but mainly concentrated in central India particularly in states like Gujarat,MaharashtraandTelangana.
India’s cotton exports have increased significantly from mid 2000s following the substantial expansion in domestic production. India has become the largest exporter in 2011-12. However, following the reduction in imports by China, India’s exports have also declined in the subsequent years. Major export destinations of India include Bangladesh, China, Pakistan,VietnamandSriLankaintherecentyears.
Cotton futures trading in India has 135 years of history in India.BombayCottonTradeassociationLtdwassetupin1875for organizing futures trading in cotton. Along with other commodities, futures trading in cotton was also discontinued during 1970s. Nevertheless, cotton futures trading onceagain has become active with revival of commodities futures trading and introduction of online trading on national multi-commodity exchanges in the early 2000s. Futures contracts of cotton are available on domestic exchanges for kapas (raw cotton) and ginned cotton.
cotton is an important fibre crop grown all over the world as a raw material mainly for textile industry and it is used in fabric since ancient times. cotton is used, either in its pure form or as blend with synthetic fibers such as polyester and other fibers like rayon, in the manufacturing of a number of textile products. apart from the textile industry, cotton is also used in the manufacturing of products such as fishnets, coffee filters, tents, cotton paper, bookbinding etc.
cotton

COMMODITY INSIGHTS YEARBOOK 2021
119
cottonFUndaMentaLS
Cotton Fundmentals (In 000’s oF 480 lB Bales)particular 2016-17 2017-18 2018-19 2019-20 2020-21global scenarioBeginning Stocks 90278 80264 81096 80047 98158Production 106677 123960 118582 121398 112422Imports 37874 41551 42435 40739 48392Total Supply 234829 245775 242113 242184 258972Exports 38092 41691 41552 41232 48047Domestic Consumption 116473 122988 120514 102794 119143Ending Stocks 80264 81096 80047 98158 91782Indian scenarioBeginning Stocks 7044 7880 9225 9314 16884Production 27000 29000 26500 29500 28300Imports 2736 1677 1800 2300 800Total Supply 36780 38557 37525 41114 45984Exports 4550 5182 3500 3250 6100Domestic Consumption 24350 24150 24000 20000 24000Ending Stocks 7880 9225 10025 17864 15884major producing CountriesWorld 106679 123784 119013 121983 112422India 27000 29000 26500 29500 28300China 22750 27500 27750 27250 29500United States 17170 20923 18367 19913 14608Pakistan 7020 9220 12750 6200 4500Brazil 7700 8200 7600 13400 10750major Consuming CountriesWorld 116383 122882 120346 102127 119014China 38500 41000 39500 33000 40000India 24350 24150 24000 20000 24000Pakistan 10325 10925 10725 9200 10400Bangladesh 6810 7510 7410 6500 8400Turkey 6550 7450 6800 6600 7700major Importing CountriesWorld 37697 41146 42359 40026 48392Bangladesh 6800 7600 7200 7000 8500Vietnam 5500 7000 6900 7136 7280China 5032 5710 9640 2300 12750Turkey 3679 4024 3499 4577 5350Indonesia 3391 3498 3050 2600 2250mjor exporting CountriesWorld 37852 41408 41228 40740 48047United States 14917 16279 14763 15527 16350India 4550 5182 3500 3250 6100Brazil 2789 4174 6014 8937 11014Australia 3731 3915 3632 1360 1350Mali 1100 1300 1350 1175 600Note: 1 Indian bale = 170 Kg of Kapas; 1 US Bale (480 pound) = 217.7 Kg; 1 Indian Candy = 355.62 Kg of lint cotton
Source: USDA PSD (as downloaded in September, 2021) (crop year Aug-Jul)
119

COMMODITY INSIGHTS YEARBOOK 2021
120
cottonFUndaMentaLS
Cotton Fundmentals 2016-17 2017-18 2018-19 2019-20 2020-21
Cotton Balance sheet India (in 000 bales of 170 kg)OpeningStock 3640 3600 3300 3200 12500Crop 34500 36500 31200 36000 35450Import 3090 1500 2900 1550 1000total supply 41240 41600 37400 40750 48950Mill Consumption 26270 27500 27600 21800 28800S.S.I Consumption 2620 2900 2700 1800 2400Non Textile Consumption 1750 1500 1200 1400 1800Export 5820 6900 4400 5000 7700total demand 36460 38800 35900 30000 40700Closing Stock 4780 2800 1500 10750 8250Source: Cotton Association of India (CAI) *as estimated by CAI released in its last meeting held on 31-07-2021
major producing states All India 34500 37000 33300 36500 36000Gujarat 9500 10384 9000 8900 9000Maharashtra 8850 8335 7600 8700 8400Telangana 4800 5440 4200 5400 5100Karnataka 1800 1732 1600 2000 2200Andhra Pradesh 1900 2160 1500 1800 1700Source: Cotton Advisory Board (CAB)
maJor Import sourCes and eXport destInatIons For IndIa (value In rs. lakH)2016-17 2017-18 2018-19 2019-20 2020-21
Country value Country value Country value Country value Country valuemajor export destinations
Bangladesh Pr 1070508 Bangladesh Pr 1174638 Bangladesh Pr 1311889 Bangladesh Pr 1173995 Bangladesh Pr 1313964
China P Rp 903809 China P Rp 647642 China P Rp 1244429 China P Rp 552162 China P Rp 941954
Pakistan Ir 320460 Pakistan Ir 350297 Pakistan Ir 384233 SriLanka 167427 Vietnam Soc Rep 309911
Vietnam Soc Rep 189219 Vietnam Soc Rep 280744 SriLankaDsr 316536 EGYPTARP 154227 KOREARP 144433
SriLankaDsr 161284 SriLanka 143521 SriLanka 168124 Vietnam Soc Rep 146672 SriLanka 141031
Total 4439176 Total 4541151 Total 5502070 Total 4071481 Total 4666266
major Import sources
U S A 194060 USA 297575 U S A 238421 U S A 437397 U S A 111218
Australia 189126 Australia 91174 China P Rp 84797 China P Rp 83451 Egypt A Rp 73480
China P Rp 83518 China P Rp 84172 Egypt A Rp 43568 Egypt A Rp 60688 China P Rp 50230
Egypt A Rp 38574 Egypt A Rp 48819 Australia 41346 COTED’IVOIRE 57002 Bangladesh Pr 25442
Mali 38147 Mali 44128 Bangladesh Pr 16356 Brazil 39707 COTED’IVOIRE 12588
Total 758280 Total 760677 Total 583464 Total 1078833 Total 377439
Source: Export-Import Data Bank, Ministry of Commerce, GoI
120

COMMODITY INSIGHTS YEARBOOK 2021
121
India 25%
China 26%
United States 13%
Pakistan 4%
Brazil 10%
Others 22%
World Cotton Production in 2020-21
Source: USDA
China 34%
India 20%
Pakistan 9%
Bangladesh 7%
Turkey 6%
Others 24%
Cotton Consumption in 2020-21
Source: USDA
121
COMMODITY INSIGHTS YEARBOOK 2021

COMMODITY INSIGHTS YEARBOOK 2021
122
Gujarat 25%
Maharashtra 23%
Telangana 14%
Karnataka 6%
Andhra Pradesh 5%
Others 27%
Cotton Production in Inida in 2020-21
Source: Department of Agriculture & Cooperation, Ministry of Agriculture
U S A 29%
Egypt 20%
China 13%
Bangladesh 7%
COTE D' IVOIRE
3%
Others 28%
Cotton Exports from India in 2020-21
Source: Export-Import Data Bank, Ministry of Commerce, GoI
122
COMMODITY INSIGHTS YEARBOOK 2021

COMMODITY INSIGHTS YEARBOOK 2021
123
OILSEEDSCOMPLEX
123

COMMODITY INSIGHTS YEARBOOK 2021
124
Major edible oilseeds produced include soya bean, rapeseed & mustard, sunflower, groundnut andsesamum. Apart from the seeds, vegetable oils are also extracted from other plant parts such as fruit pulp (mesocarp) in case of palm oil, kernel in case of coconut etc.Oilsextractedfromcastorseedarenon-edibleandused for industrial purposes such as lubricants.
India produces on average around 20 million tons of edible oilseeds annually including groundnut, mustard, soya bean, sunflower, sesamum, etc., and about 2 million tons of non-edible oilseeds including castor seed, niger seed and linseed. In spite of this, India is a net importer of edible oils to the tune of about 15 million tons on averageeveryyear,whichaccountsforabout65-70%oftotal domestic consumption requirement with palm oil being the major part of it.
Overaperiod,Indianconsumers’preferencehasshiftedtopalm oil and the country has become the largest importer of palm oil in the world. Domestic production of palm oil is miniscule, India is largely dependent on imports from the world’s two largest producers, Malaysia and Indonesia according to USDA. Palm is largely imported in theformofcrudepalmoil(CPO)duetofavourabletariffrates compared to processed and refined oil in order to incentivize the domestic processors. For the benefit of all the stakeholders and participants of value chain to hedge against price risk generated from volatile price movements, futures contracts are available on domestic commodity derivatives exchanges for all major oils and oilseeds.
Prices are influenced by domestic oilseed production, demand-supply scenario in major producing countries, demand and supply scenario of other substitutes in the domestic and global markets, weather and other factors influencing production in major producing and supplying countries. In addition, prices are also influenced by the trade policies in India in terms of changes in quantitative and qualitative restrictions on import of edible oils, particularly of palm oil.
Vegetable oils, derived from oilseeds and other plant parts, are important source of fats in human nutrition. Vegetable oils are also used in a number of non-edible product preparation and as lubricants. oilseeds are characterized by containing large proportions of oil ranging from 18% in soyabeans to more than 40% in groundnut, sunflower and mustard seeds. Soyabean is richer in proteins than oil and it is crushed mainly for its meal. oil meal or cake is the solid leftover after extracting oil from oilseeds and is used as animal feed or fertilizer.
VeGetaBLe oILS

COMMODITY INSIGHTS YEARBOOK 2021
125
PaLM oILFUndaMentaLS
palm oIl Fundamentals (000 tonnes)
particular 2016-17 2017-18 2018-19 2019-20 2020-21
global scenario
Beginning Stocks 7989 9129 11095 12170 12446
Production 59134 63918 67241 66180 66141
Imports 42126 42581 45943 43389 43511
Total Supply 109249 115627 124278 121739 122098
Exports 44517 44296 47089 43949 44290
Domestic Consumption 55602 60236 65019 65345 66676
Ending Stocks 9129 11095 12170 12446 11132
Indian scenario
Beginning Stocks 543 980 1031 1780 1263
Production 181 181 181 181 181
Imports 8474 7809 8809 6711 6804
Total Supply 9199 8970 10022 8673 8248
Domestic Consumption 8219 7939 8242 7410 7704
Ending Stocks 980 1031 1780 1263 544Source: USDA PSD (Oct-Sep)
125

COMMODITY INSIGHTS YEARBOOK 2021
126
PaLM oILFUndaMentaLS
palm oIl Fundamentals (000 tonnes)
Country 2016-17 2017-18 2018-19 2019-20 2020-21
major producing Countries
World 65267 70457 74120 72915 72908
Indonesia 36000 39500 41500 42500 43500
Malaysia 18858 19683 20800 19255 17800
Thailand 2500 2778 3034 2652 2845
Colombia 1099 1549 1582 1507 1559
Nigeria 990 1025 1130 1140 1275
major Consuming Countries
World 61559 66766 71994 72178 74032
Indonesia 9160 11555 13485 14545 15025
India 9350 9120 9375 8460 8855
European Union 6800 6575 6550 6710 6755
China 4750 5100 7012 6433 6790
Malaysia 2587 3238 3522 3543 3370
major exporting Countries
World 48924 48828 51907 48445 49948
Indonesia 27633 26967 29279 26249 28680
Malaysia 16313 16472 18362 17212 16100
Guatemala 718 800 828 758 850
Colombia 502 697 677 611 675
PapuaNewGuinea 664 684 730 571 580
major Importing Countries
World 45927 46935 50648 47646 49176
India 9341 8608 9710 7398 8500
European Union 7219 6834 7070 7146 6450
China 4881 5320 6795 6719 6750
Pakistan 3075 3093 3175 3275 3425
Bangladesh 1347 1635 1569 1510 1625Source: USDA (Oct-Sep)
126

COMMODITY INSIGHTS YEARBOOK 2021
127
PaLM oILFUndaMentaLS
palm oIl Fundamentals (000 tonnes)
state 2015-16 2016-17 2017-18 2018-19 2019-20
major states producing in India
Andhra Pradesh 194 191 235 233 208
Telangana 11 9 27 37 38
Kerala 7 6 5 5 5
Karnataka 3 2 2 2 2
Tamil Nadu 1 1 1 1 1
total 219 210 271 279 255Source: National Mission on Oilseeds and Oil Palm, Ministry of Agriculture and Farmers Welfare, GoI
Composition of palm oil Imports
particular 2016-17 2017-18 2018-19 2019-20 2020-21
RBD Palmolein 2605 1938 2477 382 39
CrudePalmOil 5747 5860 5928 6048 4961
total 8352 7798 8405 6430 5000Source: Solvent Extractors Association of India (Nov-Oct) *Nov-Aug 2020
particular 2016-17 2017-18 2018-19 2019-20 2020-21
Imports sources for India (Crude palm oil)
Indonesia 3337 4585 4157 4272 4095
Malaysia 1963 1721 1713 1489 2799Source: Ministry of commerce and industry, GOI (Apr-Mar)
127

COMMODITY INSIGHTS YEARBOOK 2021
128
Indonesia 60%
Malaysia 24%
Thailand 4%
Colombia 2%
Nigeria 2%
Others 8%
Palm Oil Producers 2020-21
Source: USDA
Indonesia 20%
India 12%
European Union 9%
China 9%
Malaysia 5%
Others 45%
Palm Oil Consumers 2020-21
Source: USDA
128
COMMODITY INSIGHTS YEARBOOK 2021

COMMODITY INSIGHTS YEARBOOK 2021
129
caStor SeedFUndaMentaLS
Castor seed & oIl Fundamentals (000 tonnes)particular 2015 2016 2017 2018 2019global scenarioCastor seed Producing countriesWorld 1988 1598 3218 3221 1408India 1752 1376 1568 1198 1197Mozambique 75 77 80 85 85China 47 40 55 27 36Brazil 40 25 13 14 16Myanmar 13 13 13 12 13Castor oil ImportersWorld 606 645 498 961 628China 229 260 269 281 254France 68 84 61 72 56US 61 61 61 63 56Germany 55 44 58 61 65Netherlands 37 38 49 50 53Castor oil exportersWorld 667 684 728 683 636India 544 564 627 596 547Netherlands 50 55 44 38 41France 21 19 18 15 15Germany 18 16 13 12 10United States of America 8 12 7 7 5Source: FAOStat (www.faostat.fao.org)
Castor seed & oIl Fundamentals (000 tonnes)
2016-17 2017-18 2018-19 2019-20 2020-21
Indian scenario (000 tonnes)
Castor seed production 1376 1568 1198 1849 1651
Castor oil production 509 580 450 726 611
Castor oil Exports 557 651 572 548 686
major producing states (000 tonnes)
All India 1376 1568 1198 1962 1755
Gujarat 850 1230 889 1659 1495
Rajasthan 123 162 147 245 223
AndhraPradesh&Telangana 64 28 24 33 22Source: Department of Agriculture, Ministry of Agriculture, The Central Organisation for Oil Industry and Trade (COOIT), Solvent Extractors Association (SEA)
129

COMMODITY INSIGHTS YEARBOOK 2021
130
0
100
200
300
400
500
600
700
800
0
500
1000
1500
2000
2500
2001
-02
2002
-03
2003
-04
2004
-05
2005
-06
2006
-07
2007
-08
2008
-09
2009
-10
2010
-11
2011
-12
2012
-13
2013
-14
2014
-15
2015
-16
2016
-17
2017
-18
2018
-19
2019
-20
2020
-21
Cast
or o
il ex
port
s
Cast
or s
eed
prod
uctio
n Castor seed production and oil exports by India (000 tonnes)
Production ExportsSource: Ministry of agriculture, GoI
India 85%
Mozambique 6%
China 3%
Others 6%
Major producing countries
Source: FAOSTAT
130
COMMODITY INSIGHTS YEARBOOK 2021

COMMODITY INSIGHTS YEARBOOK 2021
131
SPICES
131

COMMODITY INSIGHTS YEARBOOK 2021
132
Spices production is concentrated in Kerala, Karnataka and Tamil Nadu for all major perennial spice crops like pepper, cardamom, cloves, cinnamon etc. However, spices that are grown as annual field crops such as turmeric, jeera, chillies, coriander, fenugreek, fennel etc., are spread across country particularly in the states of Andhra Pradesh, Telangana, Maharashtra,GujaratandRajasthan.
Pepper is known to be one of the oldest spices traded across countries and is popularly called as the King of Spices. Ride dried berries have pungent smell and strong tangy taste with number of health benefits. Berries are used for seasoning the food either whole or in powdered form. Essential oils and oleoresins are extracted from pepper are used for medicinal purposes. Major pepper producing countries are Vietnam, India, Indonesia and Brazil.
Cardamom is another important spice and is popularly referred as queen of spices owing to its sweet and pleasant aroma. It is the most valued spice after saffron and vanilla. Economic important parts of cardamom are dried fruits and seeds used to flavor food. Cardamom oil and oleoresins, extracted from seeds, are also used to flavour foods and ayurvedic medicines. India and Guatemala are the majorproducers of cardamom in the world.
Mentha oil is an essential oil extracted from the leaves of mentha or mint herb. Mentha oil is used in medicines, ingredient of many cosmetics and perfumes and is also an important component of aroma therapy, unani and ayurvedic medicines. It is also used as insect repellents. Apart from mentha oil, other products are also produced from mentha leaves that are of significant export value. India and China are major producing countries. In India, mentha is largely produced in Uttar Pradesh and to some extent in Bihar.
Spices exports from commands a formidable position in the world. Exports of mentha products are the second largest among spices exported from the country in terms of value standing only next to cardamom. Futures contracts are available on domestic commodity exchanges for number of spices including cardamom, mentha oil, jeera, coriander, turmeric and pepper to hedge against volatile price movements.
Important factors influencing prices include domestic demand-supply, export demand, crop condition in major producing countries, weather conditions affecting output estimations in India and other major producing countries, trade related policies such as tariffs and non-tariff restrictions, change in government policies affecting production, processing and trade within India and other major producing countries.
Spices are important ingredients of Indian cuisine. India particularly southern India is known as land of spices. India has been producing number of spices including pepper, cardamom, cloves, cinnamon, nutmeg, ginger and turmeric since ancient times. India is the largest producer, consumer and exporter of major spices historically. But, in the recent years, production and exports from other countries like Vietnam and Guatemala have increased significantly.
SPIceS

COMMODITY INSIGHTS YEARBOOK 2021
133
cardaMoMFUndaMentaLS
Cardamom Fundamentals (tonnes)global scenario 2015-16 2016-17 2017-18 2018-19 2019-20productionGuatemala 36000 35475 36197 38330 38387India 23890 17990 20650 12940 11235Total 59890 53465 56847 44940 49622exportsGuatemala 34000 31000 35819 36818 36890India 5500 3850 5680 2850 1850Indian scenarioProduction 23890 19625 20650 12950 11235Import 850 1720 685 479 470Export 5500 3850 5680 2850 1850Consumption 18,000 18000 17000 13000 1350major states producing in IndiaKerala 21500 17215 18350 11535 10075Karnataka 1440 1435 1450 690 620Tamil Nadu 950 975 850 715 540Total 23890 19625 20650 12940 11235Source: FAOSTAT, Spices Board of India, Trade Estimates
major exporting destinations for India Country 2015-16 2016-17 2017-18 2018-19 2019-20Saudi Arabia 3969 2500 2923 121 18UAE 493 494 1084 1191 860USA 119 96 214 118 224Kuwait 198 153 196 660 175Iran 143 135 302 218 119Total (includes others) 5500 3850 5680 2850 1850Source: Spices Board of India
133

COMMODITY INSIGHTS YEARBOOK 2021
134
Kerala 90%
Karnataka 5%
Tamil Nadu 5%
Cardamom Production in India in 2019-20
Source: Spices Board of India
UAE 47%
USA 12%
Kuwait 10%
Iran 6%
Others 25%
India's Cardamom Exports Destinations 2019-20
Source: Spices Board of India
134
COMMODITY INSIGHTS YEARBOOK 2021

COMMODITY INSIGHTS YEARBOOK 2021
135
MentHa oILFUndaMentaLS
mentHa oIl Fundamentals (tonnes)
(apr -mar) 2016-17 2017-18 2018-19 2019-20 2020-21
Production 32000 35000 37000 37000 36000
Exports 22300 21500 21610 24470 27400
Consumption 12500 13000 13500 13500 14000
Source: Trade Estimates, Spices Board of India
mentha oil export destinations for India
Country 2015-16 2016-17 2017-18 2018-19 2019-20
China 9518 9360 10310 10827 12722
U.S 4860 3130 3792 3559 3987
Netherlands 639 951 1230 710 838
Singapore 1892 711 842 1170 1261
Germany 1155 707 929 707 750
France 817 668 586 533 635
Japan 877 484 595 548 531
U.K 544 463 442 404 432
Phillipines 263 217 192 316 313
Total(InclOthers) 21150 22300 21500 21610 24470
Source: Spices Board of India NA- Not Available
135

COMMODITY INSIGHTS YEARBOOK 2021
136
others 15%
China 50%
U.S 16%
Netherlands 3%
Singapore 5%
Germany 3%
France 3%
Japan 2%
U.K 2%
Phillipines 1%
Mentha oil Export Destinations
Source: Spices Board of India
136
COMMODITY INSIGHTS YEARBOOK 2021

COMMODITY INSIGHTS YEARBOOK 2021
137
RUBBER
137

COMMODITY INSIGHTS YEARBOOK 2021
138
Major consuming industry of natural rubber is automobile industry accounting for over 65 % of natural rubber consumption. It is used for manufacture of wide range of products including tyres and tubes, hoses, conveyor belts, foam mattresses, footwear, balloons, toys and several other products of daily use. It also has engineering application in shock absorption, vibration isolation and road surfacing etc.
Worldwide consumption for natural rubber has increased steadily in the recent decade and the Asian markets continue to drive demand for the raw material. Thailand, Indonesia, India, China, Malaysia, Vietnam are the major producers of rubber.
In India, cultivation of rubber is mainly concentrated in the southern states - Tamil Nadu and Kerala. Kerala is the main area of cultivation which covers 80% of the total sown area. However,rubberisalsocultivatedinpartsofKarnataka,Goa,Konkan Region of Maharashtra, hinterlands of coastal Andhra PradeshandOrissa,thenorth-easternstates,AndamanandNicobar Islands etc.
India is the sixth largest producer of natural rubber and second place in world consumption. Even though the total consumption in the country exceeds production, India manages to export natural rubber as and when there is a price gap between the international market and the domestic market. Indian natural rubber is the preferred raw material because of its unique qualities, when compared to other elastomers, including synthetic rubber.
Rubber prices are influenced by various factors including global as well as domestic production, weather conditions, carry over stock position, currency movement, prices of alternatives or substitutes such as synthetic rubber, which is derived from crude oil and hence prices of crude oil etc. In order to manage price risk, rubber futures are available on both international and Indian commodity exchanges includingTOCOM,SICOM,SHFE,MCXetc.
natural rubber is derived from the rubber tree scientifically known as Hevea brasiliensis. It is a native of South america and was introduced to India by the British. rubber is made from the latex that is extracted from the bark of the rubber tree. It is extracted by controlled wounding on the bark of the tree and the process is called as tapping. the latex contains up to 40% of natural rubber.
natUraL rUBBer

COMMODITY INSIGHTS YEARBOOK 2021
139
rUBBerFUndaMentaLS
rubber Fundamentals (tonnes)
Indian scenario 2016-17 2017-18 2018-19 2019-20 2020-21
Production 691000 694000 651000 712000 715000
Consumption 1044075 1112210 1211940 1134120 1096410
Imports 426188 469760 582351 457223 410478
Exports 20920 5072 4551 12872 11343
Source: Rubber Board of India
major producing Countries (000 tonnes) 2015 2016 2017 2018 2019
World 13284 13554 14305 14676 14617
Thailand 4466 4519 4503 4814 4840
Indonesia 3145 3307 3680 3630 3449
Viet Nam 1013 1035 1095 1138 1185
India 945 967 975 988 1001
China 816 816 817 824 840
major exporting countries (in 000 tonnes ) 2015 2016 2017 2018 2019
World 1302 1511 1536 1703 1672
Thailand 1073 1240 1186 1299 1074
Viet Nam 74 80 99 61 159
Guatemala 42 40 51 52 55
Malaysia 32 38 33 27 23
Belgium 20 30 30 20 28
major Importing countries (in 000 tonnes ) 2015 2016 2017 2018 2019
World 1195 1171 1269 1360 1306
China 386 432 501 598 560
Malaysia 318 318 323 333 312
US 50 49 55 48 47
Iran 50 33 28 30 30
Source: FAOSTAT
139

COMMODITY INSIGHTS YEARBOOK 2021
140
Thailand 33%
Indonesia 24%
Viet Nam 8%
India 7%
China 6%
Others 22%
Natural Rubber Producers 2019
Source: FAOSTAT
Thailand 64%
Viet Nam 10%
Guatemala 3%
Malaysia 1%
Belgium 2%
Others 20%
Natural Rubber Exporters 2019
Source: FAOSTAT
140
COMMODITY INSIGHTS YEARBOOK 2021


National Institute of Securities Markets (NISM)Plot No. IS 1 & IS 2, Patalganga Industrial Area,
Village Mohopada (Wasambe), Rasayani, District Raigad, Maharashtra - 410 222 Tel. No. 91-2192-668300 | www.nism.ac.in
Issued in Public Interest by NISM and MCX Investor Protection FundRead the Risk Disclosure Document (RDD) carefully before transacting in commodity futures and options
Multi Commodity Exchange of India LimitedExchange Square, Suren Road, Chakala, Andheri East, Mumbai - 400 093
Tel. No.: 91-22-6731 8888, CIN: L51909MH2002PLC135594, [email protected], www.mcxindia.com
Electronic copy of the yearbook is available at:https://www.mcxindia.com/education-training/publications/commodity-insights-yearbook
Please give your feedback at [email protected]

![Emersonian : [Emerson College yearbook]](https://static.fdokumen.com/doc/165x107/6321be5e117b4414ec0b98a5/emersonian-emerson-college-yearbook.jpg)