STATISTICAL YEARBOOK
216
NATIONAL INSTITUTE OF STATISTICS OF RWANDA REPUBLIC OF RWANDA STATISTICAL YEARBOOK 2019
-
Upload
khangminh22 -
Category
Documents
-
view
3 -
download
0
Transcript of STATISTICAL YEARBOOK
NATIONAL INSTITUTE OF
STATISTICS OF RWANDAREPUBLIC OF RWANDA
STATISTICAL YEARBOOK
2019
NATIONAL INSTITUTE OF
STATISTICS OF RWANDAREPUBLIC OF RWANDA
National Institute of Statistics of RwandaRwanda Statistical YearBook 2019
The Rwanda Statistical YearBook 2019 is produced by the National Institute of Statistics of Rwanda (NISR).
Additional information about the Rwanda Statistical YearBook 2019 may be obtained from NISR:
P.O. Box 6139, Kigali, Rwanda;E-mail: [email protected];Website: http://www.statistics.gov.rw
ISBN: 978-99977-43-44-2
Recommended citation:National Institute of Statistics of Rwanda (NISR), Rwanda Statistical YearBook 2019, December 2019
Yusuf MurangwaDirector General, NISR
Foreword
Timely and reliable statistics are considered essential for evidence-based policy and decision-making and for better support to policy implementation, monitoring progress and evaluation of outcomes and impacts of development initiatives such as the Sustainable Development Goals (SDGs), AU Agenda 2063, EAC Vision 2050, First National Strategy for Transformation (NST1), and Sector Strategic Plans (SSPs). These initiatives have accordingly resulted in an unprecedented increase in demand for statistics as policy makers and other stakeholders seek information on national development.
Hence, in our efforts to tackle this issue, the Annual Statistical Yearbook is prepared to be a compendium of statistical information dealing with a wide range of development-pertinent topics. As such, this book is designed to serve as a standard summary of statistics on the social, political, and economic situation of Rwanda. It also serves as convenient volume for statistical reference and as a guide to other statistical publications and sources.
This edition provides the now available and disaggregated (where applicable) data of Rwanda in various sectors including Health; Education; Environment; Agriculture; Water and Energy (production and consumption); Transportation and Communication; Travel and Tourism; Income, Expenditure and Wealth; Banking, Insurance and Finance; Business and Trade; Law Enforcement, Courts and Order.
Users of the Statistical Yearbook are urged to make their data needs know for consideration in planning for future editions. We are confident that this Yearbook will become key storage of development information on Rwanda.

STATISTICAL YEARBOOK 2019
iii
Acknowledgement
The Statistical Yearbook 2019 edition was prepared by NISR through the team made of Statisticians, namely:
Mr. Emmanuel Christian NYABYENDA, SDGs and NST Monitoring Statistician, Mr. Jean Luc KABERA,
Data Portals Management Officer, Mr. Olivier NIYIZIBYOSE, Professional Intern, Ms. Jeannette
MUKANGANGO, Support Staff, Norbert HABIMANA Ag. Team Leader Statistician in charge of Research,
Publication and Dissemination and Mr. Jean Claude NYIRIMANZI, Acting Director of Statistical Methods,
Research and Publication, under the general direction of Mr. Yusuf MURANGWA, Director General.
The cooperation of many contributors to this edition is gratefully acknowledged. The source note below each
table credits the various government and private sector agencies that have collaborated in furnishing the infor-
mation for the Statistical Yearbook.
STATISTICAL YEARBOOK 2019
iv
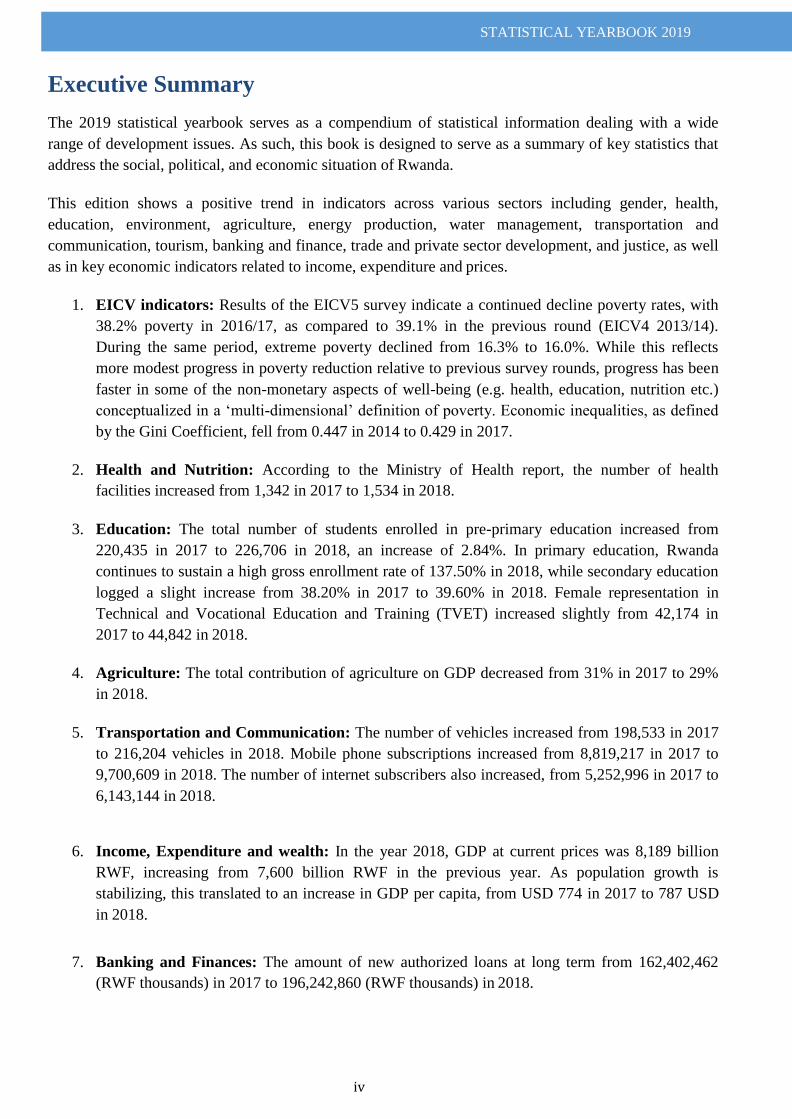
Executive Summary
The 2019 statistical yearbook serves as a compendium of statistical information dealing with a wide
range of development issues. As such, this book is designed to serve as a summary of key statistics that
address the social, political, and economic situation of Rwanda.
This edition shows a positive trend in indicators across various sectors including gender, health,
education, environment, agriculture, energy production, water management, transportation and
communication, tourism, banking and finance, trade and private sector development, and justice, as well
as in key economic indicators related to income, expenditure and prices.
1. EICV indicators: Results of the EICV5 survey indicate a continued decline poverty rates, with
38.2% poverty in 2016/17, as compared to 39.1% in the previous round (EICV4 2013/14).
During the same period, extreme poverty declined from 16.3% to 16.0%. While this reflects
more modest progress in poverty reduction relative to previous survey rounds, progress has been
faster in some of the non-monetary aspects of well-being (e.g. health, education, nutrition etc.)
conceptualized in a „multi-dimensional‟ definition of poverty. Economic inequalities, as defined
by the Gini Coefficient, fell from 0.447 in 2014 to 0.429 in 2017.
2. Health and Nutrition: According to the Ministry of Health report, the number of health
facilities increased from 1,342 in 2017 to 1,534 in 2018.
3. Education: The total number of students enrolled in pre-primary education increased from
220,435 in 2017 to 226,706 in 2018, an increase of 2.84%. In primary education, Rwanda
continues to sustain a high gross enrollment rate of 137.50% in 2018, while secondary education
logged a slight increase from 38.20% in 2017 to 39.60% in 2018. Female representation in
Technical and Vocational Education and Training (TVET) increased slightly from 42,174 in
2017 to 44,842 in 2018.
4. Agriculture: The total contribution of agriculture on GDP decreased from 31% in 2017 to 29%
in 2018.
5. Transportation and Communication: The number of vehicles increased from 198,533 in 2017
to 216,204 vehicles in 2018. Mobile phone subscriptions increased from 8,819,217 in 2017 to
9,700,609 in 2018. The number of internet subscribers also increased, from 5,252,996 in 2017 to
6,143,144 in 2018.
6. Income, Expenditure and wealth: In the year 2018, GDP at current prices was 8,189 billion
RWF, increasing from 7,600 billion RWF in the previous year. As population growth is
stabilizing, this translated to an increase in GDP per capita, from USD 774 in 2017 to 787 USD
in 2018.
7. Banking and Finances: The amount of new authorized loans at long term from 162,402,462
(RWF thousands) in 2017 to 196,242,860 (RWF thousands) in 2018.
STATISTICAL YEARBOOK 2019
v
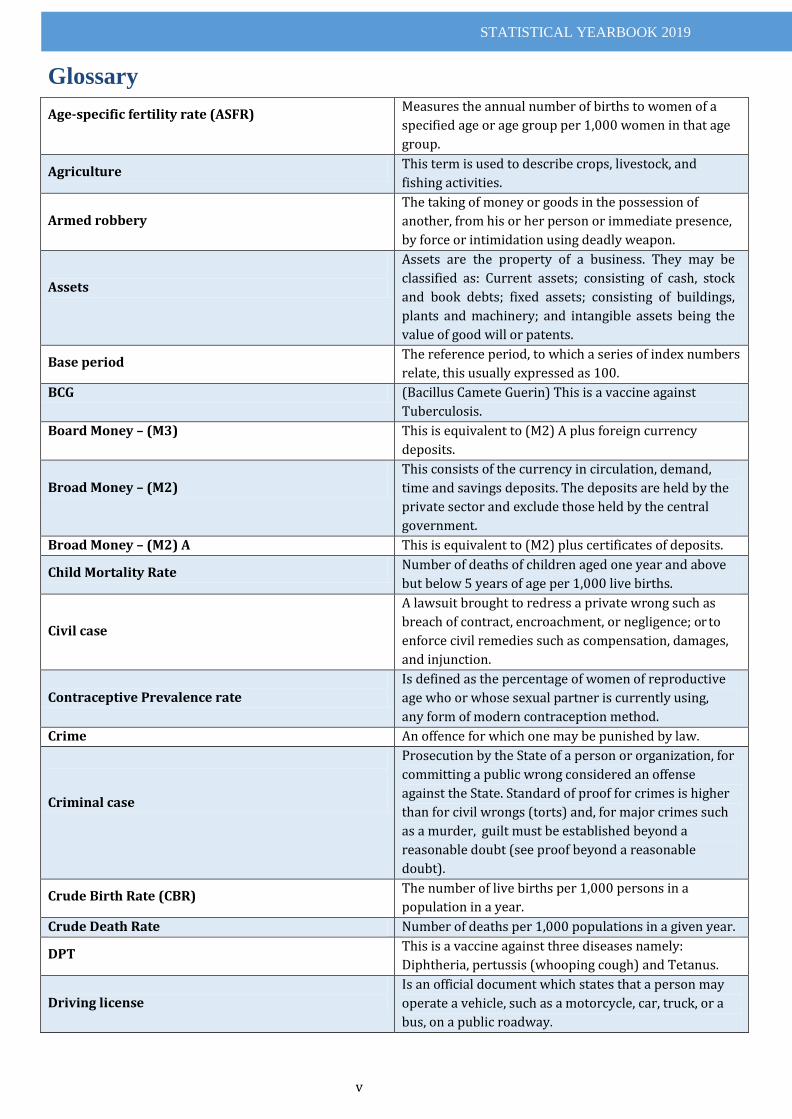
Glossary
Age-specific fertility rate (ASFR) Measures the annual number of births to women of a
specified age or age group per 1,000 women in that age
group.
Agriculture This term is used to describe crops, livestock, and
fishing activities.
Armed robbery
The taking of money or goods in the possession of
another, from his or her person or immediate presence,
by force or intimidation using deadly weapon.
Assets
Assets are the property of a business. They may be
classified as: Current assets; consisting of cash, stock
and book debts; fixed assets; consisting of buildings,
plants and machinery; and intangible assets being the
value of good will or patents.
Base period The reference period, to which a series of index numbers
relate, this usually expressed as 100.
BCG (Bacillus Camete Guerin) This is a vaccine against
Tuberculosis.
Board Money – (M3) This is equivalent to (M2) A plus foreign currency
deposits.
Broad Money – (M2)
This consists of the currency in circulation, demand,
time and savings deposits. The deposits are held by the
private sector and exclude those held by the central
government.
Broad Money – (M2) A This is equivalent to (M2) plus certificates of deposits.
Child Mortality Rate Number of deaths of children aged one year and above
but below 5 years of age per 1,000 live births.
Civil case
A lawsuit brought to redress a private wrong such as
breach of contract, encroachment, or negligence; or to
enforce civil remedies such as compensation, damages,
and injunction.
Contraceptive Prevalence rate
Is defined as the percentage of women of reproductive
age who or whose sexual partner is currently using,
any form of modern contraception method.
Crime An offence for which one may be punished by law.
Criminal case
Prosecution by the State of a person or organization, for
committing a public wrong considered an offense
against the State. Standard of proof for crimes is higher
than for civil wrongs (torts) and, for major crimes such
as a murder, guilt must be established beyond a
reasonable doubt (see proof beyond a reasonable
doubt).
Crude Birth Rate (CBR) The number of live births per 1,000 persons in a
population in a year.
Crude Death Rate Number of deaths per 1,000 populations in a given year.
DPT This is a vaccine against three diseases namely:
Diphtheria, pertussis (whooping cough) and Tetanus.
Driving license
Is an official document which states that a person may
operate a vehicle, such as a motorcycle, car, truck, or a
bus, on a public roadway.
STATISTICAL YEARBOOK 2019
vi
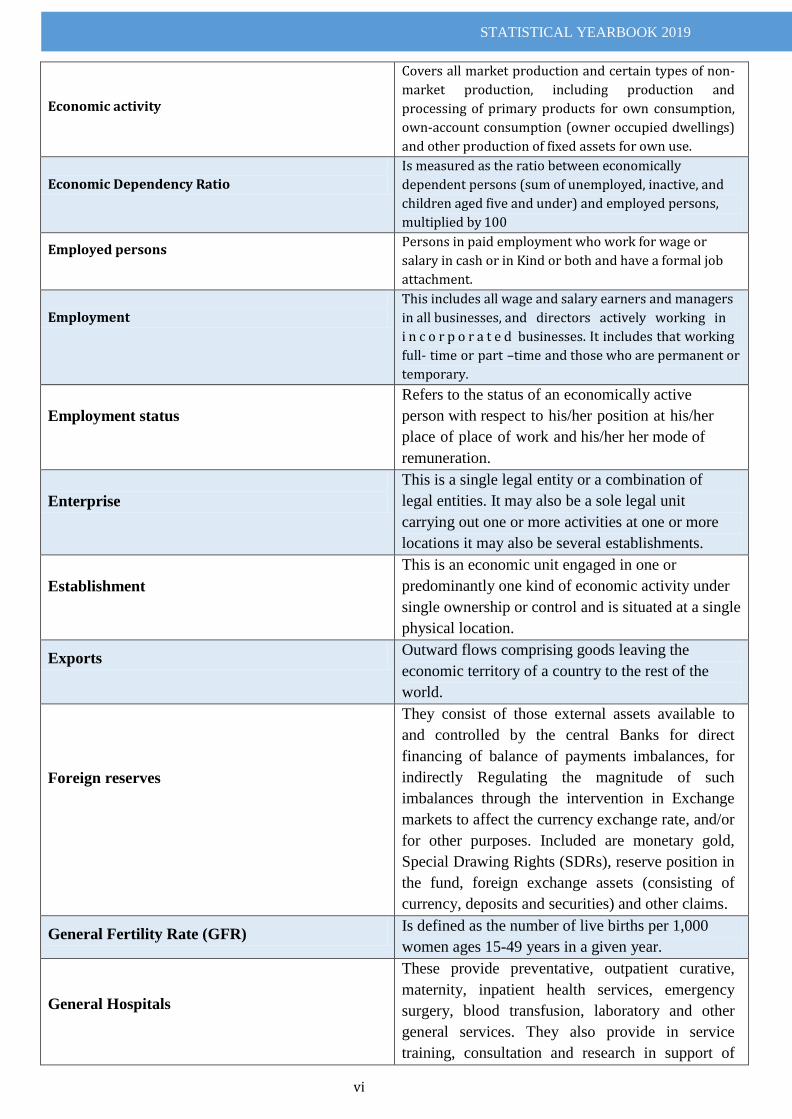
Economic activity
Covers all market production and certain types of non-
market production, including production and
processing of primary products for own consumption,
own-account consumption (owner occupied dwellings)
and other production of fixed assets for own use.
Economic Dependency Ratio
Is measured as the ratio between economically
dependent persons (sum of unemployed, inactive, and
children aged five and under) and employed persons,
multiplied by 100
Employed persons Persons in paid employment who work for wage or
salary in cash or in Kind or both and have a formal job
attachment.
Employment
This includes all wage and salary earners and managers
in all businesses, and directors actively working in
i n c o r p o r a t e d businesses. It includes that working
full- time or part –time and those who are permanent or
temporary.
Employment status
Refers to the status of an economically active
person with respect to his/her position at his/her
place of place of work and his/her her mode of
remuneration.
Enterprise
This is a single legal entity or a combination of
legal entities. It may also be a sole legal unit
carrying out one or more activities at one or more
locations it may also be several establishments.
Establishment
This is an economic unit engaged in one or
predominantly one kind of economic activity under
single ownership or control and is situated at a single
physical location.
Exports Outward flows comprising goods leaving the
economic territory of a country to the rest of the
world.
Foreign reserves
They consist of those external assets available to
and controlled by the central Banks for direct
financing of balance of payments imbalances, for
indirectly Regulating the magnitude of such
imbalances through the intervention in Exchange
markets to affect the currency exchange rate, and/or
for other purposes. Included are monetary gold,
Special Drawing Rights (SDRs), reserve position in
the fund, foreign exchange assets (consisting of
currency, deposits and securities) and other claims.
General Fertility Rate (GFR) Is defined as the number of live births per 1,000
women ages 15-49 years in a given year.
General Hospitals
These provide preventative, outpatient curative,
maternity, inpatient health services, emergency
surgery, blood transfusion, laboratory and other
general services. They also provide in service
training, consultation and research in support of
STATISTICAL YEARBOOK 2019
vii
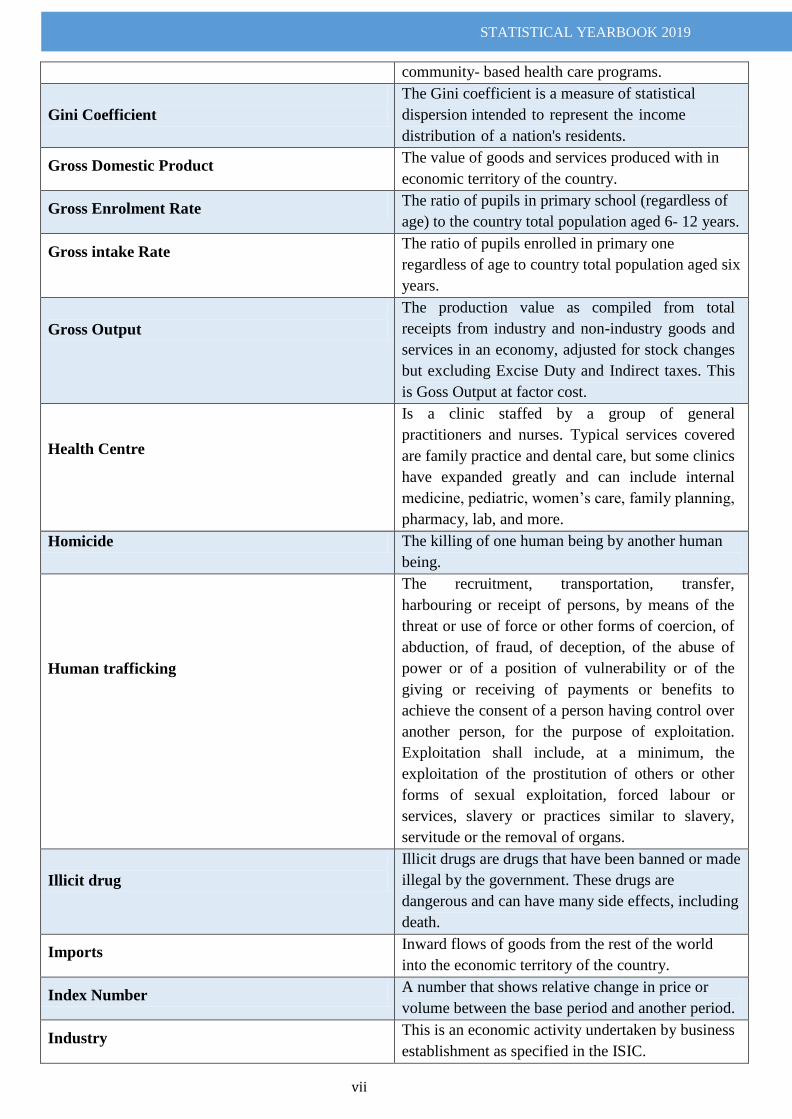
community- based health care programs.
Gini Coefficient
The Gini coefficient is a measure of statistical
dispersion intended to represent the income
distribution of a nation's residents.
Gross Domestic Product The value of goods and services produced with in
economic territory of the country.
Gross Enrolment Rate The ratio of pupils in primary school (regardless of
age) to the country total population aged 6- 12 years.
Gross intake Rate The ratio of pupils enrolled in primary one
regardless of age to country total population aged six
years.
Gross Output
The production value as compiled from total
receipts from industry and non-industry goods and
services in an economy, adjusted for stock changes
but excluding Excise Duty and Indirect taxes. This
is Goss Output at factor cost.
Health Centre
Is a clinic staffed by a group of general
practitioners and nurses. Typical services covered
are family practice and dental care, but some clinics
have expanded greatly and can include internal
medicine, pediatric, women‟s care, family planning,
pharmacy, lab, and more.
Homicide The killing of one human being by another human
being.
Human trafficking
The recruitment, transportation, transfer,
harbouring or receipt of persons, by means of the
threat or use of force or other forms of coercion, of
abduction, of fraud, of deception, of the abuse of
power or of a position of vulnerability or of the
giving or receiving of payments or benefits to
achieve the consent of a person having control over
another person, for the purpose of exploitation.
Exploitation shall include, at a minimum, the
exploitation of the prostitution of others or other
forms of sexual exploitation, forced labour or
services, slavery or practices similar to slavery,
servitude or the removal of organs.
Illicit drug
Illicit drugs are drugs that have been banned or made
illegal by the government. These drugs are
dangerous and can have many side effects, including
death.
Imports Inward flows of goods from the rest of the world
into the economic territory of the country.
Index Number A number that shows relative change in price or
volume between the base period and another period.
Industry This is an economic activity undertaken by business
establishment as specified in the ISIC.
STATISTICAL YEARBOOK 2019
viii
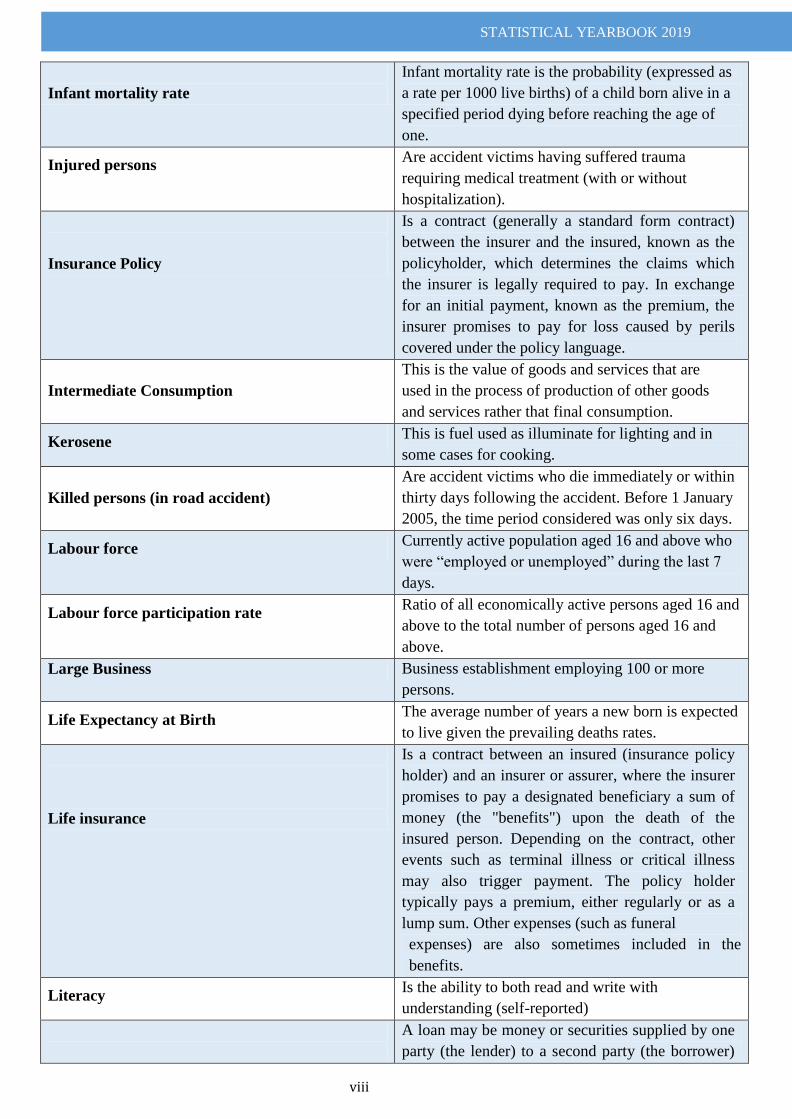
Infant mortality rate
Infant mortality rate is the probability (expressed as
a rate per 1000 live births) of a child born alive in a
specified period dying before reaching the age of
one.
Injured persons Are accident victims having suffered trauma
requiring medical treatment (with or without
hospitalization).
Insurance Policy
Is a contract (generally a standard form contract)
between the insurer and the insured, known as the
policyholder, which determines the claims which
the insurer is legally required to pay. In exchange
for an initial payment, known as the premium, the
insurer promises to pay for loss caused by perils
covered under the policy language.
Intermediate Consumption
This is the value of goods and services that are
used in the process of production of other goods
and services rather that final consumption.
Kerosene This is fuel used as illuminate for lighting and in
some cases for cooking.
Killed persons (in road accident)
Are accident victims who die immediately or within
thirty days following the accident. Before 1 January
2005, the time period considered was only six days.
Labour force Currently active population aged 16 and above who
were “employed or unemployed” during the last 7
days.
Labour force participation rate Ratio of all economically active persons aged 16 and
above to the total number of persons aged 16 and
above.
Large Business Business establishment employing 100 or more
persons.
Life Expectancy at Birth The average number of years a new born is expected
to live given the prevailing deaths rates.
Life insurance
Is a contract between an insured (insurance policy
holder) and an insurer or assurer, where the insurer
promises to pay a designated beneficiary a sum of
money (the "benefits") upon the death of the
insured person. Depending on the contract, other
events such as terminal illness or critical illness
may also trigger payment. The policy holder
typically pays a premium, either regularly or as a
lump sum. Other expenses (such as funeral
expenses) are also sometimes included in the
benefits.
Literacy Is the ability to both read and write with
understanding (self-reported)
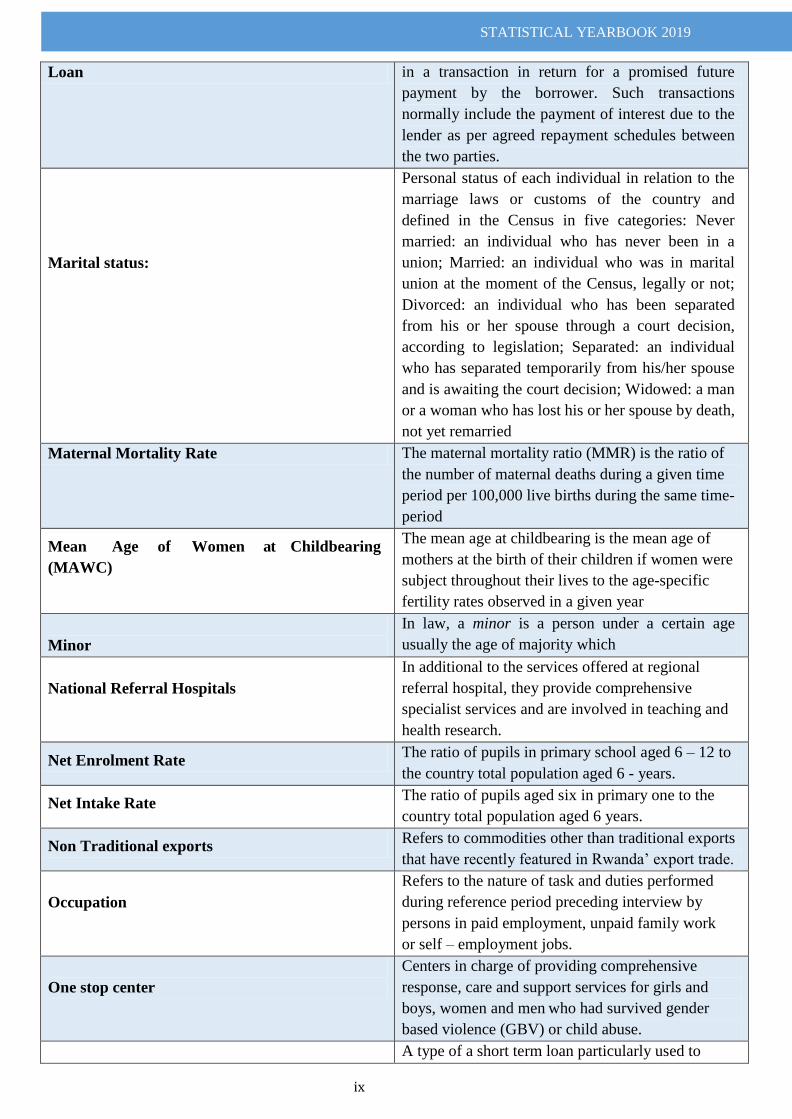
A loan may be money or securities supplied by one
party (the lender) to a second party (the borrower)
STATISTICAL YEARBOOK 2019
ix
Loan in a transaction in return for a promised future
payment by the borrower. Such transactions
normally include the payment of interest due to the
lender as per agreed repayment schedules between
the two parties.
Marital status:
Personal status of each individual in relation to the
marriage laws or customs of the country and
defined in the Census in five categories: Never
married: an individual who has never been in a
union; Married: an individual who was in marital
union at the moment of the Census, legally or not;
Divorced: an individual who has been separated
from his or her spouse through a court decision,
according to legislation; Separated: an individual
who has separated temporarily from his/her spouse
and is awaiting the court decision; Widowed: a man
or a woman who has lost his or her spouse by death,
not yet remarried
Maternal Mortality Rate The maternal mortality ratio (MMR) is the ratio of
the number of maternal deaths during a given time
period per 100,000 live births during the same time-
period
Mean Age of Women at Childbearing
(MAWC)
The mean age at childbearing is the mean age of
mothers at the birth of their children if women were
subject throughout their lives to the age-specific
fertility rates observed in a given year
Minor
In law, a minor is a person under a certain age
usually the age of majority which legally demarcates childhood from adulthood. The age depends upon jurisdiction and application, but is generally 18 years old.
National Referral Hospitals
In additional to the services offered at regional
referral hospital, they provide comprehensive
specialist services and are involved in teaching and
health research.
Net Enrolment Rate The ratio of pupils in primary school aged 6 – 12 to
the country total population aged 6 - years.
Net Intake Rate The ratio of pupils aged six in primary one to the
country total population aged 6 years.
Non Traditional exports Refers to commodities other than traditional exports
that have recently featured in Rwanda‟ export trade.
Occupation
Refers to the nature of task and duties performed
during reference period preceding interview by
persons in paid employment, unpaid family work
or self – employment jobs.
One stop center
Centers in charge of providing comprehensive
response, care and support services for girls and
boys, women and men who had survived gender
based violence (GBV) or child abuse.
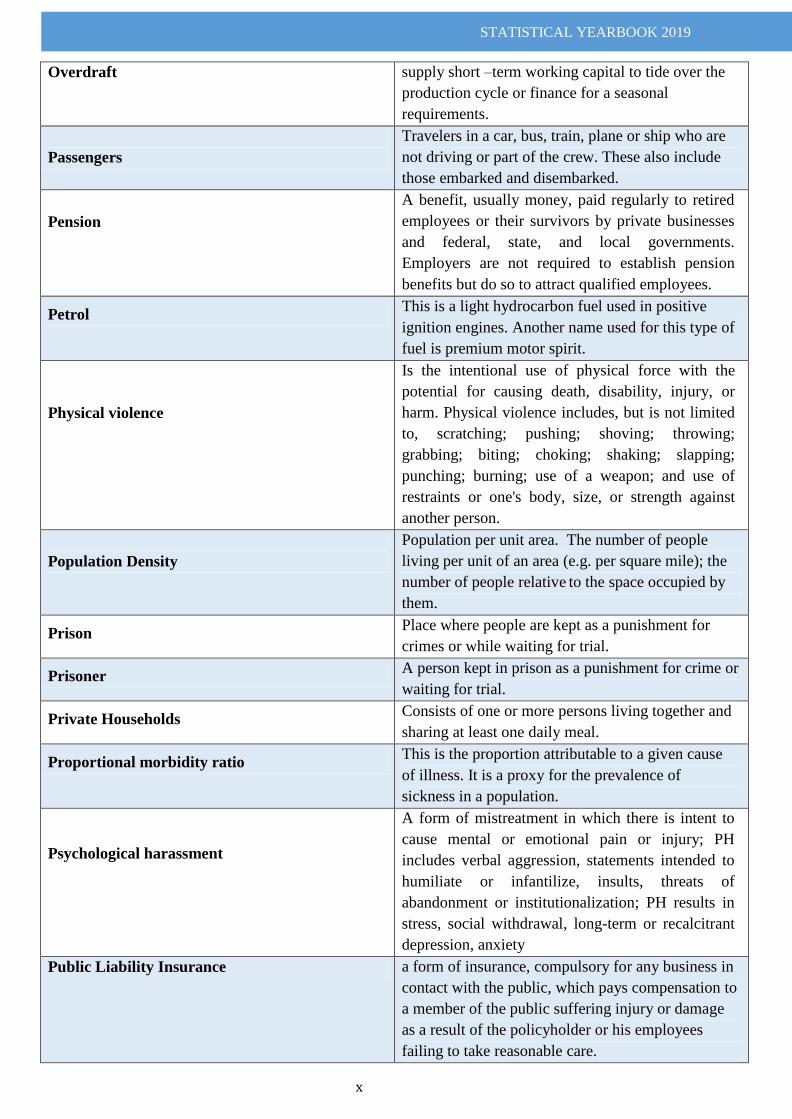
A type of a short term loan particularly used to
STATISTICAL YEARBOOK 2019
x
Overdraft supply short –term working capital to tide over the
production cycle or finance for a seasonal
requirements.
Passengers
Travelers in a car, bus, train, plane or ship who are
not driving or part of the crew. These also include
those embarked and disembarked.
Pension
A benefit, usually money, paid regularly to retired
employees or their survivors by private businesses
and federal, state, and local governments.
Employers are not required to establish pension
benefits but do so to attract qualified employees.
Petrol This is a light hydrocarbon fuel used in positive
ignition engines. Another name used for this type of
fuel is premium motor spirit.
Physical violence
Is the intentional use of physical force with the
potential for causing death, disability, injury, or
harm. Physical violence includes, but is not limited
to, scratching; pushing; shoving; throwing;
grabbing; biting; choking; shaking; slapping;
punching; burning; use of a weapon; and use of
restraints or one's body, size, or strength against
another person.
Population Density
Population per unit area. The number of people
living per unit of an area (e.g. per square mile); the
number of people relative to the space occupied by
them.
Prison Place where people are kept as a punishment for
crimes or while waiting for trial.
Prisoner A person kept in prison as a punishment for crime or
waiting for trial.
Private Households Consists of one or more persons living together and
sharing at least one daily meal.
Proportional morbidity ratio This is the proportion attributable to a given cause
of illness. It is a proxy for the prevalence of
sickness in a population.
Psychological harassment
A form of mistreatment in which there is intent to
cause mental or emotional pain or injury; PH
includes verbal aggression, statements intended to
humiliate or infantilize, insults, threats of
abandonment or institutionalization; PH results in
stress, social withdrawal, long-term or recalcitrant
depression, anxiety
Public Liability Insurance a form of insurance, compulsory for any business in
contact with the public, which pays compensation to
a member of the public suffering injury or damage
as a result of the policyholder or his employees
failing to take reasonable care.
STATISTICAL YEARBOOK 2019
xi
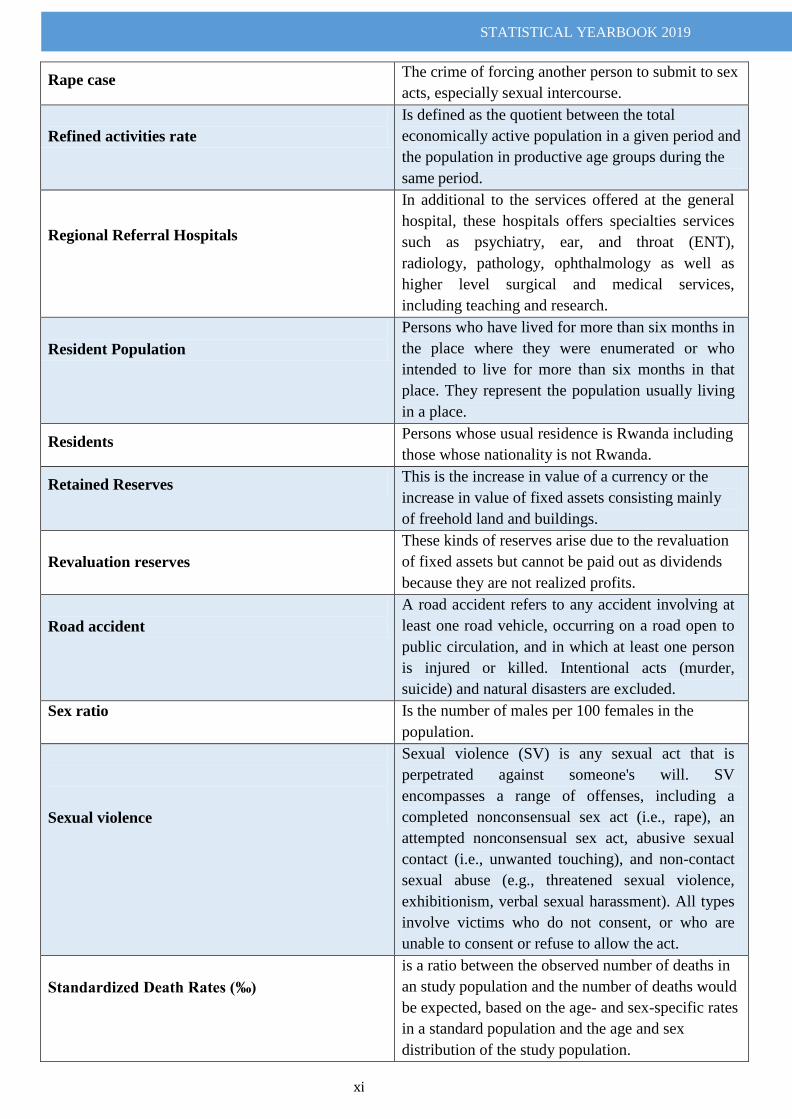
Rape case The crime of forcing another person to submit to sex
acts, especially sexual intercourse.
Refined activities rate
Is defined as the quotient between the total
economically active population in a given period and
the population in productive age groups during the
same period.
Regional Referral Hospitals
In additional to the services offered at the general
hospital, these hospitals offers specialties services
such as psychiatry, ear, and throat (ENT),
radiology, pathology, ophthalmology as well as
higher level surgical and medical services,
including teaching and research.
Resident Population
Persons who have lived for more than six months in
the place where they were enumerated or who
intended to live for more than six months in that
place. They represent the population usually living
in a place.
Residents Persons whose usual residence is Rwanda including
those whose nationality is not Rwanda.
Retained Reserves This is the increase in value of a currency or the
increase in value of fixed assets consisting mainly
of freehold land and buildings.
Revaluation reserves
These kinds of reserves arise due to the revaluation
of fixed assets but cannot be paid out as dividends
because they are not realized profits.
Road accident
A road accident refers to any accident involving at
least one road vehicle, occurring on a road open to
public circulation, and in which at least one person
is injured or killed. Intentional acts (murder,
suicide) and natural disasters are excluded.
Sex ratio Is the number of males per 100 females in the
population.
Sexual violence
Sexual violence (SV) is any sexual act that is
perpetrated against someone's will. SV
encompasses a range of offenses, including a
completed nonconsensual sex act (i.e., rape), an
attempted nonconsensual sex act, abusive sexual
contact (i.e., unwanted touching), and non-contact
sexual abuse (e.g., threatened sexual violence,
exhibitionism, verbal sexual harassment). All types
involve victims who do not consent, or who are
unable to consent or refuse to allow the act.
Standardized Death Rates (‰)
is a ratio between the observed number of deaths in
an study population and the number of deaths would
be expected, based on the age- and sex-specific rates
in a standard population and the age and sex
distribution of the study population.
STATISTICAL YEARBOOK 2019
xii
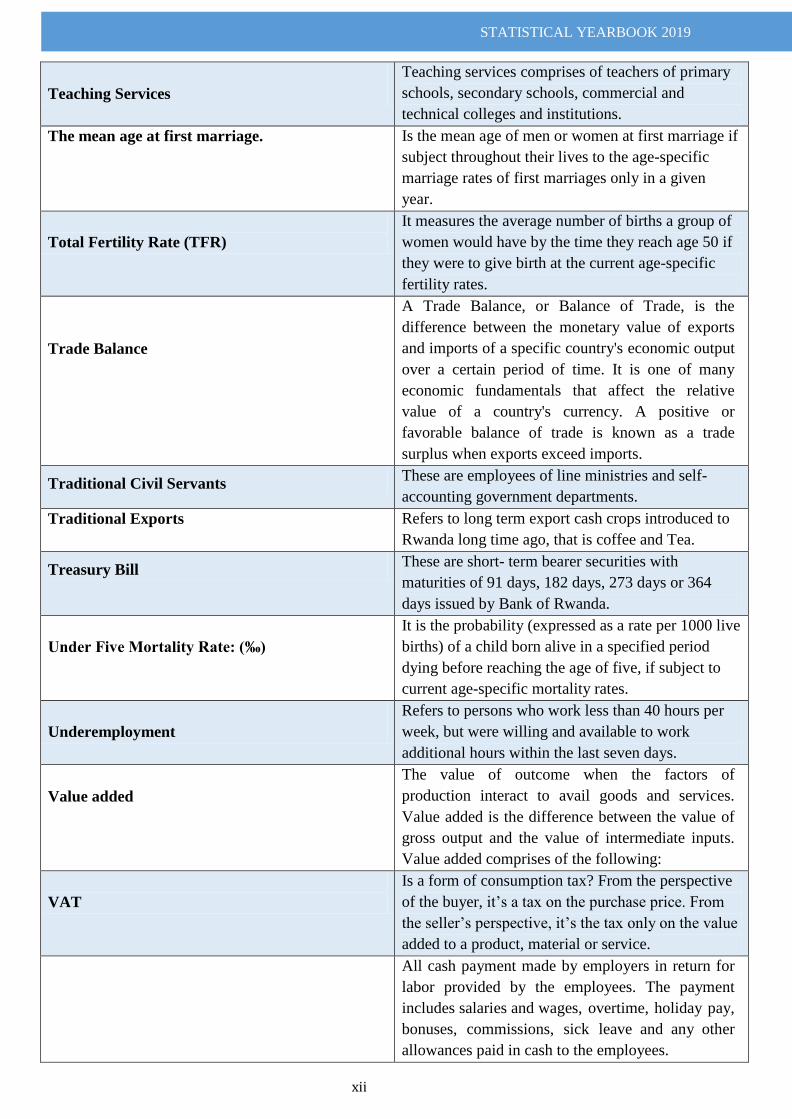
Teaching Services
Teaching services comprises of teachers of primary
schools, secondary schools, commercial and
technical colleges and institutions.
The mean age at first marriage. Is the mean age of men or women at first marriage if
subject throughout their lives to the age-specific
marriage rates of first marriages only in a given
year.
Total Fertility Rate (TFR)
It measures the average number of births a group of
women would have by the time they reach age 50 if
they were to give birth at the current age-specific
fertility rates.
Trade Balance
A Trade Balance, or Balance of Trade, is the
difference between the monetary value of exports
and imports of a specific country's economic output
over a certain period of time. It is one of many
economic fundamentals that affect the relative
value of a country's currency. A positive or
favorable balance of trade is known as a trade
surplus when exports exceed imports.
Traditional Civil Servants These are employees of line ministries and self-
accounting government departments.
Traditional Exports Refers to long term export cash crops introduced to
Rwanda long time ago, that is coffee and Tea.
Treasury Bill These are short- term bearer securities with
maturities of 91 days, 182 days, 273 days or 364
days issued by Bank of Rwanda.
Under Five Mortality Rate: (‰)
It is the probability (expressed as a rate per 1000 live
births) of a child born alive in a specified period
dying before reaching the age of five, if subject to
current age-specific mortality rates.
Underemployment
Refers to persons who work less than 40 hours per
week, but were willing and available to work
additional hours within the last seven days.
Value added
The value of outcome when the factors of
production interact to avail goods and services.
Value added is the difference between the value of
gross output and the value of intermediate inputs.
Value added comprises of the following:
VAT
Is a form of consumption tax? From the perspective
of the buyer, it‟s a tax on the purchase price. From
the seller‟s perspective, it‟s the tax only on the value
added to a product, material or service.
All cash payment made by employers in return for
labor provided by the employees. The payment
includes salaries and wages, overtime, holiday pay,
bonuses, commissions, sick leave and any other
allowances paid in cash to the employees.
STATISTICAL YEARBOOK 2019
xiii
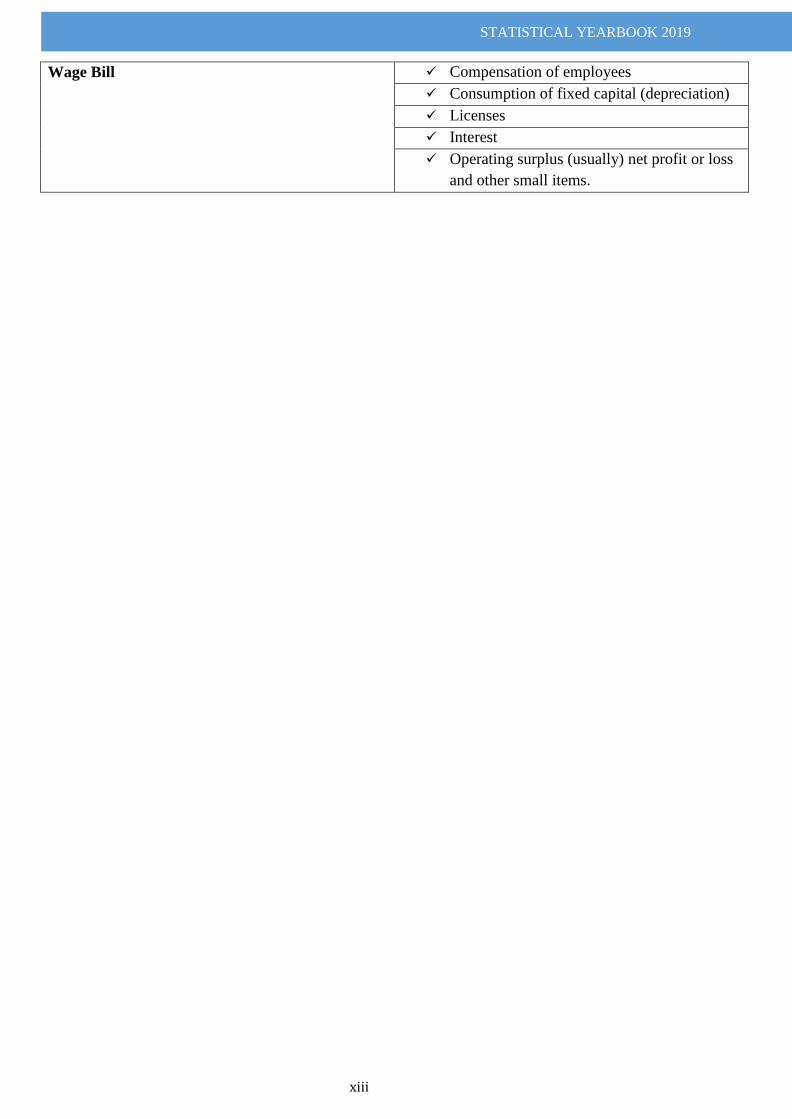
Wage Bill Compensation of employees
Consumption of fixed capital (depreciation)
Licenses
Interest
Operating surplus (usually) net profit or loss
and other small items.
STATISTICAL YEARBOOK 2019
xiv
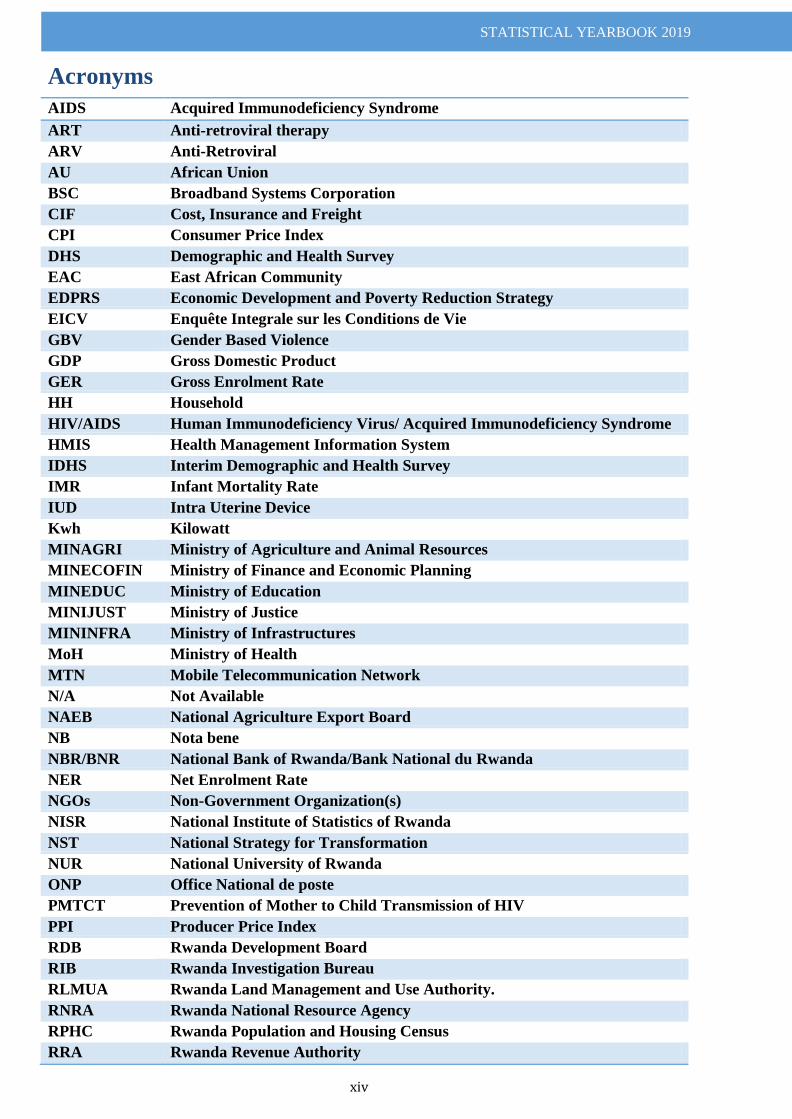
Acronyms
AIDS Acquired Immunodeficiency Syndrome
ART Anti-retroviral therapy
ARV Anti-Retroviral
AU African Union
BSC Broadband Systems Corporation
CIF Cost, Insurance and Freight
CPI Consumer Price Index
DHS Demographic and Health Survey
EAC East African Community
EDPRS Economic Development and Poverty Reduction Strategy
EICV Enquête Integrale sur les Conditions de Vie
GBV Gender Based Violence
GDP Gross Domestic Product
GER Gross Enrolment Rate
HH Household
HIV/AIDS Human Immunodeficiency Virus/ Acquired Immunodeficiency Syndrome
HMIS Health Management Information System
IDHS Interim Demographic and Health Survey
IMR Infant Mortality Rate
IUD Intra Uterine Device
Kwh Kilowatt
MINAGRI Ministry of Agriculture and Animal Resources
MINECOFIN Ministry of Finance and Economic Planning
MINEDUC Ministry of Education
MINIJUST Ministry of Justice
MININFRA Ministry of Infrastructures
MoH Ministry of Health
MTN Mobile Telecommunication Network
N/A Not Available
NAEB National Agriculture Export Board
NB Nota bene
NBR/BNR National Bank of Rwanda/Bank National du Rwanda
NER Net Enrolment Rate
NGOs Non-Government Organization(s)
NISR National Institute of Statistics of Rwanda
NST National Strategy for Transformation
NUR National University of Rwanda
ONP Office National de poste
PMTCT Prevention of Mother to Child Transmission of HIV
PPI Producer Price Index
RDB Rwanda Development Board
RIB Rwanda Investigation Bureau
RLMUA Rwanda Land Management and Use Authority.
RNRA Rwanda National Resource Agency
RPHC Rwanda Population and Housing Census
RRA Rwanda Revenue Authority
STATISTICAL YEARBOOK 2019
xv
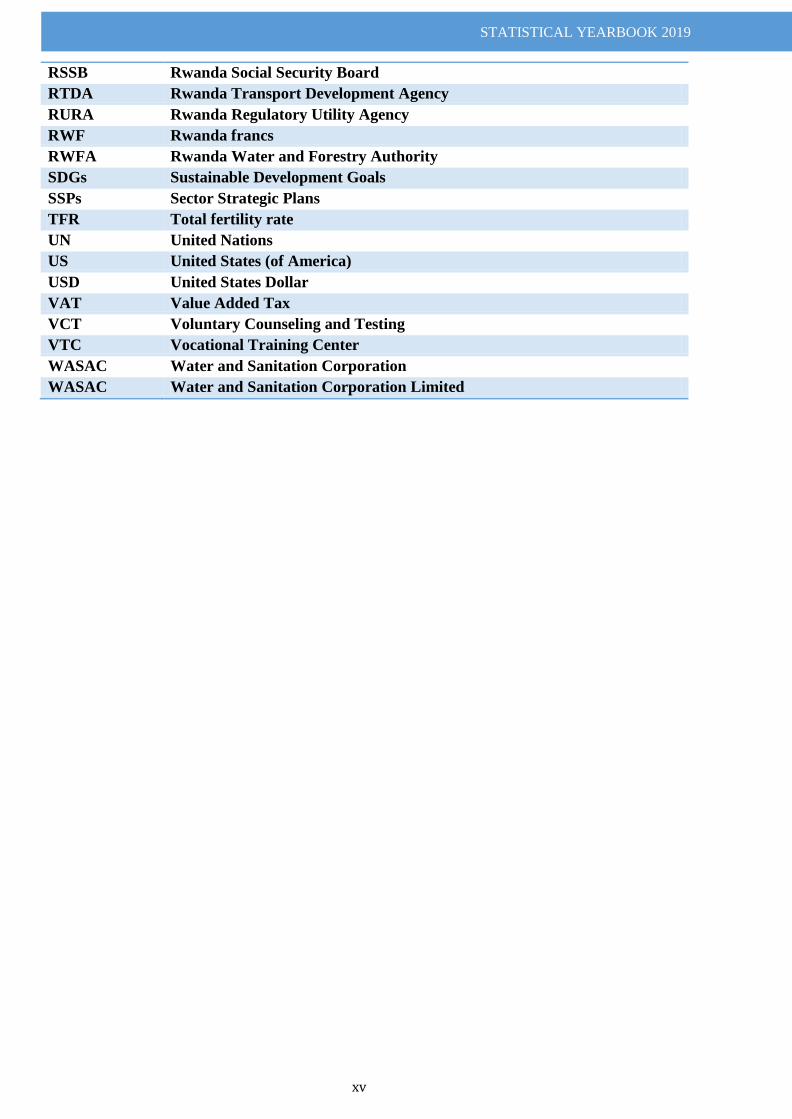
RSSB Rwanda Social Security Board
RTDA Rwanda Transport Development Agency
RURA Rwanda Regulatory Utility Agency
RWF Rwanda francs
RWFA Rwanda Water and Forestry Authority
SDGs Sustainable Development Goals
SSPs Sector Strategic Plans
TFR Total fertility rate
UN United Nations
US United States (of America)
USD United States Dollar
VAT Value Added Tax
VCT Voluntary Counseling and Testing
VTC Vocational Training Center
WASAC Water and Sanitation Corporation
WASAC Water and Sanitation Corporation Limited
STATISTICAL YEARBOOK 2019
xvi
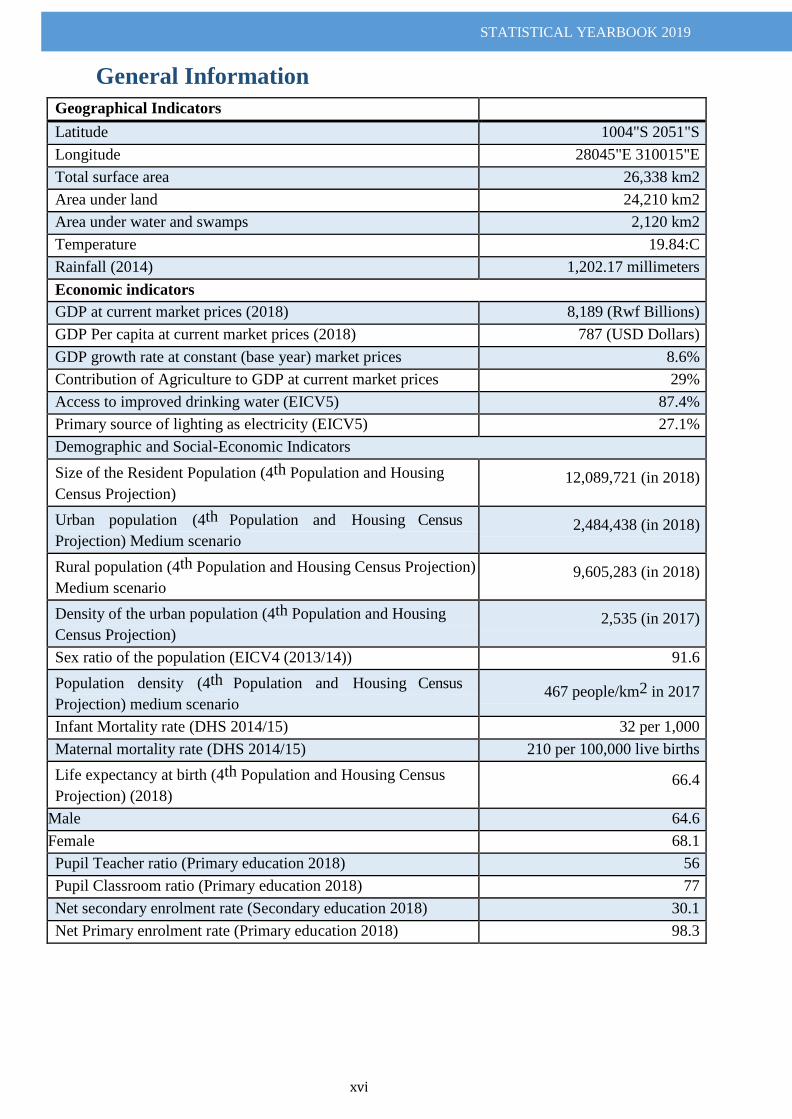
General Information
Geographical Indicators
Latitude 1004"S 2051"S
Longitude 28045"E 310015"E
Total surface area 26,338 km2
Area under land 24,210 km2
Area under water and swamps 2,120 km2
Temperature 19.84:C
Rainfall (2014) 1,202.17 millimeters
Economic indicators
GDP at current market prices (2018) 8,189 (Rwf Billions)
GDP Per capita at current market prices (2018) 787 (USD Dollars)
GDP growth rate at constant (base year) market prices 8.6%
Contribution of Agriculture to GDP at current market prices 29%
Access to improved drinking water (EICV5) 87.4%
Primary source of lighting as electricity (EICV5) 27.1%
Demographic and Social-Economic Indicators
Size of the Resident Population (4th Population and Housing
Census Projection) 12,089,721 (in 2018)
Urban population (4th Population and Housing Census
Projection) Medium scenario 2,484,438 (in 2018)
Rural population (4th Population and Housing Census Projection)
Medium scenario 9,605,283 (in 2018)
Density of the urban population (4th Population and Housing
Census Projection) 2,535 (in 2017)
Sex ratio of the population (EICV4 (2013/14)) 91.6
Population density (4th Population and Housing Census
Projection) medium scenario 467 people/km2 in 2017
Infant Mortality rate (DHS 2014/15) 32 per 1,000
Maternal mortality rate (DHS 2014/15) 210 per 100,000 live births
Life expectancy at birth (4th Population and Housing Census
Projection) (2018) 66.4
Male 64.6
Female 68.1
Pupil Teacher ratio (Primary education 2018) 56
Pupil Classroom ratio (Primary education 2018) 77
Net secondary enrolment rate (Secondary education 2018) 30.1
Net Primary enrolment rate (Primary education 2018) 98.3
STATISTICAL YEARBOOK 2019
xvii
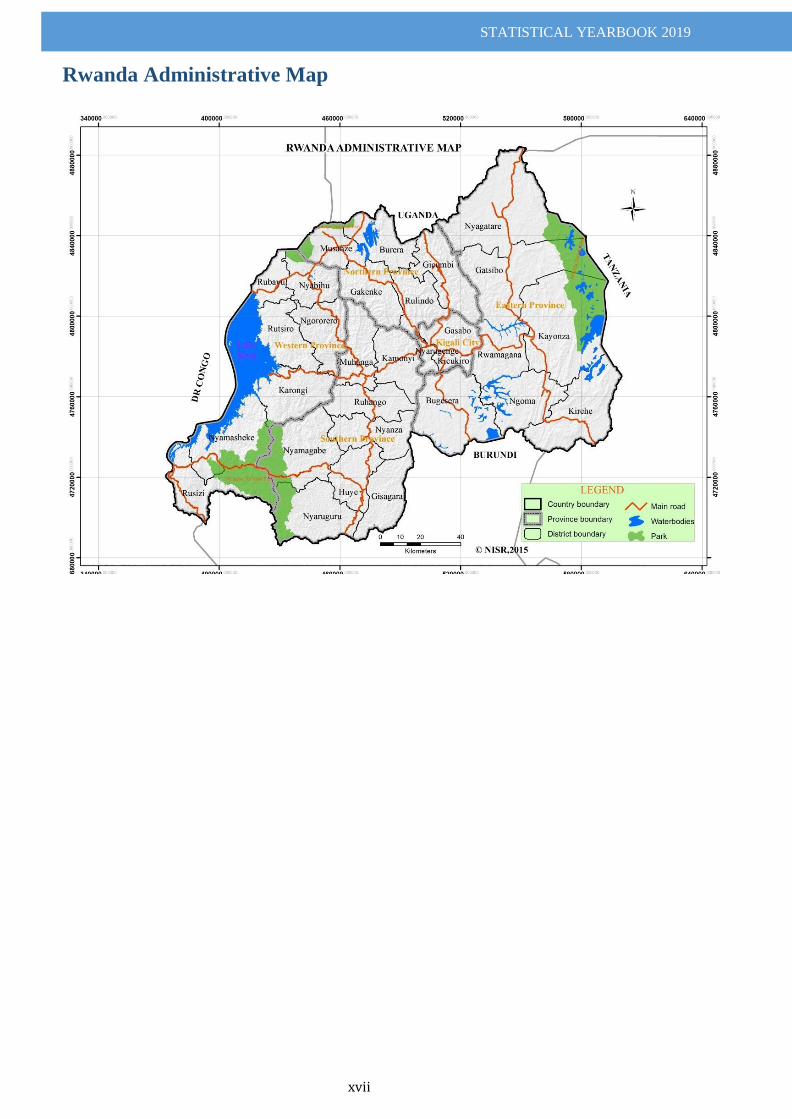
Rwanda Administrative Map
STATISTICAL YEARBOOK 2019
xviii
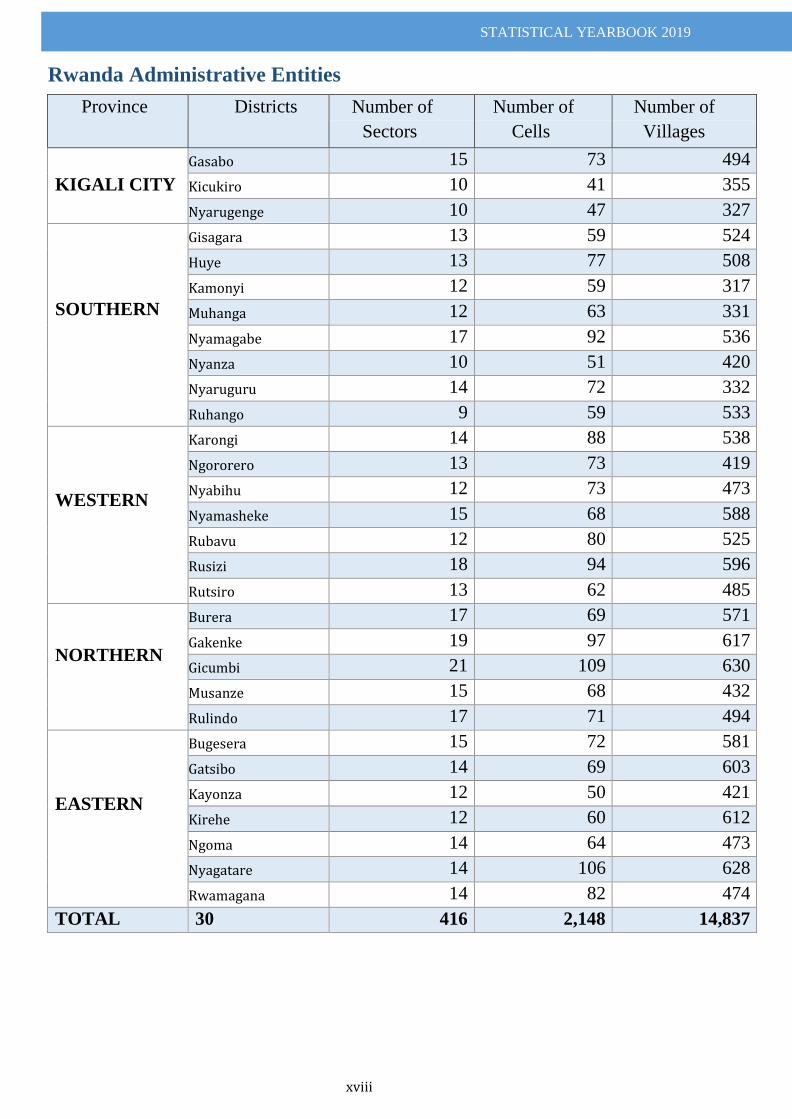
Rwanda Administrative Entities
Province Districts Number of
Sectors
Number of
Cells
Number of
Villages
KIGALI CITY
Gasabo 15 73 494
Kicukiro 10 41 355
Nyarugenge 10 47 327
SOUTHERN
Gisagara 13 59 524
Huye 13 77 508
Kamonyi 12 59 317
Muhanga 12 63 331
Nyamagabe 17 92 536
Nyanza 10 51 420
Nyaruguru 14 72 332
Ruhango 9 59 533
WESTERN
Karongi 14 88 538
Ngororero 13 73 419
Nyabihu 12 73 473
Nyamasheke 15 68 588
Rubavu 12 80 525
Rusizi 18 94 596
Rutsiro 13 62 485
NORTHERN
Burera 17 69 571
Gakenke 19 97 617
Gicumbi 21 109 630
Musanze 15 68 432
Rulindo 17 71 494
EASTERN
Bugesera 15 72 581
Gatsibo 14 69 603
Kayonza 12 50 421
Kirehe 12 60 612
Ngoma 14 64 473
Nyagatare 14 106 628
Rwamagana 14 82 474
TOTAL 30 416 2,148 14,837
STATISTICAL YEARBOOK 2019
xix
Table of Contents
Contents
Foreword ................................................................................................................................................................................................................. ii
Acknowledgement .................................................................................................................................................................................................. i
Executive Summary ............................................................................................................................................................................................. iv
Glossary ..................................................................................................................................................................................................................... v
Acronyms ...............................................................................................................................................................................................................xiv
General Information ...........................................................................................................................................................................................xvi
List of Tables ........................................................................................................................................................................................................ xxi
List of Figures .....................................................................................................................................................................................................xxv
CHAPTER I: EICV and DHS ............................................................................................................................................................................ 1
EICV ........................................................................................................................................................................................................... 2 1.1
DHS ............................................................................................................................................................................................................ 5 1.2
CHAPTER II: GENDER ..................................................................................................................................................................................... 7
Gender Statistics ..................................................................................................................................................................................... 8 2.1
CHAPTER III: HEALTH and NUTRITION ............................................................................................................................................. 11
Infant and Maternal Health Indicators .......................................................................................................................................... 12 3.1
HIV Prevalence .................................................................................................................................................................................... 13 3.2
Family Planning ................................................................................................................................................................................... 18 3.3
Malaria .................................................................................................................................................................................................... 19 3.4
Tuberculosis .......................................................................................................................................................................................... 19 3.5
Nutrition ................................................................................................................................................................................................. 21 3.6
Gender Based Violence ..................................................................................................................................................................... 23 3.7
Morbidity ............................................................................................................................................................................................... 24 3.8
Hospitalization and Mortality .......................................................................................................................................................... 25 3.9
Health Workers ....................................................................................................................................................................... 29 3.10
CHAPTER IV: EDUCATION ........................................................................................................................................................................ 32
Pre-Primary Education ....................................................................................................................................................................... 33 4.1
Primary Education ............................................................................................................................................................................... 34 4.2
Secondary Education .......................................................................................................................................................................... 43 4.3
TVET and tertiary education ........................................................................................................................................................... 53 4.4
CHAPTER V: ENVIRONMENT .................................................................................................................................................................. 62
Environment and Climate Change ................................................................................................................................................. 63 5.1
Land ......................................................................................................................................................................................................... 64 5.2
Geology and Mines Department ..................................................................................................................................................... 67 5.3
Forestry ................................................................................................................................................................................................... 69 5.4
Disasters ................................................................................................................................................................................................. 69 5.5
Rainfall and Temperature ................................................................................................................................................................. 73 5.6
Water Resources Management ........................................................................................................................................................ 79 5.7
CHAPTER VI: AGRICULTURE .................................................................................................................................................................. 80
Production .............................................................................................................................................................................................. 81 6.1
Export of Crop, Animal and Animal Product ............................................................................................................................. 81 6.2
STATISTICAL YEARBOOK 2019
xx
CHAPTER VII: WATER and ENERGY PRODUCTION .................................................................................................................... 93
Electricity Indicators .......................................................................................................................................................................... 94 7.1
Water Indicators ................................................................................................................................................................................... 97 7.2
CHAPTER VIII: TRANSPORTATION and COMMUNICATION ................................................................................................ 100
Aircraft .................................................................................................................................................................................................. 101 8.1
Land Transport ................................................................................................................................................................................... 102 8.2
Communication .................................................................................................................................................................................. 105 8.3
Road Transport Services ................................................................................................................................................................. 107 8.4
CHAPTER IX: TRAVEL and TOURISM ................................................................................................................................................ 108
Travel .................................................................................................................................................................................................... 109 9.1
Tourism ................................................................................................................................................................................................. 114 9.2
CHAPTER X: INCOME, EXPENDITURE and WEALTH ............................................................................................................... 120
National Accounts ............................................................................................................................................................... 121 10.1
CHAPTER XI: PRICES INDEXES ............................................................................................................................................................ 131
Producer Price Index........................................................................................................................................................... 132 11.1
CHAPTER XII: BANKING and FINANCE ............................................................................................................................................ 140
Banking ................................................................................................................................................................................... 141 12.1
Insurance................................................................................................................................................................................. 160 12.2
Public Finance ...................................................................................................................................................................... 166 12.3
CHAPTER XIII: BUSINESS ENTERPRISES and FOREIGN TRADE ........................................................................................ 168
External Trade....................................................................................................................................................................... 169 13.1
Partner Country Analysis .................................................................................................................................................. 172 13.2
CHAPTER XIV: LAW ENFORCEMENT, COURT AND ORDER ............................................................................................... 175
Law Enforcement ................................................................................................................................................................. 176 14.1
Court and Order .................................................................................................................................................................... 178 14.2
STATISTICAL YEARBOOK 2019
xxi
List of Tables
Table 1.1.1: EICV Indicators ............................................................................................................................................................................. 2 Table 1.2.1: DHS Indicators .............................................................................................................................................................................. 5 Table 2.1.1: Women in higher positions compared to men ................................................................................................................ 8 Table 2.1.2: Primary education enrollment .............................................................................................................................................. 8 Table 2.1.3: Secondary education enrollment .......................................................................................................................................... 9 Table 3.1.1: Caesarian sections in District Hospitals and referral Hospitals ............................................................................ 12 Table 3.1.2: Births and prenatal deaths in public health centers, referral hospitals and district hospitals ................ 12 Table 3.2.1: HIV prevalence rate by some characteristics in VCT ................................................................................................. 13 Table 3.2.2: HIV prevalence rate among VCT ........................................................................................................................................ 14 Table 3.2.3: HIV+ prevalence among pregnant women by province ........................................................................................... 15 Table 3.2.4: HIV+ pregnant women who received Anti-retroviral therapy (ART) to reduce the risk of MTCT/PMTCT (15-49) .................................................................................................................................................................................... 15 Table 3.2.5: Percentage of ARV (Anti-Retroviral) Distribution and Children on ARV .......................................................... 15 Table 3.2.6: Percentage of ARV (Anti-Retroviral) distribution by type of health facility .................................................... 16 Table 3.2.7: Number of couples tested for HIV ..................................................................................................................................... 16 Table 3.2.8: Voluntary HIV /AIDS testing by age group .................................................................................................................... 16 Table 3.3.1: Family Planning Users by method and units distributed in health facilities ................................................... 18 Table 3.4.1: Malaria proportional Mortality 2012-2018 .................................................................................................................. 19 Table 3.5.1: Incidence of tuberculosis 2013-2018 .............................................................................................................................. 19 Table 3.5.2 : Community Health Workers (CHWs) participation in community DOTS ........................................................ 20 Table 3.6.1: Growth monitoring for less than 5 years by community health workers ......................................................... 21 Table 3.6.2: Hospitalization for childhood malnutrition and health outcomes ....................................................................... 21 Table 3.6.3: Outpatient treatment of malnutrition and health outcomes .................................................................................. 22 Table 3.7.1: Gender Based Violence ........................................................................................................................................................... 23 Table 3.7.2: Utilization rate of curative services in public and private health facilities ...................................................... 24 Table 3.8.1: Outpatient visits in public and private Health Facilities and Community (Outpatient care) ................... 24 Table 3.9.1: Deaths reported in public and private health facilities ............................................................................................ 25 Table 3.9.2: Top ten causes of morbidity in child U5 in Health Centers, 2016 ........................................................................ 25 Table 3.9.3: Top causes of morbidity in health centers, 2014-2016 (All Age groups) ......................................................... 25 Table 3.9.4: Top causes of morbidity in Hospital, 2014-2016 (All Age group) ....................................................................... 26 Table 3.9.5: Top ten causes of death in health centers, District/Provincial and Referral Hospitals, 2016 (All Age group) ..................................................................................................................................................................................................................... 26 Table 3.9.6: Selected surgical interventions .......................................................................................................................................... 27 Table 3.9.7: Radiology Exams ....................................................................................................................................................................... 28 Table 3.9.8: Number of RSSB Affiliates and dependents (medical scheme) by District ...................................................... 28 Table 3.10.1: Health workers in public sector ...................................................................................................................................... 29 Table 3.10.2: Number of Health Facilities ............................................................................................................................................... 29 Table 3.10.3: Number of beds by public health facility type ........................................................................................................... 30 Table 3.10.4: Availability of power in public health facilities ......................................................................................................... 30 Table 3.10.5: Availability of water in public Health facilities (%) ................................................................................................ 30 Table 3.10.6: Distribution of computers and printers by type of health facility, 2016 ........................................................ 30 Table 3.10.7: Internet access in health centers and hospitals ........................................................................................................ 31 Table 3.10.8: Transport owned by district hospitals and public health centers, 2016 ........................................................ 31 Table 3.10.9: Basic medical equipment in District Hospitals and Health Centers, 2016 ..................................................... 31 Table 4.1.1: Pre-primary profile 2013-2018.......................................................................................................................................... 33 Table 4.1.2: Pre-primary schools, classrooms, pupils and staff by status in 2018................................................................. 33 Table 4.1.3: Pre-primary pupils with disabilities in 2018 ................................................................................................................ 34 Table 4.2.1: School by Ownership from 2016 to 2018 ...................................................................................................................... 34 Table 4.2.2: Table 4.2.2: School by level from 2017 to 2018 .......................................................................................................... 35 Table 4.2.3: Primary profile from 2014 to 2018 .................................................................................................................................. 35 Table 4.2.4: Primary promotion repetition and dropout by district in 2017/2018 .............................................................. 36 Table 4.2.5: Primary Enrollment by grade in 2016 and 2018 ........................................................................................................ 37 Table 4.2.6: Primary school leaving examination results from 2012 to 2018 ......................................................................... 39 Table 4.2.7: Primary school pupils with disabilities in 2018 .......................................................................................................... 40 Table 4.2.8: Primary school pupils with disability enrolled in 2016 and 2018 ...................................................................... 41 Table 4.2.9: Number of primary school and classrooms by school status from 2016 to 2018 ......................................... 41 Table 4.2.10: Number of primary schools by settings in 2017 and 2018 .................................................................................. 42
STATISTICAL YEARBOOK 2019
xxii
Table 4.2.11: Primary schools, classrooms and desks by District in 2016, 2017, and 2018 ............................................. 42 Table 4.3.1: School by level ........................................................................................................................................................................... 43 Table 4.3.2: School by type of ownership ................................................................................................................................................ 43 Table 4.3.3: Profile of secondary education from 2014 to 2018 ................................................................................................... 44 Table 4.3.4: Secondary schools, students and staff by status in 2018 ......................................................................................... 45 Table 4.3.5 : Secondary students enrolled by grade from 2016 to 2018 .................................................................................. 45 Table 4.3.6: Secondary school students enrolled with disability in 2018 ................................................................................. 45 Table 4.3.7: Secondary school students enrolled with disabilities from 2016 to 2018 ....................................................... 46 Table 4.3.8: Number of secondary schools, classrooms and desks by school status from 2016 to 2018 .................... 46 Table 4.3.9: Trends in Lower Secondary from 2012 to 2018 ......................................................................................................... 47 Table 4.3.10: Lower Secondary promotion, repetition and dropout rate.................................................................................. 47 Table 4.3.11: Secondary Repetition, Dropout and Promotion rates by district in 2017/2018 ........................................ 48 Table 4.3.12: Lower secondary school leaving examination results from 2011to 2018 ..................................................... 49 Table 4.3.13: Trends in Upper Secondary from 2014 to 2018 ....................................................................................................... 50 Table 4.3.14: Upper Secondary Promotion, Repetition and Dropout Rate from 2012/13 to 2017/18 ........................ 51 Table 4.3.15: Upper secondary students enrolled in 2018 by status and by fields of education..................................... 51 Table 4.3.16: Upper secondary students enrolled in 2017 and 2018 by field of education............................................... 51 Table 4.3.17: Upper secondary school leaving examination results from 2015 to 2018 .................................................... 51 Table 4.3.18: Secondary schools’ classrooms desks by district from 2016 to 2018 ............................................................. 51 Table 4.4.1: Trend in TVET from 2015 to 2018 .................................................................................................................................... 53 Table 4.4.2: Profile in VTCs from 2015 to 2018 ................................................................................................................................... 54 Table 4.4.3: Percentage of VTC (TVET LEVEL 1 TO 5) Students by Sex and by Trade in 2018 ........................................ 55 Table 4.4.4: Number of trainees enrolled in TVET by type of disability in 2018 .................................................................... 57 Table 4.4.5: TVET graduate by levels from 2015 to 2017 ................................................................................................................ 57 Table 4.4.6: Profile of tertiary education students from 2015/2016 to 2017/2018 ............................................................ 58 Table 4.4.7: Students enrolment in tertiary education from 2015 to 2018 .............................................................................. 58 Table 4.4.8: Tertiary graduates by exit award in 2015/2016 and 2016/2017 ....................................................................... 59 Table 4.4.9: Tertiary Students by Fields of Education 2017/2018 .............................................................................................. 59 Table 4.4.10: Tertiary education students with disability in 2016/2017 and 2017/2018 ................................................ 60 Table 4.4.11: Number of academic staff by Qualification and Nationality 2018..................................................................... 60 Table 4.4.12: VTC classrooms desks by District 2015, 2016 and 2018 (TVET level 1 to 5) .............................................. 61 Table 5.1.1: Climate change projection .................................................................................................................................................... 63 Table 5.1.2: Integrated Water Resources Management .................................................................................................................... 63 Table 5.2.1: Land ownership by district and by gender from 2017 to 2018 ............................................................................ 64 Table 5.2.2: Land transfers by district ...................................................................................................................................................... 65 Table 5.2.3: Land transactions by district ............................................................................................................................................... 66 Table 5.3.1: Volume of Mineral Exports in kg by quarter from 2015 to 2018 ......................................................................... 67 Table 5.3.2: Value of minerals in USD ....................................................................................................................................................... 67 Table 5.3.3: Value of mineral exports in USD by quarter from 2015 to 2018 .......................................................................... 68 Table 5.4.1: Natural forest coverage (area in ha) ................................................................................................................................ 69 Table 5.4.2: Forest plantation (Area in ha) ............................................................................................................................................. 69 Table 5.5.1: Number of death attributed to disasters 2017-2018 ................................................................................................ 69 Table 5.5.2: Number of houses damaged (Household affected by disasters) 2017-2018 .................................................. 71 Table 5.6.1: Monthly Rainfall Total in mm .............................................................................................................................................. 73 Table 5.6.2: Monthly Mean Maximum Temperature in degree Celsius ...................................................................................... 75 Table 5.6.3: Monthly Mean Minimum Temperature in degree Celsius ....................................................................................... 77 Table 5.7.1: Integrated Water Resources Management in 2019 ................................................................................................... 79 Table 6.1.1: Production of major cash crops in Tons ......................................................................................................................... 81 Table 6.1.2: Land area under production for major cash crops '000 Hectare ......................................................................... 81 Table 6.2.1: Exports of Vegetables ............................................................................................................................................................. 81 Table 6.2.2: Exports of Fruits ....................................................................................................................................................................... 82 Table 6.2.3: Exports of Meat ......................................................................................................................................................................... 83 Table 6.2.4: Exports of Milk........................................................................................................................................................................... 84 Table 6.2.5: Exports of Hides and skins ................................................................................................................................................... 84 Table 6.2.6: Export of cereals ....................................................................................................................................................................... 84 Table 6.2.7: Export of pulses products ..................................................................................................................................................... 87 Table 6.2.8: Export of bananas products ................................................................................................................................................. 87 Table 6.2.9: Export of Roots and tubers ................................................................................................................................................... 88 Table 6.2.10: Exports of Refined Pyrethrum.......................................................................................................................................... 88
STATISTICAL YEARBOOK 2019
xxiii
Table 6.2.11: Exports of Essential Oils ..................................................................................................................................................... 89 Table 6.2.12: Export of live animals .......................................................................................................................................................... 90 Table 6.2.13: Fish Exports ............................................................................................................................................................................. 92 Table 6.2.14: Administrative data for artificial insemination ......................................................................................................... 92 Table 7.1.1: Electricity production by source location ...................................................................................................................... 94 Table 7.1.2: Electricity Customers .............................................................................................................................................................. 94 Table 7.1.3: Electricity Exportation and importation (Kwh) .......................................................................................................... 96 Table 7.1.4: Electricity consumption (Kwh) .......................................................................................................................................... 96 Table 7.1.5: Electricity new tariff for industries and domestic used ........................................................................................... 96 Table 7.2.1: Water production by source location in (m3) ............................................................................................................... 97 Table 7.2.2: Consumption price by quantity .......................................................................................................................................... 98 Table 7.2.3: Water Customers ...................................................................................................................................................................... 98 Table 7.2.4: Water Consumption in (m3) ................................................................................................................................................. 99 Table 8.1.1: Aircraft movements, Commercial passengers and Cargo ...................................................................................... 101 Table 8.2.1: Classification of roads in (km) .......................................................................................................................................... 102 Table 8.2.2: Cumulative Number of vehicles registered by categories ..................................................................................... 103 Table 8.3.1: Key Communication indicators ........................................................................................................................................ 105 Table 8.3.2: Cumulative registered vs Active Pay TV Subscribers .............................................................................................. 105 Table 8.3.3: Number of internet subscribers per operator ............................................................................................................ 106 Table 8.3.4: Access to post and courier service 2015 to 2018 ..................................................................................................... 106 Table 8.4.1: Trend in the number of licensed road transport operators per category ...................................................... 107 Table 8.4.2: Types of cars used in the road transportation of persons ..................................................................................... 107 Table 9.1.1: Visitor Arrivals in Rwanda by Region and Mode of Transport............................................................................ 109 Table 9.1.2: Visitor Arrivals in Rwanda by Purpose of Visit and Mode of Transport ......................................................... 110 Table 9.1.3: Visitor Arrivals in Rwanda by Purpose of Visit and country of origin ............................................................. 111 Table 9.1.4: Entry and Exits by purpose of movements from January 2014 to June 2015 ............................................... 113 Table 9.2.1: Parks Visits from 2005-2017............................................................................................................................................. 114 Table 9.2.2: Number of visitors in different National park by nationality .............................................................................. 114 Table 9.2.3: Number of Accommodation facilities and rooms per districts............................................................................ 115 Table 9.2.4: Number of Gorillas ................................................................................................................................................................. 116 Table 9.2.5: Investment past performance and Job created by year.......................................................................................... 117 Table 9.2.6: Foreign Direct Investment Flows, 2012 - 2016 (US$ Million) ............................................................................. 117 Table 9.2.7: Number of Jobs Created through Foreign Investments, 2012-2016 ................................................................. 117 Table 9.2.8: Rwanda’s ten major sources of investment 2015-2017......................................................................................... 118 Table 9.2.9: Rwanda’s Sectoral Distribution of Foreign Investment 2016 and 2017 ......................................................... 119 Table 10.1.1: Macro-economic aggregates ........................................................................................................................................... 121 Table 10.1.2: Gross Domestic Product by Kind of Activity at current prices (in billion Frw) ......................................... 123 Table 10.1.3: Gross Domestic Product by Kind of Activity Shares at current prices (percentages) ............................. 125 Table 10.1.4: GDP by Kind of Activity at constant 2014 prices (in billion Frw).................................................................... 126 Table 10.1.5: Growth rates of GDP by Kind of Activity at constant 2014 prices (Percentage change from previous year) ...................................................................................................................................................................................................................... 127 Table 10.1.6: Gross Domestic Product by Kind of Activity / Deflators (2014 = 100) ......................................................... 129 Table 10.1.7: Expenditure on GDP (in billion Rwf) ........................................................................................................................... 130 Table 10.2.1: Producer Price Index -Manufacturing Sector Goods Produced mainly for local sales (Base Period: 2010 =100) ........................................................................................................................................................................................................ 132 Table 10.2.2: Monthly Evolution of consumer price Index (CPI) [2018] /Base: 2014; Reference: February 2014=100 ........................................................................................................................................................................................................... 137 Table 10.2.3: Monthly Evolution of consumer price Index (CPI) [2019]/ Base: 2014; Reference: February 2014=100 ........................................................................................................................................................................................................... 138 Table 11.1.1: Monetary Survey (in Rwf billion).................................................................................................................................. 141 Table 11.1.2: Outstanding loans by sector of activity and by maturity for 2017- 2018 (in Rwf thousands) ........... 141 Table 11.1.3: Quarterly new authorized loans by sector of activities and maturity 2011-2018 (in RWF thousand) Long term ........................................................................................................................................................................................................... 147 Table 11.1.4: Quarterly new authorized loans by sector of activities and maturity 2011-2018 (in Rwf thousand) short term ........................................................................................................................................................................................................... 149 Table 11.1.5: Quarterly new authorized loans by sector of activities and maturity 2011-2018 (in Rwf thousands) medium term ..................................................................................................................................................................................................... 151 Table 11.1.6: Average exchange rates of the major currencies .................................................................................................... 153 Table 11.1.7: Average exchange rates of the major currencies .................................................................................................... 153
STATISTICAL YEARBOOK 2019
xxiv
Table 11.1.8: Interest Rates Structure .................................................................................................................................................... 155 Table 11.1.9: Balance of Payment in USD Million .............................................................................................................................. 156 Table 11.1.10: Operation of the central government in calendar year ..................................................................................... 158 Table 11.2.1: RSSB/Pension ........................................................................................................................................................................ 160 Table 11.2.2: Total Number of members (Active and passive) by sex and by district ....................................................... 160 Table 11.2.3: Active Members (declared members) by Sex and by district ............................................................................ 161 Table 11.2.4: Passive Members by Sex and by district .................................................................................................................... 162 Table 11.2.5: Pension Amount by categories and by sex ................................................................................................................ 162 Table 11.2.6: Total Contributions by district ....................................................................................................................................... 163 Table 11.2.7: Employers contribution by district and by categories ......................................................................................... 164 Table 11.2.8: Total Number of contributing Institutions by District and by Categories ................................................... 165 Table 11.2.9: Registrations to Mutuelles de Sante statistics by District ................................................................................... 165 Table 11.3.1: Operation of the central government in calendar year ........................................................................................ 166 Table 12.1.1: Rwanda's formal external trade in goods (values in US$ million) .................................................................. 169 Table 12.1.2: Products exported by Rwanda in the year 2017-2019Q2 (US $ millions) ................................................... 169 Table 12.1.3: Top Products imported by Rwanda in 2017-2019Q2 (Values in US$ Million) .......................................... 170 Table 12.1.4: Top 20 destinations of re-exports of Rwanda in 2017-2019 Q2 (Value: US $ millions) ........................ 171 Table 12.2.1: Top 20 destinations of exports of Rwanda in 2017-2019Q2 (Values in US$ million) ............................ 172 Table 12.2.2: Trade in Goods of Rwanda with selected regional organizations (Value in US$ million) ..................... 173 Table 12.2.3: Exhibitors by origin ............................................................................................................................................................ 174 Table 12.2.4: Number of Exhibitors registered during the Annual Made in Rwanda Expo (MIR) from 2016-2018) ................................................................................................................................................................................................................................. 174 Table 13.1.1: Breakdown of 10 most crime by crime from 2015 to 2018 ............................................................................... 176 Table 13.1.2: Distribution of crimes by type, According to province from 2015 to 2018 ................................................ 177 Table 13.1.3: Cases related to family conflicts from 2015 to 2018 ............................................................................................ 177 Table 13.1.4: Drug cases registered from 2015 to 2018 ................................................................................................................. 177 Table 13.1.5: Breakdown of 10 most Crime by province in 2017 ............................................................................................... 177 Table 13.2.1: Cases in Court Years, 2014 -2018 ................................................................................................................................. 178 Table 13.2.2: Judged Cases .......................................................................................................................................................................... 179 Table 13.2.3: Commercial Courts .............................................................................................................................................................. 180 Table 13.2.4: Number of driving licenses delivered by categories and by sex ...................................................................... 181 Table 13.2.5: Vehicle inspection in Rwanda from 2015-2018 ..................................................................................................... 182 Table 13.2.6: Roads accidents .................................................................................................................................................................... 183 Table 13.2.7: Fire Accidental ...................................................................................................................................................................... 183
STATISTICAL YEARBOOK 2019
xxv
List of Figures
Figure 1.1.1: Poverty and Extreme Poverty .............................................................................................................................................. 3 Figure 1.2.1: Maternal mortality ratio ......................................................................................................................................................... 6 Figure 2.1.1: Primary education enrollment ............................................................................................................................................. 9 Figure 2.1.2: Secondary education enrollment ..................................................................................................................................... 10 Figure 3.2.1: HIV prevalence rate in VCT by Province ....................................................................................................................... 14 Figure 4.2.1: School by Ownership in 2018 ............................................................................................................................................ 34 Figure 4.2.2: Primary Enrollment by grade in 2016 and 2018 ...................................................................................................... 38 Figure 4.2.3: Primary school leaving examination results from 2012 to 2018 ....................................................................... 39 Figure 5.3.1: Value of mineral exports in USD by quarter ................................................................................................................ 68 Figure 7.2.1: Total Water production in Rwanda (m3) ...................................................................................................................... 98 Figure 7.2.2: Water Customers by year in Rwanda ............................................................................................................................. 99 Figure 8.1.1: Evolution of Aircraft Movements and Commercial air passengers ................................................................. 102 Figure 8.2.1: Cumulative number of Registered Vehicles in Rwanda ........................................................................................ 104 Figure 9.2.1: Accommodation facilities in Rwanda ........................................................................................................................... 116 Figure 10.1.1: Gross Domestic Product (Rwf billions) ..................................................................................................................... 122 Figure 10.1.2: GDP per head (in current US dollars) ........................................................................................................................ 122 Figure 14.2.1: Cases in Court Year 2018-2019.................................................................................................................................... 179 Figure 14.2.2: Total Judged cases ............................................................................................................................................................. 180

STATISTICAL YEARBOOK 2019
1
CHAPTER I: EICV and DHS
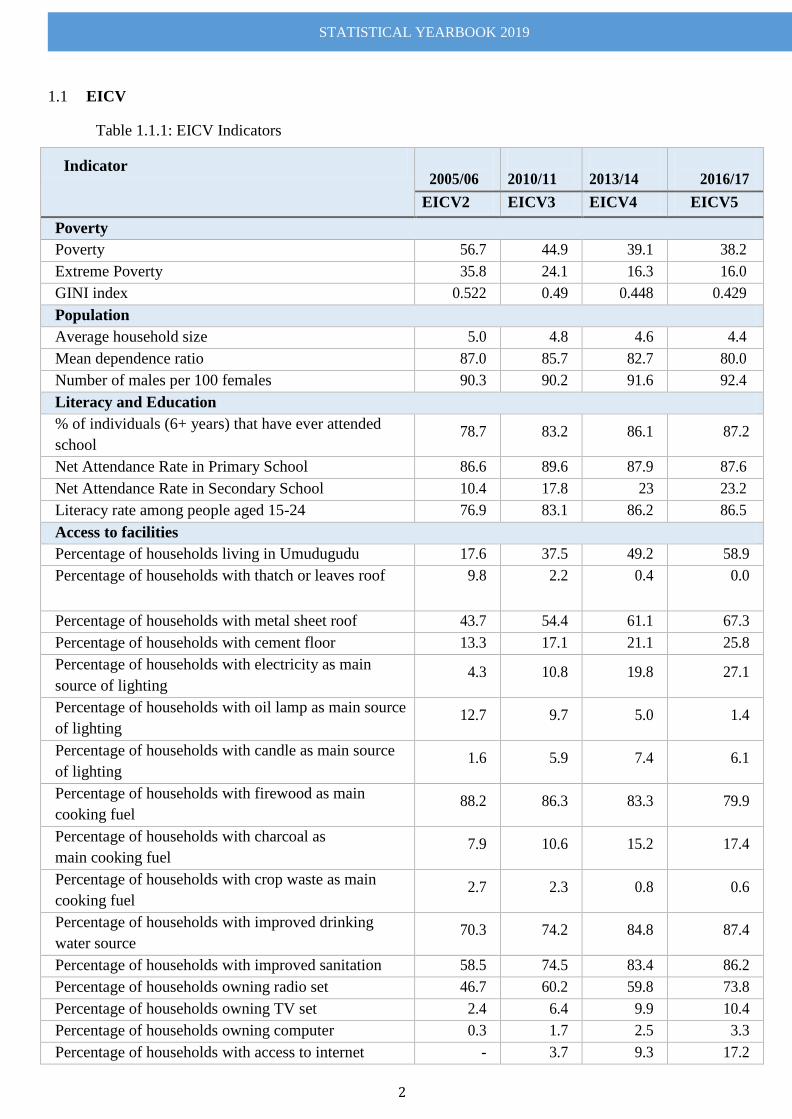
STATISTICAL YEARBOOK 2019
2
EICV 1.1
Table 1.1.1: EICV Indicators
Indicator
2005/06
2010/11
2013/14
2016/17
EICV2 EICV3 EICV4 EICV5
Poverty
Poverty 56.7 44.9 39.1 38.2
Extreme Poverty 35.8 24.1 16.3 16.0
GINI index 0.522 0.49 0.448 0.429
Population
Average household size 5.0 4.8 4.6 4.4
Mean dependence ratio 87.0 85.7 82.7 80.0
Number of males per 100 females 90.3 90.2 91.6 92.4
Literacy and Education
% of individuals (6+ years) that have ever attended
school 78.7 83.2 86.1 87.2
Net Attendance Rate in Primary School 86.6 89.6 87.9 87.6
Net Attendance Rate in Secondary School 10.4 17.8 23 23.2
Literacy rate among people aged 15-24 76.9 83.1 86.2 86.5
Access to facilities
Percentage of households living in Umudugudu 17.6 37.5 49.2 58.9
Percentage of households with thatch or leaves roof 9.8 2.2 0.4 0.0
Percentage of households with metal sheet roof 43.7 54.4 61.1 67.3
Percentage of households with cement floor 13.3 17.1 21.1 25.8
Percentage of households with electricity as main
source of lighting 4.3 10.8 19.8 27.1
Percentage of households with oil lamp as main source
of lighting 12.7 9.7 5.0 1.4
Percentage of households with candle as main source
of lighting 1.6 5.9 7.4 6.1
Percentage of households with firewood as main
cooking fuel 88.2 86.3 83.3 79.9
Percentage of households with charcoal as
main cooking fuel 7.9 10.6 15.2 17.4
Percentage of households with crop waste as main
cooking fuel 2.7 2.3 0.8 0.6
Percentage of households with improved drinking
water source 70.3 74.2 84.8 87.4
Percentage of households with improved sanitation 58.5 74.5 83.4 86.2
Percentage of households owning radio set 46.7 60.2 59.8 73.8
Percentage of households owning TV set 2.4 6.4 9.9 10.4
Percentage of households owning computer 0.3 1.7 2.5 3.3
Percentage of households with access to internet - 3.7 9.3 17.2
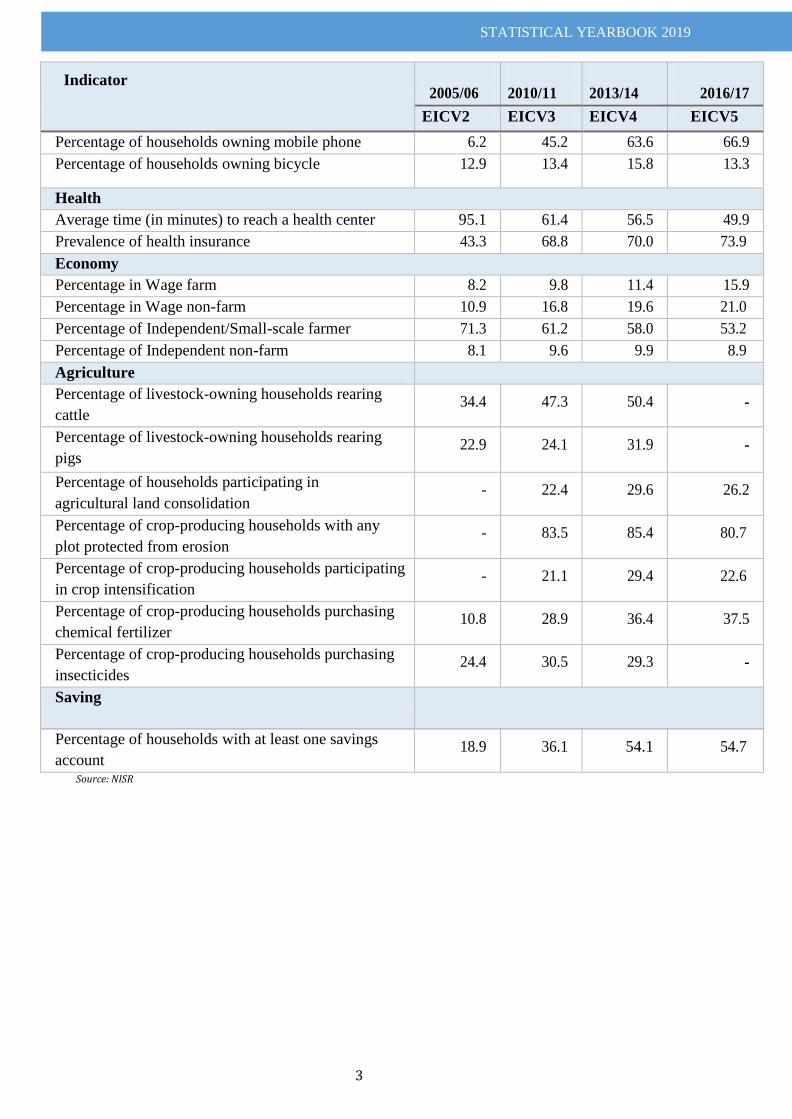
STATISTICAL YEARBOOK 2019
3
Indicator
2005/06
2010/11
2013/14
2016/17
EICV2 EICV3 EICV4 EICV5
Percentage of households owning mobile phone 6.2 45.2 63.6 66.9
Percentage of households owning bicycle 12.9 13.4 15.8 13.3
Health
Average time (in minutes) to reach a health center 95.1 61.4 56.5 49.9
Prevalence of health insurance 43.3 68.8 70.0 73.9
Economy
Percentage in Wage farm 8.2 9.8 11.4 15.9
Percentage in Wage non-farm 10.9 16.8 19.6 21.0
Percentage of Independent/Small-scale farmer 71.3 61.2 58.0 53.2
Percentage of Independent non-farm 8.1 9.6 9.9 8.9
Agriculture
Percentage of livestock-owning households rearing
cattle 34.4 47.3 50.4 -
Percentage of livestock-owning households rearing
pigs 22.9 24.1 31.9 -
Percentage of households participating in
agricultural land consolidation - 22.4 29.6 26.2
Percentage of crop-producing households with any
plot protected from erosion - 83.5 85.4 80.7
Percentage of crop-producing households participating
in crop intensification - 21.1 29.4 22.6
Percentage of crop-producing households purchasing
chemical fertilizer 10.8 28.9 36.4 37.5
Percentage of crop-producing households purchasing
insecticides 24.4 30.5 29.3 -
Saving
Percentage of households with at least one savings
account 18.9 36.1 54.1 54.7
Source: NISR
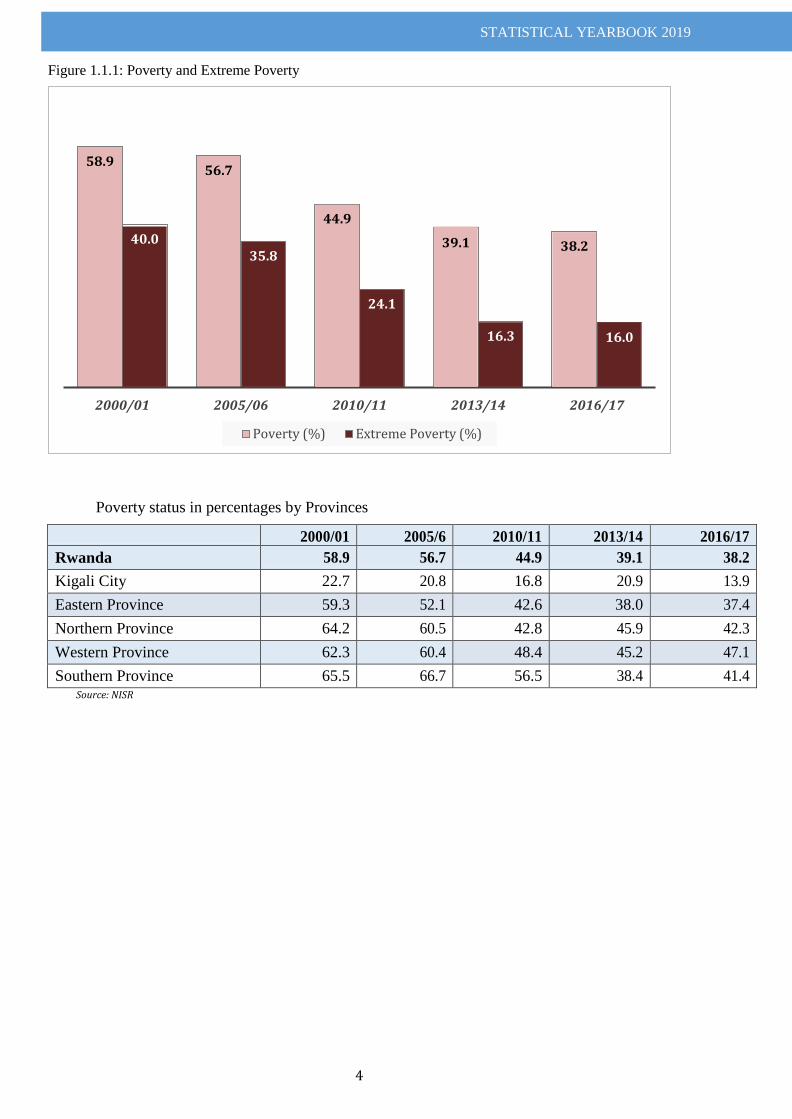
STATISTICAL YEARBOOK 2019
4
Figure 1.1.1: Poverty and Extreme Poverty
Poverty status in percentages by Provinces
2000/01 2005/6 2010/11 2013/14 2016/17
Rwanda 58.9 56.7 44.9 39.1 38.2
Kigali City 22.7 20.8 16.8 20.9 13.9
Eastern Province 59.3 52.1 42.6 38.0 37.4
Northern Province 64.2 60.5 42.8 45.9 42.3
Western Province 62.3 60.4 48.4 45.2 47.1
Southern Province 65.5 66.7 56.5 38.4 41.4 Source: NISR
2000/01 2005/06 2010/11 2013/14 2016/17
16.0 16.3
24.1
35.8 38.2 39.1 40.0
44.9
56.7 58.9
Poverty (%) Extreme Poverty (%)
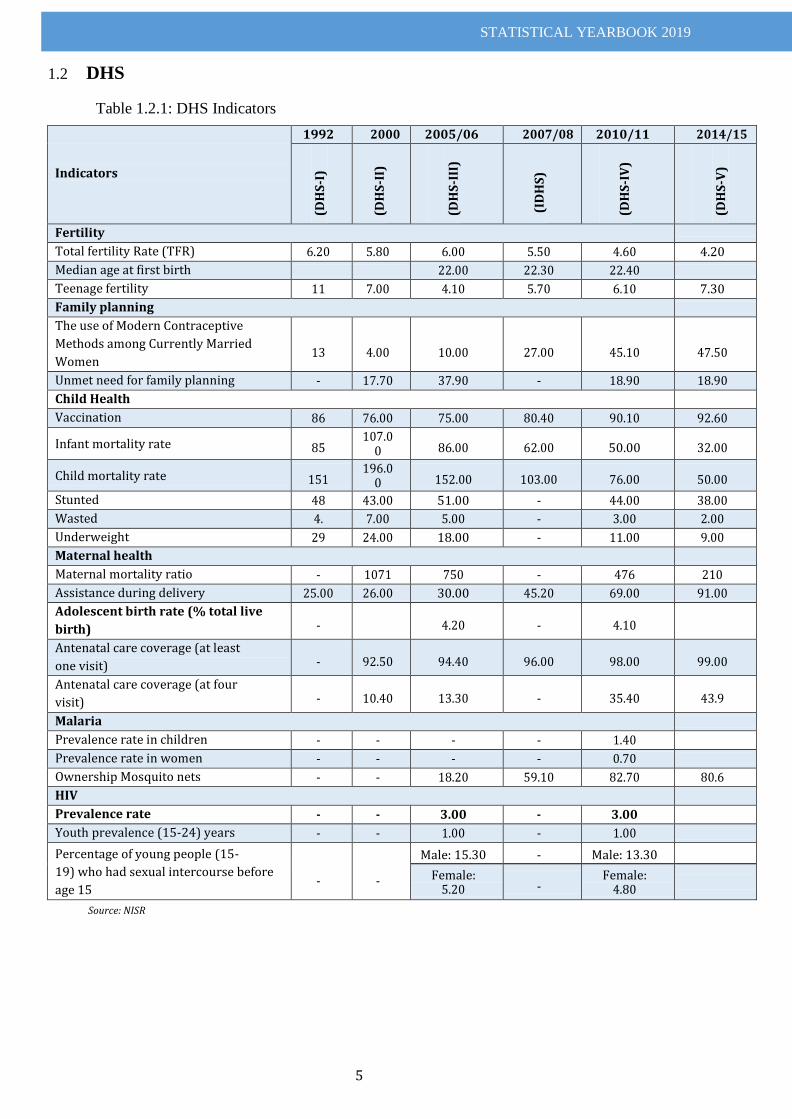
STATISTICAL YEARBOOK 2019
5
DHS 1.2
Table 1.2.1: DHS Indicators
Indicators
1992 2000 2005/06 2007/08 2010/11 2014/15
(DH
S-I
)
(DH
S-I
I)
(D
HS
-III
)
(ID
HS
)
(D
HS
-IV
)
(DH
S-V
)
Fertility
Total fertility Rate (TFR) 6.20 5.80 6.00 5.50 4.60 4.20
Median age at first birth 22.00 22.30 22.40
Teenage fertility 11 7.00 4.10 5.70 6.10 7.30
Family planning
The use of Modern Contraceptive
Methods among Currently Married
Women
13
4.00
10.00
27.00
45.10
47.50
Unmet need for family planning - 17.70 37.90 - 18.90 18.90
Child Health
Vaccination 86 76.00 75.00 80.40 90.10 92.60
Infant mortality rate 85 107.0
0 86.00 62.00 50.00 32.00
Child mortality rate 151 196.0
0 152.00 103.00 76.00 50.00
Stunted 48 43.00 51.00 - 44.00 38.00
Wasted 4. 7.00 5.00 - 3.00 2.00
Underweight 29 24.00 18.00 - 11.00 9.00
Maternal health
Maternal mortality ratio - 1071 750 - 476 210
Assistance during delivery 25.00 26.00 30.00 45.20 69.00 91.00
Adolescent birth rate (% total live
birth) - 4.20 - 4.10
Antenatal care coverage (at least
one visit) - 92.50 94.40 96.00 98.00 99.00
Antenatal care coverage (at four
visit) - 10.40 13.30 - 35.40 43.9
Malaria
Prevalence rate in children - - - - 1.40
Prevalence rate in women - - - - 0.70
Ownership Mosquito nets - - 18.20 59.10 82.70 80.6
HIV
Prevalence rate - - 3.00 - 3.00
Youth prevalence (15-24) years - - 1.00 - 1.00
Percentage of young people (15-
19) who had sexual intercourse before
age 15
-
-
Male: 15.30 - Male: 13.30
Female: 5.20 -
Female: 4.80
Source: NISR
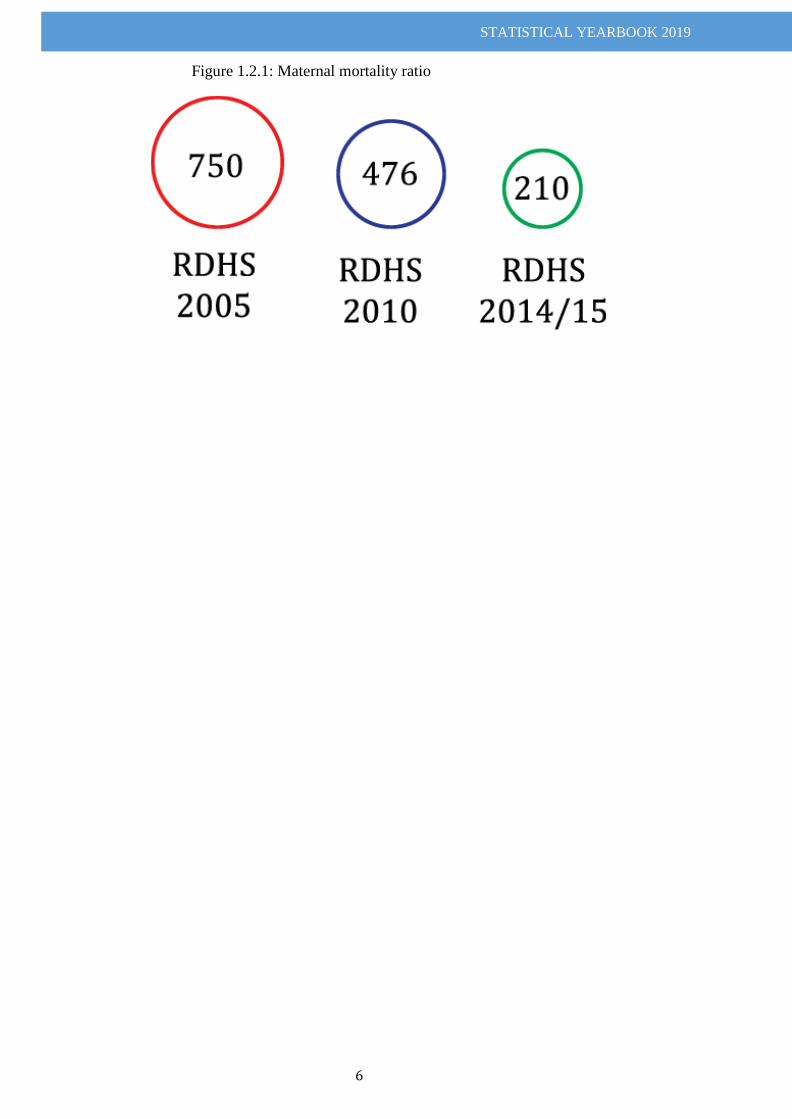
STATISTICAL YEARBOOK 2019
6
Figure 1.2.1: Maternal mortality ratio
STATISTICAL YEARBOOK 2019
7
CHAPTER II: GENDER
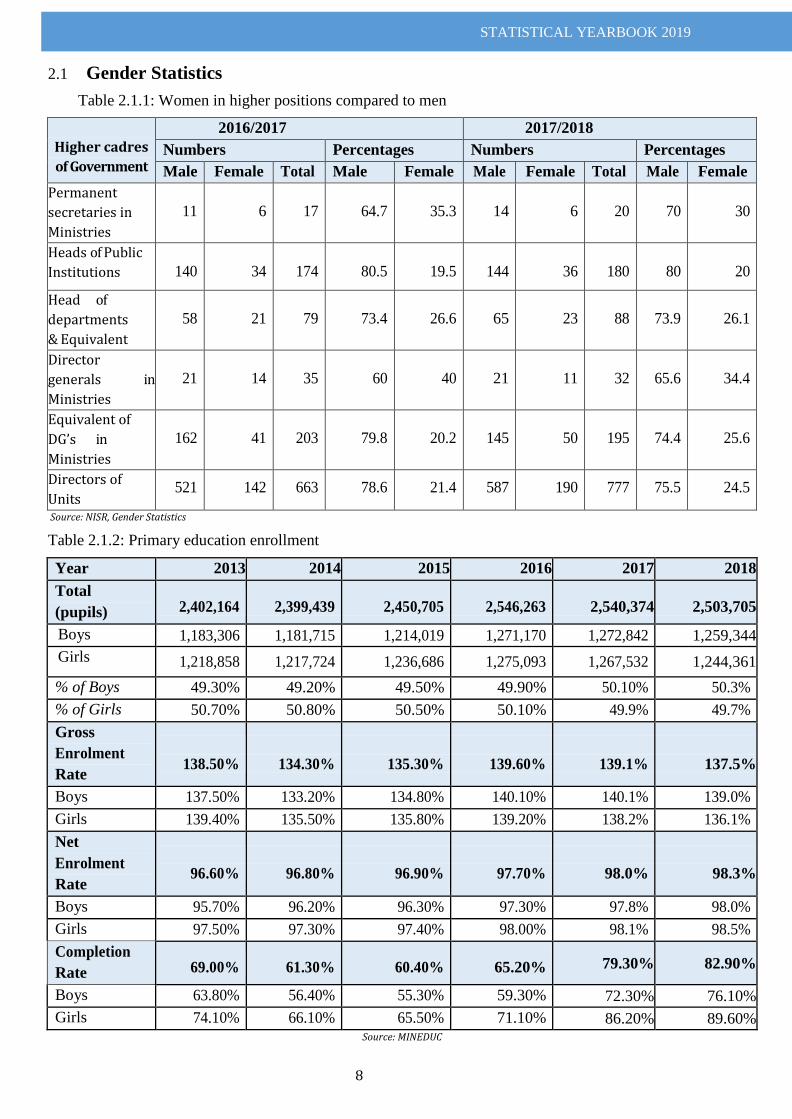
STATISTICAL YEARBOOK 2019
8
Gender Statistics 2.1
Table 2.1.1: Women in higher positions compared to men
Higher cadres
of Government
2016/2017 2017/2018
Numbers Percentages Numbers Percentages
Male Female Total Male Female Male Female Total Male Female
Permanent
secretaries in
Ministries
11
6
17
64.7
35.3
14
6
20
70
30
Heads of Public
Institutions
140
34
174
80.5
19.5
144
36
180
80
20
Head of
departments
& Equivalent
58
21
79
73.4
26.6
65
23
88
73.9
26.1
Director
generals in
Ministries
21
14
35
60
40
21
11
32
65.6
34.4
Equivalent of
DG’s in
Ministries
162
41
203
79.8
20.2
145
50
195
74.4
25.6
Directors of
Units 521 142 663 78.6 21.4 587 190 777 75.5 24.5
Source: NISR, Gender Statistics
Table 2.1.2: Primary education enrollment
Year 2013 2014 2015 2016 2017 2018
Total
(pupils) 2,402,164 2,399,439 2,450,705 2,546,263 2,540,374 2,503,705
Boys 1,183,306 1,181,715 1,214,019 1,271,170 1,272,842 1,259,344
Girls 1,218,858 1,217,724 1,236,686 1,275,093 1,267,532 1,244,361
% of Boys 49.30% 49.20% 49.50% 49.90% 50.10% 50.3%
% of Girls 50.70% 50.80% 50.50% 50.10% 49.9% 49.7%
Gross
Enrolment
Rate
138.50%
134.30%
135.30%
139.60%
139.1%
137.5%
Boys 137.50% 133.20% 134.80% 140.10% 140.1% 139.0%
Girls 139.40% 135.50% 135.80% 139.20% 138.2% 136.1%
Net
Enrolment
Rate
96.60%
96.80%
96.90%
97.70%
98.0%
98.3%
Boys 95.70% 96.20% 96.30% 97.30% 97.8% 98.0%
Girls 97.50% 97.30% 97.40% 98.00% 98.1% 98.5%
Completion
Rate 69.00% 61.30% 60.40% 65.20% 79.30% 82.90%
Boys 63.80% 56.40% 55.30% 59.30% 72.30% 76.10%
Girls 74.10% 66.10% 65.50% 71.10% 86.20% 89.60% Source: MINEDUC
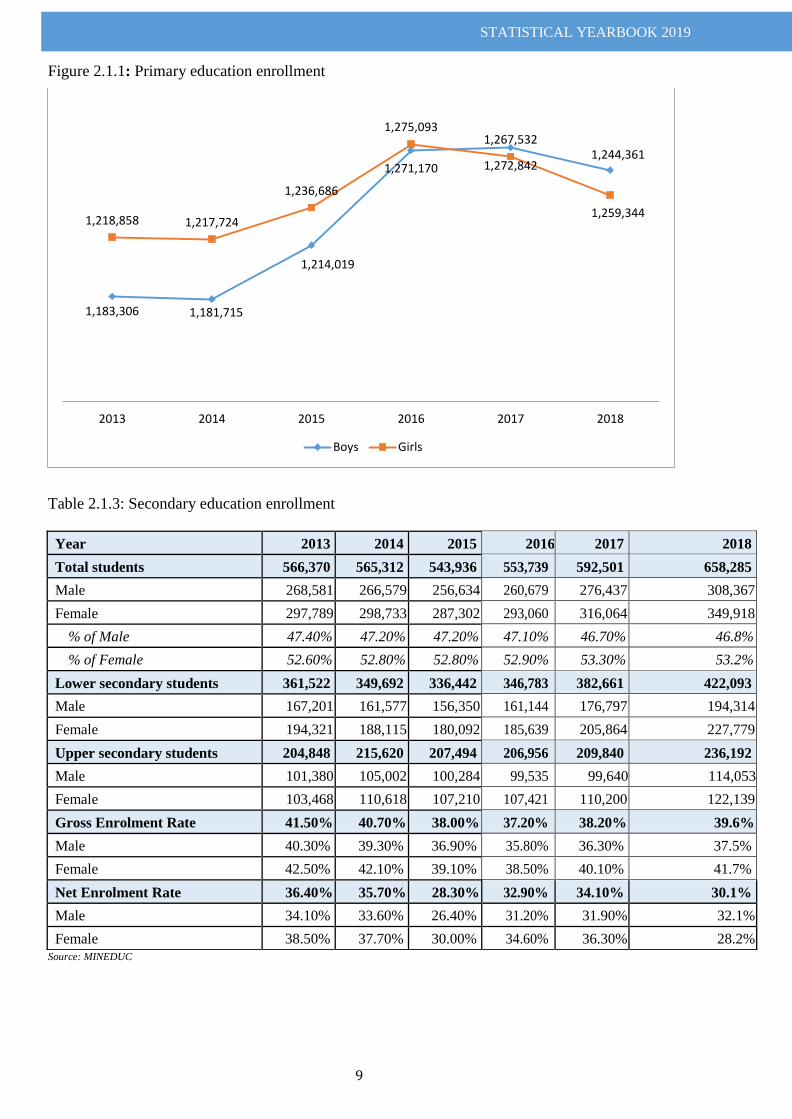
STATISTICAL YEARBOOK 2019
9
Figure 2.1.1: Primary education enrollment
Table 2.1.3: Secondary education enrollment
Source: MINEDUC
1,183,306 1,181,715
1,214,019
1,271,170 1,272,842
1,259,344 1,218,858 1,217,724
1,236,686
1,275,093 1,267,532
1,244,361
2013 2014 2015 2016 2017 2018
Boys Girls
Year 2013 2014 2015 2016 2017 2018
Total students 566,370 565,312 543,936 553,739 592,501 658,285
Male 268,581 266,579 256,634 260,679 276,437 308,367
Female 297,789 298,733 287,302 293,060 316,064 349,918
% of Male 47.40% 47.20% 47.20% 47.10% 46.70% 46.8%
% of Female 52.60% 52.80% 52.80% 52.90% 53.30% 53.2%
Lower secondary students 361,522 349,692 336,442 346,783 382,661 422,093
Male 167,201 161,577 156,350 161,144 176,797 194,314
Female 194,321 188,115 180,092 185,639 205,864 227,779
Upper secondary students 204,848 215,620 207,494 206,956 209,840 236,192
Male 101,380 105,002 100,284 99,535 99,640 114,053
Female 103,468 110,618 107,210 107,421 110,200 122,139
Gross Enrolment Rate 41.50% 40.70% 38.00% 37.20% 38.20% 39.6%
Male 40.30% 39.30% 36.90% 35.80% 36.30% 37.5%
Female 42.50% 42.10% 39.10% 38.50% 40.10% 41.7%
Net Enrolment Rate 36.40% 35.70% 28.30% 32.90% 34.10% 30.1%
Male 34.10% 33.60% 26.40% 31.20% 31.90% 32.1%
Female 38.50% 37.70% 30.00% 34.60% 36.30% 28.2%
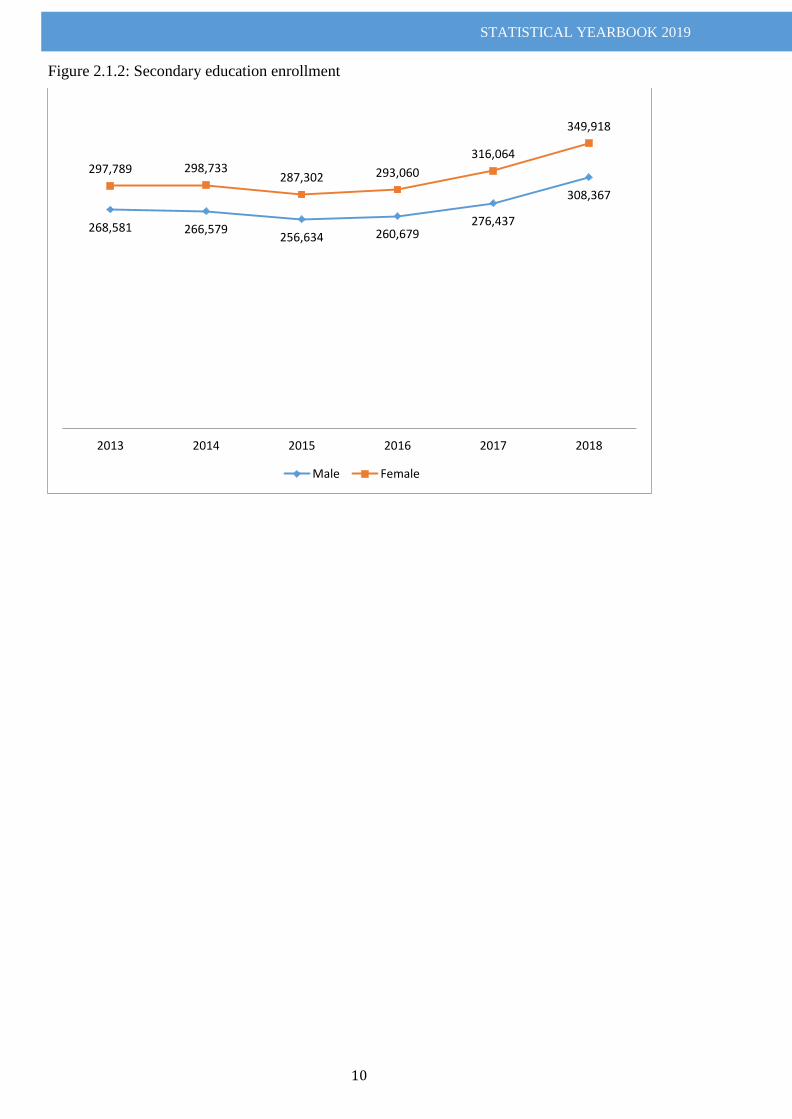
STATISTICAL YEARBOOK 2019
10
Figure 2.1.2: Secondary education enrollment
268,581 266,579 256,634 260,679
276,437
308,367
297,789 298,733 287,302 293,060
316,064
349,918
2013 2014 2015 2016 2017 2018
Male Female
STATISTICAL YEARBOOK 2019
11
CHAPTER III: HEALTH and NUTRITION
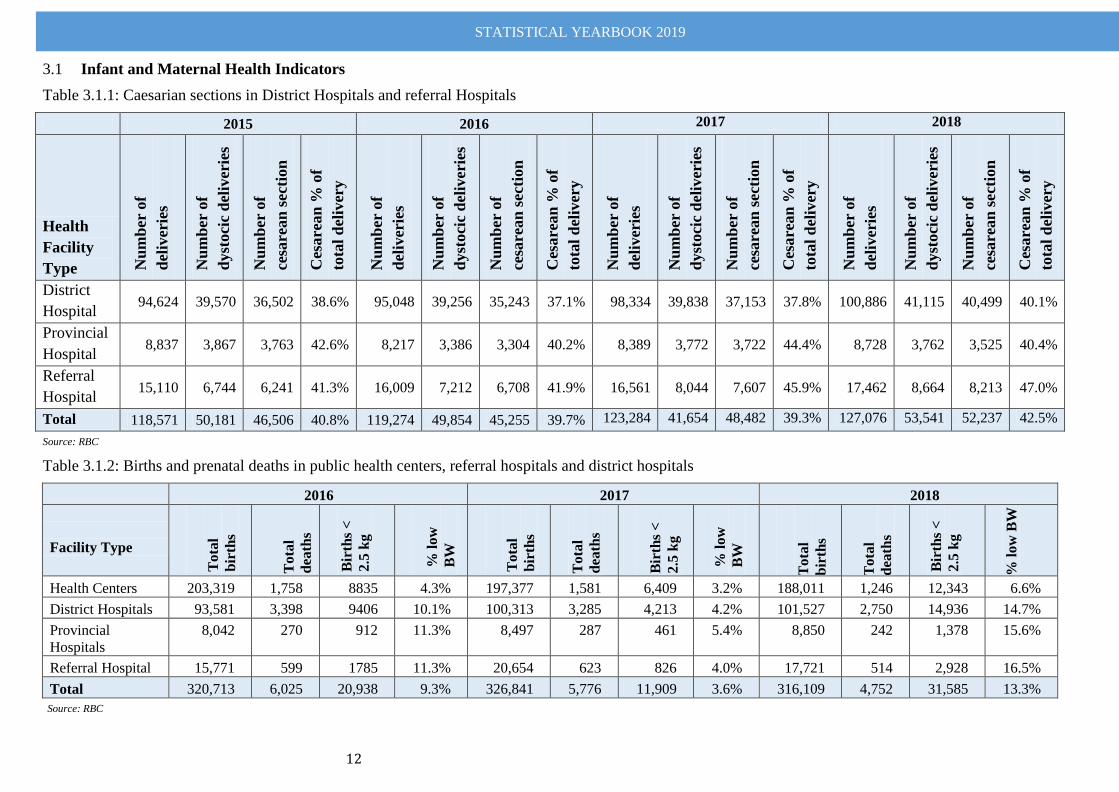
STATISTICAL YEARBOOK 2019
12
Infant and Maternal Health Indicators 3.1
Table 3.1.1: Caesarian sections in District Hospitals and referral Hospitals
2015 2016 2017 2018
Health
Facility
Type Nu
mb
er o
f
del
iver
ies
Nu
mb
er o
f
dyst
oci
c d
eliv
erie
s
Nu
mb
er o
f
cesa
rean
sect
ion
Ces
are
an
% o
f
tota
l d
eliv
ery
Nu
mb
er o
f
del
iver
ies
Nu
mb
er o
f
dyst
oci
c d
eliv
erie
s
Nu
mb
er o
f
cesa
rean
sect
ion
Ces
are
an
% o
f
tota
l d
eliv
ery
Nu
mb
er o
f
del
iver
ies
Nu
mb
er o
f
dyst
oci
c d
eliv
erie
s
Nu
mb
er o
f
cesa
rean
sect
ion
Ces
are
an
% o
f
tota
l d
eliv
ery
Nu
mb
er o
f
del
iver
ies
Nu
mb
er o
f
dyst
oci
c d
eliv
erie
s
Nu
mb
er o
f
cesa
rean
sect
ion
Ces
are
an
% o
f
tota
l d
eliv
ery
District
Hospital 94,624 39,570 36,502 38.6% 95,048 39,256 35,243 37.1% 98,334 39,838 37,153 37.8% 100,886 41,115 40,499 40.1%
Provincial
Hospital 8,837 3,867 3,763 42.6% 8,217 3,386 3,304 40.2% 8,389 3,772 3,722 44.4% 8,728 3,762 3,525 40.4%
Referral
Hospital 15,110 6,744 6,241 41.3% 16,009 7,212 6,708 41.9% 16,561 8,044 7,607 45.9% 17,462 8,664 8,213 47.0%
Total 118,571 50,181 46,506 40.8% 119,274 49,854 45,255 39.7% 123,284 41,654 48,482 39.3% 127,076 53,541 52,237 42.5%
Source: RBC
Table 3.1.2: Births and prenatal deaths in public health centers, referral hospitals and district hospitals
2016 2017 2018
Facility Type
To
tal
bir
ths
To
tal
dea
ths
Bir
ths
<
2.5
kg
% l
ow
BW
To
tal
bir
ths
To
tal
dea
ths
Bir
ths
<
2.5
kg
% l
ow
BW
To
tal
bir
ths
To
tal
dea
ths
Bir
ths
<
2.5
kg
% l
ow
BW
Health Centers 203,319 1,758 8835 4.3% 197,377 1,581 6,409 3.2% 188,011 1,246 12,343 6.6%
District Hospitals 93,581 3,398 9406 10.1% 100,313 3,285 4,213 4.2% 101,527 2,750 14,936 14.7%
Provincial
Hospitals
8,042 270 912 11.3% 8,497 287 461 5.4% 8,850 242 1,378 15.6%
Referral Hospital 15,771 599 1785 11.3% 20,654 623 826 4.0% 17,721 514 2,928 16.5%
Total 320,713 6,025 20,938 9.3% 326,841 5,776 11,909 3.6% 316,109 4,752 31,585 13.3%
Source: RBC
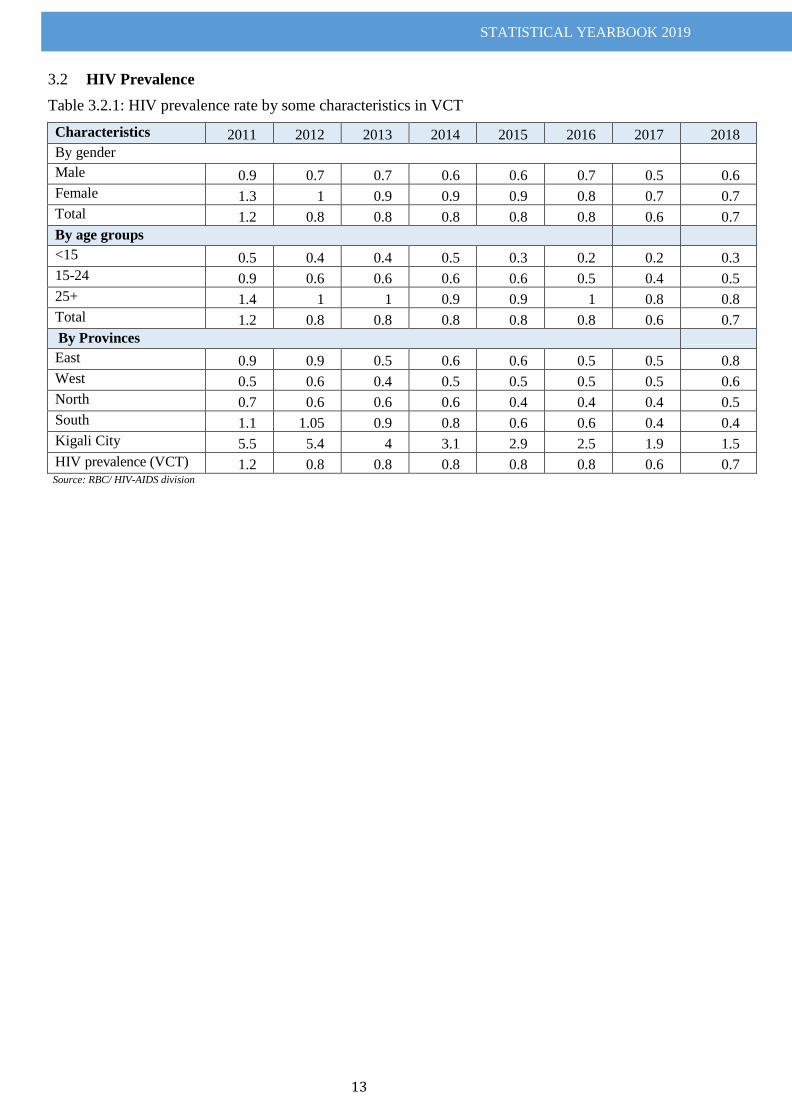
STATISTICAL YEARBOOK 2019
13
HIV Prevalence 3.2
Table 3.2.1: HIV prevalence rate by some characteristics in VCT
Characteristics 2011 2012 2013 2014 2015 2016 2017 2018
By gender
Male 0.9 0.7 0.7 0.6 0.6 0.7 0.5 0.6
Female 1.3 1 0.9 0.9 0.9 0.8 0.7 0.7
Total 1.2 0.8 0.8 0.8 0.8 0.8 0.6 0.7
By age groups
<15 0.5 0.4 0.4 0.5 0.3 0.2 0.2 0.3
15-24 0.9 0.6 0.6 0.6 0.6 0.5 0.4 0.5
25+ 1.4 1 1 0.9 0.9 1 0.8 0.8
Total 1.2 0.8 0.8 0.8 0.8 0.8 0.6 0.7
By Provinces
East 0.9 0.9 0.5 0.6 0.6 0.5 0.5 0.8
West 0.5 0.6 0.4 0.5 0.5 0.5 0.5 0.6
North 0.7 0.6 0.6 0.6 0.4 0.4 0.4 0.5
South 1.1 1.05 0.9 0.8 0.6 0.6 0.4 0.4
Kigali City 5.5 5.4 4 3.1 2.9 2.5 1.9 1.5
HIV prevalence (VCT) 1.2 0.8 0.8 0.8 0.8 0.8 0.6 0.7 Source: RBC/ HIV-AIDS division
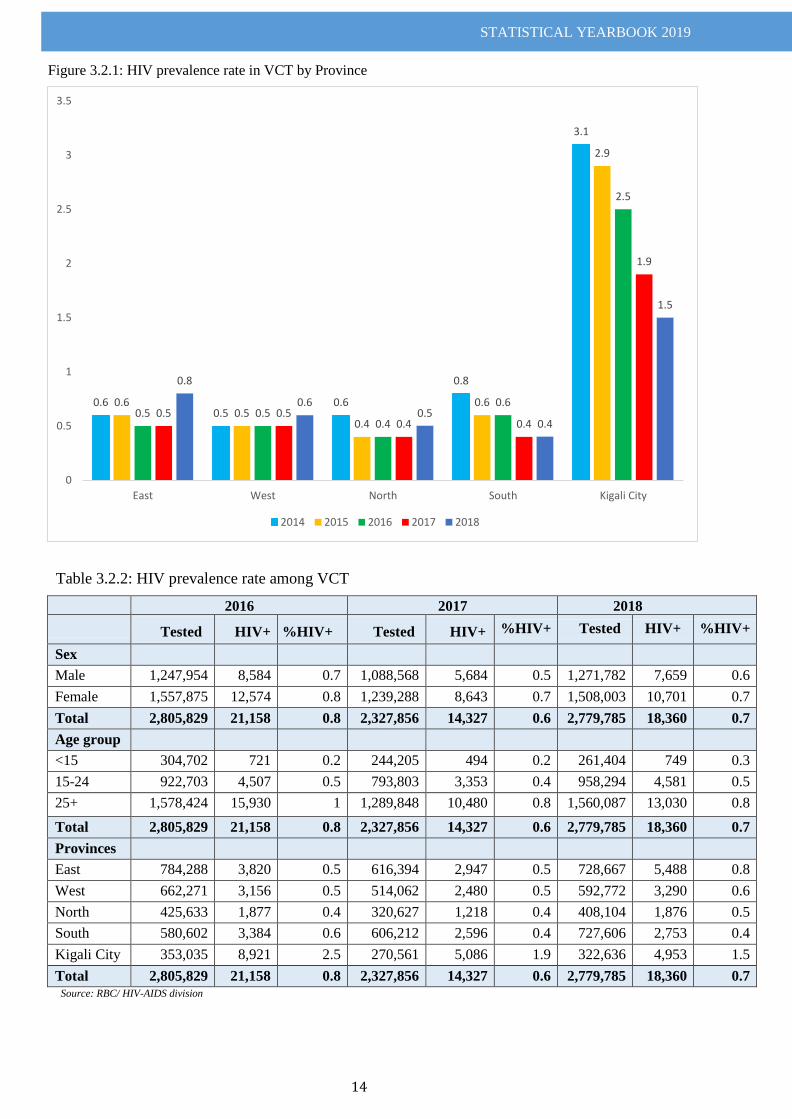
STATISTICAL YEARBOOK 2019
14
Figure 3.2.1: HIV prevalence rate in VCT by Province
Table 3.2.2: HIV prevalence rate among VCT
2016 2017 2018
Tested HIV+ %HIV+ Tested HIV+ %HIV+ Tested HIV+ %HIV+
Sex
Male 1,247,954 8,584 0.7 1,088,568 5,684 0.5 1,271,782 7,659 0.6
Female 1,557,875 12,574 0.8 1,239,288 8,643 0.7 1,508,003 10,701 0.7
Total 2,805,829 21,158 0.8 2,327,856 14,327 0.6 2,779,785 18,360 0.7
Age group
<15 304,702 721 0.2 244,205 494 0.2 261,404 749 0.3
15-24 922,703 4,507 0.5 793,803 3,353 0.4 958,294 4,581 0.5
25+ 1,578,424 15,930 1 1,289,848 10,480 0.8 1,560,087 13,030 0.8
Total 2,805,829 21,158 0.8 2,327,856 14,327 0.6 2,779,785 18,360 0.7
Provinces
East 784,288 3,820 0.5 616,394 2,947 0.5 728,667 5,488 0.8
West 662,271 3,156 0.5 514,062 2,480 0.5 592,772 3,290 0.6
North 425,633 1,877 0.4 320,627 1,218 0.4 408,104 1,876 0.5
South 580,602 3,384 0.6 606,212 2,596 0.4 727,606 2,753 0.4
Kigali City 353,035 8,921 2.5 270,561 5,086 1.9 322,636 4,953 1.5
Total 2,805,829 21,158 0.8 2,327,856 14,327 0.6 2,779,785 18,360 0.7 Source: RBC/ HIV-AIDS division
0.6 0.5
0.6
0.8
3.1
0.6 0.5
0.4
0.6
2.9
0.5 0.5 0.4
0.6
2.5
0.5 0.5 0.4 0.4
1.9
0.8
0.6 0.5
0.4
1.5
0
0.5
1
1.5
2
2.5
3
3.5
East West North South Kigali City
2014 2015 2016 2017 2018
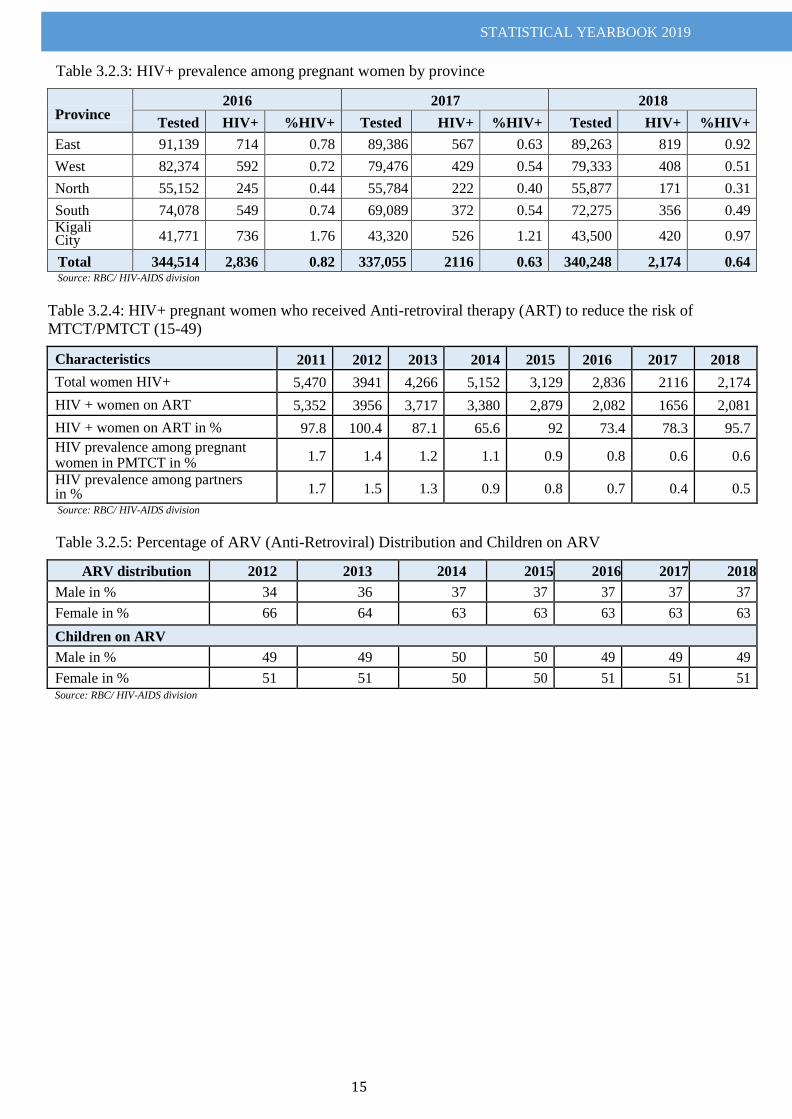
STATISTICAL YEARBOOK 2019
15
Table 3.2.3: HIV+ prevalence among pregnant women by province
Province 2016 2017 2018
Tested HIV+ %HIV+ Tested HIV+ %HIV+ Tested HIV+ %HIV+
East 91,139 714 0.78 89,386 567 0.63 89,263 819 0.92
West 82,374 592 0.72 79,476 429 0.54 79,333 408 0.51
North 55,152 245 0.44 55,784 222 0.40 55,877 171 0.31
South 74,078 549 0.74 69,089 372 0.54 72,275 356 0.49 Kigali City 41,771 736 1.76 43,320 526 1.21 43,500 420 0.97
Total 344,514 2,836 0.82 337,055 2116 0.63 340,248 2,174 0.64 Source: RBC/ HIV-AIDS division
Table 3.2.4: HIV+ pregnant women who received Anti-retroviral therapy (ART) to reduce the risk of
MTCT/PMTCT (15-49)
Characteristics 2011 2012 2013 2014 2015 2016 2017 2018
Total women HIV+ 5,470 3941 4,266 5,152 3,129 2,836 2116 2,174
HIV + women on ART 5,352 3956 3,717 3,380 2,879 2,082 1656 2,081
HIV + women on ART in % 97.8 100.4 87.1 65.6 92 73.4 78.3 95.7
HIV prevalence among pregnant women in PMTCT in %
1.7 1.4 1.2 1.1 0.9 0.8 0.6 0.6
HIV prevalence among partners in % 1.7 1.5 1.3 0.9 0.8 0.7 0.4 0.5
Source: RBC/ HIV-AIDS division
Table 3.2.5: Percentage of ARV (Anti-Retroviral) Distribution and Children on ARV
ARV distribution 2012 2013 2014 2015 2016 2017 2018
Male in % 34 36 37 37 37 37 37
Female in % 66 64 63 63 63 63 63
Children on ARV
Male in % 49 49 50 50 49 49 49
Female in % 51 51 50 50 51 51 51 Source: RBC/ HIV-AIDS division
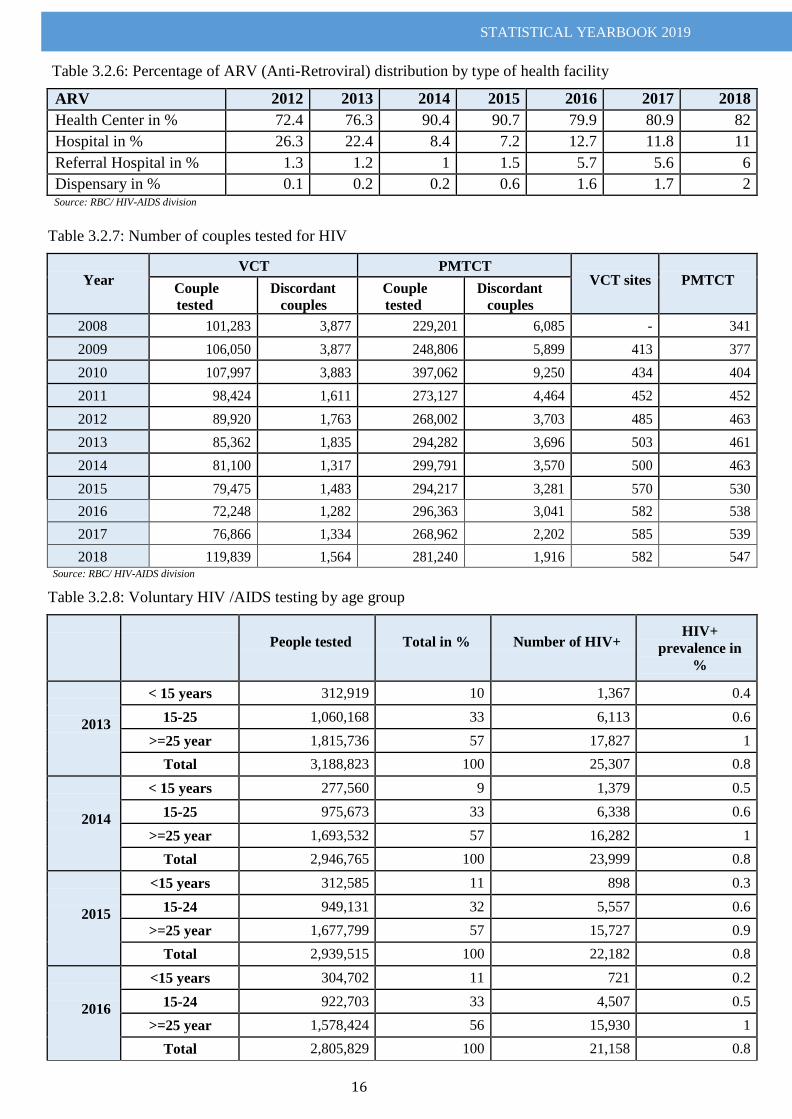
STATISTICAL YEARBOOK 2019
16
Table 3.2.6: Percentage of ARV (Anti-Retroviral) distribution by type of health facility
ARV 2012 2013 2014 2015 2016 2017 2018
Health Center in % 72.4 76.3 90.4 90.7 79.9 80.9 82
Hospital in % 26.3 22.4 8.4 7.2 12.7 11.8 11
Referral Hospital in % 1.3 1.2 1 1.5 5.7 5.6 6
Dispensary in % 0.1 0.2 0.2 0.6 1.6 1.7 2 Source: RBC/ HIV-AIDS division
Table 3.2.7: Number of couples tested for HIV
Year VCT PMTCT
VCT sites
PMTCT Couple
tested
Discordant
couples
Couple
tested
Discordant
couples
2008 101,283 3,877 229,201 6,085 - 341
2009 106,050 3,877 248,806 5,899 413 377
2010 107,997 3,883 397,062 9,250 434 404
2011 98,424 1,611 273,127 4,464 452 452
2012 89,920 1,763 268,002 3,703 485 463
2013 85,362 1,835 294,282 3,696 503 461
2014 81,100 1,317 299,791 3,570 500 463
2015 79,475 1,483 294,217 3,281 570 530
2016 72,248 1,282 296,363 3,041 582 538
2017 76,866 1,334 268,962 2,202 585 539
2018 119,839 1,564 281,240 1,916 582 547 Source: RBC/ HIV-AIDS division
Table 3.2.8: Voluntary HIV /AIDS testing by age group
People tested
Total in %
Number of HIV+ HIV+
prevalence in
%
2013
< 15 years 312,919 10 1,367 0.4
15-25 1,060,168 33 6,113 0.6
>=25 year 1,815,736 57 17,827 1
Total 3,188,823 100 25,307 0.8
2014
< 15 years 277,560 9 1,379 0.5
15-25 975,673 33 6,338 0.6
>=25 year 1,693,532 57 16,282 1
Total 2,946,765 100 23,999 0.8
2015
<15 years 312,585 11 898 0.3
15-24 949,131 32 5,557 0.6
>=25 year 1,677,799 57 15,727 0.9
Total 2,939,515 100 22,182 0.8
2016
<15 years 304,702 11 721 0.2
15-24 922,703 33 4,507 0.5
>=25 year 1,578,424 56 15,930 1
Total 2,805,829 100 21,158 0.8
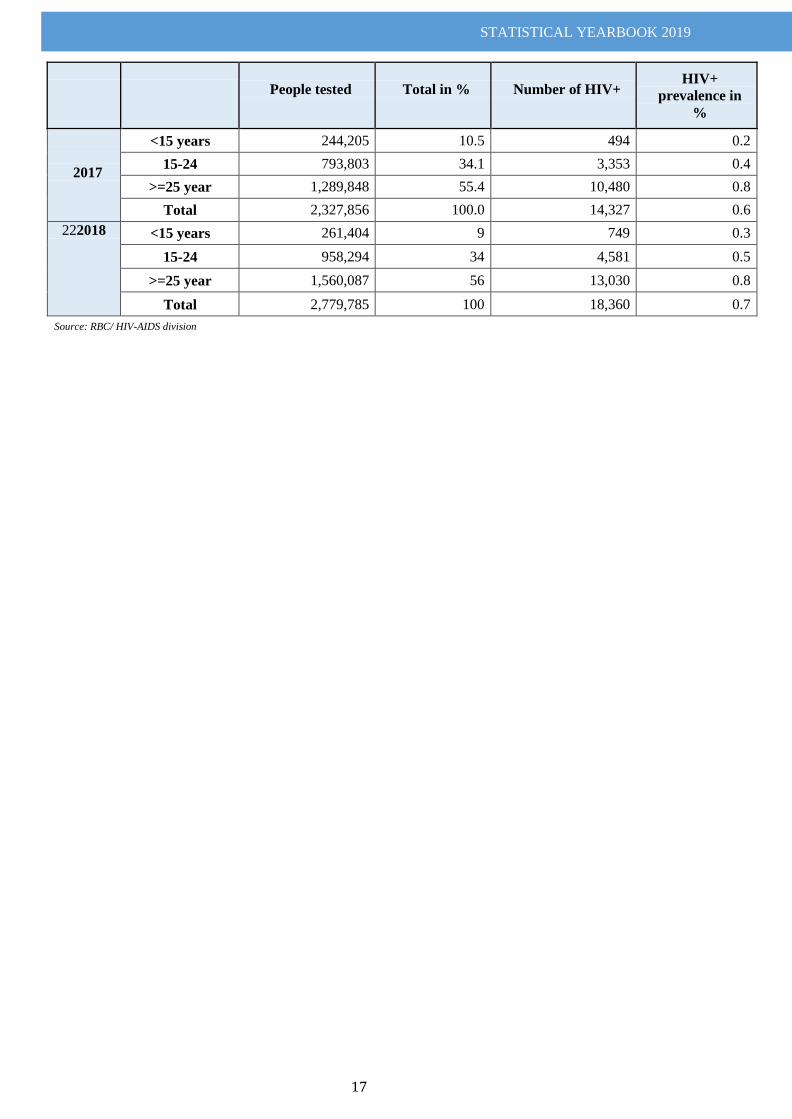
STATISTICAL YEARBOOK 2019
17
People tested
Total in %
Number of HIV+ HIV+
prevalence in
%
2017
<15 years 244,205 10.5 494 0.2
15-24 793,803 34.1 3,353 0.4
>=25 year 1,289,848 55.4 10,480 0.8
Total 2,327,856 100.0 14,327 0.6
222018 <15 years 261,404 9 749 0.3
15-24 958,294 34 4,581 0.5
>=25 year 1,560,087 56 13,030 0.8
Total 2,779,785 100 18,360 0.7
Source: RBC/ HIV-AIDS division
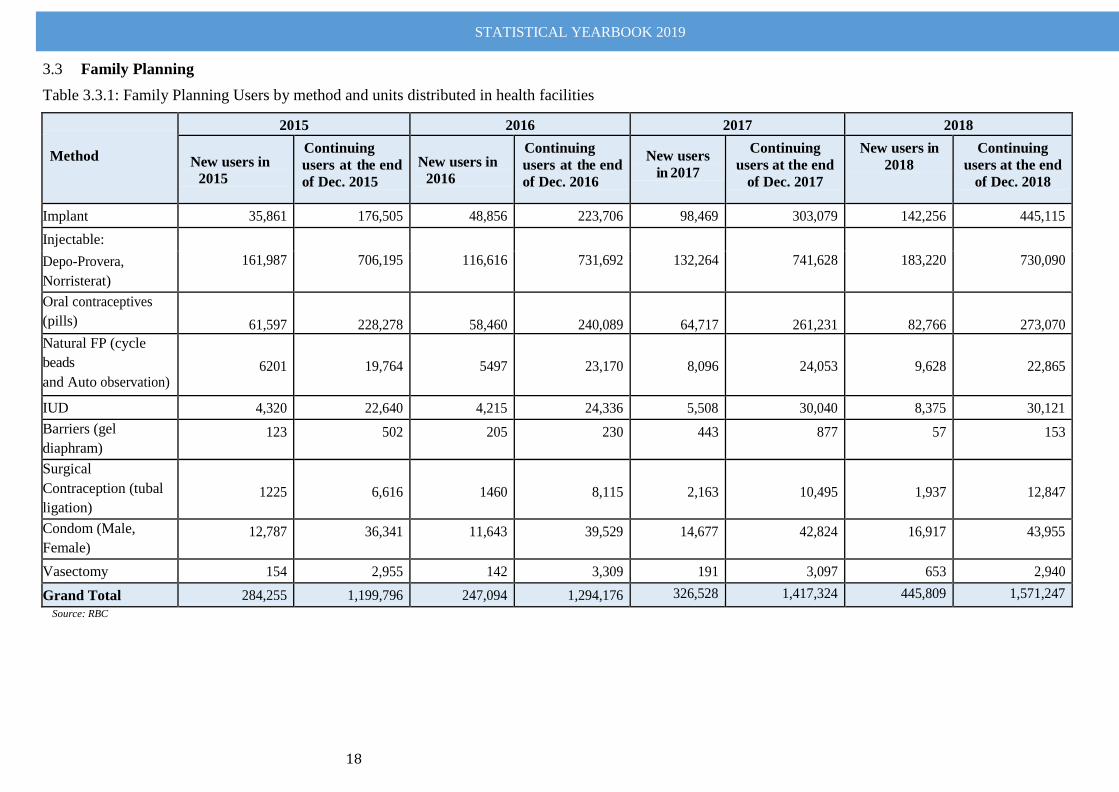
STATISTICAL YEARBOOK 2019
18
Family Planning 3.3
Table 3.3.1: Family Planning Users by method and units distributed in health facilities
Method
2015 2016 2017 2018
New users in
2015
Continuing
users at the end
of Dec. 2015
New users in
2016
Continuing
users at the end
of Dec. 2016
New users
in 2017
Continuing
users at the end
of Dec. 2017
New users in
2018
Continuing
users at the end
of Dec. 2018
Implant 35,861 176,505 48,856 223,706 98,469 303,079 142,256 445,115
Injectable:
161,987
706,195
116,616
731,692
132,264
741,628
183,220
730,090 Depo-Provera,
Norristerat)
Oral contraceptives
(pills)
61,597
228,278
58,460
240,089
64,717
261,231
82,766
273,070
Natural FP (cycle
beads
and Auto observation)
6201
19,764
5497
23,170
8,096
24,053
9,628
22,865
IUD 4,320 22,640 4,215 24,336 5,508 30,040 8,375 30,121
Barriers (gel
diaphram) 123 502 205 230 443 877 57 153
Surgical
Contraception (tubal
ligation)
1225
6,616
1460
8,115
2,163
10,495
1,937
12,847
Condom (Male,
Female) 12,787 36,341 11,643 39,529 14,677 42,824 16,917 43,955
Vasectomy 154 2,955 142 3,309 191 3,097 653 2,940
Grand Total 284,255 1,199,796 247,094 1,294,176 326,528 1,417,324 445,809 1,571,247
Source: RBC
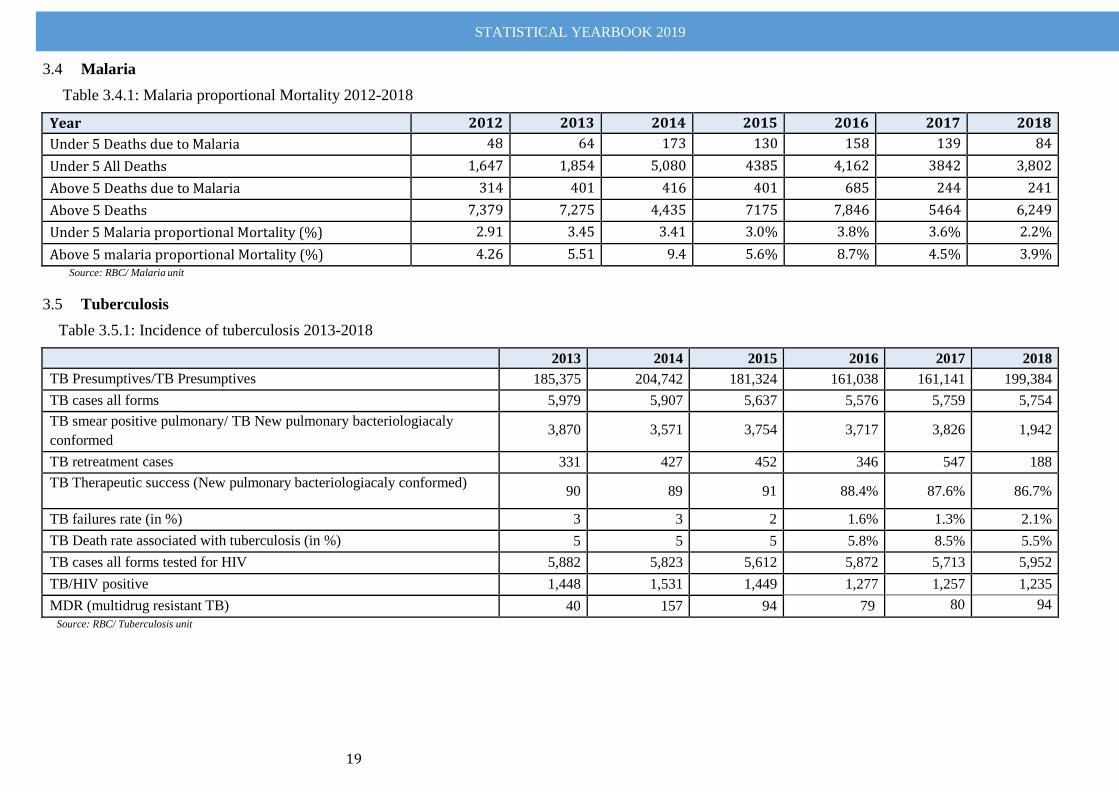
STATISTICAL YEARBOOK 2019
19
Malaria 3.4
Table 3.4.1: Malaria proportional Mortality 2012-2018
Year 2012 2013 2014 2015 2016 2017 2018
Under 5 Deaths due to Malaria 48 64 173 130 158 139 84
Under 5 All Deaths 1,647 1,854 5,080 4385 4,162 3842 3,802
Above 5 Deaths due to Malaria 314 401 416 401 685 244 241
Above 5 Deaths 7,379 7,275 4,435 7175 7,846 5464 6,249
Under 5 Malaria proportional Mortality (%) 2.91 3.45 3.41 3.0% 3.8% 3.6% 2.2%
Above 5 malaria proportional Mortality (%) 4.26 5.51 9.4 5.6% 8.7% 4.5% 3.9% Source: RBC/ Malaria unit
Tuberculosis 3.5
Table 3.5.1: Incidence of tuberculosis 2013-2018
2013 2014 2015 2016 2017 2018
TB Presumptives/TB Presumptives 185,375 204,742 181,324 161,038 161,141 199,384
TB cases all forms 5,979 5,907 5,637 5,576 5,759 5,754
TB smear positive pulmonary/ TB New pulmonary bacteriologiacaly
conformed 3,870 3,571 3,754 3,717 3,826 1,942
TB retreatment cases 331 427 452 346 547 188
TB Therapeutic success (New pulmonary bacteriologiacaly conformed) 90 89 91 88.4% 87.6% 86.7%
TB failures rate (in %) 3 3 2 1.6% 1.3% 2.1%
TB Death rate associated with tuberculosis (in %) 5 5 5 5.8% 8.5% 5.5%
TB cases all forms tested for HIV 5,882 5,823 5,612 5,872 5,713 5,952
TB/HIV positive 1,448 1,531 1,449 1,277 1,257 1,235
MDR (multidrug resistant TB) 40 157 94 79 80 94
Source: RBC/ Tuberculosis unit
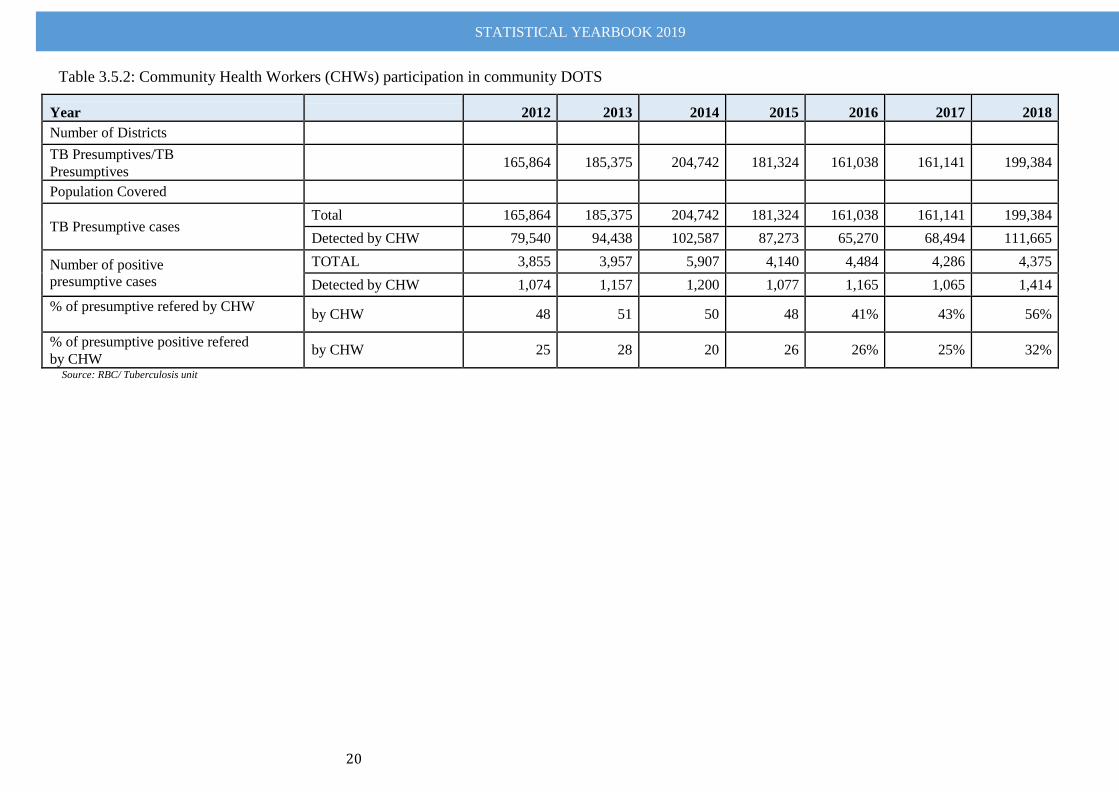
STATISTICAL YEARBOOK 2019
20
Table 3.5.2: Community Health Workers (CHWs) participation in community DOTS
Year 2012 2013 2014 2015 2016 2017 2018
Number of Districts
TB Presumptives/TB
Presumptives
165,864 185,375 204,742 181,324 161,038 161,141 199,384
Population Covered
TB Presumptive cases Total 165,864 185,375 204,742 181,324 161,038 161,141 199,384
Detected by CHW 79,540 94,438 102,587 87,273 65,270 68,494 111,665
Number of positive
presumptive cases
TOTAL 3,855 3,957 5,907 4,140 4,484 4,286 4,375
Detected by CHW 1,074 1,157 1,200 1,077 1,165 1,065 1,414
% of presumptive refered by CHW by CHW 48 51 50 48 41% 43% 56%
% of presumptive positive refered
by CHW by CHW 25 28 20 26 26% 25% 32%
Source: RBC/ Tuberculosis unit
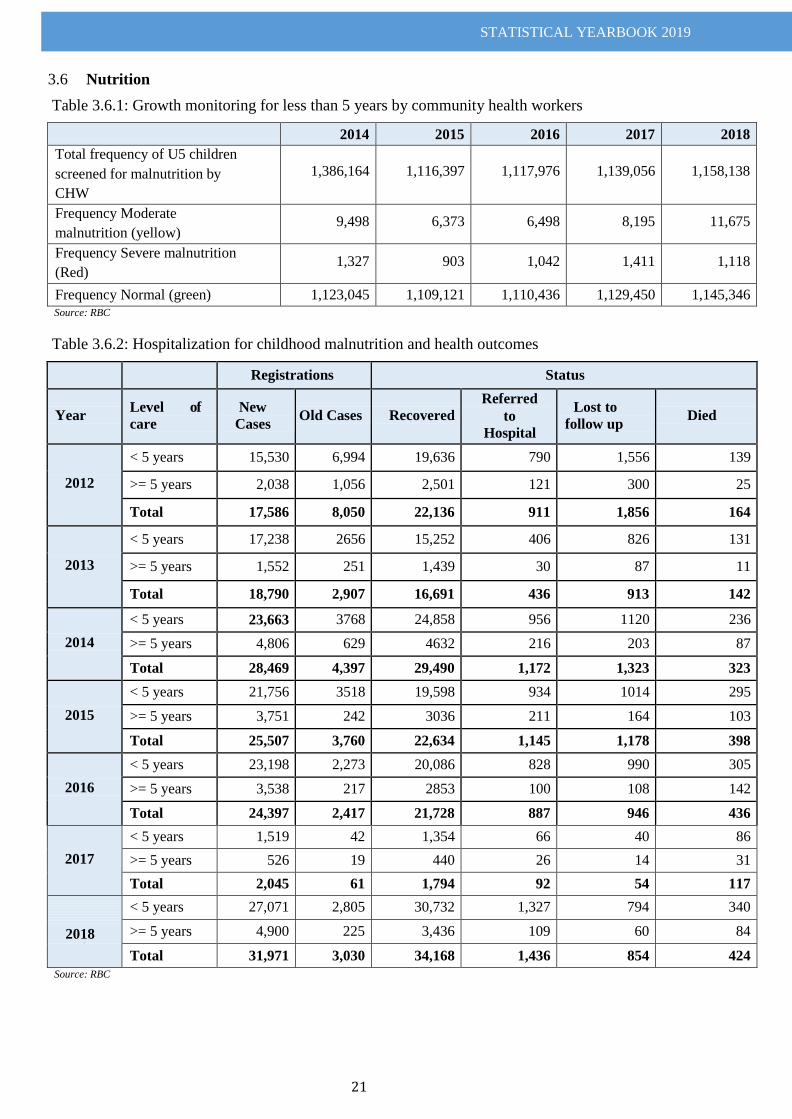
STATISTICAL YEARBOOK 2019
21
Nutrition 3.6
Table 3.6.1: Growth monitoring for less than 5 years by community health workers
2014 2015 2016 2017 2018
Total frequency of U5 children
screened for malnutrition by
CHW
1,386,164
1,116,397
1,117,976
1,139,056
1,158,138
Frequency Moderate
malnutrition (yellow) 9,498 6,373 6,498 8,195 11,675
Frequency Severe malnutrition
(Red) 1,327 903 1,042 1,411 1,118
Frequency Normal (green) 1,123,045 1,109,121 1,110,436 1,129,450 1,145,346 Source: RBC
Table 3.6.2: Hospitalization for childhood malnutrition and health outcomes
Registrations Status
Year Level of
care
New
Cases
Old Cases
Recovered
Referred
to
Hospital
Lost to
follow up
Died
2012
< 5 years 15,530 6,994 19,636 790 1,556 139
>= 5 years 2,038 1,056 2,501 121 300 25
Total 17,586 8,050 22,136 911 1,856 164
2013
< 5 years 17,238 2656 15,252 406 826 131
>= 5 years 1,552 251 1,439 30 87 11
Total 18,790 2,907 16,691 436 913 142
2014
< 5 years 23,663 3768 24,858 956 1120 236
>= 5 years 4,806 629 4632 216 203 87
Total 28,469 4,397 29,490 1,172 1,323 323
2015
< 5 years 21,756 3518 19,598 934 1014 295
>= 5 years 3,751 242 3036 211 164 103
Total 25,507 3,760 22,634 1,145 1,178 398
2016
< 5 years 23,198 2,273 20,086 828 990 305
>= 5 years 3,538 217 2853 100 108 142
Total 24,397 2,417 21,728 887 946 436
2017
< 5 years 1,519 42 1,354 66 40 86
>= 5 years 526 19 440 26 14 31
Total 2,045 61 1,794 92 54 117
2018
21
< 5 years 27,071 2,805 30,732 1,327 794 340
>= 5 years 4,900 225 3,436 109 60 84
Total 31,971 3,030 34,168 1,436 854 424
Source: RBC
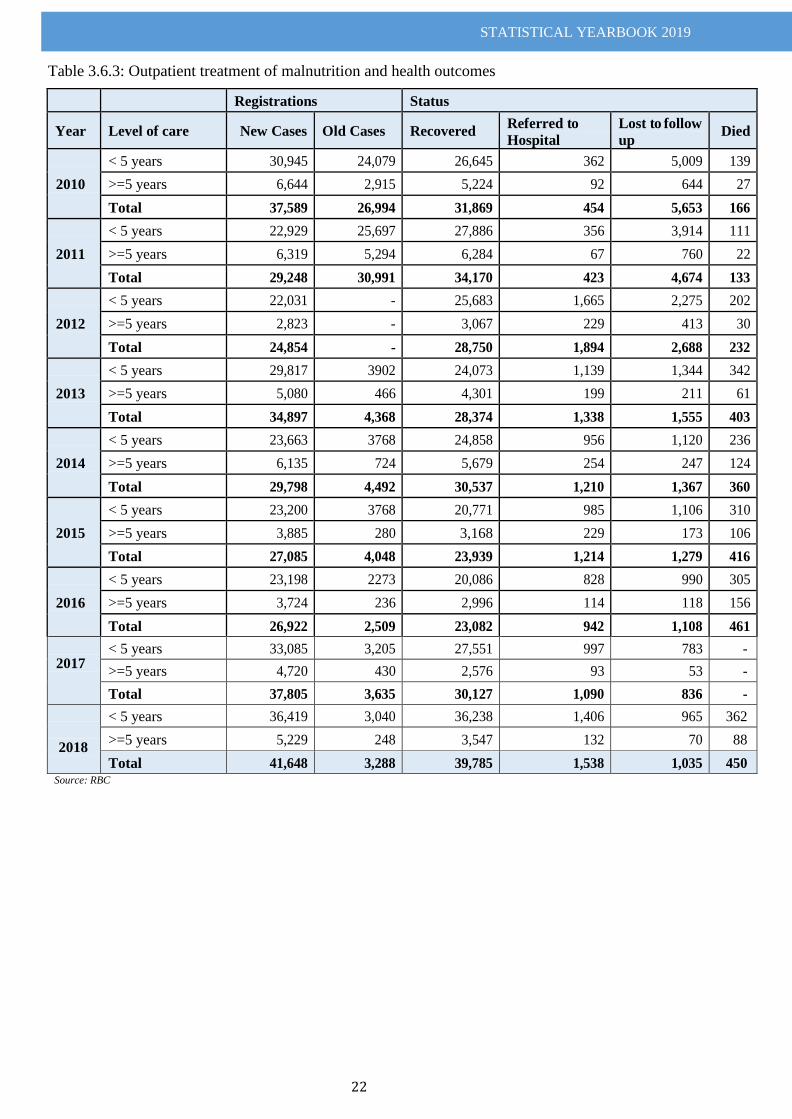
STATISTICAL YEARBOOK 2019
22
Table 3.6.3: Outpatient treatment of malnutrition and health outcomes
Registrations Status
Year Level of care New Cases Old Cases Recovered Referred to
Hospital
Lost to follow
up Died
2010
< 5 years 30,945 24,079 26,645 362 5,009 139
>=5 years 6,644 2,915 5,224 92 644 27
Total 37,589 26,994 31,869 454 5,653 166
2011
< 5 years 22,929 25,697 27,886 356 3,914 111
>=5 years 6,319 5,294 6,284 67 760 22
Total 29,248 30,991 34,170 423 4,674 133
2012
< 5 years 22,031 - 25,683 1,665 2,275 202
>=5 years 2,823 - 3,067 229 413 30
Total 24,854 - 28,750 1,894 2,688 232
2013
< 5 years 29,817 3902 24,073 1,139 1,344 342
>=5 years 5,080 466 4,301 199 211 61
Total 34,897 4,368 28,374 1,338 1,555 403
2014
< 5 years 23,663 3768 24,858 956 1,120 236
>=5 years 6,135 724 5,679 254 247 124
Total 29,798 4,492 30,537 1,210 1,367 360
2015
< 5 years 23,200 3768 20,771 985 1,106 310
>=5 years 3,885 280 3,168 229 173 106
Total 27,085 4,048 23,939 1,214 1,279 416
2016
< 5 years 23,198 2273 20,086 828 990 305
>=5 years 3,724 236 2,996 114 118 156
Total 26,922 2,509 23,082 942 1,108 461
2017 < 5 years 33,085 3,205 27,551 997 783 -
>=5 years 4,720 430 2,576 93 53 -
Total 37,805 3,635 30,127 1,090 836 -
2018
< 5 years 36,419 3,040 36,238 1,406 965 362
>=5 years 5,229 248 3,547 132 70 88
Total 41,648 3,288 39,785 1,538 1,035 450 Source: RBC
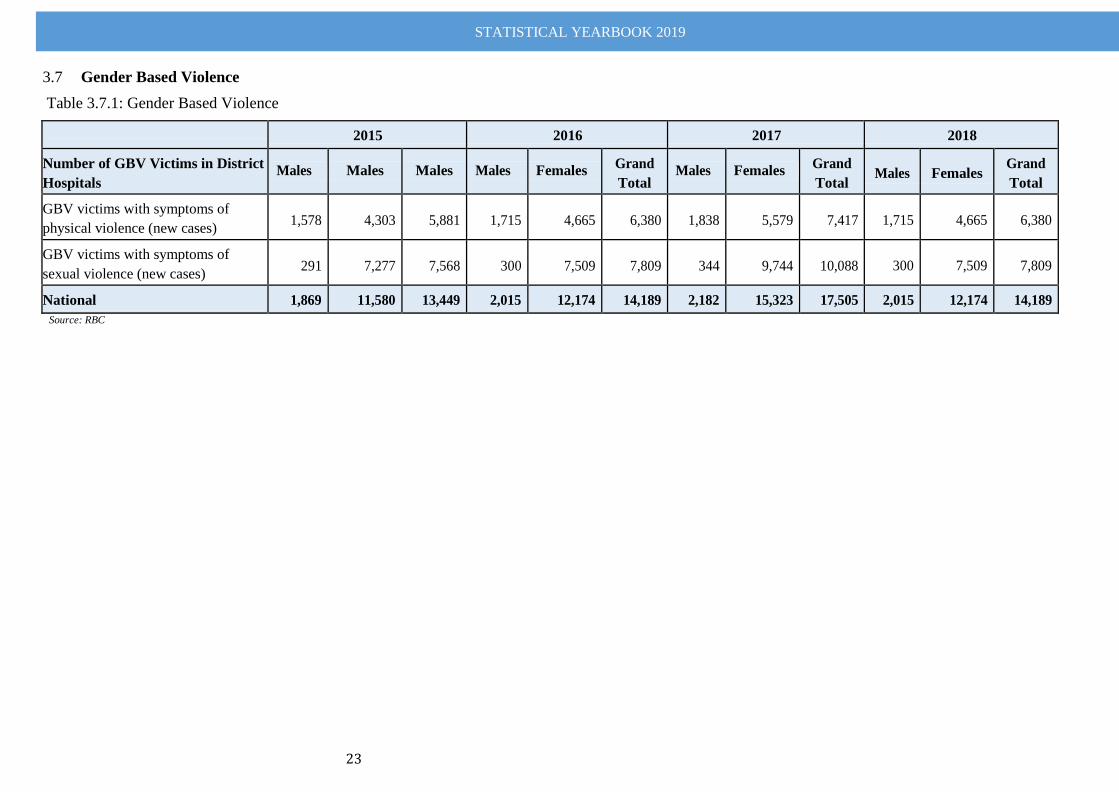
STATISTICAL YEARBOOK 2019
23
Gender Based Violence 3.7
Table 3.7.1: Gender Based Violence
2015 2016 2017 2018
Number of GBV Victims in District
Hospitals Males Males Males Males Females
Grand
Total Males Females
Grand
Total Males Females
Grand
Total
GBV victims with symptoms of
physical violence (new cases)
1,578
4,303
5,881
1,715
4,665
6,380
1,838
5,579
7,417
1,715
4,665
6,380
GBV victims with symptoms of
sexual violence (new cases)
291
7,277
7,568
300
7,509
7,809
344
9,744
10,088
300
7,509
7,809
National 1,869 11,580 13,449 2,015 12,174 14,189 2,182 15,323 17,505 2,015 12,174 14,189
Source: RBC
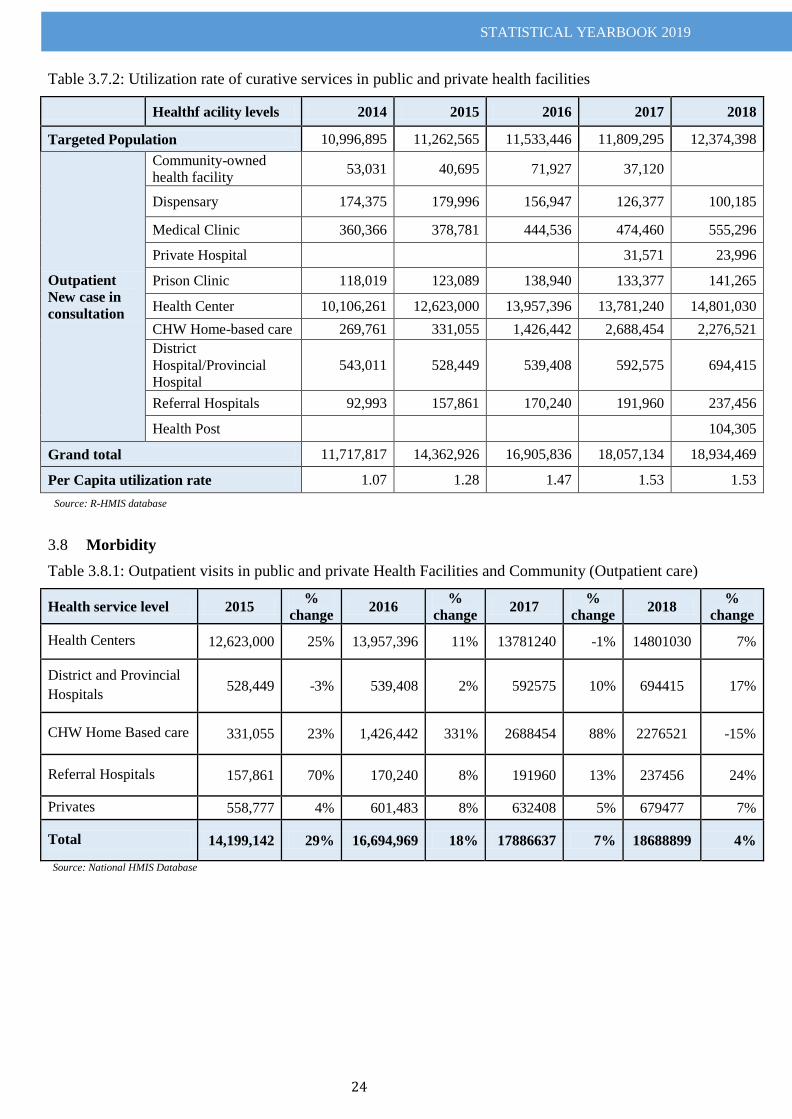
STATISTICAL YEARBOOK 2019
24
Table 3.7.2: Utilization rate of curative services in public and private health facilities
Healthf acility levels 2014 2015 2016 2017 2018
Targeted Population 10,996,895 11,262,565 11,533,446 11,809,295 12,374,398
Outpatient
New case in
consultation
Community-owned
health facility 53,031 40,695 71,927 37,120
Dispensary 174,375 179,996 156,947 126,377 100,185
Medical Clinic 360,366 378,781 444,536 474,460 555,296
Private Hospital 31,571 23,996
Prison Clinic 118,019 123,089 138,940 133,377 141,265
Health Center 10,106,261 12,623,000 13,957,396 13,781,240 14,801,030
CHW Home-based care 269,761 331,055 1,426,442 2,688,454 2,276,521
District
Hospital/Provincial
Hospital
543,011 528,449 539,408 592,575 694,415
Referral Hospitals 92,993 157,861 170,240 191,960 237,456
Health Post 104,305
Grand total 11,717,817 14,362,926 16,905,836 18,057,134 18,934,469
Per Capita utilization rate 1.07 1.28 1.47 1.53 1.53
Source: R-HMIS database
Morbidity 3.8
Table 3.8.1: Outpatient visits in public and private Health Facilities and Community (Outpatient care)
Health service level 2015 %
change 2016
%
change 2017
%
change 2018
%
change
Health Centers 12,623,000 25% 13,957,396 11% 13781240 -1% 14801030 7%
District and Provincial
Hospitals 528,449 -3% 539,408 2% 592575 10% 694415 17%
CHW Home Based care 331,055 23% 1,426,442 331% 2688454 88% 2276521 -15%
Referral Hospitals 157,861 70% 170,240 8% 191960 13% 237456 24%
Privates 558,777 4% 601,483 8% 632408 5% 679477 7%
Total 14,199,142 29% 16,694,969 18% 17886637 7% 18688899 4%
Source: National HMIS Database
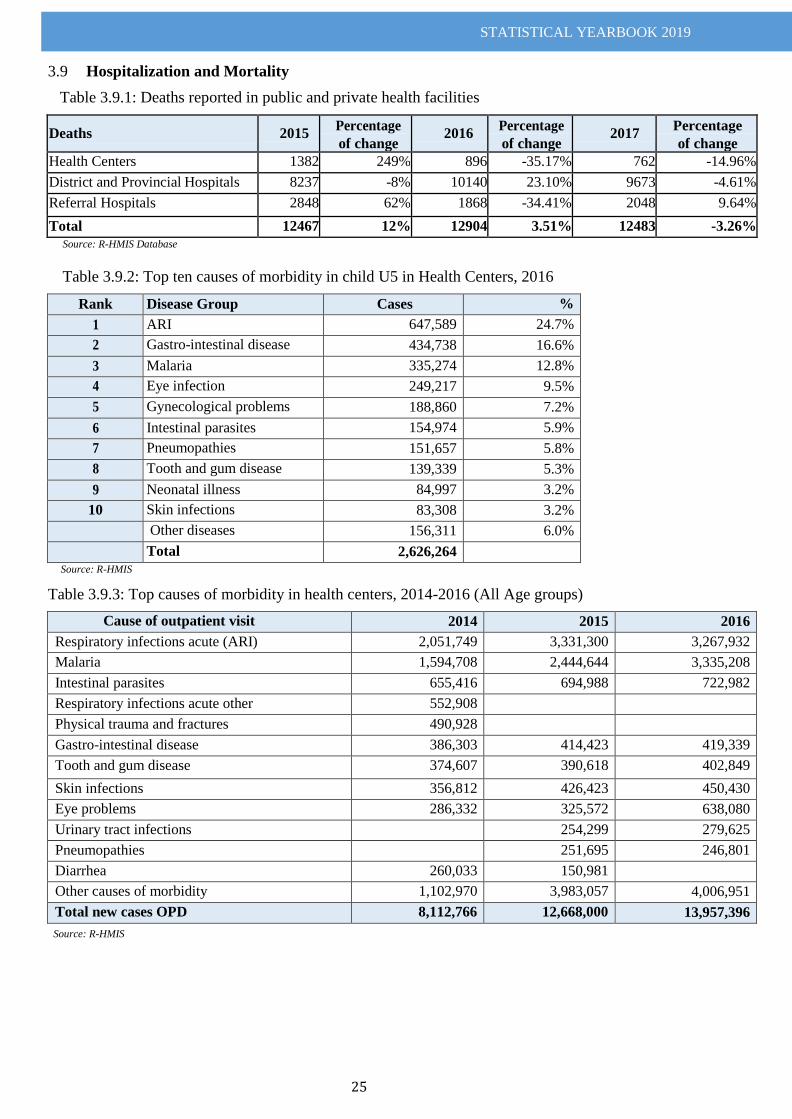
STATISTICAL YEARBOOK 2019
25
Hospitalization and Mortality 3.9
Table 3.9.1: Deaths reported in public and private health facilities
Deaths 2015 Percentage
of change 2016
Percentage
of change 2017
Percentage
of change
Health Centers 1382 249% 896 -35.17% 762 -14.96%
District and Provincial Hospitals 8237 -8% 10140 23.10% 9673 -4.61%
Referral Hospitals 2848 62% 1868 -34.41% 2048 9.64%
Total 12467 12% 12904 3.51% 12483 -3.26%
Source: R-HMIS Database
Table 3.9.2: Top ten causes of morbidity in child U5 in Health Centers, 2016
Rank Disease Group Cases %
1 ARI 647,589 24.7%
2 Gastro-intestinal disease 434,738 16.6%
3 Malaria 335,274 12.8%
4 Eye infection 249,217 9.5%
5 Gynecological problems 188,860 7.2%
6 Intestinal parasites 154,974 5.9%
7 Pneumopathies 151,657 5.8%
8 Tooth and gum disease 139,339 5.3%
9 Neonatal illness 84,997 3.2%
10 Skin infections 83,308 3.2%
Other diseases 156,311 6.0%
Total 2,626,264
Source: R-HMIS
Table 3.9.3: Top causes of morbidity in health centers, 2014-2016 (All Age groups)
Cause of outpatient visit 2014 2015 2016
Respiratory infections acute (ARI) 2,051,749 3,331,300 3,267,932
Malaria 1,594,708 2,444,644 3,335,208
Intestinal parasites 655,416 694,988 722,982
Respiratory infections acute other 552,908
Physical trauma and fractures 490,928
Gastro-intestinal disease 386,303 414,423 419,339
Tooth and gum disease 374,607 390,618 402,849
Skin infections 356,812 426,423 450,430
Eye problems 286,332 325,572 638,080
Urinary tract infections 254,299 279,625
Pneumopathies 251,695 246,801
Diarrhea 260,033 150,981
Other causes of morbidity 1,102,970 3,983,057 4,006,951
Total new cases OPD 8,112,766 12,668,000 13,957,396
Source: R-HMIS
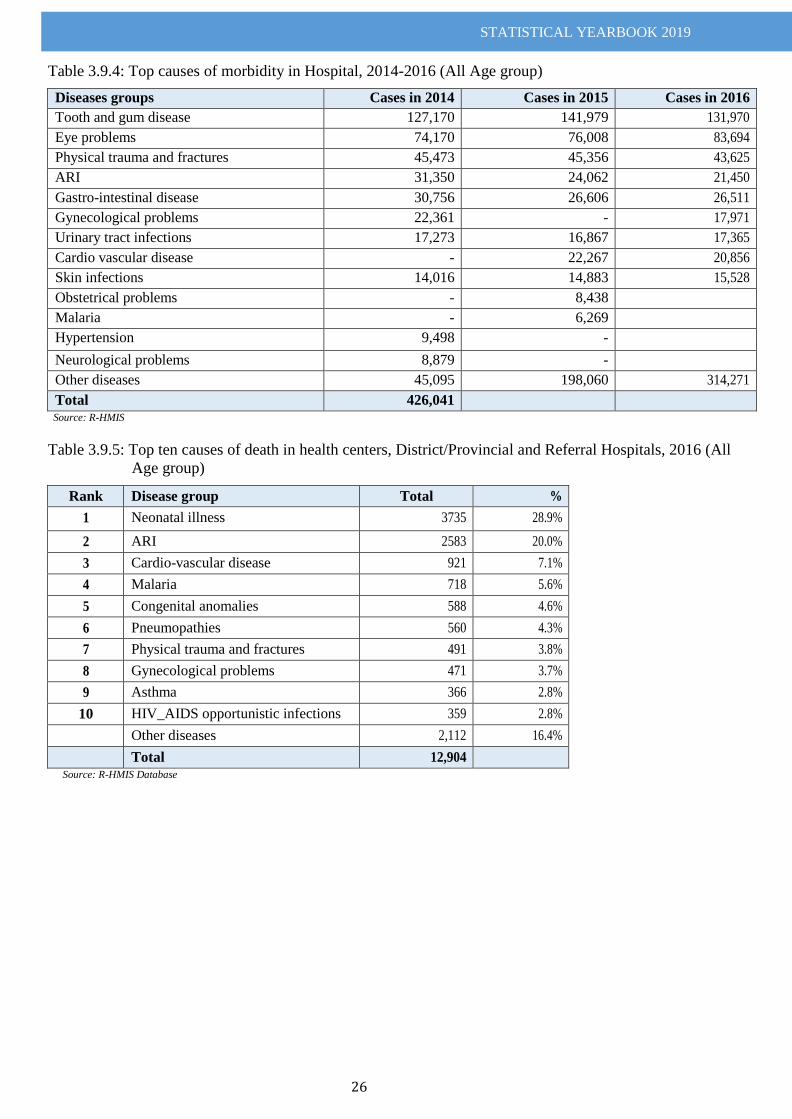
STATISTICAL YEARBOOK 2019
26
Table 3.9.4: Top causes of morbidity in Hospital, 2014-2016 (All Age group)
Diseases groups Cases in 2014 Cases in 2015 Cases in 2016
Tooth and gum disease 127,170 141,979 131,970
Eye problems 74,170 76,008 83,694
Physical trauma and fractures 45,473 45,356 43,625
ARI 31,350 24,062 21,450
Gastro-intestinal disease 30,756 26,606 26,511
Gynecological problems 22,361 - 17,971
Urinary tract infections 17,273 16,867 17,365
Cardio vascular disease - 22,267 20,856
Skin infections 14,016 14,883 15,528
Obstetrical problems - 8,438
Malaria - 6,269
Hypertension 9,498 -
Neurological problems 8,879 -
Other diseases 45,095 198,060 314,271
Total 426,041 Source: R-HMIS
Table 3.9.5: Top ten causes of death in health centers, District/Provincial and Referral Hospitals, 2016 (All
Age group)
Rank Disease group Total %
1 Neonatal illness 3735 28.9%
2 ARI 2583 20.0%
3 Cardio-vascular disease 921 7.1%
4 Malaria 718 5.6%
5 Congenital anomalies 588 4.6%
6 Pneumopathies 560 4.3%
7 Physical trauma and fractures 491 3.8%
8 Gynecological problems 471 3.7%
9 Asthma 366 2.8%
10 HIV_AIDS opportunistic infections 359 2.8%
Other diseases 2,112 16.4%
Total 12,904
Source: R-HMIS Database
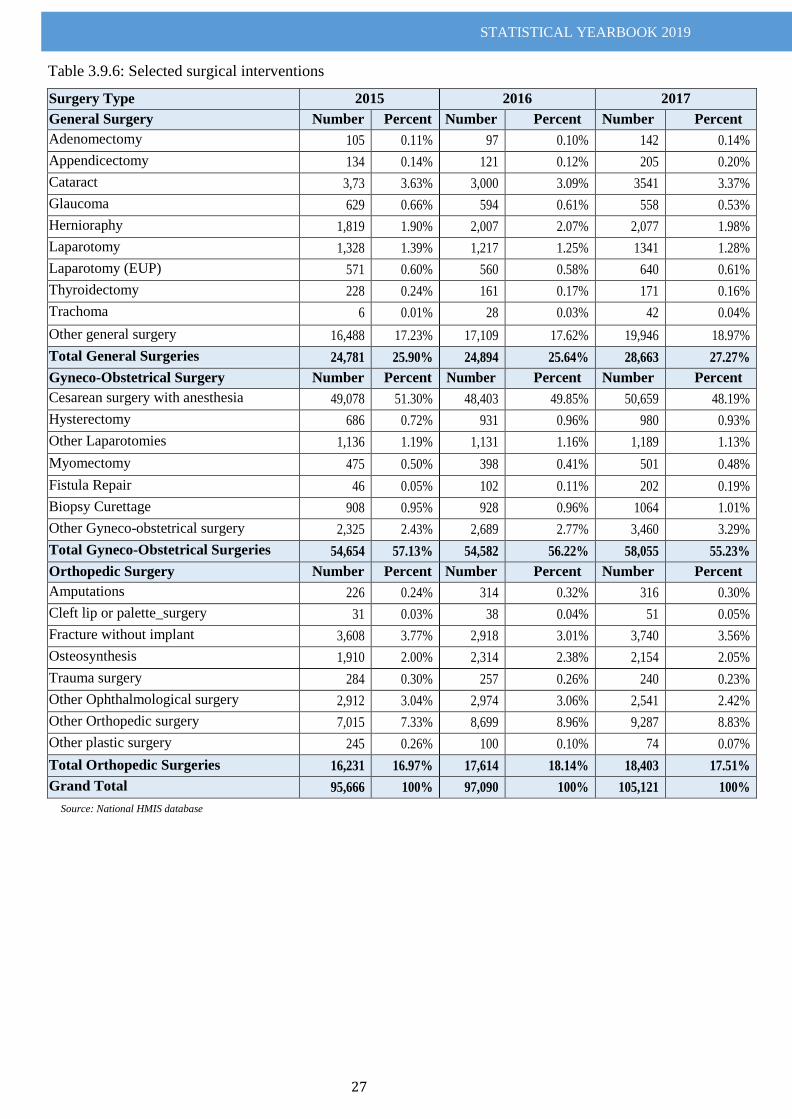
STATISTICAL YEARBOOK 2019
27
Table 3.9.6: Selected surgical interventions
Surgery Type 2015 2016 2017
General Surgery Number Percent Number Percent Number Percent
Adenomectomy 105 0.11% 97 0.10% 142 0.14%
Appendicectomy 134 0.14% 121 0.12% 205 0.20%
Cataract 3,73 3.63% 3,000 3.09% 3541 3.37%
Glaucoma 629 0.66% 594 0.61% 558 0.53%
Hernioraphy 1,819 1.90% 2,007 2.07% 2,077 1.98%
Laparotomy 1,328 1.39% 1,217 1.25% 1341 1.28%
Laparotomy (EUP) 571 0.60% 560 0.58% 640 0.61%
Thyroidectomy 228 0.24% 161 0.17% 171 0.16%
Trachoma 6 0.01% 28 0.03% 42 0.04%
Other general surgery 16,488 17.23% 17,109 17.62% 19,946 18.97%
Total General Surgeries 24,781 25.90% 24,894 25.64% 28,663 27.27%
Gyneco-Obstetrical Surgery Number Percent Number Percent Number Percent
Cesarean surgery with anesthesia 49,078 51.30% 48,403 49.85% 50,659 48.19%
Hysterectomy 686 0.72% 931 0.96% 980 0.93%
Other Laparotomies 1,136 1.19% 1,131 1.16% 1,189 1.13%
Myomectomy 475 0.50% 398 0.41% 501 0.48%
Fistula Repair 46 0.05% 102 0.11% 202 0.19%
Biopsy Curettage 908 0.95% 928 0.96% 1064 1.01%
Other Gyneco-obstetrical surgery 2,325 2.43% 2,689 2.77% 3,460 3.29%
Total Gyneco-Obstetrical Surgeries 54,654 57.13% 54,582 56.22% 58,055 55.23%
Orthopedic Surgery Number Percent Number Percent Number Percent
Amputations 226 0.24% 314 0.32% 316 0.30%
Cleft lip or palette_surgery 31 0.03% 38 0.04% 51 0.05%
Fracture without implant 3,608 3.77% 2,918 3.01% 3,740 3.56%
Osteosynthesis 1,910 2.00% 2,314 2.38% 2,154 2.05%
Trauma surgery 284 0.30% 257 0.26% 240 0.23%
Other Ophthalmological surgery 2,912 3.04% 2,974 3.06% 2,541 2.42%
Other Orthopedic surgery 7,015 7.33% 8,699 8.96% 9,287 8.83%
Other plastic surgery 245 0.26% 100 0.10% 74 0.07%
Total Orthopedic Surgeries 16,231 16.97% 17,614 18.14% 18,403 17.51%
Grand Total 95,666 100% 97,090 100% 105,121 100%
Source: National HMIS database
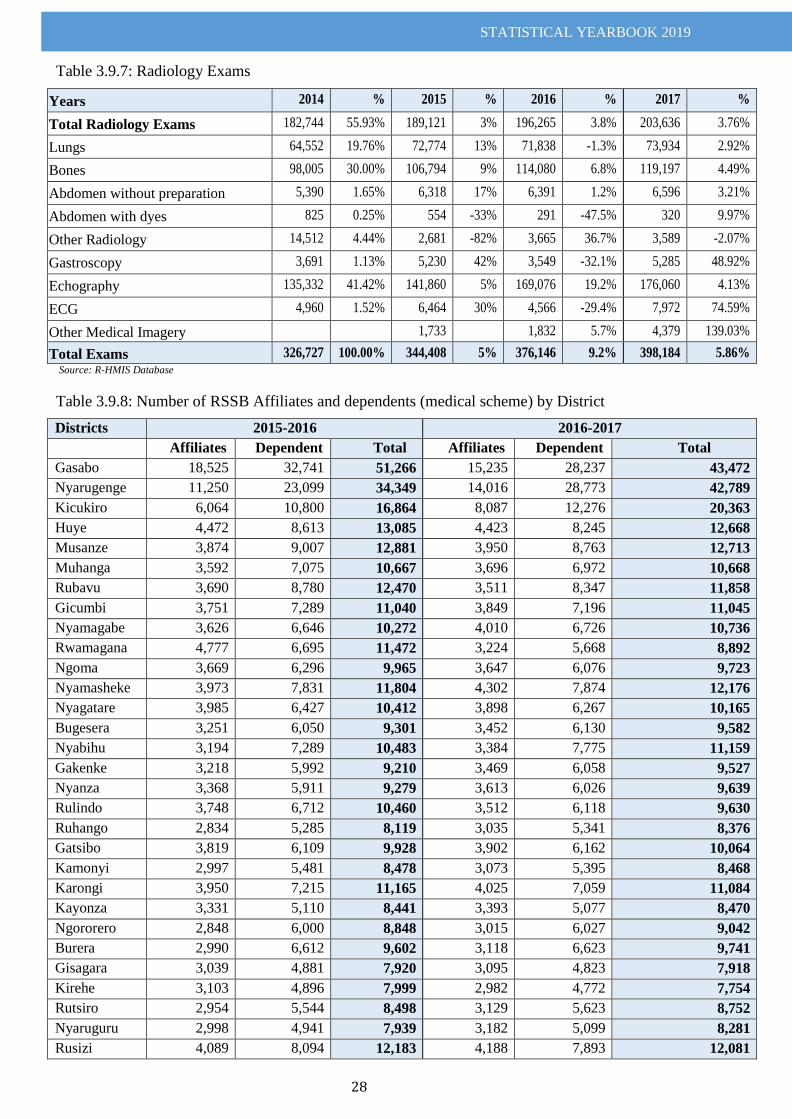
STATISTICAL YEARBOOK 2019
28
Table 3.9.7: Radiology Exams
Years 2014 % 2015 % 2016 % 2017 %
Total Radiology Exams 182,744 55.93% 189,121 3% 196,265 3.8% 203,636 3.76%
Lungs 64,552 19.76% 72,774 13% 71,838 -1.3% 73,934 2.92%
Bones 98,005 30.00% 106,794 9% 114,080 6.8% 119,197 4.49%
Abdomen without preparation 5,390 1.65% 6,318 17% 6,391 1.2% 6,596 3.21%
Abdomen with dyes 825 0.25% 554 -33% 291 -47.5% 320 9.97%
Other Radiology 14,512 4.44% 2,681 -82% 3,665 36.7% 3,589 -2.07%
Gastroscopy 3,691 1.13% 5,230 42% 3,549 -32.1% 5,285 48.92%
Echography 135,332 41.42% 141,860 5% 169,076 19.2% 176,060 4.13%
ECG 4,960 1.52% 6,464 30% 4,566 -29.4% 7,972 74.59%
Other Medical Imagery 1,733 1,832 5.7% 4,379 139.03%
Total Exams 326,727 100.00% 344,408 5% 376,146 9.2% 398,184 5.86% Source: R-HMIS Database
Table 3.9.8: Number of RSSB Affiliates and dependents (medical scheme) by District
Districts 2015-2016 2016-2017
Affiliates Dependent Total Affiliates Dependent Total
Gasabo 18,525 32,741 51,266 15,235 28,237 43,472
Nyarugenge 11,250 23,099 34,349 14,016 28,773 42,789
Kicukiro 6,064 10,800 16,864 8,087 12,276 20,363
Huye 4,472 8,613 13,085 4,423 8,245 12,668
Musanze 3,874 9,007 12,881 3,950 8,763 12,713
Muhanga 3,592 7,075 10,667 3,696 6,972 10,668
Rubavu 3,690 8,780 12,470 3,511 8,347 11,858
Gicumbi 3,751 7,289 11,040 3,849 7,196 11,045
Nyamagabe 3,626 6,646 10,272 4,010 6,726 10,736
Rwamagana 4,777 6,695 11,472 3,224 5,668 8,892
Ngoma 3,669 6,296 9,965 3,647 6,076 9,723
Nyamasheke 3,973 7,831 11,804 4,302 7,874 12,176
Nyagatare 3,985 6,427 10,412 3,898 6,267 10,165
Bugesera 3,251 6,050 9,301 3,452 6,130 9,582
Nyabihu 3,194 7,289 10,483 3,384 7,775 11,159
Gakenke 3,218 5,992 9,210 3,469 6,058 9,527
Nyanza 3,368 5,911 9,279 3,613 6,026 9,639
Rulindo 3,748 6,712 10,460 3,512 6,118 9,630
Ruhango 2,834 5,285 8,119 3,035 5,341 8,376
Gatsibo 3,819 6,109 9,928 3,902 6,162 10,064
Kamonyi 2,997 5,481 8,478 3,073 5,395 8,468
Karongi 3,950 7,215 11,165 4,025 7,059 11,084
Kayonza 3,331 5,110 8,441 3,393 5,077 8,470
Ngororero 2,848 6,000 8,848 3,015 6,027 9,042
Burera 2,990 6,612 9,602 3,118 6,623 9,741
Gisagara 3,039 4,881 7,920 3,095 4,823 7,918
Kirehe 3,103 4,896 7,999 2,982 4,772 7,754
Rutsiro 2,954 5,544 8,498 3,129 5,623 8,752
Nyaruguru 2,998 4,941 7,939 3,182 5,099 8,281
Rusizi 4,089 8,094 12,183 4,188 7,893 12,081
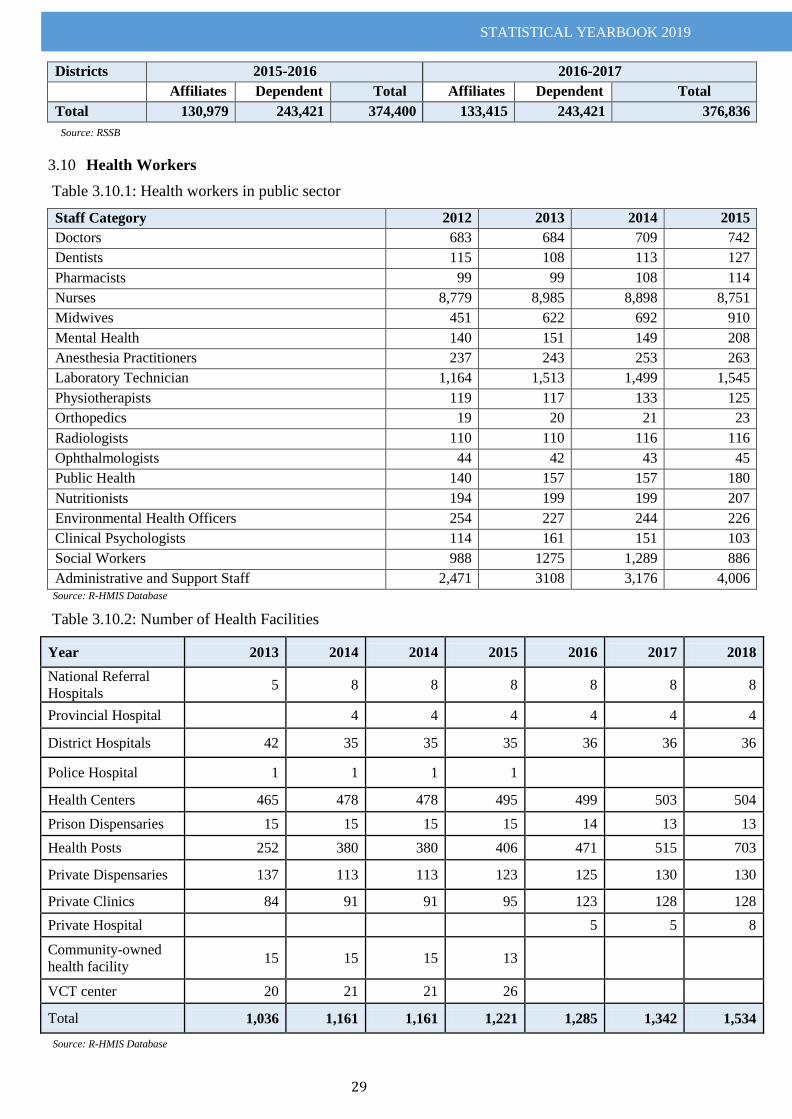
STATISTICAL YEARBOOK 2019
29
Districts 2015-2016 2016-2017
Affiliates Dependent Total Affiliates Dependent Total
Total 130,979 243,421 374,400 133,415 243,421 376,836
Source: RSSB
Health Workers 3.10
Table 3.10.1: Health workers in public sector
Staff Category 2012 2013 2014 2015
Doctors 683 684 709 742
Dentists 115 108 113 127
Pharmacists 99 99 108 114
Nurses 8,779 8,985 8,898 8,751
Midwives 451 622 692 910
Mental Health 140 151 149 208
Anesthesia Practitioners 237 243 253 263
Laboratory Technician 1,164 1,513 1,499 1,545
Physiotherapists 119 117 133 125
Orthopedics 19 20 21 23
Radiologists 110 110 116 116
Ophthalmologists 44 42 43 45
Public Health 140 157 157 180
Nutritionists 194 199 199 207
Environmental Health Officers 254 227 244 226
Clinical Psychologists 114 161 151 103
Social Workers 988 1275 1,289 886
Administrative and Support Staff 2,471 3108 3,176 4,006 Source: R-HMIS Database
Table 3.10.2: Number of Health Facilities
Year 2013 2014 2014 2015 2016 2017 2018
National Referral
Hospitals 5 8 8 8 8 8 8
Provincial Hospital
4 4 4 4 4 4
District Hospitals 42 35 35 35 36 36 36
Police Hospital 1 1 1 1
Health Centers 465 478 478 495 499 503 504
Prison Dispensaries 15 15 15 15 14 13 13
Health Posts 252 380 380 406 471 515 703
Private Dispensaries 137 113 113 123 125 130 130
Private Clinics 84 91 91 95 123 128 128
Private Hospital
5 5 8
Community-owned
health facility 15 15 15 13
VCT center 20 21 21 26
Total 1,036 1,161 1,161 1,221 1,285 1,342 1,534
Source: R-HMIS Database
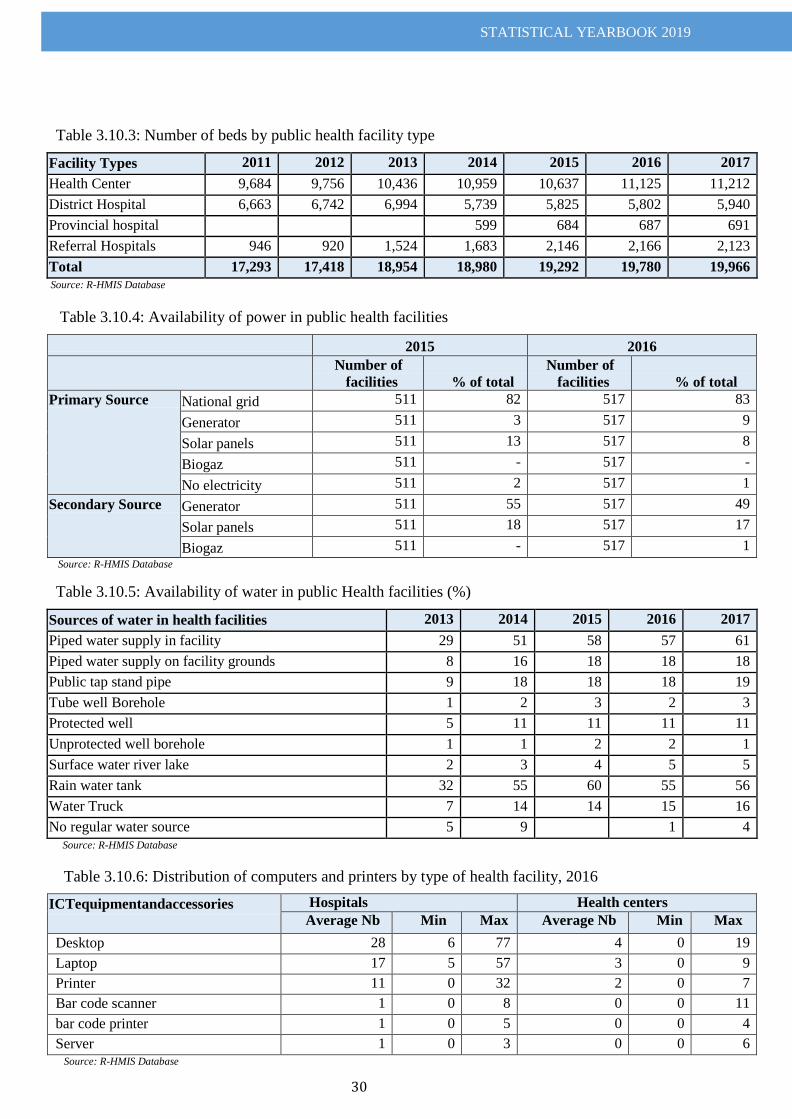
STATISTICAL YEARBOOK 2019
30
Table 3.10.3: Number of beds by public health facility type
Facility Types 2011 2012 2013 2014 2015 2016 2017
Health Center 9,684 9,756 10,436 10,959 10,637 11,125 11,212
District Hospital 6,663 6,742 6,994 5,739 5,825 5,802 5,940
Provincial hospital 599 684 687 691
Referral Hospitals 946 920 1,524 1,683 2,146 2,166 2,123
Total 17,293 17,418 18,954 18,980 19,292 19,780 19,966
Source: R-HMIS Database
Table 3.10.4: Availability of power in public health facilities
2015 2016
Number of
facilities
% of total
Number of
facilities
% of total
Primary Source National grid 511 82 517 83
Generator 511 3 517 9
Solar panels 511 13 517 8
Biogaz 511 - 517 -
No electricity 511 2 517 1
Secondary Source Generator 511 55 517 49
Solar panels 511 18 517 17
Biogaz 511 - 517 1
Source: R-HMIS Database
Table 3.10.5: Availability of water in public Health facilities (%)
Sources of water in health facilities 2013 2014 2015 2016 2017
Piped water supply in facility 29 51 58 57 61
Piped water supply on facility grounds 8 16 18 18 18
Public tap stand pipe 9 18 18 18 19
Tube well Borehole 1 2 3 2 3
Protected well 5 11 11 11 11
Unprotected well borehole 1 1 2 2 1
Surface water river lake 2 3 4 5 5
Rain water tank 32 55 60 55 56
Water Truck 7 14 14 15 16
No regular water source 5 9 1 4
Source: R-HMIS Database
Table 3.10.6: Distribution of computers and printers by type of health facility, 2016
ICTequipmentandaccessories Hospitals Health centers
Average Nb Min Max Average Nb Min Max
Desktop 28 6 77 4 0 19
Laptop 17 5 57 3 0 9
Printer 11 0 32 2 0 7
Bar code scanner 1 0 8 0 0 11
bar code printer 1 0 5 0 0 4
Server 1 0 3 0 0 6 Source: R-HMIS Database
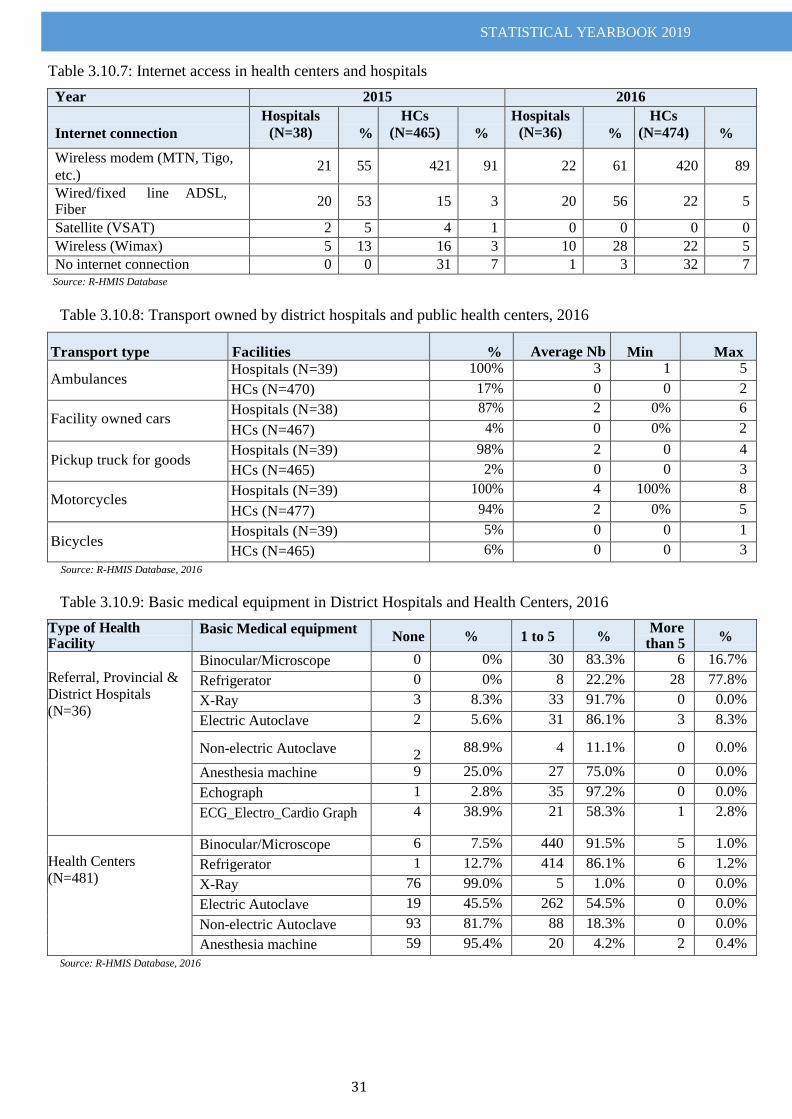
STATISTICAL YEARBOOK 2019
31
Table 3.10.7: Internet access in health centers and hospitals
Year 2015 2016
Internet connection
Hospitals
(N=38)
%
HCs
(N=465)
%
Hospitals
(N=36)
%
HCs
(N=474)
%
Wireless modem (MTN, Tigo,
etc.) 21 55 421 91 22 61 420 89
Wired/fixed line ADSL, Fiber
20 53 15 3 20 56 22 5
Satellite (VSAT) 2 5 4 1 0 0 0 0
Wireless (Wimax) 5 13 16 3 10 28 22 5
No internet connection 0 0 31 7 1 3 32 7 Source: R-HMIS Database
Table 3.10.8: Transport owned by district hospitals and public health centers, 2016
Transport type Facilities % Average Nb Min Max
Ambulances Hospitals (N=39) 100% 3 1 5
HCs (N=470) 17% 0 0 2
Facility owned cars Hospitals (N=38) 87% 2 0% 6
HCs (N=467) 4% 0 0% 2
Pickup truck for goods Hospitals (N=39) 98% 2 0 4
HCs (N=465) 2% 0 0 3
Motorcycles Hospitals (N=39) 100% 4 100% 8
HCs (N=477) 94% 2 0% 5
Bicycles Hospitals (N=39) 5% 0 0 1
HCs (N=465) 6% 0 0 3
Source: R-HMIS Database, 2016
Table 3.10.9: Basic medical equipment in District Hospitals and Health Centers, 2016
Type of Health Facility
Basic Medical equipment None % 1 to 5 %
More than 5
%
Referral, Provincial &
District Hospitals
(N=36)
Binocular/Microscope 0 0% 30 83.3% 6 16.7%
Refrigerator 0 0% 8 22.2% 28 77.8%
X-Ray 3 8.3% 33 91.7% 0 0.0%
Electric Autoclave 2 5.6% 31 86.1% 3 8.3%
Non-electric Autoclave
2 88.9% 4 11.1% 0 0.0%
Anesthesia machine 9 25.0% 27 75.0% 0 0.0%
Echograph 1 2.8% 35 97.2% 0 0.0%
ECG_Electro_Cardio Graph 4 38.9% 21 58.3% 1 2.8%
Health Centers
(N=481)
Binocular/Microscope 6 7.5% 440 91.5% 5 1.0%
Refrigerator 1 12.7% 414 86.1% 6 1.2%
X-Ray 76 99.0% 5 1.0% 0 0.0%
Electric Autoclave 19 45.5% 262 54.5% 0 0.0%
Non-electric Autoclave 93 81.7% 88 18.3% 0 0.0%
Anesthesia machine 59 95.4% 20 4.2% 2 0.4%
Source: R-HMIS Database, 2016
STATISTICAL YEARBOOK 2019
32
CHAPTER IV: EDUCATION
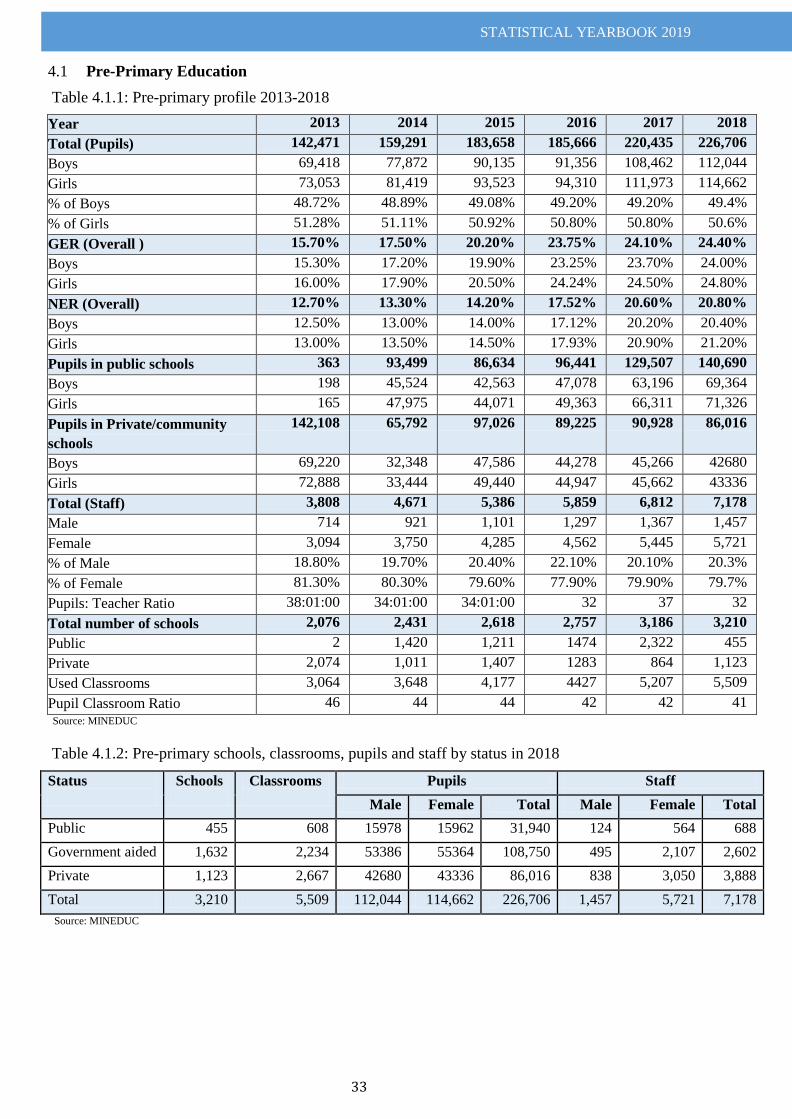
STATISTICAL YEARBOOK 2019
33
Pre-Primary Education 4.1
Table 4.1.1: Pre-primary profile 2013-2018
Year 2013 2014 2015 2016 2017 2018
Total (Pupils) 142,471 159,291 183,658 185,666 220,435 226,706
Boys 69,418 77,872 90,135 91,356 108,462 112,044
Girls 73,053 81,419 93,523 94,310 111,973 114,662
% of Boys 48.72% 48.89% 49.08% 49.20% 49.20% 49.4%
% of Girls 51.28% 51.11% 50.92% 50.80% 50.80% 50.6%
GER (Overall ) 15.70% 17.50% 20.20% 23.75% 24.10% 24.40%
Boys 15.30% 17.20% 19.90% 23.25% 23.70% 24.00%
Girls 16.00% 17.90% 20.50% 24.24% 24.50% 24.80%
NER (Overall) 12.70% 13.30% 14.20% 17.52% 20.60% 20.80%
Boys 12.50% 13.00% 14.00% 17.12% 20.20% 20.40%
Girls 13.00% 13.50% 14.50% 17.93% 20.90% 21.20%
Pupils in public schools 363 93,499 86,634 96,441 129,507 140,690
Boys 198 45,524 42,563 47,078 63,196 69,364
Girls 165 47,975 44,071 49,363 66,311 71,326
Pupils in Private/community
schools
142,108 65,792 97,026 89,225 90,928 86,016
Boys 69,220 32,348 47,586 44,278 45,266 42680
Girls 72,888 33,444 49,440 44,947 45,662 43336
Total (Staff) 3,808 4,671 5,386 5,859 6,812 7,178
Male 714 921 1,101 1,297 1,367 1,457
Female 3,094 3,750 4,285 4,562 5,445 5,721
% of Male 18.80% 19.70% 20.40% 22.10% 20.10% 20.3%
% of Female 81.30% 80.30% 79.60% 77.90% 79.90% 79.7%
Pupils: Teacher Ratio 38:01:00 34:01:00 34:01:00 32 37 32
Total number of schools 2,076 2,431 2,618 2,757 3,186 3,210
Public 2 1,420 1,211 1474 2,322 455
Private 2,074 1,011 1,407 1283 864 1,123
Used Classrooms 3,064 3,648 4,177 4427 5,207 5,509
Pupil Classroom Ratio 46 44 44 42 42 41
Source: MINEDUC
Table 4.1.2: Pre-primary schools, classrooms, pupils and staff by status in 2018
Status
Schools
Classrooms
Pupils Staff
Male Female Total Male Female Total
Public 455 608 15978 15962 31,940 124 564 688
Government aided 1,632 2,234 53386 55364 108,750 495 2,107 2,602
Private 1,123 2,667 42680 43336 86,016 838 3,050 3,888
Total 3,210 5,509 112,044 114,662 226,706 1,457 5,721 7,178
Source: MINEDUC
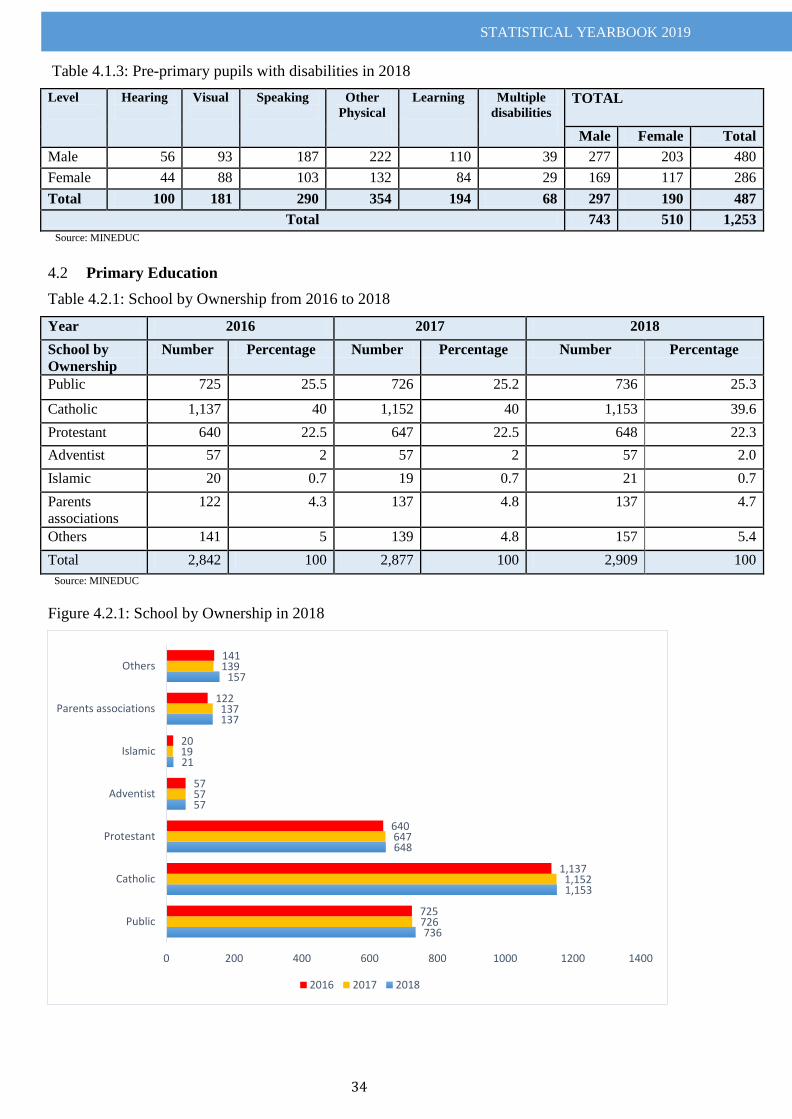
STATISTICAL YEARBOOK 2019
34
Table 4.1.3: Pre-primary pupils with disabilities in 2018
Level
Hearing
Visual
Speaking
Other
Physical
Learning
Multiple
disabilities
TOTAL
Male Female Total
Male 56 93 187 222 110 39 277 203 480
Female 44 88 103 132 84 29 169 117 286
Total 100 181 290 354 194 68 297 190 487
Total 743 510 1,253
Source: MINEDUC
Primary Education 4.2
Table 4.2.1: School by Ownership from 2016 to 2018
Year 2016 2017 2018
School by
Ownership
Number Percentage Number Percentage Number Percentage
Public 725 25.5 726 25.2 736 25.3
Catholic 1,137 40 1,152 40 1,153 39.6
Protestant 640 22.5 647 22.5 648 22.3
Adventist 57 2 57 2 57 2.0
Islamic 20 0.7 19 0.7 21 0.7
Parents
associations
122 4.3 137 4.8 137 4.7
Others 141 5 139 4.8 157 5.4
Total 2,842 100 2,877 100 2,909 100
Source: MINEDUC
Figure 4.2.1: School by Ownership in 2018
736
1,153
648
57
21
137
157
726
1,152
647
57
19
137
139
725
1,137
640
57
20
122
141
0 200 400 600 800 1000 1200 1400
Public
Catholic
Protestant
Adventist
Islamic
Parents associations
Others
2016 2017 2018
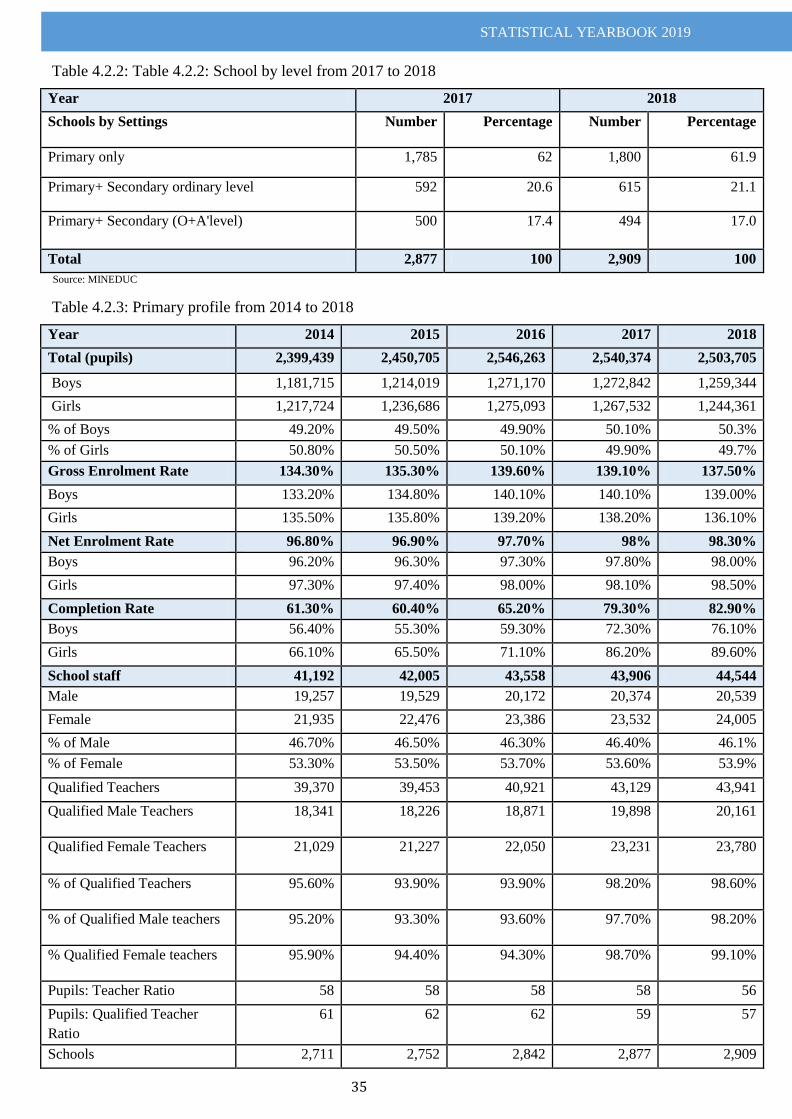
STATISTICAL YEARBOOK 2019
35
Table 4.2.2: Table 4.2.2: School by level from 2017 to 2018
Year 2017 2018
Schools by Settings Number Percentage Number Percentage
Primary only 1,785 62 1,800 61.9
Primary+ Secondary ordinary level 592 20.6 615 21.1
Primary+ Secondary (O+A'level) 500 17.4 494 17.0
Total 2,877 100 2,909 100
Source: MINEDUC
Table 4.2.3: Primary profile from 2014 to 2018
Year 2014 2015 2016 2017 2018
Total (pupils) 2,399,439 2,450,705 2,546,263 2,540,374 2,503,705
Boys 1,181,715 1,214,019 1,271,170 1,272,842 1,259,344
Girls 1,217,724 1,236,686 1,275,093 1,267,532 1,244,361
% of Boys 49.20% 49.50% 49.90% 50.10% 50.3%
% of Girls 50.80% 50.50% 50.10% 49.90% 49.7%
Gross Enrolment Rate 134.30% 135.30% 139.60% 139.10% 137.50%
Boys 133.20% 134.80% 140.10% 140.10% 139.00%
Girls 135.50% 135.80% 139.20% 138.20% 136.10%
Net Enrolment Rate 96.80% 96.90% 97.70% 98% 98.30%
Boys 96.20% 96.30% 97.30% 97.80% 98.00%
Girls 97.30% 97.40% 98.00% 98.10% 98.50%
Completion Rate 61.30% 60.40% 65.20% 79.30% 82.90%
Boys 56.40% 55.30% 59.30% 72.30% 76.10%
Girls 66.10% 65.50% 71.10% 86.20% 89.60%
School staff 41,192 42,005 43,558 43,906 44,544
Male 19,257 19,529 20,172 20,374 20,539
Female 21,935 22,476 23,386 23,532 24,005
% of Male 46.70% 46.50% 46.30% 46.40% 46.1%
% of Female 53.30% 53.50% 53.70% 53.60% 53.9%
Qualified Teachers 39,370 39,453 40,921 43,129 43,941
Qualified Male Teachers 18,341 18,226 18,871 19,898 20,161
Qualified Female Teachers 21,029 21,227 22,050 23,231 23,780
% of Qualified Teachers 95.60% 93.90% 93.90% 98.20% 98.60%
% of Qualified Male teachers 95.20% 93.30% 93.60% 97.70% 98.20%
% Qualified Female teachers 95.90% 94.40% 94.30% 98.70% 99.10%
Pupils: Teacher Ratio 58 58 58 58 56
Pupils: Qualified Teacher
Ratio
61 62 62 59 57
Schools 2,711 2,752 2,842 2,877 2,909
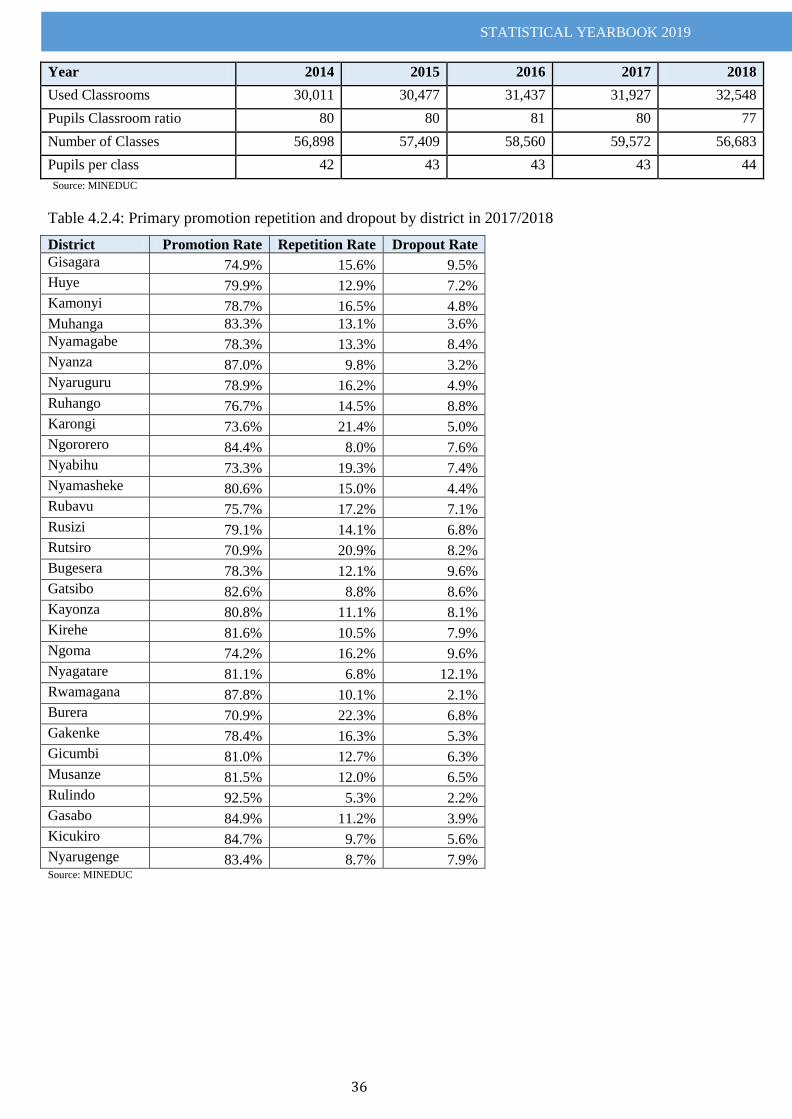
STATISTICAL YEARBOOK 2019
36
Year 2014 2015 2016 2017 2018
Used Classrooms 30,011 30,477 31,437 31,927 32,548
Pupils Classroom ratio 80 80 81 80 77
Number of Classes 56,898 57,409 58,560 59,572 56,683
Pupils per class 42 43 43 43 44
Source: MINEDUC
Table 4.2.4: Primary promotion repetition and dropout by district in 2017/2018
District Promotion Rate Repetition Rate Dropout Rate
Gisagara 74.9% 15.6% 9.5%
Huye 79.9% 12.9% 7.2%
Kamonyi 78.7% 16.5% 4.8%
Muhanga 83.3% 13.1% 3.6%
Nyamagabe 78.3% 13.3% 8.4%
Nyanza 87.0% 9.8% 3.2%
Nyaruguru 78.9% 16.2% 4.9%
Ruhango 76.7% 14.5% 8.8%
Karongi 73.6% 21.4% 5.0%
Ngororero 84.4% 8.0% 7.6%
Nyabihu 73.3% 19.3% 7.4%
Nyamasheke 80.6% 15.0% 4.4%
Rubavu 75.7% 17.2% 7.1%
Rusizi 79.1% 14.1% 6.8%
Rutsiro 70.9% 20.9% 8.2%
Bugesera 78.3% 12.1% 9.6%
Gatsibo 82.6% 8.8% 8.6%
Kayonza 80.8% 11.1% 8.1%
Kirehe 81.6% 10.5% 7.9%
Ngoma 74.2% 16.2% 9.6%
Nyagatare 81.1% 6.8% 12.1%
Rwamagana 87.8% 10.1% 2.1%
Burera 70.9% 22.3% 6.8%
Gakenke 78.4% 16.3% 5.3%
Gicumbi 81.0% 12.7% 6.3%
Musanze 81.5% 12.0% 6.5%
Rulindo 92.5% 5.3% 2.2%
Gasabo 84.9% 11.2% 3.9%
Kicukiro 84.7% 9.7% 5.6%
Nyarugenge 83.4% 8.7% 7.9% Source: MINEDUC
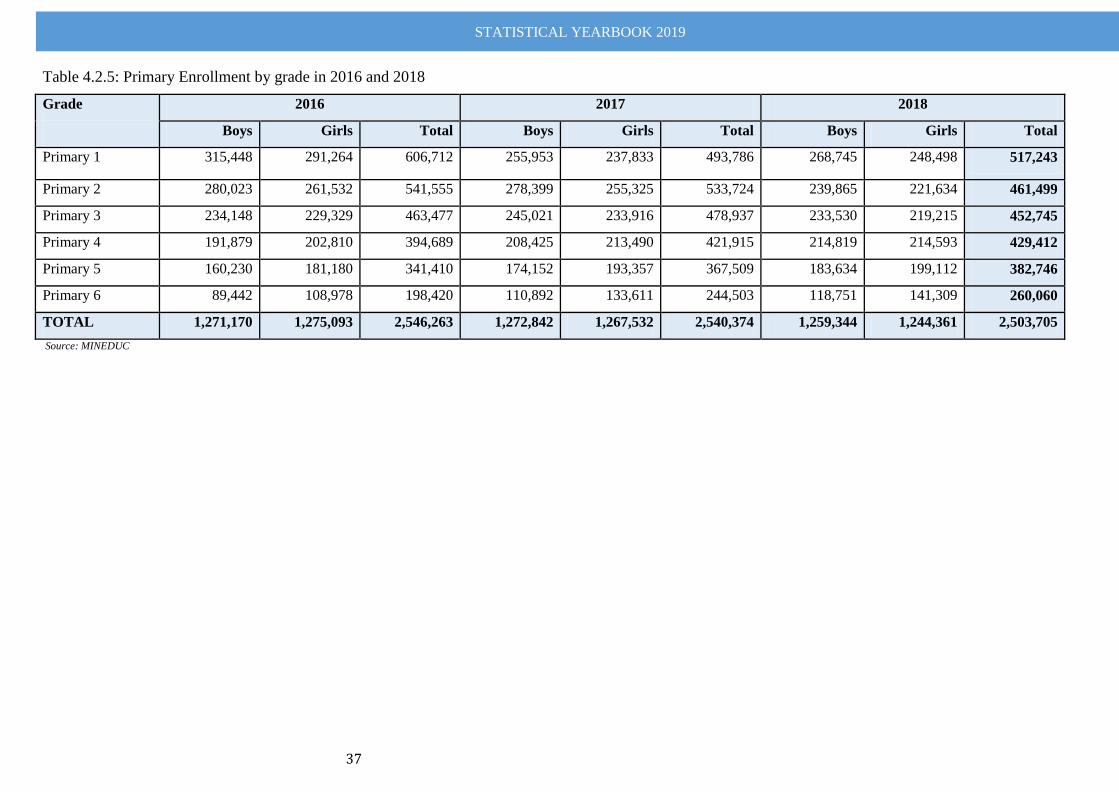
STATISTICAL YEARBOOK 2019
37
Table 4.2.5: Primary Enrollment by grade in 2016 and 2018
Grade
2016 2017 2018
Boys Girls Total Boys Girls Total Boys Girls Total
Primary 1 315,448 291,264 606,712 255,953 237,833 493,786 268,745 248,498 517,243
Primary 2 280,023 261,532 541,555 278,399 255,325 533,724 239,865 221,634 461,499
Primary 3 234,148 229,329 463,477 245,021 233,916 478,937 233,530 219,215 452,745
Primary 4 191,879 202,810 394,689 208,425 213,490 421,915 214,819 214,593 429,412
Primary 5 160,230 181,180 341,410 174,152 193,357 367,509 183,634 199,112 382,746
Primary 6 89,442 108,978 198,420 110,892 133,611 244,503 118,751 141,309 260,060
TOTAL 1,271,170 1,275,093 2,546,263 1,272,842 1,267,532 2,540,374 1,259,344 1,244,361 2,503,705
Source: MINEDUC
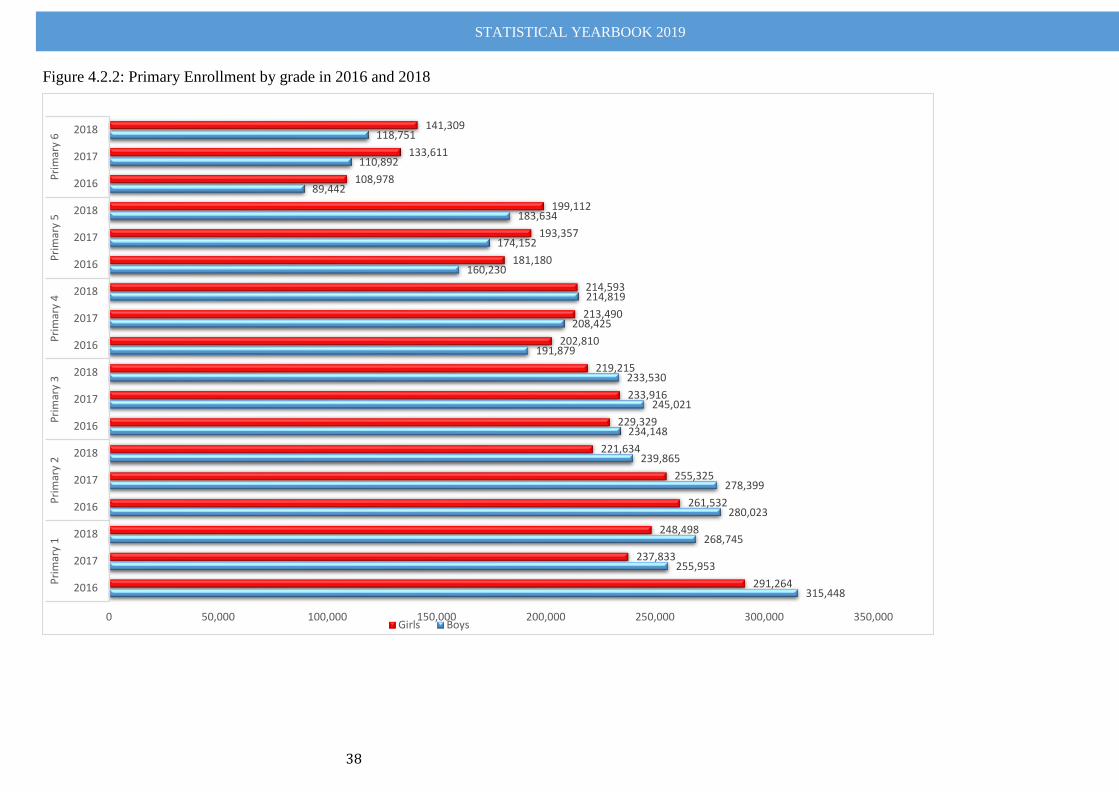
STATISTICAL YEARBOOK 2019
38
Figure 4.2.2: Primary Enrollment by grade in 2016 and 2018
315,448
255,953
268,745
280,023
278,399
239,865
234,148
245,021
233,530
191,879
208,425
214,819
160,230
174,152
183,634
89,442
110,892
118,751
291,264
237,833
248,498
261,532
255,325
221,634
229,329
233,916
219,215
202,810
213,490
214,593
181,180
193,357
199,112
108,978
133,611
141,309
0 50,000 100,000 150,000 200,000 250,000 300,000 350,000
2016
2017
2018
2016
2017
2018
2016
2017
2018
2016
2017
2018
2016
2017
2018
2016
2017
2018
Pri
mar
y 1
Pri
mar
y 2
Pri
mar
y 3
Pri
mar
y 4
Pri
mar
y 5
Pri
mar
y 6
Girls Boys
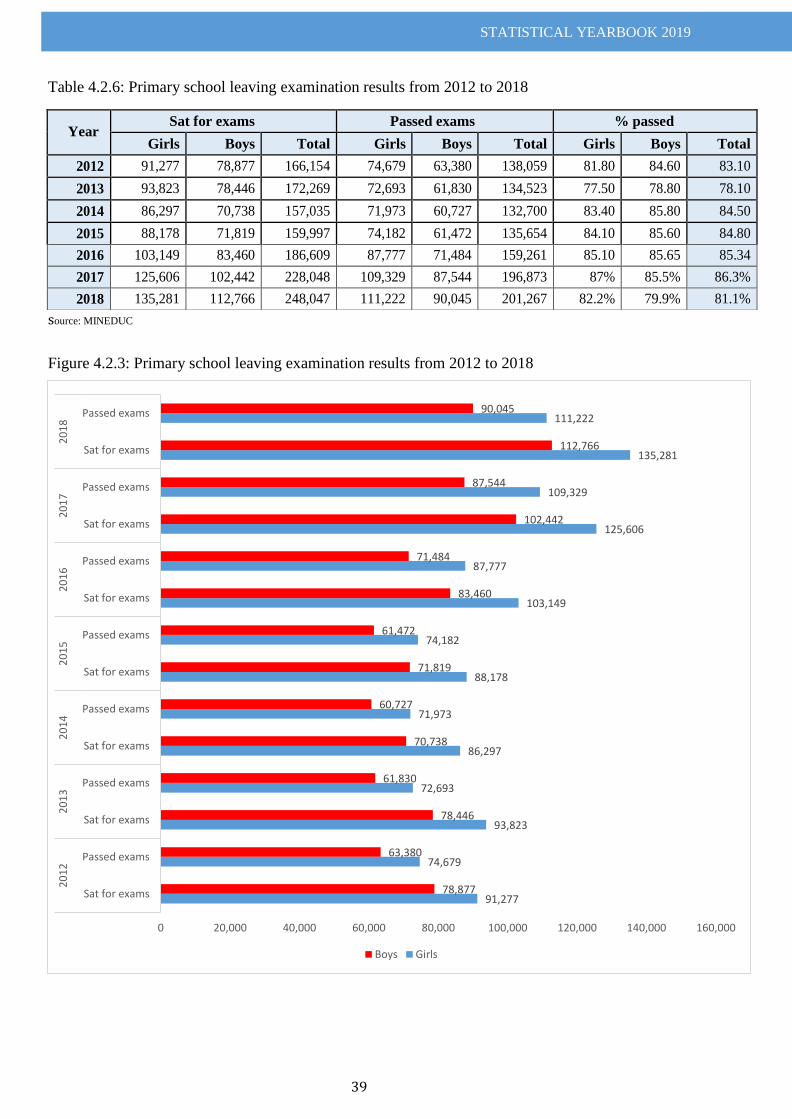
STATISTICAL YEARBOOK 2019
39
Table 4.2.6: Primary school leaving examination results from 2012 to 2018
source: MINEDUC
Figure 4.2.3: Primary school leaving examination results from 2012 to 2018
91,277
74,679
93,823
72,693
86,297
71,973
88,178
74,182
103,149
87,777
125,606
109,329
135,281
111,222
78,877
63,380
78,446
61,830
70,738
60,727
71,819
61,472
83,460
71,484
102,442
87,544
112,766
90,045
0 20,000 40,000 60,000 80,000 100,000 120,000 140,000 160,000
Sat for exams
Passed exams
Sat for exams
Passed exams
Sat for exams
Passed exams
Sat for exams
Passed exams
Sat for exams
Passed exams
Sat for exams
Passed exams
Sat for exams
Passed exams
20
12
20
13
20
14
20
15
20
16
20
17
20
18
Boys Girls
Year Sat for exams Passed exams % passed
Girls Boys Total Girls Boys Total Girls Boys Total
2012 91,277 78,877 166,154 74,679 63,380 138,059 81.80 84.60 83.10
2013 93,823 78,446 172,269 72,693 61,830 134,523 77.50 78.80 78.10
2014 86,297 70,738 157,035 71,973 60,727 132,700 83.40 85.80 84.50
2015 88,178 71,819 159,997 74,182 61,472 135,654 84.10 85.60 84.80
2016 103,149 83,460 186,609 87,777 71,484 159,261 85.10 85.65 85.34
2017 125,606 102,442 228,048 109,329 87,544 196,873 87% 85.5% 86.3%
2018 135,281 112,766 248,047 111,222 90,045 201,267 82.2% 79.9% 81.1%
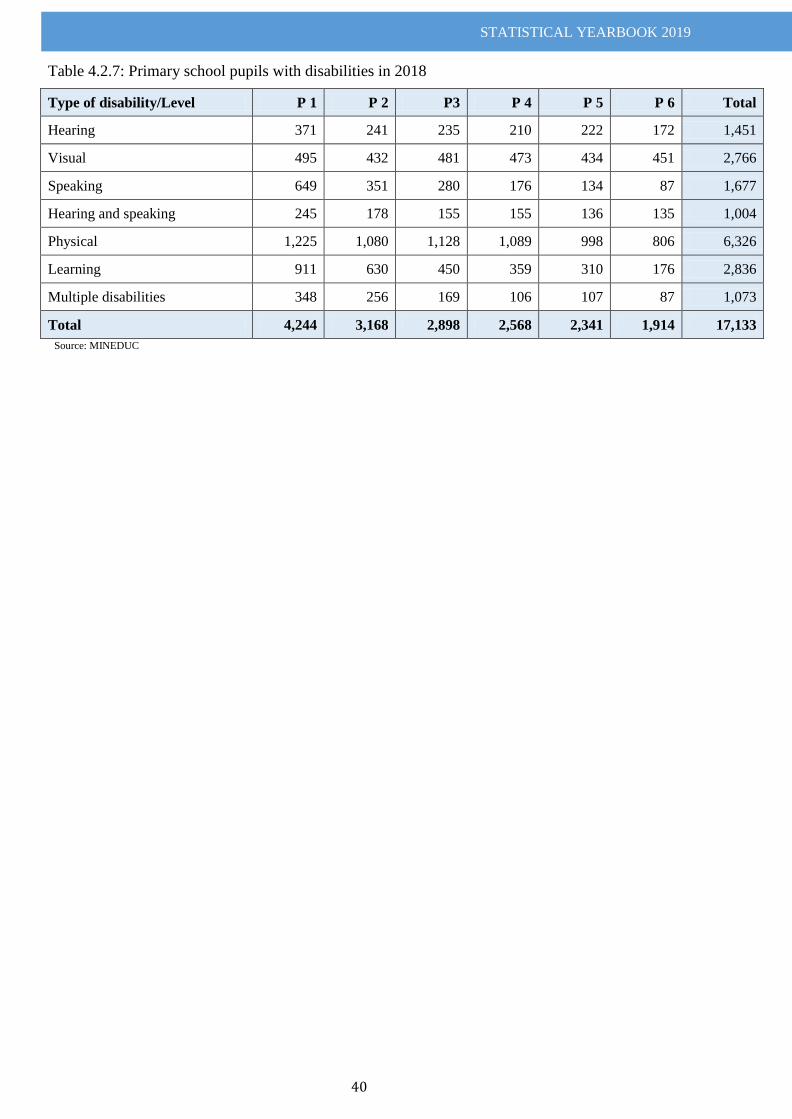
STATISTICAL YEARBOOK 2019
40
Table 4.2.7: Primary school pupils with disabilities in 2018
Type of disability/Level P 1 P 2 P3 P 4 P 5 P 6 Total
Hearing 371 241 235 210 222 172 1,451
Visual 495 432 481 473 434 451 2,766
Speaking 649 351 280 176 134 87 1,677
Hearing and speaking 245 178 155 155 136 135 1,004
Physical 1,225 1,080 1,128 1,089 998 806 6,326
Learning 911 630 450 359 310 176 2,836
Multiple disabilities 348 256 169 106 107 87 1,073
Total 4,244 3,168 2,898 2,568 2,341 1,914 17,133
Source: MINEDUC
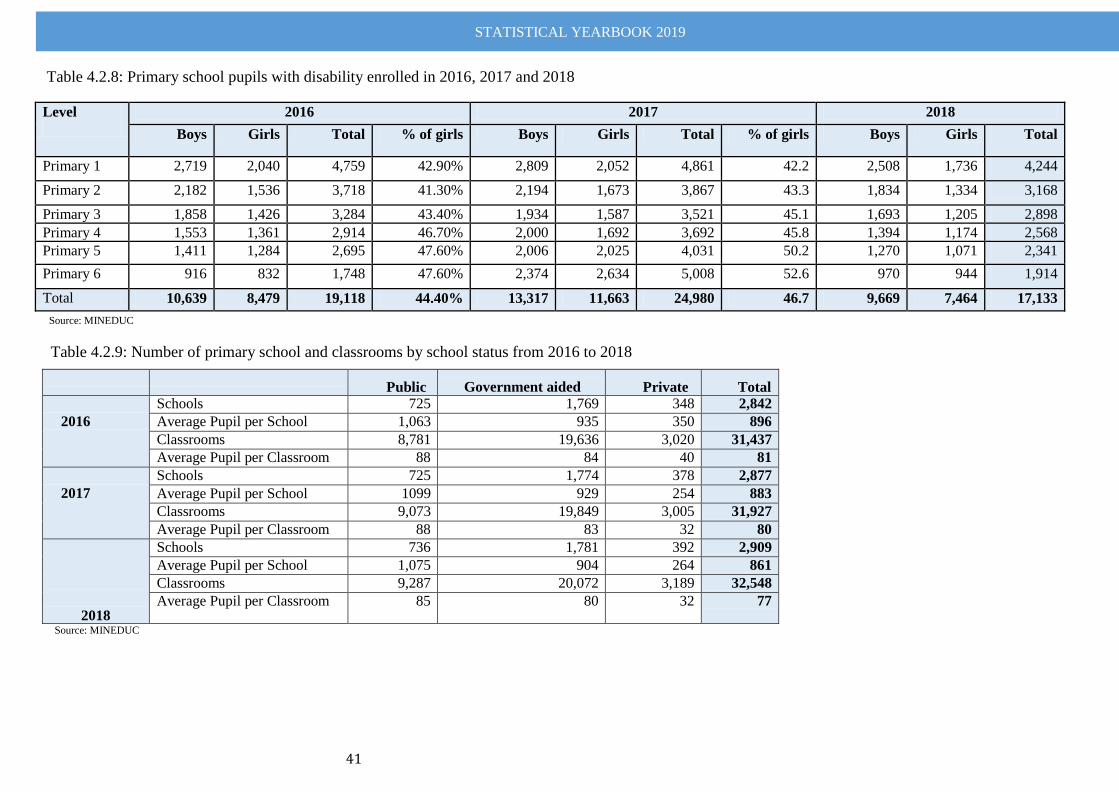
STATISTICAL YEARBOOK 2019
41
Table 4.2.8: Primary school pupils with disability enrolled in 2016, 2017 and 2018
Level
2016 2017 2018
Boys Girls Total % of girls Boys Girls Total % of girls Boys Girls Total
Primary 1 2,719 2,040 4,759 42.90% 2,809 2,052 4,861 42.2 2,508 1,736 4,244
Primary 2 2,182 1,536 3,718 41.30% 2,194 1,673 3,867 43.3 1,834 1,334 3,168
Primary 3 1,858 1,426 3,284 43.40% 1,934 1,587 3,521 45.1 1,693 1,205 2,898
Primary 4 1,553 1,361 2,914 46.70% 2,000 1,692 3,692 45.8 1,394 1,174 2,568
Primary 5 1,411 1,284 2,695 47.60% 2,006 2,025 4,031 50.2 1,270 1,071 2,341
Primary 6 916 832 1,748 47.60% 2,374 2,634 5,008 52.6 970 944 1,914
Total 10,639 8,479 19,118 44.40% 13,317 11,663 24,980 46.7 9,669 7,464 17,133
Source: MINEDUC
Table 4.2.9: Number of primary school and classrooms by school status from 2016 to 2018
Public Government aided Private Total
2016
Schools 725 1,769 348 2,842
Average Pupil per School 1,063 935 350 896
Classrooms 8,781 19,636 3,020 31,437
Average Pupil per Classroom 88 84 40 81
2017
Schools 725 1,774 378 2,877
Average Pupil per School 1099 929 254 883
Classrooms 9,073 19,849 3,005 31,927
Average Pupil per Classroom 88 83 32 80
2018
Schools 736 1,781 392 2,909
Average Pupil per School 1,075 904 264 861
Classrooms 9,287 20,072 3,189 32,548
Average Pupil per Classroom 85 80 32 77
Source: MINEDUC
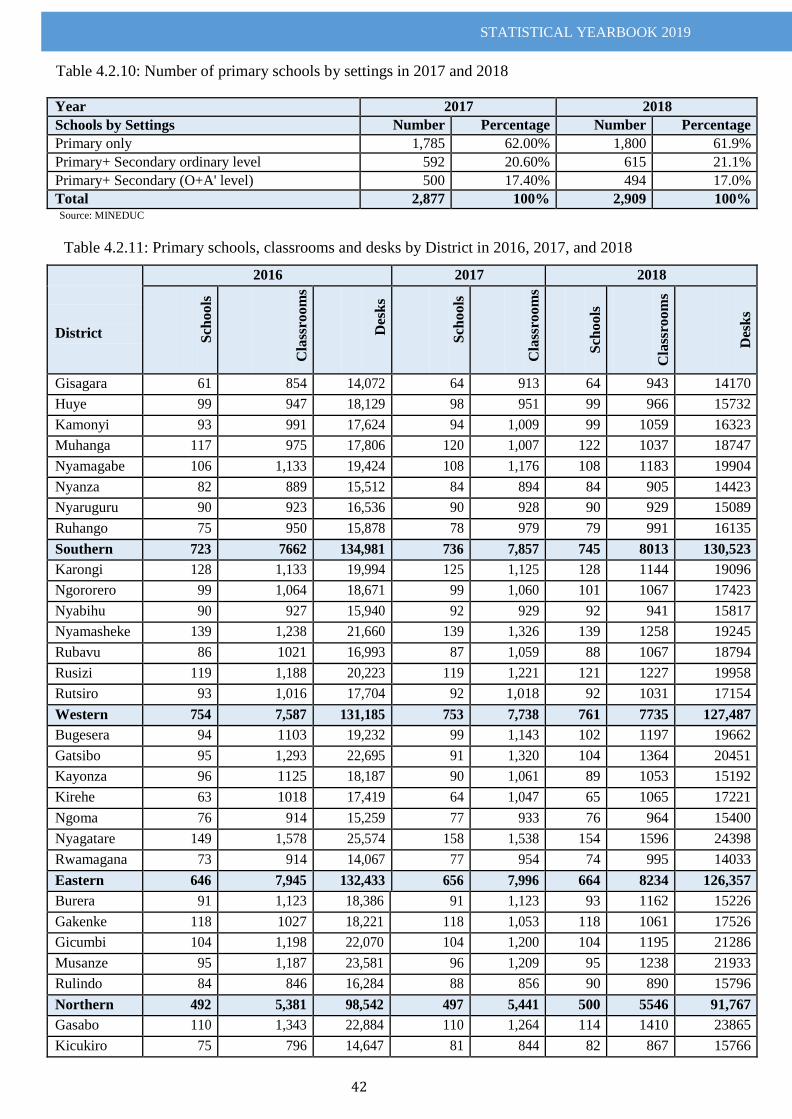
STATISTICAL YEARBOOK 2019
42
Table 4.2.10: Number of primary schools by settings in 2017 and 2018 Year 2017 2018
Schools by Settings Number Percentage Number Percentage
Primary only 1,785 62.00% 1,800 61.9%
Primary+ Secondary ordinary level 592 20.60% 615 21.1%
Primary+ Secondary (O+A' level) 500 17.40% 494 17.0%
Total 2,877 100% 2,909 100% Source: MINEDUC
Table 4.2.11: Primary schools, classrooms and desks by District in 2016, 2017, and 2018
District
2016 2017 2018
Sch
oo
ls
Cla
ssro
om
s
Des
ks
Sch
oo
ls
Cla
ssro
om
s
Sch
oo
ls
Cla
ssro
om
s
Des
ks
Gisagara 61 854 14,072 64 913 64 943 14170
Huye 99 947 18,129 98 951 99 966 15732
Kamonyi 93 991 17,624 94 1,009 99 1059 16323
Muhanga 117 975 17,806 120 1,007 122 1037 18747
Nyamagabe 106 1,133 19,424 108 1,176 108 1183 19904
Nyanza 82 889 15,512 84 894 84 905 14423
Nyaruguru 90 923 16,536 90 928 90 929 15089
Ruhango 75 950 15,878 78 979 79 991 16135
Southern 723 7662 134,981 736 7,857 745 8013 130,523
Karongi 128 1,133 19,994 125 1,125 128 1144 19096
Ngororero 99 1,064 18,671 99 1,060 101 1067 17423
Nyabihu 90 927 15,940 92 929 92 941 15817
Nyamasheke 139 1,238 21,660 139 1,326 139 1258 19245
Rubavu 86 1021 16,993 87 1,059 88 1067 18794
Rusizi 119 1,188 20,223 119 1,221 121 1227 19958
Rutsiro 93 1,016 17,704 92 1,018 92 1031 17154
Western 754 7,587 131,185 753 7,738 761 7735 127,487
Bugesera 94 1103 19,232 99 1,143 102 1197 19662
Gatsibo 95 1,293 22,695 91 1,320 104 1364 20451
Kayonza 96 1125 18,187 90 1,061 89 1053 15192
Kirehe 63 1018 17,419 64 1,047 65 1065 17221
Ngoma 76 914 15,259 77 933 76 964 15400
Nyagatare 149 1,578 25,574 158 1,538 154 1596 24398
Rwamagana 73 914 14,067 77 954 74 995 14033
Eastern 646 7,945 132,433 656 7,996 664 8234 126,357
Burera 91 1,123 18,386 91 1,123 93 1162 15226
Gakenke 118 1027 18,221 118 1,053 118 1061 17526
Gicumbi 104 1,198 22,070 104 1,200 104 1195 21286
Musanze 95 1,187 23,581 96 1,209 95 1238 21933
Rulindo 84 846 16,284 88 856 90 890 15796
Northern 492 5,381 98,542 497 5,441 500 5546 91,767
Gasabo 110 1,343 22,884 110 1,264 114 1410 23865
Kicukiro 75 796 14,647 81 844 82 867 15766
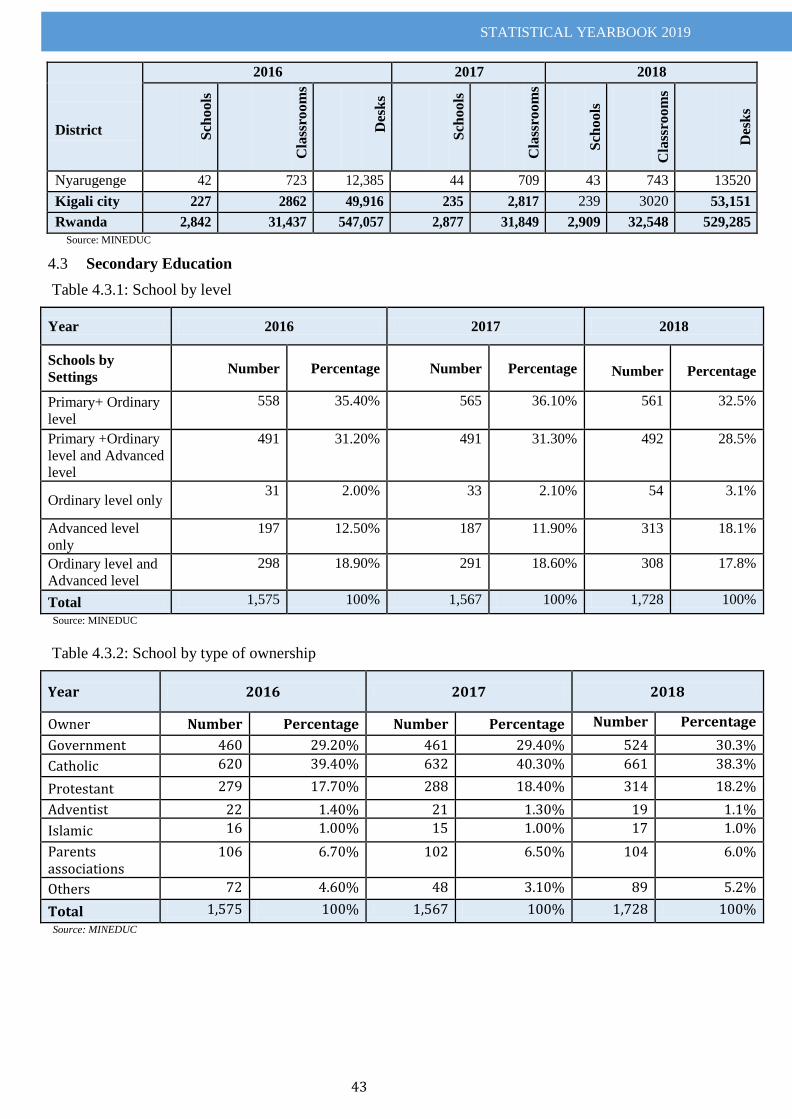
STATISTICAL YEARBOOK 2019
43
District
2016 2017 2018
Sch
oo
ls
Cla
ssro
om
s
Des
ks
Sch
oo
ls
Cla
ssro
om
s
Sch
oo
ls
Cla
ssro
om
s
Des
ks
Nyarugenge 42 723 12,385 44 709 43 743 13520
Kigali city 227 2862 49,916 235 2,817 239 3020 53,151
Rwanda 2,842 31,437 547,057 2,877 31,849 2,909 32,548 529,285
Source: MINEDUC
Secondary Education 4.3
Table 4.3.1: School by level
Year 2016 2017 2018
Schools by
Settings Number Percentage Number Percentage
Number
Percentage
Primary+ Ordinary
level
558 35.40% 565 36.10% 561 32.5%
Primary +Ordinary
level and Advanced
level
491 31.20% 491 31.30% 492 28.5%
Ordinary level only 31 2.00% 33 2.10% 54 3.1%
Advanced level
only
197 12.50% 187 11.90% 313 18.1%
Ordinary level and
Advanced level
298 18.90% 291 18.60% 308 17.8%
Total 1,575 100% 1,567 100% 1,728 100%
Source: MINEDUC
Table 4.3.2: School by type of ownership
Year 2016 2017 2018
Owner Number Percentage Number Percentage Number Percentage
Government 460 29.20% 461 29.40% 524 30.3%
Catholic 620 39.40% 632 40.30% 661 38.3%
Protestant 279 17.70% 288 18.40% 314 18.2%
Adventist 22 1.40% 21 1.30% 19 1.1%
Islamic 16 1.00% 15 1.00% 17 1.0%
Parents associations
106 6.70% 102 6.50% 104 6.0%
Others 72 4.60% 48 3.10% 89 5.2%
Total 1,575 100% 1,567 100% 1,728 100%
Source: MINEDUC
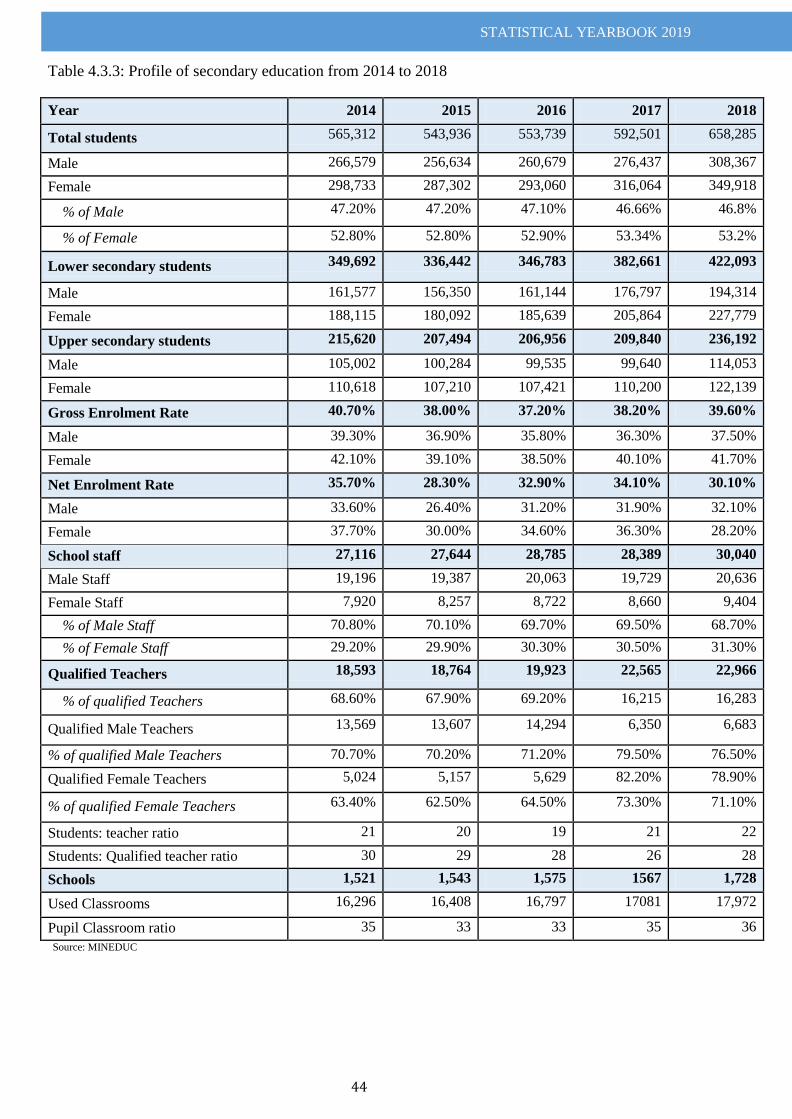
STATISTICAL YEARBOOK 2019
44
Table 4.3.3: Profile of secondary education from 2014 to 2018
Year 2014 2015 2016 2017 2018
Total students 565,312 543,936 553,739 592,501 658,285
Male 266,579 256,634 260,679 276,437 308,367
Female 298,733 287,302 293,060 316,064 349,918
% of Male 47.20% 47.20% 47.10% 46.66% 46.8%
% of Female 52.80% 52.80% 52.90% 53.34% 53.2%
Lower secondary students 349,692 336,442 346,783 382,661 422,093
Male 161,577 156,350 161,144 176,797 194,314
Female 188,115 180,092 185,639 205,864 227,779
Upper secondary students 215,620 207,494 206,956 209,840 236,192
Male 105,002 100,284 99,535 99,640 114,053
Female 110,618 107,210 107,421 110,200 122,139
Gross Enrolment Rate 40.70% 38.00% 37.20% 38.20% 39.60%
Male 39.30% 36.90% 35.80% 36.30% 37.50%
Female 42.10% 39.10% 38.50% 40.10% 41.70%
Net Enrolment Rate 35.70% 28.30% 32.90% 34.10% 30.10%
Male 33.60% 26.40% 31.20% 31.90% 32.10%
Female 37.70% 30.00% 34.60% 36.30% 28.20%
School staff 27,116 27,644 28,785 28,389 30,040
Male Staff 19,196 19,387 20,063 19,729 20,636
Female Staff 7,920 8,257 8,722 8,660 9,404
% of Male Staff 70.80% 70.10% 69.70% 69.50% 68.70%
% of Female Staff 29.20% 29.90% 30.30% 30.50% 31.30%
Qualified Teachers 18,593 18,764 19,923 22,565 22,966
% of qualified Teachers 68.60% 67.90% 69.20% 16,215 16,283
Qualified Male Teachers 13,569 13,607 14,294 6,350 6,683
% of qualified Male Teachers 70.70% 70.20% 71.20% 79.50% 76.50%
Qualified Female Teachers 5,024 5,157 5,629 82.20% 78.90%
% of qualified Female Teachers 63.40% 62.50% 64.50% 73.30% 71.10%
Students: teacher ratio 21 20 19 21 22
Students: Qualified teacher ratio 30 29 28 26 28
Schools 1,521 1,543 1,575 1567 1,728
Used Classrooms 16,296 16,408 16,797 17081 17,972
Pupil Classroom ratio 35 33 33 35 36
Source: MINEDUC
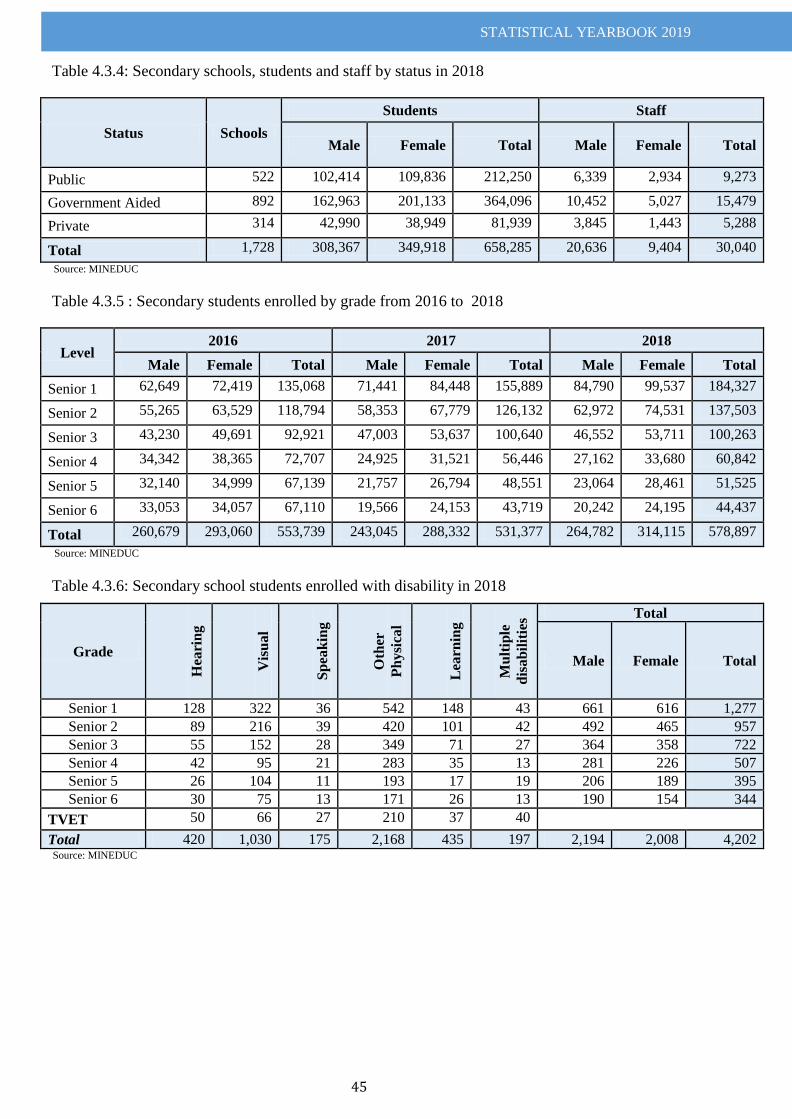
STATISTICAL YEARBOOK 2019
45
Table 4.3.4: Secondary schools, students and staff by status in 2018
Status Schools
Students Staff
Male Female Total Male Female Total
Public 522 102,414 109,836 212,250 6,339 2,934 9,273
Government Aided 892 162,963 201,133 364,096 10,452 5,027 15,479
Private 314 42,990 38,949 81,939 3,845 1,443 5,288
Total 1,728 308,367 349,918 658,285 20,636 9,404 30,040
Source: MINEDUC
Table 4.3.5 : Secondary students enrolled by grade from 2016 to 2018
Level 2016 2017 2018
Male Female Total Male Female Total Male Female Total
Senior 1 62,649 72,419 135,068 71,441 84,448 155,889 84,790 99,537 184,327
Senior 2 55,265 63,529 118,794 58,353 67,779 126,132 62,972 74,531 137,503
Senior 3 43,230 49,691 92,921 47,003 53,637 100,640 46,552 53,711 100,263
Senior 4 34,342 38,365 72,707 24,925 31,521 56,446 27,162 33,680 60,842
Senior 5 32,140 34,999 67,139 21,757 26,794 48,551 23,064 28,461 51,525
Senior 6 33,053 34,057 67,110 19,566 24,153 43,719 20,242 24,195 44,437
Total 260,679 293,060 553,739 243,045 288,332 531,377 264,782 314,115 578,897
Source: MINEDUC
Table 4.3.6: Secondary school students enrolled with disability in 2018
Grade
Hea
rin
g
Vis
ual
Sp
eak
ing
Oth
er
Ph
ysi
cal
Lea
rnin
g
Mu
ltip
le
dis
ab
ilit
ies Total
Male Female Total
Senior 1 128 322 36 542 148 43 661 616 1,277
Senior 2 89 216 39 420 101 42 492 465 957
Senior 3 55 152 28 349 71 27 364 358 722
Senior 4 42 95 21 283 35 13 281 226 507
Senior 5 26 104 11 193 17 19 206 189 395
Senior 6 30 75 13 171 26 13 190 154 344
TVET 50 66 27 210 37 40
Total 420 1,030 175 2,168 435 197 2,194 2,008 4,202 Source: MINEDUC
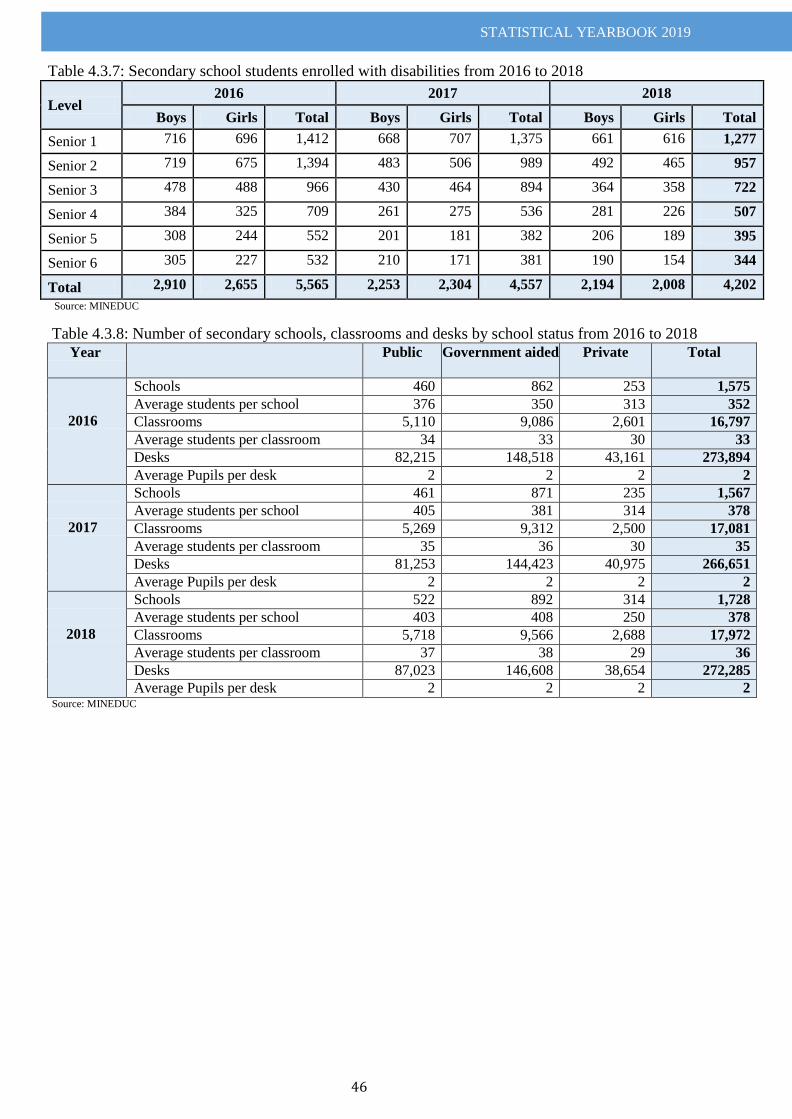
STATISTICAL YEARBOOK 2019
46
Table 4.3.7: Secondary school students enrolled with disabilities from 2016 to 2018
Level 2016 2017 2018
Boys Girls Total Boys Girls Total Boys Girls Total
Senior 1 716 696 1,412 668 707 1,375 661 616 1,277
Senior 2 719 675 1,394 483 506 989 492 465 957
Senior 3 478 488 966 430 464 894 364 358 722
Senior 4 384 325 709 261 275 536 281 226 507
Senior 5 308 244 552 201 181 382 206 189 395
Senior 6 305 227 532 210 171 381 190 154 344
Total 2,910 2,655 5,565 2,253 2,304 4,557 2,194 2,008 4,202
Source: MINEDUC
Table 4.3.8: Number of secondary schools, classrooms and desks by school status from 2016 to 2018 Year Public Government aided Private Total
2016
Schools 460 862 253 1,575
Average students per school 376 350 313 352
Classrooms 5,110 9,086 2,601 16,797
Average students per classroom 34 33 30 33
Desks 82,215 148,518 43,161 273,894
Average Pupils per desk 2 2 2 2
2017
Schools 461 871 235 1,567
Average students per school 405 381 314 378
Classrooms 5,269 9,312 2,500 17,081
Average students per classroom 35 36 30 35
Desks 81,253 144,423 40,975 266,651
Average Pupils per desk 2 2 2 2
2018
Schools 522 892 314 1,728
Average students per school 403 408 250 378
Classrooms 5,718 9,566 2,688 17,972
Average students per classroom 37 38 29 36
Desks 87,023 146,608 38,654 272,285
Average Pupils per desk 2 2 2 2 Source: MINEDUC
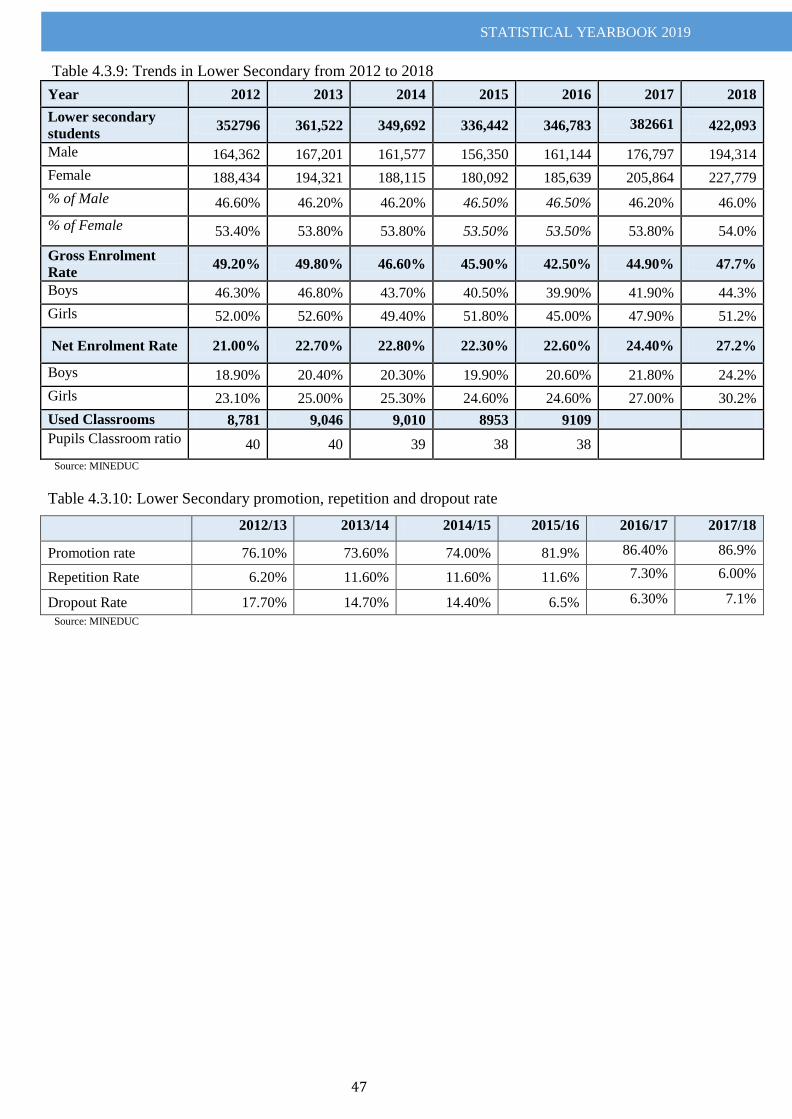
STATISTICAL YEARBOOK 2019
47
Table 4.3.9: Trends in Lower Secondary from 2012 to 2018
Year 2012 2013 2014 2015 2016 2017 2018
Lower secondary
students 352796 361,522 349,692 336,442 346,783 382661 422,093
Male 164,362 167,201 161,577 156,350 161,144 176,797 194,314
Female 188,434 194,321 188,115 180,092 185,639 205,864 227,779
% of Male 46.60% 46.20% 46.20% 46.50% 46.50% 46.20% 46.0%
% of Female 53.40% 53.80% 53.80% 53.50% 53.50% 53.80% 54.0%
Gross Enrolment
Rate 49.20% 49.80% 46.60% 45.90% 42.50% 44.90% 47.7%
Boys 46.30% 46.80% 43.70% 40.50% 39.90% 41.90% 44.3%
Girls 52.00% 52.60% 49.40% 51.80% 45.00% 47.90% 51.2%
Net Enrolment Rate 21.00% 22.70% 22.80% 22.30% 22.60% 24.40% 27.2%
Boys 18.90% 20.40% 20.30% 19.90% 20.60% 21.80% 24.2%
Girls 23.10% 25.00% 25.30% 24.60% 24.60% 27.00% 30.2%
Used Classrooms 8,781 9,046 9,010 8953 9109
Pupils Classroom ratio 40 40 39 38 38
Source: MINEDUC
Table 4.3.10: Lower Secondary promotion, repetition and dropout rate
2012/13 2013/14 2014/15 2015/16 2016/17 2017/18
Promotion rate 76.10% 73.60% 74.00% 81.9% 86.40% 86.9%
Repetition Rate 6.20% 11.60% 11.60% 11.6% 7.30% 6.00%
Dropout Rate 17.70% 14.70% 14.40% 6.5% 6.30% 7.1%
Source: MINEDUC
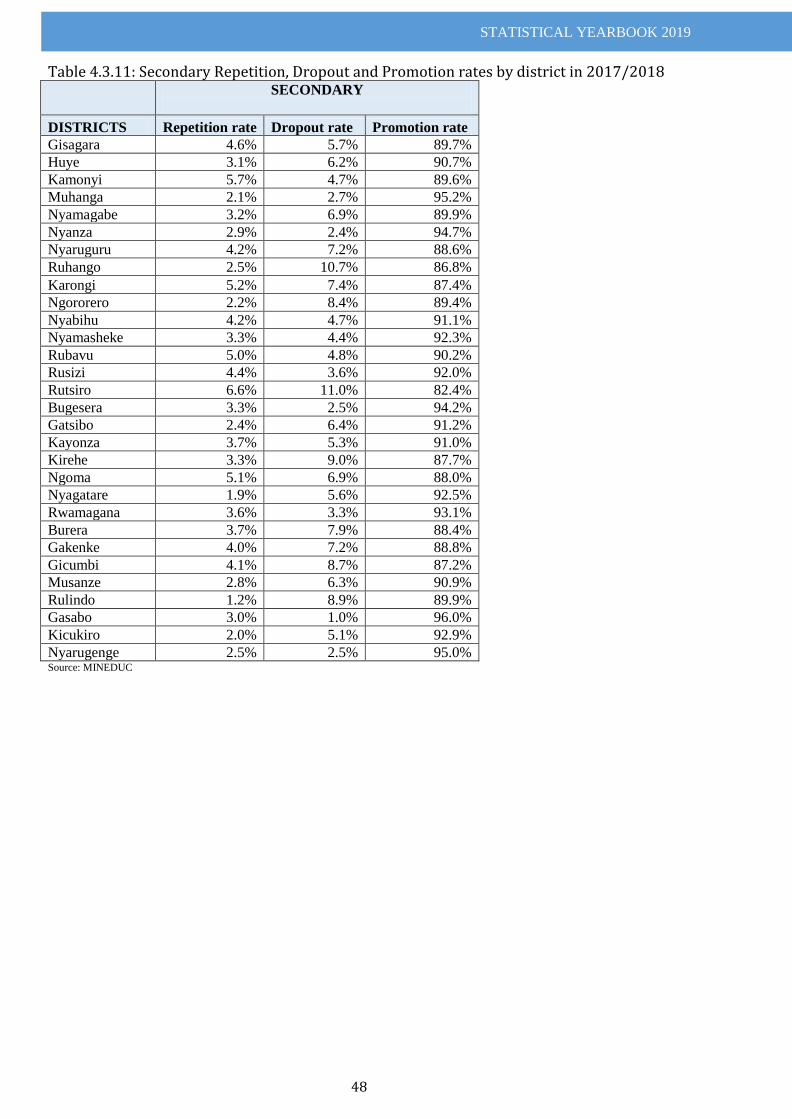
STATISTICAL YEARBOOK 2019
48
Table 4.3.11: Secondary Repetition, Dropout and Promotion rates by district in 2017/2018
SECONDARY
DISTRICTS Repetition rate Dropout rate Promotion rate
Gisagara 4.6% 5.7% 89.7%
Huye 3.1% 6.2% 90.7%
Kamonyi 5.7% 4.7% 89.6%
Muhanga 2.1% 2.7% 95.2%
Nyamagabe 3.2% 6.9% 89.9%
Nyanza 2.9% 2.4% 94.7%
Nyaruguru 4.2% 7.2% 88.6%
Ruhango 2.5% 10.7% 86.8%
Karongi 5.2% 7.4% 87.4%
Ngororero 2.2% 8.4% 89.4%
Nyabihu 4.2% 4.7% 91.1%
Nyamasheke 3.3% 4.4% 92.3%
Rubavu 5.0% 4.8% 90.2%
Rusizi 4.4% 3.6% 92.0%
Rutsiro 6.6% 11.0% 82.4%
Bugesera 3.3% 2.5% 94.2%
Gatsibo 2.4% 6.4% 91.2%
Kayonza 3.7% 5.3% 91.0%
Kirehe 3.3% 9.0% 87.7%
Ngoma 5.1% 6.9% 88.0%
Nyagatare 1.9% 5.6% 92.5%
Rwamagana 3.6% 3.3% 93.1%
Burera 3.7% 7.9% 88.4%
Gakenke 4.0% 7.2% 88.8%
Gicumbi 4.1% 8.7% 87.2%
Musanze 2.8% 6.3% 90.9%
Rulindo 1.2% 8.9% 89.9%
Gasabo 3.0% 1.0% 96.0%
Kicukiro 2.0% 5.1% 92.9%
Nyarugenge 2.5% 2.5% 95.0% Source: MINEDUC
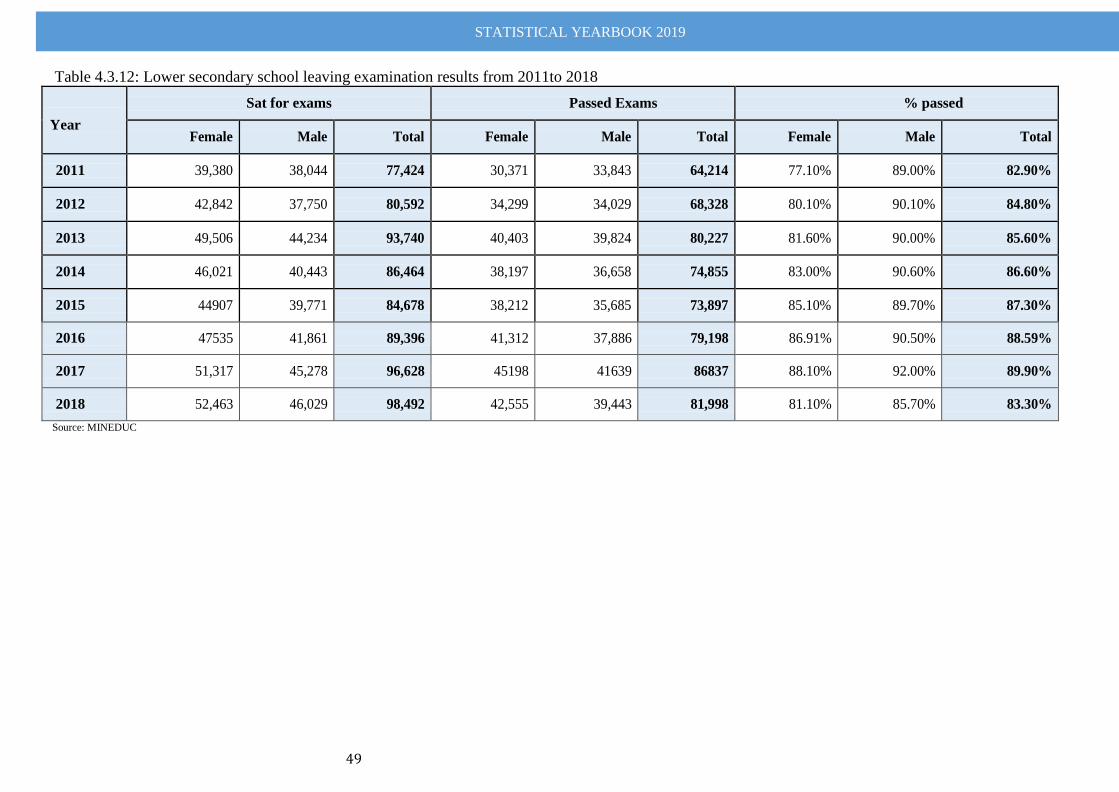
STATISTICAL YEARBOOK 2019
49
Table 4.3.12: Lower secondary school leaving examination results from 2011to 2018
Year
Sat for exams Passed Exams % passed
Female Male Total Female Male Total Female Male Total
2011 39,380 38,044 77,424 30,371 33,843 64,214 77.10% 89.00% 82.90%
2012 42,842 37,750 80,592 34,299 34,029 68,328 80.10% 90.10% 84.80%
2013 49,506 44,234 93,740 40,403 39,824 80,227 81.60% 90.00% 85.60%
2014 46,021 40,443 86,464 38,197 36,658 74,855 83.00% 90.60% 86.60%
2015 44907 39,771 84,678 38,212 35,685 73,897 85.10% 89.70% 87.30%
2016 47535 41,861 89,396 41,312 37,886 79,198 86.91% 90.50% 88.59%
2017 51,317 45,278 96,628 45198 41639 86837 88.10% 92.00% 89.90%
2018 52,463 46,029 98,492 42,555 39,443 81,998 81.10% 85.70% 83.30%
Source: MINEDUC
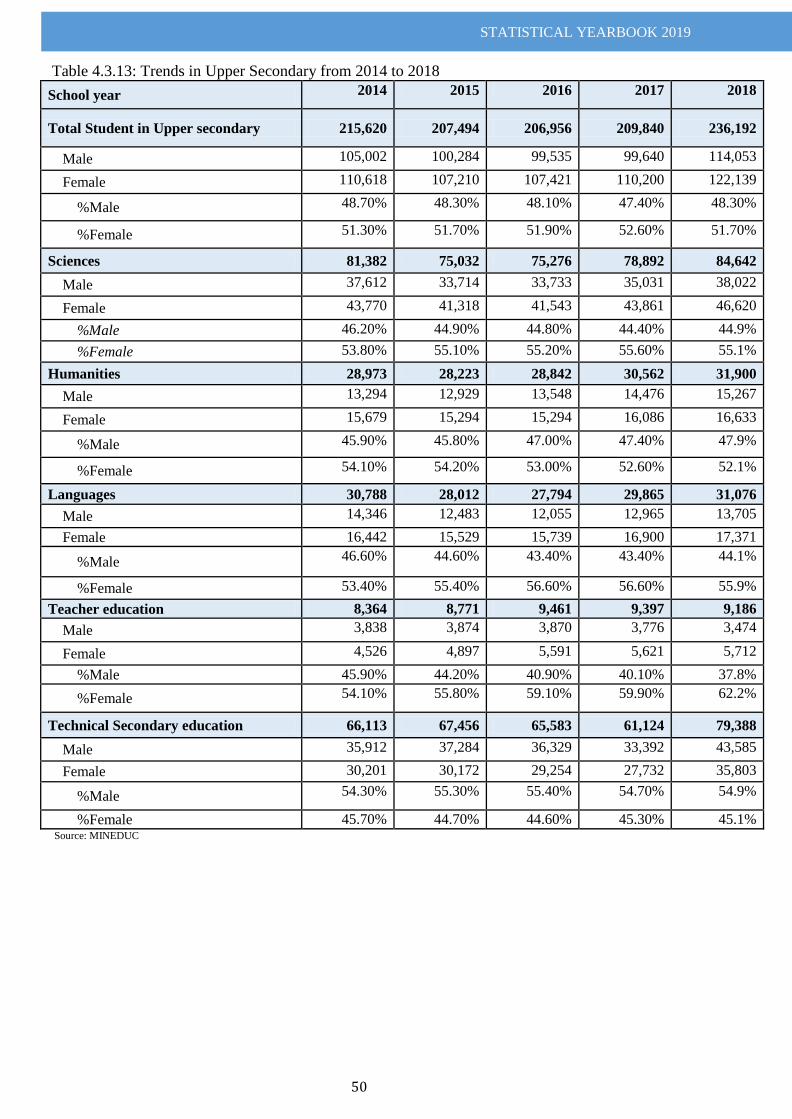
STATISTICAL YEARBOOK 2019
50
Table 4.3.13: Trends in Upper Secondary from 2014 to 2018
School year 2014 2015 2016 2017 2018
Total Student in Upper secondary 215,620 207,494 206,956 209,840 236,192
Male 105,002 100,284 99,535 99,640 114,053
Female 110,618 107,210 107,421 110,200 122,139
%Male 48.70% 48.30% 48.10% 47.40% 48.30%
%Female 51.30% 51.70% 51.90% 52.60% 51.70%
Sciences 81,382 75,032 75,276 78,892 84,642
Male 37,612 33,714 33,733 35,031 38,022
Female 43,770 41,318 41,543 43,861 46,620
%Male 46.20% 44.90% 44.80% 44.40% 44.9%
%Female 53.80% 55.10% 55.20% 55.60% 55.1%
Humanities 28,973 28,223 28,842 30,562 31,900
Male 13,294 12,929 13,548 14,476 15,267
Female 15,679 15,294 15,294 16,086 16,633
%Male 45.90% 45.80% 47.00% 47.40% 47.9%
%Female 54.10% 54.20% 53.00% 52.60% 52.1%
Languages 30,788 28,012 27,794 29,865 31,076
Male 14,346 12,483 12,055 12,965 13,705
Female 16,442 15,529 15,739 16,900 17,371
%Male 46.60% 44.60% 43.40% 43.40% 44.1%
%Female 53.40% 55.40% 56.60% 56.60% 55.9%
Teacher education 8,364 8,771 9,461 9,397 9,186
Male 3,838 3,874 3,870 3,776 3,474
Female 4,526 4,897 5,591 5,621 5,712
%Male 45.90% 44.20% 40.90% 40.10% 37.8%
%Female 54.10% 55.80% 59.10% 59.90% 62.2%
Technical Secondary education 66,113 67,456 65,583 61,124 79,388
Male 35,912 37,284 36,329 33,392 43,585
Female 30,201 30,172 29,254 27,732 35,803
%Male 54.30% 55.30% 55.40% 54.70% 54.9%
%Female 45.70% 44.70% 44.60% 45.30% 45.1% Source: MINEDUC
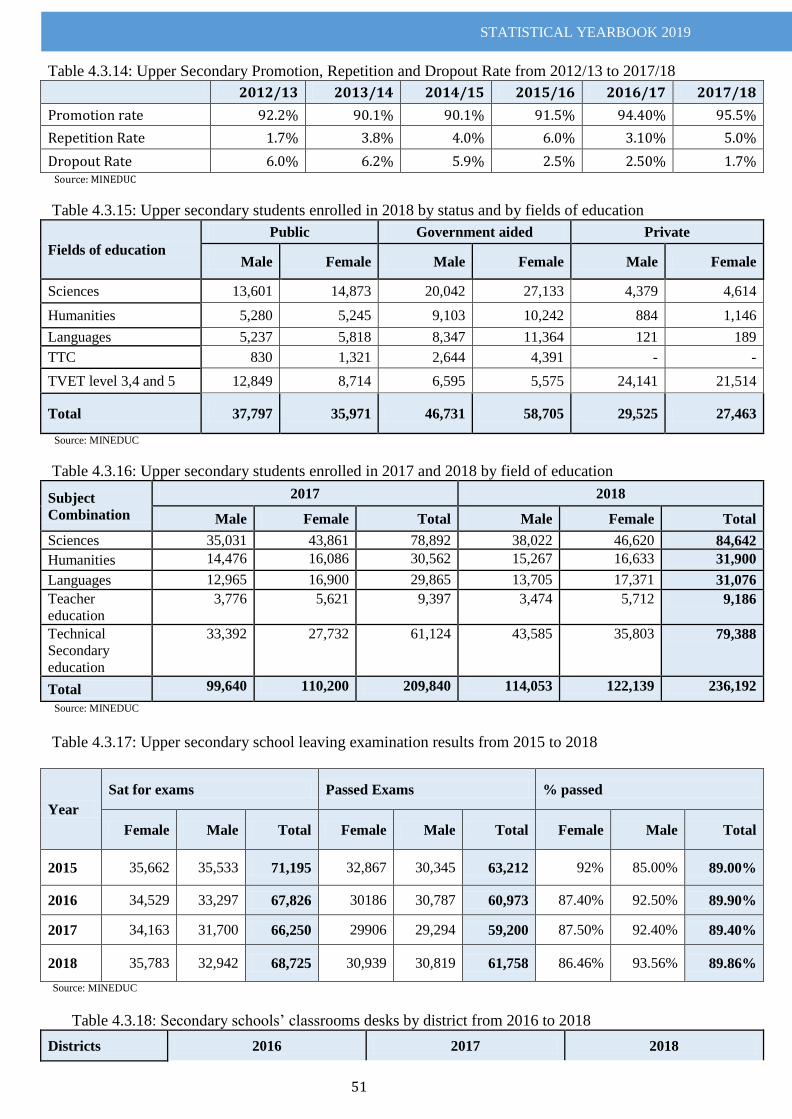
STATISTICAL YEARBOOK 2019
51
Table 4.3.14: Upper Secondary Promotion, Repetition and Dropout Rate from 2012/13 to 2017/18
2012/13 2013/14 2014/15 2015/16 2016/17 2017/18
Promotion rate 92.2% 90.1% 90.1% 91.5% 94.40% 95.5%
Repetition Rate 1.7% 3.8% 4.0% 6.0% 3.10% 5.0%
Dropout Rate 6.0% 6.2% 5.9% 2.5% 2.50% 1.7% Source: MINEDUC
Table 4.3.15: Upper secondary students enrolled in 2018 by status and by fields of education
Fields of education
Public Government aided Private
Male Female Male Female Male Female
Sciences 13,601 14,873 20,042 27,133 4,379 4,614
Humanities 5,280 5,245 9,103 10,242 884 1,146
Languages 5,237 5,818 8,347 11,364 121 189
TTC 830 1,321 2,644 4,391 - -
TVET level 3,4 and 5 12,849 8,714 6,595 5,575 24,141 21,514
Total 37,797 35,971 46,731 58,705 29,525 27,463
Source: MINEDUC
Table 4.3.16: Upper secondary students enrolled in 2017 and 2018 by field of education
Subject
Combination
2017 2018
Male Female Total Male Female Total
Sciences 35,031 43,861 78,892 38,022 46,620 84,642
Humanities 14,476 16,086 30,562 15,267 16,633 31,900
Languages 12,965 16,900 29,865 13,705 17,371 31,076
Teacher
education
3,776 5,621 9,397 3,474 5,712 9,186
Technical
Secondary
education
33,392 27,732 61,124 43,585 35,803 79,388
Total 99,640 110,200 209,840 114,053 122,139 236,192
Source: MINEDUC
Table 4.3.17: Upper secondary school leaving examination results from 2015 to 2018
Year
Sat for exams Passed Exams % passed
Female Male Total Female Male Total Female Male Total
2015 35,662 35,533 71,195 32,867 30,345 63,212 92% 85.00% 89.00%
2016 34,529 33,297 67,826 30186 30,787 60,973 87.40% 92.50% 89.90%
2017 34,163 31,700 66,250 29906 29,294 59,200 87.50% 92.40% 89.40%
2018 35,783 32,942 68,725 30,939 30,819 61,758 86.46% 93.56% 89.86%
Source: MINEDUC
Table 4.3.18: Secondary schools‟ classrooms desks by district from 2016 to 2018
Districts 2016 2017 2018
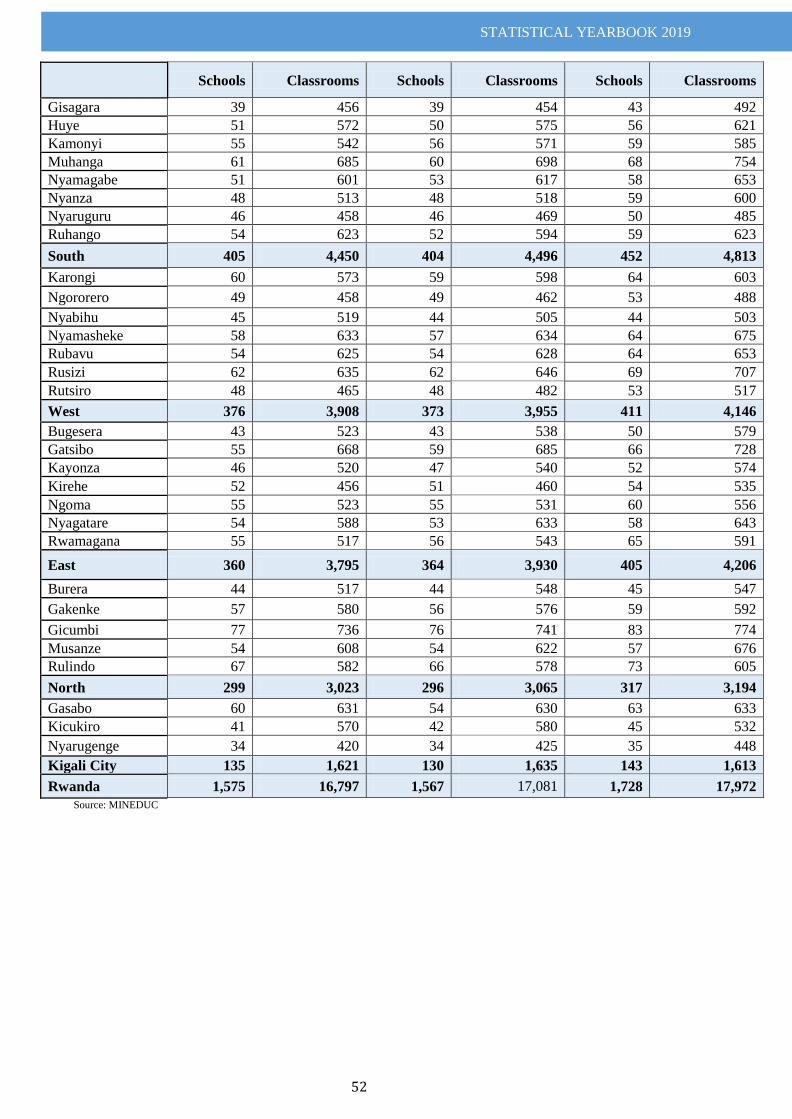
STATISTICAL YEARBOOK 2019
52
Schools Classrooms Schools Classrooms Schools Classrooms
Gisagara 39 456 39 454 43 492
Huye 51 572 50 575 56 621
Kamonyi 55 542 56 571 59 585
Muhanga 61 685 60 698 68 754
Nyamagabe 51 601 53 617 58 653
Nyanza 48 513 48 518 59 600
Nyaruguru 46 458 46 469 50 485
Ruhango 54 623 52 594 59 623
South 405 4,450 404 4,496 452 4,813
Karongi 60 573 59 598 64 603
Ngororero 49 458 49 462 53 488
Nyabihu 45 519 44 505 44 503
Nyamasheke 58 633 57 634 64 675
Rubavu 54 625 54 628 64 653
Rusizi 62 635 62 646 69 707
Rutsiro 48 465 48 482 53 517
West 376 3,908 373 3,955 411 4,146
Bugesera 43 523 43 538 50 579
Gatsibo 55 668 59 685 66 728
Kayonza 46 520 47 540 52 574
Kirehe 52 456 51 460 54 535
Ngoma 55 523 55 531 60 556
Nyagatare 54 588 53 633 58 643
Rwamagana 55 517 56 543 65 591
East 360 3,795 364 3,930 405 4,206
Burera 44 517 44 548 45 547
Gakenke 57 580 56 576 59 592
Gicumbi 77 736 76 741 83 774
Musanze 54 608 54 622 57 676
Rulindo 67 582 66 578 73 605
North 299 3,023 296 3,065 317 3,194
Gasabo 60 631 54 630 63 633
Kicukiro 41 570 42 580 45 532
Nyarugenge 34 420 34 425 35 448
Kigali City 135 1,621 130 1,635 143 1,613
Rwanda 1,575 16,797 1,567 17,081 1,728 17,972
Source: MINEDUC
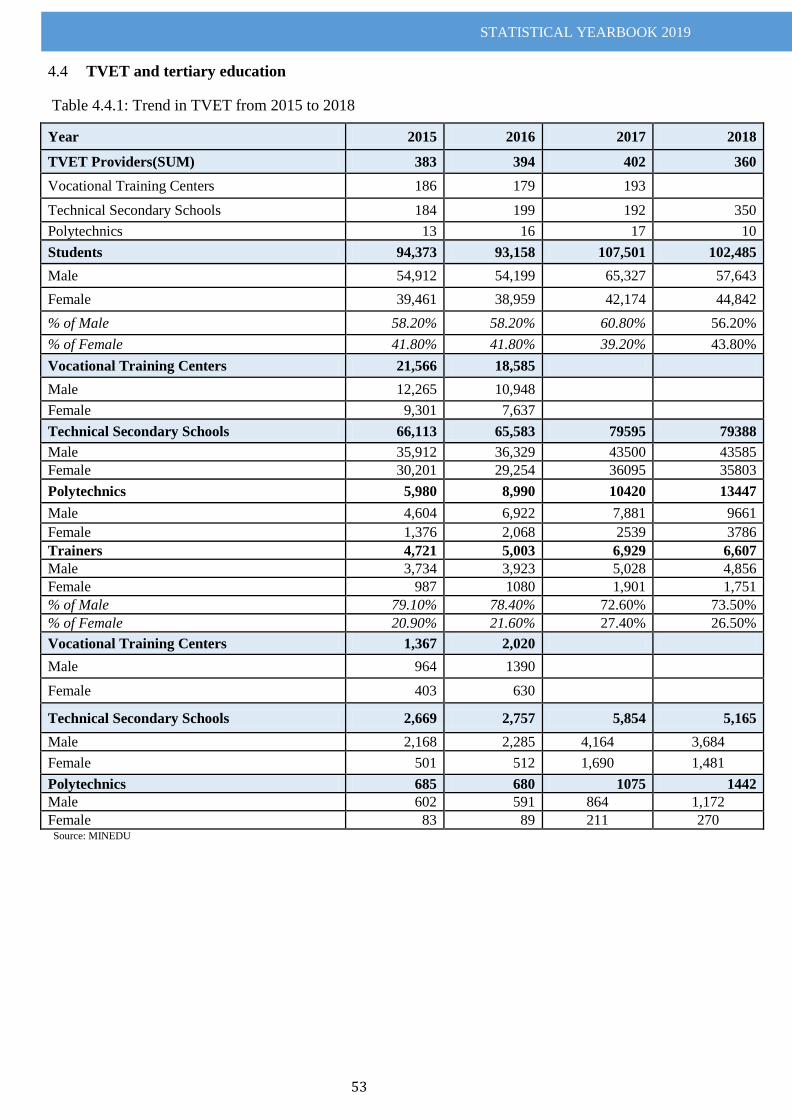
STATISTICAL YEARBOOK 2019
53
TVET and tertiary education 4.4
Table 4.4.1: Trend in TVET from 2015 to 2018
Year 2015 2016 2017 2018
TVET Providers(SUM) 383 394 402 360
Vocational Training Centers 186 179 193
Technical Secondary Schools 184 199 192 350
Polytechnics 13 16 17 10
Students 94,373 93,158 107,501 102,485
Male 54,912 54,199 65,327 57,643
Female 39,461 38,959 42,174 44,842
% of Male 58.20% 58.20% 60.80% 56.20%
% of Female 41.80% 41.80% 39.20% 43.80%
Vocational Training Centers 21,566 18,585
Male 12,265 10,948
Female 9,301 7,637
Technical Secondary Schools 66,113 65,583 79595 79388
Male 35,912 36,329 43500 43585
Female 30,201 29,254 36095 35803
Polytechnics 5,980 8,990 10420 13447
Male 4,604 6,922 7,881 9661
Female 1,376 2,068 2539 3786
Trainers 4,721 5,003 6,929 6,607
Male 3,734 3,923 5,028 4,856
Female 987 1080 1,901 1,751
% of Male 79.10% 78.40% 72.60% 73.50%
% of Female 20.90% 21.60% 27.40% 26.50%
Vocational Training Centers 1,367 2,020
Male 964 1390
Female 403 630
Technical Secondary Schools 2,669 2,757 5,854 5,165
Male 2,168 2,285 4,164 3,684
Female 501 512 1,690 1,481
Polytechnics 685 680 1075 1442
Male 602 591 864 1,172
Female 83 89 211 270 Source: MINEDU
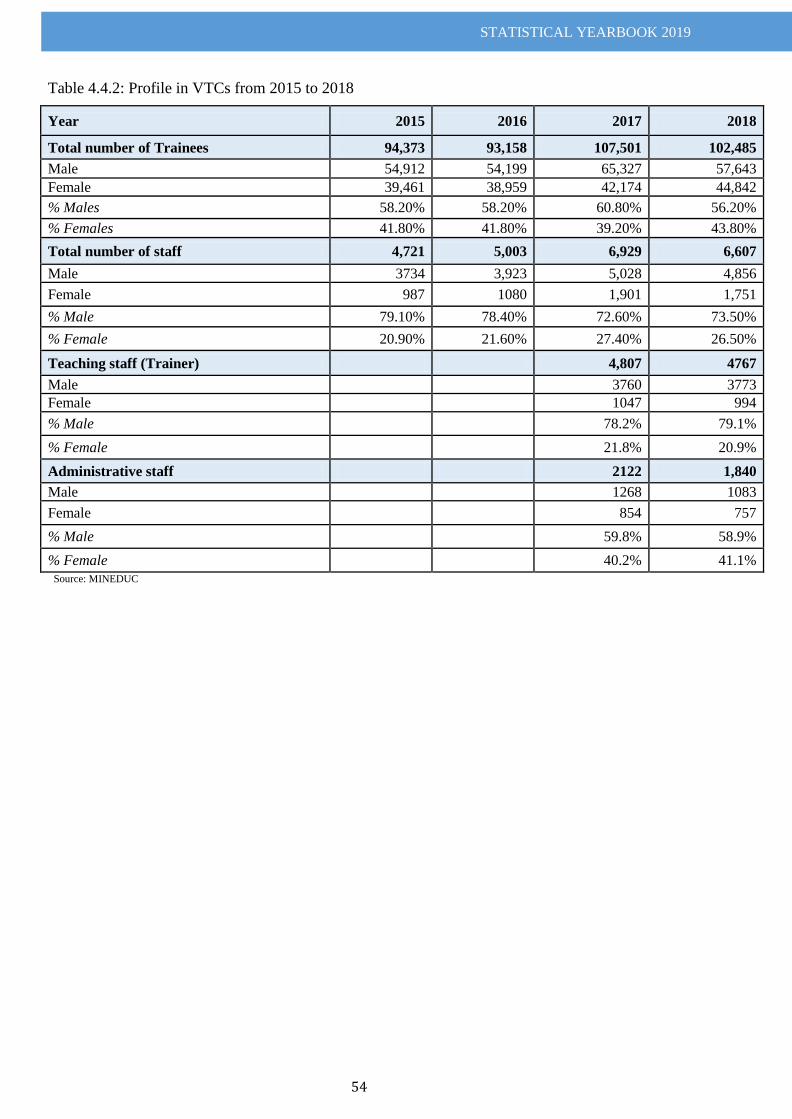
STATISTICAL YEARBOOK 2019
54
Table 4.4.2: Profile in VTCs from 2015 to 2018
Year 2015 2016 2017 2018
Total number of Trainees 94,373 93,158 107,501 102,485
Male 54,912 54,199 65,327 57,643
Female 39,461 38,959 42,174 44,842
% Males 58.20% 58.20% 60.80% 56.20%
% Females 41.80% 41.80% 39.20% 43.80%
Total number of staff 4,721 5,003 6,929 6,607
Male 3734 3,923 5,028 4,856
Female 987 1080 1,901 1,751
% Male 79.10% 78.40% 72.60% 73.50%
% Female 20.90% 21.60% 27.40% 26.50%
Teaching staff (Trainer) 4,807 4767
Male 3760 3773
Female 1047 994
% Male 78.2% 79.1%
% Female 21.8% 20.9%
Administrative staff 2122 1,840
Male 1268 1083
Female 854 757
% Male 59.8% 58.9%
% Female 40.2% 41.1%
Source: MINEDUC
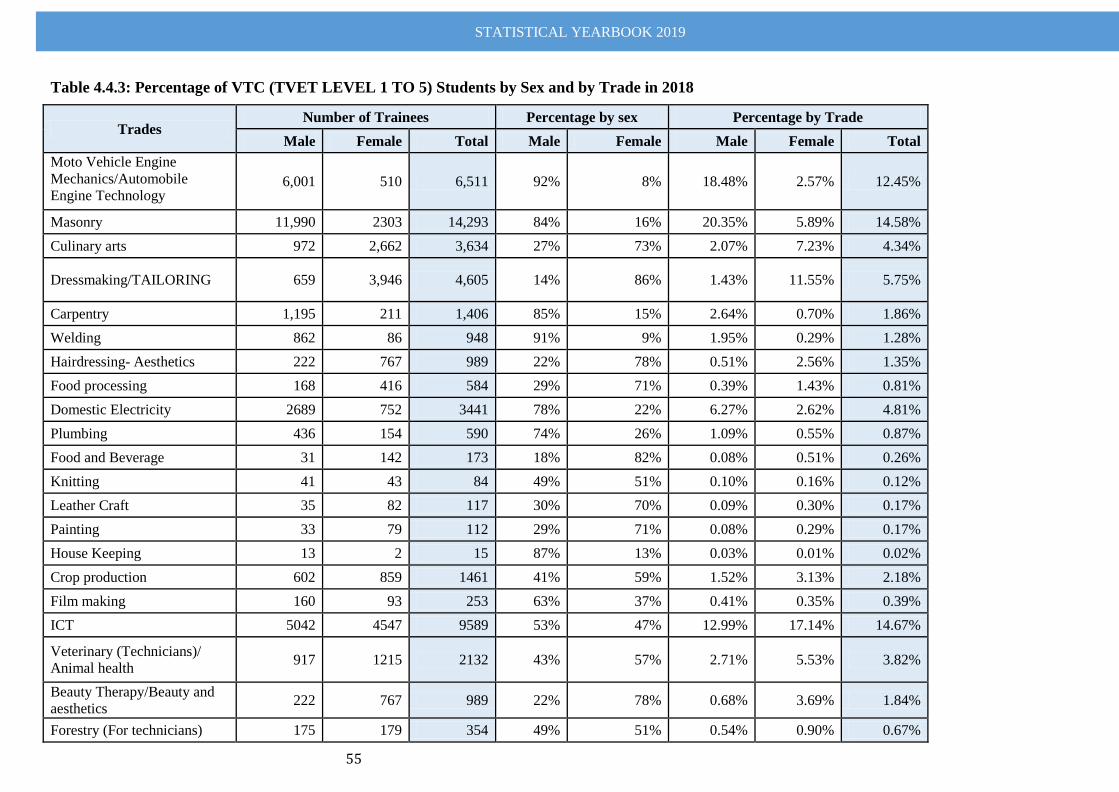
STATISTICAL YEARBOOK 2019
55
Table 4.4.3: Percentage of VTC (TVET LEVEL 1 TO 5) Students by Sex and by Trade in 2018
Trades Number of Trainees Percentage by sex Percentage by Trade
Male Female Total Male Female Male Female Total
Moto Vehicle Engine
Mechanics/Automobile
Engine Technology 6,001 510 6,511 92% 8% 18.48% 2.57% 12.45%
Masonry 11,990 2303 14,293 84% 16% 20.35% 5.89% 14.58%
Culinary arts 972 2,662 3,634 27% 73% 2.07% 7.23% 4.34%
Dressmaking/TAILORING 659 3,946 4,605 14% 86% 1.43% 11.55% 5.75%
Carpentry 1,195 211 1,406 85% 15% 2.64% 0.70% 1.86%
Welding 862 86 948 91% 9% 1.95% 0.29% 1.28%
Hairdressing- Aesthetics 222 767 989 22% 78% 0.51% 2.56% 1.35%
Food processing 168 416 584 29% 71% 0.39% 1.43% 0.81%
Domestic Electricity 2689 752 3441 78% 22% 6.27% 2.62% 4.81%
Plumbing 436 154 590 74% 26% 1.09% 0.55% 0.87%
Food and Beverage 31 142 173 18% 82% 0.08% 0.51% 0.26%
Knitting 41 43 84 49% 51% 0.10% 0.16% 0.12%
Leather Craft 35 82 117 30% 70% 0.09% 0.30% 0.17%
Painting 33 79 112 29% 71% 0.08% 0.29% 0.17%
House Keeping 13 2 15 87% 13% 0.03% 0.01% 0.02%
Crop production 602 859 1461 41% 59% 1.52% 3.13% 2.18%
Film making 160 93 253 63% 37% 0.41% 0.35% 0.39%
ICT 5042 4547 9589 53% 47% 12.99% 17.14% 14.67%
Veterinary (Technicians)/
Animal health 917 1215 2132 43% 57% 2.71% 5.53% 3.82%
Beauty Therapy/Beauty and
aesthetics 222 767 989 22% 78% 0.68% 3.69% 1.84%
Forestry (For technicians) 175 179 354 49% 51% 0.54% 0.90% 0.67%
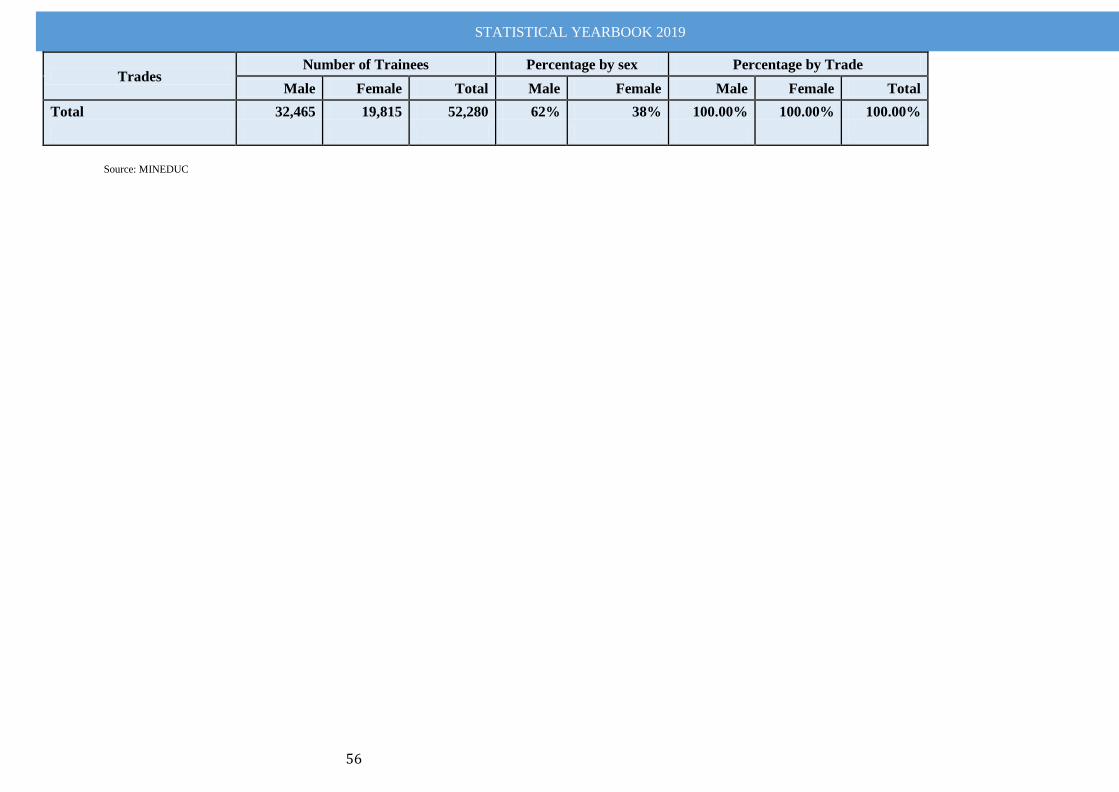
STATISTICAL YEARBOOK 2019
56
Trades Number of Trainees Percentage by sex Percentage by Trade
Male Female Total Male Female Male Female Total
Total 32,465 19,815 52,280 62% 38% 100.00% 100.00% 100.00%
Source: MINEDUC
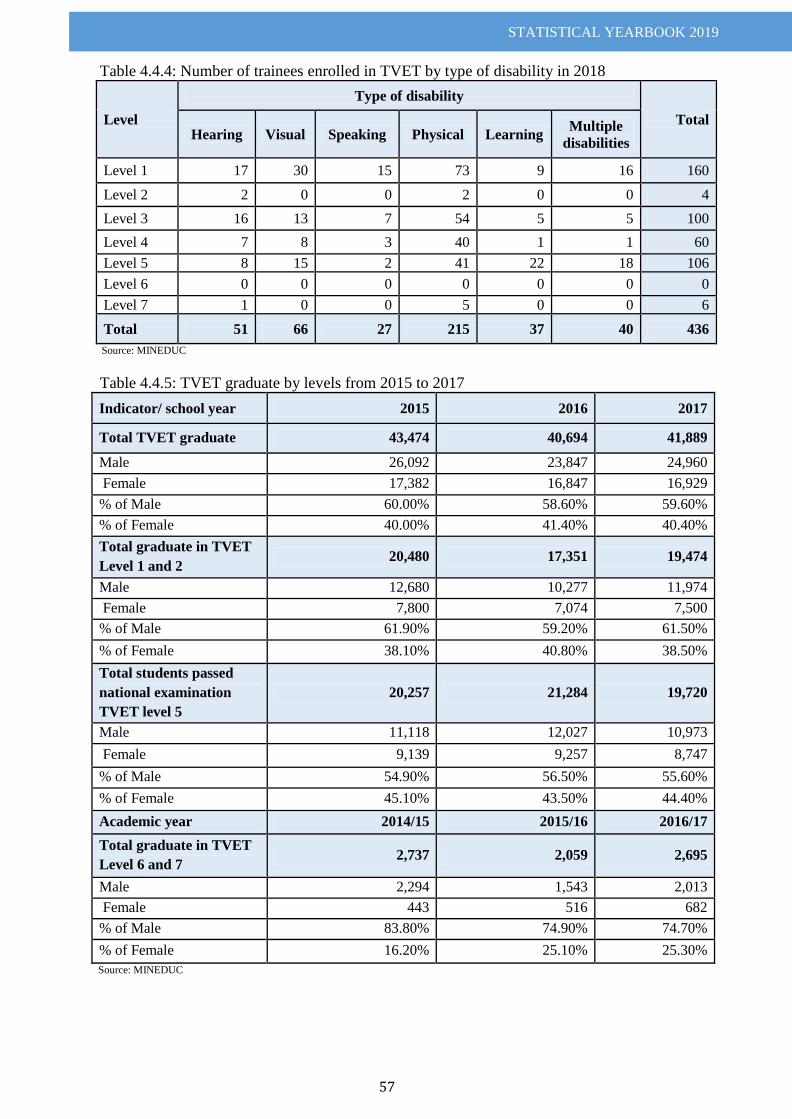
STATISTICAL YEARBOOK 2019
57
Table 4.4.4: Number of trainees enrolled in TVET by type of disability in 2018
Level
Type of disability
Total Hearing Visual Speaking Physical Learning
Multiple
disabilities
Level 1 17 30 15 73 9 16 160
Level 2 2 0 0 2 0 0 4
Level 3 16 13 7 54 5 5 100
Level 4 7 8 3 40 1 1 60
Level 5 8 15 2 41 22 18 106
Level 6 0 0 0 0 0 0 0
Level 7 1 0 0 5 0 0 6
Total 51 66 27 215 37 40 436
Source: MINEDUC
Table 4.4.5: TVET graduate by levels from 2015 to 2017
Indicator/ school year 2015 2016 2017
Total TVET graduate 43,474 40,694 41,889
Male 26,092 23,847 24,960
Female 17,382 16,847 16,929
% of Male 60.00% 58.60% 59.60%
% of Female 40.00% 41.40% 40.40%
Total graduate in TVET
Level 1 and 2 20,480 17,351 19,474
Male 12,680 10,277 11,974
Female 7,800 7,074 7,500
% of Male 61.90% 59.20% 61.50%
% of Female 38.10% 40.80% 38.50%
Total students passed
national examination
TVET level 5
20,257 21,284 19,720
Male 11,118 12,027 10,973
Female 9,139 9,257 8,747
% of Male 54.90% 56.50% 55.60%
% of Female 45.10% 43.50% 44.40%
Academic year 2014/15 2015/16 2016/17
Total graduate in TVET
Level 6 and 7 2,737 2,059 2,695
Male 2,294 1,543 2,013
Female 443 516 682
% of Male 83.80% 74.90% 74.70%
% of Female 16.20% 25.10% 25.30%
Source: MINEDUC
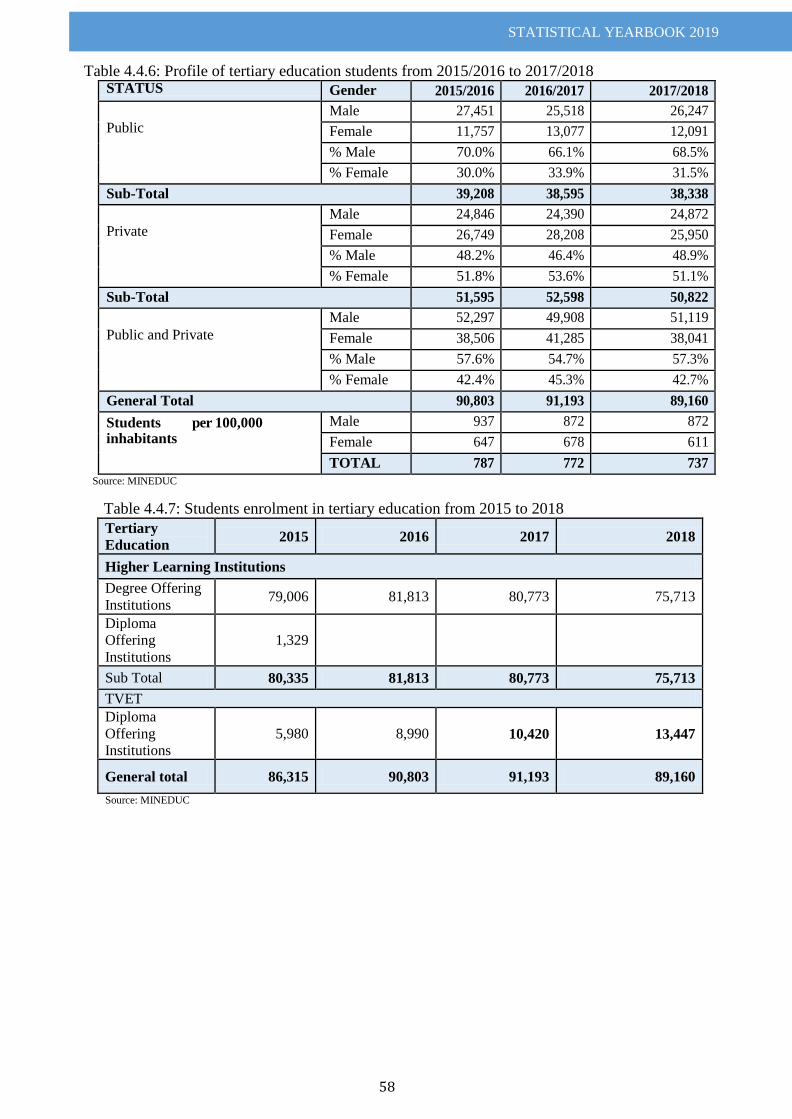
STATISTICAL YEARBOOK 2019
58
Table 4.4.6: Profile of tertiary education students from 2015/2016 to 2017/2018 STATUS Gender 2015/2016 2016/2017 2017/2018
Public
Male 27,451 25,518 26,247
Female 11,757 13,077 12,091
% Male 70.0% 66.1% 68.5%
% Female 30.0% 33.9% 31.5%
Sub-Total 39,208 38,595 38,338
Private
Male 24,846 24,390 24,872
Female 26,749 28,208 25,950
% Male 48.2% 46.4% 48.9%
% Female 51.8% 53.6% 51.1%
Sub-Total 51,595 52,598 50,822
Public and Private
Male 52,297 49,908 51,119
Female 38,506 41,285 38,041
% Male 57.6% 54.7% 57.3%
% Female 42.4% 45.3% 42.7%
General Total 90,803 91,193 89,160
Students per 100,000 inhabitants
Male 937 872 872
Female 647 678 611
TOTAL 787 772 737
Source: MINEDUC
Table 4.4.7: Students enrolment in tertiary education from 2015 to 2018
Tertiary
Education 2015 2016 2017 2018
Higher Learning Institutions
Degree Offering
Institutions 79,006 81,813 80,773 75,713
Diploma
Offering
Institutions
1,329
Sub Total 80,335 81,813 80,773 75,713
TVET
Diploma
Offering
Institutions
5,980 8,990 10,420 13,447
General total 86,315 90,803 91,193 89,160
Source: MINEDUC
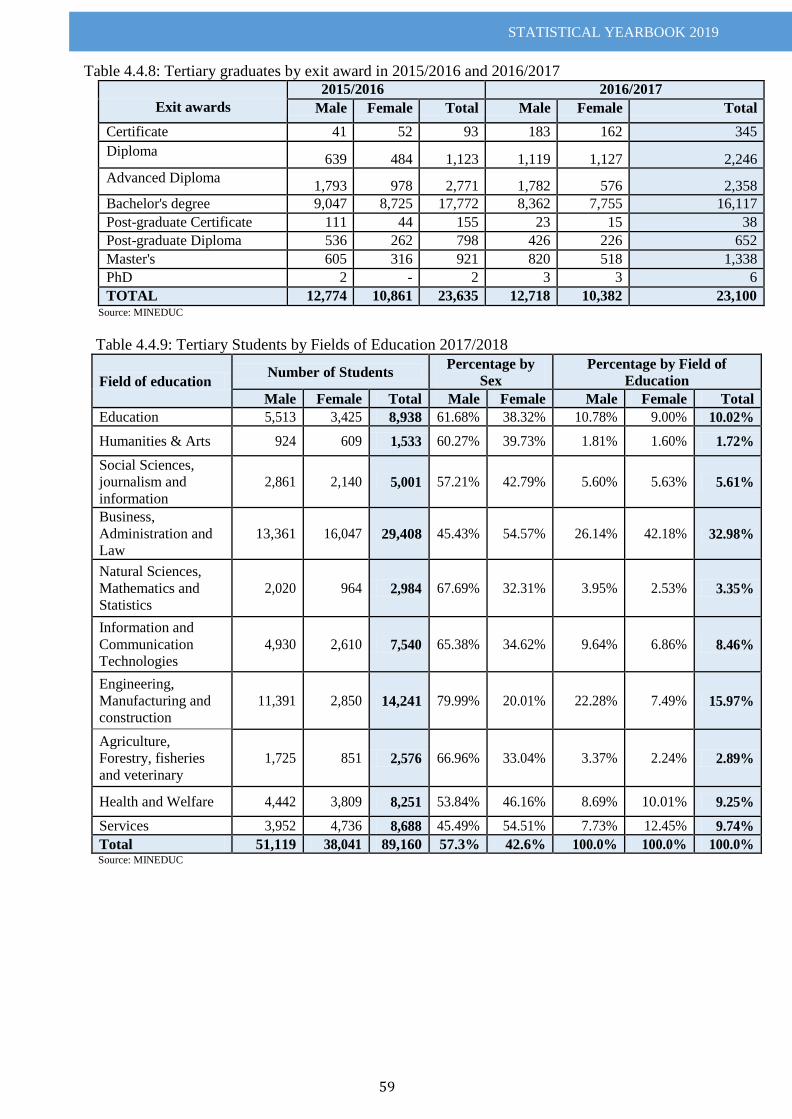
STATISTICAL YEARBOOK 2019
59
Table 4.4.8: Tertiary graduates by exit award in 2015/2016 and 2016/2017
Exit awards
2015/2016 2016/2017
Male Female Total Male Female Total
Certificate 41 52 93 183 162 345
Diploma 639 484 1,123 1,119 1,127 2,246
Advanced Diploma 1,793 978 2,771 1,782 576 2,358
Bachelor's degree 9,047 8,725 17,772 8,362 7,755 16,117
Post-graduate Certificate 111 44 155 23 15 38
Post-graduate Diploma 536 262 798 426 226 652
Master's 605 316 921 820 518 1,338
PhD 2 - 2 3 3 6
TOTAL 12,774 10,861 23,635 12,718 10,382 23,100 Source: MINEDUC
Table 4.4.9: Tertiary Students by Fields of Education 2017/2018
Field of education Number of Students
Percentage by
Sex
Percentage by Field of
Education
Male Female Total Male Female Male Female Total
Education 5,513 3,425 8,938 61.68% 38.32% 10.78% 9.00% 10.02%
Humanities & Arts 924 609 1,533 60.27% 39.73% 1.81% 1.60% 1.72%
Social Sciences,
journalism and
information
2,861 2,140 5,001 57.21% 42.79% 5.60% 5.63% 5.61%
Business,
Administration and
Law
13,361 16,047 29,408 45.43% 54.57% 26.14% 42.18% 32.98%
Natural Sciences,
Mathematics and
Statistics
2,020 964 2,984 67.69% 32.31% 3.95% 2.53% 3.35%
Information and
Communication
Technologies
4,930 2,610 7,540 65.38% 34.62% 9.64% 6.86% 8.46%
Engineering,
Manufacturing and
construction
11,391 2,850 14,241 79.99% 20.01% 22.28% 7.49% 15.97%
Agriculture,
Forestry, fisheries
and veterinary
1,725 851 2,576 66.96% 33.04% 3.37% 2.24% 2.89%
Health and Welfare 4,442 3,809 8,251 53.84% 46.16% 8.69% 10.01% 9.25%
Services 3,952 4,736 8,688 45.49% 54.51% 7.73% 12.45% 9.74%
Total 51,119 38,041 89,160 57.3% 42.6% 100.0% 100.0% 100.0% Source: MINEDUC
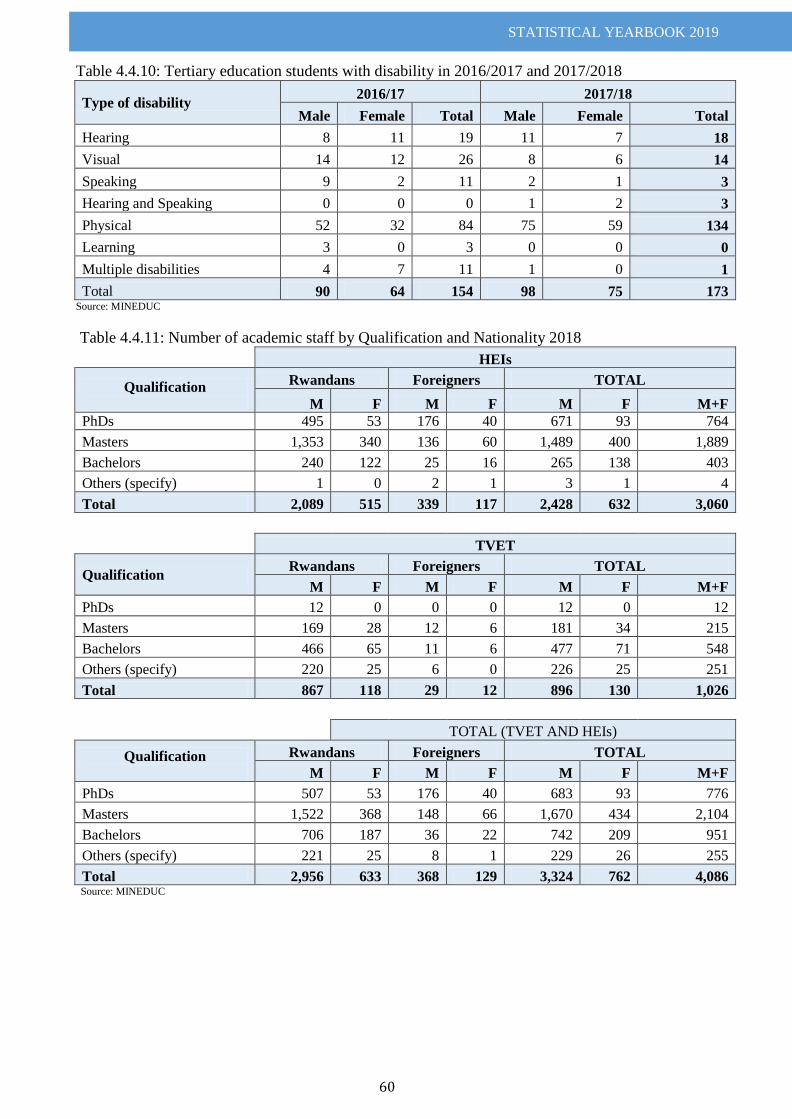
STATISTICAL YEARBOOK 2019
60
Table 4.4.10: Tertiary education students with disability in 2016/2017 and 2017/2018
Type of disability 2016/17 2017/18
Male Female Total Male Female Total
Hearing 8 11 19 11 7 18
Visual 14 12 26 8 6 14
Speaking 9 2 11 2 1 3
Hearing and Speaking 0 0 0 1 2 3
Physical 52 32 84 75 59 134
Learning 3 0 3 0 0 0
Multiple disabilities 4 7 11 1 0 1
Total 90 64 154 98 75 173 Source: MINEDUC
Table 4.4.11: Number of academic staff by Qualification and Nationality 2018
HEIs
Qualification
Rwandans Foreigners TOTAL
M F M F M F M+F
PhDs 495 53 176 40 671 93 764
Masters 1,353 340 136 60 1,489 400 1,889
Bachelors 240 122 25 16 265 138 403
Others (specify) 1 0 2 1 3 1 4
Total 2,089 515 339 117 2,428 632 3,060
TVET
Qualification Rwandans Foreigners TOTAL
M F M F M F M+F
PhDs 12 0 0 0 12 0 12
Masters 169 28 12 6 181 34 215
Bachelors 466 65 11 6 477 71 548
Others (specify) 220 25 6 0 226 25 251
Total 867 118 29 12 896 130 1,026
TOTAL (TVET AND HEIs)
Qualification
Rwandans Foreigners TOTAL
M F M F M F M+F
PhDs 507 53 176 40 683 93 776
Masters 1,522 368 148 66 1,670 434 2,104
Bachelors 706 187 36 22 742 209 951
Others (specify) 221 25 8 1 229 26 255
Total 2,956 633 368 129 3,324 762 4,086 Source: MINEDUC
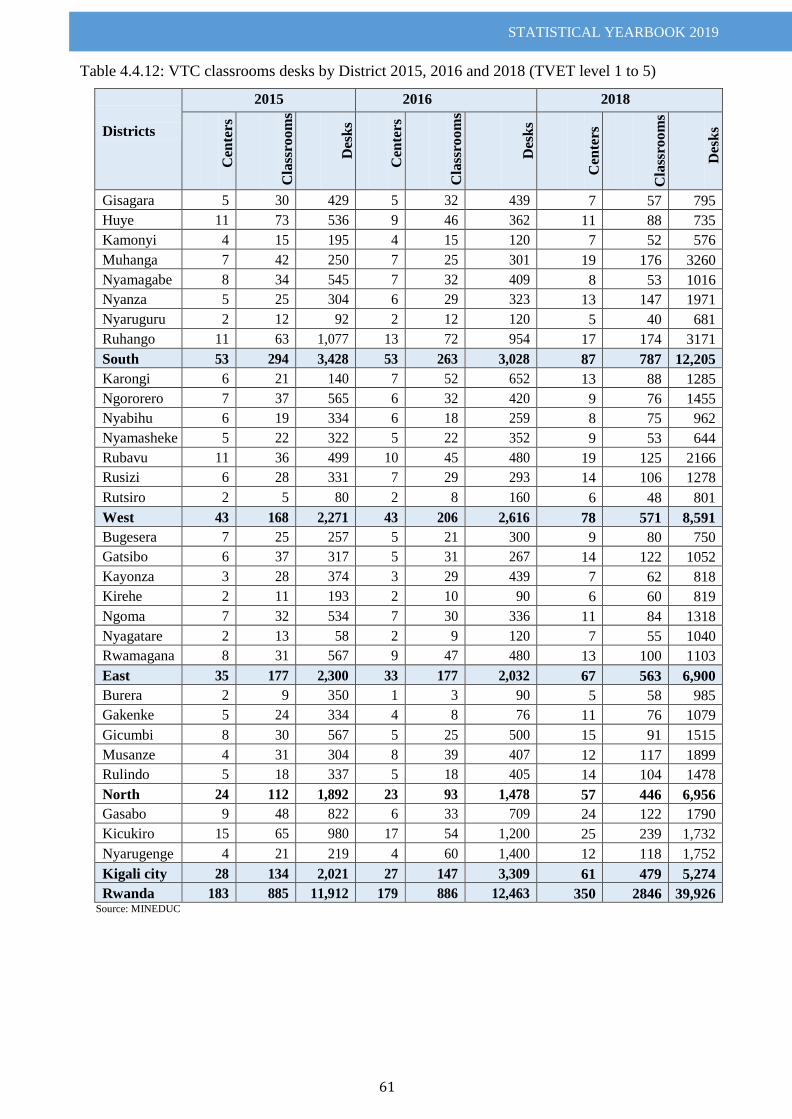
STATISTICAL YEARBOOK 2019
61
Table 4.4.12: VTC classrooms desks by District 2015, 2016 and 2018 (TVET level 1 to 5)
Districts
2015 2016 2018
Cen
ters
Cla
ssro
om
s
Des
ks
Cen
ters
Cla
ssro
om
s
Des
ks
Cen
ters
Cla
ssro
om
s
D
esk
s
Gisagara 5 30 429 5 32 439 7 57 795
Huye 11 73 536 9 46 362 11 88 735
Kamonyi 4 15 195 4 15 120 7 52 576
Muhanga 7 42 250 7 25 301 19 176 3260
Nyamagabe 8 34 545 7 32 409 8 53 1016
Nyanza 5 25 304 6 29 323 13 147 1971
Nyaruguru 2 12 92 2 12 120 5 40 681
Ruhango 11 63 1,077 13 72 954 17 174 3171
South 53 294 3,428 53 263 3,028 87 787 12,205
Karongi 6 21 140 7 52 652 13 88 1285
Ngororero 7 37 565 6 32 420 9 76 1455
Nyabihu 6 19 334 6 18 259 8 75 962
Nyamasheke 5 22 322 5 22 352 9 53 644
Rubavu 11 36 499 10 45 480 19 125 2166
Rusizi 6 28 331 7 29 293 14 106 1278
Rutsiro 2 5 80 2 8 160 6 48 801
West 43 168 2,271 43 206 2,616 78 571 8,591
Bugesera 7 25 257 5 21 300 9 80 750
Gatsibo 6 37 317 5 31 267 14 122 1052
Kayonza 3 28 374 3 29 439 7 62 818
Kirehe 2 11 193 2 10 90 6 60 819
Ngoma 7 32 534 7 30 336 11 84 1318
Nyagatare 2 13 58 2 9 120 7 55 1040
Rwamagana 8 31 567 9 47 480 13 100 1103
East 35 177 2,300 33 177 2,032 67 563 6,900
Burera 2 9 350 1 3 90 5 58 985
Gakenke 5 24 334 4 8 76 11 76 1079
Gicumbi 8 30 567 5 25 500 15 91 1515
Musanze 4 31 304 8 39 407 12 117 1899
Rulindo 5 18 337 5 18 405 14 104 1478
North 24 112 1,892 23 93 1,478 57 446 6,956
Gasabo 9 48 822 6 33 709 24 122 1790
Kicukiro 15 65 980 17 54 1,200 25 239 1,732
Nyarugenge 4 21 219 4 60 1,400 12 118 1,752
Kigali city 28 134 2,021 27 147 3,309 61 479 5,274
Rwanda 183 885 11,912 179 886 12,463 350 2846 39,926 Source: MINEDUC
STATISTICAL YEARBOOK 2019
62
CHAPTER V: ENVIRONMENT
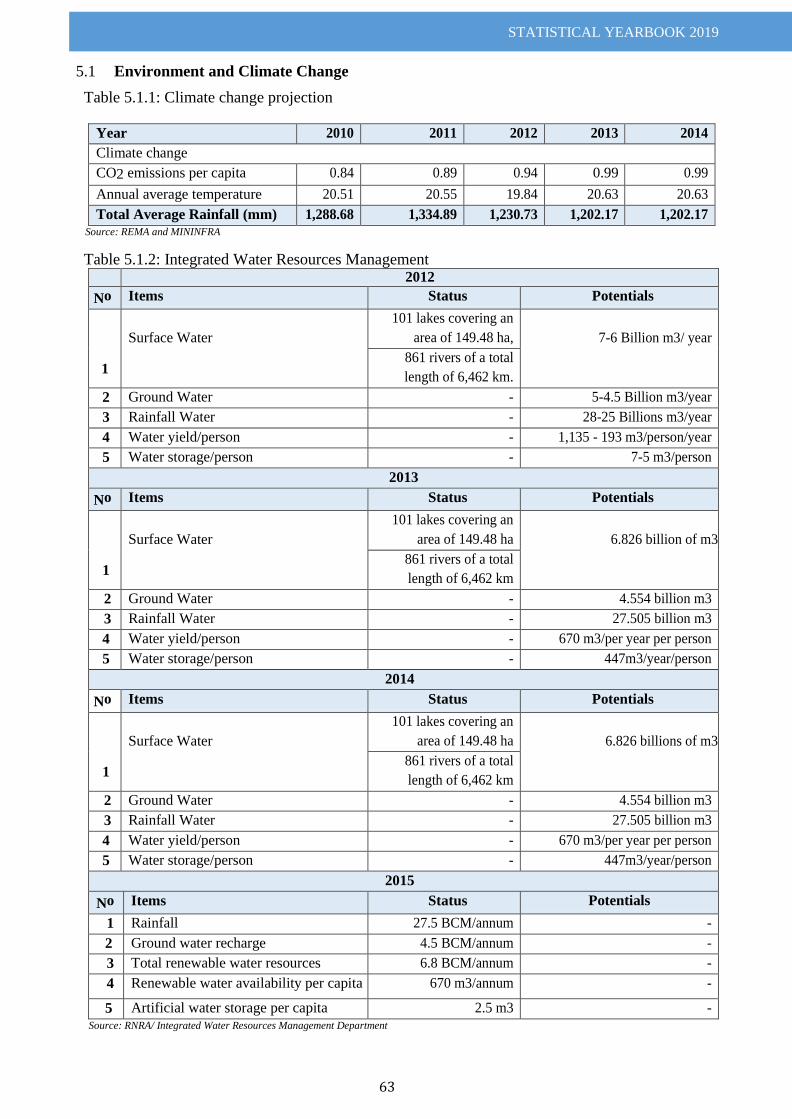
STATISTICAL YEARBOOK 2019
63
Environment and Climate Change 5.1
Table 5.1.1: Climate change projection
Year 2010 2011 2012 2013 2014
Climate change
CO2 emissions per capita 0.84 0.89 0.94 0.99 0.99
Annual average temperature 20.51 20.55 19.84 20.63 20.63
Total Average Rainfall (mm) 1,288.68 1,334.89 1,230.73 1,202.17 1,202.17 Source: REMA and MININFRA
Table 5.1.2: Integrated Water Resources Management 2012
No Items Status Potentials
1
Surface Water
101 lakes covering an
area of 149.48 ha,
7-6 Billion m3/ year
861 rivers of a total
length of 6,462 km.
2 Ground Water - 5-4.5 Billion m3/year
3 Rainfall Water - 28-25 Billions m3/year
4 Water yield/person - 1,135 - 193 m3/person/year
5 Water storage/person - 7-5 m3/person
2013
No Items Status Potentials
1
Surface Water
101 lakes covering an
area of 149.48 ha
6.826 billion of m3
861 rivers of a total
length of 6,462 km
2 Ground Water - 4.554 billion m3
3 Rainfall Water - 27.505 billion m3
4 Water yield/person - 670 m3/per year per person
5 Water storage/person - 447m3/year/person
2014
No Items Status Potentials
1
Surface Water
101 lakes covering an
area of 149.48 ha
6.826 billions of m3
861 rivers of a total
length of 6,462 km
2 Ground Water - 4.554 billion m3
3 Rainfall Water - 27.505 billion m3
4 Water yield/person - 670 m3/per year per person
5 Water storage/person - 447m3/year/person
2015
No Items Status Potentials
1 Rainfall 27.5 BCM/annum -
2 Ground water recharge 4.5 BCM/annum -
3 Total renewable water resources 6.8 BCM/annum -
4 Renewable water availability per capita 670 m3/annum -
5 Artificial water storage per capita 2.5 m3 - Source: RNRA/ Integrated Water Resources Management Department
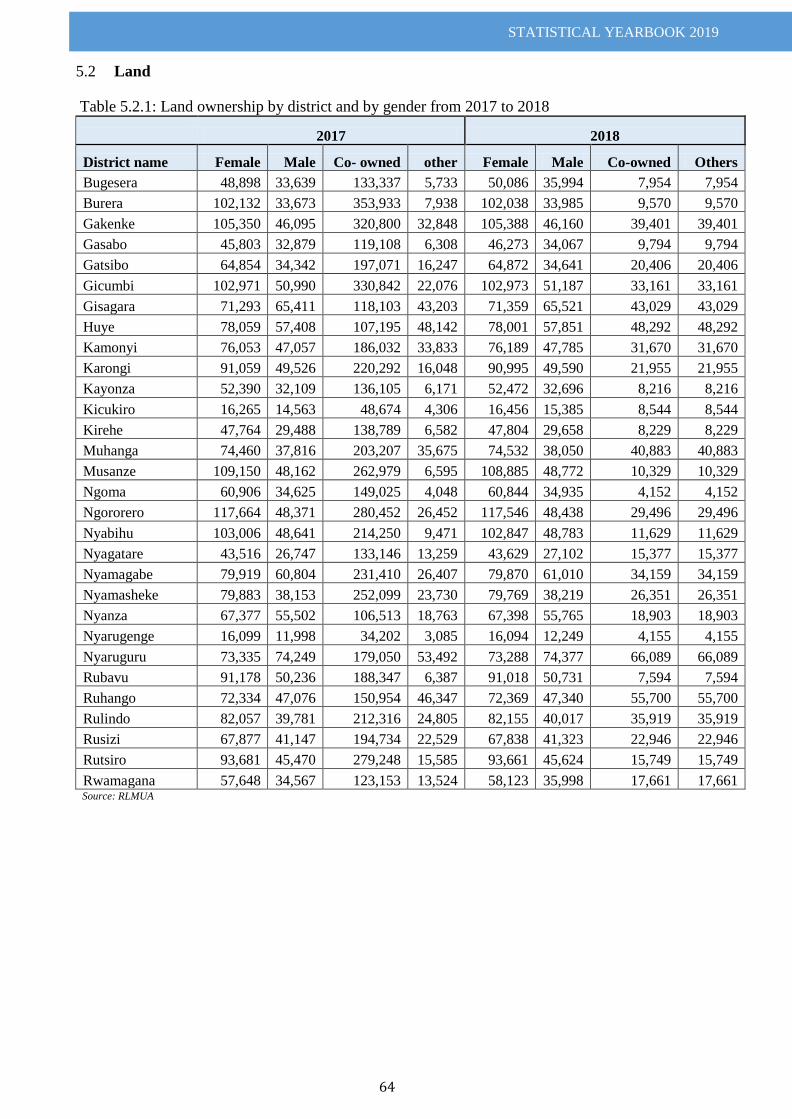
STATISTICAL YEARBOOK 2019
64
Land 5.2 Table 5.2.1: Land ownership by district and by gender from 2017 to 2018
2017 2018
District name Female Male Co- owned other Female Male Co-owned Others
Bugesera 48,898 33,639 133,337 5,733 50,086 35,994 7,954 7,954
Burera 102,132 33,673 353,933 7,938 102,038 33,985 9,570 9,570
Gakenke 105,350 46,095 320,800 32,848 105,388 46,160 39,401 39,401
Gasabo 45,803 32,879 119,108 6,308 46,273 34,067 9,794 9,794
Gatsibo 64,854 34,342 197,071 16,247 64,872 34,641 20,406 20,406
Gicumbi 102,971 50,990 330,842 22,076 102,973 51,187 33,161 33,161
Gisagara 71,293 65,411 118,103 43,203 71,359 65,521 43,029 43,029
Huye 78,059 57,408 107,195 48,142 78,001 57,851 48,292 48,292
Kamonyi 76,053 47,057 186,032 33,833 76,189 47,785 31,670 31,670
Karongi 91,059 49,526 220,292 16,048 90,995 49,590 21,955 21,955
Kayonza 52,390 32,109 136,105 6,171 52,472 32,696 8,216 8,216
Kicukiro 16,265 14,563 48,674 4,306 16,456 15,385 8,544 8,544
Kirehe 47,764 29,488 138,789 6,582 47,804 29,658 8,229 8,229
Muhanga 74,460 37,816 203,207 35,675 74,532 38,050 40,883 40,883
Musanze 109,150 48,162 262,979 6,595 108,885 48,772 10,329 10,329
Ngoma 60,906 34,625 149,025 4,048 60,844 34,935 4,152 4,152
Ngororero 117,664 48,371 280,452 26,452 117,546 48,438 29,496 29,496
Nyabihu 103,006 48,641 214,250 9,471 102,847 48,783 11,629 11,629
Nyagatare 43,516 26,747 133,146 13,259 43,629 27,102 15,377 15,377
Nyamagabe 79,919 60,804 231,410 26,407 79,870 61,010 34,159 34,159
Nyamasheke 79,883 38,153 252,099 23,730 79,769 38,219 26,351 26,351
Nyanza 67,377 55,502 106,513 18,763 67,398 55,765 18,903 18,903
Nyarugenge 16,099 11,998 34,202 3,085 16,094 12,249 4,155 4,155
Nyaruguru 73,335 74,249 179,050 53,492 73,288 74,377 66,089 66,089
Rubavu 91,178 50,236 188,347 6,387 91,018 50,731 7,594 7,594
Ruhango 72,334 47,076 150,954 46,347 72,369 47,340 55,700 55,700
Rulindo 82,057 39,781 212,316 24,805 82,155 40,017 35,919 35,919
Rusizi 67,877 41,147 194,734 22,529 67,838 41,323 22,946 22,946
Rutsiro 93,681 45,470 279,248 15,585 93,661 45,624 15,749 15,749
Rwamagana 57,648 34,567 123,153 13,524 58,123 35,998 17,661 17,661 Source: RLMUA
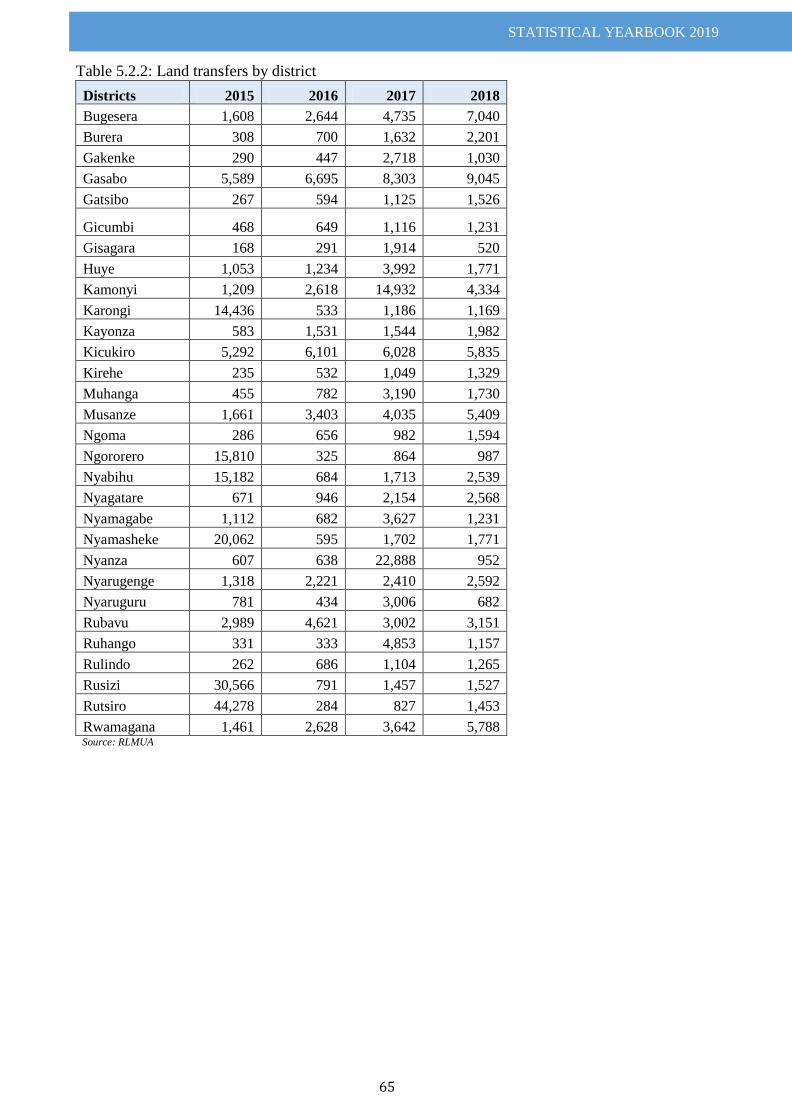
STATISTICAL YEARBOOK 2019
65
Table 5.2.2: Land transfers by district
Districts 2015 2016 2017 2018
Bugesera 1,608 2,644 4,735 7,040
Burera 308 700 1,632 2,201
Gakenke 290 447 2,718 1,030
Gasabo 5,589 6,695 8,303 9,045
Gatsibo 267 594 1,125 1,526
Gicumbi 468 649 1,116 1,231
Gisagara 168 291 1,914 520
Huye 1,053 1,234 3,992 1,771
Kamonyi 1,209 2,618 14,932 4,334
Karongi 14,436 533 1,186 1,169
Kayonza 583 1,531 1,544 1,982
Kicukiro 5,292 6,101 6,028 5,835
Kirehe 235 532 1,049 1,329
Muhanga 455 782 3,190 1,730
Musanze 1,661 3,403 4,035 5,409
Ngoma 286 656 982 1,594
Ngororero 15,810 325 864 987
Nyabihu 15,182 684 1,713 2,539
Nyagatare 671 946 2,154 2,568
Nyamagabe 1,112 682 3,627 1,231
Nyamasheke 20,062 595 1,702 1,771
Nyanza 607 638 22,888 952
Nyarugenge 1,318 2,221 2,410 2,592
Nyaruguru 781 434 3,006 682
Rubavu 2,989 4,621 3,002 3,151
Ruhango 331 333 4,853 1,157
Rulindo 262 686 1,104 1,265
Rusizi 30,566 791 1,457 1,527
Rutsiro 44,278 284 827 1,453
Rwamagana 1,461 2,628 3,642 5,788 Source: RLMUA

STATISTICAL YEARBOOK 2019
66
Table 5.2.3: Land transactions by district
District 2016 2017 2018
Bugesera 13,324 16,885 26,585
Burera 4,128 6,109 9,646
Gakenke 7,469 5,293 21,285
Gasabo 20,354 22,750 26,071
Gatsibo 3,076 4,549 12,022
Gicumbi 3,878 3,976 26,336
Gisagara 1,451 3,576 3,005
Huye 4,581 4,736 7,157
Kamonyi 7,483 10,186 12,418
Karongi 3,255 6,617 13,116
Kayonza 5,001 5,619 8,942
Kicukiro 14,909 17,124 21,090
Kirehe 4,019 7,699 6,282
Muhanga 3,221 6,972 18,822
Musanze 11,177 15,719 22,261
Ngoma 2,942 5,173 4,263
Ngororero 1,860 7,449 8,073
Nyabihu 4,052 10,188 8,736
Nyagatare 5,348 5,525 9,950
Nyamagabe 2,201 4,159 19,317
Nyamasheke 3,379 8,967 10,806
Nyanza 2,651 3,020 5,101
Nyarugenge 5,145 6,415 7,361
Nyaruguru 4,769 2,306 35,150
Rubavu 10,243 11,058 9,526
Ruhango 3,407 3,937 32,314
Rulindo 2,493 5,820 25,134
Rusizi 6,222 6,229 5,832
Rutsiro 2,224 4,752 4,277
Rwamagana 8,741 13,229 24,323 Source: RLMUA
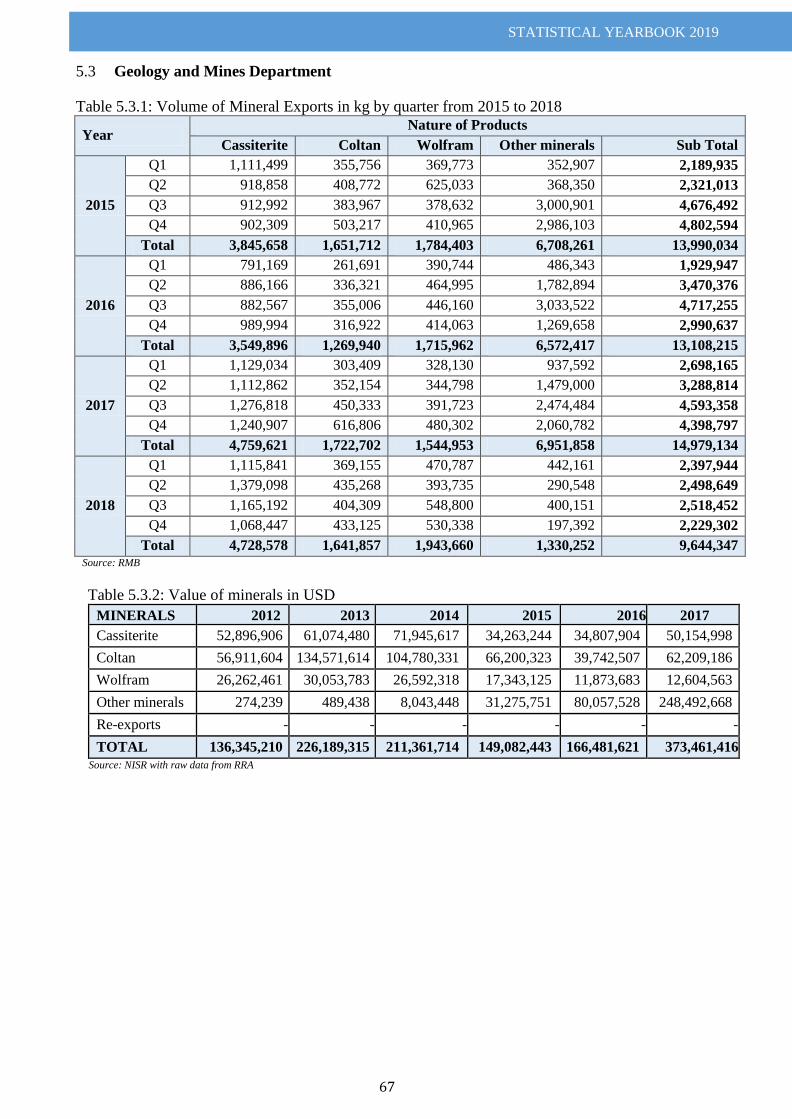
STATISTICAL YEARBOOK 2019
67
Geology and Mines Department 5.3 Table 5.3.1: Volume of Mineral Exports in kg by quarter from 2015 to 2018
Year Nature of Products
Cassiterite Coltan Wolfram Other minerals Sub Total
2015
Q1 1,111,499 355,756 369,773 352,907 2,189,935
Q2 918,858 408,772 625,033 368,350 2,321,013
Q3 912,992 383,967 378,632 3,000,901 4,676,492
Q4 902,309 503,217 410,965 2,986,103 4,802,594
Total 3,845,658 1,651,712 1,784,403 6,708,261 13,990,034
2016
Q1 791,169 261,691 390,744 486,343 1,929,947
Q2 886,166 336,321 464,995 1,782,894 3,470,376
Q3 882,567 355,006 446,160 3,033,522 4,717,255
Q4 989,994 316,922 414,063 1,269,658 2,990,637
Total 3,549,896 1,269,940 1,715,962 6,572,417 13,108,215
2017
Q1 1,129,034 303,409 328,130 937,592 2,698,165
Q2 1,112,862 352,154 344,798 1,479,000 3,288,814
Q3 1,276,818 450,333 391,723 2,474,484 4,593,358
Q4 1,240,907 616,806 480,302 2,060,782 4,398,797
Total 4,759,621 1,722,702 1,544,953 6,951,858 14,979,134
2018
Q1 1,115,841 369,155 470,787 442,161 2,397,944
Q2 1,379,098 435,268 393,735 290,548 2,498,649
Q3 1,165,192 404,309 548,800 400,151 2,518,452
Q4 1,068,447 433,125 530,338 197,392 2,229,302
Total 4,728,578 1,641,857 1,943,660 1,330,252 9,644,347 Source: RMB
Table 5.3.2: Value of minerals in USD
MINERALS 2012 2013 2014 2015 2016 2017
Cassiterite 52,896,906 61,074,480 71,945,617 34,263,244 34,807,904 50,154,998
Coltan 56,911,604 134,571,614 104,780,331 66,200,323 39,742,507 62,209,186
Wolfram 26,262,461 30,053,783 26,592,318 17,343,125 11,873,683 12,604,563
Other minerals 274,239 489,438 8,043,448 31,275,751 80,057,528 248,492,668
Re-exports - - - - - -
TOTAL 136,345,210 226,189,315 211,361,714 149,082,443 166,481,621 373,461,416
Source: NISR with raw data from RRA
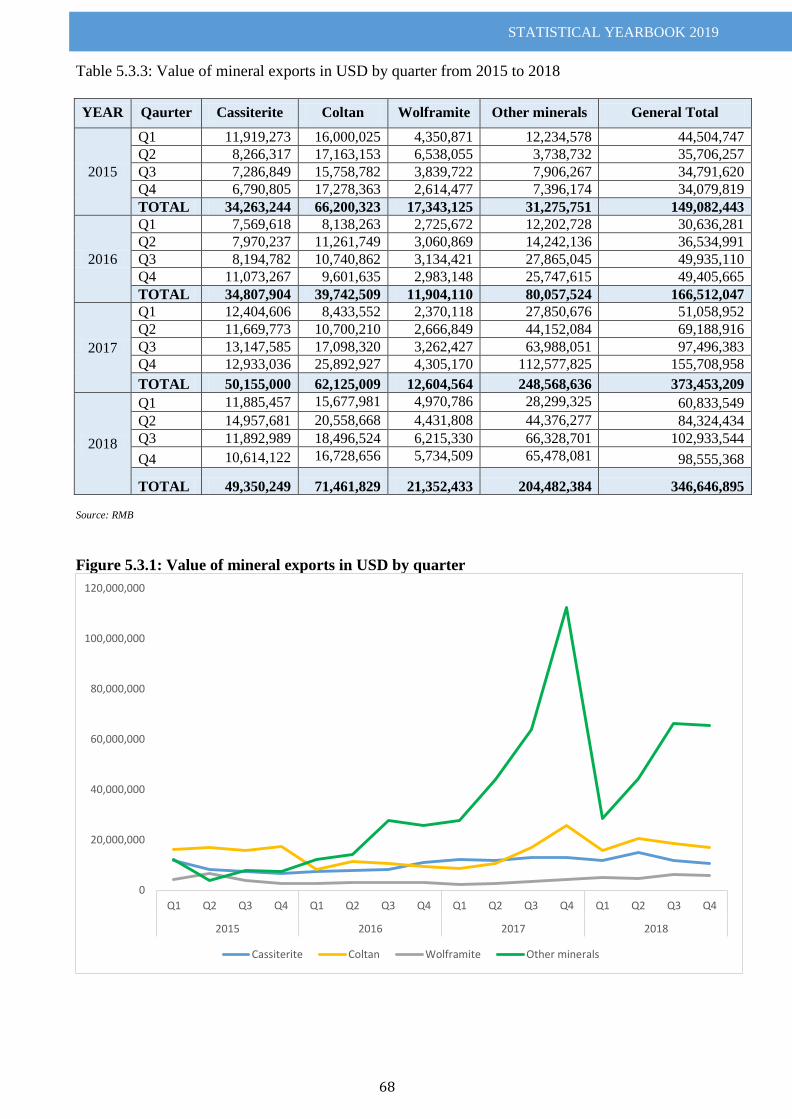
STATISTICAL YEARBOOK 2019
68
Table 5.3.3: Value of mineral exports in USD by quarter from 2015 to 2018
Source: RMB
Figure 5.3.1: Value of mineral exports in USD by quarter
0
20,000,000
40,000,000
60,000,000
80,000,000
100,000,000
120,000,000
Q1 Q2 Q3 Q4 Q1 Q2 Q3 Q4 Q1 Q2 Q3 Q4 Q1 Q2 Q3 Q4
2015 2016 2017 2018
Cassiterite Coltan Wolframite Other minerals
YEAR Qaurter Cassiterite Coltan Wolframite Other minerals General Total
2015
Q1 11,919,273 16,000,025 4,350,871 12,234,578 44,504,747
Q2 8,266,317 17,163,153 6,538,055 3,738,732 35,706,257
Q3 7,286,849 15,758,782 3,839,722 7,906,267 34,791,620
Q4 6,790,805 17,278,363 2,614,477 7,396,174 34,079,819
TOTAL 34,263,244 66,200,323 17,343,125 31,275,751 149,082,443
2016
Q1 7,569,618 8,138,263 2,725,672 12,202,728 30,636,281
Q2 7,970,237 11,261,749 3,060,869 14,242,136 36,534,991
Q3 8,194,782 10,740,862 3,134,421 27,865,045 49,935,110
Q4 11,073,267 9,601,635 2,983,148 25,747,615 49,405,665
TOTAL 34,807,904 39,742,509 11,904,110 80,057,524 166,512,047
2017
Q1 12,404,606 8,433,552 2,370,118 27,850,676 51,058,952
Q2 11,669,773 10,700,210 2,666,849 44,152,084 69,188,916
Q3 13,147,585 17,098,320 3,262,427 63,988,051 97,496,383
Q4 12,933,036 25,892,927 4,305,170 112,577,825 155,708,958
TOTAL 50,155,000 62,125,009 12,604,564 248,568,636 373,453,209
2018
Q1 11,885,457 15,677,981 4,970,786 28,299,325 60,833,549
Q2 14,957,681 20,558,668 4,431,808 44,376,277 84,324,434
Q3 11,892,989 18,496,524 6,215,330 66,328,701 102,933,544
Q4 10,614,122 16,728,656 5,734,509 65,478,081 98,555,368
TOTAL 49,350,249 71,461,829 21,352,433 204,482,384 346,646,895
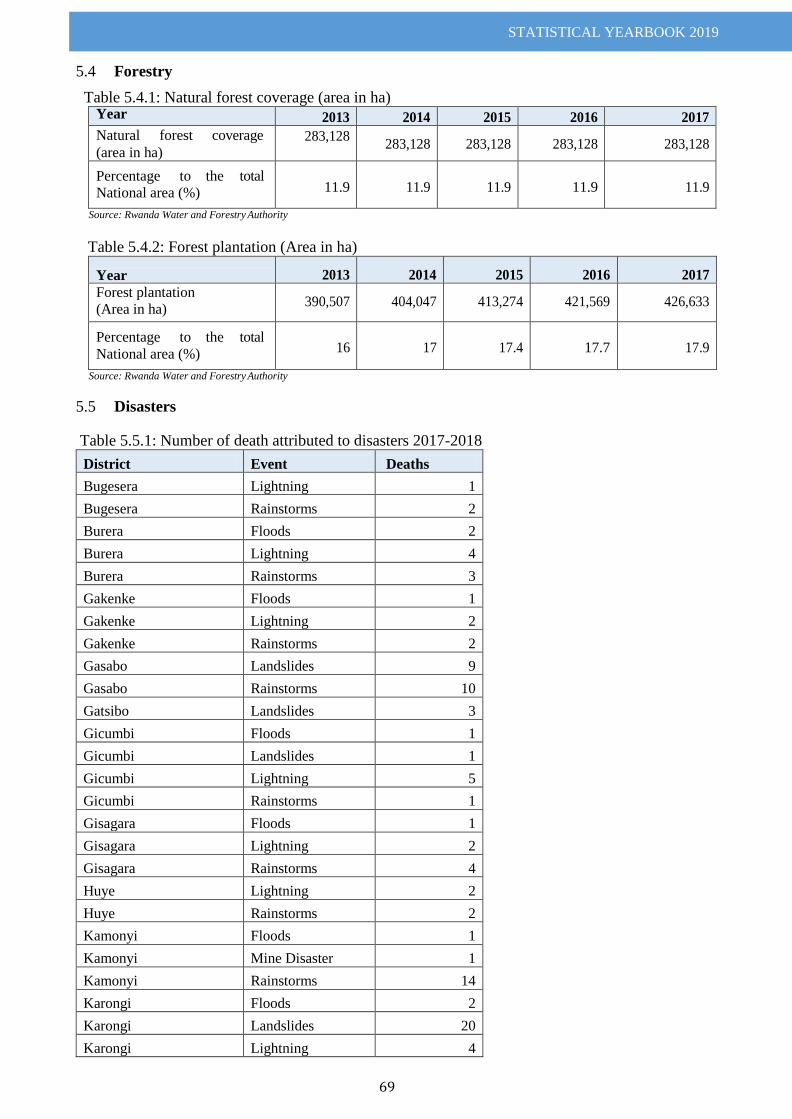
STATISTICAL YEARBOOK 2019
69
Forestry 5.4
Table 5.4.1: Natural forest coverage (area in ha) Year 2013 2014 2015 2016 2017
Natural forest coverage
(area in ha) 283,128
283,128 283,128 283,128 283,128
Percentage to the total
National area (%)
11.9
11.9
11.9
11.9
11.9
Source: Rwanda Water and Forestry Authority
Table 5.4.2: Forest plantation (Area in ha)
Year 2013 2014 2015 2016 2017
Forest plantation
(Area in ha) 390,507 404,047 413,274 421,569 426,633
Percentage to the total
National area (%)
16
17
17.4
17.7
17.9
Source: Rwanda Water and Forestry Authority
Disasters 5.5
Table 5.5.1: Number of death attributed to disasters 2017-2018
District Event Deaths
Bugesera Lightning 1
Bugesera Rainstorms 2
Burera Floods 2
Burera Lightning 4
Burera Rainstorms 3
Gakenke Floods 1
Gakenke Lightning 2
Gakenke Rainstorms 2
Gasabo Landslides 9
Gasabo Rainstorms 10
Gatsibo Landslides 3
Gicumbi Floods 1
Gicumbi Landslides 1
Gicumbi Lightning 5
Gicumbi Rainstorms 1
Gisagara Floods 1
Gisagara Lightning 2
Gisagara Rainstorms 4
Huye Lightning 2
Huye Rainstorms 2
Kamonyi Floods 1
Kamonyi Mine Disaster 1
Kamonyi Rainstorms 14
Karongi Floods 2
Karongi Landslides 20
Karongi Lightning 4
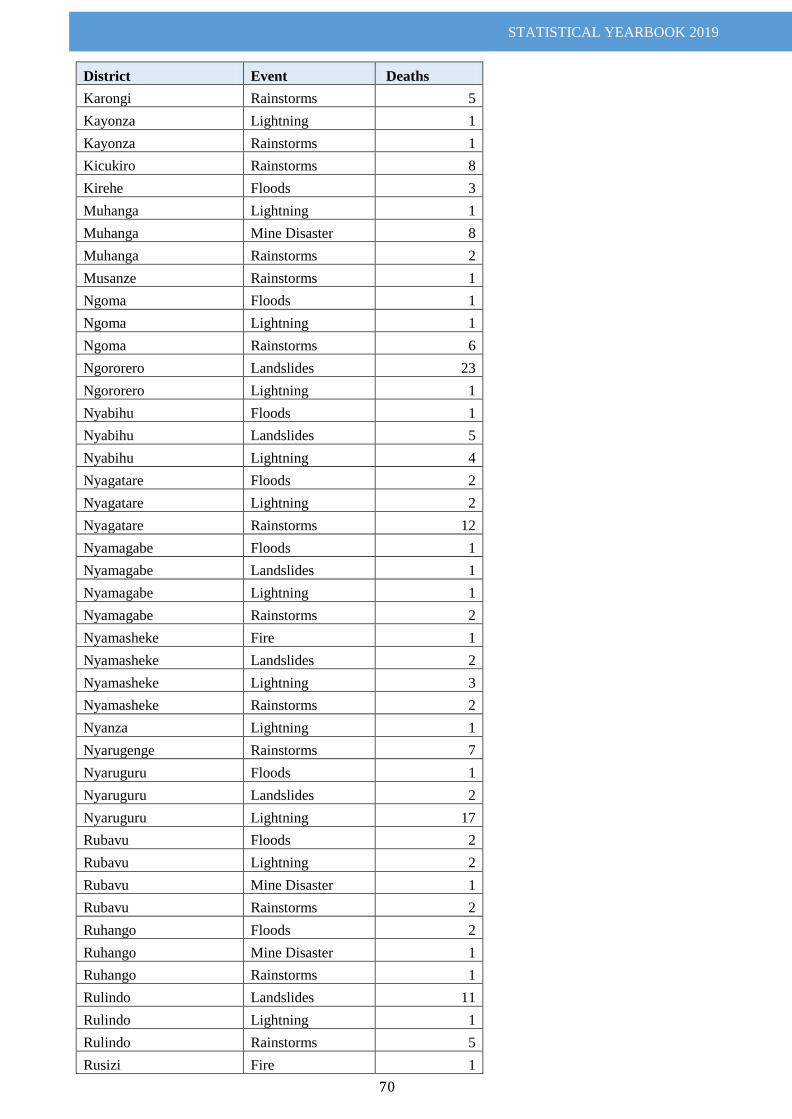
STATISTICAL YEARBOOK 2019
70
District Event Deaths
Karongi Rainstorms 5
Kayonza Lightning 1
Kayonza Rainstorms 1
Kicukiro Rainstorms 8
Kirehe Floods 3
Muhanga Lightning 1
Muhanga Mine Disaster 8
Muhanga Rainstorms 2
Musanze Rainstorms 1
Ngoma Floods 1
Ngoma Lightning 1
Ngoma Rainstorms 6
Ngororero Landslides 23
Ngororero Lightning 1
Nyabihu Floods 1
Nyabihu Landslides 5
Nyabihu Lightning 4
Nyagatare Floods 2
Nyagatare Lightning 2
Nyagatare Rainstorms 12
Nyamagabe Floods 1
Nyamagabe Landslides 1
Nyamagabe Lightning 1
Nyamagabe Rainstorms 2
Nyamasheke Fire 1
Nyamasheke Landslides 2
Nyamasheke Lightning 3
Nyamasheke Rainstorms 2
Nyanza Lightning 1
Nyarugenge Rainstorms 7
Nyaruguru Floods 1
Nyaruguru Landslides 2
Nyaruguru Lightning 17
Rubavu Floods 2
Rubavu Lightning 2
Rubavu Mine Disaster 1
Rubavu Rainstorms 2
Ruhango Floods 2
Ruhango Mine Disaster 1
Ruhango Rainstorms 1
Rulindo Landslides 11
Rulindo Lightning 1
Rulindo Rainstorms 5
Rusizi Fire 1
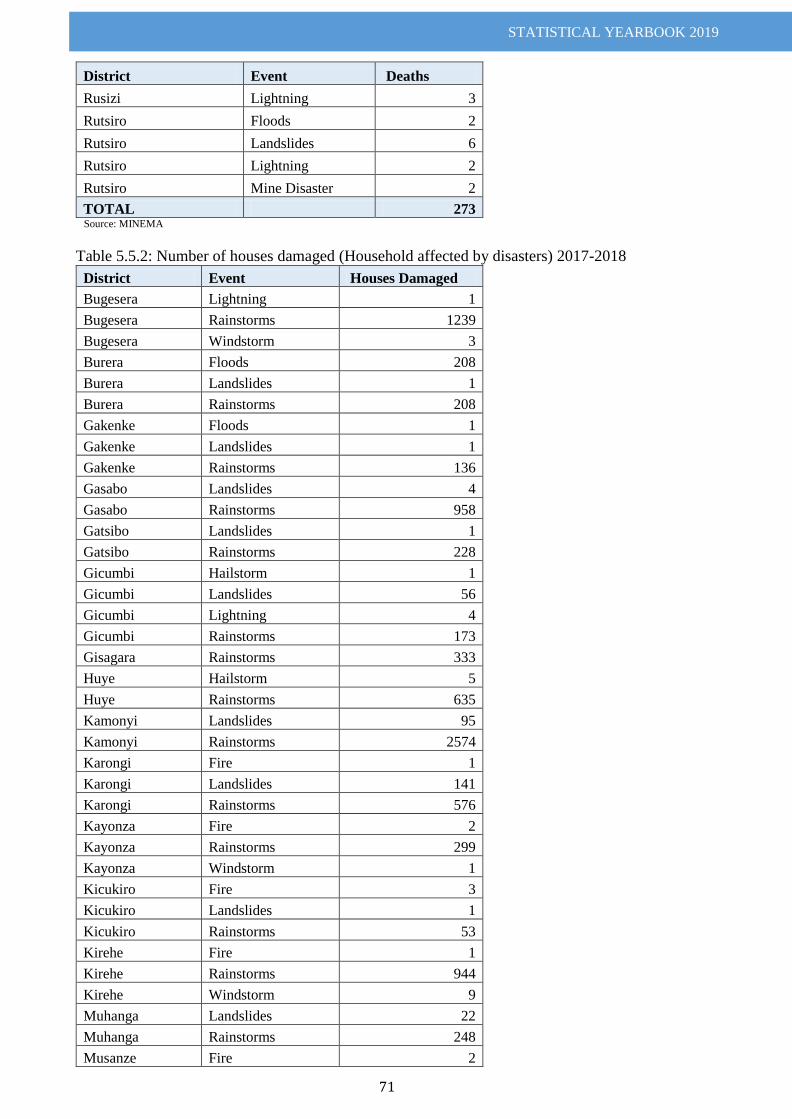
STATISTICAL YEARBOOK 2019
71
District Event Deaths
Rusizi Lightning 3
Rutsiro Floods 2
Rutsiro Landslides 6
Rutsiro Lightning 2
Rutsiro Mine Disaster 2
TOTAL 273 Source: MINEMA
Table 5.5.2: Number of houses damaged (Household affected by disasters) 2017-2018
District Event Houses Damaged
Bugesera Lightning 1
Bugesera Rainstorms 1239
Bugesera Windstorm 3
Burera Floods 208
Burera Landslides 1
Burera Rainstorms 208
Gakenke Floods 1
Gakenke Landslides 1
Gakenke Rainstorms 136
Gasabo Landslides 4
Gasabo Rainstorms 958
Gatsibo Landslides 1
Gatsibo Rainstorms 228
Gicumbi Hailstorm 1
Gicumbi Landslides 56
Gicumbi Lightning 4
Gicumbi Rainstorms 173
Gisagara Rainstorms 333
Huye Hailstorm 5
Huye Rainstorms 635
Kamonyi Landslides 95
Kamonyi Rainstorms 2574
Karongi Fire 1
Karongi Landslides 141
Karongi Rainstorms 576
Kayonza Fire 2
Kayonza Rainstorms 299
Kayonza Windstorm 1
Kicukiro Fire 3
Kicukiro Landslides 1
Kicukiro Rainstorms 53
Kirehe Fire 1
Kirehe Rainstorms 944
Kirehe Windstorm 9
Muhanga Landslides 22
Muhanga Rainstorms 248
Musanze Fire 2
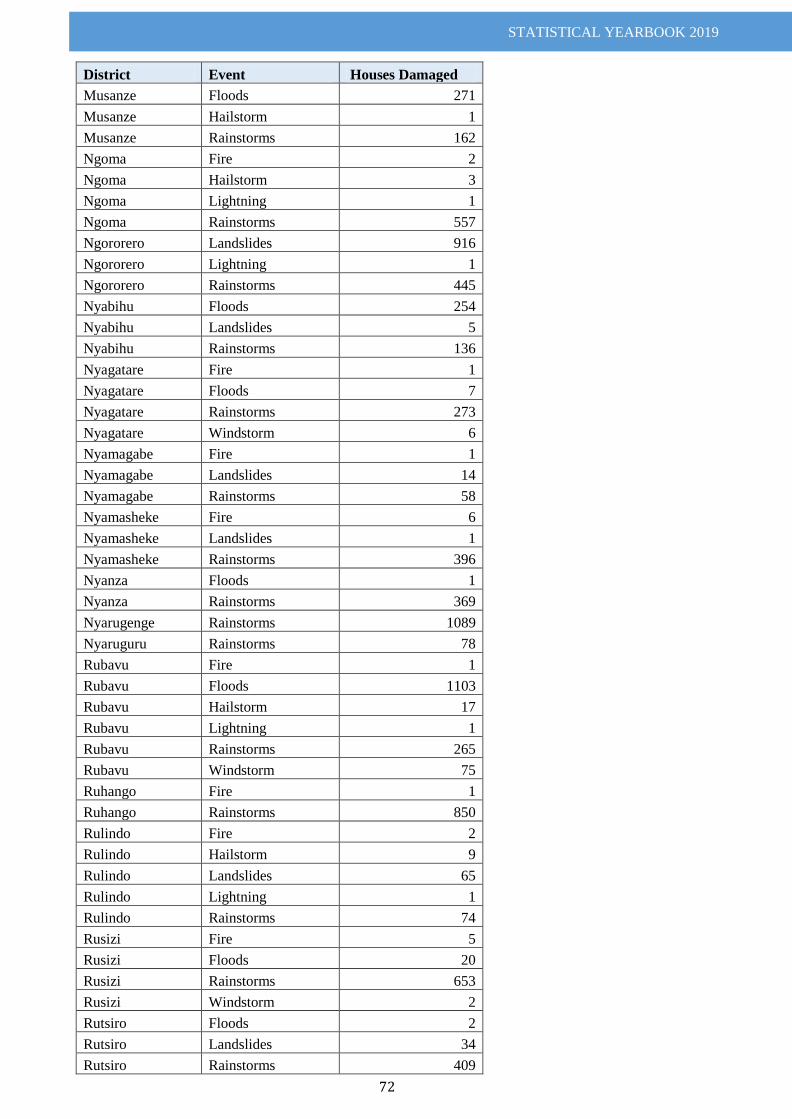
STATISTICAL YEARBOOK 2019
72
District Event Houses Damaged
Musanze Floods 271
Musanze Hailstorm 1
Musanze Rainstorms 162
Ngoma Fire 2
Ngoma Hailstorm 3
Ngoma Lightning 1
Ngoma Rainstorms 557
Ngororero Landslides 916
Ngororero Lightning 1
Ngororero Rainstorms 445
Nyabihu Floods 254
Nyabihu Landslides 5
Nyabihu Rainstorms 136
Nyagatare Fire 1
Nyagatare Floods 7
Nyagatare Rainstorms 273
Nyagatare Windstorm 6
Nyamagabe Fire 1
Nyamagabe Landslides 14
Nyamagabe Rainstorms 58
Nyamasheke Fire 6
Nyamasheke Landslides 1
Nyamasheke Rainstorms 396
Nyanza Floods 1
Nyanza Rainstorms 369
Nyarugenge Rainstorms 1089
Nyaruguru Rainstorms 78
Rubavu Fire 1
Rubavu Floods 1103
Rubavu Hailstorm 17
Rubavu Lightning 1
Rubavu Rainstorms 265
Rubavu Windstorm 75
Ruhango Fire 1
Ruhango Rainstorms 850
Rulindo Fire 2
Rulindo Hailstorm 9
Rulindo Landslides 65
Rulindo Lightning 1
Rulindo Rainstorms 74
Rusizi Fire 5
Rusizi Floods 20
Rusizi Rainstorms 653
Rusizi Windstorm 2
Rutsiro Floods 2
Rutsiro Landslides 34
Rutsiro Rainstorms 409
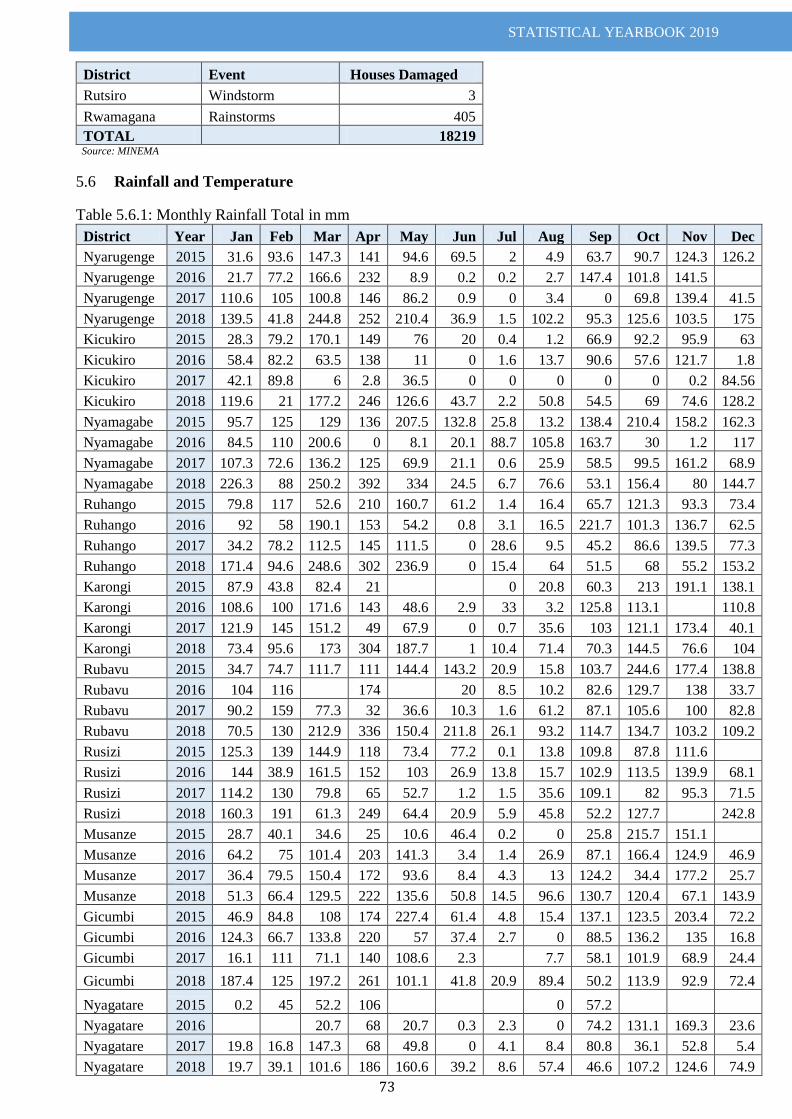
STATISTICAL YEARBOOK 2019
73
District Event Houses Damaged
Rutsiro Windstorm 3
Rwamagana Rainstorms 405
TOTAL
18219 Source: MINEMA
Rainfall and Temperature 5.6
Table 5.6.1: Monthly Rainfall Total in mm
District Year Jan Feb Mar Apr May Jun Jul Aug Sep Oct Nov Dec
Nyarugenge 2015 31.6 93.6 147.3 141 94.6 69.5 2 4.9 63.7 90.7 124.3 126.2
Nyarugenge 2016 21.7 77.2 166.6 232 8.9 0.2 0.2 2.7 147.4 101.8 141.5
Nyarugenge 2017 110.6 105 100.8 146 86.2 0.9 0 3.4 0 69.8 139.4 41.5
Nyarugenge 2018 139.5 41.8 244.8 252 210.4 36.9 1.5 102.2 95.3 125.6 103.5 175
Kicukiro 2015 28.3 79.2 170.1 149 76 20 0.4 1.2 66.9 92.2 95.9 63
Kicukiro 2016 58.4 82.2 63.5 138 11 0 1.6 13.7 90.6 57.6 121.7 1.8
Kicukiro 2017 42.1 89.8 6 2.8 36.5 0 0 0 0 0 0.2 84.56
Kicukiro 2018 119.6 21 177.2 246 126.6 43.7 2.2 50.8 54.5 69 74.6 128.2
Nyamagabe 2015 95.7 125 129 136 207.5 132.8 25.8 13.2 138.4 210.4 158.2 162.3
Nyamagabe 2016 84.5 110 200.6 0 8.1 20.1 88.7 105.8 163.7 30 1.2 117
Nyamagabe 2017 107.3 72.6 136.2 125 69.9 21.1 0.6 25.9 58.5 99.5 161.2 68.9
Nyamagabe 2018 226.3 88 250.2 392 334 24.5 6.7 76.6 53.1 156.4 80 144.7
Ruhango 2015 79.8 117 52.6 210 160.7 61.2 1.4 16.4 65.7 121.3 93.3 73.4
Ruhango 2016 92 58 190.1 153 54.2 0.8 3.1 16.5 221.7 101.3 136.7 62.5
Ruhango 2017 34.2 78.2 112.5 145 111.5 0 28.6 9.5 45.2 86.6 139.5 77.3
Ruhango 2018 171.4 94.6 248.6 302 236.9 0 15.4 64 51.5 68 55.2 153.2
Karongi 2015 87.9 43.8 82.4 21 0 20.8 60.3 213 191.1 138.1
Karongi 2016 108.6 100 171.6 143 48.6 2.9 33 3.2 125.8 113.1 110.8
Karongi 2017 121.9 145 151.2 49 67.9 0 0.7 35.6 103 121.1 173.4 40.1
Karongi 2018 73.4 95.6 173 304 187.7 1 10.4 71.4 70.3 144.5 76.6 104
Rubavu 2015 34.7 74.7 111.7 111 144.4 143.2 20.9 15.8 103.7 244.6 177.4 138.8
Rubavu 2016 104 116 174 20 8.5 10.2 82.6 129.7 138 33.7
Rubavu 2017 90.2 159 77.3 32 36.6 10.3 1.6 61.2 87.1 105.6 100 82.8
Rubavu 2018 70.5 130 212.9 336 150.4 211.8 26.1 93.2 114.7 134.7 103.2 109.2
Rusizi 2015 125.3 139 144.9 118 73.4 77.2 0.1 13.8 109.8 87.8 111.6
Rusizi 2016 144 38.9 161.5 152 103 26.9 13.8 15.7 102.9 113.5 139.9 68.1
Rusizi 2017 114.2 130 79.8 65 52.7 1.2 1.5 35.6 109.1 82 95.3 71.5
Rusizi 2018 160.3 191 61.3 249 64.4 20.9 5.9 45.8 52.2 127.7 242.8
Musanze 2015 28.7 40.1 34.6 25 10.6 46.4 0.2 0 25.8 215.7 151.1
Musanze 2016 64.2 75 101.4 203 141.3 3.4 1.4 26.9 87.1 166.4 124.9 46.9
Musanze 2017 36.4 79.5 150.4 172 93.6 8.4 4.3 13 124.2 34.4 177.2 25.7
Musanze 2018 51.3 66.4 129.5 222 135.6 50.8 14.5 96.6 130.7 120.4 67.1 143.9
Gicumbi 2015 46.9 84.8 108 174 227.4 61.4 4.8 15.4 137.1 123.5 203.4 72.2
Gicumbi 2016 124.3 66.7 133.8 220 57 37.4 2.7 0 88.5 136.2 135 16.8
Gicumbi 2017 16.1 111 71.1 140 108.6 2.3 7.7 58.1 101.9 68.9 24.4
Gicumbi 2018 187.4 125 197.2 261 101.1 41.8 20.9 89.4 50.2 113.9 92.9 72.4
Nyagatare 2015 0.2 45 52.2 106 0 57.2
Nyagatare 2016 20.7 68 20.7 0.3 2.3 0 74.2 131.1 169.3 23.6
Nyagatare 2017 19.8 16.8 147.3 68 49.8 0 4.1 8.4 80.8 36.1 52.8 5.4
Nyagatare 2018 19.7 39.1 101.6 186 160.6 39.2 8.6 57.4 46.6 107.2 124.6 74.9
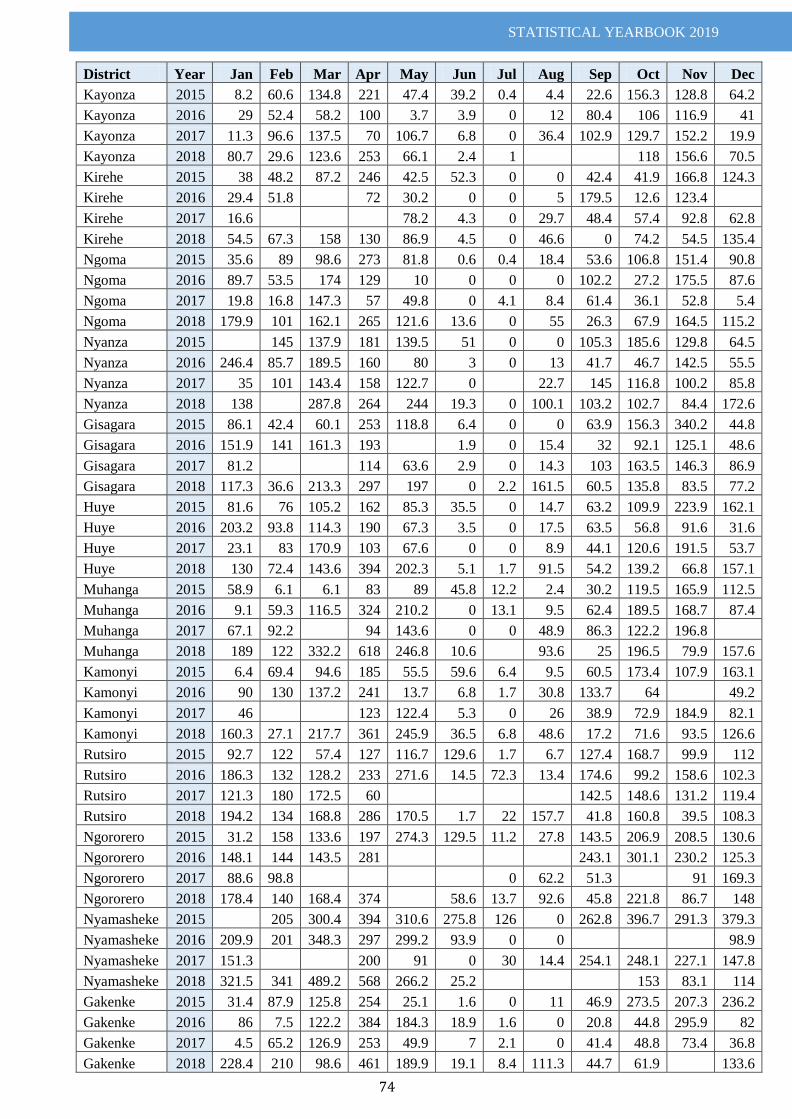
STATISTICAL YEARBOOK 2019
74
District Year Jan Feb Mar Apr May Jun Jul Aug Sep Oct Nov Dec
Kayonza 2015 8.2 60.6 134.8 221 47.4 39.2 0.4 4.4 22.6 156.3 128.8 64.2
Kayonza 2016 29 52.4 58.2 100 3.7 3.9 0 12 80.4 106 116.9 41
Kayonza 2017 11.3 96.6 137.5 70 106.7 6.8 0 36.4 102.9 129.7 152.2 19.9
Kayonza 2018 80.7 29.6 123.6 253 66.1 2.4 1 118 156.6 70.5
Kirehe 2015 38 48.2 87.2 246 42.5 52.3 0 0 42.4 41.9 166.8 124.3
Kirehe 2016 29.4 51.8 72 30.2 0 0 5 179.5 12.6 123.4
Kirehe 2017 16.6 78.2 4.3 0 29.7 48.4 57.4 92.8 62.8
Kirehe 2018 54.5 67.3 158 130 86.9 4.5 0 46.6 0 74.2 54.5 135.4
Ngoma 2015 35.6 89 98.6 273 81.8 0.6 0.4 18.4 53.6 106.8 151.4 90.8
Ngoma 2016 89.7 53.5 174 129 10 0 0 0 102.2 27.2 175.5 87.6
Ngoma 2017 19.8 16.8 147.3 57 49.8 0 4.1 8.4 61.4 36.1 52.8 5.4
Ngoma 2018 179.9 101 162.1 265 121.6 13.6 0 55 26.3 67.9 164.5 115.2
Nyanza 2015 145 137.9 181 139.5 51 0 0 105.3 185.6 129.8 64.5
Nyanza 2016 246.4 85.7 189.5 160 80 3 0 13 41.7 46.7 142.5 55.5
Nyanza 2017 35 101 143.4 158 122.7 0 22.7 145 116.8 100.2 85.8
Nyanza 2018 138 287.8 264 244 19.3 0 100.1 103.2 102.7 84.4 172.6
Gisagara 2015 86.1 42.4 60.1 253 118.8 6.4 0 0 63.9 156.3 340.2 44.8
Gisagara 2016 151.9 141 161.3 193 1.9 0 15.4 32 92.1 125.1 48.6
Gisagara 2017 81.2 114 63.6 2.9 0 14.3 103 163.5 146.3 86.9
Gisagara 2018 117.3 36.6 213.3 297 197 0 2.2 161.5 60.5 135.8 83.5 77.2
Huye 2015 81.6 76 105.2 162 85.3 35.5 0 14.7 63.2 109.9 223.9 162.1
Huye 2016 203.2 93.8 114.3 190 67.3 3.5 0 17.5 63.5 56.8 91.6 31.6
Huye 2017 23.1 83 170.9 103 67.6 0 0 8.9 44.1 120.6 191.5 53.7
Huye 2018 130 72.4 143.6 394 202.3 5.1 1.7 91.5 54.2 139.2 66.8 157.1
Muhanga 2015 58.9 6.1 6.1 83 89 45.8 12.2 2.4 30.2 119.5 165.9 112.5
Muhanga 2016 9.1 59.3 116.5 324 210.2 0 13.1 9.5 62.4 189.5 168.7 87.4
Muhanga 2017 67.1 92.2 94 143.6 0 0 48.9 86.3 122.2 196.8
Muhanga 2018 189 122 332.2 618 246.8 10.6 93.6 25 196.5 79.9 157.6
Kamonyi 2015 6.4 69.4 94.6 185 55.5 59.6 6.4 9.5 60.5 173.4 107.9 163.1
Kamonyi 2016 90 130 137.2 241 13.7 6.8 1.7 30.8 133.7 64 49.2
Kamonyi 2017 46 123 122.4 5.3 0 26 38.9 72.9 184.9 82.1
Kamonyi 2018 160.3 27.1 217.7 361 245.9 36.5 6.8 48.6 17.2 71.6 93.5 126.6
Rutsiro 2015 92.7 122 57.4 127 116.7 129.6 1.7 6.7 127.4 168.7 99.9 112
Rutsiro 2016 186.3 132 128.2 233 271.6 14.5 72.3 13.4 174.6 99.2 158.6 102.3
Rutsiro 2017 121.3 180 172.5 60 142.5 148.6 131.2 119.4
Rutsiro 2018 194.2 134 168.8 286 170.5 1.7 22 157.7 41.8 160.8 39.5 108.3
Ngororero 2015 31.2 158 133.6 197 274.3 129.5 11.2 27.8 143.5 206.9 208.5 130.6
Ngororero 2016 148.1 144 143.5 281 243.1 301.1 230.2 125.3
Ngororero 2017 88.6 98.8 0 62.2 51.3 91 169.3
Ngororero 2018 178.4 140 168.4 374 58.6 13.7 92.6 45.8 221.8 86.7 148
Nyamasheke 2015 205 300.4 394 310.6 275.8 126 0 262.8 396.7 291.3 379.3
Nyamasheke 2016 209.9 201 348.3 297 299.2 93.9 0 0 98.9
Nyamasheke 2017 151.3 200 91 0 30 14.4 254.1 248.1 227.1 147.8
Nyamasheke 2018 321.5 341 489.2 568 266.2 25.2 153 83.1 114
Gakenke 2015 31.4 87.9 125.8 254 25.1 1.6 0 11 46.9 273.5 207.3 236.2
Gakenke 2016 86 7.5 122.2 384 184.3 18.9 1.6 0 20.8 44.8 295.9 82
Gakenke 2017 4.5 65.2 126.9 253 49.9 7 2.1 0 41.4 48.8 73.4 36.8
Gakenke 2018 228.4 210 98.6 461 189.9 19.1 8.4 111.3 44.7 61.9 133.6
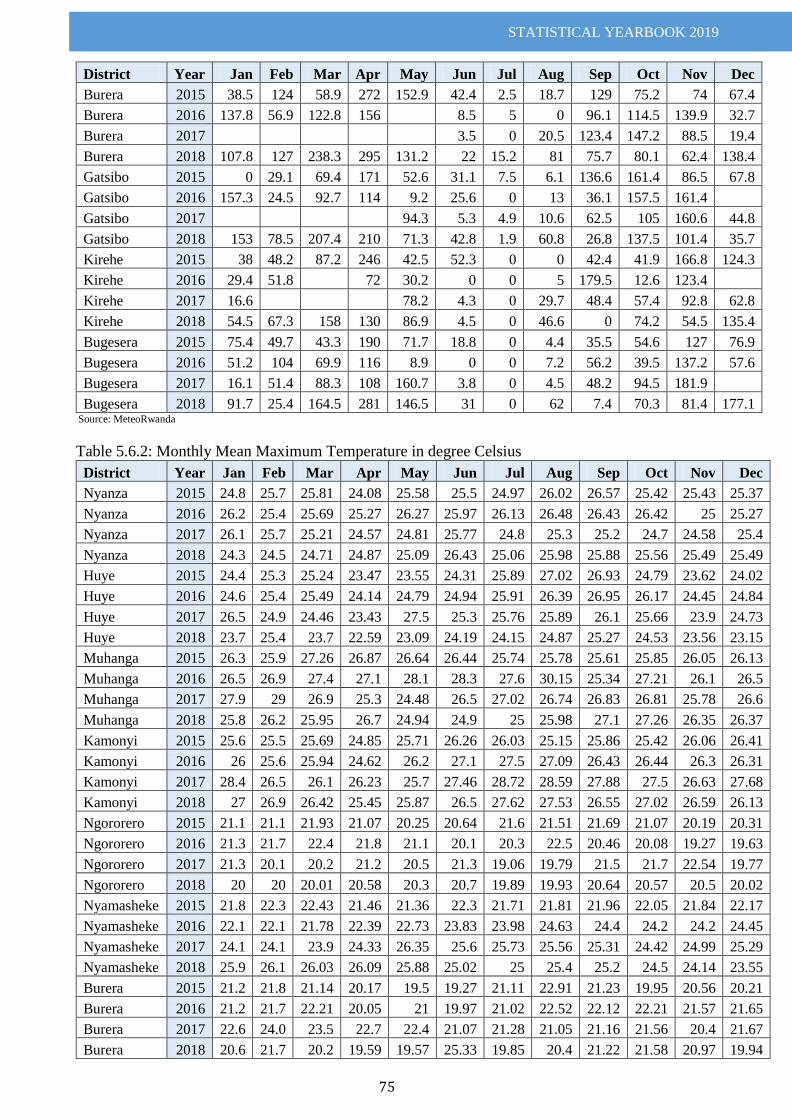
STATISTICAL YEARBOOK 2019
75
District Year Jan Feb Mar Apr May Jun Jul Aug Sep Oct Nov Dec
Burera 2015 38.5 124 58.9 272 152.9 42.4 2.5 18.7 129 75.2 74 67.4
Burera 2016 137.8 56.9 122.8 156 8.5 5 0 96.1 114.5 139.9 32.7
Burera 2017 3.5 0 20.5 123.4 147.2 88.5 19.4
Burera 2018 107.8 127 238.3 295 131.2 22 15.2 81 75.7 80.1 62.4 138.4
Gatsibo 2015 0 29.1 69.4 171 52.6 31.1 7.5 6.1 136.6 161.4 86.5 67.8
Gatsibo 2016 157.3 24.5 92.7 114 9.2 25.6 0 13 36.1 157.5 161.4
Gatsibo 2017 94.3 5.3 4.9 10.6 62.5 105 160.6 44.8
Gatsibo 2018 153 78.5 207.4 210 71.3 42.8 1.9 60.8 26.8 137.5 101.4 35.7
Kirehe 2015 38 48.2 87.2 246 42.5 52.3 0 0 42.4 41.9 166.8 124.3
Kirehe 2016 29.4 51.8 72 30.2 0 0 5 179.5 12.6 123.4
Kirehe 2017 16.6 78.2 4.3 0 29.7 48.4 57.4 92.8 62.8
Kirehe 2018 54.5 67.3 158 130 86.9 4.5 0 46.6 0 74.2 54.5 135.4
Bugesera 2015 75.4 49.7 43.3 190 71.7 18.8 0 4.4 35.5 54.6 127 76.9
Bugesera 2016 51.2 104 69.9 116 8.9 0 0 7.2 56.2 39.5 137.2 57.6
Bugesera 2017 16.1 51.4 88.3 108 160.7 3.8 0 4.5 48.2 94.5 181.9
Bugesera 2018 91.7 25.4 164.5 281 146.5 31 0 62 7.4 70.3 81.4 177.1 Source: MeteoRwanda
Table 5.6.2: Monthly Mean Maximum Temperature in degree Celsius
District Year Jan Feb Mar Apr May Jun Jul Aug Sep Oct Nov Dec
Nyanza 2015 24.8 25.7 25.81 24.08 25.58 25.5 24.97 26.02 26.57 25.42 25.43 25.37
Nyanza 2016 26.2 25.4 25.69 25.27 26.27 25.97 26.13 26.48 26.43 26.42 25 25.27
Nyanza 2017 26.1 25.7 25.21 24.57 24.81 25.77 24.8 25.3 25.2 24.7 24.58 25.4
Nyanza 2018 24.3 24.5 24.71 24.87 25.09 26.43 25.06 25.98 25.88 25.56 25.49 25.49
Huye 2015 24.4 25.3 25.24 23.47 23.55 24.31 25.89 27.02 26.93 24.79 23.62 24.02
Huye 2016 24.6 25.4 25.49 24.14 24.79 24.94 25.91 26.39 26.95 26.17 24.45 24.84
Huye 2017 26.5 24.9 24.46 23.43 27.5 25.3 25.76 25.89 26.1 25.66 23.9 24.73
Huye 2018 23.7 25.4 23.7 22.59 23.09 24.19 24.15 24.87 25.27 24.53 23.56 23.15
Muhanga 2015 26.3 25.9 27.26 26.87 26.64 26.44 25.74 25.78 25.61 25.85 26.05 26.13
Muhanga 2016 26.5 26.9 27.4 27.1 28.1 28.3 27.6 30.15 25.34 27.21 26.1 26.5
Muhanga 2017 27.9 29 26.9 25.3 24.48 26.5 27.02 26.74 26.83 26.81 25.78 26.6
Muhanga 2018 25.8 26.2 25.95 26.7 24.94 24.9 25 25.98 27.1 27.26 26.35 26.37
Kamonyi 2015 25.6 25.5 25.69 24.85 25.71 26.26 26.03 25.15 25.86 25.42 26.06 26.41
Kamonyi 2016 26 25.6 25.94 24.62 26.2 27.1 27.5 27.09 26.43 26.44 26.3 26.31
Kamonyi 2017 28.4 26.5 26.1 26.23 25.7 27.46 28.72 28.59 27.88 27.5 26.63 27.68
Kamonyi 2018 27 26.9 26.42 25.45 25.87 26.5 27.62 27.53 26.55 27.02 26.59 26.13
Ngororero 2015 21.1 21.1 21.93 21.07 20.25 20.64 21.6 21.51 21.69 21.07 20.19 20.31
Ngororero 2016 21.3 21.7 22.4 21.8 21.1 20.1 20.3 22.5 20.46 20.08 19.27 19.63
Ngororero 2017 21.3 20.1 20.2 21.2 20.5 21.3 19.06 19.79 21.5 21.7 22.54 19.77
Ngororero 2018 20 20 20.01 20.58 20.3 20.7 19.89 19.93 20.64 20.57 20.5 20.02
Nyamasheke 2015 21.8 22.3 22.43 21.46 21.36 22.3 21.71 21.81 21.96 22.05 21.84 22.17
Nyamasheke 2016 22.1 22.1 21.78 22.39 22.73 23.83 23.98 24.63 24.4 24.2 24.2 24.45
Nyamasheke 2017 24.1 24.1 23.9 24.33 26.35 25.6 25.73 25.56 25.31 24.42 24.99 25.29
Nyamasheke 2018 25.9 26.1 26.03 26.09 25.88 25.02 25 25.4 25.2 24.5 24.14 23.55
Burera 2015 21.2 21.8 21.14 20.17 19.5 19.27 21.11 22.91 21.23 19.95 20.56 20.21
Burera 2016 21.2 21.7 22.21 20.05 21 19.97 21.02 22.52 22.12 22.21 21.57 21.65
Burera 2017 22.6 24.0 23.5 22.7 22.4 21.07 21.28 21.05 21.16 21.56 20.4 21.67
Burera 2018 20.6 21.7 20.2 19.59 19.57 25.33 19.85 20.4 21.22 21.58 20.97 19.94
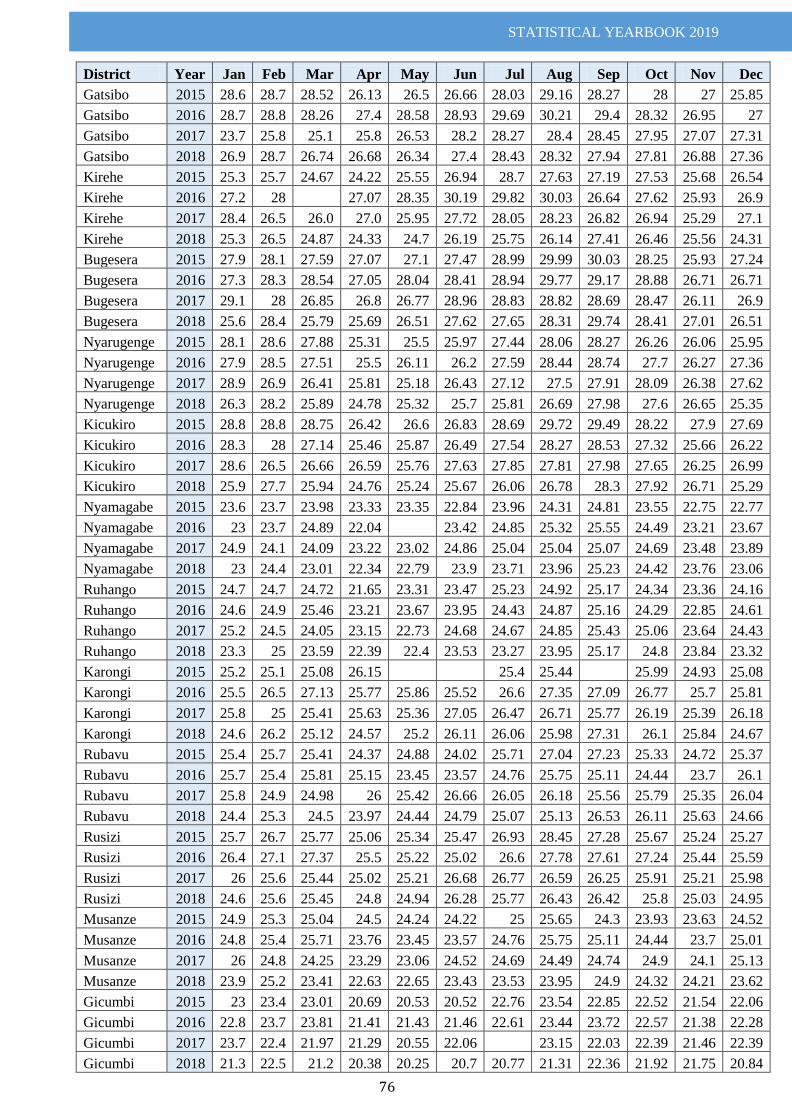
STATISTICAL YEARBOOK 2019
76
District Year Jan Feb Mar Apr May Jun Jul Aug Sep Oct Nov Dec
Gatsibo 2015 28.6 28.7 28.52 26.13 26.5 26.66 28.03 29.16 28.27 28 27 25.85
Gatsibo 2016 28.7 28.8 28.26 27.4 28.58 28.93 29.69 30.21 29.4 28.32 26.95 27
Gatsibo 2017 23.7 25.8 25.1 25.8 26.53 28.2 28.27 28.4 28.45 27.95 27.07 27.31
Gatsibo 2018 26.9 28.7 26.74 26.68 26.34 27.4 28.43 28.32 27.94 27.81 26.88 27.36
Kirehe 2015 25.3 25.7 24.67 24.22 25.55 26.94 28.7 27.63 27.19 27.53 25.68 26.54
Kirehe 2016 27.2 28 27.07 28.35 30.19 29.82 30.03 26.64 27.62 25.93 26.9
Kirehe 2017 28.4 26.5 26.0 27.0 25.95 27.72 28.05 28.23 26.82 26.94 25.29 27.1
Kirehe 2018 25.3 26.5 24.87 24.33 24.7 26.19 25.75 26.14 27.41 26.46 25.56 24.31
Bugesera 2015 27.9 28.1 27.59 27.07 27.1 27.47 28.99 29.99 30.03 28.25 25.93 27.24
Bugesera 2016 27.3 28.3 28.54 27.05 28.04 28.41 28.94 29.77 29.17 28.88 26.71 26.71
Bugesera 2017 29.1 28 26.85 26.8 26.77 28.96 28.83 28.82 28.69 28.47 26.11 26.9
Bugesera 2018 25.6 28.4 25.79 25.69 26.51 27.62 27.65 28.31 29.74 28.41 27.01 26.51
Nyarugenge 2015 28.1 28.6 27.88 25.31 25.5 25.97 27.44 28.06 28.27 26.26 26.06 25.95
Nyarugenge 2016 27.9 28.5 27.51 25.5 26.11 26.2 27.59 28.44 28.74 27.7 26.27 27.36
Nyarugenge 2017 28.9 26.9 26.41 25.81 25.18 26.43 27.12 27.5 27.91 28.09 26.38 27.62
Nyarugenge 2018 26.3 28.2 25.89 24.78 25.32 25.7 25.81 26.69 27.98 27.6 26.65 25.35
Kicukiro 2015 28.8 28.8 28.75 26.42 26.6 26.83 28.69 29.72 29.49 28.22 27.9 27.69
Kicukiro 2016 28.3 28 27.14 25.46 25.87 26.49 27.54 28.27 28.53 27.32 25.66 26.22
Kicukiro 2017 28.6 26.5 26.66 26.59 25.76 27.63 27.85 27.81 27.98 27.65 26.25 26.99
Kicukiro 2018 25.9 27.7 25.94 24.76 25.24 25.67 26.06 26.78 28.3 27.92 26.71 25.29
Nyamagabe 2015 23.6 23.7 23.98 23.33 23.35 22.84 23.96 24.31 24.81 23.55 22.75 22.77
Nyamagabe 2016 23 23.7 24.89 22.04 23.42 24.85 25.32 25.55 24.49 23.21 23.67
Nyamagabe 2017 24.9 24.1 24.09 23.22 23.02 24.86 25.04 25.04 25.07 24.69 23.48 23.89
Nyamagabe 2018 23 24.4 23.01 22.34 22.79 23.9 23.71 23.96 25.23 24.42 23.76 23.06
Ruhango 2015 24.7 24.7 24.72 21.65 23.31 23.47 25.23 24.92 25.17 24.34 23.36 24.16
Ruhango 2016 24.6 24.9 25.46 23.21 23.67 23.95 24.43 24.87 25.16 24.29 22.85 24.61
Ruhango 2017 25.2 24.5 24.05 23.15 22.73 24.68 24.67 24.85 25.43 25.06 23.64 24.43
Ruhango 2018 23.3 25 23.59 22.39 22.4 23.53 23.27 23.95 25.17 24.8 23.84 23.32
Karongi 2015 25.2 25.1 25.08 26.15 25.4 25.44 25.99 24.93 25.08
Karongi 2016 25.5 26.5 27.13 25.77 25.86 25.52 26.6 27.35 27.09 26.77 25.7 25.81
Karongi 2017 25.8 25 25.41 25.63 25.36 27.05 26.47 26.71 25.77 26.19 25.39 26.18
Karongi 2018 24.6 26.2 25.12 24.57 25.2 26.11 26.06 25.98 27.31 26.1 25.84 24.67
Rubavu 2015 25.4 25.7 25.41 24.37 24.88 24.02 25.71 27.04 27.23 25.33 24.72 25.37
Rubavu 2016 25.7 25.4 25.81 25.15 23.45 23.57 24.76 25.75 25.11 24.44 23.7 26.1
Rubavu 2017 25.8 24.9 24.98 26 25.42 26.66 26.05 26.18 25.56 25.79 25.35 26.04
Rubavu 2018 24.4 25.3 24.5 23.97 24.44 24.79 25.07 25.13 26.53 26.11 25.63 24.66
Rusizi 2015 25.7 26.7 25.77 25.06 25.34 25.47 26.93 28.45 27.28 25.67 25.24 25.27
Rusizi 2016 26.4 27.1 27.37 25.5 25.22 25.02 26.6 27.78 27.61 27.24 25.44 25.59
Rusizi 2017 26 25.6 25.44 25.02 25.21 26.68 26.77 26.59 26.25 25.91 25.21 25.98
Rusizi 2018 24.6 25.6 25.45 24.8 24.94 26.28 25.77 26.43 26.42 25.8 25.03 24.95
Musanze 2015 24.9 25.3 25.04 24.5 24.24 24.22 25 25.65 24.3 23.93 23.63 24.52
Musanze 2016 24.8 25.4 25.71 23.76 23.45 23.57 24.76 25.75 25.11 24.44 23.7 25.01
Musanze 2017 26 24.8 24.25 23.29 23.06 24.52 24.69 24.49 24.74 24.9 24.1 25.13
Musanze 2018 23.9 25.2 23.41 22.63 22.65 23.43 23.53 23.95 24.9 24.32 24.21 23.62
Gicumbi 2015 23 23.4 23.01 20.69 20.53 20.52 22.76 23.54 22.85 22.52 21.54 22.06
Gicumbi 2016 22.8 23.7 23.81 21.41 21.43 21.46 22.61 23.44 23.72 22.57 21.38 22.28
Gicumbi 2017 23.7 22.4 21.97 21.29 20.55 22.06 23.15 22.03 22.39 21.46 22.39
Gicumbi 2018 21.3 22.5 21.2 20.38 20.25 20.7 20.77 21.31 22.36 21.92 21.75 20.84
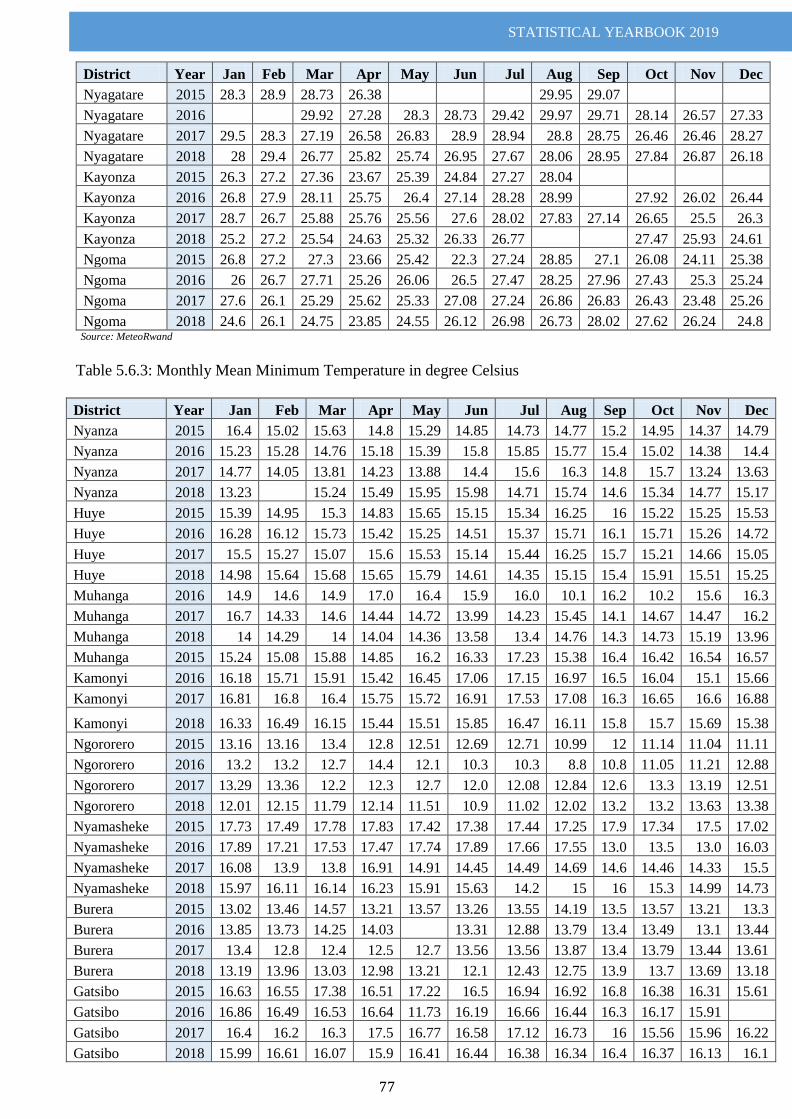
STATISTICAL YEARBOOK 2019
77
District Year Jan Feb Mar Apr May Jun Jul Aug Sep Oct Nov Dec
Nyagatare 2015 28.3 28.9 28.73 26.38 29.95 29.07
Nyagatare 2016 29.92 27.28 28.3 28.73 29.42 29.97 29.71 28.14 26.57 27.33
Nyagatare 2017 29.5 28.3 27.19 26.58 26.83 28.9 28.94 28.8 28.75 26.46 26.46 28.27
Nyagatare 2018 28 29.4 26.77 25.82 25.74 26.95 27.67 28.06 28.95 27.84 26.87 26.18
Kayonza 2015 26.3 27.2 27.36 23.67 25.39 24.84 27.27 28.04
Kayonza 2016 26.8 27.9 28.11 25.75 26.4 27.14 28.28 28.99 27.92 26.02 26.44
Kayonza 2017 28.7 26.7 25.88 25.76 25.56 27.6 28.02 27.83 27.14 26.65 25.5 26.3
Kayonza 2018 25.2 27.2 25.54 24.63 25.32 26.33 26.77 27.47 25.93 24.61
Ngoma 2015 26.8 27.2 27.3 23.66 25.42 22.3 27.24 28.85 27.1 26.08 24.11 25.38
Ngoma 2016 26 26.7 27.71 25.26 26.06 26.5 27.47 28.25 27.96 27.43 25.3 25.24
Ngoma 2017 27.6 26.1 25.29 25.62 25.33 27.08 27.24 26.86 26.83 26.43 23.48 25.26
Ngoma 2018 24.6 26.1 24.75 23.85 24.55 26.12 26.98 26.73 28.02 27.62 26.24 24.8 Source: MeteoRwand
Table 5.6.3: Monthly Mean Minimum Temperature in degree Celsius
District Year Jan Feb Mar Apr May Jun Jul Aug Sep Oct Nov Dec
Nyanza 2015 16.4 15.02 15.63 14.8 15.29 14.85 14.73 14.77 15.2 14.95 14.37 14.79
Nyanza 2016 15.23 15.28 14.76 15.18 15.39 15.8 15.85 15.77 15.4 15.02 14.38 14.4
Nyanza 2017 14.77 14.05 13.81 14.23 13.88 14.4 15.6 16.3 14.8 15.7 13.24 13.63
Nyanza 2018 13.23 15.24 15.49 15.95 15.98 14.71 15.74 14.6 15.34 14.77 15.17
Huye 2015 15.39 14.95 15.3 14.83 15.65 15.15 15.34 16.25 16 15.22 15.25 15.53
Huye 2016 16.28 16.12 15.73 15.42 15.25 14.51 15.37 15.71 16.1 15.71 15.26 14.72
Huye 2017 15.5 15.27 15.07 15.6 15.53 15.14 15.44 16.25 15.7 15.21 14.66 15.05
Huye 2018 14.98 15.64 15.68 15.65 15.79 14.61 14.35 15.15 15.4 15.91 15.51 15.25
Muhanga 2016 14.9 14.6 14.9 17.0 16.4 15.9 16.0 10.1 16.2 10.2 15.6 16.3
Muhanga 2017 16.7 14.33 14.6 14.44 14.72 13.99 14.23 15.45 14.1 14.67 14.47 16.2
Muhanga 2018 14 14.29 14 14.04 14.36 13.58 13.4 14.76 14.3 14.73 15.19 13.96
Muhanga 2015 15.24 15.08 15.88 14.85 16.2 16.33 17.23 15.38 16.4 16.42 16.54 16.57
Kamonyi 2016 16.18 15.71 15.91 15.42 16.45 17.06 17.15 16.97 16.5 16.04 15.1 15.66
Kamonyi 2017 16.81 16.8 16.4 15.75 15.72 16.91 17.53 17.08 16.3 16.65 16.6 16.88
Kamonyi 2018 16.33 16.49 16.15 15.44 15.51 15.85 16.47 16.11 15.8 15.7 15.69 15.38
Ngororero 2015 13.16 13.16 13.4 12.8 12.51 12.69 12.71 10.99 12 11.14 11.04 11.11
Ngororero 2016 13.2 13.2 12.7 14.4 12.1 10.3 10.3 8.8 10.8 11.05 11.21 12.88
Ngororero 2017 13.29 13.36 12.2 12.3 12.7 12.0 12.08 12.84 12.6 13.3 13.19 12.51
Ngororero 2018 12.01 12.15 11.79 12.14 11.51 10.9 11.02 12.02 13.2 13.2 13.63 13.38
Nyamasheke 2015 17.73 17.49 17.78 17.83 17.42 17.38 17.44 17.25 17.9 17.34 17.5 17.02
Nyamasheke 2016 17.89 17.21 17.53 17.47 17.74 17.89 17.66 17.55 13.0 13.5 13.0 16.03
Nyamasheke 2017 16.08 13.9 13.8 16.91 14.91 14.45 14.49 14.69 14.6 14.46 14.33 15.5
Nyamasheke 2018 15.97 16.11 16.14 16.23 15.91 15.63 14.2 15 16 15.3 14.99 14.73
Burera 2015 13.02 13.46 14.57 13.21 13.57 13.26 13.55 14.19 13.5 13.57 13.21 13.3
Burera 2016 13.85 13.73 14.25 14.03 13.31 12.88 13.79 13.4 13.49 13.1 13.44
Burera 2017 13.4 12.8 12.4 12.5 12.7 13.56 13.56 13.87 13.4 13.79 13.44 13.61
Burera 2018 13.19 13.96 13.03 12.98 13.21 12.1 12.43 12.75 13.9 13.7 13.69 13.18
Gatsibo 2015 16.63 16.55 17.38 16.51 17.22 16.5 16.94 16.92 16.8 16.38 16.31 15.61
Gatsibo 2016 16.86 16.49 16.53 16.64 11.73 16.19 16.66 16.44 16.3 16.17 15.91
Gatsibo 2017 16.4 16.2 16.3 17.5 16.77 16.58 17.12 16.73 16 15.56 15.96 16.22
Gatsibo 2018 15.99 16.61 16.07 15.9 16.41 16.44 16.38 16.34 16.4 16.37 16.13 16.1
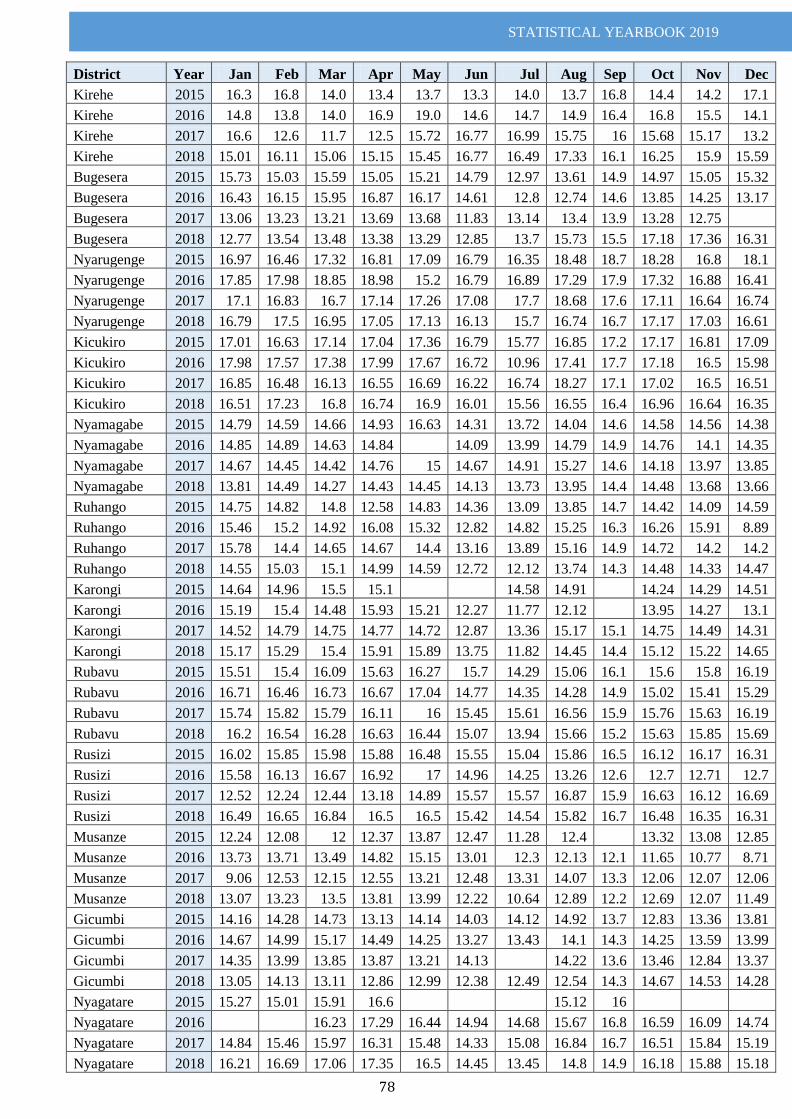
STATISTICAL YEARBOOK 2019
78
District Year Jan Feb Mar Apr May Jun Jul Aug Sep Oct Nov Dec
Kirehe 2015 16.3 16.8 14.0 13.4 13.7 13.3 14.0 13.7 16.8 14.4 14.2 17.1
Kirehe 2016 14.8 13.8 14.0 16.9 19.0 14.6 14.7 14.9 16.4 16.8 15.5 14.1
Kirehe 2017 16.6 12.6 11.7 12.5 15.72 16.77 16.99 15.75 16 15.68 15.17 13.2
Kirehe 2018 15.01 16.11 15.06 15.15 15.45 16.77 16.49 17.33 16.1 16.25 15.9 15.59
Bugesera 2015 15.73 15.03 15.59 15.05 15.21 14.79 12.97 13.61 14.9 14.97 15.05 15.32
Bugesera 2016 16.43 16.15 15.95 16.87 16.17 14.61 12.8 12.74 14.6 13.85 14.25 13.17
Bugesera 2017 13.06 13.23 13.21 13.69 13.68 11.83 13.14 13.4 13.9 13.28 12.75
Bugesera 2018 12.77 13.54 13.48 13.38 13.29 12.85 13.7 15.73 15.5 17.18 17.36 16.31
Nyarugenge 2015 16.97 16.46 17.32 16.81 17.09 16.79 16.35 18.48 18.7 18.28 16.8 18.1
Nyarugenge 2016 17.85 17.98 18.85 18.98 15.2 16.79 16.89 17.29 17.9 17.32 16.88 16.41
Nyarugenge 2017 17.1 16.83 16.7 17.14 17.26 17.08 17.7 18.68 17.6 17.11 16.64 16.74
Nyarugenge 2018 16.79 17.5 16.95 17.05 17.13 16.13 15.7 16.74 16.7 17.17 17.03 16.61
Kicukiro 2015 17.01 16.63 17.14 17.04 17.36 16.79 15.77 16.85 17.2 17.17 16.81 17.09
Kicukiro 2016 17.98 17.57 17.38 17.99 17.67 16.72 10.96 17.41 17.7 17.18 16.5 15.98
Kicukiro 2017 16.85 16.48 16.13 16.55 16.69 16.22 16.74 18.27 17.1 17.02 16.5 16.51
Kicukiro 2018 16.51 17.23 16.8 16.74 16.9 16.01 15.56 16.55 16.4 16.96 16.64 16.35
Nyamagabe 2015 14.79 14.59 14.66 14.93 16.63 14.31 13.72 14.04 14.6 14.58 14.56 14.38
Nyamagabe 2016 14.85 14.89 14.63 14.84 14.09 13.99 14.79 14.9 14.76 14.1 14.35
Nyamagabe 2017 14.67 14.45 14.42 14.76 15 14.67 14.91 15.27 14.6 14.18 13.97 13.85
Nyamagabe 2018 13.81 14.49 14.27 14.43 14.45 14.13 13.73 13.95 14.4 14.48 13.68 13.66
Ruhango 2015 14.75 14.82 14.8 12.58 14.83 14.36 13.09 13.85 14.7 14.42 14.09 14.59
Ruhango 2016 15.46 15.2 14.92 16.08 15.32 12.82 14.82 15.25 16.3 16.26 15.91 8.89
Ruhango 2017 15.78 14.4 14.65 14.67 14.4 13.16 13.89 15.16 14.9 14.72 14.2 14.2
Ruhango 2018 14.55 15.03 15.1 14.99 14.59 12.72 12.12 13.74 14.3 14.48 14.33 14.47
Karongi 2015 14.64 14.96 15.5 15.1 14.58 14.91 14.24 14.29 14.51
Karongi 2016 15.19 15.4 14.48 15.93 15.21 12.27 11.77 12.12 13.95 14.27 13.1
Karongi 2017 14.52 14.79 14.75 14.77 14.72 12.87 13.36 15.17 15.1 14.75 14.49 14.31
Karongi 2018 15.17 15.29 15.4 15.91 15.89 13.75 11.82 14.45 14.4 15.12 15.22 14.65
Rubavu 2015 15.51 15.4 16.09 15.63 16.27 15.7 14.29 15.06 16.1 15.6 15.8 16.19
Rubavu 2016 16.71 16.46 16.73 16.67 17.04 14.77 14.35 14.28 14.9 15.02 15.41 15.29
Rubavu 2017 15.74 15.82 15.79 16.11 16 15.45 15.61 16.56 15.9 15.76 15.63 16.19
Rubavu 2018 16.2 16.54 16.28 16.63 16.44 15.07 13.94 15.66 15.2 15.63 15.85 15.69
Rusizi 2015 16.02 15.85 15.98 15.88 16.48 15.55 15.04 15.86 16.5 16.12 16.17 16.31
Rusizi 2016 15.58 16.13 16.67 16.92 17 14.96 14.25 13.26 12.6 12.7 12.71 12.7
Rusizi 2017 12.52 12.24 12.44 13.18 14.89 15.57 15.57 16.87 15.9 16.63 16.12 16.69
Rusizi 2018 16.49 16.65 16.84 16.5 16.5 15.42 14.54 15.82 16.7 16.48 16.35 16.31
Musanze 2015 12.24 12.08 12 12.37 13.87 12.47 11.28 12.4 13.32 13.08 12.85
Musanze 2016 13.73 13.71 13.49 14.82 15.15 13.01 12.3 12.13 12.1 11.65 10.77 8.71
Musanze 2017 9.06 12.53 12.15 12.55 13.21 12.48 13.31 14.07 13.3 12.06 12.07 12.06
Musanze 2018 13.07 13.23 13.5 13.81 13.99 12.22 10.64 12.89 12.2 12.69 12.07 11.49
Gicumbi 2015 14.16 14.28 14.73 13.13 14.14 14.03 14.12 14.92 13.7 12.83 13.36 13.81
Gicumbi 2016 14.67 14.99 15.17 14.49 14.25 13.27 13.43 14.1 14.3 14.25 13.59 13.99
Gicumbi 2017 14.35 13.99 13.85 13.87 13.21 14.13 14.22 13.6 13.46 12.84 13.37
Gicumbi 2018 13.05 14.13 13.11 12.86 12.99 12.38 12.49 12.54 14.3 14.67 14.53 14.28
Nyagatare 2015 15.27 15.01 15.91 16.6 15.12 16
Nyagatare 2016 16.23 17.29 16.44 14.94 14.68 15.67 16.8 16.59 16.09 14.74
Nyagatare 2017 14.84 15.46 15.97 16.31 15.48 14.33 15.08 16.84 16.7 16.51 15.84 15.19
Nyagatare 2018 16.21 16.69 17.06 17.35 16.5 14.45 13.45 14.8 14.9 16.18 15.88 15.18
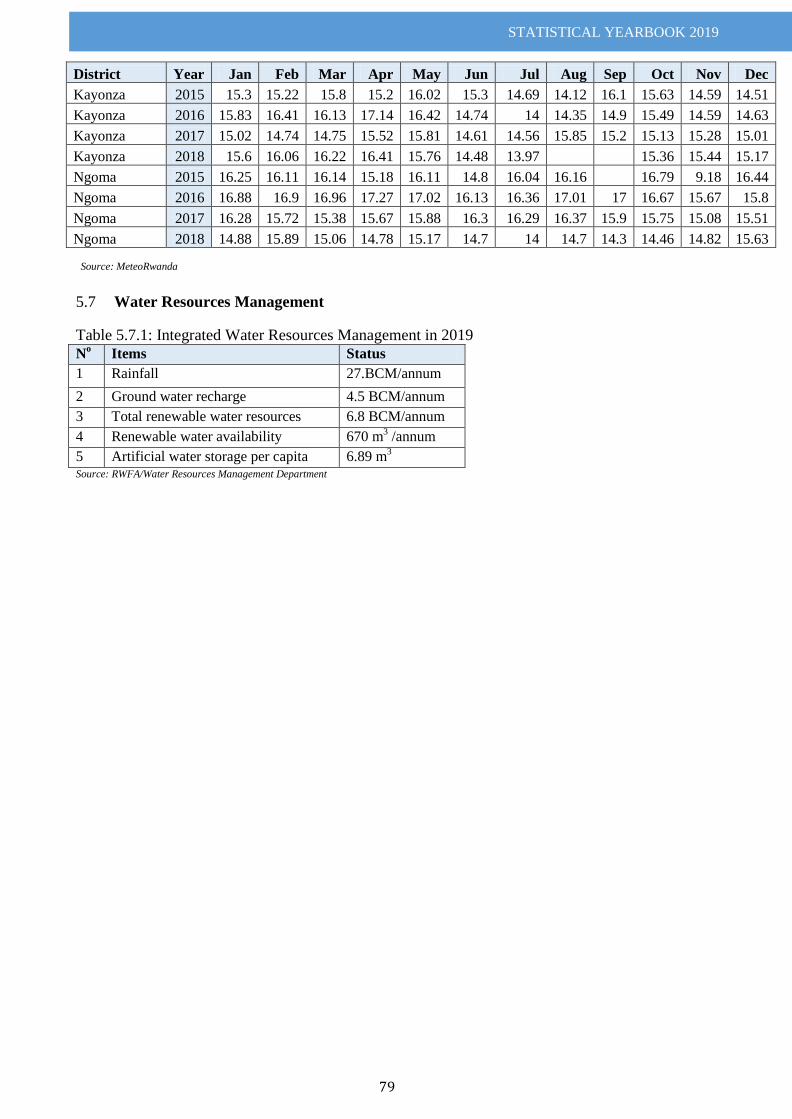
STATISTICAL YEARBOOK 2019
79
District Year Jan Feb Mar Apr May Jun Jul Aug Sep Oct Nov Dec
Kayonza 2015 15.3 15.22 15.8 15.2 16.02 15.3 14.69 14.12 16.1 15.63 14.59 14.51
Kayonza 2016 15.83 16.41 16.13 17.14 16.42 14.74 14 14.35 14.9 15.49 14.59 14.63
Kayonza 2017 15.02 14.74 14.75 15.52 15.81 14.61 14.56 15.85 15.2 15.13 15.28 15.01
Kayonza 2018 15.6 16.06 16.22 16.41 15.76 14.48 13.97 15.36 15.44 15.17
Ngoma 2015 16.25 16.11 16.14 15.18 16.11 14.8 16.04 16.16 16.79 9.18 16.44
Ngoma 2016 16.88 16.9 16.96 17.27 17.02 16.13 16.36 17.01 17 16.67 15.67 15.8
Ngoma 2017 16.28 15.72 15.38 15.67 15.88 16.3 16.29 16.37 15.9 15.75 15.08 15.51
Ngoma 2018 14.88 15.89 15.06 14.78 15.17 14.7 14 14.7 14.3 14.46 14.82 15.63 Source: MeteoRwanda
Water Resources Management 5.7
Table 5.7.1: Integrated Water Resources Management in 2019
No Items Status
1 Rainfall 27.BCM/annum
2 Ground water recharge 4.5 BCM/annum
3 Total renewable water resources 6.8 BCM/annum
4 Renewable water availability 670 m3 /annum
5 Artificial water storage per capita 6.89 m3
Source: RWFA/Water Resources Management Department
STATISTICAL YEARBOOK 2019
80
CHAPTER VI: AGRICULTURE
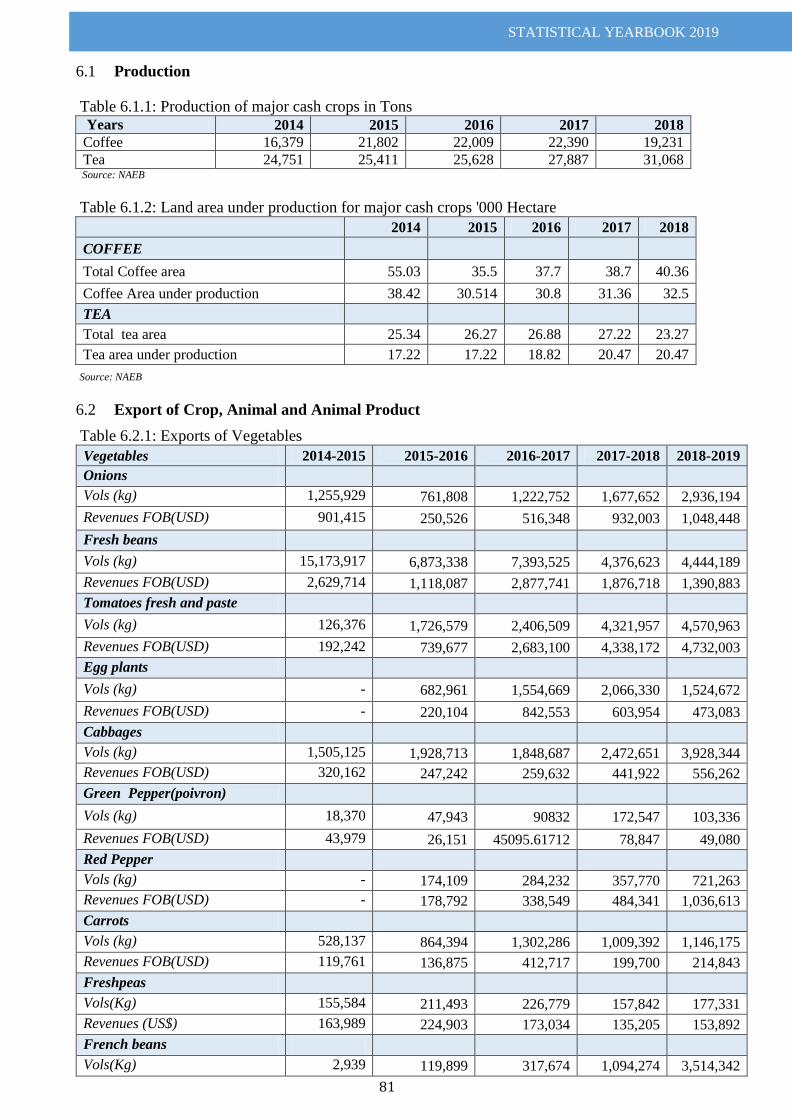
STATISTICAL YEARBOOK 2019
81
Production 6.1 Table 6.1.1: Production of major cash crops in Tons Years 2014 2015 2016 2017 2018
Coffee 16,379 21,802 22,009 22,390 19,231
Tea 24,751 25,411 25,628 27,887 31,068 Source: NAEB
Table 6.1.2: Land area under production for major cash crops '000 Hectare
Source: NAEB
Export of Crop, Animal and Animal Product 6.2
Table 6.2.1: Exports of Vegetables
Vegetables 2014-2015 2015-2016 2016-2017 2017-2018 2018-2019
Onions
Vols (kg) 1,255,929 761,808 1,222,752 1,677,652 2,936,194
Revenues FOB(USD) 901,415 250,526 516,348 932,003 1,048,448
Fresh beans
Vols (kg) 15,173,917 6,873,338 7,393,525 4,376,623 4,444,189
Revenues FOB(USD) 2,629,714 1,118,087 2,877,741 1,876,718 1,390,883
Tomatoes fresh and paste
Vols (kg) 126,376 1,726,579 2,406,509 4,321,957 4,570,963
Revenues FOB(USD) 192,242 739,677 2,683,100 4,338,172 4,732,003
Egg plants
Vols (kg) - 682,961 1,554,669 2,066,330 1,524,672
Revenues FOB(USD) - 220,104 842,553 603,954 473,083
Cabbages
Vols (kg) 1,505,125 1,928,713 1,848,687 2,472,651 3,928,344
Revenues FOB(USD) 320,162 247,242 259,632 441,922 556,262
Green Pepper(poivron)
Vols (kg) 18,370 47,943 90832 172,547 103,336
Revenues FOB(USD) 43,979 26,151 45095.61712 78,847 49,080
Red Pepper
Vols (kg) - 174,109 284,232 357,770 721,263
Revenues FOB(USD) - 178,792 338,549 484,341 1,036,613
Carrots
Vols (kg) 528,137 864,394 1,302,286 1,009,392 1,146,175
Revenues FOB(USD) 119,761 136,875 412,717 199,700 214,843
Freshpeas
Vols(Kg) 155,584 211,493 226,779 157,842 177,331
Revenues (US$) 163,989 224,903 173,034 135,205 153,892
French beans
Vols(Kg) 2,939 119,899 317,674 1,094,274 3,514,342
2014 2015 2016 2017 2018
COFFEE
Total Coffee area 55.03 35.5 37.7 38.7 40.36
Coffee Area under production 38.42 30.514 30.8 31.36 32.5
TEA
Total tea area 25.34 26.27 26.88 27.22 23.27
Tea area under production 17.22 17.22 18.82 20.47 20.47
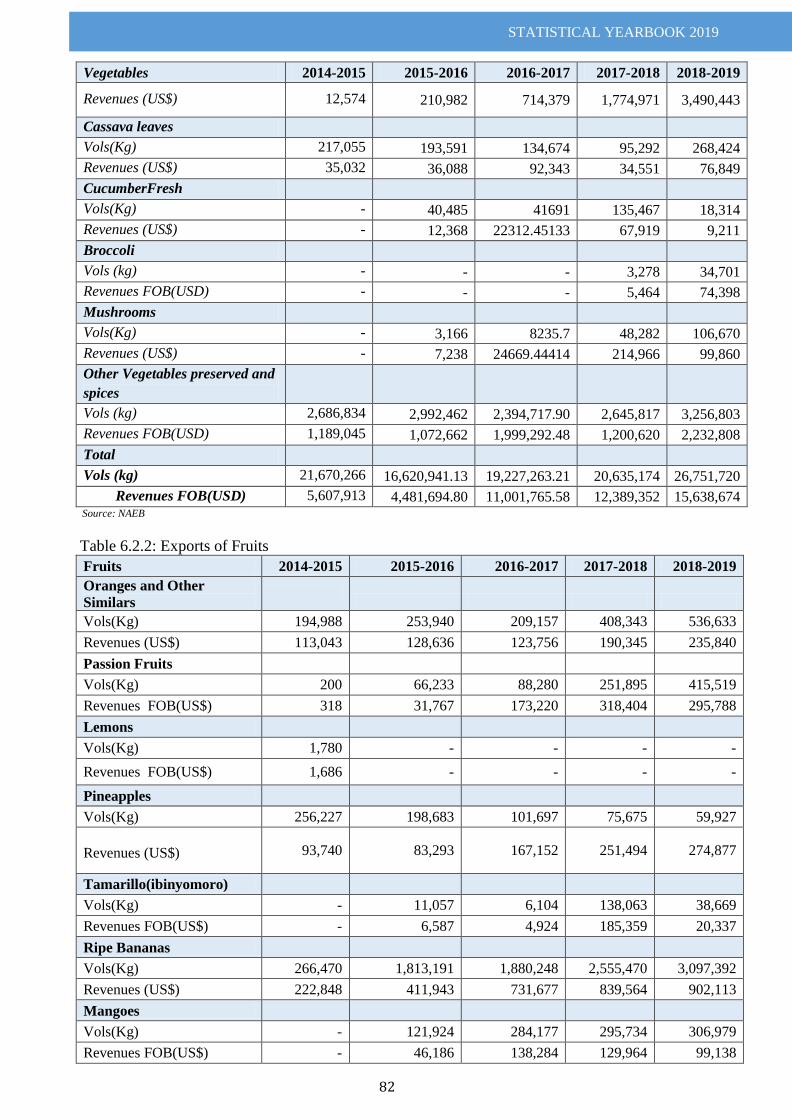
STATISTICAL YEARBOOK 2019
82
Vegetables 2014-2015 2015-2016 2016-2017 2017-2018 2018-2019
Revenues (US$) 12,574 210,982 714,379 1,774,971 3,490,443
Cassava leaves
Vols(Kg) 217,055 193,591 134,674 95,292 268,424
Revenues (US$) 35,032 36,088 92,343 34,551 76,849
CucumberFresh
Vols(Kg) - 40,485 41691 135,467 18,314
Revenues (US$) - 12,368 22312.45133 67,919 9,211
Broccoli
Vols (kg) - - - 3,278 34,701
Revenues FOB(USD) - - - 5,464 74,398
Mushrooms
Vols(Kg) - 3,166 8235.7 48,282 106,670
Revenues (US$) - 7,238 24669.44414 214,966 99,860
Other Vegetables preserved and
spices
Vols (kg) 2,686,834 2,992,462 2,394,717.90 2,645,817 3,256,803
Revenues FOB(USD) 1,189,045 1,072,662 1,999,292.48 1,200,620 2,232,808
Total
Vols (kg) 21,670,266 16,620,941.13 19,227,263.21 20,635,174 26,751,720
Revenues FOB(USD) 5,607,913 4,481,694.80 11,001,765.58 12,389,352 15,638,674 Source: NAEB
Table 6.2.2: Exports of Fruits
Fruits 2014-2015 2015-2016 2016-2017 2017-2018 2018-2019
Oranges and Other
Similars
Vols(Kg) 194,988 253,940 209,157 408,343 536,633
Revenues (US$) 113,043 128,636 123,756 190,345 235,840
Passion Fruits
Vols(Kg) 200 66,233 88,280 251,895 415,519
Revenues FOB(US$) 318 31,767 173,220 318,404 295,788
Lemons
Vols(Kg) 1,780 - - - -
Revenues FOB(US$) 1,686 - - - -
Pineapples
Vols(Kg) 256,227 198,683 101,697 75,675 59,927
Revenues (US$) 93,740 83,293 167,152 251,494 274,877
Tamarillo(ibinyomoro)
Vols(Kg) - 11,057 6,104 138,063 38,669
Revenues FOB(US$) - 6,587 4,924 185,359 20,337
Ripe Bananas
Vols(Kg) 266,470 1,813,191 1,880,248 2,555,470 3,097,392
Revenues (US$) 222,848 411,943 731,677 839,564 902,113
Mangoes
Vols(Kg) - 121,924 284,177 295,734 306,979
Revenues FOB(US$) - 46,186 138,284 129,964 99,138
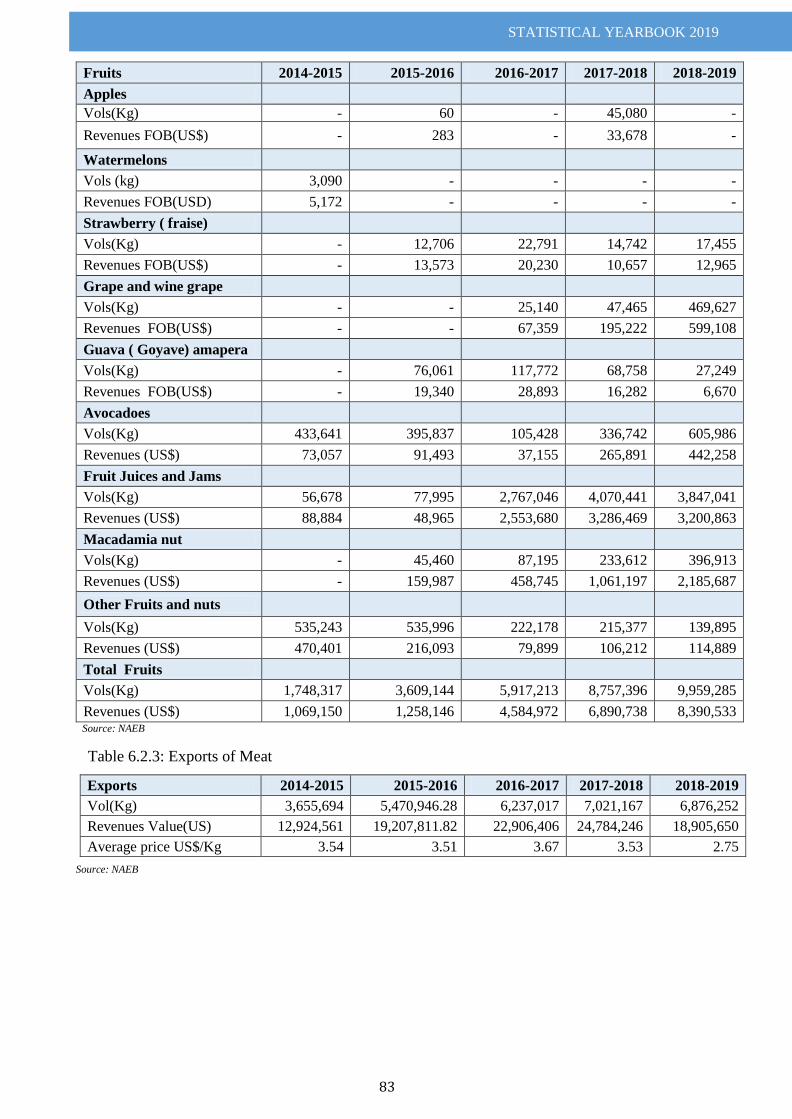
STATISTICAL YEARBOOK 2019
83
Fruits 2014-2015 2015-2016 2016-2017 2017-2018 2018-2019
Apples
Vols(Kg) - 60 - 45,080 -
Revenues FOB(US$) - 283 - 33,678 -
Watermelons
Vols (kg) 3,090 - - - -
Revenues FOB(USD) 5,172 - - - -
Strawberry ( fraise)
Vols(Kg) - 12,706 22,791 14,742 17,455
Revenues FOB(US$) - 13,573 20,230 10,657 12,965
Grape and wine grape
Vols(Kg) - - 25,140 47,465 469,627
Revenues FOB(US$) - - 67,359 195,222 599,108
Guava ( Goyave) amapera
Vols(Kg) - 76,061 117,772 68,758 27,249
Revenues FOB(US$) - 19,340 28,893 16,282 6,670
Avocadoes
Vols(Kg) 433,641 395,837 105,428 336,742 605,986
Revenues (US$) 73,057 91,493 37,155 265,891 442,258
Fruit Juices and Jams
Vols(Kg) 56,678 77,995 2,767,046 4,070,441 3,847,041
Revenues (US$) 88,884 48,965 2,553,680 3,286,469 3,200,863
Macadamia nut
Vols(Kg) - 45,460 87,195 233,612 396,913
Revenues (US$) - 159,987 458,745 1,061,197 2,185,687
Other Fruits and nuts
Vols(Kg) 535,243 535,996 222,178 215,377 139,895
Revenues (US$) 470,401 216,093 79,899 106,212 114,889
Total Fruits
Vols(Kg) 1,748,317 3,609,144 5,917,213 8,757,396 9,959,285
Revenues (US$) 1,069,150 1,258,146 4,584,972 6,890,738 8,390,533 Source: NAEB
Table 6.2.3: Exports of Meat
Source: NAEB
Exports 2014-2015 2015-2016 2016-2017 2017-2018 2018-2019
Vol(Kg) 3,655,694 5,470,946.28 6,237,017 7,021,167 6,876,252
Revenues Value(US) 12,924,561 19,207,811.82 22,906,406 24,784,246 18,905,650
Average price US$/Kg 3.54 3.51 3.67 3.53 2.75
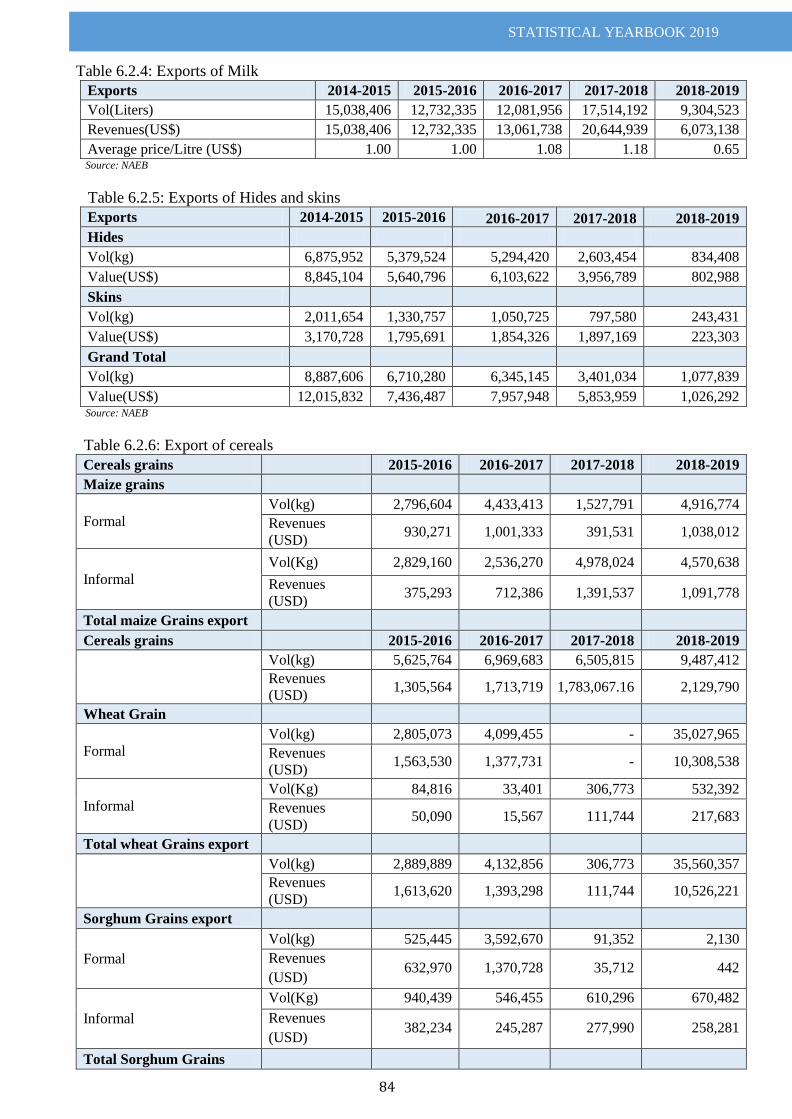
STATISTICAL YEARBOOK 2019
84
Table 6.2.4: Exports of Milk
Exports 2014-2015 2015-2016 2016-2017 2017-2018 2018-2019
Vol(Liters) 15,038,406 12,732,335 12,081,956 17,514,192 9,304,523
Revenues(US$) 15,038,406 12,732,335 13,061,738 20,644,939 6,073,138
Average price/Litre (US$) 1.00 1.00 1.08 1.18 0.65 Source: NAEB
Table 6.2.5: Exports of Hides and skins
Exports 2014-2015 2015-2016 2016-2017 2017-2018 2018-2019
Hides
Vol(kg) 6,875,952 5,379,524 5,294,420 2,603,454 834,408
Value(US$) 8,845,104 5,640,796 6,103,622 3,956,789 802,988
Skins
Vol(kg) 2,011,654 1,330,757 1,050,725 797,580 243,431
Value(US$) 3,170,728 1,795,691 1,854,326 1,897,169 223,303
Grand Total
Vol(kg) 8,887,606 6,710,280 6,345,145 3,401,034 1,077,839
Value(US$) 12,015,832 7,436,487 7,957,948 5,853,959 1,026,292 Source: NAEB
Table 6.2.6: Export of cereals
Cereals grains 2015-2016 2016-2017 2017-2018 2018-2019
Maize grains
Formal
Vol(kg) 2,796,604 4,433,413 1,527,791 4,916,774
Revenues
(USD) 930,271 1,001,333 391,531 1,038,012
Informal
Vol(Kg) 2,829,160 2,536,270 4,978,024 4,570,638
Revenues
(USD) 375,293 712,386 1,391,537 1,091,778
Total maize Grains export
Cereals grains 2015-2016 2016-2017 2017-2018 2018-2019
Vol(kg) 5,625,764 6,969,683 6,505,815 9,487,412
Revenues
(USD) 1,305,564 1,713,719 1,783,067.16 2,129,790
Wheat Grain
Formal
Vol(kg) 2,805,073 4,099,455 - 35,027,965
Revenues
(USD) 1,563,530 1,377,731 - 10,308,538
Informal
Vol(Kg) 84,816 33,401 306,773 532,392
Revenues
(USD) 50,090 15,567 111,744 217,683
Total wheat Grains export
Vol(kg) 2,889,889 4,132,856 306,773 35,560,357
Revenues
(USD) 1,613,620 1,393,298 111,744 10,526,221
Sorghum Grains export
Formal
Vol(kg) 525,445 3,592,670 91,352 2,130
Revenues
(USD) 632,970 1,370,728 35,712 442
Informal
Vol(Kg) 940,439 546,455 610,296 670,482
Revenues
(USD) 382,234 245,287 277,990 258,281
Total Sorghum Grains
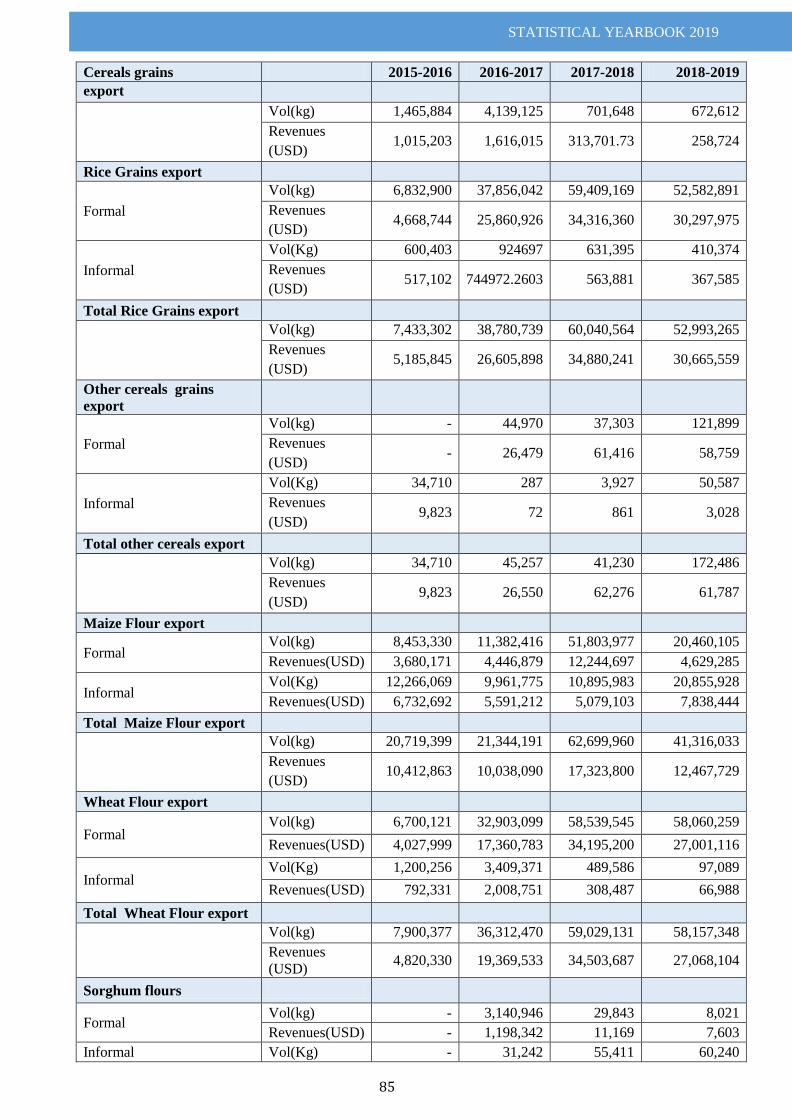
STATISTICAL YEARBOOK 2019
85
Cereals grains 2015-2016 2016-2017 2017-2018 2018-2019
export
Vol(kg) 1,465,884 4,139,125 701,648 672,612
Revenues
(USD) 1,015,203 1,616,015 313,701.73 258,724
Rice Grains export
Formal
Vol(kg) 6,832,900 37,856,042 59,409,169 52,582,891
Revenues
(USD) 4,668,744 25,860,926 34,316,360 30,297,975
Informal
Vol(Kg) 600,403 924697 631,395 410,374
Revenues
(USD) 517,102 744972.2603 563,881 367,585
Total Rice Grains export
Vol(kg) 7,433,302 38,780,739 60,040,564 52,993,265
Revenues
(USD) 5,185,845 26,605,898 34,880,241 30,665,559
Other cereals grains
export
Formal
Vol(kg) - 44,970 37,303 121,899
Revenues
(USD) - 26,479 61,416 58,759
Informal
Vol(Kg) 34,710 287 3,927 50,587
Revenues
(USD) 9,823 72 861 3,028
Total other cereals export
Vol(kg) 34,710 45,257 41,230 172,486
Revenues
(USD) 9,823 26,550 62,276 61,787
Maize Flour export
Formal Vol(kg) 8,453,330 11,382,416 51,803,977 20,460,105
Revenues(USD) 3,680,171 4,446,879 12,244,697 4,629,285
Informal Vol(Kg) 12,266,069 9,961,775 10,895,983 20,855,928
Revenues(USD) 6,732,692 5,591,212 5,079,103 7,838,444
Total Maize Flour export
Vol(kg) 20,719,399 21,344,191 62,699,960 41,316,033
Revenues
(USD) 10,412,863 10,038,090 17,323,800 12,467,729
Wheat Flour export
Formal Vol(kg) 6,700,121 32,903,099 58,539,545 58,060,259
Revenues(USD) 4,027,999 17,360,783 34,195,200 27,001,116
Informal Vol(Kg) 1,200,256 3,409,371 489,586 97,089
Revenues(USD) 792,331 2,008,751 308,487 66,988
Total Wheat Flour export
Vol(kg) 7,900,377 36,312,470 59,029,131 58,157,348
Revenues
(USD) 4,820,330 19,369,533 34,503,687 27,068,104
Sorghum flours
Formal Vol(kg) - 3,140,946 29,843 8,021
Revenues(USD) - 1,198,342 11,169 7,603
Informal Vol(Kg) - 31,242 55,411 60,240
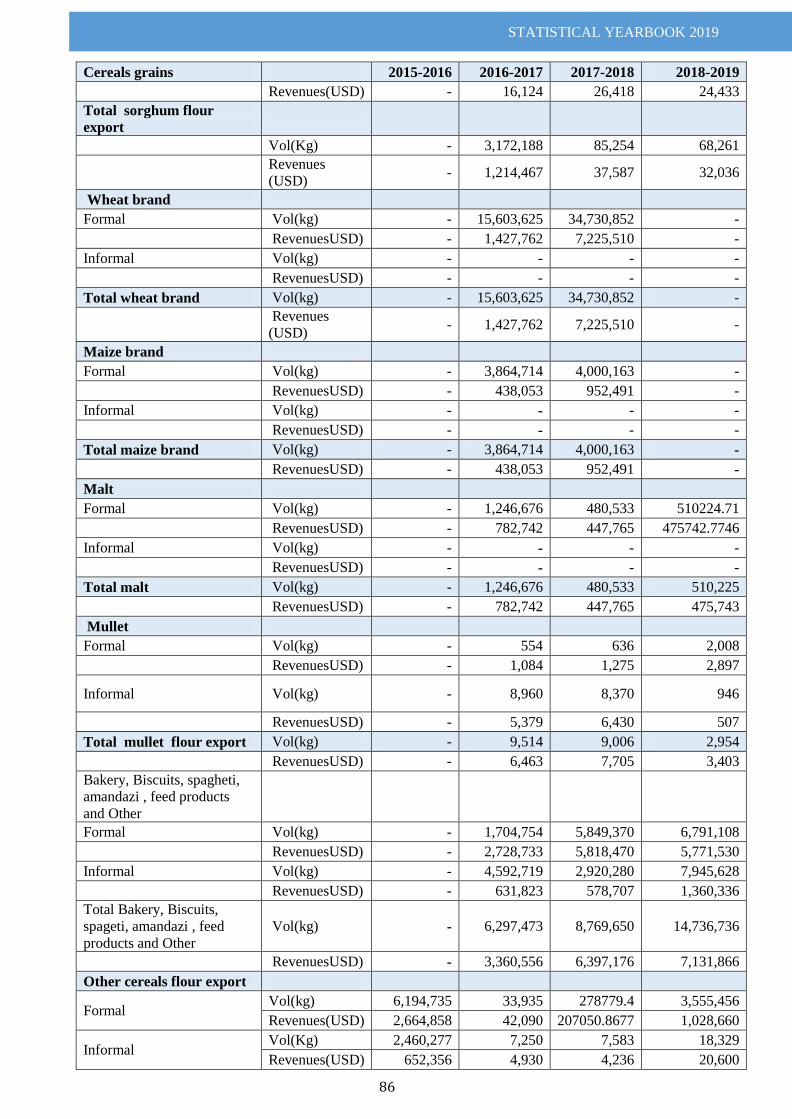
STATISTICAL YEARBOOK 2019
86
Cereals grains 2015-2016 2016-2017 2017-2018 2018-2019
Revenues(USD) - 16,124 26,418 24,433
Total sorghum flour
export
Vol(Kg) - 3,172,188 85,254 68,261
Revenues
(USD) - 1,214,467 37,587 32,036
Wheat brand
Formal Vol(kg) - 15,603,625 34,730,852 -
RevenuesUSD) - 1,427,762 7,225,510 -
Informal Vol(kg) - - - -
RevenuesUSD) - - - -
Total wheat brand Vol(kg) - 15,603,625 34,730,852 -
Revenues
(USD) - 1,427,762 7,225,510 -
Maize brand
Formal Vol(kg) - 3,864,714 4,000,163 -
RevenuesUSD) - 438,053 952,491 -
Informal Vol(kg) - - - -
RevenuesUSD) - - - -
Total maize brand Vol(kg) - 3,864,714 4,000,163 -
RevenuesUSD) - 438,053 952,491 -
Malt
Formal Vol(kg) - 1,246,676 480,533 510224.71
RevenuesUSD) - 782,742 447,765 475742.7746
Informal Vol(kg) - - - -
RevenuesUSD) - - - -
Total malt Vol(kg) - 1,246,676 480,533 510,225
RevenuesUSD) - 782,742 447,765 475,743
Mullet
Formal Vol(kg) - 554 636 2,008
RevenuesUSD) - 1,084 1,275 2,897
Informal Vol(kg) - 8,960 8,370 946
RevenuesUSD) - 5,379 6,430 507
Total mullet flour export Vol(kg) - 9,514 9,006 2,954
RevenuesUSD) - 6,463 7,705 3,403
Bakery, Biscuits, spagheti,
amandazi , feed products
and Other
Formal Vol(kg) - 1,704,754 5,849,370 6,791,108
RevenuesUSD) - 2,728,733 5,818,470 5,771,530
Informal Vol(kg) - 4,592,719 2,920,280 7,945,628
RevenuesUSD) - 631,823 578,707 1,360,336
Total Bakery, Biscuits,
spageti, amandazi , feed
products and Other
Vol(kg) - 6,297,473 8,769,650 14,736,736
RevenuesUSD) - 3,360,556 6,397,176 7,131,866
Other cereals flour export
Formal Vol(kg) 6,194,735 33,935 278779.4 3,555,456
Revenues(USD) 2,664,858 42,090 207050.8677 1,028,660
Informal Vol(Kg) 2,460,277 7,250 7,583 18,329
Revenues(USD) 652,356 4,930 4,236 20,600
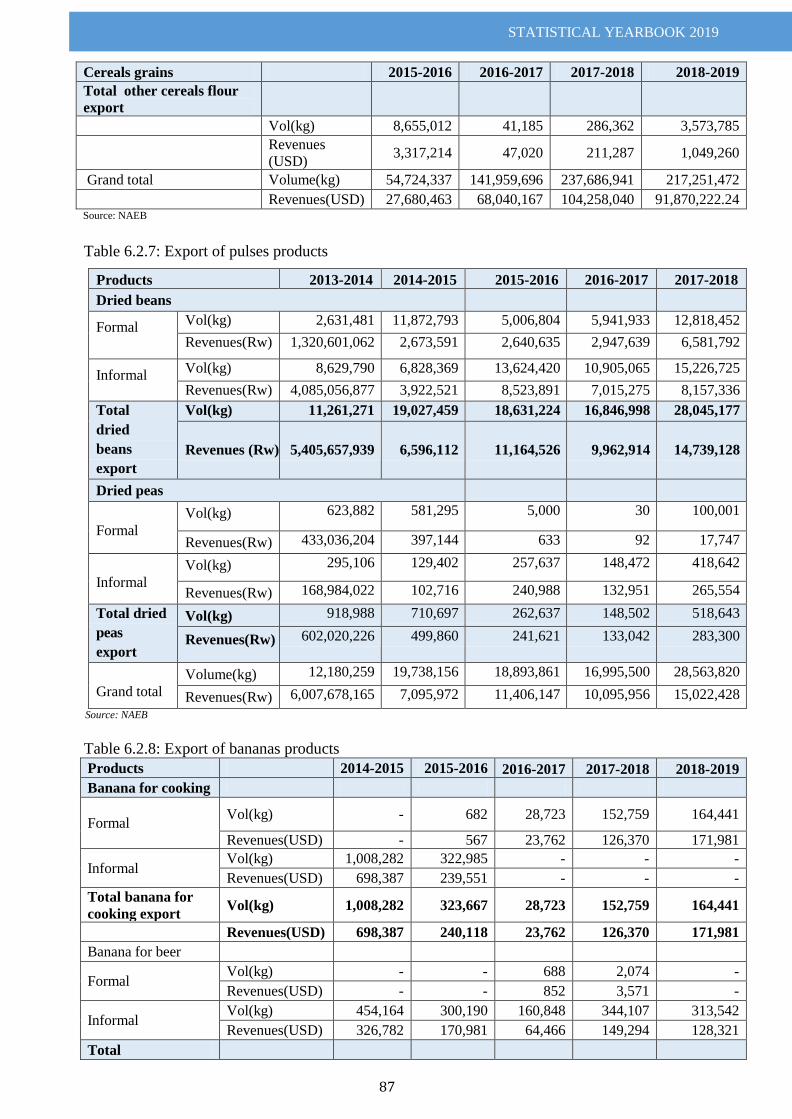
STATISTICAL YEARBOOK 2019
87
Cereals grains 2015-2016 2016-2017 2017-2018 2018-2019
Total other cereals flour
export
Vol(kg) 8,655,012 41,185 286,362 3,573,785
Revenues
(USD) 3,317,214 47,020 211,287 1,049,260
Grand total Volume(kg) 54,724,337 141,959,696 237,686,941 217,251,472
Revenues(USD) 27,680,463 68,040,167 104,258,040 91,870,222.24 Source: NAEB
Table 6.2.7: Export of pulses products
Products 2013-2014 2014-2015 2015-2016 2016-2017 2017-2018
Dried beans
Formal Vol(kg) 2,631,481 11,872,793 5,006,804 5,941,933 12,818,452
Revenues(Rw) 1,320,601,062 2,673,591 2,640,635 2,947,639 6,581,792
Informal Vol(kg) 8,629,790 6,828,369 13,624,420 10,905,065 15,226,725
Revenues(Rw) 4,085,056,877 3,922,521 8,523,891 7,015,275 8,157,336
Total
dried
beans
export
Vol(kg) 11,261,271 19,027,459 18,631,224 16,846,998 28,045,177
Revenues (Rw)
5,405,657,939
6,596,112
11,164,526
9,962,914
14,739,128
Dried peas
Formal
Vol(kg) 623,882 581,295 5,000 30 100,001
Revenues(Rw) 433,036,204 397,144 633 92 17,747
Informal
Vol(kg) 295,106 129,402 257,637 148,472 418,642
Revenues(Rw) 168,984,022 102,716 240,988 132,951 265,554
Total dried
peas
export
Vol(kg) 918,988 710,697 262,637 148,502 518,643
Revenues(Rw) 602,020,226 499,860 241,621 133,042 283,300
Grand total
Volume(kg) 12,180,259 19,738,156 18,893,861 16,995,500 28,563,820
Revenues(Rw) 6,007,678,165 7,095,972 11,406,147 10,095,956 15,022,428
Source: NAEB
Table 6.2.8: Export of bananas products
Products 2014-2015 2015-2016 2016-2017 2017-2018 2018-2019
Banana for cooking
Formal Vol(kg) - 682 28,723 152,759 164,441
Revenues(USD) - 567 23,762 126,370 171,981
Informal Vol(kg) 1,008,282 322,985 - - -
Revenues(USD) 698,387 239,551 - - -
Total banana for
cooking export Vol(kg) 1,008,282 323,667 28,723 152,759 164,441
Revenues(USD) 698,387 240,118 23,762 126,370 171,981
Banana for beer
Formal Vol(kg) - - 688 2,074 -
Revenues(USD) - - 852 3,571 -
Informal Vol(kg) 454,164 300,190 160,848 344,107 313,542
Revenues(USD) 326,782 170,981 64,466 149,294 128,321
Total
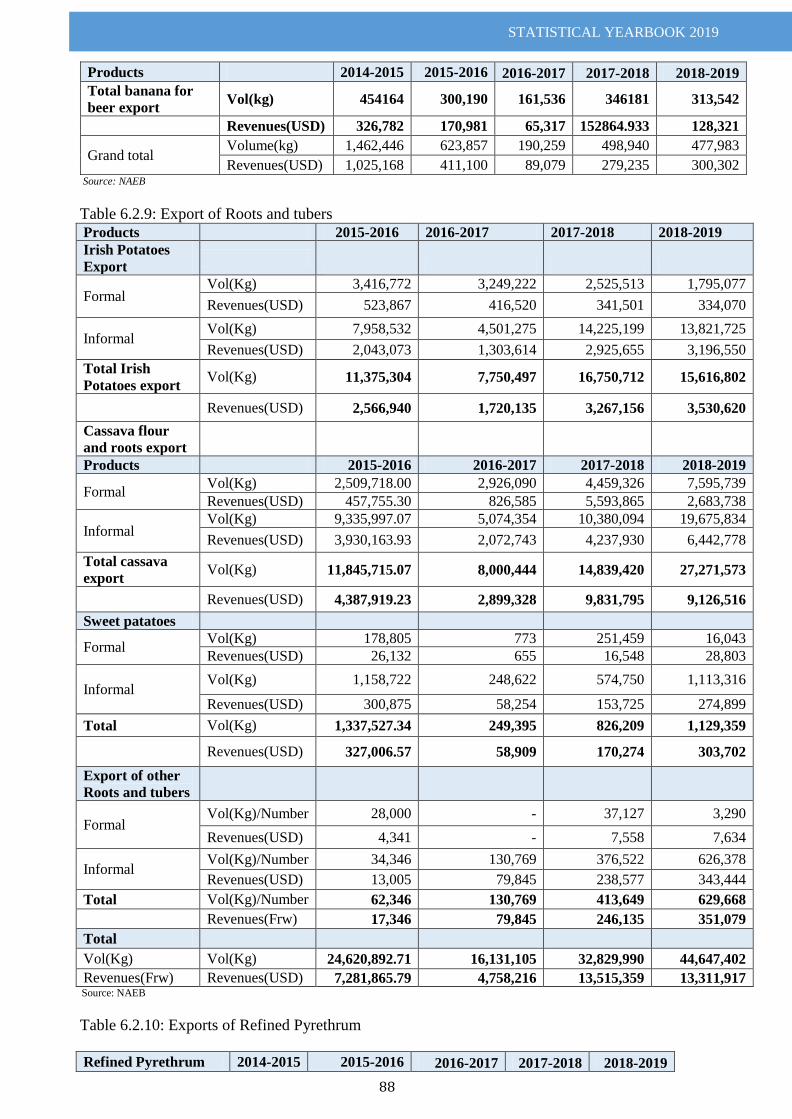
STATISTICAL YEARBOOK 2019
88
Products 2014-2015 2015-2016 2016-2017 2017-2018 2018-2019
Total banana for
beer export Vol(kg) 454164 300,190 161,536 346181 313,542
Revenues(USD) 326,782 170,981 65,317 152864.933 128,321
Grand total Volume(kg) 1,462,446 623,857 190,259 498,940 477,983
Revenues(USD) 1,025,168 411,100 89,079 279,235 300,302 Source: NAEB
Table 6.2.9: Export of Roots and tubers
Products 2015-2016 2016-2017 2017-2018 2018-2019
Irish Potatoes
Export
Formal Vol(Kg) 3,416,772 3,249,222 2,525,513 1,795,077
Revenues(USD) 523,867 416,520 341,501 334,070
Informal Vol(Kg) 7,958,532 4,501,275 14,225,199 13,821,725
Revenues(USD) 2,043,073 1,303,614 2,925,655 3,196,550
Total Irish
Potatoes export Vol(Kg) 11,375,304 7,750,497 16,750,712 15,616,802
Revenues(USD) 2,566,940 1,720,135 3,267,156 3,530,620
Cassava flour
and roots export
Products 2015-2016 2016-2017 2017-2018 2018-2019
Formal Vol(Kg) 2,509,718.00 2,926,090 4,459,326 7,595,739
Revenues(USD) 457,755.30 826,585 5,593,865 2,683,738
Informal Vol(Kg) 9,335,997.07 5,074,354 10,380,094 19,675,834
Revenues(USD) 3,930,163.93 2,072,743 4,237,930 6,442,778
Total cassava
export Vol(Kg) 11,845,715.07 8,000,444 14,839,420 27,271,573
Revenues(USD) 4,387,919.23 2,899,328 9,831,795 9,126,516
Sweet patatoes
Formal Vol(Kg) 178,805 773 251,459 16,043
Revenues(USD) 26,132 655 16,548 28,803
Informal Vol(Kg) 1,158,722 248,622 574,750 1,113,316
Revenues(USD) 300,875 58,254 153,725 274,899
Total Vol(Kg) 1,337,527.34 249,395 826,209 1,129,359
Revenues(USD) 327,006.57 58,909 170,274 303,702
Export of other
Roots and tubers
Formal Vol(Kg)/Number 28,000 - 37,127 3,290
Revenues(USD) 4,341 - 7,558 7,634
Informal Vol(Kg)/Number 34,346 130,769 376,522 626,378
Revenues(USD) 13,005 79,845 238,577 343,444
Total Vol(Kg)/Number 62,346 130,769 413,649 629,668
Revenues(Frw) 17,346 79,845 246,135 351,079
Total
Vol(Kg) Vol(Kg) 24,620,892.71 16,131,105 32,829,990 44,647,402
Revenues(Frw) Revenues(USD) 7,281,865.79 4,758,216 13,515,359 13,311,917 Source: NAEB
Table 6.2.10: Exports of Refined Pyrethrum
Refined Pyrethrum 2014-2015 2015-2016 2016-2017 2017-2018 2018-2019
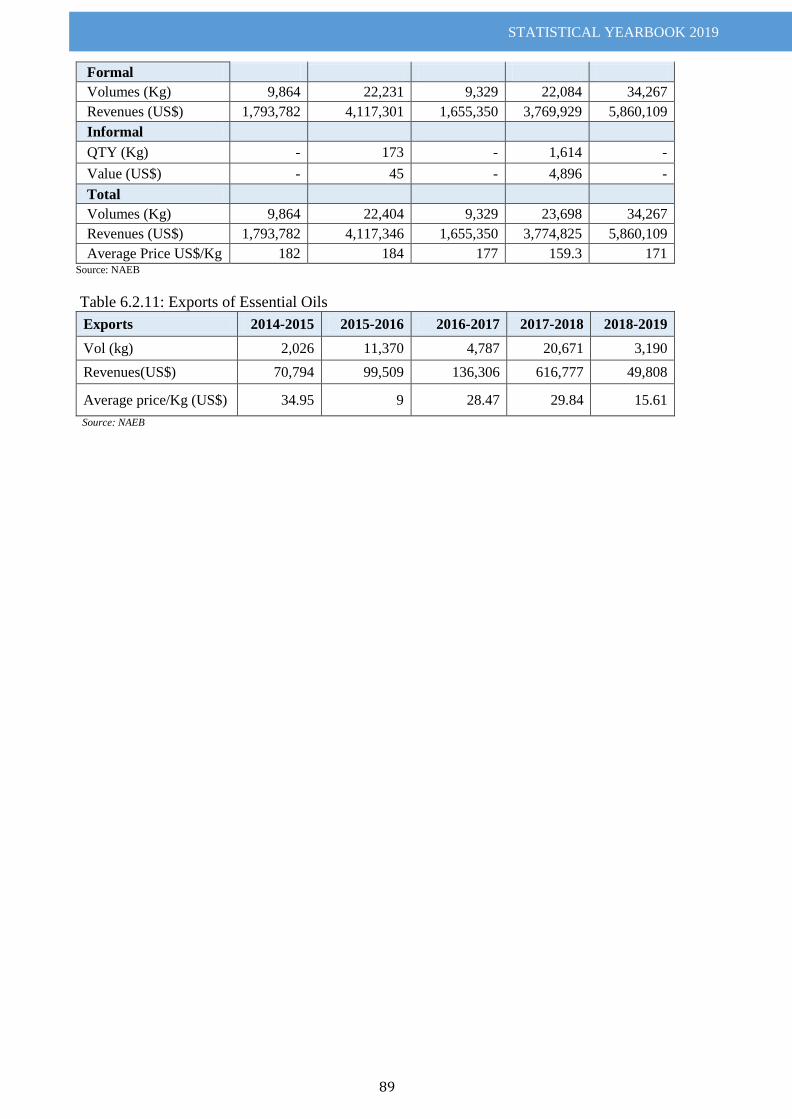
STATISTICAL YEARBOOK 2019
89
Formal
Volumes (Kg) 9,864 22,231 9,329 22,084 34,267
Revenues (US$) 1,793,782 4,117,301 1,655,350 3,769,929 5,860,109
Informal
QTY (Kg) - 173 - 1,614 -
Value (US$) - 45 - 4,896 -
Total
Volumes (Kg) 9,864 22,404 9,329 23,698 34,267
Revenues (US$) 1,793,782 4,117,346 1,655,350 3,774,825 5,860,109
Average Price US$/Kg 182 184 177 159.3 171 Source: NAEB
Table 6.2.11: Exports of Essential Oils
Exports 2014-2015 2015-2016 2016-2017 2017-2018 2018-2019
Vol (kg) 2,026 11,370 4,787 20,671 3,190
Revenues(US$) 70,794 99,509 136,306 616,777 49,808
Average price/Kg (US$) 34.95 9 28.47 29.84 15.61
Source: NAEB
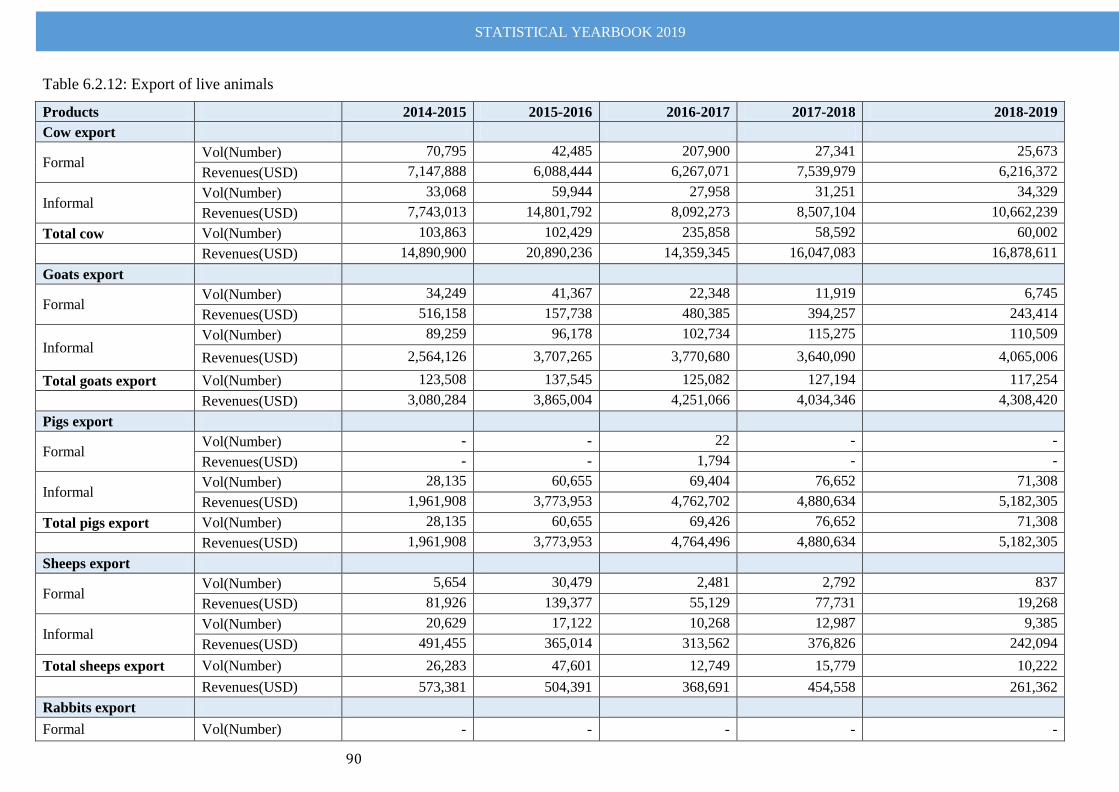
STATISTICAL YEARBOOK 2019
90
Table 6.2.12: Export of live animals
Products 2014-2015 2015-2016 2016-2017 2017-2018 2018-2019
Cow export
Formal Vol(Number) 70,795 42,485 207,900 27,341 25,673
Revenues(USD) 7,147,888 6,088,444 6,267,071 7,539,979 6,216,372
Informal Vol(Number) 33,068 59,944 27,958 31,251 34,329
Revenues(USD) 7,743,013 14,801,792 8,092,273 8,507,104 10,662,239
Total cow Vol(Number) 103,863 102,429 235,858 58,592 60,002
Revenues(USD) 14,890,900 20,890,236 14,359,345 16,047,083 16,878,611
Goats export
Formal Vol(Number) 34,249 41,367 22,348 11,919 6,745
Revenues(USD) 516,158 157,738 480,385 394,257 243,414
Informal Vol(Number) 89,259 96,178 102,734 115,275 110,509
Revenues(USD) 2,564,126 3,707,265 3,770,680 3,640,090 4,065,006
Total goats export Vol(Number) 123,508 137,545 125,082 127,194 117,254
Revenues(USD) 3,080,284 3,865,004 4,251,066 4,034,346 4,308,420
Pigs export
Formal Vol(Number) - - 22 - -
Revenues(USD) - - 1,794 - -
Informal Vol(Number) 28,135 60,655 69,404 76,652 71,308
Revenues(USD) 1,961,908 3,773,953 4,762,702 4,880,634 5,182,305
Total pigs export Vol(Number) 28,135 60,655 69,426 76,652 71,308
Revenues(USD) 1,961,908 3,773,953 4,764,496 4,880,634 5,182,305
Sheeps export
Formal Vol(Number) 5,654 30,479 2,481 2,792 837
Revenues(USD) 81,926 139,377 55,129 77,731 19,268
Informal Vol(Number) 20,629 17,122 10,268 12,987 9,385
Revenues(USD) 491,455 365,014 313,562 376,826 242,094
Total sheeps export Vol(Number) 26,283 47,601 12,749 15,779 10,222
Revenues(USD) 573,381 504,391 368,691 454,558 261,362
Rabbits export
Formal Vol(Number) - - - - -
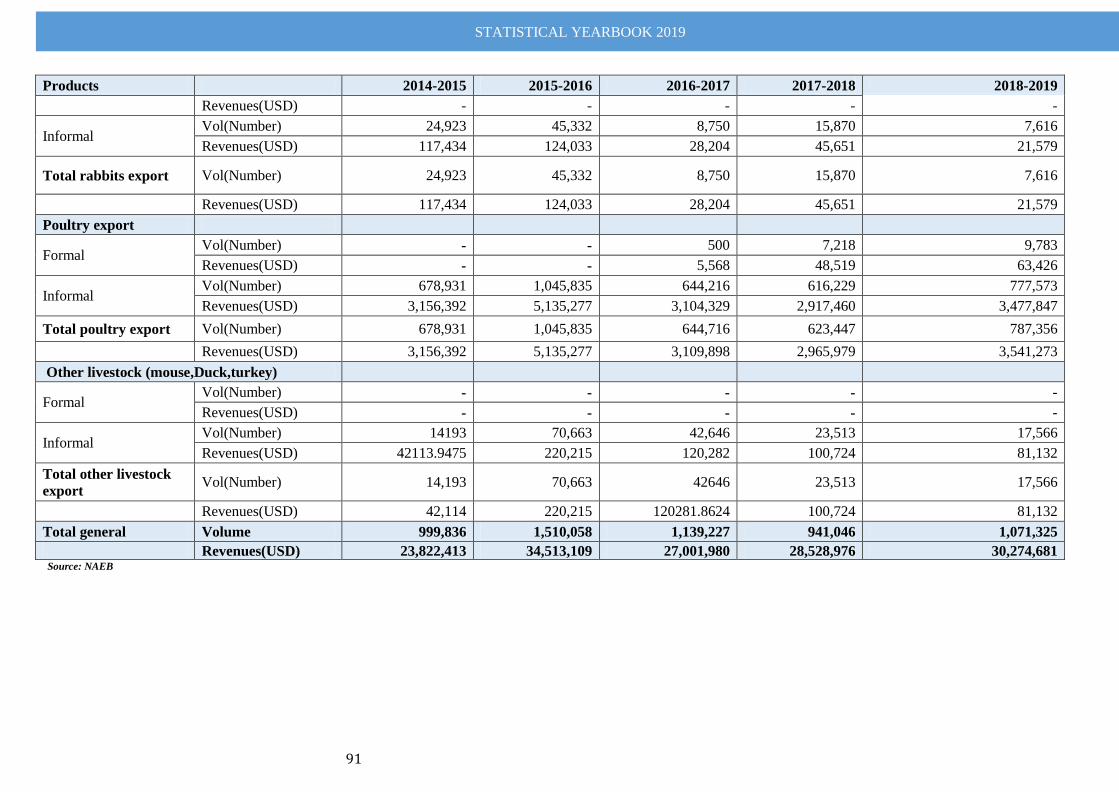
STATISTICAL YEARBOOK 2019
91
Products 2014-2015 2015-2016 2016-2017 2017-2018 2018-2019
Revenues(USD) - - - - -
Informal Vol(Number) 24,923 45,332 8,750 15,870 7,616
Revenues(USD) 117,434 124,033 28,204 45,651 21,579
Total rabbits export Vol(Number) 24,923 45,332 8,750 15,870 7,616
Revenues(USD) 117,434 124,033 28,204 45,651 21,579
Poultry export
Formal Vol(Number) - - 500 7,218 9,783
Revenues(USD) - - 5,568 48,519 63,426
Informal Vol(Number) 678,931 1,045,835 644,216 616,229 777,573
Revenues(USD) 3,156,392 5,135,277 3,104,329 2,917,460 3,477,847
Total poultry export Vol(Number) 678,931 1,045,835 644,716 623,447 787,356
Revenues(USD) 3,156,392 5,135,277 3,109,898 2,965,979 3,541,273
Other livestock (mouse,Duck,turkey)
Formal Vol(Number) - - - - -
Revenues(USD) - - - - -
Informal Vol(Number) 14193 70,663 42,646 23,513 17,566
Revenues(USD) 42113.9475 220,215 120,282 100,724 81,132
Total other livestock
export Vol(Number) 14,193 70,663 42646 23,513 17,566
Revenues(USD) 42,114 220,215 120281.8624 100,724 81,132
Total general Volume 999,836 1,510,058 1,139,227 941,046 1,071,325
Revenues(USD) 23,822,413 34,513,109 27,001,980 28,528,976 30,274,681 Source: NAEB
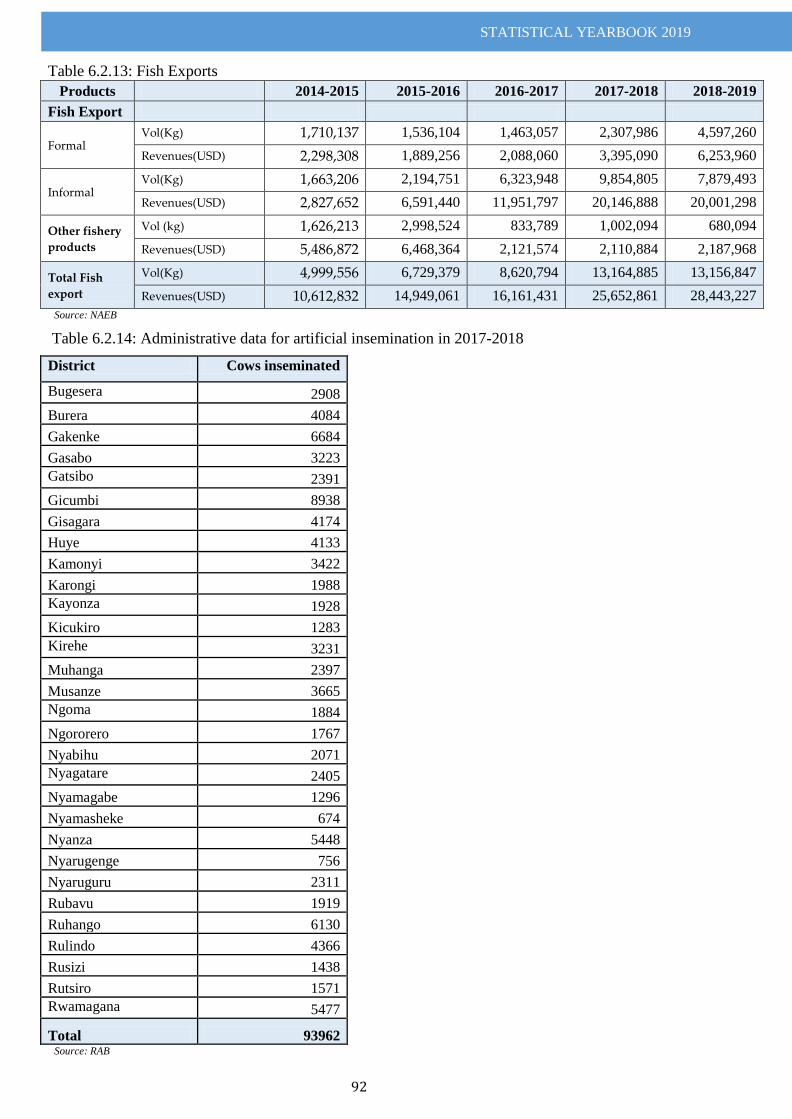
STATISTICAL YEARBOOK 2019
92
Table 6.2.13: Fish Exports
Products 2014-2015 2015-2016 2016-2017 2017-2018 2018-2019
Fish Export
Formal Vol(Kg) 1,710,137 1,536,104 1,463,057 2,307,986 4,597,260
Revenues(USD) 2,298,308 1,889,256 2,088,060 3,395,090 6,253,960
Informal Vol(Kg) 1,663,206 2,194,751 6,323,948 9,854,805 7,879,493
Revenues(USD) 2,827,652 6,591,440 11,951,797 20,146,888 20,001,298
Other fishery
products
Vol (kg) 1,626,213 2,998,524 833,789 1,002,094 680,094
Revenues(USD) 5,486,872 6,468,364 2,121,574 2,110,884 2,187,968
Total Fish
export
Vol(Kg) 4,999,556 6,729,379 8,620,794 13,164,885 13,156,847
Revenues(USD) 10,612,832 14,949,061 16,161,431 25,652,861 28,443,227
Source: NAEB
Table 6.2.14: Administrative data for artificial insemination in 2017-2018
District Cows inseminated
Bugesera 2908
Burera 4084
Gakenke 6684
Gasabo 3223
Gatsibo 2391
Gicumbi 8938
Gisagara 4174
Huye 4133
Kamonyi 3422
Karongi 1988
Kayonza 1928
Kicukiro 1283
Kirehe 3231
Muhanga 2397
Musanze 3665
Ngoma 1884
Ngororero 1767
Nyabihu 2071
Nyagatare 2405
Nyamagabe 1296
Nyamasheke 674
Nyanza 5448
Nyarugenge 756
Nyaruguru 2311
Rubavu 1919
Ruhango 6130
Rulindo 4366
Rusizi 1438
Rutsiro 1571
Rwamagana 5477
Total 93962 Source: RAB
STATISTICAL YEARBOOK 2019
93
CHAPTER VII: WATER and ENERGY PRODUCTION
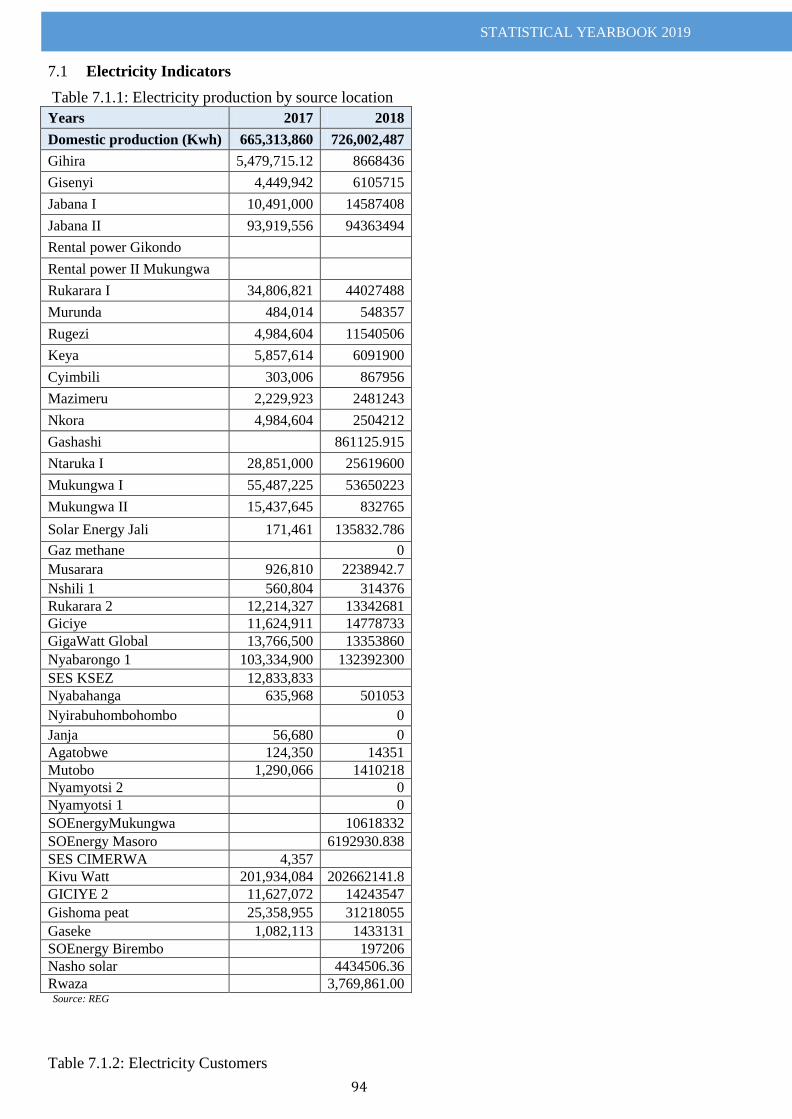
STATISTICAL YEARBOOK 2019
94
Electricity Indicators 7.1
Table 7.1.1: Electricity production by source location
Years 2017 2018
Domestic production (Kwh) 665,313,860 726,002,487
Gihira 5,479,715.12 8668436
Gisenyi 4,449,942 6105715
Jabana I 10,491,000 14587408
Jabana II 93,919,556 94363494
Rental power Gikondo
Rental power II Mukungwa
Rukarara I 34,806,821 44027488
Murunda 484,014 548357
Rugezi 4,984,604 11540506
Keya 5,857,614 6091900
Cyimbili 303,006 867956
Mazimeru 2,229,923 2481243
Nkora 4,984,604 2504212
Gashashi
861125.915
Ntaruka I 28,851,000 25619600
Mukungwa I 55,487,225 53650223
Mukungwa II 15,437,645 832765
Solar Energy Jali 171,461 135832.786
Gaz methane
0
Musarara 926,810 2238942.7
Nshili 1 560,804 314376
Rukarara 2 12,214,327 13342681
Giciye 11,624,911 14778733
GigaWatt Global 13,766,500 13353860
Nyabarongo 1 103,334,900 132392300
SES KSEZ 12,833,833
Nyabahanga 635,968 501053
Nyirabuhombohombo
0
Janja 56,680 0
Agatobwe 124,350 14351
Mutobo 1,290,066 1410218
Nyamyotsi 2
0
Nyamyotsi 1
0
SOEnergyMukungwa
10618332
SOEnergy Masoro
6192930.838
SES CIMERWA 4,357
Kivu Watt 201,934,084 202662141.8
GICIYE 2 11,627,072 14243547
Gishoma peat 25,358,955 31218055
Gaseke 1,082,113 1433131
SOEnergy Birembo 197206
Nasho solar 4434506.36
Rwaza
3,769,861.00 Source: REG
Table 7.1.2: Electricity Customers
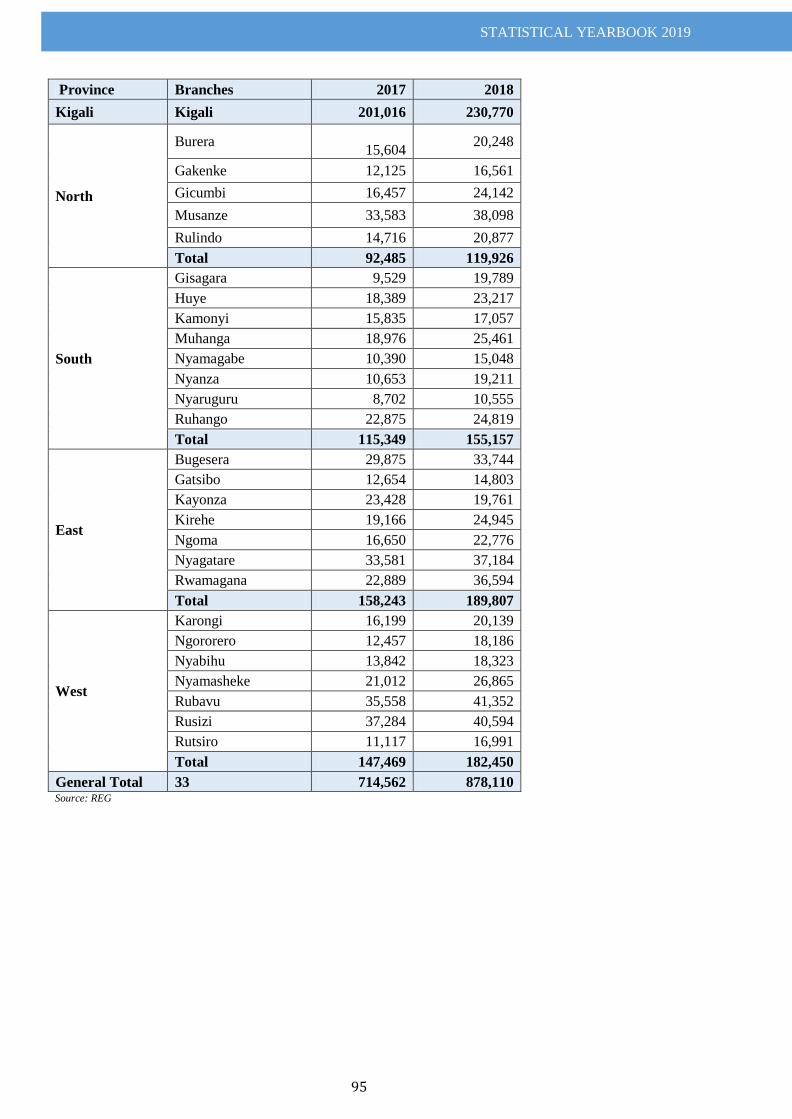
STATISTICAL YEARBOOK 2019
95
Province Branches 2017 2018
Kigali Kigali 201,016 230,770
North
Burera
15,604 20,248
Gakenke 12,125 16,561
Gicumbi 16,457 24,142
Musanze 33,583 38,098
Rulindo 14,716 20,877
Total 92,485 119,926
South
Gisagara 9,529 19,789
Huye 18,389 23,217
Kamonyi 15,835 17,057
Muhanga 18,976 25,461
Nyamagabe 10,390 15,048
Nyanza 10,653 19,211
Nyaruguru 8,702 10,555
Ruhango 22,875 24,819
Total 115,349 155,157
East
Bugesera 29,875 33,744
Gatsibo 12,654 14,803
Kayonza 23,428 19,761
Kirehe 19,166 24,945
Ngoma 16,650 22,776
Nyagatare 33,581 37,184
Rwamagana 22,889 36,594
Total 158,243 189,807
West
Karongi 16,199 20,139
Ngororero 12,457 18,186
Nyabihu 13,842 18,323
Nyamasheke 21,012 26,865
Rubavu 35,558 41,352
Rusizi 37,284 40,594
Rutsiro 11,117 16,991
Total 147,469 182,450
General Total 33 714,562 878,110 Source: REG
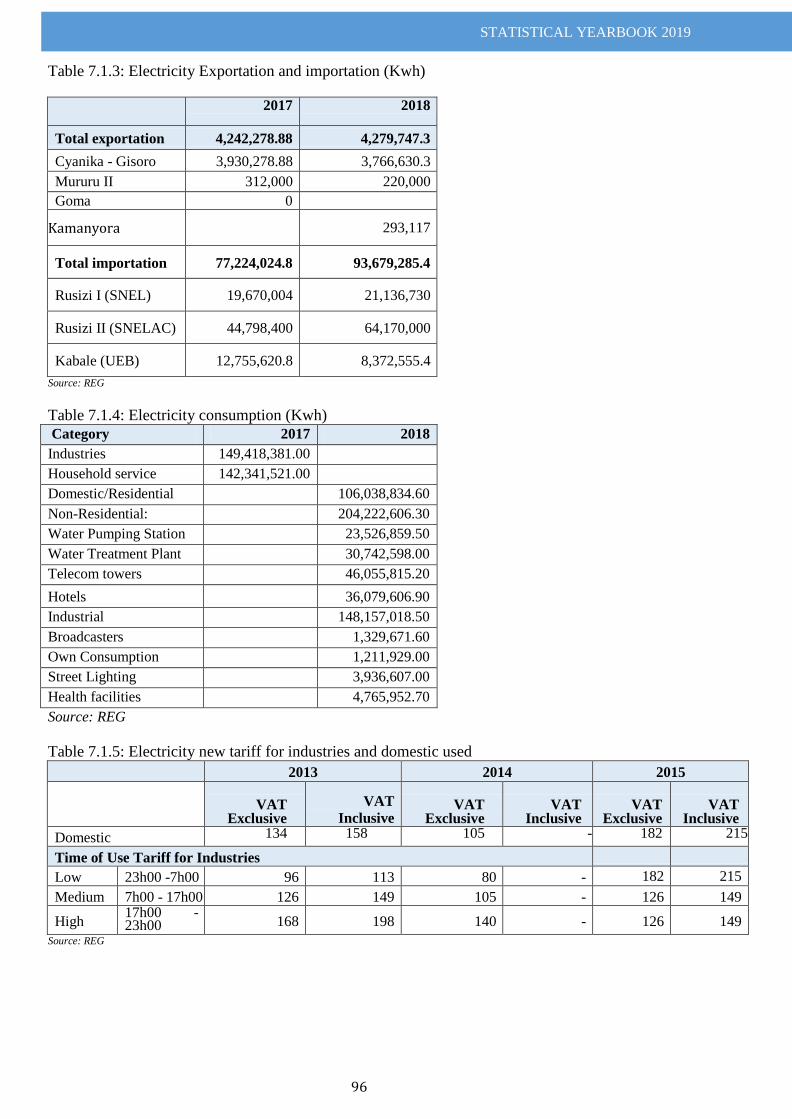
STATISTICAL YEARBOOK 2019
96
Table 7.1.3: Electricity Exportation and importation (Kwh) 2017 2018
Total exportation 4,242,278.88 4,279,747.3
Cyanika - Gisoro 3,930,278.88 3,766,630.3
Mururu II 312,000 220,000
Goma 0
Kamanyora 293,117
Total importation 77,224,024.8 93,679,285.4
Rusizi I (SNEL) 19,670,004 21,136,730
Rusizi II (SNELAC) 44,798,400 64,170,000
Kabale (UEB) 12,755,620.8 8,372,555.4
Source: REG
Table 7.1.4: Electricity consumption (Kwh)
Category 2017 2018
Industries 149,418,381.00
Household service 142,341,521.00
Domestic/Residential 106,038,834.60
Non-Residential: 204,222,606.30
Water Pumping Station 23,526,859.50
Water Treatment Plant 30,742,598.00
Telecom towers 46,055,815.20
Hotels 36,079,606.90
Industrial 148,157,018.50
Broadcasters 1,329,671.60
Own Consumption 1,211,929.00
Street Lighting 3,936,607.00
Health facilities 4,765,952.70
Source: REG
Table 7.1.5: Electricity new tariff for industries and domestic used 2013 2014 2015
VAT
Exclusive
VAT
Inclusive VAT
Exclusive VAT
Inclusive VAT
Exclusive VAT
Inclusive
Domestic 134 158 105 - 182 215
Time of Use Tariff for Industries
Low 23h00 -7h00 96 113 80 - 182 215
Medium 7h00 - 17h00 126 149 105 - 126 149
High 17h00 - 23h00 168 198 140 - 126 149
Source: REG
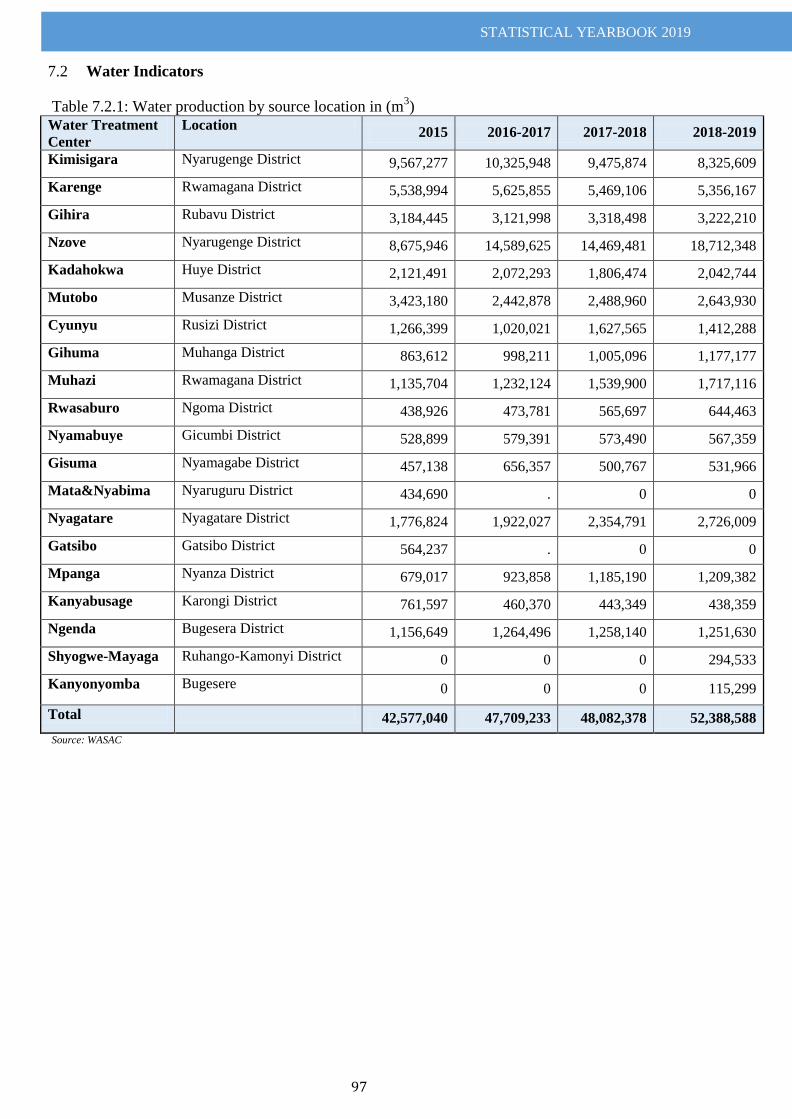
STATISTICAL YEARBOOK 2019
97
Water Indicators 7.2 Table 7.2.1: Water production by source location in (m
3)
Water Treatment
Center
Location 2015 2016-2017 2017-2018 2018-2019
Kimisigara Nyarugenge District 9,567,277 10,325,948 9,475,874 8,325,609
Karenge Rwamagana District 5,538,994 5,625,855 5,469,106 5,356,167
Gihira Rubavu District 3,184,445 3,121,998 3,318,498 3,222,210
Nzove Nyarugenge District 8,675,946 14,589,625 14,469,481 18,712,348
Kadahokwa Huye District 2,121,491 2,072,293 1,806,474 2,042,744
Mutobo Musanze District 3,423,180 2,442,878 2,488,960 2,643,930
Cyunyu Rusizi District 1,266,399 1,020,021 1,627,565 1,412,288
Gihuma Muhanga District 863,612 998,211 1,005,096 1,177,177
Muhazi Rwamagana District 1,135,704 1,232,124 1,539,900 1,717,116
Rwasaburo Ngoma District 438,926 473,781 565,697 644,463
Nyamabuye Gicumbi District 528,899 579,391 573,490 567,359
Gisuma Nyamagabe District 457,138 656,357 500,767 531,966
Mata&Nyabima Nyaruguru District 434,690 . 0 0
Nyagatare Nyagatare District 1,776,824 1,922,027 2,354,791 2,726,009
Gatsibo Gatsibo District 564,237 . 0 0
Mpanga Nyanza District 679,017 923,858 1,185,190 1,209,382
Kanyabusage Karongi District 761,597 460,370 443,349 438,359
Ngenda Bugesera District 1,156,649 1,264,496 1,258,140 1,251,630
Shyogwe-Mayaga Ruhango-Kamonyi District 0 0 0 294,533
Kanyonyomba Bugesere 0 0 0 115,299
Total 42,577,040 47,709,233 48,082,378 52,388,588
Source: WASAC
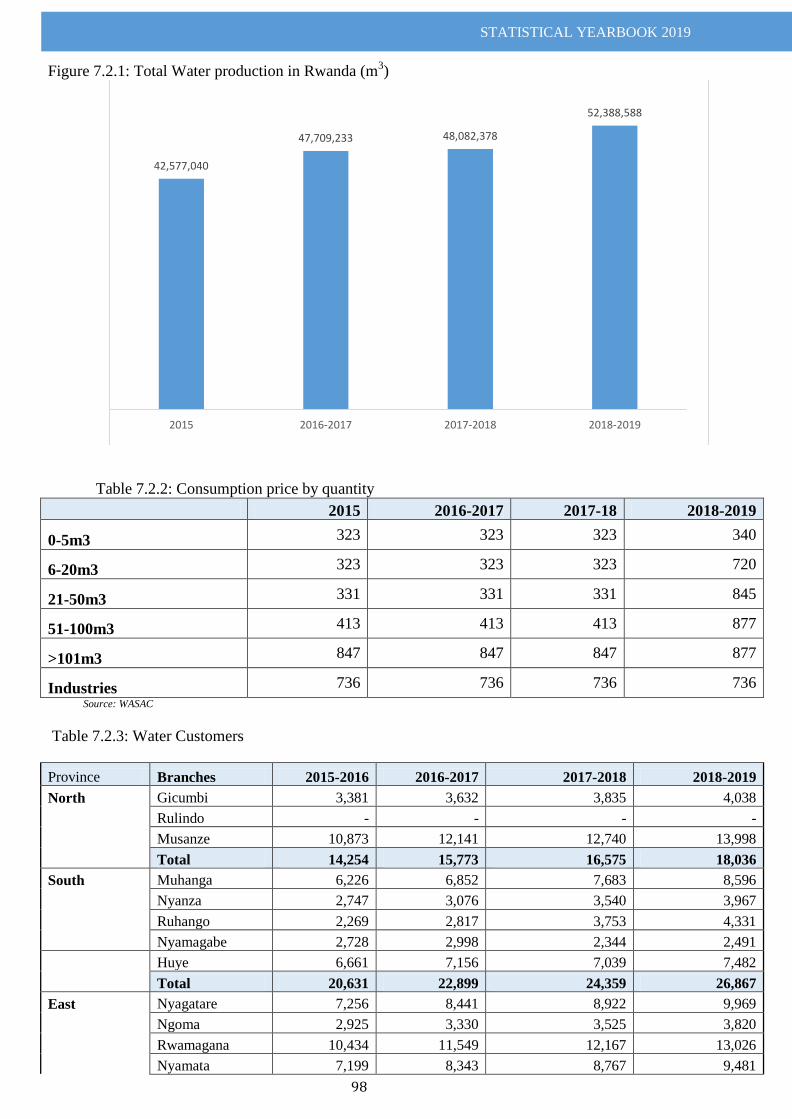
STATISTICAL YEARBOOK 2019
98
Figure 7.2.1: Total Water production in Rwanda (m3)
Table 7.2.2: Consumption price by quantity
2015 2016-2017 2017-18 2018-2019
0-5m3 323 323 323 340
6-20m3 323 323 323 720
21-50m3 331 331 331 845
51-100m3 413 413 413 877
>101m3 847 847 847 877
Industries 736 736 736 736
Source: WASAC
Table 7.2.3: Water Customers
Province Branches 2015-2016 2016-2017 2017-2018 2018-2019
North Gicumbi 3,381 3,632 3,835 4,038
Rulindo - - - -
Musanze 10,873 12,141 12,740 13,998
Total 14,254 15,773 16,575 18,036
South Muhanga 6,226 6,852 7,683 8,596
Nyanza 2,747 3,076 3,540 3,967
Ruhango 2,269 2,817 3,753 4,331
Nyamagabe 2,728 2,998 2,344 2,491
Huye 6,661 7,156 7,039 7,482
Total 20,631 22,899 24,359 26,867
East Nyagatare 7,256 8,441 8,922 9,969
Ngoma 2,925 3,330 3,525 3,820
Rwamagana 10,434 11,549 12,167 13,026
Nyamata 7,199 8,343 8,767 9,481
42,577,040
47,709,233 48,082,378
52,388,588
2015 2016-2017 2017-2018 2018-2019
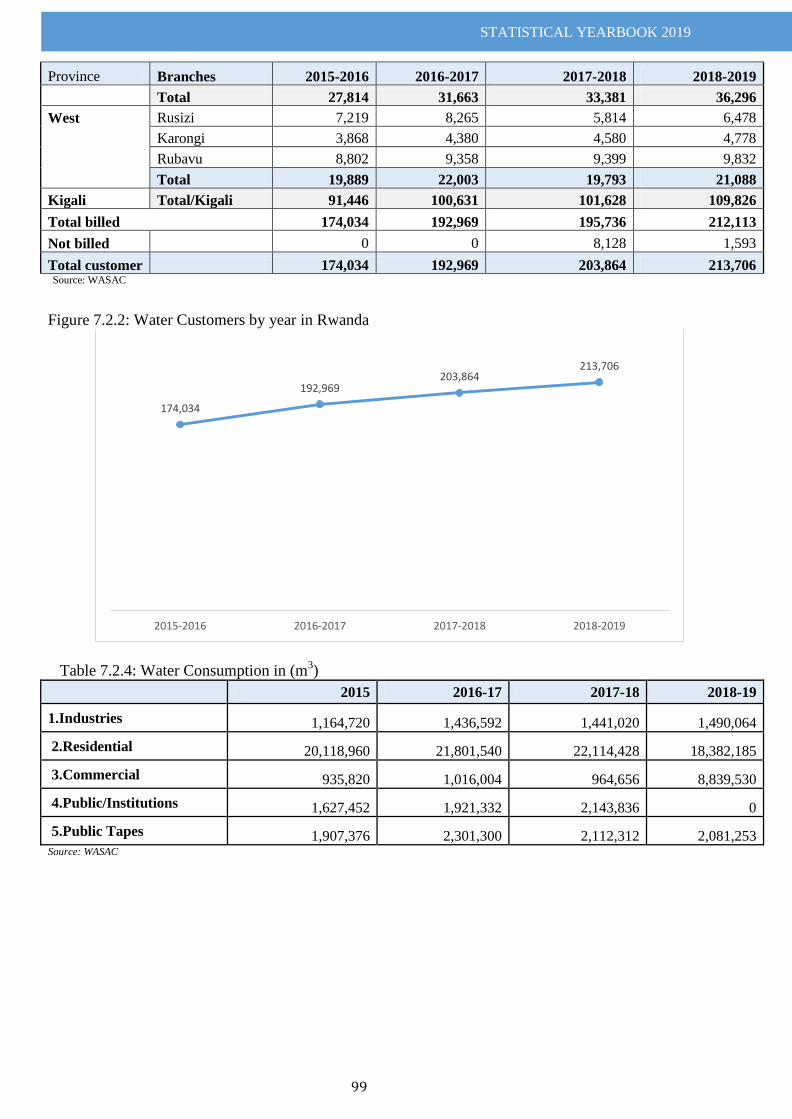
STATISTICAL YEARBOOK 2019
99
Province Branches 2015-2016 2016-2017 2017-2018 2018-2019
Total 27,814 31,663 33,381 36,296
West Rusizi 7,219 8,265 5,814 6,478
Karongi 3,868 4,380 4,580 4,778
Rubavu 8,802 9,358 9,399 9,832
Total 19,889 22,003 19,793 21,088
Kigali Total/Kigali 91,446 100,631 101,628 109,826
Total billed 174,034 192,969 195,736 212,113
Not billed 0 0 8,128 1,593
Total customer 174,034 192,969 203,864 213,706 Source: WASAC
Figure 7.2.2: Water Customers by year in Rwanda
Table 7.2.4: Water Consumption in (m3)
2015 2016-17 2017-18 2018-19
1.Industries 1,164,720 1,436,592 1,441,020 1,490,064
2.Residential 20,118,960 21,801,540 22,114,428 18,382,185
3.Commercial 935,820 1,016,004 964,656 8,839,530
4.Public/Institutions 1,627,452 1,921,332 2,143,836 0
5.Public Tapes 1,907,376 2,301,300 2,112,312 2,081,253 Source: WASAC
174,034
192,969 203,864
213,706
2015-2016 2016-2017 2017-2018 2018-2019
STATISTICAL YEARBOOK 2019
100
CHAPTER VIII: TRANSPORTATION and COMMUNICATION
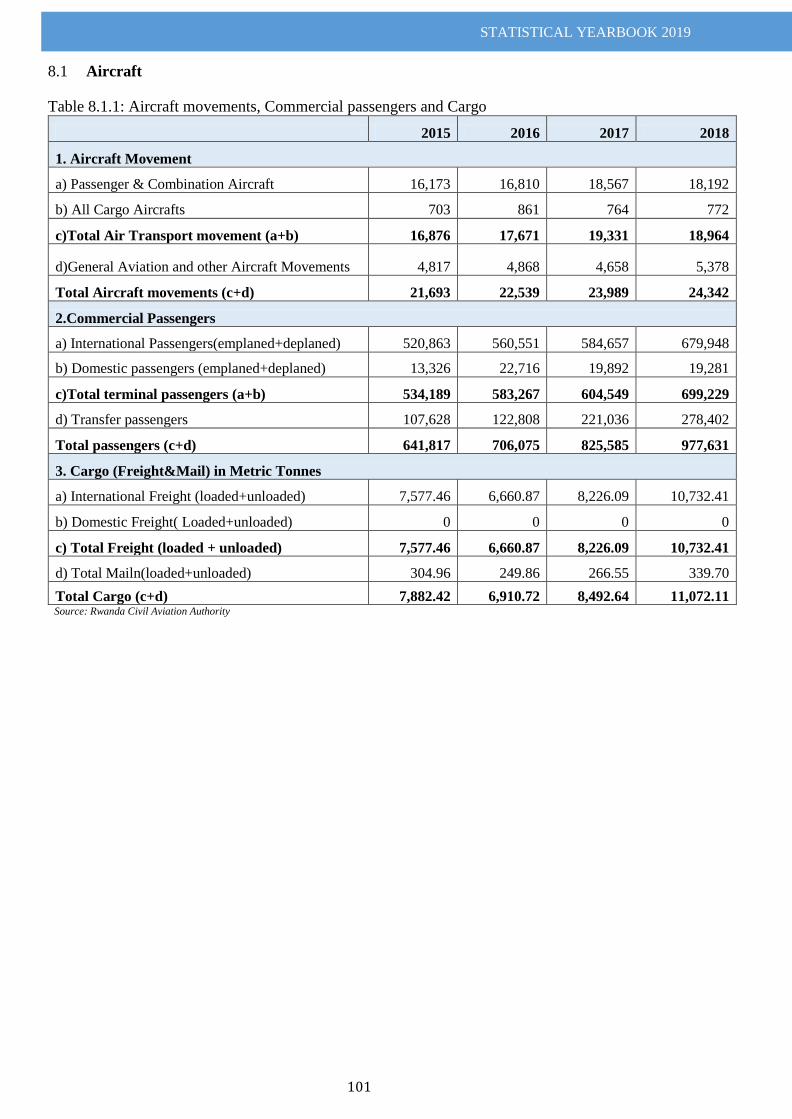
STATISTICAL YEARBOOK 2019
101
Aircraft 8.1 Table 8.1.1: Aircraft movements, Commercial passengers and Cargo
2015 2016 2017 2018
1. Aircraft Movement
a) Passenger & Combination Aircraft 16,173 16,810 18,567 18,192
b) All Cargo Aircrafts 703 861 764 772
c)Total Air Transport movement (a+b) 16,876 17,671 19,331 18,964
d)General Aviation and other Aircraft Movements 4,817 4,868 4,658 5,378
Total Aircraft movements (c+d) 21,693 22,539 23,989 24,342
2.Commercial Passengers
a) International Passengers(emplaned+deplaned) 520,863 560,551 584,657 679,948
b) Domestic passengers (emplaned+deplaned) 13,326 22,716 19,892 19,281
c)Total terminal passengers (a+b) 534,189 583,267 604,549 699,229
d) Transfer passengers 107,628 122,808 221,036 278,402
Total passengers (c+d) 641,817 706,075 825,585 977,631
3. Cargo (Freight&Mail) in Metric Tonnes
a) International Freight (loaded+unloaded) 7,577.46 6,660.87 8,226.09 10,732.41
b) Domestic Freight( Loaded+unloaded) 0 0 0 0
c) Total Freight (loaded + unloaded) 7,577.46 6,660.87 8,226.09 10,732.41
d) Total Mailn(loaded+unloaded) 304.96 249.86 266.55 339.70
Total Cargo (c+d) 7,882.42 6,910.72 8,492.64 11,072.11 Source: Rwanda Civil Aviation Authority
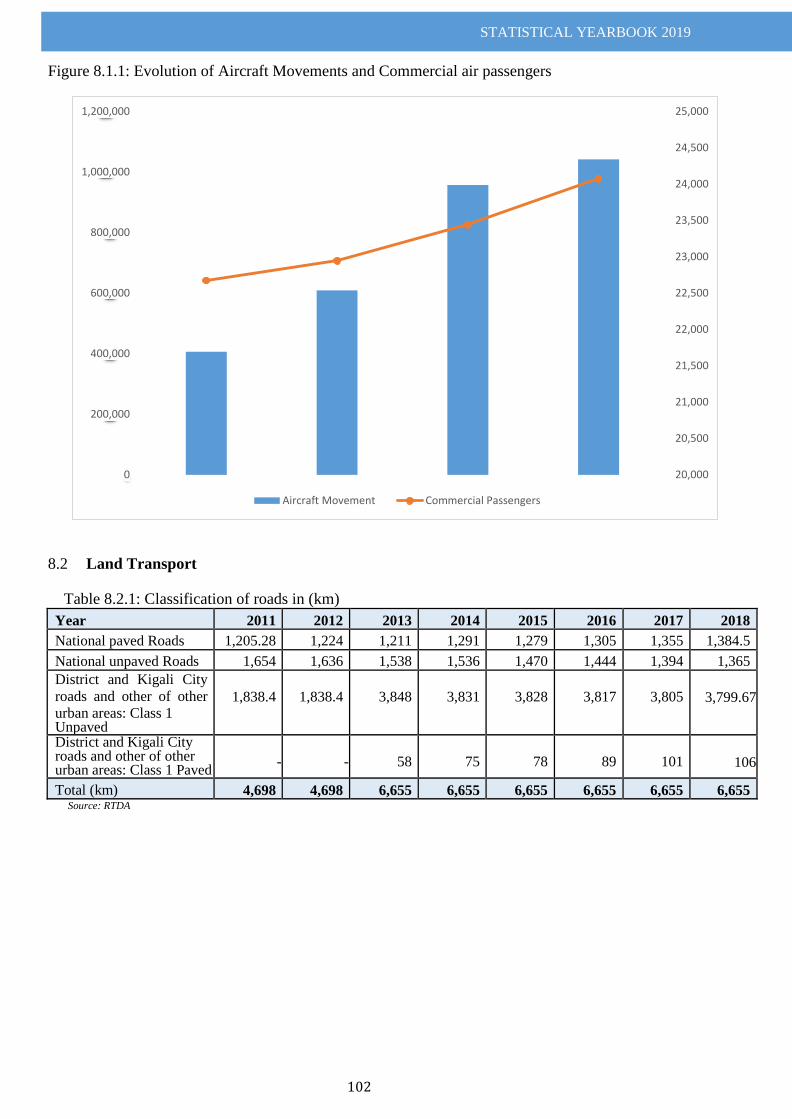
STATISTICAL YEARBOOK 2019
102
Figure 8.1.1: Evolution of Aircraft Movements and Commercial air passengers
Land Transport 8.2 Table 8.2.1: Classification of roads in (km)
Year 2011 2012 2013 2014 2015 2016 2017 2018
National paved Roads 1,205.28 1,224 1,211 1,291 1,279 1,305 1,355 1,384.5
National unpaved Roads 1,654 1,636 1,538 1,536 1,470 1,444 1,394 1,365
District and Kigali City
roads and other of other
urban areas: Class 1 Unpaved
1,838.4
1,838.4
3,848
3,831
3,828
3,817
3,805
3,799.67
District and Kigali City roads and other of other urban areas: Class 1 Paved
-
-
58
75
78
89
101
106
Total (km) 4,698 4,698 6,655 6,655 6,655 6,655 6,655 6,655 Source: RTDA
20,000
20,500
21,000
21,500
22,000
22,500
23,000
23,500
24,000
24,500
25,000
0
200,000
400,000
600,000
800,000
1,000,000
1,200,000
Aircraft Movement Commercial Passengers
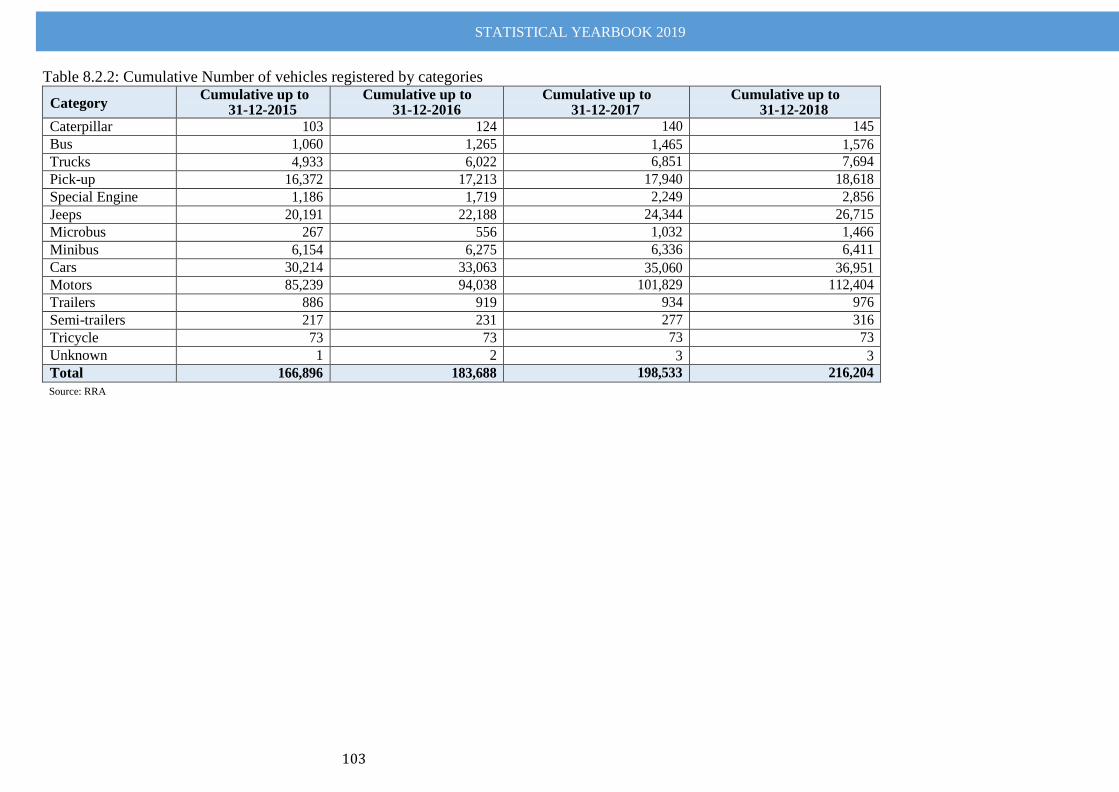
STATISTICAL YEARBOOK 2019
103
Table 8.2.2: Cumulative Number of vehicles registered by categories
Category Cumulative up to
31-12-2015 Cumulative up to
31-12-2016 Cumulative up to
31-12-2017 Cumulative up to
31-12-2018
Caterpillar 103 124 140 145
Bus 1,060 1,265 1,465 1,576
Trucks 4,933 6,022 6,851 7,694
Pick-up 16,372 17,213 17,940 18,618
Special Engine 1,186 1,719 2,249 2,856
Jeeps 20,191 22,188 24,344 26,715
Microbus 267 556 1,032 1,466
Minibus 6,154 6,275 6,336 6,411
Cars 30,214 33,063 35,060 36,951
Motors 85,239 94,038 101,829 112,404
Trailers 886 919 934 976
Semi-trailers 217 231 277 316
Tricycle 73 73 73 73
Unknown 1 2 3 3
Total 166,896 183,688 198,533 216,204
Source: RRA
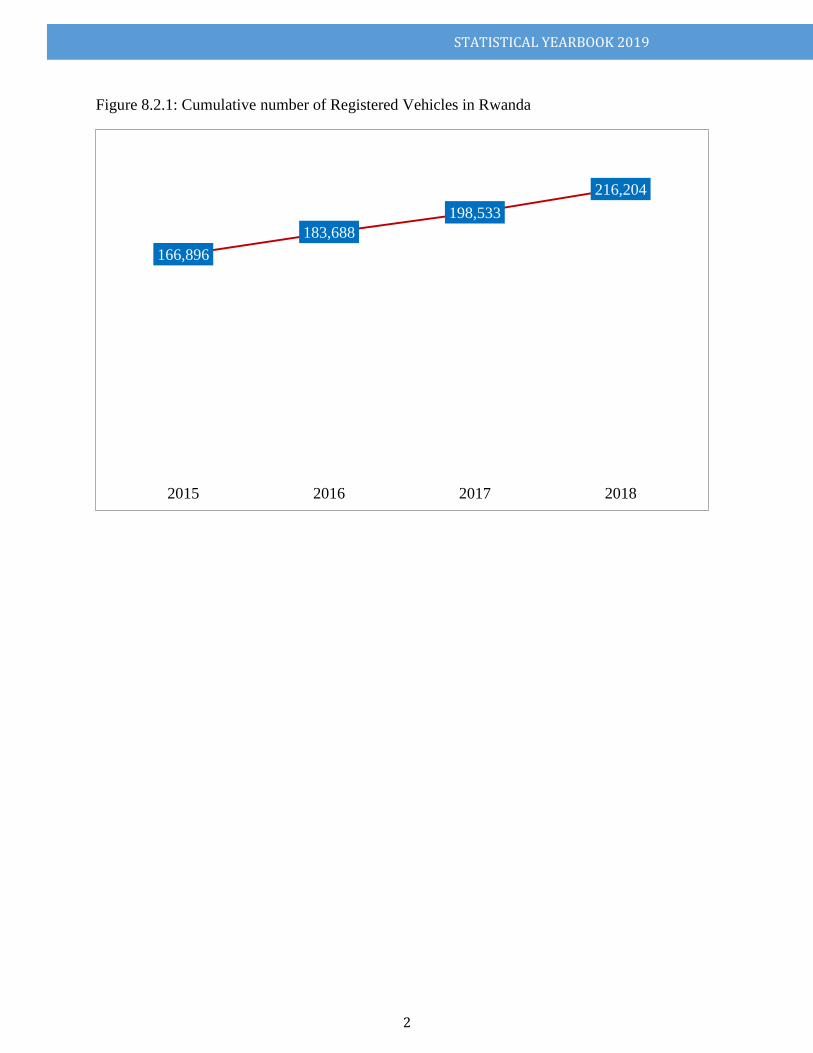
STATISTICAL YEARBOOK 2019
2
Figure 8.2.1: Cumulative number of Registered Vehicles in Rwanda
166,896
183,688
198,533
216,204
2015 2016 2017 2018
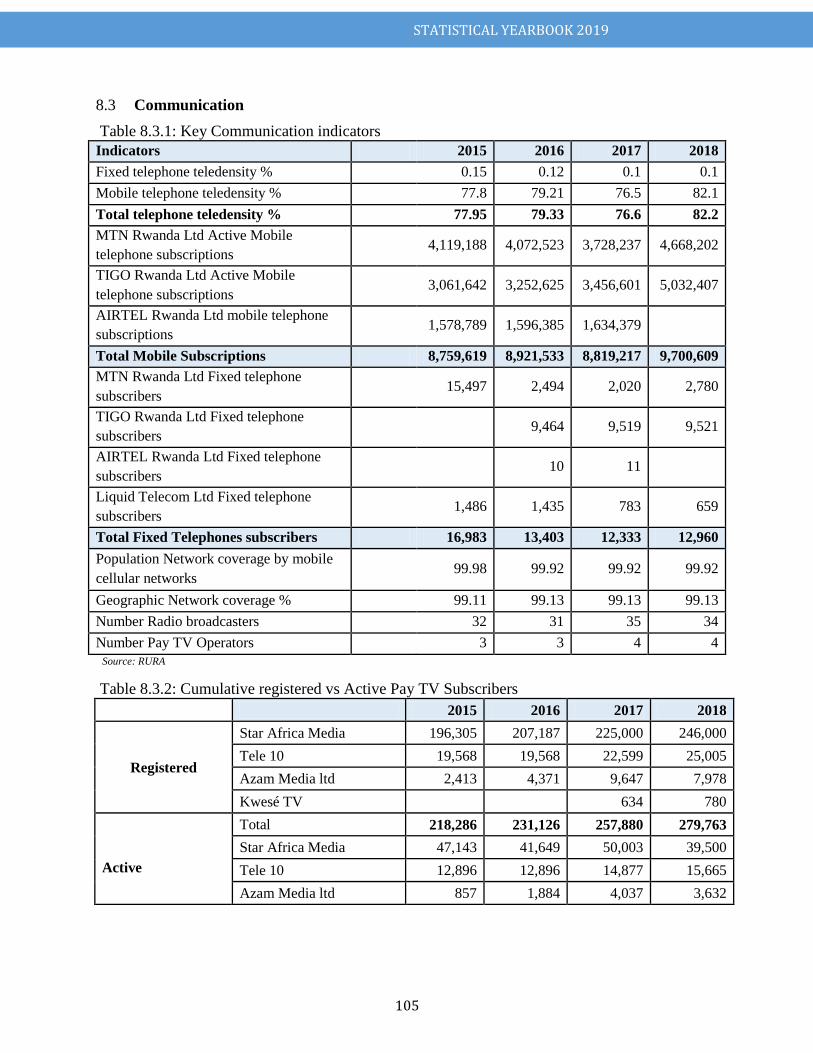
STATISTICAL YEARBOOK 2019
105
Communication 8.3
Table 8.3.1: Key Communication indicators
Indicators 2015 2016 2017 2018
Fixed telephone teledensity % 0.15 0.12 0.1 0.1
Mobile telephone teledensity % 77.8 79.21 76.5 82.1
Total telephone teledensity % 77.95 79.33 76.6 82.2
MTN Rwanda Ltd Active Mobile
telephone subscriptions
4,119,188 4,072,523 3,728,237 4,668,202
TIGO Rwanda Ltd Active Mobile
telephone subscriptions
3,061,642 3,252,625 3,456,601 5,032,407
AIRTEL Rwanda Ltd mobile telephone
subscriptions
1,578,789 1,596,385 1,634,379
Total Mobile Subscriptions 8,759,619 8,921,533 8,819,217 9,700,609
MTN Rwanda Ltd Fixed telephone
subscribers
15,497 2,494 2,020 2,780
TIGO Rwanda Ltd Fixed telephone
subscribers
9,464 9,519 9,521
AIRTEL Rwanda Ltd Fixed telephone
subscribers
10 11
Liquid Telecom Ltd Fixed telephone
subscribers
1,486 1,435 783 659
Total Fixed Telephones subscribers 16,983 13,403 12,333 12,960
Population Network coverage by mobile
cellular networks
99.98 99.92 99.92 99.92
Geographic Network coverage % 99.11 99.13 99.13 99.13
Number Radio broadcasters 32 31 35 34
Number Pay TV Operators 3 3 4 4
Source: RURA
Table 8.3.2: Cumulative registered vs Active Pay TV Subscribers
2015 2016 2017 2018
Registered
Star Africa Media 196,305 207,187 225,000 246,000
Tele 10 19,568 19,568 22,599 25,005
Azam Media ltd 2,413 4,371 9,647 7,978
Kwesé TV 634 780
Active
Total 218,286 231,126 257,880 279,763
Star Africa Media 47,143 41,649 50,003 39,500
Tele 10 12,896 12,896 14,877 15,665
Azam Media ltd 857 1,884 4,037 3,632
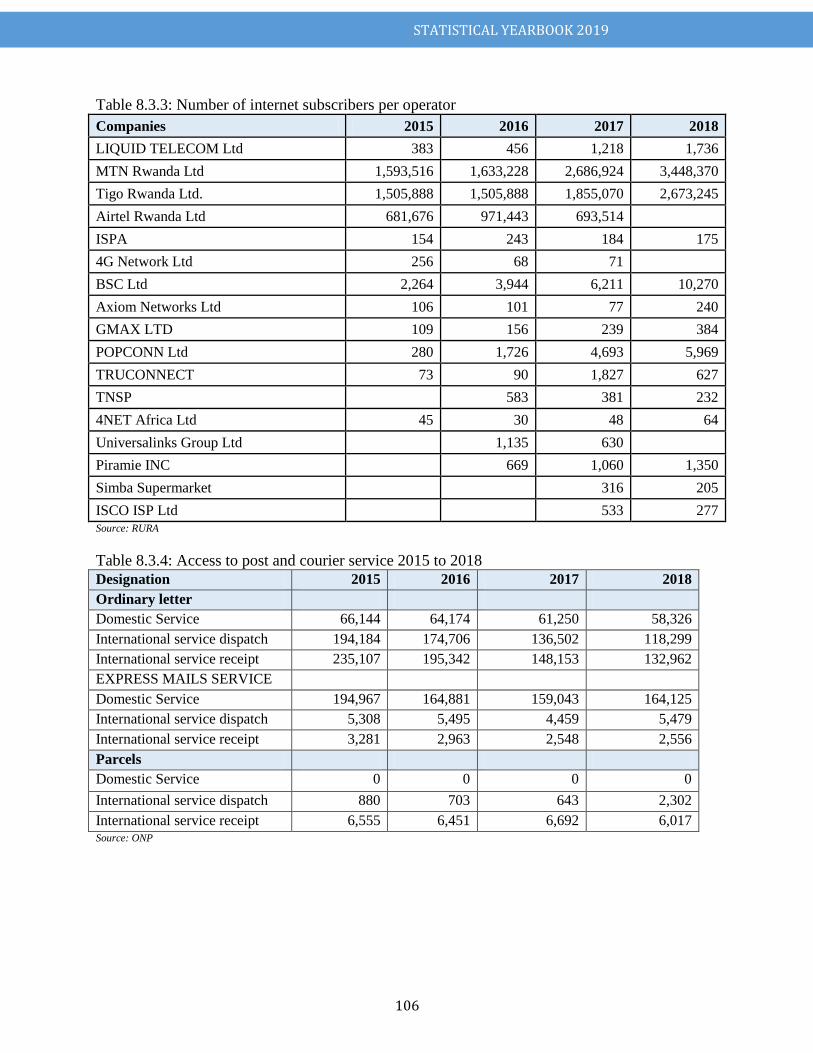
STATISTICAL YEARBOOK 2019
106
Table 8.3.3: Number of internet subscribers per operator
Companies 2015 2016 2017 2018
LIQUID TELECOM Ltd 383 456 1,218 1,736
MTN Rwanda Ltd 1,593,516 1,633,228 2,686,924 3,448,370
Tigo Rwanda Ltd. 1,505,888 1,505,888 1,855,070 2,673,245
Airtel Rwanda Ltd 681,676 971,443 693,514
ISPA 154 243 184 175
4G Network Ltd 256 68 71
BSC Ltd 2,264 3,944 6,211 10,270
Axiom Networks Ltd 106 101 77 240
GMAX LTD 109 156 239 384
POPCONN Ltd 280 1,726 4,693 5,969
TRUCONNECT 73 90 1,827 627
TNSP
583 381 232
4NET Africa Ltd 45 30 48 64
Universalinks Group Ltd
1,135 630
Piramie INC
669 1,060 1,350
Simba Supermarket
316 205
ISCO ISP Ltd
533 277 Source: RURA
Table 8.3.4: Access to post and courier service 2015 to 2018
Designation 2015 2016 2017 2018
Ordinary letter
Domestic Service 66,144 64,174 61,250 58,326
International service dispatch 194,184 174,706 136,502 118,299
International service receipt 235,107 195,342 148,153 132,962
EXPRESS MAILS SERVICE
Domestic Service 194,967 164,881 159,043 164,125
International service dispatch 5,308 5,495 4,459 5,479
International service receipt 3,281 2,963 2,548 2,556
Parcels
Domestic Service 0 0 0 0
International service dispatch 880 703 643 2,302
International service receipt 6,555 6,451 6,692 6,017 Source: ONP
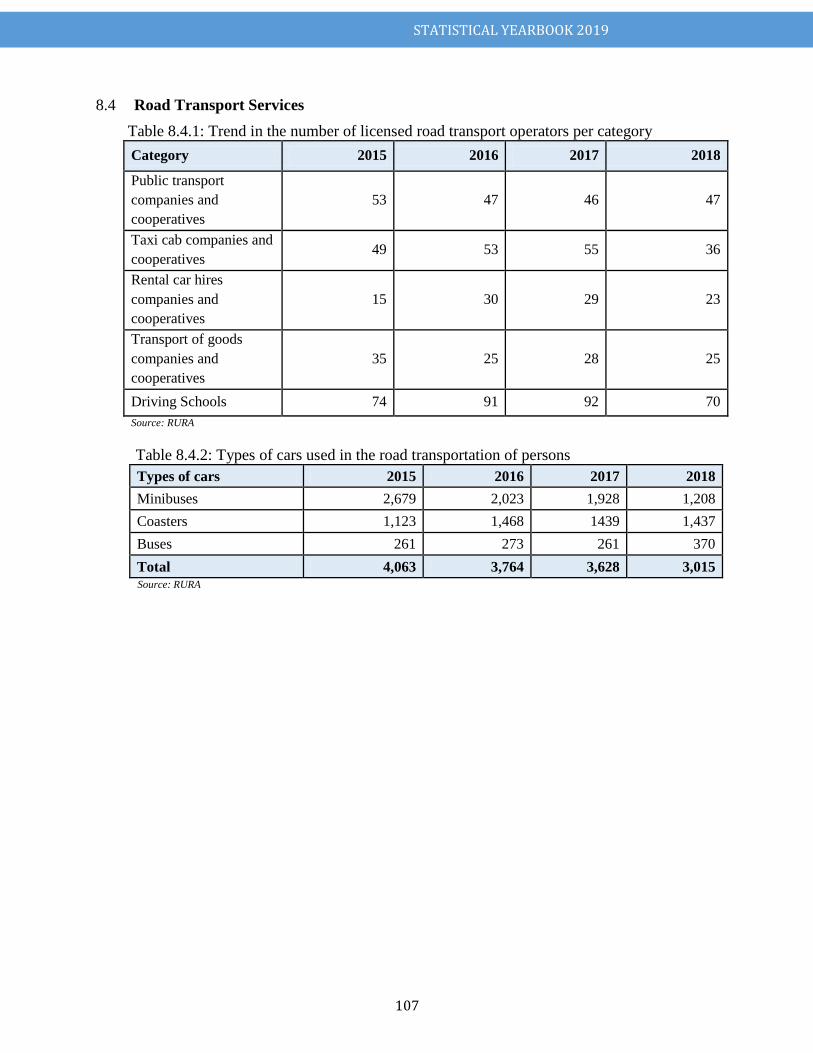
STATISTICAL YEARBOOK 2019
107
Road Transport Services 8.4
Table 8.4.1: Trend in the number of licensed road transport operators per category
Category 2015 2016 2017 2018
Public transport
companies and
cooperatives
53 47 46 47
Taxi cab companies and
cooperatives 49 53 55 36
Rental car hires
companies and
cooperatives
15 30 29 23
Transport of goods
companies and
cooperatives
35 25 28 25
Driving Schools 74 91 92 70
Source: RURA
Table 8.4.2: Types of cars used in the road transportation of persons
Types of cars 2015 2016 2017 2018
Minibuses 2,679 2,023 1,928 1,208
Coasters 1,123 1,468 1439 1,437
Buses 261 273 261 370
Total 4,063 3,764 3,628 3,015 Source: RURA
STATISTICAL YEARBOOK 2019
108
CHAPTER IX: TRAVEL and TOURISM
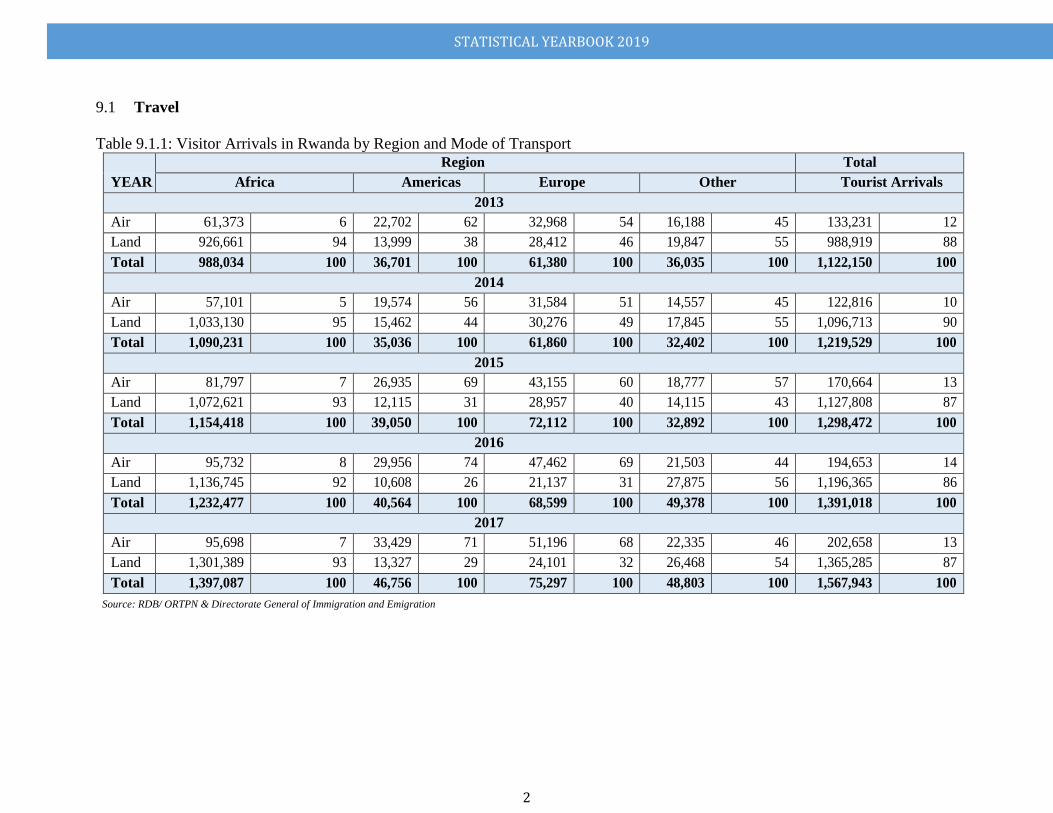
STATISTICAL YEARBOOK 2019
2
Travel 9.1
Table 9.1.1: Visitor Arrivals in Rwanda by Region and Mode of Transport
YEAR
Region Total
Africa Americas Europe Other Tourist Arrivals
2013
Air 61,373 6 22,702 62 32,968 54 16,188 45 133,231 12
Land 926,661 94 13,999 38 28,412 46 19,847 55 988,919 88
Total 988,034 100 36,701 100 61,380 100 36,035 100 1,122,150 100
2014
Air 57,101 5 19,574 56 31,584 51 14,557 45 122,816 10
Land 1,033,130 95 15,462 44 30,276 49 17,845 55 1,096,713 90
Total 1,090,231 100 35,036 100 61,860 100 32,402 100 1,219,529 100
2015
Air 81,797 7 26,935 69 43,155 60 18,777 57 170,664 13
Land 1,072,621 93 12,115 31 28,957 40 14,115 43 1,127,808 87
Total 1,154,418 100 39,050 100 72,112 100 32,892 100 1,298,472 100
2016
Air 95,732 8 29,956 74 47,462 69 21,503 44 194,653 14
Land 1,136,745 92 10,608 26 21,137 31 27,875 56 1,196,365 86
Total 1,232,477 100 40,564 100 68,599 100 49,378 100 1,391,018 100
2017
Air 95,698 7 33,429 71 51,196 68 22,335 46 202,658 13
Land 1,301,389 93 13,327 29 24,101 32 26,468 54 1,365,285 87
Total 1,397,087 100 46,756 100 75,297 100 48,803 100 1,567,943 100
Source: RDB/ ORTPN & Directorate General of Immigration and Emigration
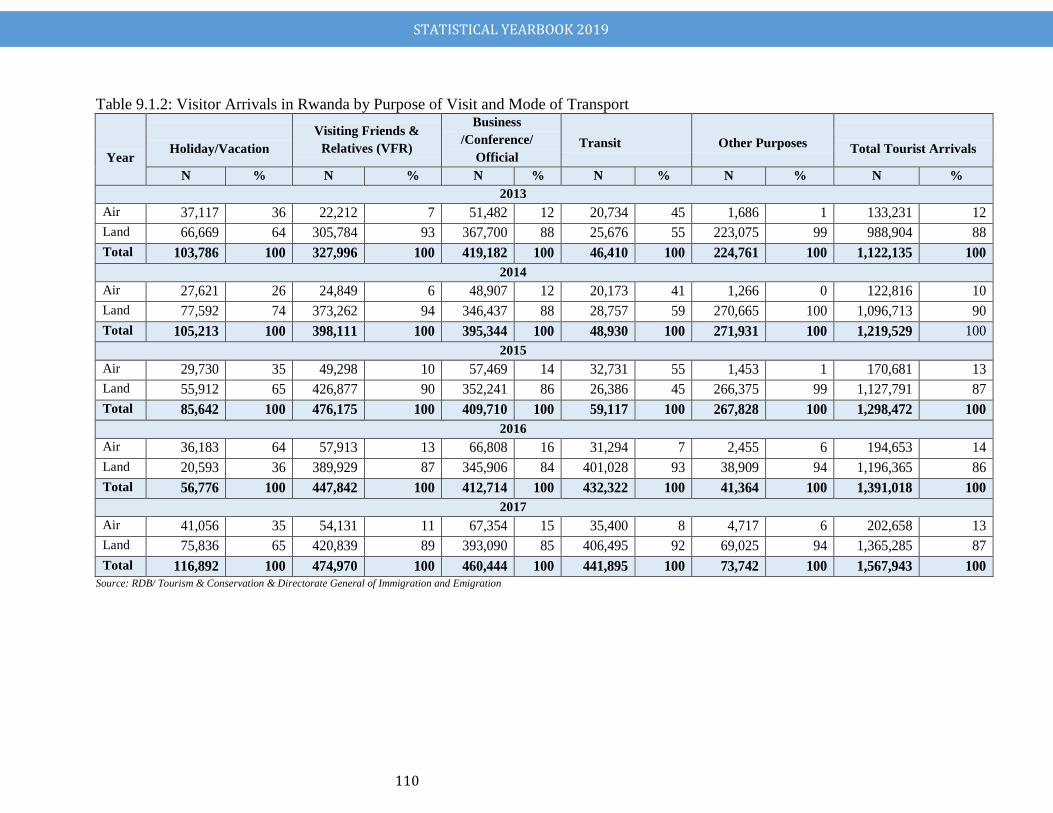
STATISTICAL YEARBOOK 2019
110
Table 9.1.2: Visitor Arrivals in Rwanda by Purpose of Visit and Mode of Transport
Year
Holiday/Vacation
Visiting Friends &
Relatives (VFR)
Business
/Conference/
Official Transit Other Purposes
Total Tourist Arrivals
N % N % N % N % N % N %
2013
Air 37,117 36 22,212 7 51,482 12 20,734 45 1,686 1 133,231 12
Land 66,669 64 305,784 93 367,700 88 25,676 55 223,075 99 988,904 88
Total 103,786 100 327,996 100 419,182 100 46,410 100 224,761 100 1,122,135 100
2014
Air 27,621 26 24,849 6 48,907 12 20,173 41 1,266 0 122,816 10
Land 77,592 74 373,262 94 346,437 88 28,757 59 270,665 100 1,096,713 90
Total 105,213 100 398,111 100 395,344 100 48,930 100 271,931 100 1,219,529 100
2015
Air 29,730 35 49,298 10 57,469 14 32,731 55 1,453 1 170,681 13
Land 55,912 65 426,877 90 352,241 86 26,386 45 266,375 99 1,127,791 87
Total 85,642 100 476,175 100 409,710 100 59,117 100 267,828 100 1,298,472 100
2016
Air 36,183 64 57,913 13 66,808 16 31,294 7 2,455 6 194,653 14
Land 20,593 36 389,929 87 345,906 84 401,028 93 38,909 94 1,196,365 86
Total 56,776 100 447,842 100 412,714 100 432,322 100 41,364 100 1,391,018 100
2017
Air 41,056 35 54,131 11 67,354 15 35,400 8 4,717 6 202,658 13
Land 75,836 65 420,839 89 393,090 85 406,495 92 69,025 94 1,365,285 87
Total 116,892 100 474,970 100 460,444 100 441,895 100 73,742 100 1,567,943 100 Source: RDB/ Tourism & Conservation & Directorate General of Immigration and Emigration
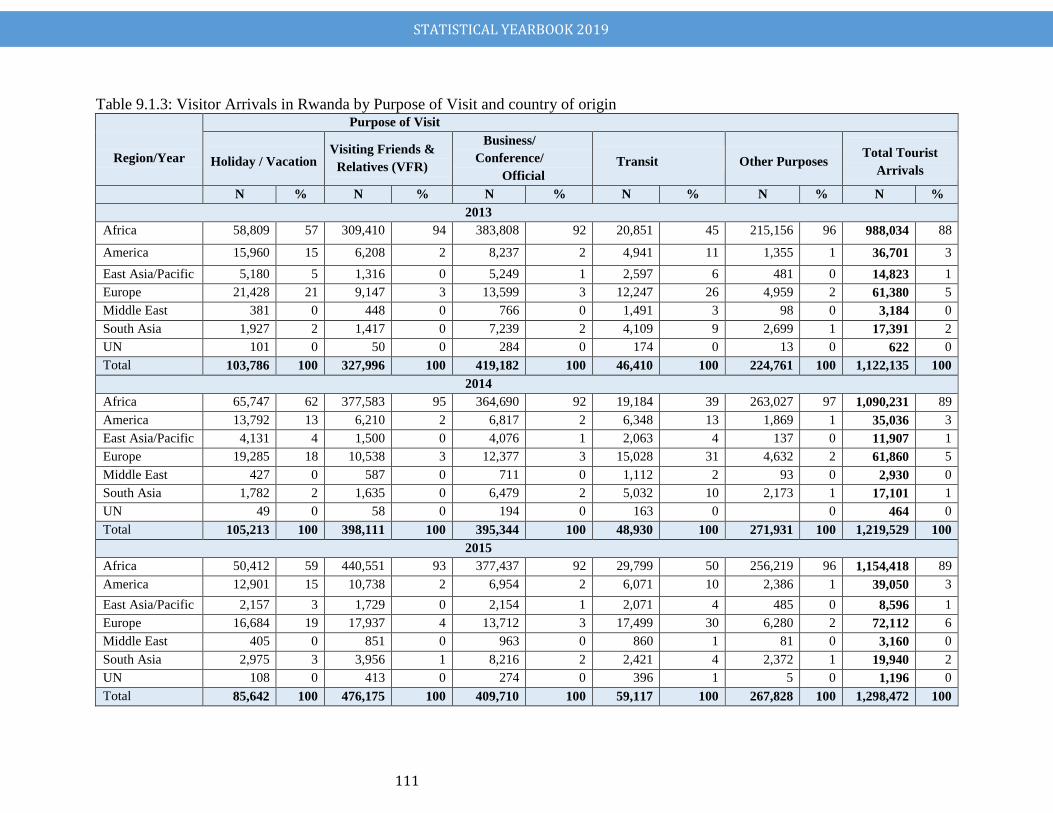
STATISTICAL YEARBOOK 2019
111
Table 9.1.3: Visitor Arrivals in Rwanda by Purpose of Visit and country of origin
Region/Year
Purpose of Visit
Holiday / Vacation Visiting Friends &
Relatives (VFR)
Business/
Conference/
Official Transit Other Purposes
Total Tourist
Arrivals
N % N % N % N % N % N %
2013
Africa 58,809 57 309,410 94 383,808 92 20,851 45 215,156 96 988,034 88
America 15,960 15 6,208 2 8,237 2 4,941 11 1,355 1 36,701 3
East Asia/Pacific 5,180 5 1,316 0 5,249 1 2,597 6 481 0 14,823 1
Europe 21,428 21 9,147 3 13,599 3 12,247 26 4,959 2 61,380 5
Middle East 381 0 448 0 766 0 1,491 3 98 0 3,184 0
South Asia 1,927 2 1,417 0 7,239 2 4,109 9 2,699 1 17,391 2
UN 101 0 50 0 284 0 174 0 13 0 622 0
Total 103,786 100 327,996 100 419,182 100 46,410 100 224,761 100 1,122,135 100
2014
Africa 65,747 62 377,583 95 364,690 92 19,184 39 263,027 97 1,090,231 89
America 13,792 13 6,210 2 6,817 2 6,348 13 1,869 1 35,036 3
East Asia/Pacific 4,131 4 1,500 0 4,076 1 2,063 4 137 0 11,907 1
Europe 19,285 18 10,538 3 12,377 3 15,028 31 4,632 2 61,860 5
Middle East 427 0 587 0 711 0 1,112 2 93 0 2,930 0
South Asia 1,782 2 1,635 0 6,479 2 5,032 10 2,173 1 17,101 1
UN 49 0 58 0 194 0 163 0 0 464 0
Total 105,213 100 398,111 100 395,344 100 48,930 100 271,931 100 1,219,529 100
2015
Africa 50,412 59 440,551 93 377,437 92 29,799 50 256,219 96 1,154,418 89
America 12,901 15 10,738 2 6,954 2 6,071 10 2,386 1 39,050 3
East Asia/Pacific 2,157 3 1,729 0 2,154 1 2,071 4 485 0 8,596 1
Europe 16,684 19 17,937 4 13,712 3 17,499 30 6,280 2 72,112 6
Middle East 405 0 851 0 963 0 860 1 81 0 3,160 0
South Asia 2,975 3 3,956 1 8,216 2 2,421 4 2,372 1 19,940 2
UN 108 0 413 0 274 0 396 1 5 0 1,196 0
Total 85,642 100 476,175 100 409,710 100 59,117 100 267,828 100 1,298,472 100
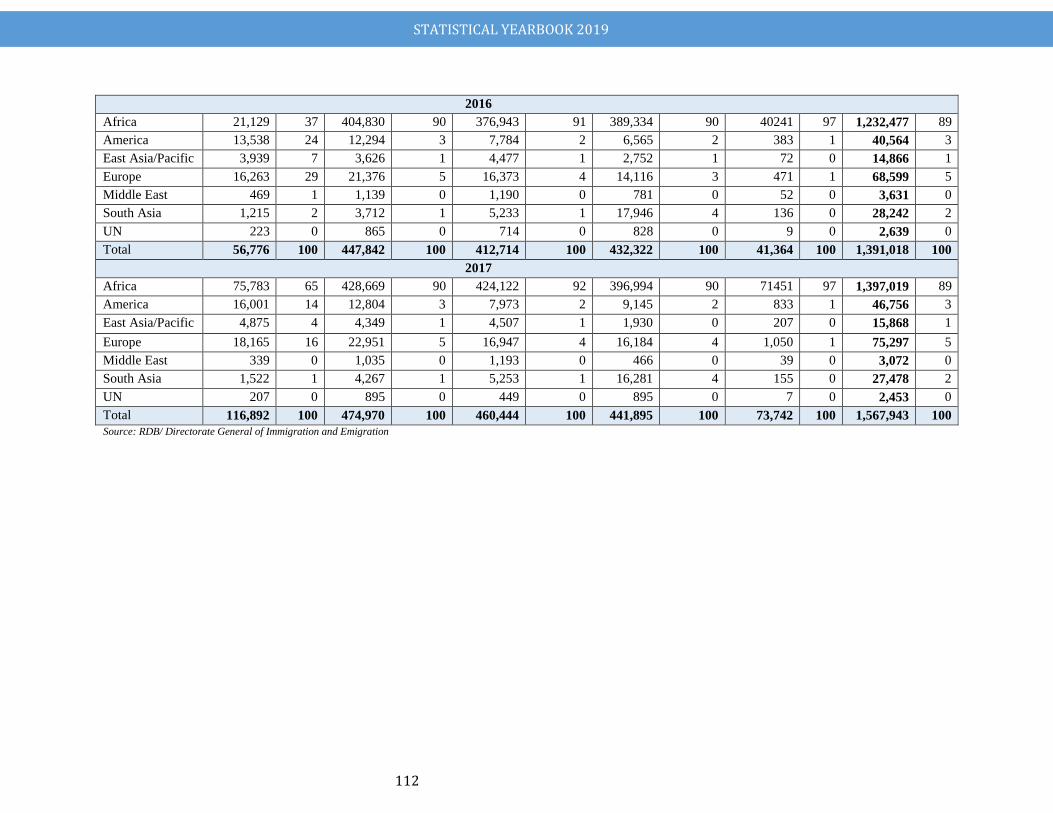
STATISTICAL YEARBOOK 2019
112
2016
Africa 21,129 37 404,830 90 376,943 91 389,334 90 40241 97 1,232,477 89
America 13,538 24 12,294 3 7,784 2 6,565 2 383 1 40,564 3
East Asia/Pacific 3,939 7 3,626 1 4,477 1 2,752 1 72 0 14,866 1
Europe 16,263 29 21,376 5 16,373 4 14,116 3 471 1 68,599 5
Middle East 469 1 1,139 0 1,190 0 781 0 52 0 3,631 0
South Asia 1,215 2 3,712 1 5,233 1 17,946 4 136 0 28,242 2
UN 223 0 865 0 714 0 828 0 9 0 2,639 0
Total 56,776 100 447,842 100 412,714 100 432,322 100 41,364 100 1,391,018 100
2017
Africa 75,783 65 428,669 90 424,122 92 396,994 90 71451 97 1,397,019 89
America 16,001 14 12,804 3 7,973 2 9,145 2 833 1 46,756 3
East Asia/Pacific 4,875 4 4,349 1 4,507 1 1,930 0 207 0 15,868 1
Europe 18,165 16 22,951 5 16,947 4 16,184 4 1,050 1 75,297 5
Middle East 339 0 1,035 0 1,193 0 466 0 39 0 3,072 0
South Asia 1,522 1 4,267 1 5,253 1 16,281 4 155 0 27,478 2
UN 207 0 895 0 449 0 895 0 7 0 2,453 0
Total 116,892 100 474,970 100 460,444 100 441,895 100 73,742 100 1,567,943 100
Source: RDB/ Directorate General of Immigration and Emigration
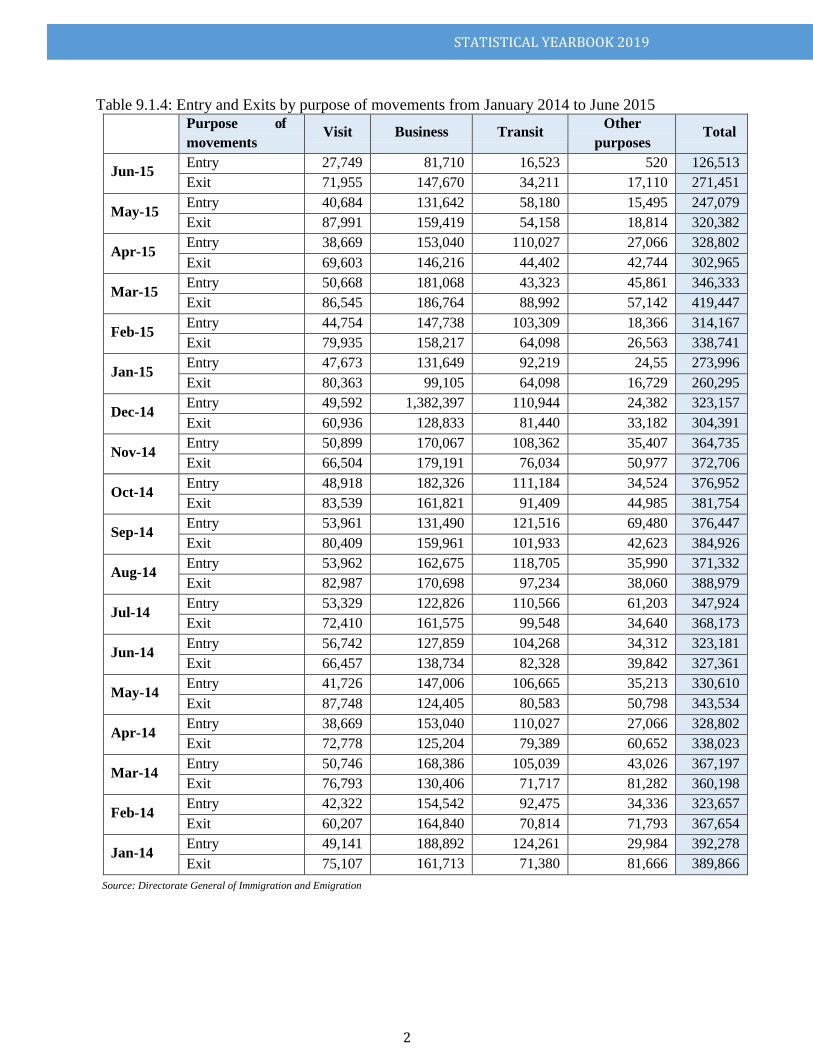
STATISTICAL YEARBOOK 2019
2
Table 9.1.4: Entry and Exits by purpose of movements from January 2014 to June 2015 Purpose of
movements Visit Business Transit
Other
purposes Total
Jun-15 Entry 27,749 81,710 16,523 520 126,513
Exit 71,955 147,670 34,211 17,110 271,451
May-15 Entry 40,684 131,642 58,180 15,495 247,079
Exit 87,991 159,419 54,158 18,814 320,382
Apr-15 Entry 38,669 153,040 110,027 27,066 328,802
Exit 69,603 146,216 44,402 42,744 302,965
Mar-15 Entry 50,668 181,068 43,323 45,861 346,333
Exit 86,545 186,764 88,992 57,142 419,447
Feb-15 Entry 44,754 147,738 103,309 18,366 314,167
Exit 79,935 158,217 64,098 26,563 338,741
Jan-15 Entry 47,673 131,649 92,219 24,55 273,996
Exit 80,363 99,105 64,098 16,729 260,295
Dec-14 Entry 49,592 1,382,397 110,944 24,382 323,157
Exit 60,936 128,833 81,440 33,182 304,391
Nov-14 Entry 50,899 170,067 108,362 35,407 364,735
Exit 66,504 179,191 76,034 50,977 372,706
Oct-14 Entry 48,918 182,326 111,184 34,524 376,952
Exit 83,539 161,821 91,409 44,985 381,754
Sep-14 Entry 53,961 131,490 121,516 69,480 376,447
Exit 80,409 159,961 101,933 42,623 384,926
Aug-14 Entry 53,962 162,675 118,705 35,990 371,332
Exit 82,987 170,698 97,234 38,060 388,979
Jul-14 Entry 53,329 122,826 110,566 61,203 347,924
Exit 72,410 161,575 99,548 34,640 368,173
Jun-14 Entry 56,742 127,859 104,268 34,312 323,181
Exit 66,457 138,734 82,328 39,842 327,361
May-14 Entry 41,726 147,006 106,665 35,213 330,610
Exit 87,748 124,405 80,583 50,798 343,534
Apr-14 Entry 38,669 153,040 110,027 27,066 328,802
Exit 72,778 125,204 79,389 60,652 338,023
Mar-14 Entry 50,746 168,386 105,039 43,026 367,197
Exit 76,793 130,406 71,717 81,282 360,198
Feb-14 Entry 42,322 154,542 92,475 34,336 323,657
Exit 60,207 164,840 70,814 71,793 367,654
Jan-14 Entry 49,141 188,892 124,261 29,984 392,278
Exit 75,107 161,713 71,380 81,666 389,866
Source: Directorate General of Immigration and Emigration
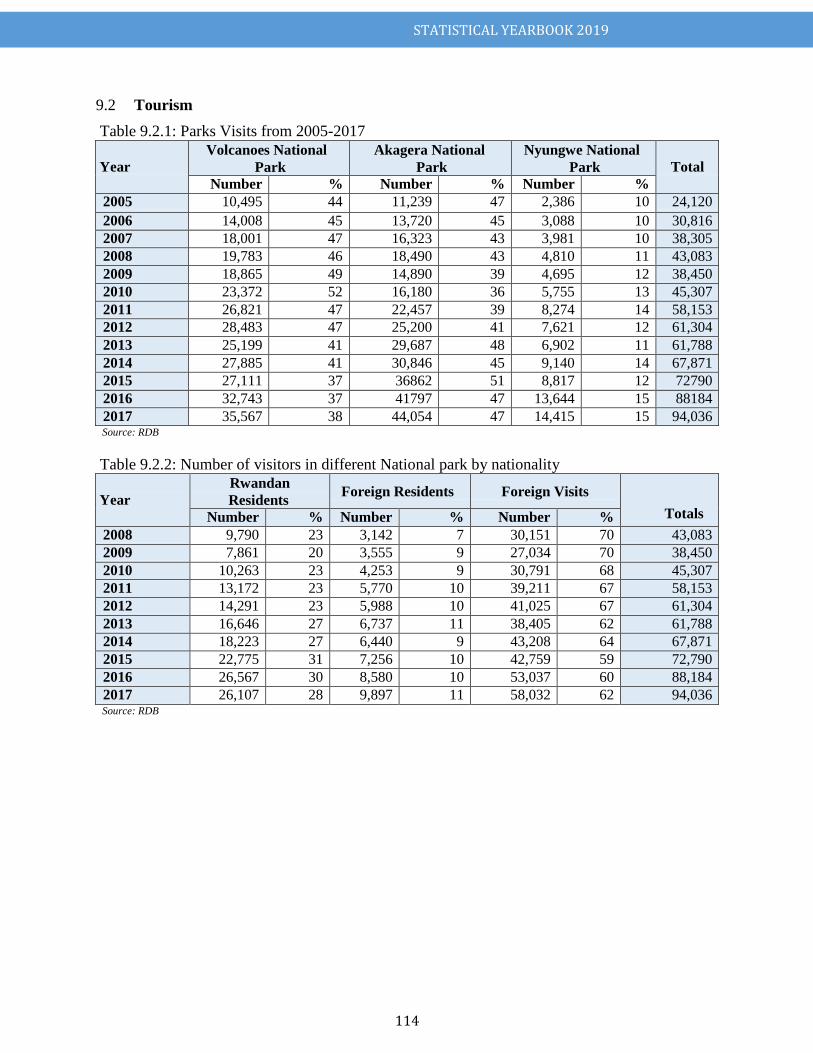
STATISTICAL YEARBOOK 2019
114
Tourism 9.2
Table 9.2.1: Parks Visits from 2005-2017
Year
Volcanoes National
Park
Akagera National
Park
Nyungwe National
Park
Total
Number % Number % Number %
2005 10,495 44 11,239 47 2,386 10 24,120
2006 14,008 45 13,720 45 3,088 10 30,816
2007 18,001 47 16,323 43 3,981 10 38,305
2008 19,783 46 18,490 43 4,810 11 43,083
2009 18,865 49 14,890 39 4,695 12 38,450
2010 23,372 52 16,180 36 5,755 13 45,307
2011 26,821 47 22,457 39 8,274 14 58,153
2012 28,483 47 25,200 41 7,621 12 61,304
2013 25,199 41 29,687 48 6,902 11 61,788
2014 27,885 41 30,846 45 9,140 14 67,871
2015 27,111 37 36862 51 8,817 12 72790
2016 32,743 37 41797 47 13,644 15 88184
2017 35,567 38 44,054 47 14,415 15 94,036 Source: RDB
Table 9.2.2: Number of visitors in different National park by nationality
Year
Rwandan
Residents Foreign Residents Foreign Visits
Totals Number % Number % Number %
2008 9,790 23 3,142 7 30,151 70 43,083
2009 7,861 20 3,555 9 27,034 70 38,450
2010 10,263 23 4,253 9 30,791 68 45,307
2011 13,172 23 5,770 10 39,211 67 58,153
2012 14,291 23 5,988 10 41,025 67 61,304
2013 16,646 27 6,737 11 38,405 62 61,788
2014 18,223 27 6,440 9 43,208 64 67,871
2015 22,775 31 7,256 10 42,759 59 72,790
2016 26,567 30 8,580 10 53,037 60 88,184
2017 26,107 28 9,897 11 58,032 62 94,036 Source: RDB
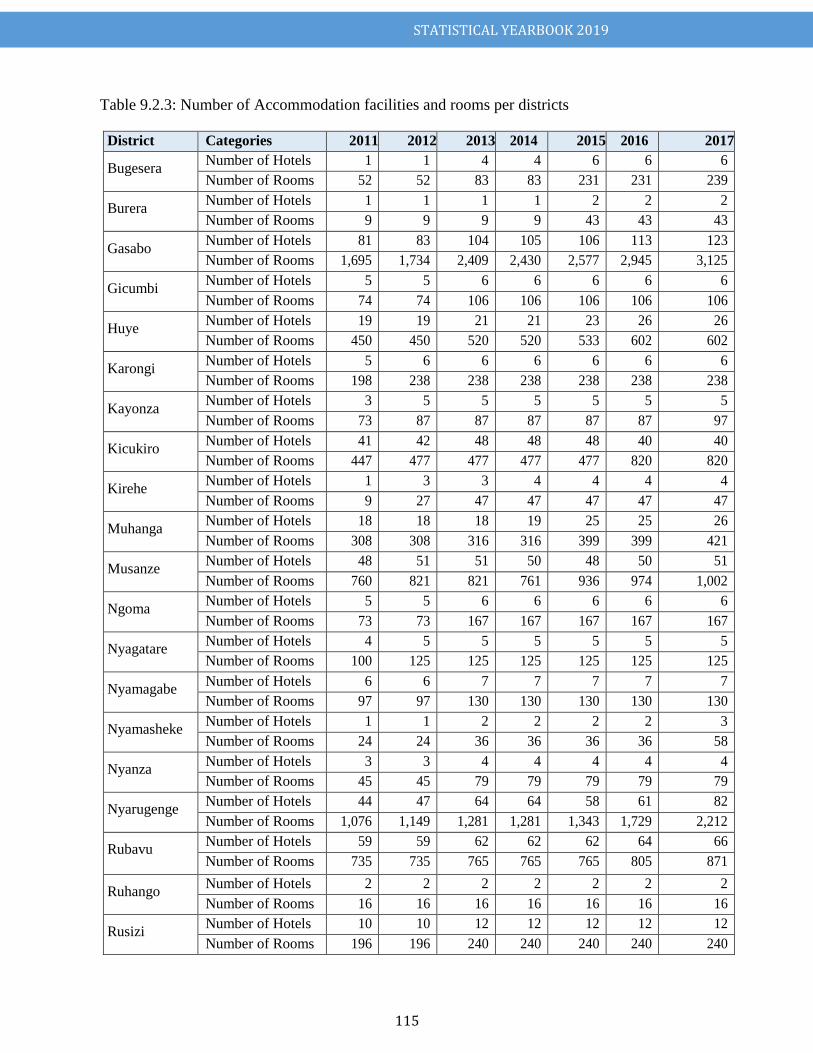
STATISTICAL YEARBOOK 2019
115
Table 9.2.3: Number of Accommodation facilities and rooms per districts
District Categories 2011 2012 2013 2014 2015 2016 2017
Bugesera Number of Hotels 1 1 4 4 6 6 6
Number of Rooms 52 52 83 83 231 231 239
Burera Number of Hotels 1 1 1 1 2 2 2
Number of Rooms 9 9 9 9 43 43 43
Gasabo Number of Hotels 81 83 104 105 106 113 123
Number of Rooms 1,695 1,734 2,409 2,430 2,577 2,945 3,125
Gicumbi Number of Hotels 5 5 6 6 6 6 6
Number of Rooms 74 74 106 106 106 106 106
Huye Number of Hotels 19 19 21 21 23 26 26
Number of Rooms 450 450 520 520 533 602 602
Karongi Number of Hotels 5 6 6 6 6 6 6
Number of Rooms 198 238 238 238 238 238 238
Kayonza Number of Hotels 3 5 5 5 5 5 5
Number of Rooms 73 87 87 87 87 87 97
Kicukiro Number of Hotels 41 42 48 48 48 40 40
Number of Rooms 447 477 477 477 477 820 820
Kirehe Number of Hotels 1 3 3 4 4 4 4
Number of Rooms 9 27 47 47 47 47 47
Muhanga Number of Hotels 18 18 18 19 25 25 26
Number of Rooms 308 308 316 316 399 399 421
Musanze Number of Hotels 48 51 51 50 48 50 51
Number of Rooms 760 821 821 761 936 974 1,002
Ngoma Number of Hotels 5 5 6 6 6 6 6
Number of Rooms 73 73 167 167 167 167 167
Nyagatare Number of Hotels 4 5 5 5 5 5 5
Number of Rooms 100 125 125 125 125 125 125
Nyamagabe Number of Hotels 6 6 7 7 7 7 7
Number of Rooms 97 97 130 130 130 130 130
Nyamasheke Number of Hotels 1 1 2 2 2 2 3
Number of Rooms 24 24 36 36 36 36 58
Nyanza Number of Hotels 3 3 4 4 4 4 4
Number of Rooms 45 45 79 79 79 79 79
Nyarugenge Number of Hotels 44 47 64 64 58 61 82
Number of Rooms 1,076 1,149 1,281 1,281 1,343 1,729 2,212
Rubavu Number of Hotels 59 59 62 62 62 64 66
Number of Rooms 735 735 765 765 765 805 871
Ruhango Number of Hotels 2 2 2 2 2 2 2
Number of Rooms 16 16 16 16 16 16 16
Rusizi Number of Hotels 10 10 12 12 12 12 12
Number of Rooms 196 196 240 240 240 240 240
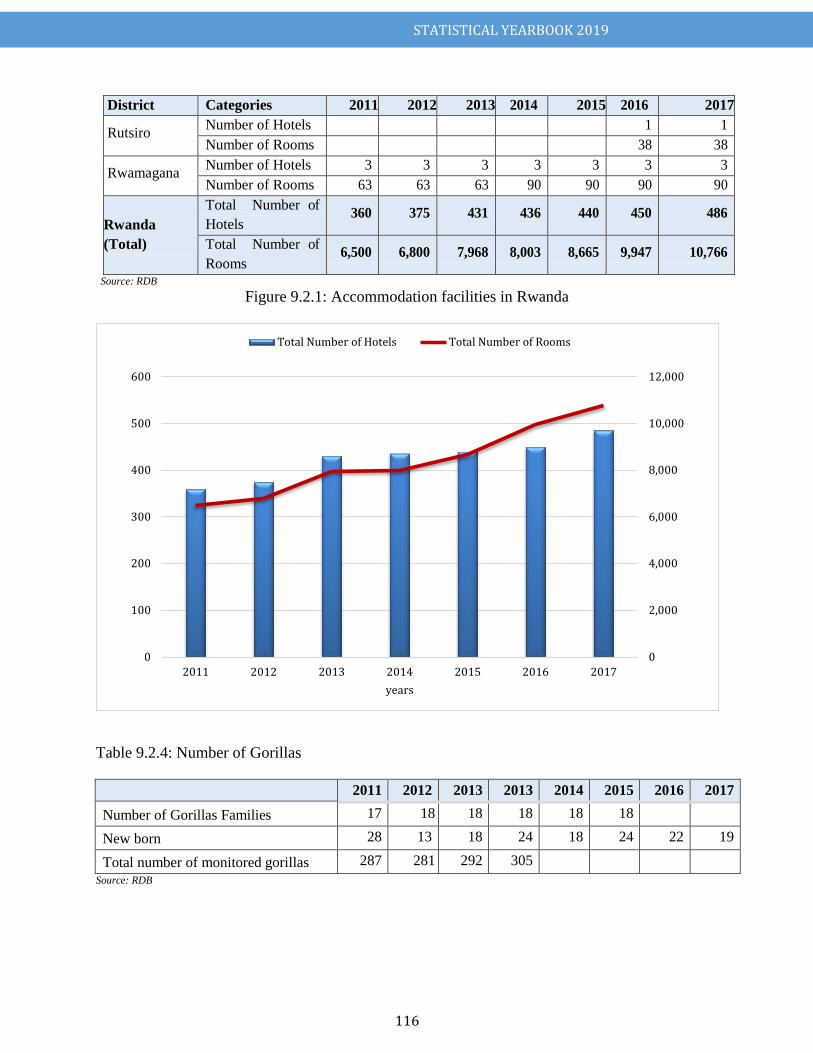
STATISTICAL YEARBOOK 2019
116
District Categories 2011 2012 2013 2014 2015 2016 2017
Rutsiro Number of Hotels 1 1
Number of Rooms 38 38
Rwamagana Number of Hotels 3 3 3 3 3 3 3
Number of Rooms 63 63 63 90 90 90 90
Rwanda
(Total)
Total Number of
Hotels 360 375 431 436 440 450 486
Total Number of
Rooms 6,500 6,800 7,968 8,003 8,665 9,947 10,766
Source: RDB
Figure 9.2.1: Accommodation facilities in Rwanda
Table 9.2.4: Number of Gorillas 2011 2012 2013 2013 2014 2015 2016 2017
Number of Gorillas Families 17 18 18 18 18 18
New born 28 13 18 24 18 24 22 19
Total number of monitored gorillas 287 281 292 305
Source: RDB
2017 2016 2015 2014
years
2011 2012 2013
0 0
2,000 100
4,000 200
6,000 300
8,000 400
10,000 500
12,000 600
Total Number of Rooms Total Number of Hotels
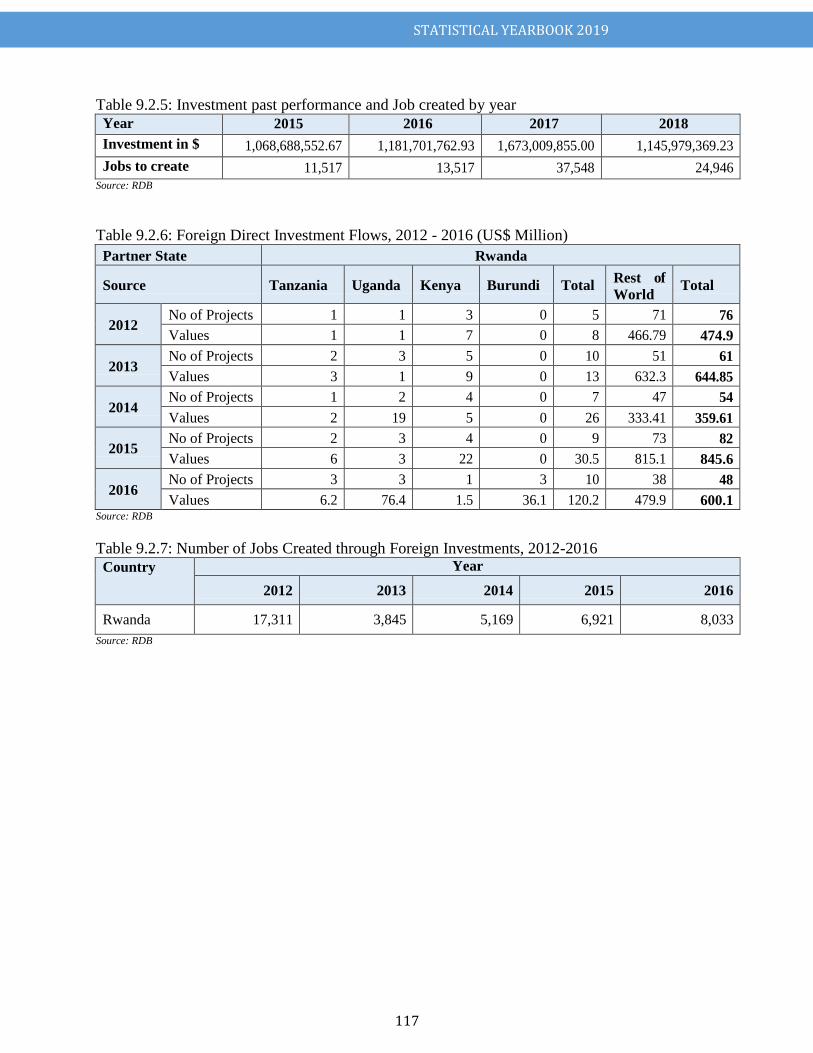
STATISTICAL YEARBOOK 2019
117
Table 9.2.5: Investment past performance and Job created by year
Year 2015 2016 2017 2018
Investment in $ 1,068,688,552.67 1,181,701,762.93 1,673,009,855.00 1,145,979,369.23
Jobs to create 11,517 13,517 37,548 24,946 Source: RDB
Table 9.2.6: Foreign Direct Investment Flows, 2012 - 2016 (US$ Million)
Partner State Rwanda
Source Tanzania Uganda Kenya Burundi Total Rest of
World Total
2012 No of Projects 1 1 3 0 5 71 76
Values 1 1 7 0 8 466.79 474.9
2013 No of Projects 2 3 5 0 10 51 61
Values 3 1 9 0 13 632.3 644.85
2014 No of Projects 1 2 4 0 7 47 54
Values 2 19 5 0 26 333.41 359.61
2015 No of Projects 2 3 4 0 9 73 82
Values 6 3 22 0 30.5 815.1 845.6
2016 No of Projects 3 3 1 3 10 38 48
Values 6.2 76.4 1.5 36.1 120.2 479.9 600.1 Source: RDB
Table 9.2.7: Number of Jobs Created through Foreign Investments, 2012-2016
Country Year
2012 2013 2014 2015 2016
Rwanda 17,311 3,845 5,169 6,921 8,033
Source: RDB
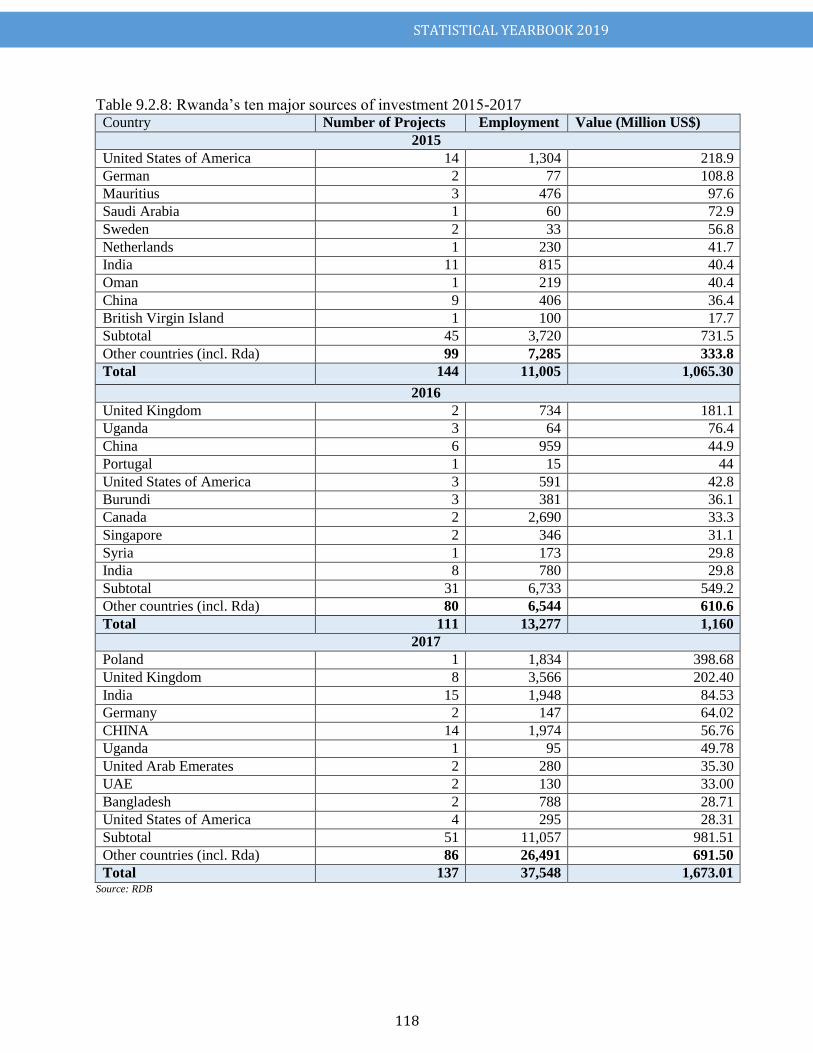
STATISTICAL YEARBOOK 2019
118
Table 9.2.8: Rwanda‟s ten major sources of investment 2015-2017 Country Number of Projects Employment Value (Million US$)
2015
United States of America 14 1,304 218.9
German 2 77 108.8
Mauritius 3 476 97.6
Saudi Arabia 1 60 72.9
Sweden 2 33 56.8
Netherlands 1 230 41.7
India 11 815 40.4
Oman 1 219 40.4
China 9 406 36.4
British Virgin Island 1 100 17.7
Subtotal 45 3,720 731.5
Other countries (incl. Rda) 99 7,285 333.8
Total 144 11,005 1,065.30
2016
United Kingdom 2 734 181.1
Uganda 3 64 76.4
China 6 959 44.9
Portugal 1 15 44
United States of America 3 591 42.8
Burundi 3 381 36.1
Canada 2 2,690 33.3
Singapore 2 346 31.1
Syria 1 173 29.8
India 8 780 29.8
Subtotal 31 6,733 549.2
Other countries (incl. Rda) 80 6,544 610.6
Total 111 13,277 1,160
2017
Poland 1 1,834 398.68
United Kingdom 8 3,566 202.40
India 15 1,948 84.53
Germany 2 147 64.02
CHINA 14 1,974 56.76
Uganda 1 95 49.78
United Arab Emerates 2 280 35.30
UAE 2 130 33.00
Bangladesh 2 788 28.71
United States of America 4 295 28.31
Subtotal 51 11,057 981.51
Other countries (incl. Rda) 86 26,491 691.50
Total 137 37,548 1,673.01 Source: RDB
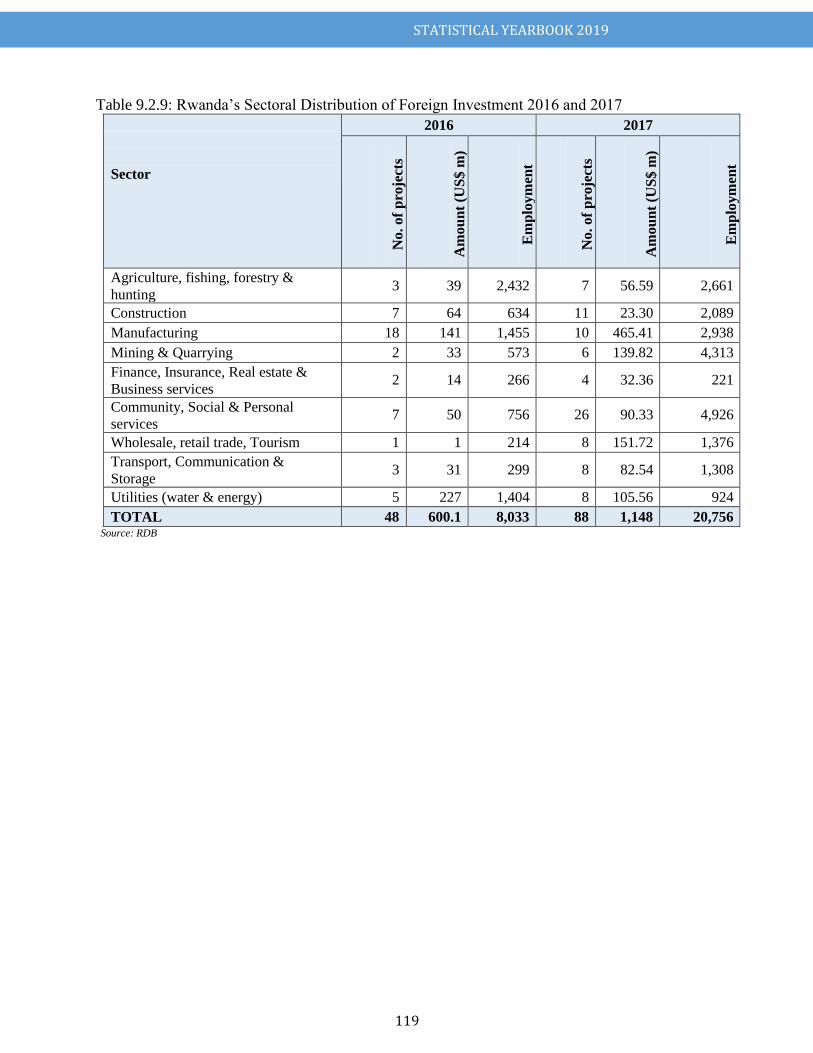
STATISTICAL YEARBOOK 2019
119
Table 9.2.9: Rwanda‟s Sectoral Distribution of Foreign Investment 2016 and 2017
Sector
2016 2017
No
. o
f p
roje
cts
Am
ou
nt
(US
$ m
)
Em
plo
ym
ent
No
. o
f p
roje
cts
Am
ou
nt
(US
$ m
)
Em
plo
ym
ent
Agriculture, fishing, forestry &
hunting 3 39 2,432 7 56.59 2,661
Construction 7 64 634 11 23.30 2,089
Manufacturing 18 141 1,455 10 465.41 2,938
Mining & Quarrying 2 33 573 6 139.82 4,313
Finance, Insurance, Real estate &
Business services 2 14 266 4 32.36 221
Community, Social & Personal
services 7 50 756 26 90.33 4,926
Wholesale, retail trade, Tourism 1 1 214 8 151.72 1,376
Transport, Communication &
Storage 3 31 299 8 82.54 1,308
Utilities (water & energy) 5 227 1,404 8 105.56 924
TOTAL 48 600.1 8,033 88 1,148 20,756 Source: RDB
STATISTICAL YEARBOOK 2019
120
CHAPTER X: INCOME, EXPENDITURE and WEALTH
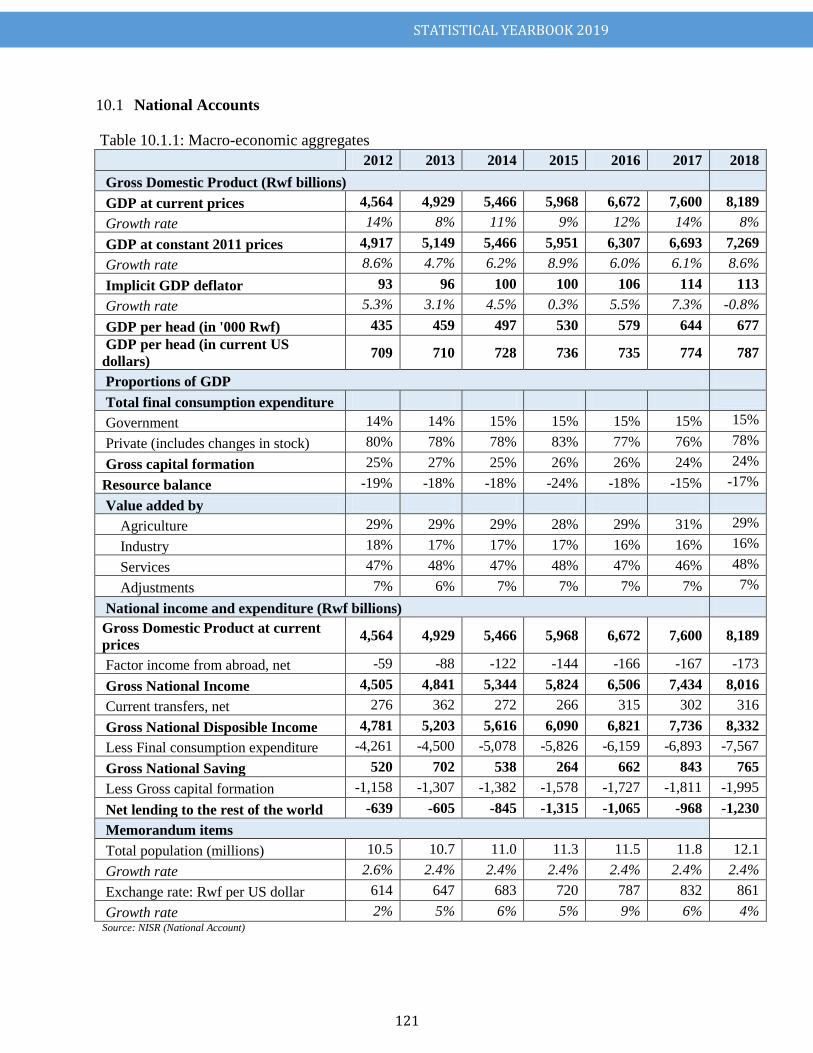
STATISTICAL YEARBOOK 2019
121
National Accounts 10.1 Table 10.1.1: Macro-economic aggregates
2012 2013 2014 2015 2016 2017 2018
Gross Domestic Product (Rwf billions)
GDP at current prices 4,564 4,929 5,466 5,968 6,672 7,600 8,189
Growth rate 14% 8% 11% 9% 12% 14% 8%
GDP at constant 2011 prices 4,917 5,149 5,466 5,951 6,307 6,693 7,269
Growth rate 8.6% 4.7% 6.2% 8.9% 6.0% 6.1% 8.6%
Implicit GDP deflator 93 96 100 100 106 114 113
Growth rate 5.3% 3.1% 4.5% 0.3% 5.5% 7.3% -0.8%
GDP per head (in '000 Rwf) 435 459 497 530 579 644 677
GDP per head (in current US
dollars) 709 710 728 736 735 774 787
Proportions of GDP
Total final consumption expenditure
Government 14% 14% 15% 15% 15% 15% 15%
Private (includes changes in stock) 80% 78% 78% 83% 77% 76% 78%
Gross capital formation 25% 27% 25% 26% 26% 24% 24%
Resource balance -19% -18% -18% -24% -18% -15% -17%
Value added by
Agriculture 29% 29% 29% 28% 29% 31% 29%
Industry 18% 17% 17% 17% 16% 16% 16%
Services 47% 48% 47% 48% 47% 46% 48%
Adjustments 7% 6% 7% 7% 7% 7% 7%
National income and expenditure (Rwf billions)
Gross Domestic Product at current
prices 4,564 4,929 5,466 5,968 6,672 7,600 8,189
Factor income from abroad, net -59 -88 -122 -144 -166 -167 -173
Gross National Income 4,505 4,841 5,344 5,824 6,506 7,434 8,016
Current transfers, net 276 362 272 266 315 302 316
Gross National Disposible Income 4,781 5,203 5,616 6,090 6,821 7,736 8,332
Less Final consumption expenditure -4,261 -4,500 -5,078 -5,826 -6,159 -6,893 -7,567
Gross National Saving 520 702 538 264 662 843 765
Less Gross capital formation -1,158 -1,307 -1,382 -1,578 -1,727 -1,811 -1,995
Net lending to the rest of the world -639 -605 -845 -1,315 -1,065 -968 -1,230
Memorandum items
Total population (millions) 10.5 10.7 11.0 11.3 11.5 11.8 12.1
Growth rate 2.6% 2.4% 2.4% 2.4% 2.4% 2.4% 2.4%
Exchange rate: Rwf per US dollar 614 647 683 720 787 832 861
Growth rate 2% 5% 6% 5% 9% 6% 4% Source: NISR (National Account)
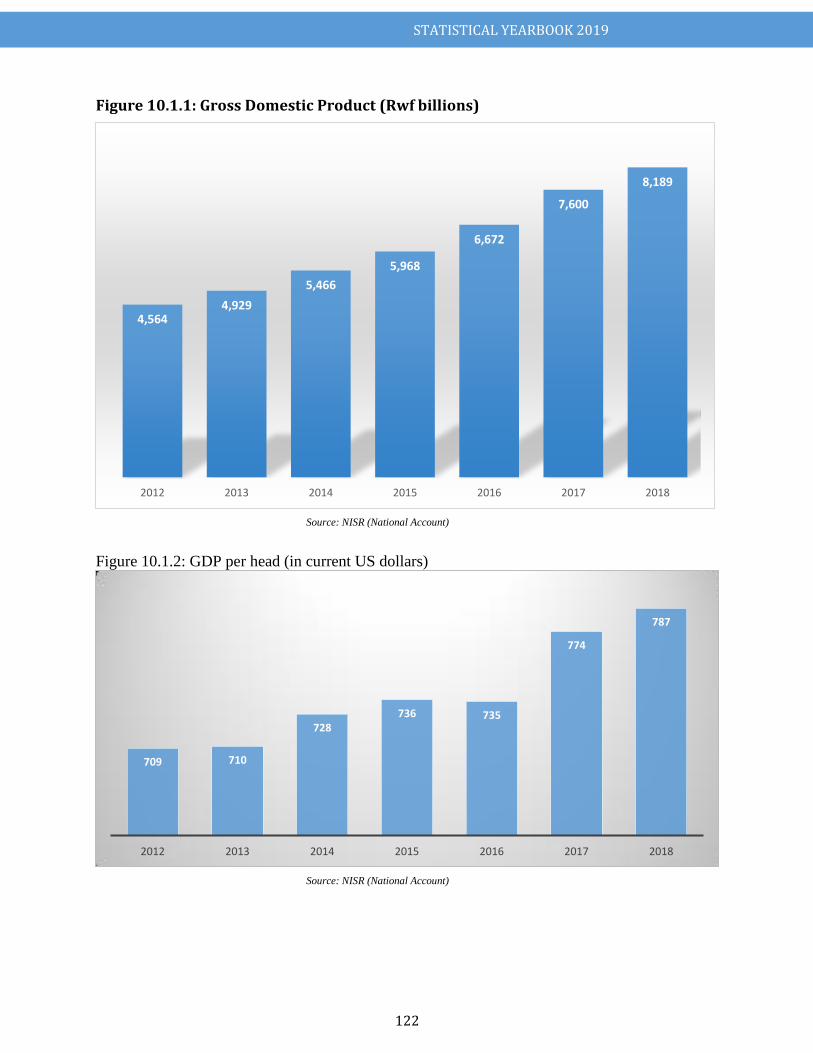
STATISTICAL YEARBOOK 2019
122
Figure 10.1.1: Gross Domestic Product (Rwf billions)
Source: NISR (National Account)
Figure 10.1.2: GDP per head (in current US dollars)
Source: NISR (National Account)
4,564 4,929
5,466
5,968
6,672
7,600
8,189
2012 2013 2014 2015 2016 2017 2018
709 710
728 736 735
774
787
2012 2013 2014 2015 2016 2017 2018
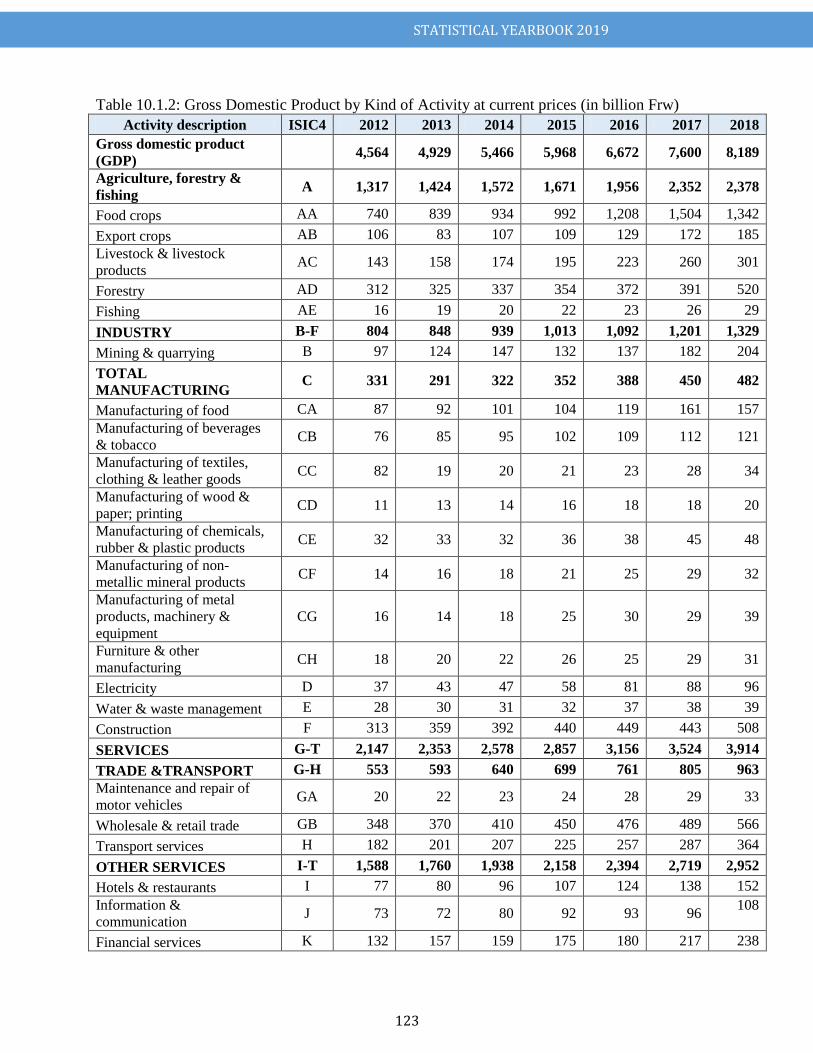
STATISTICAL YEARBOOK 2019
123
Table 10.1.2: Gross Domestic Product by Kind of Activity at current prices (in billion Frw)
Activity description ISIC4 2012 2013 2014 2015 2016 2017 2018
Gross domestic product
(GDP) 4,564 4,929 5,466 5,968 6,672 7,600 8,189
Agriculture, forestry &
fishing A 1,317 1,424 1,572 1,671 1,956 2,352 2,378
Food crops AA 740 839 934 992 1,208 1,504 1,342
Export crops AB 106 83 107 109 129 172 185
Livestock & livestock
products AC 143 158 174 195 223 260 301
Forestry AD 312 325 337 354 372 391 520
Fishing AE 16 19 20 22 23 26 29
INDUSTRY B-F 804 848 939 1,013 1,092 1,201 1,329
Mining & quarrying B 97 124 147 132 137 182 204
TOTAL
MANUFACTURING C 331 291 322 352 388 450 482
Manufacturing of food CA 87 92 101 104 119 161 157
Manufacturing of beverages
& tobacco CB 76 85 95 102 109 112 121
Manufacturing of textiles,
clothing & leather goods CC 82 19 20 21 23 28 34
Manufacturing of wood &
paper; printing CD 11 13 14 16 18 18 20
Manufacturing of chemicals,
rubber & plastic products CE 32 33 32 36 38 45 48
Manufacturing of non-
metallic mineral products CF 14 16 18 21 25 29 32
Manufacturing of metal
products, machinery &
equipment
CG 16 14 18 25 30 29 39
Furniture & other
manufacturing CH 18 20 22 26 25 29 31
Electricity D 37 43 47 58 81 88 96
Water & waste management E 28 30 31 32 37 38 39
Construction F 313 359 392 440 449 443 508
SERVICES G-T 2,147 2,353 2,578 2,857 3,156 3,524 3,914
TRADE &TRANSPORT G-H 553 593 640 699 761 805 963
Maintenance and repair of
motor vehicles GA 20 22 23 24 28 29 33
Wholesale & retail trade GB 348 370 410 450 476 489 566
Transport services H 182 201 207 225 257 287 364
OTHER SERVICES I-T 1,588 1,760 1,938 2,158 2,394 2,719 2,952
Hotels & restaurants I 77 80 96 107 124 138 152
Information &
communication J 73 72 80 92 93 96
108
Financial services K 132 157 159 175 180 217 238
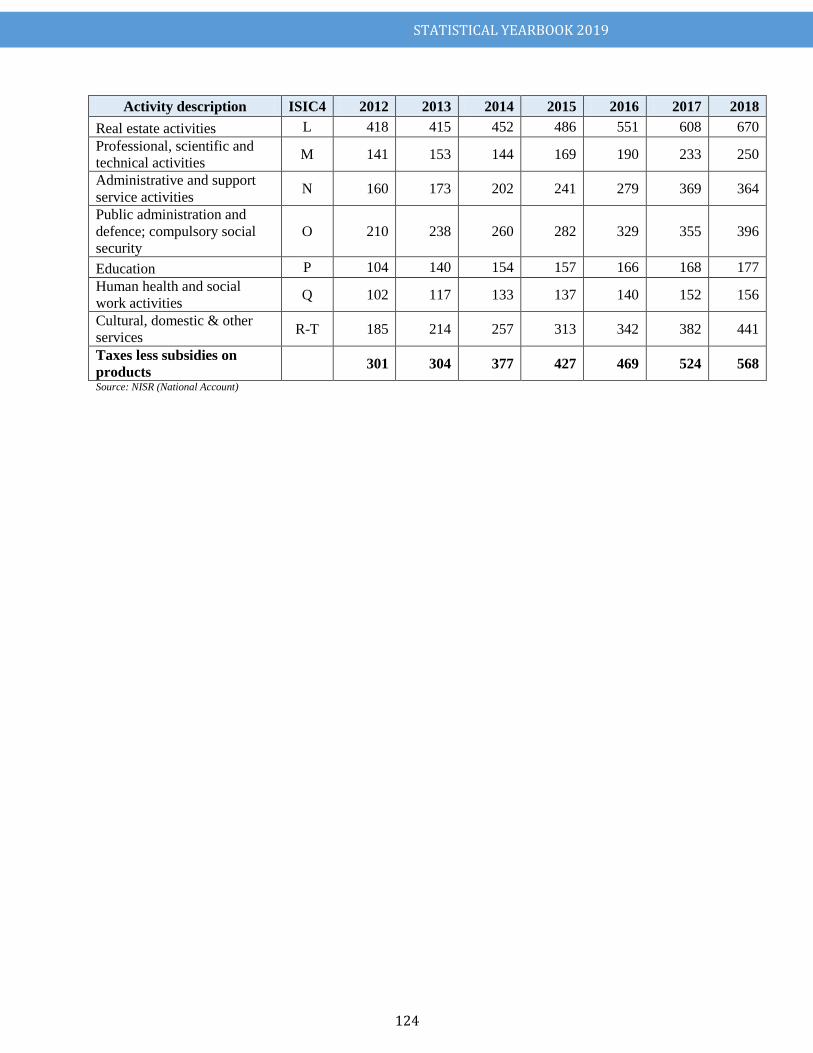
STATISTICAL YEARBOOK 2019
124
Activity description ISIC4 2012 2013 2014 2015 2016 2017 2018
Real estate activities L 418 415 452 486 551 608 670
Professional, scientific and
technical activities M 141 153 144 169 190 233 250
Administrative and support
service activities N 160 173 202 241 279 369 364
Public administration and
defence; compulsory social
security
O 210 238 260 282 329 355 396
Education P 104 140 154 157 166 168 177
Human health and social
work activities Q 102 117 133 137 140 152 156
Cultural, domestic & other
services R-T 185 214 257 313 342 382 441
Taxes less subsidies on
products 301 304 377 427 469 524 568
Source: NISR (National Account)
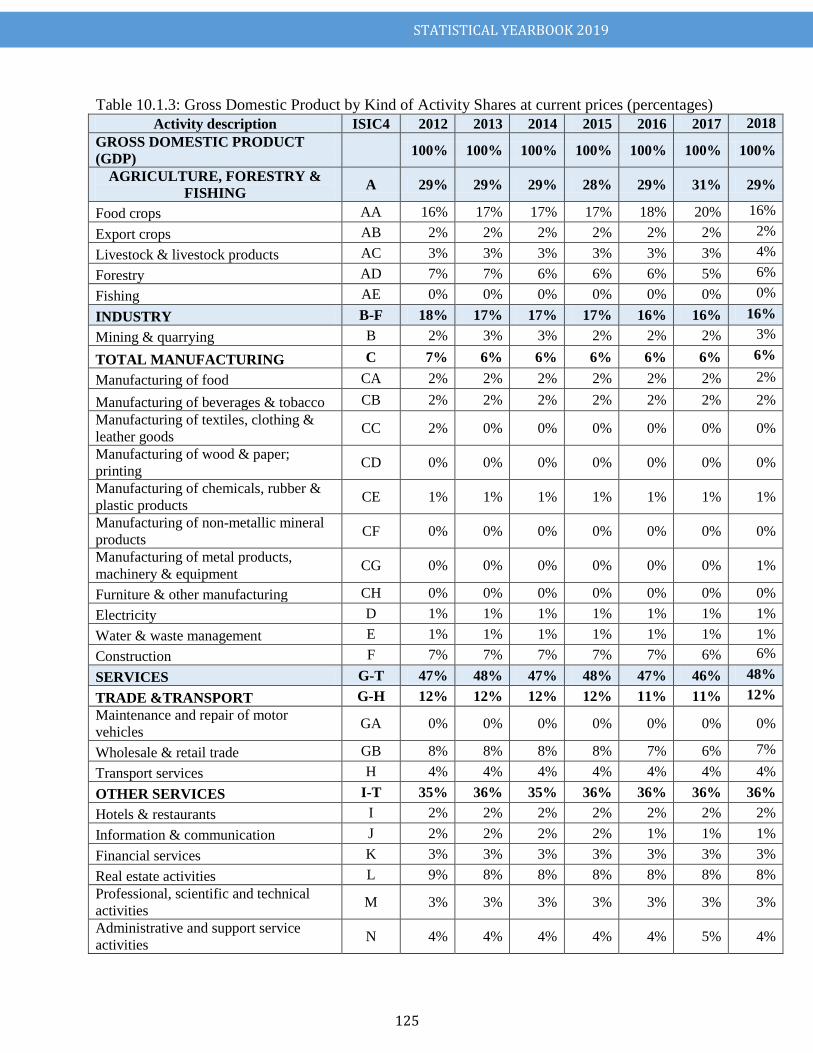
STATISTICAL YEARBOOK 2019
125
Table 10.1.3: Gross Domestic Product by Kind of Activity Shares at current prices (percentages)
Activity description ISIC4 2012 2013 2014 2015 2016 2017 2018
GROSS DOMESTIC PRODUCT
(GDP) 100% 100% 100% 100% 100% 100% 100%
AGRICULTURE, FORESTRY &
FISHING A 29% 29% 29% 28% 29% 31% 29%
Food crops AA 16% 17% 17% 17% 18% 20% 16%
Export crops AB 2% 2% 2% 2% 2% 2% 2%
Livestock & livestock products AC 3% 3% 3% 3% 3% 3% 4%
Forestry AD 7% 7% 6% 6% 6% 5% 6%
Fishing AE 0% 0% 0% 0% 0% 0% 0%
INDUSTRY B-F 18% 17% 17% 17% 16% 16% 16%
Mining & quarrying B 2% 3% 3% 2% 2% 2% 3%
TOTAL MANUFACTURING C 7% 6% 6% 6% 6% 6% 6%
Manufacturing of food CA 2% 2% 2% 2% 2% 2% 2%
Manufacturing of beverages & tobacco CB 2% 2% 2% 2% 2% 2% 2%
Manufacturing of textiles, clothing &
leather goods CC 2% 0% 0% 0% 0% 0% 0%
Manufacturing of wood & paper;
printing CD 0% 0% 0% 0% 0% 0% 0%
Manufacturing of chemicals, rubber &
plastic products CE 1% 1% 1% 1% 1% 1% 1%
Manufacturing of non-metallic mineral
products CF 0% 0% 0% 0% 0% 0% 0%
Manufacturing of metal products,
machinery & equipment CG 0% 0% 0% 0% 0% 0% 1%
Furniture & other manufacturing CH 0% 0% 0% 0% 0% 0% 0%
Electricity D 1% 1% 1% 1% 1% 1% 1%
Water & waste management E 1% 1% 1% 1% 1% 1% 1%
Construction F 7% 7% 7% 7% 7% 6% 6%
SERVICES G-T 47% 48% 47% 48% 47% 46% 48%
TRADE &TRANSPORT G-H 12% 12% 12% 12% 11% 11% 12%
Maintenance and repair of motor
vehicles GA 0% 0% 0% 0% 0% 0% 0%
Wholesale & retail trade GB 8% 8% 8% 8% 7% 6% 7%
Transport services H 4% 4% 4% 4% 4% 4% 4%
OTHER SERVICES I-T 35% 36% 35% 36% 36% 36% 36%
Hotels & restaurants I 2% 2% 2% 2% 2% 2% 2%
Information & communication J 2% 2% 2% 2% 1% 1% 1%
Financial services K 3% 3% 3% 3% 3% 3% 3%
Real estate activities L 9% 8% 8% 8% 8% 8% 8%
Professional, scientific and technical
activities M 3% 3% 3% 3% 3% 3% 3%
Administrative and support service
activities N 4% 4% 4% 4% 4% 5% 4%
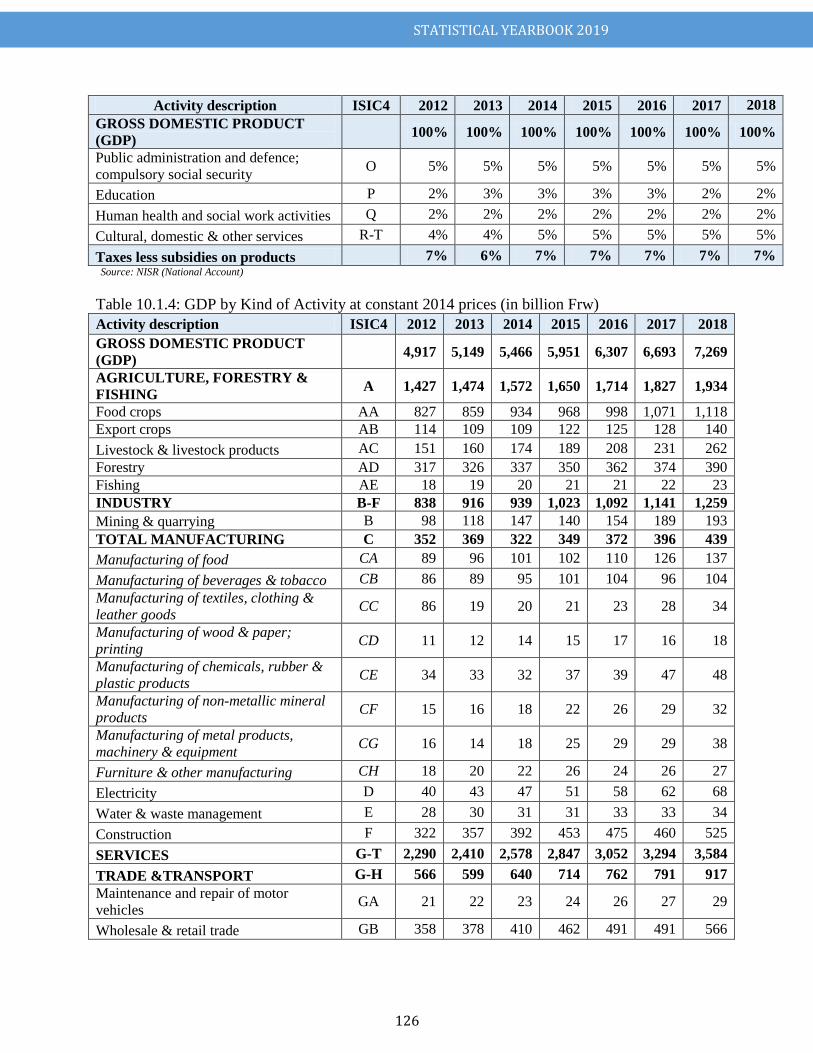
STATISTICAL YEARBOOK 2019
126
Activity description ISIC4 2012 2013 2014 2015 2016 2017 2018
GROSS DOMESTIC PRODUCT
(GDP) 100% 100% 100% 100% 100% 100% 100%
Public administration and defence;
compulsory social security O 5% 5% 5% 5% 5% 5% 5%
Education P 2% 3% 3% 3% 3% 2% 2%
Human health and social work activities Q 2% 2% 2% 2% 2% 2% 2%
Cultural, domestic & other services R-T 4% 4% 5% 5% 5% 5% 5%
Taxes less subsidies on products 7% 6% 7% 7% 7% 7% 7% Source: NISR (National Account)
Table 10.1.4: GDP by Kind of Activity at constant 2014 prices (in billion Frw)
Activity description ISIC4 2012 2013 2014 2015 2016 2017 2018
GROSS DOMESTIC PRODUCT
(GDP) 4,917 5,149 5,466 5,951 6,307 6,693 7,269
AGRICULTURE, FORESTRY &
FISHING A 1,427 1,474 1,572 1,650 1,714 1,827 1,934
Food crops AA 827 859 934 968 998 1,071 1,118
Export crops AB 114 109 109 122 125 128 140
Livestock & livestock products AC 151 160 174 189 208 231 262
Forestry AD 317 326 337 350 362 374 390
Fishing AE 18 19 20 21 21 22 23
INDUSTRY B-F 838 916 939 1,023 1,092 1,141 1,259
Mining & quarrying B 98 118 147 140 154 189 193
TOTAL MANUFACTURING C 352 369 322 349 372 396 439
Manufacturing of food CA 89 96 101 102 110 126 137
Manufacturing of beverages & tobacco CB 86 89 95 101 104 96 104
Manufacturing of textiles, clothing &
leather goods CC 86 19 20 21 23 28 34
Manufacturing of wood & paper;
printing CD 11 12 14 15 17 16 18
Manufacturing of chemicals, rubber &
plastic products CE 34 33 32 37 39 47 48
Manufacturing of non-metallic mineral
products CF 15 16 18 22 26 29 32
Manufacturing of metal products,
machinery & equipment CG 16 14 18 25 29 29 38
Furniture & other manufacturing CH 18 20 22 26 24 26 27
Electricity D 40 43 47 51 58 62 68
Water & waste management E 28 30 31 31 33 33 34
Construction F 322 357 392 453 475 460 525
SERVICES G-T 2,290 2,410 2,578 2,847 3,052 3,294 3,584
TRADE &TRANSPORT G-H 566 599 640 714 762 791 917
Maintenance and repair of motor
vehicles GA 21 22 23 24 26 27 29
Wholesale & retail trade GB 358 378 410 462 491 491 566
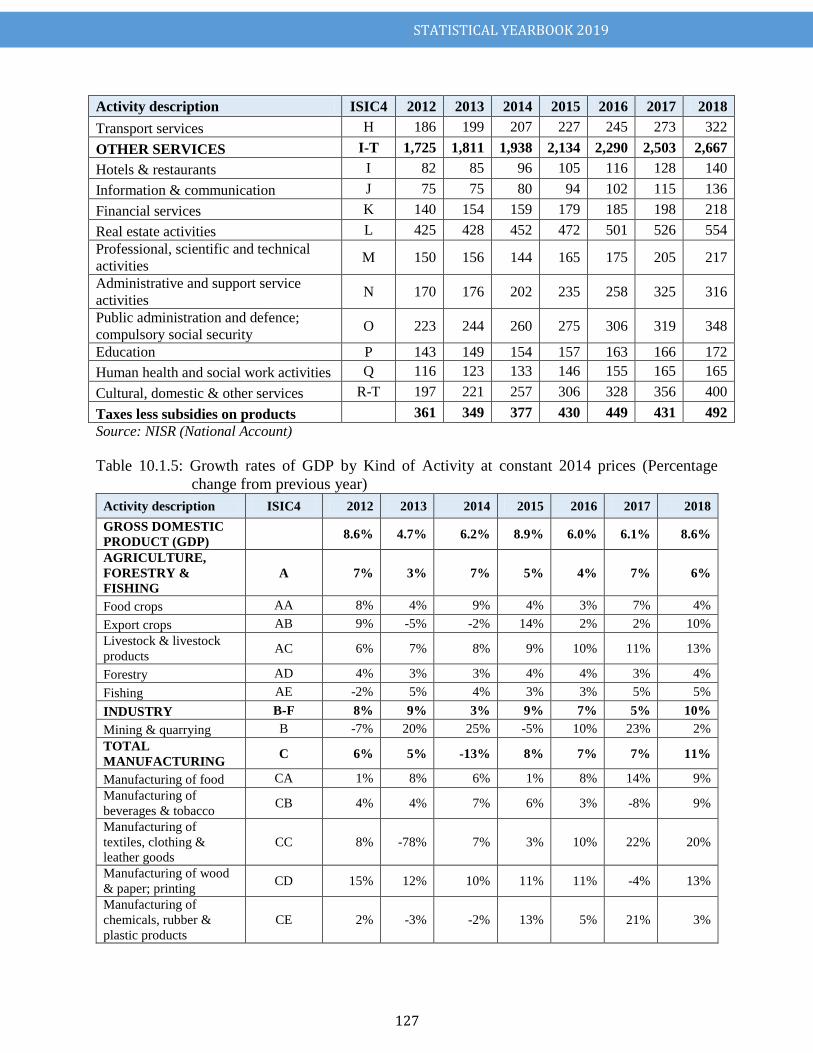
STATISTICAL YEARBOOK 2019
127
Activity description ISIC4 2012 2013 2014 2015 2016 2017 2018
Transport services H 186 199 207 227 245 273 322
OTHER SERVICES I-T 1,725 1,811 1,938 2,134 2,290 2,503 2,667
Hotels & restaurants I 82 85 96 105 116 128 140
Information & communication J 75 75 80 94 102 115 136
Financial services K 140 154 159 179 185 198 218
Real estate activities L 425 428 452 472 501 526 554
Professional, scientific and technical
activities M 150 156 144 165 175 205 217
Administrative and support service
activities N 170 176 202 235 258 325 316
Public administration and defence;
compulsory social security O 223 244 260 275 306 319 348
Education P 143 149 154 157 163 166 172
Human health and social work activities Q 116 123 133 146 155 165 165
Cultural, domestic & other services R-T 197 221 257 306 328 356 400
Taxes less subsidies on products
361 349 377 430 449 431 492
Source: NISR (National Account)
Table 10.1.5: Growth rates of GDP by Kind of Activity at constant 2014 prices (Percentage
change from previous year)
Activity description ISIC4 2012 2013 2014 2015 2016 2017 2018
GROSS DOMESTIC
PRODUCT (GDP) 8.6% 4.7% 6.2% 8.9% 6.0% 6.1% 8.6%
AGRICULTURE,
FORESTRY &
FISHING
A 7% 3% 7% 5% 4% 7% 6%
Food crops AA 8% 4% 9% 4% 3% 7% 4%
Export crops AB 9% -5% -2% 14% 2% 2% 10%
Livestock & livestock
products AC 6% 7% 8% 9% 10% 11% 13%
Forestry AD 4% 3% 3% 4% 4% 3% 4%
Fishing AE -2% 5% 4% 3% 3% 5% 5%
INDUSTRY B-F 8% 9% 3% 9% 7% 5% 10%
Mining & quarrying B -7% 20% 25% -5% 10% 23% 2%
TOTAL
MANUFACTURING C 6% 5% -13% 8% 7% 7% 11%
Manufacturing of food CA 1% 8% 6% 1% 8% 14% 9%
Manufacturing of
beverages & tobacco CB 4% 4% 7% 6% 3% -8% 9%
Manufacturing of
textiles, clothing &
leather goods
CC 8% -78% 7% 3% 10% 22% 20%
Manufacturing of wood
& paper; printing CD 15% 12% 10% 11% 11% -4% 13%
Manufacturing of
chemicals, rubber &
plastic products
CE 2% -3% -2% 13% 5% 21% 3%
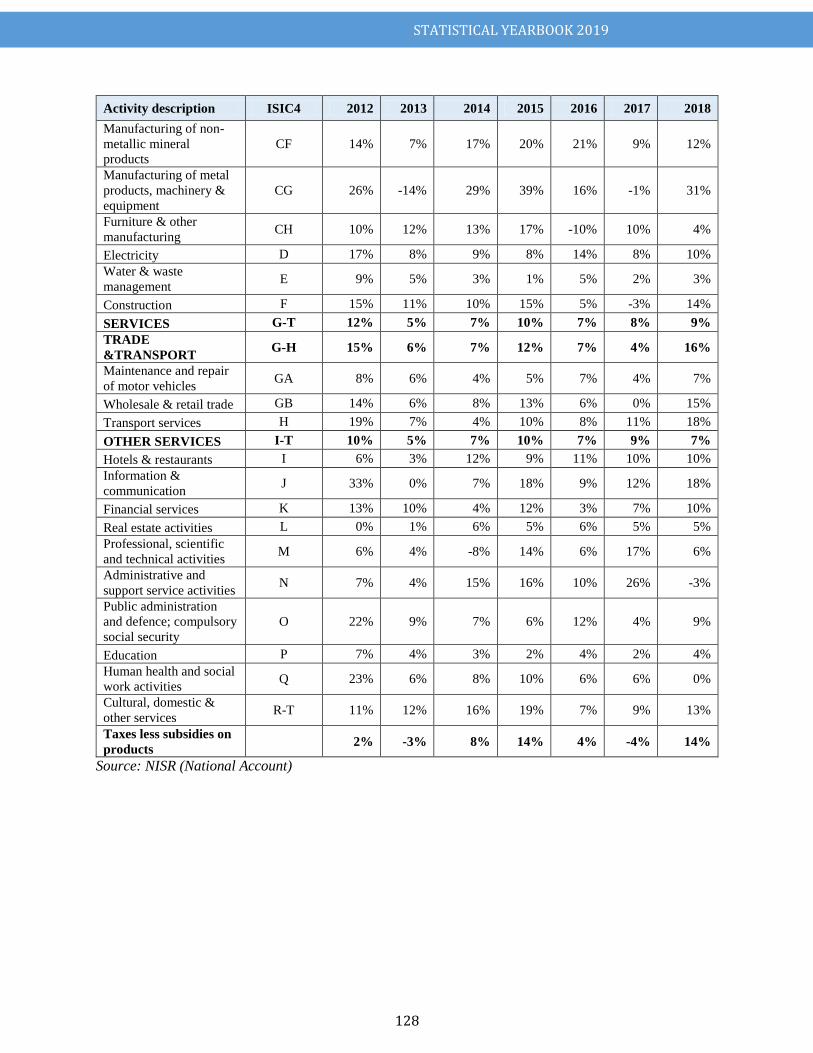
STATISTICAL YEARBOOK 2019
128
Activity description ISIC4 2012 2013 2014 2015 2016 2017 2018
Manufacturing of non-
metallic mineral
products
CF 14% 7% 17% 20% 21% 9% 12%
Manufacturing of metal
products, machinery &
equipment
CG 26% -14% 29% 39% 16% -1% 31%
Furniture & other
manufacturing CH 10% 12% 13% 17% -10% 10% 4%
Electricity D 17% 8% 9% 8% 14% 8% 10%
Water & waste
management E 9% 5% 3% 1% 5% 2% 3%
Construction F 15% 11% 10% 15% 5% -3% 14%
SERVICES G-T 12% 5% 7% 10% 7% 8% 9%
TRADE
&TRANSPORT G-H 15% 6% 7% 12% 7% 4% 16%
Maintenance and repair
of motor vehicles GA 8% 6% 4% 5% 7% 4% 7%
Wholesale & retail trade GB 14% 6% 8% 13% 6% 0% 15%
Transport services H 19% 7% 4% 10% 8% 11% 18%
OTHER SERVICES I-T 10% 5% 7% 10% 7% 9% 7%
Hotels & restaurants I 6% 3% 12% 9% 11% 10% 10%
Information &
communication J 33% 0% 7% 18% 9% 12% 18%
Financial services K 13% 10% 4% 12% 3% 7% 10%
Real estate activities L 0% 1% 6% 5% 6% 5% 5%
Professional, scientific
and technical activities M 6% 4% -8% 14% 6% 17% 6%
Administrative and
support service activities N 7% 4% 15% 16% 10% 26% -3%
Public administration
and defence; compulsory
social security
O 22% 9% 7% 6% 12% 4% 9%
Education P 7% 4% 3% 2% 4% 2% 4%
Human health and social
work activities Q 23% 6% 8% 10% 6% 6% 0%
Cultural, domestic &
other services R-T 11% 12% 16% 19% 7% 9% 13%
Taxes less subsidies on
products 2% -3% 8% 14% 4% -4% 14%
Source: NISR (National Account)
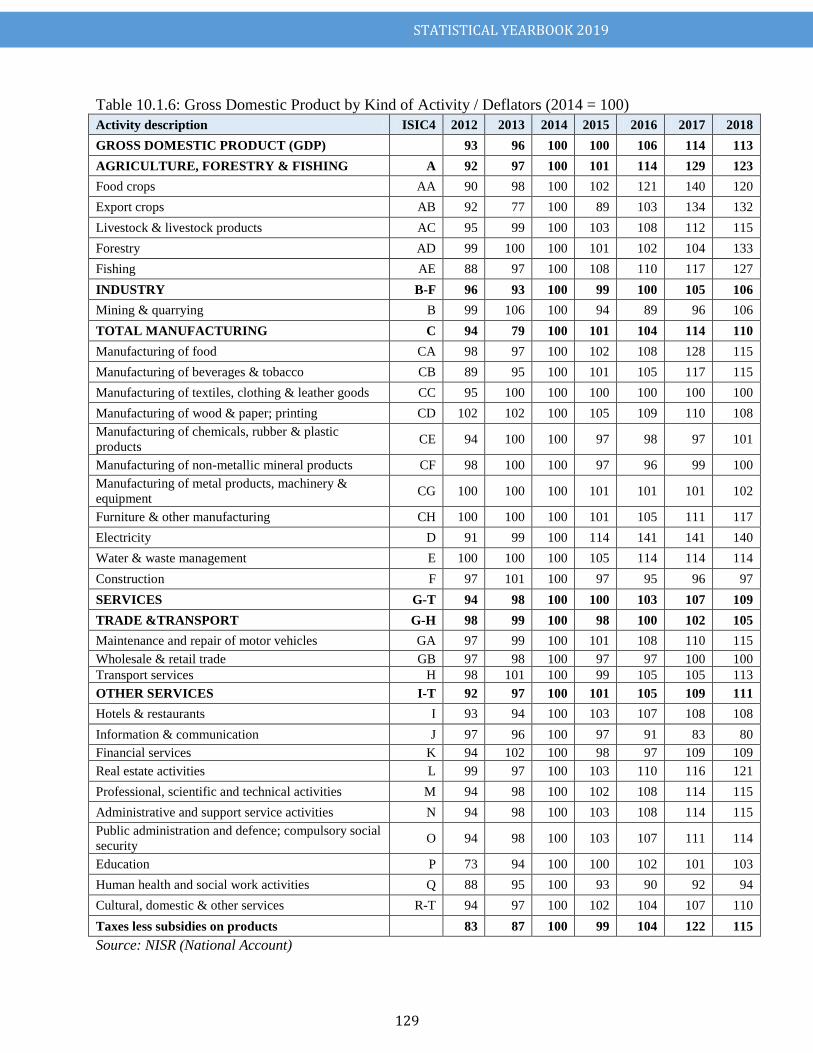
STATISTICAL YEARBOOK 2019
129
Table 10.1.6: Gross Domestic Product by Kind of Activity / Deflators (2014 = 100)
Activity description ISIC4 2012 2013 2014 2015 2016 2017 2018
GROSS DOMESTIC PRODUCT (GDP)
93 96 100 100 106 114 113
AGRICULTURE, FORESTRY & FISHING A 92 97 100 101 114 129 123
Food crops AA 90 98 100 102 121 140 120
Export crops AB 92 77 100 89 103 134 132
Livestock & livestock products AC 95 99 100 103 108 112 115
Forestry AD 99 100 100 101 102 104 133
Fishing AE 88 97 100 108 110 117 127
INDUSTRY B-F 96 93 100 99 100 105 106
Mining & quarrying B 99 106 100 94 89 96 106
TOTAL MANUFACTURING C 94 79 100 101 104 114 110
Manufacturing of food CA 98 97 100 102 108 128 115
Manufacturing of beverages & tobacco CB 89 95 100 101 105 117 115
Manufacturing of textiles, clothing & leather goods CC 95 100 100 100 100 100 100
Manufacturing of wood & paper; printing CD 102 102 100 105 109 110 108
Manufacturing of chemicals, rubber & plastic
products CE 94 100 100 97 98 97 101
Manufacturing of non-metallic mineral products CF 98 100 100 97 96 99 100
Manufacturing of metal products, machinery &
equipment CG 100 100 100 101 101 101 102
Furniture & other manufacturing CH 100 100 100 101 105 111 117
Electricity D 91 99 100 114 141 141 140
Water & waste management E 100 100 100 105 114 114 114
Construction F 97 101 100 97 95 96 97
SERVICES G-T 94 98 100 100 103 107 109
TRADE &TRANSPORT G-H 98 99 100 98 100 102 105
Maintenance and repair of motor vehicles GA 97 99 100 101 108 110 115
Wholesale & retail trade GB 97 98 100 97 97 100 100
Transport services H 98 101 100 99 105 105 113
OTHER SERVICES I-T 92 97 100 101 105 109 111
Hotels & restaurants I 93 94 100 103 107 108 108
Information & communication J 97 96 100 97 91 83 80
Financial services K 94 102 100 98 97 109 109
Real estate activities L 99 97 100 103 110 116 121
Professional, scientific and technical activities M 94 98 100 102 108 114 115
Administrative and support service activities N 94 98 100 103 108 114 115
Public administration and defence; compulsory social
security O 94 98 100 103 107 111 114
Education P 73 94 100 100 102 101 103
Human health and social work activities Q 88 95 100 93 90 92 94
Cultural, domestic & other services R-T 94 97 100 102 104 107 110
Taxes less subsidies on products
83 87 100 99 104 122 115
Source: NISR (National Account)
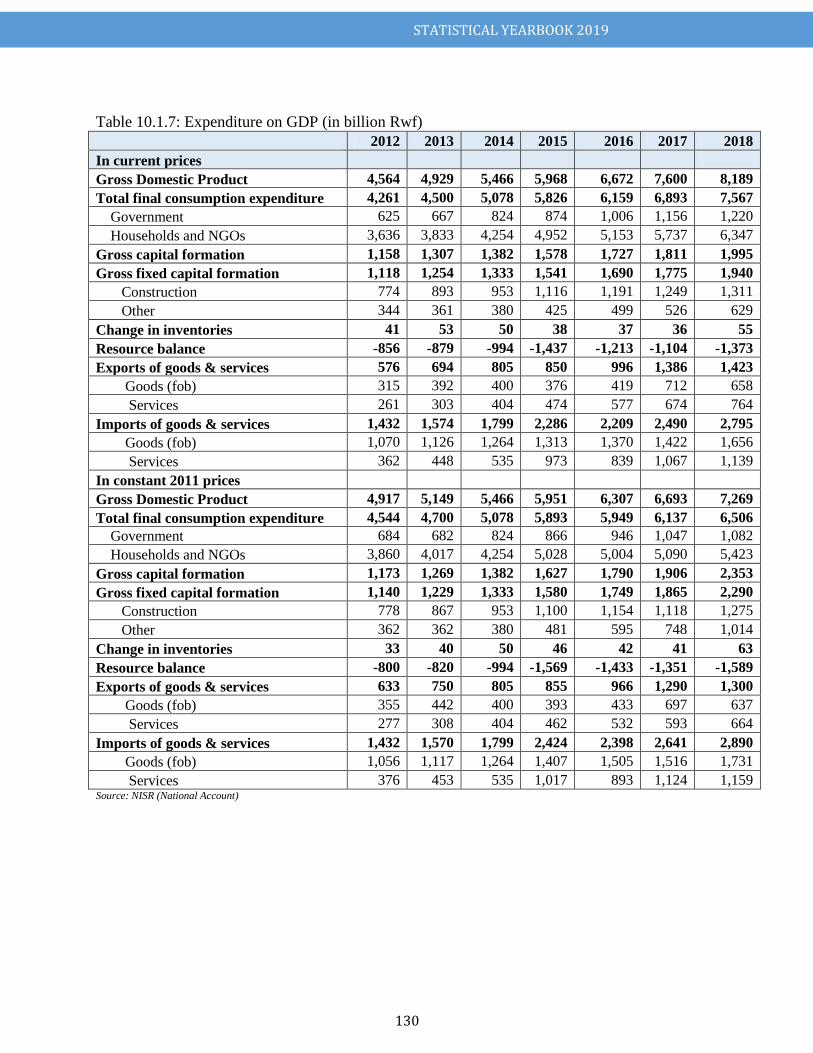
STATISTICAL YEARBOOK 2019
130
Table 10.1.7: Expenditure on GDP (in billion Rwf)
2012 2013 2014 2015 2016 2017 2018
In current prices
Gross Domestic Product 4,564 4,929 5,466 5,968 6,672 7,600 8,189
Total final consumption expenditure 4,261 4,500 5,078 5,826 6,159 6,893 7,567
Government 625 667 824 874 1,006 1,156 1,220
Households and NGOs 3,636 3,833 4,254 4,952 5,153 5,737 6,347
Gross capital formation 1,158 1,307 1,382 1,578 1,727 1,811 1,995
Gross fixed capital formation 1,118 1,254 1,333 1,541 1,690 1,775 1,940
Construction 774 893 953 1,116 1,191 1,249 1,311
Other 344 361 380 425 499 526 629
Change in inventories 41 53 50 38 37 36 55
Resource balance -856 -879 -994 -1,437 -1,213 -1,104 -1,373
Exports of goods & services 576 694 805 850 996 1,386 1,423
Goods (fob) 315 392 400 376 419 712 658
Services 261 303 404 474 577 674 764
Imports of goods & services 1,432 1,574 1,799 2,286 2,209 2,490 2,795
Goods (fob) 1,070 1,126 1,264 1,313 1,370 1,422 1,656
Services 362 448 535 973 839 1,067 1,139
In constant 2011 prices
Gross Domestic Product 4,917 5,149 5,466 5,951 6,307 6,693 7,269
Total final consumption expenditure 4,544 4,700 5,078 5,893 5,949 6,137 6,506
Government 684 682 824 866 946 1,047 1,082
Households and NGOs 3,860 4,017 4,254 5,028 5,004 5,090 5,423
Gross capital formation 1,173 1,269 1,382 1,627 1,790 1,906 2,353
Gross fixed capital formation 1,140 1,229 1,333 1,580 1,749 1,865 2,290
Construction 778 867 953 1,100 1,154 1,118 1,275
Other 362 362 380 481 595 748 1,014
Change in inventories 33 40 50 46 42 41 63
Resource balance -800 -820 -994 -1,569 -1,433 -1,351 -1,589
Exports of goods & services 633 750 805 855 966 1,290 1,300
Goods (fob) 355 442 400 393 433 697 637
Services 277 308 404 462 532 593 664
Imports of goods & services 1,432 1,570 1,799 2,424 2,398 2,641 2,890
Goods (fob) 1,056 1,117 1,264 1,407 1,505 1,516 1,731
Services 376 453 535 1,017 893 1,124 1,159 Source: NISR (National Account)
STATISTICAL YEARBOOK 2019
131
CHAPTER XI: PRICES INDEXES
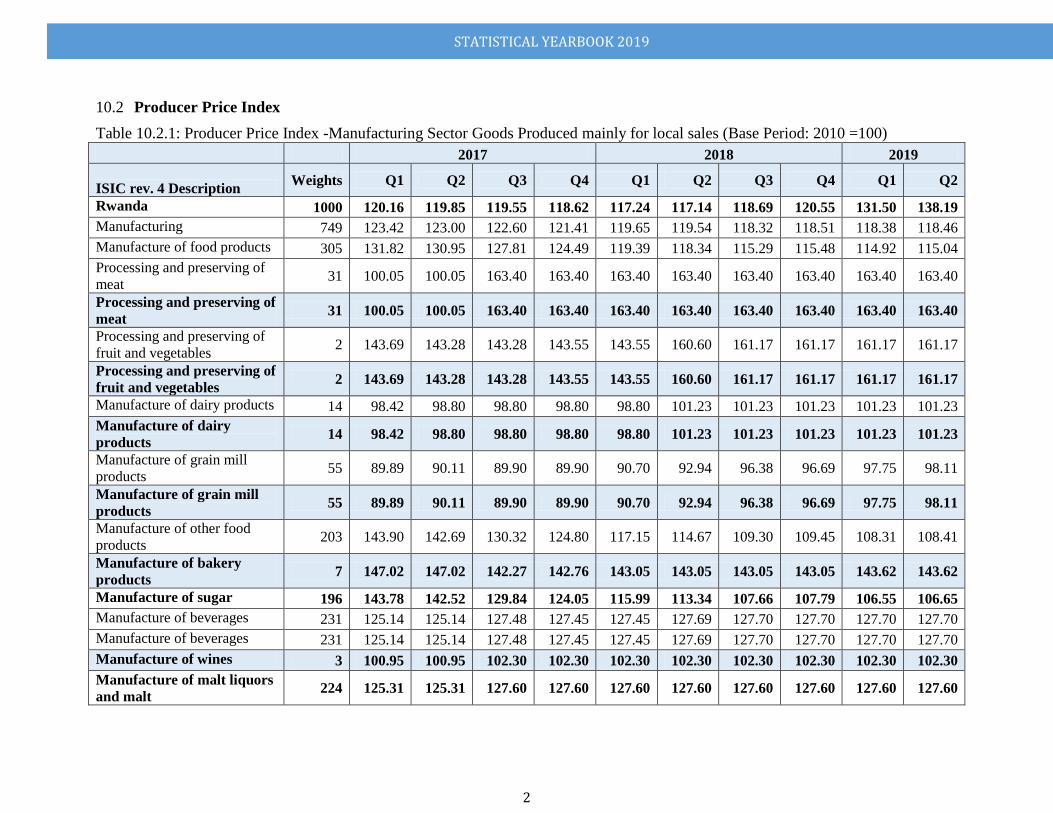
STATISTICAL YEARBOOK 2019
2
Producer Price Index 10.2
Table 10.2.1: Producer Price Index -Manufacturing Sector Goods Produced mainly for local sales (Base Period: 2010 =100)
2017 2018 2019
ISIC rev. 4 Description Weights Q1 Q2 Q3 Q4 Q1 Q2 Q3 Q4 Q1 Q2
Rwanda 1000 120.16 119.85 119.55 118.62 117.24 117.14 118.69 120.55 131.50 138.19
Manufacturing 749 123.42 123.00 122.60 121.41 119.65 119.54 118.32 118.51 118.38 118.46
Manufacture of food products 305 131.82 130.95 127.81 124.49 119.39 118.34 115.29 115.48 114.92 115.04
Processing and preserving of
meat 31 100.05 100.05 163.40 163.40 163.40 163.40 163.40 163.40 163.40 163.40
Processing and preserving of
meat 31 100.05 100.05 163.40 163.40 163.40 163.40 163.40 163.40 163.40 163.40
Processing and preserving of
fruit and vegetables 2 143.69 143.28 143.28 143.55 143.55 160.60 161.17 161.17 161.17 161.17
Processing and preserving of
fruit and vegetables 2 143.69 143.28 143.28 143.55 143.55 160.60 161.17 161.17 161.17 161.17
Manufacture of dairy products 14 98.42 98.80 98.80 98.80 98.80 101.23 101.23 101.23 101.23 101.23
Manufacture of dairy
products 14 98.42 98.80 98.80 98.80 98.80 101.23 101.23 101.23 101.23 101.23
Manufacture of grain mill
products 55 89.89 90.11 89.90 89.90 90.70 92.94 96.38 96.69 97.75 98.11
Manufacture of grain mill
products 55 89.89 90.11 89.90 89.90 90.70 92.94 96.38 96.69 97.75 98.11
Manufacture of other food
products 203 143.90 142.69 130.32 124.80 117.15 114.67 109.30 109.45 108.31 108.41
Manufacture of bakery
products 7 147.02 147.02 142.27 142.76 143.05 143.05 143.05 143.05 143.62 143.62
Manufacture of sugar 196 143.78 142.52 129.84 124.05 115.99 113.34 107.66 107.79 106.55 106.65
Manufacture of beverages 231 125.14 125.14 127.48 127.45 127.45 127.69 127.70 127.70 127.70 127.70
Manufacture of beverages 231 125.14 125.14 127.48 127.45 127.45 127.69 127.70 127.70 127.70 127.70
Manufacture of wines 3 100.95 100.95 102.30 102.30 102.30 102.30 102.30 102.30 102.30 102.30
Manufacture of malt liquors
and malt 224 125.31 125.31 127.60 127.60 127.60 127.60 127.60 127.60 127.60 127.60
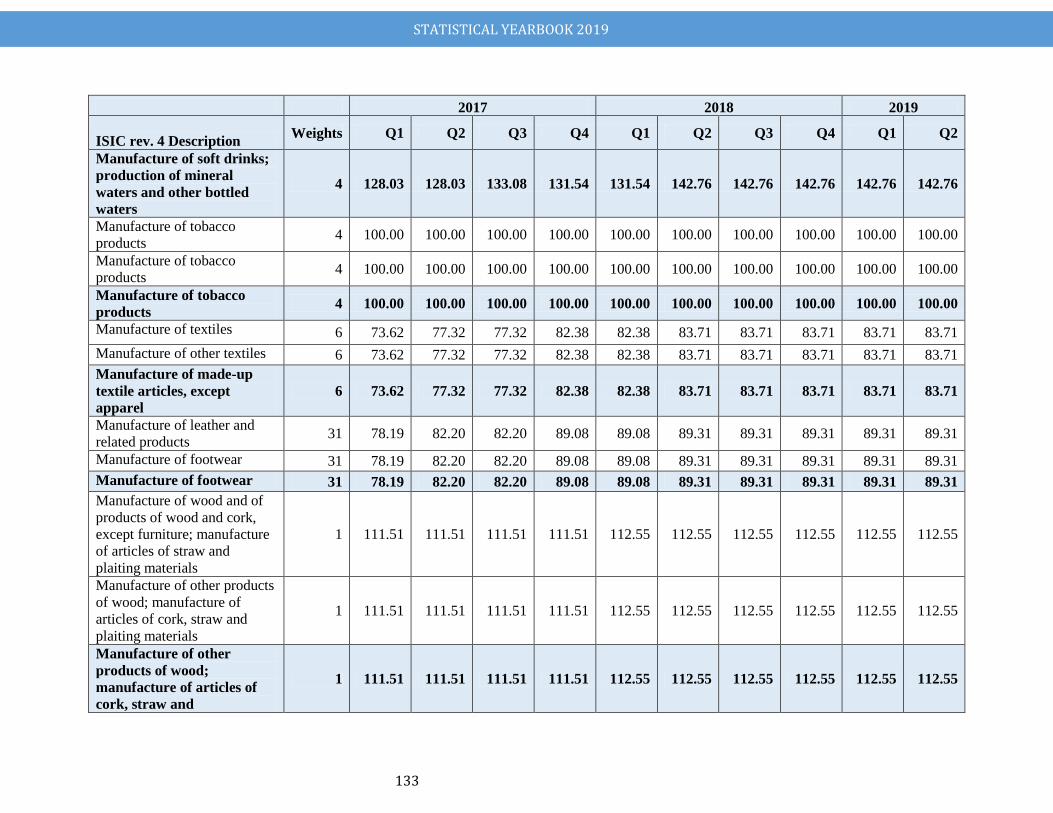
STATISTICAL YEARBOOK 2019
133
2017 2018 2019
ISIC rev. 4 Description Weights Q1 Q2 Q3 Q4 Q1 Q2 Q3 Q4 Q1 Q2
Manufacture of soft drinks;
production of mineral
waters and other bottled
waters
4 128.03 128.03 133.08 131.54 131.54 142.76 142.76 142.76 142.76 142.76
Manufacture of tobacco
products 4 100.00 100.00 100.00 100.00 100.00 100.00 100.00 100.00 100.00 100.00
Manufacture of tobacco
products 4 100.00 100.00 100.00 100.00 100.00 100.00 100.00 100.00 100.00 100.00
Manufacture of tobacco
products 4 100.00 100.00 100.00 100.00 100.00 100.00 100.00 100.00 100.00 100.00
Manufacture of textiles 6 73.62 77.32 77.32 82.38 82.38 83.71 83.71 83.71 83.71 83.71
Manufacture of other textiles 6 73.62 77.32 77.32 82.38 82.38 83.71 83.71 83.71 83.71 83.71
Manufacture of made-up
textile articles, except
apparel
6 73.62 77.32 77.32 82.38 82.38 83.71 83.71 83.71 83.71 83.71
Manufacture of leather and
related products 31 78.19 82.20 82.20 89.08 89.08 89.31 89.31 89.31 89.31 89.31
Manufacture of footwear 31 78.19 82.20 82.20 89.08 89.08 89.31 89.31 89.31 89.31 89.31
Manufacture of footwear 31 78.19 82.20 82.20 89.08 89.08 89.31 89.31 89.31 89.31 89.31
Manufacture of wood and of
products of wood and cork,
except furniture; manufacture
of articles of straw and
plaiting materials
1 111.51 111.51 111.51 111.51 112.55 112.55 112.55 112.55 112.55 112.55
Manufacture of other products
of wood; manufacture of
articles of cork, straw and
plaiting materials
1 111.51 111.51 111.51 111.51 112.55 112.55 112.55 112.55 112.55 112.55
Manufacture of other
products of wood;
manufacture of articles of
cork, straw and
1 111.51 111.51 111.51 111.51 112.55 112.55 112.55 112.55 112.55 112.55
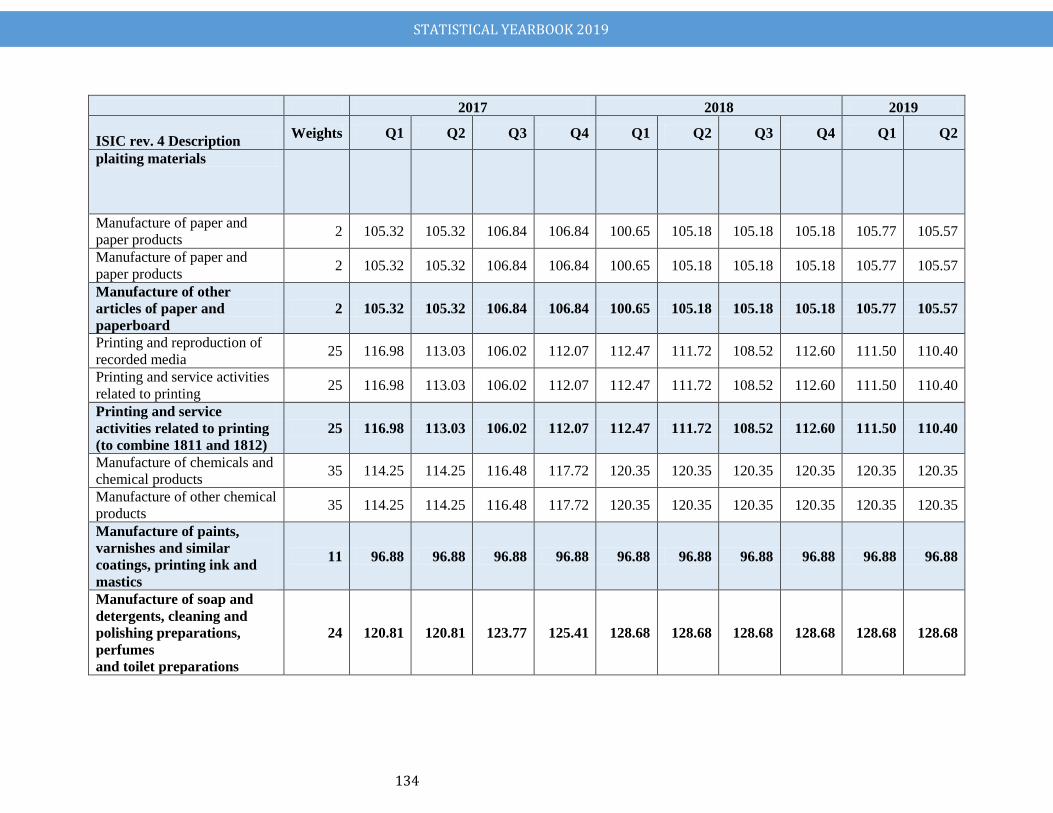
STATISTICAL YEARBOOK 2019
134
2017 2018 2019
ISIC rev. 4 Description Weights Q1 Q2 Q3 Q4 Q1 Q2 Q3 Q4 Q1 Q2
plaiting materials
Manufacture of paper and
paper products 2 105.32 105.32 106.84 106.84 100.65 105.18 105.18 105.18 105.77 105.57
Manufacture of paper and
paper products 2 105.32 105.32 106.84 106.84 100.65 105.18 105.18 105.18 105.77 105.57
Manufacture of other
articles of paper and
paperboard
2 105.32 105.32 106.84 106.84 100.65 105.18 105.18 105.18 105.77 105.57
Printing and reproduction of
recorded media 25 116.98 113.03 106.02 112.07 112.47 111.72 108.52 112.60 111.50 110.40
Printing and service activities
related to printing 25 116.98 113.03 106.02 112.07 112.47 111.72 108.52 112.60 111.50 110.40
Printing and service
activities related to printing
(to combine 1811 and 1812)
25 116.98 113.03 106.02 112.07 112.47 111.72 108.52 112.60 111.50 110.40
Manufacture of chemicals and
chemical products 35 114.25 114.25 116.48 117.72 120.35 120.35 120.35 120.35 120.35 120.35
Manufacture of other chemical
products 35 114.25 114.25 116.48 117.72 120.35 120.35 120.35 120.35 120.35 120.35
Manufacture of paints,
varnishes and similar
coatings, printing ink and
mastics
11 96.88 96.88 96.88 96.88 96.88 96.88 96.88 96.88 96.88 96.88
Manufacture of soap and
detergents, cleaning and
polishing preparations,
perfumes
and toilet preparations
24 120.81 120.81 123.77 125.41 128.68 128.68 128.68 128.68 128.68 128.68
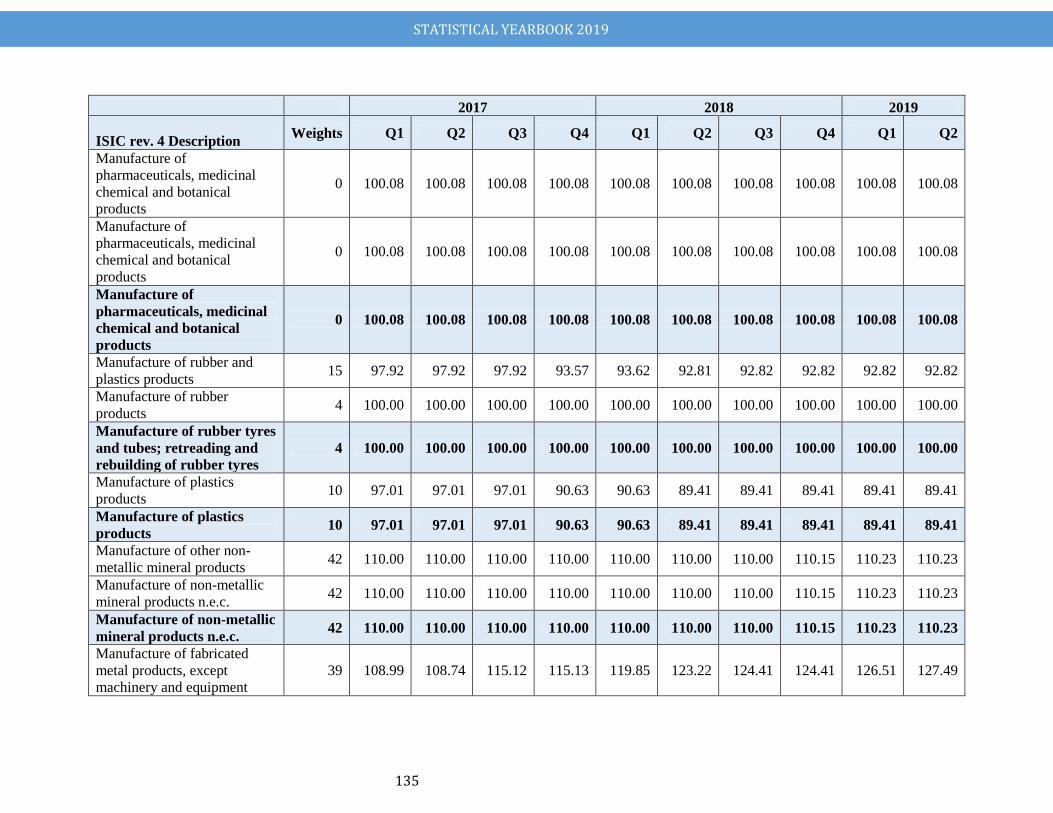
STATISTICAL YEARBOOK 2019
135
2017 2018 2019
ISIC rev. 4 Description Weights Q1 Q2 Q3 Q4 Q1 Q2 Q3 Q4 Q1 Q2
Manufacture of
pharmaceuticals, medicinal
chemical and botanical
products
0 100.08 100.08 100.08 100.08 100.08 100.08 100.08 100.08 100.08 100.08
Manufacture of
pharmaceuticals, medicinal
chemical and botanical
products
0 100.08 100.08 100.08 100.08 100.08 100.08 100.08 100.08 100.08 100.08
Manufacture of
pharmaceuticals, medicinal
chemical and botanical
products
0 100.08 100.08 100.08 100.08 100.08 100.08 100.08 100.08 100.08 100.08
Manufacture of rubber and
plastics products 15 97.92 97.92 97.92 93.57 93.62 92.81 92.82 92.82 92.82 92.82
Manufacture of rubber
products 4 100.00 100.00 100.00 100.00 100.00 100.00 100.00 100.00 100.00 100.00
Manufacture of rubber tyres
and tubes; retreading and
rebuilding of rubber tyres
4 100.00 100.00 100.00 100.00 100.00 100.00 100.00 100.00 100.00 100.00
Manufacture of plastics
products 10 97.01 97.01 97.01 90.63 90.63 89.41 89.41 89.41 89.41 89.41
Manufacture of plastics
products 10 97.01 97.01 97.01 90.63 90.63 89.41 89.41 89.41 89.41 89.41
Manufacture of other non-
metallic mineral products 42 110.00 110.00 110.00 110.00 110.00 110.00 110.00 110.15 110.23 110.23
Manufacture of non-metallic
mineral products n.e.c. 42 110.00 110.00 110.00 110.00 110.00 110.00 110.00 110.15 110.23 110.23
Manufacture of non-metallic
mineral products n.e.c. 42 110.00 110.00 110.00 110.00 110.00 110.00 110.00 110.15 110.23 110.23
Manufacture of fabricated
metal products, except
machinery and equipment
39 108.99 108.74 115.12 115.13 119.85 123.22 124.41 124.41 126.51 127.49
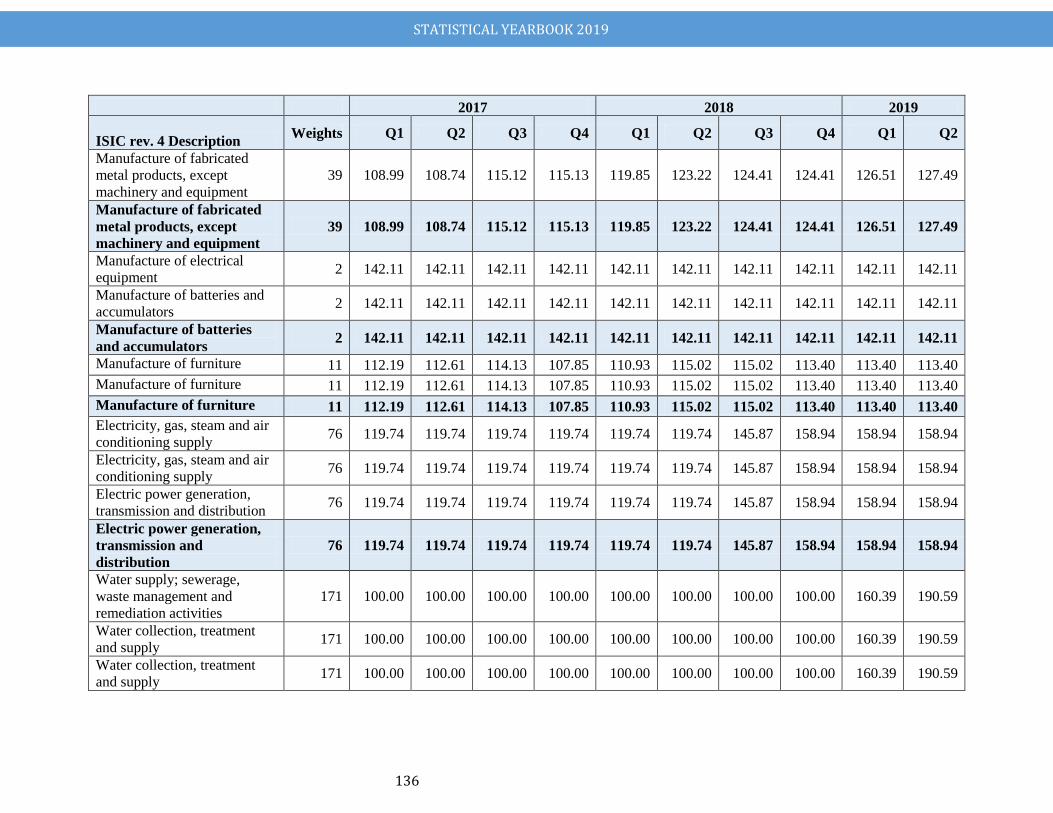
STATISTICAL YEARBOOK 2019
136
2017 2018 2019
ISIC rev. 4 Description Weights Q1 Q2 Q3 Q4 Q1 Q2 Q3 Q4 Q1 Q2
Manufacture of fabricated
metal products, except
machinery and equipment
39 108.99 108.74 115.12 115.13 119.85 123.22 124.41 124.41 126.51 127.49
Manufacture of fabricated
metal products, except
machinery and equipment
39 108.99 108.74 115.12 115.13 119.85 123.22 124.41 124.41 126.51 127.49
Manufacture of electrical
equipment 2 142.11 142.11 142.11 142.11 142.11 142.11 142.11 142.11 142.11 142.11
Manufacture of batteries and
accumulators 2 142.11 142.11 142.11 142.11 142.11 142.11 142.11 142.11 142.11 142.11
Manufacture of batteries
and accumulators 2 142.11 142.11 142.11 142.11 142.11 142.11 142.11 142.11 142.11 142.11
Manufacture of furniture 11 112.19 112.61 114.13 107.85 110.93 115.02 115.02 113.40 113.40 113.40
Manufacture of furniture 11 112.19 112.61 114.13 107.85 110.93 115.02 115.02 113.40 113.40 113.40
Manufacture of furniture 11 112.19 112.61 114.13 107.85 110.93 115.02 115.02 113.40 113.40 113.40
Electricity, gas, steam and air
conditioning supply 76 119.74 119.74 119.74 119.74 119.74 119.74 145.87 158.94 158.94 158.94
Electricity, gas, steam and air
conditioning supply 76 119.74 119.74 119.74 119.74 119.74 119.74 145.87 158.94 158.94 158.94
Electric power generation,
transmission and distribution 76 119.74 119.74 119.74 119.74 119.74 119.74 145.87 158.94 158.94 158.94
Electric power generation,
transmission and
distribution
76 119.74 119.74 119.74 119.74 119.74 119.74 145.87 158.94 158.94 158.94
Water supply; sewerage,
waste management and
remediation activities
171 100.00 100.00 100.00 100.00 100.00 100.00 100.00 100.00 160.39 190.59
Water collection, treatment
and supply 171 100.00 100.00 100.00 100.00 100.00 100.00 100.00 100.00 160.39 190.59
Water collection, treatment
and supply 171 100.00 100.00 100.00 100.00 100.00 100.00 100.00 100.00 160.39 190.59
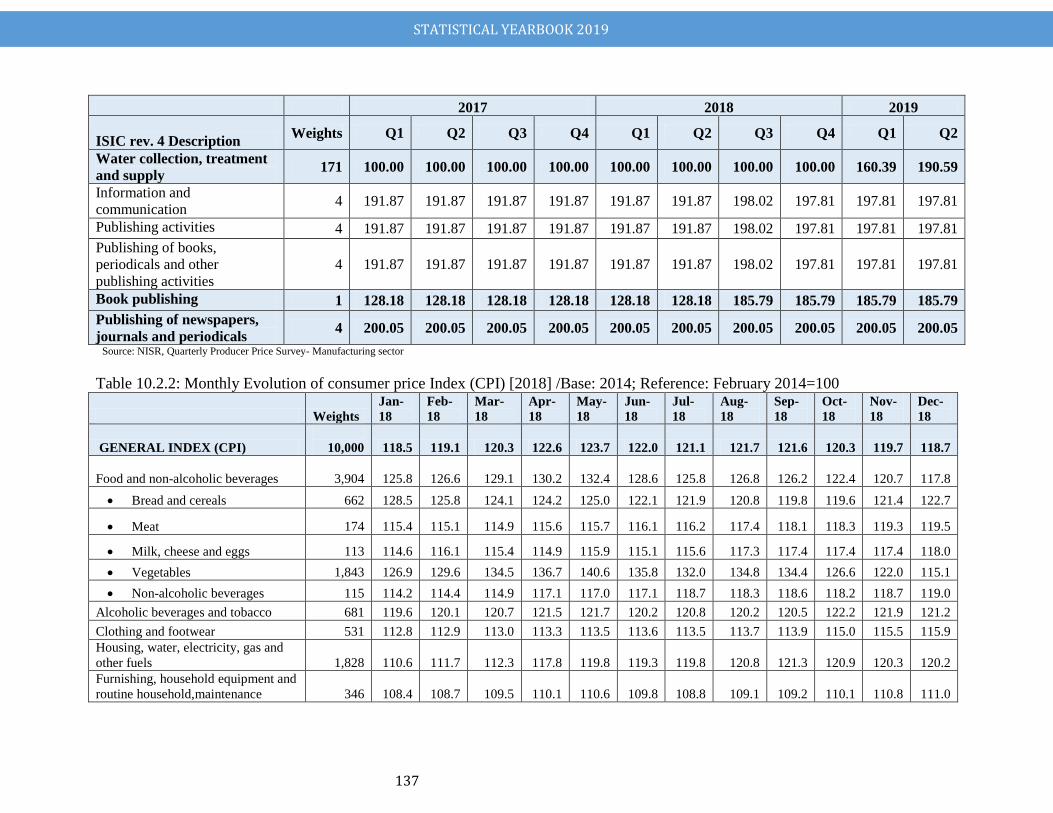
STATISTICAL YEARBOOK 2019
137
2017 2018 2019
ISIC rev. 4 Description Weights Q1 Q2 Q3 Q4 Q1 Q2 Q3 Q4 Q1 Q2
Water collection, treatment
and supply 171 100.00 100.00 100.00 100.00 100.00 100.00 100.00 100.00 160.39 190.59
Information and
communication 4 191.87 191.87 191.87 191.87 191.87 191.87 198.02 197.81 197.81 197.81
Publishing activities 4 191.87 191.87 191.87 191.87 191.87 191.87 198.02 197.81 197.81 197.81
Publishing of books,
periodicals and other
publishing activities
4 191.87 191.87 191.87 191.87 191.87 191.87 198.02 197.81 197.81 197.81
Book publishing 1 128.18 128.18 128.18 128.18 128.18 128.18 185.79 185.79 185.79 185.79
Publishing of newspapers,
journals and periodicals 4 200.05 200.05 200.05 200.05 200.05 200.05 200.05 200.05 200.05 200.05
Source: NISR, Quarterly Producer Price Survey- Manufacturing sector
Table 10.2.2: Monthly Evolution of consumer price Index (CPI) [2018] /Base: 2014; Reference: February 2014=100
Weights
Jan-
18
Feb-
18
Mar-
18
Apr-
18
May-
18
Jun-
18
Jul-
18
Aug-
18
Sep-
18
Oct-
18
Nov-
18
Dec-
18
GENERAL INDEX (CPI)
10,000 118.5 119.1 120.3 122.6 123.7 122.0 121.1 121.7 121.6 120.3 119.7 118.7
Food and non-alcoholic beverages
3,904 125.8 126.6 129.1 130.2 132.4 128.6 125.8 126.8 126.2 122.4 120.7 117.8
Bread and cereals 662 128.5 125.8 124.1 124.2 125.0 122.1 121.9 120.8 119.8 119.6 121.4 122.7
Meat 174 115.4 115.1 114.9 115.6 115.7 116.1 116.2 117.4 118.1 118.3 119.3 119.5
Milk, cheese and eggs 113 114.6 116.1 115.4 114.9 115.9 115.1 115.6 117.3 117.4 117.4 117.4 118.0
Vegetables 1,843 126.9 129.6 134.5 136.7 140.6 135.8 132.0 134.8 134.4 126.6 122.0 115.1
Non-alcoholic beverages 115 114.2 114.4 114.9 117.1 117.0 117.1 118.7 118.3 118.6 118.2 118.7 119.0
Alcoholic beverages and tobacco 681 119.6 120.1 120.7 121.5 121.7 120.2 120.8 120.2 120.5 122.2 121.9 121.2
Clothing and footwear 531 112.8 112.9 113.0 113.3 113.5 113.6 113.5 113.7 113.9 115.0 115.5 115.9
Housing, water, electricity, gas and
other fuels 1,828 110.6 111.7 112.3 117.8 119.8 119.3 119.8 120.8 121.3 120.9 120.3 120.2
Furnishing, household equipment and
routine household,maintenance 346 108.4 108.7 109.5 110.1 110.6 109.8 108.8 109.1 109.2 110.1 110.8 111.0
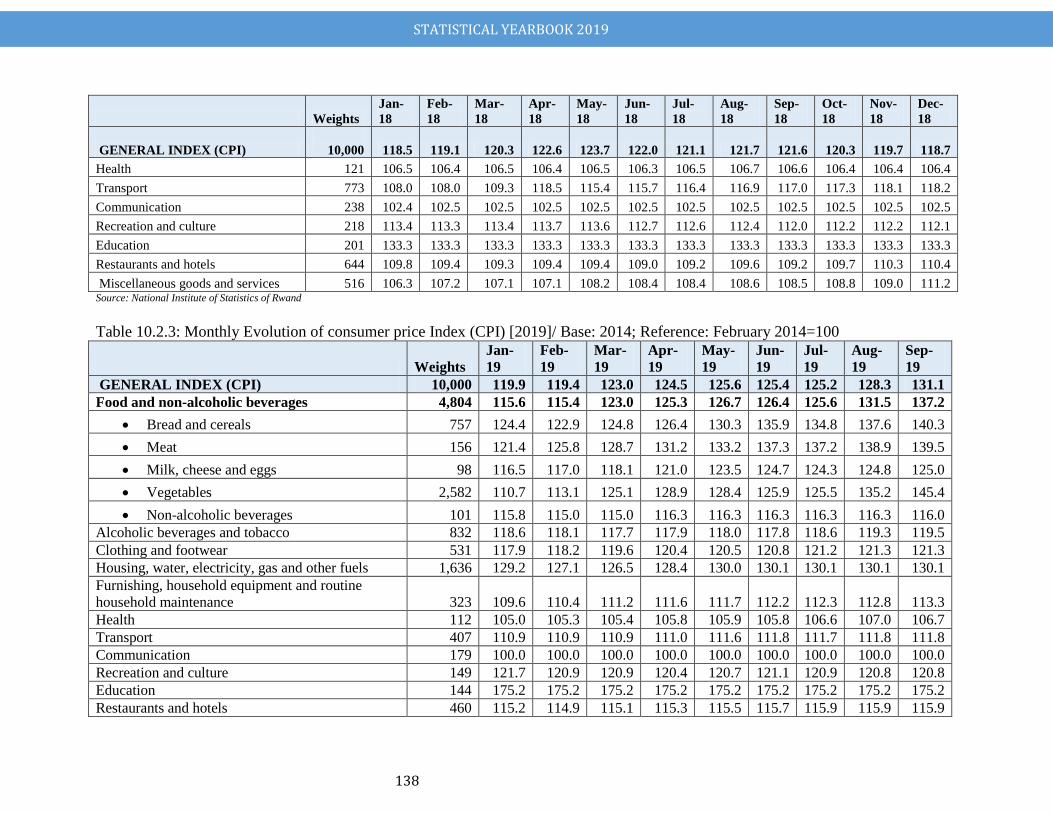
STATISTICAL YEARBOOK 2019
138
Weights
Jan-
18
Feb-
18
Mar-
18
Apr-
18
May-
18
Jun-
18
Jul-
18
Aug-
18
Sep-
18
Oct-
18
Nov-
18
Dec-
18
GENERAL INDEX (CPI)
10,000 118.5 119.1 120.3 122.6 123.7 122.0 121.1 121.7 121.6 120.3 119.7 118.7
Health 121 106.5 106.4 106.5 106.4 106.5 106.3 106.5 106.7 106.6 106.4 106.4 106.4
Transport 773 108.0 108.0 109.3 118.5 115.4 115.7 116.4 116.9 117.0 117.3 118.1 118.2
Communication 238 102.4 102.5 102.5 102.5 102.5 102.5 102.5 102.5 102.5 102.5 102.5 102.5
Recreation and culture 218 113.4 113.3 113.4 113.7 113.6 112.7 112.6 112.4 112.0 112.2 112.2 112.1
Education 201 133.3 133.3 133.3 133.3 133.3 133.3 133.3 133.3 133.3 133.3 133.3 133.3
Restaurants and hotels 644 109.8 109.4 109.3 109.4 109.4 109.0 109.2 109.6 109.2 109.7 110.3 110.4
Miscellaneous goods and services 516 106.3 107.2 107.1 107.1 108.2 108.4 108.4 108.6 108.5 108.8 109.0 111.2 Source: National Institute of Statistics of Rwand
Table 10.2.3: Monthly Evolution of consumer price Index (CPI) [2019]/ Base: 2014; Reference: February 2014=100
Weights
Jan-
19
Feb-
19
Mar-
19
Apr-
19
May-
19
Jun-
19
Jul-
19
Aug-
19
Sep-
19
GENERAL INDEX (CPI) 10,000 119.9 119.4 123.0 124.5 125.6 125.4 125.2 128.3 131.1
Food and non-alcoholic beverages 4,804 115.6 115.4 123.0 125.3 126.7 126.4 125.6 131.5 137.2
Bread and cereals 757 124.4 122.9 124.8 126.4 130.3 135.9 134.8 137.6 140.3
Meat 156 121.4 125.8 128.7 131.2 133.2 137.3 137.2 138.9 139.5
Milk, cheese and eggs 98 116.5 117.0 118.1 121.0 123.5 124.7 124.3 124.8 125.0
Vegetables 2,582 110.7 113.1 125.1 128.9 128.4 125.9 125.5 135.2 145.4
Non-alcoholic beverages 101 115.8 115.0 115.0 116.3 116.3 116.3 116.3 116.3 116.0
Alcoholic beverages and tobacco 832 118.6 118.1 117.7 117.9 118.0 117.8 118.6 119.3 119.5
Clothing and footwear 531 117.9 118.2 119.6 120.4 120.5 120.8 121.2 121.3 121.3
Housing, water, electricity, gas and other fuels 1,636 129.2 127.1 126.5 128.4 130.0 130.1 130.1 130.1 130.1
Furnishing, household equipment and routine
household maintenance 323 109.6 110.4 111.2 111.6 111.7 112.2 112.3 112.8 113.3
Health 112 105.0 105.3 105.4 105.8 105.9 105.8 106.6 107.0 106.7
Transport 407 110.9 110.9 110.9 111.0 111.6 111.8 111.7 111.8 111.8
Communication 179 100.0 100.0 100.0 100.0 100.0 100.0 100.0 100.0 100.0
Recreation and culture 149 121.7 120.9 120.9 120.4 120.7 121.1 120.9 120.8 120.8
Education 144 175.2 175.2 175.2 175.2 175.2 175.2 175.2 175.2 175.2
Restaurants and hotels 460 115.2 114.9 115.1 115.3 115.5 115.7 115.9 115.9 115.9
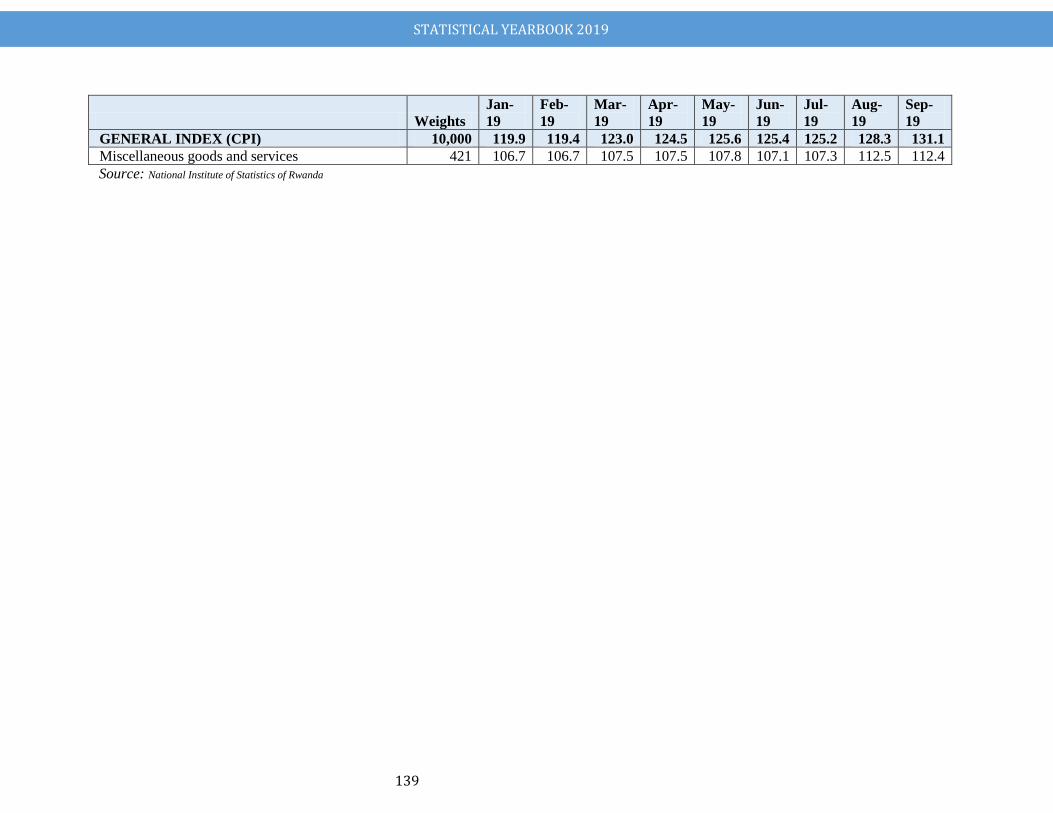
STATISTICAL YEARBOOK 2019
139
Weights
Jan-
19
Feb-
19
Mar-
19
Apr-
19
May-
19
Jun-
19
Jul-
19
Aug-
19
Sep-
19
GENERAL INDEX (CPI) 10,000 119.9 119.4 123.0 124.5 125.6 125.4 125.2 128.3 131.1
Miscellaneous goods and services 421 106.7 106.7 107.5 107.5 107.8 107.1 107.3 112.5 112.4
Source: National Institute of Statistics of Rwanda
STATISTICAL YEARBOOK 2019
2
CHAPTER XII: BANKING and FINANCE
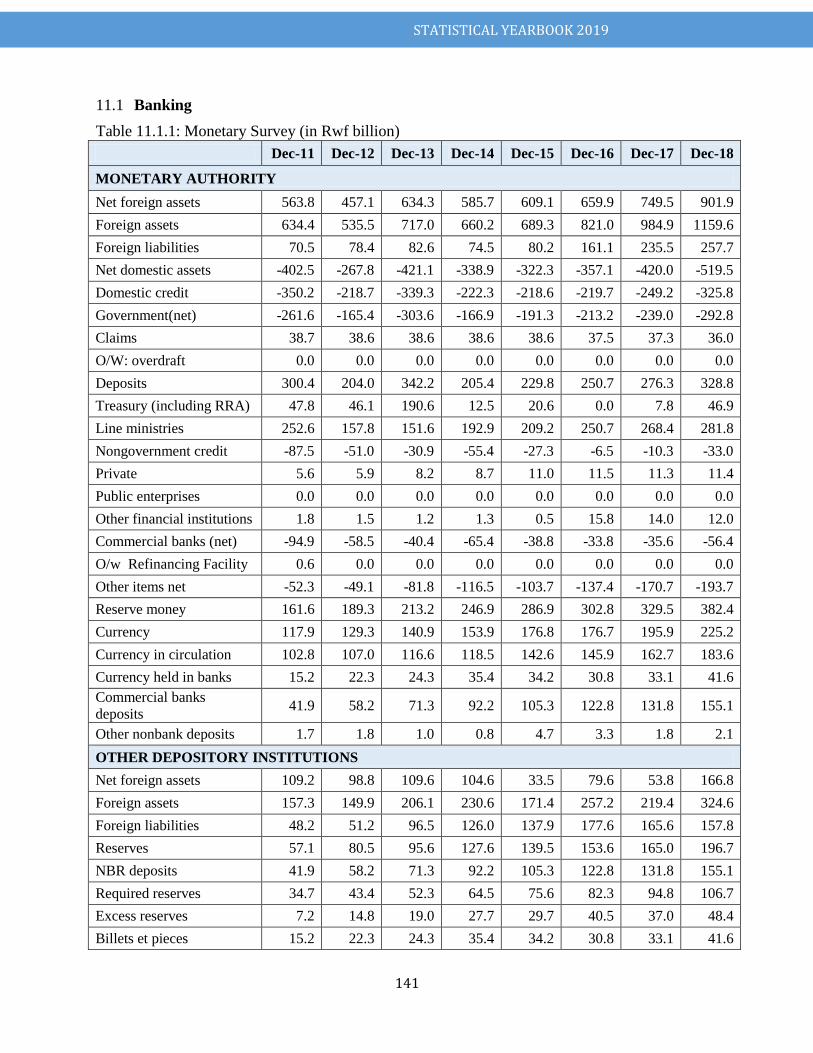
STATISTICAL YEARBOOK 2019
141
Banking 11.1
Table 11.1.1: Monetary Survey (in Rwf billion)
Dec-11 Dec-12 Dec-13 Dec-14 Dec-15 Dec-16 Dec-17 Dec-18
MONETARY AUTHORITY
Net foreign assets 563.8 457.1 634.3 585.7 609.1 659.9 749.5 901.9
Foreign assets 634.4 535.5 717.0 660.2 689.3 821.0 984.9 1159.6
Foreign liabilities 70.5 78.4 82.6 74.5 80.2 161.1 235.5 257.7
Net domestic assets -402.5 -267.8 -421.1 -338.9 -322.3 -357.1 -420.0 -519.5
Domestic credit -350.2 -218.7 -339.3 -222.3 -218.6 -219.7 -249.2 -325.8
Government(net) -261.6 -165.4 -303.6 -166.9 -191.3 -213.2 -239.0 -292.8
Claims 38.7 38.6 38.6 38.6 38.6 37.5 37.3 36.0
O/W: overdraft 0.0 0.0 0.0 0.0 0.0 0.0 0.0 0.0
Deposits 300.4 204.0 342.2 205.4 229.8 250.7 276.3 328.8
Treasury (including RRA) 47.8 46.1 190.6 12.5 20.6 0.0 7.8 46.9
Line ministries 252.6 157.8 151.6 192.9 209.2 250.7 268.4 281.8
Nongovernment credit -87.5 -51.0 -30.9 -55.4 -27.3 -6.5 -10.3 -33.0
Private 5.6 5.9 8.2 8.7 11.0 11.5 11.3 11.4
Public enterprises 0.0 0.0 0.0 0.0 0.0 0.0 0.0 0.0
Other financial institutions 1.8 1.5 1.2 1.3 0.5 15.8 14.0 12.0
Commercial banks (net) -94.9 -58.5 -40.4 -65.4 -38.8 -33.8 -35.6 -56.4
O/w Refinancing Facility 0.6 0.0 0.0 0.0 0.0 0.0 0.0 0.0
Other items net -52.3 -49.1 -81.8 -116.5 -103.7 -137.4 -170.7 -193.7
Reserve money 161.6 189.3 213.2 246.9 286.9 302.8 329.5 382.4
Currency 117.9 129.3 140.9 153.9 176.8 176.7 195.9 225.2
Currency in circulation 102.8 107.0 116.6 118.5 142.6 145.9 162.7 183.6
Currency held in banks 15.2 22.3 24.3 35.4 34.2 30.8 33.1 41.6
Commercial banks
deposits 41.9 58.2 71.3 92.2 105.3 122.8 131.8 155.1
Other nonbank deposits 1.7 1.8 1.0 0.8 4.7 3.3 1.8 2.1
OTHER DEPOSITORY INSTITUTIONS
Net foreign assets 109.2 98.8 109.6 104.6 33.5 79.6 53.8 166.8
Foreign assets 157.3 149.9 206.1 230.6 171.4 257.2 219.4 324.6
Foreign liabilities 48.2 51.2 96.5 126.0 137.9 177.6 165.6 157.8
Reserves 57.1 80.5 95.6 127.6 139.5 153.6 165.0 196.7
NBR deposits 41.9 58.2 71.3 92.2 105.3 122.8 131.8 155.1
Required reserves 34.7 43.4 52.3 64.5 75.6 82.3 94.8 106.7
Excess reserves 7.2 14.8 19.0 27.7 29.7 40.5 37.0 48.4
Billets et pieces 15.2 22.3 24.3 35.4 34.2 30.8 33.1 41.6
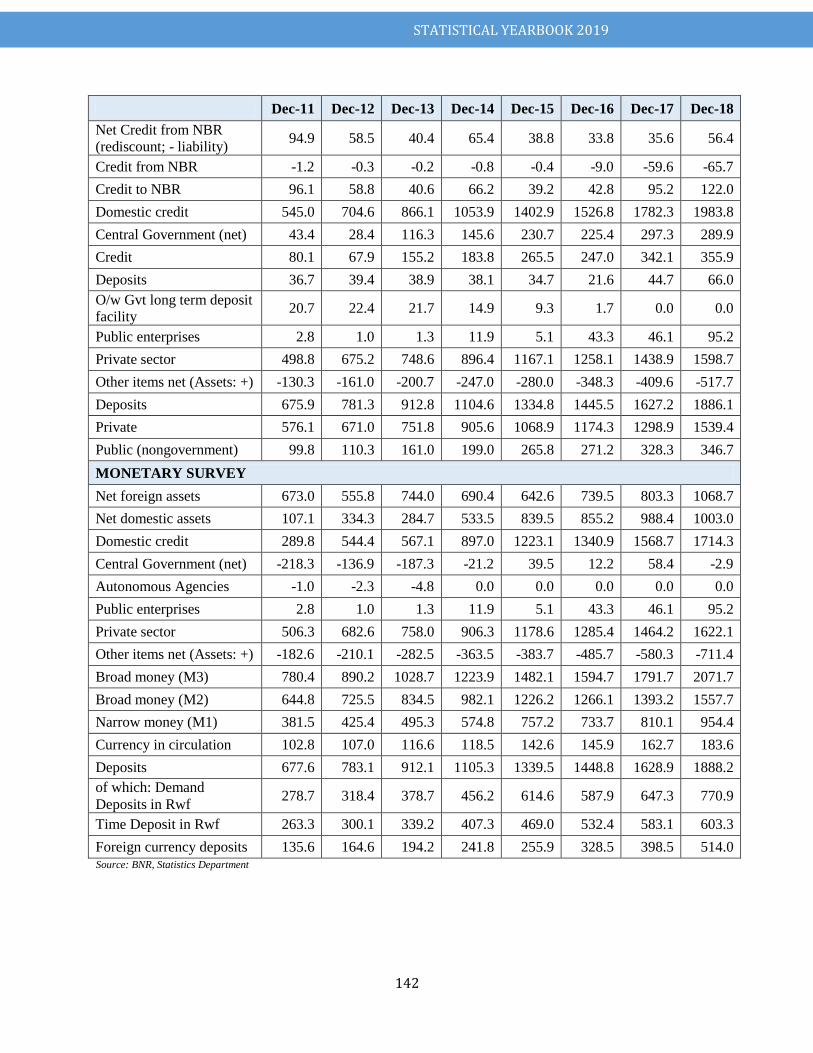
STATISTICAL YEARBOOK 2019
142
Dec-11 Dec-12 Dec-13 Dec-14 Dec-15 Dec-16 Dec-17 Dec-18
Net Credit from NBR
(rediscount; - liability) 94.9 58.5 40.4 65.4 38.8 33.8 35.6 56.4
Credit from NBR -1.2 -0.3 -0.2 -0.8 -0.4 -9.0 -59.6 -65.7
Credit to NBR 96.1 58.8 40.6 66.2 39.2 42.8 95.2 122.0
Domestic credit 545.0 704.6 866.1 1053.9 1402.9 1526.8 1782.3 1983.8
Central Government (net) 43.4 28.4 116.3 145.6 230.7 225.4 297.3 289.9
Credit 80.1 67.9 155.2 183.8 265.5 247.0 342.1 355.9
Deposits 36.7 39.4 38.9 38.1 34.7 21.6 44.7 66.0
O/w Gvt long term deposit
facility 20.7 22.4 21.7 14.9 9.3 1.7 0.0 0.0
Public enterprises 2.8 1.0 1.3 11.9 5.1 43.3 46.1 95.2
Private sector 498.8 675.2 748.6 896.4 1167.1 1258.1 1438.9 1598.7
Other items net (Assets: +) -130.3 -161.0 -200.7 -247.0 -280.0 -348.3 -409.6 -517.7
Deposits 675.9 781.3 912.8 1104.6 1334.8 1445.5 1627.2 1886.1
Private 576.1 671.0 751.8 905.6 1068.9 1174.3 1298.9 1539.4
Public (nongovernment) 99.8 110.3 161.0 199.0 265.8 271.2 328.3 346.7
MONETARY SURVEY
Net foreign assets 673.0 555.8 744.0 690.4 642.6 739.5 803.3 1068.7
Net domestic assets 107.1 334.3 284.7 533.5 839.5 855.2 988.4 1003.0
Domestic credit 289.8 544.4 567.1 897.0 1223.1 1340.9 1568.7 1714.3
Central Government (net) -218.3 -136.9 -187.3 -21.2 39.5 12.2 58.4 -2.9
Autonomous Agencies -1.0 -2.3 -4.8 0.0 0.0 0.0 0.0 0.0
Public enterprises 2.8 1.0 1.3 11.9 5.1 43.3 46.1 95.2
Private sector 506.3 682.6 758.0 906.3 1178.6 1285.4 1464.2 1622.1
Other items net (Assets: +) -182.6 -210.1 -282.5 -363.5 -383.7 -485.7 -580.3 -711.4
Broad money (M3) 780.4 890.2 1028.7 1223.9 1482.1 1594.7 1791.7 2071.7
Broad money (M2) 644.8 725.5 834.5 982.1 1226.2 1266.1 1393.2 1557.7
Narrow money (M1) 381.5 425.4 495.3 574.8 757.2 733.7 810.1 954.4
Currency in circulation 102.8 107.0 116.6 118.5 142.6 145.9 162.7 183.6
Deposits 677.6 783.1 912.1 1105.3 1339.5 1448.8 1628.9 1888.2
of which: Demand
Deposits in Rwf 278.7 318.4 378.7 456.2 614.6 587.9 647.3 770.9
Time Deposit in Rwf 263.3 300.1 339.2 407.3 469.0 532.4 583.1 603.3
Foreign currency deposits 135.6 164.6 194.2 241.8 255.9 328.5 398.5 514.0 Source: BNR, Statistics Department
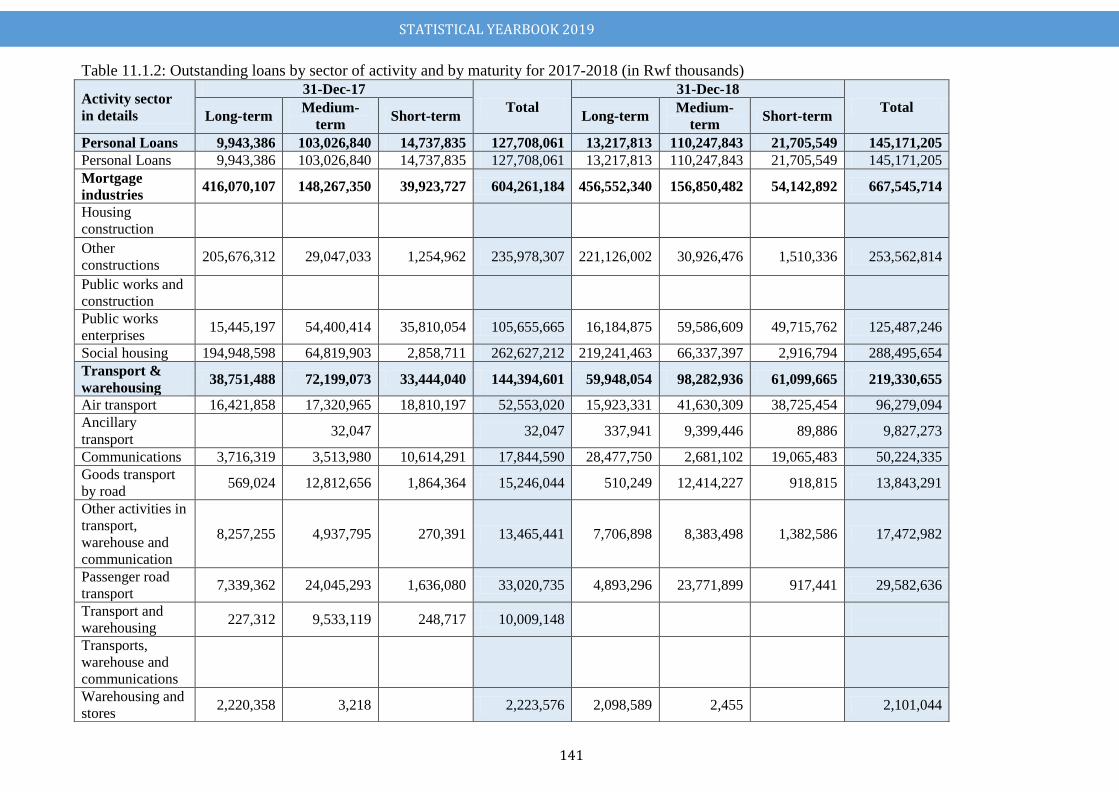
STATISTICAL YEARBOOK 2019
141
Table 11.1.2: Outstanding loans by sector of activity and by maturity for 2017-2018 (in Rwf thousands)
Activity sector
in details
31-Dec-17
Total
31-Dec-18
Total Long-term
Medium-
term Short-term Long-term
Medium-
term Short-term
Personal Loans 9,943,386 103,026,840 14,737,835 127,708,061 13,217,813 110,247,843 21,705,549 145,171,205
Personal Loans 9,943,386 103,026,840 14,737,835 127,708,061 13,217,813 110,247,843 21,705,549 145,171,205
Mortgage
industries 416,070,107 148,267,350 39,923,727 604,261,184 456,552,340 156,850,482 54,142,892 667,545,714
Housing
construction
Other
constructions 205,676,312 29,047,033 1,254,962 235,978,307 221,126,002 30,926,476 1,510,336 253,562,814
Public works and
construction
Public works
enterprises 15,445,197 54,400,414 35,810,054 105,655,665 16,184,875 59,586,609 49,715,762 125,487,246
Social housing 194,948,598 64,819,903 2,858,711 262,627,212 219,241,463 66,337,397 2,916,794 288,495,654
Transport &
warehousing 38,751,488 72,199,073 33,444,040 144,394,601 59,948,054 98,282,936 61,099,665 219,330,655
Air transport 16,421,858 17,320,965 18,810,197 52,553,020 15,923,331 41,630,309 38,725,454 96,279,094
Ancillary
transport 32,047
32,047 337,941 9,399,446 89,886 9,827,273
Communications 3,716,319 3,513,980 10,614,291 17,844,590 28,477,750 2,681,102 19,065,483 50,224,335
Goods transport
by road 569,024 12,812,656 1,864,364 15,246,044 510,249 12,414,227 918,815 13,843,291
Other activities in
transport,
warehouse and
communication
8,257,255 4,937,795 270,391 13,465,441 7,706,898 8,383,498 1,382,586 17,472,982
Passenger road
transport 7,339,362 24,045,293 1,636,080 33,020,735 4,893,296 23,771,899 917,441 29,582,636
Transport and
warehousing 227,312 9,533,119 248,717 10,009,148
Transports,
warehouse and
communications
Warehousing and
stores 2,220,358 3,218
2,223,576 2,098,589 2,455
2,101,044
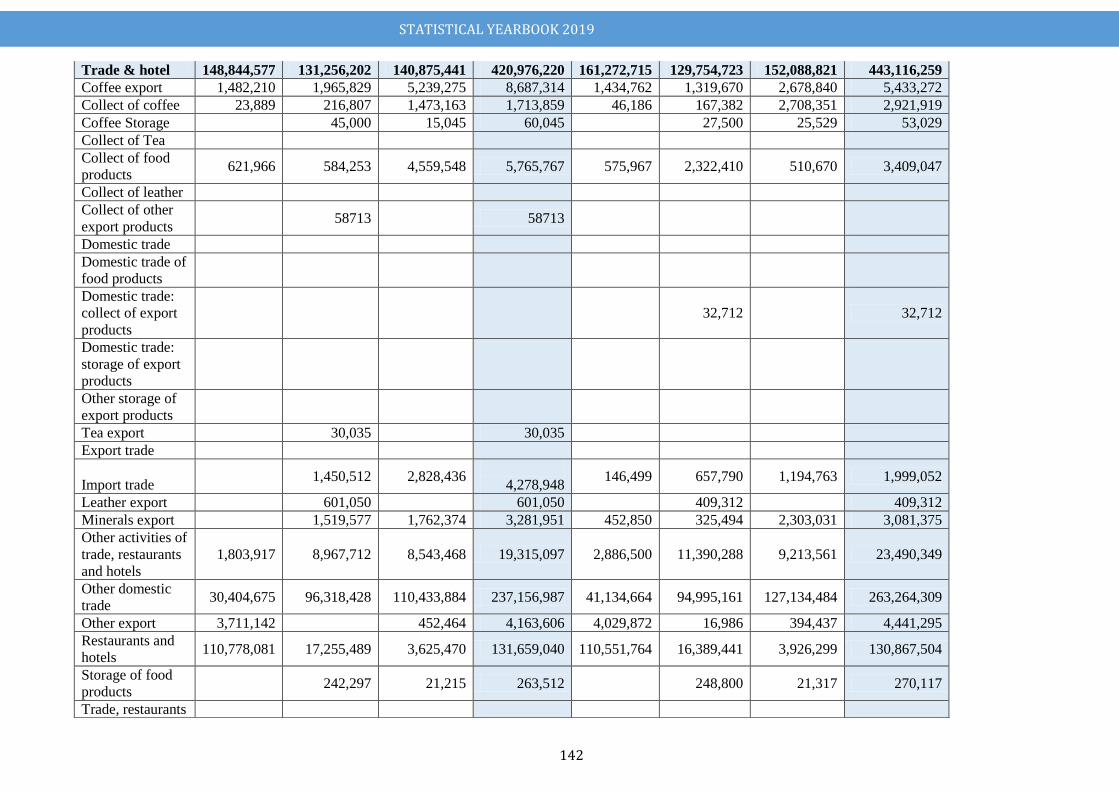
STATISTICAL YEARBOOK 2019
142
Trade & hotel 148,844,577 131,256,202 140,875,441 420,976,220 161,272,715 129,754,723 152,088,821 443,116,259
Coffee export 1,482,210 1,965,829 5,239,275 8,687,314 1,434,762 1,319,670 2,678,840 5,433,272
Collect of coffee 23,889 216,807 1,473,163 1,713,859 46,186 167,382 2,708,351 2,921,919
Coffee Storage
45,000 15,045 60,045
27,500 25,529 53,029
Collect of Tea
Collect of food
products 621,966 584,253 4,559,548 5,765,767 575,967 2,322,410 510,670 3,409,047
Collect of leather
Collect of other
export products 58713
58713
Domestic trade
Domestic trade of
food products
Domestic trade:
collect of export
products
32,712
32,712
Domestic trade:
storage of export
products
Other storage of
export products
Tea export
30,035
30,035
Export trade
Import trade 1,450,512 2,828,436
4,278,948 146,499 657,790 1,194,763 1,999,052
Leather export
601,050
601,050
409,312
409,312
Minerals export
1,519,577 1,762,374 3,281,951 452,850 325,494 2,303,031 3,081,375
Other activities of
trade, restaurants
and hotels
1,803,917 8,967,712 8,543,468 19,315,097 2,886,500 11,390,288 9,213,561 23,490,349
Other domestic
trade 30,404,675 96,318,428 110,433,884 237,156,987 41,134,664 94,995,161 127,134,484 263,264,309
Other export 3,711,142
452,464 4,163,606 4,029,872 16,986 394,437 4,441,295
Restaurants and
hotels 110,778,081 17,255,489 3,625,470 131,659,040 110,551,764 16,389,441 3,926,299 130,867,504
Storage of food
products 242,297 21,215 263,512
248,800 21,317 270,117
Trade, restaurants
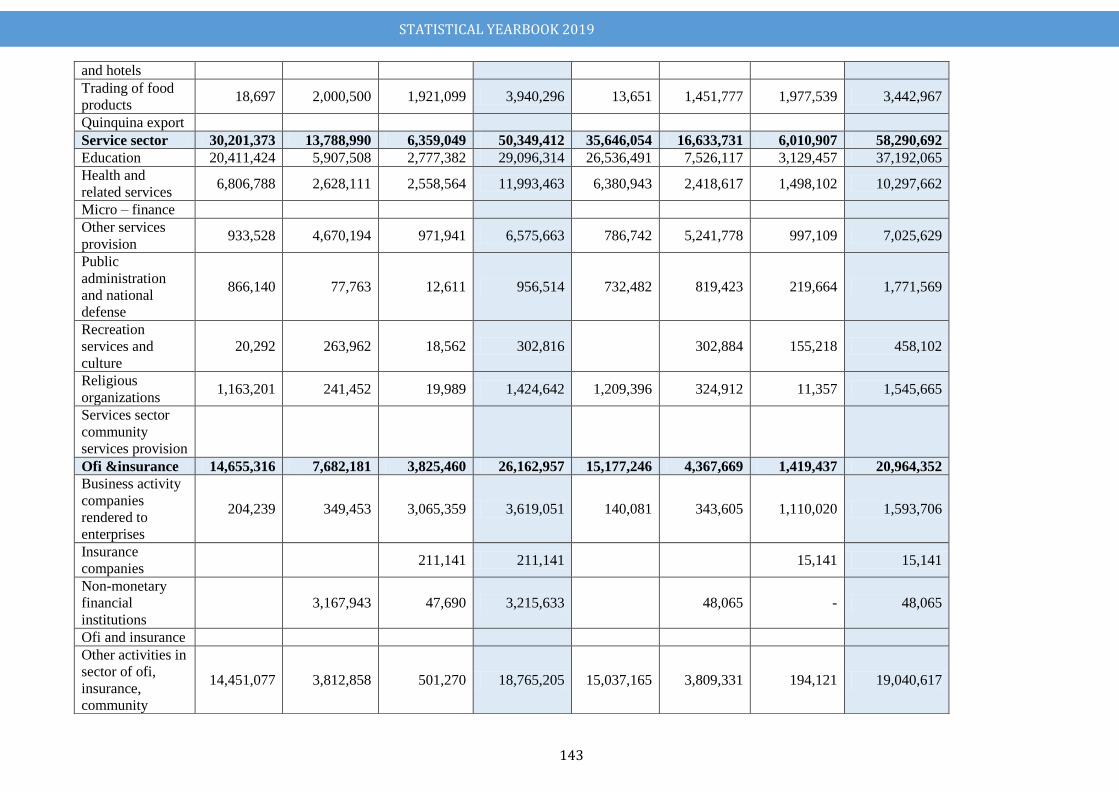
STATISTICAL YEARBOOK 2019
143
and hotels
Trading of food
products 18,697 2,000,500 1,921,099 3,940,296 13,651 1,451,777 1,977,539 3,442,967
Quinquina export
Service sector 30,201,373 13,788,990 6,359,049 50,349,412 35,646,054 16,633,731 6,010,907 58,290,692
Education 20,411,424 5,907,508 2,777,382 29,096,314 26,536,491 7,526,117 3,129,457 37,192,065
Health and
related services 6,806,788 2,628,111 2,558,564 11,993,463 6,380,943 2,418,617 1,498,102 10,297,662
Micro – finance
Other services
provision 933,528 4,670,194 971,941 6,575,663 786,742 5,241,778 997,109 7,025,629
Public
administration
and national
defense
866,140 77,763 12,611 956,514 732,482 819,423 219,664 1,771,569
Recreation
services and
culture
20,292 263,962 18,562 302,816
302,884 155,218 458,102
Religious
organizations 1,163,201 241,452 19,989 1,424,642 1,209,396 324,912 11,357 1,545,665
Services sector
community
services provision
Ofi &insurance 14,655,316 7,682,181 3,825,460 26,162,957 15,177,246 4,367,669 1,419,437 20,964,352
Business activity
companies
rendered to
enterprises
204,239 349,453 3,065,359 3,619,051 140,081 343,605 1,110,020 1,593,706
Insurance
companies 211,141 211,141
15,141 15,141
Non-monetary
financial
institutions
3,167,943 47,690 3,215,633
48,065 - 48,065
Ofi and insurance
Other activities in
sector of ofi,
insurance,
community
14,451,077 3,812,858 501,270 18,765,205 15,037,165 3,809,331 194,121 19,040,617
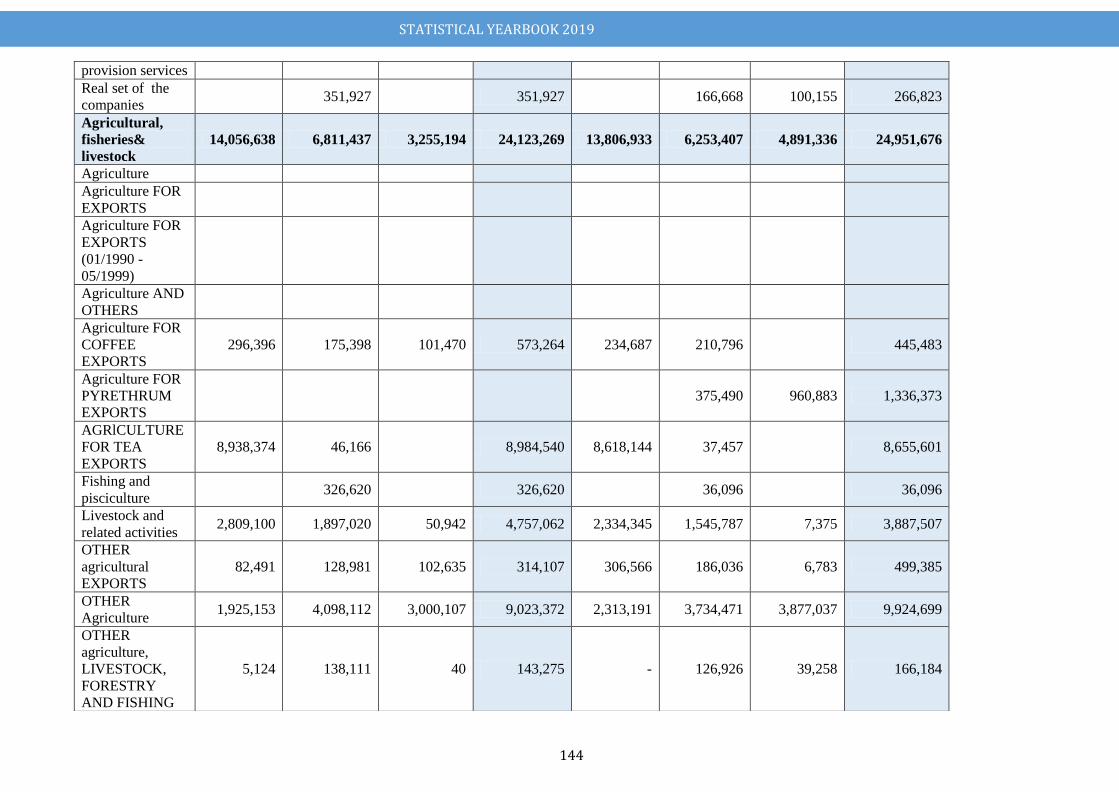
STATISTICAL YEARBOOK 2019
144
provision services
Real set of the
companies 351,927
351,927
166,668 100,155 266,823
Agricultural,
fisheries&
livestock
14,056,638 6,811,437 3,255,194 24,123,269 13,806,933 6,253,407 4,891,336 24,951,676
Agriculture
Agriculture FOR
EXPORTS
Agriculture FOR
EXPORTS
(01/1990 -
05/1999)
Agriculture AND
OTHERS
Agriculture FOR
COFFEE
EXPORTS
296,396 175,398 101,470 573,264 234,687 210,796
445,483
Agriculture FOR
PYRETHRUM
EXPORTS
375,490 960,883 1,336,373
AGRlCULTURE
FOR TEA
EXPORTS
8,938,374 46,166
8,984,540 8,618,144 37,457
8,655,601
Fishing and
pisciculture 326,620
326,620
36,096
36,096
Livestock and
related activities 2,809,100 1,897,020 50,942 4,757,062 2,334,345 1,545,787 7,375 3,887,507
OTHER
agricultural
EXPORTS
82,491 128,981 102,635 314,107 306,566 186,036 6,783 499,385
OTHER
Agriculture 1,925,153 4,098,112 3,000,107 9,023,372 2,313,191 3,734,471 3,877,037 9,924,699
OTHER
agriculture,
LIVESTOCK,
FORESTRY
AND FISHING
5,124 138,111 40 143,275 - 126,926 39,258 166,184
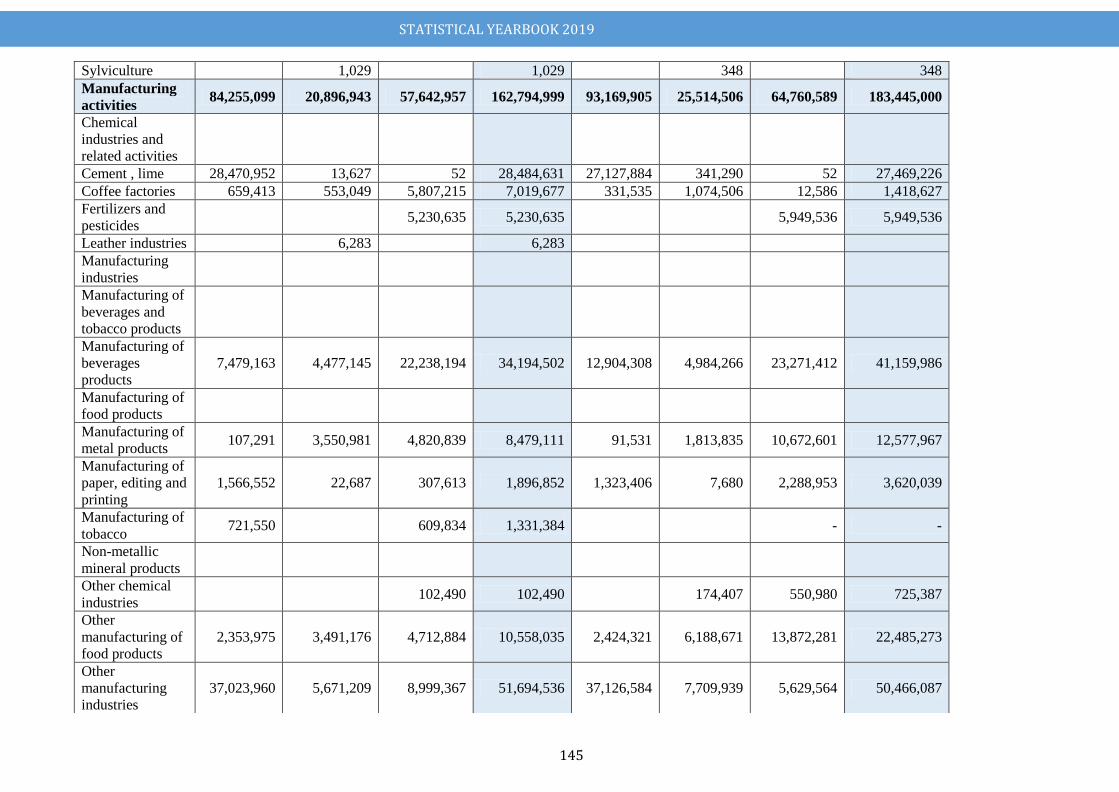
STATISTICAL YEARBOOK 2019
145
Sylviculture
1,029
1,029
348
348
Manufacturing
activities 84,255,099 20,896,943 57,642,957 162,794,999 93,169,905 25,514,506 64,760,589 183,445,000
Chemical
industries and
related activities
Cement , lime 28,470,952 13,627 52 28,484,631 27,127,884 341,290 52 27,469,226
Coffee factories 659,413 553,049 5,807,215 7,019,677 331,535 1,074,506 12,586 1,418,627
Fertilizers and
pesticides 5,230,635 5,230,635
5,949,536 5,949,536
Leather industries
6,283
6,283
Manufacturing
industries
Manufacturing of
beverages and
tobacco products
Manufacturing of
beverages
products
7,479,163 4,477,145 22,238,194 34,194,502 12,904,308 4,984,266 23,271,412 41,159,986
Manufacturing of
food products
Manufacturing of
metal products 107,291 3,550,981 4,820,839 8,479,111 91,531 1,813,835 10,672,601 12,577,967
Manufacturing of
paper, editing and
printing
1,566,552 22,687 307,613 1,896,852 1,323,406 7,680 2,288,953 3,620,039
Manufacturing of
tobacco 721,550
609,834 1,331,384
- -
Non-metallic
mineral products
Other chemical
industries 102,490 102,490
174,407 550,980 725,387
Other
manufacturing of
food products
2,353,975 3,491,176 4,712,884 10,558,035 2,424,321 6,188,671 13,872,281 22,485,273
Other
manufacturing
industries
37,023,960 5,671,209 8,999,367 51,694,536 37,126,584 7,709,939 5,629,564 50,466,087
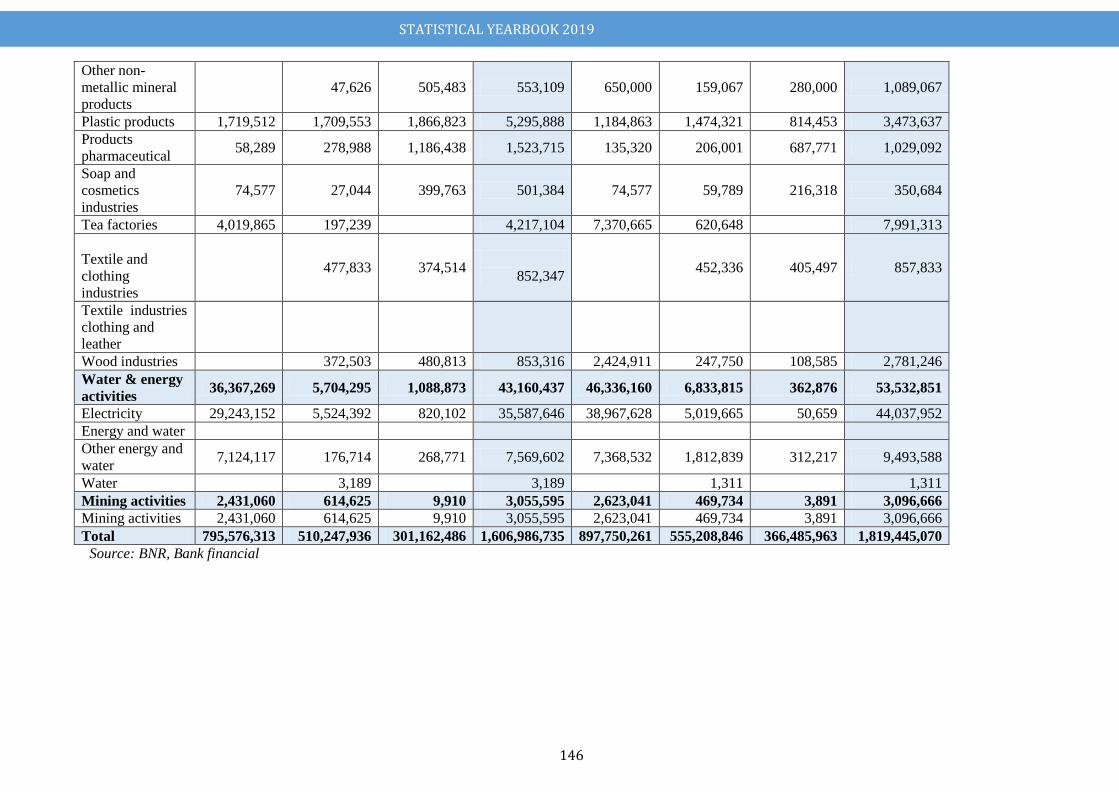
STATISTICAL YEARBOOK 2019
146
Source: BNR, Bank financial
Other non-
metallic mineral
products
47,626 505,483 553,109 650,000 159,067 280,000 1,089,067
Plastic products 1,719,512 1,709,553 1,866,823 5,295,888 1,184,863 1,474,321 814,453 3,473,637
Products
pharmaceutical 58,289 278,988 1,186,438 1,523,715 135,320 206,001 687,771 1,029,092
Soap and
cosmetics
industries
74,577 27,044 399,763 501,384 74,577 59,789 216,318 350,684
Tea factories 4,019,865 197,239
4,217,104 7,370,665 620,648
7,991,313
Textile and
clothing
industries
477,833 374,514
852,347 452,336 405,497 857,833
Textile industries
clothing and
leather
Wood industries
372,503 480,813 853,316 2,424,911 247,750 108,585 2,781,246
Water & energy
activities 36,367,269 5,704,295 1,088,873 43,160,437 46,336,160 6,833,815 362,876 53,532,851
Electricity 29,243,152 5,524,392 820,102 35,587,646 38,967,628 5,019,665 50,659 44,037,952
Energy and water
Other energy and
water 7,124,117 176,714 268,771 7,569,602 7,368,532 1,812,839 312,217 9,493,588
Water
3,189
3,189
1,311
1,311
Mining activities 2,431,060 614,625 9,910 3,055,595 2,623,041 469,734 3,891 3,096,666
Mining activities 2,431,060 614,625 9,910 3,055,595 2,623,041 469,734 3,891 3,096,666
Total 795,576,313 510,247,936 301,162,486 1,606,986,735 897,750,261 555,208,846 366,485,963 1,819,445,070
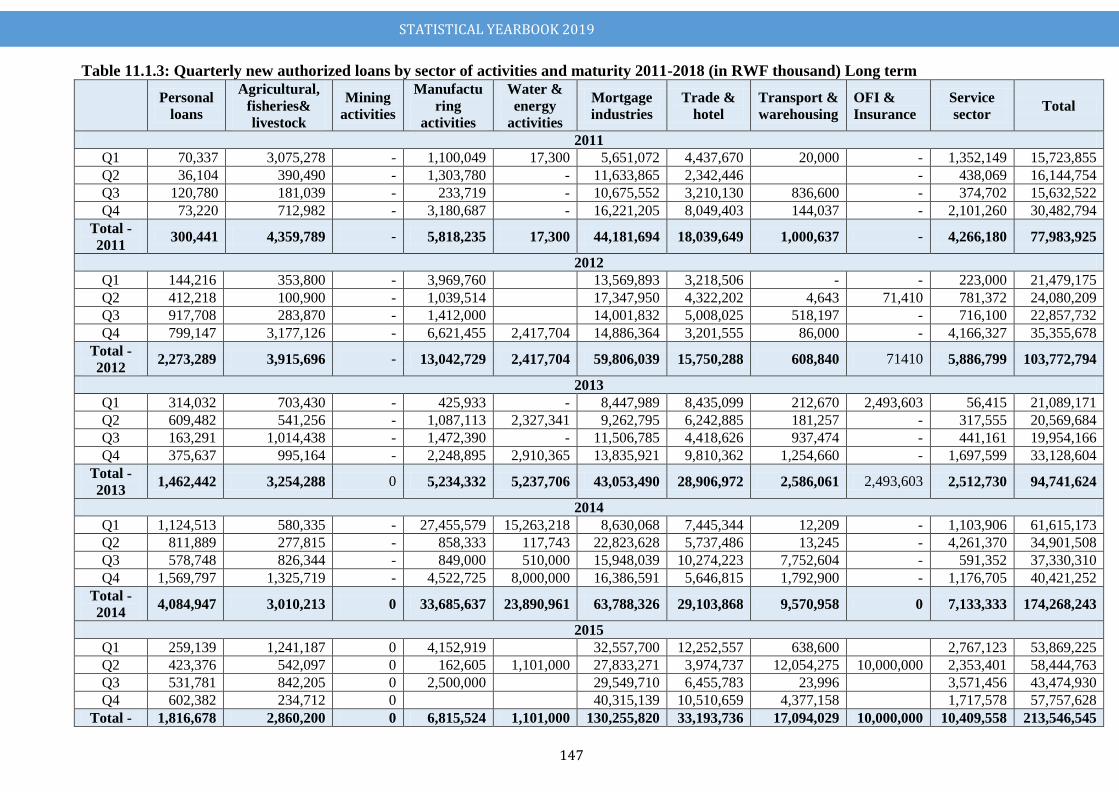
STATISTICAL YEARBOOK 2019
147
Table 11.1.3: Quarterly new authorized loans by sector of activities and maturity 2011-2018 (in RWF thousand) Long term
Personal
loans
Agricultural,
fisheries&
livestock
Mining
activities
Manufactu
ring
activities
Water &
energy
activities
Mortgage
industries
Trade &
hotel
Transport &
warehousing
OFI &
Insurance
Service
sector Total
2011
Q1 70,337 3,075,278 - 1,100,049 17,300 5,651,072 4,437,670 20,000 - 1,352,149 15,723,855
Q2 36,104 390,490 - 1,303,780 - 11,633,865 2,342,446
- 438,069 16,144,754
Q3 120,780 181,039 - 233,719 - 10,675,552 3,210,130 836,600 - 374,702 15,632,522
Q4 73,220 712,982 - 3,180,687 - 16,221,205 8,049,403 144,037 - 2,101,260 30,482,794
Total -
2011 300,441 4,359,789 - 5,818,235 17,300 44,181,694 18,039,649 1,000,637 - 4,266,180 77,983,925
2012
Q1 144,216 353,800 - 3,969,760
13,569,893 3,218,506 - - 223,000 21,479,175
Q2 412,218 100,900 - 1,039,514
17,347,950 4,322,202 4,643 71,410 781,372 24,080,209
Q3 917,708 283,870 - 1,412,000
14,001,832 5,008,025 518,197 - 716,100 22,857,732
Q4 799,147 3,177,126 - 6,621,455 2,417,704 14,886,364 3,201,555 86,000 - 4,166,327 35,355,678
Total -
2012 2,273,289 3,915,696 - 13,042,729 2,417,704 59,806,039 15,750,288 608,840 71410 5,886,799 103,772,794
2013
Q1 314,032 703,430 - 425,933 - 8,447,989 8,435,099 212,670 2,493,603 56,415 21,089,171
Q2 609,482 541,256 - 1,087,113 2,327,341 9,262,795 6,242,885 181,257 - 317,555 20,569,684
Q3 163,291 1,014,438 - 1,472,390 - 11,506,785 4,418,626 937,474 - 441,161 19,954,166
Q4 375,637 995,164 - 2,248,895 2,910,365 13,835,921 9,810,362 1,254,660 - 1,697,599 33,128,604
Total -
2013 1,462,442 3,254,288 0 5,234,332 5,237,706 43,053,490 28,906,972 2,586,061 2,493,603 2,512,730 94,741,624
2014
Q1 1,124,513 580,335 - 27,455,579 15,263,218 8,630,068 7,445,344 12,209 - 1,103,906 61,615,173
Q2 811,889 277,815 - 858,333 117,743 22,823,628 5,737,486 13,245 - 4,261,370 34,901,508
Q3 578,748 826,344 - 849,000 510,000 15,948,039 10,274,223 7,752,604 - 591,352 37,330,310
Q4 1,569,797 1,325,719 - 4,522,725 8,000,000 16,386,591 5,646,815 1,792,900 - 1,176,705 40,421,252
Total -
2014 4,084,947 3,010,213 0 33,685,637 23,890,961 63,788,326 29,103,868 9,570,958 0 7,133,333 174,268,243
2015
Q1 259,139 1,241,187 0 4,152,919
32,557,700 12,252,557 638,600
2,767,123 53,869,225
Q2 423,376 542,097 0 162,605 1,101,000 27,833,271 3,974,737 12,054,275 10,000,000 2,353,401 58,444,763
Q3 531,781 842,205 0 2,500,000
29,549,710 6,455,783 23,996
3,571,456 43,474,930
Q4 602,382 234,712 0
40,315,139 10,510,659 4,377,158
1,717,578 57,757,628
Total - 1,816,678 2,860,200 0 6,815,524 1,101,000 130,255,820 33,193,736 17,094,029 10,000,000 10,409,558 213,546,545
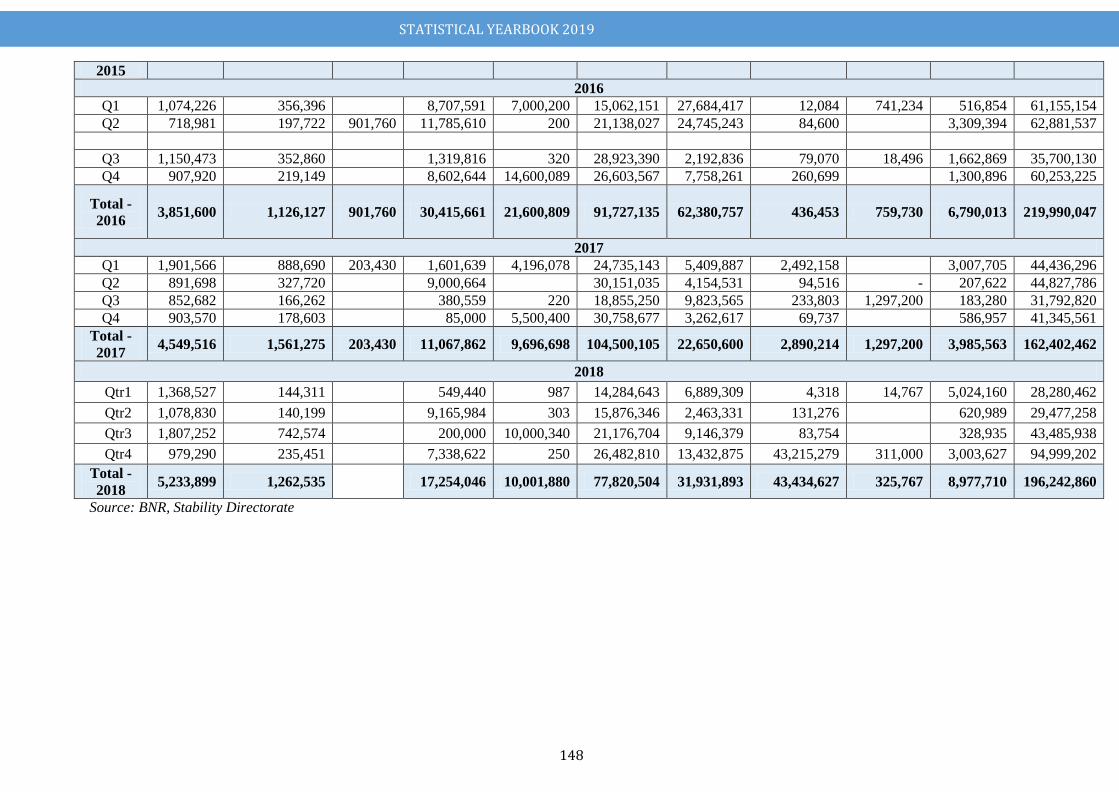
STATISTICAL YEARBOOK 2019
148
2015
2016
Q1 1,074,226 356,396
8,707,591 7,000,200 15,062,151 27,684,417 12,084 741,234 516,854 61,155,154
Q2 718,981 197,722 901,760 11,785,610 200 21,138,027 24,745,243 84,600
3,309,394 62,881,537
Q3 1,150,473 352,860
1,319,816 320 28,923,390 2,192,836 79,070 18,496 1,662,869 35,700,130
Q4 907,920 219,149
8,602,644 14,600,089 26,603,567 7,758,261 260,699
1,300,896 60,253,225
Total -
2016 3,851,600 1,126,127 901,760 30,415,661 21,600,809 91,727,135 62,380,757 436,453 759,730 6,790,013 219,990,047
2017
Q1 1,901,566 888,690 203,430 1,601,639 4,196,078 24,735,143 5,409,887 2,492,158
3,007,705 44,436,296
Q2 891,698 327,720
9,000,664
30,151,035 4,154,531 94,516 - 207,622 44,827,786
Q3 852,682 166,262
380,559 220 18,855,250 9,823,565 233,803 1,297,200 183,280 31,792,820
Q4 903,570 178,603
85,000 5,500,400 30,758,677 3,262,617 69,737
586,957 41,345,561
Total -
2017 4,549,516 1,561,275 203,430 11,067,862 9,696,698 104,500,105 22,650,600 2,890,214 1,297,200 3,985,563 162,402,462
2018
Qtr1 1,368,527 144,311
549,440 987 14,284,643 6,889,309 4,318 14,767 5,024,160 28,280,462
Qtr2 1,078,830 140,199
9,165,984 303 15,876,346 2,463,331 131,276
620,989 29,477,258
Qtr3 1,807,252 742,574
200,000 10,000,340 21,176,704 9,146,379 83,754
328,935 43,485,938
Qtr4 979,290 235,451
7,338,622 250 26,482,810 13,432,875 43,215,279 311,000 3,003,627 94,999,202
Total -
2018 5,233,899 1,262,535
17,254,046 10,001,880 77,820,504 31,931,893 43,434,627 325,767 8,977,710 196,242,860
Source: BNR, Stability Directorate
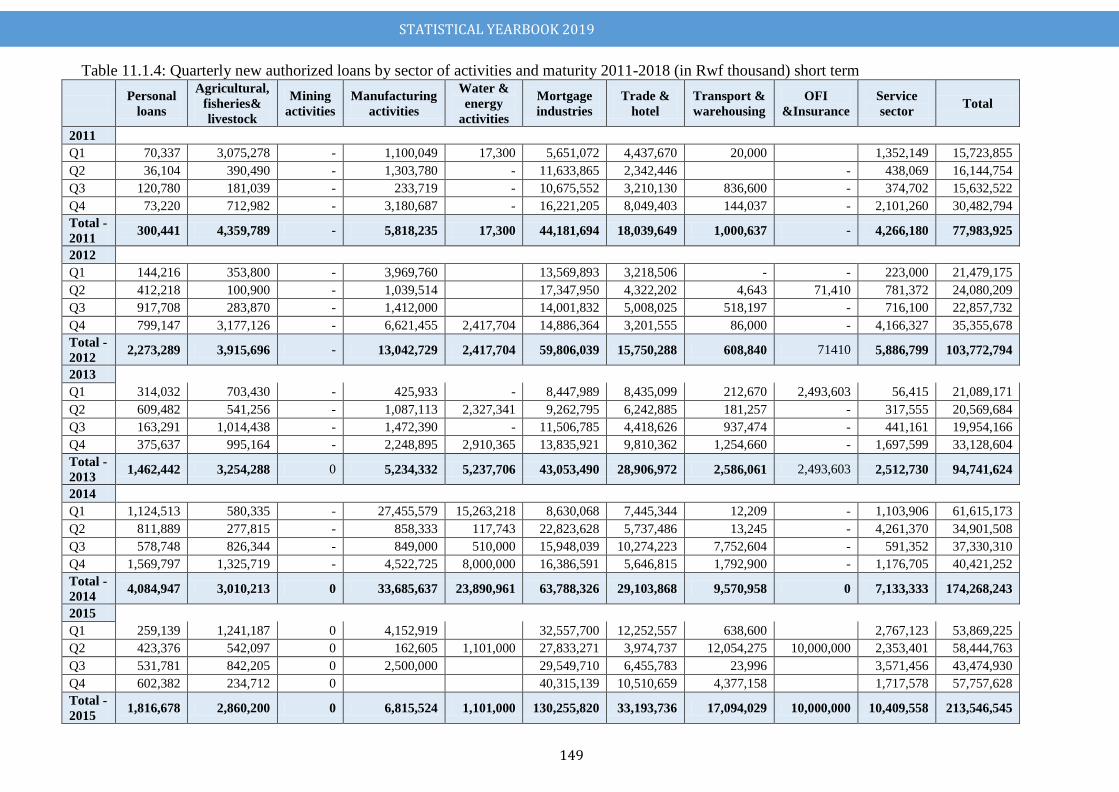
STATISTICAL YEARBOOK 2019
149
Table 11.1.4: Quarterly new authorized loans by sector of activities and maturity 2011-2018 (in Rwf thousand) short term
Personal
loans
Agricultural,
fisheries&
livestock
Mining
activities
Manufacturing
activities
Water &
energy
activities
Mortgage
industries
Trade &
hotel
Transport &
warehousing
OFI
&Insurance
Service
sector Total
2011
Q1 70,337 3,075,278 - 1,100,049 17,300 5,651,072 4,437,670 20,000 1,352,149 15,723,855
Q2 36,104 390,490 - 1,303,780 - 11,633,865 2,342,446 - 438,069 16,144,754
Q3 120,780 181,039 - 233,719 - 10,675,552 3,210,130 836,600 - 374,702 15,632,522
Q4 73,220 712,982 - 3,180,687 - 16,221,205 8,049,403 144,037 - 2,101,260 30,482,794
Total -
2011 300,441 4,359,789 - 5,818,235 17,300 44,181,694 18,039,649 1,000,637 - 4,266,180 77,983,925
2012
Q1 144,216 353,800 - 3,969,760 13,569,893 3,218,506 - - 223,000 21,479,175
Q2 412,218 100,900 - 1,039,514 17,347,950 4,322,202 4,643 71,410 781,372 24,080,209
Q3 917,708 283,870 - 1,412,000 14,001,832 5,008,025 518,197 - 716,100 22,857,732
Q4 799,147 3,177,126 - 6,621,455 2,417,704 14,886,364 3,201,555 86,000 - 4,166,327 35,355,678
Total -
2012 2,273,289 3,915,696 - 13,042,729 2,417,704 59,806,039 15,750,288 608,840 71410 5,886,799 103,772,794
2013
Q1 314,032 703,430 - 425,933 - 8,447,989 8,435,099 212,670 2,493,603 56,415 21,089,171
Q2 609,482 541,256 - 1,087,113 2,327,341 9,262,795 6,242,885 181,257 - 317,555 20,569,684
Q3 163,291 1,014,438 - 1,472,390 - 11,506,785 4,418,626 937,474 - 441,161 19,954,166
Q4 375,637 995,164 - 2,248,895 2,910,365 13,835,921 9,810,362 1,254,660 - 1,697,599 33,128,604
Total -
2013 1,462,442 3,254,288 0 5,234,332 5,237,706 43,053,490 28,906,972 2,586,061 2,493,603 2,512,730 94,741,624
2014
Q1 1,124,513 580,335 - 27,455,579 15,263,218 8,630,068 7,445,344 12,209 - 1,103,906 61,615,173
Q2 811,889 277,815 - 858,333 117,743 22,823,628 5,737,486 13,245 - 4,261,370 34,901,508
Q3 578,748 826,344 - 849,000 510,000 15,948,039 10,274,223 7,752,604 - 591,352 37,330,310
Q4 1,569,797 1,325,719 - 4,522,725 8,000,000 16,386,591 5,646,815 1,792,900 - 1,176,705 40,421,252
Total -
2014 4,084,947 3,010,213 0 33,685,637 23,890,961 63,788,326 29,103,868 9,570,958 0 7,133,333 174,268,243
2015
Q1 259,139 1,241,187 0 4,152,919 32,557,700 12,252,557 638,600 2,767,123 53,869,225
Q2 423,376 542,097 0 162,605 1,101,000 27,833,271 3,974,737 12,054,275 10,000,000 2,353,401 58,444,763
Q3 531,781 842,205 0 2,500,000 29,549,710 6,455,783 23,996 3,571,456 43,474,930
Q4 602,382 234,712 0 40,315,139 10,510,659 4,377,158 1,717,578 57,757,628
Total -
2015 1,816,678 2,860,200 0 6,815,524 1,101,000 130,255,820 33,193,736 17,094,029 10,000,000 10,409,558 213,546,545
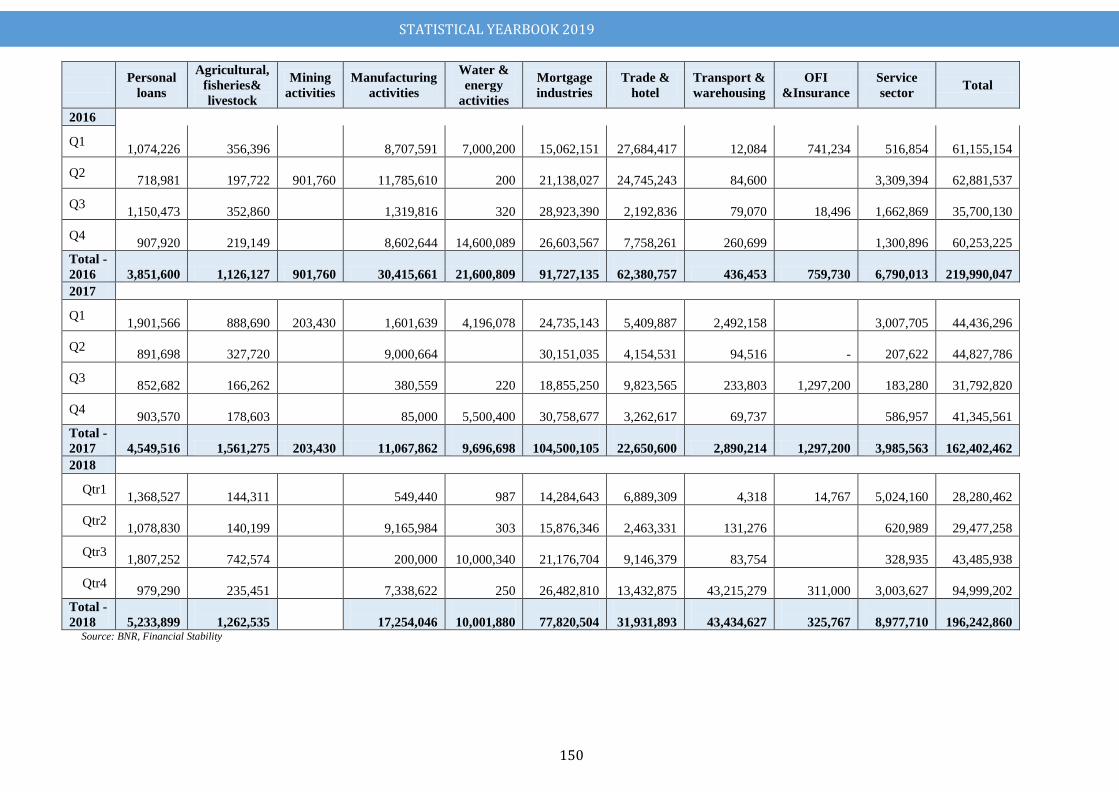
STATISTICAL YEARBOOK 2019
150
Personal
loans
Agricultural,
fisheries&
livestock
Mining
activities
Manufacturing
activities
Water &
energy
activities
Mortgage
industries
Trade &
hotel
Transport &
warehousing
OFI
&Insurance
Service
sector Total
2016
Q1
1,074,226 356,396 8,707,591
7,000,200
15,062,151
27,684,417 12,084 741,234 516,854
61,155,154
Q2 718,981 197,722
901,760 11,785,610 200
21,138,027
24,745,243 84,600 3,309,394
62,881,537
Q3
1,150,473 352,860 1,319,816 320
28,923,390
2,192,836 79,070 18,496 1,662,869
35,700,130
Q4 907,920 219,149 8,602,644
14,600,089
26,603,567
7,758,261 260,699 1,300,896
60,253,225
Total -
2016 3,851,600 1,126,127 901,760 30,415,661 21,600,809
91,727,135
62,380,757 436,453 759,730 6,790,013
219,990,047
2017
Q1
1,901,566 888,690
203,430 1,601,639
4,196,078
24,735,143
5,409,887 2,492,158 3,007,705
44,436,296
Q2 891,698 327,720 9,000,664
30,151,035
4,154,531 94,516 - 207,622
44,827,786
Q3 852,682 166,262 380,559 220
18,855,250
9,823,565 233,803 1,297,200 183,280
31,792,820
Q4 903,570 178,603 85,000
5,500,400
30,758,677
3,262,617 69,737 586,957
41,345,561
Total -
2017
4,549,516 1,561,275 203,430 11,067,862
9,696,698
104,500,105
22,650,600 2,890,214 1,297,200 3,985,563
162,402,462
2018
Qtr1
1,368,527
144,311
549,440
987
14,284,643
6,889,309
4,318
14,767
5,024,160
28,280,462
Qtr2
1,078,830
140,199
9,165,984
303
15,876,346
2,463,331
131,276
620,989
29,477,258
Qtr3
1,807,252
742,574
200,000
10,000,340
21,176,704
9,146,379
83,754
328,935
43,485,938
Qtr4
979,290
235,451
7,338,622
250
26,482,810
13,432,875
43,215,279
311,000
3,003,627
94,999,202
Total -
2018
5,233,899
1,262,535
17,254,046
10,001,880
77,820,504
31,931,893
43,434,627
325,767
8,977,710
196,242,860 Source: BNR, Financial Stability
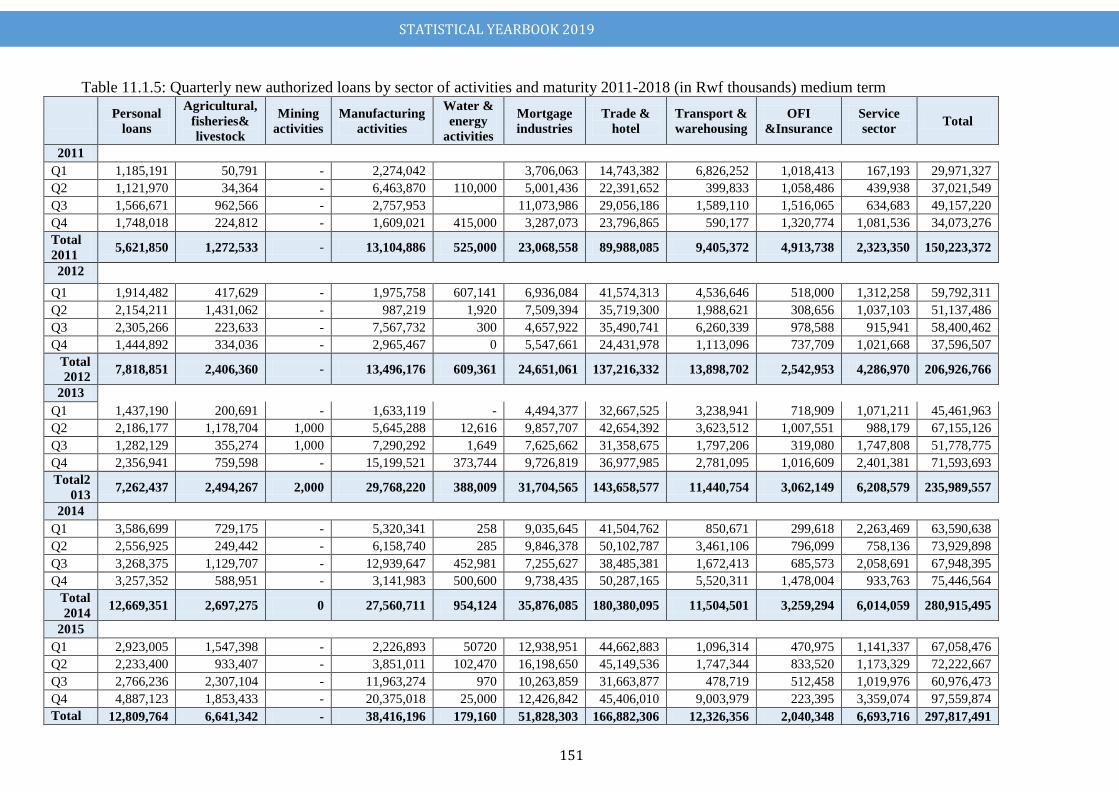
STATISTICAL YEARBOOK 2019
151
Table 11.1.5: Quarterly new authorized loans by sector of activities and maturity 2011-2018 (in Rwf thousands) medium term
Personal
loans
Agricultural,
fisheries&
livestock
Mining
activities
Manufacturing
activities
Water &
energy
activities
Mortgage
industries
Trade &
hotel
Transport &
warehousing
OFI
&Insurance
Service
sector Total
2011
Q1 1,185,191 50,791 - 2,274,042
3,706,063 14,743,382 6,826,252 1,018,413 167,193 29,971,327
Q2 1,121,970 34,364 - 6,463,870 110,000 5,001,436 22,391,652 399,833 1,058,486 439,938 37,021,549
Q3 1,566,671 962,566 - 2,757,953
11,073,986 29,056,186 1,589,110 1,516,065 634,683 49,157,220
Q4 1,748,018 224,812 - 1,609,021 415,000 3,287,073 23,796,865 590,177 1,320,774 1,081,536 34,073,276
Total
2011 5,621,850 1,272,533 - 13,104,886 525,000 23,068,558 89,988,085 9,405,372 4,913,738 2,323,350 150,223,372
2012
Q1 1,914,482 417,629 - 1,975,758 607,141 6,936,084 41,574,313 4,536,646 518,000 1,312,258 59,792,311
Q2 2,154,211 1,431,062 - 987,219 1,920 7,509,394 35,719,300 1,988,621 308,656 1,037,103 51,137,486
Q3 2,305,266 223,633 - 7,567,732 300 4,657,922 35,490,741 6,260,339 978,588 915,941 58,400,462
Q4 1,444,892 334,036 - 2,965,467 0 5,547,661 24,431,978 1,113,096 737,709 1,021,668 37,596,507
Total
2012 7,818,851 2,406,360 - 13,496,176 609,361 24,651,061 137,216,332 13,898,702 2,542,953 4,286,970 206,926,766
2013
Q1 1,437,190 200,691 - 1,633,119 - 4,494,377 32,667,525 3,238,941 718,909 1,071,211 45,461,963
Q2 2,186,177 1,178,704 1,000 5,645,288 12,616 9,857,707 42,654,392 3,623,512 1,007,551 988,179 67,155,126
Q3 1,282,129 355,274 1,000 7,290,292 1,649 7,625,662 31,358,675 1,797,206 319,080 1,747,808 51,778,775
Q4 2,356,941 759,598 - 15,199,521 373,744 9,726,819 36,977,985 2,781,095 1,016,609 2,401,381 71,593,693
Total2
013 7,262,437 2,494,267 2,000 29,768,220 388,009 31,704,565 143,658,577 11,440,754 3,062,149 6,208,579 235,989,557
2014
Q1 3,586,699 729,175 - 5,320,341 258 9,035,645 41,504,762 850,671 299,618 2,263,469 63,590,638
Q2 2,556,925 249,442 - 6,158,740 285 9,846,378 50,102,787 3,461,106 796,099 758,136 73,929,898
Q3 3,268,375 1,129,707 - 12,939,647 452,981 7,255,627 38,485,381 1,672,413 685,573 2,058,691 67,948,395
Q4 3,257,352 588,951 - 3,141,983 500,600 9,738,435 50,287,165 5,520,311 1,478,004 933,763 75,446,564
Total
2014 12,669,351 2,697,275 0 27,560,711 954,124 35,876,085 180,380,095 11,504,501 3,259,294 6,014,059 280,915,495
2015
Q1 2,923,005 1,547,398 - 2,226,893 50720 12,938,951 44,662,883 1,096,314 470,975 1,141,337 67,058,476
Q2 2,233,400 933,407 - 3,851,011 102,470 16,198,650 45,149,536 1,747,344 833,520 1,173,329 72,222,667
Q3 2,766,236 2,307,104 - 11,963,274 970 10,263,859 31,663,877 478,719 512,458 1,019,976 60,976,473
Q4 4,887,123 1,853,433 - 20,375,018 25,000 12,426,842 45,406,010 9,003,979 223,395 3,359,074 97,559,874
Total 12,809,764 6,641,342 - 38,416,196 179,160 51,828,303 166,882,306 12,326,356 2,040,348 6,693,716 297,817,491
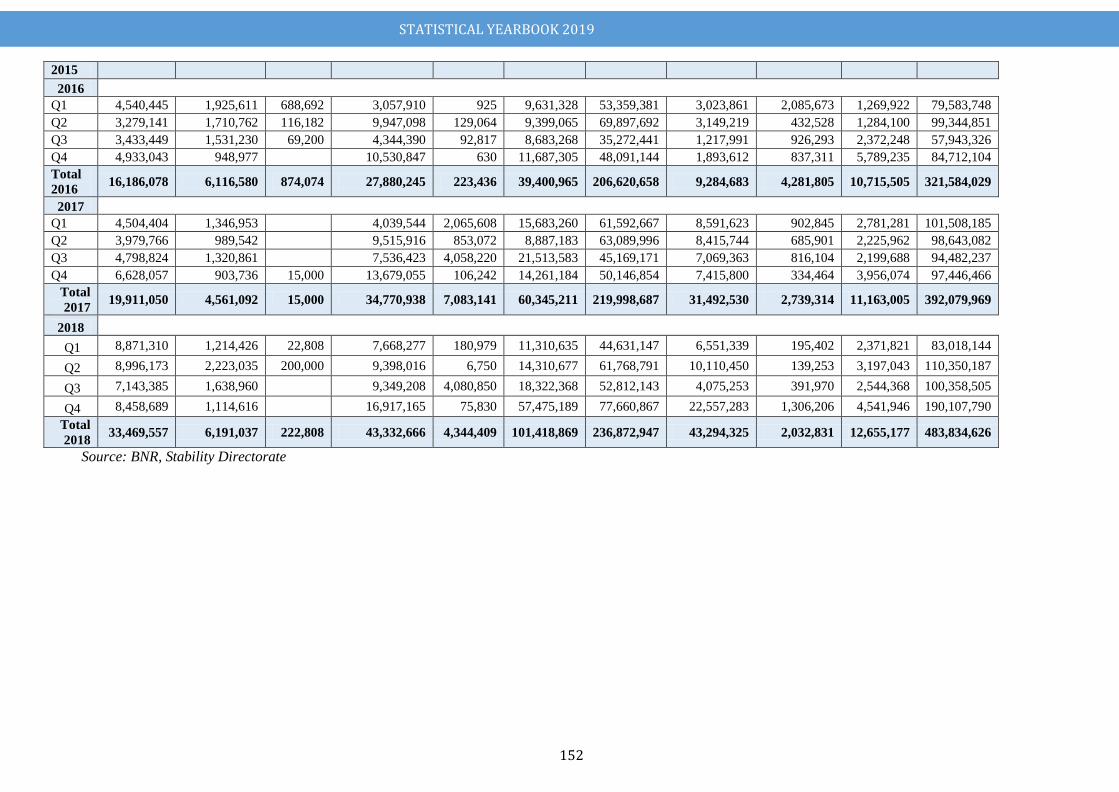
STATISTICAL YEARBOOK 2019
152
2015
2016
Q1 4,540,445 1,925,611 688,692 3,057,910 925 9,631,328 53,359,381 3,023,861 2,085,673 1,269,922 79,583,748
Q2 3,279,141 1,710,762 116,182 9,947,098 129,064 9,399,065 69,897,692 3,149,219 432,528 1,284,100 99,344,851
Q3 3,433,449 1,531,230 69,200 4,344,390 92,817 8,683,268 35,272,441 1,217,991 926,293 2,372,248 57,943,326
Q4 4,933,043 948,977
10,530,847 630 11,687,305 48,091,144 1,893,612 837,311 5,789,235 84,712,104
Total
2016 16,186,078 6,116,580 874,074 27,880,245 223,436 39,400,965 206,620,658 9,284,683 4,281,805 10,715,505 321,584,029
2017
Q1 4,504,404 1,346,953
4,039,544 2,065,608 15,683,260 61,592,667 8,591,623 902,845 2,781,281 101,508,185
Q2 3,979,766 989,542
9,515,916 853,072 8,887,183 63,089,996 8,415,744 685,901 2,225,962 98,643,082
Q3 4,798,824 1,320,861
7,536,423 4,058,220 21,513,583 45,169,171 7,069,363 816,104 2,199,688 94,482,237
Q4 6,628,057 903,736 15,000 13,679,055 106,242 14,261,184 50,146,854 7,415,800 334,464 3,956,074 97,446,466
Total
2017 19,911,050 4,561,092 15,000 34,770,938 7,083,141 60,345,211 219,998,687 31,492,530 2,739,314 11,163,005 392,079,969
2018
Q1 8,871,310 1,214,426 22,808 7,668,277 180,979 11,310,635 44,631,147 6,551,339 195,402 2,371,821 83,018,144
Q2 8,996,173 2,223,035 200,000 9,398,016 6,750 14,310,677 61,768,791 10,110,450 139,253 3,197,043 110,350,187
Q3 7,143,385 1,638,960
9,349,208 4,080,850 18,322,368 52,812,143 4,075,253 391,970 2,544,368 100,358,505
Q4 8,458,689 1,114,616
16,917,165 75,830 57,475,189 77,660,867 22,557,283 1,306,206 4,541,946 190,107,790
Total
2018 33,469,557 6,191,037 222,808 43,332,666 4,344,409 101,418,869 236,872,947 43,294,325 2,032,831 12,655,177 483,834,626
Source: BNR, Stability Directorate
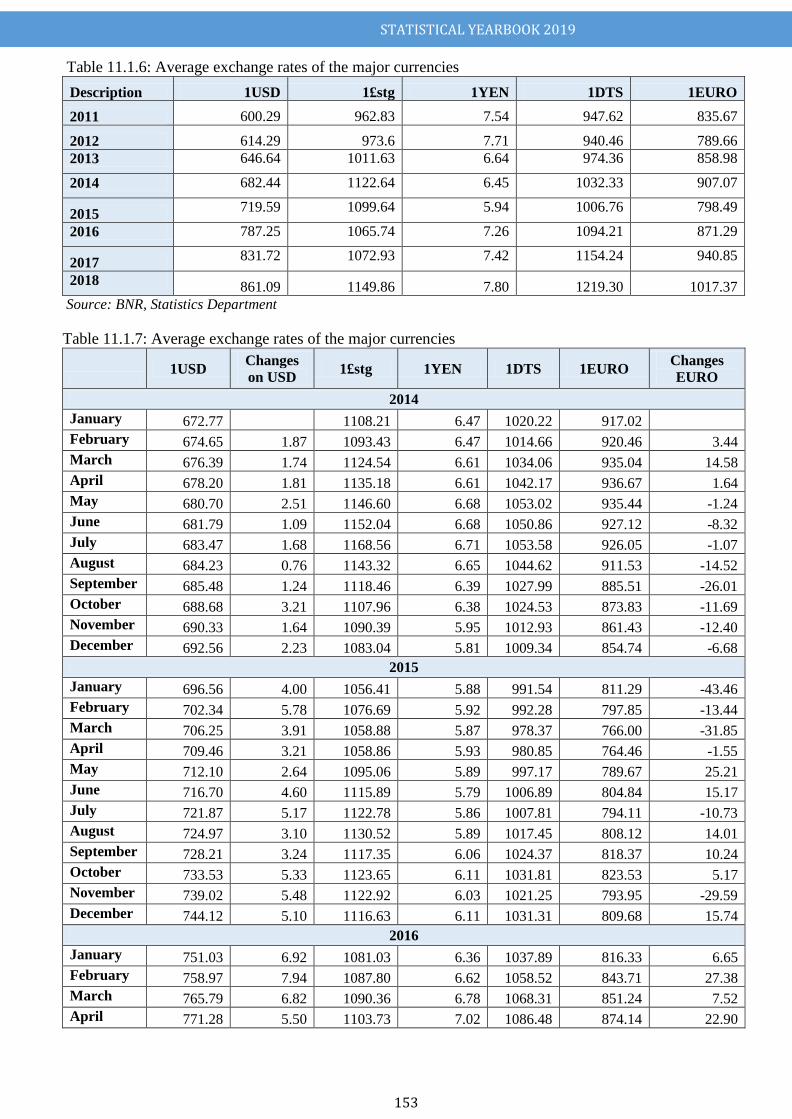
STATISTICAL YEARBOOK 2019
153
Table 11.1.6: Average exchange rates of the major currencies
Description 1USD 1£stg 1YEN 1DTS 1EURO
2011 600.29 962.83 7.54 947.62 835.67
2012 614.29 973.6 7.71 940.46 789.66
2013 646.64 1011.63 6.64 974.36 858.98
2014 682.44 1122.64 6.45 1032.33 907.07
2015 719.59 1099.64 5.94 1006.76 798.49
2016 787.25 1065.74 7.26 1094.21 871.29
2017 831.72 1072.93 7.42 1154.24 940.85
2018 861.09 1149.86 7.80 1219.30 1017.37
Source: BNR, Statistics Department
Table 11.1.7: Average exchange rates of the major currencies
1USD
Changes
on USD 1£stg 1YEN 1DTS 1EURO
Changes
EURO
2014
January 672.77 1108.21 6.47 1020.22 917.02
February 674.65 1.87 1093.43 6.47 1014.66 920.46 3.44
March 676.39 1.74 1124.54 6.61 1034.06 935.04 14.58
April 678.20 1.81 1135.18 6.61 1042.17 936.67 1.64
May 680.70 2.51 1146.60 6.68 1053.02 935.44 -1.24
June 681.79 1.09 1152.04 6.68 1050.86 927.12 -8.32
July 683.47 1.68 1168.56 6.71 1053.58 926.05 -1.07
August 684.23 0.76 1143.32 6.65 1044.62 911.53 -14.52
September 685.48 1.24 1118.46 6.39 1027.99 885.51 -26.01
October 688.68 3.21 1107.96 6.38 1024.53 873.83 -11.69
November 690.33 1.64 1090.39 5.95 1012.93 861.43 -12.40
December 692.56 2.23 1083.04 5.81 1009.34 854.74 -6.68
2015
January 696.56 4.00 1056.41 5.88 991.54 811.29 -43.46
February 702.34 5.78 1076.69 5.92 992.28 797.85 -13.44
March 706.25 3.91 1058.88 5.87 978.37 766.00 -31.85
April 709.46 3.21 1058.86 5.93 980.85 764.46 -1.55
May 712.10 2.64 1095.06 5.89 997.17 789.67 25.21
June 716.70 4.60 1115.89 5.79 1006.89 804.84 15.17
July 721.87 5.17 1122.78 5.86 1007.81 794.11 -10.73
August 724.97 3.10 1130.52 5.89 1017.45 808.12 14.01
September 728.21 3.24 1117.35 6.06 1024.37 818.37 10.24
October 733.53 5.33 1123.65 6.11 1031.81 823.53 5.17
November 739.02 5.48 1122.92 6.03 1021.25 793.95 -29.59
December 744.12 5.10 1116.63 6.11 1031.31 809.68 15.74
2016
January 751.03 6.92 1081.03 6.36 1037.89 816.33 6.65
February 758.97 7.94 1087.80 6.62 1058.52 843.71 27.38
March 765.79 6.82 1090.36 6.78 1068.31 851.24 7.52
April 771.28 5.50 1103.73 7.02 1086.48 874.14 22.90
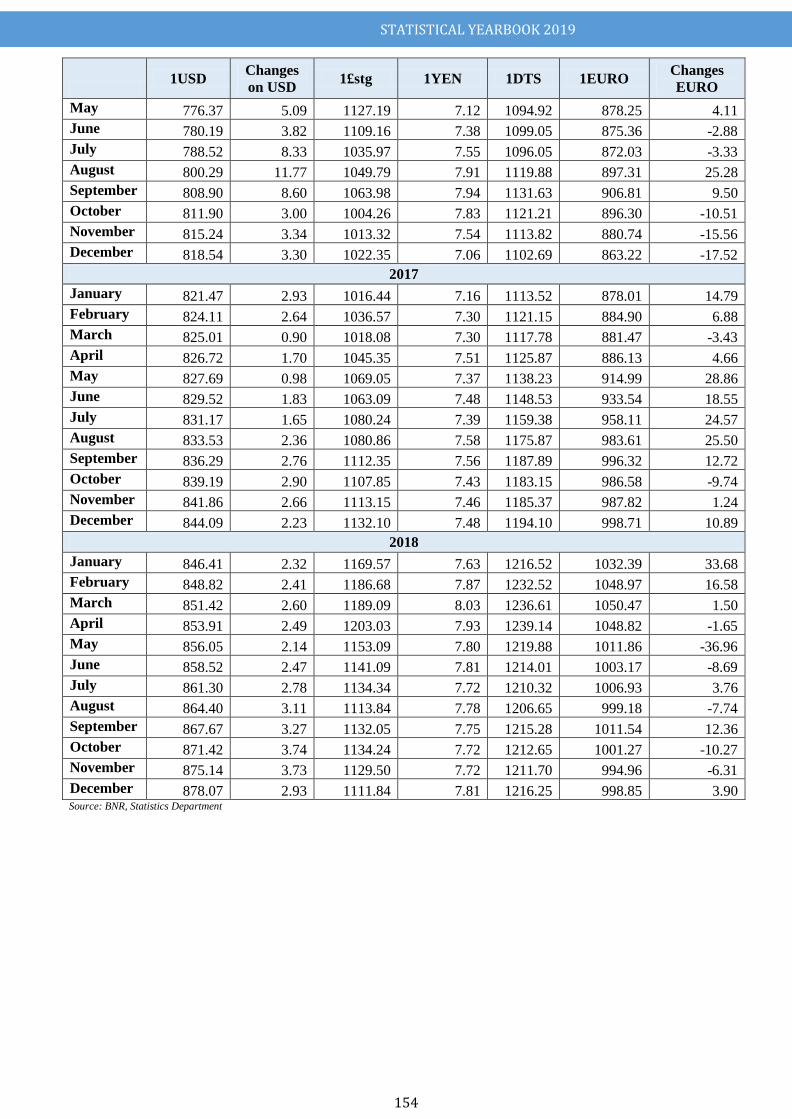
STATISTICAL YEARBOOK 2019
154
1USD
Changes
on USD 1£stg 1YEN 1DTS 1EURO
Changes
EURO
May 776.37 5.09 1127.19 7.12 1094.92 878.25 4.11
June 780.19 3.82 1109.16 7.38 1099.05 875.36 -2.88
July 788.52 8.33 1035.97 7.55 1096.05 872.03 -3.33
August 800.29 11.77 1049.79 7.91 1119.88 897.31 25.28
September 808.90 8.60 1063.98 7.94 1131.63 906.81 9.50
October 811.90 3.00 1004.26 7.83 1121.21 896.30 -10.51
November 815.24 3.34 1013.32 7.54 1113.82 880.74 -15.56
December 818.54 3.30 1022.35 7.06 1102.69 863.22 -17.52
2017
January 821.47 2.93 1016.44 7.16 1113.52 878.01 14.79
February 824.11 2.64 1036.57 7.30 1121.15 884.90 6.88
March 825.01 0.90 1018.08 7.30 1117.78 881.47 -3.43
April 826.72 1.70 1045.35 7.51 1125.87 886.13 4.66
May 827.69 0.98 1069.05 7.37 1138.23 914.99 28.86
June 829.52 1.83 1063.09 7.48 1148.53 933.54 18.55
July 831.17 1.65 1080.24 7.39 1159.38 958.11 24.57
August 833.53 2.36 1080.86 7.58 1175.87 983.61 25.50
September 836.29 2.76 1112.35 7.56 1187.89 996.32 12.72
October 839.19 2.90 1107.85 7.43 1183.15 986.58 -9.74
November 841.86 2.66 1113.15 7.46 1185.37 987.82 1.24
December 844.09 2.23 1132.10 7.48 1194.10 998.71 10.89
2018
January 846.41 2.32 1169.57 7.63 1216.52 1032.39 33.68
February 848.82 2.41 1186.68 7.87 1232.52 1048.97 16.58
March 851.42 2.60 1189.09 8.03 1236.61 1050.47 1.50
April 853.91 2.49 1203.03 7.93 1239.14 1048.82 -1.65
May 856.05 2.14 1153.09 7.80 1219.88 1011.86 -36.96
June 858.52 2.47 1141.09 7.81 1214.01 1003.17 -8.69
July 861.30 2.78 1134.34 7.72 1210.32 1006.93 3.76
August 864.40 3.11 1113.84 7.78 1206.65 999.18 -7.74
September 867.67 3.27 1132.05 7.75 1215.28 1011.54 12.36
October 871.42 3.74 1134.24 7.72 1212.65 1001.27 -10.27
November 875.14 3.73 1129.50 7.72 1211.70 994.96 -6.31
December 878.07 2.93 1111.84 7.81 1216.25 998.85 3.90 Source: BNR, Statistics Department
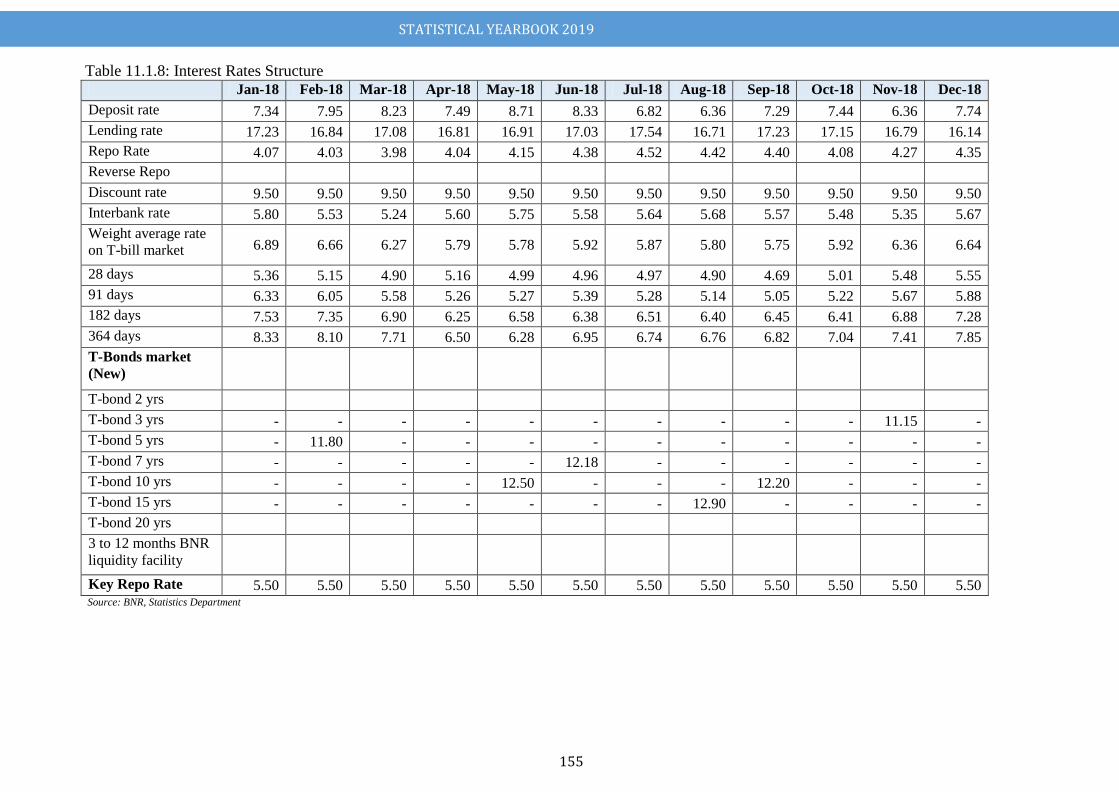
STATISTICAL YEARBOOK 2019
155
Table 11.1.8: Interest Rates Structure Jan-18 Feb-18 Mar-18 Apr-18 May-18 Jun-18 Jul-18 Aug-18 Sep-18 Oct-18 Nov-18 Dec-18
Deposit rate 7.34 7.95 8.23 7.49 8.71 8.33 6.82 6.36 7.29 7.44 6.36 7.74
Lending rate 17.23 16.84 17.08 16.81 16.91 17.03 17.54 16.71 17.23 17.15 16.79 16.14
Repo Rate 4.07 4.03 3.98 4.04 4.15 4.38 4.52 4.42 4.40 4.08 4.27 4.35
Reverse Repo
Discount rate 9.50 9.50 9.50 9.50 9.50 9.50 9.50 9.50 9.50 9.50 9.50 9.50
Interbank rate 5.80 5.53 5.24 5.60 5.75 5.58 5.64 5.68 5.57 5.48 5.35 5.67
Weight average rate
on T-bill market 6.89 6.66 6.27 5.79 5.78 5.92 5.87 5.80 5.75 5.92 6.36 6.64
28 days 5.36 5.15 4.90 5.16 4.99 4.96 4.97 4.90 4.69 5.01 5.48 5.55
91 days 6.33 6.05 5.58 5.26 5.27 5.39 5.28 5.14 5.05 5.22 5.67 5.88
182 days 7.53 7.35 6.90 6.25 6.58 6.38 6.51 6.40 6.45 6.41 6.88 7.28
364 days 8.33 8.10 7.71 6.50 6.28 6.95 6.74 6.76 6.82 7.04 7.41 7.85
T-Bonds market
(New)
T-bond 2 yrs
T-bond 3 yrs - - - - - - - - - - 11.15 -
T-bond 5 yrs - 11.80 - - - - - - - - - -
T-bond 7 yrs - - - - - 12.18 - - - - - -
T-bond 10 yrs - - - - 12.50 - - - 12.20 - - -
T-bond 15 yrs - - - - - - - 12.90 - - - -
T-bond 20 yrs
3 to 12 months BNR
liquidity facility
Key Repo Rate 5.50 5.50 5.50 5.50 5.50 5.50 5.50 5.50 5.50 5.50 5.50 5.50 Source: BNR, Statistics Department
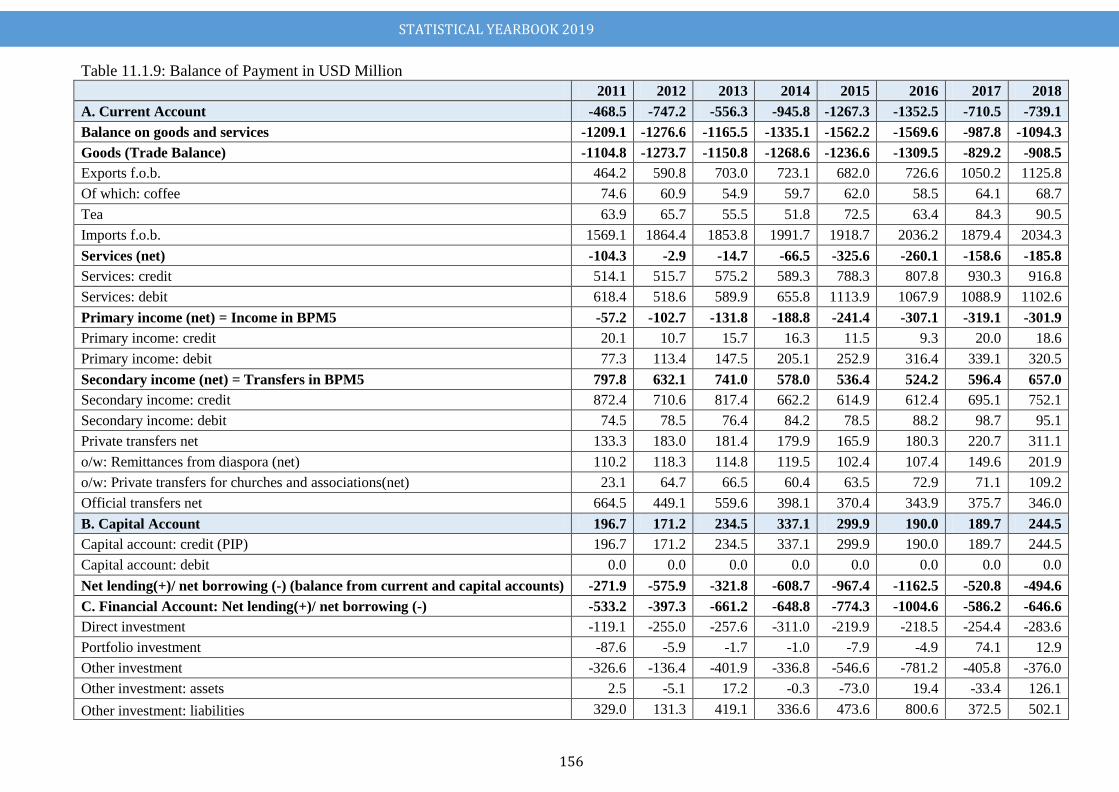
STATISTICAL YEARBOOK 2019
156
Table 11.1.9: Balance of Payment in USD Million
2011 2012 2013 2014 2015 2016 2017 2018
A. Current Account -468.5 -747.2 -556.3 -945.8 -1267.3 -1352.5 -710.5 -739.1
Balance on goods and services -1209.1 -1276.6 -1165.5 -1335.1 -1562.2 -1569.6 -987.8 -1094.3
Goods (Trade Balance) -1104.8 -1273.7 -1150.8 -1268.6 -1236.6 -1309.5 -829.2 -908.5
Exports f.o.b. 464.2 590.8 703.0 723.1 682.0 726.6 1050.2 1125.8
Of which: coffee 74.6 60.9 54.9 59.7 62.0 58.5 64.1 68.7
Tea 63.9 65.7 55.5 51.8 72.5 63.4 84.3 90.5
Imports f.o.b. 1569.1 1864.4 1853.8 1991.7 1918.7 2036.2 1879.4 2034.3
Services (net) -104.3 -2.9 -14.7 -66.5 -325.6 -260.1 -158.6 -185.8
Services: credit 514.1 515.7 575.2 589.3 788.3 807.8 930.3 916.8
Services: debit 618.4 518.6 589.9 655.8 1113.9 1067.9 1088.9 1102.6
Primary income (net) = Income in BPM5 -57.2 -102.7 -131.8 -188.8 -241.4 -307.1 -319.1 -301.9
Primary income: credit 20.1 10.7 15.7 16.3 11.5 9.3 20.0 18.6
Primary income: debit 77.3 113.4 147.5 205.1 252.9 316.4 339.1 320.5
Secondary income (net) = Transfers in BPM5 797.8 632.1 741.0 578.0 536.4 524.2 596.4 657.0
Secondary income: credit 872.4 710.6 817.4 662.2 614.9 612.4 695.1 752.1
Secondary income: debit 74.5 78.5 76.4 84.2 78.5 88.2 98.7 95.1
Private transfers net 133.3 183.0 181.4 179.9 165.9 180.3 220.7 311.1
o/w: Remittances from diaspora (net) 110.2 118.3 114.8 119.5 102.4 107.4 149.6 201.9
o/w: Private transfers for churches and associations(net) 23.1 64.7 66.5 60.4 63.5 72.9 71.1 109.2
Official transfers net 664.5 449.1 559.6 398.1 370.4 343.9 375.7 346.0
B. Capital Account 196.7 171.2 234.5 337.1 299.9 190.0 189.7 244.5
Capital account: credit (PIP) 196.7 171.2 234.5 337.1 299.9 190.0 189.7 244.5
Capital account: debit 0.0 0.0 0.0 0.0 0.0 0.0 0.0 0.0
Net lending(+)/ net borrowing (-) (balance from current and capital accounts) -271.9 -575.9 -321.8 -608.7 -967.4 -1162.5 -520.8 -494.6
C. Financial Account: Net lending(+)/ net borrowing (-) -533.2 -397.3 -661.2 -648.8 -774.3 -1004.6 -586.2 -646.6
Direct investment -119.1 -255.0 -257.6 -311.0 -219.9 -218.5 -254.4 -283.6
Portfolio investment -87.6 -5.9 -1.7 -1.0 -7.9 -4.9 74.1 12.9
Other investment -326.6 -136.4 -401.9 -336.8 -546.6 -781.2 -405.8 -376.0
Other investment: assets 2.5 -5.1 17.2 -0.3 -73.0 19.4 -33.4 126.1
Other investment: liabilities 329.0 131.3 419.1 336.6 473.6 800.6 372.5 502.1
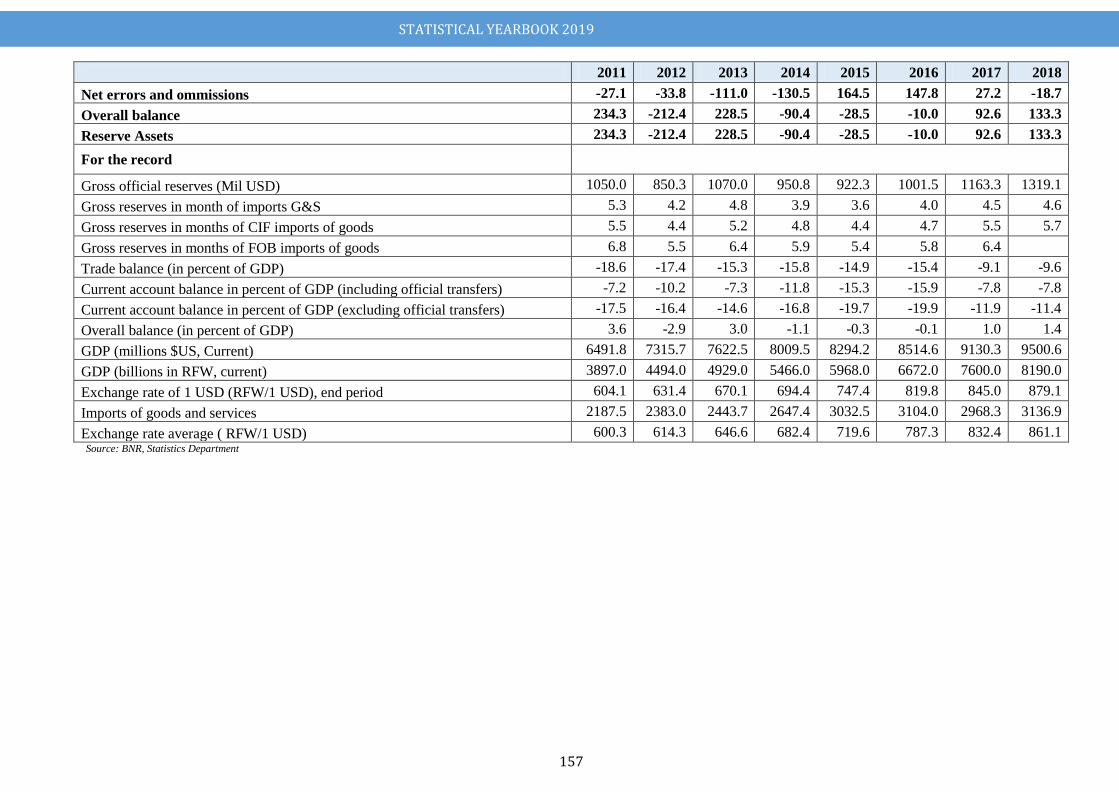
STATISTICAL YEARBOOK 2019
157
2011 2012 2013 2014 2015 2016 2017 2018
Net errors and ommissions -27.1 -33.8 -111.0 -130.5 164.5 147.8 27.2 -18.7
Overall balance 234.3 -212.4 228.5 -90.4 -28.5 -10.0 92.6 133.3
Reserve Assets 234.3 -212.4 228.5 -90.4 -28.5 -10.0 92.6 133.3
For the record
Gross official reserves (Mil USD) 1050.0 850.3 1070.0 950.8 922.3 1001.5 1163.3 1319.1
Gross reserves in month of imports G&S 5.3 4.2 4.8 3.9 3.6 4.0 4.5 4.6
Gross reserves in months of CIF imports of goods 5.5 4.4 5.2 4.8 4.4 4.7 5.5 5.7
Gross reserves in months of FOB imports of goods 6.8 5.5 6.4 5.9 5.4 5.8 6.4
Trade balance (in percent of GDP) -18.6 -17.4 -15.3 -15.8 -14.9 -15.4 -9.1 -9.6
Current account balance in percent of GDP (including official transfers) -7.2 -10.2 -7.3 -11.8 -15.3 -15.9 -7.8 -7.8
Current account balance in percent of GDP (excluding official transfers) -17.5 -16.4 -14.6 -16.8 -19.7 -19.9 -11.9 -11.4
Overall balance (in percent of GDP) 3.6 -2.9 3.0 -1.1 -0.3 -0.1 1.0 1.4
GDP (millions $US, Current) 6491.8 7315.7 7622.5 8009.5 8294.2 8514.6 9130.3 9500.6
GDP (billions in RFW, current) 3897.0 4494.0 4929.0 5466.0 5968.0 6672.0 7600.0 8190.0
Exchange rate of 1 USD (RFW/1 USD), end period 604.1 631.4 670.1 694.4 747.4 819.8 845.0 879.1
Imports of goods and services 2187.5 2383.0 2443.7 2647.4 3032.5 3104.0 2968.3 3136.9
Exchange rate average ( RFW/1 USD) 600.3 614.3 646.6 682.4 719.6 787.3 832.4 861.1 Source: BNR, Statistics Department
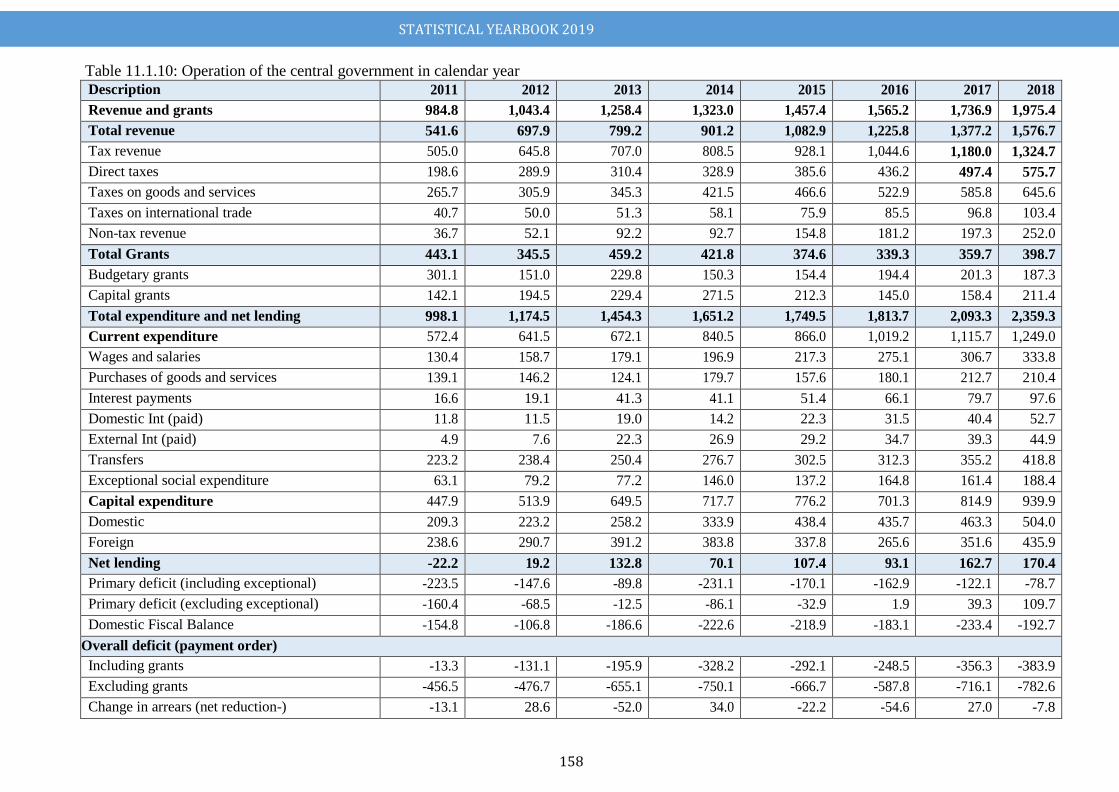
STATISTICAL YEARBOOK 2019
158
Table 11.1.10: Operation of the central government in calendar year
Description 2011 2012 2013 2014 2015 2016 2017 2018
Revenue and grants 984.8 1,043.4 1,258.4 1,323.0 1,457.4 1,565.2 1,736.9 1,975.4
Total revenue 541.6 697.9 799.2 901.2 1,082.9 1,225.8 1,377.2 1,576.7
Tax revenue 505.0 645.8 707.0 808.5 928.1 1,044.6 1,180.0 1,324.7
Direct taxes 198.6 289.9 310.4 328.9 385.6 436.2 497.4 575.7
Taxes on goods and services 265.7 305.9 345.3 421.5 466.6 522.9 585.8 645.6
Taxes on international trade 40.7 50.0 51.3 58.1 75.9 85.5 96.8 103.4
Non-tax revenue 36.7 52.1 92.2 92.7 154.8 181.2 197.3 252.0
Total Grants 443.1 345.5 459.2 421.8 374.6 339.3 359.7 398.7
Budgetary grants 301.1 151.0 229.8 150.3 154.4 194.4 201.3 187.3
Capital grants 142.1 194.5 229.4 271.5 212.3 145.0 158.4 211.4
Total expenditure and net lending 998.1 1,174.5 1,454.3 1,651.2 1,749.5 1,813.7 2,093.3 2,359.3
Current expenditure 572.4 641.5 672.1 840.5 866.0 1,019.2 1,115.7 1,249.0
Wages and salaries 130.4 158.7 179.1 196.9 217.3 275.1 306.7 333.8
Purchases of goods and services 139.1 146.2 124.1 179.7 157.6 180.1 212.7 210.4
Interest payments 16.6 19.1 41.3 41.1 51.4 66.1 79.7 97.6
Domestic Int (paid) 11.8 11.5 19.0 14.2 22.3 31.5 40.4 52.7
External Int (paid) 4.9 7.6 22.3 26.9 29.2 34.7 39.3 44.9
Transfers 223.2 238.4 250.4 276.7 302.5 312.3 355.2 418.8
Exceptional social expenditure 63.1 79.2 77.2 146.0 137.2 164.8 161.4 188.4
Capital expenditure 447.9 513.9 649.5 717.7 776.2 701.3 814.9 939.9
Domestic 209.3 223.2 258.2 333.9 438.4 435.7 463.3 504.0
Foreign 238.6 290.7 391.2 383.8 337.8 265.6 351.6 435.9
Net lending -22.2 19.2 132.8 70.1 107.4 93.1 162.7 170.4
Primary deficit (including exceptional) -223.5 -147.6 -89.8 -231.1 -170.1 -162.9 -122.1 -78.7
Primary deficit (excluding exceptional) -160.4 -68.5 -12.5 -86.1 -32.9 1.9 39.3 109.7
Domestic Fiscal Balance -154.8 -106.8 -186.6 -222.6 -218.9 -183.1 -233.4 -192.7
Overall deficit (payment order)
Including grants -13.3 -131.1 -195.9 -328.2 -292.1 -248.5 -356.3 -383.9
Excluding grants -456.5 -476.7 -655.1 -750.1 -666.7 -587.8 -716.1 -782.6
Change in arrears (net reduction-) -13.1 28.6 -52.0 34.0 -22.2 -54.6 27.0 -7.8
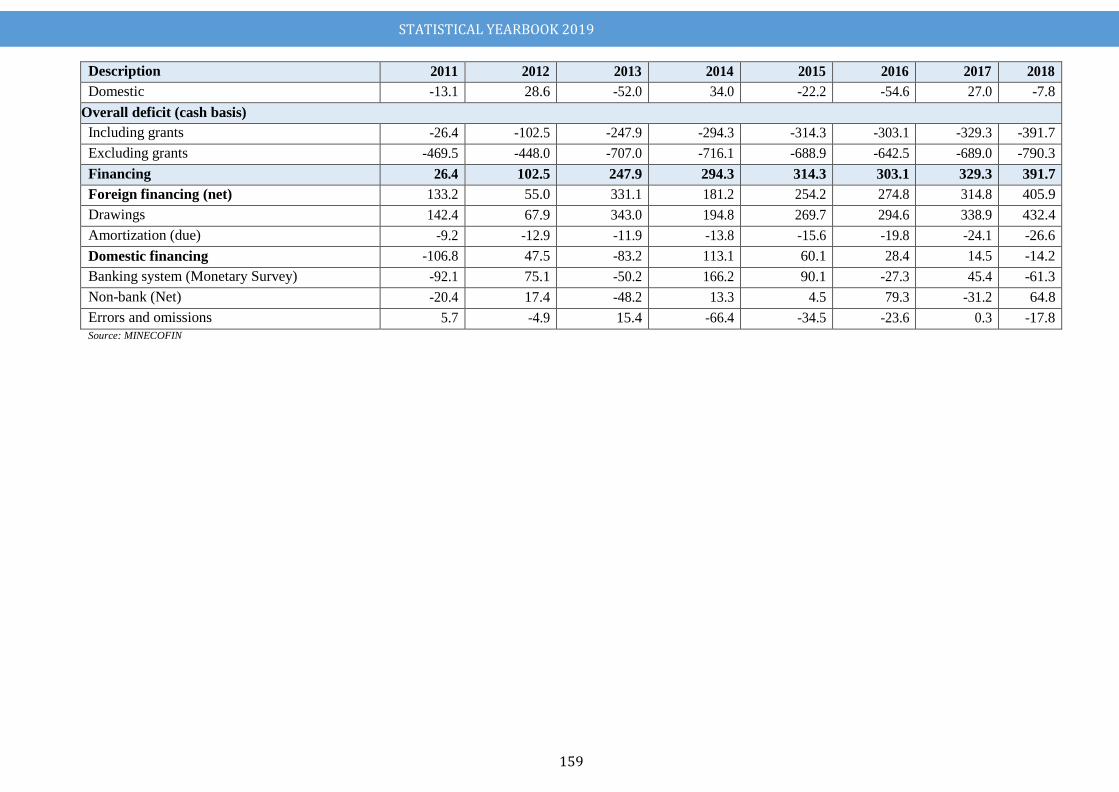
STATISTICAL YEARBOOK 2019
159
Description 2011 2012 2013 2014 2015 2016 2017 2018
Domestic -13.1 28.6 -52.0 34.0 -22.2 -54.6 27.0 -7.8
Overall deficit (cash basis)
Including grants -26.4 -102.5 -247.9 -294.3 -314.3 -303.1 -329.3 -391.7
Excluding grants -469.5 -448.0 -707.0 -716.1 -688.9 -642.5 -689.0 -790.3
Financing 26.4 102.5 247.9 294.3 314.3 303.1 329.3 391.7
Foreign financing (net) 133.2 55.0 331.1 181.2 254.2 274.8 314.8 405.9
Drawings 142.4 67.9 343.0 194.8 269.7 294.6 338.9 432.4
Amortization (due) -9.2 -12.9 -11.9 -13.8 -15.6 -19.8 -24.1 -26.6
Domestic financing -106.8 47.5 -83.2 113.1 60.1 28.4 14.5 -14.2
Banking system (Monetary Survey) -92.1 75.1 -50.2 166.2 90.1 -27.3 45.4 -61.3
Non-bank (Net) -20.4 17.4 -48.2 13.3 4.5 79.3 -31.2 64.8
Errors and omissions 5.7 -4.9 15.4 -66.4 -34.5 -23.6 0.3 -17.8 Source: MINECOFIN
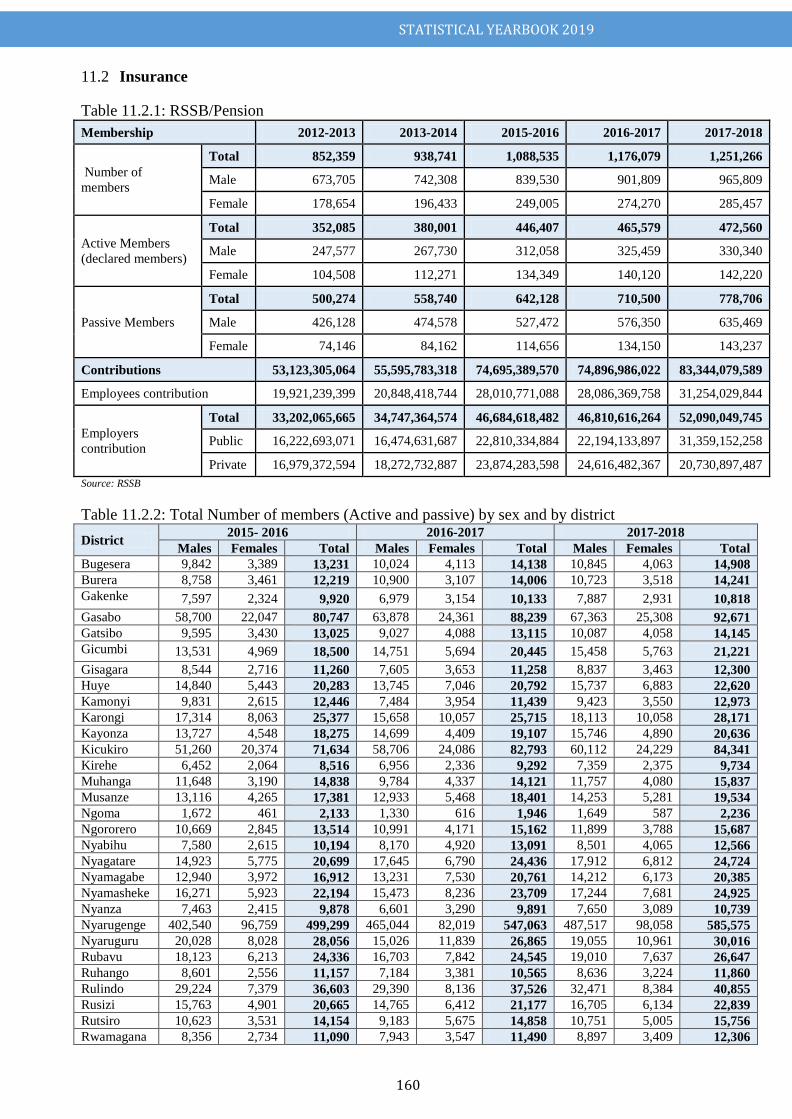
STATISTICAL YEARBOOK 2019
160
Insurance 11.2
Table 11.2.1: RSSB/Pension
Membership 2012-2013 2013-2014 2015-2016 2016-2017 2017-2018
Number of
members
Total 852,359 938,741 1,088,535 1,176,079 1,251,266
Male 673,705 742,308 839,530 901,809 965,809
Female 178,654 196,433 249,005 274,270 285,457
Active Members
(declared members)
Total 352,085 380,001 446,407 465,579 472,560
Male 247,577 267,730 312,058 325,459 330,340
Female 104,508 112,271 134,349 140,120 142,220
Passive Members
Total 500,274 558,740 642,128 710,500 778,706
Male 426,128 474,578 527,472 576,350 635,469
Female 74,146 84,162 114,656 134,150 143,237
Contributions 53,123,305,064 55,595,783,318 74,695,389,570 74,896,986,022 83,344,079,589
Employees contribution 19,921,239,399 20,848,418,744 28,010,771,088 28,086,369,758 31,254,029,844
Employers
contribution
Total 33,202,065,665 34,747,364,574 46,684,618,482 46,810,616,264 52,090,049,745
Public 16,222,693,071 16,474,631,687 22,810,334,884 22,194,133,897 31,359,152,258
Private 16,979,372,594 18,272,732,887 23,874,283,598 24,616,482,367 20,730,897,487
Source: RSSB
Table 11.2.2: Total Number of members (Active and passive) by sex and by district
District 2015- 2016 2016-2017 2017-2018
Males Females Total Males Females Total Males Females Total
Bugesera 9,842 3,389 13,231 10,024 4,113 14,138 10,845 4,063 14,908
Burera 8,758 3,461 12,219 10,900 3,107 14,006 10,723 3,518 14,241
Gakenke 7,597 2,324 9,920 6,979 3,154 10,133 7,887 2,931 10,818
Gasabo 58,700 22,047 80,747 63,878 24,361 88,239 67,363 25,308 92,671
Gatsibo 9,595 3,430 13,025 9,027 4,088 13,115 10,087 4,058 14,145
Gicumbi 13,531 4,969 18,500 14,751 5,694 20,445 15,458 5,763 21,221
Gisagara 8,544 2,716 11,260 7,605 3,653 11,258 8,837 3,463 12,300
Huye 14,840 5,443 20,283 13,745 7,046 20,792 15,737 6,883 22,620
Kamonyi 9,831 2,615 12,446 7,484 3,954 11,439 9,423 3,550 12,973
Karongi 17,314 8,063 25,377 15,658 10,057 25,715 18,113 10,058 28,171
Kayonza 13,727 4,548 18,275 14,699 4,409 19,107 15,746 4,890 20,636
Kicukiro 51,260 20,374 71,634 58,706 24,086 82,793 60,112 24,229 84,341
Kirehe 6,452 2,064 8,516 6,956 2,336 9,292 7,359 2,375 9,734
Muhanga 11,648 3,190 14,838 9,784 4,337 14,121 11,757 4,080 15,837
Musanze 13,116 4,265 17,381 12,933 5,468 18,401 14,253 5,281 19,534
Ngoma 1,672 461 2,133 1,330 616 1,946 1,649 587 2,236
Ngororero 10,669 2,845 13,514 10,991 4,171 15,162 11,899 3,788 15,687
Nyabihu 7,580 2,615 10,194 8,170 4,920 13,091 8,501 4,065 12,566
Nyagatare 14,923 5,775 20,699 17,645 6,790 24,436 17,912 6,812 24,724
Nyamagabe 12,940 3,972 16,912 13,231 7,530 20,761 14,212 6,173 20,385
Nyamasheke 16,271 5,923 22,194 15,473 8,236 23,709 17,244 7,681 24,925
Nyanza 7,463 2,415 9,878 6,601 3,290 9,891 7,650 3,089 10,739
Nyarugenge 402,540 96,759 499,299 465,044 82,019 547,063 487,517 98,058 585,575
Nyaruguru 20,028 8,028 28,056 15,026 11,839 26,865 19,055 10,961 30,016
Rubavu 18,123 6,213 24,336 16,703 7,842 24,545 19,010 7,637 26,647
Ruhango 8,601 2,556 11,157 7,184 3,381 10,565 8,636 3,224 11,860
Rulindo 29,224 7,379 36,603 29,390 8,136 37,526 32,471 8,384 40,855
Rusizi 15,763 4,901 20,665 14,765 6,412 21,177 16,705 6,134 22,839
Rutsiro 10,623 3,531 14,154 9,183 5,675 14,858 10,751 5,005 15,756
Rwamagana 8,356 2,734 11,090 7,943 3,547 11,490 8,897 3,409 12,306
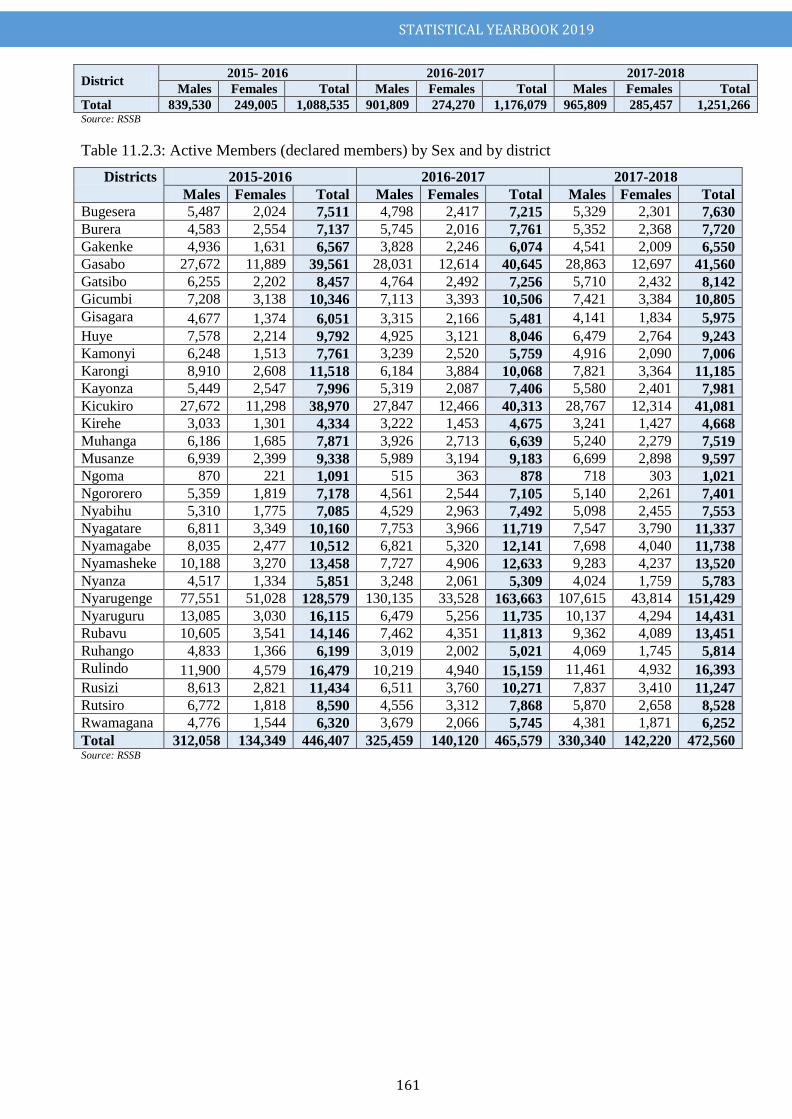
STATISTICAL YEARBOOK 2019
161
District 2015- 2016 2016-2017 2017-2018
Males Females Total Males Females Total Males Females Total
Total 839,530 249,005 1,088,535 901,809 274,270 1,176,079 965,809 285,457 1,251,266 Source: RSSB
Table 11.2.3: Active Members (declared members) by Sex and by district
Districts 2015-2016 2016-2017 2017-2018
Males Females Total Males Females Total Males Females Total
Bugesera 5,487 2,024 7,511 4,798 2,417 7,215 5,329 2,301 7,630
Burera 4,583 2,554 7,137 5,745 2,016 7,761 5,352 2,368 7,720
Gakenke 4,936 1,631 6,567 3,828 2,246 6,074 4,541 2,009 6,550
Gasabo 27,672 11,889 39,561 28,031 12,614 40,645 28,863 12,697 41,560
Gatsibo 6,255 2,202 8,457 4,764 2,492 7,256 5,710 2,432 8,142
Gicumbi 7,208 3,138 10,346 7,113 3,393 10,506 7,421 3,384 10,805
Gisagara 4,677 1,374 6,051 3,315 2,166 5,481 4,141 1,834 5,975
Huye 7,578 2,214 9,792 4,925 3,121 8,046 6,479 2,764 9,243
Kamonyi 6,248 1,513 7,761 3,239 2,520 5,759 4,916 2,090 7,006
Karongi 8,910 2,608 11,518 6,184 3,884 10,068 7,821 3,364 11,185
Kayonza 5,449 2,547 7,996 5,319 2,087 7,406 5,580 2,401 7,981
Kicukiro 27,672 11,298 38,970 27,847 12,466 40,313 28,767 12,314 41,081
Kirehe 3,033 1,301 4,334 3,222 1,453 4,675 3,241 1,427 4,668
Muhanga 6,186 1,685 7,871 3,926 2,713 6,639 5,240 2,279 7,519
Musanze 6,939 2,399 9,338 5,989 3,194 9,183 6,699 2,898 9,597
Ngoma 870 221 1,091 515 363 878 718 303 1,021
Ngororero 5,359 1,819 7,178 4,561 2,544 7,105 5,140 2,261 7,401
Nyabihu 5,310 1,775 7,085 4,529 2,963 7,492 5,098 2,455 7,553
Nyagatare 6,811 3,349 10,160 7,753 3,966 11,719 7,547 3,790 11,337
Nyamagabe 8,035 2,477 10,512 6,821 5,320 12,141 7,698 4,040 11,738
Nyamasheke 10,188 3,270 13,458 7,727 4,906 12,633 9,283 4,237 13,520
Nyanza 4,517 1,334 5,851 3,248 2,061 5,309 4,024 1,759 5,783
Nyarugenge 77,551 51,028 128,579 130,135 33,528 163,663 107,615 43,814 151,429
Nyaruguru 13,085 3,030 16,115 6,479 5,256 11,735 10,137 4,294 14,431
Rubavu 10,605 3,541 14,146 7,462 4,351 11,813 9,362 4,089 13,451
Ruhango 4,833 1,366 6,199 3,019 2,002 5,021 4,069 1,745 5,814
Rulindo 11,900 4,579 16,479 10,219 4,940 15,159 11,461 4,932 16,393
Rusizi 8,613 2,821 11,434 6,511 3,760 10,271 7,837 3,410 11,247
Rutsiro 6,772 1,818 8,590 4,556 3,312 7,868 5,870 2,658 8,528
Rwamagana 4,776 1,544 6,320 3,679 2,066 5,745 4,381 1,871 6,252
Total 312,058 134,349 446,407 325,459 140,120 465,579 330,340 142,220 472,560 Source: RSSB
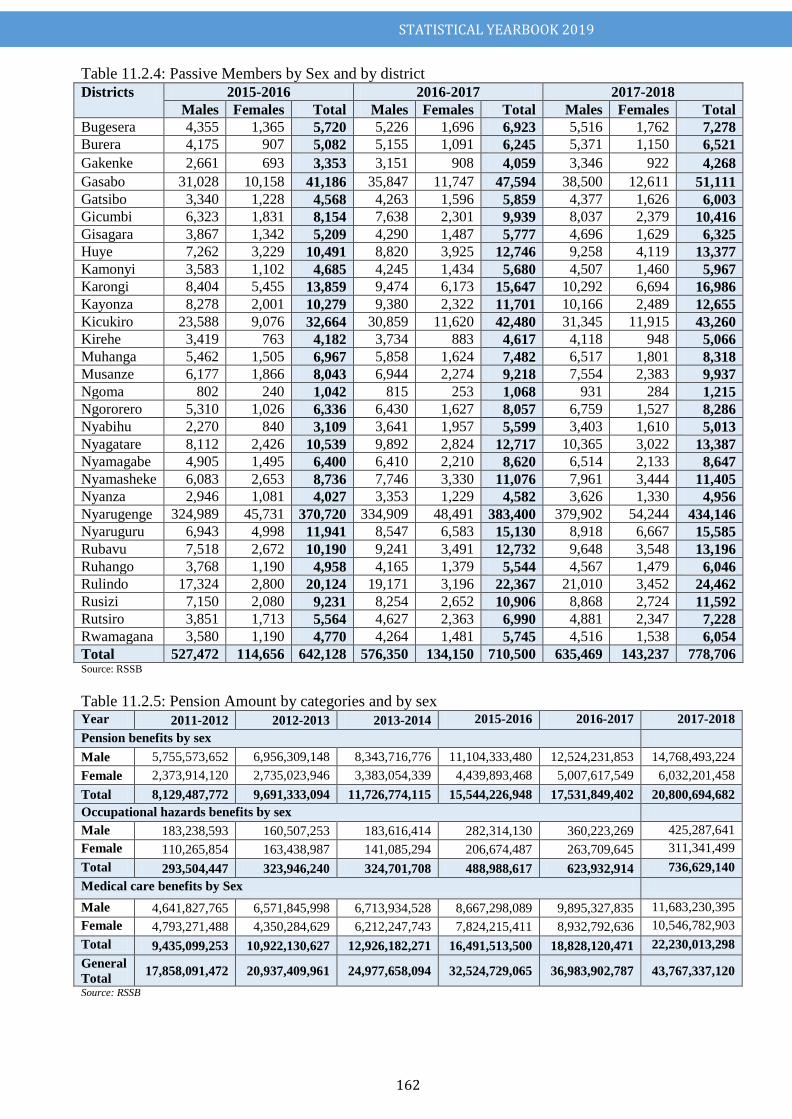
STATISTICAL YEARBOOK 2019
162
Table 11.2.4: Passive Members by Sex and by district
Districts 2015-2016 2016-2017 2017-2018
Males Females Total Males Females Total Males Females Total
Bugesera 4,355 1,365 5,720 5,226 1,696 6,923 5,516 1,762 7,278
Burera 4,175 907 5,082 5,155 1,091 6,245 5,371 1,150 6,521
Gakenke 2,661 693 3,353 3,151 908 4,059 3,346 922 4,268
Gasabo 31,028 10,158 41,186 35,847 11,747 47,594 38,500 12,611 51,111
Gatsibo 3,340 1,228 4,568 4,263 1,596 5,859 4,377 1,626 6,003
Gicumbi 6,323 1,831 8,154 7,638 2,301 9,939 8,037 2,379 10,416
Gisagara 3,867 1,342 5,209 4,290 1,487 5,777 4,696 1,629 6,325
Huye 7,262 3,229 10,491 8,820 3,925 12,746 9,258 4,119 13,377
Kamonyi 3,583 1,102 4,685 4,245 1,434 5,680 4,507 1,460 5,967
Karongi 8,404 5,455 13,859 9,474 6,173 15,647 10,292 6,694 16,986
Kayonza 8,278 2,001 10,279 9,380 2,322 11,701 10,166 2,489 12,655
Kicukiro 23,588 9,076 32,664 30,859 11,620 42,480 31,345 11,915 43,260
Kirehe 3,419 763 4,182 3,734 883 4,617 4,118 948 5,066
Muhanga 5,462 1,505 6,967 5,858 1,624 7,482 6,517 1,801 8,318
Musanze 6,177 1,866 8,043 6,944 2,274 9,218 7,554 2,383 9,937
Ngoma 802 240 1,042 815 253 1,068 931 284 1,215
Ngororero 5,310 1,026 6,336 6,430 1,627 8,057 6,759 1,527 8,286
Nyabihu 2,270 840 3,109 3,641 1,957 5,599 3,403 1,610 5,013
Nyagatare 8,112 2,426 10,539 9,892 2,824 12,717 10,365 3,022 13,387
Nyamagabe 4,905 1,495 6,400 6,410 2,210 8,620 6,514 2,133 8,647
Nyamasheke 6,083 2,653 8,736 7,746 3,330 11,076 7,961 3,444 11,405
Nyanza 2,946 1,081 4,027 3,353 1,229 4,582 3,626 1,330 4,956
Nyarugenge 324,989 45,731 370,720 334,909 48,491 383,400 379,902 54,244 434,146
Nyaruguru 6,943 4,998 11,941 8,547 6,583 15,130 8,918 6,667 15,585
Rubavu 7,518 2,672 10,190 9,241 3,491 12,732 9,648 3,548 13,196
Ruhango 3,768 1,190 4,958 4,165 1,379 5,544 4,567 1,479 6,046
Rulindo 17,324 2,800 20,124 19,171 3,196 22,367 21,010 3,452 24,462
Rusizi 7,150 2,080 9,231 8,254 2,652 10,906 8,868 2,724 11,592
Rutsiro 3,851 1,713 5,564 4,627 2,363 6,990 4,881 2,347 7,228
Rwamagana 3,580 1,190 4,770 4,264 1,481 5,745 4,516 1,538 6,054
Total 527,472 114,656 642,128 576,350 134,150 710,500 635,469 143,237 778,706 Source: RSSB
Table 11.2.5: Pension Amount by categories and by sex Year 2011-2012 2012-2013 2013-2014 2015-2016 2016-2017 2017-2018
Pension benefits by sex
Male 5,755,573,652 6,956,309,148 8,343,716,776 11,104,333,480 12,524,231,853 14,768,493,224
Female 2,373,914,120 2,735,023,946 3,383,054,339 4,439,893,468 5,007,617,549 6,032,201,458
Total 8,129,487,772 9,691,333,094 11,726,774,115 15,544,226,948 17,531,849,402 20,800,694,682
Occupational hazards benefits by sex
Male 183,238,593 160,507,253 183,616,414 282,314,130 360,223,269 425,287,641
Female 110,265,854 163,438,987 141,085,294 206,674,487 263,709,645 311,341,499
Total 293,504,447 323,946,240 324,701,708 488,988,617 623,932,914 736,629,140
Medical care benefits by Sex
Male 4,641,827,765 6,571,845,998 6,713,934,528 8,667,298,089 9,895,327,835 11,683,230,395
Female 4,793,271,488 4,350,284,629 6,212,247,743 7,824,215,411 8,932,792,636 10,546,782,903
Total 9,435,099,253 10,922,130,627 12,926,182,271 16,491,513,500 18,828,120,471 22,230,013,298
General
Total 17,858,091,472 20,937,409,961 24,977,658,094 32,524,729,065 36,983,902,787 43,767,337,120
Source: RSSB
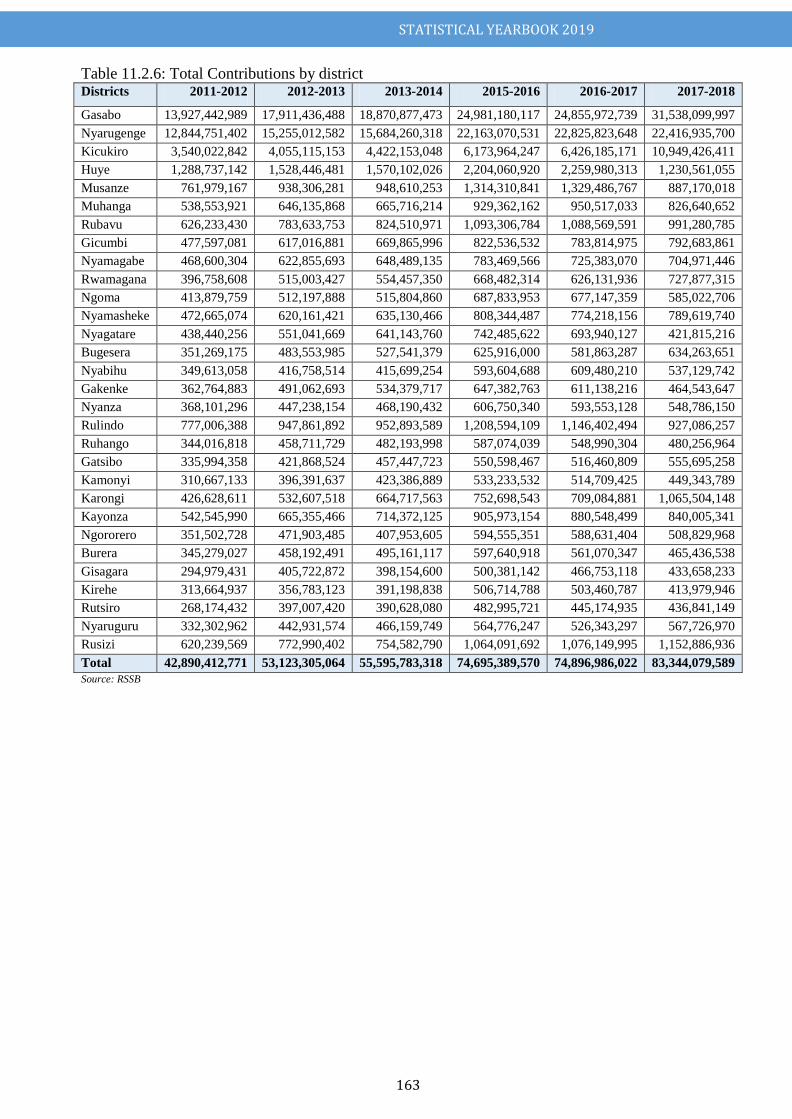
STATISTICAL YEARBOOK 2019
163
Table 11.2.6: Total Contributions by district Districts 2011-2012 2012-2013 2013-2014 2015-2016 2016-2017 2017-2018
Gasabo 13,927,442,989 17,911,436,488 18,870,877,473 24,981,180,117 24,855,972,739 31,538,099,997
Nyarugenge 12,844,751,402 15,255,012,582 15,684,260,318 22,163,070,531 22,825,823,648 22,416,935,700
Kicukiro 3,540,022,842 4,055,115,153 4,422,153,048 6,173,964,247 6,426,185,171 10,949,426,411
Huye 1,288,737,142 1,528,446,481 1,570,102,026 2,204,060,920 2,259,980,313 1,230,561,055
Musanze 761,979,167 938,306,281 948,610,253 1,314,310,841 1,329,486,767 887,170,018
Muhanga 538,553,921 646,135,868 665,716,214 929,362,162 950,517,033 826,640,652
Rubavu 626,233,430 783,633,753 824,510,971 1,093,306,784 1,088,569,591 991,280,785
Gicumbi 477,597,081 617,016,881 669,865,996 822,536,532 783,814,975 792,683,861
Nyamagabe 468,600,304 622,855,693 648,489,135 783,469,566 725,383,070 704,971,446
Rwamagana 396,758,608 515,003,427 554,457,350 668,482,314 626,131,936 727,877,315
Ngoma 413,879,759 512,197,888 515,804,860 687,833,953 677,147,359 585,022,706
Nyamasheke 472,665,074 620,161,421 635,130,466 808,344,487 774,218,156 789,619,740
Nyagatare 438,440,256 551,041,669 641,143,760 742,485,622 693,940,127 421,815,216
Bugesera 351,269,175 483,553,985 527,541,379 625,916,000 581,863,287 634,263,651
Nyabihu 349,613,058 416,758,514 415,699,254 593,604,688 609,480,210 537,129,742
Gakenke 362,764,883 491,062,693 534,379,717 647,382,763 611,138,216 464,543,647
Nyanza 368,101,296 447,238,154 468,190,432 606,750,340 593,553,128 548,786,150
Rulindo 777,006,388 947,861,892 952,893,589 1,208,594,109 1,146,402,494 927,086,257
Ruhango 344,016,818 458,711,729 482,193,998 587,074,039 548,990,304 480,256,964
Gatsibo 335,994,358 421,868,524 457,447,723 550,598,467 516,460,809 555,695,258
Kamonyi 310,667,133 396,391,637 423,386,889 533,233,532 514,709,425 449,343,789
Karongi 426,628,611 532,607,518 664,717,563 752,698,543 709,084,881 1,065,504,148
Kayonza 542,545,990 665,355,466 714,372,125 905,973,154 880,548,499 840,005,341
Ngororero 351,502,728 471,903,485 407,953,605 594,555,351 588,631,404 508,829,968
Burera 345,279,027 458,192,491 495,161,117 597,640,918 561,070,347 465,436,538
Gisagara 294,979,431 405,722,872 398,154,600 500,381,142 466,753,118 433,658,233
Kirehe 313,664,937 356,783,123 391,198,838 506,714,788 503,460,787 413,979,946
Rutsiro 268,174,432 397,007,420 390,628,080 482,995,721 445,174,935 436,841,149
Nyaruguru 332,302,962 442,931,574 466,159,749 564,776,247 526,343,297 567,726,970
Rusizi 620,239,569 772,990,402 754,582,790 1,064,091,692 1,076,149,995 1,152,886,936
Total 42,890,412,771 53,123,305,064 55,595,783,318 74,695,389,570 74,896,986,022 83,344,079,589
Source: RSSB
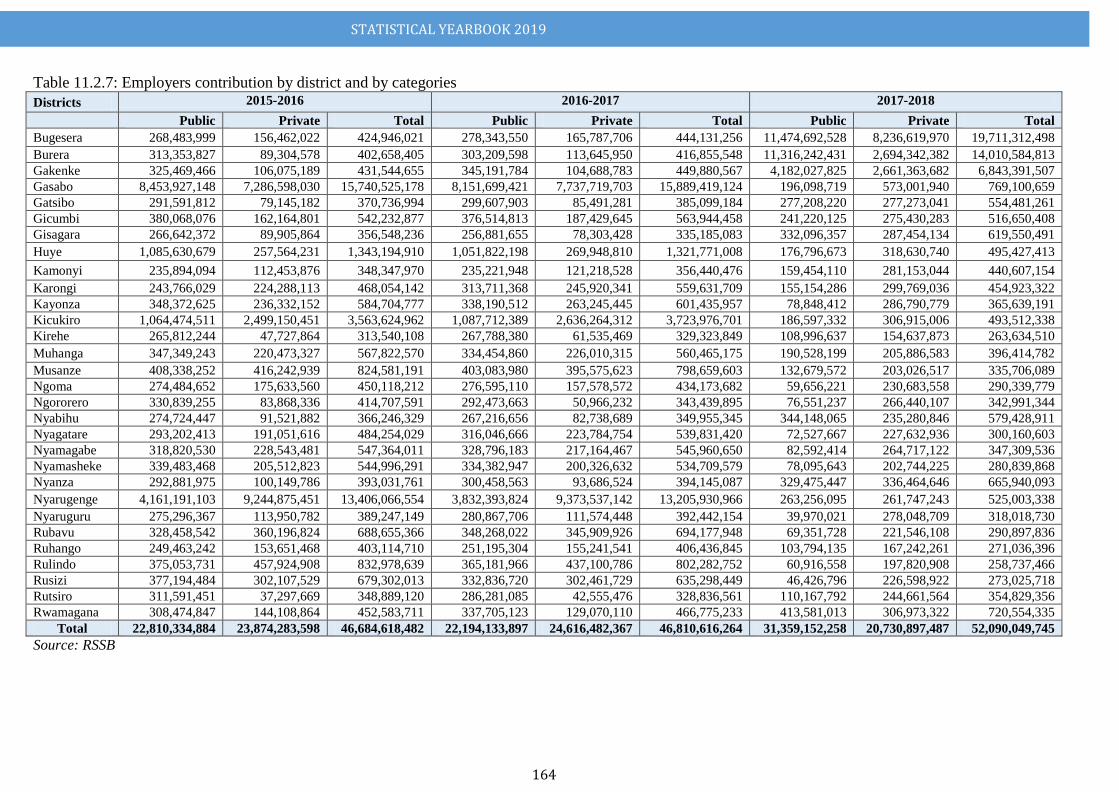
STATISTICAL YEARBOOK 2019
164
Table 11.2.7: Employers contribution by district and by categories
Districts 2015-2016 2016-2017 2017-2018
Public Private Total Public Private Total Public Private Total
Bugesera 268,483,999 156,462,022 424,946,021 278,343,550 165,787,706 444,131,256 11,474,692,528 8,236,619,970 19,711,312,498
Burera 313,353,827 89,304,578 402,658,405 303,209,598 113,645,950 416,855,548 11,316,242,431 2,694,342,382 14,010,584,813
Gakenke 325,469,466 106,075,189 431,544,655 345,191,784 104,688,783 449,880,567 4,182,027,825 2,661,363,682 6,843,391,507
Gasabo 8,453,927,148 7,286,598,030 15,740,525,178 8,151,699,421 7,737,719,703 15,889,419,124 196,098,719 573,001,940 769,100,659
Gatsibo 291,591,812 79,145,182 370,736,994 299,607,903 85,491,281 385,099,184 277,208,220 277,273,041 554,481,261
Gicumbi 380,068,076 162,164,801 542,232,877 376,514,813 187,429,645 563,944,458 241,220,125 275,430,283 516,650,408
Gisagara 266,642,372 89,905,864 356,548,236 256,881,655 78,303,428 335,185,083 332,096,357 287,454,134 619,550,491
Huye 1,085,630,679 257,564,231 1,343,194,910 1,051,822,198 269,948,810 1,321,771,008 176,796,673 318,630,740 495,427,413
Kamonyi 235,894,094 112,453,876 348,347,970 235,221,948 121,218,528 356,440,476 159,454,110 281,153,044 440,607,154
Karongi 243,766,029 224,288,113 468,054,142 313,711,368 245,920,341 559,631,709 155,154,286 299,769,036 454,923,322
Kayonza 348,372,625 236,332,152 584,704,777 338,190,512 263,245,445 601,435,957 78,848,412 286,790,779 365,639,191
Kicukiro 1,064,474,511 2,499,150,451 3,563,624,962 1,087,712,389 2,636,264,312 3,723,976,701 186,597,332 306,915,006 493,512,338
Kirehe 265,812,244 47,727,864 313,540,108 267,788,380 61,535,469 329,323,849 108,996,637 154,637,873 263,634,510
Muhanga 347,349,243 220,473,327 567,822,570 334,454,860 226,010,315 560,465,175 190,528,199 205,886,583 396,414,782
Musanze 408,338,252 416,242,939 824,581,191 403,083,980 395,575,623 798,659,603 132,679,572 203,026,517 335,706,089
Ngoma 274,484,652 175,633,560 450,118,212 276,595,110 157,578,572 434,173,682 59,656,221 230,683,558 290,339,779
Ngororero 330,839,255 83,868,336 414,707,591 292,473,663 50,966,232 343,439,895 76,551,237 266,440,107 342,991,344
Nyabihu 274,724,447 91,521,882 366,246,329 267,216,656 82,738,689 349,955,345 344,148,065 235,280,846 579,428,911
Nyagatare 293,202,413 191,051,616 484,254,029 316,046,666 223,784,754 539,831,420 72,527,667 227,632,936 300,160,603
Nyamagabe 318,820,530 228,543,481 547,364,011 328,796,183 217,164,467 545,960,650 82,592,414 264,717,122 347,309,536
Nyamasheke 339,483,468 205,512,823 544,996,291 334,382,947 200,326,632 534,709,579 78,095,643 202,744,225 280,839,868
Nyanza 292,881,975 100,149,786 393,031,761 300,458,563 93,686,524 394,145,087 329,475,447 336,464,646 665,940,093
Nyarugenge 4,161,191,103 9,244,875,451 13,406,066,554 3,832,393,824 9,373,537,142 13,205,930,966 263,256,095 261,747,243 525,003,338
Nyaruguru 275,296,367 113,950,782 389,247,149 280,867,706 111,574,448 392,442,154 39,970,021 278,048,709 318,018,730
Rubavu 328,458,542 360,196,824 688,655,366 348,268,022 345,909,926 694,177,948 69,351,728 221,546,108 290,897,836
Ruhango 249,463,242 153,651,468 403,114,710 251,195,304 155,241,541 406,436,845 103,794,135 167,242,261 271,036,396
Rulindo 375,053,731 457,924,908 832,978,639 365,181,966 437,100,786 802,282,752 60,916,558 197,820,908 258,737,466
Rusizi 377,194,484 302,107,529 679,302,013 332,836,720 302,461,729 635,298,449 46,426,796 226,598,922 273,025,718
Rutsiro 311,591,451 37,297,669 348,889,120 286,281,085 42,555,476 328,836,561 110,167,792 244,661,564 354,829,356
Rwamagana 308,474,847 144,108,864 452,583,711 337,705,123 129,070,110 466,775,233 413,581,013 306,973,322 720,554,335
Total 22,810,334,884 23,874,283,598 46,684,618,482 22,194,133,897 24,616,482,367 46,810,616,264 31,359,152,258 20,730,897,487 52,090,049,745
Source: RSSB
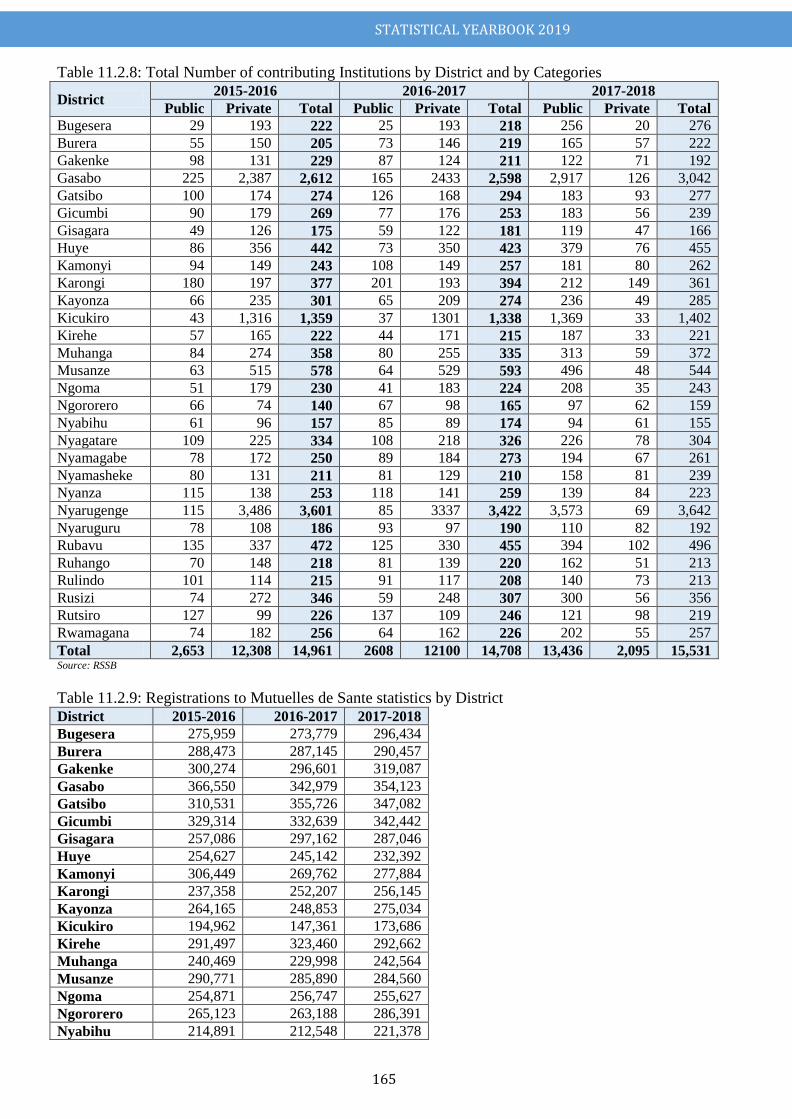
STATISTICAL YEARBOOK 2019
165
Table 11.2.8: Total Number of contributing Institutions by District and by Categories
District 2015-2016 2016-2017 2017-2018
Public Private Total Public Private Total Public Private Total
Bugesera 29 193 222 25 193 218 256 20 276
Burera 55 150 205 73 146 219 165 57 222
Gakenke 98 131 229 87 124 211 122 71 192
Gasabo 225 2,387 2,612 165 2433 2,598 2,917 126 3,042
Gatsibo 100 174 274 126 168 294 183 93 277
Gicumbi 90 179 269 77 176 253 183 56 239
Gisagara 49 126 175 59 122 181 119 47 166
Huye 86 356 442 73 350 423 379 76 455
Kamonyi 94 149 243 108 149 257 181 80 262
Karongi 180 197 377 201 193 394 212 149 361
Kayonza 66 235 301 65 209 274 236 49 285
Kicukiro 43 1,316 1,359 37 1301 1,338 1,369 33 1,402
Kirehe 57 165 222 44 171 215 187 33 221
Muhanga 84 274 358 80 255 335 313 59 372
Musanze 63 515 578 64 529 593 496 48 544
Ngoma 51 179 230 41 183 224 208 35 243
Ngororero 66 74 140 67 98 165 97 62 159
Nyabihu 61 96 157 85 89 174 94 61 155
Nyagatare 109 225 334 108 218 326 226 78 304
Nyamagabe 78 172 250 89 184 273 194 67 261
Nyamasheke 80 131 211 81 129 210 158 81 239
Nyanza 115 138 253 118 141 259 139 84 223
Nyarugenge 115 3,486 3,601 85 3337 3,422 3,573 69 3,642
Nyaruguru 78 108 186 93 97 190 110 82 192
Rubavu 135 337 472 125 330 455 394 102 496
Ruhango 70 148 218 81 139 220 162 51 213
Rulindo 101 114 215 91 117 208 140 73 213
Rusizi 74 272 346 59 248 307 300 56 356
Rutsiro 127 99 226 137 109 246 121 98 219
Rwamagana 74 182 256 64 162 226 202 55 257
Total 2,653 12,308 14,961 2608 12100 14,708 13,436 2,095 15,531 Source: RSSB
Table 11.2.9: Registrations to Mutuelles de Sante statistics by District
District 2015-2016 2016-2017 2017-2018
Bugesera 275,959 273,779 296,434
Burera 288,473 287,145 290,457
Gakenke 300,274 296,601 319,087
Gasabo 366,550 342,979 354,123
Gatsibo 310,531 355,726 347,082
Gicumbi 329,314 332,639 342,442
Gisagara 257,086 297,162 287,046
Huye 254,627 245,142 232,392
Kamonyi 306,449 269,762 277,884
Karongi 237,358 252,207 256,145
Kayonza 264,165 248,853 275,034
Kicukiro 194,962 147,361 173,686
Kirehe 291,497 323,460 292,662
Muhanga 240,469 229,998 242,564
Musanze 290,771 285,890 284,560
Ngoma 254,871 256,747 255,627
Ngororero 265,123 263,188 286,391
Nyabihu 214,891 212,548 221,378
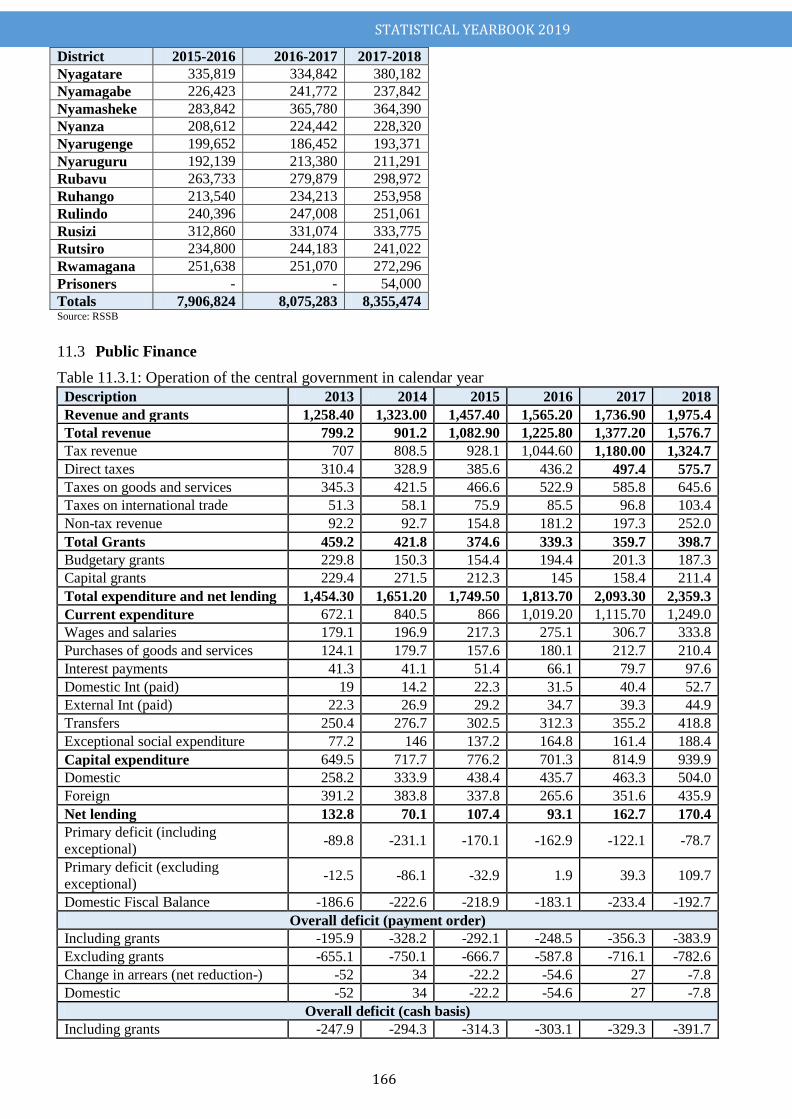
STATISTICAL YEARBOOK 2019
166
District 2015-2016 2016-2017 2017-2018
Nyagatare 335,819 334,842 380,182
Nyamagabe 226,423 241,772 237,842
Nyamasheke 283,842 365,780 364,390
Nyanza 208,612 224,442 228,320
Nyarugenge 199,652 186,452 193,371
Nyaruguru 192,139 213,380 211,291
Rubavu 263,733 279,879 298,972
Ruhango 213,540 234,213 253,958
Rulindo 240,396 247,008 251,061
Rusizi 312,860 331,074 333,775
Rutsiro 234,800 244,183 241,022
Rwamagana 251,638 251,070 272,296
Prisoners - - 54,000
Totals 7,906,824 8,075,283 8,355,474 Source: RSSB
Public Finance 11.3
Table 11.3.1: Operation of the central government in calendar year
Description 2013 2014 2015 2016 2017 2018
Revenue and grants 1,258.40 1,323.00 1,457.40 1,565.20 1,736.90 1,975.4
Total revenue 799.2 901.2 1,082.90 1,225.80 1,377.20 1,576.7
Tax revenue 707 808.5 928.1 1,044.60 1,180.00 1,324.7
Direct taxes 310.4 328.9 385.6 436.2 497.4 575.7
Taxes on goods and services 345.3 421.5 466.6 522.9 585.8 645.6
Taxes on international trade 51.3 58.1 75.9 85.5 96.8 103.4
Non-tax revenue 92.2 92.7 154.8 181.2 197.3 252.0
Total Grants 459.2 421.8 374.6 339.3 359.7 398.7
Budgetary grants 229.8 150.3 154.4 194.4 201.3 187.3
Capital grants 229.4 271.5 212.3 145 158.4 211.4
Total expenditure and net lending 1,454.30 1,651.20 1,749.50 1,813.70 2,093.30 2,359.3
Current expenditure 672.1 840.5 866 1,019.20 1,115.70 1,249.0
Wages and salaries 179.1 196.9 217.3 275.1 306.7 333.8
Purchases of goods and services 124.1 179.7 157.6 180.1 212.7 210.4
Interest payments 41.3 41.1 51.4 66.1 79.7 97.6
Domestic Int (paid) 19 14.2 22.3 31.5 40.4 52.7
External Int (paid) 22.3 26.9 29.2 34.7 39.3 44.9
Transfers 250.4 276.7 302.5 312.3 355.2 418.8
Exceptional social expenditure 77.2 146 137.2 164.8 161.4 188.4
Capital expenditure 649.5 717.7 776.2 701.3 814.9 939.9
Domestic 258.2 333.9 438.4 435.7 463.3 504.0
Foreign 391.2 383.8 337.8 265.6 351.6 435.9
Net lending 132.8 70.1 107.4 93.1 162.7 170.4
Primary deficit (including
exceptional) -89.8 -231.1 -170.1 -162.9 -122.1 -78.7
Primary deficit (excluding
exceptional) -12.5 -86.1 -32.9 1.9 39.3 109.7
Domestic Fiscal Balance -186.6 -222.6 -218.9 -183.1 -233.4 -192.7
Overall deficit (payment order)
Including grants -195.9 -328.2 -292.1 -248.5 -356.3 -383.9
Excluding grants -655.1 -750.1 -666.7 -587.8 -716.1 -782.6
Change in arrears (net reduction-) -52 34 -22.2 -54.6 27 -7.8
Domestic -52 34 -22.2 -54.6 27 -7.8
Overall deficit (cash basis)
Including grants -247.9 -294.3 -314.3 -303.1 -329.3 -391.7
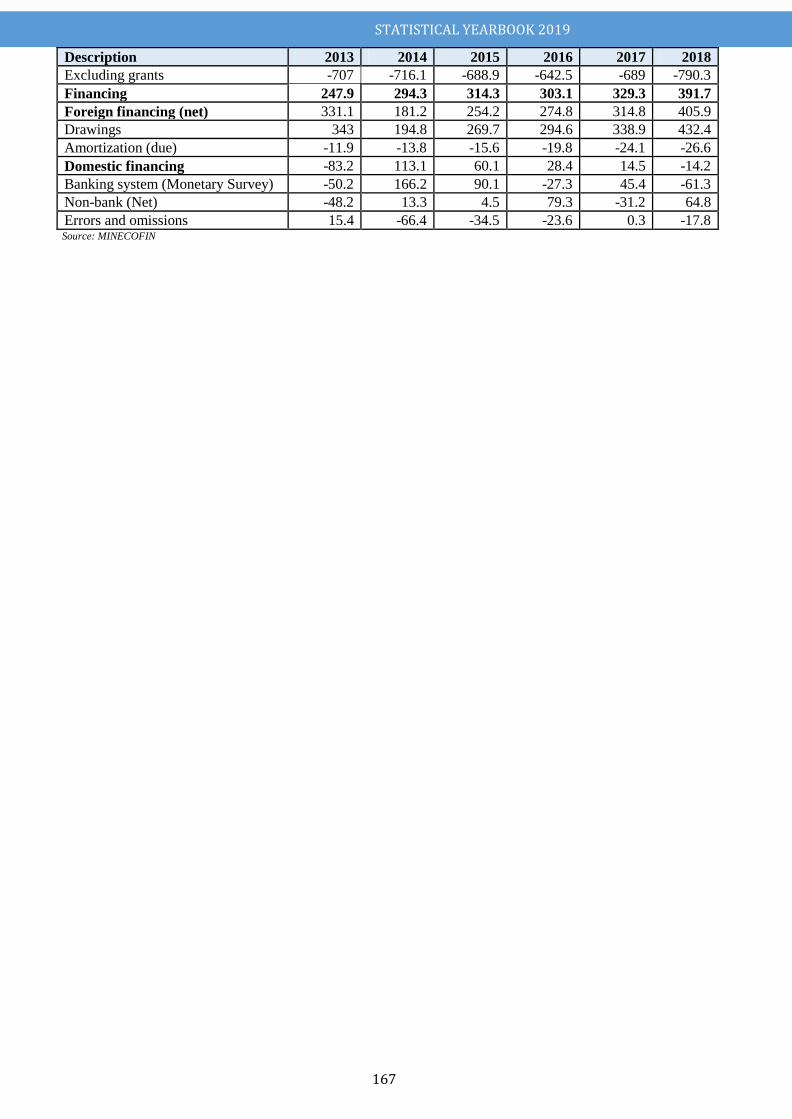
STATISTICAL YEARBOOK 2019
167
Description 2013 2014 2015 2016 2017 2018
Excluding grants -707 -716.1 -688.9 -642.5 -689 -790.3
Financing 247.9 294.3 314.3 303.1 329.3 391.7
Foreign financing (net) 331.1 181.2 254.2 274.8 314.8 405.9
Drawings 343 194.8 269.7 294.6 338.9 432.4
Amortization (due) -11.9 -13.8 -15.6 -19.8 -24.1 -26.6
Domestic financing -83.2 113.1 60.1 28.4 14.5 -14.2
Banking system (Monetary Survey) -50.2 166.2 90.1 -27.3 45.4 -61.3
Non-bank (Net) -48.2 13.3 4.5 79.3 -31.2 64.8
Errors and omissions 15.4 -66.4 -34.5 -23.6 0.3 -17.8 Source: MINECOFIN
STATISTICAL YEARBOOK 2019
168
CHAPTER XIII: BUSINESS ENTERPRISES and FOREIGN TRADE
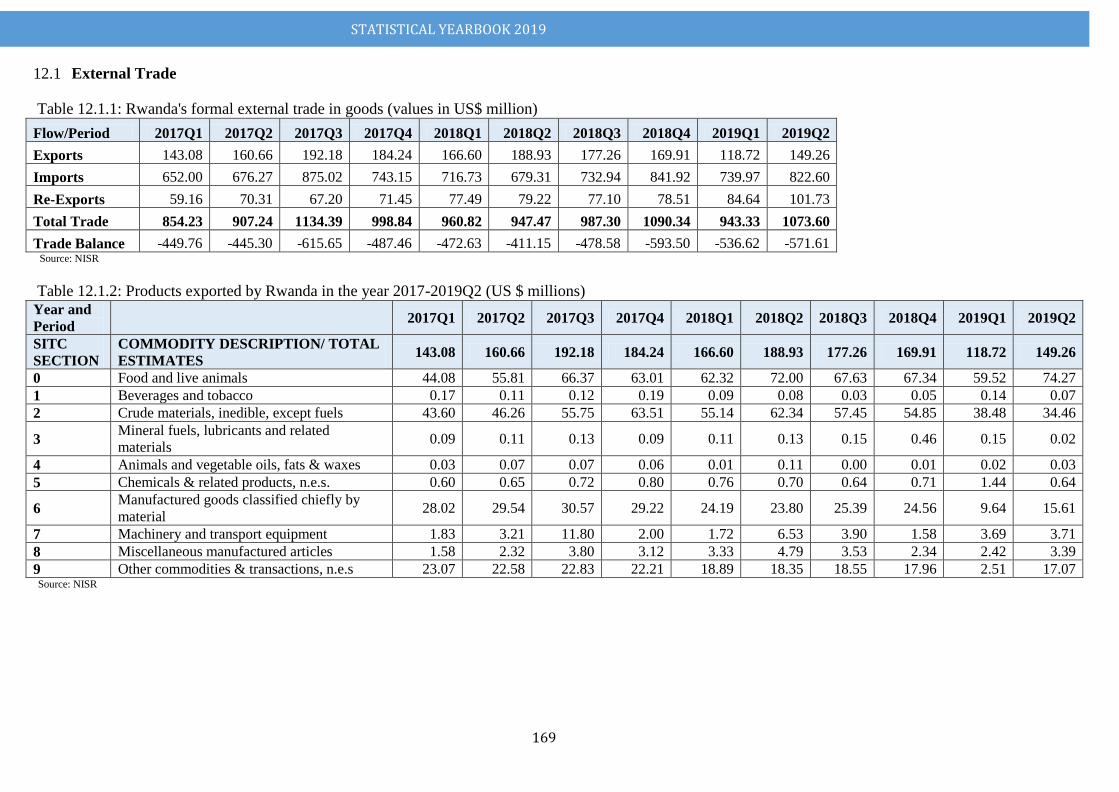
STATISTICAL YEARBOOK 2019
169
External Trade 12.1 Table 12.1.1: Rwanda's formal external trade in goods (values in US$ million)
Flow/Period 2017Q1 2017Q2 2017Q3 2017Q4 2018Q1 2018Q2 2018Q3 2018Q4 2019Q1 2019Q2
Exports 143.08 160.66 192.18 184.24 166.60 188.93 177.26 169.91 118.72 149.26
Imports 652.00 676.27 875.02 743.15 716.73 679.31 732.94 841.92 739.97 822.60
Re-Exports 59.16 70.31 67.20 71.45 77.49 79.22 77.10 78.51 84.64 101.73
Total Trade 854.23 907.24 1134.39 998.84 960.82 947.47 987.30 1090.34 943.33 1073.60
Trade Balance -449.76 -445.30 -615.65 -487.46 -472.63 -411.15 -478.58 -593.50 -536.62 -571.61 Source: NISR
Table 12.1.2: Products exported by Rwanda in the year 2017-2019Q2 (US $ millions)
Year and
Period 2017Q1 2017Q2 2017Q3 2017Q4 2018Q1 2018Q2 2018Q3 2018Q4 2019Q1 2019Q2
SITC
SECTION
COMMODITY DESCRIPTION/ TOTAL
ESTIMATES 143.08 160.66 192.18 184.24 166.60 188.93 177.26 169.91 118.72 149.26
0 Food and live animals 44.08 55.81 66.37 63.01 62.32 72.00 67.63 67.34 59.52 74.27
1 Beverages and tobacco 0.17 0.11 0.12 0.19 0.09 0.08 0.03 0.05 0.14 0.07
2 Crude materials, inedible, except fuels 43.60 46.26 55.75 63.51 55.14 62.34 57.45 54.85 38.48 34.46
3 Mineral fuels, lubricants and related
materials 0.09 0.11 0.13 0.09 0.11 0.13 0.15 0.46 0.15 0.02
4 Animals and vegetable oils, fats & waxes 0.03 0.07 0.07 0.06 0.01 0.11 0.00 0.01 0.02 0.03
5 Chemicals & related products, n.e.s. 0.60 0.65 0.72 0.80 0.76 0.70 0.64 0.71 1.44 0.64
6 Manufactured goods classified chiefly by
material 28.02 29.54 30.57 29.22 24.19 23.80 25.39 24.56 9.64 15.61
7 Machinery and transport equipment 1.83 3.21 11.80 2.00 1.72 6.53 3.90 1.58 3.69 3.71
8 Miscellaneous manufactured articles 1.58 2.32 3.80 3.12 3.33 4.79 3.53 2.34 2.42 3.39
9 Other commodities & transactions, n.e.s 23.07 22.58 22.83 22.21 18.89 18.35 18.55 17.96 2.51 17.07 Source: NISR
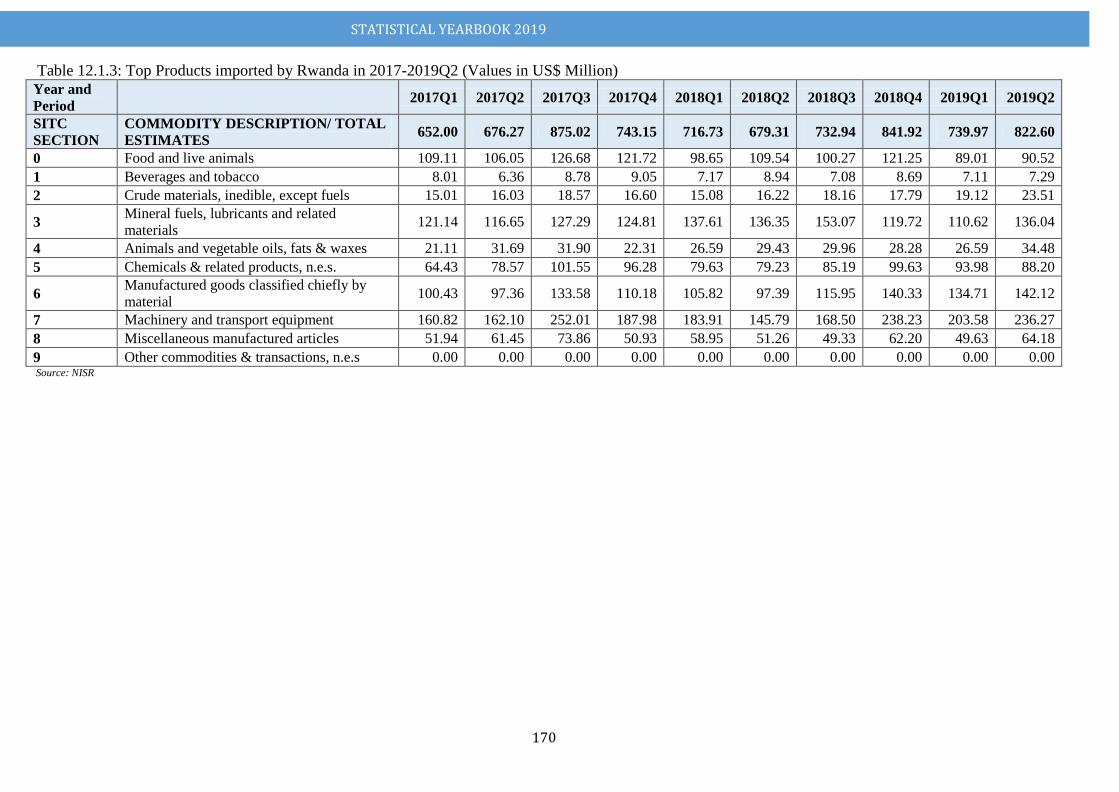
STATISTICAL YEARBOOK 2019
170
Table 12.1.3: Top Products imported by Rwanda in 2017-2019Q2 (Values in US$ Million)
Year and
Period 2017Q1 2017Q2 2017Q3 2017Q4 2018Q1 2018Q2 2018Q3 2018Q4 2019Q1 2019Q2
SITC
SECTION
COMMODITY DESCRIPTION/ TOTAL
ESTIMATES 652.00 676.27 875.02 743.15 716.73 679.31 732.94 841.92 739.97 822.60
0 Food and live animals 109.11 106.05 126.68 121.72 98.65 109.54 100.27 121.25 89.01 90.52
1 Beverages and tobacco 8.01 6.36 8.78 9.05 7.17 8.94 7.08 8.69 7.11 7.29
2 Crude materials, inedible, except fuels 15.01 16.03 18.57 16.60 15.08 16.22 18.16 17.79 19.12 23.51
3 Mineral fuels, lubricants and related
materials 121.14 116.65 127.29 124.81 137.61 136.35 153.07 119.72 110.62 136.04
4 Animals and vegetable oils, fats & waxes 21.11 31.69 31.90 22.31 26.59 29.43 29.96 28.28 26.59 34.48
5 Chemicals & related products, n.e.s. 64.43 78.57 101.55 96.28 79.63 79.23 85.19 99.63 93.98 88.20
6 Manufactured goods classified chiefly by
material 100.43 97.36 133.58 110.18 105.82 97.39 115.95 140.33 134.71 142.12
7 Machinery and transport equipment 160.82 162.10 252.01 187.98 183.91 145.79 168.50 238.23 203.58 236.27
8 Miscellaneous manufactured articles 51.94 61.45 73.86 50.93 58.95 51.26 49.33 62.20 49.63 64.18
9 Other commodities & transactions, n.e.s 0.00 0.00 0.00 0.00 0.00 0.00 0.00 0.00 0.00 0.00 Source: NISR
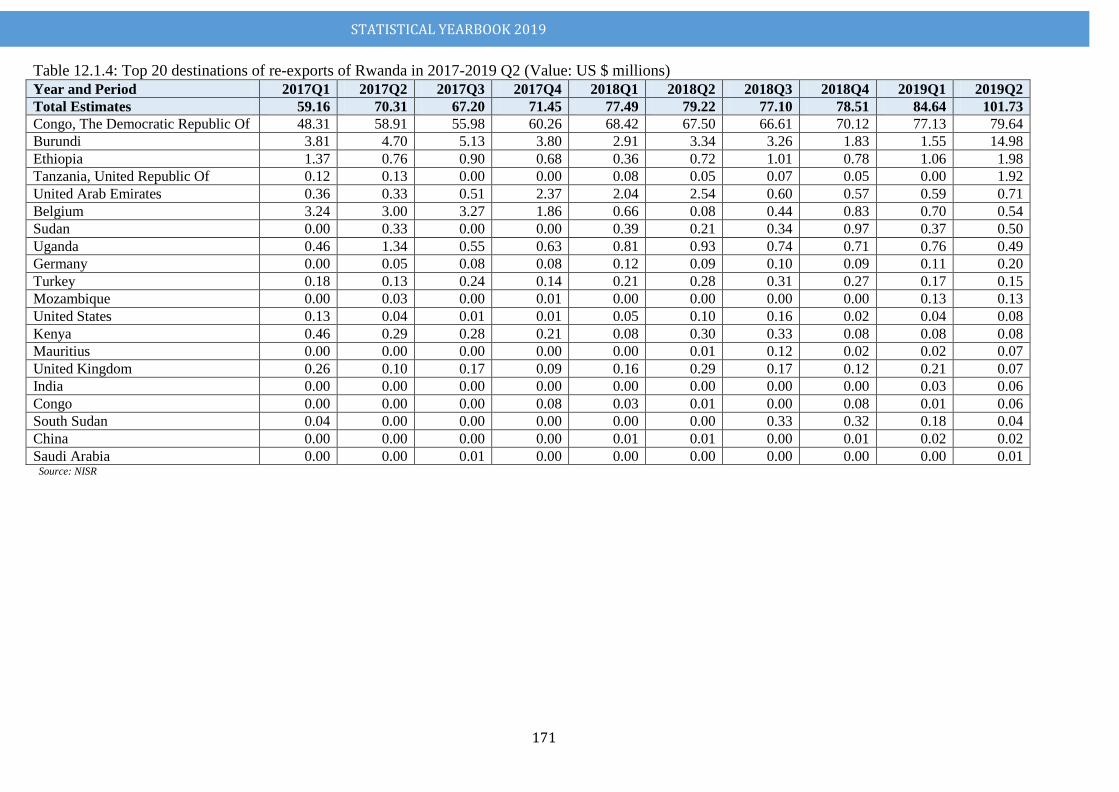
STATISTICAL YEARBOOK 2019
171
Table 12.1.4: Top 20 destinations of re-exports of Rwanda in 2017-2019 Q2 (Value: US $ millions)
Year and Period 2017Q1 2017Q2 2017Q3 2017Q4 2018Q1 2018Q2 2018Q3 2018Q4 2019Q1 2019Q2
Total Estimates 59.16 70.31 67.20 71.45 77.49 79.22 77.10 78.51 84.64 101.73
Congo, The Democratic Republic Of 48.31 58.91 55.98 60.26 68.42 67.50 66.61 70.12 77.13 79.64
Burundi 3.81 4.70 5.13 3.80 2.91 3.34 3.26 1.83 1.55 14.98
Ethiopia 1.37 0.76 0.90 0.68 0.36 0.72 1.01 0.78 1.06 1.98
Tanzania, United Republic Of 0.12 0.13 0.00 0.00 0.08 0.05 0.07 0.05 0.00 1.92
United Arab Emirates 0.36 0.33 0.51 2.37 2.04 2.54 0.60 0.57 0.59 0.71
Belgium 3.24 3.00 3.27 1.86 0.66 0.08 0.44 0.83 0.70 0.54
Sudan 0.00 0.33 0.00 0.00 0.39 0.21 0.34 0.97 0.37 0.50
Uganda 0.46 1.34 0.55 0.63 0.81 0.93 0.74 0.71 0.76 0.49
Germany 0.00 0.05 0.08 0.08 0.12 0.09 0.10 0.09 0.11 0.20
Turkey 0.18 0.13 0.24 0.14 0.21 0.28 0.31 0.27 0.17 0.15
Mozambique 0.00 0.03 0.00 0.01 0.00 0.00 0.00 0.00 0.13 0.13
United States 0.13 0.04 0.01 0.01 0.05 0.10 0.16 0.02 0.04 0.08
Kenya 0.46 0.29 0.28 0.21 0.08 0.30 0.33 0.08 0.08 0.08
Mauritius 0.00 0.00 0.00 0.00 0.00 0.01 0.12 0.02 0.02 0.07
United Kingdom 0.26 0.10 0.17 0.09 0.16 0.29 0.17 0.12 0.21 0.07
India 0.00 0.00 0.00 0.00 0.00 0.00 0.00 0.00 0.03 0.06
Congo 0.00 0.00 0.00 0.08 0.03 0.01 0.00 0.08 0.01 0.06
South Sudan 0.04 0.00 0.00 0.00 0.00 0.00 0.33 0.32 0.18 0.04
China 0.00 0.00 0.00 0.00 0.01 0.01 0.00 0.01 0.02 0.02
Saudi Arabia 0.00 0.00 0.01 0.00 0.00 0.00 0.00 0.00 0.00 0.01 Source: NISR
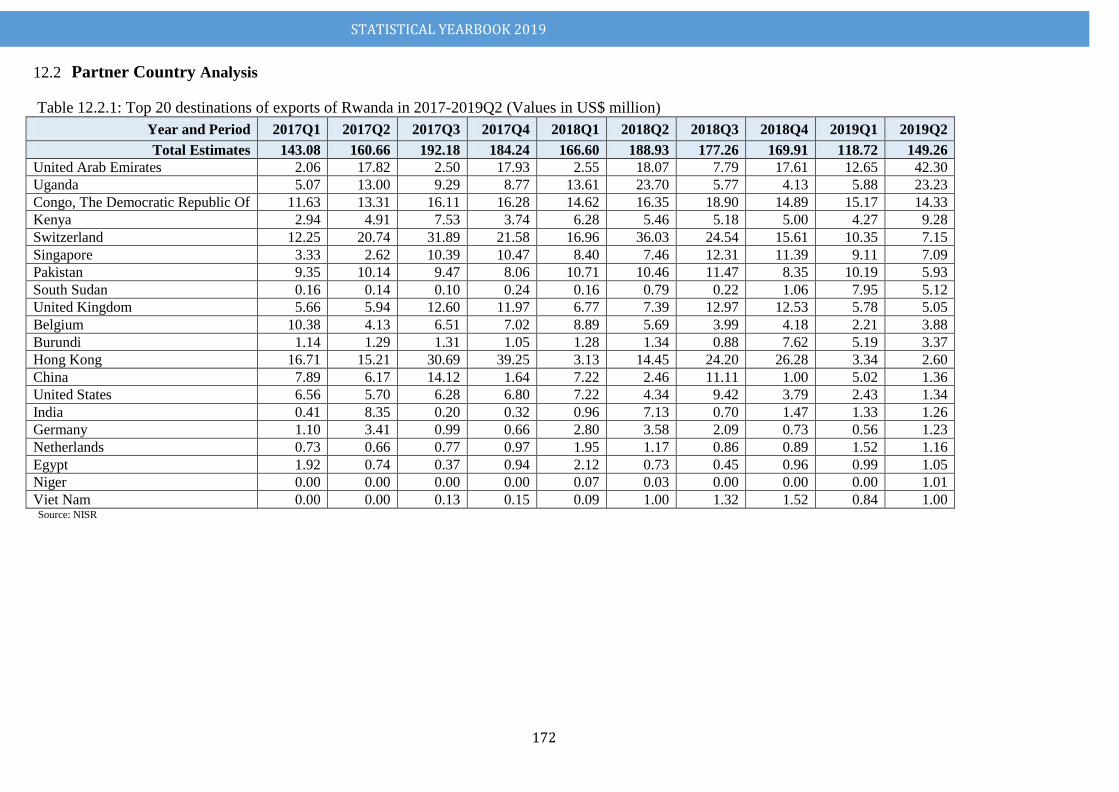
STATISTICAL YEARBOOK 2019
172
Partner Country Analysis 12.2 Table 12.2.1: Top 20 destinations of exports of Rwanda in 2017-2019Q2 (Values in US$ million)
Year and Period 2017Q1 2017Q2 2017Q3 2017Q4 2018Q1 2018Q2 2018Q3 2018Q4 2019Q1 2019Q2
Total Estimates 143.08 160.66 192.18 184.24 166.60 188.93 177.26 169.91 118.72 149.26
United Arab Emirates 2.06 17.82 2.50 17.93 2.55 18.07 7.79 17.61 12.65 42.30
Uganda 5.07 13.00 9.29 8.77 13.61 23.70 5.77 4.13 5.88 23.23
Congo, The Democratic Republic Of 11.63 13.31 16.11 16.28 14.62 16.35 18.90 14.89 15.17 14.33
Kenya 2.94 4.91 7.53 3.74 6.28 5.46 5.18 5.00 4.27 9.28
Switzerland 12.25 20.74 31.89 21.58 16.96 36.03 24.54 15.61 10.35 7.15
Singapore 3.33 2.62 10.39 10.47 8.40 7.46 12.31 11.39 9.11 7.09
Pakistan 9.35 10.14 9.47 8.06 10.71 10.46 11.47 8.35 10.19 5.93
South Sudan 0.16 0.14 0.10 0.24 0.16 0.79 0.22 1.06 7.95 5.12
United Kingdom 5.66 5.94 12.60 11.97 6.77 7.39 12.97 12.53 5.78 5.05
Belgium 10.38 4.13 6.51 7.02 8.89 5.69 3.99 4.18 2.21 3.88
Burundi 1.14 1.29 1.31 1.05 1.28 1.34 0.88 7.62 5.19 3.37
Hong Kong 16.71 15.21 30.69 39.25 3.13 14.45 24.20 26.28 3.34 2.60
China 7.89 6.17 14.12 1.64 7.22 2.46 11.11 1.00 5.02 1.36
United States 6.56 5.70 6.28 6.80 7.22 4.34 9.42 3.79 2.43 1.34
India 0.41 8.35 0.20 0.32 0.96 7.13 0.70 1.47 1.33 1.26
Germany 1.10 3.41 0.99 0.66 2.80 3.58 2.09 0.73 0.56 1.23
Netherlands 0.73 0.66 0.77 0.97 1.95 1.17 0.86 0.89 1.52 1.16
Egypt 1.92 0.74 0.37 0.94 2.12 0.73 0.45 0.96 0.99 1.05
Niger 0.00 0.00 0.00 0.00 0.07 0.03 0.00 0.00 0.00 1.01
Viet Nam 0.00 0.00 0.13 0.15 0.09 1.00 1.32 1.52 0.84 1.00 Source: NISR
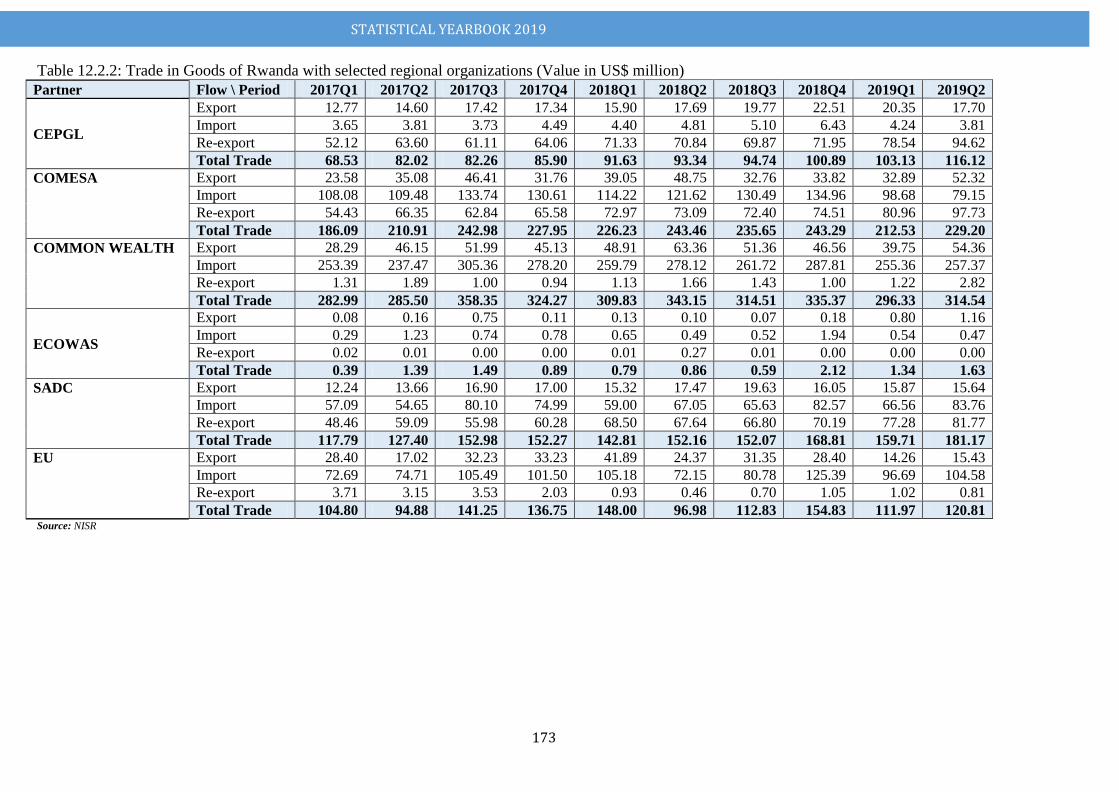
STATISTICAL YEARBOOK 2019
173
Table 12.2.2: Trade in Goods of Rwanda with selected regional organizations (Value in US$ million)
Partner Flow \ Period 2017Q1 2017Q2 2017Q3 2017Q4 2018Q1 2018Q2 2018Q3 2018Q4 2019Q1 2019Q2
CEPGL
Export 12.77 14.60 17.42 17.34 15.90 17.69 19.77 22.51 20.35 17.70
Import 3.65 3.81 3.73 4.49 4.40 4.81 5.10 6.43 4.24 3.81
Re-export 52.12 63.60 61.11 64.06 71.33 70.84 69.87 71.95 78.54 94.62
Total Trade 68.53 82.02 82.26 85.90 91.63 93.34 94.74 100.89 103.13 116.12
COMESA Export 23.58 35.08 46.41 31.76 39.05 48.75 32.76 33.82 32.89 52.32
Import 108.08 109.48 133.74 130.61 114.22 121.62 130.49 134.96 98.68 79.15
Re-export 54.43 66.35 62.84 65.58 72.97 73.09 72.40 74.51 80.96 97.73
Total Trade 186.09 210.91 242.98 227.95 226.23 243.46 235.65 243.29 212.53 229.20
COMMON WEALTH Export 28.29 46.15 51.99 45.13 48.91 63.36 51.36 46.56 39.75 54.36
Import 253.39 237.47 305.36 278.20 259.79 278.12 261.72 287.81 255.36 257.37
Re-export 1.31 1.89 1.00 0.94 1.13 1.66 1.43 1.00 1.22 2.82
Total Trade 282.99 285.50 358.35 324.27 309.83 343.15 314.51 335.37 296.33 314.54
ECOWAS
Export 0.08 0.16 0.75 0.11 0.13 0.10 0.07 0.18 0.80 1.16
Import 0.29 1.23 0.74 0.78 0.65 0.49 0.52 1.94 0.54 0.47
Re-export 0.02 0.01 0.00 0.00 0.01 0.27 0.01 0.00 0.00 0.00
Total Trade 0.39 1.39 1.49 0.89 0.79 0.86 0.59 2.12 1.34 1.63
SADC Export 12.24 13.66 16.90 17.00 15.32 17.47 19.63 16.05 15.87 15.64
Import 57.09 54.65 80.10 74.99 59.00 67.05 65.63 82.57 66.56 83.76
Re-export 48.46 59.09 55.98 60.28 68.50 67.64 66.80 70.19 77.28 81.77
Total Trade 117.79 127.40 152.98 152.27 142.81 152.16 152.07 168.81 159.71 181.17
EU Export 28.40 17.02 32.23 33.23 41.89 24.37 31.35 28.40 14.26 15.43
Import 72.69 74.71 105.49 101.50 105.18 72.15 80.78 125.39 96.69 104.58
Re-export 3.71 3.15 3.53 2.03 0.93 0.46 0.70 1.05 1.02 0.81
Total Trade 104.80 94.88 141.25 136.75 148.00 96.98 112.83 154.83 111.97 120.81
Source: NISR
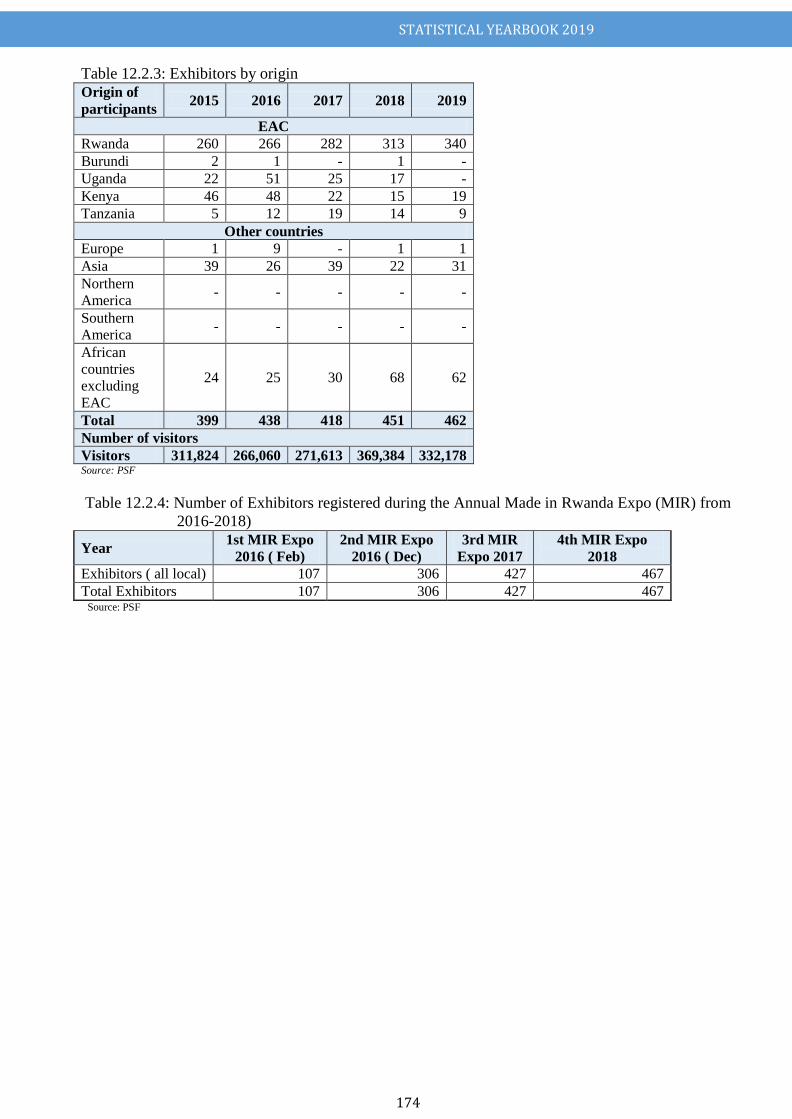
STATISTICAL YEARBOOK 2019
174
Table 12.2.3: Exhibitors by origin
Origin of
participants 2015 2016 2017 2018 2019
EAC
Rwanda 260 266 282 313 340
Burundi 2 1 - 1 -
Uganda 22 51 25 17 -
Kenya 46 48 22 15 19
Tanzania 5 12 19 14 9
Other countries
Europe 1 9 - 1 1
Asia 39 26 39 22 31
Northern
America - - - - -
Southern
America - - - - -
African
countries
excluding
EAC
24 25 30 68 62
Total 399 438 418 451 462
Number of visitors
Visitors 311,824 266,060 271,613 369,384 332,178 Source: PSF
Table 12.2.4: Number of Exhibitors registered during the Annual Made in Rwanda Expo (MIR) from
2016-2018)
Year 1st MIR Expo
2016 ( Feb)
2nd MIR Expo
2016 ( Dec)
3rd MIR
Expo 2017
4th MIR Expo
2018
Exhibitors ( all local) 107 306 427 467
Total Exhibitors 107 306 427 467 Source: PSF
STATISTICAL YEARBOOK 2019
175
CHAPTER XIV: LAW ENFORCEMENT, COURT AND ORDER
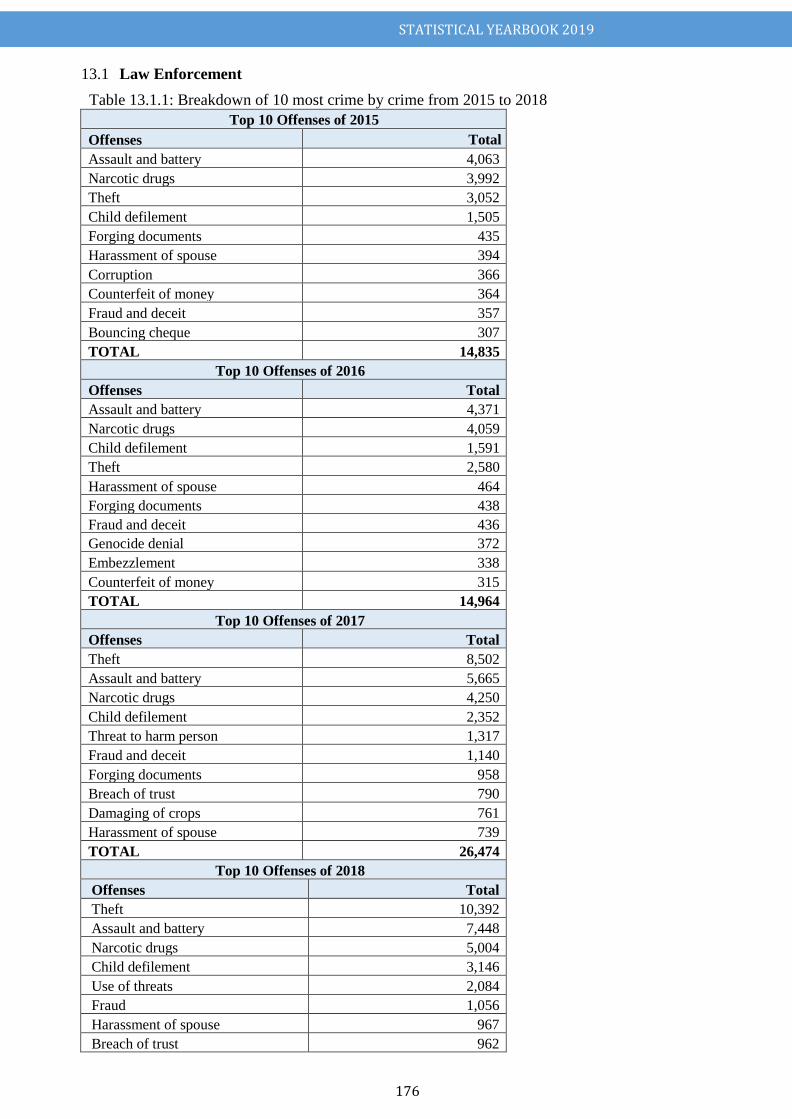
STATISTICAL YEARBOOK 2019
176
Law Enforcement 13.1
Table 13.1.1: Breakdown of 10 most crime by crime from 2015 to 2018
Top 10 Offenses of 2015
Offenses Total
Assault and battery 4,063
Narcotic drugs 3,992
Theft 3,052
Child defilement 1,505
Forging documents 435
Harassment of spouse 394
Corruption 366
Counterfeit of money 364
Fraud and deceit 357
Bouncing cheque 307
TOTAL 14,835
Top 10 Offenses of 2016
Offenses Total
Assault and battery 4,371
Narcotic drugs 4,059
Child defilement 1,591
Theft 2,580
Harassment of spouse 464
Forging documents 438
Fraud and deceit 436
Genocide denial 372
Embezzlement 338
Counterfeit of money 315
TOTAL 14,964
Top 10 Offenses of 2017
Offenses Total
Theft 8,502
Assault and battery 5,665
Narcotic drugs 4,250
Child defilement 2,352
Threat to harm person 1,317
Fraud and deceit 1,140
Forging documents 958
Breach of trust 790
Damaging of crops 761
Harassment of spouse 739
TOTAL 26,474
Top 10 Offenses of 2018
Offenses Total
Theft 10,392
Assault and battery 7,448
Narcotic drugs 5,004
Child defilement 3,146
Use of threats 2,084
Fraud 1,056
Harassment of spouse 967
Breach of trust 962
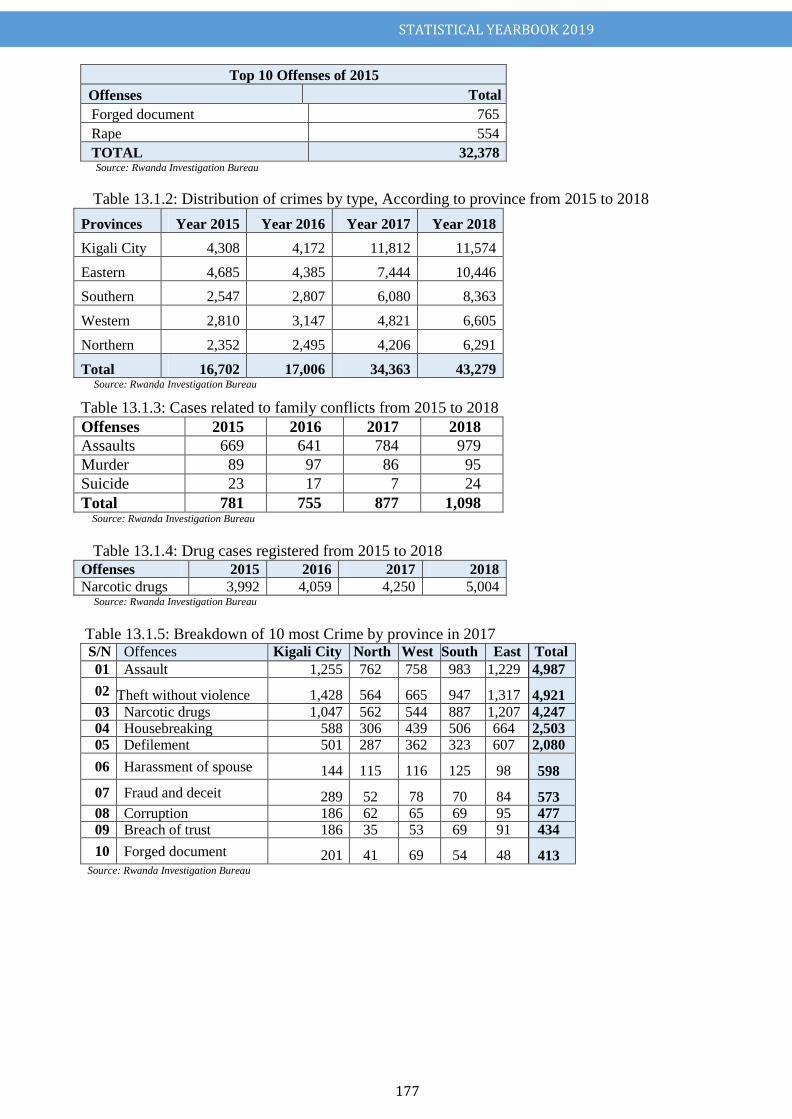
STATISTICAL YEARBOOK 2019
177
Top 10 Offenses of 2015
Offenses Total
Forged document 765
Rape 554
TOTAL 32,378 Source: Rwanda Investigation Bureau
Table 13.1.2: Distribution of crimes by type, According to province from 2015 to 2018
Provinces Year 2015 Year 2016 Year 2017 Year 2018
Kigali City 4,308 4,172 11,812 11,574
Eastern 4,685 4,385 7,444 10,446
Southern 2,547 2,807 6,080 8,363
Western 2,810 3,147 4,821 6,605
Northern 2,352 2,495 4,206 6,291
Total 16,702 17,006 34,363 43,279 Source: Rwanda Investigation Bureau
Table 13.1.3: Cases related to family conflicts from 2015 to 2018
Offenses 2015 2016 2017 2018
Assaults 669 641 784 979
Murder 89 97 86 95
Suicide 23 17 7 24
Total 781 755 877 1,098 Source: Rwanda Investigation Bureau
Table 13.1.4: Drug cases registered from 2015 to 2018
Offenses 2015 2016 2017 2018
Narcotic drugs 3,992 4,059 4,250 5,004 Source: Rwanda Investigation Bureau
Table 13.1.5: Breakdown of 10 most Crime by province in 2017 S/N Offences Kigali City North West South East Total
01 Assault 1,255 762 758 983 1,229 4,987
02 Theft without violence 1,428 564 665 947 1,317 4,921
03 Narcotic drugs 1,047 562 544 887 1,207 4,247
04 Housebreaking 588 306 439 506 664 2,503
05 Defilement 501 287 362 323 607 2,080
06 Harassment of spouse 144 115 116 125 98 598
07 Fraud and deceit 289 52 78 70 84 573 08 Corruption 186 62 65 69 95 477
09 Breach of trust 186 35 53 69 91 434
10 Forged document 201 41 69 54 48 413 Source: Rwanda Investigation Bureau
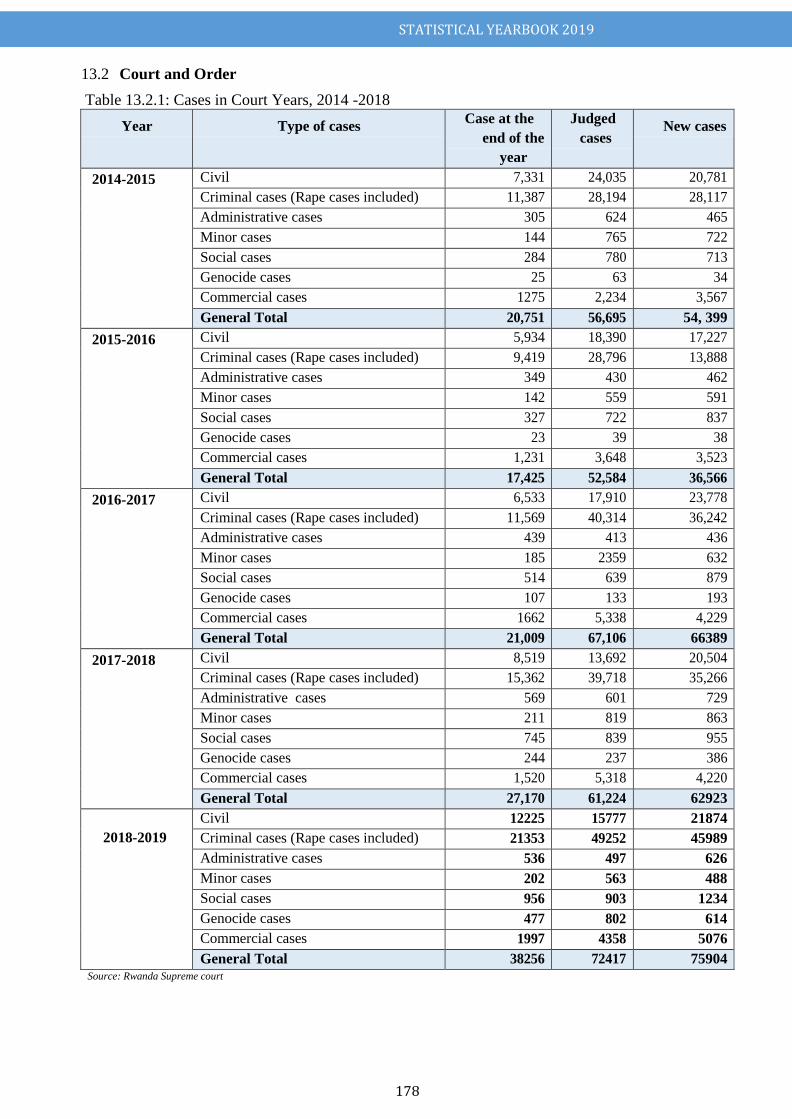
STATISTICAL YEARBOOK 2019
178
Court and Order 13.2
Table 13.2.1: Cases in Court Years, 2014 -2018
Year Type of cases Case at the
end of the
year
Judged
cases New cases
2014-2015 Civil 7,331 24,035 20,781
Criminal cases (Rape cases included) 11,387 28,194 28,117
Administrative cases 305 624 465
Minor cases 144 765 722
Social cases 284 780 713
Genocide cases 25 63 34
Commercial cases 1275 2,234 3,567
General Total 20,751 56,695 54, 399
2015-2016 Civil 5,934 18,390 17,227
Criminal cases (Rape cases included) 9,419 28,796 13,888
Administrative cases 349 430 462
Minor cases 142 559 591
Social cases 327 722 837
Genocide cases 23 39 38
Commercial cases 1,231 3,648 3,523
General Total 17,425 52,584 36,566
2016-2017 Civil 6,533 17,910 23,778
Criminal cases (Rape cases included) 11,569 40,314 36,242
Administrative cases 439 413 436
Minor cases 185 2359 632
Social cases 514 639 879
Genocide cases 107 133 193
Commercial cases 1662 5,338 4,229
General Total 21,009 67,106 66389
2017-2018 Civil 8,519 13,692 20,504
Criminal cases (Rape cases included) 15,362 39,718 35,266
Administrative cases 569 601 729
Minor cases 211 819 863
Social cases 745 839 955
Genocide cases 244 237 386
Commercial cases 1,520 5,318 4,220
General Total 27,170 61,224 62923
2018-2019
Civil 12225 15777 21874
Criminal cases (Rape cases included) 21353 49252 45989
Administrative cases 536 497 626
Minor cases 202 563 488
Social cases 956 903 1234
Genocide cases 477 802 614
Commercial cases 1997 4358 5076
General Total 38256 72417 75904 Source: Rwanda Supreme court
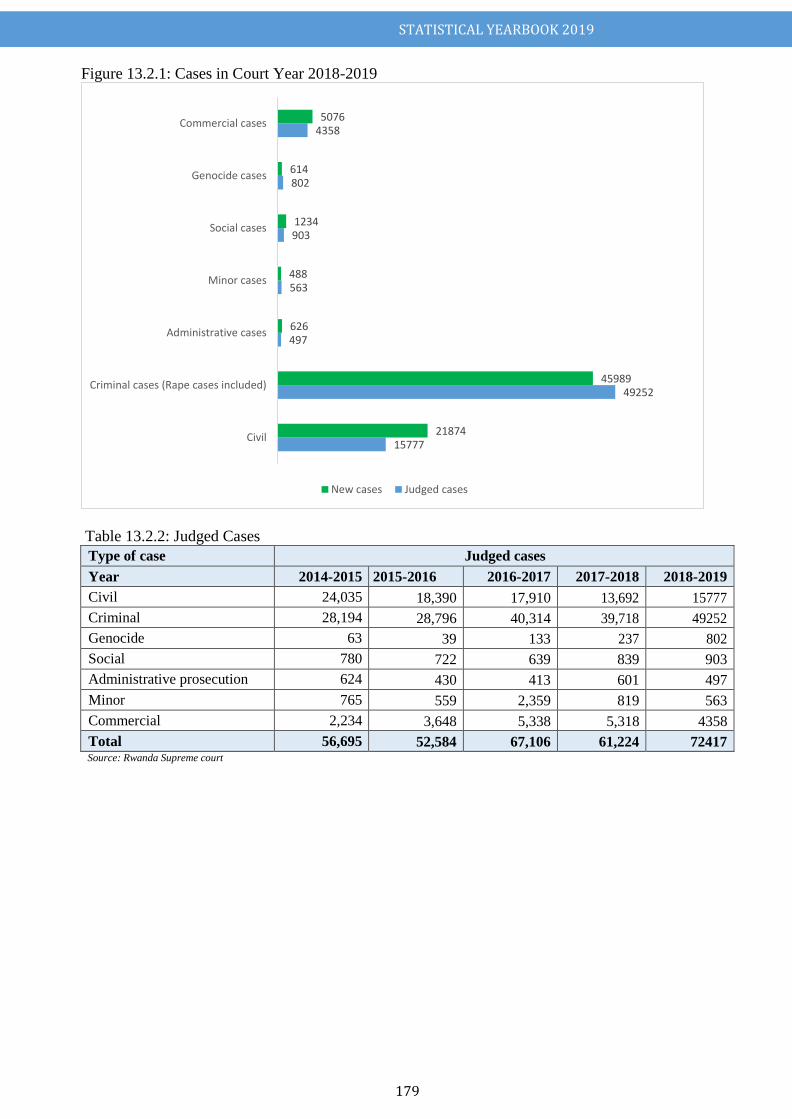
STATISTICAL YEARBOOK 2019
179
Figure 13.2.1: Cases in Court Year 2018-2019
Table 13.2.2: Judged Cases
Type of case Judged cases
Year 2014-2015 2015-2016 2016-2017 2017-2018 2018-2019
Civil 24,035 18,390 17,910 13,692 15777
Criminal 28,194 28,796 40,314 39,718 49252
Genocide 63 39 133 237 802
Social 780 722 639 839 903
Administrative prosecution 624 430 413 601 497
Minor 765 559 2,359 819 563
Commercial 2,234 3,648 5,338 5,318 4358
Total 56,695 52,584 67,106 61,224 72417 Source: Rwanda Supreme court
15777
49252
497
563
903
802
4358
21874
45989
626
488
1234
614
5076
Civil
Criminal cases (Rape cases included)
Administrative cases
Minor cases
Social cases
Genocide cases
Commercial cases
New cases Judged cases
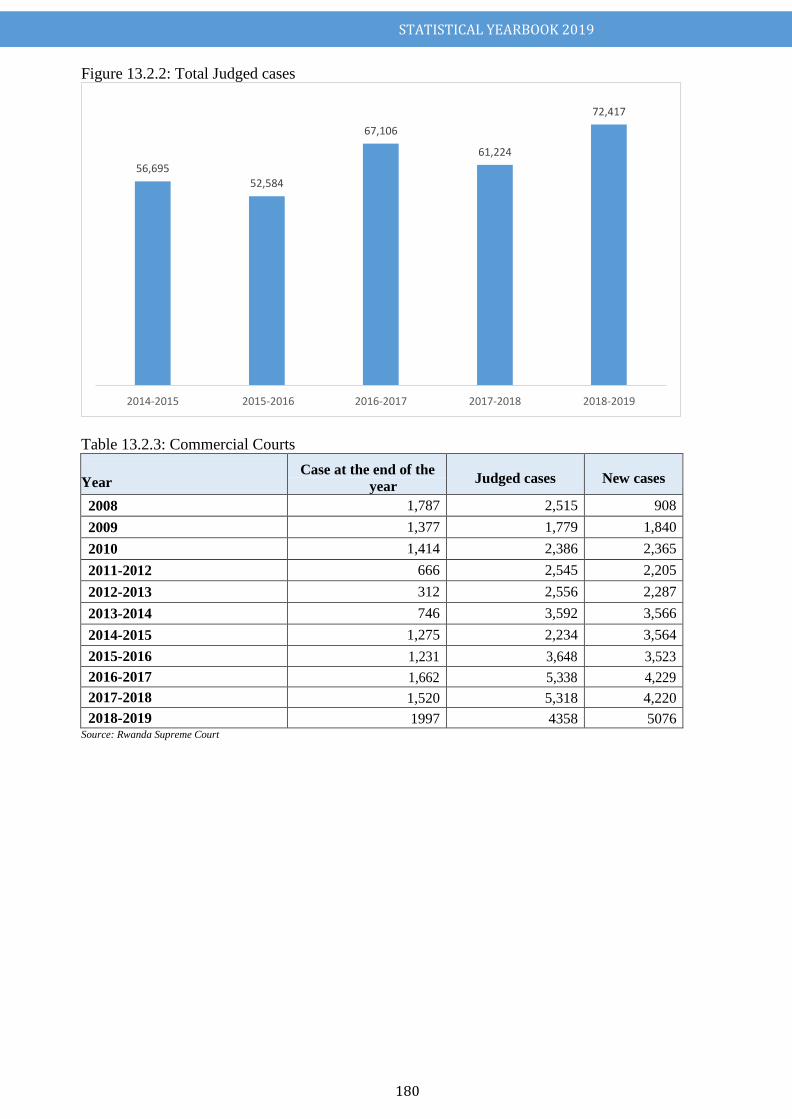
STATISTICAL YEARBOOK 2019
180
Figure 13.2.2: Total Judged cases
Table 13.2.3: Commercial Courts
Year Case at the end of the
year Judged cases New cases
2008 1,787 2,515 908
2009 1,377 1,779 1,840
2010 1,414 2,386 2,365
2011-2012 666 2,545 2,205
2012-2013 312 2,556 2,287
2013-2014 746 3,592 3,566
2014-2015 1,275 2,234 3,564
2015-2016 1,231 3,648 3,523
2016-2017 1,662 5,338 4,229
2017-2018 1,520 5,318 4,220
2018-2019 1997 4358 5076 Source: Rwanda Supreme Court
56,695 52,584
67,106
61,224
72,417
2014-2015 2015-2016 2016-2017 2017-2018 2018-2019
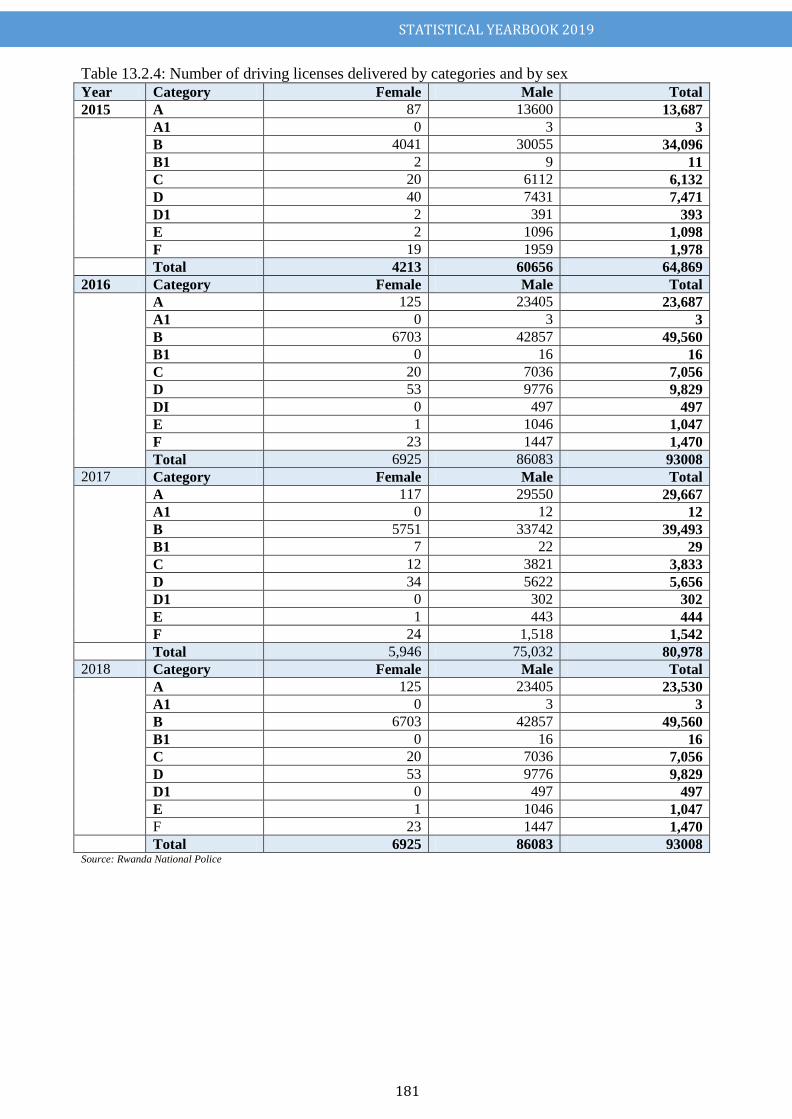
STATISTICAL YEARBOOK 2019
181
Table 13.2.4: Number of driving licenses delivered by categories and by sex
Year Category Female Male Total
2015 A 87 13600 13,687
A1 0 3 3
B 4041 30055 34,096
B1 2 9 11
C 20 6112 6,132
D 40 7431 7,471
D1 2 391 393
E 2 1096 1,098
F 19 1959 1,978
Total 4213 60656 64,869
2016 Category Female Male Total
A 125 23405 23,687
A1 0 3 3
B 6703 42857 49,560
B1 0 16 16
C 20 7036 7,056
D 53 9776 9,829
DI 0 497 497
E 1 1046 1,047
F 23 1447 1,470
Total 6925 86083 93008
2017 Category Female Male Total
A 117 29550 29,667
A1 0 12 12
B 5751 33742 39,493
B1 7 22 29
C 12 3821 3,833
D 34 5622 5,656
D1 0 302 302
E 1 443 444
F 24 1,518 1,542
Total 5,946 75,032 80,978
2018 Category Female Male Total
A 125 23405 23,530
A1 0 3 3
B 6703 42857 49,560
B1 0 16 16
C 20 7036 7,056
D 53 9776 9,829
D1 0 497 497
E 1 1046 1,047
F 23 1447 1,470
Total 6925 86083 93008 Source: Rwanda National Police
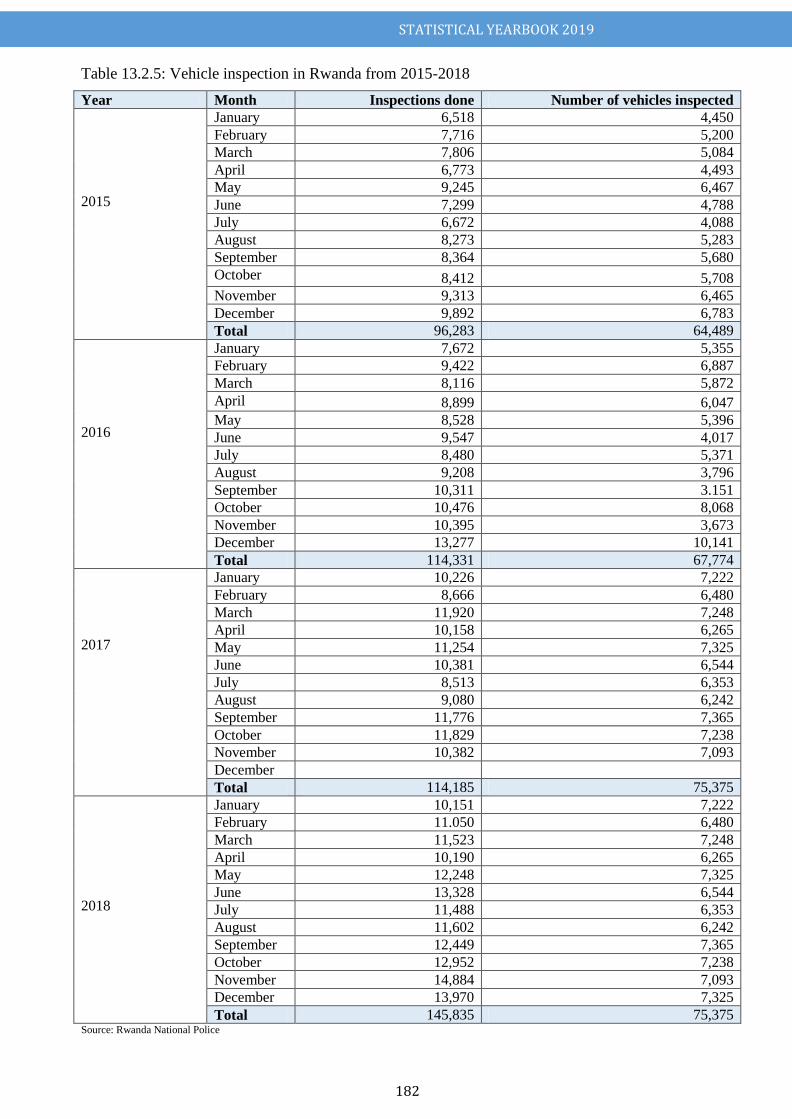
STATISTICAL YEARBOOK 2019
182
Table 13.2.5: Vehicle inspection in Rwanda from 2015-2018
Year Month Inspections done Number of vehicles inspected
2015
January 6,518 4,450
February 7,716 5,200
March 7,806 5,084
April 6,773 4,493
May 9,245 6,467
June 7,299 4,788
July 6,672 4,088
August 8,273 5,283
September 8,364 5,680
October 8,412 5,708
November 9,313 6,465
December 9,892 6,783
Total 96,283 64,489
2016
January 7,672 5,355
February 9,422 6,887
March 8,116 5,872
April 8,899 6,047
May 8,528 5,396
June 9,547 4,017
July 8,480 5,371
August 9,208 3,796
September 10,311 3.151
October 10,476 8,068
November 10,395 3,673
December 13,277 10,141
Total 114,331 67,774
2017
January 10,226 7,222
February 8,666 6,480
March 11,920 7,248
April 10,158 6,265
May 11,254 7,325
June 10,381 6,544
July 8,513 6,353
August 9,080 6,242
September 11,776 7,365
October 11,829 7,238
November 10,382 7,093
December
Total 114,185 75,375
2018
January 10,151 7,222
February 11.050 6,480
March 11,523 7,248
April 10,190 6,265
May 12,248 7,325
June 13,328 6,544
July 11,488 6,353
August 11,602 6,242
September 12,449 7,365
October 12,952 7,238
November 14,884 7,093
December 13,970 7,325
Total 145,835 75,375 Source: Rwanda National Police
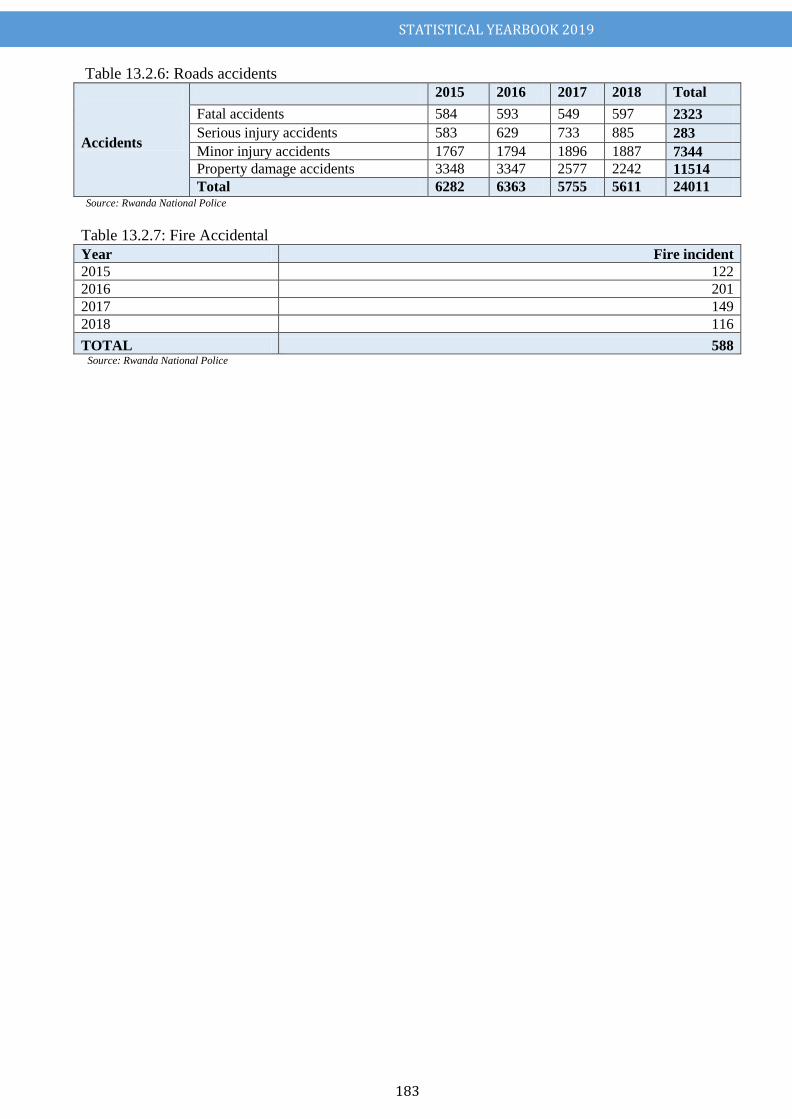
STATISTICAL YEARBOOK 2019
183
Table 13.2.6: Roads accidents
Accidents
2015 2016 2017 2018 Total
Fatal accidents 584 593 549 597 2323
Serious injury accidents 583 629 733 885 283
Minor injury accidents 1767 1794 1896 1887 7344
Property damage accidents 3348 3347 2577 2242 11514
Total 6282 6363 5755 5611 24011 Source: Rwanda National Police
Table 13.2.7: Fire Accidental
Year Fire incident
2015 122
2016 201
2017 149
2018 116
TOTAL 588 Source: Rwanda National Police
STATISTICAL YEARBOOK 2019
184
National Institute of Statistics of Rwanda P. O. Box 6139 Kigali – Rwanda
Website: www.statistics.gov.rw