FAO statistical yearbook 2014: Africa food and agriculture
187
-
Upload
khangminh22 -
Category
Documents
-
view
2 -
download
0
Transcript of FAO statistical yearbook 2014: Africa food and agriculture

ISSN 2306-1162


FAO STATISTICAL YEARBOOK2014Africa
Food and Agriculture
Food and Agriculture Organization of the United NationsRegional Office for Africa
Accra, 2014

The designations employed and the presentation of material in this information product do not imply the expression of any opinion whatsoever on the part of the Food and Agriculture Organization of the United Nations (FAO) concerning the legal or development status of any country, territory, city or area or of its authorities, or concerning the delimitation of its frontiers or boundaries. The mention of specific companies or products of manufacturers, whether or not these have been patented, does not imply that these have been endorsed or recommended by FAO in preference to others of a similar nature that are not mentioned.
The views expressed in this information product are those of the author(s) and do not necessarily reflect the views or policies of FAO.
ISBN 978-92-5-108165-5 (print)E-ISBN 978-92-5-108166-2 (PDF)
© FAO, 2014
FAO encourages the use, reproduction and dissemination of material in this information product. Except where otherwise indicated, material may be copied, downloaded and printed for private study, research and teaching purposes, or for use in non-commercial products or services, provided that appropriate acknowledgement of FAO as the source and copyright holder is given and that FAO’s endorsement of users’ views, products or services is not implied in any way.
All requests for translation and adaptation rights, and for resale and other commercial use rights should be made via www.fao.org/contact-us/licence-request or addressed to [email protected].
FAO information products are available on the FAO website (www.fao.org/publications) and can be purchased through [email protected].

ForewordThe objective of the FAO Regional Office for Africa (RAF) is to improve sustainable nutri-tion and food security in the African continent. To realize this vision, RAF focuses its workon promoting sustainable increases in agricultural production, enhancing sustainable useand management of natural resources, supporting market access and measures for bettertrade and promoting information and knowledge management and sharing. The issue ofbetter monitoring progress, learning from experiences, best practices and improving furtheractivities is of great importance to RAF, and statistical data constitute an important input.
The FAO Statistical Yearbook 2014: Africa Food and Agriculture, which RAF is pleased to re-lease, aims to disseminate statistical information that will help all stakeholders to access,easily and quickly, a set of statistics on food and agriculture related to the current themesand domains of interest in the region. The document provides users in Africa and abroadwith statistics and reliable indicators on food and agriculture that can be used for policyformulation, monitoring and evaluation. These statistics and indicators cover a wide rangeof themes: agricultural production, productivity and growth, capital, rural population andwell-being, poverty, labour, food security, food safety and nutrition, natural resource use inagricultural activities (e.g. land, water and forest), climate change, environmental pollutionand biodiversity.
The 2014 Statistical Yearbook is the second release using the new publication format, pro-moted by the FAO Statistics Division. It goes beyond the traditional compilation of tables byincluding more graphs, maps and text, highlighting the main trends and issues observed inthe data. This new format responds to new demands for a more comprehensive set of statis-tics and indicators that provide a broader and more in-depth examination of the variousroles of agriculture.
This edition responds to the specific needs of African and other users by providing indicatorsfor each country as well as aggregate indicators for FAO sub-regions in Africa, the RegionalEconomic Communities and for the entire African continent. Indicators for other regions ofthe world are also presented for easy comparison.
We hope you will find this book informative, useful and reader-friendly.
Bukar Tijani Pietro GennariAssistant Director-General, FAO Chief Statistician,
FAO Regional Representative for Africa and Director, Statistics Division
iii

iv

Acknowledgements
The FAO Regional Office for Africa (FAORAF) and the FAO Statistics Division (ESS) ofthe Food and Agriculture Organization of the United Nations would like to acknowl-edge the collective effort of statisticians and other staff in national statistical offices,ministries of agriculture and other ministries and government departments in this re-gion that constantly provide data to FAO. In addition we would like to acknowledge theongoing cooperation with regional and international institutions and non-governmentorganizations, whose efforts have made this publication possible.
This publication was jointly prepared by FAORAF and ESS. The work was carried un-der the guidance of Bukar Tijani (Regional Representative and Assistant Director Gen-eral, FAORAF) and Pietro Gennari (Chief Statistician, FAO, and Director, ESS). Produc-tion was managed by Eloi Ouedraogo (FAORAF) and his team in Accra, which includedMarcel Ouattara (FAORAF); and Amy Heyman (ESS) and her team in Rome, which in-cluded Filippo Gheri (ESS) and Shira Fano (ESS). Contributors were Nienke Beintema(the International Food Policy Research Institute – IFPRI), Riccardo Biancalani (NRC),Andrea Borlizzi (ESS), Chiara Brunelli (ESS), Carlo Cafiero (ESS), Cinzia Cerri (ESS), Ro-cio Condor-Golec (Climate, Energy and Tenure Division – NRC), Piero Conforti (ESS),Elisenda Estruch (Gender, Equity and Rural Employment Division – ESW), AlessandroFerrara (NRC), Karen Frenken (Land and Water Division – NRL), Nandini Gunewardena(FAOLOW) , Gary Jones (International Monetary Fund – IMF), Arvydas Lebedys (ForestEconomics, Policy and Products Division – FOE) , ErdginMane (ESS), Robert Mayo (ESS),Verena Nowak (Nutrition Division – ESN), Michael Rahija (IFPRI), Simone Rossi (NRC),Mirella Salvatore (NRC), Nadia Scialabba (NRC), Gert-Jan Stads (IFPRI), Nathalie Troubat(ESS), Sachiko Tsuji (Statistics and Information Service – FIPS), Francesco Tubiello(NRC), Stefania Vannuccini (FIPS), NathanWanner (ESS) and Firas Yassin (ESS). A specialthanks goes to Andrea Alcibiade (ESS), Guido Barbaglia (ESS), Giorgia DeSantis (ESS),James Edge (ESS), Carola Fabi (ESS), Amanda Gordon (ESS), Nicola Graziani (ESS), FabioGrita (ESS), Michelle Kendrick (ESA), Francesca Pittueo, Adam Prakash (ESS), GordonRamsay, Nicholas Sakoff (ESS), Nicola Selleri (ESS), Sylvaine Thomas (ESS), and BorisVeytsman.
v

vi

How to use this book
The structure
The FAO Statistical Yearbook products build on the process that be-gan with the 2012 edition. The book has been created from begin-ning to end with the statistical software R and the typesetting lan-guage LATEX: from data retrieval, to data processing, indicator con-struction, and blueprint-ready pdf file for distribution. This techniquehas circumvented the traditional route of manual production, involv-ing costly software licences, significant labour costs and inefficienciesassociated with a lack of integration.
Using data from global statistical providers, including FAO, the publi-cation presents a visual synthesis of major trends and factors shapingthe global food and agricultural landscape, and their interplay withbroader environmental, social and economic dimensions. In doing so,it serves as a unique reference point of world food and agriculture forpolicy-makers, donor agencies, researchers, analysts and the generalpublic.
vii

The book is divided into four thematic parts, in an attempt to presentthe full spectrum of issues relevant to the subject matter:
Part 1 The setting measures the state of the agricultural resourcebase by assessing the supply of land, labour, capital and inputs,and examining the pressure on the world food system stemmingfrom demographic and macroeconomic change.
Part 2 Hunger dimensions gauges the state of food insecurity andmalnutrition, measuring the multitude of dimensions that giverise to hunger and shape undernourishment.
Part 3 Feeding the world evaluates the past and present productivecapacity of world agriculture, together with the role of trade inmeeting changing food, feed and other demands.
Part 4 Sustainability dimensions examines the sustainability of agri-culture in the context of the pressure it exerts on the envi-ronment, including the interaction of agriculture with climatechange, and how it can provide ecosystem services through thebio-based economy.
Several page spreads are used to present each thematic issue. Eachspread contains visualizations of the data in maps and charts, alongwith text providing background to the salient issues and an assess-ment of current trends. Tables are provided at the end of each part. Alist of indicators used throughout the book and a section on conceptsand methods can be found in Part 5.
Country definitions and classification
The publication follows the FAO Regional Office for Africa composi-tion (see “Table: Country list” or http://www.fao.org/africa).
South Sudan declared independence on 9 July 2011. When available,data for the Sudan and South Sudan are shown separately. In the ta-bles, the Sudan (former) is also reported. Based on the data available,the assessment presented in the map of the Sudan and South Sudanreflects the situation up to 2011 of the Sudan (former).
viii

Aggregations
Two types of aggregations are used in the book: sum and weightedmean. Two restrictions are imposed when computing the aggrega-tion: i) the sufficiency condition – the aggregation is computed onlywhen sufficient countries have reported data, and the current thresh-old is set at 50 percent of the variable and the weighting variable,if present; and ii) the comparability condition – as aggregations areusually computed over time, this condition is designed to ensure thatthe number of countries is comparable over several years; under thecurrent restriction the number of countries may not vary bymore than15 over time.
Data presentation conventions
The cutoff date for the data is 30 September 2013.
• When country data have not been reported for the reference year,an asterisk (*) on the year label indicates that the value for themost recent year available is shown. For example, 2008–2010*means that the most recent value for the period from 2008 to2010 is shown. When a growth rate is computed, the specifiedinterval always refers to available data.
• A billion is 1 000 million.
• A trillion is 1 000 billion.
• A blank means that data are not available or that aggregates can-not be calculated because of missing data for the years shown.
• In tables, 0 or 0.0 means zero or a number that is small enoughto round to zero at the displayed number of decimal places.
• A ~ in the maps refers to the range specified in the class intervals.
ix

x

CONTENTS Foreword: iii
Acknowledgements: v
How to use this book: vii
Part 1 The Setting: 1
Overview 2Economy 6Land and Water 8Labour 12Inputs 14Capital and Investment 16Innovation 18Tables 20
Part 2 Hunger dimensions: 31
Number undernourished and their prevalence in the population 32Anthropometric indicators 34Poverty 36Food Availability 38Economic and physical access 40Clean water and sanitation 42Economic and political stability 44Education and health 48Natural and human-made risks 50Tables 52
Part 3 Feeding the world: 61
Aggregate agriculture 62Growth in crop production 64Trends in the crop sector 66Trends in the livestock sector 76Trends in the fisheries sector 82Trends in agricultural trade 86Tables 94
Part 4 Sustainability dimensions: 115
Land and Forestry 116Water 120Biodiversity 122Agri-environmental indicators 124Organic farming 126Bio-based economy 128Climate change 130Greenhouse gas emissions 132Tables 134
Part 5 Metadata: 143Country list 143Metadata 145Bibliography 167
ix

List of Charts
1 Africa rural and urban population (1960-2050) . . . . . . . . . . . . . . . . . . . . . . . . . . . . . . . . . . . . . . . . . . . . . . 22 Rural and urban population, share of total population (2011) . . . . . . . . . . . . . . . . . . . . . . . . . . . . . . . . . . . . . 23 Agricultural population, share of total population (1990 and 2012) . . . . . . . . . . . . . . . . . . . . . . . . . . . . . . . . . 34 Population ages 0-14, 15-64 and 65+, share of total (2010) . . . . . . . . . . . . . . . . . . . . . . . . . . . . . . . . . . . . . . 35 Life expectancy at birth, selected countries (2000-2011) . . . . . . . . . . . . . . . . . . . . . . . . . . . . . . . . . . . . . . . . 46 Value added in agriculture, industry, and services as shares of GDP (2009) . . . . . . . . . . . . . . . . . . . . . . . . . . . . . 67 Africa trade, FDI, and ODA as shares of GDP (2000-2012) . . . . . . . . . . . . . . . . . . . . . . . . . . . . . . . . . . . . . . . 68 Arable land per capita (2000-2011) . . . . . . . . . . . . . . . . . . . . . . . . . . . . . . . . . . . . . . . . . . . . . . . . . . . . . 89 Land area (2011) . . . . . . . . . . . . . . . . . . . . . . . . . . . . . . . . . . . . . . . . . . . . . . . . . . . . . . . . . . . . . . . . 910 Agricultural area (2011) . . . . . . . . . . . . . . . . . . . . . . . . . . . . . . . . . . . . . . . . . . . . . . . . . . . . . . . . . . . . 911 Irrigation potential, selected countries (2012) . . . . . . . . . . . . . . . . . . . . . . . . . . . . . . . . . . . . . . . . . . . . . . 1012 Total equipped area (2009) . . . . . . . . . . . . . . . . . . . . . . . . . . . . . . . . . . . . . . . . . . . . . . . . . . . . . . . . . . 1013 Female employment in agriculture, share of female employment, selected countries (2005-2010*) . . . . . . . . . . . . . 1214 Labor force participation rate by gender, ages 15+ (2011) . . . . . . . . . . . . . . . . . . . . . . . . . . . . . . . . . . . . . . . 1215 Africa fertilizer consumption per ha of arable area and permanent crops (2002-2011) . . . . . . . . . . . . . . . . . . . . . 1416 Fertilizer consumption per ha of arable land and permanent crops (2011) . . . . . . . . . . . . . . . . . . . . . . . . . . . . . 1417 Africa credit to agriculture, share of added value in agriculture, selected countries (2005-2010) . . . . . . . . . . . . . . . 1618 ODA received in agriculture, total share of ODA (2002 and 2010) . . . . . . . . . . . . . . . . . . . . . . . . . . . . . . . . . . 1619 Share of components in capital stock (2007) . . . . . . . . . . . . . . . . . . . . . . . . . . . . . . . . . . . . . . . . . . . . . . . 1720 Government expenditures in agriculture, forestry, fishing, and hunting, selected countries (2010) . . . . . . . . . . . . . . 1721 Total public agricultural research expenditure, share of agricultural GDP, selected countries (2008) . . . . . . . . . . . . . 1822 Mobile cellular, broadband internet, and telephone lines subscribers (2012) . . . . . . . . . . . . . . . . . . . . . . . . . . . 1823 Undernourishment in the developing world (1990-1992 to 2011-2013) . . . . . . . . . . . . . . . . . . . . . . . . . . . . . . 3224 Number of people undernourished (1990-1992 and 2011-2013) . . . . . . . . . . . . . . . . . . . . . . . . . . . . . . . . . . . 3225 Percentage of children under 5 years of age who are stunted (2005-2011*) . . . . . . . . . . . . . . . . . . . . . . . . . . . . 3426 Percentage of children under 5 years of age who underweight (2005-2011*) . . . . . . . . . . . . . . . . . . . . . . . . . . . 3427 People in the world living on less than 2005 PPP $1.25 and $2 a day (1981-2005) . . . . . . . . . . . . . . . . . . . . . . . 3628 Gini coefficient for African countries (1995-2000 and 2007-2010) . . . . . . . . . . . . . . . . . . . . . . . . . . . . . . . . . . 3629 Average dietary supply adequacy (1990-1992 and 2011-2013) . . . . . . . . . . . . . . . . . . . . . . . . . . . . . . . . . . . . 3830 Trend of the value of food production (1992-2011) . . . . . . . . . . . . . . . . . . . . . . . . . . . . . . . . . . . . . . . . . . . 3831 Share of energy supply derived from cereals, roots and tubers (1990-1992 and 2008-2010) . . . . . . . . . . . . . . . . . . 3932 Relative change in average protein supply (between 1990-1992 and 2008-2010) . . . . . . . . . . . . . . . . . . . . . . . . 3933 Relative change in average protein supply from animal origin (between 1990-1992 and 2008-2010) . . . . . . . . . . . . 3934 Relative change in average fat supply (between 1990-1992 and 2008-2010) . . . . . . . . . . . . . . . . . . . . . . . . . . . 3935 Rail lines density (2011) . . . . . . . . . . . . . . . . . . . . . . . . . . . . . . . . . . . . . . . . . . . . . . . . . . . . . . . . . . . . 4036 Relative price of food (2000-2010) . . . . . . . . . . . . . . . . . . . . . . . . . . . . . . . . . . . . . . . . . . . . . . . . . . . . . 4037 Percentage of population without reasonable access to improved water sources (1992 and 2011) . . . . . . . . . . . . . . 4238 Percentage of population without reasonable access to improved sanitation facilities (1992 and 2011) . . . . . . . . . . . 4239 Value of food imports over total merchandise exports (1992 and 2010) . . . . . . . . . . . . . . . . . . . . . . . . . . . . . . 4440 Cereal import dependency ratio (1992 and 2009) . . . . . . . . . . . . . . . . . . . . . . . . . . . . . . . . . . . . . . . . . . . . 4441 Domestic food price volatility (1995-2013) . . . . . . . . . . . . . . . . . . . . . . . . . . . . . . . . . . . . . . . . . . . . . . . . 4542 Per capita food production variability (1990-2011) . . . . . . . . . . . . . . . . . . . . . . . . . . . . . . . . . . . . . . . . . . . 4543 Domestic food price volatility (2000 and 2013) . . . . . . . . . . . . . . . . . . . . . . . . . . . . . . . . . . . . . . . . . . . . . 4644 Domestic food price volatility (2000 and 2013) . . . . . . . . . . . . . . . . . . . . . . . . . . . . . . . . . . . . . . . . . . . . . 4645 Per capita food supply variability (1995-2010) . . . . . . . . . . . . . . . . . . . . . . . . . . . . . . . . . . . . . . . . . . . . . . 4746 Girls’ and boys’ enrolment in primary education (2011) . . . . . . . . . . . . . . . . . . . . . . . . . . . . . . . . . . . . . . . . . 4847 Total health expenditure, share of GDP (1995-2011) . . . . . . . . . . . . . . . . . . . . . . . . . . . . . . . . . . . . . . . . . . 4848 Droughts, floods, extreme temperatures - share of population affected (2009) . . . . . . . . . . . . . . . . . . . . . . . . . . 5049 Refugees in Africa region (2000-2011) . . . . . . . . . . . . . . . . . . . . . . . . . . . . . . . . . . . . . . . . . . . . . . . . . . . 5050 Food supply in crops primary equivalent (2000-2009) . . . . . . . . . . . . . . . . . . . . . . . . . . . . . . . . . . . . . . . . . 6251 Africa protein and fat supply in crops primary equivalent (2000-2009) . . . . . . . . . . . . . . . . . . . . . . . . . . . . . . . 6252 Protein supply in crops primary equivalent (2009) . . . . . . . . . . . . . . . . . . . . . . . . . . . . . . . . . . . . . . . . . . . . 6353 Fat supply in crops primary equivalent (2009) . . . . . . . . . . . . . . . . . . . . . . . . . . . . . . . . . . . . . . . . . . . . . . 6354 Crops, gross per capita production index number (2004-2006 = 100) (2000-2011) . . . . . . . . . . . . . . . . . . . . . . . . 6455 Growth in cereal production (2000-2012) . . . . . . . . . . . . . . . . . . . . . . . . . . . . . . . . . . . . . . . . . . . . . . . . . 6456 Per capita cereal production (2000-2011) . . . . . . . . . . . . . . . . . . . . . . . . . . . . . . . . . . . . . . . . . . . . . . . . . 6657 Per capita coarse grain production (2000-2011) . . . . . . . . . . . . . . . . . . . . . . . . . . . . . . . . . . . . . . . . . . . . . 6658 Per capita rice production, selected countries (2011) . . . . . . . . . . . . . . . . . . . . . . . . . . . . . . . . . . . . . . . . . . 6859 Per capita wheat production (2011) . . . . . . . . . . . . . . . . . . . . . . . . . . . . . . . . . . . . . . . . . . . . . . . . . . . . . 68
x

LIST OF CHARTS
60 Per capita oil crop production (2000-2011) . . . . . . . . . . . . . . . . . . . . . . . . . . . . . . . . . . . . . . . . . . . . . . . . 7061 Per capita pulse production (2000-2011) . . . . . . . . . . . . . . . . . . . . . . . . . . . . . . . . . . . . . . . . . . . . . . . . . 7062 Per capita root and tuber production (2000-2011) . . . . . . . . . . . . . . . . . . . . . . . . . . . . . . . . . . . . . . . . . . . . 7263 Per capita citrus fruit production (2000-2011) . . . . . . . . . . . . . . . . . . . . . . . . . . . . . . . . . . . . . . . . . . . . . . 7264 Per capita fruit production, excluding melons (2000-2011) . . . . . . . . . . . . . . . . . . . . . . . . . . . . . . . . . . . . . . 7465 Per capita vegetable production, including melons (2000-2011) . . . . . . . . . . . . . . . . . . . . . . . . . . . . . . . . . . . 7466 Africa stocks of cattle and buffaloes, and sheep and goats (2000-2011) . . . . . . . . . . . . . . . . . . . . . . . . . . . . . . 7667 Stock of poultry birds (2000-2011) . . . . . . . . . . . . . . . . . . . . . . . . . . . . . . . . . . . . . . . . . . . . . . . . . . . . . 7668 Stocks of cattle and buffaloes, and sheep and goats (2011) . . . . . . . . . . . . . . . . . . . . . . . . . . . . . . . . . . . . . . 7769 Stock of poultry birds (2011) . . . . . . . . . . . . . . . . . . . . . . . . . . . . . . . . . . . . . . . . . . . . . . . . . . . . . . . . . 7770 Africa meat production (2000-2011) . . . . . . . . . . . . . . . . . . . . . . . . . . . . . . . . . . . . . . . . . . . . . . . . . . . . 7871 Meat production by type (2011) . . . . . . . . . . . . . . . . . . . . . . . . . . . . . . . . . . . . . . . . . . . . . . . . . . . . . . . 7872 Africa per capita meat production (2000-2011) . . . . . . . . . . . . . . . . . . . . . . . . . . . . . . . . . . . . . . . . . . . . . 7973 Per capita total meat production (2011) . . . . . . . . . . . . . . . . . . . . . . . . . . . . . . . . . . . . . . . . . . . . . . . . . . 7974 Egg production (2000-2011) . . . . . . . . . . . . . . . . . . . . . . . . . . . . . . . . . . . . . . . . . . . . . . . . . . . . . . . . . 8075 Cheese production (2011) . . . . . . . . . . . . . . . . . . . . . . . . . . . . . . . . . . . . . . . . . . . . . . . . . . . . . . . . . . . 8076 Capture fish production, per capita (2000-2011) . . . . . . . . . . . . . . . . . . . . . . . . . . . . . . . . . . . . . . . . . . . . . 8277 Aquaculture fish production, per capita (2000-2011) . . . . . . . . . . . . . . . . . . . . . . . . . . . . . . . . . . . . . . . . . . 8278 State of the world’s fishery stocks (1974-2009) . . . . . . . . . . . . . . . . . . . . . . . . . . . . . . . . . . . . . . . . . . . . . . 8479 Composition of fish products (2009) . . . . . . . . . . . . . . . . . . . . . . . . . . . . . . . . . . . . . . . . . . . . . . . . . . . . 8480 Per capita world fish food supply (1990-2011) . . . . . . . . . . . . . . . . . . . . . . . . . . . . . . . . . . . . . . . . . . . . . . 8581 Sugar and honey net trade (2000-2011) . . . . . . . . . . . . . . . . . . . . . . . . . . . . . . . . . . . . . . . . . . . . . . . . . . 8682 Sugar and honey net trade (2011) . . . . . . . . . . . . . . . . . . . . . . . . . . . . . . . . . . . . . . . . . . . . . . . . . . . . . . 8683 Africa composition of global exports (2000-2011) . . . . . . . . . . . . . . . . . . . . . . . . . . . . . . . . . . . . . . . . . . . . 8784 Cereal net trade (2000-2011) . . . . . . . . . . . . . . . . . . . . . . . . . . . . . . . . . . . . . . . . . . . . . . . . . . . . . . . . . 8885 Cereal net trade (2011) . . . . . . . . . . . . . . . . . . . . . . . . . . . . . . . . . . . . . . . . . . . . . . . . . . . . . . . . . . . . 8886 Major export flows of cocoa beans from African countries (US$, 2011) . . . . . . . . . . . . . . . . . . . . . . . . . . . . . . . 8987 Fruit and vegetables net trade (2000-2011) . . . . . . . . . . . . . . . . . . . . . . . . . . . . . . . . . . . . . . . . . . . . . . . . 9088 Fruit and vegetables net trade (2011) . . . . . . . . . . . . . . . . . . . . . . . . . . . . . . . . . . . . . . . . . . . . . . . . . . . 9089 Major export flows of unmanufactured tobacco from African countries (US$, 2011) . . . . . . . . . . . . . . . . . . . . . . . 9190 Net trade of coffe, tea, cocoa, and spices (2000-2011) . . . . . . . . . . . . . . . . . . . . . . . . . . . . . . . . . . . . . . . . . 9291 Net trade of coffe, tea, cocoa, and spices (2011) . . . . . . . . . . . . . . . . . . . . . . . . . . . . . . . . . . . . . . . . . . . . . 9292 Major export flows of coffee (green) from African countries (US$, 2011) . . . . . . . . . . . . . . . . . . . . . . . . . . . . . . 9393 Annual growth rate in forest area (1990-2011) . . . . . . . . . . . . . . . . . . . . . . . . . . . . . . . . . . . . . . . . . . . . . . 11694 Forest characteristics (2010) . . . . . . . . . . . . . . . . . . . . . . . . . . . . . . . . . . . . . . . . . . . . . . . . . . . . . . . . . 11695 Africa production of selected forest products (1970-2012) . . . . . . . . . . . . . . . . . . . . . . . . . . . . . . . . . . . . . . . 11896 Africa production of selected forest products (1970-2012) . . . . . . . . . . . . . . . . . . . . . . . . . . . . . . . . . . . . . . . 11897 Exports of forest products (2000 and 2012) . . . . . . . . . . . . . . . . . . . . . . . . . . . . . . . . . . . . . . . . . . . . . . . . 11998 Imports of forest products (2000 and 2012) . . . . . . . . . . . . . . . . . . . . . . . . . . . . . . . . . . . . . . . . . . . . . . . . 11999 Freshwater withdrawal by agricultural sector, shares of total (2000-2010*) . . . . . . . . . . . . . . . . . . . . . . . . . . . . 120100 Freshwater withdrawal by industrial sector, shares of total (2000-2010*) . . . . . . . . . . . . . . . . . . . . . . . . . . . . . 120101 Species threatened in Africa (2012) . . . . . . . . . . . . . . . . . . . . . . . . . . . . . . . . . . . . . . . . . . . . . . . . . . . . . 122102 Terrestrial protected areas, share of total land area (1990 and 2010) . . . . . . . . . . . . . . . . . . . . . . . . . . . . . . . . 122103 Livestock density per ha of agricultural land, cattle and buffaloes, sheep and goats (2011) . . . . . . . . . . . . . . . . . . 124104 Agricultural land, share of total land area (1992-2011) . . . . . . . . . . . . . . . . . . . . . . . . . . . . . . . . . . . . . . . . . 124105 Organic water pollutant (BOD) emissions (2005) . . . . . . . . . . . . . . . . . . . . . . . . . . . . . . . . . . . . . . . . . . . . . 125106 Organic water pollutant (BOD) emissions per worker (2005) . . . . . . . . . . . . . . . . . . . . . . . . . . . . . . . . . . . . . 125107 Organic agriculture area (2011) . . . . . . . . . . . . . . . . . . . . . . . . . . . . . . . . . . . . . . . . . . . . . . . . . . . . . . . 126108 Organic agriculture, share of total agricultural area (2011) . . . . . . . . . . . . . . . . . . . . . . . . . . . . . . . . . . . . . . 126109 World area under bioenergy crops (2005-2010) . . . . . . . . . . . . . . . . . . . . . . . . . . . . . . . . . . . . . . . . . . . . . 128110 Biofuel production (1990-2009) . . . . . . . . . . . . . . . . . . . . . . . . . . . . . . . . . . . . . . . . . . . . . . . . . . . . . . . 128111 Share of food crop usage in world bio-based economy (2009) . . . . . . . . . . . . . . . . . . . . . . . . . . . . . . . . . . . . 129112 Global land-ocean temperature index, base period 1951-1980 (1880-2012) . . . . . . . . . . . . . . . . . . . . . . . . . . . . 130113 Global land-ocean temperature index for three latitude bands, base period 1951-1981 (1880-2011) . . . . . . . . . . . . 130114 Net emissions/removals from net forest conversions (1990, 2000 and 2010) . . . . . . . . . . . . . . . . . . . . . . . . . . . 132115 Greenhouse gas emissions from cultivated organic soils (2010) . . . . . . . . . . . . . . . . . . . . . . . . . . . . . . . . . . . 132116 Africa agricultural greenhouse gas emissions by sector (2010) . . . . . . . . . . . . . . . . . . . . . . . . . . . . . . . . . . . . 133
xi

List of Maps
1 Population annual growth (percent, 2000-2012) . . . . . . . . . . . . . . . . . . . . . . . . . . . . . . . . . . . . . . . . . . . . . 32 GNI per capita (current US$, 2011-2012*) . . . . . . . . . . . . . . . . . . . . . . . . . . . . . . . . . . . . . . . . . . . . . . . . . 53 Under-5 mortality rate (per 1000 live births, 2010-2011*) . . . . . . . . . . . . . . . . . . . . . . . . . . . . . . . . . . . . . . . 54 Agriculture, value added per worker annual growth (percent, 2011-2012) . . . . . . . . . . . . . . . . . . . . . . . . . . . . . 75 Agriculture, value added as share of GDP (percent, 2008-2012*) . . . . . . . . . . . . . . . . . . . . . . . . . . . . . . . . . . . 76 Cropland per capita (ha/cap, 2011) . . . . . . . . . . . . . . . . . . . . . . . . . . . . . . . . . . . . . . . . . . . . . . . . . . . . . 97 Share of equipped area actually irrigated (percent, 2000-2012*) . . . . . . . . . . . . . . . . . . . . . . . . . . . . . . . . . . . 118 Water resources per capita (m3/yr/cap, 2010) . . . . . . . . . . . . . . . . . . . . . . . . . . . . . . . . . . . . . . . . . . . . . . . 119 Employment in agriculture, share of total employment (percent, 2005-2010*) . . . . . . . . . . . . . . . . . . . . . . . . . . 1310 Children in employment, total (percent, 2000-2011*) . . . . . . . . . . . . . . . . . . . . . . . . . . . . . . . . . . . . . . . . . . 1311 Nitrogen and phosphate fertilizers consumption per ha of arable area and permanent crops (tonne/ha, 2011) . . . . . . 1512 Agricultural tractors, total (tractors, 2000-2010*) . . . . . . . . . . . . . . . . . . . . . . . . . . . . . . . . . . . . . . . . . . . . 1513 FDI (inward flows) to agriculture (million US$, 2010-2011*) . . . . . . . . . . . . . . . . . . . . . . . . . . . . . . . . . . . . . . 1714 Access to mobile cellular phone subscriptions annual growth (percent, 2000-2011) . . . . . . . . . . . . . . . . . . . . . . . 1915 Total public agricultural research expenditure, share of agricultural GDP (percent, 2006-2010*) . . . . . . . . . . . . . . . 1916 Map of hunger (percent, prevalence of undernourishment 2011-2013) . . . . . . . . . . . . . . . . . . . . . . . . . . . . . . . 3317 Prevalence of food inadequacy (percent, 2011-2013) . . . . . . . . . . . . . . . . . . . . . . . . . . . . . . . . . . . . . . . . . . 3318 Percentage of children under 5 years of age who are stunted (percent, 2005-2011*) . . . . . . . . . . . . . . . . . . . . . . 3519 Percentage of children under 5 years of age who are underweight (percent, 2005-2011*) . . . . . . . . . . . . . . . . . . . 3520 Poverty gap at national poverty line (percent, 2005-2012*) . . . . . . . . . . . . . . . . . . . . . . . . . . . . . . . . . . . . . . 3721 Poverty headcount ratio at national poverty line, share of population (percent, 2005-2011*) . . . . . . . . . . . . . . . . . 3722 Road density (km per 100 square km of land area, 2005-2010*) . . . . . . . . . . . . . . . . . . . . . . . . . . . . . . . . . . . 4123 Percent of paved roads over total roads (percent, 2005-2010*) . . . . . . . . . . . . . . . . . . . . . . . . . . . . . . . . . . . . 4124 Share of population without reasonable access to improved water sources (percent, 2011) . . . . . . . . . . . . . . . . . . 4325 Share of population without reasonable access to improved sanitation facilities (percent, 2011) . . . . . . . . . . . . . . . 4326 Political stability and absence of violence/terrorism (index, 2009) . . . . . . . . . . . . . . . . . . . . . . . . . . . . . . . . . . 4727 Literacy rate, adult female - share of females ages 15 and above (percent, 2005-2010*) . . . . . . . . . . . . . . . . . . . . 4928 Primary completion rate, total (percent, 2005-2010*) . . . . . . . . . . . . . . . . . . . . . . . . . . . . . . . . . . . . . . . . . . 4929 Droughts, floods, extreme temperatures - share of population affected (average 1990-2009) (percent, 2009) . . . . . . . 5130 UNHCR total population of concern (thousand people, 2011) . . . . . . . . . . . . . . . . . . . . . . . . . . . . . . . . . . . . . 5131 Food supply in crops primary equivalent (kcal/cap/day, 2009) . . . . . . . . . . . . . . . . . . . . . . . . . . . . . . . . . . . . 6332 Crops, net per capita production index number (2004-2006 = 100) (index, 2011) . . . . . . . . . . . . . . . . . . . . . . . . . 6533 Food, net per capita production index number (2004-2006 = 100) (index, 2011) . . . . . . . . . . . . . . . . . . . . . . . . . 6534 Cereal producing countries (million tonnes, 2011) . . . . . . . . . . . . . . . . . . . . . . . . . . . . . . . . . . . . . . . . . . . . 6735 Coarse grain producing countries (million tonnes, 2011) . . . . . . . . . . . . . . . . . . . . . . . . . . . . . . . . . . . . . . . . 6736 Rice producing countries (million tonnes, 2011) . . . . . . . . . . . . . . . . . . . . . . . . . . . . . . . . . . . . . . . . . . . . . 6937 Wheat producing countries (million tonnes, 2011) . . . . . . . . . . . . . . . . . . . . . . . . . . . . . . . . . . . . . . . . . . . . 6938 Oil crop producing countries (million tonnes, 2011) . . . . . . . . . . . . . . . . . . . . . . . . . . . . . . . . . . . . . . . . . . . 7139 Pulse producing countries (million tonnes, 2011) . . . . . . . . . . . . . . . . . . . . . . . . . . . . . . . . . . . . . . . . . . . . 7140 Root and tuber producing countries (million tonnes, 2011) . . . . . . . . . . . . . . . . . . . . . . . . . . . . . . . . . . . . . . 7341 Per capita citrus fruit production (tonne/cap, 2011) . . . . . . . . . . . . . . . . . . . . . . . . . . . . . . . . . . . . . . . . . . . 7342 Fruit producing countries, excluding melons (million tonnes, 2011) . . . . . . . . . . . . . . . . . . . . . . . . . . . . . . . . . 7543 Vegetable producing countries, including melons (million tonnes, 2011) . . . . . . . . . . . . . . . . . . . . . . . . . . . . . . 7544 Stock of cattle and buffaloes (million heads, 2011) . . . . . . . . . . . . . . . . . . . . . . . . . . . . . . . . . . . . . . . . . . . 7745 Meat producing countries (million tonnes, 2011) . . . . . . . . . . . . . . . . . . . . . . . . . . . . . . . . . . . . . . . . . . . . 7946 Milk production (million tonnes, 2011) . . . . . . . . . . . . . . . . . . . . . . . . . . . . . . . . . . . . . . . . . . . . . . . . . . . 8147 Butter and ghee production (million tonnes, 2011) . . . . . . . . . . . . . . . . . . . . . . . . . . . . . . . . . . . . . . . . . . . 8148 Capture fish producing countries (thousand tonnes, 2011) . . . . . . . . . . . . . . . . . . . . . . . . . . . . . . . . . . . . . . . 8349 Aquaculture producing countries (thousand tonnes, 2011) . . . . . . . . . . . . . . . . . . . . . . . . . . . . . . . . . . . . . . . 8350 Geo-location of harvests by capture and aquaculture (thousand tonnes, 2010) . . . . . . . . . . . . . . . . . . . . . . . . . . 8551 Import value index (index, 2010) . . . . . . . . . . . . . . . . . . . . . . . . . . . . . . . . . . . . . . . . . . . . . . . . . . . . . . 8752 Global distribution of risks associated with main agricultural production systems . . . . . . . . . . . . . . . . . . . . . . . . 11753 Forest area as share of total land area (percent, 2011) . . . . . . . . . . . . . . . . . . . . . . . . . . . . . . . . . . . . . . . . . 11754 Roundwood production (thousand m3, 2012) . . . . . . . . . . . . . . . . . . . . . . . . . . . . . . . . . . . . . . . . . . . . . . . 11955 Total water withdrawal per capita (m3/yr/cap, 2000-2010*) . . . . . . . . . . . . . . . . . . . . . . . . . . . . . . . . . . . . . . 12156 Renenwable freshwater resources withdrawn by agriculture (percent, 2000-2010*) . . . . . . . . . . . . . . . . . . . . . . . 12157 Terrestrial protected areas, share of total land area (percent, 2010) . . . . . . . . . . . . . . . . . . . . . . . . . . . . . . . . . 12358 Marine protected areas, share of territorial waters (percent, 2010) . . . . . . . . . . . . . . . . . . . . . . . . . . . . . . . . . . 12359 Nitrogen fertilizer consumption per ha of arable area and permanent crops (kg/ha, 2009) . . . . . . . . . . . . . . . . . . . 125
xii

LIST OF MAPS
60 Organic agriculture area (ha, 2011) . . . . . . . . . . . . . . . . . . . . . . . . . . . . . . . . . . . . . . . . . . . . . . . . . . . . . 12761 Organic agriculture, share of total agricultural area (percent, 2011) . . . . . . . . . . . . . . . . . . . . . . . . . . . . . . . . . 12762 Biofuel production (kilotonne of oil equivalent, 2009) . . . . . . . . . . . . . . . . . . . . . . . . . . . . . . . . . . . . . . . . . 12963 Surface temperature, anomaly versus 1951-1980 (degrees Celsius, 2012) . . . . . . . . . . . . . . . . . . . . . . . . . . . . . 13164 Share of population living in areas with elevation of 5 meters or less (percent, 2000) . . . . . . . . . . . . . . . . . . . . . . 13165 Total agricultural greenhouse gas emissions (gigagrams CO2eq, 2010) . . . . . . . . . . . . . . . . . . . . . . . . . . . . . . . 133
xiii

List of Tables
1 Population and structure . . . . . . . . . . . . . . . . . . . . . . . . . . . . . . . . . . . . . . . . . . . . . . . . . . . . . . . . . . . 202 Demographic indicators . . . . . . . . . . . . . . . . . . . . . . . . . . . . . . . . . . . . . . . . . . . . . . . . . . . . . . . . . . . . 213 Economy . . . . . . . . . . . . . . . . . . . . . . . . . . . . . . . . . . . . . . . . . . . . . . . . . . . . . . . . . . . . . . . . . . . . . 224 Land . . . . . . . . . . . . . . . . . . . . . . . . . . . . . . . . . . . . . . . . . . . . . . . . . . . . . . . . . . . . . . . . . . . . . . . . 235 Water resources per capita and irrigation . . . . . . . . . . . . . . . . . . . . . . . . . . . . . . . . . . . . . . . . . . . . . . . . . 246 Labour . . . . . . . . . . . . . . . . . . . . . . . . . . . . . . . . . . . . . . . . . . . . . . . . . . . . . . . . . . . . . . . . . . . . . . . 257 Inputs . . . . . . . . . . . . . . . . . . . . . . . . . . . . . . . . . . . . . . . . . . . . . . . . . . . . . . . . . . . . . . . . . . . . . . . 268 Agricultural capital stock . . . . . . . . . . . . . . . . . . . . . . . . . . . . . . . . . . . . . . . . . . . . . . . . . . . . . . . . . . . 279 Foreign direct investment and official development assistance . . . . . . . . . . . . . . . . . . . . . . . . . . . . . . . . . . . . 2810 Government expenditures . . . . . . . . . . . . . . . . . . . . . . . . . . . . . . . . . . . . . . . . . . . . . . . . . . . . . . . . . . . 2911 Innovation . . . . . . . . . . . . . . . . . . . . . . . . . . . . . . . . . . . . . . . . . . . . . . . . . . . . . . . . . . . . . . . . . . . . 3012 Outcomes: Inadequate access to food . . . . . . . . . . . . . . . . . . . . . . . . . . . . . . . . . . . . . . . . . . . . . . . . . . . 5213 Utilization . . . . . . . . . . . . . . . . . . . . . . . . . . . . . . . . . . . . . . . . . . . . . . . . . . . . . . . . . . . . . . . . . . . . 5314 Poverty . . . . . . . . . . . . . . . . . . . . . . . . . . . . . . . . . . . . . . . . . . . . . . . . . . . . . . . . . . . . . . . . . . . . . . 5415 Determinants: Availability . . . . . . . . . . . . . . . . . . . . . . . . . . . . . . . . . . . . . . . . . . . . . . . . . . . . . . . . . . 5516 Determinants: Physical and economic access . . . . . . . . . . . . . . . . . . . . . . . . . . . . . . . . . . . . . . . . . . . . . . . 5617 Vulnerability/Stability . . . . . . . . . . . . . . . . . . . . . . . . . . . . . . . . . . . . . . . . . . . . . . . . . . . . . . . . . . . . . 5718 Health and education . . . . . . . . . . . . . . . . . . . . . . . . . . . . . . . . . . . . . . . . . . . . . . . . . . . . . . . . . . . . . 5819 Population at risk . . . . . . . . . . . . . . . . . . . . . . . . . . . . . . . . . . . . . . . . . . . . . . . . . . . . . . . . . . . . . . . . 5920 Cereal producers and their productivity . . . . . . . . . . . . . . . . . . . . . . . . . . . . . . . . . . . . . . . . . . . . . . . . . . 9421 Coarse grain producers and their productivity . . . . . . . . . . . . . . . . . . . . . . . . . . . . . . . . . . . . . . . . . . . . . . 9522 Rice producers and their productivity . . . . . . . . . . . . . . . . . . . . . . . . . . . . . . . . . . . . . . . . . . . . . . . . . . . . 9623 Wheat producers and their productivity . . . . . . . . . . . . . . . . . . . . . . . . . . . . . . . . . . . . . . . . . . . . . . . . . . 9724 Oilcrop producers and their productivity . . . . . . . . . . . . . . . . . . . . . . . . . . . . . . . . . . . . . . . . . . . . . . . . . . 9825 Pulse producers and their productivity . . . . . . . . . . . . . . . . . . . . . . . . . . . . . . . . . . . . . . . . . . . . . . . . . . . 9926 Root and tuber producers and their productivity . . . . . . . . . . . . . . . . . . . . . . . . . . . . . . . . . . . . . . . . . . . . . 10027 Vegetable producers and their productivity . . . . . . . . . . . . . . . . . . . . . . . . . . . . . . . . . . . . . . . . . . . . . . . . 10128 Sugar producers and their productivity . . . . . . . . . . . . . . . . . . . . . . . . . . . . . . . . . . . . . . . . . . . . . . . . . . . 10229 Treenut producers and their productivity . . . . . . . . . . . . . . . . . . . . . . . . . . . . . . . . . . . . . . . . . . . . . . . . . 10330 Fruit producers and their productivity . . . . . . . . . . . . . . . . . . . . . . . . . . . . . . . . . . . . . . . . . . . . . . . . . . . 10431 Citrus fruit producers and their productivity . . . . . . . . . . . . . . . . . . . . . . . . . . . . . . . . . . . . . . . . . . . . . . . 10532 Fibre crop producers and their productivity . . . . . . . . . . . . . . . . . . . . . . . . . . . . . . . . . . . . . . . . . . . . . . . . 10633 Jute and jute-like producers and their productivity . . . . . . . . . . . . . . . . . . . . . . . . . . . . . . . . . . . . . . . . . . . 10734 Meat producers . . . . . . . . . . . . . . . . . . . . . . . . . . . . . . . . . . . . . . . . . . . . . . . . . . . . . . . . . . . . . . . . . 10835 Eggs, milk, and processed milk . . . . . . . . . . . . . . . . . . . . . . . . . . . . . . . . . . . . . . . . . . . . . . . . . . . . . . . . 10936 Fish production . . . . . . . . . . . . . . . . . . . . . . . . . . . . . . . . . . . . . . . . . . . . . . . . . . . . . . . . . . . . . . . . . 11037 Volume of total cereal trade . . . . . . . . . . . . . . . . . . . . . . . . . . . . . . . . . . . . . . . . . . . . . . . . . . . . . . . . . 11138 Volume of total oilseeds, and sugar and honey trade . . . . . . . . . . . . . . . . . . . . . . . . . . . . . . . . . . . . . . . . . . 11239 Volume of total meat and dairy products trade . . . . . . . . . . . . . . . . . . . . . . . . . . . . . . . . . . . . . . . . . . . . . . 11340 Value of fish trade . . . . . . . . . . . . . . . . . . . . . . . . . . . . . . . . . . . . . . . . . . . . . . . . . . . . . . . . . . . . . . . 11441 Land and Forestry . . . . . . . . . . . . . . . . . . . . . . . . . . . . . . . . . . . . . . . . . . . . . . . . . . . . . . . . . . . . . . . . 13442 Forestry production and trade . . . . . . . . . . . . . . . . . . . . . . . . . . . . . . . . . . . . . . . . . . . . . . . . . . . . . . . . 13543 Forestry production: finished products . . . . . . . . . . . . . . . . . . . . . . . . . . . . . . . . . . . . . . . . . . . . . . . . . . . 13644 Water withdrawal and pressure on renewable water resources . . . . . . . . . . . . . . . . . . . . . . . . . . . . . . . . . . . . 13745 Species threatened and nationally protected areas . . . . . . . . . . . . . . . . . . . . . . . . . . . . . . . . . . . . . . . . . . . 13846 Agri-environmental indicators . . . . . . . . . . . . . . . . . . . . . . . . . . . . . . . . . . . . . . . . . . . . . . . . . . . . . . . . 13947 Water pollution . . . . . . . . . . . . . . . . . . . . . . . . . . . . . . . . . . . . . . . . . . . . . . . . . . . . . . . . . . . . . . . . . 14048 Renewable feedstocks . . . . . . . . . . . . . . . . . . . . . . . . . . . . . . . . . . . . . . . . . . . . . . . . . . . . . . . . . . . . . 14149 Agricultural emissions . . . . . . . . . . . . . . . . . . . . . . . . . . . . . . . . . . . . . . . . . . . . . . . . . . . . . . . . . . . . . 142
xiv

PART
1The Setting
1

Overview
The world’s population is constantly growing, especially inurban areas. Indeed in 2011, the world had 47.5 percent ofrural population against 52.6 percent for urban. Data anal-ysis at the regional level shows that the Regional Office forAfrica (RAF) was the region with the largest rural popula-tion. The Regional Office for Asia and the Pacific (RAP) wasplaced second, followed by the Regional Office for the NearEast (RNE), the Regional Office for Europe & Central Asia(REU), and finally the Regional Office for Latin America andthe Caribbean (RLAC). In RAF, 63.9 percent of the popula-tion lived in rural areas and only 36.1 percent in urban areas.North Africa stood out, with more than half (55.2 percent) ofthe population in urban areas (table 1, chart 2). At a sub-regional level, in RAF, for 2011, East Africa had the largestproportion of the rural population (79.1 percent) followed byCentral Africa (61.7 percent), Southern Africa (55.8 percent)and West Africa (55.1 percent).
According to the age group, RAF had the highest proportionof extreme youth of its population compared with the otherregions of the world. Indeed, in 2011, the population under15 years was estimated at 28.5 percent at the global level.In RAF, this population was 42.4 percent while it was 25.1percent in RAP, 17.4 percent in REU, 27.9 percent for RLAC,and 31.5 percent in RNE. With the exception of North Africa,where this segment of the population accounted for 29.3percent, the extreme youth of the African population wassignificant and evenly distributed as it accounted for 44.5percent in Central Africa, 42.8 percent in East Africa, 39.4percent in Southern Africa, and 43 percent in West Africa,(table 1, chart 4).
As for agricultural population, in 2012, at the global level,the proportion of agricultural population in the total popu-lation was 31.7 percent, while in RAF it was 54.2 percent.RAP was second with 30.2 percent, then RNE with 22.7 per-cent, RLAC, 15.2 percent, and REU, 7.8 percent. This meansthat Africa recorded a large proportion of agricultural popu-lation, except for North Africa, which was low (23.5 percent),(table 1). From 1990 to 2012, a general decline in the trendof the proportion of the agricultural population in the totalpopulation in all sub-regions was observed. In North Africathe decline was more pronounced. It was also high in Cen-tral Africa, but relatively low in South Africa (chart 3).
CHART 1: Africa rural and urban population(1960-2050)
0
500
1000
1500
1960 1980 2000 2025 2050
millionpeople
Urban Rural
Source: United Nations Population Division.Data after 2011 are projections.
CHART 2: Rural and urban population, share of totalpopulation (2011)
0
25
50
75
100
CentralAfrica
EasternAfrica
NorthAfrica
SouthernAfrica
WesternAfrica
World
percent
Urban Rural
Source: United Nations Population Division.
2

THE SETTING
MAP 1: Population annual growth (percent, 2000-2012)
No data available
0.1315 ~ < 1.6
1.6 ~ < 2.2
2.2 ~ < 2.6
2.6 ~ < 3
3 ~ 3.7
Source: United Nations Population Division.
CHART 3: Agricultural population, share of totalpopulation (1990 and 2012)
0
20
40
60
80
CentralAfrica
EasternAfrica
NorthAfrica
SouthernAfrica
WesternAfrica
World
percent
1990 2012
Source: FAO, Statistics Division (FAOSTAT) and United Nations Pop-ulation Division.
CHART 4: Population ages 0-14, 15-64 and 65+, shareof total (2010)
0
25
50
75
100
CentralAfrica
EasternAfrica
NorthAfrica
SouthernAfrica
WesternAfrica
percent
Population 0-14 Population 15-64 Population 65+
Source: United Nations Population Division.
3

Population growth was rapid in RAF. This increase in popu-lation could be explained by several factors including: (i) thedecline in infant mortality, and (ii) the improvement of lifeexpectancy.
The rate of infant mortality was down in all regions. At theglobal level, it declined by 15 per 1 000 live births between2000 and 2012, which is encouraging. In Africa, the de-cline was the greatest. Indeed the drop was 22.6 per 1 000live births for all of Africa and 22.9 per 1 000 live birthsfor RAF, whereas it was 14.4 per 1 000 live births for RAP,6.3 per 1 000 live births for REU, 7 per 1 000 live births forRLAC, and 9 per 1 000 live births for RNE, (Table 2). Lifeexpectancy at birth increased worldwide during the period2000-2012, with the exception of South Africa where it de-clined due to the AIDS pandemic. These results are encour-aging, particularly in Africa and in RAF. However the healthpolicies that helped achieve these results should be main-tained and strengthened as infant mortality rates remainedpersistently high especially in Africa and also as the lowestlife expectancy was recorded in Africa.
Furthermore, during the period 2010-2012, the life ex-pectancy at birth at the global level was 70.5 years. RAF(55.9 years) recorded theweakest life expectancy at birth fol-lowed by the RAP (70.9 years). In contrast REU (76.3 years),RLAC (74.4 years), and RNE (70.6 years) had the longest lifeexpectancy at birth which is above the global average, (Table2). The weak life expectancy at birth in RAF is mainly as a re-sult of the very low life expectancy at birth of Central Africa(50.8 years). East Africa, with 60.5 years, had a much bet-ter indicator than West Africa whose life expectancy at birthwas 54 years and that of Southern Africa (55.1 years). As forNorth Africa, with a life expectancy at birth of 71.1 years, itwas well above the African average and close to the globalaverage, (chart 5). However there was a wide disparity be-tween countries. Indeed chart 5 shows that 8 countries (Sey-chelles, Tunisia, Libya, Mauritius, Algeria, Cape Verde, Egyptand Morocco) had a life expectancy at birth over 70 years.For 9 countries it was between 60 and 70 years. In contrast,for 11 countries, it was less than 50 years, which was toolow. Among these countries were Guinea-Bissau, and SierraLeone in West Africa, and Central African Republic, the Chad,Democratic Republic of the Congo in Central Africa, Burundiand Somalia in East Africa, Mozambique, Lesotho, Swazilandand Zambia in Southern Africa.
Further reading
• World Population Prospects: the 2011 revision (www.un.org/esa/population/)
• UN Population Fund (www.unfpa.org/)• FAO Food and Nutrition Security in Urban Environments(www.fao.org/ag/agn/nutrition/urban_security_en.stm)
CHART 5: Life expectancy at birth, selected countries(2000-2011)
Sierra LeoneZambia
Central African RepublicZimbabwe
Guinea-BissauAngola
Democratic Republic of the CongoLiberiaBurundiMalawiUgandaNigeriaRwanda
MozambiqueMali
LesothoGuineaNigerSomaliaChad
SwazilandEquatorial Guinea
CameroonCôte d’IvoireBurkina Faso
United Republic of TanzaniaBotswanaEthiopiaKenyaBeninDjiboutiCongo
South AfricaTogoGambiaSenegalEritrea
Sudan (former)MauritaniaNamibiaComorosGhana
MadagascarGabon
Sao Tome and PrincipeMoroccoEgypt
Cape VerdeAlgeriaMauritiusLibyaTunisia
Seychelles
40 50 60 70 80years
2000 2011
Source: World Bank (WDI).
4

THE SETTING
MAP 2: GNI per capita (current US$, 2011-2012*)
No data available
220 ~ < 480
480 ~ < 680
680 ~ < 1 330
1 330 ~ < 3 870
3 870 ~ 13 560
Source: World Bank (WDI).
MAP 3: Under-5 mortality rate (per 1000 live births, 2010-2011*)
No data available
13.8 ~ < 50
50 ~ < 78
78 ~ < 100
100 ~ < 130
130 ~ 185.3
Source: World Bank (WDI).
5

Economy
“The global economy appears to be transitioning toward aperiod of more stability, but slower growth. Global GrossDomestic Product (GDP), which slowed in mid-2012, is re-covering, and a modest acceleration in quarterly GDP is ex-pected during the course of 2013”. In 2012, the Gross Do-mestic Product (GDP) of the world was estimated at U.S.$69 569 billion. RAF accounted for only U.S. $1 263 bil-lion, which was very low. Within the regions, North Africa,with U.S. $666 billion in GDP was the highest. It was fol-lowed closely by Southern Africa (U.S. $605 billion), thenWest Africa (U.S. $401 billion), East Africa (U.S. $151 billion)and Central Africa (U.S. $106 billion). “Sub-Saharan AfricaGDP is projected1 to pick up to 4.9 percent in 2013, 5.2 per-cent in 2014, and 5.4 percent in 2015. Excluding, the region’slargest economy, South Africa, GDP growth for the rest of theregion is expected to increase by 6.2 percent in 2013 and2014, and further strengthen to 6.4 percent in 2015”.
At the global level, in 2009-11, the share of the value addedof services was the largest (73 percent), while industry ac-counted for a quarter, and agriculture had the smallest sharewith only 2 percent. However in RAF, agriculture rather rep-resented a significant portion of about 14.3 percent com-pared with the global level. Services (55 percent) and indus-try (30.7 percent) however, accounted for a significant part ofthe value added in all RAF sub-regions. The significance ofthe value added of the agricultural sector in RAF can be ex-plained by the contributions from Central Africa, East Africaand West Africa. In contrast, the Southern Africa and NorthAfrica recorded a low value added in agriculture (Chart 6).This small contribution to the added value of the agricul-tural sector was due to the situation of countries such asBotswana, Seychelles and South Africa. These countries arestructured as developed countries where agriculture occu-pies a low position in the value added.
“Exports from Sub-Saharan Africa were not spared the de-cline in global trade during 2012 (the exception being agri-cultural exporters whose trade held up during the secondhalf of the year). Industrial production slowed sharply in thesecond half of 2012 among oil exporting economies (Angola,Gabon, and Nigeria), partly because of domestic challengesin Nigeria”. Foreign direct investment inflows to developingcountries remained robust in 2012 after the increased un-certainty in global financial markets earlier in the year.
Further reading
• World Bank: Global Economic Prospects (wwwr.worldbank.org/prospects/)
• International Monetary Fund: World Economic Outlook(www.imf.org/external/index.htm)
1The World Bank. 2013. Global Economic Prospects, Volume 7,June 2013, World Bank, Washington, DC.
CHART 6: Value added in agriculture, industry, andservices as shares of GDP (2009)
0
25
50
75
100
Central
Africa Ea
st
Africa
North
Africa
Southern
Africa We
st
Africa
percent
Agriculture Industry Services
Source: World Bank (WDI).
CHART 7: Africa trade, FDI, and ODA as shares of GDP(2000-2012)
0
20
40
60
80
2000 2005 2010
percent
Trade FDI ODA
Source: World Bank (WDI).
6

THE SETTING
MAP 4: Agriculture, value added per worker annual growth (percent, 2011-2012)
No data available
−5.516 ~ < 0.29
0.29 ~ < 1.5
1.5 ~ < 2.8
2.8 ~ < 4.5
4.5 ~ 9.588
Source: World Bank.
MAP 5: Agriculture, value added as share of GDP (percent, 2008-2012*)
No data available
1.865 ~ < 8.1
8.1 ~ < 15
15 ~ < 27
27 ~ < 33
33 ~ 56.82
Source: World Bank (WDI).
7

Land and Water
“The world’s land and water resources are finite and underpressure from a growing population. Global figures showa relatively low portion of land and water actually used byagriculture, but these figures hide major regional variationsand a series of locally important imbalances between de-mand and supply”.2
In 2011, of the over 12 766 million hectares of land areain the world, agriculture occupied 37.4 percent, forests 31.0percent and the others 32 percent. In RAF, agriculture ac-counted for 43.6 percent of the land area and forests 27.9percent. For RAP, agriculture was 38.9 percent and forests31.3 percent. In REU, it was 29.7 percent for agricultureand 38.3 percent for forests while in RLAC, 36.7 percent foragriculture and 46.8 percent for forests and finally in RNE,agriculture was 33.8 percent and only 1.9 percent for forest(table 4, chart 9).
Compared with other regions, in RAF, more land area wasoccupied by agriculture and less so by forests. This is theresult of the fact that, in East Africa, almost half (49.8 per-cent) of the land area was reserved for agriculture and muchless by forests (17.5 percent). It was also due to the signifi-cant use of land area for agriculture in Southern Africa (55.3percent) and West Africa (47.6 percent).
The geographical environment of North Africa is such thatonly a small proportion of land area (17.6 percent) is devotedto agriculture and only 1.4 percent for forests.
The area covered by agriculture is the total area of arableland, land under permanent crops and permanent pastures.In 2011, at the global level, the area covered by agriculturewas divided into 68.5 percent for the Permanent pasture (thebiggest part), 28.6 percent for arable land and 3.2 percent forland under permanent crops (chart 10).
RAP and REU are the two regions that have more than threequarters of agricultural land that are arable; the other re-gions are below the average. In RAF, arable land accountedfor 20.3 percent. The shares for the different sub-regions areWest Africa (29.7 percent), followed by East Africa (24.6 per-cent), Central Africa (19.4 percent) and last Southern Africa(10.5 percent).
In 2011, the lands under permanent crops represented 2.6percent of agricultural land in RAF, 4.0 percent in RAP, 2.5percent in REU, 2.7 percent for RLAC and 1.9 percent forRNE. Comparing the FAI Regions, RAP had more lands un-der permanent crops. RAF occupied the third position, butit should be noted that within RAF, West Africa was a spe-cial case, with highest percentage of lands under permanentcrops (4.3 percent), while North Africa was 2.8 percent, Cen-tral Africa 2.4 percent, East Africa 3.7 percent and SouthernAfrica with only 0.5 percent.
2 FAO. 2011. The State of theworld’s land andwater resources forfood and agriculture (SOLAW) – Managing systems at risk. Food andAgriculture Organization of the United Nations, Rome and Earth-scan, London.
CHART 8: Arable land per capita (2000-2011)
DjiboutiSeychellesEgypt
Sao Tome and PrincipeMauritiusCape VerdeRwanda
Sierra LeoneLiberia
Democratic Republic of the CongoSomaliaComorosBurundiEthiopiaEritreaCongoKenya
SwazilandLesotho
Côte d’IvoireMauritaniaMadagascarBotswanaGhana
MozambiqueAngolaGambiaUganda
Guinea-BissauNigeriaMalawi
Equatorial GuineaAlgeria
United Republic of TanzaniaGuineaGabonZambia
ZimbabweBurkina Faso
TunisiaMorocco
South AfricaSenegalLibyaBenin
CameroonMali
NamibiaChad
Sudan (former)Central African Republic
TogoNiger
0.0 0.5 1.0ha/cap
2000 2011
Source: FAO, Statistics Division (FAOSTAT) and United Nations Pop-ulation Division.
8

THE SETTING
MAP 6: Cropland per capita (ha/cap, 2011)
No data available
0.002208 ~ < 0.13
0.13 ~ < 0.21
0.21 ~ < 0.28
0.28 ~ < 0.35
0.35 ~ 0.9335
Source: FAO, Statistics Division (FAOSTAT) and United Nations Population Division.
CHART 9: Land area (2011)
0
25
50
75
100
CentralAfrica
EasternAfrica
NorthAfrica
SouthernAfrica
WesternAfrica
World
percent
Agricultural Forest Other
Source: FAO, Statistics Division (FAOSTAT).
CHART 10: Agricultural area (2011)
0
25
50
75
100
CentralAfrica
EasternAfrica
NorthAfrica
SouthernAfrica
WesternAfrica
World
percent
Arable
Permanent crops
Permanent meadows and pastures
Source: FAO, Statistics Division (FAOSTAT).
9

RNE had the biggest land under permanent meadows andpasture (85.3 percent). RAF was second, with 77.8 percent,followed by RLAC (74.6 percent), RAP (65.4 percent) and fi-nally REU (56.1 percent).
Regions that have contributed the most to the position ofRAF were, in order of size, Southern Africa (89.0 percent ofpermanent meadows and pasture), North Africa (79.6 per-cent), Central Africa (78.1 percent), East Africa (74.3 percent)and West Africa (66.0 percent).
The Democratic Republic of the Congo had the biggest irri-gation potential in 2012 with 7 million ha. It was followedby Egypt with just above 4 million ha, and Angola with al-most 4 million ha (chart 11). The vast portion of equippedland for irrigation actually irrigated (hundred percent) wasrecorded in Egypt, Ethiopia, Namibia, South Africa, Tanza-nia, and Zambia (map 7).
Egypt also had the largest total equipped area for irrigationin 2009 (roughly 3.5 million ha). It was followed by (for-mer) Sudan, South Africa and Morocco. Conversely Angola,Guinea, Kenya, Mozambique and Senegal had the lowest to-tal irrigation (chart 12).
In 2010, Cameroon, Central Africa Republic, Congo, Demo-cratic Republic of the Congo, Gabon, and Madagascar hadthe biggest water resources per capita ranging from 14 300to 205 788 m3/yr/cap. (map 8). In contrast some coun-tries such as Burkina Faso, Ethiopia, Kenya, Nigeria, Somalia,South Africa and Zimbabwe experienced the lowest waterresources per capita (110 to 1 030 m3/yr/cap).
Further reading
• AQUASTAT, FAO’s global information system on wa-ter and agriculture (http://www.fao.org/nr/water/aquastat/main/index.stm)
• FAO The State of the World’s Land and Water Resources forFood and Agriculture (SOLAW) - Managing Systems at Risk2011 (www.fao.org/nr/solaw/solaw-home/en/)
• Bruinsma (2011)• FAO Natural Resources and Environment Department(www.fao.org/nr/)
CHART 11: Irrigation potential, selected countries(2012)
Guinea
Zambia
Kenya
Tunisia
Mali
Liberia
Sierra Leone
South Africa
Madagascar
Morocco
Ghana
Central African Republic
United Republic of Tanzania
Nigeria
Ethiopia
Sudan (former)
Mozambique
Angola
Egypt
Democratic Republic of the Congo
2 4 6million ha
Source: Land and Water Division (AQUASTAT).The irrigation potential area includes the area already equipped forirrigation.
CHART 12: Total equipped area (2009)
Angola
Guinea
Kenya
Mozambique
Senegal
Zambia
Zimbabwe
United Republic of Tanzania
Somalia
Mali
Ethiopia
Nigeria
Tunisia
Libya
Algeria
Madagascar
Morocco
South Africa
Sudan (former)
Egypt
0 1 2 3million ha
Source: Land and Water Division (AQUASTAT).
10

THE SETTING
MAP 7: Share of equipped area actually irrigated (percent, 2000-2012*)
No data available
13 ~ < 57
57 ~ < 82
82 ~ < 90
90 ~ < 100
100 ~ 100
Source: Land and Water Division (AQUASTAT).
MAP 8: Water resources per capita (m3/yr/cap, 2010)
No data available
110 ~ < 1 030
1 030 ~ < 2 030
2 030 ~ < 3 820
3 820 ~ < 14 300
14 300 ~ 205 788
Source: Land and Water Division (AQUASTAT).
11

Labour
“Labor force participation rate is the proportion of the pop-ulation aged 15 years and above that is economically active:all people who supply labor for the production of goods andservices during a specified period”.3 In 2010, this rate was50.6 percent for women and 77.3 percent for men at theglobal level. In RAF, women had the highest rate of laborparticipation (62.8 percent) followed by RAP (49.4 percent),then REU (49.9 percent), RLAC (53.3 percent), and RNE (21.6percent). With regard to men, RLAC had the highest laborforce participation rate, followed by RAP, RAF, RNE, and REU.
Within RAF, East Africa had the highest women’s participa-tion rate (68.8 percent), followed by Central Africa (68.3 per-cent), Southern Africa (66.9 percent), and West Africa (53.2percent). North Africa had the lowest rate with 22.5 per-cent. The male labor force participation rate recorded inEast Africa was very high, more than 83.1 percent; in South-ern Africa, it was 76.2 percent, Central Africa (74.7 per-cent), North Africa (73.6 percent), and West Africa (71 per-cent). This exceptional high rate is due to the elevated ratesrecorded by Eritrea, Ethiopia, and Rwanda.
The portion of female employment in agriculture, over thetotal female employment was significant (more than 75 per-cent) over the period 2005-2010, in Burkina Faso, Madagas-car, Zambia, and Ethiopia. Conversely it was low (less than12.5 percent) in Mauritius, Algeria and South Africa (chart 13and map 9).
With respect to child labour, the new estimates released bythe ILO, “indicated that 168 million children worldwide areengaged in child labour, accounting for almost 11 percentof the child population as a whole. Children in hazardouswork that directly endangers their health, safety and moraldevelopment make up more than half of all child labourers,numbering 85 million in absolute terms. The largest abso-lute number of child labourers is found in the Asia and thePacific region but Sub-Saharan Africa continues to be theregion with the highest incidence of child labour with morethan one in five children in child labour”.4
The new estimates (ILO) indicate that the number of chil-dren engaged in child labour has declined by one third since2000, from 246 million to 168 million. The most spectacu-lar increase occurred in the four years between 2008 and2012, when child labour fell by 22 percent. Nevertheless, inAfrica, the portion of child labour employment as a wholeremained high (range between 47 to 74.4 percent) in somecountries, including Benin, Central African Republic (CAR),Ghana, Niger, Sierra Leone, Somalia, and Togo (Map 10).
Further reading
• FAO (2012b)
3 Source: World Bank (WDI).4 ILO-IPEC Marking progress against child labour - Global esti-
mates and trends 2000-2012 / International Labour Office, Inter-national Programme on the Elimination of Child Labour (IPEC) -Geneva: ILO, 2013.
CHART 13: Female employment in agriculture, share offemale employment, selected countries (2005-2010*)
South Africa
Algeria
Mauritius
Gabon
Niger
Congo
Egypt
Liberia
Cameroon
Morocco
Kenya
Ethiopia
Zambia
Madagascar
Burkina Faso
0 25 50 75percent
Source: World Bank (WDI).
CHART 14: Labor force participation rate by gender,ages 15+ (2011)
0
20
40
60
80
CentralAfrica
EasternAfrica
NorthAfrica
SouthernAfrica
WesternAfrica
World
percent
Male Female
Source: World Bank (WDI).
12

THE SETTING
MAP 9: Employment in agriculture, share of total employment (percent, 2005-2010*)
No data available
4.9 ~ < 23
23 ~ < 38
38 ~ < 57
57 ~ < 73
73 ~ 84.8
Source: World Bank (WDI).
MAP 10: Children in employment, total (percent, 2000-2011*)
No data available
2.6 ~ < 19
19 ~ < 30
30 ~ < 39
39 ~ < 47
47 ~ 74.4
Source: World Bank (WDI).
13

Inputs
Inputs are a range of materials that may be used to enhanceagricultural productivity. Most important among these arefertilizers and improved seeds.
“Fertilizers are organic or inorganic substances containingchemical elements that improve plant growth and fertilityof the soil. Organic fertilizers (manure) are derived from an-imal products and plant residues containing organic nutri-ents such as nitrogen. However, the percentage content ofnutrients in organic fertilizers is relatively low. In inorganicor mineral fertilizers, the nutrients are inorganic salts, ob-tained by extraction or physical and chemical processes”.5
Inorganic fertilizers are most commonly a blend of three pri-mary plant nutrients in varying proportions: N - nitrogen, P- phosphorus, K - Potassium. Chart 15 shows that fertilizerconsumption in Africa per ha of arable land and permanentcrops rose from 10.5 kg/ha in 2002 to about 11.5 kg/ha in2011, in keeping the same share of all the primary plant nu-trients (nitrogen, phosphate, potash).
Concerning fertilizer consumption in tons per ha of arableland and permanent crops, RAF Africa was the lowest con-sumer in inorganic fertilizers with the lowest proportionsof Nitrogen, Phosphate and Potash. In contrast, RAP wasthe top user of fertilizer with high rate of nitrogen, phos-phate and an average rate of potash. The low consump-tion of fertilizers in RAF in 2011, can be explained by thelow consumptions of fertilizer of Central Africa, West Africaand East Africa, which had recorded less than 12 kg/ha each.In contrast, North Africa was the biggest fertilizer user perha (almost 80 kg/ha) with substantial share of nitrogen andphosphate but a low proportion of potash. North Africa wasfollowed by Southern Africa, with roughly 25 kg/ha (chart16).
Egypt, Libya, Morocco, South Africa, Tunisia, and Zambia,with more than 23 ton/ha each, recorded the highest nitro-gen and phosphate fertilizer consumptions per ha of arableland and permanent crops in 2011.
Pesticides can increase agricultural productivity but, whenhandled improperly, they are toxic to humans and otherspecies. Use can be reduced through the practice of In-tegrated Pest Management (IPM), which uses informationon pest populations to estimate losses and adjust pesticidedoses accordingly.
Plant breeding also plays an important role in bolsteringproductivity by adapting cultivated varieties to local condi-tions and making them more resilient to biotic (e.g. insects,diseases, viruses) and abiotic (e.g. droughts, floods) stresses.
Further reading
• Schmidhuber, J. and Bruinsma, J. (2011)• FAO Agriculture Department (www.fao.org/ag/portal/index_en/en/)
5Glossary of Environment Statistics, Studies in Methods, SeriesF, No. 67, UN, 1997.
CHART 15: Africa fertilizer consumption per ha ofarable area and permanent crops (2002-2011)
0
3
6
9
12
2002 2011
kg/ha
Nitrogen Phosphate Potash
Source: FAO, Statistics Division (FAOSTAT).
CHART 16: Fertilizer consumption per ha of arable landand permanent crops (2011)
0
20
40
60
80
CentralAfrica
EasternAfrica
NorthAfrica
SouthernAfrica
WesternAfrica
kg/ha
Nitrogen Phosphate Potash
Source: FAO, Statistics Division (FAOSTAT).
14

THE SETTING
MAP 11: Nitrogen and phosphate fertilizers consumption per ha of arable area and permanent crops (tonne/ha, 2011)
No data available
0 ~ < 1
1 ~ < 5
5 ~ < 7.9
7.9 ~ < 23
23 ~ 452.5
Source: FAO, Statistics Division (FAOSTAT).
MAP 12: Agricultural tractors, total (tractors, 2000-2010*)
No data available
6 ~ < 430
430 ~ < 1 410
1 410 ~ < 8 260
8 260 ~ < 31 200
31 200 ~ 104 529
Source: FAO, Statistics Division (FAOSTAT).
15

Capital and Investment
Given its strong impact on welfare, investment is particu-larly important in agriculture: countries that perform bestin terms of reducing poverty and hunger are also those thathave achieved higher net investment rates per agriculturalworker.
The share of credit to agriculture in the added value of agri-culture in Africa grew from roughly 4 percent from 2005 toaround 10 percent in 2010. This is made up of agriculture,forestry and fisheries. Chart 17 shows that only the part ofagriculture experienced strong growth.
From 2000 to 2010, Official Development Assistance (ODA)in terms of total receipts of RAF countries rose from 24 913million to 42 252 million U.S. dollars, implying a growthrate of 76 percent over 10 years. Furthermore in 2010,RAF’s share accounted for 6.6 percent. At the sub-regionallevel, the major contribution to this share came from WestAfrica (9.1 percent), followed by East Africa (7.8 percent).Next was North Africa, Southern Africa, with Central Africalagging behind. Nevertheless this indicator rose rapidlyin North Africa and in West Africa, (chart 18). Concerning[200B?][200B?]forestry and fishery, the contribution of ODAis minor; in RAF, it was 0.5 percent for forestry and 0.3 per-cent for fishery.
Gross Fixed Capital Formation (GFCF) in the agricultural sec-tor includes two main components, which are gross fixedcapital formation in agricultural and non-agricultural prod-ucts. GFCF in agriculture products is a production for finaluse in the sector. GFCF of the agriculture sector in agricul-tural products consists exclusively of two types of products:animal (livestock fixed assets, livestock inventory) and plan-tations (plantation crops). GFCF in non-agricultural productscorresponds to land development and structures for live-stock machinery and equipment.
With respect to government expenditures in agriculture,chart 20 shows that only Zimbabwe had devoted a sig-nificant part of government expenditures to agriculture,forestry, fishing and hunting vis-à-vis total government ex-penditures (16 percent). All other countries spent less than6 percent. For some countries like Egypt, Nigeria, Seychellesand Sierra Leone, this share was low (less than 2 percent) in2010.
Further reading
• FAO How to Feed the World in 2050: Investment Brief(www.fao.org/wsfs/forum2050/)
• FAO Foreign Investment in Agriculture (www.fao.org/economic/est/investments/)
• Principles for Responsible Agricultural Investment that Re-spects Rights, Livelihoods and Resources (www.unctad.org/en/Pages/Home.aspx)
• Foreign Agriculture Investment Database (www.fao.org/tc/policy-support/investment-policy/fdi/en/)
CHART 17: Africa credit to agriculture, share of addedvalue in agriculture, selected countries (2005-2010)
0
2
4
6
2005 2010
percent
Agriculture Forestry Fishing
Source: FAO, Statistics Division.
CHART 18: ODA received in agriculture, total share ofODA (2002 and 2010)
0.0
2.5
5.0
7.5
CentralAfrica
EasternAfrica
NorthAfrica
SouthernAfrica
WesternAfrica
percent
2002 2010
Source: FAO, Statistics Division.
16

THE SETTING
MAP 13: FDI (inward flows) to agriculture (million US$, 2010-2011*)
No data available
0 ~ < 2.5
2.5 ~ < 7.6
7.6 ~ < 14
14 ~ < 28
28 ~ 42.95
Source: Foreign agriculture investment database.
CHART 19: Share of components in capital stock (2007)
0
25
50
75
100
CentralAfrica
EasternAfrica
NorthAfrica
SouthernAfrica
WesternAfrica
percent
Land development
Livestock fixed assets
Livestock inventory
Machinery and equipment
Plantation crops
Structures for livestock
Source: FAO, Statistics Division (FAOSTAT).
CHART 20: Government expenditures in agriculture,forestry, fishing, and hunting, selected countries (2010)
Nigeria
Seychelles
Sierra Leone
Egypt
Lesotho
Liberia
Cape Verde
United Republic of Tanzania
Uganda
Namibia
Kenya
Swaziland
Tunisia
Zimbabwe
4 8 12 16percent of total outlays
Source: FAO, Statistics Division (FAOSTAT).
17

Innovation
In 2011, at the global level, there were 8.5 subscribers for100 people for fixed broadband internet, 85.4 subscribersfor 100 people for mobile and 17 lines for 100 people fortelephone line (table 11). In Africa, information technologyand communication is expanding. Indeed compared with theglobal level, all the indicators in Africa were low includingthe fixed broadband Internet (0.6 subscribers per 100 peo-ple), mobile cellular phones (61.7 subscriptions per 100 peo-ple) and fixed telephone lines (2.8 lines per 100 people).
The trends are similar in RAF. RAF, with only 0.2 subscribersfor 100 people, had the less subscribers for fixed broadbandinternet, whereas RAP recorded 6.5, REU 20.0, RLAC 7.7, andRNE 2.3 per 100 people. As for mobile phone use, RAF alsoaccounted for the lower subscription (53.2) while RAP had81, REU 128.7, RLAC 105.3, and RNE 94.9.
With regards to fixed telephone lines, RAF had the small-est number of telephone lines (1.4 lines per 100 people). Incontrast RAP recorded 14.1 lines per 100 people, REU 36.9,RLAC 18.1, and RNE 14.7.
Nevertheless, mobile cellular subscribers greater than in-ternet and telephone lines for the entire Africa sub-region.North Africa recorded the greatest number of subscribers(106.1) whereas the average at the global level was 85.4subscribers (chart 22). Annual growth in access to mobilecellular phone subscriptions was significant (more than 80to 98.78 percent) during the period 2000-2010 in countriessuch as Burkina Faso, Cameroon, DR Congo, Ethiopia, Mali,Nigeria, and Niger (map 14).
What accounts for Africa lagging behind in innovation is thelack of funds for research. As shown in chart 21, with theexception of Botswana, which had an allocation of publicfunds for agricultural research from the agricultural GDP ofequal to roughly 4.3 percent and Mauritius almost 4 percent,most of the countries in RAF spent less than 2 percent ofagricultural GDP on research. Mauritania, Senegal, Ghana,Congo, Uganda, Kenya, Namibia, Botswana, South Africa de-voted between 1.2 to 4.32 percent of agricultural GDP to re-search expenditure. These proportions, though low, are thehighest (map 15).
Further reading
• Agricultural Science and Technology Indicators (www.asti.cgiar.org/)
• ASTI Global Assessment of Agricultural R & D Spending(www.ifpri.org/sites/default/files/publications/astiglobalassessment.pdf)
CHART 21: Total public agricultural researchexpenditure, share of agricultural GDP, selected
countries (2008)
Gambia
United Republic of Tanzania
Rwanda
Côte d’Ivoire
Benin
Mali
Morocco
Malawi
Seychelles
Congo
Senegal
Ghana
Mauritania
Uganda
Kenya
Burundi
South Africa
Namibia
Mauritius
Botswana
1 2 3 4percent
Source: ASTI.
CHART 22: Mobile cellular, broadband internet, andtelephone lines subscribers (2012)
0
30
60
90
120
CentralAfrica
EasternAfrica
NorthAfrica
SouthernAfrica
WesternAfrica
World
subscribersper100people
Internet Mobile cellulars Telephone lines
Source: World Bank (WDI).
18

THE SETTING
MAP 14: Access to mobile cellular phone subscriptions annual growth (percent, 2000-2011)
No data available
18.62 ~ < 45
45 ~ < 58
58 ~ < 65
65 ~ < 81
81 ~ 98.78
Source: World Bank (WDI).
MAP 15: Total public agricultural research expenditure, share of agricultural GDP (percent, 2006-2010*)
No data available
0.17 ~ < 0.3
0.3 ~ < 0.49
0.49 ~ < 0.6
0.6 ~ < 1.2
1.2 ~ 4.32
Source: ASTI.
19

TABLE 1: Population and structurePopulation Age composition
total rural urban density agricultural between overshare of total 0-14 65+
thousandpeople
thousandpeople
percent percent percent percentpeople/km2
percent percent percent percent
2000 2012 2000 2011 2000 2011 2011 2000 2012 2010 2010Africa 811099 1070096 64.2 60.0 35.8 40.0 35.9 55.1 49.3 40.3 3.5North Africa 141662 170217 48.6 44.8 51.4 55.2 28.9 30.4 23.5 29.3 5.1Algeria 30534 36486 39.2 27.0 60.8 73.0 15.9 24.2 20.2 27.0 4.6Egypt 67648 83958 57.2 56.5 42.8 43.5 79.8 34.7 26.6 31.5 5.0Libya 5231 6469 23.7 22.3 76.3 77.7 3.5 5.8 2.7 30.4 4.3Morocco 28793 32599 46.7 43.0 53.3 57.0 71.8 33.7 24.5 28.0 5.5SudanTunisia 9456 10705 36.6 33.7 63.4 66.3 68.7 23.8 19.9 23.5 7.0Regional Office for Africa 668229 898226 68.5 63.9 31.5 36.1 37.6 60.4 54.2 42.4 3.2Central Africa 82260 113160 66.0 61.7 34.0 38.3 20.6 61.0 52.6 44.5 3.0Cameroon 15678 20469 54.5 47.9 45.5 52.1 44.8 53.2 38.5 40.6 3.5Central African Republic 3702 4576 62.3 60.9 37.6 39.1 7.1 72.6 61.2 40.4 4.0Chad 8222 11831 78.5 78.2 21.5 21.8 9.6 75.4 63.4 45.4 2.9Congo 3136 4233 41.3 36.3 58.7 63.6 12.4 40.0 30.4 40.6 3.7Democratic Republic of theCongo
49626 69575 70.7 65.7 29.3 34.3 28.2 62.1 56.2 46.3 2.7
Equatorial Guinea 520 740 61.2 60.6 38.8 39.4 25.5 69.4 63.2 39.3 3.0Gabon 1235 1564 19.9 13.8 80.2 86.2 6.2 37.7 24.7 35.5 4.3Sao Tome and Principe 141 172 46.8 37.3 53.2 62.7 190.8 62.4 55.8 40.6 4.2East Africa 215542 294609 82.5 79.1 17.5 20.9 50.9 77.0 70.4 42.8 3.1Burundi 6374 8749 91.8 89.1 8.3 10.9 371.5 90.8 88.9 37.9 2.9Djibouti 732 923 23.5 23.0 76.5 77.0 36.5 78.3 73.1 35.9 3.4Eritrea 3668 5581 82.4 78.7 17.6 21.3 58.7 77.0 73.1 41.6 2.5Ethiopia 65578 86539 85.3 83.0 14.7 17.0 89.4 82.3 76.2 41.5 3.3Kenya 31254 42749 80.1 76.0 19.9 24.0 73.8 75.4 69.6 42.5 2.7Rwanda 8098 11272 86.2 80.9 13.8 19.1 451.7 90.8 89.0 42.6 2.7Somalia 7399 9797 66.8 62.3 33.2 37.7 15.8 70.1 64.6 44.9 2.7South SudanSudan (former) 34188 45722 19.7 60.9 49.6 40.1 3.6Uganda 24213 35621 87.9 84.4 12.1 15.6 175.9 79.0 72.2 48.4 2.5United Republic of Tanzania 34038 47656 77.7 73.3 22.3 26.7 52.3 78.3 72.2 44.7 3.1Southern Africa 134710 170114 59.9 55.8 40.1 44.2 26.0 51.4 48.7 39.4 3.7Angola 13926 20163 51.0 40.8 49.0 59.2 16.2 71.8 68.7 46.6 2.5Botswana 1758 2053 46.8 38.4 53.2 61.6 3.5 43.9 41.6 32.6 3.9Comoros 562 773 72.1 72.0 28.1 28.0 376.3 73.7 68.4 42.6 2.6Lesotho 1964 2217 80.0 72.4 20.0 27.6 66.8 41.7 38.2 37.4 4.3Madagascar 15364 21929 72.9 67.4 27.1 32.6 37.3 74.8 69.1 43.1 3.1Malawi 11229 15883 85.4 84.3 14.6 15.7 164.0 78.0 71.8 45.8 3.1Mauritius 1196 1314 57.4 58.2 42.6 41.8 633.5 11.5 7.4 21.9 6.9Mozambique 18201 24475 70.9 68.8 29.1 31.2 31.3 78.5 75.4 44.1 3.3Namibia 1896 2364 67.6 61.6 32.4 38.4 2.7 49.1 39.4 36.4 3.7Seychelles 79 87 49.4 46.0 50.6 54.0 190.1 78.5 73.6South Africa 44760 50738 43.1 38.0 56.9 62.0 41.7 13.9 9.1 30.1 4.6Swaziland 1064 1220 77.3 78.8 22.7 21.3 70.5 35.4 27.5 38.4 3.4Zambia 10202 13884 65.2 60.8 34.8 39.2 18.3 69.1 62.0 46.4 3.0Zimbabwe 12509 13014 66.2 61.4 33.8 38.6 34.5 62.9 55.0 38.9 4.2West Africa 235717 320343 61.5 55.1 38.5 44.9 51.7 50.2 42.8 43.0 3.2Benin 6518 9352 61.7 55.1 38.3 44.9 86.7 54.0 42.4 43.7 3.1Burkina Faso 12294 17482 82.2 73.5 17.8 26.5 58.5 92.2 92.0 45.3 2.2Cabo Verde 437 505 46.7 37.3 53.5 62.7 121.7 23.1 15.8 31.9 6.0Côte d’Ivoire 16582 20595 56.5 48.7 43.5 51.3 61.0 48.8 35.8 40.9 3.8Gambia 1297 1825 51.2 42.7 48.8 57.3 171.4 79.1 75.3 43.9 2.2Ghana 19165 25546 56.0 48.1 44.0 51.9 109.1 56.4 53.3 38.6 3.8Guinea 8344 10481 69.0 64.6 31.0 35.4 45.4 83.8 78.9 42.9 3.3Guinea-Bissau 1241 1580 64.1 56.1 35.9 44.0 57.8 82.5 78.7 41.3 3.3Liberia 2847 4245 55.7 51.8 44.3 48.2 42.4 67.5 60.8 43.5 2.8Mali 11295 16319 71.9 65.1 28.1 34.9 11.8 80.7 73.6 47.2 2.2Mauritania 2643 3623 60.0 58.5 40.0 41.5 3.6 52.7 49.9 39.9 2.7Niger 10922 16644 83.8 82.2 16.2 17.8 13.0 85.7 82.3 49.0 2.2Nigeria 123689 166629 57.6 50.4 42.4 49.6 180.3 33.3 23.4 42.8 3.4Senegal 9506 13108 59.7 57.5 40.3 42.5 69.2 73.5 69.6 43.7 2.4Sierra Leone 4143 6126 64.2 60.8 35.8 39.2 81.9 65.0 58.9 43.0 1.9Togo 4794 6283 67.1 62.0 32.9 38.0 119.0 59.7 52.1 39.6 3.4CEMAC 32493 43413 59.0 55.4 41.0 44.6 14.8 59.4 46.8 41.7 3.4CEN-SAD 393894 518668 58.8 54.4 41.2 45.6 38.6 46.8 39.4 39.4 3.7COMESA 348815 465262 73.4 70.9 26.6 29.1 41.0 64.4 58.4 40.9 3.4ECCAS 102560 142072 65.6 60.4 34.4 39.6 21.2 64.3 57.1 44.4 2.9ECOWAS 233074 316720 61.5 55.1 38.5 44.9 61.6 50.2 42.7 43.0 3.2IGAD 167032 226932 83.1 80.1 16.9 19.9 47.0 75.5 68.4 42.6 3.1SADC 217812 286572 65.1 61.1 34.9 38.9 28.9 58.0 54.4 41.9 3.3UEMOA 73152 101363 69.0 63.7 31.0 36.3 28.1 71.5 65.9 44.5 2.7UMA 76657 89882 41.3 34.5 58.7 65.5 15.6 27.4 21.7 27.7 5.1Regional Office for Asia andthe Pacific
3640853 4110736 50.0 47.3 50.0 52.7 81.2 34.9 30.2 25.1 7.7
Regional Office for Europeand Central Asia
866961 900803 31.7 29.6 68.3 70.4 33.5 11.1 7.8 17.4 14.4
Regional Office for LatinAmerica and the Caribbean
516162 597748 24.7 21.0 75.3 79.0 29.7 20.6 15.2 27.9 6.8
Regional Office for the NearEast
338485 432218 42.6 38.8 57.4 61.2 29.2 29.8 22.7 31.5 4.3
World 6100688 7028688 50.5 47.5 49.7 52.6 53.5 35.7 31.7 28.5 7.5
20

TABLE 2: Demographic indicatorsGNI per capita Infant mortality Under-5 mortality Life expectancy at birthcurrent US$ per 1,000 live births per 1,000 live births total
US$ US$ rate rate rate rate years years2000 2012 2000-01* 2010-12* 2000-01* 2010-12* 2000-01* 2010-12*
Africa 673 1614 82.9 60.3 134.6 91.4 53.7 58.4North Africa 1512 3084 40.2 26.2 54.6 34.5 69.2 71.1Algeria 1540 28.2 17.8 32.8 20.8 69.1 70.8Egypt 1470 3000 33.8 18.7 41.9 22.0 68.8 70.7Libya 23.6 13.8 27.5 16.1 72.3 75.0Morocco 1320 2950 40.6 27.7 48.1 32.3 68.3 70.4Sudan 66.2 50.6 103.0 75.5Tunisia 2310 4150 23.6 14.4 28.1 16.8 72.8 74.8Regional Office for Africa 496 1383 86.1 63.2 140.6 96.1 50.5 55.9Central Africa 276 769 89.0 73.0 140.4 110.4 48.0 50.8Cameroon 600 1170 89.4 63.0 145.8 98.5 51.8 54.1Central African Republic 270 490 108.0 92.8 163.3 133.1 43.8 48.8Chad 180 740 104.3 91.3 186.6 154.4 46.8 50.2Congo 570 2550 74.6 63.9 118.0 98.9 52.4 57.8Democratic Republic of theCongo
90 220 112.3 102.2 171.2 150.4 46.7 49.3
Equatorial Guinea 1260 13560 96.7 74.3 139.0 103.6 47.8 52.1Gabon 3100 10070 55.5 43.9 84.9 64.7 59.5 62.7Sao Tome and Principe 1320 54.9 39.0 83.1 55.0 63.5 66.0East Africa 258 681 85.9 56.9 138.0 85.7 52.7 60.5Burundi 130 240 91.1 68.9 147.9 107.8 48.5 53.1Djibouti 760 83.9 67.3 106.8 83.2 57.1 60.8Eritrea 180 450 55.9 38.3 84.9 53.8 56.6 61.7Ethiopia 130 410 86.6 48.6 139.7 71.9 52.9 62.3Kenya 420 850 67.2 49.8 108.4 75.5 52.8 60.4Rwanda 230 100.6 40.8 167.7 58.9 49.1 62.9Somalia 103.3 93.1 170.6 151.6 51.2 54.4South Sudan 103.9 68.8 171.8 107.7Sudan (former) 330 1450 58.3 61.7Uganda 260 440 85.4 48.9 140.1 74.0 49.0 58.0United Republic of Tanzania 310 570 75.4 39.3 122.6 57.3 50.5 60.1Southern Africa 1327 3416 76.9 55.7 121.1 83.7 50.5 55.1Angola 420 4580 119.8 102.2 201.3 168.5 46.0 51.1Botswana 3120 7430 54.5 42.9 86.9 56.0 49.4 46.7Comoros 410 840 70.9 59.3 98.4 80.1 58.1 60.4Lesotho 580 1380 81.0 72.7 116.5 102.1 45.7 48.2Madagascar 250 430 66.0 42.2 102.6 60.6 59.1 63.8Malawi 150 320 96.5 49.2 162.4 77.1 46.3 54.1Mauritius 3870 8570 15.0 12.8 17.1 14.9 71.8 73.3Mozambique 230 510 106.9 67.2 157.6 96.1 47.5 49.5Namibia 1950 5640 47.9 29.2 73.9 41.3 54.4 63.3Seychelles 7390 11640 11.9 11.5 13.9 13.3 73.5South Africa 3050 7610 52.3 34.2 76.7 47.2 54.6 55.3Swaziland 1520 2860 80.7 57.0 124.7 84.9 47.4 48.7Zambia 310 1350 95.3 58.7 161.0 95.0 42.5 55.8Zimbabwe 490 680 59.9 58.6 101.4 95.2 43.3 55.9West Africa 317 1165 91.4 67.6 156.5 104.3 49.4 54.0Benin 360 750 88.5 60.4 143.2 92.8 55.5 58.9Burkina Faso 250 670 95.2 67.7 183.2 108.0 50.9 55.4Cabo Verde 1310 3810 29.1 19.5 35.5 22.9 70.0 74.2Côte d’Ivoire 670 1220 97.4 78.1 142.9 110.7 46.3 50.0Gambia 670 510 61.1 49.9 111.7 75.6 55.5 58.4Ghana 340 1550 64.8 49.9 100.6 74.2 57.1 60.8Guinea 380 460 99.3 67.5 163.1 105.3 51.3 55.6Guinea-Bissau 160 550 103.3 82.9 170.6 133.0 51.6 53.8Liberia 180 370 112.2 58.2 164.1 78.4 52.5 59.9Mali 250 660 113.1 81.4 212.4 132.7 49.5 54.2Mauritania 510 1110 74.4 65.8 108.9 86.5 59.8 61.2Niger 170 370 97.7 64.8 217.4 119.5 51.4 57.5Nigeria 270 1430 109.3 80.1 181.9 127.9 46.9 51.7Senegal 510 1040 67.7 46.2 132.5 63.0 58.2 63.0Sierra Leone 160 580 140.9 120.1 230.8 187.2 38.8 45.1Togo 300 500 75.4 63.5 119.5 98.3 53.6 55.8CEMAC 559 1648 89.6 72.7 143.2 111.5 49.9 53.1CEN-SAD 640 1666 87.2 65.4 145.5 100.3 55.6 59.0COMESA 492 1084 77.0 52.7 121.3 78.1 55.0 60.7ECCAS 286 1278 92.9 75.9 148.5 116.8 47.7 51.0ECOWAS 315 1165 92.4 67.7 159.3 105.4 49.3 53.9IGAD 253 82.4 58.7 130.7 88.3 53.5 60.8SADC 889 2174 80.4 58.3 127.4 87.9 49.6 54.5UEMOA 379 774 93.0 68.3 168.6 108.3 51.3 55.8UMA 1515 43.9 32.1 58.5 40.2 69.2 71.0Regional Office for Asia andthe Pacific
2202 5612 44.8 30.4 58.7 38.0 68.3 70.9
Regional Office for Europeand Central Asia
11912 24003 19.1 12.8 22.8 14.9 73.4 76.3
Regional Office for LatinAmerica and the Caribbean
3847 9145 26.4 19.4 32.7 23.3 71.8 74.4
Regional Office for the NearEast
1966 34.6 25.6 46.1 32.7 68.5 70.6
World 5323 10116 53.8 38.8 81.5 55.4 67.9 70.5
21

TABLE 3: EconomyGross domestic product Value added, share of GDP Share of GDPtotal current US$ agriculture industry services trade FDI ODA
billionUS$
billionUS$
percent percent percent percent percent percent
2000 2012 2010-12* 2010-12* 2010-12* 2011-12* 2011-12* 2011Africa 589 1928 67.6 2.5North Africa 247 666 62.1 0.9 0.0Algeria 55 208 6.9 62.1 31.0 52.4 1.4 0.0Egypt 100 257 13.9 36.7 49.3 44.8 −0.2 0.0Libya 34Morocco 37 96 15.1 29.9 55.1 86.6 2.5 0.0Sudan 59 0.0Tunisia 21 46 8.7 29.9 61.4 106.6 0.9 0.0Regional Office for Africa 342 1263 70.8 3.2 0.0Central Africa 25 106 92.2 8.0 0.1Cameroon 9 25 65.4 1.4 0.0Central African Republic 1 2 35.6 5.0 0.1Chad 1 11 66.2 17.5 0.0Congo 3 14 3.4 76.6 20.0 122.1 20.3 0.0Democratic Republic of theCongo
4 18 45.6 21.8 32.6 146.3 10.2 0.4
Equatorial Guinea 1 18 139.9 4.4 0.0Gabon 5 19 3.9 0.0Sao Tome and Principe 0 0 68.8 8.5 0.3East Africa 53 151 58.5 2.6 0.1Burundi 1 2 34.7 18.3 47.0 47.0 0.1 0.2Djibouti 1Eritrea 1 3 37.5 0.7 0.1Ethiopia 8 43 46.4 10.5 43.1 48.7 2.0 0.1Kenya 13 37 29.3 17.4 53.3 71.8 1.0 0.1Rwanda 2 7 33.0 15.9 51.1 46.0 1.7 0.2SomaliaSouth Sudan 9 0.1Sudan (former) 12 24.5 28.1 47.4 34.8 4.8Uganda 6 20 23.4 25.4 51.2 58.1 8.7 0.1United Republic of Tanzania 10 28 27.7 25.1 47.2 81.3 4.6 0.1Southern Africa 179 605 69.3 1.7 0.0Angola 9 114 9.3 62.1 28.6 108.3 −2.9 0.0Botswana 6 14 3.0 34.9 62.2 95.1 2.0 0.0Comoros 0 1 67.1 1.1 0.1Lesotho 1 2 7.4 34.6 58.0 154.5 5.2 0.1Madagascar 4 10 63.2 9.2 0.0Malawi 2 4 30.2 19.3 50.5 69.1 1.6 0.1Mauritius 5 10 3.6 25.8 70.6 119.9 2.4 0.0Mozambique 4 15 30.3 23.3 46.4 75.7 16.5 0.2Namibia 4 13 95.0 7.7 0.0Seychelles 1 1 2.2 13.6 84.2 144.7 13.1 0.0South Africa 133 384 2.6 28.4 69.0 59.6 1.5 0.0Swaziland 2 4 7.5 47.7 44.8 141.3 2.4 0.0Zambia 3 21 19.5 37.3 43.2 83.1 10.3 0.1Zimbabwe 7 11 15.7 36.9 47.4 137.3 4.0 0.1West Africa 84 401 76.0 4.6 0.0Benin 2 8 32.4 13.2 54.3 41.9 1.6 0.1Burkina Faso 3 10 33.8 24.3 41.9 49.7 0.1 0.1Cabo Verde 1 2 10.4 17.8 71.8 114.8 2.8 0.1Côte d’Ivoire 10 25 1.4 0.1Gambia 1 1 18.9 13.5 67.7 76.0 4.0 0.2Ghana 5 41 22.7 27.3 50.0 102.1 8.1 0.0Guinea 3 7 22.1 44.8 33.1 78.4 18.8 0.0Guinea-Bissau 0 1 2.0 0.1Liberia 1 2 53.1 10.2 36.7 120.8 84.9 0.5Mali 2 10 61.8 1.7 0.1Mauritania 1 4 15.5 50.1 34.4 152.3 1.1 0.1Niger 2 7 76.5 16.8 0.1Nigeria 46 263 75.2 3.6 0.0Senegal 5 14 14.8 23.7 61.4 68.0 2.0 0.1Sierra Leone 1 4 56.7 8.3 35.0 69.9 24.3 0.1Togo 1 4 31.3 15.8 52.8 97.6 1.5 0.2CEMAC 21 88 72.6 7.6 0.0CEN-SAD 287 872 63.8 2.7 0.0COMESA 204 518 18.7 31.9 49.4 58.2 1.7 0.0ECCAS 35 223 94.7 2.5 0.0ECOWAS 82 397 27.9 22.5 49.7 75.0 4.6 0.0IGAD 41 172 0.1SADC 193 650 6.8 30.4 62.8 71.9 2.0 0.0UEMOA 26 78 63.5 2.6 0.1UMA 148 354 10.0 45.2 44.8 71.2 1.6 0.0Regional Office for Asia andthe Pacific
8450 23671 4.9 31.4 63.7 47.6 2.3 0.0
Regional Office for Europeand Central Asia
9704 21289 1.8 26.2 72.0 83.6 1.8
Regional Office for LatinAmerica and the Caribbean
2080 5614 6.3 32.4 61.3 46.6 3.0 0.0
Regional Office for the NearEast
818 82.0 1.4
World 31979 69569 58.6 2.5
22

TABLE 4: LandLand area Agricultural area Cropland
totalagricultural
forest other total arable permanent per capita
crops meadows& pastures
million ha percent percent percent thousandha
percent percent percent ha/cap
2011 2011 2011 2011 2011 2011 2011 2011 2011Africa 2727 37.9 22.0 42.2 1169696 19.8 2.6 78.2 0.24North Africa 574 17.6 1.4 81.0 209488 19.1 2.8 79.6 0.17Algeria 238 17.4 0.6 82.0 41383 18.1 2.2 79.7 0.23Egypt 100 3.7 0.1 96.2 3665 78.3 21.7 0.04Libya 176 8.9 0.1 91.0 15585 11.2 2.1 86.6 0.32Morocco 45 67.5 11.5 21.0 30104 26.4 3.9 69.8 0.28Sudan 108679 15.7 0.2 84.2Tunisia 16 64.8 6.6 28.6 10072 28.2 23.8 48.0 0.49Regional Office for Africa 2126 43.6 27.9 30.2 955135 20.3 2.6 77.8 0.25Central Africa 525 20.3 48.3 33.3 106440 19.4 2.4 78.1 0.21Cameroon 47 20.3 41.7 38.0 9600 64.6 14.6 20.8 0.38Central African Republic 62 8.2 36.2 55.6 5080 35.4 1.6 63.0 0.42Chad 126 39.7 9.1 51.3 49932 9.8 0.1 90.1 0.43Congo 34 30.9 65.6 3.5 10560 4.7 0.6 94.7 0.14Democratic Republic of theCongo
227 11.4 67.9 20.8 25755 26.4 2.9 70.7 0.11
Equatorial Guinea 3 10.8 57.5 31.6 304 42.8 23.0 34.2 0.28Gabon 26 20.0 85.4 5160 6.3 3.3 90.4 0.32Sao Tome and Principe 0 50.7 28.1 21.1 49 17.9 80.1 2.1 0.28East Africa 346 49.8 17.5 32.8 200591 24.6 3.7 74.3 0.20Burundi 3 86.4 6.6 6.9 2220 41.4 18.0 40.5 0.15Djibouti 2 73.4 0.2 26.3 1702 0.1 99.9 0.00Eritrea 10 75.2 15.1 9.7 7592 9.1 0.0 90.9 0.13Ethiopia 100 35.7 12.2 52.2 35683 40.8 3.1 56.0 0.19Kenya 57 48.2 6.1 45.7 27450 20.0 2.4 77.6 0.15Rwanda 2 77.8 18.0 4.1 1920 63.5 13.0 23.4 0.13Somalia 63 70.3 10.6 19.0 44129 2.5 0.1 97.4 0.12South Sudan 28533 90.3Sudan (former)Uganda 20 70.4 14.5 15.1 14062 48.0 15.6 36.4 0.26United Republic of Tanzania 89 42.1 37.3 20.6 37300 31.1 4.6 64.3 0.29Southern Africa 649 55.3 31.7 16.5 359345 10.5 0.5 89.0 0.24Angola 125 46.8 46.8 6.4 58390 7.0 0.5 92.5 0.22Botswana 57 45.6 19.8 34.5 25861 1.0 0.0 99.0 0.13Comoros 0 83.3 1.4 15.3 155 52.9 37.4 9.7 0.19Lesotho 3 76.2 1.5 22.4 2312 13.3 0.2 86.5 0.14Madagascar 58 71.2 21.5 7.3 41395 8.5 1.4 90.1 0.19Malawi 9 59.2 34.0 6.8 5580 64.5 2.3 33.2 0.24Mauritius 0 43.8 17.3 38.9 89 87.6 4.5 7.9 0.06Mozambique 79 62.8 49.4 49400 10.5 0.4 89.1 0.23Namibia 82 47.1 8.8 44.1 38809 2.1 0.0 97.9 0.35Seychelles 0 6.5 88.5 5.0 3 33.3 66.7 0.03South Africa 121 79.4 7.6 12.9 96374 12.5 0.4 87.1 0.25Swaziland 2 71.0 33.0 1222 14.3 1.2 84.5 0.16Zambia 74 31.5 66.3 2.2 23435 14.5 0.1 85.3 0.25Zimbabwe 39 42.2 39.5 18.3 16320 25.1 0.7 74.1 0.33West Africa 606 47.6 12.0 40.8 288759 29.7 4.3 66.0 0.31Benin 11 30.4 40.0 29.6 3430 75.2 8.7 16.0 0.32Burkina Faso 27 43.0 20.4 36.6 11765 48.4 0.6 51.0 0.34Cabo Verde 0 18.6 21.0 60.3 75 62.7 4.0 33.3 0.10Côte d’Ivoire 32 64.5 32.7 2.8 20500 14.1 21.5 64.4 0.36Gambia 1 60.8 47.6 615 73.2 0.8 26.0 0.26Ghana 23 69.9 21.2 8.9 15900 30.2 17.6 52.2 0.30Guinea 25 58.0 26.5 15.6 14240 20.0 4.8 75.1 0.35Guinea-Bissau 3 58.0 71.6 1630 18.4 15.3 66.3 0.36Liberia 10 27.3 44.6 28.1 2630 17.1 6.8 76.0 0.15Mali 122 34.1 10.2 55.7 41621 16.5 0.3 83.2 0.44Mauritania 103 38.5 0.2 61.2 39711 1.1 0.0 98.8 0.13Niger 127 34.6 0.9 64.5 43782 34.1 0.1 65.7 0.93Nigeria 91 83.7 9.5 6.9 76200 47.2 4.2 48.6 0.24Senegal 19 49.4 43.8 6.8 9505 40.5 0.6 58.9 0.31Sierra Leone 7 48.0 37.8 14.3 3435 32.0 3.9 64.0 0.21Togo 5 68.4 4.9 26.7 3720 67.5 5.6 26.9 0.44CEMAC 298 27.0 33.4 43.8 80636 17.2 2.2 80.6 0.37CEN-SAD 1077 37.4 10.6 52.3 539961 24.1 3.3 74.0 0.27COMESA 879 25.5 29.1 45.6 361045 22.0 2.3 77.7 0.15ECCAS 652 25.6 47.9 27.9 167050 15.4 2.0 82.7 0.21ECOWAS 503 49.5 14.4 36.6 249048 34.3 5.0 60.7 0.32IGAD 252 51.8 10.6 37.6 267830 19.1 1.8 80.4 0.18SADC 965 43.8 40.7 18.0 422245 13.3 1.0 85.7 0.22UEMOA 347 39.2 12.9 48.5 135953 29.2 4.0 66.8 0.46UMA 577 23.7 1.4 74.9 136855 15.0 3.5 81.5 0.28Regional Office for Asia andthe Pacific
5013 38.9 31.3 29.8 1951899 30.8 4.0 65.4 0.17
Regional Office for Europeand Central Asia
2694 29.7 38.3 32.0 800592 41.5 2.5 56.1 0.39
Regional Office for LatinAmerica and the Caribbean
2013 36.7 46.8 16.4 739587 22.7 2.7 74.6 0.32
Regional Office for the NearEast
1222 33.8 1.9 64.4 521071 13.7 1.9 85.0 0.17
World 12766 37.4 31.0 32.0 4911605 28.6 3.2 68.5 0.22
23

TABLE 5: Water resources per capita and irrigationWater resources Irrigationper capita potential total area
equippedequipped area actually irrigated
year sharem3/yr/cap m3/yr/cap m3/yr/cap thousand
hathousandha
year percent
1990 2000 2010 2012 2009 1987-2012 1987-2012*AfricaNorth AfricaAlgeria 461 382 329 510 570 2001 80Egypt 1008 847 706 4420 3650 2002 100Libya 162 134 110 40 470 2000 67Morocco 1170 1007 908 1664 1458 2004 98SudanTunisia 559 486 438 560 445Regional Office for AfricaCentral AfricaCameroon 23438 18210 14567 290 29Central African Republic 49199 39006 32811 1900 1 1987 51Chad 7154 5230 3830 335 30 2002 87Congo 348263 265306 205788 340 2 1993 11Democratic Republic of theCongo
35241 25853 19449 7000 11
Equatorial Guinea 69519 50000 37143 30Gabon 176534 132794 108970 440 4Sao Tome and Principe 18793 15461 13212 11 10East AfricaBurundi 2238 1967 1496 215 23Djibouti 534 410 337 2 1 1999 38Eritrea 1718 1199 188 21 1993 62Ethiopia 1860 1471 2700 290 2001 100Kenya 1309 982 758 539 103 2003 94Rwanda 1336 1173 894 165 9Somalia 2228 1987 1575 240 200South SudanSudan (former) 2435 1887 1481 2784 1863 2000 43Uganda 3729 2726 1975 90 9 1998 64United Republic of Tanzania 3778 2828 2147 2132 184 2002 100Southern AfricaAngola 14320 10628 7756 3700 80 2005 13Botswana 8857 6962 6099 13 2 2002 85Comoros 2740 2135 1633 0 0 1987 65Lesotho 3191 2663 2409 13 3 1999 3Madagascar 29873 21934 16269 1517 1086 2000 51Malawi 1842 1539 1160 162 59 2002 96Mauritius 2595 2300 2118 33 22 2002 98Mozambique 16026 11928 9281 3072 118 2001 34Namibia 12523 9346 7762 47 8 2002 100Seychelles 1 0 2003 86South Africa 1359 1117 997 1500 1498 2000 100Swaziland 5226 4239 3803 93 50 2000 90Zambia 13384 10312 8037 523 156 2002 100Zimbabwe 1910 1599 1591 366 174 1999 85West AfricaBenin 5529 4049 2982 322 12 2002 75Burkina Faso 1341 1017 759 165 30 2001 54Cabo Verde 862 686 605 3 3 1997 66Côte d’Ivoire 6482 4893 4111 475 73 1994 92Gambia 8282 6168 4630 80 2 1999 47Ghana 3596 2776 2181 1900 34 2000 90Guinea 39243 27085 22641 520 95Guinea-Bissau 30482 24980 20462 281 25 1996 100Liberia 109074 81489 58087 600 3Mali 11530 8853 6506 566 236 2000 75Mauritania 5711 4313 3295 250 45 2004 51Niger 4321 3081 2169 270 74 2005 89Nigeria 2934 2314 1807 2331 293 2004 75Senegal 5358 4082 3120 409 120Sierra Leone 40181 38619 27267 807 30Togo 4010 3066 2439 180 7 1996 86CEMACCEN-SADCOMESAECCASECOWASIGADSADCUEMOAUMARegional Office for Asia andthe PacificRegional Office for Europeand Central AsiaRegional Office for LatinAmerica and the CaribbeanRegional Office for the NearEastWorld
24

TABLE 6: LabourEmployment Employment in agriculture Labor force Children in
employmentfemale male share of
totalfemale male participation rate % of
childrenages 7-14
share offemale
employment
share ofmale
employment
female male total
millionpeople
millionpeople
percent percent percent percent percent percent
2010 2010 2005-12* 2005-12* 2005-12* 2010 2010 2000-12*Africa 152 209 56.3 75.9North Africa 11 39 22.5 73.6Algeria 2 8 11.7 6.4 12.6 14.7 71.7Egypt 5 19 28.2 45.6 28.2 23.5 74.2 7.9Libya 1 2 30.4 76.9Morocco 3 8 40.2 60.2 33.0 25.9 74.7 4.5Sudan 12.5Tunisia 1 2 17.7 25.3 69.7Regional Office for Africa 141 169 62.8 76.4Central Africa 19 20 68.3 74.7Cameroon 4 4 53.3 58.1 48.9 63.9 77.3 43.4Central African Republic 1 1 72.5 85.2 67.0Chad 2 2 64.5 80.2 60.4Congo 1 1 35.4 39.3 31.3 68.2 72.7 30.1Democratic Republic of theCongo
12 12 70.2 72.4 20.5
Equatorial Guinea 0 0 80.6 92.3Gabon 0 0 24.2 33.7 17.3 56.0 64.9Sao Tome and Principe 43.2 76.4East Africa 50 60 68.8 83.1Burundi 2 2 83.7 81.9 31.9Djibouti 35.5 67.0Eritrea 1 1 79.6 90.0Ethiopia 18 21 79.3 74.8 83.2 78.3 89.9 26.1Kenya 6 8 61.1 68.0 54.5 61.2 71.5 37.7Rwanda 3 2 78.8 86.3 85.2 7.5Somalia 1 2 37.6 77.0 43.5South Sudan 45.6Sudan (former) 3 7 30.8 76.5 19.1Uganda 6 7 65.6 76.2 79.6 38.2United Republic of Tanzania 10 10 76.5 80.0 72.7 88.3 90.3 31.1Southern Africa 29 32 66.9 76.2Angola 3 4 62.7 77.0 30.1Botswana 0 0 29.9 24.3 35.1 71.6 81.5Comoros 0 0 34.7 80.4Lesotho 0 0 58.7 73.3 2.6Madagascar 5 5 80.4 81.1 79.8 83.5 88.7 26.0Malawi 3 3 85.0 81.2 40.3Mauritius 0 0 8.7 7.8 9.5 43.9 75.7Mozambique 5 5 86.3 83.0 27.4Namibia 0 0 16.3 8.2 22.7 58.4 69.8SeychellesSouth Africa 6 8 4.9 3.8 5.7 43.8 60.4Swaziland 0 0 43.5 70.7 13.3Zambia 2 2 72.2 78.9 65.9 73.3 85.7 34.4Zimbabwe 3 3 82.9 89.5West Africa 44 57 53.2 71.0Benin 2 2 67.1 78.3 74.4Burkina Faso 4 4 84.8 87.2 82.3 77.5 90.5 42.1Cabo Verde 0 0 50.2 83.1Côte d’Ivoire 3 5 51.5 81.3 45.7Gambia 0 0 72.4 83.2 35.9Ghana 5 5 57.2 53.2 61.4 66.8 71.6 48.9Guinea 2 2 65.2 78.3Guinea-Bissau 0 0 67.8 78.2 50.5Liberia 1 1 48.9 48.3 49.5 57.8 64.0 18.4Mali 1 3 66.0 63.9 67.8 36.8 69.7 23.0Mauritania 0 1 28.4 79.1 21.3Niger 2 3 56.9 37.8 64.1 39.8 90.1 47.1Nigeria 20 27 47.8 63.0 40.7Senegal 2 3 33.7 33.0 34.1 66.0 88.3 17.4Sierra Leone 1 1 66.4 68.9 53.7Togo 1 1 54.1 48.2 60.5 80.3 81.2 48.8CEMAC 7 9 65.4 78.3CEN-SAD 59 99 44.0 72.7COMESA 70 95 60.4 79.6ECCAS 24 26 68.5 75.4ECOWAS 43 57 53.5 70.9IGAD 35 45 63.3 81.5SADC 50 53 71.3 77.6UEMOA 15 21 57.1 83.0UMA 6 20 21.7 73.2Regional Office for Asia andthe Pacific
728 1168 49.4 80.0
Regional Office for Europeand Central Asia
175 213 14.1 12.5 13.5 49.9 67.3
Regional Office for LatinAmerica and the Caribbean
105 155 14.9 9.1 19.7 53.3 80.1
Regional Office for the NearEast
24 97 21.6 73.5
World 1201 1820 50.6 77.3
25

TABLE 7: InputsAgricul-turaltractors
Pesticidesuse
Fertilizers consumption
total per ha ofarableland andpermanentcrops
per ha of arable land and permanent crops
nitrogen phosphate potashtractors kg/ha kg/ha kg/ha kg/ha2000-12* 2008-12* 2011 2011 2011
Africa 13.26 9.11 1.63North Africa 40.59 34.43 1.96Algeria 104529 0.50 7.52 3.84 3.74Egypt 103188 366.98 85.51 7.57Libya 39733 29.31 15.22 0.00Morocco 26.44 34.69 2.30Sudan 5.08 4.01 0.22Tunisia 40438 0.43 11.23 155.22 1.14Regional Office for Africa 6.87 3.24 1.55Central Africa 2.57 0.61 1.68Cameroon 1.45 4.94 1.14 2.99Central African RepublicChadCongo 1.33 0.53 3.04Democratic Republic of theCongo
0.40 0.12 0.27
Equatorial GuineaGabon 0.66 0.04 1.32Sao Tome and PrincipeEast Africa 5.91 4.96 0.72Burundi 1.12 0.07 0.00Djibouti 6Eritrea 463 0.81 0.00 0.00Ethiopia 0.28 9.90 10.27 0.00Kenya 12844 12.28 9.02 3.30Rwanda 56 0.12 0.05 0.02 0.00Somalia 1371South Sudan 0.00 0.00 0.00Sudan (former) 25564Uganda 0.85 0.29 0.21United Republic of Tanzania 21207 4.28 2.29 1.05Southern Africa 18.44 6.33 4.13Angola 2.73 1.16 1.24Botswana 3371ComorosLesothoMadagascar 550 0.08 1.40 0.60 0.70Malawi 0.11 22.92 3.82 2.06Mauritius 25.70 93.91 27.68 108.33Mozambique 0.14 6.04 1.38 0.28Namibia 6.01 0.33 0.19Seychelles 5.00 1.67 3.33South Africa 63200 31.34 12.86 8.03Swaziland 1550Zambia 33.91 7.81 6.65Zimbabwe 13.59 6.17 2.41West Africa 3.74 1.72 0.92Benin 1.54 1.42 1.42Burkina Faso 0.14 5.15 2.65 2.78Cabo Verde 56Côte d’Ivoire 8981 3.50 1.26 2.99Gambia 5.78 2.19 2.19Ghana 1807 1.97 5.60 8.70 3.72Guinea 5388 0.13 0.73 0.08 0.06Guinea-BissauLiberiaMali 1300 0.00 16.25 4.33 0.36Mauritania 390 0.03Niger 0.00 0.25 0.13 0.13Nigeria 24800 2.95 0.65 0.27Senegal 645 3.83 2.62 0.22Sierra LeoneTogo 129 0.02 0.47 0.00 0.00CEMACCEN-SAD 16.20 12.87 1.10COMESA 24.18 8.50 1.30ECCASECOWAS 3.74 1.72 0.92IGAD 6.34 5.60 0.50SADC 12.98 4.64 2.95UEMOA 4.34 1.59 1.06UMA 168530 17.06 47.99 2.35Regional Office for Asia andthe Pacific
106.76 35.62 22.36
Regional Office for Europeand Central Asia
11467067 45.08 11.69 12.29
Regional Office for LatinAmerica and the Caribbean
45.66 32.58 32.64
Regional Office for the NearEast
651197 35.94 26.59 3.66
World 73.34 26.83 19.82
26

TABLE 8: Agricultural capital stockGross capital stock
total sharep.a. growth land
developmentplantationcrops
livestockfixedassets
livestockinventory
structuresfor
livestock
machinery&
equipmentmillionUS$
percent percent percent percent percent percent percent percent
2007 1990-2000 2000-07 2007 2007 2007 2007 2007 2007Africa 526417 1.7 1.8 32.1 7.1 42.9 7.6 6.6 3.8North Africa 95180 1.4 0.9 61.7 6.5 19.8 3.5 1.6 7.0Algeria 14545 1.0 1.2 42.0 6.9 28.8 5.1 1.4 15.8Egypt 36793 2.3 1.5 73.6 2.3 15.1 2.7 2.3 4.0Libya 7531 −0.1 0.7 64.6 5.6 15.4 2.7 0.5 11.1Morocco 26006 0.7 0.0 63.2 4.9 22.9 4.0 1.2 3.7SudanTunisia 10304 1.8 0.8 40.5 25.5 19.2 3.4 0.9 10.5Regional Office for Africa 430811 1.8 2.0 25.5 7.3 48.0 8.5 7.7 3.0Central Africa 23722 1.1 1.2 25.5 11.9 43.5 7.7 7.7 3.8Cameroon 7423 0.9 0.3 24.0 17.5 41.4 7.3 7.8 1.9Central African Republic 2492 2.5 1.8 15.8 2.6 56.0 9.9 13.8 1.8Chad 7111 2.7 3.1 19.5 0.5 57.5 10.1 10.9 1.5Congo 636 1.1 1.5 32.5 12.6 40.1 7.1 2.0 5.7Democratic Republic of theCongo
5023 −1.2 −0.2 38.4 16.6 27.5 4.9 2.1 10.6
Equatorial Guinea 369 0.1 −2.1 27.1 66.8 3.4 0.6 0.1 1.9Gabon 444 1.0 −0.7 26.4 38.3 22.7 4.0 0.9 7.7Sao Tome and Principe 225 0.7 0.2 54.1 42.7 1.9 0.3 0.2 0.8East Africa 166898 2.2 2.7 18.6 3.7 56.8 10.0 8.4 2.4Burundi 1685 −1.0 4.5 16.0 17.8 46.7 8.2 3.4 7.7Djibouti 386 1.9 0.1 2.4 0.0 73.2 12.9 9.1 2.4Eritrea 3396 −0.5 17.8 0.1 63.4 11.2 5.8 1.8Ethiopia 48891 5.7 5.9 1.2 69.1 12.2 9.3 2.3Kenya 18542 −0.8 2.0 15.4 4.1 59.0 10.4 7.2 3.8Rwanda 2007 0.6 5.1 11.4 9.0 57.5 10.1 5.2 6.8Somalia 13261 −0.3 0.1 21.7 0.4 59.3 10.5 7.3 0.8South SudanSudan (former) 48106 4.5 1.4 29.4 0.4 50.9 9.0 9.0 1.3Uganda 8730 1.8 2.5 12.8 19.8 45.9 8.1 8.3 5.2United Republic of Tanzania 21894 1.7 1.2 27.9 11.1 42.6 7.5 7.9 2.9Southern Africa 98055 0.3 0.1 32.4 5.6 38.9 6.9 11.2 5.0Angola 6663 0.7 0.6 32.7 7.4 42.5 7.5 5.9 4.0Botswana 1870 −0.3 −1.5 4.6 0.1 65.8 11.6 12.7 5.2Comoros 140 1.9 0.7 17.3 47.5 21.3 3.8 3.8 6.3Lesotho 1082 0.9 −0.8 12.2 0.5 64.7 11.4 7.1 4.0Madagascar 17689 0.3 −0.2 46.5 4.2 36.3 6.4 4.9 1.6Malawi 3125 2.8 3.1 35.5 4.0 42.8 7.6 3.3 6.7Mauritius 274 0.5 0.4 60.9 1.8 24.8 4.4 0.9 7.2Mozambique 4953 2.1 1.4 37.0 5.3 38.9 6.9 3.4 8.7Namibia 2653 0.8 0.4 14.8 0.5 61.4 10.8 9.4 3.1Seychelles 11 0.5 −5.1 3.6 43.0 33.9 6.0 1.0 12.5South Africa 43832 0.1 −0.2 33.8 8.3 28.4 5.0 18.3 6.3Swaziland 820 −0.3 −0.7 37.5 2.4 44.3 7.8 6.7 1.3Zambia 5987 0.9 1.5 30.9 0.8 50.7 8.9 4.6 4.1Zimbabwe 8957 −0.6 −0.4 7.7 0.6 68.5 12.1 5.8 5.3West Africa 142135 2.6 2.7 28.9 11.8 44.7 7.9 4.5 2.3Benin 2957 3.5 2.0 29.8 11.8 42.8 7.5 6.1 2.0Burkina Faso 10177 3.8 4.1 11.0 0.5 65.5 11.6 8.8 2.6Cabo Verde 207 2.2 4.4 19.1 1.9 64.5 11.4 2.5 0.7Côte d’Ivoire 7852 1.1 0.9 16.9 65.3 11.4 2.0 1.6 2.7Gambia 376 1.3 4.2 21.8 1.1 51.2 9.0 11.2 5.5Ghana 7209 2.6 2.9 16.7 37.0 34.4 6.1 2.3 3.6Guinea 5399 5.4 4.8 12.4 8.0 59.3 10.5 7.2 2.6Guinea-Bissau 1821 3.9 0.8 24.9 29.3 35.6 6.3 3.0 0.9Liberia 637 1.7 0.9 23.8 45.4 20.7 3.6 0.9 5.7Mali 12642 4.1 3.4 30.2 1.1 51.5 9.1 6.8 1.4Mauritania 4331 3.1 1.2 8.9 0.3 70.9 12.5 6.6 0.7Niger 13096 3.5 3.1 27.7 0.3 54.1 9.5 7.3 1.1Nigeria 60871 2.1 2.6 40.1 11.0 36.6 6.5 3.2 2.7Senegal 10561 1.5 1.1 11.9 0.4 70.3 12.4 3.5 1.4Sierra Leone 2224 1.0 6.2 44.2 9.7 34.5 6.1 3.3 2.1Togo 1775 0.7 1.7 34.7 9.0 43.2 7.6 2.6 2.9CEMAC 18474 1.7 1.5 21.6 10.3 48.3 8.5 9.3 2.0CEN-SAD 287725 2.4 1.8 38.9 7.6 38.9 6.9 4.8 2.9COMESA 218094 1.9 2.2 31.4 3.2 47.3 8.3 6.5 3.4ECCAS 32071 0.9 1.2 26.5 11.3 43.4 7.7 7.1 4.0ECOWAS 137804 2.5 2.7 29.5 12.1 43.9 7.7 4.4 2.3IGAD 141312 2.9 17.3 2.4 59.1 10.4 8.6 2.2SADC 124832 0.5 0.3 31.9 6.9 39.1 6.9 10.3 4.9UEMOA 60880 2.8 2.5 21.5 10.6 51.3 9.1 5.7 1.8UMA 62717 1.0 0.6 51.0 8.5 26.1 4.6 1.5 8.3Regional Office for Asia andthe Pacific
1719508 0.9 0.7 32.5 10.2 25.9 4.6 4.1 22.6
Regional Office for Europeand Central Asia
1239351 −0.4 35.2 5.8 16.5 2.9 4.3 35.3
Regional Office for LatinAmerica and the Caribbean
725911 0.5 0.9 24.3 6.9 47.1 8.3 5.2 8.1
Regional Office for the NearEast
335938 1.9 1.2 61.9 3.3 21.9 3.9 2.3 6.7
World 4797327 0.6 0.6 31.0 7.6 26.8 4.7 5.4 24.5
27

TABLE 9: Foreign direct investment and official development assistanceFDI, inward flows ODA
agriculture, hunting, forestry, fishing food, beverages, tobacco total receipts agriculture forestry fisheryshare oftotal
share oftotal
share oftotal
thousandUS$
thousandUS$
thousandUS$
thousandUS$
millionUS$
millionUS$
percent percent percent
2000-01* 2011-12* 2000-01* 2011-12* 2000 2010 2010 2010 2010Africa 28865 48740North Africa 3937 5827 5.2 0.0 0.8Algeria 225 294 0.4 0.0 2.8Egypt 15860 35740 1970 2531 6.0 0.0 0.0Libya 0 46 0.1 0.0 0.0Morocco 6150 0 996 2138 6.8 0.0 1.9Sudan 0 0Tunisia 6190 0 12440 0 746 818 0.5 0.0 0.1Regional Office for Africa 24913 42252 6.6 0.5 0.3Central Africa 1885 6971 2.8 0.5 0.1Cameroon 635 763 7.6 1.7 0.0Central African Republic 170 256 0.7 0.4 0.0Chad 521 549 1.8 0.0 0.0Congo 76 1344 0.1 0.0 0.0Democratic Republic of theCongo
276 3726 2.7 0.3 0.0
Equatorial Guinea 34 83 0.0 0.1 0.3Gabon 110 208 10.9 3.9 0.6Sao Tome and Principe 64 41 6.4 0.0 2.6East Africa 8209 14589 7.8 0.4 0.2Burundi 212 576 19.2 0.0 0.0Djibouti 122 175 0.8 0.1 0.0Eritrea 523 107 3.0 0.0 10.6Ethiopia 14540 37690 1466 3479 6.7 0.6 0.0Kenya 1475 3489 9.9 0.4 0.4Rwanda 730 1050 6.6 0.9 0.0Somalia 140 394 0.3 0.0 0.0South Sudan 0 0Sudan (former) 7.3 0.1 0.0Uganda 50 0 1589 2102 10.8 0.0 0.0United Republic of Tanzania −10710 0 1952 3217 4.5 0.2 0.0Southern Africa 7089 8158 4.2 0.6 0.2Angola 449 501 6.0 0.1 0.0Botswana 45 120 0.6 0.1 0.0Comoros 37 82 2.1 0.0 0.1Lesotho 75 262 0.1 0.0 0.0Madagascar 630 343 5.6 0.6 0.2Malawi 871 1061 6.6 1.9 0.0Mauritius 480 6170 0 0 36 322 0.0 0.0 0.0Mozambique 6010 0 2260 2225 2.5 0.6 0.6Namibia 160 395 2.0 1.3 0.6Seychelles 5 56 0.0 0.0 2.0South Africa 614 1211 1.2 0.7 0.1Swaziland 38 126 5.0 0.0 0.0Zambia 1593 852 4.8 0.0 0.0Zimbabwe 279 602 15.5 0.0 0.0West Africa 7730 12534 9.1 0.5 0.5Benin 526 665 3.3 0.2 0.1Burkina Faso 687 929 8.4 0.3 0.1Cabo Verde 118 239 1.1 0.0 0.6Côte d’Ivoire 738 831 10.8 2.1 0.0Gambia 67 194 9.0 0.0 0.1Ghana 961 1780 7.0 0.8 0.3Guinea 230 153 5.5 0.4 0.1Guinea-Bissau 151 146 0.9 0.1 7.2Liberia 33 1573 2.4 0.2 0.0Mali 856 1028 22.8 0.2 1.9Mauritania 0 277 379 1.0 0.0 2.5Niger 500 608 8.1 0.0 0.0Nigeria 320 0 1024 1449 5.5 0.0 0.0Senegal 1012 1493 17.4 1.3 1.0Sierra Leone 437 516 16.7 0.0 0.0Togo 113 549 7.6 0.0 0.0CEMAC 1545 3203 2.9 0.7 0.1CEN-SAD 12328 18859 7.6 0.3 0.6COMESA 11849 20725 7.1 0.4 0.1ECCAS 2546 8048 4.2 0.4 0.1ECOWAS 7453 12155 9.3 0.5 0.5IGAD 5316 9746 8.3 0.4 0.3SADC 9280 15019 3.9 0.5 0.1UEMOA 4583 6250 12.4 0.7 0.8UMA 2244 3676 4.2 0.0 1.6Regional Office for Asia andthe Pacific
22256 43802 4.3 0.4 0.1
Regional Office for Europeand Central Asia
5636 8877
Regional Office for LatinAmerica and the Caribbean
8633 13085 5.6 2.5 0.4
Regional Office for the NearEast
6205 11726 3.9 0.0 0.7
World 68583 123943
28

TABLE 10: Government expendituresAgriculture, forestry, fishing, and hunting Environmental Protection
% of total outlays % of agricultural GDP % of total outlayscash non-cash cash non-cash cash non-cashpercent percent percent percent percent percent2009-12* 2009-12* 2009-12* 2009-12* 2009-12* 2009-12*
AfricaNorth AfricaAlgeria 3.6 23.4 0.3Egypt 1.9 4.3 0.4LibyaMoroccoSudanTunisia 5.5 17.3 1.6Regional Office for AfricaCentral AfricaCameroonCentral African Republic 2.3 0.8 0.0ChadCongo 3.6 24.6 2.3Democratic Republic of theCongoEquatorial Guinea 0.8 12.5 4.0GabonSao Tome and Principe 3.1 0.5East AfricaBurundiDjiboutiEritreaEthiopia 17.5 6.1 0.0Kenya 4.6 5.7 0.8RwandaSomaliaSouth SudanSudan (former)Uganda 3.9 3.4 0.2United Republic of Tanzania 1.6 2.5Southern AfricaAngola 4.1 21.5 0.6Botswana 3.0 50.9ComorosLesotho 2.4 13.2 0.3MadagascarMalawiMauritius 3.8 30.1 3.4Mozambique 0.4Namibia 4.1 13.6Seychelles 1.5 4.7South Africa 1.2 16.5 0.3Swaziland 4.9 31.5ZambiaZimbabwe 16.0West AfricaBenin 1.4 0.4Burkina Faso 2.5 0.2Cabo Verde 3.3 12.6 1.0Côte d’Ivoire 0.7 1.3 0.4GambiaGhana 1.5 0.5 2.9GuineaGuinea-BissauLiberia 2.4 0.0Mali 2.2 0.6MauritaniaNigerNigeria 0.9SenegalSierra Leone 1.1 0.6 0.1TogoCEMACCEN-SADCOMESAECCASECOWASIGADSADCUEMOAUMARegional Office for Asia andthe PacificRegional Office for Europeand Central AsiaRegional Office for LatinAmerica and the CaribbeanRegional Office for the NearEastWorld
29

TABLE 11: InnovationAgricultural R&D spending Total
publicagric.research
FixedbroadbandInternet
Mobilecellulars
Telephonelines
CPIAbusinessregulatoryenvironment
expendituresper 100people
per 100people
per 100people
rating
share ofGDP
(1=low to6=high)
million2005 PPPUS$
million2005 PPPUS$
percentsubscribers subscriptions
lines rating
2000 2008 2008 2011 2011 2011 2012Africa 1889 2324 0.6 61.7 2.8North Africa 572 576 2.4 106.1 10.5Algeria 102 112 2.8 99.0 8.5Egypt 298 293 2.2 101.1 10.6Libya 23 11 1.1 155.7 15.6Morocco 104 96 0.6 1.8 113.3 11.0Sudan 2.5Tunisia 46 63 5.1 116.9 11.5Regional Office for Africa 1317 1748 0.2 53.2 1.4Central Africa 97 111 0.0 34.1 0.7Cameroon 32 43 0.0 52.4 3.3 3.0Central African Republic 8 9 0.0 22.1 0.1 2.0Chad 14 8 0.1 31.8 0.3 2.5Congo 3 4 0.8 0.0 93.8 0.3 2.5Democratic Republic of theCongo
35 44 0.0 23.1 0.1 2.5
Equatorial Guinea 2 2 0.2 66.5 2.0Gabon 2 2 0.2 0.3 154.5 1.5Sao Tome and Principe 0 0 0.4 68.3 4.7 3.0East Africa 342 490 0.0 40.8 0.9Burundi 4 10 1.8 0.0 22.3 0.3 3.0Djibouti 0 0 1.2 21.3 2.0 3.5Eritrea 8 3 0.4 0.0 4.5 1.1 2.0Ethiopia 49 69 0.3 0.0 16.7 1.0 3.5Kenya 151 173 1.3 0.1 67.5 0.7 3.5Rwanda 14 18 0.5 0.0 40.6 0.4 4.0Somalia 6.9 1.0South Sudan 2.5Sudan (former) 38 52 0.3 0.0 56.1 1.1Uganda 39 88 1.2 0.1 48.4 1.3 4.0United Republic of Tanzania 38 77 0.5 0.0 55.5 0.3 3.5Southern Africa 450 466 0.7 72.0 3.7Angola 11 39 0.1 48.4 1.5 2.0Botswana 20 19 4.3 0.8 142.8 7.4Comoros 2 2 0.0 28.7 3.1 2.5Lesotho 1 1 0.1 56.2 1.8 3.5Madagascar 9 12 0.3 0.0 40.7 0.6 3.0Malawi 28 21 0.7 0.0 25.7 1.1 3.0Mauritius 23 22 3.9 9.8 99.0 28.7Mozambique 4 18 0.4 0.1 32.8 0.4 3.0Namibia 21 22 2.0 0.8 96.4 6.8Seychelles 0 0 0.7 10.4 145.7 32.1South Africa 283 273 2.0 1.8 126.8 8.2Swaziland 2 2 0.2 63.7 6.3Zambia 15 8 0.3 0.1 60.6 0.6 3.5Zimbabwe 32 28 0.3 72.1 2.8 2.0West Africa 428 681 0.2 61.4 0.8Benin 13 22 0.6 0.0 85.3 1.7 3.5Burkina Faso 23 19 0.4 0.1 45.3 0.8 3.5Cabo Verde 1 1 4.0 79.2 14.9 3.5Côte d’Ivoire 56 43 0.5 0.2 86.1 1.3 3.0Gambia 3 2 0.5 0.0 78.9 2.8 3.5Ghana 41 100 0.9 0.3 84.8 1.1 4.5Guinea 10 4 0.2 0.0 44.0 0.2 2.5Guinea-Bissau 4 5 0.0 56.2 0.3 2.5Liberia 5 5 0.0 49.2 0.1 3.0Mali 31 25 0.6 0.0 68.3 0.7 3.5Mauritania 6 6 1.2 0.2 93.6 2.0 3.0Niger 5 6 0.2 0.0 29.5 0.5 3.0Nigeria 191 404 0.4 0.1 58.6 0.4 3.5Senegal 25 25 0.9 0.7 73.3 2.7 4.0Sierra Leone 1 6 0.3 35.6 0.3 3.0Togo 12 8 0.5 0.1 50.4 3.6 3.0CEMAC 62 68 0.1 51.6 1.8CEN-SAD 951 1207 0.7 70.4 3.5COMESA 769 854 0.5 51.1 2.9ECCAS 112 160 0.0 35.4 0.8ECOWAS 422 675 0.2 61.1 0.8IGAD 286 384 0.1 38.4 1.0SADC 522 585 0.4 57.6 2.3UEMOA 170 153 0.2 62.6 1.3UMA 280 289 2.5 110.2 10.0Regional Office for Asia andthe Pacific
9942 13454 6.5 81.0 14.1
Regional Office for Europeand Central Asia
6267 7315 20.0 128.7 36.9
Regional Office for LatinAmerica and the Caribbean
2826 3302 7.7 105.3 18.1
Regional Office for the NearEast
1541 1731 2.3 94.9 14.7
World 26053 31744 8.5 85.4 17.0
30

PART
2Hunger dimensions
31

Number undernourished and their preva-lence in the population
The number of undernourished persons in the developingworld was about one billion in 1990-1992. It declined slowlyto reach 842 million in 2011-13, which is a reduction of200 million undernourished in 20 years. This reduction isstill too low if we are to attain the figure of 500 million un-dernourished by the year 2015 as envisaged by the Millen-nium Development Goals (MDGs). In developing countries,the percentage of undernourished dropped by 23.6 percentin 1990-92 to 14.3 percent in 2011-13, which is a reduc-tion of 10 percent. However in RAF, it was estimated at 32.8percent in 1990-92, but this too dropped to 24.8 percent in2011-13. These results clearly show that Africa remains theregion with the highest proportion of undernourished com-pared to the other developing countries and that this pro-portion declined more slowly (Chart 23).
There are also some discrepancies in the distribution of thenumber of undernourished within the regions. Indeed, EastAfrica had the largest number (less than 90 million in 1990-1992), and the number increased to more than 100 mil-lion undernourished in 2011-13. In contrast, North Africarecorded less than 5 million in 1990-92, which droppedslightly by 2011-13.
West Africa, with more than 40 million undernourished in1990-92, experienced a drop, reaching just over 30 millionin 2011-13. Paradoxically, regions such as Central Africa andSouthern Africa, which had relatively low undernourishedpopulation in 1990-1992 but then experienced an increase.Specifically, the increase recorded in Central Africa was high:from 13.4 million undernourished to 44.1 million over twodecades (Chart 24).
The disparity is also observed from one country to an-other. Map 16 shows that in 2011-13, hunger affected morethan 35 percent of the population in countries like Eritrea,Ethiopia, Mozambique, and Zambia. Moreover between 25and 35 percent of the population faced hunger in Chad,Botswana, Burkina Faso, Burundi, Kenya, Liberia, Madagas-car, Namibia, Rwanda, Sierra Leone, Tanzania, Uganda, andZimbabwe.
Furthermore, with regard to the food inadequacy in 2011-13, the prevalence was high in Africa (27 percent), espe-cially more than 40 percent in Central Africa, East Africa andSouthern Africa (with the exception of Mauritius and SouthAfrica). In West Africa, food inadequacy prevalence was low(15.9 percent) but high in Burkina Faso, Liberia, Senegal andSierra Leone.
Further reading
• FAO The State of Food Insecurity in the World 2013 -The multiple dimensions of food security (www.fao.org/publications/sofi/en/)
• FAO The State of Food Insecurity in the World 2012 -Economic Growth Is Necessary but Not Sufficient to Accel-erate Reduction of Hunger and Malnutrition (www.fao.org/publications/sofi/en/)
• FAO Hunger Portal (www.fao.org/hunger)
CHART 23: Undernourishment in the developing world(1990-1992 to 2011-2013)
500
600
700
800
900
1000
15
20
25
30
Number
Prevalence
1992
2002
2007
2010
20132015
percentageundernourished
millions
Prevalence, MDG target
Prevalence developing world
Prevalence in Africa
Number, WFS target
Number developing world
Source: FAO, Statistics Division.
CHART 24: Number of people undernourished(1990-1992 and 2011-2013)
0
30
60
90
CentralAfrica
EasternAfrica
NorthAfrica
SouthernAfrica
WesternAfrica
millionpeople
1990-1992 2011-2013
Source: FAO, Statistics Division.
32

HUNGER DIMENSIONS
MAP 16: Map of hunger (percent, prevalence of undernourishment 2011-2013)
No data available
0 ~ < 5
5 ~ < 15
15 ~ < 25
25 ~ < 35
35 ~ 100
Source: FAO, Statistics Division.
MAP 17: Prevalence of food inadequacy (percent, 2011-2013)
No data available
0 ~ < 5
5 ~ < 15
15 ~ < 25
25 ~ < 35
35 ~ 100
Source: FAO, Statistics Division.
33

Anthropometric indicators
Anthropometric measures are an important element of thenew FAO suite of food security indicators. They convey infor-mation on themost dramatic and long-lasting consequencesof chronic and acute undernourishment. Measures in chil-dren under five years can approximate the nutritional statusof a population. Stunting is the outcome of prolonged inad-equate nutrition and/or repeated infections; wasting is theconsequence of acute malnutrition; and low body weight re-flects a combination of chronic and acute malnutrition. An-thropometric data are not available and updated as regularlyas other indicators, and this prevents a complete comparisonacross countries, regions and time periods.
During the period (2005-11), Niger and Burundi experienceda very high percentage stunting among children under 5years (more than 50 percent). For others, it ranged between40 to 50 percent. In ascending order, the countries were:Nigeria, United Republic of Tanzania, Somalia, Mozambique,Ethiopia, Rwanda, Benin, Central African Republic, Zambia,Malawi and Madagascar.
In contrast some countries had stunting rates in children un-der 5 years of less than 40 percent. They were, in an as-cending order: Djibouti, which recorded the lowest rate (30percent), followed by Burkina Faso, Kenya, Cameroon, SierraLeone, Mali, Uganda, Lesotho, and Liberia (Chart 25, Map18).
The percentage of underweight children under 5 years of age(2005-11) was very high for Niger and Burundi (more than 30percent). It was between 25 and 30 percent for Burkina Faso,Nigeria, Mali, Central African Republic, Congo (DR), Ethiopia,Côte d’Ivoire, Somalia, Sudan and Djibouti (in an ascendingorder) (Chart 26). However it was lower (less than 20 per-cent) in Uganda, Kenya, Cameroon, Guinea-Bissau, Namibia,Mozambique, and Senegal (in ascending order) (Chart 26,Map19).
Further reading
• FAONutrition and Consumer Protection Division (www.fao.org/food/)
• UNICEF Nutrition (www.unicef.org/nutrition/)
CHART 25: Percentage of children under 5 years of agewho are stunted (2005-2011*)
Uganda
Lesotho
Côte d’Ivoire
Liberia
Guinea
Swaziland
Nigeria
Somalia
United Republic of Tanzania
Mozambique
Ethiopia
Rwanda
Benin
Central African Republic
Zambia
Democratic Republic of the Congo
Malawi
Madagascar
Niger
Burundi
40 45 50 55percent
Source: FAO, Statistics Division.
CHART 26: Percentage of children under 5 years of agewho underweight (2005-2011*)
Liberia
Togo
Guinea
Sierra Leone
Burkina Faso
Nigeria
Mali
Central African Republic
Democratic Republic of the Congo
Ethiopia
Côte d’Ivoire
Djibouti
Sudan (former)
Somalia
Burundi
Niger
20 25 30 35 40percent
Source: FAO, Statistics Division.
34

HUNGER DIMENSIONS
MAP 18: Percentage of children under 5 years of age who are stunted (percent, 2005-2011*)
No data available
0 ~ < 10
10 ~ < 20
20 ~ < 30
30 ~ < 40
40 ~ 100
Source: FAO, Statistics Division.
MAP 19: Percentage of children under 5 years of age who are underweight (percent, 2005-2011*)
No data available
0 ~ < 10
10 ~ < 20
20 ~ < 30
30 ~ 40
Source: FAO, Statistics Division.
35

Poverty
Poverty is the main determinant of hunger. But, like hunger,poverty is also multifaceted; it is not simply defined by alack of income or consumption and includes deprivation inareas of health, education, nutrition, security, empowermentand dignity. Vulnerability is another dimension of poverty.Without effective copingmechanisms, excessive exposure toshocks – such as droughts or sudden price swings – createsthe risk of future poverty. All of these dimensions interactwith and reinforce one another. However, to facilitate inter-national comparison, poverty indicators generally measurethe proportion of a population whose income is below a par-ticular threshold.
Among these indicators is the poverty gap against the na-tional poverty line, which indicates the gap (missing) to befilled in order to bring all of the poor to the poverty line.Poverty is a determinant of hunger. Poor households gener-ally spend large shares of their incomes on food, andmany ofthem, even among farmers, are net food buyers. The inabil-ity of poor families to consume enough food to meet dietaryrequirements can have long-lasting impacts on labour andproductivity and hamper development prospects.
In 2005-12, the poverty gap against national poverty linewas high for some African countries (between 26 and 45.3percent) in Central African Republic (CAR), Democratic Re-public of Congo, Equatorial Guinea, Madagascar, Mozam-bique, Nigeria, Swaziland and Zambia. However, this indi-cator was low (3.6 - 9.7 percent) in Benin, Egypt, Ethiopia,Namibia, Ghana, South Africa, and Uganda (Map 20).
Many countries with a high poverty gap at the nationalpoverty line are the same as those that have recorded highpoverty per capita at the national poverty line, share of pop-ulation (Map 21).
There is more than one country where a considerable pro-portion of population living with less than $2 per day (PPP)is associated with a high prevalence of undernourishment.This is the case in Africa, for instance, in Burundi, Ethiopia,Mozambique, and Zambia. In other countries, however, ahigh proportion of population below the same poverty lineis associated with prevalence of food insecurity close to theregional average, which is 27 percent. For Africa, this is thecase of the Central African Republic, Guinea, Liberia, Mada-gascar, and Rwanda. In contrast, there are countries – Nige-ria for example – where a high level of poverty is associatedwith prevalence of undernourishment below 10 percent.
Further reading
• MDG Indicators web site: http://mdgs.un.org/unsd/mdg/Metadata.aspx?IndicatorId=0&SeriesId=584
• World Bank Poverty Reduction and Equity Group (wwwr.worldbank.org/poverty)
CHART 27: People in the world living on less than 2005PPP $1.25 and $2 a day (1981-2005)
1.5
2.0
2.5
1980 1985 1990 1995 2000 2005
billionpeople
$1.25 $2
Source: World Bank (WDI).
CHART 28: Gini coefficient for African countries(1995-2000 and 2007-2010)
NamibiaSeychelles
30
40
50
60
70
30 40 50 60 701995-2000
2007-10
Source: World Bank (WDI).
36

HUNGER DIMENSIONS
MAP 20: Poverty gap at national poverty line (percent, 2005-2012*)
No data available
3.6 ~ < 9.7
9.7 ~ < 15
15 ~ < 19
19 ~ < 26
26 ~ 45.3
Source: World Bank (WDI).
MAP 21: Poverty headcount ratio at national poverty line, share of population (percent, 2005-2011*)
No data available
9 ~ < 29
29 ~ < 44
44 ~ < 51
51 ~ < 63
63 ~ 76.8
Source: World Bank (WDI).
37

Food Availability
One of the key determinants of food security lies in the avail-ability of food and its constituents. Dietary energy may beavailable but not diversified enough to provide the macroand micro nutrients essential for a healthy life. Informationon food available for consumption is mainly obtained at anaggregate level through food balance sheets, which providedata on the amount of energy and protein available per per-son per day at the country level. However, this informationreports only on the energy or nutrients available for con-sumption at the national level, not the food consumed byindividuals. Even if dietary energy supply is a good indicatorof food availability, other indicators, such as food adequacy,are needed to provide information on the gap between foodsupply and average energy requirements.
Between 1990 and 2011, the share of energy supply derivedfrom cereals, roots and tubers increased in Central Africa,and East Africa. Southern Africa experienced no growth,while North Africa and West Africa recorded a slight drop.(Chart 31).
On the whole, with the exception of Central Africa where therelative change in average protein supply (between 1990-92and 2008-10) was negative, for all other parts of Africa, thisrelative change was positive. West Africa had the highestrelative change in average protein supply (over 20 percent),followed by North Africa (just under 15 percent) and EastAfrica and Southern Africa with less than 10 percent each(Chart 32).
Considering animal-based protein supply, the relativechanges became negative for East Africa and again for Cen-tral Africa. It was positive in North Africa, Southern Africa,and West Africa; this relative change in average animal-based protein supply increased dramatically (over 40 per-cent) in North Africa, followed by West Africa and SouthernAfrica (chart 33).
In conclusion one could say that the relative change in aver-age protein supply in North Africa was mainly due to animal-based protein supply. This does not seem to be the casefor West Africa and Southern Africa. In East Africa, appar-ently the relative change in protein supply was not relatedto animal-based protein.
With regard to fat supply, here again Central Africa recordeda negative relative change in average fat supply. West Africahad the highest (over 20 percent), followed by SouthernAfrica (about 15 percent), North Africa and East Africa (chart34).
Further reading
• WHO Nutrition and disorders (www.who.int/topics/nutrition/en/)
• FAO The State of Food Insecurity in the World 2013 -The multiple dimensions of food security (www.fao.org/publications/sofi/en/)
CHART 29: Average dietary supply adequacy(1990-1992 and 2011-2013)
80
100
120
140
80 100 120 1401990-1992
2011-2013
Eastern Africa
Middle Africa
Northern Africa
Southern Africa
Western Africa
Source: FAO, Statistics Division.
CHART 30: Trend of the value of food production(1992-2011)
100
150
200
250
1995 2000 2005 2010
I$/cap
Central Africa
Eastern Africa
North Africa
Southern Africa
Western Africa
Source: FAO, Statistics Division.
38
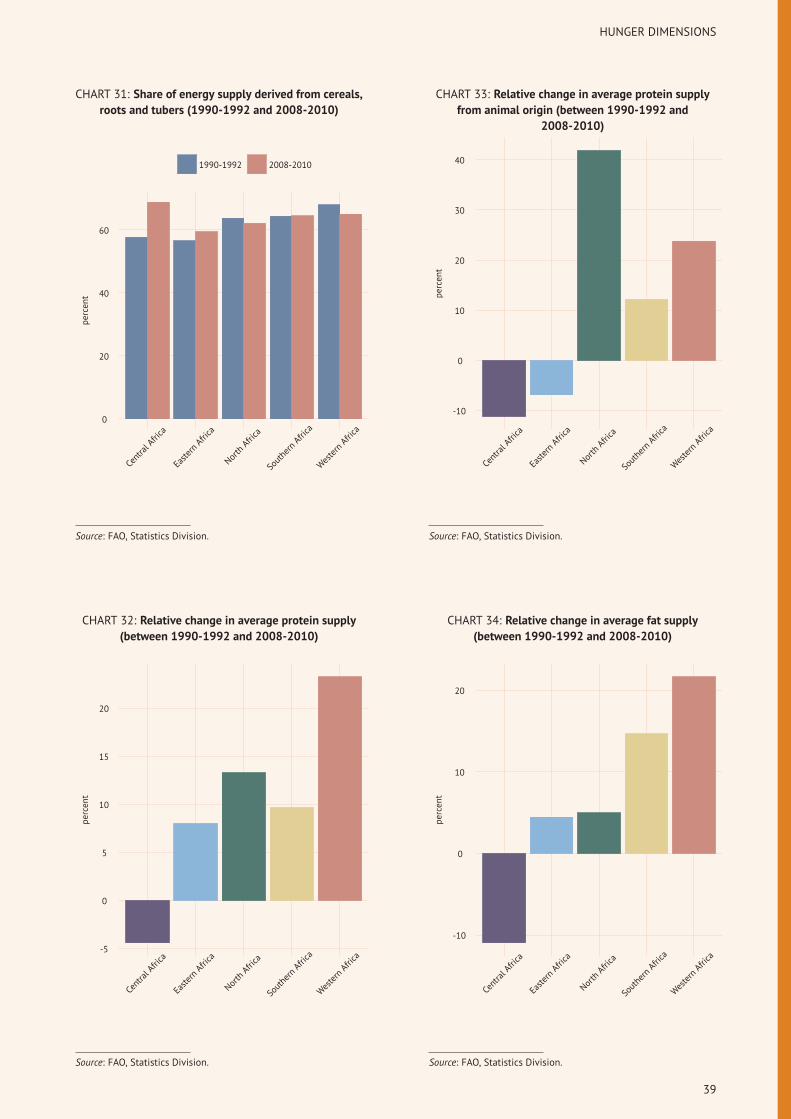
HUNGER DIMENSIONS
CHART 31: Share of energy supply derived from cereals,roots and tubers (1990-1992 and 2008-2010)
0
20
40
60
CentralAfrica
EasternAfrica
NorthAfrica
SouthernAfrica
WesternAfrica
percent
1990-1992 2008-2010
Source: FAO, Statistics Division.
CHART 32: Relative change in average protein supply(between 1990-1992 and 2008-2010)
-5
0
5
10
15
20
CentralAfrica
EasternAfrica
NorthAfrica
SouthernAfrica
WesternAfrica
percent
Source: FAO, Statistics Division.
CHART 33: Relative change in average protein supplyfrom animal origin (between 1990-1992 and
2008-2010)
-10
0
10
20
30
40
CentralAfrica
EasternAfrica
NorthAfrica
SouthernAfrica
WesternAfrica
percent
Source: FAO, Statistics Division.
CHART 34: Relative change in average fat supply(between 1990-1992 and 2008-2010)
-10
0
10
20
CentralAfrica
EasternAfrica
NorthAfrica
SouthernAfrica
WesternAfrica
percent
Source: FAO, Statistics Division.
39

Economic and physical access
As long as food is available but is not adequately distributedamong the population, hunger will be an issue. It is there-fore necessary to ensure that people have physical and eco-nomic access to food.
Access to food is primarily determined by incomes, foodprices and the ability of households and individuals to ac-cess social support. Over the entire period from 2000 to2010, West Africa recorded the highest relative food price in-dex (around 2.3 in 2001-2002) vis-à-vis other parts of Africa.Central Africa had the second highest, with indexes between2.1 and 2.2 in 2010. The relative food price index for South-ern Africa was the lowest, moving from just over 1.4 to justover 1.6 during the same period. North Africa was higherthan East Africa until around 2004 when the trend was re-versed and East Africa’s index greater until2010 (chart 36).
Beyond economic affordability, physical access to food is fa-cilitated by adequate infrastructure, such as rail lines andpaved roads. These facilitate the access and the function-ing of markets, help reduce price arbitrage, and the deliveryof food and non-food products across regions and betweenrural and urban areas. Except for South Africa and Swazi-land, where the rail line density in 2011 exceeded 1.5 kmper 100 square km of land area, for most countries in Africa,the density was below 0.5 (chart 35).
As regards roads, in 2005-10, Morocco, Tunisia, Egypt, Côted’Ivoire, Ghana, Senegal, Kenya, Tanzania had the highestroad density (14 to 110 km per 100 square km of land area).In countries such as Central African Republic (CAR), Chad,Mali, Mauritania and Niger, the density was very low (lessthan 3.4 km per 100 square km of land area), (Map 22).
With respect to paved roads, only Algeria, Egypt, Tunisia,Mauritius, and Seychelles had a percentage of paved roadsout of total roads higher than 75.
Further reading
• The Implications of Soaring Food Prices and the Global Fi-nancial and Economic Crisis for Agricultural Developmentand Food and Nutrition Security in the Near East fromthe 30th Regional Conference (http://www.fao.org/docrep/meeting/020/k9532e.pdf)
• FAO The State of Food Insecurity in the World 2013 -The multiple dimensions of food security (www.fao.org/publications/sofi/en/)
CHART 35: Rail lines density (2011)
Mauritania
Algeria
Botswana
Democratic Republic of the Congo
Sudan (former)
Côte d’Ivoire
Cameroon
Burkina Faso
Gabon
Mozambique
Morocco
Egypt
Tunisia
Swaziland
South Africa
0.0 0.5 1.0 1.5km per 100 square km of land area
Source: FAO, Statistics Division.
CHART 36: Relative price of food (2000-2010)
1.4
1.6
1.8
2.0
2.2
2.4
2000 2002 2004 2006 2008 2010
index
Central Africa
Eastern Africa
North Africa
Southern Africa
Western Africa
Source: FAO, Statistics Division.
40

HUNGER DIMENSIONS
MAP 22: Road density (km per 100 square km of land area, 2005-2010*)
No data available
1 ~ < 3.4
3.4 ~ < 5
5 ~ < 7.5
7.5 ~ < 14
14 ~ 110.4
Source: FAO, Statistics Division.
MAP 23: Percent of paved roads over total roads (percent, 2005-2010*)
No data available
6.8 ~ < 13
13 ~ < 17
17 ~ < 27
27 ~ < 72
72 ~ 98
Source: FAO, Statistics Division.
41

Clean water and sanitation
Access to clean water and sanitation facilities affects healthconditions of individuals and households, and hence theirability to utilize food. The body’s capacity to absorb nutri-ents requires a good health status, especially in young indi-viduals. Therefore, these two indicators are considered animportant part of the suite of food security indicators.
North Africa recorded the lowest percentage (approximately12 percent) of population without reasonable access to im-proved water sources in 1992. In addition, this percentagedropped to even less than 10 percent in 2011. In contrast,other parts of Africa had high percentages, ranging fromless than 40 percent in Southern Africa to about 60 percentfor East Africa in 1992. They all experienced a decrease in2011, with percentages ranging from less than 30 percentfor Southern Africa to 45 percent for Central Africa (Chart37). The situation is critical in countries such as Chad, Demo-cratic Republic of the Congo, Ethiopia, Madagascar, Mauri-tania, Mozambique, Niger and Somalia, where more thanhalf of the population was without reasonable access to im-proved water sources in 2011 (Map 24).
Low levels of access to clean water are associated in severalcountries with high levels of undernourishment and a highfrequency of underweight children. This is the case, for in-stance, in Ethiopia, Mozambique, Sudan and Zambia. Whilethis association does not make it possible for establishingcausality, it does warrant further investigation.
As in the case of access to improved water sources, thepercentage of population without access to reasonable im-proved sanitation facilities was lowest in North Africa (25percent in 1992), which declined significantly to only 10 per-cent in 2011. However access to improved sanitation facil-ities in other parts of Africa was problematic. Indeed thepercentage of population without access to adequate sanita-tion facilities was very high in 1992, ranging from almost 60percent for Southern Africa to more than 80 percent for EastAfrica. However, a slight decrease was observed in 2011,where percentages ranged from approximately 52 percentfor Southern Africa to roughly 75 percent for East Africa andWest Africa. As the data show, the situation of access to im-proved sanitation facilities remains crucial and very alarm-ing in Africa (chart 38).
Further reading
• UNICEF Water, Sanitation and Hygiene (www.unicef.org/wash/)
CHART 37: Percentage of population withoutreasonable access to improved water sources (1992 and
2011)
0
20
40
60
CentralAfrica
EasternAfrica
NorthAfrica
SouthernAfrica
WesternAfrica
percent
1992 2011
Source: FAO, Statistics Division.
CHART 38: Percentage of population withoutreasonable access to improved sanitation facilities
(1992 and 2011)
0
20
40
60
80
CentralAfrica
EasternAfrica
NorthAfrica
SouthernAfrica
WesternAfrica
percent
1992 2011
Source: FAO, Statistics Division.
42

HUNGER DIMENSIONS
MAP 24: Share of population without reasonable access to improved water sources (percent, 2011)
No data available
0 ~ < 5
5 ~ < 10
10 ~ < 25
25 ~ < 50
50 ~ 100
Source: FAO, Statistics Division.
MAP 25: Share of population without reasonable access to improved sanitation facilities (percent, 2011)
No data available
0 ~ < 5
5 ~ < 10
10 ~ < 25
25 ~ < 50
50 ~ 100
Source: FAO, Statistics Division.
43

Economic and political stability
On the whole, throughout the period 1992-2010, the valueof food imports vis-à-vis total merchandise exports wasaround 10 percent for RAF and higher in East Africa (morethan 25 percent) than in other parts of Africa. This indicatorassesses the country capacity to finance its food imports byrevenue gained from all commodities exports. East Africawas followed by North Africa, West Africa, Central Africaand Southern Africa. In general, the value of food importsover total commodity exports was down in all parts of Africa(Chart 39).
However, the cereal import dependency ratio, which ex-presses the importance of cereal imports as a part of to-tal availability, increased across Africa between 1992-2009,with the exception of Southern Africa where it recorded adrop. At 43 percent in 1992 and 50 percent by 2009, NorthAfrica had the highest ratio. It was followed by Central Africawith a ratio, which increased from 26 percent in 1992 to30 percent in 2009. Then came East Africa and West Africa,whose results were almost similar with ratios that rangedfrom about 13 percent to 20 percent (chart 40).
CHART 39: Value of food imports over totalmerchandise exports (1992 and 2010)
0
10
20
30
CentralAfrica
EasternAfrica
NorthAfrica
SouthernAfrica
WesternAfrica
percent
1992 2010
Source: FAO, Statistics Division.
CHART 40: Cereal import dependency ratio (1992 and2009)
0
10
20
30
40
50
CentralAfrica
EasternAfrica
NorthAfrica
SouthernAfrica
WesternAfrica
percent
1992 2009
Source: FAO, Statistics Division.
44

HUNGER DIMENSIONS
CHART 41: Domestic food price volatility (1995-2013)
25
50
75
100
1995 2000 2005 2010
index
Central Africa Eastern Africa North Africa Southern Africa Western Africa
Source: FAO, Statistics Division.
CHART 42: Per capita food production variability (1990-2011)
0
5
10
15
1990 1995 2000 2005 2010
index
Central Africa Eastern Africa North Africa Southern Africa Western Africa
Source: FAO, Statistics Division.
45

In 2000 the highest domestic food price volatility index (30percent) was recorded in Africa, while in Europe the indexwas 20 percent, Asia 18 percent, Oceania 15 percent. Thelowest level was in America (about 12 percent). Howeverin 2013, the domestic food price volatility index droppedsignificantly in Africa, to about 18 percent. Paradoxically in2013, there was tremendous growth in those parts of worldwhere it was lowest in 2000, especially in Europe, where itshowed a 28 percent increase (Chart 43).
In Africa, disparities exist from region to region. In fact,in 2000, while the domestic food price volatility index washighest in Southern Africa (just under 60 percent) and WestAfrica (over 50 percent), it was relatively low in Central Africa(33 percent), very low in East Africa (12 percent) and NorthAfrica (less than 10 percent), (chart 44).
In 2009, political stability and absence of violence/terrorismindex was high (0.39-0.85) in Libya, Mozambique, Namibiaand Zambia (map 26).
Further reading
• FAO The State of Food Insecurity in the World 2012 - Eco-nomic Growth Is Necessary but Not Sufficient to Acceller-ate Reduction of Hunger and Malnutrition (www.fao.org/publications/sofi/en/)
• Global Information and Early Warning System (www.fao.org/giews/english/index.htm)
• Prakash (2011) (www.fao.org/economic/est/issues/volatility/vgm/en/)
CHART 43: Domestic food price volatility (2000 and2013)
0
10
20
30
Africa
Americas
Asia
Europe
Oceania
World
index
2000 2013
Source: FAO, Statistics Division.
CHART 44: Domestic food price volatility (2000 and2013)
0
20
40
60
CentralAfrica
EasternAfrica
NorthAfrica
SouthernAfrica
WesternAfrica
index
2000 2013
Source: FAO, Statistics Division.
46

HUNGER DIMENSIONS
CHART 45: Per capita food supply variability (1995-2010)
0
30
60
90
1995 2000 2005 2010
index
Central Africa Eastern Africa North Africa Southern Africa Western Africa
Source: FAO, Statistics Division.
MAP 26: Political stability and absence of violence/terrorism (index, 2009)
No data available
−2.05 ~ < −1.1
−1.1 ~ < −0.49
−0.49 ~ < 0.004
0.004 ~ < 0.39
0.39 ~ 0.85
Source: FAO, Statistics Division.
47

Education and health
Over the period 2005-2010, the literacy rate for adult fe-male was high (88 percent) in Namibia, South Africa andZimbabwe. It ranged from 64 percent to 85 percent in Gabon,Kenya, Libya, Tanzania and Uganda. However, it was very lowin Burkina Faso, Chad, Ethiopia, Guinea, Mali, Niger, Senegaland Sierra Leone.
The primary completion rate was very high (86-133 per-cent) during the period 2005-2010 in Algeria, Egypt, Ghana,Kenya, Tanzania, Zambia and Botswana. It was also high(71-86 percent) in Cameroon, Nigeria, Morocco, Namibia andMadagascar. However, this rate was low in Angola, Burk-ina, CAR, Chad, Côte d’Ivoire, Mali and Niger. Several factorsaccount for this low rate, such as lack of school infrastruc-ture. However, other reasons include economic problems(poverty and economic deprivation) and the perception ofnon-profitability of the school.
Health is one of the major components of physical, socialand mental well-being and remains one of the primary con-cerns of well-being. Good health is a crucial element ofhuman development. Health is one main cause of poorperformance of people in the agricultural sector in Africa.Therefore the health sector requires huge capital expendi-ture budgets (health facilities, training, medical equipment,etc.) and operating expenditure (remuneration of medicalstaff, drug purchase expenditure, etc.). It therefore seemsthat there is the need to increase the total expenditure giventhe rapid population growth in Africa. This is achieved withdifficulty insofar as the share of total health expenditure asa percentage of GDP has remained below 6 percent since1995 in all African regions with the exception of SouthernAfrica.
Indeed, over the period 1995-2010, Southern Africarecorded the largest share of total health expenditure asa percentage of GDP. This share varied between 7 percentand 8 percent. West Africa had the next highest, which var-ied roughly between 5 percent and 6 percent with huge an-nual variations. Central Africa had the lowest expenditureon health, which remained around 4 percent of the GDP from1995 to 2008 and then grew at 5 percent to reach around 4.5percent in 2010 (Chart 47).
Further reading
• UNESCO education (www.unesco.org/new/en/education/)• UNDPHumanDevelopment Report 2010 - The RealWealthof Nations: Pathways to Human Development (hdr.undp.org/en/reports/global/hdr2010/)
• O’Donovan (2008)
CHART 46: Girls’ and boys’ enrolment in primaryeducation (2011)
DjiboutiEquatorial Guinea
EritreaLiberia40
60
80
100
40 60 80 100girls (percent net)
boys(percentnet)
Eastern Africa
Middle Africa
Northern Africa
Southern Africa
Western Africa
Source: World Bank (WDI).
CHART 47: Total health expenditure, share of GDP(1995-2011)
4
5
6
7
8
1995 2000 2005 2010
percent
Central Africa
Eastern Africa
North Africa
Southern Africa
Western Africa
Source: World Bank (WDI).
48
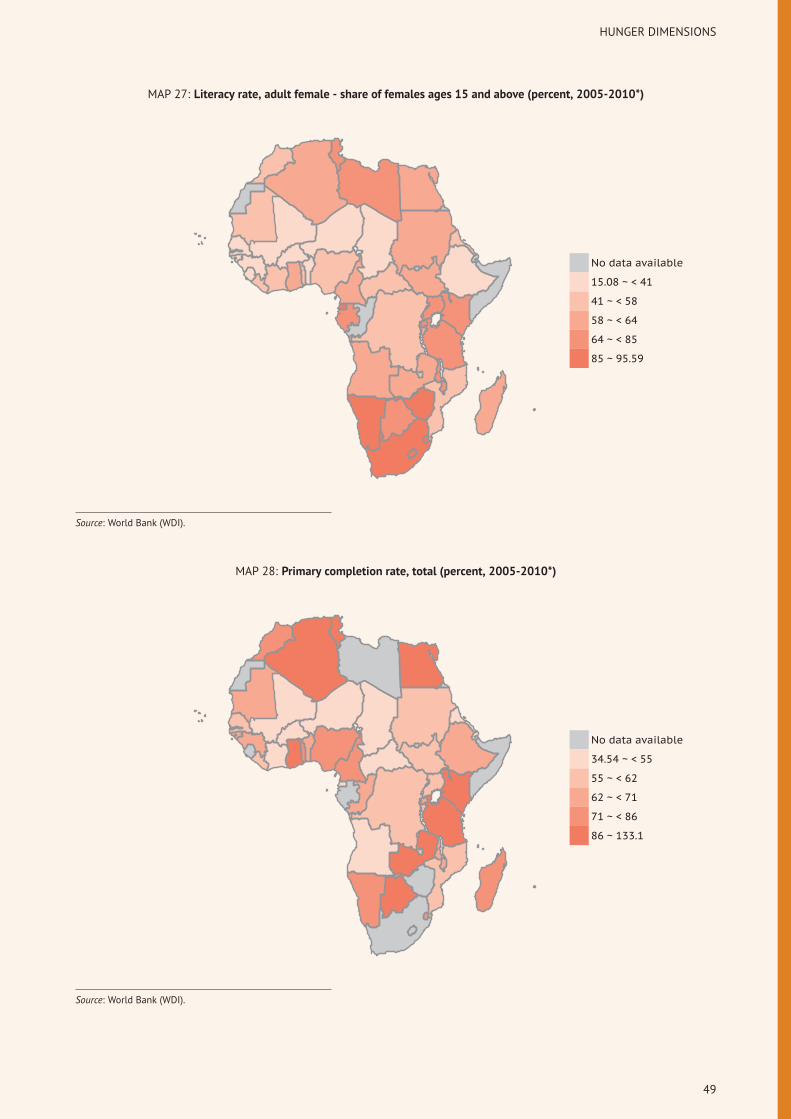
HUNGER DIMENSIONS
MAP 27: Literacy rate, adult female - share of females ages 15 and above (percent, 2005-2010*)
No data available
15.08 ~ < 41
41 ~ < 58
58 ~ < 64
64 ~ < 85
85 ~ 95.59
Source: World Bank (WDI).
MAP 28: Primary completion rate, total (percent, 2005-2010*)
No data available
34.54 ~ < 55
55 ~ < 62
62 ~ < 71
71 ~ < 86
86 ~ 133.1
Source: World Bank (WDI).
49

Natural and human-made risks
Armed conflict and natural disasters pose significant risksto a population’s food security, especially when combinedwith poverty, poor governance, scarce resources, unsustain-able livelihood systems and/or the breakdown of local in-stitutions. Under these circumstances, a perceived temporalshock or short-lived crisis can turn into a self-perpetuatingvicious cycle from which countries will find it difficult to ex-tricate themselves and return to a path of longer-term de-velopment. Severe events can have an irreversible impacton human capital and societal systems. Armed conflicts andnatural disasters, therefore, represent ongoing and funda-mental threats to both lives and livelihoods, the recoveryfrom which is progressively more difficult over time.
Among countries in the world most affected by disasters,68 percent of these were flood-related, 19 percent storms-related, 10 percent drought-related, 2 percent related to ex-treme temperatures, and 1 percent earthquake-related. Al-most all of the floods occurred in Asia, which made the areamostly affected by natural disasters in general, followed byAfrica, which was substantially affected by drought. Morethan 7 million people were affected by drought and about 3million by floods in 2011.
East Africa recorded the largest share of population affected(more than 3.5 percent) by droughts, floods, extreme tem-peratures, followed by Southern Africa (around 2.8 percent).Other regions were well below 2.5 percent. It was mainlyin North Africa that the share of population was almost in-significant.
However there were extreme disparities among countries.Though some countries in East Africa recorded 7.5 percent, inSouthern Africa, two countries were above 7.5 percent (chart48). The less affected countries included Kenya, Mauritania,Mozambique, Namibia, Niger, Somalia and Zambia.
Natural disasters and armed conflicts lead to large num-bers of displaced people. In 2011, refugees, both men andwomen, in RAF region were roughly 3 million people, com-prising (chart 49). In some countries the affected popula-tion was above 500 000. However, the corresponding pop-ulation has been under 2 000 in the cases of Burkina Faso,Gabon, Niger, and in all of the countries of Southern Africa,including Madagascar. By September 2011, the food crisisin the Horn of Africa, a result of the worst drought since1950-1951, affected 12 million people in Djibouti, Ethiopia,Kenya and Uganda, with parts of southern Somalia experi-encing famine. The situation was worsened by high localcereal prices, excessive livestock mortality, conflict and re-stricted humanitarian access.
Further reading
• Centre for Research on the Epidemiology of Disasters(www.cred.be/)
• United Nations High Commissioner for Refugees (www.unhcr.org)
• Internal Displacement Monitoring Centre (http://www.internal-displacement.org/)
CHART 48: Droughts, floods, extreme temperatures -share of population affected (2009)
0.0
2.5
5.0
7.5
CentralAfrica
EasternAfrica
NorthAfrica
SouthernAfrica
WesternAfrica
percent
Source: World Bank (WDI).
CHART 49: Refugees in Africa region (2000-2011)
0
1
2
3
2000 2002 2004 2006 2008 2010
millionpeople
Female Male
Source: Statistical Online Population Database.
50

HUNGER DIMENSIONS
MAP 29: Droughts, floods, extreme temperatures - share of population affected (average 1990-2009) (percent, 2009)
No data available
0 ~ < 0.076
0.076 ~ < 0.6
0.6 ~ < 1.5
1.5 ~ < 3.4
3.4 ~ 9.227
Source: World Bank (WDI).
MAP 30: UNHCR total population of concern (thousand people, 2011)
No data available
0 ~ < 1.8
1.8 ~ < 16
16 ~ < 76
76 ~ 1 365
Source: Statistical Online Population Database.
51

TABLE 12: Outcomes: Inadequate access to foodInadequate access to food
prevalence of number of % of foodexpendi-ture of thepoor
depth of the food deficit prevalence of food inadequacy
undernourishment undernourishedpercent percent million
peoplemillionpeople
percentkcal/cap/day kcal/cap/day
percent percent
1990-92 2011-13 1990-92 2011-13 2000-12* 1990-92 2011-13 1990-92 2011-13Africa 27.3 21.2 177.6 226.4 179 145 34.4 27.0North Africa 3.7 2.1 4.5 3.6 21 13 7.0 4.9Algeria 5.5 < 5 1.4 ns 31 15 9.2 < 5Egypt < 5 < 5 ns ns 13 8 5.5 < 5Libya < 5 < 5 ns ns 5 8 < 5 < 5Morocco 6.7 5.0 1.7 ns 38 31 10.7 9.0SudanTunisia < 5 < 5 ns ns 41.0 5 6 < 5 < 5Regional Office for Africa 32.8 24.8 173.1 222.7 241 189 41.1 31.2Central Africa 21.3 39.2 13.4 44.1 151 354 28.6 45.4Cameroon 38.3 13.3 4.8 2.7 263 85 49.2 20.9Central African Republic 48.5 28.2 1.5 1.3 364 196 58.9 38.0Chad 60.1 29.4 3.7 3.5 82.0 493 216 68.8 36.6Congo 42.4 33.0 1.0 1.4 309 234 52.6 43.3Democratic Republic of theCongoEquatorial GuineaGabon 9.5 5.6 0.1 0.1 47.0 56 35 16.8 11.3Sao Tome and Principe 22.9 7.2 0.0 0.0 144 45 32.1 12.5East Africa 49.0 36.1 82.8 106.5 385 281 57.7 44.0Burundi 44.4 67.3 2.5 5.9 52.0 312 581 54.5 76.7Djibouti 70.2 20.5 0.4 0.2 620 143 78.0 29.2Eritrea 61.3 2.4 3.4 488 71.8Ethiopia 37.1 35.5 32.1 57.0 314 44.0Kenya 34.8 25.8 8.4 11.0 221 166 45.0 36.1Rwanda 52.3 29.7 3.6 3.4 393 201 60.7 38.4Somalia 76.0South SudanSudan (former) 41.9 11.4 17.8 72.0 294 328 51.8 45.3Uganda 27.1 30.1 5.0 10.7 59.0 166 192 35.8 37.3United Republic of Tanzania 28.8 33.0 7.6 15.7 77.0 180 221 38.1 40.5Southern Africa 29.8 21.4 32.6 36.3 220 148 37.1 28.2Angola 63.2 24.4 6.7 4.9 500 153 71.5 32.2Botswana 25.1 25.7 0.4 0.5 163 187 35.0 37.8Comoros 41.4 65.3 0.2 0.5 343 655 51.8 75.0Lesotho 17.0 15.7 0.3 0.3 102 102 24.6 23.9Madagascar 24.4 27.2 2.8 6.0 78.0 152 176 33.1 36.6Malawi 45.2 20.0 4.3 3.2 49.0 331 119 54.2 26.9Mauritius 8.6 5.4 0.1 0.1 58 37 15.5 11.0Mozambique 57.8 36.8 8.0 9.0 451 269 65.2 43.8Namibia 36.2 29.3 0.5 0.7 250 212 47.4 41.2Seychelles 16.5 8.3 0.0 0.0 95 49 25.7 14.8South Africa < 5 < 5 ns ns 49.0 30 13 9.3 < 5Swaziland 15.8 35.8 0.1 0.4 92 262 23.1 47.9Zambia 33.8 43.1 2.7 6.0 77.0 225 306 43.1 52.5Zimbabwe 43.6 30.5 4.7 4.0 330 225 52.5 39.7West Africa 24.0 10.8 45.2 34.5 156 67 32.5 15.9Benin 22.4 6.1 1.1 0.6 138 34 30.5 9.9Burkina Faso 22.9 25.0 2.2 4.4 60.0 142 178 31.1 30.7Cabo Verde 13.6 9.6 0.0 0.0 47.0 81 66 20.8 17.0Côte d’Ivoire 13.3 20.5 1.7 4.2 45.0 76 133 21.1 27.0Gambia 18.2 16.0 0.2 0.3 113 102 25.6 23.2Ghana 44.4 < 5 6.8 ns 322 18 54.5 5.8Guinea 18.2 15.2 1.1 1.6 111 91 24.7 21.1Guinea-Bissau 21.8 10.1 0.2 0.2 138 61 29.9 15.6Liberia 29.6 28.6 0.6 1.2 205 201 37.0 36.3Mali 24.9 7.3 2.2 1.2 79.0 153 39 32.9 11.3Mauritania 12.9 7.8 0.3 0.3 76 46 18.9 12.5Niger 35.5 13.9 2.9 2.3 51.0 239 77 44.3 19.5Nigeria 21.3 7.3 21.3 12.1 133 42 29.7 11.9Senegal 22.0 21.6 1.6 2.8 139 142 30.6 30.7Sierra Leone 42.5 29.4 1.7 1.8 333 209 51.0 37.1Togo 34.8 15.5 1.3 1.0 85.0 236 98 44.1 22.9CEMACCEN-SADCOMESAECCASECOWASIGADSADCUEMOAUMARegional Office for Asia andthe Pacific
20.9 11.8 735.0 528.7 157 88 31.7 20.5
Regional Office for Europeand Central Asia
8.2 < 5 10.0 ns 19 12 5.9 3.9
Regional Office for LatinAmerica and the Caribbean
14.7 7.9 65.6 47.0 97 56 21.8 14.1
Regional Office for the NearEast
9.0 10.0 25.8 43.7 59 78 13.5 14.6
World 18.9 12.0 1015.3 842.3 128 83 26.2 18.4
52

TABLE 13: UtilizationOutcomes
children under 5 years of age adultsunderweight stunted wasted
underweightpercent percent percent percent percent percent percent1990-95* 2005-11* 1990-95* 2005-11* 1990-95* 2005-11* 1990-2011*
AfricaNorth AfricaAlgeria 11.3 3.7 22 16 9.6 4.0Egypt 10.8 6.8 35 31 5.7 7.9Libya 4.3 5.6 21 21 3.7 6.5Morocco 8.1 3.1 30 15 2.6 2.3 5.3SudanTunisia 8.1 3.3 31 9 4.5 3.4Regional Office for AfricaCentral AfricaCameroon 18.0 16.6 36 36 4.5 7.3Central African Republic 20.4 28.0 35 45 7.8 12.2ChadCongo 11.8 31 8.0Democratic Republic of theCongo
30.7 28.2 51 46 11.4 14.0
Equatorial GuineaGabonSao Tome and Principe 14.4 32 11.2East AfricaBurundi 35.2 58 9.0Djibouti 29.6 33 26.0Eritrea 38.3 44 20.2Ethiopia 29.2 44 10.1Kenya 19.8 16.4 40 35 9.4 7.0Rwanda 24.3 11.7 57 44 5.0 3.0Somalia 32.8 42 13.2South SudanSudan (former) 31.8 31.7 39 38 18.8 21.0Uganda 21.5 16.4 45 39 7.0 6.3United Republic of Tanzania 25.1 16.2 50 42 7.9 4.9Southern AfricaAngola 15.6 29 8.2Botswana 11.2 31 7.2Comoros 16.2 39 5.8Lesotho 18.9 13.5 38 39 22.4 3.9Madagascar 30.4 55 49 9.0 19.2Malawi 26.5 13.8 54 48 8.5 4.1Mauritius 13.0 14 15.7Mozambique 23.9 18.3 60 44 9.6 4.2Namibia 21.5 17.5 36 30 9.6 7.5SeychellesSouth Africa 8.0 8.7 29 24 3.3 4.7 8.6Swaziland 7.3 40 1.1Zambia 21.2 14.9 58 46 6.3 5.6Zimbabwe 11.7 10.1 29 32 6.3 3.1 9.9West AfricaBenin 20.2 45 8.4Burkina Faso 29.6 26.0 41 35 15.5 11.3Cabo Verde 11.8 21 6.9Côte d’Ivoire 20.9 29.4 32 39 11.2 14.0Gambia 15.8 28 7.4Ghana 25.1 14.3 34 29 14.6 8.7Guinea 21.2 20.8 35 40 14.0 8.3Guinea-Bissau 17.2 28 5.6Liberia 20.4 39 7.8Mali 27.9 38 15.3Mauritania 43.3 15.9 55 23 17.4 8.1Niger 41.0 39.9 48 55 18.9 12.4Nigeria 35.1 26.7 44 41 20.6 14.4Senegal 21.9 19.2 34 29 9.4 9.8Sierra Leone 25.4 21.3 41 37 10.2 10.5Togo 20.5 27 6.0CEMACCEN-SADCOMESAECCASECOWASIGADSADCUEMOAUMARegional Office for Asia andthe PacificRegional Office for Europeand Central AsiaRegional Office for LatinAmerica and the CaribbeanRegional Office for the NearEastWorld
53

TABLE 14: PovertyHeadcount ratio Gap GINI Income sharein $ per day (PPP) in $ per day (PPP) at national
povertyline
at ruralpovertyline
coefficient held byhighest20%
held bylowest20%
1.25 2 1.25 2percent percent percent percent percent percent index percent percent2005-12* 2005-12* 2005-12* 2005-12* 2005-12* 2005-12* 2005-12* 2005-12* 2005-12*
AfricaNorth AfricaAlgeriaEgypt 1.7 15.4 0.4 2.8 3.6 31 40 9.2LibyaMorocco 2.5 14.0 0.5 3.2 41 48 6.5Sudan 16.2 21.3 35Tunisia 1.1 4.2 0.4 1.1 36 43 6.7Regional Office for AfricaCentral AfricaCameroon 9.6 30.4 1.2 8.2 12.3 17.5 39 46 6.7Central African Republic 62.8 80.1 31.3 46.8 33.1 35.0 56 61 3.4ChadCongo 54.1 74.4 22.8 38.8 18.9 20.6 47 53 5.0Democratic Republic of theCongo
87.7 95.2 52.8 67.6 32.2 34.9 44 51 5.5
Equatorial Guinea 45.3 49.8Gabon 4.8 19.6 0.9 5.0 10.0 16.0 41 48 6.2Sao Tome and Principe 24.8East AfricaBurundi 81.3 93.5 36.4 56.1 23.4 24.2 33 43 9.0DjiboutiEritreaEthiopia 30.6 66.0 8.2 23.6 7.8 8.0 34 42 8.0Kenya 43.4 67.2 16.9 31.8 16.3 17.5 48 53 4.8Rwanda 63.2 82.4 26.6 44.6 14.8 26.0 51 57 5.2SomaliaSouth Sudan 23.7 26.5 46Sudan (former) 19.8 44.1 5.5 15.4 42 6.8Uganda 38.0 64.7 12.2 27.4 6.8 7.6 44 51 5.8United Republic of Tanzania 67.9 87.9 28.1 47.5 9.9 11.0 38 45 6.8Southern AfricaAngola 43.4 67.4 16.4 31.5 43 49 5.4BotswanaComorosLesothoMadagascar 81.3 92.6 43.3 60.1 26.8 28.9 44 50 5.4Malawi 61.6 82.3 26.2 44.0 18.9 21.4 44 50 5.6MauritiusMozambique 59.6 81.8 25.1 42.9 21.2 22.2 46 51 5.2Namibia 8.8 11.6Seychelles 0.2 1.8 0.1 0.3 66 70 3.7South Africa 13.8 31.3 2.3 10.2 7.0 63 68 2.7Swaziland 40.6 60.4 16.0 29.3 30.4 36.9 51 57 4.0Zambia 74.5 86.6 41.9 56.8 28.0 37.9 57 62 3.6ZimbabweWest AfricaBenin 9.5 10.1Burkina Faso 44.6 72.6 14.7 31.7 15.1 17.4 40 47 6.7Cabo Verde 8.1 14.3Côte d’Ivoire 23.8 46.3 7.5 17.8 15.3 20.3 42 48 5.6Gambia 27.9Ghana 28.6 51.8 9.9 21.3 9.6 13.5 43 49 5.2Guinea 43.3 69.6 15.0 31.0 18.4 22.6 39 46 6.3Guinea-BissauLiberia 83.8 94.9 40.9 59.6 24.4 26.3 38 45 6.4Mali 50.4 78.7 16.4 35.2 13.2 15.6 33 41 8.0Mauritania 23.4 47.7 6.8 17.7 14.5 22.3 40 47 6.0Niger 43.6 75.2 12.4 30.8 19.6 21.2 35 43 8.1Nigeria 68.0 84.5 33.7 50.2 26.2 30.3 49 54 4.4Senegal 29.6 55.2 9.1 21.9 14.5 18.6 40 47 6.0Sierra Leone 51.7 79.6 16.6 35.8 35 44 7.8Togo 28.2 52.6 8.8 20.9 24.4 33.1 39 46 6.0CEMACCEN-SADCOMESAECCASECOWASIGADSADCUEMOAUMARegional Office for Asia andthe PacificRegional Office for Europeand Central AsiaRegional Office for LatinAmerica and the CaribbeanRegional Office for the NearEastWorld
54

TABLE 15: Determinants: AvailabilityAvailability
average dietary supply value of food production share of energy supply derived average supply ofadequacy per capita from cereals, roots and tubers protein protein of animal origin
percent percent I$/cap I$/cap percent percent g/cap/day g/cap/day g/cap/day g/cap/day1990-92 2011-13 1990-92 2009-11 1990-92 2008-10 1990-92 2008-10 1990-92 2008-10
Africa 108 117 150 179 64 63 57 65 12 15North Africa 138 144 175 246 64 62 82 93 16 22Algeria 133 146 117 183 59 58 77 89 19 23Egypt 142 147 177 259 68 67 84 97 13 21Libya 144 139 172 175 49 52 81 80 27 27Morocco 135 139 188 265 64 60 84 89 15 21SudanTunisia 140 139 302 332 56 53 85 95 19 26Regional Office for Africa 100 111 152 160 62 64 52 59 12 13Central Africa 114 98 126 108 58 69 40 38 8 7Cameroon 93 113 152 241 59 57 49 62 11 11Central African Republic 88 101 168 210 57 55 41 51 15 18Chad 80 106 129 125 65 65 51 64 12 10Congo 92 98 82 100 60 62 46 43 19 14Democratic Republic of theCongoEquatorial Guinea 80 61Gabon 115 119 209 170 46 52 72 82 36 41Sao Tome and Principe 103 122 116 180 52 47 52 63 13 17East Africa 88 101 157 138 57 59 55 60 15 14Burundi 91 76 173 126 46 50 59 43 4 2Djibouti 73 107 74 72 56 55 41 59 12 16Eritrea 78 46 79 81 50 7Ethiopia 101 109 81 75 63 8Kenya 95 101 150 160 55 55 55 60 17 17Rwanda 89 105 168 198 49 51 44 54 4 5SomaliaSouth SudanSudan (former) 92 103 156 261 58 48 62 75 21 30Uganda 108 110 178 155 45 45 51 49 11 12United Republic of Tanzania 103 105 139 154 70 59 55 55 11 10Southern Africa 102 111 144 171 64 64 56 61 16 18Angola 79 107 78 186 59 60 35 46 13 14Botswana 100 98 159 136 48 48 68 61 29 23Comoros 92 78 116 96 58 57 54 49 15 14Lesotho 110 110 61 57 78 80 65 67 10 10Madagascar 105 102 196 167 74 79 52 48 16 11Malawi 90 113 75 169 73 71 51 62 5 5Mauritius 117 124 218 195 49 47 70 84 28 38Mozambique 83 102 70 83 76 75 31 43 4 5Namibia 93 96 260 177 61 57 58 62 19 23Seychelles 105 114 78 46 47 49 71 78 36 35South Africa 121 132 211 241 55 54 74 84 26 34Swaziland 110 92 288 239 56 60 58 58 17 17Zambia 97 91 85 101 77 74 51 47 11 10Zimbabwe 90 99 95 97 64 59 50 55 9 12West Africa 106 125 161 193 68 65 52 64 10 12Benin 107 134 148 198 74 71 54 64 8 11Burkina Faso 108 119 109 122 76 72 71 80 8 9Cabo Verde 112 115 70 97 55 46 62 74 20 33Côte d’Ivoire 119 124 248 254 66 67 53 54 15 12Gambia 109 112 73 77 58 62 52 62 12 15Ghana 91 144 172 271 68 64 43 60 15 16Guinea 118 122 166 180 63 64 57 56 7 9Guinea-Bissau 107 122 141 200 69 62 46 45 9 9Liberia 106 106 91 80 67 69 39 38 7 6Mali 105 131 145 213 69 70 62 72 16 19Mauritania 119 129 163 138 55 49 79 85 33 36Niger 97 120 133 190 76 59 56 80 12 19Nigeria 107 127 170 195 67 65 49 64 7 10Senegal 104 104 109 116 65 62 66 62 19 18Sierra Leone 93 105 94 119 61 61 42 50 8 11Togo 97 114 102 131 75 73 48 55 8 8CEMACCEN-SADCOMESAECCASECOWASIGADSADCUEMOAUMARegional Office for Asia andthe Pacific
107 117 175 259 63 57 59 75 15 26
Regional Office for Europeand Central Asia
132 135 431 419 29 38 79 101 42 53
Regional Office for LatinAmerica and the Caribbean
117 127 315 457 43 40 68 82 30 41
Regional Office for the NearEast
131 130 177 226 61 57 74 82 18 24
World 114 122 240 302 56 51 69 79 24 31
55

TABLE 16: Determinants: Physical and economic accessAccess
physical access economic access lack of access to% of paved roads rail lines density road density food price level index water sanitation
percent percent km per100
square kmof landarea
km per100
square kmof landarea
km per100
square kmof landarea
km per100
square kmof landarea
index index index percent percent
1990 2005-10* 1990 2005-11* 1990 2005-10* 2000 2005 2013 2011 2011Africa 7 1.8 1.8 1.9 33 60North Africa 62 77 6 1.8 1.8 8 10Algeria 67 77 0.2 0.1 4 5 16 5Egypt 72 92 0.5 0.5 14 2.0 1.8 2.0 1 5Libya 52 4 3Morocco 49 70 0.4 0.5 13 13 1.6 1.6 1.6 18 30Sudan 2 10Tunisia 76 76 1.4 0.7 12 12 1.7 1.7 1.8 4 10Regional Office for Africa 1.8 1.9 37 69Central Africa 2.1 2.1 46 68Cameroon 10 17 0.2 0.2 7 6 1.9 1.9 26 52Central African Republic 7 4 3 2.2 2.2 33 66Chad 1 2 3 2.3 2.5 50 88Congo 10 7 0.2 4 5 2.5 2.1 28 82Democratic Republic of theCongo
0.2 0.2 54 69
Equatorial Guinea 9 2.0 2.1Gabon 8 12 0.3 0.3 3 3 2.1 2.1 12 67Sao Tome and Principe 62 2.1 2.0 3 66East Africa 5 1.8 1.8 43 74Burundi 2.3 2.2 26 50Djibouti 3.4 12 7 39Eritrea 19 3Ethiopia 15 14 2 4 1.7 1.8 1.9 51 79Kenya 13 14 0.4 0.3 11 11 1.7 1.9 39 71Rwanda 9 50 1.5 1.7 1.8 31 39Somalia 11 3 70 76South SudanSudan (former) 34 0.2 0.2 0 45 76Uganda 0.5 1.7 1.7 1.9 25 65United Republic of Tanzania 15 0.5 0.3 10 1.9 2.0 2.4 47 88Southern Africa 1.4 1.5 29 52Angola 2.0 2.1 47 41Botswana 32 33 0.1 1 4 1.9 1.8 1.9 3 36Comoros 69Lesotho 18 53 17 2.3 1.9 22 74Madagascar 15 16 0.1 6 2.1 2.2 2.0 52 86Malawi 0.7 0.7 9 2.3 2.1 16 47Mauritius 93 98 88 101 1.6 1.6 0 9Mozambique 17 21 0.4 3 4 1.9 1.9 53 81Namibia 11 14 0.3 8 5 1.5 1.6 1.8 7 68Seychelles 57 96 110 4 3South Africa 1.8 1.8 1.3 1.4 8 26Swaziland 1.7 16 1.5 1.8 28 43Zambia 17 0.2 5 1.7 1.7 1.4 36 58Zimbabwe 14 0.7 0.7 23 1.9 1.9 20 60West Africa 16 8 2.3 2.3 33 74Benin 20 0.7 2.4 2.1 2.0 24 86Burkina Faso 17 0.2 6 1.9 1.9 2.1 20 82Cabo Verde 78 27 1.5 1.5 1.4 11 37Côte d’Ivoire 9 8 0.2 0.2 25 1.9 1.9 20 76Gambia 21 2.5 2.7 11 32Ghana 20 13 0.4 0.4 16 46 2.4 2.4 1.7 14 86Guinea 15 12 1.9 2.4 26 81Guinea-Bissau 8 11 2.0 28 81Liberia 6 8 26 82Mali 11 25 0.0 1 2 1.9 2.0 2.0 35 78Mauritania 30 0.1 1 1 2.0 2.1 50 73Niger 29 21 1 2 1.9 2.0 2.5 50 90Nigeria 0.4 13 2.4 2.5 39 69Senegal 27 36 0.5 7 8 2.0 2.1 2.0 27 49Sierra Leone 11 16 2.2 2.4 2.4 42 87Togo 21 21 13 20 2.2 2.2 41 89CEMACCEN-SADCOMESAECCASECOWASIGADSADCUEMOAUMARegional Office for Asia andthe Pacific
55 18 24 1.7 1.7 9 42
Regional Office for Europeand Central Asia
26 29 1.2 1.2 2 6
Regional Office for LatinAmerica and the Caribbean
15 20 14 15 1.3 1.3 6 19
Regional Office for the NearEast
54 5 1.6 1.6 10 10
World 0.8 0.9 21 25 11 37
56

TABLE 17: Vulnerability/StabilityValue of food imports over total merchandise exports Cereal import dependency ratio Percent of arable land equipped for irrigation
percent percent percent percent percent percent percent percent percent1990-92 1999-2001 2008-10 1990-92 1999-2001 2007-09 1990-92 1999-2001 2009-11
Africa 13 12 10 27 30 30 6 7 6North Africa 18 16 13 43 53 50 21 24 26Algeria 16 13 10 62 80 71 7 7 8Egypt 69 46 33 38 36 36 100 100 100Libya 9 9 4 90 91 92 26 26 27Morocco 15 17 20 27 60 54 14 16 18Sudan 11Tunisia 11 9 10 35 67 60 13 14 16Regional Office for Africa 10 9 9 18 18 22 4 4 3Central Africa 10 8 6 26 26 30 0 0 0Cameroon 9 13 17 34 30 33 0 0 0Central African Republic 26 11 37 31 21 19 0 0 0Chad 12 16 3 7 5 8 0 1 1Congo 9 6 4 96 95 90 0 0 0Democratic Republic of theCongo
26 26 19 0 0 0
Equatorial GuineaGabon 5 5 5 79 86 83 1 1 1Sao Tome and Principe 113 48 248 77 86 85 100 100 100East Africa 34 33 26 13 17 20 5 6 2Burundi 27 41 76 11 14 25 2 2 2Djibouti 247 298 561 100 100 100 100 100 50Eritrea 197 861 52 59 4 3Ethiopia 52 61 11 10 3 2Kenya 18 23 27 14 26 36 1 2 2Rwanda 46 72 57 11 20 22 0 1 1Somalia 80 81 140 20 19 18South SudanSudan (former) 42 21 15 18 22 25 15 11Uganda 14 26 31 2 7 18 0 0 0United Republic of Tanzania 22 44 18 4 12 14 2 2 2Southern Africa 7 6 6 29 18 25 9 9 9Angola 11 5 4 50 52 55 3 3 2Botswana 11 12 11 82 98 90 0 0 1Comoros 89 118 431 71 70 74 0 0 0Lesotho 148 49 17 72 55 85 1 1 1Madagascar 18 20 26 6 12 9 40 37 31Malawi 24 8 19 18 4 6 1 2 2Mauritius 14 14 24 100 100 100 18 23 26Mozambique 156 43 25 60 23 30 3 3 2Namibia 9 15 6 63 72 65 1 1 1Seychelles 54 21 17 100 100 100 0 0 30South Africa 3 3 4 24 13 19 9 11 13Swaziland 13 15 10 56 58 79 26 28 29Zambia 6 9 4 24 9 5 1 5 4Zimbabwe 9 5 33 31 9 52 4 5 4West Africa 12 11 11 13 18 19 1 1 1Benin 38 45 37 35 12 19 1 0 0Burkina Faso 53 55 24 8 12 8 1 1 0Cabo Verde 822 578 475 90 73 94 7 7 7Côte d’Ivoire 13 9 10 40 47 59 3 3 2Gambia 142 313 242 52 40 46 1 1 1Ghana 21 17 17 26 24 31 0 1 1Guinea 16 18 24 27 21 14 3 4 3Guinea-Bissau 165 49 54 33 38 27 7 8 8Liberia 21 28 108 60 64 64 1 1 1Mali 25 18 17 5 7 6 4 5 4Mauritania 27 43 23 74 68 75 10 10 10Niger 29 39 26 6 9 7 0 0 0Nigeria 5 6 6 4 14 14 1 1 1Senegal 47 54 60 42 48 55 2 4 3Sierra Leone 59 590 67 30 50 28 6 5 3Togo 27 12 27 24 17 16 0 0 0CEMACCEN-SADCOMESAECCASECOWASIGADSADCUEMOAUMARegional Office for Asia andthe Pacific
5 4 4 11 10 9 33 31 36
Regional Office for Europeand Central Asia
7 5 6 18 16 21 16 13 13
Regional Office for LatinAmerica and the Caribbean
9 8 6 22 30 30 13 13 13
Regional Office for the NearEast
12 9 7 41 53 53 30 32 42
World 7 5 5 15 15 16 19 21 23
57

TABLE 18: Health and educationLiteracyrate
Primary completion rate School enrollment Health expenditure
adultfemale, %of femalesages 15 +
total primary share of GDP
female malepercent percent percent percent percent percent percent percent percent2005-10* 1990 2010 1990 2010 1990 2010 1995 2010
Africa 5.1 6.0North Africa 96 4.1 5.2Algeria 64 81 96 81 95 94 97 4.2 4.3Egypt 64 101 3.9 4.7Libya 83 3.5Morocco 44 52 85 46 93 67 95 3.9 5.9Sudan 7.2Tunisia 71 80 87 97 5.8 5.7Regional Office for Africa 67 5.7 6.5Central Africa 60 3.7 4.6Cameroon 63 54 79 67 85 76 98 3.9 5.1Central African Republic 43 30 41 46 60 69 81 3.9 3.8Chad 24 17 35 5.8 4.0Congo 60 71 89 92 3.2 2.3Democratic Republic of theCongo
57 59 3.6 7.5
Equatorial Guinea 91 52 56 57 5.9 4.2Gabon 85 3.0 3.5Sao Tome and Principe 85 79 85 7.5East Africa 68 3.9 5.7Burundi 62 41 56 5.5 9.1Djibouti 32 25 33 4.0Eritrea 58 40 31 36 4.5 2.9Ethiopia 29 62 79 84 2.8 4.8Kenya 84 4.3 4.4Rwanda 68 45 70 4.5 10.4SomaliaSouth Sudan 2.1Sudan (former) 62 3.4Uganda 65 57 92 90 5.8 9.2United Republic of Tanzania 67 90 52 51 3.6 7.2Southern Africa 68 6.7 7.4Angola 58 47 78 93 5.1 3.4Botswana 85 89 89 82 4.2 5.1Comoros 70 4.7 5.3Lesotho 96 58 70 78 75 63 72 8.1 11.5Madagascar 62 36 72 69 70 2.8 3.6Malawi 68 28 68 5.0 8.4Mauritius 86 111 3.6 6.2Mozambique 43 27 61 89 94 5.3 6.3Namibia 88 81 83 87 76 83 6.2 5.5Seychelles 92 133 5.2 3.3South Africa 87 7.4 8.7Swaziland 87 63 77 76 72 5.0 7.8Zambia 62 103 92 90 5.6 6.0Zimbabwe 90 0.1West Africa 68 4.8 5.7Benin 30 19 70 28 55 4.7 4.3Burkina Faso 22 18 45 56 60 4.3 7.4Cabo Verde 79 57 99 92 94 5.3 4.8Côte d’Ivoire 47 40 5.1 6.2Gambia 40 70 67 64 3.3 4.4Ghana 61 5.3 5.2Guinea 30 21 64 18 70 36 83 5.5 6.2Guinea-Bissau 41 68 72 75 6.4 7.0Liberia 57 0.0 16.4Mali 20 55 57 66 5.2 6.5Mauritania 51 29 76 72 4.8 6.1Niger 15 17 41 18 51 29 63 3.4 4.8Nigeria 50 74 55 60 4.5 5.4Senegal 39 43 59 39 78 53 73 3.9 5.8Sierra Leone 31 15.3 20.8Togo 44 38 74 55 79 4.6 7.5CEMAC 42 61 3.7 4.0CEN-SAD 4.2 5.5COMESA 3.7 5.4ECCAS 57 4.0 4.0ECOWAS 68 4.8 5.7IGAD 3.9 5.9SADC 70 6.5 7.4UEMOA 30 54 4.6 6.1UMA 67 4.2 5.0Regional Office for Asia andthe Pacific
5.8 6.4
Regional Office for Europeand Central Asia
99 8.4 9.8
Regional Office for LatinAmerica and the Caribbean
102 6.5 7.6
Regional Office for the NearEast
3.8 4.6
World 8.8 10.3
58

TABLE 19: Population at riskDroughts,floods,extr temp
UNHCR population of concern
% ofpopulationaffected
total totalrefugees
internallydisplacedpersons
others andstatelesspersons
percent thousandpeople
thousandpeople
thousandpeople
thousandpeople
thousandpeople
2009 2000 2011 2011 2011 2011Africa 1.5 2640 5053 105 4445 12North Africa 0.0 23 306 0 0 0Algeria 0.0 14 94 0 0 0Egypt 0.0 7 114 0 0 0Libya 0.0 2 96 0 0 0Morocco 0.1 0 1 0 0 0Sudan 0 0 0 0 0Tunisia 0.1 0 0 0 0 0Regional Office for Africa 1.9 2616 4747 105 4445 12Central Africa 0.3 518 633 0 1938 9Cameroon 0.1 4 0 0 0 0Central African Republic 0.2 56 200 0 105 0Chad 2.7 18 433 0 124 0Congo 0.3 119 0 0 0 0Democratic Republic of theCongo
0.0 300 0 0 1709 0
Equatorial Guinea 0 0 0 0 0Gabon 21 0 0 0 9Sao Tome and Principe 0 0 0 0 0East Africa 3.1 1214 3079 105 2326 0Burundi 2.4 27 130 0 79 0Djibouti 6.8 23 22 0 0 0Eritrea 7.3 2 5 0 0 0Ethiopia 3.3 195 290 0 0 0Kenya 6.5 206 922 0 300 0Rwanda 1.3 30 63 0 0 0Somalia 4.6 0 1365 0 1357 0South Sudan 0 0 105 560 0Sudan (former) 2.8Uganda 0.9 219 282 0 30 0United Republic of Tanzania 1.5 511 0 0 0 0Southern Africa 2.8 323 105 0 54 0Angola 1.0 12 23 0 0 0Botswana 0.7 4 4 0 0 0Comoros 0.0 0 0 0 0 0Lesotho 3.4 0 0 0 0 0Madagascar 0.9 0 0 0 0 0Malawi 8.8 4 17 0 0 0Mauritius 0.0 0 0 0 0 0Mozambique 3.7 2 14 0 0 0Namibia 3.4 28 7 0 0 0Seychelles 0.1 0 0 0 0 0South Africa 1.8 19 0 0 0 0Swaziland 9.2 0 0 0 0 0Zambia 4.2 251 34 0 0 0Zimbabwe 4 6 0 54 0West Africa 0.7 561 931 0 127 3Benin 0.9 2 8 0 0 0Burkina Faso 1.3 1 1 0 0 0Cabo Verde 0.0 0 0 0 0 0Côte d’Ivoire 0.0 0 754 0 127 1Gambia 0.2 12 10 0 0 0Ghana 1.0 0 26 0 0 0Guinea 0.2 426 17 0 0 0Guinea-Bissau 0.5 8 8 0 0 0Liberia 1.9 54 0 0 0 2Mali 0.7 9 18 0 0 0Mauritania 3.1 0 27 0 0 0Niger 7.5 1 0 0 0 0Nigeria 0.1 7 10 0 0 0Senegal 0.6 23 23 0 0 0Sierra Leone 0.2 7 8 0 0 0Togo 0.5 12 20 0 0 0CEMAC 0.9 218 633 0 229 9CEN-SAD 0.9 242 3123 105 2273 3COMESA 2.3 1271 1981 105 2732 0ECCAS 0.6 557 786 0 2017 9ECOWAS 0.7 561 904 0 127 3IGAD 3.6 646 2886 105 2247 0SADC 1.9 1135 105 0 1764 0UEMOA 1.7 55 832 0 127 1UMA 0.2 17 218 0 0 0Regional Office for Asia andthe Pacific
4.4 3154 6556 1 1566 955
Regional Office for Europeand Central Asia
0.2 2009 2589 3 1294 17
Regional Office for LatinAmerica and the Caribbean
0.5 34 338 0 3888 0
Regional Office for the NearEast
0.9 273 3900 0 1680 0
World 2.9 8350 17564 109 12844 980
59

60

PART
3Feeding the world
61

Aggregate agriculture
FAO projections show that, even with decreasing consump-tion, agricultural production still needs to increase by 60percent (and nearly 80 percent in developing countries) inthe next four decades or so in order to cope with a 39 per-cent increase in world population and increase global di-etary energy supply beyond 3 000 kcal per person per day.This translates into the additional production of almost onebillion tons of cereals and just less than 200 million tons ofmeat annually by 2050.
For the world as a whole, per capita food supply has risenfrom about 2 200 kcal/person/day in the early 1960s to over2 800 kcal/person/day by 2009. At 3 370 kcal/person/day,Europe is the region with the greatest average supply.
In Africa, North Africa’s food supply in primary crop equiv-alent was well above 3 000 kcal/cap/day in 2000, and itrecorded a growth until 2009. North Africa is followed byWest Africa, where it rose from 2 500 kcal/cap/day in 2000to 2 700 kcal/cap/day in 2009. Southern Africa rose from 2300 to 2 400 kcal/cap/day during the same period. In EastAfrica food supply was slightly above 2 000 kcal/cap/day,while Central Africa was just under 2 000 kcal/cap/day forthe entire nine year period (chart 50).
Algeria, Egypt, Gabon, Ghana, Libya, Mauritania, Morocco,South Africa and Tunisia had the highest food supply of pri-mary food crops, which ranged between 2 730 and 3 349kcal/cap/day in 2009 (map 31).
In Africa during 2000-2009, protein supply quantity in pri-mary crops equivalent varied between 54 and 58 g/cap/day,whereas primary crops fat supply quantity equivalent rangedbetween 45 to 50 g/cap/day (chart 51).
In 2009 food supply in crops primary crops equivalent, NorthAfrica recorded the highest level (90 g/cap/day) of food sup-ply in crops primary equivalent, followed by West Africa(roughly 63 g/cap/day), South Africa, East Africa and CentralAfrica (chart 52).
Also North Africa recorded the highest fat supply in pri-mary crops equivalent (63 g/cap/day) in 2009, howeverthe gap between North Africa and West Africa (roughly 61g/cap/day), was much closer than that of primary food cropssupply equivalent (chart 53).
Further reading
• FAO Agricultural Development Economics Division (www.fao.org/economic/esa/esa-home/en/)
• Bruinsma (2011)
CHART 50: Food supply in crops primary equivalent(2000-2009)
2000
2500
3000
2000 2002 2004 2006 2008
kcal/cap/day
Central Africa
Eastern Africa
North Africa
Southern Africa
Western Africa
Source: FAO, Statistics Division (FAOSTAT).
CHART 51: Africa protein and fat supply in cropsprimary equivalent (2000-2009)
48
52
56
2000 2002 2004 2006 2008
g/cap/day
Protein supply quantity in crops primary equivalent
Fat supply quantity in crops primary equivalent
Source: FAO, Statistics Division (FAOSTAT).
62

FEEDING THE WORLD
MAP 31: Food supply in crops primary equivalent (kcal/cap/day, 2009)
No data available
1 604 ~ < 2 120
2 120 ~ < 2 260
2 260 ~ < 2 480
2 480 ~ < 2 730
2 730 ~ 3 349
Source: FAO, Statistics Division (FAOSTAT).
CHART 52: Protein supply in crops primary equivalent(2009)
0
25
50
75
100
CentralAfrica
EasternAfrica
NorthAfrica
SouthernAfrica
WesternAfrica
g/cap/day
Source: FAO, Statistics Division (FAOSTAT).
CHART 53: Fat supply in crops primary equivalent(2009)
0
25
50
75
CentralAfrica
EasternAfrica
NorthAfrica
SouthernAfrica
WesternAfrica
g/cap/day
Source: FAO, Statistics Division (FAOSTAT).
63

Growth in crop production
Over the past 50 years or so, global crop production has ex-panded three-fold. Growth in crop production goes handin hand with an increase and/or expansion in crop yieldsin the physical area (arable land) allocated to crops, which– together with increases in crop intensification, such ashigher multiple cropping and/or shortening of fallow peri-ods – leads to an expansion in the area harvested. Over thepast five decades, global arable land increased by 67 mil-lion ha as a result of two opposite trends: an increase of107 million ha in developing countries and a decline of 40million ha in developed countries. The arable land in thelatter group peaked in the mid-1980s and has been fallingsince at an accelerated rate. Hence, increase in yields andmore intensive use of land accounts for the overall growthin crop production in developed countries.
In fact, much of the increase in global crop production overthis period can be attributed to improvements in yield, fol-lowed by an expansion in arable land, while a small part isdue to crop intensification. These trends, however, are notuniform across regions.
An increase in cereal production (2000-2012) was highest(more than 6 percent) in East Africa due to the large har-vested area and improved yields. North Africa had the sec-ond highest growth rate, which can be explained mainlyby the improvement in yields than by an increase in har-vested area. North Africa was followed by Central Africa,where growth in cereal production was related more to anincrease in harvested area than improvement in yields. Fi-nally growth inWest Africa and Southern Africa can primarilybe explained by harvested area than yield (chart 55).
The gross per capita crop production index number of RAFwas higher than the world level from 2000 through 2003.However from 2004, changes occurred. The trend reversed,and the index at the global level gradually passed RAF. From2007 to 2010, a significant variation emerged, with stronggrowth in the global index and erratic movement of the in-dex for RAF region (chart 54).
Map 32 shows that the net per capita crop production indexnumber ranged from 120 to 176.1 in Algeria, CAR, Demo-cratic Republic of the Congo, Ethiopia, Mozambique, Nigerand Zambia. As for the net per capita food production indexnumber (map 33), the observations were similar: the coun-tries that had recorded the highest index for crops were sim-ilar for the food index.
Further reading
• FAOWorld Agriculture: Towards 2030/2050 - Prospects forFood, Nutrition, Agriculture and Major Commodity Groups(www.fao.org/docrep/009/a0607e/a0607e00.htm)
• FAO Food Outlook (www.fao.org/giews/english/fo/index.htm)
CHART 54: Crops, gross per capita production indexnumber (2004-2006 = 100) (2000-2011)
95
100
105
110
2000 2002 2004 2006 2008 2010
index
Regional Office for Africa
World
Source: FAO, Statistics Division (FAOSTAT).
CHART 55: Growth in cereal production (2000-2012)
0
2
4
6
CentralAfrica
EasternAfrica
NorthAfrica
SouthernAfrica
WesternAfrica
percent
Production Harvested area Yield
Source: FAO, Statistics Division (FAOSTAT).
64

FEEDING THE WORLD
MAP 32: Crops, net per capita production index number (2004-2006 = 100) (index, 2011)
No data available
67.25 ~ < 93
93 ~ < 100
100 ~ < 110
110 ~ < 120
120 ~ 176.1
Source: FAO, Statistics Division (FAOSTAT).
MAP 33: Food, net per capita production index number (2004-2006 = 100) (index, 2011)
No data available
70.67 ~ < 94
94 ~ < 100
100 ~ < 110
110 ~ < 120
120 ~ 158.8
Source: FAO, Statistics Division (FAOSTAT).
65

Trends in the crop sector
At the regional level in 2010 and 2011, the African regionranked fourth in cereal production, after RAP REU, and RLAC.RNE recorded the lowest production.
In terms of per capita, over the period 2000-2011, the re-gion with the highest per capita cereal production was NorthAfrica, followed by West Africa, then Southern Africa, EastAfrica. Central Africa had the smallest production (Chart 56).
In North Africa, Algeria recorded a huge growth rate in cerealproduction (13.4 percent) in the region over the period 2000-2011. This rate is due to both improved yields (4.6 percent)and an increase in area harvested (8.5 percent). However thehighest rate was recorded by Morocco (14.3 percent), whichcan primarily be explained by the increase in yield (14.4 per-cent).
In Central Africa, strong growth in grain production wasrecorded during the period 2000-2011 in Cameroon, whichhad an annual average growth of 8.1 percent and Congo at9.5 percent. The high growth recorded in Cameroon is re-lated to an increase in area, while in Congo, it was due tothe combined effect of both yield and area.
In East Africa, the highest increase in cereal production (12.3percent) was observed in Rwanda through increased yields,in view of the very limited availability of arable land of thecountry. High cereal growth rates were recorded in othercountries in East Africa: Eritrea (6.8 percent), Ethiopia (7.5percent) and the United Republic of Tanzania (7.3 percent).However, since 2000, Somalia has been facing a decline incereal production with an average rate of -3.1 percent overten years. This can be explained by the fact that there wasno growth in planted area and a rapid decrease in yields.Growth in the United Republic of Tanzania, is primarily ex-plained by the increase planted in areas (7.7 percent), (table20).
Compared to the other regions, RAF was fourth in the pro-duction of coarse grains. The production of coarse grains inAfrica was 115.3 million tons in 2010 and 112.8 million tonsin 2011 and had an average annual growth rate of 3.9 per-cent, which was primarily due to improvements in yield andexpansion in area. Similarly, in RAF, there was a slight de-crease between 2010 and 2011, but the production grew by3.9 percent as it did across Africa. The production in NorthAfrica was almost stagnant from 2010-2011, but its growthwas 3.6 percent from 2000 to 2011.
The decrease in coarse grain production in RAF was due tothe drop in production in Central and West Africa, and alsothe slight reduction in the production recorded in SouthernAfrica.
West Africa was the top per capita coarse grain producerbetween 2000-2011, with a per capita production rangingbetween 120-160 kg/cap. The next largest producers wereSouthern Africa, East Africa, North Africa and Central Africa(chart 57). Egypt, Ethiopia, Kenya, Mali, Niger, Nigeria, SouthAfrica and Tanzania were the biggest producers with produc-tion ranging between 3.5 - 17.4 million tons of coarse grainproduced in 2011 (map 35).
CHART 56: Per capita cereal production (2000-2011)
50
100
150
200
250
2000 2002 2004 2006 2008 2010
kg/cap
Central Africa
Eastern Africa
North Africa
Southern Africa
Western Africa
Source: FAO, Statistics Division (FAOSTAT) and United Nations Pop-ulation Division.
CHART 57: Per capita coarse grain production(2000-2011)
40
80
120
160
2000 2002 2004 2006 2008 2010
kg/cap
Central Africa
Eastern Africa
North Africa
Southern Africa
Western Africa
Source: FAO, Statistics Division (FAOSTAT) and United Nations Pop-ulation Division.
66

FEEDING THE WORLD
MAP 34: Cereal producing countries (million tonnes, 2011)
No data available
0.000014 ~ < 0.15
0.15 ~ < 0.86
0.86 ~ < 2.3
2.3 ~ < 3.9
3.9 ~ 22.17
Source: FAO, Statistics Division (FAOSTAT).
MAP 35: Coarse grain producing countries (million tonnes, 2011)
No data available
0.000014 ~ < 0.081
0.081 ~ < 0.36
0.36 ~ < 1.3
1.3 ~ < 3.5
3.5 ~ 17.43
Source: FAO, Statistics Division (FAOSTAT).
67

The bulk of world rice production is destined for food, al-though some quantities are used in domestic animal feedproduction. Rice is the main staple for more than half of theworld’s population, with Asia representing the largest pro-ducing and consuming region. In recent years, rice has alsobecome an important staple throughout Africa.
Rice production in North Africa increased from 2010 to 2011.However, over the last ten years (2000-2011), this level ofproduction dropped as the annual growth rate was -0.5 per-cent. In contrast RAF recorded a reduction in rice productionfrom 2010 to 2011 due to the decrease of production in EastAfrica, Southern Africa and West Africa. Only Central Africarecorded a slight increase between 2010 and 2011. Para-doxically, all of these sub-regions showed positive annualgrowth from 2000 to 2011. At 10.2 percent, East Africa hadthe highest annual growth (Table 22).
In 2011, the largest per capita producers of rice were Mada-gascar, followed by Sierra Leone, Guinea, Guinea-Bissau andMali where per capita rice production was above 100 kg/cap.Madagascar recorded roughly 200 kg/cap (chart 58).
With respect to wheat, more of the earth’s surface is coveredby wheat than by any other food crop. Wheat is the thirdmost produced cereal after maize and rice, but in terms ofdietary intake, it is currently second to rice as the main foodcrop, given the more extensive use of maize as animal feed.Currently, around 70 percent of this crop is used for food,19 percent for animal feed, and the remaining 11 percent isused for industrial purposes.
In 2011, the leading producers of wheat per capita in Africawere Morocco, with almost 200 kg/cap, followed by Tunisia(150 kg/cap), Egypt (100 kg/cap) and Algeria (75 kg/cap)(chart 59). In terms of volume, Ethiopia and South Africaproduced high quantities of wheat (map 37).
CHART 58: Per capita rice production, selectedcountries (2011)
Mozambique
Burkina Faso
Chad
Togo
Ghana
Benin
Nigeria
Gambia
Senegal
Côte d’Ivoire
Comoros
Mauritania
United Republic of Tanzania
Egypt
Liberia
Mali
Guinea-Bissau
Guinea
Sierra Leone
Madagascar
50 100 150 200kg/cap
Source: FAO, Statistics Division (FAOSTAT) and United Nations Pop-ulation Division.
CHART 59: Per capita wheat production (2011)
Mozambique
Nigeria
Burundi
Mali
United Republic of Tanzania
Zimbabwe
Eritrea
Namibia
Kenya
Sudan (former)
Rwanda
Lesotho
Zambia
Libya
Ethiopia
South Africa
Algeria
Egypt
Tunisia
Morocco
0 50 100 150kg/cap
Source: FAO, Statistics Division (FAOSTAT) and United Nations Pop-ulation Division.
68

FEEDING THE WORLD
MAP 36: Rice producing countries (million tonnes, 2011)
No data available
0.000092 ~ < 0.022
0.022 ~ < 0.084
0.084 ~ < 0.19
0.19 ~ < 0.45
0.45 ~ 5.675
Source: FAO, Statistics Division (FAOSTAT).
MAP 37: Wheat producing countries (million tonnes, 2011)
No data available
0 ~ < 0.0031
0.0031 ~ < 0.016
0.016 ~ < 0.072
0.072 ~ < 0.29
0.29 ~ 8.407
Source: FAO, Statistics Division (FAOSTAT).
69

Oil crop production in Africa grew from 9 981 thousand tonsin 2010 to 10 341 thousand tons in 2011 mainly as a resultof the expansion of area (2.8 percent). Over the period 2000-2011, production has risen at an annual rate of 4.6 percent.Compared to the other regions, North Africa recorded a de-crease in oil crop production from 2010 to 2011 after a 5.9percent growth between 2000 and 2011.
In RAF, production also rose from 9 060 million to 9 448million tons from 2010 to 2011. The region had an annualgrowth rate from 2000-2011 of 4.5 percent. This growth canbe explained by strong production in Central Africa, EastAfrica and Southern Africa, which recorded an increase intheir production. There was only a drop in West Africa be-tween 2010 to 2011, however overall production contin-uously increased between 2000-2006. Nevertheless WestAfrica was the leader in per capita oil crop production. Itrecorded more than 15 kg/cap, whereas the average in Cen-tral Africa was around 10 kg/cap (chart 60).
The leading oil crop producing countries in 2011 with pro-duction levels above 0.25 million tons were Cameroon, Côted’Ivoire, Democratic Republic of the Congo, Ethiopia, Ghana,Morocco, Nigeria, South Africa, Tanzania and Uganda (map38).
In Africa, pulse production fell from 15 292 thousand tons in2010 to 13 887 thousand tons in 2011, whichmeans a reduc-tion of roughly 9 percent. However production increased onaverage over the period 2000-2011 with an annual growthrate of 5.8 percent. This last result can be explained more byexpansion of areas (4.2 percent) than by yields (1.5 percent).
In terms of volume, RAF was the second largest producer ofpulses after RAP; REU was third, and RLAC was fourth whileRNE lagged behind. RAF, like RLAC, recorded a drop in pulseproduction from 2010 to 2011. This could be explained bythe huge reduction of the production in West Africa, whichwas the leading pulse producer in 2010. Nevertheless pro-duction in West Africa grew at an annual rate of 6.6 percentover the past 10 years (2000-2010) due to expansion of area.
The other sub-regions of RAF (Central Africa, East Africa andSouthern Africa) recorded growth in production in 2010-2011. Pulse production also increased in North Africa (table25). In 2011, the leading producers with production levelsbetween 0.4 million and 1 969 million tons were BurkinaFaso, Niger and Nigeria in West Africa; Cameroon in CentralAfrica; Ethiopia, Kenya, Malawi, Mozambique, Tanzania andUganda in Southern Africa (map 39).
CHART 60: Per capita oil crop production (2000-2011)
5
10
15
2000 2002 2004 2006 2008 2010
kg/cap
Central Africa
Eastern Africa
North Africa
Southern Africa
Western Africa
Source: FAO, Statistics Division (FAOSTAT) and United Nations Pop-ulation Division.
CHART 61: Per capita pulse production (2000-2011)
5
10
15
20
2000 2002 2004 2006 2008 2010
kg/cap
Central Africa
Eastern Africa
North Africa
Southern Africa
Western Africa
Source: FAO, Statistics Division (FAOSTAT) and United Nations Pop-ulation Division.
70

FEEDING THE WORLD
MAP 38: Oil crop producing countries (million tonnes, 2011)
No data available
0.0001526 ~ < 0.011
0.011 ~ < 0.042
0.042 ~ < 0.13
0.13 ~ < 0.25
0.25 ~ 2.776
Source: FAO, Statistics Division (FAOSTAT).
MAP 39: Pulse producing countries (million tonnes, 2011)
No data available
0.00035 ~ < 0.0096
0.0096 ~ < 0.043
0.043 ~ < 0.13
0.13 ~ < 0.4
0.4 ~ 1.969
Source: FAO, Statistics Division (FAOSTAT).
71

In Africa, production of roots and tubers rose from 239 053thousand tons in 2010 to 258 415 thousand tons in 2011,with a growth of 8.1 percent. Likewise, production increasedover the period 2000-2011 at an annual growth rate of 4.3percent. These results could be explained by improvementsin both area (2.1 percent) and yields (1.8 percent).
In terms of volume, just like pulse production, RAF was thesecond producer of roots and tubers after RAP. REUwas third,followed by RLAC and last (table 26). RAF registered an in-crease in the production of roots and tubers from 2010 to2011. This increase was due to the growth in productionobserved in all sub-regions of Africa. The highest increasewas recorded in North Africa (13.7 percent), followed byWestAfrica (11.8 percent); Central Africa (4.1 percent) and South-ern Africa (3.3 percent).
In terms of per capita production, West Africa was the bestproducer of roots and tubers from 2000 to 2011, with its pro-duction around 400 kg/cap during the period 2000-2010. Itwas followed by Central Africa (under 300 kg/cap) which de-clined over the same period, then Southern Africa (increas-ing from less than 200 kg/cap in 2000 to almost 300 kg/capin 2011). East Africa per capita production (just over 100kg/cap) was stagnant. North Africa had the lowest per capitaroot and tubers production, which increased from roughly 30kg/cap in 2000 to around 60 kg/cap in 2011 (chart 62).
In 2011, the countries with the highest production lev-els (between 6.2 million 97.18 million tons) were: An-gola, Cameroon, Côte d’Ivoire, Democratic Republic of theCongo, Ghana, Nigeria, Ethiopia, Mozambique, Tanzania andUganda (map 40).
RAF recorded an increase in citrus fruit production from2010 to 2011. This increase was due to the increase inproduction observed all over Africa. Nevertheless in RAF,Central Africa recorded the highest percentage in citrus fruitproduction (23.5 percent), and West Africa came second (9.9percent). North Africa also recorded high growth (14 per-cent).
In terms of per capita production, North Africa was thelargest producer of citrus fruit from 2000 to 2011, as it grewfrom around 30 kg/cap to 40 kg/cap. It was followed by WestAfrica and Southern Africa (both from above 15 kg/cap tojust under 30 kg/cap in 2011). Next were East Africa andCentral Africa, whose per capita productions were just over5 kg/cap (chart 63). In 2011, the leading producers were: Al-geria, Egypt, Guinea, Morocco, South Africa and Tunisia (map41).
CHART 62: Per capita root and tuber production(2000-2011)
100
200
300
400
2000 2002 2004 2006 2008 2010
kg/cap
Central Africa
Eastern Africa
North Africa
Southern Africa
Western Africa
Source: FAO, Statistics Division (FAOSTAT) and United Nations Pop-ulation Division.
CHART 63: Per capita citrus fruit production(2000-2011)
10
20
30
40
2000 2002 2004 2006 2008 2010
kg/cap
Central Africa
Eastern Africa
North Africa
Southern Africa
Western Africa
Source: FAO, Statistics Division (FAOSTAT) and United Nations Pop-ulation Division.
72

FEEDING THE WORLD
MAP 40: Root and tuber producing countries (million tonnes, 2011)
No data available
0.0002227 ~ < 0.1
0.1 ~ < 0.42
0.42 ~ < 1.5
1.5 ~ < 6.2
6.2 ~ 97.18
Source: FAO, Statistics Division (FAOSTAT).
MAP 41: Per capita citrus fruit production (tonne/cap, 2011)
No data available
0.007489 ~ < 0.88
0.88 ~ < 2.5
2.5 ~ < 7.1
7.1 ~ < 21
21 ~ 68.47
Source: FAO, Statistics Division (FAOSTAT) and United Nations Population Division.
73

During the period 2000-2011, fruit production grew by 3.4percent at the global level. In Africa, production rose from85.723 million in 2010 to 88.925 million in 2011, whichmeant a growth rate of 3.7 percent. Nevertheless, for theperiod 2000-2011, African production recorded an annualgrowth rate of 4.2 percent. RAF as a region had the samerate (4.2 percent), while RAP was 5.2 percent. In the otherregions, growth in fruit production was below the global av-erage: 0.5 percent in REU, 1.7 percent in RLAC and 2.5 per-cent in RNE (Table 30). Within Africa, North Africa recordedthe same growth in fruit production as RAF (4.2 percent) overthe period. It is explained by a 2.5 percent increase in areaand a 1.6 percent improvement in yield.
Fruit production was 5.9 percent in Central Africa and 6.7percent in Southern Africa. In Central Africa, the increasewas due more to improvements in yield, while, in SouthernAfrica, it was related more to an increase in area.
Based on per capita production, two periods can be high-lighted. From 2000 to 2005, the leading sub-regions interms of per capita production were East Africa, North Africa,West Africa, Central Africa and South Africa. From 2005 to2011, somemajor changes occurred, and North Africa, whichwas the second largest producer, moved became the first,followed by East Africa. Next were Central Africa, SouthernAfrica,and finally West Africa (chart 64). The countries thatexceeded the production of 3.2 million tons were Morocco,Algeria, Egypt, Ghana, Nigeria, Cameroon, Angola, SouthAfrica, Tanzania and Uganda (map 42).
In Africa vegetable production, including melons, stagnatedbetween 2010 (70 869 thousand tons) and 2011 (70 879thousand tons). Nevertheless, production has increased atan annual rate of 3.5 percent over the last 11 years (2000-2011). Growth in vegetable production, including melons,was lower in RAF (3.4 percent) than in RAP (4.0 percent), buthigher than RLAC (2.3 percent) and REU (1.9 percent). RNEwas the region that recorded the biggest growth (4.5 per-cent).
North Africa was the largest per capita producer, with veg-etable production increasing from slightly over 150 kg/capin 2000 to more than 200 kg/cap in 2011. In contrast, percapita production of the other parts of Africa was far below,particularly East Africa and Central Africa, whose per capitavegetable production, including melons, was largely under50 kg/cap. West Africa was just over 50 kg/cap, which was farbelow the level of North Africa (chart 65). The leading pro-ducing countries of vegetables, including melons, were Mo-rocco, Algeria, Tunisia, Egypt, Nigeria, Cameroon, Ethiopia,Kenya, Tanzania and South Africa (map 43).
Further reading
• The State of Food and Agriculture 2012: Investing in agri-culture for a better future (www.fao.org/publications/sofa/en/)
• OECD-FAO Agricultural Outlook 2012-2021 (www.oecd.org/site/oecd-faoagriculturaloutlook/)
CHART 64: Per capita fruit production, excludingmelons (2000-2011)
60
80
100
2000 2002 2004 2006 2008 2010
kg/cap
Central Africa
Eastern Africa
North Africa
Southern Africa
Western Africa
Source: FAO, Statistics Division (FAOSTAT) and United Nations Pop-ulation Division.
CHART 65: Per capita vegetable production, includingmelons (2000-2011)
50
100
150
200
2000 2002 2004 2006 2008 2010
kg/cap
Central Africa
Eastern Africa
North Africa
Southern Africa
Western Africa
Source: FAO, Statistics Division (FAOSTAT) and United Nations Pop-ulation Division.
74

FEEDING THE WORLD
MAP 42: Fruit producing countries, excluding melons (million tonnes, 2011)
No data available
0.002656 ~ < 0.051
0.051 ~ < 0.23
0.23 ~ < 0.67
0.67 ~ < 3.2
3.2 ~ 10.79
Source: FAO, Statistics Division (FAOSTAT).
MAP 43: Vegetable producing countries, including melons (million tonnes, 2011)
No data available
0.002789 ~ < 0.042
0.042 ~ < 0.18
0.18 ~ < 0.52
0.52 ~ < 1.5
1.5 ~ 18.95
Source: FAO, Statistics Division (FAOSTAT).
75

Trends in the livestock sector
In many countries across the world, a shift in diets towardsmeat and dairy products is driving animal production. In thelast few decades, in developing countries – where nearlyall of the world population increase is taking place – con-sumption of meat has been growing at over 2.7 percent perannum, and milk and dairy products at 3.5 to 4.0 percent perannum.
In 2011, based on livestock numbers, Burkina Faso, Egypt,Ethiopia, Kenya, Madagascar, Mali, Niger, Nigeria, SouthAfrica and Tanzania each recorded between 8.4 to 53.4 mil-lion heads of cattle and buffaloes (Map 44).
With respect to cattle and buffaloes (2011), the sub-region ofAfrica with the most heads was East Africa, followed by WestAfrica and Southern Africa. Concerning sheep and goats,East Africa and West Africa topped the producers with morethan 0.2 billion heads of sheep and goats in 2011 (chart 68).
North Africa possessed the highest stock of poultry birds(2000-2011) compared to other parts of Africa. This stockrose from more than 0.4 billion heads in 2000 to more than0.5 billion heads in 2011. West Africa was second; its stockof poultry birds accounted for 0.3 billion in 2000. SouthernAfrica was in third with a stock less than 0.3 billion in 2000,which increased to less than 0.4 billion by 2011. Next wasEast Africa, whose stock was less than 0.2 billion, which in-creased to slightly over 0.2 billion. Central Africa had thelowest stock of poultry, which remained under 0.1 billion(chart 67 and 69).
CHART 66: Africa stocks of cattle and buffaloes, andsheep and goats (2000-2011)
0.0
0.2
0.4
0.6
0.8
2000 2002 2004 2006 2008 2010
billionheads
Cattle and buffaloes Sheep and goats
Source: FAO, Statistics Division (FAOSTAT).
CHART 67: Stock of poultry birds (2000-2011)
0.1
0.2
0.3
0.4
0.5
2000 2002 2004 2006 2008 2010
billionheads
Central Africa
Eastern Africa
North Africa
Southern Africa
Western Africa
Source: FAO, Statistics Division (FAOSTAT).
76

FEEDING THE WORLD
MAP 44: Stock of cattle and buffaloes (million heads, 2011)
No data available
0.00066 ~ < 0.32
0.32 ~ < 1.1
1.1 ~ < 3
3 ~ < 8.4
8.4 ~ 53.38
Source: FAO, Statistics Division (FAOSTAT).
CHART 68: Stocks of cattle and buffaloes, and sheepand goats (2011)
0.00
0.05
0.10
0.15
0.20
CentralAfrica
EasternAfrica
NorthAfrica
SouthernAfrica
WesternAfrica
billionheads
Cattle and buffaloes Sheep and goats
Source: FAO, Statistics Division (FAOSTAT).
CHART 69: Stock of poultry birds (2011)
0.0
0.2
0.4
0.6
CentralAfrica
EasternAfrica
NorthAfrica
SouthernAfrica
WesternAfrica
billionheads
Source: FAO, Statistics Division (FAOSTAT).
77
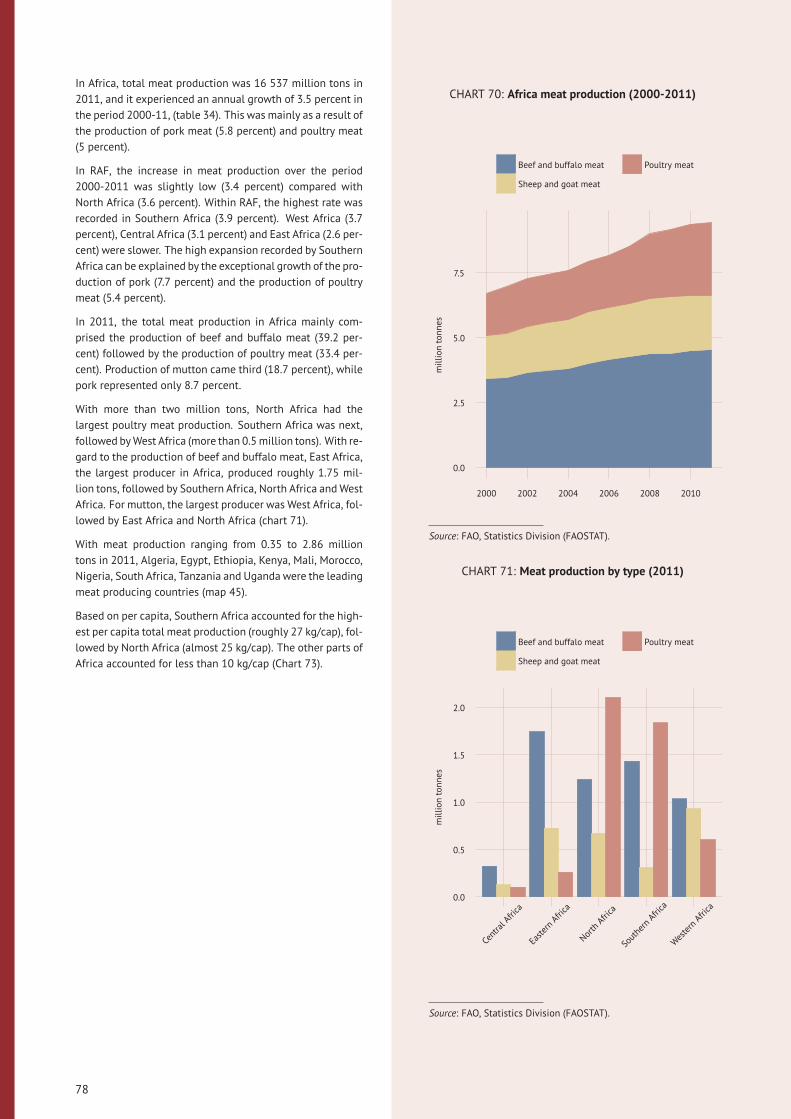
In Africa, total meat production was 16 537 million tons in2011, and it experienced an annual growth of 3.5 percent inthe period 2000-11, (table 34). This was mainly as a result ofthe production of pork meat (5.8 percent) and poultry meat(5 percent).
In RAF, the increase in meat production over the period2000-2011 was slightly low (3.4 percent) compared withNorth Africa (3.6 percent). Within RAF, the highest rate wasrecorded in Southern Africa (3.9 percent). West Africa (3.7percent), Central Africa (3.1 percent) and East Africa (2.6 per-cent) were slower. The high expansion recorded by SouthernAfrica can be explained by the exceptional growth of the pro-duction of pork (7.7 percent) and the production of poultrymeat (5.4 percent).
In 2011, the total meat production in Africa mainly com-prised the production of beef and buffalo meat (39.2 per-cent) followed by the production of poultry meat (33.4 per-cent). Production of mutton came third (18.7 percent), whilepork represented only 8.7 percent.
With more than two million tons, North Africa had thelargest poultry meat production. Southern Africa was next,followed byWest Africa (more than 0.5million tons). With re-gard to the production of beef and buffalo meat, East Africa,the largest producer in Africa, produced roughly 1.75 mil-lion tons, followed by Southern Africa, North Africa andWestAfrica. For mutton, the largest producer was West Africa, fol-lowed by East Africa and North Africa (chart 71).
With meat production ranging from 0.35 to 2.86 milliontons in 2011, Algeria, Egypt, Ethiopia, Kenya, Mali, Morocco,Nigeria, South Africa, Tanzania and Uganda were the leadingmeat producing countries (map 45).
Based on per capita, Southern Africa accounted for the high-est per capita total meat production (roughly 27 kg/cap), fol-lowed by North Africa (almost 25 kg/cap). The other parts ofAfrica accounted for less than 10 kg/cap (Chart 73).
CHART 70: Africa meat production (2000-2011)
0.0
2.5
5.0
7.5
2000 2002 2004 2006 2008 2010
milliontonnes
Beef and buffalo meat
Sheep and goat meat
Poultry meat
Source: FAO, Statistics Division (FAOSTAT).
CHART 71: Meat production by type (2011)
0.0
0.5
1.0
1.5
2.0
CentralAfrica
EasternAfrica
NorthAfrica
SouthernAfrica
WesternAfrica
milliontonnes
Beef and buffalo meat
Sheep and goat meat
Poultry meat
Source: FAO, Statistics Division (FAOSTAT).
78

FEEDING THE WORLD
MAP 45: Meat producing countries (million tonnes, 2011)
No data available
0.000586 ~ < 0.03
0.03 ~ < 0.085
0.085 ~ < 0.2
0.2 ~ < 0.35
0.35 ~ 2.855
Source: FAO, Statistics Division (FAOSTAT).
CHART 72: Africa per capita meat production(2000-2011)
0
3
6
9
2000 2002 2004 2006 2008 2010
kg/cap
Beef and buffalo meat
Sheep and goat meat
Poultry meat
Source: FAO, Statistics Division (FAOSTAT) and United Nations Pop-ulation Division.
CHART 73: Per capita total meat production (2011)
0
20
40
CentralAfrica
EasternAfrica
NorthAfrica
SouthernAfrica
WesternAfrica
kg/cap
Source: FAO, Statistics Division (FAOSTAT) and United Nations Pop-ulation Division.
79

In Africa, egg production was 2 771 thousand tons in 2011.From 2000 to 2011, global egg production in Africa grewat an average annual growth rate of 4.1 percent and milkat 4.9 percent. The RAF and RLAC regions had the highestgrowth rates of milk production, 4.4 percent and 3.4 percentrespectively (table 35).
Central Africa was the smallest producer, with two percentof RAF milk production, whereas Southern Africa accountedfor 15.8 percent and West Africa 14.2 percent. East Africawas the largest producer of milk in RAF, with 68 percent ofregional production.
From 2000 to 2010 West Africa had the highest growth rateof milk production (6.9 percent) in RAF, primarily due to thefast increase in milk production in Cape Verde (8.4 percent),Mali (12.4 percent) and Sierra Leone (6.9 percent).
The leading milk producing countries were Algeria, Egypt,Ethiopia, Kenya, Mali, Morocco, Somalia, Tanzania and SouthAfrica. These countries each had more than 1.2 million tonsof milk in 2011 (map 46).
In Africa, Egypt was the biggest cheese producer in 2011,with a production of more than 0.6 million tons. Sudan, for-mer next, albeit much smaller with less than 0.2 million tonsof cheese.
Concerning butter and ghee production, the leading produc-ing countries withmore than 14 thousand tons in 2011, wereEgypt, Ethiopia, Kenya, Morocco and Tanzania (map 47).
Further reading
• FAO Animal Production and Health Division (www.fao.org/ag/portal/aga-index/en/)
• The State of Food and Agriculture 2009: Livestock in thebalance (www.fao.org/docrep/012/i0680e/i0680e00.htm)
CHART 74: Egg production (2000-2011)
0.00
0.25
0.50
0.75
2000 2002 2004 2006 2008 2010
milliontonnes
Central Africa
Eastern Africa
North Africa
Southern Africa
Western Africa
Source: FAO, Statistics Division (FAOSTAT).
CHART 75: Cheese production (2011)
Kenya
Namibia
Eritrea
Zambia
Angola
Algeria
Zimbabwe
Botswana
Tunisia
Mauritania
Ethiopia
Nigeria
United Republic of Tanzania
South Africa
Morocco
Niger
Sudan (former)
Egypt
0.0 0.2 0.4 0.6million tonnes
Source: FAO, Statistics Division (FAOSTAT).
80

FEEDING THE WORLD
MAP 46: Milk production (million tonnes, 2011)
No data available
0.000011 ~ < 0.017
0.017 ~ < 0.067
0.067 ~ < 0.22
0.22 ~ < 1.2
1.2 ~ 5.78
Source: FAO, Statistics Division (FAOSTAT).
MAP 47: Butter and ghee production (million tonnes, 2011)
No data available
0.000015 ~ < 0.00038
0.00038 ~ < 0.00083
0.00083 ~ < 0.0035
0.0035 ~ < 0.014
0.014 ~ 0.1276
Source: FAO, Statistics Division (FAOSTAT).
81

Trends in the fisheries sector
Capture fisheries and aquaculture supplied the world withabout 168 million tons of fish in 2010 (for a total value ofUSD 217.5 billion), of which about 122 million tons was uti-lized as food for people providing an estimated per capitafish supply of about 18 kg (live weight equivalent).
Fish production in RAF was estimated at 6.01 million tons in2011 (table 36). It consisted of 83 percent of capture and 17percent for aquaculture. In RAF, capture fish production waslow compared to other regions and recorded a growth rateof 2.3 percent. In REU and RLAC, capture fish production wasdeclining, respectively -1.3 percent and -1.1 percent.
West Africa had the highest growth rate (3.4 percent), fol-lowed by East Africa (2.7 percent), whereas the growth ofcapture fish production was low in Central Africa (0.9 per-cent) and Southern Africa (1.0 percent) over the period 2000-2011 (table 36).
In per capita terms, Southern Africa was the major per capitacapture fish producer from 2000 to 2011. Nevertheless theper capita fish capture in this sub-region dropped from about14 kg/cap to 11 kg/cap during the same period. North Africa(around 10 kg/cap) had the next highest, followed by WestAfrica with a per capita fish production below 9 kg/cap. InCentral Africa per capita production dropped from roughly 7kg/cap in 2000 to less than 6 kg/cap 2011. East Africa had aper capita fish production of approximately 3 kg/cap duringthe same period (chart 76).
Regarding the production from aquaculture, Aquacultureproduction has grown worldwide. It has expanded on aver-age 22.8 percent from 2000 to 2011. This significant growthof aquaculture is linked to the strong growth recorded in EastAfrica (27.2 percent) and West Africa (21.0 percent).
Some countries have contributed substantially to this ex-pansion, including Burkina Faso (44.0 percent), Cameroon(29.2 percent), Kenya (40.8 percent), Mali (47.0 percent) andUganda (52.6 percent).
Based on per capita production, Chart 77 showed that NorthAfrica was the major per capita aquaculture fish producercompared to the other parts of Africa. Its per capita produc-tion jumped from more than 2 kg/cap in 2000 to 6 kg/cap in2011, while the other parts of Africa were increasing underone kg/cap over the same period.
In 2011, the leading aquaculture producing countries (pro-duction between 7.9 to 986.8 thousand tons) were Madagas-car, Zambia, Tanzania, Kenya, Uganda, Nigeria, Ghana, Egyptand Tunisia (map 49).
CHART 76: Capture fish production, per capita(2000-2011)
6
9
12
15
2000 2002 2004 2006 2008 2010
kg/cap
Central Africa
Eastern Africa
North Africa
Southern Africa
Western Africa
Source: Fisheries and Aquaculture Department (Fishery and Aqua-culture statistics) and United Nations Population Division.
CHART 77: Aquaculture fish production, per capita(2000-2011)
0
2
4
6
2000 2002 2004 2006 2008 2010
kg/cap
Central Africa
Eastern Africa
North Africa
Southern Africa
Western Africa
Source: Fisheries and Aquaculture Department (Fishery and Aqua-culture statistics) and United Nations Population Division.
82

FEEDING THE WORLD
MAP 48: Capture fish producing countries (thousand tonnes, 2011)
No data available
0.045 ~ < 11
11 ~ < 34
34 ~ < 86
86 ~ < 250
250 ~ 964.7
Source: Fisheries and Aquaculture Department (Fishery and Aquaculture statistics).
MAP 49: Aquaculture producing countries (thousand tonnes, 2011)
No data available
0 ~ < 0.057
0.057 ~ < 0.33
0.33 ~ < 1.5
1.5 ~ < 7.9
7.9 ~ 986.8
Source: Fisheries and Aquaculture Department (Fishery and Aquaculture statistics).
83

The substantial harvests by capture and aquaculture aregeo-located in Asia and Near East Japan. The harvests in Asiawere due to the huge aquaculture harvest while in Near EastJapan, it was by capture. Asia possessed the biggest aqua-culture production in the World (Map 50).
On the map of Africa, the main geo-locations of harvestwere: north of Madagascar, South Africa, west of Senegaland Cape Verde, Central Africa and North Africa. The har-vests accounted for more capture than aquaculture, which isonly developed in Central Africa and North Africa.
The other important geo-locations of harvest were North-East of Australia, West of Australia, West Argentina, aroundthe United Kingdom, all withmore capture than aquaculture.
In 2009, aquaculture fish production comprised:
• freshwater and diadromous fish (almost 70 percent)
• molluscs excluding cephalopods (roughly 20 percent)
• crustaceans (around 8 percent)
• marine fish (2 percent)
• and others
In contrast, compared to aquaculture, capture fish produc-tion accounted for:
• more marine fish (about 74 percent)
• less freshwater and diadromous fish (almost 12 per-cent)
• less crustaceans (around 6 percent)
• more cephalopods (around 4 percent)
• small part of molluscs excluding cephalopods (roughly3 percent)
• and others
Further reading
• FAO The State of World Fisheries and Aquaculture (SOFIA)(www.fao.org/fishery/sofia/en)
• FAO Fisheries and Aquaculture Department (www.fao.org/fishery/en)
CHART 78: State of the world’s fishery stocks(1974-2009)
0
25
50
75
100
1974 2009variable
percent
Recovering,depletedor overexploitedFullyexploitedUnder ormoderatelyexploited
Source: FAO, Fisheries and Aquaculture Department (fishery andaquaculture statistics).
CHART 79: Composition of fish products (2009)
0
25
50
75
100
Aquaculture
Capture
percent
Others
CephalopodsMolluscsexcludingcephalopodsCrustaceans
Freshwater anddiadromous fishMarinefish
Source: FAO, Fisheries and Aquaculture Department (fishery andaquaculture statistics).
84

FEEDING THE WORLD
MAP 50: Geo-location of harvests by capture and aquaculture (thousand tonnes, 2010)
Geo location harvests (thousand tonnes, 2010)
50500
5 000
50 000 Capture
Aquaculture
Source: FAO, Fisheries and Aquaculture Department (fishery and aquaculture statistics).
CHART 80: Per capita world fish food supply (1990-2011)
0
5
10
15
1990 1995 2000 2005 2010
kg/cap
Capture fish food supply Aquaculture fish food supply
Source: Fisheries and Aquaculture Department (Fishery and Aquaculture statistics) and United Nations Population Division.
85

Trends in agricultural trade
Most of the food consumed worldwide is grown locally.Where this is not possible, global trade has been instrumen-tal in helping countries fill the gap in order to achieve foodsecurity. The scale of food and agricultural trade today isunprecedented. In real terms, international flows have in-creased around fivefold over the past fifty years, which alsoreflects global trends in overall trade. This expansion, how-ever, has been unevenly distributed across regions. For muchof this period, the rich world outpaced the poor world in thevery area where developing countries are supposed to havea comparative advantage.
In general, production growth rates in most developing re-gions have been slightly below those of demand, as theiragricultural imports have grown faster than their exports,thus leading to a gradual erosion of their traditional surplusin agricultural trade (excluding fishery and forestry prod-ucts). By the turn of the 1990s the trend was for the surplusto diminish and become a net deficit.
The commercial balance or net exports of sugar and honeyin the economy can be defined as the difference betweenthe monetary value of exports and imports of output in aneconomy over a certain period, measured in the currency ofthat economy.
From 2000 to 2011, the net trade in sugar and honey inAfrica was only positive for Southern Africa. All the othersub-regions experienced a trade deficit or a trade gap, whichmeans that they imported more sugar and honey than theyexported. North Africa recorded the widest gap, whichmeans it imported more sugar and honey vis-à-vis its ex-ports. West Africa followed with the second widest gap, fol-lowed by East Africa. Central Africa recorded the narrowestgap. (chart 81).
In 2011, North Africa’s gap of was approximately –2 billionconstant 2005 US$, followed by West Africa. In contrast,Southern Africa held a positive balance, also known as atrade surplus, of less than 0.5 billion constant 2005 US$,(chart 82).
CHART 81: Sugar and honey net trade (2000-2011)
-2
-1
0
1
2000 2002 2004 2006 2008 2010
billionconstant2005US$
Central Africa
Eastern Africa
North Africa
Regional Office for Africa
Southern Africa
Western Africa
Source: FAO, Statistics Division (FAOSTAT) and World Bank.
CHART 82: Sugar and honey net trade (2011)
-2.0
-1.5
-1.0
-0.5
0.0
0.5
CentralAfrica
EasternAfrica
NorthAfrica
SouthernAfrica
WesternAfrica
billionconstant2005US$
Source: FAO, Statistics Division (FAOSTAT) and World Bank.
86

FEEDING THE WORLD
MAP 51: Import value index (index, 2010)
No data available
81 ~ < 130
130 ~ < 160
160 ~ < 170
170 ~ < 200
200 ~ 357
Source: FAO, Statistics Division (FAOSTAT).
CHART 83: Africa composition of global exports (2000-2011)
0
5
10
15
20
2000 2002 2004 2006 2008 2010
billionconstant2005US$
Cereals and prep.
Meat and meat prep.
Fruit and vegetables
Dairy products (milk equivalent)
Oilseeds
Sugar and honey
Veg. oils
Coffe, tea, cocoa, and spices
Beverages
Source: FAO, Statistics Division (FAOSTAT) and World Bank.
87

The commercial balance or net exports of cereal in the econ-omy can be defined as the difference between the monetaryvalue of exports and imports of output in an economy overa certain period, measured in the currency of that economy.Africa recorded a growth in imports of 7 percent from 2010to 2011. At the same time exports increased by 26 percent.Even with this large jump in exports, Africa recorded a nega-tive balance, which is referred to as a trade deficit, in cereals.Therefore, despite its increase, the export quantity was farlower than imports and therefore the gap in cereal importsremains too high.
The same situation was observed in RAF and all of the sub-regions of Africa. They all recorded a negative balance (atrade deficit or a trade gap), which means that they importedmore cereal than they exported (chart 84). For instance in2011, the net trade for cereal was less than -10 billion inconstant 2005 US$ in North Africa. In West Africa, it wasalmost - 6 billion (Chart 85).
CHART 84: Cereal net trade (2000-2011)
-9
-6
-3
0
2000 2002 2004 2006 2008 2010
billionconstant2005US$
Central Africa
Eastern Africa
North Africa
Regional Office for Africa
Southern Africa
Western Africa
Source: FAO, Statistics Division (FAOSTAT) and World Bank.
CHART 85: Cereal net trade (2011)
-9
-6
-3
0
CentralAfrica
EasternAfrica
NorthAfrica
SouthernAfrica
WesternAfrica
billionconstant2005US$
Source: FAO, Statistics Division (FAOSTAT) and World Bank.
88

FEEDING THE WORLD
CHART 86: Major export flows of cocoa beans from African countries (US$, 2011)
Belgium
Brazil
Cameroon
Canada
Côte d'Ivoire
Estonia
France
Germany
Italy
Malaysia
Mexico
Netherlands
Poland
Spain
Turkey
United Kingdom
United States of America
Ten largest export flows of cocoa beans
Exporting country Importing country Million US$
Côte d’Ivoire Netherlands 756.23
Côte d’Ivoire United States of America 511.65
Cameroon Netherlands 428.4
Ghana Netherlands 249.34
Côte d’Ivoire Belgium 169.48
Côte d’Ivoire Estonia 168.01
Côte d’Ivoire Germany 161.46
Ghana United Kingdom 146.74
Côte d’Ivoire France 99.3
Ghana Belgium 95.81
Source: FAO, Statistics Division (FAOSTAT).The flows cover ninety-five percent of the exports of cocoa beans from African countries.
89

The commercial balance or net exports of fruits and vegeta-bles in the economy can be defined as the difference be-tween the monetary value of exports and imports of outputin an economy over a certain period, measured in the cur-rency of that economy.
From 2000 to 2011, net trade in fruits and vegetables waspositive for the RAF region and all of the sub-regions. In2011, Southern Africa recorded the biggest trade surplus,followed by North Africa that had a level of trade surplus ofmore than 1.5 billion constant 2005 US$. East Africa wasnext, with a trade surplus of roughly 0.5 billion constant2005 US$. For Central Africa, the trade surplus remainedconstant, at around zero from, 2000 to 2011 (chart 87 and88).
CHART 87: Fruit and vegetables net trade (2000-2011)
0
1
2
2000 2002 2004 2006 2008 2010
billionconstant2005US$
Central Africa
Eastern Africa
North Africa
Regional Office for Africa
Southern Africa
Western Africa
Source: FAO, Statistics Division (FAOSTAT) and World Bank.
CHART 88: Fruit and vegetables net trade (2011)
0
1
2
CentralAfrica
EasternAfrica
NorthAfrica
SouthernAfrica
WesternAfrica
billionconstant2005US$
Source: FAO, Statistics Division (FAOSTAT) and World Bank.
90

FEEDING THE WORLD
CHART 89: Major export flows of unmanufactured tobacco from African countries (US$, 2011)
Belgium
China
Egypt
Germany
Indonesia
MalawiMozambique
Netherlands
Philippines
Poland
Republic of Korea
Russian Federation
South AfricaSwitzerland
United Arab Emirates
United Kingdom
United Republic of Tanzania
United States of America
Zambia
Zimbabwe
Ten largest export flows of unmanifactured tobacco
Exporting country Importing country Million US$
Malawi Belgium 187.71
Zimbabwe China 177.22
Malawi Egypt 146.06
Malawi Germany 86.88
United Republic of Tanzania Belgium 67.86
Zimbabwe United Kingdom 65.02
Malawi Netherlands 63.07
Malawi United States of America 61.08
Zambia Malawi 60.63
Malawi China 47.11
Source: FAO, Statistics Division (FAOSTAT).The flows cover seventy-five percent of the exports of unmanufactured tobacco from African countries.
91

A positive balance is known as a trade surplus if exports aregreater than imports. A negative balance is referred to as atrade deficit. From 2000 to 2011, the net trade in coffee, tea,cocoa, and spices was positive for RAF. This trade surplusgrew from roughly 3.5 billion constant 2005 US$ in 2000 tomore than 10 billion constant 2005 US$ in 2011.
Over the period of 2000 to 2011, West Africa recorded a largetrade surplus of coffee, tea, cocoa and spices, which rosefrom just below 2.5 to 7.5 billion constant 2005 US$. EastAfrica had the next largest, with a net trade that grew from1.3 to 2.5 billion constant 2005 US$. Central Africa, withthe third largest increase in trade surplus, was very low. Incontrast, Southern Africa and North Africa recorded a tradedeficit from 2000 to 2011, (chart 90).
Further reading
• FAO Trade and Markets Division (www.fao.org/economic/est/)
CHART 90: Net trade of coffe, tea, cocoa, and spices(2000-2011)
0.0
2.5
5.0
7.5
10.0
2000 2002 2004 2006 2008 2010
billionconstant2005US$
Central Africa
Eastern Africa
North Africa
Regional Office for Africa
Southern Africa
Western Africa
Source: FAO, Statistics Division (FAOSTAT).
CHART 91: Net trade of coffe, tea, cocoa, and spices(2011)
0.0
2.5
5.0
7.5
CentralAfrica
EasternAfrica
NorthAfrica
SouthernAfrica
WesternAfrica
billionconstant2005US$
Source: FAO, Statistics Division (FAOSTAT).
92

FEEDING THE WORLD
CHART 92: Major export flows of coffee (green) from African countries (US$, 2011)
Algeria
Belgium
Côte d'Ivoire
Ethiopia
France
Germany
Italy
Japan
Rwanda
Saudi Arabia
Spain
Sudan (former)
Sweden
Switzerland
Uganda
United Kingdom
United Republic of Tanzania
United States of America
Ten largest export flows of coffee (green)
Exporting country Importing country Million US$
Ethiopia Germany 226.71
Ethiopia Saudi Arabia 102.35
Côte d’Ivoire Algeria 82.47
Ethiopia United States of America 69.44
Uganda Germany 59.22
Côte d’Ivoire Spain 49.03
Uganda Sudan (former) 47.8
Ethiopia Belgium 46.49
Uganda Switzerland 42.72
Kenya Germany 35.19
Source: FAO, Statistics Division (FAOSTAT).The flows cover seventy percent of the exports of coffee (green) from African countries.
93

TABLE 20: Cereal producers and their productivityCereals
area yield productiontotal p.a.
growthtotal p.a.
growthtotal p.a. growth
thousandha
percent thousandhg/ha
percent thousandtonnes
thousandtonnes
percent percent
2011 2000-11 2011 2000-11 2010 2011 1990-2000 2000-11Africa 111054.0 2.7 14.8 1.5 162890.3 163891.5 4.5North Africa 12738.1 2.1 29.1 3.1 32614.6 37049.5 2.4 5.7Algeria 2584.7 8.5 14.4 4.6 4002.3 3728.3 −5.4 13.4Egypt 3037.8 0.9 72.5 −0.0 19450.5 22014.9 4.4 0.8Libya 365.0 0.5 7.5 1.4 217.9 275.1 −2.0 2.0Morocco 5382.2 −0.1 16.1 14.4 7834.4 8689.2 −10.8 14.3SudanTunisia 1368.3 1.7 17.1 5.2 1109.5 2342.0 −3.9 7.0Regional Office for Africa 98310.9 2.8 12.9 1.5 130260.3 126825.1 2.3 4.2Central Africa 6292.6 3.3 10.5 1.7 7009.7 6629.9 3.0 5.2Cameroon 1777.6 8.5 16.8 −0.4 3011.8 2988.1 4.6 8.1Central African Republic 170.2 −0.0 15.2 4.2 249.0 259.0 6.4 4.1Chad 2010.9 1.2 7.7 3.5 2149.5 1553.3 4.5 4.8Congo 33.2 8.9 8.1 0.5 24.9 27.1 5.2 9.5Democratic Republic of theCongo
2272.8 1.2 7.7 −0.2 1527.8 1753.4 0.5 1.0
Equatorial GuineaGabon 26.6 4.4 17.0 0.4 43.0 45.2 1.3 4.8Sao Tome and Principe 1.3 2.4 30.0 2.7 3.6 3.9 −1.9 5.2East Africa 31366.3 4.0 12.9 2.6 36910.1 40527.8 1.6 6.5Burundi 246.7 2.1 13.3 0.6 313.2 328.5 −1.8 2.7Djibouti 0.0 1.4 20.0 0.8 0.0 0.0 1.0 2.2Eritrea 446.6 2.8 5.8 4.0 243.6 258.1 6.8Ethiopia 9690.7 2.8 18.3 4.6 15534.2 17761.2 7.5Kenya 2679.6 3.3 15.1 0.9 4347.4 4058.6 −0.7 4.2Rwanda 407.0 3.4 21.1 8.6 745.6 857.3 −1.0 12.3Somalia 570.8 0.6 4.9 −3.6 256.6 279.0 −3.8 −3.1South SudanSudan (former) 9929.2 4.0 5.6 1.0 3562.3 5598.0 6.5 5.0Uganda 1702.0 2.0 20.8 2.8 3270.4 3536.0 2.9 4.8United Republic of Tanzania 5693.7 7.7 13.8 −0.4 8636.7 7851.1 −0.9 7.3Southern Africa 15516.3 1.6 20.3 0.7 31874.0 31436.8 2.6 2.7Angola 1945.7 7.4 6.9 1.8 1135.2 1350.7 7.4 9.3Botswana 173.0 −0.8 3.9 10.4 50.3 67.2 −7.6 9.5Comoros 23.6 2.6 14.1 1.5 30.5 33.3 1.4 4.1Lesotho 156.6 −2.6 6.6 −0.7 173.2 104.0 −4.7 −3.3Madagascar 1772.8 2.1 26.7 3.2 5162.9 4740.1 0.3 5.4Malawi 1874.1 1.6 20.9 2.0 3610.3 3925.0 6.4 3.7Mauritius 0.2 8.0 39.0 −7.2 0.3 0.6 −12.2 0.2Mozambique 2816.1 4.0 10.4 1.7 2285.7 2931.9 8.0 5.7Namibia 301.0 −0.7 5.0 2.6 122.5 149.1 2.1 1.9SeychellesSouth Africa 3210.4 −4.4 40.2 3.5 14699.3 12918.6 2.3 −1.1Swaziland 69.2 −0.1 12.4 −2.4 68.9 86.0 0.3 −2.5Zambia 1231.1 5.0 27.3 4.5 3097.6 3362.7 −0.0 9.8Zimbabwe 1942.5 0.7 9.1 −3.9 1437.2 1767.6 −0.2 −3.2West Africa 45135.6 2.3 10.7 1.3 54466.6 48230.5 2.5 3.2Benin 1044.6 1.4 14.8 2.7 1333.4 1544.2 6.2 4.1Burkina Faso 3684.4 3.0 10.0 1.3 4560.5 3666.4 4.2 4.4Cabo Verde 31.3 0.2 1.8 −12.7 7.0 5.6 7.9 −12.5Côte d’Ivoire 854.1 1.0 16.8 0.0 1478.2 1436.8 0.4 1.0Gambia 210.9 4.1 8.7 −3.6 363.5 183.2 6.9 0.4Ghana 1642.9 2.1 15.9 1.8 2906.7 2619.0 7.3 3.9Guinea 1988.6 4.6 14.8 −0.1 2743.0 2947.0 5.4 4.6Guinea-Bissau 159.6 −0.1 14.9 2.8 256.6 237.7 0.6 2.7Liberia 250.0 5.2 12.0 −0.6 296.1 300.0 0.2 4.6Mali 5799.8 8.8 10.0 −0.1 6415.7 5777.9 2.7 8.7Mauritania 144.9 −3.2 13.9 4.4 275.7 202.1 5.7 1.1Niger 9976.8 2.8 3.8 2.5 5203.2 3782.1 −0.0 5.4Nigeria 16627.2 −0.8 13.3 1.2 24656.3 22165.8 1.9 0.3Senegal 1139.4 −0.2 9.7 0.9 1769.2 1101.0 0.5 0.6Sierra Leone 718.1 12.0 16.8 4.1 1155.5 1204.0 −8.9 16.6Togo 863.1 1.9 12.3 1.3 1045.9 1057.9 4.3 3.3CEMAC 4018.5 4.5 12.1 1.5 5478.3 4872.6 4.6 6.8CEN-SAD 66275.4 2.2 13.0 1.9 86544.7 86377.9 2.7 3.9COMESA 37690.9 2.7 18.7 0.9 62620.7 70356.5 3.3 4.2ECCAS 8485.0 4.2 9.8 1.6 8458.0 8309.1 3.2 5.8ECOWAS 44990.7 2.3 10.7 1.0 54190.9 48028.5 2.4 3.2IGAD 25018.9 3.2 12.6 2.0 27214.6 31490.9 6.2SADC 23459.3 3.1 17.5 0.5 42008.0 41008.0 2.1 3.5UEMOA 23521.7 4.0 7.9 1.4 22062.8 18603.9 2.4 5.3UMA 9845.2 2.4 15.5 6.7 13439.7 15236.7 −6.9 12.6Regional Office for Asia andthe Pacific
375106.3 0.5 36.4 2.1 1268915.1 1365849.7 1.5 2.5
Regional Office for Europeand Central Asia
151096.4 0.0 36.0 2.9 466580.0 543366.9 2.4
Regional Office for LatinAmerica and the Caribbean
50741.7 0.7 38.0 2.5 193900.4 193029.1 3.7 3.5
Regional Office for the NearEast
38551.9 2.3 19.4 10.3 70082.6 74896.0 1.1 5.4
World 707328.2 0.6 36.6 5.0 2474121.9 2589143.3 2.4
94

TABLE 21: Coarse grain producers and their productivityCoarse grains
area yield productiontotal p.a.
growthtotal p.a.
growthtotal p.a. growth
thousandha
percent thousandhg/ha
percent thousandtonnes
thousandtonnes
percent percent
2011 2000-11 2011 2000-11 2010 2011 1990-2000 2000-11Africa 90371.3 2.6 12.5 1.6 115310.9 112817.9 3.9North Africa 5174.6 1.9 24.4 1.4 12647.6 12605.0 1.1 3.6Algeria 912.1 4.9 12.9 1.6 1396.9 1173.1 −14.9 6.6Egypt 1159.7 0.8 68.4 0.3 7943.6 7932.8 3.0 1.1Libya 215.0 1.4 5.1 0.2 111.9 109.1 −3.9 1.6Morocco 2291.7 −0.6 11.6 8.5 2907.7 2653.6 −14.0 7.8SudanTunisia 596.1 8.9 12.4 1.4 287.5 736.5 −6.7 10.4Regional Office for Africa 85191.7 2.6 11.8 1.8 102648.1 100196.3 2.5 3.9Central Africa 5469.5 2.6 10.8 2.0 6308.0 5881.8 3.5 4.7Cameroon 1621.8 7.7 17.3 0.4 2857.9 2813.0 4.8 8.1Central African Republic 145.2 −1.2 15.1 4.6 210.0 219.0 5.8 3.4Chad 1880.0 −0.6 7.3 1.9 1970.0 1379.0 4.6 1.3Congo 30.1 3.4 8.4 0.7 23.3 25.4 6.5 4.1Democratic Republic of theCongo
1765.0 1.5 7.9 −0.0 1201.7 1398.0 1.2 1.4
Equatorial GuineaGabon 26.0 4.7 16.7 0.9 41.5 43.5 1.3 5.6Sao Tome and Principe 1.3 1.2 30.0 3.3 3.6 3.9 −1.9 4.5East Africa 27973.6 3.0 12.1 1.6 29466.0 33943.9 2.3 4.4Burundi 207.0 1.4 11.0 −0.3 221.1 227.3 −2.6 1.1Djibouti 0.0 0.0 20.0 1.6 0.0 0.0 1.0 1.6Eritrea 420.9 3.0 5.4 −0.7 210.9 229.3 2.3Ethiopia 8107.6 1.8 18.3 4.5 12355.5 14815.1 6.4Kenya 2520.0 2.8 14.6 −0.9 3749.9 3678.9 −0.7 1.8Rwanda 348.1 1.6 19.7 8.4 601.1 686.1 −1.0 10.1Somalia 565.0 0.7 4.5 −5.6 235.0 256.0 −3.7 −4.9South SudanSudan (former) 9739.8 1.5 5.4 −1.0 3136.0 5281.0 8.7 0.5Uganda 1599.0 1.9 20.5 2.2 3032.3 3280.0 2.7 4.2United Republic of Tanzania 4466.1 9.8 12.3 −4.9 5924.2 5490.1 −1.0 4.4Southern Africa 12976.7 3.0 18.7 2.5 24950.0 24287.6 2.8 5.7Angola 1916.0 7.5 6.9 1.1 1113.5 1323.4 7.5 8.7Botswana 173.0 15.4 3.9 −3.3 50.3 67.2 −7.6 11.5Comoros 2.6 4.9 26.2 1.0 6.5 6.8 0.6 6.0Lesotho 136.5 −5.1 6.1 −3.5 153.1 83.9 −4.3 −8.5Madagascar 304.2 4.5 14.1 4.3 413.1 429.9 0.9 9.1Malawi 1811.3 1.7 21.0 6.2 3497.8 3805.4 6.5 8.0Mauritius 0.0 −2.3 74.4 0.3 0.3 0.3 −12.1 −1.9Mozambique 2565.4 5.3 10.3 1.7 2010.3 2640.2 8.3 7.0Namibia 298.8 0.8 4.5 2.1 110.0 135.1 2.3 3.0SeychellesSouth Africa 2604.7 −2.7 41.9 5.8 13266.4 10911.0 2.1 2.9Swaziland 68.8 1.6 12.4 −1.3 68.4 85.3 0.7 0.3Zambia 1166.0 5.9 26.4 7.3 2873.7 3076.0 −0.2 13.6Zimbabwe 1929.2 2.2 8.9 −1.7 1386.5 1723.0 0.2 0.4West Africa 38772.0 2.2 9.3 0.2 41924.3 36083.0 2.3 2.1Benin 961.6 1.2 13.8 2.9 1208.5 1324.2 5.8 4.1Burkina Faso 3548.2 1.2 9.7 0.2 4289.9 3425.5 4.0 1.3Cabo Verde 31.3 0.2 1.8 −12.0 7.0 5.6 7.9 −11.8Côte d’Ivoire 474.4 1.2 15.5 −0.4 755.6 734.4 1.8 0.9Gambia 168.9 1.7 7.8 −4.0 263.6 132.1 7.5 −2.4Ghana 1445.4 1.6 14.9 3.1 2415.1 2155.0 6.7 4.8Guinea 1153.6 7.5 11.1 −1.0 1244.0 1277.0 7.5 6.4Guinea-Bissau 53.3 −5.3 8.1 −0.3 47.4 43.0 5.0 −5.6LiberiaMali 4959.5 8.7 8.1 0.6 4086.3 4002.6 0.5 9.4Mauritania 112.0 −4.7 3.4 −0.5 138.8 38.1 7.3 −5.2Niger 9952.4 2.4 3.8 −0.4 5164.6 3745.3 0.0 2.0Nigeria 13948.6 −0.1 12.5 0.2 20073.8 17433.4 1.8 0.1Senegal 1030.2 −0.4 6.7 −1.2 1165.2 695.2 0.4 −1.6Sierra Leone 114.2 12.5 11.0 1.2 128.8 126.0 −8.9 13.8Togo 818.4 1.9 11.6 0.4 935.8 945.7 4.0 2.3CEMAC 3703.1 3.1 12.1 1.7 5102.6 4479.9 4.7 5.7CEN-SAD 54491.1 1.8 9.8 1.0 57553.4 53565.5 2.5 2.1COMESA 31364.5 1.9 14.9 1.9 40810.3 46764.3 3.1 4.6ECCAS 7592.5 3.8 9.8 1.8 7642.6 7432.6 3.7 5.3ECOWAS 38660.0 2.2 9.3 0.2 41785.5 36044.9 2.3 2.2IGAD 22952.4 1.8 12.0 1.2 22719.5 27540.3 4.2SADC 19205.2 4.4 16.2 2.2 32069.4 31168.9 2.3 5.3UEMOA 21797.9 3.4 6.8 0.4 17653.1 14915.8 2.2 3.8UMA 4127.0 2.0 11.4 3.0 4842.8 4710.4 −10.0 7.7Regional Office for Asia andthe Pacific
103968.3 0.5 33.6 2.9 315063.1 349338.4 0.6 4.0
Regional Office for Europeand Central Asia
65345.5 −1.3 39.2 3.6 215550.4 255874.5 1.0
Regional Office for LatinAmerica and the Caribbean
35959.6 0.9 37.7 2.9 137614.2 135733.0 4.4 3.1
Regional Office for the NearEast
19837.5 1.1 12.9 5.7 25377.4 25687.2 1.1 2.2
World 323285.8 0.9 36.0 3.3 1121167.5 1165188.4 2.8
95

TABLE 22: Rice producers and their productivityRice
area yield productiontotal p.a.
growthtotal p.a.
growthtotal p.a. growth
thousandha
percent thousandhg/ha
percent thousandtonnes
thousandtonnes
percent percent
2011 2000-11 2011 2000-11 2010 2011 1990-2000 2000-11AfricaNorth Africa 595.9 −1.0 95.5 1.8 4380.2 5693.1 6.7 −0.5Algeria 0.2 −0.9 15.3 −0.5 0.2 0.3 −14.6 −1.3Egypt 593.2 −1.0 95.7 0.5 4329.5 5675.0 6.6 −0.5LibyaMorocco 2.5 −6.9 70.2 4.1 50.5 17.8 22.4 −3.1SudanTunisiaRegional Office for Africa 10222.6 4.5 19.9 2.3 21533.4 20368.4 2.6 6.1Central Africa 813.8 5.2 9.0 0.1 682.5 735.0 0.3 4.1Cameroon 155.1 20.3 11.2 −8.6 153.1 174.1 1.0 10.0Central African Republic 25.0 4.4 16.0 0.6 39.0 40.0 11.4 5.1Chad 130.0 3.4 13.3 2.3 170.0 172.6 3.4 5.8Congo 3.1 4.9 5.4 −2.3 1.6 1.7 −0.6 2.5Democratic Republic of theCongo
500.0 1.0 6.9 −0.8 317.2 345.0 −1.5 0.2
Equatorial GuineaGabon 0.6 1.8 27.6 3.0 1.5 1.7 2.3 4.9Sao Tome and PrincipeEast Africa 1319.9 8.8 22.0 6.0 3251.0 2901.8 1.6 10.2Burundi 28.2 4.7 32.4 0.6 83.0 91.4 2.6 5.3DjiboutiEritreaEthiopia 29.9 12.5 30.3 4.7 103.1 90.4 17.7Kenya 28.0 6.6 39.7 0.5 85.5 111.2 2.5 7.1Rwanda 14.6 11.8 55.2 6.6 67.3 80.5 2.3 19.2Somalia 3.1 10.9 70.2 12.1 20.4 21.9 −18.2 24.3South SudanSudan (former) 6.7 1.9 37.2 8.8 23.4 25.0 23.1 10.9Uganda 90.0 2.0 25.9 5.0 218.1 233.0 7.3 7.2United Republic of Tanzania 1119.3 9.4 20.1 0.6 2650.1 2248.3 0.5 10.1Southern Africa 1840.3 2.2 26.0 0.7 5202.5 4792.0 0.8 5.1Angola 26.0 17.8 8.9 −3.7 17.7 23.2 6.8 13.5BotswanaComoros 21.0 2.3 12.6 1.4 24.0 26.5 1.6 3.8LesothoMadagascar 1464.0 1.8 29.4 3.3 4738.0 4300.2 0.2 5.1Malawi 61.6 3.2 19.1 1.4 110.1 117.7 5.2 4.6Mauritius 0.1 26.3 0.0 0.3Mozambique 238.8 2.4 11.4 1.3 257.5 271.4 6.5 3.8NamibiaSeychellesSouth Africa 1.0 −0.1 25.0 −1.5 2.9 2.5 2.9 −1.5Swaziland 0.0 −4.0 28.8 −1.5 0.1 0.1 −25.7 −5.4Zambia 27.5 7.6 18.0 4.3 51.7 49.4 4.2 12.2Zimbabwe 0.3 1.8 20.9 0.4 0.6 0.6 0.7 2.2West Africa 6248.6 4.1 19.1 1.1 12397.4 11939.5 3.5 5.6Benin 83.0 12.2 26.5 2.1 125.0 220.0 16.2 14.6Burkina Faso 136.3 11.7 17.7 −3.3 270.7 240.9 8.0 8.0Cabo VerdeCôte d’Ivoire 379.7 1.0 18.5 0.1 722.6 702.4 −1.0 1.1Gambia 42.0 9.6 12.2 −5.3 99.9 51.1 4.8 3.8Ghana 197.5 5.0 23.5 0.8 491.6 464.0 11.9 5.8Guinea 835.0 2.1 20.0 1.4 1499.0 1670.0 4.4 3.5Guinea-Bissau 106.3 3.3 18.3 2.3 209.2 194.7 −1.5 5.7Liberia 250.0 5.2 12.0 −0.6 296.1 300.0 0.2 4.6Mali 830.4 8.1 21.0 −0.0 2305.6 1741.5 10.2 8.1Mauritania 31.1 5.1 51.9 1.9 134.4 161.1 3.9 7.0Niger 20.0 −0.9 15.2 −5.2 30.0 30.5 −1.8 −6.0Nigeria 2579.5 1.5 17.7 1.5 4472.5 4567.3 2.8 3.0Senegal 109.2 2.2 37.2 4.3 604.0 405.8 1.1 6.5Sierra Leone 603.9 11.5 17.9 4.6 1026.7 1078.0 −8.9 16.6Togo 44.7 3.0 25.1 2.5 110.1 112.2 9.5 5.5CEMAC 313.8 11.9 12.4 0.2 365.2 390.0 3.6 7.6CEN-SAD 6164.1 3.9 26.1 3.1 15420.8 16087.3 5.0 3.7COMESA 2865.1 1.4 38.9 2.7 10151.6 11146.5 2.4ECCAS 868.0 5.6 9.8 −0.0 783.2 849.7 0.6 4.5ECOWAS 6217.5 4.1 18.9 0.9 12262.9 11778.4 3.5 5.6IGADSADC 3438.7 4.4 21.4 0.6 8145.9 7358.8 0.6 6.4UEMOA 1709.6 6.1 21.3 1.0 4377.2 3648.0 4.7 6.6UMARegional Office for Asia andthe Pacific
144342.4 0.5 45.2 2.1 632301.3 652582.7 1.8
Regional Office for Europeand Central AsiaRegional Office for LatinAmerica and the Caribbean
5909.4 −0.3 49.3 2.4 25828.5 29156.0 4.6 2.4
Regional Office for the NearEastWorld
96

TABLE 23: Wheat producers and their productivityWheat
area yield productiontotal p.a.
growthtotal p.a.
growthtotal p.a. growth
thousandha
percent thousandhg/ha
percent thousandtonnes
thousandtonnes
percent percent
2011 2000-11 2011 2000-11 2010 2011 1990-2000 2000-11AfricaNorth AfricaAlgeria 1672.4 6.6 15.3 4.7 2605.2 2554.9 0.1 11.6Egypt 1284.9 2.0 65.4 0.3 7177.4 8407.1 4.4 2.3Libya 150.0 −0.4 11.1 3.1 106.0 166.0 −0.3 2.6Morocco 3088.0 0.6 19.5 13.7 4876.1 6017.8 −9.2 14.3SudanTunisia 772.2 0.7 20.8 5.3 822.0 1605.5 −2.8 6.0Regional Office for AfricaCentral AfricaCameroon 0.7 10.5 14.0 −2.1 0.9 1.0 0.5 8.2Central African RepublicChad 0.9 −6.7 19.8 3.0 9.5 1.7 2.5 −4.0CongoDemocratic Republic of theCongo
7.8 0.6 13.3 0.3 8.8 10.4 3.4 0.9
Equatorial GuineaGabonSao Tome and PrincipeEast AfricaBurundi 11.5 2.3 8.5 2.1 9.0 9.8 −3.4 4.4DjiboutiEritrea 25.7 0.9 11.2 6.0 32.7 28.8 6.9Ethiopia 1553.2 3.5 18.4 4.3 3075.6 2855.7 7.9Kenya 131.5 −0.0 20.4 2.5 512.0 268.5 −2.0 2.5Rwanda 44.3 14.4 20.5 11.1 77.2 90.7 −5.2 27.2Somalia 2.7 0.2 3.9 0.6 1.2 1.0 0.4 0.8South SudanSudan (former) 182.7 6.4 16.0 −3.4 403.0 292.0 −6.3 2.9Uganda 13.0 5.8 17.7 0.3 20.0 23.0 11.6 6.1United Republic of Tanzania 108.3 3.8 10.4 7.8 62.4 112.7 −11.1 11.9Southern AfricaAngola 3.6 4.1 11.0 −3.9 4.0 4.0 4.8 0.0Botswana 0.0 0.0 0.0 −4.4ComorosLesotho 20.1 −1.5 10.0 3.9 20.1 20.1 −7.3 2.3Madagascar 4.6 1.1 22.0 −0.1 11.9 10.0 6.1 1.0Malawi 1.2 −5.5 15.2 6.1 2.3 1.8 1.0 0.2MauritiusMozambique 11.9 20.8 17.0 5.0 17.9 20.4 −14.1 26.8Namibia 2.2 6.8 63.6 6.4 12.5 14.0 −2.5 13.6SeychellesSouth Africa 604.7 −3.9 33.2 2.2 1430.0 2005.0 3.6 −1.7Swaziland 0.3 4.6 19.1 2.2 0.4 0.6 −14.5 6.9Zambia 37.6 10.9 63.1 0.1 172.3 237.3 3.1 11.0Zimbabwe 13.0 −10.2 33.8 −4.2 50.1 44.0 −3.4 −14.0West AfricaBeninBurkina FasoCabo VerdeCôte d’IvoireGambiaGhanaGuineaGuinea-BissauLiberiaMali 9.8 12.7 34.4 3.5 23.8 33.8 11.6 16.7Mauritania 1.8 16.9 16.0 1.0 2.4 2.9 −1.8 18.0Niger 4.4 −2.6 14.3 −2.3 8.7 6.3 −1.7 −4.9Nigeria 99.0 6.0 16.7 1.6 110.0 165.0 3.9 7.7SenegalSierra LeoneTogoCEMACCEN-SADCOMESA 3461.3 2.9 36.0 1.3 11658.8 12445.7 3.9ECCASECOWASIGAD 1908.8 3.5 18.2 1.7 4044.6 3469.0 7.1SADC 815.4 −1.7 30.4 2.1 1792.7 2480.2 2.7 0.3UEMOAUMA 5684.4 2.3 18.2 6.0 8411.7 10347.1 −4.8 12.2Regional Office for Asia andthe PacificRegional Office for Europeand Central Asia
84730.8 0.9 33.2 2.2 245028.8 281512.1 2.7
Regional Office for LatinAmerica and the CaribbeanRegional Office for the NearEast
17555.0 2.2 23.2 2.5 36998.6 40794.5 0.4 6.6
World
97

TABLE 24: Oilcrop producers and their productivityOilcrops
area yield productiontotal p.a.
growthtotal p.a.
growthtotal p.a. growth
thousandha
percent thousandhg/ha
percent thousandtonnes
thousandtonnes
percent percent
2011 2000-11 2011 2000-11 2010 2011 1990-2000 2000-11Africa 34527.9 2.8 3.0 0.8 9981.3 10341.5 3.7 4.6North Africa 3703.4 2.9 2.4 1.9 920.8 892.8 0.5 5.9Algeria 331.2 5.3 4.6 3.4 84.4 152.5 −1.0 8.9Egypt 390.4 0.1 5.9 0.5 222.2 231.9 4.0 0.6Libya 226.0 4.3 1.6 −5.6 46.2 35.7 8.2 −1.5Morocco 958.9 4.3 3.6 6.5 371.8 344.4 −4.0 11.0SudanTunisia 1796.8 2.2 0.7 −2.1 196.2 128.4 −3.7 0.0Regional Office for Africa 30822.9 2.7 3.1 1.1 9060.0 9448.0 4.0 4.5Central Africa 2868.7 0.9 4.4 1.1 1211.2 1255.5 1.4 4.2Cameroon 867.9 3.5 6.9 4.1 576.1 596.3 1.1 7.7Central African Republic 222.0 0.0 3.5 1.7 69.6 77.3 1.6 1.7Chad 787.8 −1.1 2.0 1.6 147.9 154.4 9.5 0.5Congo 66.6 1.8 5.7 1.3 38.0 38.1 −0.3 3.2Democratic Republic of theCongo
871.4 0.0 4.2 0.9 355.9 363.2 −1.8 0.9
Equatorial Guinea 7.4 0.9 9.6 −0.2 7.1 7.1 −1.7 0.7Gabon 30.5 2.1 3.6 −3.6 9.1 10.9 3.0 −1.6Sao Tome and Principe 15.2 1.3 5.4 2.2 7.5 8.2 2.4 3.5East Africa 9035.1 3.7 2.4 4.6 1525.5 2123.8 8.0 9.6Burundi 34.7 6.2 4.6 4.0 17.0 15.8 −3.1 10.4DjiboutiEritrea 63.2 3.7 0.7 −5.3 4.5 4.2 −1.9Ethiopia 886.3 6.0 2.8 6.5 247.8 252.2 12.9Kenya 246.5 1.3 1.7 −1.0 36.7 41.9 3.3 0.3Rwanda 70.8 4.6 1.6 3.6 14.6 11.2 −2.2 8.4Somalia 105.9 2.4 3.7 8.3 36.9 39.1 −5.5 10.9South SudanSudan (former) 3412.2 −0.8 1.8 3.4 379.0 601.7 12.6 2.6Uganda 1299.9 3.7 2.8 4.2 329.1 365.4 3.7 8.1United Republic of Tanzania 2915.6 8.6 2.7 6.0 460.0 792.2 2.4 15.1Southern Africa 4464.0 4.9 2.6 −0.2 921.1 1177.9 1.1 5.1Angola 384.8 12.4 3.0 −6.6 109.9 117.2 1.6 4.9Botswana 15.7 8.0 2.4 −3.9 2.7 3.8 15.4 3.8Comoros 34.7 0.9 3.3 0.5 11.1 11.4 1.5 1.3LesothoMadagascar 114.3 −0.5 2.4 −0.3 26.7 26.9 0.2 −0.8Malawi 443.3 6.7 2.6 2.8 109.8 115.5 10.4 9.6Mauritius 0.7 0.6 5.2 0.2 0.4 0.3 −9.1 0.8Mozambique 1122.6 4.6 1.4 −2.0 157.5 161.2 1.6 2.4Namibia 0.9 −13.4 1.7 0.3 0.2 0.2 1.3 −13.1Seychelles 0.6 −1.5 6.1 0.2 0.3 0.4 −7.1 −1.3South Africa 1178.5 5.7 4.5 −0.7 351.5 532.8 −1.0 5.0Swaziland 10.4 −10.2 0.9 2.3 1.3 1.0 −8.2 −8.1Zambia 446.1 5.8 2.9 6.5 88.0 130.0 4.0 12.7Zimbabwe 711.5 −0.5 1.1 −3.8 61.6 77.2 1.9 −4.3West Africa 14455.1 1.8 3.4 −0.3 5402.2 4890.9 4.2 2.1Benin 519.2 −0.1 2.3 −0.1 138.1 121.8 6.3 −0.2Burkina Faso 965.1 6.1 1.8 0.7 213.8 177.5 0.2 6.8Cabo Verde 1.8 0.5 4.1 −1.0 0.7 0.8 −2.4 −0.5Côte d’Ivoire 637.6 0.6 7.7 1.8 467.3 493.9 0.5 2.4Gambia 124.5 −0.6 2.4 −3.4 46.8 30.5 6.0 −3.9Ghana 827.8 4.6 4.1 −1.5 353.9 340.9 3.5 3.0Guinea 581.0 0.9 2.9 0.8 169.6 170.1 5.0 1.7Guinea-Bissau 54.8 3.4 4.6 −1.6 26.6 25.3 1.6 1.7Liberia 34.4 −0.3 14.5 0.3 50.0 50.0 5.9 0.0Mali 938.8 5.6 2.2 −0.1 180.7 208.9 1.1 5.4Mauritania 5.3 −4.6 1.9 −0.0 1.2 1.0 0.8 −4.6Niger 892.0 6.1 1.9 7.1 169.1 167.5 21.3 13.7Nigeria 7588.0 0.7 3.7 0.7 3036.5 2776.0 4.9 1.3Senegal 926.6 −1.8 1.9 −3.6 407.8 179.5 4.0 −5.4Sierra Leone 157.9 11.6 5.9 −5.5 89.7 93.0 −3.1 5.5Togo 200.4 −0.9 2.7 3.9 50.3 54.3 0.6 3.0CEMAC 1982.1 1.2 4.5 1.0 847.8 884.1 3.5 5.6CEN-SAD 21865.0 1.5 2.9 0.5 6716.1 6347.4 4.7 2.6COMESA 9262.9 1.6 2.5 1.5 1952.1 2285.9 5.3 4.8ECCAS 3288.3 2.3 4.2 0.9 1338.1 1388.5 1.4 4.3ECOWAS 14449.8 1.8 3.4 −0.3 5401.0 4889.9 4.2 2.1IGAD 6013.9 1.4 2.2 4.6 1034.0 1304.5 6.3SADC 8216.3 5.7 2.8 0.3 1725.8 2321.9 0.5 7.9UEMOA 5134.5 3.0 2.8 1.0 1653.7 1428.6 3.0 3.5UMA 3318.2 3.3 2.0 2.3 699.8 661.9 −1.8 7.7Regional Office for Asia andthe Pacific
114835.8 1.8 8.1 2.3 85313.4 93018.4 4.9 5.5
Regional Office for Europeand Central Asia
41076.2 4.2 6.5 2.5 22841.5 26526.4 6.8
Regional Office for LatinAmerica and the Caribbean
55340.8 5.3 5.7 2.7 29614.2 31404.5 4.9 6.7
Regional Office for the NearEast
8720.6 1.0 2.5 1.5 1912.1 2152.6 5.8 3.9
World 278924.6 2.5 6.4 2.4 169622.8 179676.1 4.4 5.2
98

TABLE 25: Pulse producers and their productivityPulses
area yield productiontotal p.a.
growthtotal p.a.
growthtotal p.a. growth
thousandha
percent thousandhg/ha
percent thousandtonnes
thousandtonnes
percent percent
2011 2000-11 2011 2000-11 2010 2011 1990-2000 2000-11Africa 22429.7 4.2 6.2 1.5 15292.0 13887.6 5.8North Africa 724.3 0.9 11.8 3.8 769.7 852.0 −3.6 5.7Algeria 80.0 2.2 9.3 9.4 72.4 74.5 −4.6 11.7Egypt 102.0 −3.1 29.7 0.0 315.4 302.7 −2.2 −3.1Libya 4.2 −5.7 21.2 3.0 8.6 8.9 0.5 −2.9Morocco 429.7 1.6 7.9 10.0 282.4 339.6 −11.6 11.7SudanTunisia 108.4 1.2 11.7 6.3 91.0 126.4 −0.5 7.6Regional Office for Africa 21702.8 4.4 6.0 1.0 14520.3 13033.2 3.2 5.9Central Africa 1274.3 4.2 7.5 1.3 899.2 950.1 7.7 5.1Cameroon 618.8 7.0 9.0 0.3 532.3 556.0 13.6 7.3Central African Republic 34.0 1.9 10.0 0.6 31.3 34.0 5.4 2.5Chad 172.0 0.7 7.1 1.6 121.6 122.0 9.9 2.4Congo 14.0 2.5 7.1 −0.7 9.6 10.0 2.4 1.7Democratic Republic of theCongo
435.2 1.9 5.2 −0.3 204.0 227.7 −0.8 1.5
Equatorial GuineaGabon 0.3 −2.4 11.7 4.6 0.3 0.4 3.6 2.1Sao Tome and PrincipeEast Africa 6843.6 2.6 8.4 1.7 5512.5 5781.3 1.7 4.4Burundi 309.5 1.6 7.7 −0.8 237.6 238.6 −5.1 0.8Djibouti 7.2 −1.4 3.0 0.8 1.8 2.1 1.4 −0.6Eritrea 55.6 −5.3 7.5 7.5 37.8 41.6 1.8Ethiopia 1359.7 1.7 14.5 4.6 1888.0 1968.6 6.4Kenya 1477.0 2.3 5.2 2.1 593.9 770.9 −4.7 4.4Rwanda 383.8 0.5 9.5 3.7 365.5 365.1 1.1 4.3Somalia 85.6 3.8 3.0 1.2 21.3 25.8 0.7 5.0South SudanSudan (former) 346.6 7.3 9.2 −4.8 290.0 319.7 9.7 2.2Uganda 1189.9 2.8 5.5 −1.7 666.0 652.5 1.5 1.1United Republic of Tanzania 1628.7 3.2 8.6 1.3 1410.7 1396.5 4.9 4.6Southern Africa 3025.3 11.0 5.2 −0.6 1393.5 1573.2 1.3 9.2Angola 786.9 13.5 3.9 0.0 250.1 303.5 8.6 13.5Botswana 34.7 5.8 1.1 −17.6 3.9 3.8 −0.3 −12.9Comoros 15.5 2.1 8.7 0.8 12.4 13.4 2.8 2.9Lesotho 19.0 −0.4 4.1 −5.7 10.3 7.8 3.3 −6.1Madagascar 121.5 1.7 10.4 1.0 116.9 126.3 5.5 2.8Malawi 685.4 3.6 7.5 3.0 435.6 512.9 −0.1 6.7MauritiusMozambique 1136.6 17.1 4.0 −1.9 415.0 459.1 0.8 14.9Namibia 17.6 3.7 10.8 −0.2 19.1 18.9 5.0 3.5SeychellesSouth Africa 65.0 −3.3 9.8 −1.5 73.7 63.4 −3.5 −4.7Swaziland 6.4 −1.5 4.5 0.2 3.2 2.9 −2.5 −1.3Zambia 60.0 5.0 5.0 0.9 27.0 30.2 1.1 5.9Zimbabwe 76.8 1.0 4.0 −5.6 26.3 31.0 0.4 −4.7West Africa 10559.6 3.6 4.5 0.9 6715.2 4728.6 4.7 6.6Benin 218.9 4.2 9.2 1.9 202.7 200.6 6.2 6.2Burkina Faso 998.9 10.9 5.1 −0.6 704.1 507.3 −1.4 10.2Cabo Verde 16.2 −5.6 1.8 3.7 2.8 2.9 −6.7 −2.2Côte d’Ivoire 57.1 4.1 8.4 1.4 47.0 48.0 13.6 5.6Gambia 11.0 0.9 2.0 −2.0 2.1 2.2 −3.9 −1.1Ghana 250.0 4.1 1.0 0.2 23.1 24.0 0.5 4.3Guinea 60.0 −0.7 9.2 0.7 55.9 55.0 −0.1 0.0Guinea-Bissau 9.3 8.1 3.6 −4.3 3.3 3.4 0.3 3.5Liberia 4.9 −1.0 7.3 1.2 3.5 3.6 1.6 0.3Mali 288.1 0.2 5.5 2.7 155.3 158.9 14.5 2.8Mauritania 122.2 2.1 3.9 0.0 56.9 47.9 4.8 2.1Niger 4774.3 5.8 3.3 10.1 1832.1 1572.3 2.7 16.5Nigeria 3320.0 −1.1 5.8 −0.3 3424.2 1916.8 4.7 −1.4Senegal 94.9 −3.9 3.0 −0.7 49.0 28.3 14.3 −4.6Sierra Leone 119.6 6.2 6.2 −1.0 70.4 73.9 1.1 5.1Togo 214.2 3.2 3.9 2.0 82.8 83.5 8.1 5.3CEMAC 839.1 5.4 8.6 1.5 695.1 722.4 11.9 6.2CEN-SAD 11722.1 3.5 5.1 1.8 7813.1 5959.0 4.0 6.1COMESA 6636.3 2.3 8.5 1.2 5229.9 5614.9 −0.1 4.0ECCAS 2370.7 7.0 6.3 1.0 1386.9 1492.2 4.5 6.1ECOWAS 10437.4 3.7 4.5 1.0 6658.3 4680.7 4.7 6.7IGAD 4521.6 2.6 8.4 1.8 3498.7 3781.2 4.6SADC 5073.8 7.7 6.3 −0.5 2995.7 3184.0 2.8 6.7UEMOA 6655.7 6.0 3.9 1.5 3076.2 2602.3 5.3 12.8UMA 744.5 1.6 8.0 5.6 511.2 597.3 −4.8 9.9Regional Office for Asia andthe Pacific
43794.6 2.9 8.3 0.5 32612.4 36302.9 3.4
Regional Office for Europeand Central Asia
4679.5 0.7 18.3 2.9 8312.5 8578.4 1.5
Regional Office for LatinAmerica and the Caribbean
6887.8 −0.8 9.2 1.0 6620.3 6337.9 1.9 0.9
Regional Office for the NearEast
2387.0 0.7 9.7 −2.5 2170.8 2312.6 2.2 3.5
World 79398.6 2.6 8.6 0.7 69626.9 68218.5 2.9
99

TABLE 26: Root and tuber producers and their productivityRoots and tubers
area yield productiontotal p.a.
growthtotal p.a.
growthtotal p.a. growth
thousandha
percent thousandhg/ha
percent thousandtonnes
thousandtonnes
percent percent
2011 2000-11 2011 2000-11 2010 2011 1990-2000 2000-11Africa 25661.7 2.1 100.7 1.8 239052.6 258415.0 5.5 4.3North Africa 410.7 5.0 268.9 2.7 9713.5 11041.5 2.3 8.2Algeria 131.9 5.6 292.8 5.3 3300.3 3862.2 4.1 11.1Egypt 177.3 6.7 266.3 1.0 4137.7 4721.2 1.2 7.8Libya 18.6 6.3 189.2 −0.5 290.0 352.0 2.7 5.8Morocco 58.7 −0.4 296.3 4.6 1615.5 1739.1 2.0 4.2SudanTunisia 24.2 1.4 151.7 0.7 370.0 367.0 2.9 2.2Regional Office for Africa 25250.5 2.1 98.0 1.6 229331.6 247366.5 5.5 4.1Central Africa 3819.8 2.0 72.6 0.0 26645.8 27749.4 −0.4 1.9Cameroon 635.4 4.5 105.7 1.4 6294.7 6714.3 2.9 6.0Central African Republic 347.9 2.1 36.9 −0.2 1233.2 1282.5 2.4 1.9Chad 111.0 2.2 71.3 1.0 809.5 791.0 −2.0 3.2Congo 164.1 4.6 75.2 −1.4 1230.3 1233.9 1.6 3.1Democratic Republic of theCongo
2404.2 1.1 70.4 −1.1 16308.2 16936.6 −1.4 0.0
Equatorial Guinea 46.0 2.3 41.7 3.1 188.1 192.0 1.3 5.4Gabon 106.3 3.1 52.8 −0.9 541.9 560.6 1.6 2.3Sao Tome and Principe 4.9 2.5 78.5 −1.1 40.0 38.6 15.9 1.3East Africa 4693.0 1.7 77.1 2.4 35337.9 36182.8 1.8 3.6Burundi 224.7 0.4 69.5 0.2 1663.2 1560.2 0.3 0.6DjiboutiEritrea 18.1 −7.4 35.4 1.1 65.2 64.1 −6.3Ethiopia 859.1 3.3 73.0 −0.7 6414.7 6271.5 2.6Kenya 249.1 0.6 153.8 7.3 3896.6 3831.5 0.1 8.0Rwanda 509.4 1.6 113.9 4.8 5213.3 5802.0 7.2 6.5Somalia 10.1 2.6 94.8 −0.5 88.0 95.3 4.1 2.1South SudanSudan (former) 109.8 2.5 63.3 −0.0 709.6 694.6 9.4 2.5Uganda 1068.7 0.4 75.6 −0.1 8831.3 8076.8 3.9 0.3United Republic of Tanzania 1644.2 2.2 59.5 2.1 8456.1 9786.8 −3.3 4.3Southern Africa 4333.0 4.2 102.9 2.1 43161.1 44592.7 8.8 7.2Angola 1335.4 7.4 121.5 4.2 15686.5 16219.9 10.0 12.0Botswana 8.5 −2.3 114.3 3.6 92.9 97.0 2.6 1.2Comoros 15.6 0.8 58.9 1.4 87.1 91.6 2.6 2.2Lesotho 6.8 2.3 164.7 0.0 99.0 112.0 6.8 2.3Madagascar 752.4 3.4 66.8 0.1 4395.5 5027.1 0.9 3.5Malawi 380.4 0.5 194.1 3.4 7674.9 7383.6 25.6 3.9Mauritius 1.1 4.6 204.6 −0.3 23.4 23.3 −2.4 4.3Mozambique 1426.9 3.4 78.2 2.6 10845.2 11152.0 2.2 6.0Namibia 41.2 2.9 86.9 0.2 342.5 357.6 1.9 3.1Seychelles 0.0 −5.2 125.0 7.5 0.2 0.2 1.4 1.9South Africa 82.0 0.5 274.5 1.6 2156.0 2251.2 3.0 2.2Swaziland 13.2 1.9 50.6 0.2 64.8 66.9 2.0 2.1Zambia 217.4 2.3 70.3 2.8 1427.5 1528.6 2.2 5.2Zimbabwe 52.1 1.8 54.1 0.9 265.6 281.5 5.0 2.7West Africa 12404.7 1.5 111.9 1.7 124186.8 138841.6 7.2 3.7Benin 400.4 0.3 151.0 3.2 6147.7 6044.7 7.5 3.5Burkina Faso 25.2 7.5 97.7 2.2 196.1 246.0 3.6 9.8Cabo Verde 1.2 −0.1 111.4 2.8 13.5 13.7 −6.2 2.7Côte d’Ivoire 1271.2 3.8 63.1 −2.1 7828.8 8018.0 3.6 1.7Gambia 2.6 0.5 36.8 1.9 8.2 9.7 1.7 2.3Ghana 1571.1 2.2 139.8 2.5 20939.5 21966.1 11.6 4.7Guinea 193.8 0.6 72.4 1.4 1291.9 1403.2 3.5 2.0Guinea-Bissau 21.1 4.6 87.7 1.2 161.3 184.6 3.5 5.9Liberia 69.2 −0.7 81.4 1.5 558.0 563.1 1.5 0.8Mali 23.2 9.1 217.4 3.3 415.5 504.4 10.2 12.7Mauritania 3.1 0.7 22.2 −0.3 6.9 7.0 0.9 0.5Niger 11.9 1.4 151.7 −3.1 183.7 180.4 2.0 −1.7Nigeria 8441.4 1.0 115.1 2.7 84052.3 97184.7 6.8 3.7Senegal 22.8 −3.0 91.3 4.4 266.2 208.0 7.8 1.3Sierra Leone 104.8 5.5 53.0 1.2 472.0 555.4 6.8 6.7Togo 241.7 1.8 72.5 1.0 1645.2 1752.6 2.5 2.8CEMAC 1410.7 3.5 76.4 0.5 10297.7 10774.2 2.1 4.7CEN-SAD 13097.7 1.6 112.7 1.6 132280.1 147616.2 6.9 3.9COMESA 7071.1 1.7 88.7 1.9 61468.6 62713.5 3.9 2.9ECCAS 5379.9 3.3 84.6 0.8 43995.6 45529.5 1.3 5.4ECOWAS 12401.6 1.5 111.9 1.8 124179.9 138834.6 7.2 3.7IGAD 2314.8 1.6 82.2 2.1 20005.3 19033.8 2.7SADC 8365.8 2.9 85.1 2.0 67838.3 71224.5 3.4 5.1UEMOA 2017.4 2.9 85.0 1.5 16844.5 17138.7 4.9 2.9UMA 236.5 3.7 267.5 3.1 5582.7 6327.3 3.1 8.4Regional Office for Asia andthe Pacific
19840.8 −0.2 182.2 2.3 332905.7 361493.8 2.7 1.7
Regional Office for Europeand Central Asia
6835.7 −2.6 210.1 2.2 121002.2 143608.2 −0.2
Regional Office for LatinAmerica and the Caribbean
4247.1 0.6 133.7 1.0 55490.8 56775.0 1.0 1.4
Regional Office for the NearEast
808.5 3.0 233.1 2.2 16863.8 18845.7 4.2 5.7
World 54932.8 0.8 147.6 1.7 749787.2 810845.4 2.8 2.1
100

TABLE 27: Vegetable producers and their productivityVegetables (including melons)
area yield productiontotal p.a.
growthtotal p.a.
growthtotal p.a. growth
thousandha
percent thousandhg/ha
percent thousandtonnes
thousandtonnes
percent percent
2011 2000-11 2011 2000-11 2010 2011 1990-2000 2000-11Africa 6877.8 2.0 103.1 1.6 70869.8 70879.7 4.4 3.5North Africa 1482.3 1.9 229.3 2.3 34011.9 33986.8 4.1 3.6Algeria 308.9 2.7 180.6 4.4 5215.6 5578.9 5.1 7.3Egypt 776.3 2.0 244.1 0.2 19487.1 18945.5 4.9 2.2Libya 65.8 −0.5 148.8 1.3 947.4 979.0 2.4 0.8Morocco 192.3 1.7 292.4 3.6 5397.7 5624.6 0.5 5.4SudanTunisia 138.9 1.0 205.8 2.0 2964.1 2858.8 2.9 3.0Regional Office for Africa 5387.9 2.1 68.4 1.3 36810.0 36846.1 4.7 3.4Central Africa 649.3 3.7 51.0 0.5 3062.8 3312.2 5.8 4.7Cameroon 509.6 4.1 45.8 1.5 2114.5 2334.8 9.0 5.7Central African Republic 11.4 0.9 85.8 0.6 95.0 98.2 3.0 1.5Chad 9.8 −0.4 105.3 0.1 99.2 103.6 3.7 −0.3Congo 16.5 3.3 84.6 0.3 138.2 139.3 2.1 3.6Democratic Republic of theCongo
90.1 2.1 63.8 0.5 556.8 575.3 −1.6 2.5
Equatorial GuineaGabon 10.3 6.1 48.2 −2.8 48.0 49.6 1.7 3.1Sao Tome and Principe 1.5 2.3 75.8 3.0 11.0 11.4 9.0 5.4East Africa 1464.5 4.2 77.3 1.2 11368.8 11327.7 4.8 4.7Burundi 44.8 6.7 97.0 −1.1 430.0 435.0 1.3 5.6Djibouti 4.8 −0.6 74.2 3.9 37.4 35.2 1.5 3.3Eritrea 14.5 2.5 36.2 3.6 55.8 52.5 6.2Ethiopia 349.1 3.2 46.5 2.8 1673.6 1622.7 6.1Kenya 161.8 0.7 124.5 1.7 2527.3 2014.9 7.7 2.4Rwanda 94.2 4.8 67.9 2.8 657.6 639.8 6.6 7.8Somalia 23.2 5.8 47.7 −2.2 114.4 110.5 0.4 3.4South SudanSudan (former) 229.4 1.9 138.9 1.9 2996.4 3186.3 6.2 3.8Uganda 195.5 7.3 55.6 −0.8 986.0 1085.9 2.8 6.4United Republic of Tanzania 347.3 6.1 61.8 −0.6 1890.3 2144.9 −0.0 5.5Southern Africa 554.3 4.8 93.0 1.3 4991.7 5155.3 0.6 3.6Angola 75.4 4.3 50.0 −1.0 364.6 376.8 0.6 3.2Botswana 3.6 0.4 110.6 7.7 39.8 40.2 −0.1 8.2Comoros 0.8 −1.1 78.4 1.3 7.0 6.5 2.3 0.2Lesotho 3.3 1.2 93.4 2.8 31.3 30.9 −2.1 4.0Madagascar 49.1 −1.7 89.5 4.0 393.3 439.1 0.4 2.3Malawi 75.6 6.1 50.1 −3.0 364.5 378.8 0.6 2.9Mauritius 5.5 −0.3 128.3 −2.2 72.4 71.1 7.6 −2.5Mozambique 99.6 15.2 47.8 −1.3 449.7 476.0 −5.4 13.8Namibia 5.9 4.8 101.2 4.0 60.0 59.9 9.9 9.0Seychelles 0.6 7.8 50.0 −4.2 2.6 2.8 1.6 3.3South Africa 149.9 1.4 173.9 0.5 2619.8 2607.4 0.7 2.0Swaziland 1.6 2.1 78.9 −0.6 12.5 12.6 −1.5 1.5Zambia 53.0 3.0 80.3 1.3 365.9 425.6 −0.2 4.3Zimbabwe 30.3 1.8 75.0 2.1 208.5 227.6 −0.4 3.9West Africa 2719.9 −0.0 62.7 2.2 17386.8 17050.9 5.6 2.2Benin 81.3 −0.6 44.2 0.8 371.8 359.0 5.1 0.1Burkina Faso 29.7 −4.9 94.1 2.7 298.7 279.8 4.7 −2.3Cabo Verde 1.3 2.7 209.0 2.5 26.1 27.2 9.6 5.3Côte d’Ivoire 159.1 −4.4 41.6 2.3 643.3 661.4 3.6 −2.2Gambia 2.0 1.5 60.0 1.1 12.2 12.0 0.2 2.6Ghana 76.9 −6.2 87.4 7.7 636.3 671.7 4.3 1.0Guinea 191.5 −3.4 28.3 3.9 563.9 542.7 1.7 0.3Guinea-Bissau 5.8 1.7 59.6 1.1 37.0 34.6 2.0 2.8Liberia 22.3 −3.0 49.1 2.6 106.9 109.4 4.9 −0.5Mali 83.3 1.5 105.2 1.6 824.1 876.1 2.4 3.1Mauritania 1.5 −14.7 31.2 15.6 5.2 4.8 −2.9 −1.4Niger 79.8 3.9 112.6 −2.6 796.7 898.9 8.0 1.2Nigeria 1869.4 0.7 61.2 1.9 11830.2 11439.6 6.4 2.6Senegal 42.5 4.0 153.6 0.4 726.0 653.1 7.5 4.4Sierra Leone 45.6 4.6 74.4 1.2 364.7 339.6 −0.3 5.8Togo 27.8 −3.7 50.8 4.3 143.7 141.0 −1.6 0.4CEMAC 557.6 4.0 48.9 0.1 2495.0 2725.5 7.8 5.1CEN-SAD 3992.8 0.8 121.4 1.7 48993.0 48476.9 4.7 2.7COMESA 2242.8 2.8 138.8 0.8 31781.9 31136.5 4.7 2.9ECCAS 769.5 3.9 53.6 0.2 3857.4 4124.0 4.8 4.6ECOWAS 2718.4 −0.0 62.7 1.9 17381.6 17046.1 5.6 2.2IGAD 978.2 3.3 82.9 1.7 8390.9 8108.0 4.3SADC 990.8 5.0 79.4 1.1 7431.8 7869.0 0.2 4.0UEMOA 509.3 −0.7 76.7 0.9 3841.3 3903.9 4.9 1.2UMA 707.6 1.8 212.6 3.4 14529.9 15046.1 2.6 5.3Regional Office for Asia andthe Pacific
40228.5 2.6 199.5 1.9 765574.7 802500.3 8.4 4.0
Regional Office for Europeand Central Asia
6180.7 −0.2 239.4 2.4 139087.9 147958.1 1.9
Regional Office for LatinAmerica and the Caribbean
2643.6 1.3 163.6 1.8 43185.2 43247.7 4.8 2.3
Regional Office for the NearEast
3318.6 2.3 225.3 1.8 70058.3 74754.6 4.1 4.5
World 56733.7 2.1 192.2 1.7 1048660.4 1090425.0 6.7 3.4
101

TABLE 28: Sugar producers and their productivitySugar
area yield productiontotal p.a.
growthtotal p.a.
growthtotal p.a. growth
thousandha
percent thousandhg/ha
percent thousandtonnes
thousandtonnes
percent percent
2011 2000-11 2011 2000-11 2010 2011 1990-2000 2000-11AfricaNorth AfricaAlgeriaEgypt 152.0 9.3 492.5 −0.3 7840.3 7486.1 17.5 9.0LibyaMorocco 47.1 −1.3 644.8 1.7 2435.9 3035.1 −0.3 0.5SudanTunisia 0.0 0.0 0.0 −23.0Regional Office for AfricaCentral AfricaCameroonCentral African RepublicChadCongoDemocratic Republic of theCongoEquatorial GuineaGabonSao Tome and PrincipeEast AfricaBurundiDjiboutiEritreaEthiopiaKenyaRwandaSomaliaSouth SudanSudan (former)UgandaUnited Republic of TanzaniaSouthern AfricaAngolaBotswanaComorosLesothoMadagascarMalawiMauritiusMozambiqueNamibiaSeychellesSouth AfricaSwazilandZambiaZimbabweWest AfricaBeninBurkina FasoCabo VerdeCôte d’IvoireGambiaGhanaGuineaGuinea-BissauLiberiaMali 0.3 142.9 3.9 4.0MauritaniaNigerNigeriaSenegalSierra LeoneTogoCEMACCEN-SADCOMESAECCASECOWASIGADSADCUEMOAUMARegional Office for Asia andthe PacificRegional Office for Europeand Central Asia
3927.5 169526.9 213754.0
Regional Office for LatinAmerica and the CaribbeanRegional Office for the NearEastWorld
102

TABLE 29: Treenut producers and their productivityTreenuts
area yield productiontotal p.a.
growthtotal p.a.
growthtotal p.a. growth
thousandha
percent thousandhg/ha
percent thousandtonnes
thousandtonnes
percent percent
2011 2000-11 2011 2000-11 2010 2011 1990-2000 2000-11AfricaNorth AfricaAlgeria 39.8 3.5 5.6 −4.9 57.0 22.4 8.5 −1.5Egypt 5.0 −2.8 73.3 5.8 41.7 36.8 16.9 2.8Libya 43.8 −1.6 8.7 5.1 29.5 37.9 −2.3 3.5Morocco 151.4 0.5 7.0 3.1 97.8 106.1 1.9 3.6SudanTunisia 227.2 0.2 2.8 0.1 54.4 63.2 1.6 0.2Regional Office for AfricaCentral AfricaCameroon 0.3 8.1 11.7 −4.4 0.3 0.3 0.3 3.4Central African RepublicChadCongoDemocratic Republic of theCongoEquatorial GuineaGabonSao Tome and PrincipeEast AfricaBurundiDjiboutiEritreaEthiopia 60.3 0.0 10.5 −1.0 53.1 63.2 −0.9Kenya 34.5 −0.7 12.9 6.5 37.4 44.6 10.0 5.7RwandaSomaliaSouth SudanSudan (former)UgandaUnited Republic of Tanzania 412.6 14.2 3.5 −11.9 94.4 145.2 19.5 0.6Southern AfricaAngola 2.8 0.0 7.4 6.0 1.8 2.1 3.0 6.0BotswanaComorosLesothoMadagascar 15.4 −0.6 4.5 0.9 5.8 6.9 2.0 0.2Malawi 3.2 4.4 10.2 0.7 2.8 3.3 1.1 5.1Mauritius 0.0 0.0 −6.7 1.7Mozambique 140.0 6.6 8.1 −0.4 96.6 112.8 9.9 6.3NamibiaSeychellesSouth Africa 4.2 3.7 36.9 −0.1 13.0 15.5 18.0 3.6Swaziland 0.8 1.3 15.1 −3.8 1.0 1.2 −2.6ZambiaZimbabwe 2.0 6.5 11.3 1.6 1.9 2.3 2.4 8.3West AfricaBenin 484.8 9.0 2.8 2.3 121.2 135.9 27.3 11.5Burkina Faso 11.7 0.5 6.1 2.9 6.2 7.2 10.6 3.4Cabo VerdeCôte d’Ivoire 887.7 15.8 4.7 1.5 400.6 417.5 18.8 17.6GambiaGhana 68.5 11.7 5.4 2.1 31.3 37.1 28.8 14.0Guinea 7.3 15.5 11.5 2.3 7.1 8.5 −3.9 18.2Guinea-Bissau 222.5 0.5 5.8 4.8 108.0 128.7 9.3 5.3Liberia 2.8 0.9 9.4 0.6 2.8 2.6 0.1 1.5Mali 11.1 4.0 5.0 −0.5 4.6 5.6 13.5 3.4MauritaniaNigerNigeria 367.9 3.2 22.9 2.2 837.0 842.0 29.4 5.4Senegal 19.0 −2.9 5.3 0.8 9.3 10.0 14.7 −2.2Sierra LeoneTogo 0.6 7.6 17.0 2.8 0.8 1.0 −5.9 10.6CEMACCEN-SADCOMESAECCASECOWAS 2083.9 9.9 7.7 2.1 1528.9 1596.0 25.4 9.3IGADSADCUEMOA 1637.5 11.3 4.3 2.3 650.7 705.9 16.5 13.6UMA 462.3 0.4 5.0 1.6 238.6 229.6 2.1 2.2Regional Office for Asia andthe PacificRegional Office for Europeand Central Asia
1743.0 0.6 12.0 2.3 2160.3 2090.8 1.3
Regional Office for LatinAmerica and the CaribbeanRegional Office for the NearEast
1005.3 0.7 16.6 10.6 1565.4 1664.6 4.6 9.0
World
103

TABLE 30: Fruit producers and their productivityFruit (excluding melons)
area yield productiontotal p.a.
growthtotal p.a.
growthtotal p.a. growth
thousandha
percent thousandhg/ha
percent thousandtonnes
thousandtonnes
percent percent
2011 2000-11 2011 2000-11 2010 2011 1990-2000 2000-11Africa 11309.6 1.7 78.6 1.6 85723.5 88925.1 2.9 4.2North Africa 1654.4 2.7 114.7 1.5 17772.5 18973.1 3.7 4.2Algeria 499.8 4.9 74.0 4.0 3304.2 3697.9 3.9 9.0Egypt 490.9 1.5 202.1 1.7 9581.2 9922.3 4.2 3.3Libya 64.9 1.9 62.0 0.4 386.1 402.5 0.1 2.3Morocco 365.6 2.3 99.5 0.5 3279.8 3637.8 2.9 2.8SudanTunisia 233.2 1.6 56.3 0.7 1221.3 1312.5 3.8 2.4Regional Office for Africa 9646.2 1.5 72.4 1.7 67885.9 69884.2 2.6 4.2Central Africa 1047.2 1.3 89.4 2.0 8563.0 9361.8 −0.6 5.9Cameroon 401.2 2.3 130.1 6.6 4863.6 5219.0 1.3 9.1Central African Republic 63.2 −0.3 44.4 1.0 274.6 280.3 2.5 0.7Chad 35.9 3.3 33.2 −1.4 117.7 119.5 −0.8 1.8Congo 37.5 2.4 72.6 −0.5 262.0 272.3 5.1 1.8Democratic Republic of theCongo
422.0 0.3 72.1 1.8 2540.7 3044.6 −3.5 2.1
Equatorial Guinea 12.9 1.3 54.2 1.5 69.2 69.8 2.3 2.9Gabon 68.6 1.7 46.4 −1.0 398.2 318.5 2.1 0.7Sao Tome and Principe 5.8 2.0 65.2 0.7 37.0 37.9 12.4 2.7East Africa 4111.7 1.6 65.3 1.0 26733.4 26839.9 1.9 3.3Burundi 393.5 0.7 49.9 1.2 2027.7 1964.7 −0.2 1.9Djibouti 3.4 3.4 5.9 −0.1Eritrea 0.7 5.7 78.9 −2.5 5.4 5.3 3.1Ethiopia 76.0 4.2 89.2 1.1 603.8 677.5 5.3Kenya 197.1 2.6 145.9 −0.0 3270.7 2876.3 5.1 2.6Rwanda 386.3 0.2 88.1 3.4 3080.8 3402.6 −2.0 3.6Somalia 23.2 0.8 96.4 0.5 230.0 223.3 −4.4 1.3South SudanSudan (former) 241.2 5.1 120.1 2.5 2813.3 2896.3 6.7 7.6Uganda 1863.2 0.6 54.9 −0.5 10203.8 10233.1 1.8 0.1United Republic of Tanzania 930.5 3.4 49.0 4.9 4494.5 4557.4 3.1 8.5Southern Africa 1004.0 3.1 125.6 1.6 11637.7 12614.0 2.6 6.7Angola 161.5 10.5 203.0 8.5 2640.9 3279.1 1.0 19.9Botswana 2.1 −0.9 31.0 −3.4 5.9 6.6 −0.9 −4.2Comoros 8.8 −1.8 77.3 2.6 77.7 68.2 2.0 0.8Lesotho 4.3 2.9 35.9 −2.4 14.5 15.3 −2.0 0.5Madagascar 239.5 2.9 50.5 −0.0 1181.5 1210.2 1.1 2.8Malawi 101.5 −0.1 103.8 3.2 1061.4 1053.7 4.6 3.1Mauritius 1.6 7.1 160.3 −0.5 22.8 26.5 4.6 6.6Mozambique 105.0 6.8 64.2 1.1 647.3 673.6 −2.7 7.9Namibia 8.7 10.3 50.1 −0.9 42.2 43.8 5.3 9.3Seychelles 0.2 1.2 156.7 −0.9 2.5 2.7 1.9 0.3South Africa 294.3 −0.3 195.4 1.4 5465.5 5751.3 3.2 1.1Swaziland 15.4 3.2 82.0 −1.2 120.7 126.0 −3.7 1.9Zambia 24.9 1.7 44.5 −0.8 112.2 111.1 −0.3 0.9Zimbabwe 36.2 −1.1 68.0 1.7 242.4 246.0 2.9 0.6West Africa 3483.2 0.9 60.5 1.9 20951.7 21068.5 4.6 2.9Benin 50.8 4.0 66.8 2.8 444.1 339.5 −1.0 6.9Burkina Faso 16.4 −2.9 59.7 3.6 93.8 97.7 2.7 0.7Cabo Verde 1.5 −0.5 130.4 1.9 18.9 19.5 1.4 1.4Côte d’Ivoire 573.0 0.2 38.4 −0.8 2190.0 2202.1 4.1 −0.6Gambia 1.7 1.6 50.4 2.6 8.6 8.8 4.8 4.2Ghana 402.4 2.1 114.4 4.0 4483.1 4603.3 10.0 6.1Guinea 287.1 0.3 43.1 1.7 1218.7 1237.3 1.5 2.0Guinea-Bissau 22.9 0.9 43.7 1.1 96.2 100.1 2.7 2.1Liberia 37.0 0.8 51.5 0.2 188.7 190.3 4.8 1.0Mali 59.8 1.9 72.3 3.1 430.5 432.2 5.0 5.0Mauritania 9.4 4.7 26.0 −4.6 24.0 24.5 7.5 −0.2Niger 91.8 17.6 53.1 1.4 504.3 487.5 4.9 19.2Nigeria 1839.0 −0.1 58.7 1.5 10762.9 10790.0 3.8 1.4Senegal 33.8 4.9 67.7 0.2 195.6 228.9 2.6 5.1Sierra Leone 47.4 2.6 51.7 0.8 232.5 245.2 1.1 3.4Togo 9.2 −3.8 67.1 3.5 59.9 61.7 3.4 −0.4CEMAC 619.4 2.0 101.4 2.3 5985.3 6279.3 1.7 7.8CEN-SAD 4712.8 1.4 82.0 1.5 37680.5 38658.7 4.3 3.3COMESA 4563.9 1.2 83.9 0.8 37338.1 38272.9 2.0 2.5ECCAS 1602.2 2.1 91.2 3.7 13231.6 14605.7 −0.4 8.5ECOWAS 3473.8 0.9 60.6 2.1 20927.8 21044.1 4.6 2.9IGAD 2401.4 1.3 70.4 0.4 17130.3 16915.1 2.1SADC 2347.7 2.7 85.8 1.7 18595.2 20147.8 1.5 6.4UEMOA 857.6 2.5 46.1 2.1 4014.3 3949.7 3.8 3.6UMA 1173.0 3.3 77.4 0.9 8215.3 9075.2 3.2 5.3Regional Office for Asia andthe Pacific
26853.4 2.7 114.1 0.6 292685.3 306370.0 6.9 5.2
Regional Office for Europeand Central Asia
9517.2 −0.6 98.1 1.4 89393.8 93317.7 0.5
Regional Office for LatinAmerica and the Caribbean
7435.5 0.7 155.9 1.1 111885.6 115885.2 3.0 1.7
Regional Office for the NearEast
3890.9 1.4 107.0 1.0 40936.4 41625.6 4.6 2.5
World 56642.1 1.6 112.6 1.0 612512.7 637575.6 4.0 3.4
104

TABLE 31: Citrus fruit producers and their productivityCitrus fruit
area yield productiontotal p.a.
growthtotal p.a.
growthtotal p.a. growth
thousandha
percent thousandhg/ha
percent thousandtonnes
thousandtonnes
percent percent
2011 2000-11 2011 2000-11 2010 2011 1990-2000 2000-11AfricaNorth Africa 368.3 2.3 190.2 2.0 6148.4 7006.5 1.7 4.2Algeria 55.7 2.7 198.9 6.0 788.7 1107.3 4.4 8.9Egypt 166.2 1.7 224.5 2.5 3523.0 3730.7 0.6 4.2Libya 7.6 1.4 101.8 −0.0 74.9 77.4 −3.9 1.4Morocco 105.4 2.9 155.8 −1.5 1359.7 1642.2 3.2 1.3SudanTunisia 33.4 3.1 134.3 1.0 402.2 448.9 0.2 4.1Regional Office for Africa 1190.5 1.2 78.0 2.0 8914.4 9291.4 5.2 3.2Central Africa 22.0 0.0 137.8 1.7 244.8 303.1 0.6 1.9Cameroon 0.1 0.1 7.6 6.0Central African Republic 7.0 0.1 54.7 2.1 31.1 38.6 3.9 2.2ChadCongo 1.9 1.7 83.6 0.6 13.5 16.2 15.1 2.3Democratic Republic of theCongo
12.8 −0.3 193.2 2.1 199.0 247.0 −0.8 1.8
Equatorial GuineaGabon 0.2 0.2 53.2 1.6 1.2 1.2 1.6 1.9Sao Tome and PrincipeEast Africa 93.3 6.9 104.5 2.1 962.6 976.6 9.7 8.2BurundiDjibouti 1.6 1.5 6.0 −1.4EritreaEthiopia 6.9 3.6 88.4 3.2 62.7 61.0 7.0Kenya 23.4 0.7 115.5 2.8 260.5 269.9 16.6 3.5Rwanda 4.3 25.5 38.9 9.5 15.0 16.6 37.5Somalia 4.1 −0.0 59.6 1.5 22.9 24.7 −7.4 1.4South SudanSudan (former) 42.1 10.7 132.7 −0.1 554.5 557.8 6.6 10.7UgandaUnited Republic of Tanzania 12.6 3.1 35.8 −2.0 45.4 45.1 1.3 1.1Southern Africa 156.0 1.2 190.8 1.3 2709.4 2976.5 4.8 3.4Angola 21.2 4.2 125.9 7.3 247.6 266.9 0.3 11.8Botswana 0.1 −1.3 46.2 1.3 0.5 0.6 1.0 0.0ComorosLesothoMadagascar 15.7 −1.6 65.2 2.1 86.4 102.5 −0.2 0.4Malawi 0.5 1.1 53.0 −0.2 2.5 2.6 0.0 0.9Mauritius 0.2 4.9 32.0 −2.4 0.5 0.5 10.6 2.4Mozambique 11.0 5.5 47.1 −0.3 46.5 51.7 −4.9 5.2Namibia 0.2 2.0 60.1 0.2 1.2 1.3 2.2Seychelles 0.0 5.4 119.2 −3.7 0.1 0.1 1.0 1.5South Africa 75.3 0.7 309.7 2.0 2124.9 2331.1 5.8 2.7Swaziland 12.2 3.0 67.5 −2.0 81.3 82.4 −1.5 0.9Zambia 0.9 −2.3 45.7 4.3 3.5 4.3 −1.1 1.9Zimbabwe 18.6 −0.9 71.0 1.1 114.5 132.4 4.7 0.2West Africa 919.2 0.6 54.8 5.2 4997.6 5035.2 5.2 2.1Benin 4.8 1.0 28.2 −2.0 13.4 13.5 3.4 −1.0Burkina Faso 0.2 −2.3 63.2 2.2 1.4 1.4 3.4 −0.1Cabo VerdeCôte d’Ivoire 9.9 2.1 109.3 1.0 106.5 107.7 4.5 3.1GambiaGhana 23.2 −6.5 278.4 13.5 626.0 645.0 16.4 6.1Guinea 44.6 0.8 53.4 0.4 236.4 238.0 0.0 1.1Guinea-Bissau 2.0 −2.1 52.5 2.4 10.1 10.3 3.4 0.2Liberia 2.2 −3.7 36.0 2.9 7.8 8.0 3.4 −0.9Mali 8.5 1.5 54.1 5.7 43.0 46.0 3.8 7.3MauritaniaNigerNigeria 795.0 0.8 47.8 0.7 3800.0 3800.0 4.5 1.4Senegal 8.0 5.7 62.5 −1.1 40.0 50.0 1.0 4.4Sierra Leone 17.8 2.3 57.0 −0.3 99.2 101.3 1.6 2.0Togo 3.1 −3.5 44.6 3.2 13.8 14.0 3.1 −0.4CEMAC 45.8 56.1 7.1 2.3CEN-SAD 1240.5 1.4 91.2 3.1 10730.9 11318.9 3.4 3.2COMESA 311.4 2.8 169.8 1.2 4979.8 5286.8 4.6ECCASECOWAS 919.2 0.6 54.8 5.2 4997.6 5035.2 5.2 2.1IGADSADC 181.4 1.3 180.2 1.3 2953.8 3268.6 4.3 3.2UEMOA 36.5 1.9 66.6 1.7 228.2 242.9 3.5 3.6UMA 202.1 2.8 162.1 1.8 2625.4 3275.8 2.9 4.3Regional Office for Asia andthe Pacific
3863.9 4.1 125.4 2.3 47928.5 48456.5 8.1
Regional Office for Europeand Central AsiaRegional Office for LatinAmerica and the Caribbean
2121.5 0.1 178.9 1.6 36330.1 37949.7 3.8 0.1
Regional Office for the NearEast
702.3 1.4 173.2 1.0 11645.8 12163.4 3.7 2.5
World
105

TABLE 32: Fibre crop producers and their productivityFibre crops
area yield productiontotal p.a.
growthtotal p.a.
growthtotal p.a. growth
thousandha
percent thousandhg/ha
percent thousandtonnes
thousandtonnes
percent percent
2011 2000-11 2011 2000-11 2010 2011 1990-2000 2000-11AfricaNorth Africa 236.6 −0.1 6.3 −4.8 149.6 149.6 −2.9 −4.3Algeria 0.2 7.7 1.0 −5.4 0.0 0.0 −0.5 1.9Egypt 229.5 −0.2 6.4 −4.2 147.5 147.4 −2.8 −4.3LibyaMorocco 4.1 3.8 3.7 −6.2 1.5 1.5 −15.7 −2.6SudanTunisia 2.7 2.9 2.4 −4.2 0.6 0.6 8.2 −1.4Regional Office for Africa 4089.9 1.1 3.1 1.1 1197.8 1264.1 3.7 0.2Central Africa 459.4 −2.3 2.4 −2.1 104.3 110.7 2.8 −3.4Cameroon 180.2 −0.9 3.6 −1.5 62.1 65.1 6.2 −2.4Central African Republic 27.3 −4.9 1.6 −3.0 4.2 4.3 −3.1 −7.8Chad 175.0 −4.2 1.6 −2.3 25.5 28.0 −0.4 −6.4CongoDemocratic Republic of theCongo
75.0 −0.3 1.7 −0.4 12.3 13.1 −0.1 −0.6
Equatorial Guinea 1.8 0.0 1.3 −4.9 0.2 0.2 −3.0 −4.9GabonSao Tome and PrincipeEast Africa 980.5 0.7 2.6 4.3 246.9 252.0 −2.9 2.7Burundi 4.5 2.0 1.8 −4.9 0.7 0.8 −6.6 −3.0DjiboutiEritreaEthiopia 413.5 3.8 1.1 −1.5 36.8 43.6 2.2Kenya 61.5 −0.1 5.7 3.8 27.8 34.8 −7.1 3.7Rwanda 0.0 0.0 0.0Somalia 16.5 2.9 1.3 −1.0 1.8 2.1 7.2 2.0South SudanSudan (former) 42.0 −12.0 6.5 6.9 19.9 27.3 −8.7 −5.9Uganda 160.0 −4.0 3.0 12.0 25.8 47.6 13.7 7.6United Republic of Tanzania 282.6 0.9 3.4 1.7 134.1 95.8 −2.4 2.6Southern Africa 827.7 2.4 2.9 4.2 137.1 242.9 3.3 1.0Angola 4.8 −7.7 5.3 0.3 2.3 2.5 −0.4 −7.3Botswana 0.4 −8.0 5.0 −4.4 0.2 0.2 1.8 −12.0Comoros 0.0 0.0 0.0LesothoMadagascar 34.2 −3.9 8.1 1.4 24.8 27.8 −1.0 −2.5Malawi 60.2 3.6 2.3 −0.2 8.0 14.1 1.2 3.4Mauritius 0.1 0.6 6.0 −1.6 0.1 0.1 1.8 −1.1Mozambique 198.4 5.1 2.0 3.8 24.4 40.6 2.2 9.1Namibia 0.0 0.0 0.0 45.2SeychellesSouth Africa 11.1 −13.9 20.5 12.2 12.7 22.6 −5.8 −3.4Swaziland 2.5 −19.7 2.3 5.4 0.6 0.6 −11.5 −15.4Zambia 121.9 7.5 3.4 −0.5 24.0 42.0 6.2 7.0Zimbabwe 394.1 0.5 2.3 −3.5 40.0 92.3 6.6 −3.0West Africa 1822.3 1.5 3.6 −1.5 709.5 658.5 5.7 −0.4Benin 208.1 −3.8 3.7 −2.3 76.3 76.3 9.9 −6.1Burkina Faso 395.1 6.0 4.4 −1.5 190.0 175.0 3.5 4.4Cabo VerdeCôte d’Ivoire 250.0 −1.4 3.1 −6.0 82.2 76.5 5.1 −7.3Gambia 1.3 10.0 1.3 −1.5 0.2 0.2 −20.0 8.4Ghana 26.0 −5.8 3.6 2.3 9.3 9.3 10.8 −3.7Guinea 44.0 −1.8 3.0 −5.3 13.4 13.4 29.7 −7.0Guinea-Bissau 4.7 4.5 3.2 −2.6 1.5 1.5 2.1 1.8LiberiaMali 492.8 7.2 3.0 −3.4 82.5 149.6 −1.4 3.6MauritaniaNiger 10.0 0.0 3.3 −2.7 1.2 3.3 17.2 −2.7Nigeria 260.6 −6.4 3.9 3.2 221.2 101.4 4.4 −3.4Senegal 30.0 2.7 4.3 0.8 10.0 13.0 −4.5 3.6Sierra Leone 7.8 9.0 1.3 4.1Togo 99.8 −3.1 3.0 −1.3 14.0 30.0 3.8 −4.3CEMAC 384.4 −2.7 2.5 −2.5 92.0 97.6 3.1 −3.8CEN-SAD 2275.4 0.6 3.7 −1.1 897.2 856.4 2.2 −1.4COMESA 1598.9 368.2 491.6ECCAS 468.7 −2.3 2.4 −1.6 107.3 114.0 2.6 −3.5ECOWAS 1822.3 1.5 3.6 −1.5 709.5 658.5 5.7 −0.4IGADSADC 1185.3 1.9 3.0 3.9 283.5 351.8 1.9 1.4UEMOA 1490.4 3.0 3.5 −2.2 457.7 525.2 4.8 0.4UMARegional Office for Asia andthe PacificRegional Office for Europeand Central Asia
3451.7 2998.3 3162.5
Regional Office for LatinAmerica and the Caribbean
2985.1 4.6 9.8 0.9 1948.2 2911.1 −1.7 6.4
Regional Office for the NearEastWorld
106

TABLE 33: Jute and jute-like producers and their productivityJute and jute-like
area yield productiontotal p.a.
growthtotal p.a.
growthtotal p.a. growth
thousandha
percent thousandhg/ha
percent thousandtonnes
thousandtonnes
percent percent
2011 2000-11 2011 2000-11 2010 2011 1990-2000 2000-11AfricaNorth AfricaAlgeriaEgypt 0.9 −0.5 23.3 0.1 2.2 2.1 −5.8 −0.4LibyaMoroccoSudanTunisiaRegional Office for AfricaCentral AfricaCameroon 0.2 2.3 3.3 −3.6 0.1 0.1 −1.2 −1.3Central African Republic 0.5 0.7 2.1 1.0 0.1 0.1 1.4 1.7ChadCongoDemocratic Republic of theCongo
9.0 −0.2 7.1 1.2 5.6 6.4 3.5 1.0
Equatorial GuineaGabonSao Tome and PrincipeEast AfricaBurundiDjiboutiEritreaEthiopia 1.9 2.3 2.9 −5.0 0.5 0.6 −2.8KenyaRwandaSomaliaSouth SudanSudan (former) 3.2 3.2 1.0 −0.3UgandaUnited Republic of TanzaniaSouthern AfricaAngola 1.2 1.6 7.5 −2.6 0.8 0.9 −0.6 −1.0BotswanaComorosLesothoMadagascar 0.6 −2.1 4.7 −4.6 0.2 0.3 −0.2 −6.6MalawiMauritiusMozambique 7.1 1.5 5.5 −0.0 3.7 3.9 −0.7 1.5NamibiaSeychellesSouth Africa 1.1 0.0 7.8 −2.2 0.7 0.9 −0.1 −2.2SwazilandZambiaZimbabwe 4.1 2.5 5.6 −1.6 2.0 2.3 3.3 0.8West AfricaBeninBurkina FasoCabo VerdeCôte d’IvoireGambiaGhanaGuineaGuinea-BissauLiberiaMali 2.8 1.5 5.7 2.2 1.5 1.6 −7.5 3.8MauritaniaNigerNigeria 1.0 0.0 13.9 4.3 1.2 1.4 0.1 4.3SenegalSierra LeoneTogoCEMACCEN-SADCOMESAECCASECOWASIGADSADCUEMOAUMARegional Office for Asia andthe PacificRegional Office for Europeand Central AsiaRegional Office for LatinAmerica and the CaribbeanRegional Office for the NearEastWorld
107

TABLE 34: Meat producersTotal meat production
total beef and buffalo pig sheep and goat poultryp.a.
growthp.a.
growthp.a.
growthp.a.
growthp.a.
growththousandtonnes
percent thousandtonnes
percent thousandtonnes
percent thousandtonnes
percent thousandtonnes
percent
2011 2000-11 2011 2000-11 2011 2000-11 2011 2000-11 2011 2000-11Africa 16536.9 3.5 5773.2 2.9 1282.9 5.8 2758.0 2.8 4930.5 5.0North Africa 4223.3 3.6 1239.5 3.3 1.3 −5.7 668.2 3.0 2104.8 4.5Algeria 689.0 1.8 125.4 −0.5 0.1 −0.9 270.2 4.0 280.0 1.3Egypt 1993.7 3.8 850.3 4.2 0.5 −16.0 127.2 4.9 900.8 3.9Libya 180.1 2.3 8.0 −0.2 43.5 3.4 123.5 2.1Morocco 1083.0 5.2 198.7 3.2 0.6 0.4 167.0 1.2 650.5 7.8SudanTunisia 277.4 0.9 57.2 −0.4 0.1 −3.3 60.3 −0.4 150.0 2.3Regional Office for Africa 12271.1 3.4 4531.9 2.8 1266.8 5.8 2089.0 2.8 2804.0 5.3Central Africa 994.1 3.1 323.5 2.5 85.3 4.2 126.5 2.6 103.4 8.2Cameroon 330.9 4.0 118.0 2.2 39.0 8.4 37.1 1.4 70.0 11.5Central African Republic 164.6 3.2 88.0 2.5 15.9 2.6 23.6 6.9 5.9 5.7Chad 150.7 2.5 97.2 2.5 0.6 3.2 41.5 2.8 5.3 1.2Congo 57.3 7.5 6.4 13.3 1.9 2.8 1.5 2.9 6.5 1.0Democratic Republic of theCongo
252.8 1.4 12.6 −0.6 24.5 −0.6 21.7 −0.1 11.0 −0.5
Equatorial Guinea 0.6 0.8 0.0 0.7 0.2 0.8 0.1 0.6 0.2 1.0Gabon 36.1 1.2 1.1 0.3 3.2 0.2 1.0 0.6 3.8 0.0Sao Tome and Principe 1.1 2.4 0.1 2.2 0.1 3.4 0.0 1.3 0.8 2.4East Africa 3289.4 2.6 1743.7 3.0 155.8 3.5 723.9 1.7 260.5 3.7Burundi 24.4 2.1 9.9 1.3 2.1 2.8 3.2 −0.2 7.1 1.9Djibouti 11.3 0.0 6.0 0.0 4.6 0.1Eritrea 42.6 2.6 25.9 4.3 12.4 0.2 1.7 −0.8Ethiopia 737.1 4.4 412.0 3.1 1.8 2.3 153.0 8.6 65.2 5.1Kenya 635.9 4.6 458.0 5.4 12.8 1.0 90.2 2.5 21.5 4.5Rwanda 69.8 5.9 34.8 6.6 7.8 8.2 9.4 9.6 2.5 5.2Somalia 190.6 1.0 59.6 −0.3 0.1 −1.6 83.2 1.9 3.5 0.9South SudanSudan (former) 795.5 −0.4 345.0 1.4 279.0 −2.8 40.0 4.0Uganda 381.1 3.3 129.8 2.7 117.0 3.8 42.0 3.1 62.1 3.2United Republic of Tanzania 401.0 1.6 262.6 1.2 14.1 1.0 47.1 1.6 56.8 2.6Southern Africa 4411.7 3.9 1430.9 2.0 660.3 7.7 309.1 2.2 1836.8 5.4Angola 229.7 4.0 100.3 0.6 76.4 9.2 21.6 6.4 22.5 10.2Botswana 86.3 3.4 47.0 4.5 0.5 −5.8 7.5 0.6 6.2 −3.1Comoros 2.2 1.3 1.2 1.9 0.5 0.7 0.5 0.4Lesotho 29.0 0.5 12.5 1.9 3.6 −3.6 6.3 0.3 1.6 −1.3Madagascar 313.9 2.3 165.8 1.0 55.4 9.2 12.6 4.8 72.2 1.0Malawi 129.5 6.8 34.1 6.3 44.2 6.9 28.9 11.4 22.4 3.5Mauritius 51.1 6.3 2.4 −2.9 0.8 −0.7 0.1 −5.1 47.1 7.6Mozambique 185.5 −0.4 19.2 4.4 97.8 −2.0 25.0 −0.1 43.0 2.5Namibia 77.3 −2.1 34.3 −5.5 4.6 9.1 16.1 −0.8 16.0 4.4Seychelles 1.4 −3.7 0.0 −22.0 0.5 −6.6 0.0 0.5 0.9 −1.1South Africa 2854.6 4.7 828.6 2.6 320.0 10.8 165.4 0.7 1492.5 5.6Swaziland 26.0 0.2 16.4 −0.6 1.9 3.9 2.2 −3.3 5.5 4.3Zambia 178.5 2.5 67.2 2.2 23.1 7.8 9.5 5.8 43.0 1.9Zimbabwe 246.6 2.5 102.0 0.1 31.5 3.4 13.4 −0.3 63.4 8.7West Africa 3575.9 3.7 1033.8 3.8 365.5 3.9 929.5 3.9 603.2 5.4Benin 75.1 4.0 30.1 4.8 4.8 2.2 8.3 2.4 23.8 6.2Burkina Faso 256.7 4.2 122.5 5.4 31.8 4.3 53.6 3.0 38.2 3.4Cabo Verde 11.3 3.3 0.9 6.2 8.6 2.6 1.0 7.3 0.7 4.2Côte d’Ivoire 249.5 1.9 29.2 −1.2 7.2 1.1 12.3 1.5 33.7 3.9Gambia 8.6 2.0 3.8 0.9 0.8 7.0 1.5 7.1 1.2 2.4Ghana 237.8 2.7 20.6 −1.3 19.1 5.2 37.8 6.2 41.0 7.0Guinea 91.5 5.4 58.3 5.7 1.7 0.7 16.6 7.0 9.0 7.2Guinea-Bissau 25.8 3.3 6.5 3.4 15.0 3.2 2.4 3.7 1.9 4.3Liberia 32.5 3.7 1.1 1.1 9.7 7.5 1.9 3.4 11.8 5.4Mali 366.5 6.3 156.0 9.7 2.6 2.9 123.0 5.9 41.2 3.2Mauritania 101.5 2.1 27.0 2.3 45.0 2.5 4.5 0.9Niger 318.0 3.2 136.7 1.3 1.4 0.3 109.4 5.0 12.0 0.8Nigeria 1508.6 3.3 357.5 2.3 239.4 3.9 463.7 3.0 285.0 5.4Senegal 187.2 4.4 65.1 3.2 11.1 1.7 38.2 4.5 55.8 8.3Sierra Leone 39.4 4.6 9.0 4.3 2.1 −0.6 3.4 10.4 13.8 2.4Togo 66.0 5.3 9.4 3.2 10.1 4.7 11.3 4.3 29.6 8.6CEMAC 740.2 3.7 310.8 2.6 60.7 6.2 104.7 3.2 91.7 9.3CEN-SAD 8263.5 3.3 2684.7 3.3 372.9 3.8 1709.4 2.3 2470.8 5.1COMESA 6073.6 3.1 2681.5 3.4 323.9 5.0 853.2 2.6 1490.5 3.8ECCAS 1248.2 3.2 433.8 2.0 163.9 6.5 151.2 3.1 133.0 8.2ECOWAS 3474.4 3.7 1006.8 3.9 365.5 3.9 884.5 3.9 598.7 5.5IGAD 2794.1 2.6 1436.4 3.3 664.3 1.6 194.1 4.1SADC 5063.3 3.6 1704.9 1.9 698.9 7.3 377.4 2.0 1904.1 5.3UEMOA 1544.8 4.2 555.5 4.9 84.0 3.3 358.5 4.7 236.2 5.4UMA 2331.1 3.3 416.2 1.5 586.0 2.6 1208.5 5.0Regional Office for Asia andthe Pacific
129303.1 3.5 19607.6 2.0 63596.5 3.4 7753.5 2.2 35422.1 5.3
Regional Office for Europeand Central Asia
63842.0 1.8 13132.1 0.5 27807.7 1.2 2200.7 0.6 19312.9 5.3
Regional Office for LatinAmerica and the Caribbean
47166.0 3.6 17021.0 2.1 6884.8 2.9 446.2 0.9 22242.2 5.5
Regional Office for the NearEast
9808.7 3.0 2238.8 2.7 1823.3 0.8 5269.5 4.9
World 298871.1 2.7 66333.8 1.4 110270.2 2.6 13407.0 2.0 102249.0 4.3
108

TABLE 35: Eggs, milk, and processed milkProduction
eggs milk butter andghee
cheese evaporatand
condensedmilk
skim milkand
buttermilk
p.a.growth
p.a.growth
thousandtonnes
percent milliontonnes
percent thousandtonnes
thousandtonnes
thousandtonnes
thousandtonnes
2011 2000-11 2011 2000-11 2011 2011 2011 2011Africa 2771.2 4.1 41.6 4.9North Africa 920.6 3.5 12.4 4.6Algeria 195.0 6.2 3.0 6.4 2.7 1.5Egypt 305.5 5.1 5.8 3.9 127.6 644.5Libya 62.5 0.4 0.2 0.9Morocco 265.0 1.1 2.3 5.7 33.5 44.3SudanTunisia 92.6 1.1 1.1 1.6 6.5 4.1Regional Office for Africa 1843.9 4.4 29.2 5.0Central Africa 34.9 1.6 0.6 2.1Cameroon 15.0 1.3 0.2 2.2Central African Republic 2.3 1.1 0.1 1.8Chad 4.0 0.8 0.3 2.1 0.5Congo 1.6 3.2 0.0 2.1Democratic Republic of theCongo
8.9 2.2 0.0 4.3
Equatorial Guinea 0.4 3.3Gabon 2.1 0.7 0.0 −0.3Sao Tome and Principe 0.6 3.9 0.0 2.0East Africa 240.0 2.4 19.1 5.6Burundi 3.0 0.2 0.1 7.6 0.2Djibouti 0.0 1.2Eritrea 2.2 2.6 0.1 4.7 1.4 0.6Ethiopia 39.6 3.0 4.4 14.2 17.6 5.8Kenya 94.4 4.1 4.3 5.5 14.7 0.3 0.8 2.5Rwanda 2.9 2.5 0.2 5.3 0.7Somalia 2.4 −0.4 2.6 2.1 9.5South SudanSudan (former) 38.0 1.0 4.3 −2.7 17.0 155.7Uganda 23.1 1.1 1.2 8.0 0.0 0.0United Republic of Tanzania 34.2 −0.3 1.8 7.8 31.5 13.0Southern Africa 684.9 5.4 4.9 1.5Angola 4.5 0.4 0.2 −0.5 0.5 1.2Botswana 4.5 3.1 0.1 −0.4 1.1 2.6Comoros 0.8 0.4 0.0 1.2Lesotho 1.7 1.1 0.0 2.1Madagascar 20.6 0.5 0.6 0.4 1.7Malawi 20.2 0.3 0.1 3.4Mauritius 10.5 −1.6 0.0 0.6Mozambique 41.6 34.1 0.1 0.7Namibia 4.4 6.2 0.1 2.4 0.6 0.4Seychelles 1.3 −4.3 0.0 −26.6South Africa 490.0 4.0 3.3 2.3 12.4 44.2 56.4 15.0Swaziland 1.2 0.9 0.0 1.1 0.2Zambia 54.0 3.0 0.1 1.5 0.3 1.1Zimbabwe 29.6 2.7 0.4 −1.6 2.1 2.5 5.7 1.1West Africa 884.2 4.2 4.5 6.9Benin 14.4 6.9 0.0 2.9Burkina Faso 52.0 2.6 0.3 3.9 1.0Cabo Verde 2.2 1.4 0.0 8.4Côte d’Ivoire 32.0 −0.3 0.0 1.7Gambia 0.9 2.2 0.0 1.6Ghana 39.8 5.6 0.0 1.3Guinea 25.0 6.8 0.1 4.7 0.3Guinea-Bissau 1.4 3.2 0.0 2.5Liberia 5.6 2.4 0.0 −0.2Mali 14.0 1.5 1.8 12.4Mauritania 5.5 1.4 0.4 1.7 0.9 5.6Niger 7.9 0.2 1.0 3.8 13.0 55.6Nigeria 636.0 4.3 0.6 3.4 12.7 10.2Senegal 28.9 9.7 0.2 4.1 0.7Sierra Leone 9.2 1.2 0.0 6.9Togo 9.3 3.6 0.0 1.0 0.0CEMAC 25.4 1.3 0.6 2.1CEN-SAD 1626.8 3.4 20.8 3.0COMESA 718.4 3.4 21.8 5.0ECCAS 42.4 1.4 0.9 2.0ECOWAS 878.7 4.2 4.1 7.4IGAD 199.8 2.9 17.0 5.3 60.3SADC 727.2 5.1 6.8 3.3UEMOA 160.0 3.5 3.3 8.3UMA 620.6 2.6 7.0 5.0 43.5 55.6Regional Office for Asia andthe Pacific
43830.4 2.7 304.7 4.4
Regional Office for Europeand Central Asia
12239.2 1.6 249.8 0.6 2599.7 10609.2 2079.9 1411.8
Regional Office for LatinAmerica and the Caribbean
7495.4 3.6 81.8 3.4
Regional Office for the NearEast
2384.0 3.2 30.4 2.8 411.3 1386.9
World 70615.6 2.5 739.4 2.8
109

TABLE 36: Fish productionFish production
capture aquaculturetotal inland marine p.a.
growthtotal inland marine p.a.
growththousandtonnes
thousandtonnes
thousandtonnes
thousandtonnes
percent thousandtonnes
thousandtonnes
thousandtonnes
thousandtonnes
percent
2010 2011 2011 2011 2000-11 2010 2011 2011 2011 2000-11Africa 7695.9 7618.2 2703.7 4914.6 2.0 1425.7 1539.9 1387.8North Africa 1770.2 1574.6 262.9 1311.7 0.1 928.5 998.8 990.9 10.2Algeria 93.6 101.8 101.8 −1.0 1.8 2.2 2.0 0.2 18.4Egypt 385.2 375.4 253.1 122.3 −0.2 919.6 986.8 986.8 10.2Libya 50.0 30.0 0.0 30.0 −4.5 0.2 0.2 0.0 0.2 8.3Morocco 1143.7 964.7 9.0 955.7 0.5 1.5 1.4 1.1 0.3 −2.7SudanTunisia 97.8 102.8 0.9 102.0 0.7 5.4 8.1 0.9 7.2 16.2Regional Office for Africa 5901.4 6010.6 2440.7 3569.8 2.3 497.0 540.9 396.9 22.8Central Africa 570.2 587.2 444.4 142.9 0.9 4.2 4.2 4.2 7.9Cameroon 140.0 140.0 75.0 65.0 2.0 0.8 0.8 0.8 29.2Central African Republic 35.0 35.0 35.0 8.0 0.2 0.2 0.2 3.2Chad 50.0 60.0 60.0 −2.9Congo 65.2 73.2 33.4 39.8 4.3 0.1 0.1 0.1 0.3Democratic Republic of theCongo
236.0 236.0 230.0 6.0 −0.4 3.0 3.0 3.0 3.3
Equatorial Guinea 7.4 7.1 1.0 6.1 6.3 0.0 0.0 0.0Gabon 32.0 32.0 10.0 22.0 −3.6 0.2 0.2 0.2 −10.7Sao Tome and Principe 4.6 3.9 0.0 3.9 −0.3East Africa 1081.8 1148.5 1020.8 127.7 2.7 242.6 248.4 111.4 27.2Burundi 17.3 10.7 10.7 −4.3 0.0 0.0 0.0 0.0Djibouti 1.6 1.7 0.0 1.7 6.9Eritrea 3.3 2.6 0.0 2.6 −13.3Ethiopia 18.1 24.0 24.0 4.0 0.0 0.0 0.0 4.8Kenya 140.4 181.6 174.4 7.2 −1.5 12.2 22.1 22.1 40.8Rwanda 13.0 17.2 17.2 8.9 0.6 0.6 0.6 8.0Somalia 30.0 30.0 0.2 29.8 2.0South SudanSudan (former) 71.4 71.0 66.0 5.0 2.7 2.2 2.2 2.2 7.4Uganda 413.8 437.4 437.4 6.5 95.0 85.7 85.7 52.6United Republic of Tanzania 373.1 372.3 291.0 81.3 0.4 132.5 137.6 0.6 137.0 9.6Southern Africa 1909.9 1799.4 279.7 1519.7 1.0 34.6 41.4 34.5 9.4Angola 263.0 262.5 10.0 252.5 0.8 0.3 0.4 0.4 49.3Botswana 0.1 0.2 0.2 3.2Comoros 52.3 25.1 0.0 25.1 6.0Lesotho 0.0 0.0 0.0 3.1 0.3 0.3 0.3 39.0Madagascar 129.6 127.1 30.8 96.2 0.4 10.9 10.5 8.8 1.7 2.6Malawi 98.3 82.4 82.4 4.6 2.6 3.4 3.4 18.5Mauritius 7.2 5.0 0.0 5.0 −5.8 0.6 0.5 0.1 0.5 18.0Mozambique 164.7 189.0 72.6 116.5 14.8 0.9 0.8 0.3 0.5Namibia 379.3 413.9 2.8 411.1 −3.2 0.7 0.6 0.1 0.5 20.9Seychelles 87.1 75.4 0.0 75.4 7.9 0.0 0.0 0.0South Africa 641.3 538.8 0.9 537.9 −1.9 5.1 6.5 2.7 3.7 7.8Swaziland 0.1 0.1 0.1 0.0 0.2 0.2 0.2 11.1Zambia 76.4 69.4 69.4 0.4 10.3 10.5 10.5 8.6Zimbabwe 10.5 10.5 10.5 −2.0 2.7 7.6 7.6 12.2West Africa 2339.5 2475.4 695.8 1779.6 3.4 215.6 246.9 246.8 21.0Benin 39.8 38.8 31.1 7.7 1.7 0.4 0.4 0.4Burkina Faso 14.5 15.0 15.0 5.3 0.4 0.3 0.3 44.0Cabo Verde 19.5 22.5 0.0 22.5 7.1Côte d’Ivoire 69.5 71.7 6.4 65.3 −1.0 1.7 3.4 3.4 9.9Gambia 46.4 45.0 4.4 40.6 4.1 0.0 0.0 0.0 0.0 15.8Ghana 351.2 333.5 90.0 243.5 −2.7 10.2 19.1 19.1 13.0Guinea 113.5 115.0 18.0 97.0 2.1 0.0 0.0 0.0Guinea-Bissau 6.8 6.8 0.1 6.6 0.6Liberia 8.0 8.0 0.8 7.2 −3.3 0.0 0.0 0.0 −0.9Mali 100.0 108.1 108.1 −0.1 2.1 2.1 2.1 47.0Mauritania 276.2 372.0 15.0 357.0 11.3Niger 40.0 53.2 53.2 11.4 0.1 0.1 0.1 17.1Nigeria 617.0 635.5 301.3 334.2 3.4 200.5 221.1 221.1 21.6Senegal 409.5 427.1 33.4 393.7 −0.2 0.1 0.3 0.2 0.1 11.2Sierra Leone 200.0 199.0 14.0 185.0 9.3 0.0 0.0 0.0 3.8Togo 27.5 24.1 5.0 19.1 0.7 0.1 0.0 0.0 0.0CEMAC 329.6 347.3 214.4 133.0 1.8 1.2 1.2 1.2 18.8CEN-SAD 3850.3 3664.2 1087.0 2577.2 1.3 1144.7 1245.8 1237.9 12.3COMESA 1811.5 1782.4 1405.9 2.1 1060.1 1133.6 1131.2 13.9ECCAS 850.5 860.4 465.0 395.4 0.8 4.6 4.7 4.7 11.4ECOWAS 2063.2 2103.4 680.8 1422.6 2.0 215.6 246.9 246.8 21.0IGAD 678.5 748.4 702.0 3.8SADC 2466.6 2382.7 800.7 0.7 170.0 182.0 38.1 9.4UEMOA 707.6 744.9 252.4 0.8 4.8 6.6 6.4 24.1UMA 1661.3 1571.3 24.9 1546.4 2.9 8.9 12.0 4.1 8.0 14.3Regional Office for Asia andthe Pacific
52193.1 52427.4 7584.2 40830.9 1.6 71078.9 76070.0 40619.5 7.9
Regional Office for Europeand Central Asia
14138.8 13647.7 470.0 −1.3 2665.7 2824.5 578.3 4.0
Regional Office for LatinAmerica and the Caribbean
12195.8 16669.0 508.0 16161.0 −1.1 1933.3 2396.8 1009.3 10.9
Regional Office for the NearEast
3096.1 3029.1 453.1 2576.0 2.2 1208.3 1305.9 1295.8 11.9
World 89956.7 94497.1 11053.9 79033.6 0.6 78066.9 83704.6 43994.8
110

TABLE 37: Volume of total cereal tradeCereals
imports exports
thousandtonnes
thousandtonnes
thousandtonnes
thousandtonnes
thousandtonnes
thousandtonnes
thousandtonnes
thousandtonnes
2000 2009 2010 2011 2000 2009 2010 2011Africa 45125.0 63896.6 66449.8 70899.3 2125.1 3555.8 3982.9 5009.8North Africa 27587.8 31994.8 36411.0 38335.6 725.9 913.0 847.3 420.2Algeria 7508.9 7910.3 7930.0 11091.7 0.0 6.0 8.4 0.0Egypt 9654.8 14584.9 16814.0 16999.5 395.3 773.5 704.2 217.6Libya 2718.7 3103.5 2903.9 1882.1 0.7 4.1 0.0 0.0Morocco 5215.0 4415.1 5510.6 5602.8 98.5 99.6 122.5 17.1SudanTunisia 2490.3 1981.0 3252.5 2759.6 231.5 29.7 12.3 185.4Regional Office for Africa 17536.8 31901.7 30038.8 32563.3 1399.2 2642.8 3135.6 4589.6Central Africa 1127.6 2068.7 2033.4 2458.6 1.4 25.7 30.5 22.4Cameroon 396.6 907.4 779.5 946.1 1.0 0.1 6.0 1.7Central African Republic 41.3 41.6 37.8 43.7 0.0 0.0 0.0 0.0Chad 50.6 192.7 183.6 167.0 0.0 0.0 0.0 0.0Congo 218.3 233.8 201.7 380.0 0.0 4.3 4.6 0.7Democratic Republic of theCongo
288.7 490.2 643.4 717.0 0.1 21.3 20.0 20.0
Equatorial Guinea 14.4 25.0 29.3 32.9Gabon 107.4 159.6 145.3 157.1 0.3 0.0 0.0 0.0Sao Tome and Principe 10.4 18.4 12.8 14.8 0.0 0.0 0.0 0.0East Africa 5169.7 10413.5 8843.1 9598.9 187.9 197.3 585.8 508.8Burundi 38.0 69.6 61.7 47.1 0.0 0.5 0.8 1.4Djibouti 68.6 560.6 183.3 619.5 0.0 0.0 0.0 0.0Eritrea 292.9 252.2 219.9 303.2 0.0 0.0 0.0 0.0Ethiopia 1271.6 2229.2 2134.1 1850.8 4.4 0.1 59.2 83.1Kenya 1165.0 2710.8 1420.0 2229.0 19.0 18.9 83.3 79.6Rwanda 41.3 131.2 231.8 205.4 0.0 0.4 2.1 16.4Somalia 261.1 610.9 362.7 469.2 0.0 0.0 0.0 0.0South SudanSudan (former) 1312.5 2384.8 2539.5 2140.6 52.7 1.2 5.3 32.6Uganda 172.3 513.7 463.7 531.2 7.6 105.1 210.6 126.1United Republic of Tanzania 546.4 950.6 1226.3 1202.8 104.3 71.3 224.5 169.6Southern Africa 4177.7 6968.1 6455.9 7544.3 1069.9 1968.1 1634.4 3766.5Angola 540.9 819.6 786.8 877.5 0.0 0.5 0.5 0.5Botswana 178.9 208.5 292.0 201.8 3.3 6.9 4.7 2.8Comoros 27.7 46.4 67.3 52.1 0.0 0.0 0.0 0.0Lesotho 194.8 291.8 256.0 256.2 1.4 0.1 0.1 0.1Madagascar 314.7 221.3 283.7 378.1 3.3 0.8 1.6 2.9Malawi 72.2 214.6 199.1 169.4 11.0 15.4 26.1 387.8Mauritius 288.1 328.3 326.8 291.0 38.8 33.3 36.9 23.3Mozambique 426.1 1018.8 958.2 891.4 0.0 15.8 62.2 61.0Namibia 156.9 131.2 161.3 79.5 2.3 0.2 0.3 0.5Seychelles 12.2 17.5 18.3 13.7 0.0 0.0 0.0 0.0South Africa 1710.4 2153.1 2106.0 3013.2 815.8 1822.5 1376.3 2715.9Swaziland 76.5 169.9 174.3 179.9 4.1 0.8 0.7 0.8Zambia 69.4 70.4 17.5 27.6 20.0 71.4 124.7 569.7Zimbabwe 109.0 1276.7 808.7 1112.9 170.0 0.4 0.3 1.3West Africa 7061.8 12451.4 12706.4 12961.5 140.1 451.7 884.8 291.9Benin 94.2 714.3 649.1 441.9 2.1 143.4 581.9 10.7Burkina Faso 263.2 375.0 354.8 432.6 59.2 17.7 35.0 24.8Cabo Verde 63.9 135.3 84.5 73.0 0.0 0.0 0.0 0.0Côte d’Ivoire 746.6 1664.7 1409.2 1441.9 2.5 126.9 104.0 105.9Gambia 122.3 206.6 274.6 164.0 0.2 1.1 0.1 1.9Ghana 450.8 804.5 685.4 944.8 2.4 0.4 8.8 0.2Guinea 288.2 402.9 430.7 260.8 0.1 15.1 10.1 10.1Guinea-Bissau 88.8 90.7 63.4 74.0 0.0 0.0 0.0 0.0Liberia 216.5 357.1 339.3 168.7 0.0 0.1 0.1 0.1Mali 113.8 242.2 213.7 239.1 12.8 0.2 1.5 2.8Mauritania 274.0 588.0 459.4 439.1Niger 256.8 257.9 326.3 272.0 0.1 10.9 40.9 8.1Nigeria 3051.1 4981.1 5872.2 6245.1 29.3 0.3 0.3 2.0Senegal 793.6 1332.1 1273.1 1365.5 0.5 103.6 72.8 121.7Sierra Leone 141.8 135.4 142.4 217.7 0.0 0.0 0.0 0.0Togo 96.4 163.5 128.3 181.3 30.7 32.1 29.5 3.7CEMAC 828.5 1560.2 1377.2 1726.8 1.3 4.4 10.6 2.5CEN-SAD 28569.3 39498.9 43806.8 43227.9 918.5 1344.8 1719.1 734.7COMESA 17994.1 29375.8 29511.0 29750.3 726.8 1047.1 1275.9 1562.6ECCAS 1706.5 2957.9 2881.9 3383.2 1.4 26.7 31.8 24.3ECOWAS 6787.8 11863.4 12247.0 12522.4 140.1 451.7 884.8 291.9IGAD 4544.1 9262.1 7323.3 8143.6 83.6 125.2 358.4 321.5SADC 4985.0 8362.4 8258.4 9412.0 1174.3 2060.7 1878.9 3956.0UEMOA 2453.4 4840.5 4418.0 4448.3 108.0 434.8 865.6 277.7UMA 18207.0 17997.8 20056.4 21775.3 330.6 139.4 143.1 202.5Regional Office for Asia andthe Pacific
85147.4 86287.1 90411.0 90783.1 58783.7 74750.4 71967.3 86798.4
Regional Office for Europeand Central Asia
64609.5 85544.0 84544.8 88890.3 82249.3 144818.9 131167.7 126372.3
Regional Office for LatinAmerica and the Caribbean
43983.9 46538.7 49685.7 51468.6 26006.6 33720.0 43685.7 49072.7
Regional Office for the NearEast
61417.3 77898.1 79128.3 75818.5 1548.2 2695.8 3414.8 1111.9
World 271019.8 328858.6 336408.2 343234.5 273088.0 330193.0 340306.1 349647.4
111

TABLE 38: Volume of total oilseeds, and sugar and honey tradeOilseeds Sugar and honey
imports exports imports exports
thousandtonnes
thousandtonnes
thousandtonnes
thousandtonnes
thousandtonnes
thousandtonnes
thousandtonnes
thousandtonnes
2000 2011 2000 2011 2000 2011 2000 2011Africa 1034.7 2117.1 1090.5 1274.4 5150.3 10837.1 4477.6 3744.9North Africa 766.5 1807.0 34.5 52.8 2295.5 4389.0 355.1 858.7Algeria 3.4 51.3 0.0 0.0 844.6 1589.7 0.4 350.5Egypt 380.8 1213.7 11.8 52.2 443.1 1294.1 217.0 442.0Libya 29.6 1.6 22.7 0.1 166.7 159.0 0.1 0.0Morocco 322.2 58.1 0.1 0.1 563.0 870.5 135.8 45.4SudanTunisia 30.6 482.3 0.0 0.3 278.1 475.7 1.8 20.8Regional Office for Africa 268.2 310.2 1056.0 1221.6 2854.6 6448.1 4122.5 2886.2Central Africa 8.6 3.6 8.7 0.7 168.4 376.7 35.4 17.1Cameroon 7.8 0.4 1.4 0.1 51.5 100.2 1.1 5.6Central African Republic 0.0 0.0 0.1 0.0 9.4 13.5 0.0 0.0Chad 0.0 0.0 7.0 0.5 25.9 91.7 0.0 0.0Congo 0.1 0.1 0.0 0.0 29.6 2.9 32.5 7.5Democratic Republic of theCongo
0.1 1.3 0.0 0.0 47.7 157.1 0.0 3.5
Equatorial Guinea 1.5 7.1Gabon 0.6 1.7 0.0 0.1 1.0 1.9 1.8 0.5Sao Tome and Principe 0.0 0.0 0.2 0.0 1.7 2.2East Africa 15.9 89.6 332.4 512.8 557.4 1917.9 351.6 346.9Burundi 0.9 1.2 0.0 0.0 1.9 22.6 5.0 0.3Djibouti 0.0 1.2 0.0 0.2 14.2 152.1 0.0 87.4Eritrea 0.5 0.4 8.9 78.3 0.0 0.0Ethiopia 1.7 3.6 38.3 275.6 23.8 252.1 71.2 0.7Kenya 4.9 40.2 1.1 10.6 118.8 303.6 19.8 58.4Rwanda 0.0 13.1 0.0 0.0 8.0 51.0 0.0 0.0Somalia 0.0 0.0 0.0 0.0 151.8 129.0 0.0 0.0South SudanSudan (former) 2.3 13.5 267.4 113.9 30.0 569.3 237.9 61.1Uganda 0.2 4.0 6.5 25.0 64.5 178.4 1.9 111.0United Republic of Tanzania 5.9 12.8 18.5 87.1 135.5 181.7 15.8 27.9Southern Africa 207.2 126.5 178.4 229.7 636.7 1081.6 3626.8 2133.8Angola 0.1 1.7 0.0 0.0 90.9 259.3 0.0 0.0Botswana 0.9 3.6 1.8 11.3 56.3 79.1 1.5 2.2Comoros 0.0 0.3 0.0 0.0 2.3 5.6 0.0 0.0Lesotho 1.5 1.7 26.7 31.4Madagascar 0.0 0.2 0.5 2.3 31.6 114.5 1.0 20.3Malawi 6.2 18.2 3.3 42.5 7.9 3.5 48.2 294.3Mauritius 1.8 2.2 0.0 0.1 40.6 45.5 502.4 499.2Mozambique 0.3 7.5 18.9 46.4 238.1 58.6 68.6 288.7Namibia 0.6 1.0 0.0 0.0 71.8 22.4 6.3 0.6Seychelles 1.4 2.0 0.0 0.0 3.4 2.4 0.0 0.0South Africa 178.4 69.6 38.3 91.4 38.0 378.7 1686.2 286.9Swaziland 4.1 4.3 12.5 0.9 14.4 9.9 947.2 312.0Zambia 8.2 7.7 12.0 18.1 3.7 8.6 87.9 319.8Zimbabwe 3.7 6.5 91.1 16.6 10.9 62.0 277.6 110.0West Africa 36.5 90.5 536.5 478.4 1492.2 3071.9 108.8 388.4Benin 0.7 2.5 119.6 23.9 18.6 119.8 0.2 84.2Burkina Faso 0.1 8.8 27.1 160.8 11.1 68.7 2.9 0.0Cabo Verde 0.8 0.0 0.0 0.0 13.9 19.9 0.0 0.0Côte d’Ivoire 1.7 1.9 50.2 37.0 33.5 22.9 81.1 11.2Gambia 9.0 0.0 27.0 2.2 84.2 73.6 0.3 18.3Ghana 0.4 14.3 48.3 38.4 134.4 481.1 3.6 225.8Guinea 0.0 0.1 13.4 1.2 58.8 128.5 0.0 0.0Guinea-Bissau 0.0 0.6 3.7 0.0 11.1 12.7 0.0 9.2Liberia 0.0 0.5 0.0 0.0 11.8 15.4 0.0 0.0Mali 0.4 11.0 12.7 33.0 95.4 91.8 0.0 0.0Mauritania 0.1 0.1 0.0 0.0 206.4 202.9 0.0 0.0Niger 0.7 0.6 4.6 2.6 51.9 60.0 2.0 16.2Nigeria 19.1 34.2 199.4 150.0 705.7 1535.9 1.3 2.3Senegal 0.5 15.6 3.4 19.3 23.7 148.0 15.1 4.3Sierra Leone 0.0 0.0 0.0 0.0 12.9 22.5 0.0 0.0Togo 2.9 0.1 26.9 9.9 19.0 68.1 2.3 16.8CEMAC 8.4 2.2 8.5 0.7 119.0 217.3 35.4 13.6CEN-SAD 801.0 1861.0 832.6 644.9 2906.5 6559.3 701.4 1045.0COMESA 445.9 1334.8 467.8 558.7 1042.4 3469.5 2417.1 2320.1ECCAS 9.7 6.5 8.7 0.7 261.2 658.5 40.4 17.4ECOWAS 36.4 90.4 536.5 478.4 1285.7 2869.0 108.8 388.4IGAD 9.1 62.5 313.9 425.6 412.0 1662.7 330.8 318.6SADC 213.3 140.4 196.8 316.8 817.6 1414.8 3642.6 2165.3UEMOA 7.0 41.2 248.4 286.5 264.2 592.0 103.5 141.9UMA 385.8 593.3 22.7 0.6 2058.8 3297.7 138.0 416.7Regional Office for Asia andthe Pacific
28711.6 71606.6 5406.5 5458.7 18284.5 21563.1 13966.0 15656.7
Regional Office for Europeand Central Asia
26913.0 34699.6 10010.2 16697.5 20140.5 25011.2 14318.4 13673.1
Regional Office for LatinAmerica and the Caribbean
7883.2 7069.5 18651.6 51548.5 1836.1 5393.5 16386.6 33548.6
Regional Office for the NearEast
1700.7 4934.7 339.4 201.2 6967.1 12436.2 1327.0 2101.9
World 68961.3 121238.8 67741.0 121908.8 49827.8 74548.3 51314.1 71486.3
112

TABLE 39: Volume of total meat and dairy products tradeTotal meat Dairy products (milk equivalent)
imports exports imports exports
thousandtonnes
thousandtonnes
thousandtonnes
thousandtonnes
thousandtonnes
thousandtonnes
thousandtonnes
thousandtonnes
2000 2011 2000 2011 2000 2011 2000 2011Africa 778.1 2011.0 118.5 156.6 4870.7 8959.2 356.5 1010.2North Africa 234.8 338.5 1.7 9.1 2759.9 5561.6 69.3 695.0Algeria 18.6 65.6 0.0 0.0 1552.5 2792.8 0.0 1.2Egypt 205.7 243.8 0.8 3.1 727.8 2120.9 17.7 643.3Libya 3.3 9.1 0.0 0.0 157.0 288.7 0.4 0.1Morocco 2.8 14.3 0.3 0.6 254.1 280.1 9.6 8.1SudanTunisia 4.5 5.8 0.6 5.3 68.5 79.2 41.6 42.3Regional Office for Africa 543.1 1672.3 116.7 147.5 2110.1 3396.9 287.2 315.2Central Africa 99.4 310.4 0.2 0.0 189.4 299.5 5.2 5.3Cameroon 15.6 3.1 0.0 0.0 48.9 82.8 4.2 4.6Central African Republic 0.1 0.3 0.0 0.0 2.8 3.9 0.1 0.0Chad 0.1 0.1 0.2 0.0 4.7 9.4 0.0 0.0Congo 18.6 99.5 0.0 0.0 46.4 56.9 0.0 0.2Democratic Republic of theCongo
19.0 95.7 0.0 0.0 40.7 93.3 0.0 0.0
Equatorial Guinea 4.7 26.0 1.7 0.2Gabon 41.1 83.6 0.0 0.0 42.8 51.1 0.9 0.1Sao Tome and Principe 0.2 2.0 1.4 1.9 0.0 0.4East Africa 2.3 11.7 10.8 26.6 165.4 325.2 8.6 72.4Burundi 0.0 0.1 0.0 0.0 5.1 7.0 0.0 0.0Djibouti 0.7 1.9 0.0 0.0 43.1 20.1 0.0 0.4Eritrea 0.1 0.0 15.2 0.2 0.7 0.7Ethiopia 0.1 0.1 1.2 18.3 8.3 10.6 0.0 4.4Kenya 0.2 0.4 0.7 3.4 14.7 43.4 2.8 34.4Rwanda 0.1 0.2 0.0 0.0 4.2 6.6 0.0 0.6Somalia 0.0 0.0 0.0 0.0 5.0 8.9 0.0 0.0South SudanSudan (former) 0.3 5.2 8.6 4.5 43.5 193.6 1.6 0.1Uganda 0.1 1.0 0.0 0.3 2.3 11.6 1.0 31.3United Republic of Tanzania 0.6 2.7 0.3 0.0 23.9 23.3 2.4 0.7Southern Africa 324.7 889.7 104.2 63.9 675.6 740.3 202.4 128.9Angola 81.3 391.3 0.0 0.0 19.9 43.0 0.0 0.0Botswana 3.4 8.5 21.2 13.9 147.5 95.3 0.4 0.5Comoros 2.5 10.0 0.0 0.0 1.9 3.9 0.0 0.0Lesotho 6.2 7.8 0.0 0.0 5.6 6.3Madagascar 0.2 1.2 0.1 0.0 22.2 31.3 0.3 0.0Malawi 0.0 0.2 0.0 0.0 8.2 28.7 0.0 5.8Mauritius 15.8 14.6 0.5 0.3 128.8 135.2 1.1 3.7Mozambique 5.3 18.4 0.0 0.0 36.0 36.3 0.0 0.7Namibia 32.0 18.0 32.9 22.1 36.6 24.4 3.7 0.2Seychelles 2.1 4.7 0.0 0.1 8.3 6.3 0.0 0.0South Africa 170.6 378.8 22.0 27.0 180.3 198.7 130.3 112.4Swaziland 4.6 2.6 7.5 0.1 60.4 21.2 7.1 0.0Zambia 0.4 1.9 0.1 0.1 12.2 28.4 0.6 5.4Zimbabwe 0.3 31.5 20.0 0.3 7.6 81.3 58.8 0.1West Africa 116.7 460.5 1.5 57.0 1079.8 2031.9 71.1 108.5Benin 56.8 155.6 0.9 54.5 29.2 40.9 0.0 0.4Burkina Faso 0.1 0.3 0.0 0.0 45.9 49.7 0.2 0.3Cabo Verde 2.7 11.6 0.0 0.0 23.1 40.7 0.0 0.0Côte d’Ivoire 10.3 18.1 0.1 0.1 123.6 112.5 59.8 10.9Gambia 2.0 6.8 0.0 0.5 24.8 103.1 0.1 13.7Ghana 22.1 179.2 0.2 0.0 89.3 207.7 2.1 7.2Guinea 1.8 12.3 0.0 0.1 40.4 49.7 0.0 0.2Guinea-Bissau 1.0 1.5 0.0 0.0 3.1 7.0 0.0 0.0Liberia 5.5 27.2 0.0 0.0 7.0 10.0 0.0 0.0Mali 0.2 1.7 0.0 0.1 66.5 69.2 0.0 0.5Mauritania 2.8 11.5 0.0 0.0 31.2 182.4 0.1 0.0Niger 0.1 0.5 0.1 0.0 30.8 71.6 1.2 2.5Nigeria 0.3 2.8 0.0 0.0 427.8 881.2 0.0 9.3Senegal 1.8 7.0 0.1 0.3 121.5 173.2 4.8 30.5Sierra Leone 1.3 11.3 0.0 0.0 2.4 9.8Togo 8.0 13.0 0.2 1.4 13.3 23.3 2.8 33.1CEMAC 80.2 212.6 0.2 0.0 147.3 204.3 5.2 4.9CEN-SAD 329.5 715.6 12.0 70.6 2308.8 4767.9 142.6 803.3COMESA 255.6 424.4 39.3 30.6 1311.6 3132.2 92.2 730.3ECCAS 180.7 701.8 0.2 0.0 214.4 349.5 5.2 5.3ECOWAS 113.9 449.0 1.5 57.0 1048.6 1849.5 71.0 108.5IGAD 1.6 8.7 10.4 26.6 132.2 288.3 6.2 71.2SADC 341.9 978.1 104.5 63.9 738.3 853.0 204.8 129.6UEMOA 78.3 197.8 1.3 56.4 433.9 547.3 68.8 78.2UMA 31.9 106.2 0.9 6.0 2063.2 3623.2 51.7 51.7Regional Office for Asia andthe Pacific
6190.9 9817.4 4121.5 5067.9 12510.4 23445.3 15810.3 16051.4
Regional Office for Europeand Central Asia
10721.7 18661.5 10998.0 18942.4 37263.0 54808.8 50444.3 70629.3
Regional Office for LatinAmerica and the Caribbean
1811.9 3301.8 2418.4 7838.4 6861.9 7310.7 2029.1 4711.4
Regional Office for the NearEast
1174.4 3176.3 49.2 213.3 6638.0 12710.8 541.1 4571.4
World 23347.1 39266.2 24457.2 42014.0 69181.6 103361.9 72773.4 105486.8
113

TABLE 40: Value of fish tradeFish
imports exports
millionUS$
millionUS$
millionUS$
millionUS$
millionUS$
millionUS$
millionUS$
millionUS$
2000 2009 2010 2011 2000 2009 2010 2011Africa 956.8 3406.9 3636.7 4582.4 2697.2 4884.7 4975.0 5042.5North Africa 213.1 763.8 811.3 896.6 1053.9 1725.4 1719.3 1778.0Algeria 12.5 53.9 50.4 58.5 4.2 8.5 5.9 5.9Egypt 170.9 475.5 499.9 530.9 1.2 14.1 15.2 23.6Libya 9.1 51.9 70.8 77.8 11.8 4.8 4.8 4.5Morocco 9.1 115.8 123.4 155.8 950.4 1547.8 1539.4 1523.4SudanTunisia 11.6 66.6 66.8 73.6 86.2 150.2 154.0 220.6Regional Office for Africa 743.5 2643.1 2825.3 3685.7 1639.3 3149.8 3246.0 3254.8Central Africa 87.4 424.3 437.1 577.5 18.0 6.1 5.8 4.1Cameroon 27.7 243.3 188.2 323.8 0.9 2.2 2.9 1.3Central African Republic 0.2 3.0 4.0 3.1 0.0Chad 0.0 0.5 0.5 0.5 0.0 0.0 0.0 0.0Congo 20.7 51.3 57.0 68.9 2.2 1.1 1.0 1.0Democratic Republic of theCongo
26.2 81.0 144.6 114.9 0.6 0.6 0.7 0.7
Equatorial Guinea 2.7 25.5 19.0 23.2 1.6 0.1 0.0 0.0Gabon 9.8 19.6 23.6 42.8 12.6 2.1 1.1 1.1Sao Tome and Principe 0.1 0.2 0.2 0.3 0.1 0.0 0.0 0.0East Africa 8.0 30.6 32.6 45.9 167.2 317.5 308.0 293.5Burundi 0.1 0.2 0.4 1.2 0.1 0.2 0.2 0.2Djibouti 1.5 2.4 1.2 2.2 0.0 0.0 0.1 0.2Eritrea 0.1 0.1 0.2 0.0 2.1 1.6 1.6 1.7Ethiopia 0.1 1.1 1.2 1.6 0.0 0.3 0.4 0.4Kenya 4.6 6.6 7.8 11.6 38.9 57.1 63.8 54.8Rwanda 0.1 5.5 6.4 11.1 0.3 0.8 0.1Somalia 0.1 5.5 3.5 4.0 2.3 3.1 3.0 3.1South SudanSudan (former) 0.9 4.6 7.1 9.0 0.2 0.2 0.6 0.3Uganda 0.1 0.8 1.5 2.8 28.9 109.2 129.2 138.0United Republic of Tanzania 0.4 4.0 3.3 2.2 94.7 145.5 108.3 94.8Southern Africa 209.0 839.4 843.4 1062.1 859.1 1846.2 2082.8 2254.7Angola 16.3 109.2 119.0 179.8 10.8 9.4 16.7 12.4Botswana 11.3 9.3 13.1 11.2 0.0 0.3 0.1 0.2Comoros 0.3 1.2 2.0 1.7 0.0Lesotho 9.2 2.1 2.1 2.1Madagascar 6.7 18.0 27.3 43.3 37.3 115.2 113.4 159.7Malawi 0.6 2.7 2.0 1.7 0.1 0.2 0.3 0.5Mauritius 41.7 235.5 234.2 298.6 36.7 284.5 265.5 342.2Mozambique 9.4 39.8 35.5 58.3 99.6 66.7 57.0 52.2Namibia 24.2 55.6 51.5 48.9 283.3 714.4 783.2 772.7Seychelles 11.5 87.4 78.9 95.9 113.5 210.2 275.4 301.1South Africa 59.1 260.6 241.3 270.5 270.4 441.8 565.7 599.9Swaziland 8.3 3.6 3.4 3.6 2.6 0.2 0.2 0.1Zambia 1.7 8.4 11.7 19.1 0.4 1.2 2.1 8.8Zimbabwe 8.6 6.0 21.3 27.3 4.3 2.2 3.2 4.8West Africa 439.0 1348.8 1512.2 2000.2 594.9 980.0 849.5 702.5Benin 8.7 27.7 27.5 31.6 1.5 0.2 1.3 1.9Burkina Faso 1.4 9.1 9.1 10.0 0.0 1.0 0.7 0.6Cabo Verde 0.6 3.0 2.4 3.7 1.3 14.9 37.5 56.0Côte d’Ivoire 132.1 363.5 289.0 337.4 128.9 170.3 23.9 2.1Gambia 0.5 0.8 1.5 0.8 3.6 5.2 6.8 5.4Ghana 83.6 121.4 146.4 281.4 78.5 53.9 34.9 31.6Guinea 8.2 8.8 7.4 10.8 2.2 9.3 10.0 12.0Guinea-Bissau 0.3 1.5 1.0 1.2 2.9 3.2 3.4 3.6Liberia 2.8 2.6 5.4 9.6 0.0 1.0 1.2 0.4Mali 1.7 9.4 12.1 11.1 0.4 0.1 0.1 0.3Mauritania 0.0 0.4 0.8 0.7 87.2 126.4 152.2 182.2Niger 0.5 1.4 1.8 1.2 1.6 0.3 0.6 0.8Nigeria 181.6 783.9 973.7 1246.7 12.5 337.0 323.9 83.8Senegal 1.6 1.1 5.8 17.4 260.3 242.2 239.2 307.5Sierra Leone 3.5 4.1 4.1 4.1 11.1 9.8 9.8 9.8Togo 12.0 10.1 24.4 32.6 3.0 5.2 4.1 4.5CEMAC 61.1 343.1 292.4 462.3 17.3 5.5 5.0 3.4CEN-SAD 634.0 2063.5 2281.0 2843.7 1558.6 2551.2 2368.5 2229.6COMESA 293.2 992.3 1122.1 1254.5 278.7 802.0 877.5 1041.7ECCAS 103.8 533.6 556.5 758.5 29.0 15.8 22.6 16.7ECOWAS 439.0 1348.3 1511.4 1999.5 507.8 853.6 697.3 520.3IGAD 7.4 21.0 22.5 31.3 72.4 171.5 198.7 198.4SADC 235.4 923.2 989.3 1177.5 954.4 1992.3 2191.8 2350.2UEMOA 158.2 423.8 370.6 442.5 398.6 422.4 273.2 321.2UMA 42.3 288.7 312.2 366.4 1139.9 1837.8 1856.3 1936.7Regional Office for Asia andthe Pacific
20975.7 28093.6 32446.0 38951.7 19834.0 35430.0 42662.0 51368.6
Regional Office for Europeand Central Asia
21967.8 46172.3 49713.8 56548.3 18231.7 35791.9 40469.7 45602.9
Regional Office for LatinAmerica and the Caribbean
1061.5 3019.9 3544.2 4098.5 6821.2 11241.0 11546.2 14436.6
Regional Office for the NearEast
598.2 1789.9 2151.9 2478.8 1358.6 2388.6 2632.0 2747.3
World 60089.2 99895.9 111137.9 128985.4 55759.5 96372.7 109629.6 128161.4
114

PART
4Sustainability dimensions
115

Land and Forestry
Forests play an essential role in mitigating climate changeand providing products and ecosystem services that are es-sential to the prosperity of humankind. The latest estimateof the world’s total forest area is over four billion hectares,corresponding to about 30 percent of the total land area oran average of 0.6 hectares per capita. The five most forest-rich countries (the Russian Federation, Brazil, Canada, theUnited States of America and China) presently account formore than half of the planet’s total forest area. Ten countriesor areas have no forest at all, and an additional 54 have for-est on less than 10 percent of their total land area. Changesin land cover have caused the most pressing environmen-tal issue in recent decades. Deforestation and land use in-tensification, especially its impact on soil degradation, areat the heart of the issue. However, in much of the world,the current picture of land cover change shows a continuingslowdown in converting forests to areas for crop or livestockproduction and the steady growth of protected areas. At theglobal level, deforestation has decreased from an estimated16 million hectares per annum in the last decade.
In Africa forests accounted for 25.3 percent of total land areain 1990, and it has dropped to 22 percent in 2011 (table 41).For RAF, the forest represented 32.1 in 1990 but fell to 27.9by 2011. This could be explained by the reduction in theforests in all the sub-regions, particularly the huge declinein East Africa where the percentage of forests fell from 28.6percent in 1990 to 17.5 percent in 2011. West Africa alsoexperienced a huge drop in annual growth rate in forest arearoughly equal to that of East Africa (chart 93).
In 2011, Map 53 shows that Angola, Congo, Democratic Re-public of the Congo , Gabon, Liberia, Mozambique and Zam-bia had the biggest forest area as share of total land area(44 percent to 88.5 percent).
In 2010, the RAF forest area comprised 9.9 percent of pri-mary forest, 87.4 percent of other naturally regenerated for-est and only 2.7 percent of planted forest. Other naturallyregenerated forest was the most represented in all of thesub-regions except Central Africa. Indeed in Southern Africa,it was 95.8 percent and was the most represented comparedto the other sub-regions of RAF. Similarly for West Africa,it was almost 92 percent. However, Central Africa recordedmore planted forest and primary forest than the other sub-regions (chart 94).
CHART 93: Annual growth rate in forest area(1990-2011)
-5.0
-2.5
0.0
2.5
CentralAfrica
EasternAfrica
NorthAfrica
SouthernAfrica
WesternAfrica
percent
Source: FAO, Statistics Division (FAOSTAT).
CHART 94: Forest characteristics (2010)
0
25
50
75
100
CentralAfrica
EasternAfrica
NorthAfrica
SouthernAfrica
WesternAfrica
percent
Other naturally regenerated forest
Primary forest
Planted forest
Source: Global Forest Resources Assessment.
116

SUSTAINABILITY DIMENSIONS
MAP 52: Global distribution of risks associated with main agricultural production systems
Source: FAO, Fisheries and Aquaculture Department (fishery and aquaculture statistics).
MAP 53: Forest area as share of total land area (percent, 2011)
No data available
0.07092 ~ < 6.6
6.6 ~ < 15
15 ~ < 31
31 ~ < 44
44 ~ 88.48
Source: FAO, Statistics Division (FAOSTAT).
117

The total production of round wood was about 655 billioncubic meters in 2011-12, and comprised 45 percent of in-dustrial roundwood and 55 percent wood fuel. The high-est production was recorded in RAP, followed by RAF (table42). RAP first, and then REU, RAF and RLAC had a trade sur-plus of roundwood as they exported more roundwood thanthey imported. Therefore during 2011, they recorded a pos-itive balance for round wood. On the other hand, RNE had adeficit of about 790 500 cubic meters. Within RAF, with theexception of East Africa, all other sub-regions had a tradesurplus. North Africa however, had deficit of about 520 000cubic meter.
In 2011-12, with a total production of about 1.65 billion cu-bic meters of industrial roundwood, RAF accounted for only4 percent, while REU alone accounted for 33 percent andRAP 30 percent. Over the period 1962-2012, this productionrecorded a strong growth in RLAC (4.2 percent) compared toRAF, where growth was 2.5 percent. Within RAF, SouthernAfrica had the largest production (34 percent), followed byWest Africa (25 percent), with the other sub-regions sharingthe remainder: 21 percent for Central Africa and 19 percentfor East Africa (table 42).
In 2011, wood fuel production was about 1.88 billion cubicmeters, and the RAP region accounted for roughly 42 per-cent, while RAF was 31 percent. Within RAF, East Africa wasthe biggest producer of wood fuel, with 39 percent of pro-duction in the region, followed by West Africa (31 percent),Central Africa (17 percent) and Southern Africa (13 percent).From 1962 to 2012, production grew at an average rate of2.2 percent in RAF, which was the highest rate compared tothe other regions. (Table 42)
With regard to sawnwood, in 2011-12, RAF had the lowestproduction. Within RAF, West Africa was the biggest pro-ducer with 46 percent of production in the region followedby Southern Africa 30 percent. Central Africa (17 percent)and East Africa (7 percent) were the lowest producers ofsawnwood in 2011 (Table 43).
In 2012, the biggest producers of roundwood, whose pro-duction ranged between 15 300 and 106 901 thousand cu-bic meters, were Democratic Republic of the Congo, Egypt,Ethiopia, Ghana, Kenya, Mozambique, Nigeria, South Africa,Sudan, Tanzania and Uganda (map 54).
Central Africa and Southern Africa experienced significantgrowth in the exports of forest products between 2000 and2012. In West Africa, North Africa and East Africa, the jumpwas less significant (chart 97).
Further reading
• FAO The State of the World’s Land and Water Resources forFood and Agriculture (SOLAW) - Managing Systems at Risk2011 (www.fao.org/nr/solaw/solaw-home/en/)
• UN International Year of Forests 2011 (www.fao.org/forestry/iyf2011/en/)
• FAO Land degradation assessment (www.fao.org/nr/land/degradation/en/)
• Global Forest Resources Assessment 2010 (www.fao.org/forestry/fra/fra2010/en/)
CHART 95: Africa production of selected forest products(1970-2012)
2
4
6
8
1970 1980 1990 2000 2010
millionm3
Sawnwood Wood-based panels
Source: FAO, Statistics Division (FAOSTAT).
CHART 96: Africa production of selected forest products(1970-2012)
1
2
3
1970 1980 1990 2000 2010
millionm3
Recovered paper Wood pulp Paper and paperboard
Source: FAO, Statistics Division (FAOSTAT).
118

SUSTAINABILITY DIMENSIONS
MAP 54: Roundwood production (thousand m3, 2012)
No data available
11 ~ < 1 200
1 200 ~ < 4 490
4 490 ~ < 8 060
8 060 ~ < 15 300
15 300 ~ 106 901
Source: FAO, Statistics Division (FAOSTAT).
CHART 97: Exports of forest products (2000 and 2012)
0.0
0.5
1.0
1.5
2.0
CentralAfrica
EasternAfrica
NorthAfrica
SouthernAfrica
WesternAfrica
billionUS$
2000 2012
Source: FAO, Statistics Division (FAOSTAT).
CHART 98: Imports of forest products (2000 and 2012)
0
1
2
3
4
5
CentralAfrica
EasternAfrica
NorthAfrica
SouthernAfrica
WesternAfrica
billionUS$
2000 2012
Source: FAO, Statistics Division (FAOSTAT).
119

Water
A very small proportion of the planet’s water is available forhuman use. Around 2.5 percent of the world’s water is fresh-water. Out of this, more than two-thirds is locked away inglaciers, ice caps and permafrost, and one-third in ground-water. The remaining 1.3 percent of the world’s total fresh-water is surface water in rivers and other forms such as iceand snow, and lakes and swamps.
In Africa during the period 2000-10, the total per capita wa-ter withdrawal was high (more than 330 to 1 037 cubic me-ters per annum per capita) for some countries like Egypt,Libya, Mali, Madagascar, Mauritania, Morocco, Somalia andZimbabwe (map 55).
Concerning agriculture, countries that withdrew sizeableamounts of water for agriculture from 2000-10 include So-malia, Madagascar, Sudan (former), Swaziland, Eritrea, Mau-ritania, Ethiopia, Senegal and Cape Verde (Chart 99)
For Africa, countries whose share of freshwater resourceswithdrawn by agriculture is large, therefore more than 15percent in 2005, include all countries of North Africa, So-malia, South Africa, Sudan and Zimbabwe). Countries whoseshare of freshwater resources withdrawn by agriculture wasbetween 5 and 15 percent were Burkina Faso, Djibouti, Er-itrea, Kenya, Mali, Mauritania, Niger and Senegal. And thosewhose rates are less than 0.5 percent were Angola, Benin,Gambia, Lesotho, Liberia, Mozambique, Sierra Leone and al-most all the countries of Central Africa (map 56).
More than 20 percent of the water withdrawn was by theindustrial sector: Lesotho (exceptional 40 percent), Angola,Seychelles, Liberia, the Gambia, Chad, Benin and Congo(Chart 100).
During the period 2000-10, Egypt, Libya, Madagascar, Mali,Mauritania, Morocco, Somalia and Zimbabwe recorded thelargest total per capita water withdrawal, which was esti-mated between 330 and 1 037 m3/yr/cap (Map 55).
Map 56 shows that Algeria, Egypt, Morocco, Libya, Somalia,Tunisia and Zimbabwe had the highest percentage of fresh-water resources withdrawn by agriculture (2000-10).
Further reading
• FAO The State of the World’s Land and Water Resources forFood and Agriculture (SOLAW) - Managing Systems at Risk2011 (www.fao.org/nr/solaw/solaw-home/en/)
• FAO Water (www.fao.org/nr/water/)• FAO AQUASTAT (www.fao.org/nr/aquastat/)
CHART 99: Freshwater withdrawal by agriculturalsector, shares of total (2000-2010*)
Kenya
Tunisia
Guinea-Bissau
Libya
Malawi
Guinea
Egypt
Morocco
Niger
United Republic of Tanzania
Mali
Cape Verde
Senegal
Ethiopia
Mauritania
Eritrea
Swaziland
Sudan (former)
Madagascar
Somalia
80 85 90 95 100percent
Source: Land and Water Division (AQUASTAT).
CHART 100: Freshwater withdrawal by industrial sector,shares of total (2000-2010*)
Rwanda
Gabon
Sierra Leone
Ghana
Algeria
Uganda
Equatorial Guinea
Nigeria
Central African Republic
Botswana
Côte d’Ivoire
Democratic Republic of the Congo
Congo
Benin
Chad
Gambia
Liberia
Seychelles
Angola
Lesotho
10 20 30 40percent
Source: Land and Water Division (AQUASTAT).
120

SUSTAINABILITY DIMENSIONS
MAP 55: Total water withdrawal per capita (m3/yr/cap, 2000-2010*)
No data available
12 ~ < 39
39 ~ < 76
76 ~ < 150
150 ~ < 330
330 ~ 1 037
Source: Land and Water Division (AQUASTAT).
MAP 56: Renenwable freshwater resources withdrawn by agriculture (percent, 2000-2010*)
No data available
0 ~ < 0.2
0.2 ~ < 0.88
0.88 ~ < 4.7
4.7 ~ < 16
16 ~ 512
Source: Land and Water Division (AQUASTAT).
121

Biodiversity
Biodiversity concerns the degree of variation of life formswithin a given ecosystem and is ultimately a measure of thehealth of the environment. Biodiversity for food and agri-culture includes the components of biological diversity thatare essential for feeding human populations and improvingthe quality of life. It includes the variety and variability ofecosystems, animals, plants and microorganisms, at the ge-netic, species and ecosystem levels, which are necessary tosustain human life as well as the key functions of ecosys-tems. It is the result of thousands of years of farmers’ andbreeders’ activities, land and forest utilization, and fisheriesand aquaculture activities combined with millions of yearsof natural selection.
Approximately 2 600 plant species threatened, 2 000 fishspecies and 811 bird species.
Protected land as a percent of total land area increased dur-ing the period 1990-2010 in all parts of Africa and on av-erage in the world. Southern Africa had the biggest share(more than 15 percent), followed by Central Africa, EastAfrica, and West Africa. At less than 5 percent, North Africahad the lowest portion.
With regard to the distribution of this indicator by country,Map 57 shows that countries such as Benin, Botswana, Côted’Ivoire, Ethiopia, Senegal, Tanzania, Zambia and Zimbabwehad between 18 and 42 percent of their terrestrial areas pro-tected.
Countries with a large portion of protected marine areas –therefore from 8 to 42 percent of territorial waters – includeCongo, Egypt, Kenya, Mauritania, Namibia and Tanzania.
Further reading
• FAO Biodiversity (www.fao.org/biodiversity)• UN International Year of Biodiversity 2010 (www.fao.org/biodiversity/2010-international-year-of-biodiversity)
• FAO/INFOODS: Nutrition and Biodiversity (www.fao.org/infoods/infoods/food-biodiversity/en/)
CHART 101: Species threatened in Africa (2012)
0
1
2
thousandspecies
Bird species
Fish species
Mammal species
Plant species
Source: World Bank (WDI).
CHART 102: Terrestrial protected areas, share of totalland area (1990 and 2010)
0
5
10
15
CentralAfrica
EasternAfrica
NorthAfrica
SouthernAfrica
WesternAfrica
World
percent
1990 2010
Source: World Bank (WDI).
122

SUSTAINABILITY DIMENSIONS
MAP 57: Terrestrial protected areas, share of total land area (percent, 2010)
No data available
0.002569 ~ < 2.5
2.5 ~ < 6.8
6.8 ~ < 12
12 ~ < 18
18 ~ 42.02
Source: World Bank (WDI).
MAP 58: Marine protected areas, share of territorial waters (percent, 2010)
No data available
0 ~ < 0.000014
0.000014 ~ < 0.12
0.12 ~ < 1.2
1.2 ~ < 8.2
8.2 ~ 45.82
Source: World Bank (WDI).
123

Agri-environmental indicators
Agriculture has a significant and complex impact on the en-vironment. Indeed, the management of agricultural land,increasing arable land, the use of fertilizers and pesticides,irrigation systems practiced, etc. have effects that can inthe long term adversely affect the environment. Similarly,the types of farming practiced can have a devastating ef-fect. It is therefore necessary to define appropriate agri-environmental indicators to monitor and measure the envi-ronmental impact of these activities in terms of agriculturaland environmental policies of countries to ensure sustain-able development of the environment. Taking into accountthe availability of data, some agri-environmental indicatorsadopted by the FAO were analyzed in this part of the year-book. They concern:
• Livestock density per ha of agricultural land, cattle andbuffaloes, sheep and goats
In East Africa, this indicator was the highest for cattle andbuffaloes in 2011 compared to all other regions of Africa.Similarly the regionwas also highest for sheep and goats. In-deed, sheep and goat density per ha of agricultural land wasmore significant (over 0.75 head/ha) in East Africa, NorthAfrica and West Africa than the others sub-regions, (chart103).
• Agricultural land’s portion of total land area
This indicator was higher (over 50 percent) for SouthernAfrica than the other sub-regions; however its growth wasslow from 1995 to 2011. Trends in East Africa (around 50percent) were similar to Southern Africa, whereas the otherparts of Africa lagged far behind with less than 20 percent(chart 104).
• Nitrogen fertilizer consumption per ha of arable landand land under permanent crops
In 2009 Morocco, Tunisia, Libya, Egypt, Zambia, Zimbabweand South Africa recorded the highest level of nitrogen fer-tilizer consumption per ha of arable land and land underpermanent crops. The indicator for these countries variedbetween 15 kg/ha and 326.8 kg/ha.
• Organic water pollutant (BOD) emissions
In 2005, South Africa was the leader in organic water pollu-tant emissions with almost 0.2 million kg/day. Madagascarand Morocco were next, in the range of 0.05 to 0.10 millionkg / day (chart 105). In terms of per worker, Botswana andTanzania experienced roughly 0.35 kg/day/worker, whichwere the highest level of emissions compared to the othercountries. Ethiopia and Eritrea came next, with emissionsper worker between, 0.20 and 0.25 kg/day (chart 106).
Further reading
• OECD (www.oecd.org/agriculture/env/indicators)• EUROSTAT (http://epp.eurostat.ec.europa.eu/portal/page/portal/agri_environmental_indicators/introduction)
CHART 103: Livestock density per ha of agriculturalland, cattle and buffaloes, sheep and goats (2011)
0.00
0.25
0.50
0.75
CentralAfrica
EasternAfrica
NorthAfrica
SouthernAfrica
WesternAfrica
head/ha
Cattle and buffaloes Sheep and goats
Source: FAO, Statistics Division (FAOSTAT).
CHART 104: Agricultural land, share of total land area(1992-2011)
20
30
40
50
1995 2000 2005 2010
percent
Central Africa
Eastern Africa
North Africa
Southern Africa
Western Africa
Source: FAO, Statistics Division (FAOSTAT).
124

SUSTAINABILITY DIMENSIONS
MAP 59: Nitrogen fertilizer consumption per ha of arable area and permanent crops (kg/ha, 2009)
No data available
0.2203 ~ < 0.8
0.8 ~ < 2.6
2.6 ~ < 4.5
4.5 ~ < 15
15 ~ 326.8
Source: FAO, Statistics Division (FAOSTAT).
CHART 105: Organic water pollutant (BOD) emissions(2005)
Eritrea
Botswana
Lesotho
Mauritius
Ethiopia
United Republic of Tanzania
Morocco
Madagascar
South Africa
0.00 0.05 0.10 0.15 0.20million kg/day
Source: World Bank (WDI).
CHART 106: Organic water pollutant (BOD) emissionsper worker (2005)
Lesotho
Madagascar
Morocco
South Africa
Mauritius
Eritrea
Ethiopia
United Republic of Tanzania
Botswana
0.15 0.20 0.25 0.30 0.35kg/day/worker
Source: World Bank (WDI).
125

Organic farming
Organic agriculture is a productionmanagement system thataims to promote and enhance ecosystem health, includingbiological cycles and soil biological activity. It is based onminimizing the use of external inputs and represents a de-liberate attempt to make the best use of local natural re-sources. Methods are used to minimize air, soil and waterpollution. Organic agriculture comprises a range of land,plant and animal management procedures, governed by aset of rules and limits usually enforced by inspection andcertification schemes. Synthetic pesticides, mineral fertil-izers, synthetic preservatives, pharmaceuticals, GeneticallyModified Organisms (GMOs), sewage sludge and irradiationare prohibited in all organic standards.
East Africa is the part of Africa with a large organic area(more than 0.75 million ha), whereas the other sub-regionwere under 0.25 million of ha. Central Africa had the small-est organic agriculture area (Chart 107).
In 2011, countries such as Democratic Republic of the Congo,Egypt, South Africa, Tanzania, Tunisia, and Uganda de-votedmore land to organic agriculture ranking between over34 500 to 228 400 ha (map 60).
The countries with the highest portion of organic agricul-tural land were Egypt, Tanzania, Tunisia and Uganda (map61).
“The majority of certified organic produce in Africa is des-tined for export markets. The major crops are coffee, olives,cocoa, oilseeds and cotton. The European Union is Africa’slargest market for agricultural products. There is a grow-ing recognition among policy makers that organic agricul-ture has a significant role to play in addressing the pressingproblems of food insecurity, poverty and climate change inAfrica”.6
Further reading
• FAO Organic Agriculture (www.fao.org/organicag/en/)• FAO Organic Agriculture and Environmental Stabilityof the Food Supply - FAO (ftp://ftp.fao.org/docrep/fao/meeting/012/ah950e.pdf)
6 FiBL & IFOAM (2013): The World of Organic Agriculture 2013.Frick and Bonn
CHART 107: Organic agriculture area (2011)
0.00
0.25
0.50
0.75
CentralAfrica
EasternAfrica
NorthAfrica
SouthernAfrica
WesternAfrica
millionha
Source: FAO, Statistics Division (FAOSTAT).
CHART 108: Organic agriculture, share of totalagricultural area (2011)
0
2
4
6
CentralAfrica
EasternAfrica
NorthAfrica
SouthernAfrica
WesternAfrica
percent
Source: FAO, Statistics Division (FAOSTAT).
126

SUSTAINABILITY DIMENSIONS
MAP 60: Organic agriculture area (ha, 2011)
No data available
10 ~ < 520
520 ~ < 3 860
3 860 ~ < 13 900
13 900 ~ < 34 500
34 500 ~ 228 400
Source: FAO, Statistics Division (FAOSTAT).
MAP 61: Organic agriculture, share of total agricultural area (percent, 2011)
No data available
0.0001827 ~ < 0.0088
0.0088 ~ < 0.034
0.034 ~ < 0.07
0.07 ~ < 0.24
0.24 ~ 9.24
Source: FAO, Statistics Division (FAOSTAT).
127

Bio-based economy
There is general consensus on the definition of the bio-based economy provided in the European Commission’sbackground paper7 for public consultation:
. . . a low waste production chain starting from the use ofland and sea, through the transformation and productionof bio-based products adapted to the requirements of end-users. More precisely, a bio-based economy integrates thefull range of natural and renewable biological resources —land and sea resources, biodiversity and biological materials(plant, animal and microbial), through to the processing andthe consumption of these bio-resources. The bio-economyencompasses the agriculture, forestry, fisheries, food andbiotechnology sectors, as well as a wide range of industrialsectors, ranging from the production of energy and chemi-cals to building and transport. It comprises a broad range ofgeneric and specific technological solutions (already avail-able or still to be developed) which could be applied acrossthese sectors to enable growth and sustainable develop-ment, for example in terms of food security and require-ments for industrial material for future generations.
From 2005 to 2010, among the bioenergy crops, maize wasthe largest in the world, followed closely by oil crops. Sugarwas the third largest. However, some bioenergy crops suchas wheat and cassava were quite insignificant because verysmall areas were allocated for their production (chart 109).
Biofuel production (1990-2009) was higher in West Africa,where in 1990, production was more than 60 thousand kilo-tons of oil equivalent, and it grew rapidly to reach roughly100 thousand kilotons by 2009. After West Africa was EastAfrica, with a biofuel production ranging between 30 to 60thousand kilotons. Next in size was South Africa (30 to 40),Central Africa (15 to 30), and then North Africa with the low-est biofuel production of less than 5 thousand kilotons from1990 to 2009 (chart 110).
The leading biofuel producing countries in 2009 were An-gola, Côte d’Ivoire, Democratic Republic of the Congo,Ethiopia, Ghana, Kenya, Mozambique, Nigeria, South Africa,Tanzania, and Zambia. Their production ranged between 6280 and 91 907 kilotons of oil equivalent, (map 62).
Further reading
• FAO Bioenergy (www.fao.org/bioenergy)• UN International Year of Natural Fibres(www.naturalfibres2009.org/en/index.html)
7 http://ec.europa.eu/research/consultations/bioeconomy/bio-based-economy-for-europe-part2.pdf
CHART 109: World area under bioenergy crops(2005-2010)
0.00
0.01
0.02
0.03
0.04
2005 2006 2007 2008 2009 2010
millionha
Cassava
Maize
Oil crops
Sugar
Wheat
Source: FAO.
CHART 110: Biofuel production (1990-2009)
0
30
60
90
1990 1995 2000 2005
thousandkilotonneofoilequivalent
Central Africa
Eastern Africa
North Africa
Southern Africa
Western Africa
Source: IEA.
128

SUSTAINABILITY DIMENSIONS
MAP 62: Biofuel production (kilotonne of oil equivalent, 2009)
No data available
0 ~ < 480
480 ~ < 6 280
6 280 ~ 91 907
Source: IEA.
CHART 111: Share of food crop usage in world bio-based economy (2009)
0
25
50
75
100
Cassava
Coconut
Maize
Palmoilfruit
Soybean seed
Sugarcane
Wheat
percent
Food and feed Material Energy
Source: FAO, Statistics Division.
129

Climate change
Climate change generally refers to a long-term increase inglobal temperatures. Global atmospheric temperature ispredicted to rise by roughly 4◦C by 2080, consistent witha doubling of atmospheric CO2 concentration. Mean tem-peratures are expected to rise at a faster rate in the upperlatitudes, with slower rates in equatorial regions. Mean tem-perature rise at altitude is expected to be higher than atsea level, resulting in intensification of convective precipi-tation and acceleration of snowmelt and glacier retreat. Inresponse to global warming, the hydrological cycle is ex-pected to accelerate, as rising temperatures increase the rateof evaporation from land and sea. Thus rainfall is predictedto rise in the tropics and higher latitudes, but decrease inthe already dry semi-arid to arid mid-latitudes and in the in-terior of large continents. Water-scarce areas of the worldwill generally become drier and hotter. Both rainfall andtemperatures are predicted to become more variable, with aconsequent higher incidence of droughts and floods, some-times in the same place.
Since 1900, the global land-ocean temperature index hasincreased rapidly. Indeed, from 1950 to 2000, chart 112highlights a strong ascending slope, hence strong increasein global temperatures. If current trends continue over thenext decades, the world could see a further increase in theglobal land-ocean temperature index.
Climate change according to scientists is believed to causethe increased frequency and also severity of natural disas-ters. However, the causes of climate change remain complexand an often controversial topic.
The poorest and most food-insecure regions around theglobe will be the most vulnerable under climate change.First, already scarce land and water resources will likely be-come even scarcer, and secondly insufficient technical and fi-nancial means will make adaptation to the new climate verydifficult.
Further reading
• FAO Climate Change (www.fao.org/climatechange/)• FAO Climate Change, Water and Food Security 2011• FAO Energy-smart food for people and climate (www.fao.org/docrep/014/i2454e/i2454e00.pdf)
• Intergovernmental Panel on Climate Change (IPCC) (www.ipcc.ch/)
• NASA (http://data.giss.nasa.gov/gistemp/)
CHART 112: Global land-ocean temperature index, baseperiod 1951-1980 (1880-2012)
-0.50
-0.25
0.00
0.25
0.50
1900 1950 2000
degreeCelsius
Annual mean 5-Year running mean
Source: NASA.
CHART 113: Global land-ocean temperature index forthree latitude bands, base period 1951-1981
(1880-2011)
-0.5
0.0
0.5
1.0
1900 1950 2000
degreeCelsius
Northern latitudes
Low latitudes
Southern latitudes
Source: NASA.
130

SUSTAINABILITY DIMENSIONS
MAP 63: Surface temperature, anomaly versus 1951-1980 (degrees Celsius, 2012)
Source: NASA, GISS Surface Temperature Analysis.
MAP 64: Share of population living in areas with elevation of 5 meters or less (percent, 2000)
No data available
0 ~ < 1.3
1.3 ~ < 3.4
3.4 ~ < 8.8
8.8 ~ 41.33
Source: World Bank (WDI).
131

Greenhouse gas emissions
Greenhouse gas (GHG) emissions from agriculture, includingcrop and livestock production, forestry and associated landuse changes, are responsible for a significant fraction of an-thropogenic emissions, up to 30 percent globally accordingto the Intergovernmental Panel on Climate Change (IPCC).GHG emissions presented in this section are available fromthe newly launched FAOSTAT Emissions database.
Regarding agricultural emissions, CO2 equivalent (CO2 eq)emissions in 2010 was mainly due first, to enteric fermenta-tion representing more than 200 thousand gigagrams CO2eq, and secondly, to manure left on pasture (chart 116). RAPwas the largest emitter of CO2 in the world. Indeed, it wasthe largest producer of CO2 eq due to the enteric fermen-tation, manure management, rice cultivation, synthetic fer-tilizers, left manure on pasture, crop residues and due toburning crop residues, (Table 49).
RAF’s emissions were low compared to other regions. In-deed RAF was the fourth largest GHG emitter from entericfermentation and from manure management.
Compared with the other sub-regions, greenhouse gas emis-sions from cultivated organic soils of East Africa was roughly35 thousand gigagrams CO2 eq in 2010. In fact for Cen-tral Africa, Southern Africa and West Africa, greenhouse gasemissions from cultivated organic soils was lower than 5thousand gigagrams CO2 eq (chart 115).
The countries in which the total agricultural greenhouse gasemissions was the highest (ranging between 16 100 and 75982 gigagrams CO2 eq, 2010) were Burkina Faso, Mali, Nigerand Nigeria in West Africa, Egypt in North Africa, Ethiopia,Kenya, Somalia, Tanzania and Uganda in East Africa, andSouth Africa and Madagascar in Southern Africa (map 65).
Further reading
• IPCC (www.ipcc.ch/)• FAOSTAT (http://faostat.fao.org/)• Monitoring and Assessment of GHG Emissions and Mit-igation Potentials in Agriculture, MICCA (www.fao.org/climatechange/micca/ghg/en/)
CHART 114: Net emissions/removals from net forestconversions (1990, 2000 and 2010)
0
100
200
300
CentralAfrica
EasternAfrica
NorthAfrica
SouthernAfrica
WesternAfrica
thousandgigagramsCO
2eq
1990 2000 2010
Source: FAO, Statistics Division (FAOSTAT).
CHART 115: Greenhouse gas emissions from cultivatedorganic soils (2010)
0
10
20
30
CentralAfrica
EasternAfrica
SouthernAfrica
WesternAfrica
thousandgigagramsCO
2eq
Source: FAO, Statistics Division (FAOSTAT).
132

SUSTAINABILITY DIMENSIONS
MAP 65: Total agricultural greenhouse gas emissions (gigagrams CO2eq, 2010)
No data available
0 ~ < 620
620 ~ < 2 900
2 900 ~ < 6 100
6 100 ~ < 16 100
16 100 ~ 75 982
Source: FAO, Statistics Division (FAOSTAT).
CHART 116: Africa agricultural greenhouse gas emissions by sector (2010)
0
50
100
150
200
thousandgigagramsCO
2eq
Enteric fermentation
Manure management
Rice cultivation
Synthetic fertilizers
Manure applied to soils
Manure left on pasture
Crop residues
Cultivated organic soils
Burning crop residues
Source: FAO, Statistics Division (FAOSTAT).
133

TABLE 41: Land and ForestryForest area Forest characteristics
total % total land primary forest other naturally regenerated forest planted forest
thousandha
thousandha
percent percent percent percent percent percent percent percent
1990 2011 1990 2011 1990 2010 1990 2010 1990 2010Africa 749238 601104 25.3 22.0 2.2 9.4 97.4 87.7 0.4 13.0North Africa 7620 7934 1.3 1.4 0.0 0.0 82.1 74.7 17.9 25.3Algeria 1667 1483 0.7 0.6 0.0 0.0 80.0 72.9 20.0 27.1Egypt 44 71 0.0 0.1 0.0 0.0 0.0 0.0 100.0 100.0Libya 217 217 0.1 0.1 0.0 0.0 0.0 0.0 100.0 100.0Morocco 5049 5141 11.3 11.5 0.0 0.0 90.5 87.9 9.5 12.1SudanTunisia 643 1022 4.1 6.6 0.0 0.0 54.4 31.4 45.6 68.6Regional Office for Africa 724070 592369 32.1 27.9 2.2 11.9 97.4 85.6 0.4 13.1Central Africa 267605 253581 51.0 48.3 39.3 30.3 60.6 69.5 0.2 42.4Cameroon 24316 19696 51.4 41.7Central African Republic 23203 22575 37.2 36.2 16.8 10.5 83.2 89.5 0.0 0.0Chad 13110 11446 10.4 9.1 1.6 1.6 98.3 98.3 0.1 0.1Congo 22726 22399 66.5 65.6 33.2 33.2 66.6 66.5 0.2 0.3Democratic Republic of theCongo
160363 153824 70.7 67.9 100.0 100.0
Equatorial Guinea 1860 1614 66.3 57.5 0.0 0.0 100.0 100.0 0.0 0.0Gabon 22000 22000 85.4 85.4 95.2 65.2 4.7 34.7 0.1 0.1Sao Tome and Principe 27 27 28.1 28.1 40.7 40.7 59.3 59.3 0.0 0.0East Africa 135230 60354 28.6 17.5 10.6 11.2 85.1 83.0 4.3 5.8Burundi 289 170 11.3 6.6 38.1 23.3 61.9 36.6 0.0 40.1Djibouti 6 6 0.2 0.2 0.0 0.0 100.0 100.0 0.0 0.0Eritrea 1528 15.1 0.0 0.0 99.4 97.8 0.6 2.2Ethiopia 12155 12.2 0.0 0.0 96.8 95.8 3.2 4.2Kenya 3708 3456 6.5 6.1 18.7 18.9 74.9 75.5 6.4 5.7Rwanda 318 445 12.9 18.0 2.2 1.6 19.8 12.6 78.0 85.7Somalia 8282 6670 13.2 10.6 0.0 0.0 100.0 100.0 0.0 0.0South SudanSudan (former) 76381 32.1 20.0 20.0 72.9 71.3 7.1 8.7Uganda 4751 2900 23.8 14.5 0.0 0.0 99.3 98.3 0.7 1.7United Republic of Tanzania 41495 33025 46.8 37.3 0.0 0.0 99.6 99.3 0.4 0.7Southern Africa 229231 205844 35.3 31.7 3.0 2.8 95.9 95.8 1.1 1.5Angola 60976 58355 48.9 46.8 0.0 0.0 99.8 99.8 0.2 0.2Botswana 13718 11233 24.2 19.8 0.0 0.0 100.0 100.0 0.0 0.0Comoros 12 3 6.4 1.4 0.0 0.0 83.3 66.7 16.7 33.3Lesotho 40 44 1.3 1.5 0.0 0.0 85.0 76.4 15.0 23.6Madagascar 13692 12496 23.5 21.5 24.6 24.2 73.7 72.5 1.7 3.3Malawi 3896 3204 41.3 34.0 44.3 28.9 52.3 59.9 3.4 11.3Mauritius 39 35 19.1 17.3 0.0 0.0 61.3 57.7 38.7 42.3Mozambique 43378 38811 55.2 49.4 0.0 0.0 99.9 99.8 0.1 0.2Namibia 8762 7216 10.6 8.8 0.0 0.0 100.0 100.0 0.0 0.0Seychelles 41 41 88.5 88.5 4.9 4.9 83.3 83.3 11.8 11.8South Africa 9241 9241 7.6 7.6 10.2 10.2 72.2 70.7 17.6 19.1Swaziland 472 567 27.4 33.0 0.0 0.0 66.1 75.1 33.9 24.9Zambia 52800 49301 71.0 66.3 0.0 0.0 99.9 99.9 0.1 0.1Zimbabwe 22164 15297 57.3 39.5 3.6 5.1 95.7 94.2 0.7 0.7West Africa 92004 72590 15.2 12.0 0.2 4.3 99.7 92.3 0.0 3.4Benin 5761 4511 51.1 40.0 0.0 0.0 99.8 99.6 0.2 0.4Burkina Faso 6847 5589 25.0 20.4 0.0 0.0 99.9 98.1 0.1 1.9Cabo Verde 58 85 14.3 21.0 0.0 0.0 0.0 0.0 100.0 100.0Côte d’Ivoire 10222 10403 32.1 32.7 6.1 6.0 92.4 90.8 1.5 3.2Gambia 442 482 43.7 47.6 0.3 0.2 99.4 99.5 0.3 0.3Ghana 7448 4825 32.7 21.2 5.3 8.0 94.0 86.7 0.7 5.3Guinea 7264 6508 29.6 26.5 0.9 1.0 98.3 97.6 0.8 1.4Guinea-Bissau 2216 2012 78.8 71.6 0.0 0.0 100.0 100.0 0.0 0.0Liberia 4929 4299 51.2 44.6 3.6 4.0 96.3 95.8 0.2 0.2Mali 14072 12411 11.5 10.2 0.0 0.0 100.0 95.8 0.0 4.2Mauritania 415 237 0.4 0.2 0.0 0.0 98.8 91.3 1.2 8.7Niger 1945 1192 1.5 0.9 11.3 18.3 86.2 69.4 2.5 12.3Nigeria 17234 8631 18.9 9.5 9.0 0.0 89.5 95.8 1.5 4.2Senegal 9348 8433 48.6 43.8 18.8 18.3 79.0 76.2 2.2 5.5Sierra Leone 3118 2706 43.5 37.8 7.2 4.1 92.6 95.3 0.2 0.5Togo 685 267 12.6 4.9 0.0 0.0 96.5 85.4 3.5 14.6CEMAC 107215 99730 36.0 33.4 39.3 30.3 60.6 69.5 0.1 0.2CEN-SAD 211214 114438 16.2 10.6 1.0 10.6 98.7 84.0 0.3 5.4COMESA 355928 255715 31.9 29.1 11.2 11.3 84.9 83.7 3.8 29.2ECCAS 328870 312106 50.4 47.9 22.7 17.6 77.2 82.2 0.2 29.9ECOWAS 91589 72353 18.2 14.4 0.2 4.3 99.7 92.3 0.0 3.4IGAD 26714 10.6 14.5 15.1 79.8 77.8 5.6 7.1SADC 431077 392689 44.7 40.7 2.5 2.4 96.5 96.2 1.0 20.8UEMOA 51096 44817 14.7 12.9 0.1 5.3 99.9 91.0 0.0 3.7UMA 7991 8101 1.4 1.4 0.0 0.0 83.4 75.9 16.6 24.1Regional Office for Asia andthe Pacific
744278 1567564 24.3 31.3 41.8 36.4 55.1 53.1 3.2 10.5
Regional Office for Europeand Central Asia
1031346 38.3 22.4 23.1 70.2 68.1 7.4 8.8
Regional Office for LatinAmerica and the Caribbean
1039686 942806 51.6 46.8 75.1 72.9 24.0 25.0 0.9 2.0
Regional Office for the NearEast
98673 22656 6.8 1.9 16.1 15.7 75.7 73.9 8.2 10.4
World 4168399 3957571 32.0 31.0 28.0 38.2 69.1 52.9 3.0 9.9
134

TABLE 42: Forestry production and tradeProduction of selected forest products
industrial roundwood woodfuel roundwoodtotal p.a.
growthtotal p.a.
growthtotal p.a.
growthexport import
thousandm3
percent thousandm3
percent thousandm3
percent thousandm3
thousandm3
2011-12 1962-2012 2011-12 1962-2012 2011-12 1962-2012 2011-12 2011-12Africa 72357 636853 2.1 709211 2.1 3918.7 703.8North Africa 3286 1.8 50408 1.3 53693 1.3 18.1 537.0Algeria 139 0.2 8317 2.1 8455 2.1 0.3 6.4Egypt 268 3.1 17601 1.1 17869 1.1 2.8 269.3Libya 116 3.4 975 2.4 1091 2.5 0.0 5.1Morocco 372 0.2 6741 0.5 7113 0.5 5.1 244.5Sudan 2173 14583 16756 9.8 0.6Tunisia 218 2.9 2191 1.1 2409 1.2 0.1 11.2Regional Office for Africa 69067 2.5 586388 2.2 655455 2.1 3898.2 166.3Central Africa 14392 2.1 101280 2.5 115672 2.5 2331.9 9.2Cameroon 2175 2.1 10081 0.8 12256 1.0 514.1 5.2Central African Republic 732 2.0 2000 0.5 2732 0.8 176.0 0.0Chad 761 1.8 7300 2.0 8061 2.0 0.0 1.4Congo 2194 2.9 1379 1.0 3573 2.0 985.0 1.5Democratic Republic of theCongo
4592 2.2 78894 2.9 83486 2.9 260.0 0.7
Equatorial Guinea 525 0.7 447 0.7 972 0.7 329.7 0.4Gabon 3400 1.6 1070 2.2 4470 1.7 67.0 0.0Sao Tome and Principe 13 109 1.7 122 1.9 0.1 0.0East Africa 12794 3.6 228669 2.1 241463 2.1 27.3 44.0Burundi 883 7.3 9536 2.0 10419 2.2 2.8 0.3Djibouti 0 367 367 10.1 0.0 1.4Eritrea 1 1264 1265 0.2 0.0Ethiopia 2935 103966 106901 0.1 4.8Kenya 1246 2.0 26400 2.3 27646 2.3 3.5 12.6Rwanda 1212 6.5 5000 1.1 6212 1.5 0.1 8.8Somalia 110 1.9 13957 3.3 14067 3.3 0.6 1.5South Sudan 0 4383 4383 0.0 0.0Sudan (former)Uganda 4093 3.3 40726 2.1 44819 2.2 10.3 9.4United Republic of Tanzania 2314 2.2 23069 1.3 25383 1.3 9.7 4.9Southern Africa 24462 2.3 74753 2.8 99215 2.4 454.2 51.1Angola 1096 0.9 4194 2.6 5290 2.1 7.1 6.4Botswana 105 2.3 690 0.4 795 0.5 0.0 0.4Comoros 25 280 3.7 304 3.9 0.0 0.0Lesotho 0 2108 0.7 2108 0.7 0.0 0.0Madagascar 281 −0.8 13045 3.6 13326 3.3 1.8 3.5Malawi 1400 4.6 5528 1.0 6928 1.4 5.8 0.0Mauritius 4 −3.4 7 −3.9 11 −3.7 0.4 15.3Mozambique 1416 1.0 16724 1.8 18140 1.8 265.5 13.0Namibia 0 833 1.8 833 1.8 17.4 8.6Seychelles 10 3 13 0.4 0.1South Africa 17952 2.4 12000 6.4 29952 3.2 154.1 2.8Swaziland 330 1.7 1093 1423 4.7 0.0 0.0Zambia 1325 3.0 9382 2.1 10707 2.1 1.0 0.4Zimbabwe 518 2.0 8867 1.6 9385 1.6 0.7 0.5West Africa 17418 2.3 181687 1.8 199105 1.7 1084.7 62.1Benin 427 2.3 6363 0.5 6790 0.6 241.2 0.1Burkina Faso 1171 3.6 13145 1.5 14316 1.6 0.5 0.4Cabo Verde 0 200 1.8 200 1.8 5.3 1.8Côte d’Ivoire 1469 −0.3 9035 0.7 10504 0.5 156.7 0.0Gambia 113 6.4 713 2.4 825 2.7 2.8 0.8Ghana 1289 −0.8 40203 3.7 41492 3.2 269.7 18.7Guinea 651 1.8 12063 0.7 12714 0.7 38.1 0.3Guinea-Bissau 132 0.6 2675 3.9 2807 3.6 14.5 0.0Liberia 538 2.8 7508 4.5 8046 4.3 139.0 0.0Mali 413 1.6 5445 1.5 5857 1.5 2.5 0.8Mauritania 3 0.0 1919 2.1 1922 2.1 0.3 31.5Niger 701 3.4 2857 0.5 3558 0.8 0.2 1.1Nigeria 9418 2.9 63999 1.1 73417 1.3 96.5 1.9Senegal 804 2.2 5478 1.2 6282 1.3 1.1 4.3Sierra Leone 124 −0.1 5660 0.0 5783 0.0 19.0 0.1Togo 166 1.5 4424 0.5 4590 0.5 97.3 0.2CEMAC 9787 2.0 22276 1.3 32063 1.4 2071.8 8.5CEN-SAD 21540 2.2 239146 1.9 260686 1.8 1235.6 563.4COMESA 21412 341901 363313 2.4 299.7 333.0ECCAS 16371 2.3 115011 2.5 131382 2.4 2341.8 15.9ECOWAS 17415 2.3 179767 1.8 197182 1.7 1084.4 30.6IGAD 10558 205646 216204 24.5 30.4SADC 31344 2.3 176436 2.7 207780 2.5 724.0 56.7UEMOA 5283 1.9 49421 1.2 54704 1.2 514.0 6.9UMA 848 1.3 20143 1.5 20991 1.4 5.8 298.7Regional Office for Asia andthe Pacific
492829 791993 0.4 1284822 0.6 45379.5 60337.6
Regional Office for Europeand Central Asia
548725 158139 706864 61838.4 55978.3
Regional Office for LatinAmerica and the Caribbean
221276 4.2 289182 1.2 510458 2.1 1430.0 242.5
Regional Office for the NearEast
4059 53680 1.3 57738 1.2 40.9 964.5
World 1652146 1882369 1.1 3534516 1.1 116680.1 124720.0
135

TABLE 43: Forestry production: finished productsProduction of selected forest products
sawnwood wood-based panels wood pulp paper and paperboardtotal p.a.
growthtotal p.a.
growthtotal p.a.
growthtotal p.a.
growththousandm3
percent thousandm3
percent thousandtonnes
percent thousandtonnes
percent
2011-12 1962-2012 2011-12 1962-2012 2011-12 1962-2012 2011-12 1962-2012Africa 8566 2871 2633 3747North Africa 210 248 262 999Algeria 13 −3.0 48 0 46 1.2Egypt 12 59 3.2 41 660 4.1Libya 31 4.2 0 0 6 1.8Morocco 83 2.7 35 3.4 221 4.7 127 2.2Sudan 51 2 0 3Tunisia 20 4.3 104 0 157 7.8Regional Office for Africa 8353 2623 2371 2748Central Africa 1923 595 0 6Cameroon 993 5.0 78 3.7 0 0Central African Republic 54 0.6 5 0 0Chad 2 0 0 0Congo 214 3.8 93 4.9 0 3Democratic Republic of theCongo
150 0.1 4 −4.8 0 3 3.3
Equatorial Guinea 4 −3.1 28 0 0Gabon 500 5.2 387 3.3 0 0Sao Tome and Principe 5 0 0 0East Africa 533 214 56 106Burundi 83 0 0 0Djibouti 0 0 0 0Eritrea 0 0 0 0Ethiopia 18 103 0 78Kenya 142 2.1 83 0 0Rwanda 135 0 0 0Somalia 14 2.1 0 0 0South Sudan 0 0 0 0Sudan (former)Uganda 117 2.9 24 3.4 0 3United Republic of Tanzania 24 −2.9 5 4.2 56 25Southern Africa 2357 742 2292 2616Angola 5 −5.3 11 15 0.1 0Botswana 0 0 0 0Comoros 0 0 0 0Lesotho 0 0 0 0Madagascar 104 1.1 1 1 10Malawi 45 2.8 18 0 0Mauritius 2 −1.6 0 0 0Mozambique 198 0.8 2 −0.7 0 2Namibia 0 0 0 0Seychelles 1 0 0 0South Africa 1567 1.8 617 3.7 2276 3.7 2442 4.9Swaziland 102 1.9 8 0 49Zambia 157 3.0 18 0 4Zimbabwe 177 2.1 68 0 109 5.9West Africa 3540 1071 23 20Benin 84 4.3 0 0 0Burkina Faso 5 0 0 0Cabo Verde 0 0 0 0Côte d’Ivoire 700 3.3 477 8.0 0 0Gambia 1 2.4 0 0 0Ghana 515 0.4 451 6.8 0 0Guinea 30 1.0 42 0 0Guinea-Bissau 16 1.5 0 0 0Liberia 80 1.5 0 0 0Mali 13 0.5 0 0 0Mauritania 14 2 0 1Niger 4 0 0 0Nigeria 2002 4.2 97 2.7 23 19Senegal 25 1.0 0 0 0Sierra Leone 5 −1.3 0 0 0Togo 46 6.5 2 0 0CEMAC 1767 4.8 591 0 3CEN-SAD 3764 1232 285 972COMESA 1327 388 42 925ECCAS 2011 4.4 606 15 6ECOWAS 3526 3.3 1069 23 19IGAD 342 211 0 84SADC 2531 1.7 752 2348 2644UEMOA 893 3.4 479 0 0UMA 161 2.8 189 221 337 4.7Regional Office for Asia andthe Pacific
140473 165941 39878 184549
Regional Office for Europeand Central Asia
143131 81610 47314 107209
Regional Office for LatinAmerica and the Caribbean
42296 2.6 17538 22174 20078
Regional Office for the NearEast
285 1743 508 3290
World 408768 299008 173722 399734
136

TABLE 44: Water withdrawal and pressure on renewable water resourcesYears Water withdrawal by sector Water withdrawal % of renewable freshwater resources
% of total total per capita withdrawn
agriculturalindustrial municipal total by
agricultureyear percent percent percent million
m3/yrm3/yr/cap percent percent
1975-2010 2010* 2010* 2010* 2010* 2010* 2010* 2010*AfricaNorth AfricaAlgeria 2000 63.9 13.5 22.5 6161 196 52.7 33.8Egypt 2000 86.4 5.9 7.8 68300 973 94.7 103.0Libya 2000 82.8 3.1 14.1 4326 796 609.7 512.0Morocco 2000 87.3 2.9 9.8 12607 428 43.5 38.0SudanTunisia 2000 82.0 4.2 13.8 2640 296 61.3 47.1Regional Office for AfricaCentral AfricaCameroon 2000 76.1 7.1 16.8 959 58 0.3 0.3Central African Republic 2000 1.5 16.5 82.0 67 17 0.0 0.0Chad 2000 51.8 24.1 24.1 367 42 0.9 0.4Congo 2002 8.7 21.7 69.6 46 14 0.0 0.0Democratic Republic of theCongo
2000 17.7 19.8 62.6 622 12 0.0 0.0
Equatorial Guinea 2000 5.7 14.9 79.3 17 31 0.1 0.0Gabon 2000 38.5 8.8 52.8 130 101 0.1 0.0Sao Tome and PrincipeEast AfricaBurundi 2000 77.1 5.9 17.0 288 43 2.3 1.8Djibouti 2000 15.8 0.0 84.2 19 25 6.3 1.0Eritrea 2004 94.5 0.2 5.3 582 121 9.2 8.7Ethiopia 2002 93.6 0.4 6.0 5558 81 4.6 4.3Kenya 2003 79.2 3.7 17.2 2735 73 8.9 7.1Rwanda 2000 68.0 8.0 24.0 150 17 1.6 1.1Somalia 2003 99.5 0.1 0.5 3298 378 22.4 22.3South SudanSudan (former) 2000 97.1 0.6 2.3 37140 1037 57.6 55.9Uganda 2002 37.8 14.5 47.7 317 12 0.5 0.2United Republic of Tanzania 2002 89.4 0.5 10.2 5184 145 5.4 4.8Southern AfricaAngola 2000 32.8 28.8 38.4 641 43 0.4 0.1Botswana 2000 41.2 18.0 40.7 194 107 1.6 0.7Comoros 1999 47.0 5.0 48.0 10 17 0.8 0.4Lesotho 2000 20.0 40.0 40.0 50 25 1.0 0.2Madagascar 2000 97.5 0.9 1.6 14680 899 4.4 4.2Malawi 2000 83.5 4.1 12.3 970 82 5.6 4.7Mauritius 2003 67.7 2.8 29.5 725 568 26.4 17.9Mozambique 2000 73.9 3.3 22.8 744 39 0.3 0.3Namibia 2000 71.0 4.7 24.3 300 152 1.7 1.2Seychelles 2003 6.6 27.7 65.7 14 161South Africa 2000 62.7 6.0 31.2 12496 272 25.0 15.7Swaziland 2000 96.5 1.2 2.3 1042 962 23.1 22.3Zambia 2000 75.9 7.5 16.7 1740 163 1.7 1.3Zimbabwe 2002 78.9 7.1 14.0 4205 334 21.0 16.6West AfricaBenin 2001 45.4 23.1 31.5 130 19 0.5 0.2Burkina Faso 2000 70.1 1.6 28.3 985 76 7.9 5.5Cabo Verde 2000 90.9 1.8 7.3 22 49 6.8 6.7Côte d’Ivoire 2000 42.6 19.1 38.3 1409 82 1.7 0.7Gambia 2000 28.1 24.4 47.5 71 52 0.9 0.3Ghana 2000 66.4 9.7 23.9 982 49 1.8 1.2Guinea 2000 83.9 3.2 12.9 1620 188 0.7 0.6Guinea-Bissau 2000 82.3 4.6 13.1 175 136 0.6 0.5Liberia 2000 33.6 26.6 39.8 179 60 0.1 0.0Mali 2000 90.1 0.9 9.0 6546 545 6.5 5.9Mauritania 2000 93.7 1.6 4.7 1601 572 14.0 13.2Niger 2000 88.0 1.2 10.8 2364 202 7.0 6.2Nigeria 2000 53.5 15.1 31.5 10306 79 3.6 1.9Senegal 2002 93.0 2.6 4.4 2221 222 5.7 5.3Sierra Leone 2000 71.0 9.7 19.4 493 110 0.3 0.2Togo 2002 45.0 2.4 52.7 169 33 1.2 0.5CEMACCEN-SADCOMESAECCASECOWASIGADSADCUEMOAUMARegional Office for Asia andthe PacificRegional Office for Europeand Central AsiaRegional Office for LatinAmerica and the CaribbeanRegional Office for the NearEastWorld
137

TABLE 45: Species threatened and nationally protected areasThreatened species Nationally protected areas
mammals birds fish higherplants
terrestrial territorial waters
% of total land area % of territorial watersspecies species species species percent percent percent percent2012 2012 2012 2012 1990 2010 1990 2010
Africa 817 811 1945 2608 9.2 10.2North Africa 89 60 180 53 3.1 3.8Algeria 14 11 36 13 6.3 6.3 0.2 0.3Egypt 18 10 40 2 1.9 5.9 4.4 9.3Libya 12 4 24 3 0.1 0.1 0.0 0.1Morocco 17 11 45 29 1.2 1.5 0.8 1.3Sudan 15 17Tunisia 13 7 35 6 1.3 1.3 1.1 1.2Regional Office for Africa 728 751 1765 2555 10.8 11.7Central Africa 138 111 346 738 9.9 11.0Cameroon 38 24 111 376 7.0 9.2 0.4 0.4Central African Republic 8 13 3 17 17.5 17.7Chad 13 11 1 3 9.4 9.4Congo 11 4 45 37 5.4 9.4 0.0 32.8Democratic Republic of theCongo
30 35 83 85 10.0 10.0 3.8 4.4
Equatorial Guinea 19 6 28 67 7.3 19.2 0.0 2.6Gabon 14 5 61 119 4.6 15.1 0.2 7.3Sao Tome and Principe 5 13 14 34East Africa 182 203 428 539 9.0 10.8Burundi 11 12 17 3 3.8 4.8Djibouti 8 9 17 2 0.0 0.0 0.2 0.2Eritrea 10 14 19 4 5.0 0.0 0.0Ethiopia 33 26 14 25 18.4Kenya 28 34 68 128 11.6 11.8 5.2 10.5Rwanda 20 14 9 5 9.9 10.0Somalia 15 14 28 23 0.6 0.6 0.0 0.0South Sudan 0 14Sudan (former) 20 17 4.2 4.2 0.0 0.0Uganda 22 22 61 37 7.9 10.3United Republic of Tanzania 35 44 175 295 26.6 27.5 3.7 10.0Southern Africa 175 241 462 720 15.5 16.5Angola 15 25 39 33 12.4 12.4 0.1 0.1Botswana 7 10 2 1 30.3 30.9Comoros 5 9 6 4 0.0 0.0Lesotho 2 7 1 4 0.5 0.5Madagascar 65 35 86 358 2.2 3.1 0.0 0.1Malawi 7 15 101 16 15.0 15.0Mauritius 6 11 15 88 1.7 4.5 0.3 0.3Mozambique 12 26 54 42 14.8 15.8 1.8 3.3Namibia 12 26 28 25 14.4 14.9 0.5 8.2Seychelles 5 10 18 55 42.0 42.0 0.5 0.5South Africa 24 41 85 67 6.5 6.9 0.7 6.5Swaziland 6 11 4 3 3.0 3.0Zambia 9 15 20 10 36.0 36.0Zimbabwe 3 14 18.0 28.0West Africa 233 196 529 558 7.8 8.1Benin 11 9 27 13 23.8 23.8 0.0 0.0Burkina Faso 9 9 4 3 13.7 14.2Cabo Verde 3 4 24 3 2.5 2.5 0.0 0.0Côte d’Ivoire 23 20 45 104 22.6 22.6 0.1 0.1Gambia 10 10 23 4 1.5 1.5 0.1 0.1Ghana 16 17 44 115 14.6 14.7 0.0 0.0Guinea 21 17 66 22 6.8 6.8 0.0 0.0Guinea-Bissau 12 9 31 4 7.6 16.1 2.7 45.8Liberia 18 13 53 47 1.6 1.8 0.0 0.0Mali 12 13 2 7 2.3 2.4Mauritania 16 13 32 0 0.5 0.5 32.1 32.1Niger 12 9 4 2 7.1 7.1Nigeria 26 18 59 167 11.6 12.8 0.2 0.2Senegal 16 13 45 9 24.1 24.1 5.8 12.4Sierra Leone 17 13 47 48 4.9 4.9 0.0 0.0Togo 11 9 23 10 11.3 11.3 0.0 0.0CEMAC 103 63 249 619 9.8 11.7CEN-SAD 327 295 645 643 6.2 6.7COMESA 310 317 625 859 7.9 9.6ECCAS 164 148 402 774 10.3 11.2ECOWAS 217 183 497 558 9.3 9.7IGAD 131 150 227 236 7.8SADC 235 311 714 1096 15.2 16.0UEMOA 106 91 181 152 8.9 9.1UMA 72 46 172 51 2.9 2.9Regional Office for Asia andthe Pacific
1147 1204 1549 2978 9.0 10.5
Regional Office for Europeand Central Asia
328 478 1047 648 9.0
Regional Office for LatinAmerica and the Caribbean
599 960 1051 4090 9.7 20.2
Regional Office for the NearEast
219 209 460 245 3.9 7.9
World 3075 3753 6229 11212 9.1 12.3
138

TABLE 46: Agri-environmental indicatorsStock of Organic water pollutant (BOD) emissions
cattle and buffaloes sheep and goats poultry birdsper ha of agricultural area per ha of agricultural area per ha of agricultural areahead/ha head/ha head/ha head/ha head/ha head/ha kg/day
kg/day/worker2000 2011 2000 2011 2000 2011 2005-06* 2005-06*
Africa 0.2 0.2 0.4 0.5 1.1 1.7North Africa 0.1 0.1 0.7 0.8 4.6 5.7Algeria 0.0 0.0 0.5 0.7 2.8 3.1Egypt 2.1 2.3 2.4 2.6 36.1 39.7Libya 0.0 0.0 0.3 0.6 1.6 2.2Morocco 0.1 0.1 0.7 0.8 4.5 6.1 79829.1 0.2SudanTunisia 0.1 0.1 0.9 0.8 6.7 8.3Regional Office for Africa 0.2 0.3 0.4 0.5 0.8 1.3Central Africa 0.2 0.2 0.2 0.3 0.6 0.8Cameroon 0.6 0.5 0.9 0.9 2.4 4.8Central African Republic 0.6 0.8 0.6 1.2 0.8 1.3Chad 0.1 0.2 0.2 0.2 0.1 0.1Congo 0.0 0.0 0.0 0.0 0.2 0.3Democratic Republic of theCongo
0.0 0.0 0.2 0.2 0.8 0.8
Equatorial Guinea 0.0 0.0 0.1 0.2 1.0 1.3Gabon 0.0 0.0 0.1 0.1 0.6 0.6Sao Tome and Principe 0.1 0.1 0.2 0.2 7.8 9.8East Africa 0.4 0.6 0.6 0.9 0.5 1.0Burundi 0.2 0.3 0.5 1.2 1.8 2.3Djibouti 0.2 0.2 0.6 0.6Eritrea 0.3 0.3 0.5 0.5 0.2 0.2 2774.9 0.2Ethiopia 1.1 1.5 0.6 1.4 0.9 1.4 26759.0 0.2Kenya 0.4 0.7 0.7 1.7 1.0 1.4Rwanda 0.4 0.6 0.6 2.0 0.8 2.3Somalia 0.1 0.1 0.6 0.5 0.1 0.1South SudanSudan (former) 0.3 0.6 0.3Uganda 0.5 0.6 0.6 0.8 2.2 2.5United Republic of Tanzania 0.5 0.6 0.5 0.6 0.9 0.9 30022.3 0.3Southern Africa 0.1 0.1 0.2 0.2 0.8 1.1Angola 0.1 0.1 0.0 0.1 0.1 0.3Botswana 0.1 0.1 0.1 0.1 0.1 0.2 5016.0 0.3Comoros 0.4 0.3 0.9 0.9 3.4 3.4Lesotho 0.3 0.3 0.8 0.9 0.4 0.2 4021.7 0.1Madagascar 0.3 0.2 0.0 0.0 0.8 0.9 92769.7 0.1Malawi 0.2 0.2 0.4 0.8 3.1 3.0Mauritius 0.3 0.1 0.8 0.5 76.7 161.3 15436.0 0.2Mozambique 0.0 0.0 0.1 0.1 0.7 0.8Namibia 0.1 0.1 0.1 0.1 0.1 0.1Seychelles 0.4 0.2 1.3 1.8 138.8 118.3South Africa 0.1 0.1 0.4 0.3 1.3 2.0 191580.5 0.2Swaziland 0.5 0.5 0.4 0.2 2.5 2.9Zambia 0.1 0.1 0.1 0.1 1.3 1.5Zimbabwe 0.4 0.3 0.2 0.2 1.2 2.1West Africa 0.2 0.2 0.6 0.8 1.1 1.8Benin 0.5 0.6 0.6 0.7 3.7 5.0Burkina Faso 0.5 0.7 1.6 1.8 2.3 3.4Cabo Verde 0.3 0.6 1.7 3.4 6.8 9.3Côte d’Ivoire 0.1 0.1 0.1 0.1 1.5 2.1Gambia 0.7 0.6 0.5 0.9 1.1 1.5Ghana 0.1 0.1 0.4 0.6 1.4 3.3Guinea 0.2 0.3 0.1 0.2 0.9 1.1Guinea-Bissau 0.3 0.4 0.4 0.7 0.8 1.1Liberia 0.0 0.0 0.2 0.2 1.6 2.8Mali 0.2 0.2 0.4 0.7 0.6 0.9Mauritania 0.0 0.0 0.3 0.4 0.1 0.1Niger 0.1 0.2 0.5 0.5 0.3 0.4Nigeria 0.2 0.2 1.0 1.3 1.6 2.7Senegal 0.3 0.4 1.0 1.1 2.8 4.6Sierra Leone 0.1 0.2 0.1 0.5 2.5 3.3Togo 0.1 0.1 0.8 1.1 2.5 6.2CEMAC 0.2 0.2 0.2 0.3 0.5 0.8CEN-SAD 0.2 0.2 0.6 0.7 1.3 2.4COMESA 0.3 0.5 0.5 0.7 1.2 2.1ECCAS 0.1 0.1 0.2 0.2 0.4 0.7ECOWAS 0.2 0.2 0.6 0.8 1.3 2.1IGAD 0.4 0.7 0.6 1.0 0.5SADC 0.2 0.2 0.2 0.2 0.8 1.1UEMOA 0.2 0.3 0.5 0.7 1.1 1.6UMA 0.0 0.1 0.5 0.6 2.5 3.2Regional Office for Asia andthe Pacific
0.3 0.4 0.5 0.5 3.9 6.5
Regional Office for Europeand Central Asia
0.2 0.2 0.3 0.3 2.8 3.3
Regional Office for LatinAmerica and the Caribbean
0.5 0.6 0.2 0.2 3.1 4.2
Regional Office for the NearEast
0.1 0.1 0.5 0.8 1.9 6.9
World 0.3 0.3 0.4 0.4 3.3 4.8
139

TABLE 47: Water pollutionWater pollution
% of total BOD emissionschemicalindustry
clay andglassindustry
foodindustry
metalindustry
otherindustry
paper andpulp
industry
textileindustry
woodindustry
percent percent percent percent percent percent percent percent2005-06* 2005-06* 2005-06* 2005-06* 2005-06* 2005-06* 2005-06* 2005-06*
AfricaNorth AfricaAlgeriaEgyptLibyaMorocco 8.7 9.5 17.4 1.0 16.7 2.8 42.1 1.9SudanTunisiaRegional Office for AfricaCentral AfricaCameroonCentral African RepublicChadCongoDemocratic Republic of theCongoEquatorial GuineaGabonSao Tome and PrincipeEast AfricaBurundiDjiboutiEritrea 9.5 13.2 30.0 0.2 17.8 4.1 25.1Ethiopia 10.6 8.5 30.7 1.8 11.3 6.8 28.8 1.5KenyaRwandaSomaliaSouth SudanSudan (former)UgandaUnited Republic of Tanzania 8.6 1.9 61.2 2.6 5.3 4.8 12.7 2.9Southern AfricaAngolaBotswana 0.6 56.7 36.9 2.4 3.4ComorosLesotho 1.1 1.2 3.4 0.9 1.9 0.5 91.0Madagascar 12.4 2.8 7.6 0.3 10.0 1.6 58.9 6.3MalawiMauritius 6.1 15.1 0.4 11.0 3.8 63.1 0.6MozambiqueNamibiaSeychellesSouth Africa 11.4 5.2 14.7 5.8 39.6 7.0 11.9 4.3SwazilandZambiaZimbabweWest AfricaBeninBurkina FasoCabo VerdeCôte d’IvoireGambiaGhanaGuineaGuinea-BissauLiberiaMaliMauritaniaNigerNigeriaSenegalSierra LeoneTogoCEMACCEN-SADCOMESAECCASECOWASIGADSADCUEMOAUMARegional Office for Asia andthe PacificRegional Office for Europeand Central AsiaRegional Office for LatinAmerica and the CaribbeanRegional Office for the NearEastWorld
140

TABLE 48: Renewable feedstocksProduction Organic
agricultureProduction
biofuel % of totalarea
natural fibre recovered paper
totalthousandkilotonneof oil
equivalent
thousandkilotonneof oil
equivalent
percent thousandtonnes
thousandtonnes
thousandtonnes
thousandtonnes
2000 2009 2011 1993 2011 2000 2012Africa 191.1 247.7 1298.7 1698.2North Africa 2.9 3.6 432.5 149.6 460.0 493.0Algeria 0.1 0.1 0.0 0.0 0.0 37.0 32.0Egypt 1.3 1.6 2.2 429.6 147.4 350.0 380.0Libya 0.1 0.2 0.0 0.0Morocco 0.4 0.5 0.1 2.3 1.5 35.0 35.0Sudan 0.0 0.0 0.0 6.0Tunisia 0.9 1.3 1.8 0.5 0.6 38.0 40.0Regional Office for Africa 188.2 244.2 1062.7 1264.1 838.7 1205.2Central Africa 22.3 27.7 110.5 110.7 0.0 0.0Cameroon 5.0 4.4 0.0 51.9 65.1 0.0 0.0Central African Republic 0.0 0.0 7.0 4.3 0.0 0.0Chad 0.0 0.0 37.1 28.0 0.0 0.0Congo 0.6 0.7 0.0 0.0Democratic Republic of theCongo
15.8 21.5 0.2 14.1 13.1 0.0 0.0
Equatorial Guinea 0.0 0.0 0.4 0.2 0.0 0.0Gabon 0.9 1.1 0.0 0.0Sao Tome and Principe 0.0 0.0 9.2 0.0 0.0East Africa 41.6 62.1 221.3 252.0 40.5 40.5Burundi 0.0 0.0 0.0 3.6 0.8 0.0 0.0Djibouti 0.0 0.0 0.0 0.0Eritrea 0.5 0.6 0.0 0.0Ethiopia 17.4 30.1 0.4 22.7 43.6 2.5 2.5Kenya 11.2 14.2 0.0 40.5 34.8 38.0 38.0Rwanda 0.0 0.0 0.2 0.0 0.0 0.0 0.0Somalia 0.0 0.0 1.7 2.1 0.0 0.0South Sudan 0.0 0.0 0.0 0.0Sudan (former) 51.6 27.3Uganda 0.0 0.0 1.6 11.1 47.6 0.0 0.0United Republic of Tanzania 12.5 17.2 0.3 90.1 95.8 0.0 0.0Southern Africa 36.3 42.8 182.7 242.9 784.2 1150.7Angola 5.5 7.2 5.8 2.5 0.0 0.0Botswana 0.5 0.5 0.4 0.2 0.0 0.0Comoros 0.0 0.0 1.7 0.0 0.0 0.0 0.0Lesotho 0.0 0.0 0.0 0.0 0.0Madagascar 0.0 0.0 0.1 37.4 27.8 2.2 2.2Malawi 0.0 0.0 0.0 11.9 14.1 0.0 0.0Mauritius 0.0 0.0 0.0 0.1 0.1 3.0 3.0Mozambique 6.4 8.0 0.0 20.5 40.6 5.0 5.0Namibia 0.2 0.2 0.0 0.1 0.0 0.0 0.0Seychelles 0.0 0.0 0.0 0.0South Africa 12.9 14.4 0.0 16.1 22.6 690.0 1064.5Swaziland 0.0 0.0 0.0 4.9 0.6 6.0 6.0Zambia 5.1 6.4 0.0 16.1 42.0 0.0 0.0Zimbabwe 5.6 6.2 0.0 69.4 92.3 78.0 70.0West Africa 88.1 111.5 548.3 658.5 14.0 14.0Benin 1.4 2.0 0.0 115.6 76.3 0.0 0.0Burkina Faso 0.0 0.0 0.2 61.0 175.0 0.0 0.0Cabo Verde 0.0 0.0 0.0 0.0Côte d’Ivoire 4.2 7.8 0.1 105.6 76.5 6.0 6.0Gambia 0.0 0.0 0.0 1.4 0.2 0.0 0.0Ghana 5.3 6.5 0.1 16.0 9.3 0.0 0.0Guinea 0.0 0.0 8.5 13.4 0.0 0.0Guinea-Bissau 0.0 0.0 0.7 1.5 0.0 0.0Liberia 0.0 0.0 0.0 0.0Mali 0.0 0.0 0.0 102.2 149.6 0.0 0.0Mauritania 0.0 0.0 0.0 0.0Niger 0.0 0.0 0.0 1.5 3.3 0.0 0.0Nigeria 74.2 91.9 0.0 70.9 101.4 8.0 8.0Senegal 1.2 1.2 0.1 20.0 13.0 0.0 0.0Sierra Leone 0.0 0.0 4.8 9.0 0.0 0.0Togo 1.8 2.2 0.0 40.0 30.0 0.0 0.0CEMAC 6.5 6.3 96.4 97.6 0.0 0.0CEN-SAD 91.4 115.6 1069.5 856.4 437.0 475.0COMESA 57.1 80.6 0.3 712.9 491.6 479.7 507.7ECCAS 27.8 34.9 119.8 114.0 0.0 0.0ECOWAS 88.1 111.5 0.0 548.3 658.5 14.0 14.0IGAD 29.2 44.8 40.5 46.5SADC 64.5 81.5 0.1 286.9 351.8 784.2 1150.7UEMOA 8.6 13.2 0.1 446.6 525.2 6.0 6.0UMA 1.6 2.0 110.0 107.0Regional Office for Asia andthe Pacific
521.2 560.7 0.8 42391.1 90639.3
Regional Office for Europeand Central Asia
69.9 104.7 1.4 3162.5 44836.7 56745.3
Regional Office for LatinAmerica and the Caribbean
90.7 123.6 0.9 1273.2 2911.1 5533.0 10311.2
Regional Office for the NearEast
3.5 4.2 753.0 2247.0
World 942.0 1120.4 142813.5 212515.9
141

TABLE 49: Agricultural emissionsEnteric
fermentationManuremanagement
Ricecultivation
Syntheticfertilizers
Manureapplied tosoils
Manureleft onpasture
Cropresidues
Cultivatedorganicsoils
Burningcrop
residues
gigagramsCO2eq
gigagramsCO2eq
gigagramsCO2eq
gigagramsCO2eq
gigagramsCO2eq
gigagramsCO2eq
gigagramsCO2eq
gigagramsCO2eq
gigagramsCO2eq
2010 2010 2010 2010 2010 2010 2010 2010 2010Africa 251440 16358 26391 19433 7212 173124 9823 5177 2572.5North Africa 22815 1486 2746 11124 672 15291 2044 0 283.8Algeria 4621 246 1 294 146 3900 366 0 53.6Egypt 9828 721 2702 9198 170 3962 997 0 118.4Libya 1265 66 0 305 37 1134 24 0 3.9Morocco 5257 324 44 881 220 4650 576 0 95.6Sudan 0 0 0 0 0 0 0 0 0.0Tunisia 1844 129 0 447 100 1645 81 0 12.3Regional Office for Africa 228466 14842 23645 8309 6520 157705 7777 5177 2287.6Central Africa 16557 1376 508 104 602 11384 483 281 194.3Cameroon 4304 455 78 75 235 3345 188 115 57.8Central African Republic 3198 296 25 0 142 2377 15 0 6.9Chad 7688 355 191 0 70 4447 125 0 16.8Congo 264 26 4 1 12 206 2 121 1.6Democratic Republic of theCongo
1032 204 210 24 118 937 150 3 109.4
Equatorial Guinea 5 1 0 0 1 6 0 1 0.0Gabon 62 38 1 4 24 60 2 42 1.6Sao Tome and Principe 5 1 0 0 1 6 0 0 0.1East Africa 102354 4760 4072 1893 1884 65292 1998 3359 615.2Burundi 701 67 37 8 37 568 31 326 9.1Djibouti 374 16 0 0 3 230 0 0 0.0Eritrea 2315 94 0 2 34 1417 25 0 2.1Ethiopia 44008 1765 140 1008 578 29216 763 1293 159.9Kenya 16949 695 30 457 300 11234 286 42 134.0Rwanda 1333 159 19 1 87 1007 91 290 13.6Somalia 12752 627 9 0 81 4561 37 0 13.1South Sudan 0 0 0 0 0 0 0 0 0.0Sudan (former)Uganda 7303 641 128 41 392 5308 248 691 62.6United Republic of Tanzania 16620 695 3708 377 374 11751 517 717 220.9Southern Africa 38142 3184 7382 4460 1637 28965 1929 1260 774.9Angola 3576 450 141 30 236 2654 133 12 99.7Botswana 2148 90 0 0 28 1502 6 0 3.6Comoros 52 2 112 0 1 41 3 0 0.8Lesotho 728 27 0 0 17 499 14 0 9.3Madagascar 7258 508 6719 29 261 5178 318 140 73.9Malawi 1194 348 87 556 205 1000 262 58 106.8Mauritius 11 12 0 35 12 79 0 0 2.4Mozambique 1501 285 272 280 174 1285 181 0 113.9Namibia 2196 98 0 0 31 1596 8 0 1.8Seychelles 1 1 0 0 1 2 0 0 0.0South Africa 12667 843 7 2570 402 9986 733 26 198.7Swaziland 486 25 0 0 13 354 5 0 5.6Zambia 2381 225 45 501 119 1878 153 1023 71.0Zimbabwe 3942 268 0 460 137 2912 114 0 87.5West Africa 71413 5522 11683 1852 2396 52064 3368 278 703.3Benin 1643 140 23 0 66 1265 102 0 57.7Burkina Faso 8541 765 700 265 352 6269 310 0 54.3Cabo Verde 71 41 0 0 25 53 1 0 2.2Côte d’Ivoire 1424 139 253 175 82 1260 101 180 34.6Gambia 381 22 456 12 7 262 27 0 6.3Ghana 1960 196 256 80 109 1762 162 15 68.7Guinea 3765 170 2007 16 68 2771 184 70 60.5Guinea-Bissau 580 86 148 0 47 424 18 0 3.9Liberia 96 50 62 0 32 113 34 12 9.7Mali 10975 514 1009 576 171 7409 384 0 57.0Mauritania 4067 194 151 0 34 2136 24 0 2.4Niger 11456 536 41 31 121 7061 444 0 1.8Nigeria 21433 2225 5593 517 1086 17476 1310 0 274.9Senegal 3686 260 216 173 100 2730 103 0 13.0Sierra Leone 680 55 755 0 18 442 87 0 21.2Togo 655 130 11 7 77 632 76 0 35.2CEMAC 15521 1171 298 80 484 10441 332 278 84.7CEN-SAD 108082 7748 12606 12669 3126 71568 5041 208 908.2COMESA 100433 5820 10230 12623 2504 66457 3471 3866 961.0ECCAS 20834 1894 686 142 875 14606 647 618 303.0ECOWAS 67346 5328 11531 1852 2362 49928 3344 278 700.9IGAD 83701 3839 307 1508 1387 51966 1359 2026 371.6SADC 55742 4081 11189 4861 2127 41612 2593 1980 1104.4UEMOA 38959 2570 2402 1228 1017 27049 1538 180 257.4UMA 17054 960 195 1927 536 13465 1071 0 167.8Regional Office for Asia andthe Pacific
809434 169122 457990 435707 127041 264047 74036 56496 9150.0
Regional Office for Europeand Central Asia
274240 99643 7909 100457 48548 49963 27897 29124 3218.1
Regional Office for LatinAmerica and the Caribbean
526629 22670 17027 47721 23512 208745 19177 1605 2756.6
Regional Office for the NearEast
57726 6346 5781 17311 4986 37525 4417 0 634.5
World 1960484 348079 519531 682636 220255 741025 152903 99048 19701.7
142

PART
5Metadata
143

RAF geographical composition
North Africa West Africa Central Africa East Africa Southern AfricaAlgeria Benin Cameroon Burundi AngolaEgypt Burkina Faso Central African Republic Djibouti BotswanaLibyan Arab Jamahiriya Cape Verde Chad Eritrea ComorosMorocco Côte d’Ivoire Congo Ethiopia LesothoSudan Gambia Democratic Republic of the Congo Kenya MadagascarTunisia Ghana Equatorial Guinea Rwanda Malawi
Guinea Gabon Somalia MauritiusGuinea-Bissau Sao Tome and Principe South Sudan MozambiqueLiberia Sudan (former) NamibiaMali Uganda SeychellesMauritania United Republic of Tanzania South AfricaNiger SwazilandNigeria ZambiaSenegal ZimbabweSierra LeoneTogo
144

METADATA
Metadata
AggregationTwo types of aggregation are used in the book, namely sum andweighted mean. Two restrictions are imposed when computingthe aggregation. Sufficiency condition: the aggregation is com-puted only when sufficient countries has reported data. The currentthreshold is set at 50% of the variable and the weighting variableif present. Comparability condition: Since aggregation are usuallycomputed over years, this condition is designed to ensure that thenumber of reporting entites are comparable over the years. The cur-rent restriction is that the number of reporting entities does not varyabove 15 countries in order to account for transition in countries.
Agricultural area (ha)Agricultural area, this category is the sum of areas under a) arableland - land under temporary agricultural crops (multiple-croppedareas are counted only once), temporary meadows for mowing orpasture, land under market and kitchen gardens and land temporar-ily fallow (less than five years). The abandoned land resulting fromshifting cultivation is not included in this category. Data for "Arableland" are not meant to indicate the amount of land that is poten-tially cultivable; (b) permanent crops - land cultivated with long-term crops which do not have to be replanted for several years (suchas cocoa and coffee); land under trees and shrubs producing flow-ers, such as roses and jasmine; and nurseries (except those for foresttrees, which should be classified under "forest"); and (c) permanentmeadows and pastures - land used permanently (five years or more)to grow herbaceous forage crops, either cultivated or growing wild(wild prairie or grazing land). Data are expressed in 1000 hectares.Source: FAO, Statistics Division (FAOSTAT)Owner: FAO
Agricultural area organic (ha)Sum of areas under "Agricultural area certified organic" and "Agri-cultural area in conversion to organic". Agricultural area certifiedorganic is the land area exclusively dedicated to organic agricultureand managed by applying organic agriculture methods. It refers tothe land area fully converted to organic agriculture. It is the por-tion of land area (including arable lands, pastures or wild areas)managed (cultivated) or wild harvested in accordance with specificorganic standards or technical regulations and that has been in-spected and approved by a certification body. Agricultural area inconversion to organic is the land area which is going through theorganic conversion process, usually two years period of conversionto organic land.Source: FAO, Statistics Division (FAOSTAT)Owner: FAO
Agricultural population, totalAgricultural population is defined as all persons depending for theirlivelihood on agriculture, hunting, fishing and forestry. It comprisesall persons economically active in agriculture as well as their non-working dependents. It is not necessary that this referred populationexclusively come from rural population.Source: FAO, Statistics Division (FAOSTAT)Owner: FAO
Agricultural production indicesThe FAO indices of agricultural production show the relative levelof the aggregate volume of agricultural production for each year incomparison with the base period 1999-2001. They are based onthe sum of price-weighted quantities of different agricultural com-modities produced after deductions of quantities used as seed andfeed weighted in a similar manner. The resulting aggregate repre-sents, therefore, disposable production for any use except as seedand feed. All the indices at the country, regional and world levels arecalculated by the Laspeyres formula. Production quantities of eachcommodity are weighted by 1999-2001 average international com-modity prices and summed for each year. To obtain the index, theaggregate for a given year is divided by the average aggregate forthe base period 1999-2001. Since the FAO indices are based on theconcept of agriculture as a single enterprise, amounts of seed and
feed are subtracted from the production data to avoid double count-ing , once in the production data and oncewith the crops or livestockproduced from them. Deductions for seed (in the case of eggs, forhatching) and for livestock and poultry feed apply to both domesti-cally produced and imported commodities. They cover only primaryagricultural products destined to animal feed (e.g. maize, potatoes,milk, etc.). Processed and semi-processed feed items such as bran,oilcakes, meals and molasses have been completely excluded fromthe calculations at all stages. It should be noted that when calcu-lating indices of agricultural, food and nonfood production, all in-termediate primary inputs of agricultural origin are deducted. How-ever, for indices of any other commodity group, only inputs origi-nating from within the same group are deducted; thus, only seed isremoved from the group "crops" and from all crop subgroups, suchas cereals, oil crops, etc.; and both feed and seed originating fromwithin the livestock sector (e.g. milk feed, hatching eggs) are re-moved from the group "livestock products". For the main two live-stock subgroups, namely, meat and milk, only feed originating fromthe respective subgroup is removed. Indices which take into ac-count deductions for feed and seed are referred to as ”net”. Indicescalculated without any deductions for feed and seed are referredto as ”gross”.The"international commodity prices" are used in orderto avoid the use of exchange rates for obtaining continental andworld aggregates, and also to improve and facilitate internationalcomparative analysis of productivity at the national level. These"international prices", expressed in so-called"international dollars",are derived using a Geary-Khamis formula for the agricultural sec-tor. This method assigns a single "price" to each commodity. Forexample, one metric ton of wheat has the same price regardlessof the country where it was produced. The currency unit in whichthe prices are expressed has no influence on the indices published.The commodities covered in the computation of indices of agricul-tural production are all crops and livestock products originating ineach country. Practically all products are covered, with the main ex-ception of fodder crops. The category of food production includescommodities that are considered edible and that contain nutrients.Accordingly, coffee and tea are excluded along with inedible com-modities because, although edible, they have practically no nutri-tive value. Prices applied to meat in reality represent the prices ofanimals for slaughtering in terms of live weight. For example, if theprice of one metric ton (1000 kg) of pigs alive is 825 dollars and theratio meat to live weight is 75 to 100, the price applicable to 750 kgof pig meat will be 825 dollars, corresponding to 1100 dollars permetric tons. The indices are calculated from production data pre-sented on a calendar year basis. The FAO indices may differ fromthose produced by the countries themselves because of differencesin concepts of production, coverage, weights, time reference of dataand methods of calculation.
Agricultural tractors, total (tractors)Agricultural tractors generally refer to wheel and crawler or track-laying type tractors (excluding garden tractors) used in agriculture.Data are expressed in numbers in use in the agricultural sector.Source: FAO, Statistics Division (FAOSTAT)Owner: FAO
Agricultural water withdrawal, share of total water withdrawal (per-cent)Agricultural water withdrawal as percentage of total water with-drawal.Source: Land and Water Division (AQUASTAT)Owner: FAO
Agriculture value added per worker (constant 2000 US$)Agriculture value added per worker is a measure of agricultural pro-ductivity. Value added in agriculture measures the output of theagricultural sector (ISIC divisions 1-5) less the value of intermediateinputs. Agriculture comprises value added from forestry, hunting,and fishing as well as cultivation of crops and livestock production.Data are in constant 2000 U.S. dollars.Source: World Bank (WDI)Owner: Derived from World Bank national accounts files and Foodand Agriculture Organization, Production Yearbook and data files.
145

Agriculture, Forestry, Fishing, and Hunting, Cash (Budg. Cen. Govt.)(share of agricultural GDP)See ’Government expenditure’.Source: FAO, Statistics Division (FAOSTAT)Owner: FAO
Agriculture, Forestry, Fishing, and Hunting, Cash (Budg. Cen. Govt.)(share of total outlays)See ’Government expenditure’.Source: FAO, Statistics Division (FAOSTAT)Owner: FAO
Agriculture, Forestry, Fishing, and Hunting, Noncash (Budg. Cen.Govt.) (share of agricultural GDP)See ’Government expenditure’.Source: FAO, Statistics Division (FAOSTAT)Owner: FAO
Agriculture, Forestry, Fishing, and Hunting, Noncash (Budg. Cen.Govt.) (share of total outlays)See ’Government expenditure’.Source: FAO, Statistics Division (FAOSTAT)Owner: FAO
Agriculture, value added (percent of GDP)Agriculture corresponds to ISIC divisions 1-5 and includes forestry,hunting, and fishing, as well as cultivation of crops and livestockproduction. Value added is the net output of a sector after addingup all outputs and subtracting intermediate inputs. It is calculatedwithout making deductions for depreciation of fabricated assets ordepletion and degradation of natural resources. The origin of valueadded is determined by the International Standard Industrial Classi-fication (ISIC), revision 3. Note: For VAB countries, gross value addedat factor cost is used as the denominator.Source: World Bank (WDI)Owner: World Bank national accounts data, and OECD National Ac-counts data files.
All GHG agricultural sectors, total emissions in CO2eq (gigagrams)Agriculture Total contains all the emissions produced in the differ-ent agricultural emissions sub-domains, providing a picture of thecontribution to the total amount of GHG emissions from agriculture.GHG Emissions from agriculture consist of non-CO2 gases, namelymethane (CH4) and nitrous oxide (N2O), produced by crop and live-stock production and management activities.Source: FAO, Statistics Division (FAOSTAT)Owner: FAO
Aquaculture fish production (tonnes)Aquaculture is defined as the farming of aquatic organisms. Farm-ing implies some form of intervention in the rearing process to en-hance production, such as regular stocking, feeding, protection frompredators, etc. Farming also implies individual or corporate owner-ship of the stock being cultivated. For statistical purposes, aquaticorganisms which are harvested by an individual or corporate bodywhich has owned them throughout their rearing period contribute toaquaculture, while aquatic organisms which are exploitable by thepublic as a common property resource, with or without appropriatelicenses, are the harvest of fisheries. In the case of capture-basedaquaculture, only the incremental growth (or weight gain) in captiv-ity, could and should be reported as the production from aquacul-ture. Data included here covers an aquaculture production of fish,molluscs, crustaceans and miscellaneous aquatic animals but ex-cluding production for marine mammals, crocodiles, corals, pearls,sponges and aquatic plants.Source: Fisheries and Aquaculture Department (Fishery and Aqua-culture statistics)Owner: FAO
Aquaculture fish production inland (tonnes)Aquaculture production from inland areas.Source: Fisheries and Aquaculture Department (Fishery and Aqua-culture statistics)Owner: FAO
Aquaculture fish production marine (tonnes)Aquaculture production from marine areas.Source: Fisheries and Aquaculture Department (Fishery and Aqua-culture statistics)Owner: FAO
Arable land (ha)Arable land is the land under temporary agricultural crops (multiple-cropped areas are counted only once), temporarymeadows formow-ing or pasture, land undermarket and kitchen gardens and land tem-porarily fallow (less than five years). The abandoned land resultingfrom shifting cultivation is not included in this category. Data for’Arable land’ are not meant to indicate the amount of land that ispotentially cultivable.Source: FAO, Statistics Division (FAOSTAT)Owner: FAO
Arable land and permanent crops (ha)Arable land and Permanent crops, this category is the sum of areasunder ’Arable land’ and ’Permanent crops’.Source: FAO, Statistics Division (FAOSTAT)Owner: FAO
Area under bioenergy crops (ha)The assumed land area required to produce a given annual quantityof biofuel production.Source: FAOOwner: Based on IEA biofuel production data
Artificial sweetenersHigh-intensity or low-caloric sweetening agents that are producedchemically.
Average dietary supply adequacy (index)The indicator expresses the Dietary Energy Supply (DES) as a per-centage of the Average Dietary Energy Requirement (ADER) in thecountry. Each country’s or region’s average supply of calories forfood consumption is normalized by the average dietary energy re-quirement estimated for its population, to provide an index of ade-quacy of the food supply in terms of calories. Analyzed together withthe prevalence of undernourishment, it allows discerning whetherundernourishment is mainly due to insufficiency of the food supplyor to particularly bad distribution. The indicator is calculated as anaverage over 3 years to reduce the impact of possible errors in es-timated DES, due to the difficulties in properly accounting of stockvariations in major food. It thus provides an indicator of structuralfood supply adequacy.Source: FAO, Statistics DivisionOwner: FAO
Average fat supply (g/cap/day)National average fat supply (expressed in grams per caput per day).Source: FAO, Statistics DivisionOwner: FAO
Average protein supply (g/cap/day)National average protein supply (expressed in grams per caput perday). As other indicators based on Food balance Sheets data, it iscalculated on 3 year averages, to reduce the impact of errors inrecording of annual stock variations.Source: FAO, Statistics DivisionOwner: FAO
146

METADATA
Average supply of protein of animal origin (g/cap/day)National average protein supply (expressed in grams per caput perday). It includes the following groups: Meat; Offals; Animal Fatsand Products; Milk and Products; Eggs, Fish, Seafood and Products;and Acquatic Products, other. The indicator is calculated on 3 yearaverages.Source: FAO, Statistics DivisionOwner: FAO
Beef and buffalo meat (tonnes)See ’Buffalos’, ’Meat, total’, and ’Production’.Source: FAO, Statistics Division (FAOSTAT)Owner: FAO
Biofuel production (energy, kilotonne of oil equivalent)Sum of ethanol and biodiesel production, reported in kilotonne ofoil equivalent.Source: IEAOwner: Energy Balances of OECD Countries and Energy Balances ofNon-OECD Countries, 2011 editions
Bird species, threatenedBirds are listed for countries included within their breeding or win-tering ranges. Threatened species are the number of species clas-sified by the IUCN as endangered, vulnerable, rare, indeterminate,out of danger, or insufficiently known.Source: World Bank (WDI)Owner: United Nations Environmental Program and the World Con-servation Monitoring Centre, and International Union for Conserva-tion of Nature, Red List of Threatened Species.
BuffaloesIndian, Asiatic, pigmy, water buffalo (Bubalus bubalus; B. arnee; B.depressicornis); African buffalo (genus Syncerus); American bison(Bison bison); European bison (Bison bonasus); beeffalo (cross be-tween a bison and a domesticated beef animal). See 866. Excludeswild bisons and buffaloes.
Burning crop residues, total emissions in CO2eq (gigagrams)Greenhouse Gas (GHG) emissions from burning crop residues consistof methane and nitrous oxide gases produced by the combustion ofa percentage of the crop residues burnt on-site.Source: FAO, Statistics Division (FAOSTAT)Owner: FAO
Butter and ghee production (tonnes)See ’Butter, ghee’ and ’Production’.Source: FAO, Statistics Division (FAOSTAT)Owner: FAO
Butter, GheeDefault composition: 886 Butter, cow milk, 887 Ghee, butteroil ofcow milk, 952 Butter, buffalo milk, 953 Ghee, of buffalo milk, 983Butter and ghee, sheep milk, 1022 Butter of goat mlk
Capture fish production (tonnes)Capture fishery is defined as the hunting, collecting and gatheringactivities directed at removing or collecting live wild aquatic organ-isms. The capture production statistics here indicates the nominalcatches of aquatic organisms, killed, caught, trapped or collected forall commercial, industrial, recreational and subsistence purposes inlive weight equivalent. Data included here covers capture produc-tion of fish, molluscs, crustaceans and miscellaneous aquatic an-imals but excluding production for marine mammals, crocodiles,corals, pearls, sponges and aquatic plants.Source: Fisheries and Aquaculture Department (Fishery and Aqua-culture statistics)Owner: FAO
Capture fish production inland (tonnes)Capture fishery production from inland areas.Source: Fisheries and Aquaculture Department (Fishery and Aqua-culture statistics)Owner: FAO
Capture fish production marine (tonnes)Capture fishery production from marine areas.Source: Fisheries and Aquaculture Department (Fishery and Aqua-culture statistics)Owner: FAO
CassavaManioc, mandioca, yuca (Manihot esculenta, syn. M. utilissima);yuca dulce (M. palmata, syn. M. dulcis). A semi-permanent cropgrown in tropical and subtropical regions. Sometimes bitter andsweet cassavas are referred to as separate species, the former beingM. esculenta and the latter M. palmata, but this is incorrect since thetoxicity varies according to location. Cassava is the staple food inmany tropical countries. It is not traded internationally in its freshstate because tubers deteriorate very rapidly.
CattleCommon ox (Bos taurus); zebu, humped ox (Bos indicus); Asiatic ox(subgenus Bibos); Tibetan yak (Poephagus grunniens). Animals ofthe genus listed, regardless of age, sex, or purpose raised. Data areexpressed in number of heads.
Cattle and buffaloes (heads)See ’Cattle’ and ’Buffaloes’.Source: FAO, Statistics Division (FAOSTAT)Owner: FAO
Cereal exports (tonnes)Exports (volume) of cereals.Source: FAO, Statistics Division (FAOSTAT)Owner: FAO
Cereal import dependency ratio (percent)Cereal imports/(cereal production+cereal import-cereal export). Theindicator is calculated on 3 year averages.Source: FAO, Statistics DivisionOwner: FAO
Cereal imports (tonnes)Imports (volume) of cereals.Source: FAO, Statistics Division (FAOSTAT)Owner: FAO
CerealsCereals include Wheat, Rice Paddy, Barley, Maize, Popcorn, Rye,Oats, Millets, Sorghum, Buckwheat, Quinoa, Fonio, Triticale, CanarySeed, Mixed Grain and Cereals Nes.
Cereals harvested area (ha)See ’Cereals’ and ’Crop area’.Source: FAO, Statistics Division (FAOSTAT)Owner: FAO
Cereals production (tonnes)See ’Cereals’ and ’Crop production’.Source: FAO, Statistics Division (FAOSTAT)Owner: FAO
Cereals yield (hg/ha)See ’Cereals’ and ’Crop yield’.Source: FAO, Statistics Division (FAOSTAT)Owner: FAO
147

Cheese (all kinds) production (tonnes)All kinds of cheese. See also ’Production’.Source: FAO, Statistics Division (FAOSTAT)Owner: FAO
ChickensFowl (Gallus domesticus); Guinea fowl (Numida meleagris. Domes-ticated birds only. Data are expressed in thousands.
Chickens (heads)See ’Chickens’ and ’Production’.Source: FAO, Statistics Division (FAOSTAT)Owner: FAO
Children in employment, total (share of children ages 7-14)Children in employment refer to children involved in economic ac-tivity for at least one hour in the reference week of the survey.Source: World Bank (WDI)Owner: Understanding Children’s Work project based on data fromILO, UNICEF and the World Bank.
CitrusIncluding inter alia: bergamot (Citrus bergamia); citron (C. medicavar. cedrata); chinotto (C. myrtifolia); kumquat (Fortunella japonica).Some minor varieties of citrus are used primarily in the preparationof perfumes and soft drinks.
Citrus fruit harvested area (ha)See ’Fruit, citrus nes’ and ’Crop area’.Source: FAO, Statistics Division (FAOSTAT)Owner: FAO
Citrus fruit production (tonnes)See ’Fruit, citrus nes’ and ’Crop production’.Source: FAO, Statistics Division (FAOSTAT)Owner: FAO
Citrus fruit yield (hg/ha)See ’Fruit, citrus nes’ and ’Crop yield’.Source: FAO, Statistics Division (FAOSTAT)Owner: FAO
Coarse grainCoarse grains include Barley, Maize, Popcorn, Rye, Oats, Millet,Sorghum, Buckwheat, Quinoa, Fonio, Triticale, Canary seed, Mixedgrain and Cereals, nes.
Coarse grain harvested area (ha)See ’Coarse grain’ and ’Crop area’.Source: FAO, Statistics Division (FAOSTAT)Owner: FAO
Coarse grain production (tonnes)See ’Coarse grain’ and ’Crop production’.Source: FAO, Statistics Division (FAOSTAT)Owner: FAO
Coarse grain yield (hg/ha)See ’Coarse grain’ and ’Crop yield’.Source: FAO, Statistics Division (FAOSTAT)Owner: FAO
Cocoa, beansTheobroma cacao. The seeds contained in the fruit of the cacao-tree, including whole or broken, raw or roasted.
Cocoa, pasteObtained by grinding roasted cocoa beans. Also called liquor. Notdefatted.
Coconut OilDefault composition: Oil, coconut (copra)
CoconutsCocos nucifera Husked coconut. In shell, covered by the endocarp,while exocarp (the smooth outer skin) and mesocarp (the fibrouscovering) are removed. Immature nuts contain a milky juice thatis consumed as a refreshing drink. Mature nuts are consumed assuch, or processed for copra or desiccated coconut. The flesh, fromwhich copra/oil is extracted, constitutes 40-70% of the weight ofthe husked coconut. The oil content is about 36% of the flesh.
Cotton lintGossypium spp. Fibres from ginning seed cotton that have not beencarded or combed. Trade data also include fibres that have beencleaned, bleached, dyed or rendered absorbent.
Cottonseed OilDefault composition: Oil, cottonseed
CPIA business regulatory environment rating (1=low to 6=high)Business regulatory environment assesses the extent to which thelegal, regulatory, and policy environments help or hinder privatebusinesses in investing, creating jobs, and becoming more produc-tive.Source: World Bank (WDI)Owner: World Bank Group, CPIA database(http://www.worldbank.org/ida).
Crop areaCrop area is a surface of land on which a crop is grown. In general,the areameasured for cadastral purposes includes, in addition to thearea cultivated, headlands, ditches and other non-cultivated areas.Such an area can be called gross area as against the net area whichincludes only the portion of the gross area actually cultivated. Forvarious reasons, e.g. natural calamities or economic considerations,certain areas planted or sown with a given crop are not harvested orare harvested before the crop reaches maturity. Hence the need forthe concept of area to be sub-divided into sown or planted area andharvested area. Sown area data are necessary to estimate quantitiesused for seeding purposes; harvested area, to provide reliable andaccurate yield and production data. A peculiarity of permanent cropsis that number of trees or plants is reported in addition to or, insteadof, the area planted. This is particularly so as regards plants growingoutside of compact plantations, which are either interplanted withother crops or are scattered. Both area and number of trees arealso divided into productive or bearing and non-productive or non-bearing areas or trees. In most cases, non-bearing refers to youngplants that are not yet bearing.
Crop productionCrop production data refer to the actual harvested production fromthe field or orchard and gardens, excluding harvesting and thresh-ing losses and that part of crop not harvested for any reason. Pro-duction therefore includes the quantities of the commodity sold inthe market (marketed production) and the quantities consumed orused by the producers (auto-consumption). When the productiondata available refers to a production period falling into two succes-sive calendar years and it is not possible to allocate the relativeproduction to each of them, it is usual to refer production data tothat year into which the bulk of the production falls. Crop produc-tion data are recorded in tonnes (t). In many countries, crop pro-duction data are obtained as a function of the estimated yield andthe total area. If such a compilation method of production statisticsis enforced by the country, it must be ensured that the total areadoes not refer to sown or planted area, which would give then the<U+393C><U+3E31>biological production’, but to the actually har-vested area during the year.\
148

METADATA
Crop residues, total emissions in CO2eq (gigagrams)
Greenhouse Gas (GHG) emissions from crop residues consist of ni-trous oxide gas from decomposition of nitrogen in crop residues lefton managed soils.
Source: FAO, Statistics Division (FAOSTAT)
Owner: FAO
Crop yield
Harvested production per unit of harvested area for crop products.In most of the cases yield data are not recorded but obtained by di-viding the production data by the data on area harvested. Data onyields of permanent crops are not as reliable as those for temporarycrops either because most of the area information may correspondto planted area, as for grapes, or because of the scarcity and unreli-ability of the area figures reported by the countries, as for examplefor cocoa and coffee.
Crops net per capita production index number (2004-2006 = 100)
See ’Agricultural production indices’.
Source: FAO, Statistics Division (FAOSTAT)
Owner: FAO
Cultivated organic soils, total emissions in CO2eq (gigagrams)
Greenhouse gas (GHG) emissions data from cultivated organic soilsare those associated with nitrous oxide gas from drained organicsoils. Computed at Tier 1 and complemented by geo-spatial data,following the 2006 IPCC Guidelines for National GHG Inventories(IPCC, 2006). Available by country, with global coverage and relativeto the period 1990-2010 with annual updates.
Source: FAO, Statistics Division (FAOSTAT)
Owner: FAO
Dairy products (milk equivalent) exports (tonnes)
Exports (volume) of dairy products (milk equivalent).
Source: FAO, Statistics Division (FAOSTAT)
Owner: FAO
Dairy products (milk equivalent) imports (tonnes)
Imports (volume) of dairy products (milk equivalent).
Source: FAO, Statistics Division (FAOSTAT)
Owner: FAO
Depth of the food deficit (kcal/cap/day)
The depth of the food deficit indicates how many calories wouldbe needed to lift the undernourished from their status, everythingelse being constant. The average intensity of food deprivation ofthe undernourished, estimated as the difference between the av-erage dietary energy requirement and the average dietary energyconsumption of the undernourished population (food-deprived), ismultiplied by the number of undernourished to provide an estimateof the total food deficit in the country, which is then normalized bythe total population. The indicator is calculated as an average over3 years.
Source: FAO, Statistics Division
Owner: FAO
Domestic food price volatility (index)
The Domestic Food Price Volatility is a measure of variation of theDomestic Food Price Level Index. It has been computed as the Stan-dard Deviation (SD) of the deviations from the trend over the previ-ous five years.
Source: FAO, Statistics Division
Owner: ILO and World Bank ICP (International Comparison Project)
Droughts, floods, extreme temperatures (percent of population af-fected, average 1990-2009)Droughts, floods and extreme temperatures is the annual averagepercentage of the population that is affected by natural disastersclassified as either droughts, floods, or extreme temperature events.A drought is an extended period of time characterized by a defi-ciency in a region’s water supply that is the result of constantly be-low average precipitation. A drought can lead to losses to agricul-ture, affect inland navigation and hydropower plants, and cause alack of drinking water and famine. A flood is a significant rise ofwater level in a stream, lake, reservoir or coastal region. Extremetemperature events are either cold waves or heat waves. A coldwave can be both a prolonged period of excessively cold weatherand the sudden invasion of very cold air over a large area. Alongwith frost it can cause damage to agriculture, infrastructure, andproperty. A heat wave is a prolonged period of excessively hot andsometimes also humid weather relative to normal climate patternsof a certain region. Population affected is the number of peopleinjured, left homeless or requiring immediate assistance during aperiod of emergency resulting from a natural disaster; it can alsoinclude displaced or evacuated people. Average percentage of pop-ulation affected is calculated by dividing the sum of total affectedfor the period stated by the sum of the annual population figuresfor the period stated.Source: World Bank (WDI)Owner: EM-DAT: The OFDA/CRED International Disaster Database:www.emdat.be, Universite Catholique de Louvain, Brussels (Bel-gium), World Bank.
Egg productionCovers all domestic birds which have contributed to egg produc-tion during the year, wherever they lay and the corresponding totalproduction, including eggs intended to be used for hatching but ex-cluding waste on farms.
EggsDefault composition: 1062 Eggs, hen, in shell, 1063 Eggs, liquid,1064 Eggs, dried, 1091 Eggs, other bird, in shell; nutrient data only:916 Egg albumine
Eggs primary production (tonnes)See ’Eggs’ and ’Egg production’.Source: FAO, Statistics Division (FAOSTAT)Owner: FAO
EmissionsThe release of greenhouse gases and/or their precursors into theatmosphere over a specified area and period of time.
Employees, agriculture, female (share of female employment)Employees are people who work for a public or private employerand receive remuneration in wages, salary, commission, tips, piecerates, or pay in kind.Source: World Bank (WDI)Owner: International Labour Organization, Key Indicators of theLabour Market database.
Employees, agriculture, male (share of male employment)Employees are people who work for a public or private employerand receive remuneration in wages, salary, commission, tips, piecerates, or pay in kind.Source: World Bank (WDI)Owner: International Labour Organization, Key Indicators of theLabour Market database.
Employment in agriculture (share of total employment)Employees are people who work for a public or private employerand receive remuneration in wages, salary, commission, tips, piecerates, or pay in kind.Source: World Bank (WDI)Owner: International Labour Organization, Key Indicators of theLabour Market database.
149

Employment, totalEmployees are people who work for a public or private employerand receive remuneration in wages, salary, commission, tips, piecerates, or pay in kind.
Source: World Bank
Owner: International Labour Organization, Key Indicators of theLabour Market database.
Enteric fermentation, total emissions in CO2eq (gigagrams)Greenhouse gas (GHG) emissions from enteric fermentation consistof methane gas produced in digestive systems of ruminants and toa lesser extent of non-ruminants.
Source: FAO, Statistics Division (FAOSTAT)
Owner: FAO
Environmental Protection, Cash (Budg. Cen. Govt.) (share of totaloutlays)See ’Government expenditure’.
Source: FAO, Statistics Division (FAOSTAT)
Owner: FAO
Environmental Protection, Noncash (Budg. Cen. Govt.) (share oftotal outlays)See ’Government expenditure’.
Source: FAO, Statistics Division (FAOSTAT)
Owner: FAO
Evaporated and condensed milk production (tonnes)See ’Milk excluding butter’ and ’Milk production (tonnes)’.
Source: FAO, Statistics Division (FAOSTAT)
Owner: FAO
Export of forest products (USD)Forest materials for commercial use.
Source: FAO, Statistics Division (FAOSTAT)
Owner: FAO
Export of roundwood (m3)See ’Roundwood’.
Source: FAO, Statistics Division (FAOSTAT)
Owner: FAO
Exports of beverages (US$)Value of exports of beverages in current US$.
Source: FAO, Statistics Division (FAOSTAT)
Owner: FAO
Exports of cereals and prep. (US$)Value of exports of cereals and prep. in current US$.
Source: FAO, Statistics Division (FAOSTAT)
Owner: FAO
Exports of coffe, tea, cocoa, and spices (US$)Value of exports of coffe, tea, cocoa, and spices in current US$.
Source: FAO, Statistics Division (FAOSTAT)
Owner: FAO
Exports of dairy products (milk equivalent) (US$)Value of exports of milk equivalent in current US$.
Source: FAO, Statistics Division (FAOSTAT)
Owner: FAO
Exports of fish (US$)Value of exports of fish in current US$ (data reported include fish,molluscs, crustaceans, and miscellaneous aquatic animals but ex-cluding marine mammals, crocodiles, corals, pearls, sponges andaquatic plants, miscellaneous aquatic animal products and fishwaste).Source: Fisheries and Aquaculture Department (Fishery and Aqua-culture statistics)Owner: FAO
Exports of fruit and vegetables (US$)Value of exports of fruit and vegetables in current US$.Source: FAO, Statistics Division (FAOSTAT)Owner: FAO
Exports of meat and meat prep. (US$)Value of exports of meat and meat prep. in current US$.Source: FAO, Statistics Division (FAOSTAT)Owner: FAO
Exports of oilseeds (US$)Value of exports of oilseeds in current US$.Source: FAO, Statistics Division (FAOSTAT)Owner: FAO
Exports of sugar and honey (US$)Value of exports of sugar and honey in current US$.Source: FAO, Statistics Division (FAOSTAT)Owner: FAO
Exports of veg. oils (US$)Value of exports of veg. oils in current US$.Source: FAO, Statistics Division (FAOSTAT)Owner: FAO
Fat supply quantity in crops primary equivalent (g/cap/day)Fat supply quantity in crops primary equivalent.Source: FAO, Statistics Division (FAOSTAT)Owner: FAO
Fats, Animals, RawDefault composition: 869 Fat, cattle, 871 Fat, cattle butcher, 949Fat, buffaloes, 979 Fat, sheep, 994 Grease incl. lanolin wool, 1019Fat, goats, 1037 Fat, pigs, 1040 Fat, pig butcher, 1043 Lard, 1065Fat, poultry, 1066 Fat, poultry, rendered, 1129 Fat, camels, 1160 Fat,other camelids, 1168 Oils, fats of animal nes, 1221 Lard stearine oil,1222 Degras, 1225 Tallow, 1243 Fat, nes, prepared
FDI inward flows - Agriculture, hunting, forestry, fishing (currentUSD)Inflows of foreign direct investment (FDI) in agriculture, hunting,forestry, and fishing.Source: Foreign agriculture investment databaseOwner: UNCTAD
FDI inward flows - Agriculture, hunting, forestry, fishing + Food, bev-erages, tobacco (current USD)Inflows of foreign direct investment (FDI) in agriculture, hunting,forestry, and fishing + food, beverages, tobacco.Source: Foreign agriculture investment databaseOwner: UNCTAD
FDI inward flows - Food, beverages, tobacco (current USD)Inflows of foreign direct investment (FDI) in food, beverages, to-bacco.Source: Foreign agriculture investment databaseOwner: UNCTAD
150

METADATA
Female employment, totalEmployees are people who work for a public or private employerand receive remuneration in wages, salary, commission, tips, piecerates, or pay in kind.
Source: World Bank
Owner: International Labour Organization, Key Indicators of theLabour Market database.
Fertilizers consumptionMineral fertilizers made their appearance with the Industrial revolu-tion and had an important role in sustaining the growing populationof earth: half the population of earth are now estimated to be fedwith crops grown using synthetic fertilizers (Erisman et al. 2008).Fertilizers can have a negative impact on the environment, leadingto eutrophication and poisoning of water, and pollution of soil (e.g.heavy metals, soil acidification, POP-Persistent Organic Pollutants).Also, the production of fertilizers is energy intensive and mineablephosphorus reserves are finite.
Fertilizers Manufactured, nesMineral or chemical fertilizers not elsewhere specified.
Fertilizers, OrganicAnimal or vegetable fertilizers, whether or not mixed together orchemically treated; fertilizers produced by the mixing or chemicaltreatment of animal or vegetable products.
Fibre crop harvested area (ha)See ’Fibre crops’ and ’Crop area’.
Source: FAO, Statistics Division (FAOSTAT)
Owner: FAO
Fibre crop yield (hg/ha)See ’Fibre crops’ and ’Crop yield’.
Source: FAO, Statistics Division (FAOSTAT)
Owner: FAO
Fibre cropsNatural fibre crops include Agave Fibres Nes, Cotton lint, Fibre CropsNes, Flax fibre and tow, Hemp TowWaste, Jute, Manila Fibre (Abaca),Other Bastfibres, Ramie, Seed cotton and Sisal.
Fibre crops production (tonnes)See ’Fibre crops’ and ’Crop production’.
Source: FAO, Statistics Division (FAOSTAT)
Owner: FAO
Fish species, threatenedFish species are based on Froese, R. and Pauly, D. (eds). 2008.Threatened species are the number of species classified by the IUCNas endangered, vulnerable, rare, indeterminate, out of danger, or in-sufficiently known.
Source: World Bank (WDI)
Owner: Froese, R. and Pauly, D. (eds). 2008. FishBase database,www.fishbase.org.
Fixed broadband Internet subscribers (per 100 people)Fixed broadband Internet subscribers are the number of broadbandsubscribers with a digital subscriber line, cable modem, or otherhigh-speed technology.
Source: World Bank (WDI)
Owner: International Telecommunication Union, World Telecommu-nication/ICT Development Report and database, and World Bank es-timates.
FoodData refer to the total amount of the commodity available as hu-man food during the reference period. Data include the commodityin question, as well as any commodity derived therefrom as a resultof further processing. Food from maize, for example, comprises theamount of maize, maize meal and any other products derived there-from available for human consumption. Food from milk relates tothe amounts of milk as such, as well as the fresh milk equivalent ofdairy products.
Food net per capita production index number (2004-2006 = 100)See ’Agricultural production indices’.Source: FAO, Statistics Division (FAOSTAT)Owner: FAO
Food Price Level Index (index)The Domestic Food Price Level Index is calculated by dividing theFood Purchasing Power Parity (FPPP) by the General PPP, thus proid-ing an index of the price of food in the country relative to the priceof the generic cosnumption basket. Data are available for 2005 fromthe ICP Program. It is then extended to other years by adjusting bothnumerator and denominator using the relative chenges in Food CPIand General CPI as provided by ILO.Source: FAO, Statistics DivisionOwner: ILO and World Bank ICP (International Comparison Project)
Food productionFor primary commodities, production relates to the total domesticproduction whether inside or outside the agricultural sector, i.e. in-cluding non-commercial production and production in kitchen gar-dens. Unless otherwise indicated, production is reported at the farmlevel for primary crops (i.e. excluding harvesting losses for crops)and livestock items and in terms of live weight (i.e. the actual ex-water weight of the catch at the time of capture) for primary fishitems. Production of processed commodities relates to the total out-put of the commodity at the manufacture level (i.e. it comprises out-put from domestic and imported raw materials of originating prod-ucts). Reporting units are chosen accordingly, e.g. cereals are re-ported in terms of grains and paddy rice. As a general rule, all dataon meat are expressed in terms of carcass weight. Usually the dataon production relate to that which takes place during the referenceperiod. However, production of certain crops may relate to the har-vest of the year preceding the utilization period if harvesting takesplace late in the year. In such instances, the production of a givenyear largely moves into consumption in the subsequent year. In theFood Balance Sheets a distinction is made between "output" and"input". The production of primary as well as of derived products isreported under "output". For derived commodities, the amounts ofthe originating commodity that are required for obtaining the out-put of the derived product are indicated under "input", and are ex-pressed in terms of the originating commodity. The various factorsused, i.e. milling rates, extraction rates, conversion or processingfactors, carcass weights, milk yield, egg weights etc., should indi-cate the average national rate at which these commodities are gen-erally converted.
Food supply in crops primary equivalent (kcal/cap/day)Food supply in crops primary equivalent.Source: FAO, Statistics Division (FAOSTAT)Owner: FAO
Foreign direct investment, net inflows (percent of GDP)Foreign direct investment are the net inflows of investment to ac-quire a lasting management interest (10 percent or more of votingstock) in an enterprise operating in an economy other than that ofthe investor. It is the sum of equity capital, reinvestment of earn-ings, other long-term capital, and short-term capital as shown in thebalance of payments. This series shows net inflows (new investmentinflows less disinvestment) in the reporting economy from foreigninvestors, and is divided by GDP.Source: World Bank (WDI)Owner: International Monetary Fund, International Financial Statis-tics and Balance of Payments databases, World Bank, Global Devel-opment Finance, and World Bank and OECD GDP estimates.
151

Forest area (ha)Forest area is the land spanning more than 0.5 hectares with treeshigher than 5 metres and a canopy cover of more than 10 percent,or trees able to reach these thresholds in situ. It does not includeland that is predominantly under agricultural or urban land use. For-est is determined both by the presence of trees and the absence ofother predominant land uses. The trees should be able to reach aminimum height of 5 metres (m) in situ. Areas under reforestationthat have not yet reached but are expected to reach a canopy coverof 10 percent and a tree height of 5 m are included, as are tem-porarily unstocked areas, resulting from human intervention or nat-ural causes, which are expected to regenerate. Includes: areas withbamboo and palms provided that height and canopy cover criteriaare met; forest roads, firebreaks and other small open areas; forestin national parks, nature reserves and other protected areas suchas those of specific scientific, historical, cultural or spiritual inter-est; windbreaks, shelterbelts and corridors of trees with an area ofmore than 0.5 ha and width of more than 20 m; plantations primar-ily used for forestry or protective purposes, such as: rubber-woodplantations and cork, oak stands. Excludes: tree stands in agricul-tural production systems, for example in fruit plantations and agro-forestry systems. The term also excludes trees in urban parks andgardens.Source: FAO, Statistics Division (FAOSTAT)Owner: FAO
Freshwater FishDefault composition: 1501 Frwtr Diad F, 1502 Frwtr Fz Whl, 1503Frwtr Fillet, 1504 Frwtr Fz Flt, 1505 Frwtr Cured, 1506 FrwtrCanned, 1507 Frwtr Pr nes, 1508 Frwtr Meals
Fruit harvested area (ha)See ’Fruit, excluding melons’ and ’Crop area’.Source: FAO, Statistics Division (FAOSTAT)Owner: FAO
Fruit production, excluding melons (tonnes)See ’Fruit, excluding melons’ and ’Crop production’.Source: FAO, Statistics Division (FAOSTAT)Owner: FAO
Fruit yield (hg/ha)See ’Fruit, excluding melons’ and ’Crop yield’.Source: FAO, Statistics Division (FAOSTAT)Owner: FAO
Fruit, citrus nesIncluding inter alia: bergamot (Citrus bergamia); citron (C. medicavar. cedrata); chinotto (C. myrtifolia); kumquat (Fortunella japonica).Some minor varieties of citrus are used primarily in the preparationof perfumes and soft drinks.
Fruit, excluding melonsFruit Crops consist of fruits and berries that, with few exceptions,are characterized by their sweet taste. Nearly all are permanentcrops, mainly from trees, bushes and shrubs, as well as vines andpalms. Fruits and berries grow on branches, stalks or the trunks ofplants, usually singly, but sometimes grouped in bunches or clusters(e.g. bananas and grapes). Commercial crops are cultivated in plan-tations, but significant quantities of fruits are also collected fromscattered plants that may or may not be cultivated.
Fruit, fresh nesIncluding inter alia: azarole (Crataegus azarolus); babaco (Car-ica pentagona); elderberry (Sambucus nigra); jujube (Zizyphus ju-juba); litchi (nephelium litchi); loquat (Eriobotrya japonica); med-lar (Mespilus germanica); pawpaw (Asimina triloba); pomegranate(Punica granatum); prickly pear (Opuntia ficus-indica); rose hips(Rosa spp.); rowanberry (Sorbus aucuparia); service-apple (Sorbusdomestica); tamarind (Tamarindus indica); tree-strawberry (Arbutusunedo). Other fresh fruit that are not identified separately becauseof their minor relevance at the international level. Because of theirlimited local importance, some countries report fresh fruit underthis heading that are classified separately by FAO.
GDP (current US$)GDP at purchaser’s prices is the sum of gross value added by all res-ident producers in the economy plus any product taxes and minusany subsidies not included in the value of the products. It is cal-culated without making deductions for depreciation of fabricatedassets or for depletion and degradation of natural resources. Dataare in current U.S. dollars. Dollar figures for GDP are converted fromdomestic currencies using single year official exchange rates. For afew countries where the official exchange rate does not reflect therate effectively applied to actual foreign exchange transactions, analternative conversion factor is used.
Source: World Bank (WDI)
Owner: World Bank national accounts data, and OECD National Ac-counts data files.
GINI indexGini index measures the extent to which the distribution of income(or, in some cases, consumption expenditure) among individuals orhouseholds within an economy deviates from a perfectly equal dis-tribution. A Lorenz curve plots the cumulative percentages of totalincome received against the cumulative number of recipients, start-ing with the poorest individual or household. The Gini index mea-sures the area between the Lorenz curve and a hypothetical line ofabsolute equality, expressed as a percentage of the maximum areaunder the line. Thus a Gini index of 0 represents perfect equality,while an index of 100 implies perfect inequality.
Source: World Bank (WDI)
Owner: World Bank, Development Research Group. Data are basedon primary household survey data obtained from government sta-tistical agencies and World Bank country departments. Data forhigh-income economies are from the Luxembourg Income Studydatabase. For more information and methodology, please see Pov-calNet (http://iresearch.worldbank.org/PovcalNet/index.htm).
Global 5-Year running mean land-ocean temperature index (degreeCelsius)Global 5-years running mean land-ocean temperature index, withbase period 1951-1980.
Source: NASA
Owner: Hansen et al. 2007
Global annual mean land-ocean temperature index (degree Celsius)Global annual mean land-ocean temperature index, with base pe-riod 1951-1980.
Source: NASA
Owner: Hansen et al. 2006
Global annual mean land-ocean temperature index, low latitudes23.6N-23.6S (degree Celsius)Global annual mean land-ocean temperature index, low latitudes23.6N-23.6S with base period 1951-1980.
Source: NASA
Owner: Hansen et al. 2009
Global annual mean land-ocean temperature index, northern lati-tudes 90N-23.6N (degree Celsius)Global annual mean land-ocean temperature index, northern lati-tudes 90N-23.6N with base period 1951-1980.
Source: NASA
Owner: Hansen et al. 2008
Global annual mean land-ocean temperature index, southern lati-tudes 23.6S-90S (degree Celsius)Global annual mean land-ocean temperature index, southern lati-tudes 23.6S-90S with base period 1951-1980.
Source: NASA
Owner: Hansen et al. 2010
152

METADATA
GNI per capita, Atlas method (current US$)GNI per capita (formerly GNP per capita) is the gross national in-come, converted to U.S. dollars using the World Bank Atlas method,divided by the midyear population. GNI is the sum of value added byall resident producers plus any product taxes (less subsidies) not in-cluded in the valuation of output plus net receipts of primary income(compensation of employees and property income) from abroad.GNI, calculated in national currency, is usually converted to U.S. dol-lars at official exchange rates for comparisons across economies, al-though an alternative rate is used when the official exchange rate isjudged to diverge by an exceptionally large margin from the rate ac-tually applied in international transactions. To smooth fluctuationsin prices and exchange rates, a special Atlas method of conversion isused by the World Bank. This applies a conversion factor that aver-ages the exchange rate for a given year and the two preceding years,adjusted for differences in rates of inflation between the country,and through 2000, the G-5 countries (France, Germany, Japan, theUnited Kingdom, and the United States). From 2001, these countriesinclude the Euro area, Japan, the United Kingdom, and the UnitedStates.Source: World Bank (WDI)Owner: World Bank national accounts data, and OECD National Ac-counts data files.
GoatsIncludes Hircus, Ibex, Nubiana, Pyrenaica, Tibetana, Kashmir andAngora.
Government expenditureData presented on government expenditure refers to Core Areas ofGovernment Functions Relevant to the Agriculture Sector based onthe Classification of Functions of Government (COFOG) as outlinedin the IMF’s Government Finance Statistics Manual, 2001 (GFSM2001). COFOG is essential for making international comparisonsof the extent to which governments are involved in economic andsocial functions because it avoids problems associated with organi-zational changes in a single government, and problems of organi-zational differences among countries. Statistics on expenditures inagriculture, forestry and fisheries and on environmental protectioncan be used to study the effectiveness of government programs thatsupport an enabling environment for essential public goods withhigh economic and social returns. COFOG provides key aggregatesthat could be used as indicators or measures of results / outcomes.
Government expenditure allocated to agricultural and rural devel-opmentData on government expenditure on agriculture refers to all non-repayable payments, whether capital or current, requited or not bygovernment for the agricultural and rural development sector.
Grain, mixedA mixture of cereal species that are sown and harvested together.The mixture wheat/rye is known as meslin, but in trade is usuallyclassified with wheat.
GrapesDefault composition: 560 Grapes, 561 Raisins, 562 Juice, grape, 563Grapes, must
Gross capital stock (constant 2005 prices)The estimate of capital stock in agriculture refers to a value thatis attached to the total physical capital capacity available for re-peated use in the production of other goods, in existence at specificpoint in time in the economy of agriculture sector. The estimates ofinvestment in agriculture have indirectly been derived by the FAOFAO, Statistics Division using physical data on livestock, tractors,irrigated land and land under permanent crops etc., and the aver-age prices for the year 1995. These data enabled the derivation ofthe capital stock in agriculture which is the gross, and the annualchange in the latter is taken to reflect investment in agriculture.Source: FAO, Statistics Division (FAOSTAT)Owner: FAO
Gross capital stock, land development (constant 2005 prices)See ’Gross capital stock (constant 2005 prices)’.Source: FAO, Statistics Division (FAOSTAT)Owner: FAO
Gross capital stock, livestock fixed assets (constant 2005 prices)See ’Gross capital stock (constant 2005 prices)’.Source: FAO, Statistics Division (FAOSTAT)Owner: FAO
Gross capital stock, livestock inventory (constant 2005 prices)See ’Gross capital stock (constant 2005 prices)’.Source: FAO, Statistics Division (FAOSTAT)Owner: FAO
Gross capital stock, machinery & equipment (constant 2005 prices)See ’Gross capital stock (constant 2005 prices)’.Source: FAO, Statistics Division (FAOSTAT)Owner: FAO
Gross capital stock, plantation crops (constant 2005 prices)See ’Gross capital stock (constant 2005 prices)’.Source: FAO, Statistics Division (FAOSTAT)Owner: FAO
Gross capital stock, structures for livestock (constant 2005 prices)See ’Gross capital stock (constant 2005 prices)’.Source: FAO, Statistics Division (FAOSTAT)Owner: FAO
Groundnut OilDefault composition: 244 Oil, groundnut
Health expenditure, total (percent of GDP)Total health expenditure is the sum of public and private health ex-penditure. It covers the provision of health services (preventive andcurative), family planning activities, nutrition activities, and emer-gency aid designated for health but does not include provision ofwater and sanitation.Source: World Bank (WDI)Owner: World Health Organization National Health Accountdatabase (see http://apps.who.int/nha/database for the most recentupdates).
Honey, naturalHoney produced by bees (Apis mellifera) or by other insects.
Import of forest products (USD)Forest materials for commercial use.Source: FAO, Statistics Division (FAOSTAT)Owner: FAO
Import of roundwood (m3)See ’Roundwood’.Source: FAO, Statistics Division (FAOSTAT)Owner: FAO
Import value index (2004-2006 = 100)Value indices represent the change in the current values of Importc.i.f. (cost, insurance and freight) all expressed in US dollars. Forcountries which report import values on an f.o.b. (free on board)basis, these are adjusted to approximate c.i.f. values (by a standardfactor of 112 percent).Source: FAO, Statistics Division (FAOSTAT)Owner: FAO
153

Imports of fish (US$)Value of imports of fish in current US$ (data reported include fish,molluscs, crustaceans, and miscellaneous aquatic animals but ex-cluding production for marine mammals, crocodiles, corals, pearls,sponges and aquatic plants, miscellaneous aquatic animal productsand fish waste).Source: Fisheries and Aquaculture Department (Fishery and Aqua-culture statistics)Owner: FAO
Income share held by highest 20% (percent)Percentage share of income or consumption is the share that ac-crues to subgroups of population indicated by deciles or quintiles.Percentage shares by quintile may not sum to 100 because of round-ing.Source: World Bank (WDI)Owner: World Bank, Development Research Group. Data are basedon primary household survey data obtained from government sta-tistical agencies and World Bank country departments. Data forhigh-income economies are from the Luxembourg Income Studydatabase. For more information and methodology, please see Pov-calNet (http://iresearch.worldbank.org/PovcalNet/index.htm).
Income share held by lowest 20% (percent)Percentage share of income or consumption is the share that ac-crues to subgroups of population indicated by deciles or quintiles.Percentage shares by quintile may not sum to 100 because of round-ing.Source: World Bank (WDI)Owner: World Bank, Development Research Group. Data are basedon primary household survey data obtained from government sta-tistical agencies and World Bank country departments. Data forhigh-income economies are from the Luxembourg Income Studydatabase. For more information and methodology, please see Pov-calNet (http://iresearch.worldbank.org/PovcalNet/index.htm).
Industrial roundwoodThe wood removed (volume of roundwood under bark) for produc-tion of goods and services other than energy production (wood-fuel). It represents the sum of: sawlogs and veneer logs; pulp-wood, round and split; and other industrial roundwood. Seehttp://www.fao.org/forestry/62283/en/ for further information.
Industrial roundwood production (m3)See ’Industrial roundwood’ and ’Production’.Source: FAO, Statistics Division (FAOSTAT)Owner: FAO
Industrial water withdrawal, share of total water withdrawal (per-cent)Industrial water withdrawal as percentage of total water with-drawal.Source: Land and Water Division (AQUASTAT)Owner: FAO
Industry, value added (percent of GDP)Industry corresponds to ISIC divisions 10-45 and includes manu-facturing (ISIC divisions 15-37). It comprises value added in mining,manufacturing (also reported as a separate subgroup), construction,electricity, water, and gas. Value added is the net output of a sectorafter adding up all outputs and subtracting intermediate inputs. Itis calculated without making deductions for depreciation of fabri-cated assets or depletion and degradation of natural resources. Theorigin of value added is determined by the International StandardIndustrial Classification (ISIC), revision 3. Note: For VAB countries,gross value added at factor cost is used as the denominator.Source: World Bank (WDI)Owner: World Bank national accounts data, and OECD National Ac-counts data files.
Internally displaced persons, totalInternally Displaced Persons (IDPs) are people or groups of individu-als who have been forced to leave their homes or places of habitualresidence, in particular as a result of, or in order to avoid the effectsof armed conflict, situations of generalized violence, violations ofhuman rights or natural- or human-made disasters, and who havenot crossed an international border. For purposes of UNHCR’s statis-tics, this population only includes conflict-generated IDPs to whomthe Office extends protection and/or assistance. As such, UNHCRstatistics do not provide a comprehensive picture of global internaldisplacement. Moreover, UNHCR’s IDP statistics are not necessar-ily representative of the entire IDP population in a given countrybut are exclusively limited to the ones who are protected and/or as-sisted by the Office. For global IDP estimates, consult the InternalDisplacement Monitoring Centre (IDMC) of the Norwegian RefugeeCouncil (NRC) website. The 2007 IDP population category also in-cludes people in IDP-like situations. This sub-category is descriptivein nature and includes groups of persons who are inside their coun-try of nationality or habitual residence and who face protection riskssimilar to those of IDPs but who, for practical or other reasons, couldnot be reported as such.
Source: Statistical Online Population Database
Owner: UNHCR
Irrigation potential (ha)Area of land which is potentially irrigable. Country/regional stud-ies assess this value according to different methods. For example,some consider only land resources, others consider land resourcesplus water availability, others include economical aspects in theirassessments (such as distance and/or difference in elevation be-tween the suitable land and the available water) or environmentalaspects, etc. If available, this information is given in the individualcountry profiles. The figure includes the area already under agricul-tural water management.
Source: Land and Water Division (AQUASTAT)
Owner: FAO
Jute and jute-likeWhite jute (Corchorus capsularis); red jute, tossa (C. olitorius). Tradedata cover raw or processed jute (but not spun), tow and waste, yarnwaste and garnetted stock and may include jute-like fibres.
Jute and jute-like harvested area (ha)See ’Jute and jute-like’ and ’Crop area’.
Source: FAO, Statistics Division (FAOSTAT)
Owner: FAO
Jute and jute-like production (tonnes)See ’Jute and jute-like’ and ’Crop production’.
Source: FAO, Statistics Division (FAOSTAT)
Owner: FAO
Jute and jute-like yield (hg/ha)See ’Jute and jute-like’ and ’Crop yield’.
Source: FAO, Statistics Division (FAOSTAT)
Owner: FAO
Labor participation rate, female (share of female population ages15+)Labor force participation rate is the proportion of the populationages 15 and older that is economically active: all people who supplylabor for the production of goods and services during a specifiedperiod.
Source: World Bank (WDI)
Owner: International Labour Organization, Key Indicators of theLabour Market database.
154

METADATA
Labor participation rate, male (share of male population ages 15+)Labor force participation rate is the proportion of the populationages 15 and older that is economically active: all people who supplylabor for the production of goods and services during a specifiedperiod.Source: World Bank (WDI)Owner: International Labour Organization, Key Indicators of theLabour Market database.
Land area (sq. km)Land area is a country’s total area, excluding area under inlandwaterbodies, national claims to continental shelf, and exclusive economiczones. In most cases the definition of inland water bodies includesmajor rivers and lakes.Source: World Bank (WDI)Owner: Food and Agriculture Organization, electronic files and website.
Life expectancy at birth, total (years)Life expectancy at birth indicates the number of years a newborninfant would live if prevailing patterns of mortality at the time of itsbirth were to stay the same throughout its life.Source: World Bank (WDI)Owner: UNPD World Population Prospects 2010
Literacy rate, adult female (percent of females ages 15 and above)Adult literacy rate is the percentage of people ages 15 and abovewho can, with understanding, read and write a short, simple state-ment on their everyday life.Source: World Bank (WDI)Owner: United Nations Educational, Scientific, and Cultural Organi-zation (UNESCO) Institute for Statistics.
LivestockAnimals such as cattle and sheep which are kept on the holding orotherwise for agricultural production.
MaizeZea mays Corn, Indian corn, mealies. A grain with a high germ con-tent. At the national level, hybrid and ordinary maize should bereported separately owing to widely different yields and uses. Usedlargely for animal feed and commercial starch production.
Male employment, totalEmployees are people who work for a public or private employerand receive remuneration in wages, salary, commission, tips, piecerates, or pay in kind.Source: World BankOwner: International Labour Organization, Key Indicators of theLabour Market database.
Mammal species, threatenedMammal species are mammals excluding whales and porpoises.Threatened species are the number of species classified by the IUCNas endangered, vulnerable, rare, indeterminate, out of danger, or in-sufficiently known.Source: World Bank (WDI)Owner: United Nations Environmental Program and the World Con-servation Monitoring Centre, and International Union for Conserva-tion of Nature, Red List of Threatened Species.
Manufactures Unit Value (MUV) (index)The MUV is a composite index of prices for manufactured exportsfrom the fifteen major developed and emerging economies to low-and middle-income economies, valued in U.S. dollars. For the MUV(15) index, unit value indexes in local currency for each countryare converted to U.S. dollars using market exchange rates and arecombined using weights determined by the share of each coun-try’s exports in G15 exports to low- and middle-income countries.
The shares are calculated using SITC revision 3 Manufactures ex-ports data from UN COMTRADE in 2005, the base year. The pri-mary manufacturing prices index source is OECD’s Domestic Pro-ducer Price Index (PPI) for manufacturing. Whenever PPI is notavailable, export price indexes or the export unit values are usedas proxies. The countries and relative weights (in parentheses)are: Brazil (2.95%), Canada (0.93%), China (11.79%), France (5.87%),Germany (13.29%), India (1.77%), Italy (6.07%), Japan (16.70%),Mexico (0.93%), South Africa (0.75%), South Korea (10.95%), Spain(2.30%), Thailand (2.51%), United Kingdom (3.50%), and UnitedStates (19.68%).Source: World BankOwner: World Bank, Development Prospects Group; Historical USGDP deflator: US Department of Commerce.
Manure applied to soils, total emissions in CO2eq (gigagrams)Greenhouse gas (GHG) emissions from manure applied to soils con-sist of nitrous oxide gas from nitrogen additions to managed soilsfrom treated manure.Source: FAO, Statistics Division (FAOSTAT)Owner: FAO
Manure left on pasture, total emissions in CO2eq (gigagrams)Greenhouse Gases (GHG) emissions data from manure left on pas-ture consist of nitrous oxide gas from nitrogen additions tomanagedsoils from grazing livestock.Source: FAO, Statistics Division (FAOSTAT)Owner: FAO
Manure management, total emissions in CO2eq (gigagrams)Greenhouse gas (GHG) emissions from manure management con-sist of methane and nitrous oxide gases from aerobic and anaerobicdecomposition processes.Source: FAO, Statistics Division (FAOSTAT)Owner: FAO
Marine protected areas (share of territorial waters)Marine protected areas are areas of intertidal or subtidal terrain–and overlying water and associated flora and fauna and historicaland cultural features–that have been reserved by law or other ef-fective means to protect part or all of the enclosed environment.Source: World Bank (WDI)Owner: United Nations Environmental Program and the World Con-servation Monitoring Centre, as compiled by the World ResourcesInstitute, based on data from national authorities, national legisla-tion and international agreements.
Meat, assIncluding frog legs, marine mammals, etc. Some countries include-under this heading meats that are listed above, but which are notre-ported separately. Fresh, chilled or frozen.
Meat, beef, preparationsMeat and offal (o/t liver) that are boiled, steamed, grilled,fried,roasted or otherwise cooked. Includes prepared meals thatcontain morethan 20% of meat and offal by weight.
Meat, totalMeat from animals, fresh, chilled or frozen, with bone in. All datashown relate to total meat production from both commercial andfarm slaughter. Data are given in terms of dressed carcass weight,i.e. excluding offals and slaughter fats.
Meat, total (tonnes)See ’Meat, total’ and ’Production’.Source: FAO, Statistics Division (FAOSTAT)Owner: FAO
155

MilkWhole freshmilk production from Buffalos, Camels, Cows, Goats andSheep.
Milk excluding butterDefault composition: 882 Milk, whole fresh cow, 888 Milk, skimmedcow, 889 Milk, whole condensed, 890 Whey, condensed, 891 Yo-ghurt, 892 Yoghurt, concentrated or not, 893 Buttermilk, curdled,acidified milk, 894 Milk, whole evaporated, 895 Milk, skimmedevaporated, 896 Milk, skimmed condensed, 897 Milk, whole dried,898 Milk, skimmed dried, 899 Milk, dry buttermilk, 900 Whey, dry,901 Cheese, whole cow milk, 904 Cheese, skimmed cow milk, 905Whey, cheese, 907 Cheese, processed, 908 Milk, reconstituted, 917Casein, 951 Milk, whole fresh buffalo, 954 Milk, skimmed buffalo,955 Cheese, buffalo milk, 982 Milk, whole fresh sheep, 984 Cheese,sheep milk, 985 Milk, skimmed sheep, 1020 Milk, whole fresh goat,1021 Cheese of goat mlk, 1023 Milk, skimmed goat, 1130 Milk,whole fresh camel; nutrient data only: 903 Whey, fresh, 909 Milk,products of natural constituents nes, 910 Ice cream and edible ice
Milk production (tonnes)Production data of milk indicates the quantity of milk produced dur-ing the year from the animals of the species to which the SupplyUtilization Accounts refer. Milk production data is reported accord-ing to the concept of net milk production: total production of wholefresh milk, excluding the milk sucked by young animals but includ-ing amounts fed to livestock.Source: FAO, Statistics Division (FAOSTAT)Owner: FAO
Mobile cellular subscriptions (per 100 people)Mobile cellular telephone subscriptions are subscriptions to a publicmobile telephone service using cellular technology, which provideaccess to the public switched telephone network. Post-paid and pre-paid subscriptions are included.Source: World Bank (WDI)Owner: International Telecommunication Union, World Telecommu-nication/ICT Development Report and database, and World Bank es-timates.
Mortality rate, infant (per 1000 live births)Infant mortality rate is the number of infants dying before reachingone year of age, per 1000 live births in a given year.Source: World Bank (WDI)Owner: UNICEF, WHO, World Bank and UNPD
Mortality rate, under-5 (per 1,000 live births)Under-five mortality rate is the probability per 1,000 that a newbornbaby will die before reaching age five, if subject to current age-specific mortality rates.Source: World Bank (WDI)Owner: Level & Trends in Child Mortality. Report 2011. EstimatesDeveloped by the UN Inter-agency Group for Child Mortality Esti-mation (UNICEF, WHO, World Bank, UN DESA, UNPD).
Municipal water withdrawal, share of total water withdrawal (per-cent)Municipal water withdrawal as percentage of total water with-drawal.Source: Land and Water Division (AQUASTAT)Owner: FAO
Natural PhosphatesProducts obtained by grinding soft mineral phosphates and contain-ing tricalcium phosphate and calcium carbonate as essential ingre-dients. The minimum content of nutrients is 25% P2O5 (Phosphorusexpressed as P2O5 soluble in mineral acids, at least 55% of the de-clared content of P2O5 being soluble in 2% formic acid).
Natural Sodium NitrateChemically obtained product containing sodium nitrate as its essen-tial ingredient. The minimum content of nutrients is 15% N (Nitro-gen expressed as nitric nitrogen).
Net forest conversion, net emissions/removal in CO2eq (gigagrams)GHG emissions data from forest land are currently limited to emis-sions from net forest conversion to non-forest land. They consist ofthe balance of CO2 sources and sinks associated with deforestationand afforestation activities within a country.
Source: FAO, Statistics Division (FAOSTAT)
Owner: FAO
Net official development assistance and official aid received (currentUS$)Net official development assistance (ODA) consists of disbursementsof loans made on concessional terms (net of repayments of princi-pal) and grants by official agencies of the members of the Develop-ment Assistance Committee (DAC), by multilateral institutions, andby non-DAC countries to promote economic development and wel-fare in countries and territories in the DAC list of ODA recipients.It includes loans with a grant element of at least 25 percent (cal-culated at a rate of discount of 10 percent). Net official aid refersto aid flows (net of repayments) from official donors to countriesand territories in part II of the DAC list of recipients: more advancedcountries of Central and Eastern Europe, the countries of the formerSoviet Union, and certain advanced developing countries and terri-tories. Official aid is provided under terms and conditions similar tothose for ODA. Part II of the DAC List was abolished in 2005. Thecollection of data on official aid and other resource flows to Part IIcountries ended with 2004 data. Data are in current U.S. dollars.
Source: World Bank (WDI)
Owner: Development Assistance Committee of the Organisationfor Economic Co-operation and Development, Geographical Dis-tribution of Financial Flows to Developing Countries, Develop-ment Co-operation Report, and International Development Statis-tics database. Data
Nitrogen and phosphate fertilizers consumption (tonnes of K20 to-tal nutrients)Nitrogen and phosphate fertilizers consumption.
Source: FAO, Statistics Division
Owner: FAO
Nitrogen fertilizers consumption (tonnes of N total nutrients)Nitrogen fertilizers consumption.
Source: FAO, Statistics Division (FAOSTAT)
Owner: FAO
Number of people undernourished, totalEstimated number of people at risk of undernourishment. It is cal-culated by applying the estimated prevalence of undernourishmentto the total population in each period.
Source: FAO, Statistics Division
Owner: FAO
ODA received for agriculture sector (US$)See ’Official Development Assistance’
Source: FAO, Statistics Division
Owner: The EAA dataset is compiled from OECD (as given includedin the OECD internet home-page), DAC Reports, Annual Reports ofthe World Bank and data received from other organizations on re-gional development. The data are processed by following a seriesof steps such as analyses, including systematic checking and verifi-cations at various stages for enhancing the quality of the data priorto dissemination on FAOSTAT.
156

METADATA
ODA received for fishing sector (US$)See ’Official Development Assistance’Source: FAO, Statistics DivisionOwner: The EAA dataset is compiled from OECD (as given includedin the OECD internet home-page), DAC Reports, Annual Reports ofthe World Bank and data received from other organizations on re-gional development. The data are processed by following a seriesof steps such as analyses, including systematic checking and verifi-cations at various stages for enhancing the quality of the data priorto dissemination on FAOSTAT.
ODA received for forestry sector (US$)See ’Official Development Assistance’Source: FAO, Statistics DivisionOwner: The EAA dataset is compiled from OECD (as given includedin the OECD internet home-page), DAC Reports, Annual Reports ofthe World Bank and data received from other organizations on re-gional development. The data are processed by following a seriesof steps such as analyses, including systematic checking and verifi-cations at various stages for enhancing the quality of the data priorto dissemination on FAOSTAT.
Official Development AssistanceThe concessional (Official Development Assistance, ODA) and non-Concessional commitments made by bilateral and multilateraldonors to developing countries is referred to as ’External Assistanceto Agriculture’. The term ’Agriculture’ is generally used in the broadsense to cover agriculture, forestry, fisheries, land and water, agro-industries, environment, manufacturing of agricultural inputs andmachinery, regional and river development, and rural development.The narrow concept of agriculture has also been defined to lookat the contribution made to develop agriculture in a strict sense.This includes assistance provided for the development of agricul-ture (crop and animal husbandry), forestry, fisheries (including train-ing, extension and research) and development of land and waterresources.
Oil-bearing cropsOil-bearing crops or oil crops include both annual (usually calledoilseeds) and perennial plants whose seeds, fruits or mesocarp andnuts are valued mainly for the edible or industrial oils that are ex-tracted from them. They include: Castor oil seed, Coconuts, Cot-tonseed, Groundnuts, with shell, Hempseed, Jojoba Seeds, KariteNuts (Sheanuts), Linseed, Melonseed, Mustard seed, Oil palm fruit,Oilseeds, Nes, Olives, Palm kernels, Palm oil, Poppy seed, Rape-seed, Safflower seed, Seed cotton, Sesame seed, Soybeans, Sun-flower seed and Tung Nuts.
Oil-bearing crops harvested area, share of world totalSee ’Oil-bearing crops’ and ’Crop area’.Source: FAO, Statistics Division (FAOSTAT)Owner: FAO
Oil-bearing crops production (tonnes)See ’Oil-bearing crops’ and ’Crop production’.Source: FAO, Statistics Division (FAOSTAT)Owner: FAO
Oil-bearing crops yield (hg/ha)See ’Oil-bearing crops’ and ’Crop yield’.Source: FAO, Statistics Division (FAOSTAT)Owner: FAO
Oil, maizeExtracted from germ by pressure or by solvents.
Oil, palmObtained from the mesocarp of the fruit of the oil palm by pressure,and also by solvent from the residues of the pressure extraction.
Oilcrops Oil, OtherDefault composition: 263 Karite nuts (sheanuts), 265 Castor oilseed, 275 Tung nuts, 277 Jojoba seed, 280 Safflower seed, 296Poppy seed, 299 Melonseed, 305 Tallowtree seed, 310 Kapok fruit,311 Kapokseed in shell, 312 Kapokseed shelled, 333 Linseed, 336Hempseed, 339 Oilseeds nes, 343 Flour, oilseeds
Oilseeds exports (tonnes)Exports (volume) of oilseeds.Source: FAO, Statistics Division (FAOSTAT)Owner: FAO
Oilseeds imports (tonnes)Imports (volume) of oilseeds.Source: FAO, Statistics Division (FAOSTAT)Owner: FAO
Oilseeds nesIncludes inter alia: beech nut (Fagus sylvatica);(Aleuritesmoluccana);(Carapa guineensis);(Croton tiglium);(Bassialatifolia);(Guizotia abyssinica);(Licania rigida);(Perillafrutescens);(Jatropha curcas);(Shorea robusta);(Pongamiaglabra);(Astrocaryum spp.). Other oilseeds, oleaginous fruitsand nuts that are not identified separately because of their minorrelevance at the international level. Because of their limited localimportance, some countries report commodities under this headingthat are classified individually by FAO. Also included under thiscode are tea seeds, grape pips and tomato seeds from which oil isextracted.
Olive OilDefault composition: 261 Oil, olive, virgin, 274 Oil, olive residues
Organic water pollutant (BOD) emissions (kg per day per worker)Emissions per worker are total emissions of organic water pollutantsdivided by the number of industrial workers. Organic water pollu-tants are measured by biochemical oxygen demand, which refers tothe amount of oxygen that bacteria in water will consume in break-ing down waste. This is a standard water-treatment test for thepresence of organic pollutants.Source: World Bank (WDI)Owner: World Bank and UNIDO’s industry database.
Organic water pollutant (BOD) emissions (kg per day)Emissions of organic water pollutants are measured by biochemicaloxygen demand, which refers to the amount of oxygen that bacteriain water will consume in breaking down waste. This is a standardwater-treatment test for the presence of organic pollutants.Source: World Bank (WDI)Owner: 1998 study by Hemamala Hettige, Muthukumara Mani,and David Wheeler, "Industrial Pollution in Economic Development:Kuznets Revisited" (available at www.worldbank.org/nipr). The datawere updated by the World Bank’s Development Research Group us-ing the same methodology as the initial study.
Other land (ha)Other land is the land not classified as Agricultural land and For-est area. It includes built-up and related land, barren land, otherwooded land, etc.Source: FAO, Statistics Division (FAOSTAT)Owner: FAO
Other naturally regenerated forest (ha)Naturally regenerated forest is forest predominantly composed oftrees established through natural regeneration. Other naturally re-generated forest is forest where there are clearly visible indicationsof human activities.Source: Global Forest Resources AssessmentOwner: FAO
157

Others and stateless, totalPopulation of concern to UNHCR, others and stateless.Source: Statistical Online Population DatabaseOwner: UNHCR
Palmkernel OilDefault composition: 258 Oil, palm kernel
Paper and paperboardThe sum of Paper and Paperboard, Newsprint, Paper and Paperboardother than Newsprint, Printing and Writing Paper, Other Paper andPaperboard, Household and Sanitary Paper, Wrapping and Packag-ing Paper and Paperboard andOther Paper and Paperboard Not Else-where Specified. See http://www.fao.org/forestry/62283/en/ for fur-ther information.
Paper and paperboard production (tonnes)See ’Paper and paperboard’ and ’Production’.Source: FAO, Statistics Division (FAOSTAT)Owner: FAO
Part of equipped area actually irrigated (percent)Percent of area equipped for irrigation that is actually irrigated inany given year, expressed in percentage. Irrigated land that is cul-tivated more than once a year is counted only once.Source: Land and Water Division (AQUASTAT)Owner: FAO
PastryAll baked products excluding those listed under bread. Pastry prod-ucts may contain ingredients other than wheat flour, such as milk,eggs, sugar, honey, starch, fats, fruit, seeds, etc.
Per Capita food production variability (index)Per capita food production variability corresponds to the variabilityof the net food production value in constant 2004-2006 1000 Inter-national $ (Net Food PIN) divided by the population number as fromUN 2010 estimates. Variability is based on the trend of the Net FoodPIN per capita over the period 1985 to 2010 and corresponds to thestandard deviation of the deviation from the trend over a period of5 years. Missing values for Eritrea/Ethiopia, former Yugoslavia andCaucasus countries for 1985 to 1992 are estimated backward usingthe share of the value of food production of each country in the totalvalue of the region it belonged to prior to 1992.Source: FAO, Statistics DivisionOwner: FAO
Per Capita food supply variability (index)Food supply variability correspond to the variable Food supply totalin kcal/person/day as estimated by the FAO Statistic Division. Thevariability is obtained as the standard deviation over 5 years of thedeviation from the trend of per capita food supply observed duringthe period 1990 to 2010.Source: FAO, Statistics DivisionOwner: FAO
Per capita supplyEstimates of per capita food supplies available for human consump-tion during the reference period in terms of quantity, caloric value,protein and fat content. Calorie supplies are reported in kilocalories(1 calorie = 4.19 kilojoules). Per capita supplies in terms of productweight are derived from the total supplies available for human con-sumption (i.e. Food) by dividing the quantities of Food by the totalpopulation actually partaking of the food supplies during the ref-erence period, i.e. the present in-area (de facto) population withinthe present geographical boundaries of the country. In other words,nationals living abroad during the reference period are excluded,but foreigners living in the country are included. Adjustments aremade wherever possible for part-time presence or absence, suchas temporary migrants, tourists and refugees supported by special
schemes (if it has not been possible to allow for the amounts pro-vided by such schemes under imports). In almost all cases, thepopulation figures used are the mid-year estimates published bythe United Nations Population Division. Per capita supply figuresshown in the commodity balances therefore represent only the av-erage supply available for the population as a whole and do notnecessarily indicate what is actually consumed by individuals. Evenif they are taken as approximation to per capita consumption, it isimportant to note that the amount of food actually consumed maybe lower than the quantity shown here, depending on the degreeof losses of edible food and nutrients in the household, e.g. dur-ing storage, in preparation and cooking etc. In many cases com-modities are not consumed in the primary form in which they arepresented in the commodity balance, e.g. cereals enter the house-hold mainly in processed form like flour, meal, husked or milledrice. To take this fact into account, the caloric value, the protein andfat content shown against primary commodities in the commoditybalances have been derived by applying the appropriate food com-position factors to the quantities of the processed commodities andnot by multiplying the quantities shown in the commodity balancewith the food composition factors relating to primary commodities.
Percent of adults who are underweight (percent)Percentage of adults who are underweight, as defined by a BodyMass Index (BMI) below the international reference standard of 18.5.To calculate an individual’s BMI, weight and height data are need.The BMI is weight (kg) divided by squared height (m).Source: FAO, Statistics DivisionOwner: World Health Organization (WHO)
Percent of arable land equipped for irrigation (percent)Percent of arable land equipped for irrigation. The indicator is cal-culated on 3 year averages.Source: FAO, Statistics DivisionOwner: FAO
Percent of paved roads over total roads (percent)Paved roads are those surfaced with crushed stone (macadam) andhydrocarbon binder or bituminized agents, with concrete, or withcobblestones, as a percentage of all the country’s roads, measured inlength. Regional aggregates are computed as weighted average us-ing total road network as weight. Because of the low coverage, miss-ing values were interpolated using linear trend between two pointsor extrapolated backward and forward using the closest point. Notethat regional aggregates were calculated only if countries for whichdata were available represented more than 70% of the total lenghtof road network of the region they belong to.Source: FAO, Statistics DivisionOwner: International Road Federation, World Road Statistics andelectronic files, except where noted.
Percentage of children under 5 years of age who are stunted (per-cent)Percentage of stunting (height-for-age less than -2 standard devia-tions of the WHO Child Growth Standards median) among childrenaged 0-5 years.Source: FAO, Statistics DivisionOwner: World Health Organization (WHO)
Percentage of children under 5 years of age who are underweight(percent)Percentage of underweight (weight-for-age less than -2 standarddeviations of the WHO Child Growth Standards median) among chil-dren aged 0-5 years.Source: FAO, Statistics DivisionOwner: World Health Organization (WHO)
Percentage of children under 5 years of age who are wasted (per-cent)Percentage of (weight-for-height less than -2 standard deviations ofthe WHO Child Growth Standards median) among children aged 0-5years.Source: FAO, Statistics DivisionOwner: World Health Organization (WHO)
158

METADATA
Percentage of population with no reasonable access to improvedsanitation facilities (percent)Access to improved sanitation facilities refers to the percentage ofthe population with at least adequate access to excreta disposal fa-cilities that can effectively prevent human, animal, and insect con-tact with excreta. Improved facilities range from simple but pro-tected pit latrines to flush toilets with a sewerage connection. Tobe effective, facilities must be correctly constructed and properlymaintained.Source: FAO, Statistics DivisionOwner: World Health Organization (WHO)
Percentage of population with no reasonable access to improvedwater sources (percent)Access to an improved water source refers to the percentage of thepopulation with reasonable access to an adequate amount of waterfrom an improved source, such as a household connection, publicstandpipe, borehole, protected well or spring, and rainwater collec-tion. Unimproved sources include vendors, tanker trucks, and un-protected wells and springs. Reasonable access is defined as theavailability of at least 20 liters a person a day from a source withinone kilometer of the dwelling.Source: FAO, Statistics DivisionOwner: World Health Organization (WHO)
Permanent crops (ha)Permanent crops is the land cultivated with long-term crops whichdo not have to be replanted for several years (such as cocoa and cof-fee); land under trees and shrubs producing flowers, such as rosesand jasmine; and nurseries (except those for forest trees, whichshould be classified under "forest"). Permanent meadows and pas-tures are excluded from land under permanent crops.Source: FAO, Statistics Division (FAOSTAT)Owner: FAO
Permanent meadows and pastures (ha)Permanent meadows and pastures is the land used permanently(five years or more) to grow herbaceous forage crops, either cul-tivated or growing wild (wild prairie or grazing land). Data are ex-pressed in 1000 hectares.Source: FAO, Statistics Division (FAOSTAT)Owner: FAO
Pesticide consumptionData refer to quantities of pesticides applied to crops and seeds inthe agriculture sector. Figures are generally expressed in terms ofactive ingredients. Data are expressed in tonnes (t). However, due tosome country reporting practices, the data may be reported by: con-sumption in formulated product (including diluents and adjuvants);sales; distribution or imports for use in the agricultural sector. Inthese cases it is specified in the country notes.
PesticidesPesticides refer to insecticides, fungicides, herbicides, disinfectantsand any substance or mixture of substances intended for prevent-ing, destroying or controlling any pest, including vectors of humanor animal disease, unwanted species of plants or animals causingharm during or otherwise interfering with the production, process-ing, storage, transport or marketing of food, agricultural commodi-ties, wood and wood products or animal feedstuffs, or substanceswhich may be administered to animals for the control of insects,arachnids or other pests in or on their bodies. The term includessubstances intended for use as a plant growth regulator, defoliant,desiccant or agent for thinning fruit or preventing the prematurefall of fruit, and substances applied to crops either before or afterharvest to protect the commodity from deterioration during storageand transport.
Phosphate fertilizers consumption (tonnes of P205 total nutrients)Phosphate fertilizers consumption.Source: FAO, Statistics Division (FAOSTAT)Owner: FAO
Pig meatMeat, with the bone in, of domestic or wild pigs (e.g. wildboars),whether fresh, chilled or frozen.
Pig meat per capita (tonne/cap)See ’Pig meat’ and ’Production’.Source: FAO, Statistics Division (FAOSTAT)Owner: FAO
PigsDomestic pig (Sus domestica); wild boar (Sus scrofa). See 866. Ex-cludes non-domesticated wild boars.
Plant species (higher), threatenedHigher plants are native vascular plant species. Threatened speciesare the number of species classified by the IUCN as endangered, vul-nerable, rare, indeterminate, out of danger, or insufficiently known.Source: World Bank (WDI)Owner: United Nations Environmental Program and the World Con-servation Monitoring Centre, and International Union for Conserva-tion of Nature, Red List of Threatened Species.
Planted forest (ha)Planted forest is forest predominantly composed of trees estab-lished through planting and/or deliberate seeding.Source: Global Forest Resources AssessmentOwner: FAO
Political stability and absence of violence/terrorism (index)Political stability and absence of violence measures perceptions ofthe likelihood that the government will be destabilized or over-thrown by unconstitutional or violent means, including politically-motivated violence and terrorism.Source: FAO, Statistics DivisionOwner: WorldWide Governance Indicators
Population ages 0-14, totalPopulation with age between 0 and 14 years.Source: United Nations Population DivisionOwner: United Nations Population Division, World PopulationProspects.
Population ages 15-64, totalPopulation with age between 15 and 64 years.Source: United Nations Population DivisionOwner: United Nations Population Division, World PopulationProspects.
Population ages 65 and above, totalPopulation with age above 65.Source: United Nations Population DivisionOwner: United Nations Population Division, World PopulationProspects.
Population density (people per sq. km of land area)Population density is midyear population divided by land area insquare kilometers. Population is based on the de facto definitionof population, which counts all residents regardless of legal statusor citizenship–except for refugees not permanently settled in thecountry of asylum, who are generally considered part of the popu-lation of their country of origin. Land area is a country’s total area,excluding area under inland water bodies, national claims to conti-nental shelf, and exclusive economic zones. In most cases the defi-nition of inland water bodies includes major rivers and lakes.Source: World Bank (WDI)Owner: Food and Agriculture Organization and World Bank popula-tion estimates.
159

Population living in areas where elevation is below 5 meters (shareof total population)Population below 5m is the percentage of the total population livingin areas where the elevation is 5 meters or less.Source: World Bank (WDI)Owner: Center for International Earth Science Information Network(CIESIN), Place II dataset.
Population, totalTotal population is based on the de facto definition of population,which counts all residents regardless of legal status or citizenship–except for refugees not permanently settled in the country of asy-lum, who are generally considered part of the population of theircountry of origin. The values shown are midyear estimates.Source: United Nations Population DivisionOwner: United Nations Population Division, World PopulationProspects.
Potash fertilizers consumption (tonnes of K20 total nutrients)Potash fertilizers consumption.Source: FAO, Statistics Division (FAOSTAT)Owner: FAO
Potassium SulphateIs a white crystalline salt and contains 48 to 52 per cent potash(K20). Potassium sulfate can be extracted from naturally occurringbrines or by the decomposition of potassium chloride with sulfuricacid.
Poultry birds (heads)Domesticated birds for commercial use.Source: FAO, Statistics Division (FAOSTAT)Owner: FAO
Poultry meatPoultry birds, fresh, chilled or frozen, with bone in. All data shownrelate to total meat production from both commercial and farmslaughter. Data are given in terms of dressed carcass weight, i.e. ex-cluding offals and slaughter fats. Poultry meat includes Bird meat,nes, Chicken meat, Duck meat, Goose and guinea fowl meat andTurkey meat.
Poultry meat (tonnes)See ’Poultry meat’ and ’Production’.Source: FAO, Statistics Division (FAOSTAT)Owner: FAO
Poverty gap at $1.25 a day PPP (percent)Poverty gap is the mean shortfall from the poverty line (countingthe nonpoor as having zero shortfall), expressed as a percentage ofthe poverty line. This measure reflects the depth of poverty as wellas its incidence.Source: World Bank (WDI)Owner: World Bank, Development Research Group. Data are basedon primary household survey data obtained from government sta-tistical agencies and World Bank country departments. Data forhigh-income economies are from the Luxembourg Income Studydatabase. For more information and methodology, please see Pov-calNet (http://iresearch.worldbank.org/PovcalNet/index.htm).
Poverty gap at $2 a day PPP (percente)Poverty gap is the mean shortfall from the poverty line (countingthe nonpoor as having zero shortfall), expressed as a percentage ofthe poverty line. This measure reflects the depth of poverty as wellas its incidence.Source: World Bank (WDI)Owner: World Bank, Development Research Group. Data are basedon primary household survey data obtained from government sta-tistical agencies and World Bank country departments. Data forhigh-income economies are from the Luxembourg Income Studydatabase. For more information and methodology, please see Pov-calNet (http://iresearch.worldbank.org/PovcalNet/index.htm).
Poverty gap at national poverty line (percent)Poverty gap at national poverty line is the mean shortfall from thepoverty line (counting the nonpoor as having zero shortfall) as apercentage of the poverty line. This measure reflects the depth ofpoverty as well as its incidence.Source: World Bank (WDI)Owner: Global Poverty Working Group. Data are based on WorldBank’s country poverty assessments and country Poverty ReductionStrategies.
Poverty gap at rural poverty line (percent)Poverty gap at rural poverty line is the mean shortfall from thepoverty line (counting the nonpoor as having zero shortfall) as apercentage of the national rural poverty line. This measure reflectsthe depth of poverty as well as its incidence.Source: World Bank (WDI)Owner: Global Poverty Working Group. Data are based on WorldBank’s country poverty assessments and country Poverty ReductionStrategies.
Poverty headcount ratio at $1.25 a day PPP (percent of population)Population below $1.25 a day is the percentage of the populationliving on less than $1.25 a day at 2005 international prices. As aresult of revisions in PPP exchange rates, poverty rates for individualcountries cannot be compared with poverty rates reported in earliereditions.Source: World Bank (WDI)Owner: World Bank, Development Research Group. Data are basedon primary household survey data obtained from government sta-tistical agencies and World Bank country departments. Data forhigh-income economies are from the Luxembourg Income Studydatabase. For more information and methodology, please see Pov-calNet (http://iresearch.worldbank.org/PovcalNet/index.htm).
Poverty headcount ratio at $2 a day PPP (percent of population)Population below $2 a day is the percentage of the population liv-ing on less than $2.00 a day at 2005 international prices. As a re-sult of revisions in PPP exchange rates, poverty rates for individualcountries cannot be compared with poverty rates reported in earliereditions.Source: World Bank (WDI)Owner: World Bank, Development Research Group. Data are basedon primary household survey data obtained from government sta-tistical agencies and World Bank country departments. Data forhigh-income economies are from the Luxembourg Income Studydatabase. For more information and methodology, please see Pov-calNet (http://iresearch.worldbank.org/PovcalNet/index.htm).
Poverty headcount ratio at national poverty line (percent of popu-lation)Poverty headcount ratio at national poverty line (% of population).Source: World Bank (WDI)Owner: Global Poverty Working Group. Data are based on WorldBank’s country poverty assessments and country Poverty ReductionStrategies.
Prevalence of food inadequacy (percent)It is conceptually analogous to the prevalence of undernourishment, but calculated setting the caloric threshold to a higher level, by us-ing a Physical Activity Level (PAL) coefficient of 1.75, as opposed to1.55. It measures the percentage of the population that is at risk ofnot covering the food requirements associated with normal phys-ical activity, and therefore including also those who, even thoughcannot be considered chronically undernourished, are likely beingconditioned in their economic activity by insufficient food. Whilethe PoU is an estimator of chronic food deprivation ("hunger"), thisnew estimator is a less conservative measure of food inadequacy inthe population. The indicator is calculated on 3 year averages.Source: FAO, Statistics DivisionOwner: FAO
160

METADATA
Prevalence of undernourishment (percent)Proportion of the population estimated to be at risk of caloric in-adequacy. This is the traditional FAO hunger indicator, adopted asofficial Millenium Development Goal indicator for goal 1, target 1.9.The indicator is calculated on 3 year averages.Source: FAO, Statistics DivisionOwner: FAO
Primary completion rate, total (percent of relevant age group)Primary completion rate is the percentage of students completingthe last year of primary school. It is calculated by taking the totalnumber of students in the last grade of primary school, minus thenumber of repeaters in that grade, divided by the total number ofchildren of official graduation age.Source: World Bank (WDI)Owner: United Nations Educational, Scientific, and Cultural Organi-zation (UNESCO) Institute for Statistics.
Primary forest (ha)Primary forest is naturally regenerated forest of native species,where there are no clearly visible indications of human activitiesand the ecological processes are not significantly disturbed.Source: Global Forest Resources AssessmentOwner: FAO
ProductionFigures relate to the total domestic production whether inside oroutside the agricultural sector, i.e. it includes non-commercial pro-duction and production from kitchen gardens. Unless otherwise in-dicated, production is reported at the farm level for crop and live-stock products (i.e. in the case of crops, excluding harvesting losses)and in terms of live weight for fish items (i.e. the actual ex-waterweight at the time of the catch). All data shown relate to totalmeat production from both commercial and farm slaughter. Dataare expressed in terms of dressed carcass weight, excluding offaland slaughter fats. Production of beef and buffalo meat includesveal; mutton and goat meat includes meat from lambs and kids; pigmeat includes bacon and ham in fresh equivalent. Poultry meat in-cludes meat from all domestic birds and refers, wherever possible,to ready-to-cook weight.
Production - Livestock primaryLivestock primary products include products from live and slaugh-tered animals. Products from slaughtered animals include meat, of-fals, raw fats, fresh hides and skins. Products from live animals in-clude milk, eggs, honey, beeswax and fibres of animal origin. Alldata shown relate to total meat production from both commer-cial and farm slaughter. Data are given in terms of dressed car-cass weight, i.e. excluding offals and slaughter fats. Productionof beef and buffalo meat includes veal; mutton and goat meat in-cludes meat from lambs and kids, respectively; pig meat includesbacon and ham in fresh equivalent. Poultry meat includes meatfrom all domestic birds and refers, wherever possible, to ready-to-cook weight. Cow milk production relates to total production ofwhole fresh milk, excluding the milk sucked by young animals butincluding amounts fed to livestock. The concept of production ofbuffalo, sheep and goat milk is the same as for cow milk; however,the coverage is probably less adequate. Egg production covers alldomestic birds which have contributed to egg production during theyear, wherever they lay and the corresponding total production, in-cluding eggs intended to be used for hatching but excluding wasteon farms.
Protein supply quantity in crops primary equivalent (g/cap/day)Protein supply quantity in crops primary equivalent.Source: FAO, Statistics Division (FAOSTAT)Owner: FAO
PulsesPulses are annual leguminous crops yielding from one to 12 grainsor seeds of variable size, shape and colour within a pod. They areused for both food and feed. The term "pulses" is limited to crops
harvested solely for dry grain, thereby excluding crops harvestedgreen for food (green peas, green beans, etc.) which are classifiedas vegetable crops. Also excluded are those crops used mainly foroil extraction (e.g. soybean and groundnuts) and leguminous crops(e.g. seeds of clover and alfalfa) that are used exclusively for sowingpurposes. They include Bambara beans, Beans, dry, Broad beans,horse beans, dry, Chick peas, Cow peas, dry, Lentils, Lupins, Peas,dry, Pigeon peas, Pulses, nes, and Vetches.
Pulses harvested area (ha)See ’Pulses’ and ’Crop area’.Source: FAO, Statistics Division (FAOSTAT)Owner: FAO
Pulses production (tonnes)See ’Pulses’ and ’Crop production’.Source: FAO, Statistics Division (FAOSTAT)Owner: FAO
Pulses yield (hg/ha)See ’Pulses’ and ’Crop yield’.Source: FAO, Statistics Division (FAOSTAT)Owner: FAO
Rail lines density (percent)Rail lines density corresponds to the ratio between the length ofrailway route available for train service, irrespective of the numberof parallel tracks (rail lines, total route in km) with the area of thecountry. Regional aggregates are computed as weighted averageusing surface area as weight. Because of the low coverage, missingvalues were interpolated using linear trend between two points orextrapolated backward and forward using closest point. Note thatregional aggregates were calculated only if countries for which datawere available represented more than 70% of the total area of theregion they belong to.Source: FAO, Statistics DivisionOwner: International Road Federation, World Road Statistics andelectronic files, except where noted.
Rape and Mustard OilDefault composition: Oil, rapeseed, mustard
Recovered paperWaste and scraps of paper or paperboard that have been collectedfor re-use as a raw material for the manufacture of paper and pa-perboard. It includes: paper and paperboard that has been usedfor its original purpose and residues from paper and paperboardproduction. See http://www.fao.org/forestry/62283/en/ for furtherinformation.
Recovered paper production (tonnes)See ’Recovered paper’ and ’Production’.Source: FAO, Statistics Division (FAOSTAT)Owner: FAO
Rice (paddy)Oryza spp., mainly oryza sativa. Rice grain after threshing and win-nowing. Also known as rice in the husk and rough rice. Used mainlyfor human food.
Rice (paddy) production (tonnes)See ’Rice (paddy)’ and ’Crop production’.Source: FAO, Statistics Division (FAOSTAT)Owner: FAO
Rice cultivation, total emissions in CO2eq (gigagrams)Greenhouse gas (GHG) emissions from rice cultivation consist ofmethane gas from the anaerobic decomposition of organic matterin paddy fields.Source: FAO, Statistics Division (FAOSTAT)Owner: FAO
161

Rice harvested area (ha)See ’Rice (paddy)’ and ’Crop area’.Source: FAO, Statistics Division (FAOSTAT)Owner: FAO
Rice yield (hg/ha)See ’Rice (paddy)’ and ’Crop yield’.Source: FAO, Statistics Division (FAOSTAT)Owner: FAO
Road density (percent)Road density is the ratio of the length of the country’s total roadnetwork to the country’s land area. The road network includes allroads in the country: motorways, highways, main or national roads,secondary or regional roads, and other urban and rural roads. Re-gional aggregates are computed as weighted average using surfacearea as weight. Because of the low coverage, missing values wereinterpolated using linear trend between two points or extrapolatedbackward and forward using the closest point. Note that regionalaggregates were calculated only if countries for which data wereavailable represented more than 70% of the total area of the regionthey belong to.Source: FAO, Statistics DivisionOwner: International Road Federation, World Road Statistics andelectronic files, except where noted.
Root and tuber cropsRoots and tubers are plants yielding starchy roots, tubers, rhizomes,corms and stems. They include Potatoes, Sweet Potatoes, Cassava,Yautia (Cocoyam), Taro (Cocoyam), Yams, Roots And Tubers Nes.
Root and tuber crops production (tonnes)See ’Root and tuber crops’ and ’Crop production’.Source: FAO, Statistics Division (FAOSTAT)Owner: FAO
Roots and tubers harvested area (ha)See ’Root and tuber crops’ and ’Crop area’.Source: FAO, Statistics Division (FAOSTAT)Owner: FAO
Roots and tubers yield (hg/ha)See ’Root and tuber crops’ and ’Crop yield’.Source: FAO, Statistics Division (FAOSTAT)Owner: FAO
Roots and tubers, nesIncluding inter alia: arracacha (Arracacoa xanthorrhiza); arrow-root (Maranta arundinacea); chufa (Cyperus esculentus); sago palm(Metroxylon spp.); oca and ullucu (Oxalis tuberosa and Ullucustuberosus); yam bean, jicama (Pachyrxhizus erosus, P. angulatus);mashua (Tropaeolum tuberosum); Jerusalem artichoke, topinambur(Helianthus tuberosus). Other tubers, roots or rhizomes, fresh, thatare not identified separately because of their minor relevance atthe international level. Because of their limited local importance,some countries report roots and tubers under this commodity head-ing that are classified individually by FAO.
RoundwoodAll roundwood felled or otherwise harvested and removed. It com-prises all wood obtained from removals, i.e. the quantities removedfrom forests and from trees outside the forest, including wood re-covered from natural, felling and logging losses during the period,calendar year or forest year. It includes: all wood removed with orwithout bark, including wood removed in its round form, or split,roughly squared or in other form (e.g. branches, roots, stumps andburls (where these are harvested) and wood that is roughly shapedor pointed. In the production statistics, it represents the sum of:wood fuel, including wood for charcoal; sawlogs and veneer logs;pulpwood, round and split; and other industrial roundwood. Seehttp://www.fao.org/forestry/62283/en/ for further information.
Roundwood production (m3)See ’Roundwood’ and ’Production’.Source: FAO, Statistics Division (FAOSTAT)Owner: FAO
Rural population, totalRural population refers to people living in rural areas as defined bynational statistical offices.Source: United Nations Population DivisionOwner: United Nations Population Division, World UrbanizationProspects.
Safflower seedCarthamus tinctorius. Valued mainly for its oil. Minor uses includeas a human food and as poultry feed.
Safflower seedGlycine soja. The most important oil crop. Also widely consumedas a bean and in the form of various derived products because of itshigh protein content, e.g. soya milk, meat, etc.
SawnwoodWood that has been produced from both domestic and importedroundwood, either by sawing lengthways or by a profile-chippingprocess and that, with a few exceptions, exceeds 5 mm in thick-ness. It includes: planks, beams, joists, boards, rafters, scantlings,laths, boxboards, sleepers and "lumber", etc., in the following forms:unplaned, planed, grooved, tongued, fingerjointed, chamfered, rab-beted, V-jointed, beaded, etc. It excludes: wooden flooring. Seehttp://www.fao.org/forestry/62283/en/ for further information.
Sawnwood production (m3)See ’Sawnwood’ and ’Production’.Source: FAO, Statistics Division (FAOSTAT)Owner: FAO
School enrollment, primary, female (percent net)Net enrollment ratio is the ratio of children of official school agebased on the International Standard Classification of Education1997 who are enrolled in school to the population of the corre-sponding official school age. Primary education provides childrenwith basic reading, writing, and mathematics skills along with anelementary understanding of such subjects as history, geography,natural science, social science, art, and music.Source: World Bank (WDI)Owner: United Nations Educational, Scientific, and Cultural Organi-zation (UNESCO) Institute for Statistics.
School enrollment, primary, male (percent net)Net enrollment ratio is the ratio of children of official school agebased on the International Standard Classification of Education1997 who are enrolled in school to the population of the corre-sponding official school age. Primary education provides childrenwith basic reading, writing, and mathematics skills along with anelementary understanding of such subjects as history, geography,natural science, social science, art, and music.Source: World Bank (WDI)Owner: United Nations Educational, Scientific, and Cultural Organi-zation (UNESCO) Institute for Statistics.
Services, etc., value added (percent of GDP)Services correspond to ISIC divisions 50-99 and they include valueadded in wholesale and retail trade (including hotels and restau-rants), transport, and government, financial, professional, and per-sonal services such as education, health care, and real estate ser-vices. Also included are imputed bank service charges, import du-ties, and any statistical discrepancies noted by national compilersas well as discrepancies arising from rescaling. Value added is thenet output of a sector after adding up all outputs and subtractingintermediate inputs. It is calculated without making deductions for
162

METADATA
depreciation of fabricated assets or depletion and degradation ofnatural resources. The industrial origin of value added is deter-mined by the International Standard Industrial Classification (ISIC),revision 3. Note: For VAB countries, gross value added at factor costis used as the denominator.Source: World Bank (WDI)Owner: World Bank national accounts data, and OECD National Ac-counts data files.
Sesameseed OilDefault composition: Oil, sesame
Share of energy supply derived from cereals, roots and tubers (per-cent)Energy supply (in kcal/caput/day) provided by cereals, roots and tu-bers divided by total Dietary Energy Supply (DES) (in kcal/caput/day)calculated from the correponding categories in the FAOSTAT FoodBalance Sheets. As other indicators based on Food Balance Sheetsdata, it is calculated on 3 year averages, to reduce the errors due tothe difficulties in recording annual stock changes.Source: FAO, Statistics DivisionOwner: FAO
Share of feedstocks used in bioenergy production (percent)Estimated shares of commodity globally used in non-food sectors,including industrial renewable materials and bioenergy.Source: FAO, Statistics DivisionOwner: FAO
Share of food expenditure of the poor (percent)Proportion of food consumption over total consumption (food andnon-food) for the lowest income quintile of the population.Source: FAO, Statistics DivisionOwner: FAO
Share of freshwater resources withdrawn by agriculture (percent)Water withdrawn for irrigation in a given year, expressed in percentof the total actual renewable water resources (TRWR_actual). Thisparameter is an indication of the pressure on the renewable waterresources caused by irrigation.Source: Land and Water Division (AQUASTAT)Owner: FAO
SheepOvis spp.. See ’Cattle’. Includes Uriel, Argali, Bighorn, Karakul andAstrakhan.
Sheep and goat meat (tonnes)See ’Sheep’, ’Goats’, ’Meat, total’, and ’Production’.Source: FAO, Statistics Division (FAOSTAT)Owner: FAO
Sheep and goats (heads)See ’Sheep’ and ’Goats’.Source: FAO, Statistics Division (FAOSTAT)Owner: FAO
Skim milk and buttermilk production, dry (tonnes)See ’Milk excluding butter’ and ’Milk production (tonnes)’.Source: FAO, Statistics Division (FAOSTAT)Owner: FAO
Soyabean OilDefault composition: Oil, soybean
SugarBeta vulgaris var. altissima. In some producing countries, marginalquantities are consumed, either directly as food or in the preparationof jams.
Sugar (Raw Equivalent)Default composition: 158 Sugar, cane, raw, centrifugal, 159 Sugar,beet, raw, centrifugal, 162 Sugar Raw Centrifugal, 164 Sugar refined,168 Sugar confectionery, 171 Sugar flavoured
Sugar and honey exports (tonnes)Exports (volume) of sugar and honey.Source: FAO, Statistics Division (FAOSTAT)Owner: FAO
Sugar and honey imports (tonnes)Imports (volume) of sugar and honey.Source: FAO, Statistics Division (FAOSTAT)Owner: FAO
Sugar beetBeta vulgaris var. altissima. In some producing countries, marginalquantities are consumed, either directly as food or in the preparationof jams.
Sugar caneSaccharum officinarum. In some producing countries, marginalquantities of sugar cane are consumed, either directly as food orin the form of juice.
Sugar harvested area (ha)See ’Sugar’ and ’Crop area’.Source: FAO, Statistics Division (FAOSTAT)Owner: FAO
Sugar production (tonnes)See ’Sugar’ and ’Crop production’.Source: FAO, Statistics Division (FAOSTAT)Owner: FAO
Sugar yield (hg/ha)See ’Sugar’ and ’Crop yield’.Source: FAO, Statistics Division (FAOSTAT)Owner: FAO
Sunflower seedHelianthus annuus. Valued mainly for its oil. Minor uses include asa human food and as feed for birds.
Sunflowerseed OilDefault composition: Oil, sunflower
Synthetic fertilizers, total emissions in CO2eq (gigagrams)Greenhouse gas (GHG) emissions from synthetic fertilizers consistof nitrous oxide gas from synthetic nitrogen additions to managedsoils.Source: FAO, Statistics Division (FAOSTAT)Owner: FAO
Telephone lines (per 100 people)Telephone lines are fixed telephone lines that connect a subscriber’sterminal equipment to the public switched telephone network andthat have a port on a telephone exchange. Integrated services digi-tal network channels ands fixed wireless subscribers are included.Source: World Bank (WDI)Owner: International Telecommunication Union, World Telecommu-nication/ICT Development Report and database, and World Bank es-timates.
163

Terrestrial protected areas (share of total land area)Terrestrial protected areas are totally or partially protected areas ofat least 1,000 hectares that are designated by national authorities asscientific reserves with limited public access, national parks, naturalmonuments, nature reserves or wildlife sanctuaries, protected land-scapes, and areas managed mainly for sustainable use. Marine ar-eas, unclassified areas, littoral (intertidal) areas, and sites protectedunder local or provincial law are excluded.Source: World Bank (WDI)Owner: United Nations Environmental Program and the World Con-servation Monitoring Centre, as compiled by the World ResourcesInstitute, based on data from national authorities, national legisla-tion and international agreements.
Total area equipped for irrigation (ha)Area equipped to provide water (via irrigation) to crops. It includesareas equipped for full/partial control irrigation, equipped lowlandareas, and areas equipped for spate irrigation.Source: Land and Water Division (AQUASTAT)Owner: FAO
Total female population of concern to UNHCR, totalSee ’Total population of concern to UNHCR, total’.Source: Statistical Online Population DatabaseOwner: UNHCR
Total forest (ha)Sum of ’Other naturally regenerated forest (ha)’, ’Primary forest (ha)’,and ’Planted forest (ha)’.Source: Global Forest Resources AssessmentOwner: FAO
Total land area (ha)Land area is the total area of the country excluding area under in-land water bodies. Possible variations in the data may be due toupdating and revisions of the country data and not necessarily toany change of area. Data are expressed in 1 000 hectares.Source: FAO, Statistics Division (FAOSTAT)Owner: FAO
Total male population of concern to UNHCR, totalSee ’Total population of concern to UNHCR, total’.Source: Statistical Online Population DatabaseOwner: UNHCR
Total meat exports (tonnes)Exports (volume) of total meat.Source: FAO, Statistics Division (FAOSTAT)Owner: FAO
Total meat imports (tonnes)Imports (volume) of total meat.Source: FAO, Statistics Division (FAOSTAT)Owner: FAO
Total ODA received (US$)See ’Official Development Assistance’Source: FAO, Statistics DivisionOwner: The EAA dataset is compiled from OECD (as given includedin the OECD internet home-page), DAC Reports, Annual Reports ofthe World Bank and data received from other organizations on re-gional development. The data are processed by following a seriesof steps such as analyses, including systematic checking and verifi-cations at various stages for enhancing the quality of the data priorto dissemination on FAOSTAT.
Total pesticides use (tonnes)Pesticides refer to insecticides, fungicides, herbicides, disinfectantsand any substance or mixture of substances intended for prevent-ing, destroying or controlling any pest, including vectors of humanor animal disease, unwanted species of plants or animals causingharm during or otherwise interfering with the production, process-ing, storage, transport or marketing of food, agricultural commodi-ties, wood and wood products or animal feedstuffs, or substanceswhich may be administered to animals for the control of insects,arachnids or other pests in or on their bodies. The term includessubstances intended for use as a plant growth regulator, defoliant,desiccant or agent for thinning fruit or preventing the prematurefall of fruit, and substances applied to crops either before or afterharvest to protect the commodity from deterioration during stor-age and transport. Pesticides use data refers to quantities of pesti-cides applied to crops and seeds in the agriculture sector. Figuresare expressed in metric tons of active ingredients. However, due tosome country reporting practices, the data may be reported by: usein formulated product; sales; distribution or imports for use in theagricultural sector. In these cases it is specified in the country notes.Source: FAO FAO, Statistics DivisionOwner: FAO
Total population of concern to UNHCR, totalPopulation of concern to UNHCR includes: refugees, asylum-seekers, returned refugees, internally displaced persons (IDPs) pro-tected/assisted by UNHCR, returned IDPs, stateless persons, andothers of concern to UNHCR.Source: Statistical Online Population DatabaseOwner: UNHCR
Total public agricultural expenditures in R & D (2005 PPP US$)Total public agricultural expenditures in R & D.Source: ASTIOwner: ASTI 2012, Eurostat 2012, OECD, 2012, andvarious country-level secondary sources (see for moreinformation on data sources and estimations onhttp://www.asti.cgiar.org/pdf/CountrySourcesEstimations.pdf).Agricultural GDP from World Bank (2012).
Total public agricultural research expenditures (share of agriculturalGDP)Total public agricultural research expenditures as share of agricul-tural GDP.Source: ASTIOwner: ASTI 2012, Eurostat 2012, OECD, 2012, andvarious country-level secondary sources (see for moreinformation on data sources and estimations onhttp://www.asti.cgiar.org/pdf/CountrySourcesEstimations.pdf).Agricultural GDP from World Bank (2012).
Total refugees, totalIn UNHCR statistics, refugees include individuals recognized un-der the 1951 Convention relating to the Status of Refugees; its1967 Protocol; the 1969 OAU Convention Governing the Specific As-pects of Refugee Problems in Africa; those recognized in accordancewith the UNHCR Statute; individuals granted complementary formsof protection; or, those enjoying ’temporary protection’. The 2007refugee population category also includes people in a refugee-likesituation, most of who were previously included in the Others ofconcern group. This sub-category is descriptive in nature and in-cludes groups of persons who are outside their country or territoryof origin and who face protection risks similar to those of refugees,but for whom refugee status has, for practical or other reasons, notbeen ascertained.Source: Statistical Online Population DatabaseOwner: UNHCR
Total share of freshwater resources withdrawn (percent)Total freshwater withdrawn in a given year, expressed in percentageof the actual total renewable water resources (TRWR_actual). This
164

METADATA
parameter is an indication of the pressure on the renewable waterresources.Source: Land and Water Division (AQUASTAT)Owner: FAO
Total water withdrawal (m3/yr)Annual quantity of water withdrawn for agricultural, industrial andmunicipal purposes. It includes renewable freshwater resourcesas well as potential over-abstraction of renewable groundwater orwithdrawal of fossil groundwater and potential use of desalinatedwater or treated wastewater. It does not include in stream uses,which are characterized by a very low net consumption rate, suchas recreation, navigation, hydropower, inland capture fisheries, etc.Source: Land and Water Division (AQUASTAT)Owner: FAO
Total water withdrawal per capita (m3/yr/person)Total annual amount of water withdrawn per capita.Source: Land and Water Division (AQUASTAT)Owner: FAO
Trade (percent of GDP)Trade is the sum of exports and imports of goods and services mea-sured as a share of gross domestic product.Source: World Bank (WDI)Owner: World Bank national accounts data, and OECD National Ac-counts data files.
Treenuts harvested area (ha)See ’Treenuts’ and ’Crop area’.Source: FAO, Statistics Division (FAOSTAT)Owner: FAO
Treenuts production (tonnes)See ’Treenuts’ and ’Crop production’.Source: FAO, Statistics Division (FAOSTAT)Owner: FAO
Treenuts yield (hg/ha)See ’Treenuts’ and ’Crop yield’.Source: FAO, Statistics Division (FAOSTAT)Owner: FAO
Urban population, totalUrban population refers to people living in urban areas as definedby national statistical offices.Source: United Nations Population DivisionOwner: United Nations Population Division, World UrbanizationProspects.
Value of agricultural exportsValue of agricultural exports should be reported in national cur-rency, US dollars or other currency. Export values are mostly re-ported as FOB. In the FAOSTAT database export values are ex-pressed in thousand US dollars.
Value of agricultural importsValue of agricultural imports should be reported in national cur-rency, US dollars or other currency. Import values are mostly re-ported as CIF. In the FAOSTAT database import values are expressedin thousand US dollars.
Value of food imports over total merchandise exports (percent)Value of food (excl. fish) imports over total merchandise exports.The indicator is calculated on 3 year averages.Source: FAO, Statistics DivisionOwner: FAO
Value of food production per capita (I$/cap)The total value of Annual Food Production, as estimated by FAO andpublished by FAOSTAT in International Dollars (I$) divided by thetotal population. It provides a cross country comparable measureof the relative economic size of the food production sector in thecountry. The indicator is calculated on 3 year averages.Source: FAO, Statistics DivisionOwner: FAO
Vegetable production (tonnes)See ’Vegetable, including melons’ and ’Crop production’.Source: FAO, Statistics Division (FAOSTAT)Owner: FAO
Vegetable, including melonsVegetables, as classified in this group, are mainly annual plants cul-tivated as field and garden crops in the open and under glass, andused almost exclusively for food. Vegetables grown principally foranimal feed or seed should be excluded. Certain plants, normallyclassified as cereals and pulses, belong to this group when har-vested green, such as green maize, green peas, etc. This groupingdiffers from international trade classifications for vegetables in thatit includes melons and watermelons, which are normally consideredto be fruit crops. But, whereas fruit crops are virtually all perma-nent crops, melons and watermelons are similar to vegetables inthat they are temporary crops. Chillies and green peppers are in-cluded in this grouping when they are harvested for consumptionas vegetables and not processed into spices. FAO production datafor green peas and green beans refer to the total weight includ-ing pods, although some countries report on a shelled weight basis.The weight of the pods ranges from 40 to 50 percent for peas to upto 70 percent for broad beans. Area data on small vegetable gar-dens are often omitted in agricultural surveys, although productionestimates may be reported. Trade data for fresh vegetables also in-clude chilled vegetables, meaning the temperature of the productshas been reduced to around 0C without the products being frozen.
Vegetables harvested area (ha)See ’Vegetable, including melons’ and ’Crop area’.Source: FAO, Statistics Division (FAOSTAT)Owner: FAO
Vegetables yield (hg/ha)See ’Vegetable, including melons’ and ’Crop yield’.Source: FAO, Statistics Division (FAOSTAT)Owner: FAO
Vegetables, fresh nesIncluding inter alia: bamboo shoots (Bambusa spp.); beets, chards(Beta vulgaris); capers (Capparis spinosa); cardoons (Cynara cardun-culus); celery (Apium graveolens); chervil (Anthriscus cerefolium);cress (Lepidium sativum); fennel (Foeniculum vulgare); horseradish(Cochlearia armoracia); marjoram, sweet (Majorana hortensis); oys-ter plant (Tragopogon porrifolius); parsley (Petroselinum crispum);parsnips (Pastinaca sativa); radish (Raphanus sativus); rhubarb(Rheum spp.); rutabagas, swedes (Brassica napus); savory (Saturejahortensis); scorzonera (Scorzonera hispanica); sorrel (Rumex ace-tosa); soybean sprouts tarragon (Artemisia dracunculus); watercress(Nasturtium officinale). Other vegetables that are not identified sep-arately because of their minor relevance at the international level.Because of their limited local importance, some countries reportvegetables under this heading that are classified individually byFAO.
WasteAmount of the commodity in question lost through wastage (waste)during the year at all stages between the level at which produc-tion is recorded and the household, i.e. storage and transportation.Losses occurring before and during harvest are excluded. Wastefrom both edible and inedible parts of the commodity occurring inthe household is also excluded. Quantities lost during the transfor-mation of primary commodities into processed products are taken
165

into account in the assessment of respective extraction/conversionrates. Distribution wastes tend to be considerable in countries withhot humid climate, difficult transportation and inadequate storageor processing facilities. This applies to the more perishable food-stuffs, and especially to those which have to be transported orstored for a long time in a tropical climate. Waste is often esti-mated as a fixed percentage of availability, the latter being definedas production plus imports plus stock withdrawals.
Water pollution, chemical industry (share of total BOD emissions)Industry shares of emissions of organic water pollutants refer toemissions from manufacturing activities as defined by two-digit di-visions of the International Standard Industrial Classification (ISIC),revision 2: chemicals (35). Emissions of organic water pollutantsare measured by biochemical oxygen demand, which refers to theamount of oxygen that bacteria in water will consume in breakingdown waste. This is a standard water-treatment test for the pres-ence of organic pollutants.Source: World Bank (WDI)Owner: 1998 study by Hemamala Hettige, Muthukumara Mani,and David Wheeler, "Industrial Pollution in Economic Development:Kuznets Revisited" (available at www.worldbank.org/nipr). The datawere updated by the World Bank’s Development Research Group us-ing the same methodology as the initial study.
Water pollution, clay and glass industry (share of total BOD emis-sions)See ’Water pollution, chemical industry (% of total BOD emissions)’.Source: World Bank (WDI)Owner: See ’Water pollution, chemical industry (% of total BODemissions)’.
Water pollution, food industry (share of total BOD emissions)See ’Water pollution, chemical industry (% of total BOD emissions)’.Source: World Bank (WDI)Owner: See ’Water pollution, chemical industry (% of total BODemissions)’.
Water pollution, metal industry (share of total BOD emissions)See ’Water pollution, chemical industry (% of total BOD emissions)’.Source: World Bank (WDI)Owner: See ’Water pollution, chemical industry (% of total BODemissions)’.
Water pollution, other industry (share of total BOD emissions)See ’Water pollution, chemical industry (% of total BOD emissions)’.Source: World Bank (WDI)Owner: See ’Water pollution, chemical industry (% of total BODemissions)’.
Water pollution, paper and pulp industry (share of total BOD emis-sions)See ’Water pollution, chemical industry (% of total BOD emissions)’.Source: World Bank (WDI)Owner: See ’Water pollution, chemical industry (% of total BODemissions)’.
Water pollution, textile industry (share of total BOD emissions)See ’Water pollution, chemical industry (% of total BOD emissions)’.Source: World Bank (WDI)Owner: See ’Water pollution, chemical industry (% of total BODemissions)’.
Water pollution, wood industry (share of total BOD emissions)See ’Water pollution, chemical industry (% of total BOD emissions)’.Source: World Bank (WDI)Owner: See ’Water pollution, chemical industry (% of total BODemissions)’.
Water resources per capita (m3/yr/person)Total annual internal renewable water resources per inhabitant.Source: Land and Water Division (AQUASTAT)Owner: FAO
WheatTriticum spp.: common (T. aestivum) durum (T. durum) spelt (T.spelta). Common and durumwheat are the main types. Among com-mon wheat, the main varieties are spring and winter, hard and soft,and red and white. At the national level, different varieties shouldbe reported separately, reflecting their different uses. Used mainlyfor human food.
Wheat harvested area (ha)See ’Wheat’ and ’Crop area’.Source: FAO, Statistics Division (FAOSTAT)Owner: FAO
Wheat production (tonnes)See ’Wheat’ and ’Crop production.Source: FAO, Statistics Division (FAOSTAT)Owner: FAO
Wheat yield (hg/ha)See ’Wheat’ and ’Crop yield’.Source: FAO, Statistics Division (FAOSTAT)Owner: FAO
Wood-based panelsThe wood-based panels category is an aggregate category. Inthe production and trade statistics, it represents the sum of:veneer sheets, plywood, particle board, and fibreboard. Seehttp://www.fao.org/forestry/62283/en/ for further information.
Wood-based panels production (m3)See ’Wood-based panels’ and ’Production’.Source: FAO, Statistics Division (FAOSTAT)Owner: FAO
Wood pulpWood pulp is a fibrous material prepared from pulpwood, woodchips, particles, residues or recovered paper by mechanical and/orchemical process for further manufacture into paper, paperboard,fibreboard or other cellulose products. In the production and tradestatistics, it represents the sum of: mechanical wood pulp; semi-chemical wood pulp; chemical wood pulp; and dissolving woodpulp. See http://www.fao.org/forestry/62283/en/ for further infor-mation.
Wood pulp production (tonnes)See ’Wood pulp’ and ’Production’.Source: FAO, Statistics Division (FAOSTAT)Owner: FAO
WoodfuelRoundwood that will be used as fuel for purposes such as cook-ing, heating or power production. It includes: wood harvested frommain stems, branches and other parts of trees (where these are har-vested for fuel) and wood that will be used for charcoal produc-tion (e.g. in pit kilns and portable ovens). The volume of round-wood used in charcoal production, is estimated by using a fac-tor of 6.0 to convert from the weight (MT) of charcoal producedto the solid volume (CUM) of roundwood used in production. Itis reported in cubic metres underbark (i.e. excluding bark). Seehttp://www.fao.org/forestry/62283/en/ for further information.
Woodfuel production (m3)See ’Woodfuel’ and ’Production’.Source: FAO, Statistics Division (FAOSTAT)Owner: FAO
166

Bibliography
African Development Bank 2012. The African Economic Outlook: Promoting Youth Employment, OECD publishing.
2013. The African Economic Outlook: Structural Trasformation and Natural Resources, OECD publishing.
Bruinsma, J. 2011. The Resources Outlook: By How Much Do Land, Water and Crop Yields Need to Increase by 2050?, in Looking Ahead in World Foodand Agriculture: Perspectives to 2050, ed. by Conforti, P. FAO, Rome.
FAO 2009. The State of Food and Agriculture 2009 - Livestock in the Balance, FAO, Rome.
2010. Global Forest Resources Assessment 2010 - Main Report, FAO, Rome.
2011a. Climate Change, Water and Food Security, FAO, Rome.
2011b. The State of Food and Agriculture 2010-11 - Women in Agriculture: Closing the Gender Gap for Development, FAO, Rome.
2011c. The State of Food Insecurity in the World 2011 - How Does International Price Volatility Affect Domestic Economies and Food Security?, FAO,Rome.
2011d. The State of the World’s Land and Water Resources for Food and Agriculture - Managing Systems at Risk, FAO, Rome.
2012a. State of the World’s Forests 2012 - The Role of Forests in Human History, FAO, Rome.
2012b. The State of Food and Agriculture 2012 - Investing in Agriculture for a Better Future, FAO, Rome.
2012c. The State of Food Insecurity in the World 2012 - Economic growth is necessary but not suffcient to accelerate reduction of hunger andmalnutrition, FAO, Rome.
2012d. The State of World Fisheries and Aquaculture 2012, FAO, Rome.
2012e. World Agriculture: Towards 2030/2050 - The 2012 Revision, FAO, Rome.
2013. The State of Food Insecurity in the World 2013 - The Multiple Dimensions of Food Security, FAO, Rome.
IEA 2009. World Energy Outlook 2009 Fact Sheet: Why Is Our Current Pathway Unsustainable?, International Energy Agency (IEA), Paris.
2010. World Energy Outlook 2010, IEA, Paris.
2013. World Energy Outlook 2013, IEA, Paris.
Various years a. Energy Balances of Non-OECD Countries, IEA, Paris.
Various years b. Energy Balances of OECD Countries, IEA, Paris.
Various years c. Energy Statistics of Non-OECD Countries, IEA, Paris.
Various years d. Energy Statistics of OECD Countries, IEA, Paris.
IFAD 2011. Rural Poverty Report 2011 - New Realities, New Challenges: New Opportunities for Tomorrow’s Generation, International Fund for AgriculturalDevelopment (IFAD), Rome.
ILO 2009. Guide to the New Millennium Development Goals Employment Indicators, International Labour Organization (ILO), Geneva.
2012. Global Employment Trends 2012. Preventing a deeper job crisis, ILO, Geneva.
2013. Global Employment Trends 2013 - Recovering from a second jobs dip, ILO, Geneva.
Various years a. Key Indicators of the Labour Market (KILM), ILO, Geneva.
Various years b. Yearbook of Labour Statistics, ILO, Geneva.
IMF Various years . International Financial Statistics Yearbook, International Monetary Fund (IMF), Washington, D.C.
O’Donovan, D. 2008. The Atlas of Health: Mapping the Challenges and Causes of Disease. Earthscan, London.
OECD Various years a. Development Co-operation Report, Organization for Economic Co-operation and Development (OECD), Paris.
Various years b. Geographical Distribution of Financial Flows to Developing Economies, OECD, Paris.
167

OECD and FAO 2012. Agricultural Outlook 2012-2021, Organisation for Economic Co-operation and Development (OECD) and FAO.
Partnership on Measuring ICT for Development 2008. The Global Information Society: A Statistical View, United Nations, Santiago.
Prakash, A. (ed.) 2011. Safeguarding Food Security in Volatile Global Markets. FAO, Rome.
R Core Team 2012.R: A Language and Environment for Statistical Computing, R Foundation for Statistical Computing, Vienna, Austria. ISBN 3-900051-07-0.
Schmidhuber, J., Bruinsma, J. & Boedeker, G. 2011. Capital Requirements for Agriculture in Dveloping Countries to 2050, in Looking Ahead in WorldFood and Agriculture: Perspectives to 2050, ed. by Conforti, P. Food and Agriculture Organization.
Schmidhuber, J. and Bruinsma, J. 2011. Investing Towards a World Free of Hunger, Lowering Vulnerability and Enhancing Resilience, in SafeguardingFood Security in Volatile Global Markets, ed. by Prakash, A. FAO, Rome.
UN 2008a. International Standard Industrial Classification of All Economic Activities, 4th Revision. Statistical Papers Series M, No. 4, Rev. 4, United Nations(UN), New York.
2008b. Kyoto Protocol to the United Nations Framework Convention on Climate Change, United Nations Framework Convention on Climate Change,New York.
2009a. Copenhagen Accord, United Nations Framework Convention on Climate Change, Copenhagen.
2009b. Fact Sheet: Stepping Up International Action on Climate Change: The Road to Copenhagen, United Nations Framework Convention onClimate Change, New York.
UNDP 2010. Human Development Report - The Real Wealth of Nations: Pathways to Human Development, United Nations Development Programme (UNDP),New York.
2011. Human Development Report - Sustainability and Equity: A Better Future for All, UNDP, New York.
UNESCO 2009. World Water Development Report 3: Water in a Changing World, UNESCO, Paris.
2010. UNESCO Science Report 2010, UNESCO, Paris.
2011. International Standard Classification of Education, 2011 revision, United Nations Educational, Scientific, and Cultural Organization (UN-ESCO), Paris.
Various years a. EFA Global Monitoring Report, UNESCO, Paris.
Various years b. Global Education Digest, UNESCO, Paris.
UNPD 2011. World Population Prospects: The 2010 Revision, UNPD, United Nations, Department of Economic and Social Affairs, New York.
2013. Trends in Total Migrant Stock: 2013 Revision, United Nations Population Division (UNPD), United Nations, Department of Economic andSocial Affairs, New York.
Various years. World Urbanization Prospects, UNPD, United Nations, Department of Economic and Social Affairs, New York.
von Cramon-Taubadel, S. and Gustavo, A. and de Haen, H. and Nivyevskyi, O. 2011. Investment in Developing Countries Food and Agriculture - AssessingAgricultural Capital Stocks and Their Impact on Productivity, in Looking Ahead in World Food and Agriculture: Perspectives to 2050, ed. by Conforti, P.FAO, Rome.
WHO and UNICEF 2012. Progress on Drinking Water and Sanitation, World Health Organization (WHO) and United Nations Children’s Fund (UNICEF),New York.
World Bank 2013. World Development Report 2013: Jobs. Oxford University Press, New York.
Various years . World Development Indicators - Various issues, WB, Washington, D.C.
World Bank and IMF 2012. Global Monitoring Report: Food Prices, Nutrition, and the Millennium Development Goals,World Bank and International MonetaryFund (IMF), Washington, D.C.
168

169