CommodIty SyStemS ASSeSSment methodoLoGy - IICA
256
By Jerry La Gra Co-authors: Lisa Kitinoja Karol Alpízar COMMODITY SYSTEMS ASSESSMENT METHODOLOGY for Value Chain Problem and Project Identification A first step in food loss reduction
-
Upload
khangminh22 -
Category
Documents
-
view
0 -
download
0
Transcript of CommodIty SyStemS ASSeSSment methodoLoGy - IICA

Com
modity System
s Assessment M
ethodology for Value Chain Problem
and Project Identification
Inter-American Institute for Cooperation on Agriculture
Headquarters. P.O. Box 55-2200San Jose, Vazquez de Coronado, San Isidro11101 - Costa RicaPhone: (+506) 2216 0222 / Fax: (+506) 2216 0233e-mail: [email protected]: www.iica.int
By Jerry La GraCo-authors:Lisa KitinojaKarol Alpízar
CommodIty SyStemS
ASSeSSment methodoLoGy for Value Chain Problem
and Project Identification A first step in food loss reduction

Commodity SyStemS
ASSeSSment methodology for Value Chain Problem
and Project Identification A first step in food loss reduction
By Jerry la graCo-authors:Lisa KitinojaKarol Alpízar
Inter-American Institute for Cooperation on Agriculture (IICA), 2016
Commodity Systems Assessment Methodology for Value Chain Problem and Project Identification : A first step in food loss reduction by IICA is published under license Creative Commons
Attribution-ShareAlike 3.0 IGO (CC-BY-SA 3.0 IGO)
(http://creativecommons.org/licenses/by-sa/3.0/igo/)
Based on a work at www.iica.int
IICA encourages the fair use of this document. Proper citation is requested.
This publication is also available in electronic (PDF) format from the Institute’s Web site: http://www.iica.int
Editorial coordination: Karol AlpízarTranslator: Ingrid McLarenLayout: Tatiana CastroCover design: Tatiana CastroPrinted: IICA Print Shop
San José, Costa Rica2016
La Gra, Jerry Commodity Systems Assessment Methodology for Value Chain Problem and
Project Identification : A first step in food loss reduction / Jerry La Gra, Lisa Kitinoja, Karol Alpízar . – San Jose, C.R. : IICA, 2016.
VIII, 246 p.; 21.5 cm x 28 cm
ISBN: 978-92-9248-650-1
1. Agricultural development 2. Methodology 3. Sustainable development 4. Product development 5. Development projects 6. Food security 7. Project evaluation I. Kitinoja, Lisa II. Alpízar, Karol III. IICA IV. Title
AGRIS DEWEY E10 338.19

Commodity Systems Assessment Methodology for Value Chain Problem and Project Identifi cation iii
table of Contents
Acknowledgments ..................................................................................................................................... vi
Foreword .................................................................................................................................................. vii
Chapter 1. Introduction ..............................................................................................................................1
Chapter 2. Food Losses: Why does reduction matter? ...........................................................................17
Chapter 3. Introduction to the agricultural value chain ............................................................................25
Chapter 4. Priority components for problem analysis ..............................................................................37
Chapter 5. Application of the agricultural value chain assessment methodology ...................................67
Chapter 6. Identifying problems and their solutions ................................................................................89
Chapter 7. Organizing a workshop .........................................................................................................113
References .............................................................................................................................................121
Annexs ....................................................................................................................................................125
Annex 1. Checklist of potential problems in an agricultural value chain ................................................126
Annex 2. Example questionnaires for agricultural value chain components ..........................................140
Annex 3. Example questionnaires for collecting information on public sector
institutions, farmers organizations and development projects ................................................213
Annex 4. Simplifi ed questions for each component of the agricultural value chain ...............................220
Annex 5. Summary of the postharvest system of mango in Uttar Pradesh, India ..................................223
Annex 6. Worksheets for quantifying postharvest losses of leafy vegetables,
fruits, roots, tubers and bulbs in agricultural value chains ......................................................224
Annex 7. Postharvest cost-benefi t worksheet ........................................................................................245

iv inter-American institute for Cooperation on Agriculture
list of Figures
Figure 1.1. Sustainable development is derived from an integration of farmer’s
satisfaction and effi cient government support services ............................................ 15
Figure 3.1A. The movement of eggplant (Solanum melongena) from producer
to consumer in Ghana ................................................................................................ 27
Figure 3.1B. Steps in the rice postharvest system (Oryza sativa) and percent losses
at each stage in Nigeria ............................................................................................. 28
Figure 3.1C. Marketing channels for quinoa (Chenopodium quinoa) in Arequipa, Peru ................ 29
Figure 3.2. Participants in an agricultural value chain .................................................................. 31
Figure 3.3. Causes of pre and postharvest losses at diff erent points in an agricultural
value chain ................................................................................................................ 33
Figure 3.4. Facilitating services to overcome physical and economic losses at distinct
points in an agricultural value chain ........................................................................... 36
Figure 4.1. Principal components for an agricultural value chain assessment from the
food losses perspective ............................................................................................. 40
Figure 5.1. Steps in the production process of most crops ......................................................... 72
Figure 6.1. Problem tree showing cause and eff ect relationships in the production and
marketing of mango in Uttar Pradesh, India .............................................................. 95
Figure 6.2. Objectives tree for the production and marketing of mango in
Uttar Pradesh, India ................................................................................................... 97
Figure 6.3. Identifi cation of alternative strategies and projects, based on
the objectives tree ............................................................................................ 99
Acknowledgments ......................................................................................................................................6
Foreword ....................................................................................................................................................7
Chapter 1. Introduction ..............................................................................................................................9
Chapter 2. Food Losses: Why does reduction matter? ...........................................................................23
Chapter 3. Introduction to the agricultural value chain ............................................................................31
Chapter 4. Priority components for problem analysis ..............................................................................43
Chapter 5. Application of the agricultural value chain assessment methodology ...................................73
Chapter 6. Identifying problems and their solutions ................................................................................95
Chapter 7. Organizing a workshop .........................................................................................................121
References .............................................................................................................................................131
Annex 1. Checklist of potential problems in an agricultural value chain ................................................135
Annex 2. Example questionnaires for agricultural value chain components ..........................................151
Annex 3. Example questionnaires for collecting information on public sector
institutions, farmers organizations and development projects ................................................233
Annex 4. Simplifi ed questions for each component of the agricultural value chain ...............................241
Annex 5. Summary of the postharvest system of mango in Uttar Pradesh, India ..................................245
Annex 6. Worksheets for quantifying postharvest losses of leafy vegetables,
fruits, roots, tubers and bulbs in agricultural value chains ......................................................247
Annex 7. Postharvest cost-benefi t worksheet ........................................................................................278

Commodity Systems Assessment Methodology for Value Chain Problem and Project Identifi cation v
list of tables
table 5.1. Summary of production process for product X in country Z ......................................... 73
table 5.2. Magnitude of losses caused by pre-harvest factors for product X in country Z .......... 74
Table 5.3. Feasibility of reducing the pre-harvest factors causing pre-harvest or
postharvest losses ......................................................................................................... 75
table 5.4. Flow diagram of steps in a postharvest system ............................................................ 78
table 5.5. Identifi cation of participants and their respective actions in the postharvest
process for product X in country Z ................................................................................ 80
table 5.6. Impact of postharvest operations on postharvest losses for product X in country Z ...... 81
table 5.7. Feasibility of reducing postharvest losses in technological and economic terms ........ 82
table 5.8. Characteristics of demand for product X in country Z ................................................. 85
table 5.9. Assessment of postharvest losses for diff erent crops on farm level in India ................ 87
table 6.1. Priority problems in the production of mango in Uttar Pradesh, India ......................... 93
table 6.2. Expected impact of eff orts to modify an agricultural value chain ............................... 102
table 6.3. Prioritization of selected actions and projects for improving of mango
production in Uttar Pradesh, India ............................................................................... 104
table 6.4. Cost-benefi ts use of secateurs for eggplant harvest in Jessore, Bangladesh ............ 110
table 7.1. Checklist for organizing a workshop ........................................................................... 120

vi inter-American institute for Cooperation on Agriculture
Acknowledgments The authors gratefully acknowledge the contributions to
this document by the following professionals:
Alejandra Bentancur
María Febres
James French
Kurt Manrique
Viviana Palmieri
Ainsworth Riley
Inter-American Institute for Cooperation on Agriculture (IICA)
Hala Chahine
Postharvest Education Foundation (PEF)
The Inter-American Institute for Cooperation on Agriculture played a major role in the
revision activities. The Postharvest Education Foundation’s provided new data collection
and cost/benefi t worksheets.

Commodity Systems Assessment Methodology for Value Chain Problem and Project Identifi cation vii
Foreword The global population is expected to reach 9 billion by the year 2050. As a result, food production will
need to increase by 60 percent in order to meet future food demand. However, increasing production
will not suffi ce if one third of the food produced for human consumption continues to be lost or
wasted. The global fi ght against hunger must include efforts to avoid food losses (postharvest losses).
Throughout its history, the Inter-American Institute for Cooperation on Agriculture (IICA) has been
committed to food and nutritional security in the Americas. One of the Institute’s contributions, as
stated in its 2014-2018 Medium-term Plan, is “improving institutional capacity to reduce losses of
food and raw materials throughout the agricultural chains.” As a result, IICA, together with Jerry
La Gra (a retired IICA specialist) and Lisa Kitinoja, has created a new edition of the manual entitled
“Commodity Systems Assessment Methodology for Value Chain Problem and Project Identifi cation,”
which features revised and updated content.
The Commodity Systems Assessment Methodology (CSAM) seeks to identify weaknesses throughout
agricultural value chains that lead to food losses (postharvest losses) and, at the same time, identify
solutions and prepare proposals for improving their effi ciency. Use of this methodology by different
stakeholders represents the fi rst step toward reducing food losses.
Professionals from different organizations have dedicated years of research and tests in numerous
countries to the development of the methodology presented in this manual. Therefore, we proudly
present this methodology for application and further development by its users.
Through this methodology, which focuses on reducing losses of food and raw materials, we hope to
contribute to improving the effi ciency and productivity of agricultural value chains, making them more
competitive and sustainable; this, in turn, will benefi t the food and nutritional security of countries.
Daniel Rodriguez SaenzLeader Flagship Project
Competitiveness and sustainability of agricultural chains
for food security and economic development
IICA


Chapter
1
Introduction

2 inter-American institute for Cooperation on Agriculture
Developmental themes and buzz-words that have infl uenced agricultural development
Agriculture development themes and strategies are defi ned by international banks and development
organizations. These themes evolve over time and tend to highlight what banks and development
organizations consider to be priority constraints to agriculture development at particular points in
time. Most development banks and aid organizations were formed after World War II when there
was a strong push for international development and poverty alleviation. In the 1960s, John F.
Kennedy created the Peace Corps and the Alliance for Progress to help develop Latin America and
the Caribbean. The fi rst Peace Corps Volunteers (PCVs) were trained in community and integrated
rural development and many of them worked with small farmers on micro- sized projects. Those
projects that responded to the real needs and capabilities of farmers contributed to sustainable
development. Failed projects frequently led to small farmers migrating to urban areas where they
often became traders.
The Alliance for Progress helped put the green revolution on the fast track and progress was made in
increasing production and productivity of food grains through plant breeding and farm mechanization.
By the 1970s success of the green revolution was causing gluts in the agricultural value chains which
focused international attention on postharvest handling, infrastructure development, and technology
transfer. With a worldwide scarcity of agricultural technologists, development banks and USAID
invested millions in training young professionals. Institution building was seen as the way forward
and agricultural centers for training house extension offi cers cropped up in developing countries.
Over time, agricultural support services to small farmers began to improve.
In 1973 E.F. Schumacher published the book ‘Small is Beautiful’ (considered by some to be one of
the most infl uential books since the Second World War). Schumacher’s work grew out of his research
on village-based economies in England. He argued that the modern economy was unsustainable, that
nature’s resistance to pollution was limited, and that government efforts should be concentrated on
sustainable development. He suggested that the “philosophy of materialism” should take second
place to the ideals of justice, harmony and health. Like the philosopher Rene Descartes, Schumacher
believed that the best way to understand reality was by breaking it down into smaller and smaller
components until the problems and their causes were clearly exposed.
By the 1980s the increased production from the green revolution was triggering bottlenecks in
transport, storage and processing centers, causing postharvest losses to soar and governments to
defi ne new agricultural sector policies. The demand for more and better market infrastructure grew.
Governments had access to grants and soft-loans from donors and development banks but were
uncertain about the best way forward. The lack of a good understanding of national value chains led
to the construction of much infrastructure that proved to be unsustainable over time.
Development organizations like World Bank, Food and Agriculture Organization of the United
Nations (FAO), IICA, Ministries of Agriculture, NGOs and consultants engaged young national

Commodity Systems Assessment Methodology for Value Chain Problem and Project Identifi cation 3
professionals many of whom studied abroad and participated in research and the development of
innovative research methodologies (e.g. rapid rural appraisals, SWOT analysis, logical framework
and problem tree analysis, participatory rural appraisal, value chain analysis and stakeholder
analysis, among others.). From the early 1980s, the United States Agency for International
Development (USAID), FAO and the International Fund for Agricultural Development (IFAD),
among others, expressed their concern with the high levels of postharvest losses occurring in most
crops and countries. In 1985 Michael Porter published Competitive Advantage and introduced the
value chain concept.
From the 1970s and well into the 2000s poverty in farming communities continued to impel rural
populations to migrate to cities. By 2007 over 50 percent of the world’s population was living in
urban areas. While total world population increased over three times (from 2.5 billion in 1950 to
more than 7 billion in 2014) the world’s urban population increased over fi ve times (from 746 million
in 1950 to 3.9 billion in 2014). To meet the growing demand of urban populations for diverse
types of food, marketing and merchandising concepts multiplied, value added activities increased
and links in the supply chain grew fewer in number but much larger in terms of volume of food
handled. By 2011 donors and researchers were once again becoming increasingly concerned with
the high levels of postharvest losses.
Over the past 50 years development themes have focused on green revolution, market infrastructure,
institution building, training technical resources, market systems, postharvest loss reduction, and
food safety issues, among others. These themes are not always in sync with country needs since
each country has its own particular set of circumstances (political, institutional, environmental,
social, economic and technological). While development organizations prioritize their particular
development themes, countries must deal with problems along the complete agricultural value
chain (from planting the seed to consumption of food by consumers). To resolve priority problems
in the agricultural value chain both donors and countries use the project format. When projects
achieve their objectives they contribute to sustainable development; however, most agricultural
development projects fail for multiple reasons.
Over the past 50 years international organizations and governments have spent billions of dollars
on agricultural development projects with less than desired results. The improvement in the quality
of agricultural projects is essential to bring about sustainable agricultural development.
Agriculture project defi ned
From a development perspective, an agricultural project is an interrelated set of activities starting and
ending at specifi ed points in time and aimed at achieving the intended benefi ciary’s desired results,
with a pre-determined quantity of resources. For a project to succeed, the inputs and activities must
be suffi cient to achieve the project’s desired results and a few specifi c objectives. If the project is well-
designed and well-executed diffi culties (problems and their causes) will be eliminated and this will
contribute to the sustainable development of the project’s long term goal.

4 inter-American institute for Cooperation on Agriculture
Why agriculture projects fail: priority pitfalls
In 1973, the Iowa State University Press published a book by William and Elizabeth Paddock titled: “We
Don’t Know How: An independent audit of what they call success in foreign assistance.” The Paddocks
found that the information provided in dozens of fi nal project reports they examined did not coincide
with the real conditions on project sites they visited in seven countries in Central America and Mexico.
They concluded that:
“Development professionals do not know how to carry out an effective economic development program, either a big
one or a small one.”
“No one knows how – not the U.S. government, not the Rockefeller Foundation, not the international banks and
agencies, not the missionaries,”
And, they reached the conclusion that:
“The problem lies in the fact that we do not know that we do not know how. We have no knowledge of our own
ignorance.”
When information was being gathered in the 1970s/1980s for the fi rst edition of the Commodity Systems
Assessment Methodology (CSAM), every country visited in the Caribbean, Central America and South
East Asia had stories to tell about failed multi-million dollar agricultural investment projects. The projects
were not just of one type but ranged across the whole agriculture sector; including, over exuberance of
governments in promoting “grow more crops” that led to gluts; construction of storage facilities of the wrong
type or built in the wrong place; sophisticated information systems designed without clear understanding of
intended user’s needs for information; research programs based more on researchers’ interests rather than
on farmers’ needs; processing and cold storage plants built in the wrong place or to the wrong scale, and
planting of fruit orchards of the wrong variety for the existing market. These are just a small sample of failed
efforts found in countries in South East Asia and the Americas.
More recently, a case study of agricultural and rural development projects in one geographical region of
Guyana, South America, found that of a total of seventy attempts at agriculture development, fewer than
ten showed any degree of success. The others just became a faded memory, leaving little more than lessons
learned for the occasional researcher or practitioner of agriculture and rural development.
With the improved access to worldwide information on the Internet, it is now much easier to fi nd
reference to failed projects; for example: the International Finance Corporation of the World Bank
found that only 50% of Africa projects succeed (meaning the other 50% failed) (AP 2007). The
International Project Leadership Academy has prepared a list of 101 common causes of project failure
(International Project Leadership Academy 2016a). In fact, failed projects are becoming so common
there are now special events to identify failed projects. In 2015 the World Bank co-sponsored Fail Fair
which celebrates projects that fail as a way of making developers more aware of the pitfalls leading to

Commodity Systems Assessment Methodology for Value Chain Problem and Project Identifi cation 5
their failure. This is an innovative way of educating persons interested in improving the effi ciency of
development projects.
The rest of this section identifi es some of the main pitfalls contributing to the failure of agriculture and
rural development projects in today’s world. People engaged in project formulation, implementation
and evaluation should be aware of the following types of pitfalls.
Pitfall #1: Underestimating the role of project benefi ciaries.
In any agricultural value chain there are many actors (e.g. farmers, technical and service personnel)
and institutions (e.g. ministries, NGOs, donors, banks, corporations) involved. The most important
participants are the project benefi ciaries, for obvious reasons. The purpose of most projects is to remove
the constraints (and their causes) negatively affecting the particular project’s intended benefi ciaries.
Projects tend to fail when they neglect to fully comprehend the conditions, problems, needs and
priorities of these benefi ciaries. The problems and causes hindering farmers and other rural groups of
people are the most often misunderstood.
Project designers often assume they know what the rural folks need and want, but they frequently
blunder. According to the International Project Leadership Academy’s Catalogue of (project)
Catastrophes the classic mistake is “failure to identify or engage the stakeholders”. A project is
considered a failure whenever it does not meet the expectations of its stakeholders.
Pitfall #2: The discipline bias trap.
There is no doubt that humans are biased creatures and they tend to be biased in favor of those areas
for which they have the most information and knowledge. Economists look for problems and solutions
in areas linked to costs and benefi ts; agronomists prioritize problems with soil and plant diseases;
entomologists focus on insects; weed specialists highlight weed problems, and food technologists and
postharvest specialists zero in on constraints caused by improper sorting, cleaning, packing, cooling,
transport and processing.
Specialists, given the task of identifying priority problems in a particular food system, nine times
out of ten will come up with problems and solutions in their respective fi elds of expertise. That
is understandable and is the reason that project teams must be interdisciplinary. Any project that
is designed and implemented with a disciplinary bias will be hamstrung, offering only partial
solutions. Such projects have a high risk of failure.
Pitfall #3: The hazards of multi-institutional projects.
If only one institution is included in project design it will likely fail for lack of support from other
key institutions. The involvement of more than one institution in a project will probably result in
failure due to lack of effective coordination and integration. Working with multiple institutions is
6 inter-American institute for Cooperation on Agriculture
extremely diffi cult but the success of the project hinges on this. Effective integration of institutions
in a development project requires absolute transparency, centralized management of resources,
effective and detailed planning, competent management, and a manager with leadership and
communication skills. Most projects lack these characteristics, and consequently they fail. Effective
project planning can reduce the danger of falling into this trap.
Pitfall #4: The danger of projects having too short a duration.
Some projects have a life expectancy of just one year but most fall into the range of two to
three years. Occasionally a three year project will be extended for an additional few years. What
determines the length of a project, in theory, is the period of time it takes to implement the
programmed activities and achieve the project’s specifi c objectives and desired results. In practice,
the length of most projects is determined by the period of time allowed by the donors. The smaller
the amount of money the shorter the length of time allowed by donors for implementation. In
reality, projects with greater longevity have a much better chance of success. The reason is that
project benefi ciaries are people, or institutions consisting of people, and changing their habits is a
long term process. Even the best projects risk failure if forced by donors to end too soon.
Pitfall #5: The money snare: too little or too much.
The “money snare” comes into play when project designers negotiate with donors. The designer may
be asked to downscale the project budget (leaving activities unchanged) to coincide with the money
available from the donor. Such an action cripples the project from the beginning since there will be
insuffi cient money to implement the necessary activities to achieve the desired results.
At the other extreme are donors well into their budget year with too much money on hand to be
disbursed wisely in the time remaining; however, rather than roll the funds over to the next year
(and, heaven forbid, risk their budget being cut the following year) they hurry to spend the money
unwisely on weak projects that have not been properly vetted.
Pitfall #6: The “commodity system methodology is too-complex” trap.
Commodity systems have grown signifi cantly more complex over the past 50 years as a result of a
much larger urban population; more products and types of products in the food system; increasing
types of packaging materials, new marketing channels (internet and social media, etc.) and expanded
storage, processing and transportation networks.
However, it is still possible to effectively study any commodity from farm to consumer. In fact, it
was for that purpose that the fi rst edition of CSAM was published. Those who get caught-up in “the
whole system is too-complex trap” fi nd themselves studying only part of a system, thereby discovering
only part of the problem, and consequently, implementing only part of the solution. Decision makers
are often in a hurry and quick to claim they cannot afford the time it takes to implement individual

Commodity Systems Assessment Methodology for Value Chain Problem and Project Identifi cation 7
commodity studies over a few months; they then waste several years implementing projects that are
doomed to fail because they were poorly designed.
Pitfall #7: Overdependence on readily available information.
Consultants on short term contracts, especially international experts unfamiliar with local conditions,
do not have time for primary research and often base their conclusions on available documents found
in the host country. Since they are unaware of local history, they may base their research on books and
reports that are out of date or contain mistaken facts. Analyzing production and marketing value chains
using out of date information and/or erroneous can leads consultants reach the wrong conclusions and
to make the wrong recommendations in their reports; information that serves as the basis for future
development projects. Information on the causes and quantities of postharvest food losses is usually
missing and can only be obtained from on the spot research. Inaccuracies in consultant’s reports often
lead to weaknesses in project design and ends in project failure.
To minimize the risk of this pitfall, decision makers should compare the total costs (money and quality
of information) of hiring consultants with the total costs of using local personnel to research value
chains.
Pitfall #8: A chain is only as strong as its weakest link.
Common sense tells us that a necklace with three broken links will not serve its purpose if the jeweler
only repairs one or two of the broken links. However, in real life there are thousands of examples of
politicians, bureaucrats, professionals, and donors who try to repair just one link in an agricultural
value chain that has multiple weak or broken links. They undoubtedly see the broken link they are
trying to repair but they don’t see the other weak and broken links in the same chain. They don’t
see them because they are looking in the wrong places, or they only have money to fi x one broken
link, or they plan to fi x one fi rst and then the others later but never get around to the others because
governments change.
Another possibility is that the specialist heading up the project identifi ed, for example, the need
for cold storage but failed to diagnose weaknesses at other points in the cool chain. Or perhaps he/
she did not analyze the faults in farmer organization, take note of the high bank interest rates or
recognize the threats from the carambola fruit fl y, missing roads, or the weak extension service.
The commodity system is more than just one value chain between farm and consumer. It is a
complex system of interconnected food chains and support services.
Pitfall #9: We don’t know how to prepare a project and we don’t know that we don’t know how syndrome.
Project formulation can be very easy or quite diffi cult. The more one knows about the basic problems
and their causes at each point in the commodity system the easier it becomes to formulate a good

8 inter-American institute for Cooperation on Agriculture
project, i.e. one that resolves the stakeholder’s problems. A commodity system is made up of many
sub-systems, each of which affects effi ciency. Since there are very few people who understand all
the components of any one commodity system it is necessary to use an interdisciplinary or team
approach to diagnose the problems and choose the best solutions. An agronomist can deal with
the agronomic problems and solutions; the economist may provide technical advice on costs and
benefi ts; the sociologist or anthropologist will consider the social concerns and the farm engineer
and food technologist will search for technical problems and solutions. Since institutions and
politicians play a critical role in project design and implementation it is necessary to have their
participation in all stages.
The fi rst step in project formulation is the diagnosis of the main problems of the intended
benefi ciaries. Too often this step is bypassed because a political decision maker defi nes a priori what
project to formulate. By making such a top-down decision the politician is cutting to the chase,
bypassing the diagnostic stage. In so doing he/she is hammering the fi rst nail into the project’s
coffi n. Rather than focusing on the intended project benefi ciaries’ priority problems, the politician
has inserted his/her personal bias. From that point on the technical team will be formulating a
project doomed to failure and team members will not know that they do not know what they are
doing.
Pitfall #10: Failure to convert problems and their causes into practical activities and objectives.
A project is a set of interrelated activities aimed at achieving desired results and specifi c objectives
that contribute towards the achievement of a more general development goal. Once the costs
of the necessary actions to achieve each activity are quantified the total project cost can be
estimated. However, to determine the projects necessary actions the problems and their causes
must first be described. This process embraces a logical framework that facilitates the design
and formulation of realistic projects from the bottom up. It begins with specific problem
identification and ends by stating the projects goal and title. The eight important steps in this
bottom up process are identified below:
1. Identify and list problems.
2. Describe causes of main problems.
3. Identify and quantify actions needed to eliminate causes of problems.
4. Defi ne projects main activities to achieve desired results.
5. Describe desired results.
6. Defi ne specifi c objectives.
7. Defi ne project goal.
8. Give project a name.

Commodity Systems Assessment Methodology for Value Chain Problem and Project Identifi cation 9
When donors, government institutions, NGOs, consultants, or other organizations assume they know
what the problem is and dictate same to the project design team the bottom-up logical framework is
converted into the traditional top-down decision making approach. The end result is usually a failed
project. The project will fail because the causes of the real problems were not clearly defi ned and
participation of the intended project benefi ciaries was marginalized.
The easiest way to avoid this pitfall is by ensuring that intended benefi ciaries are integrated into
the process that identifi es problems and describes their causes. The value chain problem and project
identifi cation methodology described in this document was created for that purpose.
Pitfall #11: Misjudging the importance of quality, place, timeliness and price is costly.
The purpose of production, postharvest and marketing systems (chains and channels) is to deliver a
specifi ed quantity of product of a desired quality to a specifi c place at a specifi c time for a competitive
price paid by the buyer. At each point (link) in the system (chain) the product is affected by physical
conditions, temperature, packing materials, means of transport and, most importantly, decisions made
by the different product handlers (farmers, technicians, workers, intermediaries, and others). Every
decision made by every participant at each link in the chain will impact upon one or more of the
following: product quality, place and time of delivery and price of the product. When too many wrong
decisions are made by decision makers in any agricultural value chain, postharvest losses increase
and product quality and value decrease. During project implementation, decision makers often focus
on increasing production, adding value or reducing postharvest losses while overlooking critical
components such as policy decisions and food health issues and standards (e.g. certifi cation of afl atoxin
levels and quality control measures) that can lead to failed projects.
Pitfall #12: The lack of transparency is the mother of all pitfalls.
In a recent research paper the International Monetary Fund estimates that 2% of global GDP is now
annually paid in bribes. The document argues that strategies to fi ght corruption require transparency,
a clear legal framework and a credible threat of prosecution. The paper suggests that public sector
corruption siphons off USD1.5 to USD 2 trillion annually from the global economy and much more in
stunted economic growth, lost tax revenues and sustained poverty (IMF 2016).
the top ten classical mistakes causing project failures
There are an infi nite number of causes of project failures. The twelve pitfalls listed above identify
some of them. The shortlist of “classic mistakes” identifi ed through interviews of leaders of failed
projects by the International Project Leadership Academy showed that most failed projects fi t into
two categories: things the project team did poorly and things the team failed to do at all (International
Project Leadership Academy 2016b). The ten most common classic mistakes are listed below:

10 inter-American institute for Cooperation on Agriculture
1. Failure to ask or answer the question: What are we really trying to achieve?
2. Failure to establish a decision making structure appropriate to project needs.
3. Failure to identify or wholly engage the stakeholders.
4. Failure to establish eff ective communication links between participants in value chain.
5. Underestimation of the complexity of the project.
6. making key decisions without identifying or considering alternatives.
7. Failure to provide suffi cient training of benefi ciaries in project management.
8. Failure to think ahead and foresee and address potential problems.
9. Allowing a pet idea to become the chosen solution without considering options.
10. team members developing individual components before thinking through total system.
Every participant (institution, ministry, donor, bank, NGO, farmer, intermediary, technician,
university, etc.) involved in a commodity system can cause a project to fail or help it to succeed.
Every project has its own package of resources, participants and issues that contribute to success
or failure. Those projects that use a holistic common-sense approach, involve key participants in
decision making, and have adequate resources, longevity and a good communication system, will
have a good chance of success; those that do not will have an excellent chance of failure.
A tale of two projects
During the 1st decade of the 2nd millennium two rural development projects with many similarities were
formulated, fi nanced and implemented in Guyana, South America: Sustainable peanut production
for Amerindian Villages (the peanut project) began in 2001 and ended in 2013; biodiversity &
sustainable development of butterfl y production in Iwokrama reserve (the butterfl y project) began
in 2006 and ended in 2010. Each project was implemented in the North Rupununi of Region 9 in

Commodity Systems Assessment Methodology for Value Chain Problem and Project Identifi cation 11
close coordination with international universities, government institutions, NGOs and Amerindian
Indigenous communities.
The fi rst three years of the butterfl y project were funded by the Darwin Initiative and Warwich
University. The fourth and fi nal year was funded by the British High Commission (BHC) and World
Wildlife Fund. The fi ve year peanut project was extended for seven years converting it into a 12 year
project. Funding for the peanut project was obtained from the USAID Peanut CRSP program, the US
Embassy and the Canada Fund. Each project cost was in the vicinity of USD 600,000; all were grant
funded, with the exception of in-kind contributions from participating villages.
For the butterfl y project the expected results were:
1. Increased awareness and knowledge of butterfl ies in Iwokrama forest.
2. Scientists with knowledge on butterfl y densities, habits and economic value.
3. Village adults and youths educated on importance of butterfl ies in biodiversity.
4. Butterfl y hub established at Fairview producing and exporting butterfl ies.
5. Sustainable jobs and incomes in the butterfl y trade benefi ting 5,000 people in 16 villages.
For the peanut project the expected results were:
1. Field trials conducted and best seeding rates and peanut varieties determined.
2. Nutrient needs for peanuts in diverse soil types determined.
3. Small-scale labor-saving devices and machinery obtained and demonstrated.
4. Village farmers trained in peanut production and postharvest technologies.
5. Most favorable economic and social applications for peanuts determined.
6. Seven cottage industries processing and marketing peanut products.
7. Cottage industries supplying school students with daily snacks on a sustainable basis.
8. Seventy women trained in business management and employed in school snack program.
9. At least 35 farmers selling peanuts, cassava and fruit on sustained basis.
The butterfl y project achieved its fi rst three expected results to a signifi cant extent. Major outcomes
from this initiative include the award of advanced degrees in biology to two Guyanese university
students in the UK; the publication of a butterfl y farmers guide on rearing methods, and life cycles for
common butterfl y species, as well as training of several students and farmers in its use; and publication
of a fi eld guide butterfl y identifi cation manual with the active participation of village leaders and
Guyanese students.
Expected result (4) was partially achieved given that a large, round and screened butterfl y house
with a cement moat fi lled with water (to prevent predator access to the butterfl y collection inside)
was constructed. However, this structure proved to be unsustainable and was not predator-proof.

12 inter-American institute for Cooperation on Agriculture
Marketing tests were not made until after the butterfl y house was operational. It was only at this
point that the managers realized that the fi ve-day marketing window they had to get the pupas from
butterfl y house to international markets was insuffi cient, given local road and air service conditions. It
was then realized that the butterfl y house should have been located closer to an international airport.
Following the closing of the project the butterfl y house was abandoned and has since been taken over
by the encroaching jungle. The butterfl y house was the heart of this project and when it died so did
the project. The project failed to create one job lasting beyond the end of the project in 2010. The main
effect on the 5,000 intended stakeholders in the 16 Amerindian villages was one of frustration from
seeing the failure of the project they had so fervently supported.
The peanut project achieved the fi rst fi ve expected results listed above by the end of the fi rst four years;
productivity per acre jumped by 50% and annual peanut production increased by 300%, to 1.4 million
pounds. However, farmer celebration of the bumper crop lasted only as long as it took them to learn
there was a glut of peanuts in the main market in Georgetown and their peanuts could not compete
with cheaper imported peanuts. Even though a market study had been carried out, it did not identify
a signifi cant weakness in government statistics (two million pounds of contraband peanuts were being
smuggled into Guyana annually along the Surinam border to avoid a 7% import duty).
In the fi fth year of the peanut project the team managers modifi ed the project to focus on adding value
to peanuts for sales in local markets. In 2005 seven cottage industries were established and staff was
trained to manufacture peanut butter for the school snack program. By 2007 all the cottage industries
were employing personnel and operating at a profi t. The remaining four expected results listed above
were achieved. When the project ended at the end of 2012, 4,000 nursery and primary school students
in 41 villages were receiving daily snacks consisting of a peanut butter and cassava sandwich and a
glass of fresh fruit juice. More than one hundred and forty jobs had been created for village women
and more than 400 farmers were selling peanuts, cassava and fruit to the school snack program on a
small but signifi cant scale. Total income received annually by the women employees and the farmers
exceeded USD 137,000 approximately. Management of the school snack program was turned over to
local government in January 2013 and as of July 2016 the program has expanded further; providing
daily snacks to 4,500 children in 46 villages.
What were the factors that allowed the peanut project to achieve its desired results and what
prevented the butterfl y project from reaching its desired results?
Peanut project ideas developed from regional discussions with farmers over a two year period prior to
project commencement and farmers participated in all decision making. A participatory approach was
applied in project proposal development.
The butterfl y project was prepared at Warwich University, funded by Darwin Initiative and promoted to
local counterparts. A top-down approach to decision making led to the inability to consider other more
practical options, a disciplinary biological bias and a shortage of market information.

Commodity Systems Assessment Methodology for Value Chain Problem and Project Identifi cation 13
The peanut team was interdisciplinary from its beginning, including planners, farmers, agriculturists,
sociologists, economists and local coordinators, representing more than ten disciplines. The butterfl y
technical team consisted of mainly biologists and local coordinators, and thus it had a built-in discipline bias.
The peanut project researched the whole production, processing and marketing system from its inception.
The butterfl y research was focused almost entirely on the butterfl y production system.
While marketing was a main constraint for both projects there was a signifi cant difference in how the two
projects dealt with their problems. For the butterfl y project the marketing constraints were discovered too
late, when fi nancial resources were nearly depleted. The problems were too complex to deal with over
the short time remaining in the project. The project manager declared the project a success in the fi nal
report, specifying that the actual production and marketing of butterfl ies would be the responsibility of
the respective villages. When the peanut project discovered that peanuts could not compete pricewise
in the coastal market of Guyana the strategy was switched to one of adding value and marketing peanut
butter in the hinterland; to the school feeding program, the army, loggers and miners. This ability to
change project strategy mid-way through the project turned potential failure of the peanut project into
success.
The peanut project used the CSAM methodology to generate information on the full peanut production,
postharvest and marketing system in Guyana and worked with village farmers and processors in
formulating the project from the bottom up. The butterfl y project failed because its objective was never
properly scrutinized with intended stakeholders and institutional partners prior to commencement.
The peanut project used a commodity systems approach in problem analysis and spread its
investment over a long period of time (12 years) during which it was able to achieve its specifi c
objectives and most of its desired results. The butterfl y project, on the other hand, used a piecemeal
approach, with a discipline bias, and was unable to achieve its main outputs. It spent a relatively
large amount of money in the fi rst three years and ended the project with poor results in the fourth
year. Whereas the peanut project created over 100 jobs, established seven sustainable cottage
industries and helped institutionalize a school feeding program, the butterfl y project ended in
failure since it did not create even a single job for its targeted stakeholders (5,000 people in 16
villages).
the link between projects and sustainable development
Sustainable agricultural development requires that resources (human, physical and fi nancial) be
organized in such a way that humans, animals, wildlife and all natural resources are sustained over
time to the benefi t of all.
During the organizational stage of agricultural development projects diverse participants (stakeholders,
benefi ciaries, service providers, politicians, government institutions, donors, NGOs, volunteers, among
others) make decisions that impact on project results. When right decisions are made in project design
14 inter-American institute for Cooperation on Agriculture
and implementation, the desired project results are achieved and these contribute towards sustainable
development. When wrong decisions are made desired project results are not achieved and the project
fails, contributing to unsustainable development. Making the right decisions requires access to accurate
and up- to- date information. There is a growing consensus that too many agricultural development
projects fail. This implies a shortage of accurate decision-making information and weakness in method.
It stands to reason that the quality of agriculture development projects could be signifi cantly improved
through two specifi c actions:
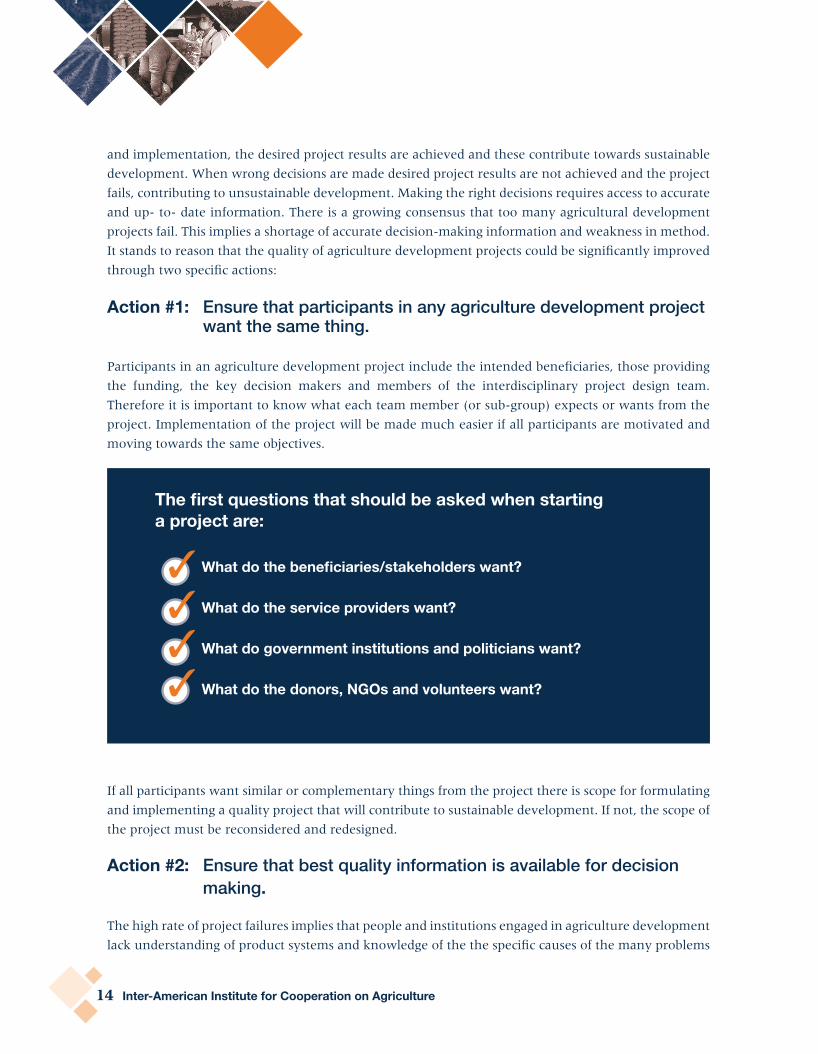
Action #1: Ensure that participants in any agriculture development project want the same thing.
Participants in an agriculture development project include the intended benefi ciaries, those providing
the funding, the key decision makers and members of the interdisciplinary project design team.
Therefore it is important to know what each team member (or sub-group) expects or wants from the
project. Implementation of the project will be made much easier if all participants are motivated and
moving towards the same objectives.
The fi rst questions that should be asked when starting a project are:
What do the benefi ciaries/stakeholders want?
What do the service providers want?
What do government institutions and politicians want?
What do the donors, ngos and volunteers want?
If all participants want similar or complementary things from the project there is scope for formulating
and implementing a quality project that will contribute to sustainable development. If not, the scope of
the project must be reconsidered and redesigned.
Action #2: Ensure that best quality information is available for decision making.
The high rate of project failures implies that people and institutions engaged in agriculture development
lack understanding of product systems and knowledge of the the specifi c causes of the many problems

Commodity Systems Assessment Methodology for Value Chain Problem and Project Identifi cation 15
impacting value chains. This is not surprising considering the large number of participants engaged in
decision making at each component of every product system. It is easy to conclude that things that
can and do go wrong in an agricultural value chain are infi nite in number. Given such a situation it
is not feasible to try to develop an effi cient agricultural value chain by trial and error methods or top-
down decision making. Agriculture project failure can be linked to technical, social, economic, political,
institutional and environmental causes. Consequently, it is imperative that research generate accurate
decision making information on these six crucial areas. Herein lies the utility of the Commodity Systems
Assessment Methodology (CSAM). CSAM generates the baseline information and knowledge required
to understand value chains and crucial for the formulation of quality projects.
Farmers, the main benefi ciaries of agricultural projects, tend to be temporarily satisfi ed when they have
access to appropriate technologies, adequate economic returns from product sales, and satisfactory
social benefi ts (Figure 1a). However, long term farmer satisfaction requires integrated development
which entails adequate environmental safeguards, effi cient institutionalized services and reliable
political support (Figure 1b). The door to sustainable rural development opens only after these two sets
of conditions have been met.
Figure 1.1. Sustainable development is derived from an integration of farmer’s satisfaction and effi cient government support services
Sustainabledevelopment
Integrateddevolopment
Environmental
controlsInstitutionalservices
Politicalsupport
Temporarysatisfaction
Social
benefi tsAppropiatetechnology
Economicreturns
Figure 1a. Figure 1b. Temporary farmer satisfaction Integrated rural development

16 inter-American institute for Cooperation on Agriculture
A little bit about food systems
Food systems begin with pre-production planning and continue from production through postharvest
handling to marketing and fi nal consumption. At each step in the chain a variety of persons and
institutions make decisions that affect the quantity, quality and value of the product. When decision
makers implement agricultural development projects without being aware of the reality at each step
in the product chain, they end up with a partial solution that soon becomes a failed project. CSAM
provides diverse formats that researchers can use to document conditions at each component of a
particular agricultural value chain, thereby generating quality information that decision makers can
use in the formulation of effi cient development projects. Quality information and effective and effi cient
project implementation are necessary for sustainable agricultural development.
Food losses: Why does reduction
matter?
Chapter
2

18 inter-American institute for Cooperation on Agriculture
This document refers to “food losses” as the reduction in the quality and quantity of food intended for
human consumption along the agricultural value chain from harvest prior to the consumption phase
which are namely production, postharvest handling, storage, processing, marketing and distribution
stages (HLPE 2014; Gustavsson et al. 2011).
Around one third of the food produced (some 1.3 billion tons) for human consumption is not eaten.
It has been estimated that halving such losses by 2050 would cover a quarter of the gap in food needs
worldwide (Lipinski et al. 2013). The problem arises in determining which of the losses can be feasibly
reduced.
The distribution of food losses along agricultural value chains varies by region and product.
In mid/high income countries, the highest percentage of losses occurs at the level of distribution
and consumption, while in low-income countries losses are higher at the pre-harvest, harvest and
postharvest stages (HLPE 2014).
Food losses negatively impact the sustainability of agricultural value chains by causing physical and
economic losses, reducing returns on investments, and diminishing food availability and quality (HLPE
2014). According to Kummu et al. (2012) one billion additional people could be fed if losses in food
crops were halved.
Countries are also affected by natural resources being used in food production and then lost along
the agricultural value chains; for instance food loss is associated with about 173 million cubic
meters of water consumption per year, representing 24 percent of all water used in agriculture. The
amount of land used to grow food that becomes lost has been estimated at 198 million hectares per
year, an area roughly the size of Mexico, together with 26 to 28 million tons of fertilizers (Lipinski
et al. 2013).
According to FAO (2013), global food losses are responsible for approximately 3,300 million metric
tons of emissions of greenhouse gases (equivalent carbon dioxide). If this amount of food was lost from
a country, it would be among the three largest emitters of greenhouse gases (just behind the United
States and China).
Reducing food losses along the agricultural value chains would strengthen access and increase availability
of food, generate greater exportable surpluses, and improve effi ciency in the use of countries’ natural
resources.
Food security and nutrition: relationship to food losses
The best known and accepted defi nition of food security states that: “Food security exists when all
persons at all times have physical and economic access to suffi cient, safe and nutritious food to meet
their dietary needs and food preferences for an active and healthy life” (FAO 1996).

Commodity Systems Assessment Methodology for Value Chain Problem and Project Identifi cation 19
Food security involves meeting four interrelated conditions or dimensions: a) the availability or
existence of suffi cient quantities of food of appropriate quality for all individuals; b) access, understood
as access by individuals to adequate resources and entitlements for acquiring appropriate and nutritious
food consistent with their culture; c) conditions that ensure the biological use of food to achieve a
state of nutritional well-being where physiological needs are met ; and d) stability in both availability
and access to adequate food at all times.
By 2015, most countries had met the target set by the Millennium Development Goal to “halve the
proportion of hungry people”. However, progress has been uneven across countries and regions and
some 795 million people still suffer from hunger and nearly one billion still live in extreme poverty.
Extreme poverty is concentrated disproportionately in rural areas, and dependence by the poor on
agriculture for their livelihoods and the high proportion of their spending on food, makes agriculture
vital for the achievement of their food security (FAO et al. 2015).
Global agriculture is challenged to increase production by 70% by 2050 and improve accessibility to meet
the food demand of a population estimated to be 9 billion people for that year. To meet this challenge, it will
be necessary to achieve a more effi cient, but environmentally sustainable agricultural production, capable
of ensuring availability and access to safe and nutritious food for the entire world population.
As indicated, food produced but not eaten has environmental and economic costs. Food that is lost
represents a missed opportunity to improve food and nutrition security for people and mitigate the
environmental impacts generated by the agricultural sector.
In 2015, the United Nations proposed the Sustainable Development Goals which were adopted by
world leaders. These seek to end poverty in all its forms, reduce inequality, combat climate change
and promote environmental protection. The Objective 12: “Ensure sustainable consumption and
production patterns” relates to food loss and waste and has as one of its goals: “By 2030, to halve per
capita global food waste at the retail and consumer levels and reduce food losses along production and
supply chains, including postharvest losses” (United Nations 2016).
Purpose and origin of this manual
This manual describes a methodology for identifying problems and causes leading to food losses
(postharvest losses) along an agricultural value chain. It then goes on to describe the process of
converting problems to solutions using the project format.
In any attempt to solve problems there are three basic steps:
1. Identifi cation and description of the problem.2. Identifi cation and formulation of the solution.3. Execution of the solution.
20 inter-American institute for Cooperation on Agriculture
This manual concentrates on steps one and two; both are interdependent, effective solutions that
cannot be prepared without a clear understanding of the problem(s).
While numerous books and training courses concentrate on project identifi cation, formulation,
evaluation, and monitoring, relatively little information is available on problem analysis, particularly
from the perspective of agricultural value chains.
During university training, students are taught to identify problems using a comprehensive and
interdisciplinary approach. However, when students become professionals, they usually fi nd themselves
in very narrow positions within public or private sector institutions. Here, they tend to concentrate on
very specifi c problems, making decisions with the limited information at hand. Even within many
developmental organizations, there is often a lack of interdisciplinary communication and coordination,
leading to projects which fail or achieve only partial solutions.
Most persons involved in project identifi cation and formulation do not have the time, methodology
or resources to organize and implement a proper diagnosis of problems, a process which could take
several months. Consequently, problem and project identifi cation becomes dependent on literature
and secondary data which may lack detail and accuracy.
The key to problem solution is proper problem identifi cation
Using the step-by-step methodology and instruments presented in this manual, professionals will be
able to gather accurate information avoiding some of the pitfalls described earlier. Working together
as an interdisciplinary team, they will be able to systematically organize their combined knowledge
into a comprehensive overview of a particular agricultural value chain. This will produce the necessary
information for quality problem and project identifi cation, thereby improving the chances for success
of the respective development projects. In this way, local participants will play a more direct role in the
determination of those priority projects which get submitted to funding agencies.
A basic assumption made throughout this manual is that human resources are available in developing
countries who, when presented with good baseline information on an agricultural value chain, will be
able to identify projects and establish realistic priorities. The more complete and accurate the information
base, the more likely the right decisions will be made to overcome the identifi ed problems.
Application of this manual
This manual will prove useful to technicians and decision makers interested in rapid appraisals and
development from an agricultural value chain perspective.
The application of the methodology requires an interdisciplinary or team approach. It is unlikely
that one person will have all the knowledge to properly identify the problems related to pre-production,
production, harvest, postharvest, and marketing which make up any agricultural value chain.

Commodity Systems Assessment Methodology for Value Chain Problem and Project Identifi cation 21
This manual can be used in a workshop environment to train professionals, farmers, and others, in the
agricultural value chain approach, either from a theoretical point of view, or as an applied, in-service,
case study form of training. In the fi rst instance the trainees may be of the same or different disciplines.
When the case study approach is used, the trainees should include persons with expertise in multiple
disciplines, e.g. economics, agronomy, social sciences, food technology, postharvest, and marketing.
The CSAM methodology will prove useful to planning bodies, ministries of agriculture, marketing
boards, corporations, research institutes, and other national institutions seeking systematic improvement
within existing agricultural value chains. At the regional or national level, the methodology will prove
valuable in the identifi cation and formulaton of agricultural development projects. It will be of particular
value in the execution of rapid appraisal exercises, using interdisciplinary teams of national specialists.
A systematic and interdisciplinary application of this methodology will allow a rapid appraisal of an
agricultural value chain. It will facilitate the identifi cation of priority problems, causes of problems and
alterative project ideas, and permit the ordering of solutions into a development strategy and time frame.
Finally, for the student, this manual will promote a better understanding of the agricultural value
chains and the interrelationships between the diverse components and participants. It should serve
as a reference document for technical schools and universities teaching agricultural economics, food
technology, postharvest handling, agronomy, sociology, and other subjects related to agricultural
development.
An important feature of this methodology is that it permits an analysis of the whole agricultural
value chain as well as certain components of interest, thereby facilitating the identifi cation
and prioritization of problems throughout the chain. This leads to the development of more realistic
solutions to priority problems. The methodology brings many concepts, instruments and techniques
together in one document and presents them as an integrated whole.
origin of the methodology
The methodology presented in this manual draws upon the work of a great number of specialists and was
developed over several years. The original idea for the methodology stems from a study executed in Haiti
describing the production and marketing system for beans (Phaseolus vulgaris), using an anthropological
case study approach (Murray and Alvarez 1973). This case study on bean marketing focused on the diverse
participants in a particular agricultural value chain and their decision making processes. It served as a
model for a series of marketing studies carried out in Haiti and the Dominican Republic by the Inter-
American Institute for Cooperation on Agriculture (IICA).
In 1975, IICA’s specialits developed a technological approach for describing a food system, integrating the
industrial fIow diagram concept with a step by step case study method (Amezquita and La Gra 1979).
Case studies using this technological focus were carried out in the Dominican Republic on white potatoes
(Solanum tuberosum) and tomatoes (Solanum lycopersicum) (SEA and IICA 1976, 1977).
22 inter-American institute for Cooperation on Agriculture
In analyzing the alternative approaches used by anthropologists, food technologists and agricultural
economists, it became apparent that none of the three approaches provided a complete picture of an
agricultural value chain. However, the integration of the three approaches yielded a comprehensive
overview, facilitating problem and project identifi cation.
During the 1970s and 1980s, development planners contributed valuable tools for project
identification and design. However, by the mid-1980’s, a paradoxical situation seemed to exist
and continues today: while methodological instruments were available to study and evaluate
food systems, while techniques and methods for project identification and formulation were
commonly known and available at the national level, and while competent professionals were
available in developing countries, a high percentage of agricultural development projects
continued to yield poor results.
Analyses at the country level indicated that one of the reasons for this situation was the lack of
integration and coordination among the diverse institutions involved in the development process,
and among specialists in the planning and execution of their work programs.
Review of experiences in developing countries showed that many research, training, infrastructure,
information, agriculture and other types of projects ended without producing the desired results. Some
examples:
• Many governments established information systems without a clear defi nition of users’
needs for information. The raw data collected often went unused and most systems were
abandoned when external funding ended.
• Ministries of Agriculture often implement projects to increase production or productivity
before markets are identifi ed. This frequently results in higher production costs and lower
returns to farmers- the result of increased output, gluts and a corresponding drop in
market price.
• Universities and research centers often design and implement research programs without
a clear understanding of farmers’ problems and needs. This leads to scarce resources being
allocated to problems of scientifi c interest but of low priority to farmers.
An interinstitutional eff ort
Brought together in 1983 by common interests, the Postharvest Institute for Perishables (PIP) solicited
the assistance of IICA to develop a methodology for quantifying postharvest losses. The fi rst joint
activity was the application of a modifi ed version of an IICA case study methodology (Amezquita and
La Gra 1979) to salad tomatoes and Chinese cabbage (Brassica rapa) in Taiwan (La Gra et al. 1983)
under the sponsorship of the Asian Vegetable Research and Development Center (AVRDC).

Commodity Systems Assessment Methodology for Value Chain Problem and Project Identifi cation 23
From this experience it was concluded that loss assessments should begin with a comprehensive
overview of the agricultural value chain. It was further concluded that due to the high cost in
time and resources required to accurately quantify losses, such exercises should only be conducted
after an initial assessment of an agricultural value chain or when quantitative data is required to
evaluate the economic feasibility of introducing changes. From that point on, IICA and PIP decided
to concentrate on developing an approach to evaluating agricultural value chains using existing
instruments and methods.
In 1985, the ASEAN Food Handling Bureau (AFHB) invited IICA to participate in a workshop
on postharvest loss assessment in Manila, Philippines. IICA presented a comprehensive approach
for studying systems and identifying those points in the system where food losses were greatest
(ASEAN Food Handling Bureau 1985).
In an attempt to develop a comprehensive methodology for analyzing systems, from a postharvest
point of view, PIP, AFHB and IICA formed an interdisciplinary team in 1986 to visit ASEAN countries
and identify common problems and needs of public and private sector institutions dealing with
postharvest problems. As a result of numerous consultations with professionals in fi ve countries,
the fi rst version of this manual was prepared (La Gra et al. 1987).
In 1987, the University of California at Davis, and PIP at the University of Idaho, with support from
USAID, FAO and IICA, combined forces in the organization of a training course for 20 technicians
from the Eastern Caribbean. The training concentrated on methods for reducing postharvest losses
in perishables, based on an agricultural value chain approach (PIP/UCDAVIS 1987).
The fi rst edition of this manual was compiled in 1988 in draft form. It was fi eld tested in Malaysia
at the Malaysian Agricultural Research and Development Institute (MARDI), under the joint
sponsorship of MARDI, AFHB, PIP and IICA. During the two week in-service workshop, 24 MARDI
professionals, covering 12 disciplines, applied the methodology step-by-step, as presented in
Chapter 5 of this manual.
During the 1990s the methodology was utilized by Extension Systems International in a variety of
USAID and the US Department of Agriculture (USDA) funded projects in Egypt, India and Indonesia.
In 2005 parts of the fi rst edition of this manual were translated into Arabic for systematic training
of scientists, extension offi cers and farmers in Egypt and Lebanon. Since 2008 CSAM has been used
by consultants trained by World Food Logistics Organization (WFLO) to organize workshops and
training sessions for scientists, university students and farmers around the world. Since 2011 the
Postharvest Education Foundation (PEF) e-learning programs have trained more than 500 young
people in the methodology, principles and practices. CSAM usage has been expanded by PEF from
the original focus on fruits and vegetables to all types of cereals, pulses, roots, tuber crops, and cash
crops such as coffee (Coffea spp.).


Introduction to the agricultural
value chain
Chapter
3
26 inter-American institute for Cooperation on Agriculture
Any agricultural value chain begins with decisions of what to produce and in what quantities. It
continues through to the point where the product is consumed. Between these two points, many
disciplines, including economics, sociology, political science, health, engineering, agronomy,
entomology, pathology, planning, food science, and others, interact to contribute to the understanding
and functioning of the system. The functioning and structure of the agrifood systems can be completely
understood only if one spends the time to analyze them from the points of view of many disciplines.
The methodology presented in this manual, therefore, emphasizes the necessity to include experts from
a number of disciplines to ensure as complete an understanding as possible.
The fi elds of social science, food technology and economics have contributed valuable methods and
instruments for analyzing food systems. Given each discipline’s particular biases and different objectives,
one should not be surprised that their respective research techniques and methods of data presentation
vary. For example, when presenting a fl ow diagram of a marketing channel for a particular product, the
social scientist is likely to emphasize the human element (Figure 3.1A), food technologists, the technical
aspect (Figure 3.1B), and the economist, the institutional side (Figure 3.1C). None of these methods is
necessarily more correct than the others; each is simply a means for facilitating the comprehension of
a complex system from a particular perspective.
The three distinct methods, when treated individually, tend to produce a partial view of an agricultural
system. However, when the three disciplines are combined for the study of a specifi c agricultural value
chain, they provide a more complete understanding of the system, including better awareness of
problems and better clarity of the roles of the diverse participants in the chain.
Researchers, regardless of their discipline, are normally under fi nancial and time constraints and
must choose between being very exact, about very little (the case study approach), or taking a broad
overview of the subject of interest.
Researchers in all disciplines tend to ask the same basic questions:
Who? What? How? When? Where? Why? and How much?
However, the interpretations of the answers to these questions tend to vary with the discipline. For
example, in analyzing why farmers do not apply best cultural practices, agronomists and economists
may emphasize the lack of farmer knowledge or the lack of proper inputs while the social scientist may
point to the farmers’ tendency to minimize risk.
Solutions vary greatly depending upon which explanation is considered the cause of the problem. For
example, in the fi rst instance, the solution might call for training programs or the establishment of
farm supply outlets; in the second case, emphasis might be given to reducing farmer risk by improving
market certainty.

Commodity Systems Assessment Methodology for Value Chain Problem and Project Identifi cation 27
Figure 3.1A. The movement of eggplant (Solanum melongena) from producer to consumer in Ghana
Small scale farmers
Primary wholesaler
Secondary wholesaler
Grocery shop & Supermarket
Retailer + roadside sellers
Export(Burkina Faso,
Togo)
Processing
Farm reject
Households
Hotels
Traditional restaurants
Production Marketing Consumption
Source: Kitinoja 2010.

28 inter-American institute for Cooperation on Agriculture
Figure 3.1B. Steps in the rice postharvest system (Oryza sativa) and percent losses at each step in Nigeria
Expected production100%
HarvestPostharvest Postharvest4.35 % losses
4.98 % losses
0.23 % losses
0.23 % losses
0.23 % losses
1.16 % losses
3.53 % losses
0.49 % losses
2.45 % losses
0.36 % losses
1.08 % losses
0.23 % losses
2.20 % losses
3 % losses
1.37 % losses
Threshing and winnowing
Transport from farm to home
Drying
Storage
Transportation to the market
Parboiling
Storage
Transport of milled rice from processing to home
Transport to processing
Storage
Transport to wholesale market
Transport to retail market
Retail market
Wholesale market
Milling
Drying parboiled paddy
4.98 % losses4.98 % losses
0.23 % losses0.23 % losses
0.23 % losses0.23 % losses
1.37 % losses1.37 % losses
0.36 % losses0.36 % lossesfrom processing to homefrom processing to homefrom processing to home
1.08 % losses1.08 % losses
0.23 % losses0.23 % losses
2.20 % losses2.20 % losses2.20 % losses2.20 % losses
3 % losses3 % losses
4.35 % losses4.35 % losses
Total product reaching consumers75.1% aprox.
Source: Based on data of Oguntade et al. 2014.

Commodity Systems Assessment Methodology for Value Chain Problem and Project Identifi cation 29
Figure 3.1C. Marketing channels for quinoa (Chenopodium quinoa) in Arequipa, Peru
PRO
DUCT
ION
STOC
KPILI
NGPR
OCES
SING
MAR
KETI
NGCO
NSUM
PTIO
N
0.01
%
44.9
4%
0.82
%
0.25
%
MAR
KETI
NG N
ETW
ORK
Chan
nel
Conv
entio
nal q
uino
a
Orga
nic q
uino
a
Quin
oa p
rodu
ctio
n
Stor
age
Self-
cons
umpt
ion
Seed
s
Reta
il st
ockp
iler
Puno
Reta
iler
59.8
2%
0.21
%
Prod
uctio
n in
Pun
o0.
19%
0.48
%
Lima
Agro
-indu
stry
Cons
umer
0.58
%
Lima
Agro
-indu
stry
0.07
%
Fairs
0.01
%
Who
lesa
lest
ockp
iler
Puno
0.37
%
Stoc
kpile
rAr
equi
pa
0.90
%
Dire
ct
expo
rt
41.5
5%
Expo
rtco
mpa
nies
0.43
%
Areq
uipa
Who
lesa
ler
14.3
5%
0.18
%Or
gani
c qui
noa
30%
10%
0%
Seed
s: Pu
no,
Chicl
ayo a
nd B
oliv
ia
0.03
%
Loca
l reg
iona
l m
arke
t16
.16%
Lima
mar
ket
1.54
%
Extr
a-re
gion
al
mar
ket
1.44
%
Areq
uipa
pro
cess
or
45.4
3%
0.05
%0.11
%
0.21
%
0.01
%0.
36%
0.45
%
13.4
1%
0.08
%
13.7
6%
0.18
%
0.23
% 0.13
%
0.45
%
41.1
3%
0.48
%
0.07
%0.
07%
0.41
%
0.58
%
1.91
%
1.44
%
0.96
%
0.49
%
0.09
%
1615
17
19
18
1413
12
11
10
20
9
87
6
2
1
54
3
00
Source: IICA 2015

30 inter-American institute for Cooperation on Agriculture
Often mistakes are due to decision making without adequate situational and problem analysis. In other
cases, the cause of the problem may be traced to a particular disciplinary bias, or too little participation
from key disciplines or national politics.
While nearly all professionals and decision makers agree on the need for closer cooperation, effective
coordination is more the exception rather than the rule. This may be due simply to a shortage of time or
it may be as a result of interinstitutional jealousy and competition among professionals. Coordination
does occur, however, when each participant has something to gain by cooperating. By using an
agricultural value chain approach to problem analysis, participants can be shown that interdisciplinary
exchange and coordination will produce better results, thus benefi tting the nation and all those
associated with a successful project.
Agricultural value chain
From a socio-economic standpoint, an agricultural value chain can be interpreted as a system that
brings together socially and economically interrelated actors who participate in coordinated activities
that add value to a particular good or service, from its production until it reaches the consumer. Such
a system includes suppliers of goods and services, processing, manufacturing, transportation, logistics
and other support services, such as fi nancing and government policies. This value-adding connection
does not necessarily represent a fair or linear process (Garcia - Winder et al. 2009).
At the same time, the agricultural value chain may also be interpreted from an analytical perspective
for understanding relations between actors in agriculture and rural areas, from input supply and
primary production to fi nal delivery of the products to the consumer, where relations established may
be contractual or commercial (Garcia - Winder et al. 2009).
In Figure 3.2, the agricultural value chain is visualized as a circle, extending from production planning
(decision making) through production, harvest and distribution to consumers, thereby setting the stage
for the next cycle of planning, production, etc. The components depicted in Figure 3.2 are applicable,
in general, to all food crops, as well as livestock and fi sheries. All of these stages are interdependent
since the decisions and actions at one point will affect the quantity, quality and price of the agricultural
product at subsequent points.
For all agricultural products there exists a period of information analysis and planning; a stage of
preparation for production (pre-production); a period of production; a time for harvest; usually several
occasions for transportation; stages where assembly, packaging or selection occurs; one or several
periods of short or longer term storage; and a stage where the agricultural product is distributed to the
fi nal consumers. The only stage in Figure 3.2 which may be irrelevant for some agricultural products
is processing.
The complexity of an agricultural value chain will vary depending on such things as the level of
development of the country, geographical location, type crop, time of year, weather, road conditions,

Commodity Systems Assessment Methodology for Value Chain Problem and Project Identifi cation 31
available technology, infrastructure, labor supply, distance to markets, market demand, and others. A
systematic approach to evaluating the diverse components of an agricultural value chain is presented
in Chapter 4.
Figure 3.2. Participants in an agricultural value chain
ASSEMBLY/SORTING/PACKING- Intermediaries- Farmer Organizations- Farm Families- Exporters- Farmers
tRAnSPoRt- Farmers- Truckers- Farmer Organizations- Intermediaries
tRAnSPoRt- Cooperatives- Marketing Boards/Corporations- Truckers- Farmers
StoRAge- Marketing Boards/ Corporations- Farmer Organizations- Wholesalers- Retailers- Warehousemen
PRoCeSSing- Entrepreneurs- Farmer Organizations
diStRiBUtion- Marketing Boards/Corporations- Wholesalers- Retailers- ExportersPRODUCTION/PLANNING
- Institutions- Policy Makers- Technicians- Farmers- Consumers
PRodUCtion- Farmers- Laborers- Farm Families- Extensionists- Bankers
hARVeSt- Farmer Organizations- Intermediaries- Farmers- Extensionists- Laborers- Family Laborers
PRe-PRodUCtion- Extensionists- Farmers- Bankers- Researchers- Agribusiness Persons

32 inter-American institute for Cooperation on Agriculture
Participants in an agricultural value chain
In addition to identifying key points in an agricultural value chain, Figure 3.2 also identifi es the different
types of participants functioning at the diverse points in most agricultural value chains. These include
private sector individuals such as farmers, truckers, and marketing intermediaries, and institutions
such as ministries of agriculture, farmers’ organizations, and marketing boards that belong to the public
sector. Types of participants vary with the agricultural product, country and particular circumstances.
While all participants make decisions which may affect the quality, quantity and price of a particular
product in an agricultural value chain, there is a basic difference between the two groups. Decisions
made by private sector participants are normally determined by that person’s desire to secure economic
gain. Decisions made by public sector participants are guided by a number of non-economic motives.
In analyzing a particular agricultural value chain, it is very important to obtain a clear understanding of
the diverse participants in the system and their respective roles and motivation. For example, decisions
made by politicians to construct infrastructure to satisfy a local constituency may increase the costs of
operation and food losses. Ideally, the higher costs (lower economic effi ciency) can be justifi ed by social
or other remuneration, but often this is not the case.
A private sector, profi t-motivated decision can also contribute to ineffi ciencies in the total system. For
example, decisions made by farmers or intermediaries to minimize investments in packaging materials
may maximize their individual returns but result in increased postharvest losses at later points in the
food system.
Causes of food losses
Some of the causes of pre and postharvest losses at different points in the agricultural value chain are
indicated in Figure 3.3. While possible causes of food losses are infi nite in number, some are more
common than others.
Food losses may be the result of negative climatic conditions, poor physical facilities, technology used,
cultural practices, high costs of farm inputs, low market prices, low motivation of human resources and
an infi nite number of other causes. It should be noted that these conditions may be specifi c to a region
and time of year. When reporting the results of a study, this detail should be noted to determine if the
results can be extrapolated to include neighboring territories.
In most cases, with the exceptions of climatic conditions and catastrophes, the causes of pre and
postharvest losses are directly or indirectly related to decisions made by one or more of the diverse
participants in the agricultural value chain.

Commodity Systems Assessment Methodology for Value Chain Problem and Project Identifi cation 33
Figure 3.3. Causes of pre and postharvest losses at diff erent points in an agricultural value chain
ASSEMBLY/SORTING/PACKING- Improper postharvest handling- Delays- Defi cient engineering, design or
fi nishing of packing material- Physical, mechanical, and physio-
logical damage- Lack of infrastructure- Inappropriate technologies
tRAnSPoRt- Environmental conditions- Physical & mechanical damage- Physiological damage
tRAnSPoRt- Delays- Poor coordination- Poor technology
StoRAge- Physical, mechanical, or
physiological damage caused by:
rough handling, bacteria, fungus, mildew, insects, or rodents and environment
PRoCeSSing- Physical, mechanical,
or physiological damage
- Ineffi ciencies- Poorly trained workers- Inappropriate
technologies
diStRiBUtion- Defi ciencies in: organization, transport, storage,
management, technology, training
- Consumer habits- Public sector environment
PRODUCTION/PLANNING- Poor information- Poor production planning- Weak credit & price policies- Weak institutions - Poor services- Poor planned marketing/storage
facilities- Poor road development - Inappropriate marketing policies
PRodUCtion- Poor cultural
practices- Pest and disease
damage- Ecological & soil
conditions- Poor water
management- Physiological
damage- Mechanical
damage
hARVeSt- Wrong time for harvest- Climatic damage- Physiological damage- Mechanical damage
PRe-PRodUCtion- Lack of information- Poor management ability- Poor roads- Low level of technical knowledge- Poor quality planting materials- Poor locations of nurseries

34 inter-American institute for Cooperation on Agriculture
It is important to stress how wrong decisions or problems occurring at an earlier stage in
the agricultural value chain may affect food availability, quality, nutritional value and cost
at a later stage. Some examples: A ministry of agriculture may introduce a specifi c cultivar which
later proves to be unmarketable, poor quality planting material which may result in low levels of
productivity and/or poor product quality; poor cultural practices may have these same effects, as will
poor harvesting practices; physical damage during harvest, transport or packaging will affect product quality
further down the line, resulting in both physical and fi nancial losses; physiological damage during storage
will not only defeat the purpose for which storage was intended (extending the life and availability of the
product) but will also result in greater economic loss as a result of the high storage costs.
Food losses include changes in product quality. Such losses reduce shelf life, lower economic value in
the market, produce nutritional losses and affect food safety.
According to Kitinoja (2010), there are four major factors that contribute to consistently high postharvest
losses in perishable products:
1- Failure to use harvest indices: When horticultural produce is harvested at the proper
time, it is at its peek eating quality, market value and potential postharvest life. Produce
harvested too early or too late will not display its highest quality characteristics or have
its optimum shelf life. Fruits harvested too early may lack time to develop their full
complement of nutrients, will not ripen properly and could lack fl avor or size. Many
vegetables, if harvested too early, will suffer higher rates of water loss, while if harvested
too late, may be fi brous or seedy, or be more susceptible to decay.
2- inadequate packages: Poor quality packages such as sacks or baskets will allow the
produce to be bruised, squashed and receive abrasions during handling and transport to
market, and this damage will allow postharvest decay organisms to gain easy entry. Most
postharvest organisms cannot gain a foothold if the produce has not been damaged or
allowed to become stressed (from heat or water loss), so avoiding any abrasions, cuts or
bruises will immediately reduce decay rates.
3- lack of temperature management: As temperature increases, water loss and respiration
rates increase, which immediately leads to weight loss, and farmers or marketers can have
10% less food to sell by the next day. As days pass, and if the ambient temperature is
high, the overall quality of fresh produce will quickly decline and its market value will be
lower than it was on the day of harvest. A conservative estimate is that the wilted, bruised,
squashed or decaying produce will have a 20% to 30% lower market value compared to
the same freshly harvested produce.
These fi rst three sources of postharvest losses might easily add up 30 to 40% in lower
value compared to what was estimated at the farm gate, all without even one item of
produce having been thrown away. It is well known that better packaging and some form

Commodity Systems Assessment Methodology for Value Chain Problem and Project Identifi cation 35
of cooling are effective in reducing these types of food losses. The use of proper sanitation
procedures is very effective at reducing contamination with pathogens and decay causing
organisms. The best type of package and the cooling method and degree of cooling will
depend upon the agricultural product and its market value. Local costs and market prices
will determine whether or not the practice is affordable for any given small farmer or
marketer.
The fourth important factor that acts to increase postharvest losses is:
4- low market value: It is not uncommon during times of peak production for farmers to
sell their fresh produce at a loss, abandon their horticultural crops in the fi eld, or utilize
them as animal feed, since the cost of transporting the crops to market can be higher
than their current market value. In these cases (for fruit crops), being able to slow down
the rate of ripening by doing some kind of cooling or by using a treatment such as the
ethylene action inhibitor [1-Methyl-cyclopropane (1-MCP)] can help spread out the
supply peak, extend the marketing period and prevent prices from crashing. Alternatively,
transforming fruits and vegetables of low value, at the peak of production, into more
stable high value products (for future sale or consumption) can be done using simple, low
cost food processing methods.
Facilitating services
To overcome constraints within the food system, both the public and private sectors must provide
effective services which benefi t farmers, farmer organizations, intermediaries, and other key participants
who make the system work. The effi ciency of any agricultural value chain is in direct relationship to
the effi ciency of the support services received by the diverse participants engaged in production, adding
value and marketing. Some important services which are required at each point of the system are
identifi ed in Figure 3.4. While services such as information, technical assistance and credit are required
at nearly each step in the food system, others may be specifi c to particular points in the food system,
e.g. transportation, standards and quality control.
Figures 3.2, 3.3, and 3.4 thus show not only the interdependence of the diverse components of a food
system but also demonstrate the usefulness of a multi-disciplinary, and preferably, multi-institutional
approach in the identifi cation and analysis of problems and alternative solutions.

36 inter-American institute for Cooperation on Agriculture
Figure 3.4. Facilitating services to overcome physical and economic losses at distinct points in an agricultural value chain
ASSEMBLY/SORTING/PACKING- Adequate facilities- Packing material supply- Access to credit- Norms and standards- Technical transfer- Price/market information
tRAnSPoRt- Availability at competitive costs- Proper technology- Proper containers
tRAnSPoRt- Effi cient service- Coordination of needs
StoRAge- Research and technology
transfer- Adequate facilities- Technical assistance- Good management- Production/marketing
information
PRoCeSSing- Research and
technology transfer- Grades and standards- Quality control- Technical assistance- Credit- Production/marketing
information
diStRiBUtion- Channels for low income groups- Price control mechanisms- Transport systems- Credit- Production/marketing information
PRODUCTION/PLANNING- Strong institutions- Effi cient services- Good information- Eff ective policies
PRodUCtion- Access to credit- Farm input supply- Technical assistance- Production and mar-
ket information
hARVeSt- Market information- Access to credit- Norms and standards- Access to proper
technology
PRe-PRodUCtion- Access to planning information- Access to credit- Access to planting materials- Proper research/transfer

Chapter
4
Priority components for problem
analysis
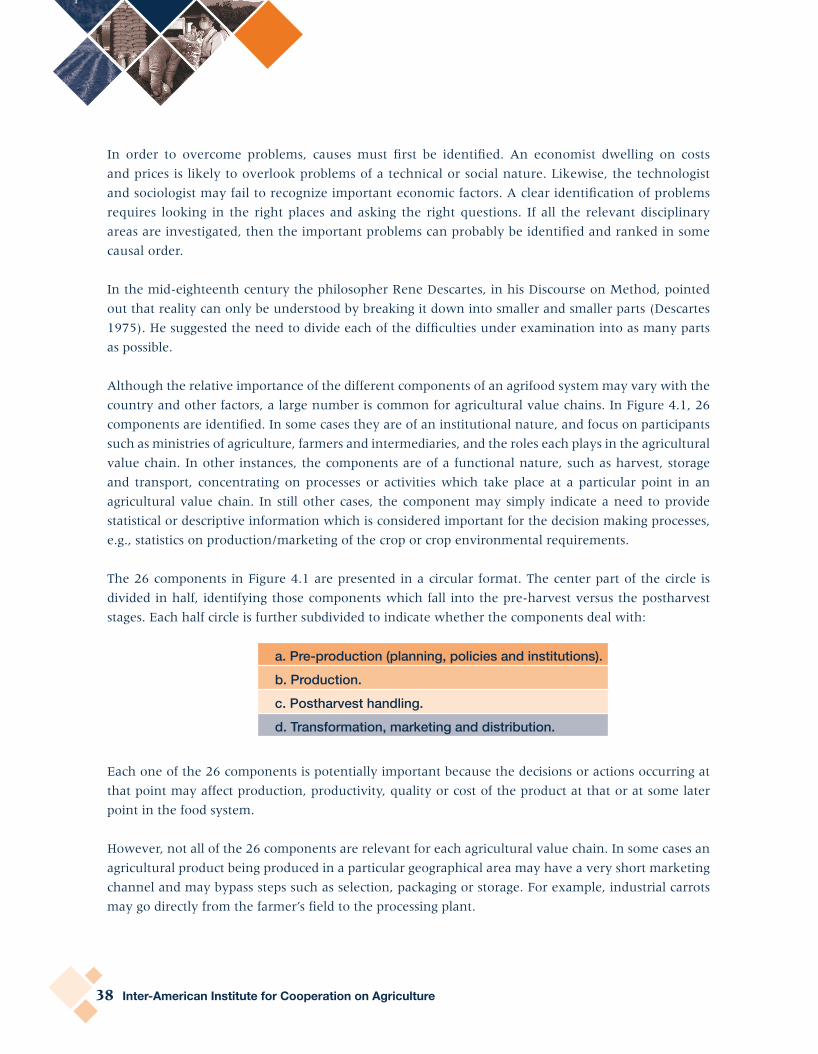
38 inter-American institute for Cooperation on Agriculture
In order to overcome problems, causes must fi rst be identifi ed. An economist dwelling on costs
and prices is likely to overlook problems of a technical or social nature. Likewise, the technologist
and sociologist may fail to recognize important economic factors. A clear identifi cation of problems
requires looking in the right places and asking the right questions. If all the relevant disciplinary
areas are investigated, then the important problems can probably be identifi ed and ranked in some
causal order.
In the mid-eighteenth century the philosopher Rene Descartes, in his Discourse on Method, pointed
out that reality can only be understood by breaking it down into smaller and smaller parts (Descartes
1975). He suggested the need to divide each of the diffi culties under examination into as many parts
as possible.
Although the relative importance of the different components of an agrifood system may vary with the
country and other factors, a large number is common for agricultural value chains. In Figure 4.1, 26
components are identifi ed. In some cases they are of an institutional nature, and focus on participants
such as ministries of agriculture, farmers and intermediaries, and the roles each plays in the agricultural
value chain. In other instances, the components are of a functional nature, such as harvest, storage
and transport, concentrating on processes or activities which take place at a particular point in an
agricultural value chain. In still other cases, the component may simply indicate a need to provide
statistical or descriptive information which is considered important for the decision making processes,
e.g., statistics on production/marketing of the crop or crop environmental requirements.
The 26 components in Figure 4.1 are presented in a circular format. The center part of the circle is
divided in half, identifying those components which fall into the pre-harvest versus the postharvest
stages. Each half circle is further subdivided to indicate whether the components deal with:
a. Pre-production (planning, policies and institutions).b. Production.c. Postharvest handling.d. Transformation, marketing and distribution.
Each one of the 26 components is potentially important because the decisions or actions occurring at
that point may affect production, productivity, quality or cost of the product at that or at some later
point in the food system.
However, not all of the 26 components are relevant for each agricultural value chain. In some cases an
agricultural product being produced in a particular geographical area may have a very short marketing
channel and may bypass steps such as selection, packaging or storage. For example, industrial carrots
may go directly from the farmer’s fi eld to the processing plant.

Commodity Systems Assessment Methodology for Value Chain Problem and Project Identifi cation 39
Components which may not be applicable to many crops include those such as pre-harvest treatments
(component 10), delays (component 19), other operations (component 20), agroprocessing (component
21), and exports (component 25). The other components should be relevant for nearly all agricultural
value chains. On the other hand, it is expected that researchers of a specifi c agricultural product in a
particular country may identify more than 26 relevant components. The 26 components included here
are indicative, but not all encompassing.
The remainder of this chapter presents a short description of each of the 26 components. In each
case the importance of the particular component and the type of information to be collected are
described. An analysis of each relevant component for a particular agricultural value chain will permit
a good understanding of what takes place at each point in the agrifood system and how production,
productivity, product, quality, or cost may be affected.
For the researcher interested in designing a questionnaire to collect information on one or more of
the 26 components, guideline questionnaires are provided in Annex 2 and 3. A summary list of key
questions related to each component of the agricultural value chain is included in Annex 4. It should
be stressed that these questionnaires are of a general nature and for reference purposes only. Each
questionnaire should be modifi ed to meet specifi c needs such as: the agricultural product,
the geographic area, and the specifi c interests of the researcher and the institution he or she
represents, among others.
As with the design of any questionnaire, the researcher must have a clear understanding of the type of
output desired and how the information will be presented (tables, graphs, descriptive paragraphs, etc.)
and utilized. It is only after the researcher has a clear understanding of what information is required
and how it will be presented and utilized that he or she should design the questionnaire to generate
the desired results. In this way only useful information will be collected, thus minimizing time and
expense.

40 inter-American institute for Cooperation on Agriculture
Figure 4.1. Principal components for an agricultural value chain assessment from the food losses perspective
GOVERNMENT POLICIES
RELEVANT INSTITUTIONS
FACILITATING
SERVICES
FARMER
ORGANIZATIONS ENVIRONM
ENTAL
CONDITIONS
AVAILABILITY
SEEDS/PLANTS
FARM
ERS’
CULT
URAL
PRAC
TICE
S
PEST
S AN
D DI
SEAS
ES
PRE-HARVEST
TREATMENTS
PRODUCTION
COSTS
HARVEST
GRADING AND INSPECTIONPOSTHARVEST
TREATMENTSPACKAGINGCOOLINGSTORAGE
TRANSPORT
DELAYS/
WAITING
OTH
ER H
ANDLIN
G P
ROCE
SSIN
G
MAR
KET
INTE
RMED
IARI
ES
MARKET
INFO
RMATIO
N
CONSUMER
DEMAND
MARKETING
COSTS
IMPORTANCE OF PRODUCT 1
2
3
4
5
6 7 8
9
10
11
12
13
14
1516
1718192021
22
23
24
26
PRE-PRODUCTION PRODUCTION
POSTHARVEST
HANDLING
MARKETING
PRE-HARVEST
POSTHARVEST
EXPORTS
25

Commodity Systems Assessment Methodology for Value Chain Problem and Project Identifi cation 41
ComPonent 01: RelAtiVe imPoRtAnCe oF PRodUCtAgricultural products vary in their importance to the national economy from one country to another.
For domestic consumption and for export can be ranked from most to least important either by
quantities produced, imported or exported, the respective economic values of these quantities or the
number of people involved in the agricultural value chain.
This section is intended to document the relative importance to the national economy of the agricultural
product under study. The more important the agricultural product, the more likely it is to be taken into
consideration in policy decisions and consequently allocated greater amounts of resources. Agricultural
products of low volumes and values or with low social impact, are less likely to be provided with the
infrastructure and services required for effi cient operations.
The relative importance of the agricultural product can be determined by analyzing production, imports,
exports, and national/regional development plans.
Specifi c questions might relate to the following areas:*
a. Quantity and value of national and/or regional production by year.
b. Total area harvested.
c. Volumes and values of particular cultivars/varieties/types.
d. Quantity and value of the agricultural product imported and exported.
e. Relative importance of the product in national development plans.
f. Ongoing or planned projects or plans which will affect the production and marketing of this agricultural product.
g. Others to be determined. *
* For GUIDE QUESTIONNAIRE, see Annex 2, Component 01.
42 inter-American institute for Cooperation on Agriculture
ComPonent 02: PUBllC SeCtoR PollCieSWhen the public sector establishes developmental policies for the agricultural sector, objectives are
normally oriented to increase production and provide higher returns to farmers or reduce costs to
consumers. Generally, the aim is to improve the welfare of both the rural and urban populations.
Since policy decisions are often made with biased or incomplete information, public sector policies
sometimes negatively affect specifi c social groups or the overall economy. Such is the case when
government promotes production without considering the effective market for the selected crop or
livestock, thus provoking gluts and reduced returns to farmers. Price policies can lead to decreased
production; for example, fi xing retail milk prices at near or below costs of production forces cutbacks
on dairy herds and increased imports of low cost powdered milk. Although the consumer may benefi t
in price, the product may be of a lower quality and the national economy will lose foreign exchange.
In other instances, implementation of a particular policy may actually lead to greater postharvest losses
or introduce ineffi ciencies into the agricultural value chain. For example, a government decision to
undertake the marketing of perishable produce usually leads to increased food losses due to low levels
of effi ciency and poor management of storage facilities.
When analyzing public policy related to an agricultural value chain, it is important to identify those
which either positively or negatively affect production, price, income, and product quality.
Questions to be asked can include: *
a. What specifi c policy or set of policies affect production, price and product quality?
b. What policies affect the internal marketing system?
c. What policies affect imports and/or exports of the product?
d. What policies affect consumption patterns?
e. What taxes cause incentives or disincentives to production or marketing?
f. What institutions are involved in determining the policies identifi ed?
g. Others to be determined. *
* For GUIDE QUESTIONNAIRE, see Annex 1, Component 02.

Commodity Systems Assessment Methodology for Value Chain Problem and Project Identifi cation 43
ComPonent 03: ReleVAnt inStitUtionSAll countries have a variety of public and private sector institutions carrying out actions which have an
impact upon pre and postharvest losses of livestock and crops. The effi ciency of the overall production
and marketing system is often determined by the effectiveness of these institutions and the services
they provide.
Because of the diversity of institutions, their internal complexity and their tendency to limit their
activities to specialized areas, coordination and communication between them is normally lacking.
Consequently, personnel from any one institution are unlikely to have a complete understanding of
the whole agricultural value chain.
The purpose of this section is to identify the principal institutions involved in pre-harvest and postharvest
aspects of the agricultural value chain under study and generate baseline information necessary to
answer the following questions: *
a. What institutions are involved in actions which will affect the production, processing and marketing of the product(s) under study?
b. What functions, services or other actions are undertaken by the respective institutions which may affect the quantity, quality and price of the product in question?
c. Why are they (functions, services, actions) undertaken?
d. Where in the agricultural value chain are these actions undertaken?
e. When are they undertaken?
f. How are they undertaken?
g. With what resources are they undertaken?
- human?
- fi nancial?
- physical?
h. Others to be determined. *
* For GUIDE QUESTIONNAIRE, see Annex 2, Component 03.

44 inter-American institute for Cooperation on Agriculture
ComPonent 04: FACilltAting SeRViCeSProductivity and product quality are often a function of the services available from public and/or private
sector institutions. This is even truer in the case of small farmers with limited access to resources. If
facilitating services (technical assistance, information, credit, farm inputs, and others) are adequate,
yields and quality of products are likely to be high. When services are poor or nonexistent, yields and
quality of produce are more likely to be low.
In this section, facilitating services offered by institutions identifi ed in component 03 will be described
and evaluated. The purpose is to determine their positive or negative impact upon the production,
postharvest handling, and marketing of the product being studied.
Types of services to be considered include:
a. Construction and maintenance of farm to market roads.
b. Generation and transfer of technology.
c. Supply of planting material.
d. Supply of information for decision making.
e. Supply and access to credit.
f. Supply and access to farm inputs.
g. Availability of vehicles to transport produce.
h. Availability of technical assistance.
i. Availability of facilities for postharvest handling.
j. Others.
For each type of service, questions should address such things as:*
a. Frequency and quality of service.
b. Accessibility of the service to the intended recipients.
c. Timeliness of the service.
d. Duplication/competition between institutions.
e. Users’ opinions of the service.
f. Impact of the service on production, harvest, postharvest handling, and distribution.
g. Others to be determined. *
* For GUIDE QUESTIONNAIRE, see Annex 2, Component 04.
Commodity Systems Assessment Methodology for Value Chain Problem and Project Identifi cation 45
ComPonent 05: FARmeR oRgAniZAtionSAgricultural products from small scale or family farming are marketed in very small volumes and with
a wide range in quality. If modern technologies are used, unit costs of production may be very high and
net returns to the farmer quite low.
One way for small farmers to overcome this situation, in an attempt to increase net economic returns,
is to organize into groups, associations or cooperatives. The assembly of relatively large volumes of a
particular product by a group of farmers can lead to economies of scale, improved postharvest handling
and therefore better quality produce, higher prices and increased net returns.
It takes years to organize and develop effective farmers’ organizations with the capability of providing
effective services to their members. In the meantime, their organizational weakness or non-existence
can be a serious deterrent to development. Existing farmer organizations should be identifi ed and their
respective strengths and weaknesses evaluated.
Types of information to be collected should include: *
a. Names of farmers’ organizations, whose members produce, handle and/or market the product being studied.
b. Quality of management and administration of the organization.
c. Level of participation of members.
d. Types, frequency and quality of services offered.
e. Types of products handled.
f. Experiences in production, marketing and processing.
g. Availability of human, fi nancial and physical resources.
h. Others to be determined. *
* For GUIDE QUESTIONNAIRE, see Annex 2, Component 05.

46 inter-American institute for Cooperation on Agriculture
ComPonent 06: enViRonmentAl ReQUiRementS And ConStRAintS
The natural resources and environment of the production area affect not only the quantity of yields
but also the quality of the produce and the time of maturity (for fruits). Too much or too little rain, too
high or too low temperatures, strong winds, steep slopes, or other negative environmental factors can
signifi cantly affect the quantity and quality of agricultural produce.
Since product quality normally cannot be improved after harvest, it is important to initiate the
postharvest process with the highest quality possible. If low yields and/or low quality are due to
particular environmental conditions, it is important to identify these constraints as early as possible.
The object is to avoid unnecessary costs which reduce the product’s competitiveness.
The types of information pertaining to the geographical area of production include:*
a. Soil conditions and fertility.
b. Amount and distribution of rainfall.
c. Period of drought.
d. Water logging.
e. Danger of fl ooding during the growing season.
f. Risk of damage caused by strong winds.
g. Average relative humidity.
h. Temperatures (high, average, low).
i. Slope of the land.
j. Altitude.
k. Comparative advantages of environment as far as market opportunities are concerned.
l. Others to be determined. *
* For GUIDE QUESTIONNAIRE, see Annex 2, Component 06.

Commodity Systems Assessment Methodology for Value Chain Problem and Project Identifi cation 47
ComPonent 07: AVAilABility oF SeedS And otheR genetiC mAteRiAlS
The production of quality produce requires access to quality genetic material (seeds, plants, tubers,
livestock, poultry, etc.) at the farm level. When farmers cannot obtain quality genetic material they
tend to utilize whatever is available. This often leads to products of inherent poor quality, or even the
wrong variety for the market. Proper genetic material can generate increased productivity and higher
net incomes for farmers and intermediaries.
Sources of seeds and genetic material should be identifi ed so evaluators can determine whether the
quantity or quality is a constraint to production. If access to seeds and genetic material is determined
to be a serious constraint, it may indicate the need for research, improving sources and/or delivery
systems.
The type of information to be collected in this section relates to the following areas:*
a. Sources of seeds, planting and genetic materials.
b. Seeds and genetic material free from pests and diseases.
c. Farmers’ access to seeds and genetic materials (traditional or certifi cate).
d. Overall quality of seeds and genetic material.
e. Farmers’ and extension agents’ opinions of seeds and genetic materials.
f. Government’s role and effi ciency in supply of seeds and genetic materials.
g. Cost of seeds and genetic material to farmers.
h. Advantages of alternative seeds, planting materials and genetic stock.
i. Others to be determined. *
* For GUIDE QUESTIONNAIRE, see Annex 2, Component 07.

48 inter-American institute for Cooperation on Agriculture
ComPonent 08: FARmeRS’ CUltURAl PRACtiCeSSince product quality normally cannot be improved after the production phase, it is necessary to
stimulate and train farmers to produce the best quality within their means. One of the principal
causes of low quality produce is the farmer’s poor cultural practices. In many cases poor cultural
practices are a refl ection of the farmer’s attempt to minimize risks and use of farm inputs. For example,
due to market uncertainties, the farmer may reduce production costs by declining to use certain farm
inputs. In other cases poor cultural practices may simply be the result of a lack of information or lack
of access to appropriate technologies.
The agricultural value chain evaluators should identify and describe the typical cultural practices used
by most farmers and how they affect both product quality and productivity.
Types of information to consider are:*
a. Farmers’ motives for growing the crop.
b. Source and quality of seeds, planting material or livestock.
c. Type of farming systems used.
d. Cultural practices with respect to:
– soil preparation.
– planting techniques.
– fertilization.
– irrigation.
– use of labor.
– use of machinery.
– weed control.
– pest control.
– disease control.
– pruning.
– shade control.
– management of farm waste.
– others.
e. Harvesting techniques and tools used.
f. Postharvest handling practices.
g. Decision making process for harvest and marketing of produce.
h. Others to be determined. *
* For GUIDE QUESTIONNAIRE, see Annex 2, Component 08.

Commodity Systems Assessment Methodology for Value Chain Problem and Project Identifi cation 49
ComPonent 09: PeStS And diSeASeSMost agricultural crops, poultry and livestock are affected by pest and disease problems at some point
in the agrifood system, either prior to harvest or during the postharvest stage. In some cases these pests
and diseases may be economically insignifi cant, while in others, they may cause so much damage that
the profi tability is affected. In some instances the pests and diseases may be of quarantine signifi cance,
thus prohibiting the agricultural product from crossing borders. This reduces the potential for earning
foreign exchange.
The purpose of this section is to identify pests and diseases affecting the agricultural product being
studied and to determine whether or not they are, or could become, of economic or quarantine
signifi cance.
Types of information to be considered include: *
a. Identifi cation of all economically signifi cant pests and diseases which affect the productivity and/or quality of the product, in order of importance.
b. Identifi cation of pests and/or diseases of quarantine signifi cance, by country.
c. Identifi cation, analysis or description of the type of damage done to the product by each pest/disease, with respect to:
– quantity.
– quality.
– value.
– consumer demand.
d. Identifi cation and analysis of alternative methods and costs of control (pre-harvest and
postharvest) of each pest and/or disease.
e. Identifi cation of potential marketing constraints caused by chemical controls (toxic residues).
f. Identifi cation of potential constraints to the introduction of an effective control program.
g. Description of ongoing or planned actions or projects to deal with constraints.
h. Others to be determined. *
* For GUIDE QUESTIONNAIRE, see Annex 2, Component 09.

50 inter-American institute for Cooperation on Agriculture
ComPonent 10: PRe-hARVeSt tReAtmentSPre-harvest treatments, either physical or chemical, may have a favorable or unfavorable impact upon
postharvest quality. Examples of treatments include such things as:
a. Folding the maize plant to dry the grains; this helps to reach best humidity percentage for threshing and storage. It also protects the cob from bird attacks.
b. Twisting of cabbage (90 degrees) before harvest to break some roots and induce wilting. This causes the wrapper leaves to tighten, thereby helping to protect head during postharvest.
c. Wrapping fruit while still on tree. For example: apples (Malus domestica), star fruit (Averrhoa
carambola) and bananas (Musa spp.) may be wrapped with paper or plastic to prevent attack from birds, fruit fl ies and other pests or to enhance ripening or fruit color.
d. Chemical treatments while in the fi eld to extend postharvest storage life or enhance marketability.
In some cases chemical application can lead to postharvest residues which create marketing constraints.
All physical and chemical pre-harvest treatments which affect the postharvest quality of the agricultural
product under study should be identifi ed.
The information to be collected includes: *
a. Identifi cation and description of physical and chemical treatments used on the product under study.
b. Description of why, when and where each action is taken.
c. Identifi cation of the type of participant carrying out the action.
d. Description of what impact the action has on:
– quantity of production.
– quality of production.
– storage life.
– marketability.
– price of product.
e. Identifi cation of possible alternative treatments.
f. Costs and benefi ts of pre-harvest treatments.
g. Others to be determined. *
* For GUIDE QUESTIONNAIRE, see Annex 2, Component 10.
Commodity Systems Assessment Methodology for Value Chain Problem and Project Identifi cation 51
ComPonent 11: PRodUCtion CoStSFarming anywhere in the world is a high risk enterprise, for small farmers it is particularly risky.
Failure to earn adequate returns from their efforts will directly affect their family’s nutrition, health,
and education, in addition to their future efforts to continue farming. If the farming business lacks
economic incentives, the farmers’ children and perhaps the farmer him/herself will migrate to urban
areas searching for a better way of life.
The small scale farmer is cost conscious and will try to minimize his/her risks, especially when markets
are uncertain. Production costs vary greatly with farm type and size. Minimizing costs can affect the
quality and quantity of produce.
A complete analysis should consider labor, inputs, agricultural insurances (if the farm uses such),
administration, and their relations in any given agricultural value chain. An analysis of all production
costs can provide useful insights into possible causes of low yields and/or low quality of produce. It may
also demonstrate the economic advantages and disadvantages of using different inputs and different
production strategies.
The type of information to be collected includes: *
a. Establishment of assumptions regarding the size and operations of a typical farm.
b. Identifi cation of all types of production costs and their benefi ts.
c. Quantifi cation of the production costs for a representative group of farmers.
d. Comparison of costs of production recommended by the technician and those actually incurred by the farmer.
e. Analysis of advantages and disadvantages of using each type of input.
f. Others to be determined. *
* For GUIDE QUESTIONNAIRE, see Annex 2, Component 11

52 inter-American institute for Cooperation on Agriculture
ComPonent 12: CRoP hARVeStWhen and how a product is harvested (or an animal is slaughtered) affects its postharvest life. A
product harvested too early, too late, or damaged by improper techniques or tools will have a shortened
postharvest life.
Steep terrain in growing areas may cause further diffi culty by increasing risk to laborers, labor costs and
damage to produce. Socio-economic conditions which permit or stimulate the stealing of food may also
be contributing factors. For example, where food theft is common, farmers harvest their produce before
it reaches its proper stage of maturity and stop raising animals. This practice affects product quality,
quantity and returns from sales.
The techniques used to harvest the product (or to slaughter an animal) can be identifi ed and described.
The impact of harvesting practices on marketable produce can be indicated.
The information to be collected should cover the following aspects*:
a. Identifi cation of who harvests the crop.
b. Description of what actually takes place during harvest.
c. Description of why the crop or animal is harvested in a particular manner.
d. Identifi cation of time when harvest takes place (time of year and time of day).
e. Evaluation of how the harvesting techniques may affect marketable quantity and quality.
f. Determination of relationships between harvesting practices and postharvest losses.
g. Identifi cation of alternative methods for improving harvest techniques.
h. Identifi cation and description of the harvesting tools and their positive and negative aspects.
i. Costs and benefi ts of crop harvest.
j. Others to be determined. *
* For GUIDE QUESTIONNAIRE see Annex 2, Component 12.
Commodity Systems Assessment Methodology for Value Chain Problem and Project Identifi cation 53
ComPonent 13: SeleCtion, SiZing, gRAding, And inSPeCtionSelection, sizing, grading, and inspection are terms with closely related meanings. In all cases the objective is
to categorize the product in such a way that it will satisfy the needs of intermediaries, agroprocessors and/or
the intended consumers. In many developing countries, consumers tend to be more concerned with price
than quality. In these circumstances, selection, sizing or grading may be minimal and appear to the casual
observer as nonexistent. However, even in low income countries, consumers do have minimum standards
and the marketing systems have evolved over time to satisfy these requirements.
Care should be taken to study the process and methods used in traditional marketing systems to satisfy
consumer demand. Likewise it is important to understand marketing strategies adopted by wholesalers
or retailers, e.g., to minimize their postharvest losses, marketers may mix produce of different sizes and
quality and sell to consumers by the pile or bunch.
In developed countries, higher incomes allow consumers to demand higher quality produce. Consequently,
more attention and expense is given to the act of selection, sizing and grading. In some cases, buyers
(domestic or international) send inspectors to assure that the produce meets the desired quality standards.
The more selection, sizing, grading, and inspection which takes place, the higher the cost of the product
to the consumer. Due to high quality standards in export markets or agroprocessors, large percentages of
produce are often selected out or rejected prior to shipping. The lower grade produce is then sold on the
domestic market, fed to animals or becomes a postharvest loss.
This section identifi es where selection, sizing, grading, and inspection occur in the agricultural value
chain and describes what takes place. The type of information gathered should include*:
a. Identifi cation of points in the agricultural value chain where some form of grading,
selection, classifi cation or inspection takes place.
b. Description of the actions carried out at each point.
c. Identifi cation of who is responsible for each action.
d. Identifi cation of when each action is carried out.
e. Description of where each action is carried out.
f. Analysis of why the action is carried out as it is.
g. Identifi cation of the tools, equipment, other material and laborers used in carrying out the
actions.
h. Identifi cation of what criteria are used in carrying out the actions.
i. Description of the relationships between the respective actions and market requirements.
j. Magnitude of postharvest losses at diverse points in the system; where selection, sizing,
grading and inspection take place.
k. Costs and benefi ts of selection, grading and inspection.
l. Others to be determined. *
* For GUIDE QUESTIONNAIRE, see Annex 2, Component 13.

54 inter-American institute for Cooperation on Agriculture
ComPonent 14: PoSthARVeSt ChemiCAl And PhySiCAl tReAtment
Horticultural crops are frequently treated chemically and/or physically during the postharvest stage as
a means of extending shelf life or making the product more attractive to the consumer. As an example,
ethylene gas may be used to enhance ripening of bananas.
Physical treatments include such actions as washing root crops, waxing citrus and cassava, and bagging.
The types of chemical and physical treatments applied during the postharvest stage will be identifi ed
and described. The information to be collected should include the following*:
a. Identifi cation of physical and chemical treatments and chemicals used.
b. Purpose of each type of treatment and how the quality of the agricultural product is
affected.
c. Identifi cation of where and when in the postharvest system the treatment takes place.
d. Description of how the treatment is carried out and what is actually done to the agricultural
product.
e. Identifi cation of who carries out the treatment.
f. Identifi cation and description of the tools, equipment, materials and labor used in the
treatment.
g. Identifi cation of the potential impact of the treatment in the marketplace (how will
consumers react?).
h. Costs and benefi ts of chemical and physical treatments.
i. Others to be determined. *
* For GUIDE QUESTIONNAIRE, see Annex 2, Component 14.

Commodity Systems Assessment Methodology for Value Chain Problem and Project Identifi cation 55
ComPonent 15: PACKAGING Packaging protects the product during postharvest handling and divides the product into more
manageable units. It also improves the presentation of the product so it will be more acceptable to
middlemen and consumers. Packaging is necessary for nearly all types of produce. As a general rule:
the more perishable the agricultural product, the greater the importance of the quality of the package,
and the more sophisticated the market, the more important the presentation of the package.
The characteristics of packaging materials, methods used in packaging, and the relevant costs should be
determined. Types of information should include*:
a. Identifi cation of the points in the postharvest system where packaging or repackaging
occurs.
b. Determination of the specifi c purpose of packaging.
c. Identifi cation of who undertakes the packaging and where it takes place.
d. Description of what is done to the product during the packaging process and how it is
carried out.
e. Characteristics of the package: size, strength, presentation, color, label, availability.
f. Minimum packaging requirements on local and international markets.
g. Number of times package can be used and procedure for recycling.
h. Ownership of the package, if the package is reusable.
i. Information on reuse of package.
j. Costs and benefi ts of packaging.
k. Others to be determined. *
* For GUIDE QUESTIONNAIRE, see Annex 2, Component 15.

56 inter-American institute for Cooperation on Agriculture
ComPonent 16: CoollngIt is often good practice to harvest early in the morning to take advantage of lower prevailing
temperatures. The respiration rate of the product increases with the ambient temperature: the higher
the rate of respiration the shorter the postharvest life. However, early morning harvesting may not be
feasible or temperatures may not be as low as desired. Rapid cooling (pre-cooling) of the product to the
recommended storage temperature will prolong its postharvest life. Pre-cooling particularly benefi ts
highly perishable products.
Pre-cooling is not commonly carried out in most developing countries. Cooling for holding purposes at
airports, seaports and marketing terminals is a more common practice. However, poor administration
and operation of these installations frequently results in high postharvest losses. The high costs of
operation of cold storage facilities often results in their being abandoned. Many intermediaries prefer
the use of refrigerated containers which are mobile and less costly to operate.
Information relevant to cooling which should be collected includes:*
a. Identifi cation of the type of cooling presently carried out (pre-cooling, temporary storage, maintenance storage).
b. Description of the facilities, method(s) and equipment used in the cooling process.
c. Identifi cation of locations where cooling is carried out.
d. Identifi cation of who operates the cooling facilities.
e. Determination of the effectiveness of the system for removing fi eld heat and extending shelf life.
f. Analysis of cool-chain: does product remain in controlled temperature environment until it reaches the market?
g. Costs and benefi ts of operating each cooling system.
h. Feasibility of introducing cooling systems.
i. Others to be determined. *
* For GUIDE QUESTIONNAIRE, see Annex 2, Component 16.

Commodity Systems Assessment Methodology for Value Chain Problem and Project Identifi cation 57
ComPonent 17: StoRAge To store a product and maintain its quality, the storage environment must be effi ciently controlled. In
general, the temperature and humidity of air around the product are the major factors which contribute
to maintenance of product quality. Under optimum temperature and humidity conditions, storage life
will be extended to the maximum. Concentrations of the gases oxygen, carbon dioxide, and ethylene
in the storage atmosphere can affect the storage life of the product. Certain combinations can stimulate
the ripening process (controlled atmosphere).
A complete assessment of storage will identify the strengths and weaknesses of the conditions and general
characteristics of the storage environment. Storage takes place when the product is intentionally placed in
a specifi c location to protect it from adverse conditions, or while it is awaiting sale.
The information to be collected should include*:
a. Identifi cation of points in the postharvest system where storage takes place.
b. Description of the type of storage and reasons for storing the product.
c. Characteristics of the storage facility:
– facilities and equipment (types and level of maintenance).
– humidity range and methods of control.
– temperature range and methods of control.
– atmosphere of storage facility and control methods.
– danger of contamination by toxic materials.
– others.
d. Normal duration of the product in each type of storage.
e. Ownership of storage facilities.
f. Persons responsible for storage operations.
g. Method of operation of storage facilities.
h. Type of damage caused to the agricultural product while in storage.
i. Added costs to product price due to storage.
j. Costs and benefi ts of storage.
k. Location of the facility in proximity to the farm(s).
l. Number of and types of crops stored in the facility.
m. Others to be determined. *
* For GUIDE QUESTIONNAIRE, see Annex 2, Component 17.

58 inter-American institute for Cooperation on Agriculture
ComPonent 18: tRAnSPoRt In order for agricultural products to be useful to consumers, they must reach the diverse markets on a
timely basis. As the product moves through the value chain it may be transported by humans, animals,
airplanes, boats, or ground vehicles. It may be transported many times and by different methods from
remote rural farms. It may be carried by humans, animals, animal drawn carts or boats; from a rural
assembly point, it may be transported by motorized vehicle to a regional or central wholesale market;
from farms or from central assembly points it may be carried by airplane, train or ship to foreign
markets.
Each time the product is transported from one point to another it is handled, delayed, vibrated, placed
under pressure, and subjected to a variety of conditions which may negatively affect the quality of the
product and therefore its marketability.
Types of transportation used and points in the agricultural value chain where transport occurs should
be identifi ed and described.
Information to be collected should include:*
a. Identifi cation of the diverse points in the agricultural value chain where transportation occurs, as well as the participants, and methods used.
b. Description of the transportation process and the conditions during transport: enclosures, temperature, humidity, height of stacking, nearness of produce to heat source (e.g., engines, air circulation), time of day and others.
c. Sanitation of the transport units (how frequent and by whom?).
d. Distance (kilometers or miles) and duration (hours, days, minutes) of the transport.
e. Description of the type of damage which occurs to the product during transport and expected causes.
f. Identifi cation of the costs added to the value of the product as a result of transportation at different points.
g. Costs and benefi ts of transport.
h. Others to be determined. *
* For GUIDE QUESTIONNAIRE, see Annex 2, Component 18.

Commodity Systems Assessment Methodology for Value Chain Problem and Project Identifi cation 59
ComPonent 19: delAyS oR WAiting As any product moves through the agricultural value chain towards its fi nal destination (the consumer)
it undergoes periods of delay or waiting. For example, products may be forced to wait to be loaded,
unloaded, or paperwork at border crossings.
While a product is undergoing a delay or is waiting, it may be adversely affected by
temperature, humidity or other atmospheric conditions. The product may absorb undesirable
odors, be subjected to direct sunlight, or in some other way be adversely affected by temporary
conditions or circumstances, thus lowering product quality.
In some cases the delays are natural steps in the postharvest system, for example: tomatoes in a pile at
the edge of the fi eld awaiting the next step (packaging, grading). In other cases the delays may be for
socio-economic or political reasons, for example, customs personnel may delay produce at a port or
border until papers are completed and “informal taxes” are paid.
The information to be collected identifi es where delays or waiting occur and why, and should include:*
a. Points in postharvest system where delays and waiting occur.
b. Characteristics of each delay:
– cause of the delay.
– person or thing responsible for causing delay.
– length of the delay.
– environmental conditions at point of delay.
c. Normal conditions of the product at the point of delay.
d. Damage done to the product as a result of the delay and cause of the damage:
– in terms of quality.
– in terms of quantity.
– in terms of product value.
e. Alternatives for reducing the delays or waiting period.
f. Costs and benefi ts of delays or waiting.
g. Others to be determined. *
* For GUIDE QUESTIONNAIRE, see Annex 2, Component 19.

60 inter-American institute for Cooperation on Agriculture
ComPonent 20: otheR oPeRAtionSAs a product moves between the points of harvest and consumption, it passes through a series of steps
which may be referred to as postharvest processes by the technologist or marketing functions (storage,
transport, packaging, etc.) by the agricultural economist. Since it is not possible to include references
to all the potential operations that may occur between harvest and consumption, “other operations” is
included here as a catch-all.
The operations may be sub-divided into two types. Major operations are those of considerable
signifi cance in the particular agricultural value chain; for example, the fi eld curing of onions. Minor
operations are important but to a lesser degree; for example, the act of placing a product in a container
during harvest, unloading the product from the harvest container, loading a package onto a vehicle,
or off-loading. These minor operations are usually conducted rapidly and at low cost, but in some
instances may be signifi cant in increasing or reducing damage to a product.
This section identifi es signifi cant major and minor operations which may affect postharvest losses in
the agricultural value chain but are not included in any other section of the study.
The data collector should analyze the movement of the product from the point of harvest to the point
of retail and list all operations that occur and the point in the system where they take place.
The type of information to be collected includes the following:*
a. Identifi cation of the specifi c operations and the points in the postharvest system where these operations occur.
b. Description of each operation.
c. Identifi cation of who executes the operation and where and when it is carried out.
d. Details as to why it is carried out in the present manner.
e. Determination of what impact this operation may have on product availability and quality.
f. Evaluation of the costs and benefi ts each operation adds to the value of the product.
g. Others to be determined. *
* For GUIDE QUESTIONNAIRE, see Annex 2, Component 20.

Commodity Systems Assessment Methodology for Value Chain Problem and Project Identifi cation 61
ComPonent 21: AgRoPRoCeSSingAgroprocessing includes any operation which chemically and/or physically changes the character of
the raw product for the purpose of extending its shelf life or converting the product into a more
marketable form. The processing of food tends to stop or delay degradation and is a useful way of
reducing postharvest losses. Agroprocessing is an important method for increasing the marketability of
products which cannot compete in fresh markets.
This section will identify all types of agroprocessing undertaken by participants in the value chain and
describe their most relevant characteristics. Types of information to be collected include:*
a. Identifi cation of the types of agroprocessing the product undergoes and the point in the postharvest system where they occur.
b. Distance from the production fi eld to the agroprocessing facilities and transfer time.
c. Description of the process which takes place.
d. Identifi cation and description of the market for which the product is processed.
e. Participants involved in the processing function and their level of expertise.
f. The costs and benefi ts as a result of agroprocessing.
g. Impact of processing on postharvest losses and markets:
– reduction in losses.
– increase in earnings to farmers.
– benefi ts to consumers.
h. Problems of supply of raw material.
i. Others to be determined. *
* For GUIDE QUESTIONNAIRE, see Annex 2, Component 21.

62 inter-American institute for Cooperation on Agriculture
COMPONENT 22: MARKETING INTERMEDIARIESIn the marketing of any product there are a wide variety of intermediaries, for example, wholesalers,
retailers and exporters. These can be further subdivided depending upon characteristics such as the size
of their operations, products handled and the consumer groups they serve. Since different consumer
groups demand different levels of services, the functions and characteristics of intermediaries vary
widely.
This section will identify the principal types of intermediaries involved in the marketing of the product
under study and describe their respective operations within the marketing system. Their characteristics
should be outlined with the purpose of better understanding how the system works and identifying
those factors which may affect quantity, quality and price of product being traded.
The types of information to be collected include:*
a. Identifi cation of the principal types of intermediaries.
b. Description of the principal functions of each type of intermediary and where, when and how in the system the functions are carried out.
c. Evaluation of the reasons why the functions are carried out in the present manner.
d. Inventory of available equipment, facilities, infrastructure and other resources used by intermediaries.
e. Description of most important resources necessary for effective handling and marketing of products.
f. Identifi cation of the differences in quality, if any, of the product handled by the different types of intermediaries and the reasons for the differences.
g. Defi ciencies in the operations which affect the quality or lead to losses in quantity of a product.
h. Determination of the principal factors affecting marketing costs.
i. Major costs added by the intermediary and benefi ts received from such investments.
j. Others to be determined. *
* For GUIDE QUESTIONNAIRE, see Annex 2, Component 22.

Commodity Systems Assessment Methodology for Value Chain Problem and Project Identifi cation 63
COMPONENT 23: MARKET INFORMATIONThe most important aspect of an agricultural value chain is the price for which a product can be sold.
When prices are very low farmers may not even bother to harvest their crops. This occurs when farmers
anticipate that the added costs of harvesting and marketing will be greater than the expected sales
price. At the opposite extreme, when prices are high, farmers and intermediaries will be stimulated to
use techniques to maintain quality and improve presentation, even at a high cost.
When prices are high, some consumers will accept lower quality for a lower price. On the other hand,
when market prices are low, consumers demand higher quality. High levels of postharvest losses are
sometimes caused indirectly by low market prices. An awareness of prices in the marketplace will
provide useful insights on supply, demand, and possible causes of postharvest losses.
Market information includes more than just market prices. It is important to have access to reliable
information on existing and future supplies, as well as trends and conditions of consumer demand.
Market information is supplied by multiple sources including farmers, market wholesalers, retailers,
truckers, governments and donors, among others. With the introduction of cell phones and smart
phones farmers have increasingly easier and faster access to market information.
This section should identify types and sources of price and market information available and characterize
that information.
Data to be gathered include:*
a. Price and market information available:
– type of information available and source.
– frequency, reliability and quality of information.
– time period and markets covered.
– types of analyses of market information carried out.
b. Availability of information on supply of the product:
– type of information and source.
– frequency, reliability and quality of information.
c. Analysis of price/market information:
– seasonal price indices and high/low periods.
– causes of price fl uctuation.
– relationships between price, quantity, quality and postharvest losses.
– type of marketing arragements.
d. Others to be determined. *
* For GUIDE QUESTIONNAIRE, see Annex 2, Component 23.

64 inter-American institute for Cooperation on Agriculture
ComPonent 24: ConSUmeR demAndDemand for fresh and processed produce varies greatly by country and by consumer group within
individual countries. Particular preferences are the result of diverse factors, such as income, time,
traditions and religion.
Low income consumers tend to purchase lower quality produce, given their interest in minimizing
costs. High income consumers are usually prepared to pay higher prices for better quality produce.
Social and religious traditions can be determinants for the type and quality of produce acceptable to
consumer groups. Many religions have specifi c requirements for food preparation, specifying quality,
content and timeliness of preparation.
In terms of the product being studied, it is important to be aware of the economic status and the
cultural and religious preferences of the consumers and/or potential consumers.
Proposed changes in any agrifood system, whether to reduce postharvest losses, introduce new
technology or modify packaging, must be tested to determine whether the proposed changes will be
acceptable or not to the consumer in economic, cultural and/or religious terms.
Consumers can be identifi ed and classifi ed into categories, and their respective preferences for the
product characterized.
Types of information to be generated include: *
a. Identifi cation of principal markets: international, regional and domestic.
b. Identifi cation of consumer groups within each important market: high, medium and low
income; ethnic groups and religious groups.
c. Identifi cation of particular preferences for the product: cultivar, size, color, fl avor,
texture, maturity, acid/brix ratio, quality desired, packaging requirements, number
units/package, others.
d. Others to be determined. *
* For GUIDE QUESTIONNAIRE, see Annex 2, Component 24.

Commodity Systems Assessment Methodology for Value Chain Problem and Project Identifi cation 65
ComPonent 25: eXPoRtSDeveloping countries are giving more attention to the export of non-traditional agricultural produce
as a source of foreign exchange earnings. As production for exports increases, so does competition
between countries for the same markets.
In order to export effectively, the exporting country must be able to compete favorably with other
suppliers in terms of quantity, quality, price, and continuity of supply. In other words, they must have
both comparative and competitive advantages in the production and marketing of a specifi c product in
a particular market.
To determine the feasibility of exporting the product in question, the types of information to be collected
should include: *
a. Identifi cation of the specifi c product cultivar or breed to be exported.
b. Characteristics of the demand for a specifi c product in each potential market:
– country of destination.
– particular characteristics of the product desired by the importing country (size, weight, color, fl avor, texture, maturity, type of package, weight of package, etc.).
– quarantine restrictions.
– religious, cultural and price preferences.
– present sources of supply and competitors to each market.
– tariff and non-tariff trade restrictions.
– transportation problems to importing countries.
– potential labor (off loading) problems of importing country and other constraints.
– reliability of importer/brokerage services.
– form in which payments will be made.
c. Characteristics of supply of the particular product:
– availability of product over time.
– volume of actual and potential exports.
– ability to meet the demand requirements (quantity, quality, price, product characteristics, transportation).
– pest, disease and food safety constraints.
– postharvest handling constraints.
– infrastructure constraints.
– ability to compete favorably with other countries.
– other constraints.
d. Others to be determined. *
* For GUIDE QUESTIONNAIRE, see Annex 2, Component 25

66 inter-American institute for Cooperation on Agriculture
COMPONENT 26: POSTHARVEST AND MARKETING COSTSIn marketing systems around the world, people wholesale and retail a wide variety of produce in
many forms. One can observe produce in woven baskets, fertilizer bags, new or used cardboard boxes,
homemade wooden boxes, waxed or styrofoam boxes with ice and produce without packaging of any
sort. Transportation may be undertaken with human or animal power, vehicles, boats, airplanes, or
with other methods.
The hectic pace of traditional markets gives casual observers the feeling of disorganization. Within
this apparent chaos of traditional marketing systems is a certain structure based on the precept of
minimization of costs. Just as farmers attempt to minimize their production costs under conditions of
market uncertainty, marketing intermediaries tend to minimize their marketing costs. They use a wide
range of marketing strategies which may include packing produce in the fi eld, minimizing investments
in packaging material, utilizing public or rented transportation, or maximizing the use of family labor.
Although technical advisers and consultants constantly recommend “improved packaging,” “better
facilities,” “new equipment,” and “improved methods,” all intended to contribute to better organization
and improved marketing effi ciency, intermediaries often fi nd that these suggestions are not cost
effective.
To determine the feasibility of introducing innovations into the marketing process, it is necessary to
obtain real postharvest handling/marketing costs.
This section will generate information to permit the identifi cation and quantifi cation of marketing
costs. As examples: *
a. For each type of participant (farmer, intermediary, cooperative, marketing board, wholesaler, retailer, exporter, etc.) identify all types of marketing costs between the farm and fi nal market.
b. Quantify all marketing costs including such items as: transportation, packaging, labor, information, communication and paperwork, among others.
c. Identify strategies that participants use that increase or decrease postharvest and marketing costs.
d. Others to be determined. *
*For GUIDE QUESTIONNAIRE, see Annex 2, Component 26.

Application of the agricultural
value chain assessment
methodology
Chapter
5

68 inter-American institute for Cooperation on Agriculture
The globalized economy and modern society have new parameters of consumption and demands for
quality, which have resulted in greater standardization of the quality parameters for food. In addition, there
is greater awareness and responsibility for health, the environment and the people who produce food.
These factors together have set new trends in consumption and marketing patterns of agricultural products.
An ideal agricultural value chain allows a product to move from the farm to consumer, arriving at its
fi nal destination at a price the consumer is willing to pay and with only minimal losses in quantity or
quality. Losses which do occur are indicative of ineffi ciencies within a particular value chain.
For society to improve the effi ciency of existing agricultural value chains, it must increase the level of
knowledge, technology and/or resources available to participants in the system and/or reduce the level
of risk in production and marketing.
Facilitating the availability of fi nancial resources to groups of farmers to permit the purchase of trucks,
storage facilities and necessary equipment, may contribute to improved effi ciency in an agricultural value
chain and farmers’ insertion into inclusive and fair trade chains. Training of farmers and intermediaries in
improved methods of management, production, postharvest handling, and marketing are examples of ways
to increase their level of knowledge, optimizing techniques and technologies and improving the profi tability
of all stakeholders or interest groups.
Any successful attempt to introduce innovations into a traditional system will require an integrated effort
between those who make the existing system work (farmers, traders, bankers, and truckers, among others)
and those who would like to see the effi ciency of the overall agrifood systems improved (specialists, support
institutions, politicians and other decision makers). Development of effi cient agricultural value chains
requires a joint effort between the private and public sectors.
Integrating the practical with the technical, or the private sector with the public sector, requires a detailed
understanding of existing systems and how they operate. It requires the identifi cation of the distinct actors in
the system and an understanding of the role played by each. Generally, this type of information is not readily
available in one document, one institution or individual; however, it can be obtained and organized through a
systematic effort.
The rest of Chapter 5 will show how information on specifi c agricultural value chains can be collected and
organized to identify main components, participants and priority constraints. This will facilitate the design
of solutions and strategies oriented towards the improvement of agrifood systems. These solutions will be
the focus of Chapter 6.
Formation of an interdisciplinary team
Describing and analyzing an agricultural value chain is a team effort requiring input from specialists of
multiple disciplines. One of the fi rst steps in organizing the study of an agricultural value chain is therefore
the formation of an interdisciplinary team. The exact make up of this team will vary with the type of

Commodity Systems Assessment Methodology for Value Chain Problem and Project Identifi cation 69
agricultural value chain, the availability of human resources and support institutions, and the results desired
from the study. This team should include the specialists most knowledgeable about the diverse components
of a particular agricultural value chain. It should comprise persons from both the private and public sectors,
including farmers, intermediaries, transporters, agroprocessors, storage facility operators, extension agents,
planners, and policy makers.
If it is anticipated that the proposed solutions will require support from public sector institutions, then persons
from such institutions should be included on the interdisciplinary team. In this way the study serves as in-
service training for the individuals and may facilitate decision making during the implementation process.
The team should be as few in number as possible but broad-based enough to cover all important components of
the agricultural value chain. If the group is too large for effective interchange, it may be subdivided into two or
more interdisciplinary teams which will meet from time to time to exchange knowledge and reach a consensus.
According to Malaysian Agricultural Research and Development Institute (1988) another option that
has worked successfully is to divide the group by discipline, allowing planners and economists to concentrate
on pre-production, agronomists, entomologists and other production oriented people to work on
production, postharvest related people to concentrate on postharvest, and agricultural economists and
marketing specialists to work on marketing and distribution. Each group works separately as a team
but reports frequently to the others. In this option, each subgroup is composed of persons from similar
disciplines; therefore, their analyses are more likely to be carried out in greater depth.
The following sections on pre-production, production, postharvest handling, marketing and
distribution present the steps to be taken and tools to be used by the interdisciplinary team(s) during
the agricultural value chain assessment.
Review of existing literature, reports and records
The interdisciplinary team should undertake a review of literature, reports and records relating to the
agricultural value chain under study, in order to describe the current knowledge base regarding the
overall chain, postharvest losses, loss assessment methods, extent of losses and available technology.
Secondary sources will serve as an input to complement what is collected through the application of
different methods of data collection (eg. questionnaires) taking into account each of the areas that make
up the agricultural value chain: pre-production, production, postharvest and marketing/ distribution.
data collection of primary sources
In collecting data from the fi eld and stakeholders, the interdisciplinary team should select a sample that
ensures the quality and representativeness of the information for each component of the agricultural
value chain: pre-production, production, postharvest handling and marketing/distribution.

70 inter-American institute for Cooperation on Agriculture
Unless there is an interest in a specifi c region, the sample should include those regions or territories
with higher production volumes of the crop being studied. The team leader should identify the path
that follows the product throughout the agricultural value chain.
Various methods of data collection for triangulating the information should also be used. Several
examples are presented throughout this manual.
Analysis of the stages that integrate the agricultural value chain
Pre-production
Most of the components described in this quadrant (component 01-07, Figure 4.1) are applicable to
more than one product and are of a more general nature than are the components of the remaining
three sections, which tend to be product specifi c.
In the description of the pre-production phase it is important to ensure that the interdisciplinary team
includes specialists from central and agricultural planning units familiar with institutional structure
and services from both public and private sectors. The team should also include production specialists
familiar with natural resources, environmental conditions, and existing systems for the production and
distribution of planting material.
One of the fi rst types of analysis to be carried out by the interdisciplinary team is regarding institutions.
Given the often large number of public and private institutions involved in agriculture development
activities, it is often a major achievement just to identify them and their respective divisions/units
and functions relevant to the product under study. For each public sector institution pertinent to the
production and marketing of the product of interest, a questionnaire similar to that shown in Annex
3-A should be completed.
In the case of private institutions, care should be taken to identify organizations of farmers and other
support groups which affect the production, postharvest handling or marketing of the product being
studied. Profi les of representative farmers’ organizations can be prepared, including information on
their backgrounds, organizational structures, characteristics of members, experiences, problems, and
needs (see questionnaire format in Annex 3-B).
Information on development projects and activities which affect the agricultural value chain and are
sponsored by private sector groups or bilateral, regional, international, or other types of development
organizations, should be collected using the guideline questionnaire presented in Annex 3-C.
The interdisciplinary team should identify, analyze, and summarize existing policies, plans, programs,
and projects which affect the product of interest. Likewise, existing tax and fi nancial incentives should
be identifi ed and described, with a brief analysis of their present or expected impact on the specifi c
agricultural product.

Commodity Systems Assessment Methodology for Value Chain Problem and Project Identifi cation 71
This analysis of pre-production aspects should provide a fi rst indication of the feasibility of expanding
and/or improving the production of the product. If, for example, the only feasible growing area requires
a road which is not expected to be constructed for several years, it would be impractical to promote
increased production. Likewise, if planting material is a constraint, the production program may have
to be delayed. If institutional weaknesses are detected, policy changes or institutional strengthening
activities may be required as a pre-condition.
Production
While it is true that there are many differences in the production of fruit, vegetables, root crops,
and grains, and that each specifi c crop has its own particular characteristics and needs, it is also true,
in general, that nearly all agricultural crops have similar needs. For example, all require some soil
preparation or planting substrate. Most crops are placed in the ground in the form of seed or plants.
All require water, fertilizers, weed and pest control. Most undergo pollination and all are eventually
harvested.
This commonality among crops facilitates the design of a model which can be used for describing the
production process for any crop.
The best starting place for an analysis of the production system is the identifi cation of the diverse steps
in the production process. For most crops this entails some variation of those shown in Figure 5.1.
Based on this general model, steps can be added and/or deleted until all the important steps in the
production process have been identifi ed for the particular product studied.

72 inter-American institute for Cooperation on Agriculture
Figure 5.1. Steps in the production process of most crops
Preparation for planting
Acquisition of planting material
Soil preparation (e.g. plowing)
Planting and replacement
Fertilizer application
Irrigation
Pest and disease control
Weed control
Pollination
Pruning and training
Thinning
Harvesting
The formation of the interdisciplinary team should take into consideration these basic steps in the
production process. This is to ensure that the team includes members with the necessary expertise for
an in-depth and complete analysis. For each step in the production process, the team must identify
the different types of participants and analyze the positive or negative impact of each upon product
quantity and quality in the pre-harvest and postharvest stages. One way of beginning this process is by
answering the following six basic questions:

Commodity Systems Assessment Methodology for Value Chain Problem and Project Identifi cation 73
1. Who is responsible for the action?
2. What action is taken?
3. How is the action carried out?
4. When is the action carried out?
5. Why is the action carried out in that manner and not some other?
6. Where is the action carried out?
After discussion and analysis in plenary sessions, the interdisciplinary team can summarize the answers
to the above questions in a table format, with the steps of the production process along the vertical axis
and the above six questions along the horizontal axis as shown in Table 5.1.
table 5.1. Summary of production process for product X in country Z
Steps in theproductionprocess*
Whatactiontaken?
Whotakes
action?
howactiontaken?
Whenactiontaken?
Whyactiontaken?
Whereactiontaken?
Soil preparation
Hole preparation
Acquiring seeds/plants
Planting
Fertilization
Irrigation
Pest/disease control
Weeding
Pollination
Pruning & training
Thinning
Harvest
*The steps should be modifi ed in accordance with the particular product being studied.
The summary table should be supplemented with additional detail presented in tables or text.
Descriptive material might include information on such things as common farming systems, methods
of propagation of planting material, nursery management and standards used, description of cultivars
or seeds, type of fertilization, particular cultural practices, pest and disease control, and impact of pre-
harvest factors on postharvest losses, among others.

74 inter-American institute for Cooperation on Agriculture
The principal reason for describing the production system is to identify operations within the existing
system which negatively affect product yields and/or quality, or contribute unnecessarily to costs of
production. Although resources and time are not normally available to quantify the actual impact of
pre-harvest factors on either pre-harvest or postharvest losses, the interdisciplinary team (including
farmers) can make a useful subjective evaluation of their signifi cance. The resuIts of such an evaluation
can then be summarized following the format presented in Table 5.2.
Table 5.2 provides a format to indicate the magnitude of losses (both pre-harvest and postharvest)
caused by preharvest factors. For example, improper practices in training fruit trees in the nursery, or
on the farm, may cause fruit to come in contact with the ground, resulting in reduced quality, hence
unmarketability. Losses may occur prior to harvest as a result of pests or diseases. Produce reaching
the point of maturity may be of poor quality for a variety of reasons, for example: the lack of proper
fertilization, poor water management, or inadequate control of birds or other pests.
The production specialists, including farmers, may decide simply to indicate the magnitude of the losses
with an X in the respective column of Table 5.2, or if they have suffi cient information, may choose to
calculate the percent of losses at specifi c points in the system.
table 5.2. Magnitude of losses caused by pre-harvest factors for product X in country Z
Steps in the Not signifi cant Signifi cant Very signifi cant
production process+ Quan* Qual* Quan* Qual* Quan* Qual*
Land preparation
Hole preparation
Acquiring plants/seeds
Planting
Fertilization
Irrigation
Pest/disease
Weeding
Pollination
Pruning & training
Thinning
Harvest
* “Quan” = Quantity of losses; “Qual” = Quality of losses+ The steps should be modifi ed to refl ect the system being studied.Note: Place “X” in the appropriate box for each step. In those cases where “X” indicates signifi cant or very signifi cant losses, details should be provided in writing. If reliable information is available, the “X” can be replaced by an estimated percentage loss.

Commodity Systems Assessment Methodology for Value Chain Problem and Project Identifi cation 75
The interdisciplinary team (including farmers) should be asked to address the following question:
Given the existing state of the art, can the pre-harvest factors causing pre-harvest or
postharvest losses be reduced in technological and/or economic terms? From Table 5.3,
the experts should discuss in plenary session each of the causes identifi ed as “signifi cant” or “very
signifi cant” and decide whether the causes of pre-harvest and/or postharvest losses can be controlled
or eliminated in technological and/or economic terms. Their responses can be summarized using a
format similar to that presented in Table 5.3.
table 5.3. Feasibility of reducing the pre-harvest factors causing pre-harvest or postharvest losses
Steps in the production process*
Reducible in Reducible in
technological terms economic terms
yes no yes no
Soil preparation
Hole preparation
Acquiring plants or seeds
Planting
Fertilization
Irrigation
Pest/disease
Weeding
Pollination
Pruning & training
Thinning
Harvest
* The steps should be modifi ed to refl ect the system being studied.
By identifying those pre-harvest factors which experts feel signifi cantly affect either pre-harvest or
postharvest losses and which can be feasibly modifi ed, decision makers are provided with necessary
information to help them allocate scarce resources. They may decide to designate resources to
eliminate or reduce the indicated constraint, for example, improve planting material by building
nursery infrastructure and training nursery managers. On the other hand, if immediate solutions are
not available, they may decide to allocate additional resources for research to identify solutions, for
example, the selection of cultivars tolerant to a specifi c pest or disease.

76 inter-American institute for Cooperation on Agriculture
Postharvest
No technology has yet been developed which can completely stop the deterioration of food, whether in
the fresh or processed form. Consequently, once food enters the postharvest state it begins a process of
continuous deterioration, and the success of food distribution depends in great part on the capacity and
effectiveness of the marketing system and the methods used to reduce the speed of the deterioration
processes.
Most chemical reactions in fresh food products are regulated by the catalytic action of enzymes. The
activity of enzymes is in turn partially regulated by temperature and tends to increase from two to four
times for each 10 °C rise in the temperature of the medium where the reaction takes place. For this
reason temperature is considered the most important determining factor in the deterioration of food
products and the consequent duration of postharvest life.
The second most important factor, especially in the tropics, is humidity. While high humidity favors
growth of fungi, molds and bacteria, low humidity, especially when combined with high temperature,
can cause produce such as fruits, vegetables, tubers, roots, and meats to dehydrate, thus affecting
weight, quality and appearance. While the deterioration process is relatively slow in the case of grains,
the postharvest life span of produce such as leafy vegetables can be as short as a few hours.
In the previous section, production, the product was attached to the mother plant and all efforts to
maintain productivity and quality took place in the farmer’s fi eld. In the postharvest stage, the product
depends on its accumulated reserves and moves from point to point where conditions, environment
and types of treatment vary. In describing the postharvest process, the objective is to identify and
describe each point where people, machines, tools, or other physical materials come in contact with the
product, affecting its quantity, quality and appearance, and eventually its price.
For example, improper harvesting or the manner of placing a product in a container may break the
skin on the product, exposing it to pathological damage at a later stage. Mechanical damage may
occur as root crops are dug. Loose packing may cause damage due to vibration during transportation.
Weak containers may cause damage from weight pressure. Products may inadvertently be left in direct
sunlight or in storage under undesirable conditions of temperature or humidity.
The pressure for economic gain may lead some agricultural value chain participants to make decisions
which will negatively affect product quality at a later stage, for example: farmers watering down
products or adding soil and stones to increase weight. As the number of participants and steps in the
postharvest system increase, the opportunities for damage also increase.
As a product moves from the point of harvest to its fi nal destination, many types of handling and
functions are carried out which affect the particular product. To facilitate the study of the postharvest
process, these actions have been categorized into fi ve types.

Commodity Systems Assessment Methodology for Value Chain Problem and Project Identifi cation 77
operation: Those eventualities which a product undergoes and which prepare it for a following step. For
example: the act of harvesting a product, trimming, washing, waxing, and packing, among others.
transport: Transport takes place when a product is moved from one place to another, except when such
movement forms part of an “Operation” or is caused by a participant at the site during an “Operation”
or an “Inspection.”
Inspection or classifi cation: This occurs when products are examined to verify their quality, quantity
or other characteristics. It includes the process of regrouping products into different categories or classes.
delays (waiting): This occurs when conditions do not permit or do not require the immediate execution
of a planned following step. When the delay is intentional, the action is classifi ed as an “Operation.”
Storage: This takes place when the product is intentionally placed in a specifi c location to protect it
from adverse conditions or to hold until it can be marketed.
In describing the postharvest system, the interdisciplinary team should identify all the important steps
where the product undergoes a particular treatment, and set-up a matrix similar to that shown in
Table 5.4. As each important step in the system is identifi ed, it should be categorized as an Operation
(O), Transport (T), Inspection (I), Delay (D), or Storage (S). The movement of the product can then be
diagrammed in columns of Table 5.4, by connecting symbols from step to step with a line.
The next step in describing the postharvest system is to generate the additional information to fi ll in
the remaining columns of Table 5.4, indicating ambient temperature and relative humidity at each step,
distance covered when movement is involved, and time required to complete the action. Any other
relevant information can be included in the column for observations.
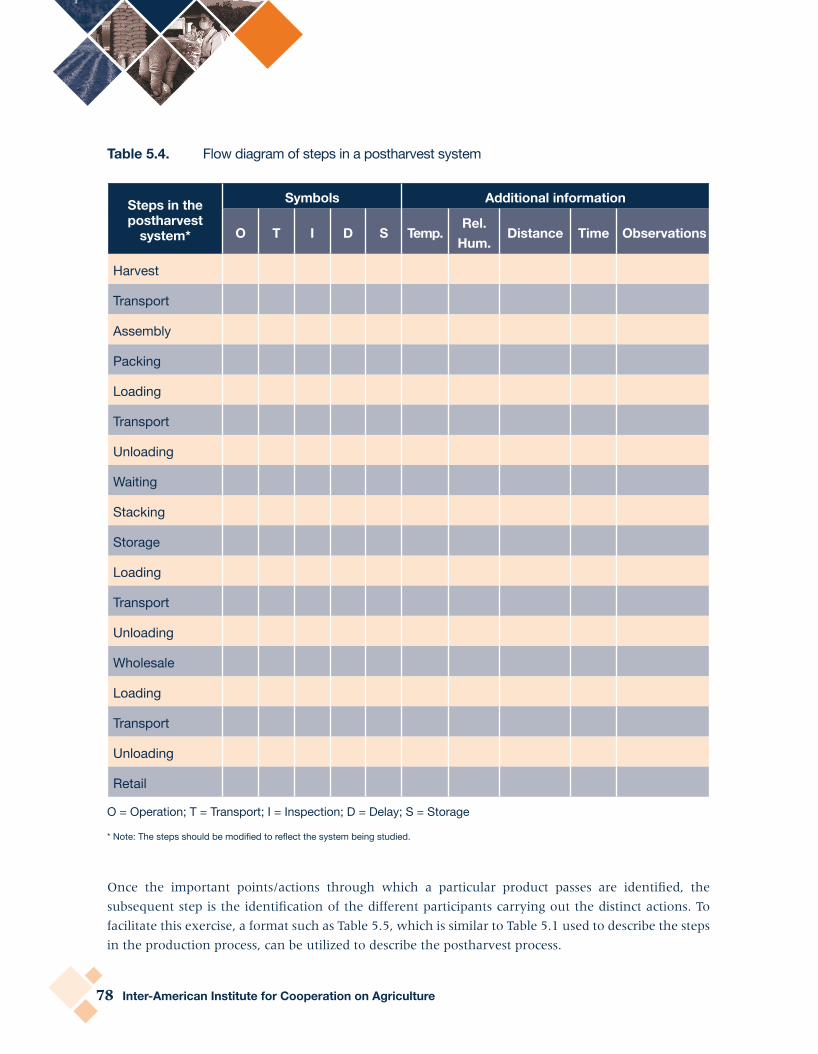
78 inter-American institute for Cooperation on Agriculture
table 5.4. Flow diagram of steps in a postharvest system
Steps in thepostharvest
system*
Symbols Additional information
o t i d S temp.Rel.
hum.distance time observations
Harvest
Transport
Assembly
Packing
Loading
Transport
Unloading
Waiting
Stacking
Storage
Loading
Transport
Unloading
Wholesale
Loading
Transport
Unloading
Retail
O = Operation; T = Transport; I = Inspection; D = Delay; S = Storage
* Note: The steps should be modifi ed to refl ect the system being studied.
Once the important points/actions through which a particular product passes are identifi ed, the
subsequent step is the identifi cation of the different participants carrying out the distinct actions. To
facilitate this exercise, a format such as Table 5.5, which is similar to Table 5.1 used to describe the steps
in the production process, can be utilized to describe the postharvest process.

Commodity Systems Assessment Methodology for Value Chain Problem and Project Identifi cation 79
In Table 5.5, each step in the postharvest process for a particular agricultural product is listed in the
fi rst vertical column. The respective answers to the six questions along the horizontal axis should be
written into the corresponding boxes. An example of a completed table, based on a case study of mango
(Mangifera indica) in Uttar Pradesh (India), is presented in Annex 5.
Since the information presented in table format is only a summary, it must be supported by more
detailed information describing each step in the postharvest process, participants involved, equipment
and materials utilized, and actions taken.
The information gathered by the specialists forming the interdisciplinary team will identify the principal
causal factors contributing to postharvest losses. In plenary sessions, the specialists should agree on the
level of signifi cance of postharvest losses at distinct points in the system. These can be summarized in
a format such as Table 5.6.
In the analytical process the specialists must keep in mind that:
1. A low percentage of losses can be signifi cant if the total volume of products handled is
large or if the cost of reducing losses is low.
2. What is viewed as insignifi cant for one socio-economic strata may be quite signifi cant for
another.
Based on the information from the previous tables, interviews with farmers and intermediaries,
knowledge and experience of the postharvest specialists, and other descriptive information, graphical
presentations can be made which will summarize the range of postharvest losses at different points in
the agricultural value chain.

80 inter-American institute for Cooperation on Agriculture
table 5.5. Identifi cation of participants and their respective actions in the postharvest process for product X in country Z
Steps in thepostharvest
system*
Whatactiontaken?
Whotakes
action?
howactiontaken?
Whenactiontaken?
Whyactiontaken?
Whereactiontaken?
Harvest
Transport
Assembly
Packing
Loading
Transport
Unloading
Waiting
Stacking
Storage
Loading
Transport
Unloading
Wholesale
Loading
Transport
Unloading
Retail
* Note: The steps should be modifi ed to refl ect the system being studied.

Commodity Systems Assessment Methodology for Value Chain Problem and Project Identifi cation 81
table 5.6. Impact of postharvest operations on postharvest losses for product X in country Z
Steps in thepostharvest system+
Not signifi cant Signifi cant Very signifi cant
Quan* Qual* Quan* Qual* Quan* Qual*
Harvest
Transport
Assembly
Packing
Loading
Transport
Unloading
Waiting
Stacking
Storage
Loading
Transport
Unloading
Wholesale
Loading
Transport
Unloading
Retail
* “Quan” = Quantity of losses; “Qual” = Quality of losses.+ The steps should be modifi ed to refl ect the system being studied.Note: Place “X” in the appropriate column for each step in the system. In those cases where “X” indicates signifi cant or very signifi cant, provide further details in writing. When reliable quantifi ed loss information is available, replace “X” with a percentage.
As was done in the analysis of the production system, the interdisciplinary team can ask the question:
Given the existing state of the art, can the postharvest factors causing postharvest losses
be reduced in technological and/or economic terms? After discussion among the specialists,
including farmers, intermediaries and other relevant participants, the answers can be summarized in a
table similar to that shown in Table 5.7.
The identifi cation of those points where postharvest losses are felt to be signifi cant will facilitate
decision making. If the interdisciplinary team feels that losses can be reduced in both technological
and economic terms, then innovations and modifi cations to the system can be suggested. These may
include actions or project ideas requiring investments in such things as infrastructure, equipment,
tools, materials, training, or policy recommendations which affect the postharvest system.
If it is felt that losses cannot be reduced in either technical or economic terms, then perhaps
recommendations can be made for specifi c research projects at different points in the system.

82 inter-American institute for Cooperation on Agriculture
table 5.7. Feasibility of reducing postharvest losses in technological and economic terms
Steps in thepostharvest system*
Reducible intechnological terms
Reducible ineconomic terms
yes no yes no
Harvest
Transport
Assembly
Packing
Loading
Transport
Unloading
Waiting
Stacking
Storage
Loading
Transport
Unloading
Wholesale
Loading
Transport
Unloading
Retail
* Note: The steps should be modifi ed to refl ect the system being studied.

Commodity Systems Assessment Methodology for Value Chain Problem and Project Identifi cation 83
marketing and distribution
Marketing must be considered during the planning of production and throughout all the business
activities associated with the fl ow of goods and services from production to consumption. In this regard,
as mentioned previously, it is necessary to identify the path that the product follows throughout the
agricultural value chain.
The concept of market is present when the farmer makes decisions about what crops to plant, when
to plant, which and how many inputs to apply, how much and what source of labor to use, when
to harvest, and when to sell to whom. The intermediary is also thinking of the market when s/he
decides what products to buy, what quantities, what quality and at what price; how and when to
transport, select, store, package and sell the produce. Marketing is the integrating force for all
these different decisions.
Developing countries are keen to increase their earnings of foreign exchange. They normally attempt to
do this either by increasing their domestic production of imported items or by increasing their exports
of traditional and non-traditional products. Most countries attempt to do both.
Effective marketing, whether local, regional, or extra-regional, requires the ability to provide some
minimum quantity of an agreed-upon-quality product to a given market on a regular basis and at
a competitive price. When analyzing the marketing distribution system, it is necessary to generate
information which will permit a good understanding of the system and its potential for development.
The make up of the interdisciplinary team should include persons knowledgeable of marketing
institutions, transportation, agroprocessing, and both domestic and export marketing. As identifi ed in
the fi nal quadrant of Figure 4.1, the components dealing with marketing, distribution and agroprocessing
should be identifi ed, described and analyzed.
Emphasis should be given to the collection of differentiated information on wholesale and retail
marketing, taking into account the following:
• Participants in the marketing system.
• Market channels.
• Sales volumes, prices, marketing costs and profi tability.
• Estimated volume of product losses.
• Availability and access to fi nancing.
• Service institutions and quality of services provided.
• Characteristics of consumer demand (domestic and abroad).
• Agroprocessing capabilities.
• Availability of transport.
• Available marketing infrastructure.
• Potential to supply domestic and export markets.
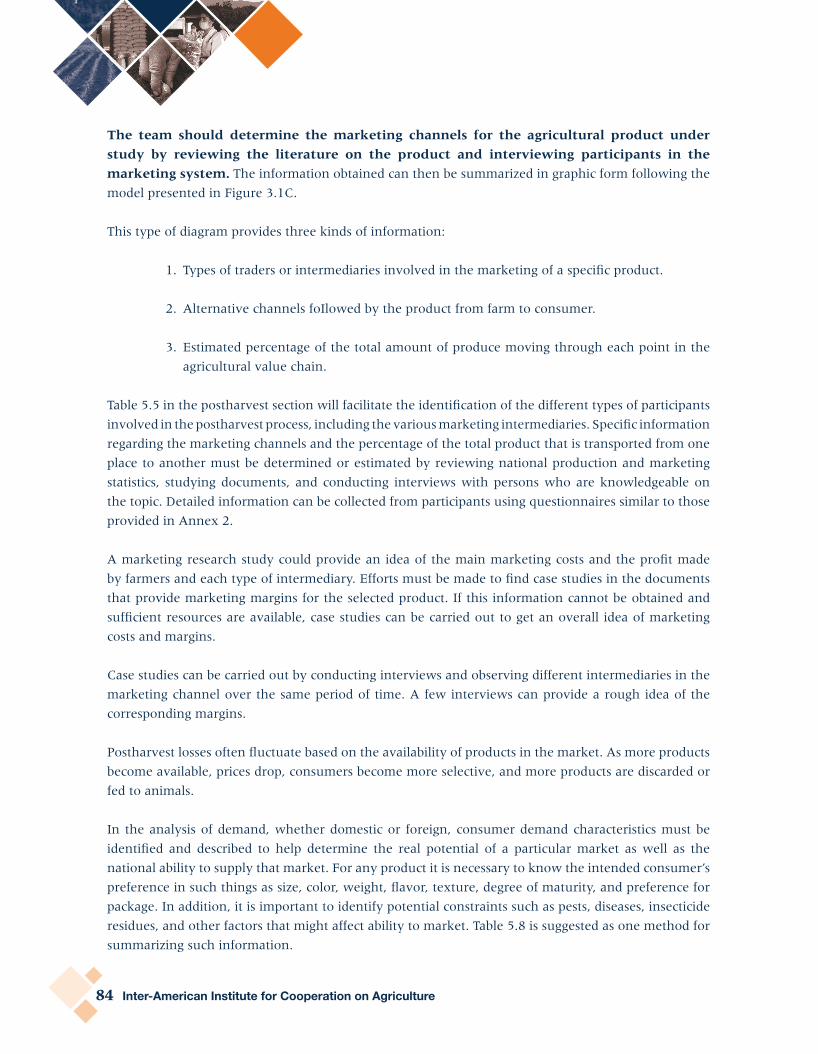
84 inter-American institute for Cooperation on Agriculture
The team should determine the marketing channels for the agricultural product under
study by reviewing the literature on the product and interviewing participants in the
marketing system. The information obtained can then be summarized in graphic form following the
model presented in Figure 3.1C.
This type of diagram provides three kinds of information:
1. Types of traders or intermediaries involved in the marketing of a specifi c product.
2. Alternative channels foIlowed by the product from farm to consumer.
3. Estimated percentage of the total amount of produce moving through each point in the
agricultural value chain.
Table 5.5 in the postharvest section will facilitate the identifi cation of the different types of participants
involved in the postharvest process, including the various marketing intermediaries. Specifi c information
regarding the marketing channels and the percentage of the total product that is transported from one
place to another must be determined or estimated by reviewing national production and marketing
statistics, studying documents, and conducting interviews with persons who are knowledgeable on
the topic. Detailed information can be collected from participants using questionnaires similar to those
provided in Annex 2.
A marketing research study could provide an idea of the main marketing costs and the profi t made
by farmers and each type of intermediary. Efforts must be made to fi nd case studies in the documents
that provide marketing margins for the selected product. If this information cannot be obtained and
suffi cient resources are available, case studies can be carried out to get an overall idea of marketing
costs and margins.
Case studies can be carried out by conducting interviews and observing different intermediaries in the
marketing channel over the same period of time. A few interviews can provide a rough idea of the
corresponding margins.
Postharvest losses often fl uctuate based on the availability of products in the market. As more products
become available, prices drop, consumers become more selective, and more products are discarded or
fed to animals.
In the analysis of demand, whether domestic or foreign, consumer demand characteristics must be
identifi ed and described to help determine the real potential of a particular market as well as the
national ability to supply that market. For any product it is necessary to know the intended consumer’s
preference in such things as size, color, weight, fl avor, texture, degree of maturity, and preference for
package. In addition, it is important to identify potential constraints such as pests, diseases, insecticide
residues, and other factors that might affect ability to market. Table 5.8 is suggested as one method for
summarizing such information.

Commodity Systems Assessment Methodology for Value Chain Problem and Project Identifi cation 85
table 5.8. Characteristics of demand for product X in country Z
demand characteristics*information for intended market
domestic export
Preferred cultivar
Preferred size
Preferred weight
Preferred color
Preferred fl avor
Desired texture
Preferred degree maturity
Preferred type package
No. units per package
Preferred w/package
Other preferences
Constraints
Pest problems
Disease problems
Insecticide residues
Quarantine restrictions
Other constraints
* Note: This list should be modifi ed based on available information and information needs for the agricultural product being studied.

86 inter-American institute for Cooperation on Agriculture
Food losses quantifi cation
Food losses (postharvest losses) quantifi cation along the agricultural value chain allows, among other
things:
• Identifi cation of the points along the agricultural value chain where more food loss occurs
and identifi cation of strategies (technologies and postharvest practices) most appropriate
for loss reduction.
• Establishment of a base-line for comparing the progress following change in strategy.
Targets can be set and progress can be compared.
• Monitoring and evaluation of strategies implemented to reduce food losses.
• Setting a goal for reducing food losses and tracking it over time.
• Estimating the fi nancial cost of food losses along the agricultural value chain, or one of its
components in particular.
• Generation of statistics on food losses in the agricultural value chain under study.
There are three major types of food losses:
Quantitative losses: loss of weight, loss of volume; discards due to physical damage or serious decays.
Qualitative losses: damage, loss of freshness, poor visual appearance, changes in color, wilting, yellowing, dehydration or water loss, decay symptoms, or nutritional losses.
economic losses: loss of monetary value per kilogram (kg) or per unit.
Both quantitative and qualitative losses will result in monetary or economic losses. In the fi rst case,
there is less volume or weight to sell, and in the second case, the price offered for the produce will be
lower than that offered for higher quality food products.
The CSAM process, involving interviews, observations and measurements of physical losses allow
documenting the causes and sources as well as the amount of losses. Any existing data as well as new
data can be gathered and analyzed. In addition to Tables 5.2 and 5.6, in Annex 6 there are a series of
worksheets that enable rapid quantifi cation of losses in quantity and quality for fruits, roots, tubers,
bulbs, and leafy vegetables chains at the farm, storage, wholesale and retail levels.

Commodity Systems Assessment Methodology for Value Chain Problem and Project Identifi cation 87
Table 5.9 corresponds to an example of the information collected at farm level in India for different
crops using the worksheets presented in Annex 6.
table 5.9. Assessment of postharvest losses for diff erent crops on farm level in India
Crop Air temp. °C
Pulp temp.
°C
Package size (lbs.)
Packageprotection
% decay
% mechanical
damage
% sorted out before
saleTomatoes 30.1 25.1 27 4 5 10.5 8.7
Mangoes 34.5 31.6 8.4 4.4 5 6.5 6.5
Eggplant 34.3 35.5 35 2.5 7.5 14 13.8
Cucurbits 30.5 26.9 21 2.9 4.5 9 12.7
Okra 31.2 32.1 34 2.3 2.6 8.8 18.5
Litchis 31.6 27.3 43 2.9 8.5 14 9.8
Notes:Package protection rating: 5 = excellentPhysical losses: damage, decay and defective produce that is sorted out and not sold for human consumption
Source: Kitinoja 2010.
In 2016 the World Resources Institute (WRI), The Consumers Goods Forum (CGF), Food and Agriculture
Organization of the United Nations (FAO), FUSIONS project, United Nations Environment Programme
(UNEP), The Waste and Resources Action Programme (WRAP) and the World Business Council for
Sustainable Development (WBCSD) launched the fi rst version of the Food Loss and Waste Accounting and
Reporting Standard. The document is available on the website: http://fl wprotocol.org/
Socio-economic implications of food losses
Food losses have signifi cant fi nancial implications along the entire agricultural value chain in the form
of direct costs and foregone benefi ts; these reduce profi tability and competitiveness.
Environmental externalities linked to food losses can be monetized to consider the costs involved, not
only for actors at a particular point in the agricultural value chain but also for society in general; this
helps enhance the discussions on investment and policies.
According to the FLW protocol (2016), when quantifying the fi nancial implications of food losses, it is
important to keep in mind that a complex set of variables affects economic value. When an entity seeks

88 inter-American institute for Cooperation on Agriculture
accurate estimates of potential fi nancial gains or losses, factors such as the volatility of prices as well as
currencies should be taken into account.
It is also important to be clear about which fi nancial elements have been considered, for example:
• Price of inputs (e.g. for farmers: the cost of fertilizers and pesticides).
• Price of labor.
• Value of lost revenue (e.g. if 20 percent of produce is rejected due to poor quality).
• Costs associated with collecting the losses (e.g. in the fi eld).
• Costs (or revenues) from disposing of or treating the food losses.
• Costs associated with environmental impacts (e.g. greenhouse gas emissions, water use, land use).

Chapter
6
Identifying problems and
their solutions
90 inter-American institute for Cooperation on Agriculture
Once the methodology has revealed the internal workings of an agricultural value chain and identifi ed
its main problems, it becomes relatively easy to identify possible solutions. The interdisciplinary team
will have identifi ed and described the principal characteristics of the participants and their respective
actions throughout the agricultural value chain. As team members obtain information about the
qualities of pre-production, production, harvest, postharvest, and marketing, they will begin to decide
what is working well within the agricultural value chain and what is not. Team members will then be
able to link problems and their causes with particular participants (farmers, intermediaries, companies,
organizations, institutions, and others). This information, when properly organized and analyzed, will
lead to the design of solutions, expressed in the form of projects.
The objective of this chapter is to present some instruments which will facilitate the identifi cation and
organization of problems and their causes, and the design of solutions.
Problem analysisProblems occur at all points in any agricultural value chain and come in all sizes. Small problems (bad
quality seeds, poor pruning and improper harvesting) occurring on the farm may become very large
problems in the marketplace when the produce cannot be sold due to poor quality. Someone who
observes a farmer in the marketplace unable to sell his produce might conclude that the problem is in
the market. In fact, the inability to market a product is usually an indicator of problem(s) in the agricultural
value chain. Unless we know the root problem and its causes, we cannot design effective solutions.
Any analysis of problems affecting an agricultural value chain must necessarily look for
causes in each component of the respective value chain.
Problem analysis has been defi ned by GTZ (1983) as a set of techniques to:
• analyze the existing situation surrounding a given problem condition.
• identify the major problems and the core problem of a situation.
• visualize the cause-effect relationships in a problem tree diagram.
The starting point in problem analysis, therefore, should be the identifi cation of as many of the related
problems as possible and their respective causes.
As should be apparent from any analysis of an agricultural value chain, the problems vary in accordance
with the type of participant. Farmers, for example, may have problems related to land, labor, information,
fi nancial resources, cultural practices, management, markets, and more. The farmers’ problems are
likely to cover the full range, from planning all the way through the system to marketing.
The more in-depth the agricultural value chain analysis carried out, the greater the number of
problems and causes identifi ed. The purpose of the detailed description of an agricultural value chain is

Commodity Systems Assessment Methodology for Value Chain Problem and Project Identifi cation 91
to provide an information base for problem identifi cation. If each member of the interdisciplinary team
is experienced and knowledgeable in his/her particular area, and if the description of the agricultural
value chain is carried out in detail, then conditions will be set for a problem brainstorming session.
During the application of the CSAM methodology the interdisciplinary team will also identify new
research, training and practical extension needs, as well as advocacy issues that could help to reduce
food losses.
Research needs are problems that have no immediate solution and which require further study,
adaptive research experiments, or fi eld testing; for example, postharvest losses linked to a pest for
which no known treatment is available.
Training and/or extension needs, such as existing information that growers, handlers and marketers
need to learn about. Examples include: providing information on maturity indices so growers will
know when to harvest for best quality and shelf life, and providing information on the costs and
benefi ts of a postharvest handing practice or storage technology.
Advocacy issues are needs that cannot be addressed by individual farmers, traders or scientists, but
need the government or society to take part in solving or making public investments. A good example
is poor roads from the farming areas to the marketplaces.
Instruments for analyzing problems and fi nding solutions
Brainstorming for problem identifi cation
Brainstorming about agricultural value chain problems and possible solutions can be made easier if
participants are gathered in a pleasant and informal environment with an effective discussion leader.
Brainstorming sessions can be held by conducting a card dynamic. During this exercise cards and
pens are handed out to the attendees, and they are asked to respond to the guided questions that are
formulated one by one, in a brief and anonymous manner. For example: What are the limiting factors
for crop X? What are your suggestions to solve the problems affecting crop X?
After allowing some quiet time to answer the questions, the cards are collected and placed on the
blackboard for all the participants to see. Then there is a collective debate in order to group together
relevant issues. The discussion and exchange of ideas that is generated with the cards is very rewarding
and stimulating. It motivates the participants to freely express themselves, present possible solutions
and express their commitment to participating in future activities. Subsequently, this tool becomes a
valuable instrument for building a problem tree.

92 inter-American institute for Cooperation on Agriculture
Problem checklist
Once the brainstorming session is completed, the interdisciplinary team may choose to review the checklist
of potential problems presented in Annex 1. Since this is a rather long list, it could take several hours or
days to analyze point by point. To avoid inappropriate use of scarce time, the checklist should be reviewed
quickly by each team member, to jog the memory, with the purpose of identifying important problems or
causes of problems that may have been overlooked in the brainstorming session.
The checklist may also be used as a format to summarize problems as shown in Table 6.1 or to serve
as a guide in organizing the problems from the brainstorming exercise by particular components of
the agricultural value chain. By grouping the problems according to their respective points in the
agricultural value chain, the team puts them in a perspective which contributes to understanding of
cause and effect relationships.
The priority problems identifi ed in Table 6.1 were obtained in 2009 as follows: First, an interdisciplinary
team carried out a brainstorming session to identify the problems affecting the mango value chain in
Uttar Pradesh, India. A very long list of problems was obtained which was then reordered following
the guideline checklist in Annex 1. The same team of specialists then reviewed the complete list of
problems to identify those of highest priority. These were then listed as presented in Table 6.1. The
point in the system where the problem occurs and the nature of that problem are presented in the fi rst
column of Table 6.1. More specifi c details of the problem are indicated in the last column on the right.
In this latter case, details should be included, showing how the problem affects quality, quantity, price
or availability of product.

Commodity Systems Assessment Methodology for Value Chain Problem and Project Identifi cation 93
table 6.1. Priority problems in the production of mango in Uttar Pradesh, India
Point in agricultural supply chain where problem occurs
indicate priority problems
outline problems impacting quality, quantity, price or availability
AgRiCUltURAl PoliCy
- Price control X No involvement by the Agricultural Product Mar-keting Board.
- Pesticide control legislation X Not enforced.
inStitUtionAl iSSUeS
- Coordination among institutions X Poor coordination in planning, processing and marketing.
PRe-PRodUCtion
- Planting material X No credit available for purchasing planting ma-terials.
CRoP ChARACteRiStiCS
- Farmers X40% own 2 or fewer hectares (small, marginal farmers). They sell harvests to intermediaries up to several years in advance.
- Intermediaries X Take care of the plantations & harvest and market the fruits. Control information on market prices.
PRodUCtion
- Agricultural inputs X Use of toxic products such as monocrotophos and chlorpyrifos.
- Technical knowledge X No access to technical information for increasing productivity and reducing production costs.
hARVeSt
- Harvest X Inadequate harvesting methods.
PoSthARVeSt hAndling
- Treatment with chemicals X Use of calcium carbide although prohibited by law.
- Cooling X No infrastructure available.
PRoCeSSing
- Processing Units X No opportunity for small and marginal mango producers.
MARKETS /MARKETING- Organization X Farmers’ unorganized. - Price X Information not easily accessible.
X Crops sold two to three years in advance to in-termediary.
- Transport X Trucks with cooling systems available only for export.
ConSUmPtion- Domestic X Demand by each region for particular variety.
* Note: The data for this table was prepared by going through the problem checklist in Annex 1. Only the priority problems checked with an “X” are summarized here.

94 inter-American institute for Cooperation on Agriculture
Problem tree diagram
A problem tree diagram is a way of visualizing the cause and effect relationships regarding a particular
problem situation. In such a diagram the causes are presented at lower levels and the effects at upper
levels. The core problem connects the two. Thus the analogy with a tree: the trunk represents the core
problem, the roots are the causes, and the branches represent the effects. The more specifi c the causes,
the more likely they are to lie at the lower levels of the tree diagram; however, the location of a
problem on a tree diagram does not necessarily indicate its level of importance.
There is no one correct way of formulating a tree diagram. Different individuals or groups, given the
same list of problems and causes, will normally organize them differently in a tree diagram. This is due
to the different levels of knowledge and experience of each person, and the amount of time available
for analysis. Given suffi cient time and exhaustive discussion, however, different interdisciplinary teams
are likely to produce very similar results. In general, the more complete the level of knowledge of the
participants and the longer the time dedicated to analysis, the greater the likelihood of similarity in
results.
As has been stressed earlier, the key to problem solution is proper problem identifi cation. The
tree diagram facilitates the organization of problems into a logical sequence which will lead to logical
conclusions and the identifi cation of cost-effective solutions.
Figure 6.1 illustrates the information presented in Table 6.1 in a problem tree format. In this instance
the core problem is established as “plantations and harvesting of mangoes neglected”. The causes of
this core problem, as shown in Figure 6.1, are due to: “poor institutional services”, “lack of information
on markets and prices”, “intermediaries take care of plantations and harvesting”. The causes of each of
these respective problems are identifi ed in the lower levels of the problem tree.
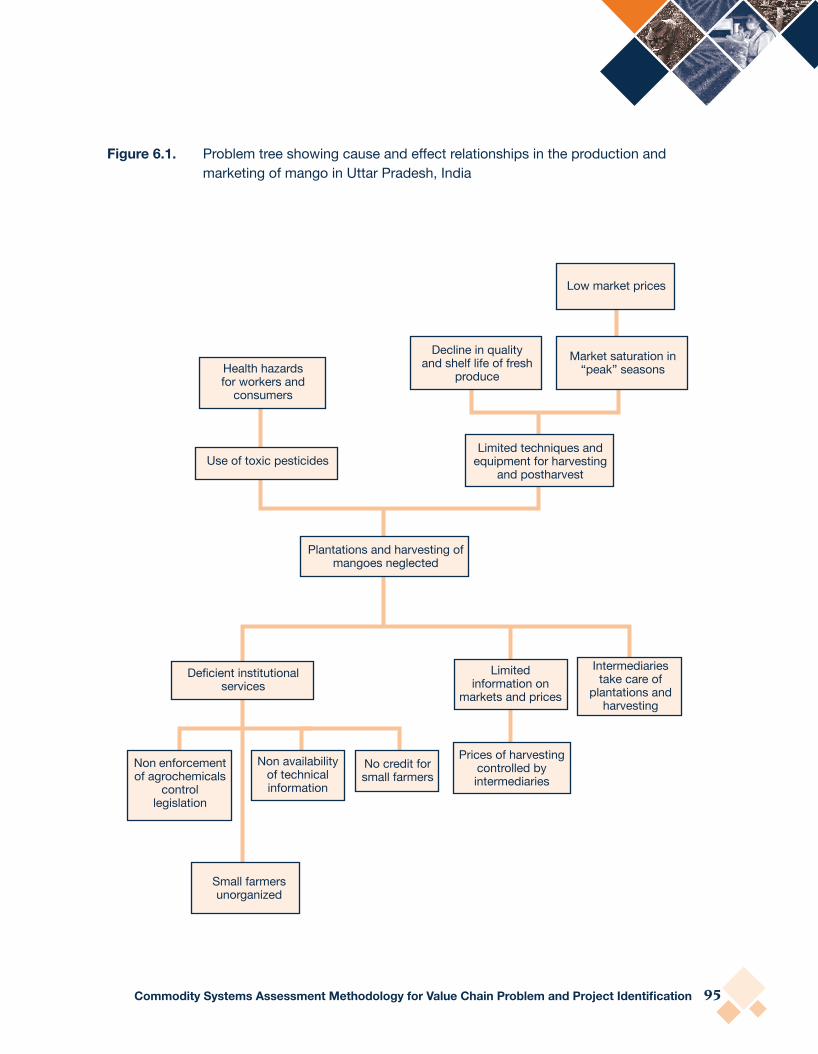
Commodity Systems Assessment Methodology for Value Chain Problem and Project Identifi cation 95
Figure 6.1. Problem tree showing cause and eff ect relationships in the production and marketing of mango in Uttar Pradesh, India
Low market prices
Market saturation in “peak” seasons
Decline in quality and shelf life of fresh
produceHealth hazards for workers and
consumers
Use of toxic pesticidesLimited techniques and
equipment for harvesting and postharvest
Plantations and harvesting of mangoes neglected
Defi cient institutional services
Non enforcement of agrochemicals
control legislation
Non availability of technical information
No credit for small farmers
Prices of harvesting controlled by intermediaries
Small farmers unorganized
Limited information on
markets and prices
Intermediaries take care of
plantations and harvesting
96 inter-American institute for Cooperation on Agriculture
Two effects from the core problem have been identifi ed in Figure 6.1. These are: (1) use of toxic
pesticides that become health hazards for those involved in applying and those consuming its residues
in fruit; (2) limited equipment and techniques for harvesting and post harvesting handling. Such
limitations decrease the quality and shelf life of fresh produce and saturate markets in the “peak”
production season.
As desired, causes and effects can be detailed to the point where several pages might be required to
present the entire problem tree. In general, the more detailed the analysis, the more complete the
understanding of the agricultural value chain and the greater the probability of designing
effective solutions.
The problem analysis can be concluded when the interdisciplinary team decides:
a) That the essential information has been included in the causal network, and
b) The cause-effect relationships which characterize the problem situation can be clearly
distinguished.
objectives analysis
The objectives analysis is the process whereby the problems are converted into objectives and goals
towards which activities can be directed. It also includes an analysis of the objectives to determine
whether they are practical and can be achieved.
In carrying out the objectives analysis there are fi ve basic steps:
1. All the negative statements shown on the problem tree are restated as positive statements.
2. All the objectives are reviewed to assure that they are desirable and realistically achievable in an acceptable time frame.
3. Those objectives which do not meet the conditions mentioned in (2) are modifi ed. Those which are undesirable or cannot be achieved are deleted.
4. Any new objectives which are desirable or necessary to complement existing ones should be added to the diagram.
5. The “means-end” relationships thus derived should be thoroughly examined to assure validity, logic and completeness of the diagram. Modifi cations should be made as necessary.
When the problem cannot easily be converted into positive statements (objectives) it may indicate an
unclear statement of the problem. In that case the problem should be reconsidered and rewritten.
In the fi nal analysis of each objective, the question should be asked whether the achievement of the
lower level objectives is suffi cient to achieve the next highest objective. In other words, has the cause-
effect relationship (Figure 6.1) been transformed into a means-end relationship (Figure 6.2)?

Commodity Systems Assessment Methodology for Value Chain Problem and Project Identifi cation 97
By starting at the bottom of the objectives tree (Figure 6.2) and working upwards, it can be seen that
the achievement of the lower level objectives will lead to the achievement of the objective at the next
highest level. Each objective seems to be realistic and attainable within the actual circumstance of the
local culture and environment. Thus we can conclude that the objectives contained in this tree diagram
are viable and can give direction to development projects.
Figure 6.2. Objectives tree for the production and marketing of mango in Uttar Pradesh, India (derived from Figure 6.1: problem tree)
Improved quality and shelf life for fresh produce
Use of toxic pesticides eliminated
Improved quality of mango plantations
and harvesting
Improved institutional services
Small farmers associations
Enforced agrochemicals
control legislation
Access to technical
information
Credit access for small farmers
Transparent information on
markets and prices
Easy access to information on markets and
prices
Owners take care of plantations and harvesting
Health hazards for workers and consumers reduced
Available techniques and equipment for harvest and
postharvest
Better market prices
Unsaturated markets during “peak” season

98 inter-American institute for Cooperation on Agriculture
Analysis of strategy alternatives and project identifi cation
Continuing with the mango example in Uttar Pradesh, Figure 6.3 shows some worksheet notations
which can help in an analysis of the situation. Each of the rows of objectives has been assigned a
number from one (top row) to seven (bottom row). The objectives in the top rows are quite general
whereas those in the bottom rows are more specifi c. If the problem tree had been developed to its full
extent, the bottom-most rows would be even more specifi c. As the objectives become more specifi c,
they might better be called expected results or outputs. For example, in row 7, expected results might
include: an association of small mango farmers in Uttar Pradesh up and running.
If an attempt were made to defi ne one general objective which encompasses all these objectives (rows
1 to 4) it might be as follows: “Improve quality of mango plantations and harvesting”.
At the fi fth level of objectives (Figure 6.3), there is a distinct dichotomy in which one branch specifi es
objectives to be achieved within public sector institutions, e.g., ministry of agriculture, and the other
branch specifi es objectives which can best be achieved by working directly with the private sector
(farmers). Since target groups are different in each case, it would make sense to consider these as two
distinct project areas within an overall strategy.

Commodity Systems Assessment Methodology for Value Chain Problem and Project Identifi cation 99
Figure 6.3. Identifi cation of alternative strategies and projects, based on the objectives tree (Figure 6.2)
1
2
3
4
5
6
7
Use of toxic pesticides eliminated
Improved quality of mango plantations and
harvesting
Enforced agrochemicals
control legislation
Credit access for small farmers
Improved quality and shelf life for fresh
produce
Available techniques and equipment for harvest and
postharvest
Health hazards for workers and
consumers reduced
Unsaturated markets during “peak”
season
Better market prices
Transparent information on
markets and prices
Small farmers associations
Improved institutional services
Owners take care of plantations and
harvesting
Access to technical
information
Easy access to information on markets
and prices

100 inter-American institute for Cooperation on Agriculture
Participant analysis
When persons, groups, institutions, and organizations see that they have something to gain from a
project, they are much more likely to play an active role in working toward the success of the project.
Problems do not exist in isolation but are closely linked with people, groups, institutions, and
organizations, and usually more than one person or group. This leads to a further complication in
that a problem affecting one person or group in a negative way may be benefi cial to others. Therefore,
any attempt to remove a particular constraint may come up against resistance. For example:
• Import laws disadvantageous to farmers may have been lobbied into place by traders. Since
traders (importers, wholesalers, exporters) normally have more political and economic
clout than do farmers, the laws are diffi cult to change.
• The organization of a marketing cooperative may put some intermediaries out of business.
These might then use their economic strength and political infl uence to weaken the
cooperative.
• A government marketing board may be suffering great losses in both money and produce
while benefi tting employees with jobs, and consumers through low prices. Any attempt
to improve operational effi ciency by reducing staff will be met with strong resistance.
• Two or more institutions may be duplicating research or training efforts, but professional
pride and competition may keep them apart.
Parallel to the process of describing systems and identifying problems, the interdisciplinary team
should analyze the various types of participants and their characteristics, for example: status, interests,
resources, motives, attitudes, strengths, weaknesses, and their potential support or opposition to
actions that remove constraints. Important questions are: Which are the target groups? Which will play
a supporting role? Which will benefi t from the actions (potential supporters)? Which will be affected
negatively (potential opponents)? An attempt should also be made to identify how the persons or
groups will be affected.
In the execution of the participant analysis, the interdisciplinary team should collect the necessary
information to fi ll in Table 6.2. The steps involved in this process are indicated below:
1. List all types of participants (persons, intermediaries, groups, companies, organizations,
institutions, projects etc.) identifi ed in the analysis of the agricultural value chain. These
are all potential target, support, or opposition groups (Note: At this point the reader should
refer to Tables 5.1 and 5.5 where different participants in the production and postharvest
systems were identifi ed).

Commodity Systems Assessment Methodology for Value Chain Problem and Project Identifi cation 101
2. Review the list to determine whether each represents a homogeneous unit or whether
the group can be further subdivided. For example, government institutions can be divided
into the ministry of agriculture, planning unit, and marketing board. Intermediaries may
be categorized as wholesalers, retailers, and exporters.
3. Characterize and analyze each participant type, considering his/her social characteristics,
organizational structure, status, interests, motives, attitudes, strengths, weaknesses,
shortcomings, and potential role to be played.
4. Identify possible positive and negative consequences of introducing changes into the
agricultural value chain and the potential impact upon the different participant groups.
5. Fill in Table 6.2 indicating whether participants are target, support or opposition groups,
or whether they belong to some other group affected by changes in the system. Describe
how they are affected, emphasizing the economic or social impact.
6. In the case of ongoing projects, identify those which complement, duplicate or compete
with the proposed project.
7. Develop strategies for coordinating with the more important persons, groups and/or
ongoing projects.
Projects benefi tting large numbers of participants are more likely to receive support during the
implementation phase. Projects having a negative impact on some participants with strong economic
and/or political clout are more likely to run into delays during the implementation phase.

102 inter-American institute for Cooperation on Agriculture
table 6.2. Expected impact of eff orts to modify an agricultural value chain
Participants inthe agricultural value chain*
How aff ected:
Positive eff ects Negative eff ects
target groups:
-
-
-
-Support groups:
-
-
-
-Other groups aff ected:
-
-
-
-Ongoing projects aff ected:
-
-
-
-
* Note: Refer to table 5.4 and 5.8 to identify the participants.

Commodity Systems Assessment Methodology for Value Chain Problem and Project Identifi cation 103
Summary of project identifi cation
The results for the analysis of Figures 6.1 to 6.3 are summarized as follows:
• A causal relationship has been identifi ed between problems occurring on the farm, with
intermediaries, during postharvest handling and within public sector institutions.
• It therefore stands to reason that resolution of the problems at the lower levels of the
problem tree could produce a positive impact across the subsector under analysis.
• The objectives tree facilitates the identifi cation of objectives and desired results which lead
to the formulation of projects to overcome the identifi ed problems.
• By identifying participants, ongoing actions, and means-end relationships, conditions are
set to identify priority project areas.
Given this information, a possible strategy to improve quality of mango production in Uttar Pradesh
can be summarized as follows:
• Execute a series of actions through both public and private sectors to improve the quality
of the plantations and handling of mangos during harvest and postharvest and thus
improve the quality and safety of fresh produce in the domestic market.
• Focus efforts in the selected areas of production by improving institutional services to
small mango producers, including access to credit, technical and market information, and
assistance in strengthening their association.
Criteria for establishing priorities
Since there may or may not be suffi cient resources for implementing all activities and projects
simultaneously, some projects or activities should take precedence over others. In the case of Uttar
Pradesh, for example, tools for improving harvest and postharvest techniques are top priority while
actions such as access to credit for small producers, though important, are lower priority.
Criteria to be considered in determining priority should include technical feasibility, costs and benefi ts
of the project or action, social impact, and political support for project or action. Criteria of local
signifi cance can be added as conditions warrant. To quantify the relative importance of the different
projects, the interdisciplinary team carrying out the analysis can arbitrarily assign numbers to each
criterion; say one for low priority and fi ve for high priority. An application of this methodology for the
case of mango in Uttar Pradesh is presented in Table 6.3.

104 inter-American institute for Cooperation on Agriculture
table 6.3. Prioritization of selected actions and projects for improving mango production in Uttar Pradesh, India
Actions and projects
CRITERIA*Credit
for small farmers
Encourage small farmers organization
Improve harvesting
tools
Improve knowledge of postharvest techniques
Improve supply of non-toxic
agricultural inputs
1. Technical feasibility 1 1 5 5 4
2. Benefi ts/costs 5 5 3 3 5
3. Social impact 5 5 3 3 3
4. Political feasibility 1 3 5 5 3
Total 12 14 16 16 15
5. Falls within national objectives
No No Yes Yes No
6. Falls within executing institution’s objectives
No No Yes Yes No
7. Priority of timeliness 4 4 5 5 3
*1. If technology readily exists, it is 5; the more adaptive research required, the lower the rating.2. The higher the benefi t to cost ratio, the better the rating; 5 is the highest.3. The greater the social impact, the higher the rating; 5 is the highest.4. The lower the degree of political opposition, the higher the rating; 5 is highest.5. “Yes” if action is in line with national objectives; “No” if it is not.6. “Yes” if action is in line with implementing institutions’ objectives; “No” if it is not.7. The higher the number (5 highest), the more timely the action and the more likely that the action is a precondition for other
actions. Lower numbers indicate that the action can be delayed until other actions are put in place.
After totalling the number of points, however, there are at least three additional questions which
should be asked:
• Does the project fall within national objectives?
• Does the project fall within the objectives of the organization that will implement them?
• When should the action be initiated relative to the other actions?
The responses to these three questions, for the case of mango in Uttar Pradesh, are presented in the
second part of Table 6.3. Only two out of the fi ve actions fall within national objectives.
With regard to the implementation sequence, the third and fourth activities have top priority, followed
by activities fi ve and two, then activity one, in that order. The reason for this arrangement is that with
the implementation of activities three and four, results for achieving the objective: “Improve quality of

Commodity Systems Assessment Methodology for Value Chain Problem and Project Identifi cation 105
mango plantations and harvesting” will occur more quickly. For this objective, as well as activities three
and four to be successful, participation and access to credit for small producers would be very helpful.
At this point it is useful to ask another question:
• What important political decisions must be made before implementation can take place?
This question should be asked for each project identifi ed, considering that sometimes the implementing
agency is unable to execute certain actions without the authorization of another agency or institution.
Some examples:
1. Licenses may be needed to import inputs that are not produced in the country.
2. A policy change may be required before a new marketing strategy can be applied.
3. A change in the organizational structure of an institution may require cabinet approval.
If these possible bottlenecks can be identifi ed during the design stage, then strategies can be developed
to keep them from becoming hindrances to the project during implementation.
Other useful questions are:
• What are government development policy priorities?
• Is available manpower suffi cient to implement the project?
• Will the action or project complement or compete with similar actions by other donor or support groups?
• Are there any other local, regional, or national conditions which may affect project implementation?
Project profi les
While there are many defi nitions for development projects, the important thing is to understand a
project’s characteristics. The more salient are the following:
1. Projects have a physical dimension which establishes limits to their available resources.
2. Projects have a temporal dimension. Since they begin and end at specifi c times, they can be differentiated from ongoing institutional activities.
3. Projects conform to a well-defi ned unit (group of actions) which can be evaluated to determine its success.
4. Projects have clearly defi ned objectives which tend to be innovative rather than perpetuating an existing situation.
Hence, a project is a set of interrelated activities aimed at a common goal/objective and
implemented during a given period of time with a predetermined quantity of resources
(objectives + resources + activities + time).

106 inter-American institute for Cooperation on Agriculture
If we accept this defi nition of a project, then we can prepare a project profi le by:
1. Defi ning its goals, objectives and expected outputs.
2. Describing the project’s principal activities.
3. Indicating the resource requirements to implement the activities.
4. Establishing a time frame for the beginning and ending of the project.
Anyone capable of analyzing an agricultural value chain and identifying priority problems and needs
is also capable of identifying a project idea and expressing it in the form of a project profi le.
The key to project identifi cation and formulation is knowing what the priority problems are. Since
the priority problems have been neatly organized in the problem tree (Figure 6.1), converted to
objectives in the objectives tree (Figure 6.2) and analyzed in alternative strategy analysis (Figure 6.3),
the writing of a project profi le is a straightforward task. That is, the system analysis has identifi ed all
the basic information necessary to prepare one, or several, project profi les.
While different people and organizations use different outlines for project profi les, basically they all
contain the same type of information to greater or lesser degrees. Based on the defi nition of a project
given above, the following minimum information should be included in a project profi le:
1. Title (refl ects the most important feature of the project).
2. Defi nition of problems/justifi cation (derived from the problem tree).
3. Goals or general objectives (derived from an analysis of objectives tree and alternative strategies).
4. Specifi c objectives (derived from analysis of the objectives tree and alternative strategies).
5. Expected outputs (identifi ed from the lower levels of the objectives tree). The expected outputs are the results wanted at the end of the project.
6. Activities to be executed under the project which will produce the expected outputs.
(These are a logical extension of the expected outputs and must be carried out to achieve
the expected outputs).
7. Expected duration of the project (determined by the time required to complete all project
activities in their proper sequence).
8. Estimate of costs (derived from an analysis of inputs required to implement activities).
9. Implementing organization or agency (determined through an evaluation of
organizational capability, source of funding, and local politics).
Project profi les are short descriptions of potential projects. As noted, they can be written in many
different formats.

Commodity Systems Assessment Methodology for Value Chain Problem and Project Identifi cation 107
Points for inclusion when drafting a project proposal for postharvest loss reduction Kitinoja (2010) proposes including the following issues for achieving success in a project oriented to
reduce postharvest losses (food losses):
1) Focus on the benefi ciaries
Many project assessments point to the need to advocate farmers’ agribusiness skills, attitudes and
aspirations, for example:
• Treat farmers as agribusiness people rather than just farmers.
• Aim to be not only more productive but more profi table.
• Ask smallholder farmers to consider issues beyond their farm plots (address the entire agricultural value chain and understand the needs of their buyers).
• Deliver targeted training or agricultural extension services that help improve the quality of produce, postharvest handling and marketing linkages.
• Provide training in local languages and incorporate audio-visual training aids.
2) Work through groups whenever possible
Whether via informal groups, cooperatives or formal associations, it is vital to work with groups to
impact policy and reach large numbers of people. Groups are the key to:
• Assessing local needs, facilitating targeted training, introducing new crops and technologies.
• Strengthening marketing capacity and market linkages.
• Managing contracts and sales beyond capacity of individuals.
• Building privatization efforts (moving from project provided services to community provided services).
• Development of fi nancing opportunities (eg.micro-credit).
• Designing appropriate, cost effective and innovative delivery systems (providing people with the information and skills they need, when, where and in a way they can best understand and use it).
• Include women in all relevant issues like access to credit, training and extension services. Women participation in such areas has proven to increase productivity and effi ciency.
3) Postharvest best practices should be incorporated early on in projects
There is a long history of agricultural development projects to improve production and marketing
that have been biased towards production and have overlooked postharvest activities. One cause of
this problem is discipline bias. The purpose of development projects is to improve the effi ciency of the

108 inter-American institute for Cooperation on Agriculture
agricultural value chain; consequently, emphasis should be given to strengthening those links in the
chain where profi ts to farmers, intermediaries and other participants can be increased the most.
• Do not neglect the postharvest components of the agricultural value chain.
• Identifying appropriate postharvest interventions is crucial to increasing farm profi tability. Barriers affecting adoption of postharvest interventions include complexity, unavailability of technologies and perception that investment costs are too high.
• Advantages of sorting, grading, packing, cooling, storage and other topics should be addressed via agricultural extension.
• Best practices training should be supported by appropriate infrastructure development and technology improvements.
4) invest more wisely in postharvest infrastructure
Most countries have examples of high profi le and costly projects that failed. These include signifi cant
postharvest infrastructure; silos, warehouses and cold storage facilities, among others. Causes of failure
include poor planning, wrong location, poor design and high costs of operation, among others. Some
guidelines to making wise investments in postharvest infrastructure are as follows:
• Develop the infrastructure to enhance agribusiness activities (consider location, access, costs, etc.).
• Match the facilities (cost, size, scope) to local needs and management capabilities.
• Avoid over-building. Large facilities are very diffi cult for smallholders to manage and can be too costly to be profi table.
• Develop or enhance the agricultural value chains by assisting buyers to meet and interact with farmers (market linkages).
• Make investments earlier in the project (on the farms, at packinghouses, for transport or storage, in markets, and market information systems).
• Deliver training to ensure that infrastructure is utilized, managed and maintained properly.Training in postharvest issues increases readiness and willingness to make changes, but if postharvest infrastructure and marketing support is not there for participants, the results of training can be frustration. Similarly, providing infrastructure without training can be a disaster waiting to happen, since successful postharvest management requires complex knowledge and skills.
• Make sure that technical support is available and a program is fi nanced to ensure an effective transfer of appropriate technologies to the operators of the infrastructure.
5) Build local capacity (strengthen institutions, human resources, community services)
Training should leave behind a cadre of local trainers and support service businesses to continue the
work that is started by a development project. Capacity building includes:

Commodity Systems Assessment Methodology for Value Chain Problem and Project Identifi cation 109
• Technical and educational program development.
• Training of master trainers.
• Network creation (helping members of the value chain meet and get to know each other).
• Resource identifi cation and strengthening of support services (local postharvest suppliers, repair services, engineers, credit).
• Building functional local capacity seems to have a strong relationship to sustainability.
• Sending farmers on “study tours” to regional or capital markets helps them to better understand the value chain for their crops.
• Designing appropriate innovation delivery systems depends upon fi rst developing this local capacity.
6) Projects should have a longer term focus, rather than the traditional 2 to 5 years, to increase the likelihood of sustainable results
• Project cycles should not be too short. Two to fi ve years does not provide enough time to build a solid base that will allow a project to work successfully with low resource communities.
• Projects that follow on past projects and follow up on any evaluation based recommendations can achieve good results.
• Development project plans should be fl exible enough to allow for adjustments during implementation.
• Ten years for a full scale project cycle is recommended.
Calculating relative costs and expected benefi ts of postharvest technologies and practicesCalculating costs and benefi ts can provide information to determine profi tability and whether the use
of certain technologies and agricultural and postharvest handling practices can improve the income
of farmers or marketers. Besides, it allows comparisons using two or more different practices in the
context of the same operation.
For comparing a current practice to a new postharvest technology or practice, actual local market prices
can be used. The amount available for sale will depend upon estimations of postharvest losses percentage.
To rapidly determine potential economic benefi ts for a specifi c postharvest technology or practice, a
simplifi ed cost/benefi t worksheet can be used. In each of cases developed for the CSAM process, data
on the relative costs of the traditional versus improved practices, estimations of percentage produce
losses and local market value/kg can be used to calculate potential benefi ts.
By considering only the costs which differ between the two practices for a sample load (100 kg or 1000
kg, whichever is more appropriate for the farmer or trader), it is simple to calculate the additional
market value of one load of the crop that is related to the change in the handling practice. There may
or may not be recurring costs to consider.

110 inter-American institute for Cooperation on Agriculture
Sometimes the local market price may vary with quality or size (grade 1, grade 2, etc.), so you may
have more than one price to consider. The return on investment (ROI) that you determine for the crop
and technology combination can be negative or positive; if negative, it may take several uses of the new
practice or technology before reaching the break-even point.
Annex 7 provides a worksheet that can be used to determine the relative costs and expected benefi ts of
using a new postharvest practice or technology. The following table demonstrates how a positive return
of investment (ROI) can be obtained in less than one season. Not only are postharvest losses reduced
but plant health and productivy of harvesters is greatly improved at a very low cost.
table 6.4. Cost-benefi ts use of secateurs for eggplant harvest in Jessore, Bangladesh
type information Current/ Traditional Practice New / Improved Practicedescription of action taken Pulling fruit from plant. Using secateurs to cut fruit
from plant.
disadvantage Risks damaging both fruit and plant and is a slower process.
-
Costs USD 2 per secateurs (4 secateurs)
- USD 2 x 4 = USD 8
Relative cost 0 + USD 8 Expected benefi ts
% losses 5-10% 0%Amount for sale 900-950 kg 1000 kgValue/kg (average price) USD 0.30 / kg USD 0.32 /kgTotal market value From USD 270 to USD 285 USD 320Market value minus costs (USD 285 – USD 0)
USD 285 maximum
(USD 320 – USD 8)
USD 312Relative profi t for the season (USD 312 – USD 285)
USD 27ROI Less than one season.
Tools are fully paid for during the fi rst season of use.
Source: Kitinoja 2016.

Commodity Systems Assessment Methodology for Value Chain Problem and Project Identifi cation 111
general observations on the use of the CSAm methodology and project profi les
The purpose of this manual is to provide a methodology to study a particular agricultural value chain,
to identify priority problems occurring throughout and the means of resolving them. The careful reader
will then have the necessary information and tools to identify problems and to prepare project profi les.
What do we do with a project profi le? The answer is to move them into the proper channels where they
will be seen and read by decision makers and hopefully be converted into funded projects. This funding
can then be used to execute priority activities which will improve the effi ciency of agricultural value
chains. These outputs will hopefully generate economic or social benefi ts for the intended benefi ciaries
of the project.
In all countries, there are local, national, multinational, international, bilateral and non-governmental
organizations active in agricultural development activities. They may provide loans, grants and
technical assistance. While some organizations only work through governments, others only provide
their assistance through the private sector.
In whatever circumstances, the project profi le plays a key role in obtaining assistance from development
organizations. Project profi les resulting from the application of the methodology represent the principal
results of a thorough, albeit rapid, appraisal of an agricultural value chain. Those individuals who have
managed the implementation of the methodology must ensure that decision-makers, when presented
with project profi les, understand the tremendous effort that has gone into the identifi cation of priority
problems and the subsequent design of appropriate solutions expressed in project format.
In most cases, project profi les are not immediately fi nanced since they normally do not provide the
potential donor with suffi cient information to determine feasibility and level of risk. Still, it is the
project profi le which either stimulates the donors to ask for additional information (a positive sign) or
indicate that they are not interested, avoiding further waste of time.
One way of contributing to agriculture development is by learning to formulate a good project. The fi rst
step in this process is learning to write a good project profi le.


Chapter
7
Organizing a workshop

114 inter-American institute for Cooperation on Agriculture
This chapter provides guidance on the considerations that should be taken into account to organize a
workshop to apply the CSAM methodology.
Some or all of the following results can be obtained during the workshop:
1. Descriptive and quantitative baseline documents on the agricultural value chain of interest,
including institutional, production, postharvest, and marketing aspects.
2. Identifi cation of signifi cant problems affecting the agricultural value chain.
3. Determination of the magnitude and causes of postharvest losses and other problems in
the agricultural value chain.
4. Identifi cation of appropriate projects and interventions to alleviate the problems identifi ed.
5. Defi nition of a strategy or plan of action for developing solutions and implementing actions.
6. Training of national professionals in the application of the methodology.
7. Training of participants to have a better understanding of an agricultural value chain and
all its interrelationships.
Participants in the workshops will form an interdisciplinary group, including farmers, marketing
intermediaries, private sector businessmen and public sector professionals. A coordinating individual
or group will be designated to oversee all aspects of the workshop, including planning, implementation
and presentation of the results to appropriate authorities.
Coordinating committee
A coordinating committee for the workshop should be formed several weeks or months prior to the
expected inauguration of the event. Members of this committee should be drawn from each of the
sponsoring and support institutions. The coordinating committee should determine the objectives of
the workshop, identify the needs in personnel, fi nancial and logistical support to obtain the desired
results, identify the type of support to be provided by the sponsoring institutions and take care of the
necessary organization and management.
Chairperson: Selected as the head of the coordinating committee, the chairperson is responsible for
communication and coordination with other institutions involved in the event, overseeing all sub-
committees, and having the fi nal word on all decisions affecting the workshop.
Secretariat: The secretariat includes a coordinator, designated by the chairperson, one or more
secretaries and a support staff (as needed). Members will be provided on a full-time basis by the
respective institutions sponsoring the workshop. The secretariat will provide all the necessary secretarial
and administrative services. It will prepare, organize and distribute all draft documents, and distribute
the fi nal workshop report at the closing ceremony of the workshop.

Commodity Systems Assessment Methodology for Value Chain Problem and Project Identifi cation 115
Working groups: Prior to the execution of the workshop, working groups will be formed to generate
baseline information in areas such as pre-production and institutional aspects, production, postharvest, and
marketing. Each of these groups will have a coordinator who will form part of the workshop coordinating
committee. Prior to the workshop, these coordinators will prepare baseline documents from secondary data
in their respective areas and present them to the other participants during the initial days of the workshop.
institutional support
The impact of the workshop will depend to a great degree on the type of institutional support received in
terms of material and human resources. If the participants attend on a part-time basis and material support
is weak, they will receive the message that their respective institutions are not considering the workshop
as a very serious training event. Consequently, the level of learning and transfer will be low. However, if
participants are relieved of their normal duties, allowed to participate on a full-time basis and are notifi ed that
they will be expected to apply the methodology in their future activities, a more positive message will be sent.
The type of institutional support required from the sponsoring institution(s) can be summarized as follows:
Participants: All participants will be expected to be involved on a full-time basis for the duration of the
workshop. This will also apply to administrative and secretarial support staff.
equipment: Sponsoring institutions will make available all necessary equipment to assure a successful
workshop. This will include: administrative staff and fi eld trips; access to computers, printers and projectors;
access to photocopying services; and others as deemed necessary.
materials: Participants and administrative personnel must have access to all the materials required to
satisfactorily undertake their assignments.
meals: For the duration of the workshop, arrangements should be made for participants to take their lunch
as a group. This will facilitate maintaining a rigid schedule, a requirement if the desired outputs are to be
achieved. Given the intensive nature of the workshop, morning and afternoon breaks with refreshments
may be desirable. These breaks also help build rapport between participants.
miscellaneous: There may be unforeseen expenses, and therefore a small fund should be established to
cover miscellaneous expenses.
Baseline documents
Workshop participants will include a large number of individuals specialized in specifi c areas who, more than
likely, are unfamiliar with other disciplines. For example, macroeconomists are likely to know relatively little
about production and postharvest handling of a particular crop; agronomists and food technologists may
well fi nd economic terminology confusing, and marketing specialists may know little about pest and disease
constraints.

116 inter-American institute for Cooperation on Agriculture
As a means of informing the participants about the state of the art of a particular agricultural value chain,
baseline documents should be prepared by the respective coordinators of the working groups prior to the
workshop. During the fi rst days of the workshop, the baseline documents will be presented and discussed
among the participants. Each baseline document will provide descriptive and quantitative information on
specifi c components of a particular agricultural value chain, as indicated below.
macroeconomic baseline document: This document will include information on the relative importance
of the particular agricultural value chain to the economy. It will identify the relevant public sector institutions
and describe their functions, services, national agricultural policies, and special projects, programs and plans
which may affect the agricultural value chain being studied. The document will identify incentive programs
and policies (tax, fi nance, exemptions); private sector institutions and organizations (farmer organizations
and non-profi t support groups) and summarize their services and functions and principal problems, etc.
Production baseline document: This document should contain information on the importance of the
particular product being studied; history of national production; environmental requirements; agronomical
characteristics; actual production constraints and comparative advantages; planting or genetic material;
cultural practices; pests and diseases; production costs; principal problems and needs, etc.
Postharvest baseline document: This document will cover the identifi cation and description of existing
postharvest handling practices; available infrastructure and equipment; agroprocessing potential and
characteristics; principal problems and needs, etc.
marketing baseline document: This document should consider imports and exports of the product being
studied; national and external supply and demand; marketing channels; marketing margins; characteristics
of demand; consumption patterns; marketing costs; market potential, etc.
The summary list of key questions related to each component of the commodity system (Annex 4) can assist
the workshop team to gather available materials and prepare the baseline documents.
Resource persons
Agricultural value chain specialist: One resource person familiar with the CSAM methodology should
be available for the duration of the workshop, including pre-workshop activities, in order to assist the
coordinating committee in organizational arrangements and activities during the workshop. If the value
chain specialist does not reside in the country of the workshop, he/she will liaise with workshop organizers
using existing technologies to facilitate the organization of pre-workshop activities.
The functions of the value chain specialist will include:
a. Providing the terms of reference for preparation of the baseline documents by the coordinators of the working groups.
Commodity Systems Assessment Methodology for Value Chain Problem and Project Identifi cation 117
b. Coordinating with the workshop chairman to ensure that all necessary resources have
been allocated for the workshop, including qualifi ed participants, materials, transportation,
equipment, eating arrangements, fi eld trip arrangements, working and offi ce space,
administrative and support staff, copying service, etc.
c. Making an introductory presentation at the workshop on the methodology, the diverse
tools presented in this manual and their use.
d. Opening the plenary sessions each day of the workshop with summaries of the previous
day’s accomplishments, material to be covered and expected outputs for that day.
e. Responding to questions from participants and leaders of the different working groups
with regard to methodology and presentation of results.
f. Functioning as a central clearing house for all material produced for and during the workshop
and assist the coordinating committee in the preparation of the fi nal workshop report.
g. Other tasks that the coordinating committee may determine.
Planners: An introductory presentation to the workshop should be given by some decision maker from
the agricultural sector (for example: national planning offi ce, ministry of agriculture) focusing on national
development plans with respect to the agricultural value chain being studied.
Farmers: In addition to the farmers selected to participate in the workshop on a full-time basis, representative
farmers, with different size operations and methods of farming, should be selected as resource persons. Ideally,
fi eld trips to their farms should be arranged. These farmers should be asked to discuss such things as their cultural
practices, pest and disease constraints, operation costs, methods of postharvest handling and marketing, decision-
making processes for their farming operations, and their principal problems and needs, etc.
intermediaries: Depending on the agricultural value chain, intermediaries involved in transportation,
assembly, wholesaling, retailing, storage, and export should be identifi ed and arrangements made for
fi eld visits to their sites of operation. These intermediaries should be asked to describe their operations,
their interrelationships with farmers, other intermediaries and government, and their principal needs for
improvement. Each visit should include a period for questions and answers.
Agroprocessors: Arrangements should be made to visit facilities of those products which undergo some
form of agroprocessing and to discuss with management their operations, problems and needs.
Selection of participants
While the number of workshop participants should be adjusted to meet local demand, facilities and
circumstances, in general, the number should not exceed twenty fi ve. Groups larger than this become diffi cult
to manage, particularly when making fi eld visits. The participants should include farmers, intermediaries,
businessmen, and specialists from disciplines such as economics, agricultural economics, agronomy,
entomology, food technology, engineering, marketing, sociology/anthropology, resource development and
other disciplines relevant to the case at hand.

118 inter-American institute for Cooperation on Agriculture
Participants may be drawn from institution(s) sponsoring the workshop, as well as from other public sector
institutions, private sector organizations and the farming community.
development of workshop agendaEach workshop agenda will be adapted to the local needs and the available resources of the sponsoring
institution(s). While most workshops should be similar in content, the time dedicated to each element will
likely vary. The workshop program should include:
• Registration of participants and inauguration of workshop.
• Presentation of the methodology.
• Presentation of baseline information documents on the product being studied.
• Identifi cation and collection of missing information.
• Field trips to farms, postharvest handling and agroprocessing facilities.
• Description of the distinct components of the agricultural value chain.
• Analysis and prioritization of problems in the agricultural value chain.
• Identifi cation of project ideas and required actions to overcome problems.
• Formulation of project profi les or projects.
The actual workshop program will be determined by the coordinating committee, assisted by the CSAM
methodology specialist, prior to the workshop.
As a general rule, most of the workshop time will be dedicated to the identifi cation and collection of
missing information, description of the agricultural value chain, problem analysis and the identifi cation
and formulation of solutions. The more information included in the baseline documents (prepared prior
to the workshop), the less time required for information collection during the workshop. The more time
remaining towards the end of the workshop, the greater scope there will be for formulating valuable project
documents.
Conducting the workshopThe workshop should be conducted in an informal atmosphere and should be dynamic and fl exible enough
to adjust to needs as they develop. Each workshop should have a moderator or facilitator who specializes
in communication and group dynamics. This facilitator should be a key person in integrating workshop
participants so that they play active roles in the discussion of problems and solutions. He or she may also
assist the chairperson in overcoming logistical and other problems as they arise.
After the opening ceremony has concluded, the methodology specialist will present an overview of the
methodology to be used during the workshop, showing how a systematic, step-by-step analysis can result in
a rapid assessment of a specifi c agricultural value chain. Immediately thereafter the coordinators from each
of the working groups will summarize the information contained in their respective baseline documents.

Commodity Systems Assessment Methodology for Value Chain Problem and Project Identifi cation 119
The need for additional information will then be evaluated, and subsequent activities may include the
design of questionnaires, interviews and fi eld visits to collect missing information.
Due to the diffi culty of working in large groups, the plenary body should be divided into interdisciplinary
subgroups of between fi ve and eight persons. Each subgroup should include farmers, people with
postharvest and marketing experience and professionals from as many disciplines as possible. Whenever
group work is required, i.e., for the collection of missing information, for problem analysis, for the
identifi cation of project ideas and other solutions, and for the formulation of project profi les, these
subgroups should be convened. Each subgroup should select its own coordinator and rapporteur for
reporting back to the plenary session.
Plenary sessions are required each time new information, methodologies or working instruments are
introduced. Longer plenary sessions are required to present and discuss the results of the working groups
and to carry out activities of mutual interest such as brainstorming.
The workshop facilitator and coordinating committee should periodically evaluate the progress of the
workshop. When certain sessions seem to become tedious or boring, a fi eld trip can be planned or new
subject material introduced to stimulate the group. The order of presentation of subject material can be
adjusted to meet the needs of the participants.
The workshop duration will depend on level of detail desired, resources available, and the complexity of
the agricultural value chain being studied.
Collection of missing informationChapter 4 describes in considerable detail the type of information which should be obtained on each
of the relevant components of a given agricultural value chain. A comparison of Chapter 4 guidelines
with the baseline documents presented by the working groups will give an indication of the missing
information which may need to be collected. Some of the missing information may be obtained from
secondary documents. Some may also be collected during fi eld visits to farmers, intermediaries, exporters
or other participants in the agricultural value chain. In cases where questionnaires are required, the
guidelines in Annex 2, 3 and 4 may prove useful.
Each working group will determine its particular requirements for additional information and will develop
methods to generate this during the time allocated for this activity. In some instances the necessary
information may be impossible to collect in the time period available. In such cases, recommendations
should be made for developing longer-term research activities to be carried out after the workshop.
Checklist for organizing a workshopTo facilitate the organization of the workshop and to ensure that all members of the coordinating
committee and institutional decision makers are kept informed of the headway being made, a checklist
of workshop activities should be maintained. The chairman of the coordinating committee, and each
member, should keep their own copy of the checklist. A model of a workshop checklist is presented in
Table 7.1

120 inter-American institute for Cooperation on Agriculture
table 7.1 Checklist for organizing a workshop
Workshop activities date action taken Person responsible
1. Formation of coordinating committee: chairperson, secretariat, working groups
2. Identifi cation of all institutional support required
3. Selection of the agricultural value chain specialist
4. Selection and invitation of participants by source
5. Preparation of baseline documents: - macro-economics - production - postharvest - marketing
6. Identifi cation of missing information needed: - macro-economics - production - postharvest - marketing
7. Selection and invitation of national resource support persons: - planners - farmers - intermediaries - agroprocessors - others
8. Detailed workshop program
9. Materials and equipment: - paper - projectors - camera - computer - copying and printing facilities - other
10. Food arrangements
11. Field trip arrangements
12. Transportation arrangements
13. Execution of workshop program
References
122 inter-American institute for Cooperation on Agriculture
Amezquita, R; La Gra, J. 1979. A methodological approach to identifying and reducing postharvest food losses.
Inter-American Institute for Cooperation on Agriculture. Santo Domingo, Dominican Republic, IICA. 84 p.
AP (Associated Press). 2007. Examples of failed aid-funded projects in Africa (on line). NBC News, United States; 23 Dec.
Consulted Jun 22. 2016. Available at www.nbcnews.com/id/22380448
ASEAN Food Handling Bureau. 1985. Workshop report. Workshop on Postharvest Loss Assessment of Horticultural
Produce (1985, Manila, Philippines). Kuala Lumpur, Malaysia.
Descartes, R. 1975. Discourse on method. Veitch, J (trad.). London, United Kingdom, Dent. 89 p.
FAO (Food and Agriculture Organization of the United Nations, Italy). 1996. Rome Declaration on World Food Security
(on line). Rome, Italy. Consulted Mar 23. 2016. Available at http://www.fao.org/docrep/003/w3613s/w3613s00.htm
FAO (Food and Agriculture Organization of the United Nations, Italy). 2013. Toolkit Reducing the Food Wastage
Footprint. Rome, Italy. 14 p.
FAO (Food and Agriculture Organization of the United Nations, Italy); IFAD (International Fund for Agricultural
Development, Italy); WFP (World Food Program, United States). 2015. The State of World Food Insecurity. 2015.
Rome, Italy. 62 p.
García-Winder, M; Riveros H; Pavez, I; Rodríguez, D; Lam, F; Arias, J; Herrera, D. 2009. Agri-food chains: instrument for
strengthening instutional capacity of agricultural and rural sector (on line). COMUNIICA 5 May-August. Consulted
Apr 11. 2016. Available at http://repiica.iica.int/docs/B1617i/B1617i.pdf
GTZ (Deutsche Gesellschaft für Technische Zusammenarbeit, Germany). 1983. ZOPP planning method. Frankfurt,
Germany. p. 25-31
Gustavsson, J; Cederberg, C; Sonesson, U; van Otterdijk, R; Meybeck, A. 2011.Global food losses and food waste: extent,
causes and prevention. Rome, Italy, FAO. 29 p.
HLPE (High Level Panel of Experts on Food Security and Nutrition of the Committee on World Food Security, Italy).
2014. Food losses and waste in the context of sustainable food systems. A report by the High Level Panel of Experts
on Food Security and Nutrition of the Committee on World Food Security. Rome, Italy. 116 p.
IICA (Inter-American Institute for Cooperation on Agriculture, Peru). 2015. The marketing and producction of quinoa
in Peru. Lima, Peru. 175 p.
IMF (International Monetary Fund). 2016. Corruption: Costs and Mitigating Strategies (on line). Washington, D.C,
United States. Consulted Jun 22. 2016. Available at http://www.imf.org/external/pubs/ft/sdn/2016/sdn1605.pdf
IPLA (International Project Leadership Academy, Canada). 2016a. 101 Causes of Project Failure. Consulted Jun 22. 2016.
Available at http://calleam.com/WTPF/?page_id=2338
IPLA (International Project Leadership Academy, Canada). 2016b. Classic Mistakes. Consulted Jun 22. 2016. Available at
http://calleam.com/WTPF/?page_id=799
Kitinoja, L. 2010. Identifi cation of Appropriate Postharvest Technologies for Improving Market Access and Incomes for
Small Horticultural Farmers in Sub-Saharan Africa and South Asia. Alexandria, Virginia, United States. World Food
Logistics Organization. 321 p.
Kitinoja, L. 2016. Assessment for Winrock International Cold Chain Bangladesh Alliance project Bangladesh. (electronic
mail). Oregon, United States.
Kitinoja, L; Kasmire, R.F. 2002. Making the Link: Extension of Postharvest Technology, Chapter 38. In Kader, A.A.
(ed.), Postharvest Technology for Horticultural Crops 3 ed. Oakland, California, University of California. 535 p.
(UC DANR Publication 3311).
Kummu, M; de Moel, H; Porkka, M; Siebert, S; Varis, O; Ward, P.J. 2012. Lost food, wasted resources: Global food supply chain
losses and their impacts on freshwater, cropland, and fertiliser use. Science of the Total Environment (438): 477-489.
Commodity Systems Assessment Methodology for Value Chain Problem and Project Identifi cation 123
La Gra, J. 1990. A commodity systems assessment methodology for problem and project identifi cation. Moscow, Idaho,
Postharvest Institute for Perishables, University of Idaho, IICA, AFHB. 102 p.
La Gra, J; Jones, J; C.S. Tsou- Samson, C.S. 1983. An integrated approach to the study of postharvest problems in
tropical countries: A case study in Taiwan. Moscow, Idaho,United States, University of Idaho, Postharvest Institute
for Perishables. 97 p.
La Gra, J; Poo-Chow, L; Haggerty, R. 1987. A postharvest methodology: Commodity systems approach for the identifi cation
of ineffi ciencies in food systems. Moscow, United States. University of Idaho, Postharvest Institute for Perishables. sp.
Lipinski, B; Hanson, Craig; Lomax, James; Kitinoja, L; Waite, R; Searchinger, T. 2013. Reducing Food Loss and Waste.
Washington, D.C, United States, WRI. 36 p. Working Paper, Installment of Creating a Sustainable Food Future.
MARDI (Malaysian Agricultural Research and Development Institute). 1988. Assessment of the commodity system for
carambola in Malaysia: description, problem identifi cation and alternative solutions. Kuala Lumpur, Malaysia. 123 p.
Murray, G; Alvarez, M. 1973. The marketing of beans in Haiti: An exploratory study. Port-au-Prince, Haiti, IICA. 60 p.
Oguntade, A; Thylmann, D; Deimling, S. 2014. Post-harvest losses of rice in Nigeria and their ecological footprint.
Frankfurt, Germany, GIZ. 50 p.
Paddock, W. and Paddock, E. 1973. We Don’t Know How: An Independent Audit of What They Call Success in Foreign
Assistance. Ames, Iowa, United States, Iowa State University Press. 253 p.
Parfi tt, J; Barthel, M; Macnaughton, S. 2010. Food waste within food supply chains: quantifi cation and potential for
change to 2050. Philosophical Transactions of the Royal Society B (365): 3065-3081
PEF (Postharvest Education Foundation, United States). 2016. Worksheets for quantifying postharvest losses of leafy
vegetables, fruits, roots, tubers and bulbs in agricultural value chains 2011-2016 (electronic mail). Oregon.
PIP (Postharvest Institute for Perishables, United States); UCDavis (University of California at Davis, United States). 1987.
Reduction of postharvest losses in perishable crops: fi nal report (of training course). Moscow, Idaho, United States,
University of Idaho, Postharvest Institute for Perishables. 86 p. No. PIP/UC Davis/California/August 87/No. 94.
Porter, ME. 1985. The competitive advantage: creating and sustaining superior performance. New York, United States,
Free Press. 557 p.
SEA (Secretary of State Agriculture); IICA (Instituto Interamericano de Cooperación para la Agricultura, República
Dominicana). 1976. Estudio sobre pérdidas poscosecha de papa en la República Dominicana. Santo Domingo,
Dominican Republic. 75 p.
SEA (Secretary of State Agriculture); IICA (Instituto Interamericano de Cooperación para la Agricultura, República
Dominicana). 1977. Estudio sobre pérdidas poscosecha de tomate en la República Dominicana. Santo Domingo,
Dominican Republic. 70 p.
UN (United Nations, United States). 2016. Sustainable Development Goals (on line). Washington, D.C, United States.
Consulted Mar 22. 2016. Available at http://www.un.org/sustainabledevelopment/es/
WRI (World Resources Institute, United States); CGF (Consumers Goods Forum, France); FAO (Food and Agriculture
Organization of the United Nations, Italy), FUSIONS project, UNEP (United Nations Environment Programme,
United States), WRAP (Waste and Resources Action Programme, United Kingdom) y WBCSD (World Business
Council for Sustainable Development, Switzerland). 2016. Food Loss and Waste Accounting and Reporting Standard
(on line). Vers. 1.0. Washington, D.C. United States. Consulted Jun 22. 2016. Available at: http://fl wprotocol.org/


Annexs

126 inter-American institute for Cooperation on Agriculture
Agricultural product: Indicate whether the analysis is being undertakenon a: ( ) national; ( ) regional; or ( ) Iocal basis.
Pre-production considerations on agricultural sector policies:
nature of the problemif problem
area indicate with (x)
Describe how problem aff ects quantity, quality, price or
availability of product
Institutional organization ( )
Urban or rural salaries ( )
Taxes: Import or export ( )
Price policies ( )
Credit policies ( )
Land reform policies ( )
Natural resource management ( )
Irrigation policies ( )
Production and distribution of planting material ( )
Farm input supply ( )
Technology ( )
Farmer organization ( )
Marketing policies ( )
Agroprocessing policies ( )
Import policies ( )
Export policies ( )
Incentives:
- tax ( )
- fi nancial ( )
- other ( )
ANNEX 1Checklist of potential problems in an agricultural value chain.
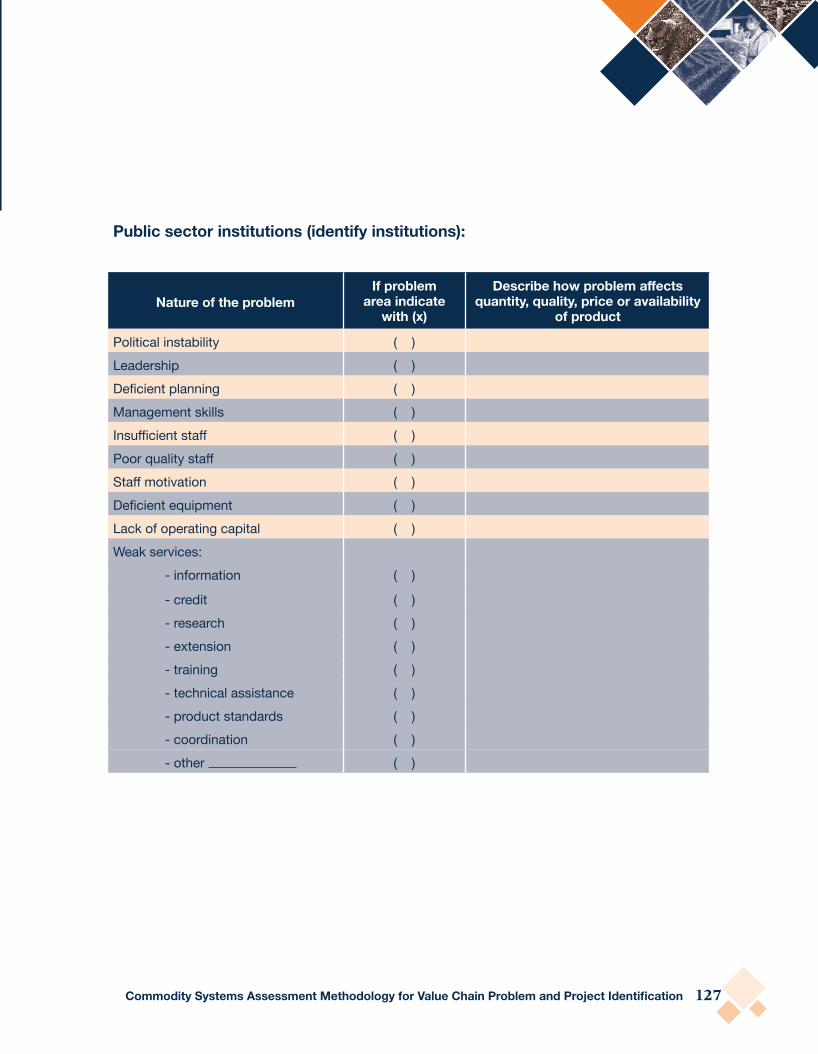
Commodity Systems Assessment Methodology for Value Chain Problem and Project Identifi cation 127
Public sector institutions (identify institutions):
nature of the problemif problem
area indicate with (x)
Describe how problem aff ects quantity, quality, price or availability
of product
Political instability ( )Leadership ( )Defi cient planning ( )Management skills ( )Insuffi cient staff ( )Poor quality staff ( )Staff motivation ( )Defi cient equipment ( )Lack of operating capital ( )Weak services: - information ( )
- credit ( ) - research ( ) - extension ( ) - training ( ) - technical assistance ( ) - product standards ( ) - coordination ( ) - other ( )

128 inter-American institute for Cooperation on Agriculture
Private Sector organizations (farmers, intermediaries, exporters, others):
nature of the problemif problem
area indicate with (x)
Describe how problem aff ects quantity, quality, price or availability
of product
Legal structure ( )
Public sector control ( )
Leadership ( )
Unclear role and functions ( )
Small active membership ( )
Low level member commitment ( )
Members widely scattered ( )
Communication ( )
Lack of resources ( )
Management skills ( )
Insuffi cient staff ( )
Staff skills ( )
Staff motivation ( )
Job description or terms of reference ( )
Poor planning ( )
Decision-making ( )
Poor follow-through ( )
Monitoring of staff ( )
Financial management ( )
Communication ( )
Marketing policy ( )
Pricing policy ( )
Filing systems ( )
Offi ce space ( )
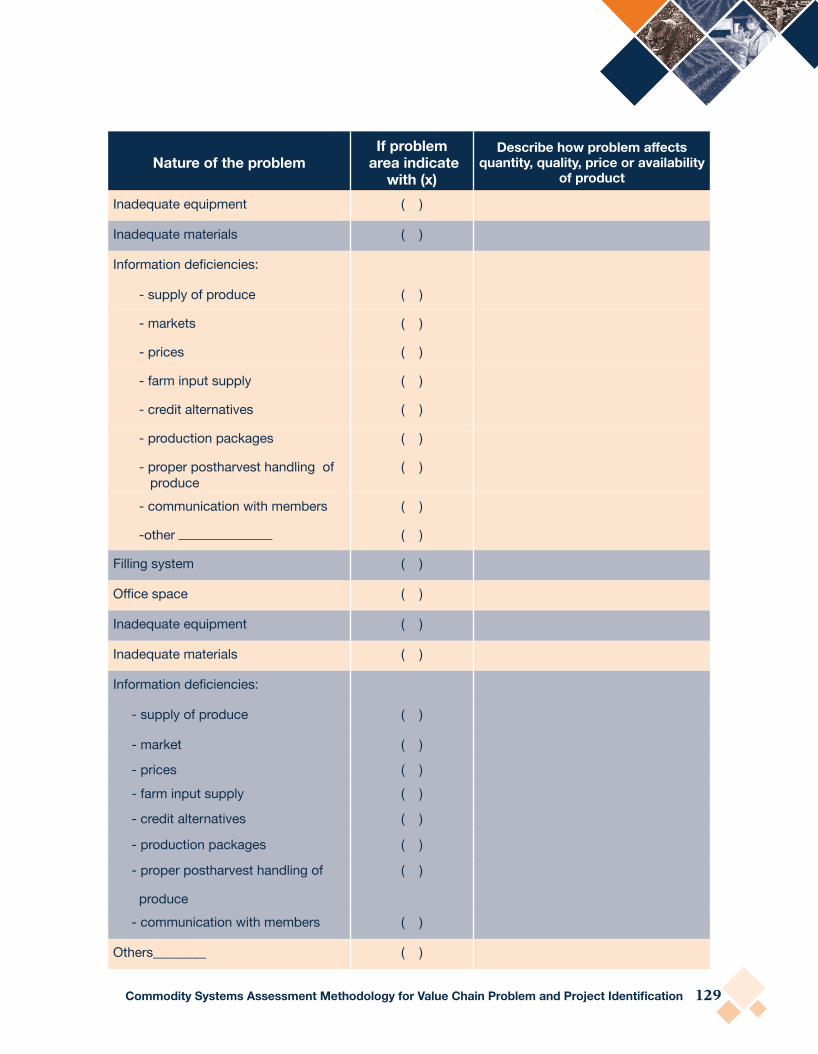
Commodity Systems Assessment Methodology for Value Chain Problem and Project Identifi cation 129
nature of the problemif problem
area indicate with (x)
Describe how problem aff ects quantity, quality, price or availability
of product
Inadequate equipment ( )
Inadequate materials ( )
Information defi ciencies:
- supply of produce ( )
- markets ( )
- prices ( )
- farm input supply ( )
- credit alternatives ( )
- production packages ( )
- proper postharvest handling of produce
( )
- communication with members ( )
-other ( )
Filling system ( )
Offi ce space ( )
Inadequate equipment ( )
Inadequate materials ( )
Information defi ciencies:
- supply of produce ( )
- market ( )
- prices ( )
- farm input supply ( )
- credit alternatives ( )
- production packages ( )
- proper postharvest handling of
produce
( )
- communication with members ( )
Others________ ( )

130 inter-American institute for Cooperation on Agriculture
Ecological conditions which negatively aff ect the product:
nature of the problemif problem
area indicate with (x)
Describe how problem aff ects quantity, quality, price or availability
of productLatitude/sunlight ( )Altitude ( )Soil ( )Rainfall ( )Wind ( )Temperature ( )Relative humidity ( )Others __________ ( )
Infrastructure/Equipment limitations:
nature of the problemif problem
area indicate with (x)
Describe how problem aff ects quantity, quality, price or availability
of productRoads non-existent ( )Roads in poor condition ( )Irrigation systems ( )Storage facilities ( )Marketplaces ( )Packing houses ( )Packing equipment ( )Packing materials ( )Airports ( )Sea ports ( )Tractors or other equipment ( )Others __________ ( )

Commodity Systems Assessment Methodology for Value Chain Problem and Project Identifi cation 131
Planting material:
nature of the problemif problem
area indicate with (x)
Describe how problem aff ects quantity, quality, price or availability
of productDefi cient infrastructure ( )Lack of proper equipment ( )Lack of technical know-how ( )Unavailability to farmers ( )Poor quality plants ( )Others __________ ( )
Problem characteristics inherent to crop:
nature of the problemif problem
area indicate with (x)
Describe how problem aff ects quantity, quality, price or availability
of productSeasonality ( )Height of plant/tree ( )Other growth characteristics ( )Susceptibility to pests/diseases ( )Short shelf life of product ( )Poor storage capabilities ( )Color ( )Flavor ( )Size ( )Shape ( )Quantity of fruit set ( )Others __________ ( )

132 inter-American institute for Cooperation on Agriculture
Production related problem areas:
nature of the problem if problem area indicate with (x)
Describe how problem aff ects quantity, quality, price or
availability of product
Climatic constrains ( )Soil constrains ( )Land constrains ( )Water related defi ciencies: -too little water ( ) -too much water ( ) -inadequate irrigation systems ( ) -poor water management ( )Seeds planting material: -unavailable ( ) -poor quality ( ) -expensive ( )Credit: -unavailable ( ) -diffi cult to access ( )Farm inputs: -unavailable ( ) -poor quality ( ) -high costs ( )Lack of technical know-how with respect to: -farm management ( ) -integrated pest management ( ) -crop establishment ( ) -crop maintenance ( ) -pruning ( ) -training ( ) -spraying ( ) -weeding ( ) -fertilization ( ) -pollination process ( )

Commodity Systems Assessment Methodology for Value Chain Problem and Project Identifi cation 133
nature of the problem if problem area indicate with (x)
Describe how problem aff ects quantity, quality, price or
availability of product
-water management ( ) -large scale cultivation ( ) -other ( )Labor: -unavailable ( ) -ineffi cient ( ) -high cost ( )Actual farming system: -limits yields ( ) -aff ects crop quality ( )Pests/diseases: -eff ect on marketability ( ) -lack of control method ( ) -excess use of chemicals ( )
-requirement of too much labor ( ) -expense of control ( )High costs/production ( )
Others_________ ( )
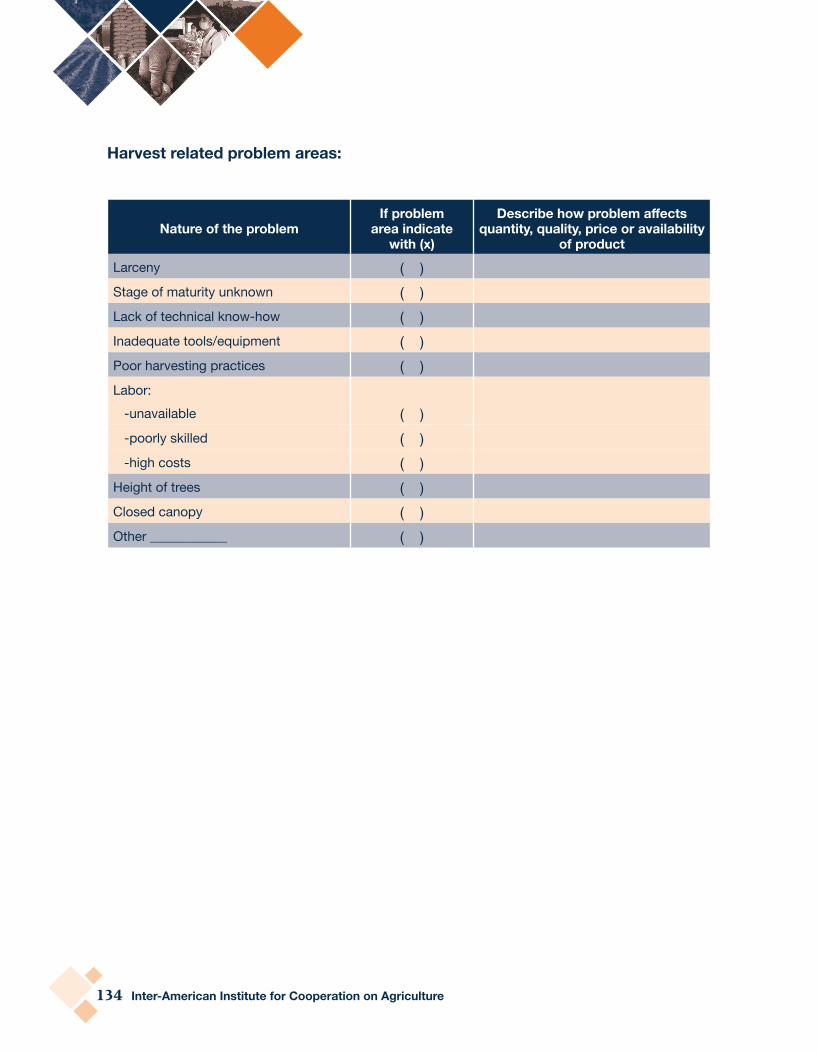
134 inter-American institute for Cooperation on Agriculture
harvest related problem areas:
nature of the problemif problem
area indicate with (x)
Describe how problem aff ects quantity, quality, price or availability
of productLarceny ( )Stage of maturity unknown ( )Lack of technical know-how ( )Inadequate tools/equipment ( )Poor harvesting practices ( )Labor: -unavailable ( ) -poorly skilled ( ) -high costs ( )Height of trees ( )Closed canopy ( )Other ____________ ( )

Commodity Systems Assessment Methodology for Value Chain Problem and Project Identifi cation 135
Postharvest handling problems:
nature of the problemif problem
area indicate with (x)
Describe how problem aff ects quantity, quality, price or availability
of productRough on-farm handling ( )Poor fi eld containers ( )Poor in-fi eld sanitation ( )Scarce labor ( )Lack of shade ( )Improper stacking ( )Rough loading/unloading ( )On-farm transport ( )Delays at ports ( )Poor roads ( )Chemical treatments ( )Washing ( )Cleaning ( )Sizing ( )Grading ( )Precooling ( )Packaging: -unavailable ( ) -insuffi cient strength ( ) -high cost ( ) -poor packing facilities ( ) -quality/weight controls ( ) -improper labeling ( )Quality control ( )Wrong temperature ( )Wrong humidity ( )Lack of technical know-how ( )High costs of handling ( )Lack of infrastructure ( )Other _____________ ( )

136 inter-American institute for Cooperation on Agriculture
Agroprocessing limitations:
nature of the problemif problem
area indicate with (x)
Describe how problem aff ects quantity, quality, price or availability
of productRaw material: -small volumes available ( ) -lack of continuous supply ( ) -poor quality ( ) -high costs ( )Imported inputs (jars, etc.) ( )Lack of facilities ( )Defi cient or outdated equipment ( )Poor product development ( )High production costs ( )Low quality output ( )Lack of technical assistance ( )Lack of operating capital ( )Lack of market development ( )Other ( )

Commodity Systems Assessment Methodology for Value Chain Problem and Project Identifi cation 137
markets and marketing problems:
nature of the problemif problem
area indicate with (x)
Describe how problem aff ects quantity, quality, price or
availability of product
Markets: -lack of market development or promotion
( )
-small and/or specialized market niche ( ) -limit to particular time of year ( ) -quarantine restrictions ( ) -other restrictions or trade barriers ( ) -taxes, duties, etc. ( ) -strong competition ( ) -controlled by interest groups ( ) -local/regional politics ( ) -diffi culty in obtaining payment ( ) -other ( )Product: -lack of product development ( ) -quality poor ( ) -volumes small ( ) -prices too high ( ) -lack continuous supply ( ) -collection system ( ) -lack of quality control ( ) -other ( )Transportation: -unavailable ( ) -irregular ( ) -limited space ( ) -freight costs too high ( ) -insurance expensive ( ) -other ( )

138 inter-American institute for Cooperation on Agriculture
nature of the problemif problem
area indicate with (x)
Describe how problem aff ects quantity, quality, price or
availability of product
Information: -supply statistics ( ) -market intelligence ( ) -poor analysis ( ) -other ( )Technical assistance ( )Means of verifi cation unavailable in importing country
( )
Diffi culty in collection of payments ( )Delays with documentation ( )Port facilities poor ( )Other ( )

Commodity Systems Assessment Methodology for Value Chain Problem and Project Identifi cation 139
Pricing and consumer demand problems:
nature of the problemif problem
area indicate with (x)
Describe how problem aff ects quantity, quality, price or availability
of productImports sold at lower price than domestic supply
( )
Irregular supplies to meet consumer demand
( )
High costs to consumers ( )Consumers lack familiarity with product
( )
Product poorly presented ( )Characteristics of consumer demand unknown
( )
Other________________ ( )
There are approximately 250 potential problems listed here which can impact the quantity of product produced or its quality, price or availability. Due to the participants’ lack of experience it may be diffi cult for them to understand how some of the potential problems listed above may impact the product. A useful classroom exercise is to dedicate approximately two hours going through the list as a group eff ort. Participants and instructors alike can make suggestions as to how a certain “potential problem” may impact the product. This is a good way to stimulate group discussion and to transfer experiences between the diff erent participants.

140 inter-American institute for Cooperation on Agriculture
ComPonent 01: Relative importance of Product
Name of data collector: Telephone:
Title: Institution:
1. Overall agriculture setting:
Total national land area: (sq mi, acres, ha)
Area suitable for agriculture: (sq mi, acres, ha)
Marginal land area:
Steep land:
Deep peat:
Acid sulphate:
Marsh land:
Salty soils:
Others (specify):
2. Area (ha, acres) suitable for cultivation of crop group, e.g., fruit cultivation:
Area (ha, acres) suitable for specifi c crop cultivation:
3. Common Name:
Scientitic Name:
Commercial Clones:
1.
2.
3.
4.
ANNEX 2 example questionnaires for agricultural value chain components.

Commodity Systems Assessment Methodology for Value Chain Problem and Project Identifi cation 141
4. Total crop area planted and level of production for the past fi ve years.
year hectares Production
5. Projected hectarage cultivated and expected level of production for the next fi ve years (based on normal growth trend).
year hectares Production
6. Major producing areas and estimated hectares:
Region/location hectares Production
7. Import/Export information for the last fi ve years:
yearexport import
Quantity Value Quantity Value
8. Is this crop given priority in the National Development Plan? yes ( ) no ( )
9. If no, why not?

142 inter-American institute for Cooperation on Agriculture
10. If yes, what are the criteria for selection?
( ) food security ( ) export potential
( ) market demand ( ) employment
( ) income generation ( ) marginal land use
( ) others (specify):
11. If the crop is for export, what are the country’s major comparative advantages in production and export?
( ) low production costs ( ) fruit fl y-free zones
( ) low transport costs ( ) high quality product
( ) few pest/disease problems ( ) others (specify):
12. Observations:
13. Summary of problems identifi ed which may aff ect production, processing, postharvest handling or marketing of crop:
1.
2.
3.
4.
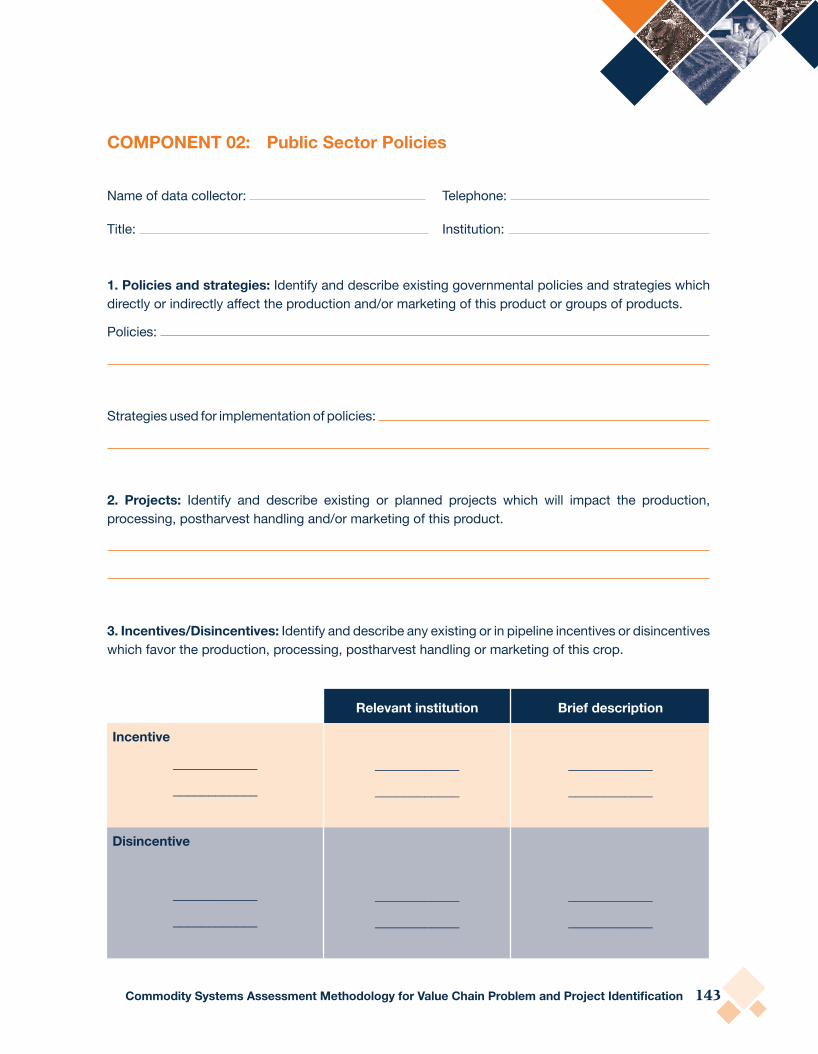
Commodity Systems Assessment Methodology for Value Chain Problem and Project Identifi cation 143
ComPonent 02: Public Sector Policies
Name of data collector: Telephone:
Title: Institution:
1. Policies and strategies: Identify and describe existing governmental policies and strategies which directly or indirectly aff ect the production and/or marketing of this product or groups of products.
Policies:
Strategies used for implementation of policies:
2. Projects: Identify and describe existing or planned projects which will impact the production, processing, postharvest handling and/or marketing of this product.
3. Incentives/Disincentives: Identify and describe any existing or in pipeline incentives or disincentives which favor the production, processing, postharvest handling or marketing of this crop.
Relevant institution Brief description
incentive
____________
________________________
____________
____________
____________
disincentive
____________
________________________
____________
____________
____________

144 inter-American institute for Cooperation on Agriculture
4. Are national production goals established for this agricultural product?
yes ( ) no ( ). If yes, what are they:
5. Which policy or policies most strongly impact the crop production system, to what degree, and why?
6. Do any of the policies/strategies impact the postharvest losses?
yes ( ) no ( )
Explain:
7. Summary of problems identifi ed which may impact production, processing, postharvest handling or marketing of crop.
1.
2.
3.
4.
5.

Commodity Systems Assessment Methodology for Value Chain Problem and Project Identifi cation 145
ComPonent 03: Relevant institutions
Name of data collector: Telephone:
Title: Institution:
1. Institutions responsible for planning:
ministry department or Unit Responsibilities
2. Institutions involved in production system:
ministry department or Unit Responsibilities
3. Institutions involved in processing of product:
ministry department or Unit Responsibilities
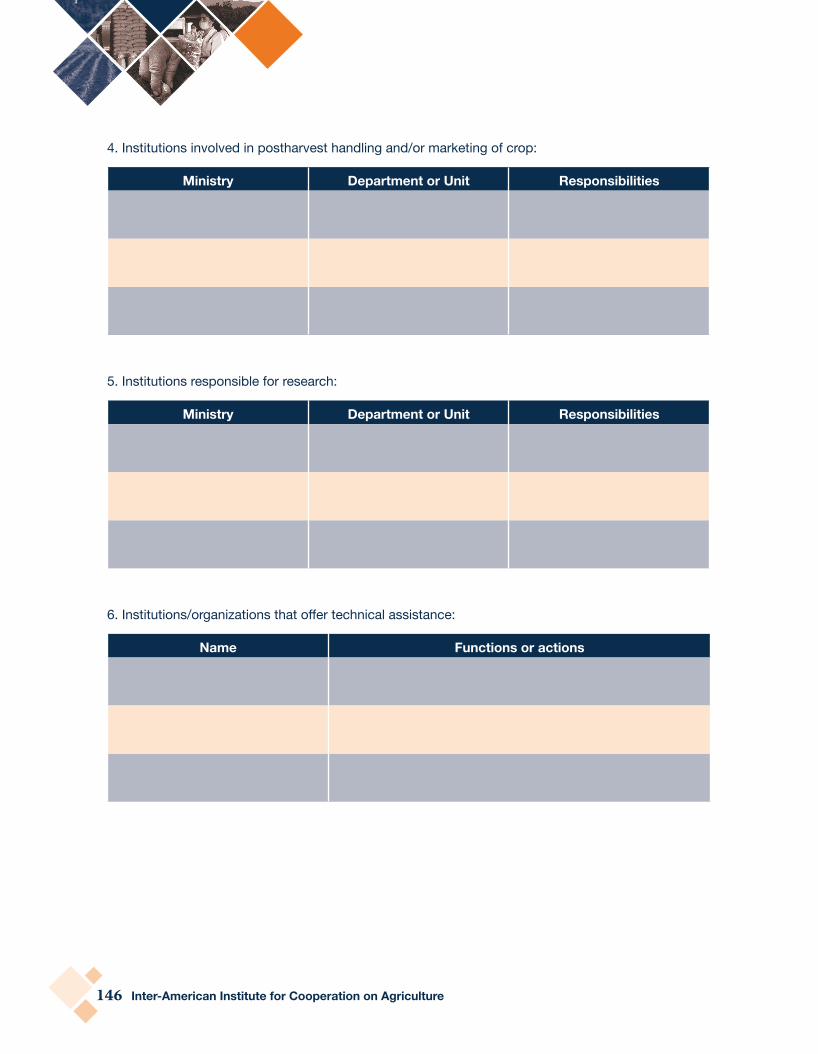
146 inter-American institute for Cooperation on Agriculture
4. Institutions involved in postharvest handling and/or marketing of crop:
ministry department or Unit Responsibilities
5. Institutions responsible for research:
ministry department or Unit Responsibilities
6. Institutions/organizations that off er technical assistance:
name Functions or actions

Commodity Systems Assessment Methodology for Value Chain Problem and Project Identifi cation 147
7. Private sector institutions/organizations involved with crop:
name Functions or actions
8. Other ministries/departments directly or indirectly involved in the development of crop:
Ministry/Department Responsibility or functions
9. Identify the coordinating body, if any, responsible for the development of the crop industry and describe its function:
Name of coordinating body:
Functions:
a.
b.
c.

148 inter-American institute for Cooperation on Agriculture
10. Indicate level of coordination of the various institutional activities:
Well coordinated Satisfactory Poorly coordinated
Planning ( ) ( ) ( )
Production ( ) ( ) ( )
Processing ( ) ( ) ( )
Marketing ( ) ( ) ( )
Research ( ) ( ) ( )
11. Summary of key public and private sector institutions for the development of the crop industry:
name of institution, unit, department or organization Principal constrains

Commodity Systems Assessment Methodology for Value Chain Problem and Project Identifi cation 149
ComPonent 04: Facilitating Services
Name of data collector: Telephone:
Title: Institution:
1. Transportation:
a. Farm accessibility (road conditions):
( ) good ( ) acceptable ( ) poor
Observations:
b. Availability of vehicles for:
good Acceptable Poor
• Production inputs ( ) ( ) ( )
• Farm to packinghouse ( ) ( ) ( )
• Farm to market ( ) ( ) ( )
• Packinghouse to wholesaler ( ) ( ) ( )
• Packinghouse to port ( ) ( ) ( )
• Export: air shipments ( ) ( ) ( )
sea shipments ( ) ( ) ( )
c. Describe priority constraints aff ecting transportation:

150 inter-American institute for Cooperation on Agriculture
2. Information (info):
Production Postharvest markets Pricesyes no yes no yes no yes no
Institutional info available?Suffi cient for decision making?Sources of institutional info?Other sources of information?
Describe priority constrains related to information:
a.
b.
3. Credit:
Sources type of collateral required
interest rate limits of credit Suffi cientyes no
Describe constraints with respect to credit:
a.
b.
4. Farm inputs:
types of farm input Available when needed Principal source of inputyes no
FertilizersChemicalsToolsIrrigation EquipmentNatural PesticidesOthers
Describe constraints related to supply of farm inputs:
a.
b.

Commodity Systems Assessment Methodology for Value Chain Problem and Project Identifi cation 151
5. Technical assistance (TA):
operationtA is available TA is suffi cientyes no Source of tA yes no
ProductionPostharvestMarketingProcessing
Describe constraints with respect to technical assistance:
a.
b.
6. Postharvest facilities:
is capacity suffi cient?
is service effi cient?
type Owner/Operator yes no yes noCold roomPacking houseRefrigerated truckOthers (specify)
7. Describe constraints with respect to postharvest facilities:
a.
b.
8. Identify and describe any other existing or needed services or infrastructure relevant to the production, processing, postharvest handling, or marketing of the crop in question:

152 inter-American institute for Cooperation on Agriculture
ComPonent 05: Farmer organizations
Name of data collector: Telephone:
Title: Institution:
1. Identify the active farmer organizations involved in the production or marketing of the crop. For each organization identifi ed, provide the following information:
a. Name of organization:
b. Name of key person:
c. Location, address:
d. Number of active members:
e. Types of commodities handled:
f. Services off ered to members, e.g., information, technical assistance, credit, transport,
storage, grading of produce, farm input, supply, marketing, etc.:
g. Important experiences of the organization in production, postharvest handling, processing or marketing:
h. Quantify the organization’s resources (human resources, fi nancial resources, vehicles, equipment, buildings, etc.):
i. The management/administration of this organization is considered:
very good ( ) good ( ) satisfactory ( ) poor ( ) very poor ( )
j. Does this farmer organization have full time management?
yes ( ) no ( )
k. Does this farmer organization have an established fi nancial accounting system?
yes ( ) no ( )
Commodity Systems Assessment Methodology for Value Chain Problem and Project Identifi cation 153
l. How important is the crop to this farmer organization?
( ) very important ( ) average importance ( ) not important
m. How important is the organization’s participation in the production / marketing of the product nationwide?
( ) very important ( ) average importance ( ) not important
n. Describe the principal problems identifi ed by the farmer organization:
2. Does government policy favor ( ) or disfavor ( ) the strengthening of farmer organizations?
3. Identify the active farmer organizations within the potential production areas. For each, provide the following information:
a. Name of organization:
b. Name of key person:
c. Location, address:
d. Number of active members:
e. Types of products handled:
f. Services off ered to members, e.g., information, technical assistance, credit, transport,
storage, grading of produce, farm input, supply, marketing, etc.:
g. Important experiences of the organization in production, postharvest handling, processing or marketing:
h. Quantify the organization’s resources (human resources, fi nancial resources, vehicles, equipment, buildings, etc.):
i. The management/administration of this organization is considered:
very good ( ) good ( ) satisfactory ( ) poor ( ) very poor ( )

154 inter-American institute for Cooperation on Agriculture
j. Does this farmer organization have full time management?
yes ( ) no ( )
k. This farmer organization has an established fi nancial accounting system.
yes ( ) no ( )
l. How important is the crop to this farmer organization?
( ) very important ( ) average importance ( ) not important
m. Describe the principal problems identifi ed by the farmer organization:
4. If there are no farmer organizations dealing with the product, explain why not:
Recommendations with respect to farmer organizations:
5. Summarize the principal problems aff ecting the development of farmer organizations:
1.
2.

Commodity Systems Assessment Methodology for Value Chain Problem and Project Identifi cation 155
ComPonent 06: environmental Requirements and Constraints
Name of data collector: Telephone:
Title: Institution:
1. Optimum growing conditions for crop:
1.1 Soil: a. type:
b. pH:
c. slope:
1.2 Water:
a. Monthly water requirements:
b. Water quality:
c. Water source(s):
1.3 Temperature range within which crop does well:
1.4 Humidity range within which crop does well:
1.5 Photoperiod (Iength of daylight required):
1.6 Other:
2. Crop sensitivity to weather conditions:
Sensitive moderate tolerant Remarks
• drought ( ) ( ) ( )• heavy rain ( ) ( ) ( )• water logging ( ) ( ) ( )• strong winds ( ) ( ) ( )• high temperatures ( ) ( ) ( )
• low temperatures ( ) ( ) ( )
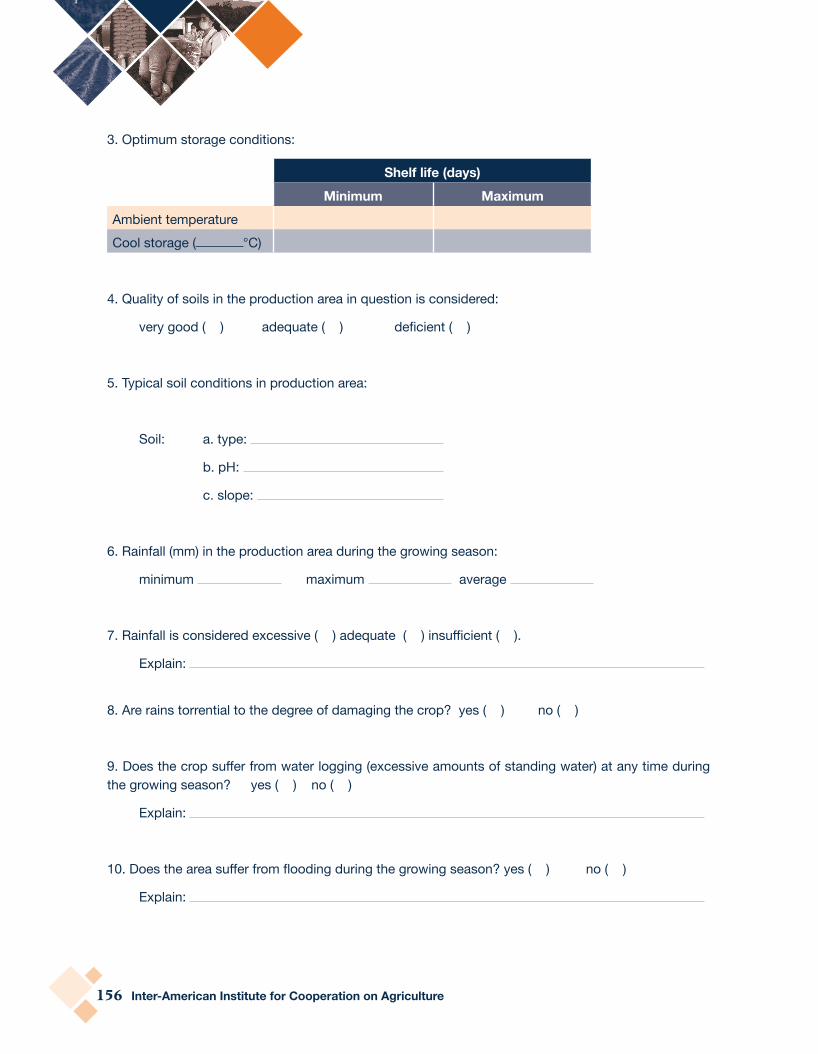
156 inter-American institute for Cooperation on Agriculture
3. Optimum storage conditions:
Shelf life (days)minimum maximum
Ambient temperatureCool storage ( °C)
4. Quality of soils in the production area in question is considered:
very good ( ) adequate ( ) defi cient ( )
5. Typical soil conditions in production area:
Soil: a. type:
b. pH:
c. slope:
6. Rainfall (mm) in the production area during the growing season:
minimum maximum average
7. Rainfall is considered excessive ( ) adequate ( ) insuffi cient ( ).
Explain:
8. Are rains torrential to the degree of damaging the crop? yes ( ) no ( )
9. Does the crop suff er from water logging (excessive amounts of standing water) at any time during the growing season? yes ( ) no ( )
Explain:
10. Does the area suff er from fl ooding during the growing season? yes ( ) no ( )
Explain:

Commodity Systems Assessment Methodology for Value Chain Problem and Project Identifi cation 157
11. In case of drought conditions, is irrigation available? yes ( ) no ( )
Explain:
12. What is the temperature of the area during the growing season?
minimum maximum average
13. Is frost or cold temperature a constraint in this area? yes ( ) no ( )
Explain:
14. Are high temperatures a problem for this crop in this area? yes ( ) no ( )
Explain:
15. What is the average relative humidity of the area during the growing season? %
Is there a signifi cant daily variation? yes ( ) no ( )
Explain:
16. What is the slope of most of the land in the growing area?
very fl at ( ) gently sloping ( ) moderately sloping ( ) steep ( )
very steep ( ) rolling ( ) mixed fl at and sloping ( )
17. How do the above ecological conditions generally aff ect crop production and/or yields?
18. Summarize problems which may impact production and/or postharvest handling:
1.
2.

158 inter-American institute for Cooperation on Agriculture
ComPonent 07: Availability of Seeds and Planting materials
Name of data collector: Telephone:
Title: Institution:
1. Commercial seeds available:
name Source
2. For each type available, answer the following questions:
type 1 type 2 type 3
Yield (good, moderate, poor)Quality (good, moderate, poor)Cost (high, medium, low)Demand (high, medium, low)
3. Is there a need to introduce new seeds or cultivars? yes ( ) no ( )
4. If yes, what improvements are needed?
5. Principal source of planting material?
6. Is planting material imported ( )? produced by the government ( )?
commercial growers ( )? farmers ( )? others?
7. Are seeds hybrid ( )? open pollinated ( )? other
Commodity Systems Assessment Methodology for Value Chain Problem and Project Identifi cation 159
8. Is the quality of planting material considered high ( )? satisfactory ( )? low ( )?
9. Is the germination rate of seeds high (80-100%) ( )? medium (60-80%) ( )?
low (Iess than 60%) ( )?
10. Are seeds or planting material readily available? yes ( ) no ( )
11. What are the principal complaints from farmers concerning seeds/plants (quality, cost, availability,
etc.)?
12. What are the opinions of extension agents with respect to these complaints?
13. Are fruit tree plants obtained from private ( ) or public sector nurseries ( )?
Name of source:
14. If obtained from the public sector, are they subsidized? yes ( ) no ( )
Explain:
15. Age of plants when moved from nursery to fi eld?
16. Are they seedlings ( )? or grafted ( )? If grafted, are they trained?
yes ( ) no ( )
17. Grafting success rate: high ( ) medium ( ) low ( )
18. Are plants certifi ed disease free ( )? appear to be disease free ( )? or
do they appear diseased ( )?
160 inter-American institute for Cooperation on Agriculture
19. Are plants available in suffi cient quantity to meet demand? yes ( ) no ( )
Explain:
20. If credit available to the farmers to allow purchase of seeds or plant stock?
21. Are seeds or plant stocks generally available at the proper time of year?
22. Based on available seeds or planting material, are productivity and quality expected to behigh ( ) medium ( ) or low ( )?
23. Summary of problems identifi ed which may aff ect the production, processing, or postharvest life of product.
1.
2.
3.
24. Observations:

Commodity Systems Assessment Methodology for Value Chain Problem and Project Identifi cation 161
ComPonent 08: Farmers’ Cultural Practices
Name of data collector: Telephone:
Title: Institution:
1. Why does the farmer grow this crop?
( ) no other alternative ( ) tradition ( ) best money-making alternative
( ) other (specify)
2. Most common type of farming system:
( ) monocrop ( ) intercrop ( ) slash and burn ( ) plantation ( ) backyard garden
( ) rotation ( ) other (specify)
3. How is the ground prepared for planting?
( ) plowed by tractor ( ) plowed with animals ( ) worked by hand
Describe:
4. Planting hole size and method of preparation:
5. Describe type of planting material used:
6. Describe planting distance and pattern used:
7. Do farmers carry out a plant protection spray program for pests and disease? yes ( ) no ( )
If yes, describe methods:
8. Do farmers fertilize the crop? yes ( ) no ( )
If yes, describe method, formula, frequency, and quantity used:
162 inter-American institute for Cooperation on Agriculture
9. Do farmers use irrigation? yes ( ) no ( )
If yes, describe the method and frequency:
10. What is the principal source of labor?
( ) family ( ) exchange of labor with neighbors ( ) hired full-time
( ) hired part-time ( ) other (specify)
11. Is the supply of labor a problem during production? yes ( ) no ( )
During harvest? yes ( ) no ( ). Explain
12. Laborers are: ( ) highly skilled ( ) satisfactory ( ) poorly skilled
13. Are attempts made to control shade? yes ( ) no ( )
Describe method/frequency of control
14. Do farmers prune this crop?
yes ( ) no ( ). If yes, how?
15. Describe method, frequency, and adequacy of weed control
16. How do farmers make the decision when to harvest the crop?
( ) maturity ( ) market price ( ) danger from theft
( ) other (specify)
17. How is crop harvested?
( ) mechanically ( ) manual labor ( ) family labor
( ) other (specify)

Commodity Systems Assessment Methodology for Value Chain Problem and Project Identifi cation 163
18. What tools are used during harvest?
19. What is the average area (hectares, acres) planted by typical farmers?
minimum maximum
20. Does the farmer grow the crop on land that is ( ) owned ( ) rented ( ) share-cropped
( ) communally farmed ( ) other?
21. What changes in cultural practices might contribute most to an improvement in product quality?
22. What changes in cultural practices might contribute most to an increase in production?
23. What changes in cultural practices might contribute most to a decrease in per unit production costs?
24. Summarize the cultural practices which are likely to impact production, processing, postharvest handling, or marketing of product.
1.
2.
164 inter-American institute for Cooperation on Agriculture
ComPonent 09: Pests and diseases
Name of data collector: Telephone:
Title: Institution:
List all pests and diseases which impact upon the productivity or quality importance. In each case, indicate economic or quarantine signifi cance.
name of pest Signifi cance (economic or Quarantine) name of disease Signifi cance
(economic or Quarantine)
For each pest or disease listed above, complete the following questionnaire.
1. The following information pertains to a pest ( ), or disease ( ), or economic ( ), or quarantine ( ) signifi cance.
2. Common name:
3. Scientifi c name:
4. The damage done by this pest or disease aff ects the following:
yes no describe negative impact• Quantity available for market• Quality of product• Price of product• Consumer demand• Other:
5. Technologies are available to prevent ( ) eradicate ( ) or control ( ) the pest and/or disease, or are not available ( ).

Commodity Systems Assessment Methodology for Value Chain Problem and Project Identifi cation 165
6. Costs of control are economically feasible ( ) or not economically feasible ( ).
7. In the case of export crops, in which foreign market(s) is this pest or disease of QUARANTINE
signifi cance?
8. What pre-harvest control methods are presently used for this pest or disease?
9. What postharvest control methods are presently used for this pest or disease?
10. What alternatives exist to control this pest or disease?
Pre-harvest: ( ) chemical control ( ) biological control Describe:
Postharvest: ( ) chemical control ( ) biological control Describe:
11. Does treatment produce a residue hazard? yes ( ) no ( ). If yes, explain:
12. Does treatment aff ect other organisms benefi cial to the yield and quality of the crop?
13. How do the farmers decide to control the pest or disease in question? (Does the farmer apply at
the fi rst sign of insects or disease or only after the crop is severely infested?)
14. Type of pesticide most commonly used?
15. With what frequency do farmers spray?
16. Who does the spraying (farmer, worker, co-operative, ministry of agriculture, other)?

166 inter-American institute for Cooperation on Agriculture
17. Does the farmer consciously attempt to minimize his chemical spraying costs?
yes ( ) no ( ). If yes, how does s/he do this?
18. What type of equipment do farmers have for chemical spraying? knapsack sprayers ( )
tractor operated ( ) airplane ( ) other:
19. What is the magnitude of the pest/disease damage with:
a. No control/treatment?
b. Optimum control/treatment?
c. Average farmer treatment?
20. Identify and describe any signifi cant disorder to product caused by physiological and/or nutritional factors other than pests and diseases:
21. Summarize problems caused by pests/diseases or use of chemicals to control pests/diseases which aff ect the production, processing, postharvest handling, or marketing of the crop.
1.
2.
22. Observations:

Commodity Systems Assessment Methodology for Value Chain Problem and Project Identifi cation 167
ComPonent 10: Pre-harvest treatments
Name of data collector: Telephone:
Title: Institution:
1. Do the farmers in the region carry out any type of physical treatment to the crop prior to harvest which may aff ect production or its postharvest quality? yes ( ) no ( )
If yes, please describe each treatment:
a. Name of physical treatment:
b. Description of action taken:
c. Why is this action taken?
d. Who carries out the action?
e. When is the action carried out?
f. Description of the impact or results of the action taken (how is the quantity, quality, storage, shelf life, market value, etc., aff ected)?
2. Do the farmers in the region carry out any type of chemical treatment to the crop prior to harvest which may aff ect production or its postharvest quality? yes ( ) no ( )
If yes, please describe each treatment:
a. Name of chemical treatment:
b. Description of action taken:
c. Why is this action taken?
d. Who carries out the action?
e. When is the action carried out?
f. Description of the impact or results of the action taken (how is the quantity, quality,
storage, shelf life, market value, etc. aff ected?)

168 inter-American institute for Cooperation on Agriculture
name Source
3. Are there recommended treatments which farmers are unaware of or do not use for some other reason? yes ( ) no ( )
If yes:
a. Name of treatment:
b. Purpose of treatment:
c. Why is it not used by farmers?
4. Identify and describe other pre-harvest treatments which might favorably aff ect postharvest quality.
a.
b.
c.
d.
5. Summarize the problems resulting from pre-harvest treatments which may aff ect production, processing, postharvest, and marketing of the crop.
1.
2.
3.
4.
Commodity Systems Assessment Methodology for Value Chain Problem and Project Identifi cation 169
ComPonent 11: Production and marketing Costs
Name of data collector: Telephone:
Title: Institution:
1. Identify and select diff erent farming alternatives to be analyzed, e.g., alternative A could be one hectare size farms and alternative B could be 20 hectare size farms.
2. For each alternative, establish basic assumptions about how the farm is operated, e.g.:
a. Labor: small farm may use all family labor and minimum purchased farm inputs; larger farm may hire labor and use optimum level of recommended farm inputs.
b. Market: small farmer may sell all produce at farm gate while large farmer might export 60% of production.
c. Product sales price: maximum, minimum, average.
d. Product yield: high, low, average.
e. Number of plants/hectare.
f. Number of years productivity of perennials.
g. Production or expected production.
h. Others.

170 inter-American institute for Cooperation on Agriculture
3. Identify all the cost components and calculate their contribution to the cost of a unit quantity of the product.
A. Capital investment B. operating and maintenance C. Crop production costsLand premium:• rent• taxes
Rent Land preparation
Land clearing Road and drainage maintenance HolingDrainage Fencing maintenance Planting:
• material• labor• fertilizers• replacement plants
Fencing Vehicle maintenance Fertilization:• labor• material• machinery
Buildings Facilities maintenance:• water supply• insurance• building maintenance
Irrigation:• water• equipment• labor
Vehicles Agriculture tool replacement Pest and disease control:• labor• material• equipment
Irrigation equipment Fixed salary and wages Weed control:• labor• material• equipment
Electricity Administration and management Bagging fruit on trees:• material• labor
Farm equipment/machinery
Costs and credit Pruning and training:• labor• equipment
Offi ce equipment Others Harvesting cost:• labor• boxes and baskets• equipment

Commodity Systems Assessment Methodology for Value Chain Problem and Project Identifi cation 171
A. Capital investment B. operating and maintenance C. Crop production costsProcessing facilities:• coldrooms• ripening room• table• weighing machine
In-fi eld transportation:• labor• materials
Others:• agricultural insurance
Other production costs:• pollinating agents• others

172 inter-American institute for Cooperation on Agriculture
ComPonent 12: Crop harvest
Name of data collector: Telephone:
Title: Institution:
1. Who defi nes the time of harvest?
2. Who harvests the crop?
3. Describe in detail the harvest operation:
4. Why is the crop harvested in this particular manner?
5. When is the harvest undertaken? Time of day
6. Under what conditions? Temperature Relative humidity
7. Does the present method of harvest appear to aff ect: quantity of produce available for market ( ), quality of produce available for market ( ), value of produce available for market ( )?
Explain:
8. Does the volume of produce unsuitable for market appear to be: high ( ), medium ( ), low ( )? Describe the causes, e.g., size of product, weather damage, pest damage, disease damage, lack of soil nutrients, sun damage, harvest damage, others
9. Estimate percentage of crop suitable for market: %.
10. Identify and describe the harvesting tools:
11. Is the entire crop harvested at one time? yes ( ) no ( ). If no, why not and how is selection made
for that part which is harvested?
12. Identify harvest seasons for each cultivar or variety of crop (if more than one):
Cultivar months of harvest no. months in crop cycle

Commodity Systems Assessment Methodology for Value Chain Problem and Project Identifi cation 173
13. Which, if any, cultivar produces off season?
14. Optimum harvesting parameters:
Moisture content
Color/appearance
Tenderness/texture
15. Maturity index known: yes ( ) no ( ). If yes, describe:
16. What criteria are used by the pickers in selecting the product for harvest?
17. For the principal cultivar(s):
What is a good yield per hectare under good growing conditions? tons
What is a good yield per hectare under average conditions? tons
18. Sensitivity to mechanical damage during harvest: high ( ) medium ( ) low ( )
19. Sensitivity to dehydration: high ( ) medium ( ) low ( )
20. Summarize the problems occurring at harvest which may aff ect the processing, postharvest handling, or marketing of the product.
1.
2.
3.
4.
5.
21. Observations:

174 inter-American institute for Cooperation on Agriculture
ComPonent 13-A: Selection
Name of data collector: Telephone:
Title: Institution:
1. Identify the points in the postharvest system where some form of selection takes place.
Point in the system Action that takes place
2. For each action identifi ed above provide the following information:
a. Name of action:
b. Time required for the action to take place:
c. Describe the action:
d. Who is responsible for conducting the action?
e. When is the action carried out?
f. Why is this action carried out?
g. Where is this operation carried out?
h. Is the activity carried out with laborers? yes ( ) no ( )
If yes, how many?
i. Is the activity carried out with machines/tools/equipment? yes ( ) no ( )
If yes, identify and describe:

Commodity Systems Assessment Methodology for Value Chain Problem and Project Identifi cation 175
j. What criteria are used in this action?
yes no describeProduct shape ( ) ( )
Product size ( ) ( )
Product weight ( ) ( )
Maturity ( ) ( )
Color ( ) ( )
Pest/disease damage ( ) ( )
Physical injury ( ) ( )
Mechanical injury ( ) ( )
Cleanliness ( ) ( )
Other ( ) ( )
k. Is this operation required to meet market demand? yes ( ) no ( )
Explain:
l. What is (are) the probable end use (s) of culled product?
3. If the product is divided into diff erent groups or categories at this point due to the selection process, identify the diff erent categories and the approximate % of produce moving into each channel.
For example:
grade % of total destination
1st Grade 40% Export
2nd Grade 35% Domestic market
3rd Grade 15% Agroprocessing
Culls 10% Animal feed
total 100%

176 inter-American institute for Cooperation on Agriculture
4. What portion of culled product, if any, is a complete loss and does not generate any economic return? %
Explain:
5. Identify any problems occurring at this point which may aff ect postharvest losses.
1.
2.
3.
4.
5.

Commodity Systems Assessment Methodology for Value Chain Problem and Project Identifi cation 177
ComPonent 13-B: Sizing and grading
Name of data collector: Telephone:
Title: Institution:
1. Identify the points in the postharvest systems where some form of sizing or grading takes place.
Point in the system Action that takes place
2. For each action identifi ed above provide the following information:
a. Name of action:
b. Time required for the action to take place:
c. Describe the action:
d. Who is responsible for conducting the action?
e. When is the action carried out?
f. Why is this action carried out?
g. Where is this operation carried out?
h. Is the activity carried out with laborers? yes ( ) no ( )
If yes, how many?
i. Is the activity carried out with machines/tools/equipment? yes ( ) no ( ). If yes, identify and describe:
j. Is this operation required to meet market demand? yes ( ) no ( )
Explain:
k. What is (are) the probable end use(s) of culled product?
178 inter-American institute for Cooperation on Agriculture
l. What criteria are used in this action?
yes no describeProduct shape ( ) ( )
Product size ( ) ( )
Product weight ( ) ( )
Maturity ( ) ( )
Color ( ) ( )
Pest/disease damage ( ) ( )
Physical injury ( ) ( )
Mechanical injury ( ) ( )
Cleanliness ( ) ( )
Other ( ) ( )
3. Are any sizing or grading standards used for this product? yes ( ) no ( ). If yes, identify and
describe the standard:
4. If the product is divided into diff erent groups or categories at this point due to the sizing or grading process, identify the diff erent categories and the approximate % of produce moving into each channel.
For example:
grade % of total destination
1st Grade 40% Export
2nd Grade 35% Domestic market
3rd Grade 15% Agroprocessing
Culls 10% Animal feed
total 100%

Commodity Systems Assessment Methodology for Value Chain Problem and Project Identifi cation 179
5. What portion of culled product, if any, is a complete loss and does not generate any economic
return? %
Explain:
6. Identify any problems occurring at this point which may aff ect postharvest losses.
1.
2.
3.
4.
5.

180 inter-American institute for Cooperation on Agriculture
ComPonent 13-C: inspection
Name of data collector: Telephone:
Title: Institution:
1. Identify the points in the postharvest systems where some form of inspection takes place.
Point in the system Action that takes place
2. For each action identifi ed above provide the following information:
a. Name of action:
b. Time required for the action to take place:
c. Describe the action:
d. Describe the sampling procedure:
e. Who is responsible for conducting the action?
f. When is this action carried out?
g. Why is this action carried out?
h. Where is this operation carried out?
i. Is the activity carried out with machines/tools/equipment? yes ( ) no ( ). If yes, identify and describe:

Commodity Systems Assessment Methodology for Value Chain Problem and Project Identifi cation 181
j. What criteria are used in this action?
(A) Quality control (packinghouse line)
Criteria yes no describe
Product shape ( ) ( )
Product size ( ) ( )
Product weight ( ) ( )
Maturity ( ) ( )
Color ( ) ( )
Pest/disease damage ( ) ( )
Physical injury ( ) ( )
Mechanical injury ( ) ( )
Cleanliness ( ) ( )
Other ( ) ( )
(B) Plant quarantine (exporting and importing)
Criteria yes no describeDisease ( ) ( )
Pest ( ) ( )Chemical residues ( ) ( )Other ( ) ( )
(C) Customs
Criteria yes no describeDrug control ( ) ( )
Pest/disease ( ) ( )Other ( ) ( )

182 inter-American institute for Cooperation on Agriculture
k. Is this operation required to meet market demand? yes ( ) no ( )
Explain:
3. Identify any problems ocurring at this point which may aff ect postharvest losses.
1.
2.
3.
4.
5.

Commodity Systems Assessment Methodology for Value Chain Problem and Project Identifi cation 183
ComPonent 14: Postharvest Chemical and Physical treatments
Name of data collector: Telephone:
Title: Institution:
ChemiCAl tReAtment1. Is any chemical applied to the product during the postharvest stage?
yes ( ) no ( ). If yes, list the chemicals below:
generic name Brand name
2. For each chemical used, answer the following questions.
a. What is the name of the chemical?
b. Why is the chemical used?
c. Who applies the chemical?
d. When is the chemical applied?
e. Where is the chemical applied?
f. How often is the chemical applied?
g. How is the chemical applied (spray, dip, etc.)?
h. In what concentration is it applied?
i. Does the use of this chemical represent a health hazard for workers? yes ( ) no ( ), for consumers? yes ( ) no ( ). If yes, explain:
j. Costs of treatment?
Observations:

184 inter-American institute for Cooperation on Agriculture
PhySiCAl tReAtment
1. Does this product receive any special physical treatment in the postharvest stage which aff ects its quality, shelf life or marketability? yes ( ) no ( )
2. If yes, identify each type of physical treatment:
a.
b.
c.
3. For each physical treatment, provide the following information:
a. Name of physical treatment:
b. Description of treatment:
c. Purpose of treatment:
d. Who undertakes the treatment?
e. When is the treatment done?
f. Where is the treatment undertaken?
g. What costs are involved in the treatment?
Observations:
4. Summarize the problems at this point which may aff ect processing or postharvest losses of product.
1.
2.
3.
4.
5.

Commodity Systems Assessment Methodology for Value Chain Problem and Project Identifi cation 185
ComPonent 15: Packaging
Name of data collector: Telephone:
Title: Institution:
1. Identify the points in the postharvest system where packaging or repackaging occur:
location yes no describe
On the farm ( ) ( )
Rural collection point ( ) ( )
Regional collection point ( ) ( )
Packing house ( ) ( )
Local market ( ) ( )
Wholesale market ( ) ( )
Cottage industry ( ) ( )
Agro-industry ( ) ( )
Supermarket ( ) ( )
Point of export ( ) ( )
Other ( ) ( )
2. For each instance where packaging takes place, provide the following information:
a. Why is it necessary to package?
b. Who undertakes the packaging?
c. Where does the packaging take place?
d. When does the packaging take place?

186 inter-American institute for Cooperation on Agriculture
e. How long does the packaging process take?
f. How is the product handled/packaged (describe)?
g. What type of packaging material is used?
h. Why is that particular packaging material used?
i. What is the size of the package used?
• dimensions (cm) x x
• number of units of product per package
• weight of package: gross net
j. Does the particular package have the mechanical strength to adequately protect the product during:
Activity yes no Comments
Handling ( ) ( )
Transportation ( ) ( )
Stacking ( ) ( )
Storage ( ) ( )
Other ( ) ( )
k. Is the packaging material readily available? yes ( ) no ( )
l. Does the package meet the handling and marketing requirements in terms of:
Package
characteristics
domestic market export marketif negative explain
yes no yes no
Weight
Size
Shape
Material
Design
Labeling

Commodity Systems Assessment Methodology for Value Chain Problem and Project Identifi cation 187
m. Can the package be re-used? yes ( ) no ( ). If yes, state the estimated number of times:
n. Who owns the package (container)?
o. If the containers are reused, explain the procedure.
p. What is the per unit cost of the package or container?
q. What is the cost of the labor involved in packaging?
3. a. Is cushioning material used? yes ( ) no ( ). If yes, what type?
Why that particular type?
b. Can the cushioning material be re-used? yes ( ) no ( ). If yes, state the estimated number of times:
c. What is the cost of the cushioning material per container?
4. If produce is not packaged, why not? not needed ( ) lack of knowledge ( )
lack of materials ( ) not economical ( ) other
5. Summarize problems which aff ect postharvest losses due to packaging or lack of:
1.
2.
3.
4.
5.
6. Observations:
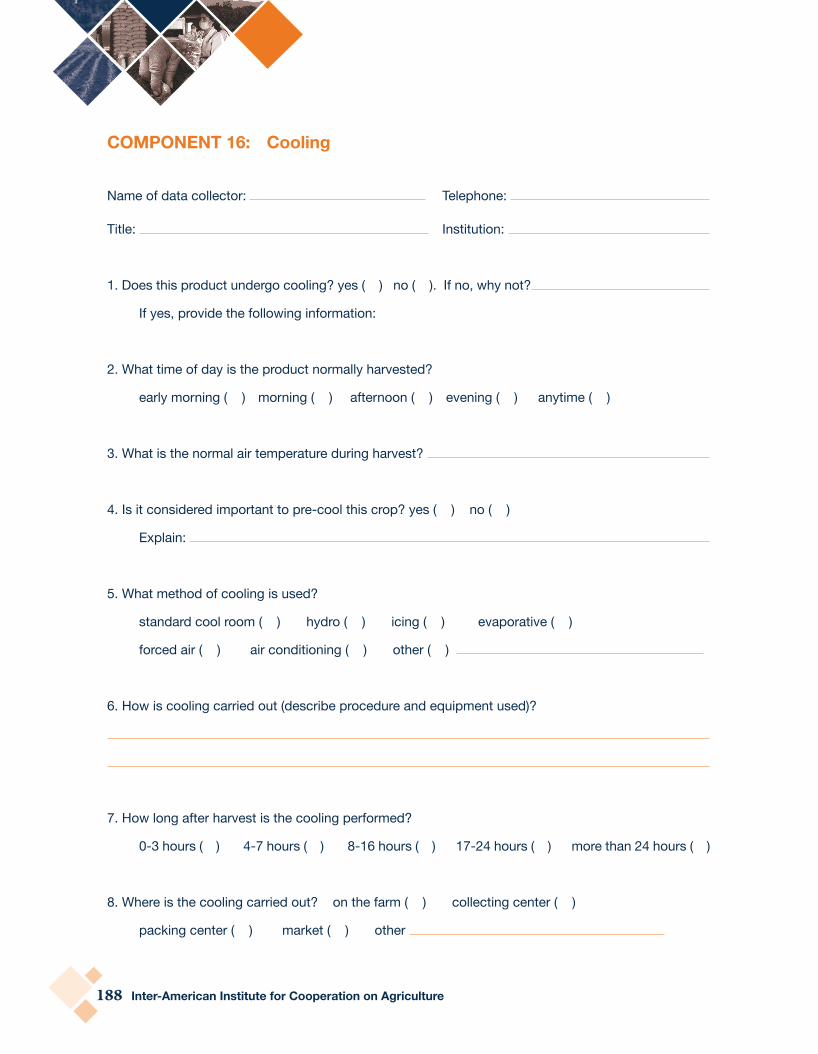
188 inter-American institute for Cooperation on Agriculture
ComPonent 16: Cooling
Name of data collector: Telephone:
Title: Institution:
1. Does this product undergo cooling? yes ( ) no ( ). If no, why not?
If yes, provide the following information:
2. What time of day is the product normally harvested?
early morning ( ) morning ( ) afternoon ( ) evening ( ) anytime ( )
3. What is the normal air temperature during harvest?
4. Is it considered important to pre-cool this crop? yes ( ) no ( )
Explain:
5. What method of cooling is used?
standard cool room ( ) hydro ( ) icing ( ) evaporative ( )
forced air ( ) air conditioning ( ) other ( )
6. How is cooling carried out (describe procedure and equipment used)?
7. How long after harvest is the cooling performed?
0-3 hours ( ) 4-7 hours ( ) 8-16 hours ( ) 17-24 hours ( ) more than 24 hours ( )
8. Where is the cooling carried out? on the farm ( ) collecting center ( )
packing center ( ) market ( ) other

Commodity Systems Assessment Methodology for Value Chain Problem and Project Identifi cation 189
9. Are there collective use installations where cooling is carried out? ( ) yes ( ) no
Explain:
10. Who performs the cooling?
farmer ( ) middleman ( ) buyer ( ) government ( ) other
11. Who monitors the correct use and maintenance of facilities?
12. How long is the cooling period? hours
13. What is the temperature range of the cooling medium?
14. Once cooled, is the product ever removed from the cool chain on its way to the fi nal market?
yes ( ) no ( ) Describe:
15. What are the costs of the cooling operation, per kg of produce?
16. Summarize problems identifi ed at this point which may aff ect postharvest losses and/or marketing of the product.
1.
2.
3.
4.
5.
17. Observations:

190 inter-American institute for Cooperation on Agriculture
ComPonent 17: Storage
Name of data collector: Telephone:
Title: Institution:
1. Identify the points in the postharvest system where storage takes place.
Points in postharvest system yes no duration of storage (days)On the farm ( ) ( )Rural collecting point ( ) ( )Regional collecting point ( ) ( )Packing house ( ) ( )Retail market ( ) ( )Whole sale market ( ) ( )Agroindustry ( ) ( )Supermarket ( ) ( )Export warehouses ( ) ( )Container terminal (export) ( ) ( )Government marketing board ( ) ( )Import warehouses ( ) ( )Other _________________ ( ) ( )
2. For each instance of storage identifi ed, provide the following information:
a. Type of storage (from 1 above):
b. Who is responsible for the storage? farmer ( ) middleman ( ) goverment ( )
wholesaler ( ) retailer ( ) processor ( ) other
c. What is the purpose of storage? await shipping ( ) await better market price ( )
maintain quality ( ) assemble larger volumes ( ) other
d. Describe the storage facilities and equipment.
e. How long after harvest does the product normally go into storage (hours and days)?
f. How long is the holding period?
g. At what degree of ripeness/maturity is the product when it is normally placed into storage?

Commodity Systems Assessment Methodology for Value Chain Problem and Project Identifi cation 191
h. How does the quality of produce change during the storage period?
i. Is air temperature controlled in the storage environment? yes ( ) no ( )
Explain:
j. What is the range of air temperature in the storage environment?
k. Is humidity controlled in the storage environment? yes ( ) no ( )
Explain:
l. What is the range of relative humidity in the storage environment?
m. Is the atmosphere in the storage facility modifi ed ( ) or controlled ( )?
Describe:
n. Is the product normally stored by itself ( ) or with other produce ( )? If with other produce, specify what kind:
o. Describe the type of container in which the product is packaged during storage
p. Who owns the storage facilities?
q. Who operates the storage facilities?
r. Who gives maintenance to the storage facilities?
s. Does the storage facilities have a plan for pest control? yes ( ) no ( )
t. What is the cost of holding the produce?
u. Is the storage facility operated effi ciently? yes ( ) no ( ). If no, explain:
3. Summarize storage problems which may aff ect postharvest losses.
1.
2.
3.
4. Observations:

192 inter-American institute for Cooperation on Agriculture
ComPonent 18: transport
Name of data collector: Telephone:
Title: Institution:
1. Identify each point in the agricultural value chain where the product undergoes movement from one point to another with the purpose of getting it to a new location.
Where transportation takes place method of transport
a. from to
b. from to
c. from to
d. from to
e. from to
2. For each case identifi ed above, provide the following information:
a. From to
b. Who is responsible for the transportation?
farmer ( ) middleman ( ) wholesaler ( ) retailer ( ) government ( )
other
c. When is produce normally transported?
early morning ( ) morning ( ) afternoon ( ) evening ( ) night ( ) anytime ( )
d. Method of transport?
human ( ) animal ( ) motorcycle ( ) truck ( ) ship ( )
airplane ( ) other

Commodity Systems Assessment Methodology for Value Chain Problem and Project Identifi cation 193
e. Describe the transportation process.
f. Describe the containers used during this stage of transport.
g. How is produce stacked during transport?
h. Identify and describe any type of damage/bruising which occurs to the product during transport.
i. Identify the costs involved during this stage of transportation:
type costs yes no type unit Cost/unit
Labor
Packaging
Animal rental
Vehicle service
Containers
Other
j. What is the duration of this stage of transport?
Hours days
k. What is the distance covered?
l. Who owns the containers during this stage of transport?
m. Who owns the product during transport?
3. Summary of problems during transport which may aff ect processing, postharvest handling, or marketing.
1.
2.
3.
4.
5.
4. Observations:

194 inter-American institute for Cooperation on Agriculture
ComPonent 19: delays or Waiting
Name of data collector: Telephone:
Title: Institution:
1. Identify all those points in the postharvest system where delays or waiting occur.
Points in postharvest system yes no describeon the farm ( ) ( )during transport ( ) ( )at packinghouse ( ) ( )at wholesale market ( ) ( )at retail market ( ) ( )at processing factory ( ) ( )at supermarket ( ) ( )at airport ( ) ( )at seaport ( ) ( )other ( ) ( )
2. For each instance of delay or waiting, provide the following information:
a. Point in system where delay or waiting occurs (from 1 above)
b. What is the cause of delay?
c. Who is responsible for the delay?
d. How long is the normal delay at this point? minutes hours days
e. What can be done to reduce the time of the delay?
f. How is the product protected at the point of delay?
g. What are the environmental conditions for the product at the point of delay?
direct sunlight or shade temperature
relative humidity air movement
other debilitating environmental conditions:

Commodity Systems Assessment Methodology for Value Chain Problem and Project Identifi cation 195
h. Describe how the delay or waiting may aff ect the quality of the product (changes in appearance, texture, aroma, fl avor, weight loss/gain, disease development, etc.).
i. Does the delay aff ect the price of the produce? yes ( ) no ( ). If yes, explain:
3. Summarize those problems caused by delays/waiting which may negatively aff ect processing postharvest handling, or marketing.
1.
2.
3.
4.
5.
4. Observations:

196 inter-American institute for Cooperation on Agriculture
ComPonent 20: other operations
Name of data collector: Telephone:
Title: Institution:
1. operation name Point in the agricultural value chain where
operation occurs
2. For each operation, provide the following information:
a. Name of operation.
b. Describe what takes place.
c. Who executes the operation?
d. Where is the operation carried out?
e. When is the operation carried out?
f. Why is it done in the present manner?
g. What is the impact of this operation on quality or quantity of the product?
h. How could this operation be improved?
3. Identify and describe all problems related to these operations which can aff ect processing, postharvest handling, or marketing of the product.
1.
2.
3.
4.
5.
4. Observations:

Commodity Systems Assessment Methodology for Value Chain Problem and Project Identifi cation 197
ComPonent 21: Agroprocessing
Name of data collector: Telephone:
Title: Institution:
1. Does the produce undergo any type of processing or semi-processing at any point in the postharvest system? yes ( ) no ( )
IF NO, ANSWER THE FOLLOWING QUESTION
IF YES, GO TO QUESTION #3
2. Is there any possibility over the medium or long term for developing a processing industry for this crop? yes ( ) no ( ). If yes, explain (type of industry, principal constraints, etc.):
3. Where does the processing take place? on the farm ( ), home industry ( ),
plant-sized industry ( ), market ( ), supermarket ( ), other
4. What percentage of the produce arriving at the point of processing is culled before the processing
begins? % . What is the destination of the culled produce?
5. What type of processing is carried out?
type processing yes no observations
• canning in glass jars ( ) ( )
• canning in metal cans ( ) ( )
• dehydration/drying ( ) ( )
• making jam & jelly ( ) ( )
• candying ( ) ( )
• pickling ( ) ( )
• juicing ( ) ( )
• slicing in brine ( ) ( )
• concentrating ( ) ( )
• freezing ( ) ( )
• other ___________ ( ) ( )
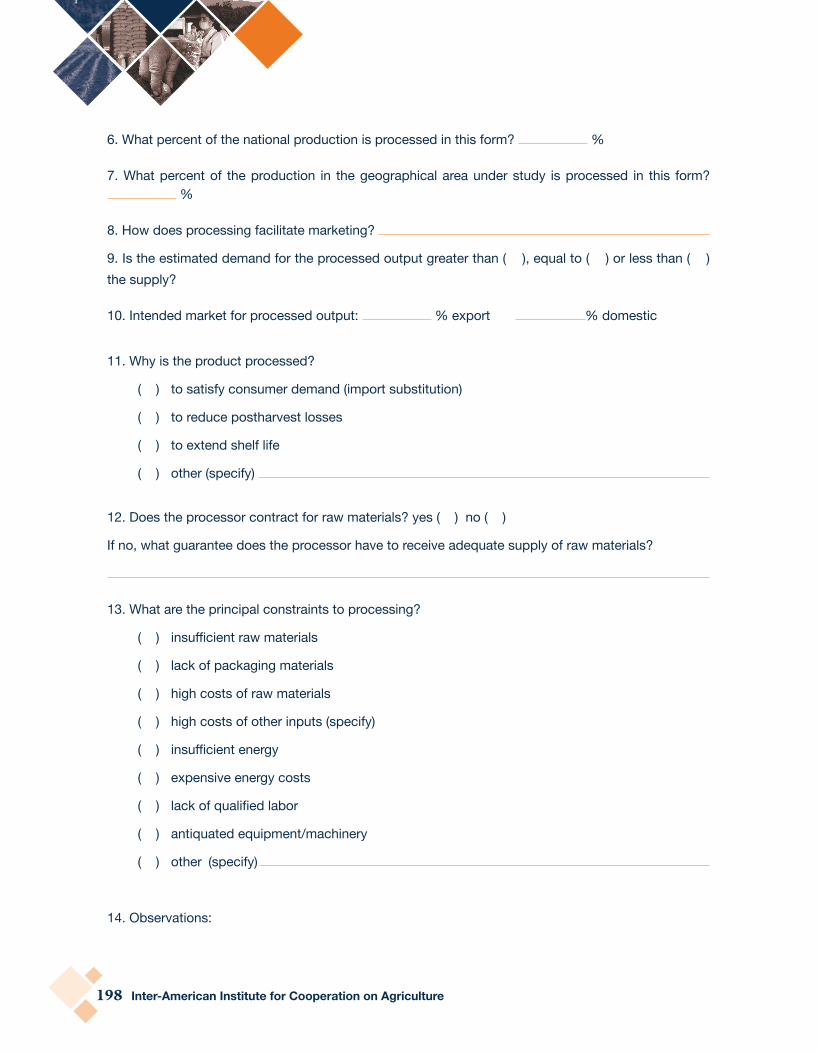
198 inter-American institute for Cooperation on Agriculture
6. What percent of the national production is processed in this form? %
7. What percent of the production in the geographical area under study is processed in this form? %
8. How does processing facilitate marketing?
9. Is the estimated demand for the processed output greater than ( ), equal to ( ) or less than ( ) the supply?
10. Intended market for processed output: % export % domestic
11. Why is the product processed?
( ) to satisfy consumer demand (import substitution)
( ) to reduce postharvest losses
( ) to extend shelf life
( ) other (specify)
12. Does the processor contract for raw materials? yes ( ) no ( )
If no, what guarantee does the processor have to receive adequate supply of raw materials?
13. What are the principal constraints to processing?
( ) insuffi cient raw materials
( ) lack of packaging materials
( ) high costs of raw materials
( ) high costs of other inputs (specify)
( ) insuffi cient energy
( ) expensive energy costs
( ) lack of qualifi ed labor
( ) antiquated equipment/machinery
( ) other (specify)
14. Observations:

Commodity Systems Assessment Methodology for Value Chain Problem and Project Identifi cation 199
ComPonent 22: marketing intermediaries
Name of data collector: Telephone:
Title: Institution:
1. Identify the diff erent types of intermediaries involved with the marketing of the product under study.
type of intermediary Brief descriptionLocal collectors/traders:
Wholesalers:
Retailers:
Government buyers:
Exporters:
Agroprocessors:
Others:

200 inter-American institute for Cooperation on Agriculture
2. For each type of intermediary identifi ed in 1, provide the following information:
a. Describe the principal functions of this type of intermediary.
b. How does the intermediary carry out these functions?
c. Where are these functions carried out?
d. When are these functions carried out?
e. Other persons involved in carrying out these functions?
f. Why are these actions carried out in the present manner?
g. What facilities, equipment, vehicles, etc., does the intermediary use to carry out the activities?
h. What is an average sized operation for this type of intermediary (tons of product handled
per calendar year)?
i. How could the handling of this product be improved?
j. Would improvement in handling increase costs for the operation? yes ( ) no ( )
k. If yes, can this cost be passed on to consumers? yes ( ) no ( )
l. What are the principal constraints for this intermediary which aff ect the effi cient handling of the
product?
3. Are there any ethnic groups which specialize in marketing? yes ( ) no ( )
If yes, how does this aff ect:
a. Quality:
b. Price:
c. Cost:
4. If possible, collect the following information from each type of intermediary:
a. What are the conditions of purchase to the supplier?

Commodity Systems Assessment Methodology for Value Chain Problem and Project Identifi cation 201
b. How is price determined?
c. Who determines the price?
d. What are the payment terms to the supplier?
e. Is product quality a problem? yes ( ) no ( )
f. Is obtaining suffi cient volume a problem? yes ( ) no ( )
Explain:
g. What tricks do farmers use when selling produce to intermediaries (e.g. adding foreign
material, placing best produce on top, etc.)?
5. Summarize problems relating to intermediaries which aff ect postharvest handling and/or marketing and/or processing.
1.
2.
3.

202 inter-American institute for Cooperation on Agriculture
ComPonent 23: market information
Name of data collector: Telephone:
Title: Institution:
1. Is statistical price information available for the product under study? yes ( ) no ( )
2. If yes, for what calendar years?
3. Type of price information available
Source of price informationFrequency of information
daily weekly monthly yearly
Farm gate
Wholesale
Retail
Export
4. Has a seasonal price index been prepared for this crop? yes ( ) no ( )
5. If a seasonal price index exists, which are the months of the year when prices are
lowest? highest?

Commodity Systems Assessment Methodology for Value Chain Problem and Project Identifi cation 203
6. During those months when prices are lowest, are the low prices due to:
Causes of price fl uctuation yes no
decline in consumer demand
favorable growing conditions/excess supply
poor production planning/excess supply
increase in imports
reduction of exports
trade regulations
increase in supply of substitutes
other
7. During those months when prices are highest, are the high prices due to:
Causes of price fl uctuation yes no
increase in consumer demand
poor growing conditions/scarcity
poor production planning/scarcity
reduction in imports
increase of exports
trade regulations
decline in supply of substitutes
other
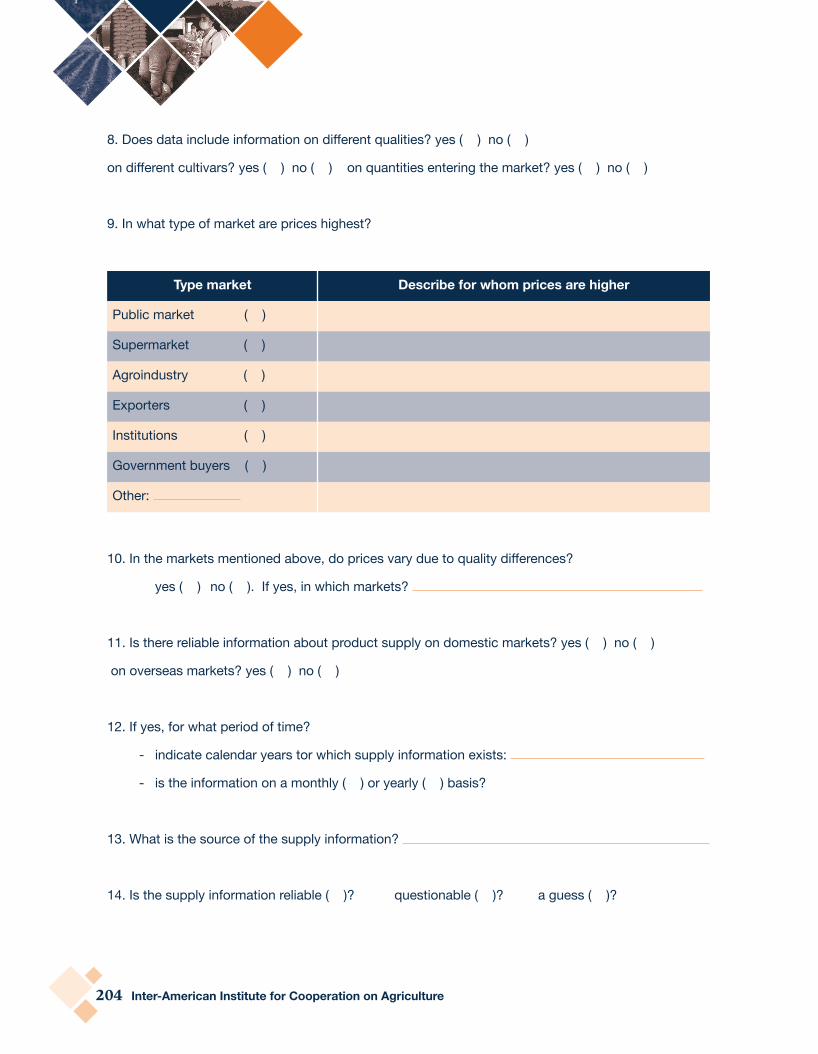
204 inter-American institute for Cooperation on Agriculture
8. Does data include information on diff erent qualities? yes ( ) no ( )
on diff erent cultivars? yes ( ) no ( ) on quantities entering the market? yes ( ) no ( )
9. In what type of market are prices highest?
type market describe for whom prices are higher
Public market ( )
Supermarket ( )
Agroindustry ( )
Exporters ( )
Institutions ( )
Government buyers ( )
Other:
10. In the markets mentioned above, do prices vary due to quality diff erences?
yes ( ) no ( ). If yes, in which markets?
11. Is there reliable information about product supply on domestic markets? yes ( ) no ( )
on overseas markets? yes ( ) no ( )
12. If yes, for what period of time?
- indicate calendar years tor which supply information exists:
- is the information on a monthly ( ) or yearly ( ) basis?
13. What is the source of the supply information?
14. Is the supply information reliable ( )? questionable ( )? a guess ( )?

Commodity Systems Assessment Methodology for Value Chain Problem and Project Identifi cation 205
15. Provide following price information for year:
type marketlow price high price
USd per unit month USd per unit month
Farmgate
Local market
Wholesale
Retail
Export
Other
16. Summary of price-related problems which may aff ect postharvest losses.
1.
2.
3.

206 inter-American institute for Cooperation on Agriculture
ComPonent 24: Consumer demand
Name of data collector: Telephone:
Title: Institution:
1. What percent of total national production of this product is sold on the domestic
market? % export market? %
2. What percent of the production in the geographical area under study goes to the domestic market? % export market %
3. Which consumers purchase the product in domestic and export markets.
type consumer domestic market export market
Low income consumers % %
Medium income consumers % %
High income consumer % %
total (%) 100 100
4. Indicate ethnic group consumption of this product:
ethnic group domestic market export market
% %
% %
% %
% %
total (%) 100 100
5. For each important consumer group identifi ed above, provide the following information for the applicable questions:
a. Preferred cultivar?

Commodity Systems Assessment Methodology for Value Chain Problem and Project Identifi cation 207
b. Preferred size?
c. Preferred color?
d. Desired fl avor?
e. Desired texture?
f. Preferred degree of maturity?
g. Preferred type of package?
h. Desired number of units/products per package?
i. Consumer willingness to accept pest or disease blemishes? will accept ( ) will not accept( )
j. Which of the following is most important to this consumer group: quality ( ) or price ( )?
k. How sensitive is this consumer group to fl uctuations in product prices?
( ) very sensitive (small price increase decreases consumer purchases)
( ) moderately sensitive
( ) slightly sensitive
( ) not very sensitive (Iarge price increase won’t decrease amount purchased)
l. Desired product characteristics for religious, cultural, and medicinal uses:
religious:
cultural:
medicinal uses:
other:
6. Summarize the characteristics of consumer demand which are most likely to aff ect the marketability of the product in question.
1.
2.
3.
4.
5.
7. Observations:
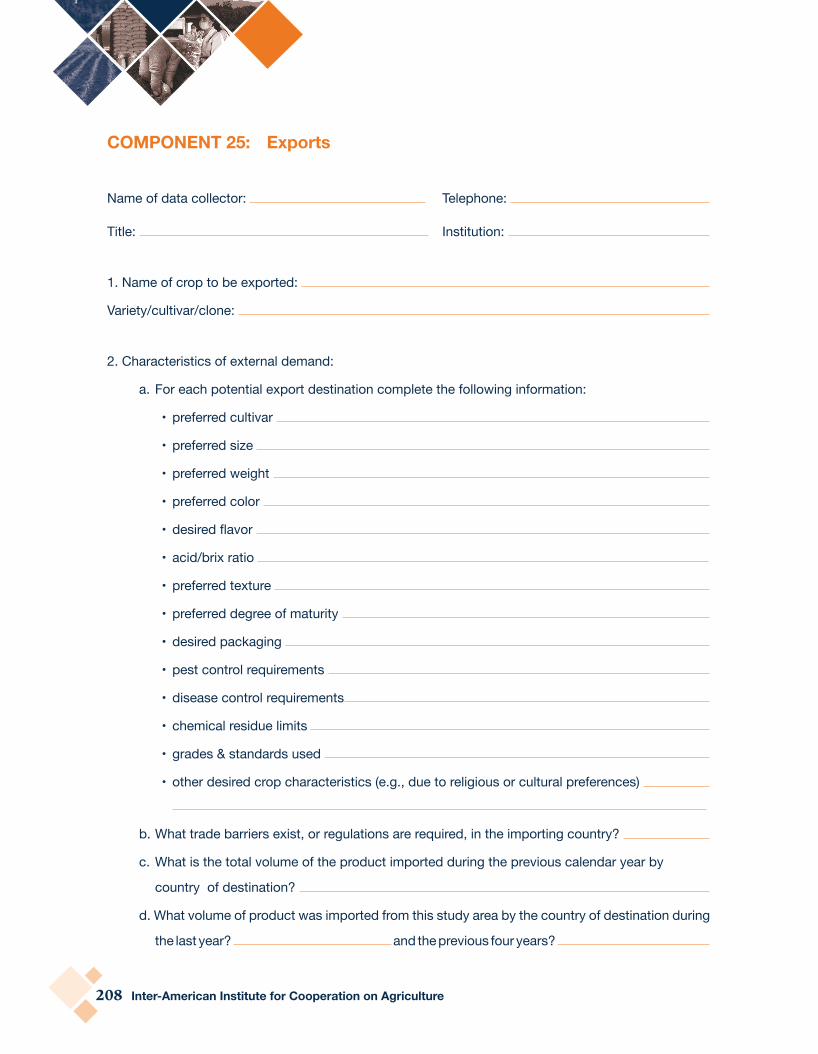
208 inter-American institute for Cooperation on Agriculture
ComPonent 25: exports
Name of data collector: Telephone:
Title: Institution:
1. Name of crop to be exported:
Variety/cultivar/clone:
2. Characteristics of external demand:
a. For each potential export destination complete the following information:
• preferred cultivar
• preferred size
• preferred weight
• preferred color
• desired fl avor
• acid/brix ratio
• preferred texture
• preferred degree of maturity
• desired packaging
• pest control requirements
• disease control requirements
• chemical residue limits
• grades & standards used
• other desired crop characteristics (e.g., due to religious or cultural preferences)
b. What trade barriers exist, or regulations are required, in the importing country?
c. What is the total volume of the product imported during the previous calendar year by
country of destination?
d. What volume of product was imported from this study area by the country of destination during
the last year? and the previous four years?

Commodity Systems Assessment Methodology for Value Chain Problem and Project Identifi cation 209
3. Characteristics of supply:
Total national production over last fi ve years
years tons Value ($)
4. Principal constraints which limit exports:
type constraints yes no describe problem
• Market information ( ) ( )
• Insect problems ( ) ( )
• Disease problems ( ) ( )
• Climatic problems ( ) ( )
• Postharvest handling problems:
infrastructure ( ) ( )
technology ( ) ( )
technical assistance ( ) ( )
funds ( ) ( )
other ( ) ( )
• Transportation problems:
sea transport ( ) ( )
air transport ( ) ( )
• Insuffi cient volumes ( ) ( )
• Trade barriers:
excessive documentation ( ) ( )
import licenses ( ) ( )
• Delays in payments ( ) ( )
• Other ( ) ( )

210 inter-American institute for Cooperation on Agriculture
5. Potential competition:
a. Which are the principal competing countries for this same market?
b. What actions must be taken to compete favorably with these countries?
• with respect to quality:
• with respect to supply:
• with respect to price:
• with respect to product safety:
• shipping methods:
• market research and development:
• market information:
• market promotion:

Commodity Systems Assessment Methodology for Value Chain Problem and Project Identifi cation 211
6. Can the farmers/intermediaries meet the external demand requirements with respect to:
demand requirement yes no Comments
• proper cultivar/variety ( ) ( )
• product size ( ) ( )
• product weight ( ) ( )
• color ( ) ( )
• fl avor ( ) ( )
• texture ( ) ( )
• maturity ( ) ( )
• freedom from pests ( ) ( )
• freedom from disease ( ) ( )
• appearance ( ) ( )
• quarantine controls ( ) ( )
• health regulations ( ) ( )
• trade restrictions ( ) ( )
• packaging requirements ( ) ( )
• product quantity ( ) ( )
• product quality ( ) ( )
• price ( ) ( )
• others: ( ) ( )
( ) ( )
7. Summary of principal problems with respect to exports.
1.
2.
3.
4.
5.
8. Observations:

212 inter-American institute for Cooperation on Agriculture
ComPonent 26: Postharvest and marketing Costs
Name of data collector: Telephone:
Title: Institution:
1. Identify each step (operation) in the marketing channel (for the product being studied), from the point of harvest to sales, and present them in a list. Consider such aspects as: harvest, selection, grading, packaging, cooling, transport, processing, wholesaling, retailing, exporting, and others.
2. Prepare a list of all the diff erent types of participants involved in the marketing of the product in question, considering: farmers, farmer organizations, rural traders, intermediaries, wholesalers, retailers, supermarkets, agroprocessors, marketing boards, government institutions, transport companies, cool storage suppliers, packing house operators, customs, port personnel, and others.
3. For each participant in the agricultural value chain, identify respective postharvest and marketing costs which aff ect the price of the agricultural product, considering such things as: labor, materials, equipment, chemical and physical treatments, vehicles, transportation fees, storage, processing, cooling services, packaging, grading/sorting, inspection, custom fees, technical assistance, and others.
4. From point of harvest to retail, list the operations (steps in marketing channel) in the order in which they occur. For each operation, list the respective participants, type of cost, and the respective cost. For example:
operation Participants Cost items Cost
Harvest Traders Supervision USD 8.00/day
Pickers Picking, selection USD 0.06/kg
Packing Packers Labor USD 0.01/kg
Cushion material USD 0.04/kg
Cartons USD 1.35/kg

Commodity Systems Assessment Methodology for Value Chain Problem and Project Identifi cation 213
Annex 3-A Format for the collection of information on public sector institutions aff ecting the agricultural value chain
1. Name of the institution:
Relevant subdivisions:
2. Names/titles of key persons within the institutions who directly or indirectly aff ect the agricultural value chain of interest, and how:
Name/Title how person makes impactExample: Samuel Jones/Project offi cer Potato project coordinator
3. List staff who work with or in some way aff ect the product of interest:
Type of staff number Functions impacting productExample: entomologist 2 Control of fruit fl y
4. Total amount of institution’s budget in most recent year:
Allocated: USD Spent: USD
5. Percent of budget which aff ects the product of interest: %
ANNEX 3 example questionnaires for collecting information on public sectorinstitutions, farmer organizations and development projects.
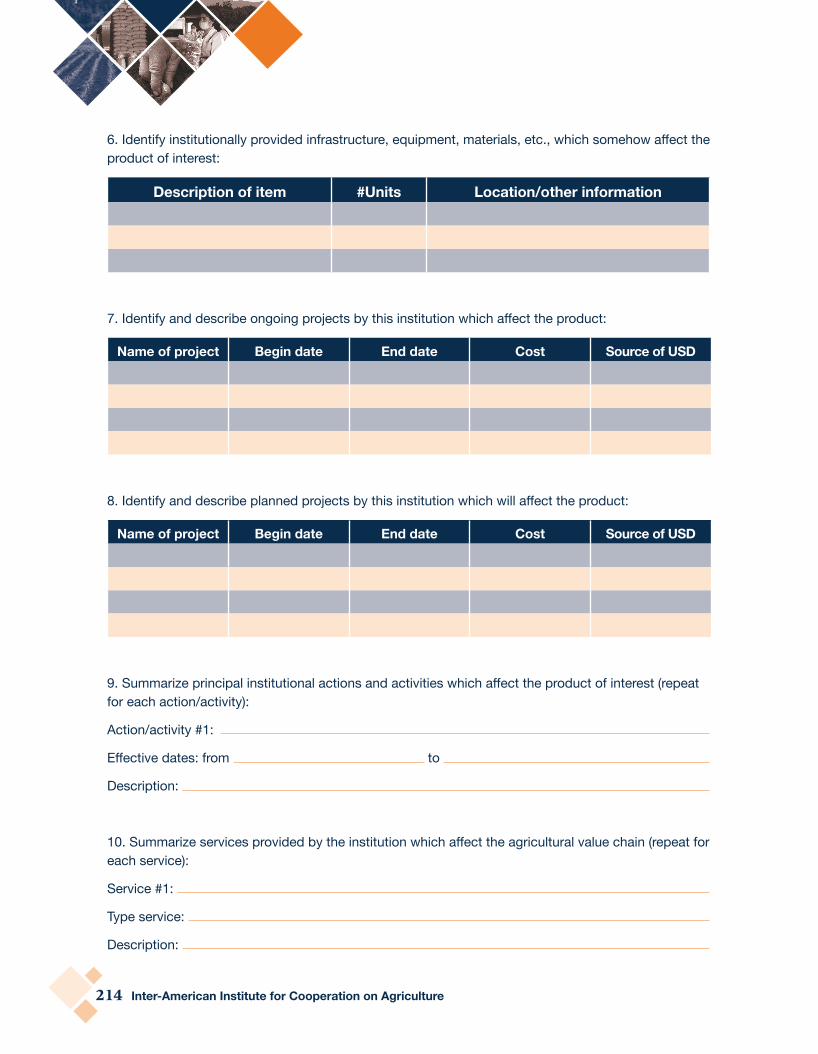
214 inter-American institute for Cooperation on Agriculture
6. Identify institutionally provided infrastructure, equipment, materials, etc., which somehow aff ect the product of interest:
description of item #Units Location/other information
7. Identify and describe ongoing projects by this institution which aff ect the product:
name of project Begin date end date Cost Source of USd
8. Identify and describe planned projects by this institution which will aff ect the product:
name of project Begin date end date Cost Source of USd
9. Summarize principal institutional actions and activities which aff ect the product of interest (repeat for each action/activity):
Action/activity #1:
Eff ective dates: from to
Description:
10. Summarize services provided by the institution which aff ect the agricultural value chain (repeat for each service):
Service #1:
Type service:
Description:

Commodity Systems Assessment Methodology for Value Chain Problem and Project Identifi cation 215
11. Summarize principal institutional constraints aff ecting the product (repeat for each constraint):
Constraint #1:
Description of constraint:
Impact of constraint (how it aff ects product):
12. Other observations:

216 inter-American institute for Cooperation on Agriculture
Annex 3-B information on farmer organizations
1. Name of farmer organization:
2. Year founded:
3. Address/location:
4. Name(s) and position(s) of key person(s):
5. Number of active members (most recent year):
6. Type of products handled:
7. Product sales most recent year (tons and USD value): Year:
8. Types of service off ered to members (for product being studied):
type service yes no CommentsCredit ( ) ( )
Technical assistance ( ) ( )
Information ( ) ( )
Farm inputs ( ) ( )
Spraying ( ) ( )
Processing ( ) ( )
Marketing ( ) ( )
Storage ( ) ( )
Transport ( ) ( )
Other ( ) ( )
9. Identifi cation of infrastructure/equipment/materials, etc. which may impact upon the product of interest:
description of item #Units Location/other information

Commodity Systems Assessment Methodology for Value Chain Problem and Project Identifi cation 217
10. Briefl y describe the relevant experiences of the farmer organization in the production, postharvest handling, marketing, processing, or distribution of the product of interest.
11. Identify and describe linkages/relationships with other organizations (public, private, bilateral, international, etc.)
a. Other farmer organizations:
b. Public sector institutions:
c. Support organizations:
d. Donor organizations:
e. Others (specify):
12. Identify and describe ongoing projects impacting the product:
name of project Begin date end date Cost Source of USd
13. Identity and describe planned projects which will aff ect the product:
name of project Begin date end date Cost Source of USd
14. Principal institutional constraints impacting product (repeat for each constraint):
Constraint #1:
Description of constraint:
Impact of constraint (how it aff ects product):
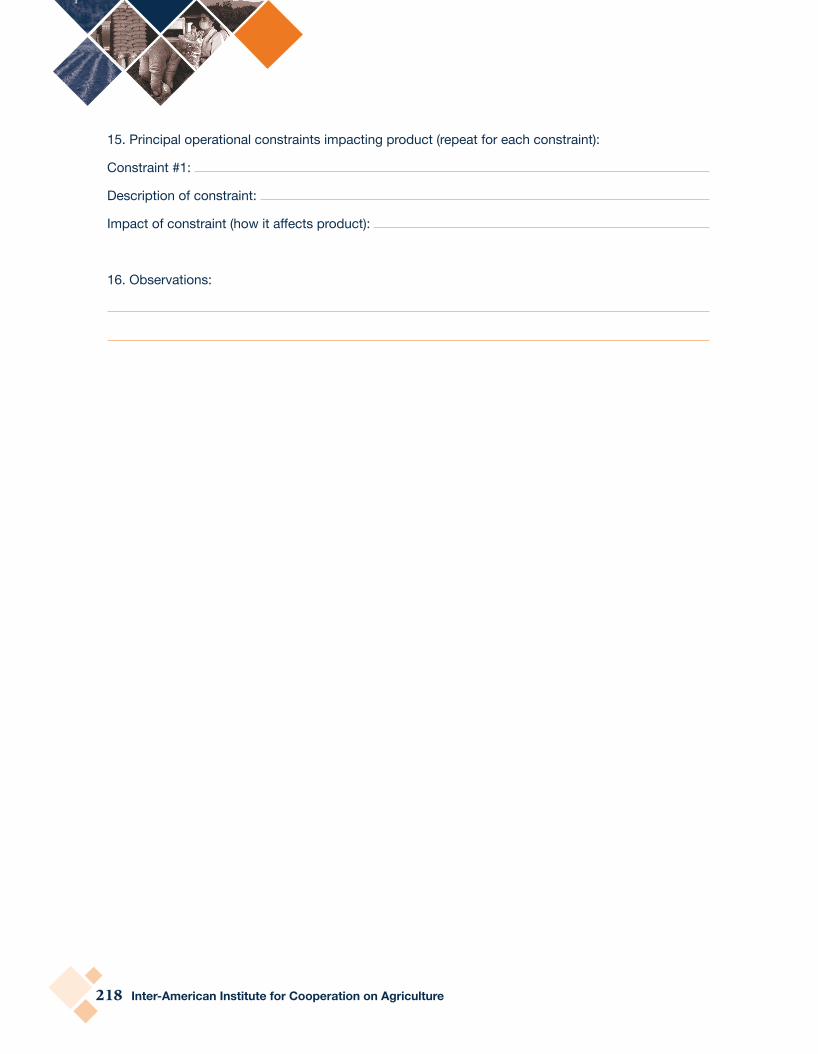
218 inter-American institute for Cooperation on Agriculture
15. Principal operational constraints impacting product (repeat for each constraint):
Constraint #1:
Description of constraint:
Impact of constraint (how it aff ects product):
16. Observations:

Commodity Systems Assessment Methodology for Value Chain Problem and Project Identifi cation 219
Annex 3-C Inventory of development projects and activities aff ecting the agricultural value chain
1. Prepare a list of all projects and activities which may aff ect the product being studied.
2. For each project or activity, answer the following questions:
a. Name of the project or activity:
b. Beginning date: Ending date:
c. Sponsoring institution:
d. Total cost: USD Local currency
e. Objectives:
f. Status: ( ) ahead of schedule, ( ) on schedule, ( ) behind schedule
g. Principal constraints aff ecting project:
h. Expected impact on the product being studied:
3. For each project activity, identify the technical personnel associated with the product of interest.
name Area of expertise time to be in country

220 inter-American institute for Cooperation on Agriculture
Components 1 - 7: Pre-production1- importance of the crop. What is the relative importance of the crop? Base your estimate of importance
on available information, on number of producers, amount produced, area of production, and/or market value.
2- governmental policies. Are there any laws, regulations, incentives or disincentives related to producing or marketing the crop? (e.g., existing price supports or controls, banned pesticides or residue limits).
3- Relevant institutions. Are there any organizations involved in projects related to production or marketing the crop? What are the objectives of the projects? How many people are participating?
4- Facilitating services. What services are available to producers and marketers (for example: credit, inputs, technical advice, subsidies)?
5- Producer/shipper organizations. Are there any producer or marketer organizations involved with the crop? What benefi ts or services do they provide to participants? At what cost?
6- environmental conditions. Does the local climate, soils or other factors limit the quality of production? Are the cultivars produced appropriate for the location?
7- Availability of planting materials. Are seeds or planting materials of adequate quality? Can growers obtain adequate supplies when needed?
Components 8 - 11: Production8- Farmers’ general cultural practices. Do any farming practices in use have an eff ect on produce
quality (irrigation, weed control, fertilization practices, fi eld sanitation)?
9- Pests and diseases. Are there any insects, fungi, bacteria, weeds or other pests present that aff ect the quality of produce?
10- Pre-harvest treatments. What kinds of pre-harvest treatments might aff ect postharvest quality (such as use of pesticides, pruning practices, thinning)?
11- Production costs. Estimate the total cost of production (inputs, labor, rent, etc). What are the costs of any proposed alternative methods?
ANNEX 4 Simplifi ed questions for each component of the agricultural value chain. Source: Kitinoja And Kasmire 2002. Modifi ed From La Gra 1990.
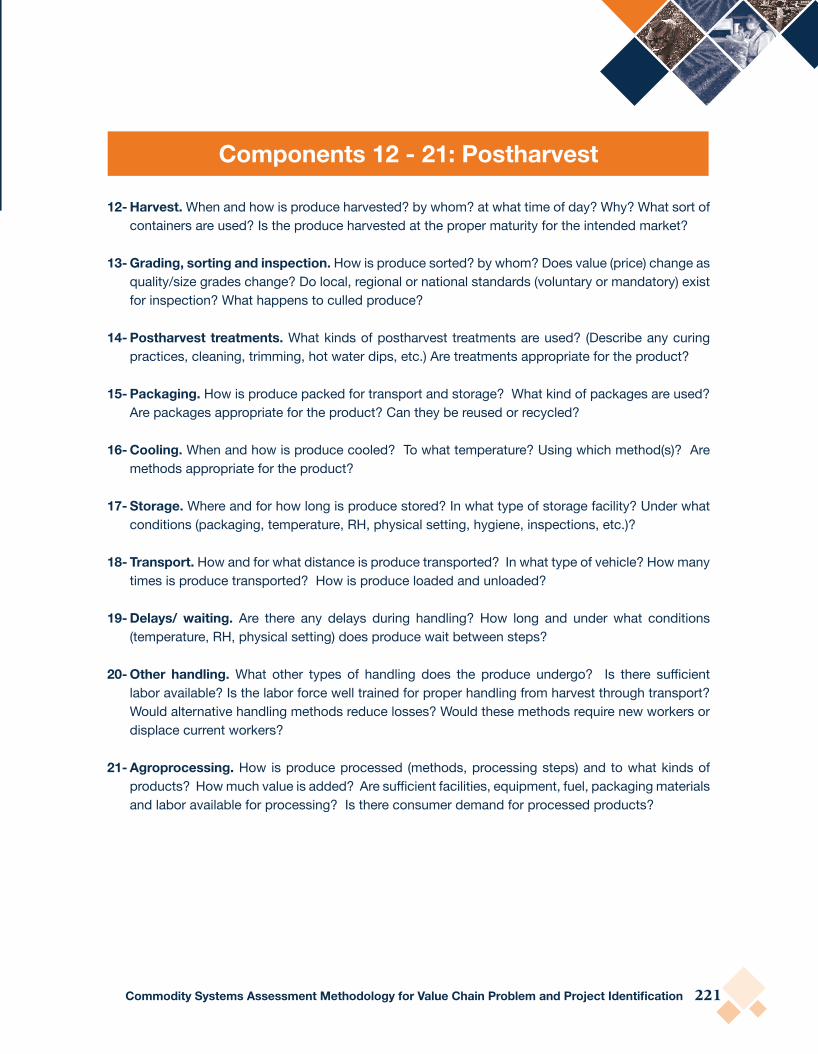
Commodity Systems Assessment Methodology for Value Chain Problem and Project Identifi cation 221
Components 12 - 21: Postharvest
12- harvest. When and how is produce harvested? by whom? at what time of day? Why? What sort of containers are used? Is the produce harvested at the proper maturity for the intended market?
13- grading, sorting and inspection. How is produce sorted? by whom? Does value (price) change as quality/size grades change? Do local, regional or national standards (voluntary or mandatory) exist for inspection? What happens to culled produce?
14- Postharvest treatments. What kinds of postharvest treatments are used? (Describe any curing practices, cleaning, trimming, hot water dips, etc.) Are treatments appropriate for the product?
15- Packaging. How is produce packed for transport and storage? What kind of packages are used? Are packages appropriate for the product? Can they be reused or recycled?
16- Cooling. When and how is produce cooled? To what temperature? Using which method(s)? Are methods appropriate for the product?
17- Storage. Where and for how long is produce stored? In what type of storage facility? Under what conditions (packaging, temperature, RH, physical setting, hygiene, inspections, etc.)?
18- transport. How and for what distance is produce transported? In what type of vehicle? How many times is produce transported? How is produce loaded and unloaded?
19- Delays/ waiting. Are there any delays during handling? How long and under what conditions (temperature, RH, physical setting) does produce wait between steps?
20- other handling. What other types of handling does the produce undergo? Is there suffi cient labor available? Is the labor force well trained for proper handling from harvest through transport? Would alternative handling methods reduce losses? Would these methods require new workers or displace current workers?
21- Agroprocessing. How is produce processed (methods, processing steps) and to what kinds of products? How much value is added? Are suffi cient facilities, equipment, fuel, packaging materials and labor available for processing? Is there consumer demand for processed products?

222 inter-American institute for Cooperation on Agriculture
Components 22 - 26: marketing
22- market intermediaries. Who are the handlers of the crop between producers and consumers? How long do they have control of produce and how do they handle it? Who is responsible for losses /who suff ers fi nancially? Is produce handled on consignment; marketed via direct sales; moved through wholesalers?
23- market information. Do handlers and marketers have access to current prices and volumes in order to plan their marketing strategies? How do they collect the information? Who does the recordkeeping? Is information accurate, reliable, timely, and useful to decision makers?
24- Consumer demand. Do consumers have specifi c preferences for produce sizes, fl avors, colors, maturities, quality grades, packages types, package sizes or other characteristics? Are there any signs of unmet demand and/or over-supply? How do consumers react to the use of postharvest treatments (pesticides, irradiation, coatings, etc.) or certain packaging methods (plastic, styrofoam, recyclables)?
25- exports. Is this product produced for export? What are the specifi c requirements for export (regulations of importing country with respect to grades, packaging, pest control, etc.)?
26- marketing costs. Estimate the total marketing costs for the crop (inputs and labor for harvest, packaging, grading, transport, storage, processing, etc.). Do handlers/ marketers have access to credit? Are prevailing market interest rates at a level that allows the borrower to repay the loan and still make a profi t? Is supporting infrastructure adequate (roads, marketing facilities, management skills of staff , communication systems such as telephone, fax, e-mail services)?
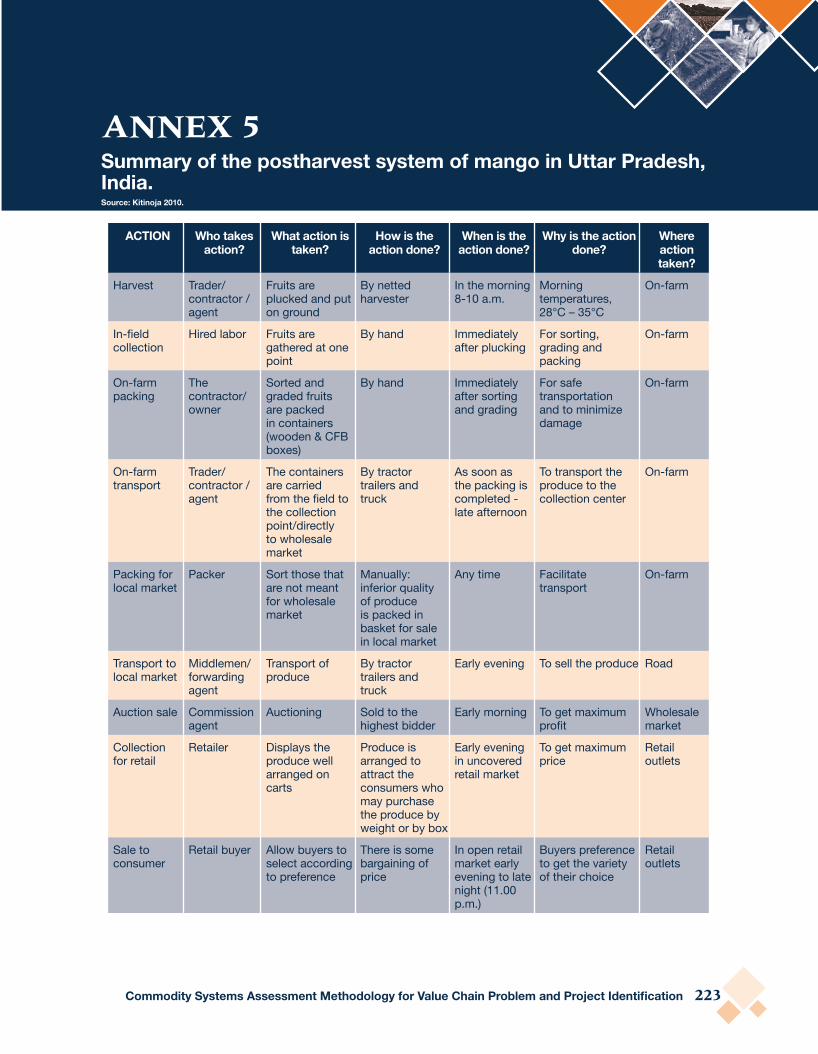
Commodity Systems Assessment Methodology for Value Chain Problem and Project Identifi cation 223
ACtion Who takes action?
What action is taken?
how is the action done?
When is the action done?
Why is the action done?
Where action taken?
Harvest Trader/ contractor /agent
Fruits are plucked and put on ground
By netted harvester
In the morning 8-10 a.m.
Morning temperatures, 28°C – 35°C
On-farm
In-fi eld collection
Hired labor Fruits are gathered at one point
By hand Immediately after plucking
For sorting, grading and packing
On-farm
On-farm packing
The contractor/ owner
Sorted and graded fruits are packed in containers (wooden & CFB boxes)
By hand Immediately after sorting and grading
For safe transportation and to minimize damage
On-farm
On-farm transport
Trader/contractor /agent
The containers are carried from the fi eld to the collection point/directly to wholesale market
By tractor trailers and truck
As soon as the packing is completed - late afternoon
To transport the produce to the collection center
On-farm
Packing for local market
Packer Sort those that are not meant for wholesale market
Manually: inferior quality of produce is packed in basket for sale in local market
Any time Facilitate transport
On-farm
Transport to local market
Middlemen/ forwarding agent
Transport of produce
By tractor trailers and truck
Early evening To sell the produce Road
Auction sale Commission agent
Auctioning Sold to the highest bidder
Early morning To get maximum profi t
Wholesale market
Collection for retail
Retailer Displays the produce well arranged on carts
Produce is arranged to attract the consumers who may purchase the produce by weight or by box
Early evening in uncovered retail market
To get maximum price
Retail outlets
Sale to consumer
Retail buyer Allow buyers to select according to preference
There is some bargaining of price
In open retail market early evening to late night (11.00 p.m.)
Buyers preference to get the variety of their choice
Retail outlets
ANNEX 5 Summary of the postharvest system of mango in Uttar Pradesh, india. Source: Kitinoja 2010.

224 inter-American institute for Cooperation on Agriculture
Annex 6A. Worksheet for quantifying postharvest losses of leafy vegetables on farm level.
on farm data collection worksheet name of data collector:
leafy greens Variety (if known ) or describe color, shape, etc.
Code: Farm
Questions and observations At harvest Farm gate
Date
Location of farm
Size of farm
Crops produced
Season for leafy greens (range of harvesting dates on this farm)
Name of destination market if known
Distance to market if known km Expected journey time hours
Sorting - selecting out that produce which will not be sent to the market
Was sorting done at harvest? Yes/No
If Yes, estimate waste (discarded)
% or left in the fi eld
% Reason for sorting out:
Was sorting done before farm gate sale? Yes/No
If Yes, estimate waste (discarded):
% Reason for sorting out:
Size grading: is there any grading into diff erent sizes on the farm?
If Yes, estimate % in each category: Large % ; Medium % ; Small %
If Yes, estimate % in each category: Large % ; Medium % ; Small %
Does price off ered vary by quality grade? Describe grading criteria: If Yes, what is the price off ered for each quality grade? Highest ; Middle ; Lowest
Expected farm gate price: Price off ered (by weight? by volume? by number of containers?) Price per kg:
ANNEX 6 Worksheets for quantifying post harvest losses of leafy vegetables, fruits, roots, tubers and bulbs in agricultural value chains. Source: PeF 2016.

Commodity Systems Assessment Methodology for Value Chain Problem and Project Identifi cation 225
meASURementS At harvest Farm gate (to be measured again if possible)
Sample size (select random samples) count of 20 bunches count of 20 bunches
Time from harvest hour
Time of day
Air temperature °C °C
Relative humidity indicator %RH: Wet bulb T: °CDry bulb T : °C
%RH: Wet bulb T: °CDry bulb T : °C
Pulp temperature in °C (3 randomly selected bunches)
Quality sort for defects, decay, damage ( # out of count of 20) Ratings from 5 = Extreme defects, decay or damage; 3 = moderate; 1 = none
Number of rating 5 Number of rating 3 Number of rating 1
Number of rating 5 Number of rating 3 Number of rating 1
Number with obvious defects ie: cracks, sunburn, misshapen, shrivel, over-mature, etc.
Describe defects found (take photos)
At harvest Farm gate (to be measured again if possible)
Number with decay symptoms ie: fungus, mildew, bacterial spots, etc.
Describe decay found (take photos)
Number damaged ie: bruises, cuts, mechanical injury, insect damage.
Describe damages found (take photos)
Maturity rating: 5 = large, more mature 3 = medium size1= younger, very immature
Number large, more mature
Number medium size
Number young, very immature
Number large, more mature
Number medium size
Number young, very immature

226 inter-American institute for Cooperation on Agriculture
Rate package protection (mark one with an X)
5 = very strong, protective 4 = strong, moderately
protective 3 = somewhat strong,
protective 2 = weak, not very
protective 1 = no pack or very
weak, no protection
5 = very strong, protective 4 = strong, moderately
protective 3 = somewhat strong,
protective 2 = weak, not very
protective 1 = no pack or very weak,
no protection
Describe package or container: type, material, dimensions, cooling effi ciency (take photos)
Size and/ or weight of package or container
Weight loss on farm (set aside an initial random sample, weigh it again at time of sale)
Initial weight of sample Weight at time of sale
% are calculated by #/20 or weight/total weight of sample or count/total count of sample.

Commodity Systems Assessment Methodology for Value Chain Problem and Project Identifi cation 227
Annex 6B. Worksheet for quantifying postharvest losses of leafy vegetables at the wholesale market.
Wholesale data collection worksheet name of data collector:
leafy greens Variety (if known ) or describe color, shape, etc.
Code: Farm
Questions and observations on arrival At the time of sale
Date
Name of market
Location of market
Season for leafy greens (range of sales dates at this market)
Distance from farm if known km
Sorting - selecting out that produce which will not be resold
Was sorting done before delivery? Yes/No
If Yes, estimate waste (discarded) _______% Reason for sorting out:
Was sorting done before sale? Yes/No
If Yes, estimate waste (discarded):
% Reason for sorting out:
Size grading: is there any grading into diff erent sizes at the market?
If Yes, estimate % in each category: Large % ; Medium % ; Small %
If Yes, estimate % in each category: Large % ; Medium % ; Small %
Does price off ered vary by quality grade? Describe grading criteria: If Yes, what is the price off ered for each quality grade? Highest ; Middle ; Lowest
Expected wholesale price Price range (by weight? by volume? by number of containers? ) Price per kg:
meASURementS on arrival At the time of sale
Sample size (select random samples) count of 20 one package ( = total number)
Time from harvest if known
Time of day
Air temperature °C °C
Relative humidity indicator %RH: Wet bulb T: °CDry bulb T : °C
%RH: Wet bulb T: °CDry bulb T : °C

228 inter-American institute for Cooperation on Agriculture
Pulp temperature in °C (3 randomly selected bunches)
Quality sort for defects, decay, damage ( # out of count of 20) Ratings from 5 = Extreme defects, decay or damage; 3 = moderate; 1 = none
Number of rating 5 Number of rating 3 Number of rating 1
Number of rating 5 Number of rating 3 Number of rating 1
Number with obvious defects ie: cracks, sunburn, misshapen, shrivel, over-mature, etc.
Describe defects found (take photos)
on arrival At the time of sale
Number with decay symptoms ie: fungus, mildew, bacterial spots, etc.
Describe decay found (take photos)
Number damaged ie: bruises, cuts, mechanical injury, insect damage.
Describe damages found (take photos)
Maturity rating:
5 = large, more mature
3 = medium size
1 = younger, very immature
Number large, more mature
Number medium size
Number young, very immature
Number large, more mature
Number medium size
Number young, very immature
Rate package protection (mark one with an X)
5 = very strong, protective
4 = strong, moderately protective
3 = somewhat strong, protective
2 = weak, not very protective
1 = no pack or very weak, no protection
5 = very strong, protective
4 = strong, moderately protective
3 = somewhat strong, protective
2 = weak, not very protective
1 = no pack or very weak, no protection
Describe package or container: type, material, dimensions, cooling effi ciency (take photos)
Size and/ or weight of package or container
Weight loss on farm (set aside an initial random sample, weigh it again at time of sale)
Initial weight of sample Weight at time of sale
% are calculated by #/20 or weight/total weight of sample or count/total count of sample.

Commodity Systems Assessment Methodology for Value Chain Problem and Project Identifi cation 229
Annex 6C. Worksheet for quantifying postharvest losses of leafy vegetables at the retail market.
Retail data collection worksheet name of data collector:
leafy greens Variety (if known ) or describe color, shape, etc.
Code: Retail
Questions and observations on arrival 6 to 8 hours later
Date
Name of market
Location of market
Season for leafy greens (range of sales dates at this market)
Distance from wholesale market km
Sorting - selecting out that produce which will not be resold
Was sorting done before purchase? Yes/No
If Yes, estimate waste (discarded)
% Reason for sorting out:
Was sorting done before sale? Yes/No
If Yes, estimate waste (discarded):
% Reason for sorting out:
Size grading: is there any grading into diff erent sizes at the market?
If Yes, estimate % in each category: Large % ; Medium % ; Small %
If Yes, estimate % in each category: Large % ; Medium % ; Small %
Does price off ered vary by quality grade? Describe grading criteria: If Yes, what is the price off ered for each quality grade? Highest ; Middle ; Lowest
Expected retail price: Price range (by weight? by volume? by number of containers? ) Price per kg:
meASURementS on arrival 6 to 8 hours later
Sample size (select random samples) count of 20 bunches count of 20 bunches
Time from harvest if known
Time of day
Air temperature °C °C
Relative humidity indicator %RH: Wet bulb T: °CDry bulb T : °C
%RH: Wet bulb T: °CDry bulb T : °C
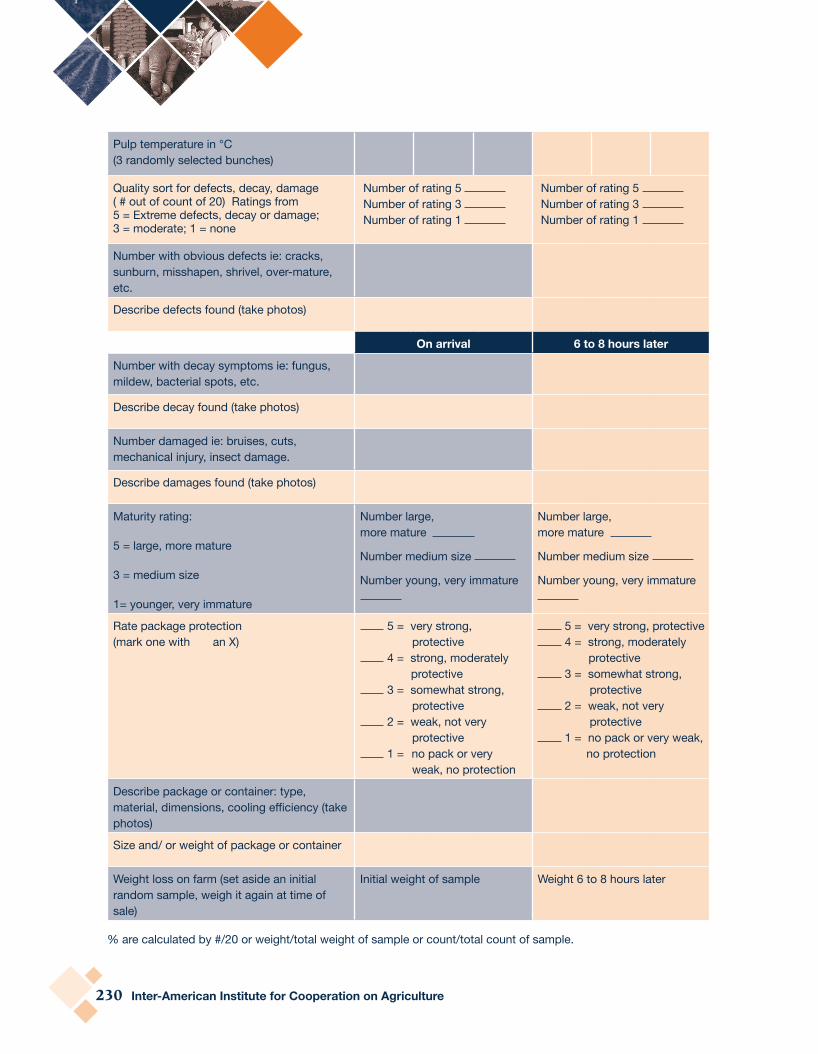
230 inter-American institute for Cooperation on Agriculture
Pulp temperature in °C (3 randomly selected bunches)
Quality sort for defects, decay, damage ( # out of count of 20) Ratings from 5 = Extreme defects, decay or damage; 3 = moderate; 1 = none
Number of rating 5 Number of rating 3 Number of rating 1
Number of rating 5 Number of rating 3 Number of rating 1
Number with obvious defects ie: cracks, sunburn, misshapen, shrivel, over-mature, etc.
Describe defects found (take photos)
on arrival 6 to 8 hours later
Number with decay symptoms ie: fungus, mildew, bacterial spots, etc.
Describe decay found (take photos)
Number damaged ie: bruises, cuts, mechanical injury, insect damage.
Describe damages found (take photos)
Maturity rating:
5 = large, more mature
3 = medium size
1= younger, very immature
Number large, more mature
Number medium size
Number young, very immature
Number large, more mature
Number medium size
Number young, very immature
Rate package protection (mark one with an X)
5 = very strong, protective
4 = strong, moderately protective
3 = somewhat strong, protective
2 = weak, not very protective
1 = no pack or very weak, no protection
5 = very strong, protective 4 = strong, moderately
protective 3 = somewhat strong,
protective 2 = weak, not very
protective 1 = no pack or very weak,
no protection
Describe package or container: type, material, dimensions, cooling effi ciency (take photos)
Size and/ or weight of package or container
Weight loss on farm (set aside an initial random sample, weigh it again at time of sale)
Initial weight of sample Weight 6 to 8 hours later
% are calculated by #/20 or weight/total weight of sample or count/total count of sample.

Commodity Systems Assessment Methodology for Value Chain Problem and Project Identifi cation 231
Annex 6d. Worksheet for quantifying postharvest losses of fruits on farm level.
on farm data collection worksheet name of data collector:
Fruit (nAme) Variety (if known ) or describe color, shape, etc.
Code Farm_____
Questions and observations At harvest Farm gate
Date
Location of farm
Size of farm
Crops produced
Season for (range of harvesting dates on this farm)
Name of destination market if known
Distance from wholesale market km Expected journey time hours
Sorting - selecting out that produce which will not be sent to the market
Was sorting done at harvest? Yes/No
If Yes, estimate waste (discarded) _______% or left on the tree ______% Reason for sorting out:
Was sorting done before farm gate sale? Yes/No
If Yes, estimate waste (discarded):
% Reason for sorting out:
Ripening - is ripening done before sale? If yes, estimate weight loss: %
Size grading: is there any grading into diff erent sizes on the farm?
If Yes, estimate % in each category: Large % ; Medium % ; Small %
If Yes, estimate % in each category: Large % ; Medium % ; Small %
Does price off ered vary by quality grade? Describe grading criteria: If Yes, what is the price off ered for each quality grade? Highest ; Middle ; Lowest
Expected farm gate price: Price off ered _______ (by weight? by volume? by number of containers? ) Price per kg: _______
meASURementS At harvest Farm gate (to be measured again if possible)
Sample size (select random samples) count of 20 count of 20
Time from harvest hour
Time of day
Air temperature °C °C
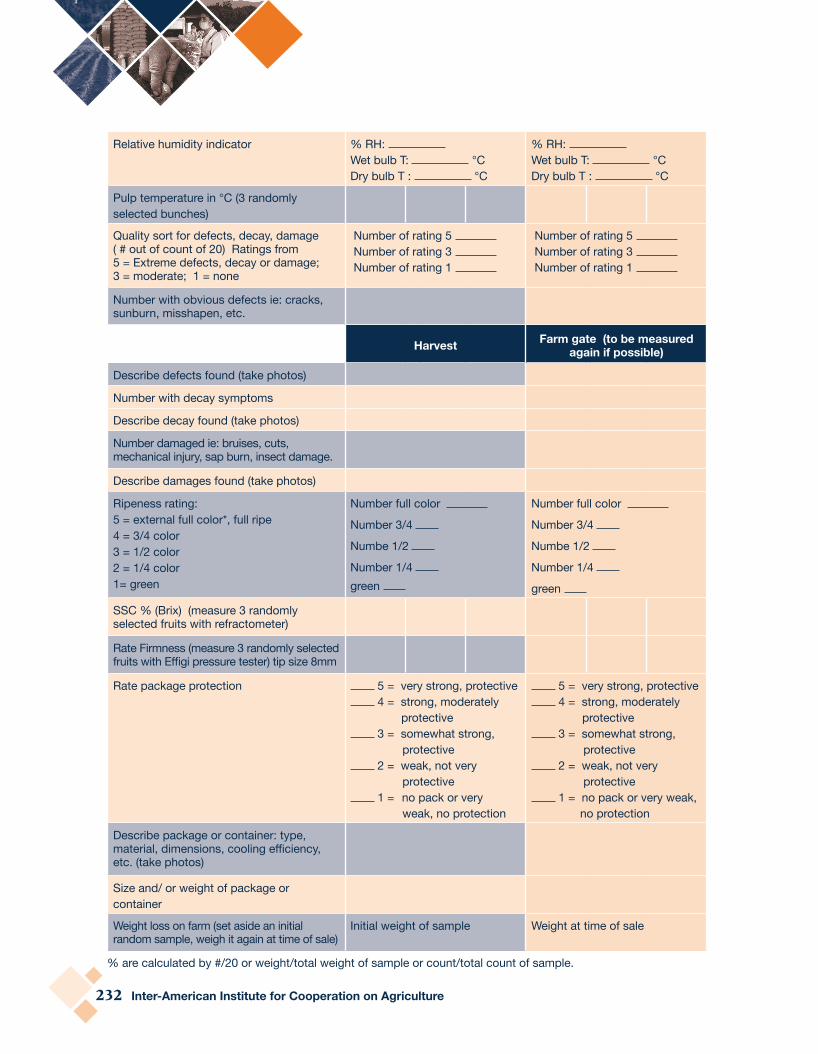
232 inter-American institute for Cooperation on Agriculture
Relative humidity indicator % RH: Wet bulb T: °CDry bulb T : °C
% RH: Wet bulb T: °CDry bulb T : °C
Pulp temperature in °C (3 randomly selected bunches)
Quality sort for defects, decay, damage ( # out of count of 20) Ratings from 5 = Extreme defects, decay or damage; 3 = moderate; 1 = none
Number of rating 5 Number of rating 3 Number of rating 1
Number of rating 5 Number of rating 3 Number of rating 1
Number with obvious defects ie: cracks, sunburn, misshapen, etc.
harvest Farm gate (to be measured again if possible)
Describe defects found (take photos)
Number with decay symptoms
Describe decay found (take photos)
Number damaged ie: bruises, cuts, mechanical injury, sap burn, insect damage.
Describe damages found (take photos)
Ripeness rating: 5 = external full color*, full ripe 4 = 3/4 color 3 = 1/2 color2 = 1/4 color 1= green
Number full color
Number 3/4
Numbe 1/2
Number 1/4 green
Number full color
Number 3/4
Numbe 1/2
Number 1/4
green
SSC % (Brix) (measure 3 randomly selected fruits with refractometer)
Rate Firmness (measure 3 randomly selected fruits with Effi gi pressure tester) tip size 8mm
Rate package protection 5 = very strong, protective 4 = strong, moderately
protective 3 = somewhat strong,
protective 2 = weak, not very
protective 1 = no pack or very
weak, no protection
5 = very strong, protective 4 = strong, moderately
protective 3 = somewhat strong,
protective 2 = weak, not very
protective 1 = no pack or very weak,
no protection
Describe package or container: type, material, dimensions, cooling effi ciency, etc. (take photos)
Size and/ or weight of package or container
Weight loss on farm (set aside an initial random sample, weigh it again at time of sale)
Initial weight of sample Weight at time of sale
% are calculated by #/20 or weight/total weight of sample or count/total count of sample.

Commodity Systems Assessment Methodology for Value Chain Problem and Project Identifi cation 233
Annex 6e. Worksheet for quantifying postharvest losses of fruits at the wholesale market.
Wholesale data collection worksheet name of data collector:
Fruit (nAme) Variety (if known ) or describe color, shape, etc.
Code: Wholesale____
Questions and observations on arrival At time of sale
Date
Name of market
Location of market
Season for (range of dates of sales at this market)
Name of destination market if known
Distance from wholesale market km Expected journey time hours
Sorting - selecting out that produce which will not be resold
Was sorting done before delivery? Yes/No
If Yes, estimate waste (discarded)
% Reason for sorting out:
Was sorting done before sale? Yes/No
If Yes, estimate waste (discarded):
% Reason for sorting out:
Size grading: is there any grading into diff erent sizes at the market?
If Yes, estimate % in each category: Large % ; Medium % ; Small %
If Yes, estimate % in each category: Large % ; Medium % ; Small %
Does price off ered vary by quality grade? Describe grading criteria: If Yes, what is the price off ered for each quality grade? Highest ; Middle ; Lowest
Expected wholesale price: Price off ered (by weight? by volume? by number of containers? ) Price per kg:
meASURementS on arrival At time of sale (to be measured again if possible)
Sample size (select random samples) count of 20 one package ( _______ = total number)
Time from harvest (if known)
Time of day
Air temperature °C °C

234 inter-American institute for Cooperation on Agriculture
Relative humidity indicator % RH: Wet bulb T: °CDry bulb T : °C
% RH: Wet bulb T: °CDry bulb T : °C
Pulp temperature in °C (3 randomly selected bunches)
Quality sort for defects, decay, damage ( # out of count of 20) Ratings from 5 = Extreme defects, decay or damage; 3 = moderate; 1 = none
Number of rating 5 Number of rating 3 Number of rating 1
Number of rating 5 Number of rating 3 Number of rating 1
Number with obvious defects ie: cracks, sunburn, misshapen, etc.
Describe defects found (take photos)
on arrival At time of sale
Number with decay symptoms ie: fungus, bacterial rots, etc.
Describe decay found (take photos)
Number damaged ie: bruises, cuts, mechanical injury, sap burn, insect damage.
Describe damages found (take photos)
Ripeness rating: 5 = external full color*, full ripe 4 = 3/4 color 3 = 1/2 color2 = 1/4 color 1= green
Number full color Number 3/4 Number 1/2 Number 1/4 green
Number full color Number 3/4 Number 1/2 Number 1/4 green
SSC % (Brix) (measure 3 randomly selected fruits with refractometer)
Rate Firmness (measure 3 randomly selected fruits with Effi gi pressure tester) tip size 8mm
Rate package protection 5 = very strong, protective 4 = strong, moderately
protective 3 = somewhat strong,
protective 2 = weak, not very
protective 1 = no pack or very
weak, no protection
5 = very strong, protective 4 = strong, moderately
protective 3 = somewhat strong,
protective 2 = weak, not very
protective 1 = no pack or very weak,
no protection
Describe package or container: type, material, dimensions, cooling effi ciency, etc. (take photos)
Size and/ or weight of package or container
Weight loss on farm (set aside an initial random sample, weigh it again at time of sale)
Initial weight of sample Weight at time of sale
% are calculated by #/20 or weight/total weight of sample or count/total count of sample.

Commodity Systems Assessment Methodology for Value Chain Problem and Project Identifi cation 235
Annex 6F. Worksheet for quantifying post harvest losses of fruits at the retail market.
Retail data collection worksheet name of data collector:
Fruit (nAme) Variety (if known ) or describe color, shape, etc.
Code: Retail
Questions and observations on arrival 6 to 8 hours after arrival
Date
Name of market
Location of market
Season for mangoes (range of dates of sales at this market)
Distance from wholesale market km
Sorting - selecting out that produce which will not be resold
Was sorting done before delivery? Yes/No
If Yes, estimate waste (discarded) % Reason for sorting out:
Was sorting done before sale? Yes/No
If Yes, estimate waste (discarded):
% Reason for sorting out:
Size grading: is there any grading into diff erent sizes at the market?
If Yes, estimate % in each category: Large % ; Medium % ; Small %
If Yes, estimate % in each category: Large % ; Medium % ; Small %
Does price off ered vary by quality grade? Describe grading criteria: If Yes, what is the price off ered for each quality grade? Highest ; Middle ; Lowest
Expected wholesale price: Price off ered (by weight? by volume? by number of containers? ) Price per kg:
meASURementS on arrival 6 to 8 hours after arrival
Sample size (select random samples) count of 20 count of 20
Time from harvest (if known)
Time of day
Air temperature °C °C
Relative humidity indicator % RH: Wet bulb T: °CDry bulb T : °C
% RH: Wet bulb T: °CDry bulb T : °C

236 inter-American institute for Cooperation on Agriculture
Pulp temperature in °C (3 randomly selected bunches)
Quality sort for defects, decay, damage ( # out of count of 20) Ratings from 5 = Extreme defects, decay or damage; 3 = moderate; 1 = none
Number of rating 5 Number of rating 3 Number of rating 1
Number of rating 5 Number of rating 3 Number of rating 1
Number with obvious defects ie: cracks, sunburn, misshapen, etc.
Describe defects found (take photos)
on arrival 6 to 8 hours after arrival
Number with decay symptoms ie: fungus, bacterial rots, etc.
Describe decay found (take photos)
Number damaged ie: bruises, cuts, mechanical injury, sap burn, insect damage.
Describe damages found (take photos)
Ripeness rating: 5= external full color*, full ripe 4= 3/4 color 3= 1/2 color2= 1/4 color 1=green
Number full color Number 3/4 Number 1/2 Number 1/4 green
Number full color Number 3/4 Number 1/2 Number 1/4 green
SSC % (Brix) (measure 3 randomly selected fruits with refractometer)
Rate Firmness (measure 3 randomly selected fruits with Effi gi pressure tester) tip size 8mm
Rate package protection 5 = very strong, protective 4 = strong, moderately
protective 3 = somewhat strong,
protective 2 = weak, not very
protective 1 = no pack or very
weak, no protection
5 = very strong, protective 4 = strong, moderately
protective 3 = somewhat strong,
protective 2 = weak, not very
protective 1 = no pack or very weak,
no protection
Describe package or container: type, material, dimensions, cooling effi ciency, etc. (take photos)
Size and/ or weight of package or container
Weight loss on farm (set aside an initial random sample, weigh it again at time of sale)
Initial weight of sample 6 to 8 hours after arrival
% are calculated by #/20 or weight/total weight of sample or count/total count of sample.

Commodity Systems Assessment Methodology for Value Chain Problem and Project Identifi cation 237
Annex 6g. Worksheet for quantifying postharvest losses of roots, tubers and bulbs on farm level.
on farm data collection worksheet name of data collector:
Root, tuber or bulb Variety (if known ) or describe color, shape, etc.
Code: Farm
Questions and observations At harvest Farm gate
Date
Location of farm
Size of farm
Crops produced
Season for (range of harvesting dates on this farm)
Name of destination market if known
Distance to market if known km Expected journey time hours
Sorting - selecting out that produce which will not be sent to the market
Was sorting done at harvest? Yes/No
If Yes, estimate waste (discarded)
% Reason for sorting out:
Was sorting done before farm gate sale? Yes/No
If Yes, estimate waste (discarded):
% Reason for sorting out:
Was curing done on the farm? If yes, estimate weight loss: %
Size grading: is there any grading into diff erent sizes on the farm?
If Yes, estimate % in each category: Large % ; Medium % ; Small %
If Yes, estimate % in each category: Large % ; Medium % ; Small %
Does price off ered vary by quality grade? Describe grading criteria: If Yes, what is the price off ered for each quality grade? Highest ; Middle ; Lowest
Expected farm gate price: Price off ered (by weight? by volume? by number of containers? ) Price per kg:
meASURementS At harvest Farm gate (to be measured again if possible)
Sample size (select random samples) count of 20 count of 20
Time from harvest hour
Time of day

238 inter-American institute for Cooperation on Agriculture
Air temperature °C °C
Relative humidity indicator % RH: Wet bulb T: °CDry bulb T : °C
% RH: Wet bulb T: °CDry bulb T : °C
Pulp temperature in °C (3 randomly selected bunches)
Quality sort for defects, decay, damage ( # out of count of 20) Ratings from 5 = Extreme defects, decay or damage; 3 = moderate; 1 = none
Number of rating 5 Number of rating 3 Number of rating 1
Number of rating 5 Number of rating 3 Number of rating 1
Number with obvious defects ie: cracks, sunburn, misshapen, shrivel, over-mature, darkening, etc.
Describe defects found (take photos)
harvest Farm gate (to be measured again if possible)
Number with decay symptoms ie: fungus, mildew, bacterial spots, rot, etc.
Describe decay found (take photos)
Number damaged ie: bruises, cuts, mechanical injury, insect damage.
Describe damages found (take photos)
Quality rating: 5 = large 3 = medium size1= small
Number large size
Number medium size
Number small
Number large size
Number medium size
Number small
Rate package protection (mark one with an X)
5 = very strong, protective 4 = strong, moderately
protective 3 = somewhat strong,
protective 2 = weak, not very
protective 1 = no pack or very
weak, no protection
5 = very strong, protective 4 = strong, moderately
protective 3 = somewhat strong,
protective 2 = weak, not very
protective 1 = no pack or very weak,
no protection
Describe package or container: type, material, dimensions, cooling effi ciency (take photos)
Size and/ or weight of package or container
Weight loss on farm (set aside an initial random sample, weigh it again at time of sale)
Initial weight of sample Weight at time of sale
% are calculated by #/20 or weight/total weight of sample or count/total count of sample.
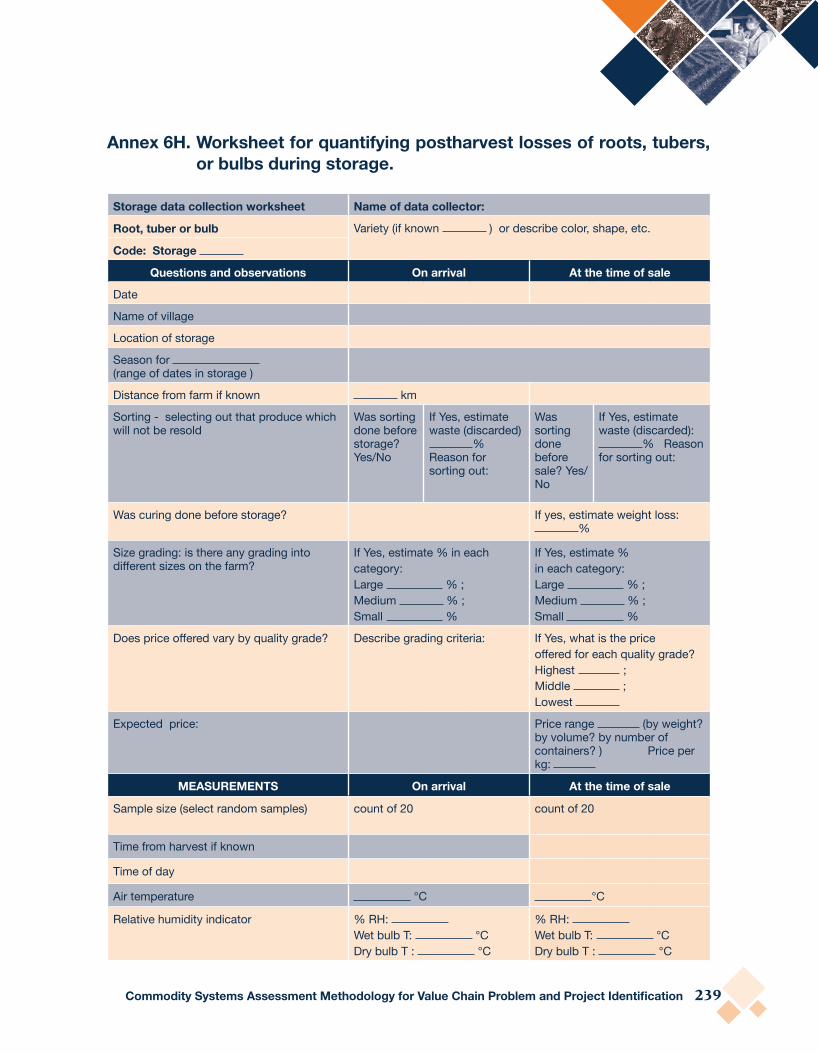
Commodity Systems Assessment Methodology for Value Chain Problem and Project Identifi cation 239
Annex 6h. Worksheet for quantifying postharvest losses of roots, tubers, or bulbs during storage.
Storage data collection worksheet name of data collector:
Root, tuber or bulb Variety (if known ) or describe color, shape, etc.
Code: Storage
Questions and observations on arrival At the time of sale
Date
Name of village
Location of storage
Season for (range of dates in storage )
Distance from farm if known km
Sorting - selecting out that produce which will not be resold
Was sorting done before storage? Yes/No
If Yes, estimate waste (discarded)
% Reason for sorting out:
Was sorting done before sale? Yes/No
If Yes, estimate waste (discarded):
% Reason for sorting out:
Was curing done before storage? If yes, estimate weight loss: %
Size grading: is there any grading into diff erent sizes on the farm?
If Yes, estimate % in each category: Large % ; Medium % ; Small %
If Yes, estimate % in each category: Large % ; Medium % ; Small %
Does price off ered vary by quality grade? Describe grading criteria: If Yes, what is the price off ered for each quality grade? Highest ; Middle ; Lowest
Expected price: Price range (by weight? by volume? by number of containers? ) Price per kg:
meASURementS on arrival At the time of sale
Sample size (select random samples) count of 20 count of 20
Time from harvest if known
Time of day
Air temperature °C °C
Relative humidity indicator % RH: Wet bulb T: °CDry bulb T : °C
% RH: Wet bulb T: °CDry bulb T : °C

240 inter-American institute for Cooperation on Agriculture
Pulp temperature in °C (3 randomly selected bunches)
Quality sort for defects, decay, damage ( # out of count of 20) Ratings from 5 = Extreme defects, decay or damage; 3 = moderate; 1 = none
Number of rating 5 Number of rating 3 Number of rating 1
Number of rating 5 Number of rating 3 Number of rating 1
Number with obvious defects ie: cracks, sunburn, misshapen, shrivel, over-mature, darkening, etc.
Describe defects found (take photos)
on arrival At the time of sale
Number with decay symptoms ie: fungus, mildew, bacterial spots, rot, etc.
Describe decay found (take photos)
Number damaged ie: bruises, cuts, mechanical injury, insect damage.
Describe damages found (take photos)
Quality rating: 5 = large 3 = medium size1= small
Number large size
Number medium size
Number small
Number large size
Number medium size
Number small
Rate package protection (mark one with an X)
5 = very strong, protective 4 = strong, moderately
protective 3 = somewhat strong,
protective 2 = weak, not very
protective 1 = no pack or very
weak, no protection
5 = very strong, protective 4 = strong, moderately
protective 3 = somewhat strong,
protective 2 = weak, not very
protective 1 = no pack or very weak,
no protection
Describe package or container: type, material, dimensions, cooling effi ciency (take photos)
Size and/ or weight of package or container
Weight loss on farm (set aside an initial random sample, weigh it again at time of sale)
Initial weight of sample Weight at time of sale
% are calculated by #/20 or weight/total weight of sample or count/total count of sample.

Commodity Systems Assessment Methodology for Value Chain Problem and Project Identifi cation 241
Annex 6i. Worksheet for quantifying postharvest losses of roots, tubers and bulbs at the wholesale market.
Wholesale data collection worksheet name of data collector:
Root, tuber or bulb Variety (if known ) or describe color, shape, etc.
Code: Farm
Questions and observations on arrival At the time of sale
Date
Name of market
Location of market
Season for (range of sales dates in this market)
Distance from farm if known km
Sorting - selecting out that produce which will not be resold
Was sorting done before delivery? Yes/No
If Yes, estimate waste (discarded)
% Reason for sorting out:
Was sorting done before sale? Yes/No
If Yes, estimate waste (discarded):
% Reason for sorting out:
Was curing done at this market? If yes, estimate weight loss: %
Size grading: is there any grading into diff erent sizes on the farm?
If Yes, estimate % in each category: Large % ; Medium % ; Small %
If Yes, estimate % in each category: Large % ; Medium % ; Small %
Does price off ered vary by quality grade? Describe grading criteria: If Yes, what is the price off ered for each quality grade? Highest ; Middle ; Lowest
Expected wholesale price: Price off ered (by weight? by volume? by number of containers? ) Price per kg:
meASURementS on arrival At the time of sale
Sample size (select random samples) count of 20 one package ( = total number)
Time from harvest if known
Time of day
Air temperature °C °C

242 inter-American institute for Cooperation on Agriculture
Relative humidity indicator % RH: Wet bulb T: °CDry bulb T : °C
% RH: Wet bulb T: °CDry bulb T : °C
Pulp temperature in °C (3 randomly selected bunches)
Quality sort for defects, decay, damage ( # out of count of 20) Ratings from 5= Extreme defects, decay or damage; 3 = moderate; 1 = none
Number of rating 5 Number of rating 3 Number of rating 1
Number of rating 5 Number of rating 3 Number of rating 1
Number with obvious defects ie: cracks, sunburn, misshapen, shrivel, over-mature, darkening, etc.
Describe defects found (take photos)
on arrival At the time of sale
Number with decay symptoms ie: fungus, mildew, bacterial spots, rot, etc.
Describe decay found (take photos)
Number damaged ie: bruises, cuts, mechanical injury, insect damage.
Describe damages found (take photos)
Quality rating: 5 = large 3 = medium size1= small
Number large size
Number medium size
Number small
Number large size
Number medium size
Number small
Rate package protection (mark one with an X)
5 = very strong, protective 4 = strong, moderately
protective 3 = somewhat strong,
protective 2 = weak, not very
protective 1 = no pack or very
weak, no protection
5 = very strong, protective 4 = strong, moderately
protective 3 = somewhat strong,
protective 2 = weak, not very
protective 1 = no pack or very weak,
no protection
Describe package or container: type, material, dimensions, cooling effi ciency (take photos)
Size and/ or weight of package or container
Weight loss on farm (set aside an initial random sample, weigh it again at time of sale)
Initial weight of sample Weight at time of sale
% are calculated by #/20 or weight/total weight of sample or count/total count of sample.

Commodity Systems Assessment Methodology for Value Chain Problem and Project Identifi cation 243
Annex 6J. Worksheet for quantifying postharvest losses of roots, tubers or bulbs at the retail market.
Retail data collection worksheet name of data collector:
Root, tuber or bulb Variety (if known ) or describe color, shape, etc.
Code: Farm
Questions and observations on arrival 6 to 8 hours later
Date
Name of market
Location of market
Season for potatoes (range of sales dates in this market)
Distance from farm if known km
Sorting - selecting out that produce which will not be resold
Was sorting done before delivery? Yes/No
If Yes, estimate waste (discarded)
% Reason for sorting out:
Was sorting done before sale? Yes/No
If Yes, estimate waste (discarded):
% Reason for sorting out:
Was curing done at this market? If yes, estimate weight loss: %
Size grading: is there any grading into diff erent sizes on the farm?
If Yes, estimate % in each category: Large % ; Medium % ; Small %
If Yes, estimate % in each category: Large % ; Medium % ; Small %
Does price off ered vary by quality grade? Describe grading criteria: If Yes, what is the price off ered for each quality grade? Highest ; Middle ; Lowest
Expected retail price: Price range (by weight? by volume? by number of containers? ) Price per kg:
meASURementS on arrival 6 to 8 hours later
Sample size (select random samples) count of 20 count of 20
Time from harvest if known
Time of day
Air temperature °C °C

244 inter-American institute for Cooperation on Agriculture
Relative humidity indicator % RH: Wet bulb T: °CDry bulb T : °C
% RH: Wet bulb T: °CDry bulb T : °C
Pulp temperature in °C (3 randomly selected bunches)
Quality sort for defects, decay, damage ( # out of count of 20) Ratings from 5 = Extreme defects, decay or damage; 3 = moderate; 1 = none
Number of rating 5 Number of rating 3 Number of rating 1
Number of rating 5 Number of rating 3 Number of rating 1
Number with obvious defects ie: cracks, sunburn, misshapen, shrivel, over-mature, darkening, etc.
Describe defects found (take photos)
on arrival 6 to 8 hours later
Number with decay symptoms ie: fungus, mildew, bacterial spots, rot, etc.
Describe decay found (take photos)
Number damaged ie: bruises, cuts, mechanical injury, insect damage.
Describe damages found (take photos)
Quality rating: 5 = large 3 = medium size1= small
Number large size
Number medium size
Number small
Number large size
Number medium size
Number small
Rate package protection (mark one with an X)
5 = very strong, protective 4 = strong, moderately
protective 3 = somewhat strong,
protective 2 = weak, not very
protective 1 = no pack or very
weak, no protection
5 = very strong, protective 4 = strong, moderately
protective 3 = somewhat strong,
protective 2 = weak, not very
protective 1 = no pack or very weak,
no protection
Describe package or container: type, material, dimensions, cooling effi ciency (take photos)
Size and/ or weight of package or container
Weight loss on farm (set aside an initial random sample, weigh it again at time of sale)
Initial weight of sample Weight at 6 to 8 hours later
% are calculated by #/20 or weight/total weight of sample or count/total count of sample.
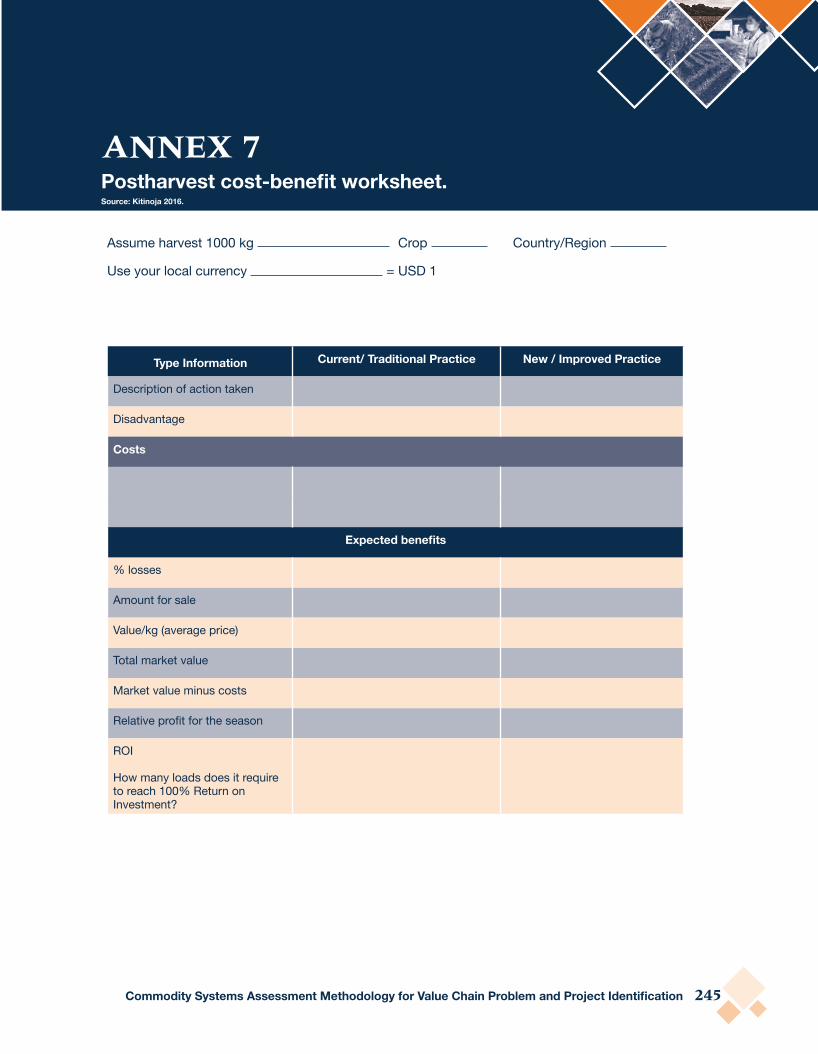
Commodity Systems Assessment Methodology for Value Chain Problem and Project Identifi cation 245
Assume harvest 1000 kg Crop Country/Region
Use your local currency = USD 1
type information Current/ Traditional Practice New / Improved Practice
Description of action taken
Disadvantage
Costs
Expected benefi ts
% losses
Amount for sale
Value/kg (average price)
Total market value
Market value minus costs
Relative profi t for the season
ROI
How many loads does it require to reach 100% Return on Investment?
ANNEX 7 Postharvest cost-benefi t worksheet. Source: Kitinoja 2016.

Printed at IICA Print Shop
IICA Headquarters, San Jose, Costa Rica
Press Run: 100 copies

Com
modity System
s Assessment M
ethodology for Value Chain Problem
and Project Identification
Inter-American Institute for Cooperation on Agriculture
Headquarters. P.O. Box 55-2200San Jose, Vazquez de Coronado, San Isidro11101 - Costa RicaPhone: (+506) 2216 0222 / Fax: (+506) 2216 0233e-mail: [email protected]: www.iica.int
By Jerry La GraCo-authors:Lisa KitinojaKarol Alpízar
CommodIty SyStemS
ASSeSSment methodoLoGy for Value Chain Problem
and Project Identification A first step in food loss reduction