commodity - 0 mari
44
COMMODITY 0 MARI<ETS M A Y ANDTHE DEVELOPING COUNTRIES vol.H b. 3 Regionalism boosts agricultural trade Oil pricesfall-finally Coffee pricessurge Metalspricesrebound .1._ -- ## |S S ,~~~~~~~~~~~~~~~~~~ Public Disclosure Authorized Public Disclosure Authorized Public Disclosure Authorized Public Disclosure Authorized Public Disclosure Authorized Public Disclosure Authorized Public Disclosure Authorized Public Disclosure Authorized
-
Upload
khangminh22 -
Category
Documents
-
view
2 -
download
0
Transcript of commodity - 0 mari

COMMODITY0 MARI<ETS M A Y
ANDTHE DEVELOPING COUNTRIES
vol.H b. 3
Regionalism boosts agricultural trade
Oil prices fall-finally
Coffee prices surge
Metals prices rebound
.1._--##
|S S ,~~~~~~~~~~~~~~~~~~
Pub
lic D
iscl
osur
e A
utho
rized
Pub
lic D
iscl
osur
e A
utho
rized
Pub
lic D
iscl
osur
e A
utho
rized
Pub
lic D
iscl
osur
e A
utho
rized
Pub
lic D
iscl
osur
e A
utho
rized
Pub
lic D
iscl
osur
e A
utho
rized
Pub
lic D
iscl
osur
e A
utho
rized
Pub
lic D
iscl
osur
e A
utho
rized

CONTENTS AND SUMMARY
SUMMARY PAGE 4 in Cote d'Ivoire, a sizable deficit is still pro-
jected for 1996/97. Prices are responding to
SPECIAL FEATURE the deficit forecast, though large stocks will
_ REGIONALISM AND AGRICULTURAL prevent prices from rising too rapidly.
TRADE PAGE 6 * COFFEE PAGE 14
Regionalism is on the rise, and agricultural Coffee prices are up-36% for arabica and
trade is affected more dramatically than man- 8% for robusta. Fueling the rise are low lev-
ufactures trade. When Greece, Portugal, and els of stocks, expected low production in
Spain joined the EC, agricultural trade Brazil and Colombia, and futures purchases
increased. If Eastern European countries are by speculative funds.
admitted to the EU, their agricultural exports * TEA PAGE 15
are likely to increase more than manufactures. Prices increase sharply in response to tghtsupply and strong demand. Extremely dry
MANAGING COMMODITY weather in Africa hurts production in most
PRICE RISK tea growing countries, particularly Kenya.
* WAREHOUSE RECEIPTS-BASED LENDING Demand continues strong in major import-
IN VENEZUELA PAGE 8 ing countries.
Warehouse receipts-based lending has been
used in Venezuela since the 1 930s, but recent FOODmarket reforms have given new life to this FATS AND OILS
type of inventory-based collateral. * FATS AND OILS PAGE 16
Improved crop prospects for soybeans and
ENERGY rapeseed lead to an upward adjustment in
* COAL PAGE 9 the USDA estimate of world oilseed produc-
US prices weaken because of mild weather tion. An even greater increase in demand is
CHANGE IN QUARTERLY and high utility stocks. Real prices are expect- expected to reduce oilseed ending stocks toAVERAGES,4Q96TO1Q97. ed to decline over the longer term as several 28 days of use.Percent
E:nergy - low-cost suppliers increase production and * COCONUT OIL PAGE 16Nonenergy +7.8 force other producers to boost productivity. Production is expected to return to normal
Totae agnculture +2757 * NATURAL GAS PAGE 9 after plunging some 430,000 tons last year.
Total food +4.9 USgaspricesfallbecauseofmildwinterweath- Prices should return to 1996 levels.
Grainis +435 er and an improved supply-demand balance. * PALM OIL PAGE 17Other +6.4 Demand for storage injections and for power Despite an 8% increase in production over
Rawmaterals +0.7 generation should keep prices firm this sum- last year, stocks decline an unexpected 16%,
Fertilizer + 1.0 mer. In Europe gas prices hold because of lags reflecting strong demand from China. GoodMetals and minerals +8.7 in contract price indexation with oil products. prospects for continued growth will keep
* PETROLEUM PAGE 10 Malaysia the leading palm oil producer.
Mild weather and increased supply cause a * SOYBEAN OIL PAGE 17
sharp price drop. Large increases in non- Improved yields-especially in South
OPEC supplies are expected to outstrip America-boost world soybean production
growth in demand this year, leading to lower to almost 144 million tons. Demand is
prices. Though inventories should rise, the expected to grow even faster, depressing
industry will be reluctant to build stocks with- stocks to their lowest levels in 20 years.
out a financial incentive.
GRAINS
BEVERAGES * GRAINS PAGE 18
* COCOA PAGE 14 Prices increase on higher than expected con-
Despite improved forecasts for the main crop sumption and concerns for next year. Some
2 COMMODITY MARKETS AND THE DEVELOPING COUNTRIES

CONTENTS AND SUMMARY
rebuilding of stocks reduces prospects for * RUBBER PAGE 23
higher prices. INRA III comes into force. Thailand boosts* MAIZE PAGE 18 its intervention price. An Indonesian group
Prices recover from their harvest lows, but takes over rubber plantations in Cameroon.
further increases will depend on the US crop. * TIMBER PAGE 24
If US farmers' planting intentions are real- Prices of tropical hardwood logs are on the
ized and yields are normal, prices could be skids because of sluggish demand. Non-
heading lower by early summer. tropical timbers are taking over more of the
* RICE PAGE 19 market from tropical timbers.
World import demand is expected to fall to17.4 million tons in 1997 from the high of FERTILIZERS21.0 million tons in calendar 1995. The resul- * FERTILIZERS PAGE 24
tant weakening of world prices could make A new IFPRI report concludes that the world
exports from India and some other countries will have the capacity to produce between 147
uncompetitive. and 163 million tons of fertilizer nutrients in* WHEAT PAGE 19 2000 but will need to increase capacity by an
Prices are strong, but record or near-record additional 51 million tons between 2000 andcrops in Argentina and Australia should cap 2020 to meet projected effective demand.
price increases. Major exporting countries * POTASSIUM CHLORIDE PAGE 25have rebuilt stocks, which should further Negotiations on contract prices between
limit price increases. major exporters and importers for the firsthalf of 1997 end with prices unchanged from
OTHER FOOD those in the second half of 1996. Lower world
* BANANAS PAGE 20 potash production and weak imports by
Prices continue to climb. WTO panel rules China and India in 1996 account for the
against the EU banana regime, according to weak prices. Producers expect better sales inpress reports. 1997.
* SHRIMP PAGE 21 * TSP PAGE 25Prices stay high as supplies from Asia remain TSP and DAP prices fall slightly, but recentlow. Many Asian suppliers have been hurt by increases in grain prices should supportthe US embargo and by disease on shrimp phosphate use. Prices for phosphate rock
farms. were up about $3/ton in 1996, and further
* SUGAR PAGE 21 increases are expected.
Prices hold as the market receives offsetting * UREA PAGE 26
news. Russia and Ukraine pursue protective Prices weaken during the quarter on
policies. US legislators propose important prospects of sharply lower imports by China.reforms to the US sugar program. The Chinese government raises import taxes
and duties in an apparent effort to lowerAGRICULTURAL RAW imports to accommodate increased domestic
MATERIALS production.* COTTON PAGE 22
Prices rise a modest 4% over the last quarter. METALS AND MINERALSUnexpectedly high cotton shipments to * ALUMINUM PAGE 26
China boosted its imports last season by 2 Improved consumption in the US, Europe,
million tons. China now holds almost half of andJapan and interest from funds and spec-
world stocks. Developing countries are ulators are pushing up prices. Stocks haveincreasingly using futures and options as risk been drawn down despite rising production,management tools. provoking bullish sentiments in the market.
MAY 1997 3

* COPPER PAGE 27 ing the quarter, with much of the increase
Cash prices settle around $2,400-$2,500/ coming from Norway and Mexico and other
ton. Backwardation narrows, and stocks Latin American countries. Although it was
tighten. up, non-OPEC production was up less than
* GOLD PAGE 28 expected because of bad weather and techni-
Prices fall to $351/toz for the quarter, from cal delays. Warm weather in OECD countries
$376/toz the previous quarter, as the market kept world crude oil demand increases below
faces a stream of bad news. European central expectations. Demand grew more rapidly in
bank selling increases as countries try to non-OECD countries.lower their debt to GDP ratios in preparation Agricultural prices rose 7.7% for the quar-
for European monetary union. Demand also ter after falling an equal amount the two pre-
falls in most of Asia and the Middle East. vious quarters. Nearly all agricultural sectors* IRON ORE AND STEEL PAGE 28 joined in the upswing. Arabica coffee expe-
Australian and Brazilian producers receive a rienced the largest price boost, soaring
1.1% increase in iron ore prices. US demand 35.0% following lower production in Brazil
continues strong. Prices increase modestly in and Colombia. Rising demand in Brazil is
US, Europe, and Asia for some steel products. also leaving less coffee for export. Colombia
experienced a sharp decline in productionCOMMODITY PRICES because of low world prices and an appreci-* COMMODITY PRICE INDICES PAGE 5 ating currency caused by rising oil export
* COMMODITY PRICE OUTLOOK PAGE 29 revenues.
Food prices were also higher, with the
SUMMARY index up 5.0%. Reasons for the increase are
Energy prices fell in response to mild unclear. Prices were up 3.8% for grains, 4.5%weather and supply increases from both for fats and oils, and 6.4% for other foods.
OPEC and non-OPEC suppliers. Nonenergy Much of the increase in grain prices reflect-prices rose 7.8% in a broad-based increase to ed a rebound from the sharp declines overwhich all major components of the price the previous several months. The increase inindex contributed. Agricultural prices were fats and oils prices was driven by rising soy-up 7.7%, led by a 21.5% upturn in beverages bean prices and tight stocks, while other food
as supply disruptions occurred in Brazil and prices were led by sharply higher bananaColombia. Metals and minerals prices were prices. Food prices should decline over the
up 8.7%, driven by sharp increases for alu- coming months as supplies of the new north-
minum and copper. ern hemisphere crops begin to reach theEnergy prices may finally be heading down market. A poor harvest, however, would
as a mild winter ended the tight supply- almost certainly drive prices higher.
demand balance that had persisted for many Metals and minerals prices rose 8.7%,months. Inventories have been partly rebuilt, continuing the rally that began in the fourth
and both OPEC and non-OPEC supplies are quarter of 1996. Prices were 11.7% higher for
projected to grow. Non-OPEC supplies aluminum, 12.4% for copper, and 14.1% for
should increase strongly throughout the year, zinc. Higher demand in Europe, Japan, andreducing prices and building up stock levels. the US helped drive up prices, with an assist
OPEC production rose during the quarter in from rising residential construction and
all member countries, averaging 2 mb/d industrial output. European demandabove quota; higher production from Iraq appears strong, leading to sharply higher
under the UN's six-month oil-for-food pro- prices in local currency. Demand has showngram accounted for much of the increase. less strength in Asia than in Europe or the USNon-OPEC production rose 0.32 mb/d dur- and is expected to weaken.
4 COMMODITY MARKETS AND THE DEVELOPING COUNTRIES

COMMODITY PRICE INDICES
FIGURE 1. WEIGHTED INDEX OF PRIMARY COMMODITY PRICES FOR LOW- AND MIDDLE-INCOME
ECONOMIES
ENERGY (CRUDE OIL)-: NONENERGY COMMODITIESlnde cxrren t,rx(1990=10,0) 'nex crrentUS4nIsrs (990-I -.0)-
15 130 : ; 0 1 i52 :t fh f00 125:
-130
110~~~~~~~~~~~~~~~~~~~1
96:: MR ,,0070
50 90
85
.- 83 848586 87 8889 90 9 92 93 9495 96 97 83 84 8S 86 87 88 89 90 91 92 93 94 95 96 97
TOTAL FOOD MFTALS AND MINERALS
140
120
1990=100~~~~~~~~~~~~~~~~~1
'too
~~~~~~~80~~~~~~~~~~870~~~~~~~~~~~~~~~~~7
83 84 8 5 86 87988889 90 91 92 93 94 195 :96 97 83; 84 85 86 87 88 89 90 9! 92 939495 96i97
TABLE I. WEIGHTED INDEX OF PRIMARY COMMODITY PRICES FOR LOW- AND MIDDLE-INCOME
ECONOMIES IN CURRENT DOLLARS1990= 100
Agriculture
Nonenergv Food Raw moterials Metalscommod- Total agH- Total Fats Other Total row and
Energy ities culture Beverages food and oils Groins food mratenols Timber Fertilizers minercis(100)1 (100) (69.1) (16.9) (29.4) (10. 1) (6.9) (12.4) (22.8) (9.3) (2.7) (28.2)
Annual1994 69.4 1 11.6 123.3 148.8 106.8 125.9 102.1 93.9 125.8 156.6 93.4 84.61995 75.1 122.2 131.3 151.2 116,9 136.6 120.4 98.8 135.2 139.5 103.6 101.61996 89.3 1 15.1 125.5 126.5 123.6 147.0 140.6 95.0 127.1 139.5 1 19.8 89.1
Quarterly1 996Q I 80.0 1 17. 1 1 26.2 124.0 124.8 142.6 147.1 97.8 129.7 135.5 116.2 94.71996Q2 84.8 119.4 130.3 131.3 129.7 150.1 157.2 97.6 1 30.3 141.4 1 18.9 92.81996Q3 90.8 113.1 124.7 126.6 123.2 147.7 139.6 94.0 125.2 141.1 121.1 83.81996Q4 101.4 110.7 120.7 124.0 1 16.8 147.8 118.4 90.5 123.3 139.9 123.0 85.11997QI 91.8 119.3 130.0 150.6 122.6 154.5 122.9 96.3 124.2 140.0 124.2 92.5
Monthly1996 Mar 84.8 117.2 126.2 124.8 124.9 140.2 150.4 98.0 128.9 137.5 1 18.7 95.01996 Apr 90.3 120.0 130.2 129.1 131.2 151.5 156.7 1 00.2 129.8 141.1 118.7 95.21996 May 83.3 121.2 131.7 134.1 130.8 152.0 161.3 96.3 131.0 142.1 1 18.7 95.91996Jun 80.9 1 17.0 129.0 130.7 127.1 146.7 153.5 96.3 130.2 140.8 1 19.2 87.41996Jul 85.6 1 14.0 125.8 126.8 125.0 143.2 150.3 95.8 126.3 140.5 1I19.7 84.21996Aug 89.3 113.6 125.2 129.4 123.3 147.2 141.2 93.8 124.4 140.7 121.1 84.41 996 Sep 97.3 111.7 123.1 123.7 121,4 152.7 127.3 92.5 124.8 142.2 122.5 82.819960ct 103.2 109.9 121.1 126.6 1 16.1 145.4 120.0 89.9 123.4 142.4 123.0 81.31996Nov 97.9 111.6 121.3 125.3 116.9 147.8 117.4 91.3 124.2 141.6 123.0 86.61996 Dec 103.2 1 10.7 119.7 120.1 117.4 150.2 117.9 90.3 122.4 135.8 123.0 87.41997Jan 101.5 1 15.0 124.2 129.4 121.4 152.0 123.7 95.1 123.8 139.0 124.5 91.61997 Feb 89.3 1 19.1 130.0 151.3 122.2 153.9 122.6 96.0 124.2 140.2 124.1 92.11997 Mar 84.5 123.6 135.8 171.1 124.1 157.5 122.4 97.7 124.7 140.9 124.1 93.7
a. Crude oil index.Note: Weighted by average 1987-89 export values for low- and middle-income economies,Source: World Bank, International Economics Department, Commodity Poaicy and Analysis Unit.
MAY 1997 5

SPECIAL FEATURE
REGIONALISM AND The impact on EC9 exports to Greece is
AGRICULTURAL TRADE similar (figure 3). The share of EC9 agricul-
Since the late 1980s a reinvigorated tural products in Greece's agricultural
regionalism has emerged in many parts of importsjumped from 31% in 1980 to 56% in
the world. Integration within Europe inten- 1981. The share continued to rise, reaching
sified in the early 1990s when EC countries more than 70% by the 1990s. Once again, the
removed many of the obstacles to the move- picture was quite different for manufactures.
ment of goods and services within the region. The EC9's share in Greece's manufacturing
Recently, the renamed European Union imports remained unchanged at aroundadmitted Austria, Finland, and Sweden and 60%. Trade patterns following the accession
began moving toward monetary integration. of Spain and Portugal in 1986 reveal similar
Under the North American Free Trade trends.Agreement (NAFTA) signed in December To see how regional integration affects
1992, Canada, Mexico, and the US agreed to agriculture and manufacturing trade, we
abolish tariffs and nontariff barriers by 2009. used a simple computable general equilibri-
Asia's attempts to form free trade areas um (CGE) model to test two propositions:
and other economic unions have been gain- the impact of regional integration is stronger
ing momentum as well. In 1990 Premier when the initial degree of protection is high-Mahathir of Malaysia recommended that er and when the initial degree of product dif-
Asian countries form their own economic ferentiation is lower. Taken together, the two
bloc, to counter possibly adverse effects of propositions predict that the impact of
economic integration outside of Asia. In the regionalism will be larger on agriculturalBogor Declaration of 1994 members of Asia- trade than on manufacturing trade because
Pacific Economic Cooperation (APEC) the initial level of protection is greater and
agreed to make trade and investment free the degree of product differentiation is
and open for industrial countries by 2010 smaller for agricultural products.and for developing countries by 2020. What is the intuition behind these propo-
sitions? Suppose that EC9 countries haveEC EXPANSION AND AGRICULTURAL TRADE imposed high tariffs on commodity A and
To see what happens to trade flows when low tariffs on commodity B. Before Greece is
a regional economic union expands, we admitted to the EC, Greece's exports of com-
examined the accession of Greece to the EC modity A, like those from the rest of thein 1981 and that of Spain and Portugal in world, are subject to the high tariff. But when
1986. Sufficient time has now elapsed to Greece is admitted, the high tariff is lifted.show the full impact of that regional Greece then has a big advantage over the rest
integration.A brief look at the data reveals that agri- FIGURE 2. GREEK EXPORTS TO EC9
cultural trade is affected more dramatically Share in total EC9 imports
than trade in manufactured goods. Before 1.5 Agculture
Greece joined the EC in 1981, its share in AEC9 agricultural imports had been around
0.6% for more than a decade (figure 2). But 0.9
once Greece was admitted to the EC, its sharebegan to increase sharply. By the end of the 0.6
1980s Greece's share was more than double 0.3
its pre-accession level. Manufactures tradeshowed no such remarkable increase in its 6.0 0 r 985 990 1995
i970 17 90 18 90 19
share of intraregional trade. Source: Goto 1997.
6 COMMODITY MARKETS AND THE DEVELOPING COUNTRIES

SPECIAL FEATURE
of the world. For commodity B, however, lift- A PREDICTION
ing the tariff does not give Greece much of Having established the mechanisms
an advantage because the rate is very low to underlying trade flows after integration, westart with. Since trade barriers imposed on can speculate on the impact of future region-
agricultural products are generally higher al integration. For example, if Eastern
than those imposed on manufacturing prod- European countries are admitted to the EUucts, the impact of regionalism on agricul- their exports of agricultural products would
tural trade should be stronger. likely increase more than their exports ofWhat about the impact of product differ- manufactured goods. Similarly, if APEC
entiation? Consider a highly differentiated countries free up their trade regimes, agri-
product like automobiles. Small price differ- cultural trade among members is likely to
ences may not affect a consumer's decision increase substantially. But such an increaseabout which car to buy. A price decline fol- in agricultural trade within the region can
lowing a tariff reduction would not increase result from a shifting of trade volume in favor
demand for the exported product very of member countries (trade diversion) asmuch. But if the product is nearly homoge- well as from a genuine increase in trade vol-
neous (and therefore consumers care only ume (trade creation). In fact, recent increas-about price), the impact of a price decline is es in intra-EU agricultural trade were
tremendous. Because agricultural products achieved at the expense of imports from
are generally less differentiated than manu- North America and Africa.factures, the impact of regionalism on agri- Certain highly differentiated agricultural
cultural trade should be stronger. commodities are less likely to be affected byFurther, regional integration has differ- the progress of regional integration. For
ent impacts on different agricultural prod- example, rice in the Japanese market is high-ucts, depending on the degree of product ly differentiated. In fact, contrary to the pop-differentiation (figure 4). Plotting the trade ular belief in Japan that domestic riceshares of old members (EC9 countries) and production will be wiped out when thethose of Greece before and after integration Japanese rice market is liberalized, our simu-reveals that less differentiated goods, such as lations suggest that partial liberalization of thecereals and fats and oils, are less affected by Japanese rice market under the APEC free
integration than more differentiated prod- trade agreement will have a relatively smallucts, such as fruits and vegetables and bever- impact. Total liberalization, however, will pro-
ages and tobacco. foundly affectJapanese rice production.
FIGURE 4. CHANGE IN SHARES OF EC9's IMPORTSFROM GREECE, BY COMMODITY
FIGURE 3. EC9'S EXPORTS TO GREECE Percent
Share in total Greek imports 5
80 * Before accession
70 Mannufacture 4 * After accession
60, 3 For more detail on this arti-
so | 2 cle and the CGE model, see
40 l - - _ i J. Goto, 1997, "RegionalEconomic Integration and
30 }~ _ Agricultural Trade," World
Ageculture 0 Bank, International20 Agncufture Cerea Fats and oils Fruits and Beverages Manufacture
1970 1975 1980 1985 i990 1995 egetabres and tobacco Economics Department,Source: Goto 1997, Source: Goto 1997. Washington, D.C.
MAY 1997 7
MANAGING COMMODITY PRICE RISK
WAREHOUSE RECEIPTS-BASED LENDING IN VENEZUELAIn the last issue of Commodity Markets wzd Despite the long history and strong
the Dc�ek�ping Countries, we distussed how legal basis for inventory-based collateral in
warehouse receipts can facilitate the use of Venezuela, however, government inter-
inventories when financing commodity ventions and monopolies in cocoa and
trade and production. When domestic coffee displaced incentives for storage, so
markets for commodities and for storage the method fell into disuse. With the
work well, and when they are backed by reforms in coffee and other agriculturalappropriate laws and regulations, stored markets initiated at the beginning of the
commodity inventories can provide secure decade, warehouse-receipt lending in
and easily liquidated collateral for finan- Venezuela has staged a comeback.cial institutions. In turn, the reduced risks In the coffee industry, inventory-based
for the lender can lead to better access and lending is becoming an increasinglycheaper credit for the industry and lower attractive alternative to letter-of-
costs. In this issue, we look at how invento- credit-based financing. Venezuela pro-
ry financing works in Venezuela duces about 1.5 million bags of
In Venezuela the legal basis for lend- high-quality arabica coffee and exportsing against warehouse receipts dates to about 30% of it. FonCafe, until 1991 agov-
1936. Two documents, the cert�jficado-de eminent monopoly, now markets about
deposito and the bono de prenda, together 8% of the crop but will soon withdraw
provide an effective way of collateralizing from marketing altogether. (It will, how-inventories, performing the same eco- ever, stay in the hulling business, where it
nomic function as US-style warehouse retains, an 82% share of the market.)receipts. The certificado is a claim identi- Although seven finns control nearly 80%
tying the quantity and quality of goods of the market, some 123 firms now coin-
stored, while the bono reassigns owner- pete in the domestic market. About 18
ship. Once ownership has been reas- firms, including cooperatives and large
signed, creditors who present the farmers, operate in the export market
warehouse manager with a valid certifica- Although both domestic and interna-
do de deposito can take possession of the tonal trade are financed using letters of
inventory with two days notice. The origi- credit, inventory-financing (pig7wracion) is
nal depositor of the inventories-the per- becoming increasingly popular for domes-
son to whom the certificado was tic trade. Coffee is placed into stornge, and -
issued-has those two business days to certificados and bonos are issued. Banks
challenge the claim. When commodity then lend directly against the documents
markets are liquid, the cost-in time and at8O-90% of the marketvalue of the inven-
money-of recovering collateral against tories. The inventories are stored with pro-
bad debt is minimal. Further, when par- ducers and processors as well as in
ticipants have access to futures and third-party warehouses. Two domestic
options markets, the value of the collater- Banks, Banco Provencial and Banco
al can be guaranteed by hedging the Caribbean, provide most of the inventory-
underlying price, based lending.
8 COMMODITY MARKETS AND THE DEVELOPING COUNTRIES

ENERGY
COAL NATURAL GAS 3.82YEARLY (US dollrs/mnt) 3.D^5EC Us coal prices
56.50 US thenrml, fo.b. Hampton 3. 0 96fl .67 n56.50 Roads, Norfolk. fell 9.6% and
i.5 ~~~~~~natural gas prices| \ ._ 0 / \ 19.5% because
48.50 80 85 90 95I 984 (US doitcrs/mmbtu) of mild winterSpot, Henry Hub,I \ ALPoauisiana', ' / \ weather. Inven-
tories of both43.10 2.23 _ fuels also1980 AR
37 80 96 increased, which197
could signal fur-36.)7 36.481987 3 994 4.89 ther weakness.
SEP MAR96 97 Crude oil prices
HIGHER UTILITY STOCKS WEAKEN US PRICES MILD WEATHER LOWERS PRESSURE ON INVENTORIES fell 9.5%.
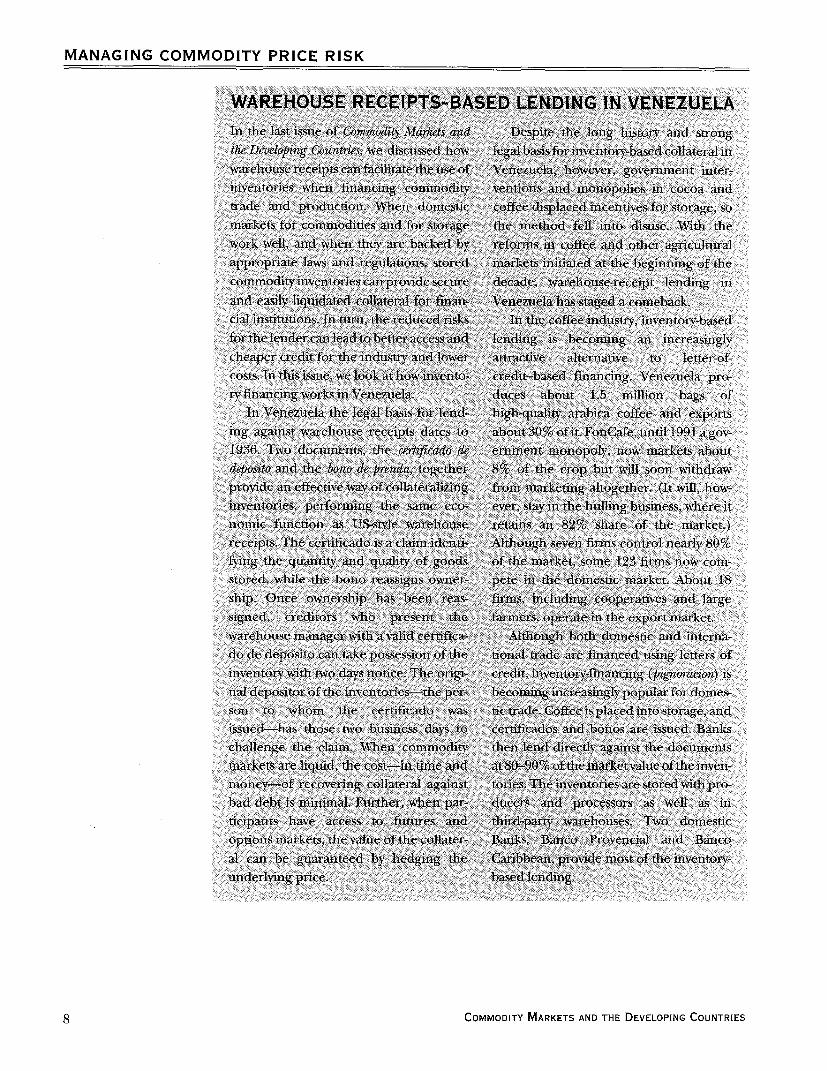
US coal prices softened in the first quarter US natural gas prices fell sharply from /990 = /00 f014
as mild winter weather reduced consumption. their highs in mid-January as mild winter Q4Electric utilities ended the winter with unusu- weather reduced consumption and removedally large stockpiles and so will defer spring much of the pressure on inventories. A late
purchases for the summer air conditioning winter cold spell firmed prices only slightly, 18
season. Thus prices could soften further in the evidence of a much-improved gas supply- /1996 1997
second quarter, particularly for low-sulfur demand balance. While lower gas prices stim- Q3 Qcoals. ulated some fuel-switching to gas from 84986
For the past year low-sulfur coal has been residual fuel oil, the net effect on demand Q2more available than high-sulfur grades, partly was downward.because low-priced emission credits have The winter weather reprieve improved
enabled power companies to offset the burning gas inventories. Low stores last year had keptof high-sulfur fuel. As a result, expected boiler prices high throughout much of 1996.modifications or scrubber retrofits have been Because of weak demand this winter, storage
delayed. Companies are showing some reluc- levels ended the first quarter some 25% high-tance to invest in new capital equipment in the er than the depleted level of 755 billion cubic
face of increased competition arising from feet (Bcf) a year earlier. Storage levels are
deregulation of the electric power industry,. also higher than they were at the same timeUS coal demand is expected to increase in 1993 and 1994.
modestly this year and next, mainly for power The improved inventory situation will havegeneration, which accounts for 83% of US a moderating influence on prices, giving oper-domestic coal consumption. Production is ators more flexibility during the injection sea-expected to outstrip supply, with all the gains son. Nevertheless, inventory levels are still lowcoming in the western regions as output con- by historical standards, so the demand for
tinues to decline in Appalachia and the inte- storage injections should support prices thisrior. Exports are expected to edge higher, but spring. During the summer months demandprices should soften. for power generation and for further storage
Steam coal negotiations for 1997 between injections should provide a floor for prices at
Japanese utilities and Australian, Canadian, around $1.85 per million Btus (mmbtu). By
and Indonesian suppliers were settled at the onset of winter storage levels are expected
around $2/ton discount to last year's prices. to up near 3,000 Bcf, their normal level inUS west coast shippers were holding out for recent years with the exception of 1996.
better deals, given strong domestic demand With gas deliverability in the US improv-
for western coal. ing, only modest increases in prices are
MAY 1997 9

ENERGY
expected heading into winter. Barring PETROLEUM 2361 2362
unforeseen circumstances and assuming (US dollors/bbl) 96 96
normal weather, prices should remain rela- Dubai,ondWestTexGsIntermed,ote.
tively low next winter and into the medium
term. Bottlenecks for western gas moving 2066
eastward are being gradually removed, and APR96
increased pipeline capacity from Canada will
be completed next year. The resurgence last
year in offshore gas exploration and devel- 40 i933
opment in the Gulf of Mexico is expected to 30 MAR
lead to new supplies in 1997 and 1998, allow- JUN 2096 2
ing US gas production to climb steadily over * -5 10
the period.
The use of salt cavern storage and mar-keting hubs along major pipeline systems has PRICES FALL SHARPLY AND FURTHER DECLINES ARE
enabled storage owners to maintain lower EXPECTED
stocks than in the past. In the gas-producing Oil prices fell sharply during the firstregions, in particular, salt cavern storage quarter due largely to mild weather and sup-allows increased turnover of gas inventories, ply increases from both OPEC and non-effectively reducing required levels of stor- OPEC sources. The year opened with high
age. prices, tight supplies, and low stocks, but the
In Europe gas prices have changed little mild winter quickly improved the supply-despite lower oil prices because of price demand balance. Non-OPEC supplies areindexation lags with petroleum products for projected to increase strongly throughout
long-term gas contracts. By summer the the year, tilting the balance into surplus and
effects of lower oil prices should start to show bringing down prices-a contrast with last
up in European border prices for gas. Thus year's "failure of expectations" of supplies
sellers benefited from high prices this winter, (from non-OPEC sources and from Iraq).when seasonal demand is highest. OPEC production rose 0.8 million barrels
Gas demand has continued to grow a day (mb/d) during the first quarter. More
strongly in Europe. Cold weather, rising than half the increase was from Iraq underdemand for power generation, and contin- the UN's six-month $2 billion oil-for-foodued conversion of residential heating systems program (table 2). Iraq's output averaged 1.1are all contributing to the rising share of gas mb/d in the first quarter, slightly below itsin the European energy balance. Germany OPEC quota level of 1.2 mb/d. Productionhad 800,000 conversions to gas in 1996, the rose in all OPEC countries, and total crude
highest number in Europe. oil production averaged 2 mb/d aboveGas began flowing into Europe last year quota. All OPEC members but Iraq were
from several new projects-from Russia's above quota, including Saudi Arabia and
"Yamal" project, from Algeria via the Kuwait (including their half shares of
Maghreb pipeline, and from Norway's Troll Neutral Zone production and deducting
field. Gas from these three countries will con- 0.15 mb/d of Saudi offshore Abu Safa pro-stitute 45% of the European gas market in duction, whose proceeds go to Bahrain).
1997. In late 1998, when the Interconnector Venezuela was the largest over-producer, atpipeline is completed, spot gas from the lib- nearly 0.8 mb/d above its agreed ceiling.eralized UK market will begin flowing into Nigeria was 0.4 mb/d above quota, followedthe heart of Europe. This will be the initial by Saudi Arabia at 0.1 mb/d (excluding its
penetration of competitively priced gas. production for Bahrain).
10 COMMODITY MARKETS AND THE DEVELOPING COUNTRIES

ENERGY
The large increase in OPEC production prices. This uncertainty has likely been theprompted speculation about whether the main reason why adjustments to quotas have
organization will adjust quotas at its June been continually deferred. A strong marketmeeting. The adjustrnent would have to be last year allowed OPEC to set aside the quota
more than a simple upward adjustment for issue, but it is unclear whether this year'seach country because Venezuela and Nigeria potentially weak market will prompt actionare already disproportionately above quota, on quotas. The uncertainty about Iraq couldand Venezuela's output is expected to rise lead to continued avoidance of any actionssteadily in the near term. Production from on quotas.
the Gulf countries (excluding the resump- Non-OPEC production rose 0.32 mb/dtion of output from Iraq and Kuwait) has in the first quarter, with much of the increaserisen only slightly since the Gulf war despite originating in Norway and Latin Americaan 8.6 mb/d increase in world demand out- (table 3); Mexico had the largest increase inside the former Soviet Union (FSU) between Latin America (0.11 mb/d). The non-OPEC
1991 and 1996. Prices have nonetheless increase, although notable, was about 0.9remained reasonably firm-particularly last mb/d below initial estimates by theyear-and there has been some net increase International Energy Agency (IEA), mainlyin demand for OPEC output (mainly for because of the effects of bad weather andKuwait, Iraq, and Venezuela). Thus there has technical delays in new field production.been little financial pressure on the group as Most of the shortfall was in the OECD, par-a whole to deal with quota adjustments or ticularly in the UK, but also in Norway, theviolations. US, and Australia. Non-OPEC production is
A key question is how long Saudi Arabia expected to record significant gains throughand other Gulf producers will leave produc- the remainder of the year.tion at current levels in the face of rising World oil demand rose an estimated 1.5%world demand and production gains by in the first quarter, which is below the 2%other OPEC members, notably Venezuela. plus rates of the past three years. WarmUncertainty about Iraq's production is a fur- weather in the northern OECD countriesther complication. If the UN sanctions are resulted in fairly flat oil demand in the threelifted, OPEC would have to significantly main regions (table 4). Non-OECD oilrealign quotas to prevent a steep drop in demand grew an estimated 5%, with the
strongest growth continuing to occur in Asia.
TABLE 2. OPEC CRUDE OIL PRODUCTION The Republic of Korea registered littleAND QUOTASMilIions of barreis per day TABLE 3. NON-OPEC OIL SUPPLY
1994 1995 4Q96 IQ97 Quotas Mi/lions of barrels per dcyChange
Algeria 0.75 0.76 0.85 0.86 0.750 1994 1995 4Q96 nQ97 4Q96 to IQ97Indonesia 1.32 1.34 1.40 1.42 1.330Iran 3.61 3.65 3.66 3.70 3.600 United States 8.64 8.61 8.70 8.59 -0.11Iraq 0.53 0.55 0.65 1.11 1.200 Canada 2.28 2.40 2.53 2.55 0.02Kuwait 1.84 1.84 1.81 1.83 2.000, United Kingdom 2.71 2.79 3.00 2.97 -0.03Libya 1.38 1.41 1.40 1.41 1.390 Norway 2.69 2.91 3.28 3.37 0.09Neutral Zone 0.39 0.43 0.52 0.53 Other OECD 1.32 1.28 1.29 1.38 0.09Nigeria 1.90 1.93 2.23 2.27 1.865 Latin America 5.94 6.08 6.57 6.75 0.18Qatar 0.41 0.45 0.51 0.56 0.378 Africa 2.43 2.58 2.82 2.84 0.02Saudi Arabia 7.90 7.94 7.90 7.98 8.000a Middle East 1.79 1.87 1.99 1.98 -0.01UAE 2.22 2.20 2.27 2.28 2.161 China 2.84 2.99 3.15 3.23 0.08Venezuela 2.44 2.58 3.03 3.12 2.359 OtherAsia 1.94 2.07 2.04 2.03 -0.01Total Crude 24.67 25.07 26.24 27.05 25.033 FSU 7.27 7.12 7.06 7.01 -0.05NGL5s 2.38 2.42 2.66 2.83 East Europe 0.28 0.27 0.28 0.28 0.00Total OPEC 27.05 27.48 28.90 29.88 Processing Gain 1.43 1.46 1.55 1.57 0.02
a. Quota includes share af Neutral Zone. Total non-OPEC 41.56 42.43 44.25 44.57 0.32b. Natural gas liquids (NGLs). Note: Includes NGLs, nonconventional, and other supply sources.Source: international Energy Agency and OPECNA. Source: International Energy Agency.
MAY 1997 11

ENERGY
demand growth during January and inventories were unusually low. Stock levels
February, especially when compared with its are still low by historical standards, however,
robust growth during the past decade. because of just-in-time inventory practices
Higher prices, a more sluggish economy, and introduced in mid-1995.
high demand in the corresponding period In the critical US market crude oil and
last year contributed to the flat demand. It middle distillate stocks ended the quarter
will be interesting to see whether this trend above last year's levels. Low demand for heat-
continues or whether it is merely an aberra- ing oil took some of the pressure off refiners
tion in an otherwise upward trend. At some to maximize distillate output at the expense
point there will be a saturation effect from of gasoline. Nevertheless, gasoline stocks
the extremely rapid growth in oil demand in were below last year's levels heading into the
Korea and elsewhere in Asia, but its timing is spring and summer driving season, which
uncertain. may strengthen demand in the near term,
In the countries of the FSU, production although the US gasoline market did not get
and export data show a continuing decline in off to a strong start this year. In Europe and
apparent oil demand. The first-quarter level the Pacific crude and product stocks were at
of 4.2 mb/d represents less than half the comfortable levels at the end of the first quar-
recent peak of 9.0 mb/d in the late 1980s. Oil ter and above levels a year ago.
demand began to show a bottoming trend A large seasonal build of inventories is
last year. Although demand could still slip projected for the second and third quarters,
further, the long and steep decline is clearly implying a further decline in prices (table 5).
almost over. Current supply and demand projections sug-Oil inventories, a key feature of last year's gest a stockbuild of more than 2.5 mb/d for
tight market, have improved because of weak both quarters, assuming OPEC crude oil pro-
weather-related demand and increases in oil duction continues at recent levels and output
production from OPEC and non-OPEC of natural gas liquids rises moderately as
sources. OECD oil inventories were drawn expected. These stockbuilds are about 1
down about 0.1 mb/d in the first quarter; a mb/d above typical gains for this time of
year earlier the drawdown was 1.5 mb/d. year.OECD inventories would thus be some 3% The forward price curve for crude oil
higher than last year, when end-of-winter moved from steep backwardation at the
TABLE 4. OIL CONSUMPTION
Millions of barrels per doy Percentage change
FSU end Developing FSU ond DevelopingOECD Eastern Europe countries Totol OECD Eastem Europe countries Total
1990 38.1 10.1 8.2 66.4 0.3 -5.0 4.1 0.51991 38.2 9.7 18.9 66.8 0.4 -4.1 3.7 0.61992 38.8 8.3 20. 67.3 1.7 -13.8 6.4 0.81993 39.0 7.0 21.5 67.5 0.5 -16.1 6.7 0.31994 40.0 6.2 22.7 68.9 2.5 -11.4 5.8 2.11995 40.4 6.1 23.8 70.3 1.0 -[.6 4.8 2.01996 41.1 5.7 25.1 71.9 1.7 -6.6 5.5 2.31 Q95 41.1 6.5 23.9 71.5 1.0 -3.0 6.6 2.42Q95 39.2 5.8 23.5 68.5 1.1 1.8 6.2 2.93Q95 39.9 5.8 23.4 69.0 0.4 -[.7 4.8 1.64Q95 41.4 6.3 24.4 72.1 1.3 0.0 4.5 2.31 Q96 42.1 6.1 24.9 73.1 2.4 -6.2 4.2 2.22Q96 39.6 5.6 24.7 69.9 1.1 -3.4 4.9 2.03Q96 40.6 5.6 24.8 71.0 2.0 -3.4 6.1 2.94Q96 42.2 5.6 25.8 73.6 1.9 -11.1 5.7 2.11 Q97 42.2 5.8 26.2 74.2 0.2 -4.9 5.2 [.5
Source International Energy Agency and Wor d Bank.
12 COMMODITY MARKETS AND THE DEVELOPING COUNTRIES

ENERGY
beginning of the year to an essentially flat weigh the growth in demand, implying risingprofile at the end of the first quarter (with inventories and lower prices-even allowing
slight contango beginning to appear), reflec- for lower-than-expected non-OPEC output.
tive of the turn from acute prompt demand The industry remains reluctant to raise
to a more balanced market. Given the inventories without financial incentive to do
implied large stockbuild over the next two so, and lower prices and greater contango
quarters, prices are expected to fall and move are expected.
further into contango. For the fourth quarter the IEA is project-That prices have not moved more quickly ing a large increase in non-OPEC supplies-
into contango, especially given the mild win- nearly 2 million mb/d higher than duringter, suggests that the market is more in bal- the third quarter and 3 mb/d over the fourth
ance than is generally depicted. Clearly, a quarter of last year. The implied stockdraw ofnumber of factors have helped stabilize 1.3 mb/d is not atypical, but it assumes no
prices, including a shortfall in non-OPEC further increase in OPEC output. Should
supplies and the late winter cold weather. some OPEC members continue to edge pro-Further support could come from unavoid- duction higher, prices could remain weakable delays in new supplies or other possible well into the fourth quarter.
disruptions-political unrest in Nigeria, A number of uncertainties remain,
which is threatening crude output there, and explaining the lack of consensus among ana-
uncertainty about whether Iraq's oil-for-food lysts on the direction of oil prices this year.
program will continue after the first six- Last year's expectations of oil supplies frommonth period. Moreover, stocks remain rel- Iraq and from non-OPEC sources fell short
atively low, especially US gasoline stocks, so and, combined with low stocks, contributedspring buying could provide some strength to the sharp rise in prices last fall. Oil stocks,
on the demand side. though still low, have improved since then,Despite these factors, if supply and and only a significant shortfall in crude sup-
demand projections are reasonably accurate, plies is likely to stem the projected decline in
new supplies are likely to significantly out- prices this year.
TABLE 5. WORLD PETROLEUM DEMAND AND SUPPLYMillions of borrels per day
1994 1995 IQ96 2Q96 3Q96 4Q96 1996 IQ97 2Q97 3Q97 4Q97 1997
DemandOECD 40.0 40.4 42.1 39.6 40.6 42.2 41.1 42,2 40.3 41.3 43.0 41.7FSU 4.9 4.7 4.6 4.2 4.3 4.2 4.3 4.2 4.0 4.2 4.6 4.2Other 24.0 25.2 26.4 26.1 26.1 27.2 26.5 27.8 27.5 27.2 28.5 27.8Total 68.9 70.3 73.1 69.9 71.0 73.6 71.9 74.2 71.8 72.7 76.1 73.7
SupplyOECD 17.6 18.0 18.3 18.2 18.2 18.8 18.4 18.9 18.8 19.1 20.4 19.3FSU 7.3 7.1 7.0 7.0 7.1 7.1 7.0 7.0 7.0 7.1 7.3 7.1Other' 16.7 17.3 18.0 18.0 18.1 18.4 18.1 18.6 18.8 19.1 19.5 18.9OPECb 27.0 27.5 28.2 28.2 28.6 28.9 28.5 29.9 30.0 30.1 30.2 30.1Total 68.6 69.9 71.5 71.4 72.0 73.2 72.0 74.4 74.6 75.4 77.4 75.1
Stock change and miscellaneousOECD 0.2 -0.3 -1.3 1.1 0.4 -0.5 -0.I -0.1Floating/transit -0.1 0.1 -0.3 0.1 0.0 -0.1 -0.1 0.2Other/miscellaneous -0.3 -0.2 -0.1 0.3 0.6 0.2 0.3 0.2Total -0.2 -0.4 -1.6 1.5 1.0 -0.5 0.1 0.3
Note: Inc udes natural gas liquids (NGLs), nonconventional, and other supply sources. FSU compr ses countr es of the former Soviet Union.a. Includes processing gains (I .5 mb/d in 1996).b. Includes NGLs (2.6 mb/d in 1996).Source; International Energy Agency and World Bank.
MAY 1997 13

BEVERAGES
COCOA COFFEE__153.75 15236 (UScents/kg)e_ JUN MAR CO indiator price, other 429A24
96 ~~ ~ ~~~~~~97 mild crob,cco New York MARcrnd BremenlHomburg 500 97
Sl'fSl;]tiSg,];tg' / g w w ~~~~~~~~~~~~~~~~~~~~~400/
ESU E /4564 | | S ~~~ ~~~~~~~~~~~~~~~~~~~~~~~200/96 33W^;s80 85 90 95
=5 _ ~~~~~~~~~~ICCO drady price,\ I New York ond London. 30
284,99_ 3 0~~20 \ MAY/
=:U9SllSl E ~~0 85 90 950 9E622P SEP 257.98Z --- 96 96 96
PRICES IMPROVE WITH DEFICIT PROJECTIONS ARABICA PRICES SHOOT UP
After starting the year on a downward path, Arabica prices rose sharply during the
cocoa prices rallied in March. Prices fell 4% quarter, while robusta prices rose modestly.
between January and February before posting In recent months robusta prices have been
a 11% gain in March. Higher main crop fore- less than half those of arabicas, possibly the
casts for C6te d'Ivoire led to the decline. widest price differential in history. Differ-
Revised forecasts were up by 50,000 tons, ences in the world supplies of arabica andbringing the main crop to around 1 million robusta account for most of this large pricetons. Preliminary projections put the mid-crop disparity. While robusta production fromat 150,000 tons, for a 1996/97 Ivorian crop Uganda and Vietnam has increased substan-total of 1.15 million tons-close to the 1.2 mil- tially in recent years, arabica supply has
lion tons in 1995/96. In addition, more than declined mainly because of low output in
1 million tons of cocoa are held at warehous- Brazil and Colombia.
es in Western Europe and the US, and some Vietnam's coffee production continues to
sources estimate that an additional 400,000 rise. Vietnam exported about 3.5 milliontons are held in warehouses in C6te d'Ivoire. bags in 1996, making it the world's seventh
Despite these improved forecasts most largest coffee exporter. Because prices areanalysts project a sizable deficit for 1996/97; usually considerably higher for arabica than
our forecast is for a 120,000 ton shortfall. As for robusta, Vietnam plans to begin arabica
the main crop season in West Africa comes to production as well.a close at the end of April, reductions in Uganda's production has increased
inventories to meet the projected deficit will sharply since it liberalized its market in the
have an impact on the market. The key ques- early 1990s. With the liberalization cametion is whether shipments from producing higher producer prices and increased avail-countries will be sufficient to meet demand ability of the seedlings of high-yielding vari-
before the first 1997/98 crop arrivals. In addi- eties. Coffee growers planted a large numbertion, the large concentration of stocks-more of these varieties in the last few years, and
than 500,000 tons-of one major trading production shot up from about 3 millionhouse greatly concerns market participants. bags to 4 million bags. Production is expect-
The 1996/97 deficit, together with expecta- ed to reach 5 million bags within a few years.tions of another sizable deficit in 1997/98, is Ten million new robusta plants and four mil-pressuring prices. lion arabica seedlings are to be available to
Plans are underway in C6te d'Ivoire to farmers every year, implying annual replant-
increase processing capacity for cocoa beans ing rates of 2% for robustas and 5% for ara-from 180,000 tons to 350,000 tons by 1998. bicas. The new varieties are reported to yield
14 COMMODITY MARKETS AND THE DEVELOPING COUNTRIES

BEVERAGES
3,000 kg of dry cherry per hectare, more than TEA 213.06MAR
double the average yield of 1,200 kg for most
of the old varieties. D 9/2
Colombia appears to be experiencing a A sharp decline in output. Production dropped 18732
from 14 million bags a few years ago, to 12.9 96
million bags in 1995/96 and to an estimated
8.3-10.5 million bags for the current crop. / cents/kg)
Low real producer prices caused by low world overage fo ltea. 350
prices and the appreciating currency are 17p . 300
behind the decline. The booming energy sec- 96 250
tor has caused other exportable sectors to 1j6L20 150
decline victims of the "Dutch disease." 96 80 85 90 95
Colombia Coffee Federation staff say that TIGHT SUPPLY AND STRONG DEMAND BOOST PRICES
Colombia will not be able to supply adequate Tea prices at major auctions rose each
amounts of coffee unless prices at the New week during the first three months of theYork Exchange are at least 1400/lb. year in response to tight supplies and
There is quite a bit of speculation about increased demand. Mombasa prices were
Brazil's 1997/98 crop. Forecasts range especially strong, up 25% in real terms over
between 20 and 27 million bags-the the same quarter last year as African output1996/97 crop was about 28 million bags. The fell. London prices reached 213¢/kg in
main reason for the decline is the biannual March, 32% above the 169¢/kg of the samecycle of coffee trees and the cold winter. month last year in real terms.
However, exports for the coming year could Extremely dry weather in East Africa hurtbe substantially lower than this year for production in Kenya, northern Tanzania,
another reason as well: booming domestic and Uganda. Kenya's production this Marchconsumption. Rising incomes and much was reported to be half that of last March.
lower inflation have increased Brazil's The shortage of African tea kept Mombasa
domestic consumption from about 9 million prices high.bags in 1994 to about 11 million bags in 1996, Seasonal production lows in India and Sri
with some analysts expecting it to rise as high Lanka, in addition to Africa's low output,as 15 million bags in 1997. The implications meant that tea was scarce on world markets
of an increase of this size are significant. A 4 during the first quarter. Unusually cold
million bag increase in consumption corre- weather in India caused delays in production.
sponds to more than 4% of world consump- Increased consumption in major tea con-tion, an increase that could boost world suming countries pushed world tea demand to
coffee prices by as much as 15% to 20% in very high levels. Russia and countries inthe short to medium term. Central Asia and the Middle East continued to
The recent sharp increases in coffee increase their tea imports. The increased
prices are at least in part supported by spec- imports by Russia and increased domestic con-ulative fund activities. The big price differ- sumption in India raised tea prices in Indiaence between the two types of coffee reflects after a year of low prices. Also, Iraq's return to
this. the market contributed to strong demand inBecause of very low stocks, uncertainty the world market.
about the outputs of Brazil and Colombia, In coming monthsteapriceswill depend on
and the approaching frost season in Brazil, how the drought affects African output. In the
coffee prices will be extremely volatile and near term the strong demand of recent
high in the coming months. months is likely to keep prices firm.
MAY 1997 15

FOOD
FATS AND OILS COCONUT OIL 1,2001,000
STOCKS OF OILSEED AND VEGETABLE OIL WEAKEN 800gee e C - ~~~~~~~~~~~~~~~~~~~~~~~~~~~~~~~~~~~~~~600
Improved crop prospects for soybeans in 8J6N0i 400JUN20
Brazil, Paraguay, and China and for rapeseed 96 80 85 90 95 200
in India and China led to a 1.8 million ton P(hilUppmes idonesirn,E =....S c ulk, c. f Rotterdscm.upward adjustment (to 259.1 million tons) in b
the US Department of Agriculture's estimate 777.0
51 9 IE _ of world oilseed production for 1996/97. An 7 DEC
even greater increase in demand (mainly by APR
737.00* _ China and India) is expected to reduce oilseed MAR
ending stocks to 28 days of use. Soybean prices 72 i.00 97
_ i should experience some upward pressure. 96
Vegetable oil output is expected to followsuit. While the gains in output by Argentina, EXPORTS ARE RECOVERING
Chile, India, and the Philippines were partly At $758/ton coconut oil prices are almost
_ offset by reduced crushing in Brazil and the unchanged from last quarter, but they remain
EU, strong demand is likely to reduce total considerably higher than a year ago ($724/
oil ending stocks to 33 days. ton). This year's high prices reflect mainlyChina again has the world's highest reduced exports from the Philippines follow-
demand growth in both meals and fats and ing a sizable decline in 1995/96 output.
oils this season, owing mainly to its high real World production of coconut oil plungedGNP growth (expected to be 10% this year), by 430,000 tons during 1995/96, including a
large population, and still low per capita use sharp decline in stocks to a five-year low ofof fats and oils and livestock products. 368,000 tons. The reduction was much
India's vegetable oil imports are also boom- stronger than had been anticipated and hasing, despite record oilseed production. Con- been the main force behind this year's high
sumption should continue to outstrip prices. Exports of coconut oil to the EU and
production since a dramatic increase in the US have been substantially curtailed.domestic production is unlikely over the Combined 1996/97 net exports of
next few years, and imports are expected to coconut oil from the Philippines, Indonesia,
expand considerably. At current growth and Malaysia (the three dominant world pro-rates the production-consumption gap will ducers) are forecast at 1.86 million tons, or
put India in the same imports league as 8% higher than a year earlier. Indonesia is
China. expected to more than double its exportsPoland's import requirements for oilseeds, from 148,000 tons last year to 390,000 tons
oils, and oilmeals will again be high in this year. A moderate increase in Philippine1997/98. Poland will remain a large importer exports is also expected, from 899,000 tonsof rapeseed, although part of the rapeseed to 957,000 tons.demand may again be met by soybeans. Oil World reports that if the expected
For more than a year the EU has been 300,000 ton increase in world output materi-
debating whether to allow genetically modi- alizes, coconut oil prices will come under
fied oilseeds into its markets. Despite heavy heavy pressure in the months ahead and willpressure from environmental groups and probably return to 1996 levels.
stiff opposition from some member states, Despite lower price prospects, US use of
the EU parliament approved the novel-foods coconut oil is forecast at only 563,000 tons-regulations in mid-January. This measure 9% above last year's level. US imports couldpaves the way for the arrival of genetically exceed use levels, however, if prices becomemodified oilseeds. attractive for rebuilding stocks.
16 COMMODITY MARKETS AND THE DEVELOPING COUNTRIES

FOOD
SOYBEAN OIL ~~~~~~~~~800PALM OIL 580.00 SOYEA OI0 FATS AND OILSFEB 0 ASADOL
56200 MAY 500 Prices were upAPR 96 400
96 in.0 8 5 90 9530 4.5%, led by anSEP 54055 582.00 808909 8.8% rise for soy-
z s ~~~~~~~~MAR APR SEP\ / 97 96 \ S96 beans.
00 1~~~~~~~~~~~~~~~~~~~40 990 = 100\ / ~~~OCT \/ \541.00IS.96 ~~~~~~~~~~~~~~~~~~~MAR 1545
(US dollors/mt) 97 1997Matoysion, 5% bulk,c.i.f NW Europe. 0 Q 1
600 /99V ^w_2~~~~~~~600 _ /50 1/476.00 400 1996 f
JUL m . n(US do/lorslmot) 51/4.00 Q296 200 Dutch, crude, DEC
80 85 90 95 fo.b. ex-mil. 96
PRODUCTION CONTINUES TO GROW SUPPLIES ARE TIGHT 147.7 147.8
Despite an accelerated expansion in out- Soybean prices averaged $534/ton in the 1996 1996
put to 8.4 million tons (8% above last year), first quarter, almost 3% higher than in the
Malaysian palm oil stocks were down 16% previous quarter. The price boost reflects afrom last year, a reflection mainly of the 4.5 million ton increase in US soybean dis-
strong recovery in China's imports. appearance (crushings plus exports) during
Dwindling stocks put upward pressure on the past four months, most of it exported topalm oil prices, which rose to $569/ton in fill the 4.1 million ton shortfall in oilseed sup-
the first quarter of 1997, up 9% from a year plies in other countries. The shortfalls wereearlier and 4% from the previous quarter. a consequence of the increase in grain plant-
China, the world's leading vegetable oil ings at the expense of oilseeds in 1995/96 in
importer, is expected to import 1.5 million response to strong grain prices.tons of palm oil to make up for reduced World soybean production for 1996/97 isdomestic output of rapeseed, cottonseed, forecast at 134 million tons (up 7% from a
and peanut oil. How much China will need year ago), reflecting record yields in Southand when it may decide to import cannot be America (mainly Brazil and Paraguay) andpredicted, however, in the absence of stock China. The South American crop is expect-data. ed to be 11.5% larger than last year's harvest
After the successful expansion of soybean, and 6% larger than the previous record crop
rapeseed, and sunflower seed areas in India, of 1995. US soybean production is forecast atpolicymakers remain hopeful that palm oil 64.84 million tons, up from 59.24 last year.cultivation can be substantially expanded. Even though soybean production is high-Disease and water supply problems have er, the increase in livestock production andhampered palm oil production, however, the shortfall in the production of other
despite the government's determination and oilseeds, which was down 6% over 1996, arethe concerted efforts of some Indian expected to increase demand for soybeansagribusiness firms. The USDA reports that even more. The soybean meal trade will alsoeven under the most optimistic scenario grow, though US exports may slow because ofIndia's palm oil production is unlikely to South America's large crops and Brazil's lift-
meet domestic demand in the near future. ing of its export tax on soybeans. South
Malaysia's palm oil production (which America's soybean meal will be directed most-
accounts for more than two-thirds of world ly to the EU, where demand for feedgrain is
production) is expected to reach 8.8 million higher than normal following the mad cow
tons by 2000, up from 7.7 million tons in disease outbreak. Soybean stock to use ratios1995. are expected to fall to historic lows.
MAY 1997 17

FOOD
GRAINS MAIZEPRICES RISE ON INCREASED CONSUMPTION AND 20402
96CONCERNS FOR NEXT YEAR
Wheat and maize prices strengthened 190.3
during the past few months as consumption 96
proved stronger than expected, while riceprices drifted lower on weak demand.Flooding in the upper midwest of the US has (USdollorslmt)
raised concern about next year's wheat and fo.b. Gufports. 200 127.60
coarse grains crop, leading to higher market so 7
prices. However, stocks have been rebuilt to j 00
levels that should discourage further price 50 DEC80 85 90 95 96
increases so long as yields are roughly normal
during the coming planting season. PRICES RISE, BUT FURTHER INCREASES DEPEND ON
The southern hemisphere grain crop has CROP PROSPECTS
been excellent, providing a buffer against a Maize export prices recovered from their
poor crop next year. Both Argentina and $118/ton level of November 1996 to $127.6/Australia had record or near-record grain ton in March. Further price increases
crops, and Brazil had a good crop as well. depend primarily on prospects for the nextArgentina's grain production in 1996 was up crop, now being planted in the northern
more than 40% over 1995, and much of this hemisphere. World stock levels are low
increase will be available for export. Canada enough that a poor crop in a major produc-
and the EU, the other major exporters, also er would lead to higher prices. Prospects
had large crops. appear good for the US, the main exporter,
Imports look stronger than had been with 76% of exports in 1996/97. US farmers'expected, but at 198 million tons they will still planting intentions are for a 2.4% increase in
fall about 1 % short of last year's level and well maize area. Canadian barley plantings arebelow world trade of 220 million tons in 1991. likely to increase at the expense of wheat in
Ending stocks are expected to rise about 10%, response to current price trends.
to 270 million tons, and stocks in the five World coarse grain stocks are expected tolargest grain exporting countries are expect- rebuild slightly from 93 million tons (11 % of
ed to reach 100 million tons, up nearly 40 mil- consumption in the previous year) to 109
lion tons. World grain consumption rose million tons-still only 12.5% of consump-3.3% in 1996/97 (July-June) over the previ- tion. More significant for prices than the
ous year, but consumption growth has aver- global stock level, however, are stocks held byaged only 0.7% a year since 1990, and much major exporters, which have increased by 22of the sharp increase in 1996/97 was due to a million tons to 49 million tons. Further eas-
recovery from the high prices of 1995. ing the price situation is the slow pace of
Next year's crop prospects appear favor- exports, which are expected to remain at 88
able, with some exceptions. The Inter- million tons for the second consecutive year.
national Grains Council reports good wheat China has reversed direction again and is
crop prospects for China, the EU, and now a maize exporter after two years as an
Ukraine. In India favorable planting condi- importer. China's net exports of all coarse
tions and high domestic prices are expected grains are expected to total 1 million tons fol-to result in a large wheat crop. A wet spring lowing a record maize crop. Exports haveand heavy flooding in the US have raised con- gone mostly to feed producers in neighbor-
cerns about the spring crops, but it is still too ing countries. Prices of Chinese exports haveearly to know the full consequences. been above US and Argentine prices.
18 COMMODITY MARKETS AND THE DEVELOPING COUNTRIES

FOOD
RICE (US dollor/ot) 500 WHEAT 250Thri, 5% roken, vuite. U _ 400 _
nd,cotee morket survey (US dollorsmt) 200pnce, fo.b. Bangkok. 300 US, no. I Hord Red Wnter,
200 Guffpon. prompt shpment. 15035 ° O5100 #9262 IS E 9 0
358 00 80 85 90 95 2076 96 0 5909JUL ~APR96 356.00 96A JA97NK \ COARSE GRAIN STOCKS
97 z g x \(WORLD)
APR MAR_176l M
31i 2 75 DEC i78 71 FDEC 9 SEP 172*f33
96 9 96 FEB
PRICES DROP AS IMPORTS WEAKEN AND RECORD SOUTHERN HEMISPHERE CROPS SHOULD
PRODUCTION PROBLEMS ARE OVERCOME CAP PRICE INCREASES
Rice prices increased sharply injanuary on Both Argentina and Australia have har-
news of flooding in Vietnam, delayed harvests vested record or near-record wheat crops
in Thailand, lower production and export and have been exporting aggressively. *.
estimates for Australia, and lower imports by Import demand is not expected to increase '-N--j.%- -'-
China. Since then, prices have drifted lower enough to absorb the increased production, -
as import demand weakened and production however, and stocks in the five largest export-delays in Thailand and Vietnam were over- ing countries are expected to increase by at
come. Pakistan took advantage of delayed least 15 million tons. Despite the record
exports from other countries to increase its wheat crop in the southern hemisphere and
exports and to discount prices. The spread increasing stock levels, prices have remainedbetween high- and low-quality rice widened as strong.Pakistan increased exports of low-quality rice. Prospects for the 1997/98 crop are good,
Total world imports are expected to fall to according to the International Grains17.4 million tons in calendar 1997 according Council's early April report. The council pro-to the USDA's March estimates. That would jects a slight increase over the 1996/97 cropbe the lowest level since 1994, when Japan and reports favorable growing conditions insurprised the market by importing 2.4 mil- the EU, China, India, and most of Central 0 too
lion tons of rice following a cool growing sea- and Eastern Europe. Wheat plantings are . -
son and poor harvest. The largest importers expected to fall in Canada and the USin 1997 are expected to be Brazil at 1.5 mil- because of higher soybean and maize prices.
lion tons and Indonesia and Iran at 1.0 mil- Import demand should total about 92 mil-lion tons each. The Philippines is also lion tons during 1996/97, the lowest level in
expected to be a large importer since con- ten years. The drop reflects the collapse ofsumption has grown more rapidly than pro- imports to 2.9 million tons in Russia and theduction during the past several years. other former Soviet republics. The region - 9.
Bangladesh, a large importer in 1995 and had netimports of 14.6 million tons as recent- . K
1996, is expected to be nearly self-sufficient. ly as 1990/91. Importers in the Middle East, Note: Data for 1996/97 ore estfmated.
India's rice exports in calendar 1997 are Asia, and elsewhere have not increased S-ere: USDA, FAS.
expected to fall to 1.5 million tons, well imports enough to offset these declines.below the 3.25 million tons in 1996 and 4.2 India, a net exporter last year, is expectedmillion tons in 1995. The effect of lower to import nearly 2 million tons in 1996/97 inworld market prices on India's competitive- an effort to keep government stocks aboveness accounts for much of this reduction. minimum targets.
MAY 1997 19

FOOD
BANANAS 600 challenge any factual errors in the document
(US dohorasmt) 500 before it becomes public and so that partici-Cen[ra! ond South 655
pTericn, mporter'snr 400 MAR pants can try again to negotiate a settlement(fo.r) usports. 300 _ independent of WTO authority but with the
605.17 80 85 90 95APR6 / knowledge of the likely outcome of the WTO96
case. If both sides cannot reach a negotiated
settlement, the document will become pub-lic. The losing party can adopt the panel's
recommendations, appeal the matter to a
42s.>_ / board of judges (which rules only on theJUL panel's legal interpretation of GATT rules),96
37545 or offer compensation.96 If the press reports are factual, and barring
INTERNATIONAL MARKET POSTS STRONG SEASONAL a reversal on appeal, the WTO ruling willGAINS most likely force a change in the regime with-
Prices for freely traded bananas posted in 18 months. Modification of the tariff-quotagains during the first quarter. The first quar- to provide greater access to all producers is
ter has historically been a time of seasonally likely to increase competition, further erod-
strong prices, but prices were especially ing the difference between international and
strong this year. For the first time since 1992 EU domestic prices. Reforms should benefitprices stayed above the $600/ton mark for EU consumers and competitive banana pro-
two consecutive months. ducers but are likely to bring additional hard-
In October 1994, following the announce- ships to ACP producers.
ment of the Framework Agreement and in For Caribbean producers modification ofresponse to a petition filed under Section the licensing arrangements is likely to lower301 of US trade law, the US Trade the value of the licenses currently held by theRepresentative's office initiated a unilateral Windward Island Banana Development and
investigation into the EU banana import Exporting Company (WIBDECO)-which isregime. The investigation evolved into a owned by the Windward banana industries in
World Trade Organization (WTO) panel partnership with Fyffes. Debt backing the pur-
request in April 1996. In March 1997 the chase of the Windward banana business from
panel released its confidential report to the Geest is guaranteed by the governments of
disputing participants. According to recent Dominica, Grenada, St. Lucia, and St. Vincent.press reports, the panel found against quota Following news of the ruling, the European
allocations under the Framework Agreement Banana Producers Association announced its
and the practice of allocating 30% of mar- support for ACP-producing countries. Theketing licenses to traditional importers of association urged its members in France,
African, Caribbean, and Pacific (ACP) Portugal, and Spain to call on their govern-
bananas. The panel said that the EU acted ments to act to prevent a potential increase inunreasonably in setting ACP quotas well Latin American bananas into the EU.
above historical export levels. At the same In related news Panama's banana exportstime the panel did not explicitly find against fell nearly 10% during the first quarter over
the ACP quota, challenge the two-year waiv- the same period in 1996, a downward trender of key GATT provisions for Lome that is expected to continue. Government offi-Convention (ACP) countries, or rule against cials blamed the decline on EU import quo-
the tariff preference for ACP countries. tas. At the same time Ecuador announcedThe preliminary report is supposed to substantial gains from bananas during the
remain confidential so that participants can quarter because of higher prices and volumes.
20 COMMODITY MARKETS AND THE DEVELOPING COUNTRIES

FOOD
SHRIMP SUGAR U c n 860
JUN ~~~~~~~MAR oaw' fob utond4A4U96NS , 149'7/ Cainbbeannports. 20
28U6 80 85 90 95
96
26.4/APR
(US dolloru/gJ 96US Gulf bron,headless, 26-30count per pound,o4iolescie Nen York. V 5 24.49
25/ 9 Ii/3.09 MAY
SEP 296
APR 923.5796 80 85 90 95 JAN
PRICES STAY HIGH BECAUSE OF SHORT SUPPLY PRICES REMAIN STEADY
Shrimp prices stayed high into the second Prices in the first quarter were practicallyquarter, reflecting reduced exports from sev- unchanged from the fourth quarter of 1996,
eral Asian countries. China reduced exports averaging 240/kg. With anticipated purchas-substantially-its exports to the US in 1996 es from China failing to materialize, the mar-
were just half those in 1995, and its exports to ket stayed put, despite a downward revision of
Japan have been down sharply in recent the Thai crop following lower sugar recovery
months. The US embargo and disease among at the mill. Estimates now put the crop near
farm shrimp have led to lower exports. last year's 6.3 million tons. Low soil moisture
Vietnam's shrimp production has also been is a concern in Europe, where a warm springhurt by disease, which sent prices soaring in has accelerated planting schedules. Off-
Vietnam. Supplies from Ecuador and Mexico setting these developments was news of betterhave also been low. recovery rates in northern and northeastern
Another factor affecting the world shrimp Brazil, where the current crop is nearly
market in recent months has been the yen- crushed. Analysts revised estimates of thisdollar exchange rate. The yen has depreciat- year's cane crop upward to 287 million tons.ed 18% against the US dollar in the past 12 Starting on May 15, Russia will impose amonths. Because shrimp prices in the world 25% duty on most refined sugar imports.market are quoted in US dollars, yen prices Sugar from Belarus, Kazakstan, and Kyrgyz
have soared more than 30 percent in the past Republic will be exempted under an existing12 months, weakening demand in Japan. customs agreement. The plan replaces an ear-
Trade figures show a significant shift lier strategy of restricting imports through a
among suppliers. Exports from East Asian 1.5 million ton quota, including a maximumsuppliers such as China and Thailand are import of 1.15 million tons from Ukraine.
down, while those from South Asian suppli- Last year Russia imported 1.7 million tons ofers such as Bangladesh and India are sharply raw sugar and 1.44 million tons of whitehigher. Response to the recent Indian sugar, primarily of Ukrainian origin.Seafood Fair suggested that buyers from Meanwhile, Ukraine announced plans toTaiwan (China), the Republic of Korea, and dramatically increase domestic sugar prices
China are interested in importing shrimp if to nearly double world averages. The gov-prices are right. ernment will impose quotas of 1.5 million
The shrimp season begins in April in tons for domestic use. Last year Ukraine pro-Bangladesh and in Calcutta, India, but sup- duced 3.29 million tons (white equivalent).plies appear uncertain. With inventories The plan calls for continued governmentdepleted, shrimp prices are likely to stay firm. intervention in agriculture since sugar pro-
MAY 1997 21

FOOD
ducers will have to acquire their quotas from COTTON 250
local authorities. i82.50 2^w200APR 182.92 /50
In the US Congress, Representatives Daniel 96 JUN
Miller and Richard Schumer announced plans 80 85 90 95 100
to introduce a bill to reform US sugar policy.The proposed bill would reduce the sugar loan 7.72
rate over six years, from $0.18 to $0.14 a pound; 97
convert loans from nonrecourse to recourse;
remove regional adjustments to create a singlenational loan rate; and terminate the loan pro-
gram in 2003. The current quota system would (US cents/kg)Cotton Outlook A 166. 12
remain in place, with import levels regulated to Index, c.i.f Liverprol SEPend Enrnpe. 96
protect the $0.14 a pound floor.
Venezuela has agreed to drop its tempo- PRODUCTION-CONSUMPTION GAP IS CLOSING
rary ban on sugar imports from neighboring While New York futures moved in a rela-countries and to allow 387,000 tons of imports tively narrow range during the first quarter,
from Colombia and other neighbors. the medium staple cotton indicator price
The Mexican industry continues to con- (Cotlook A index) rose to 1770/kg, still
solidate. Grupo Santos bought three mills in below the 1870/kg average for the same
Veracruz and San Louis Potosi, while Grupo quarter of 1996, but up from last quarter'sAzucarero Mexico bought two mills in 170¢/kg. Prices are expected to remain
Veracruz. Despite mounting debt stemming steady, according to the Internationalfrom leveraged buyouts and devaluation of Cotton Advisory Committee (ICAC).
the peso, the industry has attracted substan- The ICAC adjusted its forecast of worldtial investment. Sugar recovery rates continue production for 1996/97 up a notch, from
to improve, rising from last year's 10.61 % to 18.7 to 19.1 million tons, primarily because10.74%. Confusion surrounds announced of higher than expected output in Pakistan
price hikes, however. The industry agreed to and Australia. The outbreak of the leaf curlraise the price paid for cane, based on a sug- virus seems to have damaged Pakistani cot-
gested government formula. The hike would ton less than originally expected. Australia'srequire an increase in consumer prices, but cotton production registered a 29% increaseprices are deregulated. Boosting domestic over 1995/96, reflecting an expansion in dry-prices would thus require collective action by land plantings and higher yields. The
the industry to dump sugar outside Mexico's increase is expected to continue through theprotected domestic market into lower-priced next few years, boosting Australia's produc-international markets. Without clear enforce- tion to an expected 700,000 tons from its cur-ment mechanisms, individual mills have rent 400,000 tons. In East Africa, notably inincentives to avoid "voluntary" exports. Tanzania, Uganda, and Zimbabwe, policy
In the Philippines the government has reforms appear to have contributed to sub-purchased nearly 1.63 million 50-kilo bags of stantial increases in cotton production, withsugar to prop up domestic prices. Sugar out- even larger payoffs expected in the future.put from September to March increased US cotton production is estimated at 4 mil-nearly 11 % over the same period a year ago. lion tons for 1997/98,3% lower than the pre-
In other news, the government of Peru vious year's crop. The decline is attributed toplans to sell off minority stakes in 20 sugar the decoupling of support from productionmills. In Turkey the government raised levels, a result of the 1996 Farm Bill. Analysts
import taxes on sugar from 100% to 135% at the Beltwide Cotton Conferences of 1997following a better-than-expected harvest. observed that genetically engineered (Bt)
22 COMMODITY MARKETS AND THE DEVELOPING COUNTRIES

AGRICULTURAL RAW MATERIALS
cotton looks promising in terms of higher RUBBER 200148.44 i The index of
yield potential. In 1996/97 about 12% of US MAY pie wsucotton was of the Bt type, and 30,000 hectares 90.7 pices was upof Bt cotton were planted in Australia. Cotton 145 730 85 90 95 50 quarter th
APR quarter, witharea declined in Mexico, which is expected to 96 \ (US centsl/k)
cut production by a quarter in 1997/98, to pfo.bt.KudaLumpur. lower and cotton190,000 tons. Higher production is expected and wool higher.in China, where the government seems to be
_ ~~~~~~~~~~1990 = 100devoting more attention to the cotton sector. 1/227303
Currently, the outlook for 1997/98 is 19.5 MAR 1996
million tons. 124.12O9 t22.07
World cotton consumption is currently 96t
estimated at 19 million tons, which wouldleave world stocks practically unchanged. SUPPLIES OUTPACE DEMAND 1250 1 124.2
Unexpectedly high shipments in China (close Prices for Malaysian rubber averaged 1996 1996 Q/
to 300,000 tons more than the previously esti- 123¢/kg for the quarter, down about 30 frommated 200,000 tons) combined with better the previous quarter. Year-end stocks contin-than expected yields boosted China's ending ue to grow, with supplies outpacing demandstocks by some 2 million tons. Estimates put for the third consecutive year. The Inter-China's stocks at almost half of world stocks. national Rubber Studies Group estimates
The gradual withdrawal of government 1996 natural rubber production at 6.29 mil-enterprises from cotton marketing and trade lion tons, up from 5.96 million tons in 1995.in many developing countries has prompted Consumption grew as well, but at a slowerfarmers associations and cotton traders and pace, from 5.93 million tons in 1995 to 6.24exporters to reconsider risk management million tons in 1996.tools. India has announced policy changes to In February the third International Nat-allow trading in cotton futures contracts in ural Rubber Agreement (INRA III) cameBombay. Turkey is also considering opening into force when China ratified the 1995a cotton futures exchange. Brazil launched a agreement. The INRA Council met in Marchcotton futures contract at the Bolsa de and approved the appointments of Ahmad &t scJn'p hS'
Mercadorias in San Paulo last year. Mexico Zubeir Haji Noordin of Malaysia as executive - -6
has made options available to cotton farmers director and James F. Hegarty of the US asthrough the New York Cotton Exchange for buffer stock manager. The council namedthe past few years. This trend is expected to RSS1, RSS3, TSR10, and TSR20 for inclusion . -,
spread to other developing countries. in the buffer stock.There is widespread concern about the Also in February the Thai government
decline in cotton's share in fibers. The share revised its domestic market intervention pricefell from 50% in 1985 to 45% in 1995. In a upward by 2.5 baht to 27.5 baht/kg (roughly - '' >'
plenary session in Tashkent last October, the 1050/kg) for unsmoked sheet 3. If interna- Souce: Irnmatio-l Cttn Avsory
ICAC decided to examine the issue and to tional prices fall much below current levels,identify steps to reverse the trend. the government would be required to pur-
Cotton Outlook reported that the European chase domestic production.Commission intends to seek confirmation of In Liberia, Bridgestone Corp., parent com-the provisional antidumping duties imposed pany of Firestone tires, has resumed rubberlast November on imports ofyarn from six sup- exports, shipping 370,000 gallons of latex topliers-China, Egypt, India, Indonesia, France in February. Before the seven-year civilPakistan, and Turkey. If confirmed, the duties war, Firestone's plantations in Liberia werewill remain in place for five years. producing 90-100 tons of dried rubber daily.
MAY 1997 23

AGRICULTURAL RAW MATERIALS
TIMBER FERTILIZERS263.48 MANUFACTURING CAPACITY MUST RISE IN THE LONG
LOGS AUG
261.65 96 RUN
96A The outlook for fertilizer demand andsupply through 2020 was examined in a
{25248 JUN \_< September 1996 report from the Inter-96 A national Food Policy Research Institute
(US doflarslr) (IFPRI) in Washington, D.C. (Balu L. BumbMolaysian, meranb, sales Dpnce by impote,s, Tokyo. 237.35
400 MAR and Carlos A. Baanante, "The Role of
30 0 Fertilizer in Sustaining Food Security and
200 235Ebi8 Protecting the Environment to 2020," IFPRI100 997 Discussion Paper 17.) While 2020 exceeds the
80 85 90 95planning horizon for most companies, such a
PRICES DECLINE ON SLUGGISH DEMAND broad perspective provides new insights.
Malaysian log prices in theJapanese mar- The report concludes that the world willket fell 3.6% in the first quarter because of have the capacity to produce between 147 and
moderate demand and competition from 163 million tons of fertilizer nutrients in 2000
softwoods and logs from Papua New Guinea but will need to increase capacity by an addi-
and Africa. Softwood logs are increasingly tional 51 million tons between 2000 and 2020displacing hardwood logs in plywood manu- to meet projected effective demand in 2020.facturing, reducing demand for tropical The increase in fertilizer nutrients will consisthardwood logs. of about 29 million tons of nitrogen, 15 mil-
Demand for tropical timber (logs and lion tons of phosphate, and 8 million tons oflumber) is expected to decline from 7.4 potash. Asia, which will account for more than
million cubic meters in 1996 to 7.1 million 90% of the global fertilizer deficit, will need to
cubic meters in 1997. Softwood timber is invest in manufacturing capacity and raiseexpected to make up the difference. The imports. North America and Eurasia will main-
decision by Sabah (Malaysia) to lift the tain surplus positions in total fertilizer supply,
1991 export ban on logs has also contribut- although North America will have a deficit ofed to the price decline. Following a 6.4 nitrogen fertilizer and Eurasia of phosphate.decline in 1995, housing starts inJapan rose Most other regions will have a deficit of two or
11.2% in 1996 promising improved demand more nutrients.conditions. Fertilizer production will need to grow by
In Europe both log and sawnwood prices 1.4% a year from 2000 to 2020, well below thedeclined during the first quarter, mainly 5.7% growth during 1960-90. But raw materi-
because of sluggish demand. In France als, capital investment, technology, and pricesdeclines in housing starts are holding down could all constrain the increases in production
demand. Imports were down substantially for needed by 2020. According to the report, raw1996: down 12% over 1995 for tropical logs materials for production are not likely to be
and 60% for sawntimber. major constraints, nor are funds for invest-In the UK a gradual recovery in demand ment. Technological improvements have
is expected, with reports of a continuing increased energy efficiency, allowing econom-recovery in the housing market. The use of ical, smaller-scale plants. The constraint most
tropical hardwoods has been declining in likely to bind is low prices resulting from over-the UK, however. Imports of tropical timber capacity in some countries. But this constraint
fell by nearly half between 1992 and 1996, would be self-correcting, since underinvest-while imports of nontropical timber almost ment would lead to higher prices. In this res-
doubled. pect the future looks somewhat like the past.
24 COMMODITY MARKETS AND THE DEVELOPING COUNTRIES
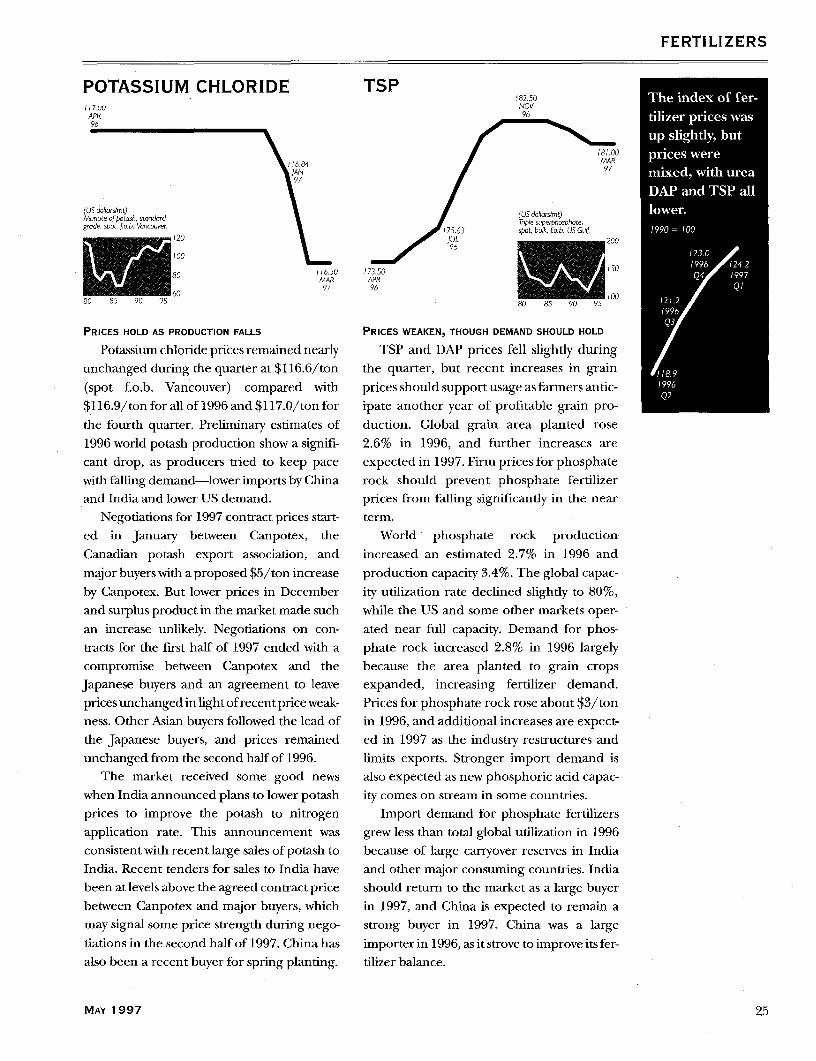
FERTILIZERS
POTASSIUM CHLORIDE TSP The index of fer-11700 NOVAPR tilizer prices was90,
up slightly, but11684 prices were
116 84 9JAN mixed, with urea
DAP and TSP all(US dollors/mt) (US dollors/mt) lower.Maiate of potash, standard Trple sperphphotgrade, spot, fo.b. Vbnco,er st75.63 spt, bulk fob. US Guof 1990 = 100
/20 I/i~~~~~~~~~~JL 200
00 /~~~~~~~~~~~~9 23.0
* 8~ ~~00 116.50 (73.50 150 ( 996 /2.280 ~~MAR APR 4w'19974
60 97 96 QC80 85 90 95 80 85 90 95 100121
1996Q3
PRICES HOLD AS PRODUCTION FALLS PRICES WEAKEN, THOUGH DEMAND SHOULD HOLD
Potassium chloride prices remained nearly TSP and DAP prices fell slightly duringunchanged during the quarter at $116.6/ton the quarter, but recent increases in grain /8.9
(spot f.o.b. Vancouver) compared with prices should support usage as farmers antic- 1996
$116.9/ton for all of 1996 and $117.0/ton for ipate another year of profitable grain pro-the fourth quarter. Preliminary estimates of duction. Global grain area planted rose1996 world potash production show a signifi- 2.6% in 1996, and further increases arecant drop, as producers tried to keep pace expected in 1997. Firm prices for phosphatewith falling demand-lower imports by China rock should prevent phosphate fertilizerand India and lower US demand. prices from falling significantly in the near
Negotiations for 1997 contract prices start- term.ed in January between Canpotex, the World phosphate rock productionCanadian potash export association, and increased an estimated 2.7% in 1996 andmajor buyers with a proposed $5/ton increase production capacity 3.4%. The global capac-by Canpotex. But lower prices in December ity utilization rate declined slightly to 80%,and surplus product in the market made such while the US and some other markets oper-an increase unlikely. Negotiations on con- ated near full capacity. Demand for phos-tracts for the first half of 1997 ended with a phate rock increased 2.8% in 1996 largelycompromise between Canpotex and the because the area planted to grain cropsJapanese buyers and an agreement to leave expanded, increasing fertilizer demand.prices unchanged in light of recent price weak- Prices for phosphate rock rose about $3/tonness. Other Asian buyers followed the lead of in 1996, and additional increases are expect-the Japanese buyers, and prices remained ed in 1997 as the industry restructures andunchanged from the second half of 1996. limits exports. Stronger import demand is
The market received some good news also expected as new phosphoric acid capac-when India announced plans to lower potash ity comes on stream in some countries.prices to improve the potash to nitrogen Import demand for phosphate fertilizersapplication rate. This announcement was grew less than total global utilization in 1996consistent with recent large sales of potash to because of large carryover reserves in IndiaIndia. Recent tenders for sales to India have and other major consuming countries. Indiabeen at levels above the agreed contract price should return to the market as a large buyerbetween Canpotex and major buyers, which in 1997, and China is expected to remain amay signal some price strength during nego- strong buyer in 1997. China was a largetiations in the second half of 1997. China has importer in 1996, as it strove to improve its fer-also been a recent buyer for spring planting. tilizer balance.
MAY 1997 25

FERTILIZERS
UREA 250 ALUMINUM 3,000
2 i3.L50 202 0 2,500JUL ~~~~~~~~~~~~~~~~~~~~~~~~~~~~~2,50002 000
i 99.20 io A Soo500APR so\ 80 85 90 95 1,587.23 80 85 90 95
96 \ \ APR96
l,3.57MAR
MAY 1,~~~~~~~~~~~~~~~~~~~~~~463.3696 ~~~~~~~~~~~~~~~~~AUG
96
(US dollarsImt) 166.40 (US dollorslmt) V 3634Bgged, 5pot, fopb. MAR LIVE, prmary mngots, OCTW Eurpe. 9b/hgh grcde, cosh. 96
PRICES PLUMMET AS CHINA LIMITS IMPORTS IMPROVED DEMAND AND FUND BUYING ARE PUSHING
Urea prices dropped sharply during the UP PRICES
quarter as demand weakened and market Prices rose 11.7% during the first quarter,
uncertainties increased. By March prices had reflecting improved demand from con-
fallen to $166.4/ton (fo.b. Western Europe) sumers and attracting fund and speculativefor bagged urea, down from $193.6/ton in buying. Bullish sentiments have also beenDecember. Buyers began to delay purchases fueled by reductions in stocks held by theas prices fell in December, hoping that prices London Metal Exchange (LME) and the
would weaken further. Uncertainties about International Primary Aluminium Institute
higher import taxes on fertilizer in China (IPAI). At 890,000 tons in February, LME
added to the cautious sentiment among buy- stocks were well down from December's
ers. An announcement by the Indian gov- 951,000 tons. Production was up during the
emnment that imports were likely to fall in first quarter, with most of the growth coming
1997 further undermined the market. in Asia. With some Western capacity still idle
China began to collect higher import and adequate new projects in the short term,
duties (5%) and value-added taxes (13%) on the industry is likely to meet demand.imports in January, although official debate Aluminum consumption is rising inJapan
continues over whether the taxes will remain. with increases in housing starts and com-Imports had previously faced a 3% import mercial building. In addition, the deprecia-duty. The higher taxes seem consistent with tion of the yen relative to the dollar hasefforts by the Chinese government to limit benefited car exports. Despite the negativeimports following the introduction of five impact of Japan's sales tax increase, alu-new urea plants with ajoint capacity of 3 mil- minum consumption is projected to grow
lion tons. Since Chinese imports account for around 3% in 1997, up from 2% in 1996. Innearly 30% of world urea trade, the new Europe increased construction activity, par-
plants could be a significant blow to market' ticularly in Germany and the UK, has boost-prospects for urea. The Chinese government ed aluminum consumption. Car sales fell inis reportedly planning to reduce urea early 1997, a reflection mainly of strong 1996
imports in 1997 by as much as 2 million tons. sales in response to incentive programs.India increased urea prices by 10% in Feb- European consumption prospects look even
ruary and announced plans to increase subsi- stronger for 1998, when industrial output isdies on phosphate and potash fertilizers. The projected to rise. In the US consumptionhigher urea prices and lower phosphate and growth is supported by strong demand for
potash prices should help to improve the fer- consumer durables and even strongertilizer balance, which currently favors nitrogen. orders.
26 COMMODITY MARKETS AND THE DEVELOPING COUNTRIES

METALS AND MINERALS
COPPER 3,00 developments suggest. LME and Comex
2,000 stocks reached a low point in mid-December etals and mo-2,65826 fso500 1996 of about 120,000 tons. By March 8.7% as alumi-
2,658.26 000 il oo87o saui_MAY80 85 90 95 exchange stocks had doubled to 240,000 tons.
2,595.78\ 2,421 29 They have been gradually decreasing since num increasedAPR ~~~~~~~~MAR117,cpe
96 \ 97 then as a sufficient level of backwardation was .4o, copper
reached. However, the rate at which stocks 14.1%.
were entering the exchanges earlier in thequarter (5,000 tons a month) has not histori- 1990 = 100 92.5
cally produced the price resilience that cop- 928 19971996 Q
(US doiorslmt) per markets have recently exhibited. A Q2ULIE, cathode ,9MI.45settementapnces SEP possible explanation for the strong prices issettlernent p6ice 96
that consumption has been better than pre-UNANTICIPATED CONSUMPTION HELPS KEEP PRICES dicted. Consumption of global refined copper 85.
STRONG is estimated to have increased 4.6% through /996
After a volatile second half of 1996, copper the first quarter on a year-on-year basis. 83 8 Q4
markets were comparatively stable in the first First-quarter copper consumption in the Q3
quarter of 1997. Cash copper prices at the US was about 5% above last year's, althoughLME rose to nearly $2,600/ton in mid- consumption will likely cool as the recent rise
January, then settled in the $2,400-$2,500/ in US interest rates dampens construction
ton range through March. In contrast, three- activity and purchases of consumer durablesmonth prices rallied throughout February slow. In Western Europe consumption started
before settling into a tighter range of slowly in 1997 but picked up briskly in
$2,370-$2,440 during March. February, partly reflecting delayed business ____________
Backwardation narrowed from more than after January's poor weather. Apart from the ThnJhauisanetnc
$300/ton in latejanuary to below $50/ton in catch-up effect there appears to be genuine .
March. The large backwardation was initiated improvement in European market condi-by dealers trying to squeeze the market by sell- tions, with prices for copper and other raw
ing at cash settlement prices with the inten- materials sharply higher in local currency 856
tion of buying back stocks in three months at terms.
a profit. However, as more dealers put their The Asian market offers much less causecopper on the market, the backwardation for optimism. The recent upturn in thenarrowed to within the $30-$50/ton range. Japanese economy has helped consumption, -.N
There was also a change in cross-Atlantic but any resurgence in demand will be short-arbitrage during the first quarter. During lived as the recent construction boom comes
January the LME cash price was at an average to an end. The Republic of Korea's industri- =
premium to the Comex first position of al and construction sectors are beginning a s fS.'
2.1¢t/lb, but by the beginning of March predicted downturn, as demonstrated by '9
Comex held a 4¢/lb premium over the March's substantial drop in consumption.LME-a 60 switch. The growing strength of Also, it remains to be seen whether China willthe US dollar on international currency mar- be as active a buyer as it was last year. . '227.3
kets has raised LME prices in many countries Market fundamentals suggest the contin- 96
in local currency terms, especially in uation of a virtually balanced global market 97
Germany and Japan. Thus developments in until mid-1997. Conditions in the physical - 9-5currency markets have probably contributed ~~~~~~~~~~~~NOV
currency markets have probably contributed market suggest little reason for prices to fall 96
to the strength of copper prices. significantly below $2,400/ton. Prices should Source. Metot Bulletin.
A look at copper stocks indicates that the retreat for the third quarter as a large market
market may not be as healthy as these price surplus develops.
MAY 1997 27

METALS AND MINERALS
GOLD 600 IRON ORE AND STEELIRON ORE 3325
39~ . 32.50APR 3 __3 00 * t98296 80 85 90 95
383.47 ~ (US dollors/troy ounce)
UK, 99.5% flne.
28.09 19979 80
MAR ~~~~~~~~~~~~~~~25.4797 YEARLY (US cents/mt Fe) ;994
EBroziion, cvrd contract price346.589t ~~to Germony
FEB t.23.5097 988
GOLD SUFFERS A BARRAGE OF BAD NEWS PRICES SET FOR IRON ORE; STEEL PRICES VARY
Gold prices averaged $351.2/toz during Japanese buyers and Australian sellersthe first quarter, down from $376.0 in the reached agreement on prices for deliveries
previous quarter, as gold markets suffered a of fines and lump. Fines increased 1.1 % for
series of blows. A proposal by a Swiss law- Hamersley, which set its price at 29.1 ' per drymaker to sell gold to raise money to com- metric ton unit (f.o.b.). Lump ore prices
pensate Holocaust survivors sent prices were rolled over at 37.7¢/dmtu (f.o.b.). Thereeling even though the sales might not Brazilian ore producer CVRD and German
occur for years. According to gold traders, buyers also agreed to a 1.1% rise in fines to
European central bank selling has been 28.88¢/mtu (f.o.b.) for Tubarao. Carajas
depressing gold prices for months as coun- fines were increased 0.5% to 31.15¢/mtu
tries prepare for the European monetary (f.o.b.) Ponta da Madeira. Carajas lump was
union by trying to lower their debt to GDP rolled over at 35.250/mtu (f.o.b.). Pig ironratios. Fund trading has also been on the prices continued to advance on a global basis
short side, driven by trend traders. for most of the quarter.As though this were not enough bad news, Steel prices were unchanged or slightly
the market was taken in by the Busang gold weaker during the first quarter. The outlook
mine discovery in Indonesia. Reports of the for world spot prices looks mixed for the
largest gold discovery in history turned to upcoming quarter. There are expectations ofdust as an audit report finally ended specu- increasing demand in Europe and Asia, and
lation about just how much gold was in the although there is some danger of oversupply,
Borneo rainforest. The answer appears to be the US economy remains strong. Increased"not much." Share prices of the Canadian imports at low prices from Russian and
company Bre-X Minerals fell back to earth. Ukrainian mills continue to hamperIn a glimmer of good news, demand start- attempts to raise prices in North America
ed to rise again as gold fell below $350/toz. and Europe.India had a 6% increase in offtake in 1996 as In Europe a 5-6% recovery in production
its strong economy fueled demand. In most is expected for 1997. January production inof the rest of Asia demand has been weak, Western Europe was up 5.6% over January
with demand down 13% in China and 8-9% 1996. Prices should follow upward, especiallyin Thailand. Partly offsetting the lower for hot rolled coils and coated sheet, but thus
demand in much of the rest of East Asia was far attempts to raise prices have failed. Hothigher demand in Indonesia and the rolled band (f.o.b.) is currently at $315/mt,Republic of Korea. Demand has been weak significantly below the US spot price ofin Middle East markets as well. $395/mt for hot-rolled band.
28 COMMODITY MARKETS AND THE DEVELOPING COUNTRIES

COMMODITY PRICE OUTLOOK
COAL Rising low-cost production NATU RAL GAS Prices remain firm because EN E R G Ywill weaken prices (EUROPE) of lagged indexation of contracts
IPrice i s ^ _
4 | 1 | _ . E 1 E 11- l -,. , .. .... .......................... ,,.,,, ,,.,,,,,,,-'~~~~~~~~~~~~~~~~~~~~~~~~~~~~~~~~~~~~~~~~~~~~~~~~~~~~~~~~~~~~~~~~~~~~~~~~~~~~~~~~~~~~~~~~.. . .... .
1995 96 97 98 99 2000 1995 96 97 98 99 2000
NATURAL GAS US supply-demand PETROLEUM Increases in supply(US) balance improves greatly lead to price declines
70 pe~~~~~~~~~~ce~~~~~r 9 ~~~~~70 percent
3.0 IliU m, r *jIhJ l ............ 2COO 1.31.
Price i curren
2.73~~~~~~~~~11
Prce micurrentI !, dollars p ier barre l
1.0~ 5t ~ _ __- L1__
1995 96 97 98 99 2000 1995 96 97 98 99 2000
COCOA Prices are responding COFFEE Higher pricesPin 1997 BEVERAGEnSto projected deficits
70 percent
1970 1980 t990 2000 1111 111
1995 96 97 98 99 2000 1995 96 97 98 99 2000
MAY 1997 29

COMMODITY PRICE OUTLOOK
6.0c 70 percen2t4.50 ~ ~ ~~~~~~~~pn nt O650 10dlas p,obability
2.50 2 g C 1,000f.50 1 Pri. n, W.S.. ~~~~~~~~~~~~750
1970 1980 1990 2000 2010 1970 19i80 9 90 2000 2010
250[ Price in cUrrent I, Price in current
j dollars per kilogram dollars per metric ton
2~~~~~~~~~~~~~~~~~~~~~7 1:X 1 IFOOD~~~~~~~~~~~olr ge k,"
600 p
400/- ~ ~ ~ ~ ~ ~ ~~4
_______ I_i_i. 750< 4=00
i.50L \ .- ,,200 _ r_1995 96 97 98 99 2000 1995 96 97 98 99 2000
FOOD ---
FATS AND OILS
1,400 ~~~~~~~~~~ ~ ~~~~~~70 percent OM5 Price inco=, 70 percent1,100 ~~~~~~~~~~~~~~~ ~~preb,b,f,y .500 1990 douses prnob,briln
550 Peice in constant' 702~~~d~t'b~~n U b
1970 18 902010 1972 980 090 20!0
750n - ~ 900 -Price incretPrice in currentdollars pber metric ton idollars per metri~ ton
70020 A0 625
500~~~~~~~~~6
350K 3 T00 S1995 96 97 98 99 2000 1995 96 97 98 99 2000
GRAINS
2 75 ~~~~~~~~~~~~~I70 percent .050 Peni onot 70~ percet225 pnbaI ore b,lity 75 d99tr6lborn
i75~~~~~~~~~~~~~~~~~~~~~~0125 Pien snt4500
i970 MO8 1990 2010 1970 !980 1990 2010
- r- ~~~~~~~~~~500 - -Price in current IPrice incurn
80dollars per metric ton dollars p~er metrl ton
1801-W
30 COMMODITY MARKETS AND THE DEVELOPING COUNTRIES~~~~~~~~~~~~~~~~~~00

COMMODITY PRICE OUTLOOK
WHEAT Prices should recede BANANAS Lower prices expected in 1998 OTHER FOOD
~~1 ' ] ~70 percer m0-'||-i _~s
~50 9
1970 980 990 M103
1995 96 97 98 99 2000 1995 96 97 98 99 2000
BEEF Prices are on the rise CITRUS Prices remain firm(ORANGES)
_ ~~~~~~~~~~~~~~~~~~~~~~~~~~~~~~~~~~~~~~~~~~~~~ot,
9_ WU4e 980 990 2000
'. 9 F - w_ _ _ _ , _ --- _
1995 96 97 98 99 2000 1995 96 97 98 99 2000
SHRIMP Prices stay high because SUGAR Prices level offof limited export supply
ent0; i 70
|~~~~~~~~~~~~~~~~~~~~~~~11E S L
1970 1980 1990 2000 19311 t 970 1980 i 990 2000 l191
^- ~~~~~~~~~~~~~~~~~~35r ---- _Price in currentcents ps rkilogrd m
25 25.
20 __
1995 96 97 98 99 2000 1995 96 97 98 99 2000
MAY 1997 31

COMMODITY PRICE OUTLOOK
AGR ICUL- _1 _ Z _ 3 = _ _TURAL
R AW 4001 70p-cent 250 70 pe-cen
MATER IALS 3255! 50 0 roa_
175 P_c in Pricent incwen1970 1980 1990 000 2010 1970 980 1990 2000 2010
240 2 _ 1400
/995 96 97 98 99 2000 /995 96 97 98 99 2000
Price in, curentet 70pre 0 Price in curestnt!7 ecr
210 ~~~~~~~~~~~,~.b~n201790dles
200 _
40 990d47 s 0 0 0 /980 /99 0 20 20)0| 20 97 0dlr .S 0-0 9 0 /90 2 ; 0 0 20oobli 0250 - 1 10o
200 - . _ _ 80 _
1995 96 97 98 99 2000 1995 96 97 98 99 2000
FERTILIZERS__
500, 70 pe,e, 9} 70 pece
0 rice 625s/tpicltinst. n7 jpercet
400i A,fen I00 I9t doble d,strib cOn
2 00 10
E 290 980 1990 2000 20i /970 /980 /990 2000 20/0
995 96 97 98 99 2000 1995 96 97 98 99 2000
32 COMMODITY MARKETS AND THE DEVELOPING COUNTRIES

COMMODITY PRICE OUTLOOK
ALUMINUM Prices rise as consumption COPPER Prices continue to fall M ETALS ANDand fund purchases improve M INERALS
1970 1980 1990 (99t A 200 h11
)995 96 97 98 99 2000 1 995 96 97 98 99 2000
GOLD Prices fall in 1997 IRON ORE Prices continueto rise slowly
_970 0980 2990 20u .11.1
=,,, _ _ _ _ ~~~~~~~~~40~~~~~~~~~~~~~~~~~~~4 I Price in current r_
30
25.
20 1995 96 97 98 99 2000 1995 96 97 98 99 2000
MAY 1997 33
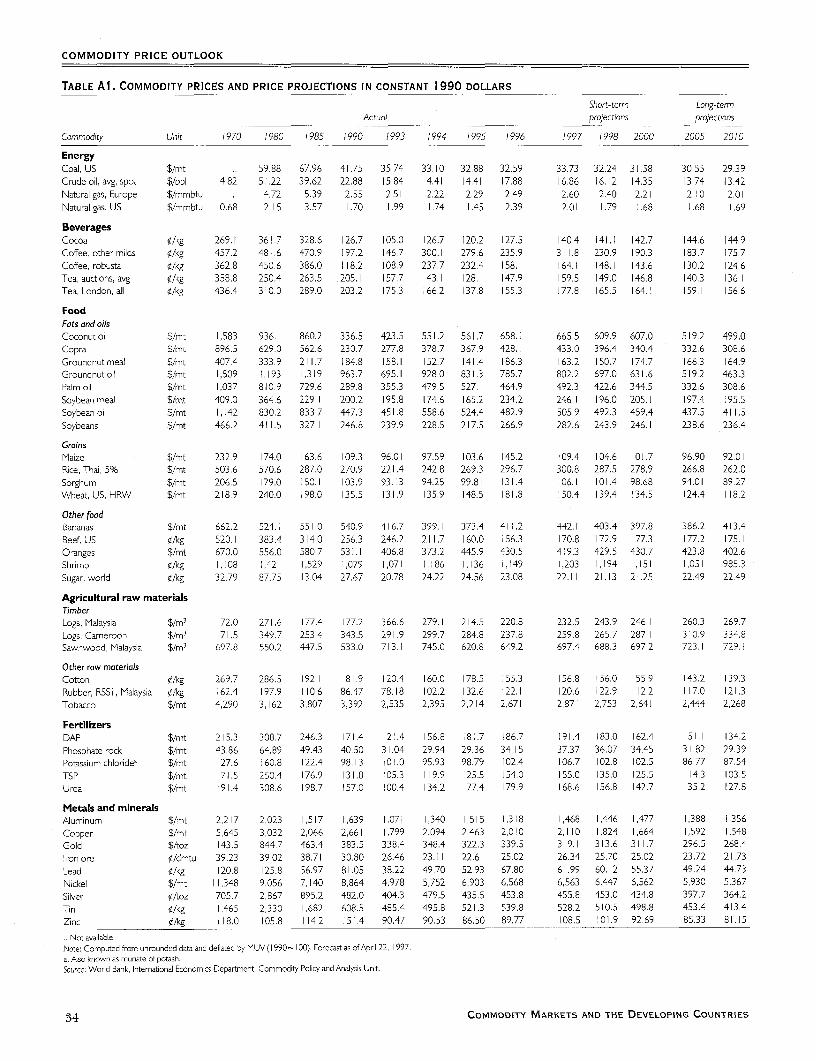
COMMODITY PRICE OUTLOOK
TABLE Al. COMMODITY PRICES AND PRICE PROJECTIONS IN CONSTANT I 990 DOLLARS
Short-term Long-termActual projections projections
Commodity Unit 1970 1980 1985 1990 1993 1994 1995 1996 1997 1998 2000 2005 2010
EnergyCoal, US $/mt .. 59.88 67.96 41.75 35.74 33.10 32.88 32.59 33.73 32.24 31.58 30.55 29.39
Crudeoil, avg, spot $/bbl 4.82 51.22 39.62 22.88 15.84 4.41 14.41 17.88 16.86 16.12 14.35 13.74 13.42
Natural gas, Europe $/mmbtu .. 4.72 5.39 2.55 2.51 2.22 2.29 2.49 2.60 2.40 2.21 2.10 2.01
Natural gas, US $/mmbtu 0.68 2.15 3.57 1.70 1.99 1.74 1.45 2.39 2.01 1.79 1.68 1.68 1.69
BeveragesCocoa ¢/kg 269.1 361.7 328.6 126.7 105.0 126.7 120.2 127.5 140.4 141.1 142.7 144.6 144.9Coffee, othermilds ¢/kg 457.2 481.6 470.9 197.2 146.7 300.1 279.6 235.9 311.8 230.9 190.3 183.7 175.7
Coffee, robusta ¢/kg 362.8 450.6 386.0 1 18.2 108.9 237.7 232.4 158. 164.1 148.1 143.6 130.2 124.6Tea, auctions, avg ¢/kg 358.8 250.4 263.5 205. 157.7 43.1 128.1 147.9 159.5 149.0 146.8 140.3 136.1Tea, London, all /kg 436.4 310.0 289.0 203.2 175.3 166.2 137.8 155.3 177.8 65.5 164.1 159.1 156.6
FoodFats and oilsCoconut oil $/mt 1,583 936.1 860.2 336.5 423.5 551.2 56 .7 658.1 665.5 609.9 607.0 519.2 499.0Copra $/mt 896.5 629.0 562.6 230.7 277.8 378.7 367.9 428.1 433.0 396.4 340.4 332.6 308.6
Groundnut meal $/mt 407.4 333.9 211.7 184.8 158.1 152.7 141.4 186.3 163.2 150.7 174.7 166.3 164.9Groundnut oil $/mt 1,509 1,193 1,319 963.7 695.1 928.0 831.3 785.7 802.2 697.0 631.6 519.2 463.3Palm oil $/mt 1,037 810.9 729.6 289.8 355.3 479.5 527, 464.9 492.3 422.6 344.5 332.6 308.6
Soybeanmeal $/mt 409.0 364.6 229.1 200.2 195.8 174.6 165.2 234.2 246.1 196.0 205.1 197.4 195.5
Soybean oil $/mt 1,142 830,2 833.7 447.3 451.8 558.6 524.4 482.9 505.9 492.3 459.4 437.5 411.5Soybeans $/mt 466.2 411.5 327.1 246.8 239.9 228.5 217.5 266.9 282.6 243.9 246.1 238.6 236,4
GrainsMaize $/mt 232.9 174.0 163.6 109.3 96.01 97.59 103.6 145.2 109.4 104.6 101.7 96.90 92.01
Rice, Thai, 5% $/mt 503.6 570.6 287.0 270.9 221.4 242.8 269.3 296.7 300.8 287.5 278.9 266.8 262.0
Sorghum $/mt 206.5 179.0 150.1 103.9 93.13 94.25 99.81 131.4 106.1 101.4 98.68 94.01 89.27Wheat, US, HRW $/mt 218.9 240.0 198.0 135.5 131.9 135.9 148.5 181.8 150.4 139.4 1 34.5 124.4 1 18.2
Other foodBananas $/mt 662.2 524.1 551.0 540.9 416.7 399.1 373.4 411.2 442.1 403.4 397.8 386.2 413.4
Beef, US ¢/kg 520.1 383.4 314.0 256.3 246.2 211.7 160.0 156.3 170.8 172.9 177.3 177.2 175.1
Oranges $/mt 670.0 556.0 580.7 531.1 406.8 373.2 445.9 430.5 419.3 429.5 430.7 423.8 402.6Shrimp ¢/kg 1,108 1.421 1,529 1,079 1,071 1,186 .136 1,149 1.203 1,194 1,151 1,051 985.3
Sugar, world ¢/kg 32.79 87.75 13.04 27.67 20.78 24.22 24.56 23.08 22.1 1 21.13 21.25 22.49 22.49
Agricultural raw materialsTimberLogs, Malays a $/m3 172.0 271.6 177.4 177.2 366.6 279.1 214.5 220.8 232.5 243.9 246.1 260.3 269.7Logs, Cameroon $/M3 171.5 349.7 253.4 343.5 291.9 299.7 284.8 237.8 259.8 265.7 287.1 310.9 334.8Sawnwood, Malaysia $/m3 697.8 550.2 447.5 533.0 713.1 745.0 620.8 649.2 697.4 688.3 697.2 723.1 729.1
Other raw materialsCotton 4/kg 269.7 286.5 192.1 81.9 120.4 160.0 178.5 155.3 156.8 156.0 155.9 143.2 139.3
Rubber, RSSI, Malaysia ¢/kg 162.4 197.9 1 10.6 86.47 78.18 102.2 132.6 [22.1 120.6 122.9 1 12.2 1 17.0 121.3Tobacco $/mt 4,290 3,162 3,807 3,392 2,535 2,395 2,214 2,671 2,871 2,753 2,641 2,444 2,268
FertilizersDAP $/mt 215.3 308.7 246.3 171.4 121.4 156.8 181.7 186.7 191.4 183.0 162.4 ISI.1 134.2
Phosphate rock $/mt 43.86 64.89 49.43 40.50 31.04 29.94 29.36 34.15 37.37 36.07 34.45 31.82 29.39Potassium chloridea $/mt 127.6 160.8 122.4 98.13 101.0 95.93 98.79 102.4 106.7 102.8 102.5 86.77 87.54TSP $/mt 171.5 250.4 176.9 131.8 105.3 1 19.9 125.5 154.0 155.0 135.0 125.5 1 14.3 103.5Urea $/mt 191.4 308.6 198.7 157.0 100.4 134.2 177.4 179.9 168.6 156.8 142.7 135.2 127.8
Metals and mineralsAluminum $/mt 2,217 2,023 1,517 1,639 1,071 1,340 .515 1,318 1,468 1,446 1,477 1,388 1,356
Copper $/mt 5,645 3,032 2,066 2,661 1,799 2,094 2,463 2,010 2, 110 1.824 1,664 1,592 1,548Gold $/toz 143.5 844.7 463.4 383.5 338.4 348.4 322.3 339.5 319.1 313.6 311.7 296.5 268.4
Iron ore ¢/dmtu 39.23 39.02 38.71 30.80 26.46 23.11 22.61 25.02 26.34 25.70 25.02 23.72 21.73Lead 4/kg 120.8 125.8 56.97 81.05 38.22 49.70 52.93 67.80 61.99 60.12 55.37 49.24 44.73Nickel $/mt 11,348 9,056 7,140 8,864 4,978 5,752 6,903 6,568 6,563 6,447 6,562 5,930 5,367Silver O/toz 705.7 2,867 895.2 482.0 404.3 479.5 435.5 453.8 455.8 453.0 434.8 397.7 364.2Tin 4/kg 1,465 2,330 1,682 608.5 485.4 495.8 521.3 539.8 528.2 510.5 498.8 453.4 413.4Zinc 4/kg I 18.0 105.8 114.2 151.4 90.47 90.53 86.50 89.77 108.5 101.9 92.69 85.33 81.15
.. Not available.Note: Computedfrom unrounded dataand deflated byMUV(1990C100). ForecastasofApr I22 997.a. Aso known as muriate of potash.Source: World Bank, International Economics Department, Commodity Polity and Analysis Unt.
34 COMMODITY MARKETS AND THE DEVELOPING COUNTRIES
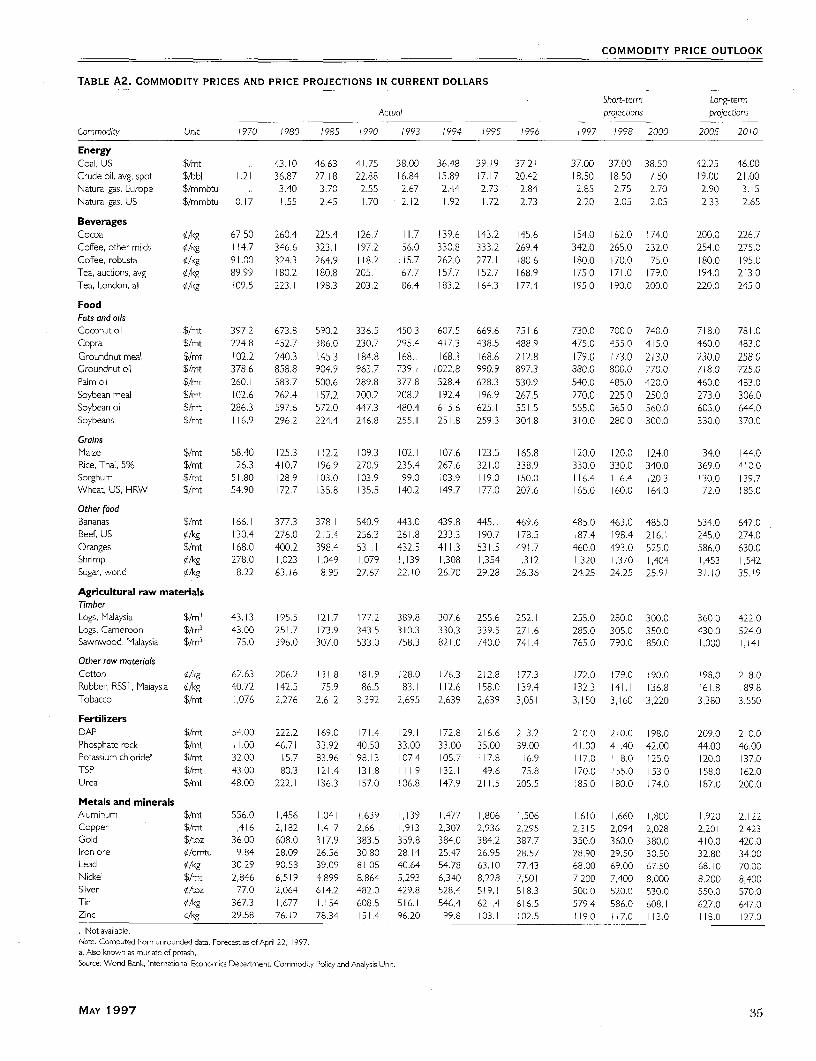
COMMODITY PRICE OUTLOOK
TABLE A2. COMMODITY PRICES AND PRICE PROJECTIONS IN CURRENT DOLLARS
Short-term Long-termActuol projections projections
Commodity Unit 1970 1980 1985 1990 1993 1994 1995 1996 1997 1998 2000 2005 2010
EnergyCoal, US $/mt .. 43.0 46.63 41.75 38.00 36.48 39.19 37.2i 37.00 37.00 38.50 42.25 46.00Crude oil, avg, spot $/bbl 1.21 36.87 27.18 22.88 16.84 15.89 17.17 20.42 18.50 18.50 17.50 19.00 21.00Natural gas, Europe $/mmbtu .. 3.40 3.70 2.55 2.67 2.44 2.73 2.84 2.85 2.75 2.70 2.90 3.15Natural gas, US $/mmbtu 0.17 1.55 2.45 1.70 2.12 1.92 1.72 2.73 2.20 2.05 2.05 2.33 2.65
BeveragesCocoa ¢/kg 67.50 260.4 225.4 126.7 111.7 139.6 143.2 145.6 154.0 162.0 174.0 200.0 226.7Coffee, othermilds ¢/kg 1 14.7 346.6 323.1 197.2 156.0 330.8 333.2 269.4 342.0 265.0 232.0 254.0 275.0Coffee, robusta ¢/kg 91.00 324.3 264.9 118.2 115.7 262.0 277.1 180.6 180.0 170.0 175.0 180.0 195.0Tea, auctions, avg ¢/kg 89.99 180.2 180.8 205.1 167.7 157.7 152.7 168.9 175.0 171.0 179.0 194.0 213.0Tea, London, all ¢/kg 109.5 223. 198.3 203.2 186.4 183.2 164.3 177.4 195.0 190.0 200.0 220.0 245.0
FoodFats and oilsCoconut oil $/mt 397.2 673.8 590.2 336.5 450.3 607.5 669.6 751.6 730.0 700.0 740.0 718.0 781.0Copra $/mt 224.8 452.7 386.0 230.7 295.4 417.3 438.5 488.9 475.0 455.0 415.0 460.0 483.0Groundnutmeal $/mt 102.2 240.3 145.3 184.8 168.1 168.3 168.6 212.8 179.0 173.0 213.0 230.0 258.0Groundnutoil $/mt 378.6 858.8 904.9 963.7 739,1 1022.8 990.9 897.3 880.0 800.0 770.0 718.0 725.0Palm oil $/mt 260.1 583.7 500.6 289.8 377.8 528.4 628.3 530.9 540.0 485.0 420.0 460.0 483.0Soybean meal $/mt 102.6 262.4 157.2 200.2 208.2 192.4 196.9 267.5 270.0 225.0 250.0 273.0 306.0Soybean oil $/mt 286.3 597.6 572.0 447.3 480.4 615.6 625.1 551.5 555.0 565.0 560.0 605.0 644.0Soybeans $/mt 116.9 296.2 224.4 246.8 255.1 25 .8 259.3 304.8 310.0 280.0 300.0 330.0 370.0
GrainsMaize $/mt 58.40 125.3 112.2 109.3 102.1 107.6 123.5 165.8 120.0 120.0 124.0 134.0 144.0Rice, Thai, 5% $/mt 126.3 410.7 196.9 270.9 235.4 267.6 321.0 338.9 330.0 330.0 340.0 369.0 410.0Sorghum $/mt 51.80 28.9 103.0 103.9 99.0 103.9 1 19.0 150.0 116.4 116.4 120.3 130.0 139.7Wheat, US, HRW $/mt 54.90 172.7 135.8 135.5 140.2 149.7 177.0 207.6 165.0 160.0 164.0 172.0 185.0
Other foodBananas $/mt 166.1 377.3 378.1 540.9 443.0 439.8 445.1 469.6 485.0 463.0 485.0 534.0 647.0Beef, US ¢/kg 130.4 276.0 215.4 256.3 261.8 233.3 190.7 178.5 187.4 198.4 216.1 245.0 274.0Oranges $/mt 168.0 400.2 398.4 531.1 432.5 411.3 531.5 491.7 460.0 493.0 525.0 586.0 630.0Shrimp ¢/kg 278.0 1,023 1,049 1,079 1,139 1,308 1,354 1,312 1.320 1,370 1,404 1,453 1,542Sugar,world ¢/kg 8.22 63.16 8.95 27.67 22.10 26.70 29.28 26.36 24.25 24.25 25.91 31.10 35.19
Agricultural raw materialsTimberLogs, Malaysia $/m3 43.13 195.5 121.7 177.2 389.8 307.6 255.6 252.1 255.0 280.0 300.0 360.0 422.0Logs, Cameroon $/m3 43.00 251.7 173.9 343.5 310.3 330.3 339.5 271.6 285.0 305.0 350.0 430.0 524.0Sawnwood, Malaysia $/m3 175.0 396.0 307.0 533.0 758.3 821.0 740.0 741.4 765.0 790.0 850.0 1,000 1,141
Other raw materialsCotton ¢/kg 67.63 206.2 131.8 81.9 128.0 176.3 212.8 177.3 172.0 179.0 190.0 198.0 218.0Rubber, RSSI, Malaysia ¢/kg 40.72 142.5 75.9 86.5 83.1 112.6 158.0 139.4 132.3 141.1 136.8 161.8 189.8Tobacco $/mt 1,076 2.276 2,612 3,392 2,695 2,639 2,639 3,051 3,150 3,160 3,220 3,380 3.550
FertilizersDAP $/mt 54.00 222.2 169.0 171.4 129.1 172.8 216.6 2 3.2 210.0 210.0 198.0 209.0 210.0Phosphate rock $/mt I 1.00 46.71 33.92 40.50 33.00 33.00 35.00 39.00 41.00 41.40 42.00 44.00 46.00Potassium chloride, $/mt 32.00 115.7 83.96 98.13 107.4 105.7 1 17.8 1 16.9 1 17.0 1 18.0 125.0 120.0 137.0TSP $/mt 43.00 180.3 121.4 131.8 111.9 132.1 49.6 175.8 170.0 155.0 153.0 158.0 162.0Urea $/mt 48.00 222.1 136.3 157.0 106.8 147.9 211.5 205.5 185.0 180.0 174.0 187.0 200.0
Metals and mineralsAluminum $/mt 556.0 1,456 1,041 1,639 1,139 1,477 1,806 1,506 1.610 1,660 1,800 1,920 2,122Copper $/mt 1,416 2,182 1,417 2,66 1,9 3 2,307 2,936 2,295 2.315 2,094 2,028 2,201 2,423Gold $/toz 36.00 608.0 317.9 383.5 359.8 384.0 384.2 387.7 350.0 360.0 380.0 410.0 420.0Iron ore ¢/dmtu 9.84 28.09 26.56 30.80 28.14 25.47 26.95 28.57 28.90 29.50 30.50 32.80 34.00Lead /lkg 30.29 90.58 39.09 81.05 40.64 54.78 63.10 77.43 68.00 69.00 67.50 68.10 70.00Nickel $/mt 2.846 6,519 4,899 8,864 5,293 6,340 8,228 7,50/ 7,200 7,400 8.000 8.200 8,400Silver ¢toz 177.0 2,064 614.2 482.0 429.8 528.4 519.1 518.3 500.0 520.0 530.0 550.0 570.0Tin ¢/kg 367.3 1,677 1,154 608.5 516.1 546.4 621.4 616.5 579.4 586.0 608.1 627.0 647.0Zinc c/kg 29.58 76.12 78.34 151.4 96.20 99.8 103.1 102.5 1/19.0 117.0 113.0 1 18.0 127.0.. Not available.
Note: Computed from unrounded data. Forecast as of April 22. 1997.a. Also known as muriate of potash,Source: World Bank, International Sconomics Department, Commodity Policy and Analysis Un t.
MAY 1997 35

COMMODITY PRICE OUTLOOK
TABLE A3. WEIGHTED INDEX OF COMMODITY PRICES IN CURRENT DOLLARS AND IN CONSTANT I 990 DOLLARS1990= 100
Agriculture
Nonenergy Food Raw motenails Metolscommod- Totol Total Other Total raw and
Energy ities ogriculture Beverages food Fats and oils Groins foods materals Timber Fertilizers mineralsYear (100) (100' (69.!)' (16.9)' (29.4)' (10.1)' (6.9)' (12.4)' (22.8)' (9.3)' (2.7)' (28.2)'
Current dollars
1980 161.2 125.9 138.3 182.4 139.3 148.7 134.3 134.3 104.6 79.02 128.9 95.111985 118.8 91.44 100.2 164.1 86.31 113.0 89.23 62.80 70.84 59.06 89.03 70.17
1990 100.0 100.0 100.0 100.0 100.0 100.0 100.0 100.0 100.0 100.0 100.0 100.01991 84.67 95.30 97.63 92.94 99.15 104.5 101.7 93.35 99.15 104.2 102.4 88.901992 83.13 91.80 93.95 77.46 [00.0 I11 .7 101.7 89.53 98.34 114.5 95.80 86.141993 73.62 91.38 98.78 83.62 98.57 111.5 93.65 90.72 .10.3 152.4 83.66 73.941994 69.43 111.6 123.3 148.8 106.8 125.9 102.1 93.87 125.8 156.6 93.36 84.611995 75.06 122.2 131.3 151.2 116.9 136.6 120.4 98.84 135.2 139.5 103.6 101.61996 89.25 115.1 125.5 126.5 123.6 147,0 140.6 94.97 127.1 139.5 119.8 89.11997 80.86 117.5 128.2 147.9 18.0 148.3 [18.4 93.07 126.6 143.6 118.8 91.04
1998 80.86 113.0 122.6 127.4 112.3 131.9 117.3 93.49 132.2 149.5 112.0 89.72
2000 76.49 115.0 124.3 121.7 115.5 134.1 120.8 97.26 137.5 160.7 111.5 92.512005 83.04 126.2 137.8 133.8 125.1 144.6 129.7 106.6 157.1 89.6 1 5.8 98.652010 91.79 139.0 153.1 146.9 136.9 158.3 141.5 116.7 178.6 217.2 119.5 106.3
Constant / 990 dollars
1980 223.9 174.9 192.2 253.4 193.5 206.6 186.6 186.6 145.3 109.8 179.1 132.11985 173.2 33.3 146.0 239.2 125.8 164.7 130.0 91.53 103.2 86.08 129.8 102.3
1990 100.0 100.0 100.0 100.0 100.0 100.0 100.0 100.0 [00.0 100.0 100.0 100.01991 82.82 93.22 95.50 90.91 96.98 102.2 99.47 91.31 96.99 101.9 100.2 86.961992 77.96 86.09 88. 0 72.63 93.78 104.7 95.37 83.96 92.21 107.3 89.84 80.781993 69.24 85.94 92.90 78.64 92.70 104.9 88.08 85.32 103.7 143.3 78.68 69.541994 63.00 101.3 111.9 135.0 96.94 114.3 92.63 85.17 114.1 42.1 84.71 76.771995 62.97 102.5 110.2 126.8 98.07 1 14.6 01.0 82.92 1 13.4 117.1 86.91 85.241996 78.15 100.8 109.9 110.7 108.3 128.7 123.1 83.16 111.3 122.1 104.9 78.03997 73.71 107.1 1 16.8 134.8 107.6 35.2 107.9 84.84 115.5 130.9 108.3 82.99998 70.45 98.5 106.8 111.0 97.84 114.9 102.2 81.45 115.2 130.2 97.54 78.17
2000 62.74 94.32 101.9 99.84 94.73 110.0 99.08 79.78 112.8 [31.8 9 .50 75.882005 60.05 91.24 99.64 96.75 90.48 104.6 93.78 77.08 113.6 137.1 83.70 71.342010 58.65 88.83 97.83 93.88 87.46 01.2 90.40 74.59 114.1 I138.8 76.35 67.92
Note: F gures for 1997-20 10 are projections. Weights used are the average 1987-89 export va ues for low- and middle- ncome economies. Forecast as of April 22, [997.a. Percentage share of commodity group in nonenergy index,Source: Wor[d Bank, Internationa Economics Department, Commodity Po icy and Analysis Unit,
TABLE A4. INFLATION INDICES FOR SELECTED YEARS
G-5 MIUV index, US GDP deflator
Yeor 1990=100 % change 1990= 100 % change
1980 71.98 64.54
1985 68.6 -0.95 83.77 5.66
1990 100.0 7.83 100.0 3.611991 102.2 2.23 104.0 3.951992 106.6 4.31 106.8 2.781993 106.3 -0.29 109.6 2.601994 1 0.2 3.65 112.2 2.341995 119.2 8.15 115.0 2.481996 114.2 4.19 117.2 1.951997 109.7 -3.94 119.7 2.101998 114.8 4.63 122.2 2.10
2000 121.9 3.06 127.1 2.00
2005 138.3 2.55 141.7 2.20
2010 156.5 2.50 158.0 2.20
Note: Figures for 1996-2010 are projections, except 1996 US GDP deflator is a pre iminary estimate. Forecast as of Apr 122, 1997. Growth rates for years 1985, 1990,2000, 2005, and 20 0 are compound annual rates of change between adjacent end-point years; all others are annual growth rates from the previous year.a. Unit value index in US do lar terms of manufactures exported from the G-5 countr es (France, Germany, Japan, UK, and US), weighted proportonally to thecountries' exports to the developing countries.Source: G-5 MUV index, G-S GDP/GNP deflator, and G-7 CPI: World Bank. US GDP deflator: US Department of Commerce.
36 COMMODITY MARKETS AND THE DEVELOPING COUNTRIES

COMMODITY PRICE OUTLOOK
TABLE A5. COMMODITY PRICE PROBABILITY DISTRIBUTIONS IN CONSTANT 1990 DOLLARS
70% probability distribution
Commodity Unit 1997 1998 2000 2005
EnergyCoal, US $/mt 28.26-39.20 25.27-39.21 22.97-40.19 18.44-42.66Crude oil, avg. spot $/bbl 13.22-20.51 12.20-20.04 10.05-18.87 7.95-19.52Natural gas, Europe $/mmbtu 2.32-3.01 1.83-2.96 1.56-2.87 1.34-2.86Natural gas, US $/mmbtu 1.60-2.42 .31-2.22 1.15-2.21 1.01-2.36
BeveragesCocoa ¢/kg 126.2-151.5 119.1-167.3 113.4-179.6 107.1-195.2Coffee, other milds ¢/kg 255.2-380.1 173.4-295.3 132.9-260.8 122.9-261.0Coffee, robusta ¢/kg 124.9-209.7 108.0-192.5 100.9-196.9 86.77-184.4Tea, auctions, avg. ¢/kg 143.6-177.1 129.7-168.5 123.3-167.3 109.6- 168.6Tea, London, all ¢/kg 160.0-200.9 144.0-187.1 137.8-187.0 124.1-190.9
FoodFats and oilsCoconut oil $/mt 598.9-732.0 518.4-701.3 455.3-758.8 363.7-674.7Copra $/mt 390.2-476.8 337.2-455.7 255.1-425.7 232.8-432.4Groundnutmeal $/mt 146.8-179.6 128.1-173.4 131.2-218.2 116.4-216.2Groundnut oil $/mt 722.0-882.4 592.4-801.5 474.1-789.9 363.7-674.7Palm oil $/mt 443.0-541.5 358.9-486.1 258.4-430.6 232.8-432.4Soybean meal $/mt 221.5-270.7 166.4-225.6 154.2-256.7 138.1-256.7Soybean oil $/mt 455.8-557.0 418.2-566.3 344.5-574.2 306.6-569.1Soybeans $/mt 254.3-310.8 207.4-280.5 184.6-307.6 167.0-310.2
GrainsMaize $/mt 96.26-122.5 83.64-125.5 77.27-128.1 62.98-135.7Rice, Thai, 5% $/mt 246.7-355.0 218.5-362.3 200.8-362.6 160.1-400.2Sorghum $/mt 93.35-118.9 81.11-121.7 74.97-124.4 61.10-131.6Wheat, US. HRW $/mt 123.3-177.5 105.9-175.6 96.87-174.9 74.63-177.9
Other foodBananas $/mt 389.2-486.8 346.8-452.2 326.5-461.8 239.4-509.1Beef, US ¢/kg 150.3-191.3 141.7-204.0 133.0-221.6 118.7 235.7Oranges $/mt 343.8-494.8 326.5-541.2 310. 1-555.6 283.9-563.6Shrimp ¢/kg 1,135-1,294 1,015-1,397 875.2-1,543 772.3-1,524Sugar, world f/kg 19.90-24.32 18.59-23.66 17.85-24.65 15.29-29.68
Agricultural raw materialsTimberLogs, Malaysia $/m3 208.9-250.8 205.8-289.2 195.5-309.7 192.8-351.4Logs, Cameroon $/m3 233.9-280.8 224.2-315.0 228.1-361.3 230.3-419.7Sawnwood. Malaysia $/m3 635.0-760.8 580.7-815.8 554.0-877.5 535.7-976.1
Other raw materialsCotton f/kg 141.3-172.3 132.4-178.6 116.5-194.4 100.5-186.6Rubber, RSSI, Malaysia f/kg 106.1-141.1 105.7-145.5 92.04-135.8 76.07-175.5Tobacco $/mt 2,527-3,216 2,257-3,249 1,981-3,302 1,638-3,250
FertilizersDAP $/mt 157.0-225.9 139.0-230.5 1 17.0-21 1.1 98.27-204.1Phosphate rock $/mt 30.63-44.12 27.44-45.48 24.77-44.79 20.68 42.95Potassium chloridea $/mt 87.42-125.9 78. 5-129.6 73.82-133.3 52.06-121 .5TSP $/mt 127.1-182.9 102.6-170.2 90.39-163.2 68.55-160.0Urea $/mt 138.3-199.0 1 19.2-197.6 102.8-185.5 81.13-189.3
Metals and mineralsAluminum $/mt 1,340-1,605 1,220-1,714 1,173-1,858 1,029-1,874Copper $/mt 1,955-2,336 1,539-2,163 1,321-2,094 1,179-2,148Gold $/toz 261.6-376.5 238.4-395.2 224.4-402.1 177.9-429.9Iron ore ¢/dmtu 23.15-29.44 21.08-30.32 19.03-31.01 16.63-31.53Lead f/kg 50.87-73.11 45.65-75.71 39.87-71.45 32.76-66.45Nickel $/mt 5,382-7,745 4,900-8,123 4,725-8,465 3.558-8,30 1Silver ¢/toz 373.7-537.8 344.3-570.8 313.0-560.8 238.6-576.7Tin f/kg 433.1-623.2 388.0-643.3 359.1-643.4 272.0-589.4Zinc f/kg 88.97-128.0 77.45-128.4 66.77-119.6 56.84-1 13.7Note: Forecast as of Apr 1 22, 1997.a. Also known as muriate of potash,Source: World Bank, International Economics Department, Commodity Po icy and Ana ysis Unit.
MAY 1997 37

COMMODITY PRICE OUTLOOK
TABLE A6. COMMODITY PRICE PROBABILITY DISTRIBUTIONS IN CURRENT DOLLARS
70% probobility distribution
Commodity Unit 1997 1998 2000 2005
EnergyCoal, US $/mt 31.00-43.00 29.00-45.00 28.00-49.00 25.50-59.00Crude oil, avg. spot $/bbl 14.50-22.50 14.00-23.00 12,25-23.00 11.00-27.00Natural gas, Europe $/mmbtu 2.55-3.30 2.10-3.40 1.90-3.50 1.85-3.95Natural gas, US $/mmbtu 1.75-2.65 1.50-2.55 1.40-2.70 1.40-3.26
BeveragesCocoa ¢/kg 138.5-166.3 136.7-192.0 138.3-219.0 148.2-270.0Coffee, othermilds ¢/kg 280.0-417.0 199.0-339.0 162.0-318.0 170.0-361.0Coffee, robusta ¢/kg 137.0-230.0 124.0-221.0 123.0-240.0 120.0-255.0Tea, auctions, avg. ¢/kg 157.5-194.3 148.9-193.4 150.3-203.9 151.5-233.1Tea, London, all /kg 175.5-220.4 165.3-214.7 168.0-228.0 171.6-264.0
FoodFats and oilsCoconut oil $/mt 657.0-803.0 595.0-805.0 555.0-925.0 503.0-933.0Copra $/mt 428.0-523.0 387.0-523.0 311.0-5 19.0 322.0-598.0Groundnut meal $/mt 161.0-197.0 147.0-199.0 160.0-266.0 161 .0-299.0Groundnut oil $/mt 792.0-968.0 680.0-920.0 578.0-963.0 503.0-933.0Palm oil $/mt 486.0-594.0 412.0-558.0 3 15.0-525.0 322.0-598.0Soybean meal $/mt 243.0-297.0 191.0-259.0 188.0-3i3.0 191.0-355.0Soybean oi $/mt 500.0-61 .0 480.0-650.0 420.0-700.0 424.0-787.0Soybeans $/mt 279.0-341.0 238.0-322.0 225.0-375.0 231.0-429.0
GrainsMaize $/mt 105.6-134.4 96.00-144.0 94.20-156.2 87.10-187.6Rice, Thai, 5% $/mt 270.6-389.4 250.8-415.8 244.8-442.0 221.4-553.5Sorghum $/mt 102.4-130.4 93.10-139.7 91.40-151.6 84.50-182.0Wheat, US, HRW $/mrt 135.3-194.7 12 .6-201.6 1 18.1-213.2 103.2-246.0
Other foodBananas $/mt 427.0-534.0 398.0-519.0 398.0-563.0 331.0-704.0Beef, US ¢/kg 164.9-209.9 162.7-234.1 162.1-270.1 164.2-325.9Oranges $/mt 377.2-542.8 374.7 621.2 378.0-677.3 392.6-779.4Shrimp ¢/kg 1,245-1,420 1,165-1,603 1,067-1,881 1,068-2,107Sugar, world ¢/kg 2 1.83-26.68 21.34-27.16 21.76-30.05 2 .15-41 .05
Agricultural raw materialsTimberLogs, Malaysia $/m3 229.1-275.1 236.2-331.9 238.4-377.6 266.7-486.0Logs, Cameroon $/m3 256.6-308.0 257.3-361 .5 278.1 -440.5 3 18.6-580.4Sawnwood, Malaysia $/m3 696.6-834.7 666.5-936.4 675.4- 070 740.8-1,350
Other raw materialsCotton f/kg 155.0-189,0 152.0-205.0 142.0-237.0 139.0-258.0Rubber, RSSI, Malaysia f/kg 1 16.4-154.8 121.3-167.0 112.2-165.5 105.2-242.7Tobacco $/mt 2,772 3,528 2,591-3,729 2,415-4,025 2,265-4.495
FertilizersDAP $/mt 172.2-247.8 159.6-264.6 142.6-257.4 135.9-282.2Phosphate rock $/mt 33.60-48.40 31.50-52.20 30.20-54.60 28.60-59.40Potassium chlor dea $/mt 95.90- 138.1 89.70-148.7 90.00-162.5 72.00-168.0TSP $/mt 139.4-200.6 117.8-195.3 11 0.2-198.9 94.80-221.2Urea $/mt 151.7-218.3 136.8-226.8 125.3-226.2 1 12.2-261.8
Metals and mineralsAluminum $/mt 1,470-1,760 1,400-1,968 1,430-2,265 1,422-2,592Copper $/mt 2,145-2,563 1,767-2,482 1,61 1-2,553 1,631-2,971Cold $/toz 287.0-413.0 273.6-453.6 273.6-490.2 246.0-594.5Iron ore /dmctu 25.40-32.30 24.20-34.80 23.20-37.80 23.00-43.60Lead ¢ kg 55.80-80.20 52.40 86.90 48.60-87.10 45.30-91.90Nicke $/mt 5,904-8,496 5,624-9,324 5,760-10,320 4,920-11,480Silver f/toz 410.0-590.0 395.2-655.2 381.6-683.7 330.0-797.5Tin f/kg 475.1-683.7 445.4-738.4 437.8-784.4 376.2-815.1Zinc f/kg 97.60-140.4 88.90-147.4 81.40-145.8 78.60-157.2
Note: Forecast as of Apr 122, 1997.a. Also known as munate of potash.Source: Worid Bank, International Economics Department, Commodity Policy and Analysis Unit.
38 COMMODITY MARKETS AND THE DEVELOPING COUNTRIES

COMMODITY PRICE OUTLOOK
TABLE A7. RECENT COMMODITY PRICES
Annual averages Quarterly averages Monthly averages
Jan-Dec Jan-Dec Jan-Mar Jon-Mar Apr-Jun Jul-Sep Oct-Dec Jan-Mar Jan Feb MarCommodity Unit 1995 1996 1997 1996 1996 1996 1996 /997 1997 1997 1997
EnergyCoalAustralia $/mt 39.37 38.07 36.91 39.22 38.58 38.28 36.22 36.91 35.23 38.58US $/mt 39.1 9 37.2 37.80 36.77 37.10 37.60 37.38 37.80 37.80 37.80 37.80
Crude oil, avg., spot, $/bbl 17.17 20.42 20.99 18.30 19.41 20.76 23.21 20.99 23.23 20.42 1 9.33Brent' $/bbl 17.07 20.65 21.17 18.63 19.47 20.93 23.57 21.17 23.47 20.83 19.21Dubaia $/bbl 16.11 18.54 19.32 16.56 17.25 18.94 21.41 19.32 21.28 18.60 18.09West Texas mnt.' $/bbl 18.34 22.07 22.48 19.71 21.52 22.42 24.64 22.48 24.93 21.83 20.69
Natural gasEurope $/mmbtu 2.73 2.84 2.89 2.73 2.91 2.79 2.95 2.89 2.89 2.89 2.89US $/mmbtu 1.72 2.73 2.47 3.43 2.32 2.12 3.07 2.47 3.31 2.22 1.89
BeveragesCocoab ¢/kg 143.2 145.6 144.1 135.3 150.6 149.1 147.3 144.1 142.8 1373 152.4CoffeeOther mildsb ¢/kg 333.2 269.4 364.5 261.3 278.0 270.0 268.4 364.5 292.9 371.2 429.2Robusta' 0/kg 277.1 180.6 163.8 204.2 196.9 169.8 151.5 163.8 148.1 166.2 176.9
TeaAuctions (4), average' ¢/kg 152.7 168.9 175.5 158.7 170.4 175.0 171.7 175.5 171.4 174.1 81. ILondonauction b ¢/kg 164.3 177.4 198.8 173.6 172.7 172.9 90.2 198.8 189.7 193.5 213.1
FoodFats and oilsCoconut oilb $/mt 669.6 751.6 757.7 724.0 783.3 746.0 753.0 757.7 768.0 768.0 737.0Copra $/mt 438.5 488.9 497.0 464.0 510.7 501.3 479.7 497.0 506.0 496.0 489.0Groundnut meal $/mt 168.6 212.8 239.0 186.3 217.7 215.0 232.0 239.0 236.0 230.0 251.0Groundnut oil' $/mt 990.9 897.3 885.3 931.7 898.7 888.7 870.0 885.3 874.0 886.0 896.0Palm aill $/mt 628.3 530.9 568.7 524.0 540.7 51 1.3 547.7 568.7 567.0 580.0 559.0Soybean mealb $/mt 196.9 267.5 287.3 253.0 269.0 273.7 274.3 287.3 280.0 282.0 300.0Soybean oilb $/mt 625.1 551.5 534.0 546.7 578.7 561.0 519.7 534.0 534.0 527.0 541.0Soybeansb $/mt 259.3 304.8 313.7 299.7 315.3 316.0 288.3 313.7 301.0 308.0 332.0
GrainsMaizeb $/mt 123.5 165.8 122.5 168.6 197.3 176.2 121.1 122.5 118.4 121.7 127.6RiceThai, 5%b $/mt 321.0 338.9 343.8 365.6 333.7 340.6 315.7 343.8 356.0 347.0 328.3Thai, 35% $/mt 290.2 275.8 269.3 311.7 272.7 269.2 249.8 269.3 276.8 270.3 260.8Thai,AI.Special $/mt 262.8 232.7 224.8 262.5 243.2 218.9 206.3 224.8 217.5 225.8 231.3
Sorghum' $/mt 1 19.0 150.0 112.2 160.0 183.1 148.8 108.2 112.2 105.7 I11.2 1 19.7WheatCanada $/mt 207.1 230.8 186.9 232.6 277.2 220.2 193.3 186.9 188.7 183.5 188.5US, HRW1b $/mt 177.0 207.6 174.9 213.7 249.0 191.0 176.7 174.9 175.7 172.4 176.6US, SRW $/mt 167.4 187.4 150.5 202.2 213.9 175.3 158.4 150.5 154.0 143.6 153.8
Other foodBananas' $/mt 445.1 469.6 615.0 501.4 541.8 409.0 426.1 615.0 580.4 629.0 635.6Beef1' ¢/kg 190.7 178.5 191.2 182.8 176.2 73.9 181.2 191.2 179.6 188.1 205.8Fishmeal $/mt 495.0 586.0 562.7 635.3 570.0 550.7 588.0 562.7 576.0 558.0 554.0Lamb %/kg 262.1 329.5 365.5 262.6 332.3 351.0 371.9 365.5 379.3 367.4 349.9Oranges' $/mt 531.5 491.7 417.0 442.1 536.0 527.7 460.9 417.0 424.6 406.7 419.6Shrimp ¢/kg 1,354 1,312 1,393 1,203 1,366 1,326 1,353 1,393 1,389 1,389 1,400SugarEU, domesticb ¢/kg 68.8 68.3 66.3 68.7 68.0 68.5 68.1 66.3 69.0 65.4 64.6US, domesticb g/kg 50.8 49.3 48.2 49.6 49.7 48.9 48.9 48.2 48.2 48.2 48.1Worldb g/kg 29.3 26.4 24.0 28.1 26.1 27.3 23.9 24.0 23.6 23.8 24.5
Agricultural raw materialsTimberLogsMalaysia' $/m3 255.6 252.1 237.7 244.6 256.7 260.6 246.6 237.7 240.6 235.2 237.4Cameroon $/m3 339.5 271.6 268.1 278.1 254.0 267.4 286.8 268.1 276.9 265.3 262.3
Plywood ¢/sheet 584.4 529.5 491.8 535.6 526.7 532.4 523.3 491.8 499.9 487.8 487.8SawnwoodMalaysiab $/m3 740.0 741.4 751.3 720.6 750.8 747.6 746.5 751.3 743.8 753.3 756.6Ghana $/m3 632.5 540.8 548.9 530.8 524.8 531.5 576. 548.9 551.2 551.2 544.2
Woodpulp $/mt 853.5 574.1 532.7 678.7 499.2 545.5 573.0 532.7 546.2 526.0 526.0
MAY 1997 39

COMMODITY PRICE OUTLOOK
TABLE A7. RECENT COMMODITY PRICES (CONTINUED)
Annual averages Quarterly averages Monthly averages
Jan-Dec Jan-Dec Jan-Mar Jan-Mar Apr Jun Jul-Sep Oct-Dec Jan-Mar Jan Feb MarCommodity Unit 1995 1996 1997 1996 1996 1996 1996 1997 1997 1997 1997
Other raw materialsCottonb ¢/kg 212.8 177.3 177.0 187.0 182.8 170. 169.5 177.0 176.1 177.3 177.7Jute $/mt 368.0 457.5 364.8 525.4 502.3 403.3 399.2 364.8 372.0 350.0 372.5RubberMalaysiab ¢/kg 158.0 139.4 122.6 152.8 147.1 132.0 125.6 122.6 123.1 122.1 122.7NY ¢/kg 181.4 160.7 139.7 176.2 166.9 153.4 146. 139.7 143.5 142.9 132.8Singapore ¢/kg 160.0 140.9 121.3 156.9 148.7 131.8 126.2 121.3 122.0 120.9 120.9
Sisal $/mt 709.7 868.3 809.0 843.3 860.0 890.0 880.0 809.0 822.0 832.5 772.5Wool ¢/kg 488.3 416.3 424.4 430.0 410.8 412.4 412.0 424.4 417.2 421.5 434.5
FertilizersDAP $/mt 216.6 213.2 200.6 231.7 204.5 206.9 209.5 200.6 206.2 200.8 194.8
Phosphaterock' $/mt 35.0 39.0 41.0 39.0 39.0 39.0 39.0 41.0 41.0 41.0 4t.0Potassiumchloride $/mt 117.8 116.9 116.6 116.7 117.0 117.0 117.0 116.6 116.8 116.5 116.5TSPb $/mt 149.6 175.8 181.3 168.4 173.9 178.6 182.5 181.3 181.9 181.0 181.0Urea $/mt 211.5 205.5 176.7 220.0 198.5 206.4 197.0 176.7 188.5 175.3 166.4
Metals and mineralsAluminumb $/mt 1,806 1,506 1,596 1,598 1,553 1,443 1,429 1,596 1,576 1,580 1,632Copper' $/mt 2,936 2,295 2,421 2,572 2,476 1,979 2,153 2,421 2,435 2,406 2,421Gold $ toz 384.2 387.7 351.2 400.1 390.0 384.7 376.0 351.2 355.1 346.6 351.8Iron oreb ¢/dmtu 26.95 28.57 28.88 28.57 28.57 28.57 28.57 28.88 28.88 28.88 28.88Leadb ¢kg 63.1 77.4 68.2 76.6 81.7 79.9 71.6 68.2 69.2 66.0 69.5Nickel' $/mt 8,228 7,501 7,567 8,033 7,926 7,192 6,852 7,567 7,072 7,735 7,896Silver ¢/toz 519.1 518.3 501.7 553.7 529.9 504.8 484.9 501.7 476.4 508.8 519.9Steel products (8) index' 1990= 100 106.7 96.3 90.1 10 .6 96.4 95.1 92.1 90.1 90.0 89.1 91.2Steel
Cold rolled coilsheet ¢/mt 554.2 483.9 440.0 523.3 500.0 474.0 438.3 440.0 440.0 430.0 450.0Hot rolled coilsheet ¢/mt 440.8 365.6 331.7 390.0 373.3 367.3 331.7 331.7 330.0 330.0 335.0Rebar ¢/mt 381.7 360.2 330.0 370.0 353.3 360.7 356.7 330.0 330.0 330.0 330.0Wire rod ¢/mt 420.8 438.5 393.3 463.3 443.3 437.3 410.0 393.3 390.0 390.0 400.0
Tinb ¢/g 621.4 616.5 589.0 622.1 636.2 615.4 592.3 589.0 587.8 588.3 590.9ZincP ¢/kg 103.1 102.5 117.4 104.0 103.0 100.2 102.9 117.4 108.7 117.9 125.5
World Bank commodity price indices for low- and middle-income countries (1990 = 100)Petroleum 75.1 89.3 86.9 80.0 84.8 90.8 101.4 91.8 101.5 89.3 84.5Nonenergycommodities 122.2 1 15.1 1 12.2 1 17.1 1 19.4 1 13.1 1 10.7 1 19.3 1 15.0 119.1 123.6Agriculture 131.3 125.5 121.6 126.2 130.3 124.7 120.7 130.0 124.2 130.0 135.8Beverages 151.2 126.5 122.7 124.0 131.3 126.6 124.0 150.6 129.4 151.3 171.1Food 1 16.9 123.6 1 17.1 124.8 129.7 123.2 1 16.8 122.6 121.4 122.2 124.1
Fatsand oils 136.6 147.0 143.2 142.6 150.1 147.7 147.8 154.5 152.0 153.9 157.5Grains 120.4 140.6 1 19.5 147.1 157.2 139.6 1 18.4 122.9 123.7 122.6 122.4Other food 98.8 95.0 94.5 97.8 97.6 94.0 90.5 96.3 95.1 96.0 97.7
Raw materials 135.2 127.1 126.4 129.7 130.3 125.2 123.3 124.2 123.8 124.2 124.7Timber 139.5 139.5 143.2 135.5 141.4 141.1 139.9 140.0 139.0 140.2 140.9Otherrawmaterials 132.3 1 18.7 1 14.9 125.6 122.8 114.3 1 12.0 113.4 1 3.4 113.3 1 13.6
Fertilizers 103.6 1 9.8 1 17.2 116.2 1 18.9 121.1 123.0 124.2 124.5 124.1 1 24.1Metals and minerals 101.6 89.1 88.6 94.7 92.8 83.8 85.1 92.5 91.6 92.1 93.7
Note: Prices as of April 4, 1997. Monthly updates of commodity prices are availab e on the internet at http:Avww.worldbank.org/html/eccp/ieccp.htmIa. Included n the petroleum index.b. Included in the nonenergy index.c. Not included in the nonenergy index.Source: World Bank, International Economics Depantment, Commodity Policy and Analysis Unit.
40 COMMODITY MARKETS AND THE DEVELOPING COUNTRIES

COMMODITY PRICE OUTLOOK
COMMODITY DESCRIPTIONSEnergy *SugGr (world), International Sugar Agreement (ISA) daily price, raw, fo.b. and stowedCool (Austrolicn), thermal, 12,000 btuAb, less than 1.0% su fur, 14% ash, fo.b, piers, at greater Caribbean ports
Newcastle/Port Kembla Agricultural raw materials*Coa/ (US), thermal, 12,000 btu,lb, less than 1.0% sulfur, 12% ash, fo.b. piers, Other raw materials
Hampton Road/Norfolk Cotton (Cotlook A index), middling 1-3/32 inch, cif. EuropeNoturol Gos (Europe), average import border price Jute (Bongladesh), raw, white D, f.o.b, Chittagong/ChainaNoturol GCs (US), spot price at Henry Hub, Louisiana *Rubber (Moloysion). RSS 1, in bales, Malaysian Rubber Exchange and Licensing*Petroleum (spot), average spot price of Brent, Dubai, and West Texas Intermediate, Board, mid-day buyers' asking price for prompt or 30 days' delivery, fo.b. Kuala
equally weighed LumpurPetroleum (spot), UK Brent 38° API, fo.b. UK ports Rubber (Asian), RSS 1, in bales, Rubber Association of Singapore Commodity ExchangePetroleum (spot), Dubai Fateh 320 API, fo.b. Dubai (RASCE)/ Singapore Commodity Exchange, midday buyers' asking price forPetroleum (spot), West Texas Intermediate (WTI) 40° API, fo.b, Midland, Texas prompt or 30 days delivery; prior to June 1992, spot, SingaporeBeverages Rubber (ony origin), RSS I, in bales, Rubber Traders Association (RTA), spot, New YorkCocoa (ICCO), International Cocoa Organization daily price, average of the first three Sisal (East African). UG (rejects), c.if. UK
positions on the terminal markets of New York and London, nearest three future Tobocco (US) unmanufactured, unit va ue of genera imports, 1 2-month movingtrading months averages
Coffee (ICO), International Coffee Organization indicator price, other mild arab cas, Wool (Dominion), crossbred, 56's, clean, c.if. UKaverage New York and Bremen/Hamburg markets, ex-dock Timber
Coffee (ICO), International Coffee Organization indicator price, robustas, average New Logs (MGloysion), merant, Sarawak, sale price charged by importers, Tokyo; prior toYork and Le Hawre/Marseilles markets, ex-dock February 1993, average of Sabah and Sarawak weighted by Japanese import
*Tea (Auctions, average), leaf at Calcutta auction, and all tea at Colombo, London, and volumesNairobi/Mombasa auctions, arithmetic averages of weekly quotes Logs (fVest Africon), sapelli, high quality (loyal and marchand), f o.b. Cameroon
Tea (London Guctions), all tea, arithmetic averages of weekly quotes Plywood (Southeost Asion), Lauan, 3-ply, extra, 9 1 m3 x 182 m3 x 4 mm, wholesaleFoods prce, spot TokyoFats and oils Sawnwood (Ghanoion), sapele, bundled, f.o.b. TakoradiCoconut oil (Philippines/lndonesicn), bulk, c.i.f. Rotterdam *Sownwood (Molaysian), dark red seraya/meranti, select and better quality, GeneralCoprG (Philippines/lndonesion), bulk, c.i.f. N.W. Europe Market Specification (GMS), width 6 inches or more, average 7 to 8 inches; lengthGroundnut meol (Argentne), 48/50%, c.i.f. Rotterdam 8 inches or more, average 12 to 14 inches; thickness I to 2 inches; kiln dry, c&fGroundnut oil (ony origin), c.i.f Rotterdam UK portsPalm oil (Moaloysion), 5% bulk, c.i.f. N. W. Europe Woodpulp (Swedish), softwood, su phate, bleached, air-dryweight, c.if. North Sea portsSoybean meol (any origin), Argentine 45/46% extraction, c. if, Rotterdam: prior to Fertilizers
1990, US 44% DAP (diammonium phosphote), bulk, spot, fo.b. US GulfSoybean oil (Dutch), crude, f.o.b. ex-mill Phosphote rock (Moroccan), 70% BPL, contract, f.a.s. CasablancaSoybeons (US), c.i.f. Rotterdam Potassium chloride (muriate of potosh), standard grade, spot, fo.b. VancouverGrains TSP (triple superphosphate). bulk, spot, f.o.b. US GulfMoize (US), no. 2, yellow, f.o.b. US Gulf ports Urea (varying origins), bagged, spot, fo.b. West Europe'Rice (Thai), 5% broken, white rice (WR), milled, indicative market price based on Metals and minerals
weekly surveys of export transactions (indicative survey price), government Aluminum (LME) London Metal Exchonge, unalloyed primary ingots, high grade,standard, f.o.b. Bangkok minimum 99.7% purty, cash price
Rice (Thoi), 35% broken, WR, milled, indicative survey price, govemment standard, Copper (LME), grade A, minimum 99.9935% purity, cathodes and wire bar shapes,f.o.b. Bangkok settlement price
Rice (Thai), 100% broken, A. I Special, broken kernel obtained from the milling of WR Gold (UK), 99.5% fine, London afternoon fixing, average of dai y rates15%, 20%, and 25%, indicative survey price, government standard, f.o.b. Iron ore (Brazilian), CVRD Southern System standard sinter fines (SSF), 64.2% Fe (iron)Bangkok content (dry weight) ores, moisture content 6.5%, contract price to Europe, f.o.b.
Sorghum (US), no. 2 milo yellow, f.o.b. Gulf ports Tubarao. Dry metric ton unit (dmtu) stands for mt 1% Fe-unit. To convert price inWheat (Canadian), no. I, Western Red Spring (CWRS), in store, St. Lawrence, export cents/dmtu to $/dmt ssf (dry ore), multiply by percent Fe content. For example,
price 28.88 cents/dmtu is $1 8.54/dmt ssf. To convert to wet mt ssf (natural or wet ore),*Wheat (US), no. I. hard red winter, ordinary protein, export price delivered atthe multiply by percent Fe content by (I minus percent moisture content). 28.88
Gulf port for prompt or 30 days shipment cents/dmtu is $ I7.34/Wet rat ssf. Iron ore in most countries is traded in terms ofWheat (US), no. 2, soft red winter, export price delivered at the Gulf port for prompt dry mt, and shipped in wet mt. For 1989-96, Fe content was 64.3% and mois-
or 30 days shipment ture content 6.9%Other foods Lead (LME), refined, 99.97% purity, settlement priceBananas (Central and South American), first-class quality tropical pack, importer's price Nickel (LME), cathodes, minimum 99.8% purity, official moming session, weekly
to jobber or processor, f.o.b. US ports average bid/asked priceBeef (Austratian/New Zealend), cow forequarters, frozen boneless, 85% chemical lean, Silver (Handy & Harmon), 99.9% grade ref ned, New York
c.i.f. US port (East Coast), ex-dock Steel products pnce index, 1990= 100, Japanese), composite price index for eightFishmeal (any origin), 64-65%, c&f Hamburg, nfs selected steel products based on quotations f.o.b. Japan excluding shipments toLamb (New Zeaoland), frozen whole carcasses, wholesale price, Smithfield market, the US and China, weighted by product shares of apparent combined consump-
London tion (volume of deliveries) in Germany, Japan, and the US. The eight products are:Oranges (Meditenranean exporters) navel, EEC indicative import price. c.i.f. Paris rebar (concrete reinforcing bars), merch bar (merchant bars), wire rod, sectionShnmp (US), frozen, Gulf brown, shell-on, headless. 26 to 30 count per pound, (H-shape), plate (medium), hot rolled coil/sheet, cold roiled coil/sheet, and galva-
wholesale price at New York n zed iron sheetSugar (EU), European Union negotiated import price for raw unpackaged sugar from Tin (LME), refined, 99.85% purity, settlement price
African, Caribbean, and Paclfic (ACP) countries under Lome Conventions c.i.f. Zinc (LME), special high grade, minimum 99.995% purity, weekly average bid/askedEuropean ports price, official morning session; prior to April 1990, high grade. minimum 99,95%
Sugar (US), import price, nearest future, c. i.f. New York purity, settlement price
0 The price series forecast in tables Al and A2.
MAY 1997 41

The best in developmentstatistics just got better!
_~~~~~~~~.aI o * 6
The World Bank introduces its most comprehensive, statistics-packed product todate-World Development Indicators 1997. Formerly the statistical appendix to theWorld Development Report, these comprehensive data are now available in theirown volume and have been enlarged to include more than 80 tables with some400 indicators. This major new publication provides an expanded view of theworld economy for more than 130 countries-with chapters focusing on peo-ple, economy, environment, states and markets, and global links. Concise,insightful commentary tells the story of how people live and work, and howcountries are expanding and changing.
April 1997 350 Pages Stock no. 13701 (ISBN 0-8213-3701-7) $60.00
This comprehensive database, which replaces World Data, contains most of the under-lying time-series data for the World Development Indicators and World Bank Atlas. We'veadded powerful new features-now you can generate maps and charts, and downloadyour results to other software programs. Requires Windows 3.1 .TM
April 1997 Individual Version: Stock no. 13703 (ISBN 0-8213-3703-3) $275.00Network Version: Stock no. 13702 (ISBN 0-8213-3702-5) $550.00
One of the Bank's most popular offerings, the Atlas has been redesignedas a companion to the World Development Indicators. Tables, charts, and 21colorful maps address the development themes of people, economy, envi-ronment, and states and markets. This easy-to-use, inexpensive book is aninternational standard in statistical compilations and an ideal reference foroffice or classroom. Text, maps, and references appear in English, French,and Spanish.April 1997 48 Pages Stock no. 13576 (ISBN 0-8213-3 576-6) $ 15.00
The World BankPO Box 7247-8619 * Philadelphia, PA 19 170-86 19 * USA Lt±J-i]
telephone 202 473 1155 * fax 202 522 2627
-_1*1 S S I I I III* I I I. .1 I I III I I

World Bank quarterlies
Commodity Markets and the --------------------------------------------Developing Countri. Yes, please enter my subscription for theD eveloping C ountries Worl Bank qatrlis as iniaeNot just the facts, unbiased analyses. The World Bank isn't in the WOrd an quarte a ditbusiness of selling commodities. As an international lender putting l Commodity Markets and the Developing Countriesmillions of dollars at risk every day, we demand objectivity regard- l US$150/yearing the commodities markets that play such an important role in Financial Flows and the Developing Countriesdeveloping countries. That is why you get unbiased forecasts that US$150/yeanare based on our own research.
Four times a year World Bank commodity experts examine pro- l Enclosed is my check for US$ . . drawn on a US bank andduction, consumption, and factors from climate to exchange rates payable to the World Bank in US dollars. For payment in local currency,to give you the intelligence you need to make better decisions. please ask for the distributor in your area.
Only Commodity Markets covers such a wide range of theworld's commodities-28 in all-with substantive yet succinct Charge my:
reports on: reprt on_ VISA _ MasterCard American Express* Energy resources: coal, natural gas, petroleum* Foods and beverages: bananas, beef, citrus, shrimp, sugar; l_l
cocoa, coffee, tea; coconut oil, palm oil, soybean oil; maize, Credit CardAccountNumber Expiration Daterice, wheat
* Agricultural raw materials: cotton, jute, rubber, timber _* Fertilizers: potassium chloride, TSP, urea Signature* Metals and minerals: aluminum, copper, gold, iron ore and Name: l
steelIssued February, May, August, and November. I Company:Approximately 40 pages/lISSN 1020-0967 1 Address: _
Financial Flo ws an d the ' City/State/Postal Code: _________________iSteoaCd
Developing Countries I Country: _
The most comprehensive source on the subject is also the only lsource that brings you the dependable data and authoritative anal- I Bill my organization. Institutional customers only. Please include ayses used by senior executives at the World Bank. purchase order.
Four times a year World Bank experts analyze the data from over l140 developing countries, including exclusive information report- Name led by members under our Debtor Reporting System. I I
Only Financial Flows covers the entire developing world, not Company: _just the top emerging markets. It's organized in seven sections for j Address: easy reference:
* International lending and capital markets* Equity portfolio and foreign direct investment l City/State/Postal Code: l* Bilateral and multilateral official capital flows C _* Debt relief update* Commercial bank provisioning and capital adequacy CQ057* Special financial brief e
Financial Flows gives you a wealth of statistical information aswell. A statistical appendix includes tables with invaluable time- Cut out form above and mail to:series data on external debt, foreign direct investment, commercial The World Bankbank claims on developing countries, secondary market price of PO Box 7247-7956developing-country debt, funds and loans raised on international Philadelphia, PA 19170-7956capital markets, and more. USA
Issued February, May, August, and November. To have your order shipped faster, call 201-476-2192 to charge by creditApproximately 40 pages/lISSN 1020-0975 card, or send this completed order coupon by facsimile to 201-476-2197.
Visit the World Bank's publications catalog on the World Wide Web: http://www.worldbank.org/

COMMODTANDTHE6DVLPIGCUNRE
Commodity Markets and the DevelpnCotreis produced by teCmmdtPocyadAlsiUnilt of the InternainlEooic eatetothe World Bank. Frifrainaottecnetcall Donald Mitchela 0-7-84o a202-522-3564. Thopnosepesdaetsefthe authors and shul n b tManner to theWorld B , to it Ba of Eci
Directors, or to tecutiste ersn tipuiblished quarterl nFbur,My uut nNovember. -the ana usrpinrt s$5.0Send subscriptionodrtoW ldBkPuiblications, Box74-96PhldpiaPA 9707956, USA eehn 214629
r~~Ak_
© 1997 The International Bank for Recontuioand Development/The World Bank18 18 H Street, NW, Washino. D203,USAll rights reservedManufactured in the United StatesA oAmrica -
Vol. 4, no. 3__________________________________ISSN 1020-0967 _ _ _ _ _ _ _ _ _ _ _ _ _ _ _ _ _ _ _ _ _ _ _ _ _
ISBN 0-8213-3962-1
@ Printed on recycled p p r_ _ _ _ _ _ _ _ __ _ _ _ _ _ _ _ _ _ _ __ _ _ _ _ _ _ _ _ _ _ _