P W 0 0 0 0 0 6 8 6 S.E.C. Registration Number ... - | PBCOM
481
P W 0 0 0 0 0 6 8 6 S.E.C. Registration Number P H I L I P P I N E B A N K O F C O M M U N I C A T I O N S (Company's Full Name) P B C O M T O W E R , 6 7 9 5 A Y A L A A V E N U E C O R N E R V . A . R U F I N O S T R E E T M A K A T I C I T Y (Business Address: No. Street City/ Town/ Province) Michael Stephen H. Lao (02) 8830-7062 Contact Person Company Telephone Number 3 rd Tuesday of June 1 2 3 1 2 0 I S Month Day Form Type Month Day Fiscal Year Annual Meeting Secondary License Type, If Applicable M S R D Dept. Requiring this Doc. Amended Articles Number/Section Total Amount of Borrowings 3 9 9 Total No. of Stockholders Domestic Foreign To be accomplished by SEC Personnel Concerned File Number LCU Document I.D. Cashier STAMPS
-
Upload
khangminh22 -
Category
Documents
-
view
2 -
download
0
Transcript of P W 0 0 0 0 0 6 8 6 S.E.C. Registration Number ... - | PBCOM

P W 0 0 0 0 0 6 8 6
S.E.C. Registration Number
P H I L I P P I N E B A N K O F C O M M U N I C A T I O N S
(Company's Full Name)
P B C O M T O W E R , 6 7 9 5 A Y A L A A V E N U E
C O R N E R V . A . R U F I N O S T R E E T
M A K A T I C I T Y
(Business Address: No. Street City/ Town/ Province)
Michael Stephen H. Lao (02) 8830-7062
Contact Person
Company Telephone Number
3rd Tuesday of June
1 2 3 1 2 0 I S
Month Day Form Type Month Day
Fiscal Year Annual Meeting
Secondary License Type, If
Applicable
M S R D
Dept. Requiring this Doc. Amended Articles Number/Section
Total Amount of Borrowings
3 9 9
Total No. of Stockholders Domestic Foreign
To be accomplished by SEC Personnel Concerned
File Number LCU
Document I.D. Cashier
STAMPS

NOTICE OF THE ANNUAL MEETING OF STOCKHOLDERS
Please take notice that the Annual Meeting of Stockholders of the PHILIPPINE BANK OF
COMMUNICATIONS (“PBCOM”) will be held on Tuesday, 7 June 2022, 9:00 a.m. to 10:00 a.m.
The meeting will be conducted virtually and can be accessed at the link provided in the Bank’s website at
https://www.pbcom.com.ph/.
A G E N D A
1. Call to Order
2. Certification of Notice and Quorum
3. Review and Approval of the Minutes of the Previous Meeting held on 15 June 2021
(Annual Meeting), and 15 March 2022 (Special Meeting)
4. Annual Report of Management and Approval of the Audited Financial Statements for
2021
5. Ratification of Acts of the Board of Directors and Management since the Last Annual
Meeting of Stockholders
6. Election of Directors
7. Appointment of External Auditor
8. Other Matters
9. Adjournment
For purposes of the meeting, only stockholders of record as of 18 April 2022 are entitled to notice of, and
to vote at, the Annual Meeting of Stockholders.
In light of the community quarantine measures still in place, PBCOM will be holding a virtual Annual
Meeting. The conduct of the Annual Meeting will be streamed live, and stockholders may attend,
participate and vote only through proxy, remote communication or in absentia. The requirements and
procedures for voting in absentia and participation through remote communication are set forth in the
Information Statement.
Stockholders who choose to vote by proxy must submit and address their signed proxy to the attention of
the Corporate Secretary at 5/F PBCOM Tower, 6795 Ayala Avenue corner V.A. Rufino Street, Makati
City or via e-mail at [email protected] not later than 5:00 p.m. on or before 30 May
2022.
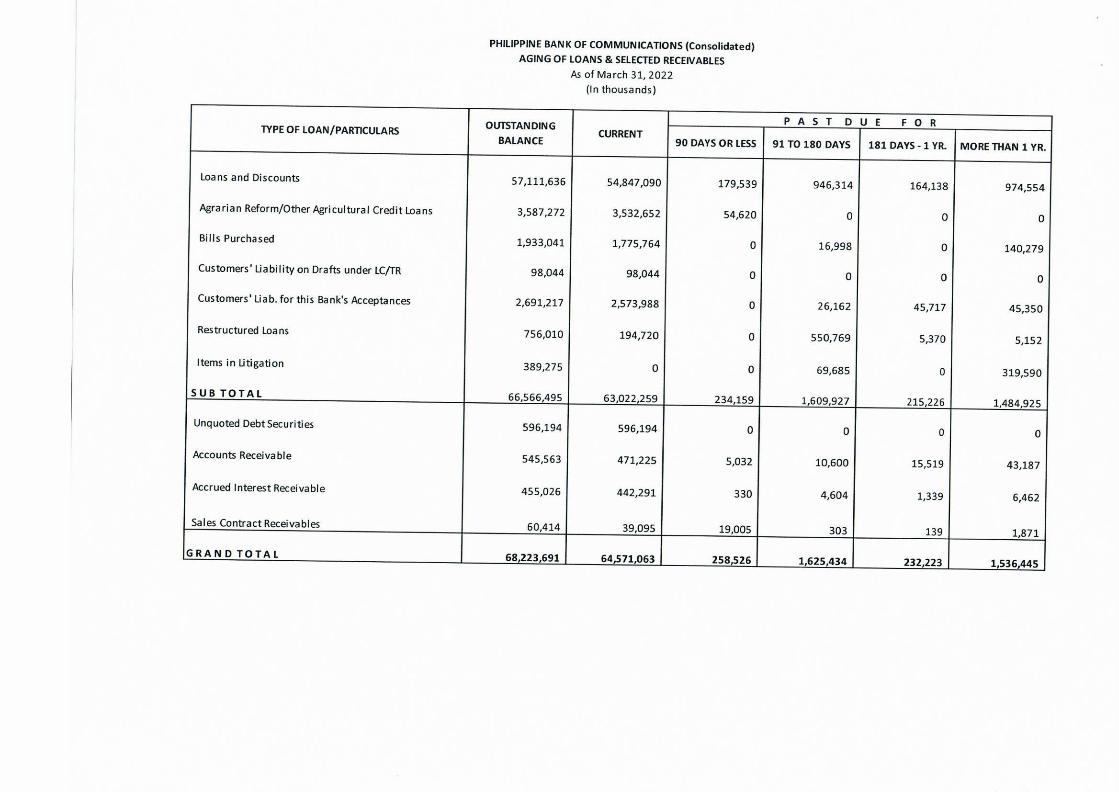
In compliance with SEC Resolution No. 196, Series of 2015, a copy of the Unaudited Interim Financial
Statements of PBCOM with Management Discussion and Analysis for the period ended 31 March 2022
shall be posted in PBCOM’s website at https://www.pbcom.com.ph/ on or before 30 May 2022. A hard
copy of the said interim financial statements shall be provided within a reasonable time upon request by
any stockholder.
Copies of the following documents will be available upon request: (i) Minutes of the Annual Meeting of
Stockholders held on 15 June 2021; (ii) Minutes of the Special Meeting of Stockholders held on 15 March
2022; (iii) Information Statement; (iv) Management Report; (v) Audited Financial Statements for the year
2021.
PBCOM IS NOT SOLICITING PROXIES.
MICHAEL STEPHEN H. LAO
Corporate Secretary

Philippine Bank of Communications 2022 SEC Form 20-IS
Page 2
SECURITIES AND EXCHANGE COMMISSION
SEC FORM 20-IS
INFORMATION STATEMENT PURSUANT TO SECTION 20 OF THE
SECURITIES REGULATION CODE
1. Check the Appropriate box
Preliminary Information Statement
X Definitive Information Statement
2. Name of Registrant as specified in its charter PHILIPPINE BANK OF
COMMUNICATIONS
3. Province, country or other jurisdiction of incorporation or
organization Philippines
4. SEC Identification Number PW00000686
5. BIR Tax Identification Number 000-263-340-000
6. Address of Principal Office PBCOM Tower, 6795 Ayala Avenue corner V.A. Rufino Street,
Makati City 1226, Philippines
7. Registrant’s telephone number, including area code (632) 8830-7000
8. Date, time and place of meeting of security holders
Date 7 June 2022, Tuesday
Time 9:00 a.m. to 10:00 a.m.
Place Virtual Stockholders’ Meeting at the link to be provided in PBCOM’s website -
https://www.pbcom.com.ph/
9. Approximate date on which the Information Statement is first to be sent or given to security holders
17 May 2022
10 Securities registered pursuant to Section 8 and 12 of the Code or Sections 4 and 8 of the RSA
(information of the number of shares and amount of debt is applicable only to corporate registrants)
Title of Each Class
Number of Common Stock Outstanding or
Amount of Debt Outstanding
Common Stock 480,645,163 shares
Debt Outstanding None
11. Are any or all of the registrant’s securities listed on a Stock Exchange?
Yes √ No
12. If yes, disclose the name of such Stock Exchange and the class of securities listed therein:
Philippine Stock Exchange, Inc. Common Shares

Philippine Bank of Communications 2022 SEC Form 20-IS
Page 3
We are not asking you for a proxy and you are requested not to send us a proxy.
GENERAL INFORMATION
Date, Time and Place of Meeting of Security Holders
Date : 7 June 2022, Tuesday
Time : 9:00 a.m. to 10:00 a.m.
Place : Virtual Stockholders’ Meeting at the link to be provided in PBCOM’s website -
https://www.pbcom.com.ph/
Mailing Address of the Bank
The complete mailing address of the Philippine Bank of Communications (hereinafter, “PBCOM”, the
“Bank” or the “Corporation”) is:
PHILIPPINE BANK OF COMMUNICATIONS
PBCOM Tower, 6795 Ayala Ave. corner V.A. Rufino St.
Makati City 1226, Philippines
Record Date
The record date for the purpose of determining the stockholders entitled to notice of, and to vote at, the
Annual Meeting of the Stockholders is 18 April 2022 (the “Record Date”).
Approximate Date of First Release of Information Statement
The approximate date on which this Information Statement will be first sent out to the stockholders of the
Bank is on 17 May 2022.
Dissenter’s Right of Appraisal
In accordance with Title X of the Revised Corporation Code, any stockholder of the Bank has the right to
dissent and demand payment of the fair value of his shares in the following instances:
1. In case any amendment to the articles of incorporation has the effect of changing or restricting the rights
of any stockholder or class of shares, or of authorizing preferences in any respect superior to those of
outstanding shares of any class, or of extending or shortening the term of corporate existence;
2. In case of sale, lease, exchange, transfer, mortgage, pledge or other disposition of all or substantially
all of the corporate property and assets as provided in the Revised Corporation Code; and
3. In case of merger or consolidation; and
4. In case of investment of corporate funds for any purpose other than the primary purpose of the
corporation.
The procedure for the exercise of such appraisal right by the stockholders is as follows:
1. The stockholder voted against the proposed corporate action.

Philippine Bank of Communications 2022 SEC Form 20-IS
Page 4
2. The dissenting stockholder shall make a written demand on the corporation within thirty (30) days after
the date on which the vote was taken for payment of the fair market value of his shares. The failure of
the stockholder to make the demand within such period shall be deemed a waiver of the appraisal right.
3. If the proposed corporate action is implemented or effected, the corporation shall pay to such
stockholder, upon surrender of the certificate(s) of stock within ten (10) days after demanding payment
for his shares, the fair value thereof; and
4. Upon payment of the agreed or awarded price, the stockholder shall transfer his shares to the
corporation.
To date, there are no corporate matters or actions that will entitle dissenting stockholders to exercise their
right of appraisal as provided in Title X of the Revised Corporation Code.
Interest of Certain Persons in or Opposition to Matters to be Acted Upon
There is no matter to be acted upon in which any director or executive officer is involved or had a direct,
indirect or substantial interest (except the election of directors).
No director has informed the registrant, in writing or otherwise, that he intends to oppose any action to be
taken by the registrant at the Meeting.
CONTROL AND COMPENSATION INFORMATION
Voting Securities and Principal Holders Thereof
(a) Total Number of Shares Outstanding as of the date of this report: 480,645,163 common
shares
Number of Votes per Share: One (1) vote per share.
(b) Record Date: All stockholders of record as of the close of business on 18 April 2022 are entitled
to notice of, and to vote at, the Annual Meeting.
(c) Pursuant to Article II, Section 2 of the Bank’s By-laws, a stockholder may vote during the Annual
Stockholders’ Meeting in person or by proxy.
In accordance with Section 23 of the Revised Corporation Code, a stockholder may vote for the
directors of the Bank in any of the following manner:
1. He may vote such number of shares for as many persons as there are directors to be elected.
He may cumulate said shares and give one candidate as many votes as the number of directors
to be elected multiplied by his shares; or
2. He may distribute them in the same principle among as many candidates as he shall see fit.
3. In any of the foregoing instances, the total number of votes cast by the shareholder should not
exceed the number of shares owned by him as shown in the books of the Bank multiplied by
the number of directors to be elected.
Pursuant to Sections 23 and 57 of the Revised Corporation Code which allow voting through
remote communication or in absentia, stockholders may access the Bank’s online web address at
https://www.pbcom.com.ph/, to be able to register and vote in absentia on the matters for approval
at the meeting. A stockholder who votes in absentia shall be deemed present for purposes of
quorum.

Philippine Bank of Communications 2022 SEC Form 20-IS
Page 5
Participants may send questions or remarks via the livestream portal. Stockholders may also send
questions and/or remarks in advance or during the meeting to the Corporate Secretary at
The requirements and procedures for voting in absentia and participation through remote
communication are set forth under Annex “A” of this Information Statement.
Security Ownership of Certain Record and Beneficial Owners as of March 31, 2022:
There are no delinquent stocks and the direct and indirect record of beneficial owners of more
than five percent (5%) of common shares of the Bank as of March 31, 2022 are:
Title of
Class
Name and Address of Record
Owner and relationship with
Issuer
Name of Beneficial
Ownership and
relationship with
Record Owner
Citizenship No. of
Shares
% Held
Common P.G. Holdings, Inc.
900 Romualdez St., Paco, Manila
Stockholder
Lucio L. Co-Chairman
and Susan P. Co-
Director- Authorized
to vote the shares
Filipino 186,241,408 38.75%
Common VFC Land Resources, Inc.
1379 San Gregorio St., Paco,
Manila
Stockholder
Various stockholders
Lucio L. Co –
Authorized to vote the
shares
Filipino 73,619,638 15.32%
Common Ralph C. Nubla, Jr.*
2 Sanso Street, Corinthian
Gardens, Quezon City
Stockholder
Ralph C. Nubla, Jr. –
same as record owner
Filipino 51,779,374 10.77%
Common PCD Nominee Corporation
29th Floor, BDO Equitable Tower,
8751 Paseo de Roxas, Makati City
Stockholder
Various stockholders
No stockholder owns
more than 5% of the
company’s voting
securities through
PCD
Filipino
Non-Filipino
49,138,903
2,002,061
51,140,964
10.64%
Common Eric O. Recto**
5/F PBCOM Tower 6795 Ayala
Ave. cor. V.A. Rufino St., Makati
City
Stockholder
Eric O. Recto – same
as record owner
Filipino 50,159,424 10.43%
Common Telengtan Brothers & Sons, Inc.
Km. 14, South Superhighway,
Paranaque City
Stockholder
Various stockholders
Authorized to vote the
shares-any one the ff:
Bunsit Carlos G.
Chung/Felix
Chung/Ching Tiong
Keng
Filipino 31,859,844 6.63%
*- 5,260,338 shares of the 51,779,374 shares of Ralph C. Nubla, Jr. are under PCD Nominee Corp. ** - 323,648 shares of the 50,159,424 shares of Eric O. Recto are under PCD Nominee Corporation
Except as stated above, the Board of Directors and Management of the Bank have no knowledge of any
person who, as of the date of this report, was indirectly or directly the beneficial owner of more than five
percent (5%) of the Bank’s outstanding shares of common stock or who has voting power or investment
power with respect to shares comprising more than five percent (5%) of the outstanding shares of common
stock. There are no persons holding more than five percent (5%) of the Bank’s common stocks that are
under a voting trust or similar agreement.
The PCD, being a nominee corporation, only holds legal title, not beneficial ownership of the
lodged shares. The beneficial owners, such as the clients of PCD, have the power to decide how
their shares are to be voted
Security Ownership of Management

Philippine Bank of Communications 2022 SEC Form 20-IS
Page 6
The following are the number of shares of common stock owned of record and beneficially by the directors
and executive officers of the Bank and the percentage of shareholdings of each, as of March 31, 2022:
Title of
Class
Name of Beneficial
Owner
Amount and Nature of Beneficial
Ownership
Citizenship Percent
Common Eric O. Recto Direct 50,159,424 Filipino 10.43%
Common Leonardo B. Dayao Direct 10,001 Filipino 0.00%
Common Patricia May T. Siy Direct 100 Filipino 0.00%
Common Bunsit Carlos G. Chung Direct 550,716 Filipino 0.11%
Indirect 449,294 0.09%
Common Lucio L. Co Direct 1 Filipino 0.00%
Indirect 93,120,704 19.37%
Common Susan P. Co Direct 1 Filipino 0.00%
Indirect 93,027,584 19.35%
Common Jaime J. Bautista Direct 100 Filipino 0.00%
Common Jack E. Huang Direct 100 Filipino 0.00%
Common Levi B. Labra Direct 100 Filipino 0.00%
Common Gregorio T. Yu Direct 1,432,692 Filipino 0.30%
Common Robert Y. Cokeng Direct 200 Filipino 0.00%
Common Conrado A. Gloria, Jr. Direct 100 Filipino 0.00%
Common Bienvenido E. Laguesma Direct 100 Filipino 0.00%
Common Emmanuel Y. Mendoza Direct 100 Filipino 0.00%
Common Gilda E. Pico Direct 100 Filipino 0.00%
Common John Howard D. Medina N/A 0 Filipino 0.00%
Common Alan E. Atienza N/A 0 Filipino 0.00%
Common Victor E. Martinez N/A 0 Filipino 0.00%
Common Arlene M. Datu N/A 0 Filipino 0.00%
Common Expedito G. Garcia N/A 0 Filipino 0.00%
Common Erico C. Indita N/A 0 Filipino 0.00%
Common Jane Lim-Laragan N/A 0 Filipino 0.00%
Common Jeruel N. Lobien N/A 0 Filipino 0.00%
Common Mina F. Martinez N/A 0 Filipino 0.00%
Common Michael Stephen H. Lao N/A 0 Filipino 0.00%
Except as disclosed above, the Bank has not received from any of the directors or executive officers of
the Bank any statement of ownership, whether of record or beneficially, of more than five percent (5%)
of the Bank’s outstanding shares of common stock. As known by the Bank, the aggregate number of
common shares owned directly by all key officers and directors as a group as of March 31, 2022 is
238,751,417 common shares.
Changes in Control
There are no voting trust agreements or any other similar agreement that may result in a change in control
of the Bank of which the Bank has any knowledge. No change in control of the Bank has occurred since
the beginning of its last fiscal year.
Directors and Executive Officers
Pursuant to the Bank’s By-Laws, the directors are elected at the annual stockholders’ meeting to hold
office until next succeeding annual meeting and until their respective successors in interest have been
elected and qualified.
The following names have been nominated for election to the Board of Directors for the ensuing year:
Eric O. Recto
Leonardo B. Dayao
Patricia May T. Siy
Lucio L. Co
Susan P. Co
Jaime J. Bautista

Philippine Bank of Communications 2022 SEC Form 20-IS
Page 7
Bunsit Carlos G. Chung
Jack E. Huang
Levi B. Labra
Gregorio T. Yu
Robert Y. Cokeng – Independent Director
Conrado A. Gloria, Jr. – Independent Director
Bienvenido E. Laguesma – Independent Director
Emmanuel Y. Mendoza – Independent Director
Gilda E. Pico – Independent Director
The aforementioned list of nominees had been evaluated and confirmed by the Nominations Committee
of the Bank.
The nominees for Independent Director have all the qualifications and none of the disqualifications of an
Independent Director.
The following names were nominated as members of the Executive, Risk Oversight, Governance, Audit,
Related Party Transactions (RPT), and Trust Committees for the ensuing year:
Executive Committee
a. Lucio L. Co (Chairperson)
b. Eric O. Recto (Vice Chairperson)
c. Leonardo B. Dayao (Vice Chairperson)
d. Patricia May T. Siy
e. Bunsit Carlos G. Chung
f. Jaime J. Bautista
Risk Oversight Committee
a. Conrado A. Gloria, Jr. (Chairperson / Independent Director)
b. Robert Y. Cokeng (Independent Director)
c. Bienvenido E. Laguesma (Independent Director)
d. Levi B. Labra
e. Patricia May T. Siy
Governance Committee
a. Gilda E. Pico (Chairperson / Independent Director)
b. Conrado A. Gloria, Jr. (Independent Director)
c. Bienvenido E. Laguesma (Independent Director)
d. Eric O. Recto
e. Leonardo B. Dayao
The Governance Committee also serves as the Bank’s Nominations Committee, Compensation and
Remuneration Committee and Performance Evaluation Committee.
Audit Committee
a. Emmanuel Y. Mendoza (Chairperson / Independent Director)
b. Gilda E. Pico (Independent Director)
c. Jaime J. Bautista
RPT Committee
a. Robert Y. Cokeng (Chairperson/Independent Director)
b. Conrado A. Gloria, Jr. (Independent Director)
c. Levi B. Labra
Trust Committee

Philippine Bank of Communications 2022 SEC Form 20-IS
Page 8
a. Eric O. Recto (Chairperson)
b. Robert Y. Cokeng (Independent Director)
c. Patricia May T. Siy
d. Jack Ekian T. Huang
e. Dreda Teresa D. Mendoza/Trust Officer
Rules on Nomination and Election of Directors and Independent Directors and Manner of Voting
In compliance with SEC SRC Rule 38, and as a matter of practice, the Bank has adopted the following
rules in the nomination and election of directors.
SEC.1. Period. All the nominations for directors and independent directors shall be submitted to the
Nominations Committee through any of the members of the committee or the Corporate Secretary at any
time before the submission of the Definitive Information Statement to the Securities and Exchange
Commission, allowing the Nominations Committee sufficient time to pass upon the qualifications of the
nominees.
SEC.2. Form and Contents. All nominations shall be in writing duly signed by a stockholder and accepted
and conformed to by the nominees likewise in writing indicating whether a particular nominee/s is/are
intended to be an independent director or not. It must contain the nominee’s age, educational attainment,
work and/or business experience and/or affiliation.
SEC.3. Qualifications. No individual shall be nominated as director or independent director unless he
meets the minimum requirements/qualifications prescribed by the regulatory agencies/offices concerned
of listed banks.
SEC.4. List of Candidates. The Nominations Committee shall pre-screen the qualifications of the
nominees and prepare the final list of candidates, including a summary of all relevant information about
them.
Names of Directors and Executive Officers
The following are the names, ages and periods of service of the nominee Directors and executive officers
of the Company with a brief description of the business experience during the past five years of each of
the directors and executive officers:
Board of Directors
ERIC O. RECTO, Chairman of the Board and Director
Mr. Recto, Filipino, 58 years old, was elected Director and Vice Chairman of the Board on July 26, 2011,
appointed Co-Chairman of the Board on January 18, 2012 and Chairman of the Board on May 23, 2012.
He is presently Chairman and President of Bedfordbury Development Corporation; Vice-Chairman of
Alphaland Corporation; Vice Chairman and President of Atok-Big Wedge Co., Inc. ; President and
Director of Q-Tech Alliance Holdings, Inc.; Independent Director of Aboitiz Power Corporation;
Independent Director of PH Resorts Group Holdings, Inc.; Independent Director of Waterfront Cebu City
Casino Hotel Inc.; Independent Director of Davao Insular Hotel Company Inc.; Independent Director of
Manila Water Company, Inc.; Director of DITO CME Holdings Corp. (formerly ISM Communications
Corporation); and Owner of Premium Wine Exchange Inc. Mr. Recto served as Undersecretary of
Finance of the Republic of the Philippines from 2002 to 2005, in charge of handling both the International
Finance Group and the Privatization Office. Before his stint with the government, he was Chief Finance
Officer of Alaska Milk Corporation and Belle Corporation. Mr. Recto has a degree in Industrial
Engineering from the University of the Philippines as well as an MBA from the Johnson School, Cornell
University.

Philippine Bank of Communications 2022 SEC Form 20-IS
Page 9
LEONARDO B. DAYAO, Vice Chairman and Director
Mr. Dayao, Filipino, 78 years old, was elected Director on September 29, 2014 and Co-Vice Chairman
on October 24, 2014. Mr. Dayao currently holds the following positions in publicly listed companies:
President of Cosco Capital, Inc. and Director of Puregold Price Club, Inc. He also holds various positions
in the following privately-owned companies: Chairman and President of Fertuna Holdings Corp.,
Chairman of Catuiran Hydropower Corporation, Grass Gold Renewable Energy (G2REC) Corporation
Kareila Management Corporation, League One Finance and Leasing Corporation, Pamana Water
Corporation, PSMT Philippines, Inc., S&R Pizza (Harbor Point), Inc., S&R Pizza, Inc.; Vice-Chairman
of Ayagold Retailers, Inc.; President of Alcorn Petroleum Minerals Corporation, K4 Water Resources
Corporation, NE Pacific Shopping Centers Corporation, Puregold Duty Free (Subic), Inc., Puregold
Finance, Inc., San Jose City I Power Corp., Southern Untility Management Services, Incorporated
(SUMSI), Union Energy Corporation; Vice-President of Alerce Holdings Corp., Bellagio Holdings, Inc.,
KMC Realty Corporation, Puregold Properties, Inc., Union Equities, Inc.; and Director of Canaria
Holdings Corporation, Entenso Equities Incorporated, Karayan Hydropower Corporation and Puregold
Realty Leasing & Management, Inc. He received a Bachelor of Science Degree in Commerce from Far
Eastern University. He is a Certified Public Accountant and has completed Basic Management Program
at Asian Institute of Management and earned units in MBA from University of the Philippines-Cebu.
LUCIO L. CO, Chairman of the Executive Committee and Director
Mr. Co, Filipino, 67 years old was elected Director on September 29, 2014. Mr. Co currently holds the
following positions in other publicly listed companies: Director and Chairman of Puregold Price Club,
Inc., Chairman of Cosco Capital, Inc. and Chairman and President of The Keepers Holdings, Inc.
(formally Da Vinci Capital Holdings, Inc.), He is also the Chairman of the following privately-owned
companies: Alcorn Petroleum & Minerals Corporation, Bellagio Holdings, Inc., Canaria Holdings
Corporation, Ellimac Prime Holdings, Inc., Entenso Equities Incorporated, Invescap Incorporated, NE
Pacific Shopping Centers Corporation, P.G. Holdings, Inc., Puregold Duty Free (Subic), Inc., Puregold
Duty Free, Inc., Puregold Finance, Inc., Puregold Properties, Inc., Puregold Realty Leasing &
Management, Inc., San Jose City I Power Corp., Union Energy Corporation, and Union Equities, Inc., He
is also a Director of the following privately-owned companies: Catuiran Hydropower Corporation,
Cleangreen Energy Corporation, Grass Gold Renewable Energy (G2REC) Corporation, Karayan
Hydropower Corporation, Kareila Management Corp., LCCK & Sons Realty Corporation, League One
Finance and Leasing Corporation, Meritus Prime Distributions, Inc., Montosco, Inc., Nation Realty, Inc.,
Pamana Water Corporation, PPCI Subic Inc., Patagonia Holdings Corp., Premier Wine & Spirits, Inc.,
S&R Pizza (Harbor Point), Inc., and S&R Pizza, Inc., Tower 6789 Corporation and VS Gripal Power
Corporation. He is a member of the Board of Trustees of Adamson University and Luis Co Chi Kiat
Foundation, Inc. Mr. Co has been an entrepreneur for the past 40 years.
PATRICIA MAY T. SIY, President & CEO and Director
Ms. Siy, Filipino, 62 years old, was elected Director, President and Chief Executive Officer on June 1,
2015. Immediately before joining PBCOM, she served as Chief Corporate Planning Officer of Travellers
International Hotel Group from 2012 and as Chief Finance Officer of Rustan’s Supercenter Inc. from 2011
to 2012. Her banking experience spanned 31 years. She was with Security Bank Corporation where she
held various positions from 2000 to 2011 in Middle Market Lending and Corporate Lending leading to
the Executive Vice President post for the Commercial and Retail Banking Segment. She held senior
positions in Standard Chartered Bank from 1994 to 2000 in the fields of Regional and Philippine
Consumer Credit, Group Special Asset Management, and Corporate Banking in Cebu and Head
Office. Her first Bank was Private Development Corporation of the Philippines where she stayed from
1983 to 1994 as Project Analyst, Cebu Lending Head, Visayas Lending Head, and then Branch Lending
Head. Ms. Siy graduated from De La Salle University with a Bachelor of Science degree in Industrial
Management Engineering minor in Chemical Engineering.
JAIME J. BAUTISTA, Director
Mr. Bautista, 65 years old, was elected Director on July 14, 2020. He is currently a Director of Air Speed
International Inc., Alphaland Corp., Belle Corp. Cosco Capital Inc., Gothong Southern Shipping, Inc.,

Philippine Bank of Communications 2022 SEC Form 20-IS
Page 10
Nickel Asia Corp. and Premium Leisure Corp. At present, he is a member of the Board of Trustees of the
University of the East, UE Ramon Magsaysay Medical Memorial Center and International School of
Sustainable Tourism. Mr. Bautista started his career as Staff Auditor of SyCip, Gorres Velayo and Co. He
joined the Lucio Tan Group (LTG) of Companies in 1980 occupying various management positions in the
group which is involved in cigarette manufacturing, brewery, piggery, construction, electronics, real
estate, property development, banking, distillery, chemical and alcohol manufacturing, education
Import/export and other businesses. Mr. Bautista was appointed as Vice President- Comptroller and was
promoted to Senior Vice President and Chief Finance Officer of Philippine Airlines (PAL) in 1994,
Executive Vice President in 1998 and President in 2004 until his retirement in 2012. He was appointed
again as President of PAL until his second retirement on June 30, 2019. He graduated Magna Cum Laude
from Colegio de San Juan de Letran with a degree of Bachelor of Science in Commerce. Mr. Bautista is
a Certified Public Accountant.
BUNSIT CARLOS G. CHUNG, Director
Mr. Chung, Filipino, 72 years old, was elected Director on June 17, 1997. He is Chairman & President of
Supima Holdings, Inc., and Director of La Suerte Cigar & Cigarette Factory, Century Container
Corporation, Bicutan Container Corporation, Tosen Foods Corporation, PBCom Finance Corporation,
State Investment, Inc. and State Properties, Inc. He is an Advisory member of the Board of Trustees of
Xavier School Inc., and a member of the Board of Trustees of Immaculate Conception Academy
(Greenhills) Scholarship Foundation, Seng Guan Temple, Angelo King Foundation Inc. and Kim Siu
Ching Family Association, Vice-Chairman & President of Tiong Se Academy. Mr. Chung has a degree
in AB (Economics) & Business Administration from De La Salle University as well as an MBA from the
University of Southern California.
SUSAN P. CO, Director
Mrs. Co, Filipino, 64 years old was elected Director on September 29, 2014. She currently holds the
positions of Vice-Chairman of Puregold Price Club, Inc. and Vice-Chairman and Treasurer of Cosco
Capital, Inc., both publicly listed companies. Mrs. Co is the Chairman of Tower 6789 Corporation and
Director of the following privately-owned companies: Bellagio Holdings, Inc., Blue Ocean Holdings, Inc.,
Canaria Holdings Corporation, Ellimac Prime Holdings, Inc., Kareila Management Corp., KMC Realty
Corp., Meritus Prime Distributions, Inc., Montosco, Inc., Nation Realty, Inc., NE Pacific Shopping Center
Corporation, P.G. Holdings, Inc., Patagonia Holdings Corp., PPCI Subic Inc., Premier Wines and Spirits,
Puregold Duty Free (Subic), Inc., Puregold Duty Free, Inc., Puregold Properties, Inc., Puregold Realty
Leasing & Management, Inc., S&R Pizza (Harbor Point), Inc., S&R Pizza, Inc., San Jose City I Power
Corp., Union Energy Corporation and Union Equities, Inc. Mrs. Co received a Bachelor of Science Degree
in Commerce from the University of Santo Tomas.
JACK EKIAN T. HUANG, Director
Mr. Huang, Filipino, 68 years old, was elected Director on June 4, 2019. He currently holds the positions
of Director of Puregold Price Club Inc. and First Abacus Financial Holdings Corporation, Vice President
of Abacus Capital and Investment Corporation, Director and Vice President of Abacus Securities
Corporation and Director and Treasurer of Richmedia Network Inc. Mr. Huang is also a member of the
Board of Trustees of Sacred Heart School (Ateneo de Cebu), In the past, he was Assistant Vice President
of the Bank of the Philippine Islands, Branch Manager of Ayala Investment & Development Corporation
and Director and General Manager of Cebu Business Continuous Forms. Mr. Huang obtained his
Bachelor of Arts in Economics at the Ateneo de Manila University.
LEVI B. LABRA, Director
Mr. Labra, Filipino, 64 years old, served as an Independent Director from October 24, 2014 until his
election as a regular member of the Board of Directors on February 22, 2017. Mr. Labra is also a Director
of Cosco Capital, Inc., a publicly listed company. He obtained his Bachelor of Science in Business
Administration (Cum Laude) at the University of San Carlos, Cebu City.
GREGORIO T. YU, Director

Philippine Bank of Communications 2022 SEC Form 20-IS
Page 11
Mr. Yu, Filipino, 63 years old, was elected Director on July 26, 2011 and is presently the Chairman of
Auto Nation Group, Inc., Cats Automobile Corp and Nexus Technology Inc. He is also the Vice
Chairman and Director of Sterling Bank of Asia. Mr. Yu is also a director of various private institutions,
among which are CATS Asian Cars, Inc and American Motorcycles, Inc. He is also a Director of Unistar
Credit and Finance Corporation, Glyph Studios, Inc., Prople BPO Inc., WSI Corporation, and Jupiter
Systems Corporation. Mr. Yu is also an Independent Director of Alphaland Corporation, Glacier
Megafridge, EEI Corporation, DITO CME Holdings Corporation, APO Agua Infrastructura
Inc., Philequity Management Inc., Vantage Financial Corporation (formerly E-business Services, Inc.
and Vantage Equities Inc.. He is also a Board Member of Ballet Philippines and The Manila Symphony
Orchestra since 2009. He received his MBA from the Wharton School of the University of Pennsylvania
in 1983 and his Bachelor of Arts in Economics (Honors Program) Summa Cum Laude from De La Salle
University in 1978.
ROBERT Y. COKENG, Independent Director
Mr. Cokeng, Filipino, 71 years old, was elected Independent Director on June 15, 2021. He is currently
the Chairman and President of F&J Prince Holdings Corporation (PSE-listed), Magellan Capital Holdings
Corporation, Magellan Utilities Development Corporation, Consolidated Tobacco Industries of the
Philippines, Center Industrial and Investment Inc., Malabrigo Corp., and Pinamucan Power
Corporation. He is also the Managing Director of Essential Holdings Ltd. and Chairman of Pointwest
Technologies Corporation, Pointwest Innovations Corporation and Ipads Developers Corporation. Mr.
Cokeng is the Chairman of the Executive Committee of Business Process Outsourcing International and
an Independent Director of Cosco Capital, Inc., a publicly listed company. Mr. Cokeng started as Senior
Investment Officer and Philippine Country Officer in International Finance Corp. (World Bank Group),
Washington, D.C. from 1976 to 1986 and Planning Associate in Mobil Oil Philippines from 1971 to
1972. Mr. Cokeng graduated from the Ateneo University with a degree of Bachelor of Arts in Economics
Honors Program in 1971, Magna Cum Laude. He obtained his Masters in Business Administration
Degree from Harvard University in 1976 and completed it with High Distinction and was designated as a
Baker Scholar.
CONRADO A. GLORIA, JR., Independent Director
Mr. Gloria, Filipino, 62 years old, was elected Independent Director on June 4, 2019. He currently holds
the positions of President & CEO of GIV Capital Holdings Corporation and Corporate Secretary of Miguel
and Maria Group of Restaurants, Inc. In the past, he served as President & COO of Investment & Capital
Corporation of the Philippines, Executive Vice President and Managing Director of SB Capital Investment
Corporation, President of SB Equities, Inc., Senior Vice President of Southeast Asia Cement Holdings
Inc. and Senior Finance Officer of International Finance Corporation. Mr. Gloria obtained his Bachelor
of Arts in Economics at the University of the Philippines and his Masters in Business Administration at
the Asian Institute of Management.
BIENVENIDO E. LAGUESMA, Independent Director
Atty. Laguesma, 71 years old, was elected Independent Director on October 30, 2019. He is currently a
Partner at Laguesma Magsalin Fernandez & Quirolgico Law Offices and an Independent Director of
Cosco Capital, Inc., The Keepers Holdings, Inc. (formerly Da Vinci Capital Holdings, Inc.) and PAL
Holdings, Inc. Atty. Laguesma also sits as Member of the Board of Trustees of Maritime Academy of
Asia and the Pacific and Vice Chairman of Anda Power Corporation. In the past, Atty. Laguesma was a
Director of First Metro Investment Corporation, Chairman of Charter Ping An Insurance Corporation,
Director of DARE Philippines, Inc., and Member of the Board of Regents of the Pamantasan Ng Lungsod
ng Maynila (PLM). He also served the government from 1976-2001 and 2011-2016 in various capacities,
notably as, among others: 1) Commissioner and Ex-Officio Commissioner of the Social Security System;
2) Director of Land Bank of the Philippines; 3) Director of HMDF (Pag-ibig Fund); 4) Director of Aurora
Pacific Economic Zone Authority; 5) Secretary and Undersecretary of the Department of Labor and
Employment; and 6) Presidential Assistant of the Office of the President of the Republic of the Philippines.
Atty. Laguesma obtained his AB Political Science degree at the Lyceum of the Philippines and his
Bachelor of Laws at the Ateneo College of Law. He also attended a course in Public Service

Philippine Bank of Communications 2022 SEC Form 20-IS
Page 12
Administration at the Royal Institute of Public Administration in London, U.K. and Executive Service
Development Program at the Development Academy of the Philippines.
EMMANUEL Y. MENDOZA, Independent Director
Mr. Mendoza, Filipino, 57 years old, was elected Independent Director on December 19, 2014. He is
currently the Managing Partner of Mendoza Querido & Co., (a member firm of Moore Stephens
International Limited) and President of MQ Agri Unlimited Inc. He is also an Independent Director of
Medicard Philippines, Inc. He obtained his Bachelor in Business Administration in Accountancy at the
University of the Philippines and a Master in Management at the Asian Institute of Management. Mr.
Mendoza is a Certified Public Accountant.
GILDA E. PICO, Independent Director
Ms. Pico, Filipino, 75 years old, was elected Independent Director on February 22, 2017. She is currently
Chairman of the Board of Producers Savings Bank Corporation where she was formerly a
Director/Consultant. Ms. Pico is also connected with Marinor Development Corporation as
Director/Treasurer, Gilart Holdings Corporation as President and PayMaya Philippines as Independent
Director. In the past, Ms. Pico was President and CEO of Land Bank of the Philippines from November
2006 to July 2016. She was Land Bank’s Acting President from July 2005 to November 2006 and Trustee
of Land Bank Countryside Development Fund from 2005 to 2015. She also served as Chairman/Director
in various government and private institutions engaged in leasing, realty, insurance, guarantees,
microfinancing, rural and development banking from 1985 to 2016 such as LBP Insurance Brokerage,
Inc., LBP Leasing and Finance Corporation, Landbank Realty Corp., Masaganang Sakahan, Inc., National
Livelihood Development Corporation, Peoples Credit and Finance Corporation, Philippine Crop
Insurance Corporation, among others. Ms. Pico obtained her Bachelor of Science Degree in Commerce
in 1966 from the College of the Holy Spirit where she graduated Magna Cum Laude and earned units in
Masters in Business Administration from the University of the East. Ms. Pico is a Certified Public
Accountant.
Independent Directors
As approved by the Board of Directors, the procedure for the nomination of independent directors shall
be as follows:
The nomination of independent directors shall be conducted by the Nominations Committee prior to the
Annual Meeting. All recommendations shall be signed by the nominating stockholders together with the
acceptance and conformity by the nominees for election. The Nominations Committee shall pre-screen
the qualifications and prepare a final list of all candidates and put in place screening policies and
parameters to enable it to effectively review the qualifications of the nominees for independent directors.
After the nomination, the Nominations Committee shall prepare a Final List of Candidates which shall
contain all the information about all the nominees for independent directors, as required by existing and
applicable rules, which list, shall be made available to the Commission and to all stockholders through
the filing and distribution of the information statement, or in such other reports the Company is required
to submit the Commission. The name of the person or group of persons who recommended the nomination
of the independent director shall be identified in such report including any relation with the nominee.
Only nominees whose names appear on the final list of candidates shall be eligible for election as
independent directors. No other nomination shall be entertained after the final list of candidates shall have
been prepared. No further nominations shall be entertained or allowed on the floor during the actual annual
stockholders’ meeting.
All nominees, Messrs. Robert Y. Cokeng, Conrado A. Gloria, Jr., Bienvenido E. Laguesma, Emmanuel
Y. Mendoza and Mrs. Gilda E. Pico do not have a relationship with the Bank which would interfere with
the exercise of independent judgment in carrying out responsibilities of a director. None of them are
related to any of the directors or officers of the Company.

Philippine Bank of Communications 2022 SEC Form 20-IS
Page 13
The Chairman of the Bank, Mr. Eric O. Recto, has recommended the nominations of Messrs. Robert Y.
Cokeng, Conrado A. Gloria, Jr., Bienvenido E. Laguesma, Emmanuel Y. Mendoza and Mrs. Gilda E. Pico
as independent directors for the ensuing year. Mr. Recto is not related to any of the mentioned nominees.
The Nominations Committee has taken into consideration the qualifications to be an Independent Director.
Attached as Annexes “B”, “C”. “D”, “E” and “F” are the Certificates of the Qualifications of the
Nominees for Independent Directors. The Nominations Committee is composed of Mrs. Gilda E. Pico
(Chairperson), Messrs. Eric O. Recto, Leonardo B. Dayao, Conrado A. Gloria, Jr. and Bienvenido E.
Laguesma.
EXECUTIVE OFFICERS
JOHN HOWARD D. MEDINA, Executive Vice President and Chief Operations Officer
Mr. Medina, Filipino, 52 years old, joined PBCOM in 2017 and has over 25 years of experience in the
banking industry as a senior executive in the Philippines and as an adviser to large banks in the United
States. Mr. Medina obtained his Bachelor of Science in Industrial Engineering degree from the University
of the Philippines, Diliman and Master of Business Administration degree from the Shidler College of
Business at the University of Hawai’i at Manoa. He was also awarded Graduate Certificates in Leadership
from The East–West Center, International Management from the Pacific Asian Management Institute, and
European Management from the European Summer School for Advanced Management held in Marseilles,
France.
ALAN E. ATIENZA, Executive Vice President – Treasurer
Mr. Atienza, Filipino, 51 years old, joined PBCOM in 2015 and has over 25 years of banking experience
in Trading and Treasury Operations. He has been a recipient of numerous industry awards for Fixed
Income Trading and has been a board member of Money Market Association of the Philippines (MART).
Mr. Atienza obtained both his Bachelor of Arts in Economics and his Master of Business Administration
degree from San Sebastian College.
VICTOR O. MARTINEZ, Executive Vice President – Corporate and Commercial Banking Group Head
Mr. Martinez, 56 years old, joined PBCOM in 2020 and has over 26 years of experience in the banking
industry in the area of Institutional, Corporate and Commercial Banking covering industries in real estate,
telcos, logistics, coal-fired & renewable energy power generation, power distribution, construction,
gaming & entertainment. Mr. Martinez graduated from DLSU with a BS degree in Commerce, major in
Management of Financial Institutions and from the Atkinson Graduate School of Management of
Willamette University with a Master’s degree in Management, major in Finance.
ARLENE M. DATU, Senior Vice President – Comptroller
Ms. Datu, Filipino, 63 years old, joined PBCOM in 2013 and has over 38 years of banking experience
gained from Local and Foreign Banks as well as a Credit Card Company. She has extensive exposure on
Financial Accounting, Management Profitability Reporting and Analysis, Regulatory Compliance,
Operations, Risk and Audit. Ms. Datu obtained her Bachelor of Science major in Accounting from
Polytechnic University of the Philippines.
EXPEDITO G. GARCIA, Senior Vice President – Transaction Banking Group
Mr. Garcia, Filipino, 54 years old, joined PBCOM in 2015 with over 29 years of extensive Management
and Banking experience, with the last 18 years spent in a senior supervisory role. He has strong
background in Corporate Cash Management and Managing and Developing Electronic Banking Channels
with exposure to both corporate and retail markets. Mr. Garcia, obtained both his Bachelor of Science in
Industrial Management Engineering minor in Mechanical Engineering and Master’s Degree in Business
Administration from De La Salle University. He also holds a Certificate in International Cash
Management from the Association of Corporate Treasurers, United Kingdom.

Philippine Bank of Communications 2022 SEC Form 20-IS
Page 14
ERICO C. INDITA, Senior Vice President – Branch Banking Group
Mr. Indita, 53 years old, joined the Bank in 2020 with over 26 years of banking experience particularly in
Retail Banking. He obtained his Bachelor of Science degree in Commerce, major in Management, from
San Beda College & his MBA from the Ateneo Graduate School of Business.
JANE LIM-LARAGAN, Senior Vice President – General Services Group
Atty. Laragan, Filipino, 54 years old, joined PBCOM in 2016 and has 20 years of experience in various
Department: Legal, Human Resources, General Services, Compliance and Risk. Atty. Laragan obtained
her Bachelor’s Degree in Commerce Major in Economics, and Bachelor’s Degree in Law from the
University of Santo Tomas.
JERUEL N. LOBIEN, Senior Vice President – Chief Audit Executive
Mr. Lobien, Filipino, 44 years old, joined the Bank in 2014 with more than 8 years of banking experience
and 6 years of auditing/internal audit work. He completed his Executive Masters in Business Management
at AIM and graduated from UP with a BS in Business Administration & Accountancy (cum laude). He
also has a Certification on Control Self-Assessment, is a Certified Internal Auditor and a Certified Public
Accountant.
MINA F. MARTINEZ, Senior Vice President – Human Resources Group Head
Ms. Martinez, Filipino, 59 years old, joined PBCOM in 2015 with more than 20 years of experience in
HR, specializing in employee relations, counseling, performance management, benefits and compensation
administration, policy development and documentation, motivation, organization and leadership. She has
a Bachelor of Arts degree, major in Mass Communications from the Far Eastern University.
MICHAEL STEPHEN H. LAO, Corporate Secretary
Atty. Lao, Filipino, 38 years old, was elected Corporate Secretary on June 4, 2019. He is concurrently the
Bank’s Corporate Information Officer which he holds since November 30, 2014. Atty. Lao was the Bank’s
Assistant Corporate Secretary from November 30, 2014 up to his election as Corporate Secretary. He is
currently a Partner at Zambrano Gruba Caganda and Advincula Law Offices. Atty. Lao received his
Bachelor of Science degree in Business Administration from College of Saint Benilde and his Juris Doctor
degree from Ateneo de Manila School of Law in 2012. He was admitted to the Philippine Bar in 2013.
Attached is a certification that the abovementioned Directors and Executive Officers are not presently
connected with any government agency or government-owned or controlled corporation (Annex “G”).
Directorships in Other Reporting Companies
Mr. Eric O. Recto is also a Director of DITO CME Holdings Corp. (formerly ISM Communications
Corporation), Atok-Big Wedge Co. Inc. and Aboitiz Power Corporation
Mr. Leonardo B. Dayao is also a Director of Puregold Price Club, Inc. and Cosco Capital, Inc.
Mr. Lucio L. Co is also a Director of Puregold Price Club, Inc., Cosco Capital, Inc., and The Keepers
Holdings, Inc. (formerly Da Vinci Capital Holdings, Inc).
Ms. Susan P. Co is also a Director of Puregold Price Club, Inc. and Cosco Capital, Inc.
Mr. Jaime J. Bautista is also a Director of Cosco Capital, Inc.
Mr. Levi B. Labra is also a Director of Cosco Capital, Inc.
Mr. Gregorio T. Yu is also a Director of DITO CME Holdings (formerly ISM Communications
Corporation) and Vantage Equities, Inc.
Mr. Jack Ekian T. Huang is also a Director of Puregold Price Club, Inc. and First Abacus Financial
Holdings Corporation.
Mr. Robert Y. Cokeng is also a Director of F & J Prince Holdings Corp. and an Independent Director
of Cosco Capital, Inc.
Mr. Bienvenido E. Laguesma is also an Independent Director of Cosco Capital, Inc. and Keepers
Holdings, Inc. (formerly Da Vinci Capital Holdings, Inc.)

Philippine Bank of Communications 2022 SEC Form 20-IS
Page 15
Shares of Atok-Big Wedge Co., Inc. (AB), DITO CME Holdings Corp. (DITO) (formerly ISM
Communications Corporation), Aboitiz Power Corporation (AP), Puregold Price Club, Inc. (PGOLD),
Cosco Capital, Inc. (COSCO), Keepers Holdings, Inc. (KEEPR) (formerly Da Vinci Capital Holdings,
Inc.), Vantage Equities, Inc. (V), First Abacus Financial Holdings Corp.(FAF), F&J Prince Holdings
Corp. (FJP) are all listed in the Philippine Stock Exchange, Inc.
Significant Employee
There is none to disclose. The Bank currently does not employ any person who is not an executive officer
but makes a significant contribution to the business.
Family Relationships
Mr. Lucio L. Co and Ms. Susan P. Co are husband and wife. Other than the foregoing, the persons
nominated or chosen by the Bank to become directors or executive officers are not related to each other
up to the fourth civil degree either by consanguinity or affinity.
Involvement in Certain Legal Proceedings
PBCOM has certain loan-related suits and claims that remain unsettled. It is not practicable to estimate
the potential financial statement impact of these contingencies. However, in the opinion of management,
the suits and claims, if decided adversely, will not involve sums that would have a material effect on the
financial statements.
Certain Relationships and Related Transactions
Parties are considered to be related if one party has the ability, directly or indirectly, to control the other
party or exercise significant influence over the other party in making financial and operating decisions.
The Bank’s transactions with related parties include key management personnel, affiliates (i.e. entities
which are controlled), significantly influenced by or for which significant voting power is held by the
Bank or key management personnel or their close family members and retirement plan for the benefit of
the Bank’s employee). These transactions are made in the ordinary course of business and on substantially
same terms with that of other parties.
The Bank’s related party transactions below are also presented and discussed in details in the Audited
Financial Statements.
Related Party Transaction with the Bank
Post-retirement Plan Investment made in retirement plan is approved by the Bank’s Retirement
Board. Trust fee income from such service and total deposits maintained
with the Bank in 2021 amounted P=2.65 Million and P=42.50 Million,
respectively while interest expenses paid by the Bank to the deposits was P=
0.14 Million.
Provident Fund Outstanding deposit and interest paid by the Bank as of year-end was P=42.0
Million and P=0.12 Million, respectively while trust fees earned from such
service amounted to P=2.36 Million.
Key Management
Personnel
Senior Management Team constitutes key management personnel for
purposes of PAS 24. Short term benefits and post-employment benefits
given to SMT in 2021 amounted to P=141.57 Million and P=8.28 Million,
respectively. Year-end balance of deposits and interest expenses paid by the
Bank amounted to P=37.62 Million and P=0.02 Million respectively.
Affiliate Year-end balance of deposits and interest expenses incurred by the Bank
amounted P18.23 Million and P=0.015 Million, respectively. Rental income
earned for the year is P=0.153 Million.

Philippine Bank of Communications 2022 SEC Form 20-IS
Page 16
Compensation of Directors and Executive Officers
Since the Bank obtained an exemption from the SEC to disclose the required detailed compensation
information, disclosure of aggregate compensation paid or accrued during the last three fiscal years 2019
to 2021 of the Bank's Chief Executive Officer and four other most highly compensated executive officers
are as follows:
2021 2020 2019 CEO and four most
highly compensated
Executive officers
Patricia May T. Siy
President & CEO
John Howard D. Medina
Executive Vice President
Alan E. Atienza
Executive Vice President
Victor O. Martinez
Executive Vice President
Arlene M. Datu
Senior Vice President
Patricia May T. Siy
President & CEO
John Howard D. Medina
Executive Vice President
Alan E. Atienza
Executive Vice President
Victor O. Martinez
Executive Vice President
Arlene M. Datu
Senior Vice President
Patricia May T. Siy
President & CEO
John Howard D. Medina
Executive Vice President
Alan E. Atienza
Senior Vice President
Arlene M. Datu
Senior Vice President
Expedito G. Garcia, Jr.
Senior Vice President
Salary
Bonus
Other Annual
Compensation
P=60,175
20,258
P=50,719
18,685
P=48,960
16,320
TOTAL P= 80,433 P=69,404 P=65,280
All officers and directors as Group Unnamed
Salary
Bonus Other Annual
Compensation
P= 624,600
193,915
-
P=621,114
192,947
-
P=620,420
188,364
-
TOTAL P= 818,515 P=814,061 P=808,784
The following is the estimated annual compensation for year 2022:
Salary Bonus
Other Annual
Compensation Total
Total of CEO and
Four most highly
compensated
Executive Officers
P=60,775 P=20,258 none P=81,033
All officers as a
group unnamed
626,772 196,542 none 823,314
The director’s per diem amounted to P13.36 Million, P=12.43 Million and P=9.75 Million, as of December
31, 2021, 2020 and 2019, respectively.
Each member of the Board of Directors received the following per diems for the year 2021:
Subsidiaries Year-end balance of deposits incurred by the Bank amounted P8.9 Million.
Significant Investors Year-end balance of deposits and interest expenses incurred by the Bank
amounted P=5.68 Billion and P=15.64 Million, respectively. Rental income
during the year amounted to P=2.04 Million and rent-related depreciation
and interest expense were P=24.37 Million and P=4.2 Million, respectively.
Loans and receivables outstanding balance is P2.9 Billion.

Philippine Bank of Communications 2022 SEC Form 20-IS
Page 17
(Php)
Name of Director Amount
Bautista, Jaime J. 1,830,000.00
Cokeng, Robert Y.* 787,500.00
Gloria, Conrado, Jr. A. 1,532,500.00
Huang, Jack Ekian T. 1,387,500.00
Jalandoni, Jesus Jr. S.** 482,500.00
Labra, Levi B. 1,475,000.00
Laguesma, Bienvenido E. 1,507,500.00
Mendoza, Emmanuel Y. 1,442,500.00
Pico, Gilda E. 1,527,500.00
Yu, Gregorio T. 1,387,500.00
Total 13,360,000.00
* - effective 6-15-2021
** - up to 5-3-2021
The five (5) Independent and four (4) other regular Directors are entitled to per diems for attending Board
meetings. The remaining six (6) Directors have waived their right to receive per diems. As stipulated in
the By-laws, Directors are also entitled to share in the net profits to be distributed in such manner as the
Board may provide but not exceeding four (4) percent. Other than the per diems, the directors did not
receive any share in the net profit of the Bank for the last two (2) years.
There are no other terms and conditions with regard to employment contract between PBCOM and named
Executive Officers or any other more compensatory plans or arrangement except those disclosed above.
There are no Outstanding Warrants or Options held by the Directors, Officers as of December 31, 2021.
The Bank has no record of adjusting or amending the exercise price of stock warrants previously awarded
to any of the officers and directors.
Independent Public Accountant
The accounting firm of Sycip, Gorres, Velayo and Co. (“SGV”), with address at SGV Building, 6760
Ayala Avenue, Makati City, has been the Bank’s independent public accountants for the past years. The
same accounting firm will likely be recommended for re-election at the scheduled annual meeting this
year. Mr. Ray Francis C. Balagtas was assigned partner starting in 2019 in compliance with SRC
68(3)(b)(ix).
SGV is expected to be represented in the coming Annual Stockholders’ Meeting with an opportunity to
make statements, if they so desire, and will be available to respond to appropriate questions.
There is no disagreement with the Bank's accountants on matters of accounting and financial disclosure.
The aggregate external audit fees billed for each of the last three (3) fiscal years for the audit of the
registrant’s annual financial statements or services that are normally provided by the external auditors are
as follows:
Fiscal Year Audit Fees All other fees
2021 P=4,721
2020 P=3,943
2019 3,787

Philippine Bank of Communications 2022 SEC Form 20-IS
Page 18
The above audit fees are inclusive of the following: (a) Other assurance related services by the External
Auditor that are reasonably related to the performance of the audit or review of the Bank’s financial
statements and (b) All Other Fees. Fees paid to professional partnerships like SGV are not subject to
withholding tax.
The Audit Committee is directly responsible in selecting and appointing the independent public
accountants. Annually, the Committee recommends that the Board request shareholder ratification of the
appointment of the independent public accountants. The Committee is also responsible for setting the
compensation of the independent public accountants and periodically reviews the fees charged for all
permitted audit-related expenses and other services. It is also their responsibility to evaluate and, when
appropriate, to remove the independent public accountants.
At present, the Audit Committee is composed of: Emmanuel Y. Mendoza as Chairman with Gilda E. Pico
and Jaime J. Bautista as members.
Compensation Plans
No action pertaining to any plan involving the payment or distribution of cash or non-cash compensation
will be taken during the Annual Meeting.
Action with Respect to Reports
The stockholders will be asked to approve or ratify during the Annual Stockholders Meeting the following
matters:
1. Review and approval of the Minutes of the Previous Meeting held on 15 June 2021
(copy attached as Annex “H”) covering the following matters:
a. Certification of Notice and Quorum
b. Approval of Minutes of Previous Stockholders’ Meeting Held on 14 July 2020
c. Annual Report of Management and Approval of the Audited Financial
Statements for 2020
d. Ratification of the Acts of the Board of Directors and Management since the last
Annual Meeting of Stockholders
e. Amendment of the By-Laws to include BSP-prescribed Board Level Committees
of the Bank
f. Election of Directors
g. Appointment of External Auditors
h. Discussion of Reports and Other Matters
Prior to adjournment, the Chairman opened the floor for discussion with the
stockholders present, and asked the Secretary of the meeting if there were
questions submitted. The Secretary informed the Chairman that no
questions have been submitted by the stockholders, and that participating
stockholders are given the opportunity to submit questions or remarks via
the livestream portal by using the ‘Q&A’ button found at the bottom of their
screens. Stockholders may also send questions and/or remarks in advance
or during the meeting to the Corporate Secretary at
2. Review and approval of the Minutes of the Special Stockholders Meeting held on 15 March
2022 (copy attached as Annex “I”) covering the following matters:
Philippine Bank of Communications 2022 SEC Form 20-IS
Page 19
a. Certification of Notice and Quorum
b. Amendment of the Articles of Incorporation to change the Bank’s primary purpose from
commercial bank to universal bank, and the term of existence from 50 years to perpetual
existence.
There are no other items submitted for approval or consideration, other than those required in the ordinary
course of business that requires approval or presentation to the shareholders of the Bank.
Other Matters
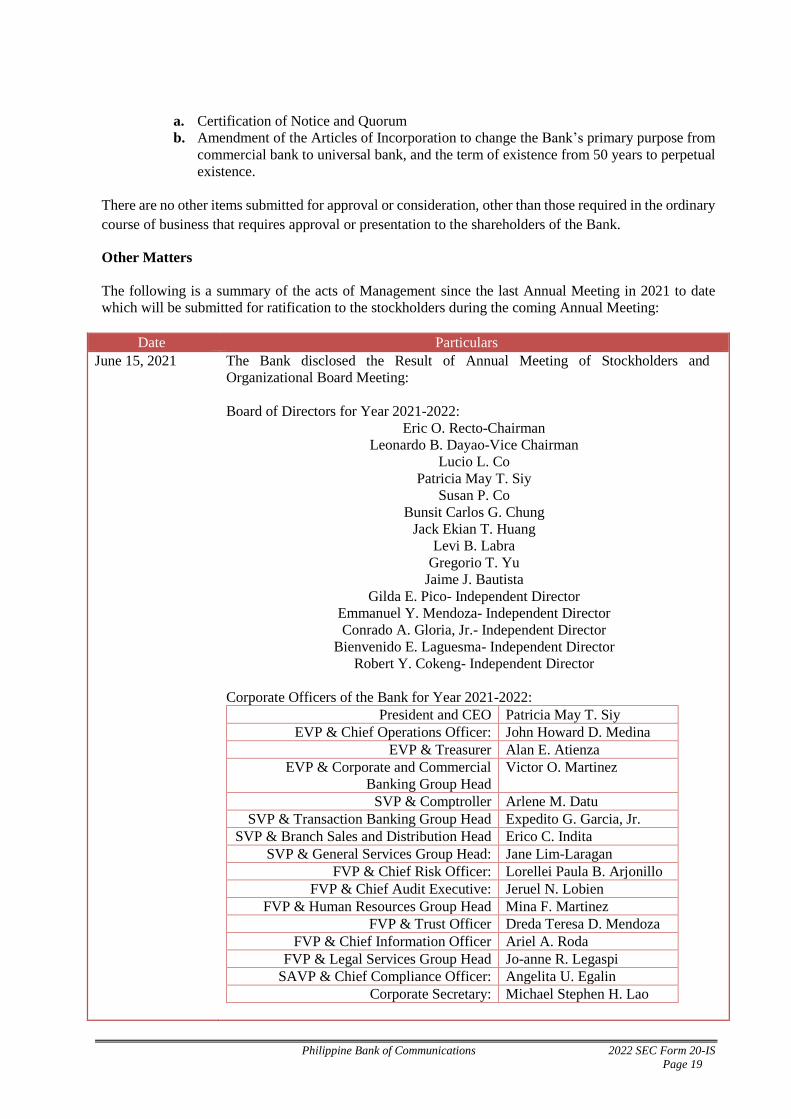
The following is a summary of the acts of Management since the last Annual Meeting in 2021 to date
which will be submitted for ratification to the stockholders during the coming Annual Meeting:
Date Particulars
June 15, 2021 The Bank disclosed the Result of Annual Meeting of Stockholders and
Organizational Board Meeting:
Board of Directors for Year 2021-2022:
Eric O. Recto-Chairman
Leonardo B. Dayao-Vice Chairman
Lucio L. Co
Patricia May T. Siy
Susan P. Co
Bunsit Carlos G. Chung
Jack Ekian T. Huang
Levi B. Labra
Gregorio T. Yu
Jaime J. Bautista
Gilda E. Pico- Independent Director
Emmanuel Y. Mendoza- Independent Director
Conrado A. Gloria, Jr.- Independent Director
Bienvenido E. Laguesma- Independent Director
Robert Y. Cokeng- Independent Director
Corporate Officers of the Bank for Year 2021-2022:
President and CEO Patricia May T. Siy
EVP & Chief Operations Officer: John Howard D. Medina
EVP & Treasurer Alan E. Atienza
EVP & Corporate and Commercial
Banking Group Head
Victor O. Martinez
SVP & Comptroller Arlene M. Datu
SVP & Transaction Banking Group Head Expedito G. Garcia, Jr.
SVP & Branch Sales and Distribution Head Erico C. Indita
SVP & General Services Group Head: Jane Lim-Laragan
FVP & Chief Risk Officer: Lorellei Paula B. Arjonillo
FVP & Chief Audit Executive: Jeruel N. Lobien
FVP & Human Resources Group Head Mina F. Martinez
FVP & Trust Officer Dreda Teresa D. Mendoza
FVP & Chief Information Officer Ariel A. Roda
FVP & Legal Services Group Head Jo-anne R. Legaspi
SAVP & Chief Compliance Officer: Angelita U. Egalin
Corporate Secretary: Michael Stephen H. Lao

Philippine Bank of Communications 2022 SEC Form 20-IS
Page 20
The Board of Directors likewise constituted the following committees and
appointed the following members thereof:
Executive Committee:
a) Lucio L. Co (Chairperson)
b) Eric O. Recto (Vice Chairperson)
c) Leonardo B. Dayao (Vice Chairperson)
d) Patricia May T. Siy
e) Bunsit Carlos G. Chung
f) Jaime J. Bautista.
Audit Committee:
a) Emmanuel Y. Mendoza (Chairperson/Independent Director)
b) Gilda E. Pico (Independent Director)
c) Levi B. Labra
d) Jaime J. Bautista
*Audit Committee members cannot concurrently serve as trust Committee
members
Governance Committee:
a) Gilda E. Pico (Chairperson/Independent Director)
b) Conrado A. Gloria, Jr. (Independent Director)
c) Bienvenido E. Laguesma (Independent Director)
d) Eric O. Recto
e) Leonardo B. Dayao
The Governance Committee also serves as the Bank’s Nominations Committee,
Compensation and Remuneration Committees, and Performance Evaluation
Committee.
Related Party Transactions Committee
a) Robert Y. Cokeng (Chairperson/ Independent Director)
b) Conrado A. Gloria, Jr. (Independent Director)
c) Gilda E. Pico (Independent Director)
d) Levi B. Labra
Risk Oversight Committee:
a) Conrado A. Gloria, Jr. (Chairperson/Independent Director)
b) Bienvenido E. Laguesma (Independent Director)
c) Robert Y. Cokeng (Independent Director)
d) Levi B. Labra
e) Patricia May T. Siy
Trust Committee
a) Eric O. Recto (Chairperson)
b) Robert Y. Cokeng (Independent Directors)
c) Patricia May T. Siy
d) Jack Ekian T. Huang
e) Dreda Teresa D. Mendoza (Trust Officer)
*Trust Committee members cannot be appointed as Audit Committee members
June 15, 2021 The Bank disclosed the Amendments to its By-Laws (Annual Stockholders’
Meeting)

Philippine Bank of Communications 2022 SEC Form 20-IS
Page 21
June 30, 2021 The Bank disclosed the Change in Directors and/or Officers(resignation/Removal or
Appointment/Election and/or Promotion- (Mr. Jeruel N. Lobien, SVP, Chief Audit
Executive and Ms. Mina F. Martinez, SVP, HR Head)
July 28, 2021 The Bank disclosed the new composition of its Audit Committee:
FROM TO
Chairman: Emmanuel Y. Mendoza (ID)
Members: Gilda E. Pico (ID)
Levi B. Labra
Jaime J. Bautista
Chairman : Emmanuel Y. Mendoza (ID)
Members : Gilda E. Pico (ID)
Jaime J. Bautista
August 4, 2021 The Bank disclosed the Statement of Condition as of June 30, 2021
August 4, 2021 The Bank disclosed its Reply to the Exchange’s Query regarding Disclosure of
Personal and Sensitive Information Relating to the Bank’s 2021 General Information
Sheet
October 27, 2021 The Bank disclosed the 2021 Amendments to its By-Laws
November 5, 2021 The Bank disclosed its Statement of Condition as of September 30, 2021
December 7, 2021 The Bank disclosed the Upgrade of its Banking License from Commercial Bank to
Universal Bank
January 17, 2022 The Bank disclosed the Reply to Exchange’s Query re Certification of Top 100 100
Stockholders as of 12/31/2021.
January 18, 2022 The Bank disclosed the Amendments to By-Laws
January 26, 2022 The Bank disclosed the Amendments to Articles of Incorporation
January 26, 2022 The Bank disclosed the Notice of 2022 Special Stockholders’ Meeting.
Date and Time 15 March 2022 (Tuesday) at 9:00 A.M.. to 10:00 A.M.
Venue Virtual Stockholders’ Meeting at the link to be provided in
PBCOM’s Website- https://www.pbcom.com.ph/
Record Date 14 February 2022
January 27, 2022 The Bank disclosed the Directors’ Attendance for 2021
February 4, 2022 The Bank disclosed a Press Release- PBCOM Obtains Universal Banking License
February 18, 2022 The Bank disclosed the Statement of Condition as of December 31, 2021
March 14, 2022 The Bank disclosed the Amendments to Articles of Incorporation
March 15, 2022 The Bank disclosed the Results of Special Stockholders’ Meeting
March 30, 2022 The Bank disclosed the Notice of 2022 Annual Stockholders’ Meeting
Date and Time 7 June (Tuesday), 9:00 A.M. to 10 A.M.
Venue Virtual Stockholders’ Meeting at the link to be provided in
PBCOM’s Website- https://www.pbcom.com.ph/
Record Date 18 April 2022
Voting Procedures
The vote required for acts requiring stockholders’ approval is at least a majority of the
outstanding capital stock.
In the election of directors, the fifteen (15) nominees with the greatest number of votes will be
elected directors.
Every stockholder is entitled to one vote. However, with respect to the election of directors, the
stockholders may vote such number of shares for as many persons as there are directors to be

Philippine Bank of Communications 2022 SEC Form 20-IS
Page 22
elected, or he may cumulate said shares and give one candidate as many votes as the number of
directors to be elected, or he may distribute them on the same principle among as many candidates
as he shall see fit; provided, that the total number of votes cast by him shall not exceed the number
of shares owned by him as shown in the books of the Corporation multiplied by the number of
directors to be elected.
Shareholders who are unable to attend the meeting may choose to execute a proxy form or vote
electronically in absentia using the Bank’s online web address at https://www.pbcom.com.ph/. A
stockholder who votes in absentia shall be deemed present for purposes of quorum. The
requirements and procedures for voting in absentia and participation through remote
communication are set forth under Annex “A” of this Information Statement.
Proxies must be submitted to the Corporate Secretary not later than 5:00 p.m. on or before 30
May 2022.
The method of counting the votes of the shareholders shall be in accordance with the general
provisions of the Revised Corporation Code of the Philippines. Counting will be done by
tabulation of the votes by the Corporate Secretary with the assistance of his staff and the stock
and transfer agent.
Corporate Governance
PBCOM Board of Directors and Management, employees and shareholders, believe that Corporate
Governance is a necessary component of what constitutes sound strategic business management. Thus,
the Bank has undertaken every effort necessary to create awareness for this within the organization.
All Directors and Senior Management are required to attend a seminar on corporate governance which
shall be conducted by a private or government institution duly recognized/accredited by the BSP. Training
of directors include an orientation program on Corporate Governance (conducted by training providers
duly accredited by the SEC) for first-time directors for at least eight (8) hours and annual continuing
training for at least four (4) hours for all directors and key officers including the Corporate Secretary and
Chief Compliance Officer. However, due to the Covid - 19 Pandemic the scheduled 2021 Corporate
Governance Seminar for Directors and Senior Management was cancelled.
The Board, Senior Management and all employees conduct themselves with utmost honesty and integrity
in the discharge of their duties, functions and responsibilities, thus nurturing the continuing success of the
Bank and securing its competitiveness in the best interest of the Bank, its shareholders and other
stakeholders. Bank Officers promote the good governance practices within the Bank by ensuring that
policies on governance are consistently adopted across the organization, with measurable standards,
initiatives and specific responsibilities and accountabilities for each personnel.
Consistent with the global practices of good Corporate Governance, the Bank’s overriding commitment
to a culture of good governance is seen through the following underlying principles:
1. It is the Bank’s objective to enhance shareholders’ value by making the most efficient use of
resources. Its human capital strategy is one of its vital focus areas, as it is a principal indicator for
the company’s success.
2. The Board of Directors constitutes Board Committees namely: Governance, Audit, Risk
Oversight, Related Party Transaction and Trust Committees which are all chaired by Independent
Directors and composed of majority of Independent Directors, all of whom have a good
understanding of the business.
3. The Governance Committee is responsible for ensuring the Board's effectiveness and due
observance of Corporate Governance principles and guidelines. They assist the Board of Directors

Philippine Bank of Communications 2022 SEC Form 20-IS
Page 23
in fulfilling its corporate governance responsibilities. Attached is the 2021 Summary of the
Performance Evaluation of the Board and Board Committees (Annex “J”)
4. The Governance Committee, through its Nominations Sub-Committee, ensures the quality of its
leadership, consistent with its “fit and proper” rule when selecting its Directors and Senior
Management Team, while the Performance Evaluation Sub-Committee, recommends and
oversees the implementation of a Performance Management Process for Senior Management and
the Members of the Board, review performance vis-a-vis agreed upon objectives, evaluate
progress made with respect to Senior Management Directors Development plans, monitor
changes in professional affiliations, personal status even health, which could have qualifications,
resignation and succession implications.
5. Transparency in its Annual Reports is ensured and reflects true and fair accounting information
prepared in accordance with applicable standards; disclose and discuss all material risks; and
disclose and explain the rationale for all material estimates. Disclosures are all completed in a
timely manner.
6. To ensure that all act in the best interest of the Bank, full disclosure by its Directors, Officers and
Employees on any actual or expected conflict of interest is required
7. The Bank’s Corporate Governance Manual, Code of Ethics and Code of Conduct clearly states
Management’s philosophy and compliance standards.
Annually, the Bank through the Governance Committee reviews the Corporate Governance Manual and
recommends changes/amendments/revisions for the approval of the Board of Directors when and where
necessary.
In addition, to promote strong governance culture and transparency, the Bank’s compliance with the Code
of Corporate Governance are disclosed in the Integrated Annual Corporate Governance Report.

Philippine Bank of Communications 2022 SEC Form 20-IS
Page 24
FINANCIAL AND OTHER INFORMATION
Financial Statements
Copies of the audited financial statements for the period ended December 31, 2021 shall be made available
to the stockholders in the Bank’s website at https://www.pbcom.com.ph/.
Item I – The Company
Philippine Bank of Communications ("PBCOM" or the "Bank") was incorporated as one of the earliest
non-American foreign banks in the country on August 23, 1939. It received the authority to engage in
commercial banking from the then Bureau of Banking of the Department of Finance under the Philippine
Commonwealth, with a capitalization of Two Million Pesos. The Bank commenced operations on
September 4, 1939. However, its operations were temporarily interrupted during World War II, but were
immediately reconstituted in 1945 through the infusion of fresh funds. The Bank started under full Filipino
ownership in 1974 when a group of industrialists led by Ralph Nubla, Sr. bought majority of the Bank’s
outstanding shares.
The Bank is a registered government securities dealer, having been granted the license on December 14,
1981. It also has a Trust license which was approved on August 24, 1961.
PBCOM acquired a license to operate as an expanded commercial bank from the Bangko Sentral ng
Pilipinas (“Bangko Sentral” or “BSP”) on December 24, 1993 and operated as such until the year 2000.
In order to focus on its core strengths and maximize utilization of available resources, the Bank applied
for the conversion of its expanded commercial bank license into a regular commercial banking license
which was approved by the Monetary Board of the BSP on March 31, 2000. PBCOM had since opted to
capitalize on its core strength by focusing on and pursuing traditional commercial banking operations. In
December 2000, the Bank acquired 100% of Consumer Savings Bank as part of its strategy to expand its
consumer banking business.
On July 26 2011, the major shareholders of the Bank, namely the Chung, Luy, and Nubla Groups, signed
a Memorandum of Agreement (MOA) with a group of investors led by ISM Communications Corporation
(the “ISM Group”), involving the sale of their entire stake in the Bank to the ISM Group and the
commitment of the Chung and Nubla groups to reinvest the proceeds of the sale of their respective shares
amounting to approximately P2.8 Billion in the Bank.
On October 13, 2011, the Monetary Board approved the acquisition of PBCOM by the ISM Group.
On December 23, 2011, the acquisition by the ISM Group of a controlling interest in the Bank was
successfully transacted through the facilities of the Philippine Stock Exchange.
On December 27, 2011, the Chung and Nubla Groups reinvested P=2.4 Billion as deposits for future
subscription of PBCOM shares of stock. Another P=0.4 Billion was deposited in March 2012 and additional
22 Million in April 2012 to complete their commitment of approximately P=2.8 Billion.
On May 31, 2012, the LFM Properties Group deposited P=0.72 Billion for future subscription to PBCOM
shares of stock. Another P30 Million was deposited by the LFM Properties Group on October 24, 2012.
On February 8, 2013, BSP issued a Certificate of Authority to the Bank for it to register its Amended
Articles of Incorporation and Amended By-Laws with the SEC.
On March 8, 2013, the Bank obtained approval from SEC for a quasi-reorganization and an increase in
authorized capital stock. The Articles of Incorporation was amended to implement the following:

Philippine Bank of Communications 2022 SEC Form 20-IS
Page 25
a. Reclassification of Bank’s existing 120,000,000 preferred shares to common shares;
b. Reduction of the par value of all its common shares from P=100 per share to P=25 per share;
and
c. Increase in authorized capital stock to P=19,000,000,000 divided into 760,000,000 common
shares with a par value of P=25 per share.
The reclassification of the said preferred shares to common shares took effect on March 19, 2013. On
December 2013, the Bank received the approval of both the BSP and SEC to apply P=3.94B in APIC to
partially wipe out the bank’s outstanding deficit.
On March 26, 2014, the Bank exited from the 10-years Financial Assistance Agreement with PDIC by
settling the loan of P=7.6 Billion which represents financial assistance by the latter to the Bank in 2004.
The subscription by P.G. Holdings, Inc. (PGH) to the new shares of the Parent Company amounting to P=
5.98 billion was approved by the BSP on September 23, 2014. The first installment of P=1.79 billion was
paid by PGH on September 25, 2014. Subsequently, on October 1, 2014, VFC Land Resources Inc. (VFC)
bought 59.24 million shares at P=33.00 per share from the ISM Group. PGH and VFC are beneficially
owned by the family of Mr. Lucio Co, bringing his total stake in the Parent Company to 49.99%.
On September 22, 2015, June 29, 2016 and September 11, 2017, the Parent Company received the second,
third and final installment payments, respectively, each amounting to P=1.39 billion for the subscribed
shares of PGH.
In 2015, both PGH and VFC bought additional 2.4 million shares and on following year an additional
0.49 million shares and 9.49 million shares were acquired by PGH and VFC, respectively. In 2018, PGH
bought an additional 2.27 million shares and VFC acquired 0.49 million additional shares in 2019. The
Co Family’s total stake in the Parent Company is at 53.65% as of December 31, 2020.
On July 29, 2019, PBCOM sold its stake in PBCOM Rural Bank, Inc. as it consolidates its efforts and
resources at the parent level.
On 20 January 2022, the Monetary Board of Bangko Sentral ng Pilipinas approved PBCOM’s application
to upgrade its license to a Universal Bank subject to completion of requisite regulatory requirements.
PBCOM’s Board of Directors, in its Special Stockholder’s Meeting held last 15 March 2022, approved
the amendment of the Bank’s Articles of Incorporation to (a) Change the Bank’s primary purpose to a
Universal Bank from a Commercial Bank and (b) Change the Bank’s Corporate term to Perpetual from
50 years.
Business of Registrant
PBCOM offers a wide range of products and services to clients. These includes basic commercial banking
services such as deposit products, credit and loan facilities, trade-related services, treasury and foreign
exchange trading, cash management services and Trust and Investment Management services.
Deposit products and services include peso, dollar and third currency savings, checking and time deposit
accounts, ATM accounts, foreign and domestic remittance services, cash management services namely
deposit pick-up and cash delivery, payroll and check-writing services. Ancillary services such as safety
deposit boxes and manager’s checks, demand drafts, acceptance of tax and SSS payments are also
available, these products and services are offered to both individuals and corporate clients.
Credit and loan facilities include working capital financing, post-dated check discounting, specialized
lending programs such as contract-to-sell financing and Micro-Finance. Other credit related products
include home, auto and personal loans as well as trade financing,

Philippine Bank of Communications 2022 SEC Form 20-IS
Page 26
Trade-related services include import LCs, standby LCs, credit bank guaranty and shipside bond, export
LC advising, export packing credits & export bills negotiation and collections, trade financing of
receivables and payables, domestic LCs and trust receipt financing. These services are financing facilities
offered to importers and exporters.
Treasury products include dealership and brokering of government securities and commercial papers, both
domestic and international, deposit substitutes like promissory notes and repurchase agreements, foreign
exchange proprietary trading and commercial client servicing.
Trust services include investment management services, personal trust funds, escrow agency services,
employee benefit trust services and estate planning.
Contribution to Operating Income
As of December 2021, the contribution to Operating Income is broken down as follows: (1) 83.5% is
derived from net interest income, this includes interest income from lending, investment securities and
others receivables less interest expense and finance charges (2) 16.5% is from non-interest income
consisting of trading gains, service charges, fees and commissions, income from trust operations,
profit/loss from asset sold, foreign exchange gain/loss, rental income and miscellaneous income.
The Bank does not maintain any branch or sales office abroad. Hence, all revenues are generated
domestically.
Distribution Methods of Products and Services
As of December 2021, the Parent Bank’s liability and ancillary products and services are distributed
primarily through its 95 branches, 4 of which are in Pop-Up formats situated in selected Puregold stores.
PBCOM clients may also conduct their transaction in various channels such as the 163 automated teller
machines deployed in strategic branch sites and in 70 off-site locations. In addition, the Bank has also
deployed 67 Cash Deposit Machines across various sites to help service the deposit transactions of its
clients.
The Bank has likewise expanded its digital presence through its Digital-Only Bank which BSP approved
last December 11, 2019, this will complement the existing Internet and Mobile Banking facilities of the
bank launched last June 21, 2017 and September 28, 2018, respectively.
Competition
As of end 2021, the Philippine commercial banking industry is composed of 46 Universal and Commercial
Banks) of which 17 are Private Domestic cl Banks, 3 are Government Banks and 26 are Foreign Banks
with either established subsidiaries or foreign branch licenses.
Patents, Trademarks, Licenses, Franchises, Concessions, and Royalty
PBCOM have registered the trademarks for PBCOM Online Platform and PBCOM Value Check.
Customers
PBCOM has multi-segment client base with growth seen across Individuals, Commercial and Corporate
accounts. This result stems from the bank’s focus on expanding its market through the ecosystem of its
principals.
Subsidiaries and Affiliates

Philippine Bank of Communications 2022 SEC Form 20-IS
Page 27
PBCOM Insurance Services Agency, Inc. (PISAI) was incorporated and registered with the Securities and
Exchange Commission on May 9, 2014 to engage primarily in the business of soliciting and promoting
insurance products. The company offers a range of insurance agency services specific to life and
investment-linked products to meet customers’ wealth management and risk protection needs.
On January 11, 2021, the Board of Directors of PBCOM approved the dissolution and retirement of
business of PISAI. PISAI, which has been inactive for the past 3-years have continuously remained
inactive but continued to incur operating expenses. PBCOM does not see any need for the subsidiary and
have decided to retire the business operations. PBCOM has received clearances regarding PISAI’s
dissolution from the Insurance Commission and the Makati Local Government last May 26, 2021 and
September 30, 2021; respectively, clearances from other regulatory agencies are currently being
processed.
PBCOM Finance Corporation was incorporated and registered with the SEC on January 9, 1980 to provide,
grant, and/or extend credit facilities to any person, business, juridical or otherwise. It is 40% owned by
the Bank while the remaining 60% is owned by various individual shareholders. Its principal place of
business is located at 7th floor, PBCOM Building, 214-216 Juan Luna St. Binondo, Manila.
Transaction with and/or Dependence on Related Parties
The Bank’s related parties include key management personnel, close family members of key management
personnel and entities which are controlled, significantly influenced by or for which significant voting
power is held by key management personnel or their close family members, associates and post-
employment benefits for the benefit of the Bank’s employee.
As required by BSP, the Bank discloses loan transactions with its associates, affiliates and with certain
directors, officers, stockholders and related interests (DOSRI). As of December 31, 2021 the Bank is
compliant with DOSRI rules and regulations.
The Bank’s related party transactions are presented and discussed in Note 31 of the Audited Financial
Statements.
Effect of Existing or Probable Government Regulations
Bangko Sentral ng Pilipinas
The Bank fully complies with the required capitalization for commercial banks without expanded banking
licenses (non-unibank) as prescribed by the BSP. The Bank's consolidated qualifying capital as of end-
December 31, 2021 stood at P=15.60 Billion while its capital to risk assets ratio under the BASEL III
reporting standards covering credit, market and operational risks as reported to BSP remained well above
the 10% prescribed cap at 18.18%.
Bureau of Internal Revenue
RA No. 9337, An Act Amending the National Internal Revenue Code, provides that starting January 1,
2009, the regular corporate income tax rate (RCIT) shall be 30% while interest expense allowed as a
deductible expense is reduced to 33% of interest income subject to final tax.
A Minimum Corporate Income Tax (MCIT) of 2% on modified gross income is computed and compared
with the RCIT. Any excess MCIT over RCIT is deferred and can be used as a tax credit against future
income tax liability for the next three years. In addition, NOLCO is allowed as a deduction from taxable
income in the next three years from the year of inception.
FCDU offshore income (income from non-residents) is tax-exempt while gross onshore income (interest
income from loans to residents) is subject to 10% income tax. Income from FCDU transactions, other than
offshore and onshore, is subject to the 30% RCIT or 2% MCIT whichever is applicable.

Philippine Bank of Communications 2022 SEC Form 20-IS
Page 28
On January 01, 2018, Republic Act No. 10963, known as the TRAIN Law, took effect. The law increased
the rates of Documentary Stamp Tax (DST) by 100% except on the DST on debt instruments which
increased by 50%. Among the other taxes which rates were increased are Fringe Benefit Tax from 32%
to 35%; Excise Tax on Petroleum Products up to 8php per liter/kilo; and, Final Withholding Tax on
interest income from deposit under the expanded foreign currency deposit system from 7.5% to 15%.
Corporate Recovery and Tax Incentives for Enterprises Act or “CREATE” signed into law on March 26,
2021. Under the law, the corporate income tax shall be reduced to 25% and the corresponding deductible
interest expense shall be reduced by 20% of interest income subject to final tax. While the minimum
corporate income tax shall be reduced to 1% of modified gross income, which shall be effective until June
30, 2023. There are no changes for FCDU.
Research and Development Activities
The Bank offers basic commercial banking products and services that require no significant amount to be
spent on product research & development.
Employees
As of December 31, 2021, the Parent Bank has 1,005 employees with 769 officers and 236 rank-and-file.
All rank-and-file employees are covered by a 2-year collective bargaining agreement (CBA) signed last
December 28, 2021, to cover the two-year period from January 1, 2021 to December 31, 2022. There had
been neither dispute nor occurrence of employees’ strike for the past years.
Risk Management
PBCOM applies risk management across the entire organization — from the Board of Directors, Senior
Management, Business Groups, Business Centers, support units, its subsidiaries and affiliates, and to
individual employees as well as in specific functions, programs, projects, and activities. Implementation
of the framework contributes to strengthening management practices, decision making, and resource
allocation, and increasing shareholder value while protecting the interest of its clients, maintaining trust
and confidence, and ensuring compliance with regulations.
Enterprise risk management (ERM) is the framework of policies, processes, and systems, effected by an
entity’s board of directors, management, and other personnel, applied in strategy setting and across the
enterprise, designed to identify potential events that may affect the entity, and manage risk to be within
its risk appetite, to provide reasonable assurance regarding the achievement of entity objectives.
ERM Vision, Mission, Philosophy and Objectives
Risk Vision Statement
To protect and optimize PBCOM’s enterprise value through effective risk management.
Risk Mission Statement
To develop risk awareness and a risk/return consciousness in the Bank in order to protect deposits,
preserve capital, and ensure adequate return on capital.
ERM Philosophy
PBCOM recognizes that enterprise risk management is fundamental for its safe and sound operation and
sustainable growth. It ensures business success through balanced risk and reward, operational excellence
and conformance to the highest ethical standards, and regulatory requirements.

Philippine Bank of Communications 2022 SEC Form 20-IS
Page 29
Enterprise Risk Management in PBCOM is aligned to its business objectives and strategies. It operates at
all levels and in all units of PBCOM that continually manage risk in an environment fostered by an
appropriate governance structure, a strong "control culture" and a proactive process of identification,
understanding, assessment, and mitigation of all its material risks.
ERM Objectives
To identify, measure, manage and control risks inherent in PBCOM's activities or embedded in its
portfolio;
Define and disseminate risk management philosophy and policies;
Assist risk-taking business and operating units in understanding and measuring risk/return profiles;
Develop a risk management infrastructure that includes policies and procedures, organization, limits
and approval authorities, MIS and reporting, systems and risk models and;
Promote a risk awareness and strong "control culture" in PBCOM.
PBCOM Enterprise Risk Governance
The Board of Directors is responsible for establishing and maintaining a sound risk management system
and is ultimately accountable for identifying and controlling risks; there are, however, separate
independent bodies responsible for managing and monitoring risks.
The Risk Oversight Committee (ROC) has the overall responsibility for the development of the risk
strategy and implementing principles, frameworks, policies and limits. Its primary responsibilities are to:
1. Oversee the risk management framework. The committee shall oversee the enterprise risk
management framework and ensure that there is periodic review of the effectiveness of the risk
management systems and recovery plans. It shall ensure that corrective actions are promptly
implemented to address risk management concerns.
2. Oversee the adherence to risk appetite. The committee shall ensure that the current and emerging
risk exposures are consistent with the Bank’s strategic direction and overall risk appetite. It shall
assess the overall status of adherence to the risk appetite based on the quality of compliance with
the limits structure, policies and procedures relating to risk management and control, and
performance of management, among others.
3. Oversee the risk management function. The committee shall be responsible for the
appointment/selection, remuneration, and dismissal of the Chief Risk Officer (CRO). It shall also
ensure that the risk management function has adequate resources and effectively oversees the risk
taking activities of the Bank.
The Enterprise Risk Management/ICAAP Group is the ROC’s implementing arm in carrying out its
functions. It serves the Bank’s Board of Directors and Management by assisting the Bank in
accomplishing its objectives by bringing a systematic and disciplined approach to promoting risk
management practices consistent with the type and complexity of operation of the Bank and its
subsidiaries. It assists in the management of risk that is a direct responsibility of the business and support
units.
Capital Management
PBCOM’s capital management framework involves providing shareholders optimal returns within the
ability of the capital to protect the interests of all the Bank’s stakeholders. The framework involves
monitoring both capital requirements and capital resources to ensure:
Qualifying capital remains above minimum requirements of ten (10) percent of risk weighted
assets;
Quality of capital resources aligns with the risks present or to be taken to achieve growth & return
and;

Philippine Bank of Communications 2022 SEC Form 20-IS
Page 30
Prudent balance between the growth and return required of strategic plans and the continuing
institutional strength of the Bank.
PBCOM consistently maintains a ratio of qualifying capital to risk weighted assets that are in excess of
the ten (10) percent minimum requirement of Philippine banking regulations.
The Bank, in addition, conducts an Internal Capital Adequacy Assessment Process (ICAAP), along with
its strategic planning exercise. The ICAAP provides the Bank the opportunity to:
Articulate its risk appetite, strategic growth, and return targets;
Identify the businesses, products, and services the Bank will pursue or use to achieve the targets;
Define and measure the risks each business, product, or service will create;
Consider how the Bank will mitigate and manage the identified risks;
Determine the amount and the quality of the capital resources necessary to sustain financial
strength through a risk event;
Conduct stress tests to aid in identifying break points and vulnerabilities; and
Develop capital build-up and contingency plans.
The ICAAP is a collaborative effort of the Management and the Board of Directors. PBCOM submits the
documentation of the results of its ICAAP to the supervisory review and examination of the Bangko
Sentral ng Pilipinas.
The regulatory qualifying capital of the Bank consists of Common Equity Tier 1 and Additional Tier 1
and is comprised of paid-up common stock, retained earnings including current year’s profit, and surplus
reserves, less required deductions such as unsecured credit accommodations to DOSRI, and goodwill. The
other component of regulatory capital is Gone-Concern Capital (Tier 2), which includes appraisal
increment reserves (as authorized by the Monetary Board) and general loan loss provision.
The Bank’s capital charge for credit risk is computed at 10% of credit risk-weighted on- and off- balance
sheet assets. Risk weights of on- and off-balance sheet assets are computed using the standardized approach
as specified in the MORB.
Market risk capital charge is computed using the standardized approach specified in the MORB. Under
this approach, capital for market risk is equivalent to 10% of market risk-weighted assets that cover
interest rate, equity, and foreign exchange exposures of the Bank.
Operational risk capital charge is computed using the Basic Indicator Approach, under which, capital for
operational risk is equal to 15% of the Bank’s average positive annual gross income of the previous three
years.
Market, Liquidity and Interest Rate Risk Management
Market risk arises from adverse fluctuations in the market value of financial instruments in both on- and
off-balance sheet items. The Bank employs the Value-at-Risk (VaR) at 99% confidence level to measure
market risk and performs back testing (using both hypothetical and actual back testing approaches) to
ensure an accurate and robust VaR model. Stress Testing is also employed to determine the earnings
impact of extreme market movements not captured by VaR calculations. A system of risk limits that reflect
the Bank’s level of capital, expected returns, and the overall risk appetite, is used to manage market risk.
These limits include the VAR limit, Nominal Position limit, Off-Market Tolerance limit, Management
Action Trigger, and Stop-loss limit. The Bank also uses Market Risk Assessment Matrix to assess the
overall market risk profile of the Bank.
Liquidity risk refers to the possibility that the Bank will be unable to meet its financial obligations in any
currency. To ensure compliance, the Bank requires daily monitoring of regulatory ratios such as the
Liquidity Coverage Ratio (LCR) and Net Stable Funding Ratio (NSFR). The Bank also monitors liquidity

Philippine Bank of Communications 2022 SEC Form 20-IS
Page 31
risk exposures using the following limits: liquidity indicators, liquidity funding concentration, and
Maximum Cumulative Outflow (MCO). Liquidity stress testing is also performed to measure the impact
of stressful scenarios to the Bank’s MCO profile. The Bank also applies Liquidity Risk Assessment Matrix
to assess its overall liquidity risk profile. In managing liquidity risk, the Bank also maintains substantial
holdings of High Quality Liquid Assets (HQLA) which can easily be converted to cash.
Interest rate risk arises from the possibility that changes in interest rates will affect future cash flows or
fair values of financial instruments. The Bank uses Earnings-at-Risk (EaR) and Economic Value of Equity
(EVE) based on its Interest Rate Repricing Gap profile to measure the possible impact to net interest
income and net worth of the Bank under normal and stressed interest rate movements. Likewise, risk
limits are also employed by the Bank to manage interest rate risk in the banking book. The Bank follows
a prudent policy in managing its assets and liabilities to ensure that the exposure to fluctuations in interest
rates is kept within acceptable limits.
Credit Risk Management
Credit Risk Management Process
Credit risk is the primary financial risk in the banking system and exists in all revenue generating activities.
Credit risk is the risk that one party to a financial instrument will fail to discharge an obligation and cause
the other party to incur a financial loss. The risk arises when the Bank’s funds are extended, committed,
invested, or exposed through actual or implied contractual agreements. Capital depletion through loan
losses has been the ultimate cause of most institutions' failures. The Bank’s credit risk arises from its
lending and trading of securities and foreign exchange activities.
The Bank, in recognition of the importance of identifying and rating credit risk as the initial step towards
its effective management, has put in place a comprehensive set of policies and established underwriting
processes, as approved by the Board of Directors. Regular analysis of the ability of potential and existing
borrowers to meet interest and capital repayment obligations is made, including amendment of lending
limits when appropriate. The Bank is thus able to continually manage credit-related risks in its risk asset
portfolio through objective assessments/evaluations of credit proposals prior to presentation to the
appropriate approval authority, ensuring the highest standards of credit due diligence and independence.
The Bank’s approval matrix begins at carefully reviewed and selected individual limit delegations,
working its way up to the Executive Committee (EXCOM) and the Board of Directors as appropriate.
The Bank also employs and implements an Internal Credit Risk Rating System (ICRRS) that is consistent
with global rating standards, compliant with Basel II requirements, and appropriate to the Bank’s nature,
complexity, and scale of activities. Resulting ratings/scores, together with experienced credit judgment,
serve as basis in proactively setting-up of loan loss provisions in compliance with PFRS 9.
Credit Exposure Limits
The Bank manages and controls credit risk by setting limits on the amount of risk it is willing to accept
for individual borrowers and groups of borrowers as well as limits on large exposures and real estate loan
ceilings and limits on past due and non-performing ratios per product. Such risks are monitored on a
regular basis and subjected to annual or more frequent reviews when considered necessary. These limits
are approved by the Board of Directors. The exposure to any one borrower is further restricted by sub-
limits covering on- and off-balance sheet exposures. Actual exposures against limits are monitored
regularly.
Other Credit Enhancements
Exposure to credit risk is also managed in part by obtaining collateral, suretyships, or guarantees. The
amount and type of security required depends on an assessment of the credit risk of the counterparty. In
order to minimize credit loss, additional security is sought from the borrower when impairment indicators
are observed for the relevant individual loans and advances. The Bank implements guidelines on the
acceptability and valuation parameters of specific classes of collateral for credit risk mitigation. The main
types of collateral obtained are as follows: (i) for securities lending and reverse repurchase transactions:
Philippine Bank of Communications 2022 SEC Form 20-IS
Page 32
cash or securities; (ii) for commercial lending: mortgages over real estate properties, machineries,
inventories, and trade receivables; and (iii) for retail lending: mortgages over residential properties and
vehicles. It is the Bank’s policy to dispose of repossessed properties in an orderly and timely fashion. The
proceeds are used to reduce or repay the outstanding claim. In general, the Bank does not occupy
repossessed properties for business use.
The Bank also has in place an independent post credit review of the loan portfolio quality and credit
process that allows it to continually identify and assess the risks on credit exposures and take corrective
actions. The management of the credit portfolio is subject to internal and regulatory limits which serve to
control the magnitude of credit risk exposures and preserve the quality of the portfolio. ERMG also
monitors large exposures and credit risk concentrations in accordance with BSP regulations.
Operational Risk Management
Operational risk refers to the risk of loss resulting from inadequate or failed internal processes, people,
and systems, or from external events. It includes legal risk, but excludes strategic and reputational risk.
Operational risk is inherent in all activities, products, and services, and cuts across multiple activities and
business lines within the Bank and across its subsidiaries and affiliates. The primary tool in controlling
operational risk is an effective system of internal controls, which is approved by the Board and participated
by each and every employee of the Bank.
The PBCOM’s Operational Risk Management (ORM) Framework, which provides for a strengthened
foundation and guidance on how PBCOM should effectively manage its operational risks, is regularly
reviewed by the BOD to ensure that ORM policies, processes, and systems are implemented effectively
at all decision levels.
The Bank’s ORM tools include the Risk Control Self-Assessment (RCSA), Key Risk Indicators (KRI),
and the Internal Operational Loss Database, results of which are regularly reported by the ORM Division
(ORMD) to the ROC. Operational risk reports such as Profile of Complaints, Legal Case Profile, Bank
Security Assessments, and Vendor Performance Evaluation Results are likewise regularly reported by the
respective line management to the ROC. A system for reporting of operational crimes and losses, and
policies, whistle-blowing and handling of administrative cases are also in place.
Aside from securing adequate insurance coverage over bank assets, putting up of reserve for self-
insurance, and setting up allowances for probable losses, operational risk is mitigated through preventive
and detective controls, which are embedded in operating policies and procedures, approval limits, and
authorities to govern day-to-day operations.
To instil a culture of risk awareness and a strong operational risk control environment, the Bank’s ERMG
and Compliance Management Group (CG) conduct regular in-house seminars and trainings, such as
orientation for newly-hired employees, with presentations focusing on risk management and regulatory
compliance. Both groups continuously develop and implement risk management and compliance policies,
while holding interactive meetings with operating units to address risk issues and implement process
enhancements. The Bank also employs Computer-Based Training (CBT) to make training content more
readily available and accessible.
The Bank’s Technology Risk Management Framework continues to provide strengthened foundation and
guidance on how the Bank should effectively manage emerging technology risks. It incorporates the
requirements under existing BSP regulations and which takes into account that strategic, operational,
compliance, and reputational risks are periodically reviewed and updated to ensure that all risks in the
Bank’s technology-enabled products, services, delivery channels, and processes are effectively managed
and that any gaps are being regularly monitored and addressed.
A comprehensive risk assessment and profiling methodologies for both IT functions and application
systems are in place. Risk identification and assessments over project management are enhanced from

Philippine Bank of Communications 2022 SEC Form 20-IS
Page 33
project initiation to implementation. Control validation process is incorporated in technology risk
assessments to ensure effectiveness of established risk mitigation strategy. Corrective action plans are
periodically monitored and reported to ensure risk issues are timely addressed and managed proactively.
The Bank’s risk management team continues to play an active role in providing risk insights and
assessments during launch of new products, technology and services, development of risk management
policies, and imbibing a culture of a risk aware organization through the conduct of trainings and seminars
to Bank employees.
The Bank has in place a Business Continuity Management Framework that providesguidance for
continuous operations in the event of any disruptions and proactive mechanisms designed to prevent
interruptions to critical business functions and improve the Bank’s resiliency. It follows a robust business
continuity planning process that involves the conduct of a business impact analysis/risk assessment,
periodic review and updating of business continuity plans, and conduct of BCP tests and tests evaluation.
Bankwide Business Continuity Plan, Crisis Management and Emergency Preparedness Plan, Pandemic,
and Cyber Resiliency Plans are established. These documents detail the step by step procedures to be
taken to respond to the threat or impact of a crisis, and how the Bank will respond to emergencies to
protect life, property and environment, addressed in timely manner.
Information and Cyber Security Management
PBCOM has built its Information Security Division (ISD) based on the provision of BSP Circular 982 –
Enhanced Guidelines on Information Security Management, which imposes specific technical safeguards
as well as governance, risk assessment, monitoring and testing, reporting and other requirements. PBCOM
information security management systems, framework, practices, and standards have also been created
and referenced their contents on globally renowned frameworks, standards and good practices such as
ISO/IEC 27002 and 27001; NIST Special Publications regarding information and cyber security; and
COBIT Framework for Information Security.
As we go into 2022, looking back at the plentiful year of 2021, as regards to security, PBCOM continues
to face significant amount of security challenges but does not stop them from being dedicated to
proactively protect its information, networks, and IT systems from risks, like fraud, unauthorized access,
and cyber threats. PBCOM is committed to continually developing and honing overall security capabilities
to protect/safeguard the Bank’s information and assets. In valuing customers’ trust and maintain a resilient
business, the Bank is also investing heavily on its people, processes and technology to prevent, deter,
detect and timely mitigate risks of security threats to Bank’s information and information
systems/resources.
Cybersecurity risk is an important, constant, and evolving focus of PBCOM. Having a proactive, defense-
in-depth approach to cybersecurity allows the Bank to be more vigilant and adaptive to the new, emerging
and evolving cyber-threat landscape. PBCOM Information Security Division (ISD) continues to develop
and employ additional preventative measures to continually challenge the Bank’s defenses and controls
against cyber-attacks and ensure adequate protection of the Bank’s information and information assets
that matter to their customers. The Bank recognizes the need to institute a cybersecurity culture within
PBCOM; thus, constantly promote security awareness to their people and customers.
Data Privacy Management
PBCOM cares about the protection of personal identifiable and/or sensitive information provided by
customers and/or clients, thus, shall at all times abide to the minimum regulatory and statutory
requirements. PBCOM built its privacy risk management system based on the provisions of Republic Act
10173 – Data Privacy Act of 2012, its Implementing Rules and Regulations (IRR), National Privacy
Commission (NPC) issuances, and other related laws.

Philippine Bank of Communications 2022 SEC Form 20-IS
Page 34
Privacy risk is defined as a potential loss of control over personal identifiable and/or sensitive personal
information. With the emerging threats on data privacy, the Bank has instituted control measures to
efficiently manage the risk to an acceptable level.
PBCOM, through the designated Data Protection Officer (DPO), manages the risk related to data privacy
by adhering to the five (5) pillars of compliance as mandated by the NPC, at the minimum.
Privacy Impact Assessment were the main focus for 2021, to update the inventory of the Banks processing
systems and to ensure that organizational, technical and physical security measures are in place.
Security Breach Drill were also conducted with the assistance of CISO to ensure that the Bank and its
employees will be ready to handle incidents that may lead to security breaches including data privacy
breach.
The Bank’s compliance to the data privacy is reported to the Board of Directors (BOD), through the Risk
Oversight Committee (ROC), on a quarterly basis or as deemed necessary.
Year 2022 will focus on activities contributing to increasing of awareness thru different campaigns both
for internal and external data subjects. Strengthening the employees and the Banks readiness for any
security incidents leading to privacy breach will also be an important program that will be implemented.
PBCOM is one with the National Privacy Commission on its active campaign to protect all data subjects
from any unauthorized and unlawful processing of information.
Trust Risk Management
The Trust and Wealth Management Group (TWMG) is exposed to fiduciary risks in managing funds and
assets entrusted under its care and custody. Failure of the Group to fulfil its fiduciary responsibilities to
the trustor/principal may result to a loss, damage liability, or any undesirable event that can have adverse
impact on the Bank. The major risks associated with the fiduciary activities of TWMG are market, credit,
liquidity, operational, legal, compliance, strategic, and reputation risks. Having account management,
portfolio and trading, trust credit, and operations functions within TWMG, the Bank has also designated
personnel performing independent risk management function on fiduciary activities who directly report
to the Enterprise Risk Management/ICAAP Group (ERMG). The fiduciary risk exposure exists in both
discretionary and non-discretionary trust arrangements.
Risks arising in the performance of trust duties and obligations are addressed through the Trust
Committee, Risk Oversight Committee (ROC), and ERMG. The Trust Committee performs oversight
function on wealth, trust, and other fiduciary services including the implementation of the risk
management framework ensuring that internal controls are in place relative to the fiduciary activities of
the Group. The ROC has the overall responsibility for the development of the risk strategy and
implementing principles, risk framework, policies, and limits of the Bank, including its Trust
business. ERMG spearheads the effective implementation of the risk management process through the
following risk tools and controls:
a. Monthly and Quarterly reporting to ROC and TCOM, respectively
b. Periodic stress testing of Trust and Wealth TWMG portfolio
c. Risk Control Self-Assessments (RCSA)
d. Trust risk management policies
Item 2. Properties
PBCOM’s Head Office is located at PBCOM Tower, 6795 Ayala Avenue corner V.A. Rufino Street,
Makati City. The Bank currently owns 50% of PBCOM Tower which was constructed under a Joint
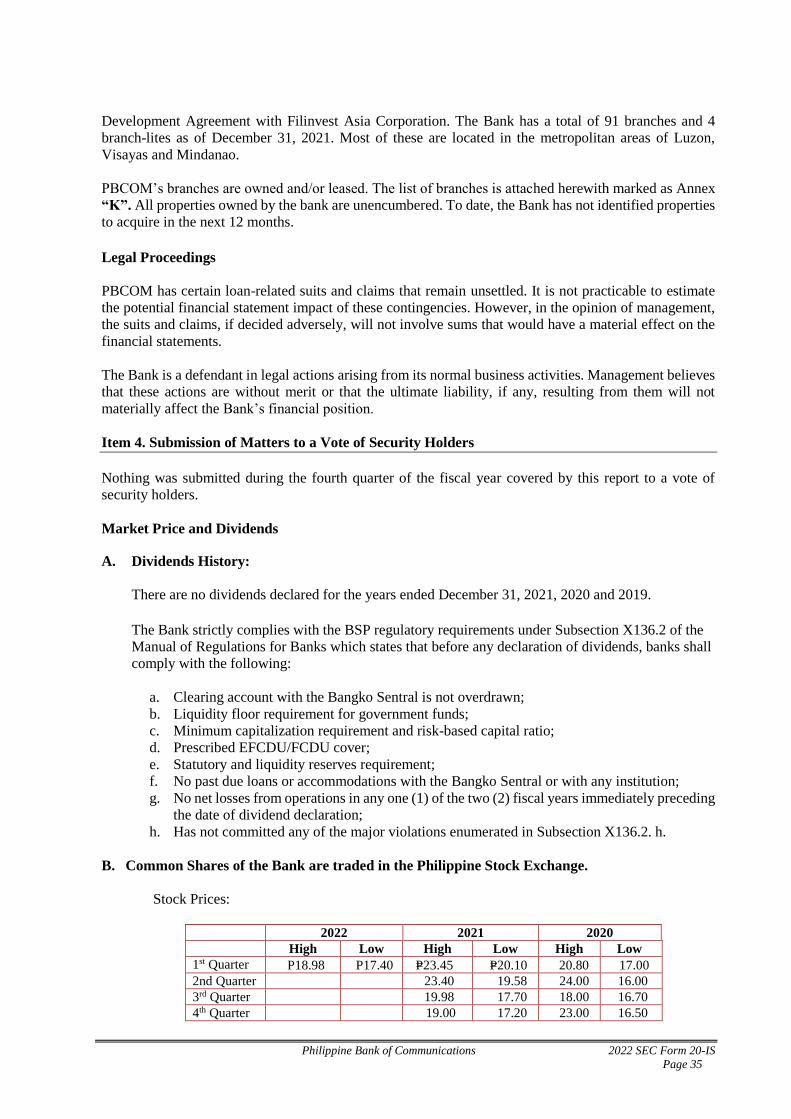
Philippine Bank of Communications 2022 SEC Form 20-IS
Page 35
Development Agreement with Filinvest Asia Corporation. The Bank has a total of 91 branches and 4
branch-lites as of December 31, 2021. Most of these are located in the metropolitan areas of Luzon,
Visayas and Mindanao.
PBCOM’s branches are owned and/or leased. The list of branches is attached herewith marked as Annex
“K”. All properties owned by the bank are unencumbered. To date, the Bank has not identified properties
to acquire in the next 12 months.
Legal Proceedings
PBCOM has certain loan-related suits and claims that remain unsettled. It is not practicable to estimate
the potential financial statement impact of these contingencies. However, in the opinion of management,
the suits and claims, if decided adversely, will not involve sums that would have a material effect on the
financial statements.
The Bank is a defendant in legal actions arising from its normal business activities. Management believes
that these actions are without merit or that the ultimate liability, if any, resulting from them will not
materially affect the Bank’s financial position.
Item 4. Submission of Matters to a Vote of Security Holders
Nothing was submitted during the fourth quarter of the fiscal year covered by this report to a vote of
security holders.
Market Price and Dividends
A. Dividends History:
There are no dividends declared for the years ended December 31, 2021, 2020 and 2019.
The Bank strictly complies with the BSP regulatory requirements under Subsection X136.2 of the
Manual of Regulations for Banks which states that before any declaration of dividends, banks shall
comply with the following:
a. Clearing account with the Bangko Sentral is not overdrawn;
b. Liquidity floor requirement for government funds;
c. Minimum capitalization requirement and risk-based capital ratio;
d. Prescribed EFCDU/FCDU cover;
e. Statutory and liquidity reserves requirement;
f. No past due loans or accommodations with the Bangko Sentral or with any institution;
g. No net losses from operations in any one (1) of the two (2) fiscal years immediately preceding
the date of dividend declaration;
h. Has not committed any of the major violations enumerated in Subsection X136.2. h.
B. Common Shares of the Bank are traded in the Philippine Stock Exchange.
Stock Prices:
2022 2021 2020
High Low High Low High Low 1st Quarter P18.98 P17.40 P=23.45 P=20.10 20.80 17.00
2nd Quarter 23.40 19.58 24.00 16.00
3rd Quarter 19.98 17.70 18.00 16.70
4th Quarter 19.00 17.20 23.00 16.50

Philippine Bank of Communications 2022 SEC Form 20-IS
Page 36
As of April 18, 2022 the closing price of the Bank’s common share was P=17.84.
C. Holders
As of March 31, 2022, there are 399 shareholders of the Bank’s 480,645,163 issued and outstanding
common shares, 17,282,888 or 3.60% of which are owned by foreigners.
The top 20 registered stockholders of the Bank as of March 31, 2022 are as follows:
Name of Shareholder Nationality No. of
Shares
%
1 P.G. Holdings, Inc. Filipino 186,241,408 38.75%
2 VFC Land Resources, Inc. Filipino 73,619,038 15.32%
3 PCD Nominee Corporation Filipino 49,138,903* 10.64%
Non-Filipino 2,002,061
4 Eric O. Recto Filipino 49,835,776 10.37%
5 Ralph C. Nubla, Jr. Filipino 46,519,036 9.68%
6 Telengtan Brothers & Sons, Inc. Filipino 31,859,844 6.63%
7 Langford Universal Finance Ltd. BVI 15,263,964 3.18%
8 La Suerte Workmen’s Compensation Fund Filipino 7,687,833 1.60%
9 TTC Development Corporation Filipino 4,181,665 0.87%
10 Roxas-Chua, Ray Anthony Go Filipino 3,070,724 0.64%
11 Cham, Edison Siy Filipino 1,790,853 0.37%
12 KLG International, Inc. Filipino 1,790,853 0.37%
13 Yu, Gregorio T. Filipino 1,432,692 0.30%
14 Chungunco, Raymond N. Filipino 604,011 0.13%
15 TFC Holdings, Inc. Filipino 562,588 0.12%
16 Chung, Bunsit G. (a.k.a. Carlos G. Chung) Filipino 550,716 0.11%
17 Chung, Patricia Regine K. Filipino 261,294 0.05%
18 Chung, Philippe Ryan K. Filipino 261,294 0.05%
19 Ching, Winnifred Filipino 187,798 0.04%
20 Ching, Jeffrey Filipino 175,505 0.04%
Total 477,038,456 99.26%
*- 5,260,338 shares of Ralph C. Nubla, Jr. and 323,648 shares of Eric O. Recto are under PCD
Nominee Corp.
The PCD, being a nominee corporation, only holds legal title, not beneficial ownership of the lodged
shares. The beneficial owners, such as the clients of PCD, have the power to decide how their shares are
to be voted.
The material information on the current shareholders and voting rights are discussed on page 5 of the
Information Statement under Security Ownership of Certain Record and Beneficial Owners.
Recent Sale of Unregistered Securities
There were no sales of unregistered securities within the fiscal year covered by this report.
The Bank has no registered debt securities. There are no existing or planned stock options. There are no
registered securities subject to redemption or call. There are no existing or planned stock warrant offerings.
Management’s Discussion and Analysis of Financial Condition and Results of Operations
(1) Management’s Discussion & Analysis

Philippine Bank of Communications 2022 SEC Form 20-IS
Page 37
Financial Condition & Results of Operations: March 31, 2022
The Bank registered a net income of P415.0 Million for the first quarter of 2022, 60.2% or P155.9 Million
higher than the P259.1 Million earned in the same period last year. Total operating income increased by
P172.0 Million or 15.0% primarily from improvements in net interest income, higher trading gains, higher
profit from sale of ROPA, and higher fees & commission.
P128.7 Million improvements in net interest income was primarily the result of P80.0 Million increase in
interest income from investments from higher yields and higher average volume, P40.8 Million increase
in interest income from loans from higher average loan volume, and from decline in Interest expense by
P11.7 Million largely due to drop in cost of funds. Increase on profit from sale of ROPA amounted to
P30.4 Million, and Fees & commission increased by P9.6 Million mainly from loan processing fees
received during the period. This is partially offset by decline in rent income by P40.0 Million due to
vacancies of leased floors, pre-terminations, and re-negotiated contracts of tenants as a result of the
COVID-19 crisis. Total operating expenses went up slightly by P2.5 Million or 0.3% mainly from higher
manpower costs.
Total Assets of the Group increased by P7.3 Billion from P109.3 Billion as of December 2021 to P116.5
Billion at the end of the first quarter of 2022. This is primarily due to P7.2 Billion higher Due from BSP
from higher investment in Overnight Deposit Facility (ODF), and P2.0 Billion increase in Loans and Other
Receivables mostly from corporate loans. This was partially offset by P1.6 Billion lower Cash on hand
mainly those with service providers and cash centers.
The Group’s gross NPL ratio is at 4.68%, 0.21 % points lower than the 4.89% ratio at the end of 2021.
Total Liabilities increased by P7.2 Billion, 7.6% higher from last year’s end level of P95.1 Billion. This
resulted mostly from P4.7 Billion increase in deposit liabilities mainly from higher demand and time
deposit volume, and P2.4 Billion increase in bills payable. Total Capital amounted to P14.25 Billion from
P14.18 Billion last December 2021. This slight increase in Capital of 0.5% was mainly contributed by
the earnings of the Bank as of the first quarter of the year.
The Group’s consolidated Risk-Based Capital Adequacy ratio is 17.58% under BASEL 3 and is well
above the 10% minimum requirement despite the global crisis on COVID-19. The ratio covers credit,
market and operational risks for the first three (3) months of 2022.
Financial Condition & Results of Operations: 2021 (Consolidated)
The Bank registered a net income of P1.57 Billion for 2021. This is P404.15M or 35% improvement from
2020’s net income of P1.17 Billion. This is mainly attributable to P1.24 Billion decline in total operating
expenses (28%) as a result of P1.10 Billion lower provision requirements for credit and impairment losses
in the current period.
Total operating income declined by P807.60 Million (14%) mainly due to net trading losses as the Bank
recognized P241.60 Million in losses, lower rent income due to vacancies of leased floors, pre-
terminations, and re-negotiated contracts of tenants brought about by the COVID 19 pandemic, and lower
fees & commission earned during the year due to decline in penalty fees in corporate loans, partly offset
by P319.29 Million (8%) improvement in net interest income primarily due to decline in interest expense
from lower cost of funds. Due to lower interest rates, interest income also fell by P255.21 Million (5%)
despite the growth in loan and investments average volume during the year.
Total assets of the Group reached P109.23 Billion in December 2021, up by P8.0 Billion from the P101.23
Billion as of December 2020. This is primarily due to P13.26 Billion increase in Investment Securities at
Amortized Cost, P5.87 Billion increase in Loans and Other Receivables, mostly from corporate loans, and
P1.35 Billion increase in Financial assets at Fair Value through Other Comprehensive Income, partially
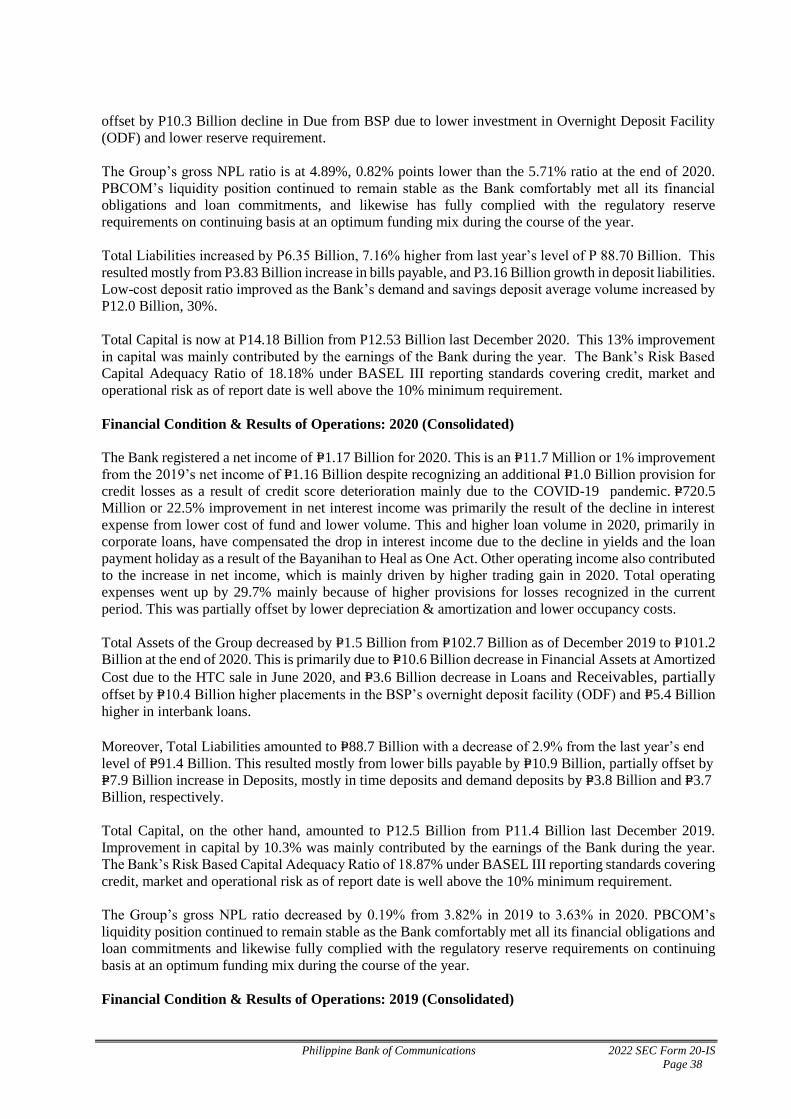
Philippine Bank of Communications 2022 SEC Form 20-IS
Page 38
offset by P10.3 Billion decline in Due from BSP due to lower investment in Overnight Deposit Facility
(ODF) and lower reserve requirement.
The Group’s gross NPL ratio is at 4.89%, 0.82% points lower than the 5.71% ratio at the end of 2020.
PBCOM’s liquidity position continued to remain stable as the Bank comfortably met all its financial
obligations and loan commitments, and likewise has fully complied with the regulatory reserve
requirements on continuing basis at an optimum funding mix during the course of the year.
Total Liabilities increased by P6.35 Billion, 7.16% higher from last year’s level of P 88.70 Billion. This
resulted mostly from P3.83 Billion increase in bills payable, and P3.16 Billion growth in deposit liabilities.
Low-cost deposit ratio improved as the Bank’s demand and savings deposit average volume increased by
P12.0 Billion, 30%.
Total Capital is now at P14.18 Billion from P12.53 Billion last December 2020. This 13% improvement
in capital was mainly contributed by the earnings of the Bank during the year. The Bank’s Risk Based
Capital Adequacy Ratio of 18.18% under BASEL III reporting standards covering credit, market and
operational risk as of report date is well above the 10% minimum requirement.
Financial Condition & Results of Operations: 2020 (Consolidated)
The Bank registered a net income of P=1.17 Billion for 2020. This is an P=11.7 Million or 1% improvement
from the 2019’s net income of P=1.16 Billion despite recognizing an additional P=1.0 Billion provision for
credit losses as a result of credit score deterioration mainly due to the COVID-19 pandemic. P=720.5
Million or 22.5% improvement in net interest income was primarily the result of the decline in interest
expense from lower cost of fund and lower volume. This and higher loan volume in 2020, primarily in
corporate loans, have compensated the drop in interest income due to the decline in yields and the loan
payment holiday as a result of the Bayanihan to Heal as One Act. Other operating income also contributed
to the increase in net income, which is mainly driven by higher trading gain in 2020. Total operating
expenses went up by 29.7% mainly because of higher provisions for losses recognized in the current
period. This was partially offset by lower depreciation & amortization and lower occupancy costs.
Total Assets of the Group decreased by P=1.5 Billion from P=102.7 Billion as of December 2019 to P=101.2
Billion at the end of 2020. This is primarily due to P=10.6 Billion decrease in Financial Assets at Amortized
Cost due to the HTC sale in June 2020, and P=3.6 Billion decrease in Loans and Receivables, partially offset by P=10.4 Billion higher placements in the BSP’s overnight deposit facility (ODF) and P=5.4 Billion
higher in interbank loans.
Moreover, Total Liabilities amounted to P=88.7 Billion with a decrease of 2.9% from the last year’s end
level of P=91.4 Billion. This resulted mostly from lower bills payable by P=10.9 Billion, partially offset by
P=7.9 Billion increase in Deposits, mostly in time deposits and demand deposits by P=3.8 Billion and P=3.7
Billion, respectively.
Total Capital, on the other hand, amounted to P12.5 Billion from P11.4 Billion last December 2019.
Improvement in capital by 10.3% was mainly contributed by the earnings of the Bank during the year.
The Bank’s Risk Based Capital Adequacy Ratio of 18.87% under BASEL III reporting standards covering
credit, market and operational risk as of report date is well above the 10% minimum requirement.
The Group’s gross NPL ratio decreased by 0.19% from 3.82% in 2019 to 3.63% in 2020. PBCOM’s
liquidity position continued to remain stable as the Bank comfortably met all its financial obligations and
loan commitments and likewise fully complied with the regulatory reserve requirements on continuing
basis at an optimum funding mix during the course of the year.
Financial Condition & Results of Operations: 2019 (Consolidated)

Philippine Bank of Communications 2022 SEC Form 20-IS
Page 39
The Bank registered a net income of P=1.2 Billion for 2019. This is a P=531 Million or 85% improvement
from the 2018’s net income of P=626.2 Million. Total operating income increased by P=971.5 Million or by
23.81% as the Bank sustains its business growth. Interest income from loans and receivables is higher by
20.01% from P=3.7 Billion in 2018 to P=4.5 Billion in 2019 as the Bank focused its efforts in expanding its
corporate and consumer loan portfolios and increasing loan yields. Interest expense however grew by P=
432.8 Million or 26.54% compared to prior year period primarily from the rise in cost of funds and the
impact of the increase in volume from the Bank’s maiden issuance of Long Term Negotiable Certificates
of Time Deposit (LTNCD). Low-cost deposit volume has improved as the Bank grew its demand and
savings deposit base to P36.4 Billion from P28.1 Billion in the previous year. Time deposit and bills
payable volume declined by P6.5 Billion and by P4.6 Billion, with balances of P36.6 Billion and P13.1
Billion, respectively by the end of current year. Trading results improved further year as the Bank
recognized P408.4 Million in gains, a P385.1 Million or a 1,650.14% increase compared to last year.
Higher profit from asset sold, rent income and service charges and fees also contributed to the growth to
the Bank’s bottom line. These were partially offset by the loss recognized from the sale of PBCOM Rural
Bank, Inc. in July amounting to P171.2 Million. Total operating expenses slightly went up by 6.5% from
last year primarily due to higher Provision for losses by P=167.7 Million, Miscellaneous expense by P=94.3
Million, and Taxes and licenses by P=81.2 Million partially offset by the decline in Occupancy and other
equipment-related costs by P=113.7 Million and lower Compensation and benefits by P=61.7 Million from
lower headcount.
Total Assets of PBCOM Group stood at P102.7 Billion at the end of 2019, from P103.7 Billion as of
December 2018 primarily from lower liquid assets by P=1.6 Billion due to the decline in Due from BSP by
33% from lower reserve requirement notwithstanding the Group’s increase in lending activities which
resulted to a P=1.1 Billion increase in loans and receivable. Total property and equipment declined by P=
295.6 Million mainly due to depreciation and amortization and write-off of leasehold improvements.
Investment properties also decreased by 6.9% due to depreciation and amortization and sale of ROPA in
2019. Moreover, other assets increased by P=210.3 Million mostly brought about by the recognition of
ROU starting in 2019 in compliance with PFRS16.
The Group’s non-performing loans (NPL) decreased by P=296.43 Million. Consequently, the Group’s
gross NPL ratio decreased by 0.58% from 4.40% in 2018 to 3.82% in 2019 as a result of improved
collection efforts. PBCOM’s liquidity position continued to remain stable as the Bank comfortably met
all its financial obligations and loan commitments and likewise fully complied with the regulatory reserve
requirements on continuing basis at an optimum funding mix during the course of the year.
Moreover, Total Liabilities amounted to P91.4 Billion with a slight decrease of 2.2% from the last year’s
end level of P93.4 Billion. This resulted mostly from lower bills payable by P4.6 Billion partially offset
by the increase in deposits, particularly on demand and savings deposit, which showed an increase of
34.3% and 17.5%, respectively.
Total Capital, on the other hand, amounted to P11.4 Billion from P10.3 Billion in 2018. Improvement in
capital by 10% was mainly contributed by the earnings of the Bank for the year. The Bank’s Risk Based
Capital Adequacy Ratio of 16.47% under BASEL III reporting standards covering credit, market and
operational risk as of report date is well above the 10% minimum requirement.
2. Discussion of various key indicators:
A. Key Financial Performance (consolidated)
Ratio March
2022
March
2021 Remarks
Net Profit Margin
(Net income divided by Gross
income)
31.49% 22.61% Net profit margin increased by 8.88 % pts. due to higher net income mainly driven by higher
operating income
Return on Average Asset
(Net income divided by Average
assets)
1.47% 1.03% Increase by 45 bps from higher net income during the current period mainly driven by
higher operating income

Philippine Bank of Communications 2022 SEC Form 20-IS
Page 40
Return on Average Equity
(Net income divided by Average equity)
11.68% 8.29% Return on average equity increased by 3.39%
pts. from higher net income during the current period driven by higher total operating income
from the results of the current operations
Capital Adequacy Ratio (Basel 3)
(Qualifying capital divided by total
of risk-weighted assets that include
credit, market and operational risk)
17.58% 18.50% Capital ratio increase by 0.59% as a result of higher total qualifying capital
Basic Earnings per share
(Net income divided by average no.
of common shares)
0.86 0.54 Increase in basic earnings per share by P0.32
from higher net income during the current
period
B. Financial Soundness (consolidated)
Ratio March
2022
December
2021 Remarks
Liquidity Ratio (Liquid Assets to
Total Deposits) Liquid Assets include cash, due from banks,
interbank loans, and trading and
inv. Securities Total deposit refers to the total of peso and foreign
currency deposits.
33.19% 28.96% Ratio increased by 4.23 % pts., mainly due to
higher liquid assets from higher placement in ODFs
Debt Ratio (Total Liability to Total Assets)
Debt refers to the total liabilities
while assets refers to total Assets
87.77% 87.02% Debt ratio increased by 75 bps from impact of increase in total liabilities exceeded the impact
of increase in total assets. Increase in
liabilities is mainly from higher deposit liabilities and bills payable
Asset to Equity Ratio (Total Asset
to Total Equity)
8.18 7.71 Ratio is higher by 47 bps mainly as result of
higher growth in assets in relation to the increase in equity
Interest Rate Coverage Ratio (Earnings before interest & taxes to Interest Expense)
565.01% 393.97%* Bank’s interest rate coverage increased by
171.04 % pts. due to higher Earnings before interest & taxes, partially offset by lower
interest expense from lower cost of funds
Net Interest Margin Net interest income over Average
Earning assets
4.17% 4.15%* Ratio slightly went up by 2 bps primarily due
to impact of improvement of ave yields, and
decline in ave COF rates * As of March 2021
3. Discussion and Analysis of Material Event/s and Uncertainties
a. The Bank has experienced an increase in past due levels in loans due to the outbreak of COVID-
19. This necessitated an increase in loan provisions. However, a gradual pick-up in business
activity is expected as the government gradually relaxes the quarantine measures.
b. The Bank does not have any material off-balance sheet transactions, arrangements, obligations
(including contingent obligations) and other relationships of the company with unconsolidated
entities or other persons created during the reporting period.
c. As of March 31, 2022, the unspent amount from the approved capital expenditures budget on
projects involving technology enhancement, and facilities improvement amounted P368.45
Million.
d. The full impact of the pandemic is still unknown and this may affect the performance of the Bank
should this further prolong. However, the Bank has taken prudent steps to mitigate the risk
through more prudent credit process, tighter credit policies and, more importantly, continue its
assessment of our portfolio by regularly doing the stress test exercise.

Philippine Bank of Communications 2022 SEC Form 20-IS
Page 41
e. There is no recorded significant income or losses during the quarter that did not come from the
Bank’s regular operations.
f. Interest income on non-discounted loan is recognized based on the accrual method of accounting
while unearned discounts are amortized to income over the term of the loans. As such, there is
no seasonal aspect that has a material impact on the Bank’s interest revenues. Non-interest
revenues, on the other hand, are largely dependent on market dynamics and economic trends
rather than on seasonal factors.
Statement of Condition: March 2022 vs. December 2021 (consolidated)
Increase
(Decrease) Percentage Remarks
Cash and Other Cash Items (1,553,550) -55.42% Lower cash on hand mainly those with service provider and in cash centers
Due from BSP 7,227,257 70.36% Higher mostly from ODF
Due from Other Banks 571,158 86.72% Higher funds with foreign banks
Interbank Loans Receivable 213,784 5.10% Higher foreign interbank loans and GS Repo
Financial assets at Fair Value
through Profit or Loss
(886,291) -100.00% Sale of investments in FVTPL
Financial assets at Fair Value
thorough Other Comprehensive Income
(322,737) -4.97% Sale of investments in FVOCI
Investment securities at Amortized
Cost
51,911 0.33% Higher due to purchase of HTC investment
Loans and Receivables 1,955,705 3.08% Increase in outstanding loans and receivables, mainly in corporate loans
Investment in a subsidiary and
associate
49 0.34% Share in net income for the period
Property and Equipment (12,492) -1.42% Decline due to depreciation recognized for the
period
Investment Properties (10,606) -0.41% Depreciation recognized for the period, offset by
ROPA foreclosures
Intangible Assets 1,656 0.31% Higher due to acquisitions, partially offset by
amortization of software during the period
Deferred tax assets 5,832 1.79% Increase mainly due to allowance for credit losses
booked during the period
Other Assets 61,279 10.58% Higher primarily from increase in prepaid expenses
Demand Deposits 2,278,858 5.54% Higher deposits volume primarily in Demand & Time deposits due to the Bank’s efforts to increase
volume of low-cost source of funds Savings Deposits 2,119,416 18.66%
Time Deposits 332,179 1.05%
Bills Payable 2,387,068 39.71% Higher due to higher bills payable – REPO FCDU,
partially offset by lower deposit substitute
Outstanding Acceptances 26,435 36.92% Due to higher bills of exchange accepted by the Bank
Manager’s Checks 64,799 37.62% Higher un-negotiated MC’s as of report date
Accrued Interest, Taxes and Other
Expenses Payable
95,871 14.08% Increase in expense accruals as of the period
Income Tax payable 106,507 159.39% Income tax due for the period
Other Liabilities (181,008) -16.38% Lower mainly from lower advance rentals and
rental security deposits
Statement of Income and Expenses : January-March 2022 vs January-March 2021
(consolidated)
Increase
(Decrease)
Percentage Remarks
Interest Income on investment securities
79,989 83.70% Higher interest income due to higher yields mainly from HTC & FVTPL
Interest Income on Loans and
receivable
40,772 4.17% Higher interest income from higher ave volume ,
partly offset by lower yields
Interest Income on IBCL 5,019 19.10% Increase from higher ave. volume, mainly in GS REPO

Philippine Bank of Communications 2022 SEC Form 20-IS
Page 42
Interest Income on Deposit with
other Banks and others
(8,769) -33.25% Lower income from decrease in ave. volume
mainly in ODF
Interest Expense on Deposit Liabilities
(22,027) -17.81% Decline in interest expense mainly from lower cost of funds and lower ave volume, mainly in
TDs
Interest Expense on Bills payable, borrowings and
others
10,311 142.24% Higher mainly due to higher ave volume of Bills Payable – Repo
Trading and Securities Gain – net 36,047 24.94% Higher trading gain, mostly unrealized
Rent Income (40,050) -26.26% Lower mainly due to downward impact of pre-
terminations and re-negotiated contracts of tenants
as a result of the COVID-19 crisis
Service Charges, Fees & Commissions
9,636 10.01% Higher mainly due to higher loan processing fees
Foreign Exchange Gain (Loss) –Net 4,121 55.40% Increase is mainly due to higher realized foreign
exchange gain
Gain on asset exchange (793) 66.53% Higher loss on valuation of foreclosed assets
Profit/(Loss) from Assets Sold 30,372 2304.40% Higher gain on sale of ROPA
Income from Trust Operations 536 8.17% Increase due to higher ave. volume of assets under
management
Miscellaneous Income 3,367 10.04% Higher mainly from forfeiture of security deposits from pre-termination of lease contracts
Compensation and Fringe Benefits 40,243 17.28% Higher manpower costs for the period
Taxes and Licenses (20,215) -14.64% Lower DST on deposits
Depreciation and Amortization (857) -0.86% Lower mainly due to fully-depreciated FFEs and lower ROPA depreciation
Occupancy and other equipment-
related costs
3,158 12.36% Higher electricity and repair costs
Provision for impairment losses 20,145 220.74% Higher loan provision requirement during the
period
Miscellaneous (39,975) -15.61% Decrease is primarily due to lower ROPA related
expenses and lower brokerage fees
Provision for income tax 13,567 10.78% Higher due to higher taxable income from higher
interest income from investments & loans, and
higher fees
A. Key Performance Indicators
Ratio December
2021 (Consolidated)
December 2020 (Consolidated)
Remarks
Profit Margin (Net income divided by Gross
income)
30.94%
19.84% Increase in ratio by 11.10 % pts. primarily due to decline in operating expenses from lower provision
for credit and impairment losses in 2021
Return on Average Asset
(Net income divided by Average assets)
1.49% 1.15% Higher by 35 bps due to increase in net income
primarily due to lower provision for credit and impairment losses, offset by impact of higher
average assets.
Return on Average Equity
Net income divided by Average equity)
11.78% 9.79% Return on average equity increased by 1.99 % pts
from higher net income mainly driven by lower operating expenses
Capital Adequacy Ratio
Qualifying capital divided by
total of risk-weighted assets that include credit, market and
operational risk)
18.18% 18.87% Decrease by 69bps due to increase in credit risk-
weighted assets arising from higher loans and
receivables in 2021
Basic Earnings per share
Net income divided by average
no. of common shares)
3.27 2.43 Increase in basic earnings per share by P0.84 from
higher net income
B. Financial Soundness
Ratio December
2021 (Consolidated)
December 2020 (Consolidated)
Remarks
Liquidity Ratio (Liquid Assets to
Total Deposits) Liquid Assets
include cash, due from banks, interbank loans, and trading and
inv. Securities. Total deposit refers
28.96% 43.40% Decreased by 14.44 % pts due to lower liquid
assets from lower placement in ODFs

Philippine Bank of Communications 2022 SEC Form 20-IS
Page 43
to the total of peso and foreign
currency deposits.
Debt Ratio (Total Liability to Total
Asset) Debt refers to the total liabilities
while assets is the total assets
87.02% 87.62% Decline by 60 bps as the increase in total assets
exceeded the increase in total liabilities. Increase in assets is mostly from investment
securities at amortized cost and loans and other
receivables, mostly from corporate loans
Asset to Equity Ratio (Total Asset to Total Equity
7.71 8.08 Ratio is lower by 37 bps mainly as result of lower growth in assets in relation to the
increase in equity
Interest Rate Coverage Ratio (Earnings before interest & taxes to
Interest Expense)
470% 231% Increased by 239 % pts. primarily due to lower interest expense mainly from lower cost of
funds and drop in ave. volume, mostly TDs
Net Interest Margin
Net interest income over Average Earning assets
4.83% 4.64% Ratio went up by 20 bps primarily from lower
interest expense due to drop in cost of funds
Statement of Condition: December 2021 vs. December 2020 (consolidated) (in thousands) Increase/(Decrease) Percentage
Change Explanation
Cash and Other Cash Items 336,242 13.63% Higher cash on hand & mainly those in cash
center and with service provider
Due from Bangko Sentral ng
Pilipinas
(10,326,382) -50.13% Lower placement in ODF
Due from Other Banks (837,892) -55.96% Lower funds with foreign banks
Interbank Loans Receivable (1,858,608) -30.70% Lower foreign interbank loans and GS Repo
Financial Assets at Fair Value
through Profit or Loss
167,997 23.39% Higher investments in FVTPL
Financial Assets at Fair Value
through Other Comprehensive
Income
1,351,4714 26.30% Purchase of investments in FVOCI
Investment Securities at
Amortized Cost
13,256,923 585.72% Higher due to additional inventory purchase in 2021
Loans and Receivables 5,873,972 10.19% Increase in outstanding loans and
receivables, mainly in corporate loans/import bills/CTS
Property and Equipment (12,400) -1.39% Decline mainly due to depreciation
recognized for the period
Investment Properties
Foreclosed properties 224,228 36.75% ROPA foreclosures in 2021 partially offset
by depreciation recognized for the period
Office units for lease (234) -8.01% Decline due to depreciation recognized for
the period
Intangible Assets (86,023) -14.02% Lower mostly due to amortization of
software during the period, partially offset
by acquisitions
Deferred Tax Assets – net 155,006 90.86% Increase in allowance probable loss
Other Assets (197,103) -25.48% Lower primarily from creditable
withholding taxes
Deposit Liabilities
Demand 10,300,825 33.37% Higher volume of demand deposits
Savings 1,694,167 17.53% Higher volume of savings deposits
Time (8,835,947) -21.89% Lower volume of time deposits
Bills Payable 3,828,144 175.37 Higher due to higher bills payable - REPO, partly offset by lower BP- deposit substitute
Outstanding Acceptances (426,204) -85.62% Lower bills of exchange accepted by the
Bank

Philippine Bank of Communications 2022 SEC Form 20-IS
Page 44
Manager’s Checks (15,853) -8.43% Lower un-negotiated MC’s as of report date
Accrued Interest, Taxes and
Other Expenses
(122,051) -15.20 Lower mainly from lower retirement obligation (net retirement asset in 2021) and
lower accrued interest for deposits due to
decline in cost of funds
Income Tax Payable (80,043) -54.50% Lower due to change from MCIT to RCIT in Q4 2020.
Deficit 1,572,560 95.97% Net income for the period
Unrealized gain on equity
securities carried at fair value
through other comprehensive
income
(46,584) -46.54% Lower unrealized gain on FVOCI
Cumulative translation
adjustment
(26,204) 12.39% Lower CTA
Remeasurement gains (losses) on
retirement liability
145,864 -138.76 Cumulative amount of actuarial gains in
2021
Statement of Condition: December 2020 vs. December 2019 (consolidated) (in thousands) Increase/(Decrease) Percentage
Change
Explanation
Cash and Other Cash Items (231,583) -8.58% Lower cash on hand mainly those with
service provider
Due from Bangko Sentral ng
Pilipinas
10,384,347 101.67% Higher mostly from ODF
Due from Other Banks 1,137,525 317.78% Higher funds with foreign banks
Interbank Loans Receivable 5,336,718 743.55% Higher investment in GS Repo in 2020
Financial Assets at Fair Value
through Profit or Loss
(949,533) -56.93% Lower investments in FVTPL
Financial Assets at Fair Value
through Other Comprehensive
Income
(2,956,546) -36.53% Sale of investments in FVOCI
Investment Securities at
Amortized Cost
(10,586,144) -82.39% Lower due to sale of HTC in 2020
Loans and Receivables (3,633,047) -5.93% Decline in outstanding loan primarily in corporate loans
Property and Equipment (79,593) -8.17% Decline mainly due to depreciation
recognized for the period
Investment Properties
Office units for lease (351) -10.72% Decline due to depreciation recognized for
the period
Intangible Assets (59,563) -8.85% Lower mostly due to amortization of software during the period, partially offset
by acquisitions
Deposit Liabilities
Demand 3,660,678 13.46% Higher volume of demand deposits
Savings 484,672 5.28% Higher volume of savings deposits
Time 3,773,285 10.31% Higher volume of time deposits
Bills Payable (10,881,980) -83.29% Lower primarily in BP-REPO
Outstanding Acceptances 405,958 441.96% Due to higher bills of exchange accepted by the Bank
Manager’s Checks (254,711) -57.52% Lower un-negotiated MC’s as of report date
Accrued Interest, Taxes and
Other Expenses
90,357 12.68% Higher expense accruals, partially offset by lower accrued interest
Income Tax Payable 123,425 526.53% Lower deductible expense
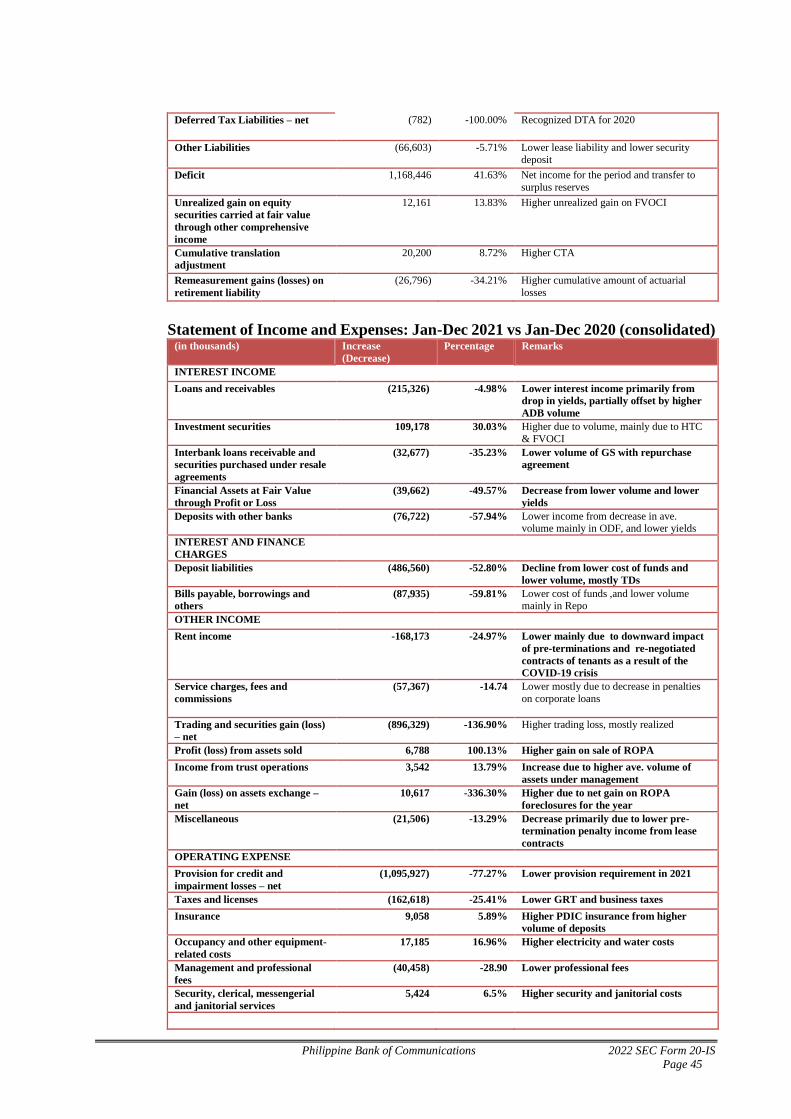
Philippine Bank of Communications 2022 SEC Form 20-IS
Page 45
Deferred Tax Liabilities – net (782) -100.00% Recognized DTA for 2020
Other Liabilities (66,603) -5.71% Lower lease liability and lower security deposit
Deficit 1,168,446 41.63% Net income for the period and transfer to
surplus reserves
Unrealized gain on equity
securities carried at fair value
through other comprehensive
income
12,161 13.83% Higher unrealized gain on FVOCI
Cumulative translation
adjustment
20,200 8.72% Higher CTA
Remeasurement gains (losses) on
retirement liability
(26,796) -34.21% Higher cumulative amount of actuarial
losses
Statement of Income and Expenses: Jan-Dec 2021 vs Jan-Dec 2020 (consolidated) (in thousands) Increase
(Decrease)
Percentage Remarks
INTEREST INCOME
Loans and receivables (215,326) -4.98% Lower interest income primarily from
drop in yields, partially offset by higher
ADB volume
Investment securities 109,178 30.03% Higher due to volume, mainly due to HTC
& FVOCI
Interbank loans receivable and
securities purchased under resale
agreements
(32,677) -35.23% Lower volume of GS with repurchase
agreement
Financial Assets at Fair Value
through Profit or Loss
(39,662) -49.57% Decrease from lower volume and lower
yields
Deposits with other banks (76,722) -57.94% Lower income from decrease in ave. volume mainly in ODF, and lower yields
INTEREST AND FINANCE
CHARGES
Deposit liabilities (486,560) -52.80% Decline from lower cost of funds and
lower volume, mostly TDs
Bills payable, borrowings and
others
(87,935) -59.81% Lower cost of funds ,and lower volume mainly in Repo
OTHER INCOME
Rent income -168,173 -24.97% Lower mainly due to downward impact
of pre-terminations and re-negotiated
contracts of tenants as a result of the
COVID-19 crisis
Service charges, fees and
commissions
(57,367) -14.74 Lower mostly due to decrease in penalties
on corporate loans
Trading and securities gain (loss)
– net
(896,329)
-136.90% Higher trading loss, mostly realized
Profit (loss) from assets sold 6,788 100.13% Higher gain on sale of ROPA
Income from trust operations 3,542 13.79% Increase due to higher ave. volume of
assets under management
Gain (loss) on assets exchange –
net
10,617 -336.30% Higher due to net gain on ROPA
foreclosures for the year
Miscellaneous (21,506) -13.29% Decrease primarily due to lower pre-
termination penalty income from lease
contracts
OPERATING EXPENSE
Provision for credit and
impairment losses – net
(1,095,927) -77.27% Lower provision requirement in 2021
Taxes and licenses (162,618) -25.41% Lower GRT and business taxes
Insurance 9,058 5.89% Higher PDIC insurance from higher
volume of deposits
Occupancy and other equipment-
related costs
17,185 16.96% Higher electricity and water costs
Management and professional
fees
(40,458) -28.90 Lower professional fees
Security, clerical, messengerial
and janitorial services
5,424 6.5% Higher security and janitorial costs

Philippine Bank of Communications 2022 SEC Form 20-IS
Page 46
Share In Net Income Of An
Associate
21 7.89% Net income from PBCOM Finance offset
by net loss from PISAI
Provision For Income Tax 26,503 11.52 Higher taxable income
Statement of Income and Expenses: Jan-Dec 2020 vs Jan-Dec 2019 (consolidated)
(in thousands) Increase
(Decrease)
Percentage Remarks
INTEREST INCOME
Investment securities (224,699) -38.19% Lower interest income mainly due
to decrease in volume mainly in
HTC as a result of the sale in 2020
Financial Assets at Fair Value
through Profit or Loss
(79,290) -49.77% Decrease from lower yields
Interbank loans receivable and
securities purchased under resale
agreements
52,500 130.45% Increase from higher volume
Deposits with other banks 120,427 1005.15% Increase from higher volume of
investments in BSP ODF
INTEREST AND FINANCE
CHARGES
Deposit liabilities (580,128) -38.63% Decline from lower cost of funds,
mainly in TDs
Bills payable, borrowings and others (414,666) -73.82% Decrease in interest expense
mainly due to lower cost of funds
and lower volume
OTHER INCOME
Rent income (62,927) -8.55% Lower PAS 17 adj mainly due to
reversals of PY accruals of
contracts that pre-terminated and
contracts with rate reductions in
2020.
Trading and securities gain (loss) –
net
246,318 60.31% Higher trading gains, mostly realized
Profit (loss) from assets sold (90,960) -93.06% Lower gain on sale of ROPA
Foreign exchange gain - net 9,312 18.67% Increase from higher gain from fx
revaluation
Income from trust operations 4,594 21.78% Higher trust fees during the
comparative period due to
diversification of products and
services, coupled with appropriate
pricing strategy to differentiate
products/services according to
complexity
Gain (loss) on assets exchange – net 8,693 73.36% Lower loss on ROPA foreclosures
Miscellaneous 20,619 14.96% Higher penalties from pre-
termination of rental agreements,
lower loss on derecognition of
asset, and higher dividends from
investments
OPERATING EXPENSE
Depreciation and amortization (65,326) -14.65% Lower depreciation mainly from
fully amortized LRI of branches,
fully depreciated furniture and
fixture and office equipment in
2020 and lower AL ROPA
depreciation due to sale in 2019
Provision for credit and impairment
losses – net
1,040,615 275.58% Higher provision requirement in
2020 mostly due to deterioration
of credit scores as the impact of
the pandemic
Insurance 13,991 10.01% Higher PDIC insurance from
higher volume of deposits
Occupancy and other equipment-
related costs
(28,886) -22.18% Lower electricity and water costs
due to limited operation of the
branches in 2020
Management and professional fees 33,456 31.40% Higher professional fees incurred
in 2020

Philippine Bank of Communications 2022 SEC Form 20-IS
Page 47
Security, clerical, messengerial and
janitorial services
(14,328) -14.66% Lower security and janitor mainly
due to limited operation of the
branches in 2020
Entertainment, amusement and
recreation
44,089 53.45% Higher expenses incurred in 2020
Miscellaneous (39,617) -9.16% Lower broker’s commission,
collection and credit investigation
fees due to lower volume
Share In Net Income Of An Associate (265) -49.91% Net loss from PISAI
Provision For Income Tax 27,732 13.70% Lower deductible expense
Net Income (Loss) From
Discontinued Operations
228,408 -100.00% No discontinued operations for
2020
Interest income on non-discounted loans is recognized based on the accrual method of
accounting while unearned discounts are amortized to income over the terms of the loans. As
such, there are no seasonal aspects that materially impact on the Bank’s interest revenues.
(3) Other material events and/or uncertainties:
The Bank does not anticipate any cash flow or liquidity problems in the next 12
months after year-end 2021.
The Bank does not foresee any events that will trigger direct or contingent financial
obligation that is material to the company, including any default or acceleration of an
obligation.
There are no material off-balance sheet transactions, arrangements, obligations
(including contingent obligations), and other relationships of the company with
unconsolidated entities or other persons created during the reporting period.
There are no material commitments for capital expenditures.
The Bank remain cautious in expanding its loan portfolio given the on-going effect
of the pandemic on the economy while the Executive Committee (EXCOM) stays
vigilant with its loan approvals.
There are no significant elements of the Bank’s income in 2021 that did not arise
from continuing operations.
There are no seasonal aspects that have a material effect on the financial condition or
results of operations.
(2) Discussion of various key indicators:
A. Key Performance Indicators
Ratio December
2020 (Consolidated)
December 2019 (Consolidated)
Remarks
Profit Margin
(Net income divided by Gross income)
19.84%
22.91% Decline in ratio by 3.07 % pts. Primarily due to
higher increase in operating expenses than increase in gross income.
Return on Average Asset
(Net income divided by Average
assets)
1.15% 1.12% Slightly higher by 3 bps due to increase in net
income despite the decline in average assets.
Return on Average Equity
Net income divided by Average
equity)
9.79% 10.68% Declined by 89 bps as the increase in equity has
overtaken the impact of higher net income
Capital Adequacy Ratio
Qualifying capital divided by total of risk-weighted assets that
include credit, market and
operational risk)
18.87% 16.47% Increased by 2.4 % pts primarily due to higher
qualifying capital by P1.3 billion and lower total risked weighted assets by P3.3 billion.
Basic Earnings per share Net income divided by average
no. of common shares)
2.43 2.41 Increased by P0.02 from higher net income

Philippine Bank of Communications 2022 SEC Form 20-IS
Page 48
B. Financial Soundness
Ratio December
2020 (Consolidated)
December 2019 (Consolidated)
Remarks
Liquidity Ratio (Liquid Assets to
Total Deposits) Liquid Assets
include cash, due from banks, interbank loans, and trading and
inv. Securities. Total deposit refers
to the total of peso and foreign currency deposits.
46.10% 48.23% Declined by 2.13 % pts. due to higher increase
in total deposits than increase in liquid assets
Debt Ratio (Total Liability to Total
Asset)
Debt refers to the total liabilities while assets is the total assets
87.62% 88.95% Decline by 1.33% pts Is mainly from decline in
liabilities, mostly from bills payable
Asset to Equity Ratio (Total Asset
to Total Equity
8.08 9.05 Declined by 0.97 % pts. due to decline in total
assets and higher equity
Interest Rate Coverage Ratio
(Earnings before interest & taxes
to Interest Expense)
231% 177% Increased by 54.97 % pts. primarily from lower
interest expense, partially offset by lower
Earnings before interest & taxes
Net Interest Margin Net interest income over Average
Earning assets
4.64% 3.85% Higher NIM by 79bps mainly from lower interest expense
Statement of Condition: December 2020 vs. December 2019 (consolidated)
(in thousands) Increase/(Decrease) Percentage Change
Explanation
Cash and Other Cash Items (231,583) -8.58% Lower cash on hand mainly those with
service provider
Due from Bangko Sentral ng
Pilipinas
10,384,347 101.67% Higher mostly from ODF
Due from Other Banks 1,137,525 317.78% Higher funds with foreign banks
Interbank Loans Receivable 5,336,718 743.55% Higher investment in GS Repo in 2020
Financial Assets at Fair Value
through Profit or Loss
(949,533) -56.93% Lower investments in FVTPL
Financial Assets at Fair Value
through Other Comprehensive
Income
(2,956,546) -36.53% Sale of investments in FVOCI
Investment Securities at
Amortized Cost
(10,586,144) -82.39% Lower due to sale of HTC in 2020
Loans and Receivables (3,633,047) -5.93% Decline in outstanding loan primarily in
corporate loans
Property and Equipment (79,593) -8.17% Decline mainly due to depreciation
recognized for the period
Investment Properties
Office units for lease (351) -10.72% Decline due to depreciation recognized for
the period
Intangible Assets (59,563) -8.85% Lower mostly due to amortization of
software during the period, partially offset
by acquisitions
Deposit Liabilities
Demand 3,660,678 13.46% Higher volume of demand deposits
Savings 484,672 5.28% Higher volume of savings deposits
Time 3,773,285 10.31% Higher volume of time deposits
Bills Payable (10,881,980) -83.29% Lower primarily in BP-REPO
Outstanding Acceptances 405,958 441.96% Due to higher bills of exchange accepted by
the Bank
Manager’s Checks (254,711) -57.52% Lower un-negotiated MC’s as of report date

Philippine Bank of Communications 2022 SEC Form 20-IS
Page 49
Accrued Interest, Taxes and
Other Expenses
90,357 12.68% Higher expense accruals, partially offset by
lower accrued interest
Income Tax Payable 123,425 526.53% Lower deductible expense
Deferred Tax Liabilities – net (782) -100.00% Recognized DTA for 2020
Other Liabilities (66,603) -5.71% Lower lease liability and lower security deposit
Deficit 1,168,446 41.63% Net income for the period and transfer to
surplus reserves
Unrealized gain on equity
securities carried at fair value
through other comprehensive
income
12,161 13.83% Higher unrealized gain on FVOCI
Cumulative translation
adjustment
20,200 8.72% Higher CTA
Remeasurement gains (losses) on
retirement liability
(26,796) -34.21% Higher cumulative amount of actuarial
losses
Statement of Income and Expenses Jan.-Dec.2020 vs Jan.-Dec. 2019 (consolidated)
(in thousands) Increase (Decrease) Percentage Remarks
INTEREST INCOME
Investment securities (224,699) -38.19% Lower interest income mainly due to
decrease in volume mainly in HTC as a
result of the sale in 2020
Financial Assets at Fair Value
through Profit or Loss
(79,290) -49.77% Decrease from lower yields
Interbank loans receivable and
securities purchased under resale
agreements
52,500 130.45% Increase from higher volume
Deposits with other banks 120,427 1005.15% Increase from higher volume of
investments in BSP ODF
INTEREST AND FINANCE CHARGES
Deposit liabilities (580,128) -38.63% Decline from lower cost of funds,
mainly in TDs
Bills payable, borrowings and
others
(414,666) -73.82% Decrease in interest expense mainly
due to lower cost of funds and lower
volume
OTHER INCOME
Rent income (62,927) -8.55% Lower PAS 17 adj mainly due to
reversals of PY accruals of contracts
that pre-terminated and contracts with
rate reductions in 2020.
Trading and securities gain (loss)
– net
246,318 60.31% Higher trading gains, mostly realized
Profit (loss) from assets sold (90,960) -93.06% Lower gain on sale of ROPA
Foreign exchange gain - net 9,312 18.67% Increase from higher gain from fx
revaluation
Income from trust operations 4,594 21.78% Higher trust fees during the
comparative period due to
diversification of products and
services, coupled with appropriate
pricing strategy to differentiate
products/services according to
complexity
Gain (loss) on assets exchange –
net
8,693 73.36% Lower loss on ROPA foreclosures
Miscellaneous 20,619 14.96% Higher penalties from pre-termination
of rental agreements, lower loss on
derecognition of asset, and higher
dividends from investments
OPERATING EXPENSE
Depreciation and amortization (65,326) -14.65% Lower depreciation mainly from fully
amortized LRI of branches, fully
depreciated furniture and fixture and
office equipment in 2020 and lower AL
ROPA depreciation due to sale in 2019

Philippine Bank of Communications 2022 SEC Form 20-IS
Page 50
Provision for credit and
impairment losses – net
1,040,615 275.58% Higher provision requirement in 2020
mostly due to deterioration of credit
scores as the impact of the pandemic
Insurance 13,991 10.01% Higher PDIC insurance from higher
volume of deposits
Occupancy and other equipment-
related costs
(28,886) -22.18% Lower electricity and water costs due
to limited operation of the branches in
2020
Management and professional
fees
33,456 31.40% Higher professional fees incurred in
2020
Security, clerical, messengerial
and janitorial services
(14,328) -14.66% Lower security and janitor mainly due
to limited operation of the branches in
2020
Entertainment, amusement and
recreation
44,089 53.45% Higher expenses incurred in 2020
Miscellaneous (39,617) -9.16% Lower broker’s commission, collection
and credit investigation fees due to
lower volume
Share In Net Income Of An
Associate
(265) -49.91% Net loss from PISAI
Provision For Income Tax 27,732 13.70% Lower deductible expense
Net Income (Loss) From
Discontinued Operations
228,408 -100.00% No discontinued operations for 2020
Interest income on non-discounted loans is recognized based on the accrual method of accounting
while unearned discounts are amortized to income over the terms of the loans. As such, there are
no seasonal aspects that materially impact on the Bank’s interest revenues.
(3) Other material events and/or uncertainties:
The Bank does not anticipate any cash flow or liquidity problems in the next 12 months
after year-end 2020.
The Bank does not foresee any events that will trigger direct or contingent financial
obligation that is material to the company, including any default or acceleration of an
obligation.
There are no material off-balance sheet transactions, arrangements, obligations (including
contingent obligations), and other relationships of the company with unconsolidated
entities or other persons created during the reporting period.
There are no material commitments for capital expenditures.
The Bank remain cautious in expanding its loan portfolio given the on-going effect of the
pandemic on the economy while the Executive Committee (EXCOM) stays vigilant with
its loan approvals.
There are no significant elements of the Bank’s income in 2020 that did not arise from
continuing operations.
There are no seasonal aspects that have a material effect on the financial condition or
results of operations.
(2) Discussion of various key indicators:
A. Key Performance Indicators
Ratio December
2019 (Consolidated)
December 2018 (Consolidated)
Remarks
Profit Margin (Net income divided by Gross
income)
22.91% 15.35% Net income rose by P531 Million resulting to a higher profit margin compared to previous year
Return on Average Asset
(Net income divided by Average assets)
1.12% 0.63% Increase in net income and average assets for the
year ended resulted to an increase ROA of 0.49% compared to previous year

Philippine Bank of Communications 2022 SEC Form 20-IS
Page 51
Return on Average Equity
Net income divided by Average
equity)
10.68% 6.18% Higher net income by 84.80% and average equity
resulted to an increase in return on average equity
compared to the previous year.
Capital Adequacy Ratio Qualifying capital divided by
total of risk-weighted assets that
include credit, market and operational risk)
16.47% 14.56% Movement in Capital Adequacy Ratio is attributable to increase in qualifying capital by
14.48%. It remains however above the 10%
minimum CAR required by the BSP.
Basic Earnings per share
Net income divided by average
no. of common shares)
2.41 1.30 The Bank's good financial performance resulted to
a higher net income which resulted to an improved
basic earnings per share.
B. Financial Soundness
Ratio December
2019 (Consolidated)
December 2018 (Consolidated)
Remarks
Liquidity Ratio (Liquid Assets to
Total Deposits) Liquid Assets
include cash, due from banks,
interbank loans, and trading and
inv. Securities. Total deposit refers
to the total of peso and foreign currency deposits.
48.23% 51.65% Decline in liquidity ratio is attributable to
movement of liquid assets which went down by
4.27%, while total deposits increased by 2.50%
Debt Ratio (Total Liability to Total
Asset)
Debt refers to the total liabilities while assets is the total assets
88.95% 90.05% Debt ratio went down by 1.10% as a result of
decrease in both total liabilities and total assets
by 2.18% and 0.97%, respectively
Asset to Equity Ratio (Total Asset
to Total Equity
9.05 10.05 The 9.97% growth in total equity resulted to
decrease in total asset to equity ratio
Interest Rate Coverage Ratio
(Earnings before interest & taxes
to Interest Expense)
177% 151% Increase of 26.21% arising from increase in
earnings before interest and taxes by 48.55%
which outweighed the increase in interest expense by 26.54%
Net Interest Margin
Net interest income over Average
Earning assets
3.85% 3.70% Slight increase of 0.15% was a result of
increase in net interest income by 11.68%,
higher than increase in average earning assets by 7.51%
(in thousands) Increase
(Decrease)
Percentage Remarks
INTEREST INCOME
Loans and receivables 745,120 20.01% Higher interest income mainly due to increase
in yields and volume
Deposits with other banks 1,136 10.47% Higher investment volume in other banks
INTEREST AND FINANCE CHARGES
Deposit liabilities 339,768 29.24% Higher due to higher cost of funds
Bills payable, borrowings and
others
93,015 19.85% Higher due to higher cost of funds and
recognition of interest expense of lease liability in compliance with PFRS 16
NET INTEREST INCOME
Rent income 75,324 11.40% Higher contract rates from renewals and
vacancy in 2019
Service charges, fees and
commissions
64,592 18.84% Increase mainly because of higher TFR income
and penalty interest
Profit (loss) from assets sold 107,301 -1122.16% Higher gain on sale of ROPA
Income from trust operations 5,388 34.30% Higher trust fees during the comparative period from increase in assets under management
Trading and securities gain (loss) –
net
385,078 1650.22% Higher net realized and unrealized gains
Gain (loss) on assets exchange – net (24,983) -190.23% Losses from ROPA foreclosures
Miscellaneous 23,606 20.67% Higher other loans fees and interest & penalties
from leasing
Compensation and fringe benefits (61,733) -5.93% Lower costs from lower headcount
Taxes and licenses 81,186 14.95% Higher from increase in GRT from higher income, higher local business tax, partially
offset by lower DST costs
Provision for credit and impairment
losses – net
167,699 79.89% Higher provision requirement in 2019

Philippine Bank of Communications 2022 SEC Form 20-IS
Page 52
Depreciation and amortization 59,064 15.27% Higher depreciation mainly from the impact of
depreciation of right of use asset in compliance
with PFRS 16
Occupancy and other equipment-related costs
(113,701) -46.61% Lower rent expense mainly from the impact of recognition of depreciation of right of use asset
instead of rent expense in compliance with
PFRS 16
Management and professional fees (6,446) -5.70% Lower consultancy fees
Communications (4,986) -9.29% Lower leased line charges
Miscellaneous 94,332 27.90% Increase is mainly due to higher brokerage fees, litigation costs, information tech
expenses, business promo costs, etc.
Share in net income of an associate 282 112.80% Share of net income from PFC
Provision for income (23,890) -10.56% Recognition of deferred tax assets on
allowance on impairment and remeasurement on retirement liability
Net income (loss) from
discontinued operation
(253,371) -1014.99% Loss from sale pf PBCRB
Statement of Condition: December 2019 vs. December 2018 (consolidated) (in thousands) Increase/(Decrease) Percentage
Change
Explanation
Cash and Other Cash Items 1,308,813 94.17% Higher cash on hand, mainly those in G4S
machine
Due from Bangko Sentral ng
Pilipinas
-5,010,861 -32.91% Lower requirement for reserve
Due from Other Banks -21,763 -5.73% Lower investment in DFOB’s
Interbank Loans Receivable 510,772 246.79% Higher investment in interbank loans during
the period
Financial Assets at Fair Value
through Profit or Loss
774,611 86.72% Higher investment in FVTPL
Financial Assets at Fair Value
through Other Comprehensive
Income
1,296,132 19.07% Higher investment in FVOCI
Property and Equipment -295,610 -28.94% Depreciation recognized for the period
Foreclosed properties -183,974 -23.82% Sale of foreclosed properties
Office units for lease -350 -9.66% Depreciation recognized for the period
Goodwill -182,227 -100.00% Due to sale of subsidiary
Deferred Tax Assets -74,487 -100.00% Due to sale of subsidiary
Other Assets 210,331 25.27% Recognition of Right-of-Use (ROU) Asset
in compliance with PFRS16 (none yet as of Dec 2018)
Deposit Liabilities
Demand 6,947,466 34.30% Higher due to increase in volume of low-
cost source of funds
Savings 1,369,631 17.54% Higher due to increase in volume of low-
cost source of funds
Time -6,463,989 -15.01% Lower TD volume due to the Bank’s efforts
to increase volume of low-cost source of
funds
Bills Payable -4,594,259 -26.02% Lower bills payable- PN and BSP overnight
lending
Outstanding Acceptances 45,511 98.20% Due to higher bills of exchange accepted by
the Bank
Manager’s Checks 345,364 354.41% Higher un-negotiated MC’s as of reporting date
Income Tax Payable 19,706 527.60% Utilization in 2018 of excess MCIT of prior
years
Deferred Tax Liabilities – net -65,479 -98.82% Due to sale of subsidiary
Other Liabilities 330,525 39.50% Higher mainly due to lease liability recognized in compliance with PFRS 16
(none yet as of Dec 2018)
Statement of Income and Expenses: Jan-Dec 2019 vs Jan-Dec 2018 (consolidated)

Philippine Bank of Communications 2022 SEC Form 20-IS
Page 53
Interest income on non-discounted loans is recognized based on the accrual method of accounting
while unearned discounts are amortized to income over the terms of the loans. As such, there are
no seasonal aspects that materially impact on the Bank’s interest revenues.
(3) Other material events and/or uncertainties:
The Bank does not anticipate any cash flow or liquidity problems in the next 12 months
after year-end 2019.
The Bank does not foresee any events that will trigger direct or contingent financial
obligation that is material to the company, including any default or acceleration of an
obligation.
There are no material off-balance sheet transactions, arrangements, obligations (including
contingent obligations), and other relationships of the company with unconsolidated
entities or other persons created during the reporting period.
There are no material commitments for capital expenditures.
There are no uncertainties regarding the sustainability of economic growth of the country
which may pose challenges in the Bank’s drive to expand its loan portfolio. Any negative
impact of a slower economic growth, however, may be overcome or mitigated at the very
least by aggressive spread management initiatives.
There are no significant elements of the Bank’s income in 2019 that did not arise from
continuing operations.
There are no seasonal aspects that have a material effect on the financial condition or
results of operations.

Philippine Bank of Communications 2022 SEC Form 20-IS
Page 54
UNDERTAKING
The Bank will post and make available for download the full version of this SEC Form 20-IS (Definitive
Information Statement), together with its annexes including the Bank’s 2021 consolidated Audited
Financial Statements in the Bank’s website at www.pbcom.com.ph/ upon its approval by the Securities
and Exchange Commission.
The Bank will likewise post, make available for download, its Interim Unaudited Financial Statements for
the first quarter of 2022 on SEC Form 17-Q in the Bank website at www.pbcom.com.ph/ on June 7, 2022.
Upon the written request of a stockholder, the Bank will provide, without charge, hard copies of the Bank’s
SEC Form 20-IS (Definitive Information Statement), SEC Form 17-A (Annual Report) and SEC Form
17-Q (Unaudited Financial Statements for the first quarter of 2022) duly filed with the Securities and
Exchange Commission. The stockholder may be charged a reasonable cost for photocopying the exhibits.
All requests may be sent to the following address:
PHILIPPINE BANK OF COMMUNICATIONS
5th Floor PBCOM Tower
6795 Ayala Avenue cor. V.A. Rufino St.
Makati City, 1226
Attention: MICHAEL STEPHEN H. LAO
Corporate Secretary
After reasonable inquiry and to the best of my knowledge and belief, I certify that the information set
forth in this report is true, complete and correct. This report is signed in the City of Makati on 28 April
2022.
PHILIPPINE BANK OF COMMUNICATIONS
Issuer
By:
MICHAEL STEPHEN H. LAO
Corporate Secretary

Annex “A”
PHILIPPINE BANK OF COMMUNICATIONS
(“PBCOM”)
2022 ANNUAL STOCKHOLDERS’ MEETING (“ASM”)
REQUIREMENTS AND PROCEDURES
FOR VOTING ELECTRONICALLY IN ABSENTIA AND
PARTICIPATION THROUGH REMOTE COMMUNICATION
A. Electronic Voting or Voting in Absentia
1. Stockholders as of 18 April 2022 may register and vote through PBCOM’s website at
https://www.pbcom.com.ph/ until 5:00 p.m. Philippine Time of 30 May 2022. To access the
voting portal at PBCOM’s website, stockholders are required to provide their: (i) complete name,
(ii) stock certificate number, (iii) valid e-mail address, and (iv) contact number to the Office of
the Corporate Secretary via e-mail at [email protected], subject to verification
and validation procedures. Stockholders who registered and voted before the cut-off time will be
counted for purposes of quorum.
2. An e-mail will be sent by the Office of the Corporate Secretary to the stockholder containing
his/her username and default password in order to login in the voting portal. Once inside the
portal, the system will prompt the stockholder to change his/her password. After the password has
been changed, the system will require the stockholder to upload a scanned copy of a valid ID to
confirm his/her identity. It is strongly recommended that stockholders do not share their username
and password with any other person and take utmost care to keep their username and password
confidential.
3. Stockholders may register at the voting portal by providing the following requirements:
a. For Individual Stockholders
i. Valid email address and active contact number (landline or cellphone);
ii. One (1) valid identification card (ID)1; and
iii. Any stock certificate issued by PBCOM in the name of the individual stockholder.
b. For Stockholders with Joint Accounts
i. An authorization letter signed by one of stockholders indicating the name of the
person authorized to cast the votes;
ii. Valid email address and active contact number for the authorized stockholder;
iii. One (1) valid identification card (ID) of the authorized stockholder; and
iv. Any valid stock certificate issued by PBCOM in the name of joint stockholders.
c. For Stockholder under PCD Nominee or “Scripless Shares”
i. Stockholders should coordinate with their broker/s and request for the full account
name and reference number or account number they provided to PBCOM;
ii. Valid email address and active contact number; and
1 Acceptable Valid IDs: Driver’s License, Passport, Unified Multi-Purpose ID (UMID), GSIS ID, company ID, PRC ID, IBP
ID, iDOLE Card, OWWA ID, Comelec Voter’s ID, Senior Citizen’s ID, or Alien Certificate of Registration / Immigrant
Certificate of Registration.

Philippine Bank of Communications 2022 SEC Form 20-IS
Page 2
iii. Any stock certificate issued by PBCOM in the name of the stockholder.
d. For Corporate Stockholders
i. Secretary’s Certificate attesting to the authority of the representative to vote the
shares on behalf of the corporate stockholder;
ii. Valid email address and active contact number for the authorized representative;
iii. One (1) valid identification card (ID) of the authorized representative; and
iv. Any valid stock certificate in the name of the corporate stockholder.
4. The online voting portal contains the agenda items for approval as set out in the Notice for the
2022 ASM.
(a) For items other than the election of Directors, stockholders have the option to vote: In Favor of,
Against, or Abstain.
(b) For election of Directors, stockholders have the option to vote his shares for all nominees, not
vote for any nominees, or vote for one or some nominees only, in such number of shares as the
stockholder prefers; provided that the total number of votes cast shall not exceed the number of
shares owned, multiplied by the number of directors to be elected. The system will automatically
compute the total number of votes the stockholder is allowed to cast, based on the number of
shares he owns.
(c) Once the stockholder completes his votes, he can proceed to submit the accomplished form by
clicking the “Submit” button.
(d) After the ballot has been submitted, the stockholder may no longer change his/her vote.
5. Thereafter, the Office of the Corporate Secretary will send a confirmation email to the stockholder
once his/her account has been verified and his/her vote has been recorded. If the account of a
stockholder cannot be verified, then the votes cast by the non-verified stockholder shall not be
recorded.
6. The Office of the Corporate Secretary shall tabulate all valid and confirmed votes cast through
electronic voting, together with the votes cast through proxies. If a stockholder cast his or her vote
electronically in absentia and also executed a proxy form, the latest vote received by the Office
of the Corporate Secretary will be counted.
7. Note that the online voting portal is open until 5:00 p.m. Philippine Time of 30 May 2022. The
voting function in the voting portal will be disabled after this time to give the Office of the
Corporate Secretary time to collate and validate votes received through the portal. Stockholders
will not be able to cast votes during the livestream of the 2022 ASM.
B. Attendance by Remote Communication
1. Stockholders who intend to participate in the 2022 ASM remotely may register using the link to
be provided in PBCOM’s website at https://www.pbcom.com.ph/ (Annual Stockholders’
Meeting) until 5:00 p.m. Philippine Time of 30 May 2022.
2. To register, stockholders will need the requirements under Item A.3 above, depending on the type
of ownership. Stockholders will also need to upload a valid ID as proof of identity.
3. Upon successful registration, the stockholder will receive an email confirmation and a unique link
which will be used to log in and view the 2022 ASM livestream.

Philippine Bank of Communications 2022 SEC Form 20-IS
Page 3
4. Please note that due to the limitations of available technology, voting will not be possible during
the 7 June 2022 ASM livestream, but participants may send questions or remarks via the
livestream portal. Stockholders may also send questions and/or remarks in advance or during the
meeting to the Corporate Secretary at [email protected].
5. Stockholders shall be responsible for their internet connectivity during the ASM.
The proceedings during the 2022 ASM will be recorded in video and audio format. For any questions
and concerns, stockholders may visit PBCOM’s website at https://www.pbcom.com.ph/ or contact the
Office of the Corporate Secretary via e-mail at [email protected] or at telephone no.
(+632) 8830-7062.


SEC Number PW-686
Company TIN 000-263-340
PHILIPPINE BANK OF COM M UNICATIONS
(Company’s Full Name)
PBCOM Tower, 6795 Ayala Avenue corner V.A. Rufino Street, M akat i Cit y
(Company’s Address: No. Street City/Town/ Province)
8830-7000
(Company’s Telephone Number)
December 31 3rd Tuesday of June
(Fiscal Year Ending) Annual M eeting
(M onth & Day)
SEC Form 17-A
(Annual Report Pursuant to Section 17 of the Securities Regulation Code
And Section 141 of the Corporat ion Code)
(FORM TYPE)
N/ A
Amendment Designation (If Applicable)
None
(Secondary License Type, if any)
Atty. M ichael Stephen H. Lao 212-167-776 June 16, 1983
(Company Representative) (TIN) (Birth Date)
------------------------------------------Do not fill below this line------------------------------------------
______________________ _________________________
Cashier File Number
______________________ _________________________
Central Receiving Unit Document ID
_______________________
LCU

SECURITIES AND EXCHANGE COM M ISSION
SEC FORM 17-A
ANNUAL REPORT PURSUANT TO SECTION 17
OF THE SECURITIES REGULATION CODE AND SECTION 141
OF THE CORPORATION CODE OF THE PHILIPPINES
1. For the fiscal year ended . December 31, 2021 .
2. SEC Identification Number. PW-686 . 3. BIR Tax Ident ificat ion No. 000-263-340
4. Exact name of issuer as specified in its charter. Philippine Bank of Communicat ions .
5. Philippines 6. (SEC Use Only)
Province, country or other jurisdict ion of Industry Classificat ion Code:
incorporat ion or organization
PBCOM Tower, 6795 Ayala Avenue cor. V.A. Rufino Street , M akat i Cit y 1226 .
7. Address of principal office Postal Code
. (632) 8830-7000 .
8. Issuer's telephone number, including area code
. N/ A .
9. Former name, former address and former fiscal year, if changed since last report
10. Securities registered pursuant to Sections 8 and 12 of SRC, or Sect ions 4 and 8 of the RSA
Title of each Class Number of shares of common
stock outstanding and amount
of debt outstanding
. Common 480,645,163 shares .
.
11. Are any or all of the securit ies listed on a Stock Exchange?
Yes [X] No [ ]
If yes, state the name of such Stock Exchange and the class/ es of securit ies listed therein:
. Philippine Stock Exchange . . Common Stock .

12. Check whether the issuer:
(a) has filed all reports required to be filed by Sect ion 17 of the SRC and SRC Rule 17.1 thereunder or
Sect ion 11 of the RSA and RSA Rule 11(a)-1 thereunder, and Sect ions 26 and 141 of the Corporation
Code of the Philippines during the preceding twelve (12) months (or for such shorter period the
registrant was required to file such reports)
Yes [/ ] No [ ]
(b) has been subject to such filing requirements for the past ninety (90) days.
Yes [/ ] No [ ]
13. State the aggregate market value of the voting stock held by non-affiliates of the regist rant . The aggregate
market value shall be computed by reference to the price at which the stock was sold, or the average bid and
asked prices of such stock, as of a specified date within sixty (60) days prior to the date of filing. If a
determinat ion as to whether a particular person or ent ity is an affiliate cannot be made without involving
unreasonable effort and expense, t he aggregate market value of the common stock held by non-affi liates may
be calculated on the basis of assumpt ions reasonable under the circumstances, provided the assumpt ions are
set forth in this Form.
Non-affiliated shares - 168,180,988
Closing price as of M arch 04, 2022 - P18.22
Aggregate market value of vot ing stock - P 3,743,985,916

1
PART I - BUSINESS AND GENERAL INFORM ATION
Item 1. The Company
Philippine Bank of Communicat ions ("PBCOM" or the "Bank" ) was incorporated as one of the earliest non-
American foreign banks in the country on August 23, 1939. It received the authority to engage in
commercial banking from the then Bureau of Banking of the Department of Finance under the Philippine
Commonwealth, with a capitalization of Two M illion Pesos. The Bank commenced operations on
September 4, 1939. However, its operat ions were temporarily interrupted during World War II, but were
immediately reconstituted in 1945 through the infusion of fresh funds. The Bank started under full Filipino
ownership in 1974 when a group of industr ialists led by Ralph Nubla Sr. bought majority of the Bank’s
outstanding shares.
The Bank is a registered government securit ies dealer, having been granted the license on December 14,
1981. It also has a Trust license which was approved on August 24, 1961.
PBCOM acquired a license to operate as an expanded commercial bank from the Bangko Sent ral ng
Pilipinas (“Bangko Sentral” or “ BSP” ) on December 24, 1993 and operated as such until the year 2000. In
order to focus on its core strengths and maximize utilizat ion of available resources, the Bank applied for
the conversion of it s expanded commercial bank license into a regular commercial banking license which
was approved by the M onetary Board of the BSP on M arch 31, 2000. PBCOM had since opted to capitalize
on its core st rength by focusing on and pursuing tradit ional commercial banking operat ions. In December
2000, the Bank acquired 100% of Consumer Savings Bank as part of its st rategy to expand its consumer
banking business.
On July 26 2011, the major shareholders of the Bank, namely the Chung, Luy, and Nubla Groups, signed a
M emorandum of Agreement (M OA) with a group of investors led by ISM Communications Corporation
(the “ ISM Group” ), involving the sale of their ent ire stake in the Bank to the ISM Group and the
commitment of the Chung and Nubla groups to reinvest the proceeds of the sale of their respective
shares amounting to approximately P2.8 Billion in the Bank.
On October 13, 2011, t he M onetary Board approved the acquisit ion of PBCOM by the ISM Group.
On December 23, 2011, the acquisit ion by the ISM Group of a controlling interest in the Bank was
successfully t ransacted through the facilit ies of the Philippine Stock Exchange.
On December 27, 2011, the Chung and Nubla Groups reinvested P=2.4 Billion as deposits for future
subscript ion of PBCOM shares of stock. Another P=0.4 Billion was deposited in M arch 2012 and addit ional
22 M illion in April 2012 to complete their commitment of approximately P=2.8 Billion.
On M ay 31, 2012, the LFM Propert ies Group deposited P=0.72 Billion for future subscription to PBCOM
shares of stock. Another P30 M illion was deposited by the LFM Propert ies Group on October 24, 2012.
On February 8, 2013, BSP issued a Certificate of Authority to the Bank for it to register its Amended
Art icles of Incorporation and Amended By-Laws with the SEC.
On M arch 8, 2013, the Bank obtained approval from SEC for a quasi-reorganization and an increase in
authorized capital stock. The Art icles of Incorporat ion was amended to implement the following:
a. Reclassificat ion of Bank’s exist ing 120,000,000 preferred shares to common shares;
b. Reduct ion of the par value of all its common shares from P=100 per share to P=25 per share; and
c. Increase in authorized capital stock to P=19,000,000,000 divided into 760,000,000 common shares
with a par value of P=25 per share.

2
The reclassification of the said preferred shares to common shares took effect on M arch 19, 2013. On
December 2013, the Bank received the approval of both the BSP and SEC to apply P=3.94B in APIC to
part ially wipe out the bank’s outstanding deficit.
On M arch 26, 2014, the Bank exited from the 10-years Financial Assistance Agreement with PDIC by
set t ling the loan of P=7.6 Billion which represents financial assistance by the lat ter to the Bank in 2004.
The subscript ion by PGH to the new shares of the Parent Company amounting to P=5.98 billion was
approved by the BSP on September 23, 2014. The first installment of P=1.79 billion was paid by PGH on
September 25, 2014. Subsequently, on October 1, 2014, VFC Land Resources Inc. (VFC) bought 59.24
million shares at P=33.00 per share from the ISM Group. PGH and VFC are beneficially owned by the family
of Mr. Lucio Co, bringing his total stake in the Parent Company to 49.99%.
On September 22, 2015, June 29, 2016 and September 11, 2017, the Parent Company received the
second, third and final installment payments, respectively, each amount ing to P=1.39 billion for the
subscribed shares of PGH.
In 2015, both PGH and VFC bought addit ional 2.4 million shares and on following year an addit ional 0.49
million shares and 9.49 million shares were acquired by PGH and VFC, respectively. In 2018, PGH bought
an addit ional 2.27 million shares and VFC acquired 0.49 million addit ional shares in 2019. The Co Family’s
total stake in the Parent Company is at 53.65% as of December 31, 2020.
On July 29, 2019, PBCOM sold its stake in PBCOM Rural Bank, Inc. as it consolidates its efforts and
resources at the parent level.
On 20 January 2022, the M onetary Board of Bangko Sentral ng Pilipinas approved PBCOM’s applicat ion to
upgrade its license to a Universal Bank subject to complet ion of requisite regulatory requirements.
PBCOM ’s Board of Directors, in its Special Stockholder’s Meet ing held last 15 M arch 2022, approved the
amendment of the Bank’s Art icles of Incorporat ion to (a) Change the Bank’s primary purpose to a
Universal Bank from a Commercial Bank and (b) Changed the Bank’s Corporate term to Perpetual from 50
years.
Business of Registrant
PBCOM offers a wide range of products and services to clients. These includes basic commercial banking
services such as deposit products, credit and loan facilit ies, t rade-related services, treasury and foreign
exchange trading, cash management services and Trust and Investment M anagement services.
Deposit products and services include peso, dollar and third currency savings, checking and time deposit
accounts, ATM accounts, foreign and domest ic remittance services, cash management services namely
deposit pick-up and cash delivery, payroll and check-writ ing services. Ancillary services such as safety
deposit boxes and manager’s checks, demand drafts, acceptance of tax and SSS payments are also
available, these products and services are offered to both individuals and corporate clients.
Credit and loan facilit ies include working capital financing, post -dated check discounting, specialized
lending programs such as contract -to-sell financing and M icro-Finance. Other credit related products
include home, auto and personal loans as well as trade financing,
Trade-related services include import LCs, standby LCs, credit bank guaranty and shipside bond, export LC
advising, export packing credits & export bills negotiat ion and collect ions, trade financing of receivables
and payables, domest ic LCs and trust receipt financing. These services are financing facilities offered to
importers and exporters.

3
Treasury products include dealership and brokering of government securit ies and commercial papers,
both domest ic and international, deposit substitutes like promissory notes and repurchase agreements,
foreign exchange proprietary t rading and commercial client servicing.
Trust services include investment management services, personal trust funds, escrow agency services,
employee benefit t rust services and estate planning.
Contribution to Operating Income
As of December 2021, the contribut ion to Operating Income is broken down as follows: (1) 83.5% is
derived from net interest income, this includes interest income from lending, investment securit ies and
others receivables less interest expense and finance charges (2) 16.5% is from non-interest income
consist ing of trading gains, service charges, fees and commissions, income from trust operat ions,
profit / loss from asset sold, foreign exchange gain/ loss, rental income and miscellaneous income.
The Bank does not maintain any branch or sales office abroad. Hence, all revenues are generated
domest ically.
Distribution M ethods of Products and Services
As of December 2021, the Parent Bank’s liability and ancillary products and services are distributed
primarily through its 95 branches, 4 of which are in Pop-Up formats situated in selected Puregold stores.
PBCOM clients may also conduct their t ransaction in various channels such as the 163 automated teller
machines deployed in st rategic branch sites and in 70 off-site locat ions. In addit ion, the Bank has also
deployed 67 Cash Deposit M achines across various sites to help service the deposit t ransact ions of its
clients.
The Bank has likewise expanded its digital presence through its Digital-Only Bank which BSP approved last
December 11, 2019, this will complement the existing Internet and M obile Banking facilit ies of the bank
launched last June 21, 2017 and September 28, 2018, respectively.
Competition
As of end 2021, the Philippine commercial banking industry is composed of 46 Universal and Commercial
Banks) of which 17 are Private Domestic cl Banks, 3 are Government Banks and 26 are Foreign Banks with
either established subsidiaries or foreign branch licenses.
Patents, Trademarks, Licenses, Franchises, Concessions, and Royalty
PBCOM have registered the trademarks for PBCOM Online Plat form and PBCOM Value Check.
Customers
PBCOM has mult i-segment client base with growth seen across Individuals, Commercial and Corporate
accounts. This result stems from the bank’s focus on expanding its market through the ecosystem of its
principals.
Subsidiaries and Affiliates
PBCOM Insurance Services Agency, Inc. (PISAI) was incorporated and registered with the Securities and
Exchange Commission on M ay 9, 2014 to engage primarily in the business of solicit ing and promoting
insurance products. The company offers a range of insurance agency services specific to life and
investment-linked products to meet customers’ wealth management and risk protect ion needs.
On January 11, 2021, the Board of Directors of PBCOM approved the dissolut ion and retirement of
business of PISAI. PISAI, which has been inactive for t he past 3-years have continuously remained inactive
but cont inued to incur operating expenses. PBCOM does not see any need for the subsidiary and have

4
decided to retire the business operations. PBCOM has received clearances regarding PISAI’s dissolut ion
from the Insurance Commission and the M akati Local Government last M ay 26, 2021 and September 30,
2021; respectively, clearances from other regulatory agencies are current ly being processed.
PBCOM Finance Corporat ion was incorporated and registered with the SEC on January 9, 1980 to provide,
grant, and/ or extend credit facilit ies to any person, business, juridical or otherwise. It is 40% owned by the
Bank while the remaining 60% is owned by various individual shareholders. Its principal place of business
is located at 7th floor, PBCOM Building, 214-216 Juan Luna St. Binondo, M anila.
Transaction with and/ or Dependence on Related Parties
The Bank’s related part ies include key management personnel, close family members of key management
personnel and entit ies which are controlled, significant ly inf luenced by or for which significant vot ing
power is held by key management personnel or their close family members, associates and post-
employment benefits for the benefit of the Bank’s employee.
As required by BSP, the Bank discloses loan t ransactions with its associates, affiliates and with certain
directors, off icers, stockholders and related interests (DOSRI). As of December 31, 2021 the Bank is
compliant with DOSRI rules and regulat ions.
The Bank’s related party transact ions are presented and discussed in Note 31 of the Audited Financial
Statements.
Effect of Existing or Probable Government Regulations
Bangko Sentral ng Pilipinas
The Bank fully complies with the required capitalization for commercial banks without expanded banking
licenses (non-unibank) as prescribed by the BSP. The Bank's consolidated qualifying capital as of end-
December 31, 2021 stood at P=15.60 Billion while its capital to risk assets rat io under the BASEL III
report ing standards covering credit , market and operat ional risks as reported to BSP remained well above
the 10% prescribed cap at 18.18%.
Bureau of Internal Revenue
RA No. 9337, An Act Amending the National Internal Revenue Code, provides that start ing January 1,
2009, the regular corporate income tax rate (RCIT) shall be 30% while interest expense allowed as a
deduct ible expense is reduced to 33% of interest income subject to final tax.
A M inimum Corporate Income Tax (M CIT) of 2% on modified gross income is computed and compared
with the RCIT. Any excess M CIT over RCIT is deferred and can be used as a tax credit against future income
tax liability for the next three years. In addit ion, NOLCO is allowed as a deduction from taxable income in
the next three years from the year of incept ion.
FCDU offshore income (income from non-residents) is tax-exempt while gross onshore income (interest
income from loans to residents) is subject to 10% income tax. Income from FCDU transactions, other than
offshore and onshore, is subject to the 30% RCIT or 2% M CIT whichever is applicable.
On January 01, 2018, Republic Act No. 10963, known as the TRAIN Law, t ook effect. The law increased the
rates of Documentary Stamp Tax (DST) by 100% except on the DST on debt instruments which increased
by 50%. Among the other taxes which rates were increased are Fringe Benefit Tax from 32% to 35%;
Excise Tax on Petroleum Products up to 8php per liter/ kilo; and, Final Withholding Tax on interest income
from deposit under the expanded foreign currency deposit system from 7.5% to 15%.
Corporate Recovery and Tax Incentives for Enterprises Act or “ CREATE” signed into law on M arch 26,
2021. Under the law, t he corporate income tax shall be reduced to 25% and the corresponding deductible

5
interest expense shall be reduced by 20% of interest income subject to final tax. While the minimum
corporate income tax shall be reduced to 1% of modified gross income, which shall be effect ive unt il June
30, 2023. There are no changes for FCDU.
Research and Development Activit ies
The Bank offers basic commercial banking products and services that require no significant amount to be
spent on product research & development.
Employees
As of December 31, 2021, the Parent Bank has 1,005 employees with 769 officers and 236 rank-and-file.
All rank-and-file employees are covered by a 2-year collect ive bargaining agreement (CBA) signed last
December 28, 2021, to cover the two-year period from January 1, 2021 to December 31, 2022. There had
been neither dispute nor occurrence of employees’ st rike for the past years.
Risk M anagement
PBCOM applies risk management across the ent ire organizat ion — from the Board of Directors, Senior
M anagement, Business Groups, Business Centers, support units, its subsidiaries and aff iliates, and to
individual employees as well as in specific funct ions, programs, projects, and act ivities. Implementation of
the framework contr ibutes to strengthening management practices, decision making, and resource
allocation, and increasing shareholder value while protecting the interest of its clients, maintaining t rust
and confidence, and ensuring compliance with regulat ions.
Enterprise r isk management (ERM ) is the framework of policies, processes, and systems, effected by an
ent ity’s board of directors, management , and other personnel, applied in strategy set t ing and across the
enterprise, designed to identify potential events that may affect the entity, and manage r isk to be within
its risk appetite, to provide reasonable assurance regarding the achievement of ent it y objectives.
ERM Vision, M ission, Philosophy and Objectives
Risk Vision Statement
To protect and opt imize PBCOM ’s enterprise value through effect ive risk management.
Risk M ission Statement
To develop risk awareness and a risk/ return consciousness in the Bank in order to protect deposits,
preserve capital, and ensure adequate return on capital.
ERM Philosophy
PBCOM recognizes that enterprise r isk management is fundamental for its safe and sound operat ion
and sustainable growth. It ensures business success through balanced risk and reward, operat ional
excellence and conformance to the highest ethical standards, and regulatory requirements.
Enterprise Risk M anagement in PBCOM is aligned to its business object ives and st rategies. It operates
at all levels and in all units of PBCOM that continually manage r isk in an environment fostered by an
appropriate governance st ructure, a st rong "control culture" and a proact ive process of ident ificat ion,
understanding, assessment , and mit igat ion of all its material risks.
ERM Objectives
To ident ify, measure, manage and control risks inherent in PBCOM 's activit ies or embedded in its
port folio;
Define and disseminate risk management philosophy and policies;
Assist risk-taking business and operating units in understanding and measuring risk/ return
profiles;

6
Develop a r isk management infrastructure that includes policies and procedures, organization,
limits and approval authorit ies, M IS and report ing, systems and risk models and;
Promote a risk awareness and strong "control culture" in PBCOM .
PBCOM Enterprise Risk Governance
The Board of Directors is responsible for establishing and maintaining a sound risk management system
and is ult imately accountable for ident ifying and controlling risks; there are, however, separate
independent bodies responsible for managing and monitoring risks.
The Risk Oversight Commit tee (ROC) has the overall responsibility for the development of the risk st rategy
and implement ing principles, frameworks, policies and limits. Its primary responsibilit ies are to:
1. Oversee the risk management framework. The committee shall oversee the enterprise risk
management framework and ensure that there is periodic review of the effect iveness of the risk
management systems and recovery plans. It shall ensure that correct ive act ions are prompt ly
implemented to address risk management concerns.
2. Oversee the adherence to risk appet ite. The commit tee shall ensure that the current and emerging
risk exposures are consistent with the Bank’s strategic direct ion and overall risk appet ite. It shall
assess the overall status of adherence to the risk appetite based on the quality of compliance with
the limits structure, policies and procedures relat ing to r isk management and control, and
performance of management, among others.
3. Oversee the risk management function. The commit tee shall be responsible for the
appointment / select ion, remunerat ion, and dismissal of the Chief Risk Officer (CRO). It shall also
ensure that the r isk management funct ion has adequate resources and effect ively oversees the risk
taking activit ies of the Bank.
The Enterprise Risk M anagement / ICAAP Group is the ROC’s implementing arm in carrying out its
funct ions. It serves the Bank’s Board of Directors and Management by assist ing the Bank in accomplishing
its objectives by bringing a systematic and disciplined approach to promoting r isk management pract ices
consistent with the type and complexity of operat ion of the Bank and its subsidiaries. It assists in the
management of risk that is a direct responsibility of the business and support units.
Capital M anagement
PBCOM ’s capital management framework involves providing shareholders opt imal returns within the
ability of the capital to protect the interests of all the Bank’s stakeholders. The framework involves
monitoring both capital requirements and capital resources to ensure:
Qualifying capital remains above minimum requirements of ten (10) percent of r isk weighted
assets;
Quality of capital resources aligns with the r isks present or to be taken to achieve growth &
return and;
Prudent balance between the growth and return required of strategic plans and the cont inuing
institut ional st rength of the Bank.
PBCOM consistent ly maintains a ratio of qualifying capital to risk weighted assets that are in excess of the
ten (10) percent minimum requirement of Philippine banking regulat ions.
The Bank, in addit ion, conducts an Internal Capit al Adequacy Assessment Process (ICAAP), along w ith its
strategic planning exercise. The ICAAP provides the Bank the opportunity to:
Art iculate it s r isk appet ite, strategic growth, and return targets;
Ident ify the businesses, products, and services the Bank will pursue or use to achieve the
targets;
Define and measure the r isks each business, product, or service will create;

7
Consider how the Bank will mit igate and manage the ident ified risks;
Determine the amount and the quality of the capital resources necessary to sustain financial
strength through a r isk event ;
Conduct stress tests to aid in ident ifying break point s and vulnerabilit ies; and
Develop capital build-up and cont ingency plans.
The ICAAP is a collaborat ive effort of the M anagement and the Board of Directors. PBCOM submits the
documentat ion of the results of its ICAAP to the supervisory review and examinat ion of the Bangko
Sentral ng Pilipinas.
The regulatory qualifying capital of the Bank consists of Common Equity Tier 1 and Addit ional Tier 1 and is
comprised of paid-up common stock, retained earnings including current year’s profit , and surplus
reserves, less required deductions such as unsecured credit accommodat ions to DOSRI, and goodwill. The
other component of regulatory capital is Gone-Concern Capital (Tier 2), which includes appraisal
increment reserves (as authorized by the M onetary Board) and general loan loss provision.
The Bank’s capital charge for credit r isk is computed at 10% of credit r isk-weighted on- and off- balance
sheet assets. Risk weights of on- and off-balance sheet assets are computed using the standardized
approach as specified in the MORB.
M arket risk capital charge is computed using the standardized approach specified in the M ORB. Under
this approach, capital for market risk is equivalent to 10% of market risk-weighted assets that cover
interest rate, equity, and foreign exchange exposures of the Bank.
Operat ional r isk capital charge is computed using the Basic Indicator Approach, under which, capital for
operat ional risk is equal to 15% of the Bank’s average positive annual gross income of the previous three
years.
M arket , Liquidity and Interest Rate Risk M anagement
M arket r isk arises from adverse fluctuat ions in the market value of financial instruments in both on- and
off-balance sheet items. The Bank employs the Value-at -Risk (VaR) at 99% confidence level to measure
market risk and performs back test ing (using both hypothet ical and actual back test ing approaches) to
ensure an accurate and robust VaR model. St ress Testing is also employed to determine the earnings
impact of ext reme market movements not captured by VaR calculat ions. A system of risk limits that
reflect the Bank’s level of capital, expected returns, and the overall r isk appet ite, is used to manage
market risk. These limits include the VAR limit , Nominal Posit ion limit, Off -M arket Tolerance limit,
M anagement Action Trigger, and Stop-loss limit. The Bank also uses M arket Risk Assessment M atrix to
assess the overall market r isk profile of the Bank.
Liquidity risk refers to the possibility that the Bank w ill be unable to meet its financial obligat ions in any
currency. To ensure compliance, the Bank requires daily monitoring of regulatory ratios such as the
Liquidity Coverage Rat io (LCR) and Net Stable Funding Rat io (NSFR). The Bank also monitors liquidity risk
exposures using the following limits: liquidity indicators, liquidity funding concentrat ion, and M aximum
Cumulative Out flow (M CO). Liquidity st ress test ing is also performed to measure the impact of st ressful
scenarios to the Bank’s M CO profile. The Bank also applies Liquidity Risk Assessment M atr ix to assess its
overall liquidity risk profile. In managing liquidity risk, the Bank also maintains substantial holdings of High
Quality Liquid Assets (HQLA) which can easily be converted to cash.
Interest rate r isk arises from the possibility that changes in interest rates will affect future cash flows or
fair values of financial inst ruments. The Bank uses Earnings-at-Risk (EaR) and Economic Value of Equity
(EVE) based on its Interest Rate Repricing Gap profile to measure the possible impact to net interest
income and net worth of the Bank under normal and st ressed interest rate movements. Likewise, risk

8
limits are also employed by the Bank to manage interest rate risk in the banking book. The Bank follows a
prudent policy in managing its assets and liabilit ies to ensure that the exposure to f luctuat ions in interest
rates is kept within acceptable limits.
Credit Risk M anagement
Credit Risk Management Process
Credit risk is the primary financial risk in the banking system and exists in all revenue generat ing activit ies.
Credit r isk is the r isk that one party to a financial inst rument will fail to discharge an obligation and cause
the other party to incur a financial loss. The risk arises when the Bank’s funds are extended, commit ted,
invested, or exposed through actual or implied contractual agreements. Capital depletion through loan
losses has been the ult imate cause of most inst itut ions' failures. The Bank’s credit risk arises from its
lending and t rading of securit ies and foreign exchange act ivit ies.
The Bank, in recognit ion of the importance of identifying and rating credit risk as the init ial step towards
its effect ive management, has put in place a comprehensive set of policies and established underwriting
processes, as approved by the Board of Directors. Regular analysis of the ability of potential and exist ing
borrowers to meet interest and capital repayment obligat ions is made, including amendment of lending
limits when appropriate. The Bank is thus able to cont inually manage credit -related risks in its risk asset
port folio through object ive assessments/ evaluations of credit proposals prior to presentation to the
appropriate approval authority, ensuring the highest standards of credit due diligence and independence.
The Bank’s approval matrix begins at carefully reviewed and selected individual limit delegations, working
its way up to t he Execut ive Commit tee (EXCOM ) and the Board of Directors as appropriate.
The Bank also employs and implements an Internal Credit Risk Rat ing System (ICRRS) that is consistent
with global rat ing standards, compliant with Basel II requirements, and appropriate to the Bank’s nature,
complexity, and scale of activit ies. Result ing rat ings/ scores, together with experienced credit judgment ,
serve as basis in proact ively set t ing-up of loan loss provisions in compliance with PFRS 9.
Credit Exposure Limits
The Bank manages and controls credit risk by set t ing limits on the amount of risk it is willing to accept for
individual borrowers and groups of borrowers as well as limits on large exposures and real estate loan
ceilings and limits on past due and non-performing rat ios per product . Such risks are monitored on a
regular basis and subjected to annual or more frequent reviews when considered necessary. These limits
are approved by the Board of Directors. The exposure to any one borrower is further restr icted by sub-
limits covering on- and off-balance sheet exposures. Actual exposures against limits are monitored
regularly.
Other Credit Enhancements
Exposure to credit risk is also managed in part by obtaining collateral, suretyships, or guarantees. The
amount and type of security required depends on an assessment of the credit risk of the counterparty. In
order to minimize credit loss, additional securit y is sought from the borrower when impairment indicators
are observed for the relevant individual loans and advances. The Bank implements guidelines on the
acceptability and valuation parameters of specific classes of collateral for credit risk m itigation. The main
types of collateral obtained are as follows: (i) for securit ies lending and reverse repurchase transactions:
cash or securit ies; (ii) for commercial lending: mortgages over real estate properties, machineries,
inventories, and t rade receivables; and (iii) for retail lending: mortgages over resident ial propert ies and
vehicles. It is the Bank’s policy to dispose of repossessed propert ies in an orderly and t imely fashion. The
proceeds are used to reduce or repay the outstanding claim. In general, the Bank does not occupy
repossessed propert ies for business use.
The Bank also has in place an independent post credit review of the loan port folio quality and credit
process that allows it to continually ident ify and assess the risks on credit exposures and take corrective

9
act ions. The management of the credit portfolio is subject to internal and regulatory limits which serve to
control the magnitude of credit r isk exposures and preserve the quality of the port folio. ERMG also
monitors large exposures and credit risk concentrat ions in accordance with BSP regulations.
Operational Risk M anagement
Operational r isk refers to the risk of loss result ing from inadequate or failed internal processes, people,
and systems, or from external events. It includes legal risk, but excludes strategic and reputational risk.
Operational risk is inherent in all act ivit ies, products, and services, and cuts across multiple act ivit ies and
business lines within the Bank and across its subsidiaries and aff iliates. The primary tool in controlling
operat ional r isk is an effect ive system of internal controls, which is approved by the Board and
part icipated by each and every employee of the Bank.
The PBCOM’s Operational Risk M anagement (ORM ) Framework, which provides for a strengthened
foundat ion and guidance on how PBCOM should effect ively manage its operat ional risks, is regularly
reviewed by the BOD to ensure that ORM policies, processes, and systems are implemented effect ively at
all decision levels.
The Bank’s ORM tools include the Risk Control Self -Assessment (RCSA), Key Risk Indicators (KRI), and the
Internal Operational Loss Database, results of which are regularly reported by the ORM Division (ORM D)
to the ROC. Operat ional r isk reports such as Profile of Complaints, Legal Case Profile, Bank Securit y
Assessments, and Vendor Performance Evaluat ion Results are likew ise regularly reported by the
respect ive line management to the ROC. A system for report ing of operat ional cr imes and losses, and
policies, whist le-blowing and handling of administ rative cases are also in place.
Aside from securing adequate insurance coverage over bank assets, putt ing up of reserve for self-
insurance, and set t ing up allowances for probable losses, operat ional risk is mit igated through preventive
and detect ive controls, which are embedded in operat ing policies and procedures, approval limits, and
authorities to govern day-to-day operat ions.
To inst ill a culture of r isk awareness and a strong operat ional risk control environment, the Bank’s ERMG
and Compliance M anagement Group (CG) conduct regular in-house seminars and trainings, such as
orientation for newly-hired employees, with presentat ions focusing on risk management and regulatory
compliance. Both groups continuously develop and implement risk management and compliance policies,
while holding interact ive meetings w ith operat ing units to address r isk issues and implement process
enhancements. The Bank also employs Computer-Based Training (CBT) to make t raining content more
readily available and accessible.
The Bank’s Technology Risk M anagement Framework continues to provide strengthened foundation and
guidance on how the Bank should effect ively manage emerging technology risks. It incorporates the
requirements under exist ing BSP regulations and which takes into account that strategic, operat ional,
compliance, and reputat ional r isks are periodically reviewed and updated to ensure that all r isks in the
Bank’s technology-enabled products, services, delivery channels, and processes are effect ively managed
and that any gaps are being regularly monitored and addressed.
A comprehensive r isk assessment and profiling methodologies for both IT funct ions and applicat ion
systems are in place. Risk ident ification and assessments over project management are enhanced from
project init iat ion to implementat ion. Control validation process is incorporated in technology risk
assessments to ensure effect iveness of established risk mit igat ion strategy. Correct ive act ion plans are
periodically monitored and reported to ensure r isk issues are t imely addressed and managed proactively.
The Bank’s risk management team cont inues to play an act ive role in providing risk insights and
assessments during launch of new products, technology and services, development of risk management
policies, and imbibing a culture of a risk aware organization through the conduct of t rainings and seminars
to Bank employees.

10
The Bank has in place a Business Continuity M anagement Framework that provides guidance for
cont inuous operat ions in the event of any disrupt ions and proactive mechanisms designed to prevent
interruptions to crit ical business funct ions and improve the Bank’s resiliency. It follows a robust business
cont inuity planning process that involves the conduct of a business impact analysis/ risk assessment ,
periodic review and updat ing of business continuity plans, and conduct of BCP tests and tests evaluat ion.
Bankwide Business Cont inuity Plan, Crisis M anagement and Emergency Preparedness Plan, Pandemic, and
Cyber Resiliency Plans are established. These documents detail the step by step procedures to be taken to
respond to the threat or impact of a crisis, and how the Bank will respond to emergencies to protect life,
property and environment , addressed in t imely manner.
Information and Cyber Security M anagement
PBCOM has built it s Information Secur ity Division (ISD) based on the provision of BSP Circular 982 –
Enhanced Guidelines on Information Security M anagement, which imposes specific technical safeguards
as well as governance, r isk assessment , monitoring and test ing, report ing and other requirements.
PBCOM informat ion security management systems, framework, pract ices, and standards have also been
created and referenced their contents on globally renowned frameworks, standards and good pract ices
such as ISO/ IEC 27002 and 27001; NIST Special Publicat ions regarding informat ion and cyber security; and
COBIT Framework for Informat ion Security.
As we go into 2022, looking back at the plent iful year of 2021, as regards to security, PBCOM continues to
face significant amount of security challenges but does not stop them from being dedicated to proactively
protect its information, networks, and IT systems from risks, like fraud, unauthorized access, and cyber
threats. PBCOM is commit ted to cont inually developing and honing overall security capabilit ies to
protect / safeguard the Bank’s information and assets. In valuing customers’ trust and maintain a resilient
business, the Bank is also invest ing heavily on its people, processes and technology to prevent, deter,
detect and timely mit igate r isks of security threats to Bank’s information and information
systems/ resources.
Cybersecurity risk is an important , constant, and evolving focus of PBCOM . Having a proact ive, defense-in-
depth approach to cybersecurity allows the Bank to be more vigilant and adapt ive to the new, emerging
and evolving cyber-threat landscape. PBCOM Information Security Division (ISD) continues to develop and
employ addit ional preventat ive measures to continually challenge the Bank’s defenses and controls
against cyber-at tacks and ensure adequate protect ion of the Bank’s information and informat ion assets
that mat ter to their customers. The Bank recognizes the need to institute a cybersecurity culture within
PBCOM ; thus, constant ly promote security awareness to their people and customers.
Data Privacy M anagement
PBCOM cares about the protect ion of personal ident ifiable and/ or sensit ive informat ion provided by
customers and/ or clients, thus, shall at all times abide to the minimum regulatory and statutory
requirements. PBCOM built its privacy r isk management system based on the provisions of Republic Act
10173 – Data Privacy Act of 2012, its Implement ing Rules and Regulations (IRR), National Privacy
Commission (NPC) issuances, and other related laws.
Privacy r isk is defined as a potent ial loss of control over personal identifiable and/ or sensit ive personal
information. With the emerging threats on data privacy, the Bank has instituted control measures to
eff icient ly manage the risk to an acceptable level.
PBCOM , through the designated Data Protect ion Officer (DPO), manages the risk related to data privacy
by adhering to the five (5) pillars of compliance as mandated by the NPC, at the minimum.
Privacy Impact Assessment were the main focus for 2021, to update the inventory of the Banks processing
systems and to ensure that organizat ional, technical and physical security measures are in place.

11
Security Breach Drill were also conducted with the assistance of CISO to ensure that the Bank and its
employees will be ready to handle incidents that may lead to security breaches including data privacy
breach.
The Bank’s compliance to the data privacy is reported to the Board of Directors (BOD), through the Risk
Oversight Commit tee (ROC), on a quarterly basis or as deemed necessary.
Year 2022 will focus on activit ies contr ibuting to increasing of awareness thru different campaigns both
for internal and external data subjects. St rengthening the employees and the Banks readiness for any
security incidents leading to privacy breach will also be an important program that will be implemented.
PBCOM is one with the National Privacy Commission on its act ive campaign to protect all data subjects
from any unauthorized and unlawful processing of information.
Trust Risk M anagement
The Trust and Wealth M anagement Group (TWMG) is exposed to fiduciary risks in managing funds and
assets ent rusted under its care and custody. Failure of the Group to fulfill its fiduciary responsibilit ies to
the trustor/ principal may result to a loss, damage liability, or any undesirable event that can have adverse
impact on the Bank. The major risks associated with the fiduciary act ivit ies of TWM G are market, credit,
liquidity, operat ional, legal, compliance, st rategic, and reputat ion risks. Having account management,
port folio and trading, trust credit , and operat ions funct ions w ithin TWMG, the Bank has also designated
personnel performing independent risk management function on fiduciary act ivit ies who direct ly report
to the Enterprise Risk M anagement / ICAAP Group (ERM G). The fiduciary risk exposure exists in both
discretionary and non-discret ionary trust arrangements.
Risks arising in the performance of t rust dut ies and obligations are addressed through the Trust
Committee, Risk Oversight Committee (ROC), and ERM G. The Trust Committee performs oversight
funct ion on wealth, trust , and other fiduciary services including the implementation of the risk
management framework ensuring that internal controls are in place relat ive to the fiduciary act ivit ies of
the Group. The ROC has the overall responsibility for the development of the risk strategy and
implementing principles, risk framework, policies, and limits of the Bank, including its Trust
business. ERMG spearheads the effective implementat ion of the risk management process through the
following risk tools and controls:
a. M onthly and Quarterly report ing to ROC and TCOM, respectively
b. Periodic stress testing of Trust and Wealth TWMG portfolio
c. Risk Control Self-Assessments (RCSA)
d. Trust risk management policies
Item 2. Properties
PBCOM ’s Head Office is located at PBCOM Tower, 6795 Ayala Avenue corner V.A. Rufino Street, M akati
City. The Bank currently owns 50% of PBCOM Tower which was constructed under a Joint Development
Agreement with Filinvest Asia Corporation. The Bank has a total of 91 branches and 4 branch-lites as of
December 31, 2021. M ost of these are located in the metropolitan areas of Luzon, Visayas and M indanao.
PBCOM ’s branches are owned and/ or leased. The list of branches is at tached herewith marked as Annex
“ A” . All propert ies owned by the bank are unencumbered. To date, the Bank has not ident ified properties
to acquire in the next 12 months.

12
Item 3. Legal Proceedings
PBCOM has certain loan-related suits and claims that remain unset t led. It is not practicable to est imate
the potent ial financial statement impact of these contingencies. However, in the opinion of management ,
the suits and claims, if decided adversely, will not involve sums that would have a material effect on the
financial statements.
The Bank is a defendant in legal act ions arising from its normal business activit ies. Management believes
that these actions are without merit or that the ult imate liability, if any, result ing from them will not
materially affect the Bank’s financial position.
Item 4. Submission of M atters to a Vote of Security Holders
Nothing was submit ted during the fourth quarter of the fiscal year covered by this report to a vote of
security holders.
PART II - OPERATIONAL AND FINANCIAL INFORM ATION
Item 5. M arket for Issuer's Common Equity and Related Stockholder M atters
M arket Information
Common shares of the Bank are t raded in the Philippine Stock Exchange.
Stock prices:
2021 2020 2019
High Low High Low High Low
First Quarter 23.45 20.10 20.80 17.00 23.95 18.02
Second Quarter 23.40 19.58 24.00 16.00 22.40 20.05
Third Quarter 19.98 17.70 18.00 16.70 22.90 20.40
Fourth Quarter 19.00 17.20 23.00 16.50 22.55 20.40
As of M arch 04, 2022, closing price of the Bank’s common share was P=18.22.
Holders
As of December 31, 2021, there were 398 shareholders of the Bank’s 480,645,163 issued and outstanding
common shares.
The top 20 registered stockholders of the Bank as of December 31, 2021 are as follows:
Name of Shareholder Nationality No. of Shares %
1 P.G. Holdings, Inc. Filipino 186,241,408 38.75%
2 VFC Land Resources, Inc. Filipino 73,619,038 15.32%
3 PCD Nominee Corporat ion: Filipino 49,157,327 10.22%
Non-Filipino 1,994,361 0.42%
4 Eric O. Recto Filipino 49,835,776 10.37%
5 Ralph C. Nubla, Jr . Filipino 46,519,036 9.68%
6 Telengtan Brothers & Sons, Inc. Filipino 31,859,844 6.63%

13
7 Langford Universal Finance Ltd. BVI 15,263,964 3.18%
8 La Suerte Workmen’s Compensation Fund Filipino 7,687,833 1.60%
9 TTC Development Corporat ion Filipino 4,181,665 0.87%
10 Roxas-Chua, Ray Anthony Go Filipino 3,070,724 0.64%
11 Cham, Edison Siy Filipino 1,790,853 0.37%
12 KLG Internat ional, Inc. Filipino 1,790,853 0.37%
13 Yu, Gregorio T. Filipino 1,432,692 0.30%
14 Chungunco, Raymond N. Filipino 604,011 0.13%
15 TFC Holdings, Inc. Filipino 562,588 0.12%
16 Chung, Bunsit G. (a.k.a. Carlos G. Chung) Filipino 550,716 0.11%
17 Chung, Patricia Regine K. Filipino 261,294 0.05%
18 Chung, Philippe Ryan K. Filipino 261,294 0.05%
19 Ching, Winnifred Filipino 187,798 0.04%
20 Ching, Jeffrey Filipino 175,505 0.04%
Dividends History:
There are no dividends declared for the years ended December 31, 2021, 2020 and 2019.
The Bank str ict ly complies w ith the BSP regulatory requirements under Subsect ion X136.2 of the M anual
of Regulat ions for Banks which states that before any declarat ion of dividends, banks shall comply with
the following:
a. Clearing account with the Bangko Sentral is not overdrawn;
b. Liquidity floor requirement for government funds;
c. M inimum capitalization requirement and risk-based capital rat io;
d. Prescribed EFCDU/ FCDU cover;
e. Statutory and liquidity reserves requirement ;
f. No past due loans or accommodat ions with the Bangko Sentral or with any inst itut ion;
g. No net losses from operat ions in any one (1) of the two (2) fiscal years immediately preceding
the date of dividend declaration;
h. Has not committed any of the major violations enumerated in Subsect ion X136.2.h.
Recent Sale of Unregistered Securities
There were no sales of unregistered securit ies w ithin the calendar year covered by this report.
The Bank has no registered debt securit ies. There are no exist ing or planned stock opt ions. There are no
registered securit ies subject to redemption or call. There are no exist ing or planned stock warrant
offerings.
Item 6. M anagement's Discussion and Analysis or Plan of Operation
(1) M anagement’s Discussion & Analysis
Financial Condit ion & Results of Operations: 2021 (Consolidated)
The Bank registered a net income of P1.57 Billion for 2021. This is P404.15M or 35% improvement from
2020’s net income of P1.17 Billion. This is mainly at tributable to P1.24 Billion decline in total operating
expenses (28%) as a result of P1.10 Billion lower provision requirements for credit and impairment losses
in the current period.

14
Total operat ing income declined by P807.60 M illion (14%) mainly due to net trading losses as the Bank
recognized P241.60 M illion in losses, lower rent income due to vacancies of leased floors, pre-
terminations, and re-negotiated contracts of tenants brought about by the COVID 19 pandemic, and lower
fees & commission earned during the year due to decline in penalty fees in corporate loans, part ly offset
by P319.29 M illion (8%) improvement in net interest income primarily due to decline in interest expense
from lower cost of funds. Due to lower interest rates, interest income also fell by P255.21 M illion (5%)
despite the growth in loan and investments average volume during the year.
Total assets of the Group reached P109.23 Billion in December 2021, up by P8.0 Billion from the P101.23
Billion as of December 2020. This is primarily due to P13.26 Billion increase in Investment Securit ies at
Amort ized Cost, P5.87 Billion increase in Loans and Other Receivables, most ly from corporate loans, and
P1.35 Billion increase in Financial assets at Fair Value through Other Comprehensive Income, part ially
offset by P10.3 Billion decline in Due from BSP due to lower investment in Overnight Deposit Facility
(ODF) and lower reserve requirement.
The Group’s gross NPL rat io is at 4.89%, 0.82% points lower than the 5.71% ratio at the end of 2020.
PBCOM ’s liquidity posit ion cont inued to remain stable as the Bank comfortably met all it s financial
obligat ions and loan commitments, and likewise has fully complied with the regulatory reserve
requirements on cont inuing basis at an optimum funding mix during the course of the year.
Total Liabilit ies increased by P6.35 Billion, 7.16% higher from last year’s level of P 88.70 Billion. This
resulted mostly from P3.83 Billion increase in bills payable, and P3.16 Billion growth in deposit liabilit ies.
Low-cost deposit rat io improved as the Bank’s demand and savings deposit average volume increased by
P12.0 Billion, 30%.
Total Capital is now at P14.18 Billion from P12.53 Billion last December 2020. This 13% improvement in
capital was mainly contributed by the earnings of the Bank during the year. The Bank’s Risk Based Capital
Adequacy Rat io of 18.18% under BASEL III report ing standards covering credit , market and operat ional
r isk as of report date is well above the 10% minimum requirement.
Financial Condit ion & Results of Operations: 2020 (Consolidated)
The Bank registered a net income of P=1.17 Billion for 2020. This is an P=11.7 M illion or 1% improvement
from the 2019’s net income of P=1.16 Billion despite recognizing an addit ional P=1.0 Billion provision for
credit losses as a result of credit score deteriorat ion mainly due to the COVID-19 pandemic. P=720.5
M illion or 22.5% improvement in net interest income was primarily the result of the decline in interest
expense from lower cost of fund and lower volume. This and higher loan volume in 2020, primarily in
corporate loans, have compensated the drop in interest income due to the decline in yields and the loan
payment holiday as a result of the Bayanihan to Heal as One Act . Other operating income also contributed
to the increase in net income, which is mainly driven by higher trading gain in 2020. Total operat ing
expenses went up by 29.7% mainly because of higher provisions for losses recognized in the current
period. This was part ially offset by lower depreciat ion & amort izat ion and lower occupancy costs.
Total Assets of the Group decreased by P=1.5 Billion from P=102.7 Billion as of December 2019 to P=101.2
Billion at the end of 2020. This is primarily due to P=10.6 Billion decrease in Financial Assets at Amort ized
Cost due to the HTC sale in June 2020, and P=3.6 Billion decrease in Loans and Receivables, part ially offset
by P=10.4 Billion higher placements in the BSP’s overnight deposit facility (ODF) and P=5.4 Billion higher in
interbank loans.
M oreover, Total Liabilit ies amounted to P=88.7 Billion with a decrease of 2.9% from the last year’s end
level of P=91.4 Billion. This resulted mostly from lower bills payable by P=10.9 Billion, part ially offset by P=7.9
Billion increase in Deposits, most ly in t ime deposits and demand deposits by P=3.8 Billion and P=3.7 Billion,
respectively.

15
Total Capital, on the other hand, amounted to P=12.5 Billion from P=11.4 Billion last Decem ber 2019.
Improvement in capital by 10.3% was mainly contr ibuted by the earnings of the Bank during the year. The
Bank’s Risk Based Capital Adequacy Ratio of 18.87% under BASEL III report ing standards covering credit,
market and operat ional risk as of report date is well above the 10% minimum requirement .
The Group’s gross NPL rat io increased by 1.89% from 3.82% in 2019 to 5.71% in 2020. PBCOM’s liquidity
posit ion cont inued to remain stable as the Bank comfortably met all its financial obligations and loan
commitments and likewise fully complied with the regulatory reserve requirements on continuing basis at
an opt imum funding mix during the course of the year.
Financial Condit ion & Results of Operations: 2019 (Consolidated)
The Bank registered a net income of P=1.2 Billion for 2019. This is a P=531 M illion or 85% improvement from
the 2018’s net income of P=626.2 M illion. Total operat ing income increased by P=971.5 M illion or by 23.81%
as the Bank sustains its business growth. Interest income from loans and receivables is higher by 20.01%
from P=3.7 Bill ion in 2018 to P=4.5 Billion in 2019 as the Bank focused it s efforts in expanding its corporate
and consumer loan portfolios and increasing loan yields. Interest expense however grew by P=432.8 M illion
or 26.54% compared to prior year period primarily from the rise in cost of funds and the impact of the
increase in volume from the Bank’s maiden issuance of Long Term Negotiable Cert ificates of Time Deposit
(LTNCD). Low-cost deposit volume has improved as the Bank grew its demand and savings deposit base
to P36.4 Billion from P28.1 Billion in the previous year. Time deposit and bills payable volume declined by
P6.5 Billion and by P4.6 Billion, with balances of P36.6 Billion and P13.1 Billion, respect ively by the end of
current year. Trading results improved further year as the Bank recognized P408.4 M illion in gains, a
P385.1 M illion or a 1,650.14% increase compared to last year. Higher profit from asset sold, rent income
and service charges and fees also contributed to the growth to the Bank’s bottom line. These were
part ially offset by the loss recognized from the sale of PBCOM Rural Bank, Inc. in July amount ing to P171.2
M illion. Total operat ing expenses slight ly went up by 6.5% from last year primarily due to higher Provision
for losses by P=167.7 M illion, M iscellaneous expense by P=94.3 M illion, and Taxes and licenses by P=81.2
M illion part ially offset by the decline in Occupancy and other equipment -related costs by P=113.7 M illion
and lower Compensat ion and benefits by P=61.7 M illion from lower headcount .
Total Assets of PBCOM Group stood at P102.7 Billion at the end of 2019, from P103.7 Billion as of
December 2018 primarily from lower liquid assets by P=1.6 Billion due to the decline in Due from BSP by
33% from lower reserve requirement notwithstanding the Group’s increase in lending act ivities which
resulted to a P=1.1 Billion increase in loans and receivable. Total property and equipment declined by P=
295.6 M illion mainly due to depreciat ion and amort izat ion and write-off of leasehold improvements.
Investment propert ies also decreased by 6.9% due to depreciation and amort izat ion and sale of ROPA in
2019. M oreover, other assets increased by P=210.3 M illion mostly brought about by the recognit ion of
ROU start ing in 2019 in compliance with PFRS16.
The Group’s non-performing loans (NPL) decreased by P=296.43 M illion. Consequently, the Group’s gross
NPL rat io decreased by 0.58% from 4.40% in 2018 to 3.82% in 2019 as a result of improved collection
efforts. PBCOM’s liquidity posit ion continued to remain stable as the Bank comfortably met all its financial
obligat ions and loan commitments and likewise fully complied with the regulatory reserve requirements
on continuing basis at an opt imum funding mix during the course of the year.
M oreover, Total Liabilit ies amounted to P91.4 Billion with a slight decrease of 2.2% from the last year’s
end level of P93.4 Billion. This resulted most ly from lower bills payable by P4.6 Billion part ially offset by
the increase in deposits, part icularly on demand and savings deposit, which showed an increase of 34.3%
and 17.5%, respectively.
Total Capital, on the other hand, amounted to P11.4 Billion from P10.3 Billion in 2018. Improvement in
capital by 10% was mainly contr ibuted by the earnings of the Bank for the year. The Bank’s Risk Based

16
Capital Adequacy Rat io of 16.47% under BASEL III report ing standards covering credit, market and
operat ional risk as of report date is well above the 10% minimum requirement.
(2) Discussion of various key indicators:
A. Key Performance Indicators
Ratio
December
2021
(Consolidated)
December 2020
(Consolidated)Remarks
Profit M argin
(Net income divided by Gross
income)
30.94% 19.84% Increase in rat io by 11.10 % pt s. primarily due to
decline in operat ing expenses fr om low er
provision for credit and impairment losses in 2021
Return on Average Asset
(Net income divided by Average
assets)
1.49% 1.15% Higher by 35 bps due to increase in net income
primarily due to lower provision for credit and
impairment losses, of fset by impact of higher
average assets.
Return on Average Equity
Net income divided by Average
equit y)
11.78% 9.79% Return on average equity increased by 1.99 % pts
from higher net income mainly driven by low er
operat ing expenses
Capital Adequacy Ratio
Qualifying capital divided by
total of risk-weighted assets that
include credit, market and
operat ional risk)
18.18% 18.87% Decrease by 69bps due t o increase in credit risk-
w eighted assets arising from higher loans and
receivables in 2021
Basic Earnings per share
Net income divided by average
no. of common shares)
3.27 2.43 Increase in basic earnings per share by P0.84 from
higher net income
B. Financial Soundness
Ratio
December
2021
(Consolidated)
December 2020
(Consolidated)Remarks
Liquidit y Rat io (Liquid Assets to
Total Deposits) Liquid Assets
include cash, due from banks,
interbank loans, and trading and
inv. Securit ies. Total deposit refers
to the total of peso and foreign
currency deposit s.
28.96% 43.40% Decreased by 14.44 % pts due to lower liquid
assets from low er placement in ODFs
Debt Rat io (Total Liability t o Total
Asset )
Debt refers to the total liabilit ies
while assets is the t otal assets
87.02% 87.62% Decline by 60 bps as t he increase in total
assets exceeded the increase in total
liabilit ies. Increase in assets is most ly from
investment securit ies at amort ized cost and
loans and other receivables, most ly from
corporat e loans
Asset to Equity Rat io (Total Asset
to Total Equity
7.71 8.08 Ratio is lower by 37 bps mainly as result of
lower growth in assets in relat ion to t he
increase in equity
Int erest Rat e Coverage Rat io
(Earnings before interest & taxes
to Int erest Expense)
470% 231% Increased by 239 % pts. pr imarily due to
lower int erest expense mainly from low er
cost of funds and drop in ave. volume, most ly
TDs
Net Interest M argin
Net interest income over Average
Earning assets
4.83% 4.64% Ratio went up by 20 bps pr imarily f rom low er
interest expense due to drop in cost of funds

17
Statement of Condit ion: December 2021 vs. December 2020 (consolidated)
(in thousands) Increase/ (Decrease) Percentage
Change
Explanation
Cash and Other Cash Items336,242 13.63% Higher cash on hand & mainly those in cash
center and with service provider
Due from Bangko Sentral ng
Pilipinas
(10,326,382) -50.13% Low er placement in ODF
Due from Other Banks (837,892) -55.96% Low er funds w ith foreign banks
Interbank Loans Receivable (1,858,608) -30.70% Low er foreign interbank loans and GS Repo
Financial Assets at Fair Value
through Profit or Loss
167,997 23.39% Higher investm ents in FVTPL
Financial Assets at Fair Value
through Other Comprehensive
Income
1,351,4714 26.30% Purchase of investments in FVOCI
Investment Securities at
Amortized Cost
13,256,923 585.72% Higher due to addit ional inventory
purchase in 2021
Loans and Receivables 5,873,972 10.19% Increase in outstanding loans and
receivables, mainly in corporat e
loans/ import bills/ CTS
Property and Equipment (12,400) -1.39% Decline mainly due t o depreciat ion
recognized for the per iod
Investment Properties
Foreclosed properties 224,228 36.75% ROPA foreclosures in 2021 part ially offset
by depreciat ion recognized for the period
Office units for lease (234) -8.01% Decline due to depreciat ion recognized for
the period
Intangible Assets (86,023) -14.02% Lower most ly due t o amortizat ion of
software during the period, partially offset
by acquisit ions
Deferred Tax Assets - net 155,006 90.86% Increase in allowance probable loss
Other Assets (197,103) -25.48% Lower pr imarily from creditable
withholding taxes
Deposit Liabilities
Demand 10,300,825 33.37% Higher volume of demand deposits
Savings 1,694,167 17.53% Higher volume of savings deposits
Time (8,835,947) -21.89% Low er volume of time deposits
Bills Payable 3,828,144 175.37 Higher due to higher bills payable - REPO,
part ly offset by low er BP- deposit
subst it ute
Outstanding Acceptances (426,204) -85.62% Low er bills of exchange accepted by the
Bank
M anager’s Checks (15,853) -8.43% Low er un-negotiated M C’s as of report date
Accrued Interest, Taxes and Other
Expenses
(122,051) -15.20 Low er mainly from low er ret irement
obligat ion (net retirement asset in 2021)
and lower accr ued interest for deposits due
to decline in cost of funds
Income Tax Payable (80,043) -54.50% Low er due t o change from M CIT to RCIT in
Q4 2020.
Deficit 1,572,560 95.97% Net income for t he per iod
Unrealized gain on equity
securities carried at fair value
(46,584) -46.54% Low er unrealized gain on FVOCI

18
through other comprehensive
income
Cumulative translation
adjustment
(26,204) 12.39% Low er CTA
Remeasurement gains (losses) on
retirement liability
145,864 -138.76 Cumulat ive amount of actuarial gains in
2021
Statement of Condit ion: December 2020 vs. December 2019 (consolidated)
(in thousands) Increase/ (Decrease) Percentage
Change
Explanation
Cash and Other Cash Items(231,583) -8.58% Low er cash on hand mainly t hose with
service provider
Due from Bangko Sentral ng
Pilipinas
10,384,347 101.67% Higher most ly from ODF
Due from Other Banks 1,137,525 317.78% Higher funds w ith foreign banks
Interbank Loans Receivable 5,336,718 743.55% Higher investm ent in GS Repo in 2020
Financial Assets at Fair Value
through Profit or Loss
(949,533) -56.93% Low er investments in FVTPL
Financial Assets at Fair Value
through Other Comprehensive
Income
(2,956,546) -36.53% Sale of investments in FVOCI
Investment Securities at
Amortized Cost
(10,586,144) -82.39% Low er due t o sale of HTC in 2020
Loans and Receivables (3,633,047) -5.93% Decline in outstanding loan primar ily in
corporat e loans
Property and Equipment (79,593) -8.17% Decline mainly due t o depreciat ion
recognized for the per iod
Investment Properties
Office units for lease (351) -10.72% Decline due to depreciat ion recognized for
the period
Intangible Assets (59,563) -8.85% Lower most ly due t o amortizat ion of
software during the period, partially offset
by acquisit ions
Deposit Liabilities
Demand 3,660,678 13.46% Higher volume of demand deposits
Savings 484,672 5.28% Higher volume of savings deposits
Time 3,773,285 10.31% Higher volume of t ime deposits
Bills Payable (10,881,980) -83.29% Lower pr imarily in BP-REPO
Outstanding Acceptances 405,958 441.96% Due t o higher bills of exchange accepted by
the Bank
M anager’s Checks (254,711) -57.52% Low er un-negotiated M C’s as of report date
Accrued Interest, Taxes and Other
Expenses
90,357 12.68% Higher expense accruals, partially of fset by
low er accrued int erest
Income Tax Payable 123,425 526.53% Low er deduct ible expense
Deferred Tax Liabilities - net (782) -100.00% Recognized DTA for 2020
Other Liabilities (66,603) -5.71% Lower lease liability and lower security
deposit
Deficit 1,168,446 41.63% Net income for t he per iod and t ransfer to
surplus reserves

19
Unrealized gain on equity
securities carried at fair value
through other comprehensive
income
12,161 13.83% Higher unrealized gain on FVOCI
Cumulative translation
adjustment
20,200 8.72% Higher CTA
Remeasurement gains (losses) on
retirement liability
(26,796) -34.21% Higher cumulat ive amount of act uarial
losses
Statement of Income and Expenses: Jan-Dec 2021 vs Jan-Dec 2020 (consolidated)
(in thousands) Increase (Decrease) Percentage Remarks
INTEREST INCOM E
Loans and receivables (215,326) -4.98% Lower int erest income pr imarily from drop
in yields, part ially offset by higher ADB
volume
Investment securit ies 109,178 30.03% Higher due to volume, mainly due to HTC &
FVOCI
Int erbank loans receivable and
securit ies purchased under resale
agreements
(32,677) -35.23% Lower volume of GS w ith repurchase
agreement
Financial Assets at Fair Value
through Profit or Loss
(39,662) -49.57% Decrease from low er volume and lower
yields
Deposits with ot her banks (76,722) -57.94% Lower income from decrease in ave.
volume mainly in ODF, and low er yields
INTEREST AND FINANCE CHARGES
Deposit liabilit ies (486,560) -52.80% Decline from low er cost of funds and low er
volume, most ly TDs
Bills payable, borrowings and
others
(87,935) -59.81% Lower cost of funds ,and low er volume
mainly in Repo
OTHER INCOM E
Rent income -168,173 -24.97% Lower mainly due t o dow nward impact of
pre-t erminations and re-negot iat ed
contracts of t enants as a result of the
COVID-19 cr isis
Service charges, fees and
commissions
(57,367) -14.74 Lower most ly due t o decr ease in penalt ies
on corporate loans
Trading and securit ies gain (loss) -
net
(896,329) -136.90% Higher t rading loss, most ly realized
Profit (loss) from assets sold 6,788 100.13% Higher gain on sale of ROPA
Income from t rust operat ions 3,542 13.79% Increase due to higher ave. volume of
assets under management
Gain (loss) on assets exchange -
net
10,617 -336.30% Higher due to net gain on ROPA
foreclosures for the year
M iscellaneous (21,506) -13.29% Decrease pr imarily due to lower pre-
terminat ion penalty income from lease
contract s
OPERATING EXPENSE
Provision for credit and
impairment losses - net
(1,095,927) -77.27% Lower provision requirement in 2021
Taxes and licenses (162,618) -25.41% Lower GRT and business taxes
Insurance 9,058 5.89% Higher PDIC insurance from higher volume
of deposits

20
Occupancy and other equipment-
related cost s
17,185 16.96% Higher elect ricity and water costs
Management and professional fees (40,458) -28.90 Lower professional fees
Security, clerical, messengerial and
janitor ial services
5,424 6.5% Higher security and janitorial costs
Share In Net Income Of An
Associate
21 7.89% Net income from PBCOM Finance offset by
net loss from PISAI
Provision For Income Tax 26,503 11.52 Higher t axable income
Statement of Income and Expenses: Jan-Dec 2020 vs Jan-Dec 2019 (consolidated)
(in thousands) Increase
(Decrease)
Percentage Remarks
INTEREST INCOM E
Investment secur it ies (224,699) -38.19% Lower int erest income mainly due to
decrease in volume mainly in HTC as a
result of the sale in 2020
Financial Assets at Fair Value
through Profit or Loss
(79,290) -49.77% Decrease from low er yields
Int erbank loans receivable and
securit ies purchased under resale
agreements
52,500 130.45% Increase fr om higher volume
Deposits with ot her banks 120,427 1005.15% Increase fr om higher volume of
invest ments in BSP ODF
INTEREST AND FINANCE CHARGES
Deposit liabilit ies (580,128) -38.63% Decline from low er cost of funds, mainly in
TDs
Bills payable, borrowings and
others
(414,666) -73.82% Decrease in interest expense mainly due t o
low er cost of funds and low er volume
OTHER INCOM E
Rent income (62,927) -8.55% Lower PAS 17 adj mainly due to reversals
of PY accruals of contract s that pre-
terminat ed and contracts with rate
reduct ions in 2020.
Trading and securit ies gain (loss) -
net
246,318 60.31% Higher t rading gains, m ost ly realized
Profit (loss) from assets sold (90,960) -93.06% Lower gain on sale of ROPA
Foreign exchange gain - net 9,312 18.67% Increase fr om higher gain fr om fx
revaluat ion
Income from t rust operat ions 4,594 21.78% Higher t rust fees during t he comparative
period due to diversificat ion of products
and services, coupled with appropriate
pr icing st rategy t o different iat e
products/ services according to complexity
Gain (loss) on assets exchange -
net
8,693 73.36% Lower loss on ROPA foreclosures
M iscellaneous 20,619 14.96% Higher penalt ies from pre-t ermination of
rental agreements, low er loss on
derecognit ion of asset , and higher
dividends from invest ments

21
OPERATING EXPENSE
Depreciation and amor tizat ion (65,326) -14.65% Lower depreciat ion mainly from fully
amort ized LRI of branches, fully
depreciated furniture and fixture and office
equipment in 2020 and lower AL ROPA
depreciation due to sale in 2019
Provision for credit and
impairment losses - net
1,040,615 275.58% Higher provision requirement in 2020
most ly due to det er iorat ion of credit scores
as the impact of t he pandemic
Insurance 13,991 10.01% Higher PDIC insurance from higher volume
of deposits
Occupancy and other equipment-
related cost s
(28,886) -22.18% Lower elect ricity and water costs due t o
limited operat ion of the branches in 2020
Management and professional fees 33,456 31.40% Higher professional fees incurred in 2020
Security, clerical, messengerial and
janitor ial services
(14,328) -14.66% Lower security and janitor mainly due t o
limited operat ion of the branches in 2020
Ent ertainment , amusement and
recreation
44,089 53.45% Higher expenses incurred in 2020
M iscellaneous (39,617) -9.16% Lower broker ’s commission, collection and
credit invest igat ion fees due to low er
volume
Share In Net Income Of An
Associate
(265) -49.91% Net loss from PISAI
Provision For Income Tax 27,732 13.70% Lower deduct ible expense
Net Income (Loss) From
Discontinued Operat ions
228,408 -100.00% No discont inued operations for 2020
Interest income on non-discounted loans is recognized based on the accrual method of account ing while
unearned discounts are amortized to income over the terms of the loans. As such, there are no seasonal
aspects that materially impact on the Bank’s interest revenues.
(3) Other material events and/ or uncertainties:
The Bank does not ant icipate any cash flow or liquidity problems in the next 12 months after
year-end 2021.
The Bank does not foresee any events that will trigger direct or contingent financial
obligat ion that is material to the company, including any default or accelerat ion of an
obligat ion.
There are no material off-balance sheet t ransactions, arrangements, obligat ions (including
cont ingent obligat ions), and other relat ionships of the company with unconsolidated entit ies
or other persons created during the report ing period.
There are no material commitments for capital expenditures.
The Bank remain cautious in expanding its loan port folio given the on-going effect of the
pandemic on the economy while the Executive Commit tee (EXCOM ) stays vigilant with its
loan approvals.
There are no significant elements of the Bank’s income in 2021 that did not arise from
cont inuing operat ions.
There are no seasonal aspects that have a material effect on the financial condit ion or
results of operat ions.

22
Item 7. Financial Statements
Attached hereto are the audited f inancial statements for the year ended December 31, 2021.
The account ing firm of Sycip, Gorres, Velayo and Co. (“ SGV” ), with address at SGV Building, 6760 Ayala
Avenue, M akat i City, has been the Bank’s independent public accountants for the past years. The same
accounting firm will likely be recommended for re-elect ion at the scheduled annual meet ing this year. M r.
Ray Francis C. Balagtas was assigned partner start ing in 2019 in compliance with SRC 68(3)(b)(ix).
SGV is expected to be represented in the coming Annual Stockholders’ M eeting with an opportunity to
make statements, if they so desire, and will be available to respond to appropriate quest ions.
There is no disagreement w ith the Bank's accountants on mat ters of accounting and financial disclosure.
The aggregate external audit fees billed for each of the last three (3) fiscal years for the audit of the
registrant ’s annual f inancial statements or services that are normally provided by the external auditors
are as follows:
Fiscal Year Audit Fees All other fees
2021 P=4,721
2020 P=3,943
2019 3,787
The above audit fees are inclusive of the following: (a) Other assurance related services by the External
Auditor that are reasonably related to the performance of the audit or review of the Bank’s financial
statements and (b) All Other Fees. Fees paid to professional partnerships like SGV are not subject to
withholding tax.
The Audit Commit tee is direct ly responsible in selecting and appoint ing the independent public
accountants. Annually, the Committee recommends that the Board request shareholder rat ification of the
appointment of the independent public accountants. The Committee is also responsible for set ting the
compensat ion of the independent public accountants and periodically reviews the fees charged for all
permit ted audit -related expenses and other services. It is also their responsibility to evaluate and, when
appropriate, t o remove the independent public accountants.
At present, the Audit Committee is composed of: Emmanuel Y. M endoza as Chairman with Gilda E. Pico
and Jaime J. Baut ista as members.
Item 8. Changes in and Disagreements with Accountants on Accounting and Financial Disclosure
There were no changes and disagreement with accountants on matters of accounting and financial
disclosure.

23
PART III - CONTROL AND COM PENSATION INFORM ATION
Item 9. Directors and Executive Officers of the Issuer
(1) Directors and Executive Officers
NAM E OFFICE AGE CITIZENSHIP
YEAR OF
ASSUM PTION
OF OFFICE
Eric O. Recto Chairman of the Board/Director 58 Filipino 2011
Leonardo B. Dayao Vice Chairman / Director 77 Filipino 2014
Lucio L. Co Director/ Chairman of the
Executive Committee
67 Filipino 2014
Patricia M ay T. Siy President & CEO / Director 61 Filipino 2015
Jaime J. Bautista Director 64 Filipino 2020
Bunsit Carlos G. Chung Director 71 Filipino 1997
Susan P. Co Director 64 Filipino 2014
Levi B. Labra Director 63 Filipino 2014/ 2017
Gregorio T. Yu Director 63 Filipino 2011
Jack Ekian T. Huang Director 67 Filipino 2019
Robert Y. Cokeng Independent Director 70 Filipino 2021
Conrado A. Gloria, Jr. Independent Director 62 Filipino 2019
Bienvenido E. Laguesma Independent Director 71 Filipino 2019
Jesus S. Jalandoni, Jr. Independent Director (up to May
3, 2021)
63 Filipino 2013
Emmanuel Y. M endoza Independent Director 57 Filipino 2014
Gilda E. Pico Independent Director 75 Filipino 2017
John Howard D. M edina Executive Vice President-COO 52 Filipino 2017
Alan E. At ienza Execut ive Vice President-
Treasurer
51 Filipino 2016
Victor O. M art inez Executive Vice President –
Corporate and Commercial
Banking Group Head
56 Filipino 2020
Arlene M. Datu Senior Vice President –
Comptroller
63 Filipino 2013
Expedito G. Garcia Senior Vice President –
Transact ion Banking
54 Filipino 2015
Erico C. Indita Senior Vice President – Branch
Banking Group
53 Filipino 2020
Jane Lim-Laragan Senior Vice President – General
Services Group
54 Filipino 2016
Jeruel N. Lobien Senior Vice President – Chief Audit
Execut ive
44 Filipino 2014
M ina F. M artinez Senior Vice President – Human
Resources Group Head
59 Filipino 2015

24
BOARD OF DIRECTORS
ERIC O. RECTO, Chairman of the Board and Director
M r. Recto, Filipino, 58 years old, was elected Director and Vice Chairman of the Board on July 26, 2011,
appointed Co-Chairman of the Board on January 18, 2012 and Chairman of the Board on M ay 23, 2012. He
is present ly Chairman and President of Bedfordbury Development Corporat ion; Vice-Chairman of
Alphaland Corporation; Vice Chairman and President of Atok-Big Wedge Co., Inc.; President and Director
of Q-Tech Alliance Holdings, Inc.; Independent Director of Aboit iz Power Corporation; Independent
Director of PH Resorts Group Holdings, Inc.; Independent Director of Waterfront Cebu City Casino Hotel
Inc.; Independent Director of Davao Insular Hotel Company Inc.; Independent Director of M anila Water
Company, Inc.; Director of DITO CM E Holdings Corp. (formerly ISM Communicat ions Corporat ion); and
Owner of Premium Wine Exchange Inc. Mr. Recto served as Undersecretary of Finance of the Republic of
the Philippines from 2002 to 2005, in charge of handling both the International Finance Group and the
Privat izat ion Off ice. Before his st int with the government, he was Chief Finance Off icer of Alaska M ilk
Corporat ion and Belle Corporat ion. M r. Recto has a degree in Industrial Engineering from the University
of the Philippines as well as an M BA from the Johnson School, Cornell University.
LEONARDO B. DAYAO, Vice Chairman and Director
M r. Dayao, Filipino, 77 years old, was elected Director on September 29, 2014 and Co-Vice Chairman on
October 24, 2014. Mr. Dayao current ly holds the following positions in publicly listed companies:
President of Cosco Capital, Inc. and Director of Puregold Price Club, Inc. He also holds various positions in
the following privately-owned companies: Chairman and President of Fertuna Holdings Corp., Chairman of
Catuiran Hydropower Corporat ion, Grass Gold Renewable Energy (G2REC) Corporation Kareila
M anagement Corporat ion, League One Finance and Leasing Corporation, Pamana Water Corporation,
PSM T Philippines, Inc., S&R Pizza (Harbor Point), Inc., S&R Pizza, Inc.; Vice-Chairman of Ayagold Retailers,
Inc.; President of Alcorn Petroleum Minerals Corporat ion, K4 Water Resources Corporation, NE Pacific
Shopping Centers Corporation, Puregold Duty Free (Subic), Inc., Puregold Finance, Inc., San Jose City I
Power Corp., Southern Unt ility M anagement Services, Incorporated (SUM SI), Union Energy Corporat ion;
Vice-President of Alerce Holdings Corp., Bellagio Holdings, Inc., KM C Realty Corporation, Puregold
Propert ies, Inc., Union Equit ies, Inc.; and Director of Canaria Holdings Corporat ion, Entenso Equities
Incorporated, Karayan Hydropower Corporation and Puregold Realty Leasing & M anagement, Inc. He
received a Bachelor of Science Degree in Commerce from Far Eastern University. He is a Cert ified Public
Accountant and has completed Basic M anagement Program at Asian Institute of M anagement and earned
units in M BA from University of the Philippines-Cebu.
LUCIO L. CO, Chairman of the Execut ive Commit tee and Director
M r. Co, Filipino, 67 years old was elected Director on September 29, 2014. M r. Co current ly holds the
following posit ions in other publicly listed companies: Director and Chairman of Puregold Price Club, Inc.,
Chairman of Cosco Capit al, Inc. and Chairman and President of The Keepers Holdings, Inc. (formally Da
Vinci Capital Holdings, Inc.), He is also the Chairman of the following privately-owned companies: Alcorn
Pet roleum & M inerals Corporat ion, Bellagio Holdings, Inc., Canaria Holdings Corporat ion, Ellimac Prime
Holdings, Inc., Entenso Equit ies Incorporated, Invescap Incorporated, NE Pacific Shopping Centers
Corporat ion, P.G. Holdings, Inc., Puregold Duty Free (Subic), Inc., Puregold Duty Free, Inc., Puregold
Finance, Inc., Puregold Propert ies, Inc., Puregold Realty Leasing & M anagement, Inc., San Jose City I Power
Corp., Union Energy Corporat ion, and Union Equit ies, Inc. He is also a Director of the following privately-
owned companies: Catuiran Hydropower Corporat ion, Cleangreen Energy Corporat ion, Grass Gold
Renewable Energy (G2REC) Corporation, Karayan Hydropower Corporat ion, Kareila M anagement Corp.,
LCCK & Sons Realty Corporat ion, League One Finance and Leasing Corporation, Meritus Prime
Dist ribut ions, Inc., M ontosco, Inc., Nation Realty, Inc., Pamana Water Corporat ion, PPCI Subic Inc.,
Patagonia Holdings Corp., Premier Wine & Spirits, Inc., S& R Pizza (Harbor Point ), Inc., and S&R Pizza, Inc.,
Tower 6789 Corporation and VS Gripal Power Corporat ion. He is a member of the Board of Trustees of

25
Adamson University and Luis Co Chi Kiat Foundation, Inc. Mr. Co has been an entrepreneur for the past 40
years.
PATRICIA M AY T. SIY, President and Chief Execut ive Off icer, Director
M s. Siy, Filipino, 61 years old, was elected Director, President and Chief Executive Officer on June 1, 2015.
Immediately before joining PBCOM , she served as Chief Corporate Planning Officer of Travellers
International Hotel Group from 2012 and as Chief Finance Officer of Rustan’s Supercenter Inc. from 2011
to 2012. Her banking experience spanned 31 years. She was with Security Bank Corporat ion where she
held various posit ions from 2000 to 2011 in M iddle M arket Lending and Corporate Lending leading to the
Executive Vice President post for the Commercial and Retail Banking Segment. She held senior positions
in Standard Chartered Bank from 1994 to 2000 in the fields of Regional and Philippine Consumer Credit,
Group Special Asset M anagement, and Corporate Banking in Cebu and Head Off ice. Her first Bank was
Private Development Corporation of the Philippines where she stayed from 1983 to 1994 as Project
Analyst , Cebu Lending Head, Visayas Lending Head, and then Branch Lending Head. M s. Siy graduated
from De La Salle University with a Bachelor of Science degree in Industrial M anagement Engineering
minor in Chemical Engineering.
JAIM E J. BAUTISTA, Director
M r. Baut ista, 64 years old, was elected Director on July 14, 2020. He is current ly a Director of Air Speed
International Inc., Alphaland Corp., Belle Corp. Cosco Capital Inc., Gothong Southern Shipping, Inc., Nickel
Asia Corp.and Premium Leisure Corp. At present, he is a member of the Board of Trustees of the
University of the East , UE Ramon M agsaysay Medical M emorial Center and International School of
Sustainable Tourism. M r. Bautista started his career as Staff Auditor of SyCip, Gorres Velayo and Co. He
joined the Lucio Tan Group (LTG) of Companies in 1980 occupying various management positions in the
group which is involved in cigaret te manufacturing, brewery, piggery, const ruct ion, electronics, real
estate, property development , banking, dist illery, chemical and alcohol manufacturing, educat ion
Import / export and other businesses. M r. Baut ista was appointed as Vice President- Comptroller and was
promoted to Senior Vice President and Chief Finance Officer of Philippine Airlines (PAL) in 1994, Execut ive
Vice President in 1998 and President in 2004 unt il his retirement in 2012. He was appointed again as
President of PAL until his second ret irement on June 30, 2019. He graduated M agna Cum Laude from
Colegio de San Juan de Letran with a degree of Bachelor of Science in Commerce. Mr. Baut ista is a
Cert ified Public Accountant.
BUNSIT CARLOS G. CHUNG, Director
M r. Chung, Filipino, 71 years old, was elected Director on June 17, 1997. He is Chairman & President of
Supima Holdings, Inc., and Director of La Suerte Cigar & Cigarette Factory, Century Container Corporation,
Bicutan Container Corporat ion, Tosen Foods Corporation, PBCom Finance Corporat ion, State Investment,
Inc. and State Propert ies, Inc. He is an Advisory member of the Board of Trustees of Xavier School Inc.,
and a member of the Board of Trustees of Immaculate Concept ion Academy (Greenhills) Scholarship
Foundat ion, Seng Guan Temple, Angelo King Foundat ion Inc. and Kim Siu Ching Family Association, Vice-
Chairman & President of Tiong Se Academy. Mr. Chung has a degree in AB (Economics) & Business
Administ rat ion from De La Salle University as well as an M BA from the University of Southern California.
SUSAN P. CO, Director
M rs. Co, Filipino, 64 years old was elected Director on September 29, 2014. She current ly holds the
posit ions of Vice-Chairman of Puregold Price Club, Inc. and Vice-Chairman and Treasurer of Cosco Capital,
Inc., both publicly listed companies. Mrs. Co is the Chairman of Tower 6789 Corporation and Director of
the following privately-owned companies: Bellagio Holdings, Inc., Blue Ocean Holdings, Inc., Canaria
Holdings Corporat ion, Ellimac Prime Holdings, Inc., Kareila M anagement Corp., KM C Realty Corp., M eritus
Prime Distr ibut ions, Inc., M ontosco, Inc., Nation Realty, Inc., NE Pacific Shopping Center Corporation, P.G.
Holdings, Inc., Patagonia Holdings Corp., PPCI Subic Inc., Premier Wines and Spirits, Puregold Duty Free
(Subic), Inc., Puregold Duty Free, Inc., Puregold Propert ies, Inc., Puregold Realty Leasing & M anagement,
Inc., S& R Pizza (Harbor Point), Inc., S& R Pizza, Inc., San Jose City I Power Corp., Union Energy Corporation

26
and Union Equit ies, Inc. Mrs. Co received a Bachelor of Science Degree in Commerce from the University
of Santo Tomas.
JACK EKIAN T. HUANG, Director
M r. Huang, Filipino, 67 years old, was elected Director on June 4, 2019. He current ly holds the posit ions
of Director of Puregold Price Club Inc. and First Abacus Financial Holdings Corporat ion, Vice President of
Abacus Capital and Investment Corporat ion, Director and Vice President of Abacus Securit ies Corporat ion
and Director and Treasurer of Richmedia Network Inc. M r. Huang is also a member of the Board of
Trustees of Sacred Heart School (Ateneo de Cebu), In the past , he was Assistant Vice President of the
Bank of the Philippine Islands, Branch M anager of Ayala Investment & Development Corporat ion and
Director and General M anager of Cebu Business Cont inuous Forms. Mr. Huang obtained his Bachelor of
Art s in Economics at the Ateneo de M anila Universit y.
LEVI B. LABRA, Director
M r. Labra, Filipino, 63 years old, served as an Independent Director from October 24, 2014 until his
election as a regular member of the Board of Directors on February 22, 2017. Mr. Labra is also a Director
of Cosco Capital, Inc., a publicly listed company. He obtained his Bachelor of Science in Business
Administ rat ion (Cum Laude) at the University of San Carlos, Cebu City.
GREGORIO T. YU, Director
M r. Yu, Filipino, 63 years old, was elected Director on July 26, 2011 and is present ly the Chairman of Auto
Nation Group, Inc., Cats Automobile Corp and Nexus Technology Inc. He is also the Vice Chairman and
Director of Sterling Bank of Asia. Mr. Yu is also a director of various private inst itutions, among which are
CATS Asian Cars, Inc. and American M otorcycles, Inc. He is also a Director of Unistar Credit and Finance
Corporat ion, Glyph Studios, Inc., Prople BPO Inc., WSI Corporat ion, and Jupiter Systems Corporat ion. M r.
Yu is also an Independent Director of Alphaland Corporat ion, Glacier M egafridge, EEI Corporation, DITO
CM E Holdings Corporat ion, APO Agua Infrastructura Inc., Philequity M anagement Inc., Vantage Financial
Corporat ion (formerly E-business Services, Inc. and Vantage Equities In. He is also a Board M ember of
Ballet Philippines and The M anila Symphony Orchestra since 2009. He received his M BA from the
Wharton School of the University of Pennsylvania in 1983 and his Bachelor of Arts in Economics (Honors
Program) Summa Cum Laude from De La Salle University in 1978.
ROBERT Y. COKENG, Independent Director
M r. Cokeng, Filipino, 70 years old, was elected Independent Director on June 15, 2021. He is current ly the
Chairman and President of F&J Prince Holdings Corporat ion (PSE-listed), M agellan Capital Holdings
Corporat ion, M agellan Ut ilit ies Development Corporat ion, Consolidated Tobacco Industries of the
Philippines, Center Industr ial and Investment Inc., M alabrigo Corp., and Pinamucan Power Corporation.
He is also the M anaging Director of Essent ial Holdings Ltd. and Chairman of Pointwest Technologies
Corporat ion, Pointwest Innovations Corporat ion and Ipads Developers Corporat ion. Mr. Cokeng is the
Chairman of the Executive Committee of Business Process Outsourcing Internat ional and an Independent
Director of Cosco Capit al, Inc., a publicly listed company. Mr. Cokeng started as Senior Investment Off icer
and Philippine Count ry Off icer in Internat ional Finance Corp. (World Bank Group), Washington, D.C. from
1976 to 1986 and Planning Associate in M obil Oil Philippines from 1971 to 1972. M r. Cokeng graduated
from the Ateneo University with a degree of Bachelor of Arts in Economics Honors Program in 1971,
M agna Cum Laude. He obtained his M asters in Business Administ ration Degree from Harvard University
in 1976 and completed it with High Dist inct ion and was designated as a Baker Scholar.
CONRADO A. GLORIA, JR., Independent Director
M r. Gloria, Filipino, 62 years old, was elected Independent Director on June 4, 2019. He current ly holds
the positions of President & CEO of GIV Capital Holdings Corporation and Corporate Secretary of M iguel
and M aria Group of Restaurants, Inc. In the past , he served as President & COO of Investment & Capital
Corporat ion of the Philippines, Executive Vice President and M anaging Director of SB Capital Investment
Corporat ion, President of SB Equities, Inc., Senior Vice President of Southeast Asia Cement Holdings Inc.

27
and Senior Finance Officer of Internat ional Finance Corporat ion. Mr. Gloria obtained his Bachelor of Arts
in Economics at the University of the Philippines and his Masters in Business Administ rat ion at the Asian
Institute of M anagement.
BIENVENIDO E. LAGUESM A, Independent Director
Atty. Laguesma, 71 years old, was elected Independent Director on October 30, 2019. He is current ly a
Partner at Laguesma M agsalin Fernandez & Quirolgico Law Offices and an Independent Director of Cosco
Capital, Inc., The Keepers Holdings, Inc. (formerly Da Vinci Capit al Holdings, Inc.) and PAL Holdings, Inc.
At t y. Laguesma also sits as M ember of the Board of Trustees of M aritime Academy of Asia and the Pacific
and Vice Chairman of Anda Power Corporat ion. In the past , Atty. Laguesma was a Director of First M etro
Investment Corporat ion, Chairman of Charter Ping An Insurance Corporat ion, Director of DARE
Philippines, Inc., and M ember of the Board of Regents of the Pamantasan Ng Lungsod ng M aynila (PLM).
He also served the government from 1976-2001 and 2011-2016 in various capacit ies, notably as, among
others: 1) Commissioner and Ex-Officio Commissioner of the Social Securit y System; 2) Director of Land
Bank of the Philippines; 3) Director of HM DF (Pag-ibig Fund); 4) Director of Aurora Pacific Economic Zone
Authority; 5) Secretary and Undersecretary of the Department of Labor and Employment ; and 6)
President ial Assistant of the Office of the President of the Republic of the Philippines. At t y. Laguesma
obtained his AB Political Science degree at the Lyceum of the Philippines and his Bachelor of Laws at the
Ateneo College of Law. He also at tended a course in Public Service Administ ration at the Royal Institute
of Public Administ rat ion in London, U.K. and Executive Service Development Program at the Development
Academy of the Philippines.
EM M ANUEL Y. M ENDOZA, Independent Director
M r. M endoza, Filipino, 57 years old, was elected Independent Director on December 19, 2014. He is
current ly the M anaging Partner of M endoza Querido & Co., (a member firm of M oore Stephens
International Limited) and President of M Q Agri Unlimited Inc. He is also an Independent Director of
M edicard Philippines, Inc. He obtained his Bachelor in Business Administ ration in Accountancy at the
University of the Philippines and a M aster in M anagement at the Asian Institute of M anagement. M r.
M endoza is a Cert ified Public Accountant.
GILDA E. PICO, Independent Director
M s. Pico, Filipino, 75 years old, was elected Independent Director on February 22, 2017. She is currently
Chairman of the Board of Producers Savings Bank Corporat ion where she was formerly a Director
/ Consultant . M s. Pico is also connected w ith M arinor Development Corporat ion as Director/ Treasurer,
Gilart Holdings Corporat ion as President and PayM aya Philippines as Independent Director. In the past,
M s. Pico was President and CEO of Land Bank of the Philippines from November 2006 to July 2016. She
was Land Bank’s Acting President from July 2005 to November 2006 and Trustee of Land Bank
Countryside Development Fund from 2005 to 2015. She also served as Chairman/ Director in various
government and private inst itut ions engaged in leasing, realty, insurance, guarantees, microfinancing,
rural and development banking from 1985 to 2016 such as LBP Insurance Brokerage, Inc., LBP Leasing and
Finance Corporation, Landbank Realty Corp., M asaganang Sakahan, Inc., National Livelihood Development
Corporat ion, Peoples Credit and Finance Corporat ion, Philippine Crop Insurance Corporation, among
others. M s. Pico obtained her Bachelor of Science Degree in Commerce in 1966 from the College of the
Holy Spirit where she graduated M agna Cum Laude and earned units in M asters in Business
Administ rat ion from the University of the East. M s. Pico is a Cert if ied Public Accountant.
M ICHAEL STEPHEN H. LAO, Corporate Secretary and Corporate Information Officer
Atty. Lao, Filipino, 38 years old, was elected Corporate Secretary on June 4, 2019. He is concurrent ly the
Bank’s Corporate Information Officer which he holds since November 30, 2014. At ty. Lao was the Bank’s
Assistant Corporate Secretary from November 30, 2014 up to his election as Corporate Secretary. He is
current ly a Partner at Zambrano Gruba Caganda and Advincula Law Offices. At ty. Lao received his
Bachelor of Science degree in Business Administrat ion from College of Saint Benilde and his Juris Doctor
degree from Ateneo de M anila School of Law in 2012. He was admit ted to the Philippine Bar in 2013.

28
EXECUTIVE OFFICERS
JOHN HOWARD D. M EDINA, Execut ive Vice President and Chief Operat ions Officer
M r. Medina, Filipino, 52 years old, joined PBCOM in 2017 and has over 25 years of experience in the
banking industry as a senior execut ive in the Philippines and as an adviser to large banks in the United
States. M r. M edina obtained his Bachelor of Science in Industrial Engineering degree from the University
of the Philippines, Diliman and M aster of Business Administ rat ion degree from the Shidler College of
Business at the University of Hawai’i at M anoa. He was also awarded Graduate Cert ificates in Leadership
from The East–West Center, International M anagement from the Pacific Asian M anagement Institute, and
European M anagement from the European Summer School for Advanced M anagement held in Marseilles,
France.
ALAN E. ATIENZA, Executive Vice President – Treasurer
M r. At ienza, Filipino, 51 years old, joined PBCOM in 2015 and has over 25 years of banking experience in
Trading and Treasury Operat ions. He has been a recipient of numerous industry awards for Fixed Income
Trading and has been a board member of M oney M arket Association of the Philippines (M ART). Mr.
At ienza obtained both his Bachelor of Arts in Economics and his M aster of Business Administrat ion degree
from San Sebast ian College.
VICTOR O. M ARTINEZ, Execut ive Vice President – Corporate and Commercial Banking Group Head
M r. M art inez, 56 years old, joined PBCOM in 2020 and has over 26 years of experience in the banking
industry in the area of Inst itutional, Corporate and Commercial Banking covering industr ies in real estate,
telcos, logist ics, coal-fired & renewable energy power generation, power dist ribut ion, construction,
gaming & entertainment. M r. M artinez graduated from DLSU with a BS degree in Commerce, major in
M anagement of Financial Inst itut ions and from the Atkinson Graduate School of M anagement of
Willamet te University with a M asters degree in M anagement, major in Finance.
ARLENE M . DATU, Senior Vice President – Comptroller
M s. Datu, Filipino, 63 years old, joined PBCOM in 2013 and has over 38 years of banking experience
gained from Local and Foreign Banks as well as a Credit Card Company. She has extensive exposure on
Financial Account ing, M anagement Profitability Report ing and Analysis, Regulatory Compliance,
Operations, Risk and Audit. M s. Datu obtained her Bachelor of Science major in Account ing from
Polytechnic University of the Philippines.
EXPEDITO G. GARCIA, Senior Vice President – Transaction Banking Group
M r. Garcia, Filipino, 54 years old, joined PBCOM in 2015 with over 29 years of extensive M anagement and
Banking experience, with the last 18 years spent in a senior supervisory role. He has strong background in
Corporate Cash M anagement and M anaging and Developing Elect ronic Banking Channels with exposure
to both corporate and retail markets. M r. Garcia, obtained both his Bachelor of Science in Industrial
M anagement Engineering minor in M echanical Engineering and M aster’s Degree in Business
Administ rat ion from De La Salle University. He also holds a Cert ificate in Internat ional Cash M anagement
from the Associat ion of Corporate Treasurers, United Kingdom.
ERICO C. INDITA, Senior Vice President – Branch Banking Group
M r. Indita, 53 years old, joined the Bank in 2020 with over 26 years of banking experience part icularly in
Retail Banking. He obtained his Bachelor of Science degree in Commerce, major in M anagement, from
San Beda College & his M BA from the Ateneo Graduate School of Business.
JANE LIM -LARAGAN, Senior Vice President – General Services Group
Att y. Laragan, Filipino, 54 years old, joined PBCOM in 2016 and has 20 years of experience in various
Department: Legal, Human Resources, General Services, Compliance and Risk. At ty. Laragan obtained her

29
Bachelors Degree in Commerce M ajor in Economics, and Bachelors Degree in Law from the University of
Santo Tomas.
JERUEL N. LOBIEN, Senior Vice President – Chief Audit Executive
M r. Lobien, Filipino, 44 years old, joined the Bank in 2014 with more than 8 years of banking experience
and 6 years of audit ing/ internal audit work. He completed his Execut ive M asters in Business
M anagement at AIM and graduated from UP with a BS in Business Administ rat ion & Accountancy (cum
laude). He also has a Cert ificat ion on Control Self-Assessment , Is a Cert if ied Internal Auditor and a
Cert ified Public Accountant.
M INA F. M ARTINEZ, Senior Vice President – Human Resources Group Head
M s. M art inez, Filipino, 59 years old, joined PBCOM in 2015 with more than 20 years of experience in HR,
specializing in employee relations, counseling, performance management , benefits and compensation
administ ration, policy development and documentation, mot ivat ion, organization and leadership. She has
a Bachelor of Arts degree, major in M ass Communicat ions from the Far Eastern University.
The directors of the bank are elected at the annual stockholder's meet ing to hold office until the next
succeeding annual meet ing and until their respective successors have been elected and qualified.
Directorship in Other Reporting Companies
M r. Eric O. Recto is also a Director of DITO CME Holdings Corp. (formerly ISM Communications
Corporat ion), Atok-Big Wedge Co. Inc. and Aboit iz Power Corporation
M r. Leonardo B. Dayao is also a Director of Puregold Price Club, Inc. and Cosco Capital, Inc.
M r. Lucio L. Co is also a Director of Puregold Price Club, Inc., Cosco Capital, Inc., and The Keepers
Holdings, Inc. (formerly Da Vinci Capital Holdings, Inc).
M s. Susan P. Co is also a Director of Puregold Price Club, Inc. and Cosco Capital, Inc.
M r. Jaime J. Bautista is also a Director of Cosco Capital, Inc.
M r. Levi B. Labra is also a Director of Cosco Capital, Inc.
M r. Gregorio T. Yu is also a Director of DITO CME Holdings (formerly ISM Communicat ions
Corporat ion) and Vantage Equit ies, Inc.
M r. Jack Ekian T. Huang is also a Director of Puregold Price Club, Inc. and First Abacus Financial
Holdings Corporat ion.
M r. Robert Y. Cokeng is also a Director of F & J Prince Holdings Corp. and an Independent
Director of Cosco Capital, Inc.
M r. Bienvenido E. Laguesma is also an Independent Director of Cosco Capital, Inc. and Keepers
Holdings, Inc. (formerly Da Vinci Capital Holdings, Inc.)
Shares of Atok-Big Wedge Co., Inc. (AB), DITO CM E Holdings Corp. (DITO) (formerly ISM Communicat ions
Corporat ion), Aboit iz Power Corporation (AP), Puregold Price Club, Inc. (PGOLD), Cosco Capital, Inc.
(COSCO), Keepers Holdings, Inc. (KEEPR) (formerly Da Vinci Capital Holdings, Inc.), Vantage Equities, Inc.
(V), First Abacus Financial Holdings Corp.(FAF), F&J Prince Holdings Corp. (FJP) are all listed in the
Philippine Stock Exchange, Inc.
(2) Significant Employees
There is none to disclose. The Bank current ly does not employ any person who is not an execut ive off icer
but makes a significant contr ibut ion to the business.
(3) Family Relationships
M r. Lucio L. Co and M s. Susan P. Co are husband and wife. Other than the foregoing, the persons
nominated or chosen by the Bank to become directors or execut ive officers are not related to each other
up to the fourth civil degree either by consanguinity or affinity.

30
(4) Involvement in Legal Proceedings
To the best of the knowledge of management, the Bank is not aware of:
any bankruptcy pet it ion f iled by or against any business of which they are incumbent directors or
senior officers, was a general partner or executive off icer either at t he t ime of the bankruptcy or
within two years prior to that t ime;
any convict ion by final judgment in a cr im inal proceeding, domestic or foreign, pending against
any of the incumbent directors or execut ive of ficers;
any order, judgment, or decree, not subsequent ly reversed, suspended or vacated, of any court
of competent jurisdiction, domestic or foreign, permanent ly or temporarily enjoining, barring,
suspending or otherw ise limit ing the involvement of the incumbent directors or execut ive
officers in any type of business, securit ies, commodities or banking activit ies; and
any finding by a domest ic or foreign court of competent jurisdict ion (in civil act ion), the SEC or
comparable foreign body, or a domest ic or foreign exchange or elect ronic marketplace or said
regulatory organization, that any of the incumbent directors or executive officers has violated a
securit ies or commodities law, and the judgment has not been reversed, suspended or vacated,
which may have a material effect in the operations and deter, bar or impede the fulfillment of
his/ her duties as a director or executive officer of the Bank.
Item 10. Executive Compensation
Compensation of Directors and Executive Officers
Since the Bank obtained an exempt ion from the SEC to disclose the required detailed compensat ion
information, disclosure of aggregate compensat ion paid or accrued during the last three fiscal years 2019
to 2021 of the Bank's Chief Execut ive Officer and four other most highly compensated execut ive officers
are as follows:
2021 2020 2019
CEO and four most
highly compensated
Executive officers
Patr icia M ay T. Siy
President & CEO
John How ard D. M edina
Execut ive Vice President
Alan E. At ienza
Execut ive Vice President
Victor O. Mart inez
Execut ive Vice President
Arlene M . Datu
Senior Vice President
Pat ricia May T. Siy
President & CEO
John Howard D. M edina
Executive Vice President
Alan E. Atienza
Executive Vice President
Victor O. M art inez
Executive Vice President
Arlene M . Datu
Senior Vice President
Pat ricia May T. Siy
President & CEO
John Howard D. M edina
Executive Vice President
Alan E. Atienza
Senior Vice President
Arlene M . Datu
Senior Vice President
Expedit o G. Garcia, Jr.
Senior Vice President
Salary
Bonus
Other Annual
Compensation
P=60,175
20,258
P=50,719
18,685
P=48,960
16,320
TOTAL P= 80,433 P=69,404 P=65,280
All officers and directors as Group Unnamed

31
Salary
Bonus
Other Annual
Compensation
P= 624,600
193,915
-
P=621,114
192,947
-
P=620,420
188,364
-
TOTAL P= 818,515 P=814,061 P=808,784
The following is the est imated annual compensat ion for year 2022:
Salary BonusOther Annual
CompensationTotal
Total of CEO and
Four most highly
compensated
Executive Officers
P=60,775 P=20,258 none P=81,033
All officers as a
group unnamed
626,772 196,542 none 823,314
The director’s per diem amounted to P13.36 M illion, P=12.43 M illion and P=9.75 M illion, as of December 31,
2021, 2020 and 2019, respect ively.
The five (5) Independent and four (4) other regular Directors are entit led to a Director’s fee for attending
Board meet ings. The remaining six (6) Directors have waived their r ight to receive Director’s fees. As
st ipulated in the By-laws, Directors are also ent it led to share in the net profits to be dist r ibuted in such
manner as the Board may provide but not exceeding four (4) percent .
There are no other terms and conditions with regard to employment contract between PBCOM and
named Execut ive Off icers or any other more compensatory plans or arrangement except those disclosed
above.
There are no Outstanding Warrants or Opt ions held by the Directors, Officers as of December 31, 2021.
The Bank has no record of adjust ing or amending the exercise price of stock warrants previously awarded
to any of the off icers and directors.
Item 11. Security Ownership of Certain Beneficial Owners and M anagement
A. Security Ownership of Certain Record and Beneficial Owners of more than 5 percent of the Bank’s
capital stock as of December 31, 2021:
Title of
Class
Name and Address of Record
Ow ner and relationship with Issuer
Name of Beneficial
Ownership and
relationship with
Record Owner
Citizenship No. of
Shares
% Held
Common P.G. Holdings, Inc.
900 Romualdez St., Paco, Manila
Stockholder
Lucio L. Co-Chairman
Susan P. Co-Direct or
Filipino 186,241,408 38.75%
Common VFC Land Resources, Inc.
1379 San Gregorio St., Paco, M anila
Stockholder
Various st ockholders
Lucio L. Co – Aut horized
to vote the shares
Filipino 73,619,038 15.32%
Common Ralph C. Nubla, Jr .
2 Sanso Street , Cor inthian Gardens,
Quezon Cit y
Stockholder
Ralph C. Nubla, Jr. –
same as record ow ner
Filipino 51,779,374* 10.77%
Common PCD Nominee Corporat ion
29 th Floor, BDO Equitable Tow er,
8751 Paseo de Roxas, M akat i City
Stockholder
Various st ockholders Filipino
Non-Filipino
49,157,327
1,994,361
51,151,688
10.22%
0.42%
10.64%
Common Eric O. Rect o Er ic O. Recto – same as Filipino 50,159,424* * 10.43%

32
5/ F PBCOM Tower 6795 Ayala Ave.
cor. V.A. Rufino St ., M akati City
Stockholder
record ow ner
Common Telengtan Brothers & Sons, Inc.
Km. 14, South Superhighway,
Paranaque City
Stockholder
Various st ockholders
Author ized t o vot e the
shares-any one the ff:
Bunsit Carlos G.
Chung/ Felix
Chung/ Ching Tiong
Keng
Filipino 31,859,844 6.63%
* 5,260,338 shares of the 51,779,374 shares of Ralph C. Nubla, Jr. are under PCD Nominee Corporation
* * 323,648 shares of the 50,159,424 shares of Eric O. Recto are under PCD Nominee Corporat ion
B. Security Ownership of M anagement as of December 31, 2021:
Title of
Class
Name of Beneficial
Ow ner
Amount and Nature of Beneficial
Ow nership
Citizenship Percent
Common Eric O. Rect o Direct 50,159,424 Filipino 10.43%
Common Leonardo B. Dayao Direct 10,001 Filipino 0.00%
Common Pat ricia May T. Siy Direct 100 Filipino 0.00%
Common Bunsit Carlos G. Chung Direct 550,716 Filipino 0.11%
Indirect 449,294 0.09%
Common Lucio L. Co Direct 1 Filipino 0.00%
Indirect 93,120,704 19.37%
Common Susan P. Co Direct 1 Filipino 0.00%
Indirect 93,027,584 19.35%
Common Levi B. Labra Direct 100 Filipino 0.00%
Common Gregorio T. Yu Direct 1,432,692 Filipino 0.30%
Common Jack E. Huang Direct 100 Filipino 0.00%
Common Jaime J. Bautista Direct 100 Filipino 0.00%
Common Robert Y. Cokeng Direct 200 Filipino 0.00%
Common Conrado A. Glor ia, Jr. Direct 100 Filipino 0.00%
Common Bienvenido E. Laguesma Direct 100 Filipino 0.00%
Common Em manuel Y. M endoza Direct 100 Filipino 0.00%
Common Gilda E. Pico Direct 100 Filipino 0.00%
C. Voting Trust Holders of 5% or more
There are no vot ing trust agreements or any other agreements/ arrangements that may result in a change
in cont rol of t he Company.
Item 12. Certain Relationships and Related Transactions
Part ies are considered to be related if one party has the ability, direct ly or indirect ly, to control the other
party or exercise significant influence over the other party in making financial and operat ing decisions.
The Bank’s transactions with related parties include key management personnel, affiliates (i.e. ent it ies
which are controlled), significantly influenced by or for which significant vot ing power is held by the Bank
or key management personnel or their close family members and ret irement plan for the benefit of the
Bank’s employee). These t ransact ions are made in the ordinary course of business and on substant ially
same terms with that of other parties.
The Bank’s related party t ransact ions below are also presented and discussed in details in the Audited
Financial Statements.
Related Party Transaction with the Bank
Post-retirement Plan Investment made in ret irement plan is approved by the Bank’s Ret irement
Board. Trust fee income from such service and total deposits maintained

33
with the Bank in 2021 amounted P=2.65 M illion and P=42.50 M illion,
respect ively while interest expenses paid by the Bank to the deposits was P=
0.14 M illion.
Provident Fund Outstanding deposit and interest paid by the Bank as of year-end was P=
42.0 M illion and P=0.12 M illion, respect ively while trust fees earned from
such service amounted to P=2.36 M illion.
Key M anagement Personnel Senior M anagement Team const itutes key management personnel for
purposes of PAS 24. Short term benefit s and post-employment benefit s
given to SM T in 2021 amounted to P=141.57 M illion and P=8.28 M illion,
respect ively. Year-end balance of deposit s and interest expenses paid by
the Bank amounted to P=37.62 M illion and P=0.02 M illion respect ively.
Affiliate Year-end balance of deposits and interest expenses incurred by the Bank
amounted P18.23 M illion and P=0.015 M illion, respect ively. Rental income
earned for the year is P=0.153 M illion.
Subsidiaries Year-end balance of deposits incurred by the Bank amounted P8.9 M illion.
Significant Investors Year-end balance of deposits and interest expenses incurred by the Bank
amounted P=5.68 Billion and P=15.64 M illion, respect ively. Rental income
during t he year amounted to P=2.04 M illion and rent-related depreciat ion
and interest expense were P=24.37 M illion and P=4.2 M illion, respect ively.
Loans and receivables outstanding balance is P=2.9 Billion
As required by BSP, the Bank discloses loans t ransact ions with certain directors, officers, shareholders and
their related interests (“ DOSRI” ) in the ordinary course of business, under commercial terms and on an
arm’s length basis observing at all t imes the legal limits prescribed under current BSP regulat ions on
DOSRI loans. The amount of individual loans to DOSRI, of which 70% must be secured, should not exceed
the amount of their respective deposits and book value of their respect ive investments in the Bank. In
the aggregate, loans to DOSRI generally should not exceed the lower of the Bank’s total unimpaired
capital or 15% of the total loan port folio. These lim its do not apply to loans secured by assets considered
as non-risk as defined in the regulations. As of December 31, 2021 the Bank is in compliance with such
regulat ions.
PART IV - CORPORATE GOVERNANCE
Item 13. Corporate Governance
PBCOM Board of Directors and M anagement, employees and shareholders, believe that Corporate
Governance is a necessary component of what const itutes sound st rategic business management. Thus,
the Bank has undertaken every effort necessary to create awareness for this within the organization. All
Directors and Senior M anagement are required to at tend its annual cont inuing educat ion program on
Corporate Governance and Risk Awareness. The Board, Senior M anagement and all employees conduct
themselves with utmost honesty and integrity in the discharge of their dut ies, functions and
responsibilities, thus nurturing the cont inuing success of the Bank and securing it s competit iveness in the
best interest of the Bank, its shareholders and other stakeholders. Bank Officers promote the good
governance pract ices within the Bank by ensuring that policies on governance are consistent ly adopted
across the organization, w ith measurable standards, init iatives and specific responsibilit ies and
accountabilit ies for each personnel.
Consistent with the global pract ices of good Corporate Governance, the Bank’s overriding commitment to
a culture of good governance is seen through the following underlying principles:
1. It is the Bank’s object ive to enhance shareholders’ value by making the most efficient use of
resources. Its human capital strategy is one of its vital focus areas, as it is a principal indicator for

34
the company’s success.
2. The Board of Directors const itutes Board Committee namely Governance, Audit, Risk Oversight
and Related Party Transact ions Commit tees which are all chaired by Independent Directors and
composed of majority of Independent Directors, all of whom have a good understanding of the
business.
3. The Governance Committee is responsible for ensuring the Board's effect iveness and due
observance of Corporate Governance principles and guidelines. They assist the Board of Directors
in fulfilling its corporate governance responsibilit ies.
4. The Governance Commit tee, through its Nominations Sub-Commit tee, ensures the quality of its
leadership, consistent w ith its “ fit and proper” rule when selecting its Directors and Senior
M anagement Team, while the Performance Evaluat ion Sub-Commit tee, recommends and
oversees the implementation of a Performance M anagement Process for Senior M anagement
and the M embers of the Board, review performance vis-a-vis agreed upon objectives, evaluate
progress made w ith respect to Senior M anagement Directors Development plans, monitor
changes in professional affiliat ions, personal status even health, which could have qualificat ions,
resignation and succession implicat ions.
5. Transparency in its Annual Reports is ensured and reflects true and fair accounting information
prepared in accordance with applicable standards; disclose and discuss all material r isks; and
disclose and explain the rat ionale for all material estimates. Disclosures are all completed in a
t imely manner.
6. To ensure that all act in the best interest of the Bank, full disclosure by its Directors, Officers and
Employees on any actual or expected conflict of interest is required
7. The Bank’s Corporate Governance M anual, Code of Ethics and Code of Conduct clearly states
M anagement’s philosophy and compliance standards.
Annually, the Bank through the Governance Commit tee reviews the Corporate Governance M anual and
recommends changes/ amendments/ revisions for the approval of the Board of Directors when and where
necessary.
In addition, to promote a st rong governance culture and transparency, the Bank’s compliance with the
Code of Corporate Governance are disclosed in the Integrated Annual Corporate Governance Report .
PART V - EXHIBITS AND SCHEDULES
Item14. Exhibits and Reports on SEC Form 17-C
1. Exhibits – None
2. Reports on SEC Form 17 – C (2021)
Date Part iculars
December 7, 2021 The Bank disclosed the Upgrade of its Banking License from Commercial Bank to
Universal Bank.
November 5, 2021 The Bank disclosed its Statement of Condit ion as of September 30, 2021.
October 27, 2021 The Bank disclosed the 2021 Amendments to its By-Laws.
August 4, 2021 The Bank disclosed its Reply to the Exchange’s Query regarding Disclosure of
Personal and Sensit ive Information Relating to the Bank’s 2021 General Informat ion
Sheet.
August 4, 2021 The Bank disclosed the Statement of Condit ion as of June 30, 2021.
July 28, 2021 The Bank disclosed the new composit ion of its Audit Commit tee:

35
FROM TO
Chairman: Emmanuel Y. M endoza (ID)
M embers: Gilda E. Pico (ID)
Levi B. Labra
Jaime J. Bautista
Chairman: Emmanuel Y. M endoza (ID)
M embers: Gilda E. Pico (ID)
Jaime J. Baut ista
June 30, 2021 The Bank disclosed the Change in Directors and/ or Officers(resignat ion/ Removal or
Appointment / Election and/ or Promotion- (M r. Jeruel N. Lobien, SVP, Chief Audit
Executive and M s. M ina F. M art inez, SVP, HR Head).
June 15, 2021 The Bank disclosed the Amendments to its By-Laws (Annual Stockholders’ M eet ing).
June 15, 2021 The Bank disclosed the Result of Annual M eet ing of Stockholders and
Organizat ional Board M eet ing:
Board of Directors for Year 2021-2022:
Eric O. Recto-Chairman
Leonardo B. Dayao-Vice Chairman
Lucio L. Co
Pat r icia M ay T. Siy
Susan P. Co
Bunsit Carlos G. Chung
Jack Ekian T. Huang
Levi B. Labra
Gregorio T. Yu
Jaime J. Bautista
Gilda E. Pico- Independent Director
Emmanuel Y. M endoza- Independent Director
Conrado A. Gloria, Jr.- Independent Director
Bienvenido E. Laguesma- Independent Director
Robert Y. Cokeng- Independent Director
Corporate Off icers of the Bank for Year 2021-2022:
President and CEO Pat ricia M ay T. Siy
EVP & Chief Operations Off icer: John Howard D. M edina
EVP & Treasurer Alan E. Atienza
EVP & Corporate and Commercial Banking
Group Head
Victor O. M art inez
SVP & Comptroller Arlene M . Datu
SVP & Transact ion Banking Group Head Expedito G. Garcia, Jr.
SVP & Branch Sales and Dist ribut ion Head Erico C. Indita
SVP & General Services Group Head: Jane Lim-Laragan
FVP & Chief Risk Officer: Lorellei Paula B. Arjonillo
FVP & Chief Audit Executive: Jeruel N. Lobien
FVP & Human Resources Group Head M ina F. M art inez
FVP & Trust Officer Dreda Teresa D. M endoza
FVP & Chief Information Officer Ariel A. Roda
FVP & Legal Services Group Head Jo-anne R. Legaspi
SAVP & Chief Compliance Officer: Angelita U. Egalin
Corporate Secretary: M ichael Stephen H. Lao
The Board of Directors likewise const ituted the following committees and
appointed the following members thereof:

36
Executive Commit tee:
a) Lucio L. Co (Chairperson)
b) Eric O. Recto (Vice Chairperson)
c) Leonardo B. Dayao (Vice Chairperson)
d) Patricia M ay T. Siy
e) Bunsit Carlos G. Chung
f) Jaime J. Bautista.
Audit Commit tee:
a) Emmanuel Y. M endoza (Chairperson/ Independent Director)
b) Gilda E. Pico (Independent Director)
c) Levi B. Labra
d) Jaime J. Bautista
* Audit Commit tee members cannot concurrent ly serve as t rust Commit tee member
Governance Commit tee:
a) Gilda E. Pico (Chairperson/ Independent Director)
b) Conrado A. Gloria, Jr. (Independent Director)
c) Bienvenido E. Laguesma (Independent Director)
d) Eric O. Recto
e) Leonardo B. Dayao
The Governance Commit tee also serves as the Bank’s Nominat ions Commit tee,
Compensat ion and Remuneration Commit tees, and Performance Evaluation Committee.
Related Party Transactions Commit tee
a) Robert Y. Cokeng (Chairperson/ Independent Director)
b) Conrado A. Gloria, Jr. (Independent Director)
c) Gilda E. Pico (Independent Director)
d) Levi B. Labra
Risk Oversight Commit tee:
a) Conrado A. Gloria, Jr. (Chairperson/ Independent Director)
b) Bienvenido E. Laguesma (Independent Director)
c) Robert Y. Cokeng (Independent Director)
d) Levi B. Labra
e) Patricia M ay T. Siy
Trust Commit tee
a) Eric O. Recto (Chairperson)
b) Robert Y. Cokeng (Independent Directors)
c) Patricia M ay T. Siy
d) Jack Ekian T. Huang
e) Dreda Teresa D. M endoza (Trust Officer)
* Trust Committee members cannot be appointed as Audit Commit tee members
M ay 26, 2021 The Bank disclosed the 2021 Amendments to its By-Laws.
M ay 12, 2021 The Bank disclosed the Change in Directors and/ or Officers(resignation/ Removal or
Appointment / Election- (Demise of Independent Director, M r. Jesus S. Jalandoni, Jr.

37
on 4 M ay 2021).
M ay 7, 2021 The Bank disclosed its Statement of Condit ion as of M arch 31, 2021.
April 28, 2021 The Bank disclosed the Not ice of 2021 Annual M eet ing.
Date and Time 15 June 2021 (Tuesday) at 9:00 A.M . to 10:00 A.M .
Venue Virtual Stockholders’ M eeting at the link to be provided in
PBCOM ’s Website- ht tps:/ / www.pbcom.com.ph/
Record Date 14 M ay 2021
February 3, 2021 The Bank disclosed its Reply to Exchange’s Query regarding Consent to Publish Personal
and Sensitive Personal Information of the Principal Officers of the Bank.
February 3, 2021 The Bank disclosed its Statement of Condit ion as of December 31, 2020.
January 27, 2021 The Bank disclosed the Change in Directors and/ or Officers (resignation/ Removal
Appointment / Elect ion and/ or Promot ion- (Appointment of M s. Dreda Teresa D. Mendoza,
as
FVP, Trust Officer and TWM G Head).
January 4, 2021 The Bank disclosed the Director’s At tendance for the Year 2020.


CONDITI
ON OF
PREMISE
S
OWNED /
LEASED
MONTHLY RENTAL
(OFFICE + PARKING
+ OTHER CHARGES)
AS OF DECEMBER
2020
EXPIRY DATE RENEWAL OPTIONS
A. BANK-OWNED PROPERTIES UTILIZED AS BRANCHES
7th Floor, PBCOM Bldg 214-216 Juan Luna St.
Binondo Manilagood owned -
4th Floor, PBCOM Bldg 214-216 Juan Luna St.
Binondo Manilagood owned -
2 CAGAYAN DE OROPBCOM Bldg. Hayes St. cor. Tiano Bros. St.
Cagayan De Oro Citygood owned -
3 CEBUMagallanes near corner Manalili Streets, Cebu
Citygood owned -
4 DAVAO 41 Monteverde St., Davao City good owned - 5 GENERAL SANTOS Santiago Blvd., General Santos City good owned - 6 ILOILO Ledesma corner Valeria Sts, Iloilo City good owned - 7 KORONADAL Gen. Santos Drive, Koronadal, South Cotabato good owned -
8 MAKATI BANKING CENTERPBCOM Tower, 6795 Ayala Avenue corner V.A.
Rufino, Makati Citygood owned -
9 MANDAUENational Highway corner Jayme Street,
Mandaue Citygood owned -
10 MANGO General Maxillom (Mango) Ave., Cebu City good owned - 11 MARIKINA 34 J.P. Rizal St., Calumpang, Marikina good owned -
12MERALCO AVE
(FORMER JULIA VARGAS)
C-1 Horizo Condominium, Meralco Avenue,
Pasig City good owned -
13 QUIRINO-DAVAO 111 E. Quirino Avenue, Davao City good owned - 14 TAGUM Pioneer Avenue, Tagum, Davao del Norte good owned -
15U.N. AVENUE
(FORMER MABINI)
U101 & 102, Don Alfonso Cond. 1108 MH del
Pilar cor. UN Ave. & Guerreo Sts., Ermita,
Manila
good owned -
B. LEASED PROPERTIES UTILIZED AS BRANCHES
1 ANGELESGround Floor, MLT Centre Building, Lot 28,
Block 2, McArthur Highway, Brgy. Ninoy Aquino,
Angeles City
good leased 101,311.23 15-Aug-2023
2 ANNAPOLISUnit 101 Victoria Plaza Condominium 41
Annapolis St., Greenhills, San Juangood leased 267,484.18 15-Apr-2024
3 AYALA-ALABANG ALPAP II Building, Investment Drive cor. Trade
St., Madrigal Busines Park, Ayala Alabang,
Muntinlupa City
good leased 266,306.90 31-Jan-2026
4 BANAWEG/F 2 Benby Building, Banawe Street, Quezon
Citygood leased 113,448.72 22-Nov-2024
5 BACOLOD Units A-E, Ground Floor, Sorrento good leased 157,926.78 29-Feb-2024
6 BAGUIOGround Floor Level, Unit Nos. 105, 106 & 106-
B, Baguio Holiday Villas, No. 10 Legarda Road,
Baguio City
good leased 226,652.07 30-Nov-2022
7 BATANGAS Diego Silang St., Batangas City good leased 133,126.88 31-Jan-20228 BMA Web-Jet Building, Quezon Ave., Q.C. good leased 99,491.49 30-Nov-2023
9 CABANATUANGround Floor, SAM Building along Maharlika
Highway, Cabanatuan Citygood leased 60,000.00 31-Jan-2024
10 CAINTAGF Unit RSJ-0106, RS City Square – Junction Ortigas Avenue Extension Brgy. Sto. Domingo,
Cainta Rizal.
good leased 76,496.56 17-Oct-2026
11 CALAMBAGround Floor Walter Mart, National Highway
corner Real Street, Calamba, Lagunagood leased 101,963.05 31-Dec-2021 relocated.
12 CALOOCAN 298-C2 6th Avenue Ext. Caloocan City good leased 87,614.27 14-Sep-2022
13 CAUAYANMateo-Patricia Bldg., Rizal Avenue Extension,
Cauayan, Isabelagood leased 86,821.88 31-May-2023
14 CEBU BUSINESS PARKLatitude Corporate Center, Mindanao Avenue,
Cebu Business Park, Cebu Citygood leased 265,643.35 21-Jun-2026
15 CONGRESSIONAL No. 8 Congressional Ave., Brgy. Bahay Toro,
Quezon Citygood leased 108,007.84 30-Apr-2022
16 CUBAO 2nd Floor SPARK Place, P. Tuazon cor. 10th
Avenue, Quezon Citygood leased 205,078.17 31-Aug-2023
17 DAGUPAN Ground Floor, Balingit Building, Arellano Street,
Dagupan Citygood leased 98,759.88 15-May-2024
18 DASMARINASEVY Building Salawag-Paliparan Road
Dasmariñas, Cavitegood leased 101,516.80 31-Oct-2022
19DAVAO BUHANGIN (reloc site
of Davao Bajada)
G/F Pacific Plaza, Lot 3, Block 18, Buhangin
Road, Davaogood leased 61,600.00 30-Apr-2026
20TACLOBAN (reloc site of
Dumaguete)Imelda Veteranos St. Brgy. 23, Tacloban City good leased 76,807.50 05-Mar-2025
21 ELCANO SHC Tower, Elcano St., San Nicolas, Manila good leased 173,978.00 28-Feb-2024
22 F1 HOTEL, BGCF1 Hotel Building, Lane Q corner Lane A Roads,
Bonifacio Global City,good leased 846,201.27 15-Feb-2023
23 GREENHILLSQuadstar Building, 80 Ortigas Avenue, San
Juan, Metro Manilagood leased 247,087.18 31-Mar-2026
24 ILIGANRoxas Avenue, Poblacion, Iligan City, Lanao del
Norte. good leased 98,126.15 18-Jul-2024
1 BINONDO BANKING CENTER
PHILIPPINE BANK OF COMMUNICATIONS
BRANCHES' SITES - OWNED AND LEASED
AS OF DECEMBER 31, 2021
No. BRANCH ADDRESS
LEASE TERMS
ANNEX A

CONDITI
ON OF
PREMISE
S
OWNED /
LEASED
MONTHLY RENTAL
(OFFICE + PARKING
+ OTHER CHARGES)
AS OF DECEMBER
2020
EXPIRY DATE RENEWAL OPTIONSNo. BRANCH ADDRESS
LEASE TERMS
25 IMUSLuis Gaerlan St., and Imus Boulevard, Imus,
Cavitegood leased 89,600.00 30-Jun-2026
26 J.P. RIZALGround Floor, Santini Corp. Building, 519 J.P.
Rizal Ave., Brgy. Olympia, Makati Citygood leased 181,226.38 30-Apr-2022
27 LA UNION Quezon Avenue, San Fernando City, La Union good leased 101,494.44 31-Jan-2022
28 LEGASPI VILLAGEUnit 1-A, Vernida I 120 Amorsolo St., Legaspi
Vill., Makati Citygood leased 85,911.21 31-Jul-2026
29 LEGAZPI CITYGround Floor De Los Santos , Commercial
Building, Landco , Business Park, Legazpi Citygood leased 163,691.61 09-Aug-2024
30 LIPAATDRMAM Building Ayala Highway Mataas na
Kahoy, Lipagood leased 112,313.31 31-Jan-2024
31 LUCENAVCCI Building Merchan cor. San Fernando,
Lucena Citygood leased 102,618.51 15-Nov-2023
32 M. DE SANTOS, DIVISORIA553-561 M. De Santos St., Divisoria, Tondo,
Manilagood leased 278,739.89 31-Mar-2025
33 MAKATI PLACE Ground Floor Unit C-15, Alphaland Makati Place,
Ayala Ave. cor. Malugay St. Makati City.good leased 174,929.13 30-Nov-2022
34 MALABON Building L, #34 Gov. Pascual Avenue corner
Ibarra Street, Brgy Acacia, Malabon City.good leased 92,265.60 24-Jun-2024
35 MALOLOSMalolos Shopping Arcade Paseo Del Congreso,
Malolos Citygood leased 73,376.24 15-Aug-2026
36 MASANGKAY 1004-1006 Masangkay St. Binondo, Manila good leased 154,560.00 30-Sep-2024
37 MEYCAUAYANMancon Building McArthur Highway, Calvario,
Meycauyan Citygood leased 92,726.56 15-Apr-2026
38 NAGAGround Floor, Rodriguez Building, 956
Panganiban St., corner Balintawak St., Naga
City
good leased 93,804.67 28-Feb-2023
39 OLONGAPOGrd. Flr. YBC Centre Mall, Rizal , Avenue
Extension, Olongapo Citygood leased 152,945.60 30-Sep-2022
40 ONGPINChinatown Center, 729 Ongpin Street, Sta.
Cruz, Manilagood leased 348,085.39 30-Sep-2022
41 PADRE RADA 951 Juan Luna Street, Tondo, Manila good leased 149,300.75 14-Jul-2022
42 PARANAQUEUnit 3-4, Kingsland Building Dr. A. Santos
Avenue, P'que. Citygood leased 160,583.13 31-May-2022
43 PASAY 2492 Taft Avenue, Pasay City good leased 129,640.00 31-Oct-2023
44 PIONEERRFM Corporate Center Pioneer cor. Sheridan
Sts., Mandaluyong Citygood leased 195,394.36 13-May-2026
45 PUREGOLD SAN PEDROPuregold San Pedro, Old National Highway cor.
Magsaysay St., San Pedro, Lagunagood leased 55,932.69 31-Jan-2025
46 QUEZON AVEAPC Building, 1186 Quezon Avenue, Quezon
Citygood leased 272,249.60 30-Sep-2026
47 SAN FERNANDOMcArthur Highway Dolores, San Fernando,
Pampangagood leased 154,224.81 31-Mar-2024
48 SAN MIGUEL AVE.Unit G101OMM-CITRA Condominium, San
Miguel Avenue, Ortigas Center, Pasig Citygood leased 175,975.02 31-Jul-2025
49 SAN PABLO Rizal Avenue, San Pablo City, Laguna good leased 55,594.90 30-Apr-2026
50 SEN. GIL PUYATUnit 101-C, Oppen Building, 349 Sen. Gil Puyat
Avenue, Makati Citygood leased 252,292.94 14-Jul-2023
51 SHAW BLVD146 Shaw Boulevard cor. San Roque St., Pasig
Citygood leased 87,823.80 15-Nov-2022
52 SOLER No. 943 Soler St., of R & S Tower, Inc.,
Binondo, Manilagood leased 129,670.40 31-May-2023
53 SOUTH GATE MALL Unit T06 and T07, Third Floor, Alphaland
Southgate Mall, 2258 Chino Roces Avenue
corner EDSA, Makati City, Metro Manila
good leased 242,039.88 18-Dec-2022
54 STA. MESA G. Araneta Avenue, Sta. Mesa, Q.C. good leased 141,737.16 31-Jul-2022
55 STA. ROSAUnit No. 2, Paseo 5, Phase 2, Paseo de Sta.
Rosagood leased 220,034.15 31-Mar-2022
56 STO. CRISTO 563 Sto. Cristo Street, Divisoria, Manila good leased 94,500.00 16-Sep-202357 T. ALONZO T. Alonzo Street, Sta. Cruz, Manila good leased 301,864.50 10-Sep-2024
58 TAGBILARANGround Floor, LTS Building, Carlos, P. Garcia
Avenue, Tagbilaran Citygood leased 67,200.00 30-Jul-2025
59 TIMOG 75 Timog Avenue, Quezon City good leased 162,954.37 15-Jul-2024
60S&R NEW Manila (reloc of
Tomas Morato)
G/F S&R Membership Shopping New Manila E.
Rodriguez Sr. Avenue, Brgy. Kalusugan, New
Manila, Quezon City
good leased 113,940.00 04-Feb-2025
61 VALENZUELA 246 McArthur Highway, Karuhatan, Valenzuela good leased 178,500.00 18-May-2022
62 ZAMBOANGA VALDEROSA LKG Building, Valderosa Street, Zamboanga City good leased 136,399.10 30-Apr-2024
63 ZAMBOANGA VETERANSBSC Tower (formerly Zamsulu Bldg.) Ground
Floor, Door 5-7, Veterans Ave., Zamboanga Citygood leased 117,928.42 30-Sep-2024
64 LAPU-LAPUGrd. Flr. Unit 11, Alpha Arcade Bldg., M.L.
Quezon National Highway, Pajo, Lapu-Lapu Citygood leased 28,986.88 31-Jul-2025
65 DIVISORIA MALL
Stalls No. 3N-01, 03 and 05 located at Third
Floor (3rd) Old Divisoria Market, bounded by
Tabora, Comercio, M. De Santos and Sto.
Cristo, Manila
good leased 129,531.72 02-Jul-2026
66 INOZA TOWERGround Floor Unit D, 40th St., Bonifacio Global
City, Taguig Citygood leased 364,455.56 07-Oct-2022
67 WILSONGround Floor Unit of ONE86 at Wilson, San
Juan, Metro Manilagood leased 82,654.43 14-Oct-2022

CONDITI
ON OF
PREMISE
S
OWNED /
LEASED
MONTHLY RENTAL
(OFFICE + PARKING
+ OTHER CHARGES)
AS OF DECEMBER
2020
EXPIRY DATE RENEWAL OPTIONSNo. BRANCH ADDRESS
LEASE TERMS
68 S & R COMMONWEALTH
Ground Floor Unit 4 of S & R Membership
Shopping – Commonwealth, Brgy. Kaligayahan, Quirino Highway, Novaliches, Quezon City
good leased 145,068.93 15-Dec-2022
69 S & R DAU
Ground Floor Unit 2 of S&R Membership
Shopping Dau, NLEX Access Road, Barangay
Dau, Mabalacat City, Pampanga
good leased 103,458.60 15-Mar-2023
70 LIBIS
of Ground Floor Commercial Spaces at Nuvo
City - Aspire Tower, 150 E. Rodriguez Jr.
Avenue cor. Calle Industria, Bagumbayan,
Quezon City
good leased 91,078.00 05-Sep-2025
71 ORMOCUnit 105, Ground Floor of L & R Building,
Bonifacio Street, District 8, Ormoc City, Leytegood leased 20,276.73 12-Jun-2022
BRANCHES OPENED IN 2019
72 BALIUAGNE Super Bodega, Dona Remedios Trinidad
Highway, Baliuag, Bulacan good leased 42,444.00 22-Sep-2024
LONG TERM BRANCH LEASE
73 CORINTHIAN GARDENS Sanso Street, Corinthian Gardens, Q.C. Leasehold Rights of P12
Million 30-Sep-2031
74 TUTUBANPrime Block Building, Tutuban Center, C.M.
Recto Avenue, Manila
Leasehold Rights of
P9.92 Million 22-Aug-2039
BRANCHES OPENED IN 2021
75INTRAMUROS (using ECHAGUE
LICENSE)AVR Building, Beaterio Intramuros Manila good leased 95,200.00 01-Apr-2026
76 LAS PINAS2012 Marcos Alvarez, Brgy. Talon Singko, Las
Pinas Citygood leased 57,086.40 27-Jan-2026
LIST OF BRANCHES LITES/ POP-UPS
1 BL- PG TAGUIGG/F Puregold Taguig, Gen. A. Luna St. cor. Col.
P. Cruz., Barangay Tuktukan, Taguig Citygood leased 41,065.71 31-Oct-2024
2 BL- PG VALENZUELAG/F Puregold Valenzuela, 419 Manila North
Road ( Mc Arthur Highway) Dalandanan,
Valenzuela City
good leased 23,240.00 31-Oct-2023
3 BL- PG PASO DE BLAS
2/F VFC Mall, Puregold Paso de Blas, Paso de
Blas cor. Gen. Luis St., Malinta Exit,Valenzuela
City
good leased 35,870.00 19-Jun-2022
4 NE Pacific Mall - Cabanatuan2/F VFC MalG/F NE Pacific Mall, Km.11,
Maharlika Hi-way, Cabanatuan Cigood leased 58,484.71 22-Jan-2023


Sycip Gorres Velayo & Co.6760 Ayala Avenue1 226 Makati CityPhilippinc$
Tel: (632) BBs l 0307Foxi (632) 8819 0S72eY.cornlPh
INDEPBNDENT AUDITOR'S REPORT
The Siockholders and the Board of Directors
Philippine Bank of Communications
PBCom Tower, 6795 Ayala Avenue
Comer V. A. Rufino Street, Makati City
Report on the Consolidated and Parent Company Financial Statements
Opinion
We have audited the consolidated financial statements of Philippine Bank of Communications and its
Subsidiary (the Group) and the parent company financial statements of Philippine Bank ofCommunications (the Parent Company), which comprise the consolidated and parent company statemelrts
offinancial position as at December 31, 2021 and 2020, and the consolidated and parent company
statements of income, consolidated and parent company statements of comprehensive income,
consolidated and parent company statements of changes in equity and consolidated and parent company
statements of cash flows for each ofthe three years in the period ended December 31,2021, and notes to
the consolidated and parent company financial statements, including a summary ofsignificaut accounting
policies.
In our opinion, the accompanying consolidated and parcnt company financial statements present fairly, in
all material respects, the financial position ofthe Group and the Parent Company as at December 31, 2021
and 2020, and their financial performance and their cash flows for each ofthe three years in the period
ended December 31,2021, in accordance with Philippine Financial Reporting Standards (PFRSS).
Basis for Opinion
We conducted our audits in accordance with Philippine Standards on Auditing (PSAs). Our
responsibilities under those standards are fufther descrlbed in the Auditor's Respo sibilities./br the Audit
o/ the Consolidated and Parent Company Financial Statements seclion ofour report. We are independent
ofthe Group and the Parent Company in accordance with the Code ofEthics for Professional
Accountants in the Philippines (the Code ofEthics) togetl.rer with the ethical requirements that are
relevant to our audit ofthe consolidated and parent company financial statements in the Philippines, and
we have fulfilled our other ethical responsibilities in accordance with these requirements and tlie Code ofEthics. We believ.e that the audit evidence we have obtained is sufficient and appropriate to provide a
basis for our opinion.
Key Audit Matter
Key audit matters are those matters that, in our professional judgment, were of most significance in our
audit of the consolidated and parent company i the currenl pcriod. Thcsc matters
rvere addlessed in the conte\t ol'oul audit o1'the; consolidafed and parent corrrpany financial slatements as
a rvhole, antl in forming oul opinion thcrcon, anrl we do not provide a separale opiuion on thcsc n]atters.
For each mauer below, our desoriptron of how * Y- PaT:d-ili6ifr-aftEr-isprovided
in that context.
i '" i APR 2R rnrril

-dkq3w
a
We have fulfilled the responsibilities described in the ,4aditor's Responsibilities.t'br the Audit of the
Consolidated and Parent Company Financial Statements section ofour repofi, including in relation to
these matters. Accordingly, our audit included the perfomance ofprocedures designed to respond to our
assessment ofthe risks ofmaterial misstatement ofthe consolidated and parent company financial
statements. The results ofour audit procedures, including the procedures performed to address the
matters below, provide the basis for our audit opinion on the accompanying consolidated and parent
company fi nancial statements.
Applicable to the Audit of the Consolidated snd Parent Company Financiol Statements
Recognition o/ expected credit losses(ECL) on loans and receivables
The Group's and the Parent Company's application ofthe expected credit loss (ECL) model in calculatingthe allowance for credit losses on loans and receivables is significant to our audit as it involves the
exercise ofsignificant management judgment. Key areas ofjudgment include: segmenting the Group's
and the Parent Company's credit risk exposures; determining the method to estimate ECL; dehning
default; identifuing exposures with significant deterioration in cledit quality; detennining assumptions to
be used in the ECL model such as the countelpalty credit risk rating, the expected life of the financial
asset, expected recoveries from defaulted accounts, and impact ofany financial support and credit
enhancements extended by any party; and incorporating forwardJooking information, including the
impact of the coronavirus pandemic, in calculating ECL.
Allowance for credit losses for loans and receivables as of December 31, 2021 for the Group and the
Parent Company amounted to P2.73 billion. Provision for credit losses ofthe Group and the Parent
Company in 2021 amounted to P0.32 billion.
Refer to Notes 3 and l7 ofthe financial statements for the details ofthe allowance for credit losses using
the ECL model.
Audit response
We obtained an understanding ofthe board approved methodologies and models used for the Group's and
the Parent Company's different credit exposures and assessed whether tliese considered the requirements
of PFRS 9, Financial lnstrunxents to reflect an unbiased and probability-weighted ontcome, and to
consider time value of money and the best available forward-looking information.
We (a) assessed the Group's and the Parent Company's segmentation of its credit risk exposures based on
homogeneity ofcredit risk characteristics; (b) tested the definition ofdefault and significant increase incredit risk critelia against historical analysis of accounts, credit risk management policies and practices inplace, and management's assessment ofthe impact ofthe coronavirus pandemic on the counterpafiies;
(c) tested the Group's and the Parent Company's application of intemal credit risk rating system,
including the impact of the coronavirus pandemic on the bomowers, by reviewing the ratings of sample
credit exposures; (d) assessed whether expected life is different from the contractual life by testing the
matuity dates rcflcctcd in thc Group's and thc P management's
assulnptions legardine fi:tule collections, advances, renewals and modilications; (e) tested
loss givcr.r dcfault by inspccting historicll recoveries and related costs. write-olfs and collatcral
valuations, and thc clhcts ol any linancial support and cledit pro by ally part,v; (1)
tested exposure at default considering outstanding : (g) cvaluatccl thc
forrvard-looking inforlnation uscd for ovcrlay available information and
j,, lr ii O r;: rililil]il]iltilt lt til
A memberl rn ol Ernsl & Youno Cloba Limfed

-1
Euildinq n betterworkinq world
-3-
our uliderstanding ofthe Group's and the Parent Company's lending portfolios and broader industry
knowledge, including the impact ofthe coronavirus pandemic; and (h) tested the effective interest rate
used in discounting the expected loss.
Further, we compared the data used in the ECL models by reconciling data from source system reports to
the data warehouse and from the data warehouse to the loss allowance analysis/models and financial
reporting systems.
To the extent that the loss allowance analysis is based on credit exposures that have been disaggregated
into subsets ofdebt financial assets with similar risk characteristics, we traced or re-performed the
disaggregation from source systems to the loss allowance analysis. We also assessed the assumptions
used where there are missing or insufficient data.
We involved our internal specialist in the perfomance of the above procedures. We recalculated
impairment provisions on a sample basis. We reviewed the completeness of tl.re disclosures made in the
financial statements.
Other Information
Management is responsible for the other information. The other infomation comprises the information
included in the SEC Form 20-IS (Definitive Infomation Statement), SEC Fonn 17-A and Annual Report
for the year ended December 3 I , 2021 , but does not include the consolidated and parent company
financial statements and our auditor's report thereon. The SEC Form 20JS (Definitive InformationStatement), SEC Form 17-A and Annual Report for the year ended December 31,2021are expected to be
made available to us after the date of this auditor's report.
Our opinion on the consolidated and parent company financial statements does not cover the other
information and we do not and will not express any form ofassurance conclusion thereon.
In connection with our audits of the consolidated and parent company financial statements, our
responsibility is to read the other information identified above and, in doing so, consider whether the
other information is materially inconsistent with the consolidated and parent company financial
statements or our knowledge obtained in the audit, or otherwise appears to be materially misstated.
Responsibilities of Management and Those Charged with Governance for the Consolidated andParent Company Financial Statements
Management is responsible for the preparation and fair presentation of the consolidated and parent
company financial statements in accordance with PFRSs, and for such intemal control as management
detemines is necessary to enable the preparation of consolidated and parent company financial
statements that are free from material misstatement, whether due to fraud or error.
]ltil il uil ilil iltIilil Iililil il
T,A X i)
?111 I 'APR
iAAU

Buildino a bettetworkind lr/orld
-4-
In preparing the consolidated and parent company financial statements, management is responsible for
assessing the Group's and the Parent Company's ability to continue as a going concem, disclosing, as
app cable, matters related to going concem and using the going concem basis of accounting unless
management either intends to liquidate the Group and the Parent Company or to cease operations, or has
no realistic altemative but to do so.
Those charged with govemance are responsible for overseeing the Group's and the Parent Company's
financial reporting process.
Auditor's Responsibilities for the Audit of the C0nsolidated and Parent Company Financial
Statem€nts
Our objectives are to obtain reasonable assurance about whether the consolidated and parent company
financial statements as a whole are free from material misstatement, whether due to fraud or eror, and to
issue an auditor's reporl that includes our opinion. Reasonable assurance is a high level ofassurance, but
is not a guarantee that an audit conducted in accordance with PSAs will always detect a material
misstatement when it exists. Misstatements can arise fi'om fraud or enor and are considered rnaterial if,individually or in the aggregate, they could reasonably be expected to influence the economic decisions ofusers taken on tlie basis ofthese consolidated and parellt company financial statements.
As part of an audit in accordance with PSAs, we exercise professional judgment and maintainprofessional skepticism throughout the audit. We also:
o Identify and assess the risks ofmate al misstaternent of tlle consolidated and parent company
financial statements, whether due to fraud or error, design and perform audit procedures responsive to
those risks, and obtain audit evidence that is sufficient and appropriate to provide a basis for our
opinion. The risk of not detecting a material misstatement resulting from fraud is higher than for one
resulting from enor, as fraud may involve collusion, forgery, intentional omissions,
misrepresentations, or the override of intemal control.
o Obtain an understanding of intemal control relevant to the audit in order to design audit procedures
that are appropriate in the circumstances, but not for the purpose of expressing an opinion on the
effectiveness ofthe Group's and the Parent Company's intemal control.
. Evaluate the appropriateness of accounting policies used and the reasonableness ofaccountingestimates and related disclosures made by management.
o Conclude on the appropriateness ofmanagement's use of the going concem basis ofaccounting and,
based on the audit evidence obtained, whether a material uncerlainty exists related to events or
conditions that may cast significant doubt on the Group's and the Parent Company's ability tocontinue as a going concem. If we conclude that a material uncertainty exists. we are required to
draw attention in our auditor's report to the related disclosures in the consolidated and parent
company financial statements or, iflsuch-disclosu+es.are..inadequate, to modify our opinion. Our
conclusions are based onthe audi
litu c cVCnts or conditions nray
going conccm.
Date
X{.*,', (,, .rr ",.r ,. ..
A.. G I'i,.C iA AU ROiiA L
iltill ilililt ilil |ilililil iltilil il
obtained up to the clate ol'our autlitor''s rcpor'l. IJorvcvcr',
h,lrl\.rn(l llrc P.rtcnt Cotrpirttl lu ('(asc lu (u liIlUC x5 ilr

.r.:il:.,: :. r )1 , .'i
. Evaluate the overall presentation, structure and content ofthe consolidated and parent company
financial statements, including the disclosures, and whethel the consolidated and parent company
financial statements represent the underlying transactions and events in a manner that achieves fairpresentation.
. Obtain sufficient appropriate audit evidence regarding the financial information ofthe entities orbusiness activities within the Group to express an opinion on the consolidated financial statements.
We are responsible for the direction, supervision and performance of the audit. We remain solelyresponsible lor our audit opinion.
We communicate with those charged with govemance regarding, among other matters, the planned scope
and timing ofthe audit and significant audit findings, including any significant deficiencies in intemalcontrol that we identify during our audit.
We also provide those charged with govemance with a statement that we have complied with relevant
ethical requirements regarding independence, and to communicate with them all relationships and other
matters that may reasonably be thought to bear on our independence, and where applicable, related
safeguards.
From the matters communicated with those charged with govemance, we determine those matters that
were of most significance in the audit ofthe consolidated and parent company financial statements of the
curent period and are therefore the key audit matters. We descnbe these matters in our auditor's reportunless law or regulation precludes public disclosure about the matter or when, in extremely rare
circumstances, we determine that a matter should not be communicated in our report because the adverse
consequences of doing so would reasonably be expected to outweigh the public interest benefits of such
communication.
Reports on the Supplementary Information Required Under Bangko Sentral ng Pilipinas (BSP)
Circular No, 1074 and Revenue Regulations No. 15-2010
Our audits were conducted for the purpose offonning an opinion on the basic financial statements taken
asawhole. The supplementary information required under BSP Circular No. l074inNote37andRevenue Regulations No. 15-2010 in Note 38 to the financial statements is presented for purposes offtling with the BSP and Bureau of Internal Revenue, respectively, and is not a required part ofthe basic
financial statements. Such infomation is the responsibility of the management of Philippine Bank ofCommunications. The information has been subjected to the auditing procedures applied in our audit ofthe basic financial statements. In our opinion, the information is fairly stated, in all material respects, inrelation to the basic furancial statements taken as a whole.
,,," I Or** rr-I
pi. i: r,, ,i ,., . .
itilil |tiltililtilI 1ilil ililt ilt ilil
A memberfrm oi Ernsl & Younq G obarLimiied

SGY3 "r.oi'r, d b\.tt,.lw.)[lrrq ,,!ar ld
-6-
The engagement partner on the audit resulting in this independent auditor's report is
Ray Francis C. Balagtas.
SYCIP GORRES VELAYO & CO,
h.k;.,!.;g'fuPartner
CPA Certificate No. 108795
Tax Identification No. 216-950-288
BOA/PRC Reg. No. 0001, August 25,2021, valid until April 15,2024SEC Partner Accreditation No. 108795-SEC (Group A)
Valid to cover audit of2021to 2025 financial statements of SEC covered institutions
SEC Firm Accreditation No. 0001-SEC (Group A)Valid to cover audit of 2021 to 2025 financial statements of SEC covered institutions
BIR Accreditation No. 08-001998- 107-2020, November 27 , 2020, valid until November 26,2023PTR No. 8853467, January 3, 2022, Makati City
April2T,2022
B.
tlDate I APR 28 ?0?? I
,
I
"" ,**'-Et El, t.,t i .-..
\lA" (; i'\^,1 iA AU Rl) itr'. ;.'.lirS l-t I r
ilIil ilillilLlili tilt ililt ilt I ilA member iirm oi Er.sl & Youns GlobalL m Gd

PHILIPPINE BANK OF COMMUNICATIONS AND SUBSIDIARYSTATEMENTS OF FINANCIAL POSITION
Consolidated I'arent Company
December 3l Dcccmbcr 3l2021 2020
{Anrorrnls in _fhousrrntls)
ASSE'tS
Cash and Otber Cash IlemsI)ut from Baugko Seno al ng I'ilipinas
(Notes 18ancl 19)
Due from Other BanksI[terbanli. Loans Receivable and Securities
Purchased under Resale Agrccnrents (N()1c ll)Financial Assets a1Fai. Value through
Profit or Loss (Note 9)
Firarcial ,,\ssets at Fair \ralue through OthorCornprehensive Income (Note l0)
Investment Securities at Anrortized Cost (Nole I 1)
Lolrs and Roccivables (Notc l2)Investments in Subsidiirt- and nn Associate
(No1c 7)
Propelty and Equipmellt (Nolc l3)Investmcnt Propcrtics (Notc 1,1)
('ondonriniunr Lrnils ltlr lcasc
l:orccloscd propcltics
Ollicc Lrnils lbr lc^se
Intangible Asscts (No1e l5)f)eltrred Titx Asscts - Net (Notc l(l)
P2,803,341
10,271,486
65n,593
il,195,846
lJlt6,29t
6.489,287
r 5.520,27e
63.497.965
14,40t
882,21'7
1.140,177
834,303
2,689
s27,503
32s,614
P2,46'7,099
20,597,868
1,495,485
6,054,454
'n8,294
5,137,8t62,263,3s6
s7611qq1
t4,tt4894,6t',7
P2,803,341
10,2'71,4u6
658,593
4,195,846
886,291
6,489,287
15,520,279
63,500,798
20,475
8U2,21',7
t,'740.17'7
83,1,303
2,689
527,503
325,6t4
P2,467,099
20,597,868
1,49s,48s
6,0s4,4s4
7t8,294
5,137,816
2,263,356
57,626,70',7
)o )()894,6t7
1,788,559
610,075) o)1
6t3,526170,608
1,788,559
610,07s) o)1
6t3,526170,608
Other Assets
ToTAI, ASS[TS
579 177.431 1',16,031
P 109 .229 ,320 P101.230.218 Pt09,236,976 p101.237.673
LIABILITIES AND trQUITY
LIABILITIESDeposit Liabilitics (N01es I I and 3 1)
Derrrancl
Srvings
TimcLonglcnrl rrcgotiallc ceItifi catcs of dcposits
P,I1.166,107
I t,359,r l231,531.570
2.889.116
P30.8(r5.282 P,I1,175,066 P30.874.1,13
9.6(14.945 11,359,112 9,664.9,1s
40.36'7.s11 31,531,570 .10,367,517
2.883.668 2,889,r16 2,833.6(18
Bills Payablc (Note l9)Outstanding,,\cceptarccs1\'Ianager's Checks
Accrued Interest, Taxes and Other Expenses(Notc 20)
Inconre Tar Payable
0thcr Liabilities (Notc 2l )
86,945,905
6.010,q88
71,609
112,247
6ti0.73,1
66,823
1,105,196
802,785
146,866
1,t00,720
6U0,648
66.82.1
1,103.979
802,637
146,866
I .099,162
8:1.781.412 86,95,1,864 31,790.273
1.182.84,1 6,0l0,9llll 2. I 8 2.lt:14
497.813 ',11,609 497,3 r 3
183.100 172,247 183.100
TOTAL LI,.\BILITIES 95,053,502 88,700.540 95,061,158 88.707,995
(Forvarcl)
flilil |tilililtiil I ilil ililt]tiflltitil
i:,i'ii L t 2n,/2

-2-
Consolidatcd I'arcDt Conlpan\
December 3l December 3l
20)o
EQUITY AT'I'IUBT]TABLB TO trQUIl'YHOI,DERS OF TIIE PAREN'T COMPANY
Comnron stock (),lolc 23)
Additional paid-in capitalSurplus reservcs (No1c 23)Deficit (Notes 2 and 23)
Unrealized gain on fiuancial assets carricd at lair\ xlue tllruuilh othel comprehensi\ c illconre(Nolc 10)
Cunrulative translation adjustmentIlemeasuremellt gains (losscs) on retireireDt liabilitY
(Note 27)
(Amounts in Thousands)
P12,016,129 *12,016,1292,262,246 2,262,246
106,418 106,922(1,638,621) (66,06r)
100,093 53,509(2t1,464) (237,668)
( I 0s. 123) 10.7 4l
Pt2,016.129
2,262,246
106.922
(66,061)
53,509
(237,66n)
40,141
P12,0t6,129
2,262,246
106,418
( 1,638,62r)
100,093
(2fi,464)
(r 05, r 23)
TOT,\t. FOUITY t 4,175,818 12.529.678 14,175,rJ18 12,529.(r78
TOTAt, LIABII,IT
See occourylryifig Nolcs lo Finatlcixl State te s.
APR 28 207?
l.Ai)i I i: { A r(i"r\ 1t- j.:
LAIIGF l,\;1.'r,'i- li: ;!, l
L_rr/
Date
IA i.., iL .- . ..
i:4r. (,1ilriCiAAc,n,;ii, i . irrillr
ilttilililIilt il IililIIilil ililll il

!1
Z
E)
(,z
zF
..]
FF
\
j
.i*r-.a.ir)0\66-fo*F-o\66o..'r'r+0.or-c.v)\oa-@o\-a--:o.ooostNo,-cl t_. :l !+
.+,+ \o * v,) o, o, F..lOr F o..i ca co t.- r.) v)+^ =t^ o- \ .-: \o^ \ +- vlr)..rO\<fO\rl\O.i.!6l t-- @ rl f)..r v
o-o to-rt--o I€ +..1 3 -/..) € \Cl:-.NF.rar €d ln:f
!to.a!tvi..rF
o-,-o6, o,5-!to-r-o,66o.71 v1 !+ 000 F-oor)\or.-cao,*F-ro..'oo:f.tori.\ l-- $ i.
+!i\o*r)o,o,t--.\O\-O,.ooocar-r)h=r,no"\1€.\1vlr-.ao,i.o,r)\o-.1a..t t-- co r) rr at v
0OW.lc\fi.t\C\Oi-' .r t-- ra ca N rar s
s o.a i w..r E
fr.trt
;3
E
E
7,
EZ
z
o
l&
{- .,} n o:
IL
0.- t c. 'o.
-i'qt
4a
cii
z
I
.E,C
v:'E !.t
,;ZY,CL{r6 S
- d lt 'i,>ea7i!E E
E
ta
UzF!
a3zf:laf..lF-,,
a
aDa
zaz
3Uz22
U
z
rc7.
j
F

t
E
I.s
cs!
Yi$8
,l
o.
i,i
(,
z.
F
=7.
FZ
U
2
JFI!z
l'_
F-
a
-
7.
,7.
F7.
U
rE
cUzFz
I1
z
Z
I!
z
d]
xFI!
Uz
Irti
L
U
=
LtlF
U
Z
9ZFI!a7.
G]
\oc\o
("1
oo..r.aoo(\at++\oa-+!ir)an\ot.-ri+Nca1q9^tr:qdIo)$-..r-o,oooo6Osfoo:r)..ro6co+o-\o..r v-H: i i
F3Fo\NO\-O|ao\F-otr.)roEoNa-:o,r.lcora) i \c .i 0a\or-i-.tNooao\rao\Fa-€a.r\eq\r.,1 .r: - -*
C\arO\-ora)!'-odra t € .7) 0a ,, rar ra, :a \D
3Ca5:aOFF':'N\'
-.':BL
.a r) o..a H..) o\.n c- -..)r)it-:a-.co\ot++\oa-":1q\o.\n-1'+-\\o.1conr)F-o,cto\oa-co-a- ..1 .+ t-. .a r)a .a o 6, sf F-O\ \O=t6* --
IF,]
!.)
,;
F
E .t
01 .l 6.6-.io6+- r\oNt--r-ca + o\ \o F- sf a.r fi a- \o@ !+ rar r- o\ra-N.+t-..ooo.ioo\+O\\O+6:
r:coo-@N-\or)N\oa-66d€-o\o.-tF-o\oooo6Osfoa-h
t--
:J
7
=
o!!JF-<El-7.a.z
<&
F
7.7.
E]
t
Ua.
E]
z
I
zF
F
-
RZ8,r E'-.tr .s,/,) ;
.e 5!oE o
>r; -
7)(JJ
j
aL!
an:E>,62E
Az
ts
!!
€;x
a1*- z.=9r2
= E€9
(,
t!zr!/,LJ
7.
F
,l.1
E
Iil
a\l
!

PHILIPPINE BANK OF COMMUNICATIONS AND SUtsSIDIARY
STATEMENTS OF COMPREHENSIVE, INCOME
(lonsolidrled
Ycars llndcd Dccembcr :ll202t 2020 2019 2021 2020 2ot9
(Amounts in'lhousands)
NET TNCOME FOR TIIE YEAR p1,s7j,064 pl,168,9t2 p1,151,257 p1,573,064 pI,168,9t2 pt.157,257
OTIIER COMPREHENSIVf, INCOME (LOSS)
FOR THD YEAR, NET OF TAXllems thal may be rcclassified to profit or loss in
subsequent periods I
Net unrealized gain (loss) on debt securilies at
fair value througb other comprehensive
income (Note 10) (62,055)
Net Dlovement in cumulative translationadjushenl (20.204, :0.200 ,54.h05) 126.204) :tr.2o0 (54.605)
(88,2s9) 27,716 13,91r (88,2s9) 27,716 t3,91 I
Items that may nol be reclassified to proflt ot loss
in subsequenl periods:
Unrealized gain on equity securities carried at
[air value tln'ough olher comprehe sr\ e
income (Note 10) l\471 4,645Change in remeasurement gairs on retirement
7,516 68,516 (62,055) 7,516 68,5r6
201,491 (71,849) (l r r.505)
15,471 4.645
204,491 (71,849) (1r r,505)liability (Note 27)Income tax relating to change in
remeasurement gaills on retirementlirhilir! (s8,61.1) .15.051 8.157 (sli,6l.l) 15.051 8.157
Iot..t.,S r r^'
Attributable to:
Equily holders ofthe PareDt Company +1.6.16,1,{0 P1.17,1.:177 p1.067.32t)
'lOl.tl, (lO)IPRltlllln-SIYli l\CONIE pl.6,t6,t.l0 p1.17,1.477 ilt.067.tl0
See a?conu)anliry Nole.\ to Fha cial Statemettts.
l_AiiGE I.A).'",
LARGE l,\rrr"v:rr'
It i: q.* .ri "..-, . ..
l,'1A" 0 kr,,tl iri /rirli,)iiA l. C,i:il
|ililtil ilililIil I ilil ililt iltillil
Arit 2 B 207?

Q
-
j
- , -t-[ -
llllllrr €-l,1ll .1
-|l6i \el rll N
=
nl*il t
€ r €.16ll i
€- - l-ll -
E -l ll9- r +lall d
: a -l+ll "E lll
€.=-lrll utod '.ildll r--
[ -l-ll a]
__ l ll :-nh to:[ o- +
ulullu
ill
. ll .-.1--ll--
^i t.i[ ^i'l'il'
:l ll
:l ll
;t I
=sEl;ll xc
aP c,l4ll I g6 ,.il Ell a,EiEIHil 5Ai;Etflt s;a o e{ell -- o
6;Eldll 6 E
ra F Ftaal oF
::l
e
e
Ea.zn
ta
OF
!.r!=sif,,:.i.*.f :.8 qT. EE E,E
=-r=iElo-e6o -i - !r- 9 0: =E .9o AE
U> Q-;.2
a
Ea(.)
a,&
Ar'rili6qE
rg
-Eg
* -, ri )^
Fp
E]
zahl
z
UEr
aFzE]
2ri33a
ataDaLtzaz
3Uzp2aUtu
z
riz
I

a
-ltV:
5
\l".}
U
srr.i
I
I
oL
I
I
^:;
t 5D -:! 9q6E;
EdsooF
.c
a;
sto0
F
ilLi[: i-n r r.,,
EIF
E l-:
s r*-*-*-'
F1 o* 2nnn
l
*
6r
i.d-
v;
E
"ir/,4
:3
I!
.J
tt
Ea==a!-4 :E=i E.!;- .:J
E'; "(o
QF
I;EEEE'iEEiEE- 3 E3 i.Eo+!! aiit
=F E
JXEE
'u .l
U-
ii
a
(\

PHILIPPINE BANK OF COMMUNICATIONS AND SUBSIDIARYSTATEMENTS OF CASH FLOWS
Consolidated
Years Ended December 31
2021 2020 2019 2021 2020 2ot9(Amounts in Thousands)
CASH FLOWS FROM OPERATINGACTIVTTIES
lncome belorc income tax fiom continuingoperations
Income belbre inconle tax from disconlinuedP1,fi29.690 P1.199.015 pt.5E8.056 r.t.829.690 pl.t9!.015 p1.359.6411
Adjustmenls to reconcile income before income taxlo net cash geDerated from (used for) operations:Depreciation and amortization (Note ll) 38?,619Provrsron for credil and rnrpairmenl losses
(Note 17) .322.301Trading loss (gain) on financial asse(s al FVOCI
(Note 26) Zt5,S42Profit from assets sold (Notes 13, 14 and 16) (13,567)Accretion ofinterest on unquoted debt securities
(Note 12) (66,038)AccrelioD of interest on lease liabilily (No1e 2 I ) 14,528Loss on sale of a subsrdiary (Nole 7J
Loss (gain) on assets exchaoge (Note 14) (1,460)Shale in nel income ofsubsidiary and an
associate (Nore 7) egj)Unrealized losses (gairs) on fulaDcjal asseh at
fair value through profii or loss 9,794Changes in operating assets and liabilities:Decrease (increase) in the amounls of:
Loans and receivables (Note 33)Fin.ncial assets at fair value through
profit or loss
Other assets
Increase (decrease) in the amounts of:Deposit liabilities
Manager's checks
Accrued inierest, taxes and olherexpenses
(6,464,0ss) 2.137,326 (3,6'78.s79) (6,464,174) 2,137.36s (3,675,826)
(t77,191) 950,011 (773,1t6) (177,191) 950,011 1773,t16\.10.1.158
380,653
|,4\8,228
(217,271)
(6,779)
(71,216)
17,603
3.151
(266)
(418)
445,979
377,613
(109,176)
(97,139)
(88,233)
18,71I
I1,850
(53r)
(1,495)
31t7,{rl9
I22.-r0 t
2115,5,12
(ll,s67)
(66,01,r)
t4,52{t
(7,160)
(22.1)
380,653 445,979
1,418,228 377,613
(27 7,278) (309,177)(6.',719) (97,739)
(77,216) (88,233)
17,603 I8,7tl17 t,173
3,157 11,850
(199) 57,58s
(478) (1,495)
59,s46 (361,667) 304,312 59,556 (363,0s6)
3,164,493 7.923,791 3,546,5t3 3,164,591 7.923,676 3,555,488(ls,8sl) 1254.1t1) 345.364 (ls,n53) (2s.1.7 u ) 1,15.:16;+
(122.051) 90,360 32,576 (r2r,989) 90.360 32.42s
, , Oth"r liubiliti :l:,:g: (q:.:gq) qZt,OZZ
Ncl cash frov cd by opcrations (235,325) 11,669,584 1,25t,662 (235,325) 13.669,584 1.488.871
CASH FLOWS FROM INVESTINGACTIVITIES
Decrease (increase) in interba ( loans reccivableAcquisitioDs of:
Financial assets at FVTOCIlnvestmeDt securities at amortized costProperly and equipmenl (Note l3)Software cosrs (Note l5)
(Forward)
432.061
(86.197.25s)
(rr.26t.2r l)(les.s-I)
(8.e71)
(3,902,952)
(78,016,514)
( 191,880)(49,35st
(15,069)
t3,t2t
(58,124.r30)
(87,133)
(39,112)
112,061
(86,497,255)
(1.r.263,2 r l)( r s5.s:l)
(8,971)
(3,902,952)
(78,0r 6,514)(191,880)
(49,355)
(r 5.069)
13,121
(68,324,130)
(87,133)
(39,172)
?it'.)')
lllrfl I I lli I l]lll ll ill ll I I ll lllil ll ll llll I I lll

*SGVFS164641*
- 2 -
Consolidated Parent Company
Years Ended December 31
2021 2020 2019 2021 2020 2019
(Amounts in Thousands)Proceeds from disposals of:
Financial assets at FVTOCI P=84,804,597 P=81,263,005 P=67,695,250 P=84,804,597 P=81,263,005 P=67,695,250
Investment securities at amortized cost – 10,498,994 – – 10,498,994 –Investment properties (Note 14) 62,581 20,441 314,655 62,581 20,441 314,655Property and equipment (Note 13) 3,475 7,671 20,532 3,475 7,671 20,532
Chattel mortgage 24,118 18,097 91,812 24,118 18,097 91,812Subsidiary – – 500,220 – – 500,220
Proceeds from maturity of investment securities 10,000 250,168 200,000 10,000 250,168 200,000
Net cash provided by (used in) investing activities (14,628,134) 9,882,606 385,155 (14,628,134) 9,882,606 385,155
CASH FLOWS FROM FINANCING
ACTIVITIES
Availments of:Bills payable 111,742,108 58,922,973 392,583,853 111,742,108 58,922,973 392,583,853Outstanding acceptances 595,094 855,416 573,187 595,094 855,416 573,187
Marginal deposits 32,857 18,700 321,701 32,857 18,700 321,701Settlements of:
Bills payable (107,981,483) (69,802,907) (397,121,016) (107,981,483) (69,802,907) (397,121,016)
Outstanding acceptances (1,036,538) (438,206) (522,775) (1,036,538) (438,206) (522,775)Marginal deposits (39,630) (46,275) (287,657) (39,630) (46,275) (287,657)Lease liabilities (Note 21) (124,868) (124,495) (119,169) (124,868) (124,495) (119,169)
Net cash provided by (used in) financing activities 3,187,540 (10,614,794) (4,571,876) 3,187,540 (10,614,794) (4,571,876)
EFFECT OF FOREIGN CURRENCY
TRANSLATION ADJUSTMENT (26,204) 20,200 (54,605) (26,204) 20,200 (54,605)NET INCREASE (DECREASE) IN CASH
AND CASH EQUIVALENTS (12,253,577) 12,724,055 (3,199,918) (12,253,577) 12,724,055 (2,960,433)
CASH AND CASH EQUIVALENTS AT
BEGINNING OF YEAR
Cash and other cash items 2,467,099 2,698,682 1,389,869 2,467,099 2,698,682 1,357,609
Due from Bangko Sentral ng Pilipinas 20,597,868 10,213,521 15,224,382 20,597,868 10,213,521 15,168,302Due from other banks 1,495,485 357,960 379,723 1,495,485 357,960 228,578Interbank loans receivable (Note 33) 2,151,502 717,736 193,843 2,151,502 717,736 193,843
26,711,954 13,987,899 17,187,817 26,711,954 13,987,899 16,948,332CASH AND CASH EQUIVALENTS AT
END OF YEAR
Cash and other cash items 2,803,341 2,467,099 2,698,682 2,803,341 2,467,099 2,698,682Due from Bangko Sentral ng Pilipinas 10,271,486 20,597,868 10,213,521 10,271,486 20,597,868 10,213,521
Due from other banks 658,593 1,495,485 357,960 658,593 1,495,485 357,960Interbank loans receivable (Note 33) 724,957 2,151,502 717,736 724,957 2,151,502 717,736
P=14,458,377 P=26,711,954 P=13,987,899 P=14,458,377 P=26,711,954 P=13,987,899
OPERATIONAL CASH FLOWS FROM INTEREST
Consolidated Parent Company
Years Ended December 31
2021 2020 2019 2021 2020 2019
(Amounts in Thousands)Interest paid P=525,620 P=1,139,197 P=2,121,862 P=525,620 P=1,139,197 P=2,103,611
Interest received 4,581,514 4,979,867 5,547,387 4,581,514 4,979,867 5,592,985
See accompanying Notes to Financial Statements.

*SGVFS164641*
PHILIPPINE BANK OF COMMUNICATIONS AND SUBSIDIARY
NOTES TO FINANCIAL STATEMENTS
1. Corporate Information
Philippine Bank of Communications (the Parent Company) is a publicly listed domestic commercialbank organized in the Philippines, primarily to engage in commercial banking services such asdeposit products, loans and trade finance, domestic and foreign fund transfers, treasury, foreignexchange and trust services.
The Parent Company’s principal place of business is at the PBCOM Tower, 6795 Ayala Avenuecorner V. A. Rufino Street, Makati City. It has a network of 91 regular branches and 4 branch-liteunits, 89 regular branches and 4 branch-lite units to serve its customers, as at December 31, 2021 and2020, respectively.
The Parent Company’s original Certificate of Incorporation was issued by the Securities andExchange Commission (SEC) on August 23, 1939. On June 21, 1988, the Board of Directors (BOD)of the Parent Company approved the amendment of Article IV of its Amended Articles ofIncorporation to extend the corporate life of the Parent Company for another 50 years or up toAugust 23, 2039. The Amended Articles of Incorporation was approved by the SEC onNovember 23, 1988.
The Parent Company acquired a license to operate as an expanded commercial bank from the BangkoSentral ng Pilipinas (BSP) on December 24, 1993. On March 31, 2000, the BSP’s Monetary Boardapproved the amendment of the Parent Company’s license to a regular commercial banking.
The Monetary Board, in its Resolution No. 96 dated 20 January 2022, approved the grant of auniversal banking license to Parent Company, subject to compliance with certain regulatoryrequirements including the amendment of the Bank's charter documents. On March 15, 2022, theBank held a special stockholders' meeting to approve the changes to the Bank's Articles ofIncorporation to reflect the upgrade of its banking license.
The BSP shall issue a Certificate of Authority to operate as a universal bank once all regulatoryconditions are complied with.
The Parent Company’s subsidiaries and an associate (collectively referred to as the Group) areengaged in the following businesses:
Effective Percentageof Ownership
Principal Place ofBusiness and Countryof IncorporationEntity 2021 2020 Line of Business
Subsidiaries
PBCom Rural Bank, Inc. (formerlyBanco Dipolog, Inc. A Rural Bank(BDI)) (PRBI)
– – Philippines Rural Bank
PBCom Insurance Services Agency, Inc.(PISAI)
100.00% 100.00% Philippines Insurance Agent
Associate
PBCom Finance Corporation (PBComFinance)
40.00% 40.00% Philippines Financing Company

- 2 -
*SGVFS164641*
Sale of PRBIOn July 29, 2019, PBCOM sold its stake in PBCom Rural Bank, Inc. as it consolidates its efforts andresources at the parent company level. As of December 31, 2021 and 2020, the Parent Company andPISAI comprise the consolidated financial statements of the Group (Note 7).
Retirement of Business Operations of PISAIOn January 11, 2021, the BOD of the Parent Company approved the dissolution and retirement ofbusiness of PISAI. PISAI, which has been inactive for the past 3 years, has continuously remainedinactive but continued to incur operating expenses. The Parent Company does not see any need forthe subsidiary and has decided to retire the business operations.
The Company has received clearances in relation to shortening of its corporate life from the InsuranceCommission and the Makati Local Government last May 26, 2021 and September 30, 2021,respectively. Clearances from other regulatory agencies are currently being processed as ofDecember 31, 2021.
2. Summary of Significant Accounting and Financial Reporting Policies
Basis of PresentationThe financial statements have been prepared on a historical cost basis, except for financial assets atfair value through profit or loss (FVTPL), financial assets at fair value through other comprehensiveincome (FVTOCI) and derivatives that are measured at fair value. The financial statements arepresented in Philippine peso (PHP or P=) and all values are rounded to the nearest thousand, unlessotherwise stated.
The financial statements of the Parent Company include the accounts maintained in the RegularBanking Unit (RBU) and Foreign Currency Deposit Unit (FCDU). The functional currency of theRBU and the FCDU is the PHP and United States dollar (USD), respectively. For financial reportingpurposes, FCDU accounts and foreign currency-denominated accounts in the RBU are translated intotheir equivalents in PHP, which is the Parent Company’s presentation currency (see accounting policyon Foreign Currency Translation). The financial statements individually prepared for these units arecombined after eliminating inter-unit accounts and transactions.
Each entity in the Group determines its own functional currency and items included in the financialstatements of each entity are measured using that functional currency. The functional currency of theParent Company’s subsidiary is the PHP.
Statement of ComplianceThe financial statements have been prepared in accordance with Philippine Financial ReportingStandards (PFRS).
Presentation of Financial StatementsThe Group and the Parent Company present its statement of financial position in order of liquidity.An analysis regarding recovery or settlement within 12 months after the statement of financialposition date (current) and more than 12 months after the statement of financial position date (non-current) is presented in Note 22.

- 3 -
*SGVFS164641*
Basis of ConsolidationThe consolidated financial statements comprise the financial statements of the Parent Company andits subsidiary. The consolidated financial statements of the Group are prepared for the same reportingyear as the Parent Company using consistent accounting policies. The subsidiary is consolidatedfrom the date on which control is transferred to the Parent Company. The Parent Company controlsan investee if, and only if, the Parent Company has:
Power over the investee (that is, existing rights that give it the current ability to direct the relevantactivities of the investee);
Exposure, or rights, to variable returns from its involvement with the investee; and
The ability to use its power over the investee to affect its returns.
Generally, there is a presumption that a majority of voting rights result in control. To support thispresumption and when the Parent Company has less than a majority of the voting or similar rights ofan investee, the Parent Company considers all relevant facts and circumstances in assessing whetherit has power over an investee, including:
The contractual arrangement with the other vote holders of the investee;
Rights arising from other contractual agreements; and
The Parent Company’s voting rights and potential voting rights.
The Parent Company re-assesses whether or not it controls an investee if facts and circumstancesindicate that there are changes to one or more of the three elements of control. Consolidation of asubsidiary begins when the Parent Company obtains control over the subsidiary and ceases when theParent Company loses control of the subsidiary. Assets, liabilities, income, expenses and othercomprehensive income (OCI) of a subsidiary acquired or disposed of during the year are included inthe consolidated financial statements from the date the Parent Company gains control until the datethe Parent Company ceases to control the subsidiary.
When necessary, adjustments are made to the financial statements of subsidiary to align theiraccounting policies with the Parent Company’s accounting policies. All intra-group assets, liabilities,equity, income, expenses and cash flows relating to transactions between entities in the Group areeliminated in full on consolidation.
A change in ownership interest of a subsidiary, without loss of control, is accounted for within equityas an adjustment to ‘Additional paid-in capital’. In such circumstances, the carrying amounts of thecontrolling and non-controlling interests are adjusted by the Group to reflect the changes in itsrelative interests in the subsidiary. Any difference between the amount by which the non-controllinginterests are adjusted and the fair value of the consideration paid or received is recognized directly inequity and attributed to the owners of the Parent Company.
When a change in ownership interest in a subsidiary occurs, which results in loss of control over thesubsidiary, the Parent Company:
Derecognizes the assets (including goodwill) and liabilities of the subsidiary;
Derecognizes the carrying amount of any non-controlling interest;
Derecognizes the related OCI recorded in equity and recycle the same to the statement of incomeor surplus;
Recognizes the fair value of the consideration received;
Recognizes the fair value of any investment retained; and
Recognizes any surplus or deficit in the statement of income.

- 4 -
*SGVFS164641*
Non-controlling InterestsNon-controlling interests represent the portion of profit or loss and net assets not owned, directly orindirectly, by the Parent Company.
Non-controlling interests are presented separately in the consolidated statement of income,consolidated statement of comprehensive income, and within equity in the consolidated statement offinancial position, separately from equity attributable to the equity holders of the Parent Company.Any losses applicable to the non-controlling interests are allocated against the interests of the non-controlling interests even if this results in the non-controlling interests having a deficit balance.
Changes in Accounting Policies and DisclosuresThe accounting policies adopted are consistent with those of the previous financial year, except forthe adoption of new standards and amendments effective as of January 1, 2021. The Group did notearly adopt any other standard, interpretation or amendment that has been issued but is not yeteffective.
Unless otherwise indicated, adoption of these new standards did not have an impact on the financialstatements of the Group.
Amendments to PFRS 9, PFRS 7, PFRS 4 and PFRS 16, Interest Rate Benchmark Reform –
Phase 2
The amendments provide the following temporary reliefs which address the financial reportingeffects when an interbank offered rate (IBOR) is replaced with an alternative nearly risk-freeinterest rate (RFR):
o Practical expedient for changes in the basis for determining the contractual cash flows as aresult of IBOR reform
o Relief from discontinuing hedging relationshipso Relief from the separately identifiable requirement when an RFR instrument is designated as
a hedge of a risk component
Amendment to PFRS 16, COVID-19-related Rent Concessions beyond 30 June 2021
The amendment provides relief to lessees from applying the PFRS 16 requirement on leasemodifications to rent concessions arising as a direct consequence of the COVID-19 pandemic. Alessee may elect not to assess whether a rent concession from a lessor is a lease modification if itmeets all of the following criteria:o The rent concession is a direct consequence of COVID-19;o The change in lease payments results in a revised lease consideration that is substantially the
same as, or less than, the lease consideration immediately preceding the change;o Any reduction in lease payments affects only payments originally due on or before
June 30, 2022; ando There is no substantive change to other terms and conditions of the lease.
A lessee that applies this practical expedient will account for any change in lease paymentsresulting from the COVID-19 related rent concession in the same way it would account for achange that is not a lease modification, i.e., as a variable lease payment.
The amendment is effective for annual reporting periods beginning on or after April 1, 2021.Early adoption is permitted.
- 5 -
*SGVFS164641*
Foreign Currency Translation
RBU
As of the statement of financial position date, foreign currency-denominated monetary assets andmonetary liabilities of the RBU are translated into PHP based on the Bankers Association of thePhilippines (BAP) closing rate prevailing at the statement of financial position date and foreigncurrency-denominated income and expenses, based on the spot rate at date of transactions. Foreignexchange differences arising from the restatement of foreign currency-denominated monetary assetsand liabilities in the RBU are credited to or charged against the statement of income in the year inwhich the rates change. Non-monetary items that are measured in terms of historical cost in a foreigncurrency are translated using the exchange rates as of the dates of the initial transactions. Non-monetary items measured at fair value in a foreign currency are translated using the exchange rates atthe date when the fair value was determined.
FCDUAs of the statement of financial position date, the FCDU’s assets and liabilities are translated intoPHP, the Parent Company’s presentation currency, at the BAP closing rate prevailing at the statementof financial position date, and income and expenses are translated at BAP weighted average rate.Exchange differences arising on translation are taken directly to the statement of comprehensiveincome as ‘Cumulative translation adjustment’. Upon actual remittance of FCDU profits to RBU, thedeferred cumulative amount recognized in the statement of comprehensive income is recognized inthe statement of income.
Fair Value MeasurementFair value is the price that would be received to sell an asset or paid to transfer a liability in an orderlytransaction between market participants at the measurement date. The fair value measurement isbased on the presumption that the transaction to sell the asset or transfer the liability takes placeeither:
In the principal market for the asset or liability; or
In the absence of a principal market, in the most advantageous market for the asset or liability.
The principal or the most advantageous market must be accessible by the Group.
The fair value of an asset or a liability is measured using the assumptions that market participantswould use when pricing the asset or liability, assuming that market participants act in their economicbest interest.
A fair value measurement of a non-financial asset takes into account a market participant’s ability togenerate economic benefits by using the asset in its highest and best use or by selling it to anothermarket participant that would use the asset in its highest and best use.
The Group uses valuation techniques that are appropriate in the circumstances and for whichsufficient data are available to measure fair value, maximizing the use of relevant observable inputsand minimizing the use of unobservable inputs.
All assets and liabilities for which fair value is measured or disclosed in the financial statements arecategorized within the fair value hierarchy, described as follows, based on the lowest level input thatis significant to the fair value measurement as a whole:
Level 1 - Quoted (unadjusted) market prices in active markets for identical assets or liabilities
Level 2 - Valuation techniques for which the lowest level input that is significant to the fair valuemeasurement is directly or indirectly observable

- 6 -
*SGVFS164641*
Level 3 - Valuation techniques for which the lowest level input that is significant to the fair valuemeasurement is unobservable
For assets and liabilities that are recognized in the financial statements on a recurring basis, the Groupdetermines whether transfers have occurred between Levels in the hierarchy by re-assessingcategorization (based on the lowest level input that is significant to the fair value measurement as awhole) at the end of each statement of financial position date.
External and internal valuers are involved for the valuation of investment properties. Selectioncriteria include market knowledge, reputation, independence, relevant accreditation, and whetherprofessional standards are maintained.
For the purpose of fair value disclosures, the Group has determined classes of assets and liabilities onthe basis of the nature, characteristics and risks of the asset and liability, and fair value hierarchy asexplained above.
Cash and Cash EquivalentsFor purposes of reporting cash flows, cash and cash equivalents include cash and other cash items,amounts due from BSP and other banks, and interbank loans receivable and securities purchasedunder resale agreements (SPURA) with original maturities of three months or less from dates ofplacements and that are subject to insignificant risks of changes in value. Due from BSP includes thestatutory reserves required by the BSP which the Group considers as cash equivalents sincewithdrawals can be made to meet the Group’s cash requirements as allowed by the BSP. Thecomponents of cash and cash equivalents are shown in the statement of cash flows. Cash and cashequivalents are carried at amortized cost in the statement of financial position.
SPURAThe Group enters into short-term purchases of securities under resale agreements of identicalsecurities with the BSP. Resale agreements are contracts under which a party purchases securitiesand resells such securities to the same selling party at a specified future date at a fixed price. Theamounts advanced under resale agreements are carried as SPURA in the statement of financialposition. SPURA are carried at cost. Interest earned on resale agreements is reported as ‘Interestincome’ in the statement of income.
Financial Instruments - Date of RecognitionThe Group recognizes financial instruments when, and only when, it becomes a party to thecontractual terms of the instrument. Purchases or sales of financial assets that require delivery ofassets within the time frame established by regulation or convention in the marketplace arerecognized on the settlement date. Settlement date accounting refers to:a. The recognition of an asset on the day it is received by the Group; andb. The derecognition of an asset and recognition of any gain or loss on disposal on the day that such
asset is delivered by the Group.
Any change in fair value of unrecognized financial asset is recognized in the statement of income orin equity, depending on the classification of the financial asset. Loans and receivables are recognizedwhen cash is advanced to the borrowers while financial liabilities are recognized when cash isreceived by the Group.
- 7 -
*SGVFS164641*
Classification, Measurement and Reclassification of Financial AssetsClassification and measurement of financial assetsFor purposes of classifying financial assets, an instrument is an ‘equity instrument’ if it is a non-derivative and meets the definition of ‘equity’ for the issuer (under PAS 32, Financial Instruments:
Presentation). All other non-derivative financial instruments are ‘debt instruments’.
Financial assets are classified, at initial recognition, as subsequently measured at amortized cost,FVTOCI, and FVTPL. The classification depends on the financial asset’s contractual cash flowcharacteristics and the Group’s business model for managing them.
In order for a financial asset to be classified and measured at amortized cost or FVTOCI, it needs togive rise to cash flows that are solely payments of principal and interest (SPPI) on the principalamount outstanding. This assessment is referred to as the SPPI test and is performed at an instrumentlevel.
The Group’s business model for managing financial assets refers to how it manages its financialassets in order to generate cash flows. The business model determines whether cash flows will resultfrom collecting contractual cash flows, selling the financial assets, or both.
Business model test
The Group determines its business model at the level that best reflects how it manages groups offinancial assets to achieve its business objective.
The Group’s business model is not assessed on an instrument-by-instrument basis, but at a higherlevel of aggregated portfolios and is based on observable factors such as:
How the performance of the business model and the financial assets held within that businessmodel are evaluated and reported to the Group’s key management personnel
The risks that affect the performance of the business model and the financial assets held withinthat business model and, in particular, the way those risks are managed
How managers of the business are compensated (for example, whether the compensation is basedon the fair value of the assets managed or on the contractual cash flows collected)
The expected frequency, value and timing of sales are also important aspects of the Group’sassessment
The business model assessment is based on reasonably expected scenarios without taking ‘worst case’or stress case’ scenarios into account. If cash flows after initial recognition are realized in a way thatis different from the Group’s original expectations, the Group does not change the classification ofthe remaining financial assets held in that business model, but incorporates such information whenassessing newly originated or newly purchased financial assets going forward.
SPPI test
As a second step of its classification process, the Group assesses the contractual terms of financialinstruments to identify whether they meet the SPPI test.
‘Principal’ for the purpose of this test is defined as the fair value of the financial asset at initialrecognition and may change over the life of the financial asset (for example, if there are repaymentsof principal or amortization of the premium/discount).

- 8 -
*SGVFS164641*
The most significant elements of interest within a lending arrangement are typically the considerationfor the time value of money and credit risk. To make the SPPI assessment, the Group appliesjudgment and considers relevant factors such as the currency in which the financial asset isdenominated, and the period for which the interest rate is set.
In contrast, contractual terms that introduce a more than de minimis exposure to risks or volatility inthe contractual cash flows that are unrelated to a basic lending arrangement do not give rise tocontractual cash flows that are SPPI on the amount outstanding. In such cases, the financial asset isrequired to be measured at FVTPL.
a. Financial Assets at Amortized CostFinancial assets are measured at amortized cost if both of the following conditions are met:
The asset is held within a business model with the objective to hold assets in order to collectcontractual cash flows; and
The contractual terms of the instrument give rise on specified dates to cash flows that areSPPI on the principal amount outstanding.
Financial assets meeting these criteria are measured initially at fair value plus transaction costs.These are subsequently measured at amortized cost using the effective interest rate (EIR) method,less allowance for credit losses, with the interest calculated recognized as ‘Interest income’ in thestatement of income. Gains and losses are recognized in the statement of income when thefinancial assets are derecognized and impaired, as well as through the amortization process. Theexpected credit losses (ECL) are recognized in the statement of income under Provision forimpairment and credit losses - net. The effects of revaluation of foreign currency denominatedinvestments are recognized in statement of income. Gains or losses arising from disposals ofthese instruments are included in Gain on sale of financial assets at amortized cost in thestatement of income.
The Group classified ‘Cash and other cash items’, ‘Due from BSP’, ‘Due from other banks’,‘Interbank loans receivable and SPURA’, ‘Loans and receivables’, ‘Investment securities atamortized cost’ and certain financial assets under ‘Other assets’ as financial assets at amortizedcost.
The Group may irrevocably elect at initial recognition to classify a financial asset that meets theamortized cost criteria above as at FVTPL if that designation eliminates or significantly reducesan accounting mismatch had the financial asset been measured at amortized cost. As ofDecember 31, 2021 and 2020, the Group has not made such designation.
b. Financial Assets at FVTOCIFinancial assets at FVTOCI include debt and equity securities.
Debt Instruments at FVTOCIThe Group applies the category of debt instruments measured at FVTOCI when both thefollowing conditions are met:
The instrument is held within a business model, the objective of which is achieved by bothcollecting contractual cash flows and selling financial assets; and
The contractual terms of the financial asset meet the SPPI test.

- 9 -
*SGVFS164641*
The initial measurement of these financial instruments includes transaction costs. Subsequently,these are measured at fair value with gains or losses arising due to changes in fair valuerecognized in OCI under ‘Unrealized gain on financial assets carried at FVTOCI’. Interestincome and foreign exchange gains and losses are recognized in the statement of income in thesame manner as for financial assets measured at amortized cost. When the Group holds morethan one investment in the same security, these are deemed to be disposed of on a first-in, first-out basis. On derecognition, cumulative gains or losses recognized in OCI are reclassified fromOCI to the statement of income.
Equity Instruments at FVTOCIAt initial recognition, the Group can make an irrevocable election (on an instrument-by-instrument basis) to designate equity instruments at FVTOCI. Designation at FVTOCI is notpermitted if the investment in equity instrument is held for trading.
Investments in equity instruments at FVTOCI are initially measured at fair value plus transactioncosts. Subsequently, these are measured at fair value, with no deduction for sale or disposalcosts. Gains and losses arising from changes in fair value are recognized in OCI and accumulatedin ‘Unrealized gain on financial assets carried at FVTOCI’ in the statement of financial position.When the asset is disposed of, the cumulative gain or loss previously recognized in ‘Unrealizedgain on financial assets carried at fair value through other comprehensive income’ is notreclassified to the statement of income, but is reclassified to ‘Deficit’.
Dividends earned on these investments in equity instruments are recognized in the statement ofincome when the Group’s right to receive the dividends is established in accordance withPFRS 9, unless the dividends clearly represent recovery of a part of the cost of the investment.Dividends earned are recognized in the statement of income, under ‘Miscellaneous income’.
c. Financial Assets at FVTPLDebt instruments that do not meet the amortized cost or FVTOCI criteria, or that meet the criteriabut the Group has chosen to designate as at FVTPL at initial recognition, are measured atFVTPL.
Investments in equity instruments are classified as at FVTPL, unless the Group designates anequity instrument that is not held for trading as at FVTOCI at initial recognition.
The Group’s financial assets at FVTPL include government securities held for trading purposes.
As of December 31, 2021 and 2020, the Group has not designated any debt instrument that meetsthe amortized cost or FVTOCI criteria as at FVTPL.
Financial assets at FVTPL are carried at fair value, with net changes in fair value recognized as‘Trading and securities gain (loss) - net’ in the statement of income. Interest earned on theseinvestments is reported as ‘Interest income’ in the statement of income.
The fair value of financial assets denominated in a foreign currency is determined in that foreigncurrency and translated at the BAP closing rate prevailing at the statement of financial positiondate. The foreign exchange component forms part of its fair value gain or loss.

- 10 -
*SGVFS164641*
d. Derivative InstrumentsDerivative instruments are initially recorded at fair value and carried as financial assets whentheir fair value is positive and as financial liabilities when their fair value is negative.
Any gains or losses arising from changes in fair value of derivative instruments that do notqualify for hedge accounting are taken directly to the statement of income.
An embedded derivative is a component of a hybrid instrument that also includes a non-derivative host contract with the effect that some of the cash flows of the combined instrumentvary in a way similar to a stand-alone derivative. An embedded derivative causes some or all ofthe cash flows that otherwise would be required by the contract to be modified according to aspecified interest rate, financial instrument price, commodity price, foreign exchange rate, indexof prices or rates, credit rating or credit index, or other variable, provided that, in the case of anon-financial variable, it is not specific to a party to the contract. A derivative that is attached to afinancial instrument, but is contractually transferable independently of that instrument, or has adifferent counterparty from that instrument, is not an embedded derivative, but a separatefinancial instrument. The Group assesses the existence of an embedded derivative on the date itfirst becomes a party to the contract, and performs re-assessment only when there is a change tothe contract that significantly modifies the contractual cash flows.
Reclassification of financial assets
The Group can reclassify financial assets if the objective of its business model for managing thosefinancial assets changes. The Group is required to reclassify as follows:
From amortized cost or FVTOCI to FVTPL, if the objective of the business model changes sothat the amortized cost or FVTOCI criteria are no longer met;
From FVTPL to amortized cost or FVTOCI, if the objective of the business model changes sothat the amortized cost or FVTOCI criteria start to be met and the characteristics of theinstrument’s contractual cash flows are SPPI; and
From amortized cost to FVTOCI if the business model changes so that the objective becomesboth to collect contractual cash flows and to sell or from FVTOCI to amortized cost if thebusiness model becomes solely for the collection of contractual cash flows.
Reclassification of financial assets designated as at FVTPL or equity financial assets at FVTOCI atinitial recognition is not permitted.
A change in the objective of the Group’s business model must be effected before the reclassificationdate. The reclassification date is the beginning of the next reporting period following the change inthe business model.
Impairment of Financial Assets
ECL represent credit losses that reflect an unbiased and probability-weighted amount which is basedon reasonable and supportable information about past events, current conditions and forecasts offuture economic conditions, and the time value of money. The objective is to record lifetime losseson all financial instruments which have experienced a significant increase in credit risk (SICR) sincetheir initial recognition. As a result, ECL allowances are measured at amounts equal to either (i) 12-month ECL or (ii) lifetime ECL for those financial instruments which have experienced a SICR sinceinitial recognition (General Approach). The 12-month ECL is the portion of lifetime ECL that resultsfrom default events on a financial instrument that are possible within the next 12 months after thereporting date. Lifetime ECLs are credit losses that result from all possible default events over theexpected life of a financial instrument.

- 11 -
*SGVFS164641*
Both the 12-month ECL and lifetime ECL are calculated on either an individual basis or a collectivebasis, depending on the nature of the underlying portfolio of financial instruments.
The Group has established a policy to perform an assessment, at the end of each reporting period, ofwhether a financial instrument’s credit risk has increased significantly since initial recognition, byconsidering the change in the risk of default occurring over the remaining life of the instrument.Based on this process, the Group categorizes its credit exposures into Stage 1, Stage 2 and Stage 3, asdescribed below:
Stage 1: When loans are first recognized, the Group recognizes an allowance based on the 12-month ECL. Stage 1 loans also include facilities where the credit risk has improved and the loanhas been reclassified from Stage 2.
Stage 2: When a loan has shown a SICR since origination, the Group records an allowance forlifetime ECL. Stage 2 loans also include facilities, where the credit risk has improved and theloan has been reclassified from Stage 3.
Stage 3: Loans considered as credit-impaired or non-performing. The Group records anallowance for lifetime ECL.
The major portfolios of financial assets identified upon initial analysis of the Group’s creditexposures are loan receivables and treasury accounts. Loan receivables are availed by corporations orspecific individuals. Hence, this portfolio is further segmented to corporate and consumer portfolios.
Definition of ‘default’ and ‘cure’
Loan receivables
The Group defines a financial instrument as in default based on the following:
Loans and receivables which are past due for more than 90 days;
There is a breach of any key covenants/agreements that will adversely affect the borrower’scapacity to pay;
Weak financial condition and results of operations that leads to the borrower’s inability togenerate sufficient cash flow for debt servicing; or
Restructuring of principal and interest or any concession granted by the Group relating to theborrower’s difficulty.
A financial instrument is considered to be no longer in default (that is, to have cured) when it nolonger meets any of the default criteria and has exhibited a satisfactory track record.
Treasury exposures
Treasury exposures are considered in default upon occurrence of a credit event, such as but notlimited to bankruptcy, failure of meeting its obligations to depositors and non-deposit obligations,becoming critically undercapitalized, restructuring of obligations, or request for moratorium.
Credit risk at initial recognition
The Group uses an internal credit assessment and approvals at various levels to determine the creditrisk of exposures at initial recognition. Assessment can be quantitative or qualitative and depends onthe materiality of the facility or the complexity of the portfolio to be assessed.
SICRThe criteria for determining whether credit risk has increased significantly vary by portfolio andinclude quantitative changes in probabilities of default and qualitative factors, including a 30-daybackstop based on delinquency. The credit risk of a particular exposure is deemed to have increasedsignificantly since initial recognition if, based on the Group’s internal credit risk assessment, theborrower or counterparty is determined to require close monitoring or with well-defined credit

- 12 -
*SGVFS164641*
weaknesses. For exposures without internal grades, if contractual payments are more than 30 dayspast due, the credit risk is deemed to have increased significantly since initial recognition. Days pastdue are determined by counting the number of days since the earliest elapsed due date in respect ofwhich full payment has not been received. Due dates are determined without considering any graceperiod that might be available to the borrower.
For other credit risk exposures such as cash in banks, interbank loans and receivables, and debtsecurities at amortized cost and at FVTOCI, the Group applies the low credit risk simplification. TheGroup considers a debt financial asset to have low risk when its credit rating is equivalent to thedefinition of investment grade. The Group evaluates whether the debt financial asset, on anindividual basis, is considered to have low credit risk using all reasonable and supportableinformation that is available without undue cost or effort.
In subsequent reporting periods, if the credit risk of the financial instrument improves such that thereis no longer a SICR since initial recognition, the Group shall revert to recognizing a 12-month ECL:
For corporate loans, an account under Stage 3 may be reverted back to Stage 2 if it showscollection history of at least six consecutive payments. If an account continuous to showscollection history of another 6 consecutive payments, and other qualitative indicators representingsubstantial increase in credit risk has abated, the account will be further reverted back to Stage 1.
For consumer loans, an account under Stage 3 may be reverted back to Stage 2 if at leastsix consecutive payments are received and days past due bucket improves to 31 to 90. If thestatus of an account further improves to current, it will be reverted back to Stage 1.
For treasury exposures, the transfer from Stage 3 to Stage 2 must be evident with payments ofinterest and/or principal for at least six months. The Group shall transfer credit exposures fromStage 2 to Stage 1 if the rating upgrades and the resulting rating falls under investment graderating bands.
RestructuringIn certain circumstances, the Group modifies the original terms and conditions of a credit exposure toform a new loan agreement or payment schedule. The modifications can be given depending on theborrower’s or counterparty’s current or expected financial difficulty. The modifications may include,but are not limited to, change in interest rate and terms, principal amount, maturity date, date andamount of periodic payments and accrual of interest and charges. Distressed restructuring withindications of unlikeliness to pay are categorized as impaired accounts and are moved to Stage 3.
ECL parameters and methodologies
ECL is a function of the probability of default (PD), exposure at default (EAD) and loss given default(LGD), with the timing of the loss also considered, and is estimated by incorporating forward-lookingeconomic information and through the use of experienced credit judgment.
The PD represents the likelihood that a credit exposure will not be repaid and will go into default ineither a 12-month horizon for Stage 1 or lifetime horizon for Stage 2. The PD for each individualtype of instrument is modelled based on historical data and is estimated based on current marketconditions and reasonable and supportable information about future economic conditions. The Groupsegmented its loan-related credit exposures based on homogenous risk characteristics and developed acorresponding PD methodology for each loan portfolio. The PD methodology for each relevantportfolio is determined based on the underlying nature or characteristic of the portfolio, behavior ofthe accounts and materiality of the segment as compared to the total portfolio. On the other hand, PDfor cash and cash equivalents, interbank loans receivables and SPURA, debt securities at amortizedcost and debt securities at FVTOCI are assessed on an individual basis using publicly availableinformation.

- 13 -
*SGVFS164641*
EAD is modelled on historical data and represents an estimate of the outstanding amount of creditexposure at the time a default may occur. Two modelling approaches were employed during EADestimation. A Balance-Based model for on-balance sheet accounts and a Credit Conversion Factor(CCF)-Based model for off-balance sheet accounts.
LGD is the amount that may not be recovered in the event of default and is modelled based onhistorical cash flow recovery and reasonable and supportable information about future economicconditions, where appropriate. LGD takes into consideration the amount and quality of any collateralheld. During LGD estimation, the discounted amounts of potential payments and expected recoveriesfrom sale of the collateral are compared to the discounted amounts of corresponding direct expensesrelated with obtaining and selling of assets.
Economic overlays
The Group incorporates economic overlays into both its assessment of whether the credit risk of aninstrument has increased significantly since its initial recognition and its measurement of ECL. Abroad range of economic overlays is considered as economic inputs, such as gross domestic product(GDP) growth rates, crude oil prices, inflation rates, business confidence index, household finalconsumption expenditure index, unemployment rates, interest rates and BSP statistical indicators.The inputs and models used for calculating ECL may not always capture all characteristics of themarket at the date of the financial statements. To reflect these, quantitative adjustments or overlaysare occasionally made as temporary adjustments when such differences are significantly material.
Debt instruments measured at FVTOCI
The ECLs for debt instruments measured at FVTOCI do not reduce the carrying amount of thesefinancial assets in the statement of financial position, which remains at fair value. Instead, an amountequal to the allowance that would arise if the assets were measured at amortized cost is recognized inOCI as an accumulated impairment amount, with a corresponding charge to the statement of income.The accumulated loss recognized in OCI is recycled to the statement of income upon derecognition ofthe assets.
Collateral valuation
To mitigate its credit risks on financial assets, the Group seeks to use collateral, if possible. Thecollateral comes in various forms, such as cash, securities, letters of credit/guarantees, real estate,receivables, inventories, other non-financial assets and credit enhancements. Collateral, unlessrepossessed, is not recorded on the Group’s statement of financial position. However, the fair valueof collateral affects the calculation of ECLs. It is generally assessed, at a minimum, at the inceptionand re-assessed annually.
To the extent possible, the Group uses active market data for valuing financial assets held ascollateral. Other financial assets which do not have readily determinable market values are valuedusing models. Non-financial collateral, such as real estate, is valued based on the data provided byinternal and external appraisers.
Write-offs
Financial assets are written off either partially or in their entirety only when the Group has stoppedpursuing the recovery.
Undrawn loan commitments
Undrawn loan commitments and letters of credit are commitments under which over the duration ofthe commitment, the Group is required to provide a loan with pre-specified terms to the customer.The nominal contractual value of undrawn loan commitments, where the loan agreed to be providedis on market terms, are not recorded in the statement of financial position. These contracts are in the

- 14 -
*SGVFS164641*
scope of the ECL requirements where the Group estimates the expected portion of the undrawn loancommitments that will be drawn over their expected life.
Classification and Measurement of Financial LiabilitiesFinancial liabilities are classified, at initial recognition, either as financial liabilities at FVTPL orother financial liabilities at amortized cost.
Financial liabilities at amortized costThese liabilities are classified as such when the substance of the contractual arrangement results inthe Group having an obligation either to deliver cash or another financial asset to the holder, or tosatisfy the obligation other than by the exchange of a fixed amount of cash or another financial assetfor a fixed number of own equity shares. The components of issued financial instruments that containboth liability and equity elements are accounted for separately, with the equity component beingassigned the residual amount after deducting from the instrument as a whole the amount separatelydetermined as the fair value of the liability component on the date of issue.
These financial liabilities are measured initially at fair value, net of directly attributable transactioncosts. After initial measurement, these liabilities are subsequently measured at amortized cost usingthe effective interest method.
Amortized cost is calculated by taking into account any discount or premium on the issue and feesthat are an integral part of the EIR.
This accounting policy relates to the statement of financial position captions ‘Deposit liabilities’,‘Bills payable’, ‘Outstanding acceptances’, ‘Manager’s checks’, and certain financial liabilities under‘Accrued interest, taxes and other expenses’ and ‘Other liabilities’ which are not designated atFVTPL.
Financial Guarantees, Letters of Credit and Undrawn Loan CommitmentsThe Group issues financial guarantees, letters of credit and loan commitments.
Financial guarantees are initially recognized in the financial statements at fair value, being thepremium received. Subsequent to initial recognition, the Group’s liability under each guarantee ismeasured at the higher of the amount initially recognized less cumulative amortization recognized inthe statement of income, and an ECL provision.
The premium received is recognized in the statement of income in ‘Service charges, fees andcommissions’ on a straight line basis over the life of the guarantee.
Undrawn loan commitments and letters of credits are commitments under which, over the duration ofthe commitment, the Group is required to provide a loan with pre-specified terms to the customer.Similar to financial guarantee contracts, these contracts are in the scope of the ECL requirements.
The nominal contractual value of financial guarantees, letters of credit and undrawn loancommitments, where the loan agreed to be provided is on market terms, are not recorded in thestatement of financial position.

- 15 -
*SGVFS164641*
Derecognition of Financial Assets and Financial Liabilities
Derecognition due to substantial modification of terms and conditions
The Group derecognizes a financial asset, such as a loan to a customer, when the terms andconditions have been renegotiated to the extent that, substantially, it becomes a new loan, with thedifference recognized as a derecognition gain or loss, to the extent that an impairment loss has notalready been recorded. The newly recognized loans are classified as Stage 1 for ECL measurementpurposes, unless the new loan is deemed to be purchased or originated credit impaired.
When assessing whether or not to derecognize a loan to a customer, amongst others, the Groupconsiders the following factors:
Change in the currency of the loan;
Introduction of an equity feature;
Change in counterparty; or
If the modification is such that the instrument would no longer meet the SPPI criterion.
The Group also performs a quantitative assessment similar to that being performed for modificationof financial liabilities. In performing the quantitative assessment, the Group considers the new termsof a financial asset to be substantially different if the present value of the cash flows under the newterms, including any fees paid net of any fees received and discounted using the original effectiveinterest rate, is at least 10% different from the present value of the remaining cash flows of theoriginal financial asset.
When the contractual cash flows of a financial asset are renegotiated or otherwise modified and therenegotiation or modification does not result in the derecognition of that financial asset, the Grouprecalculates the gross carrying amount of the financial asset as the present value of the renegotiated ormodified contractual cash flows discounted at the original EIR (or credit-adjusted EIR for purchasedor originated credit-impaired financial assets) and recognizes a modification gain or loss in thestatement of income.
When the modification of a financial asset results in the derecognition of the existing financial assetand the subsequent recognition of a new financial asset, the modified asset is considered a'new 'financial asset. Accordingly, the date of the modification shall be treated as the date of initialrecognition of that financial asset when applying the impairment requirements to the modifiedfinancial asset. The newly recognized financial asset is classified as Stage 1 for ECL measurementpurposes, unless the new financial asset is deemed to be originated as credit impaired (POCI).
Derecognition other than substantial modification
Financial Asset
A financial asset (or, when applicable, a part of a financial asset or part of a group of financial assets)is derecognized (that is, removed from the statement of financial position) when:
the rights to receive cash flows from the asset have expired;
the Group has transferred its rights to receive cash flows from the asset or has assumed anobligation to pay the received cash flows in full without material delay to a third party under a‘pass-through’ arrangement, and either the Group:a. Has transferred substantially all the risks and rewards of the asset; orb. Has neither transferred nor retained the risks and rewards of the asset, but has transferred the
control of the asset.

- 16 -
*SGVFS164641*
When the Group has transferred its rights to receive cash flows from an asset or has entered into apass-through arrangement, it evaluates if, and to what extent, it has retained the risks and rewards ofownership. When it has neither transferred nor retained substantially all of the risks and rewards ofthe asset, nor transferred control of the asset, the Group continues to recognize the transferred asset tothe extent of its continuing involvement. In that case, the Group also recognizes an associatedliability. The transferred asset and the associated liability are measured on a basis that reflects therights and obligations that the Group has retained.
Continuing involvement that takes the form of a guarantee over the transferred asset is measured atthe lower of the original carrying amount of the asset and the maximum amount of consideration thatthe Group could be required to pay.
Financial Liability
A financial liability is derecognized when the obligation under the liability is discharged or cancelledor expired. When an existing financial liability is replaced by another from the same lender onsubstantially different terms, or the terms of an existing liability are substantially modified, such anexchange or modification is treated as the derecognition of the original liability and the recognition ofa new liability. The difference between the carrying value of the original financial liability and theconsideration paid is recognized in the statement of income.
Exchange or modification of financial liabilities
The Group considers both qualitative and quantitative factors in assessing whether a modification offinancial liabilities is substantial or not. The terms are considered substantially different if the presentvalue of the cash flows under the new terms, including any fees paid net of any fees received anddiscounted using the original effective interest rate, is at least 10% different from the present value ofthe remaining cash flows of the original financial liability. However, under certain circumstances,modification or exchange of a financial liability may still be considered substantial, even where thepresent value of the cash flows under the new terms is less than 10% different from the present valueof the remaining cash flows of the original financial liability. There may be situations where themodification of the financial liability is so fundamental that immediate derecognition of the originalfinancial liability is appropriate (e.g., restructuring a financial liability to include an embedded equitycomponent).
When an existing financial liability is replaced by another from the same lender on substantiallydifferent terms, or the terms of an existing liability are substantially modified, such an exchange ormodification is treated as a derecognition of the original liability and the recognition of a newliability. The difference between the carrying value of the original financial liability and the fair valueof the new liability is recognized in profit or loss.
When the exchange or modification of the existing financial liability is not considered as substantial,the Group recalculates the gross carrying amount of the financial liability as the present value of therenegotiated or modified contractual cash flows discounted at the original EIR and recognizes amodification gain or loss in profit or loss.
If modification of terms is accounted for as an extinguishment, any costs or fees incurred arerecognized as part of the gain or loss on the extinguishment. If the modification is not accounted foras an extinguishment, any costs or fees incurred adjust the carrying amount of the financialinstrument and are amortized over the remaining term of the modified financial instrument.

- 17 -
*SGVFS164641*
Repurchase and reverse repurchase agreements
Securities sold under agreements to repurchase at a specified future date (‘repos’) are notderecognized from the statement of financial position. The corresponding cash received, includingaccrued interest, is recognized in the statement of financial position as a loan to the Group, reflectingthe economic substance of such transaction.
Offsetting of Financial InstrumentsFinancial assets and financial liabilities are offset and the net amount is reported in the statement offinancial position if there is a currently enforceable legal right to offset the recognized amounts andthere is intention to settle on a net basis, or to realize the asset and settle the liability simultaneously.The Group assesses that it has a currently enforceable right of offset if the right is not contingent on afuture event, and is legally enforceable in the normal course of business, event of default, and eventof insolvency or bankruptcy of the Group and all of the counterparties.
Investments in Subsidiary and an Associate in the Parent Company Financial StatementsSubsidiary
A subsidiary is an entity in which the Parent Company holds more than half of the issued sharecapital or controls more than 50% of the voting power, or exercises control over the operations andmanagement of the subsidiary.
Associate
An associate is an entity in which the Parent Company has significant influence. Significantinfluence is the power to participate in the financial and operating policy decisions of the investee,but does not have contro or joint control over those policies.
The Parent Company’s investments in its subsidiary and an associate and the Group’s investment inan associate are accounted for using the equity method. Under the equity method, the investments insubsidiary and an associate is initially recognized at cost. The carrying amount of the investments insubsidiary and an associate are adjusted to recognize changes in the Group’s and the ParentCompany’s share in the net assets of the subsidiary and an associate since the acquisition date.Goodwill relating to the subsidiary and an associate are included in the carrying value of theinvestments and is not amortized.
The statement of income reflects the Group’s and the Parent Company’s share of the results ofoperations of the subsidiary and an associate. Any change in OCI of the investee is presented as partof the Group’s and the Parent Company’s OCI. In addition, when there has been a change recognizeddirectly in the equity of the subsidiary or associate, the Group and the Parent Company recognizetheir share of any changes, when applicable, in the statement of changes in equity. Unrealized gainsand losses resulting from transactions between the Group and the subsidiaries and associate areeliminated to the extent of the interest in the subsidiaries and associate. The aggregate of the Group’sshare in net income (loss) of subsidiary and associate is shown in the statement of income andrepresents profit or loss after tax and non-controlling interests in the subsidiary and associate.
If the Parent Company’s share of losses in a subsidiary or an associate equals or exceeds its interest inthe subsidiary or associate, the Parent Company discontinues recognizing its share in further losses.
The financial statements of the subsidiary and an associate are prepared for the same reporting periodas the Group. When necessary, adjustments are made to bring the accounting policies in line withthose of the Group.
Dividends received are treated as a reduction to the carrying amount of the investments.

- 18 -
*SGVFS164641*
Post-acquisition changes in the share of net assets of the subsidiaries include the share in the:a. Income or losses; andb. Remeasurement losses or gains on retirement liability.
Property and EquipmentProperty and equipment, are stated at cost less accumulated depreciation and amortization and anyimpairment in value, except land, which is carried at cost less impairment in value.
The initial cost of property and equipment consists of its purchase price, including import duties,taxes and any directly attributable costs of bringing the asset to its working condition and location forits intended use. Expenditures incurred after the property and equipment have been put intooperation, such as repairs and maintenance, are charged against the statement of income in the year inwhich the costs are incurred. In situations where it can be clearly demonstrated that the expenditureshave resulted in an increase in the future economic benefits expected to be obtained from the use ofan item of property and equipment beyond its originally assessed standard of performance, theexpenditures are capitalized as an additional cost of property and equipment.
Depreciation on property and equipment is computed using the straight-line method based on theestimated useful life (EUL) of the depreciable assets.
EUL
Condominium properties 50 yearsBuildings and improvements 25 yearsFurniture, fixtures and equipment 5Leasehold improvements Shorter of 10 years or
related lease terms
The residual values, EULs and methods of depreciation and amortization of property and equipmentare reviewed at each reporting date and adjusted prospectively, if appropriate.
Fully depreciated property and equipment are retained in the accounts until these are no longer usedand no further depreciation and amortization is charged to the statement of income.
An item of property and equipment is derecognized upon disposal or when no future economicbenefits are expected from its use or disposal. Upon derecognition, the cost and the relatedaccumulated depreciation and amortization and any impairment in value of the asset are removedfrom the accounts, and any resulting gain or loss (calculated as the difference between the netdisposal proceeds and the carrying amount of the asset) is reflected as income or loss in the statementof income.
Investment PropertiesInvestment properties include condominium and office units for lease and foreclosed properties insettlement of loan receivables.
Condominium and office units for lease
Condominium and office units for lease are carried at cost, less accumulated depreciation andimpairment in value. All costs that are directly attributable to the acquisition and development ofproperty are capitalized, including borrowing costs incurred to finance the propertydevelopment. Depreciation is computed on a straight-line basis over 25 to 50 years.

- 19 -
*SGVFS164641*
Foreclosed properties
Foreclosed properties consist of land, building and improvements.
Land is carried at cost less impairment in value. Building and improvements are carried at cost,which is the fair value at acquisition date, less accumulated depreciation and accumulated impairmentlosses. Transaction costs, which include nonrefundable capital gains tax and documentary stamp tax,incurred in connection with foreclosure are capitalized as part of the carrying values of the foreclosedproperties.
Foreclosed properties are recorded as ‘Investment properties’ upon:a. Entry of judgment in case of judicial foreclosure;b. Execution of the Sheriff’s Certificate of Sale in case of extra-judicial foreclosure; orc. Notarization of the Deed of Dacion in case of dation in payment (dacion en pago).
The Group applies the cost model in accounting for foreclosed properties. Depreciation is computedon a straight-line basis over the EUL of 10 years for buildings and improvements.
The EUL of investment properties and the depreciation method are reviewed periodically to ensurethat the period and the method of depreciation are consistent with the expected pattern of economicbenefits from items of investment properties.
The carrying values of the investment properties are reviewed for impairment when events or changesin circumstances indicate that the carrying value may not be recoverable. If any such indicationexists and where the carrying values exceed the estimated recoverable amount, the investmentproperty or cash-generating units (CGUs) it is related to are written down to their recoverableamounts.
Transfers are made to investment property when, and only when, there is a change in use, evidencedby ending of owner-occupation, commencement of an operating lease to another party or ending ofconstruction or development. Transfers are made from investment property when, and only when,there is a change in use, evidenced by commencement of owner-occupation or commencement ofdevelopment with a view to sell.
Investment properties are derecognized when they have either been disposed of or when they arepermanently withdrawn from use and no future benefit is expected from its disposal. Any gains orlosses on retirement or disposal of investment properties are recognized in the statement of income inthe year of retirement or disposal under ‘Profit from assets sold’.
Intangible AssetsIntangible assets consist of goodwill, branch licenses and software costs.
Goodwill and branch licensesGoodwill acquired in a business combination is initially measured at cost being the excess of the costof the business combination over the Group’s interest in the fair value of the acquiree’s identifiableassets, liabilities and contingent liabilities. The cost of branch licenses acquired in a businesscombination is its fair value at the date of acquisition.
Following initial recognition, goodwill and branch licenses are measured at cost less any accumulatedimpairment losses.

- 20 -
*SGVFS164641*
Branch licenses have an indefinite useful life as there is no foreseeable limit to the period over whichthese assets are expected to generate net cash inflows. The assessment of indefinite life is reviewedannually to determine whether the indefinite life continues to be supportable. If not, the change inuseful life from indefinite to finite is made on a prospective basis.
Software costs
Software costs, which are purchased by the Group separately for use in its operations, are measuredon initial recognition at cost. Following initial recognition, software costs are carried at cost lessaccumulated amortization and any accumulated impairment losses.
Software costs are amortized over the economic useful life of 2 to 5 years. The amortization periodand method for software costs are reviewed at least at each statement of financial position date.Changes in the expected useful life or the expected pattern of consumption of future economicbenefits embodied in this asset is accounted for by changing the amortization period or method, asappropriate, and treated as changes in accounting estimates. The amortization expense on softwarecosts is recognized in the statement of income.
Gains or losses arising from the derecognition of an intangible asset are measured as the differencebetween the net disposal proceeds and the carrying amount of the asset and are recognized in thestatement of income when the asset is derecognized.
Impairment of Non-financial AssetsInvestments in subsidiary and an associate, property and equipment (including right-of-use assets)and software costs
At each statement of financial position date, the Group assesses whether there is any indication thatits non-financial assets may be impaired. When an indicator of impairment exists or when an annualimpairment testing for an asset is required, the Group makes a formal estimate of the recoverableamount.
Recoverable amount is the higher of an asset’s fair value less costs to sell and its value in use (VIU)and is determined for an individual asset, unless the asset does not generate cash inflows that arelargely independent from those other assets or groups of assets, in which case, the recoverableamount is assessed as part of the CGU to which it belongs.
When the carrying amount of an asset exceeds its recoverable amount, the asset is consideredimpaired and is written down to its recoverable amount.
In assessing VIU, the estimated future cash flows are discounted to their present value using a pre-taxdiscount rate that reflects current market assessments of the time value of money and the risksspecific to the asset.
An impairment loss is recognized only if the carrying amount of an asset exceeds its recoverableamount. An impairment loss is charged against the statement of income in the period in which itarises.
A previously recognized impairment loss is reversed only if there has been a change in the estimatesused to determine the recoverable amount of an asset, but not to an amount higher than the carryingamount that would have been determined (net of any depreciation and amortization) had noimpairment loss been recognized for the asset in prior years. A reversal of an impairment loss iscredited to the current statement of income.

- 21 -
*SGVFS164641*
Goodwill and branch licenses
Goodwill and branch licenses are reviewed for impairment annually or more frequently if events orchanges in circumstances indicate that the carrying value may be impaired.
Impairment is determined for goodwill and branch licenses by assessing the recoverable amount ofthe CGU (or group of CGUs) to which the goodwill and branch licenses relate. When the recoverableamount of the CGU (or group of CGUs) is less than the carrying amount of the CGU (or group ofCGUs) to which goodwill and branch licenses have been allocated, an impairment loss is recognizedimmediately in the statement of income. Impairment losses relating to goodwill cannot be reversedfor subsequent increases in its recoverable amount in future periods. For branch licenses, apreviously recognized impairment loss is reversed only if there has been a change in the estimatesused to determine the recoverable amount of this asset, but not to an amount higher than the carryingamount that would have been determined had no impairment loss been recognized for this asset inprior years.
Common Stock and Additional Paid-in CapitalCommon stocks are recorded at par. Proceeds in excess of par value are recognized under equity as‘Additional-paid-in capital’ in the statement of financial position. Incremental costs incurred whichare directly attributable to the issuance of new shares are shown in equity as a deduction fromproceeds, net of tax.
Subscribed Common StockSubscribed common stock is recognized at subscribed amount, net of subscription receivable. Thiswill be debited upon full payment of the subscription and issuance of the shares of stock.
Subscription ReceivableSubscription receivable refers to the total amount of subscription to be received. The ParentCompany accounted for the subscription receivable as a contra equity account.
Revenue RecognitionUnder PFRS 15, revenue from contracts with customers is recognized when control of the services istransferred to the customer at an amount that reflects the consideration to which the Group expects tobe entitled in exchange for those services. The Group exercises judgment, taking into considerationall of the relevant facts and circumstances when applying each step of the five-step model to contractswith customers.
The following specific recognition criteria must be met before revenue is recognized:
Revenue within the scope of PFRS 15
Fees and CommissionsLoan fees that are directly related to the acquisition and origination of loans are included in theinitial carrying amount of the loan and are amortized using the effective interest method over theterm of the loan. Loan commitment fees are recognized as earned over the term of the credit linesgranted to each borrower. Loan syndication fees are recognized upon completion of allsyndication activities and where the Group does not have further obligation to perform under thesyndication agreement.

- 22 -
*SGVFS164641*
Revenue outside the scope of PFRS 15
a. Interest IncomeInterest on interest-bearing financial assets at FVTPL are recognized based on contractual rate.Interest on financial instruments measured at amortized cost and debt instruments classified asFVTOCI is recognized based on the EIR method.
The EIR method is a method of calculating the amortized cost of a financial asset or a financialliability and allocating the interest income or interest expense over the relevant period.
The EIR is the rate that exactly discounts estimated future cash payments or receipts through theexpected life of the financial instrument or, when appropriate, a shorter period to the net carryingamount of the financial asset or financial liability.
When a financial asset becomes credit-impaired and is, therefore, regarded as Stage 3 (asdiscussed under ‘Impairment of financial assets’ above), the Group calculates interest income byapplying the EIR to the net amortized cost of the financial asset. If the financial asset cures and isno longer credit-impaired, the Group reverts to calculating interest income on a gross basis.
b. Trading and Securities Gain (Loss) - NetTrading and securities gain (loss) - net represents results arising from trading activities, includinggains and losses from changes in fair value of financial assets and liabilities at FVTPL. This alsorepresents results arising from sale of debt financial assets at FVOCI.
c. Service Charges and PenaltiesService charges and penalties are recognized only upon collection or accrued when there isreasonable degree of certainty as to its collectability.
d. DividendsDividends are recognized when the Group’s right to receive the payments is established.
e. RentalRental income arising from leased premises is accounted for on a straight-line basis over the leaseterms of ongoing leases.
Expense RecognitionExpenses are recognized at the same time as the initial recognition of a liability, or an increase in thecarrying amount of a liability, or the derecognition of an asset, or a decrease in the carrying amount ofan asset. Expenses are recognized in the statement of income:
On the basis of a direct association between the costs incurred and the earning of specific items ofincome;
On the basis of systematic and rational allocation procedures when economic benefits areexpected to arise over several accounting periods and the association can only be broadly orindirectly determined; or
Immediately when the expenditure produces no future economic benefits or when, and to theextent that, future economic benefits do not qualify or cease to qualify for recognition in thestatement of financial position as an asset.
Expenses in the statement of income are presented using the nature of expense method. General andadministrative expenses are costs attributable to administrative and other business activities of theGroup.

- 23 -
*SGVFS164641*
Interest ExpenseInterest expense for all interest-bearing financial liabilities are recognized in ‘Interest expense’ in thestatement of income using the EIR of the financial liabilities to which they relate to.
Retirement BenefitsDefined benefit plans
The Parent Company maintains defined benefit plans covering all of their respective officers andregular employees.
The net retirement liability is the aggregate of the present value of defined benefit obligation at thestatement of financial position date reduced by the fair value of plan assets and adjusted for any effectof limiting a net retirement asset to the asset ceiling. The defined benefit obligation is calculatedannually by an independent actuary. The present value of defined benefit obligation is determined bydiscounting the estimated future cash outflows using interest rates on government bonds that haveterms to maturity approximating the terms of the related net retirement. The asset ceiling is thepresent value of any economic benefits available in the form of refunds from the plan or reductions infuture contributions to the plan. The cost of providing benefits under the defined benefit plans isactuarially determined using the projected unit credit method.
Retirement costs comprise of service costs and net interest on the net retirement liability.
Service costs, which include current service costs, past service costs and gains or losses on non-routine settlements, are recognized as expense in the statement of income. Past service costs arerecognized when plan amendment or curtailment occurs.
Net interest on the net retirement liability is the change during the period in the net retirement liabilitythat arises from the passage of time, which is determined by applying the discount rate based ongovernment bonds to the net retirement liability. Net interest on the net retirement liability isrecognized as expense or income in the statement of income.
Remeasurements comprising actuarial gains and losses, return on plan assets and any change in theeffect of the asset ceiling (excluding net interest on retirement liability) are recognized immediately inOCI in the period in which they arise. Remeasurements are not reclassified to the statement ofincome in subsequent periods.
Plan assets are assets that are held by a long-term employee benefit fund. Plan assets are notavailable to the creditors of the Group, nor can they be paid directly to the Group. The fair value ofplan assets is based on market price information. When no market price is available, the fair value ofplan assets is estimated by discounting expected future cash flows using a discount rate that reflectsboth the risks associated with the plan assets and the maturity or expected disposal date of thoseassets (or, if they have no maturity, the expected period until the settlement of the relatedobligations).
The Group’s right to be reimbursed of some or all of the expenditure required to settle a definedbenefit obligation is recognized as a separate asset at fair value when and only when reimbursement isvirtually certain.
Defined contribution plans
The Parent Company also contributes to its contributory, defined-contribution type staff providentplan based on a fixed percentage of the employees’ salaries as defined in the plan.

- 24 -
*SGVFS164641*
Payments to the defined contribution plans are recognized as expenses when employees haverendered service in exchange for these contributions.
Leases
The Group assesses at contract inception whether a contract is, or contains, a lease. That is, if thecontract conveys the right to control the use of an identified asset for a period of time in exchange forconsideration.
Group as a lessee
The Group applies a single recognition and measurement approach for all leases, except for short-term leases and leases of low-value assets. The Group recognizes lease liabilities to make leasepayments and right-of-use assets representing the right to use the underlying assets.
i) Right-of-use assets presented under Property and equipmentThe Group recognizes right-of-use assets at the commencement date of the lease (i.e., the date theunderlying asset is available for use). Right-of-use assets are measured at cost, less any accumulateddepreciation and impairment losses, and adjusted for any remeasurement of lease liabilities. The costof right-of-use assets includes the amount of lease liabilities recognized adjusted by lease paymentsmade at or before the commencement date and lease incentives received. Right-of-use assets aredepreciated on a straight-line basis over the shorter of the lease term and the estimated useful lives ofthe depreciable assets. The depreciation expense is presented under ‘Depreciation and Amortization’in the statement of income.
If ownership of the leased asset transfers to the Group at the end of the lease term or the cost reflectsthe exercise of a purchase option, depreciation is calculated using the estimated useful life of theasset.
The right-of-use assets are also subject to impairment. Refer to the accounting policies in Impairmentof Nonfinancial Assets.
ii) Lease liabilitiesAt the commencement date of the lease, the Group recognizes lease liabilities measured at the presentvalue of lease payments to be made over the lease term. The lease payments include fixed payments(including in-substance fixed payments) less any lease incentives receivable, variable lease paymentsthat depend on an index or a rate, and amounts expected to be paid under residual value guarantees.The lease payments also include the exercise price of a purchase option reasonably certain to beexercised by the Group and payments of penalties for terminating the lease, if the lease term reflectsthe Group exercising the option to terminate. Variable lease payments that do not depend on an indexor a rate are recognized as expenses in the period in which the event or condition that triggers thepayment occurs. In calculating the present value of lease payments, the Group uses its incrementalborrowing rate at the lease commencement date because the interest rate implicit in the lease is notreadily determinable. After the commencement date, the amount of lease liabilities is increased toreflect the accretion of interest and reduced for the lease payments made. In addition, the carryingamount of lease liabilities is remeasured if there is a modification, a change in the lease term, achange in the lease payments (e.g., changes to future payments resulting from a change in an index orrate used to determine such lease payments) or a change in the assessment of an option to purchasethe underlying asset.

- 25 -
*SGVFS164641*
iii) Short-term leases and leases of low-value assets
The Group applies the short-term lease recognition exemption to its short-term leases of ATM sites(i.e., those leases that have a lease term of 12 months or less from the commencement date and do notcontain a purchase option). It also applies the lease of low-value assets recognition exemption toleases of ATM sites that are considered to be low value. Lease payments on short-term leases andleases of low value assets are recognized as expense on a straight-line basis over the lease term.
Group as a lessorLeases in which the Group does not transfer substantially all the risks and rewards incidental toownership of an asset are classified as operating leases. Rental income arising from leased propertiesis accounted for on a straight-line basis over the lease terms and is included in revenue in thestatement of income due to its operating nature. Initial direct costs incurred in negotiating andarranging an operating lease are added to the carrying amount of the leased asset and recognized overthe lease term on the same basis as rental income. Contingent rents are recognized as revenue in theperiod in which they are earned.
Income TaxesCurrent taxCurrent tax assets and current tax liabilities are measured at the amount expected to be recoveredfrom or paid to the tax authority. The tax rates and tax laws used to compute the amount are thosethat are enacted or substantively enacted at the statement of financial position date.
Management periodically evaluates positions taken in the tax returns with respect to situations inwhich applicable tax regulations are subject to interpretation and establishes provisions whereappropriate.
Deferred tax
Deferred tax is provided, using the balance sheet liability method, on all temporary differences at thestatement of financial position date between the tax bases of assets and liabilities and their carryingamounts for financial reporting purposes.
Deferred tax assets are recognized for all deductible temporary differences and carryforward ofunused tax credits from the excess of Minimum Corporate Income Tax (MCIT) over the RegularCorporate Income Tax (RCIT), to the extent that it is probable that taxable profit will be availableagainst which the deductible temporary differences and the carryforward of unused tax credits fromexcess MCIT over RCIT can be utilized. Deferred tax, however, is not recognized on temporarydifferences that arise from the initial recognition of an asset or liability in a transaction that is not abusiness combination and, at the time of the transaction, affects neither the accounting income nortaxable income or loss.
The carrying amount of deferred tax assets is reviewed at each statement of financial position dateand reduced to the extent that it is no longer probable that sufficient taxable profit will be available toallow all or part of the deferred tax assets to be utilized.
Deferred tax liabilities are recognized for all taxable temporary differences, with certain exceptions.
Deferred tax assets and deferred tax liabilities are measured at the tax rates that are applicable to theperiod when the asset is realized or the liability is settled, based on tax rates (and tax laws) that havebeen enacted or substantively enacted at the statement of financial position date.
Current tax and deferred tax relating to items recognized directly in equity is recognized in OCI andnot in the statement of income.

- 26 -
*SGVFS164641*
ProvisionsProvisions are recognized when an obligation (legal or constructive) is incurred as a result of a pastevent and when it is probable that an outflow of assets embodying economic benefits will be requiredto settle the obligation and a reliable estimate can be made of the amount of the obligation.
When the Group expects some or all of a provision to be reimbursed, for example, under an insurancecontract, the reimbursement is recognized as a separate asset but only when the reimbursement isvirtually certain. The expense relating to any provision is presented in the statement of income, net ofany reimbursement.
If the effect of the time value of money is material, provisions are determined by discounting theexpected future cash flows at a pre-tax rate that reflects current market assessments of the time valueof money and, where appropriate, the risks specific to the liability. When discounting is used, theincrease in the provision due to the passage of time is recognized as an ‘Interest expense’ in thestatement of income.
Contingent Assets and Contingent LiabilitiesContingent assets are not recognized but are disclosed in the notes to financial statements when aninflow of economic benefits is probable. Contingent liabilities are not recognized in the financialstatements but are disclosed in the notes to financial statements, unless the possibility of an outflowof assets embodying economic benefits is remote.
Earnings Per Share (EPS)Basic EPS is computed by dividing the net income for the year by the weighted average number ofcommon shares outstanding during the year after giving retroactive effect to stock dividends declaredand stock rights exercised during the year, if any.
Diluted EPS is calculated by dividing the net income attributable to common shareholders by theweighted average number of common shares outstanding during the year adjusted for the effects ofany dilutive potential common shares.
Dividends on Common SharesDividends on common shares are recognized as a liability and deducted from equity when approvedby the BOD of the Parent Company. Dividends for the year that are approved after the statement offinancial position date are dealt with as an event after the statement of financial position date.
Segment ReportingThe Group’s operating businesses are organized and managed separately according to the nature ofthe products and services provided, with each segment representing a strategic business unit thatoffers different products and serves different markets. Financial information on business segmentsare presented in Note 6. No geographical segment information is presented as all of the Group’soperations are in the Philippines.
Fiduciary ActivitiesAssets and income arising from fiduciary activities, together with related undertakings to return suchassets to customers, are excluded from the financial statements where the Parent Company acts in afiduciary capacity such as nominee, trustee or agent.

- 27 -
*SGVFS164641*
Events after the Statement of Financial Position DatePost year-end events that provide additional information about the Group’s financial position at thestatement of financial position date (adjusting events) are reflected in the financial statements. Postyear-end events that are not adjusting events are disclosed in the notes to financial statements whenmaterial to the financial statements.
3. Significant Accounting Judgments, Estimates and Assumptions
The preparation of the financial statements in compliance with PFRS requires the Group to makejudgments, estimates and assumptions that affect the reported amounts of assets, liabilities, incomeand expenses and disclosure of contingent assets and contingent liabilities. Future events may occurwhich will cause the assumptions used in arriving at the estimates to change. The effects of anychange in estimates are reflected in the financial statements as these become reasonably determinable.
Judgments and estimates are continuously evaluated and are based on historical experience and otherfactors, including expectations of future events that are believed to be reasonable under thecircumstances.
JudgmentsIn the process of applying the Group’s accounting policies, management has made the followingjudgments, apart from those involving estimations, which have the most significant effect on theamounts recognized in the financial statements:
Business model test
The Group’s business model can be to hold financial assets to collect contractual cash flows evenwhen sales of certain financial assets occur. PFRS 9, however, emphasizes that if more than aninfrequent number of sales are made out of a portfolio of financial assets carried at amortized cost, theentity should assess whether and how such sales are consistent with the objective of collectingcontractual cash flows. In making this judgment, the Group considers the following, among others:a. Sales attributable to an anticipated or in reaction to events of systemic proportions that may
adversely affect the behavior of customer deposits and/or the Group’s creditors. This isparticularly important, among others, for securities that are funded principally through repurchaseagreements with international banks or foreign currency swaps;
b. Sales made due to occurrence of systemic events affecting the industry that severely curtailsaccess to credit and funding other than the lending facilities of the BSP as lender of last resort inorder to forestall the need for the Group to draw on the emergency lending facilities;
c. Sales attributable to the corrective measures of the Asset and Liability Committee (ALCO) tobring the asset-liability structure and regulatory capital within the BOD’s risk appetite andtargeted ratios;
d. Sales attributable to a unanticipated significant decline in the debt instrument’s liquiditycharacteristics to meet the minimum eligibility criteria of stock of High Quality Liquid Assets(HQLA); and
e. Sales attributable to systemic movements that have been generally accepted to negatively impacteconomic conditions, credit quality, and/or the liability profile of the Group.
On May 27, 2020, the Parent Company’s BOD approved the sale of HTC securities. In June 2020,the Parent Company liquidated all of its Peso (RBU) government securities classified underinvestment securities measured at amortized cost with a total face amount of P=8.60 billion andcarrying value of P=10.44 billion. The sale resulted in a trading gain of P=2.55 million presented in thestatement of income. Under the Parent Company’s Business Model Documentation for Managing

- 28 -
*SGVFS164641*
debt Securities, a permissible sale of Hold-To-Collect (HTC) includes those attributable to systemicmovements that have been generally accepted to negatively impact economic conditions, creditquality and or liability profile of the Parent Company.
The above disposals were assessed by the Parent Company as not inconsistent with the portfolios’business models considering the conditions and reasons for which the disposals were made. Further,these disposals did not result in a change in business model and the remaining securities in theaffected portfolios continue to be accounted for at amortized cost (Note 11).
Fair value of financial instruments
Where the fair values of financial instruments cannot be derived from active markets, they aredetermined using a variety of valuation techniques. The inputs to these valuation models are takenfrom observable markets where possible, but where this is not feasible, a degree of judgment isrequired in establishing fair values.
The carrying values and corresponding fair values of financial instruments, as well as the manner inwhich fair values were determined, are discussed in more detail in Note 4.
Contingencies
The Group is currently involved in various legal proceedings. The estimate of the probable costs forthe resolution of these claims has been developed in consultation with outside counsels handling theGroup’s defense in these matters and is based upon an analysis of potential results. The Groupcurrently does not believe that these proceedings will have a material adverse effect on its financialposition. It is possible, however, that future financial performance could be materially affected bychanges in the estimates or in the effectiveness of the strategies relating to these proceedings(Note 24).
Estimates and AssumptionsECLs on loans and other receivablesThe Group’s ECL calculations are outputs of complex models with a number of underlyingassumptions regarding the choice of variable inputs and their interdependencies.
Elements of the ECL models that are considered significant accounting judgments and estimatesinclude:
The segmentation of financial assets when their ECL is assessed on a collective basis;
The definition of default;
The Group’s internal grading model, which impacts the PDs assigned to the exposures;
The Group’s criteria for assessing if there has been a SICR and so allowances for financial assetsshould be measured on a lifetime ECL basis and the qualitative assessment;
Development of ECL models, including the various formulas and the choice of inputs;
Determination of associations between macroeconomic scenarios and economic inputs, such asInflation rates, Import growth rates, Interest rates, Gross Domestic Product (GDP) growth rates,business confidence index, household final consumption expenditure index, consumerconfidence index, bank average lending rates, unemployment rates and BSP statistical indicators,and the effect on PDs;
Selection of forward-looking macroeconomic scenario variables; and
Calculation of expected recoveries from defaulted accounts.

- 29 -
*SGVFS164641*
In response to the ongoing COVID-19 pandemic, the Group conducted a re-assessment of allcorporate accounts by re-scoring the Borrower Risk Ratings (BRR) using a stressed scenario in orderto account for the ongoing and future effects of the pandemic on the borrowers’ operations andearnings. Specific impairment was likewise assessed for corporate borrowers with large exposuresespecially those that were severely affected by the pandemic.
On the other hand, for consumer loans, expert judgment was incorporated by the Group to determinethe possible deterioration in the flow rates from one bucket to the next (i.e. current to 1-30 days pastdue, 1-30 days past due to 31-60 days past due, etc. up to more than 90 days past due bucket).Forecasted figures were assessed with the required additional allowance for credit loss.
The Group revisited weight distribution on Macroeconomic Variables (MEVs) to reflectmanagement’s view of the overall business environment. The Group also revisited stages ofborrowers that were affected by the pandemic and are expected to remain unable to pay regularamortization. These exercises resulted to changes in account staging and additional loan lossprovisioning.
The carrying value of loans and receivables and allowance for credit losses on loans and receivablesare disclosed in Notes 12 and 17, respectively.
Realizability of deferred tax assets
Deferred tax assets are recognized to the extent that it is probable that future taxable profit will beavailable against which the deductible temporary differences can be utilized. Significantmanagement judgment is required to determine the amount of deferred tax assets that can berecognized, based on assumptions that are affected by expected future market or economic conditionsand the expected performance of the Group. These assumptions include management’s expectationson growth of the Group’s loans and deposit portfolios and future operating costs and expenses.
The recognized and unrecognized deferred tax assets are disclosed in Note 30.
Impairment of branch licenses
The Group determines whether branch licenses are impaired at least on an annual basis. Branchlicenses are written down for impairment where the net present value of the forecasted future cashflows from the relevant CGU is insufficient to support its carrying value.
The recoverable amount of the CGU has been determined based on a VIU calculation using theCGU’s cash flow projections from a strategic plan approved by management covering a 5-yearperiod. Key assumptions in the VIU calculations are most sensitive to the following assumptions:
Discount rate, which is based on the cost of equity by reference to comparable entities using thecapital asset pricing model;
Loan and deposit portfolios growth rates; and
Growth rate to project cash flows beyond the budget period.
The carrying values of branch licenses and details of the VIU calculations are disclosed in Note 15.
Present value of defined benefit obligation
The cost of defined benefit plans, as well as the present value of defined benefit obligation, isdetermined using an actuarial valuation. The actuarial valuation involves making variousassumptions. These include the determination of the discount rates, salary increase rates, mortalityrates and employee turnover rates. Due to the complexity of the actuarial valuation, the underlying

- 30 -
*SGVFS164641*
assumptions and its long-term nature, defined benefit obligations are highly sensitive to changes inthese assumptions. All assumptions are reviewed at each statement of financial position date.
In determining the appropriate discount rate, the Group considers the interest rates of Philippinegovernment bonds that are denominated in the currency in which the benefits will be paid, withextrapolated maturities corresponding to the expected duration of the defined benefit obligation.
Salary increase rates are based on historical annual merit, market and promotional increase and futureinflation rates.
Other assumptions, such as mortality rates and employee turnover rates, are based on publiclyavailable mortality tables and the Group’s historical experience.
The retirement asset (liability) as of December 31, 2021 and 2020 are disclosed in Note 27.
4. Fair Value Measurement
The following tables provide the fair value hierarchy of the Group’s and the Parent Company’s assetsand liabilities measured at fair value and those for which fair values should be disclosed:
Consolidated and Parent Company
2021
Fair Value
Carrying
Value Total
Quoted Prices
in Active
Market
(Level 1)
Significant
Observable
Inputs
(Level 2)
Significant
Unobservable
Inputs
(Level 3)
Assets measured at fair value
Financial assets at FVTPL:
Government securities P=886,291 P=886,291 P=886,291 P=– P=−Financial assets at FVTOCI: Debt securities:
Government securities 6,362,401 6,362,401 6,362,401 – –
Private bonds – – – – –
Equity securities 126,886 126,886 − 91,600 35,286
7,375,578 7,375,578 7,248,692 91,600 35,286
Assets for which fair values are disclosed
Investment securities at amortized cost:Government securities 15,520,279 17,139,928 17,139,928 − −
Loans and receivables:
Receivables from customers:Corporate loans 57,985,808 57,055,766 − − 57,055,766
Auto loans 520,800 509,847 − − 509,847
Home loans 3,404,733 2,618,975 − − 2,618,975
Personal loans 105,938 83,273 − − 83,273
Unquoted debt securities 678,557 945,563 − − 945,563
78,216,115 78,353,352 17,139,928 − 61,213,424
Investment properties: Condominium units for lease 1,740,177 6,963,013 − − 6,963,013
Foreclosed properties 834,303 3,072,551 − − 3,072,551
Office units for lease 2,689 53,867 − − 53,867
2,577,169 10,089,431 − − 10,089,431
P=88,168,862 P=95,818,361 P=24,388,620 P=91,600 P=71,338,141
Liability measured at fair value
Currency forwards (Note 24) P=6,042 P=6,042 P=− P=6,042 P=−Liabilities for which fair value is disclosed
Financial liabilities at amortized cost:Time deposits 31,531,570 31,552,068 − − 31,552,068
LTNCD 2,889,116 3,104,683 − 3,104,683 −Bills payable 6,010,988 6,010,678 − − 6,010,678
P=40,437,716 P=40,673,471 P=− P=3,110,725 P=37,562,746

- 31 -
*SGVFS164641*
Consolidated and Parent Company
2020
Fair Value
Carrying Value Total
Quoted Prices
in ActiveMarket
(Level 1)
Significant
Observable Inputs
(Level 2)
Significant
UnobservableInputs
(Level 3)
Assets measured at fair valueFinancial assets at FVTPL:
Government securities P=718,294 P=718,294 P=718,294 P=– P=−Financial assets at FVTOCI: Debt securities:
Government securities 5,027,547 5,027,547 5,027,547 – –Private bonds – – – – –
Equity securities 110,269 110,269 − 71,650 38,619
Currency forwards (Note 24) 10,598 10,598 – 10,598 –
5,866,708 5,866,708 5,745,841 82,248 38,619
Assets for which fair values are disclosed
Investment securities at amortized cost:Government securities 2,263,356 2,418,758 2,418,758 − −
Loans and receivables:
Receivables from customers:Corporate loans 50,770,479 49,943,881 − − 49,943,881
Auto loans 669,670 660,495 − − 660,495
Home loans 4,233,699 3,042,175 − − 3,042,175Personal loans 293,817 250,986 − − 250,986
Unquoted debt securities 851,669 1,183,439 − − 1,183,439
59,082,690 57,499,734 2,418,758 − 55,080,976
Investment properties:
Condominium units for lease 1,788,559 6,940,697 − − 6,940,697Foreclosed properties 610,075 2,472,750 − − 2,472,750
Office units for lease 2,923 45,900 − − 45,900
2,401,557 9,459,347 − − 9,459,347
67,350,955 72,825,789 8,164,599 82,248 64,578,942
Liabilities for which fair value is disclosedFinancial liabilities at amortized cost:
Time deposits 40,367,517 40,366,511 − − 40,366,511LTNCD 2,883,668 3,126,066 − 3,126,066 −
Bills payable 2,182,844 2,182,670 − − 2,182,670
P=45,434,029 P=45,675,247 P=− P=3,126,066 P=42,549,181
Movements in the fair value measurement of ‘Financial assets at FVTOCI’ categorized withinLevel 3 pertain only to the changes in fair value of unquoted equity securities. No additions anddisposals were made in 2021 and 2020.
There were no transfers between Level 1 and Level 2 fair value measurements and no transfers out ofLevel 3 fair value measurements in 2021 and 2020.
The methods and assumptions used by the Group in estimating the fair value of its assets andliabilities are as follows:
Investment SecuritiesDebt securities
Fair values are generally based on quoted market prices. If the market prices are not readilyavailable, fair values are estimated using consensus prices obtained from Bloomberg.
Equity securities - club sharesFair values of club shares are based on prices published in GG&A Club Shares and G&W ClubShares. GG&A Club Shares and G&W Club Shares are involved in trading and leasing proprietaryand non-proprietary club shares.

- 32 -
*SGVFS164641*
Unquoted equity securities
Fair values of unquoted equity securities are estimated using the guideline publicly-traded companymethod, which utilizes publicly available information from publicly-traded comparable companiesthat are the same or similar to the unlisted company being valued. Unquoted equity security holdingsof the Group are not significant to the financial statements.
Loans and ReceivablesCash and other cash items, amounts due from BSP and other banks, interbank loans receivable andSPURA
Carrying amounts approximate fair values considering that these accounts consist mostly of overnightdeposits.
Receivables from customers
Fair values of receivables from customers are estimated using the discounted cash flow methodologythat makes use of the Group’s current incremental lending rates for similar types of loans andreceivables.
Unquoted debt securitiesFair values are estimated based on the discounted cash flow methodology that makes use ofinterpolated risk-free rates plus spread.
Accrued interest receivable and returned checks and other cash items (RCOCI)Carrying amounts approximate fair values due to the short-term nature of the accounts, with someitems that are due and demandable.
Accounts receivable, sales contracts receivable and refundable security deposits
Quoted market prices are not available for these assets. These are not reported at fair value and arenot significant in relation to the Group’s total portfolio of financial instruments.
Derivative Assets/LiabilitiesCurrency forwards under Other Assets/Liabilities
Fair values are calculated by reference to the prevailing interest differential and spot exchange rate asof the statement of financial position date, taking into account the remaining term to maturity of thederivative assets/liabilities.
Financial Liabilities at Amortized CostDeposit liabilities (excluding LTNCD)
Fair values of time deposits are estimated based on the discounted cash flow methodology that makesuse of the current incremental borrowing rates for similar types of borrowings. The carrying amountof demand and savings deposit liabilities approximate fair value considering that these are due anddemandable.
LTNCDFair values of LTNCD is determined based on the market yield rate of the Parent Company’s LTNCDas provided by the Philippine Dealing and Exchange Corporation (PDEx).
Bills payable
The fair value is estimated using the discounted cash flow methodology that makes use of theGroup’s current incremental borrowing rates for similar borrowings with maturities consistent withthose remaining for the liability being valued. Where the instrument has a relatively short maturity,carrying amounts approximate fair values.

- 33 -
*SGVFS164641*
Outstanding acceptances, manager’s checks, accrued interest payable, accrued other expenses,
accounts payable, refundable security deposits and due to the Treasurer of the PhilippinesCarrying amounts approximate fair values due to the short-term nature of these accounts, with someitems that are due and demandable.
Investment PropertiesFair values of investment properties are determined based on valuations made by professionallyqualified appraisers accredited by the BSP and SEC and internal appraisers. The fair values offoreclosed assets were derived based on market sales comparison approach. Under this approach,recent transactions for similar properties in the same areas as the investment properties wereconsidered, taking into account the economic conditions prevailing at the time the valuations weremade. Prices of recent transactions are adjusted to account for differences in a property’s size, shape,location, marketability and bargaining allowances. For depreciable properties, other inputsconsidered in the valuations are the age and remaining life of the buildings.
On the other hand, the fair values of the condominium and office units for lease were determinedusing the income capitalization approach model. The income capitalization approach model is usedsince the properties generate revenue from rental income. Income capitalization approach is a methodused to convert an estimate of a single year’s income expectancy into an indication of value in onedirect step – either by dividing the income estimate by an appropriate income rate or by multiplyingthe income estimate by an appropriate income factor. The rate of interest calculated represents therelationship between income and value observed in the market and is derived through comparablesales analysis. The income from a property, usually the annual net operating income or pre-tax cashflow, is divided by its sale or equity price to obtain the income rate.
The valuation, therefore, is based on the following critical assumptions:
Rental rates;
Capitalization rate (income rate), which is based on market rent for similar properties;
Vacancy rates, which are based on vacancy rates for comparable properties within the area wherethe Group’s properties are located; and
The floor areas, which are based on the total leasable area.
Significant Unobservable InputsQuantitative information about the Group’s and the Parent Company’s fair value measurements usingsignificant unobservable inputs (Level 3) on unquoted equity securities follows:
Year
Fair Value at
December 31
Valuation
Technique(s)
Unobservable
Input(s) Range
Reasonably
Possible
Alternative
Assumption
Sensitivity of the Fair
Value to the Input
2021 P=35,286 Guideline publicly-
traded company
method
Price to book ratio 0.61:1 -0.93:1 +0.10
-0.10
P=116
(116)
Discount for lack of
marketability
30% +10%
-10%
89
(89)
2020 P=38,619 Guideline publicly-traded company
method
Price to book ratio 0.77:1 - 1.01:1 +0.10-0.10
P=116(116)
Discount for lack of
marketability
30% +10%
-10%
103
(103)
The Parent Company estimates the fair value of the unquoted equity securities using the ‘benchmarkmultiples’ of comparable publicly-traded companies. The identification of comparable companiesconsiders the similarities between the subject company being valued and the guideline companies interms of industry, market, product line or service type, growth, etc. The Parent Company also

- 34 -
*SGVFS164641*
determines an appropriate discount adjustment for the lack of marketability of these unquoted equitysecurities based on empirical evidence gathered from available public market research.
The use of reasonably possible alternative assumptions in the significant unobservable inputs willaffect the fair value of the unquoted equity securities and the OCI (before tax) as presented above.
There has been no change in the valuation techniques used from 2020 to 2021.
Description of Significant Unobservable Input to ValuationThe significant unobservable input used in the fair value measurement categorized within Level 3 ofthe fair value hierarchy:
Loans and receivables at amortized cost
Fair values of loans and receivables are estimated using the discounted cash flow methodology, usingthe Group’s current incremental lending rates for similar types of loans. The significant increase(decrease) in the current increment lending rate would result to a lower (higher) fair valuemeasurement.
Liabilities
The carrying amount of liabilities approximates fair value in view of their relatively short-termmaturity except for time deposits whose fair values are estimated using the discounted cash flowmethodology using the Bank’s incremental borrowing rates for similar borrowings with maturitiesconsistent with those for the liability being valued.
5. Financial Risk Management Objectives and Policies
IntroductionRisk is inherent in the Group’s activities but is managed through a continuing and pro-active processof identification, measurement and monitoring, subject to risk limits and other controls. This processof risk management is critical to the Group’s continuing profitability and each individual within theGroup is accountable for the risk exposures relating to his or her responsibilities.
The Group is exposed to the following risks from its financial instruments:a. Credit riskb. Liquidity riskc. Market risk
i. Interest rate riskii. Foreign currency riskiii. Equity price risk
Risk management structure
The Group’s risk management environment is characterized by a well-defined risk organizationalstructure, flow of risk information, risk-based audit coverage, and an established compliance system.
BODThe BOD of the Parent Company is responsible for establishing and maintaining a sound riskmanagement system and is ultimately accountable for identifying and controlling risks; there are,however, separate independent bodies responsible for managing and monitoring risks.

- 35 -
*SGVFS164641*
Risk Oversight Committee (ROC)
The ROC has the overall responsibility for the development of the risk strategy and implementingprinciples, frameworks, policies and limits.
Enterprise Risk Management Group (ERMG)The ERMG is an independent unit within the Parent Company that directly reports to the ROC. It isthe responsibility of the ERMG to identify, analyze and measure risks from the Parent Company’strading, lending, borrowing and other transactional activities. It also recommends control policiesand procedures to mitigate risk in identified risk areas in Treasury, Credit, Trust and other areas ofoperations.
Together with other risk control functions such as Operations Group, it performs the important day-to-day monitoring of risk exposures of the Parent Company against approved limits and reporting ofsuch exposures, and implementation of policies and control procedures.
Treasury segment
The Treasury Segment is responsible for managing the Parent Company’s assets and liabilities. It isalso primarily responsible for the management of the funding and liquidity risks of the ParentCompany.
Compliance Group
Through the Group’s Compliance Group, relevant Philippine laws and regulations, as well aspertinent BSP circulars governing the operations of rural banks, are continuously identified forguidelines on implementation. The Compliance Group is also responsible for the systematic andeffective communications systems to keep management always conscious of their obligations andlegal responsibility as trustee of public funds. It ensures the Group’s adherence to the rules andregulations and the provisions of the Manual of Regulations for Banks (MORB) prescribed by theBSP.
Internal Audit Group (IAG)
Risk management processes throughout the Group are audited by the IAG which examines both theadequacy of the procedures and the Group’s compliance thereto. The IAG discusses the results of allassessments with management, and reports its findings and recommendations to the AuditCommittee.
Risk measurement and reporting systems
The Group’s risks are measured using a method which reflects both the expected loss likely to arise innormal circumstances and unexpected losses, which are an estimate of the ultimate actual loss basedon statistical models. The models make use of probabilities derived from historical experience,adjusted to reflect the economic environment. The Group adjusted existing models to take intoaccount the probable effects of the ongoing COVID 19 pandemic. This resulted in increased loanprovisions in anticipation of increased loan losses that may be brought about by the pandemic
The Group also performed worst case scenarios that would arise in the event that extreme eventswhich are unlikely to occur, happen.
Monitoring and controlling risks are primarily performed based on limits established by the Group.These limits reflect both the business strategy and market environment of the Group, as well as thelevel of risk that the Group is willing to accept. In addition, the Group monitors and measures theoverall risk-bearing capacity in relation to the aggregate risk exposure across all risk types andactivities. In response to the ongoing pandemic, the Group implemented stricter approval policies

- 36 -
*SGVFS164641*
particularly for consumer loans. All consumer loans need to go through a pre-clearance process fromthe Executive Committee Chair and minimum approval required is from the President & CEO.
Information gathered from all the businesses is evaluated and processed in order to analyze, identifyand control and identify risks early. All significant information is presented to the BOD, the ROC,and the head of each business division. The report includes credit exposure to groups and industries,Value-at-Risk (VaR), liquidity ratios and risk profile changes. Senior management assesses theappropriateness of the allowance for credit losses on a monthly basis for prudential and financialreporting.
Credit Risk and Concentration of Assets and Liabilities and Off-Balance Sheet ItemsCredit risk is the risk that one party to a financial instrument will fail to discharge an obligation andcause the other party to incur a financial loss. The Group’s credit risk arises from its lending andtrading of and investments in securities and foreign exchange activities. The Group manages andcontrols credit risk by setting limits on the amount of risk it is willing to accept for individualborrowers and groups of borrowers, as well as limits on large lines and industry concentrations. TheERMG monitors exposures in relation to these limits.
The Group obtains security where appropriate, enters into collateral arrangements withcounterparties, and limits the duration of exposures. The Group’s credit risk management process isguided by policies and procedures established by Corporate & Commercial Banking Group (CCBG),Consumer Finance Group and ERMG and approved by the BOD.
For the corporate loan portfolio, the Group has an internal credit risk rating system (ICRRS) for thepurpose of measuring credit risk for every exposure in a consistent manner that is as accurate aspossible and uses the risk information for business and financial decision making. The ICRRS shallcover all credit exposures to companies regardless of asset size, except those whose facilities arepurely 1:1 which will be given a default Borrower Risk Rating of 1. The system has two components,namely: (a) Borrower Risk Rating (BRR) System, which provides an assessment of credit riskwithout considering the security arrangements, and (b) Composite Risk Rating (CRR), which is anaccount rating taking into account the collateral and other credit risk mitigants and the credit facilitygranted to the borrower. The Borrower Risk Rating consists of 14 grades, ten of which fall underunclassified accounts and the remaining four are classified accounts according to regulatoryprovisioning guidelines.
The Group uses a set of Minimum Risk Acceptance Criteria for its consumer loan portfolio as part ofits credit undertaking. Risks are mitigated by focusing on the accounts with a low PD whileexercising prudent judgment on accounts whose risks are higher than normal but remains within theGroup’s risk appetite.
The Group also has a post approval loan portfolio quality and credit process review in place thatallows the Group to continuously identify and assess the risks on credit exposures and take correctiveactions. This function is carried out by the Group’s Credit Policy and Review Division.
Credit risk at initial recognition
The Group uses internal credit assessment and approvals at various levels to determine the credit riskof exposures at initial recognition. Assessment considers quantitative and qualitative factors anddepends on the materiality of the facility or the complexity of the portfolio to be assessed.

- 37 -
*SGVFS164641*
Maximum exposure to credit risk
The tables below provide the analysis of the maximum exposure of the Group’s and the ParentCompany’s financial instruments to credit risk, excluding those where the carrying values as reflectedin the statements of financial position and related notes already represent the financial instrument’smaximum exposure to credit risk, before and after taking into account collateral held or other creditenhancements:
Consolidated and Parent Company
2021 2020
Gross
Maximum
Exposure* Net Exposure
Financial Effect
of Collateral or
Credit
Enhancement
Gross
MaximumExposure* Net Exposure
Financial Effectof Collateral or
CreditEnhancement
Receivables from
customers:Corporate loans P=57,985,808 P=40,259,897 P=17,725,911 P=50,770,479 P=35,809,872 P=14,960,607
Consumer loans 4,031,471 1,400,749 2,630,722 5,197,186 2,233,187 2,963,999
Total Credit exposure P=62,017,279 P=41,660,646 P=20,356,633 P=55,967,665 P=38,043,059 P=17,924,606
* Net of allowance for credit losses and unearned discount
For sales contracts receivable, the fair value of collaterals and their corresponding financial effect oncredit exposure are no longer disclosed since the system does not regularly monitor such information.The carrying value of these sales contracts receivable are disclosed in Note 12.
Risk concentrations by industry
Concentrations arise when a number of counterparties are engaged in similar business activities, oractivities in the same geographic region, or have similar economic features that would cause theirability to meet contractual obligations to be similarly affected by changes in economic, political orother conditions. Concentrations indicate the relative sensitivity of the Group’s performance todevelopments affecting a particular industry.
Group exposures and risk concentrations to industries are monitored and reported in accordance withthe Group’s policies on group lending/inter-corporate earmarking and managing large exposure andcredit risk concentrations.
Credit-related commitment risks
The Parent Company makes available to its customers guarantees that may require the ParentCompany to make payments on their behalf and enters into commitments to extend credit lines tosecure their liquidity needs. Letters of credit and guarantees (including standby letters of credit)commit the Parent Company to make payments on behalf of customers in the event of a specific act,generally related to the import or export of goods. Such commitments expose the Parent Company tosimilar risks to loans and are mitigated by the same control processes and policies.
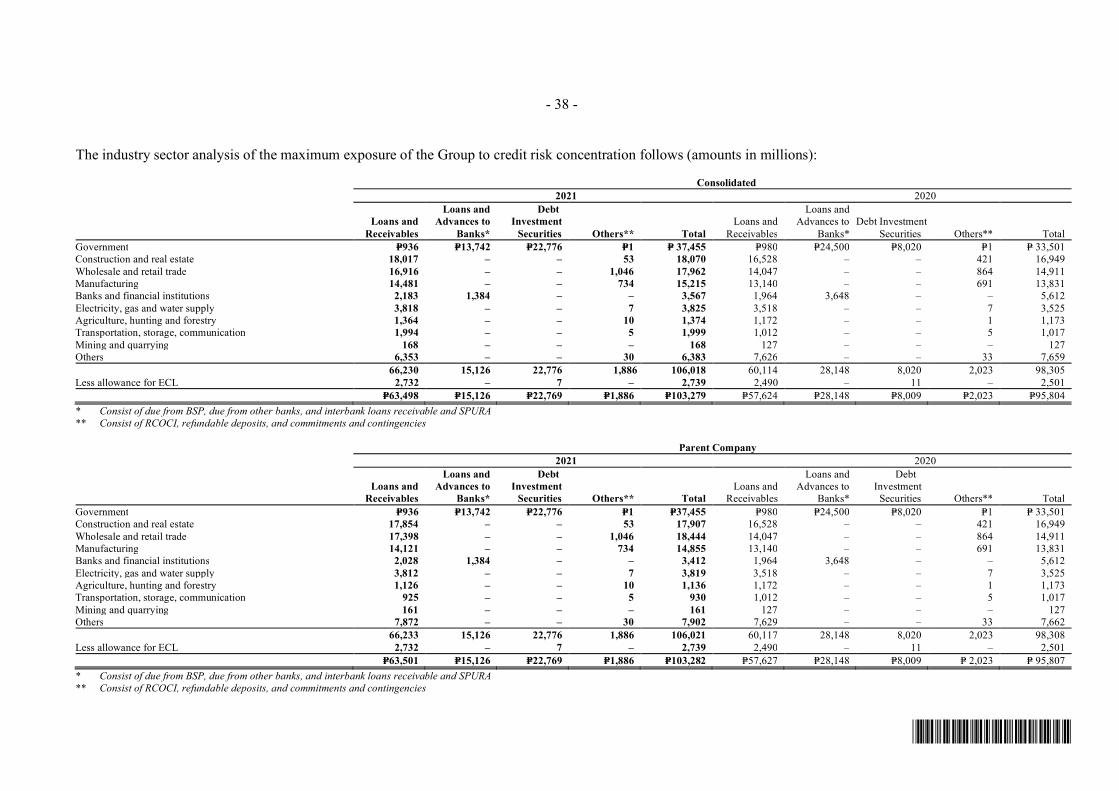
- 38 -
*SGVFS164641*
The industry sector analysis of the maximum exposure of the Group to credit risk concentration follows (amounts in millions):
Consolidated
2021 2020
Loans and
Receivables
Loans and
Advances to
Banks*
Debt
Investment
Securities Others** Total
Loans and
Receivables
Loans andAdvances to
Banks*
Debt Investment
Securities Others** Total
Government P=936 P=13,742 P=22,776 P=1 P= 37,455 P=980 P=24,500 P=8,020 P=1 P= 33,501Construction and real estate 18,017 – – 53 18,070 16,528 – – 421 16,949
Wholesale and retail trade 16,916 – – 1,046 17,962 14,047 – – 864 14,911Manufacturing 14,481 – – 734 15,215 13,140 – – 691 13,831Banks and financial institutions 2,183 1,384 – – 3,567 1,964 3,648 – – 5,612
Electricity, gas and water supply 3,818 – – 7 3,825 3,518 – – 7 3,525Agriculture, hunting and forestry 1,364 – – 10 1,374 1,172 – – 1 1,173Transportation, storage, communication 1,994 – – 5 1,999 1,012 – – 5 1,017
Mining and quarrying 168 – – – 168 127 – – – 127Others 6,353 – – 30 6,383 7,626 – – 33 7,659
66,230 15,126 22,776 1,886 106,018 60,114 28,148 8,020 2,023 98,305
Less allowance for ECL 2,732 – 7 – 2,739 2,490 – 11 – 2,501
P=63,498 P=15,126 P=22,769 P=1,886 P=103,279 P=57,624 P=28,148 P=8,009 P=2,023 P=95,804
* Consist of due from BSP, due from other banks, and interbank loans receivable and SPURA
** Consist of RCOCI, refundable deposits, and commitments and contingencies
Parent Company
2021 2020
Loans and
Receivables
Loans and
Advances to
Banks*
Debt
Investment
Securities Others** Total
Loans andReceivables
Loans andAdvances to
Banks*
DebtInvestment
Securities Others** Total
Government P=936 P=13,742 P=22,776 P=1 P=37,455 P=980 P=24,500 P=8,020 P=1 P= 33,501Construction and real estate 17,854 – – 53 17,907 16,528 – – 421 16,949
Wholesale and retail trade 17,398 – – 1,046 18,444 14,047 – – 864 14,911Manufacturing 14,121 – – 734 14,855 13,140 – – 691 13,831Banks and financial institutions 2,028 1,384 – – 3,412 1,964 3,648 – – 5,612
Electricity, gas and water supply 3,812 – – 7 3,819 3,518 – – 7 3,525Agriculture, hunting and forestry 1,126 – – 10 1,136 1,172 – – 1 1,173Transportation, storage, communication 925 – – 5 930 1,012 – – 5 1,017
Mining and quarrying 161 – – – 161 127 – – – 127Others 7,872 – – 30 7,902 7,629 – – 33 7,662
66,233 15,126 22,776 1,886 106,021 60,117 28,148 8,020 2,023 98,308
Less allowance for ECL 2,732 – 7 – 2,739 2,490 – 11 – 2,501
P=63,501 P=15,126 P=22,769 P=1,886 P=103,282 P=57,627 P=28,148 P=8,009 P= 2,023 P= 95,807
* Consist of due from BSP, due from other banks, and interbank loans receivable and SPURA
** Consist of RCOCI, refundable deposits, and commitments and contingencies

- 39 -
*SGVFS164641*
Collateral and other credit enhancements
The amount and type of collateral required depend on an assessment of the credit risk of thecounterparty. Guidelines are implemented regarding the acceptability of types of collateral andvaluation parameters.
The main types of collateral obtained are as follows:
For securities lending and reverse repurchase transactions: cash or securities
For commercial lending: deposit hold-out, mortgages over real estate properties, machineries,inventories and trade receivables
For retail lending: mortgages over residential properties and motor vehicles
It is the Group’s policy to dispose repossessed properties in an orderly fashion. The proceeds areused to reduce or repay the outstanding claim. In general, the Group does not occupy repossessedproperties for business use.
Collaterals obtained by the Group and the Parent Company from settlement of loans and receivableswhich remain outstanding as of December 31, 2021 and 2020 amounted to P=347.78 million andP=122.18 million, respectively (see Notes 14 and 16).
The Group does not hold collateral on financial assets which it may sell or repledge in the absence ofdefault by the owner of the collateral.
Credit quality per class of financial assets
In compliance with MORB Sec. X178, the Group has developed and continuously reviews andcalibrates its internal risk rating system for credit exposures aimed at uniformly assessing its creditportfolio in terms of risk profile. Where appropriate, it obtains security, enters into master nettingagreements, and limits the duration of exposures to maintain and even further enhance the quality ofthe Group’s credit exposures.
The credit quality of financial assets is monitored and managed using internal ratings and whereavailable, external ratings.
a. Loans and Receivables
Receivables from customersIn 2019, the Parent Company adopted new BRR scorecards by segmenting its portfolio furtherthus improve on the previous scorecards. The Parent Company employs specific scorecards foreach segment of the portfolio and uses specific scorecards for different classes of financialintermediaries. The new scorecards are more flexible and innovatively use more forward-lookingelements into the scoring mechanism, making the results more accurate. For purposes ofcomputing allowance, the Parent Company has prepared a transition matrix to bridge the previousrating grades to the new BRR scorecards.

- 40 -
*SGVFS164641*
The description and definition of the loan grades or ICRRS used by the Group for corporate loansfollow:
BRR Grade Description Definition
1 Excellent Excellent capacity to meet its financial commitments withminimal credit risk
2 Strong Strong capacity to meet its financial commitments with very lowcredit risk
3 Good Good capacity to meet its financial commitments with low creditrisk.
4 Fairly Good An obligor rated 4 differs from rated 3 obligor only to a smalldegree and has a fairly good capacity to meet its financialcommitments with low credit risk.
5 Satisfactory Satisfactory capacity to meet its financial commitments withmoderate credit risk
6 Fairly Satisfactory Fairly satisfactory capacity to meet its financial commitmentswith moderate credit risk
7 Acceptable Acceptable capacity to meet its financial commitments withsubstantial credit risk
8 Acceptable with Care A credit, though acceptable, needs care in granting facilities.However, the borrower is still creditworthy.
9 Acceptable with Caution A credit, though acceptable, needs significant caution to beexercised while granting facilities to the borrower. Theborrower is still creditworthy but has problems that need to beaddressed.
10 Watch List An obligor rated 10 is judged to be of poor credit standing and issubject to high default risk.
11 Especially Mentioned These are loans that have potential weaknesses that deservemanagement’s close attention. If left uncorrected, saidweaknesses may affect the repayment of the loan.
12 Substandard Loans that have well-defined weaknesses that may jeopardizerepayment/liquidation in full, either in respect of the business,cash flow, or financial position, which may include adversetrends or developments that affect willingness or repaymentability of the borrower.
13 Doubtful Loans that exhibit more sever weaknesses than those under“Substandard”, whose characteristics on the basis of currentlyknown facts, conditions, and values make collection orliquidation highly improbable, however, the exact amountremains undeterminable as yet.
14 Loss Loans which are considered uncollectible or worthless and ofsuch little value that their continuance as bankable assets is notwarranted.

- 41 -
*SGVFS164641*
The credit quality of the Group’s corporate loans under receivables from customers, which isbased on the ICRRS grade, is grouped as follows:
High Grade (BRR 1 to 7)Under this category, the borrower has the apparent ability to satisfy its obligations in full andtherefore, no loss in ultimate collection is anticipated. These loans or portions thereof are securedby hold-outs on deposits/deposit substitute, margin deposits or government-supported securities,other readily marketable collateral or are supported by sufficient credit and financial informationof favorable nature to assure repayment as agreed.
Standard Grade (BRR 8 to 10)Under this category are accounts not considered adversely classified but require closesupervision/monitoring due to some warning signals such as start-up business, substantialchanges in the business affecting operation or management, three continuous years of substantialdecline in income (exclusive of extraordinary income/losses).
Substandard Grade or Past-Due (BRR 11 to 14)Under this category are loans which exhibit unfavorable record or unsatisfactory characteristics,or where existing facts, conditions and values, make collection or liquidation in full improbable.The credit quality of the Group’s consumer loans under receivables from customers, which isbased on the age and status of delinquency of receivables and the credit standing of thecounterparties, is grouped as follows:
High GradeThis category is comprised of current receivables with no history of defaults and delayedpayments and other financial assets with counterparties that have the apparent ability to satisfytheir obligations in full. This rating includes amounts due from the BSP and due from otherbanks.
Standard GradeThis category is comprised of receivables that are technically past due, with period of default of1 to 30 days, but are still regarded as good credit quality since the counterparties have theapparent ability to satisfy their obligations in full.
Past Due but not ImpairedThese are accounts which are classified as delinquent, with period of default of 31 to 90 days.
Past Due and ImpairedThis comprised of receivables and other financial assets which are classified as non-performing,with period of default of more than 90 days.
Positive and vigorous management action is required to avert or minimize loss.

- 42 -
*SGVFS164641*
As of December 31, 2021, the credit quality of receivables from customers, net of unearneddiscount and capitalized interest of the Group and Parent Company follows:
Consolidated and Parent Company 2021
Stage 1 Stage 2 Stage 3 Total
Corporate loans:High grade P=45,551,479 P=– P=– P=45,551,479
Standard grade 4,172,469 7,877,160 – 12,049,629
Substandard grade – 20,411 – 20,411
Past due but not impaired – – – –
Past due and impaired – – 2,611,532 2,611,532
49,723,948 7,897,571 2,611,532 60,233,051
Consumer loans:Auto loans:
High grade 452,291 – – 452,291
Standard grade – – – –
Past due but not impaired – 18,702 13,704 32,406
Past due and impaired – – 113,409 113,409
452,291 18,702 127,113 598,106
Home loans:High grade 2,995,384 – – 2,995,384
Standard grade – – – –
Past due but not impaired – 82,052 41,112 123,164
Past due and impaired – – 518,054 518,054
2,995,384 82,052 559,166 3,636,602
Personal loans:High grade 109,400 – – 109,400
Standard grade – 355 – 355
Past due but not impaired – 5,224 6,186 11,410
Past due and impaired – – 91,986 91,986
109,400 5,579 98,172 213,151
Total consumer loans:High grade 3,557,075 – – 3,557,075
Standard grade – 355 – 355
Past due but not impaired – 105,978 61,002 166,980
Past due and impaired – – 723,449 723,449
3,557,075 106,333 784,451 4,447,859
Total receivables from customers:High grade 49,108,554 – – 49,108,554
Standard grade 4,172,469 7,877,515 – 12,049,984
Substandard grade – 20,411 – 20,411
Past due but not impaired – 105,978 61,002 166,980
Past due and impaired – – 3,334,981 3,334,981
P=53,281,023 P=8,003,904 P=3,395,983 P=64,680,910

- 43 -
*SGVFS164641*
Consolidated and Parent Company 2020
Stage 1 Stage 2 Stage 3 Total
Corporate loans:High grade P= 23,933,062 P=– P=– P=23,933,062Standard grade 17,192,044 8,800,097 – 25,992,141Substandard grade – 32,300 – 32,300Past due but not impaired – 25,835 – 25,835Past due and impaired – – 2,729,677 2,729,677
41,125,106 8,858,232 2,729,677 52,713,015
Consumer loans:Auto loans:
High grade 477,026 – – 477,026Standard grade 37,898 38,961 – 76,859Past due but not impaired – 33,498 15,733 49,231Past due and impaired – – 168,806 168,806
514,924 72,459 184,539 771,922
Home loans:High grade 3,725,914 – – 3,725,914Standard grade 96,765 – – 96,765Past due but not impaired – 119,337 15,051 134,388Past due and impaired – – 511,482 511,482
3,822,679 119,337 526,533 4,468,549
Personal loans:High grade 270,095 – – 270,095Standard grade 35,512 – – 35,512Past due but not impaired – 18,647 2,268 20,915Past due and impaired – – 113,591 113,591
305,607 18,647 115,859 440,113
Total consumer loans:High grade 4,473,035 – – 4,473,035Standard grade 170,175 38,961 – 209,136Past due but not impaired – 171,482 33,052 204,534Past due and impaired – – 793,879 793,879
4,643,210 210,443 826,931 5,680,584
Total receivables from customers:High grade 28,406,097 – – 28,406,097Standard grade 17,362,219 8,839,058 – 26,201,277Substandard grade – 32,300 – 32,300Past due but not impaired – 197,317 33,052 230,369
Past due and impaired – – 3,523,556 3,523,556
P=45,768,316 P=9,068,675 P=3,556,608 P=58,393,599
Movements during 2021 and 2020 for receivables from customers follows:
Consolidated and Parent Company 2021
Stage 1 Stage 2 Stage 3 Total
Corporate loans:Balance at January 1, 2021 P=41,125,106 P=8,858,232 P=2,729,677 P=52,713,015
New assets originated or
Purchased42,516,314 – – 42,516,314
Assets derecognized or repaid (28,849,119) (5,818,305) (250,973) (34,918,397)
Transfers to Stage 1 698,018 (554,253) (143,765) –
Transfers to Stage 2 (5,743,308) 5,743,308 – –
Transfers to Stage 3 – (276,593) 276,593 –
Accounts written-off – - – –
Foreign exchange adjustments (23,063) (54,818) – (77,881)
Balance at December 31, 2021 49,723,948 7,897,571 2,611,532 60,233,051
(Forward)

- 44 -
*SGVFS164641*
Consolidated and Parent Company 2021
Stage 1 Stage 2 Stage 3 TotalConsumer loans:
Auto loans:
Balance at January 1, 2021 P=514,924 P=72,459 P=184,539 P=771,922
New assets originated orPurchased
195,755– –
195,755
Assets derecognized or repaid (178,922) (75,466) (115,183) (369,571)
Transfers to Stage 1 10,657 (4,185) (6,472) –
Transfers to Stage 2 (28,603) 28,603 – –
Transfers to Stage 3 (61,520) (2,709) 64,229 –
Accounts written-off – – – –
Foreign exchange adjustments – – – –
Balance at December 31, 2021 452,291 18,702 127,113 598,106
Home loans:Balance at January 1, 2021 3,822,679 119,337 526,533 4,468,549
New assets originated orPurchased
912,293 – – 912,293
Assets derecognized or repaid (1,660,038) (10,471) (73,731) (1,744,240)
Transfers to Stage 1 61,884 (21,431) (40,453) –
Transfers to Stage 2 (81,702) 84,411 (2,709) –
Transfers to Stage 3 (59,732) (89,794) 149,526 –
Balance at December 31, 2021 2,995,384 82,052 559,166 3,636,602
Personal loans:
Balance at January 1, 2021 305,607 18,647 115,859 440,113
New assets originated orPurchased
31,625 – – 31,625
Assets derecognized or repaid (131,961) (9,654) (57,270) (198,885)
Transfers to Stage 1 1,632 (763) (869) –
Transfers to Stage 2 (10,123) 10,123 - –
Transfers to Stage 3 (87,380) (9,079) 96,459 –
Accounts written-off – (3,695) (56,007) (59,702)
Balance at December 31, 2021 109,400 5,579 98,172 213,151
Total consumer loans:Balance at January 1, 2021 4,643,210 210,443 826,931 5,680,584
New assets originated or
Purchased 1,139,673 – – 1,139,673
Assets derecognized or repaid (1,970,921) (95,591) (246,184) (2,312,696)
Transfers to Stage 1 74,173 (26,379) (47,794) –
Transfers to Stage 2 (120,428) 123,137 (2,709) –
Transfers to Stage 3 (208,632) (101,582) 310,214 –
Accounts written-off – (3,695) (56,007) (59,702)
Balance at December 31, 2021 3,557,075 106,333 784,451 4,447,859
Total receivables from customers:
Balance at January 1, 2021 45,768,316 9,068,675 3,556,608 58,393,599
New assets originated orpurchased 43,655,987 – – 43,655,987
Assets derecognized or repaid (30,820,040) (5,913,896) (497,157) (37,231,093)
Transfers to Stage 1 772,191 (580,632) (191,559) –
Transfers to Stage 2 (5,863,736) 5,866,445 (2,709) –
Transfers to Stage 3 (208,632) (378,175) 586,807 –
Accounts written-off – (3,695) (56,007) (59,702)
Foreign exchange adjustments (23,063) (54,818) - (77,881)
P=53,281,023 P=8,003,904 P=3,395,983 P=64,680,910
Consolidated and Parent Company 2020
Stage 1 Stage 2 Stage 3 Total
Corporate loans:Balance at January 1, 2020 P=49,233,092 P=3,355,774 P=1,171,838 P=53,760,704
New assets originated orPurchased
34,365,091 – – 34,365,091
Assets derecognized or repaid (30,500,160) (4,497,738) (75,189) (35,073,087)
Transfers to Stage 1 – – – –Transfers to Stage 2 (10,212,296) 10,212,296 – –Transfers to Stage 3 (1,720,838) (162,645) 1,883,483 –
Accounts written-off – – (248,734) (248,734)Foreign exchange adjustments (39,783) (49,455) (1,721) (90,959)
Balance at December 31, 2020 41,125,106 8,858,232 2,729,677 52,713,015
(Forward)

- 45 -
*SGVFS164641*
Consolidated and Parent Company 2020
Stage 1 Stage 2 Stage 3 Total
Consumer loans:Auto loans:
Balance at January 1, 2020 P=704,617 P=86,646 P=457,568 P=1,248,831New assets originated or
Purchased179,159 – – 179,159
Assets derecognized or repaid (253,777) (23,281) (85,547) (362,605)Transfers to Stage 1 – – – –Transfers to Stage 2 (61,503) 61,503 – –
Transfers to Stage 3 (53,572) (52,409) 105,981 –Accounts written-off – – (293,463) (293,463)
Balance at December 31, 2020 514,924 72,459 184,539 771,922
Home loans:Balance at January 1, 2020 4,458,480 109,941 271,893 4,840,314
New assets originated orpurchased
167,766 – – 167,766
Assets derecognized or repaid (485,833) (3,844) (49,854) (539,531)
Transfers to Stage 1 23,482 (21,238) (2,244) –Transfers to Stage 2 (118,443) 118,443 – –Transfers to Stage 3 (222,773) (83,965) 306,738 –
Balance at December 31, 2020 3,822,679 119,337 526,533 4,468,549
Personal loans:Balance at January 1, 2020 570,199 22,695 529,918 1,122,812
New assets originated orpurchased
87,234 – – 87,234
Assets derecognized or repaid (210,768) (7,543) (34,236) (252,547)
Transfers to Stage 1 1,800 (1,800) – –Transfers to Stage 2 (26,191) 14,211 11,980 –Transfers to Stage 3 (116,667) (8,916) 125,583 –
Accounts written-off – – (517,386) (517,386)
Balance at December 31, 2020 305,607 18,647 115,859 440,113
Total consumer loans:Balance at January 1, 2020 5,733,296 219,282 1,259,379 7,211,957New assets originated or
purchased434,159 – – 434,159
Assets derecognized or repaid (950,378) (34,668) (169,637) (1,154,683)Transfers to Stage 1 25,282 (23,038) (2,244) –
Transfers to Stage 2 (206,137) 194,157 11,980 –Transfers to Stage 3 (393,012) (145,290) 538,302 –Accounts written-off – – (810,849) (810,849)
Balance at December 31, 2020 4,643,210 210,443 826,931 5,680,584
Total receivables from customers:
Balance at January 1, 2020 54,966,388 3,575,056 2,431,217 60,972,661New assets originated or
purchased34,799,250 – – 34,799,250
Assets derecognized or repaid (31,450,538) (4,532,406) (244,826) (36,227,770)Transfers to Stage 1 25,282 (23,038) (2,244) –Transfers to Stage 2 (10,418,433) 10,406,453 11,980 –Transfers to Stage 3 (2,113,850) (307,935) 2,421,785 –
Accounts written-off – – (1,059,583) (1,059,583)
Foreign exchange adjustments (39,783) (49,455) (1,721) (90,959)
P=45,768,316 P=9,068,675 P=3,556,608 P=58,393,599
As of December 31, 2021 and 2020, the credit quality of the Group’s and the Parent Company’sfinancial guarantees, letters of credit and loan commitments follows:
2021
Stage 1 Stage 2 Stage 3 Total
High grade P=1,309,136 P=1,000 P=– P=1,310,136
Standard grade 303,560 236,928 – 540,488
P=1,612,696 P=237,928 P=– P=1,850,624

- 46 -
*SGVFS164641*
2020
Stage 1 Stage 2 Stage 3 Total
High grade P=1,316,906 P=– P=– P=1,316,906Standard grade 410,820 261,085 – 671,905
P=1,727,726 P=261,085 P=– P=1,988,811
Movements during 2021 and 2020 for the Group’s and the Parent Company’s financialguarantees, letters of credit and loan commitments follows:
2021
Stage 1 Stage 2 Stage 3 Total
Balance at January 1 P=1,727,726 P=261,085 P=– P=1,988,811
New assets originated or purchased 946,715 237,928 – 1,184,643
Transfers – – – –
Assets derecognized or repaid (1,061,745) (261,085) – (1,322,830)
Balance at December 31 P=1,612,696 P=237,928 P=– P=1,850,624
2020
Stage 1 Stage 2 Stage 3 Total
Balance at January 1 P=2,235,290 P=– P=– P=2,235,290New assets originated or purchased 1,096,182 – – 1,096,182Transfers (261,085) 261,085Assets derecognized or repaid (1,342,661) – – (1,342,661)
Balance at December 31 P=1,727,726 P=261,085 P=– P=1,988,811
As of December 31, 2021 and the credit quality of other receivables, gross of allowance forcredit losses follows:
Consolidated 2021
Stage 1 Stage 2 Stage 3 Total
Unquoted debt securities:High grade P=678,557 P=– P=– P=678,557
Accrued interest receivable:High grade 397,489 – – 397,489
Standard grade 38,752 108,651 – 147,403
Substandard grade – 5 – 5
Past due but not impaired – 410 232 642
Past due and impaired – – 14,231 14,231
436,241 109,066 14,463 559,770
Accounts receivable:High grade 186,900 – – 186,900
Standard grade 13,923 – – 13,923
Substandard grade – 8,084 – 8,084
Past due but not impaired – 27,035 – 27,035
Past due and impaired – – 29,844 29,844
200,823 35,119 29,844 265,786
Sales contracts receivable: High grade 37,562 – – 37,562
Standard grade – 126 – 126
Past due but not impaired – - 237 237
Past due and impaired – – 7,230 7,230
37,562 126 7,467 45,155
Total other receivables:High grade 1,300,508 – – 1,300,508
Standard grade 52,675 108,777 - 161,452
Substandard grade – 8,089 – 8,089
Past due but not impaired – 27,445 469 27,914
Past due and impaired – – 51,305 51,305
P=1,353,183 P=144,311 P=51,774 P=1,549,268

- 47 -
*SGVFS164641*
Parent Company 2021
Stage 1 Stage 2 Stage 3 Total
Unquoted debt securities:High grade P=678,557 P=– P=– P=678,557
Accrued interest receivable:High grade 397,489 – – 397,489
Standard grade 38,752 108,651 – 147,403
Substandard grade – 5 – 5
Past due but not impaired – 410 232 642
Past due and impaired – – 14,231 14,231
436,241 109,066 14,463 559,770
Accounts receivable:High grade 186,900 – – 186,900
Standard grade 16,756 – – 16,756
Substandard grade – 8,084 – 8,084
Past due but not impaired – 27,035 – 27,035
Past due and impaired – – 29,844 29,844
203,656 35,119 29,844 268,619
Sales contracts receivable:High grade 37,562 – – 37,562
Standard grade – 126 – 126
Past due but not impaired – - 237 237
Past due and impaired – – 7,230 7,230
37,562 126 7,467 45,155
Total other receivables:High grade 1,300,508 – – 1,300,508
Standard grade 55,508 108,777 - 164,285
Substandard grade – 8,089 – 8,089
Past due but not impaired – 27,445 469 27,914
Past due and impaired – – 51,305 51,305
P=1,356,016 P=144,311 P=51,774 P=1,552,101
Consolidated 2020
Unquoted debt securities:High grade P=852,565 P=– P=– P=852,565
Accrued interest receivable:High grade 215,628 - – 215,628Standard grade 80,698 114,206 51 194,955Substandard grade 48 – 48Past due but not impaired – 1,219 96 1,315Past due and impaired – – 56,598 56,598
296,326 115,473 56,745 468,544
Accounts receivable:High grade 225,401 – – 225,401Standard grade 66,280 – – 66,280Substandard grade – 25,189 – 25,189Past due but not impaired – 5,238 – 5,238Past due and impaired – – 11,192 11,192
291,681 30,427 11,192 333,300
Sales contracts receivable:High grade 22,283 – – 22,283Standard grade – 211 – 211Past due but not impaired – 8,337 – 8,337Past due and impaired – – 35,121 35,121
22,283 8,548 35,121 65,952
Total other receivables:High grade 1,315,877 – – 1,315,877Standard grade 146,978 114,417 51 261,446Substandard grade – 25,237 – 25,237Past due but not impaired – 14,794 96 14,890Past due and impaired – – 102,911 102,911
P=1,462,855 P=154,448 P=103,058 P=1,720,361

- 48 -
*SGVFS164641*
Parent Company 2020
Stage 1 Stage 2 Stage 3 Total
Unquoted debt securities:High grade P=852,565 P=– P=– P=852,565
Accrued interest receivable:High grade 215,628 - – 215,628Standard grade 80,698 114,206 51 194,955Substandard grade 48 – 48Past due but not impaired – 1,219 96 1,315Past due and impaired – – 56,598 56,598
296,326 115,473 56,745 468,544
Accounts receivable:High grade 225,401 – – 225,401Standard grade 66,280 – – 66,280Substandard grade – 25,189 – 25,189Past due but not impaired – 5,238 – 5,238
Past due and impaired – – 13,907 13,907
291,681 30,427 13,907 336,015
Sales contracts receivable:High grade 22,283 – – 22,283Standard grade – 211 – 211Past due but not impaired – 8,337 – 8,337Past due and impaired – – 35,121 35,121
22,283 8,548 35,121 65,952
Total other receivables:High grade 1,315,876 – – 1,315,876Standard grade 146,978 114,417 51 261,446Substandard grade – 25,237 – 25,237Past due but not impaired – 14,794 96 14,890Past due and impaired – – 105,627 105,627
P=1,462,854 P=154,448 P=105,774 P=1,723,076
Movements during 2021 and 2020 for other receivables follows:
Consolidated 2021
Stage 1 Stage 2 Stage 3 Total
Unquoted debt securities:
Balance at January 1, 2021 P=852,565 P=– P=– P=852,565
Assets derecognized or repaid (174,008) – – (174,008)
Balance at December 31, 2021 678,557 – – 678,557
Accrued interest receivable:Balance at January 1, 2021 296,326 115,473 56,745 468,544
New assets originated orpurchased 523,890 – – 523,890
Assets derecognized or repaid (258,191) (116,877) (55,378) (430,446)
Transfers to Stage 1 (109,197) 109,197 – –Transfers to Stage 2 (1,414) 1,414 – –Transfers to Stage 3 (15,173) (44) 15,217 –
Accounts written-off – (97) (2,121) (2,218)
Balance at December 31, 2021 436,241 109,066 14,463 559,770
Accounts receivable:
Balance at January 1, 2021 291,681 30,427 11,192 333,300
New assets originated orPurchased 3,838,735 – – 3,838,735
Assets derecognized or repaid (3,922,186) 13,573 3,370 (3,905,243)
Transfers to Stage 1 – – – –Transfers to Stage 2 – – – –
Transfers to Stage 3 (7,407) (8,881) 16,288 –Accounts written-off – – (1,006) (1,006)
Balance at December 31, 2021 200,823 35,119 29,844 265,786
(Forward)
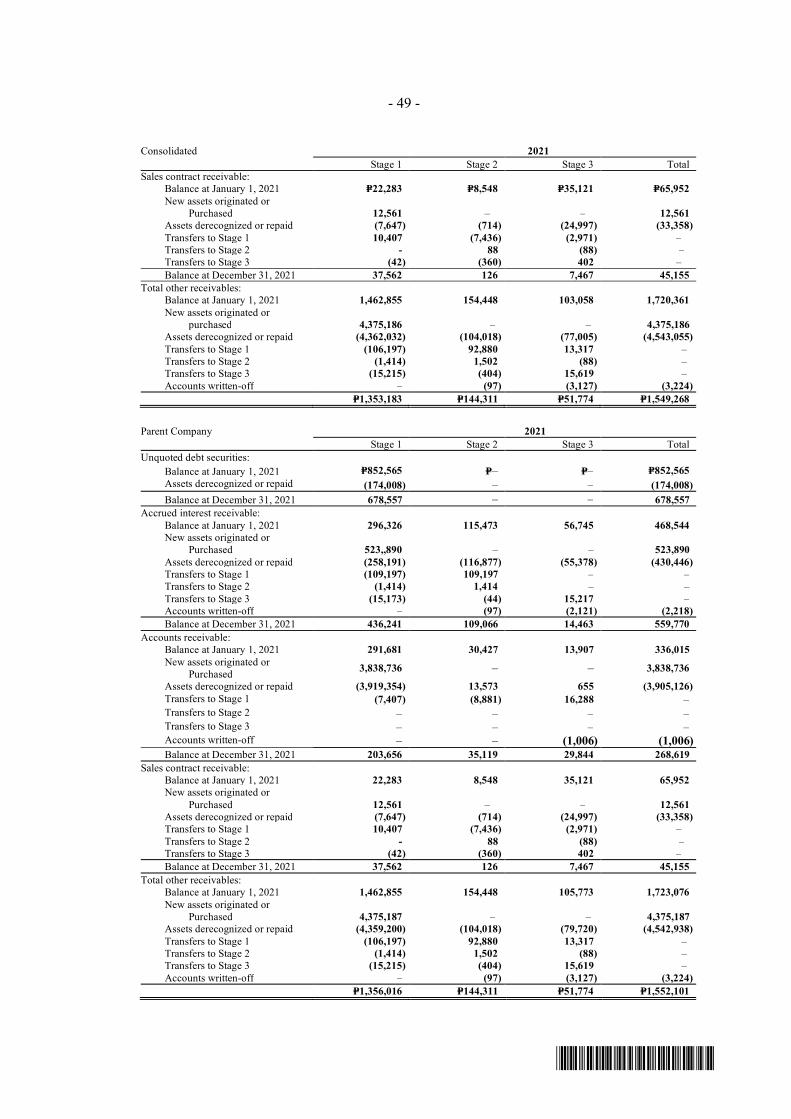
- 49 -
*SGVFS164641*
Consolidated 2021
Stage 1 Stage 2 Stage 3 TotalSales contract receivable:
Balance at January 1, 2021 P=22,283 P=8,548 P=35,121 P=65,952
New assets originated orPurchased 12,561 – – 12,561
Assets derecognized or repaid (7,647) (714) (24,997) (33,358)
Transfers to Stage 1 10,407 (7,436) (2,971) –Transfers to Stage 2 - 88 (88) –Transfers to Stage 3 (42) (360) 402 –
Balance at December 31, 2021 37,562 126 7,467 45,155
Total other receivables:Balance at January 1, 2021 1,462,855 154,448 103,058 1,720,361
New assets originated orpurchased 4,375,186 – – 4,375,186
Assets derecognized or repaid (4,362,032) (104,018) (77,005) (4,543,055)
Transfers to Stage 1 (106,197) 92,880 13,317 –Transfers to Stage 2 (1,414) 1,502 (88) –Transfers to Stage 3 (15,215) (404) 15,619 –
Accounts written-off – (97) (3,127) (3,224)
P=1,353,183 P=144,311 P=51,774 P=1,549,268
Parent Company 2021
Stage 1 Stage 2 Stage 3 Total
Unquoted debt securities:
Balance at January 1, 2021 P=852,565 P=– P=– P=852,565
Assets derecognized or repaid (174,008) – – (174,008)
Balance at December 31, 2021 678,557 – – 678,557
Accrued interest receivable:
Balance at January 1, 2021 296,326 115,473 56,745 468,544
New assets originated orPurchased 523,,890 – – 523,890
Assets derecognized or repaid (258,191) (116,877) (55,378) (430,446)
Transfers to Stage 1 (109,197) 109,197 – –Transfers to Stage 2 (1,414) 1,414 – –
Transfers to Stage 3 (15,173) (44) 15,217 –Accounts written-off – (97) (2,121) (2,218)
Balance at December 31, 2021 436,241 109,066 14,463 559,770
Accounts receivable:Balance at January 1, 2021 291,681 30,427 13,907 336,015
New assets originated orPurchased
3,838,736 – – 3,838,736
Assets derecognized or repaid (3,919,354) 13,573 655 (3,905,126)
Transfers to Stage 1 (7,407) (8,881) 16,288 –Transfers to Stage 2 – – – –Transfers to Stage 3 – – – –Accounts written-off – – (1,006) (1,006)Balance at December 31, 2021 203,656 35,119 29,844 268,619
Sales contract receivable:Balance at January 1, 2021 22,283 8,548 35,121 65,952
New assets originated or
Purchased 12,561 – – 12,561
Assets derecognized or repaid (7,647) (714) (24,997) (33,358)
Transfers to Stage 1 10,407 (7,436) (2,971) –
Transfers to Stage 2 - 88 (88) –Transfers to Stage 3 (42) (360) 402 –
Balance at December 31, 2021 37,562 126 7,467 45,155
Total other receivables:Balance at January 1, 2021 1,462,855 154,448 105,773 1,723,076
New assets originated orPurchased 4,375,187 – – 4,375,187
Assets derecognized or repaid (4,359,200) (104,018) (79,720) (4,542,938)
Transfers to Stage 1 (106,197) 92,880 13,317 –Transfers to Stage 2 (1,414) 1,502 (88) –Transfers to Stage 3 (15,215) (404) 15,619 –
Accounts written-off – (97) (3,127) (3,224)
P=1,356,016 P=144,311 P=51,774 P=1,552,101

- 50 -
*SGVFS164641*
Consolidated 2020
Stage 1 Stage 2 Stage 3 Total
Unquoted debt securities:Balance at January 1, 2020 P=1,068,193 P=– P=– P=1,068,193
Assets derecognized or repaid (215,628) – – (215,628)
Balance at December 31, 2020 852,565 – – 852,565
Accrued interest receivable:Balance at January 1, 2020 445,629 64,794 59,071 569,494New assets originated or
purchased 340,874 – – 340,874Assets derecognized or repaid (343,133) (47,511) (7,110) (397,754)Transfers to Stage 1 230 (230) – –
Transfers to Stage 2 (101,743) 101,743 – –Transfers to Stage 3 (45,531) (3,323) 48,854 –Accounts written-off – – (44,070) (44,070)
Balance at December 31, 2020 296,326 115,473 56,745 468,544
Accounts receivable:Balance at January 1, 2020 688,467 9,692 7,085 705,244
New assets originated orpurchased 4,121,822 – – 4,121,822
Assets derecognized or repaid (4,486,953) (3,741) (3,072) (4,493,766)
Transfers to Stage 1 (31,655) 29,576 2,079 –Transfers to Stage 2 – (5,100) 5,100 –Transfers to Stage 3 – – – –
Accounts written-off – – – –
Balance at December 31, 2020 291,681 30,427 11,192 333,300
Sales contract receivable:Balance at January 1, 2020 41,640 37,804 22,764 102,208New assets originated or
purchased 9,152 – – 9,152Assets derecognized or repaid (4,370) (2,467) (38,571) (45,408)Transfers to Stage 1 – – – –
Transfers to Stage 2 (10,829) 10,829 – –Transfers to Stage 3 (13,310) (37,618) 50,928 –
Balance at December 31, 2020 22,283 8,548 35,121 65,952
Total other receivables:Balance at January 1, 2020 2,243,929 112,290 88,920 2,445,139New assets originated or
purchased 4,471,848 – – 4,471,848Assets derecognized or repaid (5,050,084) (53,719) (48,753) (5,152,556)Transfers to Stage 1 (31,425) 29,346 2,079 –
Transfers to Stage 2 (112,572) 107,472 5,100 –Transfers to Stage 3 (58,841) (40,941) 99,782 –Accounts written-off – – (44,070) (44,070)
P=1,462,855 P=154,448 P=103,058 P=1,720,361
Parent Company 2020
Stage 1 Stage 2 Stage 3 Total
Unquoted debt securities:
Balance at January 1, 2020 P=1,068,193 P=– P=– P=1,068,193
Assets derecognized or repaid (215,628) – – (215,628)
Balance at December 31, 2020 852,565 – – 852,565
Accrued interest receivable:
Balance at January 1, 2020 445,629 64,794 59,071 569,494New assets originated or
Purchased340,874 – – 340,874
Assets derecognized or repaid (343,133) (47,511) (7,110) (397,754)Transfers to Stage 1 230 (230) – –Transfers to Stage 2 (101,743) 101,743 – –Transfers to Stage 3 (45,531) (3,323) 48,854 –Accounts written-off – – (44,070) (44,070)
Balance at December 31, 2020 296,326 115,473 56,745 468,544
(Forward)

- 51 -
*SGVFS164641*
Parent Company 2020
Stage 1 Stage 2 Stage 3 TotalAccounts receivable:
Balance at January 1, 2020 P=691,221 P=9,692 P=7,085 P=707,998
New assets originated orPurchased
4,121,822 – – 4,121,822
Assets derecognized or repaid (4,489,707) (3,741) (357) (4,493,805)
Transfers to Stage 1 (31,655) 29,576 2,079 –Transfers to Stage 2 – (5,100) 5,100 –Transfers to Stage 3 – – – –Accounts written-off – – – –Balance at December 31, 2020 291,681 30,427 13,907 336,015
Sales contract receivable:Balance at January 1, 2020 41,640 37,804 22,764 102,208New assets originated or
Purchased9,152 – – 9,152
Assets derecognized or repaid (4,370) (2,467) (38,571) (45,408)Transfers to Stage 1 – – – –Transfers to Stage 2 (10,829) 10,829 – –Transfers to Stage 3 (13,310) (37,618) 50,928 –Balance at December 31, 2020 22,283 8,548 35,121 65,952
Total other receivables:
Balance at January 1, 2020 2,246,683 112,290 88,920 2,447,893New assets originated or
purchased4,471,848 – – 4,471,848
Assets derecognized or repaid (5,052,839) (53,719) (46,037) (5,152,595)Transfers to Stage 1 (31,425) 29,346 2,079 –Transfers to Stage 2 (112,572) 107,472 5,100 –Transfers to Stage 3 (58,841) (40,941) 99,782 –Accounts written-off – – (44,070) (44,070)
P=1,462,854 P=154,448 P=105,774 P=1,723,076
As of December 31, 2021 and 2020, the credit quality of other financial assets (RCOCI andrefundable security deposits) are as follows:
Consolidated and Parent Company 2021
Stage 1 Stage 2 Stage 3 Total
High grade P=33,907 P=– P=– P=33,907
Standard grade 62 – – 62
Past due and impaired – – 1,564 1,564
P=33,969 P=– P=1,564 P=35,533
Consolidated and Parent Company 2020
Stage 1 Stage 2 Stage 3 Total
High grade P=33,387 P=– P=– P=33,387Standard grade 1,273 – – 1,273
P=34,660 P=– P=– P=34,660
Movements during 2021 and 2020 for other financial assets follows:
Consolidated and Parent Company 2021
Stage 1 Stage 2 Stage 3 Total
Balance at January 1 P=34,660 P=– P=– P=34,660
New assets originated or purchased 1,139 – 1,564 2,703
Assets derecognized or repaid (1,830) – – (1,830)
Balance at December 31 P=33,969 P=– P=1,564 P=35,533

- 52 -
*SGVFS164641*
Consolidated and Parent Company 2020
Stage 1 Stage 2 Stage 3 Total
Balance at January 1 P=62,356 P=– P=– P=62,356
New assets originated or purchased 2,785 – – 2,785
Assets derecognized or repaid (30,481) – – (30,481)
Balance at December 31 P=34,660 P=– P=– P=34,660
As of December 31, 2021 and 2020, restructured loans by the Group and the Parent Companywhich are neither past due nor impaired are as follow:
2021 2020
Receivables from customers:Corporate P=102,674 P=84,912Consumer 93,085 50,931
a. Due from Banks, Interbank Loans Receivables, Government Securities and CorporateInvestmentsThe Group follows an internally developed risk rating system for local banks and external riskratings [that is, Standard and Poor’s (S&P)] for foreign banks, government securities andcorporate investments.
A description of the rating systems for local banks follows:
High Grade (Tier 1)
Tier 1 - Banks categorized under this tier are capable of withstanding very difficult marketconditions for 2-3 years without deteriorating to a substandard credit classification by virtue oftheir size, reputation and ranking in the industry.
Standard Grade (Tier 2 to Tier 3)
These are accounts that have potential weaknesses that deserve management’s close attention.These potential weaknesses, if left uncorrected, may affect the repayment of the financialinstrument, thus, increase credit risk to the Group.
Tier 2 - Banks categorized under this tier may deteriorate to substandard within 1-2 years undervery difficult market conditions.
Tier 3 - Banks categorized under this tier may deteriorate to substandard within one year undervery difficult market conditions. These are banks, which fall short relative to size, in view ofperceived concern of uncertainty about their portfolio, earnings, or market condition. Banks withtotal net worth of P=3.00 billion to less than P=4.50 billion and net income of P=200.00 million toless than P=400.00 million are included in this category.
Substandard Grade (Tier 4)Tier 4 - These are banks, which fall short relative to size, in view of perceived concern ofuncertainty about their portfolio, earnings, or market condition. Banks with total net worth ofP=1.50 billion to less than P=3.00 billion and net income of P=70.00 million to less thanP=200.00 million are included in this category.
The following is the credit rating scale applicable for foreign banks, government securities, andcorporate investment outlets (aligned with S&P ratings):
AAA - Obligor’s capacity to meet its financial commitment is extremely strong.

- 53 -
*SGVFS164641*
AA - Obligor’s capacity to meet its financial commitment is very strong. It differs from thehighest-rated obligors at a minimal degree.
A - Obligor has strong capacity to meet its financial commitments but is somewhat moresusceptible to the adverse effects of changes in circumstances and economic conditions thanobligors rated in higher-rated categories.
BBB and below:
BBB - Obligation rated ‘BBB’ has adequate protection parameters. However, adverse economicconditions or changing circumstances are more likely to lead to a weakened capacity of theobligor to meet its financial commitment on the obligation.
BB - Obligation is less vulnerable to nonpayment than other speculative issues. However, it facesmajor ongoing uncertainties or exposure to adverse business, financial, or economic conditionswhich could lead to the obligor’s inadequate capacity to meet its financial commitment on theobligation.
B - Obligation rated ‘B’ is more vulnerable to nonpayment than obligations rated ‘BB’, but theobligor currently has the capacity to meet its financial commitment on the obligation. Adversebusiness, financial, or economic conditions will likely impair the obligor’s capacity orwillingness to meet its financial commitment on the obligation.
CCC - Obligation is currently vulnerable to nonpayment, and is dependent upon favorablebusiness, financial, and economic conditions for the obligor to meet its financial commitment onthe obligation. In the event of adverse business, financial, or economic conditions, the obligor isnot likely to have the capacity to meet its financial commitment on the obligation.
CC - Obligation is currently highly vulnerable to nonpayment.
C - Obligation is currently highly vulnerable to nonpayment, payment arrearages allowed by theterms of the documents, and subject of a bankruptcy petition or similar action which have notexperienced a payment default.
Among others, the ‘C’ rating may be assigned to subordinated debt, preferred stock or otherobligations on which cash payments have been suspended in accordance with the instrument’sterms or when preferred stock is the subject of a distressed exchange offer, whereby some or allof the issue is either repurchased for an amount of cash or replaced by other instruments having atotal value that is less than par.
D - Obligation is in payment default. Payments on an obligation are not made on the due dateeven if the applicable grace period has not expired. The ‘D’ rating also will be used upon thefiling of a bankruptcy petition or the taking of similar action if payments on an obligation arejeopardized. An obligation’s rating is lowered to ‘D’ upon completion of a distressed exchangeoffer, whereby some or all of the issue is either repurchased for an amount of cash or replaced byother instruments having a total value that is less than par.

- 54 -
*SGVFS164641*
As of December 31, 2021 and 2020, the credit quality of loans and advances to banks andinvestment securities, gross of allowance for ECL follows:
Consolidated andParent Company 2021
Stage 1 Stage 2 Stage 3 Total
Due from BSP:High grade P=10,271,486 P=− P=− P=10,271,486
Due from other banks:High grade 102,154 − − 102,154
Standard grade 55,4530 − − 55,4530
Unrated 1,909 − − 1,909
658,593 − − 658,593
Interbank loans receivable andSPURA:High grade 4,195,846 − − 4,195,846
Total loans and advances to banks:High grade 14,569,486 − − 14,569,486
Standard grade 554,530 − − 554,530
Unrated 1,909 − − 1,909
15,125,925 − − 15,125,925
Debt securities at FVTPLHigh grade 886,291 − − 886,291
Debt securities at FVTOCI:High grade 6,362,401 − − 6,362,401
Investment securities at amortizedcost:
High grade 15,520,279 − − 15,520,279
Total debt investment securitiesHigh grade 22,768,971 − − 22,768,971
Standard grade − − − −22,768,971 − − 22,768,971
Consolidated andParent Company 2020
Stage 1 Stage 2 Stage 3 Total
Due from BSP:High grade P=20,597,868 P=− P=− P=20,597,868
Due from other banks:High grade 1,106,389 − − 1,106,389Standard grade 387,427 − − 387,427Unrated 1,669 − − 1,669
1,495,485 − − 1,495,485
Interbank loans receivable andSPURA:High grade 6,054,454 − − 6,054,454
Total loans and advancesto banks:High grade 27,758,711 − − 27,758,711Standard grade 387,427 − − 387,427Unrated 1,669 − − 1,669
P=28,147,807 P=− P=− P=28,147,807

- 55 -
*SGVFS164641*
Consolidated andParent Company 2020
Stage 1 Stage 2 Stage 3 Total
Debt securities at FVTPLHigh grade P=718,294 P=− P=− P=718,294
Debt securities at FVTOCI:High grade 5,027,547 − − 5,027,547
Investment securities at amortizedcost:
High grade 2,263,356 − − 2,263,356
Total debt investment securitiesHigh grade 8,009,197 − − 8,009,197Standard grade − − − −
P=8,009,197 P=− P=− P=8,009,197
Total credit risk exposureThe tables below show the different credit risk exposures of the Group and of the Parent Company byrisk weight applied in accordance with BSP Circular No. 538 as reported to the BSP:
Consolidated and Parent
Company 2021
Net Risk Weights(b)
Exposures(a) 0% 20% 50% 75% 100% 150%
On-balance sheet assets(c) P=108,862 P=27,416 P=– P=14,156 P=– P=65,103 P=2,187
Credit risk weighted on- balance sheet assets
(d = b x c) 75,462 – – 7,078 – 65,103 3,280
Off-balance sheet assets(e) 11,461 9,392 1,424 – – 825 –
Credit risk weighted off- balance sheet assets
(f = b x e) 1,111 – 285 – – 825 –
Banking Book(g) – – – – – –
Counter party risk-weighted assets in Banking Books (h = b x g) – – – – – – –
Total Credit Risk WeightedAssets(d + f + h) P=76,572 P=– P=285 P=7,078 P=– P=65,929 P=3,280
(a) Net of specific provisions
Consolidated andParent Company 2020
Net Risk Weights(b)
Exposures(a) 0% 20% 50% 75% 100% 150%
On-balance sheet assets(c) P=101,681 P=28,787 P=81 P=10,214 P=– P=60,834 P=1,765
Credit risk weighted on- balance sheet assets
(d = b x c) 68,605 – 16 5,107 – 60,834 2,648
Off-balance sheet assets(e) 1,368 – 256 – – 1,112
Credit risk weighted off- balance sheet assets
(f = b x e) 14 – – – – 14 –
Banking Book(g) 1,368 – 256 – – 1,112
Counter party risk-weighted assets in Banking Books (h = b x g) 14 – – – – 14 –
Total Credit Risk WeightedAssets(d + f + h) P=69,987 P=– P=272 P=5,107 P=– P=61,960 P=2,648

- 56 -
*SGVFS164641*
Liquidity Risk and Funding ManagementLiquidity risk is the risk that the Parent Company will be unable to meet its payment obligationswhen they fall due under normal and stress circumstances. To limit this risk, management hasarranged diversified funding sources in addition to its core deposit base, manages assets with liquidityin mind and monitors future cash flows and liquidity on a daily basis.
This incorporates an assessment of expected cash flows and the availability of high grade collateralwhich could be used to secure additional funding, if required. The Parent Company also measures itsliquidity risk using the Maximum Cumulative Outflow metric. Utilization against the Board approvedMCO limit is monitored on a monthly basis and is reported to the ALCO and ROC. The ALCOmeets weekly to discuss, among others, the liquidity state of the Parent Company.
The Parent Company maintains a portfolio of highly marketable and diverse assets that can be easilyliquidated in the event of an unforeseen interruption of cash flows. The Parent Company also hascommitted lines of credit that it can access to meet liquidity needs. In addition, the Parent Companymaintains a statutory deposit with the BSP equal to 12.00% of customer deposits in December 31,2021 and 2020. The Bank also ensures that it complies with LCR and NSFR regulatory liquidity risklimits.
In managing intraday liquidity, the Parent Company utilizes its Intraday Liquidity Monitoring done inaccordance with BSP Circular 1064. The report monitors the level and trend of intraday liquidity riskexposures of the bank and its ability to meet payment and settlement obligations on a timely basis.The Parent Company also utilizes internal Liquidity Ratios that allows the Bank to easily gauge itsreadily available liquidity, based on high quality liquid assets, against deposit liabilities. These ratiosalso aid in the management of substantial liability outflows and the demand of funds for new loans.
This will allow the Parent Company to readily support its new business strategies and direction andmanagement of liquidity risk. The daily movement of Secondary Reserve serves as a primaryindicator of liquidity condition of the Parent Company. In addition, the Parent Company monitors theliquidity characteristics of its portfolio of assets that will provide necessary liquidity support duringperiods of liquidity stress as required by BSP Circular No. 905.
Analysis of financial instruments by remaining contractual maturitiesThe tables below summarize the maturity profile of the Group’s and the Parent Company’s financialinstruments as of December 31, 2021 and 2020, based on undiscounted contractual payments, exceptfor financial assets at FVTPL. Repayments which are subject to notice are treated as if notices are tobe given immediately. However, the Group and the Parent Company expect that many customerswill not request repayment on the earliest date the Group and the Parent Company could be requiredto pay and the tables do not reflect the expected cash flows indicated by the Group’s and the ParentCompany’s deposit retention history (amounts in millions):
Consolidated and Parent Company 2021
On Demand
Less than 12-Mar
1-2 Years
Beyond
Total3 Months Months 2 Years*
Financial assets
Financial assets at FVTPL P=– P=8 P=23 P=30 P=1,842 P=1,903
Financial assets at FVTOCI – 74 222 296 7,978 8,570
Investment securities at amortizedcost:
Government securities – 230 460 1,335 18,057 20,082
Loans and receivables:Due from BSP 10,271 – – – – 10,271
Due from other banks – 659 – – – 659
Interbank loans receivable – 4,217 – – – 4,217
(Forward)

- 57 -
*SGVFS164641*
Consolidated and Parent Company 2021
On Demand
Less than 12-Mar
1-2 Years
Beyond
Total3 Months Months 2 Years*
Receivables from customers:Corporate P=– P=23,565 P=13,887 P=2,738 P=28,848 P=69,038
Consumer – 155 458 782 6,522 7,917
Unquoted debt securities – – – – 678 678
Accrued interest receivable – 312 248 – – 560
Accounts receivable – 188 47 – 31 266
Sales contracts receivable – 36 2 – 7 45
Refundable deposit – – – – 35 35
RCOCI – 62 – – – 62
P=10,271 P=29,506 P=15,347 P=5,181 P=63,998 P=124,303
Financial liabilities
Deposit liabilities:Demand P=41,166 P=– P=– P=– P=– P=41,166
Savings 11,359 – – – – 11,359
Time – 24,142 4,609 950 2,141 31,842
LTNCD – 41 122 163 2,933 3,259
Bills payable:Private firms and individuals – 5,204 4 – – 5,208
Banks and other financial institutions – 280 529 – – 809
Outstanding acceptances 72 – – – – 72
Manager’s checks 172 – – – – 172
Accrued interest payable – 14 45 – – 59
Accrued other expenses – 557 – – – 557
Other liabilities: -
Accounts payable 311 – – – – 311
Refundable security deposits – 22 24 44 76 166
P=53,080 P=30,260 P=5,333 P=1,157 P=5,150 P=94,980
*Including non-performing loans and receivables
Consolidated and Parent Company 2020
On Demand
Less than 12-Mar
1-2 Years
Beyond
Total3 Months Months 2 Years*
Financial assetsFinancial assets at FVTPL P=- P=8 P=35 P=42 P=963 P=1,048Financial assets at FVTOCI – 122 229 351 6,567 7,269Investment securities at amortizedcost:
Government securities – 65 101 241 2,704 3,111Loans and receivables:
Due from BSP 20,681 – – – – 20,681Due from other banks – 1,538 – – – 1,538Interbank loans receivable – 6,098 – – – 6,098Receivables from customers:
Corporate 1,676 26,355 5,648 5,406 18,769 57,854Consumer 994 127 448 743 6,999 9,311
Unquoted debt securities – – – – 853 853Accrued interest receivable – 92 377 – – 469Accounts receivable – 225 99 – 12 336Sales contracts receivable – 23 8 – 35 66Refundable deposit – – – – 33 33RCOCI 1,273 – – – – 1,273
P=24,624 P=34,653 P=6,945 P=6,783 P=36,935 P=109,940
Financial liabilitiesDeposit liabilities:
Demand P=30,865 P=– P=– P=– P=– P=30,865Savings 9,665 – – – – 9,665Time – 34,131 3,999 1,298 1,173 40,601LTNCD – 40 123 163 3,110 3,436
Bills payable: -Private firms and individuals – 1,956 30 – – 1,986Banks and other financial institutions – 198 – – – 198
Outstanding acceptances 498 – – – – 498Manager’s checks 188 – – – – 188
(Forward)

- 58 -
*SGVFS164641*
Consolidated and Parent Company 2020
On Demand
Less than 12-Mar
1-2 Years
Beyond
Total3 Months Months 2 Years*Accrued interest payable P=– P=105 P=– P=– P=– P=105Accrued other expenses – 516 – – – 516Other liabilities: -
Accounts payable 205 – – – – 205Refundable security deposits – 57 88 7 34 186
Due to the Treasurer of thePhilippines – 41 – – – 41
P=41,421 P=37,044 P=4,240 P=1,468 P=4,317 P=88,490
*Including non-performing loans and receivables
The tables below show the contractual expiry of the Group’s and the Parent Company’s commitmentsand contingent liabilities as of December 31, 2021 and 2020 (amounts in millions):
2021
On Demand
Less than 3
Months
3 to 12
Months
Beyond
Total1 Year
Unused Commercial LC:Standby LC P=43 P=71 P=711 P=– P=825
Sight LC outstanding 190 590 110 – 890
Usance LC outstanding 6 129 – – 135
Outstanding shipping guarantees 53 – 343 – 396
Spot exchange:Sold 102 – – – 102
Bought 362 – – – 362
Currency forwards:Sold – 162 – – 162
Bought – 1 1 – 2
P=756 P=953 P=1,165 P=– P=2,874
2020
On DemandLess than 3
Months 3 to 12 Months
Beyond
Total1 Year
Unused Commercial LC:Standby LC P=231 P=98 P=784 P=– P=1,112
Sight LC outstanding 44 674 74 – 792
Usance LC outstanding 51 33 – – 84
Outstanding shippingguarantees – – 404 – 404
Spot exchange:Sold 1,300 – – – 1,300
Bought 1,461 – – – 1,461
Currency forwards:Sold – 337 – – 337
Bought 4 – – 4
P=3,087 P=1,146 P=1,262 P=– P=5,495
Liquidity Position and Leverage
Liquidity Coverage Ratio
Pursuant to BSP Circular No. 905 which aims to promote short-term resilience of banks’ liquidity riskprofile to withstand significant liquidity shocks that may last over 30 calendar days, the Group isrequired to hold and maintain an adequate level of unencumbered high-quality liquid assets (HQLA)that are sufficient to to meet its estimated total cash outflows over a 30-calendar day horizon ofliquidity stress. The LCR is the ratio of HQLAs to total net cash outflows which should be no lowerthan 100% on a daily basis. HQLA represents the Group’s stock of liquid assets that qualify forinclusion in the LCR which consists mainly of cash, regulatory reserves and unencumbered high-quality liquid securities. HQLAs therefore, serve as defense against potential stress events.

- 59 -
*SGVFS164641*
As of December 31, 2021 and 2020, LCR of the Parent Company is shown in the table below(amounts, except ratios, are expressed in millions):
2021 2020
Total Stock of High-Quality Liquid Assets P=32,848 P=34,554Total Net Cash Outflows 13,442 12,147
LCR 244.36% 284.46%
Net Stable Funding RatioPursuant to BSP Circular No. 1007, the Group is required to compute its Net Stable Funding Ratio(NSFR). The NSFR is aimed at strengthening the Group’s long-term resilience by maintaining astable funding in relation to its assets and off-balance sheet items. The NSFR is expressed as the ratioof available stable funding and the required stable funding and complements the LCR as it takes alonger view of the Group’s liquidity risk profile.
As of December 31, 2021 and 2020, NSFR of the Parent Company is shown in the table below(amounts, except ratios, are expressed in millions):
2021 2020
Available stable funding P=80,521 P=78,143Required stable funding 55,093 49,282
NSFR 146.15% 158.56%
Both LCR and NSFR should be maintained no lower than 100.00% on a daily basis under normalsituations.
Market Risk ManagementMarket risk is the risk of loss to future earnings, fair values or future cash flows that may result fromchanges in the price of a financial instrument. The value of a financial instrument may change as aresult of changes in interest rates, foreign currency exchange rates, commodity prices, equity pricesand other market changes. The Parent Company’s market risk originates from the Parent Company’sholdings of foreign exchange instruments, debt securities, equity securities and derivatives.
Value-at-Risk (VaR)
VaR is a statistical estimate of potential loss given prevailing market price trends, correlations andvolatilities. VaR estimates the potential decline in the value of a portfolio, under normal marketconditions, a given “confidence level” over a specified time horizon. VaR is used to alert seniormanagement whenever the potential for losses in the Parent Company’s portfolios exceeds the VaRlimit. This allows management to react quickly and adjust its portfolio strategies in different marketconditions in accordance with the Parent Company’s risk philosophy and appetite.
In 2021 and 2020, Parent Company uses Historical VaR Model using 99% confidence level, and a 1-day defeasance period.
The Market Risk and Capital Oversight Division runs VaR on a daily basis, monitors the VaR againstthe BOD approved VaR limit and submits Daily VaR Reports to concerned division/group/segmentheads.
To verify the validity of the VaR model used, the Treasury Operations Division performs quarterlyback testing to examine how frequently actual daily losses exceeds the daily VaR. Backtesting results

- 60 -
*SGVFS164641*
are reviewed by the head of Treasury Operations Division. Exceptions, if any, are reported to theROC and the BOD.
A summary of the VaR position of USD fixed income exposures of the Parent Company to changesin market conditions is as follows:
Interest Rate and Foreign Exchange
USD Bonds from January to
December 2021
(in P= millions)
USD Bonds from January toDecember 2020 (in P= millions)
31 December 51.10 93.66Average Daily 56.19 43.71Highest 132.73 119.46Lowest 21.25 5.43
A summary of the VaR position of PHP fixed income exposures of the Parent Company to changes inmarket conditions is as follows:
Interest Rate
Peso Bonds 2021
(in P= millions)
Peso Bonds 2020(in P= millions)
31 December 20.07 19.71Average Daily 44.47 15.31Highest 95.98 135.36Lowest 2.30 0.02
Stress testingSince VaR is designed to describe risk in normal market conditions (that is, 99.00% of the time), itmay not capture potential losses in the extreme that occur following movements outside theprevailing market trend. Stress testing is done to address extreme market conditions.
The Parent Company performs stress testing on its foreign currency trading position and on itsoutstanding investment portfolios. Stress testing is a technique used to determine the impact onearnings of above position/portfolios from conditions or scenarios deemed “extreme” but plausible.Stress testing is used to inform senior management as to where vulnerabilities in the ParentCompany’s portfolio actually lie.
This helps the Parent Company to evaluate its tolerance for risks and understand the combinations ofrisks that can produce large losses.
Unlike VaR, which reflects price behavior in everyday markets, stress tests simulate portfolioperformance during abnormal market periods. Accordingly, these provide information about risksfalling outside those typically captured by the VaR framework. Hence, losses resulting from stresstests are larger than the losses predicted by the VaR model.
The Parent Company performs the stress testing of its Bond portfolios and open FX position usinginternally developed stress test assumptions as well as the uniform set of market stress shocks asprescribed by the BSP under their Uniform Stress Testing Program for Banks. The stress testingusing internal assumptions are conducted monthly while BSP uniform stress testing are conductedsemiannually. Results of the stress tests are reported to the ALCO, ROC and BOD.
To identify possible episodes of stress in the domestic financial market, the Parent Company employsthe Citi Early Warning Signal Risk Index – Philippines that measures stress in economic and financialvariables with a view of predicting weakness in local currencies. A reading above 0.5 means that

- 61 -
*SGVFS164641*
stress is above average and a reading below 0.5 means that stress is below average. The risk indexlevel is part of the market risk assessment conducted quarterly and is reported to the ROC.
Interest Rate Risk ManagementInterest rate risk arises from the possibility that changes in the interest rates will affect future cashflows or the fair value of financial instruments. The Parent Company follows a prudent policy onmanaging its assets and liabilities so as to ensure that the exposure to fluctuations in interest rates iskept within acceptable limits.
As of December 31, 2021 and 2020, 56.72% and 85.59%, respectively, of the Bank’s total loanportfolio comprised floating rate loans which are repriced periodically by reference to the transferpool rate that reflects the Bank’s internal cost of funds. As a result of these factors, the Bank’sexposure to interest rate fluctuations, and other market risks, is significantly reduced.
The Bank, in keeping with banking industry practice, aims to achieve stability and lengthen the termstructure of its deposit base, while providing adequate liquidity to cover transactional bankingrequirements of customers. Interest is paid on substantial portion of demand accounts whichconstituted 47.35% and 36.84%, respectively, of total deposits of the Parent Company as ofDecember 31, 2021 and 2020, respectively, and pays a variable interest rate of 0.10% to 0.20% and0.10% to 0.50%, respectively. Rates on savings accounts and time deposit accounts, whichconstituted 13.06% and 36.26%, respectively, of total deposits as of December 31, 2021 and 11.53%and 48.18%, respectively, of total deposits as of December 31, 2020, are set by different criteria.Savings account rates are set by reference to prevailing market rates, while rates on time deposits andspecial savings accounts are usually priced by reference to rates applicable to prevailing rates onPhilippine Treasury Bills and other money market instruments or, in the case of foreign currencydeposits, Singapore Interbank Offer Rate and other benchmark dollar deposit rates in the Asian andinternational money markets with similar maturities.
The following tables provide for the average EIR by period of maturity or repricing of the Group andthe Parent Company as of December 31, 2021 and 2020:
Consolidated and Parent Company
2021 2020
Less than
3 Months
3 Months
to 1 Year
Greater
than
1 Year
Less than3 Months
3 Monthsto 1 Year
Greaterthan
1 Year
Peso-denominated assets
Due from banks 0.33% – – 0.10% – –Interbank loans – – – 0.03% – –Loans and receivables 7.78% 15.23% 11.36% 9.25% 18.82% 17.14%
Peso-denominated liabilities
Deposit liabilities 0.16% 1.47% 2.63% 0.16% 3.21% 3.21%Bills payable 1.07% 1.33% 0.94% 0.50%
Foreign currency-denominated
assets
Due from banks 0.07% – – 0.16% – –Interbank loans – – – 0.03% – –Loans and receivables 3.65% 5.77% 3.91% 4.99% 5.06% 3.97%
Foreign currency-denominated
liability
Deposit liabilities 0.33% 0.63% 0.90% 0.42% 1.80% 1.48%Bills payable -0.25% 0.63% – – – –
The Parent Company also monitors its exposure to fluctuations in interest rates by measuring theimpact of interest rate movements on its interest income. This is done by modeling the impact ofvarious changes in interest rates to the Parent Company ’s interest-related income and expenses.

- 62 -
*SGVFS164641*
The method by which the Parent Company measures the sensitivity of its assets and liabilities tointerest rate fluctuations is by way of interest rate analysis. This analysis provides the ParentCompany with a measure of the impact of changes in interest rates on the actual portfolio, that is, therisk exposure of future accounting income. The repricing gap is calculated by distributing thefinancial assets and financial liabilities into tenor buckets according to the time remaining to maturityor next repricing date and then obtaining the difference between the total of the repricing (interest ratesensitive) assets and repricing (interest rate sensitive) liabilities.
A gap is considered negative when the amount of interest rate sensitive liabilities exceeds the amountof interest rate sensitive assets. A gap is considered positive when the amount of interest ratesensitive assets exceeds the amount of interest rate sensitive liabilities. Accordingly, during a periodof rising interest rates, a bank with a positive gap would be better positioned than one with a negativegap to invest in or hold higher yielding assets more quickly than it would need to refinance itsinterest-bearing liabilities. During a period of falling interest rates, a bank with a positive gap wouldtend to see its assets repricing at a faster rate than one with a negative gap, which may restrain thegrowth of its net income or result in a decline in net interest income.
The following tables set forth the asset-liability gap position of the Group and the Parent Company asof December 31, 2021 and 2020 (amounts in millions):
Consolidated
2021
Up to
1 Month
More than
1 Month to
3 Months
More
than 3 to
12 Months
More than
1 Year
but less
than
2 Years
Beyond
2 Years Total
Assets
Due from other banks P=659 P=– P=– P=– P=– P=659
Interbank loans receivable 4,196 – – – – 4,196
Financial assets at FVTPL 886 – – – – 886
Financial assets at FVTOCI – – – – 6,362 6,362
Investment securities atamortized cost
– – – – 15,520 15,520
Loans and receivables 2,161 24,185 12,083 1,623 23,446 63,498
7,902 24,185 12,083 1,623 45,328 91,121
Liabilities
Deposit liabilities 13,355 12,018 3,130 907 5,011 34,421
Bills payable 3,789 1,690 532 – – 6,011
17,144 13,708 3,662 907 5,011 40,432
Asset-liability gap (P=9,242) P=10,477 P=8,421 P=716 P=40,317 P=50,689

- 63 -
*SGVFS164641*
Consolidated
2020
Up to1 Month
More than1 Month to
3 Months
Morethan 3 to
12 Months
More than1 Year
but less than2 Years
Beyond2 Years Total
AssetsDue from other banks P=1,495 P=– P=– P=– P=– P=1,495Interbank loans receivable 6,054 – – – – 6,054Financial assets at FVTPL – – 718 – – 718Financial assets at FVTOCI – – – – 5,028 5,028Investment securities at
amortized cost– – – 75 2,199 2,274
Loans and receivables 1,799 25,195 6,312 4,461 19,857 57,624
9,348 25,195 7,030 4,536 27,084 73,193
LiabilitiesDeposit liabilities 21,123 12,957 3,941 1,239 3,991 43,251Bills payable 1,759 394 30 – – 2,183
22,882 13,351 3,971 1,239 3,991 45,434
Asset-liability gap (P=13,534) P=11,844 P=3,059 P=3,297 P=23,093 P=27,759
Parent Company
2021
Up to
1 Month
More than
1 Month to
3 Months
More
than 3 to
12 Months
More than
1 Year
but less
than
2 Years
Beyond
2 Years Total
Assets
Due from other banks P=659 P=– P=– P=– P=– P=659
Interbank loans receivable 4,196 – – – – 4,196
Financial assets at FVTPL 886 – – – – 886
Financial assets at FVTOCI – – – – 6,362 6,362
Investment securities atamortized cost
– – – – 15,520 15,520
Loans and receivables 2,164 24,185 12,083 1,623 23,446 63,501
7,905 24,185 12,083 1,623 45,328 91,124
Liabilities
Deposit liabilities 13,355 12,018 3,130 907 5,011 34,421
Bills payable 3,789 1,690 532 – – 6,011
17,144 13,708 3,662 907 5,011 40,432
Asset-liability gap (P=9,239) P=10,477 P=8,421 P=716 P=40,317 P=50,692
Parent Company
2020
Up to1 Month
More than1 Month to
3 Months
Morethan 3 to
12 Months
More than1 Year
but less than2 Years
Beyond2 Years Total
AssetsDue from other banks P=1,495 P=– P=– P=– P=– P=1,495Interbank loans receivable 6,054 – – – – 6,054Financial assets at FVTPL – – – – 718 718Financial assets at FVTOCI – – – – 5,028 5,028Investment securities at
amortized cost – – – 75 2,199 2,274
Loans and receivables 1,802 25,195 6,312 4,461 19,857 57,627
9,351 25,195 6,312 4,536 27,802 73,196
(Forward)

- 64 -
*SGVFS164641*
Parent Company
2020
Up to1 Month
More than1 Month to
3 Months
Morethan 3 to
12 Months
More than1 Year
but less than2 Years
Beyond2 Years Total
LiabilitiesDeposit liabilities P=21,123 P=12,957 P=3,941 P=1,239 P=3,991 P=43,251Bills payable 1,759 394 30 – – 2,183
22,882 13,351 3,971 1,239 3,991 45,434
Asset-liability gap (P=13,531) P=11,844 P=2,341 P=3,297 P=23,811 P=27,762
The following tables demonstrate the sensitivity of the cumulative net position of risk-sensitive assetsand risk-sensitive liabilities to a reasonable change in interest rates, with all other variables heldconstant (amounts in millions):
2021
Changes in Interest Rates (in Basis Points)
Changes in interest rates (in basis points) +50 -50 +100 -100
Change in annualized net interest income P=169.52 (P=169.52) P=339.04 (P=339.04)
2020
Changes in Interest Rates (in Basis Points)
Changes in interest rates (in basis points) +50 -50 +100 -100
Change in annualized net interest income P=157.72 (P=157.72) P=315.44 (P=315.13)
The table below shows the Group’s and the Parent Company’s different market risk-weighted assets,as reported to BSP, using the standardized approach in accordance with BSP Circular No. 538:
Type of Market Risk Exposure 2021 2020
Interest rate exposures P=443,323 P=108,108Foreign exchange exposures 56,698 74,345
P=500,021 P=182,453
Foreign Currency Risk ManagementCurrency risk is the risk that the value of a financial instrument will fluctuate due to changes inforeign exchange rates. Foreign currency liabilities generally consist of foreign currency-deposits inthe Parent Company’s FCDU account made in the Philippines or which are generated fromremittances to the Philippines by Filipino expatriates and overseas Filipino workers who retain fortheir own benefit or for the benefit of a third party, foreign currency deposit accounts with the ParentCompany and foreign currency-denominated borrowings appearing in the regular books of the ParentCompany.
Foreign currency deposits are generally used to fund the Parent Company’s foreign currency-denominated loan and investment portfolio in the FCDU. Banks are required by the BSP to match theforeign currency assets with the foreign currency liabilities held through FCDUs. In addition, theBSP requires a 30.00% liquidity reserve on all foreign currency liabilities held through FCDUs.
The Parent Company ’s policy is to maintain foreign currency exposure within acceptable limits andwithin existing regulatory guidelines. The Parent Company believes that its profile of foreigncurrency exposure on its assets and liabilities is within limits for a financial institution engaged in thetype of business in which the Parent Company is engaged in.

- 65 -
*SGVFS164641*
The ERMG uses VaR, Foreign Exchange Sensitivity Testing, and Foreign Exchange Stress Testing tomeasure risk inherent to the Parent Company ’s foreign currency net exposures. In assessing theforeign currency risk, the Parent Company employs a pre-defined key risk indicator under MarketRisk Assessment Matrix to determine the level of risk (for example, Low Risk, Moderate Risk, HighRisk) the results of which are reported to the ROC on a quarterly basis.
The table summarizes the Group’s and the Parent Company’s exposure to foreign exchange risk as ofDecember 31, 2021 and 2020. Included in the table are the Group’s and the Parent Company’s assetsand liabilities at carrying amounts, categorized by currency (amounts in ‘000s):
2021 2020
USD Others* Total USD Others* Total
Assets
Cash on hand P=1,806 P=168 P=1,974 P=2,836 P=170 P=3,006
Due from other banks 44,176 4,553 48,729 14,727 3,189 17,916Interbank loans receivable 169,853 – 169,853 94,556 – 94,556Financial assets at amortized cost – 231,158 231,158 – 234,740 234,740
Loans and receivables:Corporate loans 133,519 - 133,519 632,524 – 632,524Accrued interest receivable 141 3,423 3,564 555 3,399 3,954
Other assets – 125 125 – 127 127
349,495 239,427 588,922 745,198 241,625 986,823
Liabilities
Deposit liabilities – 37,833 37,833 – 39,694 39,694Bills payable – 221,509 221,509 – – –
Outstanding acceptances 71,609 – 71,609 497,813 – 497,813Other liabilities:
Others 87 1 88 36 75 111
71,696 259,343 331,039 497,849 39,769 537,618
Net exposure P=277,799 (P=19,916) P=257,883 P=247,349 P=201,856 P=449,205
*Includes Euro, Australian Dollar, Japanese Yen, Swiss Franc, Canadian Dollar, Singapore Dollar
The tables below indicate the exposure of the Group (excluding the Parent Company’s FCDU) toUSD on its non-trading monetary assets and liabilities. The analysis calculates the effect of areasonably possible movement of the base currency rate against the USD, with all other variables heldconstant, on the statement of income and statement of comprehensive income. A negative amount inthe tables reflects a potential net reduction in income, while a positive amount reflects a potential netincrease.
2021
Changes in Foreign Exchange Rates
Changes in foreign exchange rates +3.00% -3.00% +4.00% -4.00%
Change in annualized net income P=1,701 (P=1,701) P=2,268 (P=2,268)
2020
Changes in Foreign Exchange Rates
Changes in foreign exchange rates +3.00% -3.00% +4.00% -4.00%Change in annualized net income P=2,230 (P=2,230) P=2,974 (P=2,974)
Operational RiskThe Parent Company uses the Basic Indicator Approach in computing Operational Risk inaccordance with BSP Circular No. 538 as reported to the BSP (amounts in millions):
2021 2020
Average Gross Income (Previous 3 Years) P=4,680 P=4,045Capital Charge (Average Gross Income times 18.75%(a)) 877 758
Risk Weighted Asset (Capital Charge times 10) P=8,774 P=7,585(a) Equivalent to adjusted capital charge of 15% of 125% to be consistent with required minimum Capital Adequacy Ratio of 10%

- 66 -
*SGVFS164641*
6. Segment Information
The Group’s operating businesses are organized and managed separately according to the nature ofservices provided and the different markets served with each segment representing a strategicbusiness unit. The Group’s business segments are as follow:
Branch Banking Group – handles the individual customers’ deposits, and provides overdrafts andfund transfer facilities;
Corporate Banking Group – manages the relationship with the corporate and institutional clients ofthe Parent Company with loans and credit facilities as the primary product;
Treasury Segment – is responsible for the management of the Group’s balance sheet and liquidityposition. It also handles the Group’s investments in securities, both local and abroad, as well asplacements and acceptances with other banks;
Consumer Finance Segment – provides the retail client’s credit requirements for the purchase of auto,home and personal loan requirements; and
Trust and Wealth Management Segment – is the segment that functions as the Trustee or InvestmentManager for both individual and corporate accounts.Segment’s resources, both assets and liability are those operating resources that are employed by asegment in its operating activities and that are either directly attributable to the segment or can beallocated to the segment on a reasonable basis.
Revenue is reported net of interest expense as management primarily relies on net interest revenue asa performance measure, not the gross interest income and expense. Revenue also includes tradinggains from dealing of securities.
No revenue from transactions with a single external customer or counterparty amounted to 10.00% ormore of the Group’s total revenue for 2021, 2020 and 2019.
The Group’s revenue-producing assets are located in one geographical location, which is thePhilippines, therefore, geographical segment information is no longer presented. Revenue from thirdparty includes trading gains.
The following tables present income and profit and certain asset and liability information regarding
the Group’s operating segments as of and for the years ended December 31, 2021, 2020 and 2019:
Consolidated
2021
Branch
Banking
Group
Corporate
Banking Group
Treasury
Segment
Consumer
Finance Segment
Trust and
Wealth
Management
Segment
Head office and
Rental Total
RevenueRevenue, net of interest expense
Third party (P=299,081) P=3,597,205 P=295,673 P=398,050 P=3,393 P=7,942 P=4,003,182
Intersegment 1,495,942 (1,278,380) (362,503) (74,865) (3,244) 223,050 −1,196,861 2,318,825 (66,830) 323,185 149 230,992 4,003,182
Other operating income 107,595 241,522 48,234 6,700 29,230 648,124 1,081,405
Total operating income (loss) 1,304,456 2,560,347 (18,596) 329,885 29,379 879,116 5,084,587
Compensation and fringe
benefits
595,498 194,653 68,926 109,400 21,779 26,303 1,016,559
Taxes and licenses 185,418 168,124 45,797 20,479 627 56,997 477,442
(Forwwrd)

- 67 -
*SGVFS164641*
Consolidated
2021
Branch
Banking
Group
Corporate
Banking Group
Treasury
Segment
Consumer
Finance Segment
Trust and
Wealth
Management
Segment
Head office and
Rental Total
Depreciation and amortization P=211,715 P=51,273 P=17,031 P=28,577 P=5,003 P=74,020 P=387,619
Provision for (reversal of) creditand impairment losses − 282,124 6,135 28,279 − 5,763 322,301
Occupancy and otherequipment-related costs
91,881 9,880 2,765 12,518 705 770 118,519
Other operating expenses 508,012 155,937 126,681 75,223 9,029 57,862 932,744
Net operating income (loss)before income tax (P=288,068) P=1,698,356 (P=285,931) P=55,409 (P=7,764) P=657,401 P=1,829,403
Segment resultsNet interest income P=1,196,861 P=2,318,825 P=174,768 P=323,185 P=150 P=230,991 P=4,244,780
Rent income − − − − − 505,241 505,241
Trading and securitiesgain (loss) - net − − (241,598) − − − (241,598)
Service charges, fees, andcommissions 88,604 212,836 − 6,752 − 23,537 331,729
Profit (loss) from assets sold − − − − 13,567 13,567
Foreign exchange gain - net 9,009 7,314 40,508 − − − 56,831
Income from trust operations 2 − − − 29,229 − 29,231
Gain on assets exchange - net − − − − − 7,460 7,460
Miscellaneous 9,980 21,372 7,726 (52) − 98,320 137,346
Total operating income 1,304,456 2,560,347 (18,596) 329,885 29,379 879,116 5,084,587
Compensation and fringebenefits 595,498 194,653 68,926 109,400 21,779 26,303 1,016,559
Taxes and licenses 185,418 168,124 45,797 20,479 627 56,997 477,442
Depreciation and amortization 211,715 51,273 17,031 28,577 5,003 74,020 387,619
Provision for credit andimpairment losses − 282,124 6,135 28,279 − 5,763 322,301
Occupancy and otherequipment-related costs 91,881 9,880 2,765 12,518 705 770 118,519
Other operating expenses 508,012 155,937 126,681 75,223 9,029 57,862 932,744
Total operating expenses 1,592,524 861,991 267,335 274,476 37,143 221,715 3,255,184
Segment profit (loss) (288,068) 1,698,356 (285,931) 55,409 (7,764) 657,401 1,829,403
Provision for income tax − (2,139) (106,660) − − (147,827) (256,626)
Share in net income of associate − − − − − 287 287
Net income (loss) fromcontinuing operations (288,068) 1,696,217 (392,591) 55,409 (7,764) 509,861 1,573,064
Net loss from discontinued
operations − − − − − − −(P=288,068) P=1,696,217 (P=392,591) P=55,409 (P=7,764) P=509,861 1,573,064
Segment assetsProperty and equipment P=218,683 P=− P=− P=– P=− P=663,534 P=882,217
Investment properties − − − – − 2,577,169 2,577,169
Other allocated assets 10,087,192 58,301,076 29,726,452 4,031,789 109,365 3,514,060 105,769,934
Total segment assets P=10,305,875 P=58,301,076 P=29,726,452 4,031,789 P=109,365 P=6,754,763 P=109,229,320
Total segment liabilities P=87,223,697 P=111,302 P=6,236,132 P=20,832 P=498 P=1,461,041 P=95,053,502
Consolidated
2020
BranchBanking Group
CorporateBanking Group
TreasurySegment
Consumer FinanceSegment
Trust and WealthManagement
SegmentHead office and
Rental Total
RevenueRevenue, net of interest expense Third party (P=864,759) P=3,701,429 P=1,251,051 P=481,609 P=3,109 P=10,338 P=4,582,777
Intersegment 2,661,504 (1,759,023) (522,140) (206,669) (4,156) (169,516) −1,796,745 1,942,406 728,911 274,940 (1,047) (159,178) 4,582,777
Other operating income 89,435 278,215 53,073 18,991 25,689 844,005 1,309,408
Total operating income 1,886,180 2,220,621 781,984 293,931 24,642 684,827 5,892,185
Compensation and fringebenefits
576,227 183,807 67,298 134,561 16,067 31,158 1,009,118
Taxes and licenses 271,732 207,399 100,398 30,220 1,973 28,338 640,060Depreciation and amortization 220,423 41,230 15,349 25,752 3,598 74,301 380,653Provision for (reversal of) credit
and impairment losses - 982,336 - 447,412 - (11,520) 1,418,228
Occupancy and other
equipment-related costs
77,858 8,549 2,771 10,827 363 966 101,334
Other operating expenses 480,610 153,410 158,856 82,455 16,333 52,359 944,023
Net operating income (loss)before income tax
259,330 643,890 437,312 (437,296) (13,692) 509,225 1,398,769

- 68 -
*SGVFS164641*
Consolidated
2020
BranchBanking Group
CorporateBanking Group
TreasurySegment
Consumer FinanceSegment
Trust and WealthManagement
SegmentHead office and
Rental Total
Segment results
Net interest income (loss) P=1,796,745 P=1,942,406 P=71,628 P=274,941 (P=1,048) (P=159,178) P=3,925,494Rent income − − − − − 673,414 673,414Trading and securities
gain (loss) - net − − 657,283 − − − 657,283Service charges, fees, and
commissions 78,094 247,845 − 18,991 − 44,166 389,096Profit (loss) from assets sold − − − − 6,779 6,779
Foreign exchange gain - net 7,440 6,148 45,597 - - - 59,185Income from trust operations − − − − 25,689 − 25,689Loss on assets exchange - net − − − − (3,157) (3,157)Miscellaneous 3,901 24,221 7,477 − − 122,803 158,402
Total operating income 1,886,180 2,220,620 781,985 293,932 24,641 684,827 5,892,185
Compensation and fringebenefits 576,227 183,807 67,298 134,561 16,067 31,158 1,009,118
Taxes and licenses 271,732 207,399 100,398 30,220 1,973 28,338 640,060Depreciation and amortization 220,423 41,230 15,349 25,752 3,598 74,301 380,653Provision for (reversal of) credit
and impairment losses - 982,336 − 447,412 - (11,520) 1,418,228Occupancy and other
equipment-related costs 77,858 8,549 2,771 10,827 363 966 101,334Other operating expenses 480,610 153,410 158,856 82,455 16,333 52,359 944,023
Total operating expenses 1,626,850 1,576,731 344,672 731,227 38,334 175,602 4,493,416
Segment profit (loss) 259,330 643,889 437,313 (37,295) (13,693) 509,225 1,398,769Provision for income tax (47) (8,794) (136,821) − - (84,461) (230,123)Share in net income of associate − − − − − 266 266
Net income (loss) fromcontinuing operations 259,283 635,095 300,492 (437,295) (13,693) 425,030 P=1,168,912
Net loss from discontinuedoperations - - - − - - −
P=259,283 P=635,095 P=300,492 (P=437,295) (P=13,693) P=425,030 1,168,912
Segment assetsProperty and equipment P=231,265 P=− P=− P=– P=− P=663,352 P=894,617Investment properties − − − – − 2,401,557 2,401,557Other allocated assets 9,456,803 51,117,485 28,471,664 5,214,873 71,977 3,601,242 97,934,044
Total segment assets P=9,688,068 P=51,117,485 P=28,471,664 P=5,214,873 P=71,977 P=6,666,151 P=101,230,218
Total segment liabilities P=82,186,805 P=546,583 P=4,357,647 P=37,806 P=− P=1,571,699 P=88,700,540
Consolidated
2019
BranchBanking Group
CorporateBanking Group
TreasurySegment
ConsumerFinanceSegment
Trust and WealthManagement
SegmentHead office and
Rental Total
Revenue
Revenue, net of interest expenseThird party (P=1,732,332) P=3,500,897 P=1,037,762 P=794,190 P=2,176 P=10,753 P=3,613,446Intersegment 3,299,719 (2,524,770) (667,721) (503,892) (5,333) 401,997 −
1,567,387 976,127 370,041 290,298 (3,157) 412,750 3,613,446Other operating income 99,175 300,294 31,656 42,923 21,095 943,345 1,438,488
Total operating income 1,666,562 1,276,421 401,697 333,221 17,938 1,356,095 5,051,934
Compensation and fringe benefits 538,269 172,413 71,505 137,736 20,472 38,474 978,869Taxes and licenses 233,965 175,035 80,663 34,033 3,212 97,214 624,122Depreciation and amortization 288,787 47,510 11,763 30,856 3,997 63,066 445,979Provision for (reversal of) credit and
impairment losses - 607,603 2,972 (6,421) - (226,541) 377,613
Occupancy and other
equipment-related costs
87,336 18,551 6,156 14,889 2,051 1,237 130,220
Other operating expenses 503,023 139,909 117,438 93,820 10,618 42,798 907,606
Net operating income (loss) beforeincome tax
15,182 115,400 111,200 28,308 (22,412) 1,339,847 1,587,525
Segment resultsNet interest income (loss) P=1,567,387 P=976,126 (P=38,372) P=290,298 (P=3,157) P=412,751 P=3,205,033Rent income − − − − − 736,341 736,341Trading and securities
gain (loss) - net − − 408,413 − − − 408,413Service charges, fees, and
commissions
88,803 261,470 7 42,940 - 14,287 407,507
Profit (loss) from assets sold − − − − 97,739 97,739Foreign exchange gain - net 10,077 8,407 31,389 - - - 49,873Income from trust operations − − − − 21,095 − 21,095Loss on assets exchange - net − − − − (11,850) (11,850)Miscellaneous 295 30,418 261 (17) − 106,826 137,783
Total operating income 1,666,562 1,276,421 401,698 333,221 17,938 1,356,094 5,051,934
(Forward)

- 69 -
*SGVFS164641*
Consolidated
2019
BranchBanking Group
CorporateBanking Group
TreasurySegment
ConsumerFinanceSegment
Trust and WealthManagement
SegmentHead office and
Rental TotalCompensation and fringe benefits P=538,269 P=172,413 P=71,505 P=137,736 P=20,472 P=38,474 P=978,869Taxes and licenses 233,965 175,035 80,663 34,033 3,212 97,214 624,122Depreciation and amortization 288,787 47,510 11,763 30,856 3,997 63,066 445,979Provision for (reversal of) credit and
impairment losses - 607,603 2,972 (6,421) - (226,541) 377,613Occupancy and other equipment-
related costs 87,336 18,551 6,156 14,889 2,051 1,237 130,220Other operating expenses 503,023 139,909 117,438 93,820 10,618 42,798 907,606
Total operating expenses 1,651,380 1,161,021 290,497 304,913 40,350 16,248 3,464,409
Segment profit (loss) 15,182 115,400 111,201 28,308 (22,412) 1,339,846 1,587,525Provision for income tax (372) (21,256) (158,513) (537) - (21,713) (202,391)Share in net income of associate - - - - - 531 531
Net income (loss) from continuingoperations 14,810 94,144 (47,312) 27,771 (22,412) 1,318,664 1,385,665
Net loss from discontinued operations - - - (228,408) - - (228,408)
P=14,810 P=94,144 (P=47,312) (P=200,637) (P=22,412) P=1,318,664 P=1,157,257
Segment assetsProperty and equipment P=256,010 P=− P=− P=– P=− P=718,200 P=974,210Investment properties − − − – − 2,428,666 2,428,666
Other allocated assets 12,221,371 52,971,841 24,901,964 6,393,682 72,075 2,752,477 99,313,410
Total segment assets P=12,477,381 P=52,971,841 P=24,926,182 P=6,393,682 P=72,075 P=5,899,343 P=102,740,504
Total segment liabilities P=82,248,910 P=227,974 P=7,412,992 P=936 P=− P=1,494,491 P=91,385,303
7. Investments in Subsidiary and an Associate
This account consists of investments in:
PRBICost of investment amounted to P=918.30 million which includes the consideration for the acquisitionin 2014 of P=494.54 million, additional investment of P=25.07 million in 2016 in the form of re-invested dividends, acquisition of non-controlling interests of P=0.94 million in 2016 andreclassification in 2017 of investments in RBNI and RBKI aggregating to P=397.74 million as a resultof the merger of PRBI, RBNI and RBKI, with PRBI as the surviving entity in 2017.
% of Ownership Consolidated Parent Company
2021 2020 2019 2021 2020 2019 2021 2020 2019
Subsidiaries:
Cost:
PRBI – – P=− P=− P=− P=– P=– P=–PISAI 100.00 100.00 100.00 − − − 10,000 10,000 10,000
− − − 10,000 10,000 10,000
Accumulated share in net income
Balance at January 1 − − − (3,863) (3,796) 71,097Share in net income − − − (64) (67) (58,116)
Sale of subsidiary − − (16,777)
Balance at December 31 − − − (3,927) (3,863) (3,796)
Accumulated share in OCI
Balance at January 1 − − − − − 2,582Share in change in remeasurement losses on
defined benefit liability, net of tax − − − − − (2,582)
Balance at December 31 − − − – – –
Accumulated dividends received − − −Balance at January 1 − − − − − (25,067)Sale of subsidiary − − − − − 25,067
Balance at December 31 − − − – – –
− − − 6,073 6,138 6,204
Associate - PBCom FinanceAcquisition cost 2,000 2,000 2,000 2,000 2,000 2,000
Accumulated equity in net income
Balance at January 1 12,114 11,848 11,317 12,115 11,849 11,317Share in net income 287 266 531 287 266 531
Balance at December 31 12,401 12,114 11,848 12,402 12,15 11,848
14,401 14,114 13,848 14,402 14,115 13,848
P=14,401 P=14,114 P=13,848 P=20,475 P=20,252 P=20,053

- 70 -
*SGVFS164641*
On July 25, 2019, the BSP approved the sale of 100 percent voting shares of PRBI to ProducersSavings Bank Corporation (PROSBI) for P=555.68 million. Based on the deed of sale, 10% of thepurchase price or P55.58 million shall be withheld by PROSBI and shall be paid to the ParentCompany upon presentation of the Certificate of Authorizing Registration issued by the Bureau ofInternal Revenue (BIR)while capital gains and any documentary stamp taxes arising from the sale ofthe shares shall be paid by the Parent Company. The amount withheld was collected onSeptember 10, 2020.
The sale of PRBI was meant to consolidate the efforts and resources to the Parent Company whichhas set its strategy to focus on its core businesses and expand market to the ecosystem of its majorshareholders. Loss on sale amounted to P=171.17 million. The carrying amount of the investment inPRBI sold by the Parent Company excluded branch licenses amounting to P=726.85 million. Thesebranch licenses were granted to the Parent Company in 2014 as a result of its acquisition of RBNI(subsequently merged to PRBI) in 2017. In 2019, the branch licenses were reclassified from theinvestment account as a result of the Parent Company’s divestment of PRBI. No new asset wasrecognized because the branch licenses have always been recognized as an asset of the ParentCompany since its acquisition of RBNI (Note 15).
PISAIThe investment cost of P=10.00 million represents the initial equity investment as approved by the BSPon May 2, 2014.
On January 11, 2021, the BOD of the Parent Company approved the dissolution and retirement ofbusiness of PISAI. PISAI, which has been inactive for the past 3 years, has continuously remainedinactive but continued to incur operating expenses. The Parent Company does not see any need forthe subsidiary and has decided to retire the business operations.
The Company has received clearance from the Insurance Commission and business permit from theMakati Local Government last May 26, 2021 and September 30, 2021, respectively. Clearances fromother regulatory agencies are currently being processed as of December 31, 2021.
8. Interbank Loans Receivable and Securities Purchased under Resale Agreements (SPURA)
Interbank loans receivable of the Group and the Parent Company is comprised of USD-denominatedloans of P=724.96 million ($14.22 million) and P=2.15 billion ($44.180 million) as of December 31,2021 and 2020, respectively, net of allowance for ECL (see Note 17).
As of December 31, 2021 and 2020, outstanding SPURA is P=3.47 billion and P=3.90 billion,respectively.
Interest income on the Group’s and the Parent Company’s interbank loans receivable and SPURAfollows:
2021 2020 2019
SPURA P=59,969 P=88,043 P=22,974Interbank loans receivable 100 4,703 17,272
P=60,069 P=92,746 P=40,246
Interbank loans receivable bears nominal annual interest rates ranging from 0.07% to 0.25% in 2021,1.81% to 3.94% in 2020, and 0.60% to 5.09% in 2019, while SPURA bears nominal annual interestrates of 2.00% in 2021 and ranging from 2.00% to 4.00% in 2020, and 4.00% to 4.75% in 2019.

- 71 -
*SGVFS164641*
The Parent Company is not permitted to sell or repledge the related collateral on SPURA in theabsence of default by the counterparty.
9. Financial Assets at Fair Value Through Profit or Loss (FVTPL)
Financial assets at FVTPL of the Group and the Parent Company consist of government securitiesamounting to P=886.29 million and P=718.29 million as of December 31, 2021 and 2020, respectively.
As of December 31, 2021 and 2020, financial assets at FVTPL include net unrealized gain (loss)amounting to (P=9.79 million) and P=0.48 million, respectively. Net fair value gain or loss on financialassets at FVTPL is included in ‘Trading and securities gain (loss) - net’ in the statements of income(see Note 26).
10. Financial Assets at Fair Value Through Other Comprehensive Income (FVTOCI)
As of December 31, 2021 and 2020, the Group’s and the Parent Company’s financial assets atFVTOCI consist of the following:
2021 2020
Debt securities:Government (Note 19) P=6,362,401 P=5,027,547
Equity securities:Quoted 91,600 71,650Unquoted 35,286 38,619
126,886 110,269
P=6,489,287 P=5,137,816
The Parent Company has designated the above equity investments as at FVTOCI as these are held forlong-term strategic purpose rather than for trading.
There were no dividends declared on these equity investments and no cumulative gain or loss wastransferred within equity in 2021, 2020, and 2019.
The movements in net unrealized gain on debt and equity securities recognized in OCI follow:
2021 2020
Balance at January 1 P=100,093 P=87,932
Items that may be reclassified to profit or loss in
subsequent periods
Fair value changes during the year on debtsecurities (357,686) 284,757
Losses (gains) taken to profit or loss upon sale ofFVTOCI debt securities (Note 26) 285,542 (277,278)
Provision for credit losses (Note 17) 10,089 37Items that may not be reclassified to profit or
loss in subsequent periods
Fair value changes during the year on equitysecurities 15,471 4,645
Balance at December 31 P=53,509 P=100,093

- 72 -
*SGVFS164641*
Reclassification of Financial AssetsOn January 1, 2018, the Parent Company reclassified debt securities with aggregate face amount ofP=1,623.47 million from the hold-to-collect portfolio to the FVTOCI portfolio. The reclassification ofthese debt securities resulted in recognition of unrealized gain of P=56.90 million.
In October 2020, certain debt securities in FVOCI matured and the unrealized gain previouslyrecognized from reclassification from hold-to-collect to FVTOCI portfolio in 2018 was recognized asrealized gain.
11. Investment Securities at Amortized Cost
As of December 31, 2021 and 2020, the Group’s and the Parent Company’s investment securities atamortized cost consist of the following:
2021 2020
Government securities (Note 19) P=15,527,190 P=2,273,872Less: Allowance for ECL (Note 17) (6,911) (10,516)
P=15,520,279 P=2,263,356
As of December 31, 2021, investment securities at amortized cost are comprised of the ParentCompany’s investment in peso-denominated securities amounting to P=8.39 billion and investment inforeign currency-denominated securities amounting to P=7.14 billion ($135.42 million and€4.00 million).
As of December 31, 2020, investment securities at amortized cost are comprised of the ParentCompany’s investment in peso-denominated securities amounting to P=80.55 million and investmentin foreign currency-denominated securities amounting to P=2.19 billion ($40.78 million and€3.99 million).
Peso-denominated government bonds have effective interest rates ranging from 2.38% to 4.63%,3.50% to 8.00%, and 3.63% to 8.13%, in 2021, 2020 and 2019, respectively. Foreign currency-denominated bonds have effective interest rates ranging from 1.38% to 10.63%, 2.63% to 10.63%,and 2.63% to 10.63%, in 2021, 2020 and 2019, respectively.
On May 27, 2020, the Parent Company’s BOD approved the sale of HTC securities. In June 2020,the Parent Company liquidated all of its Peso (RBU) government securities classified underinvestment securities measured at amortized cost with a total face amount of P=8.60 billion andcarrying value of P=10.44 billion. The sale resulted in a trading gain of P=2.55 million presented in thestatements of income. Under the Parent Company’s Business Model Documentation for Managingdebt Securities, a permissible sale of Hold-To-Collect (HTC) includes those attributable to systemicmovements that have been generally accepted to negatively impact economic conditions, creditquality and or liability profile of the Parent Company.
The above disposals were assessed by the Parent Company as not inconsistent with the portfolios’business models considering the conditions and reasons for which the disposals were made. Further,these disposals did not result in a change in business model and the remaining securities in theaffected portfolios continue to be accounted for at amortized cost.

- 73 -
*SGVFS164641*
12. Loans and Receivables
This account consists of:
Consolidated Parent Company
2021 2020 2021 2020
Receivables from customers:Corporate loans P=60,277,746 P=52,764,271 P=60,277,746 P=52,764,271Consumer loans:
Home loans 3,636,663 4,473,549 3,636,663 4,473,549Auto loans 598,106 771,922 598,106 771,922Personal loans 213,151 435,113 213,151 435,113
64,725,666 58,444,855 64,725,666 58,444,855Unearned discounts and capitalized
interest (44,756) (51,256) (44,756) (51,256)
64,680,910 58,393,599 64,680,910 58,393,599Unquoted debt securities 678,557 852,565 678,557 852,565Accrued interest receivable 559,770 468,544 559,770 468,544Accounts receivable 265,786 333,300 268,619 336,015Sales contracts receivable 45,155 65,952 45,155 65,952
66,230,178 60,113,960 66,233,011 60,116,675Less Allowance for ECL (Note 17) (2,732,213) (2,489,967) (2,732,213) (2,489,967)
P=63,497,965 P=57,623,993 P=63,500,798 P=57,626,707
Sale of Dealer Generated Auto Loans PortfolioOn February 27, 2019, the BOD approved the sale of the Parent Company’s dealer generated auto-loan portfolio to a local bank. On June 18, 2019, the Philippine Competition Commission approvedthe request of the Parent Company to to sell its auto-loan portfolio. The selling price amounted toP=3.55 billion which is the sum of the face value of all current outstanding loan principal balance aswell as the related accrued interest and unamortized incentives of dealer generated auto loans. OnJune 27, 2019, the local bank has fully paid the Parent Company. No gain or loss on sale wasrecognized by the Parent Company on this transaction.
The Parent Company has no other plans of disposing its remaining branch referred auto loans or otherloans.
Bayanihan to Heal as One ActOn March 25, 2020, Republic Act No. 11469, otherwise known as the Bayanihan to Heal as One Act(“Bayanihan 1 Act”) was enacted. Bayanihan 1 Act provides that all covered institutions shallimplement a 30-day grace period for all loans with principal and/or interest and lease amortizationfalling due within the ECQ Period without incurring interest on interest, penalties, fees and othercharges. Subsequently, on September 11, 2020, Republic Act No. 11494, otherwise known as theBayanihan to Recover as One Act (“Bayanihan 2 Act”), was enacted. Under Bayanihan 2 Act, a one-time sixty (60)-day grace period is granted for the payment of all existing, current and outstandingloans falling due, or any part thereof, on or before December 31, 2020, without incurring interest oninterests, penalties, fees, or other charges and thereby extending the maturity of the said loans.Furthermore, a minimum 30-day grace period shall also be granted by covered institutions to allpayments due within the period of community quarantine on rent and utility-related expenditureswithout incurring penalties, interest and other charges.

- 74 -
*SGVFS164641*
In 2020, the Group, in addition to the reliefs provided under Bayanihan 1 Act andBayanihan 2 Act, has offered financial reliefs to its borrowers/counterparties as a response to theeffect of the COVID-19 pandemic. These relief measures included the following:
Lenders were allowed to renegotiate terms of existing loan agreements either via restructuring of
loan terms, extension of maturities, or moratorium on payments/amortizations among others on a
case-to-case basis depending on financial status, cash flow, and security position of each
borrower.
Restructuring of existing receivables including extension of payment terms
Relief for principal and interest repayments
Based on the Group’s assessment, the modifications in the contractual cash flows as a result of theabove reliefs are not substantial and, therefore, did not result in the derecognition of the affectedfinancial assets but would require the recognition of modification losses. The total modificationlosses did not have a material impact on the financial statements.
Unquoted Debt SecuritiesAs of December 31, 2021 and 2020, unquoted debt securities of the Group and the Parent Companyconsist of Metro Rail Transit (MRT) bonds with the gross amount of P=678.56 million andP=852.57 million in 2021 and 2020, respectively, and an allowance for credit losses amounting toP=0.57 million and P=0.89 million in 2021 and 2020, respectively.
The accretion of interest on unquoted debt securities amounted to P=66.04 million, P=77.22 million,and P=88.23 million in 2021, 2020 and 2019, respectively, which is included under ‘Interest income -Loans and receivables’ in the statements of income.
Interest IncomeInterest income on loans and receivables consists of interest income on:
Consolidated Parent Company
2021 2020 2019 2021 2020 2019
Receivables from customers:Corporate P=3,555,476 P=3,713,692 P=3,510,142 P=3,555,476 P= 3,713,692 P=3,510,142Consumer 443,857 473,247 795,194 443,857 473,247 795,194
Unquoted debt securities 104,306 126,794 154,002 104,306 126,794 154,002Others 6,243 11,475 9,141 6,243 11,475 9,141
P=4,109,882 P=4,325,208 P=4,468,479 P=4,109,882 4,325,208 4,468,479
Of the total receivables from customers of the Group as of December 31, 2021, 2020 and 2019,56.72%, 85.59%, and 54.90%, respectively, are subject to periodic interest repricing. The remainingpeso-denominated receivables from customers earn annual fixed interest rates ranging from 1.50% to42.00% in 2021, 1.99% to 42.00% in 2020, and 1.50% to 42.00% in 2019 while foreign currency-denominated receivables from customers earn annual fixed interest rates ranging from 3.00% to7.25% in 2021, 4.00% to 9.13% in 2020 and 3.50% to 9.82% in 2019.
Unquoted debt securities have EIRs of 11.90% in 2021 and 2020, and from 6.52 % to 11.90% in2019. Sales contracts receivable bears interest rates ranging from 7.00% to 12.00% in 2021 and2020, and 7.00% to 14.00% in 2019.

- 75 -
*SGVFS164641*
13. Property and Equipment
The composition of and movements in property and equipment of the Group and the Parent Companyfollow:
Consolidated and Parent Company
2021
Land
Condominium
Properties
Buildings and
Improvements
Furniture,
Fixtures and
Equipment
Leasehold
Improvements
Right of Use
Assets (Office
Premises) Total
Cost
Balance at January 1 P=117,678 P=499,598 P=390,538 P=920,414 P=422,075 P=386,756 P=2,737,059
Additions − 725 18,720 32,282 3,786 123,024 178,537
Disposals − − − (19,638) – (74,271) (93,909)
Transfers (Notes 14 and 16) − 16,186 (27,823) 4,795 10,259 − 3,417
Balance at December 31 117,678 516,509 381,435 937,853 436,120 435,509 2,825,104
Accumulated depreciation
and amortization
Balance at January 1 − 185,526 316,802 785,631 384,789 169,694 1,842,442
Depreciation − 12,525 14,240 44,145 16,278 99,444 186,632
Disposal − − − (16,163) – (74,271) (90,434)
Transfers (Note 16) − − (2,786) 7,033 − − 4,247
Balance at December 31 − 198,051 328,256 820,646 401,067 194,867 1,942,887
Net book value P=117,678 P=318,458 P=53,179 P=117,207 P=35,053 P=240,642 P=882,217
Consolidated and Parent Company
2020
LandCondominium
PropertiesBuildings andImprovements
Furniture,Fixtures and
EquipmentLeasehold
Improvements
Right of UseAssets (Office
Premises) Total
CostBalance at January 1 P=117,678 P=481,162 P=402,244 P=889,460 P=418,178 P=341,284 P=2,650,006Additions − − 9,034 37,961 2,360 76,116 125,471Disposals − − − (18,515) (13,489) (30,644) (62,648)Transfers (Notes 14 and 16) − 18,436 (20,740) 11,508 15,026 − 24,230
Balance at December 31 117,678 499,598 390,538 920,414 422,075 386,756 2,737,059
Accumulated depreciation andamortization
Balance at January 1 − 173,608 302,479 736,849 370,047 92,813 1,675,796Depreciation − 11,918 14,323 56,315 24,061 107,525 214,142Disposal − − − (15,013) (9,319) (30,644) (54,976)
Transfers (Note 16) − − − 7,480 − − 7,480
Balance at December 31 − 185,526 316,802 785,631 384,789 169,694 1,842,442
Net book value P=117,678 P=314,072 P=73,736 P=134,783 P=37,286 P=217,062 P=894,617
The Group and Parent Company recognized gain (loss) on disposal of furniture, fixtures, andequipment, which is included under ‘Profit (loss) from assets sold’ in the statements of income,amounting to nil, (P=3.01 million), and P=0.27 million, in 2021, 2020 and 2019, respectively.
Depreciation and AmortizationDetails of this account are as follows:
Consolidated and Parent Company
2021 2020 2019
Property and equipment P=87,188 P=106,617 P=162,377Investment properties
(Note 14) 90,811 81,788 80,902Software costs (Note 15) 94,994 74,632 68,666Right-of-use assets 99,444 107,525 113,343Chattel mortgage (Note 16) 15,182 10,091 20,691
P=387,619 P=380,653 P=445,979

- 76 -
*SGVFS164641*
As of December 31, 2021 and 2020, the cost of fully depreciated furniture, fixtures and equipmentstill in use by the Group and Parent Company amounted to P=691.42 million and P=658.24 million,respectively.
14. Investment Properties
The composition of and movements in this account follow:Consolidated and Parent Company
2021
Foreclosed Properties
Office Units
for Lease
Condominium
Units for LeaseLand
Building and
Improvements Total
Cost
Balance at January 1 P=449,043 P=399,126 P=848,169 P=39,274 P=2,644,075
Additions 206,614 107,191 313,805 − −Transfer − − − 116 −Disposals (45,145) (5,475) (50,620) − −Balance at December 31 610,512 500,842 1,111,354 39,390 2,644,075
Accumulated depreciation and amortization
Balance at January 1 − 171,015 171,015 36,351 855,516
Depreciation − 42,079 42,079 350 48,382
Disposals − (1,277) (1,277) − −Balance at December 31 − 211,817 211,817 36,701 903,898
Accumulated impairment losses
Balance at January 1 31,098 35,981 67,079 − −Disposals (1,427) (418) (1,845) − −Balance at December 31 29,671 35,563 65,234 − −Net book value P=580,841 P=253,462 P=834,303 P=2,689 P=1,740,177
Consolidated and Parent Company
2020
Foreclosed Properties
Office Unitsfor Lease
CondominiumUnits for LeaseLand
Building andImprovements Total
CostBalance at January 1 P=397,348 P=399,393 P=796,741 P=39,274 P=2,644,075Additions 58,004 5,965 63,969 − −Disposals (6,309) (6,232) (12,541) − −Balance at December 31 449,043 399,126 848,169 39,274 2,644,075
Accumulated depreciation and amortizationBalance at January 1 − 139,255 139,255 36,000 807,134Depreciation − 33,055 33,055 351 48,382Disposals − (1,295) (1,295) − −Balance at December 31 − 171,015 171,015 36,351 855,516
Accumulated impairment lossesBalance at January 1 32,801 36,234 69,035 − −Disposals (1,703) (253) (1,956) − −Balance at December 31 31,098 35,981 67,079 − −Net book value P=417,945 P=192,130 P=610,075 P=2,923 P=1,788,559
Condominium units for lease represents the contributed cost of developing the Parent Company’sAyala Avenue property, originally consisting of land and fully depreciated building, into a 52-storeybuilding (the PBCom Tower) under a joint development agreement with Filinvest Asia Corporation(Filinvest Asia).
The agreement provided for equal sharing of the cost of the project and, correspondingly, of the netusable area of the building, which was converted into a condominium property. Under the agreement,the Parent Company’s share in such cost included its land along Ayala Avenue, which was given anappraised value of P=900.00 million in 1995. The related appraisal increment was closed to surplus,net of applicable deferred tax liability, upon completion of the project in 2000.

- 77 -
*SGVFS164641*
In November 2007, by virtue of condominiumization, various condominium certificates of title underthe name of the Parent Company were derived from transfer certificate of title (TCT) No. 134599where the declaration of restrictions and scope of coverage were annotated on October 23, 2007.
In May 2019, the 4th floor of Parent Company’s PBCOM tower building was converted from bank premises to Condominium units for lease.
As of December 31, 2021 and 2020, about 87.14% of the usable area that the Parent Companyacquired from the PBCOM Tower project is held for lease, with the balance used for the ParentCompany’s operations. Accordingly, the cost allocable to the areas available for lease is carried asinvestment properties, while the remaining balance is carried as condominium properties and includedin ‘Property and equipment’ (see Note 13).
As of December 31, 2021 and 2020, the aggregate fair value of investment properties amounted toP=10.09 billion and P=9.46 billion, respectively, for the Group and Parent Company, which has beendetermined based on valuations made by professionally qualified appraisers accredited by the BSPand SEC.
The Parent Company recognized rental income (included under ‘Rent income’ in the statements ofincome) amounting to P=484.93 million, P=655.92 million, and P=691.92 million in 2021, 2020 and2019, respectively, on condominium properties leased out under operating leases. In 2021, 2020 and2019, the Parent Company also recognized rental income from office units for lease amounting toP=8.11 million, P=4.57 million and P=4.42 million, respectively.
The Group and Parent recorded gain (loss) from foreclosure of loan collaterals amounting toP=7.46 million, (P=3.16 million) and (P=11.85 million) in 2021, 2020, and 2019, respectively. This ispresented as ‘Gain (loss) on assets exchange - net’ in the statements of income.
The Group and Parent recorded gain (loss) on disposal of certain foreclosed properties amounting toP=15.08 million, P=12.21 million and P=107.95 million in 2021, 2020, and 2019, respectively. This isincluded under ‘Profit (loss) from assets sold’ in the statements of income.
Direct operating expenses (included under ‘Compensation and fringe benefits’, ‘Occupancy and otherequipment-related costs’, ‘Taxes and licenses’ and ‘Miscellaneous’) arising from investmentproperties that generated rental income amounted to P=111.41 million, P=99.63 million andP=92.06 million in 2021, 2020, and 2019, respectively.
Direct operating expenses (included under ‘Compensation and fringe benefits’, ‘Occupancy and otherequipment-related costs’, ‘Taxes and licenses’ and ‘Miscellaneous’) arising from investmentproperties that did not generate rental income amounted to P=125.82 million, P=68.82 million andP=80.60 million in 2021, 2020, and 2019, respectively.
15. Intangible Assets
Intangible AssetsThe Group and Parent Company’s account consists of:
2021 2020
Branch licenses P=364,700 P=364,700Software costs 162,803 248,826
P=527,503 P=613,526

- 78 -
*SGVFS164641*
Branch licenses
Branch licenses of the Group arose from the acquisitions of Consumer Savings Bank (CSB) andPRBI. As of December 31, 2021 and 2020, details of branch licenses follow:
Branch licenses from the acquisition of:PRBI P=262,600CSB 102,100
P=364,700
The branch license incentives given to the Parent Company for its acquisition of RBNI (which waseventually merged with PRBI) was measured at fair value on September 1, 2014, the acquisition date,consistent with the requirements of PFRS 3, Business Combination. PFRS 3 requires that theidentifiable assets and liabilities arising from a business combination be measured at fair value. Thefair value of the branch licenses was based on the provisions of the Manual of Regulations for Banks(MORB) that was in effect at that time, which sets a licensing fee and processing fee per branch ofP=20.00 million and P=200.00 thousand, respectively.
On July 25, 2019, the BSP approved the sale of 100 percent voting shares of PRBI to PROSBI (seeNote 7). Accordingly, the branch licenses granted to the Parent Company’s acquisition of RBNI werereclassified from the investment account to intangible assets in the Parent Company’s separatefinancial statements. No new asset was recognized because the branch licenses have always beenrecognized as an asset of the Parent Company since its acquisition of RBNI.
As of December 31, 2021 and 2020, the individual branches were identified as the CGU for purposesof impairment testing on the branch licenses for CSB. For the impairment testing on the branchlicenses arising from the acquisition of RBNI, the Parent Company’s branch banking group wasidentified as the CGU as the branch banking group would benefit from the synergies of the additionalbranches in obtaining fresh funds from depositors for deployment.
In 2021, 2020 and 2019, the Parent Company’s impairment assessment indicates no impairment.
Key assumptions used in the VIU calculationsAs of December 31, 2021 and 2020, the recoverable amounts of the CGUs have been determinedbased on VIU calculations that use cash flow projections based on financial budgets approved bymanagement covering a 5-year period. The significant assumptions used in computing for therecoverable amount for PRBI and CSB branches in 2021 and 2020 as follows:
Significant Assumptions 2021 2020
Deposit growth rates 5.60% 6.00%Discount rate 14.21% 13.34%Terminal value growth rate 5.12% 4.81%
Deposit growth rates were based on experiences and strategies developed by the Parent Company.The discount rate used for the computation of the present value of the projected cash flows is the costof equity and was determined by reference to comparable entities. The terminal value growth rate hasbeen determined to reflect the long-term view on the CGU’s business.
Sensitivity to changes in assumptions
Management believes that no reasonably possible change in any of the above key assumptions wouldcause the carrying value of the CGU to exceed its recoverable amount.

- 79 -
*SGVFS164641*
Software
The movements of software costs follow:
Consolidated and Parent
Company
2021 2020
Balance at January 1 P=248,826 P=308,389Additions 8,971 15,069
257,797 323,458Amortization (Note 13) (94,994) (74,632)
Balance at December 31 P=162,803 P=248,826
16. Other Assets
Other assets consist of:
Consolidated Parent Company
2021 2020 2021 2020
Prepaid expenses P=187,704 144,104 187,541 143,938Tax credits 106,169 443,671 106,081 442,473Retirement asset (Note 27) 95,493 – 95,493 –Chattel mortgage 34,987 45,004 34,987 45,004Receivable from BIR 5,528 15,570 5,528 15,570RCOCI 62 1,273 62 1,273Miscellaneous 151,958 130,382 150,958 130,349
581,901 780,004 580,650 778,607Less allowance for impairment
losses (Note 17) (2,573) (2,573) (2,573) (2,573)
P=579,328 P=777,431 P=578,077 P=776,034
Receivable from BIRThis account includes creditable withholding tax and tax credit cases that are still pending SCdecision. As of December 31, 2021 and 2020, there is no balance of allowance for impairment losseson receivable from BIR.
Chattel MortgageThe movements in chattel mortgage of the Group and the Parent Company follow:
2021 2020
Cost
Balance at January 1 P=54,937 P=26,608Additions 33,970 58,211Disposals (32,731) (23,414)Transfers (Note 13) (3,420) (6,468)
Balance at December 31 52,756 54,937
Accumulated depreciation and amortization
Balance at January 1 9,933 3,963Depreciation 15,182 10,091Disposals (7,097) (2,900)Transfers (Note 13) (249) (1,221)
Balance at December 31 17,769 9,933
Net book value P=34,987 P=45,004

- 80 -
*SGVFS164641*
In 2021, 2020 and 2019, loss recognized by the Group and the Parent Company from the disposal ofcertain chattel mortgage amounted to P=1.52 million, P=2.42 million and P=10.48 million, respectively.This is included under ‘Profit (loss) from assets sold’ in the statements of income.
MiscellaneousAs of December 31, 2021 and 2020, the Group’s and the Parent Company’s miscellaneous otherassets consist of the following:
Consolidated Parent Company
2021 2020 2021 2020
Documentary stamp taxes (DST) P=63,277 P=29,172 P=63,277 P=29,172Refundable security deposits 35,471 33,387 35,471 33,387Advance rentals 17,388 17,730 17,388 17,730Stationery and supplies 10,055 6,587 10,055 6,587Others (Note 24) 25,767 43,506 24,767 43,473
P=151,958 P=130,382 P=150,958 P=130,349
“Others” of the Group and the Parent Company include trust fee receivables, shortages, derivatives,interoffice floats and other investments.
17. Allowance for Credit and Impairment Losses
As of December 31, 2021 and 2020, the analyses of changes in the allowance for ECL follow:
Interbank loans receivable and SPURA
Allowance for credit losses of interbank loans receivable and SPURA amounted to nil for theConsolidated and Parent Company in 2021 and 2020.
Investment securities at FVTOCI
Consolidated and Parent Company 2021
Stage 1 Stage 2 Stage 3 Total
Allowance for ECL, January 1, 2021 P=5,545 P=– P=– P=5,545
New investment originated or purchased 15,634 – – 15,634
Asset derecognized during the period (5,545) – – (5,545)
Allowance for ECL, December 31, 2021 P=15,634 P=– P=– P=15,634
Investment securities at amortized cost
Consolidated and Parent Company 2021
Stage 1 Stage 2 Stage 3 Total
Allowance for ECL, January 1, 2021 P=10,516 P=– P=– P=10,516
Impact of change in PD (4,381) – – (4,381)
New investment originated or purchased 776 – – 776
Allowance for ECL, December 31, 2021 P=6,911 P=– P=– P=6,911

- 81 -
*SGVFS164641*
Receivables from customers
Consolidated and Parent Company 2021
Stage 1 Stage 2 Stage 3 Total
Corporate loans:
Allowance for ECL, January 1, 2021 P=378,946 P=157,165 P=1,406,425 P=1,942,536
Newly originated assets that remained in Stage 1 as at December 31, 2021 333,000 – – 333,000
Newly originated assets that moved to Stage 2 and Stage 3 as at December 31, 2021 – 88,485 15,476 103,961
Effect of collections and othermovements (233,730) (40,134) (247,374) (521,238)
Transfers to Stage 1 8,023 (7,487) (536) –
Transfers to Stage 2 (149,428) 149,428 – –
Transfers to Stage 3 – (146,622) 146,622 –
Impact on ECL of exposures transferred
between stages 144,896 21,115 205,556 371,567
Impact on ECL of exposures that did not transfer between stages (50,343) 27,458 41,547 18,662
Foreign exchange adjustments (1,236) (9) – (1,245)
Allowance for ECL, December 31, 2021 430,128 249,399 1,567,716 2,247,243
Consumer loans:Auto loans
Allowance for ECL, January 1, 2021 12,799 8,833 80,620 102,252
Newly originated assets that remainedin Stage 1 as at December 31, 2021 3,841 – – 3,841
Newly originated assets that moved to
Stage 2 and Stage 3 as atDecember 31, 2021 – – 857 857
Effect of collections and other
movements
(788) (7,621) (32,869) (41,278)
Transfers to Stage 1 3,778 (971) (2,807) –
Transfers to Stage 2 (1,182) 1,182 – –
Transfers to Stage 3 (1,696) (4,855) 6,551 –
Impact on ECL of exposures transferredbetween stages (3,551) 11,726 6,342 14,517
Impact on ECL of exposures that didnot transfer between stages (4,103) (618) 1,838 (2,883)
Allowance for ECL, December 31, 2021 9,098 7,676 60,532 77,306
Home loans:Allowance for ECL, January 1, 2021 40,619 17,286 181,945 239,850
Newly originated assets that remainedin Stage 1 as at December 31, 2020 3,905 – – 3,905
Newly originated assets that moved to
Stage 2 and Stage 3 as atDecember 31, 2021 – – 40,102 40,102
Effect of collections and other movements
(8,842) (3,536) (55,149) (67,527)
Transfers to Stage 1 17,259 (3,354) (13,905) –
Transfers to Stage 2 (1,318) 2,275 (957) –
Transfers to Stage 3 (1,792) (9,800) 11,592 –
Impact on ECL of exposures transferredbetween stages (16,571) 8,114 31,839 23,382
Impact on ECL of exposures that did
not transfer between stages (12,977) 134 5,000 (7,843)
Allowance for ECL, December 31, 2021 20,283 11,119 200,467 231,869
Personal loans:Allowance for ECL, January 1, 2021 28,471 8,236 104,589 141,296
Newly originated assets that remained
in Stage 1 as at December 31, 2021 1,222 – – 1,222
Newly originated assets that moved to Stage 2 and Stage 3 as at
December 31, 2021 –
240 12,443 12,683
Effect of collections and other movements
(6,299) (3,938) (43,316) (53,553)
Transfers to Stage 1 1,037 (357) (680) –
Transfers to Stage 2 (1,587) 1,587 – –
(Forward)

- 82 -
*SGVFS164641*
Consolidated and Parent Company 2021
Stage 1 Stage 2 Stage 3 Total
Transfers to Stage 3 (P=7,355) (P=3,868) P=11,223 P=–
Impact on ECL of exposures transferred
between stages (963) 1,284 15,549 15,870
Impact on ECL of exposures that did not transfer between stages (5,617) (36) (886) (6,539)
Accounts written-off – (185) (3,581) (3,766)
Allowance for ECL, December 31, 2021 8,909 2,963 95,341 107,213
Total receivables from customers:
Allowance for ECL, January 1, 2021 460,835 191,520 1,773,579 2,425,934
Newly originated assets that remained in Stage 1 as at December 31, 2021 341,968 – – 341,968
Newly originated assets that moved to Stage 2 and Stage 3 as at December 31, 2021 – 88,725 68,878 157,603
Effect of collections and othermovements
(249,659) (55,229) (378,708) (683,596)
Transfers to Stage 1 30,097 (12,169) (17,928) –
Transfers to Stage 2 (153,515) 154,472 (957) –
Transfers to Stage 3 (10,843) (165,145) 175,988 –
Impact on ECL of exposures transferred
between stages
123,811 42,239 259,286 425,336
Impact on ECL of exposures that did not transfer between stages
(73,040) 26,938 47,499 1,397
Accounts written-off – (185) (3,581) (3,766)
Foreign exchange adjustments (1,236) (9) - (1,245)
Allowance for ECL, December 31, 2021 P=468,418 P=271,157 P=1,924,056 P=2,663,631
Other receivables
Consolidated and Parent Company 2021
Stage 1 Stage 2 Stage 3 Total
Unquoted debt securities:
Allowance for ECL, January 1, 2021 P=896 P=– P=– P=896
Effect of collections (325) – – (325)
Allowance for ECL, December 31, 2021 571 – – 571
Accrued interest receivable:
Allowance for ECL, January 1, 2021 2,509 2,808 19,536 24,853
Newly originated assets that remained in Stage 1 as at December 31, 2021 872 – – 872
Newly originated assets that moved to Stage 2 and Stage 3 as at December 31, 2021 – – – –
Effect of collections and othermovements (2,177) (949) (13,372) (16,498)
Transfers to Stage 1 805 (805) – –
Transfers to Stage 2 (343) 343 – –
Transfers to Stage 3 (3,882) (57) 3,939 –
Impact on ECL of exposures transferred
between stages 4,487 186 – 4,673
Impact on ECL of exposures that did not transfer between stages (797) 968 552 723
Accounts written-off – (46) (1,970) (2,016)
Foreign exchange adjustments – – – –
Allowance for ECL, December 31, 2021 1,474 2,448 8,685 12,607
Accounts receivable:Allowance for ECL, January 1, 2021 – – 28,039 28,039
Newly originated assets 383,874 – – 383,874
Effect of collections and othermovements (384,164) 7,469 10,947 (365,748)
Transfers to Stage 3 1,072 8,070 (9,142) –
Accounts written-off – – (1,006) (1,006)
Allowance for ECL, December 31, 2021 782 15,539 28,838 45,159
(Forward)

- 83 -
*SGVFS164641*
Consolidated and Parent Company 2021
Stage 1 Stage 2 Stage 3 Total
Sales contracts receivableAllowance for ECL, January 1, 2021 P=3 P=830 P=9,412 P=10,245
Newly originated assets that remainedin Stage 1 as at December 31, 2021 3 – – 3
Newly originated assets that moved to
Stage 2 and Stage 3 as atDecember 31, 2021 – 1,227 – 1,227
Effect of collections and other
movements (excluding write-offsand transfers to ROPA)
(6,339) 197 (369) (6,511)
Transfer to ROPA – – – –
Transfers to Stage 1 1,527 (1,232) (295) –
Transfers to Stage 2 - 1,906 (1,906) –
Transfers to Stage 3 (10) (240) 250 –
Impact on ECL of exposures transferredbetween stages
4,997 - 284 5,281
Allowance for ECL, December 31, 2021 181 2,688 7,376 10,245
Total other receivablesAllowance for ECL, January 1, 2021 3,408 3,638 56,987 64,033
Newly originated assets that remained
in Stage 1 as at December 31, 2021 384,749 – – 384,749
Newly originated assets that moved to Stage 2 and Stage 3 as at
December 31, 2021 – 1,227 – 1,227
Effect of collections and other movements (392,680) 6,717 (2,794) (388,757)
Transfers to Stage 1 2,332 (2,037) (295) –Transfers to Stage 2 (343) 2,249 (1,906) –Transfers to Stage 3 (2,820) 7,773 (4,953) –
Impact on ECL of exposures transferredbetween stages 9,484 186 284 9,954
Impact on ECL of exposures that did
not transfer between stages (1,122) 968 552 398
Accounts written-off - (46) (2,976) (3,022)
Allowance for ECL, December 31, 2021 P=3,008 P=20,675 P=44,899 P=68,582
Investment securities at FVTOCI
Consolidated and Parent Company 2020
Stage 1 Stage 2 Stage 3 Total
Allowance for ECL, January 1, 2020 P=5,508 P=– P=– P=5,508
Newly originated assets that remained inStage 1 as at December 31, 2020 37 – – 37
Allowance for ECL, December 31, 2020 P=5,545 P=– P=– P=5,545
Investment securities at amortized cost
Consolidated and Parent Company 2020
Stage 1 Stage 2 Stage 3 Total
Allowance for ECL, January 1, 2020 P=10,565 P=– P=– P=10,565Impact on ECL of exposures that did not
transfer between stages (49) – – (49)
Allowance for ECL, December 31, 2020 P=10,516 P=– P=– P=10,516

- 84 -
*SGVFS164641*
Receivables from customers
Consolidated and Parent Company 2020
Stage 1 Stage 2 Stage 3 Total
Corporate loans:
Allowance for ECL, January 1, 2020 P=574,595 P=69,961 P=583,480 P=1,228,036
Newly originated assets that remainedin Stage 1 as at December 31, 2020 342,271 – – 342,271
Newly originated assets that moved to Stage 2 and Stage 3 as at
December 31, 2020 1,124,179 – – 1,124,179Effect of collections and other movements (excluding write-offs
and transfers to ROPA) (447,783) (45,868) (16,597) (510,248)Transfers to ROPA – – (14,957) (14,957)Transfers to Stage 2 (133,072) 133,072 – –
Transfers to Stage 3 (1,081,239) – 1,081,239 –Impact on ECL of exposures transferred between stages (5) – 21,770 21,765
Impact on ECL of exposures that didnot transfer between stages – 862 1,571 2,433
Accounts written-off – – (248,510) (248,510)
Foreign exchange adjustments – (862) (1,571) (2,433)
Allowance for ECL, December 31, 2020 378,946 157,165 1,406,425 1,942,536
Consumer loans:Auto loans
Allowance for ECL, January 1, 2020 11,291 15,933 294,183 321,407
Newly originated assets that remainedin Stage 1 as at December 31, 2020 68,566 – – 68,566
Newly originated assets that moved to
Stage 2 and Stage 3 as atDecember 31, 2020 26,162 – – 26,162
Effect of collections and other
movements (excluding write-offsand transfers to ROPA) (7,509) (1,728) (25,788) (35,025)
Transfers to ROPA (29) (469) – (498)
Transfers to Stage 1 4,079 (3,927) (152) –Transfers to Stage 2 (6,262) 6,262 – –Transfers to Stage 3 (83,499) (14,300) 97,799 –
Impact on ECL of exposures transferredbetween stages – – (1,843) (1,843)Impact on ECL of exposures that did
not transfer between stages – 7,062 5,923 12,985Accounts written-off – – (289,502) (289,502)
Allowance for ECL, December 31, 2020 12,799 8,833 80,620 102,252
Home loans:Allowance for ECL, January 1, 2020 25,260 13,973 69,637 108,870
Newly originated assets that remainedin Stage 1 as at December 31, 2020 56,895 – – 56,895
Newly originated assets that moved to
Stage 2 and Stage 3 as atDecember 31, 2020 15,517 – – 15,517
Effect of collections and other
movements (excluding write-offsand transfers to ROPA) (7,579) (75) (6,850) (14,504)
Transfers to ROPA – – (5,901) (5,901)
Transfers to Stage 2 (14,462) 14,462 – –Transfers to Stage 3 (35,108) (11,104) 46,212 –Impact on ECL of exposures transferred
between stages 96 – 64,125 64,221Impact on ECL of exposures that did
not transfer between stages – 30 14,722 14,752
Allowance for ECL, December 31, 2020 40,619 17,286 181,945 239,850
(Forward)

- 85 -
*SGVFS164641*
Consolidated and Parent Company 2020
Stage 1 Stage 2 Stage 3 Total
Personal loans:Allowance for ECL, January 1, 2020 P=27,866 P=9,936 P=408,053 P=445,855
Newly originated assets that remainedin Stage 1 as at December 31, 2020 226,145 – – 226,145
Newly originated assets that moved to
Stage 2 and Stage 3 as atDecember 31, 2020 7,182 – – 7,182
Effect of collections and other
movements (excluding write-offsand transfers to ROPA) (12,825) – (7,067) (19,892)
Transfers to Stage 1 688 (688) – –
Transfers to Stage 2 (8,162) 8,162 – –Transfers to Stage 3 (212,422) (9,174) 221,597 –Impact on ECL of exposures transferred
between stages – – 3,526 3,526Accounts written-off – – (521,520) (521,520)
Allowance for ECL, December 31, 2020 28,471 8,236 104,589 141,296
Total receivables from customers:Allowance for ECL, January 1, 2020 639,012 109,803 1,355,353 2,104,168
Newly originated assets that remainedin Stage 1 as at December 31, 2020 693,877 – – 693,877
Newly originated assets that moved to
Stage 2 and Stage 3 as atDecember 31, 2020 1,173,040 – – 1,173,040
Effect of collections and other
movements (excluding write-offsand transfers to ROPA) (475,696) (47,671) (56,302) (579,669)
Transfers to ROPA (29) (469) (20,858) (21,356)
Transfers to Stage 1 4,767 (4,615) (152) –Transfers to Stage 2 (161,958) 161,958 – –Transfers to Stage 3 (1,412,269) (34,578) 1,446,847 –
Impact on ECL of exposures transferredbetween stages 91 – 87,578 87,669
Impact on ECL of exposures that did not transfer between stages – 7,954 22,216 30,170
Accounts written-off – – (1,059,532) (1,059,532)Foreign exchange adjustments – (862) (1,571) (2,433)
Allowance for ECL, December 31, 2020 P=460,835 P=191,520 P=1,773,579 P=2,425,934
Other receivables
Consolidated and Parent Company 2020
Stage 1 Stage 2 Stage 3 Total
Unquoted debt securities:
Allowance for ECL, January 1, 2020 P=944 P=– P=– P=944Impact on ECL of exposures that did
not transfer between stages (48) – – (48)
Allowance for ECL, December 31, 2020 896 – – 896
Accrued interest receivable:
Allowance for ECL, January 1, 2020 193 2,133 31,903 34,229Newly originated assets that remained in Stage 1 as at December 31, 2020 2,502 – – 2,502
Newly originated assets that moved to Stage 2 and Stage 3 as at December 31, 2020 20,755 – – 20,755
Effect of collections and other movements (excluding write-offs and transfers to ROPA) (193) (1,723) (1,731) (3,647)
Transfers to Stage 1 2 – (2) –Transfers to Stage 2 (2,588) 2,588 – –Transfers to Stage 3 (18,160) (305) 18,465 –
Impact on ECL of exposures transferredbetween stages (2) 115 – 113
(Forward)

- 86 -
*SGVFS164641*
Consolidated and Parent Company 2020
Stage 1 Stage 2 Stage 3 TotalImpact on ECL of exposures that did not transfer between stages P=– P=– P=102 P=102
Accounts written-off – – (29,201) (29,201)
Allowance for ECL, December 31, 2020 2,509 2,808 19,536 24,853
Accounts receivable:
Allowance for ECL, January 1, 2020 – – 11,173 11,173Impact on ECL of exposures that did not transfer between stages – – 17,020 17,020
Accounts written-off – – (154) (154)
Allowance for ECL, December 31, 2020 – – 28,039 28,039
Sales contracts receivableAllowance for ECL, January 1, 2020 2,463 1,192 6,591 10,246Newly originated assets that moved to
Stage 2 and Stage 3 as atDecember 31, 2020 8 – – 8
Effect of collections and other
movements (excluding write-offsand transfers to ROPA) (1,392) (465) (3,323) (5,180)
Transfers to Stage 1 788 (788) – –
Transfers to Stage 2 (1,213) 1,213 – –Transfers to Stage 3 (651) (347) 998 –Impact on ECL of exposures transferred
between stages – 25 3,089 3,114Impact on ECL of exposures that did not transfer between stages – – 2,057 2,057
Allowance for ECL, December 31, 2020 3 830 9,412 10,245
Total other receivables
Allowance for ECL, January 1, 2020 3,600 3,325 49,667 56,592Newly originated assets that remained in Stage 1 as at December 31, 2020 2,502 – – 2,502
Newly originated assets that moved to Stage 2 and Stage 3 as at December 31, 2020 20,763 – – 20,763
Effect of collections and other movements (excluding write-offs and transfers to ROPA) (1,585) (2,188) (5,054) (8,827)
Transfers to Stage 1 790 (788) (2) –Transfers to Stage 2 (3,801) 3,801 – –Transfers to Stage 3 (18,811) (652) 19,463 –
Impact on ECL of exposures transferredbetween stages (2) 140 3,089 3,227
Impact on ECL of exposures that did
not transfer between stages (48) – 19,179 19,131Accounts written-off – – (29,355) (29,355)Foreign exchange adjustments – – – –
Allowance for ECL, December 31, 2020 P=3,408 P=3,638 P=56,987 P=64,033
As of December 31, 2021 and 2020, changes in the allowance for credit and impairment losses of theGroup and the Parent Company follow:
Consolidated and Parent
Company
2021 2020
Balances at January 1Loans and receivables (Note 12) P=2,489,967 P=2,160,760Investment securities at FVTOCI 5,545 5,508Investment securities at amortized cost 10,516 10,565Investment properties (Note 14) 67,079 69,035Other assets (Note 16) 2,573 336,449
2,575,680 2,582,317
(Forward)

- 87 -
*SGVFS164641*
Consolidated and Parent
Company
2021 2020
Provision for credit and impairment losses P=322,301 P=1,418,228Accounts written-off, revaluation, and others (75,416) (1,424,902)
246,885 (6,674)
Balance at December 31:Loans and receivables (Note 12) 2,732,213 2,489,967Investment securities at FVTOCI 15,634 5,545Investment securities at amortized cost 6,911 10,516Investment properties (Note 14) 65,234 67,079Other assets (Note 16) 2,573 2,573
P=2,822,565 P=2,575,680
Below is the breakdown of provisions for (reversals of) credit and impairment losses:
Consolidated and Parent Company
2021 2020 2019
Financial assets and other credit-related exposures:Loans and receivables P=317,662 P=1,447,601 P=378,688Investment securities at FVTOCI 10,089 ‒ (570)Investment securities at
amortized cost (3,605) ‒ 3,109Interbank loans receivable ‒ ‒ (1)
324,146 1,447,601 381,226
Non-financial assets:Investment properties (1,845) (1,956) (3,613)Other assets (Note 16) ‒ (27,417) ‒
(1,845) (29,373) (3,613)
P=322,301 P=1,418,228 P=377,613
While the Group recognizes through the statement of income the movements in the expected creditlosses computed using the models, the Group also complies with BSP’s regulatory requirement toappropriate a portion of its earnings at an amount necessary to bring to at least 1% the allowance forcredit losses on loans (Note 23).
2021 2020 2019
Provision for credit and impairmentlosses P=322,301 P=1,418,228 P=377,613
Appropriation from current netincome 52,240 – –
Total P=374,541 P=1,418,228 P=377,613
18. Deposit Liabilities
On December 5, 2019, BSP issued Circlar No. 1063 which decreased the reserve requirements ondeposits and deposit substitutes to 14% effective December 6, 2019, meanwhile, reserve requirementson LTNCDs remained at 4%.

- 88 -
*SGVFS164641*
On March 23, 2020, BSP issued Circular No. 1082 reducing the reserve requirement against depositand deposits substitute to 12% while LTNCDs remains to have 4% reserve requirement. Further, onApril 16, 2020, BSP issued Circular No. 1083, which allows the bank to use MSME loans granted asof March 15, 2020 as allowable mode for alternative compliance on the reserve requirement. The saidalternative compliance is valid from April 24, 2020 to December 30, 2021.
As of December 31, 2021 and 2020, Due from BSP amounting to P=8.46 billion and P=8.59 billion,respectively, were set aside as reserves for deposit liabilities. As of December 31, 2021 and 2020, theGroup is in compliance with the above regulations.
On July 26, 2018, the Monetary Board of the BSP, in its Resolution No. 1220, approved the ParentCompany’s issuance of the Long-Term Negotiable Certificates of Deposits (LTNCD) of up toP=5.00 billion in one or more tranches over the course of one year, with minimum tenor of 5 years and1 day to a maximum of 7 years. The purpose of the issuance is specifically for long-term funding.
On October 8, 2018, the Parent Company issued P=2.90 billion worth of LTNCDs with a tenor of5 years and 6 months. The LTNCDs will mature on April 8, 2024 and have fixed interest rate of5.625% per annum, payable quarterly in arrears on October 8, January 8, April 8 and July 8 of eachyear, commencing on January 8, 2019. The LTNCDs are listed in the trading platform of thePhilippine Dealing & Exchange Corp. for secondary market trading.
Interest expense on deposit liabilities consists of:
Consolidated and Parent Company
2021 2020 2019
Demand P=44,004 P=64,029 P=59,077Savings 10,683 10,103 8,742Time 211,486 678,893 1,266,283LTNCD 168,726 168,434 167,485
P=434,899 P=921,459 P=1,501,587
Peso-denominated deposit liabilities earn annual fixed interest rates ranging from 0.10% to 3.00% in2021, 0.10% to 3.50% in 2020, and 0.10% to 6.85% in 2019, while foreign currency-denominateddeposit liabilities earn annual fixed interest rates ranging from 0.09% to 1.50%, 0.10% to 2.00%, and0.01% to 4.75% in 2021, 2020 and 2019, respectively.
19. Bills Payable
This account consists of the Group’s and the Parent Company’s borrowings from:
2021 2020
Private firms and individuals P=5,203,348 P=1,984,864Banks and other financial institutions 807,640 197,980
P=6,010,988 P=2,182,844

- 89 -
*SGVFS164641*
As of December 31, 2021, P=5.91 billion of the bills payable are collateralized by investment ingovernment securities. Details of the securities pledged are as follows:
Face
value
Carrying
amount
Fair
value
FVTOCI P=171,472 P=163,269 P=163,269
Investment securities at amortizedcost 5,737,155 5,863,489 5,888,170
P=5,908,627 P=6,026,758 P=6,051,439
Interest expense on bills payable and other borrowings consists of:
Consolidated Parent Company
2021 2020 2019 2021 2020 2019
Borrowed funds P=40,211 P=127,462 P=542,989 P=40,211 P=127,462 P=542,989
Lease liability (Note 21) 14,528 17,603 18,711 14,528 17,603 18,711
Net interest cost on retirementliability (Note 27) 4,360 1,969 – 4,360 1,969 –
P=59,099 147,034 561,700 P=59,099 147,034 561,700
The net interest income on retirement liability of P=5.65 million in 2019 is presented as part ofmiscellaneous income.
The Group has no dollar interbank borrowings as of December 31, 2021 and 2020.
The Parent Company did not avail of peso and dollar rediscounting facilities in 2021 and 2020.
Borrowings from private firms and individuals represent deposit substitutes with maturities of 1 to181 days and 1 to 216 days in 2021 and 2020, respectively. Bear annual interest rates ranging from0.25% to 1.13%, 0.37% to 3.88%, and 2.00% to 6.88%, in 2021, 2020 and 2019, respectively.
As of December 31, 2021 and 2020, Due from BSP amounting to P=633.53 million andP=262.4 million, respectively, were set aside as reserves for deposit substitutes.
20. Accrued Interest, Taxes and Other Expenses
This account consists of:
Consolidated Parent Company
2021 2020 2021 2020
Financial liabilities
Accrued interest payable P=59,188 P=105,338 P=59,188 P=105,338Accrued other expenses 557,368 515,674 557,282 515,526
616,556 621,012 616,470 620,864
Non-financial liabilities
Retirement liability (Note 27) – 109,004 – 109,004Accrued taxes and licenses 64,178 72,769 64,178 72,769
64,178 181,773 64,178 181,773
P=680,734 P=802,785 P=680,648 P=802,637

- 90 -
*SGVFS164641*
21. Other Liabilities
This account consists of:
Consolidated Parent Company
2021 2020 2021 2020
Financial liabilities
Accounts payable P=310,957 P=205,426 P=310,949 P=204,921Refundable security deposits 165,866 186,517 165,866 186,517Miscellaneous (Note 24) 28,060 34,848 28,060 34,848
504,883 426,791 504,875 426,286
Non-financial liabilities
Lease liability (Note 28) 252,501 239,734 252,501 239,734Deferred credits 206,412 298,580 206,412 298,580Withholding taxes payable 20,229 18,756 20,229 18,756Due to the Treasurer of the
Philippines 44,575 40,589 44,575 40,589Miscellaneous 76,596 76,270 75,387 75,517
600,313 673,929 599,104 673,176
P=1,105,196 P=1,100,720 P=1,103,979 P=1,099,462
Miscellaneous liabilities of the Group and the Parent Company include marginal deposits, cash lettersof credit, and deposit liabilities classified as dormant.
Shown below is the movement of lease liability of the Group and Parent:
2021 2020
Balance at January 1 P=239,734 P=270,554Additions 123,107 76,072Lease payments (124,868) (124,495)Interest expense (Note 19) 14,528 17,603
Balance at December 31 P=252,501 P=239,734
22. Maturity Analysis of Assets and Liabilities
The tables below show an analysis of assets and liabilities analyzed according to when they areexpected to be recovered or settled:
Consolidated
2021 2020
Due Within
One Year
Due Beyond
One Year Total
Due WithinOne Year
Due BeyondOne Year Total
Financial assets - at grossCash and other cash items P=2,803,341 P=– P=2,803,341 P=2,467,099 P=– P=2,467,099Due from BSP 10,271,486 – 10,271,486 20,597,868 – 20,597,868Due from other banks 658,593 – 658,593 1,495,485 – 1,495,485Interbank loans receivable
and SPURA (Note 8) 4,195,846 – 4,195,846 6,054,454 – 6,054,454Financial assets at FVTPL
(Note 9) 886,291 – 886,291 718,294 – 718,294Financial assets at FVTOCI
(Note 10) –6,504,921 6,504,921
–5,143,361 5,143,361
Investment securities at amortized cost (Note 11) – 15,527,190 15,527,190 – 2,273,872 2,273,872
(Forward)

- 91 -
*SGVFS164641*
Consolidated
2021 2020
Due Within
One Year
Due Beyond
One Year Total
Due WithinOne Year
Due BeyondOne Year Total
Loans and receivables (Note 12): Receivables from Customers P=40,102,875 P=24,622,791 P=64,725,666 P=34,892,624 P=23,552,231 P=58,444,855 Unquoted debt securities – 678,557 678,557 – 852,565 852,565 Accrued interest
receivable559,770 – 559,770 468,544 – 468,544
Accounts receivable 234,787 30,998 265,785 322,118 11,182 333,300 Sales contracts receivable 37,926 7,229 45,155 30,831 35,121 65,952Other assets (Note 16): Refundable security
deposits – 35,471 35,471 – 33,387 33,387 RCOCI 62 – 62 1,273 – 1,273
59,750,977 47,407,157 107,158,134 67,048,590 31,901,719 98,950,309
Non-financial assets -at gross
Investments in subsidiary and an associate (Note 7) – 14,401 14,401 – 14,114 14,114Property and equipment (Note 13) 95,149 2,729,955 2,825,104 90,658 2,646,401 2,737,059Investment properties (Note 14): Condominium units for Lease –
2,644,075 2,644,075– 2,644,075 2,644,075
Foreclosed properties – 1,111,354 1,111,354 – 848,169 848,169 Office units for lease – 39,390 39,390 – 39,274 39,274Intangible assets (Note 15) – 527,503 527,503 – 613,526 613,526Deferred tax assets (Note 30) – 325,614 325,614 – 170,608 170,608Other assets (Note 16) 291,326 272,921 564,247 206,473 548,803 755,276
386,475 7,665,213 8,051,688 297,131 7,524,970 7,822,101
P=60,137,452 P=55,072,370 P=115,209,822 P=67,345,721 P=39,426,689 P=106,772,410
Less:Unearned interest and discounts (Note 12) (44,756) (51,256)Accumulated depreciation and amortization (Notes 13, 14 and 16)
(3,113,072) (2,915,257)
Allowance for credit and impairment losses (Notes 12, 16 and 17) (2,822,674) (2,575,680)
Total 109,229,320 101,230,218
Financial liabilities
Deposit liabilities: Demand 41,166,107 – 41,166,107 30,865,282 – 30,865,282
Savings 11,359,112 – 11,359,112 9,664,945 – 9,664,945 Time 28,502,686 3,028,884 31,531,570 38,021,768 2,345,749 40,367,517
LTNCD – 2,889,116 2,889,116 – 2,883,668 2,883,668
Bills payable (Note 19) 6,010,988 – 6,010,988 2,182,844 – 2,182,844
Outstanding acceptances 71,609 – 71,609 497,813 – 497,813
Manager’s checks 172,247 – 172,247 188,100 – 188,100
Accrued interest payable (Note 20) 59,188 – 59,188 105,338 – 105,338Accrued other expenses (Note 20) 557,368 – 557,368 515,674 – 515,674
Other liabilities (Note 21): – – Accounts payable 310,957 – 310,957 205,426 – 205,426 Refundable security deposits 45,686 120,180 165,866 144,627 41,890 186,517
Miscellaneous 28,060 – 28,060 34,848 – 34,848
88,284,008 6,038,180 94,322,188 82,426,665 5,271,307 87,697,972
(Forward)

- 92 -
*SGVFS164641*
Consolidated
2021 2020
Due Within
One Year
Due Beyond
One Year Total
Due WithinOne Year
Due BeyondOne Year Total
Non-financial liabilities
Deferred tax liabilities (Note 30) P=– P=– P=0 P=– P=– P=0
Retirement liability (Notes 20 and 27) – – – – 109,004 109,004Accrued taxes and licenses (Note 20) 64,178 – 64,178 72,769 – 72,769Income tax payable 66,823 – 66,823 146,866 – 146,866Other liabilities (Note 21): Deferred credits 94,528 111,884 206,412 240,530 58,050 298,580 Lease liability 98,208 154,293 252,501 96,412 143,322 239,734 Withholding taxes payable 20,229 – 20,229 18,756 – 18,756
Due to the Treasurer ofthe Philippines 44,575 – 44,575 40,589 – 40,589
Miscellaneous 16,497 60,099 76,596 18,728 57,542 76,270
405,038 326,276 731,314 634,650 367,918 1,002,568
P=88,689,046 P=6,364,456 P=95,053,502 P=83,061,315 P=5,639,225 P=88,700,540
Parent Company
2021 2020
Due Within
One Year
Due Beyond
One Year Total
Due WithinOne Year
Due BeyondOne Year Total
Financial assets - at grossCash and other cash items P=2,803,341 P=– P=2,803,341 P=2,467,099 P=– P=2,467,099Due from BSP 10,271,486 – 10,271,486 20,597,868 – 20,597,868Due from other banks 658,593 – 658,593 1,495,485 – 1,495,485Interbank loans receivable
and SPURA (Note 8) 4,195,846 – 4,195,846 6,054,454 – 6,054,454Financial assets at FVTPL (Note 9) 886,291 – 886,291 718,294 – 718,294Financial assets at FVTOCI
(Note 10) –6,504,921 6,504,921 5,143,361 5,143,361
Investment securities at amortized cost (Note 11) 15,527,190 15,527,190 2,273,872 2,273,872Loans and receivables (Note 12): Receivables from customers 40,102,875 24,622,791 64,725,666 34,892,624 23,552,231 58,444,855 Unquoted debt securities – 678,557 678,557 – 852,565 852,565 Accrued interest
receivable 559,770–
559,770 468,544–
468,544 Accounts receivable 234,787 33,831 268,618 322,118 13,897 336,015 Sales contracts receivable 37,926 7,229 45,155 30,831 35,121 65,952Other assets (Note 16): Refundable security
deposits – 35,471 35,471 – 33,387 33,387 RCOCI 62 – 62 1,273 – 1,273
59,750,977 47,409,990 107,160,967 67,048,590 31,904,434 98,953,024
Non-financial assets -
at grossInvestments in subsidiary and an associate (Note 7) – 20,475 20,475 – 20,252 20,252Property and equipment (Note 13) 95,149 2,729,955 2,825,104 90,658 2,646,401 2,737,059Investment properties (Note 14): Condominium units for lease – 2,644,075 2,644,075 – 2,644,075 2,644,075 Foreclosed assets – 1,111,354 1,111,354 – 848,169 848,169 Office units for lease – 39,390 39,390 – 39,274 39,274Intangible assets (Note 15) – 527,503 527,503 – 613,526 613,526Deferred tax assets (Note 30) – 325,614 325,614 – 170,608 170,608Other assets (Note 16) 291,163 271,723 562,886 206,306 547,573 753,879
386,312 7,670,089 8,056,401 296,964 7,529,878 7,826,842
P=60,137,289 P=55,080,079 P=115,217,368 P=67,345,554 P=39,434,312 P=106,779,866

- 93 -
*SGVFS164641*
Parent Company
2021 2020
Due Within
One Year
Due Beyond
One Year Total
Due WithinOne Year
Due BeyondOne Year Total
Less:Unearned interest and discounts (Note 12) (P=44,756) (P=51,256)Accumulated depreciation and amortization (Notes 13, 14 and 16)
(3,113,072) (2,915,257)
Allowance for credit and impairment losses (Notes 12, 14, 16 and 17)
(2,822,564) (2,575,680)
Total P=109,236,976 P=101,237,673
Financial liabilities
Deposit liabilities: Demand P=41,175,066 P=– P=41,175,066 P=30,874,143 P=– P=30,874,143
Savings 11,359,112 – 11,359,112 9,664,945 – 9,664,945 Time 28,502,686 3,028,884 31,531,570 38,021,768 2,345,749 40,367,517 LTNCD – 2,889,116 2,889,116 – 2,883,668 2,883,668Bills payable (Note 19) 6,010,988 – 6,010,988 2,182,844 – 2,182,844
Outstanding acceptances 71,609 – 71,609 497,813 – 497,813Manager’s checks 172,247 – 172,247 188,100 – 188,100
Accrued interest payable (Note 20) 59,188 – 59,188 105,338 – 105,338Accrued other expenses (Note 20) 557,282 – 557,282 515,526 – 515,526
Other liabilities (Note 21): – –
Accounts payable 310,949 – 310,949 204,921 – 204,921 Refundable security deposits 45,686 120,180 165,866 145,087 41,430 186,517
Miscellaneous 28,060 – 28,060 34,848 – 34,848
88,292,873 6,038,180 94,331,053 82,435,333 5,270,847 87,706,180
Non-financial liabilities
Deferred tax liabilities (Note 30) – – – –
Retirement liability (Notes 20 and 27) – – – – 109,004 109,004Accrued taxes and licenses (Note 20) 64,178 – 64,178 72,769 – 72,769Income tax payable 66,823 – 66,823 146,866 – 146,866Other liabilities (Note 21):
Deferred credits 94,528 111,884 206,412 240,530 58,050 298,580
Lease liability 98,208 154,293 252,501 96,412 143,322 239,734 Withholding taxes payable 20,229 – 20,229 18,756 – 18,756 Due to the Treasurer of the Philippines 44,575 – 44,575 40,589 – 40,589
Miscellaneous 16,497 58,890 75,387 17,478 58,039 75,517
405,038 325,067 730,105 633,400 368,415 1,001,815
P=88,697,911 P=6,363,247 P=95,061,158 P=83,068,733 P=5,639,262 P=88,707,995
23. Equity
Common StockDetails and movements of common stock follow:
Shares Amount
Common - P=25 par value
Authorized 760,000
Issued and outstandingBalance at December 31 480,645 P=12,016,129

- 94 -
*SGVFS164641*
The Parent Company became listed in the PSE on May 12, 1988. After its listing in the PSE, therewas no succeeding offer/selling to the public of the Parent Company’s shares.
The summarized information on the Parent Company’s registration of securities under the SecuritiesRegulation Code follows:
Date of SEC Approval Type/Class Authorized Shares Par Value
November 23, 1988 Common Class A 7,000,000 100Common Class B 3,000,000 100
June 3, 1993 Common Class A 14,000,000 100Common Class B 6,000,000 100
September 11, 1997 Common 65,000,000 100April 6, 2001 Common 145,000,000 100March 31, 2006 Common 145,000,000 100
Preferred 120,000,000 25March 11, 2013 Common 760,000,000 25
As reported by the Parent Company’s transfer agent, AB Stock Transfers Corporation, the totalnumber of shareholders is 398 and 399 as of December 31, 2021 and 2020, respectively.
Surplus Reserves
In compliance with BSP regulations and RA No. 337, The General Banking Act, 10.00% of the ParentCompany’s profit from trust business is appropriated to surplus reserves. This annual appropriation isrequired until the surplus reserves for trust business equals 20.00% of the Parent Company’sauthorized capital stock. Surplus reserve for self-insurance represents the amount set aside to coverfor losses due to fire, defalcation by and other unlawful acts of the Parent Company’s personnel orthird parties.
Upon adoption of PFRS 9, BSP requires appropriation of a portion of the Group’s Surplus at anamount necessary to bring to at least 1% the allowance for credit losses on loans (Note 17). TheBank appropriated P=52 million out of 2021 net income to meet prudential requirements on 1%general loan loss provisioning.
DeficitThe computation of surplus available for dividend declaration in accordance with SEC MemorandumCircular No. 11 differs to a certain extent from the computation following BSP Guidelines.
In the consolidated financial statements, accumulated net earnings of the subsidiary and an associateamounting to P=12.40 million and P=14.11 million as of December 31, 2021 and 2020, respectively,that were closed out to ‘Deficit’ is not available for dividend declaration. The accumulated equity innet earnings becomes available for dividends upon declaration and receipt of cash dividends from theinvestees.
Capital ManagementThe primary objectives of the Parent Company’s capital management are to ensure that the ParentCompany complies with regulatory capital requirements and that the Parent Company maintainsstrong credit ratings and healthy capital ratios in order to support its business and to maximizeshareholders’ value.

- 95 -
*SGVFS164641*
The Parent Company manages its capital structure and makes adjustments to it in light of changes ineconomic conditions and the risk characteristics of its activities. In order to maintain or adjust thecapital structure, the Parent Company may adjust the amount of dividend payment to shareholders,return capital to shareholders or issue capital securities. No changes were made in the objectives,policies and processes from the previous years.
The Parent Company maintains an actively managed capital base to cover risks inherent in thebusiness. The adequacy of the Parent Company’s capital is monitored using, among other measures,the rules and ratios established by the Basel Committee on Banking Supervision (“Bank forInternational Settlements rules/ratios”) and adopted by the BSP as discussed below. The ParentCompany has complied in full with all its regulatory capital requirements.
BSP approvals
On December 14, 2012, the BSP, in its Resolution No. 2088, approved the request of the ParentCompany to include the P=1.92 billion appraisal increment resulting from the revaluation of PBComTower as part of unimpaired and qualifying capital in computing for net worth and capital adequacyratio. Effective January 1, 2018, the Group and the Parent Company changed their method ofaccounting for Investment Properties and Land from the fair value model and revaluation model,respectively, to the cost model, and restated the comparative information in its audited financialstatements. As approved by the BSP, however, the Parent Company continues to include the aboverevaluation increment for purposes of regulatory unimpaired and qualifying capital in its computation
of net worth and capital adequacy ratio. As of December 31, 2021 and 2020, the revaluation
increment pertaining to PBCOM Tower amounted to P=1.74 billion and P=1.64 billion, respectively.
Regulatory Qualifying CapitalUnder existing BSP regulations, the determination of the Parent Company’s compliance withregulatory requirements and ratios is based on the amount of the Group’s “qualifying capital”(regulatory net worth) as reported to the BSP, which is determined on the basis of regulatoryaccounting policies which may differ from PFRS in some respects.
The BSP, under BSP Circular No. 538 dated August 4, 2006, issued the prescribed guidelinesimplementing the revised risk-based capital adequacy framework for the Philippine banking system toconform to Basel II recommendations. The new BSP guidelines took effect on July 1, 2007.
Below is a summary of risk weights and selected exposure types:
Risk Weight Exposure/Asset Type*
0.00% Cash on hand; claims collateralized by securities issued by thenational government, BSP; loans covered by the Trade andInvestment Development Corporation of the Philippines; real estatemortgages covered by the Home Guarantee Corporation
20.00% Cash and other cash items, claims guaranteed by Philippineincorporated banks/quasi-banks with the highest credit quality;claims guaranteed by foreign incorporated banks with the highestcredit quality; loans to exporters to the extent guaranteed by SmallBusiness Guarantee and Finance Corporation
50.00% Housing loans fully secured by first mortgage on residential property;Local Government Unit (LGU) bonds which are covered by Deed ofAssignment of Internal Revenue allotment of the LGU andguaranteed by the LGU Guarantee Corporation

- 96 -
*SGVFS164641*
Risk Weight Exposure/Asset Type*75.00% Direct loans of defined Small Medium Enterprise and microfinance
loans portfolio; non-performing housing loans fully secured by firstmortgage
100.00% All other assets (for example, real estate assets) excluding thosededucted from capital (for example, deferred income tax)
150.00% All non-performing loans (except non-performing housing loans fullysecured by first mortgage) and all non-performing debt securities
*Not all inclusive
BSP Circular No. 781, Basel III Implementing Guidelines on Minimum Capital Requirements,provides the implementing guidelines on the revised risk-based capital adequacy frameworkparticularly on the minimum capital and disclosure requirements for universal banks and commercialbanks, as well as their subsidiary banks and quasi-banks, in accordance with the Basel III standards.The Circular went into effect on January 1, 2014.
The Circular defines in greater detail, the quality capital a bank must maintain to cover its risks.These include:
Tier One capital - comprises the Group’s and the Parent Company’s core capital resources thatare immediately available to sustain the financial stability of the group. Components of tier onecapital include:
- Core-Equity Tier One or CET-1 includes paid-in shares of common stock, retained earningsand accumulated OCI. CET-1 must be the predominant form of Tier One Capital.CET-1 absorbs all deductions to capital mandated by regulation. These deductions includecapital invested in affiliates, net deferred tax assets, intangible assets and goodwill items.
- Alternative Tier One or AT-1 includes other equity type claims on a bank’s statement offinancial position that are sufficiently subordinate to the claims of depositors and seniorcreditors and whose cash flow distributions are not committed and cancellable at the optionof the bank.
Tier Two capital - includes auxiliary items, such as the general loan loss provision and appraisalincrement reserves on investment property, that supplement Tier One Capital in sustaining thefinancial stability of the bank.
Banks must maintain CET-1 capital equivalent to 6.00%, Total Tier One capital equivalent to7.5% and Total capital equivalent to 10% of regulatory risk weighted assets at all times.
As of December 31, 2021 and 2020, the Group and the Parent Company reported ratios in excess ofthe regulatory requirements.
Presented below are the composition of qualifying capital and the related disclosures as reported tothe BSP (amounts in millions):
2021 2020
CET-1 Capital P=13,919 P=13,068Less: Regulatory Adjustments to CET-1 (543) (623)
13,376 12,445
Additional Tier 1 Capital − −Less: Regulatory Adjustments to AT-1 − −
− −Total Tier 1 Capital 13,376 12,445
Tier 2 Capital 2,227 2,226Less: Regulatory Adjustments to Tier 2 Capital − −Total Tier 2 Capital 2,227 2,226
Total Qualifying Capital P=15,603 P=14,671

- 97 -
*SGVFS164641*
The Group’s and the Parent Company’s RBCAR as reported to the BSP as of December 31, 2021 and2020 are shown in the table below (amounts in millions):
2021 2020
CET-1 Capital:Paid-up common stock P=12,016 P=12,016Additional paid-in capital 2,262 2,262Deficit (284) (1,217)Net unrealized gains or losses on FVTOCI 36 97Cumulative foreign currency translation 2 (12)Cumulative actuarial losses (113) (78)Minority interest in subsidiary banks − −
13,919 13,068
Less: Regulatory Adjustments to CET-1 Outstanding unsecured loans, other credit accommodations
and guarantees granted to subsidiary and affiliates – –Goodwill – –Other intangible assets 523 603
Investments in equity of unconsolidated subsidiary banksand quasi-banks, and other financial allied undertakings – –
Investments in equity of unconsolidated subsidiarysecurities dealers/brokers and insurance companies 6 6Significant minority investments 14 14
543 623
Tier 1 CapitalAdditional Tier 1 Capital − −Less: Regulatory Adjustments to AT-1 − −
− −Total Tier 1 Capital 13,376 12,445
Appraisal increment reserve 1,737 1,640General loan loss provision 490 586
2,227 2,226
Less: Regulatory Adjustments to Tier 2 Capital − −Total Tier 2 Capital 2,227 2,226
Total Qualifying Capital P=15,603 P=14,671
Credit risk-weighted assets P=76,572 P=69,987Market risk-weighted assets 500 182Operational risk-weighted assets 8,774 7,585
Total Risk Weighted Assets P=85,846 P=77,754
CET 1 Capital Ratio 15.58% 16.01%Tier 1 Capital Ratio 15.58% 16.01%Total Capital Ratio 18.18% 18.87%
Leverage ratioBSP also requires the Basel III Leverage Ratio (BLR), which is designed to act as a supplementarymeasure to the risk-based capital requirements. BLR intends to restrict the build-up of leverage in thebanking sector to avoid destabilizing deleveraging processes, which can damage the broader financialsystem and the economy. Likewise, it reinforces the risk-based requirements with a simple, non-riskbased “backstop” measure.
Exposure measure is the sum of on-balance sheet exposures, derivative exposures, and off-balancesheet items. Items that are deducted completely from capital (regulatory deductions) do not contributeto leverage, hence, deducted from the exposure measure. BLR is computed as the capital measure(Tier 1 capital) divided by the total exposure measure and should not be less than 5.00%.

- 98 -
*SGVFS164641*
As of December 31, 2021 and 2020, BLR of the Parent Company, as reported to the BSP, is shown inthe table below (amounts, except ratios, are expressed in millions):
2021 2020
Tier 1 capital P=13,376 P=12,445Total exposure measure 116,271 109,400
BLR 11.50% 11.38%
Internal Capital Adequacy Assessment Process (ICAAP)The ICAAP methodology of the Parent Company was based on the minimum regulatory capitalrequirement under BSP Circular No. 639 which involved, first, an assessment of whether the riskscovered by the Framework are fully captured; and second, an assessment of other risks the ParentCompany is exposed to which are not fully captured and covered under the Framework, and anassessment of whether and how much capital to allocate against these other risks.
The ICAAP included the articulation of the Parent Company’s Risk Appetite and the correspondinglimit on each material risk which was deliberated upon by the ICAAP Steering Committee, ROC andendorsed to the BOD for approval.
Salient points of the 2022 ICAAP Document:
The Parent Company’s total Qualifying Capital for December 31, 2021 fully covers the capitalrequirements for risks under BSP Circular Nos. 538 and 639 (Pillar 1 and Pillar 2 Risks). Thefinal ICAAP document shall be available in Q2 2022.
The Parent Company’s resulting operating environment and risk requirements from 2022 to 2024will be guided by the Capital Development and Sustainability Plan to ensure appropriate capitalcoverages not only to meet the regulatory and internal capital adequacy requirements but also toensure execution of the 3-year strategic growth within the BOD’s desired appetite for capitaladequacy. Realization of the capital plan will enable the Parent Company to have sufficientRBCAR, and even projecting significant excess of capital in 2022 to 2024.
24. Commitments and Contingent Liabilities
In the normal course of operations, the Group has various outstanding commitments and contingentliabilities such as guarantees, forward exchange contracts, and commitments to extend credit, whichare not presented in the accompanying financial statements. The Group does not anticipate anymaterial losses as a result of these transactions.
The Group has certain loan-related suits and claims that remain unsettled. It is not practicable toestimate the potential financial statement impact of these contingencies. However, in the opinion ofmanagement, the suits and claims, if decided adversely, will not involve sums that would have amaterial effect on the financial statements.
The Group is a defendant in legal actions arising from its normal business activities. Managementbelieves that these actions are without merit or that the ultimate liability, if any, resulting from themwill not materially affect the consolidated and parent company financial statements.
The allowance for credit losses on the loan commitments and financial guarantee contracts for theyears ended December 31, 2021 and 2020 amounted to nil.

- 99 -
*SGVFS164641*
The following is a summary of contingencies and commitments of the Group and the ParentCompany with the equivalent peso contractual amounts:
2021 2020
Trust department accounts P=8,631,952 P=7,973,683Standby LC 825,173 1,112,021Spot exchange:
Bought 101,998 1,300,002Sold 362,093 1,460,869
Usance LC outstanding 135,023 84,331Outstanding shipping guarantees 396,019 403,601Sight LC outstanding 890,428 792,459Outward bills for collection 13,293 32,053Currency forwards:
Bought 1,987 3,811Sold 162,464 337,400
Inward bills for collection 106,075 13,108Items held for safekeeping 19 25Items held as collateral 7 7Other contingencies 14,241 12,700
Derivative Financial InstrumentsAs of December 31, 2021, the Parent Company has outstanding buy US dollar currency forwardswith aggregate notional amount of US$3.147 million, terms of 359 days, and weighted averageforward rate of P=50.33. As of December 31, 2021, derivative liability amounting to P6.04 million ispresented under miscellaneous liability.
As of December 31, 2020, the Parent Company has outstanding buy US dollar currency forwardswith aggregate notional amount of US$6.946 million, terms of 366 days, and weighted averageforward rate of P=49.55. As of December 31, 2020, derivative asset amounting to P10.60 million ispresented under miscellaneous asset.
In 2021, 2020 and 2019, total gain (loss) on currency forwards included under ‘Trading and securitiesgain (loss) - others’ in the statements of income amounted to (P=16.64 million), P=2.56 million, andP=8.76 million, respectively (see Note 26).
25. Trust Operations
Securities and other properties (other than deposits) held by the Parent Company for its customers inits fiduciary or agency capacity are not included in the statements of financial position since these arenot assets of the Parent Company. Total assets held by the Parent Company’s trust departmentamounted to P=8.63 billion and P=7.97 billion as of December 31, 2021 and 2020, respectively(see Note 37).
As of December 31, 2021 and 2020, government securities (included under ‘Investment securitiesat amortized cost’) owned by the Parent Company with total face value of P=90.00 million andP=80.00 million, respectively, are deposited with the BSP in compliance with the requirements ofRA No. 337 relative to the Parent Company’s trust functions.

- 100 -
*SGVFS164641*
Income from the Group’s and the Parent Company’s trust operations shown under ‘Income from trustoperations’ in the statements of income amounted to P=29.23 million, P=25.69 million, andP=21.10 million in 2021, 2020 and 2019, respectively.
26. Income on Investment Securities
Interest income on investment securities follows:
2021 2020 2019
Investment securities at amortizedcost P=222,525 P=150,348 P=497,929
Financial assets at FVOCI 250,271 213,270 90,388
Investment Securities 472,796 363,618 588,317Financial assets at FVTPL 40,345 80,007 159,297
P=513,141 P=443,625 P=747,614
The Parent Company’s peso-denominated investment securities earned annual interest rates rangingfrom 2.38% to 6.25% in 2021, 2.63% to 8.00% in 2020 and 3.19% to 8.13% in 2019, while dollar-denominated investment securities earned annual interest rates ranging from 1.13% to 10.63%, 0.63%to 10.63%, and 2.63% to 10.63%, in 2021, 2020 and 2019, respectively.
The Group’s and the Parent Company’s trading and securities gain (loss) - net follows:
2021 2020 2019
Financial assets at FVTPL P=60,585 P=374,890 P=90,476Financial assets at FVTOCI (285,542) 277,278 309,176Derivatives (Note 24) (16,641) 2,563 8,761
(P=241,598) P=654,731 P=408,413
27. Employee Benefits
The existing regulatory framework, RA No. 7641, The Retirement Pay Law, requires companies withat least ten employees to pay retirement benefits to qualified private sector employees in the absenceof any retirement plan in the entity, provided however, that the employee’s retirement benefits underany collective bargaining and other agreements shall not be less than those provided under the law.The law does not require minimum funding of the plan.
Defined Benefit PlansParent Company
The Parent Company has a funded, noncontributory defined benefit retirement plan coveringsubstantially all of its officers and regular employees. The Parent Company’s annual contribution tothe retirement plan consists of a payment covering the current service cost and unfunded actuarialaccrued liability. The retirement plan provides a retirement benefit based on applicable percentage ofsalary (100% - 150%) depending on the number of years of service (minimum of five years), afraction of a month being considered as one whole month. The Parent Company’s retirement plan isin the form of a trust administered by the Parent Company’s Trust and Wealth Management Group(TWMG) under the supervision of the Retirement Board.

- 101 -
*SGVFS164641*
The latest actuarial valuation studies of the defined benefit retirement plans of the Group were madeas of December 31, 2021.
The following table shows the actuarial valuation results for the Group and the Parent Company as ofDecember 31, 2021 and 2020:
2021 2020
Fair Value of
Plan Assets
Present Value
of Obligation
Fair Value ofPlan Assets
Present Value ofObligation
Consolidated and Parent Company P=557,039 P=461,546 P=500,642 P=609,646
The amounts relating to the defined benefit retirement plans of the Group and Parent Company arepresented in the statements of financial position as follows:
2021 2020
Retirement asset* (Note 16) P=95,493 P=–Retirement liability** (Note 20) – (109,004)
Net retirement asset (liability) P=95,493 (P=109,004)
* Included in ‘Other assets’
** Included in ‘Accrued interest, taxes and other expenses’
Changes in the present value of the defined benefit obligations of the Group and the Parent as ofDecember 31, 2021 and 2020 are as follows:
Consolidated
2021 2020
Balance at January 1 P=609,646 P=512,964Sale of subsidiary (Note 7) – –Current service cost 72,798 60,898Interest cost 24,386 27,187Remeasurement losses (gains):
Actuarial gains arising from deviations of experiencefrom assumptions (37,526) (35,203)
Actuarial losses (gains) arising from changes infinancial assumptions (181,272) 86,634
Benefits paid (26,486) (42,834)Settlements – –
Balance at December 31 P=461,546 P=609,646
Changes in the fair value of the plan assets of the Group and Parent Company as of December 31,2021 and 2020 are as follows:
2021 2020
Balance at January 1 P=500,642 P=475,809Sale of subsidiary (Note 7) – –Contributions 77,158 62,867Interest income 20,026 25,218Return on plan assets (excluding interest income) (14,300) (20,418)Benefits paid (26,487) (42,834)
Balance at December 31 P=557,039 P=500,642

- 102 -
*SGVFS164641*
The fair values of plan assets by class of the Group and Parent Company as of December 31, 2021and 2020 are as follows:
2021 2020
Cash and cash equivalents P=41,000 P=139,193Debt instruments:
Philippine government 204,143 98,416Industrial 55,363 56,251Real estate 90,739 47,808Financial intermediaries 2,019 28,161Holding firms 16,238 24,977Power, electricity and water distribution 14,304 14,386Equity instruments:Real estate 41,490 27,198Holding firms 24,764 26,273Wholesale and retail trade 9,858 13,016Transport, storage and communication 15,576 11,824Financial intermediaries 12,524 9,398Power, electricity and water distribution 4,966 2,476Manufacturing 2,412 1,546Others 703 470
Other assets and liabilities 20,940 (751)
P=557,039 P=500,642
The Group’s plan assets are carried at fair value. All equity and debt instruments have quoted pricesin an active market. The fair values of other assets and liabilities, which include amounts due fromother banks, accrued interest and other receivables and trust fee payables, approximate their carryingamount due to the short-term nature of these accounts.
The plan assets are diversified investments and are not exposed to concentration risk.
The Group expects to contribute P=42.96 million to the defined retirement benefit plans in 2021.
The cost of defined benefit retirement plans, as well as the present value of the benefit obligations,are determined using actuarial valuations, which involve making various assumptions. The principalassumptions used are shown below:
Parent Company
2021 2020
Discount rate:At January 1 4.00% 5.30%At December 31 5.10% 4.00%
Salary increase rate 5.00% 7.00%Average remaining working life 13 13

- 103 -
*SGVFS164641*
The sensitivity analysis below has been determined based on reasonably possible changes of eachsignificant assumption of the Group and Parent Company as of December 31, 2021 and 2020,assuming all other assumptions were held constant. The sensitivity analysis may not berepresentative of an actual change in the defined benefit obligation as it is unlikely that changes inassumptions would occur in isolation from one another.
Increase (Decrease) in Defined
Benefit Obligation
2021 2020
Increase in discount rate of 0.50% (P=139,271) (P=73,280)Decrease in discount rate of 0.50% 43,972 148,157Increase in salary increase rate of 0.50% 47,563 144,931Decrease in salary increase rate of 0.50% (137,097) (75,783)
The amounts of defined benefit cost included in the statements of other comprehensive income as‘Remeasurement of retirement liability’, gross of tax, follow:
Consolidated Parent Company
2021 2020 2019 2021 2020 2019
Actuarial gain (loss) on benefitobligation P=218,798 (P=51,431) (P=114,109) P=218,798 (P=51,431) (P=114,109)
Return on plan assets (excludinginterest income) (14,300) (20,418) 2,604 (14,300) (20,418) 2,604
Remeasurement gains (loss) in OCI P=204,498 (P=71,849) (P=111,505) P=204,498 (P=71,849) (P=111,505)
The amounts of retirement cost included in the statements of income follow:
Consolidated Parent Company
2021 2020 2019 2021 2020 2019
Current service cost* P=72,798 P=60,898 P=42,968 P=72,798 P=60,898 P=42,968Net interest expense (Note 19) 4,360 1,969 (5,651) 4,360 1,969 (5,651)
Retirement cost P=77,158 P=62,867 P=37,317 P=77,158 P=62,867 P=37,317
*Included under ‘Compensation and fringe benefits’ in the statements of income
Shown below is the maturity profile of the undiscounted benefit payments of the Group and theParent Company as of December 31, 2021 and 2020:
Plan Year 2021 2020
Less than five years P=169,982 P=172,677More than five to ten years 309,796 343,479Ten years and above 2,193,537 3,383,230
P=2,673,315 P=3,899,386
Collective Bargaining Agreement (CBA)All of the Parent Company’s rank and file employees are covered by a CBA, the most recentnegotiation having been signed on December 28, 2021, with an effectivity period from January 1,2021 until December 31, 2022. There had been neither dispute nor occurrence of employees’ strikefor the past years.

- 104 -
*SGVFS164641*
Defined Contribution PlansParent CompanyThe Parent Company employs a provident fund scheme where the Parent Company and its coveredemployees shall contribute 11% and 5% of the employees’ basic monthly salary, respectively.Contributions are maintained under the Provident Fund account administered by the ParentCompany’s TWMG under the supervision of the Retirement/Provident Fund Board. As approved bythe Parent Company’s BOD on November 27, 2013, new officers hired after December 31, 2013,except those whose terms of employment have been negotiated prior to December 1, 2013, are nolonger eligible for inclusion in the Parent Company’s provident fund. The Parent Company’s BOD,in its meeting held on January 27, 2016, approved a change in vesting for the retirement fund from5 to 10 years effective for all new hires who sign up starting February 1, 2016.
Contributions paid and accrued by the Parent Company for both the Staff Provident Fund and theRetirement Fund recognized under ‘Compensation and fringe benefits’ in the statements of incomeamounted to P=103.84 million, P=91.28 million, and P=67.27 million in 2021, 2020 and 2019,respectively.
28. Long-term Leases
Group as a Lessee
As of December 31, 2021 and 2020, 84.04% and 81.72%, respectively of the Parent Company’sbranch sites are under lease arrangements. The lease contracts are for periods ranging from one tofive years and some are renewable at the Group’s option under certain terms and conditions. Variouslease contracts include escalation clauses, which bear an annual rent increase of 5.00% to10.00%. Asof December 31, 2021 and 2020, the Group has no contingent rent payable.
As of December 31, 2021 and 2020, the carrying amount of lease liabilities (included in ‘OtherLiabilities’ in Note 21) is P=252.50 million and P=239.74 million, respectively .
In 2021, 2020 and 2019, the Group and the Parent Company recognized interest expense on leaseliabilities (included in ‘Interest and Finance Charges’ in the Statements of Income) amounting toP=14.53 million, P=17.60 million, and P=18.71 million and rent expense from short-term leases andleases of low-value assets amounting to P=41.58 million, P=44.24 million, and P=55.90 million,respectively.
The Group’s and the Parent Company’s future minimum rentals payable under noncancellableoperating leases are as follows:
2021 2020
Within one year P=148,654 P=141,199Beyond one year but not more than five years 222,323 249,260
P=370,977 P=390,459
Group as a Lessor
The Parent Company has also entered into commercial property leases on its investment properties.These noncancellable leases have remaining noncancellable lease terms of between one to five years.The Parent Company recognized rent income, included under ‘Rent income’ in the statements of

- 105 -
*SGVFS164641*
income, amounting to P=484.93 million, P=655.92 million, and P=691.92 million, in 2021, 2020 and2019, respectively.
The Group’s and the Parent Company’s future minimum rentals receivable under noncancellableoperating leases follow:
2021 2020
Within one year P=376,557 P=678,275Beyond one year but not more than five years 489,398 3,798,817
P=865,955 P=4,477,092
29. Miscellaneous Income and Expenses
Miscellaneous income
Details of this account are as follows:Consolidated Parent Company
2021 2020 2019 2021 2020 2019
Rental charges P=70,299 P=112,721 P=108,171 P=70,299 P=112,721 P=108,171Loan charges 21,676 24,116 30,459 21,676 24,116 30,459Dividend income 3,344 9,585 3,335 3,344 9,585 3,335Loss on sale/exchange of other non-
financial assets – (3,014) (8,515) – (3,014) (8,515)Others 42,027 14,994 4,333 42,027 14,994 4,333
P=137,346 P=158,402 P=137,783 P=137,346 P=158,402 P=137,783
Miscellaneous expenses
Details of this account are as follows:Consolidated Parent Company
2021 2020 2019 2021 2020 2019
Litigation and assets acquired - relatedexpenses P=85,949 P=36,926 P=32,043 P=85,949 P=36,926 P=32,043
Information technology 77,757 81,861 83,892 77,757 81,861 83,892Fines, penalties and other charges 48,748 71,796 80,604 48,748 71,796 80,604Transaction dues 44,996 44,634 43,673 44,996 44,634 43,673Brokerage fees 27,979 38,191 37,760 27,979 38,191 37,760Stationery and supplies 18,153 13,064 13,506 18,153 13,064 13,506Fuel and lubricants 11,199 10,123 11,991 11,199 10,123 11,991Travel 10,093 12,094 5,485 10,093 12,094 5,485Freight 9,767 7,926 8,714 9,767 7,926 8,714Advertising 1,221 4,668 13,763 1,221 4,668 13,763Others 75,612 71,494 100,963 75,602 71,489 100,963
P=411,474 392,777 432,394 P=411,464 392,772 432,394
Others include account maintenance charges, contractual services, and Philippine Dealing ExchangeCorp. transaction fees.
30. Income and Other Taxes
Under Philippine tax laws, the RBU of the Parent Company and its subsidiary are subject topercentage and other taxes (presented as ‘Taxes and licenses’ in the statements of income), as well asincome taxes. Percentage and other taxes paid consist principally of gross receipts tax (GRT) andDST. Income taxes include corporate income tax, as discussed below, and final taxes paid, which

- 106 -
*SGVFS164641*
represents final withholding tax on gross interest income from government securities and otherdeposit substitutes and income from FCDU transactions. These income taxes, as well as the deferredtax benefits and provisions, are presented as ‘Provision for income tax’ in the statements of income.
RA No. 9397, An Act Amending National Internal Revenue Code, provides that the RCIT rate shall be30.00% and the interest expense allowed as a deductible expense shall be reduced by 33.00% ofinterest income subjected to final tax.
An MCIT of 2.00% of modified gross income is computed and compared with the RCIT. Any excessof MCIT over the RCIT is deferred and can be used as a tax credit against future income tax liabilityfor the next three years. In addition, NOLCO is allowed as a deduction from taxable income in thenext three years from the period of incurrence.
FCDU offshore income (income from non-residents) is tax-exempt while gross onshore income(income from residents) is generally subject to 10.00% gross income tax. In addition, interest incomeon deposit placements with other FCDUs and offshore banking units is subject to a 15.00%.. RA No.9294, An Act Restoring the Tax Exemption of Offshore Banking Units (OBUs) and FCDUs, providesthat the income derived by the FCDU from foreign currency transactions with non-residents, OBUs,local commercial banks including branches of foreign banks is tax-exempt while interest income onforeign currency loans from residents other than OBUs or other depository banks under the expandedsystem is subject to 10.00% income tax.
President Rodrigo Duterte signed into law on March 26, 2021 the Corporate Recovery and TaxIncentives for Enterprises (CREATE) Act to attract more investments and maintain fiscal prudenceand stability in the Philippines. Republic Act (RA) 11534 or the CREATE Act introduces reforms tothe corporate income tax and incentives systems. It took effect 15 days after its complete publicationin the Official Gazette or in a newspaper of general circulation or April 11, 2021.
The following are the key changes to the Philippine tax law pursuant to the CREATE Act which havean impact on the Group:
• Effective July 1, 2020, regular corporate income tax (RCIT) rate is reduced from 30% to 25% fordomestic and resident foreign corporations.
• Minimum corporate income tax (MCIT) rate reduced from 2% to 1% of gross income effectiveJuly 1, 2020 to June 30, 2023.
• Effective January 1, 2021, income tax rate for nonresident foreign corporation is reduced from30% to 25%.
• Income tax arbitrage rate reduced from 33% to 20% of interest income subject to final taxeffective July 1, 2020
As clarified by the Philippine Financial Reporting Standards Council in its Philippine InterpretationsCommittee Q&A No. 2020-07, the CREATE Act was not considered substantively enacted as ofDecember 31, 2020 even though some of the provisions have retroactive effect to July 1, 2020.The passage of the CREATE Act into law on March 26, 2011 is considered as a non-adjustingsubsequent event. Accordingly, current and deferred taxes as of and for the year endedDecember 31, 2020 continued to be computed and measured using the applicable income tax rates asof December 31, 2020 (i.e., 30% RCIT / 2% MCIT) for financial reporting purposes.

- 107 -
*SGVFS164641*
Applying the provisions of the CREATE Act, the Group would have been subjected to lower regularcorporate income tax rate of 25% effective July 1, 2020.
Based on the provisions of Revenue Memorandum Circular No. 50-2021 dated April 5, 2021 issuedby the BIR, the prorated RCIT rate of the Group for 2020 is 27.50%.
This resulted in lower provision for current income tax for the year ended December 31, 2020amounting to P=190.70 million, or a reduction of P=27.25 million. The reduced amount was reflected inthe Group’s 2020 annual income tax return but for financial reporting purposes, the changes isrecognized in the 2021 financial statements.
Further, this resulted in lower deferred tax assets as of December 31, 2020 and provision for deferredtax for the year then ended by P=30.08 million. These reductions are recognized in the 2021 financialstatements.
Provision for income tax consists of:
Consolidated and Parent Company
2021 2020 2019
Current:RCIT P=364,115 P=217,947 P=70,626Final 107,296 144,040 159,002
471,411 361,987 229,628Deferred (214,785) (131,864) (27,237)
P=256,626 P=230,123 P=202,391
The Group’s and Parent Company’s components of deferred tax assets and liabilities follow:
2021 2020
Deferred tax assets:
Allowance for ECL and impairment losses P=669,175 P=635,159Retirement liability – 32,700Accumulated Depreciation-ROPA 50,088 –Lease liability 63,126 65,119Advance rental 51,603 15,335Unamortized past service cost 9,667 6,819Excess of MCIT over RCIT – –
P=843,659 P=755,132
Deferred tax liabilities:
Revaluation increment credited to surplus free P=333,316 P=399,979Branch licenses acquired from business
combinations 65,650 78,780Right-of-use assets 60,161 65,119Retirement asset 23,874 –Unrealized gain on equity securities carried at
FVTOCI 11,016 9,869Gain on foreclosure of foreclosed of properties 21,904 25,438Unrealized foreign exchange gain 2,124 5,339
518,045 584,524
Net deferred tax assets P=325,614 P=170,608
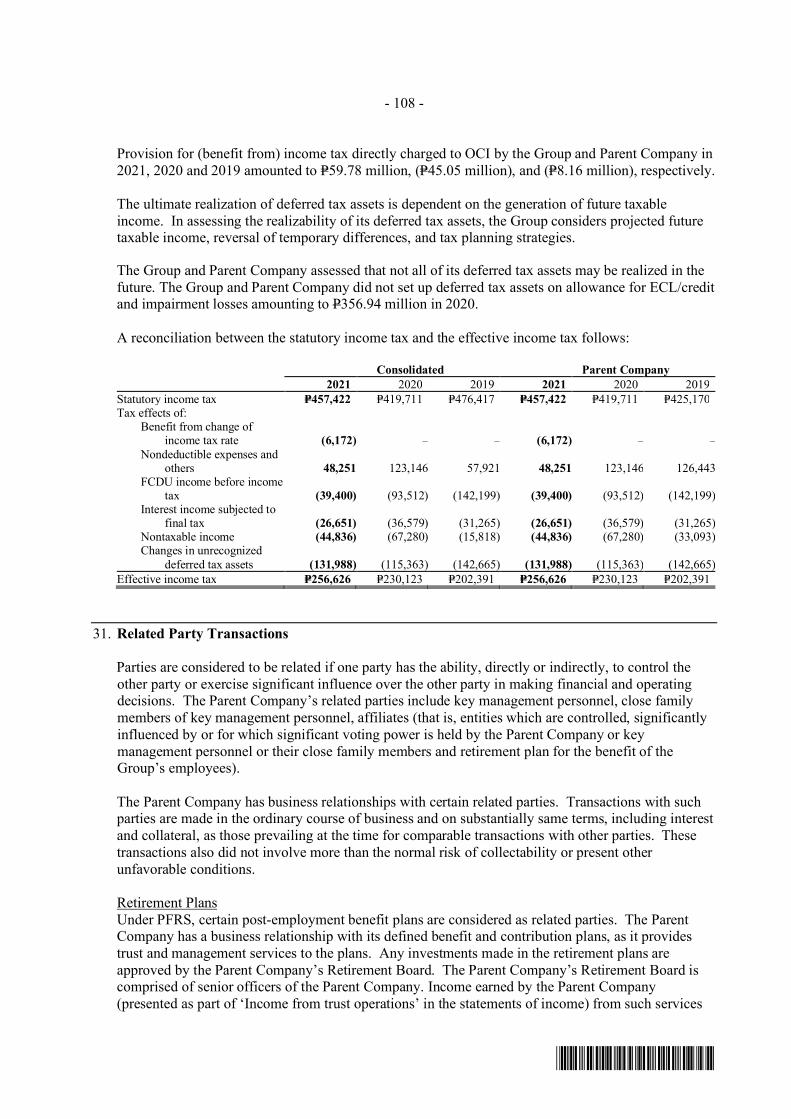
- 108 -
*SGVFS164641*
Provision for (benefit from) income tax directly charged to OCI by the Group and Parent Company in2021, 2020 and 2019 amounted to P=59.78 million, (P=45.05 million), and (P=8.16 million), respectively.
The ultimate realization of deferred tax assets is dependent on the generation of future taxableincome. In assessing the realizability of its deferred tax assets, the Group considers projected futuretaxable income, reversal of temporary differences, and tax planning strategies.
The Group and Parent Company assessed that not all of its deferred tax assets may be realized in thefuture. The Group and Parent Company did not set up deferred tax assets on allowance for ECL/creditand impairment losses amounting to P356.94 million in 2020.
A reconciliation between the statutory income tax and the effective income tax follows:
Consolidated Parent Company
2021 2020 2019 2021 2020 2019
Statutory income tax P=457,422 P=419,711 P=476,417 P=457,422 P=419,711 P=425,170Tax effects of:
Benefit from change ofincome tax rate (6,172) − − (6,172) − −
Nondeductible expenses andothers 48,251 123,146 57,921 48,251 123,146 126,443
FCDU income before incometax (39,400) (93,512) (142,199) (39,400) (93,512) (142,199)
Interest income subjected tofinal tax (26,651) (36,579) (31,265) (26,651) (36,579) (31,265)
Nontaxable income (44,836) (67,280) (15,818) (44,836) (67,280) (33,093)Changes in unrecognized
deferred tax assets (131,988) (115,363) (142,665) (131,988) (115,363) (142,665)
Effective income tax P=256,626 P=230,123 P=202,391 P=256,626 P=230,123 P=202,391
31. Related Party Transactions
Parties are considered to be related if one party has the ability, directly or indirectly, to control theother party or exercise significant influence over the other party in making financial and operatingdecisions. The Parent Company’s related parties include key management personnel, close familymembers of key management personnel, affiliates (that is, entities which are controlled, significantlyinfluenced by or for which significant voting power is held by the Parent Company or keymanagement personnel or their close family members and retirement plan for the benefit of theGroup’s employees).
The Parent Company has business relationships with certain related parties. Transactions with suchparties are made in the ordinary course of business and on substantially same terms, including interestand collateral, as those prevailing at the time for comparable transactions with other parties. Thesetransactions also did not involve more than the normal risk of collectability or present otherunfavorable conditions.
Retirement PlansUnder PFRS, certain post-employment benefit plans are considered as related parties. The ParentCompany has a business relationship with its defined benefit and contribution plans, as it providestrust and management services to the plans. Any investments made in the retirement plans areapproved by the Parent Company’s Retirement Board. The Parent Company’s Retirement Board iscomprised of senior officers of the Parent Company. Income earned by the Parent Company(presented as part of ‘Income from trust operations’ in the statements of income) from such services
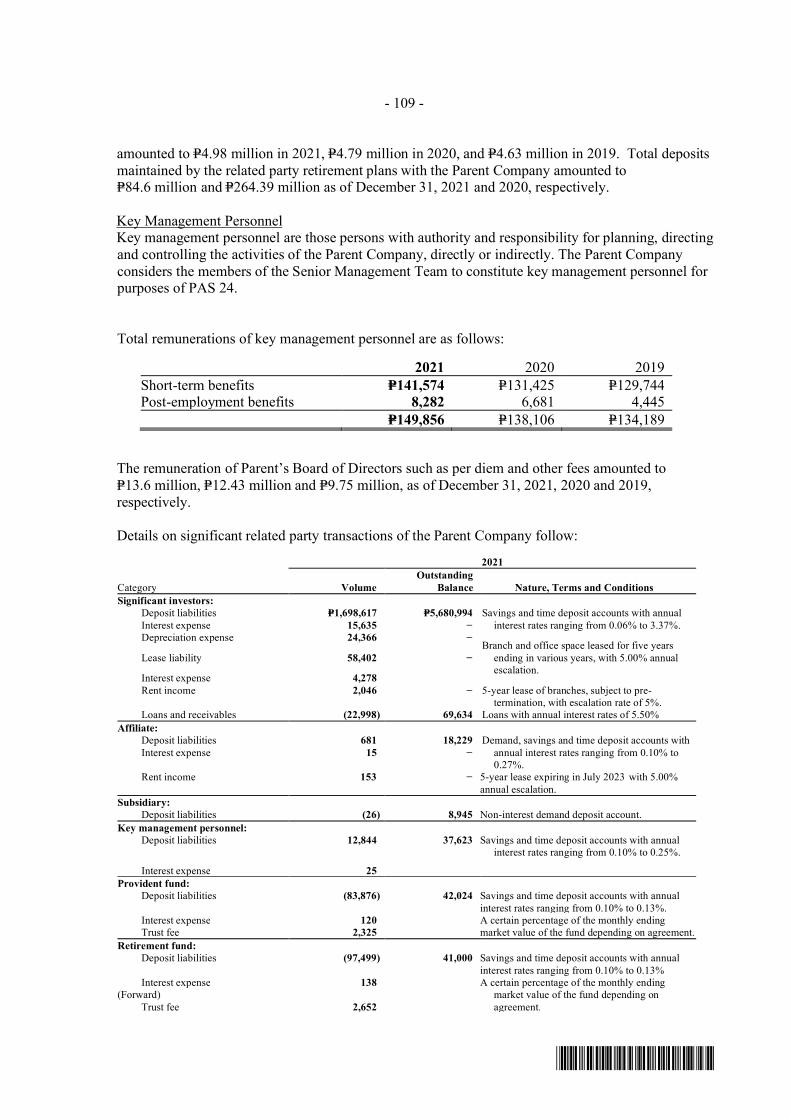
- 109 -
*SGVFS164641*
amounted to P=4.98 million in 2021, P=4.79 million in 2020, and P=4.63 million in 2019. Total depositsmaintained by the related party retirement plans with the Parent Company amounted toP=84.6 million and P=264.39 million as of December 31, 2021 and 2020, respectively.
Key Management PersonnelKey management personnel are those persons with authority and responsibility for planning, directingand controlling the activities of the Parent Company, directly or indirectly. The Parent Companyconsiders the members of the Senior Management Team to constitute key management personnel forpurposes of PAS 24.
Total remunerations of key management personnel are as follows:
2021 2020 2019
Short-term benefits P=141,574 P=131,425 P=129,744Post-employment benefits 8,282 6,681 4,445
P=149,856 P=138,106 P=134,189
The remuneration of Parent’s Board of Directors such as per diem and other fees amounted toP=13.6 million, P=12.43 million and P=9.75 million, as of December 31, 2021, 2020 and 2019,respectively.
Details on significant related party transactions of the Parent Company follow:
2021
Category Volume
Outstanding
Balance Nature, Terms and Conditions
Significant investors:
Deposit liabilities P=1,698,617 P=5,680,994 Savings and time deposit accounts with annual
interest rates ranging from 0.06% to 3.37%.Interest expense 15,635 −Depreciation expense 24,366 −
Branch and office space leased for five years
ending in various years, with 5.00% annualescalation.
Lease liability 58,402 −
Interest expense 4,278
Rent income 2,046 − 5-year lease of branches, subject to pre-termination, with escalation rate of 5%.
Loans and receivables (22,998) 69,634 Loans with annual interest rates of 5.50%
Affiliate:
Deposit liabilities 681 18,229 Demand, savings and time deposit accounts with
annual interest rates ranging from 0.10% to0.27%.
Interest expense 15 −
Rent income 153 − 5-year lease expiring in July 2023 with 5.00%
annual escalation.
Subsidiary:
Deposit liabilities (26) 8,945 Non-interest demand deposit account.
Key management personnel:
Deposit liabilities 12,844 37,623 Savings and time deposit accounts with annualinterest rates ranging from 0.10% to 0.25%.
Interest expense 25
Provident fund:
Deposit liabilities (83,876) 42,024 Savings and time deposit accounts with annual
interest rates ranging from 0.10% to 0.13%.Interest expense 120 A certain percentage of the monthly ending
market value of the fund depending on agreement.Trust fee 2,325
Retirement fund:
Deposit liabilities (97,499) 41,000 Savings and time deposit accounts with annual
interest rates ranging from 0.10% to 0.13%Interest expense 138 A certain percentage of the monthly ending
market value of the fund depending on
agreement.
(Forward)
Trust fee 2,652

- 110 -
*SGVFS164641*
2020
Category Volume
Outstanding
Balance Nature, Terms and Conditions
Significant investors:Deposit liabilities (P=4,406,238) P=3,982,377 Savings and time deposit accounts with annual
interest rates ranging from 0.06% to 3%.Interest expense 26,676 −Depreciation expense 22,559 −
Branch and office space leased for five years
ending in various years, with 5.00% annualescalation.
Lease liability (6,634) −
Interest expense 5,649
Rent income 4,064 − 5-year lease of branches, subject to pre-termination, with escalation rate of 5%.
Loans and receivables 12,843 92,632 Loans with annual interest rates ranging from
5.80% to 8.00%
Affiliate:
Deposit liabilities 2,985 17,548 Demand, savings and time deposit accounts withannual interest rates ranging from 0.10% to0.50%.
Interest expense 172 −
Rent income 157 − 5-year lease expiring in July 2023 with 5.00%annual escalation.
Subsidiary:
Deposit liabilities (5,574) 8,971 Non-interest demand deposit account.
Key management personnel:Deposit liabilities 8,240 24,779 Savings and time deposit accounts with annual
interest rates ranging from 0.10% to 2.63%.
Interest expense 66
Provident fund:
Deposit liabilities 120,691 125,900 Savings and time deposit accounts with annualinterest rates ranging from 0.10% to 0.50%.
Interest expense 256 A certain percentage of the monthly ending
market value of the fund depending on agreement.Trust fee 2,348
Retirement fund:
Deposit liabilities 137,558 138,499 Savings and time deposit accounts with annualinterest rates ranging from 0.10% to 0.50%
Interest expense 271 A certain percentage of the monthly ending
market value of the fund depending onagreement.
Trust fee 2,443
2019
Category VolumeOutstanding
Balance Nature, Terms and Conditions
Significant investors:Deposit liabilities P=3,195,068 P=8,388,615 Savings and time deposit accounts with annual
interest rates ranging from 0.10% to 6.50%.Interest expense 88,353 −Depreciation expense 20,365 −
Branch and office space leased for five years
ending in various years, with 5.00% annualescalation.
Lease Liability 78,258 78,258
Interest expense 4,774
Rent income 3,946 − 5-year lease of branches, subject to pre-termination, with escalation rate of 5%.
Loans and receivables 41,943 79,789 Loans with annual interest rates ranging from
7.25% to 8.00%
Affiliate:
Deposit liabilities 240 14,563 Demand, savings and time deposit accounts withannual interest rates ranging from 0.10% to3.00%.
Interest expense 435 −
Rent income 149 − 5-year lease expiring in July 2023 with 5.00%annual escalation.
(Forward)
Subsidiaries:Deposit liabilities (1,265) 14,545 Demand and savings deposit accounts with annual
interest rates ranging of 0.10% to 0.13%.Rent income 27 − 3-year lease expiring in May 2020 with 7.50%
and 10.00% annual escalation on second and
third year, respectively.

- 111 -
*SGVFS164641*
2019
Category VolumeOutstanding
Balance Nature, Terms and Conditions
Key management personnel:
Deposit liabilities (9,883) 16,539 Savings and time deposit accounts with annualinterest rates ranging from 0.10% to 3.00%.Interest expense 453 −
Provident fund:
Deposit liabilities (15,818) 5,209 Savings and time deposit accounts with annualinterest rates ranging from 0.10% to 1.25%.Interest expense 583 −
Trust fee P=2,267 P=− A certain percentage of the monthly ending
market value of the fund depending onagreement.
Retirement fund:Deposit liabilities (29,435) 941 Savings and time deposit accounts with annual
interest rates ranging from 0.10%Interest expense 580 −Trust fee 2,364 − A certain percentage of the monthly ending
market value of the fund depending onagreement.
32. Earnings Per Share
Basic EPS amounts are calculated by dividing the net income for the year by the weighted averagenumber of common shares outstanding during the year.
The following reflects the income and share data used in the basic and diluted earnings per sharecomputations:
2021 2020 2019
Net income attributable to equityholdersof the Parent Company P=1,573,064 P=1,168,912 P=1,157,257
Weighted average number ofcommon
shares outstanding 480,645 480,645 480,645
Basic/diluted earnings per share P=3.27 P=2.43 P=2.41
As of December 31, 2021, 2020 and 2019, there are no outstanding dilutive potential common shares.

- 112 -
*SGVFS164641*
33. Notes to Statements of Cash Flows
The amounts of interbank loans receivable and SPURA considered as cash and cash equivalents ofthe Group and Parent as of December 31, 2021, 2020 and 2019 follow:
2021 2020 2019
Interbank loans receivable andSPURA shown understatements of cash flows P=724,957 P=2,151,502 P=717,736
Interbank loans receivable andSPURA not considered ascash and cash equivalents 3,470,889 3,902,952 –
P=4,195,846 P=6,054,454 P=717,736
The following is a summary of noncash activities:
2021 2020 2019
Noncash operating activities:Additions to investment
properties from settlement ofloans (Note 14) P=313,805 P=63,969 P=210,003
Additions to chattel mortgagefrom settlement of loans(Note 16) 33,970 58,211 112,024
Noncash investing activities:Transfer to property and
equipment from investmentproperties (Notes 13 and 14) – – (53,494)
Transfer to investment propertiesfrom property and equipment(Notes 13 and 14) – – 53,494
Transfer to property andequipment from other assets(Notes 13 and 16) 3,171 5,247 6,619
Transfer to other assets fromproperty and equipment(Notes 13 and 16) (3,171) (5,247) (6,619)
Unrealized gain (loss) onfinancial assets at FVOCI 46,584 (12,161) 68,516
The changes in liabilities arising from the financing activities of the Group and Parent Company in2021, 2020 and 2019 are as follows:
January 1,
2021
Cash
Flows
Foreign
Exchange
Movement
December 31,
2021
Bills payable (Note 19) P=2,182,844 P=3,760,625 P=67,519 P=6,010,988
Outstanding acceptances 497,813 (441,444) 15,240 71,609
Marginal deposits* 6,773 (6,773) – –
Total liabilities from financing activities P=2,687,430 P=3,312,408 P=82,759 P=6,082,597
* Included in ‘Other liabilities’

- 113 -
*SGVFS164641*
January 1,2020
CashFlows
ForeignExchange
MovementDecember 31,
2020
Bills payable (Note 19) P=13,064,824 (P=10,879,934) (P=2,046) P=2,182,844Outstanding acceptances 91,855 417,210 (11,252) 497,813Marginal deposits* 34,348 (27,575) – 6,773
Total liabilities from financing activities P=13,191,027 (P=10,490,299) (P=13,298) P=2,687,430
* Included in ‘Other liabilities’
January 1,2019
CashFlows
Derecognitionof Subsidiary
ForeignExchangeMovement
December 31,2019
Bills payable (Note 19) P=17,659,043 (P=4,537,163) (P=67,758) P=10,702 P=13,064,824Outstanding acceptances 46,344 50,412 – (4,901) 91,855Marginal deposits* 304 34,044 – – 34,348
Total liabilities from financing activities P=17,705,691 (P=4,452,707) (P=67,758) P=5,801 P=13,191,027
* Included in ‘Other liabilities’
34. Offsetting of Financial Assets and Liabilities
The amendments to PFRS 7 require the Group to disclose information about rights of offset and relatedarrangements (such as collateral posting requirements) for financial instruments under an enforceablemaster netting agreements or similar arrangements. The effects of these arrangements are disclosed inthe succeeding table (amounts in thousands). None of the bills payable as of December 31, 2020 aresecured by collateral.
December 31, 2021
Financial instruments
recognized at
end of reporting
period by type
Gross carrying
amounts (before
offsetting)
Gross amounts
offset in
accordance with
the offsetting
criteria
Net amount
presented in
statements of
financial
position
[a−b]
Effects of remaining rights of
set−off (including rights to set
off financial collateral) that
do not meet PAS 32 offsetting
criteria
Net exposure
[c−d]
Financial
instruments
Fair value of
financial
collateral
[a] [b] [c] [d] [e]
Financial liabilities
Bills payable P=6,010,988 P=− P=6,010,988 P=6,026,758 P=6,051,439 P=−
The amounts disclosed in column (d) include those rights to set – off amounts that are onlyenforceable and exercisable in the event of default, insolvency or bankruptcy. These include amountsrelated to financial collateral both received and pledged, whether cash or non – cash collateral,excluding the extent of over - collateralization.
35. Approval for Release of the Financial Statements
The financial statements were authorized for issue by the BOD of the Parent Company onApril 27, 2022.

- 114 -
*SGVFS164641*
36. Standards Issued but not yet Effective
Pronouncements issued but not yet effective are listed below. The Group intends to adopt thefollowing pronouncements when they become effective. The adoption of these pronouncements isnot expected to have a significant impact on the Group’s financial statements unless otherwiseindicated.
Effective beginning on or after January 1, 2022
Amendments to PFRS 3, Reference to the Conceptual Framework
The amendments are intended to replace a reference to the Framework for the Preparation andPresentation of Financial Statements, issued in 1989, with a reference to the ConceptualFramework for Financial Reporting issued in March 2018 without significantly changing itsrequirements. The amendments added an exception to the recognition principle of PFRS 3,Business Combinations to avoid the issue of potential ‘day 2’gains or losses arising for liabilitiesand contingent liabilities that would be within the scope of PAS 37, Provisions, Contingent
Liabilities and Contingent Assets or Philippine-IFRIC 21, Levies, if incurred separately.
At the same time, the amendments add a new paragraph to PFRS 3 to clarify that contingentassets do not qualify for recognition at the acquisition date.
The amendments are effective for annual reporting periods beginning on or after January 1, 2022and apply prospectively.
Amendments to PAS 16, Plant and Equipment: Proceeds before Intended Use
The amendments prohibit entities deducting from the cost of an item of property, plant andequipment, any proceeds from selling items produced while bringing that asset to the location andcondition necessary for it to be capable of operating in the manner intended by management.Instead, an entity recognizes the proceeds from selling such items, and the costs of producingthose items, in profit or loss.
The amendment is effective for annual reporting periods beginning on or after January 1, 2022and must be applied retrospectively to items of property, plant and equipment made available foruse on or after the beginning of the earliest period presented when the entity first applies theamendment.
Amendments to PAS 37, Onerous Contracts – Costs of Fulfilling a Contract
The amendments specify which costs an entity needs to include when assessing whether acontract is onerous or loss-making. The amendments apply a “directly related cost approach”.The costs that relate directly to a contract to provide goods or services include both incrementalcosts and an allocation of costs directly related to contract activities. General and administrativecosts do not relate directly to a contract and are excluded unless they are explicitly chargeable tothe counterparty under the contract.
The amendments are effective for annual reporting periods beginning on or after January 1, 2022.The Group will apply these amendments to contracts for which it has not yet fulfilled all itsobligations at the beginning of the annual reporting period in which it first applies theamendments.

- 115 -
*SGVFS164641*
Annual Improvements to PFRSs 2018-2020 Cycle
Amendments to PFRS 1, First-time Adoption of Philippines Financial Reporting Standards,
Subsidiary as a first-time adopterThe amendment permits a subsidiary that elects to apply paragraph D16(a) of PFRS 1 tomeasure cumulative translation differences using the amounts reported by the parent, basedon the parent’s date of transition to PFRS. This amendment is also applied to an associate orjoint venture that elects to apply paragraph D16(a) of PFRS 1.
The amendment is effective for annual reporting periods beginning on or afterJanuary 1, 2022 with earlier adoption permitted.
Amendments to PFRS 9, Financial Instruments, Fees in the ’10 per cent’ test forderecognition of financial liabilities
The amendment clarifies the fees that an entity includes when assessing whether the terms ofa new or modified financial liability are substantially different from the terms of the originalfinancial liability. These fees include only those paid or received between the borrower andthe lender, including fees paid or received by either the borrower or lender on the other’sbehalf. An entity applies the amendment to financial liabilities that are modified orexchanged on or after the beginning of the annual reporting period in which the entity firstapplies the amendment.
The amendment is effective for annual reporting periods beginning on or afterJanuary 1, 2022 with earlier adoption permitted. The Group will apply the amendments tofinancial liabilities that are modified or exchanged on or after the beginning of the annualreporting period in which the entity first applies the amendment.
Amendments to PAS 41, Agriculture, Taxation in fair value measurements
The amendment removes the requirement in paragraph 22 of PAS 41 that entities excludecash flows for taxation when measuring the fair value of assets within the scope ofPAS 41.
An entity applies the amendment prospectively to fair value measurements on or after thebeginning of the first annual reporting period beginning on or after January 1, 2022 withearlier adoption permitted.
Effective beginning on or after January 1, 2023
Amendments to PAS 12, Deferred Tax related to Assets and Liabilities arising from a Single
Transaction
The amendments narrow the scope of the initial recognition exception under PAS 12, so that it nolonger applies to transactions that give rise to equal taxable and deductible temporary differences.
The amendments also clarify that where payments that settle a liability are deductible for taxpurposes, it is a matter of judgement (having considered the applicable tax law) whether suchdeductions are attributable for tax purposes to the liability recognized in the financial statements(and interest expense) or to the related asset component (and interest expense).

- 116 -
*SGVFS164641*
An entity applies the amendments to transactions that occur on or after the beginning of theearliest comparative period presented for annual reporting periods on or afterJanuary 1, 2023.
Amendments to PAS 8, Definition of Accounting Estimates
The amendments introduce a new definition of accounting estimates and clarify the distinctionbetween changes in accounting estimates and changes in accounting policies and the correction oferrors. Also, the amendments clarify that the effects on an accounting estimate of a change in aninput or a change in a measurement technique are changes in accounting estimates if they do notresult from the correction of prior period errors.
An entity applies the amendments to changes in accounting policies and changes in accountingestimates that occur on or after January 1, 2023 with earlier adoption permitted. The amendmentsare not expected to have a material impact on the Group.
Amendments to PAS 1 and PFRS Practice Statement 2, Disclosure of Accounting Policies
The amendments provide guidance and examples to help entities apply materiality judgements toaccounting policy disclosures. The amendments aim to help entities provide accounting policydisclosures that are more useful by:
o Replacing the requirement for entities to disclose their ‘significant’ accounting policies with arequirement to disclose their ‘material’ accounting policies, and
o Adding guidance on how entities apply the concept of materiality in making decisions aboutaccounting policy disclosures
The amendments to the Practice Statement provide non-mandatory guidance. Meanwhile, theamendments to PAS 1 are effective for annual periods beginning on or after January 1, 2023.Early application is permitted as long as this fact is disclosed. The amendments are not expectedto have a material impact on the Group.
Effective beginning on or after January 1, 2024
Amendments to PAS 1, Classification of Liabilities as Current or Non-currentThe amendments clarify paragraphs 69 to 76 of PAS 1, Presentation of Financial Statements, tospecify the requirements for classifying liabilities as current or non-current. The amendmentsclarify:
What is meant by a right to defer settlement;
That a right to defer must exist at the end of the reporting period;
That classification is unaffected by the likelihood that an entity will exercise its deferral right;and
That only if an embedded derivative in a convertible liability is itself an equity instrumentwould the terms of a liability not impact its classification.
The amendments are effective for annual reporting periods beginning on or after January 1, 2023and must be applied retrospectively. However, in November 2021, the International AccountingStandards Board (IASB) tentatively decided to defer the effective date to no earlier thanJanuary 1, 2024.

- 117 -
*SGVFS164641*
Effective beginning on or after January 1, 2025
PFRS 17, Insurance Contracts
PFRS 17 is a comprehensive new accounting standard for insurance contracts coveringrecognition and measurement, presentation and disclosure. Once effective, PFRS 17 will replacePFRS 4, Insurance Contracts. This new standard on insurance contracts applies to all types ofinsurance contracts (i.e., life, non-life, direct insurance and re-insurance), regardless of the type ofentities that issue them, as well as to certain guarantees and financial instruments withdiscretionary participation features. A few scope exceptions will apply.
The overall objective of PFRS 17 is to provide an accounting model for insurance contracts thatis more useful and consistent for insurers. In contrast to the requirements in PFRS 4, which arelargely based on grandfathering previous local accounting policies, PFRS 17 provides acomprehensive model for insurance contracts, covering all relevant accounting aspects. The coreof PFRS 17 is the general model, supplemented by:
A specific adaptation for contracts with direct participation features (the variable feeapproach)
A simplified approach (the premium allocation approach) mainly for short-duration contracts
On December 15, 2021, the FRSC amended the mandatory effective date of PFRS 17 fromJanuary 1, 2023 to January 1, 2025. This is consistent with Circular Letter No. 2020-62 issued bythe Insurance Commission which deferred the implementation of PFRS 17 by two (2) years afterits effective date as decided by the IASB.
PFRS 17 is effective for reporting periods beginning on or after January 1, 2025, with omparativefigures required. Early application is permitted.
37. Report on the Supplementary Information Required Under BSP Circular No. 1074
On February 7, 2020, the BSP issued Circular No. 1074 which amends certain provisions ofSection 174 of the Manual of Regulations for Banks relating to the audited financial statements. Italso required banks to disclose the following supplementary information in the financial statements:
Basic quantitative indicators of financial performance
The following basic ratios measure the financial performance of the Group and the Parent Company:
Consolidated Parent Company
2021 2020 2019 2021 2020 2019
Return on average equity(a/b) 11.78% 9.79% 10.68% 11.78% 9.79% 10.67%
a) Net income 1,573,064 1,168,912 1,157,257 1,573,064 1,168,912 1,157,257b) Average total equity 13,352,748 11,942,440 10,840,557 13,352,748 11,942,440 10,845,255
Return on average assets(a/c) 1.49% 1.15% 1.12% 1.49% 1.15% 1.13%
c ) Average total assets 105,229,769 101,985,361 103,244,912 105,237,325 101,992,873 102,307,438
Net interest margin (d/e) 4.83% 4.64% 3.85% 4.83% 4.64% 3.90%
d) Net interest income 4,244,780 3,925,494 3,205,033 4,244,780 3,925,494 3,205,033e) Average interest earning
assets 87,820,774 84,668,912 83,216,561 87,823,602 84,671,645 82,213,352

- 118 -
*SGVFS164641*
Description of Capital Instruments IssuedAs of December 31, 2021 and 2020, the Parent Company has outstanding capital stock shown below:
Shares Amount
2021 2020 2021 2020
Common - P=25 par value
Authorized 760,000 760,000
Issued and outstanding 480,645 480,645 P=12,016,129 P=12,016,129
Significant Credit Exposures as to Industry SectorThe information of the Group and Parent Company on the concentration of credit as to industrybefore taking into account the allowance for ECL follows:
2021 2020
Amount % Amount %
Wholesale and retail trade, repair ofmotor vehicles, motorcycles P=16,838,594 26.03 P=15,351,359 26.29
Real estate activities 14,509,091 22.43 12,648,584 21.66Manufacturing 14,427,907 22.31 12,478,425 21.37Electric, gas, steam and air-conditioning
supply 3,784,547 5.85 3,471,471 5.94Construction 3,373,605 5.22 3,699,796 6.34Accommodation and food service
activities 2,426,168 3.75 2,701,351 4.63Financial and insurance activities 2,144,958 3.32 1,998,754 3.42Transportation and storage 1,984,339 3.07 1,375,109 2.35Agriculture, forestry and fishing 1,360,235 2.10 1,420,167 2.43Other service activities 1,306,726 2.02 479,441 0.82Human health and social work activities 1,260,617 1.95 1,149,146 1.97Loans to individuals Primarily for
Personal Use purposes 554,014 0.86 933,090 1.60Mining and quarrying 167,562 0.26 132,348 0.23Activities of households as employers
and undifferentiated goods andservices-producing activities ofhouseholds for own use 161,709 0.25 183,280 0.31
Education 72,292 0.11 87,338 0.15Others 308,546 0.48 283,940 0.49
P=64,680,910 100.00 P=58,393,599 100.00
Breakdown of Total Loans as to SecurityThe information (gross of unearned discounts and capitalized interest) of the Group and ParentCompany relating to receivables from customers as to secured and unsecured and as to collateralfollows:
2021 2020
Amount % Amount %
Loans secured by:Real estate P=21,590,618 33.36 P=17,751,671 30.37Chattel 930,246 1.44 1,025,674 1.75Deposit hold-out 1,176,120 1.82 932,830 1.60Securities and others 4,873,531 7.53 4,844,451 8.29
Secured 28,570,515 44.15 24,554,626 42.01Unsecured loans 36,155,151 55.86 33,890,229 57.99
P=64,725,666 100.00 P=58,444,855 100.00

- 119 -
*SGVFS164641*
Breakdown of Total Loans as to StatusThe table below shows the status of the Group and the Parent Company’s loans (gross of unearneddiscounts and capitalized interest) as to performing and non-performing loans (NPL) per product lineas adjusted.
2021 2020
Performing NPL Total Performing NPL Total
Corporate loans P=57,730,355 P=2,547,391 P=60,277,746 P=50,036,262 P=2,728,009 P= 52,764,271
Consumer loansHome 3,077,456 559,207 3,636,663 3,947,017 526,532 4,473,549Auto 470,747 127,359 598,106 587,383 184,539 771,922
Personal 114,985 98,166 213,151 319,254 115,859 435,113
P=61,393,543 P=3,332,123 P=64,725,666 P=54,889,916 P=3,554,939 P=58,444,855
The Parent Company has also applied for the following reliefs with BSP for prudential reporting:
Temporary regulatory relief granted by the Bangko Sentral ng Pilipinas on the classification ofPast Due Loans and Non-Performing Loans, as indicated under BSP memorandums M-2020-008M-2020-032, and M-2020-087, due to the effects of the COVID-19 Pandemic on the loanportfolio of Banks. Subject to reporting to the BSP, eligible loans are those loans in affectedareas that should have been reclassified as past due, including those loans becoming past due ornonperforming six (6) months thereafter. The exclusion shall be allowed from March 8, 2020until December 31, 2020.
Lenders were allowed to renegotiate terms of existing loan agreements via restructuring,extension of maturities, and moratorium on payments/amortizations among others on a case-to-case basis depending on financial status, cash flow, and security position.
In accordance with BSP Circular No. 941, Amendments to the Regulations on Past Due and Non-
Performing Loans, loans, investments, receivables, or any financial asset shall be considered non-performing, even without any missed contractual payments, if it satisfies the following conditions:a. It is considered impaired under existing accounting standards;b. It is classified as doubtful or loss;c. It is under litigation; andd. There is evidence that full repayment of principal and interest is unlikely without foreclosure of
collateral, if any.
All other loans, even if not considered impaired, shall be considered non-performing if any principaland/or interest are unpaid for more than 90 days from contractual due date, or accrued interests formore than 90 days have been capitalized, refinanced, or delayed by agreement.
Non-performing loans, investments, receivables, or any financial asset (and/or any replacement loan)shall remain classified as such until:a. There is sufficient evidence to support that full collection of principal and interests is probable and
at least six consecutive payments of the required amortization of principal and/or interest arereceived; or
b. Written-off.
As of December 31, 2021 and 2020, based on the definition of NPLs under MORB Section X306.2,NPLs of P=3.33 billion for 2021 and P=3.55 billion for 2020, gross of specific allowance amounting toP=1.90 billion and P=1.78 billion, respectively. Gross and net NPL ratios (inclusive of RRP) of theGroup are 4.89% and 2.10% for 2021, respectively, and 5.71% and 2.86% for 2020, respectively.
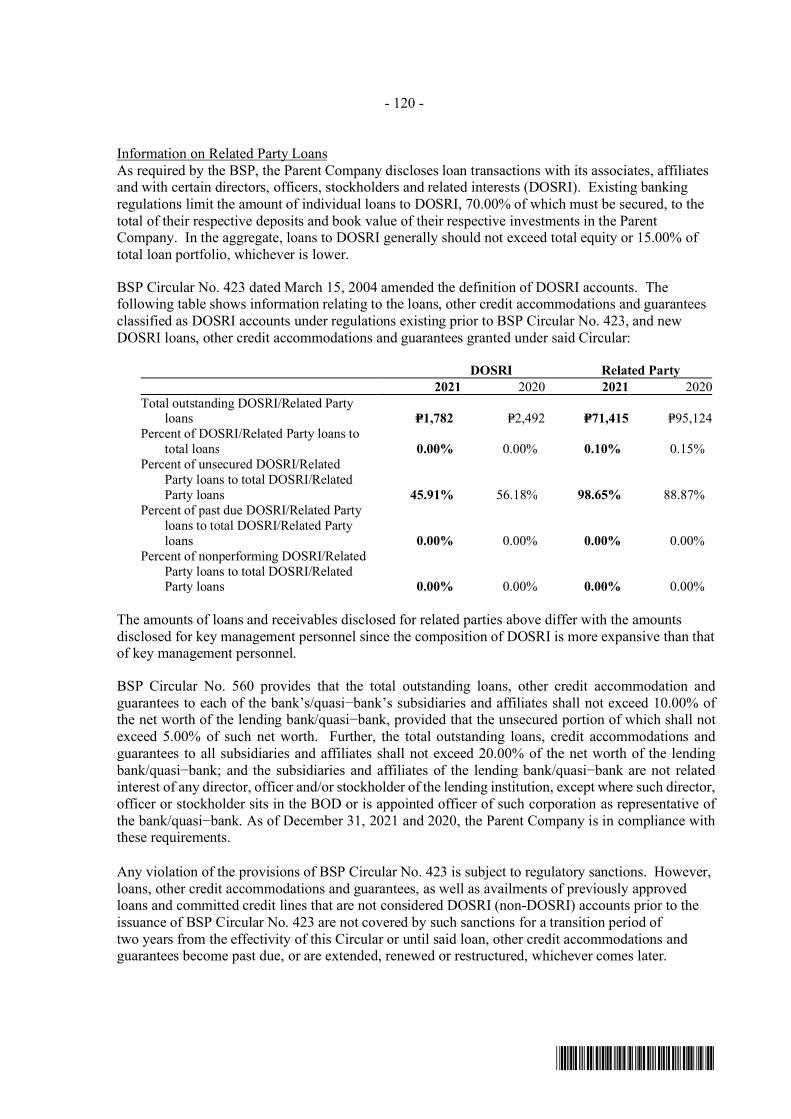
- 120 -
*SGVFS164641*
Information on Related Party LoansAs required by the BSP, the Parent Company discloses loan transactions with its associates, affiliatesand with certain directors, officers, stockholders and related interests (DOSRI). Existing bankingregulations limit the amount of individual loans to DOSRI, 70.00% of which must be secured, to thetotal of their respective deposits and book value of their respective investments in the ParentCompany. In the aggregate, loans to DOSRI generally should not exceed total equity or 15.00% oftotal loan portfolio, whichever is lower.
BSP Circular No. 423 dated March 15, 2004 amended the definition of DOSRI accounts. Thefollowing table shows information relating to the loans, other credit accommodations and guaranteesclassified as DOSRI accounts under regulations existing prior to BSP Circular No. 423, and newDOSRI loans, other credit accommodations and guarantees granted under said Circular:
DOSRI Related Party
2021 2020 2021 2020
Total outstanding DOSRI/Related Partyloans P=1,782 P=2,492 P=71,415 P=95,124
Percent of DOSRI/Related Party loans tototal loans 0.00% 0.00% 0.10% 0.15%
Percent of unsecured DOSRI/RelatedParty loans to total DOSRI/RelatedParty loans 45.91% 56.18% 98.65% 88.87%
Percent of past due DOSRI/Related Partyloans to total DOSRI/Related Partyloans 0.00% 0.00% 0.00% 0.00%
Percent of nonperforming DOSRI/RelatedParty loans to total DOSRI/RelatedParty loans 0.00% 0.00% 0.00% 0.00%
The amounts of loans and receivables disclosed for related parties above differ with the amountsdisclosed for key management personnel since the composition of DOSRI is more expansive than thatof key management personnel.
BSP Circular No. 560 provides that the total outstanding loans, other credit accommodation andguarantees to each of the bank’s/quasi−bank’s subsidiaries and affiliates shall not exceed 10.00% ofthe net worth of the lending bank/quasi−bank, provided that the unsecured portion of which shall notexceed 5.00% of such net worth. Further, the total outstanding loans, credit accommodations andguarantees to all subsidiaries and affiliates shall not exceed 20.00% of the net worth of the lendingbank/quasi−bank; and the subsidiaries and affiliates of the lending bank/quasi−bank are not related interest of any director, officer and/or stockholder of the lending institution, except where such director,officer or stockholder sits in the BOD or is appointed officer of such corporation as representative ofthe bank/quasi−bank. As of December 31, 2021 and 2020, the Parent Company is in compliance withthese requirements.
Any violation of the provisions of BSP Circular No. 423 is subject to regulatory sanctions. However,loans, other credit accommodations and guarantees, as well as availments of previously approvedloans and committed credit lines that are not considered DOSRI (non-DOSRI) accounts prior to theissuance of BSP Circular No. 423 are not covered by such sanctions for a transition period oftwo years from the effectivity of this Circular or until said loan, other credit accommodations andguarantees become past due, or are extended, renewed or restructured, whichever comes later.

- 121 -
*SGVFS164641*
On May 12, 2009, BSP issued Circular No. 654 allowing a separate individual limit of twenty−five(25.00%) of the net worth of the lending bank/quasi−bank to loans of banks/quasi−banks to theirsubsidiaries and affiliates engaged in energy and power generation.
Aggregate Amount of Secured Liabilities and Assets Pledged as SecurityAs of December 31, 2021, ‘Bills payable’ amounting to P=5.91 billion, are secured by a pledge ofcertain ‘Financial assets at FVOCI’ amounting to P=163.27 million, and ‘Investment securities atamortized cost’ amounting to P=5.86 billion.
As of December 31, 2020, no bills payable are secured by pledge on financial assets of the ParentCompany .
Commitments and contingencies
The following is a summary of contingencies and commitments of the Group and the ParentCompany with the equivalent peso contractual amounts:
2021 2020
Trust department accounts P=8,631,952 P=7,973,683Standby LC 825,173 1,112,021Spot exchange:
Bought 101,998 1,300,002Sold 362,093 1,460,869
Usance LC outstanding 135,023 84,331Outstanding shipping guarantees 396,019 403,601Sight LC outstanding 890,428 792,459Outward bills for collection 13,293 32,053Currency forwards:
Bought 1,987 3,811Sold 162,464 337,400
Inward bills for collection 106,075 13,108Items held for safekeeping 19 25Items held as collateral 7 7Other contingencies 14,241 12,700
38. Supplementary Information Under Revenue Regulations No. 15-2010
In compliance with the requirements set forth by RR No. 15-2010 hereunder are the details ofpercentage and other taxes paid or accrued by the Parent Company in 2021:
GRT P=259,189DST 169,361Local taxes 30,718Fringe benefit taxes 3,654Others 14,520
P=477,442

- 122 -
*SGVFS164641*
Withholding TaxesDetails of total remittances in 2021 and outstanding balance of withholding taxes as ofDecember 31, 2021 follow:
TotalRemittances
Balance as ofDecember 31
Final withholding taxes P=68,840 P=10,119Withholding taxes on compensation and benefits 121,522 8,038Expanded withholding taxes 28,924 2,072
P=219,286 P=20,229
Tax Assessments and CasesAs of December 31, 2021, the Parent Company has outstanding cases filed in courts for variousclaims for tax refund amounting to P=5.53 million. The case is still pending in Supreme Court for finaldecision.

*SGVFS164641*
INDEPENDENT AUDITOR’S REPORT
The Stockholders and the Board of Directors
Philippine Bank of Communications
PBCom Tower, 6795 Ayala AvenueCorner V. A. Rufino Street, Makati City
We have audited in accordance with Philippine Standards on Auditing, the consolidated financial
statements of Philippine Bank of Communications and Subsidiary (the Group) and the financial
statements of Philippine Bank of Communications (the Parent Bank) as at December 31, 2021, included
in this Form 17-A, and have issued our report thereon dated April 27, 2022. Our audits were made for thepurpose of forming an opinion on the basic financial statements taken as a whole. The schedules listed in
the Index to the Financial Statements and Supplementary Schedules are the responsibility of the Group’s
management. These schedules are presented for purposes of complying with Revised SecuritiesRegulation Code Rule 68, and are not part of the basic financial statements. These schedules have been
subjected to the auditing procedures applied in the audit of the basic financial statements and, in our
opinion, fairly state in all material respects, the information required to be set forth therein in relation to
the basic financial statements taken as a whole.
SYCIP GORRES VELAYO & CO.
Ray Francis C. Balagtas
Partner
CPA Certificate No. 108795Tax Identification No. 216-950-288
BOA/PRC Reg. No. 0001, August 25, 2021, valid until April 15, 2024
SEC Partner Accreditation No. 108795-SEC (Group A)Valid to cover audit of 2021 to 2025 financial statements of SEC covered institutions
SEC Firm Accreditation No. 0001-SEC (Group A)
Valid to cover audit of 2021 to 2025 financial statements of SEC covered institutionsBIR Accreditation No. 08-001998-107-2020, November 27, 2020, valid until November 26, 2023
PTR No. 8853467, January 3, 2022, Makati City
April 27, 2022
SyCip Gorres Velayo & Co.6760 Ayala Avenue1226 Makati CityPhilippines
Tel: (632) 8891 0307Fax: (632) 8819 0872ey.com/ph
A member firm of Ernst & Young Global Limited

*SGVFS164641*
INDEPENDENT AUDITOR’S REPORT
ON SUPPLEMENTARY SCHEDULES
The Stockholders and the Board of Directors
Philippine Bank of Communications
PBCom Tower, 6795 Ayala AvenueCorner V. A. Rufino Street, Makati City
We have audited in accordance with Philippine Standards on Auditing, the consolidated financial
statements of Philippine Bank of Communications and Subsidiary (the Group) and the financial
statements of Philippine Bank of Communications (the Parent Bank) as at December 31, 2021 and 2020,
and for each of the three years in the period ended December 31, 2021 and have issued our report thereondated April 27, 2022. Our audits were made for the purpose of forming an opinion on the basic financial
statements taken as a whole. The Supplementary Schedule on Financial Soundness Indicators, including
their definitions, formulas, calculation, and their appropriateness or usefulness to the intended users, arethe responsibility of the Group’s management. These financial soundness indicators are not measures of
operating performance defined by Philippine Financial Reporting Standards (PFRS) and may not be
comparable to similarly titled measures presented by other companies. This schedule is presented for the
purpose of complying with the Revised Securities Regulation Code Rule 68 issued by the Securities andExchange Commission and is not a required part of the basic financial statements prepared in accordance
with PFRS. The components of these financial soundness indicators have been traced to the Group’s
financial statements as at December 31, 2021 and 2020 and for each of the three years in the period endedDecember 31, 2021 and no material exceptions were noted.
SYCIP GORRES VELAYO & CO.
Ray Francis C. Balagtas
PartnerCPA Certificate No. 108795
Tax Identification No. 216-950-288
BOA/PRC Reg. No. 0001, August 25, 2021, valid until April 15, 2024SEC Partner Accreditation No. 108795-SEC (Group A)
Valid to cover audit of 2021 to 2025 financial statements of SEC covered institutions
SEC Firm Accreditation No. 0001-SEC (Group A)
Valid to cover audit of 2021 to 2025 financial statements of SEC covered institutionsBIR Accreditation No. 08-001998-107-2020, November 27, 2020, valid until November 26, 2023
PTR No. 8853467, January 3, 2022, Makati City
April 27, 2022
SyCip Gorres Velayo & Co.6760 Ayala Avenue1226 Makati CityPhilippines
Tel: (632) 8891 0307Fax: (632) 8819 0872ey.com/ph
A member firm of Ernst & Young Global Limited

PHILIPPINE BANK OF COM M UNICATIONS AND SUBSIDIARIES
INDEX TO CONSOLIDATED FINANCIAL STATEM ENTS
AND SUPPLEM ENTARY SCHEDULES
DECEM BER 31, 2021
ATTACHM ENT DESCRIPTION PAGE NO.
Reconciliat ion of Retained Earnings Available
For Dividend Declarat ion (Part 1, 4(c)) 1
Schedule For Listed Companies With A
Recent Offering Of Securit ies To The Public 2
Schedules
A Financial Assets 3
BAmounts Receivable from Directors, Officers, Employees, Related Part ies
and Principal Stockholders (Other than Related parties)4
CAmounts Receivable from Related Part ies which are eliminated during the
consolidation of Financial Statements5
D Intangible Assets - Other Assets 6
E Long-Term Debt 7
FIndebtedness to Related Part ies (Long-Term Loans from Related
Companies)8
G Guarantees of Securit ies of Other Issuers 9
H Capital Stock 10
Other Required Schedules/ Informat ion
M ap Showing the Relat ionship Between and Among
Related Ent it ies
Financial Soundness Indicators

PHILIPPINE BANK OF COM M UNICATIONS
RECONCILIATION OF RETAINED EARNINGS
AVAILABLE FOR DIVIDEND DECLARATION
AS OF DECEM BER 31, 2021
-None to report-

PHILIPPINE BANK OF COM M UNICATIONS
SCHEDULE FOR LISTED COM PANIES WITH RECENT OFFERING OF SECURITIES TO THE PUBLIC
For the period ended December 31, 2021
(in thousand)
1 Gross and net proceeds as disclosed in the final prospectus
2 Actual gross and net proceeds
Gross
Net none to report
3 Each expenditure item where the proceeds were used
Reserves
Loan
4 Balance of the proceeds as of the end of report ing period

Philippine Bank of Communications and Subsidiaries
SCHEDULE A. Financial Assets
As of December 31, 2021
Name of Issuing entit y and association of each issue
Number of
shares or
principal
amount of
bonds and
notes
Amount
shown in
the balance
sheet
Valued based
on market
quotat ion at
end of
report ing
period
Income
accrued
and
received
(i) (ii) (iii)
Financial assets at Fair Value through Profit or Loss
Republic of the Philippines 886,291 886,291 886,291 40,345
886,291 886,291 886,291 40,345
Investment Securities at Amortized Cost
Republic of the Philippines 14,191,888 14,094,628 16,900,726 216,301
Indonesian Government 232,148 1,425,652 239,202 6,224
14,424,036 15,520,279 17,139,928 222,525
Unquoted debt securit ies classified as loans
M RT III 678,557 678,557 946,133 -
678,557 678,557 946,133 -
Financial Assets at Fair Value Through Other
Comprehensive Income
Debt securities
Republic of the Philippines 4,488,961 5,384,395 5,384,395 245,239
Indonesian Government 866,983 978,006 978,006 5,032
5,355,944 6,362,401 6,362,401 250,271
Equity securit ies
Philippine Central Depository, Inc. 21,126 3,502 3,502 -
Bancnet, Inc. 63,100 23,936 23,936 -
Philippine Clearing House Corp. 21,000 5,159 5,159 -
Philippine Dealing System Holding Corporat ion 12,500 2,688 2,688 -
Club Filipino 1 350 350 -
Valley Golf Club 2 3,000 3,000 -
WackWack Golf and Country Club 2 88,000 88,000 -
M et ropolitan Club 1 250 250 -
Tower Club 1 - - -
126,886 126,886 -
(i) Each issue shall be stated separately, except that reasonable grouping, w ithout enumeration may be made of
(a)securit ies issued or guaranteed by the Philippine Government or it s agencies and (b) securities issued by the
others for which the amounts in the aggregate are not more than two percent of total assets.
(ii) State the basis of determining the amounts shown in the column. This column shall be totalled to correspond to the
respect ive balance sheet capt ion or captions.
(iii) This column may be omitted if all amounts that would be shown are the same as those in the immediately preceding
column.

Philippine Bank of Communications and Subsidiaries
SCHEDULE B. Amounts Receivable from Directors, Officers, Employees, Related Parties and Principal Stockholders (Other than Related parties)
As of December 31, 2021
Name and Designation of DebtorEnding Balance as of
December 31, 2020Additions
Amounts
Collected
Amounts
written offCurrent Not Current
Ending Balance as of
December 31, 2021
NONE TO REPORT
(i) Show separately accounts receivables and notes receivable. In case of notes receivable, indicate pertinent information such as the due date, interest rate, terms of repayment and collateral, if any.
(ii) If collect ion was ot her than in cash, explain.
(iii) Give reasons for w rite off .

Philippine Bank of Communications and Subsidiaries
SCHEDULE C. Amounts Receivable from Related Parties which are eliminated during the consolidation of Financial Statements
As of December 31, 2021
Name and Designat ion of debtor
Balance at
beginning of
period Addit ions
Amounts
collected
Amounts
writ ten off Current
Not
Current
Balance at end
of period
(i) (ii)
PBCom Insurance Agency, Inc. - - - - - -
(i) If collect ion was ot her than in cash, explain.
(ii) Give reasons for writ e off .

Philippine Bank of Communications and Subsidiaries
SCHEDULE D. Intangible Assets - Others Assets
As of December 31, 2021
Descript ion Beginning balance Addit ions at cost
Charged to cost and
expenses
Charged to
other
accounts
Other changes
addit ions
(deduct ions) Ending Balance
(i) (ii) (ii) (iii)
Branch License 364,700 364,700
Software Cost 248,826 8,971 (94,994) 162,803
(i) The informat ion required shall be grouped into (a) intangibles shown under the capt ion in intangible assets and (b) deferrals shown under the capt ion Other Assets in t he related balance sheet . Show
by major classif icat ions.
(ii) For each change representing anything ot her than an acquisit ion, clearly st ate the nature of the change and other accounts affected. Describe cost of addit ions represent ing other than cash
expenditures.
(iii) If provision for amort izat ion of int angible assets is credited in the books direct ly to the intangible asset account , the amounts shall be stated w ith explanations, including t he accounts charged.
Clearly state the nature of deduct ions if these represent anything other than regular amortizat ion.
* Provision for impairment

Philippine Bank of Communications and Subsidiaries
SCHEDULE E. Long Term Debt
As of December 31, 2021
Title of Issue and type of obligat ion
Amount authorized
by indenture
Amount shown
under capt ion
"Current port ion of
long term debt" in
related balance
sheet
Amount shown
under capt ion "Long
Term Debt" in
related balance
sheet
Interest
Rate
M aturity
Date
(i) (ii) (iii)
LTNCD 2,889,116 - 2,889,116 5.63% 8-Apr-24
(i) Include in this column each type of obligation authorized.
(ii) This column is to be totaled to correspond to the related balance sheet capt ion.
(iii) Include in this column details as to interest rates, amounts or number of periodic installments, and maturity dates.
(iii) Include in this column details as to interest rates, amounts or number of periodic installments, and maturity dates.

Philippine Bank of Communications and Subsidiaries
SCHEDULE F. Indebtedness to Related Parties (Long-Term Loans from Related companies)
As of December 31, 2021
Name of related party Balance at beginning of period Balance at end of period
(i) (ii)
NONE TO REPORT
(i) The related part ies named shall be grouped as in Schedule D. The informat ion called for shall be stated separately for any persons whose investments were shown separately in such related
schedule.
(ii) For each affiliate named in the f irst column, explain in a note heret o the nature and purpose of any material increase during the period that is in excess of 10 percent of the related balance at
either the beginning or end of the period.

Philippine Bank of Communications and Subsidiaries
SCHEDULE G. Guarantees of Securities of Other Issuers
As of December 31, 2021
Name of issuing ent ity of
securities guaranteed by the
company for which this
statement is f iled
Title of issue of each class of
securit ies guaranteed
Total amount guaranteed
and outstanding
Amount owned by person
for which statement is
filed Nature of guarantee
(i) (ii)
NONE TO REPORT
(i) Indicate in a note any sinif icant changes since the date of the last balance sheet filed. If this schedule is f iled in support of consolidated f inancial statements, there shall be set forth guarantees by any
person included in the consolidat ion except such guarantees of securit ies w hich are included in the consolidated balance sheet.
(ii) There must be a brief statement of the nature of the guarantee, such as "Guarantee of principal and interest " , Guarantee of interest " , or Guarantee of dividends" . If t he guarantee is of interest ,
dividends, or both, state the annual aggregate amount of interest or dividends so guaranteed.

Philippine Bank of Communications and Subsidiaries
SCHEDULE H. Capital Stock
As of December 31, 2021
Tit le of issue
Number of shares
authorized
Number of shares
issued and outstanding
at shown under related
balance sheet capt ion
Number of shares
reserved for options,
warrants, conversion
and other rights
Number of
shares held by
related part ies
Directors, off icers
and employees Others
(i) (ii) (iii)
COM M ON 760,000,000 480,645,163 312,464,175
(i) Include in this column each type of issue authorized.
(ii) Related part ies referred to include persons for which separate f inancial statements are f iled and those included in consolidated f inancial statements, other than the issuer of t he particular securit y.
(iii) Indicate in a note any signif icant changes since the date of the last balance sheet f iled.
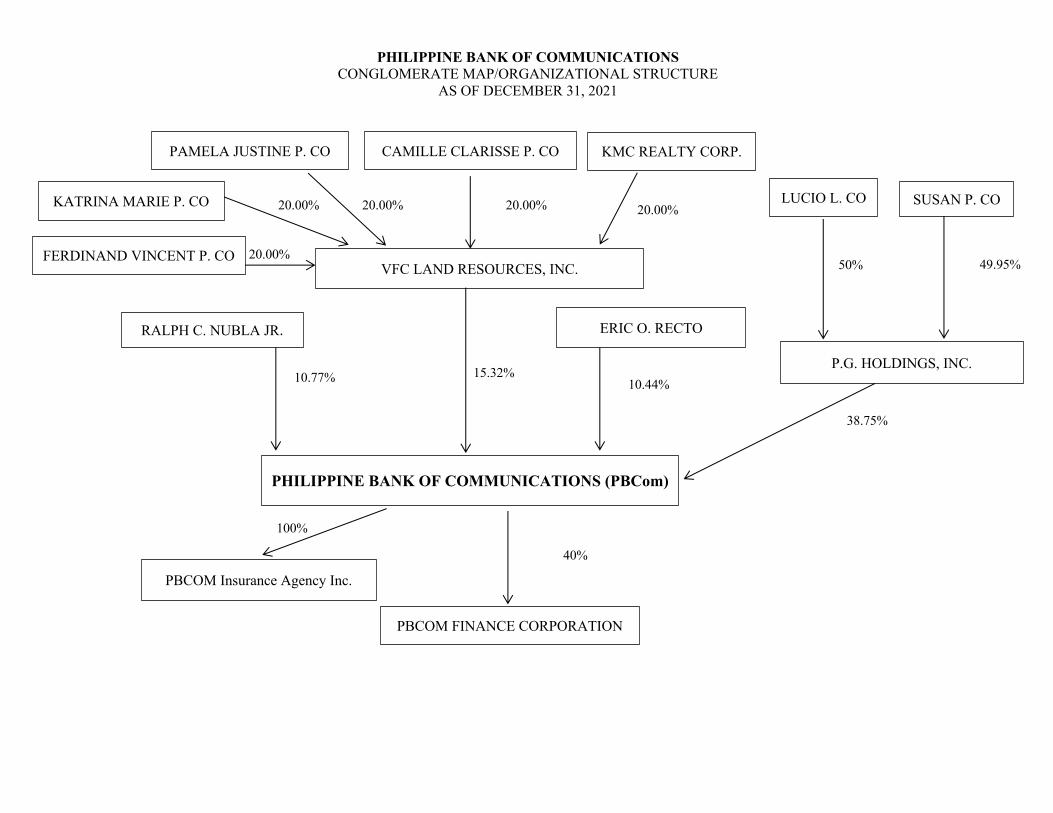
PHILIPPINE BANK OF COMMUNICATIONS
CONGLOMERATE MAP/ORGANIZATIONAL STRUCTURE
AS OF DECEMBER 31, 2021
PBCOM FINANCE CORPORATION
PHILIPPINE BANK OF COMMUNICATIONS (PBCom)
RALPH C. NUBLA JR.
VFC LAND RESOURCES, INC.
ERIC O. RECTO
P.G. HOLDINGS, INC.
SUSAN P. CO LUCIO L. CO
40%
15.32%
38.75%
10.44%
10.77%
20.00%
50% 49.95%
PBCOM Insurance Agency Inc.
100%
FERDINAND VINCENT P. CO
PAMELA JUSTINE P. CO CAMILLE CLARISSE P. CO
KATRINA MARIE P. CO
KMC REALTY CORP.
20.00%
20.00%
20.00%
20.00%

A. Key Performance Indicators
Ratios Consolidated December 31 Balances Parent December 31 Balances
2021 2020 2019 2021 2020 2019
Profit M argin 30.94% 19.84% 22.90% 30.94% 19.84% 22.90%
Net Income 1,573 1,169 1,157 1,573 1,169 1,157
Gross Income 5,085 5,892 5,052 5,085 5,892 5,052
Return on Average Asset 1.49% 1.15% 1.12% 1.49% 1.15% 1.13%
Net Income 1,573 1,169 1,157 1,573 1,169 1,157
Average Assets* 105,230 101,985 103,245 105,237 101,993 102,307
Return on Average Equity 11.78% 9.79% 10.67% 11.78% 9.79% 10.67%
Net Income 1,573 1,169 1,157 1,573 1,169 1,157
Average Equity* * 13,353 11,942 10,841 13,353 11,942 10,845
Capital Adequacy Ratio 18.18% 18.87% 16.47% 18.18% 18.87% 16.47%
Qualifying capital 15,603 14,671 13,347 15,603 14,671 13,347
Total risk-weighted assets 85,846 77,754 81,047 85,846 77,754 81,047
Basic Earnings per Share 3.27 2.43 2.41
Net income 1,573 1,169 1,157
Average No. of common shares 481 481 481
B. Financial Soundness
Liquidity Ratio 28.96% 43.40% 31.16% 28.96% 43.40% 31.16%
Liquid Assets* * * 25,178 36,361 23,645 25,178 36,361 23,645
Tot al Deposits 86,946 83,781 75,882 86,955 83,790 75,891
Debt Ratio 87.02% 87.62% 88.95% 87.02% 87.62% 88.95%
Tot al Liabilit ies 95,054 88,701 91,385 95,061 88,708 91,393
Tot al Assets 109,229 101,230 102,741 109,237 101,238 102,748
Asset to Equity 7.71 8.08 9.05 7.71 8.08 9.05
Tot al Asset 109,229 101,230 102,741 109,237 101,238 102,748
Tot al Equity 14,176 12,530 11,355 14,176 12,530 11,355
Interest Rate Coverage Ratio 470% 231% 177% 470% 231% 166%
Earnings before interest & taxes 2,324 2,468 3,651 2,324 2,468 3,423
Interest Expense 494 1,068 2,063 494 1,068 2,063
Net Interest M argin 4.83% 4.64% 3.85% 4.83% 4.64% 3.90%
Net Interest Income 4,245 3,925 3,205 4,245 3,925 3,205
Average Earning Assets* * * * 87,821 84,669 83,217 87,824 84,672 82,213
* (Current year asset + Prior year asset)/ 2
* * (Current year equity + Prior year equity)/ 2
* * * Includes cash and other cash items, due from BSP, due from other banks, IBLR and SPURA, financial assets at FVTPL and debt securit ies at FVOCI
* * * * Includes DFOB, IBLR and SPURA, financial assets at FVTPL, investments at FVOCI, investment securit ies at amort ized cost , and loans and receivable


2021 SUSTAINABILITY REPORT
PHILIPPINE BANK OF COMMUNICATIONS
PBCOM Tower, 6795 Ayala Avenue corner
V.A. Rufino St., Makati City, Philippines
Scope: Philippine Bank of Communications (Parent Bank) only
Period: January 1 to December 31, 2021
Responsible: Patricia May T. Siy, President & CEO
CONTENT
PBCOM as a Sustainable Business
Our Framework
Materiality Process
Sustainable Performance
Economic
Environment
Social
U.N. Sustainable Development Goals
3
4
5
6
10
15
30
2

ECONOMIC
This relates to how the bank directly increases the pool of economic resources that flows into the local and national economy. The
bank ensures that it does not just create economic value for itself but also that this value flows back to its stakeholders such as
stockholders, suppliers, employees, government, and the community.
ENVIRONMENT
This relates on how the bank manages the natural resources it needs for its business, as well on how it minimizes its negative impacts
to the environment. The bank monitors how efficiently it uses natural resources, which has implications on reduction of environmental
impacts from extraction and processing of these resources.
SOCIAL
This relates on how the bank manages its relationship with its stakeholders such as employees, customers, suppliers, communities, the
public, and the government. The bank ensures that it contributes to the overall growth of those invested in it, directly or indirectly.
As the country and the world continue to face the COVID-19 pandemic, the strength and resiliency of various business operations were put to test. At
Philippine Bank of Communications (PBCOM), the situation has given the Bank a chance to re-think its efforts towards building a sustainable business. It
became an opportunity to reinforce what PBCOM has always been advocating: sustainable operations through the sound and efficient management of its
economic, environmental and social impacts.
SUSTAINABLE BUSINESS
This report highlights some of the key changes and operational initiatives that the Bank has undertaken in contributing to PBCOM’s sustainability goals and
aspirations.
SUSTAINabilityPBCOM 2021 SUSTAINABILITY REPORT
3

OUR FRAMEWORK
SUSTAINabilityPBCOM 2021 SUSTAINABILITY REPORT
The over-all sustainability reporting framework of the Bank as Publicly-Listed Company follows below structure:
Disclosures should reflect the bank’s significant economic, environmental, and social impacts and should consider the reasonable expectations and
interests of key stakeholders.
PBCOM is a
Sustainable
Business
We conduct
We manage
Corporate Governance
Economic, Environment, Social
Contribute to Sustainable
Development
ECONOMIC SOCIAL
UN Sustainable Development Goals
ENVIRONMENT
Our products
4

MATERIALITY PROCESS
SUSTAINabilityPBCOM 2021 SUSTAINABILITY REPORT
The bank has applied the following processes in identifying the material topics contained in this report:
DISCOVERYASSESSMENT &
VALIDATIONPRIORITIZATION
MONITORING & REPORTING
• Data collection
• Consultation and
discuss with
stakeholders
• Shortlisting of
identified material
issues
• Ranking of all material
issues
• Shortlisting of
priorities (1-3 years)
• Metrics identification,
baselining and target
setting
• Management and
Board approval
• Monitoring of agreed
metrics
• Performance
reporting
• Review of the
organization’s Mission and Vision
• Review business
priorities
• Benchmarking with
peer banks
• Industry best practice
5

PBCOM 2021 SUSTAINABILITY REPORT
economic

ECONOMIC PERFORMANCE
SUSTAINabilityPBCOM 2021 SUSTAINABILITY REPORT
Disclosure (in Php ‘000) Amount (Parent)
Direct economic value generated (revenue) 5,084,586
Direct economic value distributed:
a) Operating costs 709,920
b) Employee wages and benefits 1,016,559
c) Payments to suppliers, other operating costs 1,011,573
d) Dividends given to stockholders and interest payments to loan providers -
e) Taxes given to government 517,067
f) Investments to community (e.g. donations, CSR) -
7

ECONOMIC PERFORMANCE
SUSTAINabilityPBCOM 2021 SUSTAINABILITY REPORT
What is the impact and where does
it occur? What is the organization’s involvement in the impact?
Which stakeholders are affected? Management Approach
Improved Return on Capital means increased
lending opportunity
• Higher investment in Human Capital
(learning and development)
• More local community involvement
• PBCOM as an engine of growth in
nation building
Board of Directors and officers, employees,
customers, suppliers and community
• Employees
• Employees and community
• Board of Directors and officers, employees,
customers, suppliers and community
Value focus in terms of the Bank’s financial standing
• Alignment of training and development with
overall strategic direction of the Bank
• Roll out of the financial inclusion program
through branches
• More inclusive lending strategy such as the
Bank’s Puhunan Plus (microlending) and
credit extension to the SME partners of the
LC Group of Companies, among others.
A. The risk of non-compliance to regulators’ requirement
• The risk of not being able to protect
customer’s deposit and investments
• The risk of negative return to
shareholders.
.
B. Cyber security
C. The risk of long-term talent shortage
Board of Directors, officers and employees
Board of Directors and officers, employees,
customers, suppliers and community
Board of Directors and officers, employees,
customers, suppliers and community
Board of Directors and officers, employees,
customers, suppliers and community
• Proactive role of the Board of Directors and
officers in corporate governance
• Adherence to AMLA and KYC regulations
• Prudent assessment of borrowers’ credit worthiness
• Cyber customer security awareness via the
Bank’s social media platform and website
• Leadership development program
• Succession planning and readiness
assessment

ECONOMIC PERFORMANCE
SUSTAINabilityPBCOM 2021 SUSTAINABILITY REPORT
What is the impact and where does it
occur? What is the organization’s involvement in the impact?
Which stakeholders are
affected?Management Approach
• Financial inclusion
• Digitalization
• Innovation
• Partnership with foundations or
charitable institutions
• Bank
• Community
• Customers
• Small business owners
• Financial inclusion program
• Execution of the Bank’s digital strategy which includes financial and operational activities leading to reduced paper and eventually moving
towards paperless.
• Incorporating innovation in providing services to our customers
• Identifying livelihood programs that can be supported by the
Corporate Social Responsibility initiatives of the Bank (La Liga
Mariquina and Green Antz)
9

PBCOM 2021 SUSTAINABILITY REPORT
environment

PBCOM GOES GREEN
SUSTAINabilityPBCOM 2021 SUSTAINABILITY REPORT
In April of 2021, PBCOM has formally launched the “PBCOM goes GREEN campaign”. This is a long-term initiative of the Bank to be more environmentally
conscious in its operations. Led by President and CEO, Ms. Patricia May Siy, along with the members of the Bank’s Senior Management Team, Leaders of
the organization have planned year-long activities and programs in relation to the green campaign.
11
The main objective of this initiative is to educate employees on the
environmental impact of their day-to-day activities, and in the end, reduce the
amount of plastic garbage produced by PBCOM employees, reduce the
amount of paper being consumed by the organization, and, actively advocate
initiatives and projects to go green and cost-save.
First in the list of our programs is the “AYOKO NG PLASTIC” campaign. An initiative to control the volume of single-use plastic within bank premises. As a
clear guideline, the bank discourages the use of plastic spoons and forks,
disposable cups, single-use plastic bags and plastic straw.

PBCOM GOES GREEN
SUSTAINabilityPBCOM 2021 SUSTAINABILITY REPORT
For unavoidable plastics, there is the “DONATE YOUR PLASTIC” drive where PBCOM encourages its employees to recycle. Recycling drop boxes were placed
in several head office locations where the bank collects dry and clean plastics. The collected plastics are then transported to the ecohub of Green Antz
builders, an organization that turns plastic wastes into eco bricks. From August up to November 2021, the bank was able to collect 80+ kilos of plastic which
were turned into eco bricks.
12

PBCOM GOES GREEN
SUSTAINabilityPBCOM 2021 SUSTAINABILITY REPORT
13
Further, PBCOM also launched the “WAG KANG MA-PAPEL” initiative. This is an inter-
department competition on who can reduce their paper consumption the most.
July 2021 marked a milestone for PBCOM office support teams with the launch of the
Procure-to-Pay (P2P) System. The first of its kind for the Bank. Purchase requests, orders,
payments, including transfers of fixed Assets & inventories have all been digitized and
turned paperless wherein approvals and status updates are now all made via the platform.
This web-based system has been successfully rolled out nationwide and is accessed by all of
the Bank’s employees further contributing to the Bank’s corporate environmental goals.
Through all the combined efforts, overall savings on 2021 vs. 2020 supplies went down 28%
for papers while toners were down 20%. This is a result of the Bank’s overall conscious work toward inclusive sustainability.
Along with these new projects are the ongoing initiatives of the bank on going paperless.
PBCOM Human Resources group continues to reduce paper consumption by turning
employees’ pay slips, employee handbooks, performance appraisal forms and other HR internal forms into digital copies.
“With these newly launched initiatives to GO GREEN, we, as an institution, hope to help lessen the
worldwide problem on waste management, and in our little way contribute in making this world a
better place to live in” Patricia May T. Siy, PBCOM President & CEO.

SUSTAINabilityPBCOM 2021 SUSTAINABILITY REPORT
PBCOM Tower’s overall commitment to continuously improve its facilities is still continuing with the year’s major aims: to reduce electricity costs while improving efficiency and still ensuring the
reliability of each equipment and the entire operability of the Tower.
With the partnership between with Philippine DCS Development
Corporation (PDDC) – an Engie Philippines & Filinvest Land Inc. joint
venture – coming into fruition, identified major equipment have been
replaced with more advanced and efficient primary pumps, secondary
pumps, chillers, cooling towers and condenser water pumps. These
greatly contributed to an average of Php 1,400,000.00 per month of
savings in electricity while maintaining a minimum efficiency of 0.782
kW/RT. With the new chillers now using ozone-friendly R-514A EcoWise
refrigerants in compliance with the Department of Energy’s guidelines and requirements, results of use are a high efficiency operation but low
negative environmental impact and global warming potential.
Six (6) High-rise elevators servicing PBCOM Tower’s 53 floors have completed its long-awaited modernization in October 2021 under KONE
Philippines. Not only was the overall look and ride of the elevators
upgraded but all major parts and equipment were replaced and
rigorously tested for safety and durability. Average waiting time has
been significantly improved due to faster door operation and
mechanism. Electricity consumption was also reduced to a significant
30% due to the new high efficiency hoisting motors, among others.
PBCOM TOWER
CONTINUES TO ADVANCE
14

PBCOM 2021 SUSTAINABILITY REPORT
social

EMPLOYEE MANAGEMENT
SUSTAINabilityPBCOM 2021 SUSTAINABILITY REPORT
679
328
Female Male
No. of employees according to gender*
12.03%Attrition Rate**
Ratio of lowest paid employee
against minimum wage :
105% ABOVE MINIMUM for lowest paid employee
* Employees are individuals who are in an employment relationship with the organization, according to national law or its
application (GRI Standards 2016 Glossary)
** Attrition are = no. of turnover/average total manpower x 100
16

EMPLOYEE MANAGEMENT
SUSTAINabilityPBCOM 2021 SUSTAINABILITY REPORT
List of Benefits Y/N% of female employees who availed for
the year
% of male employees who availed for the
year
SSS
• SSS
• Sickness
• Loan
Y
Y
Y
3.53%
3.36%
12.37%
0.00%
2.76%
9.20%
PhilHealth Y Data not available Data not available
Pag-IBIG Y 9.28% 3.68%
Parental leaves Y 3.53% 0.92%
Vacation leaves Y 100% 100%
Sick leaves Y 75.85% 71.47%
Medical benefits (aside from PhilHealth)) Y 100% 100%
Housing assistance (aside from Pag-ibig) Y 0.00% 0.00%
Retirement fund (aside from SSS) Y 6.00% 7.00%
Further education support Y 0.88% 0.00%
Telecommuting Y 100% 100%
Flexible-working Hours Y 100% 100%
(Others)
• Car loan
• Emergency loan
• Salary loan
• Bereavement
Y
Y
Y
Y
0.74%
0.74%
13.70%
1.77%
0.44%
0.15%
3.98%
1.23%
All employee benefits follow the labor standards if not exceeding them, particularly in the compensation area. Hence, there is no employee of the Bank that
is paid below the government-mandated minimum wage rate.

EMPLOYEE TRAINING AND DEVELOPMENT
SUSTAINabilityPBCOM 2021 SUSTAINABILITY REPORT
Female Male
Total training hours
provided to employees
22,899
10,519
31
28
Female Male
Average training hours provided to
employees (hours per employee)
The Bank recognizes the need to enhance employees’ competencies and development at work creating a learning culture that will bring out employees’ full potentials and peak performance.
Training and Employee Engagement Division implements programs that are based on suggestions of Group Heads during the Training Needs Analysis
activity. The output of the said activity is the training plan for the year which is divided into various development categories (Regulatory/ Mandatory,
Technical/ Functional/ Job Specific, Professional, Leadership, Culture. Several programs like Health and Fertility webinar and Yoga, the Power of Workplace
wellness were introduced for female employees for their well-being.
In 2021, we continuously widen the scope of the trainings using technology for the employees based outside of Metro Manila to join the sessions. 18

SUSTAINabilityPBCOM 2021 SUSTAINABILITY REPORT
LABOR-MANAGEMENT RELATIONS
The Bank honors its commitment made in the CBA with the union, thus maintaining industrial peace. Aside from the CBA negotiations, it also conducts
grievance meetings with the union officers to discuss issues relating to policies which affect the working conditions of rank and file employees as needed.
DIVERSITY AND EQUAL OPPORTUNITY
*Vulnerable sector includes, elderly, persons with disabilities, vulnerable women, refugees, migrants, internally displaced persons, people living with HIV and other diseases, solo parents, and the
poor or the base of the pyramid (BOP; Class D and E).
The Bank is an equal opportunity employer and recognizes, in particular, that those beyond retirement age are still productive. It looks up to
them for experience and wisdom especially for the highly technical and more senior roles in the Bank.
Disclosure Quantity% of employees covered with Collective Bargaining Agreements 22%
Number of consultations conducted with employees concerning employee-related policies 1
Disclosure Quantity% of female workers in the workforce 67%
% of male workers in the workforce 33%
Number of employees from indigenous communities and/or vulnerable sector* 30
19

SUSTAINabilityPBCOM 2021 SUSTAINABILITY REPORT
WORKPLACE CONDITIONS, LABOR STANDARDS, AND HUMAN RIGHTS: OCCUPATIONAL HEALTH AND SAFETY
Disclosure QuantitySafe Man-Hours
No. of work-related injuries 0
No. of work-related fatalities 0
No. of work related ill-health 191 COVID-19 positive
No. of safety drills 2 earthquake drills
The Bank gives priority to the health and safety of its employees by ensuring that employees and one nominated dependent each are covered by company
HMO in addition to maintaining a clinic with a company doctor and a nurse within its premises despite having a nearby hospital from its head office. We
have also certified first aiders in the head office and branches in accordance with DOLE directives.
The Bank participated in the annual fire and earthquake drills mandated by the local governments in every city or town where offices and branches are
located.
LABOR LAWS AND HUMAN RIGHTS
The Bank strictly adheres to the provisions of the Labor Code and its Implementing Rules and Regulations, as well as directives of the Department of Labor
and Employment. The Bank’s Code of Conduct explicitly states that all laws, including Labor Laws and Sexual Anti-Harassment among others, must be
strictly followed under pain of penalty for its violations.
Disclosure QuantityNo. of legal actions or employee grievances involving forced or child labor 0
20

SIGNIFICANT IMPACT ON LOCAL COMMUNITIES
SUSTAINabilityPBCOM 2021 SUSTAINABILITY REPORT
“We fulfill our social responsibility in the
communities we serve”
As stated in PBCOM’s new Vision Mission and Values, the Bank “fulfills its social responsibilities in the communities it serves”. As an institution,
PBCOM is very much involved and concerned with the welfare of the communities in which the bank has presence.
PBCOM Board of Directors, Senior Management Team, and the rest of the employees have been supporting the initiatives and activities of local
government and non-government units which has significant impact on the environment and social welfare at the barangay and municipal levels.
These activities include various fund raising projects to help victims of calamities and conflicts, protect the environment, and uplift the lives of the
less fortunate.
21

SUSTAINabilityPBCOM 2021 SUSTAINABILITY REPORT
SCENT OF JOY
22
As we continue to face the uncertainties of the Global Pandemic, PBCOM and its
employees also continue to help in little ways that they can. In December of 2021,
PBCOM initiated an employee fundraising project called “Scent of Joy” where the bank sold hanging car diffuser scents to its employees. These diffuser scents are a
product of La Liga Mariquina’s livelihood program made by the less privileged
residents of the community.
LA LIGA MARIQUINA INC. (LM) is a Non-Stock, Non-Profit Civic Organization based in
Marikina City, that advocates people empowerment. One of the primary programs of
LM is their Livelihood Program where they conduct trainings and workshops for the
less privileged members of the community, including those most affected by the
Covid-19 Pandemic.
Proceeds of the fundraising project, amounting to Php 50,000 was turned over to La
Liga Mariquina last December 28, 2021. Said donation will be used to fund the
livelihood workshops to be implemented in 2022 by LM’s “Centro Ni Maria Quina” Program.
May Siy, PBCOM President and CEO shares: “PBCOM continues to support La Liga Mariquina’s vision in building a sustainable and holistic approach to alleviating the
plight of our less privileged brothers and sisters. As La Liga Mariquina extends their
livelihood program to more than just local Marikina barangays and communities,
PBCOM and its employees are able to empower and help more and more members of
the communities that we serve”.

CUSTOMER MANAGEMENT
SUSTAINabilityPBCOM 2021 SUSTAINABILITY REPORT
87%Customer
Satisfaction for
Digital Platforms
CSAT conducted
internally by PBCOM
Customer Care
23
Customer Complaints
No substantiated complaints reported on Customer Privacy
No substantiated complaints reported on Marketing and Labeling
No substantiated complaints reported on Products & Services Health and Safety
Customer Satisfaction

SUSTAINabilityPBCOM 2021 SUSTAINABILITY REPORT
CLIENT INFORMATION USED FOR SECONDARY PURPOSESNo. of customers, users and account holders whose information is used for secondary purposes
As we enter an era of instant communication and feedback, many of today’s customers have become extremely demanding, if not just more aware of how
they should receive service from businesses. Along with this fast pace of information circulation is the availability of various channels to make the voice of
each customer heard.
While many businesses struggle to keep up, we at PBCOM, whose foundation on customer service standards have been laid out, have learned to adapt. Our
desire to provide excellent customer experience, long term, has been evident on the various programs and initiatives that we implement.
The Covid-19 Pandemic has further spurred us on towards this objective. Re-thinking the ways with which we deliver our service, PBCOM has been able to
adjust well to the needs of the times, aiming to create a sustainable customer service performance post COVID-19.
Overall, the approach of the Bank is to create meaningful relationships with our internal and external stakeholders through communication. We encourage
our employees to solicit feedback, complaints and commendations, as often as possible, and in all available channels. These shall serve as basis for policy and
product innovation with the ultimate aim of improving service delivery. We want our customers happy, and the best way to do this is by soliciting actual
feedbacks from them.
The channels that the bank uses have all shifted to digital. With “being paperless” as one of the main advocacies of the bank, Interactions via digital platforms
are now the new norm.
SUSTAINABILITY IN CUSTOMER SERVICE
Voice of Customer campaign recipients of Customer Experience Division to measure the satisfaction of New to Bank
clients onboarded via our digital platforms and Transactions for POP and PBCOMOBILE28,052
Accounts endorsed to authorized 3rd party collection agency of Consumer Finance Group 6,147
Clients offered with Bale product by Transaction Banking Group 48

CUSTOMER SERVICE IMPROVEMENT PROGRAM
SUSTAINabilityPBCOM 2021 SUSTAINABILITY REPORT
We at PBCOM believe that Customer Service is not just for front-liners. We believe that
every single member of the organization must be accountable and therefore, responsible
for the way they deliver service to their customer, whether internal or external. This is
the primary reason why service delivery is constantly being measured in each employee’sperformance appraisal.
The bank equips the team with regular trainings on customer service. This also include
trainings on soft skills like empathy and concern.
Standards for grooming, service delivery and inner spaces are also a part of the
monitoring program. For our front line associates, Service Level Agreement for
complaints resolution and feedback is also being monitored to ensure compliance.
25
EMPLOYEE BUY-IN
In PBCOM, we believe that our front liners play a very important role in making or breaking a business. Since they are the face of the company, it is
imperative that they act and breathe “customer service”. Our mentoring culture plays a big part in honing our employees’ service delivery skills. Service
delivery directives are rolled out not just for employees to comply, rather, the Bank ensures that our employees understand why they need to follow such
directives. This way, meeting the new standards that we installed are less likely to fail because they are not being forced to follow, they are involved in the
process of service improvement.
Employees’ involvement on the achievement of excellent service delivery are also recognized and rewarded. We recognize employees who demonstrate
exceptional service evidenced by being service champions in their respective groups, receiving commendations, and exceling in customer service programs.

VOICE OF CUSTOMER (VOC)
SUSTAINabilityPBCOM 2021 SUSTAINABILITY REPORT
We deploy several customer feedback platforms to know if changes are needed, and which service or products needs improvements. This include several
survey methods like website forms, SMS, email, call-outs and branch feedback mechanisms. As part of the plan, we would also do focus group discussions, in-
app feedback, and one on one feedback to further get our customers’ sentiments about the Bank’s product and service features.
We also monitor and measure customer effort. This is important for the Bank to know what processes needs improvement to make our customers’ banking
transactions easier and more convenient.
In 2021, the VOC focus were on our digital platforms as we continuously increase our presence in this space. We had to listen carefully not only to our
external customers but to our internal customers as well, so that we can stay abreast of the changing behavior in the digital norm.
The primary metrics we use to measure effectivity and performance are:
Customer Satisfaction (CSAT) – measures how satisfied our clients are with the product and/or service that they received. This is used by the various
units of the bank to determine which processes and service standard need improvement.
Net Promoter Score (NPS) – measures how likely our customers will recommend PBCOM to their peers. The Net Promoter Score (NPS) results are
used as reference for our loyalty and referral programs. This aids our retail business groups in customer retention and promoting increase in usage.
These also serve as basis for the improvement of product features for our digital platforms.
Customer Effort Survey (CES) – measures how easy and how fast our customers are able to get the assistance that they need from the bank. This
serves as the basis for our customer care’s service delivery standards.
26

VOICE OF CUSTOMER METRICS
SUSTAINabilityPBCOM 2021 SUSTAINABILITY REPORT
Complaints received are also considered as feedback and basis for
improvement. The Bank sets a Service Level of Agreement (SLA) in
complaint resolutions. Year on year, we monitor improvement on
complaints resolution. Complaints received are categorized
according to nature, and whether or not they are controllable. This
gives our operations and products team tangible and actionable
items that ensures improvement on processes and service delivery.
27
87%17%
81%93% 48% 96%
CSAT NPS CESOn-boarding, registration and transactions with POP and PBCOMobile
Service delivery through various customer service channels
CSAT (Customer Satisfaction); NPS (Net Promoter Score); CES (Customer Effort Score)
COMPLAINTS HANDLING METRICS 2021 2020 2019
SLA Achievement – complaints
addressed within SLA96.00% 99.04% 99.76%

CUSTOMER PRIVACY
SUSTAINabilityPBCOM 2021 SUSTAINABILITY REPORT
Protection of customer privacy is recognized as an essential factor for the Banks’ service standards. There is close coordination among our Data Privacy
Officer, Chief Information Security Officer, Chief Information Officer, Chief Risk Officer and our Legal Team. PBCOM strictly monitors privacy protection for all
our customers, employees, and stakeholders in accordance with the Data Privacy Act and its Implementing Rules and Regulations. Due to the vigilant
monitoring and security measures that we put in place, there are no customer complaints received concerning breach or protection of personal information.
Constant collaboration among the different units of the Bank is done on a regular basis to further strengthen our organizational, technical and physical
security measures. We see this as essential to excellent customer service. We always put our customers at the center of all banking relationships and
business decisions; this is to ensure that in PBCOM, we protect any personal information that we collect, process and store.
28

DATA SECURITY
SUSTAINabilityPBCOM 2021 SUSTAINABILITY REPORT
Looking back at the plentiful year of 2021, regards to information and cybersecurity, PBCOM continues to face significant amount of security challenges but it
does not stop them from being dedicated to proactively protect its information, networks, and IT systems from risks, like fraud, unauthorized access, and
cyber threats. Having a proactive, defense-in-depth approach to cybersecurity allows PBCOM to be more vigilant and adaptive to the new, emerging and
evolving threat landscape. In valuing customers’ trust and maintain a resilient business, the Bank invested heavily on its people, processes and technology to
prevent, deter, detect and timely mitigate risks of security threats to Bank’s information and information systems/resources.
PBCOM is committed to continually developing and honing overall security capabilities to protect/safeguard the Bank’s information and information assets.
Putting the security and safety of the Bank’s and customers’ information / data, we have adopted the four main components to cyber readiness and
resiliency, as shown in figure below.
FOUR MAIN COMPONENT OF CYBER READINESS AND RESILIENCY
Manage and Protect
The ability of the Bank to identify, assess, manage
risks, and protect information and systems from
cyber attacks, system failures and unauthorized
access, including those across supply chain.
Identify and Detect
The ability of the Bank to timely identify and detect
anomalies and potential cyber security incidents
before they can cause any significant damage,
including continuous monitoring.
Respond and Recover
The ability of the Bank to mitigate attacks, eject
intruders, analyze attacker actions, operate even if
hit by a cyber attack, and get back to business as
usual as quickly and efficiently as possible.
Govern and Assure
Information security programs, initiatives and
activities aligned with the Bank’s business objectives and is overseen from the top of the
organization and built into business as usual.

UN SUSTAINABLE DEVELOPMENT GOALS
SUSTAINabilityPBCOM 2021 SUSTAINABILITY REPORT
Key Products and
ServicesSocietal Value/Contribution to UN SDGs
Potential Negative Impact of
Contribution
Management Approach to
Negative Impact
Money Talk (Oplan Ipon) UN SDG (1) : NO POVERTY
Assist low-wage earners and the unbanked establish
savings habit through basic financial wellness program
that includes sharing of knowledge and ideas on the
proper ways of saving money.
Lack of understanding of the unbanked
segment may lead to product offerings
that may not match the need of the
customer.
Program modules are developed
according to the profile of the
target segment. The modules
are reviewed, and if necessary
amended; on an annual basis.
PBCOM2go UN SDG (9) : INDUSTRIES, INNOVATION &
INFRASTRUCTURE
A bank-booking service which allows PBCOM customers
to arrange for pick-up of banking transactions such as
cash or check deposits.
Security and public safety. Agents and transactions are
covered by insurance.
PBCOMobile UN SDG (9) : INDUSTRIES, INNOVATION &
INFRASTRUCTURE
Digital-only Bank which allows for account opening,
maintenance and transactions to be done digitally thus
providing financial accessibility and a more
environmentally-friendly means of doing financial
transactions.
1. Lack of personal relationships; and
2. Increase fraud.
1. Digital banking to be
complemented by the Bank’s brink and mortar channel;
2. Strengthen vigilance and
frequent review of the
effectivity of existing controls.
Puhunan Plus
(Microfinance Loan)
UN SDG (10) : REDUCED INEQUALITIES
Credit extension to Micro-Business owners of up to
P150.0k in loans which aides in business expansion,
generate employment opportunities and help local
economic growth.
1. Could potentially lead to borrower
being over-leverage;
2. Loan proceeds may potentially be
used to fund personal consumption
thus limiting long-term economic
growth.
Lending will focus on micro-
business owners with historical
purchases in the retail
institution partners of the Bank.
Purchases will be used in
establishing credit limit of the
borrower.

UN SUSTAINABLE DEVELOPMENT GOALS
SUSTAINabilityPBCOM 2021 SUSTAINABILITY REPORT
Key Products and
ServicesSocietal Value/ Contribution to UN SDGs
Potential Negative Impact of
Contribution
Management Approach to
Negative Impact
Basic Deposit Account UN SDG (10) : REDUCED INEQUALITIES
• A savings account that requires no more than P100.0
in account opening balance but with allowed
maximum balance of P50.0k. Account is not subject
to minimum maintaining balance.
• Follows simplified Know-Your-Customer (KYC) as
customers are deemed to be low risk.
Product may be subject to abuse given
the KYC procedure is not as stringent as
a regular account.
Institute monitoring and control
of accounts exceeding balances
of P50.0k, with accounts
exceeding the threshold
amount converted to a regular
deposit account.
Sustainable Finance UN SDG (11) : SUSTAINABLE CITIES AND COMMUNITIES
Help drive environmental sustainability through funding
of projects with focus on sustainable solutions.
Lack of expertise in identifying projects
that are consistent with the principles of
sustainable development.
Talent development to include
training in future industries such
as green energy.
Cash 360 & Check Image
Clearing System (CICS)
UN SDG (12): RESPONSIBLE CONSUMPTION &
PRODUCTION
Provides an alternative means of depositing cash &
checks without having to step out of the place of
business. This also reduces the carbon footprint of the
customer and of the Bank.
Lack of personal relationships. To be complemented by the
Bank’s brink and mortar channel.
Lending for Capacity
Development
UN SDG (17) : PARTNERSHIP FOR THE GOALS
Supporting funding requirements of partners in the
areas of Agriculture and Infrastructure development
(Build-Build-Build programs).
Absence of mechanism to monitor
bankable projects.
Close coordination with
government agencies and
private firms to enable effective
monitoring of projects that may
require funding.

PHILIPPINE BANK OF COMMUNICATIONS6795 Ayala Avenue corner V.A. Rufino Street, Makati City 1226
www.pbcom.com.ph
PhilippineBankofCommunications
(02) 8777-2266 | 1-800-10-777-2266
Philippine Bank of Communications

Philippine Bank of Communications
and Subsidiary
Financial Statements
December 31, 2021 and 2020
and Years Ended December 31, 2021, 2020
and 2019
and
Independent Auditor’s Report

*SGVFS164641*
INDEPENDENT AUDITOR’S REPORT
The Stockholders and the Board of DirectorsPhilippine Bank of Communications
Report on the Consolidated and Parent Company Financial Statements
Opinion
We have audited the consolidated financial statements of Philippine Bank of Communications and itsSubsidiary (the Group) and the parent company financial statements of Philippine Bank ofCommunications (the Parent Company), which comprise the consolidated and parent company statementsof financial position as at December 31, 2021 and 2020, and the consolidated and parent companystatements of income, consolidated and parent company statements of comprehensive income,consolidated and parent company statements of changes in equity and consolidated and parent companystatements of cash flows for each of the three years in the period ended December 31, 2021, and notes tothe consolidated and parent company financial statements, including a summary of significant accountingpolicies.
In our opinion, the accompanying consolidated and parent company financial statements present fairly, inall material respects, the financial position of the Group and the Parent Company as at December 31, 2021and 2020, and their financial performance and their cash flows for each of the three years in the periodended December 31, 2021, in accordance with Philippine Financial Reporting Standards (PFRSs).
Basis for Opinion
We conducted our audits in accordance with Philippine Standards on Auditing (PSAs). Ourresponsibilities under those standards are further described in the Auditor’s Responsibilities for the Audit
of the Consolidated and Parent Company Financial Statements section of our report. We are independentof the Group and the Parent Company in accordance with the Code of Ethics for ProfessionalAccountants in the Philippines (the Code of Ethics) together with the ethical requirements that arerelevant to our audit of the consolidated and parent company financial statements in the Philippines, andwe have fulfilled our other ethical responsibilities in accordance with these requirements and the Code ofEthics. We believe that the audit evidence we have obtained is sufficient and appropriate to provide abasis for our opinion.
Key Audit Matter
Key audit matters are those matters that, in our professional judgment, were of most significance in ouraudit of the consolidated and parent company financial statements of the current period. These matterswere addressed in the context of our audit of the consolidated and parent company financial statements asa whole, and in forming our opinion thereon, and we do not provide a separate opinion on these matters.For each matter below, our description of how our audit addressed the matter is provided in that context.
SyCip Gorres Velayo & Co.6760 Ayala Avenue1226 Makati CityPhilippines
Tel: (632) 8891 0307Fax: (632) 8819 0872ey.com/ph
A member firm of Ernst & Young Global Limited

*SGVFS164641*
- 2 -
We have fulfilled the responsibilities described in the Auditor’s Responsibilities for the Audit of the
Consolidated and Parent Company Financial Statements section of our report, including in relation tothese matters. Accordingly, our audit included the performance of procedures designed to respond to ourassessment of the risks of material misstatement of the consolidated and parent company financialstatements. The results of our audit procedures, including the procedures performed to address thematters below, provide the basis for our audit opinion on the accompanying consolidated and parentcompany financial statements.
Applicable to the Audit of the Consolidated and Parent Company Financial Statements
Recognition of expected credit losses(ECL) on loans and receivables
The Group’s and the Parent Company’s application of the expected credit loss (ECL) model in calculatingthe allowance for credit losses on loans and receivables is significant to our audit as it involves theexercise of significant management judgment. Key areas of judgment include: segmenting the Group’sand the Parent Company’s credit risk exposures; determining the method to estimate ECL; definingdefault; identifying exposures with significant deterioration in credit quality; determining assumptions tobe used in the ECL model such as the counterparty credit risk rating, the expected life of the financialasset, expected recoveries from defaulted accounts, and impact of any financial support and creditenhancements extended by any party; and incorporating forward-looking information, including theimpact of the coronavirus pandemic, in calculating ECL.
Allowance for credit losses for loans and receivables as of December 31, 2021 for the Group and theParent Company amounted to P=2.73 billion. Provision for credit losses of the Group and the ParentCompany in 2021 amounted to P=0.32 billion.
Refer to Notes 3 and 17 of the financial statements for the details of the allowance for credit losses usingthe ECL model.
Audit response
We obtained an understanding of the board approved methodologies and models used for the Group’s andthe Parent Company’s different credit exposures and assessed whether these considered the requirementsof PFRS 9, Financial Instruments to reflect an unbiased and probability-weighted outcome, and toconsider time value of money and the best available forward-looking information.
We (a) assessed the Group’s and the Parent Company’s segmentation of its credit risk exposures based onhomogeneity of credit risk characteristics; (b) tested the definition of default and significant increase incredit risk criteria against historical analysis of accounts, credit risk management policies and practices inplace, and management’s assessment of the impact of the coronavirus pandemic on the counterparties;(c) tested the Group’s and the Parent Company’s application of internal credit risk rating system,including the impact of the coronavirus pandemic on the borrowers, by reviewing the ratings of samplecredit exposures; (d) assessed whether expected life is different from the contractual life by testing thematurity dates reflected in the Group’s and the Parent Company’s records and considering management’sassumptions regarding future collections, advances, extensions, renewals and modifications; (e) testedloss given default by inspecting historical recoveries and related costs, write-offs and collateralvaluations, and the effects of any financial support and credit enhancements provided by any party; (f)tested exposure at default considering outstanding commitments and repayment scheme; (g) evaluated theforward-looking information used for overlay through corroboration of publicly available information and
A member firm of Ernst & Young Global Limited

*SGVFS164641*
- 3 -
our understanding of the Group’s and the Parent Company’s lending portfolios and broader industryknowledge, including the impact of the coronavirus pandemic; and (h) tested the effective interest rateused in discounting the expected loss.
Further, we compared the data used in the ECL models by reconciling data from source system reports tothe data warehouse and from the data warehouse to the loss allowance analysis/models and financialreporting systems.
To the extent that the loss allowance analysis is based on credit exposures that have been disaggregatedinto subsets of debt financial assets with similar risk characteristics, we traced or re-performed thedisaggregation from source systems to the loss allowance analysis. We also assessed the assumptionsused where there are missing or insufficient data.
We involved our internal specialist in the performance of the above procedures. We recalculatedimpairment provisions on a sample basis. We reviewed the completeness of the disclosures made in thefinancial statements.
Other Information
Management is responsible for the other information. The other information comprises the informationincluded in the SEC Form 20-IS (Definitive Information Statement), SEC Form 17-A and Annual Reportfor the year ended December 31, 2021, but does not include the consolidated and parent companyfinancial statements and our auditor’s report thereon. The SEC Form 20-IS (Definitive InformationStatement), SEC Form 17-A and Annual Report for the year ended December 31, 2021 are expected to bemade available to us after the date of this auditor’s report.
Our opinion on the consolidated and parent company financial statements does not cover the otherinformation and we do not and will not express any form of assurance conclusion thereon.
In connection with our audits of the consolidated and parent company financial statements, ourresponsibility is to read the other information identified above and, in doing so, consider whether theother information is materially inconsistent with the consolidated and parent company financialstatements or our knowledge obtained in the audit, or otherwise appears to be materially misstated.
Responsibilities of Management and Those Charged with Governance for the Consolidated and
Parent Company Financial Statements
Management is responsible for the preparation and fair presentation of the consolidated and parentcompany financial statements in accordance with PFRSs, and for such internal control as managementdetermines is necessary to enable the preparation of consolidated and parent company financialstatements that are free from material misstatement, whether due to fraud or error.
A member firm of Ernst & Young Global Limited

*SGVFS164641*
- 4 -
In preparing the consolidated and parent company financial statements, management is responsible forassessing the Group’s and the Parent Company’s ability to continue as a going concern, disclosing, asapplicable, matters related to going concern and using the going concern basis of accounting unlessmanagement either intends to liquidate the Group and the Parent Company or to cease operations, or hasno realistic alternative but to do so.
Those charged with governance are responsible for overseeing the Group’s and the Parent Company’sfinancial reporting process.
Auditor’s Responsibilities for the Audit of the Consolidated and Parent Company Financial
Statements
Our objectives are to obtain reasonable assurance about whether the consolidated and parent companyfinancial statements as a whole are free from material misstatement, whether due to fraud or error, and toissue an auditor’s report that includes our opinion. Reasonable assurance is a high level of assurance, butis not a guarantee that an audit conducted in accordance with PSAs will always detect a materialmisstatement when it exists. Misstatements can arise from fraud or error and are considered material if,individually or in the aggregate, they could reasonably be expected to influence the economic decisions ofusers taken on the basis of these consolidated and parent company financial statements.
As part of an audit in accordance with PSAs, we exercise professional judgment and maintainprofessional skepticism throughout the audit. We also:
Identify and assess the risks of material misstatement of the consolidated and parent companyfinancial statements, whether due to fraud or error, design and perform audit procedures responsive tothose risks, and obtain audit evidence that is sufficient and appropriate to provide a basis for ouropinion. The risk of not detecting a material misstatement resulting from fraud is higher than for oneresulting from error, as fraud may involve collusion, forgery, intentional omissions,misrepresentations, or the override of internal control.
Obtain an understanding of internal control relevant to the audit in order to design audit proceduresthat are appropriate in the circumstances, but not for the purpose of expressing an opinion on theeffectiveness of the Group’s and the Parent Company’s internal control.
Evaluate the appropriateness of accounting policies used and the reasonableness of accountingestimates and related disclosures made by management.
Conclude on the appropriateness of management’s use of the going concern basis of accounting and,based on the audit evidence obtained, whether a material uncertainty exists related to events orconditions that may cast significant doubt on the Group’s and the Parent Company’s ability tocontinue as a going concern. If we conclude that a material uncertainty exists, we are required todraw attention in our auditor’s report to the related disclosures in the consolidated and parentcompany financial statements or, if such disclosures are inadequate, to modify our opinion. Ourconclusions are based onthe audit evidence obtained up to the date of our auditor’s report. However,future events or conditions may cause the Group and the Parent Company to cease to continue as agoing concern.
A member firm of Ernst & Young Global Limited

*SGVFS164641*
- 5 -
Evaluate the overall presentation, structure and content of the consolidated and parent companyfinancial statements, including the disclosures, and whether the consolidated and parent companyfinancial statements represent the underlying transactions and events in a manner that achieves fairpresentation.
Obtain sufficient appropriate audit evidence regarding the financial information of the entities orbusiness activities within the Group to express an opinion on the consolidated financial statements.We are responsible for the direction, supervision and performance of the audit. We remain solelyresponsible for our audit opinion.
We communicate with those charged with governance regarding, among other matters, the planned scopeand timing of the audit and significant audit findings, including any significant deficiencies in internalcontrol that we identify during our audit.
We also provide those charged with governance with a statement that we have complied with relevantethical requirements regarding independence, and to communicate with them all relationships and othermatters that may reasonably be thought to bear on our independence, and where applicable, relatedsafeguards.
From the matters communicated with those charged with governance, we determine those matters thatwere of most significance in the audit of the consolidated and parent company financial statements of thecurrent period and are therefore the key audit matters. We describe these matters in our auditor’s reportunless law or regulation precludes public disclosure about the matter or when, in extremely rarecircumstances, we determine that a matter should not be communicated in our report because the adverseconsequences of doing so would reasonably be expected to outweigh the public interest benefits of suchcommunication.
Reports on the Supplementary Information Required Under Bangko Sentral ng Pilipinas (BSP)
Circular No. 1074 and Revenue Regulations No. 15-2010
Our audits were conducted for the purpose of forming an opinion on the basic financial statements takenas a whole. The supplementary information required under BSP Circular No. 1074 in Note 37 andRevenue Regulations No. 15-2010 in Note 38 to the financial statements is presented for purposes offiling with the BSP and Bureau of Internal Revenue, respectively, and is not a required part of the basicfinancial statements. Such information is the responsibility of the management of Philippine Bank ofCommunications. The information has been subjected to the auditing procedures applied in our audit ofthe basic financial statements. In our opinion, the information is fairly stated, in all material respects, inrelation to the basic financial statements taken as a whole.
A member firm of Ernst & Young Global Limited

*SGVFS164641*
- 6 -
The engagement partner on the audit resulting in this independent auditor’s report isRay Francis C. Balagtas.
SYCIP GORRES VELAYO & CO.
Ray Francis C. BalagtasPartnerCPA Certificate No. 108795Tax Identification No. 216-950-288BOA/PRC Reg. No. 0001, August 25, 2021, valid until April 15, 2024SEC Partner Accreditation No. 108795-SEC (Group A)
Valid to cover audit of 2021 to 2025 financial statements of SEC covered institutionsSEC Firm Accreditation No. 0001-SEC (Group A)
Valid to cover audit of 2021 to 2025 financial statements of SEC covered institutionsBIR Accreditation No. 08-001998-107-2020, November 27, 2020, valid until November 26, 2023PTR No. 8853467, January 3, 2022, Makati City
April 27, 2022
A member firm of Ernst & Young Global Limited

*SGVFS164641*
PHILIPPINE BANK OF COMMUNICATIONS AND SUBSIDIARY
STATEMENTS OF FINANCIAL POSITION
Consolidated Parent Company
December 31 December 31
2021 2020 2021 2020
(Amounts in Thousands)
ASSETS
Cash and Other Cash Items P=2,803,341 P=2,467,099 P=2,803,341 P=2,467,099Due from Bangko Sentral ng Pilipinas
(Notes 18 and 19) 10,271,486 20,597,868 10,271,486 20,597,868Due from Other Banks 658,593 1,495,485 658,593 1,495,485Interbank Loans Receivable and Securities
Purchased under Resale Agreements (Note 8) 4,195,846 6,054,454 4,195,846 6,054,454Financial Assets at Fair Value through
Profit or Loss (Note 9) 886,291 718,294 886,291 718,294Financial Assets at Fair Value through Other
Comprehensive Income (Note 10) 6,489,287 5,137,816 6,489,287 5,137,816Investment Securities at Amortized Cost (Note 11) 15,520,279 2,263,356 15,520,279 2,263,356Loans and Receivables (Note 12) 63,497,965 57,623,993 63,500,798 57,626,707Investments in Subsidiary and an Associate
(Note 7) 14,401 14,114 20,475 20,252Property and Equipment (Note 13) 882,217 894,617 882,217 894,617Investment Properties (Note 14)
Condominium units for lease 1,740,177 1,788,559 1,740,177 1,788,559Foreclosed properties 834,303 610,075 834,303 610,075Office units for lease 2,689 2,923 2,689 2,923
Intangible Assets (Note 15) 527,503 613,526 527,503 613,526Deferred Tax Assets - Net (Note 30) 325,614 170,608 325,614 170,608Other Assets (Note 16) 579,328 777,431 578,077 776,034
TOTAL ASSETS P=109,229,320 P=101,230,218 P=109,236,976 P=101,237,673
LIABILITIES AND EQUITY
LIABILITIES
Deposit Liabilities (Notes 18 and 31)Demand P=41,166,107 P=30,865,282 P=41,175,066 P=30,874,143Savings 11,359,112 9,664,945 11,359,112 9,664,945Time 31,531,570 40,367,517 31,531,570 40,367,517Long-term negotiable certificates of deposits 2,889,116 2,883,668 2,889,116 2,883,668
86,945,905 83,781,412 86,954,864 83,790,273Bills Payable (Note 19) 6,010,988 2,182,844 6,010,988 2,182,844Outstanding Acceptances 71,609 497,813 71,609 497,813Manager’s Checks 172,247 188,100 172,247 188,100Accrued Interest, Taxes and Other Expenses
(Note 20) 680,734 802,785 680,648 802,637Income Tax Payable 66,823 146,866 66,823 146,866Other Liabilities (Note 21) 1,105,196 1,100,720 1,103,979 1,099,462
TOTAL LIABILITIES 95,053,502 88,700,540 95,061,158 88,707,995
(Forward)

*SGVFS164641*
- 2 -
Consolidated Parent Company
December 31 December 31
2021 2020 2021 2020
(Amounts in Thousands)
EQUITY ATTRIBUTABLE TO EQUITY
HOLDERS OF THE PARENT COMPANY
Common stock (Note 23) P=12,016,129 P=12,016,129 P=12,016,129 P=12,016,129Additional paid-in capital 2,262,246 2,262,246 2,262,246 2,262,246Surplus reserves (Note 23) 106,922 106,418 106,922 106,418Deficit (Notes 2 and 23) (66,061) (1,638,621) (66,061) (1,638,621)Unrealized gain on financial assets carried at fair
value through other comprehensive income
(Note 10) 53,509 100,093 53,509 100,093Cumulative translation adjustment (237,668) (211,464) (237,668) (211,464)Remeasurement gains (losses) on retirement liability
(Note 27) 40,741 (105,123) 40,741 (105,123)
TOTAL EQUITY 14,175,818 12,529,678 14,175,818 12,529,678
TOTAL LIABILITIES AND EQUITY P=109,229,320 P=101,230,218 P=109,236,976 P=101,237,673
See accompanying Notes to Financial Statements.

*SGVFS164641*
PHILIPPINE BANK OF COMMUNICATIONS AND SUBSIDIARY
STATEMENTS OF INCOME
Consolidated Parent Company
Years Ended December 31
2021 2020 2019 2021 2020 2019
(Amounts in Thousands, Except Earnings per Share)INTEREST INCOME
Loans and receivables (Note 12) P=4,109,882 P=4,325,208 P=4,468,479 P=4,109,882 P=4,325,208 P=4,468,479Investment securities (Note 26) 472,796 363,618 588,317 472,796 363,618 588,317
Interbank loans receivable and securities purchased under resale agreements (Note 8) 60,069 92,746 40,246 60,069 92,746 40,246
Deposits with other banks 55,686 132,408 11,981 55,686 132,408 11,981Financial assets at fair value through profit or loss (Note 26) 40,345 80,007 159,297 40,345 80,007 159,297
4,738,778 4,993,987 5,268,320 4,738,778 4,993,987 5,268,320
INTEREST AND FINANCE CHARGES
Deposit liabilities (Notes 18 and 31) 434,899 921,459 1,501,587 434,899 921,459 1,501,587Bills payable, borrowings and others (Notes 19 and 21) 59,099 147,034 561,700 59,099 147,034 561,700
493,998 1,068,493 2,063,287 493,998 1,068,493 2,063,287
NET INTEREST INCOME 4,244,780 3,925,494 3,205,033 4,244,780 3,925,494 3,205,033Rent income (Notes 14, 28 and 31) 505,241 673,414 736,341 505,241 673,414 736,341Service charges, fees and commissions 331,729 389,096 407,507 331,729 389,096 407,507Trading and securities gain (loss) – net (Note 26) (241,598) 654,731 408,413 (241,598) 654,731 408,413Foreign exchange gain - net 56,831 59,185 49,873 56,831 59,185 49,873Income from trust operations (Note 25) 29,231 25,689 21,095 29,231 25,689 21,095Profit from assets sold (Notes 13, 14 and 16) 13,567 6,779 97,739 13,567 6,779 97,739Gain (loss) on assets exchange - net (Note 14) 7,460 (3,157) (11,850) 7,460 (3,157) (11,850)Gain on sale of investment securities at amortized cost (Notes 3 and 11) – 2,552 – – 2,552 –Miscellaneous (Note 29) 137,346 158,402 137,783 137,346 158,402 137,783
TOTAL OPERATING INCOME 5,084,587 5,892,185 5,051,934 5,084,587 5,892,185 5,051,934
(Forward)

*SGVFS164641*
- 2 -
Consolidated Parent Company
Years Ended December 31
2021 2020 2019 2021 2020 2019
(Amounts in Thousands, Except Earnings per Share)
OPERATING EXPENSES
Compensation and fringe benefits (Notes 14, 27 and 31) P=1,016,559 P=1,009,118 P=978,869 P=1,016,559 P=1,009,118 P=978,153
Taxes and licenses (Notes 14 and 30) 477,442 640,060 624,122 477,432 640,053 624,115Depreciation and amortization (Note 13) 387,619 380,653 445,979 387,619 380,653 445,979Provision for credit and impairment losses - net (Notes 17) 322,301 1,418,228 377,613 322,301 1,418,228 377,613Insurance 162,820 153,762 139,771 162,820 153,762 139,771Entertainment, amusement and recreation 120,375 126,572 82,483 120,375 126,572 82,483Occupancy and other equipment-related costs (Notes 14, 28 and 31) 118,519 101,334 130,220 118,519 101,334 130,169Management and professional fees 99,541 139,999 106,543 99,497 139,944 106,443Security, clerical, messengerial and janitorial services 88,850 83,426 97,754 88,850 83,426 97,747Communications 49,684 47,487 48,661 49,684 47,487 48,661Loss on sale of a subsidiary (Note 7) – – – – – 171,173Miscellaneous (Notes 14 and 29) 411,474 392,777 432,394 411,464 392,772 432,394
TOTAL OPERATING EXPENSES 3,255,184 4,493,416 3,464,409 3,255,120 4,493,349 3,634,701
INCOME BEFORE SHARE IN NET INCOME OF SUBSIDIARY AND AN
ASSOCIATE 1,829,403 1,398,769 1,587,525 1,829,467 1,398,836 1,417,233
SHARE IN NET LOSS OF SUBSIDIARY (Note 7) − − − (64) (67) (58,116)
SHARE IN NET INCOME OF AN ASSOCIATE (Note 7) 287 266 531 287 266 531
INCOME BEFORE INCOME TAX 1,829,690 1,399,035 1,588,056 1,829,690 1,399,035 1,359,648
PROVISION FOR INCOME TAX (Note 30) 256,626 230,123 202,391 256,626 230,123 202,391
NET INCOME FROM CONTINUING OPERATIONS 1,573,064 1,168,912 1,385,665 1,573,064 1,168,912 1,157,257
NET LOSS FROM DISCONTINUED OPERATIONS (Note 7) − − (228,408) − – –
NET INCOME P=1,573,064 P=1,168,912 P=1,157,257 P=1,573,064 P=1,168,912 P=1,157,257
Attributable to:Equity holders of the Parent Company P=1,573,064 P=1,168,912 P=1,157,257Non-controlling interests − – –
P=1,573,064 P=1,168,912 P=1,157,257
Basic/Diluted Earnings Per Share Attributable to Equity Holders of the Parent
Company (Note 32) P=3.27 P=2.43 P=2.41
See accompanying Notes to Financial Statements

*SGVFS164641*
PHILIPPINE BANK OF COMMUNICATIONS AND SUBSIDIARY
STATEMENTS OF COMPREHENSIVE INCOME
Consolidated Parent Company
Years Ended December 31
2021 2020 2019 2021 2020 2019
(Amounts in Thousands)
NET INCOME FOR THE YEAR P=1,573,064 P=1,168,912 P=1,157,257 P=1,573,064 P=1,168,912 P=1,157,257
OTHER COMPREHENSIVE INCOME (LOSS)
FOR THE YEAR, NET OF TAX
Items that may be reclassified to profit or loss in
subsequent periods:Net unrealized gain (loss) on debt securities at
fair value through other comprehensive
income (Note 10) (62,055) 7,516 68,516 (62,055) 7,516 68,516Net movement in cumulative translation
adjustment (26,204) 20,200 (54,605) (26,204) 20,200 (54,605)
(88,259) 27,716 13,911 (88,259) 27,716 13,911
Items that may not be reclassified to profit or lossin subsequent periods:Unrealized gain on equity securities carried at
fair value through other comprehensiveincome (Note 10) 15,471 4,645 – 15,471 4,645 –
Change in remeasurement gains on retirement
liability (Note 27) 204,497 (71,849) (111,505) 204,497 (71,849) (111,505)Income tax relating to change in
remeasurement gains on retirement
liability (58,633) 45,053 8,157 (58,633) 45,053 8,157
161,335 (22,151) (103,348) 161,335 (22,151) (103,348)
73,076 5,565 (89,437) 73,076 5,565 (89,437)
TOTAL OTHER COMPREHENSIVE INCOME P=1,646,140 P=1,174,477 P=1,067,820 P=1,646,140 P=1,174,477 P=1,067,820
Attributable to:
Equity holders of the Parent Company P=1,646,140 P=1,174,477 P=1,067,820
Non-controlling interests – – –
TOTAL COMPREHENSIVE INCOME P=1,646,140 P=1,174,477 P=1,067,820
See accompanying Notes to Financial Statements.

*SGVFS164641*
PHILIPPINE BANK OF COMMUNICATIONS AND SUBSIDIARY
STATEMENTS OF CHANGES IN EQUITY
Consolidated
Years Ended December 31, 2021, 2020 and 2019
Equity Attributable to Equity Holders of the Parent Company
Common
Stock
(Note 23)
Subscribed
Common Stock
–
net
(Note 23)Additional
Paid-in Capital
Surplus
Reserves
(Note 23)Deficit
(Notes 2 and 23)
Unrealized
Gain
(Loss) on
Financial
Assets
Carried at Fair
Value Through
Other
Comprehensive
Income (Note10)
Cumulative
Translation
Adjustment
Remeasurement
Gains (Losses)
on
Retirement
Liability
(Note 27) Total
Non-
Controlling
Interests Total Equity
(Amounts in Thousands)Balances at January 1, 2021 P=12,016,129 P=− P=2,262,246 P=106,418 (P=1,638,621) P=100,093 (P=211,464) (P=105,123) P=12,529,678 P=− P=12,529,678
Transfer to surplus reserves − − − 504 (504) − − − − − −Total comprehensive income (loss) for the year − − − − 1,573,064 (46,584) (26,204) 145,864 1,646,140 − 1,646,140
Balances at December 31, 2021 P=12,016,129 P=− P=2,262,246 P=106,922 (P=66,061) P=53,509 (P=237,668) P=40,741 P=14,175,818 P=− P=14,175,818
Balances at January 1, 2020 P=12,016,129 P=− P=2,262,246 P=105,952 (P=2,807,067) P=87,932 (P=231,664) (P=78,327) P=11,355,201 P=– P=11,355,201Transfer to surplus reserves − − − 466 (466) − − − − − −Total comprehensive income (loss) for the year − − − − 1,168,912 12,161 20,200 (26,796) 1,174,477 − 1,174,477
Balances at December 31, 2020 P=12,016,129 P=− P=2,262,246 P=106,418 (P=1,638,621) P=100,093 (P=211,464) (P=105,123) P=12,529,678 P=− P=12,529,678
Balances at January 1, 2019 P=12,016,129 P=− P=2,252,826 P=105,893 (P=3,964,265) P=19,416 (P=177,059) P=25,021 P=10,277,961 P=24 P=10,277,985Derecognition of share of PRBI as a result of sale − − 9,420 − − – – – 9,420 (24) 9,396Transfer to surplus reserves − − − 59 (59) − − − − − −Total comprehensive income (loss) for the year − − − − 1,157,257 68,516 (54,605) (103,348) 1,067,820 − 1,067,820
Balances at December 31, 2019 P=12,016,129 P=− P=2,262,246 P=105,952 (P=2,807,067) P=87,932 (P=231,664) (P=78,327) P=11,355,201 P=− P=11,355,201

*SGVFS164641*
- 2 -
Parent Company
Years Ended December 31, 2021, 2020 and 2019
Common
Stock
(Note 23)
Subscribed
Common
Stock - net
(Note 23)Additional
Paid-in Capital
Surplus
Reserves
(Note 23)Deficit
(Notes 2 and 23)
Unrealized
Gain
(Loss) on
Financial
Assets Carried
at
Fair Value
Through
Other
Comprehensive
Income
(Note 10)
Cumulative
Translation
Adjustment
Remeasurement
Gains (Losses)
on
Retirement
Liability
(Note 27) Total Equity
(Amounts in Thousands)Balances at January 1, 2021 P=12,016,129 P=− P=2,262,246 P=106,418 (P=1,638,621) P=100,093 (P=211,464) (P=105,123) P=12,529,678
Transfer to surplus reserves − − − 504 (504) − − − −Total comprehensive income (loss) for the year − − − − 1,573,064 (46,584) (26,204) 145,864 1,646,140
Balances at December 31, 2021 P=12,016,129 P=− P=2,262,246 P=106,922 (P=66,061) P=53,509 (P=237,668) P=40,741 P=14,175,818
Balances at January 1, 2020 P=12,016,129 P=− P=2,262,246 P=105,952 (P=2,807,067) P=87,932 (P=231,664) (P=78,327) P=11,355,201Transfer to surplus reserves − − − 466 (466) − − − −Total comprehensive income (loss) for the year − − − − 1,168,912 12,161 20,200 (26,796) 1,174,477
Balances at December 31, 2020 P=12,016,129 P=− P=2,262,246 P=106,418 (P=1,638,621) P=100,093 (P=211,464) (P=105,123) P=12,529,678
Balances at January 1, 2019 P=12,016,129 P=− P=2,262,246 P=105,893 (P=3,964,265) P=19,416 (P=177,059) P=25,021 P=10,287,381
Derecognition of share of PRBI as a result of sale − − − − − − − − −Transfer to surplus reserves − − − 59 (59) − − − −Total comprehensive income (loss) for the year − − − − 1,157,257 68,516 (54,605) (103,348) 1,067,820
Balances at December 31, 2019 P=12,016,129 P=− P=2,262,246 P=105,952 (P=2,807,067) P=87,932 (P=231,664) (P=78,327) P=11,355,201
See accompanying Notes to Financial Statements.

*SGVFS164641*
PHILIPPINE BANK OF COMMUNICATIONS AND SUBSIDIARY
STATEMENTS OF CASH FLOWS
Consolidated Parent Company
Years Ended December 31
2021 2020 2019 2021 2020 2019
(Amounts in Thousands)
CASH FLOWS FROM OPERATING
ACTIVITIES
Income before income tax from continuing
operations P=1,829,690 P=1,399,035 P=1,588,056 P=1,829,690 P=1,399,035 P=1,359,648Income before income tax from discontinued
operations – – (226,132) – – –
Income before income tax 1,829,690 1,399,035 1,361,924 1,829,690 1,399,035 1,359,648
Adjustments to reconcile income before income taxto net cash generated from (used for) operations:Depreciation and amortization (Note 13) 387,619 380,653 445,979 387,619 380,653 445,979
Provision for credit and impairment losses(Note 17) 322,301 1,418,228 377,613 322,301 1,418,228 377,613
Trading loss (gain) on financial assets at FVOCI
(Note 26) 285,542 (277,277) (309,176) 285,542 (277,278) (309,177)Profit from assets sold (Notes 13, 14 and 16) (13,567) (6,779) (97,739) (13,567) (6,779) (97,739)Accretion of interest on unquoted debt securities
(Note 12) (66,038) (77,216) (88,233) (66,038) (77,216) (88,233)
Accretion of interest on lease liability (Note 21) 14,528 17,603 18,711 14,528 17,603 18,711Loss on sale of a subsidiary (Note 7) – – – – – 171,173Loss (gain) on assets exchange (Note 14) (7,460) 3,157 11,850 (7,460) 3,157 11,850
Share in net income of subsidiary and anassociate (Note 7) (287) (266) (531) (223) (199) 57,585
Unrealized losses (gains) on financial assets at
fair value through profit or loss 9,794 (478) (1,495) 9,794 (478) (1,495)Changes in operating assets and liabilities:Decrease (increase) in the amounts of:
Loans and receivables (Note 33) (6,464,055) 2,137,326 (3,678,579) (6,464,174) 2,137,365 (3,675,826)Financial assets at fair value through
profit or loss (177,791) 950,011 (773,116) (177,791) 950,011 (773,116)
Other assets 304,458 59,546 (361,667) 304,312 59,556 (363,056)Increase (decrease) in the amounts of:
Deposit liabilities 3,164,493 7,923,791 3,546,513 3,164,591 7,923,676 3,555,488
Manager’s checks (15,853) (254,711) 345,364 (15,853) (254,711) 345,364Accrued interest, taxes and other
expenses (122,051) 90,360 32,576 (121,989) 90,360 32,425
Other liabilities 313,352 (93,399) 421,668 313,393 (93,399) 421,677
Net cash provided by operations (235,325) 13,669,584 1,251,662 (235,325) 13,669,584 1,488,871
Income taxes paid (551,454) (233,541) (210,254) (551,454) (233,541) (207,978)
Net cash provided by (used in) operating activities (786,779) 13,436,043 1,041,408 (786,779) 13,436,043 1,280,893
CASH FLOWS FROM INVESTING
ACTIVITIES
Decrease (increase) in interbank loans receivable 432,063 (3,902,952) 13,121 432,063 (3,902,952) 13,121Acquisitions of:
Financial assets at FVTOCI (86,497,255) (78,016,514) (68,324,130) (86,497,255) (78,016,514) (68,324,130)Investment securities at amortized cost (13,263,211) (191,880) – (13,263,211) (191,880) –Property and equipment (Note 13) (195,531) (49,355) (87,133) (195,531) (49,355) (87,133)
Software costs (Note 15) (8,971) (15,069) (39,172) (8,971) (15,069) (39,172)
(Forward)
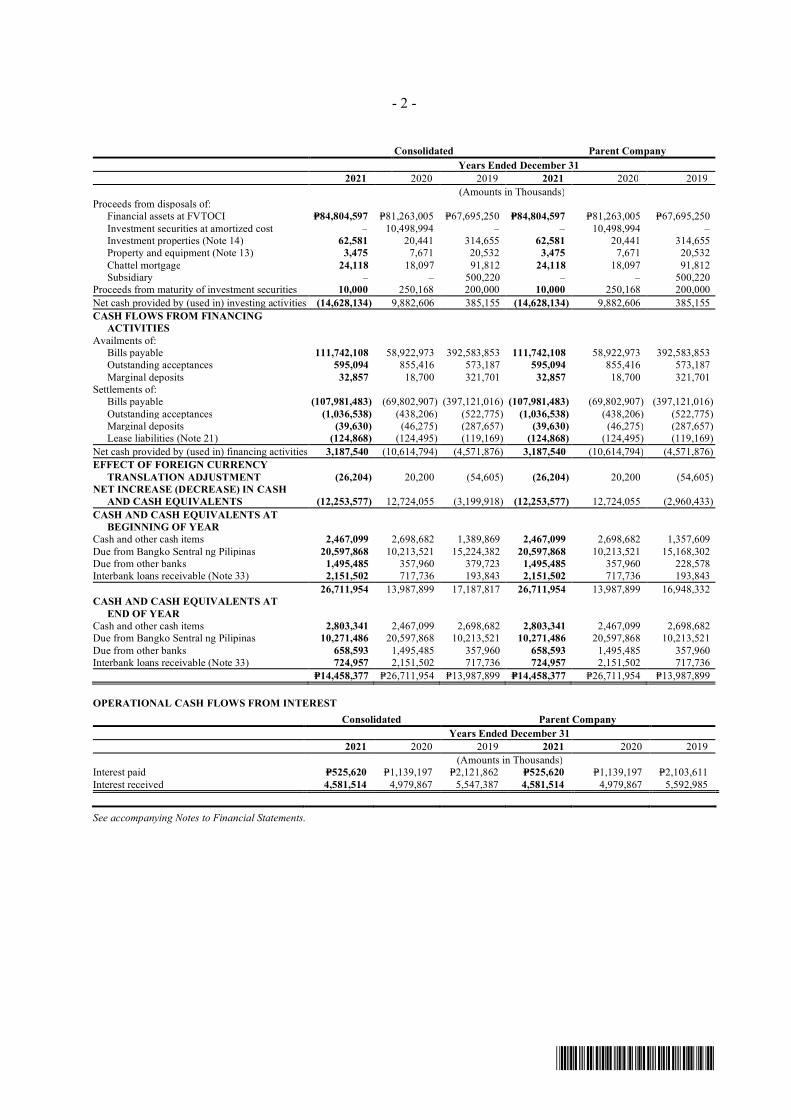
*SGVFS164641*
- 2 -
Consolidated Parent Company
Years Ended December 31
2021 2020 2019 2021 2020 2019
(Amounts in Thousands)Proceeds from disposals of:
Financial assets at FVTOCI P=84,804,597 P=81,263,005 P=67,695,250 P=84,804,597 P=81,263,005 P=67,695,250
Investment securities at amortized cost – 10,498,994 – – 10,498,994 –Investment properties (Note 14) 62,581 20,441 314,655 62,581 20,441 314,655Property and equipment (Note 13) 3,475 7,671 20,532 3,475 7,671 20,532
Chattel mortgage 24,118 18,097 91,812 24,118 18,097 91,812Subsidiary – – 500,220 – – 500,220
Proceeds from maturity of investment securities 10,000 250,168 200,000 10,000 250,168 200,000
Net cash provided by (used in) investing activities (14,628,134) 9,882,606 385,155 (14,628,134) 9,882,606 385,155
CASH FLOWS FROM FINANCING
ACTIVITIES
Availments of:Bills payable 111,742,108 58,922,973 392,583,853 111,742,108 58,922,973 392,583,853Outstanding acceptances 595,094 855,416 573,187 595,094 855,416 573,187
Marginal deposits 32,857 18,700 321,701 32,857 18,700 321,701Settlements of:
Bills payable (107,981,483) (69,802,907) (397,121,016) (107,981,483) (69,802,907) (397,121,016)
Outstanding acceptances (1,036,538) (438,206) (522,775) (1,036,538) (438,206) (522,775)Marginal deposits (39,630) (46,275) (287,657) (39,630) (46,275) (287,657)Lease liabilities (Note 21) (124,868) (124,495) (119,169) (124,868) (124,495) (119,169)
Net cash provided by (used in) financing activities 3,187,540 (10,614,794) (4,571,876) 3,187,540 (10,614,794) (4,571,876)
EFFECT OF FOREIGN CURRENCY
TRANSLATION ADJUSTMENT (26,204) 20,200 (54,605) (26,204) 20,200 (54,605)NET INCREASE (DECREASE) IN CASH
AND CASH EQUIVALENTS (12,253,577) 12,724,055 (3,199,918) (12,253,577) 12,724,055 (2,960,433)
CASH AND CASH EQUIVALENTS AT
BEGINNING OF YEAR
Cash and other cash items 2,467,099 2,698,682 1,389,869 2,467,099 2,698,682 1,357,609
Due from Bangko Sentral ng Pilipinas 20,597,868 10,213,521 15,224,382 20,597,868 10,213,521 15,168,302Due from other banks 1,495,485 357,960 379,723 1,495,485 357,960 228,578Interbank loans receivable (Note 33) 2,151,502 717,736 193,843 2,151,502 717,736 193,843
26,711,954 13,987,899 17,187,817 26,711,954 13,987,899 16,948,332CASH AND CASH EQUIVALENTS AT
END OF YEAR
Cash and other cash items 2,803,341 2,467,099 2,698,682 2,803,341 2,467,099 2,698,682Due from Bangko Sentral ng Pilipinas 10,271,486 20,597,868 10,213,521 10,271,486 20,597,868 10,213,521
Due from other banks 658,593 1,495,485 357,960 658,593 1,495,485 357,960Interbank loans receivable (Note 33) 724,957 2,151,502 717,736 724,957 2,151,502 717,736
P=14,458,377 P=26,711,954 P=13,987,899 P=14,458,377 P=26,711,954 P=13,987,899
OPERATIONAL CASH FLOWS FROM INTEREST
Consolidated Parent Company
Years Ended December 31
2021 2020 2019 2021 2020 2019
(Amounts in Thousands)Interest paid P=525,620 P=1,139,197 P=2,121,862 P=525,620 P=1,139,197 P=2,103,611
Interest received 4,581,514 4,979,867 5,547,387 4,581,514 4,979,867 5,592,985
See accompanying Notes to Financial Statements.

*SGVFS164641*
PHILIPPINE BANK OF COMMUNICATIONS AND SUBSIDIARY
NOTES TO FINANCIAL STATEMENTS
1. Corporate Information
Philippine Bank of Communications (the Parent Company) is a publicly listed domestic commercialbank organized in the Philippines, primarily to engage in commercial banking services such asdeposit products, loans and trade finance, domestic and foreign fund transfers, treasury, foreignexchange and trust services.
The Parent Company’s principal place of business is at the PBCOM Tower, 6795 Ayala Avenuecorner V. A. Rufino Street, Makati City. It has a network of 91 regular branches and 4 branch-liteunits, 89 regular branches and 4 branch-lite units to serve its customers, as at December 31, 2021 and2020, respectively.
The Parent Company’s original Certificate of Incorporation was issued by the Securities andExchange Commission (SEC) on August 23, 1939. On June 21, 1988, the Board of Directors (BOD)of the Parent Company approved the amendment of Article IV of its Amended Articles ofIncorporation to extend the corporate life of the Parent Company for another 50 years or up toAugust 23, 2039. The Amended Articles of Incorporation was approved by the SEC onNovember 23, 1988.
The Parent Company acquired a license to operate as an expanded commercial bank from the BangkoSentral ng Pilipinas (BSP) on December 24, 1993. On March 31, 2000, the BSP’s Monetary Boardapproved the amendment of the Parent Company’s license to a regular commercial banking.
The Monetary Board, in its Resolution No. 96 dated 20 January 2022, approved the grant of auniversal banking license to Parent Company, subject to compliance with certain regulatoryrequirements including the amendment of the Bank's charter documents. On March 15, 2022, theBank held a special stockholders' meeting to approve the changes to the Bank's Articles ofIncorporation to reflect the upgrade of its banking license.
The BSP shall issue a Certificate of Authority to operate as a universal bank once all regulatoryconditions are complied with.
The Parent Company’s subsidiaries and an associate (collectively referred to as the Group) areengaged in the following businesses:
Effective Percentageof Ownership
Principal Place ofBusiness and Countryof IncorporationEntity 2021 2020 Line of Business
Subsidiaries
PBCom Rural Bank, Inc. (formerlyBanco Dipolog, Inc. A Rural Bank(BDI)) (PRBI)
– – Philippines Rural Bank
PBCom Insurance Services Agency, Inc.(PISAI)
100.00% 100.00% Philippines Insurance Agent
Associate
PBCom Finance Corporation (PBComFinance)
40.00% 40.00% Philippines Financing Company

- 2 -
*SGVFS164641*
Sale of PRBIOn July 29, 2019, PBCOM sold its stake in PBCom Rural Bank, Inc. as it consolidates its efforts andresources at the parent company level. As of December 31, 2021 and 2020, the Parent Company andPISAI comprise the consolidated financial statements of the Group (Note 7).
Retirement of Business Operations of PISAIOn January 11, 2021, the BOD of the Parent Company approved the dissolution and retirement ofbusiness of PISAI. PISAI, which has been inactive for the past 3 years, has continuously remainedinactive but continued to incur operating expenses. The Parent Company does not see any need forthe subsidiary and has decided to retire the business operations.
The Company has received clearances in relation to shortening of its corporate life from the InsuranceCommission and the Makati Local Government last May 26, 2021 and September 30, 2021,respectively. Clearances from other regulatory agencies are currently being processed as ofDecember 31, 2021.
2. Summary of Significant Accounting and Financial Reporting Policies
Basis of PresentationThe financial statements have been prepared on a historical cost basis, except for financial assets atfair value through profit or loss (FVTPL), financial assets at fair value through other comprehensiveincome (FVTOCI) and derivatives that are measured at fair value. The financial statements arepresented in Philippine peso (PHP or P=) and all values are rounded to the nearest thousand, unlessotherwise stated.
The financial statements of the Parent Company include the accounts maintained in the RegularBanking Unit (RBU) and Foreign Currency Deposit Unit (FCDU). The functional currency of theRBU and the FCDU is the PHP and United States dollar (USD), respectively. For financial reportingpurposes, FCDU accounts and foreign currency-denominated accounts in the RBU are translated intotheir equivalents in PHP, which is the Parent Company’s presentation currency (see accounting policyon Foreign Currency Translation). The financial statements individually prepared for these units arecombined after eliminating inter-unit accounts and transactions.
Each entity in the Group determines its own functional currency and items included in the financialstatements of each entity are measured using that functional currency. The functional currency of theParent Company’s subsidiary is the PHP.
Statement of ComplianceThe financial statements have been prepared in accordance with Philippine Financial ReportingStandards (PFRS).
Presentation of Financial StatementsThe Group and the Parent Company present its statement of financial position in order of liquidity.An analysis regarding recovery or settlement within 12 months after the statement of financialposition date (current) and more than 12 months after the statement of financial position date (non-current) is presented in Note 22.
- 3 -
*SGVFS164641*
Basis of ConsolidationThe consolidated financial statements comprise the financial statements of the Parent Company andits subsidiary. The consolidated financial statements of the Group are prepared for the same reportingyear as the Parent Company using consistent accounting policies. The subsidiary is consolidatedfrom the date on which control is transferred to the Parent Company. The Parent Company controlsan investee if, and only if, the Parent Company has:
Power over the investee (that is, existing rights that give it the current ability to direct the relevantactivities of the investee);
Exposure, or rights, to variable returns from its involvement with the investee; and
The ability to use its power over the investee to affect its returns.
Generally, there is a presumption that a majority of voting rights result in control. To support thispresumption and when the Parent Company has less than a majority of the voting or similar rights ofan investee, the Parent Company considers all relevant facts and circumstances in assessing whetherit has power over an investee, including:
The contractual arrangement with the other vote holders of the investee;
Rights arising from other contractual agreements; and
The Parent Company’s voting rights and potential voting rights.
The Parent Company re-assesses whether or not it controls an investee if facts and circumstancesindicate that there are changes to one or more of the three elements of control. Consolidation of asubsidiary begins when the Parent Company obtains control over the subsidiary and ceases when theParent Company loses control of the subsidiary. Assets, liabilities, income, expenses and othercomprehensive income (OCI) of a subsidiary acquired or disposed of during the year are included inthe consolidated financial statements from the date the Parent Company gains control until the datethe Parent Company ceases to control the subsidiary.
When necessary, adjustments are made to the financial statements of subsidiary to align theiraccounting policies with the Parent Company’s accounting policies. All intra-group assets, liabilities,equity, income, expenses and cash flows relating to transactions between entities in the Group areeliminated in full on consolidation.
A change in ownership interest of a subsidiary, without loss of control, is accounted for within equityas an adjustment to ‘Additional paid-in capital’. In such circumstances, the carrying amounts of thecontrolling and non-controlling interests are adjusted by the Group to reflect the changes in itsrelative interests in the subsidiary. Any difference between the amount by which the non-controllinginterests are adjusted and the fair value of the consideration paid or received is recognized directly inequity and attributed to the owners of the Parent Company.
When a change in ownership interest in a subsidiary occurs, which results in loss of control over thesubsidiary, the Parent Company:
Derecognizes the assets (including goodwill) and liabilities of the subsidiary;
Derecognizes the carrying amount of any non-controlling interest;
Derecognizes the related OCI recorded in equity and recycle the same to the statement of incomeor surplus;
Recognizes the fair value of the consideration received;
Recognizes the fair value of any investment retained; and
Recognizes any surplus or deficit in the statement of income.

- 4 -
*SGVFS164641*
Non-controlling InterestsNon-controlling interests represent the portion of profit or loss and net assets not owned, directly orindirectly, by the Parent Company.
Non-controlling interests are presented separately in the consolidated statement of income,consolidated statement of comprehensive income, and within equity in the consolidated statement offinancial position, separately from equity attributable to the equity holders of the Parent Company.Any losses applicable to the non-controlling interests are allocated against the interests of the non-controlling interests even if this results in the non-controlling interests having a deficit balance.
Changes in Accounting Policies and DisclosuresThe accounting policies adopted are consistent with those of the previous financial year, except forthe adoption of new standards and amendments effective as of January 1, 2021. The Group did notearly adopt any other standard, interpretation or amendment that has been issued but is not yeteffective.
Unless otherwise indicated, adoption of these new standards did not have an impact on the financialstatements of the Group.
Amendments to PFRS 9, PFRS 7, PFRS 4 and PFRS 16, Interest Rate Benchmark Reform –
Phase 2
The amendments provide the following temporary reliefs which address the financial reportingeffects when an interbank offered rate (IBOR) is replaced with an alternative nearly risk-freeinterest rate (RFR):
o Practical expedient for changes in the basis for determining the contractual cash flows as aresult of IBOR reform
o Relief from discontinuing hedging relationshipso Relief from the separately identifiable requirement when an RFR instrument is designated as
a hedge of a risk component
Amendment to PFRS 16, COVID-19-related Rent Concessions beyond 30 June 2021
The amendment provides relief to lessees from applying the PFRS 16 requirement on leasemodifications to rent concessions arising as a direct consequence of the COVID-19 pandemic. Alessee may elect not to assess whether a rent concession from a lessor is a lease modification if itmeets all of the following criteria:o The rent concession is a direct consequence of COVID-19;o The change in lease payments results in a revised lease consideration that is substantially the
same as, or less than, the lease consideration immediately preceding the change;o Any reduction in lease payments affects only payments originally due on or before
June 30, 2022; ando There is no substantive change to other terms and conditions of the lease.
A lessee that applies this practical expedient will account for any change in lease paymentsresulting from the COVID-19 related rent concession in the same way it would account for achange that is not a lease modification, i.e., as a variable lease payment.
The amendment is effective for annual reporting periods beginning on or after April 1, 2021.Early adoption is permitted.

- 5 -
*SGVFS164641*
Foreign Currency Translation
RBU
As of the statement of financial position date, foreign currency-denominated monetary assets andmonetary liabilities of the RBU are translated into PHP based on the Bankers Association of thePhilippines (BAP) closing rate prevailing at the statement of financial position date and foreigncurrency-denominated income and expenses, based on the spot rate at date of transactions. Foreignexchange differences arising from the restatement of foreign currency-denominated monetary assetsand liabilities in the RBU are credited to or charged against the statement of income in the year inwhich the rates change. Non-monetary items that are measured in terms of historical cost in a foreigncurrency are translated using the exchange rates as of the dates of the initial transactions. Non-monetary items measured at fair value in a foreign currency are translated using the exchange rates atthe date when the fair value was determined.
FCDUAs of the statement of financial position date, the FCDU’s assets and liabilities are translated intoPHP, the Parent Company’s presentation currency, at the BAP closing rate prevailing at the statementof financial position date, and income and expenses are translated at BAP weighted average rate.Exchange differences arising on translation are taken directly to the statement of comprehensiveincome as ‘Cumulative translation adjustment’. Upon actual remittance of FCDU profits to RBU, thedeferred cumulative amount recognized in the statement of comprehensive income is recognized inthe statement of income.
Fair Value MeasurementFair value is the price that would be received to sell an asset or paid to transfer a liability in an orderlytransaction between market participants at the measurement date. The fair value measurement isbased on the presumption that the transaction to sell the asset or transfer the liability takes placeeither:
In the principal market for the asset or liability; or
In the absence of a principal market, in the most advantageous market for the asset or liability.
The principal or the most advantageous market must be accessible by the Group.
The fair value of an asset or a liability is measured using the assumptions that market participantswould use when pricing the asset or liability, assuming that market participants act in their economicbest interest.
A fair value measurement of a non-financial asset takes into account a market participant’s ability togenerate economic benefits by using the asset in its highest and best use or by selling it to anothermarket participant that would use the asset in its highest and best use.
The Group uses valuation techniques that are appropriate in the circumstances and for whichsufficient data are available to measure fair value, maximizing the use of relevant observable inputsand minimizing the use of unobservable inputs.
All assets and liabilities for which fair value is measured or disclosed in the financial statements arecategorized within the fair value hierarchy, described as follows, based on the lowest level input thatis significant to the fair value measurement as a whole:
Level 1 - Quoted (unadjusted) market prices in active markets for identical assets or liabilities
Level 2 - Valuation techniques for which the lowest level input that is significant to the fair valuemeasurement is directly or indirectly observable
- 6 -
*SGVFS164641*
Level 3 - Valuation techniques for which the lowest level input that is significant to the fair valuemeasurement is unobservable
For assets and liabilities that are recognized in the financial statements on a recurring basis, the Groupdetermines whether transfers have occurred between Levels in the hierarchy by re-assessingcategorization (based on the lowest level input that is significant to the fair value measurement as awhole) at the end of each statement of financial position date.
External and internal valuers are involved for the valuation of investment properties. Selectioncriteria include market knowledge, reputation, independence, relevant accreditation, and whetherprofessional standards are maintained.
For the purpose of fair value disclosures, the Group has determined classes of assets and liabilities onthe basis of the nature, characteristics and risks of the asset and liability, and fair value hierarchy asexplained above.
Cash and Cash EquivalentsFor purposes of reporting cash flows, cash and cash equivalents include cash and other cash items,amounts due from BSP and other banks, and interbank loans receivable and securities purchasedunder resale agreements (SPURA) with original maturities of three months or less from dates ofplacements and that are subject to insignificant risks of changes in value. Due from BSP includes thestatutory reserves required by the BSP which the Group considers as cash equivalents sincewithdrawals can be made to meet the Group’s cash requirements as allowed by the BSP. Thecomponents of cash and cash equivalents are shown in the statement of cash flows. Cash and cashequivalents are carried at amortized cost in the statement of financial position.
SPURAThe Group enters into short-term purchases of securities under resale agreements of identicalsecurities with the BSP. Resale agreements are contracts under which a party purchases securitiesand resells such securities to the same selling party at a specified future date at a fixed price. Theamounts advanced under resale agreements are carried as SPURA in the statement of financialposition. SPURA are carried at cost. Interest earned on resale agreements is reported as ‘Interestincome’ in the statement of income.
Financial Instruments - Date of RecognitionThe Group recognizes financial instruments when, and only when, it becomes a party to thecontractual terms of the instrument. Purchases or sales of financial assets that require delivery ofassets within the time frame established by regulation or convention in the marketplace arerecognized on the settlement date. Settlement date accounting refers to:a. The recognition of an asset on the day it is received by the Group; andb. The derecognition of an asset and recognition of any gain or loss on disposal on the day that such
asset is delivered by the Group.
Any change in fair value of unrecognized financial asset is recognized in the statement of income orin equity, depending on the classification of the financial asset. Loans and receivables are recognizedwhen cash is advanced to the borrowers while financial liabilities are recognized when cash isreceived by the Group.

- 7 -
*SGVFS164641*
Classification, Measurement and Reclassification of Financial AssetsClassification and measurement of financial assetsFor purposes of classifying financial assets, an instrument is an ‘equity instrument’ if it is a non-derivative and meets the definition of ‘equity’ for the issuer (under PAS 32, Financial Instruments:
Presentation). All other non-derivative financial instruments are ‘debt instruments’.
Financial assets are classified, at initial recognition, as subsequently measured at amortized cost,FVTOCI, and FVTPL. The classification depends on the financial asset’s contractual cash flowcharacteristics and the Group’s business model for managing them.
In order for a financial asset to be classified and measured at amortized cost or FVTOCI, it needs togive rise to cash flows that are solely payments of principal and interest (SPPI) on the principalamount outstanding. This assessment is referred to as the SPPI test and is performed at an instrumentlevel.
The Group’s business model for managing financial assets refers to how it manages its financialassets in order to generate cash flows. The business model determines whether cash flows will resultfrom collecting contractual cash flows, selling the financial assets, or both.
Business model test
The Group determines its business model at the level that best reflects how it manages groups offinancial assets to achieve its business objective.
The Group’s business model is not assessed on an instrument-by-instrument basis, but at a higherlevel of aggregated portfolios and is based on observable factors such as:
How the performance of the business model and the financial assets held within that businessmodel are evaluated and reported to the Group’s key management personnel
The risks that affect the performance of the business model and the financial assets held withinthat business model and, in particular, the way those risks are managed
How managers of the business are compensated (for example, whether the compensation is basedon the fair value of the assets managed or on the contractual cash flows collected)
The expected frequency, value and timing of sales are also important aspects of the Group’sassessment
The business model assessment is based on reasonably expected scenarios without taking ‘worst case’or stress case’ scenarios into account. If cash flows after initial recognition are realized in a way thatis different from the Group’s original expectations, the Group does not change the classification ofthe remaining financial assets held in that business model, but incorporates such information whenassessing newly originated or newly purchased financial assets going forward.
SPPI test
As a second step of its classification process, the Group assesses the contractual terms of financialinstruments to identify whether they meet the SPPI test.
‘Principal’ for the purpose of this test is defined as the fair value of the financial asset at initialrecognition and may change over the life of the financial asset (for example, if there are repaymentsof principal or amortization of the premium/discount).

- 8 -
*SGVFS164641*
The most significant elements of interest within a lending arrangement are typically the considerationfor the time value of money and credit risk. To make the SPPI assessment, the Group appliesjudgment and considers relevant factors such as the currency in which the financial asset isdenominated, and the period for which the interest rate is set.
In contrast, contractual terms that introduce a more than de minimis exposure to risks or volatility inthe contractual cash flows that are unrelated to a basic lending arrangement do not give rise tocontractual cash flows that are SPPI on the amount outstanding. In such cases, the financial asset isrequired to be measured at FVTPL.
a. Financial Assets at Amortized CostFinancial assets are measured at amortized cost if both of the following conditions are met:
The asset is held within a business model with the objective to hold assets in order to collectcontractual cash flows; and
The contractual terms of the instrument give rise on specified dates to cash flows that areSPPI on the principal amount outstanding.
Financial assets meeting these criteria are measured initially at fair value plus transaction costs.These are subsequently measured at amortized cost using the effective interest rate (EIR) method,less allowance for credit losses, with the interest calculated recognized as ‘Interest income’ in thestatement of income. Gains and losses are recognized in the statement of income when thefinancial assets are derecognized and impaired, as well as through the amortization process. Theexpected credit losses (ECL) are recognized in the statement of income under Provision forimpairment and credit losses - net. The effects of revaluation of foreign currency denominatedinvestments are recognized in statement of income. Gains or losses arising from disposals ofthese instruments are included in Gain on sale of financial assets at amortized cost in thestatement of income.
The Group classified ‘Cash and other cash items’, ‘Due from BSP’, ‘Due from other banks’,‘Interbank loans receivable and SPURA’, ‘Loans and receivables’, ‘Investment securities atamortized cost’ and certain financial assets under ‘Other assets’ as financial assets at amortizedcost.
The Group may irrevocably elect at initial recognition to classify a financial asset that meets theamortized cost criteria above as at FVTPL if that designation eliminates or significantly reducesan accounting mismatch had the financial asset been measured at amortized cost. As ofDecember 31, 2021 and 2020, the Group has not made such designation.
b. Financial Assets at FVTOCIFinancial assets at FVTOCI include debt and equity securities.
Debt Instruments at FVTOCIThe Group applies the category of debt instruments measured at FVTOCI when both thefollowing conditions are met:
The instrument is held within a business model, the objective of which is achieved by bothcollecting contractual cash flows and selling financial assets; and
The contractual terms of the financial asset meet the SPPI test.

- 9 -
*SGVFS164641*
The initial measurement of these financial instruments includes transaction costs. Subsequently,these are measured at fair value with gains or losses arising due to changes in fair valuerecognized in OCI under ‘Unrealized gain on financial assets carried at FVTOCI’. Interestincome and foreign exchange gains and losses are recognized in the statement of income in thesame manner as for financial assets measured at amortized cost. When the Group holds morethan one investment in the same security, these are deemed to be disposed of on a first-in, first-out basis. On derecognition, cumulative gains or losses recognized in OCI are reclassified fromOCI to the statement of income.
Equity Instruments at FVTOCIAt initial recognition, the Group can make an irrevocable election (on an instrument-by-instrument basis) to designate equity instruments at FVTOCI. Designation at FVTOCI is notpermitted if the investment in equity instrument is held for trading.
Investments in equity instruments at FVTOCI are initially measured at fair value plus transactioncosts. Subsequently, these are measured at fair value, with no deduction for sale or disposalcosts. Gains and losses arising from changes in fair value are recognized in OCI and accumulatedin ‘Unrealized gain on financial assets carried at FVTOCI’ in the statement of financial position.When the asset is disposed of, the cumulative gain or loss previously recognized in ‘Unrealizedgain on financial assets carried at fair value through other comprehensive income’ is notreclassified to the statement of income, but is reclassified to ‘Deficit’.
Dividends earned on these investments in equity instruments are recognized in the statement ofincome when the Group’s right to receive the dividends is established in accordance withPFRS 9, unless the dividends clearly represent recovery of a part of the cost of the investment.Dividends earned are recognized in the statement of income, under ‘Miscellaneous income’.
c. Financial Assets at FVTPLDebt instruments that do not meet the amortized cost or FVTOCI criteria, or that meet the criteriabut the Group has chosen to designate as at FVTPL at initial recognition, are measured atFVTPL.
Investments in equity instruments are classified as at FVTPL, unless the Group designates anequity instrument that is not held for trading as at FVTOCI at initial recognition.
The Group’s financial assets at FVTPL include government securities held for trading purposes.
As of December 31, 2021 and 2020, the Group has not designated any debt instrument that meetsthe amortized cost or FVTOCI criteria as at FVTPL.
Financial assets at FVTPL are carried at fair value, with net changes in fair value recognized as‘Trading and securities gain (loss) - net’ in the statement of income. Interest earned on theseinvestments is reported as ‘Interest income’ in the statement of income.
The fair value of financial assets denominated in a foreign currency is determined in that foreigncurrency and translated at the BAP closing rate prevailing at the statement of financial positiondate. The foreign exchange component forms part of its fair value gain or loss.

- 10 -
*SGVFS164641*
d. Derivative InstrumentsDerivative instruments are initially recorded at fair value and carried as financial assets whentheir fair value is positive and as financial liabilities when their fair value is negative.
Any gains or losses arising from changes in fair value of derivative instruments that do notqualify for hedge accounting are taken directly to the statement of income.
An embedded derivative is a component of a hybrid instrument that also includes a non-derivative host contract with the effect that some of the cash flows of the combined instrumentvary in a way similar to a stand-alone derivative. An embedded derivative causes some or all ofthe cash flows that otherwise would be required by the contract to be modified according to aspecified interest rate, financial instrument price, commodity price, foreign exchange rate, indexof prices or rates, credit rating or credit index, or other variable, provided that, in the case of anon-financial variable, it is not specific to a party to the contract. A derivative that is attached to afinancial instrument, but is contractually transferable independently of that instrument, or has adifferent counterparty from that instrument, is not an embedded derivative, but a separatefinancial instrument. The Group assesses the existence of an embedded derivative on the date itfirst becomes a party to the contract, and performs re-assessment only when there is a change tothe contract that significantly modifies the contractual cash flows.
Reclassification of financial assets
The Group can reclassify financial assets if the objective of its business model for managing thosefinancial assets changes. The Group is required to reclassify as follows:
From amortized cost or FVTOCI to FVTPL, if the objective of the business model changes sothat the amortized cost or FVTOCI criteria are no longer met;
From FVTPL to amortized cost or FVTOCI, if the objective of the business model changes sothat the amortized cost or FVTOCI criteria start to be met and the characteristics of theinstrument’s contractual cash flows are SPPI; and
From amortized cost to FVTOCI if the business model changes so that the objective becomesboth to collect contractual cash flows and to sell or from FVTOCI to amortized cost if thebusiness model becomes solely for the collection of contractual cash flows.
Reclassification of financial assets designated as at FVTPL or equity financial assets at FVTOCI atinitial recognition is not permitted.
A change in the objective of the Group’s business model must be effected before the reclassificationdate. The reclassification date is the beginning of the next reporting period following the change inthe business model.
Impairment of Financial Assets
ECL represent credit losses that reflect an unbiased and probability-weighted amount which is basedon reasonable and supportable information about past events, current conditions and forecasts offuture economic conditions, and the time value of money. The objective is to record lifetime losseson all financial instruments which have experienced a significant increase in credit risk (SICR) sincetheir initial recognition. As a result, ECL allowances are measured at amounts equal to either (i) 12-month ECL or (ii) lifetime ECL for those financial instruments which have experienced a SICR sinceinitial recognition (General Approach). The 12-month ECL is the portion of lifetime ECL that resultsfrom default events on a financial instrument that are possible within the next 12 months after thereporting date. Lifetime ECLs are credit losses that result from all possible default events over theexpected life of a financial instrument.

- 11 -
*SGVFS164641*
Both the 12-month ECL and lifetime ECL are calculated on either an individual basis or a collectivebasis, depending on the nature of the underlying portfolio of financial instruments.
The Group has established a policy to perform an assessment, at the end of each reporting period, ofwhether a financial instrument’s credit risk has increased significantly since initial recognition, byconsidering the change in the risk of default occurring over the remaining life of the instrument.Based on this process, the Group categorizes its credit exposures into Stage 1, Stage 2 and Stage 3, asdescribed below:
Stage 1: When loans are first recognized, the Group recognizes an allowance based on the 12-month ECL. Stage 1 loans also include facilities where the credit risk has improved and the loanhas been reclassified from Stage 2.
Stage 2: When a loan has shown a SICR since origination, the Group records an allowance forlifetime ECL. Stage 2 loans also include facilities, where the credit risk has improved and theloan has been reclassified from Stage 3.
Stage 3: Loans considered as credit-impaired or non-performing. The Group records anallowance for lifetime ECL.
The major portfolios of financial assets identified upon initial analysis of the Group’s creditexposures are loan receivables and treasury accounts. Loan receivables are availed by corporations orspecific individuals. Hence, this portfolio is further segmented to corporate and consumer portfolios.
Definition of ‘default’ and ‘cure’
Loan receivables
The Group defines a financial instrument as in default based on the following:
Loans and receivables which are past due for more than 90 days;
There is a breach of any key covenants/agreements that will adversely affect the borrower’scapacity to pay;
Weak financial condition and results of operations that leads to the borrower’s inability togenerate sufficient cash flow for debt servicing; or
Restructuring of principal and interest or any concession granted by the Group relating to theborrower’s difficulty.
A financial instrument is considered to be no longer in default (that is, to have cured) when it nolonger meets any of the default criteria and has exhibited a satisfactory track record.
Treasury exposures
Treasury exposures are considered in default upon occurrence of a credit event, such as but notlimited to bankruptcy, failure of meeting its obligations to depositors and non-deposit obligations,becoming critically undercapitalized, restructuring of obligations, or request for moratorium.
Credit risk at initial recognition
The Group uses an internal credit assessment and approvals at various levels to determine the creditrisk of exposures at initial recognition. Assessment can be quantitative or qualitative and depends onthe materiality of the facility or the complexity of the portfolio to be assessed.
SICRThe criteria for determining whether credit risk has increased significantly vary by portfolio andinclude quantitative changes in probabilities of default and qualitative factors, including a 30-daybackstop based on delinquency. The credit risk of a particular exposure is deemed to have increasedsignificantly since initial recognition if, based on the Group’s internal credit risk assessment, theborrower or counterparty is determined to require close monitoring or with well-defined credit

- 12 -
*SGVFS164641*
weaknesses. For exposures without internal grades, if contractual payments are more than 30 dayspast due, the credit risk is deemed to have increased significantly since initial recognition. Days pastdue are determined by counting the number of days since the earliest elapsed due date in respect ofwhich full payment has not been received. Due dates are determined without considering any graceperiod that might be available to the borrower.
For other credit risk exposures such as cash in banks, interbank loans and receivables, and debtsecurities at amortized cost and at FVTOCI, the Group applies the low credit risk simplification. TheGroup considers a debt financial asset to have low risk when its credit rating is equivalent to thedefinition of investment grade. The Group evaluates whether the debt financial asset, on anindividual basis, is considered to have low credit risk using all reasonable and supportableinformation that is available without undue cost or effort.
In subsequent reporting periods, if the credit risk of the financial instrument improves such that thereis no longer a SICR since initial recognition, the Group shall revert to recognizing a 12-month ECL:
For corporate loans, an account under Stage 3 may be reverted back to Stage 2 if it showscollection history of at least six consecutive payments. If an account continuous to showscollection history of another 6 consecutive payments, and other qualitative indicators representingsubstantial increase in credit risk has abated, the account will be further reverted back to Stage 1.
For consumer loans, an account under Stage 3 may be reverted back to Stage 2 if at leastsix consecutive payments are received and days past due bucket improves to 31 to 90. If thestatus of an account further improves to current, it will be reverted back to Stage 1.
For treasury exposures, the transfer from Stage 3 to Stage 2 must be evident with payments ofinterest and/or principal for at least six months. The Group shall transfer credit exposures fromStage 2 to Stage 1 if the rating upgrades and the resulting rating falls under investment graderating bands.
RestructuringIn certain circumstances, the Group modifies the original terms and conditions of a credit exposure toform a new loan agreement or payment schedule. The modifications can be given depending on theborrower’s or counterparty’s current or expected financial difficulty. The modifications may include,but are not limited to, change in interest rate and terms, principal amount, maturity date, date andamount of periodic payments and accrual of interest and charges. Distressed restructuring withindications of unlikeliness to pay are categorized as impaired accounts and are moved to Stage 3.
ECL parameters and methodologies
ECL is a function of the probability of default (PD), exposure at default (EAD) and loss given default(LGD), with the timing of the loss also considered, and is estimated by incorporating forward-lookingeconomic information and through the use of experienced credit judgment.
The PD represents the likelihood that a credit exposure will not be repaid and will go into default ineither a 12-month horizon for Stage 1 or lifetime horizon for Stage 2. The PD for each individualtype of instrument is modelled based on historical data and is estimated based on current marketconditions and reasonable and supportable information about future economic conditions. The Groupsegmented its loan-related credit exposures based on homogenous risk characteristics and developed acorresponding PD methodology for each loan portfolio. The PD methodology for each relevantportfolio is determined based on the underlying nature or characteristic of the portfolio, behavior ofthe accounts and materiality of the segment as compared to the total portfolio. On the other hand, PDfor cash and cash equivalents, interbank loans receivables and SPURA, debt securities at amortizedcost and debt securities at FVTOCI are assessed on an individual basis using publicly availableinformation.

- 13 -
*SGVFS164641*
EAD is modelled on historical data and represents an estimate of the outstanding amount of creditexposure at the time a default may occur. Two modelling approaches were employed during EADestimation. A Balance-Based model for on-balance sheet accounts and a Credit Conversion Factor(CCF)-Based model for off-balance sheet accounts.
LGD is the amount that may not be recovered in the event of default and is modelled based onhistorical cash flow recovery and reasonable and supportable information about future economicconditions, where appropriate. LGD takes into consideration the amount and quality of any collateralheld. During LGD estimation, the discounted amounts of potential payments and expected recoveriesfrom sale of the collateral are compared to the discounted amounts of corresponding direct expensesrelated with obtaining and selling of assets.
Economic overlays
The Group incorporates economic overlays into both its assessment of whether the credit risk of aninstrument has increased significantly since its initial recognition and its measurement of ECL. Abroad range of economic overlays is considered as economic inputs, such as gross domestic product(GDP) growth rates, crude oil prices, inflation rates, business confidence index, household finalconsumption expenditure index, unemployment rates, interest rates and BSP statistical indicators.The inputs and models used for calculating ECL may not always capture all characteristics of themarket at the date of the financial statements. To reflect these, quantitative adjustments or overlaysare occasionally made as temporary adjustments when such differences are significantly material.
Debt instruments measured at FVTOCI
The ECLs for debt instruments measured at FVTOCI do not reduce the carrying amount of thesefinancial assets in the statement of financial position, which remains at fair value. Instead, an amountequal to the allowance that would arise if the assets were measured at amortized cost is recognized inOCI as an accumulated impairment amount, with a corresponding charge to the statement of income.The accumulated loss recognized in OCI is recycled to the statement of income upon derecognition ofthe assets.
Collateral valuation
To mitigate its credit risks on financial assets, the Group seeks to use collateral, if possible. Thecollateral comes in various forms, such as cash, securities, letters of credit/guarantees, real estate,receivables, inventories, other non-financial assets and credit enhancements. Collateral, unlessrepossessed, is not recorded on the Group’s statement of financial position. However, the fair valueof collateral affects the calculation of ECLs. It is generally assessed, at a minimum, at the inceptionand re-assessed annually.
To the extent possible, the Group uses active market data for valuing financial assets held ascollateral. Other financial assets which do not have readily determinable market values are valuedusing models. Non-financial collateral, such as real estate, is valued based on the data provided byinternal and external appraisers.
Write-offs
Financial assets are written off either partially or in their entirety only when the Group has stoppedpursuing the recovery.
Undrawn loan commitments
Undrawn loan commitments and letters of credit are commitments under which over the duration ofthe commitment, the Group is required to provide a loan with pre-specified terms to the customer.The nominal contractual value of undrawn loan commitments, where the loan agreed to be providedis on market terms, are not recorded in the statement of financial position. These contracts are in the

- 14 -
*SGVFS164641*
scope of the ECL requirements where the Group estimates the expected portion of the undrawn loancommitments that will be drawn over their expected life.
Classification and Measurement of Financial LiabilitiesFinancial liabilities are classified, at initial recognition, either as financial liabilities at FVTPL orother financial liabilities at amortized cost.
Financial liabilities at amortized costThese liabilities are classified as such when the substance of the contractual arrangement results inthe Group having an obligation either to deliver cash or another financial asset to the holder, or tosatisfy the obligation other than by the exchange of a fixed amount of cash or another financial assetfor a fixed number of own equity shares. The components of issued financial instruments that containboth liability and equity elements are accounted for separately, with the equity component beingassigned the residual amount after deducting from the instrument as a whole the amount separatelydetermined as the fair value of the liability component on the date of issue.
These financial liabilities are measured initially at fair value, net of directly attributable transactioncosts. After initial measurement, these liabilities are subsequently measured at amortized cost usingthe effective interest method.
Amortized cost is calculated by taking into account any discount or premium on the issue and feesthat are an integral part of the EIR.
This accounting policy relates to the statement of financial position captions ‘Deposit liabilities’,‘Bills payable’, ‘Outstanding acceptances’, ‘Manager’s checks’, and certain financial liabilities under‘Accrued interest, taxes and other expenses’ and ‘Other liabilities’ which are not designated atFVTPL.
Financial Guarantees, Letters of Credit and Undrawn Loan CommitmentsThe Group issues financial guarantees, letters of credit and loan commitments.
Financial guarantees are initially recognized in the financial statements at fair value, being thepremium received. Subsequent to initial recognition, the Group’s liability under each guarantee ismeasured at the higher of the amount initially recognized less cumulative amortization recognized inthe statement of income, and an ECL provision.
The premium received is recognized in the statement of income in ‘Service charges, fees andcommissions’ on a straight line basis over the life of the guarantee.
Undrawn loan commitments and letters of credits are commitments under which, over the duration ofthe commitment, the Group is required to provide a loan with pre-specified terms to the customer.Similar to financial guarantee contracts, these contracts are in the scope of the ECL requirements.
The nominal contractual value of financial guarantees, letters of credit and undrawn loancommitments, where the loan agreed to be provided is on market terms, are not recorded in thestatement of financial position.

- 15 -
*SGVFS164641*
Derecognition of Financial Assets and Financial Liabilities
Derecognition due to substantial modification of terms and conditions
The Group derecognizes a financial asset, such as a loan to a customer, when the terms andconditions have been renegotiated to the extent that, substantially, it becomes a new loan, with thedifference recognized as a derecognition gain or loss, to the extent that an impairment loss has notalready been recorded. The newly recognized loans are classified as Stage 1 for ECL measurementpurposes, unless the new loan is deemed to be purchased or originated credit impaired.
When assessing whether or not to derecognize a loan to a customer, amongst others, the Groupconsiders the following factors:
Change in the currency of the loan;
Introduction of an equity feature;
Change in counterparty; or
If the modification is such that the instrument would no longer meet the SPPI criterion.
The Group also performs a quantitative assessment similar to that being performed for modificationof financial liabilities. In performing the quantitative assessment, the Group considers the new termsof a financial asset to be substantially different if the present value of the cash flows under the newterms, including any fees paid net of any fees received and discounted using the original effectiveinterest rate, is at least 10% different from the present value of the remaining cash flows of theoriginal financial asset.
When the contractual cash flows of a financial asset are renegotiated or otherwise modified and therenegotiation or modification does not result in the derecognition of that financial asset, the Grouprecalculates the gross carrying amount of the financial asset as the present value of the renegotiated ormodified contractual cash flows discounted at the original EIR (or credit-adjusted EIR for purchasedor originated credit-impaired financial assets) and recognizes a modification gain or loss in thestatement of income.
When the modification of a financial asset results in the derecognition of the existing financial assetand the subsequent recognition of a new financial asset, the modified asset is considered a'new 'financial asset. Accordingly, the date of the modification shall be treated as the date of initialrecognition of that financial asset when applying the impairment requirements to the modifiedfinancial asset. The newly recognized financial asset is classified as Stage 1 for ECL measurementpurposes, unless the new financial asset is deemed to be originated as credit impaired (POCI).
Derecognition other than substantial modification
Financial Asset
A financial asset (or, when applicable, a part of a financial asset or part of a group of financial assets)is derecognized (that is, removed from the statement of financial position) when:
the rights to receive cash flows from the asset have expired;
the Group has transferred its rights to receive cash flows from the asset or has assumed anobligation to pay the received cash flows in full without material delay to a third party under a‘pass-through’ arrangement, and either the Group:a. Has transferred substantially all the risks and rewards of the asset; orb. Has neither transferred nor retained the risks and rewards of the asset, but has transferred the
control of the asset.

- 16 -
*SGVFS164641*
When the Group has transferred its rights to receive cash flows from an asset or has entered into apass-through arrangement, it evaluates if, and to what extent, it has retained the risks and rewards ofownership. When it has neither transferred nor retained substantially all of the risks and rewards ofthe asset, nor transferred control of the asset, the Group continues to recognize the transferred asset tothe extent of its continuing involvement. In that case, the Group also recognizes an associatedliability. The transferred asset and the associated liability are measured on a basis that reflects therights and obligations that the Group has retained.
Continuing involvement that takes the form of a guarantee over the transferred asset is measured atthe lower of the original carrying amount of the asset and the maximum amount of consideration thatthe Group could be required to pay.
Financial Liability
A financial liability is derecognized when the obligation under the liability is discharged or cancelledor expired. When an existing financial liability is replaced by another from the same lender onsubstantially different terms, or the terms of an existing liability are substantially modified, such anexchange or modification is treated as the derecognition of the original liability and the recognition ofa new liability. The difference between the carrying value of the original financial liability and theconsideration paid is recognized in the statement of income.
Exchange or modification of financial liabilities
The Group considers both qualitative and quantitative factors in assessing whether a modification offinancial liabilities is substantial or not. The terms are considered substantially different if the presentvalue of the cash flows under the new terms, including any fees paid net of any fees received anddiscounted using the original effective interest rate, is at least 10% different from the present value ofthe remaining cash flows of the original financial liability. However, under certain circumstances,modification or exchange of a financial liability may still be considered substantial, even where thepresent value of the cash flows under the new terms is less than 10% different from the present valueof the remaining cash flows of the original financial liability. There may be situations where themodification of the financial liability is so fundamental that immediate derecognition of the originalfinancial liability is appropriate (e.g., restructuring a financial liability to include an embedded equitycomponent).
When an existing financial liability is replaced by another from the same lender on substantiallydifferent terms, or the terms of an existing liability are substantially modified, such an exchange ormodification is treated as a derecognition of the original liability and the recognition of a newliability. The difference between the carrying value of the original financial liability and the fair valueof the new liability is recognized in profit or loss.
When the exchange or modification of the existing financial liability is not considered as substantial,the Group recalculates the gross carrying amount of the financial liability as the present value of therenegotiated or modified contractual cash flows discounted at the original EIR and recognizes amodification gain or loss in profit or loss.
If modification of terms is accounted for as an extinguishment, any costs or fees incurred arerecognized as part of the gain or loss on the extinguishment. If the modification is not accounted foras an extinguishment, any costs or fees incurred adjust the carrying amount of the financialinstrument and are amortized over the remaining term of the modified financial instrument.

- 17 -
*SGVFS164641*
Repurchase and reverse repurchase agreements
Securities sold under agreements to repurchase at a specified future date (‘repos’) are notderecognized from the statement of financial position. The corresponding cash received, includingaccrued interest, is recognized in the statement of financial position as a loan to the Group, reflectingthe economic substance of such transaction.
Offsetting of Financial InstrumentsFinancial assets and financial liabilities are offset and the net amount is reported in the statement offinancial position if there is a currently enforceable legal right to offset the recognized amounts andthere is intention to settle on a net basis, or to realize the asset and settle the liability simultaneously.The Group assesses that it has a currently enforceable right of offset if the right is not contingent on afuture event, and is legally enforceable in the normal course of business, event of default, and eventof insolvency or bankruptcy of the Group and all of the counterparties.
Investments in Subsidiary and an Associate in the Parent Company Financial StatementsSubsidiary
A subsidiary is an entity in which the Parent Company holds more than half of the issued sharecapital or controls more than 50% of the voting power, or exercises control over the operations andmanagement of the subsidiary.
Associate
An associate is an entity in which the Parent Company has significant influence. Significantinfluence is the power to participate in the financial and operating policy decisions of the investee,but does not have contro or joint control over those policies.
The Parent Company’s investments in its subsidiary and an associate and the Group’s investment inan associate are accounted for using the equity method. Under the equity method, the investments insubsidiary and an associate is initially recognized at cost. The carrying amount of the investments insubsidiary and an associate are adjusted to recognize changes in the Group’s and the ParentCompany’s share in the net assets of the subsidiary and an associate since the acquisition date.Goodwill relating to the subsidiary and an associate are included in the carrying value of theinvestments and is not amortized.
The statement of income reflects the Group’s and the Parent Company’s share of the results ofoperations of the subsidiary and an associate. Any change in OCI of the investee is presented as partof the Group’s and the Parent Company’s OCI. In addition, when there has been a change recognizeddirectly in the equity of the subsidiary or associate, the Group and the Parent Company recognizetheir share of any changes, when applicable, in the statement of changes in equity. Unrealized gainsand losses resulting from transactions between the Group and the subsidiaries and associate areeliminated to the extent of the interest in the subsidiaries and associate. The aggregate of the Group’sshare in net income (loss) of subsidiary and associate is shown in the statement of income andrepresents profit or loss after tax and non-controlling interests in the subsidiary and associate.
If the Parent Company’s share of losses in a subsidiary or an associate equals or exceeds its interest inthe subsidiary or associate, the Parent Company discontinues recognizing its share in further losses.
The financial statements of the subsidiary and an associate are prepared for the same reporting periodas the Group. When necessary, adjustments are made to bring the accounting policies in line withthose of the Group.
Dividends received are treated as a reduction to the carrying amount of the investments.

- 18 -
*SGVFS164641*
Post-acquisition changes in the share of net assets of the subsidiaries include the share in the:a. Income or losses; andb. Remeasurement losses or gains on retirement liability.
Property and EquipmentProperty and equipment, are stated at cost less accumulated depreciation and amortization and anyimpairment in value, except land, which is carried at cost less impairment in value.
The initial cost of property and equipment consists of its purchase price, including import duties,taxes and any directly attributable costs of bringing the asset to its working condition and location forits intended use. Expenditures incurred after the property and equipment have been put intooperation, such as repairs and maintenance, are charged against the statement of income in the year inwhich the costs are incurred. In situations where it can be clearly demonstrated that the expenditureshave resulted in an increase in the future economic benefits expected to be obtained from the use ofan item of property and equipment beyond its originally assessed standard of performance, theexpenditures are capitalized as an additional cost of property and equipment.
Depreciation on property and equipment is computed using the straight-line method based on theestimated useful life (EUL) of the depreciable assets.
EUL
Condominium properties 50 yearsBuildings and improvements 25 yearsFurniture, fixtures and equipment 5Leasehold improvements Shorter of 10 years or
related lease terms
The residual values, EULs and methods of depreciation and amortization of property and equipmentare reviewed at each reporting date and adjusted prospectively, if appropriate.
Fully depreciated property and equipment are retained in the accounts until these are no longer usedand no further depreciation and amortization is charged to the statement of income.
An item of property and equipment is derecognized upon disposal or when no future economicbenefits are expected from its use or disposal. Upon derecognition, the cost and the relatedaccumulated depreciation and amortization and any impairment in value of the asset are removedfrom the accounts, and any resulting gain or loss (calculated as the difference between the netdisposal proceeds and the carrying amount of the asset) is reflected as income or loss in the statementof income.
Investment PropertiesInvestment properties include condominium and office units for lease and foreclosed properties insettlement of loan receivables.
Condominium and office units for lease
Condominium and office units for lease are carried at cost, less accumulated depreciation andimpairment in value. All costs that are directly attributable to the acquisition and development ofproperty are capitalized, including borrowing costs incurred to finance the propertydevelopment. Depreciation is computed on a straight-line basis over 25 to 50 years.

- 19 -
*SGVFS164641*
Foreclosed properties
Foreclosed properties consist of land, building and improvements.
Land is carried at cost less impairment in value. Building and improvements are carried at cost,which is the fair value at acquisition date, less accumulated depreciation and accumulated impairmentlosses. Transaction costs, which include nonrefundable capital gains tax and documentary stamp tax,incurred in connection with foreclosure are capitalized as part of the carrying values of the foreclosedproperties.
Foreclosed properties are recorded as ‘Investment properties’ upon:a. Entry of judgment in case of judicial foreclosure;b. Execution of the Sheriff’s Certificate of Sale in case of extra-judicial foreclosure; orc. Notarization of the Deed of Dacion in case of dation in payment (dacion en pago).
The Group applies the cost model in accounting for foreclosed properties. Depreciation is computedon a straight-line basis over the EUL of 10 years for buildings and improvements.
The EUL of investment properties and the depreciation method are reviewed periodically to ensurethat the period and the method of depreciation are consistent with the expected pattern of economicbenefits from items of investment properties.
The carrying values of the investment properties are reviewed for impairment when events or changesin circumstances indicate that the carrying value may not be recoverable. If any such indicationexists and where the carrying values exceed the estimated recoverable amount, the investmentproperty or cash-generating units (CGUs) it is related to are written down to their recoverableamounts.
Transfers are made to investment property when, and only when, there is a change in use, evidencedby ending of owner-occupation, commencement of an operating lease to another party or ending ofconstruction or development. Transfers are made from investment property when, and only when,there is a change in use, evidenced by commencement of owner-occupation or commencement ofdevelopment with a view to sell.
Investment properties are derecognized when they have either been disposed of or when they arepermanently withdrawn from use and no future benefit is expected from its disposal. Any gains orlosses on retirement or disposal of investment properties are recognized in the statement of income inthe year of retirement or disposal under ‘Profit from assets sold’.
Intangible AssetsIntangible assets consist of goodwill, branch licenses and software costs.
Goodwill and branch licensesGoodwill acquired in a business combination is initially measured at cost being the excess of the costof the business combination over the Group’s interest in the fair value of the acquiree’s identifiableassets, liabilities and contingent liabilities. The cost of branch licenses acquired in a businesscombination is its fair value at the date of acquisition.
Following initial recognition, goodwill and branch licenses are measured at cost less any accumulatedimpairment losses.

- 20 -
*SGVFS164641*
Branch licenses have an indefinite useful life as there is no foreseeable limit to the period over whichthese assets are expected to generate net cash inflows. The assessment of indefinite life is reviewedannually to determine whether the indefinite life continues to be supportable. If not, the change inuseful life from indefinite to finite is made on a prospective basis.
Software costs
Software costs, which are purchased by the Group separately for use in its operations, are measuredon initial recognition at cost. Following initial recognition, software costs are carried at cost lessaccumulated amortization and any accumulated impairment losses.
Software costs are amortized over the economic useful life of 2 to 5 years. The amortization periodand method for software costs are reviewed at least at each statement of financial position date.Changes in the expected useful life or the expected pattern of consumption of future economicbenefits embodied in this asset is accounted for by changing the amortization period or method, asappropriate, and treated as changes in accounting estimates. The amortization expense on softwarecosts is recognized in the statement of income.
Gains or losses arising from the derecognition of an intangible asset are measured as the differencebetween the net disposal proceeds and the carrying amount of the asset and are recognized in thestatement of income when the asset is derecognized.
Impairment of Non-financial AssetsInvestments in subsidiary and an associate, property and equipment (including right-of-use assets)and software costs
At each statement of financial position date, the Group assesses whether there is any indication thatits non-financial assets may be impaired. When an indicator of impairment exists or when an annualimpairment testing for an asset is required, the Group makes a formal estimate of the recoverableamount.
Recoverable amount is the higher of an asset’s fair value less costs to sell and its value in use (VIU)and is determined for an individual asset, unless the asset does not generate cash inflows that arelargely independent from those other assets or groups of assets, in which case, the recoverableamount is assessed as part of the CGU to which it belongs.
When the carrying amount of an asset exceeds its recoverable amount, the asset is consideredimpaired and is written down to its recoverable amount.
In assessing VIU, the estimated future cash flows are discounted to their present value using a pre-taxdiscount rate that reflects current market assessments of the time value of money and the risksspecific to the asset.
An impairment loss is recognized only if the carrying amount of an asset exceeds its recoverableamount. An impairment loss is charged against the statement of income in the period in which itarises.
A previously recognized impairment loss is reversed only if there has been a change in the estimatesused to determine the recoverable amount of an asset, but not to an amount higher than the carryingamount that would have been determined (net of any depreciation and amortization) had noimpairment loss been recognized for the asset in prior years. A reversal of an impairment loss iscredited to the current statement of income.

- 21 -
*SGVFS164641*
Goodwill and branch licenses
Goodwill and branch licenses are reviewed for impairment annually or more frequently if events orchanges in circumstances indicate that the carrying value may be impaired.
Impairment is determined for goodwill and branch licenses by assessing the recoverable amount ofthe CGU (or group of CGUs) to which the goodwill and branch licenses relate. When the recoverableamount of the CGU (or group of CGUs) is less than the carrying amount of the CGU (or group ofCGUs) to which goodwill and branch licenses have been allocated, an impairment loss is recognizedimmediately in the statement of income. Impairment losses relating to goodwill cannot be reversedfor subsequent increases in its recoverable amount in future periods. For branch licenses, apreviously recognized impairment loss is reversed only if there has been a change in the estimatesused to determine the recoverable amount of this asset, but not to an amount higher than the carryingamount that would have been determined had no impairment loss been recognized for this asset inprior years.
Common Stock and Additional Paid-in CapitalCommon stocks are recorded at par. Proceeds in excess of par value are recognized under equity as‘Additional-paid-in capital’ in the statement of financial position. Incremental costs incurred whichare directly attributable to the issuance of new shares are shown in equity as a deduction fromproceeds, net of tax.
Subscribed Common StockSubscribed common stock is recognized at subscribed amount, net of subscription receivable. Thiswill be debited upon full payment of the subscription and issuance of the shares of stock.
Subscription ReceivableSubscription receivable refers to the total amount of subscription to be received. The ParentCompany accounted for the subscription receivable as a contra equity account.
Revenue RecognitionUnder PFRS 15, revenue from contracts with customers is recognized when control of the services istransferred to the customer at an amount that reflects the consideration to which the Group expects tobe entitled in exchange for those services. The Group exercises judgment, taking into considerationall of the relevant facts and circumstances when applying each step of the five-step model to contractswith customers.
The following specific recognition criteria must be met before revenue is recognized:
Revenue within the scope of PFRS 15
Fees and CommissionsLoan fees that are directly related to the acquisition and origination of loans are included in theinitial carrying amount of the loan and are amortized using the effective interest method over theterm of the loan. Loan commitment fees are recognized as earned over the term of the credit linesgranted to each borrower. Loan syndication fees are recognized upon completion of allsyndication activities and where the Group does not have further obligation to perform under thesyndication agreement.

- 22 -
*SGVFS164641*
Revenue outside the scope of PFRS 15
a. Interest IncomeInterest on interest-bearing financial assets at FVTPL are recognized based on contractual rate.Interest on financial instruments measured at amortized cost and debt instruments classified asFVTOCI is recognized based on the EIR method.
The EIR method is a method of calculating the amortized cost of a financial asset or a financialliability and allocating the interest income or interest expense over the relevant period.
The EIR is the rate that exactly discounts estimated future cash payments or receipts through theexpected life of the financial instrument or, when appropriate, a shorter period to the net carryingamount of the financial asset or financial liability.
When a financial asset becomes credit-impaired and is, therefore, regarded as Stage 3 (asdiscussed under ‘Impairment of financial assets’ above), the Group calculates interest income byapplying the EIR to the net amortized cost of the financial asset. If the financial asset cures and isno longer credit-impaired, the Group reverts to calculating interest income on a gross basis.
b. Trading and Securities Gain (Loss) - NetTrading and securities gain (loss) - net represents results arising from trading activities, includinggains and losses from changes in fair value of financial assets and liabilities at FVTPL. This alsorepresents results arising from sale of debt financial assets at FVOCI.
c. Service Charges and PenaltiesService charges and penalties are recognized only upon collection or accrued when there isreasonable degree of certainty as to its collectability.
d. DividendsDividends are recognized when the Group’s right to receive the payments is established.
e. RentalRental income arising from leased premises is accounted for on a straight-line basis over the leaseterms of ongoing leases.
Expense RecognitionExpenses are recognized at the same time as the initial recognition of a liability, or an increase in thecarrying amount of a liability, or the derecognition of an asset, or a decrease in the carrying amount ofan asset. Expenses are recognized in the statement of income:
On the basis of a direct association between the costs incurred and the earning of specific items ofincome;
On the basis of systematic and rational allocation procedures when economic benefits areexpected to arise over several accounting periods and the association can only be broadly orindirectly determined; or
Immediately when the expenditure produces no future economic benefits or when, and to theextent that, future economic benefits do not qualify or cease to qualify for recognition in thestatement of financial position as an asset.
Expenses in the statement of income are presented using the nature of expense method. General andadministrative expenses are costs attributable to administrative and other business activities of theGroup.
- 23 -
*SGVFS164641*
Interest ExpenseInterest expense for all interest-bearing financial liabilities are recognized in ‘Interest expense’ in thestatement of income using the EIR of the financial liabilities to which they relate to.
Retirement BenefitsDefined benefit plans
The Parent Company maintains defined benefit plans covering all of their respective officers andregular employees.
The net retirement liability is the aggregate of the present value of defined benefit obligation at thestatement of financial position date reduced by the fair value of plan assets and adjusted for any effectof limiting a net retirement asset to the asset ceiling. The defined benefit obligation is calculatedannually by an independent actuary. The present value of defined benefit obligation is determined bydiscounting the estimated future cash outflows using interest rates on government bonds that haveterms to maturity approximating the terms of the related net retirement. The asset ceiling is thepresent value of any economic benefits available in the form of refunds from the plan or reductions infuture contributions to the plan. The cost of providing benefits under the defined benefit plans isactuarially determined using the projected unit credit method.
Retirement costs comprise of service costs and net interest on the net retirement liability.
Service costs, which include current service costs, past service costs and gains or losses on non-routine settlements, are recognized as expense in the statement of income. Past service costs arerecognized when plan amendment or curtailment occurs.
Net interest on the net retirement liability is the change during the period in the net retirement liabilitythat arises from the passage of time, which is determined by applying the discount rate based ongovernment bonds to the net retirement liability. Net interest on the net retirement liability isrecognized as expense or income in the statement of income.
Remeasurements comprising actuarial gains and losses, return on plan assets and any change in theeffect of the asset ceiling (excluding net interest on retirement liability) are recognized immediately inOCI in the period in which they arise. Remeasurements are not reclassified to the statement ofincome in subsequent periods.
Plan assets are assets that are held by a long-term employee benefit fund. Plan assets are notavailable to the creditors of the Group, nor can they be paid directly to the Group. The fair value ofplan assets is based on market price information. When no market price is available, the fair value ofplan assets is estimated by discounting expected future cash flows using a discount rate that reflectsboth the risks associated with the plan assets and the maturity or expected disposal date of thoseassets (or, if they have no maturity, the expected period until the settlement of the relatedobligations).
The Group’s right to be reimbursed of some or all of the expenditure required to settle a definedbenefit obligation is recognized as a separate asset at fair value when and only when reimbursement isvirtually certain.
Defined contribution plans
The Parent Company also contributes to its contributory, defined-contribution type staff providentplan based on a fixed percentage of the employees’ salaries as defined in the plan.
- 24 -
*SGVFS164641*
Payments to the defined contribution plans are recognized as expenses when employees haverendered service in exchange for these contributions.
Leases
The Group assesses at contract inception whether a contract is, or contains, a lease. That is, if thecontract conveys the right to control the use of an identified asset for a period of time in exchange forconsideration.
Group as a lessee
The Group applies a single recognition and measurement approach for all leases, except for short-term leases and leases of low-value assets. The Group recognizes lease liabilities to make leasepayments and right-of-use assets representing the right to use the underlying assets.
i) Right-of-use assets presented under Property and equipmentThe Group recognizes right-of-use assets at the commencement date of the lease (i.e., the date theunderlying asset is available for use). Right-of-use assets are measured at cost, less any accumulateddepreciation and impairment losses, and adjusted for any remeasurement of lease liabilities. The costof right-of-use assets includes the amount of lease liabilities recognized adjusted by lease paymentsmade at or before the commencement date and lease incentives received. Right-of-use assets aredepreciated on a straight-line basis over the shorter of the lease term and the estimated useful lives ofthe depreciable assets. The depreciation expense is presented under ‘Depreciation and Amortization’in the statement of income.
If ownership of the leased asset transfers to the Group at the end of the lease term or the cost reflectsthe exercise of a purchase option, depreciation is calculated using the estimated useful life of theasset.
The right-of-use assets are also subject to impairment. Refer to the accounting policies in Impairmentof Nonfinancial Assets.
ii) Lease liabilitiesAt the commencement date of the lease, the Group recognizes lease liabilities measured at the presentvalue of lease payments to be made over the lease term. The lease payments include fixed payments(including in-substance fixed payments) less any lease incentives receivable, variable lease paymentsthat depend on an index or a rate, and amounts expected to be paid under residual value guarantees.The lease payments also include the exercise price of a purchase option reasonably certain to beexercised by the Group and payments of penalties for terminating the lease, if the lease term reflectsthe Group exercising the option to terminate. Variable lease payments that do not depend on an indexor a rate are recognized as expenses in the period in which the event or condition that triggers thepayment occurs. In calculating the present value of lease payments, the Group uses its incrementalborrowing rate at the lease commencement date because the interest rate implicit in the lease is notreadily determinable. After the commencement date, the amount of lease liabilities is increased toreflect the accretion of interest and reduced for the lease payments made. In addition, the carryingamount of lease liabilities is remeasured if there is a modification, a change in the lease term, achange in the lease payments (e.g., changes to future payments resulting from a change in an index orrate used to determine such lease payments) or a change in the assessment of an option to purchasethe underlying asset.
- 25 -
*SGVFS164641*
iii) Short-term leases and leases of low-value assets
The Group applies the short-term lease recognition exemption to its short-term leases of ATM sites(i.e., those leases that have a lease term of 12 months or less from the commencement date and do notcontain a purchase option). It also applies the lease of low-value assets recognition exemption toleases of ATM sites that are considered to be low value. Lease payments on short-term leases andleases of low value assets are recognized as expense on a straight-line basis over the lease term.
Group as a lessorLeases in which the Group does not transfer substantially all the risks and rewards incidental toownership of an asset are classified as operating leases. Rental income arising from leased propertiesis accounted for on a straight-line basis over the lease terms and is included in revenue in thestatement of income due to its operating nature. Initial direct costs incurred in negotiating andarranging an operating lease are added to the carrying amount of the leased asset and recognized overthe lease term on the same basis as rental income. Contingent rents are recognized as revenue in theperiod in which they are earned.
Income TaxesCurrent taxCurrent tax assets and current tax liabilities are measured at the amount expected to be recoveredfrom or paid to the tax authority. The tax rates and tax laws used to compute the amount are thosethat are enacted or substantively enacted at the statement of financial position date.
Management periodically evaluates positions taken in the tax returns with respect to situations inwhich applicable tax regulations are subject to interpretation and establishes provisions whereappropriate.
Deferred tax
Deferred tax is provided, using the balance sheet liability method, on all temporary differences at thestatement of financial position date between the tax bases of assets and liabilities and their carryingamounts for financial reporting purposes.
Deferred tax assets are recognized for all deductible temporary differences and carryforward ofunused tax credits from the excess of Minimum Corporate Income Tax (MCIT) over the RegularCorporate Income Tax (RCIT), to the extent that it is probable that taxable profit will be availableagainst which the deductible temporary differences and the carryforward of unused tax credits fromexcess MCIT over RCIT can be utilized. Deferred tax, however, is not recognized on temporarydifferences that arise from the initial recognition of an asset or liability in a transaction that is not abusiness combination and, at the time of the transaction, affects neither the accounting income nortaxable income or loss.
The carrying amount of deferred tax assets is reviewed at each statement of financial position dateand reduced to the extent that it is no longer probable that sufficient taxable profit will be available toallow all or part of the deferred tax assets to be utilized.
Deferred tax liabilities are recognized for all taxable temporary differences, with certain exceptions.
Deferred tax assets and deferred tax liabilities are measured at the tax rates that are applicable to theperiod when the asset is realized or the liability is settled, based on tax rates (and tax laws) that havebeen enacted or substantively enacted at the statement of financial position date.
Current tax and deferred tax relating to items recognized directly in equity is recognized in OCI andnot in the statement of income.

- 26 -
*SGVFS164641*
ProvisionsProvisions are recognized when an obligation (legal or constructive) is incurred as a result of a pastevent and when it is probable that an outflow of assets embodying economic benefits will be requiredto settle the obligation and a reliable estimate can be made of the amount of the obligation.
When the Group expects some or all of a provision to be reimbursed, for example, under an insurancecontract, the reimbursement is recognized as a separate asset but only when the reimbursement isvirtually certain. The expense relating to any provision is presented in the statement of income, net ofany reimbursement.
If the effect of the time value of money is material, provisions are determined by discounting theexpected future cash flows at a pre-tax rate that reflects current market assessments of the time valueof money and, where appropriate, the risks specific to the liability. When discounting is used, theincrease in the provision due to the passage of time is recognized as an ‘Interest expense’ in thestatement of income.
Contingent Assets and Contingent LiabilitiesContingent assets are not recognized but are disclosed in the notes to financial statements when aninflow of economic benefits is probable. Contingent liabilities are not recognized in the financialstatements but are disclosed in the notes to financial statements, unless the possibility of an outflowof assets embodying economic benefits is remote.
Earnings Per Share (EPS)Basic EPS is computed by dividing the net income for the year by the weighted average number ofcommon shares outstanding during the year after giving retroactive effect to stock dividends declaredand stock rights exercised during the year, if any.
Diluted EPS is calculated by dividing the net income attributable to common shareholders by theweighted average number of common shares outstanding during the year adjusted for the effects ofany dilutive potential common shares.
Dividends on Common SharesDividends on common shares are recognized as a liability and deducted from equity when approvedby the BOD of the Parent Company. Dividends for the year that are approved after the statement offinancial position date are dealt with as an event after the statement of financial position date.
Segment ReportingThe Group’s operating businesses are organized and managed separately according to the nature ofthe products and services provided, with each segment representing a strategic business unit thatoffers different products and serves different markets. Financial information on business segmentsare presented in Note 6. No geographical segment information is presented as all of the Group’soperations are in the Philippines.
Fiduciary ActivitiesAssets and income arising from fiduciary activities, together with related undertakings to return suchassets to customers, are excluded from the financial statements where the Parent Company acts in afiduciary capacity such as nominee, trustee or agent.

- 27 -
*SGVFS164641*
Events after the Statement of Financial Position DatePost year-end events that provide additional information about the Group’s financial position at thestatement of financial position date (adjusting events) are reflected in the financial statements. Postyear-end events that are not adjusting events are disclosed in the notes to financial statements whenmaterial to the financial statements.
3. Significant Accounting Judgments, Estimates and Assumptions
The preparation of the financial statements in compliance with PFRS requires the Group to makejudgments, estimates and assumptions that affect the reported amounts of assets, liabilities, incomeand expenses and disclosure of contingent assets and contingent liabilities. Future events may occurwhich will cause the assumptions used in arriving at the estimates to change. The effects of anychange in estimates are reflected in the financial statements as these become reasonably determinable.
Judgments and estimates are continuously evaluated and are based on historical experience and otherfactors, including expectations of future events that are believed to be reasonable under thecircumstances.
JudgmentsIn the process of applying the Group’s accounting policies, management has made the followingjudgments, apart from those involving estimations, which have the most significant effect on theamounts recognized in the financial statements:
Business model test
The Group’s business model can be to hold financial assets to collect contractual cash flows evenwhen sales of certain financial assets occur. PFRS 9, however, emphasizes that if more than aninfrequent number of sales are made out of a portfolio of financial assets carried at amortized cost, theentity should assess whether and how such sales are consistent with the objective of collectingcontractual cash flows. In making this judgment, the Group considers the following, among others:a. Sales attributable to an anticipated or in reaction to events of systemic proportions that may
adversely affect the behavior of customer deposits and/or the Group’s creditors. This isparticularly important, among others, for securities that are funded principally through repurchaseagreements with international banks or foreign currency swaps;
b. Sales made due to occurrence of systemic events affecting the industry that severely curtailsaccess to credit and funding other than the lending facilities of the BSP as lender of last resort inorder to forestall the need for the Group to draw on the emergency lending facilities;
c. Sales attributable to the corrective measures of the Asset and Liability Committee (ALCO) tobring the asset-liability structure and regulatory capital within the BOD’s risk appetite andtargeted ratios;
d. Sales attributable to a unanticipated significant decline in the debt instrument’s liquiditycharacteristics to meet the minimum eligibility criteria of stock of High Quality Liquid Assets(HQLA); and
e. Sales attributable to systemic movements that have been generally accepted to negatively impacteconomic conditions, credit quality, and/or the liability profile of the Group.
On May 27, 2020, the Parent Company’s BOD approved the sale of HTC securities. In June 2020,the Parent Company liquidated all of its Peso (RBU) government securities classified underinvestment securities measured at amortized cost with a total face amount of P=8.60 billion andcarrying value of P=10.44 billion. The sale resulted in a trading gain of P=2.55 million presented in thestatement of income. Under the Parent Company’s Business Model Documentation for Managing

- 28 -
*SGVFS164641*
debt Securities, a permissible sale of Hold-To-Collect (HTC) includes those attributable to systemicmovements that have been generally accepted to negatively impact economic conditions, creditquality and or liability profile of the Parent Company.
The above disposals were assessed by the Parent Company as not inconsistent with the portfolios’business models considering the conditions and reasons for which the disposals were made. Further,these disposals did not result in a change in business model and the remaining securities in theaffected portfolios continue to be accounted for at amortized cost (Note 11).
Fair value of financial instruments
Where the fair values of financial instruments cannot be derived from active markets, they aredetermined using a variety of valuation techniques. The inputs to these valuation models are takenfrom observable markets where possible, but where this is not feasible, a degree of judgment isrequired in establishing fair values.
The carrying values and corresponding fair values of financial instruments, as well as the manner inwhich fair values were determined, are discussed in more detail in Note 4.
Contingencies
The Group is currently involved in various legal proceedings. The estimate of the probable costs forthe resolution of these claims has been developed in consultation with outside counsels handling theGroup’s defense in these matters and is based upon an analysis of potential results. The Groupcurrently does not believe that these proceedings will have a material adverse effect on its financialposition. It is possible, however, that future financial performance could be materially affected bychanges in the estimates or in the effectiveness of the strategies relating to these proceedings(Note 24).
Estimates and AssumptionsECLs on loans and other receivablesThe Group’s ECL calculations are outputs of complex models with a number of underlyingassumptions regarding the choice of variable inputs and their interdependencies.
Elements of the ECL models that are considered significant accounting judgments and estimatesinclude:
The segmentation of financial assets when their ECL is assessed on a collective basis;
The definition of default;
The Group’s internal grading model, which impacts the PDs assigned to the exposures;
The Group’s criteria for assessing if there has been a SICR and so allowances for financial assetsshould be measured on a lifetime ECL basis and the qualitative assessment;
Development of ECL models, including the various formulas and the choice of inputs;
Determination of associations between macroeconomic scenarios and economic inputs, such asInflation rates, Import growth rates, Interest rates, Gross Domestic Product (GDP) growth rates,business confidence index, household final consumption expenditure index, consumerconfidence index, bank average lending rates, unemployment rates and BSP statistical indicators,and the effect on PDs;
Selection of forward-looking macroeconomic scenario variables; and
Calculation of expected recoveries from defaulted accounts.

- 29 -
*SGVFS164641*
In response to the ongoing COVID-19 pandemic, the Group conducted a re-assessment of allcorporate accounts by re-scoring the Borrower Risk Ratings (BRR) using a stressed scenario in orderto account for the ongoing and future effects of the pandemic on the borrowers’ operations andearnings. Specific impairment was likewise assessed for corporate borrowers with large exposuresespecially those that were severely affected by the pandemic.
On the other hand, for consumer loans, expert judgment was incorporated by the Group to determinethe possible deterioration in the flow rates from one bucket to the next (i.e. current to 1-30 days pastdue, 1-30 days past due to 31-60 days past due, etc. up to more than 90 days past due bucket).Forecasted figures were assessed with the required additional allowance for credit loss.
The Group revisited weight distribution on Macroeconomic Variables (MEVs) to reflectmanagement’s view of the overall business environment. The Group also revisited stages ofborrowers that were affected by the pandemic and are expected to remain unable to pay regularamortization. These exercises resulted to changes in account staging and additional loan lossprovisioning.
The carrying value of loans and receivables and allowance for credit losses on loans and receivablesare disclosed in Notes 12 and 17, respectively.
Realizability of deferred tax assets
Deferred tax assets are recognized to the extent that it is probable that future taxable profit will beavailable against which the deductible temporary differences can be utilized. Significantmanagement judgment is required to determine the amount of deferred tax assets that can berecognized, based on assumptions that are affected by expected future market or economic conditionsand the expected performance of the Group. These assumptions include management’s expectationson growth of the Group’s loans and deposit portfolios and future operating costs and expenses.
The recognized and unrecognized deferred tax assets are disclosed in Note 30.
Impairment of branch licenses
The Group determines whether branch licenses are impaired at least on an annual basis. Branchlicenses are written down for impairment where the net present value of the forecasted future cashflows from the relevant CGU is insufficient to support its carrying value.
The recoverable amount of the CGU has been determined based on a VIU calculation using theCGU’s cash flow projections from a strategic plan approved by management covering a 5-yearperiod. Key assumptions in the VIU calculations are most sensitive to the following assumptions:
Discount rate, which is based on the cost of equity by reference to comparable entities using thecapital asset pricing model;
Loan and deposit portfolios growth rates; and
Growth rate to project cash flows beyond the budget period.
The carrying values of branch licenses and details of the VIU calculations are disclosed in Note 15.
Present value of defined benefit obligation
The cost of defined benefit plans, as well as the present value of defined benefit obligation, isdetermined using an actuarial valuation. The actuarial valuation involves making variousassumptions. These include the determination of the discount rates, salary increase rates, mortalityrates and employee turnover rates. Due to the complexity of the actuarial valuation, the underlying

- 30 -
*SGVFS164641*
assumptions and its long-term nature, defined benefit obligations are highly sensitive to changes inthese assumptions. All assumptions are reviewed at each statement of financial position date.
In determining the appropriate discount rate, the Group considers the interest rates of Philippinegovernment bonds that are denominated in the currency in which the benefits will be paid, withextrapolated maturities corresponding to the expected duration of the defined benefit obligation.
Salary increase rates are based on historical annual merit, market and promotional increase and futureinflation rates.
Other assumptions, such as mortality rates and employee turnover rates, are based on publiclyavailable mortality tables and the Group’s historical experience.
The retirement asset (liability) as of December 31, 2021 and 2020 are disclosed in Note 27.
4. Fair Value Measurement
The following tables provide the fair value hierarchy of the Group’s and the Parent Company’s assetsand liabilities measured at fair value and those for which fair values should be disclosed:
Consolidated and Parent Company
2021
Fair Value
Carrying
Value Total
Quoted Prices
in Active
Market
(Level 1)
Significant
Observable
Inputs
(Level 2)
Significant
Unobservable
Inputs
(Level 3)
Assets measured at fair value
Financial assets at FVTPL:
Government securities P=886,291 P=886,291 P=886,291 P=– P=−Financial assets at FVTOCI: Debt securities:
Government securities 6,362,401 6,362,401 6,362,401 – –
Private bonds – – – – –
Equity securities 126,886 126,886 − 91,600 35,286
7,375,578 7,375,578 7,248,692 91,600 35,286
Assets for which fair values are disclosed
Investment securities at amortized cost:Government securities 15,520,279 17,139,928 17,139,928 − −
Loans and receivables:
Receivables from customers:Corporate loans 57,985,808 57,055,766 − − 57,055,766
Auto loans 520,800 509,847 − − 509,847
Home loans 3,404,733 2,618,975 − − 2,618,975
Personal loans 105,938 83,273 − − 83,273
Unquoted debt securities 678,557 945,563 − − 945,563
78,216,115 78,353,352 17,139,928 − 61,213,424
Investment properties: Condominium units for lease 1,740,177 6,963,013 − − 6,963,013
Foreclosed properties 834,303 3,072,551 − − 3,072,551
Office units for lease 2,689 53,867 − − 53,867
2,577,169 10,089,431 − − 10,089,431
P=88,168,862 P=95,818,361 P=24,388,620 P=91,600 P=71,338,141
Liability measured at fair value
Currency forwards (Note 24) P=6,042 P=6,042 P=− P=6,042 P=−Liabilities for which fair value is disclosed
Financial liabilities at amortized cost:Time deposits 31,531,570 31,552,068 − − 31,552,068
LTNCD 2,889,116 3,104,683 − 3,104,683 −Bills payable 6,010,988 6,010,678 − − 6,010,678
P=40,437,716 P=40,673,471 P=− P=3,110,725 P=37,562,746

- 31 -
*SGVFS164641*
Consolidated and Parent Company
2020
Fair Value
Carrying Value Total
Quoted Prices
in ActiveMarket
(Level 1)
Significant
Observable Inputs
(Level 2)
Significant
UnobservableInputs
(Level 3)
Assets measured at fair valueFinancial assets at FVTPL:
Government securities P=718,294 P=718,294 P=718,294 P=– P=−Financial assets at FVTOCI: Debt securities:
Government securities 5,027,547 5,027,547 5,027,547 – –Private bonds – – – – –
Equity securities 110,269 110,269 − 71,650 38,619
Currency forwards (Note 24) 10,598 10,598 – 10,598 –
5,866,708 5,866,708 5,745,841 82,248 38,619
Assets for which fair values are disclosed
Investment securities at amortized cost:Government securities 2,263,356 2,418,758 2,418,758 − −
Loans and receivables:
Receivables from customers:Corporate loans 50,770,479 49,943,881 − − 49,943,881
Auto loans 669,670 660,495 − − 660,495
Home loans 4,233,699 3,042,175 − − 3,042,175Personal loans 293,817 250,986 − − 250,986
Unquoted debt securities 851,669 1,183,439 − − 1,183,439
59,082,690 57,499,734 2,418,758 − 55,080,976
Investment properties:
Condominium units for lease 1,788,559 6,940,697 − − 6,940,697Foreclosed properties 610,075 2,472,750 − − 2,472,750
Office units for lease 2,923 45,900 − − 45,900
2,401,557 9,459,347 − − 9,459,347
67,350,955 72,825,789 8,164,599 82,248 64,578,942
Liabilities for which fair value is disclosedFinancial liabilities at amortized cost:
Time deposits 40,367,517 40,366,511 − − 40,366,511LTNCD 2,883,668 3,126,066 − 3,126,066 −
Bills payable 2,182,844 2,182,670 − − 2,182,670
P=45,434,029 P=45,675,247 P=− P=3,126,066 P=42,549,181
Movements in the fair value measurement of ‘Financial assets at FVTOCI’ categorized withinLevel 3 pertain only to the changes in fair value of unquoted equity securities. No additions anddisposals were made in 2021 and 2020.
There were no transfers between Level 1 and Level 2 fair value measurements and no transfers out ofLevel 3 fair value measurements in 2021 and 2020.
The methods and assumptions used by the Group in estimating the fair value of its assets andliabilities are as follows:
Investment SecuritiesDebt securities
Fair values are generally based on quoted market prices. If the market prices are not readilyavailable, fair values are estimated using consensus prices obtained from Bloomberg.
Equity securities - club sharesFair values of club shares are based on prices published in GG&A Club Shares and G&W ClubShares. GG&A Club Shares and G&W Club Shares are involved in trading and leasing proprietaryand non-proprietary club shares.

- 32 -
*SGVFS164641*
Unquoted equity securities
Fair values of unquoted equity securities are estimated using the guideline publicly-traded companymethod, which utilizes publicly available information from publicly-traded comparable companiesthat are the same or similar to the unlisted company being valued. Unquoted equity security holdingsof the Group are not significant to the financial statements.
Loans and ReceivablesCash and other cash items, amounts due from BSP and other banks, interbank loans receivable andSPURA
Carrying amounts approximate fair values considering that these accounts consist mostly of overnightdeposits.
Receivables from customers
Fair values of receivables from customers are estimated using the discounted cash flow methodologythat makes use of the Group’s current incremental lending rates for similar types of loans andreceivables.
Unquoted debt securitiesFair values are estimated based on the discounted cash flow methodology that makes use ofinterpolated risk-free rates plus spread.
Accrued interest receivable and returned checks and other cash items (RCOCI)Carrying amounts approximate fair values due to the short-term nature of the accounts, with someitems that are due and demandable.
Accounts receivable, sales contracts receivable and refundable security deposits
Quoted market prices are not available for these assets. These are not reported at fair value and arenot significant in relation to the Group’s total portfolio of financial instruments.
Derivative Assets/LiabilitiesCurrency forwards under Other Assets/Liabilities
Fair values are calculated by reference to the prevailing interest differential and spot exchange rate asof the statement of financial position date, taking into account the remaining term to maturity of thederivative assets/liabilities.
Financial Liabilities at Amortized CostDeposit liabilities (excluding LTNCD)
Fair values of time deposits are estimated based on the discounted cash flow methodology that makesuse of the current incremental borrowing rates for similar types of borrowings. The carrying amountof demand and savings deposit liabilities approximate fair value considering that these are due anddemandable.
LTNCDFair values of LTNCD is determined based on the market yield rate of the Parent Company’s LTNCDas provided by the Philippine Dealing and Exchange Corporation (PDEx).
Bills payable
The fair value is estimated using the discounted cash flow methodology that makes use of theGroup’s current incremental borrowing rates for similar borrowings with maturities consistent withthose remaining for the liability being valued. Where the instrument has a relatively short maturity,carrying amounts approximate fair values.

- 33 -
*SGVFS164641*
Outstanding acceptances, manager’s checks, accrued interest payable, accrued other expenses,
accounts payable, refundable security deposits and due to the Treasurer of the PhilippinesCarrying amounts approximate fair values due to the short-term nature of these accounts, with someitems that are due and demandable.
Investment PropertiesFair values of investment properties are determined based on valuations made by professionallyqualified appraisers accredited by the BSP and SEC and internal appraisers. The fair values offoreclosed assets were derived based on market sales comparison approach. Under this approach,recent transactions for similar properties in the same areas as the investment properties wereconsidered, taking into account the economic conditions prevailing at the time the valuations weremade. Prices of recent transactions are adjusted to account for differences in a property’s size, shape,location, marketability and bargaining allowances. For depreciable properties, other inputsconsidered in the valuations are the age and remaining life of the buildings.
On the other hand, the fair values of the condominium and office units for lease were determinedusing the income capitalization approach model. The income capitalization approach model is usedsince the properties generate revenue from rental income. Income capitalization approach is a methodused to convert an estimate of a single year’s income expectancy into an indication of value in onedirect step – either by dividing the income estimate by an appropriate income rate or by multiplyingthe income estimate by an appropriate income factor. The rate of interest calculated represents therelationship between income and value observed in the market and is derived through comparablesales analysis. The income from a property, usually the annual net operating income or pre-tax cashflow, is divided by its sale or equity price to obtain the income rate.
The valuation, therefore, is based on the following critical assumptions:
Rental rates;
Capitalization rate (income rate), which is based on market rent for similar properties;
Vacancy rates, which are based on vacancy rates for comparable properties within the area wherethe Group’s properties are located; and
The floor areas, which are based on the total leasable area.
Significant Unobservable InputsQuantitative information about the Group’s and the Parent Company’s fair value measurements usingsignificant unobservable inputs (Level 3) on unquoted equity securities follows:
Year
Fair Value at
December 31
Valuation
Technique(s)
Unobservable
Input(s) Range
Reasonably
Possible
Alternative
Assumption
Sensitivity of the Fair
Value to the Input
2021 P=35,286 Guideline publicly-
traded company
method
Price to book ratio 0.61:1 -0.93:1 +0.10
-0.10
P=116
(116)
Discount for lack of
marketability
30% +10%
-10%
89
(89)
2020 P=38,619 Guideline publicly-traded company
method
Price to book ratio 0.77:1 - 1.01:1 +0.10-0.10
P=116(116)
Discount for lack of
marketability
30% +10%
-10%
103
(103)
The Parent Company estimates the fair value of the unquoted equity securities using the ‘benchmarkmultiples’ of comparable publicly-traded companies. The identification of comparable companiesconsiders the similarities between the subject company being valued and the guideline companies interms of industry, market, product line or service type, growth, etc. The Parent Company also

- 34 -
*SGVFS164641*
determines an appropriate discount adjustment for the lack of marketability of these unquoted equitysecurities based on empirical evidence gathered from available public market research.
The use of reasonably possible alternative assumptions in the significant unobservable inputs willaffect the fair value of the unquoted equity securities and the OCI (before tax) as presented above.
There has been no change in the valuation techniques used from 2020 to 2021.
Description of Significant Unobservable Input to ValuationThe significant unobservable input used in the fair value measurement categorized within Level 3 ofthe fair value hierarchy:
Loans and receivables at amortized cost
Fair values of loans and receivables are estimated using the discounted cash flow methodology, usingthe Group’s current incremental lending rates for similar types of loans. The significant increase(decrease) in the current increment lending rate would result to a lower (higher) fair valuemeasurement.
Liabilities
The carrying amount of liabilities approximates fair value in view of their relatively short-termmaturity except for time deposits whose fair values are estimated using the discounted cash flowmethodology using the Bank’s incremental borrowing rates for similar borrowings with maturitiesconsistent with those for the liability being valued.
5. Financial Risk Management Objectives and Policies
IntroductionRisk is inherent in the Group’s activities but is managed through a continuing and pro-active processof identification, measurement and monitoring, subject to risk limits and other controls. This processof risk management is critical to the Group’s continuing profitability and each individual within theGroup is accountable for the risk exposures relating to his or her responsibilities.
The Group is exposed to the following risks from its financial instruments:a. Credit riskb. Liquidity riskc. Market risk
i. Interest rate riskii. Foreign currency riskiii. Equity price risk
Risk management structure
The Group’s risk management environment is characterized by a well-defined risk organizationalstructure, flow of risk information, risk-based audit coverage, and an established compliance system.
BODThe BOD of the Parent Company is responsible for establishing and maintaining a sound riskmanagement system and is ultimately accountable for identifying and controlling risks; there are,however, separate independent bodies responsible for managing and monitoring risks.

- 35 -
*SGVFS164641*
Risk Oversight Committee (ROC)
The ROC has the overall responsibility for the development of the risk strategy and implementingprinciples, frameworks, policies and limits.
Enterprise Risk Management Group (ERMG)The ERMG is an independent unit within the Parent Company that directly reports to the ROC. It isthe responsibility of the ERMG to identify, analyze and measure risks from the Parent Company’strading, lending, borrowing and other transactional activities. It also recommends control policiesand procedures to mitigate risk in identified risk areas in Treasury, Credit, Trust and other areas ofoperations.
Together with other risk control functions such as Operations Group, it performs the important day-to-day monitoring of risk exposures of the Parent Company against approved limits and reporting ofsuch exposures, and implementation of policies and control procedures.
Treasury segment
The Treasury Segment is responsible for managing the Parent Company’s assets and liabilities. It isalso primarily responsible for the management of the funding and liquidity risks of the ParentCompany.
Compliance Group
Through the Group’s Compliance Group, relevant Philippine laws and regulations, as well aspertinent BSP circulars governing the operations of rural banks, are continuously identified forguidelines on implementation. The Compliance Group is also responsible for the systematic andeffective communications systems to keep management always conscious of their obligations andlegal responsibility as trustee of public funds. It ensures the Group’s adherence to the rules andregulations and the provisions of the Manual of Regulations for Banks (MORB) prescribed by theBSP.
Internal Audit Group (IAG)
Risk management processes throughout the Group are audited by the IAG which examines both theadequacy of the procedures and the Group’s compliance thereto. The IAG discusses the results of allassessments with management, and reports its findings and recommendations to the AuditCommittee.
Risk measurement and reporting systems
The Group’s risks are measured using a method which reflects both the expected loss likely to arise innormal circumstances and unexpected losses, which are an estimate of the ultimate actual loss basedon statistical models. The models make use of probabilities derived from historical experience,adjusted to reflect the economic environment. The Group adjusted existing models to take intoaccount the probable effects of the ongoing COVID 19 pandemic. This resulted in increased loanprovisions in anticipation of increased loan losses that may be brought about by the pandemic
The Group also performed worst case scenarios that would arise in the event that extreme eventswhich are unlikely to occur, happen.
Monitoring and controlling risks are primarily performed based on limits established by the Group.These limits reflect both the business strategy and market environment of the Group, as well as thelevel of risk that the Group is willing to accept. In addition, the Group monitors and measures theoverall risk-bearing capacity in relation to the aggregate risk exposure across all risk types andactivities. In response to the ongoing pandemic, the Group implemented stricter approval policies

- 36 -
*SGVFS164641*
particularly for consumer loans. All consumer loans need to go through a pre-clearance process fromthe Executive Committee Chair and minimum approval required is from the President & CEO.
Information gathered from all the businesses is evaluated and processed in order to analyze, identifyand control and identify risks early. All significant information is presented to the BOD, the ROC,and the head of each business division. The report includes credit exposure to groups and industries,Value-at-Risk (VaR), liquidity ratios and risk profile changes. Senior management assesses theappropriateness of the allowance for credit losses on a monthly basis for prudential and financialreporting.
Credit Risk and Concentration of Assets and Liabilities and Off-Balance Sheet ItemsCredit risk is the risk that one party to a financial instrument will fail to discharge an obligation andcause the other party to incur a financial loss. The Group’s credit risk arises from its lending andtrading of and investments in securities and foreign exchange activities. The Group manages andcontrols credit risk by setting limits on the amount of risk it is willing to accept for individualborrowers and groups of borrowers, as well as limits on large lines and industry concentrations. TheERMG monitors exposures in relation to these limits.
The Group obtains security where appropriate, enters into collateral arrangements withcounterparties, and limits the duration of exposures. The Group’s credit risk management process isguided by policies and procedures established by Corporate & Commercial Banking Group (CCBG),Consumer Finance Group and ERMG and approved by the BOD.
For the corporate loan portfolio, the Group has an internal credit risk rating system (ICRRS) for thepurpose of measuring credit risk for every exposure in a consistent manner that is as accurate aspossible and uses the risk information for business and financial decision making. The ICRRS shallcover all credit exposures to companies regardless of asset size, except those whose facilities arepurely 1:1 which will be given a default Borrower Risk Rating of 1. The system has two components,namely: (a) Borrower Risk Rating (BRR) System, which provides an assessment of credit riskwithout considering the security arrangements, and (b) Composite Risk Rating (CRR), which is anaccount rating taking into account the collateral and other credit risk mitigants and the credit facilitygranted to the borrower. The Borrower Risk Rating consists of 14 grades, ten of which fall underunclassified accounts and the remaining four are classified accounts according to regulatoryprovisioning guidelines.
The Group uses a set of Minimum Risk Acceptance Criteria for its consumer loan portfolio as part ofits credit undertaking. Risks are mitigated by focusing on the accounts with a low PD whileexercising prudent judgment on accounts whose risks are higher than normal but remains within theGroup’s risk appetite.
The Group also has a post approval loan portfolio quality and credit process review in place thatallows the Group to continuously identify and assess the risks on credit exposures and take correctiveactions. This function is carried out by the Group’s Credit Policy and Review Division.
Credit risk at initial recognition
The Group uses internal credit assessment and approvals at various levels to determine the credit riskof exposures at initial recognition. Assessment considers quantitative and qualitative factors anddepends on the materiality of the facility or the complexity of the portfolio to be assessed.
- 37 -
*SGVFS164641*
Maximum exposure to credit risk
The tables below provide the analysis of the maximum exposure of the Group’s and the ParentCompany’s financial instruments to credit risk, excluding those where the carrying values as reflectedin the statements of financial position and related notes already represent the financial instrument’smaximum exposure to credit risk, before and after taking into account collateral held or other creditenhancements:
Consolidated and Parent Company
2021 2020
Gross
Maximum
Exposure* Net Exposure
Financial Effect
of Collateral or
Credit
Enhancement
Gross
MaximumExposure* Net Exposure
Financial Effectof Collateral or
CreditEnhancement
Receivables from
customers:Corporate loans P=57,985,808 P=40,259,897 P=17,725,911 P=50,770,479 P=35,809,872 P=14,960,607
Consumer loans 4,031,471 1,400,749 2,630,722 5,197,186 2,233,187 2,963,999
Total Credit exposure P=62,017,279 P=41,660,646 P=20,356,633 P=55,967,665 P=38,043,059 P=17,924,606
* Net of allowance for credit losses and unearned discount
For sales contracts receivable, the fair value of collaterals and their corresponding financial effect oncredit exposure are no longer disclosed since the system does not regularly monitor such information.The carrying value of these sales contracts receivable are disclosed in Note 12.
Risk concentrations by industry
Concentrations arise when a number of counterparties are engaged in similar business activities, oractivities in the same geographic region, or have similar economic features that would cause theirability to meet contractual obligations to be similarly affected by changes in economic, political orother conditions. Concentrations indicate the relative sensitivity of the Group’s performance todevelopments affecting a particular industry.
Group exposures and risk concentrations to industries are monitored and reported in accordance withthe Group’s policies on group lending/inter-corporate earmarking and managing large exposure andcredit risk concentrations.
Credit-related commitment risks
The Parent Company makes available to its customers guarantees that may require the ParentCompany to make payments on their behalf and enters into commitments to extend credit lines tosecure their liquidity needs. Letters of credit and guarantees (including standby letters of credit)commit the Parent Company to make payments on behalf of customers in the event of a specific act,generally related to the import or export of goods. Such commitments expose the Parent Company tosimilar risks to loans and are mitigated by the same control processes and policies.

- 38 -
*SGVFS164641*
The industry sector analysis of the maximum exposure of the Group to credit risk concentration follows (amounts in millions):
Consolidated
2021 2020
Loans and
Receivables
Loans and
Advances to
Banks*
Debt
Investment
Securities Others** Total
Loans and
Receivables
Loans andAdvances to
Banks*
Debt Investment
Securities Others** Total
Government P=936 P=13,742 P=22,776 P=1 P= 37,455 P=980 P=24,500 P=8,020 P=1 P= 33,501Construction and real estate 18,017 – – 53 18,070 16,528 – – 421 16,949
Wholesale and retail trade 16,916 – – 1,046 17,962 14,047 – – 864 14,911Manufacturing 14,481 – – 734 15,215 13,140 – – 691 13,831Banks and financial institutions 2,183 1,384 – – 3,567 1,964 3,648 – – 5,612
Electricity, gas and water supply 3,818 – – 7 3,825 3,518 – – 7 3,525Agriculture, hunting and forestry 1,364 – – 10 1,374 1,172 – – 1 1,173Transportation, storage, communication 1,994 – – 5 1,999 1,012 – – 5 1,017
Mining and quarrying 168 – – – 168 127 – – – 127Others 6,353 – – 30 6,383 7,626 – – 33 7,659
66,230 15,126 22,776 1,886 106,018 60,114 28,148 8,020 2,023 98,305
Less allowance for ECL 2,732 – 7 – 2,739 2,490 – 11 – 2,501
P=63,498 P=15,126 P=22,769 P=1,886 P=103,279 P=57,624 P=28,148 P=8,009 P=2,023 P=95,804
* Consist of due from BSP, due from other banks, and interbank loans receivable and SPURA
** Consist of RCOCI, refundable deposits, and commitments and contingencies
Parent Company
2021 2020
Loans and
Receivables
Loans and
Advances to
Banks*
Debt
Investment
Securities Others** Total
Loans andReceivables
Loans andAdvances to
Banks*
DebtInvestment
Securities Others** Total
Government P=936 P=13,742 P=22,776 P=1 P=37,455 P=980 P=24,500 P=8,020 P=1 P= 33,501Construction and real estate 17,854 – – 53 17,907 16,528 – – 421 16,949
Wholesale and retail trade 17,398 – – 1,046 18,444 14,047 – – 864 14,911Manufacturing 14,121 – – 734 14,855 13,140 – – 691 13,831Banks and financial institutions 2,028 1,384 – – 3,412 1,964 3,648 – – 5,612
Electricity, gas and water supply 3,812 – – 7 3,819 3,518 – – 7 3,525Agriculture, hunting and forestry 1,126 – – 10 1,136 1,172 – – 1 1,173Transportation, storage, communication 925 – – 5 930 1,012 – – 5 1,017
Mining and quarrying 161 – – – 161 127 – – – 127Others 7,872 – – 30 7,902 7,629 – – 33 7,662
66,233 15,126 22,776 1,886 106,021 60,117 28,148 8,020 2,023 98,308
Less allowance for ECL 2,732 – 7 – 2,739 2,490 – 11 – 2,501
P=63,501 P=15,126 P=22,769 P=1,886 P=103,282 P=57,627 P=28,148 P=8,009 P= 2,023 P= 95,807
* Consist of due from BSP, due from other banks, and interbank loans receivable and SPURA
** Consist of RCOCI, refundable deposits, and commitments and contingencies

- 39 -
*SGVFS164641*
Collateral and other credit enhancements
The amount and type of collateral required depend on an assessment of the credit risk of thecounterparty. Guidelines are implemented regarding the acceptability of types of collateral andvaluation parameters.
The main types of collateral obtained are as follows:
For securities lending and reverse repurchase transactions: cash or securities
For commercial lending: deposit hold-out, mortgages over real estate properties, machineries,inventories and trade receivables
For retail lending: mortgages over residential properties and motor vehicles
It is the Group’s policy to dispose repossessed properties in an orderly fashion. The proceeds areused to reduce or repay the outstanding claim. In general, the Group does not occupy repossessedproperties for business use.
Collaterals obtained by the Group and the Parent Company from settlement of loans and receivableswhich remain outstanding as of December 31, 2021 and 2020 amounted to P=347.78 million andP=122.18 million, respectively (see Notes 14 and 16).
The Group does not hold collateral on financial assets which it may sell or repledge in the absence ofdefault by the owner of the collateral.
Credit quality per class of financial assets
In compliance with MORB Sec. X178, the Group has developed and continuously reviews andcalibrates its internal risk rating system for credit exposures aimed at uniformly assessing its creditportfolio in terms of risk profile. Where appropriate, it obtains security, enters into master nettingagreements, and limits the duration of exposures to maintain and even further enhance the quality ofthe Group’s credit exposures.
The credit quality of financial assets is monitored and managed using internal ratings and whereavailable, external ratings.
a. Loans and Receivables
Receivables from customersIn 2019, the Parent Company adopted new BRR scorecards by segmenting its portfolio furtherthus improve on the previous scorecards. The Parent Company employs specific scorecards foreach segment of the portfolio and uses specific scorecards for different classes of financialintermediaries. The new scorecards are more flexible and innovatively use more forward-lookingelements into the scoring mechanism, making the results more accurate. For purposes ofcomputing allowance, the Parent Company has prepared a transition matrix to bridge the previousrating grades to the new BRR scorecards.

- 40 -
*SGVFS164641*
The description and definition of the loan grades or ICRRS used by the Group for corporate loansfollow:
BRR Grade Description Definition
1 Excellent Excellent capacity to meet its financial commitments withminimal credit risk
2 Strong Strong capacity to meet its financial commitments with very lowcredit risk
3 Good Good capacity to meet its financial commitments with low creditrisk.
4 Fairly Good An obligor rated 4 differs from rated 3 obligor only to a smalldegree and has a fairly good capacity to meet its financialcommitments with low credit risk.
5 Satisfactory Satisfactory capacity to meet its financial commitments withmoderate credit risk
6 Fairly Satisfactory Fairly satisfactory capacity to meet its financial commitmentswith moderate credit risk
7 Acceptable Acceptable capacity to meet its financial commitments withsubstantial credit risk
8 Acceptable with Care A credit, though acceptable, needs care in granting facilities.However, the borrower is still creditworthy.
9 Acceptable with Caution A credit, though acceptable, needs significant caution to beexercised while granting facilities to the borrower. Theborrower is still creditworthy but has problems that need to beaddressed.
10 Watch List An obligor rated 10 is judged to be of poor credit standing and issubject to high default risk.
11 Especially Mentioned These are loans that have potential weaknesses that deservemanagement’s close attention. If left uncorrected, saidweaknesses may affect the repayment of the loan.
12 Substandard Loans that have well-defined weaknesses that may jeopardizerepayment/liquidation in full, either in respect of the business,cash flow, or financial position, which may include adversetrends or developments that affect willingness or repaymentability of the borrower.
13 Doubtful Loans that exhibit more sever weaknesses than those under“Substandard”, whose characteristics on the basis of currentlyknown facts, conditions, and values make collection orliquidation highly improbable, however, the exact amountremains undeterminable as yet.
14 Loss Loans which are considered uncollectible or worthless and ofsuch little value that their continuance as bankable assets is notwarranted.

- 41 -
*SGVFS164641*
The credit quality of the Group’s corporate loans under receivables from customers, which isbased on the ICRRS grade, is grouped as follows:
High Grade (BRR 1 to 7)Under this category, the borrower has the apparent ability to satisfy its obligations in full andtherefore, no loss in ultimate collection is anticipated. These loans or portions thereof are securedby hold-outs on deposits/deposit substitute, margin deposits or government-supported securities,other readily marketable collateral or are supported by sufficient credit and financial informationof favorable nature to assure repayment as agreed.
Standard Grade (BRR 8 to 10)Under this category are accounts not considered adversely classified but require closesupervision/monitoring due to some warning signals such as start-up business, substantialchanges in the business affecting operation or management, three continuous years of substantialdecline in income (exclusive of extraordinary income/losses).
Substandard Grade or Past-Due (BRR 11 to 14)Under this category are loans which exhibit unfavorable record or unsatisfactory characteristics,or where existing facts, conditions and values, make collection or liquidation in full improbable.The credit quality of the Group’s consumer loans under receivables from customers, which isbased on the age and status of delinquency of receivables and the credit standing of thecounterparties, is grouped as follows:
High GradeThis category is comprised of current receivables with no history of defaults and delayedpayments and other financial assets with counterparties that have the apparent ability to satisfytheir obligations in full. This rating includes amounts due from the BSP and due from otherbanks.
Standard GradeThis category is comprised of receivables that are technically past due, with period of default of1 to 30 days, but are still regarded as good credit quality since the counterparties have theapparent ability to satisfy their obligations in full.
Past Due but not ImpairedThese are accounts which are classified as delinquent, with period of default of 31 to 90 days.
Past Due and ImpairedThis comprised of receivables and other financial assets which are classified as non-performing,with period of default of more than 90 days.
Positive and vigorous management action is required to avert or minimize loss.

- 42 -
*SGVFS164641*
As of December 31, 2021, the credit quality of receivables from customers, net of unearneddiscount and capitalized interest of the Group and Parent Company follows:
Consolidated and Parent Company 2021
Stage 1 Stage 2 Stage 3 Total
Corporate loans:High grade P=45,551,479 P=– P=– P=45,551,479
Standard grade 4,172,469 7,877,160 – 12,049,629
Substandard grade – 20,411 – 20,411
Past due but not impaired – – – –
Past due and impaired – – 2,611,532 2,611,532
49,723,948 7,897,571 2,611,532 60,233,051
Consumer loans:Auto loans:
High grade 452,291 – – 452,291
Standard grade – – – –
Past due but not impaired – 18,702 13,704 32,406
Past due and impaired – – 113,409 113,409
452,291 18,702 127,113 598,106
Home loans:High grade 2,995,384 – – 2,995,384
Standard grade – – – –
Past due but not impaired – 82,052 41,112 123,164
Past due and impaired – – 518,054 518,054
2,995,384 82,052 559,166 3,636,602
Personal loans:High grade 109,400 – – 109,400
Standard grade – 355 – 355
Past due but not impaired – 5,224 6,186 11,410
Past due and impaired – – 91,986 91,986
109,400 5,579 98,172 213,151
Total consumer loans:High grade 3,557,075 – – 3,557,075
Standard grade – 355 – 355
Past due but not impaired – 105,978 61,002 166,980
Past due and impaired – – 723,449 723,449
3,557,075 106,333 784,451 4,447,859
Total receivables from customers:High grade 49,108,554 – – 49,108,554
Standard grade 4,172,469 7,877,515 – 12,049,984
Substandard grade – 20,411 – 20,411
Past due but not impaired – 105,978 61,002 166,980
Past due and impaired – – 3,334,981 3,334,981
P=53,281,023 P=8,003,904 P=3,395,983 P=64,680,910

- 43 -
*SGVFS164641*
Consolidated and Parent Company 2020
Stage 1 Stage 2 Stage 3 Total
Corporate loans:High grade P= 23,933,062 P=– P=– P=23,933,062Standard grade 17,192,044 8,800,097 – 25,992,141Substandard grade – 32,300 – 32,300Past due but not impaired – 25,835 – 25,835Past due and impaired – – 2,729,677 2,729,677
41,125,106 8,858,232 2,729,677 52,713,015
Consumer loans:Auto loans:
High grade 477,026 – – 477,026Standard grade 37,898 38,961 – 76,859Past due but not impaired – 33,498 15,733 49,231Past due and impaired – – 168,806 168,806
514,924 72,459 184,539 771,922
Home loans:High grade 3,725,914 – – 3,725,914Standard grade 96,765 – – 96,765Past due but not impaired – 119,337 15,051 134,388Past due and impaired – – 511,482 511,482
3,822,679 119,337 526,533 4,468,549
Personal loans:High grade 270,095 – – 270,095Standard grade 35,512 – – 35,512Past due but not impaired – 18,647 2,268 20,915Past due and impaired – – 113,591 113,591
305,607 18,647 115,859 440,113
Total consumer loans:High grade 4,473,035 – – 4,473,035Standard grade 170,175 38,961 – 209,136Past due but not impaired – 171,482 33,052 204,534Past due and impaired – – 793,879 793,879
4,643,210 210,443 826,931 5,680,584
Total receivables from customers:High grade 28,406,097 – – 28,406,097Standard grade 17,362,219 8,839,058 – 26,201,277Substandard grade – 32,300 – 32,300Past due but not impaired – 197,317 33,052 230,369
Past due and impaired – – 3,523,556 3,523,556
P=45,768,316 P=9,068,675 P=3,556,608 P=58,393,599
Movements during 2021 and 2020 for receivables from customers follows:
Consolidated and Parent Company 2021
Stage 1 Stage 2 Stage 3 Total
Corporate loans:Balance at January 1, 2021 P=41,125,106 P=8,858,232 P=2,729,677 P=52,713,015
New assets originated or
Purchased42,516,314 – – 42,516,314
Assets derecognized or repaid (28,849,119) (5,818,305) (250,973) (34,918,397)
Transfers to Stage 1 698,018 (554,253) (143,765) –
Transfers to Stage 2 (5,743,308) 5,743,308 – –
Transfers to Stage 3 – (276,593) 276,593 –
Accounts written-off – - – –
Foreign exchange adjustments (23,063) (54,818) – (77,881)
Balance at December 31, 2021 49,723,948 7,897,571 2,611,532 60,233,051
(Forward)

- 44 -
*SGVFS164641*
Consolidated and Parent Company 2021
Stage 1 Stage 2 Stage 3 TotalConsumer loans:
Auto loans:
Balance at January 1, 2021 P=514,924 P=72,459 P=184,539 P=771,922
New assets originated orPurchased
195,755– –
195,755
Assets derecognized or repaid (178,922) (75,466) (115,183) (369,571)
Transfers to Stage 1 10,657 (4,185) (6,472) –
Transfers to Stage 2 (28,603) 28,603 – –
Transfers to Stage 3 (61,520) (2,709) 64,229 –
Accounts written-off – – – –
Foreign exchange adjustments – – – –
Balance at December 31, 2021 452,291 18,702 127,113 598,106
Home loans:Balance at January 1, 2021 3,822,679 119,337 526,533 4,468,549
New assets originated orPurchased
912,293 – – 912,293
Assets derecognized or repaid (1,660,038) (10,471) (73,731) (1,744,240)
Transfers to Stage 1 61,884 (21,431) (40,453) –
Transfers to Stage 2 (81,702) 84,411 (2,709) –
Transfers to Stage 3 (59,732) (89,794) 149,526 –
Balance at December 31, 2021 2,995,384 82,052 559,166 3,636,602
Personal loans:
Balance at January 1, 2021 305,607 18,647 115,859 440,113
New assets originated orPurchased
31,625 – – 31,625
Assets derecognized or repaid (131,961) (9,654) (57,270) (198,885)
Transfers to Stage 1 1,632 (763) (869) –
Transfers to Stage 2 (10,123) 10,123 - –
Transfers to Stage 3 (87,380) (9,079) 96,459 –
Accounts written-off – (3,695) (56,007) (59,702)
Balance at December 31, 2021 109,400 5,579 98,172 213,151
Total consumer loans:Balance at January 1, 2021 4,643,210 210,443 826,931 5,680,584
New assets originated or
Purchased 1,139,673 – – 1,139,673
Assets derecognized or repaid (1,970,921) (95,591) (246,184) (2,312,696)
Transfers to Stage 1 74,173 (26,379) (47,794) –
Transfers to Stage 2 (120,428) 123,137 (2,709) –
Transfers to Stage 3 (208,632) (101,582) 310,214 –
Accounts written-off – (3,695) (56,007) (59,702)
Balance at December 31, 2021 3,557,075 106,333 784,451 4,447,859
Total receivables from customers:
Balance at January 1, 2021 45,768,316 9,068,675 3,556,608 58,393,599
New assets originated orpurchased 43,655,987 – – 43,655,987
Assets derecognized or repaid (30,820,040) (5,913,896) (497,157) (37,231,093)
Transfers to Stage 1 772,191 (580,632) (191,559) –
Transfers to Stage 2 (5,863,736) 5,866,445 (2,709) –
Transfers to Stage 3 (208,632) (378,175) 586,807 –
Accounts written-off – (3,695) (56,007) (59,702)
Foreign exchange adjustments (23,063) (54,818) - (77,881)
P=53,281,023 P=8,003,904 P=3,395,983 P=64,680,910
Consolidated and Parent Company 2020
Stage 1 Stage 2 Stage 3 Total
Corporate loans:Balance at January 1, 2020 P=49,233,092 P=3,355,774 P=1,171,838 P=53,760,704
New assets originated orPurchased
34,365,091 – – 34,365,091
Assets derecognized or repaid (30,500,160) (4,497,738) (75,189) (35,073,087)
Transfers to Stage 1 – – – –Transfers to Stage 2 (10,212,296) 10,212,296 – –Transfers to Stage 3 (1,720,838) (162,645) 1,883,483 –
Accounts written-off – – (248,734) (248,734)Foreign exchange adjustments (39,783) (49,455) (1,721) (90,959)
Balance at December 31, 2020 41,125,106 8,858,232 2,729,677 52,713,015
(Forward)

- 45 -
*SGVFS164641*
Consolidated and Parent Company 2020
Stage 1 Stage 2 Stage 3 Total
Consumer loans:Auto loans:
Balance at January 1, 2020 P=704,617 P=86,646 P=457,568 P=1,248,831New assets originated or
Purchased179,159 – – 179,159
Assets derecognized or repaid (253,777) (23,281) (85,547) (362,605)Transfers to Stage 1 – – – –Transfers to Stage 2 (61,503) 61,503 – –
Transfers to Stage 3 (53,572) (52,409) 105,981 –Accounts written-off – – (293,463) (293,463)
Balance at December 31, 2020 514,924 72,459 184,539 771,922
Home loans:Balance at January 1, 2020 4,458,480 109,941 271,893 4,840,314
New assets originated orpurchased
167,766 – – 167,766
Assets derecognized or repaid (485,833) (3,844) (49,854) (539,531)
Transfers to Stage 1 23,482 (21,238) (2,244) –Transfers to Stage 2 (118,443) 118,443 – –Transfers to Stage 3 (222,773) (83,965) 306,738 –
Balance at December 31, 2020 3,822,679 119,337 526,533 4,468,549
Personal loans:Balance at January 1, 2020 570,199 22,695 529,918 1,122,812
New assets originated orpurchased
87,234 – – 87,234
Assets derecognized or repaid (210,768) (7,543) (34,236) (252,547)
Transfers to Stage 1 1,800 (1,800) – –Transfers to Stage 2 (26,191) 14,211 11,980 –Transfers to Stage 3 (116,667) (8,916) 125,583 –
Accounts written-off – – (517,386) (517,386)
Balance at December 31, 2020 305,607 18,647 115,859 440,113
Total consumer loans:Balance at January 1, 2020 5,733,296 219,282 1,259,379 7,211,957New assets originated or
purchased434,159 – – 434,159
Assets derecognized or repaid (950,378) (34,668) (169,637) (1,154,683)Transfers to Stage 1 25,282 (23,038) (2,244) –
Transfers to Stage 2 (206,137) 194,157 11,980 –Transfers to Stage 3 (393,012) (145,290) 538,302 –Accounts written-off – – (810,849) (810,849)
Balance at December 31, 2020 4,643,210 210,443 826,931 5,680,584
Total receivables from customers:
Balance at January 1, 2020 54,966,388 3,575,056 2,431,217 60,972,661New assets originated or
purchased34,799,250 – – 34,799,250
Assets derecognized or repaid (31,450,538) (4,532,406) (244,826) (36,227,770)Transfers to Stage 1 25,282 (23,038) (2,244) –Transfers to Stage 2 (10,418,433) 10,406,453 11,980 –Transfers to Stage 3 (2,113,850) (307,935) 2,421,785 –
Accounts written-off – – (1,059,583) (1,059,583)
Foreign exchange adjustments (39,783) (49,455) (1,721) (90,959)
P=45,768,316 P=9,068,675 P=3,556,608 P=58,393,599
As of December 31, 2021 and 2020, the credit quality of the Group’s and the Parent Company’sfinancial guarantees, letters of credit and loan commitments follows:
2021
Stage 1 Stage 2 Stage 3 Total
High grade P=1,309,136 P=1,000 P=– P=1,310,136
Standard grade 303,560 236,928 – 540,488
P=1,612,696 P=237,928 P=– P=1,850,624

- 46 -
*SGVFS164641*
2020
Stage 1 Stage 2 Stage 3 Total
High grade P=1,316,906 P=– P=– P=1,316,906Standard grade 410,820 261,085 – 671,905
P=1,727,726 P=261,085 P=– P=1,988,811
Movements during 2021 and 2020 for the Group’s and the Parent Company’s financialguarantees, letters of credit and loan commitments follows:
2021
Stage 1 Stage 2 Stage 3 Total
Balance at January 1 P=1,727,726 P=261,085 P=– P=1,988,811
New assets originated or purchased 946,715 237,928 – 1,184,643
Transfers – – – –
Assets derecognized or repaid (1,061,745) (261,085) – (1,322,830)
Balance at December 31 P=1,612,696 P=237,928 P=– P=1,850,624
2020
Stage 1 Stage 2 Stage 3 Total
Balance at January 1 P=2,235,290 P=– P=– P=2,235,290New assets originated or purchased 1,096,182 – – 1,096,182Transfers (261,085) 261,085Assets derecognized or repaid (1,342,661) – – (1,342,661)
Balance at December 31 P=1,727,726 P=261,085 P=– P=1,988,811
As of December 31, 2021 and the credit quality of other receivables, gross of allowance forcredit losses follows:
Consolidated 2021
Stage 1 Stage 2 Stage 3 Total
Unquoted debt securities:High grade P=678,557 P=– P=– P=678,557
Accrued interest receivable:High grade 397,489 – – 397,489
Standard grade 38,752 108,651 – 147,403
Substandard grade – 5 – 5
Past due but not impaired – 410 232 642
Past due and impaired – – 14,231 14,231
436,241 109,066 14,463 559,770
Accounts receivable:High grade 186,900 – – 186,900
Standard grade 13,923 – – 13,923
Substandard grade – 8,084 – 8,084
Past due but not impaired – 27,035 – 27,035
Past due and impaired – – 29,844 29,844
200,823 35,119 29,844 265,786
Sales contracts receivable: High grade 37,562 – – 37,562
Standard grade – 126 – 126
Past due but not impaired – - 237 237
Past due and impaired – – 7,230 7,230
37,562 126 7,467 45,155
Total other receivables:High grade 1,300,508 – – 1,300,508
Standard grade 52,675 108,777 - 161,452
Substandard grade – 8,089 – 8,089
Past due but not impaired – 27,445 469 27,914
Past due and impaired – – 51,305 51,305
P=1,353,183 P=144,311 P=51,774 P=1,549,268

- 47 -
*SGVFS164641*
Parent Company 2021
Stage 1 Stage 2 Stage 3 Total
Unquoted debt securities:High grade P=678,557 P=– P=– P=678,557
Accrued interest receivable:High grade 397,489 – – 397,489
Standard grade 38,752 108,651 – 147,403
Substandard grade – 5 – 5
Past due but not impaired – 410 232 642
Past due and impaired – – 14,231 14,231
436,241 109,066 14,463 559,770
Accounts receivable:High grade 186,900 – – 186,900
Standard grade 16,756 – – 16,756
Substandard grade – 8,084 – 8,084
Past due but not impaired – 27,035 – 27,035
Past due and impaired – – 29,844 29,844
203,656 35,119 29,844 268,619
Sales contracts receivable:High grade 37,562 – – 37,562
Standard grade – 126 – 126
Past due but not impaired – - 237 237
Past due and impaired – – 7,230 7,230
37,562 126 7,467 45,155
Total other receivables:High grade 1,300,508 – – 1,300,508
Standard grade 55,508 108,777 - 164,285
Substandard grade – 8,089 – 8,089
Past due but not impaired – 27,445 469 27,914
Past due and impaired – – 51,305 51,305
P=1,356,016 P=144,311 P=51,774 P=1,552,101
Consolidated 2020
Unquoted debt securities:High grade P=852,565 P=– P=– P=852,565
Accrued interest receivable:High grade 215,628 - – 215,628Standard grade 80,698 114,206 51 194,955Substandard grade 48 – 48Past due but not impaired – 1,219 96 1,315Past due and impaired – – 56,598 56,598
296,326 115,473 56,745 468,544
Accounts receivable:High grade 225,401 – – 225,401Standard grade 66,280 – – 66,280Substandard grade – 25,189 – 25,189Past due but not impaired – 5,238 – 5,238Past due and impaired – – 11,192 11,192
291,681 30,427 11,192 333,300
Sales contracts receivable:High grade 22,283 – – 22,283Standard grade – 211 – 211Past due but not impaired – 8,337 – 8,337Past due and impaired – – 35,121 35,121
22,283 8,548 35,121 65,952
Total other receivables:High grade 1,315,877 – – 1,315,877Standard grade 146,978 114,417 51 261,446Substandard grade – 25,237 – 25,237Past due but not impaired – 14,794 96 14,890Past due and impaired – – 102,911 102,911
P=1,462,855 P=154,448 P=103,058 P=1,720,361

- 48 -
*SGVFS164641*
Parent Company 2020
Stage 1 Stage 2 Stage 3 Total
Unquoted debt securities:High grade P=852,565 P=– P=– P=852,565
Accrued interest receivable:High grade 215,628 - – 215,628Standard grade 80,698 114,206 51 194,955Substandard grade 48 – 48Past due but not impaired – 1,219 96 1,315Past due and impaired – – 56,598 56,598
296,326 115,473 56,745 468,544
Accounts receivable:High grade 225,401 – – 225,401Standard grade 66,280 – – 66,280Substandard grade – 25,189 – 25,189Past due but not impaired – 5,238 – 5,238
Past due and impaired – – 13,907 13,907
291,681 30,427 13,907 336,015
Sales contracts receivable:High grade 22,283 – – 22,283Standard grade – 211 – 211Past due but not impaired – 8,337 – 8,337Past due and impaired – – 35,121 35,121
22,283 8,548 35,121 65,952
Total other receivables:High grade 1,315,876 – – 1,315,876Standard grade 146,978 114,417 51 261,446Substandard grade – 25,237 – 25,237Past due but not impaired – 14,794 96 14,890Past due and impaired – – 105,627 105,627
P=1,462,854 P=154,448 P=105,774 P=1,723,076
Movements during 2021 and 2020 for other receivables follows:
Consolidated 2021
Stage 1 Stage 2 Stage 3 Total
Unquoted debt securities:
Balance at January 1, 2021 P=852,565 P=– P=– P=852,565
Assets derecognized or repaid (174,008) – – (174,008)
Balance at December 31, 2021 678,557 – – 678,557
Accrued interest receivable:Balance at January 1, 2021 296,326 115,473 56,745 468,544
New assets originated orpurchased 523,890 – – 523,890
Assets derecognized or repaid (258,191) (116,877) (55,378) (430,446)
Transfers to Stage 1 (109,197) 109,197 – –Transfers to Stage 2 (1,414) 1,414 – –Transfers to Stage 3 (15,173) (44) 15,217 –
Accounts written-off – (97) (2,121) (2,218)
Balance at December 31, 2021 436,241 109,066 14,463 559,770
Accounts receivable:
Balance at January 1, 2021 291,681 30,427 11,192 333,300
New assets originated orPurchased 3,838,735 – – 3,838,735
Assets derecognized or repaid (3,922,186) 13,573 3,370 (3,905,243)
Transfers to Stage 1 – – – –Transfers to Stage 2 – – – –
Transfers to Stage 3 (7,407) (8,881) 16,288 –Accounts written-off – – (1,006) (1,006)
Balance at December 31, 2021 200,823 35,119 29,844 265,786
(Forward)

- 49 -
*SGVFS164641*
Consolidated 2021
Stage 1 Stage 2 Stage 3 TotalSales contract receivable:
Balance at January 1, 2021 P=22,283 P=8,548 P=35,121 P=65,952
New assets originated orPurchased 12,561 – – 12,561
Assets derecognized or repaid (7,647) (714) (24,997) (33,358)
Transfers to Stage 1 10,407 (7,436) (2,971) –Transfers to Stage 2 - 88 (88) –Transfers to Stage 3 (42) (360) 402 –
Balance at December 31, 2021 37,562 126 7,467 45,155
Total other receivables:Balance at January 1, 2021 1,462,855 154,448 103,058 1,720,361
New assets originated orpurchased 4,375,186 – – 4,375,186
Assets derecognized or repaid (4,362,032) (104,018) (77,005) (4,543,055)
Transfers to Stage 1 (106,197) 92,880 13,317 –Transfers to Stage 2 (1,414) 1,502 (88) –Transfers to Stage 3 (15,215) (404) 15,619 –
Accounts written-off – (97) (3,127) (3,224)
P=1,353,183 P=144,311 P=51,774 P=1,549,268
Parent Company 2021
Stage 1 Stage 2 Stage 3 Total
Unquoted debt securities:
Balance at January 1, 2021 P=852,565 P=– P=– P=852,565
Assets derecognized or repaid (174,008) – – (174,008)
Balance at December 31, 2021 678,557 – – 678,557
Accrued interest receivable:
Balance at January 1, 2021 296,326 115,473 56,745 468,544
New assets originated orPurchased 523,,890 – – 523,890
Assets derecognized or repaid (258,191) (116,877) (55,378) (430,446)
Transfers to Stage 1 (109,197) 109,197 – –Transfers to Stage 2 (1,414) 1,414 – –
Transfers to Stage 3 (15,173) (44) 15,217 –Accounts written-off – (97) (2,121) (2,218)
Balance at December 31, 2021 436,241 109,066 14,463 559,770
Accounts receivable:Balance at January 1, 2021 291,681 30,427 13,907 336,015
New assets originated orPurchased
3,838,736 – – 3,838,736
Assets derecognized or repaid (3,919,354) 13,573 655 (3,905,126)
Transfers to Stage 1 (7,407) (8,881) 16,288 –Transfers to Stage 2 – – – –Transfers to Stage 3 – – – –Accounts written-off – – (1,006) (1,006)Balance at December 31, 2021 203,656 35,119 29,844 268,619
Sales contract receivable:Balance at January 1, 2021 22,283 8,548 35,121 65,952
New assets originated or
Purchased 12,561 – – 12,561
Assets derecognized or repaid (7,647) (714) (24,997) (33,358)
Transfers to Stage 1 10,407 (7,436) (2,971) –
Transfers to Stage 2 - 88 (88) –Transfers to Stage 3 (42) (360) 402 –
Balance at December 31, 2021 37,562 126 7,467 45,155
Total other receivables:Balance at January 1, 2021 1,462,855 154,448 105,773 1,723,076
New assets originated orPurchased 4,375,187 – – 4,375,187
Assets derecognized or repaid (4,359,200) (104,018) (79,720) (4,542,938)
Transfers to Stage 1 (106,197) 92,880 13,317 –Transfers to Stage 2 (1,414) 1,502 (88) –Transfers to Stage 3 (15,215) (404) 15,619 –
Accounts written-off – (97) (3,127) (3,224)
P=1,356,016 P=144,311 P=51,774 P=1,552,101

- 50 -
*SGVFS164641*
Consolidated 2020
Stage 1 Stage 2 Stage 3 Total
Unquoted debt securities:Balance at January 1, 2020 P=1,068,193 P=– P=– P=1,068,193
Assets derecognized or repaid (215,628) – – (215,628)
Balance at December 31, 2020 852,565 – – 852,565
Accrued interest receivable:Balance at January 1, 2020 445,629 64,794 59,071 569,494New assets originated or
purchased 340,874 – – 340,874Assets derecognized or repaid (343,133) (47,511) (7,110) (397,754)Transfers to Stage 1 230 (230) – –
Transfers to Stage 2 (101,743) 101,743 – –Transfers to Stage 3 (45,531) (3,323) 48,854 –Accounts written-off – – (44,070) (44,070)
Balance at December 31, 2020 296,326 115,473 56,745 468,544
Accounts receivable:Balance at January 1, 2020 688,467 9,692 7,085 705,244
New assets originated orpurchased 4,121,822 – – 4,121,822
Assets derecognized or repaid (4,486,953) (3,741) (3,072) (4,493,766)
Transfers to Stage 1 (31,655) 29,576 2,079 –Transfers to Stage 2 – (5,100) 5,100 –Transfers to Stage 3 – – – –
Accounts written-off – – – –
Balance at December 31, 2020 291,681 30,427 11,192 333,300
Sales contract receivable:Balance at January 1, 2020 41,640 37,804 22,764 102,208New assets originated or
purchased 9,152 – – 9,152Assets derecognized or repaid (4,370) (2,467) (38,571) (45,408)Transfers to Stage 1 – – – –
Transfers to Stage 2 (10,829) 10,829 – –Transfers to Stage 3 (13,310) (37,618) 50,928 –
Balance at December 31, 2020 22,283 8,548 35,121 65,952
Total other receivables:Balance at January 1, 2020 2,243,929 112,290 88,920 2,445,139New assets originated or
purchased 4,471,848 – – 4,471,848Assets derecognized or repaid (5,050,084) (53,719) (48,753) (5,152,556)Transfers to Stage 1 (31,425) 29,346 2,079 –
Transfers to Stage 2 (112,572) 107,472 5,100 –Transfers to Stage 3 (58,841) (40,941) 99,782 –Accounts written-off – – (44,070) (44,070)
P=1,462,855 P=154,448 P=103,058 P=1,720,361
Parent Company 2020
Stage 1 Stage 2 Stage 3 Total
Unquoted debt securities:
Balance at January 1, 2020 P=1,068,193 P=– P=– P=1,068,193
Assets derecognized or repaid (215,628) – – (215,628)
Balance at December 31, 2020 852,565 – – 852,565
Accrued interest receivable:
Balance at January 1, 2020 445,629 64,794 59,071 569,494New assets originated or
Purchased340,874 – – 340,874
Assets derecognized or repaid (343,133) (47,511) (7,110) (397,754)Transfers to Stage 1 230 (230) – –Transfers to Stage 2 (101,743) 101,743 – –Transfers to Stage 3 (45,531) (3,323) 48,854 –Accounts written-off – – (44,070) (44,070)
Balance at December 31, 2020 296,326 115,473 56,745 468,544
(Forward)

- 51 -
*SGVFS164641*
Parent Company 2020
Stage 1 Stage 2 Stage 3 TotalAccounts receivable:
Balance at January 1, 2020 P=691,221 P=9,692 P=7,085 P=707,998
New assets originated orPurchased
4,121,822 – – 4,121,822
Assets derecognized or repaid (4,489,707) (3,741) (357) (4,493,805)
Transfers to Stage 1 (31,655) 29,576 2,079 –Transfers to Stage 2 – (5,100) 5,100 –Transfers to Stage 3 – – – –Accounts written-off – – – –Balance at December 31, 2020 291,681 30,427 13,907 336,015
Sales contract receivable:Balance at January 1, 2020 41,640 37,804 22,764 102,208New assets originated or
Purchased9,152 – – 9,152
Assets derecognized or repaid (4,370) (2,467) (38,571) (45,408)Transfers to Stage 1 – – – –Transfers to Stage 2 (10,829) 10,829 – –Transfers to Stage 3 (13,310) (37,618) 50,928 –Balance at December 31, 2020 22,283 8,548 35,121 65,952
Total other receivables:
Balance at January 1, 2020 2,246,683 112,290 88,920 2,447,893New assets originated or
purchased4,471,848 – – 4,471,848
Assets derecognized or repaid (5,052,839) (53,719) (46,037) (5,152,595)Transfers to Stage 1 (31,425) 29,346 2,079 –Transfers to Stage 2 (112,572) 107,472 5,100 –Transfers to Stage 3 (58,841) (40,941) 99,782 –Accounts written-off – – (44,070) (44,070)
P=1,462,854 P=154,448 P=105,774 P=1,723,076
As of December 31, 2021 and 2020, the credit quality of other financial assets (RCOCI andrefundable security deposits) are as follows:
Consolidated and Parent Company 2021
Stage 1 Stage 2 Stage 3 Total
High grade P=33,907 P=– P=– P=33,907
Standard grade 62 – – 62
Past due and impaired – – 1,564 1,564
P=33,969 P=– P=1,564 P=35,533
Consolidated and Parent Company 2020
Stage 1 Stage 2 Stage 3 Total
High grade P=33,387 P=– P=– P=33,387Standard grade 1,273 – – 1,273
P=34,660 P=– P=– P=34,660
Movements during 2021 and 2020 for other financial assets follows:
Consolidated and Parent Company 2021
Stage 1 Stage 2 Stage 3 Total
Balance at January 1 P=34,660 P=– P=– P=34,660
New assets originated or purchased 1,139 – 1,564 2,703
Assets derecognized or repaid (1,830) – – (1,830)
Balance at December 31 P=33,969 P=– P=1,564 P=35,533

- 52 -
*SGVFS164641*
Consolidated and Parent Company 2020
Stage 1 Stage 2 Stage 3 Total
Balance at January 1 P=62,356 P=– P=– P=62,356
New assets originated or purchased 2,785 – – 2,785
Assets derecognized or repaid (30,481) – – (30,481)
Balance at December 31 P=34,660 P=– P=– P=34,660
As of December 31, 2021 and 2020, restructured loans by the Group and the Parent Companywhich are neither past due nor impaired are as follow:
2021 2020
Receivables from customers:Corporate P=102,674 P=84,912Consumer 93,085 50,931
a. Due from Banks, Interbank Loans Receivables, Government Securities and CorporateInvestmentsThe Group follows an internally developed risk rating system for local banks and external riskratings [that is, Standard and Poor’s (S&P)] for foreign banks, government securities andcorporate investments.
A description of the rating systems for local banks follows:
High Grade (Tier 1)
Tier 1 - Banks categorized under this tier are capable of withstanding very difficult marketconditions for 2-3 years without deteriorating to a substandard credit classification by virtue oftheir size, reputation and ranking in the industry.
Standard Grade (Tier 2 to Tier 3)
These are accounts that have potential weaknesses that deserve management’s close attention.These potential weaknesses, if left uncorrected, may affect the repayment of the financialinstrument, thus, increase credit risk to the Group.
Tier 2 - Banks categorized under this tier may deteriorate to substandard within 1-2 years undervery difficult market conditions.
Tier 3 - Banks categorized under this tier may deteriorate to substandard within one year undervery difficult market conditions. These are banks, which fall short relative to size, in view ofperceived concern of uncertainty about their portfolio, earnings, or market condition. Banks withtotal net worth of P=3.00 billion to less than P=4.50 billion and net income of P=200.00 million toless than P=400.00 million are included in this category.
Substandard Grade (Tier 4)Tier 4 - These are banks, which fall short relative to size, in view of perceived concern ofuncertainty about their portfolio, earnings, or market condition. Banks with total net worth ofP=1.50 billion to less than P=3.00 billion and net income of P=70.00 million to less thanP=200.00 million are included in this category.
The following is the credit rating scale applicable for foreign banks, government securities, andcorporate investment outlets (aligned with S&P ratings):
AAA - Obligor’s capacity to meet its financial commitment is extremely strong.
- 53 -
*SGVFS164641*
AA - Obligor’s capacity to meet its financial commitment is very strong. It differs from thehighest-rated obligors at a minimal degree.
A - Obligor has strong capacity to meet its financial commitments but is somewhat moresusceptible to the adverse effects of changes in circumstances and economic conditions thanobligors rated in higher-rated categories.
BBB and below:
BBB - Obligation rated ‘BBB’ has adequate protection parameters. However, adverse economicconditions or changing circumstances are more likely to lead to a weakened capacity of theobligor to meet its financial commitment on the obligation.
BB - Obligation is less vulnerable to nonpayment than other speculative issues. However, it facesmajor ongoing uncertainties or exposure to adverse business, financial, or economic conditionswhich could lead to the obligor’s inadequate capacity to meet its financial commitment on theobligation.
B - Obligation rated ‘B’ is more vulnerable to nonpayment than obligations rated ‘BB’, but theobligor currently has the capacity to meet its financial commitment on the obligation. Adversebusiness, financial, or economic conditions will likely impair the obligor’s capacity orwillingness to meet its financial commitment on the obligation.
CCC - Obligation is currently vulnerable to nonpayment, and is dependent upon favorablebusiness, financial, and economic conditions for the obligor to meet its financial commitment onthe obligation. In the event of adverse business, financial, or economic conditions, the obligor isnot likely to have the capacity to meet its financial commitment on the obligation.
CC - Obligation is currently highly vulnerable to nonpayment.
C - Obligation is currently highly vulnerable to nonpayment, payment arrearages allowed by theterms of the documents, and subject of a bankruptcy petition or similar action which have notexperienced a payment default.
Among others, the ‘C’ rating may be assigned to subordinated debt, preferred stock or otherobligations on which cash payments have been suspended in accordance with the instrument’sterms or when preferred stock is the subject of a distressed exchange offer, whereby some or allof the issue is either repurchased for an amount of cash or replaced by other instruments having atotal value that is less than par.
D - Obligation is in payment default. Payments on an obligation are not made on the due dateeven if the applicable grace period has not expired. The ‘D’ rating also will be used upon thefiling of a bankruptcy petition or the taking of similar action if payments on an obligation arejeopardized. An obligation’s rating is lowered to ‘D’ upon completion of a distressed exchangeoffer, whereby some or all of the issue is either repurchased for an amount of cash or replaced byother instruments having a total value that is less than par.

- 54 -
*SGVFS164641*
As of December 31, 2021 and 2020, the credit quality of loans and advances to banks andinvestment securities, gross of allowance for ECL follows:
Consolidated andParent Company 2021
Stage 1 Stage 2 Stage 3 Total
Due from BSP:High grade P=10,271,486 P=− P=− P=10,271,486
Due from other banks:High grade 102,154 − − 102,154
Standard grade 55,4530 − − 55,4530
Unrated 1,909 − − 1,909
658,593 − − 658,593
Interbank loans receivable andSPURA:High grade 4,195,846 − − 4,195,846
Total loans and advances to banks:High grade 14,569,486 − − 14,569,486
Standard grade 554,530 − − 554,530
Unrated 1,909 − − 1,909
15,125,925 − − 15,125,925
Debt securities at FVTPLHigh grade 886,291 − − 886,291
Debt securities at FVTOCI:High grade 6,362,401 − − 6,362,401
Investment securities at amortizedcost:
High grade 15,520,279 − − 15,520,279
Total debt investment securitiesHigh grade 22,768,971 − − 22,768,971
Standard grade − − − −22,768,971 − − 22,768,971
Consolidated andParent Company 2020
Stage 1 Stage 2 Stage 3 Total
Due from BSP:High grade P=20,597,868 P=− P=− P=20,597,868
Due from other banks:High grade 1,106,389 − − 1,106,389Standard grade 387,427 − − 387,427Unrated 1,669 − − 1,669
1,495,485 − − 1,495,485
Interbank loans receivable andSPURA:High grade 6,054,454 − − 6,054,454
Total loans and advancesto banks:High grade 27,758,711 − − 27,758,711Standard grade 387,427 − − 387,427Unrated 1,669 − − 1,669
P=28,147,807 P=− P=− P=28,147,807

- 55 -
*SGVFS164641*
Consolidated andParent Company 2020
Stage 1 Stage 2 Stage 3 Total
Debt securities at FVTPLHigh grade P=718,294 P=− P=− P=718,294
Debt securities at FVTOCI:High grade 5,027,547 − − 5,027,547
Investment securities at amortizedcost:
High grade 2,263,356 − − 2,263,356
Total debt investment securitiesHigh grade 8,009,197 − − 8,009,197Standard grade − − − −
P=8,009,197 P=− P=− P=8,009,197
Total credit risk exposureThe tables below show the different credit risk exposures of the Group and of the Parent Company byrisk weight applied in accordance with BSP Circular No. 538 as reported to the BSP:
Consolidated and Parent
Company 2021
Net Risk Weights(b)
Exposures(a) 0% 20% 50% 75% 100% 150%
On-balance sheet assets(c) P=108,862 P=27,416 P=– P=14,156 P=– P=65,103 P=2,187
Credit risk weighted on- balance sheet assets
(d = b x c) 75,462 – – 7,078 – 65,103 3,280
Off-balance sheet assets(e) 11,461 9,392 1,424 – – 825 –
Credit risk weighted off- balance sheet assets
(f = b x e) 1,111 – 285 – – 825 –
Banking Book(g) – – – – – –
Counter party risk-weighted assets in Banking Books (h = b x g) – – – – – – –
Total Credit Risk WeightedAssets(d + f + h) P=76,572 P=– P=285 P=7,078 P=– P=65,929 P=3,280
(a) Net of specific provisions
Consolidated andParent Company 2020
Net Risk Weights(b)
Exposures(a) 0% 20% 50% 75% 100% 150%
On-balance sheet assets(c) P=101,681 P=28,787 P=81 P=10,214 P=– P=60,834 P=1,765
Credit risk weighted on- balance sheet assets
(d = b x c) 68,605 – 16 5,107 – 60,834 2,648
Off-balance sheet assets(e) 1,368 – 256 – – 1,112
Credit risk weighted off- balance sheet assets
(f = b x e) 14 – – – – 14 –
Banking Book(g) 1,368 – 256 – – 1,112
Counter party risk-weighted assets in Banking Books (h = b x g) 14 – – – – 14 –
Total Credit Risk WeightedAssets(d + f + h) P=69,987 P=– P=272 P=5,107 P=– P=61,960 P=2,648

- 56 -
*SGVFS164641*
Liquidity Risk and Funding ManagementLiquidity risk is the risk that the Parent Company will be unable to meet its payment obligationswhen they fall due under normal and stress circumstances. To limit this risk, management hasarranged diversified funding sources in addition to its core deposit base, manages assets with liquidityin mind and monitors future cash flows and liquidity on a daily basis.
This incorporates an assessment of expected cash flows and the availability of high grade collateralwhich could be used to secure additional funding, if required. The Parent Company also measures itsliquidity risk using the Maximum Cumulative Outflow metric. Utilization against the Board approvedMCO limit is monitored on a monthly basis and is reported to the ALCO and ROC. The ALCOmeets weekly to discuss, among others, the liquidity state of the Parent Company.
The Parent Company maintains a portfolio of highly marketable and diverse assets that can be easilyliquidated in the event of an unforeseen interruption of cash flows. The Parent Company also hascommitted lines of credit that it can access to meet liquidity needs. In addition, the Parent Companymaintains a statutory deposit with the BSP equal to 12.00% of customer deposits in December 31,2021 and 2020. The Bank also ensures that it complies with LCR and NSFR regulatory liquidity risklimits.
In managing intraday liquidity, the Parent Company utilizes its Intraday Liquidity Monitoring done inaccordance with BSP Circular 1064. The report monitors the level and trend of intraday liquidity riskexposures of the bank and its ability to meet payment and settlement obligations on a timely basis.The Parent Company also utilizes internal Liquidity Ratios that allows the Bank to easily gauge itsreadily available liquidity, based on high quality liquid assets, against deposit liabilities. These ratiosalso aid in the management of substantial liability outflows and the demand of funds for new loans.
This will allow the Parent Company to readily support its new business strategies and direction andmanagement of liquidity risk. The daily movement of Secondary Reserve serves as a primaryindicator of liquidity condition of the Parent Company. In addition, the Parent Company monitors theliquidity characteristics of its portfolio of assets that will provide necessary liquidity support duringperiods of liquidity stress as required by BSP Circular No. 905.
Analysis of financial instruments by remaining contractual maturitiesThe tables below summarize the maturity profile of the Group’s and the Parent Company’s financialinstruments as of December 31, 2021 and 2020, based on undiscounted contractual payments, exceptfor financial assets at FVTPL. Repayments which are subject to notice are treated as if notices are tobe given immediately. However, the Group and the Parent Company expect that many customerswill not request repayment on the earliest date the Group and the Parent Company could be requiredto pay and the tables do not reflect the expected cash flows indicated by the Group’s and the ParentCompany’s deposit retention history (amounts in millions):
Consolidated and Parent Company 2021
On Demand
Less than 12-Mar
1-2 Years
Beyond
Total3 Months Months 2 Years*
Financial assets
Financial assets at FVTPL P=– P=8 P=23 P=30 P=1,842 P=1,903
Financial assets at FVTOCI – 74 222 296 7,978 8,570
Investment securities at amortizedcost:
Government securities – 230 460 1,335 18,057 20,082
Loans and receivables:Due from BSP 10,271 – – – – 10,271
Due from other banks – 659 – – – 659
Interbank loans receivable – 4,217 – – – 4,217
(Forward)

- 57 -
*SGVFS164641*
Consolidated and Parent Company 2021
On Demand
Less than 12-Mar
1-2 Years
Beyond
Total3 Months Months 2 Years*
Receivables from customers:Corporate P=– P=23,565 P=13,887 P=2,738 P=28,848 P=69,038
Consumer – 155 458 782 6,522 7,917
Unquoted debt securities – – – – 678 678
Accrued interest receivable – 312 248 – – 560
Accounts receivable – 188 47 – 31 266
Sales contracts receivable – 36 2 – 7 45
Refundable deposit – – – – 35 35
RCOCI – 62 – – – 62
P=10,271 P=29,506 P=15,347 P=5,181 P=63,998 P=124,303
Financial liabilities
Deposit liabilities:Demand P=41,166 P=– P=– P=– P=– P=41,166
Savings 11,359 – – – – 11,359
Time – 24,142 4,609 950 2,141 31,842
LTNCD – 41 122 163 2,933 3,259
Bills payable:Private firms and individuals – 5,204 4 – – 5,208
Banks and other financial institutions – 280 529 – – 809
Outstanding acceptances 72 – – – – 72
Manager’s checks 172 – – – – 172
Accrued interest payable – 14 45 – – 59
Accrued other expenses – 557 – – – 557
Other liabilities: -
Accounts payable 311 – – – – 311
Refundable security deposits – 22 24 44 76 166
P=53,080 P=30,260 P=5,333 P=1,157 P=5,150 P=94,980
*Including non-performing loans and receivables
Consolidated and Parent Company 2020
On Demand
Less than 12-Mar
1-2 Years
Beyond
Total3 Months Months 2 Years*
Financial assetsFinancial assets at FVTPL P=- P=8 P=35 P=42 P=963 P=1,048Financial assets at FVTOCI – 122 229 351 6,567 7,269Investment securities at amortizedcost:
Government securities – 65 101 241 2,704 3,111Loans and receivables:
Due from BSP 20,681 – – – – 20,681Due from other banks – 1,538 – – – 1,538Interbank loans receivable – 6,098 – – – 6,098Receivables from customers:
Corporate 1,676 26,355 5,648 5,406 18,769 57,854Consumer 994 127 448 743 6,999 9,311
Unquoted debt securities – – – – 853 853Accrued interest receivable – 92 377 – – 469Accounts receivable – 225 99 – 12 336Sales contracts receivable – 23 8 – 35 66Refundable deposit – – – – 33 33RCOCI 1,273 – – – – 1,273
P=24,624 P=34,653 P=6,945 P=6,783 P=36,935 P=109,940
Financial liabilitiesDeposit liabilities:
Demand P=30,865 P=– P=– P=– P=– P=30,865Savings 9,665 – – – – 9,665Time – 34,131 3,999 1,298 1,173 40,601LTNCD – 40 123 163 3,110 3,436
Bills payable: -Private firms and individuals – 1,956 30 – – 1,986Banks and other financial institutions – 198 – – – 198
Outstanding acceptances 498 – – – – 498Manager’s checks 188 – – – – 188
(Forward)

- 58 -
*SGVFS164641*
Consolidated and Parent Company 2020
On Demand
Less than 12-Mar
1-2 Years
Beyond
Total3 Months Months 2 Years*Accrued interest payable P=– P=105 P=– P=– P=– P=105Accrued other expenses – 516 – – – 516Other liabilities: -
Accounts payable 205 – – – – 205Refundable security deposits – 57 88 7 34 186
Due to the Treasurer of thePhilippines – 41 – – – 41
P=41,421 P=37,044 P=4,240 P=1,468 P=4,317 P=88,490
*Including non-performing loans and receivables
The tables below show the contractual expiry of the Group’s and the Parent Company’s commitmentsand contingent liabilities as of December 31, 2021 and 2020 (amounts in millions):
2021
On Demand
Less than 3
Months
3 to 12
Months
Beyond
Total1 Year
Unused Commercial LC:Standby LC P=43 P=71 P=711 P=– P=825
Sight LC outstanding 190 590 110 – 890
Usance LC outstanding 6 129 – – 135
Outstanding shipping guarantees 53 – 343 – 396
Spot exchange:Sold 102 – – – 102
Bought 362 – – – 362
Currency forwards:Sold – 162 – – 162
Bought – 1 1 – 2
P=756 P=953 P=1,165 P=– P=2,874
2020
On DemandLess than 3
Months 3 to 12 Months
Beyond
Total1 Year
Unused Commercial LC:Standby LC P=231 P=98 P=784 P=– P=1,112
Sight LC outstanding 44 674 74 – 792
Usance LC outstanding 51 33 – – 84
Outstanding shippingguarantees – – 404 – 404
Spot exchange:Sold 1,300 – – – 1,300
Bought 1,461 – – – 1,461
Currency forwards:Sold – 337 – – 337
Bought 4 – – 4
P=3,087 P=1,146 P=1,262 P=– P=5,495
Liquidity Position and Leverage
Liquidity Coverage Ratio
Pursuant to BSP Circular No. 905 which aims to promote short-term resilience of banks’ liquidity riskprofile to withstand significant liquidity shocks that may last over 30 calendar days, the Group isrequired to hold and maintain an adequate level of unencumbered high-quality liquid assets (HQLA)that are sufficient to to meet its estimated total cash outflows over a 30-calendar day horizon ofliquidity stress. The LCR is the ratio of HQLAs to total net cash outflows which should be no lowerthan 100% on a daily basis. HQLA represents the Group’s stock of liquid assets that qualify forinclusion in the LCR which consists mainly of cash, regulatory reserves and unencumbered high-quality liquid securities. HQLAs therefore, serve as defense against potential stress events.

- 59 -
*SGVFS164641*
As of December 31, 2021 and 2020, LCR of the Parent Company is shown in the table below(amounts, except ratios, are expressed in millions):
2021 2020
Total Stock of High-Quality Liquid Assets P=32,848 P=34,554Total Net Cash Outflows 13,442 12,147
LCR 244.36% 284.46%
Net Stable Funding RatioPursuant to BSP Circular No. 1007, the Group is required to compute its Net Stable Funding Ratio(NSFR). The NSFR is aimed at strengthening the Group’s long-term resilience by maintaining astable funding in relation to its assets and off-balance sheet items. The NSFR is expressed as the ratioof available stable funding and the required stable funding and complements the LCR as it takes alonger view of the Group’s liquidity risk profile.
As of December 31, 2021 and 2020, NSFR of the Parent Company is shown in the table below(amounts, except ratios, are expressed in millions):
2021 2020
Available stable funding P=80,521 P=78,143Required stable funding 55,093 49,282
NSFR 146.15% 158.56%
Both LCR and NSFR should be maintained no lower than 100.00% on a daily basis under normalsituations.
Market Risk ManagementMarket risk is the risk of loss to future earnings, fair values or future cash flows that may result fromchanges in the price of a financial instrument. The value of a financial instrument may change as aresult of changes in interest rates, foreign currency exchange rates, commodity prices, equity pricesand other market changes. The Parent Company’s market risk originates from the Parent Company’sholdings of foreign exchange instruments, debt securities, equity securities and derivatives.
Value-at-Risk (VaR)
VaR is a statistical estimate of potential loss given prevailing market price trends, correlations andvolatilities. VaR estimates the potential decline in the value of a portfolio, under normal marketconditions, a given “confidence level” over a specified time horizon. VaR is used to alert seniormanagement whenever the potential for losses in the Parent Company’s portfolios exceeds the VaRlimit. This allows management to react quickly and adjust its portfolio strategies in different marketconditions in accordance with the Parent Company’s risk philosophy and appetite.
In 2021 and 2020, Parent Company uses Historical VaR Model using 99% confidence level, and a 1-day defeasance period.
The Market Risk and Capital Oversight Division runs VaR on a daily basis, monitors the VaR againstthe BOD approved VaR limit and submits Daily VaR Reports to concerned division/group/segmentheads.
To verify the validity of the VaR model used, the Treasury Operations Division performs quarterlyback testing to examine how frequently actual daily losses exceeds the daily VaR. Backtesting results
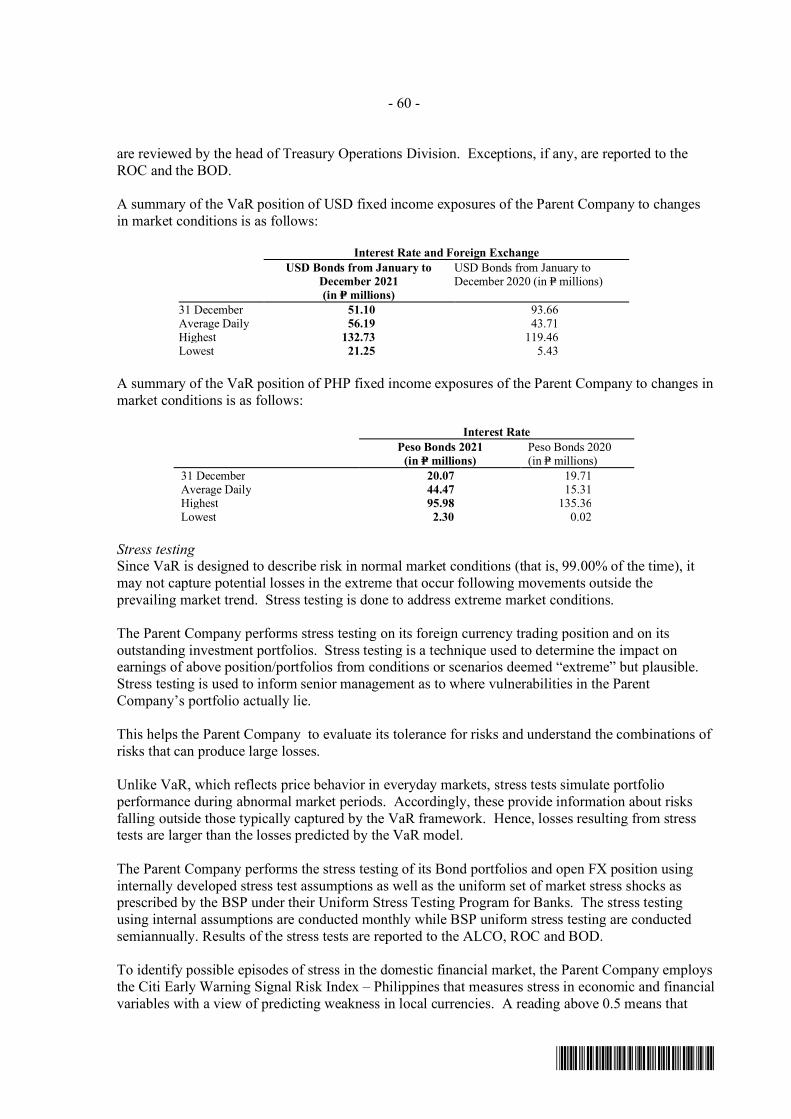
- 60 -
*SGVFS164641*
are reviewed by the head of Treasury Operations Division. Exceptions, if any, are reported to theROC and the BOD.
A summary of the VaR position of USD fixed income exposures of the Parent Company to changesin market conditions is as follows:
Interest Rate and Foreign Exchange
USD Bonds from January to
December 2021
(in P= millions)
USD Bonds from January toDecember 2020 (in P= millions)
31 December 51.10 93.66Average Daily 56.19 43.71Highest 132.73 119.46Lowest 21.25 5.43
A summary of the VaR position of PHP fixed income exposures of the Parent Company to changes inmarket conditions is as follows:
Interest Rate
Peso Bonds 2021
(in P= millions)
Peso Bonds 2020(in P= millions)
31 December 20.07 19.71Average Daily 44.47 15.31Highest 95.98 135.36Lowest 2.30 0.02
Stress testingSince VaR is designed to describe risk in normal market conditions (that is, 99.00% of the time), itmay not capture potential losses in the extreme that occur following movements outside theprevailing market trend. Stress testing is done to address extreme market conditions.
The Parent Company performs stress testing on its foreign currency trading position and on itsoutstanding investment portfolios. Stress testing is a technique used to determine the impact onearnings of above position/portfolios from conditions or scenarios deemed “extreme” but plausible.Stress testing is used to inform senior management as to where vulnerabilities in the ParentCompany’s portfolio actually lie.
This helps the Parent Company to evaluate its tolerance for risks and understand the combinations ofrisks that can produce large losses.
Unlike VaR, which reflects price behavior in everyday markets, stress tests simulate portfolioperformance during abnormal market periods. Accordingly, these provide information about risksfalling outside those typically captured by the VaR framework. Hence, losses resulting from stresstests are larger than the losses predicted by the VaR model.
The Parent Company performs the stress testing of its Bond portfolios and open FX position usinginternally developed stress test assumptions as well as the uniform set of market stress shocks asprescribed by the BSP under their Uniform Stress Testing Program for Banks. The stress testingusing internal assumptions are conducted monthly while BSP uniform stress testing are conductedsemiannually. Results of the stress tests are reported to the ALCO, ROC and BOD.
To identify possible episodes of stress in the domestic financial market, the Parent Company employsthe Citi Early Warning Signal Risk Index – Philippines that measures stress in economic and financialvariables with a view of predicting weakness in local currencies. A reading above 0.5 means that

- 61 -
*SGVFS164641*
stress is above average and a reading below 0.5 means that stress is below average. The risk indexlevel is part of the market risk assessment conducted quarterly and is reported to the ROC.
Interest Rate Risk ManagementInterest rate risk arises from the possibility that changes in the interest rates will affect future cashflows or the fair value of financial instruments. The Parent Company follows a prudent policy onmanaging its assets and liabilities so as to ensure that the exposure to fluctuations in interest rates iskept within acceptable limits.
As of December 31, 2021 and 2020, 56.72% and 85.59%, respectively, of the Bank’s total loanportfolio comprised floating rate loans which are repriced periodically by reference to the transferpool rate that reflects the Bank’s internal cost of funds. As a result of these factors, the Bank’sexposure to interest rate fluctuations, and other market risks, is significantly reduced.
The Bank, in keeping with banking industry practice, aims to achieve stability and lengthen the termstructure of its deposit base, while providing adequate liquidity to cover transactional bankingrequirements of customers. Interest is paid on substantial portion of demand accounts whichconstituted 47.35% and 36.84%, respectively, of total deposits of the Parent Company as ofDecember 31, 2021 and 2020, respectively, and pays a variable interest rate of 0.10% to 0.20% and0.10% to 0.50%, respectively. Rates on savings accounts and time deposit accounts, whichconstituted 13.06% and 36.26%, respectively, of total deposits as of December 31, 2021 and 11.53%and 48.18%, respectively, of total deposits as of December 31, 2020, are set by different criteria.Savings account rates are set by reference to prevailing market rates, while rates on time deposits andspecial savings accounts are usually priced by reference to rates applicable to prevailing rates onPhilippine Treasury Bills and other money market instruments or, in the case of foreign currencydeposits, Singapore Interbank Offer Rate and other benchmark dollar deposit rates in the Asian andinternational money markets with similar maturities.
The following tables provide for the average EIR by period of maturity or repricing of the Group andthe Parent Company as of December 31, 2021 and 2020:
Consolidated and Parent Company
2021 2020
Less than
3 Months
3 Months
to 1 Year
Greater
than
1 Year
Less than3 Months
3 Monthsto 1 Year
Greaterthan
1 Year
Peso-denominated assets
Due from banks 0.33% – – 0.10% – –Interbank loans – – – 0.03% – –Loans and receivables 7.78% 15.23% 11.36% 9.25% 18.82% 17.14%
Peso-denominated liabilities
Deposit liabilities 0.16% 1.47% 2.63% 0.16% 3.21% 3.21%Bills payable 1.07% 1.33% 0.94% 0.50%
Foreign currency-denominated
assets
Due from banks 0.07% – – 0.16% – –Interbank loans – – – 0.03% – –Loans and receivables 3.65% 5.77% 3.91% 4.99% 5.06% 3.97%
Foreign currency-denominated
liability
Deposit liabilities 0.33% 0.63% 0.90% 0.42% 1.80% 1.48%Bills payable -0.25% 0.63% – – – –
The Parent Company also monitors its exposure to fluctuations in interest rates by measuring theimpact of interest rate movements on its interest income. This is done by modeling the impact ofvarious changes in interest rates to the Parent Company ’s interest-related income and expenses.

- 62 -
*SGVFS164641*
The method by which the Parent Company measures the sensitivity of its assets and liabilities tointerest rate fluctuations is by way of interest rate analysis. This analysis provides the ParentCompany with a measure of the impact of changes in interest rates on the actual portfolio, that is, therisk exposure of future accounting income. The repricing gap is calculated by distributing thefinancial assets and financial liabilities into tenor buckets according to the time remaining to maturityor next repricing date and then obtaining the difference between the total of the repricing (interest ratesensitive) assets and repricing (interest rate sensitive) liabilities.
A gap is considered negative when the amount of interest rate sensitive liabilities exceeds the amountof interest rate sensitive assets. A gap is considered positive when the amount of interest ratesensitive assets exceeds the amount of interest rate sensitive liabilities. Accordingly, during a periodof rising interest rates, a bank with a positive gap would be better positioned than one with a negativegap to invest in or hold higher yielding assets more quickly than it would need to refinance itsinterest-bearing liabilities. During a period of falling interest rates, a bank with a positive gap wouldtend to see its assets repricing at a faster rate than one with a negative gap, which may restrain thegrowth of its net income or result in a decline in net interest income.
The following tables set forth the asset-liability gap position of the Group and the Parent Company asof December 31, 2021 and 2020 (amounts in millions):
Consolidated
2021
Up to
1 Month
More than
1 Month to
3 Months
More
than 3 to
12 Months
More than
1 Year
but less
than
2 Years
Beyond
2 Years Total
Assets
Due from other banks P=659 P=– P=– P=– P=– P=659
Interbank loans receivable 4,196 – – – – 4,196
Financial assets at FVTPL 886 – – – – 886
Financial assets at FVTOCI – – – – 6,362 6,362
Investment securities atamortized cost
– – – – 15,520 15,520
Loans and receivables 2,161 24,185 12,083 1,623 23,446 63,498
7,902 24,185 12,083 1,623 45,328 91,121
Liabilities
Deposit liabilities 13,355 12,018 3,130 907 5,011 34,421
Bills payable 3,789 1,690 532 – – 6,011
17,144 13,708 3,662 907 5,011 40,432
Asset-liability gap (P=9,242) P=10,477 P=8,421 P=716 P=40,317 P=50,689

- 63 -
*SGVFS164641*
Consolidated
2020
Up to1 Month
More than1 Month to
3 Months
Morethan 3 to
12 Months
More than1 Year
but less than2 Years
Beyond2 Years Total
AssetsDue from other banks P=1,495 P=– P=– P=– P=– P=1,495Interbank loans receivable 6,054 – – – – 6,054Financial assets at FVTPL – – 718 – – 718Financial assets at FVTOCI – – – – 5,028 5,028Investment securities at
amortized cost– – – 75 2,199 2,274
Loans and receivables 1,799 25,195 6,312 4,461 19,857 57,624
9,348 25,195 7,030 4,536 27,084 73,193
LiabilitiesDeposit liabilities 21,123 12,957 3,941 1,239 3,991 43,251Bills payable 1,759 394 30 – – 2,183
22,882 13,351 3,971 1,239 3,991 45,434
Asset-liability gap (P=13,534) P=11,844 P=3,059 P=3,297 P=23,093 P=27,759
Parent Company
2021
Up to
1 Month
More than
1 Month to
3 Months
More
than 3 to
12 Months
More than
1 Year
but less
than
2 Years
Beyond
2 Years Total
Assets
Due from other banks P=659 P=– P=– P=– P=– P=659
Interbank loans receivable 4,196 – – – – 4,196
Financial assets at FVTPL 886 – – – – 886
Financial assets at FVTOCI – – – – 6,362 6,362
Investment securities atamortized cost
– – – – 15,520 15,520
Loans and receivables 2,164 24,185 12,083 1,623 23,446 63,501
7,905 24,185 12,083 1,623 45,328 91,124
Liabilities
Deposit liabilities 13,355 12,018 3,130 907 5,011 34,421
Bills payable 3,789 1,690 532 – – 6,011
17,144 13,708 3,662 907 5,011 40,432
Asset-liability gap (P=9,239) P=10,477 P=8,421 P=716 P=40,317 P=50,692
Parent Company
2020
Up to1 Month
More than1 Month to
3 Months
Morethan 3 to
12 Months
More than1 Year
but less than2 Years
Beyond2 Years Total
AssetsDue from other banks P=1,495 P=– P=– P=– P=– P=1,495Interbank loans receivable 6,054 – – – – 6,054Financial assets at FVTPL – – – – 718 718Financial assets at FVTOCI – – – – 5,028 5,028Investment securities at
amortized cost – – – 75 2,199 2,274
Loans and receivables 1,802 25,195 6,312 4,461 19,857 57,627
9,351 25,195 6,312 4,536 27,802 73,196
(Forward)

- 64 -
*SGVFS164641*
Parent Company
2020
Up to1 Month
More than1 Month to
3 Months
Morethan 3 to
12 Months
More than1 Year
but less than2 Years
Beyond2 Years Total
LiabilitiesDeposit liabilities P=21,123 P=12,957 P=3,941 P=1,239 P=3,991 P=43,251Bills payable 1,759 394 30 – – 2,183
22,882 13,351 3,971 1,239 3,991 45,434
Asset-liability gap (P=13,531) P=11,844 P=2,341 P=3,297 P=23,811 P=27,762
The following tables demonstrate the sensitivity of the cumulative net position of risk-sensitive assetsand risk-sensitive liabilities to a reasonable change in interest rates, with all other variables heldconstant (amounts in millions):
2021
Changes in Interest Rates (in Basis Points)
Changes in interest rates (in basis points) +50 -50 +100 -100
Change in annualized net interest income P=169.52 (P=169.52) P=339.04 (P=339.04)
2020
Changes in Interest Rates (in Basis Points)
Changes in interest rates (in basis points) +50 -50 +100 -100
Change in annualized net interest income P=157.72 (P=157.72) P=315.44 (P=315.13)
The table below shows the Group’s and the Parent Company’s different market risk-weighted assets,as reported to BSP, using the standardized approach in accordance with BSP Circular No. 538:
Type of Market Risk Exposure 2021 2020
Interest rate exposures P=443,323 P=108,108Foreign exchange exposures 56,698 74,345
P=500,021 P=182,453
Foreign Currency Risk ManagementCurrency risk is the risk that the value of a financial instrument will fluctuate due to changes inforeign exchange rates. Foreign currency liabilities generally consist of foreign currency-deposits inthe Parent Company’s FCDU account made in the Philippines or which are generated fromremittances to the Philippines by Filipino expatriates and overseas Filipino workers who retain fortheir own benefit or for the benefit of a third party, foreign currency deposit accounts with the ParentCompany and foreign currency-denominated borrowings appearing in the regular books of the ParentCompany.
Foreign currency deposits are generally used to fund the Parent Company’s foreign currency-denominated loan and investment portfolio in the FCDU. Banks are required by the BSP to match theforeign currency assets with the foreign currency liabilities held through FCDUs. In addition, theBSP requires a 30.00% liquidity reserve on all foreign currency liabilities held through FCDUs.
The Parent Company ’s policy is to maintain foreign currency exposure within acceptable limits andwithin existing regulatory guidelines. The Parent Company believes that its profile of foreigncurrency exposure on its assets and liabilities is within limits for a financial institution engaged in thetype of business in which the Parent Company is engaged in.

- 65 -
*SGVFS164641*
The ERMG uses VaR, Foreign Exchange Sensitivity Testing, and Foreign Exchange Stress Testing tomeasure risk inherent to the Parent Company ’s foreign currency net exposures. In assessing theforeign currency risk, the Parent Company employs a pre-defined key risk indicator under MarketRisk Assessment Matrix to determine the level of risk (for example, Low Risk, Moderate Risk, HighRisk) the results of which are reported to the ROC on a quarterly basis.
The table summarizes the Group’s and the Parent Company’s exposure to foreign exchange risk as ofDecember 31, 2021 and 2020. Included in the table are the Group’s and the Parent Company’s assetsand liabilities at carrying amounts, categorized by currency (amounts in ‘000s):
2021 2020
USD Others* Total USD Others* Total
Assets
Cash on hand P=1,806 P=168 P=1,974 P=2,836 P=170 P=3,006
Due from other banks 44,176 4,553 48,729 14,727 3,189 17,916Interbank loans receivable 169,853 – 169,853 94,556 – 94,556Financial assets at amortized cost – 231,158 231,158 – 234,740 234,740
Loans and receivables:Corporate loans 133,519 - 133,519 632,524 – 632,524Accrued interest receivable 141 3,423 3,564 555 3,399 3,954
Other assets – 125 125 – 127 127
349,495 239,427 588,922 745,198 241,625 986,823
Liabilities
Deposit liabilities – 37,833 37,833 – 39,694 39,694Bills payable – 221,509 221,509 – – –
Outstanding acceptances 71,609 – 71,609 497,813 – 497,813Other liabilities:
Others 87 1 88 36 75 111
71,696 259,343 331,039 497,849 39,769 537,618
Net exposure P=277,799 (P=19,916) P=257,883 P=247,349 P=201,856 P=449,205
*Includes Euro, Australian Dollar, Japanese Yen, Swiss Franc, Canadian Dollar, Singapore Dollar
The tables below indicate the exposure of the Group (excluding the Parent Company’s FCDU) toUSD on its non-trading monetary assets and liabilities. The analysis calculates the effect of areasonably possible movement of the base currency rate against the USD, with all other variables heldconstant, on the statement of income and statement of comprehensive income. A negative amount inthe tables reflects a potential net reduction in income, while a positive amount reflects a potential netincrease.
2021
Changes in Foreign Exchange Rates
Changes in foreign exchange rates +3.00% -3.00% +4.00% -4.00%
Change in annualized net income P=1,701 (P=1,701) P=2,268 (P=2,268)
2020
Changes in Foreign Exchange Rates
Changes in foreign exchange rates +3.00% -3.00% +4.00% -4.00%Change in annualized net income P=2,230 (P=2,230) P=2,974 (P=2,974)
Operational RiskThe Parent Company uses the Basic Indicator Approach in computing Operational Risk inaccordance with BSP Circular No. 538 as reported to the BSP (amounts in millions):
2021 2020
Average Gross Income (Previous 3 Years) P=4,680 P=4,045Capital Charge (Average Gross Income times 18.75%(a)) 877 758
Risk Weighted Asset (Capital Charge times 10) P=8,774 P=7,585(a) Equivalent to adjusted capital charge of 15% of 125% to be consistent with required minimum Capital Adequacy Ratio of 10%

- 66 -
*SGVFS164641*
6. Segment Information
The Group’s operating businesses are organized and managed separately according to the nature ofservices provided and the different markets served with each segment representing a strategicbusiness unit. The Group’s business segments are as follow:
Branch Banking Group – handles the individual customers’ deposits, and provides overdrafts andfund transfer facilities;
Corporate Banking Group – manages the relationship with the corporate and institutional clients ofthe Parent Company with loans and credit facilities as the primary product;
Treasury Segment – is responsible for the management of the Group’s balance sheet and liquidityposition. It also handles the Group’s investments in securities, both local and abroad, as well asplacements and acceptances with other banks;
Consumer Finance Segment – provides the retail client’s credit requirements for the purchase of auto,home and personal loan requirements; and
Trust and Wealth Management Segment – is the segment that functions as the Trustee or InvestmentManager for both individual and corporate accounts.Segment’s resources, both assets and liability are those operating resources that are employed by asegment in its operating activities and that are either directly attributable to the segment or can beallocated to the segment on a reasonable basis.
Revenue is reported net of interest expense as management primarily relies on net interest revenue asa performance measure, not the gross interest income and expense. Revenue also includes tradinggains from dealing of securities.
No revenue from transactions with a single external customer or counterparty amounted to 10.00% ormore of the Group’s total revenue for 2021, 2020 and 2019.
The Group’s revenue-producing assets are located in one geographical location, which is thePhilippines, therefore, geographical segment information is no longer presented. Revenue from thirdparty includes trading gains.
The following tables present income and profit and certain asset and liability information regarding
the Group’s operating segments as of and for the years ended December 31, 2021, 2020 and 2019:
Consolidated
2021
Branch
Banking
Group
Corporate
Banking Group
Treasury
Segment
Consumer
Finance Segment
Trust and
Wealth
Management
Segment
Head office and
Rental Total
RevenueRevenue, net of interest expense
Third party (P=299,081) P=3,597,205 P=295,673 P=398,050 P=3,393 P=7,942 P=4,003,182
Intersegment 1,495,942 (1,278,380) (362,503) (74,865) (3,244) 223,050 −1,196,861 2,318,825 (66,830) 323,185 149 230,992 4,003,182
Other operating income 107,595 241,522 48,234 6,700 29,230 648,124 1,081,405
Total operating income (loss) 1,304,456 2,560,347 (18,596) 329,885 29,379 879,116 5,084,587
Compensation and fringe
benefits
595,498 194,653 68,926 109,400 21,779 26,303 1,016,559
Taxes and licenses 185,418 168,124 45,797 20,479 627 56,997 477,442
(Forwwrd)

- 67 -
*SGVFS164641*
Consolidated
2021
Branch
Banking
Group
Corporate
Banking Group
Treasury
Segment
Consumer
Finance Segment
Trust and
Wealth
Management
Segment
Head office and
Rental Total
Depreciation and amortization P=211,715 P=51,273 P=17,031 P=28,577 P=5,003 P=74,020 P=387,619
Provision for (reversal of) creditand impairment losses − 282,124 6,135 28,279 − 5,763 322,301
Occupancy and otherequipment-related costs
91,881 9,880 2,765 12,518 705 770 118,519
Other operating expenses 508,012 155,937 126,681 75,223 9,029 57,862 932,744
Net operating income (loss)before income tax (P=288,068) P=1,698,356 (P=285,931) P=55,409 (P=7,764) P=657,401 P=1,829,403
Segment resultsNet interest income P=1,196,861 P=2,318,825 P=174,768 P=323,185 P=150 P=230,991 P=4,244,780
Rent income − − − − − 505,241 505,241
Trading and securitiesgain (loss) - net − − (241,598) − − − (241,598)
Service charges, fees, andcommissions 88,604 212,836 − 6,752 − 23,537 331,729
Profit (loss) from assets sold − − − − 13,567 13,567
Foreign exchange gain - net 9,009 7,314 40,508 − − − 56,831
Income from trust operations 2 − − − 29,229 − 29,231
Gain on assets exchange - net − − − − − 7,460 7,460
Miscellaneous 9,980 21,372 7,726 (52) − 98,320 137,346
Total operating income 1,304,456 2,560,347 (18,596) 329,885 29,379 879,116 5,084,587
Compensation and fringebenefits 595,498 194,653 68,926 109,400 21,779 26,303 1,016,559
Taxes and licenses 185,418 168,124 45,797 20,479 627 56,997 477,442
Depreciation and amortization 211,715 51,273 17,031 28,577 5,003 74,020 387,619
Provision for credit andimpairment losses − 282,124 6,135 28,279 − 5,763 322,301
Occupancy and otherequipment-related costs 91,881 9,880 2,765 12,518 705 770 118,519
Other operating expenses 508,012 155,937 126,681 75,223 9,029 57,862 932,744
Total operating expenses 1,592,524 861,991 267,335 274,476 37,143 221,715 3,255,184
Segment profit (loss) (288,068) 1,698,356 (285,931) 55,409 (7,764) 657,401 1,829,403
Provision for income tax − (2,139) (106,660) − − (147,827) (256,626)
Share in net income of associate − − − − − 287 287
Net income (loss) fromcontinuing operations (288,068) 1,696,217 (392,591) 55,409 (7,764) 509,861 1,573,064
Net loss from discontinued
operations − − − − − − −(P=288,068) P=1,696,217 (P=392,591) P=55,409 (P=7,764) P=509,861 1,573,064
Segment assetsProperty and equipment P=218,683 P=− P=− P=– P=− P=663,534 P=882,217
Investment properties − − − – − 2,577,169 2,577,169
Other allocated assets 10,087,192 58,301,076 29,726,452 4,031,789 109,365 3,514,060 105,769,934
Total segment assets P=10,305,875 P=58,301,076 P=29,726,452 4,031,789 P=109,365 P=6,754,763 P=109,229,320
Total segment liabilities P=87,223,697 P=111,302 P=6,236,132 P=20,832 P=498 P=1,461,041 P=95,053,502
Consolidated
2020
BranchBanking Group
CorporateBanking Group
TreasurySegment
Consumer FinanceSegment
Trust and WealthManagement
SegmentHead office and
Rental Total
RevenueRevenue, net of interest expense Third party (P=864,759) P=3,701,429 P=1,251,051 P=481,609 P=3,109 P=10,338 P=4,582,777
Intersegment 2,661,504 (1,759,023) (522,140) (206,669) (4,156) (169,516) −1,796,745 1,942,406 728,911 274,940 (1,047) (159,178) 4,582,777
Other operating income 89,435 278,215 53,073 18,991 25,689 844,005 1,309,408
Total operating income 1,886,180 2,220,621 781,984 293,931 24,642 684,827 5,892,185
Compensation and fringebenefits
576,227 183,807 67,298 134,561 16,067 31,158 1,009,118
Taxes and licenses 271,732 207,399 100,398 30,220 1,973 28,338 640,060Depreciation and amortization 220,423 41,230 15,349 25,752 3,598 74,301 380,653Provision for (reversal of) credit
and impairment losses - 982,336 - 447,412 - (11,520) 1,418,228
Occupancy and other
equipment-related costs
77,858 8,549 2,771 10,827 363 966 101,334
Other operating expenses 480,610 153,410 158,856 82,455 16,333 52,359 944,023
Net operating income (loss)before income tax
259,330 643,890 437,312 (437,296) (13,692) 509,225 1,398,769

- 68 -
*SGVFS164641*
Consolidated
2020
BranchBanking Group
CorporateBanking Group
TreasurySegment
Consumer FinanceSegment
Trust and WealthManagement
SegmentHead office and
Rental Total
Segment results
Net interest income (loss) P=1,796,745 P=1,942,406 P=71,628 P=274,941 (P=1,048) (P=159,178) P=3,925,494Rent income − − − − − 673,414 673,414Trading and securities
gain (loss) - net − − 657,283 − − − 657,283Service charges, fees, and
commissions 78,094 247,845 − 18,991 − 44,166 389,096Profit (loss) from assets sold − − − − 6,779 6,779
Foreign exchange gain - net 7,440 6,148 45,597 - - - 59,185Income from trust operations − − − − 25,689 − 25,689Loss on assets exchange - net − − − − (3,157) (3,157)Miscellaneous 3,901 24,221 7,477 − − 122,803 158,402
Total operating income 1,886,180 2,220,620 781,985 293,932 24,641 684,827 5,892,185
Compensation and fringebenefits 576,227 183,807 67,298 134,561 16,067 31,158 1,009,118
Taxes and licenses 271,732 207,399 100,398 30,220 1,973 28,338 640,060Depreciation and amortization 220,423 41,230 15,349 25,752 3,598 74,301 380,653Provision for (reversal of) credit
and impairment losses - 982,336 − 447,412 - (11,520) 1,418,228Occupancy and other
equipment-related costs 77,858 8,549 2,771 10,827 363 966 101,334Other operating expenses 480,610 153,410 158,856 82,455 16,333 52,359 944,023
Total operating expenses 1,626,850 1,576,731 344,672 731,227 38,334 175,602 4,493,416
Segment profit (loss) 259,330 643,889 437,313 (37,295) (13,693) 509,225 1,398,769Provision for income tax (47) (8,794) (136,821) − - (84,461) (230,123)Share in net income of associate − − − − − 266 266
Net income (loss) fromcontinuing operations 259,283 635,095 300,492 (437,295) (13,693) 425,030 P=1,168,912
Net loss from discontinuedoperations - - - − - - −
P=259,283 P=635,095 P=300,492 (P=437,295) (P=13,693) P=425,030 1,168,912
Segment assetsProperty and equipment P=231,265 P=− P=− P=– P=− P=663,352 P=894,617Investment properties − − − – − 2,401,557 2,401,557Other allocated assets 9,456,803 51,117,485 28,471,664 5,214,873 71,977 3,601,242 97,934,044
Total segment assets P=9,688,068 P=51,117,485 P=28,471,664 P=5,214,873 P=71,977 P=6,666,151 P=101,230,218
Total segment liabilities P=82,186,805 P=546,583 P=4,357,647 P=37,806 P=− P=1,571,699 P=88,700,540
Consolidated
2019
BranchBanking Group
CorporateBanking Group
TreasurySegment
ConsumerFinanceSegment
Trust and WealthManagement
SegmentHead office and
Rental Total
Revenue
Revenue, net of interest expenseThird party (P=1,732,332) P=3,500,897 P=1,037,762 P=794,190 P=2,176 P=10,753 P=3,613,446Intersegment 3,299,719 (2,524,770) (667,721) (503,892) (5,333) 401,997 −
1,567,387 976,127 370,041 290,298 (3,157) 412,750 3,613,446Other operating income 99,175 300,294 31,656 42,923 21,095 943,345 1,438,488
Total operating income 1,666,562 1,276,421 401,697 333,221 17,938 1,356,095 5,051,934
Compensation and fringe benefits 538,269 172,413 71,505 137,736 20,472 38,474 978,869Taxes and licenses 233,965 175,035 80,663 34,033 3,212 97,214 624,122Depreciation and amortization 288,787 47,510 11,763 30,856 3,997 63,066 445,979Provision for (reversal of) credit and
impairment losses - 607,603 2,972 (6,421) - (226,541) 377,613
Occupancy and other
equipment-related costs
87,336 18,551 6,156 14,889 2,051 1,237 130,220
Other operating expenses 503,023 139,909 117,438 93,820 10,618 42,798 907,606
Net operating income (loss) beforeincome tax
15,182 115,400 111,200 28,308 (22,412) 1,339,847 1,587,525
Segment resultsNet interest income (loss) P=1,567,387 P=976,126 (P=38,372) P=290,298 (P=3,157) P=412,751 P=3,205,033Rent income − − − − − 736,341 736,341Trading and securities
gain (loss) - net − − 408,413 − − − 408,413Service charges, fees, and
commissions
88,803 261,470 7 42,940 - 14,287 407,507
Profit (loss) from assets sold − − − − 97,739 97,739Foreign exchange gain - net 10,077 8,407 31,389 - - - 49,873Income from trust operations − − − − 21,095 − 21,095Loss on assets exchange - net − − − − (11,850) (11,850)Miscellaneous 295 30,418 261 (17) − 106,826 137,783
Total operating income 1,666,562 1,276,421 401,698 333,221 17,938 1,356,094 5,051,934
(Forward)

- 69 -
*SGVFS164641*
Consolidated
2019
BranchBanking Group
CorporateBanking Group
TreasurySegment
ConsumerFinanceSegment
Trust and WealthManagement
SegmentHead office and
Rental TotalCompensation and fringe benefits P=538,269 P=172,413 P=71,505 P=137,736 P=20,472 P=38,474 P=978,869Taxes and licenses 233,965 175,035 80,663 34,033 3,212 97,214 624,122Depreciation and amortization 288,787 47,510 11,763 30,856 3,997 63,066 445,979Provision for (reversal of) credit and
impairment losses - 607,603 2,972 (6,421) - (226,541) 377,613Occupancy and other equipment-
related costs 87,336 18,551 6,156 14,889 2,051 1,237 130,220Other operating expenses 503,023 139,909 117,438 93,820 10,618 42,798 907,606
Total operating expenses 1,651,380 1,161,021 290,497 304,913 40,350 16,248 3,464,409
Segment profit (loss) 15,182 115,400 111,201 28,308 (22,412) 1,339,846 1,587,525Provision for income tax (372) (21,256) (158,513) (537) - (21,713) (202,391)Share in net income of associate - - - - - 531 531
Net income (loss) from continuingoperations 14,810 94,144 (47,312) 27,771 (22,412) 1,318,664 1,385,665
Net loss from discontinued operations - - - (228,408) - - (228,408)
P=14,810 P=94,144 (P=47,312) (P=200,637) (P=22,412) P=1,318,664 P=1,157,257
Segment assetsProperty and equipment P=256,010 P=− P=− P=– P=− P=718,200 P=974,210Investment properties − − − – − 2,428,666 2,428,666
Other allocated assets 12,221,371 52,971,841 24,901,964 6,393,682 72,075 2,752,477 99,313,410
Total segment assets P=12,477,381 P=52,971,841 P=24,926,182 P=6,393,682 P=72,075 P=5,899,343 P=102,740,504
Total segment liabilities P=82,248,910 P=227,974 P=7,412,992 P=936 P=− P=1,494,491 P=91,385,303
7. Investments in Subsidiary and an Associate
This account consists of investments in:
PRBICost of investment amounted to P=918.30 million which includes the consideration for the acquisitionin 2014 of P=494.54 million, additional investment of P=25.07 million in 2016 in the form of re-invested dividends, acquisition of non-controlling interests of P=0.94 million in 2016 andreclassification in 2017 of investments in RBNI and RBKI aggregating to P=397.74 million as a resultof the merger of PRBI, RBNI and RBKI, with PRBI as the surviving entity in 2017.
% of Ownership Consolidated Parent Company
2021 2020 2019 2021 2020 2019 2021 2020 2019
Subsidiaries:
Cost:
PRBI – – P=− P=− P=− P=– P=– P=–PISAI 100.00 100.00 100.00 − − − 10,000 10,000 10,000
− − − 10,000 10,000 10,000
Accumulated share in net income
Balance at January 1 − − − (3,863) (3,796) 71,097Share in net income − − − (64) (67) (58,116)
Sale of subsidiary − − (16,777)
Balance at December 31 − − − (3,927) (3,863) (3,796)
Accumulated share in OCI
Balance at January 1 − − − − − 2,582Share in change in remeasurement losses on
defined benefit liability, net of tax − − − − − (2,582)
Balance at December 31 − − − – – –
Accumulated dividends received − − −Balance at January 1 − − − − − (25,067)Sale of subsidiary − − − − − 25,067
Balance at December 31 − − − – – –
− − − 6,073 6,138 6,204
Associate - PBCom FinanceAcquisition cost 2,000 2,000 2,000 2,000 2,000 2,000
Accumulated equity in net income
Balance at January 1 12,114 11,848 11,317 12,115 11,849 11,317Share in net income 287 266 531 287 266 531
Balance at December 31 12,401 12,114 11,848 12,402 12,15 11,848
14,401 14,114 13,848 14,402 14,115 13,848
P=14,401 P=14,114 P=13,848 P=20,475 P=20,252 P=20,053

- 70 -
*SGVFS164641*
On July 25, 2019, the BSP approved the sale of 100 percent voting shares of PRBI to ProducersSavings Bank Corporation (PROSBI) for P=555.68 million. Based on the deed of sale, 10% of thepurchase price or P55.58 million shall be withheld by PROSBI and shall be paid to the ParentCompany upon presentation of the Certificate of Authorizing Registration issued by the Bureau ofInternal Revenue (BIR)while capital gains and any documentary stamp taxes arising from the sale ofthe shares shall be paid by the Parent Company. The amount withheld was collected onSeptember 10, 2020.
The sale of PRBI was meant to consolidate the efforts and resources to the Parent Company whichhas set its strategy to focus on its core businesses and expand market to the ecosystem of its majorshareholders. Loss on sale amounted to P=171.17 million. The carrying amount of the investment inPRBI sold by the Parent Company excluded branch licenses amounting to P=726.85 million. Thesebranch licenses were granted to the Parent Company in 2014 as a result of its acquisition of RBNI(subsequently merged to PRBI) in 2017. In 2019, the branch licenses were reclassified from theinvestment account as a result of the Parent Company’s divestment of PRBI. No new asset wasrecognized because the branch licenses have always been recognized as an asset of the ParentCompany since its acquisition of RBNI (Note 15).
PISAIThe investment cost of P=10.00 million represents the initial equity investment as approved by the BSPon May 2, 2014.
On January 11, 2021, the BOD of the Parent Company approved the dissolution and retirement ofbusiness of PISAI. PISAI, which has been inactive for the past 3 years, has continuously remainedinactive but continued to incur operating expenses. The Parent Company does not see any need forthe subsidiary and has decided to retire the business operations.
The Company has received clearance from the Insurance Commission and business permit from theMakati Local Government last May 26, 2021 and September 30, 2021, respectively. Clearances fromother regulatory agencies are currently being processed as of December 31, 2021.
8. Interbank Loans Receivable and Securities Purchased under Resale Agreements (SPURA)
Interbank loans receivable of the Group and the Parent Company is comprised of USD-denominatedloans of P=724.96 million ($14.22 million) and P=2.15 billion ($44.180 million) as of December 31,2021 and 2020, respectively, net of allowance for ECL (see Note 17).
As of December 31, 2021 and 2020, outstanding SPURA is P=3.47 billion and P=3.90 billion,respectively.
Interest income on the Group’s and the Parent Company’s interbank loans receivable and SPURAfollows:
2021 2020 2019
SPURA P=59,969 P=88,043 P=22,974Interbank loans receivable 100 4,703 17,272
P=60,069 P=92,746 P=40,246
Interbank loans receivable bears nominal annual interest rates ranging from 0.07% to 0.25% in 2021,1.81% to 3.94% in 2020, and 0.60% to 5.09% in 2019, while SPURA bears nominal annual interestrates of 2.00% in 2021 and ranging from 2.00% to 4.00% in 2020, and 4.00% to 4.75% in 2019.

- 71 -
*SGVFS164641*
The Parent Company is not permitted to sell or repledge the related collateral on SPURA in theabsence of default by the counterparty.
9. Financial Assets at Fair Value Through Profit or Loss (FVTPL)
Financial assets at FVTPL of the Group and the Parent Company consist of government securitiesamounting to P=886.29 million and P=718.29 million as of December 31, 2021 and 2020, respectively.
As of December 31, 2021 and 2020, financial assets at FVTPL include net unrealized gain (loss)amounting to (P=9.79 million) and P=0.48 million, respectively. Net fair value gain or loss on financialassets at FVTPL is included in ‘Trading and securities gain (loss) - net’ in the statements of income(see Note 26).
10. Financial Assets at Fair Value Through Other Comprehensive Income (FVTOCI)
As of December 31, 2021 and 2020, the Group’s and the Parent Company’s financial assets atFVTOCI consist of the following:
2021 2020
Debt securities:Government (Note 19) P=6,362,401 P=5,027,547
Equity securities:Quoted 91,600 71,650Unquoted 35,286 38,619
126,886 110,269
P=6,489,287 P=5,137,816
The Parent Company has designated the above equity investments as at FVTOCI as these are held forlong-term strategic purpose rather than for trading.
There were no dividends declared on these equity investments and no cumulative gain or loss wastransferred within equity in 2021, 2020, and 2019.
The movements in net unrealized gain on debt and equity securities recognized in OCI follow:
2021 2020
Balance at January 1 P=100,093 P=87,932
Items that may be reclassified to profit or loss in
subsequent periods
Fair value changes during the year on debtsecurities (357,686) 284,757
Losses (gains) taken to profit or loss upon sale ofFVTOCI debt securities (Note 26) 285,542 (277,278)
Provision for credit losses (Note 17) 10,089 37Items that may not be reclassified to profit or
loss in subsequent periods
Fair value changes during the year on equitysecurities 15,471 4,645
Balance at December 31 P=53,509 P=100,093

- 72 -
*SGVFS164641*
Reclassification of Financial AssetsOn January 1, 2018, the Parent Company reclassified debt securities with aggregate face amount ofP=1,623.47 million from the hold-to-collect portfolio to the FVTOCI portfolio. The reclassification ofthese debt securities resulted in recognition of unrealized gain of P=56.90 million.
In October 2020, certain debt securities in FVOCI matured and the unrealized gain previouslyrecognized from reclassification from hold-to-collect to FVTOCI portfolio in 2018 was recognized asrealized gain.
11. Investment Securities at Amortized Cost
As of December 31, 2021 and 2020, the Group’s and the Parent Company’s investment securities atamortized cost consist of the following:
2021 2020
Government securities (Note 19) P=15,527,190 P=2,273,872Less: Allowance for ECL (Note 17) (6,911) (10,516)
P=15,520,279 P=2,263,356
As of December 31, 2021, investment securities at amortized cost are comprised of the ParentCompany’s investment in peso-denominated securities amounting to P=8.39 billion and investment inforeign currency-denominated securities amounting to P=7.14 billion ($135.42 million and€4.00 million).
As of December 31, 2020, investment securities at amortized cost are comprised of the ParentCompany’s investment in peso-denominated securities amounting to P=80.55 million and investmentin foreign currency-denominated securities amounting to P=2.19 billion ($40.78 million and€3.99 million).
Peso-denominated government bonds have effective interest rates ranging from 2.38% to 4.63%,3.50% to 8.00%, and 3.63% to 8.13%, in 2021, 2020 and 2019, respectively. Foreign currency-denominated bonds have effective interest rates ranging from 1.38% to 10.63%, 2.63% to 10.63%,and 2.63% to 10.63%, in 2021, 2020 and 2019, respectively.
On May 27, 2020, the Parent Company’s BOD approved the sale of HTC securities. In June 2020,the Parent Company liquidated all of its Peso (RBU) government securities classified underinvestment securities measured at amortized cost with a total face amount of P=8.60 billion andcarrying value of P=10.44 billion. The sale resulted in a trading gain of P=2.55 million presented in thestatements of income. Under the Parent Company’s Business Model Documentation for Managingdebt Securities, a permissible sale of Hold-To-Collect (HTC) includes those attributable to systemicmovements that have been generally accepted to negatively impact economic conditions, creditquality and or liability profile of the Parent Company.
The above disposals were assessed by the Parent Company as not inconsistent with the portfolios’business models considering the conditions and reasons for which the disposals were made. Further,these disposals did not result in a change in business model and the remaining securities in theaffected portfolios continue to be accounted for at amortized cost.

- 73 -
*SGVFS164641*
12. Loans and Receivables
This account consists of:
Consolidated Parent Company
2021 2020 2021 2020
Receivables from customers:Corporate loans P=60,277,746 P=52,764,271 P=60,277,746 P=52,764,271Consumer loans:
Home loans 3,636,663 4,473,549 3,636,663 4,473,549Auto loans 598,106 771,922 598,106 771,922Personal loans 213,151 435,113 213,151 435,113
64,725,666 58,444,855 64,725,666 58,444,855Unearned discounts and capitalized
interest (44,756) (51,256) (44,756) (51,256)
64,680,910 58,393,599 64,680,910 58,393,599Unquoted debt securities 678,557 852,565 678,557 852,565Accrued interest receivable 559,770 468,544 559,770 468,544Accounts receivable 265,786 333,300 268,619 336,015Sales contracts receivable 45,155 65,952 45,155 65,952
66,230,178 60,113,960 66,233,011 60,116,675Less Allowance for ECL (Note 17) (2,732,213) (2,489,967) (2,732,213) (2,489,967)
P=63,497,965 P=57,623,993 P=63,500,798 P=57,626,707
Sale of Dealer Generated Auto Loans PortfolioOn February 27, 2019, the BOD approved the sale of the Parent Company’s dealer generated auto-loan portfolio to a local bank. On June 18, 2019, the Philippine Competition Commission approvedthe request of the Parent Company to to sell its auto-loan portfolio. The selling price amounted toP=3.55 billion which is the sum of the face value of all current outstanding loan principal balance aswell as the related accrued interest and unamortized incentives of dealer generated auto loans. OnJune 27, 2019, the local bank has fully paid the Parent Company. No gain or loss on sale wasrecognized by the Parent Company on this transaction.
The Parent Company has no other plans of disposing its remaining branch referred auto loans or otherloans.
Bayanihan to Heal as One ActOn March 25, 2020, Republic Act No. 11469, otherwise known as the Bayanihan to Heal as One Act(“Bayanihan 1 Act”) was enacted. Bayanihan 1 Act provides that all covered institutions shallimplement a 30-day grace period for all loans with principal and/or interest and lease amortizationfalling due within the ECQ Period without incurring interest on interest, penalties, fees and othercharges. Subsequently, on September 11, 2020, Republic Act No. 11494, otherwise known as theBayanihan to Recover as One Act (“Bayanihan 2 Act”), was enacted. Under Bayanihan 2 Act, a one-time sixty (60)-day grace period is granted for the payment of all existing, current and outstandingloans falling due, or any part thereof, on or before December 31, 2020, without incurring interest oninterests, penalties, fees, or other charges and thereby extending the maturity of the said loans.Furthermore, a minimum 30-day grace period shall also be granted by covered institutions to allpayments due within the period of community quarantine on rent and utility-related expenditureswithout incurring penalties, interest and other charges.

- 74 -
*SGVFS164641*
In 2020, the Group, in addition to the reliefs provided under Bayanihan 1 Act andBayanihan 2 Act, has offered financial reliefs to its borrowers/counterparties as a response to theeffect of the COVID-19 pandemic. These relief measures included the following:
Lenders were allowed to renegotiate terms of existing loan agreements either via restructuring of
loan terms, extension of maturities, or moratorium on payments/amortizations among others on a
case-to-case basis depending on financial status, cash flow, and security position of each
borrower.
Restructuring of existing receivables including extension of payment terms
Relief for principal and interest repayments
Based on the Group’s assessment, the modifications in the contractual cash flows as a result of theabove reliefs are not substantial and, therefore, did not result in the derecognition of the affectedfinancial assets but would require the recognition of modification losses. The total modificationlosses did not have a material impact on the financial statements.
Unquoted Debt SecuritiesAs of December 31, 2021 and 2020, unquoted debt securities of the Group and the Parent Companyconsist of Metro Rail Transit (MRT) bonds with the gross amount of P=678.56 million andP=852.57 million in 2021 and 2020, respectively, and an allowance for credit losses amounting toP=0.57 million and P=0.89 million in 2021 and 2020, respectively.
The accretion of interest on unquoted debt securities amounted to P=66.04 million, P=77.22 million,and P=88.23 million in 2021, 2020 and 2019, respectively, which is included under ‘Interest income -Loans and receivables’ in the statements of income.
Interest IncomeInterest income on loans and receivables consists of interest income on:
Consolidated Parent Company
2021 2020 2019 2021 2020 2019
Receivables from customers:Corporate P=3,555,476 P=3,713,692 P=3,510,142 P=3,555,476 P= 3,713,692 P=3,510,142Consumer 443,857 473,247 795,194 443,857 473,247 795,194
Unquoted debt securities 104,306 126,794 154,002 104,306 126,794 154,002Others 6,243 11,475 9,141 6,243 11,475 9,141
P=4,109,882 P=4,325,208 P=4,468,479 P=4,109,882 4,325,208 4,468,479
Of the total receivables from customers of the Group as of December 31, 2021, 2020 and 2019,56.72%, 85.59%, and 54.90%, respectively, are subject to periodic interest repricing. The remainingpeso-denominated receivables from customers earn annual fixed interest rates ranging from 1.50% to42.00% in 2021, 1.99% to 42.00% in 2020, and 1.50% to 42.00% in 2019 while foreign currency-denominated receivables from customers earn annual fixed interest rates ranging from 3.00% to7.25% in 2021, 4.00% to 9.13% in 2020 and 3.50% to 9.82% in 2019.
Unquoted debt securities have EIRs of 11.90% in 2021 and 2020, and from 6.52 % to 11.90% in2019. Sales contracts receivable bears interest rates ranging from 7.00% to 12.00% in 2021 and2020, and 7.00% to 14.00% in 2019.

- 75 -
*SGVFS164641*
13. Property and Equipment
The composition of and movements in property and equipment of the Group and the Parent Companyfollow:
Consolidated and Parent Company
2021
Land
Condominium
Properties
Buildings and
Improvements
Furniture,
Fixtures and
Equipment
Leasehold
Improvements
Right of Use
Assets (Office
Premises) Total
Cost
Balance at January 1 P=117,678 P=499,598 P=390,538 P=920,414 P=422,075 P=386,756 P=2,737,059
Additions − 725 18,720 32,282 3,786 123,024 178,537
Disposals − − − (19,638) – (74,271) (93,909)
Transfers (Notes 14 and 16) − 16,186 (27,823) 4,795 10,259 − 3,417
Balance at December 31 117,678 516,509 381,435 937,853 436,120 435,509 2,825,104
Accumulated depreciation
and amortization
Balance at January 1 − 185,526 316,802 785,631 384,789 169,694 1,842,442
Depreciation − 12,525 14,240 44,145 16,278 99,444 186,632
Disposal − − − (16,163) – (74,271) (90,434)
Transfers (Note 16) − − (2,786) 7,033 − − 4,247
Balance at December 31 − 198,051 328,256 820,646 401,067 194,867 1,942,887
Net book value P=117,678 P=318,458 P=53,179 P=117,207 P=35,053 P=240,642 P=882,217
Consolidated and Parent Company
2020
LandCondominium
PropertiesBuildings andImprovements
Furniture,Fixtures and
EquipmentLeasehold
Improvements
Right of UseAssets (Office
Premises) Total
CostBalance at January 1 P=117,678 P=481,162 P=402,244 P=889,460 P=418,178 P=341,284 P=2,650,006Additions − − 9,034 37,961 2,360 76,116 125,471Disposals − − − (18,515) (13,489) (30,644) (62,648)Transfers (Notes 14 and 16) − 18,436 (20,740) 11,508 15,026 − 24,230
Balance at December 31 117,678 499,598 390,538 920,414 422,075 386,756 2,737,059
Accumulated depreciation andamortization
Balance at January 1 − 173,608 302,479 736,849 370,047 92,813 1,675,796Depreciation − 11,918 14,323 56,315 24,061 107,525 214,142Disposal − − − (15,013) (9,319) (30,644) (54,976)
Transfers (Note 16) − − − 7,480 − − 7,480
Balance at December 31 − 185,526 316,802 785,631 384,789 169,694 1,842,442
Net book value P=117,678 P=314,072 P=73,736 P=134,783 P=37,286 P=217,062 P=894,617
The Group and Parent Company recognized gain (loss) on disposal of furniture, fixtures, andequipment, which is included under ‘Profit (loss) from assets sold’ in the statements of income,amounting to nil, (P=3.01 million), and P=0.27 million, in 2021, 2020 and 2019, respectively.
Depreciation and AmortizationDetails of this account are as follows:
Consolidated and Parent Company
2021 2020 2019
Property and equipment P=87,188 P=106,617 P=162,377Investment properties
(Note 14) 90,811 81,788 80,902Software costs (Note 15) 94,994 74,632 68,666Right-of-use assets 99,444 107,525 113,343Chattel mortgage (Note 16) 15,182 10,091 20,691
P=387,619 P=380,653 P=445,979

- 76 -
*SGVFS164641*
As of December 31, 2021 and 2020, the cost of fully depreciated furniture, fixtures and equipmentstill in use by the Group and Parent Company amounted to P=691.42 million and P=658.24 million,respectively.
14. Investment Properties
The composition of and movements in this account follow:Consolidated and Parent Company
2021
Foreclosed Properties
Office Units
for Lease
Condominium
Units for LeaseLand
Building and
Improvements Total
Cost
Balance at January 1 P=449,043 P=399,126 P=848,169 P=39,274 P=2,644,075
Additions 206,614 107,191 313,805 − −Transfer − − − 116 −Disposals (45,145) (5,475) (50,620) − −Balance at December 31 610,512 500,842 1,111,354 39,390 2,644,075
Accumulated depreciation and amortization
Balance at January 1 − 171,015 171,015 36,351 855,516
Depreciation − 42,079 42,079 350 48,382
Disposals − (1,277) (1,277) − −Balance at December 31 − 211,817 211,817 36,701 903,898
Accumulated impairment losses
Balance at January 1 31,098 35,981 67,079 − −Disposals (1,427) (418) (1,845) − −Balance at December 31 29,671 35,563 65,234 − −Net book value P=580,841 P=253,462 P=834,303 P=2,689 P=1,740,177
Consolidated and Parent Company
2020
Foreclosed Properties
Office Unitsfor Lease
CondominiumUnits for LeaseLand
Building andImprovements Total
CostBalance at January 1 P=397,348 P=399,393 P=796,741 P=39,274 P=2,644,075Additions 58,004 5,965 63,969 − −Disposals (6,309) (6,232) (12,541) − −Balance at December 31 449,043 399,126 848,169 39,274 2,644,075
Accumulated depreciation and amortizationBalance at January 1 − 139,255 139,255 36,000 807,134Depreciation − 33,055 33,055 351 48,382Disposals − (1,295) (1,295) − −Balance at December 31 − 171,015 171,015 36,351 855,516
Accumulated impairment lossesBalance at January 1 32,801 36,234 69,035 − −Disposals (1,703) (253) (1,956) − −Balance at December 31 31,098 35,981 67,079 − −Net book value P=417,945 P=192,130 P=610,075 P=2,923 P=1,788,559
Condominium units for lease represents the contributed cost of developing the Parent Company’sAyala Avenue property, originally consisting of land and fully depreciated building, into a 52-storeybuilding (the PBCom Tower) under a joint development agreement with Filinvest Asia Corporation(Filinvest Asia).
The agreement provided for equal sharing of the cost of the project and, correspondingly, of the netusable area of the building, which was converted into a condominium property. Under the agreement,the Parent Company’s share in such cost included its land along Ayala Avenue, which was given anappraised value of P=900.00 million in 1995. The related appraisal increment was closed to surplus,net of applicable deferred tax liability, upon completion of the project in 2000.

- 77 -
*SGVFS164641*
In November 2007, by virtue of condominiumization, various condominium certificates of title underthe name of the Parent Company were derived from transfer certificate of title (TCT) No. 134599where the declaration of restrictions and scope of coverage were annotated on October 23, 2007.
In May 2019, the 4th floor of Parent Company’s PBCOM tower building was converted from bank premises to Condominium units for lease.
As of December 31, 2021 and 2020, about 87.14% of the usable area that the Parent Companyacquired from the PBCOM Tower project is held for lease, with the balance used for the ParentCompany’s operations. Accordingly, the cost allocable to the areas available for lease is carried asinvestment properties, while the remaining balance is carried as condominium properties and includedin ‘Property and equipment’ (see Note 13).
As of December 31, 2021 and 2020, the aggregate fair value of investment properties amounted toP=10.09 billion and P=9.46 billion, respectively, for the Group and Parent Company, which has beendetermined based on valuations made by professionally qualified appraisers accredited by the BSPand SEC.
The Parent Company recognized rental income (included under ‘Rent income’ in the statements ofincome) amounting to P=484.93 million, P=655.92 million, and P=691.92 million in 2021, 2020 and2019, respectively, on condominium properties leased out under operating leases. In 2021, 2020 and2019, the Parent Company also recognized rental income from office units for lease amounting toP=8.11 million, P=4.57 million and P=4.42 million, respectively.
The Group and Parent recorded gain (loss) from foreclosure of loan collaterals amounting toP=7.46 million, (P=3.16 million) and (P=11.85 million) in 2021, 2020, and 2019, respectively. This ispresented as ‘Gain (loss) on assets exchange - net’ in the statements of income.
The Group and Parent recorded gain (loss) on disposal of certain foreclosed properties amounting toP=15.08 million, P=12.21 million and P=107.95 million in 2021, 2020, and 2019, respectively. This isincluded under ‘Profit (loss) from assets sold’ in the statements of income.
Direct operating expenses (included under ‘Compensation and fringe benefits’, ‘Occupancy and otherequipment-related costs’, ‘Taxes and licenses’ and ‘Miscellaneous’) arising from investmentproperties that generated rental income amounted to P=111.41 million, P=99.63 million andP=92.06 million in 2021, 2020, and 2019, respectively.
Direct operating expenses (included under ‘Compensation and fringe benefits’, ‘Occupancy and otherequipment-related costs’, ‘Taxes and licenses’ and ‘Miscellaneous’) arising from investmentproperties that did not generate rental income amounted to P=125.82 million, P=68.82 million andP=80.60 million in 2021, 2020, and 2019, respectively.
15. Intangible Assets
Intangible AssetsThe Group and Parent Company’s account consists of:
2021 2020
Branch licenses P=364,700 P=364,700Software costs 162,803 248,826
P=527,503 P=613,526

- 78 -
*SGVFS164641*
Branch licenses
Branch licenses of the Group arose from the acquisitions of Consumer Savings Bank (CSB) andPRBI. As of December 31, 2021 and 2020, details of branch licenses follow:
Branch licenses from the acquisition of:PRBI P=262,600CSB 102,100
P=364,700
The branch license incentives given to the Parent Company for its acquisition of RBNI (which waseventually merged with PRBI) was measured at fair value on September 1, 2014, the acquisition date,consistent with the requirements of PFRS 3, Business Combination. PFRS 3 requires that theidentifiable assets and liabilities arising from a business combination be measured at fair value. Thefair value of the branch licenses was based on the provisions of the Manual of Regulations for Banks(MORB) that was in effect at that time, which sets a licensing fee and processing fee per branch ofP=20.00 million and P=200.00 thousand, respectively.
On July 25, 2019, the BSP approved the sale of 100 percent voting shares of PRBI to PROSBI (seeNote 7). Accordingly, the branch licenses granted to the Parent Company’s acquisition of RBNI werereclassified from the investment account to intangible assets in the Parent Company’s separatefinancial statements. No new asset was recognized because the branch licenses have always beenrecognized as an asset of the Parent Company since its acquisition of RBNI.
As of December 31, 2021 and 2020, the individual branches were identified as the CGU for purposesof impairment testing on the branch licenses for CSB. For the impairment testing on the branchlicenses arising from the acquisition of RBNI, the Parent Company’s branch banking group wasidentified as the CGU as the branch banking group would benefit from the synergies of the additionalbranches in obtaining fresh funds from depositors for deployment.
In 2021, 2020 and 2019, the Parent Company’s impairment assessment indicates no impairment.
Key assumptions used in the VIU calculationsAs of December 31, 2021 and 2020, the recoverable amounts of the CGUs have been determinedbased on VIU calculations that use cash flow projections based on financial budgets approved bymanagement covering a 5-year period. The significant assumptions used in computing for therecoverable amount for PRBI and CSB branches in 2021 and 2020 as follows:
Significant Assumptions 2021 2020
Deposit growth rates 5.60% 6.00%Discount rate 14.21% 13.34%Terminal value growth rate 5.12% 4.81%
Deposit growth rates were based on experiences and strategies developed by the Parent Company.The discount rate used for the computation of the present value of the projected cash flows is the costof equity and was determined by reference to comparable entities. The terminal value growth rate hasbeen determined to reflect the long-term view on the CGU’s business.
Sensitivity to changes in assumptions
Management believes that no reasonably possible change in any of the above key assumptions wouldcause the carrying value of the CGU to exceed its recoverable amount.

- 79 -
*SGVFS164641*
Software
The movements of software costs follow:
Consolidated and Parent
Company
2021 2020
Balance at January 1 P=248,826 P=308,389Additions 8,971 15,069
257,797 323,458Amortization (Note 13) (94,994) (74,632)
Balance at December 31 P=162,803 P=248,826
16. Other Assets
Other assets consist of:
Consolidated Parent Company
2021 2020 2021 2020
Prepaid expenses P=187,704 144,104 187,541 143,938Tax credits 106,169 443,671 106,081 442,473Retirement asset (Note 27) 95,493 – 95,493 –Chattel mortgage 34,987 45,004 34,987 45,004Receivable from BIR 5,528 15,570 5,528 15,570RCOCI 62 1,273 62 1,273Miscellaneous 151,958 130,382 150,958 130,349
581,901 780,004 580,650 778,607Less allowance for impairment
losses (Note 17) (2,573) (2,573) (2,573) (2,573)
P=579,328 P=777,431 P=578,077 P=776,034
Receivable from BIRThis account includes creditable withholding tax and tax credit cases that are still pending SCdecision. As of December 31, 2021 and 2020, there is no balance of allowance for impairment losseson receivable from BIR.
Chattel MortgageThe movements in chattel mortgage of the Group and the Parent Company follow:
2021 2020
Cost
Balance at January 1 P=54,937 P=26,608Additions 33,970 58,211Disposals (32,731) (23,414)Transfers (Note 13) (3,420) (6,468)
Balance at December 31 52,756 54,937
Accumulated depreciation and amortization
Balance at January 1 9,933 3,963Depreciation 15,182 10,091Disposals (7,097) (2,900)Transfers (Note 13) (249) (1,221)
Balance at December 31 17,769 9,933
Net book value P=34,987 P=45,004

- 80 -
*SGVFS164641*
In 2021, 2020 and 2019, loss recognized by the Group and the Parent Company from the disposal ofcertain chattel mortgage amounted to P=1.52 million, P=2.42 million and P=10.48 million, respectively.This is included under ‘Profit (loss) from assets sold’ in the statements of income.
MiscellaneousAs of December 31, 2021 and 2020, the Group’s and the Parent Company’s miscellaneous otherassets consist of the following:
Consolidated Parent Company
2021 2020 2021 2020
Documentary stamp taxes (DST) P=63,277 P=29,172 P=63,277 P=29,172Refundable security deposits 35,471 33,387 35,471 33,387Advance rentals 17,388 17,730 17,388 17,730Stationery and supplies 10,055 6,587 10,055 6,587Others (Note 24) 25,767 43,506 24,767 43,473
P=151,958 P=130,382 P=150,958 P=130,349
“Others” of the Group and the Parent Company include trust fee receivables, shortages, derivatives,interoffice floats and other investments.
17. Allowance for Credit and Impairment Losses
As of December 31, 2021 and 2020, the analyses of changes in the allowance for ECL follow:
Interbank loans receivable and SPURA
Allowance for credit losses of interbank loans receivable and SPURA amounted to nil for theConsolidated and Parent Company in 2021 and 2020.
Investment securities at FVTOCI
Consolidated and Parent Company 2021
Stage 1 Stage 2 Stage 3 Total
Allowance for ECL, January 1, 2021 P=5,545 P=– P=– P=5,545
New investment originated or purchased 15,634 – – 15,634
Asset derecognized during the period (5,545) – – (5,545)
Allowance for ECL, December 31, 2021 P=15,634 P=– P=– P=15,634
Investment securities at amortized cost
Consolidated and Parent Company 2021
Stage 1 Stage 2 Stage 3 Total
Allowance for ECL, January 1, 2021 P=10,516 P=– P=– P=10,516
Impact of change in PD (4,381) – – (4,381)
New investment originated or purchased 776 – – 776
Allowance for ECL, December 31, 2021 P=6,911 P=– P=– P=6,911

- 81 -
*SGVFS164641*
Receivables from customers
Consolidated and Parent Company 2021
Stage 1 Stage 2 Stage 3 Total
Corporate loans:
Allowance for ECL, January 1, 2021 P=378,946 P=157,165 P=1,406,425 P=1,942,536
Newly originated assets that remained in Stage 1 as at December 31, 2021 333,000 – – 333,000
Newly originated assets that moved to Stage 2 and Stage 3 as at December 31, 2021 – 88,485 15,476 103,961
Effect of collections and othermovements (233,730) (40,134) (247,374) (521,238)
Transfers to Stage 1 8,023 (7,487) (536) –
Transfers to Stage 2 (149,428) 149,428 – –
Transfers to Stage 3 – (146,622) 146,622 –
Impact on ECL of exposures transferred
between stages 144,896 21,115 205,556 371,567
Impact on ECL of exposures that did not transfer between stages (50,343) 27,458 41,547 18,662
Foreign exchange adjustments (1,236) (9) – (1,245)
Allowance for ECL, December 31, 2021 430,128 249,399 1,567,716 2,247,243
Consumer loans:Auto loans
Allowance for ECL, January 1, 2021 12,799 8,833 80,620 102,252
Newly originated assets that remainedin Stage 1 as at December 31, 2021 3,841 – – 3,841
Newly originated assets that moved to
Stage 2 and Stage 3 as atDecember 31, 2021 – – 857 857
Effect of collections and other
movements
(788) (7,621) (32,869) (41,278)
Transfers to Stage 1 3,778 (971) (2,807) –
Transfers to Stage 2 (1,182) 1,182 – –
Transfers to Stage 3 (1,696) (4,855) 6,551 –
Impact on ECL of exposures transferredbetween stages (3,551) 11,726 6,342 14,517
Impact on ECL of exposures that didnot transfer between stages (4,103) (618) 1,838 (2,883)
Allowance for ECL, December 31, 2021 9,098 7,676 60,532 77,306
Home loans:Allowance for ECL, January 1, 2021 40,619 17,286 181,945 239,850
Newly originated assets that remainedin Stage 1 as at December 31, 2020 3,905 – – 3,905
Newly originated assets that moved to
Stage 2 and Stage 3 as atDecember 31, 2021 – – 40,102 40,102
Effect of collections and other movements
(8,842) (3,536) (55,149) (67,527)
Transfers to Stage 1 17,259 (3,354) (13,905) –
Transfers to Stage 2 (1,318) 2,275 (957) –
Transfers to Stage 3 (1,792) (9,800) 11,592 –
Impact on ECL of exposures transferredbetween stages (16,571) 8,114 31,839 23,382
Impact on ECL of exposures that did
not transfer between stages (12,977) 134 5,000 (7,843)
Allowance for ECL, December 31, 2021 20,283 11,119 200,467 231,869
Personal loans:Allowance for ECL, January 1, 2021 28,471 8,236 104,589 141,296
Newly originated assets that remained
in Stage 1 as at December 31, 2021 1,222 – – 1,222
Newly originated assets that moved to Stage 2 and Stage 3 as at
December 31, 2021 –
240 12,443 12,683
Effect of collections and other movements
(6,299) (3,938) (43,316) (53,553)
Transfers to Stage 1 1,037 (357) (680) –
Transfers to Stage 2 (1,587) 1,587 – –
(Forward)

- 82 -
*SGVFS164641*
Consolidated and Parent Company 2021
Stage 1 Stage 2 Stage 3 Total
Transfers to Stage 3 (P=7,355) (P=3,868) P=11,223 P=–
Impact on ECL of exposures transferred
between stages (963) 1,284 15,549 15,870
Impact on ECL of exposures that did not transfer between stages (5,617) (36) (886) (6,539)
Accounts written-off – (185) (3,581) (3,766)
Allowance for ECL, December 31, 2021 8,909 2,963 95,341 107,213
Total receivables from customers:
Allowance for ECL, January 1, 2021 460,835 191,520 1,773,579 2,425,934
Newly originated assets that remained in Stage 1 as at December 31, 2021 341,968 – – 341,968
Newly originated assets that moved to Stage 2 and Stage 3 as at December 31, 2021 – 88,725 68,878 157,603
Effect of collections and othermovements
(249,659) (55,229) (378,708) (683,596)
Transfers to Stage 1 30,097 (12,169) (17,928) –
Transfers to Stage 2 (153,515) 154,472 (957) –
Transfers to Stage 3 (10,843) (165,145) 175,988 –
Impact on ECL of exposures transferred
between stages
123,811 42,239 259,286 425,336
Impact on ECL of exposures that did not transfer between stages
(73,040) 26,938 47,499 1,397
Accounts written-off – (185) (3,581) (3,766)
Foreign exchange adjustments (1,236) (9) - (1,245)
Allowance for ECL, December 31, 2021 P=468,418 P=271,157 P=1,924,056 P=2,663,631
Other receivables
Consolidated and Parent Company 2021
Stage 1 Stage 2 Stage 3 Total
Unquoted debt securities:
Allowance for ECL, January 1, 2021 P=896 P=– P=– P=896
Effect of collections (325) – – (325)
Allowance for ECL, December 31, 2021 571 – – 571
Accrued interest receivable:
Allowance for ECL, January 1, 2021 2,509 2,808 19,536 24,853
Newly originated assets that remained in Stage 1 as at December 31, 2021 872 – – 872
Newly originated assets that moved to Stage 2 and Stage 3 as at December 31, 2021 – – – –
Effect of collections and othermovements (2,177) (949) (13,372) (16,498)
Transfers to Stage 1 805 (805) – –
Transfers to Stage 2 (343) 343 – –
Transfers to Stage 3 (3,882) (57) 3,939 –
Impact on ECL of exposures transferred
between stages 4,487 186 – 4,673
Impact on ECL of exposures that did not transfer between stages (797) 968 552 723
Accounts written-off – (46) (1,970) (2,016)
Foreign exchange adjustments – – – –
Allowance for ECL, December 31, 2021 1,474 2,448 8,685 12,607
Accounts receivable:Allowance for ECL, January 1, 2021 – – 28,039 28,039
Newly originated assets 383,874 – – 383,874
Effect of collections and othermovements (384,164) 7,469 10,947 (365,748)
Transfers to Stage 3 1,072 8,070 (9,142) –
Accounts written-off – – (1,006) (1,006)
Allowance for ECL, December 31, 2021 782 15,539 28,838 45,159
(Forward)

- 83 -
*SGVFS164641*
Consolidated and Parent Company 2021
Stage 1 Stage 2 Stage 3 Total
Sales contracts receivableAllowance for ECL, January 1, 2021 P=3 P=830 P=9,412 P=10,245
Newly originated assets that remainedin Stage 1 as at December 31, 2021 3 – – 3
Newly originated assets that moved to
Stage 2 and Stage 3 as atDecember 31, 2021 – 1,227 – 1,227
Effect of collections and other
movements (excluding write-offsand transfers to ROPA)
(6,339) 197 (369) (6,511)
Transfer to ROPA – – – –
Transfers to Stage 1 1,527 (1,232) (295) –
Transfers to Stage 2 - 1,906 (1,906) –
Transfers to Stage 3 (10) (240) 250 –
Impact on ECL of exposures transferredbetween stages
4,997 - 284 5,281
Allowance for ECL, December 31, 2021 181 2,688 7,376 10,245
Total other receivablesAllowance for ECL, January 1, 2021 3,408 3,638 56,987 64,033
Newly originated assets that remained
in Stage 1 as at December 31, 2021 384,749 – – 384,749
Newly originated assets that moved to Stage 2 and Stage 3 as at
December 31, 2021 – 1,227 – 1,227
Effect of collections and other movements (392,680) 6,717 (2,794) (388,757)
Transfers to Stage 1 2,332 (2,037) (295) –Transfers to Stage 2 (343) 2,249 (1,906) –Transfers to Stage 3 (2,820) 7,773 (4,953) –
Impact on ECL of exposures transferredbetween stages 9,484 186 284 9,954
Impact on ECL of exposures that did
not transfer between stages (1,122) 968 552 398
Accounts written-off - (46) (2,976) (3,022)
Allowance for ECL, December 31, 2021 P=3,008 P=20,675 P=44,899 P=68,582
Investment securities at FVTOCI
Consolidated and Parent Company 2020
Stage 1 Stage 2 Stage 3 Total
Allowance for ECL, January 1, 2020 P=5,508 P=– P=– P=5,508
Newly originated assets that remained inStage 1 as at December 31, 2020 37 – – 37
Allowance for ECL, December 31, 2020 P=5,545 P=– P=– P=5,545
Investment securities at amortized cost
Consolidated and Parent Company 2020
Stage 1 Stage 2 Stage 3 Total
Allowance for ECL, January 1, 2020 P=10,565 P=– P=– P=10,565Impact on ECL of exposures that did not
transfer between stages (49) – – (49)
Allowance for ECL, December 31, 2020 P=10,516 P=– P=– P=10,516

- 84 -
*SGVFS164641*
Receivables from customers
Consolidated and Parent Company 2020
Stage 1 Stage 2 Stage 3 Total
Corporate loans:
Allowance for ECL, January 1, 2020 P=574,595 P=69,961 P=583,480 P=1,228,036
Newly originated assets that remainedin Stage 1 as at December 31, 2020 342,271 – – 342,271
Newly originated assets that moved to Stage 2 and Stage 3 as at
December 31, 2020 1,124,179 – – 1,124,179Effect of collections and other movements (excluding write-offs
and transfers to ROPA) (447,783) (45,868) (16,597) (510,248)Transfers to ROPA – – (14,957) (14,957)Transfers to Stage 2 (133,072) 133,072 – –
Transfers to Stage 3 (1,081,239) – 1,081,239 –Impact on ECL of exposures transferred between stages (5) – 21,770 21,765
Impact on ECL of exposures that didnot transfer between stages – 862 1,571 2,433
Accounts written-off – – (248,510) (248,510)
Foreign exchange adjustments – (862) (1,571) (2,433)
Allowance for ECL, December 31, 2020 378,946 157,165 1,406,425 1,942,536
Consumer loans:Auto loans
Allowance for ECL, January 1, 2020 11,291 15,933 294,183 321,407
Newly originated assets that remainedin Stage 1 as at December 31, 2020 68,566 – – 68,566
Newly originated assets that moved to
Stage 2 and Stage 3 as atDecember 31, 2020 26,162 – – 26,162
Effect of collections and other
movements (excluding write-offsand transfers to ROPA) (7,509) (1,728) (25,788) (35,025)
Transfers to ROPA (29) (469) – (498)
Transfers to Stage 1 4,079 (3,927) (152) –Transfers to Stage 2 (6,262) 6,262 – –Transfers to Stage 3 (83,499) (14,300) 97,799 –
Impact on ECL of exposures transferredbetween stages – – (1,843) (1,843)Impact on ECL of exposures that did
not transfer between stages – 7,062 5,923 12,985Accounts written-off – – (289,502) (289,502)
Allowance for ECL, December 31, 2020 12,799 8,833 80,620 102,252
Home loans:Allowance for ECL, January 1, 2020 25,260 13,973 69,637 108,870
Newly originated assets that remainedin Stage 1 as at December 31, 2020 56,895 – – 56,895
Newly originated assets that moved to
Stage 2 and Stage 3 as atDecember 31, 2020 15,517 – – 15,517
Effect of collections and other
movements (excluding write-offsand transfers to ROPA) (7,579) (75) (6,850) (14,504)
Transfers to ROPA – – (5,901) (5,901)
Transfers to Stage 2 (14,462) 14,462 – –Transfers to Stage 3 (35,108) (11,104) 46,212 –Impact on ECL of exposures transferred
between stages 96 – 64,125 64,221Impact on ECL of exposures that did
not transfer between stages – 30 14,722 14,752
Allowance for ECL, December 31, 2020 40,619 17,286 181,945 239,850
(Forward)

- 85 -
*SGVFS164641*
Consolidated and Parent Company 2020
Stage 1 Stage 2 Stage 3 Total
Personal loans:Allowance for ECL, January 1, 2020 P=27,866 P=9,936 P=408,053 P=445,855
Newly originated assets that remainedin Stage 1 as at December 31, 2020 226,145 – – 226,145
Newly originated assets that moved to
Stage 2 and Stage 3 as atDecember 31, 2020 7,182 – – 7,182
Effect of collections and other
movements (excluding write-offsand transfers to ROPA) (12,825) – (7,067) (19,892)
Transfers to Stage 1 688 (688) – –
Transfers to Stage 2 (8,162) 8,162 – –Transfers to Stage 3 (212,422) (9,174) 221,597 –Impact on ECL of exposures transferred
between stages – – 3,526 3,526Accounts written-off – – (521,520) (521,520)
Allowance for ECL, December 31, 2020 28,471 8,236 104,589 141,296
Total receivables from customers:Allowance for ECL, January 1, 2020 639,012 109,803 1,355,353 2,104,168
Newly originated assets that remainedin Stage 1 as at December 31, 2020 693,877 – – 693,877
Newly originated assets that moved to
Stage 2 and Stage 3 as atDecember 31, 2020 1,173,040 – – 1,173,040
Effect of collections and other
movements (excluding write-offsand transfers to ROPA) (475,696) (47,671) (56,302) (579,669)
Transfers to ROPA (29) (469) (20,858) (21,356)
Transfers to Stage 1 4,767 (4,615) (152) –Transfers to Stage 2 (161,958) 161,958 – –Transfers to Stage 3 (1,412,269) (34,578) 1,446,847 –
Impact on ECL of exposures transferredbetween stages 91 – 87,578 87,669
Impact on ECL of exposures that did not transfer between stages – 7,954 22,216 30,170
Accounts written-off – – (1,059,532) (1,059,532)Foreign exchange adjustments – (862) (1,571) (2,433)
Allowance for ECL, December 31, 2020 P=460,835 P=191,520 P=1,773,579 P=2,425,934
Other receivables
Consolidated and Parent Company 2020
Stage 1 Stage 2 Stage 3 Total
Unquoted debt securities:
Allowance for ECL, January 1, 2020 P=944 P=– P=– P=944Impact on ECL of exposures that did
not transfer between stages (48) – – (48)
Allowance for ECL, December 31, 2020 896 – – 896
Accrued interest receivable:
Allowance for ECL, January 1, 2020 193 2,133 31,903 34,229Newly originated assets that remained in Stage 1 as at December 31, 2020 2,502 – – 2,502
Newly originated assets that moved to Stage 2 and Stage 3 as at December 31, 2020 20,755 – – 20,755
Effect of collections and other movements (excluding write-offs and transfers to ROPA) (193) (1,723) (1,731) (3,647)
Transfers to Stage 1 2 – (2) –Transfers to Stage 2 (2,588) 2,588 – –Transfers to Stage 3 (18,160) (305) 18,465 –
Impact on ECL of exposures transferredbetween stages (2) 115 – 113
(Forward)

- 86 -
*SGVFS164641*
Consolidated and Parent Company 2020
Stage 1 Stage 2 Stage 3 TotalImpact on ECL of exposures that did not transfer between stages P=– P=– P=102 P=102
Accounts written-off – – (29,201) (29,201)
Allowance for ECL, December 31, 2020 2,509 2,808 19,536 24,853
Accounts receivable:
Allowance for ECL, January 1, 2020 – – 11,173 11,173Impact on ECL of exposures that did not transfer between stages – – 17,020 17,020
Accounts written-off – – (154) (154)
Allowance for ECL, December 31, 2020 – – 28,039 28,039
Sales contracts receivableAllowance for ECL, January 1, 2020 2,463 1,192 6,591 10,246Newly originated assets that moved to
Stage 2 and Stage 3 as atDecember 31, 2020 8 – – 8
Effect of collections and other
movements (excluding write-offsand transfers to ROPA) (1,392) (465) (3,323) (5,180)
Transfers to Stage 1 788 (788) – –
Transfers to Stage 2 (1,213) 1,213 – –Transfers to Stage 3 (651) (347) 998 –Impact on ECL of exposures transferred
between stages – 25 3,089 3,114Impact on ECL of exposures that did not transfer between stages – – 2,057 2,057
Allowance for ECL, December 31, 2020 3 830 9,412 10,245
Total other receivables
Allowance for ECL, January 1, 2020 3,600 3,325 49,667 56,592Newly originated assets that remained in Stage 1 as at December 31, 2020 2,502 – – 2,502
Newly originated assets that moved to Stage 2 and Stage 3 as at December 31, 2020 20,763 – – 20,763
Effect of collections and other movements (excluding write-offs and transfers to ROPA) (1,585) (2,188) (5,054) (8,827)
Transfers to Stage 1 790 (788) (2) –Transfers to Stage 2 (3,801) 3,801 – –Transfers to Stage 3 (18,811) (652) 19,463 –
Impact on ECL of exposures transferredbetween stages (2) 140 3,089 3,227
Impact on ECL of exposures that did
not transfer between stages (48) – 19,179 19,131Accounts written-off – – (29,355) (29,355)Foreign exchange adjustments – – – –
Allowance for ECL, December 31, 2020 P=3,408 P=3,638 P=56,987 P=64,033
As of December 31, 2021 and 2020, changes in the allowance for credit and impairment losses of theGroup and the Parent Company follow:
Consolidated and Parent
Company
2021 2020
Balances at January 1Loans and receivables (Note 12) P=2,489,967 P=2,160,760Investment securities at FVTOCI 5,545 5,508Investment securities at amortized cost 10,516 10,565Investment properties (Note 14) 67,079 69,035Other assets (Note 16) 2,573 336,449
2,575,680 2,582,317
(Forward)

- 87 -
*SGVFS164641*
Consolidated and Parent
Company
2021 2020
Provision for credit and impairment losses P=322,301 P=1,418,228Accounts written-off, revaluation, and others (75,416) (1,424,902)
246,885 (6,674)
Balance at December 31:Loans and receivables (Note 12) 2,732,213 2,489,967Investment securities at FVTOCI 15,634 5,545Investment securities at amortized cost 6,911 10,516Investment properties (Note 14) 65,234 67,079Other assets (Note 16) 2,573 2,573
P=2,822,565 P=2,575,680
Below is the breakdown of provisions for (reversals of) credit and impairment losses:
Consolidated and Parent Company
2021 2020 2019
Financial assets and other credit-related exposures:Loans and receivables P=317,662 P=1,447,601 P=378,688Investment securities at FVTOCI 10,089 ‒ (570)Investment securities at
amortized cost (3,605) ‒ 3,109Interbank loans receivable ‒ ‒ (1)
324,146 1,447,601 381,226
Non-financial assets:Investment properties (1,845) (1,956) (3,613)Other assets (Note 16) ‒ (27,417) ‒
(1,845) (29,373) (3,613)
P=322,301 P=1,418,228 P=377,613
While the Group recognizes through the statement of income the movements in the expected creditlosses computed using the models, the Group also complies with BSP’s regulatory requirement toappropriate a portion of its earnings at an amount necessary to bring to at least 1% the allowance forcredit losses on loans (Note 23).
2021 2020 2019
Provision for credit and impairmentlosses P=322,301 P=1,418,228 P=377,613
Appropriation from current netincome 52,240 – –
Total P=374,541 P=1,418,228 P=377,613
18. Deposit Liabilities
On December 5, 2019, BSP issued Circlar No. 1063 which decreased the reserve requirements ondeposits and deposit substitutes to 14% effective December 6, 2019, meanwhile, reserve requirementson LTNCDs remained at 4%.

- 88 -
*SGVFS164641*
On March 23, 2020, BSP issued Circular No. 1082 reducing the reserve requirement against depositand deposits substitute to 12% while LTNCDs remains to have 4% reserve requirement. Further, onApril 16, 2020, BSP issued Circular No. 1083, which allows the bank to use MSME loans granted asof March 15, 2020 as allowable mode for alternative compliance on the reserve requirement. The saidalternative compliance is valid from April 24, 2020 to December 30, 2021.
As of December 31, 2021 and 2020, Due from BSP amounting to P=8.46 billion and P=8.59 billion,respectively, were set aside as reserves for deposit liabilities. As of December 31, 2021 and 2020, theGroup is in compliance with the above regulations.
On July 26, 2018, the Monetary Board of the BSP, in its Resolution No. 1220, approved the ParentCompany’s issuance of the Long-Term Negotiable Certificates of Deposits (LTNCD) of up toP=5.00 billion in one or more tranches over the course of one year, with minimum tenor of 5 years and1 day to a maximum of 7 years. The purpose of the issuance is specifically for long-term funding.
On October 8, 2018, the Parent Company issued P=2.90 billion worth of LTNCDs with a tenor of5 years and 6 months. The LTNCDs will mature on April 8, 2024 and have fixed interest rate of5.625% per annum, payable quarterly in arrears on October 8, January 8, April 8 and July 8 of eachyear, commencing on January 8, 2019. The LTNCDs are listed in the trading platform of thePhilippine Dealing & Exchange Corp. for secondary market trading.
Interest expense on deposit liabilities consists of:
Consolidated and Parent Company
2021 2020 2019
Demand P=44,004 P=64,029 P=59,077Savings 10,683 10,103 8,742Time 211,486 678,893 1,266,283LTNCD 168,726 168,434 167,485
P=434,899 P=921,459 P=1,501,587
Peso-denominated deposit liabilities earn annual fixed interest rates ranging from 0.10% to 3.00% in2021, 0.10% to 3.50% in 2020, and 0.10% to 6.85% in 2019, while foreign currency-denominateddeposit liabilities earn annual fixed interest rates ranging from 0.09% to 1.50%, 0.10% to 2.00%, and0.01% to 4.75% in 2021, 2020 and 2019, respectively.
19. Bills Payable
This account consists of the Group’s and the Parent Company’s borrowings from:
2021 2020
Private firms and individuals P=5,203,348 P=1,984,864Banks and other financial institutions 807,640 197,980
P=6,010,988 P=2,182,844

- 89 -
*SGVFS164641*
As of December 31, 2021, P=5.91 billion of the bills payable are collateralized by investment ingovernment securities. Details of the securities pledged are as follows:
Face
value
Carrying
amount
Fair
value
FVTOCI P=171,472 P=163,269 P=163,269
Investment securities at amortizedcost 5,737,155 5,863,489 5,888,170
P=5,908,627 P=6,026,758 P=6,051,439
Interest expense on bills payable and other borrowings consists of:
Consolidated Parent Company
2021 2020 2019 2021 2020 2019
Borrowed funds P=40,211 P=127,462 P=542,989 P=40,211 P=127,462 P=542,989
Lease liability (Note 21) 14,528 17,603 18,711 14,528 17,603 18,711
Net interest cost on retirementliability (Note 27) 4,360 1,969 – 4,360 1,969 –
P=59,099 147,034 561,700 P=59,099 147,034 561,700
The net interest income on retirement liability of P=5.65 million in 2019 is presented as part ofmiscellaneous income.
The Group has no dollar interbank borrowings as of December 31, 2021 and 2020.
The Parent Company did not avail of peso and dollar rediscounting facilities in 2021 and 2020.
Borrowings from private firms and individuals represent deposit substitutes with maturities of 1 to181 days and 1 to 216 days in 2021 and 2020, respectively. Bear annual interest rates ranging from0.25% to 1.13%, 0.37% to 3.88%, and 2.00% to 6.88%, in 2021, 2020 and 2019, respectively.
As of December 31, 2021 and 2020, Due from BSP amounting to P=633.53 million andP=262.4 million, respectively, were set aside as reserves for deposit substitutes.
20. Accrued Interest, Taxes and Other Expenses
This account consists of:
Consolidated Parent Company
2021 2020 2021 2020
Financial liabilities
Accrued interest payable P=59,188 P=105,338 P=59,188 P=105,338Accrued other expenses 557,368 515,674 557,282 515,526
616,556 621,012 616,470 620,864
Non-financial liabilities
Retirement liability (Note 27) – 109,004 – 109,004Accrued taxes and licenses 64,178 72,769 64,178 72,769
64,178 181,773 64,178 181,773
P=680,734 P=802,785 P=680,648 P=802,637

- 90 -
*SGVFS164641*
21. Other Liabilities
This account consists of:
Consolidated Parent Company
2021 2020 2021 2020
Financial liabilities
Accounts payable P=310,957 P=205,426 P=310,949 P=204,921Refundable security deposits 165,866 186,517 165,866 186,517Miscellaneous (Note 24) 28,060 34,848 28,060 34,848
504,883 426,791 504,875 426,286
Non-financial liabilities
Lease liability (Note 28) 252,501 239,734 252,501 239,734Deferred credits 206,412 298,580 206,412 298,580Withholding taxes payable 20,229 18,756 20,229 18,756Due to the Treasurer of the
Philippines 44,575 40,589 44,575 40,589Miscellaneous 76,596 76,270 75,387 75,517
600,313 673,929 599,104 673,176
P=1,105,196 P=1,100,720 P=1,103,979 P=1,099,462
Miscellaneous liabilities of the Group and the Parent Company include marginal deposits, cash lettersof credit, and deposit liabilities classified as dormant.
Shown below is the movement of lease liability of the Group and Parent:
2021 2020
Balance at January 1 P=239,734 P=270,554Additions 123,107 76,072Lease payments (124,868) (124,495)Interest expense (Note 19) 14,528 17,603
Balance at December 31 P=252,501 P=239,734
22. Maturity Analysis of Assets and Liabilities
The tables below show an analysis of assets and liabilities analyzed according to when they areexpected to be recovered or settled:
Consolidated
2021 2020
Due Within
One Year
Due Beyond
One Year Total
Due WithinOne Year
Due BeyondOne Year Total
Financial assets - at grossCash and other cash items P=2,803,341 P=– P=2,803,341 P=2,467,099 P=– P=2,467,099Due from BSP 10,271,486 – 10,271,486 20,597,868 – 20,597,868Due from other banks 658,593 – 658,593 1,495,485 – 1,495,485Interbank loans receivable
and SPURA (Note 8) 4,195,846 – 4,195,846 6,054,454 – 6,054,454Financial assets at FVTPL
(Note 9) 886,291 – 886,291 718,294 – 718,294Financial assets at FVTOCI
(Note 10) –6,504,921 6,504,921
–5,143,361 5,143,361
Investment securities at amortized cost (Note 11) – 15,527,190 15,527,190 – 2,273,872 2,273,872
(Forward)

- 91 -
*SGVFS164641*
Consolidated
2021 2020
Due Within
One Year
Due Beyond
One Year Total
Due WithinOne Year
Due BeyondOne Year Total
Loans and receivables (Note 12): Receivables from Customers P=40,102,875 P=24,622,791 P=64,725,666 P=34,892,624 P=23,552,231 P=58,444,855 Unquoted debt securities – 678,557 678,557 – 852,565 852,565 Accrued interest
receivable559,770 – 559,770 468,544 – 468,544
Accounts receivable 234,787 30,998 265,785 322,118 11,182 333,300 Sales contracts receivable 37,926 7,229 45,155 30,831 35,121 65,952Other assets (Note 16): Refundable security
deposits – 35,471 35,471 – 33,387 33,387 RCOCI 62 – 62 1,273 – 1,273
59,750,977 47,407,157 107,158,134 67,048,590 31,901,719 98,950,309
Non-financial assets -at gross
Investments in subsidiary and an associate (Note 7) – 14,401 14,401 – 14,114 14,114Property and equipment (Note 13) 95,149 2,729,955 2,825,104 90,658 2,646,401 2,737,059Investment properties (Note 14): Condominium units for Lease –
2,644,075 2,644,075– 2,644,075 2,644,075
Foreclosed properties – 1,111,354 1,111,354 – 848,169 848,169 Office units for lease – 39,390 39,390 – 39,274 39,274Intangible assets (Note 15) – 527,503 527,503 – 613,526 613,526Deferred tax assets (Note 30) – 325,614 325,614 – 170,608 170,608Other assets (Note 16) 291,326 272,921 564,247 206,473 548,803 755,276
386,475 7,665,213 8,051,688 297,131 7,524,970 7,822,101
P=60,137,452 P=55,072,370 P=115,209,822 P=67,345,721 P=39,426,689 P=106,772,410
Less:Unearned interest and discounts (Note 12) (44,756) (51,256)Accumulated depreciation and amortization (Notes 13, 14 and 16)
(3,113,072) (2,915,257)
Allowance for credit and impairment losses (Notes 12, 16 and 17) (2,822,674) (2,575,680)
Total 109,229,320 101,230,218
Financial liabilities
Deposit liabilities: Demand 41,166,107 – 41,166,107 30,865,282 – 30,865,282
Savings 11,359,112 – 11,359,112 9,664,945 – 9,664,945 Time 28,502,686 3,028,884 31,531,570 38,021,768 2,345,749 40,367,517
LTNCD – 2,889,116 2,889,116 – 2,883,668 2,883,668
Bills payable (Note 19) 6,010,988 – 6,010,988 2,182,844 – 2,182,844
Outstanding acceptances 71,609 – 71,609 497,813 – 497,813
Manager’s checks 172,247 – 172,247 188,100 – 188,100
Accrued interest payable (Note 20) 59,188 – 59,188 105,338 – 105,338Accrued other expenses (Note 20) 557,368 – 557,368 515,674 – 515,674
Other liabilities (Note 21): – – Accounts payable 310,957 – 310,957 205,426 – 205,426 Refundable security deposits 45,686 120,180 165,866 144,627 41,890 186,517
Miscellaneous 28,060 – 28,060 34,848 – 34,848
88,284,008 6,038,180 94,322,188 82,426,665 5,271,307 87,697,972
(Forward)

- 92 -
*SGVFS164641*
Consolidated
2021 2020
Due Within
One Year
Due Beyond
One Year Total
Due WithinOne Year
Due BeyondOne Year Total
Non-financial liabilities
Deferred tax liabilities (Note 30) P=– P=– P=0 P=– P=– P=0
Retirement liability (Notes 20 and 27) – – – – 109,004 109,004Accrued taxes and licenses (Note 20) 64,178 – 64,178 72,769 – 72,769Income tax payable 66,823 – 66,823 146,866 – 146,866Other liabilities (Note 21): Deferred credits 94,528 111,884 206,412 240,530 58,050 298,580 Lease liability 98,208 154,293 252,501 96,412 143,322 239,734 Withholding taxes payable 20,229 – 20,229 18,756 – 18,756
Due to the Treasurer ofthe Philippines 44,575 – 44,575 40,589 – 40,589
Miscellaneous 16,497 60,099 76,596 18,728 57,542 76,270
405,038 326,276 731,314 634,650 367,918 1,002,568
P=88,689,046 P=6,364,456 P=95,053,502 P=83,061,315 P=5,639,225 P=88,700,540
Parent Company
2021 2020
Due Within
One Year
Due Beyond
One Year Total
Due WithinOne Year
Due BeyondOne Year Total
Financial assets - at grossCash and other cash items P=2,803,341 P=– P=2,803,341 P=2,467,099 P=– P=2,467,099Due from BSP 10,271,486 – 10,271,486 20,597,868 – 20,597,868Due from other banks 658,593 – 658,593 1,495,485 – 1,495,485Interbank loans receivable
and SPURA (Note 8) 4,195,846 – 4,195,846 6,054,454 – 6,054,454Financial assets at FVTPL (Note 9) 886,291 – 886,291 718,294 – 718,294Financial assets at FVTOCI
(Note 10) –6,504,921 6,504,921 5,143,361 5,143,361
Investment securities at amortized cost (Note 11) 15,527,190 15,527,190 2,273,872 2,273,872Loans and receivables (Note 12): Receivables from customers 40,102,875 24,622,791 64,725,666 34,892,624 23,552,231 58,444,855 Unquoted debt securities – 678,557 678,557 – 852,565 852,565 Accrued interest
receivable 559,770–
559,770 468,544–
468,544 Accounts receivable 234,787 33,831 268,618 322,118 13,897 336,015 Sales contracts receivable 37,926 7,229 45,155 30,831 35,121 65,952Other assets (Note 16): Refundable security
deposits – 35,471 35,471 – 33,387 33,387 RCOCI 62 – 62 1,273 – 1,273
59,750,977 47,409,990 107,160,967 67,048,590 31,904,434 98,953,024
Non-financial assets -
at grossInvestments in subsidiary and an associate (Note 7) – 20,475 20,475 – 20,252 20,252Property and equipment (Note 13) 95,149 2,729,955 2,825,104 90,658 2,646,401 2,737,059Investment properties (Note 14): Condominium units for lease – 2,644,075 2,644,075 – 2,644,075 2,644,075 Foreclosed assets – 1,111,354 1,111,354 – 848,169 848,169 Office units for lease – 39,390 39,390 – 39,274 39,274Intangible assets (Note 15) – 527,503 527,503 – 613,526 613,526Deferred tax assets (Note 30) – 325,614 325,614 – 170,608 170,608Other assets (Note 16) 291,163 271,723 562,886 206,306 547,573 753,879
386,312 7,670,089 8,056,401 296,964 7,529,878 7,826,842
P=60,137,289 P=55,080,079 P=115,217,368 P=67,345,554 P=39,434,312 P=106,779,866

- 93 -
*SGVFS164641*
Parent Company
2021 2020
Due Within
One Year
Due Beyond
One Year Total
Due WithinOne Year
Due BeyondOne Year Total
Less:Unearned interest and discounts (Note 12) (P=44,756) (P=51,256)Accumulated depreciation and amortization (Notes 13, 14 and 16)
(3,113,072) (2,915,257)
Allowance for credit and impairment losses (Notes 12, 14, 16 and 17)
(2,822,564) (2,575,680)
Total P=109,236,976 P=101,237,673
Financial liabilities
Deposit liabilities: Demand P=41,175,066 P=– P=41,175,066 P=30,874,143 P=– P=30,874,143
Savings 11,359,112 – 11,359,112 9,664,945 – 9,664,945 Time 28,502,686 3,028,884 31,531,570 38,021,768 2,345,749 40,367,517 LTNCD – 2,889,116 2,889,116 – 2,883,668 2,883,668Bills payable (Note 19) 6,010,988 – 6,010,988 2,182,844 – 2,182,844
Outstanding acceptances 71,609 – 71,609 497,813 – 497,813Manager’s checks 172,247 – 172,247 188,100 – 188,100
Accrued interest payable (Note 20) 59,188 – 59,188 105,338 – 105,338Accrued other expenses (Note 20) 557,282 – 557,282 515,526 – 515,526
Other liabilities (Note 21): – –
Accounts payable 310,949 – 310,949 204,921 – 204,921 Refundable security deposits 45,686 120,180 165,866 145,087 41,430 186,517
Miscellaneous 28,060 – 28,060 34,848 – 34,848
88,292,873 6,038,180 94,331,053 82,435,333 5,270,847 87,706,180
Non-financial liabilities
Deferred tax liabilities (Note 30) – – – –
Retirement liability (Notes 20 and 27) – – – – 109,004 109,004Accrued taxes and licenses (Note 20) 64,178 – 64,178 72,769 – 72,769Income tax payable 66,823 – 66,823 146,866 – 146,866Other liabilities (Note 21):
Deferred credits 94,528 111,884 206,412 240,530 58,050 298,580
Lease liability 98,208 154,293 252,501 96,412 143,322 239,734 Withholding taxes payable 20,229 – 20,229 18,756 – 18,756 Due to the Treasurer of the Philippines 44,575 – 44,575 40,589 – 40,589
Miscellaneous 16,497 58,890 75,387 17,478 58,039 75,517
405,038 325,067 730,105 633,400 368,415 1,001,815
P=88,697,911 P=6,363,247 P=95,061,158 P=83,068,733 P=5,639,262 P=88,707,995
23. Equity
Common StockDetails and movements of common stock follow:
Shares Amount
Common - P=25 par value
Authorized 760,000
Issued and outstandingBalance at December 31 480,645 P=12,016,129

- 94 -
*SGVFS164641*
The Parent Company became listed in the PSE on May 12, 1988. After its listing in the PSE, therewas no succeeding offer/selling to the public of the Parent Company’s shares.
The summarized information on the Parent Company’s registration of securities under the SecuritiesRegulation Code follows:
Date of SEC Approval Type/Class Authorized Shares Par Value
November 23, 1988 Common Class A 7,000,000 100Common Class B 3,000,000 100
June 3, 1993 Common Class A 14,000,000 100Common Class B 6,000,000 100
September 11, 1997 Common 65,000,000 100April 6, 2001 Common 145,000,000 100March 31, 2006 Common 145,000,000 100
Preferred 120,000,000 25March 11, 2013 Common 760,000,000 25
As reported by the Parent Company’s transfer agent, AB Stock Transfers Corporation, the totalnumber of shareholders is 398 and 399 as of December 31, 2021 and 2020, respectively.
Surplus Reserves
In compliance with BSP regulations and RA No. 337, The General Banking Act, 10.00% of the ParentCompany’s profit from trust business is appropriated to surplus reserves. This annual appropriation isrequired until the surplus reserves for trust business equals 20.00% of the Parent Company’sauthorized capital stock. Surplus reserve for self-insurance represents the amount set aside to coverfor losses due to fire, defalcation by and other unlawful acts of the Parent Company’s personnel orthird parties.
Upon adoption of PFRS 9, BSP requires appropriation of a portion of the Group’s Surplus at anamount necessary to bring to at least 1% the allowance for credit losses on loans (Note 17). TheBank appropriated P=52 million out of 2021 net income to meet prudential requirements on 1%general loan loss provisioning.
DeficitThe computation of surplus available for dividend declaration in accordance with SEC MemorandumCircular No. 11 differs to a certain extent from the computation following BSP Guidelines.
In the consolidated financial statements, accumulated net earnings of the subsidiary and an associateamounting to P=12.40 million and P=14.11 million as of December 31, 2021 and 2020, respectively,that were closed out to ‘Deficit’ is not available for dividend declaration. The accumulated equity innet earnings becomes available for dividends upon declaration and receipt of cash dividends from theinvestees.
Capital ManagementThe primary objectives of the Parent Company’s capital management are to ensure that the ParentCompany complies with regulatory capital requirements and that the Parent Company maintainsstrong credit ratings and healthy capital ratios in order to support its business and to maximizeshareholders’ value.

- 95 -
*SGVFS164641*
The Parent Company manages its capital structure and makes adjustments to it in light of changes ineconomic conditions and the risk characteristics of its activities. In order to maintain or adjust thecapital structure, the Parent Company may adjust the amount of dividend payment to shareholders,return capital to shareholders or issue capital securities. No changes were made in the objectives,policies and processes from the previous years.
The Parent Company maintains an actively managed capital base to cover risks inherent in thebusiness. The adequacy of the Parent Company’s capital is monitored using, among other measures,the rules and ratios established by the Basel Committee on Banking Supervision (“Bank forInternational Settlements rules/ratios”) and adopted by the BSP as discussed below. The ParentCompany has complied in full with all its regulatory capital requirements.
BSP approvals
On December 14, 2012, the BSP, in its Resolution No. 2088, approved the request of the ParentCompany to include the P=1.92 billion appraisal increment resulting from the revaluation of PBComTower as part of unimpaired and qualifying capital in computing for net worth and capital adequacyratio. Effective January 1, 2018, the Group and the Parent Company changed their method ofaccounting for Investment Properties and Land from the fair value model and revaluation model,respectively, to the cost model, and restated the comparative information in its audited financialstatements. As approved by the BSP, however, the Parent Company continues to include the aboverevaluation increment for purposes of regulatory unimpaired and qualifying capital in its computation
of net worth and capital adequacy ratio. As of December 31, 2021 and 2020, the revaluation
increment pertaining to PBCOM Tower amounted to P=1.74 billion and P=1.64 billion, respectively.
Regulatory Qualifying CapitalUnder existing BSP regulations, the determination of the Parent Company’s compliance withregulatory requirements and ratios is based on the amount of the Group’s “qualifying capital”(regulatory net worth) as reported to the BSP, which is determined on the basis of regulatoryaccounting policies which may differ from PFRS in some respects.
The BSP, under BSP Circular No. 538 dated August 4, 2006, issued the prescribed guidelinesimplementing the revised risk-based capital adequacy framework for the Philippine banking system toconform to Basel II recommendations. The new BSP guidelines took effect on July 1, 2007.
Below is a summary of risk weights and selected exposure types:
Risk Weight Exposure/Asset Type*
0.00% Cash on hand; claims collateralized by securities issued by thenational government, BSP; loans covered by the Trade andInvestment Development Corporation of the Philippines; real estatemortgages covered by the Home Guarantee Corporation
20.00% Cash and other cash items, claims guaranteed by Philippineincorporated banks/quasi-banks with the highest credit quality;claims guaranteed by foreign incorporated banks with the highestcredit quality; loans to exporters to the extent guaranteed by SmallBusiness Guarantee and Finance Corporation
50.00% Housing loans fully secured by first mortgage on residential property;Local Government Unit (LGU) bonds which are covered by Deed ofAssignment of Internal Revenue allotment of the LGU andguaranteed by the LGU Guarantee Corporation

- 96 -
*SGVFS164641*
Risk Weight Exposure/Asset Type*75.00% Direct loans of defined Small Medium Enterprise and microfinance
loans portfolio; non-performing housing loans fully secured by firstmortgage
100.00% All other assets (for example, real estate assets) excluding thosededucted from capital (for example, deferred income tax)
150.00% All non-performing loans (except non-performing housing loans fullysecured by first mortgage) and all non-performing debt securities
*Not all inclusive
BSP Circular No. 781, Basel III Implementing Guidelines on Minimum Capital Requirements,provides the implementing guidelines on the revised risk-based capital adequacy frameworkparticularly on the minimum capital and disclosure requirements for universal banks and commercialbanks, as well as their subsidiary banks and quasi-banks, in accordance with the Basel III standards.The Circular went into effect on January 1, 2014.
The Circular defines in greater detail, the quality capital a bank must maintain to cover its risks.These include:
Tier One capital - comprises the Group’s and the Parent Company’s core capital resources thatare immediately available to sustain the financial stability of the group. Components of tier onecapital include:
- Core-Equity Tier One or CET-1 includes paid-in shares of common stock, retained earningsand accumulated OCI. CET-1 must be the predominant form of Tier One Capital.CET-1 absorbs all deductions to capital mandated by regulation. These deductions includecapital invested in affiliates, net deferred tax assets, intangible assets and goodwill items.
- Alternative Tier One or AT-1 includes other equity type claims on a bank’s statement offinancial position that are sufficiently subordinate to the claims of depositors and seniorcreditors and whose cash flow distributions are not committed and cancellable at the optionof the bank.
Tier Two capital - includes auxiliary items, such as the general loan loss provision and appraisalincrement reserves on investment property, that supplement Tier One Capital in sustaining thefinancial stability of the bank.
Banks must maintain CET-1 capital equivalent to 6.00%, Total Tier One capital equivalent to7.5% and Total capital equivalent to 10% of regulatory risk weighted assets at all times.
As of December 31, 2021 and 2020, the Group and the Parent Company reported ratios in excess ofthe regulatory requirements.
Presented below are the composition of qualifying capital and the related disclosures as reported tothe BSP (amounts in millions):
2021 2020
CET-1 Capital P=13,919 P=13,068Less: Regulatory Adjustments to CET-1 (543) (623)
13,376 12,445
Additional Tier 1 Capital − −Less: Regulatory Adjustments to AT-1 − −
− −Total Tier 1 Capital 13,376 12,445
Tier 2 Capital 2,227 2,226Less: Regulatory Adjustments to Tier 2 Capital − −Total Tier 2 Capital 2,227 2,226
Total Qualifying Capital P=15,603 P=14,671

- 97 -
*SGVFS164641*
The Group’s and the Parent Company’s RBCAR as reported to the BSP as of December 31, 2021 and2020 are shown in the table below (amounts in millions):
2021 2020
CET-1 Capital:Paid-up common stock P=12,016 P=12,016Additional paid-in capital 2,262 2,262Deficit (284) (1,217)Net unrealized gains or losses on FVTOCI 36 97Cumulative foreign currency translation 2 (12)Cumulative actuarial losses (113) (78)Minority interest in subsidiary banks − −
13,919 13,068
Less: Regulatory Adjustments to CET-1 Outstanding unsecured loans, other credit accommodations
and guarantees granted to subsidiary and affiliates – –Goodwill – –Other intangible assets 523 603
Investments in equity of unconsolidated subsidiary banksand quasi-banks, and other financial allied undertakings – –
Investments in equity of unconsolidated subsidiarysecurities dealers/brokers and insurance companies 6 6Significant minority investments 14 14
543 623
Tier 1 CapitalAdditional Tier 1 Capital − −Less: Regulatory Adjustments to AT-1 − −
− −Total Tier 1 Capital 13,376 12,445
Appraisal increment reserve 1,737 1,640General loan loss provision 490 586
2,227 2,226
Less: Regulatory Adjustments to Tier 2 Capital − −Total Tier 2 Capital 2,227 2,226
Total Qualifying Capital P=15,603 P=14,671
Credit risk-weighted assets P=76,572 P=69,987Market risk-weighted assets 500 182Operational risk-weighted assets 8,774 7,585
Total Risk Weighted Assets P=85,846 P=77,754
CET 1 Capital Ratio 15.58% 16.01%Tier 1 Capital Ratio 15.58% 16.01%Total Capital Ratio 18.18% 18.87%
Leverage ratioBSP also requires the Basel III Leverage Ratio (BLR), which is designed to act as a supplementarymeasure to the risk-based capital requirements. BLR intends to restrict the build-up of leverage in thebanking sector to avoid destabilizing deleveraging processes, which can damage the broader financialsystem and the economy. Likewise, it reinforces the risk-based requirements with a simple, non-riskbased “backstop” measure.
Exposure measure is the sum of on-balance sheet exposures, derivative exposures, and off-balancesheet items. Items that are deducted completely from capital (regulatory deductions) do not contributeto leverage, hence, deducted from the exposure measure. BLR is computed as the capital measure(Tier 1 capital) divided by the total exposure measure and should not be less than 5.00%.

- 98 -
*SGVFS164641*
As of December 31, 2021 and 2020, BLR of the Parent Company, as reported to the BSP, is shown inthe table below (amounts, except ratios, are expressed in millions):
2021 2020
Tier 1 capital P=13,376 P=12,445Total exposure measure 116,271 109,400
BLR 11.50% 11.38%
Internal Capital Adequacy Assessment Process (ICAAP)The ICAAP methodology of the Parent Company was based on the minimum regulatory capitalrequirement under BSP Circular No. 639 which involved, first, an assessment of whether the riskscovered by the Framework are fully captured; and second, an assessment of other risks the ParentCompany is exposed to which are not fully captured and covered under the Framework, and anassessment of whether and how much capital to allocate against these other risks.
The ICAAP included the articulation of the Parent Company’s Risk Appetite and the correspondinglimit on each material risk which was deliberated upon by the ICAAP Steering Committee, ROC andendorsed to the BOD for approval.
Salient points of the 2022 ICAAP Document:
The Parent Company’s total Qualifying Capital for December 31, 2021 fully covers the capitalrequirements for risks under BSP Circular Nos. 538 and 639 (Pillar 1 and Pillar 2 Risks). Thefinal ICAAP document shall be available in Q2 2022.
The Parent Company’s resulting operating environment and risk requirements from 2022 to 2024will be guided by the Capital Development and Sustainability Plan to ensure appropriate capitalcoverages not only to meet the regulatory and internal capital adequacy requirements but also toensure execution of the 3-year strategic growth within the BOD’s desired appetite for capitaladequacy. Realization of the capital plan will enable the Parent Company to have sufficientRBCAR, and even projecting significant excess of capital in 2022 to 2024.
24. Commitments and Contingent Liabilities
In the normal course of operations, the Group has various outstanding commitments and contingentliabilities such as guarantees, forward exchange contracts, and commitments to extend credit, whichare not presented in the accompanying financial statements. The Group does not anticipate anymaterial losses as a result of these transactions.
The Group has certain loan-related suits and claims that remain unsettled. It is not practicable toestimate the potential financial statement impact of these contingencies. However, in the opinion ofmanagement, the suits and claims, if decided adversely, will not involve sums that would have amaterial effect on the financial statements.
The Group is a defendant in legal actions arising from its normal business activities. Managementbelieves that these actions are without merit or that the ultimate liability, if any, resulting from themwill not materially affect the consolidated and parent company financial statements.
The allowance for credit losses on the loan commitments and financial guarantee contracts for theyears ended December 31, 2021 and 2020 amounted to nil.

- 99 -
*SGVFS164641*
The following is a summary of contingencies and commitments of the Group and the ParentCompany with the equivalent peso contractual amounts:
2021 2020
Trust department accounts P=8,631,952 P=7,973,683Standby LC 825,173 1,112,021Spot exchange:
Bought 101,998 1,300,002Sold 362,093 1,460,869
Usance LC outstanding 135,023 84,331Outstanding shipping guarantees 396,019 403,601Sight LC outstanding 890,428 792,459Outward bills for collection 13,293 32,053Currency forwards:
Bought 1,987 3,811Sold 162,464 337,400
Inward bills for collection 106,075 13,108Items held for safekeeping 19 25Items held as collateral 7 7Other contingencies 14,241 12,700
Derivative Financial InstrumentsAs of December 31, 2021, the Parent Company has outstanding buy US dollar currency forwardswith aggregate notional amount of US$3.147 million, terms of 359 days, and weighted averageforward rate of P=50.33. As of December 31, 2021, derivative liability amounting to P6.04 million ispresented under miscellaneous liability.
As of December 31, 2020, the Parent Company has outstanding buy US dollar currency forwardswith aggregate notional amount of US$6.946 million, terms of 366 days, and weighted averageforward rate of P=49.55. As of December 31, 2020, derivative asset amounting to P10.60 million ispresented under miscellaneous asset.
In 2021, 2020 and 2019, total gain (loss) on currency forwards included under ‘Trading and securitiesgain (loss) - others’ in the statements of income amounted to (P=16.64 million), P=2.56 million, andP=8.76 million, respectively (see Note 26).
25. Trust Operations
Securities and other properties (other than deposits) held by the Parent Company for its customers inits fiduciary or agency capacity are not included in the statements of financial position since these arenot assets of the Parent Company. Total assets held by the Parent Company’s trust departmentamounted to P=8.63 billion and P=7.97 billion as of December 31, 2021 and 2020, respectively(see Note 37).
As of December 31, 2021 and 2020, government securities (included under ‘Investment securitiesat amortized cost’) owned by the Parent Company with total face value of P=90.00 million andP=80.00 million, respectively, are deposited with the BSP in compliance with the requirements ofRA No. 337 relative to the Parent Company’s trust functions.

- 100 -
*SGVFS164641*
Income from the Group’s and the Parent Company’s trust operations shown under ‘Income from trustoperations’ in the statements of income amounted to P=29.23 million, P=25.69 million, andP=21.10 million in 2021, 2020 and 2019, respectively.
26. Income on Investment Securities
Interest income on investment securities follows:
2021 2020 2019
Investment securities at amortizedcost P=222,525 P=150,348 P=497,929
Financial assets at FVOCI 250,271 213,270 90,388
Investment Securities 472,796 363,618 588,317Financial assets at FVTPL 40,345 80,007 159,297
P=513,141 P=443,625 P=747,614
The Parent Company’s peso-denominated investment securities earned annual interest rates rangingfrom 2.38% to 6.25% in 2021, 2.63% to 8.00% in 2020 and 3.19% to 8.13% in 2019, while dollar-denominated investment securities earned annual interest rates ranging from 1.13% to 10.63%, 0.63%to 10.63%, and 2.63% to 10.63%, in 2021, 2020 and 2019, respectively.
The Group’s and the Parent Company’s trading and securities gain (loss) - net follows:
2021 2020 2019
Financial assets at FVTPL P=60,585 P=374,890 P=90,476Financial assets at FVTOCI (285,542) 277,278 309,176Derivatives (Note 24) (16,641) 2,563 8,761
(P=241,598) P=654,731 P=408,413
27. Employee Benefits
The existing regulatory framework, RA No. 7641, The Retirement Pay Law, requires companies withat least ten employees to pay retirement benefits to qualified private sector employees in the absenceof any retirement plan in the entity, provided however, that the employee’s retirement benefits underany collective bargaining and other agreements shall not be less than those provided under the law.The law does not require minimum funding of the plan.
Defined Benefit PlansParent Company
The Parent Company has a funded, noncontributory defined benefit retirement plan coveringsubstantially all of its officers and regular employees. The Parent Company’s annual contribution tothe retirement plan consists of a payment covering the current service cost and unfunded actuarialaccrued liability. The retirement plan provides a retirement benefit based on applicable percentage ofsalary (100% - 150%) depending on the number of years of service (minimum of five years), afraction of a month being considered as one whole month. The Parent Company’s retirement plan isin the form of a trust administered by the Parent Company’s Trust and Wealth Management Group(TWMG) under the supervision of the Retirement Board.

- 101 -
*SGVFS164641*
The latest actuarial valuation studies of the defined benefit retirement plans of the Group were madeas of December 31, 2021.
The following table shows the actuarial valuation results for the Group and the Parent Company as ofDecember 31, 2021 and 2020:
2021 2020
Fair Value of
Plan Assets
Present Value
of Obligation
Fair Value ofPlan Assets
Present Value ofObligation
Consolidated and Parent Company P=557,039 P=461,546 P=500,642 P=609,646
The amounts relating to the defined benefit retirement plans of the Group and Parent Company arepresented in the statements of financial position as follows:
2021 2020
Retirement asset* (Note 16) P=95,493 P=–Retirement liability** (Note 20) – (109,004)
Net retirement asset (liability) P=95,493 (P=109,004)
* Included in ‘Other assets’
** Included in ‘Accrued interest, taxes and other expenses’
Changes in the present value of the defined benefit obligations of the Group and the Parent as ofDecember 31, 2021 and 2020 are as follows:
Consolidated
2021 2020
Balance at January 1 P=609,646 P=512,964Sale of subsidiary (Note 7) – –Current service cost 72,798 60,898Interest cost 24,386 27,187Remeasurement losses (gains):
Actuarial gains arising from deviations of experiencefrom assumptions (37,526) (35,203)
Actuarial losses (gains) arising from changes infinancial assumptions (181,272) 86,634
Benefits paid (26,486) (42,834)Settlements – –
Balance at December 31 P=461,546 P=609,646
Changes in the fair value of the plan assets of the Group and Parent Company as of December 31,2021 and 2020 are as follows:
2021 2020
Balance at January 1 P=500,642 P=475,809Sale of subsidiary (Note 7) – –Contributions 77,158 62,867Interest income 20,026 25,218Return on plan assets (excluding interest income) (14,300) (20,418)Benefits paid (26,487) (42,834)
Balance at December 31 P=557,039 P=500,642

- 102 -
*SGVFS164641*
The fair values of plan assets by class of the Group and Parent Company as of December 31, 2021and 2020 are as follows:
2021 2020
Cash and cash equivalents P=41,000 P=139,193Debt instruments:
Philippine government 204,143 98,416Industrial 55,363 56,251Real estate 90,739 47,808Financial intermediaries 2,019 28,161Holding firms 16,238 24,977Power, electricity and water distribution 14,304 14,386Equity instruments:Real estate 41,490 27,198Holding firms 24,764 26,273Wholesale and retail trade 9,858 13,016Transport, storage and communication 15,576 11,824Financial intermediaries 12,524 9,398Power, electricity and water distribution 4,966 2,476Manufacturing 2,412 1,546Others 703 470
Other assets and liabilities 20,940 (751)
P=557,039 P=500,642
The Group’s plan assets are carried at fair value. All equity and debt instruments have quoted pricesin an active market. The fair values of other assets and liabilities, which include amounts due fromother banks, accrued interest and other receivables and trust fee payables, approximate their carryingamount due to the short-term nature of these accounts.
The plan assets are diversified investments and are not exposed to concentration risk.
The Group expects to contribute P=42.96 million to the defined retirement benefit plans in 2021.
The cost of defined benefit retirement plans, as well as the present value of the benefit obligations,are determined using actuarial valuations, which involve making various assumptions. The principalassumptions used are shown below:
Parent Company
2021 2020
Discount rate:At January 1 4.00% 5.30%At December 31 5.10% 4.00%
Salary increase rate 5.00% 7.00%Average remaining working life 13 13

- 103 -
*SGVFS164641*
The sensitivity analysis below has been determined based on reasonably possible changes of eachsignificant assumption of the Group and Parent Company as of December 31, 2021 and 2020,assuming all other assumptions were held constant. The sensitivity analysis may not berepresentative of an actual change in the defined benefit obligation as it is unlikely that changes inassumptions would occur in isolation from one another.
Increase (Decrease) in Defined
Benefit Obligation
2021 2020
Increase in discount rate of 0.50% (P=139,271) (P=73,280)Decrease in discount rate of 0.50% 43,972 148,157Increase in salary increase rate of 0.50% 47,563 144,931Decrease in salary increase rate of 0.50% (137,097) (75,783)
The amounts of defined benefit cost included in the statements of other comprehensive income as‘Remeasurement of retirement liability’, gross of tax, follow:
Consolidated Parent Company
2021 2020 2019 2021 2020 2019
Actuarial gain (loss) on benefitobligation P=218,798 (P=51,431) (P=114,109) P=218,798 (P=51,431) (P=114,109)
Return on plan assets (excludinginterest income) (14,300) (20,418) 2,604 (14,300) (20,418) 2,604
Remeasurement gains (loss) in OCI P=204,498 (P=71,849) (P=111,505) P=204,498 (P=71,849) (P=111,505)
The amounts of retirement cost included in the statements of income follow:
Consolidated Parent Company
2021 2020 2019 2021 2020 2019
Current service cost* P=72,798 P=60,898 P=42,968 P=72,798 P=60,898 P=42,968Net interest expense (Note 19) 4,360 1,969 (5,651) 4,360 1,969 (5,651)
Retirement cost P=77,158 P=62,867 P=37,317 P=77,158 P=62,867 P=37,317
*Included under ‘Compensation and fringe benefits’ in the statements of income
Shown below is the maturity profile of the undiscounted benefit payments of the Group and theParent Company as of December 31, 2021 and 2020:
Plan Year 2021 2020
Less than five years P=169,982 P=172,677More than five to ten years 309,796 343,479Ten years and above 2,193,537 3,383,230
P=2,673,315 P=3,899,386
Collective Bargaining Agreement (CBA)All of the Parent Company’s rank and file employees are covered by a CBA, the most recentnegotiation having been signed on December 28, 2021, with an effectivity period from January 1,2021 until December 31, 2022. There had been neither dispute nor occurrence of employees’ strikefor the past years.

- 104 -
*SGVFS164641*
Defined Contribution PlansParent CompanyThe Parent Company employs a provident fund scheme where the Parent Company and its coveredemployees shall contribute 11% and 5% of the employees’ basic monthly salary, respectively.Contributions are maintained under the Provident Fund account administered by the ParentCompany’s TWMG under the supervision of the Retirement/Provident Fund Board. As approved bythe Parent Company’s BOD on November 27, 2013, new officers hired after December 31, 2013,except those whose terms of employment have been negotiated prior to December 1, 2013, are nolonger eligible for inclusion in the Parent Company’s provident fund. The Parent Company’s BOD,in its meeting held on January 27, 2016, approved a change in vesting for the retirement fund from5 to 10 years effective for all new hires who sign up starting February 1, 2016.
Contributions paid and accrued by the Parent Company for both the Staff Provident Fund and theRetirement Fund recognized under ‘Compensation and fringe benefits’ in the statements of incomeamounted to P=103.84 million, P=91.28 million, and P=67.27 million in 2021, 2020 and 2019,respectively.
28. Long-term Leases
Group as a Lessee
As of December 31, 2021 and 2020, 84.04% and 81.72%, respectively of the Parent Company’sbranch sites are under lease arrangements. The lease contracts are for periods ranging from one tofive years and some are renewable at the Group’s option under certain terms and conditions. Variouslease contracts include escalation clauses, which bear an annual rent increase of 5.00% to10.00%. Asof December 31, 2021 and 2020, the Group has no contingent rent payable.
As of December 31, 2021 and 2020, the carrying amount of lease liabilities (included in ‘OtherLiabilities’ in Note 21) is P=252.50 million and P=239.74 million, respectively .
In 2021, 2020 and 2019, the Group and the Parent Company recognized interest expense on leaseliabilities (included in ‘Interest and Finance Charges’ in the Statements of Income) amounting toP=14.53 million, P=17.60 million, and P=18.71 million and rent expense from short-term leases andleases of low-value assets amounting to P=41.58 million, P=44.24 million, and P=55.90 million,respectively.
The Group’s and the Parent Company’s future minimum rentals payable under noncancellableoperating leases are as follows:
2021 2020
Within one year P=148,654 P=141,199Beyond one year but not more than five years 222,323 249,260
P=370,977 P=390,459
Group as a Lessor
The Parent Company has also entered into commercial property leases on its investment properties.These noncancellable leases have remaining noncancellable lease terms of between one to five years.The Parent Company recognized rent income, included under ‘Rent income’ in the statements of

- 105 -
*SGVFS164641*
income, amounting to P=484.93 million, P=655.92 million, and P=691.92 million, in 2021, 2020 and2019, respectively.
The Group’s and the Parent Company’s future minimum rentals receivable under noncancellableoperating leases follow:
2021 2020
Within one year P=376,557 P=678,275Beyond one year but not more than five years 489,398 3,798,817
P=865,955 P=4,477,092
29. Miscellaneous Income and Expenses
Miscellaneous income
Details of this account are as follows:Consolidated Parent Company
2021 2020 2019 2021 2020 2019
Rental charges P=70,299 P=112,721 P=108,171 P=70,299 P=112,721 P=108,171Loan charges 21,676 24,116 30,459 21,676 24,116 30,459Dividend income 3,344 9,585 3,335 3,344 9,585 3,335Loss on sale/exchange of other non-
financial assets – (3,014) (8,515) – (3,014) (8,515)Others 42,027 14,994 4,333 42,027 14,994 4,333
P=137,346 P=158,402 P=137,783 P=137,346 P=158,402 P=137,783
Miscellaneous expenses
Details of this account are as follows:Consolidated Parent Company
2021 2020 2019 2021 2020 2019
Litigation and assets acquired - relatedexpenses P=85,949 P=36,926 P=32,043 P=85,949 P=36,926 P=32,043
Information technology 77,757 81,861 83,892 77,757 81,861 83,892Fines, penalties and other charges 48,748 71,796 80,604 48,748 71,796 80,604Transaction dues 44,996 44,634 43,673 44,996 44,634 43,673Brokerage fees 27,979 38,191 37,760 27,979 38,191 37,760Stationery and supplies 18,153 13,064 13,506 18,153 13,064 13,506Fuel and lubricants 11,199 10,123 11,991 11,199 10,123 11,991Travel 10,093 12,094 5,485 10,093 12,094 5,485Freight 9,767 7,926 8,714 9,767 7,926 8,714Advertising 1,221 4,668 13,763 1,221 4,668 13,763Others 75,612 71,494 100,963 75,602 71,489 100,963
P=411,474 392,777 432,394 P=411,464 392,772 432,394
Others include account maintenance charges, contractual services, and Philippine Dealing ExchangeCorp. transaction fees.
30. Income and Other Taxes
Under Philippine tax laws, the RBU of the Parent Company and its subsidiary are subject topercentage and other taxes (presented as ‘Taxes and licenses’ in the statements of income), as well asincome taxes. Percentage and other taxes paid consist principally of gross receipts tax (GRT) andDST. Income taxes include corporate income tax, as discussed below, and final taxes paid, which
- 106 -
*SGVFS164641*
represents final withholding tax on gross interest income from government securities and otherdeposit substitutes and income from FCDU transactions. These income taxes, as well as the deferredtax benefits and provisions, are presented as ‘Provision for income tax’ in the statements of income.
RA No. 9397, An Act Amending National Internal Revenue Code, provides that the RCIT rate shall be30.00% and the interest expense allowed as a deductible expense shall be reduced by 33.00% ofinterest income subjected to final tax.
An MCIT of 2.00% of modified gross income is computed and compared with the RCIT. Any excessof MCIT over the RCIT is deferred and can be used as a tax credit against future income tax liabilityfor the next three years. In addition, NOLCO is allowed as a deduction from taxable income in thenext three years from the period of incurrence.
FCDU offshore income (income from non-residents) is tax-exempt while gross onshore income(income from residents) is generally subject to 10.00% gross income tax. In addition, interest incomeon deposit placements with other FCDUs and offshore banking units is subject to a 15.00%.. RA No.9294, An Act Restoring the Tax Exemption of Offshore Banking Units (OBUs) and FCDUs, providesthat the income derived by the FCDU from foreign currency transactions with non-residents, OBUs,local commercial banks including branches of foreign banks is tax-exempt while interest income onforeign currency loans from residents other than OBUs or other depository banks under the expandedsystem is subject to 10.00% income tax.
President Rodrigo Duterte signed into law on March 26, 2021 the Corporate Recovery and TaxIncentives for Enterprises (CREATE) Act to attract more investments and maintain fiscal prudenceand stability in the Philippines. Republic Act (RA) 11534 or the CREATE Act introduces reforms tothe corporate income tax and incentives systems. It took effect 15 days after its complete publicationin the Official Gazette or in a newspaper of general circulation or April 11, 2021.
The following are the key changes to the Philippine tax law pursuant to the CREATE Act which havean impact on the Group:
• Effective July 1, 2020, regular corporate income tax (RCIT) rate is reduced from 30% to 25% fordomestic and resident foreign corporations.
• Minimum corporate income tax (MCIT) rate reduced from 2% to 1% of gross income effectiveJuly 1, 2020 to June 30, 2023.
• Effective January 1, 2021, income tax rate for nonresident foreign corporation is reduced from30% to 25%.
• Income tax arbitrage rate reduced from 33% to 20% of interest income subject to final taxeffective July 1, 2020
As clarified by the Philippine Financial Reporting Standards Council in its Philippine InterpretationsCommittee Q&A No. 2020-07, the CREATE Act was not considered substantively enacted as ofDecember 31, 2020 even though some of the provisions have retroactive effect to July 1, 2020.The passage of the CREATE Act into law on March 26, 2011 is considered as a non-adjustingsubsequent event. Accordingly, current and deferred taxes as of and for the year endedDecember 31, 2020 continued to be computed and measured using the applicable income tax rates asof December 31, 2020 (i.e., 30% RCIT / 2% MCIT) for financial reporting purposes.

- 107 -
*SGVFS164641*
Applying the provisions of the CREATE Act, the Group would have been subjected to lower regularcorporate income tax rate of 25% effective July 1, 2020.
Based on the provisions of Revenue Memorandum Circular No. 50-2021 dated April 5, 2021 issuedby the BIR, the prorated RCIT rate of the Group for 2020 is 27.50%.
This resulted in lower provision for current income tax for the year ended December 31, 2020amounting to P=190.70 million, or a reduction of P=27.25 million. The reduced amount was reflected inthe Group’s 2020 annual income tax return but for financial reporting purposes, the changes isrecognized in the 2021 financial statements.
Further, this resulted in lower deferred tax assets as of December 31, 2020 and provision for deferredtax for the year then ended by P=30.08 million. These reductions are recognized in the 2021 financialstatements.
Provision for income tax consists of:
Consolidated and Parent Company
2021 2020 2019
Current:RCIT P=364,115 P=217,947 P=70,626Final 107,296 144,040 159,002
471,411 361,987 229,628Deferred (214,785) (131,864) (27,237)
P=256,626 P=230,123 P=202,391
The Group’s and Parent Company’s components of deferred tax assets and liabilities follow:
2021 2020
Deferred tax assets:
Allowance for ECL and impairment losses P=669,175 P=635,159Retirement liability – 32,700Accumulated Depreciation-ROPA 50,088 –Lease liability 63,126 65,119Advance rental 51,603 15,335Unamortized past service cost 9,667 6,819Excess of MCIT over RCIT – –
P=843,659 P=755,132
Deferred tax liabilities:
Revaluation increment credited to surplus free P=333,316 P=399,979Branch licenses acquired from business
combinations 65,650 78,780Right-of-use assets 60,161 65,119Retirement asset 23,874 –Unrealized gain on equity securities carried at
FVTOCI 11,016 9,869Gain on foreclosure of foreclosed of properties 21,904 25,438Unrealized foreign exchange gain 2,124 5,339
518,045 584,524
Net deferred tax assets P=325,614 P=170,608

- 108 -
*SGVFS164641*
Provision for (benefit from) income tax directly charged to OCI by the Group and Parent Company in2021, 2020 and 2019 amounted to P=59.78 million, (P=45.05 million), and (P=8.16 million), respectively.
The ultimate realization of deferred tax assets is dependent on the generation of future taxableincome. In assessing the realizability of its deferred tax assets, the Group considers projected futuretaxable income, reversal of temporary differences, and tax planning strategies.
The Group and Parent Company assessed that not all of its deferred tax assets may be realized in thefuture. The Group and Parent Company did not set up deferred tax assets on allowance for ECL/creditand impairment losses amounting to P356.94 million in 2020.
A reconciliation between the statutory income tax and the effective income tax follows:
Consolidated Parent Company
2021 2020 2019 2021 2020 2019
Statutory income tax P=457,422 P=419,711 P=476,417 P=457,422 P=419,711 P=425,170Tax effects of:
Benefit from change ofincome tax rate (6,172) − − (6,172) − −
Nondeductible expenses andothers 48,251 123,146 57,921 48,251 123,146 126,443
FCDU income before incometax (39,400) (93,512) (142,199) (39,400) (93,512) (142,199)
Interest income subjected tofinal tax (26,651) (36,579) (31,265) (26,651) (36,579) (31,265)
Nontaxable income (44,836) (67,280) (15,818) (44,836) (67,280) (33,093)Changes in unrecognized
deferred tax assets (131,988) (115,363) (142,665) (131,988) (115,363) (142,665)
Effective income tax P=256,626 P=230,123 P=202,391 P=256,626 P=230,123 P=202,391
31. Related Party Transactions
Parties are considered to be related if one party has the ability, directly or indirectly, to control theother party or exercise significant influence over the other party in making financial and operatingdecisions. The Parent Company’s related parties include key management personnel, close familymembers of key management personnel, affiliates (that is, entities which are controlled, significantlyinfluenced by or for which significant voting power is held by the Parent Company or keymanagement personnel or their close family members and retirement plan for the benefit of theGroup’s employees).
The Parent Company has business relationships with certain related parties. Transactions with suchparties are made in the ordinary course of business and on substantially same terms, including interestand collateral, as those prevailing at the time for comparable transactions with other parties. Thesetransactions also did not involve more than the normal risk of collectability or present otherunfavorable conditions.
Retirement PlansUnder PFRS, certain post-employment benefit plans are considered as related parties. The ParentCompany has a business relationship with its defined benefit and contribution plans, as it providestrust and management services to the plans. Any investments made in the retirement plans areapproved by the Parent Company’s Retirement Board. The Parent Company’s Retirement Board iscomprised of senior officers of the Parent Company. Income earned by the Parent Company(presented as part of ‘Income from trust operations’ in the statements of income) from such services

- 109 -
*SGVFS164641*
amounted to P=4.98 million in 2021, P=4.79 million in 2020, and P=4.63 million in 2019. Total depositsmaintained by the related party retirement plans with the Parent Company amounted toP=84.6 million and P=264.39 million as of December 31, 2021 and 2020, respectively.
Key Management PersonnelKey management personnel are those persons with authority and responsibility for planning, directingand controlling the activities of the Parent Company, directly or indirectly. The Parent Companyconsiders the members of the Senior Management Team to constitute key management personnel forpurposes of PAS 24.
Total remunerations of key management personnel are as follows:
2021 2020 2019
Short-term benefits P=141,574 P=131,425 P=129,744Post-employment benefits 8,282 6,681 4,445
P=149,856 P=138,106 P=134,189
The remuneration of Parent’s Board of Directors such as per diem and other fees amounted toP=13.6 million, P=12.43 million and P=9.75 million, as of December 31, 2021, 2020 and 2019,respectively.
Details on significant related party transactions of the Parent Company follow:
2021
Category Volume
Outstanding
Balance Nature, Terms and Conditions
Significant investors:
Deposit liabilities P=1,698,617 P=5,680,994 Savings and time deposit accounts with annual
interest rates ranging from 0.06% to 3.37%.Interest expense 15,635 −Depreciation expense 24,366 −
Branch and office space leased for five years
ending in various years, with 5.00% annualescalation.
Lease liability 58,402 −
Interest expense 4,278
Rent income 2,046 − 5-year lease of branches, subject to pre-termination, with escalation rate of 5%.
Loans and receivables (22,998) 69,634 Loans with annual interest rates of 5.50%
Affiliate:
Deposit liabilities 681 18,229 Demand, savings and time deposit accounts with
annual interest rates ranging from 0.10% to0.27%.
Interest expense 15 −
Rent income 153 − 5-year lease expiring in July 2023 with 5.00%
annual escalation.
Subsidiary:
Deposit liabilities (26) 8,945 Non-interest demand deposit account.
Key management personnel:
Deposit liabilities 12,844 37,623 Savings and time deposit accounts with annualinterest rates ranging from 0.10% to 0.25%.
Interest expense 25
Provident fund:
Deposit liabilities (83,876) 42,024 Savings and time deposit accounts with annual
interest rates ranging from 0.10% to 0.13%.Interest expense 120 A certain percentage of the monthly ending
market value of the fund depending on agreement.Trust fee 2,325
Retirement fund:
Deposit liabilities (97,499) 41,000 Savings and time deposit accounts with annual
interest rates ranging from 0.10% to 0.13%Interest expense 138 A certain percentage of the monthly ending
market value of the fund depending on
agreement.
(Forward)
Trust fee 2,652

- 110 -
*SGVFS164641*
2020
Category Volume
Outstanding
Balance Nature, Terms and Conditions
Significant investors:Deposit liabilities (P=4,406,238) P=3,982,377 Savings and time deposit accounts with annual
interest rates ranging from 0.06% to 3%.Interest expense 26,676 −Depreciation expense 22,559 −
Branch and office space leased for five years
ending in various years, with 5.00% annualescalation.
Lease liability (6,634) −
Interest expense 5,649
Rent income 4,064 − 5-year lease of branches, subject to pre-termination, with escalation rate of 5%.
Loans and receivables 12,843 92,632 Loans with annual interest rates ranging from
5.80% to 8.00%
Affiliate:
Deposit liabilities 2,985 17,548 Demand, savings and time deposit accounts withannual interest rates ranging from 0.10% to0.50%.
Interest expense 172 −
Rent income 157 − 5-year lease expiring in July 2023 with 5.00%annual escalation.
Subsidiary:
Deposit liabilities (5,574) 8,971 Non-interest demand deposit account.
Key management personnel:Deposit liabilities 8,240 24,779 Savings and time deposit accounts with annual
interest rates ranging from 0.10% to 2.63%.
Interest expense 66
Provident fund:
Deposit liabilities 120,691 125,900 Savings and time deposit accounts with annualinterest rates ranging from 0.10% to 0.50%.
Interest expense 256 A certain percentage of the monthly ending
market value of the fund depending on agreement.Trust fee 2,348
Retirement fund:
Deposit liabilities 137,558 138,499 Savings and time deposit accounts with annualinterest rates ranging from 0.10% to 0.50%
Interest expense 271 A certain percentage of the monthly ending
market value of the fund depending onagreement.
Trust fee 2,443
2019
Category VolumeOutstanding
Balance Nature, Terms and Conditions
Significant investors:Deposit liabilities P=3,195,068 P=8,388,615 Savings and time deposit accounts with annual
interest rates ranging from 0.10% to 6.50%.Interest expense 88,353 −Depreciation expense 20,365 −
Branch and office space leased for five years
ending in various years, with 5.00% annualescalation.
Lease Liability 78,258 78,258
Interest expense 4,774
Rent income 3,946 − 5-year lease of branches, subject to pre-termination, with escalation rate of 5%.
Loans and receivables 41,943 79,789 Loans with annual interest rates ranging from
7.25% to 8.00%
Affiliate:
Deposit liabilities 240 14,563 Demand, savings and time deposit accounts withannual interest rates ranging from 0.10% to3.00%.
Interest expense 435 −
Rent income 149 − 5-year lease expiring in July 2023 with 5.00%annual escalation.
(Forward)
Subsidiaries:Deposit liabilities (1,265) 14,545 Demand and savings deposit accounts with annual
interest rates ranging of 0.10% to 0.13%.Rent income 27 − 3-year lease expiring in May 2020 with 7.50%
and 10.00% annual escalation on second and
third year, respectively.

- 111 -
*SGVFS164641*
2019
Category VolumeOutstanding
Balance Nature, Terms and Conditions
Key management personnel:
Deposit liabilities (9,883) 16,539 Savings and time deposit accounts with annualinterest rates ranging from 0.10% to 3.00%.Interest expense 453 −
Provident fund:
Deposit liabilities (15,818) 5,209 Savings and time deposit accounts with annualinterest rates ranging from 0.10% to 1.25%.Interest expense 583 −
Trust fee P=2,267 P=− A certain percentage of the monthly ending
market value of the fund depending onagreement.
Retirement fund:Deposit liabilities (29,435) 941 Savings and time deposit accounts with annual
interest rates ranging from 0.10%Interest expense 580 −Trust fee 2,364 − A certain percentage of the monthly ending
market value of the fund depending onagreement.
32. Earnings Per Share
Basic EPS amounts are calculated by dividing the net income for the year by the weighted averagenumber of common shares outstanding during the year.
The following reflects the income and share data used in the basic and diluted earnings per sharecomputations:
2021 2020 2019
Net income attributable to equityholdersof the Parent Company P=1,573,064 P=1,168,912 P=1,157,257
Weighted average number ofcommon
shares outstanding 480,645 480,645 480,645
Basic/diluted earnings per share P=3.27 P=2.43 P=2.41
As of December 31, 2021, 2020 and 2019, there are no outstanding dilutive potential common shares.

- 112 -
*SGVFS164641*
33. Notes to Statements of Cash Flows
The amounts of interbank loans receivable and SPURA considered as cash and cash equivalents ofthe Group and Parent as of December 31, 2021, 2020 and 2019 follow:
2021 2020 2019
Interbank loans receivable andSPURA shown understatements of cash flows P=724,957 P=2,151,502 P=717,736
Interbank loans receivable andSPURA not considered ascash and cash equivalents 3,470,889 3,902,952 –
P=4,195,846 P=6,054,454 P=717,736
The following is a summary of noncash activities:
2021 2020 2019
Noncash operating activities:Additions to investment
properties from settlement ofloans (Note 14) P=313,805 P=63,969 P=210,003
Additions to chattel mortgagefrom settlement of loans(Note 16) 33,970 58,211 112,024
Noncash investing activities:Transfer to property and
equipment from investmentproperties (Notes 13 and 14) – – (53,494)
Transfer to investment propertiesfrom property and equipment(Notes 13 and 14) – – 53,494
Transfer to property andequipment from other assets(Notes 13 and 16) 3,171 5,247 6,619
Transfer to other assets fromproperty and equipment(Notes 13 and 16) (3,171) (5,247) (6,619)
Unrealized gain (loss) onfinancial assets at FVOCI 46,584 (12,161) 68,516
The changes in liabilities arising from the financing activities of the Group and Parent Company in2021, 2020 and 2019 are as follows:
January 1,
2021
Cash
Flows
Foreign
Exchange
Movement
December 31,
2021
Bills payable (Note 19) P=2,182,844 P=3,760,625 P=67,519 P=6,010,988
Outstanding acceptances 497,813 (441,444) 15,240 71,609
Marginal deposits* 6,773 (6,773) – –
Total liabilities from financing activities P=2,687,430 P=3,312,408 P=82,759 P=6,082,597
* Included in ‘Other liabilities’

- 113 -
*SGVFS164641*
January 1,2020
CashFlows
ForeignExchange
MovementDecember 31,
2020
Bills payable (Note 19) P=13,064,824 (P=10,879,934) (P=2,046) P=2,182,844Outstanding acceptances 91,855 417,210 (11,252) 497,813Marginal deposits* 34,348 (27,575) – 6,773
Total liabilities from financing activities P=13,191,027 (P=10,490,299) (P=13,298) P=2,687,430
* Included in ‘Other liabilities’
January 1,2019
CashFlows
Derecognitionof Subsidiary
ForeignExchangeMovement
December 31,2019
Bills payable (Note 19) P=17,659,043 (P=4,537,163) (P=67,758) P=10,702 P=13,064,824Outstanding acceptances 46,344 50,412 – (4,901) 91,855Marginal deposits* 304 34,044 – – 34,348
Total liabilities from financing activities P=17,705,691 (P=4,452,707) (P=67,758) P=5,801 P=13,191,027
* Included in ‘Other liabilities’
34. Offsetting of Financial Assets and Liabilities
The amendments to PFRS 7 require the Group to disclose information about rights of offset and relatedarrangements (such as collateral posting requirements) for financial instruments under an enforceablemaster netting agreements or similar arrangements. The effects of these arrangements are disclosed inthe succeeding table (amounts in thousands). None of the bills payable as of December 31, 2020 aresecured by collateral.
December 31, 2021
Financial instruments
recognized at
end of reporting
period by type
Gross carrying
amounts (before
offsetting)
Gross amounts
offset in
accordance with
the offsetting
criteria
Net amount
presented in
statements of
financial
position
[a−b]
Effects of remaining rights of
set−off (including rights to set
off financial collateral) that
do not meet PAS 32 offsetting
criteria
Net exposure
[c−d]
Financial
instruments
Fair value of
financial
collateral
[a] [b] [c] [d] [e]
Financial liabilities
Bills payable P=6,010,988 P=− P=6,010,988 P=6,026,758 P=6,051,439 P=−
The amounts disclosed in column (d) include those rights to set – off amounts that are onlyenforceable and exercisable in the event of default, insolvency or bankruptcy. These include amountsrelated to financial collateral both received and pledged, whether cash or non – cash collateral,excluding the extent of over - collateralization.
35. Approval for Release of the Financial Statements
The financial statements were authorized for issue by the BOD of the Parent Company onApril 27, 2022.

- 114 -
*SGVFS164641*
36. Standards Issued but not yet Effective
Pronouncements issued but not yet effective are listed below. The Group intends to adopt thefollowing pronouncements when they become effective. The adoption of these pronouncements isnot expected to have a significant impact on the Group’s financial statements unless otherwiseindicated.
Effective beginning on or after January 1, 2022
Amendments to PFRS 3, Reference to the Conceptual Framework
The amendments are intended to replace a reference to the Framework for the Preparation andPresentation of Financial Statements, issued in 1989, with a reference to the ConceptualFramework for Financial Reporting issued in March 2018 without significantly changing itsrequirements. The amendments added an exception to the recognition principle of PFRS 3,Business Combinations to avoid the issue of potential ‘day 2’gains or losses arising for liabilitiesand contingent liabilities that would be within the scope of PAS 37, Provisions, Contingent
Liabilities and Contingent Assets or Philippine-IFRIC 21, Levies, if incurred separately.
At the same time, the amendments add a new paragraph to PFRS 3 to clarify that contingentassets do not qualify for recognition at the acquisition date.
The amendments are effective for annual reporting periods beginning on or after January 1, 2022and apply prospectively.
Amendments to PAS 16, Plant and Equipment: Proceeds before Intended Use
The amendments prohibit entities deducting from the cost of an item of property, plant andequipment, any proceeds from selling items produced while bringing that asset to the location andcondition necessary for it to be capable of operating in the manner intended by management.Instead, an entity recognizes the proceeds from selling such items, and the costs of producingthose items, in profit or loss.
The amendment is effective for annual reporting periods beginning on or after January 1, 2022and must be applied retrospectively to items of property, plant and equipment made available foruse on or after the beginning of the earliest period presented when the entity first applies theamendment.
Amendments to PAS 37, Onerous Contracts – Costs of Fulfilling a Contract
The amendments specify which costs an entity needs to include when assessing whether acontract is onerous or loss-making. The amendments apply a “directly related cost approach”.The costs that relate directly to a contract to provide goods or services include both incrementalcosts and an allocation of costs directly related to contract activities. General and administrativecosts do not relate directly to a contract and are excluded unless they are explicitly chargeable tothe counterparty under the contract.
The amendments are effective for annual reporting periods beginning on or after January 1, 2022.The Group will apply these amendments to contracts for which it has not yet fulfilled all itsobligations at the beginning of the annual reporting period in which it first applies theamendments.
- 115 -
*SGVFS164641*
Annual Improvements to PFRSs 2018-2020 Cycle
Amendments to PFRS 1, First-time Adoption of Philippines Financial Reporting Standards,
Subsidiary as a first-time adopterThe amendment permits a subsidiary that elects to apply paragraph D16(a) of PFRS 1 tomeasure cumulative translation differences using the amounts reported by the parent, basedon the parent’s date of transition to PFRS. This amendment is also applied to an associate orjoint venture that elects to apply paragraph D16(a) of PFRS 1.
The amendment is effective for annual reporting periods beginning on or afterJanuary 1, 2022 with earlier adoption permitted.
Amendments to PFRS 9, Financial Instruments, Fees in the ’10 per cent’ test forderecognition of financial liabilities
The amendment clarifies the fees that an entity includes when assessing whether the terms ofa new or modified financial liability are substantially different from the terms of the originalfinancial liability. These fees include only those paid or received between the borrower andthe lender, including fees paid or received by either the borrower or lender on the other’sbehalf. An entity applies the amendment to financial liabilities that are modified orexchanged on or after the beginning of the annual reporting period in which the entity firstapplies the amendment.
The amendment is effective for annual reporting periods beginning on or afterJanuary 1, 2022 with earlier adoption permitted. The Group will apply the amendments tofinancial liabilities that are modified or exchanged on or after the beginning of the annualreporting period in which the entity first applies the amendment.
Amendments to PAS 41, Agriculture, Taxation in fair value measurements
The amendment removes the requirement in paragraph 22 of PAS 41 that entities excludecash flows for taxation when measuring the fair value of assets within the scope ofPAS 41.
An entity applies the amendment prospectively to fair value measurements on or after thebeginning of the first annual reporting period beginning on or after January 1, 2022 withearlier adoption permitted.
Effective beginning on or after January 1, 2023
Amendments to PAS 12, Deferred Tax related to Assets and Liabilities arising from a Single
Transaction
The amendments narrow the scope of the initial recognition exception under PAS 12, so that it nolonger applies to transactions that give rise to equal taxable and deductible temporary differences.
The amendments also clarify that where payments that settle a liability are deductible for taxpurposes, it is a matter of judgement (having considered the applicable tax law) whether suchdeductions are attributable for tax purposes to the liability recognized in the financial statements(and interest expense) or to the related asset component (and interest expense).

- 116 -
*SGVFS164641*
An entity applies the amendments to transactions that occur on or after the beginning of theearliest comparative period presented for annual reporting periods on or afterJanuary 1, 2023.
Amendments to PAS 8, Definition of Accounting Estimates
The amendments introduce a new definition of accounting estimates and clarify the distinctionbetween changes in accounting estimates and changes in accounting policies and the correction oferrors. Also, the amendments clarify that the effects on an accounting estimate of a change in aninput or a change in a measurement technique are changes in accounting estimates if they do notresult from the correction of prior period errors.
An entity applies the amendments to changes in accounting policies and changes in accountingestimates that occur on or after January 1, 2023 with earlier adoption permitted. The amendmentsare not expected to have a material impact on the Group.
Amendments to PAS 1 and PFRS Practice Statement 2, Disclosure of Accounting Policies
The amendments provide guidance and examples to help entities apply materiality judgements toaccounting policy disclosures. The amendments aim to help entities provide accounting policydisclosures that are more useful by:
o Replacing the requirement for entities to disclose their ‘significant’ accounting policies with arequirement to disclose their ‘material’ accounting policies, and
o Adding guidance on how entities apply the concept of materiality in making decisions aboutaccounting policy disclosures
The amendments to the Practice Statement provide non-mandatory guidance. Meanwhile, theamendments to PAS 1 are effective for annual periods beginning on or after January 1, 2023.Early application is permitted as long as this fact is disclosed. The amendments are not expectedto have a material impact on the Group.
Effective beginning on or after January 1, 2024
Amendments to PAS 1, Classification of Liabilities as Current or Non-currentThe amendments clarify paragraphs 69 to 76 of PAS 1, Presentation of Financial Statements, tospecify the requirements for classifying liabilities as current or non-current. The amendmentsclarify:
What is meant by a right to defer settlement;
That a right to defer must exist at the end of the reporting period;
That classification is unaffected by the likelihood that an entity will exercise its deferral right;and
That only if an embedded derivative in a convertible liability is itself an equity instrumentwould the terms of a liability not impact its classification.
The amendments are effective for annual reporting periods beginning on or after January 1, 2023and must be applied retrospectively. However, in November 2021, the International AccountingStandards Board (IASB) tentatively decided to defer the effective date to no earlier thanJanuary 1, 2024.

- 117 -
*SGVFS164641*
Effective beginning on or after January 1, 2025
PFRS 17, Insurance Contracts
PFRS 17 is a comprehensive new accounting standard for insurance contracts coveringrecognition and measurement, presentation and disclosure. Once effective, PFRS 17 will replacePFRS 4, Insurance Contracts. This new standard on insurance contracts applies to all types ofinsurance contracts (i.e., life, non-life, direct insurance and re-insurance), regardless of the type ofentities that issue them, as well as to certain guarantees and financial instruments withdiscretionary participation features. A few scope exceptions will apply.
The overall objective of PFRS 17 is to provide an accounting model for insurance contracts thatis more useful and consistent for insurers. In contrast to the requirements in PFRS 4, which arelargely based on grandfathering previous local accounting policies, PFRS 17 provides acomprehensive model for insurance contracts, covering all relevant accounting aspects. The coreof PFRS 17 is the general model, supplemented by:
A specific adaptation for contracts with direct participation features (the variable feeapproach)
A simplified approach (the premium allocation approach) mainly for short-duration contracts
On December 15, 2021, the FRSC amended the mandatory effective date of PFRS 17 fromJanuary 1, 2023 to January 1, 2025. This is consistent with Circular Letter No. 2020-62 issued bythe Insurance Commission which deferred the implementation of PFRS 17 by two (2) years afterits effective date as decided by the IASB.
PFRS 17 is effective for reporting periods beginning on or after January 1, 2025, with omparativefigures required. Early application is permitted.
37. Report on the Supplementary Information Required Under BSP Circular No. 1074
On February 7, 2020, the BSP issued Circular No. 1074 which amends certain provisions ofSection 174 of the Manual of Regulations for Banks relating to the audited financial statements. Italso required banks to disclose the following supplementary information in the financial statements:
Basic quantitative indicators of financial performance
The following basic ratios measure the financial performance of the Group and the Parent Company:
Consolidated Parent Company
2021 2020 2019 2021 2020 2019
Return on average equity(a/b) 11.78% 9.79% 10.68% 11.78% 9.79% 10.67%
a) Net income 1,573,064 1,168,912 1,157,257 1,573,064 1,168,912 1,157,257b) Average total equity 13,352,748 11,942,440 10,840,557 13,352,748 11,942,440 10,845,255
Return on average assets(a/c) 1.49% 1.15% 1.12% 1.49% 1.15% 1.13%
c ) Average total assets 105,229,769 101,985,361 103,244,912 105,237,325 101,992,873 102,307,438
Net interest margin (d/e) 4.83% 4.64% 3.85% 4.83% 4.64% 3.90%
d) Net interest income 4,244,780 3,925,494 3,205,033 4,244,780 3,925,494 3,205,033e) Average interest earning
assets 87,820,774 84,668,912 83,216,561 87,823,602 84,671,645 82,213,352

- 118 -
*SGVFS164641*
Description of Capital Instruments IssuedAs of December 31, 2021 and 2020, the Parent Company has outstanding capital stock shown below:
Shares Amount
2021 2020 2021 2020
Common - P=25 par value
Authorized 760,000 760,000
Issued and outstanding 480,645 480,645 P=12,016,129 P=12,016,129
Significant Credit Exposures as to Industry SectorThe information of the Group and Parent Company on the concentration of credit as to industrybefore taking into account the allowance for ECL follows:
2021 2020
Amount % Amount %
Wholesale and retail trade, repair ofmotor vehicles, motorcycles P=16,838,594 26.03 P=15,351,359 26.29
Real estate activities 14,509,091 22.43 12,648,584 21.66Manufacturing 14,427,907 22.31 12,478,425 21.37Electric, gas, steam and air-conditioning
supply 3,784,547 5.85 3,471,471 5.94Construction 3,373,605 5.22 3,699,796 6.34Accommodation and food service
activities 2,426,168 3.75 2,701,351 4.63Financial and insurance activities 2,144,958 3.32 1,998,754 3.42Transportation and storage 1,984,339 3.07 1,375,109 2.35Agriculture, forestry and fishing 1,360,235 2.10 1,420,167 2.43Other service activities 1,306,726 2.02 479,441 0.82Human health and social work activities 1,260,617 1.95 1,149,146 1.97Loans to individuals Primarily for
Personal Use purposes 554,014 0.86 933,090 1.60Mining and quarrying 167,562 0.26 132,348 0.23Activities of households as employers
and undifferentiated goods andservices-producing activities ofhouseholds for own use 161,709 0.25 183,280 0.31
Education 72,292 0.11 87,338 0.15Others 308,546 0.48 283,940 0.49
P=64,680,910 100.00 P=58,393,599 100.00
Breakdown of Total Loans as to SecurityThe information (gross of unearned discounts and capitalized interest) of the Group and ParentCompany relating to receivables from customers as to secured and unsecured and as to collateralfollows:
2021 2020
Amount % Amount %
Loans secured by:Real estate P=21,590,618 33.36 P=17,751,671 30.37Chattel 930,246 1.44 1,025,674 1.75Deposit hold-out 1,176,120 1.82 932,830 1.60Securities and others 4,873,531 7.53 4,844,451 8.29
Secured 28,570,515 44.15 24,554,626 42.01Unsecured loans 36,155,151 55.86 33,890,229 57.99
P=64,725,666 100.00 P=58,444,855 100.00

- 119 -
*SGVFS164641*
Breakdown of Total Loans as to StatusThe table below shows the status of the Group and the Parent Company’s loans (gross of unearneddiscounts and capitalized interest) as to performing and non-performing loans (NPL) per product lineas adjusted.
2021 2020
Performing NPL Total Performing NPL Total
Corporate loans P=57,730,355 P=2,547,391 P=60,277,746 P=50,036,262 P=2,728,009 P= 52,764,271
Consumer loansHome 3,077,456 559,207 3,636,663 3,947,017 526,532 4,473,549Auto 470,747 127,359 598,106 587,383 184,539 771,922
Personal 114,985 98,166 213,151 319,254 115,859 435,113
P=61,393,543 P=3,332,123 P=64,725,666 P=54,889,916 P=3,554,939 P=58,444,855
The Parent Company has also applied for the following reliefs with BSP for prudential reporting:
Temporary regulatory relief granted by the Bangko Sentral ng Pilipinas on the classification ofPast Due Loans and Non-Performing Loans, as indicated under BSP memorandums M-2020-008M-2020-032, and M-2020-087, due to the effects of the COVID-19 Pandemic on the loanportfolio of Banks. Subject to reporting to the BSP, eligible loans are those loans in affectedareas that should have been reclassified as past due, including those loans becoming past due ornonperforming six (6) months thereafter. The exclusion shall be allowed from March 8, 2020until December 31, 2020.
Lenders were allowed to renegotiate terms of existing loan agreements via restructuring,extension of maturities, and moratorium on payments/amortizations among others on a case-to-case basis depending on financial status, cash flow, and security position.
In accordance with BSP Circular No. 941, Amendments to the Regulations on Past Due and Non-
Performing Loans, loans, investments, receivables, or any financial asset shall be considered non-performing, even without any missed contractual payments, if it satisfies the following conditions:a. It is considered impaired under existing accounting standards;b. It is classified as doubtful or loss;c. It is under litigation; andd. There is evidence that full repayment of principal and interest is unlikely without foreclosure of
collateral, if any.
All other loans, even if not considered impaired, shall be considered non-performing if any principaland/or interest are unpaid for more than 90 days from contractual due date, or accrued interests formore than 90 days have been capitalized, refinanced, or delayed by agreement.
Non-performing loans, investments, receivables, or any financial asset (and/or any replacement loan)shall remain classified as such until:a. There is sufficient evidence to support that full collection of principal and interests is probable and
at least six consecutive payments of the required amortization of principal and/or interest arereceived; or
b. Written-off.
As of December 31, 2021 and 2020, based on the definition of NPLs under MORB Section X306.2,NPLs of P=3.33 billion for 2021 and P=3.55 billion for 2020, gross of specific allowance amounting toP=1.90 billion and P=1.78 billion, respectively. Gross and net NPL ratios (inclusive of RRP) of theGroup are 4.89% and 2.10% for 2021, respectively, and 5.71% and 2.86% for 2020, respectively.

- 120 -
*SGVFS164641*
Information on Related Party LoansAs required by the BSP, the Parent Company discloses loan transactions with its associates, affiliatesand with certain directors, officers, stockholders and related interests (DOSRI). Existing bankingregulations limit the amount of individual loans to DOSRI, 70.00% of which must be secured, to thetotal of their respective deposits and book value of their respective investments in the ParentCompany. In the aggregate, loans to DOSRI generally should not exceed total equity or 15.00% oftotal loan portfolio, whichever is lower.
BSP Circular No. 423 dated March 15, 2004 amended the definition of DOSRI accounts. Thefollowing table shows information relating to the loans, other credit accommodations and guaranteesclassified as DOSRI accounts under regulations existing prior to BSP Circular No. 423, and newDOSRI loans, other credit accommodations and guarantees granted under said Circular:
DOSRI Related Party
2021 2020 2021 2020
Total outstanding DOSRI/Related Partyloans P=1,782 P=2,492 P=71,415 P=95,124
Percent of DOSRI/Related Party loans tototal loans 0.00% 0.00% 0.10% 0.15%
Percent of unsecured DOSRI/RelatedParty loans to total DOSRI/RelatedParty loans 45.91% 56.18% 98.65% 88.87%
Percent of past due DOSRI/Related Partyloans to total DOSRI/Related Partyloans 0.00% 0.00% 0.00% 0.00%
Percent of nonperforming DOSRI/RelatedParty loans to total DOSRI/RelatedParty loans 0.00% 0.00% 0.00% 0.00%
The amounts of loans and receivables disclosed for related parties above differ with the amountsdisclosed for key management personnel since the composition of DOSRI is more expansive than thatof key management personnel.
BSP Circular No. 560 provides that the total outstanding loans, other credit accommodation andguarantees to each of the bank’s/quasi−bank’s subsidiaries and affiliates shall not exceed 10.00% ofthe net worth of the lending bank/quasi−bank, provided that the unsecured portion of which shall notexceed 5.00% of such net worth. Further, the total outstanding loans, credit accommodations andguarantees to all subsidiaries and affiliates shall not exceed 20.00% of the net worth of the lendingbank/quasi−bank; and the subsidiaries and affiliates of the lending bank/quasi−bank are not related interest of any director, officer and/or stockholder of the lending institution, except where such director,officer or stockholder sits in the BOD or is appointed officer of such corporation as representative ofthe bank/quasi−bank. As of December 31, 2021 and 2020, the Parent Company is in compliance withthese requirements.
Any violation of the provisions of BSP Circular No. 423 is subject to regulatory sanctions. However,loans, other credit accommodations and guarantees, as well as availments of previously approvedloans and committed credit lines that are not considered DOSRI (non-DOSRI) accounts prior to theissuance of BSP Circular No. 423 are not covered by such sanctions for a transition period oftwo years from the effectivity of this Circular or until said loan, other credit accommodations andguarantees become past due, or are extended, renewed or restructured, whichever comes later.

- 121 -
*SGVFS164641*
On May 12, 2009, BSP issued Circular No. 654 allowing a separate individual limit of twenty−five(25.00%) of the net worth of the lending bank/quasi−bank to loans of banks/quasi−banks to theirsubsidiaries and affiliates engaged in energy and power generation.
Aggregate Amount of Secured Liabilities and Assets Pledged as SecurityAs of December 31, 2021, ‘Bills payable’ amounting to P=5.91 billion, are secured by a pledge ofcertain ‘Financial assets at FVOCI’ amounting to P=163.27 million, and ‘Investment securities atamortized cost’ amounting to P=5.86 billion.
As of December 31, 2020, no bills payable are secured by pledge on financial assets of the ParentCompany .
Commitments and contingencies
The following is a summary of contingencies and commitments of the Group and the ParentCompany with the equivalent peso contractual amounts:
2021 2020
Trust department accounts P=8,631,952 P=7,973,683Standby LC 825,173 1,112,021Spot exchange:
Bought 101,998 1,300,002Sold 362,093 1,460,869
Usance LC outstanding 135,023 84,331Outstanding shipping guarantees 396,019 403,601Sight LC outstanding 890,428 792,459Outward bills for collection 13,293 32,053Currency forwards:
Bought 1,987 3,811Sold 162,464 337,400
Inward bills for collection 106,075 13,108Items held for safekeeping 19 25Items held as collateral 7 7Other contingencies 14,241 12,700
38. Supplementary Information Under Revenue Regulations No. 15-2010
In compliance with the requirements set forth by RR No. 15-2010 hereunder are the details ofpercentage and other taxes paid or accrued by the Parent Company in 2021:
GRT P=259,189DST 169,361Local taxes 30,718Fringe benefit taxes 3,654Others 14,520
P=477,442

- 122 -
*SGVFS164641*
Withholding TaxesDetails of total remittances in 2021 and outstanding balance of withholding taxes as ofDecember 31, 2021 follow:
TotalRemittances
Balance as ofDecember 31
Final withholding taxes P=68,840 P=10,119Withholding taxes on compensation and benefits 121,522 8,038Expanded withholding taxes 28,924 2,072
P=219,286 P=20,229
Tax Assessments and CasesAs of December 31, 2021, the Parent Company has outstanding cases filed in courts for variousclaims for tax refund amounting to P=5.53 million. The case is still pending in Supreme Court for finaldecision.