World Bank Commodity Models Volume 1
573
World Bank Commodity Models Volume 1 Public Disclosure Authorized Public Disclosure Authorized Public Disclosure Authorized Public Disclosure Authorized Public Disclosure Authorized Public Disclosure Authorized Public Disclosure Authorized Public Disclosure Authorized
-
Upload
khangminh22 -
Category
Documents
-
view
1 -
download
0
Transcript of World Bank Commodity Models Volume 1

World Bank Commodity ModelsVolume 1
Pub
lic D
iscl
osur
e A
utho
rized
Pub
lic D
iscl
osur
e A
utho
rized
Pub
lic D
iscl
osur
e A
utho
rized
Pub
lic D
iscl
osur
e A
utho
rized
Pub
lic D
iscl
osur
e A
utho
rized
Pub
lic D
iscl
osur
e A
utho
rized
Pub
lic D
iscl
osur
e A
utho
rized
Pub
lic D
iscl
osur
e A
utho
rized

Papers presented at the Vkbddq on C d i Modek and Pdides
- a
cjpyright O 1981 . The Wmld Bank 181 8 H Street. N.W. Washington. n.C. 20433, USA.
The views and interpretations in this document are those of thr! authors and should not be attributed to the World Bank, to its affiliated organizations. or to any individual acting in their behalf.

The r e r e a r c h m r k presented i n t h e r e t w , volumem goem back r r v e r a l years i n t i r e . 'Ihe s t a f f of t h e Div i r ion h a r incur red n u a t o u r debtm of g r a t i t u d e i n tirlm period. Nr. l h u t e r T i m , former D i r e c t o r of t h e Rconoaic k r a l y s l r and Projectionm Department, gave thim w r k t h e o r i g i n a l i apu l re . Mrs. Helen Hugher, uho rucceeded a s D i r e c t o r , encouraged i t and r t e e r e d i t through i ts var iour phaser. Prof. J. U e l b r o e c k (Free Univers i ty of 6 r u x e l l e r ) , Prof. C. Mpe (Univers i ty of Pennrylvania) and Prof. K. b u r s e n ( U n i v e r s i t y of k r h u s ) f o l l o v d i t c l o r e l y and c o n t r i b u t e d t o t h i s w r k i n v a r i o u s uoys.
The p a r t i c i p a n t s of t h e lh rkshop on Comodi ty Models and P o l i c i e s , h e l d i n Aarhus, Denmark, i n December 1979 deserve a s p e c i a l mention f o r t h e i r r e v i e v s and c o n s t r u c t i v e c r i t i c i s m of t h e models a s doer t h e Danish Research Council f o r the S o c i a l Sciences, rrhich shouldered p a r t of t h e c o s t s of t h e Aarhus Workshop. A l l t hese c o n t r l b u t l o n r a r c g r a t e f u l l y acknovledged.
F i n a l l y , a p a r t i c u l a r thank you is due t o Lenore Beacham, Debbie Kreamer, and Barbara Thoapsoa who typed t h e va r ious d r a f t s of t h i s r epor t and t o Vhitney V a t r i s s rrho e d i t e d t h e va r ious papers.

While t h e r e l a t i v e i s p o r t n n c e o f l r i ~ r y c o m o d i t i e s i n m r l d t r a d e h a s b e e n d e c l i n i n g o v e r t h o yearm, c o t m o d i t y e x p r t s c o n t i n u e t o be a t m j o r s o u r c e o f f o r e i g n e x c h n n p e f o r m n y . !eveloping c o u n t t ies. For t h e r e c o u n t r i e n t h e v o l a t i l i t y o f c o m o d i t y l r a r k e t n a n d t h e c o n a c q u c n t r r n c e r t a i n t i e s a b o u t e x p o r t e a r n i n g @ a n d r e t u r n s t o invcmrtacnts r t i l l c a n n t i t u t e r n c o r r s i d e r n b l c problem.
A t t e m p t s to e x p l a i n t h e b e h n v i o r o f commodity m a r k e t s u s i n g q u n n t i t n t i v e t a c h n i q u e s r e n c h b a c k to t h e b e g i n n i n g o f t h i s c e n t u r y . The r e f i n e m e n t o f t h e s e t e c h n i q u e r h a s c o c t i n u e d e v e r n i n c e . An i m p r e s n l v e amount o f q u a n : i t r r t i v e e n * i d e n c e h a s been g a t h e r e d o v e r time o n v . ~ r i o u s a s p e c t n o f c-dity m a r k e t s . Ye t , t h e deve lopment o f c c o n o m t r i c m o d e l s o f commodity m r k e t s h a s b e e n a r e l ~ t l v e l y r e c e n t phenomenon, u h i c h f o l l o r d , r a t h e r t h a n p r e c c c d e d , t h e d e v e l o p a e n t o f m c r o e c o n o m i c m o d e l s .
I t u a s n o t u n t i l t h e 1960s t h a t e c o n o m e t r i c c o m o d i t y a o d e l i n g begnn i n e a r n e s t . The %rid Bank h a s b e e n somewhat i n t h e f o r e f r c n t o f t h e s e enr1.y d e v e l o p e n t s , w i t h i t s c o c o a nnd r u b b e r m o d e l s c o m p l e t e d i n t h e l a t e 1960s - I n c o n n e c t i o n d t h t h e c o m d i t y s t a b i l i z a t i o n s t u d i e s u n d e r t a k e n t o ~ e t h e r w i t h t h e I n t e r n a t i o n a l S o n e t n r y Fund. Co-dity r e l a t e d w r k had by t h e n gone o n (n t h e Bank f o r s e v e r a l y e a r s nnd h n s s i n c e c o n t i n u e d . P r o j e c t e v a l u a t i o n a c d b i l a n c e o f p a y m e n t s n m l y s i s o f d e v e l o p i n g c o u n t r i e s r e q u i r e d r o n t i n u o u ~ a n d s y s t e a a t i c s t u d y o f c o a n o d i t y m a r k e t s a n d v i e w s o n commodity p r i c e d e v e l o p a e n t s . The Coamodit ies and E x p o r t P r o j e c t i o n s D i v i s i o n h a s , o v e r t h e y e a r s , p e r f o m d mst o f t h e s e f u n c t i o n s .
I n 1973 t h e D i v i s i o n embarked o n a m a j o r e f f o r t t o c o n s t r l l c t c o m p l e t e m o d e l s f o r s e v e r a l o f t h e corwnodi t ieu o f s p e c i a l i n t e r e s t to t h e Bank. T h i n w r k is s t i l l continuing.
T h e u a l n p u r p o s e o f t h e s e m o d e l s v a s t o p r o v i d e i n p u t s to t h e p r i c e p r o j e c t i o n w r k o f the D i v i s i o n , e v e n i f some v e r s i o n s o f t h e m o d e l s t h a t were
:developed e r e u s e d a s c o a p o n e n t s o f l a r n e r m o d e l s o f d e v e l o p i n g c o u n t r i e s ' , ~ r o u t h a n d t r a d e s u c h a s t h e SIXLINK model. 1 - - D e v e l o p e d by t h e s t a f f o f t h e b i v i s i o n a s o p e r a t i o n a l t o o l s , i h c s e w d e l s h a d t o c o n f o r m t o some ' b a s i c * c r i t e r i a : t h e y -re t o be r e l a t Q v c l y %na11 i n s i z e , e a s i l y and c h e a p l y m a n a g e a b l e , u p d a t a b l e and m a i n t a i n ' h b l e , g i v e n t h e r e s o u r c e c o n s t r a i n t s o f t h e D i v i s i o n . For t h e s e r e a s o n s , t h e mode l s b u i l t =re l a r g e l y e c o n o m e t r i c t n n a t u r e , t h e y were e s t i m a t e d u s i n g r e l a t i v e l y s i m p l e p r o c e d u r e s - u s u a l 1y OLS--and bir i 1t a r o u n d a common s t r u c t u r e - - t y p i c a l l y a s r rpp lv b l o c k , a demand b l o c k and a n i n v e n t o r y demand c q r i a t f o n n o r m a l i u ? d o n p r t c e .
T h e s e t h e o r e t i c a l a n d e m p i r i c a l s i m p 1 i f i c a t i o n s r e p r e s e n t t h e c o s t , o f t e n r e l r i c t a n t l y p a t d by t h e v a r i o u s a u t h o r s , o f b u i l d i n g and r n ; ~ i n t n i r ~ i n g i n a r e l a t i v e l y r r m i l l l and o p e r a t i o n a l l y o r i e n t e d r e s e a r c h o u t f i t a l a r g e numher o f s t r u c t u r a l m o d e l s o f c o m o d i t y m r k e t s .

Xlttt *.he except lo^., ~ 1 1 e l r [ o r e , 0: L I ~ L - i I S E and, pertraps, the j u t e ~ o d e l r , none o t t h e o t h e r s p r e r e n t e d i n t h i r paper approacher t h e f r o n t i e r 8 of academic knowledge on econometric model b u i l d i n g . Yet , t h e knouledge and c r a f t m a n ~ h i p of t h e v a r i o u r authorr--who a l l have c o n r i d e r a b l e colmodity expert ise-show up c l e a r l y a t v a r i o u r point*. Examples of t h e improvementr on t h e " r t a t e o f t h e a r t r " i n econometric c o a a o d i t y modelr can be found i n t h e r y n t h e t i c p r i c e index of t h e f a t 8 and o i l 8 model, t h e market oha re e q u a t i o n r o f t h e rubber model and t h e p r i c e / c o r t r e l a t i o n r h i p r o f t h e rupp ly equa t ion r of t h e t i n model.
Given t h e main purpore of t h e r e modelr--market p r i c e r i a r l a t i o n r and projectionr--and t h e conrequent r t r u c t u r a l c h a r a c t e r i r t i c r o f moat of them, t h e i r u r e f u l n e r s a 8 i n r t n r a e n t r f o r p o l i c y r i m u l a t i o n r ha8 been r awwha t l imi t ed . T h i r i r a l i m i t a t i o n t h a t rrc hope t o overcome a8 w r k on t h e "next genera t ion" o f modelr proceedr. A. p o l i c y a n a l y s i s w i l l p l ay a n i n c r e a s i n ~ r o l e i n t h e f u t u r e w,rk o f t h e D i v i r i o n , i ts modeling e f f o r t 8 m y have t o be r c o r l e n t e d acco rd ing ly .
We e n v i r a g e t h e deve lop len t of a few more programming type models f o r meta l r r r k e t r , t h e c o n r t r u c t i o n of t r a d e b l o c k s i n t h e e x l r t i n g econometric- models and t h e l i n k i n g o f some of t h e s i n g l e models now being developed o r r e t o o l e d (e.g. foodgrainr-feedgrainr-livestock, and t eve rages ) .
The modelr s o f a r developed by t h e C o ~ o d i t i e r and Export P r o j e c t i o n s Div i s ion a r e h e r e p re sen ted i n tw , v o l m e r . The f i r s t volume c o n t s i n s t hose t h a t -re f o r s s l l y d i s c u s s e d a t t h e Aarhus Workshop on C o m o d i t y Hodels and P o l i c i e s . The second i n c l u d e s models t h a t = r e subsequen t ly developed o r reshaped. T h e i r main purpose i s t o assemble i n a " s i n g l e place" most of t h e c o m d i t y models developed i n t h e Bank i n r e c e n t y e a r s and g i v e the r e a d e r s and u s e r s a f a i r l y complete r e f e r e n c e ins t rument .
I n c l o s i n g t h i s p r e f a c e , I w u l d l i k e t o thank a l l my former c o l l e a g u e s i n t h e Commodities and Export P r o j e c s i o n s Div i s ion who carved o u t t h i s e f f o r t o v e r t h e y e a r s wi th competence, en thus iasm and de t e rmina t ion , wi thout n e g l e c t i n g any of t h e o t h e r t a s k s normal ly performed by them. I t vas a p l e a s u r e and p r i v i l e g e t o s h a r e v i t h them t h i s g r e a t l e a r n i n g exper ience . -

Table of Contents
W D E L I N C THE WORLD COtQK)DIN MRKETS: P E R S P E C N V E S ON THE USE O F C-DITY M E T MODELS FOR FORECASTING AND SIWtATlON.. . . . . . . . . . . . . . . . 1 P. Gerard A k
ON THE EVALUATION OF ECONOMIC POReCfiTS..............*.....w..... 27 Svend Hyllsbety
THE UORLD T I N ECONCXY: AN ECONOnerRIC ANALYSIS...................... I- 1 Jaebir Chhabra, kao CriZli, Peter PoZtcrk
C M N T S ON THE U I S E HoDEL DEVELOPED BY H. HASHI~O.......e....e.... I I A - 1 Robert van der Sands
COMMENTS (33 THZ V I S E HODEL DEVELOPED BY H. HASHIHOTO.........e....... IIB-1 Ebbe Yndgaad
AN ECONOMETRIC W D E L OF THE WORLD RUBBER ECONOIff.. ................... I1 1-1 Er,,so Gr i l l i , Rag Rslterline) Peter PoZtak ,
A DYNAXIC S I W L A T L O N XODEL O F THE W R L D JUTE ECONOWY................. IV-1 .Jock Anderson, C k r t e s Blitzer, Tom Cachois, k z o Gri l l i - - THE W R L D TEA ECONOW: AN ECONOMETRIC HODEL O F I T S J * STRUCTURE, PERFOPdWYCE AND PROSPECTS....e..e....e........ee...,...o... V- 1 Soeng-I! Chrolg, Gd. . . 2 2 V F ~ o n g 3
- * I
STRUCLIJRE h~ PROSPECTS O F THE W R L D FATS AND O I L S ECONOMY ........... VI-1 S u m Arcgz~s~o, Peter PoZtak
ENERGY D E W ! IN THE DEVELOPING WORLD: ESTIHATIONS AND PROJECTIONS TO 1990 BY REGION AND C O U m R Y . . . . . . . . . . . . . . . . . . . . . . . . . . . . V I I - 1 Lutz Zo.ffp:ma, Katthias Kors
L i s t of . a r t i c i p a n t s . . . . . . . . . . . . . . . . . . . . . . . . . . . . . . . . . . . . . . . . . . . . ANNEX

)IM)ELINC OF M E WRU) COWODIfl MARKETS: PeaSPeCfms ON use OF c m x m WARI;E~ HUDELS
FOR FOBECASruo(; AND SantUTION

MIDELI= THE WRLD COMDITY W E T S : PERSPECTIVES ON THE USE OF CO!4HODITv NARKET HoDELS
FOR FORECASTING AND SIMULATION
1 . The c x t e n s i o a o f e c o n o a e t r i c modeling to t h e i n t e r m t i o n a l primary c o a w d l t y marke t s has come a t a time when t h e r e is i n c r e a s i n g need f o r a f o r e c a s t i n g and s i u l a t i o n tool. Qua t i t a t i v e , f r e q u e n t l y econometr ic , a n a l y s i s of t h e behavior of c o d i t y markets is a n e s s e n t i a l ingredient i n f o r n u l a t l n g t h e c o r o d i t y s t a b i l i z a t i o n agreements which w i l l be a c o r n e r s t o n e i n nor th-south r e l a t i o n s . Hodels a r e -w be ing used to e v a l u a t e t h e p e r f o r m n c e and cost of va r ious s t a b i l i z a t i o n schemes. They a l s o s e r v e t o
I a p p r a i s e t h e impact of f l u c t u a t i o n s i n t h e primary c o m o d l t y markets on t h e economlee of producing and c o n s d n g count t ies , t o f o r e c a s t long-run demand and supply f o r b a s i c c o r r o d l t l e a , t o estimate t h e e a r n i n g p o t e n t i a l s of deve lop ing c o u n t r i e s , t o measure t h e impact of e x p l o i t i n g t h e manganese
I nodu les on t h e ocean f l o o r , e t c .
2. The a o d e l s used f o r t h e s e purposes m e t t a k e i n t o account t h e d i v e r s i t y of t h e c o m o d i t y markets and t h e s p e c i f i c n a t u r e of t h e problems be ing cons idered . Despi te t h i s need f o r f l e x i b i l i t y , t h e e c o n o c ~ e t r l c models o t c o m d i t y markets have tended t o conform t o c e r t a i n p a t t e r n s . Methods of a p p i y i n g t h e models i n a realistic w a y - o o e t h a t t a k e s advantage of t h e structure and c o n s i s t e n c y of t h e w d e l , w i thou t i g n o r i n g t h e r e a l i t i e e of t h e world-have a l s o been developed. Thus t h e r e have been s u b s t a n t i a l advances i n a p p l y i n g economet r i c s t o t h e f i e l d of commodity marke t s , but c l e a r l y t h e r e a r e
I ~ t i l i shortcomings. The f r o n t i e r f o r f u r t h e r deve lopaen t l a broad and a s y e t unexplored.
3. T h i s pape r ' f i r s t c o n s i d e r s t h e "t ypica ' l" a p p l i e d econometric models. It t h e n d i s c u s s e s hov such models a r e used f o r f o r e c a s t f n g itnd s imula t ion . F i n a l l y , it p o i n t s o u t t h e p r i n c i p a l problems.
I - - ME BASIC '~(ARKET NODEL" PATTERN '!
4. , Econometric models of commodity markets have g r e a t promise even - t h o ' h , w i th some g l a r i n b excep t ions , they a r e relative..^ simple. T h i s i s i n 9 8 p a r ,because few economiets a p p r e c i a t e t h e technics.'. and commercial r e a l i t i e s . o f t h e worldwide markets f o r b a s i c commodities--the d i f f e r e n c e s i n q u a l i t y , t h e t e c h n i c a l a s p e c t s of product ion , t h e systems of commercia l iza t ion , t h e
I t r a n s p o r t a t t on and p rocess ing complexes, t h e s u b s t.1 t ~ l t i o n of s y n t h e t i c 1 mate r i a l , p r i c e mechanisms, e t c . I n t u r n , b u s i n e s s s p e c i a l i s t s o f t e n do no t
a p p r e c i ~ t e t h e unde r ly ing economic behavior and t h e a b i l i t y of s t r u c t u r a l models, even i f s imp le , t o provide u s e f u l i n s i g h t s i n t o market o p e r a t i o n s .

5. A g r a d a t i o n of comaodity market nwjdels can be v i s u a l i t e d an scring from t h e s i n p l e s t , h igh ly aggregated mods1 t o i n c r e a s i n g l y complex ryrL9lar. Useful models range from t h e two-equation "mini" models, which e u w m r i t e chc i n t e ~ ~ c t i o n o f v o r l d rupply and demand, t o s o r e complex econometric modela of some one o r two hundred equat ions on up t o t h e p r o g r a a d n g modela which incorpora te thousandr of r e l a t i o n r h i p r .
6 . The focua here in on what can be c a l l e d "market w d e l a , " aa d1rt:nct from "proaramming modela." L/ This d i s t i n c t i o n 1s bared not on ly on :t.e s t r u c t u r e and focur of the m d a l , bur a l r o on i t r purpore and a p p l l c ~ ~ b i l l t y . A marker model is concerned with t h e 6 " c m i n a t i o n of p r icea and wltlr t h e behavior of t h e p a r t i c i p a n t s i n the ma r:. It focure r on the r e c o n c i l i a t i o n of demand and rupply. Prograwahg moder., which g e n e r a l l y draw on highly d e t a i l e d eng ineer ing da ta , focur p r l a u r i l y on o p t l a i t a t i o n with r e r p e c t :o the vo luma c o n r u w d and produced, the l o c a t i o n of product ion and c o n r u q t i o n , o r t h e technologier used. I n a market model, theae q u e r t i o n r a r e i n c i d e n t a l t o t h e o v e r a l l d e r c r i p t i o n of the opera t ion of t h e market.
7. The d i r c u a r i o n here is a l r o l a l t e d t o econometric market models, p r i n c i p a l l y because t h i n type of ayrtem i s moat comonly used f o r f o r e c a r t i n g and s imula t ion of the e f f e c t a of policies.
Simple Hodel Under Competitive Contiitions
R . An example of a simple aa rke t model under competi t ive cond i t ions l a the f r w w o r k of t h e s e r i e s of models constructed by Mama and B t h m n (1976) f o r cocoa, c o f f e e , sugar , wheat and o t h e r food mate r ia l s . There modela were d e l i b e r a t e l y designed t o be slmple s o t h a t they could be i n t e g r a t e d i n t o the COHLIhX world model system (Ada?, 1979b). Never theless , they con ta in the under lying framework of t h e t y p i c a l comaodity model t h a t assumes competi t ive condi t ions .
9. The b a s i c approach on t h e supply s i d e is t o hypothesize p r o f i t maximization under cond i t ions of competi t ion, s u b j e c t t o an assumed production
.function, product and f a c t o r p r i c e s and, i n t h e cape of a g r i c u l t u r a l c o ~ m o d i t i e s , weather condi t ions . These assumptions can be t r a n s l a t e d i n t o a supply func t ion i n terms of the comnodity's own p r i c e , c o s t s of producticn, technology, v e a t 5 e r , e t c . - - where S, = production of commqdity j
s P, = market p r ice of comodi ty j
P,, = c o s t of v a r i a b l e inputs
1/ For a d i s c u s s i o n of the d i f f e r e n t types of models, see AJaas (1973) and - Labys (1978a. 1978b).

Pf - o p p o r t u n i t y c o s t of i n p u t s of f i x e d f a c t o r s
T - tior t r e n d , sometimes r e p r e s e n t i n g tccbnology
U - weather c o n d i t i o n s a f f e c t i n g y i e l d
10. Tuo f a c t o r s need t o be noted. Compet i t ive c o n d i t i o n s may no t app ly s t r i c t l y , a s p roduce r s of mnny a g r i c u l t u r a l p r o d u c t s have l i t t l e v o i c e i n t h e d e t e r m t n a t i o n o f p r i c e , a t l e a s t a t t h e n l c r o l e v e l , and a r e responding t o t h e i r e x p e c t a t i o n s of u r k e t " p r i ce . Sccond, t h e response of supply m y have a long l a g , g i v e n t h e r o l e of e x p e c t a t i o n r , a s well a s t h e f requency of b i o l o g i z a l and t e c h n i c a l de l ays . In t h e c a r e of c o f f e e , f o r example, i t may t a k e f o u r t o s even y e a r s be fo re n u p l a n t i n g # produce , and t h e r e may be l i t t l e o r no s h o r t - t e n f l e x i b i l i t y .
11. On t h e dermnd s i d e , l t is a s s t n e d , a s is customary, t h a t u t i l i t y meximira t ion on t h e p a r t o f consumers w i l l de t e rmine t h e f i n a l demand f o r a commodity. ffouever, i n most i l r s tances , t h e p r i a a r y comnodity is no t c o n a ~ e d d l r e c t l y , b u t r e q u i r e s i n t e r a c d i n t c p rocess ing o r m y o n l y r e p r e s e n t a smal l p a r t of t h e c o a t of a f i n a l p rod tc t . The d.-mand f u n c t i o n f o r primary coamodi t ies may t h u s i n c l u d e e l emen t s of f i n a l demand o r of i n t e m e d i a t e deatand, producing a f u n c t i o n
where Dj - cor.supption of c o c ~ m d i t y j
P, - p r i c e of comaodity j
P + ~ - p r i c e s of com?eting coaoodi t ies
T - a tioe t r end f o r t a s t e o r t e c h n o l o g i c a l chances
Again, i t is necessa ry t o a l l o v L f o r l a g s which may r e f l e c t t h e g radua l a d a p t a t i o n o f t h e c o n s m e r o r t h e t ime r e q u i r e d to develop s u b s t i t u t e s .
12. For most coomodi t ies , a model c o n s i s t i n g o n l y of equat ion? (1 ) and ( 2 ) vould be t o o s imple , s i n c e i n v e n t o r i e s a b s o r b d i s c r e p a n c i e s b e p e e n product ion and c o n s m p t i o n and p r ; r i d e a n impor tant l i n k i n t h e methanism t h a t de t e rmines p r t c e s . T y p i c a l l y , i nven to ry supply 1s determined by t h e i d e n t i t y
where I = a v a i l a b l e i n v e n t o r i e s
S j = product ion of c o m o d i t y j
Dj = consunpt ion of connodi ty j

hs i s noted belov, although t h i s i d e n t i t y d e f i n e s t h e i n v e n t o r i e s , the f a i l u r e o f computed i n v e n t o r i e s t o correspond t o a c t u a l d a t a is a f requent problem.
13. The l a s t func t ion of t h e system is t h e p r i c e e q u a t i o c usua l ly
This equat ion r e a l l y represen t s a demand f o r inven tor iee equation. Renormalized, i t bccomes:
In t h i s form, i t is a demand f o r inven tor ies equat ion, v i t h t h e des i red i n v e n t o r i e r a func t ion of conrumption ( a s o r t of t r a n s a c t i o n requirement f o r inven tor ies ) and a func t ion of pr ice .
14, The p r i c e term r e q u i r c r exp lamt ion . The demand f o r inven tor ies f o r s p e c u l a t i v e purposes i n v o l i e s a procorr of maximizing the expected p r o f i t by holding inventor ies . Invctntorier a r o accumulated u n t i l , a t t h e margin, the d i f f e r e n c e betveerr t h e cxpected p r i c e md t h e a c t u a l p r i c e e q u a l s the c o s t of holding t h e a d d i t i o n a l inventory. Tho func t ion could bo def ined a s
vhere P' - expected p r i c e
C - a mcasure of t h e ca r ry in& c o a t , inc lud ing a component f o r r i s k
IS. Since t h e r e is no i n f o r u t i o n on pa, i t i n customary to introduce a c t u a l p r i c e s a s a proxy f o r t h e p r i c e t e n . The i m p l i c i t a s s m p t i o n is t h a t of r e g r e r s i v e expectations-if tho p r i c e is unusually high, i t is expected t o f a l l ; s i n i l a r l y , i f i t is low, i t is l i k e l y to r i s e . Thur t h e r e l a t i o n between i n v e n t o r i e s and p r i c e i r genera l ly expected t o be negative.
Hodels Under C a r t e l Condit ions
16. The e s s e n t i a l d i f f e r e n c e between c o r p e t i t i v e models and those under c a r t e l (monopoly o r o l igopoly) cond i t ions is t h a t , under competi t ion, producers o r consuaers maximize t h e i r p r o f i t s wi thout recognizing t h a t t h e i r a c t i o n s may a f f e c t pr ices . I n t h e monopolist ic case , market p a r t i c i p a n t s recognize t h a t t h e i r s a l e s a f f e c t p r i c e and, moreover, t h a t they do s o i n a dynamic s e n s e , i.e., a c t i o n s today w i l l a f f e c t the r e s u l t not only today, but
, a l s o i n t h e fu tu re , The s e p l e models of petroleum, bauxi te and copper by. Pindyck (1978) i l l u s t r a t e a type of mnopoly model vhich nay be app l icab le t 3
a number of primary commodity markets. The -in 4i;:inction between the monopoly model and t h e compet i t ive market model is t h e introduction of a ao.iopoly producer and the not ion of a l i m i t pr ice . To incorpora te these f a c t o r s i n t h e monopoly model, supply is divided i n t o tuo components, one o r i g i n a t i n g i n t h e c a r t e l (S,), the o t h e r o r i g i n a t i n g ou t s ide (Snc). - 17. With respect t o t h e non-cartel component, a tra*cional supply func t ion such a s t h a t i n equat ion (2 ) may apply. However, i t i s impartant t c

r e c o g n i z e t h a t t h e s o u r c e s o f s u p p l y o u t s i d e t h e c a r t e l a r e l i k e l y t o p r o v i d e a l t o g e t h e r d i f f e r e n t r a v u a t e r i a l s - - c l a y as a s o u r c e o f a l u n i n l n rii:,ler t h a n b a u x i t e - - o r p e r h a ~ s s y n t h e t i c s u b s t i t u t e s . The s u p p l y f rom t h e s e s o u r c e s m y b e z e r o s o l o n g a s t h e p r o d u c t ? o n c o s t s c a n n o t be net. Once p r i c e 2xceeds c o s t , however , t h e s u p p l y may be v e r y l a r g e . The p r o d u c t i o n c o s t f rom Ion- c a r t e l s o u r c e s b e c o w s t h e l i m i t p r i c e beyond v h i c h t h e c a r t e l p e i c e c a n n o t r ise.
18. Demand f o r t h e c a r t e l s u p p l y is d e f i n e d a s t h e d i f f e r e n c e hetween demand a n d s u p p l y f r , I n o n - c a r t e l s o u r c e s
P r i c e a n d s u p p l y a r e d e t e r . ~ i n e d s i u u l t a n e o u s l y by t h e c a r t e l , a s s u n i n g t h a t i t c h o o s e s a p r i c e t r a j e c t o r y b*Ier time s o a s t o maximize t h e discoun:ed p r e s e n t v a l u e o f t h c f u t u r e n e t r e v t n u e e t ream. Qua t !on (6) i e t h e o b j e c t i v e f u n c t l ~ n of c a r t e l p roducerq
n
where U - p r e s e n t v a l u e o f t h e n e t f o t u r e r e v e n u e e t r e n m
r - t h e d i s c o i ~ n t rate nsairncd
C - t h e p r o d u c t i o n c o s t
Thc s y s t e a c a n be f u r t h e r r e f i n e d by r e c o g n i z i n g t h a t , f o r a n e x h a u s t i 5 l e r e s o u r c e , c o s t s i n c r e n s e as t h e r e s o u r c e b a s e is u s e d up.
19. Such a framework has c o n s i d e r a b l e p o t e n t i a l f o r t a k i : ~ i n t o a c c o u n t t h e changed c h a r a c t e r o f r e l a t i o n s be tween p r o d u c e r a n d c n n s u a e r c , o u t , t r i e s which \as been a p p a r e n t i n r e c e n t y e a r s .
E l a b o r a t i o n o f Coruaoditv Xnrket M d e l s
20. The s i m p l e c o n p e - i t i v e a n d c a r t e l models a r e o n l y t h e f i r s t s t e p i n t h e d e v e l o p a e n t o f more comprehens ive a n d r ea l i s t i c r c p r e s e q t a t i o n s o f the w o r l d cocmodi t y m a r k e t s . C o n s i d e r a b l y n o r e d e t a i l e d are t h e a p p l l e d m o d e l s , which : n v ~ l v e d i s a g g r e g a t i o n . D i s a g g r e g a t i o n s e r v z s n o t o n l y t o g i v e - b e t t e r r e p r e s e n t a t i o n o f m a r k e t b e h a v i o r , b a t a l s o p e r t l i t s m a r k e t deve lopments t o be b e t t e r r e c o g n i z e d .
21. n n t h e d e r n n d ' s i d e , i t is cus tomqry t o b r e a k dermnd down by consuming r e g i o n a n d t y p e o f consumer. Such d i s a g ~ r e g a t i o n is p a r t i c u l a r l y i n p a r t a n t i f d i f f e r 2 n c e s a r e e x p e c t e d i n t h e b e h a v f q r a l r e s p o n s e s , t e c h n o l o g i e s and t a s t e s , a n d f o r e i g n e x c h a n g e c o n s t r a i n t s o f - h e d i f f e r e n t r e g i o n s . - ; 3 6 L . '! On t h e s u p p l y s i d e , breakdowns hy c o u n t r y o r r e g i o n are u s e f u l , par- t i c u l a r _ l y t o r e f l e c t d i f f e r e n c e s i n t h e c n d i t t o n s o f p r o d u c t i o n and t o a d j u s t - f o r the - impac t o f w e a t h e r c o n d i t i o n s o r d i s e a s e o n a g g r e g a t e p r o d u c t i o n . ~ e s o u r d ? a v a i l a b i l i t t e s and p r o d u c t i o n c a p a c i t y can a l s o b e broken o u t . 8 -

23. I t is a l s o important t o recognize t h a t l o c a l r egu la t iona , much aa mininun p r i c e s , product ion quotaa , marketing boarda, expor t t axe r , e t c . , may play a r 3 l e i n d e t e n a i n i n g output. In many c a r e s t h e assumption t h a t producers respond t o t h e world coumodity p r i c e is i n v a l i d , s i n c e t h e p r i c e obta ined hy l o c a l producero dev ia te0 g r e a t l y f r o a t h e p r i c e p r e v a i l i n g i n ~ r l d coamodity marketa. Th i s a100 means t h a t a l o n g with d i saggrega t ion of supply , i t is necessary t o di6aggrega:e p r i c e , t o t r a n s l a t e t h e world market ? r t c e ir.to t h a p r i c e s t h a t apply i n t h e producing a rea .
24. The need t o d e a l wi th nominal p r i cea i n var ioua cur renc ico 10 a complication. One approach hao k e n t o f o r m l a t e t h e commodity p r i c e i n U.S. d o l l a r b , a d j u a t e d f o e t h e change i n p r i c e l eva lo , and then simply t o conver t t o o t h e r c u r r e n c i e s us ing exchange r a t a o ( r o w o f t h e problems r e l a t i n g t o cha r o l e of i n f l a t i o n and I r t a r m t i o n a l exchange r a t e movements a r e noted belw).
25 Another problem 10 t h a t t y p i c a l l y i t has n o t been poss ib le t o o b t a i n a r e a l i s t i c d i saggrega t ion of s t o c k s i n t o those h e l d by consumere and those held by producero, thoae being held f o e opecu la t ive purposes and those held f o r o r d i n a r y t r a n s a c t i o n o , f o r a u m p l e . The d a t a on s t o c k s a r e g e n e r a l l y d e f i c i e n t and lust be computed from the r e c o n c i l i a t i o n of supply and demand. I n sone a o d e l s , i t h a s been h e l p f u l t o d i v i d e t h e world market i n t o major b locks , f o r example, t h e U.S. market and t h e r e s t of t h e world, a s i n t h e copper model of F i s h e r , e t . a l . (1972), wl th t r a d e f l o v s l i n k i n g t h e markets. General ly , though, i t h a s been d i f f i c u l t t o r econc i l e t h e t r a d e ~ t a t i s t l c s o n commodities wi th those aeasur ing product ion and consumption, and t h e r e a r e feu models of c o m o d l t y markets i n which a n a t t empt has been m d e t o e x p l a i n t h e movements of commodities i n i n t e r n a t i o n a l t r a d e i n any d e t a i l .
APPLICATION OF COHHODITY HARKET HODELS
26. %is s e c t i o n cons ide r s t h e use of c o w d i t y market rnccels i n p r a c t i c e , f ~ l l w i n g a note of caut ion. The a p p l i c a t i o n of a c d e l s c a l l s f o r a c a r g f u l balance between a b s t r a c t i o n and r e a l i t y . The ,model bu i lde r and user t r y t o take advantage of t h e p o s s i b i l i t i e s of s i m p l i f y i n g t h e r e a l world which t h e model r e p r e s e n t s . S t i l l , t he m d e l m e t not be s o d i f f e r e n t from t h e r e a l cwrld as t o l o s e re levance. The w d e l is a t o o l ; t o be u s e f u l , i t nus t cap tu re t h e e s s e n t i a l s of r e a l behaviof. Fur ther , t h e user of the model must be aware of i t s correspondence t o r e a l w o r l d cond i t ions . Does i t t ake i n t o account t h e f o r c e s c u r r e n t l y af fect ing ' the market? Does i t take i n t o account t h e l a t e s t s t a t i s t i c s and o t h e r i n f o r ~ t i o n about market cond i t ions? Does i t a l low f o r e x p e c t a t i o n s ? Does i t c o n s i w a c t u a l and p o t e n t i a l p o l i c i e s , f o r example, s t a b i l i z a t i ~ n ,ans, o r t h e a c t i o n s of producer country groups? Even i f a f a i l u r e t o t a k e 11 . . . account what is a c t u a l l y going on i n t h e market does not a f f e c t t h e r e s u l t s of t h e computation, i t nay undermine t h e c r e d i b i l i t y of t h e conclusions.
27. Commodity u a r k e t models have many d j e r s e a p p l i c a t i o n s . Here :he focus is on a p p l i c a t i o n s fo r :
I. Short - tern f o r e c a s t i n g of p r i c e s and t h e earnings uf producing ing c o u ~ ~ t r f es;

11. Long-tern p r o j e c t i o n s o f s u p p l i e s and o f p r i c e s a l o n e ; and
1 . S l m u l a t i o n s of t h e c f f e c t s o f a l t e r n o t i v e s t a b i l i z a t i o n schemes.
28. In t h i s p a p e r , s h o r t - t e r m f o r e c a s t s have been d e l i b t . n l y s e p a r a t e d f r o s long-term o n c s . The i n f o r m t i o n r e q u l r e d t o ~ k e a s h o r t - t e r m f o r e c a s t I s q u i t e d ! f f e r e m : C r o n i h s * f o r a l t - v - t e r n p r o j e c t i o n , and t h t f ~ r c e u n f f c c t i n p . t h e s h o r t - t e r m out l .ook o r e d i f f e r e n t , a s n r e t h e u n c e r t n i n t i c s .
Sho r t -Te rn F o r e c a s t i n & - 29. The s h o r t - r u n f o r e c a s t is u s e f u l a s n way o f e v a l u a t i n g t h e p r o s p e c t s f o r coanodf t y p r i c e s o v e r n one o r two-yenr p e r i o d . I t is a means of a p p r a i s i n g t h e s h o r t - r u n p r o s p e c t s f o r c a r n i n g s i n p roduc ing c o u n t r i e s and f o r measu r ing t h e I ? f l a t i o n a r y and b a l a n c e o f payments p r e s s u r e s which commodity marke t c o n d i t i o n s m y impose on t h e economies o f consuming c o u n t r i e s .
30. On t h e demand s i d e , t h e dominant e l emen t i n t h e s h o r t - r u n f o r e c a s t is t h e b u s i n e s s c y c l e i n consumi n ~ c o u n t r i e s . Sho r t - t e rm e l a s t i c i t i e s o f demand w i t h r e s p e c t t o p r i c e a r e t y p i c a l l y q u i t e low. Bus ine s s c o n d i t i o n s , which c a u s e s h i f t s i n t h e c o n s u n p t i o n o f many c o u n o d i t i e s , a r e b road ly p r e d i c t a b l e , s o t h a t f o r e c a s t i n g d e ~ a n d f o r consumption o r a s i n p u t s i n t o i n d u s t r i a l a c t i v i t y is n o t d i f f i c u l t . F o r e c a s t i n g s u p p l y and i n v e n t o r i e s p r e s e n t s more d i f f i c u l t problems. The o u t p u t o f a g r i c u l t u ~ a l p r o d u c t s is a f f e c t e d by w e a t h e r c o n d i t i o n s ; y i e l d s a r e n o t a b l y d i f f i c u l t t o p r e d i c t . Supply is a l s o i n f l u e n c e d by s t r i k e s and p o l i t i c a l d i s t u r b a n c e s . I ndeed , t h e s e f a c t o r s , v h i c h a r e a l l b u t u n p r e d i c t a b l e , have been a p r i n c i p a l c a u s e o f t h e sho r t - run f l u c t u a t i o n s i n c o m ~ o d i t y p r i c e s and e a r n i n g s . F i n a l l y , w i t h r e s p e c t t o i n v e n t o r i e s , a b a s i c p r o b l e n w i t h many commodit ies is t h e d i f f i c u l t y o f - z a s u r i n g t\e l e v e l o f i n v e n t o r i e s by r e c o n c i l i n g s t a t i s t i c s on consumption and p r o d u c t i o n w i t h t h o s e on t r a d e . Moreover, i t is t h e a c t u a l l e v e l o f i n v e n t o r i e s , and n o t j u s t t h e change , t h a t is i m p o r t a n t , s i n c e t h e impact o f i n v e n t o r i e s on p r i c e s is no~ . - l i nea r . *When i n v e n t o r i e s a r e low, t h e impact o f a change i n i n v e n t o r y may be g r e a t e r t han when t h e y a r e h i g k . I n v e n t o r i e s a l s o pose problems v i t h r e s p e c t t o e x p e c t a t i o n s , a n i s s u e which is c o n s i d e r e d f u r t h e r below. - - 31. X s h o r t - t e r m f o r e c a s t f o r co -d i t i e s is by n a t u r e s u b j e c t t o '! c o n s i d e r a b l e uncerta- inty. An impor t an t r o l e o f t h e model is t o s e r v e as-a framework f o r makin t h e f o r e c a s t , and a l l o w i n g e x t e r n a l c o n d i t i o n s t o b e t ake , . i n t o account.!The model a l s o s e r v e s a s a n i n s t r m e n t t o r a p p r a l s i % a l t e r n a t i v e s c e n a r i o s o f e x t e r n a l c o n d i t i o n s and a l t e r n a t i v e p o s s i b i l i t i e s w i t h r e s p e c t t o y i e l d s o r supp ly d i s t u r b a n c e s .
Long-Tern P r e d i c t i o n s
32. Long-term p r e d i c t i o n s a r e a n i n p o r t a n t i n g r e d i e n t i n e v a l u a t i n g t h e e a r n i n g s w t e n t i a l o f p roduccr c o u n t r i e s t o be d e r i v e d from e x p o r t s o f p r imary connod i t i e s . T h i s i s a c e n t r a l c o n s i d e r a t i o n when p l a n n i n g a development s t r a c e e v .
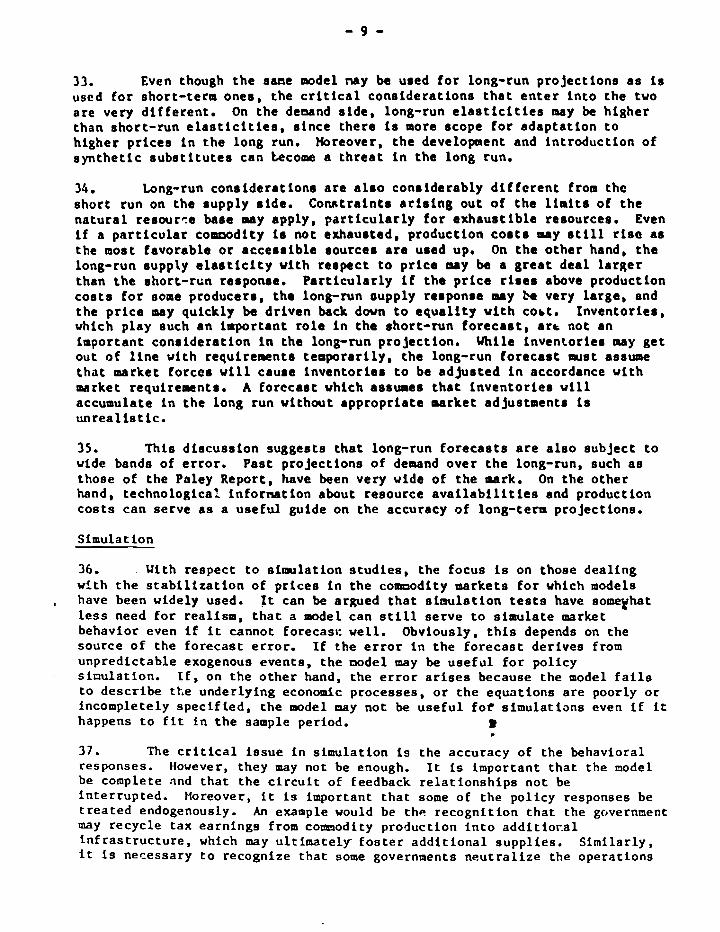
33. Even though the sane model MY be used f o r long-run projections a s is used f o r short-term ones, the c r i t i c a l considerations tha t e n t e r i n to the two are very d i f ferent. On the deaand aide, long-run e l a s t i c i t i e s may be higher than short-run e l a s t i c i t i e s , s ince there is more scope fo r adaptation t o higher pr ices i n the long run. Horeover, the deve lopen t and introduction of synthe t ic subs t i t u t e s can tecome a threa t i n the long run.
34. Long-run considerat ions a re a l s o cons iderably d i f fcrent from thc short run on the supply side. Comtra in ts a r i s i n g out of the limits of the na tura l resource base MY apply, par t icu lar ly fo r exhaustible resources. Even i f a par t icu lar commodity is not exhausted, production cos t s may s t i l l r i s e a s the most favorable o r accessible sources a r e used up. On the other hand, the long-run supply e l a s t i c i t y with respect t o pr ice m y be a grea t deal l a r ~ e r than the short-run rasponre. Part icular ly i f the price rises above production coa ts f o r some producers, the long-run oupply response may l\a very large, and the pr ice may quickly be driven back d w n t o equal i ty with cobt. Inventories, which play such an important ro le i n the short-run forecas t , a r t not an important conrideration i n the long-run project ion. While inventories may get out of l i n e v i th requirement8 temporarily, the long-run forecast m e t assume tha t market forccr w i l l cause inventories t o be adjusted i n accordance with aurket requirements. A forccast which assumes tha t inventories w i l l accumulate in the long run without appropriate aarke t adjustments is unrea l i s t ic .
35. This discussion suggests tha t long-run forecaste a r e a l s o subject t o wide bands of e r ror . Past projections of demand over the long-run, such a s those of the Pnley Report, have been very vide of the mark. On the other hand, technological infornation about resource a v a i l a b i l i t i e s and production cos t s can serve a s a useful guide on the accuracy of long-term projections.
Simulation
36. With respect t o s h l a t i o n s tudies , the focus is on those dealing with the s t a b i l i z a t i o n of pr ices in the comnodity markets f o r which models have been widely used. It can be argued tha t simulation t e a t s have someyhat l e s s need f o r realism, t h a t a model can s t i l l serve t o simulate market behavior even i f i t cannot forecasc well. Obviously, t h i s depends on the source of the forecast error . I f the e r r o r i n the forecas t derives from unpredictable exogenous events, the nodel may be useful f o r policy simulation. I f , on the other hand, the e r r o r a r i s e s because the model f a i l s t o describe the underlying economic processes, o r the equations a re poorly o r incompletely specif ied, the w d e l nay not be usefu l f o r simulations even i f i t happens t o f i t i n the sample period. 8
37. The c r i t i c a l i ssue in simulation i s the accuracy of the behavioral responses. However, they may not be enough. I t is important tha t the model be complete and that the c i r c u i t of feedback re la t ionships not be interrupted. Horeover, i t i s important tha t some of the policy responses be t rea ted endogenously. An example would be the recognition tha t the government may recycle tax earnings from comodity production i n t o additior.al i n f r a s t ruc tu re , which may ul t imately fos t e r addi t ional supplies. Similarly, i t i s necessary t o recognize tha t some governments neut ra l ize the operations

of the international markets through the imposition of special exchange rates or domestic producer prices. If these are assumed to be fixed while the market novcrs, the simulations will be incorrect.
38. One of the most iaportant applications of the commodity narket models is for evaluating alternative commodity market stabilization schemes. The broadest efforts in this direction have involved the Caaunon Fund proposal, for example, those by Ekhrman (1978). The custooary procedure has been to specify and to estimate the models assuming that an effective comsodity agreement was not in operation. Some stockpile purchases and sales are included in the sample period, as are some restrictions on production and export sales, but there is typically no explicit or implicit assmption that prices will be held within certain limits or that producers expect prices to be stabilized. N w , then, is such a model used for stabilization simulations?
39. Thia is done by imposing the actions of the stabilization agency on the model. In the case ?f stabilization with a buffer stock, a price ceiling and floor are established. If the =:el yielded a solution calling for a price b e l w the floor, the buffer stock w u l d buy to bring the price to the floor level. If the price obtained through the model solution exceeded the ceiitng, the stockpile agency w u l d draw on its stock to provide additional eupplies until the price uaa reduced to the ceiling level. Typically, a aechaniom is included to keep track of the status of the stockpile agency--it8 stock holdings, financial position and the gains and loasea from ita transactions. Normally, these conputations have been made in a deterministic fashion over the sample period, assuming neither random error in the coefficients or the equations, or in the exogenous variables.
40. The result ia an approximation of "what night have happened if" a stabilization scheme had been applied. Hwever, the calculatlon Is unique and does not a l l w for the probabllistic nature of the real world and, conse- quently, of the costs of a stabilization scheme. Stochastic s h l a t l o n in the exogenous variables, in the errors of the equatlona, and posslbly in the errors of the coefficient8 offers interesting possibilities for evaluating the risks association with stabilization schemes (Ford, 1978).
1
4 1. Relow is 9 iiscussion of a serious speclflcatlon problem, essentially a rational expectatio~s problem, which results &en the market response recog- nizes the imposition of a stabilization scheme. -
8 BRONTIERS OF ECONO!ETRIC CO?MODIfY MARKET MODELING -
4 2 . In tKls section, the frontiers of econometric modeling of commodity markets is coeidere~. It focuses on the gaps, not so much to find the flaws in present procedures as to point to areas where additional research is needed. The concern is particularly with those aspects of comnodity mark#-t modeling that have iumediate ioplications in terns of the applicat1l:ty of models for forecasting and simulation. The following are the principal considerat ions:

1. Commodity modelr and in f l a t ion and exchange rates--the " f l i gh t out of money";
11. The responres of c o m d i t y markets t o s t a b i l i z a t i o n policy; and
ill. Integrat ion of c o ~ w d i t y w d e l s in to other econorzic model cystems a
Iapact of In f l a t ion and Exchange Rates
4 3. The r e l a t ion rh ip between comwdity pr icer , i n f l a t i o n , and exchange r a t e s i s not well underrtood. Evidence from the 19708, when the price rvingr i n the major coamodity marketa were not predicted, r h w r tha t t h i r i r one of the inportant gapr i n current coumdity aodeling work.
44 . There i s no record of the ante forecart ing performance of cocmodity modele such a r the one p r o v i T f o r macroeconomic modele by HcNeer (1979). On the bae i r of '.he ex st record of e r ro r derived from model slmulations for the sumple p e ~ f i n d on the bas is of annual da ta) , average e r r o r s were obtained f o r pricer f o r eight ag r i cu l tu ra l w d e l r (Adam and Behrman, 1976). The range war from 3.2 percent for r i c e t o 11.3 percent for sugar and 13.1 percent for cocoa. These a r e f a i r l y reasonable resu l t s . The e r ro r i s l i ke ly t o be greater fo r ex ante forecasts than fo r s iau la t ionr during the sample period. Yet i n n o r ~ p e r i o d s , the modelr have been found useful fo r forecast ing outr ide the rumple period, though only when adjustments have been made t o l i n e up the forecasts and t o introduce known external 1n:ormation. Unfortunately, the saac cannot be ra id fo r periodr of rapid i n f l a t i o n and exchange r a t e in s t ab i l i t y . Hort modele estimated over a eample period prior t o 1973 have not predicted fu l ly the upsurge in comodity gricer which occurred i n 1973-74. Even modelr which included these years i n the sample period have not performed well over these years. - 11
45. This suggests tha t proper treatment of i n f l a t i o n and exchange r a t e s is a c r i t i c a l problem i n current commodity modeling. The d i f f i c u l t y is probably not one of simply t rans la t ing world prices i n t o appropriate domestic pr ices through exchange rates . I t is one of accounting for expectations conceAing i n f l a t i o n and exchange r a t e s i n the s t ruc tu re ' o f the commodity model. Although expectations a f f ec t both the detaand and the eupply s ides of a model, i t is not c l e a r tha t t h i s i s where the problem of in f l a t ion and exchange r a t e i n s t a b i l i t y has its impactc It is more l i ke ly , tha t expectations a f f e c t the equation fo r theZenand for inventories o r price. In t h i s case, the d i f f i c u l t y l i e s in g e t t i n w a handle on expectations a s to the nominal price of the coarmodity. The n o r w l approach which assumes regressive expectations, i s c l ea r ly inappropriate w en prices o r exchange ra tes a r e 'L
11 The continuous time copper node1 by Denis Richard may Le an exception. - However, the very close f i t of t h i s model, with a consistent lag, is sus- picious, par t icu lar ly since i t does not recognize external forces such a s exchange ra te i n s t a b i l i t y .

u n s t a b l e . A t t h e same t ime, i t is n o t c l e a r t h a t o t h e r conven t iona l approaches t o t h e f o r n a t i o n o f e x p e c t a t i o n s , v h i c h f o r m l a t e t h e expec ted p r i c e a s some form of t h e ve igh ted ave rage of p a s t p r i c e s , a r e b e t t e r . Indeed , one m y v a n t t o v i s u a l i z e t h e h o l d i n g of c o n n o d i t i e s a s p a r t of t h e e n t i r e phenomenon o f a s s e t adjustne:lt--"f 1 i gh t o u t of moneyQ'-which o c c u r s d u r i n g a pe r iod of r a p i d i n f l a t i o n o r exchange r a t e i n s t a b i l i t y .
P r i c e S t a b i l i z a t i o n P o l i c v S imula t ions
46. Tbe performance of nodc l s t h a t s i m u l a t e t h e e f f e c t s of p o l i c y is d i f f i c u l t t o a p p r a i s e . There Is no o b j e c t i v e s t a n d a r d a g a i n s t v h i c h t o eoapa re a "vhat i f " s i m u l a t i o n . The e r i t i e a l c o n s i d e r a t i o n is v h e t h e r t h e e q u a t i o n s c a t c h f u l l y t h e r e l e v a n t r e l a t i o n s h i p s . Thus s i m u l a t i o n performance c a n be e v a l u a t e d o n l y on t h e b a s i s of v h e t h e r t h e r e sponse d e r i v e d v i t h t h e model c o n f o r m t o a p r i o r i e x p e c t a t i o n s . Does a one-time s t o c k p i l e s a l e a f f e c t t n v e n t o r i e s and p r i c e as i t is supposed t o ? Do supp ly and demand a c t a s one would e x p e c t ? Is t h e r e u l t i m a t e l y a r ead jus tmen t t o e q u i l i b r i u m , p r e f e r a b l y one t h a t is no t Ear from t h e base s o l u t i o n e q u i l i b r i u m ?
47. While i t is h a r d t o g e n e r a l i z e , o v e r a l l , i t a p p e a r s t h a t i t h a s been p o s s i b l e t o b u i l d a o d e l s t h a t can s i m u l a t e behavior o v e r t h e sample pe r iod adequa te ly . T h i s is a n imperfec t test , h w e v e r . Suppose, f o r example, t h a t p o l i c y h a s changed s i n c e t h e time o f e s t i m a t i o n and t h a t t h e p a r t i c i p a n t s i n t h e market a r e a v a r e of t h e p o l i c y change and respond t o i t . T h i s is t h e problem t h a t o c c u r s vhen a s t a b i l i z a t i o n scheme is ;mposed and models a r e used t o e v a l u a t e i ts impact.
48. A c r i t i c a l a s a m p t i o n i n t h e work on s t o c k p i l e s i m u l a t i o n s is t h a t p r i v a t e market behav io r is una f f ec t ed by t h e i m p o s i t i o n o f a s t a b i l i z a t i o n plan. While i t is probably i n a p p r o p r i a t e t o go a s f a r a s t h e t h e o r i e s of r a t i o n a l e x p e c t a t i o n s , v h i c h sugges t t h a t a l l p o l i c y s t e p s a r e f u l l y a n t i c i p a t e d , i t is u n r e a l i s t i c t o assume, on t h e o t h e r hand , t h a t behav io r is unchanged. P a r t i c i p a n t s i n t h e market w i l l acknovledge t h e impact of t h e s t a b i l i z a t i o n p o l i c y i n t h e i r d e c i s i o n making. A s s u m i ~ g t h a t , and g iven t h e v a r i o u s components o f t h e system, v h a t is l i k e l y t o be a l t e r e d by t h e i m p o s i t i o n of a p r i c e s t a b i l i z a t i o n program?
C
49. On t h e demand s i d e , pcf:e s t a b i l i z a t i o n nay be s e e n t o have some, bu t no t a ma jo r , e f f e c t . P r i c e swings a r e l i k e l y t o be moderated and t h e adequacy o f s u p p l y a s su red . On t h e supply s i d e , t h e impact of p r i c e s t a b i l i z a t i o n may be more pronounced. P r i c e e x p e c t a t i o n s p l ay an impor t an t r o l e i n d e t e r m i n i ' o u t p u t . Even i f t h e e x p e c t a t i o n i t s e l f is n o t changed (assuming nc s y s t e m a g c e f f o r t t o a l t e r t h e long-run p r i c e ) , t h e v a r i a n c e o f p r i c e v i l l s u r e l y be - reduced. T h i s l e s s e n s r i s k and should s t i m u l a t e s u p p l y , depending on t h e *
p r i c e . Econone t r i c s t u b i e s by J u s t and o t h e r s shov c l e a r l y t h a t p r i c e * - v a r i a n c e is a f a c t o r i n t h e d e t e r m i n a t i o n of supply . F i n a l l y , t h e most s e r i o u s l y a f f e c t e d p a r t o f t h e m d e l is t h e e q u a t i o n f o r p r i c e o r demand f o r i n v e n t o r i e s ( s e e e q u a t i o n 4). F i r s t , c r ansac t i o n s demand i n c l u d e s a component f o r p r e c a u t i o n a r y r equ i r emen t s , t h a t i s , i t i n c l u d e s s t o c k p i l e s he ld a g a i n s t t h e e v e n t u a l i t y o f supp ly s h o r t a g e s . C l e a r l y , t h e p re sence of an i n t e r n a t i o n a l s t o c k p i l e v i l l reduce t h e need f o r p r e c a u t i o n a r y p r i v a t e s t o c k p i l e s , s u g g e s t i n g t h a t t h e r e is s u b s t i t u t i o n be tveen p r i v a t e and p u b l i c
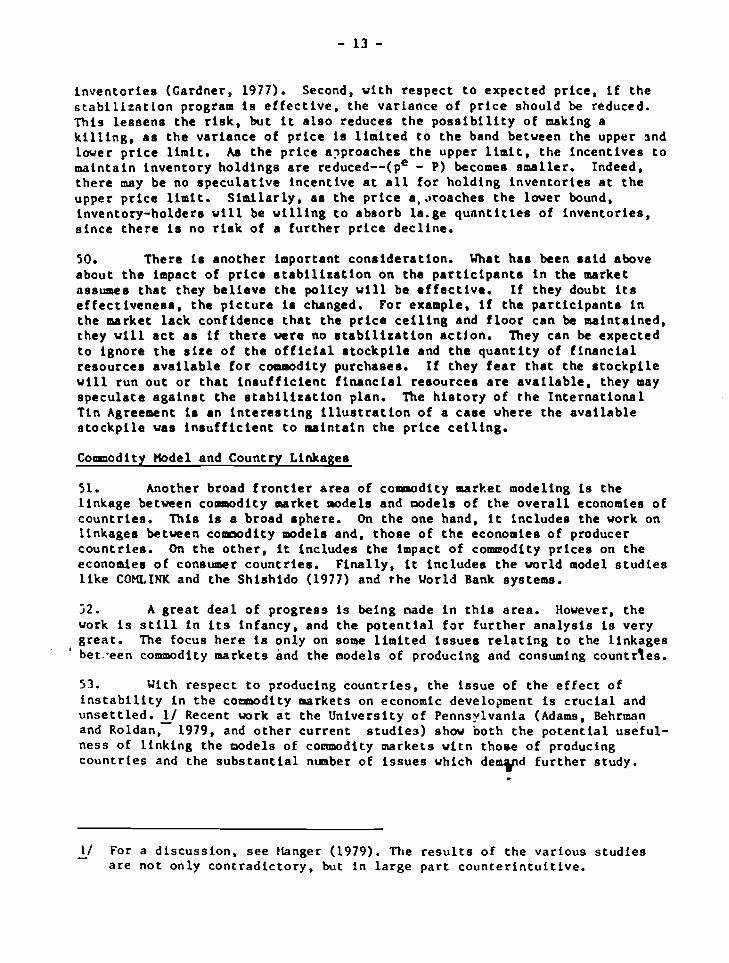
i n v e n t o r i e s (Cardner , 1977). Second, v i t h r e s p e c t t o expec t ed p r i c e , i f t h e s t a b i l i z a t i o n program i s e f f e c t i v e , t h e v a r i a n c e o f p r i c e shou ld be reduced. his l e s s e n s t h e r i s k , bu t i t a l s o r educes t h e p o s s i b i l i t y of making a k i l l i n g , a s t h e v a r i a n c e o f p r i c e is l i m i t e d t o t h e band be tveen t h e upper and l w e r p r i c e l i m i t . As t h e p r i c e a?proaches t h e upper l i m i t , t h e i n c e n t i v e s t o m a i n t a i n i n v e n t o r y h o l d i n g s a r e reduced--(pe - P) becomes sma l l e r . Indeed , t h e r e may be no s p e c u l a t i v e i n c e n t i v e a t a l l f o r h o l d i n g i n v e n t o r i e s a t t h e upper p r i c e l i m i t . S i m i l a r l y , a s t h e p r i c e a , .)roaches t h e l o v e r bound, i nven to ry -ho lde r s v i l l be v i l l i n g t o a b s o r b la .ge q u n n t i t i e s of i n v e n t o r i e s , s i n c e t h e r e is no r i s k of a f u r t h e r p r i c e d e c l i n e .
50. There is a n o t h e r impor tan t c o n s i d e r a t i o n . What h a s been s a i d above abou t t h e impact of p r i c e s t a b i l i z a t i o n on t h e p a r t i c i p a n t s i n t h e market assumes t h a t t hey b e l i e v e t h e p o l i c y v i l l be e f f e c t i v e . I f t hey doubt i ts e f f e c t i v e n e s s , t h e p i c t u r e is changed. For example, i f t h e p a r t i c i p a n t s i n t h e market l a c k con f idence t h a t t h e p r i c e c e i l i n g and f l o o r c a n be main ta ined , t hey v i l l a c t a s i f t h e r e wre no s t a b i l i z a t i o n a c t i o n . They can be expec t ed t o i g n o r e t h e s i z e of t h e o f f i c i a l s t o c k p i l e and t h e q u a n t i t y of f i n a n c i a l r e s o u r c e s a v a i l a b l e f o r commodity purchases . I f t h e y f e a r t h a t t h e s t o c k p i l e v i l l r un o u t o r t h a t i n s u f f i c i e n t f i n a n c i a l r e s o u r c e s a r e a v a i l a b l e , t hey may s p e c u l a t e a g a i n s t t h e s t a b i l i z a t i o n plan. The h i s t o r y o f t h e I n t e r n a t i o n a l T i n Agreement is an i n t e r e s t i n g i l l u s t r a t i o n o f a c a s e v h e r e t h e a v a i l a b l e s t o c k p i l e van i n s u f f i c i e n t t o ma in t a in t h e p r i c e c e i l i n g .
Commoditv Hodel and Countrv Linkanes
51. Another broad f r o n t i e r a r e a of commodity market modeling is t h e l i n k a g e between c o m o d i t y market models and w d e l s o f t h e o v e r a l l economies of c o u n t r i e s . T h i s is a broad sphere . On t h e one hand, i t i n c l u d e s t h e work on l i n k a g e s be tueen coacmdity w d e l s and , t h o s e of t h e economies of producer c o u n t r i e s . On t h e o t h e r , i t i n c l u d e s t h e impact o f commodity p r i c e s on t h e economies o f consumer c o u n t r i e s . F i n a l l y , i t i n c l u d e s t h e w r l d model s t u d i e s l i k e COHLINK and t h e S h i s h i d o (1977) and t h e World Bank systems.
J2. A g r e a t d e a l o f p r o g r e s s is be ing made i n t h i s a r e a . However, t h e vork is s t i l l i n i ts i n f a n c y , and t h e p o t e n t i a l f o r f u r t h e r a n a l y s i s is v e r y g r e a t . The focus h e r e is o n l y on some l i m i t e d i s s u e s r e l a t i n g t o t h e l i n k a g e s
' bet:een commodity marke t s and t h e models of producing and consuming count r l e s .
53. w i t h r e s p e c t t o producing c o u n t r i e s , t h e i s s u e of t h e e f f e c t o f i n s t a b i l i t y i n t h e c o m m d i t y markets on economic development is c r u c i a l and u n s e t t l e d . 1 1 Recent work a t t h e U n i v e r s i t y o f Pennsylvania (Adams, Behrman and Roldan, 1979, and o t h e r c u r r e n t s t u d i e s ) shov bo th t h e p o t e n t i a l u s e f u l - n e s s of l i n k i n g t h e n o d e l s of commodity marke t s w i t n t h o s e o f producing c o u n t r i e s and t h e s u b s t a n t i a l nunber of i s s u e s vh i ch demyld f u r t h e r s tudy . .
11 For a d i s c u s s i o n , s e e ttanger (1979). The r e s u l t s o f t h e v a r i o u s s t u d i e s - a r e n o t o n l y c o n t r a d i c t o r y , but i n l a r g e p a r t c o u n t e r i n t u i t i v e .

54. I t is a r e l a t i v e l y s t r a i g h t f o n r a r d p a t t e r to b u i l d a model o f a comaodity-producing s e c t o r and t o i n t e g r a t e i t i n t o t h e model of a producing coun t ry . I t t u r n s o u t t o be c o n s i d e r a b l y more d i f f i c u l t t o rhou t h e r e l a t i o n - s h i p r between g r w t h i n t h e producing coun t ry and t h e deve lopaen t o f t h e coamo-dity s e c t o r , p a r t i c u l a r l y w i t h r e s p e c t t o i t s f l u c t u a t i o n r . I t is wel l - knovn t h a t f o r e i g n exchange e a r n i n g s and t a x r e c e i p t r have impor tan t e f t e c t r on domes t i c development and i n f l r t i o n . I t i r n o t g e n e r a l l y a p p r e c i a t e d , however, hou much i n f luence a producer c o u n t r y ' s p o l l c l e r m y have o n a c c e n t u a t i n g or a t t e n u a t i n g t h e impact of c o a a a d i t y marke t f l u c t u a t i o n r . I n any case, s i m u l a t i n g t h e l i nkage be tveen c o m o d i t y marke t s and t h e economies o f producer c o u n t - i t s could thrcw nuch l i g h t on t h e i m p l i c a t i o n s o f a l t e r n a t i v e p r o j e c t i o n s f o r c o m m d i t y marke ts and o f v a r i o u s co-dity s t a b i l i z a t i o n p l a n s on t h e development o f coamodity-producing c o u n t r i e s .
55. On t h e o t h e r s i d e of t h e market-the l i n k a g e to consuning economier , p r o g r e s s h a s a l s o been a a d e , bu t e i g n i f l c a n t problems remain. P r i c e f l u c t u a t i o n s i n t h e n a r k e t s f o r world c o m o d i t i e s , pe t ro l eum and o t h e r i tem, have had a heavy impact on consu r~ ing c o u n t r i e s . The l i n k a g e s from t h e comr~odity m r k e t s e x t e r n a l t o t h e consuming economies a r e f a i r l y c l e a r , though they a r e not wel l -captured by t h e d a t a on t r a d e volume and p r i ce s . The i s s u e which most macro models over look Is t h e d i r e c t impact o f world commodity marke t s on t h e p r i c e s of pr imary commodities produced i n coneuming economies themselves. For example, t h e rise o f world wheat p r i c e s i n L973.-73 caused a n i n c r e a s e i n t h e c o s t of g r a i n s i n t h e US. The r e s u l t i n g i n ~ r e n ~ e s i n t h e CPI and t h e d i s t o r t i o n s i n t h e d i s t r i b u t i o n of income and i n consumer e x p e n d i t u r e s were s i g n i f i c a n t . Horeover , t h c s i t u a t i o n l e d t o a n t i - i n f l a t i o n a r y monetary and f i s c a l p o l i c y responses . When t h e r e a r e p h y s i c a l supp ly s h o r t a g e s , a s i n t h e c a s e of g a s o l i n e , t h e d i f f i c u l t y of u s i n g t h e models is even g r e a t e r . It is n o t c l e a r t h a t e x i s t i n g macro model s t r u c t u r e s accoun t f o r t h e i rrpact of commodity market f l u c t u a t i o n s on t h e economies of consuming c o u n t r i e s adequa te ly .
56. F i n a l l y , t h e r e Are t h e comprehensive models. They i n c l u d e n o t on ly t h e commodity marke t s , but t h e economies o f producing and consuming c o u n t r i e s a s w e l l . A number of frameworks a r e p o s s i b l e , b u t t h e d i s c u s s i o n h e r e focuses p r imar i l y -on t h a t o f COYLINK, t h e v e r s i o n o f t h e LINK world model sys t em t h a t i n c l u d e s )he conmodity models (Adam, 1979a and b). I n t h e COHLINK sys tem, t h e l i n k a g e s f r o = t h e models o f producing c o u n t r i e s t o t h e models o f consuming c o u n t r i e ~ a r e ach i eved p r i m a r i l y through t h e p r i c e mechanism. To summarize - b r i e f l y , 'ommodity p r i c e s a r e de te rmined i n a s e r i e s o f commodity market % models. e c o m d i t y p r i c e s then e n t e r i n t o t h e world p r i c e mechanism . th rough a t r a n s l a t i o n t o t h e t r a d e p r i c e s o f p roduce r c o u n t r i e s . Tha t is, t h e e x p o r t u n i t v a l u e s o f producing c o u n t r i e s f o r t h e p r i n c i p a l SITC c a t e g o r i e s a r e e x p l a i n e d i n t e r n s of t h e r e l e v a n t commodity p r i c e s . The e x p o r t u n i t v a l u e s of t h e LIhX s y s t e n a r e conve r t ed by a t r a d e m a t r i x procedure i n t o t h e import p r i c e s o f consuming c o u n t r i e s f o r t h e a p p r o p r i a t e SITC c a t e g o r i e s . These p r i c e s t h e n e n t e r i n t o t h e coun t ry models and a f f e c t t h e domest ic p r i c e l e v e l . There is no a t t empt t o show t h e q u a n t i t i e s of t r a d e d commodities n o r t o r e c o n c i l e p r i n a r y c o m o d i t y t r a d e f lows w i t h t h e LINK s y s t e n t r a d e e s t i m a t e s . There i s , however, a c o n p l e t e s i n u l t a n e o u s feedback from t h e economic c o n d i t i o n s p r e v a i l i n g i n t h e i n d u s t r i a l c o u n t r i e s t o t h e commodity n o d e l s , t o t h e producer coun t ry node l s and back t o t h e i n d u s t r i a l c o u n t r i e s .

57. Through t h i s mechanism i t has been p o s s i b l e t o s h w the impact of commodity p r i c e s bn the p r i c e s i n t h e i n d u s t r i a l c o u n t r i e s and on t h e i r expor t p r i ces . For example, a supply shor tage i n a primary c o m o d i t y , ruclr a s is produced by a f r o s t i n t h e cof fee p l a n t a t i o n s o r a s t r i k e i n the copper mines, causes t h e p r i c e of a c o m o d i t y t o be higher ; t h a t p r i c e feeds through the economics of consumer and producer coun t r i e s . S i m i l a r l y , an economic s t imulus i n developed c o u n t r i e s inc reases t h e demand f o r primary cotmmdities, etc.
! 8. An important a spec t of a complete system is t h a t i t accourrt f o r these typee of feedbacks. For r u m p l e , t h e a b i l i t y of producing c o u n t r i e s t o import is inc reased a s e x p o r t s increase . Economic a c t i v i t y i n developed c o u n t r i e s is s t l o u l a t e d by inc reased r e a l d tprnd, but depressed by the need t o pay higher p r i c e s (Adam, 1979a).
59. The focus of LINK has k e n on f o r e c a s t i n g , on business c y c l e develop- rPcnts and on shor t - term policy. While the system works, i t is i n t e r e s t i n g t o no te t h a t i t appears t o a t t e n u a t e p r i c e samewhat. I n soarc respec t s , t h a t r e s u l t r e f l e c t s t h e r e a l w r l d si tuation--st primary commdity t r a d e is c a r r i e d on under c o n t r a c t and does not move with t h e s p o t p r i ces , f o r example. Houevcr, i t a l s o r e f l e c t s t h e na tu re of t h e commdity market models, p a r t i c u l a r l y t h e f a i l u r e of country macro models t o recognize f u l l y t h e r o l e of primary commodity p r i ces . Never theless , d e s p i t e t h e p rob lem wi th t h e p resen t system, a j o i n t country-comodity model is e s s e n t i a l f o r desc r ib ing t h e k inds of f l u c t u a t i o n s now a f f e c t i n g t h e world economy. (It goes almost wi thout saying t h a t such a system mst a l s o inc lude markets f o r fo re ign exchange and i n t e r n a t i o n a l c a p i t a l movements.)
60. The LINK system is being extended t o d e a l w i t h locg-term p r o j e c t i o n s but , a s noted above, long-term f o r e c a s t i n g of t h e commodity markets r equ i res a somevhat d i f f e r e n t eaphasis. It is not c l e a r whether COHLINK a s p resen t ly organized can hand le that kind of task. F a i r l y e l a b o r a t e under ly ing analyses of resource a v a i l a b i l i t i e s and of resource s u b s t i t u t i o n would have t o be c a r r i e d ou t s o that t h e long-term p r o j e c t i o n s f o r t h e commodity markets w i l l be onb t rack ( C o e l l e r and Weinberg, 1978). A long-term-okiented simultaneous system would be a n important t o o l f o r examining t h e k inds of i s s u e s posed by t h e Club of Rome.
- 61. With r e s p e c t t o pol icy s i m u l a t i ns , a country-commodity model system o f f e r s p o s s i b i l i t i e s f o r working ou t f u l ! y t h e impact of proposals c u r r e n t l y being d i scussed i n va r ious North-South fqrups. It is not c l e a r t h a t the b e n e f i t s of s t a b i l i z e d commodity p r i c e s accrue p r i n c i p a l l y t o t h e producing coun t r i e s . I t is a l s o no t c l e a r vhether%igher commodity pr icea se rve a s a mechanism f o r t r a n s f e r r i n g resources from developed t o l e s s developed coun t r i e s . S i a l l a r l y , t h e c o s t and benef i t of commodity market s t a b i l i z a t i o n i n a macro con tex t cannot be appra i sed ye t . These a r e t h e types of i s sues vhich n u s t be seen i n a systems context .
6 2 . The COHLINK approach t s only one of t h e va r ious ways of handling t h e i n t e g r a t i o n of commodity market models i n t o a world system. With o t h e r s , the focus nay be d i f f e r e n t . The l e v e l of aggregat ion can be ma,'? even more

deta i led or , hopefully for many m e n , s h p l e r . The eysttm can lncorporatt input-out-output relations, t t c . This front ier is c l e a r l y one of the most far-reaching of co-di ty .

M a l F. Gerard, "Hurt High C o d i t y P r i c e s Deprese t h e World Economy? An Appl icat ion of a World Hodel System," J o u r n a l o f Po l i cy Hodelin& I (2: 19798).
, " I n t e g r a t i n g C-dity W d e l s i n t o LINK," (1979b). i n Savyer (1979) ( s e e k l v ~ ) .
, "From E c o n o w t r i c m e a l s of t h e Nation t o Hodels of I n d u s t r i e s and Firor ," H u r t o n Quar te r ly , Supplement Summar 1973.
Mama, Fa Gerard and J e r r R. I k h r u n , E c o n m t r i c Hodeling of World Comodi ty Po l i cy (Lexington, W r r t bath-Lexington, 1978).
, E c o n o w t r i c Hodrlr of World A g r i c u l t u r a l C o m d i t y h r k e t s (Cambridge, W r o t I l r l l inger , 1976).
Ma-, Fa Gerard, Jrre R. k h ~ n and R o u u l d o Roldan, " k a s u r i n g t h e Impact of Primary C o a o d i t y F luc tua t ions on E c o n d c Deve lopen t : Coffee aad Brazi l , " b r i a n E C O M ~ C Review 69 (2: 1979).
Behrman, J e r e R., I n t e r n a t i o n a l C o d i t y Agreements: An Evaluat ion of the UNCTAD I n t e g r a t e d C m d i t y Programm (Washington, D.C.: Overseas Development Counsel, 1977).
Fisher , F rank l in et. a l . , "An Econometric Hodel of t h e World Copper Industry," B e l l J o u r n a l (1972).
Ford, Derek J., "Simulation Analyses of S t a b i l i z a t i o r . P o l i c i e s i n t h e I n t e r n a t i o n a l Coffee Market," i a Mama-Behtman (1978) ( see above).
Gardner, Bruce L., "The E f f e c t s of Pub l i c and P r i v a t e Stockpi l ing," Texas 1 A6X, processed, 1977. Q
Coel le r , H.E., aad Alvin H. Weinberg, "The Age of S u b s t i t u t a b i l i t y , " American Econor ic Review 68 (6: 1978).
Labys, Walcer C., "Comodity Markets and nodels: The Range of Experience" (1978a), i n Ma- and Klein (1978). - , "Bibliography of Commodity Xarket H o d a s (1978b) i n Adams and B e h r ~ n (1978) ( see above).
Hanger, John, "A Review of the L i t e r a t u r e on Causes, E f f e c t s , and Other Aspects of Export I n s t a b i l i t y , " Univers i ty o f Pennsylvania, processed, 1979.
Pindyck, Robert S., "Gains t o Producers from t h e C a r t e l i z ~ t i o n of Exhaustible Resources," Review of Economics and S t a t i s t i c s LX (2 : 1978).

Sawyer, John A . , Hodelling the International Transrirrion n t c b n i m (hnr terdaa: Horth-Holland, 1979).
Shishido, S. , e t . a l e , "An Alternat ive World Hodel," Tsultuba Oniverrity, procersed, 1977.

ISSVES M C O ) W I D ~ met anrum SV#URY DISCUSSION

ISSUES IN COXWDITY NDEL BUILDING SWUXY DISCUSSION 11 -
I. INTRODUCTION
1. T h i s s e c t i o n c o n t a i n s a b r i e f r e v i e v of t h e v i e v s o f p a r t i c i p a n t s a t t h e seminar on g e n e r a l i s s u e s r e l a t i n g t o cocapodity models. I n some i n s t a n c e s t h e s e views a r e n o t e n t i r e l y compat ib le , a s v i l l be noted .
2 . The o b s e r v a t i o n s can be c a t e g o r i z e d under t h r e e Ireadings:
- Hethodology; - Economic theo ry ; and - O r g a n i t a t i o n
3. ;t was a rgued t h a t t h e model t echn iques be ing used i n t h e flank's commodity uork a r e i n g e n e r a l t o o p r i m i t i v e . As more a p p r o p r i a t e methods f c r mode l l i ng cocmodity marke t s o r e a v a i l a b l e , new ones need n o t ba developed. Rather , t h e problem is t o a d a p t and app ly t h e t e s t o f t h e e x i s t i n g t echn iques .
A. Improvements i n E s t i m a t i o n Techniques 21 - 4. The a p p l i c a t i o n o f s i n g l e e q u a t i o n e s t i m a t i o n s is a common f e a t u r e o f many of t h e Bank's commodity m d e l s . Hweve r , t hey a r e of t e n a n unnecessary s i m p l i f i c a t i o n . Both e f f i c i e n c y and f l e x i b i l i t y may be enhanced by u s i n g sys tems e s t i m a t i o n e i t h e r t o t a k e advantage of t h e s i m i l a r s p e c i f i c a t i o n s o f t h e e q u a t i o n s f o r a number o f u n i t s o r t o impose i ~ r i o r i , c ro s s - equa t ion c o n s t r a i n t s . The former i nvo lves t e s t i n g f o r i d e n t i c a l p a r m e t e r s on c e r t a i n s u b s t c e of v a r i a b l e s and c c p l o i t i n g e r r o r c o t r e l a t i o n e (e.g., Z e l l n e r ' s SIJRE [ s e e d n g l y u n r e l a t e d r e g r e s s i o n e q u a t i o n e l ) . 21 The l a t t e r i n v o l v e s t h e decomposi t ion of pa rame te r s i n t o s e p a r a t e p a r t s (e.g., a r e a 1's income e l a s t i c i t y f o r good j (Si ) might be w r i t t e n Bi = pi + v ), a s w e l l a s t h e J u s e o f a p r i o r i z h e o r e r i c d l r e s t r i c t i o n s l l k e t i e s y m e t r y of t h e s u b s t i t u t i o n m a t r i x T n demand theory . I n a d d i t i o n , t h e r e are t h e n r u demand systems such a e ).(uellbauerO s PTCL ( ~ r l c e - independent h e n e r a l i t e d - l i r e a r i t y ) - k ! and PICUX;
11 T h i s smmary draws on v r i t t e n c o m r r n t s b f r o n s e v e r a l p a r t i c i ) a n t s , n o t a b l y - R. V. Bacon, J. H. P. Pae l inck and A. H i n t e r s , i n a d d i t t o n t o t h e p l e n a r y d i s c u s s i o n a t t h e seminar .
- 21 Z e l l n e r (1979) appea red a t t h e same t ime a s t h e s emina r and c o n t a i n s oa-173 -
views s i m i l a r t o t h o s e expressed a t t h e c o n c l r d i n g summary s e s s i o n . d - .I - 31 Z e l l n e r (1962). - w * .. 41 Ehrellbauer (1975). -
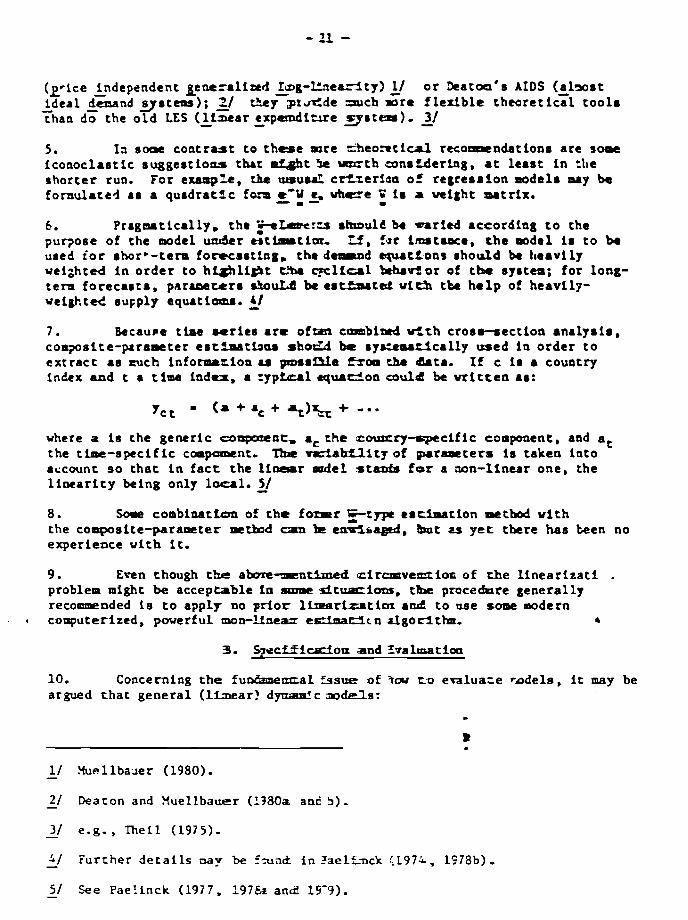
( l r l c e independent &ene=aliord I ~ ~ - ~ d e ~ t y ) L/ o r k a t o ~ * r AIDS ( a l m r t i d e a l d&nd g r t c n r ) ; &/ t h y - p x ~ l d e =ch s o r e f I e x i b l e t h r o r e t i cy1 t o o l s - than d z the o l d LES ( 1 L s t a r f r p a m d i t v e s ~ r t e ~ ) . - - 3/
5. Irr so# c o n t r a s t t o t h e s e =re c h e o = t i d r e c o ~ ~ t n d a t i o n s a r e some i c o n o c l a s t i c r u g g e r t i o u s t h r t mZght 5C =th a m s U e r l n g , a t l e a s t i n :he s h o r t e r run. For example, the u ~ ~ u u l c r L r e r i a a o f regreamion models may be fornulaced r r a q u a d r a t i c f a . ? =*U c, v h e e F is r m i g h t a r t r i x . - - 0
6 . P r r g m t i c a l l y , t h e F b u e r c s s k u l a h v a r i e d a c t o r d i n g t o the p u q o s e of the model under t r t i a u t i a r - Lf, fur Lmrtance, t h e model is t o ba used i o r rhorw- te rn fomccmrtlng, t h e damrod q u a t X o a r ahould k h e a v i l y veighted i n o r d e r t o h - l i e t t ! -11-1 b t h t r k o r of t b ryatem; f o r long- t e r n forecantm, p a r l w u r a &uLd be earr ;nr ta t w f d r th h e l p of heavfly- v e i & t d r u ~ p l y e q u t i o m r . A/ 7 . Becaura t h e w r i e s a r e o f o a caaabiard vtth c r o r n e c t i o a analysim, c o a p s f t e - p r r n m e t e r e r t i a a t b a a shocLd k r y s z m a c l c a l l y used l a o r d e r t o e x t r a c t a s m c h i n f o m z i o n u p l ~ a f L l e f s o a cha &at.. If c i a a country index and t a t ime i a d u , a :yp-l tqurc2oa auld be v r f t t e a as:
'ct - (a + a , + 4 1 % + --•
where a is t h e g e n e r i c coppoocnc. a, che counrcy-rpccific compoaent, and a t the t iu te-speci f ic cap-nt. Tho r r f a W l l t y of V r a P c t e r r is taken i n t o account s o t h a t i n f a c t t h e l i n a r m d e l otanim for a non-linear one, the l i n e a r f t y being only 1-1. 5-/
8. Scme combination of t h e f o n t ?type e s c b a t i o n octbod w i t h the c o a s p o s i t e - p a r a t e r m e b d cam IE e-bagmi, h t u yet tbe re h a s been no exper ience v i t h it.
9. Even though ttre a b o r e m t k m e d airclmveazziot of r h e l i n e a r i z a t i . problem n igh t be a c c e p t a b l e i n same d t u a z r i o n i , thrt p r o c e b r e genera l ly reco-nded is t o apply no p r i o r l i z e a r f t l t i a r a n d t o use some modern couputer ized, poverful mon-5- e s 3 ~ ~ 1 3 c n r l g o r l t h n .
3. S?ecEi d o a a n d f-valmatioo
10. Concerning t h e f u n k t e m r a l %sue of f w to e r a l u a z e r d e l s , it may be argued thac g e n e r a l ( I f s e a r ? dynsanic - M e :
11 h e l l b a s e r (1980). - 21 Deacon and Xuel lbauer (1380a and 5 ) . - 31 e.g., Thei l (1975)- - A / Furcner d e t a i l s nay be f z ~ ; r & i n faelfrnck IL97&, 1?78b),
51 See Pael inck (1977, 1 9 7 h and 15-9). -

ought t o be es t ima ted only by means of systems methods. S ing le equat ion OLS- e s t i m a t i o n v i l l lead t o b iased e s t i m a t e s o f parameters , and t h e usual s t a t i s t i c s ( t , Durbin-Watson) provided by t h e s t endard l i b r a r y program a r e misleading. Modern e s t i m t i o n programs inc lude b e t t e r adapted procedures.
- 1 11. It is recommended t h a t t h e e igenvalues of 3 1 alu_fys be analyzed t o s e e i f t h e model is s t a b l e . F u r t h e m r e , t h e s t r u c t u r e 3 1 can r e v e a l t h e n o n - i d e n t i f i a b i l i t y of c e r t a i n equat ions i n t h e system. A s tudy of t h e r e l a t i v e c o n t r i b u t i o n of the endogenous dynamics (@) and t h e exogcnoue v a r i a b l e s t o t h e explanation of t h e y t ' s a l s o deservee a t t e n t i o n , a s t h i s i e of importance in t - r n of t h e model's c a p a c i t y f o r p r o j e c t i o n s .
12. I t is a l s o d e s i r a b l e t o apply t h e nodern non-nested t e s t e o r d i s c r i m i n a t i n g betvcen models. Fur ther , i t is obviously important t o suppor t t h e s p e c i f i c a t i o n of any model a s s t r o n g l y a s p o s s i b l e no t only by economic theory, but a l s o by includi.rg ext raneous information. Th i s means t h a t t h e a p p r o p r i a t e e s t i n a t i o n procedure w i l l o f t e n be of t h e r e s t r i c t e d l e a s t squares o r t h e Coldberger-Zel1.neres mixed type.
C. Forecast in&
13. Given t h e purpose of t h e Bank's c o m o d i t y models, t h e accuracy of t h e i r f o r e c a s t i n g is of course c r l c i a l . I t should be recognized t h a t t h e f o r e c a s t e r r o r of a model stem; from two sources , v iz . e r r o r s i n t h e e s t i m a t e s of parameters and, ( o f t e n ) more important ly , e r r o r s i n t h e f o r e c a s t of t h e exogenous v a r i n b l c s of t h e nodel. It would be d e s i r a b l e t o s u b j e c t one of t h e e x i s t i n g models t o a s y s t e ~ t i c assessment of t h e r e l a t i v e importance of t h e sources of e r r o r s . 2J
14. Very o f t e n a po in t f o r e c a s t is of l i t t l e i n t e r e s t i f not accompanied by a s t andard e r r o r . I t should , t h e r e f o r e , be common p r a c t i c e t o c a l c u l a t e t h i s e r r o r vhenever a f o r e c a s t is nade. Fur ther , a more sys temat ic use of s t andard e r r o r s might be a nore r e l i a b l e and more widely accep tab le measure of t h e f o r e c a s t range than thd l e s s theoret ica l ly-based methods sometimes app l i ed (e.g., f i t t i n g l i n e s t o extreme d a t a s e t s ) .
15. The ex-post s imula t ion by a model may r e v e a l e s s e n t i a l s p e c i f i c a t i o n e r r o r s i n 15s dynamics. I f s imula t ions based on h i s t o r i c a l lagged endogenous and model-generated laqged ecdogenous v a r i a b l e s d e v i a t e s u b s t a n t i a l l y and s y s t e m a t i c a l l y from each o t h e r , i t vould be an i n d i c a t i o n t h a t t h e dynamics of t h e model &ht have been misspeci f ied . - 16. A t p r e s e n t , f o r e c a s t s a r e used f o r both short/medium and f o r mediumllong-run purposes. There is a tendency t o g e n e r a t e these on t h e b a s i s
11 Pesaran 6 Deacon (1978). - 21 For ~ - ~ t h o d o l o g y , e t c . , s e e Fe lds te in (1971). -

of d i f f e r e n t approaches and then t o l i n k them u s i n g a mechanis t ic br idging approach. Although t h i s procedure may be a t t r i k r t a b l e ta some i n s t i t u t i o n a l c o n s t r a i n t , i t s e e m very u n s a t i s f a c t o r y from a n econometric point of view. A model b u i l t t o c a p t u r e long-run dynamics which m i s s p e c i f i e s shor t - run dynamics (e.g., by i g n o r i n ~ them) is l i k e l y t o m i s s t a t e s e r i o u s l y t h e long-run dynamics a e ~ w e l l (and vice-versa). A p o s s i b l e avenue f o r e x p l o r i n g t h i s ques t ion f u r t h e r would be t o d e r i g n one model t o s e r v e both putposes and t o i n v e s t i g a t e whether I t is p o s s i b l e t o work up t o a series of i n t e g r a t e d short- tenn/long- term f o r e c a s t s . Ll
111. ECONOMIC THEORY
17 A p u r i r t ' s c la im is that be fore any model i r b u i l t , t h e t h e o r e t i c a l p r o p e r t i e s i t h a s t o s a t i s f y should ba c l e a r l y s t a t ed- -espec ia l ly , given t h e use of models, f o r a p p l i c a t i o n i n long-run work. With r e s p e c t t o e s t ima t ions , nothing should be accepted t h a t does n o t match those a p r i o r i requirementr , even i f s i g n i f i c a n t parameters have t o be r e j e c t e d o r 5 r i o r i va lues g, impoced. I f t h e t h e o r e t i c a l model w i l l n o t f i t , r econs i e r t e theory.
18 As a minimum r u l e i n modelling, a l l equa t ions should be homogeneous of degree zero i n a l l price. s o t h a t i f a l l p r i c e s a r e doubled, no r e a l v a r i a b l e would be a f f e c t e d i n t h e long run. Furthermore, a l l t ree-crop models should e x p l i c i t l y recognize t h a t p lan t ing and b a r v e r t i n g d e c i s i o n s a r e s e p a r a t e and should be b u i l t up f r o n two s e p e r a t e equa t ions , even i f e v e n t u a l l y on ly one reduced-foru equa t ion can be es t imated. Perhaps a s tandard s e t of computer sof tware could be developed t o h e l p i n t h i s case. For i n s t a n c e , having been given formulae f o r t h e y i e l d s over a t r e e ' s l i f e , t h e formation of p r i c e cxpec tc t ions and t h e determinants of ha rves t ing would au tomat ica l ly produce and e s t i a a t e a reduced-form equat ion. To be u s e f u l , such a n approach would need t o be both f l e x i b l e and robust enough t o be widely app l i cab le .
19. On t h e econometric s i d e , i t was proposed t h a t a c h e c k l i s t be s e t up t o avoid p i t f a l l s . Considera t ion should be given t o extending the l ist t o include t h e o r e t i c a l economic s p e c i f i c a t i o n requirements a s we l l .
20. Two importanc a s p e c t s of t h e Bank's commodity m o d e l s , ~ v i z . t h e p r o t l e n s of r i s k and t h e a v a i l a b i l i t y of s y n t h e t i c s u b s t i t u t e s , need f u r t h e r a t t e n t i o n . Some work is being done t o in t roduce r i s k on t h e supply s i d e of t h e models, bu t r i s k can be equa l ly important on t h e demand s j d e i f the re is a c l o s e s y n t h e t i c s u b s t i t u t e (e.g., j u te and rub tk r ) . Th i s is a new f a c t o r worth i n v e s t i g a t i n g i f s u b s t i t u t i o n is t o be s b d i e d i n depth. Risk on t h e supply s i d e can come from both p r i c e s and y i e l d s and from both t h e crop - concerned o r from competing crops. At ten t ion &st be paid t o t h e formal t rea tment o f r i s k be fo re econometric e s t i m a t i o h i s undertaken.
I -
11 k h i l e such a model w u l d appear t o be an i d e a l t o aim f o r , the l imi ted - exper ience t o d a t e wi th such an i n t e g r a t e d approach is s o promising t h a t l e s s ambitious procedures may be abandoned ( c f . a l s o subsec t ion A above).

21. For s e v e r a l c o m o d i t i e s , t h e r o l e of s y n t h e t i c s u b s t i t u t e s is c r u c i a l . Tne work undertake11 h e r e recognizes t h e d i f f i c u l t i e ~ of t h i s f a c t o r , but s e e m r a t h e r ou t of touch with modern econoae t r i c model l ing r e l a t i n g t o t h i s problem. Again, i f t h i s a r e a is i m v o r t ~ n t enough t o a e t i t something more than j u s t t h e s i a p l e s t techniques (e.g., r e l a t i v e p r i c e s ) , then i t should bc done i n more depth. I n i t i a l l y , t h e focus might be on one commdity, which would i n t u r n have automat ic b e n e f i t s f o r o t h e r s i d l a r models.
I V . ORGANIZATION
22. I t should be s t r e s s e d t h a t because of its l i m i t e d resources f o r model bu i ld ing , t h e Bank's i n s t i t u t i o n a l f a c i l i t i e s should be a s e f f i c i e n t a s poss ible . I t would be worthwhile t o provide t h e s t a f f w i t h a f i r s t - c l a s s d a t a bank, wi th l a r g e s t o c k s of d a t a and e f f i c i e n t and d i r e c t a c c e s s t o them through t h e e s t iamt lo* and s l n u l a t i o n progra-.
23. I n a d d i t i o n , ~ c c e s s t o e f f i 5 i e n t computer p r o g r a m ought t o be s o easy t h a t i t would nc; be p r o h i b i t i v e t o apply t h e f o l l w i n g procedure. S e t up s i m u l a t i o n models wi th t h e d e s i r e d t h e o r e t i c a l p r o p e r t i e s and use them with a range of guessed parameter va lues p r i o r t o e s t ima t ion . I n t h a t way t h e c r u c i a l p a r t s of t h e model would be i d e n t i f i e d and could be t h e focus of t h e bulk of t h e e s t i m a t i o n e f f o r t , poss ibly a t t h e expense of l e s s c r u c i a l p a r t s . Solving t h e models a l g e b r a i c a l l y may be ano the r way of i d e n t i f y i n g c r i t i c a l r e l a t i o n s h i p s . S imi la r ly , c e r t a i n a e t s of d a t a may prove t o be p a r t i c u l a r l y important , i n which case e f f o r t s t o improve them may be indicated.
V . CONCLUSION
24. A nmber of h igh ly re levan t obse rva t ions concerning ind iv idua l commodity models were a l s o made a t t h e concluding sess ion . These have been omit ted i n t h i s p r e s e n t a t i o n , but they have inf luenced t h e wr i t e -up of t h e papers on i n d i v i d u a l models.
25. As a f i n a l note , i t should be s t r e s s e d t h a t a l though t h e above sur.mary of comments impl ies t h a t models a r e t h e most e f f i c i e n t instrument f o r commodity a n a l y s i s , they may be i n f e r i o r t g more simple e x t r a p o l a t i o n procedures. For i n s t a n c e , even fores?en s t r u c t u r a l changes a r e not e a s i l y capturea by formal models.

References
Deaton, A.S. and J. Hue l lbaue r [1980a], "An Almost I d e a l Demand System", American Economic Review, Vol. 70 , 312-326, b y 1980.
, [1980b], Economice and Consumer Behavior , Cambridge, Cambridge U n i v e r s i t y P res s .
F e l d s t e i n , H.S. [1971] , "The E r r o r of F o r e c a r t i n Econometric I b d e l r When t h e Forecas t -Per iod Exogenour V a r i a b l e r a r e S t o c h a r t i c t l , Econometrica, Vol. 39, No. 1, 55-60, J anua ry 1971.
~ e l l b a u e r , J. [1975], "Aggregation, Income D i r t t i b u t i o n and Consumer Demand", The Review of Econoaic S t u d i e s , Vol. 42 , 525-543, October 1974 .
P a e l i n c k , J.H.P. [1974] , " I n t e g r a t e d Burinerr-Cycle and C r w t h I b d e l r : Sooe Contr ibut ions" , Crundfragen d e r S t a b i l i t a t r p o l i t i k . S c h r i f t e n r e i h e d e r Uirtscha€trwirrenrchaftlichen S e a i n a r r Ot toburen , Band 3 , 310-334, Tubingen, Ibh r .
P a e l i n c k , J.H.P. (w i th S. Wagenaar) [1977], "Treatment o f Hu l t id imenr iona l Data--A Revieu and Some Contr ibut ionr" , Revue Be l se d e S t a t i r t i q u e l d 8 1 n f o m a t i q u e e t d e Recherche O p e r a t i o n e l l e , Vol. 1 7 , No. 3: 23-48.
P a e l i n c k , J.H.P. ( w i t h J.4. C h e v a i l l e r ) , [1978a] , "Parameter Component Hodels i n S p a t i a l E c o n o ~ t r i c s , The Econometrics of Pane l Data", Annales de 181NSEE, Vol. 30-31: 83-98.
P a e l i n c k , J.H.P. [ l 9 7 8 b ] , "La p r e v i s i o n economique: du nouveau?" A.C. Decoufle (ed.), T r a i t e e l e m e n t a i r e d e p r e v i s i o n e t d e p rospec t ive , 105-135, P a r i s , P r e s s e s U n i v e r s i t a i r e s de Prance.
P a e l i n c k , J.H.P. ( w i t h L.H. Klaassen) , [1979], S p a t i a l Economrt r ics , F a r n b r o u g h , Saxon House.
Pesa ran , H.H. and A.S. Deaton [1978], "Tes t ing Non-Nested Non-Linear , Regress ion Hodels", Econometrica, Vol. 46, No. 3: 677-694, Hay 1928.
T h e i l , H. [1975-19761, Theory and Measurement of Consumer Demand, Vol. I and 11, Amsterdam, North-Holland.
Z e l l n e r , A. [1962], "An E f f i c i e n t Method o f E s t i m a t i n g Seemingly Unre la ted Regress ions and T e s t s f o r Aggregation Bias", J o u r n a l of t h e American S t a t i s t i c a l Assoc ia t ion , Vol. 57: 348-368, June-1962.
8 , [1979], " S t a t i s t i c a l Analys is o f Econometric Hddels", J o u r n a l o f t h e American S t a t i s t i c a l Assoc ia t ion , Vol. 74 , No. 367: 628-643, September 1979.

OH TEE EVALUATION OF E m O H I C PORECASTS

ON THE EVALUATION OF ECONOHIC FORECASTS _1/
I n t r o d u c t i o n
1. T h i s paper d i s c u s s e s methods f o r e v a l u a t i n g economic f o r e c a s c s . I t s t a r t s w i t h a p r e s e n t a t i o n of a l i n e a r economet r i c f o r e c a s t i n g model, vh ich is used a s a r e f e r e n c e f o r the later a n a l y s i s ; t h a s p e c i a l form o f t h e model, i n c l u d i n g i ts fo rma l c h a r a c t e r , is of no fmportance. Subsequent ly , t h e r e is a d i s c u s s i o n of t h e o b j e c t i v e s o f v a r i o u s e v a l u a t i o n p rocedures and of some of t h e t e c h n i q u e s a v a i l a b l e f o r e v a l u a t ~ n g d i f f e r e n t f o r e c a s t s and f o r e c a s t i n g methods. I t w i l l be a rgued t h a t s e v e r a l of t h e most commonly used e v a l u a t i o n t echn iques a r e e s e e n t f n l l y w o r t h l e s s o r , worse, mis leading . An a p p l i c a t i o n of some of t h e v i a b l e e v a l u a t i o n p rocedures is p r e s e n t e d a s a n i l l u s t r a t i o n of t h e i r u s e in t h e f inal s e c t ion.
The F o r e c a s t i n g Hodel
2. F o r e c a s t s of economic e v e n t s a r e u s u a l l y based on a n economic model, f o r i n s t a n c e , a n e s t i m a t e d econometr ic model, on a t h e series a n a l y s i s , and on judgmental f a c t o r s . The weight of t h e s e t h r e e e l emen t s v a r i e s from c a s e t o c a s e . However, even when t h e f o r e c a s t is c a l l e d a n econometr ic f o r e c a s t , i t u s u a l l y encompasses t h e o t h e r two e l emen t s a s w e l l .
3. A s a n example, t a k e t h e r e s t r i c t e d reduced form of a l i n e a r s t r u c - t u r a l e c o n ~ m e t r i c model
where y is a l x g v e c t o r of g endogenous v a r i a b l e s l a t time t , t Y t - 1 a l x g v e c t o r
of t h e lagged endogenous v a r i a b l e s , z a l x k v e c t o r of ( lagged and unlagged) t
exogenous v a r i a b l e s , u a l x g v e c t o r of d i s t u r b a n c e s i n t h e g e q u a t i o n s , and t
ll and ll c o e f f i c i e n t m a t r i c e s of o i d e r s qxg and kxg r e s p e c t i v e l y . 1 2 6
4 . The f o r e c a s t f o r one p e r i f i ahead is g iven by
11 T h i s pape r is a r e v i s e d v e r s i o n of a paper p r e s e n t e d a t a comnodity - models seminar i n Aarhus, Denmark i n December 1979, sponsored by t h e World Bank and t h e I n s t i t u t e of Economics, U n i v e r s i t y of Aarhus. The s e v e r a l comments From t h e p a r t i c i p a n t : a r e g r a t e f u l l y acknowledged, a l o n g w i t h t h e c o n p u t a t i o n a l a s s i s t a n c e , e t c . , of G. Langvig, K.V. N ie l s en , H. Bunzel, J . Sdondergaard, and K . Laursen. Of c o u r s e , a l l e r r o r s remain t h e r e s p o n s i b i l i t y of t h e a u t h o r . The compu ta t ions were made by means o f t h e ISISMA Program Package (see Bunzel, 1977) .

where t h e ca re28 d e r o t e an es t ima ted parameter o r v a r i a b l e . 11 The f o r e c a s t f o r h-period ahead is given by
5. I f t h e econometric model is non-linear, t h e a n a l y t i c a l s o l u t i o n r Fa (1). (2) and (3) w u l d be rep laced by s imula t ion u p e r f m e n t s ( see Klein, 1971, and I n t r i l i g a t o r , 1978).
6. For s i n p l i c i c y , only (2) is considered here . The f irst and second terms on the r i g h t hand s i d e e m r i t e t h e e f f e c t s of the sys temat ic p a r t of t h e econometric model vhich is intended t o be t h e es t imated formal represen- t a t i o n of a sound economic theory. The t h i r d component is t h e e s t i m a t e of t h e f u t u r e va lue of t h e d i s tu rbance vec to r .
7. I n a model such as t h i s , t h e series a n a l y s i s is o f t e n app l i ed both in the p r e d i c t i o n of the u o g e n o m v a r i a b l e s and in t h e (specif i c a t i o n and) f o r e c a s t of t h e d i s tu rbance processes . Furthermore, it is apparent t h a t uis- t i n g economic theory i s of l i t t l e help in t h e s p e c i f i c a t i o n of t h e l a g s t ruc - t u r e of t h e nrodel, p a r t i c u l a r l y wi th r e s p e c t t o t h e es t ima t ions of t h e l eng ths of t h e l a g s . Therefore , some form of time e e r i e r a n a l y s i s Fs of t e n app l i ed h e r e as vell, a l though very few econometricians go as f a r a n Z e l l n e r and Palm (1974) and Granger and Ncvbold (1977). who advocate t h e use of t h e time s e r i e s nrodelling technique of Box and J e n k i n s (1970) in t h e s p e c i f i c a t i o n of t h e l a g s t r u c t u r e (and the d i s tu rbance processes) .
8. The p r e d i c t i o n s of t h e f u t u r e v a l u e s of t h e e r r o r terms in %+I can be based on random drawings us ing t h e es t ima ted d i s t r i b u t i o n s and/or Information c o l l e c t e d o u t s i d e t h e model. The ,term is of t e n denoted t h e add f a c t o r o r ,
t h e judgmental component ( see , f o r ins tance , I n t r i l i g a t o r , 1978). The judg- ments can be made by t h e f o r e c a s t e r s themselves, bu t they o f t e n apply t h e op in ions and assessments of o t h e r s p e c i a l i s t s (see , f o r ins tance , Jeqsen, 1979).
i
9. Of course , f o r e c a s t s can be made by us ing exc lus ive ly e i t h & time s e r i e s f o r e c a s t l a g techniques, such a s exponent la1 smoothing and Box-Jenkins methods, o r by 9 l y I n g on t h e op in ions of e x p e r t s . However, both menods a r e r e a l l y l i m i t e d ins tances of t h e mixed f o r e c a s t Ing technique d e s c r i b e d i n (2) and (3).
1 / A s Robert Bacon of Oxford Univers i ty pointed ou t a t the seminar, i t should - be common p r a c t i c e t o r e p o r t on a s tandard e r r o r of f o r e c a s t whenever a po in t f o r e c a s t is made. For t h e computation of s tandard e r r o r s of fore- c a s t , s e e Brown (1954), Hooper and Ze l lne r (1961), Goldberger, Nagar and Odeh (1961) and F e l d s t e i n (1971).

The Objec t ives of Forecas t ing Procedures
10. In e v a l u a t i n g any f o r e c a s t i n g procedure, i t is obviously necessary t o cons ide r i ts o b j e c t i v e s . I f any o b j e c t i v e is t o p r e d i c t f u t u r e developments in a s e r i e s ~ h i c h cannot be c o n t r o l l e d o r inf luenced by the u s e r s of t h e fore- c a s t s , t h e eva lua t ion of t h e f o r e c a s t can be based on t h e v e c t o r of e r r o r s in t h e f o r e c a s t
11. There a r e s e v e r a l p o s s i b l e causes f o r t h e e r r o r s . The f i r s t is erroneous d a t a , tha second e r r o r s i n s p e c i f y i n g t h e model, t h e t h i r d , b i a s e s i n t h e e s t imated parameterr , and t h e f o u r t h , e r r o r s i n p r e d i c t i n g f u t u r e va lues of exogenous v a r i a b l e s and t h a add f a c t o r s .
12. I n o r d e r t o analyze some of t h e d i f f e r e n t cnuses, cons ide r t h e f o l l o - wing decompos it Lon
T h i s express ion d e c o q o s e s t h e t o t a l e r r o r of t h e f o r e c a s t i n t o terms which c a n be i n t e r p r e t e d a s a weighted sum of tho e r r o r s r e s u l t i n g from b i a s e s i n t h e e s t i m a t i o n of t h e c o e f f i c i e n t s an+ b i a s e s in t h e p r e d i c t i o n of t h e f u t u r e va lues of exogenous v a r i a b l e s and t h e d i s t u r b a n c e terms. The accuracy of t h e p r e d i c t i o n of t h e exogenous v a r i a b l e s can be measured d i r e c t l y by
The accuracy of t h e estimated model i t s e l f and of t h e f o r e c a s t of t h e add f a c t o r s can b e measured by
where ?;+l - y e l + zT+lJ?2 + s+l . f
13. I f t h e u s e r s of t h e f o r e c a s t have some in f luence on f u t u r e developments, and t h i s in f luence is exer ted through changes i n some of t h e exogenous v a r i a b l e s , t h e accuracy of t h e f o r e c a s t can be measured by
A where 9 - A - T+I Y T * ~ + z ~ + l * 2 + %+I

-a The elements of zT+l a r e equal t o the corresponding elements of e i t h e r =T+l - o r z T+1' depending on whether the va r i ab l a s a r e cont ro l led o r not.
14. A s t h e exogenous va r i ab l e s and the add f a c t o r s can be considered endogenous in o the r p a r t s of a t o t a l block racurs ive model descr ibing the whole economy, in the remaining pa r t of t he paper t he focus is on the pred ic t ion of the endogenous var iablas .
Evaluation Procedures
15. A proper framework f o r the evaluat ion of fo recas t s could involve com- puting the c o s t s of making incor rec t predict ions, t h a t is, by specifying a cos t funct ion f o r a l l endogenous va r i ab l a s t o be fo recas t over the e n t i r e period of the forecast . I n most p r ac t i ca l s i t ua t i ons , however, co~lputat ing the c o s t s of d i f f e r e n t fo recas t e r r o r s is not possible , f o r obvious reasons. Instead, the common p rac t i ce is t o apply, imp l i c i t l y o r exp l i c i c ly , a syn the t ic cos t function, a s , f o r instance, t he quadrat ic cos t of e r r o r function. This implies t h a t the fo recas t s w i l l be judged in terms of the expected squared e r r o r (see Granger and Newbold, 1977, ch. 4 and 8).
16. The choice of a synthe t ic cos t funct ion can be defended on the same grounds a s t h e l e a s t squares c r i t e r i o n w e d in most estimation procedures (for a discussion of t h e l e a s t squares c r i t e r i o n , see Keergdrd, 1979). Xwever, its def ic ienc ies a r e a l s o the same. The main objec t ions aga ins t the expected squared e r r o r c r i t e r i o n a r e t h a t it focuses on a s ing l e variable, t h a t a l l e r r o r s within t he forecas t period a r e given equal ve ight , and that it is symmetric.
17. A s a n i l l u s t r a t i o n , consider the pred ic t ion of the i ' t h endogenous var iab le 1-1.2,. . . ,g. Let y be the ac tua l value and fT the pred ic t ion of that
T value a t time T-h, ~=1,2,... ,N, i . e . , made h-periods previously, h=1,2,... . The e r r o r i n t he forecas t is then
The forkcast t h a t minimizes the expected squared e r r o r is ca l led the "optimal f o r ecad" , f o l loving Box and Jenkins (1970).
- 18. * The est imate of the expected squared e r r o r is
The ac tua l and forecas t values in (S), i.e.. y, and f,. can be e i t h e r f o r the l eve l s , the f irst d i f fe rences , o r the percentage changes i n the ~ e r i e s depen- ding on the purpose of the forecas t ing exercise and the form of the forecas t ing model. Notice, however, t h a t the l e v e l of an economic time series typ ica l ly appears much e a s i e r t o forecast than both the f irst d i f fe rences and the per- centage change.

19. Granger and Newbold (1977, p. 179) a rgue t h a t an eva lua t ion of a s e t of f o r e c a s t s might seek t o answer one o r more of t h e fo l lowing t h r e e qbas t ions :
"(a) Is one s e t of f o r e c a s t s b e t t e r than its compet i tors? (b) Hov good in some sense , is a p a r t i c u l a r s e t of f o r e c a s t s ? (c) Can t h e fo recas t -genera t ing mechanism be aodif l e d i n some
way s o a s t o y i e l d improved f o r e c a s t perfonaancrt"
Some of the techniques that can be app l i ed to ansver t h e s e q u e s t i o n s a r e d iscussed be low.
20. The d i r e c t a p p l i c a t i o n of D: is usua l ly of l lmi ted h e l p in a n m e r i n g q u e s t i o n s (b) and (c) , v h i l e t h e comparison of t h e average squared e r r o r s f o r two competing f o r e c a s t s can be of some value i n ansvr:ring (a ) , even i f t h e var iance r a t i o o r F- tes t is not s p ~ l i c a b l e , s i n c e t h e e r r o r s from t h e two
1 f o r e c a s t i n g procedures w i l l be both c o r r e l a t e d and s e r h l l y dependent.
21. T h e i l (1961) suggested a t ransformat ion of the average sum of squared e r r o r s a s
Denoting U1 a s t h e F i r s t Inequal: :y C o e f f i c i e n t , i t is e a s i l y shown t h a t
0 - * U1 * - 1 f o r a n optimal p r e d i c t o r , and it is argued t h a t t h e s i z e of U1 can
be tised a s an answer t o both ques t ion (a) and (b). However, a s a small example ua-d by Cranger and Newbold (1577) shows, U1 is a c t u a l l y of no va lue In answer- ing those ques t ions . Let y be generated by
T
Y T = + t T
2 where 0 < B < 1 and cT is i . i .d.(OBaE). - - I
I Let t h e p r e d i c t i o n of y f o r one per iod ahead be given by T
- which is minimized not oy b = B , but by b = 1, whatever t h e value of 0.
22 . T h i s example shows t h a t the F i r s t I n e q u a l i t y C o e f f i c i e n t produces a t l e a s t a s meaningless r e s u l t s a s t h e c o r r e l a t i o n c o e f f i c i e n t between yT and f which i t was c r i g i n a l l y cons t ruc ted t o r ep lace . The de f i c iency of the c z r r e l a t i o n c o e f f i c i e n t is t h a t a value of I impl ies t h a t y = B~ + B i f o r
T 1 T a l l values of B , # 0 , vhereas a p e r f e c t f o r e c a s t impl ies Bo = 0 and B1 = 1 a s we l l .

23. T h e i l (1966) a l s o suggested a Second I n e q u a l i t y C o e f f i c i e n t , U 2 '
2 TC: where U2 = - 1 Y 2 r r
Obviously U2 2 0. A value of U2 - rJ i n d i c a t e s a p e r f e c t f o r e c a s t , v h l l e U2 =
1 can be i n t e r p r e t e d a s a f o r e c a r t t i u t p r e d i c t s no change. I t is, of course , a p r e r e q u i s i t e f o r t h i s i n t e r p r e t a t i o n t h a t y and f a r e t h e a c t u a l and t h e p red ic ted changes. I f u > 1 , i t may h d i c a t 6 a i o r 6 c a s t t h a t is in some s e n w w r s e than t h e p r e d i c t i o a of no change.
24. The U2 coef f i c i e n t can be of sow v r l w i n a n m e r i n g q u a s t ions (a) and (b), a l though it is impossible t o te l l if t h e observed d i f f e r e n c e s between t h e va lues of U de r ived from two c o q e t i n g f o r e c a s t s a r e s i g n i f i c a n t l y dl£- ferenr . A probltm s i m i l a r t o t h a t is encountered when t h e coef f i c i e n t s of determinat ion i n tw l i n e a r r e g r e s s i o n s a r e compared (see Basmann, 1962, Koerts and Mrahamse, 1969, P e ~ r a n , 1974 and P t sa ran and Deaton, 1978).
25. I n o r d e r t o provide answers t o t h e t h i r d quest ion, T h e i l (1961) de-
composed D~ in two ways. he f i r s t was N
where f and y a r e t h e saq le means of f x and y sf and s t h e i r s tandard d e v i a t i o n s , and r t h e c o r r e l a t i o n coef f ~ c i m t &tween y, Znd f r . The second was
Froe (LO), 1 = # + us + uC where L
and
(121, (13) and (14) a r e c a l l e d t h e b i a s p ropor t ion , t h e var iance propor t ion, and t h e covar iance p ropor t ion , r e s p e c t i v e l y .

26. The i n t e r p r e t a t i o n of t h e s e p r o p o r t i o n s is no t a s s t r a igh t fo rward a s thought by T h e i l (1966) and I n t r i l i g a t o r (1978), among o t h e r s . They argued t h a t t h e f o r e c a s t e r should produce a f o r e c a s t wi th a mean and v a r i a n c e equal t o t h e mean and va r fance of t h e a c t u a l s e r i e s , t h a t is, fl and us should be minimized. The f o r e c a s t e r should a l s o have a c e r t a i n p o t e n t i a l f o r success in e q u a l i z i n g t h e means and t h e va r i ances , v h i l e i t vould be much more d i f f i c u l t t o avoid t h e e r r o r s r e s u l t i n g from imperfect c o v a r i a t i o n .
27. Following Granger and Newttold (1977) , cons ide r t h e p rocess
Y, - BY,-1 + C,
where 0 - ' 0 ' - I , and C, is i.i.J. (0.0:) .
Let t h e f o r e c a s t be g iven by f T - which is a n optinral f o r e c a s t in the sense of the expected squared e r r o r . A s N goes toward i n f i n i t y ,
l b # - 0 . 1 b u s - % ' and Iim uC - 2
K" u- K"
C implying that a s 6 varie., 8 and 3 can t ake on any value , s u b j e c t t o t h e
r e s t r i c t i o n s t h a t US > - 0, uC - < 1 and us + uC - 1.
28. The i l t e r p r e t a t i o n of US a s t h e avo idab le s y s t e u : i c e r r o r r e s u l t i n g f r o & t h e unequal v a r i a n c e s and of U' a s t h e non-avoidable random e r r o r r e su l - t i n g from imperfect c o v a r i a t i o n (see T h e i l 1965, p. 32, and I n t r i l i g a t o r , 1978, p. 525) is c e r t a i n l y not v a l i d he re , and t h e va lue of t h e decomposition must be s e r i o u s l y quest ioned.
29. The second decomposition is of more use. Prom ( I 1) ,
I
vhere # is a s def ined in (12) v h i l e
and

(15) and (ltij crc ca l l ed the regression proportion anc the disturbance pro- pox : ion, respect ively . 30. To in t e rp re t L?, 8 and #, consider the regression .
Y, ' Bo + B l f f + c, f = Ir2.....N (1 7)
and the predict ion-real izat ion diagram o' re i l (1961). shown i n Pig. 1.
Pig. 1: THE PRED1(ffIOtJ-RehLIUTION D U C M
~f th2 forecast is pe r f ec t , yf = f 1.e. B0 = 0, = 1, and c, = 0. 1
31. t h e l e a s t squares e s t i u t a of Bl is i1 = s Y s = r 1s . while - -- Y f the e a t h a t e of B0 is 4 = y - fBl. The e s t h u t e of the variance of c, is
- where s is *e covariance of y and f .
f y - T T

32. I t i a now e a s i l y seen t h a t L? and # - 0 i f and only i f io - 0 and a , - 1. In tho: c a s e , uD - 1, implying t h a t t h e average sum of squared fore- c a s t e r r o r s cqua1s t h e va r iance O C t h e d i s tu rbance term (17). h he es t imnted regression is yT - f , + a,.
1 33. (11) is t h e ~ ~ p l e analo! t o
2 2 2 y - c - - Y Y l 2 + (of - 0 a y l 2 + ( 1 - 0 )ay
2 v h r e pf and p a r a the cxpocted v a l w r of f and y,, v h f l e of
Y r
I 34. The expected squared e r r o r is minimized by f Fading t h e l a r g e s t p , given thac pf - uy and a f - pay. The cond i t ion t h a t uf - 9 and of - pay
i can be checked by r e ~ r e s s i n g y, on f and t e s t i n g t o s e e if the s lope is d i f f e r e n t f r o a 1 and tk i n t e r c e p t d i f f e r e n t from 0 .
3;. I f the j o i n t hypothesis Bo - 0 and 0, - 1 cannot be r e j e c t e d , t h e r~smple c o r r e l a t ibn between y and f, , i . e . r , can b e used as a measure of the f o r e c a s t i n g q u a l i t y . Th i s procedure is c a l l e d t h e Cranger-Nerhold pro- cedure.
36. The regress ion of yT on f, is suggested by Hincer and Zarnowitz (1369). Notice, hwever . t h a t any f o r e c a s t f r s a t i s f y i n g 8, - 0 and B1 - 1 can t e considexed opt-i only In t h e c l a s s c + df,, +e re c and d are any c o n s t a n t s (see k t a n a k a , 1974). T h i s * l i e s t h a t t h e condi t ion Bo - 0 and B1 - 1 can be considered a necessary , thou+ not In i t s e l f s u f f i c i e n t , con- d i t i o n f o r e f f i c i e n c y in t h e f o r e c a s t . Furthermore, i t can be questfoned whether the usual Xeast squares cond i t ions f o r ur.bhsed and e f f i c i e n t e s t i - mation of ahe c o e f f i c i e n t s and d i s tu rbance v a r l a n c e j c s ~ . be mkt. The e r r o r and the f ~ r e c a s c a r e uncorre. ated I / i f the f o r e c a s t is optimal In t h e expec- - ted squared e r r o r sen= (see Box t n d Jenkins , 1970), b u t t h a t need n o t be +,he c a s e f o r o t h e r f o r e c a s t s , a s pointed o u t by Ccanger and Newbold (1977), Imply- ing t h a t che OLS e s t i m a t e s a r e blased. prOblr of a u t o c o r r e l a t i o n a r e a l s o l i k e l y t o be p resen t , Implying blased es t imat of t h e t - s t a t i s t i c s , e t c . In f a c t , en optimal f o r e c a s t of more than one p e r i o d ahead produces autocorre- - l a t e d e r r o r s (see Box and Jenkins , 1970). -
*
1 The o p t h l f o r e c a s t and the e r r o r s vl.11 be asymptot ical ly uncorre la ted - only i f the f o r e c a s t s a r e based on t h e cornpcted reduced form of an e s t i - m t e d ~Fmultaneous econoaetr ic model. The reason is t-itat the e s t i m a t e s of the c o e f f i c i e n t s of the s t r u c t u r a l equat ion a r e biased, bu t c o n s i s t e n t and asympto t ics l ly cl15iased est h a t e s .
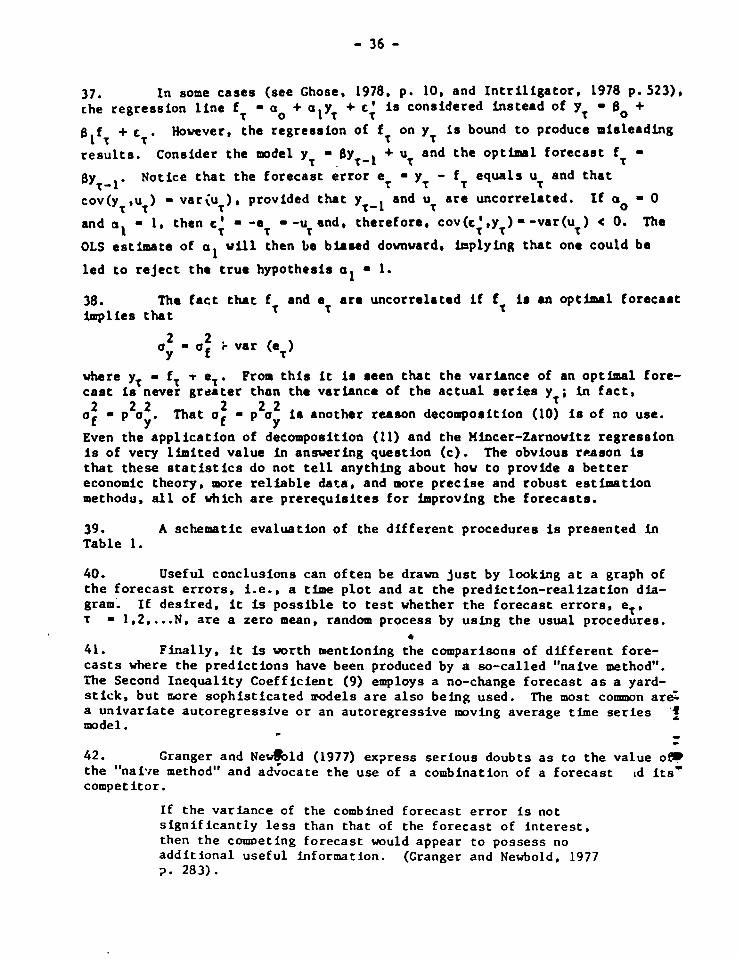
37. I n some c a s e s ( see Ghose, 1978, p. 10, and I n t r i l i g a t o r , 1978 p. 523), t h e regress ion l i n e f t - a. + alyT + c; is considered i n s t e a d of yt - Bo + Blf, + c t . However, t h e r e g r e s r l o n of f on yt f r bound t o produce mir leadlng
t r e s u l t s . Consider t h e model y - Byt-, + u and t h e opt imal f o r e c a s t f -
t 7 t Not ice that t h e f o r e c a s t e r r o r e7 - y7 - f e q u a l s u and t h a t
t t cov(ytsut) - v a r i u ), provided that yl-l and u a r e uncorre la ted . I f a. - 0
t T
and a L - 1' then c; - -e - -u and. t h e r e f o r a , cov(c ' ,y ) - -var(u ) < 0. The t r t t t
OLS e s t l m a t e of a l w i l l then ire b iased dovnward. implying that one cou ld be
l e d t o r e j e c t t h e t r u e hypo ther i r a l - 1.
38. The f a c t that f and a a r e uncor ra l r t ed i f f i a an opt imal f o r e c a r t Impl ies t h a t t t 1
a2 - a2 i v a r (e Y f t
vhere yt - f, T e,. From t h i r i t i r reen that tha va r i ance of an opt imal fore- c a s t is never g r e a t e r than t h e va r i ance of t h e a c t u a l reries y-; In f a c t *
T
i r ano the r r e a w n decomporit ioa (LO) is of no use. That o f - p ay O f - P ay. Even t h e a p p l i c a t i o n of decomposition (1 1) and t h e Hincer-Zarnovitz r e g r e s s i o n is of very l i m i t e d value i n answering ques t ion (c) . The obvious reason is t h a t t h e s e s t a t i s t i c s do n o t t e l l anything about how t o provide a b e t t e r economic theory , more r e l i a b l e data, and more p r e c i s e and robust estimation methodo, all of which a r e p r e r e q u i s i t e s f o r improving t h e f o r e c a s t s .
39 A schemetic eva lua t ion of t h e d i f f e r e n t procedures is presented i n Table 1.
40. Useful conc lus ions can o f t e n be drawn j u s t by looking a t a graph of t h e f o r e c a s t e r r o r s , i.e. , a time p l o t and a t t h e p r e d i c t f o n - r e a l i z a t i o n dia- gram. I f d e s i r e d , i t is p o s s i b l e t o t e s t whether t h e f o r e c a s t e r r o r s , e t . t = lV2,. . .N, a r e a zero mean, random process by u s i n g t h e usual procedures.
L
41. F i n a l l y , i t is worth mentioning t h e comparisons of d i E f e r e n t fore- c a s t s vhere t h e p r e d i c t i o n s have been produced by a so-cal led "naive method". The Second I n e q u a l i t y C o e f f i c i e n t (9) employs a no-change f o r e c a s t a s a yard- s t i c k , b u t wre s o p h i s t i c a t e d d e l s a r e a l s o be ing used. The most common a r c a u n t v a r i a t e a u t o r e g r e s s i v e o r a n a u t o r e g r e s s i v e moving average t ime s e r i e s model. - -
*
42. Granger and ~ e w ? o l d (1977) express s e r i o u s doubts a s t o t h e va lue o m t h e "nalve method'' and advocate t h e use of a combination of a f o r e c a s t ~d its' competi tor .
I f t h e v a r i a n c e of the combined f o r e c a s t e r r o r is not s i g n i f i c a n t l y l e s s than t h a t of the f o r e c a s t of i n t e r e s t , then t h e comoeting f o r e c a s t would appear t o possess no a d d i t i o n a l u s e f u l information. (Granger and Newbold, 1977 7. 283).

Table 1 : SUMKARY OF PROCEDURES
Stati8tic8 Preferred Helpful in ansvcring question8 Value 0 (a) (b) (c)
Average 2 Squared Error
2 DN - 0 partly no
First Inequality U1 - 0 no no no Coefficient
Second Inequality U2 = 0 partly partly no Coefficient
First 1 - U H + u s + u C Decomposition
UH-0 2 2 UH - (F - ;I / D ~ us - o no
u c - l us - ((. - -4) / D ~
- 2(1-r)s s /D 2
f Y N
Second Decomposition 1 - # + # + $
u R - o partly *
partly partly
Mncer- Zarnowitz Regression
Born' partly partly partly B1 = 1
Reversed Hincer- Zarnowit z Regression
Granger- YT I Bo+BlfT*T Bo ' 0 Newbold Yes Yes partly Procedure B1 = 1
r = corOTT , fT) r - 1
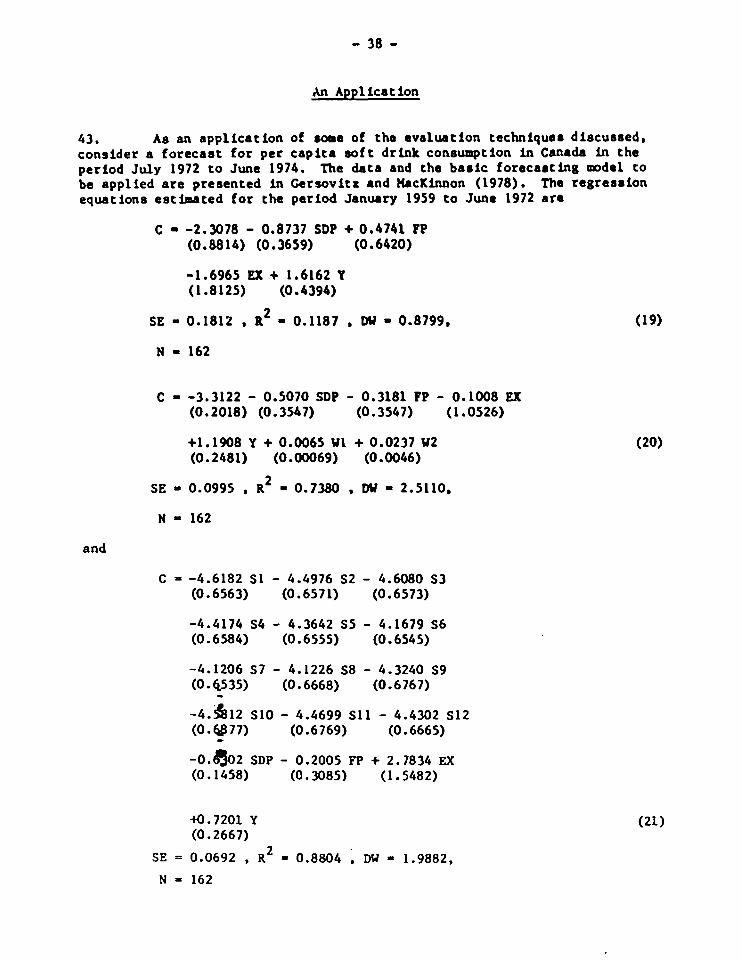
An Appl ica t ion
43. A s an application of m a of tho avaluation techniquar discussedD consider a forecast for per capita sof t drlnk consumption in Canada in the period July 1972 to Juna 1974. The data and tha baric forecarring modal to be applied are presented in Cersovitt and HacKinnon (1978). Tha ragrasrion equations estimated for tha period January 1959 to Juna 1972 era
C -2.3078 - 0.8737 SDP + 0.4741 FP (0.8814) (0.3659) (0.6420)
C = -3.3122 - 0.5070 SDP - 0.3181 FP - 0.1008 EX (0.2010) (0.3547) (0.3547) (1.0526)
and
-0. &2 SDP - 0.2005 FP + 2.7834 EX (0.1458) (0.3085) (1.5482)

where C is t h e ( n a t u r a l ) l oga r i thm o f p e r c a p i t a s o f t d r i n k consumption; 1 1 SDP is t h e loga r i thm of t h e consumer p r i c e index f o r s o f t d r i n k s r e l a t ive - to t h e consumer p r i c e index f o r a l l items, exc lud ing food; FP is t h e loga r i thm of t h e consumer p r i c e index f o r food r e l a t i v e t o t h e consumer .p r i ce index f o r a l l i t ems, exc lud ing food; W is t h e loga r i thm of t o t a l pe r sona l expendi- t u r e s on nondurable goods i n c o n s t a n t US d o l l a r s p e r c a p i t a computed by monthly i n t e r p o l a t i o n of q u a r t e r l y d a t a ; Y is t h e l o g a r i t h m of t h e r e !a t ive p a r t of Canadian p o p u l a t i o n under 25 y e a r s of age ; and S1 t o S12 a r e monchly seasona l dummies.
44. The t empera tu re , W (OF), is computed a s a u e i g h t e d ave rage of t h e overage d a i l y maximum tempera ture in Hon t rea l (weight 1 /3 ) , Toronto (weight 112) and Vancouver (weight 116) and is a p p l i e d a s a s p l i n e , w i t h W , - W - 35 i f W - > 35, and W1 - 0 o the rwise , and W2 - W - 70 i f W 2 70, and W2 - 0 o t h e r - wise .
45. Expression (19) r e p r e s e n t s a "Unified model", based on t h e assumption t h a t t h e sane model a p p l i e s t o a l l p e r i o d s , wh i l e (20). c a l l e d t h e S p l i n e model, is t h e same a s (19). b u t w i t h t h e tempera ture v a r i a b l e s added. I n (21) t h e s e a s o n a l i t y problem is accounted f o r by i n c l u d i n g t h e 12 s e a s o n a l dummies in- s t e a d of t h e c o n s t a n t term. T h i s model, denoted t h e "Lovell model", i o a p p l i - c a b l e in c a s e s of r e g u l a r s easona l movements in t h e series ( see Hannan, 1963, L o v e l l , 1963 and Hyl leberg , 1977, 1979).
46. The p r e d i c t i o n s d e r i v e d w i t h t h e t h r e e models f o r t h e pe r iod J u l y 1972 t o June 1974 a r e p re sen ted i n Tab le 2. The r e p o r t e d s t a n d a r d e r r o r s of f o r e c a s t f o r t h e p e r i o d r , r-1.2, ... N a r e computed a s
where zr is t h e column v e c t o r of r e g r e s s o r s a t t+ T, R t h e e s t i m a t e d covar- i a n c e ma t r ix of t h e r e g r e s s i o n c o e f f i c i e n t s , and a2 t h e e s t i m a t e d v a r i a n c e of t h e d i s t u r b a n c e term. 21 u - - 47. From t h e r e g r e s s i o n r e s u l t s i t should b e ' & c p e c t e d t h a t t h e Gnif i e d model w u l d perform badly when compared t o t h e o t h e r models. These expecta- - t i o n s a r e c o n f i ~ n e d by t h e r e s u l t s shown in Tab le :K * 48. In o r d e r t o e v a l u a t e and compare t h e t h r e t models, e v a l u a t i o n s t a t i s t i c s have been computed based on a c t u a l and f .3recast v a l u e s f o r per c a p i t a s o f t d r i n k consumption, and no t on t h e loga r i thms . The s t a t i s t i c s a r e shorn i n Tab le 3 and, in t h e p r e d i c t i o n - r e a l i z a t i o n diagrams in F i g u r e s 2 t o 4. Time p l o t s of t h e f o r e c a s t e r r o r s a r e p r e s e ~ t e d in F igure 5.
1 1 S o f t d r i n k consumption is measured by a volume index of s o f t d r i n k - product ion .
2 1 See F e l d s t e i n (1971) f o r t he g e n e r a l i z a t i c n of his formula Fn c a s e s - where t h e r e g r e s s o r s a r e f o r e c a s t a s w e l l .

Table 2: ACTUAL AND PReDICTED VALUES OF THE UX; OF PER CAPITA SOFT DRINK C O N S ~ I O N IN CANADA,
JULY 1972 TO JUNK 1974
Actual Unified W a l Lovall lbdal Splina lbdal
Year Honth Forecast Standard Forecart Standard Forecast Standard error of error of error of forecast f orecaet forecast
A L 1
C C C s a C s a C C

Table 3: PER W I T A SOFT DRINK CONSLMPTION--FOWT EVALUATION STATISTICS FOR THE UNIFIEDI U1VEI.L AND SPLINE HODELS*
JULY 1972 TO JUNK 1974
S t a t i s t i c s Hodel
Unif ied tove 11 Spl ine
Average squared e r r o r s 2 1 2 D~ - ijrCt .000004388 .000001032 .000002749
Second inequal i ty coef . u2 - [4:/4:1~ .1956 .0949 .I548
A
Hincer-Zarnowit z Regression
Bo
Cor re l a t ion r = cor(ytVf .2350 .9213 .8667
Average fo recas t e r r o r = ST
/a The f i g u r e s in parentheses a r e s tandard devia t ions . -

PRIOICTIW-REALIUTION DI*(IRAM. JULY l a 7 1 TO JUNE 1974, SPLINE MOOEL--PER m T A mm DRINK -ION
'r 4
World Bank-23106

Pig. 5: FORECAST EBBORS OF THE UNIPID, WVEU AND SPLINE HODELS-- PER CAPITA SOFT ORINK CONSUBTION IN CANADA,
JULY 1972 TO JUNE 1974

49. The r e s u l t s seem t o indicate tha t the Love11 model gives s l i g h t l y b e t t e r predict ions than tha Spline modal, while tha Unified modal rankr th i rd . However, the predic t ions of both tha Lovall and the Spline modela understated ac tua l per capi ta s o f t drink consumption. These r e s u l t s a r e indicated by the predict ion-real izat ion diagrams, the Mincer-Zarnowitz regression and the s ign i f i can t pos i t ive average forecast e r rors .
50. A cclparison of the cmputad valuer of tha von Naumann r a t i o
with the r igaif icanca points tabulat.~d by Hart and raproducad in Thal l (1971, pp. 126-27) .Cndicater t h r t it is imporsibla to r e j e c t a hypothesis of no pos i t ive , f i r s t -order r e r l a l cor ra la t ion of tha forecar t error. f o r the Splina modal. A s imi lar hypothanis for tha Lovall model i r rejected a t tha 10 parcent s ignif icanca lava l , bu t not a t the 5 percent level .
51. In addit ion t o tha above both tha forecas t and ac tua l values a re tha l ave l s of the se r i e s , but i t is vell-known tha t comparisons of l e v a l s can be qui ta misleading. A s a consequenca, the evaluation s t a t i s t i c s and predict ion-real izat ion d l ag raw a r e rhovn f o r the forecas ts of the percentage changes in par cap i t a s o f t dr ink consumpion in Table 4 and Figures 6-8. However, tha r e s u l t s shov the same main tendencies tha t tha l eve l s do, even when the d i f f i c u l t i e s of forecast ing parcantaga changes appear in the s t a t i s - t i c s . Furthermore, the differences in tha forecast ing performance of the models a r e megnified. The value of tha U2 s t a t i s t i c fo r the Unified model indica tes t h a t the predict ion of the model is no b e t t e r than the no-change predict ion.
52. A s ncted earlier, very f eu ins ights about how t o improve the fore- cast ing models a r e gained b j studying the evaluation s t a t i s t i c s and the
' d i f f e ren t diagrams shown below. However, thefdo e luc ida te both :he r e l a t ive and the absolute tanking of the three models.

Table 4: SOFT DRINK CONSLRBTION PER CAPITA--FORECAST EVALUATION STATISTICS FOR THE UNIFIED, UDVELL, AND SPLINE HDDELS,
1972.07 TO 1974.06, PERCENTAGE CHANCES
--
Model S t a t i e t i c e
Unified Lave11 Spline
Average Squared Errors
Second Inequality Coef. 2 2 ' 5 U2 ' I"Tfi~,I 1.0204 .6199 .9429
n
Hincer-Zarnowitz Regreseion 00
Cotre la t ion r = cor(yT.fT) -.0879 -8169 .4599
- Average Forecast ~ r r o r k e = -$=
(N-I)-~{(= i l2 Von,Nemnn Ratio Q I T T-1 1.0657 2.8956 3.5266
d L
/a The f igures in parentheses a t e standard deviations. -

fWL MLDICTIOW--RUUUTK)W OlAORAM, ULY irnmuna inr, ~ I N I UMA sow ORINU m m o u M R C U n M I QUlJal
World hnk-23107

Refe rences
Basmann, R . J . , " L e t t e r t o t h e Edi tor" , Econoae t r i ca 30 , (1962) : 924-826.
Box, C.E.P., and C.U. J e n k i n s , Time S e r i e s Ana lys i s , Forecast!r.g and Con t ro l (Sen F ranc i sco : Holden Day, 1970).
Brown, T.U., "Standard E r r o r s of F o r e c a s t of a Complete Econometric Hodel", Econometrica 22 (1954): 178-192.
Bunzel , H . , ISISHA Referenco Manual, I n s t i t u t e o f Economics, U n i v e r s i t y of Aarhus, 1977.
F e l d s t e i n , M.S.. "The E r r o r of F o r e c a s t i n Econometric Hodels When t h e F o r e c a ~ t - P e r i o d Exogenous V a r i a b l e 8 Are S t o c h a s t i c " , E c o n o w t r i c a 39 (1971): 55-60.
C e r s o v i t z . Il.. and J . G . Hncltinnon. "Seasona l i t y i n Regress ion: An A p p l i c a t i o n o f Smoothness P r io r s " , J o u r n a l o f t h e American tat is tical" A s s o c i a t i o n 73 (1978): 264-73.
Chose, A.K., "Pr ice Fore- .nsts f o r Primary Coumodities: An Evalua t ion o f P a s t Experience", mi-, The World Bank, 1978.
Coldberger , A.S.. A.L. Hcgar and H.S. Odeh, ''The Covar iance Mat r i ce s o f Reduced-Form t a e f f i c i e n t s and o f F o r e c a s t s f o r a S t r u c t u r a l E c o n o e t r i c Hodel", Econometrica 29 (196 1) : 536-573.
Granger, C.W.J., and P. Neubold, F o r e c a s t i n g Economic Tinre S e r i e s (New York: Academic P r e s s , 1977).
b n n a n , E.J., ''The E s t i ~ a t i o n of Seasona l V a r i a t i o n La Economic Tima Se r i c s " , J o u r n a l o f t h e A w r i c a n S t a t 1st i c a l Association 58 (1963) : 31-44.
t ia tanaka, U., "A Simple S u ~ ~ e s t i o n t o Improve t h e Weer-Zarnowitz C r i t e r i o n f o r t h e ~ v i l u a t i i i o f ~ o r e c a s t s " , Annals o f Economic and S o c i a l Heasurement 3 ( 1974) : 52 1-524.
Hooper, J . W . , and A. Z e l l n e r , 'The E r r o r of Fo recas t f o r U u l t i v a r i a t e Regress ion Hodels", E c o n o ~ t i l ,.' (1961): 544-555.
I
Hyl lebe rg , S., "A Comparative Study o f F i n i t e 'ample P -ope r t i e s o f L..L~ Spectrum Regress ion st imators", ~ o u r n i r l o f EC; ?ometr ics 5 (1977) : 161-182. - - ,* , " S a s o n v a r i a t i o n i reg res s ionsda ta" , i n slee B.: . Jensen - (1979): 336-3F3. - -
l n t ? i l i g a t o r , M.D., Eeonometric Hodels . Techniques, and t p p l i c a t i o n s (Amsterdam, North Holland 1978).

Jensen, B.S., "Konjunkturfonrdsigelser og kvat:aisvise Prognosemodeller", Wharton Econometric ForecastLnn. in B.S. Jensen and A. l fbsku ldss~n ed., Anvendt dkonometri (Nvt uord i sk Forlag: KSbenhavn, 1-79). 22-78.
Koerts, J., and A.P.J. h b r a h a ~ s e , On t h e Theory and Appl icat ion of t h z General L inear Hodel (& tterdam: Rotterdam Univers i ty Press , 1969).
b r g : r d , ~ . , "Al te rna t ive r ti1 XfnJs te Kvadraters Hetode", i n s e e B.S. Jensen (1979) : 388-411.
Klein, L.R., An Essay on t h e Theory of Economic Pred ic t ion (Chicago: h rkham, 1971).
Lovel l , H.C., "Seasonal Adjustment of Economic T h e Series" , Journa l of t h e APParica? S t a t i s t i c a l Associat?on 58 (1963) : 933-1010.
Hincer, J., and V. , t rnowitz, 'Tha Evaluation o f Economic Forecasting", i n J. Hincer, ad., Econnmic F o r ~ c a s t s and Expectrt ions , (New York: NBER, 1969) 1-46.
Pesaran, H.H., "On the General rroblem of Hodel Selet;tion", Revlev of Economic S t u d i e s 41 (1974) : 153-171.
and A.S. Deacon, 'Tes t fng Non-Nested lYorlinear Regression ~ o d e l s " , Econometrica 46 (1978): 677-703.
T h e i l , H., Economic Vorecasts acJ Pol icy, 2nd ed. (Amsterjam: North Holland, 1961).
, Applied Economic 2'orr.casrb-3 - (Amsterdam: North hol land, 1966).
, P r i n c i p l e s of Econometricr (New York: John H. Wiley, 1 9 i l ) .
Z e ~ ? n e r , A., and P. Palm, 'Clim S e r i e s I n a l , h i s and S t m l t a n e o u s Equation E c o n o e t r t c Hociels", - Journa l of Econometrics 2 (1974): 17-54.


ACKNOWLEDGEMENTS -
I n p r e p a r i n g t!.i; y r , ; t h e a u t h o r s r e c e i v e d a d v i c e p i s ~ ~ * + t a r . - e from t o o many p e o p l e t o ;,tr t.em a l l i n d i v i d u a l l y . We a r e p a r i l c u l a r l ; indebted t o Hrs. H. H ~ g i ~ t * , ".I. S. Singh, Hr. K. Takeuchi and Hrr. S. Auyl to (a l l of t h e World Bank). Prof . J. Vselbrocck ( U n i v e r r i t y of B r u r r e l r ) ."ref. J. Adam ( U n i v o r r i t y of Pennrylvania) , Hr. W. Ha A l l e n and Hr. P. hi ( I n t e r - n a t i o n a l T i n Counc i l ) , Hr. P. h g o u x (Conre i l C a n e r a l e d e r M n e r , France) , Hr. C. Dybalski (U.S. Government S e r v i c e 8 A d m i n i r t r a t i o n ) , Hr. K. L. H a r r i r (U.S. Bureau o f M n e r j , and Hr. W. C. h,raham (U.S. S t a t e Department) f o r t h e i r c o m n t r and s u g g e r t i o n r .
Thc views e x p r e r r e d i n t h e paper a r e t h e a u t h o r r ' , a 8 ir t h e r e s p o n s i b i l i t y f o r any o m i r r i o n s and e r r o r s .

TABLE OF CONTENTS
Page No . S M Y AND CONCLUSIONS ............................................... 1-1
.................... I . 'MB BASIC STRUCIURS OF THE WORLD TIN ECONOMY 1-3
A . Production ............................................... 1-3 B . Consumption .............................................. 1-5 C . Trade .................................................... 1-7
11 . THE EVOLUTION OF THE WORLD TIN ECONOMY I N THB POST-WOLU WAR I1 PERIOD: A BRIEF REVICY ......................................... 1-8
................................ 111. THE INTERNATIONAL TIN A C m N T S 1-10
I V . ME STRUCTURE OF THE HODEL ...................................... 1-13
A . Overview ................................................. 1-13 B . S ~ p p l y ................................................... 1-13 C . h a a n d ............................................ 1-20 D . Pr ices and Inventor ies ................................... 1-27
V. VALIDATION OF 'MB HODEL. HISTORICAL POLICY SIHULATIONS AND PBOJECTIONS . . . . . . . . . . . . . . . . . . . . ~ ~ o . * . o . * o o ~ o o ~ ~ . ~ . ~ . 1-30
A . Ex Post S i m l a t i o n s of the Model ......................... 1-30 B . U s t o r i c a l Policy S i u l a t i o n s : S t a b i l i z a t i o n of Tin
P r i ce s ................................................... 1-35 C . Pr ice Scenarios: 1978-1985 .............................. 1-41
ANNEX I Additional Equations used i n the Ex Poet Sirnrlatione of t he We1
ANHW I1 Table 11.1: b r k e t Prospects f o r Tin

page NO.
World Production of Tin-in-Concentrates and Metal--1972-74 (Average) ................... ~ ~ ~ ~ ~ ~ e . . ~ . ~ . . ~ ~ . . e ~ . 1-4
World Consumption of Tin Metal, 1972-74 (Average) ................. 1-6
World Conrumption of Tin by Major End-Uses i n Se lec ted Countr ier , 1974-76 . . . . . . . . . . . . . . . . . . . . . . . . . . . . . . . . . . . . . . . . . . . . . . . . . . 1-7
E l a r t i c i t i e r of Supply f o r T in ...................*...e..***..e*... 1-20 . E l a r t i c i t i e r of Deaand f o r T in ................... . * * * . * * * . * * * * * * * * 1-27
Summary of t h e l l c ru l t r of t h e H i r t o r i u l S i a r l a t i o n r (Model Version I) .........................*.............**............... 1-30
Summmry of t h e Raru l t r of t h e H i r t o r i u l S i a r l a t i o n r (MoBel Varrion 11) ..........................*.....*.....................* 1-35
Buf Eeretock S i a r l a t i o n r f o r Selected Tin P r i c e Ranker, 1961-73 and 1961-7s ........................*................................ 1-38
The E f f ec t of P r i c e S t a b i l i z a t i o n on S i ze and S t a b i l i t y of Export revenue^ ........................................... 1-40
Prospects f o r T i n P r i c e r Under Variare Asrrmptionr of Goveraaent S tockpi le Sales, 1978-85 ........................................ 1-42
CHARTS
Tin Price: London UCE (cash) Honthly Average, Xaximm, Minimum (1958-76) .............................................. 1-11
Plow Chart of t h e World T in Economy ................................ 1-14
H i s t o r i c a l Simulations of t h e T in Hodel (Version I): 196675 ...... 1-31
H i s t o r i c a l S i d a t i o n s of t h e Tin Hodel (Version 11): 1966-75 ... . . 1-34
M E Tin Pr ices : Actual 1950-77 and Projected 1978-85 under Di f fe ren t Assumptions Regarding U.S. s t o c k p i l e Sa les ............... 1.-43

S W Y AND CONCLUSIONS -
i. S i x deve lop ing coun t .-ies-!4alaysia, B o l i v i a , I ndones i a , Thai land , N ige r i a and Zaire--produce a b o c t 70 p e r c e n t o f t h e vorld 's t i n . The remaining 30 p e r c e n t is produced i n a l a r g e number of d e v e l o p i n g c o u n t r i e s and a few i n d u s t r i a l i z e d c o u n t r i e s ( A u s t r a l i a , t h e Un i t ed Kingdom and Sou th Afr ica) .
i i. Consumption of t i n , on t h e o t h e r hand, is c o n c e n t r a t e d i n i n d u s t r i a l i z e d count r ies -as a group, t h e y a b s o r b abou t 75 p e r c e n t of t h e vor ld ' s t i n s u p p l i e s . C e n t r a l l y planned economies account f o r a b o u t 20 p e r c e n t , and t h e remainder is c o c s u x d i n d e v e l o p i n g c o u n t r i e s . The United S t a t e s is t h e s i n g l e most impor t an t tin-consuming n a t i o n ; i ts s h a r e is about 25 p e r c e n t o f t o t a l world consumption, f o l l w e d by Japan w i t h 15 p e r c e n t and Germany and t h e Uni ted Kingdom, each w i t h a b o u t 6 pe rcen t .
iii. S l i g h t l y less than one-half of t h e o u t p u t o f t i n i n processed i n t o t i n p l a t e , t h e & s i c m a t e r i a l f o r food and beve rage c o n t a i n e r s . The demand f o r t i n f o r t h i s end-use h a s weakened, however, as t h e u se of aluminum and t i n - f r e e s t e e l i n t h e manufacture of c a n s and o t h e r c o n t a i n e r s h a s g r w n . Other 2 r i n c i p a l end-uses a r e s o l d e r s , bronze, v h i t e m e t a l and c h e d c a 1. C o n s w p t i o n o f t i n f o r t h e s e purposes h a s i nc reased s l w l y o r d e c l i n e d s i n c e World War 11.
i v . The re a r e two main r ea sons f o r t h e s l u g g i s h growth i n t h e consumption of t i n . F i r s t , t h e p r i c e s of many s u b s t i t u t e p r o d u c t s (aluminum, s t e e l , g l a s s , e t c . ) have d e c l i n e d r e l a t i v e t o t h e p r i c e of t i n , and t h e s e materials have r e p l a c e d i t i n m n y of its t r a d i t i o n a l end-uses. Second, t e c h n o l o g i c a l i n n o v a t i o n s i n t h e manufacture of t i n p l a t a have made i t p o s s i b l e t o u s e a t h i n n e r c o a t i n g of t i n on steel s h e e t s , t h u s r e d u c i n g t h e amount requi red . H i s t o r i c a l l y , t h e p r i c e of t i n h a s f l u c t u a t e d s u b s t a n t i a l l y . T h i s is caused l a r g e l y by d i f f e r e n c e s i n t h e t ime i t t a k e s t i n consumption and t i n mining t o respond t o changes i n income o r economic a c t i v i t y . While t i n consuatption u s u a l l y responds q u i c k l y , a d j u s t p e n t s i n mine o u t p u t a r e c o s t l y and time- consuming.
v. To s t a b i l i z e t h e h l s h l y v o l a t i l e t i n marke t , major t in -producing and consuming c o u n t r i e s r a t i f i e d t h e F i r s t I n t e r n a t i o n a l T i n Agreement I n 1956. T h i s agreement , which h a s been renewed f o u r t i m e s s i n c e then , is g 9 e r a l l y regarded a s t h e most s u c c e s s f u l example of a n i n t e r n a t i o n a l commodity agree- ment. Its basgc f e a t u r e , t h e u s e of a b u f f e r s t o c k and expor t c o n t m l s t o keep p r i c e s w i t h i n w r e e d limits ( p r i c e bands) , h a s become a model f o r m l a r commodity agreements . - v i . Hos t of t h e behavior of t h e world t i n economy is cap tu red i n t h e econometr ic model p re sen ted h e r e , which c o n s i s t s of 23 b e h a v i o r a l equa t ions . The model a l s o i n c o r p o r a t e s t h e t w b major i n s t i t u t i o n a l f a c t o r s t h a t i n f l u e n c e t h e t i n economy--the s t r a t e g i c t i n s t o c k p i l e i n t h e Uni ted S t a t e s and t h e I n t e r n a t i o n a l T i n Agreement. The s i m u l a t i o n r e s u l t s from t h e model s h w t h a t i t is p o s s i b l e t o c a p t u r e most of t h e behav io r of t h e world t i n economy wi th a s m a l l model.
v i i . E i g h t supply e q u a t i o n s d e s c r i b e t i n p roduc t ion i n major producing c o u n t r i e s . The weighted ave rage sho r t - t e rm p r i c e e l a s t i c i t y of supp ly was e s t i n a t e d a t 0.42, t h e cor responding long-term e l a s t i c i t y a t 1.07. T i n demand

vae analyzed on a regional b a r i r (United S t a t e r , Western Europe, Japan, South Africa, o the r i ndu r t r i a l i zed count r ie r ) , a r well a r by two c a t e g o r i o of cnd- urer: t i n p l a t e and non-tinplate. The e r t i o r t e d short-term pr ice e l a r t i e i t i e e of demcd var ied between -0.1 and -0.5, supporting the argument that deaand f o r t i n i r highly pr ice- ine la r t ic i n the rho r t t e rn .
v i i i . To e u l l n e the i-ct of p r i ce r t a b i l i z a t i o n on the t i n econow, a bufferr tock mch8ni.r was incorporated i n t o t he model. The r e r u l t r of tho s l d a t i o n r provide some l a r i g h t i n t o what r i z e bufferrtock-in t e r m of t i n r tockr and f i n r n c i a l resources-ir nececratp t o r t a b i l i z e p r i ce s within pr ice bands of varying r i r e r . The r e r u l t e 8 1 ~ 0 t h r w rome l i g h t on the impact of p r ice s t a b i l i z a t i o n on the s t a b i l i t y and amount of export revenues: market s t a b i l i z a t i o n t h a t f o l l w r r i g i d ru l e r concerning the pr ice bands vill bring about g r e a t e r revenue s t a b i l i t y , but a t the c o s t of l e s s export revenue. This trade-off between the quant i ty and r t a b i l i t y of export revenuer poses a se r ious policy d i l c r r , probably c o m a t o a l l metal producers t h a t operate i n mrkets where p r i ce i n r t a b i l i t y i r mostly demand induced.
ix. The t i n d e l var a l s o used t o ga in some in r igh t i n t c the l i ke ly prospects f o r the world t i n economy. The pro jec t ions rhov t h a t the cyc l i ca l behavior o f t i n pr ices i r l i k e l y t o continue i n the future. Different po l i c i e s on s a l e s from r tockpi les can a l t e r t he a d j u s t m a t of t i n pr icea, but i t re- l i k e l y t h t they vill s ign i f i can t ly a f f e c t t h e i r g r w t h i n the long- tern. The project ionr i nd i ca t e that t i n producers can look forward t o a period of slow but steady growth i n t he demand f o r imports of t i n and t o a continued r i s e i n t i n p r i c o ( i n r e a l t e r m ) over the long run.

I. THE BASIC STRUCTURE OF THE WRLD TIN ECONOW
A. Production
1. T i n is a t y p i c a l primary product. Almost a11 t h e t i n meta l consumed o u t s i d e t h e c e n t r a l l y planned economies o r i g i n a t e s i n developing coun t r i e s . S i x of them--Ualaysia, Bo l iv ia , Indonesia, Thai land, Niger ia and Zaire- account f o r about 7 0 percent of t h e world'r product ion of tin-in-concen- t r a t e s . About 20 o t h e r small producers account f o r a n a d d i t i o n a l 6 percent . Only t h r e e i n d u s t r i a l i z e d countr ies- -Austra l ia , t h e United Kingdom and South Afr ica-contr ibute s i g n i f i c a n t l y t o t h e supply of t i n , account ing j o i n t l y f o r j u s t under 8 percent . L i t t l e h a s been published about t i n product ion i n t h e c e n t r a l l y planned economier, which account f o r almost 16 percent of world production (Table 1).
2. T i n is mined us ing a v a r i e t y of methods (dredging, g r a v e l pumping, hydraul icking, opencast mining, deep lode mining and dulang washing). D i f f e r e n t product ion methods p r e v a i l i n d i f f e r e n t c o u n t r i e s , according t o t h e s t r u c t u r e of t h e indust ry . Over 35 percent of t h e t i n o r e produced o u t s i d e t h e c e n t r a l l y planned economies comes from g r a v e l pump u n i t s t h a t a r e o f t e n owned and opera ted by small producers. Gravel pumr d n i n g by 8-11 producers is predominant i n both Malaysia and Thai land, where i t accounts f o r over 50 percent of output. I t is a l s o important i n Indonesia , where i t accounts f o r about 40 pe rcen t of t o t a l output. Dredges produce w e t of t h e remainder of t i n o r e i n t h e s e t h r e e coun t r i e s . Dredging is a h igh ly c a p i t a l - i n t e n s i v e opera t ion c a r r i e d ou t by l a r g e ( n a t i o n a l o r f o r e i g n ) companies. Among the major producers of tin-in-concentrates--only i n B o l i v i a do l a r g e t i n mines (mainly deep lode mines) predominate.
3. The main producing c o u n t r i e s have a smel t ing capaci ty . However, Bol iv ia , Za i re , Indonesia and A u s t r a l i a s h i p p a r t of t h e i r mine output t o f o r e i g n s m e l t e r s f o r processing. The f i r s t two c o u n t r i e s depend most heavi ly on f o r e i g n smelt ing. The two leading t in-smel t ing c o u n t r i e s a r e t h e United Kingdom and Xalaysia '(Table 1). - 21
11 "Tin-in-concentrates" means t h e amount of t i n i n t i n concen t ra tes a s - e s t a b l i s h e d by chemical a n a l y s i s . Production of t in- in-concentra tes r e f e r s , t h e r e f o r e , t o the metal content of t i n ore.
2 1 Bol iv ia i s expanding h e r smelt ing capac i ty and is expected t o become s e l f - - s u f f i c i e n t by t h e end of t h e 1980s.

Table 1: WORLD PRODUCTION OF TIN-IN-CONCENTRATES AND HKTAL: 197 2-7 4 ( AVBBACB)
Tin-in- Concentrater World T o t a l Xe ta l World ,Tot!!.
('000 m o t . ) (pe rcen t ) ('000 m. t. ) (percent)
h l a y r i a Bol iv ia Thailand Indoner i a Niger ia Za i re Other8
TOTAL 171.5 - 75.7 - 141.4 - 64.1 - B o INDUSTRIALIZED COUNTRIBS
A u r t r a l i a 11.0 4.9 6.9 3.1 South Afr ica 2.4 1.0 1.8 0.8 United Kingdom 3.4 1 5 17 09 8.1 Other8 2.8 1 . 2 15.7 7 .1
TOTAL 19.6 - 8.6 - 42.3 - 19.1 - C. CENTULLY PLANNED ECONOtUSS
USSR 12.0 5.3 14 .O 6.3 chi- 22 -0 9.7 22 -0 1 0 .Q Others 1.5 0.7 1.2 0.5
TOTAL 35.5 15.7 37 02 - -- 16.8 - - Do WRLD TOTAL 226.6 100 . 0 '320.9 1 0 0 , O - - - -
8 . . . . . . . . . - Source: I n t e r n a t i o n a l Tin Council, Honthly S t a t i s t i c a l B u l l e t i n , va r ious
i s sues ; and Xeta l lgeee l l schaf t , a t a l S t a t i s t i c s , va r ious issues .

0 . Consumption
4. I n d u s t r i a l i z e d c o u n t r i e s consume about 75 percent of world t i n production; c e n t r a l l y planned economies account f o r about 20 percent ; and t h e remainder is consru~ed i n developing c o u n t r i e s .
5. The United S t a t e s is t h e s i n g l e most important tin-consuming country, wi th a sha re of about 25 percent of t o t a l world consumption, followed by Japan wi th 15 pe rcen t and t h e Federal Republic of Gemany and t h e United Kingdom, each wi th about 6 pe rc tn t . Consumption of t i n i n t h e USSR and China i s d i f f i c u l t t o gauge p r e c i s e l y and can only be i n f e r r e d from production and ne t t r a d e e s t i m a t e s . 21 Excluding t h e c e n t r a l l y planned economies, the geographical d i s t r i b u t i o n of consumption is a s shown i n Table 2.
6 . About 95 percent of a l l t i n is consumed i n m e t a l l i c form. ?he r e m i n d e r is processed i n t o var ious i n d u s t r i a l chemicals. Tin's physical propert ies--a low mel t ing po in t , ease of a l l o y i n g and of forming of chemical compounds, r e s i s t a n c e t o cor ros ion , non- toxic i ty and dood a p p e a r a n c e - w k e i t important i n modern i n d u s t r i a l technology. Its a a i n end-uses a r e i n t i n p l a t e , s o l d e r s , bronzes, whitemetals , chemicals and t inning. T i n p l a t e and t i n c o a t i n g account f o r about one-half of a l l i n d u s t r i a l u s e s (Table 3). Solder is t h e most i l lpor tant t i n a l l o y and accounts f o r about 24 percent of t i n coasumption.
7. T i n p l a t e is used mainly i n food and beverage conta iners . Solders a r e used i n a wide v a r i e t y of products ranging from t r a d i t i o n a l plumbing t o s o p h i s t i c a t e d mass-soldering f o r p r i n t e d c i r c u i t s . The heavy machinery and equipment i n d u s t r y is the main market f o r bea r ing a l l o y s (whitemetals) and bronzes. The chemical indust ry uses t i n i n numerous collpounds and i n such d i v e r s e a p p l i c a t i o n s a s vood p r e s e r v a t i v e s , c e r a a i c s , too thpas te . and p e s t i c i d e s . Pure t i n is used i n t h e form of f o i l by t h e e l e c t r i c a l indust ry .
11 Unless o t h e r v i s e s p e c i f i e d , only p r i w y t i n is considered i n t h i s - paper. The market f o r secondary t i n Jas not included i n the model because d a t a on secondary t i n a r e incomplete. I t is g e n e r a l l y believed t h a t t h i s market is h igh ly s t a b l e . The a v a i l a b l e s t a t i s t i c a l information confirms t h i s assumption. However, e f f o r t s should be made t o include the market f o r secondary t i n i n f u t u r e models.
21 S t a t i s t i c s on t i n production and consumption f o r t h e USSR and t h e People's - Republic o f China a r e not published. While s e v e r a l o rgan iza t ions have t r i e d t o e s t i m t e the da ta from a v a i l a b l e fragmented information, the r e s u l t s have d i f f e r e d , u s u a l l y widely, i n any given year.

Table 2: 'WORLD CONSWTION OF TIN METAL, 1972-74 (AVERAGE) -
Hc t a l World T o t a l
(-0CC) 8.t.) (pe rcen t )
A. INDUSTRIALIZED COUNTTIIES
North America 60.6 EC 58 09 Japan 34.9 Oceania 4 .4 Other I n d u r t r i a l i z e d 11.3
TOTAL
B. DEVELOPING COUNTRIES
TOTAL
C. 'aRLD TOTAL 186 03 - 100 .o
/a Excluding the c e n t r a l l y planned economics. - Source: I n t e r n a t i o n a l T in Council , Monthly S t a t i s t i c a l B u l l e t i n , vdrious
i s sues .
8. Because of i ts many uses , t i n f a c e s compet i t ion from a v a r i e t y of products. Aluminum is t h e s i n g l e most important s u b s t i t u t e , and i t and t i n - f r e e s t e e l a r e i n c r e a s i n g l y rep lac ing t i n p l a t e i n cans. Other s u b s t i t u t e s f o r t i n p l a t e include g l a s s , paper and p l a s t i c s . Although s a t i s f a c t o r y s u b e t i t u t e s f o r t i n f o r use i n s o l d e r s have not y e t been found, aluminum a l l o y s , copper- based a l l o y s and p l a s t i c s can be s u b s t i t u t e d f o r bronze. Lou-tin a l d n u m , copper and lead-base bear ing a l l o y s may a l s o be used i n s t e a d of vh i t e - metals . 11 -
1/ See K. L. H a r r i s , "Tin," i n Mnera la Facts and Problems, 1975 ed., U.S. - Department of t h e I n t e r i o r , Washington, D.C.: U.S. Government P r i n t i n g O f f i c e , 1976.

Table 3: CONSUXPTION OF TIN BY W O R END-USES I N SeLECTED COUNTRIES, 1974-76 - /a
End-Ure Percent of T o t a l
T i n p l a t e S o l d e r r Bronze and Bra r r
Whi teae ta l and Babbit Chemfcalr Tinning 0 t h e r r
/a I n c l u d e r U.S., France, Germany, I t a l y , U.K., Japan, A u r t r a l i a , Aur t r i a , - Switzer land, B r a z i l and India.
Source: I n t e r n a t i o n a l T i n Council, The I n t e r n a t i o n a l Impl ica t ionr of United S t a t e r D i r p o r a l of S tockp i l ed T in , 1 V 3 , and T i n S t a t i r t i c r , 1966-76.
C. Trade
9 . Developing producing c o u n t r i e r dominate t h e t i n trade---they account f o r 92 pe rcen t of t o t a l world e q m r t r of t in-in-concentrater 1/ and f o r a lmor t 80 percent of world expor t r of t i n metal. The importazce of t h e t r a d e i n t in- in-concentra ter h a r decreared d ramat ica l ly over t h e l a r t 20 yearn a r developing producing c o u n t r i e r have expanded t h e i r m e l t i n g capaci ty .
10. I n d u s t r i a l i z e d c o u n t r i e s absorb about 8 5 pe rcen t of world t i n ~ t a l expor t s , c e n t r a l l y planned economies a b u t 10 pe rcen t and developing c o u n t r i e s t h e remaining 5 percent. As a group, t h e c e n t r a l l y planned economfes a r e l a r g e l y s e l f - s u f f i c i e n t i n t i n , and they t r a d e mostly among themeelver. 21 BwCPer, t h e USSR and China have on occas ion exported b i g n i f i c a n t amounts of meta l t o i n d u s t r i a l i z e d countr ies . 3-/
w m
1/ Exports of t in-in-concentrates l a r g e l y r e f l e c t t h e imbalance betveen pro- - duc t ion and smel t ing c s p a c i t i e s i n t h e main producing coun t r i e s .
2/ Only t h e Eas te rn European c o u n t r i e s r e l y on imports from o u t s i d e t h e - c e n t r a l l y planned economies f o r a s u b s t a n t i a l amount of t h e i r t i n require- ments.
3/ For example, between 1957-60 and 1974-75. -

11. THE EVOLUTION OF T?E WRLD TIN ECONOHY I N TRE POST-WRU) WAR I1 PERIOD: A BRIEF REVIEW
11. World consumption of t i n i n t h e p o s t w a r per iod g r w more r l w l y than t h a t of o t h e r metals--at 1.7 percent per annum from 1955-74, c o q a r e d :o 4.8 percent f o r copper, 8.3 percent f o r aluminum and 4.6 percent f o r zinc. The main reason f o r i ts slw growth was che i n c r e a s i n g s u b s t i t u t i o n of t i n - f r e e s t e e l and aluminum f o r t i n p l a t e i n t h e m n c f a c t u r i n g of cans. I n a d d i t i o n , t e c h n i c a l innovations reduced t h e q u a n t i t y of t i n needed i n t i n p l a t e . 11 The u s e of t i n i n brr~nze and b r a s s decl ined sha rp ly dur ing t h e pos t -va t peFiod, whi le t h e demand f o r s o l d e r expanded only slowly. The on ly s i g n i f i c a n t g r w t h i n t h e demand f o r t i n occurred i n s p e c i a l i z e d i n d u s t r i a l uses , p a r t i c u l a r l y i n chemical production. Conridering t h e chemical indur t ry ' r 8-11 share i n t h e demand f o r t i n , i t had only a s l i g h t impact on t h e o v e r a l l g r w t h of t i n consuaption. During t h e post-var per iod, demand f o r t i n i n i n d u r t r i a l i z e d c o u n t r i e r grew s t e a d i l y a t 1.3 percent per annum, and a t r l i g h t l y higher r a t e s i n developing c o u n t r i e s and c e n t r a l l y planned econopier.
12. Unlike consumption, vor ld t i n product ion ha8 f l u c t u a t e d videly . The recovery of t h e t i n i n d u r t r y a f t e r World War I1 l a s t e d u n t i l t h e e a r l y 1950s. Then from 1953 t o 1957, miat production v i r t u a l l y s tagnated. World ou tpu t of t in- in-concentra ter f e l l d r a s t i c a l l y i n 1958 and 1959. It recovered i n 1960, remaining cons tan t u n t i l 1963. I n 1964, production began t o expand aga in , l a s t i n g u n t i l 1968. Since then, v o r l d mine production of t i n ha r r e m i n e d a t a l e v e l of about 180,000 m e t r i c t o n s a year , except f o r a mild peak i n 1972 and a smal l t rough i n 1975. Production of t i n metal f o l l w e d roughly t h e same path.
13. Many of t h e s e t r e n d r i n t h e v o r l d t i n economy i n t h e two decade8 a f t e r World War I1 r e s u l t e d from a s e r i e s of event8 t h a t s e v e r e l y a f f e c t e d t h e normal r e l a t i o n s h i p betveen demand and supp l j . The f i r s t of these involved t h e s t r a t e g i c s tocks t h a t had been b u i l t up i n conauafng c o u n t r i e s , p a r t i c u l a r l y t h e Unfted S t a t e s , begianing i n 1948 and a c c e l e r a t i n g g r e a t l y a f t e r t h e outbreak of t h e Korean War. When i n 1955 t h e United S t a t e s d iscont inued making purchases f o r i t s t i n s t o c k p i l e , a l a r g e oversupply began t o develop which had t o be cor rec ted through s t r i n g e n t c o n t r o l s on pro- duc t ion 21 and through s t o c k p i l i n g i n producing coun t r i e s . While t i n
were t r y i n g t o b r ing mine p'Poduction i n t o l i n e v i t h v o r l d consumption, a second shock occurred-the USSR began t o s e l l l a r g e q u a n t i t i e s o f t i n i n t h e world market i n 1957 and cont inued t o do s o ur. t i l 1960-61. To prevent a f u r t h e r weakening of the market, producers c u t mine productio$back sha rp ly . As a r e s u l t , i t was lagging behind consumption when t h e USSR q o p p e d i t s s a l e s of t i n i n t h e e a r l y 1960s. The United S t a t e s a l l e v i a t e d t h e &suing - - -
* I w
11 The in t roduc t ion of e l e c t r o l y t i c t i n p l a t i n g i n t h e mid-1350s has led t o a - progress ive reduct ion i n t h e amount of t i n needed t o :Dat s t e e l shee t s .
21 These c o n t r o l measures were implemented w i t h i n the framework of t h e F i r s t - I n t e r n a t i o n a l Tin Agreement.

s h o r t ~ . & e throuigh s a l e s from its s t o c k p i l e . I t was not u n t i l t h e l a t e 1960s t h a t t h e balance between world t i n product ion and consumption was res to red .
14. These o u t s i d e d i s tu rbances g r e a t l y complicated t h e normally d i f f i c u l t adjus tments between supply and demand t h a t c h a r a c t e r i z e meta ls markets. I n g e n e r a l , t h e demand f o r meta ls responds qu ick ly t o changes i n economic a c t i v i t y i n i n d u s t r i a l i z e d coun t r i e s . Changes i n mining ou tpu t , on the o t h e r hand, a r e c o s t l y and t i m e - c o n s d n g . The highly i n e l a s t i c supply of meta ls l e a d s t o s u b s t a n t i a l p r i c e f l u c t u a t i o n s whenever changes i n demand occur. The response of supply and demand t o changes i n p r i c e s is normally delayed, f u r t h e r prolonging and complicating the adjustment process.
15. Tke f a i l u r e of mine production t o a d j u s t qu ick ly t o changes i n t h e dcmand f o r t i n was t h e rurin reason fo r t h e r e l a t i v e l y l a r g e p r i c e f l u c t u a t i o n s t h a t c h a r a c t e r i z e d t h e past-World War I1 per iod, d e s p i t e t h e s t a b i l i z i n g e f f o r t s made through t h e I n t e r n a t i o n a l T i n Agreement (ITA) t h a t became e f f e c t i v e i n 1956 and t h a t was subsequently renewed i n 1941, 1966, 1971 and 1976.

111. THE INTERNATIOW TIN AGREEXEhTS
16. The main purpose of a l l f i v e I n t e r n a t i o n a l T i n Agreeaents I--qs k e n t h e stabili=::ion of t i n p r i c e s i n i n t e r n a t i o n a l markets . To a c h i e v e t b l s end, two complementary type? of a c t i o n s a r e usfd : d i r e c t i n t e r v e n t i o n i n t h e market through pur:hases f o r and s a l e s from b u f f e r s t c c k s , and t h e u s e of q u o t a s t o c o n t r o l expor t s . An i n t e r n a t i o n a l body of both p r o d u c - r s and consumers of t i n , t h e I n t e r n a t i o n a l T in Counci l (ITC), was set up t o a ~ l n i n i s t e r t h e agreements. It determined f l o o r and c e i l i n g p r i c e s between w\ i ch t i n p r i c e s were l e f t t o f1uctua:e i r e e l y ; it t r i e d t o ma in ta in market p r i c e s wi:hin t h e s e l i m i t e by buying f o r and s e l l i n g from 'ts b u f f e r s t o c k and by imposing c o n t r o l a ove r t h e e x p o r t s of member c o u n t r i e s co en i t s f i n a n c i a l r e s o u r c e s v c r e i n e u f f i c i e n t t o ma in ta in t h e ag reed f l o o r pricem. The b u f f e r s t o c k began t o f u n c t i o n i n 1357 a ~ d remained i n e f f e c t under a l l t h e f jve agreements. 11
17. F loo r and c e i l i n g p r i c e s were rev i sed r e g u l a r l y , t h e r e v i s i o n s r e f l e c t i n g t h e t r e n d s i n market p r i c e s . Because of t h e s m a l l s i z e of t h e t i n buf ferstock--25,000 metric tone e q u i v a l e n t under t h e f i r s t ITA and 20,000 m e t r i c t o n s under t h e f o l l w i n g th:ee agreements , _2/ t h e ITC found i t easier t o defend f l o o r p r i c e s i n t imes of lw demand by u s i n g expor t c o n t r o l s a s w e l l , r a t h e r t h a n by t r y i n g t o defend t h e c e i l i a g p r i c e i n t imes of h igh demand. The ITC r e s t r i c t e d e x p o r t s d u r i n g t h e p e r i o d s 1958-60, 1 9 d - 6 9 , i n 1973 and a g a i n i n 1975-76. While market p r i c e s f e l l b e l w t h e ITC f l o o r o c l y b r i e f l y i n 1958, they broke through t h e c e i l i n g i n 1961, 1964-65, 1966, 1973- 7b and 1976 (Char t 1). Although t h e United S t a t e s was n o t a member of chk
1 1 .?:, e x c e l l e n t a n a l y s i s of t h e working of t h e f i r s t f o u r IT& can be found - - i n W. Fox, Ti;.: The Working of a Counodity Agreement, Lc.ldon: Mining J o u r n a l Books. Ltd.. 1974. T h i s work p rov ides d e t a i l s on t h e modes. h i s t o r y and perf,:-anre o f t h e f i r s t f o u r ITAs. For s h o r t e r reviews of t h e t i n ag re imen t s , see H. Y. Yip, The Development of t h e T in Hin ing Indus t i n Halaya, U n i v e r s i t y of Halaya P r e s s , Kuala Lwpur , 1969; T. =*Post-War T i n Agreements ," Schwei rc r i s che Z e i t s c h r i f t f u r Vo lkswi r t sha f t und S t a t i s t i k , No. 2 , 1970,#pp. 189-236; H. W. Al len , "How - the- ' f i n I n t e r n a t i o n a l , November 1971, pp. 309-314; UNCTAD, Revi- o f t h e Opera t ion o f t h e Fourth I n t e r n a t i o n a l T in Agreement, Doc. Tr)/TIt! .5/4, A p r i l 1975; K. B a r b n , "The I n t e r n a t t o n a l Tin Agree-
Zments," J o u r n a l of World Trade Law, September 5 , 1975, pp. 445-524; and P. f?Leg.~ux, n ~ ' ~ t a i n e t 1'Accord I n t e r n a t i o n a l s u r l 'E t a in , " Revue T ie r s - Honde, X X V I I , No. 66, April-June 1976, pp. 419-432. A r z c e n t a n a l y s i s of
Zthe t i n agreements can be found i n G. W. Smith and G. R. Shink. "The - M n t e t n a t i o n a l T i n Agreewnt : A Reassessment ," The Eco-~oa ic J o u r n a l , 86 , 8 b2cember 1976, pp. 71 ;-7,8. .
2 / The F i f t h ITA, r h i c h e n t e r e d i n t o f o r c e on J u l y 1, 1376, envisaged a - b u f f e r s t o c k of 40,000 m e t r i c t o n s of t i n . However, wh i l e producers were under b ind ing ob1igat:on t o c o n t r i b u t e che e q u i v a l e n t of 20,000 m e t r i c t o n s of t i n t o t h e b u r f e r s t o c k , consumers d l d no: assume a f o r m 1 o b l i g a t i o n t o c o n t r i b u t e t h e o t h e r h a l f .

6 . - . - - - - - . - 3 0 1 1 . 3 ..0..&- -
I .I .. .",
-- I
>VI~MWIIS n n ror X D V I ~
111 (0 NOlINmm
'7TT7b-a- - - -

f i r r t four t i n rgreerrntr, L/ the U.S. government t o a large extent ured sa l e s from the U.S. rtrategic rtockpija t o cut the peako i n pricer - 2/ when they exceeded the ITC ce i l ing (1964-66 and 1973-74).
1; The Unlted S t a t e s becase a member o f t h e F i f t h ITA. - 2/ A recea t comprehensive a n a l y a i s o f U.S. s t o c k p i l e a c t i o n s can be found i n -
J. Phangmangdee, "Aaalysia o f :he United S t a t e s T i n Di sposa l s ," unpublished H . A . d i s s e r t a t i o n , Thammaoat U n i v e r s i t y , Bangkok Thailand, 1975.
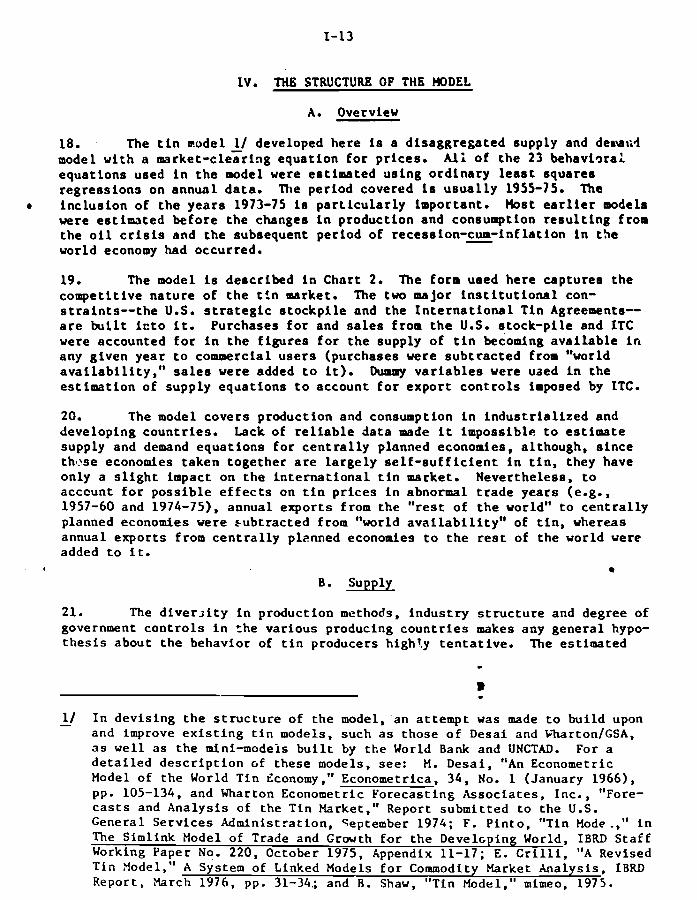
I V . THE STRUCTURE OF THE HODEL
A. Overview
18. The t i n node l 11 developed h e r e is a d i s a g g r e g a t e d supply and denutid model w i t h a m a r k e t - c l e ~ r i n g e q u a t i o n f o r p r i c e s . Ali of t h e 23 behaviors: e q u a t i o n s used i n t h e model were e s t ima ted u s i n g o r d i n a r y l e a s t squa res r e g r e s s i o n s on a n n u a l d a t a . The pe r iod covered is u s u a l l y 1955-75. The
r i n c l u s i o n of t h e y e a r s 1973-75 is p a r t i c u l a r l y impor tant . Host e a r l i e r models e r e e s t i m t e d b e f o r e t h e changes i n p roduc t ion and consumption r e s u l t i n g from t h e o i l c r i s i s and t h e subsequent pe r iod of recess ion-=- inf la t ion i n t h e world economy had occurred .
19. The model is d e s c r i b e d i n Char t 2. The form ueed h e r e cap tu re8 t h e compe t i t i ve n a t u r e of t h e t ? n market. The two major i n s t i t u t i o n a l con- s t r a i n t s - - t h e U.S. s t r a t e g i c s t o c k p i l e and t h e I n t e r n a t i o n a l T i n Agreements- a r e b u i l t i c t o i t . Purchases f o r and s a l e s from t h e U.S. s t o c k - p i l e and ITC were accounted f o r i n t h e f i g u r e s f o r t h e supply of t i n becoming a v a i l a b l e i n any g i v e n y e a r t o commercial u s e r s (purchases were s u b t r a c t e d from "world a v a i l a b i l i t y , " s a l e s were added t o i t) . Dummy v a r i a b l e s were uaed i n t h e e s t i m a t i o n of supp ly e q ~ a t i o n s t o account f o r e x p o r t c o n t r o l s imposed by ZTC.
20. The model c o v e r s p roduc t ion and consumption i n i n d u s t r i a l i z e d and deve lop ing c o u n t r i e s . Lack of r e l i a b l e d a t a made i t imposs ib l e t o e s t i m a t e supply and demand e q u a t i o n s f o r c e n t r a l l y planned economies, a l though, s i n c e thm>se economies t a k e n t o g e t h e r a r e l a r g e l y s e l f - s u f f i c i e n t i n t i n , t hey have on ly a s l i g h t impact on t h e i n t e r n a t i o n a l t i n market. Neve r the l e s s , t o account f o r p o s s i b l e e f f e c t s on t i n p r i c e s i n abnormal t r a d e y e a r s (e.g., 1957-60 and 1974-75), annua l e x p o r t s from t h e " r e s t of t h e world" t o c e n t r a l l y planned economies were s u b t r a c t e d from "world a v a i l a b i l i t y " of t i n , whereas annua l e x p o r t s from c e n t r a l l y plcnned e c o n o d e s t o t h e r e s t of t h e world were added t o i t .
B. Supply
21. The d i v e r ; i t y i n p roduc t ion methods, i n d u s t r y s t r u c t u r e and degree of government c o n t r o l s i n t h e v a r i o u s producing c o u n t r i e s makes any g e n e r a l hypo- t h e s i s abou t t h e behav io r of t i n producers high1.y t e n t a t i v e . The e s t ima ted
11 I n d e v i s i n g t h e s t r u c t u r e o f t h e model, an a t t e m p t was made t o b u i l d upon - and improve e x i s t i n g t i n models, such a s t hose o f Desai and khr ton/GSA, a s w e l l a s t h e min i lnode i s b u i l t by t h e World Bank and UNCTAD. For a d e t a i l e d d e s c r i p t i o n c f t h e s e models, see: M. Desa i , "An Econometric Model of t h e World T i n Economy," Econometrics, 34 , No. 1 (January 19661, pp. 105-134, and Uharton Econometric F o r e c a s t i n g A s s o c i a t e s , Inc. , "Fore- c a s t s and Ana lys i s of t h e T i n Market," Report submi t t ed t o t h e U.S. Genera l S e r v i c e s Admin i s t r a t ion , qeptember 1974; F. P i n t o . "Tin Mode .," i n The Siml ink Model of Trade and ~ r o u ; h f o r t h e D e v e l ~ p i n g World, I B R D s t a f f Working Paper -No. 220, October 1975, Appendix 11-17 ; E. C r i l l i , "A Revised T i n Hodel," A System of Linked Models f o r Commodity Market Ana lys i s , IBRD Repor t , Harch 1976, pp. 31-34,; and R. Shaw, "Tin Model," mimeo, 1975.


supply e q u a t i o n s were based on two un jo r assumptions. F i r s t , it was assumed t h a t t i n ;oducers a d j u s t t h e i r o u t p u t i n r e sponse t o changes i n market p r i c e s and m4.1rng c o s t s . The p r i c e s used h e r e were t h e i n t e r n a t i o n a l market p r i c e s f o r t i n , such a s t h o s e quoted on t h e London Meta l s Exchange (WE). These were d e f l a t e d by a n index o f mining c o s t s which took i n t o account t h e c o s t of f l ~ e l , machinery, equipment and l abor . The importance o f t h e s e components of c o s t d i f f e r from coun t ry t o coun t ry , r e f l e c t i n g t h e d i f f e r e n t r e l a t i v e s h a r e s of f u e l , c a p i t a l equipment and l a b o r i n t o t a l c o s t s , and were weighted accord- ingly . The ITC s u r v e y s o f c o s t f o r 1973-75 wre used t o develop t h e weights . S ince t i n mining costs depend h e a v i l y on t h e method o f mining (dredging, g r a v e l pumping, open c a s t mining, etc.), weights were f i r s t de r ived f o r t h e v a r i o u s p roduc t ion amdes and t h e n averaged on t h e basis of t h e r e l a t i v e importance of t h e v a r i o u s methods of t i n p roduc t ion i n each country. The p r i c e s were inc luded i n t h e e s t i w t e d supply e q u a t i o n s w i t h a p p r o p r i a t e lags . The econometr ic r e s u l t s i n d i c a t e a n ave rage time l a g of two t o t h r e e y e a r s i n t h e response of supply t o p r i c e changes.
22. It was f u r t h e r assumed t h a t t i n producers a d j u s t t h e i r ~ r o d u c t i o n t o meet t h e g l o b a l e x p o r t g o a l s set by t h e ITC. I n a d d i t i o n t o p r i - e s , c o s t s and p roduc t ion t a r g e t s , a h o s t of o t h e r f a c t o r s (a coun t ry ' s l a b o r s i t u a t i o n , government p o l i c i e s , t h e a v a i l a b i l i t y o f c r e d i t , t a x a t i o n , e t c . ) i n f l u e n c e supply. The impact of some of t h e s e non-pr ice f a c t o r s cou ld no t be taken i n t o account i n t h e f o r m u l a t i o n of t h e supply models, mos t ly because of a l a c k of c o n s i s t e n t i n f o r m t i o n .
2 3. The supp ly of secondary t i n metal was a l s o n o t inc luded i n t h e model, s i n c e =c.y c o u n t r i e s do n o t p u b l i s h d a t a on t h e i r p ioduc t ion of secondary t i n . For c o u n t r i e s i n which such d a t a could be o b t a i n e d !e.g., t h e United S t a t e s ) , t h e t o t a l supp ly of t h i s t i n v a r i e d l i t t l e . 11 Product ion of secondary t i n i n t h e Uni ted S c a t e s f a i l e d t o respond >en t o t h e h igh t i n p r i c e s o f 1973 and 1974. The e x p l a n a t i o n m y be t h a t recovery c o s t s i n c r a s e d ove r t h e same per iod . Attempts t o c a p t u r e s t a t i s t i c a l l y t h e p r i c e response of t h e U.S. supply of secondary t i n were l a r g e l y u n s a t i s f a c t o r y .
I
24. I n d i v i d u a l supply e q u a t i o n s f o r t i n - in -concen t r a t e s were es t ima ted f o r K a l r j s i a , Indones i a , Thai land , Bo l iv i a , N i g e r i a and Z a i r e (which t o g e t h e r a ~ r - ~ : r c e d f o r abou t 8 3 pe rcen t of world p roduc t ion o u t s i d e t h e c e n t r a l l y planned ecotromies i n 1972-74); t h e i n d u s t r i a l i % e d c o u n t r i e s a s a group (which accounted f o r a n o t h e r 10 pe rcen t ) ; and t h e "regt o f t h e world" (which accounted f o r t h e remaining 7 pe rcen t ) . The e s t i m a t e d supply equa t ions are - desc r ibed below. Es t imated supply e l a s t i c i t i s a r e compared a t t h e end of t h i s s e c t i o n . The v a l u e s i n pa ren theses b e l o e h e e s t i m a t e d c o e f f i c i e n t s are . - t va lues .
11 According t o ITC s t a t i s t i c s , consumption of secondary t i n meta l i n 14 - r e p o r t i n g c o u r ~ t r i e s was 8,800 m . t . i n 1954, 7,000 m . t . i n 1974 and 7,900 m . t . i n 1979. I n t h e United S t a t e s , t h e s i n g l e major coun t ry , consumption of secondary t i n meta l was 3,099 m . t . i n 1964, 2,000 m . t . i n 1974 and 2,200 m . t . i n 1979.

where:
S T W - production of t in-in-concentrater i n Xalayria ('000 rt)
MLCOST - index of t i n r in ing coat i n Xalayria (1970-100)
DMXC - d m variable f o r ITC export cont ro l pariodr ( r a t t o 1 f o r 1958, 1959, 1969, 1973, 1975 a d t o 0 f o r a11 other yeat8)
Indoneria (1948-7 5)
lL2 - 0.94 S.E.E. - 1.97 D.W. - 2.51
STCIND - production of t in- i r rccncmtra ter t n Indoneria ('000 at)
PTLHE - W E t i n pr ice (US$/mt)
INCOST - index of mining cos ts i n Indonesia (1970-100)
T m E = time trend (1948-1) - Thailand (1955-75)
t
S.E.E. - 1.28 D.W. - 1.65

vhere:
STCTHA = production of t i i- in-concentrate8 i n Thailand ('000 m t )
P T W - LKE t i n pr ice (US$/mt)
TLCOST = index of t i n mlning c o r t r i n Thailand (1970-100)
Bolivia (1955-75)
D.W. - 1.P4
vhere:
STCBOL = production of tin-in-concentrate8 i n Bolivia ('000 m t )
P T W - LWE t i n pr ice (~S$/mt)
BOCOST - index of t i n mining coste i n Bolivia (1970-100)
TIME = time trend (1955-1)
Nigeria (1955-75) 1/ -- (1.5) I n STCNIGt = 0.15404 + 0.92165 I n STCNIGt-l - 0.45046 DXYXC,
S.E.E. = 0.17
11 An a l t e r n a t i v e production cquation f o r Nigeria vas estimated using a - p r i o r i information about supply e l a s t i c i t i e s v i t h respect t o price. The following r e s u l t s were obtained: - ( 1 5 . 1 ) STCNIG, = -0.04702 + 0.75320 STCNIGt-l + 0.000a84 PTLHE
(4.38) [ APCOST ] t-l
S.E.E. = 1.07 D.W. = 1.09
vhe re:
AFCOST - index of t i n mining cos ts i n Africa.
Other var iab les see equations (1.5) and (1.6).
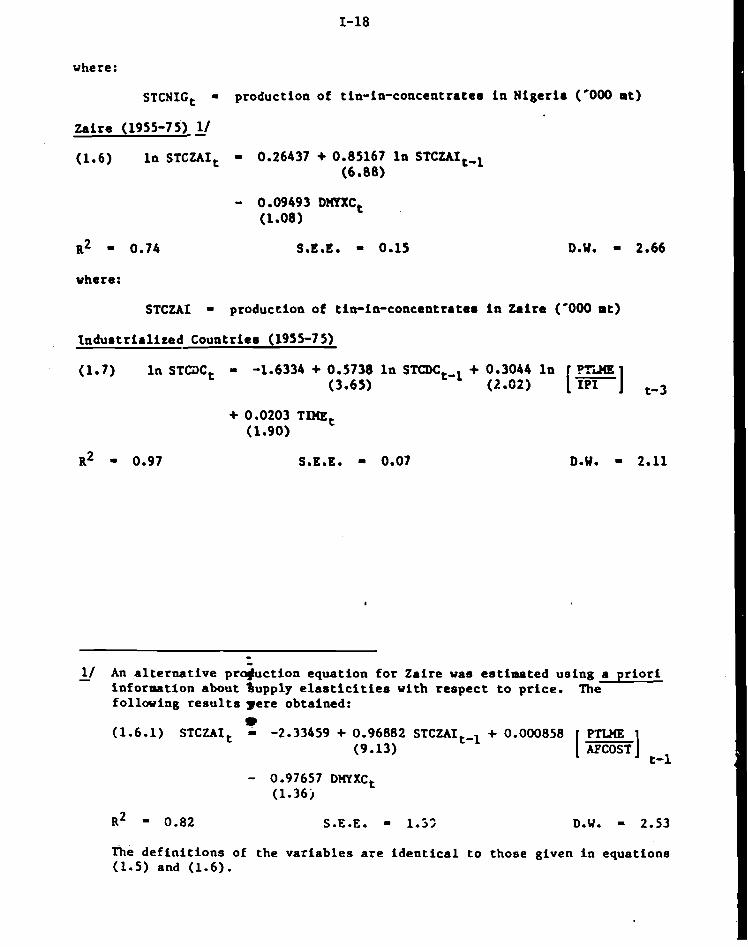
where:
STCNIGt - production of tin-in-concentrate8 i n Nigeria ('000 mt)
Zaire (1955-75) L/
where:
STCWI = production of t i n - i ~ c o n c e n t r 8 t a 8 i n Zaire ('000 mt)
l ndur t r i a l i zed Countries (1955-7 5)
S.E.E. - 0.07 D.W. - 2.11
- - 11 An a l t e rna t ive p r 4 u c t i o n equation f o r Zaire was estimated using a pr ior1 -
information about %upply e l a s t i c i t i e s with respect t o price. The f o l l w i n g r e s u l t s s e r e obtained:
R* 0.82 S.E.E. - 1-53 D.W. = 2.53
f i e de f in i t i ons of the variables a r e i den t i ca l t o those given i n equations (1.5) and (1.6).
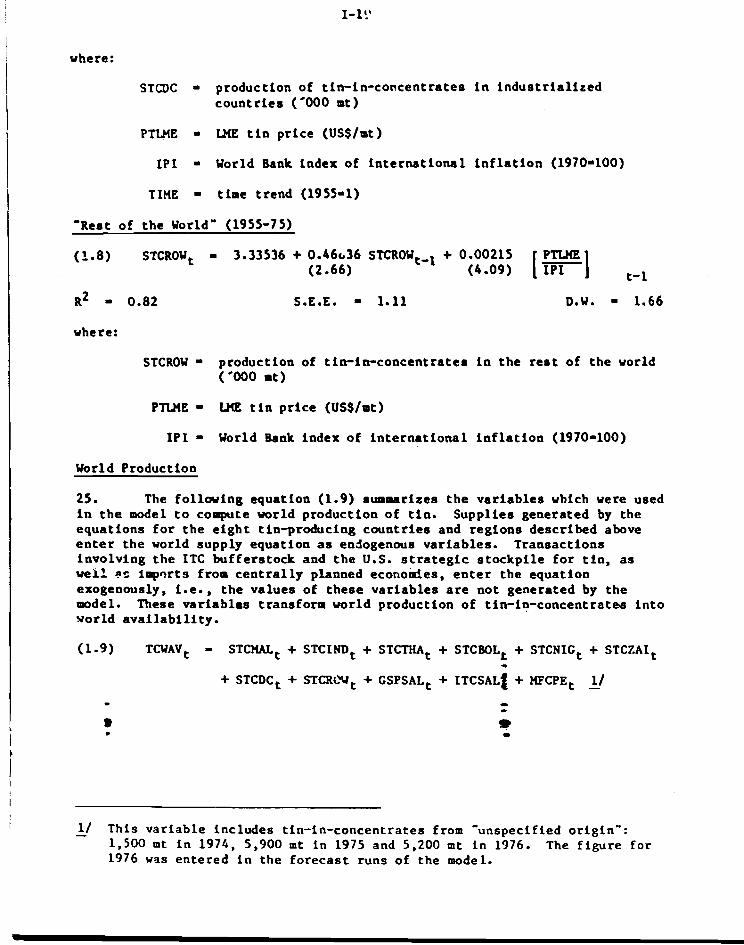
I vhere:
STCDC - production of t in- in-concentra tes i n i n d u s t r i a l i z e d c o u n t r i e s ('000 mt)
PTLME - LWE t i n p r i c e (US$/mt)
I IPI - World Bank index of i n t e r n a t i o n a l i n f l a t i o n (1970-100)
I TIME - time t r end (1955-1)
I 'Rert of t h e World' (1955-7 5)
I vhere:
STCROW - product ion of t in- in-concentra ter i n t h e r e r t of t h e vor ld ('030 mt)
I P U E - WE t i n p r i c e (US$/mt)
I P I - World Bank index OF i n t e r n a t i o n a l i n f l a t i o n (1970-100)
I World Production
25. The f o l l w i n g equat ion (1.9) r u m ~ a r i z e s t h e v a r i a b l e s vhich ve re used i n t h e model t o compute world product ion OF t i n . Supp l i es generated by the equa t ions f o r t h e e i g h t t in-producing c o u n t r i e s and reg ions descr ibed above e n t e r t h e uor ld supply equat ion as endogenous v a r i a b l e s . Transac t ions invo lv ing t h e ITC buf fe r s tock and t h e U.S. s t r a t e g i c s t o c k p i l e f o r t i n , a s w l l a s l o p a r t s from c e n t r a l l y planned e c o n o d e s , e n t e r t h e equat ion exogenously, i .e., t h e va lues OF t h e s e v a r i a b l e s a r e n o t genera ted by t h e model. These v a r i a b l e s transform u o r l d production OF t in-in-concentrates i n t o world a v a i l a b i l i t y .
/ 1 This v a r i a b l e inc ludes t in- in-concentra tes from -unspeci f ied o r ig in" : -
1,500 m t i n 1974, 5,900 m t i n 1975 and 5,200 m t i n 1976. The f i g u r e f o r 1976 was en te red i n t h e f o r e c a s t runs of t h e model.

vhere:
TCUAV = v o r l d a v a i l a b i l i t i e r of tin-in-concent rater ('000 mt)
GSPSAL - government r t o c k p i l e r a l e r ('000 m t )
ITCSAI, = ITC buf fe r r tock r a l e r ('000 mt)
HFCPE - importr from CPEr ('000 mt)
Supply E l a s t i c i t i e r
26. Table 4 b e l w rummrizer t h e r e r u l t r of the a n a l p r i r of rupply i n t e r m of p r i c e e l a r t i c i t i r r and adjurtment corf f l c i e n t r .
Table 4: ETASTICITIES OF SUPPLY PO:'. TiN
Country o r Area Corf f i c i a n t of P r i c e E l a r t i c i t y of Supply Ad jur t m n t Shoe t-Tern /. LoneTerm
Halayr ia 0.45 Indonrr l a 0.23 Thai land 0 .48 Bolivi. 0.71 I n d u r t r i a l i z r d Count t ier 0.43 Rest of t h e World 0.53
0.31* 0.70* 0.21 0.91 0.60* 1 . 2 9 0.24* 1.34* 0 30. 0.70* 1. ll* 2.09*
a The e l a r t i c i t i r r were e a t i m t e d a t t h e w a n r of production and p r i c e s - us ing t h e reaultm of l i n e a r m t a t i r t i c a l w d e l r .
S i g n i f i c a n t a t t h e 95 percent confidence l e v e l .
27. According t o t h e es t imated supply equat ions , a l l producerr (with t h e except ion of Za i re and Niger ia) a d j u s t t h e i r production when t h e r e a l p r i c e s of t i n change. A l l t h e es t imated shor t - and long-term supply e l a r t i c i t i e s (except f o r those f o r Indonesia) a r e s i g n i f i c a n t a t tke 9 5 percent confidence l e v e l o r above. The l a g wi th vhich supply r e a c t s t o r e a l p r i c e changes v a r i e s among producers: i n Malaysia, Thailand and t h e smal l producers (lumped toge ther i n " r e s t of t h e world') t h e l a g is one year ; i n Bol ivia , Indonesia and t h e i n d u s t r i a l i z e d producing c o u n t r i e s , it is t h r e e years. Short-term p r i c e e l a s t i c i t i e s of supply range from 0.2 f o r Indonesia t o 1.1 f o r t h e small producers; t h e weighted average-it 'cloaely approximates v o r l d e l a s t i c i t y of s u p p l y - i s 0.42. Long-term p r i c e e b s t i c i t i e s range from 0.7 t o 2.09, wi th a veighted average of 1.07. .
C. Demand
28. As noted, t i n is consumed i n a v a r i e t y of end-uses, with t i n p l a t e t h e most important by f a r . Demand f o r t i n i n t h i s end-use is determined by t h e

produc:ion o f t i n p l a t e , t h e p r i c e s of t i n and i ts complements (e.g., ho t - r o l l e d s t e e l s t r i p s , u h i c h a r e t h e major components of t i n p l a t e ) , o f s u b s t i t u t e s f o r t i n ( e . g . , all~minum, t h e most impor t an t s s r b s t i t u t e f o r t i n p l a t e ) and of t e c h n o l o g i c a l f a c t o r s ( such a s t h e e v o l u t i o n of e l e c t r o l y t i c t i n p l a t i n g ) . P roduc t ion of t i n p l a t e , i n t u r n , is de t e rmined by demand r e s u l t i n g from t h e p r o d u c t i o n of food and beve rages , t h e p r i c e of t i n c a n s i n r e l a t i o n t o t h o s e made of aluminum and p l a s t i c , and t e c h n i c a l f a c t o r s a f f e c t i n g t h e type oE c o n t a i n e r i z a t i o n o f food and beverages .
29. The l a r g e number and g r e a t v a r i e t y of o t h e r u s e s f o r t i n m k e i t d i f f i c u l t t o c a p t u r e i n ecouome t r i c r e l a t i o n s h i p s t h e economic f o r c e s v h i c h de t e rmine t h e demand f o r t i n i n n o n - t i n p l a t e end-uses. I n d u s t r i a l p roduc t ion emerged a s t h e s t r o n g e s t e x p l a n a t o r y v a r i a b l e . The p r i c e o f t i n v a s a l s o s t a t i s t i c n l l y s i g n i f i c a n t i n a lmos t a l l t h e e s t i m a t e d derrmnd e q u a t i o n s f o r n o n - t i n p l a t e cnd-uscs.
30. A s w i th p roduc t ion , i t u n s assumed t h a t consumer r e sponsa t o changes i n t i n p r i c e s o c c u r s o v e r a prolonged p e r i o d o f time. Institutional and t e c h r ~ o l o g i c a l r i g i d i t y of v a r i o u s t y p e s p r e v e n t s a n i t m e d i a t e ad ju s tmen t i n t h e demand f o r t i n i n r e s p o n s e t o changes i n bo th p r i c e s and d e m n d f o r f i n a l p roduc t s . I n s t i t u t i o n a l r i g i d i t y i n v o l v e s t h e ~ r k e t s t r u c t u r e of t h e f i n a l p r o d u c t s , w h i l e t e c h n i c a l c o n s t r a i n t s stem from t h e f a c t t h a t p roduc t ion p r o c e s s e s a r e d i f f i c u l t t o change i n t h e s h o r t tern. The e q u a t i o n s f o r t i n demand i n c o r p o r a t e t h o s e dynamic p r o c e s s e s o f ad ju s tmen t .
31. The demond e q u a t i o n s i n c o r p o r a t e t h e p r i c e s o f t i n and i t 8 complements and of s u b s t i t u t e s and v a r i a b l e s r e l a t e d t o economic a c t i v i t y . The l a t t e r g e n e r a l l y c o n s i s t o f i n d e x e s of i n d u s t r i a l p roduc t ion . The t i n p r i c e s u s e d were u s u a l l y LYE p r i c e s e x p r e s s e d i n U.S. d o l l a r s o r a l o c a l cu r r ency and d e f l a t e d by who le sa l e p r i c e indexes . P r i c e s of coaplements and s u b s t i t u t e s (e .g. , h o t - r o l l e d steel s h e e t s and aluminum) v e r e s i m i l a r l y exp re s sed . Where a p p r o p r i a t e , v a r i a b l e s t h a t r e p r e s e n t t h e e f f e c t s o f t e c h n o l o g i c a l changes o n t i n d e m n d v e r e a l s o i nc luded . To c a p t u r e t h e e f f e c t s of a t e c h n o l o g i c a l advance r educ ing t h e need f o r t i n , v a r i a b l e s such a s t h e pe rcen t age s h a r e of e l e c t r o l y t i c t i n p l a t e i n t o t a l t i n p l a t e p roduc t ion and t h e pe rcen t age s h a r e o f t i n c a n s i n t o t a l p r o d u c t i o n o f c a n s v e r e i nc luded i n t h e detmnd e q u a t i o n s .
32. Demand f o r ti: r a s ana lyzed on a r e g i o n a l b a s i s (Uni ted S t a t e s , Wes te rn Euro,pe, J a p a n , ~ o u t h A f r i c a , o t h e r i n d u s t r i a l i z e d c o u n t r i e s and d e v e l o p i n g c o u n t r i e s ) , a s w e l l as by t w o c a t e g o r i e s of ( t i n p l a t e and non- t i n p l a t e ) . D i sagg rega t ed end-use demand e q u a t i o n s were e s t i m a t e d f o r t h e Un i t ed S t a t e s , Wes te rn Europe and J apan , v h i c h t o g e t h e r accoun t f o r abou t 80 - p e r c e n t o f world t i n consumption o u t s i d e t h e c e n t r a l l y p lanned economies. The l e v e l o f p r ~ d ~ c t i o a . - t i n p l a t e , t h e main e x p l a n a t o r y v a r i a b l e f o r consumption '' o f t i n i n t i n p l a t e , was a l s o model led f o r t h e Un i t ed S t a t e s , Y e s t e r n Europe and J apan . 1/ The e s t i m a t e d demand e q u a t i o n s f o r major consuming c o u n t r i e s
) and t i n endzuses a r e d e s c r i b e d below. - m
11 See Annex I. -

United S t a t e s
( a ) T inp la te Uses (1953-75)
- 0.00211 PTNY -5.66929 PSTEEL -2.35658 W U S I t (3.91) [VPIUSI ] t-l (4.83) [MIUSI ] t-I (1.88)
1 1 ~ - 0.92 S.E.E. - 1.46 D.W. - 1.37
where:
DTNUS - consumption of primnrp t i n f o r t i n p l a t e uses i n the United S t a t e s ('000 at)
STPUS - production of t i n p l a t e i n t he United Scatem ('000 a t )
ETPRA: = r a t i o of e l e c t r o l y t i c t o t o t a l t i n p l a t e production in the United S t a t e s
PlW = pr i ce of t i n i n New Pork (US$/mt)
WPIUSI - US uhole.ale p r i c e index (1967-100)
PSTEEL - pr i ce of hot-rol led a t ~ e l s t r ip . (USS/mt) i n t h e United S t a t ee
DXYUSI = dummy var iab le f o r s t r i k e s i n the fabr ica ted metals indus t ry ( s e t t o 1 f o r 1959 and 1969 and t o 0 f o r a l l o t h e r pears)
(b) Non-Tinplate Umee (1955-75)
- 0.0011 P M -0.88046 TIME - 4.64169 JCDW (1.41) [ WIUSI (4.34) (4.83)
L
n2 = 0.95 S.E.E. = i.23 D.W. = 2.61
where: - - DTNOUS = C o n s ~ t i o n of primary t i n f o r non-tinplate uses i n the
~ n i t e a S t a t e s ('000 m t ) - .c
IIPUS - U S i e x of production and machinery and equipment (1967-00)
ICONUS - U S index of r e a l value of t o t a l new cone tmct ion (1972-100)
T M E - time trend (1955-1)

J c D W - dummy v a r i a b l e f o r steel s t r i k e s i n t h e United S t a t e s .
Western Europe
( a ) T i n p l a t e U6 *s (1955-75)
S.E.E. - 0.90 D.W. - 1.91
D R J E U I - consumption of p r i a a r y t i n f o r t i n p l a t e uses i n Western Europe ('000 at)
S T P E U R - product ion of t i n p l a t e i n Western Lurope ('000 ot)
P T W - W E t i n p r i c e (USSfat)
WPIEUR - v h o l e s a l e p r i c e index (1963-100). v i t h t i n consumption s h a r e s used a s weights
ETPRAT1 = r a t i o of e l e c t r o l y t i c t o t o t a l t i n p l a t e pcoduction i n Wee t e r n Europe
(b) Non-Tinplat.? Ueee (1955-75)
S.E.E. = 1.27 D.W. = 2.43
DTNOEU = con%umption of p r i a a r y t i n f o r non- t inp la te uaea i n I
Western Europe ('000 m t )
IPOECD = index of indus t r - l a1 product ion I n OECD Europe (1970-100) -

D.W73 = dummy va r i ab l e f o r unexplained l a r g e increments i n o f f i c i a l consrlzupttou s t a t i s t i c s l i t 1973 ( s e t t o 1 l o r 1973 and t o 0 f o r a l l o t h e r years ) - 11
J a ~ a n
( a ) T inp la te Uses (1955-75) -
- 0.000132 PTJAP (1.33)
R~ = 0.99
where:
S.E.E. = 0.64
DRUM - cor:eumptloa of primary t l n f o r t i c p l a t e uses I n Japan ( '000 m t )
STPJAP - production of t i n p l a t e I n Japan ('000 st)
ETPJAP = r a t i o of e l e c t r o l y t i c t o t o t a l t i n p l a t e production i n Japan
PTJAP = LHE t i n p r i c e (yenimt)
WPIJAP = wholesale p r i c e index (19201100) f o r .ra;.an
(b) Non-Tinplate Uses (1955-751
(2.6) D'ft;GJPt = 8.96771 + 0.09763 IIPJAPt -. 0.66498 ( PTJAP 1 (11.8) (2-27) 1
R a 9.96 S.E.E. = 1.00 D.W. - 1.13
DTNCI.JP = consumption of primary t i n f o r oon-t inplate c s a s i n Japan ('000 mt)
IIPJAP = index of production of t ranspor t and equipment (19701100) f o r Japan
1/ The extremely l a rge increment; i n t he use of t i n f o r non-t inplate - appl ica t ions shown by o f f i c i a l apparent consumption s t a t S s t i c s f oi- Western Europe ~ n d Japan i s probably t h e r e s u l t of i n d ~ s t r y s t ockp i l i ng of +in.

:AJAP = aluminum p r i c e i n Japan ( y d m t )
South A f r i c a (!955-7 5)
where:
DTNSAP - t o t a l consunpt ion of primary t i n i n Sou th A f t i ca ('300 m t )
TMP, n time t r e n d (1955-1)
Ct I n d u s t r i a l i z e d Coun t r l cd (1955-15) -. -
D'1;TIX = t a t 2 1 coosumptiou o f r r i a a r y t i n i n o t h e r i n d u s t r i a l i z e d tam:-ries ( '000 m t )
LIPOW: - UN i ndex of i n d c a t r i a l p r o h c t i o n (1979-130) weighted by CNP shazss f > r o t h e r i n d u s t r i a l i z - d countries
Dex-elopii~q C o u a t r i e s (1955-75) - -
!I2 = 0.91 S . E . E . 1 0.90 D.W. .-. 2.05
I)l?(LDC t c . ; : t l c~r . scnrpt ion o l p,- ' .~~ar;f ti.! i n d e v e l o p i ~ l g c m n t r i e s ('030 m t )
IIPLDC UlJ inu'ex f o r industrial p r 3 a u ~ r '-.rr (1970=100)
1 = :i.,rld Bank !;,dex of , n t e r ~ a t . ! o n a l i n f l z t i o n (197G=100?

'rlnrld Demand
7 3 . The f o l l o u i n g cqua t ion (2.10) sunmari:es t h e v a r i a b l e s which were used t o o b t a i n world demand f o r t i n . A s i n t h e c o r r e l p o n d i ~ . e q u a t i o n f o r wcr ld p roduc t ion (1.9) , t h e demand e q u a t i o n c o n s i s t s .J€ endogenous and exogenous v a r i a b l e s . n i e demnd f o r t i n i n t h e Uni ted S t a t e s , Western Europe, Japan, South A f r i c a and o t h e r i n d u s t r i a l i z e d and deve lop ing c o u n t r i e s i e gene ra t ed w i t h i n t h e modal by e q u a t i o n r (2.1) t o (2.9). P u r c h r r e r f o r t h e U.S. r t r s t e g i t t i n s t o c k p i l e and f o r t h e ITC t i n buffarr to:k and e x p o r t s t o c e n t r a l l y planned e c o n o d e r c o n s t i t u t e "ou t f l av r ' o f t i n f o r which bahav io r? l e q u a t i o n s cou ld n o t be e s t ima ted . Valuer f o r t h e r e v a r i a b l e s e n t e r t h e model exoqenour ly.
where:
T M S - world d i s a r p e a r a n c e of primary t i n me ta l
CSPPCS - government s t o c k p i l e pu rchases ( '000 a t )
ITCPCS = iTC b u i f e r s t o c k purchases ('000 m t )
XTCPE = e x p o r t s t o CTEs ('000 m t )
O the r v a r i a b l e s - see e a r l i e r equa t ions .
Demand E l a s t i c i t i z s
3 4 . The p r i c e e l a s t i c i t i e s impl ied i n t h e c o e f f i c i e n t s of t h e e s t ima ted demand e q u a t i o n s a r e susmar i t ed i n Table 5.
3 5 . The e s t i m a t e d p r i c e e l a s * i c i k i e s o f t h e demand f o r t i n i r e s t a t i s t i c a l l y less significant t h a n t h e supply e l a s t i c i t f c s (Table L ) . However, a l l had t h e c o r r e c t s i g n , and t h e i r v a l u e s f e l l w i t h i n a f a i r l y narrow range--from 4.51 t o -0.5. Tt.zse e s t i m a t e s suppor t t h e argument t h a t demand f o r t i n i s hizl@y p r i c e - i n e l a s t i c ie t h e s h o r t term. The long-term e l a s t i c i t i e s va ry w i d f l y , and i t is d i f f i c u l t t o draw any conc lus ions from t h e e l t i m a t e s i n T a b l e 5.:
* I

T a b l e 5: ELASTICITIES OF DEKAhTl FOR TIN
C o e f f i c i e n t of ? r i c e E l a s t i c i t y of Demand Adjustment Short-Term /a Lonp -Term -
Uni ted S t a t e s
T i n p l a t e Uses Non-Tinplate Usee
T i n p l a t e Uses Non-Ti n p l a t e 2 s e s
J a p a n - T i n p l a t e Uses Non-Tlnplate Uses
Othe r I n d u s t r i a l i z e d C o u n t r i e s
Developing Count r i c s
/a Est imated a t t h e mean v a l u e s o f consumption and p r i c e s . - * = S i g n i f i c a n t a t t h e 9 5 p e r c e n t con f idence l e v e l . I n.a. = Not a v a i l a b l e .
D. P r i c e s and I n v e n t o r i e s I i
36. T i n p r i c e s a r e quoted f o r t h r e e major markets: London (London Meta ls Exchange), New York and Penang (Ua lays i a ) . The h i g k l y compe t i t i ve n a t u r e of t h e world t i n economy t i e s t h e s e markets c l o s e l y t o e t h e r . Although d i f f e r e n c e s i n t h e p r i c e q u o t a t i o n s 11 b e t w e n t h e ' t h r e e occu r o c c a s i o n a l l y , ' t 'rey a r e u s u a l l y sho r t - l i ved . chart-1 s h w s t h a t t @ p r i c e s on t h e Lon,-n #Meta ls Exchange d r i f t e d s t e a d i l y upward u n t i l a b o u t d h e middle of 1373, when ' t hey t o r e t h a n doubled w i t h i n a few months. Al thouf i p r i c e s dropped t w a r d
t h e ead of 1974 and a l s o d u r i n g 1075, they cl imbed a g a i n s t e e p l y d u r i n g t h e e a r l y p a x of 1976. Among t h e many f a c t o r s a f f e c t i n g t h e p r f c e of t i n , two I
fac tors - -changes i n t f n i n v e n t o r i e s and inf la*- ion--expla in most of t h e v a r i a t i o n .
11 Adjusted f o r t - a n s f e r c o s t ( t r a n s p o r t c o s t , commissions, caxes , e t c . ) . -

3 1 . I n v e n t o r i e s a r e main ta ined by producers , t r a d e r s and consumers and by some governments f o r s e c u r i t y r ea sons . I n te rms o f i t s impact on t i n p r i c e s , t h e strategic t i n s t o c k p i l e h e l d by t h e U . S . i s t h e most impor tan t o f t h e Rove rnwnt s t ~ c k p i l e s . A c e r t a i n q u a - t i t y of t i r is a l s o h e l d by t h e I n t e r n a t i ons1 T i n Council .
38. Accura t e i n fo rma t ion on i n d u s t r y and t r a d e i n v e n t o r i e s has not been pub l i shed , and i t was t h e r e f o r e i u p o s s i b l e t o a n a l y z e i n d e t a i l t h e behavior of t i n i n v e n t o r i e s . To c a p t u r e t h e e f f e c t of changes i n i nven to ry on t i n p r i c e s , " impl ied s t o c k s " 11 were computed. I n v e n t o r y l e v e l s by themaelves have li t t l a economfc meanTng. When r e l a t e d t 3 d e m n d o r supp ly , t hey I n d i c a t e t h e l e n g t h o f t ima f o r which r e s e r v e s a r e a v a i l a b l e . The s h o r t e r t h e c ima p e r i o d , t h e g r e a t e r t h e urgency to i n c r e a s e supp ly ( o r reduce consumption) and t h u s t h e h i g h e r t h e p r e s s u r e on p r i c e s . One would e x p c c t , t h e r e f o r e , a n i n v e r s e r e l a t i o n s h i p between p r i c e s and t h e r a t i o o f i n v e n t o r i e s t o demand o r supply
39. The r e s u l t s o f t h e ec t ima ted p r i c e e q w t i o n s conf i rm t h i s e x p e c t a t i o n . I n i n t e r p r e t i n g t h e e r t t m t e d c o ~ f f i c i e n t s of t h e p r i c e equa t ion , i t may be u s e f u l t o view i t a s - pr ice-dependent demand e q u a t i o n f o r t i n s t o c k s . 2 1 The c o e f f i c i e n t a s s o c i a t e d w i t h t h e r a t i o o f s t o c k s t o world demnd (IHSW~DTW, t h e n becomes t h e p r i c e f l e x i b i l i t y o f t h e demand f o r s t o c k s . 31 The s i re of t h e c o e f f i c i e n t i n d i c a t e s t h e i q a c t of o change i n s t o c k s ( T e l a t i v e t o demand) o n t h e p r i c e of t i n , and i t a f f e c t s s i g n i f i c a n t l y t h e r e s u l t s o f t h e s i a u l a t e d b u f f e r s t o c k o p e r a t i o n s .
40. I n a d d i t i o q t o changes i n i n v e n t o r i e s , p r i c e s of t i n ( a s w e l l a s t h o s e aC o t h e r m e t a l s ) a r e h i g h l y s e n s i t i v e t o changes i n world i n f l a t i o n . The sudden i n c r e a s e i n world i n f l a t i o n hat began i n 1973 c o i n c i d e d w i t h a s t e e p rlse i n t i n p r i c e s . I n nomlnal te rms , LHE t i n p r i c e s cl imbed from US$3,500 p e r t o n i n 1972 t o $8,200 i n 1974-a 134 p e r c e n t jump w i t h i n two yea r s . I n 1975, p r i c t . dropped t o US$6,869, bu t increaried a g a i n d u r i n g 1976 t o US$7,582 p e r ton.
41. To accoun t f o r t h e e f f e c t of i n f l a t i o n on p r i c e s , t h e C.S. who le sa l e p r i c e index was i nc luded i n t h e p r i c e e q u a t i o n a s a proxy f o r world i n t l a t i o n . The e s t i m e t e d c o e f f i c i e n t indicate . a n i n f l a t i o n e l a s t i c i t y of about 1.5 p e r c e n t . Thus a 1 pe rcen t i n c r e a s e i n t h e r a t e of i n f l a t i o n ( a s measured by t h e U.S. who le sa l e p r i c e index) was a s s o c i a t e d v i t h a 1.5 pe rcen t r i s? i n t i n p r i c e s . - -
3 d
- 1/ The s t o c k s used a r e ' imptied" s t o c k s , i - e . , s t o c k s i n t h e p rev ious pe r iod , * -
p lus t o t a l market a v a i l a b i l i t i e s minas t o t a l market l o s s e s of s t o c k s i n - t h e c u r r e n t pe r iod . The computat ion of " i n p l l e d " s t o c k s w a s s t a r t e d i n 1946.
2 / Equa:ion (3 .4 ) is e q u f l a l e n t t o a supply e q u a t i o n f o r s t o c k s . - 3 / P r i c e f l e x i b i l i t y is t h e i n v e r s e of p r i c e e l a s t i c i t y ; i t i n d i c a t e s t h e -
percent change i n p r i c e s a s s o c i a t e d w i t h a one pe rcen t change i n some q u a n t i t y (demand, supp ly , s t o c k s , e t c . ) .

R~ = 0.96 S.E.E. = 0.097 D.W. - 1.81
and
P . ~ = 0.98 S.E.E. - 0.071 D.W. - 1.85
vhere:
DHY74 - dummy variable fo r the 1974 o i l c r i e i s ( se t a t 1 for 1974 and a t 0 for a l l other years)
r rw- A = dummy variable fo r the Xal3yeian-Indonesian confrontation
(set a t 1 f o r 1964 and 1965 aed a t 0 f o r a l l other years)
46. The two dummy variables (DHY74 and DHYIND) improved not aaly the s t a t i s t i c a l propert ies of the pr ice equation, but a l s o i t s usefulneos i n the s i a d a t i o n s with the model. Equations (3.2) and (3.3) e h w tha t chabsee i n the inventory-demnd r a t i o have a s igni f icant i q a c t on t i n prices. E'quation (3.3) was f i n a l l y incorporated i n t o the t i n model.
47. The following market-clearing equation closes the model:
where:
IHSW = implied vorld s tocks of priamry t i n metal ('000 m t )
TmAV = vorld a v a i l a b i i i t y of primary t i n metal ('000 mt)
T . W S = vorld losses of primary t i n metal ('000 m t ) - .

V. VALIDATION OF THE HDDEL, HISTORICAL POLICY SIHULATlONS AND PRQJECTLONS
A. Ex-Post S t a i l l a t i o n s of t h e Hodel
48. To t e s t and e v a l u a t e t h e model, ex-post s i m l a t l o n s were conducted f o r d i f f e r e n t pe r iods . The cho ice of pe r lods vas d i c t a t e d not on ly by t h e need tii tes t t h e model's p e r f o r ~ a n c e ove r d i f f e r e n t t i m e spans , but a l s o by a d e s i r e t o use t h e s i m u l a t i o a s f o r ana lyz ing p a s t po l i cy . In a l l t h e s i m u l a t i o n s , p roduc t ion of t i n p l a t e i n t h e U.S., Western Europe and Japan, a l o n g v i t h t h e New York p r i c e f o r t i n and t h e r a t i o of shipments of t i n cans t o shipments o f a l l c a n s i n t h e U.S. (STPUS, STPEUR, STPJAP, PTNY, CANRAT), were endogenized. The a d d i t i o n a l behav io ra l e q u a t i o n s used i n t h e h i s t o r i c a l s imula t ions a r e con ta ined i n Annex I.
49. The r e s u l t s of t h e d y m p i c s i m u l a t i o n s f o r t h e key endogenous v a r i a b l e s d u r i n g t h e pe r iods 1961-75 and 1966-75 a r e summarized i n Table 6. Chart 3 s h w s t h e s i m u l a t i o n results f o r t h e 1966-7s p e r i o d ("Version L" r e f e r s t o t h e model as s p e c i f i e d s o f a r ) .
Tab le 6: S W Y OF THE RESULTS OF THE HISTORICAL SIWUTIONS (MODEL VERSION I)
FTwE MNW STCW - WW 'm (~onsumpt i o n ) (Product ion)
Hean ( a c ~ u n l d a t a ) 3934 .O 170.4 168.6 88 -6 Mean ( s imula ted ) 3884 .O 17 1 .O 168.5 86 -5 RMS E r r o r /a 404 .O 4 -6 5.3 16.1 RMS E r r o r v n X ) 0.098 0,026 0,031 0,091
Kean ( a c t u a l d a t a ) 4429.0 175.2 180.4 101.5 Kean (s imula ted) 4184 ,O 177.2 182.2 103.3 RMS E r r o r /a - 425.0 4.3 6.9 7.5 - ruts E r r o r - %) 3 0.089 0.025 0.038 0.079
. . . . . . . . . . . . . . . .. . - . . 0
/a RMS is t h e root*n-square s i m u l a t i o n e r r o r . - - 50. The s i m u l a t i o n r e s u l t s i n d i c a t e t h a t i t is p o s s i b l e t o c a p t u r e most o f t h e behavior of t h e vo r ld t i n economy wi th a small model (one con ta in ing only 23 b z h a v i o r a l equat ions) . The a b i l i t y of t h e model t o s imula te t i n prices--both t h e i r long-term t r e n d a s w e l l a s shor t - t e rm changes-is quit$ remarkabl?, The r co tmean-squa re pe rcen t e r r o r of t h e s imula ted p r i c e s is 0.098 o v e r t h e 1961-75 pe r iod s i m u l a t ~ o n and 0.089 o v e r t h e 1966-75 s imula t ion period. The model a l s o s i m u l a t e s very w e l l t h e h i s t o r i c a l t u r n i n g p o i n t s i n

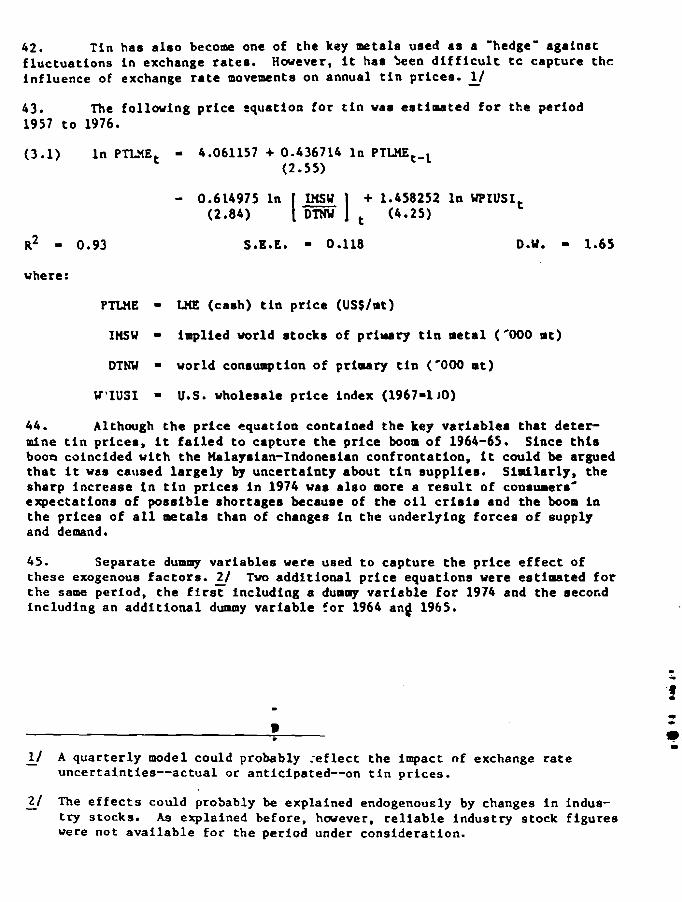
42. Tin h a s a l s o become one of t h e key meta ls used a s a 'hedge' a g a i n s t f l u c t u a t i o n s i n exchange r a t e s . However, i t h a s 5een d i f f i c u l t t c c a p t u r e t h e i n f l u e n c e of exchange r a t e movements on annual t i n p r i c e s . - 1/
43. The fo l lowing p r i c e equat ion f o r t i n was e s t ima ted f o r t h e per iod 1957 t o 1976.
It2 - 0.93 S.E.E. - 0.118 D.W. - 1.65
where:
PTLHE - LHE ( ca rh ) t i n p r i c e (US$/mt)
IHSW - implied world s t o c k s of p r i w r y t i n meta l ('000 m t )
DTNW - world conruoption of primary t i n ('000 a t )
V'IUSI - U. S. wholesale p r i c e index (1967-1 JO)
44. Although t h e p r i c e equa t ion conta ined t h e key v a r i a b l e s t h a t d e t e ~ mine t i n p r i c e s , i t f a i l e d t o c a p t u r e t h e p r i c e boom o f 1964-65. Since t h i s boon coincided w i t h t h e Ualayrian-Indonerian conf ron ta t ion , i t could be argued t h a t i t was caused l a r g e l y by u n c e r t a i n t y about t i n s u p p l i e s . Similarly, t h e s h a r p i n c r e a s e i n t i n p r i c e s i n 1974 war a l s o more a r e s u l t of conrumera' e x p e c t a t i o n s of p o s s i b l e shor t agea because of t h e o i l c r i s i r and t h e boom i n t h e p r i c e s of a l l metals than o f changes i n t h e under ly ing f o r c e r o f supply and demand.
4 5 . Separa te dummy v a r i a b l e s were used t o c a p t u r e t h e p r i c e e f f e c t of t h e s e exogenous f a c t o r s . 2/ Tvo a d d i t i o n a l p r i c e e q u a t i o n s were es t imated f o r t h e same pe r iod , t h e f i r s C inc lud ing a dummy v a r i a b l e f o r 1974 and t h e 8ecor.d i n c l u d i n g a n a d d i t i o n a l dummy v a r i a b l e f o r 1964 an# 1965.
1/ A q u a r t e r l y model cou ld probably : e f l ec t t h e impact nf exchange r a t e - u n c e r t a i n t i e s - - a c t u a l o r anticipated--on t i n p r i c e s .
2 / The e f f e c t s could probably be expla ined endogenously by changes i n indus- - t r y s tocks . As expla ined before , however, r e l i a b l e i n d u s t r y s tock f i g u r e s were no t a v a i l a b l e f o r t h e pe r iod under cons ide ra t ion .

p r i c e s : t h e peaks o f 1965 and 1974 a s w e l l a s t h e t r o u g h s of 1968 and 1975 ( s e e Char t 3).
51. The good performance of t h e model i n s i m u l a t i n g p r i c e s was mainly a t t r i b u t a b l e t o p r i c e e q u a t i o n (3.3). However, compared t o t h e o t h e r two e s t i m a t e d p r i c e e q u a t i o n s , (3.1) and (3.2), i t s c o e f f i c i e n t on t h e s tock lcon - sumption v a r i b l e was c o n s i d e r a b l y lower. Thus, f o r i d e n t i c a l l e v e l s o f t i n consumption, t h i s e q u a t i o n r e q u i r e d l a r g e r change8 i n s t o c k s t o ach i eve s i m i l a r changes i n simulated p r i c e s t han d i d t h e o t h e r p r i c e e q u a t i o n s . S i n c e one of t h e purposes of t h e t i n model is t o s iar la te t h e impact of b u f f e r s t o c k o p e r a t i o n s on p r i c e s t a b i l i z a t i o n , t h i s drawback was q u i t e s e r i o u s .
52. To c e s t t n e r e s p o ~ ~ s i v e n e s s o f p.lcea tr, charit . i n s t o c k s ( r e l a t i v e t o consumption) , t h e p r i c e e q u a t i o n was r e -e s t ima ted f o r d i f f e r e n t pe r iods . S i n c e i t was observed t h a t when re -es t imated o n s h o r t e r time p e r i o d s t h e p r i c e e q u a t i o n y i e l d e d s t a t i s t i c a l l y s i g n i f i c a n t c o e f f i c i e n t s f o r t h e s tock/consumpt ion v a r i a b l e s , and t h a t t h e v a l u e o f t h e c o e f f i c i e n t s tended toward 1 a s t h e e s t i v a t i o n pe r iod was s h o r t e n e d , t h r e e aew p r i c e e q u a t i o n s were e s t i m a t e d f o r t h e 1956-76 p e r i o d , u s i n g 0.65, 0.85 and 0.95 r e s p e c t i v e l y a s a p r i o r i c o e f f i c i e n t s f o r t h e s tock/consumpt ioa v a r i a b l e . t h e fo l lowing e q u a t i o n wan s e l e c t e d because of its f i t and s t a t i s t i c a l l y s i g n i f icaat e s t i m a t e s . 11 -
- IHSW + 1.526318 WPIUSI + 0.279531 DM74 (2.07)
S.E.E. = 0.112 D.W. = 1.46
( v a r i a b l e d e f i n i t i o n a s i n e q u a t i o n 3.2).
53. T h i s e q u a t i o n was used t o r e s i m u l a t e t h e model s i n u l a t i o n s f o r t h e 1966-75 pe r iod (Xodel Ver s ion 11). The r e s u l t s o f t h e new ex-post s i n u l a t i o n s a r e sumnurired i n T a b l e 7 and shovn i n Cha r t 4. T h i s second v e r s i o n of t h e
a
Simula t ions c a r r i e d o u t v i t h Xodel Ver s ion I showed t h a t t h e c o e f f i c i e n t a s s o c i a t e d v i t h t h e r a t i o of s t o c k s t o v o r l d demand was d e c i s i v e i n c a p t u r i n g t h e behav io r of t i n p r i c e s . While t h e e s t i m a t e d c o e f f i c i e n t s of e q u a t i o n s (3 .1 ) , (3.2) and (3.3.) y i e l d e d r ea sonab ly good results f o r t h e p a s t , expe r imen t s v i t h p r o j e c t i o n s and b u f f e r s t o c k s i rmla t io r lp showed t h a t t h e c o e f f i c i e n t needed t o be a d j u s t e d upward i n o r d e r t o be u s e f u l . Re- e s t i m a t i o n s of t h e p r i c e e q u a t i o n f o r d i f f e r e n t time p e r i o d s showed t h a t t h e a b s o l u t e v a l u e of t h e c o e f f i c i e n t i n c r e a s e d toward 1.00 a s t h e t i m e pe r iod was s h o r t e n e d t o r e f l e c t t h e most r e c e n t y e a r s . The c o e f f i c i e n t of 0 .95 i n e q u a t i o n (4.1) r e p r e s e n t s t h e l a r g e s t v a l u e t h a t was ob ta ined from t h e s e r e - e s t ima t ions . Because t h2 c o e f f i c i e n t v a s e s t i m a t e d from ve ry few o b s e r v a t i o n s , i t v a s no l o n g e r s t a t i s t i c a l l y s i g n i f i c a n t .


model p e r f c m s almost a s w e l l a s Ver s ion I i n s i m l a t i n g consumption and market p r i c e s , a n 1 b e t t e r i n s i m u l a t i n g t h e behav io r o f world p roduc t ion and s t o c k s . Ve r s ion 11 was t h e r e f o r e used f o r t h e h i s t o r i c a l p o l i c y s i m u l a t i o n s a s well a s f o r p r o j e c t i m s .
Tab le 7: SUXHARY OF THE RESULTS OF THE HISTORICAL SIHULATIONS (HODEL VERSION 11)
PTUE DT W STCW MSW. (Consump t i o n ) (product ion)
Hean ( a c t u a l ) 4429 .O 17 5.2 180.4 101.5 Hean ( s imu la t ed ) 4333.0 175.1 180.8 101.9 RHS E r r o r /a 414 .O 5.1 3.4 5.3 RHS E r r o r (in 2) 0.095 0.029 0.018 0 -059
/ a RHS is t h e root-mean-square s i m u l a t i o n e r r o r . -
9. H i s t o r i c a l Po l i cy S i m l a t i o n s : S t a b i l i z k ~ i o n of T i n P r i c t - s -- 54. Wide f l u c t u a t i o n s i n t h e p r i c e s f o r pr imary commodities have r ek ind led i n t e r e s t i n t h e v a r i o u s means of p r i c e s t a b i l i z a t i o n . S i n c e t i n is t h e on ly corplpodity f o r uh i ch a p r i c e s t a b i l i z a t i o n scheme has been i n opera- t i o n f o r more t h a n two de-.ades, t h e I n t e r n a t i o n a l T i n Agreement h a s been t h e model f o r a h o s t of p roposa l s aimed a t s t a b i l i z i n g t h e marke ts of o t h e r p r i -
3ry commodities. A l l t h e proposed s c h e ~ e s have s e v e r a l f e a t u r e s i n common: a b u f f e r s t o c k (or bu f f e r fund) mechn i sm v h i c h a l l o w s some s t a b i l i z i n g a c t i o n t o be t a k e n whcnever p r i c e s r i s e o r f a l l below a g r e e d p r i c e l e v e l s (e.g., by changing t h e l e v e l of s t o c k s o r funds under t h e c o n t r o l of t h e s t a b i l i z i n g a u t h o r i t y ) ; and some r a t i o n i n g mechanism t h a t a l l o c a t e s e x p o r t s o r p roduc t ion among p roduce r s i n times of p e r s i s t e n t e x c e s s supp ly .
55. The v a r i o u s p r o p o s a l s , i n p a r t i c u l a r t h e UNCTAD I n t e g r a t e d Program f o r Commodities, 11 have sparked a l i v e l y d e b a t e a b o u t t h e advantages and d i s a d v a n t a g e s o f marke t p r i c e s t A i l i z h t i o n . Host a f t h e d i s c u s s i o n h a s c e n t e r e d a round t h e fundamental Q e s t i on of whether t h e b e n e f i t s a s s o c i a t e d
11 UNCTAD, "An I n t e g r a t e d Program f o r Commodities: The Role of I n t e r n a t i c n a l - Buf fe r S tocks ," Report by t h e S e c r e t a r y Gene ra l o f UKCTAD, Docs. TD/B/C.7/166 Supp. 7 and TD/B/C.7/166/Supp.7/~dd.7, December 1974.

w i t h p r t c e s t a b i l i z a t i o n outweigh :he c o e t s . 11 Another e q u a l l y impor tan t ;::,.st i o n from t h e p o l i c y s t a n d p o i n t conce rns The d i s t r i b u t i o n o f b e n e f i t s and c o s t s . 2/
56. The fundamenta l q u e s t i o n o f whether , f o r a p a r t i c u l a r g roup of c o u n t r i e e ( p r o d u c e r s o r conetunere), b e n e f i t r ou tweigh c o s t s when commodity p r i c e s a r e s t a b i l i z e d is very d i f f i c u l t t o answer, even on a case-by-case b a s i s . For one , t h e d e f i n i t i o n o f c o s t s and b e n e f i t s h a s a d i r e c t b e a r i n g on t h e answer. 'Direct ' c o s t s ( s i z e of t h e s t o c k and o p e r a t i o n a l e x p e n d i t u r e s ) and " d l r e c t ' b e n e f i t 6 ( i l p a c t o f p r i c e s t a b i l i z a t i o n on t o t a l revenue and on revenue s t a b i l i t y ) c a n be gauged w i t h rome c o n f i d e n c e , w i n g a p p r o p r i a t e l y c o n r t r u c t e d and h o p e f u l l y w e l l - e 8 t i ~ t e d models f o r t h e c o m d i t i e s i n q u e r t i o n . "Indirect" cortr and b e n e f i t r , on t h e o t h e r hand, are v a r t l y more d i f t i c u l t t o c o n c e p t u a l i z e and o c a r u r e w i t h any d e g r e e of con f idence . I f p r i c e s t a b i l i t y y i e l d s i u p r o v c w n t s i n t h e inveatrcent c l i m a t e and b e t t e r p l ann ing of p r o d u c t i o n and p r o c a r r i n g o f raw m n ~ c r i a l r , t h e r e r u l t cou ld be impor tan t g a i n 8 i n we l f a r e . S i a i l a r l y , i f p r i c e r t a b i l i z a t i o n c o n t r i b u t e # s i g n i f i c a n t l y t o r educ ing t h e i n f l a t i o n a r y t r e n d r i n t h e world economy, t h e b e n e f i c e i n t e r n o f a v e r t e d o u t p u t lorrer, even i f sho r t - t e rm, cou ld be q u i t e l a r g e .
57. P r o v i d i n 8 answers--hovever t e n t a t i v e - - t o t h e s e q u e s t i o n s exceeds t h e scope of c h i 8 paper . H w e v e r , w i t h t h e h e l p o f t h e e s t i m a t e d t i n model (Vers ion I f ) , i t is p o s s i b l e t o shed sow l i g h t on t h e q u e s t i o n o f " d i r e c t " c o s t s L . I ~ b e n e f i t s o i p r i c e r t a b i l i z a t i o n i n t i n . The f o l l w i n g a n a l y s i s f o c u s e s o n l y on t h e impact o f a t i n b u f f e r s t o c k on t h r e e v a r i a b l e s : t h e i n i t i a l endowment necesclary t o ma in t a in a b u f f e r s t o c k i n f u l l o p e r a t i o n d u r i n g t h e p e r i o d s b e i n g s i a r l a t e d and t o a c h i e v e t h e d e s i r e d deg ree of p r i c e s t a b i l i t y (maximum s t o c k ) ; 31 t h e i q a c t o f p r i c e s t a b i l i z a t i o n on e x p o r t p r i c e s ; and its impact on e G o r t revenues.
58. The f i - s t v a r i a b l e , t h e mnximum s t o c k , p r o v i d e s some i n d i c a t i o n o f t h e magnitude of t h e r e s o u r c e s reqnired--and t h u s t h e ' d i r e c t " coat-of a t i n
11 See r o r example, H. C. Jqhnaon, "Commodities: Les s Developed Count r ies ' , - Demands and Developed Count r ies ' Response,' i n J. H. Bhawati, ed., The New I n t e r n a t i o n a l Economic Order (Cambridge: IffT P r e s s , 1977); J. R. Behrman, ' I n t e r n a t i o n a l Commodity Agree-~ents : An E v a l u a t i o n oE t h z UNCTAD I n t e g r a t e d Commodity Program,' Ai: i ie House Conference on S C a b i l i z i n g World Commodity Markets , A i r l i e , Va., b r c h 17-20, 1977 (mi+o).
21 The q u e s t i o n of che d i s t r i b u t i o n of g a i n s i s d e a l t w i t h i n E. Brook, E. - G r i l l i , + . Waelbroeck, "Commodity P r i c e S t n b i l i z a t t o n and t& Developing ~ o a n t ries: The Problem of Choice., " Bancb N a z i c n e l e d e l Lavoto QUE r t e r l y Review, No. 124 , Harch 1978, p ~ . 80-73. The a r t i c l e a l s o examines t h e e f f e c t s of comoc l l t y p r i c e s t a b i i i z a t i ~ c a n t h e amount and s t a b i l i t y of e x p o r t revenues .
31 I t is c l e a r t h a t t h e d e s i r e d deg ree of p r i c e s t a b i l i t y is s e t by p o l i c y - and w i l l d e t e rmine t h e s i z e o f t h e s t o c k .

b u f f e r s t o c k . The s e c o n d and t h i r d v a r i b l e s , e x p o r t p r i c e a and r e v e n u e s , s e r v e a s i n d i c a t o r s o f 'direc:' b e n e f i t s . - l!
59. To examine t h e i s p a c t o f p r i c e s t a b i l i z a t i o n o n t h e t i n economy, 3
buf f c r s t o c k mechunism was i n c o r p o r a t e d i n t o V e r s i o n I I o f t h e t i n mod:l. T h r e e d i f f e r e n t methods were uscd t o d e t e r n i n e p r i c e f l o o r and c e i l i n q s . The f i r s t method u s e d t h e p r i c e bands d e f i n e d i n t h e I n t e r n a t i o n a l T i n Agrcemcnte ( t h e r e s u l t s o f t h e s e s i m l a t i o n s were l a b e l c d ITA). 2 / I n t h e s e c o n d method, a we igh ted moving a v e r a g e o f p r i c e s o v e r a th ree-ycar -per iod was d e t e r - s i n e d . 3 / C e i l i n g 9 and f l o o r s we8re set a t a f i x e d p e r c e n t a g e above or Selw t h a t p rTce . I n t h e t h t - a method ( k n w n a s t h e t r e n d . i n t e r v c n t l o n r u l e ) , a p r i c e was computed fro^. t h e p e r c e n t change i n p r i c e * d ~ : ' i n g t h e p r e v i o u s t h r c o y e a r s a n d a p p l i e d t o t h e a v e r a g e p r i c e d u r i n g t h e p r e v i o u s t u o y e a r s . I n a l l t h r e e methods, t h e p e r c e n t v a r i a t i o n s u s e d w e r e f 10 nnd + 1 5 p c r c e n t . I f a c t u a l market prices s t a y e d w i t h i n t h o s e p r i c e s t a b i l i r a t T b n bands , t h e b u f f c r s t o c k mechanism wan n o t a c t i v a t e d . Only i f p r i c e s exccedcd t h z c e i l i n g o r d ropped t h r o u g h t h c f l o o r d i d t h e b u f f e r s t o c k r e l e a s e o r a b a o r b t i n i n t o o r f rom t h e marke t . Any t r a n s a c t i o n by t h e b u f f e r s t o c k a f f e c t e d t h e i n v c n t o r y / d e m n d ra t 10 ( IXSY/T?~WDS) a n d t h r o u g h i t t i n p r i c e s .
60. The u s e o f c e i l i n g s and f l o o r based o n ro- p a s t a v e r a g e p r i c e s (methods 2 a n d 3) h a s t h e a J v a n t a g e o f r e f l e c t i n g , t o borne e x t e n t , c h a n g e s i n t h e r e l a t i v e s t r e n g t h o f deaend a n d s u p p l y f o r t i n . However, i t c o u l d b e a r g u e d t h a t t h e p r i c e bandq c o n t s i n e d i n t h e v a r i o u p I n t e r n a t i o n a l T i n Agree- m e e t s a l s o m i r r o r t h e p r e v a i l i n g and a n t i c i p a t e d m a r k e t c o n d i t i o n s a s t h e y u d r e p e r c e i v e d by t h e n e g o t i a t i n g p a r t i e s .
61. The rest-lts o f t h e ex-pqs t s i ~ l a t i o n s o f t h e t i n b u f f e r s t o c k ( T a b ' e 8) s h w q u i t e c l e a r l y t h a t t h e s i z e o f t h e s t o c k n e c e s s a r y t o k e e p t h e market p r i c e w i t h i n t k e p r e d c t e r m ~ c c d bands a t a l l times, t h e a v e r a g e s i z e c f t h e
11 S i n c e t 5 i s a n a l y s i s by no means c o n s i d e r s a l l o f t h e most s i g n i f i c a a t - b e n e f i t s a n d c o s t s , t h e r e s u l t s s h o u l d Le i n t e r p r e t e d w i t ' some c a u t l o n . Al though o t h e r s t u d i e s have o b t a i n e d s i m i l a r r e s u l t s ( s e c C. W. Smith and C. R . S c h i n k , "The I n t e r a a t i o ~ l T i n Agreeat-ct: A Reassessment , " OJ.
c i t . ) , d e f i n i t e c o n c l u s i o n s a b o u t t h e economic u s e f u l n e s S of a t i n b u f f e r - - s t o c k h a v e t o be b a s e d on a more c o m p l e t e a n a l y s i s .
21 Under t h e v a r i o u s t i n a g r e e a e n t s , t h e buf f e r s t o c k manager was g i v e n che - f l e x i b i l i t y t o buy f o r o r s e l l f rom t h e b u f f e r s t o c k when p r i c e s were w i t h i n c e r t a i n l i m i t s above t h e f l o o r and belo-d t h e c e i l i n g . S i n c e t h i s d i s c r e t i o n a r y power c a n n o t b e i n t r o d u c e d i n t h e buf f e r c ~ o c k n o d e l , t:.e r e s u l t s s n w n h e r e u n d e r t h e ITA l a b e l o n o t c o r r e s p c - ~ d p r e c i s - l y t o ITA L p r o c e d u r e s a n d r ~ l e s of b e h a v i o r . T h e y - i n f a c t r e p r e k e n t t h e ~ e s u l t s of a more r i g i d r u l e o f behavf 3 r t h a t would a l l o v t h e buf f c r s t o c k b n a g c r t o buy o n l y dhen p r i c e s dropped t e l o u t h e f l o o r a n d t o s e l l o . . ! ~ when t h e y c l i m b e d above t h e c e i l i n g , w i t h o u t any a c t i o n i n between.
3 1 Tke u e i g h t s a r e a s f o l l w s : 0 . 7 f o r p r i c e a t t-1, 0 . 2 f o r r r l c c a t t-2 - and 0.1 f o r p r i c e a t t -3 . The a v e r a g e is t h e n a d j u s t e d f o r e x p e c t e d i n f l a t i o n , u s i n g t h e p e r c e n t a g e change i n t h e U.S. k'P1 a t t-1.

Tablo 8: ml?COStOQt SMUTI3WS ?QR SZLCCTlO T A ! ~ PRICE IUNCCS, 1961-73 ANJ 1961-71.
%viatiocr f r w ' I o l~k t ed ITA /a Ceviarioar from Trond /b 3 Year Moving Averagr / c
A o r 2 101 - + 152 - + 101 . + - 1 5 r
smas ('OOC mat.) -- 41.0 34 -0 26 .O 117 .O 2 i . C h r i u 41.0 34 00 26 .O 117 .O 2.1 .O Avo rase 29.5 17.4 12.1 73.7 17.0
(Standard 3eviation) 12.4 7 .9 5 l I 64.0 5'1 Avoraae Abnolure Chr3se 3.1 4.2 1.9 9.1 1.3
FUND (KXLLIOll US$) M ~ x i r a . ~ 127.7 107.6 90.6 366.4 ~ v e r a 8 o 87.4 49 .l 35 07 22 1.0
(Scaadard Feviation) 41.3 26 .O 20 .O 142.8 Avo raga Abro lu te Change 10.3 14.2 6 -8 29 00
STOtXS ('OW m.c.) h%inr~ 51.0 140.0 103 .C L53.0 62.0 Aver? ge 32 .O 33 a ; 24.1 84.3 23.7
(Stbndar.! Davlation) 13.5 43.6 32.2 49.3 16.2 Averago Abrolutt~ M n g e 3.9 11.2 7 .2 ld . 5 4.1
FUND (Mi l i on US$) - Haxinu 206.6 536 .O 472.1 579.3 Average 102.1 113.8 93.6 269.8
(Standard Deviatioa) 54.5 172.4 153.9 182.7 Average Abrolute Ctaage 16.4 43 -0 33 .A 40.6
/a Prica ranger as s e t tql t1.e 1nterna:iorml Tin Counci;. - /b The mid-poiat 05 th, ? r ice range was projected on the bar i r of the percent change i n -
price8 d ~ r i n g the previous three yearr. Thir percent change var then applied t o the averaie price of the previarr tm yearr. Price ce i l i ags and floors vere then expressed i n t e j l e of a f ixed pe r ce~ t age (+ 102 0;: 2 1 5 % ) from the projected mid-poin'i. Tine f o l l w l n g f o n u l a was used t o decrmine the mid-point: - -
/ c The veigt.cs selected vere 0.7, 0.2 and 0.1 tor the years ( t - l ) , (t-2) and (t-3); the - weighted average was adjusted by the US Wholesale Pticc. Index (t-1).

s t o c k p i l e , a n d , t h e r e f o r e , t h e c o s t s o f s t o b l l l z a t l o n a r e a l l q u l L e s e n s l t l v e t o t h e p r i c e - s e t t l n g r u l e u s e d by a s t a t l l l z a t ~ o n Agency. S l m l a t i o n s u s i n g t h e = r e o c c h a n l c a l tac thods o f C e t e r s l n i n ~ c e l l l n g and f l o o r p r l c c e o n t h e b a s l s o f p a s t p r l c e s (e .g . , s l o p l * o r v c l ~ h t c d a v e r a g e s l-/) show q u l t o c o n c l u e i v c l y t h a t v h c n s u c h r u l c s a r e u s e d , z u c h l ~ r g e r s t o c k s o f r l n a r c r e q u i r e d t h a n u n d e r 1TA-type r u l e s .
6 2 . The b u f f e r s t o c k s l = l a t l o n s bnscd o n S e r s l o n I1 o f t h e model a l s o i n d i c a t e t h a t t h e l n c l u s l o n o f t h e y e a r s 1974 a n d 1975 I n t h e a l m l a t l o n p e r l o d r a l s c s q u i t e s u b s t a n t l ~ l l y t h e c s t i a k t t c a o f a n x l m a and a v e r a g e e t o c k a t h a t a s : . ~ b l l l z a t l o n n p n c y n e e d s t o h o l d . T h l s l a n o t s u r p r l s l n g , g l v c n t h e sh'rp c h a n ~ c a I n t i n a i r k c t p r l c c s t h a t t o o k p l n c e s l n c c l n t r 1973 . Such p r i c e c h a n g e s r o u l d h a v e s t r a l n e d t h o r c s o u r c c s o f any p r l c c s t a b l l l z n t l o n Schc= .
6 3 . I f t h c y c n r s 1914 a n d 1975 arc c x c l u d c d , I t a p p e a r s t h a t A b u f f e r - s t o c k of a b o u t 10,000 mt r l c t o n s c o u l d h a v c e ~ l n t a l n e d p r l c e a v l t h l n t h c 1TA l l a l r ~ . S l n l l a r r e s u l t s v e r c o b t n l n c d v h c n t h e + 1 0 p e r c e n t t r e n d r u l e v a e u s e d . T h e r e s u l t s when t h e u e l g h t c d t h r e e - y c n r G v l n g avers-c r u l e ( r t d f u s t c d f o r i n f l a t i o n ) u a s u s e d shou t h a t a cmch l n r g c r s p r e a d I s n e e d e d , t h e a c t u a l s l z e depending o n u h c t h e r - + 10 p e r c e n t o r - + 1 5 p e r c e n t I s c h o s e n a s t h e =:gin. - 2 1
6 4 . T n b l c 9 s h w s c l e a r l y t h a t s t n b l l l z l n g p r l c c s by u s l n g t h e two non- IT,\ i n t e r v c n t l o n r u l c s would r e d u c e t h e l n s t a b l l i t y o f e x p o r t r e v e n u e s a u c h aore t h a c t h e t r a d l t l o n a l 1TA r u l e s w o l d : t h e c o e f f l c i c n t o f v a r i a t l o n o f c x p o r t r e v e n u e s f o r t h e 1961-75 b u f f c r s t o c k s l ~ u l a t i o n is 41.13 u1 th ;u t s t a b l l i z a t l o n , $0.05 u n d e r t h e ITA-type o f s t a b l l l z a t l o n , a n a v e r a g e o f 25.0 u n d e r t h e t r c n d p r l c c l n t e r v e n t l o n n e t h o d a n d o f 3 6 . 4 u n d e r t h e v e l g h t e d t h r e e - y e a r s o v l n p a v e r n b e p r i c e L n t e r v c n t l o n rmcthod. Houever , t h a t g r e a t e r s t a b l l l t y I n p r i c e s a n d r e v e n u e l e a c h i e v e d a t t h e e x p e n s e o f l w e r t o t a l e x p o r t r e - r e n u e s o v e r t h e s i w l a t i o n p e r i o d . T h e v a l u e o f e x p o r t r e v e n u e s ( i n c o n s t a n t 1967 USS) I s s o m h a t l w e r when i n t e r v e n t i o n r u l e s b a s e d o n p a s t p r l c e s a n d f l x e d p r l c e bands (+ 10 p e r c e n t a n d + 1 5 p e r c e n t ) a re u s e d t h a n when t h e =re i l e x l b l e p r i c e c F l l l n g s a n d f l o o r s c o n t a i n e d I n t h e I n t e r n a t i o n a l T i n ~ \ g r e c o e n t s are a p p l i c d .
6 5 . T h e s e r e s u l t 3 a r e n o t s u r p r i s f n g . Between 1961 a n d 1 9 7 5 , t i n p r i c e s a n d e x p o r t r e v e n u e s r e a c h e d t h e i r h i s t o r i c a l peak . Any e f f e c t i v e mechanism t o s t a b i l i z e p r i c e s wou ld hav! t o h a v e c u t peak p r i c e s a n d t h e r e b y r e v e n u e s . S t i l l , t h e r e s u l t s p i n p o i n t a s e r i o u s p o l i c y dilcmma: t h e a c h i e v e m e n t o f - -
' ' S o t a d j u s t e d f o r h x p e c t e d : n f l a t i o c ~ .
2 / I t s h o u l d be p o i n t e d o u t t h a t a l l t h e r e s ~ l t s shown i n T a b l e 8 a r e - p r o b a b l y o n t h c lw s i d e , s i n c e a l l t h e s i m l a t i o n s a r e d e t e r m i n i s t i c i n n a t u r e . S t o c h a s t i c sicul . t i o r i s v o u l d terid t o show h i g h e r f i g u r e s f o r b o t h s : ~ c k s and t h e f and.
3 E x p o r t r e v e n u e ; f o r t h r p e r l o l l 1961-75 L-ere d i s c o u n t e d a t t h e r a t e o f 3 - p e r c e n t p e r ye;r t o c o n p u c e r h e i r p r e s e n t v a l u e i n 1966 .

Table 9: ZFPECT OF PRICE STABILIZATIOY ON SIZE Ahl) STABILITY OF W O R T REVENUES
Deviation8 from Weighted ITA /r Deviat ionr Irom Trend /q 3 Year k v i n g Averate /c
Year ITA b n g e r 2 10: - + 152 - + 102 - + 1- Actual Revenue /d
Coeff ic ien t of Variat ion/e 40.05 24.67 25.39 36.30 32.51 41.13
To ta l Present Value/ - f 4,998 4,625 4,724 4,651
/a Pr ice ranges a s s e t by t he In t e rna t iona l Tin Council. 1
/ b The dd -po in t of t he p r i ce raoge was projec ted on the bas i s of t he percent ch:nges i n - pr i ce s dur ing t h e previous t h r ee years. This percent change w a s then applied t o the avrrage p r i ce of t he previous two years . P r i ce c e i l i n g s and f l o o r s were then expressed i n terms of a f ixed percent (+ 10% o r 2 15%) from the projected mid-point. The fo l lov ing formula was used t o d e c r r d n e the mfd-point:
Pt-1 Pt-1 + Pt-2 I l l 2 I - / C The weights s e l ec t ed were 0.7, 0.2 and 0.1 f o r the Year (5-1). ( t -2) and ( t -3) . This -
velghted average was ad jus ted by t h e US Wholesale P r i ce Index (t-1).
Id SInuLated revenues. - / e C o c f f ~ c i e n t of va r i a t i on (standard dev ia t i cn divided by mean) mul.tlplied by 100. -
/f Present value of export revenues (1961-75) i n cerms of 1967 cons tan t US d o l l a r s and - discounted 3 percent per year.

g r e a t e r p r i c i s t ; . i t y i a p l i e s l o v e r revenues . Tb is d l :emma a r i s e s - - p r o b a b l y l n a 1 1 meta l s - -wheneve* p r l c e s t a b i l l t a t i o n is e n f o r c e d r i g i d l y according t o p r e d e t e r m i n e d r u l c s f o r f * i t e r v c n t i o n based o n marke t p r i c e s . O b v i o u s l y , t h e c h o i c e between s t a b l e p r i c e s a n d h i g h e r r e v e n u e s is a d i f f i c u l t one. The answer depends , i n t e r a l i a , on t h e a t t i t u d e o f p o l i c y ~ q k e r s toward r i s k , t h e impor tance of t h e r e v e n u e s f rom a c e r t n l n c o u ~ o d i t y t o a g i v e n c o u n t r y , t h e p o l icy i n s t r u m e n t s a v a i l a b l e t o c o n t r o l t h e e f f e c t s o f revenue f l u i t u a t i o n s on t h e n a t i o n a l e c o n o ~ i e s a n d a c c e s s t o i n t e r n a t i o n a l c r e d i t .
C. P r i c e S c c n r r i o e t 1978-85
66. The t i n o o d c l ( V e r s i o n 1 1 ) was a l s o u s e d t o g a i n sow i n s l ~ h t i n t o t h e l i k c l y p r o s p e c t s f o r t h e w r l d t i n economy. I n g e n e r a l , t h e p r o j e c t i o n s o f a n e c o n o m e t r i c m d e l r e f l e c t i ts s t r u c t u r e a n d t h e a s s u m p t i o n s rde a b o u t i t s exogenous v a r i a b l e s . A s s u p p t i o n s a b o u t t h e f u t u r e v a l u e of a n economic v a r i a b l e a r e a l w a y s somewhat a r b i t r a r y . To e s t a b l i s h t h e b o u n d a r i e s f o r t h e f u t u r e t i n econoay , t h e p r o j e c t i o n s vere based o n t h r e e a l t e r n a t i v e sets o f a s s w p t i o n s f o r t h e exogenous v a r i a b l e s i n i n d u s t r i a l i z e d c o u n t r i e s f o r t h e p e r i o d 1978-85: ( 1 ) o h i g h r a t e o f i n f l a t i o n (6 .5 p e r c e n t a y e a r ) a n d h i g h ChT g r w t h r a t e s ( 5 p e r c e n t a y e a r ) a n d h e a t y s t o c k p i l c sales by t h e U.S. g o v e r n r r n t ; ( 1 1 ) a 5.5 p e r c e n t r a t e of i n f l a t i o n , medium CNP g r w t h r a t e s (4 p e r c e n t n y e a r ) , o o d e r a t e s a l e s by t h e U.S. government f rom t h e s t o c k p i l e ; and ( i l l ) a 4.5 p e r c e n t r a t e o f i n f l a t i o n , l o u GYP g r w t h r a t e s ( 3 p e r c e n t a y e a r ) , a n d no government s t o c k p i l e s a l e s .
67. P r o j e c t e d p r i c e s f o r 1985, i n c o n s t a n t 1975 'JSS term, v a r y between $13,105 p e r m e t r i c t o n (under t h e a s s u m p t i o n s o f h i g h economic g r w t h and h i g h inflation) a n d 59 ,740 p e r m e t r i c t o n ( u n d e r t h e a s s u m p t i o n o f l aw cconomic g r w t h a n d lov i n f l a t i o n ) . Given 1978 World Bank a s s u m p t i o n s r e g a r d i n g GNP growth a n d i n f l a t i o n (medium g r w t h a a d medium i n f l a t i o n ) , t i n p r i c e s i n 1985 were p r o j e c t e d t o be i n t h e $11,300-$11,900 p e r metric t o n range. Annex 11.1 s h w s t h e p r o j e c t e d v a l u e s f o r a l l k e y v a r i a b l e s - s u p p l y , demand, s t o c k s a n d pr ices--assuming m e d i m r a t e s o f g r w t h f o r GNP a n d i n f l a t i o n .
68. For t h i s e x e r c i s e , medlurn i n f l a t i o : ~ and medium GNP g r w t h r a t e s were assumed f o r I n d u s t r i a l i z e d c o u n t r i e s . f a b l e 10 shows t h e s e p r o j e c t e d ?rites ( i n 1975 c o n s t a n t US$) f o r t h e p e r i o d 197d-85 u n d e r t h r e e a l t e r n a t i v e hypo- theses r e g a r d i n g s a l e s by t h e U.S. government f rom its s t o c k p i l e . The year - by-year r e s u l t s s h w c l e a r l y t h e impact o f t h e l o s s / l a g s i n s u p p l y a n d demand
- 2n p r i c e s . As a r e s u l t o f heavy s t o c k p i l e s a l e s ( S c e n a r i o 111, p r i c e s can be ! k e p t r e l a t i v e l y lw fclr a s l o n g as s a l e s l a s t ( u n t i l 1981) . However, because - o f t h e l a g s i n t h e a d j u s t m e n t of bar:, demand a n d s u p p l y , t h e market p d c e s i n - t h e t h r e e e n s u i n g y e a r s l n c r e a s e f a s t e r t h a n u n d e r t h e medium o r no s q c k p i l e * - s a l e s c e n a r i o s . Y e d i m s t o c k p i l e s a l e s ( S c e n a r i o 11) h a v e a s i m i l a r , d f less
pronounced, e f f e c t o n t h e ad jusrment o f t i n p r i c e s . With no s t o c k p i l e s a l e s

(Scenar io 1 ) . t i n p r i c e s r e r s i n f a i r l y mtable a t around $10,500 per metr ton dur ing t h e e n t i r e p r o j e c t i o n per iod (1978-85). - 1 1
Table 10: PROSPEnS FOR TIN PRICKS USDER VARIOUS ASSUMPTIONS OF GOVERX)&NT STOWILE SALES, 1978-8s
(1975 Ysglot)
- -- --
Year
Note: A s s u q t i o n I: No government s t o c k p i l e s a l e s . Assumption 11: noderate governmtnt s t o c k p i l e s a l e s . A s s u q t i o n III: Heavy government s t o c k p i l e s a l e s .
These t h r e e p r i c e scenar ios a r e based on assumptions of medium r a t e s f o r C?lP and i n f l a t i o n .
- - 69. The pa th of t i n ae r fe t p r i c e s from 1978 t o 1985 i n cons tan t 1975 US$ terms is shown i n Chart 5. >e p r o j e c t i o n s s h w t h a t t h e c y c l i c a l behavior of t i n p r i c e s i s l i k e l y t o cont inue i n t h e f u t u r e i n t h e absence of a s t r o n g p r i c e s t a b i l i z a t i o n e f f o r t el these p r o j e c t i o n s were worked ou t on t h e assumption t h a t t h e r e w u l d be no a c t i o n involving t h e buffers tock) . I t a l s o s h w s t h a t t i n p r i c e s a r e l i k e l y t o maintain t h e t r end of lotig-term grclvth i n
1/ Heavy s t o c k p i l e s a l e s involve a d i s p o s a l of 15,000 m.t. i n 1978, 1979, - 1980 and 1981 and 5,000 m. t . a year t h e r e a f t e r . Moderate s t o c k p i l e s a l e s involve d i s p o s a l of 15,000 m . t . i n 1978, 1979 and 5,000 m.t. a year t h e r e a f t e r .


r e a l te t rw . different s t o c k p i l e r i l e p o l i c i e s c a n a l t e r t h e a d f u r t m e n t p a t h i r l . 1 p r l c e r , b u t c a n n o t modify t h e i r long- te rm g r w t h .
70. On t h e whole , i t w u l d a p p e a r f rom t h e p r o j e c t i o n r t h a t t i n p r o d u c r r r c a n l o o k f o r w a r d to A r l o u , b u t r t e a d y r ise i n t h e d e m n d f o r i w o r t r o f t h i r m e t a l , a r well a s to p r i c e r t h a t w i l l c o n t i n u e t o t i r e i n r e a l t e ~ a l o n g t h e l o n g run . H w e v e r , A B A r e r u l t o f t h e l a g o t h a t c h a r ~ c t e r i t e t h e r e r p o n r e o f d e ~ n d a n d s u p p l y t o c h a n g i n g marke t c o n d i t i o n r , t h e cur.-ant p r i c e boom w i l l b e f o l l o w e d by A p e r i o d o f u c h lover real p r i c e r which i v l i k e l y to b a g i n i n t h e e a r l y 1980r and t o l a r t u n t i l t h e mid-19808.

ADDITIONAL EQUATIOSS USED 1% TliL EX-POST SIWUTIONS OF THE MDEL
United S t a t e r
( A l . l ) T i n p l a t e P roduc t ion (1955-75)
STPUSt - -18055.86 + 63.24198 IHFWS: + 17740.05859 LMIUTt (6.32) (6.31)
It2 - 0.71 S.E.E. 296.1 D.W. - 2.05
where:
STPUS - t i n p l a t e product ion ('000 m t )
IMFBUS' - index o f i n d u r t r i s l p roduc t ion f o r u n u f a c t u r e d food, beverage8 and tobacco (19701100)
C L W T = r a t i o of s h i p o c n t r of t i n can8 t o t o t a l canr ' sh ipments
DnuusI - dummy v a r i a b l e f o r r t r i k e s i n t h e f a b r i c a t e d o c t a l i n d u s t r y
(A1.2) l o g CLYRAT = -0.11735 + 0.01559 TIHE (11.64)
RL - 0.91 S.E.E. - 0.024
where:
CLVIWT - r a t i o of shipments o f t i n cans t o t o t a l cans' shipments .
Western Europe
(A1.3) T i n p l a t e P roduc t ion (1955-75) - - ' J STPEUR - -225.93 + 50.30054 IIPEUR* - 128.60156 P ~ H E
(3.39) t (2.87) - [ PAUK* I t-1 - R= - 0.97 S.E.E. - 174.1 D.W. - b 3 3 - where:
STPEUR = t i n p l a t e product ion ('000 m t )
I I P E U R * = index of i n d u s t r i a l p roduc t ion f o r food , beverages and tobacco, OECU Europe, (1970-100)

PAUK = lut? num p r i c e Ln U K ( S l o t )
( X 1 . 4 ) Production o f Ttnplate (1955-75)
where:
STPJAP - t i n p l a t e production ('000 mt)
IIPJAP - index o f industrial production f o r food, beverage. and tobacco (1970-100)
WIJAP - w h o l e u l e p r i c e index (1970-100)
PTJAP - W E t i n p r i c e expreared in yen/mt


A YOW I R ~ A~CO m n m a c r nma: mi rnss noon


LIST OF TABLES
11.1 S t e a l P roduc t ion .......................................... 11-4 11.2 Devaloping Count r ieao- -Stee l P roduc t ion and Sha re of
Market Econor tcao P roduc t ion ......................... 11-5 I I . 3 S t e a l Conrumption ......................................... 11-6 11.4 Annual I n v e r t m a t e i n t h a I r o n and S t e a l I n d u r t r y ......... 11-8 11.5 Capac l ty f o r S t e e l Product ion ............................. 11-9 11.6 S t e e l P roduc t ion by S i t e of C o q a a y . . .. . . . . . . . . . . ... . .. . . . 11-12 11.7 Capac i ty Erpanaion Plena .................................. 11-16
111.1 Taxonomy o f Dynadc I r o n . a d S t e a l tct\nomy Hodela . . . . . . . . . 11-19
V. 1 ~ . a ~ m p t i o n o l a t h e UISC Model: 1975-1990 . . . . . . . . . . . . . . . . . 11-31 V.2 Coata o f I a v 8 a t w n t l o S t e e l Capac i ty ..................... 11-32 V.3 Ac tua l and P r o j e c t e d N 8 t I a v e a t w n t ....................... 11-33 V.4 Actual and P r o j e c t e d S t e e l C o n r u q t i o n .................... 11-M V.5 A c t u a l and P r o j e c t e d P r i c e f o r S t e e l P roduc ta ............. 11-37 V.6 A c t u a l and P r o j e c t e d I r o n Ore C o n a u q t l o a ................. 11-38
V 1 . l Solutions v i t h n o d a l A and node l C, S t e a l Conauaptlon and P r i c e ........................................... 11-45
VI.2 S o l u t i o n s v i t h h b d e l A a n d n o d a l C , Net Investment ........ 11-65
IV.l Tableau f o r Hodel A ....................................... 11-24 IV.2 Tableau f o r Model B ....................................... 11-29
V . l P r o j e c t e d Net Investment ................................... 11-34 V.2 Ac tua l and P r o j e c t e d S t e e l Consumption .................... 11-39 V.3 Ac tua l and P ro j e c t e d P r i c e f o r S t e e l P roduc t s . . . . . . . . . . . . . 11-40
APPENDIX TABLES
P r o j e c t e d Demand f o r S t e e l and S t e e l Balanke i n Regions O the r t h a n U.S. , J apan and t h e EC
Implied P r i c e and GNP E l a s t i c i t i e s of Demand f o r S t e e l P roduc t s -
Annual and Expected G t w t h , 2 f CNP (GDP) L
Reference O p e r a t i n g Cos t s , J976 Es t imated O p e r a t i n g Cos t s , 070
Es t ima ted O p e r a t i n g Cos t s , 3 r 7 5 Es t ima ted O p e r a t i n g C o s t s , 1980 Es t ima ted Opera t ing Cos t s , 1985 Es t imated O p e r a t i n g Cos t s , 1990 Reference Y i e l d , 1976 Es t imated Y i e l d , 1970-1990

1. T h l s p a y e r discusses t h e d e v e l o p a e n t of a model f o r t h e v o r l d i r o n and s t c e l economy--the VISE w d e l - - t h a t p r o J e c t a m a r k e t e l t u a t l u n s I n f u t u r e bcnc tmrrk y e a r * . I/ The n o d e l c a n p r o J e c t p r l c c s , denand a ' s u p p l y q u a n t l t l e s o f s t c e l ~ n d r c q u l r e w n t s f o r o a J o r l n p u t s and l n v e s t w n t s s t e e l p r o d u c t i o n f a c l l l t l e s . Particular a t t e n t l o n I s g i v e n t o l n v e s t w n t on d u c t i o n l a c 1 1 i t l e s . P r o j e c t i o n s a r e m d e f o r t h r e e d l a t l n c t years--1400, 19R5 and 1990, u l t h l n v e s t m e - i t ~ d e p l c t e d f o r t h e corresponding p e r l o d e of ' ;5-1980, 1980-1985 .tnd 1985-1990.
2 . n r e abodcl 1 s d c v c l o p e d a s n l l n e n r complementnr l t y p r o g r a m Y ~ 18 (LCP) p r o b l e n , u h l c h f a c l l l t a t e s d e a l i n g w i t h tw k l n d s o f d l f f l c u l t i e e i n m o d e l l i n g l n v e s t o c n t b e h a v i o r . The f i r s t l n v o l v c s a o d o l l l n g t e c h n i q u e s . I n t r e a t l n g l n v c i t a c n t , t h c r c l a a p rob lem o f how t o L n c u r p o r a t e l ~ ~ t o mode l s t h e two-way r e l a t l o n b e t u c e n c u r r e n t l n v e s t o c n t ibnd f u t u r e m a r k e t s l t u n t l o n s - - i n v e s t m e n t l n f l u c n c c d by ~ r k e t c x p c c t a t l o n s , and v l c a - v e r s a .
3. The sccond d l f f l c u l t y I s t h e c o s p l e x l t y o f m k l n g i n v e s t m e n t d e c l s l o n s i n t h e r c a l wor ld . The i r o n a n d s tee l i n d u s t r y is o f t e n v i e w d a s "bns lc" a n d as s u c h c a n n o t be s e p a r a t e d f rom o v e r a l l economic c o n s i d e r d t i o n s . Pure l y economlc r e a s o n i n g a b o u t l n v e s t w n t s is n o t a l v a y s a p p r o p r i a t e . Two models a r c , t h e r e f o r e , p r c s c n t e d i n t h i s paper . Yodel A assumes t h a t t h e l n d u s t r y e s l n v e a t u e n t d e c l s l o n s a r e bnsed o n r n t i o n a l e x p e c t a t i o n s . I t c o n s l d e l ~ t h e m r k e t s i t u a t i o n s t h a t would r e s u l t i f t h e i n d u s t r y were t o behave r a t i o n a l l y v i t h p e r f e c t f o r e s i g h t . Xodel B a s s u m e s t h a t i n v e s t m e n t p l a n s of t h e I n d u s t r y s i l l be implemented a n d p r o j e c t s i ts f u t u r e o n t h a t b a s l s . A c t u a l d e v e l o p m e n t s v i l l be somevhere b e t v e e n t h e s e t v o e x t r e m e s .
4 . I n a r a p i d l y c h a n g l n g v o r l d economy, p e r s p e c t i v e s on t h e i n d u s t r y ' s f u t u r e a l s o c h a n g e s q u i c k l y . Some a s s u q t i o n s u s e d i n t h e model , e s p e c i a l l y t h o s e a b o u t g r w t h of COP and i n v e s t m e n t p l a n s h a v e a l r e a d y been r e v i s e d dovnward s i n c e t h e f i n a l computer r u n s v e r e made. 2 1 C o n s e q u e n t l y , some c o n c l u s i o n s d e r i v e d i n t h e p a p e r need t o be r ~ v i s e d . Hovever , t h e model is s t i l l r e l e v a n t , a s i t p r o v i d e s a comprehens ive f ramevork f o r d e p i c t i n g marke t b e h a v i o r I n t h e w o r l d i r o n and s t e e l economy.
5. The s t r u c t u r e of t h e p a p e r is a s f o l l w s . S e c t i o n 11 r e v i e u s p a s t t r e n d s a n d t h e c o n d i t i o n of t h e wor ld i r o n a n d s t e e l economy i n 1979. S e c t i o n 111 p r o v l d e s a b r i e f r e v i e w of o t h e r m o d e l s o f t h e s t e e l economy. The
- .L
11 The WISE rnoiel f o c u s e s on t h e e v o l u t i o n o f t h e i r o n a n d s t e e l economy i n - - a a r k e t economies . The c e n t r a l l y p l a n n e d economies a r e t a k e n i n t c r a c c o u n t o n l y when tlfey a r e b e l i e v e d t o a f f e c t t ' ? g l o b a l m a r k e t . ~ i ~ u r e e s h o w n i n t h i s p a p e r a r e f o r market economies u n l e s s o t h e r w i s e s t a t e d .
2 1 The f i c a l compute r r u n s were made i n J u n e 19Y3, and t h e a s s u m p t i o n s i n - t h i s p a p e r a r e t h o s e t h a t p r e v a i l e d i n t h e f i r s t h a l f of 1979.

mathomatical formulation f o r the UXSE nodel i r prerented i n Section IV. Section V s h w r the project ionr u i n g Hodelr A and 8 . Section V I dercr ibar the rimulation t e a t , the r e ~ u i t i v i t y t e r t and the t e r t of t he t e r x i m l year of the model. Conclurionr appear i n Section VII. m e r e a r e t h ree appendicer. Appendix 1 presentr the ~ S E model a r a LCP problem. The e r t l m t i o n of damnd functionr fo r s t e e l i r dircurred i n Appendix 2. Appendix 3 provider information r e l a t ing t o eatimated operat ing c o r t r and yield.

i l . THE WZLD IROX ASD STEEL EC0SO.W
-4. Product ion, Cnsuapt ion and T rade
6. Steel praduccion i n the market econooiee i e concentrated i n three reei2r.s: :he '.'.S.. J a v n and the European Coamni t ies (EC) (Table 11.1). In 1971, :hey accounred tor 792 of the s t e e l produced in the m r k e t econonies. ?he ~ l l m ~ c e u l s prodwed b y other developed and developing countries. Although the $.hat.+ of deve lop i~g countr ies has been increasing s t ead i ly , i t s t i l l remins st lesr t a n 101 (Table 11.2).
7. St te l coblruqrion i s a l so concentrated i n the th ree mafor regioas, zhoryh Less EIavL ly thdn production (Tabla 11.3)--they accounted f o r 701 of rhe r z e r l co~ump:ion in nurkat econoaias in 1976. Among t b e regioru, Japan and =he S C are l a r g e exporterr , vh l l a the U.S. is a net ipporter. Other devtlopud c m n t r f c s have a s l i g h t d e f i c i t i n r t c e l ; developing countr ies a s r h a l a r s i r t e r c o v i d e r a b l e s t ee l d e f i c i t s . Consequently, the u f o r t rat21 f lon t a e plrce f roe Jap.0 and the EC t o the U.S. rnd developing countries. Hrrucrer, i t should k aoted t h r t sone aevly d e v e l o ~ c d rteel-producfug carrcriem s u h as Spain, South Africa and the Republic of Korea a r e making remzcLabJe izroa& imo t h e U.S. and EC aarkets .
8. After tke U S . f o r the f i r s t t i ne kcape a get importer of s t e e l i n 1959, ic-s i q m r t s fncreastd rapidly, i n 1968, equaling a h t 172 of f t s t o t a l s t d c o m r ~ t i o a - lbe flood of foreign s t e e l provoked charges of s t e e l dun? i a g f t o r e i p cowantries and resulted i a p ro t ec t ion i s t measures by ?he 0.5. Ln 196F. t h e U.S. persuaded J a ~ a n e s e and EC s t e e l producers t o i ~ p o s e 'vo luntaq" res-xaforrs oa tb?clr exports, a s i t ua t ion chat l a s t e d u n t i l 197b.1/ The upsurge of fore+gn s t e e l expmcs f n 1976 and 1977 prompted the U.S. t o iTtroducc a t r h e r p r i ce sys reo ea r ly i n 1978. - 21 The FC, a i s o facing i c f l w s of s t e e l
- - !/ 3. -tr c d K. Kawahito, "Steel Industry Econonics, A Conparativt Ana- - 8
l : y s b ef Stm=tur: Conduct and ~erformance," 1978, p. 2 .
/ 3 e rr igder pr ices were f i r s t s e t i n January, 1978 and a r e revised every - {ua=:er.

Table 11.1: STEEL PRODUCTION - /a
Market Economler Major Steel-Producing Regionr Other b a t r a l l y World
Ycnr U.S. Japan EC Subtotal Developed Developing Subtota l Planned Tot. 1 Countrler Countrler Economler
/a Crude s t e e l equivalent . -
Source: S t a t i e t i s c h e s Bundesqmt, Bisan und S t a h l (variour i r r u u ) , and otberr .

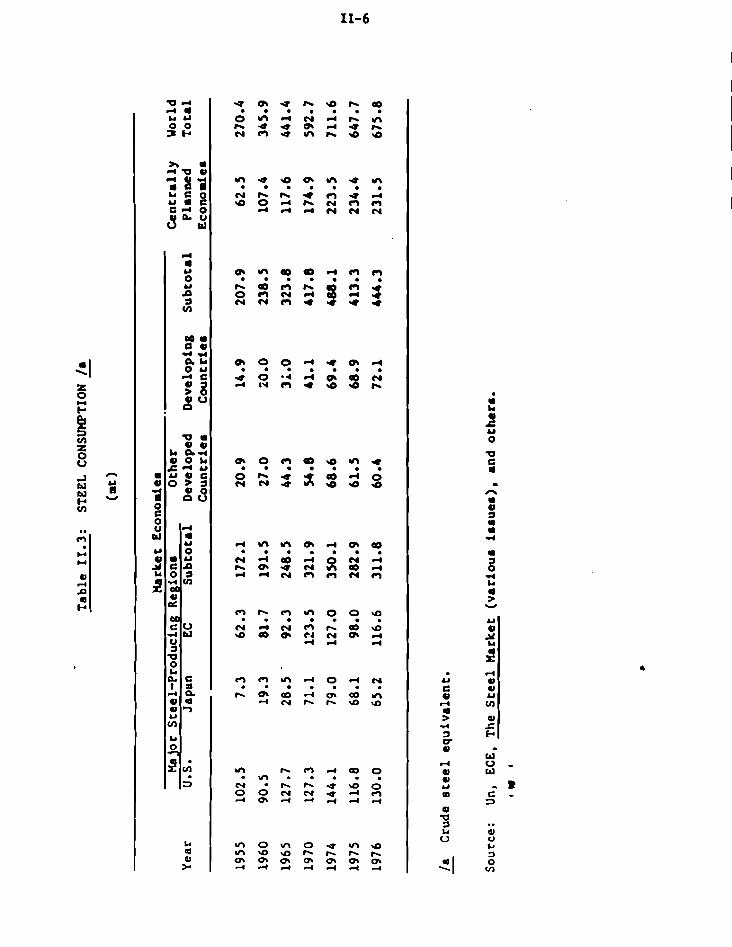

f rom J a p a n a n d newly-developed s t e e l - p r o d u c i n g c o u n t r i e s , l j k e w l s e a d o p t e d v a r i o u s p r o t e c t i o n i s t measures . 1/ To c o p e w i t h t h e "geograpi,:cal d l s l o c a t . i o n " o f s t e e l p r o d u c t i o n and c o n s u a p t i o n , OECD is w o r k i n g on a n i n t e r n a t i o n a l s teel agreement t o r e s t o r e " o r d e r l y " development i n t h e w o r l d i r o n and s t e e l i n d u s t r y . !/
B. Inves tment and T e c h n o l o g i c a l P r o g r e s s
9. The most r e a a r k a b l e phenomenon i n t h e wor ld i r o n a n d s teel i n d u s t r y i n t h e l a s t two d e c a d e s is J a p a n ' s e r r g e n c e a s t h e l e a d i n g s t e e l - p r o d u c i n g c o u n t r y . I t s p r o d u c t i o n i n c r e a s e d a l m o s t 12 times between 1955-1976, v h i l e U.S. p r o d u c t i o n vas v i r t u a l l y s t a t i o n a r y and t h e EC's p r o d u c t i o n i n c r e a s e d o n l y a b o u t 1.8 tlmes ( T a b l e 11.1).
10. The r a p l d l n c r e a s e i n J a p a n ' s p r o d u c t i o n r e s u l t e d i n p a r t from v i g o r o u s e x p a n s i o n o f l a r g e - s c a l e f a c l l i t i e r a n d t h e a d o p t i o n o f new tcchnology .
11. Al though t h e d a t a i n d i c a t e that t h e U.S., J a p a n and t h e EC i n v e s t e d comparab le amounts o f fund* between 1960 a n d 1976 ( T a b l e 11.4). t h e n a t u r e o f t h e i r i n v e s t m e n t s was s u b s t a n t i a l l y d i f f e r e n t . Between 1960 and 1976, J a p a n i n c r e a s e d i ts s teel p r o d u c t i o n c a p a c i t i e s f rom 19 m i l l i o n t o n s p e r y e a r (mtpy, h e r e i n a f t e r ) t o 152 mtpy, w h i l e t h e U.S. f rom 1 3 5 t o 144 mtpy and t h e EC from 102 t o 198 mtpy ( T a b l e 11.5). Of t h e added c a p a c i t y i n J a p a n , more t h a n 100 mtpy c o n s i s t e d o f i n t e g r a t e d g r e e n f i e l d p l a n t s , compared w i t h o n l y 10 mtpy i n t h e U.S. 21 J a p a n a l s o e x p l o i t e d e c o n o d e s o f scale i l a n d a d o p t e d modern t e c h n o l o g y s u c h a s t h e basic oxygen p r o c e s s 11 a n d c o n t i n u o u s c a s t i n g . 6-1 Ae a r e s u l t , its s teel i n d u s t r y was g r e a t l y improved. For example, i ts coke r a t i o
11 The Davlgnon p l a n 13 t h e EC c a n be c h a r a c t e r i z e d a s more d i r e c t p r o t e c - - t i o n l s t m e a s u r e s t h a n t h e U.S. c o u n t e r p a r t , i n c l u d i n g g u i d a n c e p r i c e s and " v o l u n t a r y " p r o d u c t i o n q u o t a s (The h'ew York Times, Harch 3, 1977).
2 1 The O E O a d hoc Working Group on t h e S t e e l I n d u s t r y was f i r s t set i n - 1977, a n d is b e i n g h e l d c o n t i n u a l l y .
31 I b i d . - - 4 1 k o f d d - 1 9 7 8 , J a p a n p o s s e s s e d 3 9 b l a s t f u r n a c e s whose t o t a l volume -
exceeded 2 ,000 c u b i c m e t e r s ; w o r l d v i d e t h e r e were a b o u t 1 1 5 b l a s t f u r n a c e s o f t h i s z s c a l e . ( J a p a n I r o n and S t e e l F e d e r a t i o n , Tekko T o k e i Yoran ( H a j o r s t a t i s t i c s o f t h e I r o n a n d S t e e l I n d u s t r y ) , 1978 , pp. 214-216).
I I n 19775 t h e r a t i o of s teel produced i n J z p a n by b a s i c oxygen p r o c e s s was - - 80.5%; me c o r r e s p o n d i n g r a t i o s i n t h e U.S. a n d West Germany were 61.8% and 7 4 . n . I b l d . , p. 46-47. .
6 / I n 1977, t h e r a t i o of c o n t i n u o u s l y c a s t s t ee l t o t o t a l s teel p r o d u c t i o n i n - J a p a n was 40.8%. v h i l e t h e c o r r e s p o n d i n g r a t i o s i n t h e U.S. and West Germany v e r e 11.8% a n d 34.0%. I b i d . , p. 53.

Table 11.4:s ANNUAL INVEST?fE)(TS I N THE IRON AND STEEL INDUSTRY /.
U j o r Three Other b j o r Three OCCD O t h r r
U-S. /b Japan /c EC & Sub to t a l Europe /d Canada /d Cuunt r lea l. T o t a l Tot.1 /I \ ------------------- ( I n curren: d l l l o n d o l l a r # ) ( l a 1975 conat.nt m l l l l o n d o l l a r a )
1960 1,521 598 1,231 3,350 231 n... n... n... 1961 960 767 1,691 3,418 214 74 n.8. n... 1962 911 615 1,722 3,248 196 101 n... n... 1963 1,060 463 1,687 3,190 226 104 n.8. 0.a. 1964 1,600 463 1,470 3,533 216 191 n... 0.8.
1975 3,179 3,683 3,097 9,959 - 1,467 533 tt.8 . n.6. 1976 3,255 3,509 3,100 9,864 n... n... n... n...
n... n... n.. . 0.8. n...
n... n...
/ a l nc lud lng charge p r e p a r ~ c l o n , p i g I ron ( l n c l u d l a t c o t e r l e a , c rude s tn l a d r o l l l q rill#). - /b Q p i t a l expendlcurea of AISI umber coq.nle#, uh l ch Inc lude l n w a t n n t e . p . d i t u r e# f o r moo-#tee1 u k l q . c t l v l t 1 . ~ -
( t h e A r r l c a n I r o n and S t e e l I n a t l t u t e , Annual S t a t ~ ~ t ~ c r l k p o r t ) .
/ C Japan, UITI, HIT1 J o u r n a l , b r c h 1978. - /d OECD, The I ron and S t e e l I n d u a t r y ( v a r l a r s l##ua#). - / a Eotlmnted by t he au thor . - / f Def la ted by t h e U.S. uho l e sa l e p r l c e Index. -

1 n .L.nn- .. . - - e - g ; z z $ =--n- a n - -. .(.--- (.n- nn I 0 . . . . . .??? ??:?? ?::
n
a (L u
u
I . - c c m O--.-- .n n n n e r o o a ! : 4 1 - 1 4 4 - d - 4 d d d
I :-.-4 -.-4-n nnnnn n n n
I I I
I

(kilogram3 of coke per ton of pig iron) war reduced from 619 in 1960 t o 434 in 1977, compared t o 597 in the U.S. and 482 in dest Germany in 1977. 1 / - 1 2 . The Japanese s t e e l producers a r e believed t o have the lovest operat ing cos t s , although t h e i r c a p i t a l charges a r e higher than those of the U.S. and EC, because a large portion of Japan's investment bas made i n recent years. Japanese production cos t r a r e n w used by the U.S. i n computing i t s t r i gge r prices.
C. urowth of the Iron and S t e e l Indurtry in Developing Countries
13. Although r t e e l production i n developing count t ie r accounted fo r only 9.52 of t ha t of the v r k e t econoder i n 1977, i t r g r w t h In recent yearr har been rapid and rteady (Tabler 11.1 and 11.2). Par t icu lar ly mince 1974 t h e i r p e r f o r v n c e har contrar ted rharply with tha t of developed countries. The l a t t e r , a f t a r acl.ieving record-high l cve l r of r t e e l production in 1974, almost uniformly ruf fered d r a r t i c r e t h c k s ; i n 1977 t h e i r s t e e l production uas s t i l l 142 lover than in 1974. On the other hand, production in developing countrfes hns k e n lncreaslng without s ign i f icant in ta r rupt ionr ; i n 1977 i t uar 422 higher th tn in 1974.
14. S t ee l was produced by 19 developing countr ies i n 1977. However, four-- Brazi l , India, Hexlco and South Korea ( i n order of aagnitude of production)-- accounted fo r 73.22 of the t o t a l fo r developing countrie9 (Table 11.2). As l a t e c o w r s , 11 the9e countr ies have been i n a pori:ion t o impleaent ea s i ly the newest technology. For ezample, the number of large-scale b las t furnaces of these countr ies coaparer w e l l with t ha t 1n the U.S. - 31
15. The growth of the South Korean and Brazi l ian i ron and s t e e l indus- t r i e s 1s pa r t i cu l a r ly r e u r l u b l e . The former's annual g r w t h r a t e has been 38.42 s ince the couplotion of its f i r s t integrated i ron and s t e e l m i l l i n 1973. 41 The capci ty of t ha t pill was recent ly increased from 2.6 mtpy. When the neyt s t e p in i ts expansion program is completed i n 1981, t o t a l production
11 Ibid., pp. '196-197, and nue l le r and Kauahito, op, c i t . , p. 31. - - 21 An exception is India, which has a long h is tory of modern i ron and s t e e l -
making. Tata Iron and S tee l produced India's f i r s t ca s t of pig iron in 1911 and i ts f i r s t s t e e l i n 1912.
31 As of mid-1978, of the b l a s t furnaces exc_eeding a t o t a l volume of 2,000 - cubic mete. , Brazil and India, each had three , Mexico and the Kepublic of Korea one each a s compared t o f ive in i the U.S. Japan and S tee l Federa- t i on , op. c i t . , pp. 214-216.
4 1 The i n i t i a l capacity of the s tate-run Pohang Iron and Steol Company was - only 950 thousand tons of pig i ron and 1,032 thousand tons of crude s t e e l ; hwever , i t ra ised South Korea's pig i ron and s t e e l production capacity by 5.7 and 2.3 times. Y.H. K i m , The Growth of the Korean Iron and Stee l Industry ( i n Korean), 1976, p. 75.

v l l l r e a c h 8.5 z l l l i o r t o n s (mt , h e r e i n a f t e r ) . 11 B r a z i l ' s a n n u a l g r w t h r a t e b e t w e n 1965 a n d 1977 was 11.62; i t s s tee l p r o d ~ c t l o n is e x p e c t e d a l m o s t t o d o u b l e by 1585.
16. The Z e p u b l i c of Korea h a s a l s o i n c r e a s e d i t s s tee l e x p o r t s s h a r p l y and s t e a d i l y , g o l n g from v i r t u a l l y z e r o b e f o r e 1970 t o 1.8 m t i n 1977, though i t is s t i l l a n e t i m p o r t e r . 21 If i t i n c r e a s e s i t s c a p a c i t y a s p lanned , i ts e x p o r t s v l l l be f u r t h e r i n c r e a s e d . U n l i k e t h e R e p u b l i c o f Korea, o t h e r d e v e l o p i n g c o u n t r i e s have e x p e r i e n c e d f l u c t u a t i o n s i n t h e i r s teel e x p o r t s , r e f l e c t i n g v o l a t i l e d o a e s t i c b r ~ p p l y a n d demand. C o n s i d e r i n g t h e r a p i d g r w t h i n d o m e s t i c demand, t h e i r e x p o r t c a p a b i l i t i e s w i l l be l i m i t e d , and most 21 w i l l remain s u b s t a n t i a l n e t i m p o r t e r s f o r a c o n s i d e r a b l e t ime . Hovever, t o t a l e x p o r t s f rom d e v e l o p i n g c o u n t r i e s t o m a r k e t s i n t h e U.S. a n d EC sometimes r e a c h a n i m p r e s s i v e l e v e l , 4/ c a u s i n g p r o b l e m f o r t h e l a t t e r .
I n d u s t r y S t r u c t u r e a n d P r i c i n a
17. S t e e l p r o d u c t i o n is less c o n c e n t r a t e d i n l a r g e f i r m s t h a n i n o t h e r p c t a l i n d u s t r i e s . About o n e - f i f t h o f t h e s tee l i n m a r k e t economies is produced by t h e l a r g e s t f o u r companies , t w o - t h i r d s by 3 0 companies ( T a b l e 11.6). By c o m p a r i s o n , i n t h e a l u m i n m i n d u s t r y i n m r k e t economies , t w o - t h i r d s o f p r o d u c t i o n is m e l t e d by s i x major companies . F u r t h e r , t h e number of steel- p r o d u c i n g c o u n t r i e s is l a r g e r t h a n i n o t h e r m e t a l i n d u s t r i e s . S t e e l is produced i n 5 3 c o u n t r i e s , w h i l e c o p p e r is r e f i n e d i n o n l y 3 6 c o u n t r i e s and a l u n l n u m is s ~ e l t e d i n 41. 21 T h i s c o n d i t i o n h a s l e d t o s e v e r e p r i c e c o o p e t i t i o n i n t h e i n t e r n a t i o n a l s teel marke ta .
18. H o w v e r , p r i c e s f o r d o m e s t i c s tee l i n t h e a ia jo r p r o d u c i n g c o u n t r i e s a r e r a t h e r s t a b l e , t h a n k s t o g o v e n m c n t i n t e r v e n t i o n , a common p r a c t i c e i n past s t e e l - p r o d u c i n g c o u n t r i e s . Dur ing s t ee l r e c e s s i o n s , governments a r e o f t e n a s k e d t o r e g u l a t e s t ee l i m p o r t s and t o s e t minimum p r i c e s . A good example is t h e U.S. t r i g g e r p r i c e s y s t e m , u n d e r v h i c h f o r e i g n e x p o r t e r s s e l l i n g s t ee l a t p r i c e s belw t h e t r i g g e r p r i c e s c a n a u t o m t i c a l l y be c h a r g e d a s dumping. As a result, d o m e s t i c p r o d u c e r s c a n r a i s e t h e i r s t ee l p r i c e s t o t h e l e v e l s o f t h e t r i g g e r p r i c e s v i t h o u t f e a r of f o r e i g n c o m p e t i t i o n . Thus t h e t r i g g e r p r i c e s y s t e m v i r t u a l l y d e t e r m l n e s s teel p r i c e s , b o t h f o r e i g n a n d d o m e s t i c , i n U.S.
11 The Sew York Times , February 4 , 1979. - 21 I n 1977, S o a t h Korea imported 3.6 m t a n d e x p o r t e d 1.8 m t , l e a v i n g a d e f i - -
cct o f 1.8 m t . ( A l l F i g u r e s a r e f o r c r u d e steel.) The r a t l o o f e x p o r t s o f e r p r o d u c t i o n was a b o u t 432, t h a t of i m p o r t s o v e r consumption a b o u t 58%.
31 A G o t a b l e e x c e p t i o n is I n d i a , v h i c h h a s been a n e t e x p o r t e r e x c e p t i n t h e ' - y@irs 1971 t h r o u g h 1974. I n d i a ' s e x p o r t s i n 1977 amounted t o 2.1 m t , 8 vh-ich was a b o u t 212 of t h e p r o d u c t i o n , v h i l e i ts i m p o r t s v e r e 0.7 m t , . l e a v i n g a s u r p l u s O F 1.4 m t . ( A l l t h e f i g u r e s a r e f o r c r u d e s t e e l . )
Develnlping c o u n t r i e s ' s h a r e i n t h e U.S. i m p o r t s v a s 8.5% i n 1976 a n d 9.4% - i n 1977.
51 Worldwide. S o u r c e : U S , S t a t i s t i c a l Yearbook, 1977. -

T a b 4 11.6: STEEL PRODUCTION BY SIZE OF COKPAICY - /a
Accumulated Accumulated Percentage of S i ze of Company S t e e l S t e e l Product ion i n t h e
Product ion /b - Market Economies (mt) ( X I
Accuar la ted Number of Coapanien U.S. Japan EC Othe r Coun t r i en T o t a l
15 m t and ove r 95.9 21.1 2 1 1 - 4
10 m t and o v e r 163.2 36.0 2 4 3 - 9
7 m t and ove r 212.4 46.8 5 5 4 1 1 5
4 m t and ove r 288.1 63.4 8 5 11 5 29
I r t rw 1 1
/a I n t h e market economiee i n 1976.
/b Total. ~ r o d u c t i o n i n t h e market economies i n 1976 was 443.3 m t .
Source: J apan I r o n and S t e e l Fede ra t ion , Tekko Tokei Yoran, 1977.
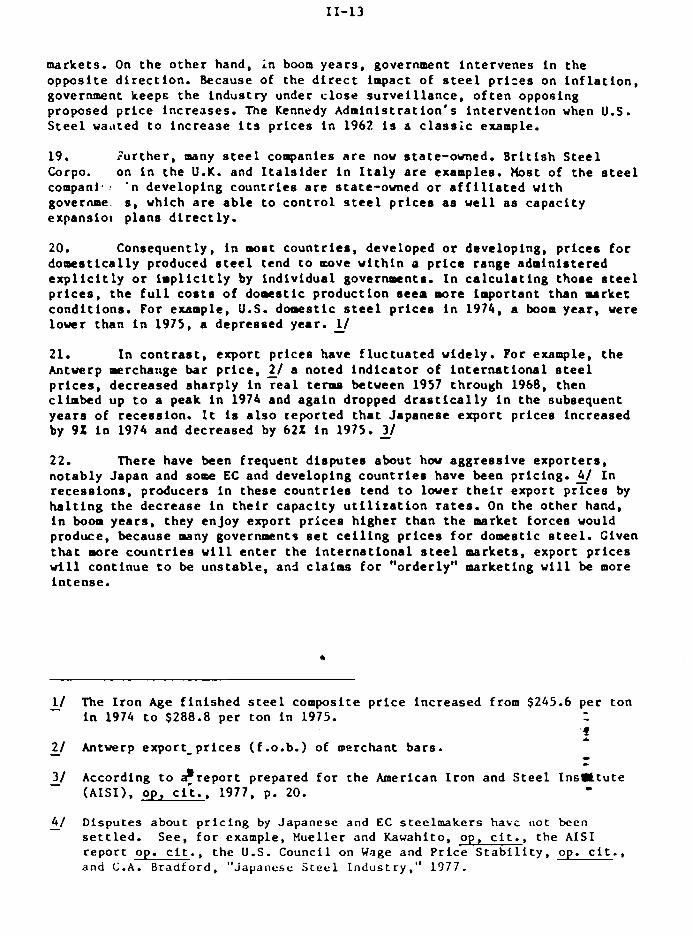
markets . On t h e o t h e r hand, i n boom y e a r s , government i n t e r v e n e s i n t h e o p p o s i t e d i r e c t i o n . Because of t h e d i r e c t impact of s t e e l p r i c e s on i n f l a t i o n , government keeps t h e i n d u s t r y under c l o s e s u r v e i l l a n c e , of t e n o p p o ~ i n g proposed p r i c e i n c r e a s e s . The Kennedy ~ d m i n i s t r a t i o n ' s i n t e r v e n t i o n when U.S. S t e e l w a , ~ t e d t o i n c r e a s e i t s p r i c e s i n 1962 is a c l a s s i c example.
19. F u r t h e r , m n y s t e e l companies a r e now state-owned. B r i t i s h S t e e l Corpo. on i n t h e U.K. and I t a l s i d e r i n I t a l y a r e examples. Host of t h e s t e e l cornpanl. ! ' n deve lop ing c o u n t r i e s a r e s tate-owned o r a f f i l i a t e d w i th governme. s, which a r e a b l e t o c o n t r o l s t e e l p r i c e s a s w e l l a s c a p a c i t y e x p a n s i o ~ p l ans d i r e c t ly .
20. Consequent ly , i n w e t c o u n t r i e s , deve loped o r deve loping , p r i c e s f o r d o m e s t i c a l l y produced s t e e l tend t o m v e w i t h i n o p r i c e range admin i s t e r ed e x p l i c i t l y o r i m p l i c i t l y by i n d i v i d u a l governments. I n c a l c u l a t i n g t h o s e s t e e l p r i c e s , t h e f u l l c o s t s of domest ic p r o d u c t i o n s e e o more impor tan t t han market c o n d i t i o n s . For example, U.S. d o a e s t i c s t e e l p r i c e s i n 1974, a boom y e a r , were l o v e r t han i n 1975, a dep re s sed year . - 11
21. I n c o n t r a s t , expor t p r i c e s have f l u c t u a t e d wide ly . For example, t h e A n t w r p merchauge bar p r i c e , 2/ a no ted i n d i c a t o r of i n t e r n a t i o n a l s t e e l p r i c e s , dec reased s h a r p l y i n r e a l t e r p e be tveen 1957 through 1968, t hen cl imbed up t o a peak i n 1974 and a g a i n dropped d r a s t i c a l l y i n t h e subsequent y e a r s of r eces s ion . I t is a l s o r epo r t ed t h a t J apanese e x p o r t p r i c e s i nc reased by 9 2 i n 1974 and dec reased by 622 i n 1975. - 31
2 2. There have been f r equen t d i s p u t e s abou t h w a g g r e s s i v e e x p o r t e r s , n o t a b l y J apan and so= EC and deve lop ing c o u n t r i e s have been p r i c i n g . 41 I n r e c e s s i o n s , p roduce r s i n t h e s e c o u n t r i e s tend t o lwer t h e i r expor t p r i c e s by h a l t i n g t h e d e c r e a s e i n t h e i r c a p a c i t y u t i l i z a t i o n r a t e s . On t h e o t h e r hand, i n boom y e a r s , t hey en joy expor t p r i c e s h i g h e r t h a n t h e market f o r c e s vould produce, because many governments s e t c e i l i n g p r i c e s f o r domest ic s t e e l . Given t h a t more c o u n t r i e s w i l l e n t e r t h e i n t e r n a t i o n a l s t e e l marke ts , expor t p r i c e s vlll c o n t i n u e t o be u n s t a b l e , and c l a i m s f o r "order ly" marke t ing w i l l be more i n t e n s e .
11 The I r o n Age f i n i s h e d s t e e l composi te p r i c e i n c r e a s e d from $245.6 p e r t o n - i n 1974 t o $288.8 p e r t on i n 1975. - -
'i 1
21 A n t w r p expor t - p r i c e s ( f .o.b.) of merchant b a r s . - - 31 According t o $ r e p o r t p repared f o r t h e American I r o n and S t e e l I n s a t u t e -
(AISI), op , c i t . , 1977, p. 20. - 4/ D i spu te s about p r i c i n g by Japanese and EC s t e e l m a k e r s have ,lot been -
s e t t l e d . See , f o r example, Mueller and Kavahi to , op, c i t . , t h e AISI r e p o r t op. c i t . , t h e U.S. Council on Wage and P r i c e S t a b i l i t y , op. c i t . , and C.A. Bradford , "Japanese S t e e l I n d u s t r y , " 1977.

Investment Decisions and Protec t ionis t Trend
23. Economically rat ional producers w i l l invest in production f a c i l i t i e s i f the expected present value of investment exceeds i t s marginal cost. However, i n addition t o the uncertaint ies involved i n the calculating of expected present valua, a number of factors-economic and non-economlc--msy cause the industry's invc~tment decisions to deviate from the purely rational.
24. The f i r s t such fac tor is the pro tec t ionis t approach taken by tha established steal-producing countries. Faced with severe competition from developing steel-producing countries, the former countr ies have been adopting protec t ionis t measures that b v a curbed s t e a l imports from the l a t t e r count r ies . As competition becomes severe, daveloped producers w i l l t r y t o implement long-run protect ionrt measuras thqt can a f f e c t the capacity ex?ansion plans of new producrr countries. L/ Becausa tha f inancir l requirements for investment in iron and staal-making f a c i l i t i e s have increased sharply i n tha l a s t d a u d a owing t o an increase i n tha scala of aco- nopically viable plants , davalopinft countries a re more dapendent on foreign f inancial resources, affording graatar opportunites fo r interventions by developed producars . 25. The second factor that my causa investment decision to deviate from economlc ra t ional i ty involvar tha aspi ra t ion of developing countries t o become industr ial ized. The iron and s t e a l in dust::^ is seen a s a symbol of indus t r ia l iza t ion , and integrated iron and s t e e l m i l l s can be an a t t r a c t i v e national target . The astablirhad rteal-producing countr ies argue that developing countries ' new f a c i l i t i e s , which often exceed the i r domestic demand, w i l l eventually dampen the internat ional s t e e l m r k e t s and aggravate the problew of excess capacity tha t the industry is current ly facing.
26. As the recovery from the industry's unprecedented recession in 1975 is much slower than i n i t i a l l y expected, the industry's investment decisions
11 See, for example, Tine American Metal Xarket, Harch 16, 1978. - w
2 1 For example, the Ogishha Vorks of Nippon Kok"an, Japan, vhich i s planned - t o produce 6 m m t of s t e e l per annum a f t e r completion, v i l l cost $3.55 b i l l ion . The Cor,neaur- project of U.S. S tee l , v i t h a planned capacity of 4 m m t per annum, is reported t o be costing $3.25 b i l l ion . See U.S. Council on Wage and Price S tab i l i ty , op. c i t . , p. 79.

have beconc more compl ica ted than eve r . 1/ AS such , t h e n e c e s s i t y of a model t h a t c a n e v a l u a t e t h e i n d u s t r y ' s inves tment p l a n s h a s been i n c r e a s e d subs t an - t i a l l y .
F. Cur ren t Recess ion and P o s s i b l e Course of t h e Recovery
27. The world i r o n and s t e e l i n d u s t r y has been i n a slump s i n c e 1975. S t e e l p roduc t ion i n market economies, a f t e r r each ing a peak of 495 m t i n 1974 dec reased t o 425 m t i n 1975. There was a s l i g h t recovery i n 1976-to 455 m t ; h o w v e r , p roduc t ion then dropped to 440 u t i n 1977. The c a p a c i t y u t i l i z a t i o n r a t e r e m i n s a roung 75%. compared t o 85% on t h e a v e r a c e i n t h e t e n y e a r s p reced ing 1975 (Tab le 11.5). - 21
28. Because of t h e lw l e v e l of steel p roduc t ion s i n c e 1975, Indus t ry e a r n i n g s d e c l i n e d s h a r p l y i n t h e U.S., . lapan and t h e EC. 31 The absence of c l e a r s i g n s of recovery and a s e v e r e finan.-ial squeeze h.3c l e a d t h e i r o n and s t e e l i ndsu t r y , e x c e p t i n some deve lop ing c o u n t r i e s , to r h e l v e a c o n s i d e r a b l e p o r t i o n of i t s p l a n s to expand. I n s t e a d , investment funds a r e be ing s p e n t l a r g e l y on p o l l u t i o n c o n t r o l f a c i l i t i e s and replacement o f worn-out equipocnt . According t c . a r e p o r t mnde by t h e I n t e r n a t i o n a l I r o n and S t e e l I n r t i t u t e ( I I S I ) , c a p a c i t y expans ion between 1978 and 1985 shou ld be o n l y 78 mtpy (Tab le 11.7). 41 a s coapared t o 183 mtpy between 1968 and 1975 (Tab le 11.5). I f t h e s e p ro j ec tTons a r e c o r r e c t , s t e e l p roduc t ion c a p a c i t i e s i n 1985 would be 700 mtpy. Assuming a normal c a p a c i t y u t i l i z a t i o n r a t e of 85%. maxi- s t e e l p roduc t ion i n 1985 would be about 600 a t p y , 20% h i g h e r t han t h e p roduc t ion l e v e l i n 1974.
29. Although t h e r e is g e n e r a l af.reement t h a t t h e i n d u s t r y is c u r r e n t l y s u f f e r i n g because of e x c e s s c a p a c i t y concern is g r w i n g t h a t t h e s h a r p l y reduced expans ion of c a p a c i t y s i n c e 1975 and t h e p lanned slw expans ion i n t h e coming y e a r s means t h a t t h e ba l ance o f d e m n d and p roduc t ion c a p a c i t y of s t e e l
11 Many of t h e p l a n s t o r a t i o n a l i z e t h a i r o n and s t e e l i n d u s t r y a i m a t t h e - s h u t d w n of i n e f f i c i e n t m i l l s . As such, they a r e provoking s t aunch objec- t i o n s from l a b o r and l o c a l p o l i t i c i a n s . See, f o r example, a ne-ds a r t i c l e on t h e shutdovn of Youngstown S h e e t and Tube Co.'s Open Hea r th Shop, - The Washington P o s t , September 20, 1977 and " S t e e l ' s Convulsive R e t r e a t i n Europe," The Xev York Times, February 4, 1979. Delaying t h e shutdovn of ou tda t ed f a c i l i t i e s v i l l a d v e r s e l y a f f e c t i n v e s t a e n t s i n modern f a c i l i t i e s .
- - d S
21 However, t h e c a p a c i t y u t i l i z a t i c n r a t e i n t h e U.S. improved c o n s i d e r a b l y , - r each ing a r eco rd s i g h l e v e l o f 90% i n 1973. v h i l s ta.qse i n Japan and t h e EC remained aroundW0Z. -
31 The e a r n i n g s of U.S. and Japanese s t e e l companies improved remarkably i n - 1978.
4 1 The I n t e r n a t i o n a l I ron and S t e e l I n s t i t u t e , "Annual Report of t h e Secre- - t a r y i e l i e r ~ l i , >lr. C h a r l e s El. 3a i c r , t o :tie E l e v e n t h I IS I Annual Conference he ld i n Rome, I t a l y , October 10-12, 1977," pp. 12-13. See a l s o Tab le 11.7.

Table 11.7: CAPACIrY EXPANSION P U S /a - (mtpy of c rude s t e e l product ion)
Eat imrted Capaci ty Expansion P l a n w d Capacity Ac tur.1 Planned / b /c Capacl ty /a
(1978-1985r - - (1973) /a - (1974-1977)
EC n.8. Other \ t e r n E u r o p e n.r. North , , ~ a r i c r n.r. ' . a t in America n.ae Afr ica n.r. Hlddle Eaet n. a . Fa r East n.a. Ocaanla n o r .
, h k r 1 /a The r e 8 i o n a l b reakdwn i a n o t ahown i n t h e o r i g i n r r l acurca. - /b Al : p r o j e c t o t h a t have been announced i n t h e p r e r a and c l e a r l y l d e a t i f i e d a s t o l o u t l o n , -
s i z e and type of ine t .* .~ lac ion .
/ C Net a d d i t i o n s , b ~ t 8ome of them rhould poaaib ly be c o t r ~ l d e r e d a8 rep lace .mnt of obsolete - c a p a c i t y which hr.8 been dismantled.
Sorrce : The I n t e r n n t l o n a l I r o n and S t e a l Institute, "Annurrl Report of t h e Sec re t a ry -Genera l , Mr. Char lee 8. Baker, t o t h e Eleventh X IS1 Annual Conference h a l d i n Rome, I t a l y , October 10 . 12, 1977," pp. 12-13.

i s g e t t i n g t i g h t e r . Considering the long lead t i n for i n v e a t w n t i n iran and stetl-making f a c l l l t l e s - - a b o u t f l v e years-and t h e great amount o f f i n a a c l a l resources required, I t would not b? p o s s i b l e t o ease a t i g h t balance read i ly , should orre occur. A s such, the aecerr i ty of a .ode1 that c a n evaluate investment plans has g r w n s u b s t a n t l ~ l l y .

111. REVIEU OF IRON A.3 STEEL EC0NO.W .WDELS
A. From S t a t l c t o Dynamic Hodels
30 I n the l a t e 1950a, modelling of the iron and a t e e l economy wra approached a # an applicat ion of proceaa analyals , In vhlch s t a t l c l inear programming (coat d n k i z a t i o n ) war coaronly employed. 11 Although the l n l t i a l object ive war t o f ind the l eaa t coat air of technology rt the plant level , the :oat mlnlmization technique of proceaa analyaia war moon extended t o a i m l a t e Industry behavior overa l l , by araualng tha t the lnduatry aa a whole behaved ao a s t o mlnlmize i t s t o t a l coat#. For eumple, Taao and Day 2/ aolved a mlnimizatlon problem for the t o t a l coat of the U.S. iron aFd a toe l lnduatry, and than attempted t o a h l a t e the allocation of prlmary and lntermedlate products among a l t e rna t ive proceases a t rach stage of lron and r t e e l proaub*ion, fo r r given period, glven production of f i n a l products and capacl t lea. Houever, r a i t war real lzrd tha t the dynamlca of the lron and s t e e l economy were important, dynanlc modela replaced the s t a t l c ones, with investment aa a fac or . I n t h l r aectlon, ax ta t l ag dynaolc models a re revleuad.
0 . Taxonomy of Dynulc )(odela of Iron and S tee l Economy
31 Any dynamfc model m a t speclfy t w aaptc ts of investment: (1) h w investment is de terdned; and (2) how investocnt a f f e c t s other varLables over the , As t o the f i r s t : i n w s t m n t i s usually based on soae expectation about ihe icdustry'r fut-re. Consequently, modela d i f f e r in terms of t h e i r formula- t ion of expectat lens, which pay be c lase l f ied in to tvo d l s t lnct approaches: (a ) expectations baa<. on backward information, o r expectations that a re expressed i n t e r w o i sole combination of the industry's past performances; and (b) expectations based on f o ~ r d information, o r ex?ectatlone that a r e expressed exp l i c i t ly i n telnrs of the expected futura performances of the industry. A s t o the second aspect , tw d i s t i n c t approaches can a l s o be identl- fied: ( a ) non-oarket dynamics approach, i n vhich the dynamics are simulated only v i th in quanti ty variables and in terac t ion between quantity and price var- iab les over time a r e t o t a l l y ignored; and (b) aarket dyaamics, i n which the dynadcs a r e captured through interact ions betveen quantity and price varia- b les over time. Thus, ex ls t ing dynamic eodels of the iron and s t e e l economy (including the WISE &el ) can k c las s i f i ed i n t o four categories. (See a l so Table 111.1.) *
1
11 Process analys is was f i r s t applied t o s tee lmking processes by T. Fabian, - - "A Linear Progradng Model of Integrated Iron and Stee l Production, 1958.
2 1 C.S. Tsao and R.H. Day, "A Process Analysis Xodel of rtle U.S. Steel - Industry," 1971. E
31 Von-integrated models, that is, models that deal with e i t h e r the demand - or the supply s ide , a r e not reviewed. Studies about demand are popular among s teel-related ins t i tu t ions . (For example, the Internat ional Iron and Sccel Ins t i tu t e , Projection '85 1972). X complicated model that examines investment given cer ta in levels of demand was d e v c l o p c d a t t h e Institute f o r Research on H w n Resources, Pennsylvania State University, "Invest- ment i n the Iron and Stee l Industry of the United States. ' ' 1977.

T a b l e I 1 1 .l: TAXOSOXY OF DYSA'IC IRON h . D STEEL ECONO!fY ,W)DELS
Expec ta t i o n based on bockward i n f o r m ; ~ t l o n
E x p e c t a t i o n based on f o w o r d information
Son-%rke t Dynamlcs Xarke t Dynamics
Cnteg3ry A: The Higglns Hodel and t h e Abe Nodel
Category 8: The Wntnnobe and Y i ? o s h l t a Model
Cntegory C: Hodels of Cntegory D: The Cost K i n i m i t a t i o n o v e r WISE Hodel Time
32. Two models a re r e p r e s e n t a t i v e of Category A: t h e H lgg ins model o f t h e U.S. s t e e l i n d u s t r y Ll and t h e Abe model of t h e U.S. and J apanese s t e e l i n d u s t r i e s . 21 Although each m d e l used d i f f e r e n t mathemat icn l t e chn iques ( a s imu l tnneous e q u a t i o n sys tem i n t h e Higglns model and r e c u r s i v e l i n e a r programming i n t h e Abe madel) , bo th hnve a s t r o n g e i o i l a r i t y .
33. I n t h e Hlggins model, t h e n t e e l p r i c e is g iven . Using t h a t p r i c e , domes t i c demand I s de te rmined by exogenous v a r i a b l e s such a s a c t i v i t y l e v e l s of s t e c l - u s i n g industries. I t is asmimed t h a t t h e s t e e l i n d u s t r y w i l l a d j u s t p roduc t ion t o meet domes t ic demand. 3 1 On t h e o t h e r hand, inves tment i n p roduc t ion f a c i l i t i e s is d e t e r d n e d Fy both i nves tmen t and p roduc t ion i n t h e p r eced ing two pe r iods . P roduc t ion c a p a c i t y is t h e n d e r i v e d by add ing i n c r e a s e d c a p a c i t y t o t h a t e x i s t i n g i n t h e p r eced ing p e r i o d . N a t u r a l l y , t h e r e is a gap between p roduc t ion and c a p a c i t y . I n t h e H lgg ins model, ad ju s tmen t .or t h i s gap is ach i eved by f r e e l y s h i f t i n g t h e c a p a c i t y u t i l i z a t i o n r a t e . T h i s does n o t a f f e c t any v a r i a b l e s i n subsequent pe r iods .
34. In t h e Abe w d e l , t h e s t e e l p r i c e is n o t g i v z n , whereas demand f o r s t e e l is g i v e n exogenously. Under t h i s ma thema t i ca l p r o g r a d n g model, i nves t - ment i n p r o d u c t i o n f a c i l i t i e s is c o n s t r a i n e d by a n uppe r l i m i t , determined s o l e l y by t h e i n d u s t r y ' s p a s t performance. Hore s p e c i f i c a l l y , t h e upper l i m i t f o r i nves tmen t is set a t e i t h e r t h e l e v e l of c a p a c i t y I n t h e p r eced ing pe r iod ( a d j u s t e d by a n a d o p t i o n c o e f f l c l e n t ) o r a t t h e gap between d e s i r e d c a p a c i t y i n t h e c u r r e n t pe r iod and t h a t i n t h e p r e c e d i n g p e r i o d . Desi 'red c a p a c i t y l e v e l i s de te rmined by expec t ed d e w n d , which is i n t u r n de te rmined by a c t i v i t y i n s t e e l - u s i n g i n d u s t r i e s and o t h e r lagged v a r i a b l e s . Whichever l i m i t is reached i n t h e s o l u t i o n , i n v e s t a e n t is d e t e r d n e d by a combina t ion of some lagged - -
'3 &
- 11 C . 1 . Higg ins , "An Econometr ic D e s c r i p t i o n of t h e U.S. I r o n and S t e e l -
I n d u s t r y ," 1969.
2 / H.A. Abe, "Dynamic Hicro-economic Xodels of P r o d u c t i o n , Inves tment and - Techno log i ca l Changz of t h e ' J . S . and J a p a n e s e I r o n and S t e e l I n d u s t r i e s , " i7 ;6 .
3 / Changes i n s t e e l :nventory a r e as-?med t o be l i n k e d t o d o t n s t i c demand. -

var iab les . Furthermore, a s with t h e Hlggins model, market dynamicr cannot bs reproduced, a s p r l c e is not included.
Category B
35. The Watanabe and Kinoshita model, L/ which d e a l s with the Japanese s t e e l Indus t ry , 10 represen ta t ive of Category 0 . Unlike t h e Higginr and Abe models, t h e p r l c e of r t e e l i r t r e a t e d endoganourly, al though domertic demand is assumed t o be independent of t h e r t e e l p r i c e and is determined only by t h e a c t i v i t y of r t e e l userr . The market d y n ~ i c e of t h e model work i n t h e follow- ing way. F i r r t , inver tpan t i n t h e c u r r e n t year determiner capac i ty i n rome f u t u r e per iod, which i n t u r n determiner t h e l e v e l of p:oduction, g lven a f ixed c a p a c i t y u t i l i z a t i o n ra te . Second, k c a u r e demand is given exogenourly, a gap between demand and production generater unintended inventory, which inf luencar p r i c e and prof i t . Third , prof i t and o t h e r v a r i a b l e r i n t h e c u r r e n t year a f f e c t investment i n r m f u t u r e period. In t h i r manner, q u a n t i t y and p r i c e va r iab le r cont inue t o i n t e r a c t u n t i l the end of t h e p r o j e c t i o n period.
36. The fonrmlt ion of expec ta t ions i n t h e Watanabe and Kinoshita model is s i m i l a r t o t h a t of t h e Higgins and A h models. I n each, i t i r a e s l w d t h a t investment is determ'ned s o l e l y on t h e baris of t h e indust ry ' r p a s t perfor- mance. Hore s p e c i f i c a l l y , i n the Watanabe and Kinorhi ta model, t h e investment func t ion c o n s i s t s o i p r o f i t i n t h e preceding two per iods and investment i n the preceding period.
Category C
37. Linear programdng models of c o s t minimization o r p r o f i t maximization over time, which a r e a n a t u r a l expansion of the s tat ic l i n e a r programming models, have been answer t o t h e c la im t h a t a v a i l a b l e information on some f u t u r e market cond i t ions , f o r example, p r i c e s o r c o s t s , should be d i r e c t l y incorporated i n t o models. There types of models have been appl ied t o var ious minerals and metals. They could a l s o be app l ied t o the i r o n and s t e e l indust ry . However, they cannot reproduce merket dynamics, o r i n t e r a c t i o n s betyeen p r i c e and q u a n t i t y v a r i a b l e s , because p r i c e e and c o s t s a r e t r e a t e d exogenously.
Category D - - 38. In t h i s ca tegory is the WISE godel of t h e i r o n and s t e e l economy model, which inc ludes market dynamics and a n investment determination scheme based on forward information. It i s t h z major s u b j e c t of ttds paper and is discussed i n d e t a i l i n t h e subsequent a c t i o n s . -
1/ T. Watanabe and S. Kinoshita, " ~ n Econometric Study of the Japanese S t e e l - Indust ry ," 1969.

I V . MATHEMATICAL FOWLATION aF THE WISE WDEL
A. O u t l i n e o f t h e WISE n o d e l
39. T h i s s e c t i o n d e r c r i b e r a v o r l d i r o n and rteel economy (WISE) oodel t h a t w i l l p r o j e c t :
( i) Inver tment i n r teel p roduc t ion c a p a c i t i e r i n 1975-1980, 1980- 1985, and 1985-1990;
( i i) P r i c e r , d a n n d and rupply q u a n t i t i e r f o r r t ee l product8 and r t ee l product ion c a p a c i t i e r ; and
(iii) The i d u r t r y ' r r e q u i r e a e n t r f o r major raw mterialr and i n p u t s i n 1980, 1985 and 1990.
40. For a r c h o f t h e r p e c i f i e d var iab le . ( a c e S e c t i o n B) t h e WISE model 1/ s o l v e r non-negative trajectorier, t h a t ra t i r f y t h e i n i t i a l condit ion. ured i';; t h e w d e l r 2/ and market e q u i l i b r i m cond i t ions . The market e q u i l i b r i u m c o n d i t i o n r Z r r u w d i n t h e VfSE model c a n be srtlrparized as f o l l w r :
(1) No s u p p l i e r 8 (rteel, rteel p roduc t ioo c a p a c i t i e r , etc.) c a n make e x c e s r p r o f i t , t h a t is, p r o f i t s i n e x c e r r of t h e 'accepted' mark-up;
( i f ) There i 8 no e x c e r s demand;
(iii) Every i t e m E o r w h i c h t h e r e i r e x c e s s s u p p l y ha8 z e r o p r i c e ;
( i v ) No a c t i v i t y t h a t r a k e s a n e g a t i v e ( excess ) p r o f i t is be ing o p e r a t e d a t a p o s i t i v e l e v e l .
41. These c o n d i t i o n s , w i th t h e o t h e r g i v e n i n i t i a l c o n d i t i o n s , can be formula ted and s o l v e d a s a l i n e a r complementari ty programming problem, :/ whose compact £ o m i s s h w n i n Appendix 1.
L
'3 1/ The WISE model v a s developed by modifying t h e s p a t i a l and tempora l6pr ice -
and a l l o c a t i o a (STPA) models, i n i t i a i l y f o r u u l a t e d by Takayama and=Judge. (T. Takayama d C.C. Judge, S p a t i a l and Temporal P r i c e and Alloc&on Models, 1971.yThe o r i g i n a l STI'A models have been used f o r v a r i o u s r g r i - c u l t u r a l commodities t h a t a r e s t o r a b l e . I n t h e s e models, t h e i n t e r t e m p o r a l l i n k a g e is made by ca r ryove r s t o c k s . By r e p l a c i n g ca r ryove r s t o c k s by inves tment , Uri was t h e f i r s t t o apply t h e STPA models t o non-ag r i cu l tu ra l i n d u s t r i e s (N.D. Uri, Toward a n E f f i c i e n t A l l o c a t i o n of E l e c t r i c a l Energy, 197 5).
2 / Actua l market c o n d i t i o n s i n 1975 were used a s t h e i n i t i a l c o n d i t i o n s . - 3/ R.W. C o t t l e and G.B. Dantzig, "Complementary P i v o t Theory of Mathematical -
Programming, " 1968.

42. The WISE model i r p r r e n t e d i n two a l t e r n a t i v e w d e l r : Hodela A and 8. I n b d e l A i t i a a r s u n d that t h e a t e e l i n d u a t v p l a a r and i s p l e w n t a inve r tmen t r i n p roduc t ion f a c i l i t i e r r a t i o n a l l y , v i t h p e r f e c t f o r e r i g h t . I n Hodel B, t h e indur t r l , l a a r r u m d t o f o l l w c u r r e n t i n v e r t m n t plana. I n c o n r i d e r a t i o n of a loaa l e a d tima of invmatmentr, i n Hodel B, i t i r arrumed t h a t t h e i a d u r t q h a r a g iven u x i u m produc t ion c a p a c i t y i n 1985.
B. No ta t ion
PDt D e u n d p r i c e of r teel ( 3 p e r t o n i n f i n i r h e d product e q u i v a l e n t ) i n y u r t
PSt - Supply p r i c e of rteel ($pe r t o n i n c rude r tee l e q u i v a l e n t ) i n y r a r t
PCt - D e u n d p r i c e ( o r d t v n d r e n t a l f e e ) f o r t h e u r e of r teel product ion c a p a c i t y ($ p e r t o n i n c rude r t e e l e q u i v a l e n t ) i n y e a r t
PI t - Supply p r i c e ( o r aupply r e n t a l f e e ) f o r t h e u r e of r teel pro- d u c t i o n c a p ~ c i t y ($ p e r t o n i n c rude e q u i v a l e n t ) i n y e a r t
PHit - D e n n d p r i c e o f r au u t e r i a l (and o t h e r i n p u t r ) i ($ p e r spec i - f i e d u n i t of i n p u t i) i n y e a r t
PLt - A v i d f a l l p r o f i t (S p e r t o n i a c rude rteel e q u i v a l e n t ) r e s u l t - i n 8 from t h e f i x e d c a p a c i t y i n y e a r t, or t h e Lagrangean multi- p l i e r o f t h e i q o r e d c a p ~ c i t y canrtr . int i n y e a r t - 11
DPt - Demand f o r s t e e l ( m t i n f i n i s h e d s t e e l product e q u i v a l e n t ) i n y e a r t
DSt - Demand f o r steel ( m t i n c rude s t e e l e q u i v a l e n t ) i n y e a r t
SSt - Supply o f steel ( m t i n c rude s t e e l e q u i v a l e n t ) i n y e a r t
CSt - S t e e l product ion c a p a c i t y (mtpy i n c rude s t e e l e q u i v a l e n t ) i n y e a r t
RHit - Demand f o r and suply of raw m a t e r i a l (and o t h e r i n p u t s ) i n y e a r t
- ISt(t + 1) = Net i n c r e a s e i n s t e e l p roduc t ion cap c rude s t e e l
e q u i v a l e n t ) r e s u l t i n g from investmen between y e a r s t and t + 1
S l a c k Var i ab le s
A l l s l a c k v a r i a b l e s s t a r t v i t h t h e l e t t e r W .
1/ Used only i n Hodel 0. -

Exogenous Va r i a b l e s
- mit - Supply p r i c e o f raw m a t e r i a l (and o t h e r i n p u t ) i i n yea r t
mt - O p e r a t i n g c o s t o t h e r t h a n t h o s e of s p e c i f i e d i n p u t s , inc lud- i n g a normal mark-up ($ p e r t o n o f c r u d a r t ee l ) i n y e a r t
- Cost of inverts.bnt ($ p e r t p y o f c ruda r t e a l product ion
lvCt ( t + c a p a c i t y implemented between y e a r s t and t + 1)
- CSO - S t e e l production c a p a c i t y ! ~ t p y i n c r u d e r t e a l e q u i v a l e n t ) i n
t h e i n i t i a l yea r (1975)
- CS2 - Illpored c o n e t r a i n t on e t e e l p roduc t ion c a p a c i t y (mtpy i n c rude
s t e e l e q u i v a l e n t ) i n 1985.
P a r a o c t e r s
+t - Yie ld , i.e., t h e to?nage of f i n i s h e d e t e e l products ( i n t ons ) produced from one t o n of c rude e t e e l i n new d l l r i n y e a r t
"it - Input-output c o e f f i c i e n t f o r i n p u t i i n new m i l l s i n y e a r t
*t - Yie ld , i . e . , t h e tonnage o f f i n i s h e d s teel product8 ( i n t one ) produced from one ton of c rude steel ( t h e industry's average) i n y e a r t
vit - Inpu t -ou tpu t c o e f f i c i e n t f o r i n p u t i i n ave rage m i l l a i n y e a r t
art = Discount r a t e i n y e a r t f o r t h e inves tment implemented between y e a r s r and r + 1
Yt = Upper l i m i t o f c a p a c i t y u t i l i z a t i o n r a t e i n y e a r t
% - I n v e r s e of t h e p r i c e c o e f f i c i e n t i n t h e demand func t ion f o r s t e e l i n y e a r t
A t _ = I n t e r c e p t of t h e demand f u n c t i o n f o r s t e e l i n yea r t - Subscrigts
t > Year ( t = 0 f o r 1975, t = 1 f o r 1980, t = 2 f o r 1985 and t = 3 IC f o r 1990) ..
i I n p u t (i = 1 f o r i r o n o r e , i = 2 f o r cok ing c o a l , i = 3 f o r s t e e l s c r a p , i - 4 f o r energy and i = 5 f o r l a b o r )
C. WISE Model A
4 3 . A l l t h e e q u i l i b r i u m c o n d i t i o n s of Model A a r e shown i n t a b l e a u form ( F i g u r e I V . 1 ) . Some e x p l a n a t i o n of t hose c o n d i t i o n s i s provided below.

11-21
FIGURE IV.l: TABLEAU FOR MODEL A
- NOTE: Subscript i's are not shown because of the limited space. =

Cos t -P r i ce R e l a t i o n s h i ~ e
44. No s t e e l m n u f a c t u r e r v i l l be a b l e t o a f f o r d t o produce s t e e l p roduc t s w i t h p r i c e e b e l w c o s t ( i n c l u d i n g a normal mrk-up) , excep t under e x t r a o r d i n a r y market s i t u a t i o n s f o r a s h o r t per iod . On t h e o t h e r hand, t h e i r o n and s t e e l i n d u s t r y , which s t i l l ma in ta ins some degree of f r e e e n t r y and e x i t , cannot a l l o v p r i c e e t o exceed c o s t s , i n c l u d i n g a normal mark-up, f o r a l o n g t ime.
4 5. The i o l l w i n l p a i r of account ing e q u a t i o n s c o n v e r t s s t e e l p r i c e s i n t e r m of f i n i s h e d s t e e l products i n t o p r i c e s i n t e r m o f c r u d e s t e e l :
m S t - -Ot PD, + PS, and VDS, - 0 (5.1)
46. The c o n s t r a i n t t h a t t h e r e be no e x c e s s p r o f i t f o r s t e e l producers is s p e c i f i e d i n t h e f o l l w i n g p a i r of equa t ions :
5 - USS, I -PSt + PCt + ifl h t PHit + OOCt and
The p a i r of e q u a t i o n s i n (5.2) w a n e t h a t (1) t h e suppl; r r i c e cannot exceed t o t a l c o s t s p l u s a n o r m 1 mrk-up and ( 2 ) t h e supp ly of s teel must be z e r o i f s t e e l p roduce r s c r e f aced v i t h a p e r s i s t e n t l o s s .
47. A s i m i l a r c o n s t r a i n t is s p e c i f i e d f o r s u p p l i e r s of s t e e l p roduc t ion c a p a c i t i e s :
UCSt - -PCt + PKt and UCSt ' CSt - 0 (5 -3 )
48. No e x c e s s p r o f i t constraint f ~ r s u p p l i e r s o f r a v m a t e r i a l (and o t h e r i n p u t ) i is a s f o l l w s :
uRni t - -PHit +IFit and t - - 0 (5.4)
Note t h a t t h e supp ly p r i c e of each r a v m a t e r i a l is g i v e n exogenously.
49. A p a i r of e q u a t i o n s (5.5) s p e c i f l e s no e x c e s s p r o f i t c o n s t r a i n t f o r i n v e s t o r s on s t e e l p roduc t ion c a p a c i t i e s :
3 - - and WISt(t + 1) = -
- 1=t+l O l t PKT + I V C t ( t + 1) !

The f i r s t term i n t h e f i r s t equa t ion r e p r e s e n t s t h e sum of d i scoun ted 11 e a r n i n g s d e r i v e d from t h e investment implemented between y e a r s t and t + 1, t h a t i s , i t s expected p r e s e n t value. The second te rm r e p r e s e n t s t h e p o r t i o n o f t h e inves tment c o s t which must be matched by e a r n i n g s i n t h e s p e c i f i e d benchmark yea r s . 2 1 The p a i r of e q u a t i o n s (5.5) means t h a t (1) t h e expected p r e s e n t va lue of Tnvertment cannot exceed i t 8 inves tment c o s t and (2 ) investment must be z e r o i f t h e former i s l e s s than t h e l a t t e r .
Price-Demand and Supply Re la t ionsh ips
50. L i n e a r demand f u n c t i o n s f o r s t e e l (expressed i n a Ein i rhed product e q u i v a l e n t ) were e s t i m a t e d o u t s i d e t h e models. 31 They r e p r e s e n t t h e e q u i l i b r i u m c o n d i t i o n 8 t h a t r e l a t e demand quantT' t iea w i t h p r i c e s :
W P t - tot DPt + PDt - \ and WDFt ' DF, - 0 ( 5 - 6 )
1 11 The d i s c o u n t r a t e art is de f ined a 8 - - 1
Where 1 - annua l r a t e of r e tu rn .
I n t h e WISE model, t h e induetry 's normal r a t e of r e t u r n , 16% pe r a n n w , wan ob ta ined from t h e U.S. Council of Wage and P r i c e S t a b i l i t y , OJ *. The r a t e of r e t u r n of 16% p e r annum was d e r i v e d from a c o s t of debt c a p i t a l of 8.5%, a before- tax c o s t of e q u i t y c a p i t a l of 19% and a deb t e q u i t y r a t i o of 3:7.
2 1 Because t h e WISE model s o l v e s market s i t u a t i o n s only f o r t h e benchmark - y e a r s of t h e p r o j e c t i o n pe r iod , inves tment c o s t f e d i n t o t h e f i r s t e q u a t i o n of (5.5) was a d j u s t e d t o match e a r n i n g s of t h e cor responding yea r s . For example, a s f o r inveetment implemented between y e a r s 0 and 1, tt.e sum of dfscounted ea rn ings i n t h e f i r s t e q u a t i o n of (5.5) i nc ludeg
I e a r n i n g s i n 1980, 1983 and 1990 on ly and does not i n c l u d e those i n t h e i n t e r m e d i a t e yea r s . Accordingly, inves tment c o s t i n t h e same equa t ion was a d j u s t e d t o match e a r n i n g s of t hose benchmark y e a r s only . Furthermore, a s f o r investment implenented between y e a r s 2 and 3, t h e sun of d iscounted e a r n i n g s i n c l u d e s e a r n i n g s i n 1990 o n l y and does n o t i nc lude those i n t h e i n t e r m e d i a t e y e a r s and y e a r s a f t e r 1990, a l t hough t h e inc reased c a p a c i t y l a s t s beyond 1990. The re fo re , investarent c o s t w b s a d j u s t e d t o match t h e t r u n c a t e d sum of ea rn ings . I n t h i s t r e a t m e n t , e a r n 4 g s i n t h e i n t e r m e d i a t e y e a r s and y e a r s a f t e r 1990 were a s sume&to be on a t r e n d c o n s i s t e n t v i t h t h o s e f o r t h e benchmark y e a r s so lved by t h e model. Consequently, a few i t e r a t i o n s were made t o a s s u r e cons i s t ency between t h e Lssumpt ions and t h e s o l u t i o n s . L a t e r , i n S e c t i o n V I , t h e v a l i d i t y of t h i s t r ea tmen t w i l l be p a r t i a l l y t e s t e d by ex tend ing t h e p r o j e c t i o n per iod up t o 2005.
31 T h e e s t i m a t i o n procedures and r e s u l t s a r e d i s c u s s e d i n Appendix 2 . -

The p a i r of e q u a t i m a (5.6) m a n s t h a t d e ~ n d q u a n t i t y and p r i c e =st s a t i s f y t h e g i v e n deuiand f u n c t i o n w i t h e q u a l i t y , a 8 l o n g a s demand q u a n t i t y is s t r i c t l y p o s i t i v e .
5 1. The f o l l w i n g a c c o u n t i n g e q u a t i o a c o n v e r t 8 demand f o r s teel i n t e rms of f i n i s h e d p r o d u c t e q u i v a l e n t i n t o demand i n t e r m o f c r u d e r t e e l e q u i v a l e n t :
WPDt - -DPt + *t DSt and UPDt - 0 (5.7)
52. The n e x t p a i r o f e q u a t i o n 8 g i v e r t h e c o n s t r a i n t r e g u l a t i n g t h e r e l a t i o n between demand f o r and rupp ly o f rteel:
UPS, - *St + SS, and U P S t * P S t - 0 (5.8)
T h i r p a i r mean8 t h a t ( I ) t h e tlemand f o r r teel c a n n o t exceed r u p p l y and (2) t h e r u p p l y p r i c e o f r tee l i r z e r o i f t h e r e i r a n e x c e r r r upp ly .
Supply o f S t e e l - I n p u t R e q u i r e w n t R e l a t i o n r h i e
53. The 1 n d u r t ~ ' r r e q u i r e w n t r f o r i n p u t s ( i r o n o r e , cok ing c o a l , s teel s c r a p , e n e r g y and l a b o r ) are d e t e r l i n e d by t h e amount o f s t e e l p roduc t i on t h rough t h e i n d u s t r y ' s a v e r a g e i n p u t - o u t p u t c o e f f i c i e n t s .
mit I - v i t S S t + R H i t and WPMit. P H i t - 0
Supply-Capac i ty and I n v e r t r c n t R e l a t l o n r h i p s
5 4 . The supp ly o f s tee l canno t exceed e x i s t i n g c a p a c i t y f o r s teel p r o d u c t i o n when t h e n o r m 1 upper lid! f o r t h e r a t e o f c a p a c i t y u t i l i z a t i o n i s c o n s i d e r e d . 11 I f t h e r e is e x c e s s c a p a c i t y , t h e demand r e n t a l f e e f o r p r o d u c t i o n c&acity m a t b e zero :
WPC, - -SSt + y t CSt and WCt ' PCt - 0 (5.10)
5 5 . The e q u i l i b r i u m c o n d i t i o n gove rn ing c a p a c i t y a n d inves t lpen t c a n be r e p r e s e n t e d a s : 2_/ 21
WKt - < S t + f IS(r - ~ ) r + C S ~ and 7 1
WPKt ' PKt - 0 (5.11)
- 11 I n t h e W I S ~ model, 852 was assumed a s a n upper l i m i t o f c a p a c i t y -
u t i l i z a t i o d rate i n a normel c o n d i t i o n , based on p a s t d a t a ( s e e T a b l e 11.4). - -
s 2 1 I n t h e CnSbmodel , i nves tmen t is e x p r e s s e d a s a n e t i n c r e a s e i n p roduc t i on -
c a p a c i t i e s . I f i t is exp re s sed a s a g r o s s i n c r e a s e , d e p r e c i a t i o n r a t e s o f p r o d u c t i o n f a c i l i t i e s shou ld be i n t r o d u c e d i n t o (5.11).
31 Although t h e l e a d t i= of i nves tmen t is n o t s p e c i f i e d e x p l i c i t l y , t h i s - t r e a t m e n t does n o t c a u s e s e r i o u s prob lems , because a g r e a t p o r t i o n of i n v e s t m e n t is b e l i e v e d t o come o n s t r e a m w i t h i n one p e r i o d i n t h e WISE model, i . e . , w i t h i n f i v e y e a r s .

E x i s t i n g capac i ty cannot exceed i n i t i a l capac i ty p l u s the capac i ty added i n t h e in te rmedia te years. I f t h e r e ha8 been excess investment, t h e rupply r e n t a l f e e of production capac i ty arrt be zero.
56. Hodel 0 inc ludes a nev conr t ra int -an upper l i m i t on the production capac i ty i n 1985. Consequently, i t 8 Lagrangean a r l t i p l i e r , PLt, i r introduced. A l l t h e e q u i l i b r i u a cond i t ionr a r e r h w n i n t ab leau form i n Figurc 1V.2.
57. The new conrtr.int i a r p o c i f i r d a r f o l l w r :
VPLt - <St + 7 q and WLt ' PLt - 0 (5.12)
vhere t - 2.
I f t h e c o n s t r a i n t is binding, PLt can be por i t ive . A p o r i t i v e PLt can be , considered a s a v i n d f a l l p r o f i t r e r u l t i n g from a t i g h t balance of r t e e l .
58. I n t h i s model, i t h u k e n arsmrtd t h a t a v l n d f a l l p r o f i t c o n r t i t u t e r a p a r t of t h e p r o f i t s t r e a r f o r i n v e a t r n t r implemented i n t h e rubrequent year. Consequently, t h c p a i r of equa t iour (5.5) is modified a 8 f o l l w r :
vherc t - 2.

11-29
FIGURE IV.2: TABLEAU FOR MODEL B

A. Outline of Hodels A and B
59. Two rtandard models (cal led rtandard i n order to dis t inguir ' \ them from the models ured fo r the r e n r i t i v i t y t e s t s discussed in the fol!owlng sect ion) were developed for projecting the world iron and s t e e l econoq for the period 1975-1980. I n M e 1 A, i t war assumed t h a t the s t e e l industry plans and impleocntb investrents i n product ion f a c i l i t i e s ra t ional ly , with pcr fec t fores ight . In nodel B , the indus;ry was assm#d t o f o l l w current invercoent plaas. Zndustry sources indicate tha t the plane for exp-nding capactty uhich ;lave been announced in the press and c l ea r ly ident i f ied a s t o location and s i z e and type of i n s t a l l a t ion would r e su l t i n an addit ional 78 mtpy , during 1978-1985. L/ Consequent ly, s t e e l production capacity i n 1985 would be a'wut 700 mtpy of crude s t ec l . Accordingly, i n Hodel B that f igure was imposed a r an upper l i l i c on production capacity i n 1985. (The major assumptions a r e sham i n Table V.1.)
B. Rerults of the WISE Hodel
60. Hodel A projected a smooth dcoelopment of s t e e l marketa in the 1980s. while Model B projected a d r a s t l c pr ice increase i n 1985, implying a t i gh t demand and supply situation i n the r iddle of che 1980r. Furthermore, the high price of s t e e l i n 1985 v i l l ~ t r h fnvestment up i n the l a t t e r par t of the 1980s. Then, i n 1990 the price 9f s t e e l w i l l drop sharply.
Results from Hodel A - 61. In Model A, the increase in s t e e l production capacity during 1975- 1980 w i l l be 30 r tpy , compared with 100 mtpy during 1970-1975 (Table V.3 and Figure V.l). Excess capacity, aggravated by the deptession i n the industry that s t a r t e d i n 1975, is ref lec ted i n the projected slw level of investment. Hwever, investment is projected t o increase capacity t o 135 mtpy during 1980- 1985, r e su l t ing i n a t o t a l capacity of 765 rncpy i n 1985- A t tha t point , investment w i l l taper of f t o an equivalent of 114 atpy between 1985 and 1990.
62 ., I n Model A, s t e e l consumption ( i n crude s t e e l equivalent) 21 w i l l increase from 427 tat i n 1975 - 3) t o 561 o t i n 1980, - 41 651 o t in 1983 a: ' 148
11 From the 1977 annual report of the I n t e r n a t i o m i Iron and S tee l Tnsti- - cute. Also see Table 2.7. .
2 1 S tee l consumption i n the WISE model represents s t e e l consumption i n the - m r k e t economies and the s t e e l balacce of cen t r a l ly planne4 economies.
31 Actual s t e e l consumption i n 1975 was 415 m t . - 4 1 The WISE model solut ion for s t e e l consumption i n 1980, which indicates i t s -
normal leve i , is 6% higher than the corresponding f igure prcjected by the World Bank in Price Prospects f o r ,%jar Primary Commodities 1978, vhere the industry's cyc l ica l inovements a re taken in to account.

888 2 ah-

Table V.2: COSTS OF IbVESI)[ENI I N STEEL U A t I T Y
(1975 cons tan t d o l l a r r per tpy of crude s t e e l production)
Creenf i e l d P lan t8
A.D. L i t t l e /a U.S. S t e e l P e t e r b r c u . U t c h e l l , hutch it^, Inc. /. Bat hlaham S t e e l
Burnr Harbor, I n d i r a r /r National S t e e l , ~ o r t a g c G h o s t
a g r a e n f i e l d p l a n t ) /a Average of t h r e e e n g i n ~ r i o g f i r u a r t i m t e r /. UNIDO /b ~ i p ~ o n T o k a n O b i r h i a r - / c U.S. S t e a l Conncaut /c
Rounding Out
(1) A.D. L i t t l e /a - - - ~ ~ - .
(2) AISI greenf i x d , p lus round o u t , average /a (3 ) AISI / a (4) R e p u b z c S t e e l , Gadsden /a (5) P e t e r Marcur, W t c h e l l , Hutchins, Inc. - /a ( 6 ) Armco S t e e l - /a (7) U N I D O / b (8) COWS -
Replacements
(1) UNIW /b - 300 C I
/ a W.J . Vaughn, C. S. Russe l l and H.C. Cochrane, "Coverument P o l i c i e s and t h e - Adoption of Innovat ions i n t h e I n t e g r a t e d I r o n and S t e e l Industry," 0 8 . - -
/ b UNIW, "Draft World-Wide Study of t h e I r o n a n 3 S t e e l Indus t ry 1975-2000," - 1976, p. 205. - - -
/c V.S. Council of Wage and P r i c e S t a b i l i t y , o ~ . L i t pp. 79-82. - -* '

Table V.3: ACTUAL AND PROJECTED NET INVESTHENT
(equivalent of mtpy o f crude r t e e l production)
Actual Projected Projected (WISE 1975-1990) (WISE 1970- Standard Modelr S e n r i t i v l t y Tercr
1985 nodel A Model B Hodel Hodel B~ b d e l h2 b d e l A~ Hodel A~

Year World Bmk -22115

m t i n 1990 (Table V.4 and Figure V.2). The annual r a t e s of g r w t h of s t e e l consumption w i l l be 5.72 f o r 1975-1980, 3.02 f o r 1980-1985 and 2.82 f o r 1985- 1990. 11 Hodel A a l s o p ro j ec t s a smooth increase i n t h e p r i c e of s t e e l , i n a sharp c o n t r a s t with the r e s u l t s of Hodel B (Table V.5 and Figure V.3). I n Hodel A, the p r i c e of s t e e l products 21 u i l l inc rease from $288 per ton in 1975 31 t o $296 per ton i n 1980, $314 per t o n i n 1985 and $339 per ton i n 1990 - 41 T ~ a b l e V.5 and Figure V.3). Furthermore, Hodel A projec:s i r on o r e consumption t o be 510 at i n 1975 - 51 and 643 m t i n 1990 - 61 (Table V.6).
Results from Hodel B
63. Hodel 8 , which has an upper l i m i t on capac i ty of 700 a tpy of crude s t e e l production i n 1985, p ro j ec t s v io l en t f luc tua t ionn i n s t e e l p r ices and investment i n 1985 and 1990 (Tables V.4 and V.5). The pro jec t ions s h w a sharp increase i n t he p r ice of s t e e l i n 1985-$377 per ton, a f i gu re t h a t is 202 higher than t h a t i n Model A. 71 The high p r i c e i n 1985 w i l l increase i n v e s t e n t i n t he l a t t e r p a r t of The 1 9 8 0 ~ ~ uhich u i l l lead t o a rapid increase i n capac i ty i n 1990. Consequently, the s t e e l p r i c e i n t h a t year w i l l drop t o $298 per ton, uhich is 122 lover than i n Hodel A. The implied annual r a t e of g r w t h i n consumption of s t e e l between 1980 t nd 1985 i n Yodel B is only 1.22 per annum, much lower than the 3.02 of Hodel A, but between 1985 and 1990 i t u i l l increase t o 5.72, h igher than t h e 2.82 of Hodel A.
11 Consequently, the annual g r w t h r a t e f o r 1975-1990 is 3.52. - 1
21 The I ron Age f in i shed composite p r i c e i n t h e U.S. was taken a s a standard - pr ice f o r s t e e l products.
31 The a c t u a l p r i c e i n 1975 was $289 per ton. - e 1
41 The projected annual g r w t h r a t e f o r t he p r i c e of s t e e l products during - 1975 and 1990 is l.la, uhich coincides v i t h t he a c t u a l growth r a t e between 1960 and 1976. !@
C
51 Actual apparent consmption of i ron ore i n 1975 vas 559 m t . - 61 Consequently, the annual grovth r a t e f o r 1975-1990 i s 2.9%. - 7; I n >lode1 a , as i n Hodel A , tne r a t e of capaci ty u r i l i z a t i o n was assumed t o -
b e 85%. I t w i l l i nc rease i f the demand and supply balance is t i g h t , a s projected by Model B. Consequently, t he p r i c e w i l l b e eased t o some ex ten t .


Table V.5: ACTUAL AND PROJECTED PRICE FOR STEEL PRODUCTS /a - - ( cons tan t 1975 do l l a r . p e r ton )
Actual /b - Projec ted Pro jec ted (WISE 1975-1990) (WISE 1970- Standard Hodelr Scncr i t iv i ty Tecrtcr
1985) Model A Hodel E Hodel Hodel El Model A2 Model A3 Hodel A4
/a The I r o n Age f i n i s h e d composite p r i c e i n 1975 c o n r t a n t d o l l a r r . - /b I ron Age ( v a r i o u s i eeuus ) . -

Table V.6: ACTUAL AND PROJECTED IRON ORE CONSUmTION /a -
Actual /b - Projected Pro jec ted (WISE 1975-1990) (WISE 1970- Standard Models S e n s i t i v i t y T e s t s
198 5) Model A Model B Hodel A1 Hodel B1 Hodel A2 Hodel A3 Hodel A4
/ a I n g ross weight. - /b World Bank, 2 e. The f i g u r e s show apparent consumption of i r o n ore. - /c Pro jec t ions i n t h e World Bank, OJ. G. -
' W '

FIGURE V.2: ACTUAL AND PROJECTED STEEL CONSUMPTION

FIGURE V.3: ACTUAL AND PROJECTED PRICE OF STEEL PRODUCTS
World B.n k - 221 14

V I . VALIDATION OF THE WISE MODEL
64 . The v a l i d i t y of t h e WISE model was t e s t e d i n t h r e e ways:
( 1 ) Was t h e model a b l e t o s i m u l a t e marke t performance i n t h e p a s t ;
( 2 ) Was t h e model s t a b l e a round i ts s o l u t i o n s ; and
( 3 ) Were t h e modol's s o l u t i o n s a f f e c t e d by t h e c h o i c e of terminal y e a r ( I .e . , 1990)?
S i m u l a t i o n T e s t o f t h e WISP Hodel - 11
Methodology of t h e qirnulat i o n test
65. Because t h e WISE model was deve-oped a s a ma thema t i ca l p r o g r a d n g model, t h e methodol.,gy f o r t h e s i m u l a t i o n test is d i f f e r e n t from t h a t f o r e c o n o m e t r i c models. Econ-tric models a r e c o n s t r u c t e d i n e t c h a way t h a t t h e marke t s i t u a t i o n ie e a c h yeaz is s o l v e d r e c u r s i v e l y , s t a r t i n g w i t h t h e i n i t i a l y e a r and moving f o n r a r d . 2/ They do n o t i n c l u d e v a r i a b l e s r e p r e s e n t i n g e x p e c t a t i o n s f o r f u t u r e m r k e t s i t u a t i o n s , e x c e p t f o r t h o s e exp re s sed i n l agged v a r i a b l e s . T h e r e f o r e , g i v e n p a s t d a t a , t h e models c a n a u t o m a t i c a l l y s o l v e e a c h y e a r ' s nrarket s l t u a t l o n i n t h e f u t u r e .
66. On :he o t h e r hand. t h e WISE model was d e s i g n e d t o s i m l a t e t h e p r a c t i c e s o f i n d u e t r i a l p l a n n e r s . A t a n y g i v e n p o i n t , i t is assumed that t h e s e p l a n n e r s have t h e i r p e r s p e c t i v e s on f u t u r e c o n d i t i o n s i n t h e s teel i n d u s t r y a s well as t h o s e o f t h e economy a s a whole. Based on t h e i r p e r s p e c t i v e s , t h e y make i n v e s t l e n t p l a n s c o v e r i n g a c e r t a i n p e r i o d i n t h e f u t u r e , f o r example, 15 years._3_/ I m p l i c i t i n t h i s s t u d y is t h e view t h a t , i n 1970, i n d u s t r i a l p l a n n e r s were making i nves tmen t p l a n s t h a t covered t h e p e r i o d 1970-1985, some o f which were ~mplemen ted i n t h e n e x t two o r t h r e e y e a r s . Howsver, a s t i m e pa s sed and new i n f o r m a t i o n ( i n c l u d i n g t h e consequences o f t h e i r d e c i s i o n s ) became ~ v a i l a b l e , t h e i r p e r s p e c t i v e s changed , and they r e v i s e d t h e i r p l a n s , making new inves tmen t s t r a t e g i e s t h a t covered t h e p e r i o d , s a y ; 1975-1990. The cew p l a n s might i n v o l v e she1vif tg p r e v i o u s l y conce ived p r o j e c t s and a d d i n g new ones . Again, b e f o r e any new p l a n s are made, t h e earlier p o r t i o n of t h e p r e v i o u s p l a n s , f o r example, t h a t i n v o l v e s t h e p e r i o d 1975-1.980, w i l l have been implemented w i t h o u t s u b s t a n t i a l change.
w 11 For a s i m u l a t i o n t es t , see, f o r example, W.C. Labys, Dynamic Commodity - Models: S p e c i f i c a t i o n , Es t ima t i on and S i m u l a t i o n , 1973, pp. 199-240.
2/ T h i s p rocedu re a l s o a p p l i e s t o r e c u r s i v e ma thema t i ca l programming models - s u c h a s t h e Abe model.
3 / The economic l i f e t i m e of t h e a v e r a g e s t e e l -mak ing f a c i l i t y is c o n s i d e r e d - t o be 20-25 y e a r s . (See t h e U.S. Counc i l o n Wage and P r i c e S t a b i l i t y , 9 c i t p. 8 0 , and H . H u e l l e r and K. Kawahito, 9 G., p. 23.) Thus, 1 5 -- * y e a r s covel-s che major p a r t o f t h e economic l i f e t i m e .

67. Ta t e s t the v a l i d i t y of the WISE model, a model war developed f o r 1970-1985 which was designed t o s imulate t h e market i n 1970 and the expected course o f development subsequent t o t h a t year. The WISE modal required t h e fol lowing t e s t procedures, d i f f e r e n t from thora f o r economatric modelr. F i r s t , i t had t o be a s f i g u r e r f o r t h e axogenour v a r i a b l a r thora t h a t ware expected i n 1970, ins tead of thore a c t u a l l y r e a l i z e d , f o r example, the CNP f o r 1970-1985 t h a t was expected i n 197C, which war much g r e a t e r than what war a c t u a l l y rea l i zed . By the same token, rha dummy v a r i a b l e i n t h e demand func t ions 1/ which a t t e a p t a t o cap ture t h e rha rp d a c l i n a i n r t e e l conrumption i n 1975 muyt be e l iminated from the 1970-198s modal, a r t h a t dspra r r ion war not a n t i c i p a t e d i n 1970. Second, the v a l i d i t y of t h e amdal muat be t a r t a d by comparing the s o l u t i o n r f o r i n v e r t w n t on ly dur ing 1970-1975 with the corresponding a c t u a l s t a t l r t i c r . Tha r o l u t i o n r f o r l a t a r par iodr a r e not r e levan t f o r t h e v a l i d i t y t a r t , al though t h r y provida i n t e r a r t i n g information on how expec ta t ions changed dur ing 1970-197s.
Resul ts o f the WISE Hodal: 1970-1985
68. The s o l u t i o n of i n v a r t w n t batwaea 1970 and 1975 a r c l o r a t o a c t u a l s t a t i s t i c s . According t o the modal, i n v a r t w n t was aquivalant t o an increaee i n capac i ty by 88 mtpy, c l o r a t o t h e n e t capac i ty i n c r a a r a of 100 mtpy (Tabla V . 3 ) . On the o t h e r hand, t h e model p ro jec ted a n i n c r e a r e i n capaci ty up t o 136 mtpy between 1975 and 1980, which ham not mata r ia l i zed . Tha s o l u t i o n f o r s t e e l consumption i n 1975 war 499 m t , f a r above a c t u a l 1975 conrumption (627 a t , Table V . 4 ) . However, i t i r i n t e r e a t i n g t h a t t h e solved f iguree f o r consumption i n 1975, 1980 and 1985 were c l o s e t o those made by t h e I n t e r - n a t i o n a l I ron and S t e e l I n s t i t u t e i n 1972, 21 when a eevere depresr ion i n the - s t e e l indus t ry was no t an t i c ipa ted .
B. S e n s i t i v i t y Tes t of t h e WISE Xodel
Five Addi t ional Xodels f o r the Test
69. The WISE model i s based on t h r e e important assumptions-(1) GDP grouch r a t e s i n t h e amjor regions; (2 ) investment c o s t s ; and (3) discount r a t e f o r t h e p r o f i t streams. To t e s t the e f f e c t s of changes i n these assumptions on nodel s o l ~ ~ t i o n s , f i v e a d d i t i o n a l models (Hodels A 1 , B,l, A2 , A3 and A4) were made. I n Xodels A and B1, the CDP growth r a t e s of the U.S., Japan and t h e EC vere lovered by 20) from those of t h e s tandard Xodels A and B , while the o t h e r assumptions vere kep t unchanged. In Xodels A2 and A3, i n v a r i a n t investment c o s t s throughout the p r o j e c t i o n period ($500 per mtpy f o r Model A2 and $700
11 See Appendix 2. -
2 1 The I n t e r n a t i o n a l I ron and S t e e l I n s t i t u t e , P ro jec t ion ' 8 5 , 1972. -

p e r n t p y f o r Yodel A,) were a s suaed , w h i l e a t r e n d of i n c r e a s i n g inves tment c o s t was a s s m d i n t h e s t a n d a r d lSodels A a n d B. 1/ I n Model Ah, t h e a n n u a l d i s c o u n t r a t e was ass-d t o be 202, a s compared A t h 162 i n t h e s t a n d a r d m d e l s . A/ ( A l l t h e a s s u ~ p t i o n s r e f e r r e d t o h e r e a c e l i s t e d i n Tab l e V.1. )
R e s u l t s of t h e S e n s i t i v i t y T e s t
70. The s e n s i t i v i t y t e s t s h w s t h a t t h e WISE model is s t a b l e around t h e s t a n d a r d model s o l u t i o n s .
71. As s h w n i n t h e r o l u t i o n e of Hodel A , i f t h e r e is no upper : i m i t on c a p a c i t y i n 1985, t h e lower GDP g t o v t h r a t e s 1 n t h e 1980s w i l l c a u s e 6
d e c r e a s e i n s teel consumption In 1985 of 1.72 and i n 1990 o f 2.82 ( T a t l e V.4). The e f f e c t on i n v e r t b c n t i s much l a r g e r ; i nves tmen t w i l l d e c r e a s e by 8.92 between 1980-1985 and by 9.6X between 1985-1990 (Tab le V.3). Am shown i n t h e s o l u t i o n s of Hodel B i f t h e i n d u a t r y f o l l w s i ts c u r r e n t c a p a c i t y expan- G a ion p l a n s , t h e l ove red DP growth r a t e s w i l l n o t f u r t h e r d e c r e a s e s t e e l pro- d u c t i o n i n 1985, because t h e s t e e l c o n o u r p t i o n i n 1935 y i e l d e d by P a d e l B i s lou enough. H w e v e r , s teel consumption i n 1990 w i l l be 3.42 lwer t h a n what is projecte.! by Hodel B. Although t h e i nves tmen t between 1980-1985 i n Model B1 w i l l n o t change f r w Xodel B, t h e inves tment between 1985-1990 i n t h e f o r w r model w i l l k 14.42 l o u e r t h a n i n t h e l a t t e r model.
72. Changes i n t h e costs of inves tment a f f e c t t h e time p r o f i l e of i n v e s t - ment s i g n i f l c a n t ly . W e 1 A*, which h a s a l o v e r and i n v a r i a b l e inves tment c o s t o v e r time p r o j e c t s (1) t h e l a r g e s t q u a n t i t y of t o t a l inveetment ove r time aaong t h e t h r e e comparable models-A, A2 a n d A3; and ( 2 j a d e l a y of some i n v e s t s e n t i n t o t h e l a t e r pe r iod i n comparison w i t h t h e s t a n d a r d Hodel A s o l u t i o n (Tab l e V.3) . The h i g h e r and i n v a r i a b l e i nvee tmen t c o s t model, Hodel A3, p r o j e c t s (1) t h e s a a l l e s t q u a n t i t y o f t o t a l i nves tmen t ; and (2) more i n v e s t a e n t i n t h e e a r l i e r p e r i o d t h a n i n t h e s t a n d a r d Xodel A s o l u t i o n . N a t u r a l l y , s t e e l p r i c e s a r e s t r o n g l y a f f e c t e d by a s s m e d inves tment c o s t s (Tab l e V.5).
11 The t r e n d of i n c r e a s i n g inves tment c o s t is b a s e i on two o b s e r v a t i o n s . - F i r s t , t h e o p p o r t b n i t i e s f o r c a p a c i t y expansfon by roundout o r brounf i e l d a r e l i k e l y t o be exhaus t ed i n t h e e a r l y 1980s; consequen t ly , i n t h e middle of t h e 1980s c a p a c i t y expans ion w i l l t a k e p l a c e i n t h e form of g r e e n f i e l d e x t a n s i o n , v h i c h is more c o s t l y t h a n o t h e r t ypes . Second, t h e inves tment c m t of g r e e n f i e l d expans ion is a n t i c i p a t e d t o i n c r e a s e . For example, t h e i&es tment c o s t of t h e loost modern i n t e g r a t e d s t e e l m i l l , t h e Nippon K ~ k a n ' s Ogishima P l a n i n J apan , is now r e p o r t e d t o be $550 p e r t on , - e f t l u d i n g t h e c o s t o f rec lamat ion . A more r e c e n t l y conce ived inves tment 8 p B n a t Conneaut, Lake E r i e , by t h e U.S. S t e e l C o r p o r a t i o n i s s a i d t o c o s t abou t $850 p e r t o n i f i t is implemented i n t h e e a r l y 1980s. The U.S. C o u n c i l on Wage a d P r i c e S t a b i l i t y , e., p. 79. See a l s o Tab l e V . 2 .
21 The f i g u r e s i n t h e s t a n d a r d models were used t o e s t i m a t e t h e c a p i t a l - c h a r g e i n t h e U.S. i n d u s t r y i n t h e U.S. Counc i l on Wage an( P r i c e S t a b i l i t y , %., p. 8 0 .

73. The model with the higher discount r a t a , Modal A&, projectr l e r r i nves tmnt and c o ~ u o p t i o n quan t i t i e r and higher s t e a l pr ice8 f o r a11 period8 than does the corresponding standard Hodel A. An increara Ln the dircount r a t a o f 227 w i l l boost the s t e e l p r ice i n 1985 by 8.62 aud i n 1990 by 9.11 ( T a b l o V. 3 through V. 5).
C. Test of the Te r r ln r l Yaar of the WISE Model
74 . Models A and B have a tima upan of 15 r a a r r , with an i n i t i a l year of 1975 and a t e r d n a l year of 1990. t o t a r t whather the ro lu t ion r a r e a f f ec t ed by the chof:e of tarrr lnr l year, a model uar daveloped f o r 1975-2005, o r ca l l ed Hods1 C. While the a r r u ~ t i o n s up t o 1990 -re t he same a s i n Hodel A , thore a l t e r 1990 werq a8 fol lour:
( i ) I n w r t s r n t coat uar a r r u w d t o r e u i n a t the r0aa l eve l r r t h a t l c r 1983-1990 i n Model A-at $700 ?er tpy; and
(ii) The in ta rcept of the d-nd function of r t e e l ( l o f ia l rhe4 rtee: product equivalent) war a s r u e d t o Lacreare by 140 m~ . f i v e year8 .
75. The r e r u l t r of Hodel C a r e rhoun with thore of Hodel A i n Table V I . 1 and VI.?. I t seere t h a t the aolut ionr f o r 1975-1990 a ra not affected by the choice of t e r d n a l year.

Table VI.l: STEEL COh'SbWTIO!i A ! PRICE SOLUTIONS YITlt --- WDEL A MID HODEL C
Steel Cot~rvmption /a Prlce of Steel Prod~,ctr Model A Model C Hodel A Hodel C
--- (kc )----- --(1375 conrrrnt $ per ton)--
la Ic crude r tee l aqulvalent. -
Table VI .2: S(iLITi1O)OS WITH WDEL A AND HODEL C, NET INVESTMENT
(equlmlent of rtpy of crude rtaal production)
- Net rrver t m n t Model A Hodel C

VII. CONCLUSION
76. The WISE model project# two a l ternat ive couraea for the vorld iron and s t e e l economy from 1980 t o 1990. Modal A ahwa a aaooth development if the a tee l industry plana and irpleosnta Inveatmnt i n production capacitlea with rat ional expectations and -.qrfect foreright. Hodel B projects a t ight balance in s t e e l ar0ur.d 1985 ( 1 ;ha induatry follova i t s current plana t o expand capacity, aasuml y ce. . 'I conditioaa with reapect t o i l ," c r 8 -the- factors. The effecta of r J h ~ balance 10 the old-1980s wulo ~ o n t l n , ' 3 be Celt In the early 1990;. .* ather uorda, a aharply increased price for : eel, which would produce a ukndfall profi t for the induatry, wuld cause F , - , ~ v e investment i n the l a t t e r part of the 1980s. This would, i n turn, cause a sharp drop i n price in t1.e early 1990..
7 7 . The iron and s t e e l econoy is a complex one and there LIB a grest deal of uncertainties on i t s future, a s indicated by the two a l ternat ive verslons of tho WISE model. Because of its importance on the economy as a whole, I t needs t o analyze market behavior of the industry and t o project i t s future a s accurately as possible. The UISE model l a believed t o be an aaalyt ical device to achieve such purposes.

Appendix 1 Page 1 of 3
Appendix 1
PRESENTATION OF THE UISE HODEL AS A LINEAR COHPLWENTARITY PROCRMINC PROBLM
The UISE model can be presented as the folloving llneat compli- aentarity programing W P ) problem: 1/
where :
x and x2 = quantity variables 1
p = p r i c e variables
E
c , , c2 , c 3 = intercepts i n demand functions
v1, w2, w3 a s lack variables
The f i r s t equation group in (A.1.1)
11 As for LCP, see R . W . Cott le and G.B. Dantzig, o p . c i t . -
(A. 1.2)
(A. 1.3)
(A. 1.4)

r e p r e r e n t r t h e e q u l l i b r ium condi t ion8 governing relat iona b e t m e n q u a n t i t y and p r i c e v s r i a b l e s o r wre s p e c i f i c a l l y , demand fuact iona. The above pair of equatiucls correrponds t o t h e pair of aqua t ioa r (5.6) i n Sect ion IV.
The second equat ion group in (A. 1.1)
w2 - A2P + CZ
and i n (A.1.2)
W X - 0 2 2 (A. 1.8)
r e p r e s e n t s t h e equ i l ib r ium conditions governing r e l a t i o n r among p r i c e v a r i a b l e r . This p a i r of equat ion8 correrpondr t o t h e p a i r of cquat iona (5.1) through (5.5) in Sect ion IV.
The t h i r d equat ion group in (A.l.l)
w - B x + B x + C 3 1 1 2 2 3
and in (A.1.2)
represen t s the equ i l ib r ium condi t ions governing r e l a t i o n s among q u a n t i t y v a r i a b l e s . T h i s p a i r of equat ions corresponds t o t h e p a i r s of equa t ions (5.7) an4 (5.12) in Sec t ion IV. L
Unlike quadra t i c progrmndng , LCP does no t r e q u i r e tha t :
(1) Q is symmetric; and
Al = -B1 and A2 = -B2
Furthermore, the Q ratrix does not need t o be p o s i t i v e d e f i n k e o r p o s i t i v e semi-def i n i t e . I n f a c t , the WISE model h a s :
1 I
A1 # -B1 and A2 f -B2 . Quadrat ic p rograming is a s p e c i a l c a s e of LCP
where:
(1) Q is symmetric; and 1 1
A1 = -R1 and A = -B2 2

Appendix 1 Page 3 of 3
Linear p r o g r a ~ i n g is also a special case of LCP
where:
Q - 0 ; and
A[ - -El and A2 - -B2
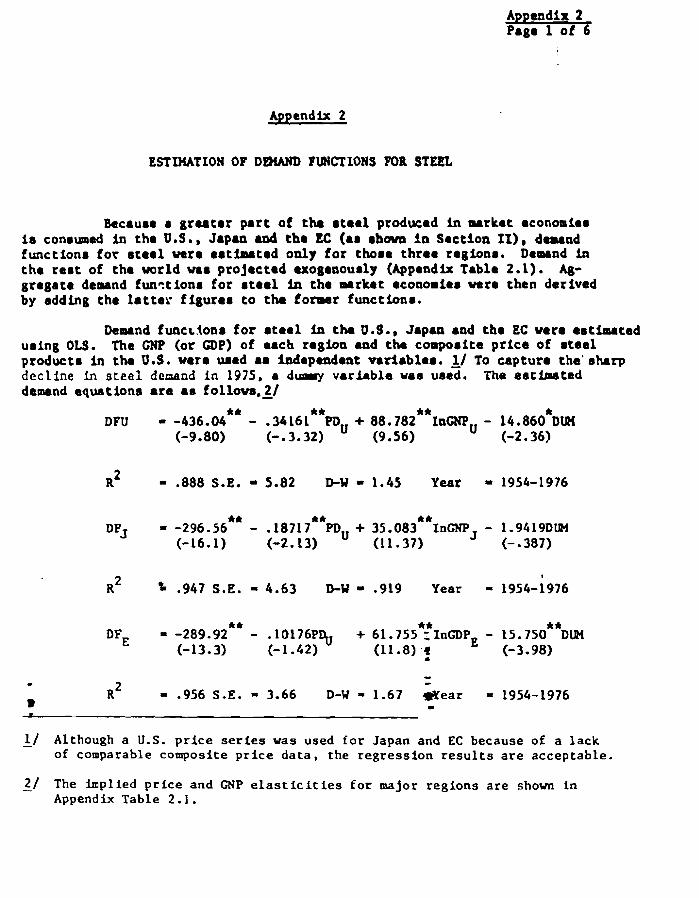
Appendix 2 Page 1 of 6
Appendix 2
ESTMATION OF DPXAND FWCTIONS FOR STEEL
Bscaure a g r ea t e r p a r t of the r t e e l produced La market e conmie r is conrumd in the U . S . , Japan and t h e EC (a@ rbovn i n Sec t ion XI), demand function, f o r r t e e l were e r t i m t e d only f o r thore t h r ee region.. Damad La t h e r an t of the w r l d war p ro jec ted uogenour ly (Appendix Table 2.1). Ag- gregate delprnd funct ion8 fo r r t e e l in the m r h t econol ie r were then darivad by adding the l a t t e r f i g u r e r t o tha former func t ioar .
Demand funcr lonr f o r r t e e l in th. U.S., Japan and t he EC were emtimated using OLS. The CNP (or GDP) of u c h region and the coppor i te p r i c e of rteel product8 in the U.S. were w e d u iadeprndent v8r iab le r . 1/ To cap ture t h e ' s h r p d e c l i n e in ~ t e e l denand in 1975, a d u m y v a r h b l e vas use;. The estimated demand equat ions ara a8 f o l l o u s , ~ /
R* - .888 S.E. = 5.82 D-W - 1.45 Year = 1954-1976
R~ t -947 S.E. - 4.63 D-W - .919 Year - 1951-i976
- - - R~ = -956 S.E. = 3.66 D-W = 1.67 Hear = 1954-1976
8 - 11 Although a U.S. p r i c e series was used f o r J apan and EC because of a l a c k -
of comparable compos i te p r i c e d a t a , t h e r e g r e s s i o n r e s u l t s a r e a c c e p t a b l e .
2 1 The impl ied p r i c e a n d GNP elas t ic i t ies f o r major r e g i o n s a r e shown i n - Appendix T a b l e 2.1.

Appendix 2 Page 2 o f 6
vhere:
DP ( ) - Consumption of s t e e l ( m t i n f i n i s h e d s t e e l product equ iva len t ) I/ - The I r o n Aga f i n i s h e d coopos i t e p r i c e ( d o l l a r s per met r i c ton) 21
mu - Cross National Product of t h e U.S. (in 1972 constant b u l l o n d o l l a r s ) 21
G H P ~ = Cross National Product of Japan (in 1970 cons tan t
b l l l i o n yen) - 41
m P ~ = Cross Domestic Product of EC (in 1970 cons tan t b i l l i o n
d o l l a r s converted wi th 1970 exchange r a t e s ) 11
Figures i n parentheses a r e t - s t a t i s t i c s .
* i n d i c a t e s a s t a t i s t i c a l s i g n i f i c a n c e a t the 95 percent l e v e l .
** i n d i c a t e s a s t a t i s t i c a l s i g n i f i c a n c e P* the 99 percent l e v e l .
The c o e f f f c i e n t e of the d m n d f u n c t i o n s used i n t h e model were der ived by feed ing a c t u a l o r e s t i r a t e d CNP, based on t h e information shown i n Appendix Table 2.3. A s expla ined in Sect ion V. CNP and t h e duony v a r l a b l e were s e l e c t e d s p e c i a l l y f o r t h e v a l i d a t i o n t e s t model, i .e., t h e WISE umdel:
11 Data sources: American I ron and S t e e l I r l$ t i tu te , Annual S t a t i s t i c a l Report - (var ious i s s u e s ) ; Japan I r o n and S t e e l Federation. Monthly Report of the I ron and S t e e l S t a t i s t i c s (va r ious i s sues ) ; UN, S t a t i s t i c a l Yearbook (var ious i s sues ) . The f i g u r e s o r i g i n a l l y expressed in terms of a crude s t e e l equ iva len t were converted i n t o those in a product equ iva len t . The + conversion f a c t o r used h e r e ( i .e . . y i e l d ) was 0.71. A -
i -
21 Data source: I ron Age v a r i o u s i s sues ) . - - 31 Data source: U.S.. Ecoiomic Report of the Pres ident (va r ious i s s u e s ) . - 4/ Data source: Japan, Economic Planning Agency, Annual Report on National -
Income S t a t i s t i c s , 1977.
5/ Data source: The World Bank. -

1970-1985. The chosen demand funct ions a r a a s folloue.
(1) For the WISE modal: 1970-1985
PDl 838 - 1 .5R)F1 ( for 1975)
PD2 1 962 - 1.59DP2 (for 1980)
PD3 - 1096 - 1 .5R)P3 (for 1985)
(2) For tha WISE modal: 1975-1990
PD1 1 928 - 1.59DP1 (for 1980)
PD2 1057 - 1.59DF2 (for 1985)
PD3 - 1207 - 1 .59DF3 (for 1990)
(3) For the WISE modal: 1975-2005
PDl - 928 - 1.59DF1(for1980)
PD2 - 1057 - 1.59DF2 (for 1985)
PD3 - 1207 - 1 .59DF3 (for 1990)
PD4 -1347 - 1.59DF4 (for 1995)
PDs - 1487 - 1 .59DFs (for 2000)
PD6 -1627 - 1.S9DF6 (for200s)

Appendix Table 2.1: PROJECTED DMAND POX STEEL AND STEEL BAWCE W REGIONS OTHER THAN U. S. , JAPAN AND THE EC a / -
, 4 hcc 4 1 Demand f o r S t e e l S t e e l Balance
Year 9evcloped Developing Countr ies C e n t r a l l y Planned East 6 O t h e ~ Countries Middle A s i a L a t i n Sub- Count r ies
Excluding N o r t h A f r i c a i f r i c a U.S., Japan 6 EC
America T o t a l
a / I n f in i shed s t e e l product equ iva len t . F igures o r i g i n a l l y expreseed in term. of c rude e t e e l equ iva len t - were converted i n t o those of product equ iva len t . The conversion r a t e s uaed were 0.71 f o r 1975 and 1980, 0.72 f o r 1985 and 0.73 f o r 1990.
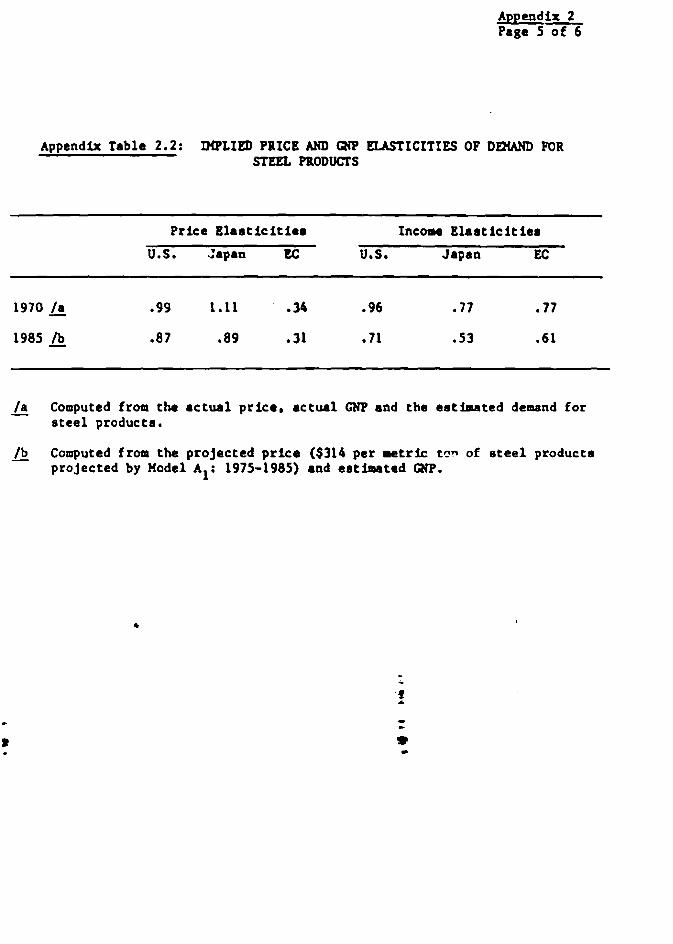
Appendix 2 Page 5 o f 6
Appendix Table 2.2: IMPLIED PRICE AND QIP eLASTICITIES OF D m WR STEEL PRODUCTS
Price B l a s t i c i t i e r Income Blas t ic it l e a
U.S. Japan EC U.S. Japan EC
/a Computed from the a c t u a l p r i c e , ac tua l CHP and the e a t h a t e d demand f o r - s t e e l products.
/b Computed from the projected p r i c e ($314 per metric ton of s t e e l products - projected by Hodel A1: 1975-1985) and estimated CNP.

h h h . . . I * * *

Appendix 3 Page 1 of 9
Appendix 3
ESTLHATION OF OPERATING 02' v AND YIELDS
In o r d e r t o develop t h e WISE model, two k i n d s o f o p e r a t i n g c o ~ t s - - t hose i n m i l l s w i th average e f f i c i e n c y and t h o s e in n t v mllls--%rere estl- mated. The former was t h e key parameter f o r s o l v i n g tha i n d u s t r y ' s input r e q u i r e l w n t s , 11 whi le t h e l a t t e r was u-d f o r p r i c e Comat ion . 2.1 To over- come t h e g r e a t d ivergence i n o p e r a t i n g c o s t s of mills, a set o f o p e r a t i n g c o s t s in a h y p o t h e t i c a l m i l l Ln 1976, based on i n f o m a t i o n on U.S. , Japanese and EC m i l l s , v a s est b a t e d (Appendlx Tabl . 3.1). 21 Then, o p r r a t fng c o s t s o f average and new m i l l s Ln o t h e r y e a r s w r o c a l c u l a t e d a s fo l lovi l .
(1) Input usage r a t e s (except f o r i r o n o r e and s c r a p 41) of nev m l l l s v e r e assumed t o be 201-301 l o u e r th.;; t h c s e of average mills;
(ii) Input usage r a t e s of new mllls vere asstmed to dec rease ove r t h e v i t h a p p r o p r i a t e r a t e s , h i c h a r e determined by type of lnvastment; 51
1 / In most c a s e s , investment in p roduc t ion c a p a c i t y is accompanied by - t echno log ica l p r o g r e s s , t h a t is, a d e c r e a s e in inpu t usage r s t e a . Consequently, i npu t usage r a t e s in a spec i f ic y e a r depend on t h e h i s t o r y of p a s t investment. I n o t h e r words, input usage rates Fn a c e r t a i n f u t u r e yea r are n o t independent of investment Fn t h e preceding y e a r s . The i n t e r a c t i o n s becveen i n p u t usage r a t e s and investment v i l l cause a s e r i o u s problem from t h e viewpoint of model- l i n g technique . Houever, t h i s problem vas n o t e l a b o r a t e d Zur'lher i n t h i s paper. A s e t of input usage rates f o r a probable r anze of investment v a s f i r s t f ed i n t o t h e model and a E i n a l s e t vas d e t z r - mined v i t h a f e v i t e r a t i o n s . The same was t h e case f o r y i e l d .
i n a r i g o r o u s a p p l i c a t i o n , input usage r a t e s of marginal producers , i n s t e a d of t h o s e of nev m i l l s , must be f ed i n t o t h e model. T h i s causes ano the r s e r i o u s problem f o r t h e d e l l i n g technique , because i t is not known which m i l l s a r e marginal producers , b e f o r e s o l v i n g t h e model. However, t h e s o l u t i o n shaved t h a t marginal producers a r e the newest m i l l s i n most cases . Thus, input: usage r a t e s of nev m i l l s i n each year v e r e kep t in t h e model.
. 3 1 Derived from t h e U.S. Council on Wage and P r i c e ~ c a b i l i t ~ . ~ o ~ . c i t . , -
p. 1 4 5 .
4 / No improvement was assumed i n the input usages f o r i ron o r e and sc rap . -
5 1 In t o t a l , o p e r a t i n g c o s t of new m i l l s were assumed t o be 20% lower than - those of average =ills. T h i s f igure roughly c o i n c i d e s wi th the f inding o f the s tudy by the U.S. Council on Wage and P r i c e S t a b i l i t y , op. c i c . , p . 82 .

Appendix 3 Page 2 of 9
( i i i ) Input usage r a t e s of average m i l l s in the subsequent year wre corputed a s weighted wan8 of the current year 's input usage ratem of average m i f l m and the input usage r a t e s of new m i l l 8 irplemented here- a f t e r ; _1/
(iv) Mort uni t input c o s t s w r e arstmed t o remain a t the 1975 levels .
The 6.w procedure war applied f o r th. e r t i u t i o a of yield. The oa t i u t t d operating c o r t r and y ie ld f o r each year a r e rho- i n Appmdix Tabler 3.2 through 3.8.
- --
1/ I t e r a t i o n s vere required a t t h i s point. -

Appendix Table I. t r LL-L OIDArlffi COSTS. 1916
- - - - - - -
Unlt Unlt lA1t Lblt Input Uuao Input Uugo laput u-C. lapvt Uu/e ? r l c o & Rater @ c r r t r Prlcoa k Rater 4 b r t a P r o & Bate@ & b a t r & I r a b t * a & Coats &
Iron Ore ( tonr) 29.40 .9bO 2 2 18.40 1.119 20.19 16-67 1.1- )(.I4 21.70 1.20 24.24
Coking 2001 '.onr) 58.13 .567 32.96 60.36 -580 35.01 60.69 .5)s 1 . 2 60.00 -56 3 3 . a
Scl.. p ( tonr) 76.81 . I 9 4 14.90 75.10 -205 15.40 73.75 ,196 I . 75.00 .20 15.00
Energy & (barrol r ) 11.00 1.13 12.43 12.65 1.25 15.81 12.81 1-41 I . 12.00 1.13 13.56
Labor (man-l~ourr) 1 2 . 2 7 8.21 100.33 6.31 9.60 b0.U 8.63 11.14 4 11.00 9.00 99
Otherr ,all ** 4 ' - 10.00 - - 10.00 - - 10.00 - - I .
TOTAL Operating Cortr - - 198.84 - - 157. 19 - - 1M.U - - 195.40 -
& In current d o l l r r r per unl t (ahoun in the l a f t c o l m ) of Input*.
f Input reauiramenca i n un i t a (ahom In th l e f t e o l m ) per ton of crud. r t ~ 1 . In current do:larr. par ton of crude r t e e l .
d The tabla in the o r ig ina l rourca rhowa u n i t lnput pr icoa and u n g o r a t o r l o r fwl o t l . ~ C u r a l w a . Poo-coLm coal and 01o:trlclry. - vhlch vero converted in ro c h o n in o i l aquivalent by tha p r a m t autbor.
Source: Coqu t rd frcm the !t.S. Council on h g a and PPrco Stability. op. c 1 ~ .

Appendix 3 Page 4 of 9
Appeczl': Tabla 3.2: ESTIHAfEO OPERATIXC COSTS, 1970
-. -- Average H i 1 1 6 h'ev H i 11s
U3ir - Input U s ~ g e Coctr /c Usaer Costa & P r i c e s /. Ratas ik Rates /b
:roc Ore ( toor) 17.40 1.24 21.62 1.24 21.82
Coking Coal ( t t a ~ ) 22.81 .58 13.23 .46 10.49
S t e a l Scrap (cons) 57.29 .21 12.03 .21 12.03
Energy (ba r r e l@) 4.67 1.18 5.51 .94 4.39
Labor (man-;wurr) 11.82 9.31 110. Oh 5.97 82.39
Other r - - 10.00 - 7.00
In 1975 constant d o l i a r r per un i t ( l i s t e d i n t h e l e f t colurrm) of inputs.
/b Input reqb i rcaen ts i n u n i t r ( l i( l ted ia t h e l a f t column) per con of crude - r t e e l .
/C 13 1975 constant d o l l a r s per ton of crude steel. -
Socrcc?: Computed f r a n Ap~endix Tabla 3.1. L

Appendix 3 Page 5 o f 9
Appendix T a b l e 3.3: ESTIMATED OPERATING COSTS, 1975
Avercge Ml l r New H i l l r Un i t I n p u t U u l * C o r t r & Urrge C o r t r & P r i c e r Rater /b Rater &
I r a Ore ( t o u r ) 22.60 1.20 27.12 1.20 27.12
Coking Coal ( tun r ) 54.19 -56 30.32 .45 24.36
S t e e l Sc rap (tc:$r) 70.78 .20 14.16 .20 14.16
?ktzay ( b a r r e l s ) 11.63 l.U 1 2 . U .90 10.47
Labor ( a m - b u r r ) 10.23 9.00 92.07 6.49 66.40
TOTU Operat ing C o s t s - - -- 186.81 - 149.51
a I n 1973 c o n s t a n t d o l l a r s p e r u n i t ( l i s t e d in t h e l e f t co lwm) of i n p u t s . - /b Inpu t requi rements i n u n i t s (listed in t h e l e f t column) p e r t o n of c rude -
a t c e l .
/ C I n 1975 c o n s t a n t d o l l a r s p e r t o n o f c rude rteel. -
Sourze: Computed £=an Appendix Tab le 3.1.

Appendix 3 Page 6 o f 9
Appendix Tabla 3.4: LSTaUfEO OPERATING COSTS, 1980
A v r r u e nil10 New ni l . l r
Iapu t U W ~ Cortr Uoaae Cortr & Pr ice0 /. bt.0 & b t a r &
I r a Ore (tono) 17.20 1.20 20.U 1.20 20.64
Cok- -1 (toor) 54.14 -56 30.32 e45 24.36
S t e a l Scrap (tau) 70.78 .20 14.16 .20 14.16
herw (burelr) 12.52 1.13 14.15 .90 11.27
Labor ( r m - b u r r ) 10.23 9.00 92.07 6.49 66.40
Others - - 10.00 - 7.00
TOTAL operat ing ~ o r t . - - 181.34 - 143,83
/. 'A 1975 c m r t m t d o l l u s per u n i t ( l i s t e d in the l e f t column) of Inputs.
/b Input r e q u i r m e n t r ia u n i t s ( l i s t e d In t h e l e f t co lmn) per toa of crude - a t ee l .
/C In 1975 c o n r t m t d o l l a r s per ton of crude s t e e l . -
Source: Coaputsl from Appendix Table 3.1.

ndix 3 e - r m
Appendix Tabla 3.5 r ESTIMATED O P W X N C COSTS, 1985
Unit Input Ur aga Cor t r U u g r b e t 8 & P r i c a r /r k t a a & h t e r &
Iron Ora ( t a r ) 20.80 1.17 24.34 1.17 24.34 Cokina Corl ( tonr) 54.14 .54 29.24 -44 23.82 S t r r l Scrap ( tour) 70.78 .19 13.45 .19 13.45 Lnrray (ba r r a l r ) 12.52 1.10 13.77 .88 11.02 Labor (am-hour,) 10.23 8.74 89.41 6.46 66.09 Otharr - - 10.00 - 7.00
TUTAL Operating Coat I - - 180.21 - 145.72
/r I n 1975 constant d o l l a r s per u n i t ( l i s t e d in t h e l e f t c o l w n ) of W t r . /b Input requirements i n u n i t s ( l i a t e d in t h e l e f t co lum) per ton of &a -
s t e e l .
/C I n 1975 constant d o l l a r s per ton of crude r t a e l . -
Source: Computed from Appendix Table 3.1.

Appendix 3 Page 8 of 9
Appendix Table 3.6: WT WTED OPERATING COSTS, 1990
Averrgr H i l l 8 N ~ W ~ i l l 8 Unit Input Uarga Cor t r /c Uarga Corta /c P r i c u /r b t r r /b b t r r &
Iron Ore (ton81 22.60 1.16 26.22 .93 21.02
Coking Coal (ton81 56.14 .54 29.26 -33 23.28
S t e e l Scrap (tons) 70.78 .19 13.65 -16 11.32
Energy (ba r r e l s ) 12.52 1.10 13.77 .88 11.02
Labor (man-hours) 10.23 8.72 89.21 6.98 71.41
Of her8 10.00 8.00
TOTAL Operating Costs -
/a I n 1975 constant d o l l a r 8 pcr u n i t ( l i s t e d i n t he l e f t column) of inputs. - /b Inplrt requirements i n u a i t s ( l i s t e d in t h e l e f t column) per too of crude
steel.
/C In 1975 constant d o l l a r s per ton of crude s t e e l . - *
Source: Coqu t ed from Appendir Table 3.1.

Appendix 3 Page 9 of 9
Appendix Table 3.7: REFERENCE YIELD, 1976 &
U.S. Japan EC -
/a Tonnage of finiehed eteal products (in tonr) produced from one ton of crude mtael.
Source: Computed from the U.S. Council on Wag. and Price Stabi l i ty , op. c i t .
Appendix Table 3.8: ESIIIHATm YIELD, 1970-1990 /a
Average H i l l s
/a Tonnage of f i n i s h e d s t e e l products ( i n tons) produced from - one ton of crude steel.
Source: Computed From Appendix Table 3 . 7 .

Appendix 4 Page 1 o f 3
Abe , A.M., "Dynamic Micro-Economic Models of P roduc t i o n , Inves tment and T e c h n o l o g i c a l Change cf t h e U.S. and J a p a n e s e I r o n a n d S t e e l I n d u s t r i e s , " in C.C. Judge and T. Takayama (eds . ) , S t u d i e s i n Economic P l a n n i n g o v e r Space and Time, Vol. I, Anraterdam: North-Holland P u b l i s h i n g C o q a n y , 1956, pp. 345-367.
Abe. A.H., R.H. Day, J.P. Nelson and W.K. Tabb, "Behaviora l , Subopt imiz ing Models of I n d u s t r k l P roduc t i o n , I nves tmen t and Technology ," fn R. H. Day and A. Cigno (eds.) , Model1 lng Economic Change: The Recurs ive Programming Approach, Amsterdam: North-Holland Pub1 i s h i n g Co., 1978.
BradEord, C.A., " Japanese S t e e l I ndus t ry , " New York: k r r i l l Lynch, 1977.
C o t t l e . X.W., and C.B. D a n t z i g , "Complementary P i v o t Theory of Ha theme t i ca l ~ ; o g r a n r m i n ~ , " i n L i n e a r h l g e b r a - a n d Its ~ p ~ l t c a t i o n s ~ New York: American E l s e n i e r P u b l i s h i n g b., Inc . , 1968 , pp. 103-125.
Day, R.H. , A.M. Abe, W.K. Tabb a n d C.S. Tsao , "Recureive Programming Models o f I n d u s t r i a l Development and T e c h n o l o g i c a l Change ," in A.P. C a r t e r and A. Brady (eds.) ,- C o n t r i b u t i o n s t o 1nput -0utpuc A n a l y s i s , Amsterdam: North-Holland P u b l i s h i n g Co., 1970.
Fab i an , T. , "A L i n e a r Programming Model o f I n t e g r a t e d I r o n and S t e e l P roduc t ion , " Management S c i e n c e , J u l y 1958 , pp. 415-429.
, "Process A n a l y s i s of t h e U.S. I r o n and S t e e l Lndustry," i n Xanne, A.S., and H.H. Uarkowi tz ( eds . ) , S t u d i e s in P r o c e s e Analys i s : Economy-Wide Produc t i o n C a p a b i l i t i e s , Cov le s Foundat ion f o r Research in E c o n m i c s Monograph No. 18, Wiley, New York, 1963.
Higgins , C.I . , "An Econometr ic D e s c r i p t i o n of t h e U.S. I r o n and S t e e l I n d u s t r y , " in L.R. Klein fed . ) . Es says in I n d u s t r i a l Econometr ics , Vol . XI, P h i l a d e l p h i a : Economic Resea rch U n i t , U n i v e r s i t y o f Pennsy lvan i a , 1969.
I n t e r n a t i o n a l Limn and S t e e l I n s t i t u t e , P r o j e c t i o n '85, B r u s s e l s : I n t e r n a t f o e 1 I r o n and S t e e l I n s t i t u t e , 1972.
, " A n k l Repor t o f t h e Sec re t a ry -Gene ra l , Hr. C h a r l e s B. Baker , t o t h e Ele-nth I I S I Annual Conference h e l d i n Rome, I t a l y , October 10-12, 1971," B r u s s e l s : I n t e r n a t i o n a l I r o n and Steel I n s t i t u t e , 1977.
Jo rgensen . D.. "Cap i t a l Theory and Investment ~ e h a v i o r ," American Economic Review, Vol. 3 , May 1963, pp. 247-257. --

Appendix 4 Page 2 of 3
Kendric, D.A. , Programming Investment in the Process Indus t r i es : An Approach t o Sec to r a l Planning, Cambridge, Xass. : The H. I.T. Press , 1967.
Kim, Y.H., The Growth of t he Korean Iron and S t e e l Industry , Seoul: Korea Development I n s t i t u t e , 1976.
S. Kinoshita, "An Econometric Analysis of t he S t e e l Industry of t h e United S t a t e s , 1950-1970," a paper presented a t t h e Third World Congress of the Econometric Society , Toronto, Canada, August 22-26, 1975.
Labys, W.C., Dynamic Commodity Models: Spac i f i c a t i on , Estimation and Simulation, Cambridge, Mass. : Ball ingar Publ ishing Company, 1975.
Ho. Y .W. , and K.L. Wang, "A Quan t i t a t i ve Economlc Analysis and Long-Bun P ro j ec t i ons of the Demand f o r S t e e l H i l l Products," U.S. Department of the I n t a r i o r , Bureau of Hines, Washington. D.C., 1970.
Huel ler , H., and K. Kawahito, S t e a l Industry Economics, A Comparative Analyr i r of S t ruc tu r e , Conduct and Performmca, New York: I n t e rna t i ona l Publ ic Re la t ions Co., Ltd., 1978.
Nelson, J.P. , "An In t e r r eg iona l Recursive Progra-ing Hodel of t he U.S. I r oa and S t e e l Industry ," Ph.D. d i s s e r t a t i o n , Hadieon, Wiac. : University of Wisconsin, 1970.
Neumann, G.R., e t a l , "Investment Behavior in the I ron and S t e e l Industry of t he United S ta tes , " Univers i ty Park, Penn.: I n s t i t u t e f o r Research on Human Resources, The Pennsylvania S t a t e University, 1975, 1976 and 1977.
Putnam, Hayes and B a r t l e t t , Inc . , Economies of I n t e rna t i ona l S t e e l Trade: Pol icy Impl icat ions f o r the United S t a t e s , An Analysis and Forecast f o r American I ron and S t e e l I n s t i t u t e , New York, 1977.
Rowley, ~ h a r l e s K., S t e e l and Publ ic Pol icy, London: H c C r a r U u l Company, 1971.
b
Russell, C.S. , and W. J. Vaughan, "A Linear Programming Hodel of Residuals Management f o r In tegra ted I ron and S t e e l Production," Jouraa l of Environmental Economics of Management, 1 , 19Z4. pp . 17-42.
' 9 Takayama, T. , and G.C. Judge, Spat la1 and ~emporal* p r i c e and Al loca t ion - Models, Aasterdam: North-Holland Publ ishing Zompany, 1971.
s ! Tsao, C.S., and R.H. Day. I1A Process Analysis n o d d of the U.S. S t e e l Industry," Management Science, 17, S e r i e s 8, June 1971, pp. 588-G08.
U r i. N.D., Toward an E f f i c i e n t Al locat ion of E l e c t r i c a l Energy, Lexington, Mass.: D.C. Heath and Co., 1975.

Appendix 4 Page 3 o f 3
U.S., Counc i l on Wage a n d P r i c e S t a b i l i t y , A Repor t t o P r e s i d e n t on P r i c e s and C o s t s in t h e Uni ted S t a t e s S t e e l I n d u s t r y , Washington, D.C., 1977
U.S., E n v i r o m e n t P r o t e c t i o n Agency, "hnaly sis of Economic E f f e c t s o f Envi ronmenta l R e g u l a t i o n s of t h e I n t e g r a t e d I r o n and S t e e l I ndus t ry , " Washington, D.C., 1977.
Varga, e t a l , "A Systems A n a l y s i s Study o f t h e I n t e g r a t e d I r o n a n d S t e e l I n d u s t r y , " Columbus, Ohio: B s t e l l a Memorial I n s t i t u t e , 1969.
Vaughan, W. J., C.S. R u s s e l l and H.C. Cochrane, "Government P o l i c i e s and t h e Adoption of I n n o v a t i o n s i n t h r I n t e g r a t e d I r o n and S t e e l I n d u s t r y , " Washin[tton D.C.: Resources f o r the F u t u r e , I n c .
Watanabe, T., and S. K i n o s h i t a , "An Econometr ic Study of t h e J a p a n e s e S t e e l I ndus t ry , " in L. K l e i n (ed.) , E s s a y s in I n d u s t r i a l Econometr ics , Vol. 111, P h i l a d e l p h i a , Penn. : Economics Research Un i t , U n i v e r s i t y of Pennsy lvan i a , 1969 , pp. 99-162.


COFWENTS ON THE WISE HODEL DEVELOPED BY ti. HASHIMITO
Impact of Linear P r o g r u i n g by P r iva t e beerprimem on Supply rad Demand
1. The u r e of p r o g r d n g mdelm by cospaniem enabler them t o w i t c h rap id ly and r a t i o n a l l y w a g remourcem t h a t can be mubotituted. Eumpler a r e not only fatm and oi ls , bu t almo copper and a l d n u m and, r ecen t l y , plaaticm and w t a l cooponurtm La, f o r e u g l e , bmpars . The l a t t e r trro e q l e s a r e from t h e a u t o m b l l e h d w t q , where two a l t e r n a t i v e produccion line. a r e ava i lab le . The irprct of much r u b s t i t u t i o n s on t h e demand f o r t h e u t e r i a l s involved is obviow.
2. P r o g r a d n g lode18 a r e a l s o used t o o p t i e i z e r a l e s , p a r t i c u l a r l y of those product8 which a r e based on t h e same rau ma te r i a l a s i n t h e petro- chemical industry . C o l p d e s a d j w t t h e i r production procesres t o emphasize thore i t e m t h a t are in t i g h t d a a n d , wi th l e s s a t t e n t i o n t o products t h a t a r e i n abundant sup?ly. The cos t of t h e f i r s t group of products represen ts a premium r a t e , whereas t h e o t h e r products mlght be p r iced s o lw a s t o be dmped. The s u b s t i t u t e s f o r such products a s n a t u r a l rubber versus syn the t i c rubber might t he r e fo r e f i nd t h w e l v e s in a r a t h e r insecure posi t ion. This mituation i m v e q l i k e l y when t h e buyers are a l s o using prograndng w d e l s and procesres t h a t enable them t o s v i t c h amng products smoothly.
Supply Fmc t ions and Curves
3. It s e e m t h a t supply funct ions should be d i s t ingu ished according t o t he type of good. Important f a c t o r s t o spec i fy supply funct ions a r e p r i c e responses t o supply, t h e l e ad times necessary f o r t h e i n s t a l l a t i o n (plant ing) of nev capac i ty , and t be l i f e t i m e of production.
4. In t h e case of m y crops, supply func t ions alone a r e adequate. Rwever , fo r goods l i k e energy, i r o n ore , and s t e e l , and perhaps i n e s t i m t i n g cur ren t supply, supply funct ions complemented by a l i e t ing of p ro j ec t s on s t ream might be more appropria te . The long lead t imes of those projecfe provide a rough idea of supply f o r a period of about 5 t o 1 0 years ahead. ' . - - 5. * On the o t h e r hand, the supply funct ion f o r these types of goods t might he t r e a t ed i n t h e same way a s t h a t used i n t h e cocoa model. Cocoa seems t o have q u i t e a nlmrber of s i m i l a r i t i e s t o some i n d u s t r i a l a c t i v i t i e s , f o r example, energy, i r on o r e and steel: i n s t a l l a t i o n t i m e is about four Years, mrxinnnn peak y i e l d s a r e reached i n about 8-12 years , and the comerc i a1 l i fec ime rms about 40 years. Int roducing t he l i f e t ime p a t h i n t o che supply funcclon might a l s o be very rewarding.

6. It vould be i n t e r e r t i n g t o in t roduce a rupply funct ion fa t h r WISE m d e l of the r t e e l indus t ry v i t h r i a i l a r p r o p e r t i r r mncioned above. I f t h a t ve r e t o be done, soma i n fomn t ion about f u t u r r c o r t r would b r necersary. Thir i r p a r t i c u l a r l y t r u e f o r 10 year r ahead i n t h e indurt ry . For exa~rp le , invertment i n cont inuo~rr cart in^, r. technology a v r i l a b l r r i nce t he beginning of t h e 19700, vould be t h e mafor mmr of expaadin8 capac i ty , improving t h e r a t e of y i e ld and reducing production co r t r . There a r e o t h e r p o s r i b i l i t i e r f o r expanding crudr r t e r l capaci ty wi th r e l a t i v e l y d n o r investment. One example is t h r water-cooled p m r l r f o r e l e c t r i c a r c furnacer.
7. The fu tu r e pos i t i on of t h r e l e c t r i c a r c furnaca may b r rnhurcrd by t h e p o r r i b i l i t y t h a t t h r a v a f l a b i l i t y o f rc rap fn i n d w t r i a l i x e d c o u n t t i e r v i l l grow f a s t e r than t h e d e u n d f o r r teel . 'Ihir vould f o s t e r wr of t he e l e c t r i c arc furnace, an i t h u lwer invsr t rmnt c o r t r a r compared with a f u l l y ln tegra ted r t e e l p lant .
b. I t i r c l e a r t h a t i n v e r t w n t ia cont inuow c a r t i n g c m only t aka place a t e x i s t i n g p l a n t s , uheraar t h e e l e c t r i c a r c furnace 18 f a r r i b l e only i n t h e placer where s c r ap is ava i l8b le .
Demand Functions
9. I n t he period s i nce 1945, goods t h a t a r e unss-produced have changed t h e t r a d i t i o n a l patter?q of consumption, following cutves of t he s a t u r a t i o n type, p a r t i c u l a r l y in i n d u s t r i a l i z e d count r ies . T o t a l consunption now seeme t o be d r i f t i n g m a p from expenditures on mass-produced goods l i k a ca r e , household durable8 and homes and more t w a r d s e rv i ce s and ind iv idua l goo&. Per c a p i t a expendi tures on ms -p roduced goods may now tend t o grow s l w l y on t h e average, al though t ha t p a t t e r n w i l l be d i s tu rbed by replaccmeot cycles. T%is pea- t h a t t h e sha r e of t he se types of expenditure8 i n t o t a l consumption v i l l f a l l and t h a t t h e i r r e l a t i onsh ip v i t h ( ;~T/GDF may be expected t o change s u b s t a n t i a l l y from t h a t obaerved i n t h e past .
10. Another reason why t he r e l a t i onsh ip s observed i n t h e p a t might no longer hold i n t he f u t u r e may be found i n t h e changes i n th'e mde r ly lng s t r u c t u r e . These changes a r e r e l a t e d t o the economy having been overs t re tched f g r some period by exogenous po l ic ies . The f i r s t such po l icy involves t h e exchange r a t e system. Since t h e mid-1960s. -export a c t i v i t i e s , among o the r s , were enhanced by t he p r eva i l i ng system of f ed exchange r a t e s . Inveatuents were s h i f t e d t o a r ea s favored by the exchan P r a t e s . As is well-known, investments provide an important s t imulus , gpd a s a r e s u l t many economies mi&~tt have been overs t re tched during t he peflod from t h e mid-19608 t o about t he mid-1970s. Hovever, the 1973/74 boom a h t have hidden t he end of t he Bret ton Woods system.
11. In those regions s e r i ous ly a f f ec t ed by the new system of exchange r2:es i n e f f e c t s i nce 1974 anti by the de t e r i o r a t i on i n t h e tenns of t rade (as a r e s u l t of the energy p r i c e h ike s ) . the downturn i n investtnent anrl f n r e l a t e d production uns -ushior,td 7 i . gove rnan t expenditures.

12. B j th these d e v e l o ~ n t s - - t h e exchange rate-induced fnvestment f LO.- 1965-1975 and government expendi tures from 1975-1980-have caused GRTICDP t o grow, a t t he same time t h a t t he ~ d e r l y i n g s t r u c t u r e changed subs t an t i a l l y . I n t h e case o f models dea l ing wi th c o a ~ o d i t i e s d i r e c t l y r e l a t ed t o p r iva t e f i n a l consmption, tXP/CDP might once have been an appropr ia te leading ind ica tor ; it is questionable, however, h w long it w i l l be so. I n t h e case of models dea l i ng with intermediate o r more processed i n d u s t r i a l c o m o d i t i e s , d i f f i c u l t i e s r i g h t a l ready have a r i s e n s i n c e 1975. Even i n the case cf i n d u s t r i a l pro;uction, GNP/CDP may no longer b e an appropria te exoftenow var iab le , p a r t i c u l a r l y where investaent-re la ted goo& a r e concerned.
13. An i l l w t r a t i o n of t he changing r e l a t i onsh ip s between demand m d exoganow va r i ab lo s i r fomd i n t he s t e e l industry . The st c o l u m of Chart I shows tha en dog en?^ va r i ab l e8 t h a t a r e explained by the exogenous va r i ab l e s i n t h e s ecmd c o l m . The t h i r d column i l l u s t r a t e s the underlying changes. Only thorough ana lys i r y i e l d s an explanation-though it is only a p a r t i a l one-of t h e ruba tanr ia l divergence between t he endogenom and exogenous var iables . A p a r t i c u l a r f ac to r is the s u b s t a n t i a l improvement i n the r a t e s of y i e ld s i n c e t h e beginning of t h e 19700. Thh means t ha t t h ~ curving unit o f measurement of a metric ton of crude rrteel is changing coneiderably i n terms of f i n a l use.

- - U C C 0 4 U d C C U 1 % ' a*
4 0 'UaLC 0 c-C


COWSTS OS TllE WISE HODEL DEVELOPED BY i. HASHIYOTO
1. Whcn I iljirccd t o bc ir d i s c u w s ; ~ n t of t h e WISE m d c l , I d i d n o t know how d i f f i c u l t t h e j o b w u l d bc. I f onc is n c t I s m i l l o r w i t h l i n e a r complcmcnt- a r i t y p rog raming - - and 1 a m C C ~ C ~ I l n l y noc--the d i f f i c u l t lcs of p c n e t r o t lng t h e H a s h i w t ~ J r B Rrc.lt.
2 . t \ t c h r g r e n t r l s k o f n i ~ u n d c r u t a n d i n g and m i s i n t c r p r c t i n g chc WISE mc*del, I have c r i t d to e x p r e s s t h c b a s i c i d c a v and r c v u l t s i n 3 much more pr im!t ivc and t r i ~ d l t l o n a l f r a a c w r k . I t t s my hope t h a t Mr. Hnsiiimoto w i l l c l c n r u p Lny m i ~ u n d c r s t a n d l n g s . c t c . i n a subsequen t v c r s i o q . S e c t i o n 2 c o n t a i n s my r c f o r n u l a t c d . s i m p l i f i e d s k c l e t o l v e r s i o n of t h c WISE model. S e c t i o n 3 c o m n t s on ~ h c c h o i c e of p i l r n m t e t v a l u e s i n t n c WISE model.
2 . - A S i m p l i f i e d WISE Model
2.1. The Hechanisrn o f WISE
3. Thc f o l l n r l n g reconstruct i o n b u i l d s or. t h c X v e r s i o n of t h e model, w i t h t h e n d d i t i o n a l n s sumpf io r~ c h a t a l l s l a c k v a r i a b l e s _ a r c Z e n . As f a r as I d e c e r ~ i n e from t h e assum?t lons of t h e p a d e l , t h i s res,llt must be gua ran t eed i n t h e A v e r s i o n .
4. 3y e l i m i n a t i n g some v a r i a b l - - ; and e x c l u d i n g r e c u r s i v e l y de t e rmined v a r i a b l e s . tllc 2. node1 m y be compressed i n t o t h e f o l l o w i n g set of e q u a t i o n s :
1
2.1.1. Costs
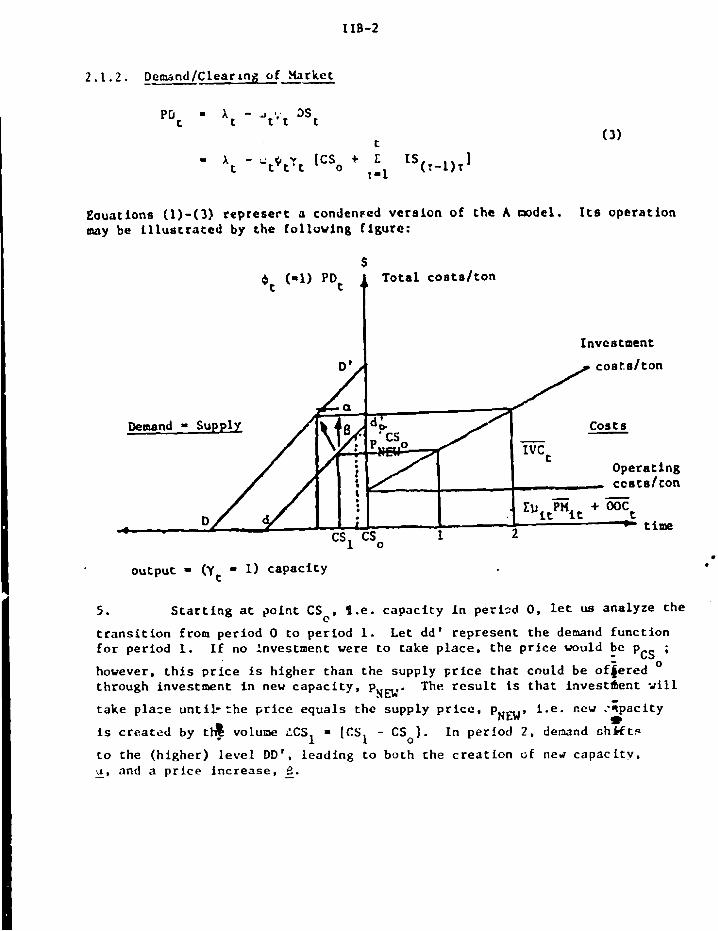
PDt m A t - d t ' t 3St
t - A t - ctltrt [CSo + IS(T- l ) r I 1-1
Eaua t ions (1)-(3) r e p r e s e r t o c o n d e n ~ c d v e r s i o n o f t h e A node l . I t s o p e r a t i o n m y be i l l u s t r a t e d by t h e [allowing f l g u r c :
6, (-1) PDt T o t a l c o e t a / t o n
Invcetment
C o s t s -
o u t p u t = (y, = 1 ) c a p a c i t y
5 . S t a r t i n g a t p o i n t C S c , 1 . . c a p a c i t y i n p e r i d 0 , l e t us a n a l y z e the
t r a n s i t i o n from p e r i o d 0 to p e r i o d 1. L e t d d ' r e p r e s e n t t h e denarid f u n c t i o n f o r p e r i o d 1. I f no tnves tment were t o t a k e p l a c e , t h e p r i c e would be - pcS ; -- however, t h i s p r i c e is h i g h e r t h a n t h e supp ly p r i c e t h a t cou ld b e o f i e r e d ' t h rough inves tmen t i n new c a p a c i t y , pxEk,. The r e s u l t is t h a t i n v e s t k n t rill
. .- - t a k e p l a c e unt i l - :he p r i c e e q u a l s t h e s u p p l y p r i c c , P ~ m ' 1.e. new :*pacity * is c r e a t e d by tt@ volume LCS = [CSl - CSo]. I n p e r i o d 2 , demand r;h)rtt.
1 t o t h e ( h i g h e r ) l e v e l D D ' , l e a d i n g t o b o t h t h e c r e a t i o n cf ned c a p a c i t y , u , and a p r i c e i n c r e a s e , 2. -
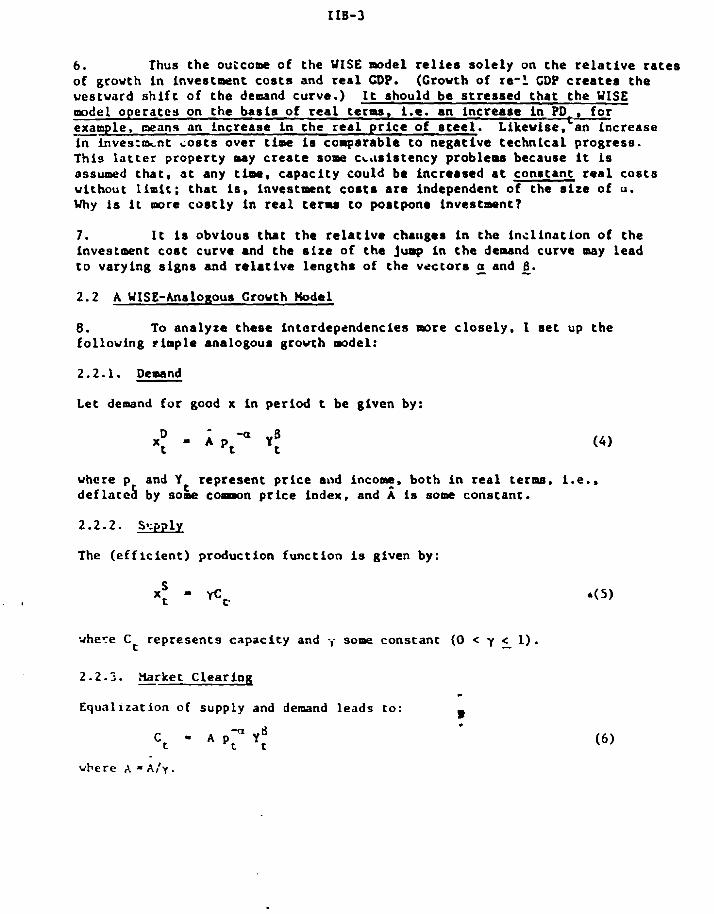
6. Thus the ouccome of the WISE model r e l i e s s o l e l y on the r e l a t i v e r a t e s of growth i n i n v e s t e n t c o s t s and r e a l CDP. (Crovth of r e - l CDP c r e a t e s t he vestvard s h i f t of t he dc-nd curve.) I t should be s t r e s s ed t ha t t h e UISE model opera tes on the b a s i s of real terms. i.e. an increase i n PD- , f o r
t n c r e a s e - i n fnves:rant c o s t s over time is comparable t o negat ive t echn ica l progress. Th is l a t t e r property may c r e a t e some c~ . r s i s tency problepr because i t is assumed t h a t , a t any time, capac i ty could be increared a t constant r e a l c o s t s without l i m i t ; t h a t is, investo~cnt c o s t s a r e independent of the s i z e of u. Why is i t more c o s t l y i n r e a l c e r u t o poatpone investment?
7. I t is obvious tha t t he r e l a t i v e chaages i n the i nc l i na t i on of the investment co s t curve and the s i z e of t h e j w p i n t h e demand curve may lead t o varying s i gns and r e l a t i v e lengtha of t he vec tors 5 and 4.
2 .2 A WISE-Analogous Crovth l b d e l
8. To analyze theee intardependencies more c l o s e l y , I s e t up t he following rimple analogous growth m d e l :
Let demand f o r good x in period t be given by:
where p and Y represent p r i c e and i n c o y , both i n r e a l terms, 1.e.. t d e f l a t e 8 by some co-n p r i c e index. and A is some conetant.
The ( e f f i c i e n t ) production funct ion is given by:
vheye C represen ts capac i ty and - j some constant (0 < y 5 1). t
2.2 -3. - Karket Clear ing - Equalization of supply and demand leads to:
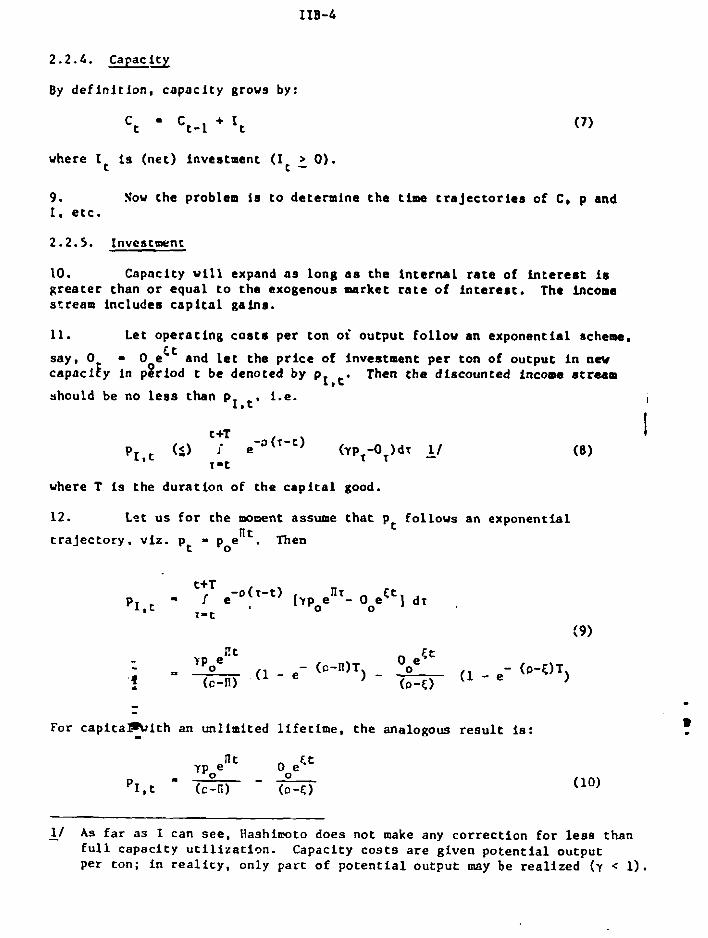
2 . 2 . 6 . Capac i ty
By d e f i n i t i o n , c a p a c i t y grows by:
where I is ( n e t ) investment ( I t 2 0). t
9. %ow t h e problem La t o de t e rmine t h e t ime t r a j e c t o r i e s a € C, p and I , e t c .
10. Cdpacity w i l l expand as l o n g a s t h e i n t e r n a l rate of i n t e r e s t is g r e a t e r than o r e q u a l t o t h e exogenous avrrket r a t e o f i n t a r e a t . The income scream inc ludes c a p i t a l g a i n s .
11. Let o p e r a t i n g c o s t s per t on o i o u t p u t f o l l o w an exponen t i a l scheme,
s a y , 0 - 0 eCt and let t h e p r i c e of inves tment p e r t o n of o u t p u t i n new capaci[y in pXriod t be denoted by pI ,=. Then t h e d i scoun ted income stream
should be no l e s s t han pI 1.e. I
I
where T is t h e d u r a t i o n of t h e c a p i t a l good.
12. Let u s f o r t h e moment assume t h a t p f o l l o w s a n e x p o n e n t i a l t t r a j e c t o r y , v i z . pt - poent. Then
For c a p i t a m i t h an un l imi t ed l i f e t i m e , t h e analogous r e s u l t is: -
11 A s f a r as I can s e e , H a s h i m t o does no t make any c o r r e c t i o n f o r l e s s t han - F u l l c a p a c i t y u t i l i z a t i o n . Capaci ty c o s t s a r e g i v e n p o t e n t i a l o u t p u t per ton; i n r e a l i c y , on ly p a r t o f p o t e n t i a l o u t p u t may be r e a l i z e d ( Y < 1 ) .

This is s o because, given pI it follows n a t u r a l l y t h a t a r i s e i n Il o r a s t '
f a l l i n e i t h e r 4 o r o w i l l l ead t o an Increase i n present value. Therefore ,
if P1.t is given exogenously, t h e investment p a t t e r n r e l i e s on t h e t h r e e
parameters meht LcceC.
13. For s i m p l i c i t y in exposi t i on and wi thout v i o l a t i n g t h e p r i n c i p l e of t h e cwdel, t h e f o l l w i n g assumptions m y be introduced:
T -, -, i .e . unlimited l i f e t i m e
O0 - 0, i . e . no o p e r a t i n g c o s t
- e 1.8. exponen t ia l rrowth i n ( r e a l ) p r i c e of P1*t P1*O capac i ty investments
Yt - ~ ~ m ~ ~ , i .e. exponen t ia l l r o v t h in r e a l income.
Given these amsumptions, (10) degenerates to :
Solviog (11) with r e s p e c t t o pt and i n s e r t i n g i t i n t o the demand equat ion (6 ) a h v e , t h e result ie:
For (2 /C ), i.e. t h e r e l r t i v e r a t e of gravth of capac i ty , t o be constant t t
and p o s i t i v e , t h e ' - ' loving i n e q u a l i t y must be f u l f i l l e d :
It s a y s simply t h a t f o r capac i ty t o grow, t h e composite p o s i t i v e e f f e c t of Income e l a s t i c i t y , 0, and t h e growth r a t e of income, v , must over take t h e negat ive e f f e c t s of p r i c e i a c r e a s e s , a, h n d t e c h n i c a l r egress , 0. For a
ct i golden age s i t u a t i o n , i.e.. where - is _constant and 6 /C
t t P V * t h e modal
Yt - must meet t h e rzquirement:
-Oa + v0 v

For 3 - 1, then 8 - 0. However, such a s i t u a t i o n would mean t h a t a golden r u l e i s incompatible wi th the UISE model, i n vhich 8 > 0 , 1.e. t he assumption o f grovth of r e a l investment cos t s .
3. S t r a t e g i c Ansunptions of t he WISE Hodel
15. As shown above, t h e s t r a t e g i c parameters of t h e WISE model a r e< 0 , a , e, V , 0.
3.1. Rate of Discount, o
16. Even though t he WISE model doas not ope ra t e i n a golden age e i t u a t ion, a value of 16 percent f o r D is excessive. I t should be noted again t h a t t he values , p r i c e s , e t c . i n t he model a r e i n r e a l p r ices . A more reasonable value f o r o would be t h e r a t e of grovth of r e a l CDP, t h a t is, 3 t o 4 percent.
17. Obviously, t h e high o value w u l d lead t o underiavertment and r e a l p r i c e increases i n t he s t e e l sec to r . I n my opinion, t h i s r e s u l t is not valici.
3 . 2 . Pr ice E l a s t i c i t y , a
18. Referr ing t o Appendix 2 of Haahimoto'r paper , where the demand Cunction es t imat ion r e s u l t s a r e presented, i t seems obvioe-s t h a t a l i n e a r demand function misspec i f i es t he mechanism o f t h e s t e e l market. Not only a r e s u b s t a n t i a l d i f f e r ences v i t h r e spec t t o c o e f f i c i e n t s between a r e a s revealed; but t h e Durbin-Watson s t a t i s t i c s a l s o i nd i ca t e a s t r o n g euto- cor re la t ion .
19. I t should be noted t h a t an undereetimation of a , which seems t o be t he case f o r Europe, l e ads t o a r e l a t i v e l y over ly s t r ong pr ice reac t ion (negative) and an overes t ipa ted investment reac t ion .
3 . 3 . The Investment Cost Growth Rate, 8
20. I quest ion whether t he (super-) growth r a t e of s t e e L production c o s t s of more than 3 percent per annum could be subs t an t i a t ed by empi r ica l , technological evidence.
3 . 4 . Growth Rate of Real CDP, v
21. T5e assumptions wi th respec t t o t h e growth r a t e s of r e a l GDP a r e r e f l e c t e d i n Table 5.1. The t o t a l percentagd i nc r ea se per yesr is more than 4 percent f o r a period of 15-20 years on t hehve rage . In my opinion, t h a t r a t e is too o p t i n i s t i c .
3.5. Income E l a s t i c i t y , 6
2 2. The i m p l i c i t 6 of WISE is approximately 0 .6 , vhich s e e m too low . I would have expected a f i gu re i n t he neighborhood of a t l e a s t 1.

4. Conclusion
23. In suray, i n my opinion the d i r e c t r e s u l t s of the WISE w d e l a re not applicable fo r policy recommendations. Howver, I am not able t o indicate what the lrodal solut ions would be i f a l l the parameters were changed in accorduice with the cements given above. I ham omitted colPsrnts on the d e t a i l s i n the paper, because they seem to be out of proportioa with the more fundamaatal issues raised above.


The au thors a r e lndebted t o Hrs. H. Hughes (IBRD), Hr. S. S i n g h (IBRD), Prof. J. Waelbroeck (University of Bruxelles) and Prof. C. Mama (University of Pennrylvanla) f o r t h e i r continued support and advice. They a l s o wirh t o thank t h e i r col leagues who have comented on the f i r a t vers ion of t he oodel, and t h e pa r t i c ipan t s a t t he Aarhua C d i t y )(odela Ser inar fo r t h e i r c a r e fu l review of t he d r a f t of t h i s rev i sed ver r ion of t he rubber model. With p a r t i c u l a r g r a t i t ude they acknowledge the he lp received in bui ld ing t h i s model from several rubber i n d w t r y o f f i c i a l a , and from Charles River Associates , Xnc. T h y take f u l l r e spons ib i l i t y fo r t h e choices made i n accepting o r r e j ec t fng t h e suggert iour t ha t were put forward and f o r the vays i n Jh ich they vare fn ta rpre ted . Al l e r r o r s and omissions remain t h e i r r o l e respons ib i l i ty .

TABLE OF COSTLYTS
Page No . I . STRUCTURE OF THr WORLD RUBBER ECONOMY .................. 111-1
A . N a t u r a l and S y n t h e t i c Rubbcrs .................. 111-1 B . Rubber U t i l i z a t i o n . Trade and P r i c c s ........... 111-8
1 1 . STRUCTURE OF THE WDEL ................................. 111-13
A . Overvicv of t h e Hodel .......................... 111-13 a . Produc t ion Equat ions ........................... 111-15 C . Demand Equations ............................... 111-21 D . Stock and P r i c e Equat ions ...................... 111-29
I I I . VALIDATION OF Tile HODEL. POLICY SIHUUTIOMS AND FORECASTING .......................................... 111-33
A . Val idheion of the Hodel ........................ 111-33 B . P o l i c y - ' imulnt ions and F o r e c a s t i n g ............. 111-38

I. StWCTU13: OF THE WRLO RUBBER ECONOHY
A. N a t u r a l and S y n t h t t l c Rubbers
The Crowth of t h e Rubber I n d u s t r y
1. N a t u r a l r u b b e r began t o e a c r g e as a n L a p o r t a n t raw a a t c r i a l d u r i n g t b e 1 9 t h c e n t u r y , s t i m u l a t e d by t h e L n d u s t r i a l i z a t i o n o f Western Europe. I / Two t e c h n o l o g i c a l i n n o v a t i o n s g r e a t l y facilitated i t s use : a a r a s t l c a t o r z h i c h made L C p o s s i b l e t o s o f t e n , mix and shape s o l i d r u b b e r ; and a v u l c a n i z n t i o n p r o c e s s which d r ~ s t i c a l l y ioproved its p h y s i c a l p r o p e r t i e s .
2. O r i g i n a l l y r ubbe r came from w i l d rubbe r t r e e s i n h r a z i l and A f r i c a . ~ l o u e v e r , p l a n t e r s i n C a s t Asia, r e c o g n i z i n g t h e economic p o t e n t i a l o f n a t u r a l r u b b e r , c l e a r e d huge t r a c t s o f l a n d and p l a n t e d them w i t h t r e e s . T h i s p l a n t s t i o n rubbe r f r m E a s t As l a (Ceylon, H n l a y s i a and t h e Ne the r l ands E a s t I n d i e s ) g r a d u a l l y r e p l a c e d t h a t from B r a z i l and Africa. The c h ~ n g e i n t h e method o f p r o d u c t i o n and t h e advan t ages o f t h e g e o g r a p h i c a l l o c a t i o n of t h e neu a r e a s o f p r o d u c t i o n l e d t o a l a r g e i n c r e a s e i n y i e l d s . S t eady improvements i n p r o d u c t i o n p r ~ c t i c e s and c o n t i n u o u s e f f o r t s t o improve t h e p r o d u c t i v i t y o f t rees s u s t a i n e d t h e upward t r e n d i n y i e l d s , making rubbe r one o f t h e most p r o f i t a b l e estate c r o p s i n t r o p i c a l a g r i c u l t u r e .
3. Xass p r o d u c t i o n of c a r s p rov ided a f u r t h e r boos t t o t h e demand f o r n a t u r a l r ubbe r i n t h e e a r l y 2 0 t h c e n t u r y . The n a t u r a l r ubbe r i n d u s t r y responder ' w i t h a n eno rnous expans ion o f a c r e a g e . Then i n t h e 1920s and 1930s t h e worldwide r e c e s s i o n s h a r p l y reduced c a r p r o d u c t i o n , w i t h a c o r r e s p o n d i n g f a l l i n t h e d e ~ a n d f o r rubber . For t h e f i r s t t i n e t h e r u b b e r i n d u s t r y c o n f r o n t e d g r w i n g s t o c k s and e x c e s s c a p a c i t y . I t e s t a b l i s h e d a scheme t o r e g u l a t e s u p p l y , 2/ which remained i n e f f e c t u n t i l 1943. During t h e s e y e a r s , t h e monopoly p o s i t i o n o f n a t u r a l r ubbe r as t h e o n l y i n d u s t r i a l e l a s t o m e r r e m i n e d v i r t u a l l y uncha l lenged .
4 . T h i s s i t u a t i o n changed a b r u p t l y w h ~ n J a p a n ' s e n t r y i n t o World War I I c u t Uesterr . Europe and t h e Uni ted S t a t e s o f f f rom E a s t Asia, t h e i r n a i n s o u r c e o f n a t u r a l rubber . I n t h e i r s e a r c h f o r a n a l t e r n a t i v e s u p p l y , 31 t h e s e c o u n t r i e s t u r n e d t o t h e i r c h e d c a l i n d u s t r i e s . The U.S. govern&nt l aunched a
- 1
1/ Throughout t h i s pape r where n o t o t h e r v i s e q u a l i f i e d , t h e t e r n s "rubber" - and z e l a s t c a e r " r e f e r t o b o t h n a t u r a l and s y n t h e t i c rubbers .
!e ?/ Th? y n t e r n a t i o n a ~ Rubber R e g u l a t i o n Agreement was i n e s s e n c e a n e x p o r t -
q u o t a scheme, backed up by l i s t t a t i o n s on p l a n t i n g s and r e p l a n t i n g s . ?or a d e t a i l e d a c c o u n t and e v a l u a r l o a of t h i s scheme and i t s o p e r a t i o n s , s e e P.T. Kauer, The Rubber I n d u s t r y : A Study i n (-.ompetition and kionopoiy (Canb r idge , :fassachuset!s: !{award U n i v e r s i t y P r e s s , 1948) . pp. 88-215.
3/ The deve lopnen t o f s y n t h e t i c r u b b e r s goes back t o t h e e a r l y 1330s . - t louever , b e f o r e t:orld War 11 s y n t h e t i c r u b b e r s accounted o n l y f o r 2 p e r c e n t o f t o t a l world rubber consunp t i on .

s u c c e s s f u l c r a s h p rog ran t o deve lop s y n t h e t i c rubber . By t h e end of World War XI, U.S. p r o d u c t i o n o f s y n t h e t i c rubbe r r eached 1 n i l l i o n t o n e a year . BY t h e n , Canadd, Ceraany and t h e USSR had a l s o deve loped a c o n s i d e r a b l e c a p a c i t y t o produce s y n t h e t i c e l a s t o a c r s .
5. A f t e r a b r i e f pe r iod of r e t r e n c h n e n t and r e r t r u c t u r f n g fo l l owing t h e end of Uor ld \ f a r 11, t h e s y n t h e t i c rubbe r i n d u s t r y began co expand aga in . I t r growth l a s t e d u i t t o u t any s e r i o u s f n t c r ; l p t i o n f o r t h e nex t t h r e e decades , s p u r r e d by t e c h n o l o g i c a l i n n o v a t i o n s , econofaicm o f s c a l e and p roduc t d i v e r s t f i c a t i o n .
6. The expans ion of s y n t h e t i c rubbe r o c c u r r e d a t t h e expense of n a t u r a l rubber . Under t h e p r e s s u r e of t h e cheape r s y n t h e t i c e l a s t o m a r s , demand and p r i c e s f o r n a t u r a l rubbe: veakened c o n s i d e r n b l y . P l a n t i n g becaae lese a r t r a c t i v e i n t h e naJoc producing c o u n t r i e s i n r e l a t i o n t o o i l balm hnd o t h e r t r o p i c a l t r e e c r o p s . S u b s t i t u t i o n f ? r n a t u r a l r u b b e r p rog re s sed f a r t on both t e c h n o l o g i c a l and econon ic grounds. On a wor ldv ide b a s i s , t h e market s h d r e o f s y n t h e t i c r u b b e r s Rrev froo l e s s t han 2 5 pe rcoq t i n t h e l a t e 1940s t o abou t 70 p e r c e n t i n t h e e a r l y 1970s. I t h a s s i n c e remained f a i r l y a t a b l e , no l r t ly as a consequence of t h e o i l c r i s i s , which drastically reduced t h e p r i c e c o n p e t t t i v e n e s s o f s y n t h e t i c r u b b e r s v i s - a -v i s n a t u r a l r ubbe r , and t h e development of r a d i a l t i res , o h i c n r e q u l r e more n a t u r a l rubber t h a n t r a d i t t o n a \ t y p e s of t i res . 1 1
The S y n t k e t i c Rubber I n d u s t r y
7. The Un i t ed S t a t e s , J a p a n and t h e European Comuni:y (KC) accoun ted f o r a b o u t 67 p e r c e n t o f v o r l d s y n t h e t i c rubbe r p r o d u c t i o n i n t h e pe r iod 1975.- 7:; t h e USSR and o t h e r European c e n t r a l l y planned economies produced a n o t h e r 28 p e r c e n t o f t h e t o t a l , t h e deve lop ing c o u n t r i e s t h e r e m i n d e r (Tab l e 1 ) . Thuo, p r o d u c t i o n :s c o n c e n t r a t e d i n a f e u c o u n t r i e s . Consumption is d i s t r i b u t e d i n rough ly t h e s a n e way: a b o u t 63 p e r c e n t o f t h e world o u t p u t o f s y n t h e t i c r u b b e r is consumed i n I n d u s t r i a l i z e d c o u n t r i e s , 27 p e r c e n t i n c e n t r a l l y p lanned economies, and t h e rest i n d e v e l o p i n g c o u n t r i e s .
8. N i t h i n e a c h r eg ion , p roducc lon c f s y n t h e t i c r u b b e r s is a l s o h i g h l y c o n c e n t r a t e d i n a few coopanies . I n t h e United S t a t e a , t h e f o u r l a r g e s t s y n t h e t i c yubber producer.; have been a c c o u n t i n g f o r a b o d t 65 p e r c e n t o f t o t a l rout. I n I t a l y , t h e Uni:ed Kingdon, t h e F e d e r z i Repub l i c o f Germany, Be lg iun , the Ne the r l ands and Canada, t h e l a r g e s t f i m s account f o r 50 pe rcen t o t n o r e o f t o t a l c a p a c i t y . The s i t u a t i o _ n is q u i t e s i n i l a r i n deve lop ing c o u n t r i e s . The miit reason f o r p h i s cocZ len t r a t i o r~ is t h a t t h e minimum econon ic s i z e o f a s y n t h e t i c rubbe r is l a r g e conpared t o t h e domes t ic c e e d s of n o s t c o u n t r i e s . - - *
I
1/ T h i r t y - n i n e pe rcenc of t h e t o t a l rubber used i n r a d i a l phssenEer c a r and - Light tr-.~ck. t i r e s , a s opposed to 15-16 p e r c e n t i n b i a s t i r e s ; 75 p e r c e n t i n r a d i a l t r u c k t i r e s , a s ooposed t o 37-$0 p e r c e n t i n b i a s t i r e s and 92-33 p e r c e n t i n r a d i a l o f f t h e road v e h i c l e t i r e s , a s opposed t o 80-85 p e r c e n t i n b i a s t i r e s . These percent . iges app ly to t h e iJ.S. market .

9 . Backward and fo rva rd i n t e g r a t i o n is a n o t h e r importan- s t r u c t ~ * . d l c h a r a c t e r i s t i c o f t h c s y n t h e t i c r u b b e t i n d u s t r y . The dependence o f t i r e manufac tu re r s on s y n t h e t i c rubbe r s encourag-rl 5ackvard Ln tea ra t ion , whi le t h e s i m i l a r i t y 'between t h e t e c h n i c a l p rocess f o l s y n t h e r i c rubber product ion ~ n d t h o s e f o r pe t rochemical p r c l u c t Ion y to- t tded l n c e n t i v e s f o r folward i n t e g r o t t o n . T i r e amrufac tu re r s and producers of pe t rochemicals t h u s domlnntc t h e s y n t h e t i c rubbe r I n d u s t r y i n laark t t economies; t h e pctrocherai,aL fnr 'ustry c o n t r o l s s l i g h t l y more t h a n 5 P v r c e n t of t h c e x i s t i n g p r o d * ~ c t i o n capacit, . f o ~
Table 1: U O U D SYSTIIETIC R U R B E R PPOWCTION
1955 -57 Avo r age 1375-77 k ~ e r n g c t. o f Uorld Z of L'orld
'000 m.c. T o t a l '000 n.t. T o t a l
INDUSTRIALIZED COUNTRIES
North Amtrica 1,193 (72.3) 2,521 (32.3) Japan - (-1 901 (11.6) Western Europe 12 ( 0.7) 1,766 (22.6) O the r Indus t rlh; 'zed - /a - ( -1 72 1 - 0)
-- - S u b t o t a l 1,295 (73.0) 2,260 'm
DEVELOPING C3UNTRIES
L a t i n Aa;erica - /c
CEIJTRALLY PLANNED ECONOHIES
USSR 374 (22.7) 1,700 (21.9: EJS t e r n Europe 7 1 ( 4.3) 4 50 ( 5.8) Ch:na, Peap le ' s Rep, of - (-; 59 ( 0.6;
' r n F -- S u b t o t a l 44 5 2,200 .2)
UORLD TOTAL
/a Ausr ra l i a . New Zealand and South h r i c a . - / b I n c l u d e s t h e Hiddle East. - / c Inc lndes I fex ico and C e n t r a l America. - Source: I n t e r n a t i o n a l R u b k c Study C r ~ u p , S t a t i s : i c a l B u l l e t i n , va r ious --
l c sues .

ry. . :het ic e l a s t o = r s , an2 the t :re ~ d n u f a c t u r l n g l n d u s t r y approximate ly 40 percen t . The r e z a l n d e r ? I !z t!:a ha: i s o f va r lou r o t h e r l n d u s t r l a l copcernr .
10. % a [ of t h e c o r p r n l e s !rr *:ih :he producrton of synthetic cubber I s ~ o ~ r c e n t r a t e d a r e t r i r n s n a t l o ~ l c o r p o r r ; i r x s . -1s applies t o 00th t l r e and p e t r o c h e n l c a l f l m pro&cing * y t h e : l e rubber. m e I n f l u e n c e of t h e s e r r a n s n a t l o n a l corporarlo=m on t h e ur ' l a a r l c c l o r elamtoncrm 1s d l f f l c u l t t o a s s e s s ? r e c i s e l y . The s : ruc ture o f cne s r l d r ra rke t , ar i t exlmtm today, 1s c l e a r l y o l i q ? p l i s t i c and c h l r a c ~ e r l z r d by only a l l a i t a d amount of p r i c e c w p c r l t l o n =on8 the l a r f c ?roOucarc. t ' a r l l nov, they have rhovn l i t t l e i n t e r e s t l t r c r t a b l l q h l n g s p t h e t i c r & b - p l a n t s i n dava lop lna c o u r ~ t r i e r . 11
11. '5hc r y n t h a c l c rubber industry producer o u l d e v r , r l e t y of r l a s t o m e t s . Ssv tn w l n typer-S3R, EmfEPDH, IR, BR, C R , I I R and NBR 21-- d m l n a t e t h e aar ie t i n t e n n of ronnrge, a c c o u n t l n ~ f o r a b o u t 98 perce'i;t of a 1 1 mynthet lc rubber8 produced c ru t r l t e t k a c e n t r a l l y planned economles (Table 2 ) .
12. n c r e a r e s e v e r a l r r y s t o c l r r s i f y r y n t h e t l c rubber : . One of t h e =st :.>anon, -h i ch has a l so a 4 v a n t a p of conveying a d l r e c t , i f l raper fec t , n o t l o n nq t k t ~re:s of c q e t l t i w k t u e n t h e v a r i o u s t y p e s of rubbe r s , d i v l d e s :hen In "genera l p u r p r e " and " spec le l ty" . SRR, BR and IR a r e c l a s s l f l e d a s g e n e r a l yurpomc; m./EPCt!, CR, SBR and I IR, t o g e t h e r u l t h t h e a n y t y p e s included 1n "o the r syn the t i c " , a r e c l a s s l f led a s s p e c l a l t v . Fach type of s y n t h e t l c r u b h r h a s c h a r a c t e r l s t l c technc~10,lcal and economlc advan tages and d i s a d v a n t a g e s r h l c h dete+nfne I t s u s e s . These are de f ined i n c m p a r l s o n 4 t h n a t u r a l rubber, uhlcb 19 s t 1 1 1 t h e p011-t cf r e fe rence f o r m n a a d e e l a s t o m e r r . ihe a p n u l e c c u r l q a d pcr for=nce r e q u i r e ~ e n t s of t h e p roduc t s m d e o u t of rubbe r a l l o r 2 i f f c r e n t d e ~ r c e s of s u a s t l t u t a b l l i t y b e t w e n d i f f e r e n t type= of rubber i n p t s , Even though g e n e r a l l z a t l o n s In t h i s f i e l d a r e o f t e n n i s l e a d l n q , I t can prabably be s a i d t h a t t h e l a r g e s t p s s l b i l i t i e s for substf c u t ion exist k t u e n n a t u r a l and g e n e r a l purpose
B - - I / I t can 5t. a r m l e d , h o r e v e r , t h a t :'e cur-.encly a ~ . i l l a b l e p r o d ~ i c t l o n -
tcchno1oe:;- p .~rtfcrr :a- lv f o r ::'re -eLyr t y p e s o f s y n t h e t i c rubber--tends t o f a v o r L.trrcb c x i s t i n ~ 3 r o d u c e r s a:! t h . 3 ~ technics 1 and economic f a c t o r s p l a c e a 11-1: 0.. t h e n lpb r qf s ~ t h e t i c r ( l t h , - r p1.ints t h a t can be t s t a b ! i shet i i n .tn7: s i ~ e l ~ - - ~ r ; r b t .
2,' .Styrt.r.:-Su~.tdtene r ~ x 5 ~ r ( S ? y \ , -:by! - . lcb-, ,rny.: , lene ruhbcr (EP!.f/EPD!'), - m l y i s o p r c n e r 1 1 5 b r (1%). ;*I 'I -tn~raAte?.i rusher ( R R ) , po lychloroprene r r ~ h h e r ( C ? ) , hilt y l n15ber ( I 1?) a-.d n i c r i Le r u h h c r (SRR) .

s y n t h e t i c r c ~ b b e r s (SBR, BR, and IR). I / IR i s t h e c l o r e a t a p t h e t i c s p p r o x i m t i o n of t h e na tu : a l e l a a t o m ~ , yet 1 t 1m no t r p e r f e c t a u b s t l t u t e on t e c h n o l o g l c a l grounds.
Tabla 2 : WRU) RUBBER PmDOCfIOn BY ruIn n p e /r
'000 m.r. ~ ~ r h r t i c Rubber t o t a l Rubber
SIR (mty tene -bu t rd l r ae rubbe r ) 3,327 (58.3) (38.3) BR ( p c l y h r a d l e ~ w rubber) 896 (15.7) (10.3) IR (polylmoprene rubber) 2W ( 3.6) ( 2.4) EPn/EPM (e thy lene -p ropy lene rubber) 290 ( 5*1) ( 3.3) CR ( r , l ych lo roprene rubbe r ) 322 ( 5*6) ( 3-71 IIR ( b u t y l rubber) 388 ( 6*8) ( 4-61 NBR ( n l t r i l e rubber) 190 ( 3.3) ( 2 . 2 1
Other Synthetic Rubbarr 9 1 ( 1*6) ( 1.1)
T o t a l Synthetic Rubbers w cmm (as.t)
Natu ra l Rubber 2,984 ( w -3)
TOTAL rtUir BER 8,690 f 1M.O) - .- - - / a Excluding t h e c e n t r a l l y plamwd e c o a o l i o . -
- Source: I n t e r n a t i o n a l ; . t s t i t u t e of S y n t h e t i c Rubber Producers (IISRP).
, The N a t u r a l Rubber InC * t r y
13. The p roduc t ion o f a a t u r a l rubber is a l s o c o n c e n t r a t e d i n a 8-11 n m b e r o f c o u n t r i e s . The t h r e e major Asian producers-Ualaysia, Indones ia and Rai land-accounted f o r abou t 80 per:ent o f w r l d p roduc t ion i n 1975-77. S r i
' a .L
1/ A more d e t a i l e d a n a l y s i s of t h e t e c h n i c a l and economic c h a r a c t e r i s t i c s of - t h e v a r i o u s types of s y n t h e t i c rubber from t h e s t a n d p o i n t of s u b s t i t u t - a b i l i t y can be found i n E. C r i l l i , B. Agos t in i and H. ' t Hooft \ le lvaars , The World Rubber Economy: S t r u c t u r e , Changes and P r o s p e c t s (Balt imore: The Johns Hopkins U n i v e r s i t y P r e s s , 1980), pp. 24-36 and 135-166. A v e r y l u c i d a n a l y s i s of t h e p rocess of choos ing between r ~ b b e r i n p u t s can h? found i n P.W. Al l en , P ~ O . Thoaas and B . C T Sekhar, The ~ e c h n o - ~ c o n o m i c P o t e n t l a l o f N R i n Kajor End-Uses (Kuala Lumpur: W B , 19731, pp. 17-23. -

Lanka, I n d i a and two A f r i c a n p r o d u c e r s , L i b e r i a a n d N i g e r i a , t o g c t h e r a c c o u n t e d f o r a n o t h e r 1 2 p e r c e n t ( T a b l e 3).
T a b l e 3: VORU) NATURAL RUBBER PROWCTION
1955-57 Average 1975-77 Average f o f World t o f U o r l d
'000 O.C. T o t a l '000 r.t. T o t a l
As la % l a y s La I n d o n e r la T h a i l a n d S r i t a n k a I n d i a O t h e r A s i a
A€ rica L i b e r i a N i g e r i a ?&ire O t h e r A f r i c a
L a t i n A a e r i c a B r a z i l O t h e r L a t i n Aaerica
S u b t o t a l
I
C h i n a , P e o p l e ' s Rep. o f Vietnam Canbodia
S u b t o t a l
WRI ' TOTAL
S o u r c e s : I n t e r n a t i o n a l Rubber S tudy C r c u p , S t a t i s t i c a l B u l l e t i n , v a r i o u s - i s s u e s ; FAO, P r o d u c t i o n Yearbook , v a r i o u s i s s u e s .

14. Natural rubber is now mostly produced by saal lholders . - 11 Although the bulk of naturai rubber t r a d l t l o ~ l l y had come froa e s t a t e s , saal lholders soon found i t an a t t r a c t l v e crop anu expanded the l r involvement in producclon. In recent years, saallholdlngs have made up the l a r ~ e s c share of thw area under rubber in the M Jor produclng count r l e s in Asia: over 95 percent i n Thalland, about 8 0 percent i n Indonesia, 6 8 percent In Kqlaysla and 54 percent In S r l Lanka. 3 In there four countries, baallholdlngs accounted for about 8 0 percent of t o t a l area under rubber durlng the l a t e 1970s. h a l l h o l d l n g s have a l s o donlnated rubber productlon in Indla and Nlgerla. Halther sml lhold lngs nor es ta te8 have a clearcut econoalc o r technical advantage i n t e r u of produrrlon; each har d l r t l n c t a t t r i b u t e # and 10 capable of produclng rubber econorically. 31 The rapid growth of the r u l l h o l d e r rec tor i n -st natural r a b k r p r G c l n l t coun t r l t r har been auch helped by government po1:cles aimed a t t a k i n ~ advantage of the toploysant that 10 created by natural ~ . ; h k r production.
15. Sost mbber e r t a t t s e r e o r l g l ~ l l y omed by European ? o ~ p a n l e r , but a re now i n the hands of na t lonr l coap.nles o r governeent au thor i t le r . In 1978, European eonpan:-s controlled only about 12 percent of the w r l d ' r productlon of natural rubber, Another 4 o r 5 percent is in the hands of emjor U.S. t l r e manufacturers. Vhlle t l r e ~ r n u f a c t u r e r s there end in Western Europe have ma ln ta l~~ed a s lzable ' c t e rc s t in natural rubber productlon, the l r back-rd lntegrat lon in to s p t h e t l c rubber productlon has l l a i t e d the l r role.
16. Natural rubber 1s a f a i r l y hoeogeneous product. Because i t s qua l i ty and perfomance cha rac te r i s t i c s a re so ell-known, i t cons t i t u t e s the standard reference for a l l other elastomers. Tradi t ional ly, i t has been traded in so l ld form-in sheets and crepes-\rhore qual i ty rars v isua l ly evaluated. There a re s i x standard grades of rlbbed m k e d sheets ( f r o a RSS 1 t o RSS 6) and an equal nmber of crepes. RSS 1, the h l ~ h e s t ~ r a d e of na tura l rubber, i s s In the past a l s o the m s t videly traded. I t s r e l a t lve loportance in recent years
11 Natural rubber is produced by e l l over one a i l l l o n smallholders and - several thousand large es ta tes . In contrast , uorld productlon of synthe t ic rubber is controlled by approximately 100 f i ims h i c h operate about 300 plants. The d i f f e ren t i a t ion betueen e s t a t e s and enallholders is based on an a r b i t r a r y cutoff point-holdings of over 4 0 hectares a r e usually coy ide red e s t a t e s ; a typical rubber smallholding rarely exceeds 5 hectares. .*
*
2 1 These p e r c e t a g e s e r e derived froa estimates of t o t a l area under rubber - i n 1978. w i n g the same year, production s t a t i s t i c s - h i c h are more r e l i ab le than area statisticq-shoved that saa l lholders accounted for 58 percent of t o t a l production in Pest Halaysia, 70 percent In Indonesia and about 95 percent In Thailand. It. these three countr ies taken together, s ~ l l h o l d e r s accounted for about 65 percen: of t o t a l production of rubber In 1978.
I/' P . M . Allen, Natural Rubber and the Synthetics (London: Crosby Lockmod, - 1972). p . 7 4 .

h a s d t n i n i s h e d , p a r t i c u l a r l y v i s - a -v i r t h e RSS 3 g r a d e , which 1 s t h e s t a n d a r d t y p e ~ l s e d i n t i r e u n u f a c t u r l n g .
17. A new form of rubbar--. b l o c k of t h e n a t u r a l e l a s t o e e r , h o s e q u a l i t y is r i g o r o u s l y d e t e r d ~ d and c o n t r o l l e d - k g a n t o be t r a d e d abou t 10 yearn ago. T e c h n l c r l t y s p e c i f i e d rubbe r h a s progressively Rained t n l a p o r t a n c e . By 1978, i t accoun t ed f o r abou t 35 p e r c e n t o f t h e t o t a l n a t u r a l r ubbe r s u p p l y , S o l i d r ubbe r , i n t h e f o m of s h e e t s , c r e p e s and b l o c k s , r t r o n ~ l y dominates n a t u r a l r ubbe r production and t r a d e . Only abou t 8 p e r c e n t o f n a t u r a l r ubbe r o u t p u t 1 s t r a d e d i n l l q u l d f o m a s l a t e x .
18. Un l ika s y n t h e t i c r u b b e r s d i c h a r e privately t r a d e d , n a t u r a l r ubbe r 1s bought and s o l d open ly and f r e e l y ( ,pot and fo rwa rd ) i n s e v e r a l o r i g l n a l and t e r d n a l urkets. me s o a t impor tan t ones i n t h e producing c o u n t r i e s a r e Kuala Llmpur, Singapore and C o l m b a ; W.u York and London a r e by f a r t h e most dominant i n c o n s u i n 6 c o u n t r l e s . 1
8 . Rubber U t l l l u t l o n , T rade and P r i c e s
19 . Rubber u t i l i u t l o n has k c o o r s t r l c t l y t i e d t o a o t a r v e h l c l e p r o d u c t i o n and use. Consequent l y , oos: r u b k c is c o n s w e d i n l n d u s t r i a l l z t d c o u n t r l e s . D a s p l t e t h e c a a r g e n c t o f c e n t r a l l y p l anned e c o n o a l e s as l a r g e u s e r s o f e l a s t o w r s la t h e post-Uorld U l r I 1 p e r i o d , : n d u s t r l a l i z e d c o u n t r i e s s t i l l accoun t f o r o v e r 60 p e r c e n t o f w r l d e l a s t o m e r c o n s m p t i o n . r a n t r a l l y planned e c o n o d e s u s e a n o t h e r 27 p e r c e n t , hilt t h e r e m i n d e r is used i n deve lop ing c o u n t r l e s (Tab l e 4) .
20. Wi th in t h e l a h u s t r l a l l z e d countries s l n - - rrorld t a r 11, t h e u s e of r ubbe r h a s I n c r e a s e d f a s t e r i n J a p ~ n and Westerr. f:~r 3pe t tan i n Nor th h r l c a , 1/ c l o s e l y r e f l e c t i n g t h e d i f f e r e n c e s rn t h e growth of t h e au tomob i l e i n d u s t r i e s i n t h e s e r e g i o n s . North A m ~ r l c a had a l r e a d y ach i eved r h i g h l e v e l o f m o t o r i z a t i o n , h e n J a p a n and W e s t e n Europe sere s t i l l i n t h e e a r l y s t a g e s o f t h i s p r o c e s s . 21 Wi th in t h e c e n t r a l l y planned economies, r ubbe r u t i l i z a t i o n i n c r e a s e d f a s t e r i n E a s t e r n Euroyz t h a n i n t h e USSR, a l t h o u g h t h i s t r e n d s eeLo t o have r e v e r s e d i t s e l f I n r e cenc y e a r s , f o l l o v l n g t h e d e c l s l o n of t h e O S : A t o i n c r e a s e au tomob i l e proC.l,ction f o r p r i v a t e use. ~ o e a l r ubbe r cons l rnp t ion a l s o i n c r e a s e d r a p i d l y i n t h e People ' s Republ ic o f China d u r i n g t h e 1950s and t h e 1960s. N e v e r t h e l e s s , d a t a show t h a t China ' s p e r c a p i t a r u b b e r use is s t i l l much l o r r t h a n I n o t h e r c e n t r a l l y p lanned economies. Automotive and i n d u s t r i a l :uses o f r u b b e r t h e r e a r e s t r i c t l y
I I - I
1 1 Throughout t h i s a r t i c l e , t h e t e r n "North America" r e f e r s t o t h e 1I.S. and I -
Canada o n l y . 1
2 / In 1950, f o r example, t h e n m b e r o f c a r s pe r 1,nOn i n h a b i t a n t s was 265 !q - t h e U.S., 139 i n Canada, 21 i n \!eqtern Eurorc., and A i n Japan . By 1972, t h e n m k r , -!rs p e r l,O0r1 i n h a b i t a n t s bad grown t o 481.2 i n t h e [ J . S . and 3 5 5 i n Canada ( an a v e r a g e r a t e o f 2.6 and 4 . 3 pe rcen t pe r y e a r r e s p e c t i v e l y ) , and t o 216 i n Western Europe and 1 % i n Japan !an ave rage annua l r a t e o f 10.7 and 2 3 . 5 p e r c e n t p e r y e a r r e s p e c t i v e l y ) .
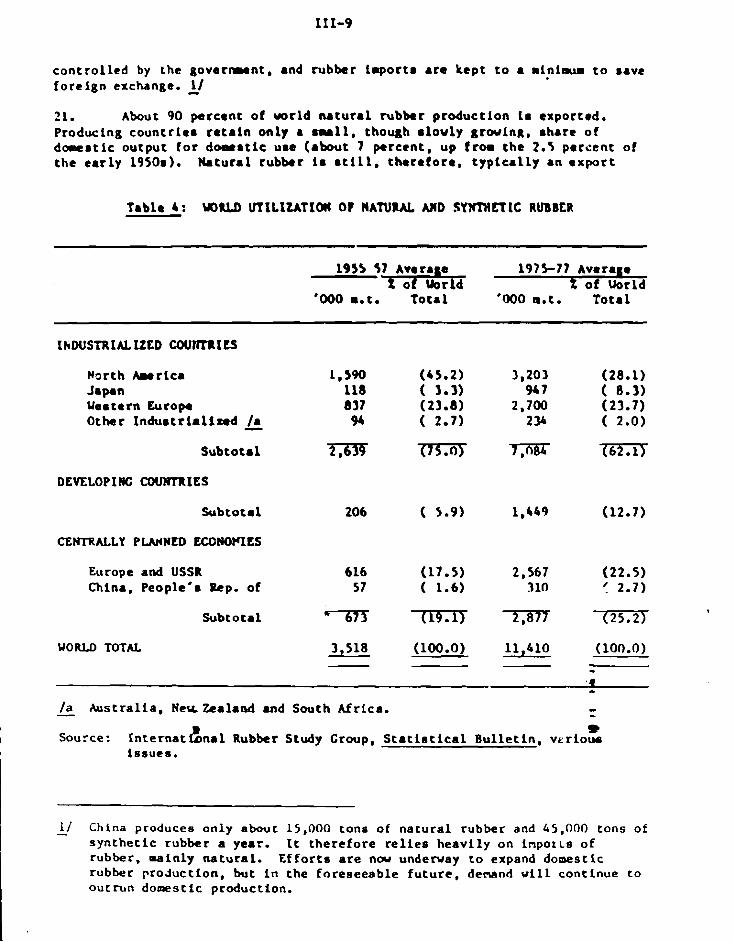
c o n t r o l l e d by t h e g o v a t r u n t , and rubber lmpor t r a r e k e p t t o a r i n i a u t o rave f o r e i g n exchange. 11
21. About 90 p e r c e n t of w r l d n a t u r a l m b k r production lr expor ted . Producing c o u n t r i a r r e t a i n on ly a mll, though r l o u l y g r w l n ~ , r h a r e o f d a v r t i c o u t p u t f o r d m r t l c u r e ( abou t 7 pe rcen t , up from t h e 2.5 pa rcen t of t h e e a r l y 1950a). N a t u r a l r u b k r i r r t l l l , t h e r a t o r e , t y p i c a l l y a n e x p o r t
Tabla b: V O U D UTXLXUTXOII OF NATURAL AMD SrWMCTIC RUBBER
19))-77 Averass X o f M r l d
'000 m e t . T o t a l '000 a.t. T o t a l
North h e r l c a 1,590 (45.2) 3,203 (28.1) Japan LA8 ( 3.3) 917 ( 8 - 3 1 U e r t a r n Europa 837 (23.81 2,700 (23.7) Other I n d u r t r i a l i d /. 94 ( 2.7) 2% ( 2.0)
S u b t o t a l 206 ( 5.9) 1,449 (12.7)
CENTRALLY PLMNeD ECOIIOFXES
Europe and USSR 616 (17.5) 2,567 (22.5) China, People ' r Rep. of 5 7 ( 1.6) 3 10 ! 2.7)
S u b t o t a l m TnY r,8n (25.2J
I /a A u s t r a l i a , Neu Zca la rd and South Afr ica . - I s I h u r c e : I n t e r n a t & n a l Rubber Study Croup, S t a t i s t leal B u l l e t i n , vr r l o u
I i s s u e s *
1/ China produces o n l y about 15,000 t o n s of n a t u r a l rubber and 45,000 tons of - s y n t h e t i c rubber a year . I t t h e r e f o r e r e l i e s h e a v i l y on inpotLs o f rubber , mainly n a t u r a l . E f f o r t s are n w underway t o expand domestic rubber p roduc t ion , but i n t h e f o r e s e e a b l e f u t u r e , denand w i l l con t inue t o o u t r u n domest ic production.

c o m d i t v . The s i ' , u a t i o n is a l n o s t t h e o p ~ o s i t e i n t h e c a r e o f s y n t h e t i c r ubbe r : o n l y 25 p e r c e n t o f w r l d p r o d u c t i c n i r e x p o r t e d ; i n c r a - t r a d e among i n d u s t r i a l i z e d c o u n t r i e r accrlunted f o r rrost o f t h a t . I n d u r t r i a l i t e d c o u n t r l e r a r e n e t e x p o r t e r s , w h i l e c e n t r a l l y planned e c o n o n i e r a r e l a r g e l y r e l f - ~ u f f f c i e n t i n s y n t h e t i c r ubbe r s . Developing c o u n t r l e r a r e net i n p o r t e r r .
22. The ~ r k e t f o r n a t u r a l r ubbe r i r h i g h l y c o a p e t i t l v e , and p r i c e s r e f l e c t even small change r i n t h e b a l a n c e o f r u p p l y and demand. S i n c e t h e deaand f o r n a t u r a l r u b b e r , a 8 r r c l l a 8 i t 8 r u p p l y , a r e q u i t e i n r e n r i t i v e t o p r i c e changer i n t h e s h o r t tern, w t u r a l r ubbe r p r l c e r f l u c t u a t e w ide ly whenever ch -nge r i n e c o n o r l c a c t i v i t y i nduce r h l f t r i n demand. 11 I n t h e o l i g o p o l i s t i c a s r k e t f o r r y n t h e t i c r u b b e r s , on t h e c o n t r a r y , prTcer a r e v e r y r t a b l e i n t h e r h o r t run. T h i s p r i c e r t a b i l i t y i r b e l i e v e d t o be a n a d d i t l o n r l f a c t o r t h a t h a r h e l p e d t h e market p o r i t l o n o f r y n t h e t i c r ubbe r r . The p r i c e r f o r n a t u r a l r u b b e r a n d SIR, t h e u J o r r y n t h e t i c r u b b e r , 2-1 a r e rhovn i n Chart 1.
2 3. Four Y J o r p r i c e peaks c a n be c l e a r l y i d e n t i f i e d i n t h e p r i c e r e r l e r f o r n a t u r a l r ubbe r . N a t u r a l r ubbe r p r i c e r r o s e r u b r t a n t i a l l y above t h e t r e n d i n t h e y e a r s 1950-51, 1955, 1959-60 and 1973-74. The peakr i n 1950-51 and 1973-74 c a n l a r g e l y be a t t r i b u t e d t o exogenour f a c t o r r : t h e Korean War and t h e o i l cr l r is . 21 The peakr i n 1955 and 1959-60, o n t h e o t h e r hand, r e f l e c t unexpec ted i n c r e a r e r i n dearnd: u o r l d a o t o r v e h i c l e p r o d u c t i o n i n c r e a s e d by 34 p e r c e n t i n 1955, by 22 p e r c e n t i n 1959 and by a n o t h e r 18 p e r c e n t i n 1960. The p r i c e t r e n d f o r SBR r h w r a r t e a d y d e c l i n e , w i t h t h e o n l y b r u k coming i n 1973-74, when t h e o i l c r l r i r d r a r t i c a l l y i n c r e a s e d t h e c o r t r o f t h e chemica l monoPers used t o produce r y n t h e t i c rubber . P r i c e s have r i n c e r i s e n mode ra t e ly , f o l l o v i n g t h e pace s e t by i npu t c o s t s .
24. Apart f rom t h e c y c l i c a l novementr i n r u b b e r p r i c e s , Char t 1 w e l l i l l u s t r a t e s t h e t r e n d s f o r bo th n a t u r a l r u b b e r and SBR. As r y n t h e t i c r u b b e r r becane i n c r e a s i n g l y impor t an t i n t h e w r l d n a r k e t s , t h e i r p r i c e s began to set t h e o v e r a l l p r i c e t r e n d , and n a t u r a l r ubbe r p r o d u c e r s became, t o a l a r g e e x t e n t , p r i c e - t a k e r s . Economies o f s c a l e and t e c h n i c a l i n n o v a t i o n s i n s y n t h e t i c r ubbe r p r o d u c t i o n reduced t h e c o s t s and p r i c e s o f t h e s e r u b b e r s ,
11 Betveen 1955 ~ n d 1978, t h e a v e r a g e p e r c e n t a g e d e v i a t i o n from t h e 3 and 5- - y e a r m v i n g a v e r a g e s was 8.2 and 12.8 p e r c e n t r e s p e c t i v e l y . -
21 The s t r u c t u r e o f t h e s y n t h e t i c r ubbe r i n d u s b y is s u c h t h a t p r i c e s c an be - e a s i l y d i f f e r e n t i a t e d b e t w e n w r k e t s - - b o t h ' r e g i o n a l l y and u s e - s p e c i f i c . For t h i s r e a s o n , i t is a lmos t im poss ib l e t o r e c o n s t r u c t a "world p r i c e , " even f o r a s p e c i f i c t y p e of s y n t h e t i c r ubbe r . For SBR, h w e v e r , t h e long- run t r e n d i n wor ld p r i c e s is approximated r e a s o n a b l y w e l l by t h e t r e n d i n U.S. e x p o r t u n i t v a l u e s .
31 Inpo r t denand f o r n a t u r a l r ubbe r was ve ry s t r o n g i n 1973 a s a consequence - of n b o o m i n i n d u s t r i a l p r o d u c t i o n which t o o k p l a c e a l n o s t s i m u l t a n e o u s l y i n a l l t h e i n d u s t r i a l i z e d c o u n t r i e s .


thereby deprerring na tura l r u b k r pr icer . 11 The o i l c r i r i r of 1971-74 and the ruboequent quadrupling of crude o i l prTcer oubr tan t ia l ly af fected both the rhort- and long-run coot eurvrr of the na tura l and o p t h e t i c r u b k r fndur t r i e r , and the in terac t ion k t - e n the price. of na tura l and oynthotic r u b k r r hao now rh i f t ed t o a d i f f e r e c t and hisher trend level. 21
11 The ava i l a b l c e v i d e n c e c o n c e r n i n g induat r l a l i z e d c o u n t r i e s seem t o - i n d i c a t e t h a ~ s y n t h e t i c r u b b e r p r i c e s a r e d e t e r m i n e d a c c o r d i n g t o a c o s t - p l u s t y p e o f model. The mark-up a p p e a r s t t j b e r e l a t e d t o demand c o n d i t i o n s .
21 For a d e t a i l e d a n a l y s i s of t h e c h a n g e s i n p r o d u c t i o n c o s t s induced by t h e - o i l c r i s i s , s e e : C r i l l i , A g o s t i n i and l l e l v a a r s , op . c i t . , pp. 36-54.

A . c r v l e w o f t h e w d e l
2 5 . The c 1 0 . ; ~ ~ c i n p c t 1 t lva. : : a t l c , n s h l p be tween n . ~ t r t r ~ t l .1rc1 a v n t h c t l c r u b b e r mkcri t h e l n t c r i ~ c t l o ~ ~ hecueen t h e s e tw l n d u s t r l e a t h e c o r n e r s t o n e o f a n y model o f t h e w r l d r u b b e r econony . The o p t l ~ l a p p r o a c h w u l d be t o n o d e 1 b o t h t h e s y n t h e t i c a c d n a t u r a l r u b b e r l n d u s t r l e s a n d t o i . \ c o r p o r e t e e x p l i c i t l y t h e s t m u l tzineous i n t e r a c t l o n be tween t h e n . I Imev.- r , p a s t a t t e m p t s t o model t h e s y n t h e t l c r u b b e r i n d u s t r y h a v e n o t b e e n v e r y s ~ ~ c c e s a f u l . A s n o t e d , t t i s o l l g o p o l l s t i . : I n s t r u c t u r e ~ n d 1 s c l o ~ e l v l n t e ~ r a t c d w i t h o t h e r l n d u s t r i c s ( t i . e s a n d c h e n l c n l s ) . h s l c lnforc l r t t i o n o n p r o d u c t i o n c n p n c l t l e a , c o s t a , p r i c e s a n d e v e n o n a c t u a l p r o d u c t t o n a r c d l f f l c u l t t o ob t .%tn . 1/
26. A bore f e a s i b l e l ~ p p r o 4 ~ c h c o n n l s t s o f i n c o r p o r a t i n g e x p l t c i t l y t h e p r i c e s of s y n t h e t i c e 1 a s t o u . t ~ i n t h e demand b l o c k o f a n o d c l f o r n a t u r a l r u b b e r . T h i s a p p r o a c h 1 s f o l l o u c d here--synthetic r u b b e r p r l c c s Are i n c l u d e d i n t h e d e m n d a n a l y s i s f o r n a t r l r a l r u b b e r a s a n exoRenous v a r i a b l e . The model p r e s e n t e d h e r e , h o w e v e r , d i f f e r s i n a n t a p o r t n n t way f r o m p r e v i o u s o n e s , 2 s i n c e i t f l r s t d e t e r m i n e s t h e j o l n t d e a a n d f o r n a t u r a l a n d s y n t h e t i c r u b b e r s a n d t h e n t h e a o r k e t s h s r e o f n . ~ t u r a l r u b b e r .
27. Thc model f o c u s e s o n t h e m r k e t f o r n a t u r a l r u b b e r . I t c o n s i s t s o f t h r e e main b l o c k s o f e q u d r i - n s : ( i ) a p t o d u c t i o n b l o c k , v i t h i n d i b i d u a l s u p p l y equations f o r t h e t h r e e M J O ~ n a t u r a l r u b b ? r - p r o d u c i n g c o u n t r i e s ; ( i i ) a d e m n d b l o c k f o r a l l e l a s t o m e r s , c o n t a t n i n ~ e q u a t i o n s f o r t h e m a j o r r u b b e r - c o n s u a i n g r e g i o n s ; and ( t t i ) a d e m n d blr..ck f o r n a t u r a l r u b b e r , c o v e r i n g t h e s a n e r e g i o n s ( C h a r t 2). The b a l a n c e o r I m b a l a n c e be tween t h e s u p p l y nnd denand f o r n a t u r a l r u b b e r is r e f l e c t e d i n c h a n g e s i n n a t u r a l r u b b e r s t o c k s . I n c o m p e t i t i v c n r r r k e t s , c h a n g e s l a s t o c k s u s u a l l y h a v e a d e c i s i v e i m p a c t o n t h e s h o r t - a n d w d i m - t e r n b e h a v i o r o f p r i c e s . The h i g h l y c o m p e t i t i v e n a t u r e o f t h e wor ld n a t u r a l r u b b e r economy ~ d e i t p o s s i b l e t o u s e t h i s r e l a t i o n s h i p b e t w e e n n a r l r e t p r i c e s and s t o c k a d j u s t m e n t s t o l i n k s u p p l y w i t h t h e d e m n d b l o c k s .
11 S t a t i s t i c s o n c o n s u n p t i o n o f s j n t h e t i c r u b b e r by n a i n t y p e s b e c a n e - a v a i l a b l e o n l y i n 1 9 7 3 and c o v e r o n l y t h e i n d u s t r i a l i z e d and d e v e l o p i n g c o u n t r i e s . On ly a g g r e g a t e s t a t i s t i c s o f d u b i o u s r e l i a b i l i t y a r e a v 2 i l a b l e f o r E a s t e r n E u r o p e a n d tk,e USSR. Y o t h i n g is k n w n a b o u t t h e c o s t 13 p r o d u c t i o n a n d - t r a n s f e r o r r a r k e t p r i c e c , v e r y L i t t l e is known a h a p r o d u c t i o n c a p a c i t i e s . I n f o r m t i o n o n C h i n a is e./en n o r c s z a r c e a n t l e s s r e l i a b l e . 8 - -
21 J . R . ? e h r m n , " E c o n o o e t r t c I lodel S f a u l a t L o r l s o f t h e l l o r l d Rubber X o r k e t ," - - i n L.R. K l e i n , e d . , E s s a y s ~n i n d u s t r i a l Cconone t r : ' s ( P h i l a d e l p h i a : -- : r n i v e r s L t y o f P e n n s y l v a n ' . ~ , 1971) V o l . I I i ; C h a r l e s . , ~ v e r A s s o c i a t e s a n d L 'har ton E c o n o n e t r l c F o r c c a s t i n g .Associates. " F o r e c a s t s and A n a l y s i s of t h e Rubbe: ::.irkc: ," .r r e p a t L ,uh,=i cced ~u thc L .S . i ; ~ r ~ t . ~ d i S e r v i c e s Administration, Wash ing ton , D.C., n i n e o , 1375.
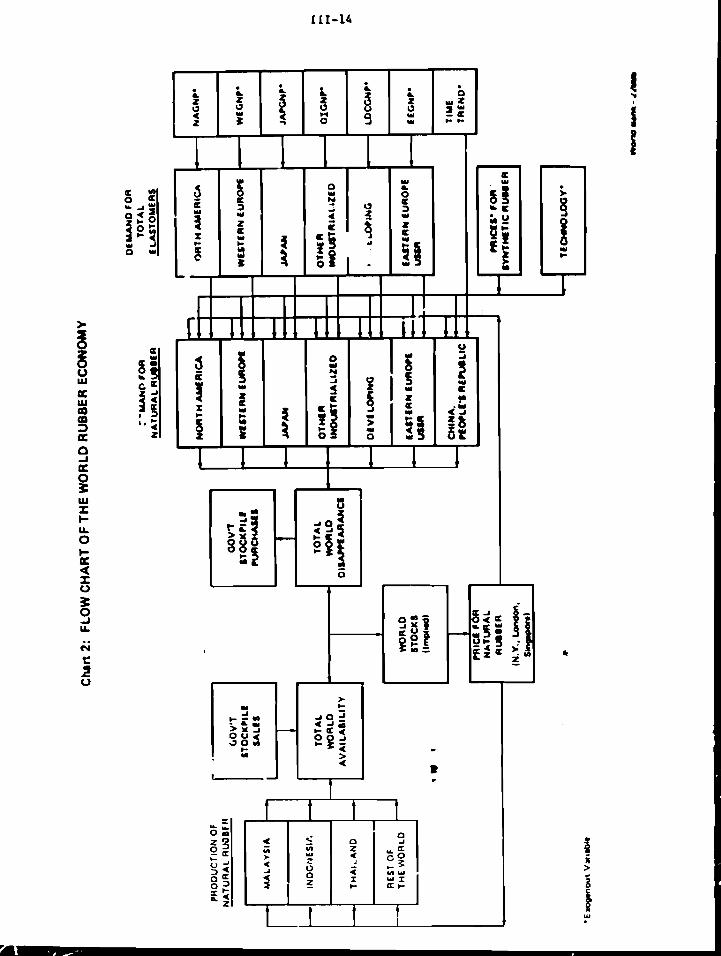

?R. nn t h e d t - m n d qidt . . t h e m d c l i n c l t ~ d c s t h e c e n t r a , l v pl.inned tscononie?i--E.~str .rn Europe and t h e CSSR ( t r e a t e d .IS .I single u n i t ) a n d 0ifn.1. !loucvt?r, I t s h o u l d he r e n e 3 b e r e d t h a t evpn h i s l c l n f o r r r a t l o n on s y n t h e t i c r t rbber p roduc t :on a n d elastomer constrnpt io,r I n t h e s e c o u n t r i c s I s s k e t c h y .~ncl o a t v e r y r e l 1 , i h l c . u b r c o v c r , no d l 5 a ~ g r c ~ a t l o n o f t h e d a t a i s p o s s l h l e u i t h l n t h e E;rs tern Ellrope-USSR b l o c k . I n c l l l l i l n ~ t h e c e n t r a l l y p lanned ccrlnnraies i n t h e n o d e l was o n l y p o e a l h l e a t t h e h l ~ h c o s t of d r n s t l c a l n p l l ~ I c n t l n n s i n t h v ? r t r ~ c t t r r ~ of t h e tiemind c q t r a t l o n s for t h e s e countries. Y e t , t o e s t n h l l s h a l i n k h e t w e n c o n s u n p t l o n o f ,111 c l a r t a n r s and e c o n o n i c r c t l v ! t y i n t h c s e c o u n t r i e s and t o d e r l v e f rom t o t a l e l a s t o n e r d c a s n d t h e t r e n d an n a t u r a l r u b b e r m ~ r k e t s h n r r a wns c o n s i d e r e d p r e f e r a b l e t o t r c n t i n ~ n a t u r a l r u h b e r c o n s u n p t iorr i n t h e c e n t r a l l y plnnned e c o n o n l e s a s c x o z c n o u s t o t h e model.
8 . P r o d t ~ c t ( o n E q t ~ a t i o n s
29. X a t u r a l r r lbbcr i s n perenn!nl c r o p . Produ t!an c f l a t r x b c ~ l n r . ~ p p r o x i m t e l y 6 y c n r r n f t c r t i t e t r c c ham been p l a n t e ' and l as t r 25-30 y e a r r on t h e a v e r a g e . Y i e l d s l n c r c a n c r a p i d l y i n t h e f i r s t 1 ' y e a r s a f t e r t h e t ree h a r r e a c h e d r m t r ~ r l t y and t h e n d e c l i n e n l o u l y , e x c e p t f o r a C W . v r a r y peak i n y l c l d s a round t h e 1 5 t h y e a r n f t c r t w t u r l t y . 11
30. Z ln t t~ rn l r u b t w r o u t p c ~ t n t a n y p a l n t d e p e n d s o n p r c v a u r d e c l r i o n r m d c hy producers w l t h r e s p e c t t o n c u p l n n t i n ~ s and r e p l a n t l n ~ s G' o l d t r e e r . T h e s c d e c i s i o n s d e t e r n i n e t h e s l u nnd aRe d l s t r ( b u t 1 o n o f t h e .-ee s t o c k a v a l l n b l c f o r t n p p i n n ( t h e m t u r e .irea) nnd c u r r e n t d e c ( s i o n a re?,-A#-.. . S I ~
f r e q u c n c y o r l n t c n s l t y o f tapp:sg ( ~ n d , n o r e r e c e n t l y , t h e u s e o f c h e n i c e l n t i r n ~ l . i n t s that i n c r e a s e t h e f l a u o f r u b b e r l a t e x Iron n a t u r e trees). / 31. Tt.ese tu , t y p e s o f d e c i s i o n s are d i f f e r e n t i n n a t u r e . To cxpnnd t h c a r e a t o be p l a n t e d o r t o r e p l a c e o l d trees is n long- term o n e , g i v e n t h e d c l n y b e t r c n plnn:!sa and p r o d u c t i o n end t h e p e r e n n i a l n a t u r e o f t h e c r o p . Thc p r o b l c o ..or t h e p r o d u c e r c a n tw t h o u g h t o f as o n e o f n e x i n l z i n g t h e pre8cr.t d i s c o u n t e d v a l u e o f a f u t u r e s t r e a m o f n e t r e t u r n s f r o n h l s i n v e s t n e n t , The s u b j e c t i v e r a t e o f d i s c o u 3 t f o r t h e p r o d u c e r is key t o t h e d e r i s i o n , A r e l a t i o n s h i p s h o u l d e x i s t b e t w e n expeczed ( f u t u r e ) p r i c e s o f m t u r a l r u b b e r , e x p e c t e d ~ r i c e s o f :onpe t in2 c r o p s , p r i c e s o f f a c t o r i n p u t s , e x p e c t e d y i e l d s a n d t h e d e c i s i o n t o p l a n t .
32. The d e c i s i o n t o t a p , on t h e r h e r hand , 1s s h o r t - t e r m . S i n c e i n t h i n i n s t a n c e t h e t o t a l P a t u t e a r e & is f l x e d , t h e p r o d u c k r c a n r e a c t t o p r i c e c h a n g e s o n l y by m o d i f y i n g t h e f r e q u e n y o r i n t e c s i t y ~ f t r e e - t a p p i n g . I n t h e
- - I - L
11 T h i s - d e c l i n e c a n nov bt del9:-ld t h r o u g h t h e u s e o f c h e m i c a l s t i m u l a n t s . - - - 21 ~ u b t j h r t r e e s p r o d u c e a f l x e d .mount o f r u b h e r o v e - t h e i r l i f e t i n e . Ry
I . - t a p p i n g n o r e f r e q u e n t l y , t h i s p o t e n t i a l y i e ~ ' c a n be r e c o v e r e d n o r e q u i c k l y . i lobever , t h e r e a r e I f n i t s t o how f r e q u e n t l y a tree can be t a p p e d w i t h o u t r e d u c i n g f u t u r e y i e l d s . The l i m i t e d e x p e r i e n c e w i t h c h e m i c a l s t i m u l a n t s s t i l l c o n s t r a i n s t h e i r a p p l i c a b i l i t y : s i n c e t h e i r 1 c . g - t e r n inpact on y i e l d s is n c t e l l - k n o u n , t h e y a r e c ~ ~ r r e n t l v used o n l y w i t h rc:a: i v c l y o i d C r e e s .

s h o r t r u n , n a t u r a l r u b b e r p r o d u c e r s t h e r e f o r e h a v e a l l n l t e d r a n g e o f o p t l o n s f o r a d f u s t l n g o u t p u t . The e c o n o a i c and t e c h n i c a l f e a s l b l l l t y of s h o r t - r u n o u t p t ~ t a d f t ~ s t n e ? t a l s o d e p e n d s o n t h e o r g a n 1 t a t l o n a l s t r u c t u r e o f t h e u n l t s o f p r o d ~ c t l o n : e s t a t e s v s . s p a l l - h o l d i n g s . The f o r m e r p r o b a b l y h a v c e v e n l e s s f l e x l b l l l t y t h a n t h e l i i t ter I n a d f u s t l n ~ production t o n n r k e t c h a n g e s i n t h e s h o t ? tcrm.
33. T o e x p l a l n l o n g - t e r n d e v e l o p e n t s i n n a t u r a l r u b b e r p r o d u c r , I t 1 s n e c e s r a r y t o mode l t h e l n v e s t o e n t d e c i s i o n s o f r u b b e r g r o r r c t s . Seve t h c o r e t l c n l m o d e l s o f t h e l n v e s t a t n t k h a v i o r o f p c r e n n l a l c r o p p r o d u c e r s h a v e b e e n d c v c l o p e d . Uhen a p p l l c d t o s p e c l f l c c a s e s , s o w o f t h e r e n o d c l s o f p ; a n t l n g decisions, h a v e y i e l d e d ~ o o d r e r u l t r , e i t h e r I n t h e i r "pure" f o r n o r h e n "nixed" 4 t h a n o u t p u t r e l a t l o n s h l ~ . ~ / l lor rcver , t h e c o n a t r n l n t a l n p o s e d by t h a n c a r c l t y o f d a t a o n p l a n t l n g h a - e r e v e r e l y l l n l t e d t h e i r u s e t o s p e c l f l c c r o p s a n d c o u n t r l e s (most l y cocoa-producing c o u n t r l e s ) . Dnta o n r u b b e r p l a n t l n ~ s a n d r e p l a n t i n g s a r e a v a l l a b l e f o r a s u f f i c l e n c l y l o n ~ p e r l o d o n l y f o r , % l a y s l a n estates. b c ~ r e l l a b l e d a t a f o r s h o r t e r p e r i o d s is a v a l l a b l e f o r Indonesian e s t a t e s a n d X a l a y s l a n - 1 1 - h o l d l n ~ s . n u s , t h e a p p l l c a b l l l t y o f p l a n t l n g m o d e l s o r e v e n p l a n t l n g o u t p u t a o d e l s o f r u b b e r I s l n d e e d v e r y I l n l t e d .
3 6 . I n a d ~ ! l t l o n t o d a t a c o n s t r a l n t r , t h e r e a r e s e r i o u s c o n c e p t u a l p r o b l e m tha : a v e t o b e f a c e d I n f o l l o u l n g t h i s a p p r o a c h . P l a n t l n g s a n d r e p l n n t l n q s a r e l n f l u ~ n c e d n o t o n l y by t h e r e l a t i v e p r o f l t a b l l i c y ,I r u b b e r a t e x p e c t e d f u t u r e p r l c e s , b u t a l s o - p a r t i c u l a r l y f o r sma l l -ho lde r s -by gove rnmen t l n v e s t a e n t s i n i n f r a s t r u c t u r e , s u b s l d i e s f o r i n p u t s , d i f f e r e n t i a l c r e d l t r a t e s , t a x I n c e n t i v e s , a n d s a r k e t i n g a n d p r l c e s u p p o r t policies. I n f o r ~ l ~ t l o n o n t h e s e f a c t o r s is s c a r c e a n d n e v e r a v a i l a b l e o n a c o n s l s t e n t
11 F o r a s u r v e y o f t h e s e m o d e l s see Y.J. Baceaan , "Supp ly R e l a t i o n s f o r - P e r e n n i a l C r o p s i n t h e L e s s Deve loped Areas , " i n C.R. U h a r t o n , Jr., e d . , S u b s i ~ t e n c e A g r i c u l t u r e a n d Economic D e v e l o p o e n t ( C h i c a g o : A l d i n e P u b l l s h l n g Co.. 1 9 6 9 ) . pp. 243-253. See also. B.C. F r e n c h and J .L . Y a t t h e t s , "a Supply ~ e s p b n s e f o r P e r e n n i a l crops," American J o u r n a l o f A g r l c c l t u r a l Economlcs ( h u g u s t 1971) . pp. 478-490.
2 / S e e Y.J. B a t e a u n , " A g g r e g a t e a n d R e g i o n a l S u p p l y F u n c t i o n s f o r C h a n l a n - Cocoa," J o u r n a l o f Farm Economics (Xay 1 9 6 5 1 , *p. 384-401; P. Xdy, "Supp ly F u n c t l o n s i n T r o p i c a l A n r i c u l t u r e . " O x f o r d U n i * e r s i t v I n s t i t u t e o f Economlc a n d ~ t a ; i s t i c s - ~ u l l e c i n i!%ay 1968) . pi. 157-188; a n d J.R. - B e h m a n , " N o n o p o l l s t i c Cocoa P r i c i n g , "AmericaS J o u r n a l o f A g r i c u l t u r a l
8 Economics (Augus t 1968) . pp. 702-719. Very u - t f u l s u r v e y s o f t h e . theoretical and e m p i r i c a l l i t e r a t u r e a r e c o n t a r n e d i n W.C. Labvs, Dynamic - -1 Cocrmodlty S d e l s : S p e c l f i c a t l o n , E s t l m t l o n a n d S l a u l a t l o n (Lexington,
; o f P r i m a r v ?Llss.: L e x i n g t o n Baoks, 1 9 7 3 ) ; and D. l a i n , S u p p l y Response: P r o d u c e r s ( K u a l a Lumpur: P e n e r b i t I ' n i v e r s l t y , !4al a y a , 1 9 7 5 ) . .* ~ x h a u s t f ~ e s u r v e y o f t h e e n p l r i c a l u t r k o n s u p p l y r e s p o n s e s I n a g r f c u l t u r e c a n hc Found i n !!. A s k a r i and .J.T. c t ~ - . ? t n a s , " ~ s t f n a t t n ~ 4 ~ r t ~ 1 t l t l 1 r a l S u p p l y Response u i t h t h e S e r l o v l a n % d e l : A S u r v e y , " I n t e r n a t l o n n l E c o n o n i c R e v f e v ( J u n e 1 9 7 7 ) . pp. 257-292.

3 5 . T',t. ?r,r!ibl p r t - s r n t c d h c r c . l tc t - -prs o n l y t.3 ewp1.1in the- p r o d u c t i o n t i e c l a i < ~ n , glvt.:i .I .ipcc 1 d lei! s t o c k o! n:rtr lrv t rt.ib!i. Since 1 t dot-s n o t i ~ i : l t ~ t t b t tre r ! t . t~ . rn ln ,~t r t -i I ) ! c?r.~::kt* i n [kt- ,z.rttirt- . rrc. l , the ?JOL!P~ Is . ~ p p l i r n h l i . n t l l y f o r e q t l m ~ t ( n d - - v ! t h <.ant. ~ ~ p p r r ) x l l t . l ~ ! r ) n - - t I t t b rac..iltrrr-~crra ( 5 - 0 yt-i tr) hctj.lv!or o f r u b b e r proc!r~cc.r.r. n.c- s ; r e c l f l c a l i o n of L I : ~ s u p p l y ~ q u a r i o n s p a s t t a l ~ t c s ;I p ; ~ r t i a l . ~ d !11ute?rnt eo ie l . I r a r a t t o n . ~ ! c - l l c s i n t h e t c c h n o l o ~ I c n 1 nnd i n s t i t u t ion.11 r o n . c t r ~ l n t n t i t a t rub*r prou!trrrra f a c e i n n t3 jus t t ~ r t h e i r p r o d u c t l o n t o rc.1.1~ 1-e p r i c e c t l a n ~ r s . 3 r1 -n r c o n s t r o l n t s f1.1vc t o d o v t t h t t ~ c - , ~ c t u n l w y n hy d r i c h p roc l l~c t I o n c a n Inc r r , t r t cd , t h e d l l f c r c r ~ t modes o f p r o d u c t l o r \ '~ncl t trr* c f f l c l r n c y of t l ~ r . v. i r lor~rr m r k e t l n ~ :rnd c l l l i t r I b t 1 ~ 1 0 n n y s t e m . .kqtr!r f rom clrc l a g g e d prrrdttc-t lon ~ ~ t r l i ~ h l e (r;ho*c s i g n i s e x p c c t t d t o bc p o c l i t l v c err a - c o n o s t c nw r l l .tn ? c t n r I e c i c n l ~ r o u n d r ) U a n d n r c l n t l v c p r i c e v , r r16\blp , t t re p r o d u c t I o n r - q ~ i t I o n a . i l s o c o n t n l n 3 t i n e t r c n d , ,timed n t t nk lny ; i n t o .rcc.oont the 1ncrc . iac n v c r t I n c i n t h e p r o d i ~ c t I v l t y ~f rubber t r ~ c . s . Rrcw $ I a n o f t h c p r i c e .ind 0 3 t h e : I n c t r c n d v n r l n b l c ~ a r c b o t h e x p e c t e d t o hz p o s i t I v c .
36. I n t ! l v t d t ~ a l s u p p l y e q u a t i o n s *-re c s t l m n t c d f n r *liRl.lystn (ZUl.NRF), t ndonc r r i a ( ISD!IRS) a n d Thai l.ind (TglAXRS;, &+t tc t~ t o ~ c t h c r a c c o u n t f o r o v e r R f l p e r c e n t of w r : d p r o d u c t i on . Thc rcc-1iradc.r l a covered by " t h c r e s t o f t h l - w r l d " c q ~ r ~ ~ t l o r r (ROLYRS). Rlt- e . i ? I m ~ t c ~ ! s u p p l y e q u n t l a a s n r c p r c ~ e n t c d b! 'ov; l c t p l i c i t ne.in e l s a t l c l t i c s of p r o l u c t l a n u t t h r e s p e c t t o p r i c e a r c cnmpnrcd n t t h e e n d of t h e s e c t l o o . o r d i n a r y ! e a s t squ . l r ce (OLS) w r c f I r ~ t u s e d t o e s t l m t e t h e eq1n t1on .c i n l i n e a r f o m : :hen t h e C o c h r a n e - O r c u t t ( t t c r n ~ l v c ) a n d HI 1Rrc t h-P.u (sc. lnof n g ) p r o c c d r ~ r e s * r e u s e d t o c o r r c c t f o r s e r l a 1 c o r r c . 1 a c I o n . ?/ To ric.11 v l t h t!le scr I .11 c o r r c l . i t .on o r o b l c m , n t h r c c - p a s s l r n s t s q u a r e p r o c c d u a c -11so t r ! cd l n t h r prpr iencc o f n l . i y , ~ r d d c p c n d c n t v a r i a b l t - i n t h e s u p p l v cBctu.ic t o n s , b u t t h e r c s a ~ l t s w r c 11ns3t 1 t ; f . lc tory . 3 1 Thc - r e s u l t s .ire . r r a ~ a r l z e d I n T.ihlc ',.
1 1 Thc 1.iggr.d p r o d a c c i o n v a r i . ~ h l e p r o x l e s t h e st( . o f t rces n v a l l a h l c fc: - t a p p i n e : t h ~ 1.1rper t h i s m i p n I t t l d e I s .it t l n e t -1 , t h e l a r p c r t t ~ c p r o d u c t i o n p o t e n t l a 1 s h o u l d be ~t t ¶ a c t . A n e ~ a t l v e s r R n f o r t h e 1 . 1 g ~ e d v a r i . i b l e . a u l d p r e s a i b l y i n d i c a t e t h a t s l . l u ~ h t e r - t a p p i n p , is a c o m o n p r a c t i c e o r t h a t c p e r v e r s e r e l a t i o n s h i p e1 .1s t s b e t w e n ~ r o d u c t i o n n; p r i c e s i n t h e m a l l - h o l d e r s ' s e c t o r . - -
i 2 ( See D. Cocttr.ine .lnd (;.it. Orct- t t , ":\ypl l c a t I o n o f I,e.lst S q u a r e Rep , r e s s i ans - t u R c l . ~ t l o n s h i p s C c n t . r l n l n c . - \ t ~ r r > c . > r r c l a t c d E r r o r f e r r s . " J o u r n a l o f t h p . - X n e r l c a n S t . l t l s t i ~ ~ l . k s s o c I a c i >n ( 1 9 5 9 1 , pp. 32-61; a n d C. I f f l d r e c h n g .I . Y . [.I!, "Demnd g e l . l t i o n s .--1 t ! ~ X a t o c o r r e l ~ t c d D i s t ~ ~ r b a a c e s ." ?:ichlnnn,
3 'r:.F'. !:I l l i s , "[..irprd ncpcnrlcnt ':,1ri;15!r.; and Seri.11 1:: ~ : o r r e l . ~ t e d E r r o r 5 ," - Q r v i ..u r r i L'~o~i,,:ir< .and S t a t 1 = t i c s ( ' o h ? ) , p p . 1 5 5 - 5 6 7 . I n p l i c i t i n --- U.;C o f c : l c t:-11 1 :-i ( o r t h e C o c h r ~ t ~ e A r c ~ i t t) p r o c e c l r ~ r c i s l v c z . , s t ~ n p t t n n


37. E q t ~ ~ t inn ( 1 .S) b e l w e : d s ~ k e s u p p l y b lock of t h e n o d e l :
U ~ L C r e :
f!;itSt - t o t a l r m r l d p r o d u c t l o n of n n t i ~ r n l r u b b e r ('000 m.t.).
38. A11 t b c c o e f f l c l e n r s of t h e f o u r s ~ p p l y c q u n t l o n s ~ s c n t c d l n T a b l e 5 h,~,;c t h e c x p c c t e d rrlgn. '.11 bu t one ( t h e l a ~ ~ e d p r o d u c t l o n v a l u e o f t h e " ~ C H L of t h c u o r l d " e q u a t i o n ) a r e a t a t l a t l c n l l y s l g n l f l c n n t a t t h e 9 1 p e r c e n t c r ) n f l d c n c e l e v e l o r above. I / ??lc explanatory w a r o f t h e a s t l n n t o d e q u n t l o n s L H r e l n t l v e l y hlRC. Sam d e ~ r c c o f p o s l t l v a a e r i a l c o r r c l a t l o n rc.+.,~lnu i n t h r e e o f t h e c n t l u n t c d e q u a t i o n s . With t h e c x c c p t l o n of t h c 1 r . d o n c ~ l n n e q u n t l o n , n t t e t x p t s to c o r r e c t f o r i t u s i n g d l f f e r c n t c s t i m s t l o n p r o c c d u r e n ( C o c h r a n e - O r c u t t , Ill ld rc th -Lu and Val l l s ) w e r e n o t s u c c e s s f u l , n o r w r c n t t c o p t s t o u s c n o n - l i n e a r s p c c l f l c a t l o n s f o r t h e s u p p l y e q u a t l o n s . Thcsc. r e s u l t s w u l d a c e a t o l n d i c n t c t h a t w h a t c v c r n u t o c o r r e ! a t l o n 1s l e f t i n t h c t h r e e e q u a t l o n s l a p r o b a b l y t h e r c s u l t o f a n "omi t ted" v a r l a b l e . W i t h i n t h e node1 a d o p t e d , a s s u n l n g t h a t t h e l a g g e d v a r i a b l e p r o x i e s t h e r t o c k o f t r e e s and t h a t t h e t ltw t r e n d c a t c h e s t h e tlw prof l l e o f y i e l d r , what seems t o be n l s s l n g I s a v a r i a b l e f o r t h e a g e c o m p o s i t i o n o f t h e tree s t o c k s , v h i c h itt a n y p o i n t depends o n p e a t p l a n t i n g and replanting r a t e s . T h i s h y p o t h e s i s f l r d s s o o c l n d l r c c t s u p p o r t l n t h e r e s u l t s t h e n s e l v e s : t h e e q u a t i o n f o r t h e c o u n t r y where t h e a g e c o n p o s l t l o n o f trees is "known" to h a v e changed t h e most--:La l a y s i a - - p r e s e n t s a r e l a t i v e l y h i g h e r ~ u t o c o r r e l a t i o n problem t h a n t h a t f o r T h a i l a n d and t h e "rest of t h e smrld" , v h e r e c h a n g e s a r e "known" to h a v e becn snaller i n t h e p o s t - u a r p e r i o d . A t t h e o t h e r e x t r e m e , t h e e q u a t i o n f o r Indones ia - - the c o u n t r y where t h e l e a s t aoount o f change i n t h e a g e c o m p o e i t i o n of trees is "known" t o have t n k c n p l n c c - u h e n s u i t a b l y c o r r e c t e d , d o c s n o t s e e n t o have a n y n u t o c o r r e l a t l o n p r o b l e n . I n t h e a b s e n c e o f a quantitative proxy f o r change i n t h e a g e c o n p o s i t i o n o f trees, t h i s h y p o t h c s l s c o u l d n o t be t e s t e d , and t h e e s t i n a t e d e q u a t i o n s *re a c c e p t e d a s such.
39. The economic s i g n i f i c a n c e o f t h e r e s u l t s c a n be summarized a s f o l l o w s : ( a ) r u b b e r producers ad j u s t t h e i r p r o d u c t i o n t o r e l a t l v e p r i c e
1/ A dunny v a r i a b l e (DY63) ~s i n c l u d e d i n t h e s u p p l y e q u a t i o n f o r I n d o n e s i a - t o a c c m n t f o r t h e impact on p r o d u c t i o n o f t h e p o l i t i c a l - m i l i t a r y c o n f r o e a t i o n b e t u e e n X a l a y s l a and I n d o n e s i a . T h a t y e a r v a s one of g r e a t e c o n o n f c d i f f i c u l t y f o r I n d o n e s i a , and o u t p u t i n t h e whole a g r i c u l t u r a l s e c t o r S u f f e r e d from i t . Rubber p r o d u c t i o n d e c l i n e d by 1 5 p e r c e n t and d i d - n o t f u Y y r e c o v e r u n t i l 1966. E c o n o m e t r i c a l l y , t h e p r e s e n c e of a l agged dependent v a r i a b l e i n t h e e q u a t i o n i a p l i e s t h a t t h e g e o o e t r i c a l l y d e c l i n i n g l a g s t r u c t u r e a f f e c t s a l l e x p l a n a t o r y v a r i a b l e s ( i n c l u d i n g t h e DY63) i n t h e s a n e uay. The e s t i n a t e d c o e f f i c i e n t o f t h e lagged dependent i n d i c a t e s t h a t t h e i m p l i c i t l a g s a r e r e l a t i v e l y s h o r t : DY63 o p e r a t e s 32 p e r c e n t a s nuch i n 1964 a s i n 1963 , 1 0 p e r c e n t a s much i n 1965, 3.4 o e r c e n t a s n u c l ~ i n 1966 and s o on ; t h e r e f o r e , i t c a p t u r e s r a t h e r w e l l t h e d i f f e r e n t i a t e d i n p a c t o v e r t i n e o f che 1963 c r i s e s on r u b b e r p r o d u c t i o n i n I n d o n e s i a .

changes, (b) t h e i r responsiveness seeas t o depend t o some extent on the production node, and ( c ) t h e i r responsiveness i n the shor t t e rn i s r e l a t i ve ly s m l l (Table 6). The g e n e t a l i a t i o n ~f the finding of the pr ice responliveness of rubber producers is one of the pos i t ive achievenents of t h i s ana lys is of supply, which was based on carefu l research of the rcprescntativc- nese of various market pr ices for d i f f e r e n t countr ies and, h e r e relevant, of export tax s t ruc tures . The d i f f e r e n t i a t ion of price e l a s t i c i t i e s for the s u p p l y o f rubber across countr ier a l s o broadly confirwa expectations: the response t o pr ice is more pronounced uhere the production comes mostly from small-holders. 11 The l a t t e r , t h r o u ~ h more frequent t u p p i n ~ , slaughter- tapping and the l i ke , have more room t o respond in the short term to price c h a n ~ e s than du e s l a t e s , A i c h noraally f o l l o u a o r e standardized production pract icer . The s i t c of the pr ice responre probably depend. to some extent on the delays v i th which pr ice infornation f i l t e r r dovr t o ran11 producerr, t h e i r
rable 6: NATURAL RUBBER SUPPLY ELASTICITIES
Country Price E l a r t i c i t y o? Supply
Sort-Tern / r -
Mslaysia Indonesia Tha i land Rest of the h r l d
*Results significa;:t a t the 95 percent confidence leve l o r above.
/a Estiarated a t the means of the relevant variables. -
- 11 The country v i th the la rges t sttall-holdeG sector-Thailand-shows the -
l a rges t supply e l a s t i c i t y in the shor t t h . On t h i s bas i s , Indonesia should follow Malaysia, and not v i c e - v e r e , a s show i n Table 6. Indonesia, however, is a;l exception t h a t p n be e a s i l y explained. In t h i s country, the rubber sec tor e a e r i e n c e d a period of d i f f i c u i t ~ i n the ea r ly t o mid-1960s vhen production uas severely damaged by inappropriate novernment pol ic ies concerning the management of e s t a t e s , excha,?qe r a t e s and the a v a i l a b i l i t y of basic inputs. The de ter iora t ion of the rl.55~: sec tor l imited in subsequent years the capacity of producers t o react e f fec t ive ly t o m r k e t changes. The low price responsiveness of production calculated a t mean pr ices r e f l ec t s these spec ia l fac tors .

: t r r i t e d ~ d r m t . r l i r l s t t e z t o p t i o n s i n :he s h o r t tern a n d p o s s l h l v on t h e f a c t L \ . ~ t SOYA. o f the 1 ?roduct.rs haye t o t a p e v e n &en p r l c c s d c c l l n e I n o r d e r t,, x ? [ n t t i . . - ! ? i n 1 3 l n c 9 2 l e v e l s . The s t ~ p p l y e l a ~ t l ~ l t l e s o b t a i n e d h e r e a r e
rrlgh1.1 !- ' ! ' 4 *- - i r t~ t h o s e o b t a l q c d 1% .I i c w o t h e r e c o n o n e t r l c s t u d l e s o f 11'1h-r prt,dt:..w . 8 - 1 . 11
GO. Thc des111d s l d e o f t h e w d c l p r o h b l y h a s a n t r o n ~ c r t h c o r c t l c n l h a s [ * t z n n ~trz s u p p l y s l d c . 6ecair*c n a t u r a l and a y n t h c t l c r u h b c r s c a n bc Lcr te rch .~n~ec l l o mtny e n d - u s e r , t h e node1 s t i r r t a 4 t h n d c t c m l n n t l o n o f t o t a l e l a s t o m - r ( I ~ L L I ~ I ~ on t h e b s l s o f n l v c n c c o n o a l c a c t l v l t y . Thc a n r k c t e h n r e o f n a t u r ' r l r u b b e r Lu :hen d e r i v e d f r o n t h e d c m n d f o r n l l c l n r t o m c r ~ on t h e b n a l n of rtb1.1t L V C p r t c r * and t c c h n o l o ~ y .
$1. Thc d c s a n d f o r -!; e l a s t o m e r s 1 s n d c r i v c d dcnand ; n p p r o x i n n t c l y h a l f of ,111 r ~ t h h c r prodraced I n t h e m r l d f * u r c d In t h e n n n r ~ f n c t u r c o f t i r e s f o r orr torwbl lcr i , comercl .11 v c h i c l e s and i n d u s t r i n l v c h i c l e s . P r o b a b l y a n o t h e r 10-15 p e r c e n t o f t h c t o t a l is u t i l i z e d f o r n o n - t i r e n u t o a o t i v e p r o d u c t s ; t h e r e f i i i n d c r 1s used f o r househo ld and i n d u s t r i a l goods. The l e v e l o f i n d u s t r i a l a c t i v i t y I s , t h e r e f o r e , k e y i n t h e d e t c r n i n a t l o n o f denand f o r r u b b e r , and i n f a c t a d l r v r t , p o s i t i v e relationship e x i s t s b e t u e e n t h e two. T h i s r ~ l i r t l o n ~ h l p m s u s e d as t h e b a s l s f o r d c t e r n i n i n g t o t a l r u b b e r demand i n t h e t h r e e m1Jor l n d u s t r l n l l r e d c o n s l m l n g a r e a s : Nor th A a e r i c a , t l e s t e r n Europe and J a p a n . The o v e r a l l l e v e l of e c o n o n l c a c t i v i t y u ~ s u s e d n s t h e i n d e p e n d e n t v a r i a b l e l n t h e t o t a l demand e q u n t l o n s f o r " o t h e r industrialized" c o u n t r i e s , t h e d e u e l o p i n p coun t r l e ~ and F a a t e r n Furope-CSSR. T h i s c h o i c e ms d i c t a t e d b y d a t a constraints.
4 2 . Thc d i r e c t a p p r o a c h f o l l o w e d h e r e Ln e x p l a i n i n g t h e denand f o r a l l e l a s t o c c r s Ls c e r t i l l n l y s o m e h a t s i n p l i f i e d . A more c o m p l e t e demand model s h o u l d d i f f e r e n t l a t e b e t e e n n r b b e r demand Ln a u t o m o t i v e and non-automotive u s e s . kc -k:.~ld f u r t h e r d i f f e r e n t i a t e b e t e e n t i r e and n o n - t i r e a u t o m o t i v e a p p l i c a t i o n s and shou!d l i a k t h e deaand f o r o r i g i n a l t i r e s and n o n - t i r e a u t o m o t i v e p a r t s t o a u t o m o t i v e p roduc tLon , a s -11 a s t h e demand f o r r e p l a c e n c n t t l r e s t o t h e i n t c n s l t y o f u s e o f motor v e h l c l e s (which i n t u r n s h o u l d dcpcnrl r r e a l disposable Lncome on t h e r e l l t i v c . o s t o f u s i n g
Z a u t o n o t l v e t r a n s p o r t a t i o n , and on t e c h n o l o g y ) . F i n a l l y , denand f o r non- a l ~ t o n o t l u e r p ~ b b e r g o o d s s h o u l d he t i e d t o L n d u s t r i a l p r o d u c t i , ~ n . T h i s
:I11 but one of t h e s e strrd!es p e r t a i n t o % l a y s i a . See R.Y. S t e r n , = - -p,. . ~ i l . ~ y . ~ : t R r ~ b ~ r Pf ioduc t ion , I n v e n t o r y IloldLngs and t h e E l a s t i c i t y of )
Expor t S r ~ p p l : ~ , " Tke S o u t h e r n Economic J o u r n a l ( A p r i 1 19651, pp. 314-326; F. Ch.~rl, ":\ P r e l l x l n a r y S tudy of t h e Supply R e s p c . ~ s c o f Yalayan Rubber - : .st . ircs," !r.il;ly,ln Econonic Review (!:ovenher 1 9 6 2 ) , pp. 1021-ln36; more r ~ i * c i t i ~ , C.5 . OIOW, "So= .Aspects of P r i c e E l n s t i c l t i e s of Rubber ?r~~c!r:r-c i - t n i n '*.- 1.1vsla." P r n c e c d i n e s of t h e I n t e r n a t t o n a l Rubber - - - - - -~
r . 9 I . r : IRRI, 1975) ; a r d Rehrman, op , c i t . , pp. - -. [ - * I ?

approach , p a r t i a l l y f o l l o u e d i n a n o t h e r S o r l d Bank r t d d y conducted f o r pur- p o s e ~ ~ o f l ong - t e rn f o r e c a r t i n g , 18 not o n l y e x t r e m e l y complex from t h r c o n c s p t u r l r t a n d p o i n t , bu t r l r o v e r y hard t o i a p l e ~ e n t p r r c t i c r l l y , g iven t h r enomoue m o u n t of r t a t i r t i c r l and t e c h n o l o ~ i c r l i n f o r r a r t i o n t h s t i t r r q u i r r ~ , no t a l l of which i s a v a i l r b l r even f o r t h e = j o t i n d u r t r i r l i z e d c o u n t r i e r .
43 . A s h o r t - c u t r ( t ~ r e 8 r t i v e r p p r o r c h , bare.! on t h e r e l r t i o n r h i p b e t w e n e l a r tou t e r d m n d and r u t o w t i v e p rcduc t lon m u l d , i n t h e op in ion of t h e a u t h o r e , be even l e s s s r t i r f r c t o r y t han t h e one f o l l o r d he re . k ~ t o m o t l v e product i on d i r e c t l y e x p l a i n s only r relr t l v e l y sarll p a r t of t o t r l rubber demand, i .e . , denand f o r o r i ~ l n ~ l t i r e s , p l u s n o n - t i r e r u t o s o t l v e rubbe r goods. The most l a p o r t a n t p o r t i o n o f drnrnd is f o r replacement t l rer and f o r non-automotive l n d u s t r l r l and household goods. Only l n r o f r r AS r u t o a o t i v e production and t o t r l l n d u r t r i r l p roduc t ion a r e c o r r e l r t e d does r u t o b o t i v e p roduc t ion an a n e x p l r n r t o r y v a r i a b l e p i c k up t h a changer i n t o t r l r ubbe r dcrrrnd ( excep t t h a t which is connrc t ed t o r e p l r c e a e n t t i r e s , uhich w r t l y depend8 on d i s p o r r S l e i n c m and l a t h u s even f u r t h e r removed f r o a au tomot ive product ion than f r o a i n d u r t r i a l p roduc t ioa ) .
A t t h e a g g r e g r t r l e v r l , i n d u r t r i r l p r o d u c t i o n r e r n s t o k t h a moat a p p r o p r i a t e e r p l a r u t o r y v a r l a h l a f o r changar i n t h a t o t a l d t l u a d f o r rubber: i t a c c o u n t r d i r e c t l y f o r a l l i a a ~ a t r i a l r ubbe r u r r d and i n d i r e c t l y f o r r e p l a c e w n t t i r e r , r i n c e changes i n i n d u s t r i a l p roduc t ion and r e a l income ara c l o r e l y c o r r e l a t e d .
45. The s i x e q u a t i o n s f o r t o t a l r u b k r d a u n d p r e r e n t e d b l o w (Tab le 7) - re f i r s t e s t i n a t e d u s i n g O t S and r u b r e q u e n t l y r e e s t i r a r t e d u s ing t h e C o c h r a n r O r c u t t and Hi ldra th-Lu t r r n s f o r a r t i o n r t o c o r r e c t f o r a e r i a l c o r r e l a t i o n . Except f o r t h a dc lund e q u r t i o n conce rn ing t h e developing c o u n t r i e s , which ws r p e c i f i e d i n double-log f o m , a 1 1 t h e o t h e r e q u a t i o n r ara i n a l i n e a r o r semi-log f o m . Only i n developing c o u n t r i e s can t h e a s s u a p t i o n o f a c o n s t a n t income e l a s t i c i t y f o r rubbe r denand be accep ted f o r f o r e c a s t i n g purposes , s i n c e p e r c a p i t a rubber u s e is s t i l l m a l l i n t h e s e c o u n t r i e s because o f t h e r e l a t i v e l y r e c e n t i n t r o d u c t i o n of m o t o r i z a t i o n i n most of t h m .
46. I n i n d u s t r i a l i z e d c o u n t r i e s , on t h e c o n t r a r y , t h e l e v e l of p e r c a p i t a rubber u s e is a1re.ady v e r y h igh and t h e r e f o r e is l i k e l y t o grow at , d e c r e a s i n g r a t e s f o r s e v e r a l reasons . With notarization c u r r e n t l y a t ex t remely h i g h l e v e l s , t h e growth o f w t o r v e h i c l e ownership and u s e i n r e l a t i o n t o r e a l income growth shou ld become l e s s s t r o n g a s t h e s a t u r a t i o n p o i n t is approached. Groving ~ a i n t e n a n c e c o s t s and i n c r e a s i n g t r a f f i c d e n s i t i e s a r e l i k e l y t o reduce t h e i n t e n s i t y v l t h which motor v e h i c l e s ( p a r t i c u l a r l y a u t o m b i l e s ) a r e used. T h i s t r e n d vill be r e i n f o r c e d by t h e h i g h e r f u e l c o s t s brought abou t by t h e o i l c r i s i s . F u r t h e r , t h e fGe1 c o n s e r v a t i o n p o l i c i e s f o l l o v e d i n n o s t i n d u s t r i a l i z e d c o u n t r i e s i a p l y , ~ a o o n g o t h e r t h i n g s , a p r o g r e s s i v e r e d u c t i o n i n t h e s i z e and /o r w i g h t 6 f motor v e h i c l e s . T h i s t r e n d vill n e g a t i v e l y a f f e c t rubber dpmnd p e r v e h i c l e produced--direct l y through t h e scale e f f e c t , and i n d i r e c t l y v i a t h e l o s e r war and t e a r of t i r e s i n l i g h t e r and s n a l l e r v e h i c l e s . For t h e s e r ea sons , l i n e a r o r semi-log
1/ See C r f l l i , A g o s t i n i and Ue lvaa r s , op. c i t . , pp. 54-56 nnd 102-117. -

Tab le 7: TOTAL ELASTOSR DE!U)r'D EOUATIONS /a -
itICRT.SSION COEFFICICXTS RECRESSION STATISTICS
Equations Constant I PRt T? S.E.E. D.V. rho Te m
( 2.3) JAPRUBD, -7.1108 +8.0387 0.9e 16.0 2.09 - (91.6)
( t v a l u e s i n pa ren theses ) .
/a Es t ima t ion pe r iod : 1957-77. - / b Semi-log f u n c t i o n : OFRUBDt = a + b In 03IPR. - /c b u b l e - l o g func t ion : I n LDCRUBD - .I + b I n LDCIPR -
4
&ere: RUBD = t o t a l e l a s t o n e r demand ('000 m . t . )
I P I = index o f i n d u s t r i a l p roduc t ion (1970-100) i n (2.11, (2.2) afid (2.3); r e a l GHP i ndex (1970=100) i n (2.41, (2.5) and (2.6).
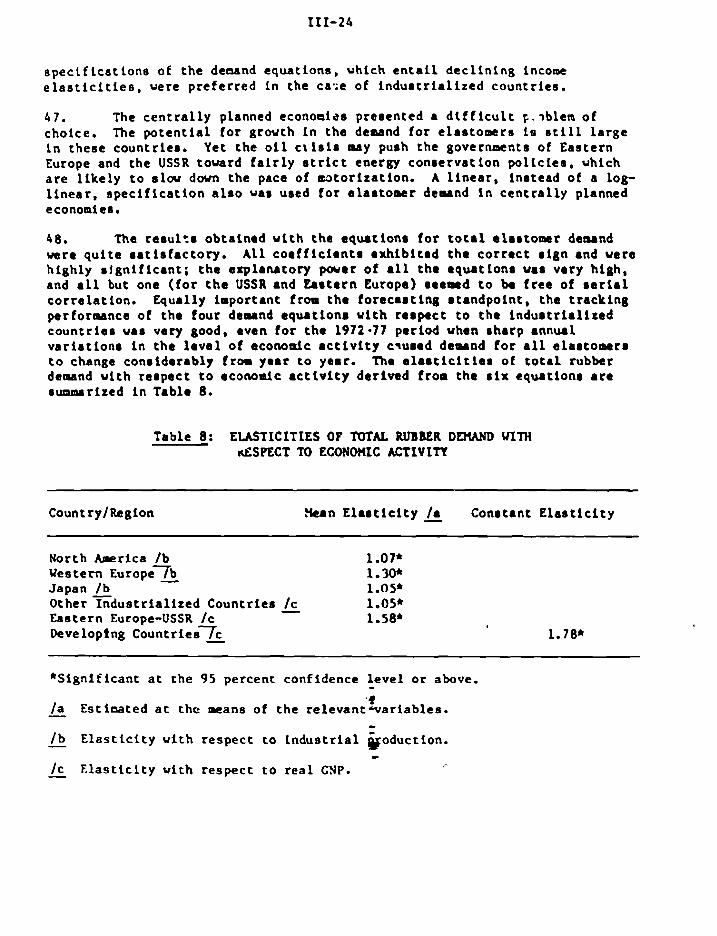
spec t f tca t lons of the deaand equations, uhich e n t a i l decl ining income e l a s t i c i t i e s , were preferred in the cae;e of indus t r ia l ized countries.
4 7 . The cent ra l ly planned econoaizs presented a difficult p.?bltm of choice. The potent ial for growth in tha dearand for elastomers ie s t i l l large in these countries. Yet the o i l c t i s i s MY push the governments of Eastern Europe and the USSR toward f a i r l y s t r i c t energy conservation pol icies , uhich a re l ikely t o s lov d m the pace of w to r i za t ion . A l i nea r , instead of a log- l i nea r , spec i f ica t ion a l s o war used for alastomer dearad i n cent ra l ly planned economies.
4 8 The resu1:r obtained with the equations for t o t a l elartomsr damand w r e qu i t e ra t i s fac tory . A l l coef f ic ien t r exhibited the correct rign and were highly r jgn i f i can t ; the axplarutory p e r of a11 the equrtionr war very high, and a l l but ona ( fo r the USSR and Eartern Europe) reemd t o be f ree of r e r i a l correlat ion. Equally important frou the forecart ing atandpoint, the tracking performance of the four dearnd equationr with reapact t o the indus t r ia l i tad countr ier war very good, even for the 1972-77 period when rharp annual variat ionr i n the leva1 of econodc a c t i v i t y cqured demand f o r a l l alartomerr t o change considerably from year t o yerr. The e l a r t i c l t i e r of t o t a l rubber demand with rerpect t o econodc a c t t v i t y derived from the s i x equrtionr a r e s w r l z e d in Table 8.
Table 8: EUSTICLTIES OF TOTAL RUBBER DE)(AND WITH rrESPECT TO E C O N W C ACTLVITY
Country/Region ! h n E l a r t i c i t y - /a Conatant E la s t i c i ty
North America /b 1.07* Western ~ u r o ~ e 7 b - 1.3W Japan /b 1.05* Other Industr ial ized Countries /c - 1.05* Eastern Europe-USSR / c 1.58* Developrng ~ o u n t r i e e 7 c - 1.78*
*Significant a t the 95 percent confidence leve l o r above. - '9
/a Estinated a t the means of the r e l evan tua r i ab le s . - - /b Elas t l c l ty v i t h respect to indus t r i a l koduct lon. - - /c E la s t l c l ty v i th respect t o rea l GNP. ,- -

h9. Equa t i on (2.7) below r e p r e s e c t 3 t o t a l derai=\3 f ,r n a t u r a l and s y n t h e t ! ~ rubbe r s :
h e r e :
TRUBD = t o t a l r a r l d e l a r t o n e r deaand , e x c l u d i n g China ('(I00 m.t.).
The Demand f o r N a t u r a l Rubber
50. An p r e v i o u s l y mentioned, i n r t e a d o f a o d e l l i n g t h e demand f o r n a t u r a l r u b b e r d i r e c t l y , a u r k e t r b r e app raach -8 used t o d e r i v e t h e deaand f o r n a t u r a l r ubbe r f rom t h a t f o r a l l e l a r t o c r a r r . The n a i n advan t age o f t h i s app roach is i ts s i m p l i c i t y . s i n c e the a r r rke t s h a r e o f n a t u r a l r ubbe r c a n b e c o n s i d e r e d independent o f a 1 1 t h e f o r c e r t h a t a f f e c t t h e denand f o r a l l e l a s t o m e r s (e.g., t h e l e v e l o f economic a c t i v i t y ) . C iven t h e size o f t h e t o t a l market f o r elartoaerr, it c a n be h y p o t h e s i u d t h a t t h e p o r t i o n g o i n g t o n a t u r a l r ubbe r depends on r e l a t l v e p r i c e s and t e c h n o l o g i c a 1 t r e n d s . Forars l ly , t h e m r k e t s h a r e model used h e r e assures t h a t : ( 1 ) u s e r s c an u t l l i z e e i t h e r n a t u r a l o r s y n t h e t i c r u b b e r ; ( 2 ) n a t u r a l and s y n t h e t i c r u t b e r s a r e c l o s e , b u t n o t p e r f e c t , s u b s t i t u t e r ; and (3 ) a change i n r e l a t i v e p r i c e s and p r o d u c t i o n t e chno logy a f f e c t s t h e p r o p o r t i o n i n h i c h n a t u r a l and s y n t h e t ' r u b b e r s a r e used. 11 - 51. The a d j u s t m e n t p r o c e s s t o changes i n r e l a t i v e p r i c e s and t e chno logy is f u r t h e r p o s t u l a t e d t o be g r a d u a l , f o r s e v e r a l r e a s o n s . F i r s t , a c o n s i d e r a b l e d e g r e e o f u n c e r t a i n t y e x i s t s a b o u t t h e p r i c e p r o s p e c t s f o r n a t u r a l r u b b e r e v e n i n t h e m e d i u tern. The time and costs involved a t t h e manu fac tu r i ng s t a R e i n s h i f t i n g f r o a o n e t y p e o f r u b b e r i n p u t to a n o t h c r imply t h a t , to induce f u l l s u b s t i t u t a b i l i t y , t h e change i n r e l a t i v e p r i c e s plst be expec t ed t o l a s t . T h i s i n t u r n suggeczs t h a t p r ice - induced i n p u t s u b s t i t u t i o n is l i k e l y t o p roceed g r a d u a l l y . The a c c e p t a n c e o f t e c h n o l o g i c a l i n n o v a t i o n s a t t h e manu fac tu r i ng s t a g e Is a l s o l i k e l y to r e q u i r e t i m e . Second, i n s t i t u t i o n a l c o n s t r a i n t s on pr ice - induced i n p d t s u b s t i t u t i o n e x i s t i n t h e r u b b e r p r o c e s s i n g sectors of many c o u n t r i e s . Aside f r o a e s t a b l i s h e d b u s i n e s s r e l a t i o n s h i p s and s u p p o r t f r on t h e W v e r n n e n t f o r t h e ach ievement o f s e l f - s u f f i c i e n c y a s g o a l s , bo th o f which t end t o encourage t h e u s e o f d o m e s t i c a l l y - produced s y n t h e t i c r ubbe r , t h e backuard i n t e g r a t i o n o f l a r g e manufac tu r e r s o f
- - 11 Even I f i t 1 s i iot s t r i c t l y c o r r e c t t o c o n t I d e r ~ y n t h e t i c r ubbe r a s 3 -
homogeneous s u b s t i t u t e f o r n a t u r a l r ubbe r , p a r t i c u l a r l y from the t e c h n o l o g i c a l s t a n d p o i n t , t h i s s i n p l i f i c a t i o n becomes n e c e s s a r y i n t h e market s h a r e model f o r m n t o f d e t a i l e d s t a t i s t i c s o n r ubbe r consumption by type . Were t h o s e s t a t i s t i c s a v a i l a b l e , a more realistic approach w u l d be t o t a k e s p e c i a l t y r ubbe r s f ro? the r o t a ? from ~ h f c h t h e m r k e t s h a r e of n a t u r a l r u b b e r is conputed.

t i r e s and o t h e r rubber productr i n t o r y n t h e t i c rubber production c o n s t i t u t e r t h e nost inpor tan t l i m i t i n g fac to r . For these r e a r o n r , a p a r t i a l a d j * ~ r t m t n t node1 'dab c b o d i e d i n t h e r p e c i f i c a t i o n of t h e market r h a r e equations.
52. Conplete a a r k e t sha re model equa t ionr e r e e r t ima ted f o r North h a e r i c a (NASRvS), Western Egrope (VEKRYS), Japan (JAPNRXS) and o the r indust r i a l i r e d (OIhiYS) and developing c o u n t r i e r (LDCHRHS). A r impler approach vas followed f o r c e n t r a l l y planned economier: e i t h e r t h e n a t u r a l rubber market s h a r e (EEhWS) o r t h e t o t a l demand f o r n a t u r a l rubber (CHINRD) v e r e f i t t e d t o a t i a e trend. Not only i r information on r y n t h e t i c rubber p r i c e s and t echno log ica l d e v e l o p e n t r i n rubber p roce r r ing almort t o t a l l y l ack ing l o r these c o u n t r i e r , hut t h e r t r o n g p o l i c i e r of s e l f - r u f f i c i e n c y they have fo l loued c a r t r e r i o u r doubtr on t h e a p p l i c a b i l i t y of a r e l a t i v e p r i c e s o d e l t o exp la in t h e changer i n t h e i r r h a r e of t h e n a t u r a l rubber market t h a t have occurred i n t h e p a r t . Aside from t h e r e l a t i v e p r i c e e f f e c t , a p a r t i c u l a r e f f o r t war m d e i n t h e c a r e of i n d u r t r i a l i z e d c o u n t r i e r t o cap tu re cho impact of t echno log ica l changer i n rubber p roce r r ing on t h e market rhare*. of ~ t u r a l rubber by t h e u r e of appropr ia te proxy v a r i a b l e r (e.g., t h e markltt pene t ra t ion of r a d i a l t i r e s ) . To account f o r t h e downward h i r t o r i c a l t r end i n n a t u r a l rubber market s h a r e r became of t h e more wlderpread t echno log ica l changrtr t h a t have a f f e c t e d t h e p e r f o r ~ n c e and p rocer r ing c h a r a c t e r i r t i c r 9f r y n t h e t l c rubbers i n the pas t 20 years , A t r end v a r i a b l e ( p o r t u l a t e d t o have a negat ive s i g n ) ME included i n t h e equat ionr f o r North h r i c a , Western Europe, Japan and o t h e r i n d u s t r i a l i z e d and developing coun t r i e r . 11 The demand equationm f o r t h e reven m j o r c o n r d n g aream, a l l e r t i u a t e d Ty ord ina ry l c a r t rquare r and cor rec ted where necersary f o r s e r i a l c o r r e l a t i o n wi th the Y a l l i r procedures, 2/ a r e presented i n Table 9.
From t h e econometric s tandpoint , t h e inc lus ion of a t r end v a r i a b l e has the advantage of reducing t h e poss ible upvard b i a s i n t h e es t ima te of t h e lagged v a r i a b l e c o e f f i c i e n t s . In t h e absence of such a va r i ab le , the h i s t o r t c a l dovnvard t rend i n n a t u r a l rubber market s h a r e s would be captured i n p a r t by t h e lagged dependent v a r i a b l e . This would a l s o b i a s upvard t h e value of the long-term e l a s t i c i t y C o e f f i c i e n t s t h a t a r e i m p l i c i t i n t h e e.juations. From t h e f o r e c a s t h g s t a n d p o i n t , the inc lus ion of a t rend va rzab le does, however, cause some 'problems, s i n c e i ts negat ive s i g n impl ies a b u i l t - i n tendency of n a t u r a l rubber market share t o cont inue t o f a L l , whereas q u a l i t a t i v e a n a l y s i s of market tendencies suggest t h a t n a t u r a l rubber m r k e t sha res a r e more l i k e l y t o s t a b i l i z e than t o cont inue dovnward a t the h i s t o r i c a l r a t e .
21 See ValLis, op. c i t . , pp. 555-567. -


53. Equat ion (3.8) b t l o v c l o r e r t h e da t and b lock o f t h e model: - 11
(3.8) ThXDt - (NARUBDt) (HAYn.YSt) + (h7SWSt) + (JAPRUBD,) (JAPhRySt)
+ (C)IRUBDt) (OI!W!St) + (LDCRUBDt) (LDChX!St)
+ (ERRURD,) (EL!iR!!St) + CHINRDt
TNRD - t o t a l u o r l d d ~ n d f o r r u t u r a l rubber .
54. The r e r u l t r u r l n g t h e u r k e t r h a r e model t a r e q u i t e r a t l r f a c t o r y f o r a l l bu t ona of t ha f l v e u j o r c o n s m l n g r eg ion r . The c o e f f i c l e n t r of t h e r e l a t l v e p r i c e r a r i a b l e had t h e expec tad n e g a t l v e r l g n and ta re r t a t i r t i u l l y h i g h l y r i g n l f l c a n t . S i o l l a r l y , t h e coefficients of t h e v a r l a b l e r uoed t o proxy technological d a v e l o p a n t r tare r l g n i f l c a n t and c o r r e c t i n r l g n . The e x p l a ~ t o r y yovr r of t h e e r t k t e d e q u t i o n r u r a l r o q u i t e high. The l e r r r a t l r f a c t o r y r e r u t r t a r e o b t a i n e d v i t h t h e e q u a t i o n f o r " o t h e r i n d u r t r l r l i z e d c o u n t r l e r , " p r o b h i y b e a u r e of t h e minimal r u i t a b i l i t y of t h e p r l c e v a r l a b l e r t h a t had t o be uued i n e r t i u t i n g t h e n a t u r c i r u b k t u r k e t r h a r e e q u a t i o n , g iven t h e l ack o f c o n r i r t e n t i n f o t v t i o n conce rn ing t h e n a t u r a l and r y n t h e t i c rubbe r p r l c e r p a i ~ by u n u f a c t u r c r r i n t h e r e c o u n t t i e r .
5 5 . The v a l u e s o f t h e s h o r t - t e r n u r k e t s h a r e e l a r t i c i t i e r r ~ r i z e d i n Table 1 0 w r e r e a r o n a b l e and conformed v l t h e x p e c t a t i o n r . Iha mean e 1 a r t i c ; t y v a l u e r ranged from .13 and .18, w l l i n l i n e wi th t h e not:on-confinned by d i r e c t a ~ l y r i s o f t h e rubbe r p roces s ing indur t ry- tha t i n t h e s h o r t t e r n , a change i n r e l a t i v e p r i c e s h a s o n l y a -11 i n f l u e n c e on t h e d e c i s i o n t o ehoose one rubber i npu t o v e r ano the r . On t h e o t h e r hand, t h e v a l u e r of t h e long-term nmrket s h a r e elasticities w r e open t o some doubt . Vh i l e g e n e r a l l y rm~ch h l g h e r :han--urual ly doublt-the shor t - te rm v a l u e s and r e l a t i v e l y l a r g e r f o r wes tern Eurcpe than f o r t h e United S t a t e r and Japan , t h u s conforming t o a - p r i o r 1 not ions-they e r e n o t a s h igh a s uas expec ted . The long- te rn e l a s t i c i t y v a l u e s & c t u a l l y ranged from .25 t o .46, uhereas v a l u e s c l o s e t o u n i t y r u l d have been c l o s e r t o e x p e c t a t i o n s . Desp i t e t h e e f f o r t s made t o f i n d a p p r o p r i a t e s p e c i f i c a t i o n s f o r t h e market s h a r e e q u a t i o n s and t o minimize t h e ser ial c o r r e l a t i c n p r o b l e m l m p l i c i t i n t h e f u n c t i o n a l s p e c i f i c a t i o n t h a t MS chosen, t h e con f idence bands around t h e e s t i a m t e d long- te rn e l a s t i c i t i e s must s t i l l be cons ide red q u i t e I l r g e .
- 11 As p r e v i o u s l y mentioned, n a t u r a l rubber emand i n China (C!:INRD) uas -
simply f i t t e d t o a t ime t r e n d : P -
R = 0.98 S.E.E. = 8.18

T a b l e 10: NATURAL RUBBER M E T SHARE EUSTICITIES
Count ry /Region P r i c e E l a s t i c i t y o f W r k e t P r i c e E l a s t i c i t y o f Z b r k e t Sha re , S h o r t - T - r ~ / a - S h a r e , Long-Term - / b
North America -18. Western Europe .13* J a p a n -14. O the r I n d u s t r i a l i z e d C o u n t r i e s .005 Dtve lop ing Count t ies .18*
* S i g n i f i c a n t a t t h e 95 p e r c e n t c o n f i d e n c e l e v e l o r above.
a Z s t j a a t e d a t t h e m a n o t t h e r e l e v a n t va r i abLes . - / b O b t a l n t d by d i v i d i n g t h e s h o r t - t e r m e l a s t i c i t y v a l u e by t h t o f t h e -
a d f u s t w n t c o e f f i c i e n t .
0. Stock and P r i c e E q u a t i o n s
56. The f o u r ma jo r m r k e t s I n which n a t u r a l r u b b e r is traded-Heu York, London, S ingapo re and Itrula t u p l r - a r e c l o r e l y l i n k e d , a n d p r i c e m v e r r n t r i n a l l f o u r a r e h l g h l y c o r r e l a t e d . The Neu York p r i c e u a r c h o s e n h e r e as r e p r e s e n t a t i v e , o n l y t o conform v i t h t h e long- tanding World bank p r a c t i c e c,f q u o t i n g n a t u r a l r u b b e r p r i c e s , c.1.f. New York. Any of t h e o t h e r t h r e e m a r r e t p r i c e s might have been chosen , v l t h o u t any a p p r e c r a b l e d i f f e r e n c e .
57. Apar t from t h r e e fac tors - rke t e x p e c t a t i o n s , which may be a f f e c t e d by t h e p r o s p e c t s o f s t r i k e s i n t h e major r u b b e r - c o ~ u d a g r e c t o r s ( e s p e c i a l l y au tomob i l e and t ires); t r a n s p o r t d i f f i c u l t i e s ; and p o l i t i c a l u n c e r t a i n t i e s i n p roduc ing count r ies - two a a j o r f a c t o r % a f f e c t t h e s h o r t - t e n p r i c e movements o f n a t u r a l rubber : changes i n i n v e n t o r i e s and changes i n i n f l a t i o n rates. I n t h e l o n g te rm, however, p r i c e smvements are l a r g e l y d e t e r m i n e d by t h e t r e n d i n s y n t h e t i c r u b t e r p r i c e s . The l a t t e r f i x t h e c e i l i n g and f l o o r w i t h i n which n a t u r a l r u b b e r p r i c e s are expec t ed t o f l u c t u a t e . 1/ The long-term pr ice : e x p e c t a t i o n s o f n a t u r a l r ubbe r u s e r s a r e g r e a t l y Tn f l uenced by t h e t r e n d 4 o f s y n t h e t i c r ubbe r p r i c e s , which, g i v e n t h e s t r u c t u r e and t h e p r i c i n g behav io r o f t h e s y n t h e t i c rubber i n d u s t r y , c a n be c l o s e l y a p p r o x i n a t e d by t h e tress i n t h e c o s t s o f t h e m a r p e t r o c h e d c a l i n p u t s . S - 58. tb w i t h uany o t h e r p r i a a r y c o m o d t t t e s , i n f o m a t i o n on n a t u r a l r ubbe r s t o c k s ts i n c o a p l e t e and n o t ve ry r e l i a b l e . The e f f o r t s made by t h e I n t e r n a t i o n a l Rubber S tudy Croup t o a s s e n b l e and k e e p upda t ed a set o f d a t a on
1/ SBR p r i z e s a t t h e bot tom and I R p r i c e s a t t h e top . -

s t o c k s have not y e t been f u l l y s u c c e s s f u l . Inventories of n a t u r a l rubber a r e kept by producers , t r a d e r s and rubber p roces so r s . I n t h e p a s t , governments have a l s o h e l d s t o c k s f o r s e c u r l t y reasons . l%e U.S. s t r a t e g i c s t o c k p i l e , n w e x h a u s t e d , was by f a r t h e ws t I n p o r t a n t . To account f o r t h e e f f e c t t h a t changes i n t h e l e v e l of s t o c k s have on n a t u r a l rubbe r p r l c e s , a time s e r i e s o f " lnp l l ed" s t o c k * was b u l l t , beglnnlng i n 1948, r a t h e r t h a n r e l y l n g on t h e r v n l l a b l e published d a t a . Taklng t h e r e p o r t e d s t o c k l e v e l o f 1948 a s t h e s t a r t i n g p o i n t , s t o c k changes were c a l c u l a t e d f o r e a c h y e a r f o l l w i n g 1948 by s u b t r a c t lng t o t a l n a t u r a l rubber d i s a p p e a r a n c e 3 f r on t o t a l availability. A1
59. The s t o c k v a r i a b l e v a r e n t e r e d i n t h e p r i c e e q u a t i o n i n t h e f o r n o f a r a t l o between t h e a b s o l u t e l e v e l s of ~ r l d l n v e n t o r i e r and conruapt lon . I t was expec t ed t o s h w a n e g a t i v e slgn--1t l a , i n t h e o p i n i o n of t h e a u t h o r r , pnre r ea sonab le t o expec t t h a t p r i c e r ( o r t h e i r change r ) a r e i n f luenced by a lpeasure t h a t r e l a t e s l ~ v e n t o r l e s t o market need than by t h e a b r o l u t e l e v e l r ( o r by changes i n t h e l e v e l s ) o f l n v c n t o r l e r . T h i s h y p o t h e s i s u a r s t a t l s t l c a l l y conf l r n e d by t h e n u w r o u s e x p t r l m e n t r conducted i n s p t c l f y l n g t h e p r l c e e q u a t i o n s f o r n a t u r a l rubber .
60. Three o t h e r e x p l a n a t o r y v a r l a b l e r were u red i n t h e p r i c e equa t ion : t h e lagged p r i c e of n a t u r a l rubber , s y n t h e t i c rubber p r i c e r and a drnrny v a r i a b l e f o r t h e 1973 o i l c r i r i r ; a 1 1 were expec t ed t o r h w a p o s i t i v e s i g n . S y n t h e t i c rubber p r i c e s 31 w r e e n t e r e d a s a n exogenouq v a r i a b l e t o account f o r t h e i n € luence e x e r t e a on n a t u r a l rubbe r p r i c e s by t h e i r t r e n d , vh i ch , g iven t h e c o m p e t i t i v e r e l a t i o n s h i p between n a t u r a l and s y n t h e t i c rubbe r s , b t cones a c r i t i c a l f a c t o r i n shap ing t h e l ong - t e rn p r i c e e x p e c t a t i o n s o f n a t u r a l rubber u se r s . F i n a l l y , a duony v a r i a b l e f o r 1973 van inc luded i n t h e p r i c e e q u a t i o n t o c a p t u r e t h e s h o r t - t e n a impact o f t h e o i l c r i s i s on t h e p r i c e o f n a t u r a l rubber . The changes i n n a t u r a l rubbe r p r i c e r which occu r r ed i n 1973 and 1974 cannot be exp la ined f u l l y v i t h o u t t a k i n g i n t o account t h e impact of e x p e c t a t i o n s g e n e r s t e d by t h e o i l c r i s i s . The dependent var iab le- - the
11 Consumption p l u s pu rchases f o r s t r a t e g i c s t o c k p i l i n g . - I P roduc t ion p l u s s a l e s f r oo s t r a t e g i c s t o c k p i l e s . - 3 The U.S. e x p o r t u n i t va lues f o r SBR were t aken a s a proxy f o r world SBR -
p r i c e s . When t h e United S t a t e s dominated t h e p r&duc t ion and t h e r e f o r e t h e p r i c e d e t e n a i n a t i o n of SBR, t h e u s e o f t h i s -.
O%
had s t r o n g j u s t i f - i c a t i o n . Froa t h e l a t e 1960s onward, hovever , t e r e l a t i v e p o s i t i o n o f t h e United S t a t e s i n t h e v o r l d p roduc t ion of SBR weakened c o n s i d e r a b l y , and t h e r e p r e s e n t a t i v e n e s s of i t s e x p o r t u n i t v a l u e s h a s become ques t ion - a b l e . The e m p i r i c a l ev idence t h a t v a s g a t h e r e d f o r t h i s s t u d y , though i n c o n p l e t e , s u g g e s t s t h e U.S. p r i c e s a r e s t i 11 q u i t e r e p r e s e n t a t i v e . ':rvc.rtheless, n n r e LVT'~. is zeeded i? t h i s f l c l d t o b u i l d , a t r h c l e a s t , n s e r i e s o f U.S., European and Japanese p r i c e s a s a n o r e r e p r e s e n t a t i v e Lndica tor of v o r l d S B R p r i c e s .
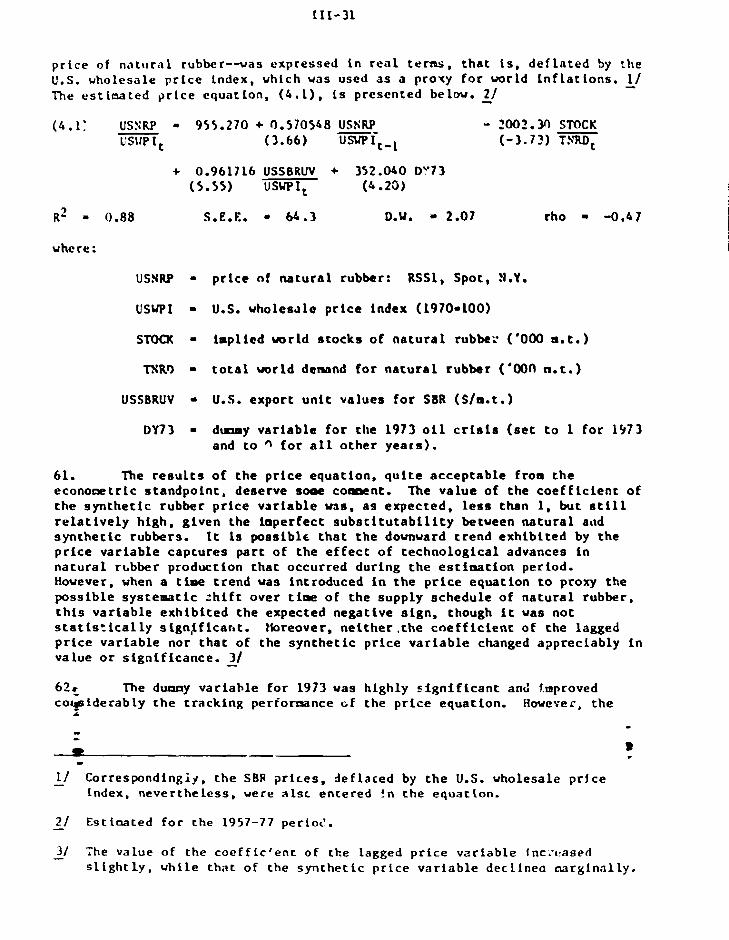
p r l c e of n a t i ~ r a l U.S. who le sa l e pc The e s t l a a t e d p r l
rubber--was e x p r e s s e d i n r e a l terra?;, t h a t is , d e f l a t e d by t h e i c e i ndex , which v a s used as a proxy f o r w r l d i n f l a t i o n s . 1/ - c e e q u a t i o n , ( 4 . 1 ) , I s p r e s e n t e d b e l w . - 2/
+ 0.961716 USSBRW + 352.040 DV73 0 . 5 5 ) USUPI, (4.20)
fZ2 - 0.88 S.E.E. - 64.3 D.U. - 2.07 rho - -0.47
USNRP - p r i c e nf n a t u r a l rubber : RSS1, S p o t , H.Y.
USUPI - U.S. who le sd l e p r i c e i ndex (1970-100)
STOCK - impl ied u o r l d s t o c k s o f n a t u r a l rubbe: ( '000 a.t.1
lNR9 - t o t a l v o r l d denand f o r n a t u r a l r u b b e r ( '000 n. t . )
USSBRUV - U.S. e x p o r t u n i t v a l u e s f o r SBR (S1a. t . )
DY73 - d m o y v a r i a b l e f o r t h e 1973 o i l cr is is (set t o 1 f o r 1973 and to f o r a l l o t h e r y e a r s ) .
61. The r e s u l t s o f t h e p r i c e e q u a t i o n , q u i t e a c c e p t a b l e f r o a t h e e c o n o n e t r i c s t a n d p o i n t , d e s e r v e s o o e c o m e n t . The v a l u e o f t h e c o e f f i c i e n t o f t h e s y n t h e t i c r u b b e r p r i c e v a r i a b l e was, a s e x p e c t e d , less t h a n 1, b u t s t i l l r e l a t i v e l y h i g h , g i v e n t h e i a p e r f e c t s u b s t i t u t a b i l i t y between n a t u r a l a t ~ d s y n t h e t i c r ubbe r s . I t Is p o s s i b l e t h a t t h e downward t r e n d e x h i b i t e d by t h e p r i c e v a r i a b l e c a p t u r e s p a r t o f t h e e f f e c t o f t e c h n o l o g i c a l advance^ i n n a t u r a l r bbbe r p r o d u c t i o n t h a t o c c u r r e d d u r i n g t h e e s t i o a t i o n pe r i od . However, when a t h e t r e n d was i n t r o d u c e d i n t h e p r i c e e q u a t i o n to proxy t h e p o s s i b l e s y s t e m a t i c t h i f t o v e r t i m e o f t h e s u p p l y s c h e d u l e o f n a t u r a l r u b b e r , t h i s v a r i a b l e e x h i b i t e d t h e expec t ed n e g a t i v e s i g n , though i t was n o t s t a t i s : i c a l l y s i g n $ f i c a r t t . ? lo reover , n e i t h e r . t h e c n e f f i c i e n t o f t h e lagged p r i c e v a r i a b l e n o r c h a t o f t h e s y n t h e t i c p r i c e v a r i a b l e changed a p p r e c i a b l y i n v a l u e o r s i g n i f i c a n c e . - 31
6 2 r The dtlsny v a r i a b l e f o r 1973 was h l g h l y s i g n i f i c a n t and Lmproved c o G i d e r a b l y t h e t r a c k i n g perio-nce c;E t h e p r i c e e q u a t i o n . Houcver, t h e
1/ C o r r e s p o n d i n g i j , t h e SBR p r i c e s , d e f l a c e d by t h e U.S. whole sa l e p r f c e - i ndex , n e v e r t h e l e s s , were a l s c e n t e r e d !n t h e e q u a t i o n .
2 1 E s t l ~ a t e d f o r t h e 1957-77 perloc!. - 31 The v a l u e of t h e coef f i c ' e n t o f t h e lagged p r f c e v a r i a b l e fnc.-c:ased -
slightly, v h i l e t h a t of t h e synthetic p r l c e v a r i a b l e d e c l i n e a n a r g i n a l l y .

geocetricaLLy dec l i n ing lag s t r u c t u r e i a p l i c i t i n the equation neans that DY73 a f f ec t ed na tu r a l robber p r i c e s 57 percent as nuch i n 1974 than i n 1973, 32 percent as mch i n 1975, 18 percent a s m c h in 1976, and 10 percent a s nuch i n 1977 and s o on, Th i s t i n e pa t t e rn f i t u expec ta t ions , i n so f a r as i t a h w s t h a t a good deal of the impact of the 1373 o i l c r i r i s on na tu r a l rubber p r ices continued t o be f e l t i n 1976 and 1975. l~oucvcr, t he quan t i t a t i ve d i s t r i b u t i o n of the impact, imp l i c i t i n t h e lag s t r u c t u r e of the equat ions , cannot be precisely j d g e d , v h i l e the length of t he d i s t r i b u t i o n r a l s e s a t l e a s t somo doubte.
63. The following equat lon, ( 4 .i I , which de te rn ines t he "implied" na tura l rubbar s tocka, vas used t o c loee tha modal,
SMCK - w r l d e tocks of ~ c u r a l rubber ('000 a . t . )
MRS - t o t a l w t l d producclon of n a t u r a l rubber ( '000 a.t.1
T?FtD - t o t a l w r l d dcarnd .or n a t u r a l rubber ('000 o.t.)
SIDCICSL - s a l e s f r o a stockpiles ('000 m.t.)
S-PR = purchases for stockpiles ('000 o.t.).

111. VALIDATION Of ME HDDEL, POLICY SI.WUTIONS AVD FORECASTING
A. V a l i d a t i o n of t h e Hodel
6 4 . The node1 was s l n u l a t c d f o r t h e e n t i r e p e r l o d 1957-77 and f o r s e v e r a l sub-per iods . Thc r e s u l t s of t h e ex-post dynanlc s l o u l a t l o n s r e g a r d i n g t h e key v a r i a b l e s of t h e m d e l (world c i a s t o a e r demand, w r l d n a t u r a l rubber demand, w r l d n a t u r a l rubbe r supply and n a t u r a l rubbe r p r i c e s ) f a r t h e 1957-77 pe r iod a r e shovn g r a p h l c a l l y i n C h a r t s 3 and 4. The n a l n statistics of t h e s i m u l a t i o n are arrrrrsrlzed i n Tab le 11. A/
Table 11: SWHCLRY RESULTS OF IIiE tiISTORICAL SIWLATIONS OF nlC HoDCL
Variabiam Uorld Elas tomer t k r l d MR l io r ld NR
S t a t 1 s t l c s D e o a ~ Oc~tend supply HR P r l c e (TRURD) (m) (TNRS) (USPNR)
1957-77 ~ c t u a l d a t a ) Hean ( s imu la t ed d a t a ) RSE /a RHSE ( i n 2 ) - 1969-77 Hean ( a c t u a l d a t a ) Wean ( s i m r l a t e d d a t a ) RMSE /a RHsE ( i n 2 ) -
/a Root-mean-square e r r o r . -
6 5 . The r e s u l t s of t h e u i t h i a - s a n p l e s h l a t i o n s i n d i c a t e t h a t t h e s t r u c t u r e o f t h e w d e l is sound. Ihe w d e l c a p t u r e d r a t h e r w e l l t h e djnamics o f t h e world r u b b e r economy ove r a per iod o f more t h a n 20 years . 'qe model's good pe r fo rnance is c lecr r ly shown by its a b i l i t y t o c a p t u r e t h e t ref id and most cF t h e t u r n i n g - p o i n t s i n world denand and supply of n a t u r a l rubber .=l / P a r t Lcu la r ly n v e w o r t h y is t h e p r i c e - t r a c k i n g performance of t h i s W a t i v e l y -
11 The Gauss-Seidel a l g o r i t h n was used f o r s o l v i n g t h e node l . -
2 / T h i s pe r fo rnance is c l e ~ r l y s u p e r i o r t o t h a t of tl.e p rev ious v e r s i o n of - t h e node 1, which showed c o n s i d e r a b l e underesc iaat i o n of t h e denand f o r t::. Jnd of supp ly i n 1973-74.

57 59 61 63 65 67 69 71 73 75 77
YEARS

Chart 38
HISTORICAL SIMULATIONS OF THE MODEL, 1957-77 '000 MT WORLD NATURAL RUBBER DEMAND CTNRD) 3,800
-ACTUAL w - - - - * S W L A T W
3,300-
3,000-
2,600-
- - *
57 59 61 63 65 67 69 71 73 75 77
YEARS

YEARS
HISTORICAL SIMULATIONS OF THE MODEL, lS7-77 '000 MT WORLD NATURAL RUBBER .SUPPLY CTNRS) 4,000 A
-ACTUAL M- --* m u T W
3,588-
3,880-1
2,588-
- -
1,500
- - * -
I I I I I I I I I I I 11.' 57 59 61 63 65 67 69 71 73 75 77

WSTORICAL SIMULATIONS OF THE MODEL, 1957-77 USS/MT NATURAL RUBBER PRICE CUSPNR)
940 -ACTUAL M- - - - * S m T E D 898-
I
540-. - -
490 - i & - - *
440 -- ..
3 Q ~ , l l l l l , l l l l 1 l l l l l , , , I
57 59 6 63 65 67 89 71 73 75 77
YEARS

sum11 model. l h ~ r i n g t h e 1957-77 per iocl , i t p i c k c d up t h e p r i c e peake o f 1959- 6 0 , 1973-74 and 1976-77, a s e l l i t t i t h e t r o t ~ g h s o f 19h4 , 1972 a n d 1975. Only d u r i n g t h e 3967-68 p e r i o d was I t s p r i c e p z r f o m i n c e u n s n t i s f a c t o r y , b u t t h i s was b e c a u s e o f t h e i ~ b i l i t y o f t h e e s t 1 n ; r t e d p r i c e e q u a t i o n t o c a p t u r e t h e market p r i c e b e h a v i o r o f n a ~ ~ ~ r a l rutr3c.r I n t ~ u y c n r s when t h e marke t was s t r o n g l y i n f l u e n c e d by a s t r i k e i t t U.S. p o r t s a n d l a b o r p rob lems I n t h e U.S. t i r e I n d u s t r y . The root-=an-~quirr l r p c r c c n t c r r o r o f t lrc s i m u l a t e d p r i c e s (0 .08) virs r n t h c r s m l l , I n view of t h e i n s t a b i l i t y o f t h e p r i c e o f n a t u r a l r u b b e r d u r i n g t l tc 21-yeirr s i m l . p t i o n p e r i o d .
66. Uhcn t h e model u a s s i n u l n t c d l o r s h o r t e r t l m c s p a n s toward t h o e n d o f t h e e s t i m t i o n p e r i o d , t h c r e s u l t s i o p r o b c d f u r t h e r . 7 h l e I s c l e a r l y s h w n by t h e s t n t i s t i c s f o r t h e d y n a n l c e i n u l n t i o n o f t h e model f o r 1969-77, c o n t a i n e d I n T a b l c 11. U I t h r e s p e c t t o t h e 1955-77 s i c u l n t i o n e , t h e roo t -oean-square p e r c e n t e r r o r s f o r t h e f o u r k e y variables--fRUBD, TNRD, TSRS and USNRP-were a l l lwer . The r o o t a e a n - s q u a r e p c r c c n t c r r o r o f t h e p r i c e v a r i a b l e became 0.047, r e f l e c t i n g t h e e x c e l l e n t p r i c e - t r a c k i n g p e r f o r n a n c e o f t h e n o d e l i n t h e l a s t n i n e y e a r s o f t h c e s t i m t i o n p e r i o d .
8. P o l i c y S i m l l n t I o n s a n d F o r e c a s t I n q
67. S e v e r a l h i s t o r i c a l p o l i c y s i a r 1 ; l t i o n s u:re r u n w i t h t h e model t o t e s t , I n t e r a l i a , t h e i n f l u e n c e o f e x c h a n g e rates and t a x a t i o n p o l i c i e e o n t h e s u p p l y a n d p r i c e s o f n a t u r a l r u b b e r I n t h e m i n p r o d u c i n g c o u n t r i e s . - 11 The r r s u l t s , n o t s h w n h e r e , i n d i c a t e t h a t f rom t h e s t a n d p o i n t o f marke t c o n p c t i t i v e n e s s , t h e exchange r a t e p o l I c i e s o f t h r l a r g e p roducers - -Malays ia a n d Indonesia--have d a a i g e d t h e marke t f o r n a t u r a l r u b b e r i n s o f a r a s t h e y h a v e l i m i t e d s u p p l y and r a i s e d t h e ~ r k e - p r i c e . T h i s was more t h e c a s e i n t h e mid t o la te 19709, when t h e a p p r e c i a t lor o f t h e .%lays ian c J r r e n c y v i s - a - v i s t h e U.S. d o l l a r ( p r o b a b l y u m v o i d a b l c ) and t h e s t a b i l i t y o f t h e I n d o n e s i a n exchange rate i n t h e p r e s e n c e o f s t r o r , g d i f f e r e n t i a l s between d o m e s t i c a n d i n t e r n a t i o n a l i n f l a t i o n reduced t h e p r o d u c t i o n o f n a t u r a l r u b b e r i n t h e small- h o l d e r s e c t o r s , making t h i s p r o d u c t less c o m p e t i t i v e t h a n i t would have o t h e r w i s e been v i s - a - v i s s y n t h e t i c r u b b e r s .
C
68. The n o d e l u a s z l s o u s e d t o f o r e c a s t n a t u r a l r u b b e r p r i c e s i n t h e n e d i u n term. I n t h e c a s c o f n a t u r a l r u b b e r , a s s i g n i n g v a l u e s to t h e key exogenous v a r i a b l e s o f :he w d e l (economic a c t i v i t y , e x c h a n g e rates, s y n t h e t i c r u b b e r p r i c e s a n d t e c h n o l o g i c a l v a r i a b l e s ) was more complex t h a n u s u a l . Deaand d e p e n d s c l o s e i y o n t h e pace o f economic a c t i v i t y a n d o n s y n t h e t i c r u b b e r p r i c e s , which are i n t u r n d e t e r n i n e d by p e t r o l e u m p r i c e s . S i n c e c h a n g e s i n t h e l a t t e r h a v e a n i n p a c t o n t h e r a t ; o f economic a c t i v i t y i n t h e n a i n c o n s u n i n g c o u n t r i e s , he v a l u e s o f t h e s e e b g e n o u s v a r i a b l e s c o u l d n o t be set i n d e p e n d e n t l y o f c a c h o t h e r d u r i n g t h e fore;as t p e r i o d .
69. To a s s i g n c o n s i s t e n t s c e n a r i o v a l u e s t o p e t r o l t u n p r i c e s , s y n t h e t i c r u b b e r p r i c e s and r a t e s o f e c o n o n i c a c t i v i c v , s v s t e n a t i c l i n k between t h e n had t o be e s t a b l i s h e d and r e s p e c t e d . The n a t u r c of t h e s u p p l y e q u a t i o n s
1/ Exchange r a t e s and t a x e s e n t e r e d t h e n o ~ i e l exogrnr*ls l :q t h r o u g h t h e - prodcrccr p r i c e v a r i a b l e s used i n t h e n . i t u r a l r l lbber s u p p l y e q u a t i o n s .

i n c l u d e d i n t h e n o d e l , moreover , d l d n o t a l l w a forecasting o f n a t u r a l r u b b e r p r o d ~ , c t l o n f o r o o r e t h a n 5 t o 6 y e a r s beyond t h e e s t l e m t l o n p e r l o d . A f o r e c n s t l n g h o r i z o n of s l x y e a r s (1978-83) was, t h e r e f o r e , chosen . For t h e y e a r s 1978 and 1979, a c t u a l ct s t 1 m : e d y e a r l y v a l u e s w e r e u s e d f o r t h e exogenous v a r l n b l e s . Beyond 1979, t h e v a l u e s o f t h e k e y exogenous v a r l a b l e e were d e t e r m i n e d u s l n g t h e UEFA/SRl w o r l d econometric model . I / T h l r model wae s l m u l n t e d u s i n g t u o a l t e r n a t i v e p e t r o l c u r p r l c c s f o r t h e 1980-83. The projected r a t e s o f e c o n o a l c a c t l v l t y I n t h e ~ j o r l n d u e t r l a l i z c d r u b b e r c o n s u n i n g , ~ r e , ~ s and i n d c v c l o p l n ~ c o u n t r l e s were t h e n m d e c o n s i s t e n t w i t h t h e two p ~ t r o l e i m p r l c e sccnar:-s. Because o f t h e e n o r a o u s d i f f l c u l t l c s l n v o l v c d i n a s u e s s l n g t h c impac t of d l f f c r e n t p e t r o l c t m p r i c e t r e n d s on t h e c c o n o a i c pcrforrrmncc o f c e n t r a l l y p lanned c c o n o a l e s , o n l y o n e cconomic a c t i v i t y s c e n a r i o u a s u s e d f o r E a s t e r n Europe a n d USSR.
70. To g o f rom c r u d e o i l p r l c e s t o s y n t h e t i c r u b b e r p r i c e s , a n e n g l n e e r - i n g c o s t f u n c t l o n d e v e l o p e d i n a p r e v i o u s U o r l d Bonk s t u d y o f r u b b e r 2/ was used . T h i s n l l o u e d a s y s t c p n t i c l l n k between c r u d e o i l p r i c e s a n d SBF c o s t s t o be e s t a b l i s h e d . P r i c e s o f SBR were a s s u n e d t o move p a r a l l e l w i t h c o s t s Ln a l l c o n s u n i n g a r e a s . T h i s a s s w p t i o n was somewhat u n s a t i s f a c t o r y , g l v e n t h r t d e x i n d f a c t o r s a r e b e l i e v e d t o p l a y a r o l e i n d e t e m i n i n g m a r k e t p r i c e s i n t h e s y n t h e t i c r u b b e r m r k e t , h e r e a mark-up t y p e o f p r i c e b e h a v i o r is p r o b a b l y p r e s e n t . ?/ W w e v e r , by a c c e p t i n g t h i s a s s ~ m p t i o n , i t was hoped t h a t a t least t h e t r e n d I n s y n t h e t i c r u b b e r p r i c e s c o u l d be c a p t u r e d . Exchange rates f o r t h e p r o d u c i n g c o u n t r i e s u e r e a s s m e d t o remain c o n s t a n t a t t h e i r estimated 1979 l e v e l . The v a l u e s o f t h e t e c h n o l o g i c a l v a r i a b l e s (e.g. , r a d i a l t l r e p e n e t r a t i o n r a t i o s ) a s s u o e d f o r t h e f o r e c a s t p e r i o d s w e r e o b t a i n e d from i n d u s t r y s o u r c e s .
71. The s l n o l r t i o n s o f t h e a o d e l o u t s i d e t h e e s t i m a t i o n samplr: u e r e s t a r t e d i n 1977. The r e s u l t s i n d i c a t e a c l e a r l y r i s i n g t r e n d i n t h e real p r i c e o f n a t u r a l r u b b e r b e g i n n i n g i n 1979 a n d l a s t i n g u n t i l 1982, when t h e rise i n n a t u r a l r u b b e r p r i c e w i l l p r o b a b l y l e v e l o f f . U r ~ d e r t h e f i r s t s c e n a r i o , t h e real p r i c e o f n a t u r a l r u b b e r would r e a c h USS670/a.t. i n 1983 , f r o n a n e s t i l n a t e d USS55Oln.t. i n 1978. Under t h e s e c o n d s c e n a r i o , n a t u r a l r o b b e r p r i c e s ( i n rca? t e r m s ) w u l d r e a c h s l i g h t l y h i g h e r l e v e l s i n 1983. The r e s u l t s i n d i c a t e t h a t t h e upward p r e s s u r e o f t h e assumed r ise i n r e a l p e t r o l e m p r i c e s on t h o s e o f n a t u r a l r u b b e r u o u l d n o r e t h a n compensate f o r t h e s i n u l t a n e o u s downward p r e s s u r e o n r u h b e r demand. - - 72. 2 The r e s u l t s o f t h e f o r e c a s t < c o n d u c t e d t h r o u g h t h e model show a ra the r ' f a v o r a b l e mediun- te rn o u t l o o k f o r n a t u r a l r u b b e r . Y e t t h e y a r e s u b j e c t t o o o r c q u a l i f i c a t i o n s t h a n is u s u a l l y t h e c a s e , g i v e n t h e u n c e r t a i n t i e s - s u r r o t d i n g a s s w e d v o r l d n a c r o e c o n o n i c s c e n a r i o s and t h e complex l i n k s t h a t - .
1 1 \41nr ton C c o n o n e t r i c Forec ; l s t ing A s s o c i a t e s , Inc . a n d SRZ I n t e r n a t i o n a l , - l l o r l d E c o n o n e t r i c !:odel, V e r s i o n 1.1. --
21 Scc C r i l l i , x \ g n s t i n i a n d l k l v n a r s , op. c i t . , pp. 85-96. -
31 The a u t h o r s of t h i s p a p e r a r e e x p l o r i n g t h c p o s s i b i l i t y of i n c l u d i n g i n - t h e model n s p e c i f i c nark-up f u n c t i o n f o r s y n t h e t i c r u b b e r p r i c c s .

exist between pe t ro leum p r i c e s , e c o n o d c a c t i v i t y i n rubber-consuming c o u n t r i e s and n a t u r a l r u b b e r p r i c e s . Moreover, w h i l e t h e a u t h o r r b e l i e v e t h a t t h e model p rov l d e s r e a s o n a b l e a n s u c r s , t h e r e s u l t s of t h e f o r e c a s t i n g e x e r c i s e s h o u l d s t i l l b e t a k e n a s p r e l i d n a r y , i n p a r t because o f t h e l i m i t e d m o u n t o f e x p e r i m e n t i a g t h a t t h e y e r e a b l e t o d o w i t h t h i s r e v i s e d v e r s i o n o f t h e rubbe r model.


The a u t h o r s w l s h t o thank t h e l r fo rmer c o l l c a g r ~ c s I n t h e Development R.:search C e n t e r a n d t h e Economlc A M I y s ~ s and Pro J c c t l o p a Department o f t h e ' i o r l d Bank who c o t m e n t e d o n t h l s paper . They a l s o w l s h t o e x p r e s s t h e l r o p p r e c l a t l o n t o t h e p a r t l c l p a n t s l n t h e S m l n a r o n P l a n n l n g I s s u e s o n N a t l o n a l R e s o u r c e s , h e l d a t t h e World knlr I n December 1977, and i n t h e C o d l t y ! b d e l l n g Seminar, h e l d I n Aarhus, Dcnrark , l n December 1979, uho r e v l e w d t h l s paper . Flna11. t h e y w l s h t o acknocrledge t h e u s e f u l n e s s o f t h e c o P p e n t s r e c e i v e d from t h r e e a n o n p o u s r e f e r e e s who rev lewed t h e p a p e r b e f o r e I t s p u b l l c a t l o n l n t h e World tank S t a f f Working P a p e r serles.
T h r e e o f t h e f o u r co-authors o f t h i s p a p e r a r e n o l o n g e r employed by t h e World Bank. Mr. J o c k Anderson 1s u l t h t h e U n l v e r s l t y o f Neu England, A r d d a l e , h u s t r a l l a ; Hr. Charles B l l t z e r 1s 4 t h t h e US I r t e r ~ t l o ~ l Development and C o o p e r a t l o n Agency; Hr. Toa C a u c h o l s is a t t h e M a s s a c h u s e t t s I n s t i t u t e o f ' t echnology .

Pig.
Introduction ........................................ 1
................................. . 11 SLIPPLY OF RAW m E 6
I f f . T K E ) ( A I L I I E t S f O R m A m ) m a m s ................ 11

U C I ~ o i tnc- Lcy ob j r . c t l . . r . s o i t h e > r ~ . p d s r d !iew I n t e r n c l t l o n n l k o n o m i c O r d e r t w s been t o s t r c n g t l r e n t h e p s i t l o n of d c : e l o p i n g c o t i n t r i e s i n m a r k e t s f o r t r a d e d r r Laary p r o d u c t s . In l n t c r n a t l o ~ l f o r i r a s t h e a c c o u n t r lcs , o f t e n syw.bklnh 3 s t h e C r ~ u p o f 77 , h a v e dtrrnncicd l n c r c a s c d s t a b i l i t y , c q u i t a b l c pr l : e s ano m c a n t n g f u l c ~ n t r o l a:er t k l r r c s o c r c c s . AS t h e p r i n c i p a l i n t c r n n - t l o n c l l n e c t r a n l s f o r ochle;.lng a t l c o s t o a r k c t s t a b i l i t y , a Cootraon Fund, : 1n.lnc t n ~ a s r r l e a o f b u f i e r s t o c k p r o g r m s , was p r o p o s e d . 11
burirrl; t h e ~ 1 s t f l v c } o a r s , l e q t h y t c c h n l c a l d i s c u s s i o n s h a v e bt.c.n h e l d on t h c p r l c c ~ t n b l l l z a t l o n f o r a c o r e g r o u p o f c o m m o d i t i e e , j u t e a o o w t t i r c . J u t e a n d j u t e p r o d u c c s h a v c b e e n ~ t e a d i l y l o s i n g m a r k e t s t o s > n t t l r t l c s i r b a t l t u t c s s l n c c t h e 1960s and t h e a c c e p t e d v l s d m 1 s t h a t , o v e r t l m c D YUPPI y l n s t n b l l i t y h a s g e n e r a t e d Lnrgc m a r k e t p r l c c f l u c t u a t i o n s , wh ich h a v e r t t e ru1a t r . d t h c s e a r c h f o r d c n r r s t i c n l l y p r d u c c d s u b t ~ t l t u t e s i n t h e l n d u s t r l a 1 1zr.d c o u n t r lcs. z / I n t h i s p a p e r , we i n v c s t l g a t c b o t h ' t h o s o u r c e s of this sup?L;* l n s t a o l l l t y a n d t h e p o t e n t i a l l p p a c t o f a n l n t e r n c r t l o n a l l y o a n n s c d buf f c r s t o c k t o s t a b F l ire p r i c e s .
In particular. a l t c r n o t i v b u f f e r s t o c k i n g r u l c t I a r e c x m i n c d i n t e r n s of t h e l r l n p n c t o n :
- e x p o r t r e ; c n u c ; - d l r c c t cos t s a n d bcne f i t s o f t h c buf f c r s t o c k o p e r a t i o n ; - r e q u l a -d o a x i m r a f u n d i n g to i n s u r e a c c e p t a b l e r i s k - t a r g e t s .
In a d d i t i o n , rrp c a k e some c o m p a r i s o n s o f a l t e r n a t i v e policies which m'dhc a l s o a c h i e v c s i o i l n r s t a b l l I t y o b j e c t i-.*en. T h e s c i n c l u d e :
- c o z p e n s a t o r y f i n a n c i n g ; - t a r i f f s a d t a x a t i o n ; - c r o p a r e a l i n i t a t i o n s .
TRe a n a l y s i s is c a r r i e d o u t u t i l i z i n g a r a t h e r sila?le d y n a n i c made1 o t t h e a m r k e t s f o r r a w j u t e r ~ r d j u t e goods . I t is o u r v i e w t h n c a n y a e a n t n g f d s t a b i l i t e t l o n p o l l c y w u l d nf f e c t t h e h o l e dynamic b e h a v i o r o f
I
I/ U S C W , "An I n t e g r a t e d progra# f o r C o i a ~ o d i t i e s : The R o l e o f - I n t e r n a t i o n a l 6 u f f e r S tocks" . ( R e p o r t b y t h e S e c r e t a r y G e n e r a l of LXCTAD) . Docs. ~3/5/~/7/lt18 Supp. 7 and TD/B1<. 7/Add. 7, Lvccnber 197.;. !& -
2 Sec Gr i l l i and ! h r r l s ? n (197:) a n d IE!i!D K c r l d J u t e E c o n m y R e p o r t - ( 1 9 7 3 1 -

j u t e marke t s by a l t e r i n g expec t a t i ons . u i t h rec'accd r i s k s , supp ly can probably b e expec ted t o expand more than denand, l e a d i n g t o Increased p r i c e p r e s s u r e and u l t i c a t e l y t o f u r t h e r inb tab1; i ty . Given the various w y e t b t f a rmer s , m a n u r ~ c t u r e r s , and c u s t o o e r s r e a c t , some of t h e objec t i \* t . s o f s t i , b l l i z a t i o n may not be f e a s i b l e except a t unreasonable c o s t .
The model h a s s u j e c t l v e p r i c e v a r l a n c e a s a n c x r l l c l t f a c t o r de t e rmin ing j u t e a r ea . In a d d i t i o n , t h e s p c c i f l c f u n c t l o ~ l f o m s were chosen t o a l l o w aaxln tm f l e x i b i l i t y In t e r n s o f d y n m i c a d j u s t m o n o . Tho model i ~ ~ : r t & r a t e s t h e behavior of j u ? o l a m e r 8 i n t ho p r i n c i p a l j u t e - ~ r o v i n g c o u n t r l c a v i t h t l l a t 0 1 j u t e g o d s oan l r f ac tu ro r s and c o n s m e r s usinf a s a r i o r 01 r q l o n - s p c c l l l c dcoand and supp ly functions. Tho mod01 has bean b p t a s e lmpls a s p o s s i b l a f o r tw reasonr . F i r s t , L~.Q u n d o r l y i q d a t a babe is n o t c x t e n s l v c , e s p e c i a l l y r ega rd ing t h e marke t s f o r J u t e goods. S i n c e d a t a d i d not a l l o w e c o n a a e t r l c s s t l m a t i o n CIA b e h a v i o r a l p a r m e t e r s i n t h a t set o f o a r k t t s . i n f o r s a l estimates u e r o raqui rod . These were d c r l v c d from i nous t ry -v ide crtudies p rcv ious ly conducted a t t h e World Bn.ik and r e f e r r e d t o p r ru lous ly . Only by keeping t h e o o d e l s h p l e c o u l d t h i s b e mean ing fu l ly done. Second, vi t h .a s imp le model, hs'ring s p e c l f i c t h e o r e t i c a l and b c h a v i o r s l p r o p c r t l e s , I t i s r e l a t i v e l y ea sy t o unders tand uhar. is i n p o r t a n t i n de:emin- i n s t he c h a r o c t c r i s t i c s of s imu la t ed p o l l c y s c e n a r i o s . I t w u l d be r a s h t o c l a i m t h a t any modcl cou ld p r e d i c t v t t h g r e a t a c c u r a c y t h e i n p a c t on t h e j u t e ( o r o t h e r ) marke ts of b u f f e r s t o c k o p e r a t i o n s . None the l e s s , models can and should bc a b l e t o i s o l ~ t e di l c h i a c t o r s p l a y t h e most impor tan t r o l e s and how they i n t e r - r e l a t e .
The paper is d i v i d e d i n t o f o u r s e c t i o n s . We begln i n S e c t i o n I w i th e b r i e f review o f t he J u t e a r k e t s , h i g h l i g h t i n g t h o s e " s t y l i z e d " f a c t s A l c h a r e l a t e r inc luded in t h e model. S e c t i o n 11 d e s c r i b e r t h e supply response of J u t e f a r o c r s ; e conooe t r i c ev idence is p resen ted shoving t h e fmportance of r i s k i n the p l an t i n s dec i s ion . I h e r e s t o f t h e o o d e l is o u t l i n e d i n S e c t i o n 111. In S e c t i o n I Y r e s u l t s f r m t h e numerical s i m u l a t i o n s a r e reviewed. Our con- c l u s i o n s a r e in S e c t i o n Y.
I. L'ORLD JUTE ECO1iOWY - A REVIEW
J u t e f i b e r is p r o d k e d I n As ia , k u t h America and Afr ica . The p l a n t -- v h i c h g r o v s a n n u a l l y -- r e q u i r e s h igh t empera tu re , deep s o i l , and r a i n i a l l d i s t r i b u t e d in such a w y a s co a s s u r e adequate s o i s t u r e t o t he young p l a n t and more abundant m o i s t u r e du r ing its growth. C o w n ~ r c i a l produc- t i o n of J u t e f i b e r is c o n c e n t r a t e d i n t he Asian Sub-Conttnent; , j n d i a and Bangladesh accoun t f o r 70% of w r l d product ion . Thai land is t h e t h i r d l a r g e s t p r d u c e r , / f o l l o c ~ d by Burpa, S e p a l , and Braz i l . (Table I ) =
I / Th.llland produces a t l s t l y .? j u t e - l i k e f :ber , k e n a f , vh ich is c o a r s e r than - ~ I I K C and f t is s n l y s i t i t a b l e in sack-mking . s u b s t a n t i a l m o u n t s of t h i s i i b c r . Ire also 3 r a d w e d i r r I c d i a & e r e i t is k n o ~ n a s mesta.

t a b l e 1: THE YORLD JVTE ECONOMY: 1972-74
Reg ion I b w Jute Raw Juro Juco Coodr Jute Produccloa ( t ) t x p r r m ( f ) Exporrr ( f ) Consumptlon(X)
DCVEi3klKC COUNTRIES 2699 (97.7) 121 (100.0) 1065 (95.6) I416 (50.5)
India 9ang lndorh n.e il and Or h e r s
8-at11 Others
CFhTMLLY PLAKED COUNTRIES L/ - 63 (2 . 3) - (0 .0) - (0.0) - 289 (10.3)
USSR 4 7 Eastera Europe - Others 16
h r c h h e r i c a - Western Europe - Japarr - Cchers -
I / F'Jrclbfing China. . - Sourcds : FAO. Wcrld Bank

J U ~ C i n a o ~ t l y used to n a n u f n c t ~ . r e c l o t t r ( I . c s r ; . ~ n (,r b u r l r ~ p ) f o r b,,~, i l~ td r a c k s ( lnc l u d i n & b v e l p a c k s 4r.J c o t c u f i - S a l e co':r-rs) , backir ig f o r t u f t e d c a r p c t r and i n d u s t r i a l \ ; rapping r s c b t ~ r l : ~ l . J u t e !:lrrl i s a l s o uaed i n w v e n c a r p e t b a c k l n g 2nd c o r d a g e . S ~ c k t i and b a s arc- b y f a r t h e most i m p o r t a n t c n d - u s c f o r j u t e i n a l l n a j o r c o n s l m p i n ~ nrc:is. I n 1 n d u s c r l a l i : c d c o u n t r i e s , h o v e v e r , b a c k i n g f o r b o t h t u f t e d and *':en c a r p e t t i l a a :.cry i o p u r t n n t m a r k a t f o r j u r e .
p r a c t i c a l l y a 1 1 t k c J u t e * i b r r Krown In I n d i n is p r o c e a s e d l o c a l l y . About 60f. ol' i t 1 3 e x p o r t e d 4 % n a n u f a r o u r c a , t h e r c m n l n d c r b a i n g c o n s u o c d 1oc'rl l y . kinglndcratr , o n t k c c o n t r a r y , p r o c c a w b s o n l y n b o u t 452 o f i t s a n t ~ a l j u t e p r o d u c t i o n , a o s t of ~ + ~ t c h is c x p c r t c d na m a n u f n c t u r c e . Thc r e m a i n d e r i e c x p e r t e c l n s r n u f l b c r . U n t i l v e r y r r . c c n t l y , ' l h n t l n n d e x p o r t e d i n f i b e r f o m -11 cwcr SO2 of i t s p r o d u c t i o n . Burma .rnd Kcpal a r c a l m o s t c x c l u s i v c l y r a v j u t e f f b c r t x p o r t c r s . k q n g l a d c s h d a z i n n t c s t h e J u t c f i b e r e x p o r t r a s rke t : i t s c x p o r t s a c c c u n t f a r 85: o f t o t a l w r l d c x p r t o f J u t e a n d f o r 59: o f t o t n l w r l d crxpor ts of j u t e and j u t e - l i k e f i b e r s . h s p i t c t h e g r o v r h o f T h a i kena f c x p r c s d u r i n g t h e mid- and l a t e 19bOs, tloc t r a d i t i o n a l q loe i -monopo ly p o e i t i o n c n j o y c d by B a n g l a d e s h i n u a r l d J u t c c x p v r t o a r k c t s hna n o t b e e n s r r i o u e l y c h a l l c tgcd. f iurca sncm ? k p n l a r c t o o m u l l -3s c x p o r ~ c r s to i n f l u c n c e t h e r a v j u t e c ~ r k e : to a n y c o n s l d e r n b l c e x t e n t . f i e m r l d m a r k e t f o r j u t e ~ n a n u f a c t u r e e - t r a d i t t o n a l l y d c m i n n t e d b:i I n d i a -- is now a l n o s t ce..enly s h o r e d b y I n d i a a n d Bangladcsh. T h a i l a n d o n l y .:cry r c c e o t l y bctcrrec ,I s i r e a b l c e x r o r t e r o f j u t e n n n u f a c t u r e s .
I n d u s t r f a 1 i r e d c o u n t r ics a c c o u n t f o r nbou t &OX to:nl m r l d j u t e c o n s m p t i o n , d r . ~ c l o p i n g c o u n c r ies f o r bout 50: and c e n t r a l l y p l a n n e d cco- n o o i e s ( e x c 1 u d i : g C h i n a ) f o r t h e r e a a i n d c r . Ho~-c~:er, ~ i l e t h e l a t t e r a r e l a r g e l y s e l f - s u f f i c i e n t i n f u t e , I/ i r . d u s t r f a l i z e d c o u n : r i e s d o n o t h a v e a n y i n d f g e m u s s u p p l y a n d a r e , t h e r e f o r e , t h e main i m p o r t e r s o f raw j u t e ( a b o u t 60% o f w r l d t o t a l ) and ~ a n u i a c t u r e r s (55L of u o r l a t o t a l ) . Among d e v e l o p - i n g c o u n t r i e s , I n d i a is t h e l a r g e s t s i n g l e c o n s m e r o f j u t e (44% o f t h e to ta l ) . -0% t h e i n d u s t r i a l t z e d c o u n t r i e s , b o t h W e s t e r n Europe a n d J a p a n h a v e a s i z e a b l e j d t e i n d u s t r y t h a t r e l i cs a n ' f i b e r i n p o r t s f r m Bangladesh a n d T h a i l a n d . The US ~ n d Canada, o n t h e c o n t r a r y , h a v e p r a c t i c a l l y no d m e s t i c p r o c e s s i n g i n d u s t r y a c d r e l y a l m o s t exclusively o n h p o r t s o f f i r i s t t e d p r o d u c t s Zroa I n d i a and B a n g l ~ d e s h . I m p o r t s o f raw j u t e a r e d u t y f & in a l l Lndus t r i a l f z c d c o u n t r i e s . L n p o r t s o f n a n g f a c t u r e s a r e d u t y f & in t h c LS, b u t s u b j e c t t o t ~ r i f f a n d some q u a n t i t a t i q . * e r e s t r i c t i o n s i n J a i u n . V e s t e r n Europe a n d Ocean ia . - - * B - The p o s i t i o n of j u t e a s t h e d c o i n n n t f i b e r t n p u t f o r b a s i c c l o t h s .
a n d cordage yroduc ts b q a n tc b c c h a l l ? n g c d i n t h c =id-19hCs b y t e x t i l e p o 1 ; u l e l i n s . P o l b ~ r o p y l e n e , a s > n t h e t i c r e s i n o b t a i n e d Sy :he po lync . a t i o n o f p r o p y l e n c , s a o n t z c r g e d a s t h e c o s t i r p o r : n n t sr:tr;t i t u c e f o r j u t e . I t had ..'er:; a c i i r a b i c c c c h n i c . ~ l p r c p e r t i c s -- l ~ i ~ ! : t c n s i l : t y . : . i i f f n e s s , i n p a c t r e s i s t . ~ n c c , a n d !or; w i ~ i : : . a s -.-ell a s : c w proc'uc:ion c o s t s , s i n c e i t s b a s i c
I / Thc c e c t r ~ 1 : y pl.1nnt.6 e c c n o = ~ f e s o f Curope h p o r t soce raw j u t e a s - .-ell a s f i ~ i s n e d p r o d u c t s . f i i i n n i s t o t ; ~ l l y s i - l f - s u f l i c i t n t .

r a v miiccr l d l - - p r o p y l e n e -- u a s a b y - p r o d u c t o f t h e pc t r o c h m l c n l i n d u s t r y . I/ p o l y p r o p y l c n v r c s l n c o u l d c a s l l y b e e x t r u d e d l n c o t a p e s and f l l m c n c s f r a n u t l i c t ~ s u l t i l b l ~ c l o t t ~ f o r b a g s a n d c a r p c t back1n.g u i ts e a d c . Cconomlcs o f e c n l c a n d t e c t ~ n o l ~ ~ l c a l lmprov. 'mcncs progressively r e d u c e d p o l y p r o p y l e n e r c s l n corrcs ( a n d p r l c c s ) i n t h e 1960s. The pol}-propylcnc c l o t h i n d u s t r y cxpandcd r a p i : l y i n U t s c c r n t :u rope , J a p a n and t h e US a n d p e n e t r a t e d v e r y s u c c e s s f u l l y a l m o s t a l l ttlc t r a d l r l o n a l j u t e n a r k e t s ( b a g s , s a c k s , c a r p c t b a c k l w and c o r d a g e ) .
I ' o l n j r o p y l e n e r c n l n 1 8 now a l m o s t a p e r f e c t s u b s t l c u t e f o r j u t e f l b c r I n most usus. l c n r ~pp!v 1 s a b u n d a n t l n a l l l n d u s c r l a l l z c d c o u n t r l c s a n d i r e p r o c c o s l n g tcchnolo( ;y 1s wl l c n c a b l l s h c d and r c a d l l y a v a i l a b l e . J u t e p r l c r t i , r c l n t l v r . t o t h o s e o f polypropylene r c s i n , a r c t h e most l n p o r t a n t f a c t o r a f f r c t l n g t h e s u b s t 1;ut i o n p r o c e s s be tween t h e s e tug t e x t l l e m a t e r i a l s . J u t c ( a n d f o r t h a t o o t t c r polypropylene) dcrrond, h o u c v c r , is f o r t h e mos t p a r t d c r i v c d d m n n d . S u b s t l c u c f o n , l n r e s p o n s e to c h a n g e s i n r e l a t i v e p r i c c s , t a k e s p l n c c s l o w l y . T c c h n l c a l c o n s c r a l n c s -- a s -11 a s p r i c e e x p e c t a t i o n s -- s l o w d m t h e s u b s c l t u t l o n p r o c e s s . Demand f o r J u t e a s a n i n p u t i n t e x t i l e o a n u f o c c u r l n g I s , c h e r e f o r c , p r i c e i n e l a s t i c l n t h e s h o r t tern. I n t h e l o n g e r r u n , a s c o p l c a l s t o c k is r e p l a c e d , s u b s t i t u t i o n t a k e s p l a c e q u i t e e a s i l y a n d J u t e dcmand I s v e r y s e n s i t l v c to r c l o t i v e p r i c e changes . 2/
I n d e v e l o p i n g c o u n t r i e s , t h e d s l a n d p i c t u r e is more v a r i e d . I n t h e ma in j u t e p roduc l n g c o u n t r i e s -- I n d i a , Bang ladesh a n d T h a i l a n d -- s y n t h e - t i c substitution is v i r t u a l l y nonexistent. I n I s t i n A m e r i c a , o t h e r b i a n c o u n t r l e s a c d t o o lesser e x t e n t in A f r i c a , p o l y p r o p y l e n e r e s i n l a a v a l l a b l c b u t i t is r r r c n L p o r t e d and s u b J c c t t o i m p o r t d u t i e s a n d o t h e r r e s t r i c t i o n s . The p r o c e s s i n g t e c h n o l c . y , o o r e o v c r , is less a c c e s s i b l e a n d t h e s t r u c t u r e o f demand f o r end-produc ts ( a b s o l u t e d m i n a n c e o f deuand f o r s a c k and b a g s ) is s u c h t h a t p r i c e e l a s t i c i t i e s -- I n b o t h t h e s h o r t a n d t h e l o n g r u n -- a r e much 10-r t h a n i n i n d u s t r i a l i z e d c o u n t r i e s .
Raw j u t e s u p p l y - v h i c h is g e o g r a p h i c a l l y v e r y c o n c e n t r a t e d -- d e p e n d s to a l a r g e e x t e n t o n j u t e p r i c e s a n d o n t h o s e o f a l t e r n a t i v e c r o p s . 10 b o t h h n g l a d e s h a n d V e s t Benga l j u t e c o m p e t e s f o p l a n d v i t h r i c e and t h e a
a n n u a l p l a n t i n g d e c i s i o n is s t r o n g l y I n f l u e n c e d by e x p e c t e d ( r e l a t i v e ) p r i c e s .
- 1 / T h i s s i t u a t i o n h a s chan, 1.1 f ie 1970s . when a s a c o n s e q u e n c e o f t h e -
o i l c r i s i s , p r o p y l e n e a. , . more a n d more t h e r o l e o f a co -p roduc t - a n d MS p r i c e d a c c o r d i n g - - * / T h e r e a r e v e r y few r e c e n t e c o n & e t r i c s t u d l e s o f j u t e and m e n f e w e r -
e c o n o n e t r i c e s t h a t e s o f p r i c e e l ~ s t i c l t i e s o f demand, g i v e n t h e no...elty of t h e s r l b s t i t u t i o n p r o c e s s a n d t h e enormous d i f f i c u l t i c s t h a c a r c e n c o u n t e r e d by r e s e a r c h e r s i n g e t t i n g t h e n e c e s s a r y con- s m p t i o n and p r i c e d a t a b y end-use . The e c o n o n e t r i c e v i d e n c e t h a t i.; a.:ni l ; lblr -- ;.?rc!rn!ar!.: f-r t!:e US z c r k c : -- : r , d f c s t e s t l i a t j u t e decand is q u i t e s e n s i t i v e t o r e l a t i v e p r i c e c h a n g e s . See G r i l l i and , ' [ o r r i son ( 1 9 7 5 ) .

I n t h c S o r t h c a s t o f T h a i l a n d , v h e r e most o f t h e f i b e r is grown, kenaf c m p e t e s f o r l a n d v i t h c a s s a v a , su( ;arcane, g r o u n d n u t s and maize. Cassava h a s bccoma i n r e c e n t y e a r s t h e s i n g l e n o s c b p o r t a n t s u b s t i t u t e c r o p i n kcnaf g rowing a r c a a . J u t e y i e l d s a r e n o t o r i o u s l y s u b J c c c t o w a t h e r - i n d u c e d rand- f l u c t u a t i o n s .
J u r e a n d j u t e goods p r i c e s f l u c t u a t e c o n s i d e r a b l y f rcm y e a r t o year . I/ Thc a c c e p t e d visdcm is t h a t s u p p l y i n s t a b i l i t y h a s generated o v c r t h e l a r g e markc t p r i c e f l u c c w t i o n s c h a t have s t i m u l a t e d t h e s e a r c h f o r and dcvelopmcnt o f s u b a c i t u t e s f o r j u t o i n c o n s m i n g c o u n t r ion. T h i s d i a g n o s i s h a s added L p c t W t o t h e r c q u c s t made by j u t e p r o d u c i n g c o u n t r i e s f o r m a r k e t p r i c c s t a b i l i z a t i o n o c a s u r c s . V h i l e t h a tw, c o u n t r i a s m o s t d e p e n d e n t o n j u t e e x p o r t 8 ( B a n g l a d e s h and I n d i a ) d i d i n t h e p a s t c a l l f o r p r i c e s c a b i l i z a - t i o n on f a m i l i a r macro-economic g r o u n d s , i n r e c e n t t h e n t h e y h a v e s t r e s s e d t h e i m p o r t a n c e o f n g r e a c c r d e g r e e o f p r i c e s c a b L l i t y f o r j u t e and j u t e p r o d u c t s a s a d i s i n c c n t i v e t o f u r t h e r s y n t h e t i c s u b s t i t u t i o n .
11. SUPPLY O F R A W JUTE
T h e r e have b e e n many s t u d i e s a d d r e s s e d t o t h e q u e s t i o n o f t h e r e s p o n s i v e n e s s o f j u t e ( a n d k e n n f ) p r o d u c e r s t o c h a n g i n g p r i c e s . Host o f t h e s e s t u d i e s have b e e n r w i e u e d r e c e n t l y b y A e h r i and Cummings (1976). P r o d u c e r s h s v e been shown ( i n t h e f rameuork o f t h e N c r l o v e a d a p t i v e e x p e c t a - t i o n s model) t o b e s t r o n g l y , b u t g e n e r a l l y i n e l a s t i c a l l y , r e s p o n s i v e t o c h a n g i n g observed, o r real o r r e l a t i v e p r i c e o f j u t e .
The a v a i l a b l e resul ts a r e g e n e r a l l y d e f i c i e n t i n t r e a t i n g t h e p r o d u c e r ' s r e s p o n s i v e n e s s t o c h a n g i n g r i s k - a c o n s i d e r a t i o n i n t u i t i v e l y i m p o r t a n t i n a n e x p l o r a t i o n o f s t a b i l i z a t i o n . E x c e p t i o n s a r e t h e s t u d i e s o f Behrman (1968) o n T h a i kenaf and t h e p r e l i m i n a r y i n v e s t i g a t i o n o f Sengupta and Sen (1969) o n I n d i a n j u t e . T h e s e s t u d i e s employed, r e s p e c t i v l e y , a r b i t r a r y moving-average s t a n d a r d d w i a t i o n v a r i a b l e s , a n d a p o r t f o l i o s e l e c t i o n model t o g r a p p l e v i c h t h e i s s u e o f f a n n e r s ' a d j u s t m e n t s t o r i s k .
I
The r e c e n t w r k o f J u s t (1974, 1975, 1977) h a s p r o v i d e d a f r e s h g e n e r a l method f o r d e a l i n g w i t h s u p p l y b e h a v i o r under r i s k . H i s method s e a u s t h e o n e a v a i l a b l e t h a t is mos t p e r t i n e n t t o t h e p r e s e n t s t u d y . Accord- i n g l y , w e have a t t e m p t e d t o g l e a n a c o n s i s t e n t s e t o f d a t a b e a r i n g o n j u t e and k e m f s u p p l y and have a p p l i e d t h e J u s t me thods t o t h e s e d a t a . ,.
L
- - - W !R
1 / R a w j u t e a c c o u n t s f o r a t l e a s t 50% o f t h e p r o d u c t i o n c o s t s o f h e s s i a n and - c a r p e t b a c k i n g c l o t h h o s e p r i c e s a r e d i r e c t l y a f f e c t e d by v a r i a t i o n s i n t h e c o s t o f t h e f i b e r . T h i s a p p l i e s t o b o t h j u t e p r o d u c i n g and j u t e i m p o r t i n g c o u n t r i e s . J u t e m i l l s i n I n d i a , Bang ladesh and T h a i l a n d compete v i t h o v e r s e a s m i l l s f o r t h e i r f i b e r s u p p l y . S e e G r i l l i and ?!orrison ( 1974) .

E n s e a t i a l l y , t h e J u s t 8pproach is t o add oecond oaaenta o l explana- t o r y v a r i a b l e r (ouch a 8 p r icea ) t o the f i r r t m a e a t s that f e a t u r e In the t r a d i t i o n a l k r l w e model of adap t ive axpec ta t lo ru (10 e. geometrical l y d i s - t r i b u t e d l ag f m c t i o o s ) . Tbe f i r s t m a e a t , o r r u b j e c t i v e expected va lue , E, i n t h i a model depends on s a t e b l a a d j w t m e a t par-ter a and can be vieued a s a g e a e t r i c a l l y v r b h t e d a u of p a r t obrer . ra t ionr on a rand- v a r i a b l e X a s i n
The a n d o g a u second moment, o r s u b j e c t i v e va r iance , V, depends n o t only oa a (and E(a)) but d m on a f u r t h e r r t a b l e a d j w m e a t p a r m e t e r 8 f o r the g e a e t r i c d u m i g h t h g of post "obrervatLoa8" oa var iance (squared d e v i a t i o a s f r a means) a s
Covariancer can be formulated i n an i d e n t i c a l uay. Such f i r s t and second r a e n t s can tbea be used aa explanatory v a r i a b l e s i n e s t i n a t h g equat ions uhich r e l a t e a dec ie foa v a r i a b l e t o previous observed v a l u e s of i n f l u e n t i a l va r iab les .
For e x a p l e , suppose f o r the mcnent t h a t planned j u t e output is represented by a r e a planted, t l , , and t h a t p r o d t r e r s a r e influenced i n t h i s
L dec i s ion only by-the m b j e c t i v e mean and var iance of "jute" (kenaf i n Thailand) p r i c e P,. m e n one simple model #or a j u t e supply f t m c t b n 1s
h e r e E and V represent sub jec t ive aeans and var iances of t h c p r i c e of d t t
j u t e and u is a well-behaved d i s tu rbance term. This p a r t i c u l a r equation t

is l inea r in the par=eters ai(non.linerr in a md 0 ) and ro, for given a and 6 , cen be estimated by ordinary l e a s t rqurrer (OLS) r q r e r r i o n rnr lyr l r . Indeed, cne eat b a t ion method i r t o rerrch the f e r r ib l e space, Oc a , 0 f o r those values of the adjustneat parareterr that give the olnlmtn rrra of squares i n the OLS equation. If u is asalaed to be a o m r l l y d i r t r lbuted ,
t t h i s I s a maxlmm 1i::lihood aearch procedure. More generr l ly , nordinerr leas t square8 regression analysla can be wed to er t lmr te a 8 and the a t slmul taneously.
However, there 18 another d i f f i c u l t y t o be confrontod i n empirical work. Sample data dl1 only be rv r i l ab la for r f i n i t a (probably 811 too b r i e f ) ee r i e r of obrervrtionr uhererr the r b w r equrtionr implici t ly ln- volve i n f i n i t e w r i e r . J u r t har iavert igrted oeveral methodo of de r l t tq vi th t h i r d i f f icu l ty . Ue reviev oaly tha t one u wed empirically to derive e r t h r t e r for tha brw-year aernr and vrriancer. 'Ihera i r no m y t o wold rrsigning some p a r a r r "prior" and l a t e r oner a0 "for rrgresrion". The prior year observations give the i n i t i a l cr t lmrter of mean, EO, r r
where tbz N observations a r e X -1, X-2*
used a s "priors" on the observed explanatory variables.
I t is best t o estimate tha prlor variance in the process of estimating the other parameters and t h i s can be accomplished by adding an additional variable La equations l i k e (3a) , naaely
where E now dependh on Eo, and the additional 'coef f l c i e n t may be J t
interpreted a s -bodying the prior variance, s ince a = a2V0 . The 3 estimation is similar to Dhrymes' (1971, p. 98) truncation remainder proceure.
i This approach URS applied to data fraa Bangladesh, India and
Thaibnd in several var iants depending on: the surrogate assmed for the - dec i3on variable (1.e. quanti ty supplied or area harvested, s ince neither planmd output nor area sown is avai lable); the part icular s e r i e s of prices; the periods taken a s "observation" and "prior to observation"; and the functional speciffcat ion of the supply equation.
The specif icat ion f ina l ly selected is about the simplest one consistent vith the object fves of t h i s study. I t recognizes substitution vith the major competing crop, "rice", ( r i c e in Bangladesh and India,
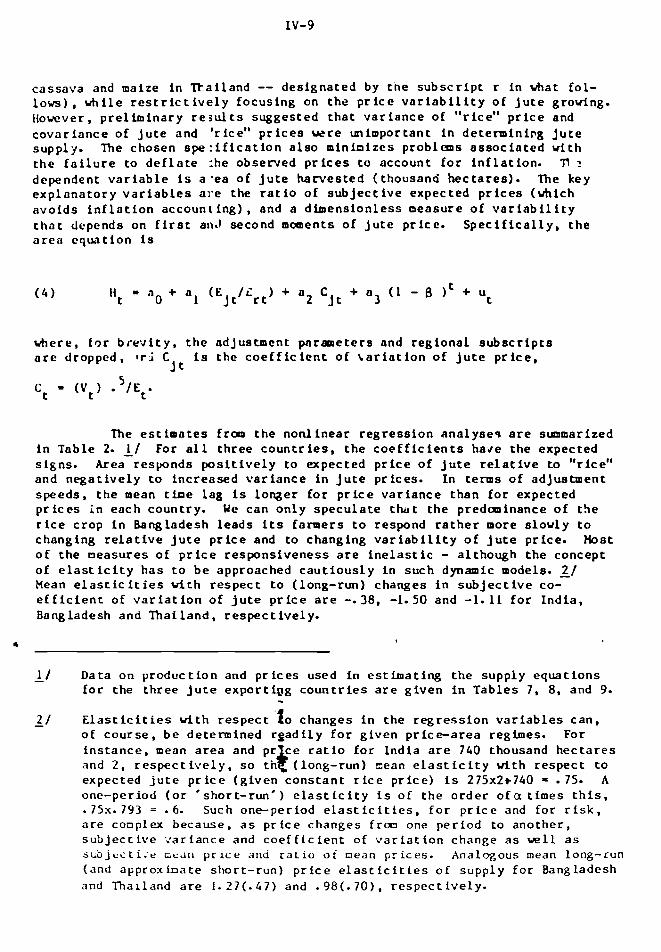
c a s s a v a and maize i n m a i l a n d -- d e s i g n a t e d by t n e s u b s c r i p t r i n what f o l - l o v s ) , v h i l e r e s t r i c t i v e l y f o c u s i n g on t h e p r i c e v a r i a b i l i t y o f j u t e g r o v i n g . Hovcver , p r e l i m i n a r y r e j u l ts s u g g e s t e d t h a t v a r i a n c e o f " r i c e " p r i c e and c o v a r i a n c e o f j u t e and ' r i c e " p r i c e s were u n i m p o r t a n t i n determining j u t e s u p p l y . The c h o s e n spe : i f i c a t i o n a l s o m i n i m i z e s problcmrs a s s o c i a t e d v i t h t h e f a i l u r e t o d e f l a t e :he o b s e r v e d p r i c e s t o a c c o u n t f o r i n f l a t i o n . V d e p e n d e n t v a r i a b l e is a - e a o f j u t e h a r v e s t e d ( t h o u s a n d h e c t a r e s ) . The key e x p l a n a t o r y v a r i a b l e s a ] -e t h e r a t i o o f s u b j e c t i v e e x p e c t e d p r i c e s (which a v o i d s i n f l a t i o n a c c o u n t i n g ) , and a d i m e n s i o n l e s s m e a s u r e o f v a r i a b i l i t y t h a t depends on f i r s t ant! second manen ts o f j u t e p r i c e . S p e c i f i c a l l y , t h e a r e a e q u a t i o n is
w h e r e , f o r b r e v i t y , t h e n d j u s t m e n t p a r m e t e r s and r e g i o n a l s u b s c r i p t s a r e d r o p p e d , p r i C is t h e c o e f f i c i e n t o f ~ o r i a t i o n o f j u t e p r i c e ,
j t
The e s t i m a t e s f r m t h e n o n l i n e a r r e g r e s s i o n a n a l y s e q a r e s m m a r i z e d i n T a b l e 2. I/ For a l l t h r e e c o u n t r i e s , t h e c o e f f i c i e n t s h a ~ e t h e e x p e c t e d s i g n s . Area r e s p o n d s p o s i t i v e l y t o e x p e c t e d p r i c e o f j u t e r e l a t i v e to " r i c e " and n e g a t i v e l y t o i n c r e a s e d v a r i a n c e i n j u t e p r i c e s . In t e rms o f a d j u s t m e n t s p e e d s , t h e mean t h e l a g is l o r y e r f o r p r i c e v a r i a n c e t h a n f o r e x p e c t e d p r i c e s I n e a c h c o u n t r y . We c a n o n l y s p e c u l a t e that t h e p r e d m i n a n c e o f t h e r i c e c r o p i n Bangladesh l e a d s i t s f a r m e r s t o respond r a t h e r more s l o w l y t o c h a n g i n g r e l a t i v e j u t e p r i c e and t o c h a n g i n g v a r i a b i l f t y o f j u t e p r f c e . H o s t o f t h e m e a s u r e s o f p r i c e r e s p o n s i v e n e s s a r e i n e l a s t i c - a l t h o u g h t h e c o n c e p t o f e l a s t i c i t y h a s t o b e approached c a u t i o u s l y i n s u c h dynamic models. 2/ Nean e l a s t i c i t i e s v i t h r e s p e c t t o ( l o n g - r u n ) c h a n g e s i n s u b j e c t i v e co- e f f i c i e n t o f v a r i a t i o n o f j u t e p r i c e a r e -. 38, -1. 50 and -1. 1 1 f o r I n d f a , Bang ladesh anci T h a i l a n d , r e s p e c t i v e l y .
11 D a t a o n p r o d u c t i o n and p r i c e s used i n e s t i m a t i n g t h e s u p p l y e q u a t i o n s - f o r t h e t h r e e j u t e e x p o r t i p g c o u n t r i e s a r e g i v e n i n T a b l e s 7, 8, and 9. -
2 / E l a s t i c i t i e s w i t h r e s p e c t '$0 c h a n g e s i n t h e r e g r e s s i o n v a r i a b l e s c a n , - o f c o u r s e , b e d e t e r m i n e d r e a d i l y f o r g i v e n p r i c e - a r e a regimes. For i n s t a n c e , mean a r e a and p r f c e r a t i o f o r I n d i a a r e 740 thousand h e c t a r e s and 2 , r e s p e c t i v e l y , s o t h a ( l o n g - r u n ) Sean e l a s t i c i t y w i t h r e s p e c t t o e x p e c t e d j u t e p r i c e ( g i v e n c o n s t a n t r i c e p r i c e ) is 27Sx2t740 = . 75. A one-per iod ( o r ' s h o r t - r u n ' ) e l a s t i c i t y is o f t h e o r d e r o f a t i m e s t h i s , .75x. 793 = .6 . Such one-per iod e l a s t i c i t i e s , f o r p r i c e and f o r r i s k , a r e c o a p l e x b e c a u s e , a s p r f c e c h a n g e s f r m one p e r i o d t o a n o t h e r , s u b j e c t i v e ; ? a r i a n c e and c o e f f i c i e n t of v a r i a t i o n c h a n g e a s w e l l a s s t ibjcet i . -r c i e j r l p r i c e a n i r a t i o o i mean p r i c e s . Analogous mean long-run ( a n d a p p r o x i n a t e s h o r t - r u n ) p r i c e e l a s t f c i t i e s o f s u p p l y f o r Bangladesh and T h a l l a n d a r e 1. 27(. 47) and .98(. 7 0 ) . r e s p e c t f v e l y .

Table 2: ESTMATED PARAnlTEBS OF .JUTE AREA RESPONSE EQUATIONS
INDIA BANGLADESH T H A I U N D
Dependent Var iable 3 Araa 103ha Araa 103ha Area 10 ha ----------------------------------------------------- Number of Obrervat ionr
P r t o b r r r v a t f o n barp le sit. _I/ 2 2 4 ( w a r e ) (1950151- (195015 I- (1 953154-
1951152) 1951 152) 1956157)
Obrervatfon aample r i te 23 23 19 ( w a r r ) (1952153- (1952153- (1956157-
---,-------------- L - L e Z e L . U l , , -1PZUZQL
Estimated C o e f f i c i e n t r and JStandard E r r o r r l
Haan adjustment a -793 -372 -708 (. 104) (. 078) ( 0 331)
Variance adjustment 8 -287 -081 133 (. 077) (. 051 (. 113)
C o e f f i c i e n t s a. 422 612 242 5
(107) (243) (1009)
Coef f ic ien t of d e t e r o i n a t b n 72 - 7 2 .74
Standard e r r o r of es t imate 7 3 100 51 1 -
Durbin-Wa tson s t a t i s t i c 2. 34 1. 79 - 2.18 ------------------------------------------*-,---- I
F i n a l Values of Var iables Used a s - start in^ Values i n Simulations
8 - Wan of j u t e p r i c e s 128. 7 122.3 3529.5 hean of competing crop p r i c e s 109.3 121.8 2093.4 Rat io of means 1- 178 1- 004 1- 686 Variance of j u t e p r i c e s 2 6 6 . 2 4 4 1 . 6 453285.0 Coef f ic ien t of v a r i a t i o n of
j u t e pr ices .I268 . 1716 . 1406
1 / Used in es t imat ing the p r i o r mean. -

The separa te modeling of y i e ld s leads t o a mu1 t i p1 i c a t i v e r i sk s p e c i f i c a t i o n uhich, a s argued by Hazel1 and Scandi t to (19151, is a most na tura l and appropria te spec i f i c a t i on fo r a r i sky supply function. For unknown r eawns , j u t e y ie ldc e a r l y in the observat ion period exh ib i t i r r egu l a r pa t te rns t h a t seec of dubious relevance to present-day production. The pa t t e rn of the aos t recent I4 years of y i e ld s (up t o 1974175) is sunmarited by a m a l l pos i t i ve trend and a d i s tu rbance term, N(S), t h a t is normally and independently d i s t r i b u t e d v i t h zero mean and standard dev ia t ion S. Thrrs, de f in ing YEAR a s the calendar year of the f i r s t half of the crop year o i n w 1900, w estimated the f o l l w i n g y i e ld cquat ions:
( Ind ia )
(6ang ladeeh)
(Thailand)
&ere Y i t is y ie ld in tonolhectare of raw jute.
In lmplmenting them i n the s t ochas t i c s i nu l a t i on model. the res idua l v a r i a t i o n in the p r i c e respcnsc f u r c t b n s was a l s o modeled e x p l i c i t l y by a s s m i n g the dis turbance t e r n , u i n ( 4 ) t o be normally d i s t r i b u t e d v i t h
t * mean zero and standard dev ia t ion ec,ual t o the standard e r r o r of the es t lmate of the respec t ive equstiana.
I * M E HllRlCEtS FOR JUTE AND JUTE COODS
Manufacturers of j u t e g o d s represen t both the denand s i d e of t h e r a u j u t e market a d the supply s i d e of t he g o d s market. I dea l l y , uc w u l d coaeider separa te ly each c l a s s of j u t e g o d s . LC, s i n c e t he source data a r e not ava i lab le a t t h i s l e v e l of d e t a i l . w e r e forced t o aggregate a l l j u t e goods in t o one. Data uls ava i l ab l e t o d i f f e r e n t i a t e country-specific Input r a t ioa, ,y 's def in ing t he quan t i ty input of raw j u t - pel* uni t of aggregate j u t e good.
Since j u t e g o d manufacturing has been a c m p e t i t i v e Industry , i t is reasonable to pos tu l a t e a supply funct ion r e l a t t ng ma~~ufac tured q ~ a n t i t i e s ~ o f j u t e goods t o prices. Mere, we a r e concerned v i t h p r i c e s of raw j u t e , k, and j u t e g d s , P. For simplic!ty, we assune a l i n e a r form which t r e a t s the tvo p r i c e s syumecrically. 1 / Thus def in ing X a s output
-E
I / The l i n ea r form used is implied vhenever va r i ab l e c o s t s (o ther than - raw j u t e ) a r e a quadradic function of t o t a l production - ~ o l m e , and the Y ' s renain constant.

of 2ut.3 goods and us ing the s u b s c r i p t s "i" and "t" t o denote regions and t ime,
In each region, r e l a t i v e domestic pricea of r av j u t e and j u t e goods d i f f e r f run t h e "uorld" p r i c e by f h e d M d g t s 3 r i c h can be r c m b i n r t i o n of t a x e s and t a r i f fa. In equa t ions ( 6 ) . t and ? represen t the I n p l i e d r d valorem
i i r a t e on goods and rav j u t e r e spec t ive ly . h/
b with any industry-wide supply func t ion , s c a l e is d t t e m i n e d by i m p l i c i t l y ho ld i tq rme f a c t o r of production fixed. Ln our motel , c r p i :rl s tock is f ixed in each reg ion , a convenient 8 I n p l i f i c r t i o n based on ,he obse rva t ion tha t n e t investment in this induntry hnr beetr e f f e c t i v e l y n i l f , ~ r q u i t e a few years , a t r end l i k e l y t o continue. SLncc investment d e c i s i o n s r.-• not being modeled, i t is reason.ble t o a s s m e r r r i d adjuntment of p rLduc t ion t o p r i c e s , and in ( 6 ) . no d i s t i n c t i o n is made b e t ~ z n rr.:* and short-run response.
Demand f o r j u t e goods is a l s o modeled on a r e g i o n a l banfs. I h e main determinant of demand (given f u t u r e r c o a a i c growth r a t e s ) i a the r e l a t i v e p r i c e of j u t e goods and t h e i r s y a t h e t i c a u b s t i t u t e s . :s noted in Sec t ion I , the short-run r e l a t i v e p r i c e e l a s t i c i t y is low in c m p a r i w ~ n with t h e low-run e l a s t i c i t y . I h e c e n t r a l reason is t h a t demand is embedded i n i n s t a l l e d c a p i t a l , o n l y p a r t of which t u r n s over i n any one pa:. Here, ve assune l i n e a r demand f m c t i o n s whose short-run p o s i t i o n re la t i* i r ; to the o r i g i n is determined by past investments and by long-run e x p e c t a t i o . d. m a t is ,
Pit where, Dit = d e ~ a n d f o r j u t e goods, r eg ion i, year t;
A i t = s c a l e of dmand , region i , year t ;
- Pit = p r i c k of s y n t h e t i c s , region i , year t.
In modeling the dynamics of t h e denand f m c t i o n s , ve assune t h a t i n each p a r t h e r e is exogenous growth i n the market fo r f i b e r s i n genera l ( j u t e '3 -
I ? The region breakdown an inds t ing scheme is: .
- * 8 i = I India 4 Korth America
2 Bangladesh 5 Western Europe 3 Thailand 6 Japan 7 Rest of World (excluding the c e n t r a l l y planned
econoofes which a r e t r ea ted a s exogenous in the model.)

and the s y n t t l e t i c s ) , r e l a t e d to expected g e q e r a l economic growth. In addi - t i o n , a c e r t a i n p r o p o r t i o n o f ju:e good c o n s m e r s is faced wi th a n inves tment d e c i s i o n -- whether t o r e i n v e s t i n j u t e -us ing equ ipaen t o r not. Ihe propor- t i o n of t h e s e u s e r s uho o p t f o r j u t e goods (and thus s h i f t t h e f u t u r e daaand schedu le ) depcnds on che expec ted f u t u r e r e l a t i v e p r i c e of j u t e t o s y t t h e t i c s . For s i m p l i c i t y , ve a s s m e t h e growth r a te of t h e demand f m c t i o n t o b e a l i n e a r f m c t i o n of t h e growth r a t e i n denand f o r f l b e r s i n g e n e r a l and t h e expec ted f u t u r e p r i c c s t r u c t u r e . That is,
where g, r c p r c s e n t s t h e cxpec tcd g r o v t h i n t o t a l f l b e r d t3and i n r eg ion A
1. T h i s f m c t i o m l Corn makes use o f tw b e n c h a r k s . P and Pf ,2 , which f * l
ve hnvc i cdependcn t ly cst h a t e d f o r e a c h region. Pi , , r e p r e s e n t s a n upper
bound on rellrt i v e p r i c e s ( b e t w e n j u t e goods and s y t t h c t i c s u b s t i t u t e s ) , s u c h
that d o a n d vlll s h r i n k i f t h e expec ted r e l a t i d e p r i c e p i t , is a b w e
t h i s b e n c b a r k . On the other hand, Pi r e p r e s e n t s a n e u t r a l expected
p r i c e a t h i c h j u t e ' s s h a r e of t h e i ' t h marke t w u l d remain cons t an t . We use a n a d a p t i v e e x p e c t a t i o n s fo rmula t ion t o r e p r e s e n t how t h e s e a r e formula ted over t he . I/
In the n m e r i c a l s i m u l a t i o n s , we take t h e p r i c e of s y n t h e t i c s a s exogenous and d o no t e x p l i c i t l y c o n s i d e r t he c o m p e t i t i v e r e a c t l o n of s y n t h e t i c s p roduce r s to j u t e goods stabilization pol icy . Lack of d a t a prevented a more s o p h i s t i c a t e d t rea tment . However, s y n t h e t i c s a r e produced i n p r o c e s s i n d u s t r i e s h e r e c o s t s of p roduc t ion g e n e r a l 1 y de t e rmine p r i c e . The p r i c e of o l l is t h u s 1 i k e l y t o have a more c r u c i a l h p a c t on t h e p r i c e o f po lypropylene ihan b u f f e r s t o c k a c t i o n i n j u t e markets.
- :
11 A s i m i l a r f o r m u l a t i o n of a dynanic charige has been used f o r a model - of w r l d o i l marke t s b? B l i t ze r , Heeraus, and S t o u t j e s d i j k (1975).
s -

In c los ing the model the re a r e tw, w r l d markets a i c h must be considered -- those fo r raw j u t e and j u t e goods. Within a reasonable d q r e e o f a pp roxba t i on , bu f f e r r tock opera t ioas occur ln the a a rka t fo r raw j u t e only. Thus, equ i l ib r i r r r in the raw j u t e market i n p l i e s
(10) A S t + h Xi, + zj - z Q i S t , where
Qi #t represen ts j u t r p rodut t loa ln region 1; y r r r t .
- E repr rban ts exogeneous expor t s of raw j u t e " t o Cent ra l ly Plumed Corntries i n year t
ASt r t a a d s f o r s t o c b purchases of raw j u t e i n p a r t.
S imi la r ly , t q r ; l l i b r i t n i n markets f o r j u t e goods r equ i r e s t h a t
where E represen ts uogenous expor t s of j u t e goods co Centrally 8 s t
Planned Countries in p a r t.
Equations ( 6 ) - (11) def ine a ccmplece dynamic syntem given va lues fo r A st, and Q i S t . The l a t t e r a r e pzwided by the scochascic supply funct ions ( 4 ) and (5). That is,
- - (12) Qit - Y i t '
vhere the ba r s a b w e the right-hand symbols s i g n i f y the ac tua l randaoly se lec ted values.
- J
Trad i t i ona l l y , stocking behavior has been d i f f iwl t t o model. In most ~ c o n o r ~ e t r i c a l l ~ e s t h a t e d ccamodity models, some fun ion, o f t en v f th G€ p r i c e a s the dependent va r i ab l e , is e s t h a t e d on the b a s i a o f 2oodness-of-f it. This procedure mula not w r k f o r t h i s study. In the f i r s t place, ve a r e concerned with a 10-15 year horizon, and in that period i t is qu i te un l ike ly t h a t any estimated stocking parape te rs w u l d remain constant. Horeover, past data yie lds behavioral i n foma t ion on n period without preknoun ou ts ide intervent ion. Int roduct ion of an in te rna t iocal s t a b i l iza t i on policy would alcost c e r t a i n l y a f fecc s ignif icancly privace stocking behavior.

There is no e n t i r e l y s a t i s f a c t o r y way o u t of t h i s d i l m o a . I h e procedure chosen La ou r s l n u l a t l o n s is t o i n t r o d u c e b u f f e r e t o c k i r q r u l e s vh ich g e n e r a l l y t a k e t h e l o r n
h e r e the upper and l o w r boundm a r e determined by p a s t p r i c e r anges and p r e s e t pollclem. l i i t h t h i s fo rmula t ion , mtock changes t a k e p l a c e o n l y i f one o f t h e l n a q r r s l l t i e e i n ( 1 3 ) i m b lnding. V h i l e admi t r ed ly t h i s is a mcchan l c a l procedure , eo a r e moat I n t e r n a t I o n a l l y negot laced mtab 11 i r a t lot, r u l e s .
LV. S IWLAT ION RESULTS
A b a s e c a s e s l n u l a t l o n us ing 1976 a s t h e s t a r t i n g po in t and cove r ing a f i f t e e n p a r hor izon f o r a d e t e m i r ' * t i c s i t u a t i o n <r,o m c e r t a i n t y In y i e l d o r s c r e a g e response) ws f i r s t conducted t o a s s e s s a t l e a s t qunl ica- r l v e l y t h e behav io r of t h e model a s l a s t ex imt ing e x p e c t a t i o n s concerning t h e f u t u r e of t h e w r l d j u t e e c o n a y . L/ The r e s u l t s f o r t he d e t e r m i n i s t i c base c a s e a r e s u a e r i z e d Fo Table 3 and d e t a i l s a r e found fn Tab les 10, 11 and 12. They b road ly conform t o t h e IBRD a s s e s m e n t of t h e f u t u r e of j u t e : t o t a l d e ~ a n d f o r j u t e goods is l i k e l y t o grow a t o n l y I t p e r p a r i n t he medim-term and almost 702 of t h e increased d a s n d coaem fram t h e producing c o u n t r i e ~ themselves. The long-run w e r q e p r i c e f o r j u t e f i b e r ($298/con i n r e a l t a m s ) , though roughly c o o p e r i t i v e wi th t h a t of polypropylene r e s i n , still I m p l i e s a l o s s i n j u t e ' s s h a r e of t h e world f i b e r market on bo th techni - c a l and non-price e c o m a i c grounds (e.g. s e l f - s u f f i c i e n c y and Import s u b s t i t u t i o n ) .
Sorevhat more s u r p r i s i n g is t h e need f o r s m e p r i c e a t a b l l i z a t l o n even in the d e t e r n i n i s t i c s i n u l a t ion. Although t h e magnitudes involved a r e r e l a t i v e l y s m a l l , i t seems c l e a r t h a t , q u i t e a p a r t from' s t o c h a s t i c d i s t u r b a n c e s , t h e dynamic a d j u s t n e a t p rocess of t h e market is a s o u r c e of p r i c e i n s t a b i l i t y (Tab le 3). T h i s is g e n e r a l l y t h e c a s e wi th a d a p t i v e expec ta t ions . If a l l e x p e c t a t i o n s e r e r a t i o n a l , t h e cause of i n s t a b i l i t y cou ld be put more e x c l u s i v e l y on the s t o c h a s t i c v a r i a b l e s .
The o a j o r e lements of t h e p l c t u r e a r e changed v e r y l i t t l e when the ~ t o c h a s t i c e lements a r e in t roduced ( s e e Table 3). Here, dynamic s i m u l a t i o n s
1 / This r e q u i r e s t h a t eqlla t i o n (13 ) be modif ied t o r e f l e c t e x i s t i n g s c a b i l - - i t a t i o n behavior . ndeed, t h e i n e l a s t i c i t y of supply and dmand in t h e short-run n e c e s s i t a t e s t h a t some s tock ad jus tmen t e x i s t -- and in r e a l i t y s t o c k t rac ' ing and hold ing does occur. Rather t han t r y t o e s t i m a t e a c d c p l c i f u n c t i o n , w e n e r e l y t r y t o r e p l i c a t e t h e o b s e r v a t i o n t h a t p r f c e s r a r e l y v a r y n o r e than 15% per year.

T a b l e 3: S L Y . ~ ! Y RESLZTS OF DETERWISIST IC Ah'D STOCHASTIC SMCUTIOSS OF THE w0DEL
D e c b r a i n i r t i c S t o c h a r c i c
M a n v o r l d p r i c e of r a v J u t e
,%an v o r l d p r i c e of J u c e j o d r
.%an r a v J u c e prod1-c t i ~ n
3ean goods produc c!u;
T o t a l d i s coun ted revenue o f e x p o r t e r s
?wan i n i t i a l bu f f c s t o c k s i z e
Paan s f m u l a t i o n s t o c k s i t e
,Yoan change in s t o c k s
!Lon a b s o l u t e change In s t o c k s 4 ' 355 Mi)
1 / Standard d e v i c t t o n s i n p a r e n t h e s e s &ere a p p l i c a b l e or cmpu ted . -

a r c c ~ l c u l a t e a l o r 1 0 0 s e t s o f rand- d i s t u r b a n c e s . I/ : lot s u r p r l ~ i n g l y , r o n t i i 4 e r a b l y n o r e s t 3 c k l n g az t t : - i cy I s r e q u i r e d t o m a i n t a i n t h e trocards o n ; v s r i v y r i c c a o L i i a c n t s . This I S d u e eo t h e a d c l i t l o n of t h e s t a c h a s t i c c . l c n r n t s (b41tc.h p r t r a y f a r : o r s s u c h .IS = a t h e r ) t o t h e b u i l t - l n a d j u u t m e n t L n n t o b l l l t y . Oo c u c r a g c , t r a d c r r . ' tma l~r r . t t s e l l e r s , o b t a i r ~ i n g aome d i e - c a w l t e d p r o i r t s ~ l t e r dcduc t i n g r r r . , . u n t c d c o o t s . ! l o r c o c c r , t h e v a l u c s o f otocks-or.-hand i ~ y l l e d a r e n m e r l c ~ l l y c o n s l a t c n t w i t h know l n i c i a l :ondl- t ions . On b a l a r r r , u n c c r t o r r . t y l c n d e t o sl i g l r t l y higher a v e r a g e p r i c e s , ~ l ! g ! r t l j ' .owl p r o d w t i o n ! ~ ' c l s , a c d ~ p a r g l n a l l y h i g h e r J i w o u n t e d revenue.
n t ~ ati;n sir i c e s C qwrrc i t Lea a r e CQLCUI dated b y n v c r ~ l n g t h e , : ~ i c r ~ ~ ~ c o l v;lctt o t the* 100 a t o c h a s t !c .nr r ln t ions . AR On0 wwliero m ~ b s u r e , ktrc d i ~ : o u n k c . d e x p o r t r e v e n u e s trru c n l c r r l a c e d Lor t h e t h r o e main p r o d u c c r s . Yc.trly r w t - n u e a a r c ~ ~ l i c c o u n c c d b y 16% a n n ~ r n l l y , n o t i n t ; t h a t l n l l a t l o n 1s n o t o t t r r u l s c cp?un ted .
Dc*ing e a c h dyn;lalc a t m u l a c l o r , ?o c h c c k a a r c made o n v h c c h e r the b u t t e r a.ock o f j u c c ha* b e e n wmpC1c.l. A l t r r t h c Las t ) r a r 0 s s l m u l n t l o n 1s r u n , t h e r o d c l c a l c u l a t t - r , u l n d s b a c k m r d r c c ~ r r s l o n +hat t h c y e a r 6 s t o c k would have t o faaye b a r n LO a.*old ever r d u c l r g 1t b c l o u zc ro . Uelng t h l s l n l t i a l :.~lur., t h e t l m * p a t h o f jute s t o c k I s c -3 l ru la t r .d . Thc means o f t h e r e cross ~ . ~ c l ? c x p e r b c n r a r c s b m i n ' f a b l e 3. S t a r t i q f r m f a l r l y h i g h i n l r t n l P C O C ~ S , a n l c s a r e a a d c co r t d u c e co the wean e l m u l n t i o a s t o c k s i z e , v h i c h is t h e n v e r o g c ; a l u c o l s t o c k s I n a l l p e r i o d s i n e a c h s l m u l a t l o n .
The model car . b e u s e d to s a a u l a t c a l m o s t m y b u f f e r s t o c k p o l i c y . In the c o n t e A t o n any l n c e r n a r l o n a l a g r e e m e n t o n J t ~ t c p r l c e s t a b l l l z a t l o n b a s e d on a n ~ r . ~ c r n a t l o r d l l y h e l d a n d f i n l n c c d b k a f f e r s t o c k , t h e s t ~ b l l l z a t i o n bot..~ds a; r l l as ~ 5 e s e c u l o r t r e n d a r o u n d which p r l c r a a r c to b e s t o b L l l z e d h e c o n e n P r n r t e r of producer-consumer b r r g a l n l n g s n d g r o u p n c g o t l a t l o n s . TO-e p o t e n t l a l b p e c t o f r. r a n g e o f r e a s o n a b l e s t a t i l l t a t i o n r u l e s c h a t a n : n c - m a t i o w l a g e w y m i g h t c r y to a d o p t I s exarr ined h e r e . n.e a l t e r n a t i v e s 7 re :
Case I - S t a b i l i z e w r l d p r i c e of rdv j u t e u l t h i n + 10X: o f p r I c r ) p a r ' s p r ' p e ; -
Case 2 - S t c t : l i z e w r l 4 r r l c e o f raw j u t e b l t h i n + 7. 5X o f S305 p e r t o n ; -
i z s e 3 -- d :ab i l i , e k r l d p r i c e o f raw j u t e v i r n i n + 7 - 52 o f ' f330 p e r t o n ; -
C tse 2 -- S = a S l d i z e G r l o p r i c e oh raw j u t e u l t h i n + 7. SP, of Ute t r e n d p r i c e ( P = 5315 (1.05)'). - - c
I / C i v r n t h e Lou r ~ r c s n i n d j a s t c e n t to r:sk shown b y t h e s u p p l y f u n c t i o n s , . - t i le ! 5 :;e.ir s f c ~ l a t i ? n p r i a d is probaD1y no: l o n g enough t o f u l i y . ~ c c o u n c i o r c h e risk e f f e c t . This rclnti.. ,el:; s h o r t s i n r r l n r i o n p e r i o d , : ~ r ) r d : ~ c , W A S C ~ I O S P ~ D I C J U S ~ of C?IC lac? . o f p r e c ise knowledge o n long- run s t r u c r u r a l change . i\ L o w e r s ic . : l a t i o n p r i g d would h;lve imp1 l e d knowledge th,!t LP d o n o t pessess.

C a s e 1 w o u l d s i m p l y r e p r e s e n t a n a t r a p t t o r e d u c e t h e a m p l i t u d e o f fluctuations b y f c l l o u r n g i n e s s e n c e , t h e d}la l r r~ics o f t h e j u t e m a r k e t u i t h o u t t r y i n g ta i n t e r f e r e wftk i t . C a s e 2 c a n b e v i e w d a s a n a t t e m p t t o stabilize p r l c e s a r o u n d a l c ;-tern a v e r a g e o f $300 p e r ton . The r a t i o n a l e o f t h i s a l t r r n a t i S : e restr o n ' 1 f a c c t h a t v i t h o u t c o n t l n u c d . .< : t r ~ o a i n c r u d e o i l p r i c e s d r iu i r . . . :p * l , p r o p y l e n e c o s t s , t h e l o n g tern c;rt .A p r i c e f o r raw j u t e is ' . r r \ -3 r e e a i n f a i r l y c o n s t a n t In r e a l te rms. C *-.e 3 '1r.d t r e p r e s e n t p s s l b . c x d p l e s o f s t a b 1 1 i z a t i o n t o g e t h e r v i c h Irihl * l- . r l c c e t h a t a r e a d v o c a t e d by p r b u r y c a a m o d l t y e x p o r t i n g c o u n t r i a s and cndo. sod - a t l eas t i n pr i n c i p l e -- by U!;CUD. ItIe f i r s t c a n b e v r c w d a e s t a b 11 l r a t l o n a r o u n d a l o n g tern a v e r a g e p r i c e 10% aba0c t t r e n d , 4 r i l e C a s e k i r a n a t t c m p c t o s t a b i l i z e p r i c e s a r o u n d a noderatel y i n c r e a r l n g l o n g - c u m t r e n d . me r e s u l c s o f t h e s e s c o c h a s c i c r l o u l n c i o n r a r e c o n p a r a d v i c h t h e b a r l c c a s a i n T a b l e 4.
In a d d i t l o n t o c h c p r e v i o u s c n l c u l a t i o n s , i n e a c h c x p c r i m c n c t h e pro! i t3 o f t h e b u f f e r s t o c k i n g o p e r a t i o n , n e t o f i n l t i s l f i ~ a n c l n g , a r e r ie termlned. h c t i n g r d e n o t e t h e d i s c o u n t r a t e , c t h c t r a n s a c t l o n e 1 ' cost o f buy ing o r o e l l i n g j u t e , a n d c t h e a n n u l s t o r a g e c o s t s , 2
Case I f l l u s t - a c e s q u i t e c l e a r l y t h e f a c c that l o v e r p r i c e v o l n c i l i c y ( v i t h r e s p e c t to t h e b a s i c case) i n d u c e s a h i g h e r end more s t a b l e a v e r a g e s u p p l y o f raw J u t e d e s p i t e t h e s l i g h t l y reduced m a r k e t p r l c e e . P r o d u c t i o n o f J u t e goods is o n l y m a r g i n a l l y a f f e c t e d . l%e e x p e r t r e s renues o f I n d i a , Bangle- d c s h a n d T h a i l a n d t o k e n t c g e o h e r o r e v i r t u n : l y unchanged w i t h r e e p c c c t o t k c b a s i c case, b u t a r c Dzorc s t a b l e . The h ~ ~ f f c r s t o c k o p e r o c i o n is, o n n v e r I .I.
m a r g i n a l l y p r o f i t a b l e a s a n e t se l ler o f l u t e .
TRe s f n u l a r d o n r e s u l t s of C a s e 2 a r e n o t v e r y d i f f e r e n t , b e c a u s e t'he long- term a v e r a g e p r i c e a r o c n d w h i c h m a r k e t p r i c e s a r e s t a b i l i z e d is ?:ery s b i l a r t o t h e mean p r i c e t h a t p r e s * a i l ~ u n d e r Case I r u l e s . P r o d u c t i o n of both raw j u t e a n d J u c e g o o d s a n d d r s c o u n t e d t o t a l cxpor : i ,mpenue o r e s u b s t a n t i a l l y ttre ace, as i n Case I a n d so is buf Ccr p r o f i t a b i l i t y ; o s m a l l e r . ~ o l a e of t r a n s c t i o m s r e d u c e s g r o s s r e y e n a e , b u t a lover s t o c k c a r r y o v e r r e d u c e s c o s t s b y a l m o s t t h e s u e a z o u n t . The o n l y s u b s t a n t i a l b e n e f i t t h a t a r i s e s co che p r o d u c e r s is t h e r e d r n c t i o n i n re;'enue i n s t s b i l i t y . The c o e f f i - c i e n t c t v a r i a t i o n of e x p o r t r c e n u e d r o p s co 1.. 22, a s c a p a r e d t o 8.8% i n P A S P ! and 9 . 5 : :n tibe S t s i c b s e . '*


Cascs 3 and Q show c l e a r l y t h a t s t r i n g e n t l i m i t s e x i s t i n the J u t e market to "strong" Uh'CTAD-type s t a b i l i z a t ion r u l e s , 1.e. p r i c e s t a b i l - iza t i o n accompanied by a t t m p t s t o r a i s e average p r i ces . The s imulat ions i n d i c a t e t h a t the price-induced higher supply of J u t e is not r e a d i l y absorbed by t h e market e i t h e r in raw f o m o r a s oanufactured goods, un less s y n t h e t i c p r i c e s = r e to r i s e s i g n i f i c a n t l y . P r i c e s t a b i l i z a t i o n i n Cora 3 t u r n s t h e modest buf f a r stock agency prof it s h o w under the pruviously exrained r u l e s i n t o a s u b s t a n t i a l loss . The agency t u r n s f r a a an aver rge s e l l e r t o an average b u p r and l o s e s about $370 m i l l i o n over the par iod, i n a d d i t i o n to required i n i t i a l c a p i t a l . The l o s r e s t o the b u f f r r s tock a u t h o r i t y a r e almost e x a c t l y e q ~ 1 to the i n c r ~ e n t in the d i rcounted v a l u r of t h e a p o r t r tvenues of the thr- major producing countr ies . h n g l a d e s h and Thailand appear to gain r e l a t i v e l y more than Ind ia in t e r n s of expor t r w e n u e f r m t h i s type o i p r i c e i n t e w e n t i o n , mostly on account of t h e i r g r e a t e r respon- s iveness of j u t e supply t o the h igher market p r l c e s sus ta ined by the a c t i o n o f the buf fe r s t o c k a u t h o r i t y .
S t a b i l i z a t i o n of raw j u t e p r i c e s , even around a modestly r i s i n g t rend (1.52 per annun), impl ies stagger1r.g l o s s e s :o the b u f f e r s tock a u t h o r i t y -- a l o o s t $1 b i l l i o n over the period due to heavy s t o c k accmu- l a t ion . Again the producer g a i n s , i n t e r n s of j o i n t expor t revenue, a r e aloos: exact::; equa l :a the i o s s e s t h a t the buf f e r s t o c k agency oould incur . Th i s type of s t a b i l i z a t i o n v i t h r i s i n g p r i c e s appears t o t a l l y u n f e a s i b l e in the J u t e market, u n l e s s , of course , t h e consuners accepted to shoulder i ts c o s t and considered it a veh ic le f o r t r a n s f e r r i n g resources t o j u t e producers o r i f s y n t h e t i c p r i c e s changed d r ~ a t i c a l l y . 1 1
In a d d i t i o n t o b u f f e r s t o c k po l l cy , s tochas t i c s imulat ions were conducted to a s s e s s the e f f e c t s of a l t e r n a t i v e production and t r a d e po l i cy o p t i o n s open to the j u t e producers and to the i n t e r n a t i o n a l community. These a l t e r n a t i v e s a r e :
Case 5 -- Raw j u t e c o s t s t o the m i l l s l o w r e d by 20% i n Bangladesh;
Case 6 -- P o s i t i v e exchange r s c e d i f f e r e n t i a l of 20% granted t o j u t e goods i n Bangladesh;
Case 7 -- J u t e a r e a r e s t r i c t i o n s i n Bangladesh; - - r a Case 8 -- Compensatory f inancing applied to j u t e expor ters . - - The r e s u l t s of t h e s t o c h a s t i c s i n u l a t i o n s f o r Cases 5, 0, and 7 ar; * cmpared to those of t h e Base Case in Table 5. S i o u l a t i o n s of C a 9 8 - a r e s m o a r i z e d in Table 6. .
Case 5 i n p l i e s a subsidy of 20% t o Gnngladesh j u t e raills o n t h e i r raw j u t e cos ts . Such i n p u t s u b s i d y s t i m u l a t e s production of j u t e goods i n Bangladesh and lovers t h e i r p r i c e s i n world markets. Prodl~ct inn o t j u t e
11 Tiicse runs Lere made i n 1978; the recent o i l p r i c e inc reases ind ica te - t h a t r e v i s i o n s i n polypropylene p r i ces uould change these r e s u l t s socr.ch.1 t.

w nr krl~lr
Wf I * *u r l . l cam- -* hr - I. *I&..*
s n O I )
HI 0))
8 Y (18))
tY (u)
nrtu Irlk.)
a t m 8 1
l l b 4 ( 1 0 )
I t * 00
M m b l f U l 9 l )
W U W
Y 0 1 )
I t 8 0)
LIIUI ~II~II)
I~~II~I
IUI
lm
nnrn ( ~ t r m ) (.On)
uxw
w ~r M. w a. III. t - ~ tn I. ~ l u r
116 t # I *
6 lB On)
t t 8 t ~ t t )
t* tub
trwa FCII)
~SMIII
IIU (1911
OI ~III
m a t l (CUM)
6Y8PI8
r n (91)
IU 0)
~ n m (~UII)
WWI
w I tn
~IWI (-5) (.M) -
umrn
UlL!
rr-. r e w a * . c l a u I. ).r(Ib8.*
)LI l%II
69 I (%:I
)It (I~II
I#)* (#I)
u t a b ( ~ t r l ~
WIWSI
0 1 (Illl
L I I 11))
U I f f I W 9 W I
99lbI l9
19s (HI
IS* (6 1
IIOII (19no)
I~WOLI
1 )9(
I * W
nwv ( t c ~ w ~ l.O*l l
utnm
U Cm
n* en1
W 4 U l
* I # ctn)
Urn em
mm Wl)
m n ~ #
Ill@ (llr)
.r) nrr
M I I B (Wrtr)
Y W
w ml Im
I.1
t t r n n~m)
n s n t t
)U
I ? U
m 5 t WII) t-m)
m u
w SLM
nma
mu
YIUOCSI
TItW
wuu--
I
STATISTICS*
r t r ha.. w LI. n m
-14 h ~ s m a 4 M ) U o
-It e t w b.4. 4.- II
bwlt .( b.4.- r-II
mt - t-w I)
A l e 1 m r - d L.,",. -----I'
e t w M e 4 . Y m
-It .t M. UI (.a@ II
-I - ('a@ I 1
tH.1 mu-d a (-IB
-I? .t w h. (-a@ m
L n l p .I &e C o d a ('W rtl
m a LW ('- I) - c-- II
-I? .t h &. (.a@ El
h t r .I ah u. ('w rt)
TM.I .mrr ('w I)
C r I I l c t m .? ~uI.~IL.
TU.1 rn"w.4 h p . l e c e ~ u

Table 6: CWPENSATORY F I W C I % FOR JUTE EXPORTERS
( n i l l i o n 5 )
IKDIA
R ~ t e of I n t e r e r t
03
BUCUDESH ( 47.9 i 110.8 ! -.12
1
I
Wan Debt
IS 3
64.9
27.7
109.5
1.3
- 5
TIUIUhTl
TOTAL
1. 13
095 1
1
- - -061 i
Haan Wximrp
Debt
61.6
- 0 8
133.4
72.5
274. 7
r-- - -
Coef f i c ient of Variation of Hean Export Revenue of 'Jute Exporting [Coun t r i e r ,
Average
Percent changa l a Haan Revenue v i th
Rerpect to Barlc Care
1. 2
b a n Debt
1 6 9
-. 3
1 . 1
. G
22.2
85.4 I
Pro f i t s of Finance F a c i l i t y
Before Compensatory Scheme
Compensatory S c h w e
62.6
235.0
b a a )(.xlmm Debt
68. 8
-4 .88 I
-095
-063
Percent change la Man Revenue v i th
Rerpect to Barlc Carq
1.2

I V - 2 3
goods is reduced s u b s t a n t i a l l y i n I n d i a and m a r g i n a l l y i n Thailand. On a w r l d b a s i s , however, supp ly of j u t e goods is increased . Higher o v e r a l l d a ~ a n d f o r raw j u t e i n producing c o u n t r i e s r educes e x p o r t a v a i l a b i l i t y and r a i s e s pr ices . In terms o f e x p o r t revenue (which i n c r e a s e s by about $300 m i l l i o n ove r I5 y e a r s ) , p r d u c e r s a s a group uould g a i n m a r g i n a l l y frcm such a po l i cy implenented by Bangladesh. I n d i a , however, would l o s e coape- t i t i v e n e s s i n the market f o r j u t e goods and s u f f e r a l o s s i n e x p o r t revenue, w h i l e Bangladesh uould r eap a lmost a l l t h e b e n e f i t s . The e f f e c t s on Tha i l and o r e smal l ; h e r revenue p o s i t i o n remains v i r t u a l l y unchanged wi th r e s p e c t t o the Basic Cafe.
Case 6, which is a v a r i a t i o n of t h e p rev ious one , can be thought o f a s an a t t ~ l p t by h:.dladesh t o auba id i ze even f u r t h e r its product ion o f j u t e goods, and , a t t h e same t h e , t o e x p l o i t t o some c x t e n t i ts nea r monopoly p o s i t i o n i n raw j u t e epxor ts . 1 / The o v e r a l l impact of such a p o l i c y i s n o t v e r y d i f f e r e n t f r a r Case 5: t o t i 1 d i scoun ted expor t revenue is r a i s e d o n l y marg ina l ly s i n c e the f a l l i n j u t e good p r i c e s a lmost comple te ly o f f s e t s t h e i n c r e a s e i n raw j u t e pr ices . The d i s t r i b u t i o n of revenue g a i n s , however, is f u r t h e r changed i n f avor of t hng ladesh and a g a i n s t India . Thai land remains v i r t u a l l y una f fec t ed .
Case 7 shove t h a t j u t e a r e a r e s t r i c t i o n s L, Bangladesh 21 uould i n c r e a s e the p r i c e s of bo th raw j u t e and j u t e goous wi thout r a i s i n g t h e j o i n t revenue of t h e t h r e e major p r d u c e r s wi th r e s p e c t t o t h a t of t h e Basic Case. Bangladesh w u l d shou lde r t he c o s t of such a p o l i c y , v i t h i ts expor t revenues dec reas ing a s a r e s u l t of reduced raw j u t e expor ts . I n d i a and Thai land , o n t h e o t h e r hand, would both g a i n in t e r n s of revenue s i n c e t h e i r product ion and e x p o r t s o f raw j u t e and j u t e goods i n c r e a s e in response t o the h i g h e r p r i c e s caused by a r e a r e s t r i c t i o n s i n Bangladesh.
In Case 8, a compensatory f i n a n c i n g scheae f o r j u t e e x p o r t e r s is t e s t e d . Here t h e p r d u c i n g c o u n t r i e s borrow frcm some l ende r ( p r e s m a b l y t h e MF) vhenever t h e i r e x p o r t revenues f a l l s h o r t of t h e ave rage revenue o f t h e Basic Case by more than 102, and pay back i n y e a r s h e n e x p o r t revenue is a b w e average. As shown in Table 6, a t an i n t e r e s t r a t e of 32 t h e t o t a l d i scoun ted c o s t o f t h e p l an w u l d be v e r y s m a l l r e q u i r i n g t o t a l f i nanc ing of $235 n i l l i o n and w e r a g t drawings o f $85 mi l l i on . Btylgladesh w u l d be the l i k e ' l y h e a v i e s t and I n d i a t h e l i k e l y l i g h t e s t u s e r of t h e f a c i l i t y . A t a n i n t e r e s t r a t e o f 82 t h e f a c i l i t y w u l d become s e l f - f i n a n c i n g . b u t t h e t o t a l f i nanc ing r e q u i r e d would i n c r e a s e t o $275 m i l l i o n and average drawings t o $110 m i l l i o n . The impact o f t h e scheme on t o t a l expor t revenue is on ba l ance p o s i t i v e , b u t h u e I n d i a and Thai land would m a r g i n a l l y b e n e f i t from i t , Bangladesh w u l d expe r i ence a marg ina l l o s s o v e r t h e period. There -
1 / A d i f f e r e n t i a l exchange r a t e i n f avor of goods e x p o r t ; i m p l i e s a " t a r i f f " - on raw j u t e expor t s .
2 1 Area is he ld co the 1972-75 average. -

is no s t r a i gh t fo rua rd vay t o evaluate the b e n e f i t s frcxa increased revenue s t a b i l i t y . I f t h i s is considered Important, coopenaatory f inance w u l d seem to the cos t e f f e c t i v e s t ra tegy . 1 1
V. CONCLUDING R E W S
In chis s tudy , ue sought t o inves t iga te i n t e rna t i ona l pol icy t o s t a b i l i z e j u t e markets using a simple and eaa i l y e a t ima t l b l e dynmic model. The conclusions t h a t can be d r a m f r m the modal r imula t ionr a r e t en t a t i ve , but e f e e l encouraging and reawnable.
Since r i s k plays a qurnt i t a t i ve ly r i g n i f i c a n t r o l e in determining the acreage farmers p l an t , i t i r important in analyziag p r i c e s t a b i l i z a t i o n p o l i c i e s t o e x p l i c i t l y model t h i s pa r t of farmer reaction. An expected, p r i c e var iance c a r r i e s a negative c o e f f i c i e n t in a l l cases. While fur-her e conme t r i c Lprovcnrents can be made and a l t e r n a t i v e a p e c t a t i o n r behavior t e s t ed , the var iance f a c t o r vill l i k e l y remain an lnpor tan t endogenous va r l ab lo in modeling c ~ m o o i t i e s l i k e ju te . The s t o p l e formulation repre- sented by equation (4) has worked ~ t i s f a c t o r l l y f o r our s h u l a t i o n s i n terms of reproduc in8 past behavior. 21
Ju t e is seen a s a c l a s s i c exmp le of markets v l t h low short-run and somewhat higher long-run e l a s t i c i t i e s . The i n t e rna l dyntmics a r e n w e r i n complete equi l ibr ium, a s d a o n e t r a t e d in the de t e rmin i s t i c vers ion of the base case , because the expectat ions of buyers, manufacturers and farmers d i f f e r and a d j u s t a t d i f f e r e n t speeds t o new pr ices . 2/ Not only v i l l a j u t e buf fe r s tock agency have to deal v i t h a g r i c u l t u r a l unce r t a in t i e s and business cyc les , bu t a l s o v i t h the i n t e rna l cyc l e s of the j u t e markets themselves. This Impl ies t h a t a complete market model is needed to c a l cu l a t e the cos t s 3nd bene f i t s of any proposed policy.
Cases 1 and 2 c l e a r l y i nd i ca t e t h a t a c e r t a i n moun t of s t a b i l i z a t i o n is f e a s i b l e and might even be prof i t a b l e f o r the buf fe r s tock agency. However, the ne t f inanc ia l ga in s t o the major j u t e producers a r e q u i t e modest, e spec i a l l y when viewed i n l l g h t of the high l eve l of buf fe r s tocks vhich w u l d be required a s an up-side r i s k hedge. It w u l d seem more d i f f i c u l t , and perhaps impossible, t o both s t a b i l i z e and r a i s e p r ices above the comparable syn the t i c s u b s t i t u t e price. The e f f e c t s of reduced pr ice r i s k and higher a c t u a l p r i c c s can e a s i l y lead t o much overproduction. Horeover, j u t e goods w u l d begin to l o se t h e i r
5 share of the t o t a l f i b e r s narke t qu i t e rapidly . While the s p e c i f i c numbers ' w u l d change i f redone a t 1979 o i l p r i c e s , the q u a l i t a t i v e conclusion renains.
- 9 I/ Ue hasten t o note tha t these c a l c u l a t i o n s a r e based on p a r t i c u l a t - s tochas t i c assunptions. If the underlying p robab i l i t y d i s t r i b u t i o n s
a r e much d i f f e r e n t f ran these, t he r e s u l t s could be d i f f e r en t . Spec i f t c numbers reported here should be i n t e rp r e t ed cau t ious ly , being expected values of randm var iables .
3 / Lie d o not v i s h to debate whether a pe r f ec t l y r a t i o n a l speculator could - achieve s t a b i l i t y , nor b ~ y t h i s has not occurred. Ue take for granted t ha t i t has not.

I n terms of a l t e r n a t i v e f o m s of policy, the choices a r e ionuner- abla. The cases ue chose for i l l u s t r a t i o n indicate tha t there is modest scope for co l l ec t ive act ion irc reducing output a b i t , but the to ta l e f f e c t s a r e hard to measure, s ince higher pr ices lead eventually to reduced market shares. From the narrow point of view of export revenue, cmpensatory financing appears cost-ef fect ive when compared with d i r e c t market intcrven- t ion.
kh i l e not f u l l y s a t i s f a c t o r y , ue fee l the simple modeling approach used here, combining econometrics v i t h indus t r ia l exper t i se and a b i t of model builders ' glue, i s a useful way t o approach commodity s t ab l l l za t ion . By focusing on t t r dynanics of supply and derra?d, the adjustment to the scabl l iza- t ion policy i t ac l f can bc exaerined. In reducing the nmbcr of parumetare to the minimua, i t i s possible tn scc whlch ones a r c the most important and in need of more carcful c s t l a t i o n . Since a model l ike t h i s can be developed frcn exiscing scn t i s c i c s in a relatively short t h e acid can cas i ly be updated and modified, ue feel the occhods o f f e r mae scope for oediua-term ana lys is of other c m ~ ~ o d i t y markets.

Table 7: PmooCTIrn AM) P P I c t s I11 m u
Sources: (1 ) : Indian Jute Hanufa=turers Association. (2) : International Jute Xmufnc curers Associa t ion. (3) : I B R D (Weighted by State Jute Acreage). (4) : I B R D (Weighted by State Jute Acreage). 5 : C41uQ (3) + col- ( 4 ) .
(4) Hameat Aus Paddy Prices
(Rupeer Per Quintal)
38.32
37.93
35.18
29.91
25.80 -------..--------------
30.24
31.08
35.71
34.23
34.32
33.23
35.11 - 36.44
39.07
44.19
56.65
70.76
88.26
73.51
71.88 - - -----
73.90
97.86 ./- 61.45
lX6.82 * - - -
(3) I l .nea t
Jute Prices
(Rupees Per Quintal)
99.53
114.12
M .99
(5) JutcfPaddy
Price Ratio
2 .6
3.0
1.6
2 .O
2.3
2 .0
2 . 0
1.7
1 .6
1.7
3 .1
2.5
2 .O
2 .1
2 .1
2.0
1 .6
1.1
1.8
1 . 8 - ----
2 .O
1 . 7
1 .8
1 . 1 - -
(2) %-tit7
b r v c s t e d
('000 Xetrfc Tons)
586.6
829.8
810.6
(1) Area
Harv8st.d
('000 Hwtates)
561.4
762.2
701.0
e
1933-54
1954-55
1955-56
1956-57
1957-58
1958-59
195960
196061
196162
196243
196364
196465
196566
196667
196748
196869
1969-70
1970-71
1971-72
1972-73
1973-74
1974-7B . 1975-76
~ g r l c u l t u r a l Year
k
Unltar
1950-51
1951-52
1952 53 484 -0
470.1 ________------..------
684.5
772.2
705.0
732.9
681.5
618.6
923.3
852.8
867.6
838.5
753.3
796.7
885.2
527.6
762.0
743.2
818.1
700.2
792.8
664.3
586.8
59.42
58.73
749.3 ::: 4 60.36 756.7
734.9
935.8
825.3
726.9
ll44 .O
982.4
1090.9
1083.6
803.4
966.2
l l46 .4
531.5
1009.0 ----------------------------------
879.9
1027.9
896.1
l l19.7
804.7
803.1
61.81
61.37
57.18
58.06 ____-__--_-----.--------------.---------------
104.65
89.25
73.94
82.59
94.97 --------------.---------------.---------------
l10.69
114.31
98.53
131.23
127.50
145.22
130.37
146.27
124.82 - -

w e 8: PROOUCTI81 AHD PRICES IN BANCWESH
(1)-(21: { 1960 to 1970: S t a t i s t i c a l Dfgcst of Bangladesh 1970 on: IBRD
(3) : P a k i s t ~ n Jute Board (4): IBRD ( 5 ) : Colurrn ( 3 ) + Col- (4)
(3) Pam Gate
Jute Prices (Tk. Per Quintal)
50.91
69.00
27.45
41.53
41.91 _-------------. .--------------.---------------
W.56
64.55
53.75
42.87
56.00 ___-----------.---------------..--------------
106.27
66.66 . 58.81
60.34
84.32 ---------------.---------------
73.39
96.56
73.90
91.13
79.79 ----------------------------------------------
94.18
103.98
140.88
141.50 - -
Abst rsct of
(4) Paddy Prices
(Tk. Per Quintal)
34.28
39.12
37.14
27.19
19.46
36.59
55. 82
46.76
44.99
46.90
43.40
44.91
47.95
42.18
44.32
52.46
68.52
61.27
68.20
67.49
66.43
83.99
120.27
175.32 - -
East Pakistan
Agricultural Year
Units:
1950-51
1951-52
1952-53
1953-54
1954-55
1955-56
1956-57
1957-58
1958-59
1959-60
1960-61
196142
1962-63
1963-64
1964-65
1965-66
1966-67
196768
1968-69
1969-70
1970-71
1971-72
1972-73
1973-74
1974-75
1975-76 - Sourres :
( 5 ) Jute/Psddy
Price Ratio
1 . 5
1 .8
.7
1.5
2.2
1.4
1.2
1 .
1 .O
1.2
2.4
1.5
1.2
1.4
1 .9
1.4
1.4
1.2
1 .3
1.2
1 .4
1.2
1.2
.8 - - --
( I ) Area
Harvested ( '000
Hectares)
692.4
719.9
771.6
390.6
503.1
661.5
497.9
632.4
618.5
556.5
614.2
833.3
697.3
688.0
671.0 __--- ----.
895.8
875.6
970.9
878.2
997.2
917.8
694 .o 896.3
888.9
607.0
526.0
1950 to
(2) Quantity
Harvcs t ed ('OOO
W t r i c Tons)
807.8
1148.7
1401. 5
434 .O
845.9
1014.6
1000.4
1034.3
1088.7
973.0
1020. 5
W 4 . 3
928.5
997.:
976.1
1 U 1 . 6
1161.1
1242.7
1043.9
1301.0
1242.6
777.9
1172.5
1088.6
720.0
816.0
. 1960: S t a t i s t f c a l

Table 9: PRflDCCnm Wb PRICES M 'MAIUN'D
Sources : (1) : IBRD. - (2) : I B R D . (3) : Rational Bank of Thailand. (4) : Composlce oE Haire and C ~ s s a v a w i g h c e d by acreage in
Nortl~eastern T h ~ i l a n d -- IBRD. (5) : C o l u m (3) f Colqgl w.
(2)
Quaacity Ilrnrsted
'000 I*c l i e im.)
rn
-
(1)
Area B a r n s t a d
rn
n
n
- 127.5
- 278.3
877.0
1720. k
711.7
957.5
1365.4
1870.0
3314.1
1400.0
730.0
1931.5
1500.0
1750.0
2950.0
2205.0
1800.0
1250.0
-
Agrlculcural Ytrt
hits:
1934-55
1955-56
1936-57
1957-58
1958-59
1939-60
1960-61
1 9 6 1 6 2
1962-63
1563-64
1 9 6 4 6 5
1965-66
1966-67
1967-68
1968-69
1969-70
1970-71
1971-72
1972-73
1973174
1974-75
1975-76
+
(3) Average
Kholasrlr
price ~ e a r t - kQk
M H Y Per Uc Ton)
2850.0
3040.0
(4)
Cosporite Cospet ing
crop price
( W T Par Hecrfe Ton)
369.6
342.9
- 2590.0
- ( 1300.0
(5) Ratio of Kcnaf to ~omponits
5.0
5.6
M9.9
596.9
630.8
679.4
7b4.7
41%. 0
695.0
621 .O - 650.4
701.7
885.4
809.0
971.8
1023.6
1106.5
952.3
1296.4
1967.2 /'
2237 .O
1973.3
32 .O 53.0
187 .G
351.0
148.0
220.0
310.0
374 .O
672.0
280.0
150.0
350.0
3QO.O
350.0
390 -0
441.0
360.0
250.0
5 . 1
3 .9
3 . 6
4 . 7
4 . 7
3 .6
5 .4
4 .6
4 .6
4 .7
2 .2
3 .1
3 .1
2 .9
3 .1
4 . 9
3.2
1 .7
1 .8
2 .1
2243.0
3195.7 - - - - - - - - - - - - - - . - - - - - - - - - - - - - - - . . - - - - - - - - - - - - - -
3592.5
23b2.6
3732.6
2849.8
3018.3 - - - - - - - - - - - - - - . - - - - - - - - - - - - - - - . - - - - - - - - - - - - - - -
3311 .O
1974.6
2525.8
3040.0
2966.7 --------------.---------------.---------------
3427.6
4690.1
4111.9
3270.0
4064.7
423C. 5


Table 11: RESCLTS OF D R E E X M S n C SDEfATIOQi ( M I C CASE)
~ A C N R X L G OF ~ t 7 e cows BY mrar ('000 b(T)

Table 12: rES'3LTS OF i)ETENfKh'KSflC S I w m f I O h (BASIC C U E )
DfM!!'P) FOR JWTE W D S BY REGION

References
( 1: h s k a r i , H. and Cbr~aings , JOT. , (1976). A ~ r i c u l t u r a l Supply Responaex A Survey of t h e Econonct r ic Evrdrncc. Praeger : Kev York.
( 2 Behrman, J- do (1968). S U P P ~ Y Rcsponde i~ Underdevrloped Agr i cu l t r e . M r t h Holland: b s t e r d m .
( 3 ) B l i t z e r , C- , Mcaraus, A * ; ~ n d S t f l u c j c s d i j k , A., (1975). "A Dynamic Hodal of Opac Trade and Production." J o u r n a l o f Development Economics, 2 ( 4 ) , pp. 319-336. -
: 4) D h r p e s , P.J. (1911). D i s t r i b u t e d Lanmr Problems o f Es t l a r t& t n d F o m l a t lon. Holdcn Day: San Francisco.
( 5 ) Cr l l ! i , FL and Harrison, R e (1914). " Ju t e and t h e Synthe t ics ." l lor ld Bank -'=If Uorkicn Paper , No. 171, Washington, D. C.
( 6 ) H a r e l l , P. & R. and ScanCi t ro , P. L., (1977). "Market I n t e r v e n t i d n when Prodac t ion is Risky." American J o u r ~ a l of A g r i c u l t u r a l Economics, 59 (1 ) , pp. 204-9.
( 7 ) J u s t , RE. (1974). Econooetr ic Ana iys f s of Product ion Dec i s ions rr i th Government 1nt:rvention: The Case of C a l i f o r n i a F i e l d Crops. C i a n n i n i Foundat iorr Monograph No. 33, Berkeley, Californicr.
( 8 ) - (1975). "Risk Response Xodels and T t e i r Use i n A g r i c u l t u r a l Po l i cy E i a l u a t i ~ n , ~ ' American Journa! of A n r i c u l t u r a l Economics, 57 (5 ) , pp. 8 3 6 4 5
( 9 ) (1977). "The E r l s t e n c e o f S t a b l e Dis:rlbuted Lags," Econooet r ica 45 (6 ) , pp. 1467-1480.
,101 Serrguptx, J. K. and Sen, A. (1969). "Econometric Supply h a c t i o n s f o r Rice end J u t e , " A r t h a n i c i 12(1 6 2 ) , pp. 1-40.
( 1 I ) UNCTAD. (19741.. " ~ n I n t e g r a t e d Programme f o r Commodities: T w Role o f I n t e r n a t i o n a l Buffer Stocks." ( t iepor t by t h e S e c r e t a r y Ge le ra1 of U:iCUD. ) D o c u e n t s TD/B/C- 7/166 Supplement 7 ar.d TD/B/C. 7/ Addend- 7.
( . 2 ) Uorld Bank (1973). The Uorld J u t e Economy. V o l m e s I and 11. Conf l d e n t l a 1 Report 114-BD, Wash',ngton, D- C. -

THE WRtD TU E C Q ~ ~ : AN ECONOMETRIC HODEL OF ITS STRUCTtlRPI,
P E R F O M C E AND PROSPECTS

T M L E OF CONTEXTS
Page No . ................................................. . I ISTRODUCTIOS V-1
................................ . A Production and Exports V-2 8 . Consurption and Imports ............................... V-6 .......................................... . C Prica Trends V-8
A . Ovarviaw of tha tW.1 and Past bdalr ................. V-12 8 . Supply Analysis ....................................... V-14 C . Deund Arulyrfr ....................................... V-24 D . Prices and Stocks ..................................... V-27
I V . W D E L SIMJUTION AND PROJECTIONS ............................. V-29
A . ErPort Silulatlon .................................... V-29 ........... 8 . ?bdel Projections and Alternative Scenarios V-29
APPENDUt 11: T M TRENDS IN AREA. YIELD AHD PRODUCTION. 1957-1990

THE WORLD TEA ECOSO.9: AY ECONOYETRIC HODEL OF ITS STRUCTURE, PERFORYrLYCE ASD PROSPECTS 1/ -
I . INTRODUCTION
T h i s p a p e r a t t e m p t s t o :
(a) model t h e s t r u c t u r e a n d p e r f o r m a n c e o f t h e wor ld t e a economy, t a k i n g i n t o a c c o u n t t h e c h a r a c t e r i s t i c s p e c u l i a r t o t e a ;
( b ) a s s e s s t h e p*rformancc o f t h e model I \ i s t o r i c a l l y and f o r p r o j e c t i o n p u r p o s e s ; a n d
( c ) n ~ l y z e t h e e f f e c t o f a l t e r n a t i v e p o l i c y s c e n a r i o s o n t h e f u t u r e deve lopment o f t h e world t e a economy w i t h e m p h a s i s o n p r o j e c t i n g f u t u r e p r i c e s .
2. S e c t l o n I I p r o v i d e s a n ~ v c r v i e u o f t h e wor ld tea economy s u m s a r i z i n g key c h n r a c t e r i s t i c s o f t h e p r o d u c t and t r a c l n g t h e p e r f o r m a n c e o f key i n d i c a t o r s ( p r o d u c t i o n , c o n s u n p t i o n , t r a d e a :~d p r i c e s ) . S e c t i o n 111 c o n t a i n s t h e cmdel s t r u c t u r e a n d t h e c c o n o m c t r i c e s t i m a t e s . I n S e c t i o n 1 V t h e h i s t o r i c s i m u l a t i o n s o f t h e model are p r e s e n t e d , t o g e t h e r w i t h t h e e x t r a p o l a t i o n o f t h e model f o r p r o j e c t i o n t o 1990. Some p o l i c y a l t e r n a t i v e s i n p r o j e c t i n g key endogenous v a r i a b l e s t o 1990 a r e a l s o e x p l o r e d . F i n a l l y , S e c t i o n V summarizes t h e c o n c l u r i o n s t h a t c a n be d r a m from t h e tea model s i m u l a t i o n s ( w i t h e m p h a s i s o-.t p r i c e p r o j e c t i o n s ) .
1/ Ue would l i k e t o t h a n k P e t e r P o l l a k , J o s d e V r i e s a n d Yaw-Cheng Yang f o r - t h e i r i n v a l u a b l e a s s i s t a n c e i n o v e r c o m i n g p r o b l e m s r e l a t e d t o t h e e s t i m a t i o n and s i m u l a t i o r o f t h i s t e a model. Thanks ar: a l s o d u e t o t h e m n y r e v i e w e r s a t t h e Aarhuc; Xorkshor ( e s p e c i a l l y T . Akiyama) f o r t h e i r v a l u a b l e c o m e n t s wh ich h a v e been i r - c o r p o r a t e d i n t h i s p a p e r .
11. AS OVERVIEU OF THE UORLD TEA ECONOKf
3. Tea may be b r o a d l y c l a s s i f i e d i n t o two types--depending on whether t h e tea l e a v e s a r e f e rmen ted ( b l a c k t e a ) o r u n f e r a e n t e d ( g r e e n t e a ) . Green t e a p r o d u c t i o n o r i g i n a t e d i n China and i t s consumption a s a d r i n k was f i r s t i nc roduced i n t o Europe by t h e Dutch r e t u r n i n g f r o a t r a d e w i t h China i n t h e 1 7 t h c e n t u r y . C o m e r c i a l b l a c k t e a p r o d u c t i o n s t a r t e d i n Assaa , I n d i a , i n t h e mid-19th c e n t u r y . L/ S t a r t i n g v i t h t h e B r i t i s h c o l o n i e s , b l a c k t e a p r o d u c t i o n h a s s i n c e s p r e a d a l l o v e r t h e t r o p i c s , and i t p r e s e n t l y r e p r e s e n t s s p p r o x i m a t e l y 7 5 p e r c e n t of a l l t e a produced. V i r t u a l l y a l l t h e t e a grown i n d e v e l o p i n g c o u n t r i e s ( e x c e p t f o r Taiwan and I n d o n e s i a ) is b l a c k ten .
A. Produc t i on a n d E x p o r t s
4 . World tea p r o d u c t i o n g r a v by 3.3 p e r c e n t a n n u a l l y from 1961 t o 1977 (Tab l e 1 ) . P roduc t i on i n c e n t r a l l y p l anned economles grew tw ice a s f a s t n s i n t h e d e v e l o p i n g c o u n t r i e s and, a s a r e s u l t , t h e c e n t r a l l y p l anned economies' share i n w r l d p r o d u c t i o n i n c r e a s e d f r o a 1 9 p e r c e n t i n 1961 t o 24 p e r c e n t i n 1977, w h i l e t h a t of t h e deve lop ing c o u n t r i e s f e l l f r o a 72 p e r c e n t t o 67 p e r c e n t . H c a w h i l e , t h e i n d u s t r i a l i z e d c o u n t r i e s ' s h a r e remained a t about 8- lo pe rcen t . The r e s p e c t i v e shares of d e v e l o p i n g c o u n t r i e s i n world o u t p u t have changed s u b s t a n t i a l l y : that of t h e b i g g e s t t r a d i t i o n a l p roduce r s , I n d i a nnd S r i Lanka dropped from 54 p e r c e n t i n 1961 t o 43 p e r c e n t i n 1977, w h i l e t h e A f r i c a n p r o d u c e r s i n c r e a s e d t h e i r s h a r e f rom 5 p e r c e n t t o 11 p e r c e n t l a r g e l y because o f e x t e n s i v e area expans ion i n t h e 1960s (Tab l e 2 ) . world p roduc t i on g r w t h (2.6 p e r c e n t a n n u a l l y d u r i n g 1961-77) h a s , however, been f a s t e r t h a n a r e a e x p a n s i o n because of y i e l d improvements a m n g r e c e n t p l a n t i n g s .
c J . The s t r u c t u r e o f p r o d u c t i o n of t e a h a s a l s o been e v o l v i n g th rough t h e yea r s . P t o d u c t i o n i n t h e e a r l y y e a r s o f t h e tea i n d u s t r y was th rough " s t e r l i n g " company e s t a t e s i n t h e Asian c o i - n i e s . Hence i n c o u n t r i e s l i k e I n d i a , S r i Lanka and l n d o a e s i a ( t h e e a r l y e n t r a n t s i n t h e p roduc t i on of t e a ) , t h e e s t a t e p r o d u c t i o n s t r u c t u r e s t i l l p r e d o p i n a t e s , b u t n w p r i m a r i l y under l o c a l p r i v a t e s e c t o r minersh ip . I t is o n l y i n a few A f r i c a n c o u n t r i e s l i k e Kenya and Tanzan i a (whose tea p r o d u c t i o n vas i n t r o d u c e d l a t e r ) t h a t s m a l l h o l d e r s c o n s t i t u t e a l a r g e p r o p o r t i o n of t o t a l t e a a c r e a g e . S t a t e ownersh ip of e s t a t e s h a s a l s o i n c r e a s e d i n many of t h e s e c o u n t r i e s i n r e c ~ u t y e a r s and o v e r a l l a r e a expans ion h a s , i n any c a s e , been i n c r e a s i n g l y . de t e rmined by n a t i o n a l t e a development p l a n s .
6. Although p r o d u c t i o n i n d e v e l o p i n g c o u n t r i e s grew h i s t o r i c a l l y a t 2.6 p e r c e n t a n n u a l l y , t h e i r e x p o r t s expanded a t o n l y a b o u t 1.7 p e r c e n t (Tab l e 3) l a r g e l y because domes t i c consumption r o s e f a s t e r t h a n p r o d u c t i o n i n key As ian c o u n t r i e s . For i n s t a n c e , I n d i a and S r i Lanka's s h a r e o f wor ld n e t e x p o r t s h a s d e c l i n e d even more d r a s t i c a l l y t h a n t h e i r s h a r e of p ' roduct ion ( f r o a 69 p e r c e n t t o 51 p e r c e n t i n 1977). With p roduc t i on i n c r e a s e s m t w e i g h i n g p o p u l a t i o n and l n c o w g r w t h , A f r i c a n t e a e x p o r t s grew a t 7.7 percegnt p e r y e a r and i n c r e a s e d t h e l r s h h r e from 9 p e r c e n t t o 1 9 p e r c e n t i n t h e same p e r i o d .
1/ G . 5 . Sar i ta r , The World Tea Economy, Oxford Unlv. P r e s s , 1972. -

T a b l e 1: TEA PRODUCTIOH, BY HAIN COUHTRIES AYD ECONOHIC REGIONS
~ r w t h Rate - /a 1961 1965 1970 1974176 1977 1961-77
Induet t i a l i z e d Countr lea 87.0 90.7 125.5 - - - - 156.8 167.5 - 1.5 -
Japan 81.4 77.6 91.2 100.3 105.0 1.9 Turkey 5.5 13.0 33.4 53.1 58.0 15.3 Other 0.1 0.1 0.9 3.4 4.5 29.9
Developing C o u n t r i e s 757.4 83L.7 929.8 1,057.0 1,173.8 - 2.6
Asia and Oceania 692.2 738.3 776.0 858.3 960.2 1.6
I n d i a 354.4 366.4 418.5 497.3 560.8 2.9 S r i Lanlca 206.5 228.2 212.2 204.8 208.6 -0.3 Indones ia 73.9 79.8 63.5 69.2 73.5 -0.9 Bangladesh 26.5 27.2 31.3 31.7 37.5 0.9 Other 30.9 36.7 50.5 55.3 59.8 4.2
M r i c a 56.4 70.4 119.5 152.4 188.9 8.1
Kenya 12.6 19.8 41.1 57.4 86.3 11.4 Ha law1 14.3 13.0 18.7 26 .O 31.7 5.9 Uganda 5.1 8.4 18.2 18.5 15.0 8.6 Nozambique 10.1 10.7 17.0 16.5 13.8 4.9 Tanzania 4.5 5.7 8.5 13.6 16.7 9.1 Other 9 - 8 12.8 16.0 20.4 25.4 7.4
L a t i n America 8.8 23.0 34.3 46.3 44.7 8.7
Argentina 5.9 15.5 25.8 35.3 34 .O 11.3 Othe r 2.9 ' 7.5 8.5 11.0 ' 11.6 8.5
C e n t r a l l y Planned E c o n ~ i e s - 263.5 216.6 291.8 387.1 418.2 5.0 --- - -
China, &in land 156.5 158.8 220.0 291.7 309.5 5.1 USSR - 39.6 48.3 66.8 86.3 99 -2 5.4 Ocher - 7.4 9.5 8 .O 9.1 9.5 1.6
!e - UORLD TOTAL 1,047.9 1,139.01,350.1 1,600.9 1,759.5 - 3.3 - -
/a Trend r e g r e s s lons aga ins c c i m e . - Source: FXO, Producrion Yearbooks, and l n c e r n a c l o n a l Tea Commlccee.

Tab le 2: TEA AREA PUYfED, BY S I N COUNTRIES M i ECONOMIC REGIONS
-('OW heccarea)--- ---(annual growth i n X ) - /a-
Industrialized Coun t r i e s 101.0 123.3 150.6 --- 1.6 - 4.8 - 2.4 -
Japan Turkey Other
Developing Coun t r i aa 910.7 1,006.8 1,043.6 0.8 - 0.9 - 0.9 - k i a and Oceania 804.7 817.2 814.8 0 .l 0 .O 0.1
I n d i a 331.3 360.1 365.0 0 8 0.3 0.6 S r i Lonka 235.5 241.9 240.6 0 .2 -0 .l 0.1 Indonesia 135.8 104.1 101.1 -2.5 -0.6 -2 3 Bangladesh 31.7 42.7 43.0 2 .8 0.2 2 .O Other 70.4 68.5 65.1 0.1 -1.0 -0.1
M r i c a 68.9 143.0 171.6 6 -1 4 .5 6 .O
Kenya 15.9 49.8 66.0 9.2 6.8 9.1 t t a l av i 11.8 15.8 17.2 2 .4 2 .1 2.3 Uganda 6.9 19.1 20.9 8.9 2 .O 7 .4 Mozambique 5 . 0 15.6 15.8 0 -1 0.3 0 .3 Tanzania 6.8 14.0 18.4 5.4 7.1 6.0 Other 12.4 28.7 33.3 7.5 3.7 6.9
L a t i n America 37.2 42.8 53.3 1.3 5.7 2.1
Argentina ' 30.7 34.3 44.4 1 .O 6.7 1.9 Other 6.5 8.5 8.9 2.8 1.0 2.7
C e n t r a l l y Planned - Economies 280.4 413.2 447.0 --- 2.) - 2.2 2.9 -
C
- China, %in land 200.0 317.5 350.0 3.2 2.7 3.6 USSR 64.4 74.7 76.0 0.6 1.1 Other 16.0 21.0 21.0 0 . 0.3 0.3
WORLD TOTAL 1,292.2 1,543.3 1,641.2 1.4 - 1.6 - 1.5 - - - -
WRLD ( e x c l . CPEs) 1,011.8 1,130.1 1,194.2
/ a Tread r e g r e s s i o n s a g a i n s t t i m e . - Source: FA0 and I n t e r n a t i o n a l Tea Committee.

T a b l e 3: T U UPORTS, /a BY .%IS CDChiRIES A?D ECONONIC REGIOSS -
C r w t h Ra te - /b 1961 1965 1970 1976/76 1977 1961-77
I n d u s r r l a l l z e d Countries 25.1 29.1 53.7 - - - 61.1 - - 67.9 6.4 -
Nether lands 0.7 0.9 20.2 21.2 18 .O 30.3 Unl t e d Kingdom 14.4 17.8 19.1 25.3 36.9 4.8 Canada 0.5 1 3 2.2 2.7 2.7 10.5 Turkey4 - 2.6 7.8 3.9 0.1 10 .O Japan4 8.0 4.6 1.5 2.9 3.6 -4.7 Other4 1.5 1.9 2.9 5.1 8.6 11.5
Developing Count r l e s 526.4 587.6 644.0 686.8 706.6 - - 1.7 - & l a and Oceanla 470.7 508.1 511.7 521.8 523.7 0.7
Ind l a 205.0 201.1 200.2 220.9 224.0 0 .3 S r l t a n k a 193.1 224.3 208.4 195.9 185.5 -0.4 Indones ia 32.2 32.3 36.9 47.9 51.2 3.6 Bangladesh 16.3 22.9 29.4 22.6 22 .O 0.6 Other 24.1 27.5 36.8 34.5 4 1 .O 3.4
Kenya 12.0 23.3 41.6 56.9 70.1 10.3 Ma law i 13.0 13.2 17.7 26.7 29.9 6.3 Uganda 4.2 6.9 15.1 15.1 15.0 8.8 Hozambique 9.9 10.1 16.6 14.1 12.3 3.2 Tanzania 3.2 4.4 7.1 10.7 12.1 8.2 Other 6 -8 7.1 10.7 13 .O 15.0 5.1
, L a t l n America 6.6 14.5 23.5 r 28.5 28.5 9.6
Argen t ina 5.4 12.3 19.1 22.2 22.8 9.1 Other 1.2 2.2 4.4 6.3 5.7 10.2
C e n t r a l l y Planned Econonl e s 42.3 $6.8 42.'- 77.1 96.8 - - - 4.4 - -
Chlna, .%inland* 34.3 32.2 30.0 58.3 70 .O 4.3 USSR 5.7 - 11.1 9.9 15.1 21.4 5.7 Other 2.3 3.5 2.3 3.7 5.4 5.5
Indicates produc ing countries. /a Gross e x p o r t s I n c l u d i n g r e e x p o r t s . - / b From t r e n d r e g r e s s i o n s a g a i n s t t i o c . - Source: FXO, P r o d u c t i o n and Trade Yearbooks, and I n t e r n a t i o n a l Tea Committee.

7. Searly 8 percent of vorld tea exports are reexports from industrial- ized countries. Traditionally, a large proportion of the tea sold in the world market has been purchased by a handful of tea vholesaling firms through London auct tons, and these firas have blended and reexported these teas to other countries (including developing countries). Other major reexporters inc lude the Setherlrnds and the USSR. In recent years, tea auctions and domestic blending in key producing count rics have assumed greater importance and the reexports f roo industrialized countries have consequently declined. 11 Prerently, about 25 to 30 percent of exports are sold through crop contracts- and the rest through auction mrkats located priaarlly in London, India, Sri tanka and Kenya. *st of tho major exporting countries rely on sales through auctions; only some countries like Argaccina, Indonesia, !lorambique, Tanzania and Ha laui export the cujorlt y of chair groduct ion thrmi~h dl rect sales. m i l e the question of price ~ a i y u l a t i o n by mltlnatlonal tradlng/blending rims is still n matter of contention, PA0 studies have s h w n that the process of price arbitrage appears to work wall among the various auction markets. - 21
8. Conswption and Ioports
8. Given the historical context in the development of tea drinking (para. 3). it is not surprising to find the highest per capita consumption of tea among UK and the f o m e r British "colonial" and n w industrialized countries like Ireland, Canada and Australia. hlile these countries ere key consawre in the w r l d tea economy, several trends in thc past one and a half decades are becoping apparent (see Table 4):
(a) Their share in w r l d consumption has declined from 33 percent in 1963 to 20 percent in 1974/76.
(b) Per capita consuopLlon is declining in a number of key indus- trialized countries. In some cases (notably UK and Austral:a), even total consuapt ion is declining.
(c) .Among the w jor economic country groupings, the centrally planned economies has been the w s t dynamic consumers with the share of USSR and People's Republic of China increasing from 15 percent in 1956 to 26 percent in 1974/76.
(d) India has emerged as the single most important tea consumer in the vorld (17Z of vorld consumption in 1974176).
Furthermore, vorld consumption of tea has seen an increase in the proportion- ate use of tea bags and soluble (instant) tea in comparison to "loose" tea. This trend in final use has resulted in the reduction of the quantity of tea
I / The volune of tea sold through producer auctions nov far outweighs that - sold through London (see Appendix I for details).
S ~ o p i c . correiation ciatrices of the m i n aucc~on markets gave coefficients - of 0.85 or more on both an annual basis (1965-75) and on a no.lthly basis (1972-'6). See Appendix I.

Tab le 4: TEA COSSLWTIOS, BY .WIN COUSTRIES AVO ECOSOYIC REGIOXS
G r w t h Rntc 1961 1965 1970 1974176 1977 1961-77
I 'nlted Klngdom 237.6 252.5 220.3 197.7 208.3 -1.2 Other Western
Europe 37.4 42.6 44.0 52.9 63.1 2.7 Unlted S t a t e s 51.0 60.0 67.1 76 .O 9 1.3 3 .O Canada 20.1 19.9 18.5 21.6 22.1 0.6 Aust ra l l t : 28.0 28.9 27.7 25.8 25.1 -0.7 Japan 69.9 78.6 106.0 113.5 112.6 3.6 Other 30.7 37.8 51.7 79 -8 87 .O 6.8
632.4 714.9 Developing Coun t r i e s 355.8 517.4 515.6 - 4 .O - Asia 276.1 329.2 402.6 502.8 575.8 4.3
I n d i a 139.6 166.0 213.0 274.0 310.0 5.2 S r l Lanka 13.0 15.7 18.9 20 -9 21.0 3.3 Indones la 41.9 45.8 27.0 22.8 27.0 -5.5 I r a n 15.6 27.3 37.7 4 1.3 50 -0 7.2 Other 66.0 77.4 106.0 143.8 167.8 5.0
Af r i ca 69.8 75.6 92.9 100.6 139.2 2.6
Egypt 22.8 29.3 20.0 20.9 26 .O -2.4 Kenya 2.2 2 -9 5.2 7.6 9 -6 9.5 Sudan 9.4 10.1 19.4 13 .O 11.5 2.7 Other 35.4 33.3 ' 43.3 59.2 62.1 4.2
L a t i n America 9.9 12.6 20.1 29 .O 29.9 6 -8 -
Xrgent i na , 1.2 2.7 5 -0 8 .O 8.8 10 -4 Other 8.7 9.9 15.1 21 .O 21.1 5.8
- C e n t r a l l y Planred
Economies E197.8 220.9 295.5 389.1 406.7 5.4 --- - China, Mainland 122.2 131.2 190.0 233.3 239.5 5.6 YSSR 60.2 73.5 86.1 130.0 137.6 5.7 Other 12.4 16.2 19.4 25.8 29.6 5.4
Source: FXO, Product ion and Trade Yearbooks, and I n t e r n a t i o n a l Tea Committee.

n e e d e d p e r c u p d r u n k a n d , t h e r e f o r e , t e n d s t o o f f s e t a n y o t h e r f a c t o r s r e s p o n s i b l e f o r c o n s u ~ p t i o n i n c r e a s e .
9. Impor t g r o w t h h a s e s s e n t i a l l y r e f l e c t e d t h e c o n s u m p t i o n p a t t e r n s a n d r e e x p o r t i n g r c q u l r e a ~ e n r s i n n o n - t e a p r o d u c l n g countries. The a b s o l u t e d c c l i n e i n t h e UK, f o r e w q l e , r e f l e c t s a d e c l i n i n g t r e n d i n d o m e d t l c c o n s u m p t i o n a n d t h c d e c l i n i n g i a p o r t a n c e o f t h e London a u c t i o n . The mos t dynamic i m p o r t e r s i n t h c p a s t decade -and-a -ha l f h a v e b e e n J a p a n 1 1 , t h c c e n t r a l l y p l a n n e d c c o n o s i e s , P a k i s t a n a n d S a u d i A r a b i a ( ~ a b l c - 5 ) .
P r l c e T r e n d s
10 . Thc a v c r n g c p r i c e of t h e d i f f e r e n t t c a s s o l d i n t h e London A u c t i o n s is n gcod l o d i c a t o r o f c h a n g e s i n g l o b 1 s u p p l y a n d d e ~ n d b a l a n c e n o t o n l y b c c a u s c of t h e c l e a r c v l d e n c e o f a r b i t r a g e a n d s i o l l a r moverwnts among m a j o r a u c t i o n m a r k e t s (see para. 7 a n d Append ix I ) , b u t London 1 s s t l l l t h e most i m p o r t a n t p l a c c w h e r c t h c w i d e s t v a r i e t y of t e a s a r e s o l d . U s l n g t h e n v e r a g e London a u c t i o n p r l c e o f tea n s o n l n d i c n t o r o f t h e g e n e r a l p r l c e t r e n d , I t may b c s e e n ( T a b l e 6 ) t h a t t e a p r i c e s h a v e b e e n c o n s i s t e n t l y d e c l i n i n g b e f o r e 1974. B e t u e e n 1 9 5 5 ar.d 1972 , t h e tea p r l c e d e c l i n e d , a t a t r e n d rate o f 2 . i p e r c e n t a n n u a l l y i n n o m l n a l ( c u r r e n t ) terms a n d by a h l g h e r r a t e (48 p c r c e n t annulr l l y ) i n real : c o a s t a n t ) t e r m , 21 h l g h l i g h t l n g t h e s u b s t a n t l a l e : o s i o n o f t h e p u r c h a s i n g p o u e r o f tea as a copr rod l ty . T e a p r l c e s d u r i n g t h i r p e r i o d h a v e a l s o b e e n r e l a t i v e l y s t a b l e . L/ S i n c e 1 9 7 3 , however , p r i c e s h d v e b e e n r a t h e r e r r a t i c , w i t h a p a r t i c u l a r l y s h a r p jump o f 7 5 p e r c e n t t a k i n g p l a c e I n 1977. A c c o r d i n g t o t h e tea t r a d e , p r l c e f l u c t u a t i o n s o f s u c h a n a m p l i t u d e a r e u n l i k e l y t o p e r s i s t s i n c e t h e y w e r e c a u s e d by t h e c o i n c i d e n t . a l o c c u r r e n c e o f s h o r t - t e r m f a c t o r s ( t h e " p u l l " e f f e c t o f u n e x p e c t e d c o f f e e p r i c e i n c r e a s e d u e t o B r a r i l l a n f r o s t , m a r k e t s p e c u l a t i o n a n d v a r i o u s g o v e r n a e n t f lscal p o l i c y i n t e r v e n t i o n ) .
11. W h i l e t h e a v e r a g e London a u c t i o n p r i c e a c t s as a good b a r o m e t e r o f t h e o v e r a l l w r l d tea m r k e t s a n d t h e tea p r i c e i n i n d i v i d u a l c o u n t r i e s g e n e r a l y move i n l i n e w i t h e a c h o t h e r , t h e r e h3s b e e n c h a n g e s i n t h e p r i c e d i f f e r e n t i a l among t h e t e a s f r o m d i f f e r e n t c o u n t r i e s . Kenyan tea , w h i c h h a d b e e n s e l l i n g a t p r i c e s s u b s t a n t i a l l y be low t h a t o f S r i Lankan a n d S o r t h I n d i a n t e a , h a s b e e n r e c e i v i n g e q u i v a l e n t o r h i g h e r p r i c e s i n London a u c t i o n s e i n c e 1967. T h i s d e v e l o p a e n t r e f l e c t s t h e t c p r o v e r w n t i n Kenya ' s t e a q u a l i t y t h a t
- - 1/ n l t h o o g h i t a l s o e x p o r t s t e a , J a p a n ' s i m p o r t s #re e s s e n t i a l l y b l a c k tea -
w h i c h i t d o e s n o t p r o d u c e i n s i g n i f i c a n t q u a n t i t i e s . - - / U s i n g t h e ' r iorld Bank 's i n d e x o f i n t e r n a t i o n a l ? h i l a t i o n ( i n d u s t r i a l i z e d .
c o u n t r i e s ' "CLF" i n d e x o f US5 p r i c e s o f n a n u f a ~ t u r e d e x p o r t s , SLTC 5-8 t o d e v e l o p i n g c o u n t r i e s ) a s a d e f l z - o r .
31' The i n d e x of f l u c t u a t i o n ( b a s e d o n t h e r o o t s e a n s q u a r e of d e v i a t i o n f r o m - 1955 t o 1976, f i v c y e a r n o v i n g a v e r a g e ) i n d i c a t e s t h a t t e a was t h e l o w e s t 1:: a r.lnge , f i . 3 p e r i e n c :a 33.3 i ; e r ; e n t f o r -;: caz.;oCicies. ( S ~ u r c e : Coumodi t i es a n d E x p o r t P r o j e c t i o n s D i v i s i o n , P r i c e P r o s p e c t s f o r !4a j o r P r i r d r y C o n n o d i t i e s , R e p o r t So. a l L / 7 R . )

T a b l e 5 : TEA IYPOXTS, r'a BY .VAIS COC?;TRIES .LSD ECOS0:tlC REGIOXS -
C r o v t h R a t e /b 1961 1965 1970 1974176 1977 19t~1-77
-
I n d u s c r l a l l z e d Counc r les
Unlced Kingdom Ochcr U e s c e r n
Europe C ~ n n d a Unlccd S c a r e s Jdpan A u s t r a l la Ocher
Devc lop lng C o ~ l n t r l e s 150.2 170.2 i27.4 262.4 287.1 - - & l a a n d O c e a n l a 74.5 80.8 116.2 161.1 185.4
tiong Kong 6.8 5.7 8.4 7.9 11.4 1 r a n 5 .8 9.7 6.2 14.1 12.3 I r a q 18.5 12.7 19.5 25.8 25.0 P a k i s t a n 16.1 20.5 29.5 47 .O 60.7 S a u d l Arabla 2.8 3.8 5.6 7.8 12.8 O t h e r 20.5 28.4 47.0 58.5 63.2
Af r t c a 68.0 80.6 98.0 88.6 93.5
E W P ~ *rocco Sudan O t h e r
C h l le O t h e r
Cent ra 11:. P l a n n e d Economies 13.5 59 .2 45 .5 86.8 86.8 - - -
USSR % h e r
f a G r o s s i c p o r t s ( i n c l u d i n g r e e x p o r t s ) . - /b From t r t . . ~ C r e g r e s s i o n s a g a i r t s t t ice. - Source : FAO, P r o d u c t i o n and T r a d e Yearbookc, and Z n t e r n a t i o n a l Tea Comni t t e e .

Table 6: TZA PRICES (W3'DON AUCTION) BY KEY PRODUCING WJhTRIBS
Average A1 1 Teas S r l Lanlrs I n d i a Kenya Halavl -- - Current US$ Constant UST Current US$
S o u r ~ e : FAO, ProCur,tian Yearbook?, and I n t e r n e t i o n a l Tea Commictez.

has a r l s e n from the lq rqe er9anslon and improvment progrzns 1nltl.r:ed since trtc e a r l y 1960s.
I 2. With t!re lncrcas lng use o f t t a bags and so lub le " l n s t n n ~ " te'r I t t l w pest decade anJ rhe advent o f a m c h less q u a L l t y d l s c r l o l n n t l n ~ gcncrc~c Lon o f tea drltd.ers i n t r a d l t t ~ c a l tea I-cnsmlng countr lcs , I i l ghc r qus I t ) tcr1.i appear t o b r l e ss p r i zed I n t're m r l d market. A poss lb le IcoAcbcor o f such a t rend i i the r:ductlon o f rhe yen lum betvccs h i g h g r w n and law gr.,vll S r l Lankan tcaa I n che 38s'. decade. I/ Thls pcholua (cxptcacied '18 a perccntnffc o f lm r . r u l l r v tea) dcc l l neJ a t a i T t t e ~ annual r a t e af .,early 12% from 1967-77.
11 This : o n p a r i s o r p r c s m .s t h ~ t c l ! m t e !.. t!?. 5r::e~aLnnnt al t 6 . z r , ~ ~ : t l i ' . y ir? - - a t t h e h i ~ h 3rcv:. rr;.; g e n e r a ; l y f -c .:j d n *-:* ~ e : 'ILLquorlng" an:; . l a \ .or ingn c h a r n c t & r l - t i c s . 11 pr;.~r.:c i : f t , . rc -rccs i n t h e method of
;-,h::;L .:LC%.. t. ( i i i t . rise orthotiox ;2c 'cn~d :r- -r...r :'is r u t t ! o g , terrri:ig arid c u r l l a g iCTC: m e t h d ) s lso p r c v l d e s d i f t :.;c-ct;e: ';: 1Ir:uur and i l . .vor ( s e e t\ppc.rdi x I). Slncn o ~ l y o r t n r Lzz ? r ~ * r e ~ ; , - ! ~ , j cc thodc predominate i n Sr!

11;. .WDEL STRUCTURE A!D ESTI!QTlOH
A . hn 3vervIcu of che )Codel and Pa t t Models - -- I. 3 . The cea nodel used In r h l s study, 1s a world a r k e t model v l t h supply dnd demand dlsaggregaced by the t a l n produclng/r.c~suming councrlce (or r rglons) and a curbet c lear lng e q w t l o n fo r p r lcc dotemlned slmlcaneouely. The general schece of che mode! r r ruccurc Ls glven In Chart I.
14. Korld supply Is obcalncd by aggregating eleven coun t r l a s / r e~1ons analyzed repacata ly and ~ r l d dtaand by aggregatlng raventeen caoncrlcs/rcqlons a l s o ar.rlyxed reparately. Tha excess of supply over demand d c c a r d n c s che addl t lon co s tocks uhlch a r e the p r l m r y d e t c r m l ~ n t of the world lndlcacor prlce. Dntr froaa 1960-78 were used fo r deoand; supply and pr ice aaa 1 y r . e ~ covered the period 1957-78. Llnlerlylng the st ructurc of supply ore correspondicg a rea afid yleld equrtlons.
15. Feu lsodelr of thc world :e& economy have been published. Adam, and Behraan analyzed che Yorld Tea Econosry i n a th ree rcglon frameuork (Indust r i a l ired count r l e s , deve!op(ng count r l e s and cen. r a l l y planned econocles) In cbnlr 1974 paper. 11 An econometric model of chc world tea market was developed by USCThD 1; 1970 21 hut che d e t o l l s have not been puhllshcd In any off l c l a l IE'iCTAD d o c m n t . A rrodcl a t che same level of d l s a ~ g r e g a t i o n as A a a a and Sehraen uas a l s o prepared by UNCTAD/FAO In 1979. - 3/ Only ~ u c o ~ h e r more dlsoggregated models have k e n developed: ( a ) an unpublished Ph.0. d l s s e r t a t l o n by X ~ r t i (which was ~ 0 o p l e t e d f n 1961 and is
- - - I / F . G . Adaan and J . P . Ekhrun, Sever! %dels J Internat ionr 1 Commodity 8 - --- . >L~rke ts , Cnivers i ty of Fr?nnsylv.?nla, 'ilharton Sct lool , nopartcent of --
Econocdc-, Peccnber 1975.
2 / UXCT:, cecre t a r i a t , Eco~-.otetr i c !Iod.-.L of the 'Jt r l d T t a Zco~~arry, (mimeo) , - -- prepared i c pa r t i c ipan t s of tblc :nter-kcrgional Seminar on the P ~ a n n l . ~ g o f t h e F~3reigr~ rr:,de Sector . Fc?ter.,Ser ? 1 - nctohcr 2 , 1970, Geneva.
31 UNCfXD/rt\O, Tea Simulat im 3odel: A Technic.al Sote, Anaex t o Docltment - TDI B i :FC/TtA/XC/I.


c l e a r l y o u t o f d a t e ) . i f a n d ( b ) a n E c o n o u x t r i c Model o f t h e K o r l d Tea Economy by USCYAD. &
16. The model p r e s e n t e d h e r e a t t e . - t o t o a n a l y z e t h e w o r l d tea economy a t a ' a i r l y h i g h l e v e l o f d i s a g g r e g a t i o n ( e l e v e n s u p p l y a n d S e v e n t e e n c o n s u i n g c o u n t r i e s o r subregions) and to i n c o r p o r a t e i n t h e s u p p l y a n a l y s l s b o t h t h e p l a n t i n g ( a r e a p l a n t e d ) a n d h u s k a d r y ( y i e l d ) d e c i r i o n s . T h i s , t o o u r k n w l e d g e , h a s n o t k e n a t t e m p t e d b e f o r e . The r e m a i n i n g p o r t i o n of t h i s c h a p t e r s e t s o u t t h e r a t l o n d l e f o r t h e f o r m u l a c i o n a n d e m p i r i c a l e r t i r s s t l o n o f s u p p l y , d e m n d a n d p r i c e .
I. Supp ly h M l y s l s
17. T e a I s a p e r a a a l a l c r o p . I t g l v e s I t s f l r s t y i e l d a b o u t two or t h r e e y e a r n a f t e r p l a n t l n g . Depending o n l o c a t i o n a n d t y p e o f p l a n t l n g m a t e r i a l s , i t t a k e r s e v e n t o n i n e y e a r s to f u l l y n a t u r e . H w e v e r , more t h a n 50% o f n m t u r e y l e l d s a r e a t t a l n e d a f t e r f l v e y e a r s . A t ree c a n c o n t i n u e t o p r o d u c e u n t i L i t is 60 t o 90 y e a r s old u i t h o n l y a s l i g h t d 2 c l i n e 1 n y i e l d s t w a r d t h e e n d o f t h e p e r i o d .
18. I n d e c i d i n g o n t h e e x p a n s i o n o f t e a p r o d u c t i o n two t y p e s o f decisions need t o be d l s t l n ~ i r r h e d : (1) a l o n g t e r m i n v e s t m e n t d e c i s i o n on new a r e a c x p a n s l o n w i t h new p l a n t l n g a n d l o r replanting o f t r e e s ; a n d ( i i ) a d e c i s i o n o n t h e e x t e n t t o r e s o r t t o v a r i o u s c r o p h u s b a n d r y p r o c e d u r e s which c o u l d a f f e c t :ea y i e l C s ( a n d t h u s p r o d u c t i o n ) on a s h o r t t e r m b a s i s .
19. V i t h r e s p e c t t o t h e i n v e s t m e n t d e c i s i o n a number of f a c t o r s s h o u l d b e b o r n e i n ~ i n d :
- I n v e s t i n g i n t h e l n f t l a l p l a n t i n g o f tea, u n l i k e a n n u a l c r o p s , i m p l i e s a l o n g t e r m c o d t m e n t o f r e s o u r c e s ( e s p e c i a l l y f o r e s t a t e s where , i n a d d i t i o n t o f a c t o r y a n d m a c h i n e r y , h o u s i n g and h e a l t h f a c i l i t i e s f o r w o r k e r s h a v e t o b e p r o v i d e d ) .
- Tea is d i f f e r e n t f rom a o s t o t h e r c r o p s i n i t s h i g h p e r h e c t a r e l a b o r r e q u i r e m e n t and i t s c o n s e q ~ t e n t l y h i g h emplogrcpent impact .
l i V . S. Y u r t i , A n E c o n o m e t r i c S t u d y o f t h e l?orl.J Tea E c o r ~ m y , 1948-1961, - -- U n p u b l i s h e d Ph.D. d i s s e r t a t i o n , U n i v e r s i t p of P e n n s y l v a n i a , 1961. I n t h i s s t u d y , s u p p l : ~ i s d i s ~ g g r e l ; . ~ t e d l n t o I n d i a : S r i Lanka a n d r e s t of t h e r o r l d ; demand c o v e r s s i x ind t l s t r1 .1 l izcd c o u n t r i e s , Ind1.1 and r e s t o f t h e m r l d .
2 : T. XK i y a u Ecc::aorrtr ic ''ode1 o f t h e V o r l d Teii Economy, rnineo, USCTtUI, SOV. -. 9 . : c : - , : ! P C . ) . Thc T O ~ C !
c o v e r s s u p p l y e q u a t i o n s f o r I n d i a , S r i Lanka, Kenya, o t h e r A f r i c a , R r n g l a d e s h . I n d o n e s i a , A r g e n t i n a and r e s t o f t h e v o r l d ; and demand e q u a t i o n s f o r I n d i a , U n i t e d S t a t r s , U n l t e d Kingdon, o t h e r i n d u s t r i a l i z e d c o u n t r i e s , o t t -o r d e v e l o p i n g and E . Europe a n d USSR.

h l g o l a b o r c o s t s c o n s t i t u t e a l a r g e p r o p o r t l o n of t o t i r l c o s t of p roduc t lon f o r t e a . 3
- C r o s s r e t u r n s p e r h e c t a r e 1 s a l s o among t h e h l g h c s t f o r expo r t c r o p s grown I n a r c n s v l t h good t e a grort lng c o n d i t i o n s . 2 1 -
Hence movlng o u t o f t e a p r o d u c t l o n I s , i n practice, d l f f l c u l c bccnusc of h igh sunk c o s t s and t h e f a c t t h a t s h l f t l n g p r o d u c t l o n from t e n t o d n 0 t h c r c r o p a l s o i n c u r s s l g n l f l c a n t e x p e n d r t u r e s (c.g., l n t h e removal of t r e e s and f a c t o r y ) and b r i n g s a b o u t t h e r c d u c t l o n I n bo th l a b o r coploymcnt and f o r e l g n exchange.
20. Y l t h r ega rd t o t h e husbandry d e c l r l o n , t e a p roduc t ion can s l g n l f l c a n t l y l n c r c a s c d l n t h e s h o r t t e rm by two methods:
- "Coarae plucking"-the p l u c k l n g of abou t f i ve l e a v e s and n bud r a t h e r t h a n t h e u s u a l two l e a v e s and n bud d u r i n g each p luck ing cyc l e . Although t e a y i e l d 1 s t h e r e b y l n c r c o s c d , l w e r q u a l l t y r e s u l t s.
- A p p l l c a t l o n of nitrogenous f e r t l l l z e r (urruolly ernaonlum s u l p h a t e ) w l t h y i e l d r e sponses v a r y i n g from 5 t o 8 kg p e r k i l og ram of n l t r ogen . T h i s r e sponse cou ld c a r r y o v e r more t han o n e y e a r depending o n t h e amount o p p l l e d .
The a v a l l a b l l l t y of t h e s e methods oeans t h a t , theoretically, t z a p roduce r s can a d j u s t r a t h e r q u l c k l y t o changlng d e m n d c o n d l t lone .
21. These d e c l s l o n s depend on a set of f n c c o r s v h l c h v n r l c s u l t h t h e d l € Feren t modes o f t e a product lon . I n c o u n c r l e s where p r l v a t e s e c t o r e s t a t e s p r e d o d r w t e , one w u l d e x p e c t t h a t f i n a n c i a l I n c e n t i v e s a f f e c t i n g t h e t e a e n t e ~ ? r i s e (p roduc t p r i c e and i npu t c o s t s ) a r e l i k e l y t o be t h e most impor tan t d e t e r m i n a n t s . I n s n a l l h o l d e r dominated c o u n t r i e s , non - f i nanc i a l f a c t o r s cou ld be a s i n p o r t a n t as f i n a n c i a l f a c t o r s .
22. The e x t e n t t h e above f a c t o r s and d e c l s l o n s predomina te would depend o n hod r e a l i s t i c 1 s t h e mpde l l l ng of p roduce r s ' lnveptment and y i e l d s t i m u l a t lon d e c i s i o n s and t h e a v a i l a b i l i t y of r e l e v a n t d a t a .
- - - I / See fw example, Y . L. L l m , "Impact .f t h e Tea I n d u s t r y on t h e Grouch of -
t h e C q l o n e s e Economy", S o c i a l and Economl c Stud i c s , December 1968; k . U. Pa lae r - Jones , P roduc t ion and H a r k e t l n g of Tea In Halawl, University of acad lnp , Department of A g r l c u l t u r a 1 Economics and Farm %nagemcnt, Develo~zacnt Studv So. 15 ( i 9 7 4 ) : S. ti. S t e r n . An A o n r a i s a l o f Tca .. Produc t ion i n Sna:L Holdings i n Kenya, P a r i s , Dcvelopmcnt Cen t r e of OECD ( 1 9 7 2 ) ; and G. S. S a r k a r , Tea: Sone P o l i c y Issues, IDS D i s c t ~ s s l o n Taper So. 1 2 A , February 19h8, U n i v e r s i t y of Susscx .
21 J. d e V r l c s , Tea: The P o s s i b i l i t i e s f o r I n t e r n a t i o n a l Ac t lon , World aank - Comoodlcy Paper So. 2 8 , J anua ry 1977, Anncx 111 , p. 8.

2 3. Revieus of t h e supply a n a l y s e s of perennials have a l r e a d y been under- taken by a nuabcr of au thor s . A/ U t h e r than provlde a g l o b a l p e r s p e c t i v e , v i r t u a l l y a l l t h e s t u d i e s p e r t a i n t o c a s e s t u d l e s of a p a r t l c u l a r c rop i n a p a r t l c u l a r cour. try ( o r r eg lon i n a coun t ry ) where d e t a i l d a t a l a oo ra r a a i l l y a v a i l a b l e . Cooprbc -;el$ l l k e t h a t of French and !!athers i/ on US aaparrgua ( a p e r e n n i a l w i t h a bea r lng l i f e of 10-15 y e a r s ) a r e a b l e t o c a p t u r e t h e d e c l s l o n -king framework v l t h r e spec t t~ new ac reage p l a n t l n g and removals of o l d p l a n t s .
24. 9 o d e l s on pe renn la l a l n developing c o u n t r t a r havc, h w e v a r , h ~ d t o be more bodcr t because of d a t a l l m l t n t l o n a . Bsteaan poa tu la t ed a p l r n t l n g d e c i s i o n model f o r Ghanian Cocoa vhlch lncorpora ted the s t o c k of t r e a a (number of b e a r l n g t r e e s ) but procrrdcd t o t s t l m a t a h i 8 supply equa t ion on t h e b r s l a of h a r v e r t e d ac reage a s a proxy. 3 S l a t l a r l y , Wlckena and Greenf t o l d 41 d e r l v r d a supp ly f u n c t l o n f o r c o f f e e I n B r a z i l baaed on a n inveacment f u n c t i o n r e l a t e d t o s t o c k of t r e e s but f i ~ l l y used p lan ted ac reage a s a proxy by making s lap1 i f y l n g a s suup t lona on cona tan t p l s o t l n g d e n s i t y and random uprooting and abandonnent of t r e e s . They d l d , h w t v e r , a t t empt a n a p r i o r 1 d l s t l n c t l o n b e t e e n t h e l n v e s t c e n t d e c l s l o n and t h e p l a n t l n g dec la lon . More r e c e n t l y , Hart ley ?/ f o r m l a c e d a dyruolc programralng wc'=l f o r p e r e n n i a l c r o p supply. He analyzed t h e producers ' d e c i s i o n t o p l a n t / r e p l a n t and uproo t , w i th t h e - a t * of c a p t u r i n g i n t e r a l l a c h e l r e x p e c t a t i o n s on f u t u r e y l e l d ( revenues) , t h e oppor tun l ty c o s t of a l t e r n a t i v e land u s e , and expected d e p l e t i o n of c a p l t a l s t o c k . The major p rob len i n e sc lma t lng t h l s type of w d e l 1s t h a t of o b t a i n i n g t h e b a s l c da ta . I n s m r y , d e s p i t e r a t h e r soph l s t1ca te . i f o r m l a t l o n s of the d e c i s i o n p rocess a f f e c t i n g t h e supply of p e r e n n i a l r , a c t u a l ana l y s i s (even a t t h e coun t ry leve 1) has requl red t h e e s t i m a t i o n of proxy v a r l a b l e r , l l m l t e d e 3 s e n t l a l l y , t o ac reage , ou tpu t and p r i c e s .
See: X. i. Bateraan, "Supply Re la r ions f o r P e r e n n i a l Crops i n t h e Less Developed rea as," i n C. R, Uharton, Jr . , ed., ~ u b s i s t e n c e Agr icu l tu re and Economic Developaent (Chicago: Aldine Pub. Co., 1969), pp. 243-253; D. L. E. Lim, Supply Response of P r i m r y Producers , Penenbi t U n i v e r s l t y Malaya, Kuala Lunpur, 1975; and H. Askarl and J. T. Cwnmtngs, A g r i c u l t u r a l Supply Response: A Survey of t h e Econometric Evidence. Kev York: Praeger Pub- l i s h e r s (1976). - .. 0. C. French and J. I.. Xathews, "A $upply Response Yodel f o r Pe renn ia l Crops," Ateeriean J o u r n a l of A&ricul tura l Economics, So. 53 (August 19711, pp. 578-490. - - * See: !I. J. Barermn, op. c l t . and D.'L. S. Lim, op. c i t .
5 / Y . R . Vickens and J. S. Greenf i e ld , "The Econoeecr ics of ~ g r i c u l t u r a l - Supply: An l ~ p p l i c a c i o n t o the Xorid Coffee !-!arketM, The Revtew of Econontcs and S t a t i s t i c s , V c l . LV 1 4 ; ~ . pp. : 0 3 - 4 4 0 .
51 Y . J. H a r t l e y , Research Proposal on: The Cons t ruc t ion of Econometric - Hodels f o r t h e Supply of P e r e n n ' a l s , (ntmeo), Development Economtcs D e p a r t w n t , World Bank, June 191';.

2 5 . The a p p r o a c h a d o p t e d i n t h i s s t u d y m y be c h a r a c t c r l z e d as p r a g w c i c I n ~ h . 1 ~ p r l a r y attention !r f o c u s e d o n a n a p r l o r l u n d e r s c a n d i n g o f c h e key measur.rblr. v , ~ r l a b l e s l i k e l y t o , r f t r c t t h e dcvr.lopmr.nt of tea s u p p l y , l n c l u d l n g t h e r c 1 . i ~ l v e L n p ~ r t r r n ~ e 3f tilt. l ong- te rm pldrnt l n g ( I n v e s t m e n t ) d e c i b f o n and ttlc s t t u r t - t c r a y L c l J ( h u s b r n d r y ) d e c l s l o n . Two fo rmu1; r t lons o f t h e n c r u c t u r e a n d p c r t o r a r n c e of s u p p l y a r e e t t e W t r . d : (-1) a m l y s l s o f D r e a and y l e l d s s e p a r c r t c l y , a n d ( b ) a n a g g r e g . l t z s u p n l y ~ l n a l y s l u ( u h l c h cornblnce t h e a r e a ond y l e l d e f f e c t s ) .
A r e a I Y l r l d F o r e u l a t l o n
26. F o r t h e r e l e v a n t c o u n t r y o r r e g l o n , ceil p r o d u c c l o n I s decomposed on f o l l w r r :
Q' - Tea p r o d u c c l a n ('000 t o n s ) I n y e a r c ; t
tlAC - .%cure teal arcs ( '000 h a ) I n y e a r t , d e f i n e d os p l a n t e d Area 1.1ggcd s l x y e a r s ;
YLDt * Y i e l d p e r u n i t - c u r e a r e a ( t o n s / h a ) i n y e a r c.
27. % c u r e a r e a f o r e a c h c o u n t r y o r r e g i o n i~ p o s t u l a t e d c o be d e c e r m i n e d by t h e f o l l c r d i n g g e n e r a l e q u a c Lon:
PTEA D = PTU-- the a v e r a g e p r i c e of a l l t e a s i n London a u c t i o n ( i n US c e n t s / l b ) - - d e f l a t e d by a p r o x y f o r i n p u t c o s t s .
T = T i n e t r e n d . C
28. S i n c e 3 a t u r e a r e a is d e f i n e d as t h e p l a n t e d a r e a l a g g e d s i x y e a r s , t h e f o r m l a t l o n o f m t u r e a c r e a g e r e s p o n s e i m p l i e s t h a t p r i c e e x p e c t a t b n s g o v e r n i n s t h e d e c i s i o n c n new p l a n t i n g o r r e p l a n t i n g o f t e a is e s s e n t i $ l y -
I
1 1 Statistics on m t u r e o r b e a r i n g a r e a 1 s d i f f i c u l t t o o b t a i n f o r t h e - m a j o r i t y of p r o d u c i n g c o u n t r i e s . Wovevcr, p l a n t e d a r e a d a t a is a v a i l a b l e € r o o F A 0 and t h e I n t e r n ~ t l o n a l Teia S o m l t t e e . P l a n t e i a r e a l a g g e d s i x ye ' l rs w s f i n a l l y ~ s e d beciause t h a t Lag v o u i d h a v e c a p t u r e d c o r e t h a n 60): of y i e l d i n g c a p a c i t y hy t h e n . S c s i d e s , t h e u s e of l o n g e r Lags d i d n o t improve t h e e s t i m t e s . ~ n d w u l d r e d u c e t h e d e g r e e s o f f r ecdom i n e s t 1edlt i n g t h e e q u a t l o n s .

thnt of the naive "extrapolative expectations" aodel of Serlove. 11 In the log form, the price coe f f i c l en t m y be ln terpre ted a8 the long-ru; e l a r t l c l t y of production slnce I t seasurer the response a f t e r planted acreage hae matured and plantlng adjustnente have h e n made. 2 1 - 29. The foruulatlon of the rea l pr lce of tea (PTEA D) l r e r r en t l a l ly am a s l ap le proxy for net lncose a c c r ~ l n g t o the t ea en te rp r l r e . F e r t l l l z e r , wage and ln teree t cos t s constitute the la rger t cooponent In production cor t r . Interest c o r t r , oore relevant t o the Long term dec l r lon , 1s not readl ly aval lable on a country barls . 21 Sla l l a r ly , the relevant wage cos ts a re a l r o d l t f l c u l t t o obtaln. For the countr ler whlch have ra la t lve ly large coffee Lndustrler In or adjacent t o the l r tea a reas (emsentlally the Afrlcon and Latln b u r l c a n count r le r ) , the prlce of coffee (PCOP) A/ 18 used as the moat relevant d e f l a t o r or proxy for unl t input coats ( p a r t l c u l r r l y labor). 51 itwevor, unl t f e r t l l l z a r coat (u~cronlua ru lphr te ) 51 a r e uead, inr teaa, f o r da t l a t lng the tea prlce In the b l a n countrfem, t~caume they do not face elmllar lnput coapetlclon from lndur t r les with readi ly ava l lab le m r l d prlce darn ( l i k e coffee) .
11 The expected pr ice P* - PC-,. (See Harc Serlove, The Dynamlcr of - Supply: Estl=clon of Farmers' Rerponre t o Price. Balt lmore: Johns Hopklas Press, 1958). The use of lagged a rea i n the above equation ( 2 ) 1s noc t o capture the long-run e l a s t i c l t i e e implied in Nerlove'e fornulation of adapttve expectations s ince such an in t e rp re t a t ion fo r a perennial crop Involving investments u l t h long gestation is re ther tenuous.
21 f h l s 1s in l i ne v l th the d r f l n i t l o n of short- and long-run price response - I given i n J. R. Behrraan, "Honopolistic Cocoa Pricing", Amerlcan Journal or
.4grlcultural Econaeics, Aug., 1968. The short-run elasticity would be the response t o harvesting and husbandry over a time period tha t is not long enough fo r new plantings t o come in to bearing.
31 I t m y , In any case, not be very importa :C especial ly among the "older" - tea grouing c o - ~ n t r i e s i n & i a (where the bulk o f tea production capacity is old and usually ful ly depreciated).
- #
L f The cof ice price chosen i s Cuatecalan prlcle, Gashed, spot h'ed York. - 5 / T h e ra t ionale is that differences in the r e l a t ive prize of tea and coffee -
c s s c n t i ~ l l y r e f l ec t the re la t ive ,lalue of the marginal product per unit input.
6 / US wholesale price of nwoniu= sulphate expressed a s an Index (FPI) with - 1970=1@0.

30. R e s u l t s o f t h e - c u r e a c r e a g e functions a r e g i v e n i n T a b l e 7 . &st imat i o n s w e r e by o r d i n a r y l e a s t s q u a r e s r e g r e s s l o n . b'here au to -cor rc1 '1 t i o n m y be p r o b l c w t i c a l t h e C o c h r a n e - O r c u t t c o r r e c t i o n p r o c c d u r c was u s e d . I / - 31. Excep t f o r L a t i n h o e r l c a a n d , p o s s i b l y , T.tnzitr~ia, t h e l o n g r u n s u p p l y e l a s t i c i t i e s arc v e r y lw. Al though t h e s i g n s a r e g e n e r a l l y c o r r e c t , significant p r i c e e f f e c t s -re found o n l y f o r L B t i n America a n d o v e r a l l d e v e l o p i n g c o u ~ t r i e s . Lagged m a t u r e a r e a was s i g n i f i c n n t f o r n l l p r o d u c i n g countries or s u b r e g i o n s e x c e p t f o r I n d i a , i n d i c a t i n g t h # t t h e p l n n t i n g d e c l s l o n is r e l a t e d o o r c to t h e p r c v l w e y e a r s p l a n t e d n r e n r a t h c r t:inn p r i c e . A s y s t e m ~ t i c i n c r c a r c I n t h e p l a n t e d (or m t u r e ) n r r n s v l t h t i m e ( r ~ r e f lcc: i o n o f t h e r a t e o f c x p a n s l o n a c t r i b u t n b l e to government t e n dcvclopmcnt p r o g r a m s ) ws f o u n d 0.11~ i n t h e A f r l c a n c o u n t r i c s o f Kcnyn a n d T a n z a n l a .
32 . The y i e l d f o r e a c h c o u n t r y or r e g l m is p o s t u l a t e d t o be d c t c r m i n e d by t h e E o l l w l n g g e n e r a l e q u a t i o n :
where:
Ln PTEA 0 and T h a v e a l r e a d y b e e n d e f i n e d ; and CLF = c l i m a t i c f a c t o r s (e.g., amount o f r a i n f a l l ) .
I n t h e l o g fo rm, t h e p r i c e c o e f f i c i e n t s may be i n t e r p r e t e d as t h e s h o r t - r u n e l a s t i c i t i e s o f p r o d u c t i o n s i n c e t h l s f o r m l a t i o n p e r m i t s r e s p o n s e t h r o u g h 9 1 c o a r s e p l u c k i n g " a n d f e r t i l i z a t i o n o v e r a tlme p e r i o d v h i c h is n o t l o n g enough f ~ r newly p l a n t e d o r r e p l a n t e d areas to come i n t o b c a r i n g ( p a r a . 20) . Ln CTEA Dt-2 is i n c l u d e d to al l- f o r :he p o s s i b l e c a r r y o v e r e f f e c t o f f e r t i l i z e r a p p l i c a t i o n . The t i m e t r e n d may b e i n t e r p r e t e d as r e p r e s e n t i n g p r o d u c t i v i t y improvements o v e r tLw d u e , f o r e x a r p l e , t o t h e i n t r o d u c t i o n G F h i g h - y i e l d i n g c l o n a l v a r i e t i e s .
33 . T h e y i e l d f u n c t i o n s are g i v e n i n T a b l e 8. C l i m a t i c d a t a f o r i n c l u d i n g CLFt as a n i n d e p e n d e n t v a r i a b l e is n o t a v a i l a b l e . But , a s w i l l be die-ussed i n p a r a . 49, t h i s mission is n o t e x p e c t e d t o be p a r t i c u l a r l y s e r i o u s f o r t e a .
34. :The r e s u l t s i n T a b l e 8 show t h s t , i n c o n t r a s t t o t h e m a t u r e a r e a e q u a t i o r i f ( T a b l e 7 ) . s i g n i f i c a n c p r i c e e f f e c t s v e r e o b t a i n e d f rom one-yea r l a g s f o r I n d i a a n d Uganda a n d two-year l a g s f o r I n d o n e s i a a n d o t h e r A s i a . S i g n i f i c Z n : t i n e t r e n d s were o b t a i n e d f o r a l l t h e e q u a t i o n s e x c e p t f o r t o t a l
- i n d u s t r i % i z e d c o u n t r i e s . T h e s e r e s u l t s show t h a t , i n g e n e r a l , t h e A s i a n 8 c o u n t r i e r a r e more r e c e p t i v e t o s h o r t - t e r m p r i c e i n c e n t i v e s , and t h u s
. c o r r e s p o n d v i t h t h e e x p e c t e d t e n d e n c y f o r p r i v a t e s e c t o r - d o m i n a t e d p r o d u c t i o n t c be n o r e r e c e p t i v e t o c h a n g e s i n p r i c e i n c e n r f v e s . T h a t s u c h an I n t e r - p r e t a t i o ~ i a p p e a r s t r be c l e a r e r i n t h e c a s e o f s h ~ r t - r u n p r i c e r e s p o n s e r a t h c r
L/ S e e D. C o c h r a n e a n d C. O r c u t t , " A p p l i c a t i o n o f L e a s t S q u z r e s R e g r e s s i o n s - t o R e l a t i o n s h i p s C o n t a i n i n g A u t o - C o r r e l a t e d E r r o r Terms," J . Am. S t a t i s t . Assoc . , \ ~ d 1 . ( 4 , pp. 32-61, 1949.

r-n
t a t r l Iudurcrlrl lad taPCrlrr 1.bIM 0.0S)I 0.315s 0.0101 0.- 0.01)l 1.4) 0.b10 4 . I cl.bSll) (s.414))- (1. SI)S)*
Idaarr lr
Otbrr
Otbrr
T i r perlod used In che 8nalysls I s 195?-10: a11 eqwclcmr -re e s t l~ .c*A w l n r a lot-;ot t m l f lcrt loo. The figure In -rr.oche.ls b o l w e u b c ~ f f l c l e c 1. che corrrs@la# c s c a t l s t l c . S I X - Scradrrd error of *rtLnute.
& D.V. - DurblmUrtro~ scaclsclc . o - mco-rerres.lre c ~ f f l c l ~ c s IP ch. h h i 8 n e S r ~ ~ t t pmcrdur*.

Other 6 . W ) 0 . W -0.OM); 0.COPb 0 . 9 2 2 9 O.O:?I 2.11 -0 .Z; 6 I (I. W¶) (-O.:IW) ( ? . W l ) )
- stqz~ficant . * c cbc 5: Errc*.. ** - rignificmc r r cbc 15 Irrcl.

than u n t u r e a r e a response r+ .~y be explained by t h e f a c t t h a t t h e d e f l a t o r s used f o r t e a p r i c e s a r e oo rc r e l e v a n t t o shor t - run ( y i e l d ) response.
35. From t h e time t r end v a r i a b l e , one could i n f e r t h a t p r o d u c t l v l t y ioprovemcnts due t o t e c h n o l o g i c a l change ( b e t t e r y l e l d i n g v a r i e t i e s ) appear t o be h i g h e s t i n Uganda, t h e C e n t r a l l y Planned Econoales, Tanzania, Ind ia and o t h e r & l a ( p r i m a r i l y Papas Seu Cuinea). These c o u n t r i e s exper lenced more than a two percent lnc rease In y l e l d a f t e r t h e e f f e c t of s h o r t term p r i c e had been t aken i n t o account. The t r e n d d e c l i n e s i n y l e l d f o r S r l Lanta and Uganda r e f l e c t s t h e p r o t r a c t e d y e a r s of s t r u c t u r a l d ls rupt ionm I n t h e l r t en economlas.
36. T o t a l world product ion can then be ob ta ined by ruomlng up t h e pro- duct lon ob ta lned f o r each coun t ry o r reglon.
n (4) Yorld Production Q* - f
1-1 : where: 1-1, ... n a r e the nunbcr of c o u n t r i e s o r reglone Selng e tud led .
Aggregate Supply F o r a ~ l a c i o n
37. .An aggrega te f ~ r w l ~ t i o n of supply was a l s o t r i e d i n o r d e r t o t e s t whether t h e e s s e n t l a 1 de te rminan t s of a c r e a g e and y i e l d s , formulated s e p a r a t e l y , could be cap tu red i n a s i n g l e equa t ion . Taking t h e measurable v a r i a b l e s p o s t u l a t e d t o a f f e c t both a r e a and y i e l d , product ion (Q') f o r each country o r r eg ion is p o s t u h t e d t o be determined a s f o l l w s :
(5 ) qS = !" (Ln PT'EA Dt-1, PTEA Dt-2, Dt-7, T) t
uhere: P T U 3 is d e f i n e d i n para. 27 and T is t h e t i m e t rend.
The e s t l m t e d =upply f u n c t i o n s a r e given i~ Table 9.
38 . The es t imated supply equatloi is In Teb le 9 appear t o ha re captured t h e key res-lts from s e p a r a t e a r e a acd y i e l h a n a l y s i s , p a r t i c u l a r l y wi th r e spec t t o s h o r t t e n a p r i c e resQonse and t h e rime t r end . As ob ta ined i n the yielc! e q u a t i o n s , t h e s h o r t term responsiveness o f I n d i a , Uganda, Indones ia , and o t h e r Asia were a l s o s i g n i f i c a n t a t approximately t h e 5 pe rcen t l e v e l o r b e t t e r . D.e t l ne t r e n d , e s s e n t i a l l y r c f l e c t i n g t h e corntined ef fec t . o f sys temlt i c a r e a expans i c n ( e s s e n t i a l l y g o v e r n ~ e n t expansion schemes) and t e c h n o l o g i c a l c h a ~ g e , was s i g n i f i c a n t f o r a l l count r l e s and subregions except f o r Incionesia. Afr ican c o u n t r i e s ' o v e l a l ? p r ~ u c t l o n grev a t nn o v e r a l l r a t e o t n h m ~ t 8 percent 3 n n u ~ l l y a s a r e s t i l t of t h e s e f a c t o r s , u h l l e Asian count r i c s exper ienced ,I corri .spcndlng growth of l e s s than 2 percent . Countr ies wi th s p e c i a l pul t i -pcrtod t c a devcloprccnt p l ans ( p a r t i c u l a r l y Kenya, Tanzania and Ug-~fida) had thc h i g h c s ~ t rcnd cocf f i c i e n t s .
'9 . 'VL. :dilg c c pi. ;<. r ,. :>T:-: ,..., ~ f f c c h s , .;hi:e ~ l s r > s ig i l i f i ca r l t i c r
;'.sia and developing c o u n t r i e s a.; a whole, vcrrr not t r a n s n i t t e d froma the m t ~ r r e . t r e ; ~ cqunt i o n s t c t h e o v e r a l l s u p ~ i y formula t ion i ~ t the country /sub-rcgion;ll l cvc l excep t f o r L a t i n America. S r i Lnnkn's ncga t ivc y i e l d t r e n d s dominated

Tbr 11- ud 1. c h a r l . a l * 1 8 195?-r8: . I t - 1 l r r r r t e r v t l u t c d -.I*& r I # # - l c , r 4r.1 L : I C . I I ~ ~ . k Tb* Ilct* I* p 4 r a c h s l a kla *uh r w f f l c l o m t l a & r e - - y I r I r t l s I l t . S t 2 - S 1 4 . d rrmr o f rrtwc*. D.Y. - b r b l r Uc.a s c 4 1 1 ~ 1 t c r . - ace-r*&r.rslrr c w f f l ~ l c n t s Lm &e C m h r w t ~ r u m & r r .

t h e t r e n d o f o v e r a l l supply; but i n Uganda, f a s t e r a r e t ex?anslon compensated f o r t h e d e c l l n l n g t r e n d s i n y l e l d s .
40. A review of t h e tres .a c o n s a p t i o n acd p r l c e s (pa ra s . 8-12) r e v e a l a aumber of f e a t u r e s vh lch :.iLd t o be c a p t ~ ~ r e d t n a n a l y r l n g t e a demand. T)..e s t e a d y p r l c e d c c l l n e , t h e inc rease I n consurJer l ncoaes and r o p u l ~ t i o n cnd t + e f a c t t h a t t e a r e p a l n s t h e cheapes t beverage PC\ cup have p rov ld td f avora t ' * c o n d l t l o n s f o r c o n s u p t l o n expariulon. A t t h e same t h e , a cor r rupondlng st ' f t i n p r e f e r e n c e s from t e a t o c o f f e e and t h e a ivcnc of * e a begs and i n s t a n t t e a have tended t o o f f s e t c o n s u ~ p t l o n e-qnns lon . The r e l a r Lve s t r e n g t h of thene opposlng deve lopocn t s d e t e r a l n e t h e p a t h of t e a consumption I n varioirs c o u n t r l + s o r reg lons .
4 1. Tku p o a t u l a t i c ~ of cca dersand which h a s glrtcn u s t h e oroar . vcc,\ng r e s u l t is t h e r u l l o u l n g :
QOPC, Apprrent consuap t lon por c a p i t a ;
PTEIIPCCF * Averago p r l c c o f a l l ccas i n London a u c t i o n o r PTEA ( i n US c c n t s / l b ) d e f l a t e d by t h e avarage p r i c e of c o f f e e o r PCCP ( G u a t e m l a n , prlore washed, s p o t , New York I n US c e n c s / l b ) .
CDPPC C3P p e r c a p i t a .
$2. Data on t e e consunpclon 1s difficult t o o b t a i n oo a vor ldwlde b a s i s . The d a t a used i n t h l s s t u d y IS chnt of "apparent consumptlon". A/ Annual s t o c k a d f u s t ~ a e n t s t o .,parent c o n s w p t l o n have been made f o r only a few n e t lmporclsg c o u n t r i e s ( ~ L n l y U K , US and h s t r t l l a ) and some p r o d * ~ c l n g c o u n c r l e o ( m l n l p I n d l a , S r l t anka and Bangledeah).
43. The c h o i c e j f p r i c e s was anocher d i f f i c u l t y i n estimating demand f u n c t i o n s on a tine series bas?s . The o n l y r e a d i l y a v a i l a b l e p r i c e s e r l e s - o b t a i n e d from t h e London t e a a u c t i o n s (PTEAj-is e s s e n t i a l l y a v h o l e s a l e p r i c e . 70 e x t r a p o l a t e t h l s p r i c e a s hav icg a n e f f e c t on t e a consumption I n o t h e r c o u n t r i e s w l th rhanglng t a r i f f s and l n t e r n a l t a x e s and cha rges can , t hc :efore, be somewhat tenuous. Time s e r i e s , of r e t a i l p r i c e s , hm,ever., ,were n 9 t a v a i l a b l e .
44. The denand r e s u l t s , obtaif isd by l e a s t s q u a r e s r e g r e s s i o n and Cochrane-Orcutt procedures , a r e g iven i n Tab le 10.
'i -
1/ For n e t e x p o r t i n g count: i e s , qpparent c o n s u r ~ t L o n = product ion minur n e t - e x p o r t s ; f o r n e t Lmpo;tLng c o u n t r i e s , a p p a r e r t consumption = ne t impcrts .

l r r
t . L lm l r
& 11- p r l o d i s 1960-78. a l l r g u r t l a * w r r rrt l-1-4 ur lnc r Ice-lo( sprclf l ' r t im. & l%n). I lgure I n p r rmtbrs ls klw e u h r c z f f l c i r n i 1. the corre*poodlq I r t r t l s t I r .

45. The use of c o f f e e p r i c e a s 8 d e f l a t o r ( t o cap~u. : compe t i t i on betucen t e a and c o f f e e ) provided expected s i g n s f o r t h e r e l e v a n t c o e f f i c i e n t s and produced, s c a t i s t t c a l l y , t h e b e s t o v e r a l l r e s u l t s , but o t h e r d e f l a t o r s ( l i k e t h e World Bank's I n t e r n a t i o n a l P r i c e Indcx) a l s o y i e l d e d s i g n i f i c a n t p o s i t i v e c - e f f i c i e n t s f o r t h e e f f e c t of t e a p r i c e s on cotrsumption. For high income c o u n t r i e s v i t h h igh p e r c a ~ i t a consuapt ion ( i n d u s t r i a l i z e d c o u n t r i e s and I r a n ) a ttme t r e n d was inc luded i n t h e demand f u v t i o n s t o c a p t u r t t h e p o s s i b i l i t y nf p e r c a p i t a c o n s u q t t o n r c a c h i n g s a t i a t i o n l e v e l s and t h e systematic chande l n t a s t e avay from t e a . Because of t h e d i f i i c u l c y of o b t a i n i n g comparable d a t a o n l y a t ima t r e n d is inc luded ( f o r o t t ? r i n d u r ~ r i a l i z c d c o u n t r t c r , o t h e r developing c o u n t r i c r and c c n t r a l l ) planned cconoa ie r ) .
46. MI. r e s u l t 8 i n d i c a t e t h a t h igh income c o u n t r i e s ( e r p e c i a l l y A u s t r a l i a and, t o a l e r a e r e x t e n t , UK) appear t o be r y r t e m t i c a l l y r v i t c h i n g o u t of t e a becaure of c a r t e r a t l ~ e r t han r e l a t i v e p r i c e r easons (i .e. , t h e i r time c . e f f i c i e n t s r a t h e r t han t h e i r r e l a t i v e p r i c e coe f f i c i e n t r v e r e r i g n i f i c a n t ) . I n r i g n i f i c a n t r e s p o m e of p e r c a p i t a t e a c o r ~ u a p t i o n t o changer i n the r e l a t i v e p r l c a of t e a and c o f f e e v e r e found i n a l l c a r e r excep t f o r I n d i a and Kenya. Clven t h e tendency f o r coapensa t ing r h i f t r i n t h e demand f u n c t i o n ( r e e para. 9) o v e r t h e y e a r r ouch a r e s u l t may n o t be a l t o g e t h e r unexpected.
47. Only f o r t h e UK, J apan , I r a n and P a k i s t a n do t h e income e l a s t i c i t i e s d e r i v e d i n t h i s s tudy conform v i t h t h ~ s e p r e v i o u s l y e s t i m a t e d by t h e Food and A g r i c u l t u r e Organ iza t ion of t h e United Na t ion r (FAO) on t h e basis of c ross- s e c t i o n a l expend i tu re s t u d i e s . 11 The r e s u l t s a r e d i f f e r e n t f o r t h e o t h e r f i v e couct: r i e s f o r v h i c h FA0 c s ~ i a a t e s a r e a v a i l a b l e . A p a r t i c u l a r l y v i d e d i f f e r e n c e i n e s t i o a t e s e x i s t s i n t h e c a s e of Indoaes i a , v h e r e FA0 h a s an income (expeirdi ture) e l a s t i c i t y of 0.8 ( expend i tu re survey of 1969) wh i l e o u r a n a l y s i s g i v e s a n income e l a s t i c i t y of -1.05. Th i s probably r e f l e c t s t h e d i f f i c u l t y of u s ing appa ren t consumption a e a measure o f "ac tua l" consumption. 3 The income e f f e c t on t e a consumption is p a r t i c u l a r l y s t r o n g f o r I r a n , Kenya, L a t i n America, USSR, S r i Lanka and Ind ia .
48. T o t a l v o r l d consumption !- t h e t e a model is o b t a i n e d by summing up consumption ob ta ined f o r each count ry o r r eg icn :
L m
(7 ) Yorld consumption QD'fW = t QDTEAJ j-1
1/ FAO, I n c o w E l s s t i c i t i e s of Demand f o r A g r i c u l t u r a l P r o d u c t s , Genera l - S t u d i e s Group, a r c h 1976.
21 An i ~ p o r t a n t problem i n Indonczia du r fng r ecen t y e a r s h a s been the l i m i t e d - a v a i l a b i l i t y of g reen t e a (about 50 p e r c z n t of domest ic consumption) a s a r e s u l t of a s t e a d y d e c l i n e i n domest ic sma l lho lde r p roduc t ion and of import r e s t r i c t i o n s . Such a s i t u a t i o n h a s r e s u l t e d i n a per c a p i t a dec! i n e i n a p p a x n t consumption of tea i n Indones ia .

vhere:
Q D T E A j - to ta l consumpcr, of tea for Lhe Ath country or region.
J - 1, . . . m are the number of countries or rsglons belng studied.
D. Prices and Stocks - 49. Two character4 t i c s of tea price behavlor ( i t s re la t ive s t ab i l i t y and secular decline through 1973) have already been noted (para. 10). The relat ive s t ab i l i t y may be a t t r ik r ted to the character l r t lc of the tea crop and i t s wr'ketlng s t ructure. Although reasonability of harvest lng (plucking) exis ts , most producers can pluck throughout the year. Hence, for a leaf crop l ike tea, adverse weather during a few months of the year has less impact on annual :yields than for seed dr f r u i t crops affected during the brief but c r i t i c a l p e r l ~ d s of tb.elr growth (e.g., flowering stage in coffee). t ea import lng, h1c::ding and packaging has also k e n character ired as being concentrated if. a few transmtlonal f i r m L/ and the oligopsonistic nature of the psrket has ai30 been at tr ibuted to be a factor i n the relaclve s t ab i l i t y of tea prices. Houcver, develgpaents i n recent years point t o the fact that collusion and price fixing in the l n t e r ~ t i o n a l tea aarket m y n w be mch ucaker. Partly due to such a tendency tea prices have a l so becoloe more volatile.
50. The secular decline characterist ic of tea prices is related to the tendency of the tea mrke t to be in oversupply and t o the relat ive perishability of tea. 2/ Hence, fas ter stock turnovers are required in the case of tea and stock accuoulation is less f lexible than i n other beveragee.
51. Carryover stocks i n any one year should, therefore, be an important determinant of >rice. In addition, the coffee price and f e r t i l i z e r price (ammonium sulphate! is postulated to have an important ef fect on tea price because of thei r importance a s proxies of input costs (para. 29) and, part icularly, the ef fect on short-term y leld response (para. 32).
Price Quation
52. The foliowing price equatton has been estimated for tea (time period - from 1956-78): i
1/ See Appendix I and G . Sarkar; Tea: Some Policy Issues, IDS Discussion - Paper, February 1978, University of Sussex, Brighton, p. 20.
2 / While tea s to rab i l i ty is s t i l l a debated issue, i t seems that tea cannot be kept for more than s ix months without loss of quality. (See Appendix I ) .
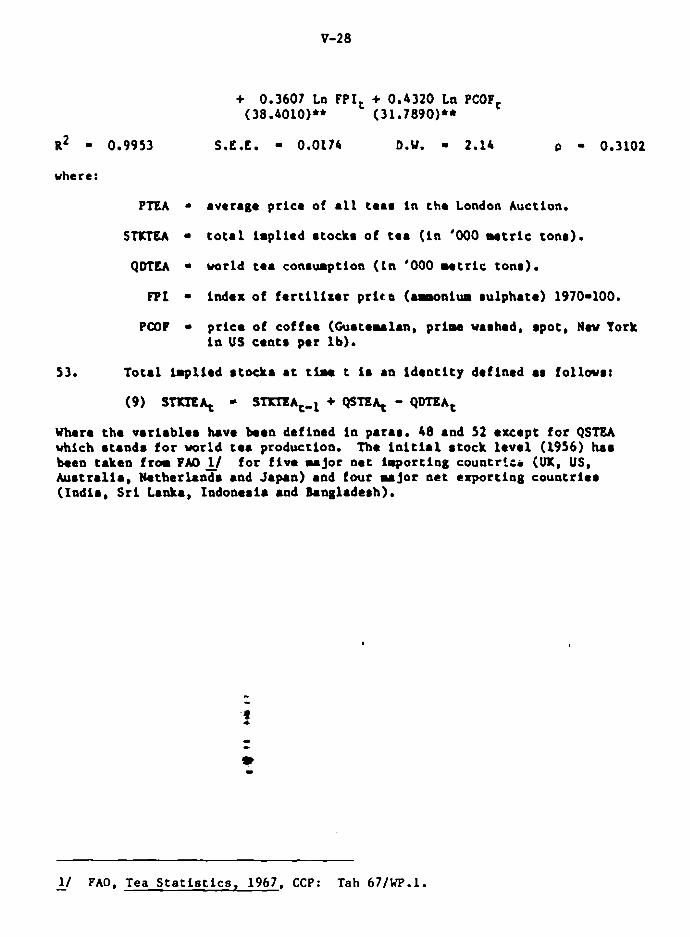
R' - 0.9953 s . ~ . E . - 0.0174 D.Y. - 2.14 P 0.3102
PfeA .I average pr ice of a11 t ea s i n the London Auction.
SnrreA - t o t a l implied stocks of t e a ( i n '000 w t r l c tonr) .
QDtW - w r l d t e a consumption ( i n '000 u t r i c tons).
FPI - index of f r r t i l i t e r p r i ce ( a m o n i w rulphate) 1970-100.
PCO? - pr ice of coffee (Guatemalan, prima washed, spot, Nw York i n US cents per lb).
53. Total implied s t d a a t t i u t i8 an iden t i t y defined as f o l l w s r
Uhere the variable8 have k e n defined i n paras. 48 and 52 except f o r QSTEA vhich s tands f o r uorld t e a production. The i n i t i a l stock l eve l (1956) h.8
been taken from PAD l/ f o r f i v e u j o r net importing count rLcb (UK, US, Austral ia , k t b e r h n & and Japan) and four ma j o r net exporting countr ies (India, S r i Lanka, Indonesia and Bangladesh).
1/ FAO, Tea Statietics, 1967, CCP: Tah 67lISP.1. -

1V. WDF.'. SI.WUTION ASD PROJECTIONS - A. Ex-Post S lmula t lon
54. A s l m u l a t l o n of t h e model f o r supply , demand, p r l c e s and s t o c k s was under taken f o r t h e 1964-1918 per lod . Because of computer c a p a c l t y p rob lea r , only t h e aggrega te supply f o r r m l a t l o n was used i n t h e s l a u l a t l o n s . The r e s u l t s f o r key v a r l a b l e s a r e g lven i n Table 1 1 belw and In Char t s 11 and 111.
55. The s l m u l a t l o n r e s u l t s l n d l c a t e t h a t t h e model cap tu red t h e performance of t h e u o r l d t e a economy q u i t e -11. I n t h e f o u r t e e n y e a r s i m u l a t i o n pe r iod , t h e rwt-mean-square error (WSE) f o r s l m l a t e d p roduc t lon d l d not exceed 2 percent of t h e a c t u a l f o r each of t h e t h r e e o a l n t eg lons ( l n d u s t r l a l l t e d count r l e s , developing count r les and c e n t r a l l y planned . -
economies). The s l m u l a t l o n f o r consuapt lon was o n l y slightly less satisfactory, l a r g e l y because of t h e c e n t r a l l y planned economies (wi th a M E of 3.5 pe rcen t ) . Implled s t o c k s s h w a much l a r g e r s l m u l a t l o n e i r o r , L/ j e t t h e movement of s imu la t ed s t o c k s 1 s i n t h e correct d l r e c t l o n and t h e p r i c e t r a c k i n g performance of t h e a o d e l 1 s not a f f e c t e d by I t .
8. Hodel P r o j e c t l ons and A l t e r n a t l v e S c e n a r l o s
Pro j e c t l o n I - The Base M e ? .
56, The model was used t o p r o j e c t t h e endogenous v a r l a b l e s ( supp ly , demand and p r l c e ) t o 1990. The exogenous v a r l a b l e s ( p o p u l a t i o n , CDP, f e r t i l i z e r p r i c e and c o f f e e p r i c e ) were p r o j e c t e d on t h e b a s i s of t h e assumpt ions used i n t h e Uorld Bank's World Developsent Report, 1980. The r e s u l t s ( h e r e a f t e r c a l l e d P r o j e c t i o n I ) a r e g i v e n i n Tab le 12,
1/ T h e lak,esc e r r o r s in s t o c k carryovers vere obtained i n the v o l a t l l e 1977 - and 1978 pe r iods .

Table 11: S W Y OF EXi'POST SIMLATLON RESULTS FOR SELECTED VARIABLES (1964-7 8)
Uorld Uorld Uorld Vorald Product ion Conrump t ion Stoeka P r i c . ~
( '000 metric t o m ) ( ~ / l b )
%an ( a c t u a l d a t a ) 1,433.9 1,345.2 389. S 62.6
W S C ( i n X ) 1 . 5 1.0 18 -0 1.0
I n d u r t r i a l i t e d C h a t r a l l y Planned Developin8 Couetr iea teonomiea Countries
Prod. Cons. Prod. Cons. Prod. Cons.
-('000 metric t o m )
Hean (actcr.1 d a t a ) 135.5 532.4 274.7 275.2 973.9 548.4
M E /a - 2.2 6.3 2.8 9.8 29.1 6.8
W E ( i n 2) 1.6 1.2 1.0 3.5 2 .O 1.2
/a Root-n-square s imula t ion e r r o r . - 57 The only d a t a a v a i l a b l e t o test t h e s h o r t term project ions--year# 1979 and .1980--ir f o r p r i c e and production a s shovn below
World Pr fce World Production P r o j e c t i o n I Actual Error /a - P r o j e c t i o n I Actual 2
(a) (b) (c)
- -(C/lb)- (2) --- (thousand tons)- @
1979 8 5 98 13 1,734 1,830 5.0 1980 93 102 9 1,786 n.a. / b -
/ b n.a. = not ava i l ab le . -

Table 12: PIUJECTION I (BASE HODEL) RESULTS
- Product ion Con8 u p c ion Price World Developing Indurt r i a l i r s d CPFA World Developing Indurtrial irad BE; mj
/a Totals may not add up due to rounding for component regionr. - Q U

CHART D EX-POSTE SIMULATION W PRODUCTION, CONSUMPTION, PRICE AND STOCKS (196Clgld)


The e r r o r f o r p r icea r e f l e c t ed a cont inuat ion of t he tendency of the model t o "undertrack" pr icea a ince 1976, a period during vhich e r r a t i c p r i c e m v e w n t a became more prcnounced.
5s. Am the above compariaoa auggeatr , a given rode l , even i f i t r t imula tea h i r t o r i c a l d e v e l o p a t well, need not necraaar i ly do a good job i n pro;ection with reapact t o the degree of r e l i a b i l i t y of r e ru l t a . An eva lua t ion haa t o be made of t he a b i l i t y of the otir, ted equa t i om t o cap ture structural changer which a r e l i k e l y t o domlmte t rends in t h e future . I f s t r u c t u r a l change, a r e l i k e l y t o be ruba t an t i a l l y d i f f e r e n t from the t rend captured i n the t h e period of a ~ l y a i a , it i r b e t t e r to undertake soma adfuatcwnta of re levan t coe f f i c i en t a t o t ake i n t o account auch change than t o ex t r apo l a t e from a r a t of e x i a t i a g e q u t i o n a which t he a m l y a t knwa would not be r e a l l a t i c .
59. Thla hypotheair l a illustrated f o r the m d a l v l t h reapect t o the impl icat ion of the dec l in ing a v a i l a b i l i t y of nau land au i t ab l e f o r l a r g e aca l e t e a expanaiorr-a phenomenon t b t t a becoming mre c r i t i c a l f o r v i r t u a l l y a l l t h e m j o r t e a producing courrtriea am can be a r ea from the average annual g r w t h r a t e of planted a rea given b e l w :
Ind l a S r i Lanka Indonesia Kenya Tanzania Uganda
-- (Average annual g r w t h i n 2)-
Except f o r Indonesia where a c t i v e nev p lan t ing programs were taking place i n t he 19709, t he r a t e of new p lan t ings have been decl ining. The negat ive r a t e s of g r w t h i n 1972-78 f o r Tanzania and Uganda r e f l e c t t h e impact of p ro t rac ted p o l i t i c a l and economic d i s rup t i ons vhich a r e l i k e l y t o be reversed (1.e.. growth w i l l be pos i t ive ) ; but t h e i r 1951-72 g r w t h perfonaance is un l ike ly t o be repeated. Hence, t o expect t h e 1951-72 planted a r ea r a t e s t o cont inue, a s us ing the estimated model implies, W d be u n r e a l i s t i c . Similar ly , ba s i c t r ends i n long-term y i e l d s could also'be a f f ec t ed depending on the ex ten t of rep lan t ing with high y ie ld ing v a r i e t i e s . For example, i n S r i Lanka (and possibly f o r Tanzania and Uganda), average y i e l d s a r e l i k e l y t o Increase a t a f a s t e r ( o r a t l e a s t decrease a t a s l oue r ) r a t e than i n the past couple of decades because of s p e c i f i c government programs focused on t e a r ehab i l i t a t i on . Hence an assessment, based on a knovledge of the re levant country or region, has t o be made on l i k e l y changes i n t he long term t rend of planted (and thus harvested) a rea and y ie ld t o achieve a more c r ed ib l e r e su l t .

P r o j e c t i o n I1 - Adjustment fo. Lvng T e r n S t r u c t u r a l Change i n Supply
60. An a:tcmpt was made t o a d j u s t t h e time t r e n d c o e f f i c i e n t s f o r e ~ p p l y i n t h e p t a j e c t i o n p e r i o d (~979-90 ) t o t a k e i n t o a c c o u r t :he l i k e l y s t r u c t u r a l changes i n l ong - t e rn a r c a and y i e l d t r e n d a d : r cus sed above. _I_/ The p r i c e c o e f f i c i e n t s a r e r e t a i n e d t o a1lw.1 f o r p r i c e e f f e c t p . The p r o j e c t i o n r e s u l t s ( P r o j e c t i o n 11) a r e i n T a b l e 1 3 f c r t h e major r e g i o n s .
61. A comparison of s e l e c t e d s c a t i s t i c r w i t h P r o j e c t i o n I and wf t h a c t u a l ( on ly y r i c e , v o r l d p roduc t ion and v o r l d conrumpzjon) 1% sumaar ized below:
World P r o d u c t i o n World Conruap t ion P r i c e -- P r o j I P r o j XI Actual P r o j I P r o j I1 Actual P r ~ j I P r o j XI z t u a l
62. Tho o v e r a l l r e d u c t i o n i n t h e time t r e n d s f o r t h e supp ly e q u a t i o n s i n P r o j e c t i o n I1 r e s u l t e d i n its s h o r t term p r i c e p r o j e c t i o n s (1979 and 1925: c l o s e r t o a c t u a l t h a n P r o j e c t i o n I ( t b e b a r e c a s e ) . P r o j e c t i o n I 1 p r i c e p r o j e c t i o n s f o r 1985 and 1990 were r e s p e c t i v e l y 1 6 p e r c e n t and 11 p e r c e n t h i g h e r t h a n f o r P r o j e c t i o n I. The d i f f a r e n c e s i n p r o d u c t l o n and consunp t ion between P r o j e c t i o n 1 and P r c j e c t i o n 11 were i n l i n e v i t h t h e d i f f e r e n c e s i n p r i c e s . P r o p u r t i o n a t e l y h i g h e r d i f f e r e n t i a l s were , however, o b t a i n e d f o r t h e s h o r t tern p r o j e c t i o n s t h a n f o r t h e l o n g e r tern.
P r o j e c t i o n 111 - Exogenous F ixed Supply P r o j e c t i o n s
63. Numerous p r o j e c t i o r u f o r t e a are based o n s i m p l e marke t e q u i l i b i i w models i n which supp ly and demand are i n i t i a l l y p r o j e c t e d i ndependen t ly ( i m p l i c i t l y a s s u n i n s t h a t p r i z e s r e o a i n unchanged d u r i n g t h e p r o j e c t i o n per iod) . The p r i c e p r o j e c t i o n under s u = h a n approach i s u s u a l l y o b t a i n e d by c a l c u l a t i n g t h e p r i c e chacae between t h e base p e r i o d and t h e p r o j e c t e d p e r i o d ( th rough t h e u s e of p r i c e e l a s t i c i t i e s o f supp ly and demand) t o e q u i l i b r a t e t h e imbalance between t h e supp ly and demand p r o j e c t e d
I / - As f a r a s p o s s i b l e , t h e a d j u s t m e n t s were made w i t h t h e p r i c e e f f e c t s - n e t t e d ou t . The impl ied a r e a and y i e l d component u n d e r l y i n g t h e a d j u s t m e n t s on t h e t i m e t r e n d coefficients f o r supp ly a r e g iven i n Appendix 11.
21 See, f o r example, t h e p r o j e c t i o n s t o 1985 unde r t aken by FA0 and t h e World - Bank's r e p o r t o n P r i c e P r o s p e c t s f o r .Xajor P r imary Commodities ( ~ e p o r t No. 814180, J a n u a r y l 9 8 0 ) , Appendix I and pp. 65-77.


exogenous ly . These s i m p l e models p r ~ ~ i d e p e r i o d by p e r i o d p r o j e c t i o n s , bu t do n o t a l l o w f o r t h e i n f l u e t \ c e o f d e v e l o p e n t s i n t h e I n t e r v e n i n g yea r s . To compare t h e e f f e c t of i n c o r p o r a t i n g supp ly p r o j e c t i o n s exogenounly, t h e i p p a c t o f two a l t e r n a t i v e s 1/ a r e a t t emp ted : ( i ) P r o j e c t i o n I I I a - "Host l i k e l y " supp ly p r o j e c t i o n s (ba sed on i n d u s t r y judgement o f l i k e l y supp ly by c o u n t r i e s o r s u b r e g i o n s ) t o 1990; and ( i t ) P r o j e c t i o n I I I b - o f f i c i a ~ c o u n t r y supp ly p r o J e c t i o n ( b a s e d on o f f l c l a l gov*r.xunt estimates r e p o r t e d t o t h e F A 0 I n t e rgove rnmen ta l Group o n Tea and o n o f f i c i a l d e v e l o p e n t p l a n s ) . The r e s u : t s a r e g i v e n i n T a b l e 14.
64. A compar i son w i t h P r o j e c t i o n 1 f o r p r l c c , v o r l d p r o d u c t i o n and wor l4 consumption is s m m a r i z c d below:
Uor ld Production P r o j e c t ion:
World Consumption P r o j e c t Lon:
P r i c e P r o J e c t icn:
I 111a 111b 1 t11a 411b I 111. I I I b
-------- ( thousand t o n s I-------- -- (a/ 1b)---
65. Some i n t e r e s t i n g d i f f e r e n c e s may k g l e a n e d from t h e comparison of methodolog ies sum-rired above. For p r - c e p r o j e c t i o n s , t h e r e a p p e a r s t o be g r e a t e r d i f f e r e ~ r c e s be tucen P r o j e c t i o n 1 and P r o j e c t i o n 111 t h a n w i t h i n P r o j e c t i o n 1x1 (1.e.. between P r o j e c t i o n 1IIa and I I I b ) . By making tea p r o d u c t i o n exogenous (i.e., n o t p e r m i t t i n g a n y s h o r t t e r m o r l ong term p r i c e r e sponse ) , p r o j e c t e d p r i c e s are m c h lwer t h a n t h e ba se case r e s u l t s . 'Fis is p r i m a r i l y due t o t h e f a c t that (i) t h e exogenous p r o d u c t i o n i n P r - j e c t i o n I I I were p r o p o r t i o n a t e l y h i g h e r t han i n t h e b a s e case ( P r o j e c t i o n I) and (11) consumption r e s u l t s were r e l a t i v e l y c l o s e ( d e s p i t e d i f f e r e n c e s i n methodology). &,n compar i son v i t h t h e r e s u l t s f rcm t h e "gap a n a l y s f s " app roach , 21 p r o j e c t e d p r i c e s i n t h e l a t t e r were c o n s i s t e n t l y h i g h e r p r i m a r i l y because its cona, a p t i o n ( p r o j e c t e d exogenous ly ) were c o n s i s t e n t l y h i g h e r t h a n t h a t from t h e model p r o j e c t i o n s . .% in t a in ing p r i c e r e sponse f o r consumption i n t h e model r e s u l t s i n less v a r i a n c e t n t h e consumption p r o j e c t i o n s . ,*
4
I / Sources : FA0 I n t e rgove rnmen ta l Group o n Tea an4 World Bank, P r i c e - P r o s p e c t s f o r Xajor Primary C o w o d i t i e s , Report No. 814180.
21 P r i c e s p r o j e c t e d by t h i s app roach (see pa ra . 6 3 ) is g i v e n i n World Bank - Report So. 814180, p. 7 7 (1985 = 1 3 9 ~ I l b and 1990 - 1 8 5 ~ 1 l b ) . The exogenous pr0duc t i .w f o r 1980, 1985 and 1990 are t h e same as P r o j e c t i o n IIIa.

T a b l e 14: PROJeCTlON I11 - BASE MODEL WITH UTE)(NATIVE FIXED SUPPLY PROJECTIONS
Product ion Canrupt ion World Developing Lndurtria1lzcd CPEr World D.veloplng tndurttlalited CPEr Price
I I I a - bet-Llkely Alternative
I I I b - Government Plan Alternative

Project ion IV - Sens i t iv i ty t o Coffee and l t r t i l i z e r Price Increases
66. The sena i t iv f ty of the base model t o changes i n coffee and f e r t i l i z e r pr ices were a l s o examined. The r e s u l t s fo r a 10 percent increase in coffee price is givcn under IVa of Table 15 while tha t f o r a s l a i l a r Lncrsnse In f e r t i l i z e r pr ice is under IVb.
67. Comparison with the base model is smnurizcd b e l w fo r pr ice, world production and world conrumption:
World Production Uorld Consumption Price P r o h c t ion: ProJcction: Prolcc t ion:
68 In c o q a r i s o n v i t h the base case ( I ) , an increase in the price of the input cos t proxies (coffee price and f e r t i l i z e r pr ice) resulted i n higher pr ices f o r t ea i n the case of the former and lover pr ices i n the case of the l a t t e r . The cos t push e f f e c t i n reducing production (and thus the production- consumption gap) through lagged prices, appears t o be more important f o r coffee pricz than f o r f e r t i l i z e r price, Tea prices, a t l e a s t i n the e a r l i e r years of the project ion, a l s o appear t o be more sens i t i ve t o changes i n the coffee pr ice than the f e r t i l i z e r price, - 1/
1/ For 1979-1990, 10 percent higher pr ice fo r coffee resul ted, on the - iverage, i n a nine percent higher tea pr ice , while tha t fo r f e r t i l i z e r ~ r ~ u l t e d i n a 4 percent lower tea price.

Product loa C o l u u s t t w world 1 d u ~ t r l r 1 l t e d h v e l o p t n ~ . Vt. h r l d ~ n d u ~ t r t r l l a d beveLopio~ a t e t r i c e
IVa - lot Htaher Coffee Prlco

V. COSCLUS IONS
69. The conc lus lons f o r p r i c e p r o j e c t i o n s ( t h e primary o b j e c t i v e of t h e s t u d y ) a r e summarized below f o r 1985 and 1990. In a l l t h e p r o j e c t i o n a l t e r n a t i v e s , t h e l e v e l of p r i c e s p r o j e c t e d f o r 1985 and 1990 would be lower than t h e a c t u a l 1979 l e v c l of 102Cllb i f ad jubtment f o r i n t e r n a t i o n a l i n € l e t i on were undertaken.
I
1990 P r i c e P r o j e c t i o n s (01lb) I P r o j e c t ion A l t e r n a t i v e s Cur ren t P r i c e Cons tant P r i c e / a
I 1985 1990 1985 1990 -
- -
I (Base Case)
11 (wi th s t r u c t u r a l ad jus tment i : ~ supply t r end8
I I I a (exogenous supply--most l i k e l y )
I I I b (exogenous supply-government p l a n ) 7 8 9 3 49 44
IVa (102 h i g h e r c o f f e e p r i c e ) 135 117 85 55
IVb (102 h i g h e r f e r t i l i z e r p r i c e ) 159 143 100 68
/a Cur ren t p r i c e d e f l a t e d by t h e World Bank's Index of I n t e r n a t i o n a l - I n f l a t i o n w i t h 1979-100. L 1
70. On t h e basis of m r k e t knowledge and s h o r t term v a l i d a t i o n of t h e p r o j e c t i o n s , t h e post l i k e l y p r i c e p r o j e c t i o n f o r t e a i n 1985 and 1996 ( 9 3 ~ / l b and 7 8 ~ / l b r e s p e c t i v e l y ) is t h e a l t e r n a 6 i v e which a d j u s t s f o r s t r u c t u r a l changes i n t h e t r e n d i n a r e a and y i e lds '%or key c o u n t r i e s . - l/
71. D i f f e r e n c e s i n p r o j e c t i o n oeth&Iology r e s u l t s i n markedly d i f f e r e n t r e s u l t s . I f product i o n were e x o g e n o u s l ~ d e t e r r n i n e d ( i .e., no p r o v i s i o n s were made f o r p r i c e response) i n l i n e w i t h t h e l e v e l s regarded most l i k e l y by market a n a l y s t s , 21 t h e r e a l p r i c e of t e a cou ld be s u b s t a n t i a l l y lower t h a n t h e mobt l i k e l y s c e n a r i o g e n e r a t e d by t h e s o d e l . k l l o u a n c e Eor p r i c e r e s p o n s e
11 The above two v a l u e s i n p a r e n t h e s i s a r e c o n s t a n t (1979) p r i c e s . - 21 See, P r i c e P r ~ s p e c t s f a r Major Primary G - m o d i t i e s , World Bank Report -
814180 (p. 77) .

and i t s e f f e c t s on production (and consumption) i n the intervening years in the model is important.
72. Tea price is oore sens i t ive t o cof fee price changes than t o f e r t i l i z e r pr ice changes. The importance of coffee prices seeps, however, t o be more apparent through i t s input e f f e c t s (used a s a proxy fo r production cos ts ) than through its output e f f e c t (via i ts lnfluenca a s a competing beverage i n consumption) .

MPEXDLX I Page 1 o f 6
TEA MARKETING
C h a r a c t e r i s t l c s o f Tea and I m p l i c a t i o n s f o r H s r k e t i n g
1. The v i d e v a r i e t y cf p rov ing and p r o c e s s i n g c o n d i t i o n s huo g i v e n r ise t o a v i d e v a r i e t y o f t e a s produced. I n a d d i t i o n t o t h e broad c a t e g o r i z a t i o n o f t e a s i n t o "black", "green" and t h e i n t e r m e d i a t e "Oolong" t e a s 11 d i f f e r e n c e s among consumers h a v t meant t i r a t d i f f e r e n t g r a a e s of l yu f and l e a f p a r t i c l e s ( b rokens ) h a v t t o be blended i n d i f f e r e n t comb ina t i ons .
2. The q u a l i t y o f t e a r ( l i k e t h a t o f v i n e ) i n d i f f i c u l t t o d e f i n e . h d t ( p r o c e s s e d ) tea may be p r i z e d n o t j u s t by i ts a p p e a r a n c e ( s i z e , c o l o r , b r i g h t n e s s ) ; i ts method of manufac ture (CTC 2 1 v e r s u s o r t h o d o x ) , b u t by c h a r a c t e r i s t i c s which c a n o n l y be e v a l u a t e d Through i n f u s i n g and t a s t i n g . The " l i q u o r " and f l a v o r of tea ( t h e r e a r t wre t h a n 100 v o r d s of d e s c r i p t i o n ) is de t e rmlned by t h e a l c i t u d e and so i l o f t h e t e a a r e a , t h e t y p e of bush ( c l o n a l o r i g i n ) , t h e time and f i n e n e s s o f p l u c k i n g and t h e s k i l l and method of p e n u f a c t u r e . The t e c h n i c a l e x p l a n a t i o n o f t h e d i f f e r e n c e s is man i f e s t ed i n t h e amount and combina t i on of a f l a v i n e s , and t h e a m b i g e n s ( f o r aroma l i q u o r i n g q u a l i t y ) , and c a f f e i n e ( f o r b r i s k n e s s ) . The r e s u l t a n t v a r i e t y of c h a r a c t e r i s t i c s make f o r a n alwst i n f i n i t e number o f " q u a l i t i e s " and c o n f e r s o n t e a i ts h e t e r o g e n e i t y v h i c h canno t be s t a n d a r d i z e d by t h e u s u a l method o f d e s c r i p t i o n . The t e a t r a d e , however, g r o u p s t h e v i d e r ange o f t e a s i n t o t h r e e broad c a t e g o r i e s : ( a ) h i g h "qua l i t y " , ( b ) "medium", and ( c ) p l a i n " f i l l e r " . 31 The combina t i on of t h e s e c a t e r f o r d i f f e r e n t consumer t a s t e s . - 3. Tea is a l s o r e l a t i v e l y p e r i s h a b l e . While t h e r e is s t i l l some d e b a t e o v e r t h e l e n g t h o f p e r i o d t e a may be s t o r e d v i t h o u t " s i g n i f i c a n t " l o s s of q u a l i t y , i t is g e n e r a l l y a g r e e d t h a t tea c o u l d l o s e i ts f l a v o r a f t e r s i x
11 **Green1* tea is unfermen-ed; "black" tea i s f u l l y f e rmen ted ; and "Oolong" - a tea is p a r t i a l l y f e r ~ e r : e d . I
21 Tea produced by t h e p r o c e s s o f c r u s h i n g , r e a r i n g and c u r l i n g . - 31 I n t h e tea t r a d e , q u a l i t y d e s c r i p t i o n s a r e o f t e n l i n k e d t o tea s u b r e g i o n s -
( o r even s p e c i f i c e s t a t e s ) o f a p a r t i c u l a r coun t ry . C u r r e n t l y t h e r a n k i n g o f t e a s may be sumnmrized a s fo l lows: ( a ) h i g h "qua l i ty" - -Dar jee l ing a n d A s s a m second f l u s h (Hay-June) from I n d i a , S r l Lanka h igh g r avn and Kenya h i g h grown; ( b ) "mediums" ( i d e n t i f i e d by i t s b r i g h t n e s s and u s e f u l l i q t r c r - - p a r t i c u l a r l y f o r tea bags) Assam and Doers ( I n d i a ) , S r i Lanka and Kenya medium grown, Malawi teas, "peak season" Indones i an and some t e a s f rom t h e Peop l e ' s Repub l i c of China (PRC); and ( c ) p l a i n s ( " f i l l e r s " ) ( i d e n t i f i e d by i t s p l a i n c o l o r and l i q u o r - - p a r t i c u l a r l y u s e f u l a s f i l l e r t e a i n b l end ing ) l o v q u a l i t y b s a m s and Dcers, some ?!alawi and most I ndones i an , Hau r i tLus , some PRC, Bangladesh, Argen t i na and Xozambique. Even l o v e r q u a l i t y ("junk") t e a a r e made--but t h e i r m a r k e t a b i l i t y is r a t h e r l i m i t e d ( t e a s from Turkey, Rus s i a , I r a n and Tanzanian o f f - g r a d e s a r e of t h i s c a t e g o r y ) . Another c a t e g o r y which is impor t an t f o r t h e Middle E a s t ararket is t h e lowland " t i p p y M d a r k t e a s from S r i Lanka and I n d i a .

APPENDIX I Page 2 o f 6
months d~tpending on s t o r a g e cond i t ions ( t r o p i c a l c l ima tes o r a o i s t cond i t ions would me.ln an even s h o r t e r per iod) and t h e vapor proof ing p roper ty of t h e containt: . i n which t h e t e a is kept.
4. The system f o r phys ica l ly marketing t h e product is, therefore, geared towards h rnd l ing these c h a r a c t e r i s t i c s . Made t e a is convent ional ly marketed i n t e a c h e s t s (usua l ly plywood wi th f o i l l i n e r ) . P e r i s h a b i l i t y and t h e need f o r a l a r g e v a r i e t y of consignment8 has a l s o w a n t t h a t t r a d i t i o n a l l y t h a blending of t e a take8 placa a t t h a consumption end of tha m r k a t i a g chain. Shipment i8 u s u a l l y i n 8-11 con8ignment8 t o g lva uniformity and 8.88 of ramp1 ing and provide8 tha r a a d i l y a v a i l a b l a t e a 8 f o r blending undar tha a u c t i o n system.
5. Tea may be markatad a i t h a r through t h a a u c t i o n 8 y 8 t e u o r through d i r e c t s a l e s . Of t h a a p p r o x i ~ t a l y ona m i l l i o n w t r i c ton8 of tea produced by developing c o u n t t i a s i n 1975-77, about 652 wa8 ao ld through auc t ion s y s t e m (56% i n producer coun t r i a8 and 9% i n London); t h a r a 8 t (35%) -8 8old d i r e c t l y t o purchaser8 who may be t r a d e r 6 and/or b lander8 ( m a Tabla 1). S r i Lanlu and Bangladesh a r e good txamplas of producer8 wi th more than 90% of t h e i r production 8old i n l o c a l auct ions . On the o t h a r hand, Argantinn and Indone8ia s e l l s t h e bulk of its crop d i r e c t l y t o purchasers. V i r t u a l l y a 1 1 of t h e production s o l d i n producer auc t ions is exported. The main except ion is 1-dia where 152 of t h e t e a production s o l d i n l o c a l a u c t i o n s (53% of t h e t o t a l , is s o l d d i r e c t l y o r s l m l l a r l y disposed.
6. Di rec t s a l e s t o l o c a l p a r k t t s i n producing coun t r i e8 usua l ly c o n s i s t of poorer q u a l i t y t e a r , t h e p r i c e of which n e i t h e r f u r t i f i e 8 t h e i r t rans- porte ' ion t o a u c t i o n s nor t h e payment by t h e producers of t h e necessary brc 'hrage fees . On t h e o t h e r hand, p r i v a t e s a l e s t o f o r e i g n buyers !?specia l ly those s o l d on forward c o n t r a c t s ) a r e usua l ly of b e t t e r q u a l i t y t-3s s i n c e t h e s e l l e r has t o maintain cons i s t ency i n its s a l e s o r r i s k t h e lo..s of a r egu la r customer. 2J
11 A good summary of t h e evidence f o r s t o r a b i l i t y of manufactured t e a may be - found i n UNCTADIFAO, The Technical Fe n a t i o n a l Bufferstock f o r Teas TD/B/IP I n t e r n a t i o n a l Stocking Arrangements wi th Supplerwntary Measures, T D / B / ~ P C / T E A / A C / ~ , J u l y 31, 1978, pp. 27-30.
21 A good example is the t e a exported '*v Malawi. -

APPENDIX I Page 3 o f 6
Tab le 1: PRODUCTION AYD DISPOSITION OF TEA BY TYPES OF SALES, AV. 1973-77
( '000 m e t r i c t o n s )
Auction S a l e s P roduc t i o n London Producer T o t a l D i r e c t S a l e s
Country
I n d i a S r i Lanka Indones i a Bangladesh Kenya
Helavi Uganda Mozambique Tanzania Argent ina
O t h e r s
TOTAL DEVEU3PINC COUNTRIES
Source: UNCTAD, Unpublished Study on Market ing and D i s t r i b u t i o n of Tea, 1978.
Harket S t r u c t u r e and Harket C o n s t r a i n t s
7 . The sellers of tea i n t h e major import marke ts f a c e t h r e e major p r o b l e y v i t h r e s p e c t t o t h e i r a b i l i t y t o b a r g a i n f o r equ,itable p r i c e s :
( a ) t h e p e r i s h a b i l i t y of t e a ;
(b) t h e o l i g o p s o n i s t i c s t c c t u r e i n its t r a d i n g , b l end ing d i s t r i b u t i o n ; and
'!
( c ) t h e l a r g e p r o p o r t i o n o e s a l e s i n t h e a u c t i o n system.
8 *
The r o l e of m u l t i n a t i o n a l c o r p o r a t i o n s i n t h e c o n t r o l of e x p o r t s f rom major tea e r o n r t i n g c o u n t r i e s is no t as h igh as t h e c o n t r o l of pu rchas ing and b l e n d i n g I n c t ~ e major i m p o r t i n g c o u n t r i e s . I n S r i I.anka and I n d i a , f o r

APPENDIX I Page 4 o f 6
example, t h e s i x l a r g e s t mul t ina t iona l companier c o n t r o l l e d on ly 46% and 32% of t h e i r r e s p e c t i v e e x p o r t s (1975-77). A/
9. S ince major importing country b lender r u s u a l l y purchase t h e bulk c f t e a imports themselves ( o r through brokers whom thew son o r c o n t r o l ) , 2/ t h e concen t ra t ion of blending by l a r g e f i rms is t h e key determinant of market con t ro l . According t o a s tudy c o d r s i o n e d by t h e Comomrealth S e c r e t a r i a t , A/ blending i n t h e UK i r dominated by four companies - 4 / and i n A u s t r a l i a and t h e US by e i g h t companies each.
10 . &It t o what e x t e n t a r e t h e r e o l lgoprony/ol igopoly f o r c e r a t work manipulating t h e t e a i n p s j o r m r k e t r ? A: t h e a u c t i o n r ( e r p e c i a l l y i n London), t h e r i t u a t i o n of a l a r g e number q4f s e l l e r r f a c i n g f e u buyerr , by i t s e l f , i r not r u f f i c i e n t t o make a card f o r market manipulation. S e l l e r r can, however, t ake advantage of a rl:uat40n of e x c e r r rupply and o f f e r lower pr ices . In ouch a s i t u a t i o n , t h e .eas which a r e not auct ioned ( o r a r e d e l i b e r a t e l y u i t h d r a r n ) f a c e r v c . l w e r p r i c e r i f r o l d o u t r i d e t h e a u c t i o n s i n c e t h e oppor tun i ty f o r holding ou t f o r h igher p r i c e r is l imi ted by p e r i r h a b i l i t y and c a r r y i n g c o r t r .
11. A u r e f u l mearure of e x p l o i t a t i o n is t h e e x t e n t n e t r e t u r n r t o t h e var iour l e v e l r of t h e t e a i n d u r t r y a r e ou t of l i n e wi th r i m l l a r i n d u s t t i e r . The conclur ionr from a repor t b t h e UK P r i c e C o m i r r i o n ' r inqu i ry i n t o t e a p r i c e s and m r k e t m r g i n r a t t h e blending, wholera le and r e t a i l l e v e l r a r e worth s u m a r i z i n g . ~ l The repor t (publ ished i n 1978) found t h a t b lenders /wholesalers maintained t h e i r h i s t o r i c g r o s r m r k e t i n g margins dur ing t h e per iod of sharp v o r l d p r i c e inc rease i n 1976177. 6/ The r e s u l t i n g increaee i n blending c o s t s were, e s s e n t i a l y , pa r rad on t o t h e r e t a i l e r and n e t margins were s u b s t a n t i a l l y increased above t h e h i s t o r i c a l r a t e . Despite t h e high concen t ra t ion a t t h e wholerale and blending l e v e l , no d e f i n i t i v e evidence on p r i c e c o l l u s i o n was found. Hwever, i t concluded t h a t , "while charac te r i zed a s a gentlemanly t r ade , t e a b lending could a f f o r d t o be more competitive." The impression of s i g n i f i c a n t o l igopoly p r o f i t s from t h e s a l e of t e a 5y blenders appears t o be f u r t h e r supported by t h e c o n s i s t e n t l y h igher p r o f i t a b i l i t y of t e a blending compared wi th t h a t of s o l u b l e cof fee
- - 1/ Unpublished UNCTAD Study on "Harketing and D i s t r i b u t i o n of Tea, 1978". .J -
d
2 / Commonwealth S e c r e t a r i a t , S tud ies Re la t ing t o t h e Development of Export? - from Bangladesh, Va. 9. Tea - Prr + a c t Summary Report , Economic Intel-) l igence Uni t , 1973.' -
3 Commonwealth S e c r e t a r i a t , i b i d , p. 7 . -
4 / Brooke Bond 0x0, Lyons Te t l ey , Typhoo Tea and CWS . ' -
5 / UK P r i c e Commission, Tea P r i c e s , Report No. 32, 1978. - . . 61 Ib id , paras . 4.15 and 5.1. - -

APPENDIX L Page 5 o f 6
manufac tur ing (based on t h e UK P r i c e C o d s a i o n ' s r e p o r t s o n t e a and c o f f e e ) .
12. me evidence f o r o l i g o p o l j " ren ts" a t t h e b l end ing /who le sa l e l e v e l i n 1974-76, however, does n o t n e c e s s a r i l y mean t h a t t h e problem i n t h e UK is a s s e r i o u s today. S i n c e t h e p u b l i c a t i o n of t h e P r i c e Collrnission Repor t , t e a b l e n d e r s and d i s t r i b u t o r s have been under ex t reme p r e s s u r e by t h e UK government t o " r a t i o n a l i z e " t h e i r o p e r a t i o n s and p r i c i n g p o l i c i e s . Also, a number of them ( p a r t i c u l a r l y t r a n a n a t i o n a l r l i k e Brooke Bond and Lyons T e t l e y ) have d i v e r s i f l e d t h e i r p roduc t l i n e s u b s t a n t i a l l y o v e r t h e yea r s . T h e i r dependence on t e a a r a n i p p o r t a n t r o u r c e of c o r p o r a t e income h a s d iminished; s o h a s t h e i r f i n a n c i a l f l e x i b i l i t y f o r moving i n and o u t of t h e market i n a b i g way because o f t i g h t e r c o r p o r a t e c o n t r o l 8 on , and t h e h i g h e r o p p o r t u n i t y c o s t o f , h o l d i n g l i q u i d cash. Hence, t h e care f o r c o l l u r i o n and p r i c e f i x i n g i n t h e ~ p a r k e t ir n w a r c h weaker.
13. The r i t u a t i o n a t t h e re tai l l e v e l i n , i n any c a s e , d i f f e r e n t t h a n f o r b l end ing i n t h a t a numb&r of v a r i e t i e r of tea are o f t e n i n t e n t i o n a l l y p r i c e d a t low l e v e l r a r a " l a r r - l eade r " i n t h e r t o r e r t o draw customers. Civen such p r a c t i c e r , t h e a r r e s s P c n t of retai 1 mnrginr i r n o t p a r t i c u l a r l y r e l evan t .
14. Furthermore, t h e ev idence f o r o l i g o p o l y r e n t s should be s e p a r a t e d from t h e c o m p e t i t i v e n a t u r e of t h e p r i c e n k i n g mechanism. D e s p i t e t h e market s t r u c t u r e dircurrred, t h e p r o c e r r of p r i c e a r b i t r a g e f o r t e a seems t o work very well a c r o s r major a u c t i o n mnrkets. (See t h e c o r r e l a t i o n m a t r i c e s Table 2.) 2/ Hence, p a r t l y i n r e c o g n i t i o n o f t h i s phenomenon, t h e p r i c i n g of d i r e c t s a l F s is u s u a l l y gea red towards t h e p r i c e s a t London a u c t i o n s .
1/ C. Uarnigatunga, Desk Study o n Tea: Blending Packaging and Product ion o f - I n s t a n t Tea. C o m o m e a l t h S e c r e t a r i a t , London, Nov. 1479 ( D r a f t ) c o m ~ a r e d ~ ~ - - - - - ~ . - "ne t p r o f i t margins" and " r e t u r n on c a p i t a l employed" f ro- t h e Tea P r i c e s r e p o r t w i t h a 1977 P r i c e Comdss ion Report on Cof fee P r i c e s and came o u t w i t h t h i s r e s u l t (p. 38). -
E 2/ Given t h e d i f f e r e n c e s i n market l e v e l s (and t h e neZd t o a d j u s t f o r -
t r a n s p o r t c o s t changes ) , c o r r e l a t i o n s among t h e p r i c e s i n t h e f i v e major markets a re s u r p r i s i n g l y very high. As e x p e c t e d , c o r r e l a t i o n s a t t h e annua l l e v e l t end t o be h i g h e r t han a t t h e monthly l e v e l . W h i l e p r i c e s a t Cochin and C a l c u t t a c o r r e l a t e very w e l l a n n u a l l y , t h e performance on a monthly b a s i s i s r a t h e r poor u n t i l t h e d a t a is d e s e a s o n a l i z e d ( r e f l e c t i n g t h e marked v a r i a t i o n i n s e a s o n a l i t y and q u a l i t y of North I n d i a n t e a s s o l d i n C a l c u t t a ) .

APPENDLX I Page 6 o f 6
Table 2: CORREUTIONS BETWEEN THE AVERAGE PRICES OF TEA, AT VARIOUS AUCTION CENTERS
(USc/ks)
London Mombasa Colombo Cochia Ca lcu t ta
Annual Data 1964-75 (12 obre rva t ionr )
London Mombar a Colombo /a Cochia Ca lcu t ta /.
Monthly Data 1972-76 (59 obre rva t ionr )
London Wmbara Colombo /. Cochin Ca lcu t ta
Monthly Data De-Searonalitcd 1972-76 !59 observa t ions )
London Mombasa Colombo /a - Cochi~r Ca lcu t ta
/a Auction p r i c e s ad jus ted f o r expor t d u t i e s and ceases. - Source: FA0 Report CCP: TE 7714, January 1977.
I

- U ' TlME TRENDS IN AREA, YIELD AND PRODUCTIOS, 1957-1990
Harvested Area Yield Production 1957-78/a - 1978-90/b - 1957-90/c - 1957-78/d - 197&90& 1957-90k 1957-78/f 1978-90h 1957-90h
Indus t r i a l i zed Count r i e e 1.5 2.3 2.4 2.1 2.1 2.1 4.6 4.2 4.5
Cen t ra l ly Plnnned Economies 4.0 0.8 2.3 2.5 1.5 2 .O 6.5 2.3 4.3
Developing Countrl ee
India 0.7 0.2 0.5 2.1 2.1 2.1 2.8 2.3 2.6 S r i Lanka 0.3 0.1 0.2 -1.7 -0.2 -0.9 -1.4 -0 -0.7 Indonee l a -2.1 0.2 -1 .0 2.8 1.6 2.2 0.; 1.2 Other A ~ i a 1 .o -d .2 0.6 2.1 2.3 2.2 3.1 .I 2.8 Kenya 9.3 7.0 8.1 0.6 0.7 0.7 9.9 7.1 8.8
Tanzania 6.5 2.5 4.4 2.4 3 .O 2.7 8.9 4.7 7.1 Uganda 9.0 0.2 5.8 0.0 0.1 0.1 9 .O 0.3 5.9 Other Africa 4.3 1 .8 3 .o 0.7 0.7 0.7 4.4 2.5 3.7 La t in America 5.6 4.5 5.0 5.8 1.9 3.8 11.4 4.9 8.8
/ a Derived from ~ise t rend c o e f f i c i e n t with long term p r i c e ( I n PTEADt-?) a a the o t h e r independent v a r i a b l e . - / b Weighted averiige fo+.k)B-8$*ahh 1984-90. 1978-84 time t r end i r der ived f tom t rend coef f i c i r n t a f o r p lanted a r e a -
(1972-78); 1984-90 : obtained from induatry judgemanta bared on a a t i n t e d p lan ted a r u f o r 1979-80 and t h e f e a s i b i l i t y of goveriment e ~ p a n s i o n plana f o r p lan ted a r e a from 1980-84.
/ c Weighted average of the r a t e r f o r 1957-78 and 1978-90. - /d Derived from Table 8 with adjuetmentr f o r conr ie t ency between harver ted a r e a t r enda and product ion t renda. - / e b a e d on indust ry judgement and a r e v i w of type8 of new p lan t ing# by country . - / f From Table 9. -
Harvested are:l r a t e plue y i e l d r a t e .

MD PRoSPECrS OF TEE U0RX.D FATS AND O I L S g0EIO)IP

TABLE OF CONTENTS
Page No . I . OVERVIEW OF THE WORLD FATS AND OILS ECONOMY ............. VI-1
A . St ruc tu r e of the World Oi l se rd Economy .......... VI-1 B . Recent Trends ................................... VI-3
.... I1 . STRUCTURE OF THE HODEL FOR THE PATS AND OILS ECOHOW VI-11
................................ A . Supply Equations VI-13 B . Demnd Equat iom ................................ VL-51 C . Pr i ce Equations f o r Fa t s and High-Protein Meals .. VI-73
I11 . MODEL SIWULATIONS AND PROJECTIONS ....................... VI-93
......................... A . Validat ion o f t h e W e 1 VI-93 ......... B . Prospects f o r t he World Oilseed Economy V1-94

I . OVERVIEW OF THE WRLD FATS AND OILS ECOKOHY 11 -
1. O i l s e e d s and t h e i r p roduc t s - - f a t s , o i l s and h igh p r o t e i n meals-- account f o r abou t 12 percent of world t r a d e . Although t h e bulk of t h e s e p roduc t s come from L n d u s t r i e ~ i z e d c o u n t r i e s , many deve lop ing c o u n t r i e s r e l y h e a v i l y on e x p o r t ea rn ings f roa o i l s e e d s ( p a r t i c u l a r l y coconut , o i l palm and groundnuts) . Host of t h e s e c o u n t r i e s a r e l o c a t e d i n t h e t r o p i c a l b e l t .
2. An impor tant c h a r a c t e r i s t i c of t h e world f a t s and o i l s economy is t h e l a r g e number of o i l -bea r ing raw ~ a t e r i a l s . On t h e b a s i s of t h e i r s o u r c e , f a t s and o i l s can be grouped i n t o vege tab le o i l s o r an ima l f a t s ( i n c l u d i n g marine o i l s ) . Vegetable 011s can b e f u r t h e r broken dovn i n t o o i l s from annua l o i l s e e d c rope and those from p e r e n n i a l t r e e crope. Soybeans, sunf lover seeds , co t tonseeds , groundnuts and rapeseeds a r e t h e major annua l c rops ; coconuts , palm f r u i t and o l i v e s a r e t h e main t r e e crops. C a t t l e , hogs, f i s h and o t h e r marine products a r e t h e main s o u r c e s o f an imal f a t b . 21
A. S t r u c t u r e of t h e World O l l s e e d Economy
Linkages Becueen O i l s and Heals
3. Many f a t s and o i l s are byprodl-cte from t h e proce. ts ing of o i l s e e d s and animal products . T h e i r supplv , then , depends l a r g e l y on t h e demnd f o r t h e p r i r . .y product . The a v a i l ~ b i l i t y of t a l l o w and l a r d , f o r example, is d i r e c t l y r e l a t e d to t h e s l c ~ g h t e r of c a t t l e and hogs. S ince most o i l s e e d s c o n t a i n both o i l and h igh-prote in w a l , t h e s u p p l i e s of v e g e t a b l e o i l s a r e f r e q u e n t l y d e t e r d n e d by 'he demnd f o r meals. The ~ o i n t recovery of t o o produc t s -o i l and meal--ft c i n g market demands t h a t a r e l a r g e i y independent o i one a n o t h e r is a n o t h e r ch: r a c t e r i s t i c f e a t u r e of t h e world o i l s e e d economy. S ince t h e e c o n o d c f o r c e s that d e t e d n e demand f o r h igh-prote in meals a r e d i f f e r e n t t han t h o s e f o r f a t s and o i l s , t h e m r k e t s f o r both t h e s e two commodities have t o be cons idered . 31 -
11 While t h e a u t h o r s a r e r e s p o n s i b l e f o r any e r r o r s , they wish t o thank - Y a r t i n Paldam, i n p a r t i c u l a r , f o r h i s e x t e n s i v e comments and suggestion..
'!
21 The f a t s and o i l s e x t r a c t e d from t h e s e raw w t e r i a l s a r e g e n e r a l l y c l a s s - - i f i e d a s " ~ i b l e / s o a p f a t s and o i l s , " r e f l e c t i n g t h e i r two major e n d - ~ s e s : t J i b l e pr*cts and soaps o r d e t e r g e n t s . These end-uses account f o r about 97 percen t bf t h e product ion of a l l major f a t s and o i l s . LC t h i s paper, t h e term " f a t s and o i l s " r e f e r s t o t h i s e d i b l e l s o a p ca tegory .
3 / The c l o s e l i n k Lc~ueec t h e markets f o r f a t s and o i l s ar,d h i g k p c o t e i n - meals i n j e c t s an a d d i t i o n a l element qf i n s t a b i l i t y i n t o the supply of vege tab le o i l s . A s t r o n g demand f o r h igh -p ro te in meals would s t i m u l a t e t h e p rocess ing of o i l s e e d s , which i n t u r n would i n c r e a s e t h e supply of vege tab le o i l s , r e g a r d l e s s of t h e demand f o r f a t s and o i l s .

Linkages t o L ive s tock and Gra in8
4. F e e d s r a i n s and h i g h - p r o t e i n meals a r e t h e two main i n g r e d i e n t s i n an ime l f e e d s . The t x a c t compos i t i on o f t h e f e e d depends on t h e n u t r i t i o n a l seeds t,f t h e an ima l s and t h e r e l a t i v e p r i c e s o f t h e i n g r e d i e n t s . Thus, t h e d e m n d i ~ r h i g h - p r ~ t e i n meal6 is t i e d t o t h e p r o d u c t i o n o f l i v e e t o c k and d a i r y p r o d u c t s , as v e l l a s t o t h e m r k e t f o r f e e d g r a i n s . The g r u d i n g s h o r t a g e of p a s t u r e h a s boos t ed t h e d e e ~ l n d f o r a ~ i m a l f e e d s by p roduce r s r a i s i n g l i v e s t o c k i n f e e d l o t c and by o t h e r l a r g e - s c a l e l i v e s t o c k o p e r a t l o n e .
Linkagee Between I n d l v i d u u l F a t e and O i l s
5. I n a d d i t i o n t o t h e l i n k a g e s between t h e m r k e t s f o r f a t s , o i l e , high- ? r o t e i n meals , f e e d g r a i n r and l i v e r t o c k p r o d u c t r , t h e r e arc a l s o c l o n e t i e r between t h e l ~ r k e t r f o r i n d i v i d u a l f a t s and 0118. Horc f a t s and o i l r a r e 1 n t a r changeab l e , and a tanufac turee of margar ine , r h o r t e n i n g , s o a p r and o t h e r f a t p r o d u c t r c a n s u b r t i t u r e o n e o i l f o r a n o t h e r , w i t h i n tt.e r p e c i f i c r e q u i r r w n t r of t h e i r p roduc t r . S i m i l a r l y , t h e a n i m a l f e e d i n d u r t r y c a n s u b s t i t u t e one h i g h - p r o t e i n maal f o r a n o t h e r i n t h e manufac ture o f f c e d r . C o n r l d e r l n q t h e s cope o f :hlC i n t e r c h a n g e a b i l i t y , t h e i r ma rke t s have t o be looked a t e l ~ u l t a n e o u e l y .
Annual Vereuo P e r a n n l a l Crope
6. he no t ed a un ique f e a t u r e of t h e f a t e and o i l s marke t is t h a t i t s s u p p l i e s come b o t h f r o a a n n u a l c r o p e and p e r e n n i a l tree c rope . The s o u r c e o f a produc t a f f e c t s h w s u p p l i e e c an be a d j u s t e d i n r e sponse t o p r i c e s and t h e s t a b i l i t y o f s u p p l i e e . P roduce r s o f a n n u a l o i l s e e d c r o p s c a n a d j u s t t h e i r p r o d u c t i o n p l a n s q u i c k l j ( u s u a l l y w i t h i n a y e a r ) . L/ p roduce r s o f tree c ropa l a c k t h i s o p t i o n . T h e i r i nves tmen t i n o i l palm, coconut o r o t h e r l i v e trees is based on p r i c e e x p e c t b t i o n s o v e r a l o n g e r p e r i o d as compared t o t h a t f o r o i l s e e d c r o p s . Because of t h e u n c e r t a i n t y , i nves tmen t i n tree c r o p s is u s u a l l y more r i s k y t h a n i n a n n u a l c rops .
7. The s u p p l y of o i l s f rom tree c r o p s is more s t a b l e t h a n t h a t o f annua l c rops . Once t h e trees have been p l a n r e d , p roduce r s u s u a l l y have no c h o i c e bu t t o h a r v e s t a s unha rves t ed c r o p s a r e a major s o u r c e of t h e d i s e a s e s which endanger th: l i f e o f t h e trees and t h u s f u t u r e h a r v e s t s .
6. The c r e e s of most p e r e n n i a l o i l s e e d c r o p s remain p r o d u c t i v e f o r more t h a n 30 y e a r s ; some s u c h a s o l i v e trees havz a l i f e s p a n of up t o 60 yea r s . -
11 ~%ny a n n u a l o i l s e e d c r o p s a r e p r o ~ u c e d i n b o t h t h e S o r t h e r n and t h e - Sou the rn Hemispheres. T h e i r p r o d u c t i o n c y c l e s a r e r ough iy oppos i te - - t h e h a r y e s t t i m e i n t h e S - u t h e r n Hemisphere c o r r e s p o n d s t o t h e p l a n t i n g itme i l l t h e Nor thern Hemisphere. Thus p l a n t i n g d e c i s i o n s i n one hemisphere a r e a f f e c t e d by t h c ou tcone of t h e h a r v e s t i n t h e o t h e r .
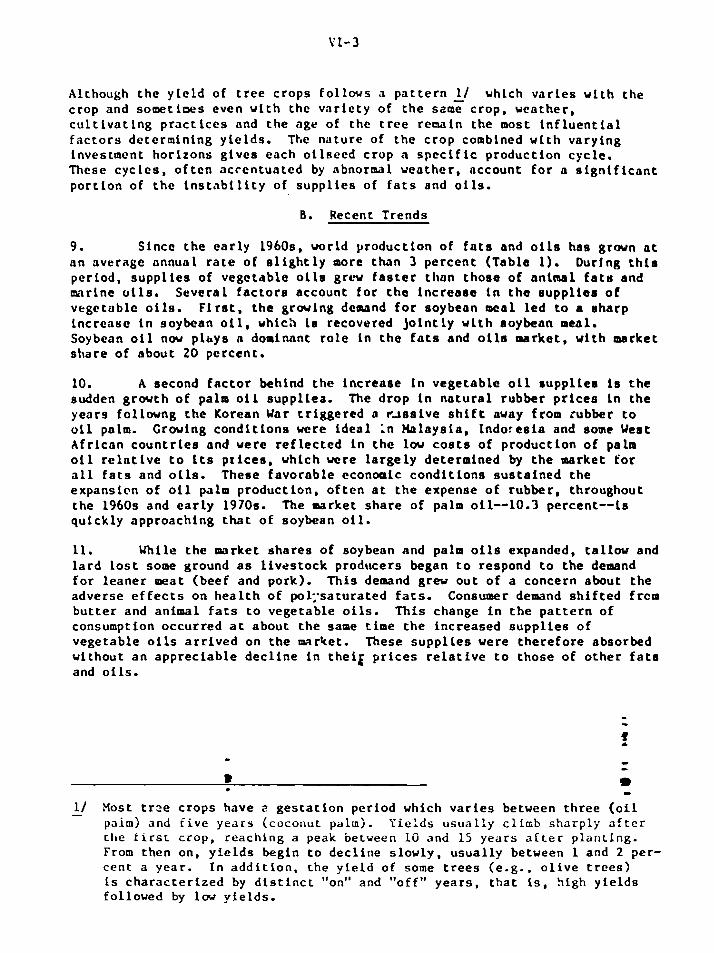
Although t h e y i e l d of t r e e c r o p s l o l l o v s a p a t t e r n _1! v h i c h v a r i e s v i t h t h e c r o p and s o m e t i c e s even v i t h t h e v a r i e t y of t h e same c r o p , wea the r , c u l t i v a t i n g p r a c t i c e s and t h e a g e of t h e t r e e r e a a i n t h e most i n f l u e n t i a l f a c t o r s d e t e r m i n i n g y i e l d s . The n a t u r e o f t h e c r o p combined v i t h v a r y i n g inves tment h o r i z o n s g i v e s e ach o i l s e e d c r o p a s p e c i f i c p r o d u c t i o n c y c l e . These c y c l e s , o f t c n a c c e n t u a t e d by abnormal w e a t h e r , a c c o u n t f o r a s i g n i f i c a n t p o r t i o n of t h e i n s t a b i l i t y of s u p p l i e s of f a t s and o i l s .
B. Recent T r e n d s
9. S i n c e t h e e a r l y 1960s. v o r l d p r o d u c t i o n o f f a t s and o i l s ha s g r w n a t a n a v e r a g e annua l r a t e o f s l i g h t l y more t h a n 3 p e r c e n t (Tab l e 1 ) . During t h l s p e r i o d , s u p p l i e s of v e g e t a b l e 011s g r c r f a s t e r t l ~ a n t h o s e of an ima l f a t e and marine o l l s . S e v e r a l f a c t o r s a ccoun t f o r t h e i n c r e a s e i n t h e e u p p l l e r o f v e g c t u b l e o l l s . F i r s t , t h e g r w i n g demand f o r soybean meal l e d t o a s h a r p i n c r e a s c i n soybean 011, which is recovered J o l n t l y v i t h soybean meal. Soybean o i l n w p l h y s n d o a i n n n t r o l e i n t h e f a t s and 011s marke t , v i t h market s h a r e of a b o u t 20 p e r c e n t .
10. A second f a c t o r beh ind t h e i n c r e a s e I n v e g e t a b l e o i l s u p p l i e r 1s t h e sudden g r w c h o f palm o i l s u p p l l e a . The d r o p i n n a t u r a l r ubbe r p r l c e s i n t h e y e a r s f o l l w n g t h e Korean Uar t r i g g e r e d R r ~ s s i v e s h i f t away from t u b b e r t o o i l pnlm. C rov ing c o n d i t i o n s w r e i d e a l i n X a l a y s i a , I n d o r e s i a and some West Af r l cnn c o u n t r i e s and were r e f l e c t e d i n t h e lov c o s t s o f p roduc t i on o f palm o i l r e l a t i v e t o I t s p r i c e s , which were l a r g e l y de t e rmined by t h e marke t f o r a l l f a t s and o i l s . These f a v o r n b l e c c o n w i c c o n d i t i o n s s u s t a i n e d t h e expans ion of o i l palm p r o d u c t i o n , o f t e n a t t h e expense o f r u b b e r , th roughout t h e 1960s and e a r l y 1970s. The market s h a r e of palm oil-10.3 percent-- is q u i c k l y app roach ing that o f soybean o i l .
11. mile t h e market s h a r e s o f soybean and palm o i l s expanded, t a l l w and l a r d l o s t some ground a s l i v e s t o c k p roduce r s began t o respond t o t h e demand f o r l e a n e r meat ( bee f and pork) . T h i s demand g r w o u t o f a conce rn abou t t h e a d v e r s e e f f e c t s o n h e a l t h o f po l ; - sa tura ted f a t s . Consuater demand s h i f t e d frcrn b u t t e r and an ima l f a t s t o v e g e t a b l e o i l s . T h i s change i n t h e p a t t e r n of consumption o c c u r r e d a t abou t t h e same t i m e t h e i n c r e a s e d s u p p l i e s o f v e g e t a b l e o i l s a r r i v e d on t h e m r k e t . These s u p p l i e s vere t h e r e f o r e absorbed w i thou t a n a p p r e c i a b l e d e c l i n e i n t h e i g p r i c e s r e l a t i v e t o t h o s e o f o t h e r f a t e and o i l s .
1/ Most t r z e c r o p s have 2 g e s t a t i o n p e r i o d which v a r i e s between t h r e e ( o i l - paim) and f i v e y e a r s (coconut palm). Y i e l d s u s u a l l y c l i m b s h a r p l y a f t e r c l ~ e f i r s t c r o p , r e a c h i n g a peak between 10 and 15 y e a r s a f t e r p l a n t i n g . From t h e n on , y i e l d s beg in t o d e c l i n e s l o w l y , u s u a l l y between 1 and 2 per - c e n t a y e a r . I n a d d i t i o n , t h e y i e l d of some trees (e.g.. o l i v e t r e e s ) is c h a r a c t e r i z e d by d i s t i n c t "on" and "o f f " y e a r s , t h a t is , h igh y i e l d s f o l l owed by lcu y i e l d s .

Table 1 : WORLD PRODUCTlON O F SELECTED PATS AND OILS (PAT OR OIL e Q U l V a , FlVE-YEAR A V w s
Product ion Crarth Rates - - - - - - - - - - - -. - - - - -
1961-65 196670 1971-75 1961651 1966-701 1 9 6 1 6 5 t # 000 m t X Shrrr '000 m t X Share msr- %-I= 1966-70 1971-75 1971-75
(in percent)
VEGETABLE OILS
From: O i l ~ e c d e Soybean Sunf lowor Cottonseed Groundnut Rapeseed
From: Tree Crops am t
Olive Ccconu t Palm Pclm Kernel
ANIMAL FATS 6 NAKINE OCLS
From: Fish Butter La rd Tallow
TOTAL FATS 6 OILS
- - - -
Source: USDA s t a t i s t i c s .

12. Fats and o i l s e n t e r the i n t e rna t i ona l markets in two forms-unpro- cessed (e.8, a s o i l s e e d s ) , o r processed ( i n t he form of o i l ) . 11 m e proport ions of o i l s eed t o -11 exports vary widely among f a t s aFd o i l s over time. They la rge ly r e f l e c t the r e l a t i v e p r o f i t a b i l i t y of o i l s eed process in^ ( o i l ex t r ac t i on ) i n producing and importing cotlnt r i e s . T rad i t i ona l l y , t he bulk of o i l s eeds traded i n t e r n t i o n a l l y is processed by the importing countr ies . Fur ther , s ince t he s t r u c t u r e of f r e i g h t r a t e s and t a r i f f s i n importing coun t r i e r fnvors t r ade i n o i l s e e d s and o i l s eed products, chey a r e traded more than f a t s and o i l s .
13 Crade i n f a t s , o i l s and high-protein meals mirrors t h e l r suppl ies . Since t he consumption of c e r t a i n f a t , o i l o r any o t h e r o i l r e ed product is highly s t a b l e i n -st producing count r ies , g r w i n g expor t s a r e usual ly r e l a t ed t o g r w i n g suppl ies . The l i n k batueea production and exports becomes s t ronger the smal ler t he share of d o v s t i c conswption. The production of palm o i l i n Southeast Asia I s l l l u s t r a t i v t : only a wll por t ion of t he palm o i l is consumed there , the bulk f l w i n g i n t o i n t e rna t i ona l markets.
14. Si.1ce the e a r l y 19600, t r ade i n f a t s and o i l s a s a group has gtovn f a s t e r than production (Table 2 and Chart 1). The corresponding average annual g r w t h r a t e s were 4.7 a-rd 3.4 percent. Thus consumers i n importing countries--lrainly t h e i ndus t t i a l i z ed count r ies - -nw have access t o a wider ra.ige of f a t s and o i l s than before.
15. Although most individual f a t s and o i l s followed t h i a t rend, exports of o i l 8 from perennial crops grew a t a s l i g h t l y lower r a t e than production (Table 3). h g r w i n g domestic demand f o r t he se o i l s (mainly l a u r i c o i l s i n Southeast Asia and palm o i l i n West Afr ica) has prevented a more rapid expansion of t h e i r trade.
16. The p r i c e s f o r f a t s and o i l s i n t he i n t e r a a t i o a a l merkets follow the general p r i c e l e v e l s f o r t h i s c d i t y group a s a whole (Charts 2 and 3). Deviations usual ly r e f l e c t a change i n t he ~ a r k e t shares of ind iv idua l f a t s o r o i l s . An increase i n t he ~ a r k e t share of an ind iv idua l f a t o r o i l i s o f t e n assoc ia ted with a dec l lne i n its pr ice r e l a t i v e t o t he general p r i c e l e v e l of t he commdjty graup. The main reason behindathis phenomenon is t h a t f a t s and o i l s a r e not pe r fec t subs t i t u t e s . Hany end-uses requ i re a s p e c i f i c product and o ther o i l s could be subs t i tu ted only a f t e r extensive ref ining. A l e s s e r denand f o r add i t i ona l q u a n t i t i e s of a c e r t a i n f a t o r o i l the re fore r e s u l t s In azdrop i n i t s r e l a t i v e pr ice . The same is a l s o t r u e with respect t o high- e o t e i n meala.
11 Some o i l s , such a s palm o i l , can be exported only i n processed form, - s ince the 011-bearing raw mate r ia l , the palm f r u i t , s p o i l s wi thin hours of harvest ing.

Chart 1 : WORLD PRODUCTION AND EXPORT OF FATS AND OILS (PERCENT)
e
PRODUCTION
1 eel 1970 1826
P A L M K I R H I L
EXPORTS
(Q7 O L M
' M U S O 4 b
I 4
OIL c o n w c o 1

Chan 2: PRICES AND EXPORT PRICE I N D E X ~ O F SELECTED FATS A N D OILS, 1OgO - 77 (US DOLLARS PER METRIC TON)
1.100- - 1 0
1.000 - BOC-
- z m-
YEARS
1/ Rku vwiqhttd by curnnt . a m .
s0UI-u: World Balk. Wac'd Bank- ' I W 1

am 3: PRICES AND EXPORT PRICE I N D E X ~ O F SELECTED FATS AND OILS, 1960 - 77 (CONSTANT ien us DOLLARS PER METRIC TON)

Table 2: WORLD TRADE OF FATS AND OILS A!j A PERCENTAGE OF PRODUCTION
VEGETABLE OILS
From: Oilseeds Soybean sunflower Cot tonreed Groundnut Raparaad
From: Tree Cropr Olive Coconut Palm Palm Kernel
A N W FATS 6 W I N E OILS
From: Firh Butter Ia r d Ta llw
TOTAL FATS 6 OILS
Source: USDA s t a t i s t i c s .

bl w 4
3 *. & w w 0.
f >
i a c( 0
a 0
2 & V
V)
2 0
9 V) z P 01 f-'
Y J 01 V)
(s 0
2 I-'
a
f .. m a! d 0 10 F'

11. STRUCTURE OF THE WDEL FOR THE FATS ASD OILS ECONOMY
17. The main o b J e c t i v e of t h e model i s t o c a p t u r e long-term changes i n t h e marke ts f o r f a t s and o i l s and h igh -p ro t e in meals . While many of t h e complex r e l a t i o n s h i p s t h a t c h a r a c t e r i z e t h e s e marke t s have been s i m p l i f i e d t o keep :he model manageable, t h e e s s e n t i a l f e a t u r e 3 o f t h e i n t e r r e l a t i o n s h i p s between t h e marke t s f o r t h e v a r i o u s o i l s e e d s and t h e i r p roduc t s have been i nco rpo ra t ed .
18. Thc model d e s c r i b e s t h e behavior of t h e t h r e e major marke t s o f t h e o i l s e e d complex: f a t s and o i l s , h lgh -p ro t e in mea l s and o i l s e e d s . Although t h e marke ts f o r f a t s snd o i l s and f o r h igh -p ro t e in meals respond t o d i f f e r e n t economic f o r c e s , t h e i r b a s i c s t r u c t u r e is s i m i l a r . For example, b o t h a r e c h a r a c t e r i z e d by a l a r g e number of p roduc t s t h a t c a n e a s i l y be i n t e r changed . Hence, t h e s t r u c t u r e of t h e models f o r t h e two mr l : e t s is i d e n t i c a l .
19. Each model c o n s i s t s o f t h r e e b locks o r sc.'.s of equa t i ons : a demand b lock w l t h d c m n d e q u a t i o n s f o r e i g h t r e g i o n s , 3 a supp ly b lock which c o n t a i n s supp ly e q u a t i o n s f o r e a c h of t h e o i l s o r h igh -p ro t e in meals , and f i n a l l y a t r a d e b lock which c o n s i s t s o f e x p o r t s u p p l y e q u a t i o n s f o r t h e s e c o m o d i t i e s and co r r e spond ing ( p r i c e - d e p e n d e n t ) impor t demand e q u a t i o n s (Cha r t 4). The e q u a t i o n s of t h e t r a d e b lock de t e rmine j o i n t l y t h e volume of e x p o r t s and t h e p r i c e s f o r i n d i v i d u a l o!ls o r h igh -p ro t e in meals. A s t o c k supply e q u a t i o n d e t e r m i n e s t h e l e v e l o f s t o c k s a t t h e end of t h e y e a r on t h e b a s i s o f opening s t o c k s and t h e gap between t o t a l demand and s u p p l i e s , t h i s e q u a t i o n c l o s e s t h e model. The r a t i o n a l e f o r i n c l u d i n g s t o c k v a r i a b l e s i n t h e model was mainly t o e s t a b l i s h a l i n k between t h e m a r k e t s f o r f a t s and o i l s and t h e one f o r h igh -p ro t e in meals.
20. The s u p p l i e s of o i l s and h igh -p ro t e i c mea l s a r e d e r i v e d d i r e c t l y from t h e supp ly of co r r e spond ing o i l s e e d s . I t is i m p l i c i t l y assumed t h a t a l l o f t h e h a r v e s t o f e a c h o i l s e e d is p roces sed i n t o o i l and meal.
21. Both FA0 and USDA d a t a were used t o e s t i m a t e t h e b e h a v i o r a l e q u a t i o n s o f t h e model. The l a c k of pub l i shed d a t a or? s t o c k s and consumption f o r bo th
L I
- 11 Although t h e r e a r e s e v e r a l e conome t r i c models f o r i n d i v i d u a l f # t s , o i l s -
o r h i g h - p r o t e i n meals , o n l y a few have a t t e m p t e d t o i n c l u d e t h e marke ts f o r a l l mJo r f a t s and o i l s s imu l t aneous ly . The major p u b l i s h s d s t u d i e s on chese mode l l i ng e f f o r t s i n c l u d e R.O. Vandenborre, Economic e l y s i s of ~ e l a t i d h s h i ~ s i n t h e I n t e r n a t i o n a l Vege t ab l e O i l and Meal S w t o r , U n i v e r s i t y of I l l i ~ o i s , Department o f Agricultural Economics Research Report 106 (Champaign, 111.: July 1870); a n d F.G. Adnms, An I n t e r r e l a t e d Econometric Modeling System f o r F a t s and O i l s Commodities, U n i v e r s i t y o f Pennsy lvan i a , The Wharton Schoo l , Department of Economics. Economics Department D i scus s ion Paper No. 3 2 7 - ( ~ h i l a d e l ~ h i a , PA.: ~ c t o b e r 1975).
21 I n d u s t r i a l i z e d c o u n t r i e s , c e n t r a l l y planned economies, L a t i n Ane r i ca , - North A f r i c a , West A f r i c a , East A f r i c a , Sou th As ia and t h e E a s t Asia and P a c i f i c .

Chut 4: STRUCTURE OF THE OILSEED ECONOMY
World Bank-22887

f a t s and o i l s and high-protein s e a l s made i t necessary t o es t imate these da ta . The following approach was taken. F i r s t , d a t a on s tocks were e s t i a a t e d on t h e b a s i s of a p - s t u l a t e d r e l a t i o n s h i p between s t o c k s , p r i c e s and t o t a l demand and some information on s t o c k s vhich was a v ~ i l a b l e f o r a f e u s e l e c t e d years. Implied t o t a l conswmption was computed from t h e es t imated s tock da ta and t h e information on groduction. The regional breakdov.l was obcained by a l l o c a t i n g t h e es t imated t o t a l consuaption t o t h e var ious regfans on the bas i s of es t imated t h e o r e t i c a l disappearance of o i l s and high-protein meals. FA0 assumptions about o i l ( w a l l y i e l d s and the s h a r e s of t h e t o t a l o i l s e e d crop processed f o r o i l e x t r a c t i o n i n each country were used t o compute t h e t h e o r e t i c a l dirappearance of o i l s and m a l r .
A. Supply t q u a t i o n r
22. The supply block of t h e aodal con tc ins supply equat ions f o r e i g h t o i l s e e d s , s i x f a t s or o i l s and f i r h e a l . FA0 s t a t i s t i c s ve re used t o es t imate t h e parameters f o r these equations. The fol lawing b a s i c Nerlovian supply adjustment model was chosen f o r tha a n a l y s i s of t h e behavior of t h e supply of o i lseeds:
vhe re :
Q O S ~ = w r l d production of o i l s e e d ( i )
P O S ~ = p r i c e of o i l s e e d ( i )
2 - set of supply n h i f t e r s
k - time lag.
23. ' f r ad i t iona l ly , t h i s model is used t o cap ture t h e year-to-year fluctuations i n t h e acreage of a g r i c u l t u r a l crops. Together wi th a n equat ion t h a t desc r ibes t h e y i e l d behavior of these crops, i t is then poss ib le t o exp la in changes i n crop production.
24. This agproach requ i res t h e es t imat foc of two behavioral equations. Crop y i e l d s l a rge ly r e f l e c t vea the r condi t ions dur ing t h e growing period. For small regions i t is usual ly poss ib le t o o b t a i n a c c u r a t e d a t a on r a i n f a l l and o t h e r weather p a t t e r n s . The usefulness of these data-as wel l a s of those on average yields--for a n a l y t i c a l purposes d e c l i n e s a s the s i z e of the region ' inc reases . It would be extremely d i f f i c u l t t o cons t ruc t a meaningful r e l a t i o n s h i p between average y i e l d s and the va r ious weather v a r i a b l e s a t a - a o r l d l eve l . Production, ins tead of acreage, was t h e r e f o r e chosen a s the , ?ependent var iable . . 2 5 . Although t h i s approach s i g n i f i c a n t l y reduced t h e required number of behavioral equat ions i n the models, i t d id not a l l e v i a t e the econometric problems a s s o c i a t e d wi th cap tur ing t h e response of producers i n many d i f f e r e n t

c o u n t r i e s t o a s e t of i n t e r n a t i o n a l market p r i c e s i n a s i n g l e equation. 1/ Further a n a l y s i s w i l l be necessary t o e a t i m t e r e g i o n a l supply equations-based on producer pr ices .
26. Considering these l i m i t a t i o n s , i t is not s u r p r i s i n g t h a t f w es t imat ions y ie lded a supply response t o p r i c e s t h a t uar s t a t i s t i c a l l y s i g n i f i c i a n t . Crops produced e i t h e r i n a small number of c o u n t r i e s o r u i n l y f o r expor t s appear t o respond more s t r o n g l y t o p r i c e s a s coppared wi th o t h e r crops. The s t a t i s t i c a l s t r e n g t h of t h e e s t i a r t e d coef f i c i e n t s is indicated through t h e t-values presented b e l w t h e e s t i a r t e d c o e f f i c i e n t s .
Vegetable O i l s from Oilseeds
27. Soybeans. Soybeanr ,re a s u b t r o p i c a l crop. They g r w beat i n a humid c l imate wi th plenty of r a i n dur ing t h e g r w i n g rearon, uhere r r d ry weather dur ing t h e r ipening period f a c i l i t a t e s t h e ha rver t . E i t h e r drought o r excass ive mois ture dur ing germlaation w i l l , however, lower y i e l d r . The c u l t i v a t i o n oC roybeans reacher f r o a t h e t rop ic8 aad t e l p e r a t e toner up t o a l a t i t u d e of more than 50 degreer. 2/ Soybeanr belong t o t h e f d l y of legume8 which can use n i t rogen i n t h e a t m o ~ p h e r e d i r e c t l y , reducing the dearnd f o r n i t r o g e n f e r t i l i z e r . A/ 28 . Soybean production i r coacent-aced i n t h t e c countr ier : t h e United S t a t e r , China and Brazi l . Together, they supply more than 90 percent of t h e
1/ In its s t a t i s t i c a l e s t imat ion form, t h e model can be w r i t t e a a s follows: -
I n t h i s f o r u l a t i o n the model r e p r e s e n t s a long-run supply re la t ionsh ip . Short-term (eSR) and long-term (el,) e l a s t i c i t i e s can be computed a s f o l lous:
*
- - 21 Dif f e r e n t g r w i n g condit id& ( c l i m t e , s o i l s , day length , etc. ) requ i re -
d i f f e r e n t v a r i e t i e s of s o y e n s . - 3/ Soybeans w i l l produce theif own ni t rogen only i f they a r e e i t h e r properly -
inocula ted wi th nodule b a c t e r i a a t t h e t i m e of p lan t ing o r i f the s o i l con ta ins these bac te r ia . Usually these b a c t e r i a u i l l l i v e f o r severa l years i n t h e s o i l . The f a c t t h a t soybeans enr ich t h e s o i l w i t h n i t rogen, along with t h e i r s h o r t g r w i n g period, makes them an i d e a l in tercrop. Thr: length o f t h e g r w i n g per iod depends, however, on t h e v a r i e t y of soybean and ranges from 75 days f o r e a r l y maturing v a r i e t i e s t o more than 200 d a y s f o r l a t e maturing ones.

wor1 .d '~ soybean needs. However, on ly t h e Uni ted S t a t e s r 1 B r a z i l can be r ega rded a s major e x p o r t e r s , is China 's p r o d u c t i o n goes t o domes t i c needs.
29. S i n c e t h e e a r l y 19609, soybean p r o d u c t i o n h a s g r w n a t an ave rage r a t e of abou t 6 p e r c e n t a yea r (Tab l e 6). M e t o f t h i s expans ion has t aken p l a c e i n t h e Uni ted S t a t e s and , more r e c e n t l y , In B r a z i l . The growing demand f o r l i v e s t o c k p roduc t s is a s s o c t a t e d w i t h t h c i n c r e a s e i n p e r c a p i t a incorw a f t e r World War 11 and t h e s h i f t t o more e f f i c i e n t l i v e s t o c k production-such 3s b r o i l e r f a c t o r i e s and f e e d l o t s - w i t h t h e i r demand f o r commercial ly manufactured an imal f eeds .
33. I n t h e f o l l o v i n g upp ply e q u a t i o n f o r soybeans , l agged soybean p r i c e s emerged a s a e t a t i e t i c a l l y s i g n i f i c a n t e x p l a n a t o r y v a r i a b l e .
Soybean Supply: 1961-77
Ft2 - 0.97
where:
SOYS - w r l d p roduc t ion o f soybeans ( '000 a t )
SOYP = p r i c e s f o r soybeans , US, 44 p e r c e n t , d e f l a t e d by t h e Index of I n t e r n a t o n a l I n f l a t i o n , CIP Rotterdam (1974 c o n s t a n t s/at
D75 - dummy v a r i a b l e set t o 1 f o r 1975
D76 = dummy v a r i a b l e set t o 1 f o r 1976
31. The p r i c e of soybeans (SOYP) l agged by one y e a r was a s t r o n g e x p l a n a t o r y v a r i a b l e o f world soybean p roduc t ion . Lts c o e f f i c i e n t is s t a t i s t i c a l l y s i g n i f i s a n t a t t h e 5 pe rcen t l e v e l . The i a p l i e d p r i c e , e l a s t i c i t y measured a t t h e mean was 0.28; t h e c o r r e s p o n d i n g long-run e l a s t i c i t y was 2.75. These e l a s t i c i t i e s a r e w i t h i n t h e range of t h o s e e s t i m a t e d by Houck, et . a l . 1/ f o r t h e Uni ted S t a t e s . Eqlratton (2.10) f i t s t h e g e n e r a l s t r u c t c l r e of ~ e r i o v e ' s a d a p t i v e e x p e c t a t i o n s ~ m o d e l . The c o e f f i c i e n t a s s o c i a t e d w i t h lagged soybean p r o d u c t i o n (StYS) - 2/ i n d i c a t e s ,
1/ James F. Houck, Hary E. Ryan and Abraham Subo tn ik , Soybeans and T h e i r - - Products : ?brkets , Hodels and Po l i cy ( H i n n e a p o l i s , Kinn.: U n i v e r s i t y of Yinneso ta P r e s s , 1972) , p. 97.
2/ T h i s v a r i a b l e prbvided t h e bulk of t h e e x p l a n a t o r y p w e r i n a lmos t a i l t h e - e s t i m a t e d s u p p l y e q u a t i o n s .

Tab le 4: SOYBEAN PRODUCTION I N KAJOR PRODUCING COUNTRIES, FIVE-YEAR -- ~ . ~ ~ R A C E S AND ~,~EMS AKNUAL CROVTH ures
Production Growth Ratea 1961-65 1966-70 1971-75 1961-651 1966-70/ 1961-65f
--- ('000 mt)- ------- (pe rcen t )--
Korea, D.P. Rep. IF3 226 24: 4.3 1.8 3.0 Korea, Rep. 163 2 14 266 5.6 4.5 5 .O H C ~ ~ C O 50 200 4 53 32.0 17.6 24.6 Roaania 3 SO 24 5 75.5 37 .4 55 - 3 'I S 19,60C 28,697 36,632 7.9 5 .O 6.5 USSR 394 537 435 6.4 -4.1 1 .o
Ocher Coun t r i e s 453 460 832 0.3 12.6 6.3
- - -
Source: FA0 d a t a .
the:ofore, t h e r a t e a t vh lcn sdybeas producers a d y r s t t o t h e d e s i r e d l e v e l of wltpue (g iven t h e i r p r i c e expec ta t i ans ) . I n equa t ion (1.1). t h e r a t e of 2dfustment is & h u t 10 pe rcen t a year.
32. In China, Japan end o t h e r Asian countries, i l a r g e p o r t i o n of t h e soybean h a r v e s t is con3tmed d i r e c t l y ee a food crop-ei ther green, d r y c r sprouted , whole o r a p l i t . Green seeds a r e used a s a vege tab le ; r o a s t e d and s.?lted i e e d s a r e 1:sed t n cakes and candies. Other food u s e s inc lude soybean f l o u r and soybean milk. The f l q r is e x t r a c t e d f ram whole beans o r t h e soybean cake t h a t r a a a i n s a f t e r t h e o i l has been removed; i t is a va luab le source o f p ro tebe and is t h e r e f o r e f r e q u e n t l y added t o p r o t e i n - d e f i c i e n t f l o u t rom c e r e a l g r a i n s - Soj-Szan milk is prepared f r o s whole beans, which have a p r o t e i n conpcsr-ion s i m i l a r LG case in .
33. Soybean O i l - .rnd Heal. The bulk o t t h e world's soybean production r e processeJ i n t o soybe& : o i l and soybean meal. Host e x ~ r a c t i o n yrocesnes use e i t h e r chemical so lve ; ts (e.g., herane) o r mechanical dev ices such a s expellers, scre;r press23 o r hydrau l i c p r c s s e s t o e x t r a c t t h e o i l conta ined i n t h e c e l l s of t h e soybean i n t h e form of d r o p l e t s <soybeans c o n t a i n between 1 3 d:ld 20 pe rcen t o i 1) . To f a c i l i t a t s t h e e x t r a c t i o n of t h e o i l , t h e soyber .J

a r e f l r s t c l eaned and t h e n c racked , hea t ed and f l a k e d . The f l a k i n g a l l o w s many more o i l - b e a r i n g c e l l s t o be exposed t o t h e chemica l s o l v e n t , when t h i s p r o c e s s is used. E x t r a c t i o n by s o l v e n t y i e l d s two products : m i s c e l l a and d e f a t t e d f l a k e s . To o b t a i n c r u d e soybean 01 1, t h e m i s c e l l a 1 s . f i l t e r e d and t h e chemica l s o l v e n t removed. Hechanica l soybean e x t r a c t i o n y i e l d a c rude soybean o i l and soybean cake . 11 D e f a t t e d f l a k e s and soybean cake a r e f u r t h e r proceesed i n t o t h e p r o t e i n f l a z e s and meal used i n t h e p r e p a r a t i o n of an imal f eeds .
34. I n t h e model, i t is s s s u a e d t h a t a l l soybeans a r e conve r t ed i n t o aoybeon o i l a t a n a v e r a g e e x t r a c t i o n r a t e of 17.5 pe rcen t . The hulk of t h e soybcon o i l ( u e u a l l y p a r t i a l l y hydrogena ted) is used f o r e d i b l e purposes , mainly i n t h e p r e p a r a t i o n of margar ine and s h o r t e n i n g , bu t a l s o a s l i q u i d cooking o i l and s a l a d o i l . 31 Soybean o i l i r r a r e l y used i n f r y i n g s i n c e t h a t produces f i s h y odo r s . The s o t i r t r u e f o r s t o r e d food p r o i u c t s which have bcen f r i e d i n soybean o i l . P a i n t r , v a r n i s h e a , s o a p s and l u b r i c a n t s a r e t h e main i n d u s t r i a l u s e r f o r roybean o i l .
35. Soybean meal is 48 pe rcen t p r o t e i n , w i t h a h i g h l y ba lanced a r l n o a c i d compos i t ion . T h e r e f o r e i t i r used i n t h e p r e p a r a t i o n o f f e e d s f o r a l l l i v e s t o c k .
36. T rade i n Soybean Products . Soybean o i l and meal e n t e r t h e i n t e r r i a t i m a 1 m r k e t s e i t h e r i n processed form, a s i n d i v i d u a l p r o d u c t s , o r unprocessed , i n t h e form o f whole beans. The bu lk o f soybean o i l e x p o r t s e n t e r s t h e i n t e r n a t i o n a l marke t s i n t h e form o f unp roces sed beans , mainly because impor t i ng c o u n t r i e s p r o t e c t t h e i r o i l s e e d processing i n d u s t r y th rough t a r i f f 8 o n impor t s o f v e g e t a b l e c i l s . U s u a l l y , o i l s e e d s c a n be imported du ty- frt!e. S i n c e t h e domes t i c demand f o r o i l s aud meals r a r e l y co r r e sponds t o t h e r a t i o of o i l a n d meal e x t r a c t e d from i n p o r t e d soybeans , many o f t h e s e c o u n t r i e s have become e x p o r t e r s o f e i t h e r soybean meal o r o i l . I n d u s t r i a l i z e d c o u n t r i e s import t h e b u l k of t h e w r l d ' s s u p p l i e s of soybeans and medl, w h i l e deve lop ing c o u n t r i e s import mainly soybean o i l (Table 5) .
37 . .'he volume a f t r a d e i n f a t s , o i l s and h igh -p ro t e in meals is de te rmined s imu l t aneous ly th rough t h e i n t e r a c t i o n of e x p o r t supp ly e q u a t i o n s and price-depnndent i m p o r t demand equa t ions . The f o l l o w i n g e q u a t i o n s sunmar i t e t h e e s t i m a t e d e x p o r t supp ly r e l a t i o n s h i p s f o r f a t s and o i l s .
- 11 Soybean cake , t h e r e a i d , ~ e of a mechanica l p r o c e s s f o r e x t r a c t ng o i l , -
u s u a l l y c o n t a i n s between i O and 12 p e r c e n t soybeac o i l . A s o 1 v e n t is used t o remove t h e remain ing o i l . For t5e p r o c e s s i n g of a small q u a n t i t y o f o l l s e e d s , a s o l v e n t c x t r . l c t i o n f a c i 1 L t y i s u s u a i l y too e x p e n s i v e . ic combina t ion of r n c h a n i c a l and s o l v e n t e x t r a c t i o n Is i n t h i s case more cos t -e f f l ~ i c n t .
2 1 Soybean o i l vas h a r d l y known be fo re Vcr ld h'ar 11. S ince t hen , t h e s h a r e - of soybean o i l i n t h e i n t e r r 3 c i o n a l marke t s f o r f a t s and o i l s h a s expanded t o a lmos t 30 pe rcen t .
3 1 Soybean o i l h a s t o be hydrogenated. Unhydrogenated soybean o i l t ends t o - deve lop u. ' ? a s a n t f i s b y o r g r a s s y f l a v o r s .

VI- 18

Soybean O i l Expor t s : 1961-77
ft2 = 0.94 S.E.E. - 0.113 D.W. - 1.90
where:
SOYFOX - world e x p o r t s of soybean o i l and soybeans- -o i l e q u i v a l e n t
SOYFOS - world p roduc t ion of soybean o i l ( '000 mt)
Dbl - d w y v a r i a b l e set t o 1 f o r 1961
D71 - dummy v a r i a b l e set t o 1 f o r 1971
SOYFOP = p r i c e s f o r soybeans, US, 44 p e r c e n t , d e f l a t e d by t h e Irrdex o f I n t e r n a t i o n a l I n f l a t i o n , CIF Rotterdam (1974 c o n s t a n t $/mt 1.
Soybean Hea 1 Expor t s : 1961-77
R~ = 0.97 S.E.E. = 0.097 D.W. = 1.41
where:
SOYWLX = world e x p o r t s o f soybean meal and soybeans--?peal r e q u i v a l e n t ('000 m t )
SOYHLS = world p roduc t ion of soybean meal ('000 mt) -
S O W = p r i c e f o r soybean o i l (1974 c o n s t p t $ / c a t ) 6
Sunf 1 ower Seeds - - - 3.. Although s u n f l o u e r s can b~ g r m i n a wide r&e of climates--from the t r o p i c s up t o a l a t i t u d e of 53 degrees--the b u l k of p roduc t ion i s c o n c e n t r a t e d i n c o u n t r i e s u i c h t e a p e r a t e climces. Sunflower p roduc t ion i s h i g h l y s e n s i t i v e t o r a i n f a l l . An i n c r e a s e i n r a i n f a l l , p a r t i c u l a r l y i f t h e r a i n f a l l is spaced evenly ove r t h e growing s e a s o n , r e s u l t s i n h i g h e r y i e l d s , a s l o n g a s t h e r c i s a d r y p e r i o d d u r i n g t h e l a t e r s t a g e s of r i pen ing .

Neverthelerr , a l a r g e share of the world'r s u n f l w t r c rop i s produced i n regionr vhara r a x n f a l l i r l e r r than 500 mm. i/ 39. Tha g r w i n g rearon of tha r u n f l w e r ranger from 70 day8 (under favorable cond i t ionr ) t o f o u r monthr f o r a a r l y mrtur ing dvrrf v a r i s t i e r . Tha bulk of t h e c rop 18 n w harver ted mschanically. A ruiall portion--mainly t h a t produced undar t r a d i t i o n a l farming condit ionr-ir r t i l l harver ted by hand; farmerr c u t t h e f l w s r r , dry them and then rub t h a reedr ou t of the f lovar r .
40 . Tha USSR i r tha l a r g e r t producer of runf lover r e e d r , accounting, on the rva r rga , f o r about 60 percent of world production. Tha combinad output of t h e USSR and o ther c e n t r a l l y planned economier r a i r e r t h i r rha ra t o about 75 percent (Tabla 6) . Although t h i r f i g u r e ha8 dacl inad r l i g h t l y during tha pas t two decader, 2 1 w r l d production r t i l l l r r g a l y r e f l e c t r f l u c t u a t i o n r i n the USSR'r harvarF. I h a f l u c t u a t i o n r a r a p r i o r r i l y c ru rad by weather condi t ionr , which vary brcaura of t h a Soviet Union'r gaographical locat ion. Thir auy exp la in why i t war not p o r r i b l a t o a r t l a a t e a r t a t i r t i c a l l y r i g n i f f c a n t r e l a t i o n r h i p batsman production and i n t a r n a t i o ~ l market p r i c e r f o r t h e eunf l w e r read.
41 . The f o l l w i n g r a l a t i o n r h i p i s ured i n t h e modal t o p r o j e c t runf lover production.
S u n f l w e r Seadr Supply: 1961-77
(1.2) SUNS, = 2232.54 + 0.7298 SUNSt,l + 0.7502 SUNPt-l (8.41) (0.33)
where :
SUNS = world production of eunflower seeds ('000 m t )
SUNP = p r i c e f o r sunflower eeede, def1a:ed by t h e Index of In te r - n a t i o n a l I n f l a t i o a (1974 cons tan t $/rat)
D63646675 = dummy v a r i a b l e set t o 1 f o r t h e years: 1963, 1964, 1966 and - - 1975 ' 9
6
D6574 = dummy v a r i a b l e s e t t o one f o r t h e years: 1965 and 1974
1/ h a r f v a r i e t i e s p roduce reasonable y i e l d s v i t h l e s s t h a n 250 mm of rain- - f a l l a year.
2 / Th-.s dec l ine was l a rge ly caused by the expansion of sunflower production - i n the United S t a t e s , A u s t r a l i a , Spain and Turkey. In 1975 the combined snare c f these coun t r i es reached 16.2 percent.

Table 6: SUNFLOWER SEED PRODUCTION I N W O R PRODUCING COUNTRIES, FIVE-YEAR AVERAGES AND AVERAGE MWAL C R O W RATES ' -
Production Growth Rates -5 1966-70 1971-75 1961-651 1966-70/ 1961-65/
1966-70 1971-75 1971-75
A r ~ e n t i n a 625 972 84 8 9.2 -2.7 3.1 Austral ia 2 6 10 1 24.6 75.9 48.0 Bulgaria 338 462 438 6.5 -1.1 2.6 China, People'e Rep. 65 69 7 0 1.2 0.3 0.7 H u n ~ rY 115 100 143 -2.8 7.4 2.2
Romania 504 7 28 760 7.6 0.9 4.2 South Mr icv 9 1 94 196 0.7 15 -8 8 .O Spain 5 59 277 63.8 36.3 49.4 Turkey 114 269 499 18.7 13.2 15.9 US 20 77 360 31.0 36.1 33.5
USSR 5,068 6,389 5,976 4.7 -1.3 1.7 Yugoslavia 20 7 299 326 7.6 1.7 4.7
Other Count r i c e 193 242 391 4.6 10.1 7.3
WORLD T O T U 7,347 9,766 10,385 - 5.9 - 1.2 - 3.5
Source: PA0 s t a t i s t i c s .

42. Trade i n Sunflower O i l and Heal. Sunflower seeds contain more than 40 percent L/ of a highly polyunsaturated vegetable o i l . 2_/ A l c rge por t ion of the production of c c n f l w e r o i l is there fore consumed a s t a b l e o r cooking o i l . The rest is used i n the manufacture of l i q u i d o i l , margarines and short;r,:?g. Lw-qual i ty s u n f l w e r o i l is bought f o r the production of soaps, pa in t s and varnishes. Sunflower cake i s used p r i nc ipa l l y a s a high-protein supplement i n l ives tock feeds , with a small quan t i ty going to nitrogeneoua f e r t i l i z e r s . Sunflower seeds a r e a l s o consumed d i r e c t l y , usua l ly a f t e r they have been roasted and sa l t ed . Considerable q u a n t i t i e s of seed a r e a l s o fed to poultry.
43. The f o l l w i n g two equationa were used i n the model t o descr ibe the behavior of sunflower o i l and meal exports:
Sunflower O i 1 Exports: 1961-77
D.U. - 1.96
SUNFOX = world exports of s u n f l w e r 01 1 and sunf l w e r seed-- 01 1 equivalent ( '000 mt)
SUNFOS = world production of s u n f l w e r o i l ('000 mt)
D676869 = dummy va r i ab l e s e t t o 1 f o r the years: 1967,.1968 and 1969
D6574 = dummy va r i ab l e s e t t o 1 f o r t h e pears: 1965 and 1974
SUNFOP = p r i c e of sunflower seed o i l , d e f l a t ed by t h e Index of I n t e rna t i ona l Ic f l a t i o n (1974 constant $/mt).
1/ Older v a r i e t i e g c o n t a i n only about 25 percent o i l . - !B
2/ Sunflower o i l c k t a i n s about 85 percent unsaturated f a t t y a c id s and 15 - percent f a t t y acids. Its f a t t y acid composition r e l a t e s l a rge ly t o growing condi t ions; i t is t h e r a t i o of l i n o l e i c t o o l e i c f a t t y a c id s , r a t h e r than the t o t a l content of unsaturated f a t t y a c id s , which var ies . Sunflower o i l ex t rac ted from seeds grown i n temperate climates contain 60 percent l i n o l e i c acid . This percentage drops t o about 20 percent i n t r op i ca l climates.

Cottonseeds
44. Cotton is grown i n a l a rge number of count r ies . The l a rge s t producers a r e the United S t a t e s , the USSR and China, followed by India , Pakistan and Braz i l (Table 7). Although the a v a i l a b i l i t y of syn the t ic f i b e r s has reduced the importance of cot ton a s the main raw mater ia l i n the production of t e x t i l e s , most producing count r ies have ~ o l i c i e s vhich sh i e ld t h e i r domestic cot ton production from the vagar ies of i n t e rna t i ona l markets.
45. The cot ton plant is grown primarily f o r i ts f i be r ; cottonseeds a r e e s s e n t i a l l y a byproduct. During the ginning operat ion, the long f i b e r s ( s t ap l e o r l i n t co t ton) a r e removed, while t he sho r t f i b e r s ( l i n t e r s ) remain a t tached t o the cottonseeds. Commercial seed co t t on c o n s i s t s of about 10-15 percent l i n t e r s , 35-40 percent h u l l s and 50-55 percent kernele. Cottonseed y i e ld s vary depending on c l i m t i c and s o i l condi t ione, a s well a s on c u l t i v a t i o n methods. Egypt's high-yield v a r i e t l e a produce on the average 1.3 tons per hec ta re on i r r i g a t e d land. I n India , where t he bulk oE the cot ton acreage i e planted with i n f e r i o r v a r i e t i e s , y i e ld s average 288 kg per hectare. In the United S t a t e s , y i e ld s f l u c t u a t e around 1.0 ton per hectare.
46. The following supply equation was es t imated f o r cottonseeds.
Cot tonseeds Supply: 1961-77
R~ - 0.90
where:
S.E.E. = 637.2 D.W. - 1.15
COTS = world production of cottonseeds ('000 mt)
COTP = p r i ce f o r cottonseeds, de f l a t ed by the Index of In te r - na t i ona l I n f l a t i o n (1974 cons tan t $/mt)
1
TIHE = time trend.

Table 7 : COTTONSEED PRODUCTION I N W O R PRODUCING COUNTRIES, FIVE-YEAR AVEWES AND AVERAGE ANNUAL GROWTH RATES
Country Production C r w t h Rater
1961-65 1966-70 1971-75 1961-631 1966-701 1961-651'
Braz i l China E W P ~ India I r a n
nexico Pakistan Sudan Turkey US
USSR 3,292 3,984 4,981
Other Countries 2,494 2,834 3,209
WORLD TOTAL
Source: FA0 s t a t i s t i c s .
To o b t a i n cottonseed production, i t was assumed t h a t a supply of seed co t ton vould y i e l d a n average of 60 percent cottonseeds.
47. Trade i n Cottonseed O i l and Cake. Cuunercial u s e of cottonseed depends l a r g e l y on s u i t a b l e crushing capaci ty and inexpensive t r a n s p o r t from ttie g inner ies . The o i l content of cottonseeds is l o w . 11 I f f r e i g h t r a t e s a r e high, t h e p r o f i t a b i l i t y of e x t r a c t i n g o i l i s reducex.
48. Crude cottonseed o i l has a s t r o n g c h a r a c t e r i s t i c f l a v o r and a dark, reddish-brown color. The q u a l i t y of t h e o i l and i n p a r t i c u l a r its f r e e f a t t y ac id content depend l a r g e l y on weather condi t ions a f t e r t h e c o t t o n has matured, and hence on loca t ion . -Dry weather tends t o improve t h e q u a l i t y of the crude o i l ; excessive r a i n f a 4 (o r s to rage of seeds with a high moisture co->tent) w i l l lower it. .
It' The whole seed conta ins 15-24 percent o i l , t h e ke rne l about 30-38 percent. -

49. Cottonseed o i l con ta ins a l a rge por t ion of s a tu r a t ed f a t t y acids. &cause of t h a t , t h e o i l s o l i d i f i e s p a r t i a l l y a t temperatures below 50°to 60' P. Almost a l l cottonseed o i l i s used i n s a l ad and cooking o i l , shortenings and margarine. A small por t ion i s w e d f o r packaging f i s h and cured meat.
50. Cottonseed cake (an wel l a s t he whole seed) is fed pr imari ly t o c a t t l e . It con ta ins a t ox i c substance, gossypol, of which a content of 1-2 percent is t ox i c t o small an iPa l s such a s hogs and chicken. The h u l l s recovered i n cottonseed mi l l i ng a r e used a s roughage f o r l i ve s tock feed.
51. The following equat ions were used i n t h e model t o descr ibe t rade i n cottonseed o i l and meal exports .
Cottonseed O i l Exports: 1961-77
R~ - 0.86 S.E.E. - 0.083 D.W. - '.GO
where:
COTFOX - world exports of cottonseed o i l and c o t t o n s e e d s - o i l equivalent
COTFOS - world production of cottonseed o i l ('000 m t )
D666768 - dummy va r i ab l e s e t t o 1 f o r t h e years: 1966, 1967 and 1968
D6465 = dummy va r i ab l e s e t t o 1 f o r t he years: 1964 and 1965
COTFOP - p r i ce of cottonseed o i l , d e f l a t e d by t h e Index of , I n t e rna t i ona l I n f l a t i o n (1974 constant $/mt)
Cottonseed )leal Exports: 1961-77
(1.3.2) I n COTHLXt = -0.2183 + 1.1542 I n COTHLSt - I n COTWLSt-l (4.56) (1.18)
R = 0.80 S.E.E. = 0.072 D.U. = 2.21
wher r :
C O R a X = world exports of cottonseed meal and cot tonseeds-meal equivalent ('000 m t )
COTMLS world production of cottonseed meal ('000 m t )

D7374 = dwrimy v a r i a b l e s e t t o 1 f o r the years: 1973 and 1974
COTHLP = p r i c e f o r cottonseed meal (1974 cons tan t $/mt).
Groundnuts
52. The production of groundnuts is concentra ted i n t h r e e : l i a a t i c regions: humid sub t rop ica l , t r o p i c a l savanna and monsoon c l i p a t a s , where i t i s g r w n a s a rain-fed crop dur ing the wet season and under i r r i g a t i o n during the dry season. Table 8 shows t h i s concentrar ion of groundnut production.
53. India , China and the United S t a t e r produce about ha l f the uor ld ' r output of groundnutr. Year-to-year f l u c t u a t i o n r i n world groundnut production can ba t r aced back t o ha rves t s i n t h a r s c o u n t r i a r . Ind ia ' r production f l u c t u a t e s widely around a l e v e l of about 5 m i l l i o n t o n r , l a r g e l y r r f l e c t i n g weather cond i t ions during the g r a t i n g seaeon. Since groundnutr nerd plenty of mois ture while g r w i n g but dry w a t h e r dur ing t h e ha rves t , a a l i g h t r h i f t i n the p a t t e r n of monsoone has a d e c i r i v e impact on yie lde .
5 4 . Production i n the o t h r tvo major producing :ountriee h ~ r k e n t rending upvards s t e a d i l y . Since the United S t a t e s has imposed c o n t r o l r over acreage, g r w t h i n production is l a r g e l y the r e s u l t of inc reases i n yie lds . Production of groundnute i n Veet African c o u n t r i e r has decl ined during the p a s t two decades.
55. The f o l l w i n g r e l a t i o n e h i p is used i n t h e model t o capture the supply response f o r groundnuts.
R' = 0.76 S.S.E. - 238.6 , D.W. = 1.02
where:
GROS * W r l d prcductlon of groundnuts-shelled equivalent ('000 m t )
! CROP = p r i c e f o r grour.dnuts, d e f l a t e d by the Index of I n t e r n a t i o n a l
S n f l a t i o n (1976 constant $/mt) s
D657276 a Uummy v a r i a b l e s e t t o 1 f o r the years: 1965, 1972 and 1976
D6973 = dummy v a r i a b l e set t o 1 f o r t h e years: 1969 and 1973

Table 8: GROUNDNUT PRODUCTION ( I N SHELL) I N M O B PRODUCING COUNTRIES, FIVE-YEAR AViUGES AND AVERACE ANNUAL G R O W FATES
Count rv Production C r w t h Rates
1961-65 1966-70 1971-75 1961-651 1966-701 1961-65/
Argentina 2,071 2,478 2,691 3 .7 1.7 2 .7 B r a z i l 357 300 349 -3.4 3.1 -0.2 Bur- 356 408 454 2.8 2 .2 2.5 China 225 308 376 6.5 4.1 5.3 Ind ia 5,125 5,203 5,559 0.3 1.3 0.8
Indones ia 417 446 503 1.4 2.4 1.9 Niger ia 1,858 1,698 7 06 -1.8 -16.1 -9.2 Senegal 1,000 814 874 -4.0 1 4 -1.3 South Afr ica 890 1,175 1,567 5.7 5.9 5.8 Sudan 329 330 736 0.1 17 .4 8.4
Other Countr ies 3,214 3,885 3,931 3 . 9 0.2 2.0
UORLD TOTAL 15,842 17,045 17,766 - 1.5 O e 8 - 1 e l -
Source: FA0 s t a t i s t i c s .
56. Trade i n Groundnut O i l and Weal. I n genera l , groundnuts of high q u a l i t y are consumed d i r e c t l y e i t h e r raw, r o a s t e d o r i n s o w processed form (e.g., peanut b u t t e r , confec t iona ry p roduc t s ) , vhe reas l w e r - 4 r a d e groundnuts a r e used f o e o i l . The p r i c e s f o r the v a r i o u s f i n a l products (food products , o i l and meal) determilie t h e s h a r e of groundnut product ion which moves i n t o e i t h e r market. - 57. T r a d i t i o n a l l y , t h e o i l s e e d c rush ing i$us t ry h a s absorbed t h e b u l ~ of t h e world's groundnut production. Of t h e two p roduc t s recovered i n the - e x t r a c t i o n process--groundnut o i l and meal- -o i l - u s u a l l y has twice t h e value of cake. The f a t s and o i l s market has t h e r e f o r e @ s t r o n g e r impact on groundnut p r i c e s than t h e market f o r h igh-prote in meals. - 58. She l l ed groundnuts c o n t a i n between 45 and 55 pe rcen t o i l . The e x t r a c t e d c rude o i l is p a l e yellow and has t h e c h a r a c t e r i s t i c f l a v o r and odor of groundnuts. Like cot tonseed o i l , i t s o l i d i f i e s i f r e f r i g e r a t e d . The end- u ses o f t h e two o i l s a r e t h e r e f o r e s i m i l a r : s h o r t e n i n g s , margarines, mayonnaise, a n d cooking and s a l a d o i l s .

59. The r e s i d u e t h a t r e tmins a f t e r t h e o i l has beea ext rac ted- the groundnut cake--is used a s a p r o t e i n suppleme!nt i n l i v e s t o c k f eeds . S ince t h e e a r l y 19609, l i v e s t o c k producers have been aware of t h e p o t e n t i a l f o r groundnuts becoming i n f e c t e d w i t h a f l a t o x i n , a harmful subs t ance produced by some s p e c i f i c s t r a i n s of a mold ( s p e r g l l l u s f l a w s ) . A high moi s tu re c o n t e n t i n k e r n e l s and cake w i l l encourage i t e growth. While i t c a n be re loved r e l a t i v e l y e a s i l y from groundnut o i l d u r i n g t h e r e f i n i n g p rocess , removing i t from t h e cake is c o s t l y . Hsjor impor t ing c o u n t r i e s have imp lemnted s t r i c t t e s t s t o d e t e c t contaminat ion by a f l a t o x i n .
60. The fo l lowing two e q u a t i o n s were used i n t h e model t o d e s c r i b e t h e world t r a d e i n groundnut o i l and cakes.
Croundnut O i 1: 1961-77
R~ - 0.73 S.E.E. * 0.091 D.W. 1.76
where:
CROFOX - v o r l d e x p o r t s of groundnut o i l aad grouadaute- -o i l e q u i v a l e n t ( '000 at)
CROFOS - w r l d p roduc t ion of groundnut o i l ('000 a t )
D69707174 - dummy v a r i a b l e set t o 1 f o r t h e yeare: 1969, 1970, 1971 and 1974
GROPOP = p r i c e of g r m n d n u t o i l , d e f l a t e d by t h e Index of Iater- n a t i o n a l I n f l a t i o n (1974 c o n s t a n t $/mt).
Croundnut Heal Exports: 1961-77
R~ - 0.79 S.E.E. = 0.054 - where:
D.W. = 3.27
GROIHLX = world e x p o r t s of groundnut ,eal and groundnuts - -meal e q u i v a l e n t ( '000 m t )
GRO.HLS = world product ion of groundnut meal ('000 me)

VI- 29
CROIUP - p r i c e f o r groundnut =a1 (1974 cons tan t $ / a t )
D6264 - drrnny va r i ab l e s e t t o 1 f o r t h e years: 1962 and 1964
D74 = dummy va r i ab l e s e t t o 1 f o r t h e year 1974
61. Rapereed production ha8 grown a h s t a s rap id ly a s soybean production--at a n average r a t e of 5.6 percent a year r i a c e t he e a r l y 1960s (Table 9). Mort of t h i r expansion is the r e s u l t of i a c r t a aed planting8 i n Canada and Pranee. Ind ia , t h e main producer, expanded i t 8 rapareed plant ing8 a t a r a t e b e l w t h a t of the w r l d average.
Table 91 RAPBSSSD ERODUCTION I N W O R PRODUCING COUNTRIES, FIVE-YKAR AVERAGES AND AVERAGE AHNUAL C R O W W B S
Count rv Production C r w t h Rate8
1961-65 3966.70 197L-75 1961-65/ 1966-70/ 1961-65/'
(-- '000 m t 1 ( percent 1
Banglaleeh 94 116 '14 4.3 -0.4 2.0 Canada 278 796 ,,492 23.4 13.4 18.3 China 1,035 1,052 1,159 0 .3 2 .O 1.1 Czechoelovakia 59 69 107 3.2 9.2 6.1 Dcnnrk 42 29 80 -7.1 22.5 6.7 France 19 7 46 2 64 7 18.6 7 .O 12.6
Cermny, Den. Rep. 171 Germany, Fed. Rep. 100 Ind la 1.277 Pakistan 221 Poland 323 Sweden 153
Oth,r Countries 34 9
WRLD TOTAL 4,299 5,502 7,444 5.1 - 6.2 - 5.6 -
Source: FA0 s t a t i s t i c s . -
62. The rape p lan t includes annual as w e l l a s b i enn i a l v a r i e t i e s . It grows bes t i n temperate c l imates and i n t he sub t rop ics dur ing the cool season. Biennial v a r i e t i e s a r e usually planted dur ing the f a l l i n regions where win te rs a r e not too severe. Production is concentrated I n th ree countr ies : Ind ia , Canada and China. Together they supply about 60 percent of world production.

63. The rape p l a n t needs 128s than 5 0 0 mm of r d f n f a l l . I n I n d i a t h e bulk of t h e c r o p c o s c s from a r e a s wi th a n annua l r a i n f a l l of between 120 and 600 nq. In t e rc ropped u i t h o t h e r c rops , such a s b l - l e y o r wheat, i t i r a l s o g r w n on i r r i g a t e d land.
64. I t was not p o s s i b l e t o e s t i m a t e a statistically s i g n i f i c a n t recponse by rapeseed producers tr, I . c e r n e t i o n a l market p r i c e s . The e q u a t i o n used t o c s . i m t e t h e s c p p l j of rapeseed i n t h e model is ~ B w n telw. The e s t ima ted p r I c e r < f i c l e n t is statistically ueai . T h i r i u no t ~ u r p c i s i n g , c o n r i d e r i n g t h e b i d e d;f i c r e n c e s t h a t e x i s t I n t h e r e sFonre of prchq:.:t:co t o changer i n '.nternttt;orml market p r i c e s i n t h e t h r e e major producing count r te r - - India , C n ~ d a and China.
( 1.5) RAPS, .-1520.56 + 1.0270 + J .l?;i RAPPt,-- (9 .a61 (1.41)
where:
P N S = world product ion of r rpesecd ('OM m t )
RAPP = ? r i c e fot rapeseed, d e f l a t e d by t h e Index of I n t e r n a t i o n a l I n f l a t i o n (1974 c o n s t a n t $ / a t )
k 3 6 9 a dunmy v a r - a b l e set to !. f o r t h e years : 1963 and 1969
D707l = dummy v e r i ~ b l e set t o 1 f o r t h c years : 1970 and 197: ,
65. -- Trade i n Rapeseed O i 1. Rapeseed o* i , d a r k y e i l o v o r amber i n c o l o r , is c h a r a c t e r t z e d by a high con ten t c f er.:~ic a c i d . I n Europe and Asia i t is a n i n l y used f o r e d i b l e purposes-in t h e p roduc t ion eI ( f l u i d ) margarfnes and a s 3 s a l a d o i l ( i t is a popular s a l a d of 1 i n France) . In tk. : Uni ted S t a t e s , f . t . 4~ usefl most ly i n t h e ~anu :ac tu re o f i u b r i c a n t s . Rapeseed cake , l i k e o t h e r o i r s e e d cakes , Is a p r o t e i ~ supplement i n a n i ~ a l feeds . - - - 66* The followin;: eq::=ition d e s c r i b e s t h e v o r l d t r a d e i n rapeseed o i l , ..-,:TI i n t h e model.
Raneseed GI 1: 1363.-77 -.--

where:
RAPPOX - world exports of rapareed o i l and rapcrcedr--oil equivalent ( '000 m t )
RAPPQS - w r l d productioc of rapebead o i l ('000 at)
W1 - d u a y var iab le ret tc 1 f o r 19. t
D69 - dummy var iab le ret t o 1 !'om r S i
RAPPOP - p r i ce of raperrad o i l , d a f ~ a r e d by t h e Index of I n t e r - na t i ona l I n f l a t i o n (1974 conr tan t $ / m )
Rapeseed Heal Kxporter 1961-77
where;
RAPKLX - world exports of rapareed o c a l and rapereedr-meal equivalent ( '000 rt)
RIS)(LS - world production of zapcreed meal ('000 at)
R A P W = p r i c e f o r rapeseed our1 (1974 constant $/mt)
D7177 = dummy var iab le s e t t o 1 f o r t h e years: 1971 and 1977
D7475 = dummy var iab le s e t t o 1 f o r t he years: 1974 and 1975 , * Vegetable O i l s f r o a Tree Crops
67. Olive O i l . The o l i v e t r eg t h r i v e s l o t he warm and dry a reas of temperate aad sub t rop i ca l c l i ~ a t e t q 11 It needs mild winters-frost can cause s e r i ous dantage-and p r e f e r s l i t t l e ' r a i n dur ing flr lverlng and a s the f r u i t r ipens . - 21 Therefore, o l i v e t reeszare o f t e n planted i n a r ea s bordering de se r t s , where r a i n f a l l i s i r r e g u w . Production-and a l s o consumption-31 -
11 The o l l v e t r e e w i l l grow but not beaz f r u i t i n t he t rop ics . - 21 Carnmercfal groves i n the Heditcrranean a r e r a r e l y i r r i g a t e d . However, -
i r r i g a t i o n is cormion i n Ca l i fo rn ia ' s o l i v e groves.
31 The bulk of the o l i v e o i l harvest i s consumed i n producing countr ies . - Only abo~r t 6 percent of t o t a l production e n t e r s i n t e rna t i ona l markets.

of o l ives is concentrated in the Hedlterranean region, 11 with t t s dry summers, m i l d winters and even temperatures, the r c s u l t o f i t s proximity t o the sea (Table 10).
68. Under good g rwing conditions, o l ive t r ees produce the i r f i r s t crop a f t e r s i x years. In d r y zones the gestat ion period w i l l extend up t o 20 years before s igni f icant yields a r e obtained. On the other hand, i n those clfmatcs, the o l ive t r ees bear f r u i t for a t leas t 50 years, almost twice a s long a s under l e s s favorable grouing conditions. The o l ive t r e e bears f r u i t only every two years. Some t r eee have s lgn i f l can t y ie lds only every three or four years. On the average, a t r ee produces between 10 and 15 kg of o l ives a year. Product ion cycles vary widely between--and aven within--producing countries, and world product ion ref l cc t s t h i s cyc l ica l behavior. - 21
69. The s u p p l y equation for olivo o i l r e f l e c t s the important cha rac te r i s t i c s of o l ive o i l production. S t a t i s t i c a l l y , the most s igni f icant price response was obtained with prices lagged by nine years. The dependent variable lagged by two years was included t o capture tho two-year production cycles,
Olive O i l Supply: 1969-77
R~ - 0.97 S.E.E. - 0,019 D.U. = 2.82
where:
OLIS = world production of o l ive o i l ('000 m t )
OLIP = price of o l ive o i l , def lated by the Index of Lnternational In f l a t ion (1974 constant $lmc)
D76 = dummy variable qet YO 1 for 1976
D7077 = duamy variable set t o 1 for 1970 and 1977
11 I t a ly and Spain produce each about one-third of the world's ol ive o i l . - However, the most rapid expansion of o l ive o i l production has taken place i n Tunisia.
21 World production peaks whenever several major producing countries - experience an "on year" (an upswing in t h e i r production cycle).

Table 10: OLIVE OIL PRODUCTION I N W O R PRODUCING COUNTRIES, FIVE-YEAR AYERAGES AND AVERA[;E ANNUAL GROWTH RATES
Production Crowth Rates 1961-65 1966-70 1971-75 1961-65/ 1966-70/ 196165/
Argent ins Greece I t a l y Spain Syria Tunisia Turkey
Other Countries 161 159 142 -0.2 -2.2 -1.2
WORLD TOTAL 1,300 1,408 1,580 - 1.6 - 2.3 -- 2 .o
Source: FA0 s t a t i s t i c s .
70. Trade i n Ol ive O i l . About 90 percent of the o l i ve s iarveeted a r e used f o r o i l ex t rac t ion . The remaining 10 percent a r e marketed a s t ab l e o l ives . The o i l content of o l i v e s (th; whoit f r u i t ) va r i e s between 35 and 70 percent. With t h e except ion of a spa11 por t ion , o l i v e o i l is used exclusively f o r ed ib l e purposes, mainly a s cookiog and s a l ad o i l . Unlike o ther vegetable o i l s , o l i v e o i l can be consuaed d i r e c t l y without f u r t h e r re f in ing . L/ The f i r s t press ing of o l i v e s y i e l d s "virgin" o i l . Successive press ings y ie ld l w e r q u a l i t y o i l . With t h e he lp of so lven t ex t r ac t i on , i t is a l s o possible t o e x t r a c t t h e o i l t h a t remains i n the res idue l e f t over from mechanical o i l ex t rac t ion . Thie o i l ("olive foots") is i ned ib l e and is used i n the manufacture of soap.
71. Olive o i l is expensive compared t o o the r f a t s and o i l s . Since the lower grades r e t a i n t h e i r s t r ong f l avor , they a r e f requent ly blended with o the r d l d - f l a v o r e d o i l s such a s soybean o r cottonseed. The amount of o l i v e o i l i n the blend va r i e s betveen 5 and 10 percent.
7 2. The following equat ion was used i n t he \ode1 t o descr ibe world traCe i n o l i v e o i l . .
1 / This i s t r u e of good qua l i t y o l i ve o i l . Lower grades a r e usual ly ref ined - and marketed a f t e r they have been blended with b e t t e r grades.

Olive O i l Exports: 1961-77
vhere:
OLIPOX - vorld exports of o l i v e o i l ('000 a t )
OLIS - vorld production of o l i v e o i l ('000 mt)
D637475 - dummy va r i ab l e met t o 1 f o r t he years8 1963, 1974 and 1975
OLIP - p r i ce of o i i v e o i l , d e f l a t e d by the Index of I n t e rna t i oaa l I a f l a t i o n (1976 coa r t an t $ /a t ) .
Palm O i l and Palm Kernel O i l
73. O i l p a l m prodvce more o i l per u n i t of land thsa any o ther o i l r e ed crop. Their f r u i t con ta ins tw o i l s : palm o i l and palm kernel o i l ( t he l a t t e r ex t rac ted from the seed). The e c o n d c l i f e of a tree is about 30 years. It produces i ts f i r s t crop t he t h i r d year a f t e r p lan t ing and reaches peak y i e l d s (2.5 tons per ac re ) between t h e e igh th and t he t en th years; from then on y i e l d s dec l i ne gradual ly a t about 2 percent per year. A/
74. O i l palms ;reed betveen 1,800 and 2,000 M of r a i n f a l l , d i s t r i bu t ed regu la r ly over t h e year , about 2,000 hours of suashiae , and s u f f i c i e n t f e r t i l i z e r (n i t rogen and potash) i f the high y i e l d s mentioned e a r l i e r a r e t o be a t t a ined . On t he o the r hand, they r equ i r e l i t t l e l abor compared with o the r t r e e crops. %st of t h e labor is needed f o r harvest ing, which demands c a r e f u l handling of the f r e s h f r u i t bunches. Bruising of t he palm f r u i t (and a delay i n processing) l eads t o t he formation of f r e e f a t t y ac ids , l w e r i n g the q u a l i t y and pr ice o f t t h e palm o i l . To produce h igh-qua l i ty palm o i l a t low cos t , harvest ing and processing have t o be well-synchronized. Thus good management and a wel l?ra inta ined t r an spo r t a t i on n e t w ~ r k have a dec i s ive impact on the p r o f i t a b i l i t y of o i l palm e s t a t e s . Considering the needs f o r roads, t r an spo r t a t i on and processing f a c i l i t i e s , t he production of palm o i l is more capi t ) l - than labor-intensive. - -
1/ Modern o i l palm e s t a t e s have se lec ted v a r i e t i e s t h a t produce palm f r u i t s - with a smaller kernel than those found i n wild groves. Most exports of palm kernel o i l o r i g i n a t e i n West African count r ies , which produce most of t h e i r palm o i l from wfld groves.

75. During t h e 19608, palm o i l product ion g r w a t 2.4 pe rcen t per yea - . S ince 1970, t h e r a t e of growth has a c c e l e r a t e d t o more t h a n 10 percent a y e a r , compared w i t h a n annua l g r w t h r a t e of 4.2 pe rcen t f o r a l l f a t s and o i l s . Th i s s t e e p i n c r e a s e r e f l e c t s t h e r ap id expans ion of o i l palm p lan t ing6 I n Malaysia, Indones i a a;rd t h e Ivory Coast . During t h e l a t e 1950s. about tuo- t h i r d s of t h e wor ld ' s palm o i l ou tpu t was produced i n Af r i ca ; tvo c o u n t r i e s , N ige r i a , and Z a i r e , t hen s u p p l i e d more t h a n h a l f t h e wor ld ' s palm o i l . Although s t i l l maJor producers , t h e combined s h a r e of t h e s e c o u n t r i e s had dropped t o about 30 percent by 1974, s l i g h t l y l e s s t han Malaysia 's sha re . 1/ From 1966-70 t o 1971-75, Ha lays i a ' s p roduc t ion grew a t a n ave rage annual rate of 25 percent (Table 11) . Though Ha lays i a is n w t h e world's l e a d i n g producer of palm o i l , t h e d e c l i n e i n West Afr ican p roduc t ion has r e c e n t l y been r eve r sed , a s r i s i n g demand f o r f a t s and o i l s i n t h i s r eg ion has l ed t o l a r g e inves tments i n t h e o i l palm i n s e v e r a l West Af r i can c o u n t r i e s .
76. The fo l lowing e q u a t i o n war used i n t h e model t o estimata palm o i l product ion .
Palm O i l Supply: 1969-77
where:
PAHS = v o r l d product ion of palm o i l ( '000 mt)
PAUP = p r i c e s f o r palm o i l , Halays ian 5 p e r c e n t , d e f l a t e d by t h e Index of I n t e r n a t i o n a l I n f l a t i o n (1974 c o n s t a n t $/mt)
RUBPRI = p r i c e f o r rubber (1974 c o n s t a n t $/mt)
D73 = dummy v a r i a b l e s e t to 1 f o r 1973
11 C i v i l d i s o r d e r s were a major f a c t o r i n t h e d e c l i n e of palm o i l product ion - i n t h e s e two c o u n t r t e s . Production was d i s r u p t e d i n 1964-67 i n Z a i r e and i n 1967-69 I n Nige r i a .

Table 11: PAW OIL PRODUCTION I N M O B PBODUCINC COUNTRIES, FIVE-YEAR AVERACES AND AVERACI AHhiU GBOVra RATES
Production Crovth Rater Country 1961-65 1966-70 1971-75 1961-651 1966-70/ 1961-651,
1966-70 1971-75 1971-75
Angola 38 Came toon 43 Colombia 1 Dahomey 25 Indoneria 151 Ivory Coast 15 Ualays ia 120 Nigeria 540 Papua N e w Guinea S i e r r a Leone 37 Zaire 210
Other Countrier 147 189 208 5.2 1.9 3.5
WORLD TOTAL
Source: FA0 s t a t i s t i c s .
77 . Because the h a ~ t s t i n g of f r e sh f r u i t bunches w i l l cont inue even i f palm o i l p r ices should f a l l b e l w var iab le c o s t s , l/ the supply of palm o i l i n response t o p r ices i s expected t o be h igh ly i n e i a s t i c . Producers have few a l t e r n a t i v e production possibilities, sho r t of uprooting t he p a l ~ u r , 2 / and they have t o c o l l e c t the r i pe f r e s h f r u i t bunches t o prevent the pes t s and d i seases t h a t a r e caused by overr ipe and r o t t i n g f r u i t . The decis ion t o e x t r a c t t he o i l w i l l depend la rge ly on t he d i r e c t c o s t s of operat ing the m i l l and t h e marketing c o s t s f o r the end products-palm o i l , palm kerne l o i l and palm kerne l cake.
1 This statement r e f e r s mainly t o palm o i l produced on es ta tes . ; The supply - from independent smallholders working a t the f r i n g e of the o i f palm e s t a t e s cu co l l e c t i ng f r u i t i n v i l d groves is more price-elaskic. These p r o d u c e r ~ h a v e usual ly a wider range of employment opportuni t&s than producers,on smallholder e s t a t e s , and they a r e a l s o l e s s concecned about the danger of p lan t d i seases caused by r o t t i n g f r u i t s .
2/ Variable co s t s include the cos t of picking t he f r e s h f r u i t bunches, the - cos t of t r anspor t ing them t o the processing plant and the cos t of palm o i l ex t rac t ion .

78. The palm f r u i t y i e l d s two o i l s - p a l m o i l , which is contained i n t h e f l e s h y o u t e r p a r t (mesocarp) of t h e palm f r u i t l e t s , and t h e palm kerne l o i l which is e x t r a c t e d from t h e hard c o r e - m o r e s p e c i f i c a l l y , t h e p a l m kernel-of the f r u i t l e t s .
79. The s i z e of t h e ke rne l s v a r i e s wi th t h e o i l palm var ie ty . The l a r g e s t k e r n e l s a r e c o l l e c t e d from wild g r w i n g palms. P lan t breeders have, h w e v e r , been s u ~ : e s s f u l i n reducing t h e s i z e of t h e k e r n e l r e l a t i v e t o t h e f l e shy p a r t of t h e f r u i t . The o i l palm v a r i e t i e s , which y i e l d l a r g e r e m t e a of palm o i l than palm kerne l o i l have become more common i n Southeast Ania, whereas West Afr ica , with i ts l a r g e v l l d o i l palm groves, dominates the market f o r palm kernels .
80. Palm kerne l o i l is ex t rac ted from t h e d r i e d k e r n e l r of the palm f r u i t l e t e . The o i l con ten t of the ke rne l s v a r i e s between 44 and 53 percent. The phys ica l p r o p e r t i e s and chemical composition of palm k e r n e l o i l r e r e a b l e r t h a t of coconut o i l , f o r which it i r t h e r e f o r e f requent ly sube t i tu ted . Like palm o i l , i t i s uaed i n soap and food products. Bccauee of i t s s l i g h t l y higher content of unaaturated f a t t y a c i d s , i t is proceseed i n t o confectionary bu t te r . F rac t iona t ion of palm kerne l o i l y i e l d s a l i q u i d and s o l i d f r a c t i o n . The e t e a r i n e fractir;:: is used as a e u b e t i t u t e f o r cocoa b u t t e r , the o l e i n f r a c t i o n is p re fe r red i n t h e preparat ion of baked goods and i n t h e menufacture of sLaps.
81. Although palm o i l and palm kerne l s a r e j o i n t l y recovered i n the palm o i l e x t r a c t i o n process, t h e i r eupply i e domianted by d i f f e r e n t regione. Therefore a eepara te eupply equation f o r palm k e r n e l s was est imated.
Palm Kernel O i l Supply: 1966-77
g2 = 0.94 S.E.E. = 31.03 D.W. - 2.21
where:
PAKS = world production of palm k e r n e l s ( '000 mt)
P N = p r i c e f o r palm kernels , d e f l a t e d by t h e Index of I n t e r n a t i o n a l I n f l a t i o n , CIP Europe (1974 constant $/mt)
D6773 = dummy v a r i a b l e se: t o 1 f o r t h e yearf . 1967 and 1973
D707477 = dummy v a r i a b l e s e t t o 1 fo; t h e years: 1970, 1974 and 1977 8 .
1/ Paln kernel o i l conta ins more s a t u r a t e d f a t t y a c i d s than coconut o i l . - I t is the re fore more s o l i d .

82. The fol loving e q u a t ~ o n r describe world t !~portr of palm o i l and palm kernel o i l .
Palm O i l Exports: 1960-77
R2 - 0.99 S.E.E. - 0.054 D.W. - 2.26
where:
PAHS - world production of palm o i l ('000 mt)
PAHP - pr icar f o r palm o i l , k h y r i a n 5 percent, def lated by the Index of I o t e n u t i o c u l I n f l a t i o n (1974 coar taa t $/mt)
PANOX - vorld exportr of pala o i l ('000 m t )
D74 - duamy v r r i r b l a r e t t o 1 f o r 1974
Palm Knrnal O i l Exportr: 1961-77
R2 = 0.85 S E E 14.15 D.W. = 2.69
where:
PAKFOX - vorld exports of palm kerne l o i l and palm kernels--oi l equivalent ( '000 m t )
PAKFOS = vorld production of palm kerne l o i l ('000 m t )
PAKPOP = pr ices of palm kernel o i l , def la ted by the I r . . x of ' In te rna t iona l In f l a t i on ('1974 constant $ jo t )
D67 = d u u y var iab le s e t t o 1 f o r 1967 - - M876 = dumq var iab le s e t t o 1 f o r t he years: 1968 and 1976 9 1 - D75 - dummy var iab le s e t t o 1 f o r 1975 - - s
~ o r o n u t 01 1 .
83. The coconut palm t r e e requires a warm sunny climate v i t h an even temperature of about 8s0p (2g0c). I t g r w e best i n a r eas v i t h a r a i n f a l l of

1,300 t o 2,300 mm a y e a r , d i s t r i b u t e d evenly . 11 Coconut palms t h e r e f o r e a r e grown i n a b e l t t h a t ex t ends abou t 20 deg rees o n e i t h e r s i d e of t h e e q u a t o r , While t h e t r a d i t i o n a l coconut t r e e produces i t s f i r s t c r o p about 6 t o 9 y e a r s a f t e r p l a n t i n g , r e c e n t l y developed hybr id dwarf v a r i e t i e s have shor tened t h i s g e s t a t i o n pe r iod t o about 4 yea r s . The economic l i f e s p a n of a coconut t r e e e x t e n d s w e l l beyond 50 yea r s .
84. Coconut palms produce a bunch of mature coconuts each month, 21 which a r e t hen processed i n t o copra. (High-qual i ty copra can o n l y be &de from f u l l y r i p e n u t s , t h a t is, n u t s which have f a l l e n n a t u r a l l y o r v e r e hand- picked.) The o u t e r p a r t of t h e coconut , t h e s o - c a l l e d exocarp , is t h i c k and f i b r o u s and y i e l d s t h e c o i r . 31 Beneath t h e exoca rp is a ha rd s h e l l , Attached t o t h e i n s i d e o f t h i y s h e l l is t h e endocarp , a t h i c k l a y e r of coconut meat which, a f t e r be ing d r i e d , y i e l d s t h e copra. The coconut a l s o c o n t a i n s a l i q u i d , c a l l e d coconut v a t e r .
85. The P h i l i p p i n e s and Indones ia dominate t h e p roduc t ion and t r a d e of coconut and coconut products . The i r combined p roduc t ion o f coconute (copra e q u i v a l e n t ) amounts t o more than 60 pe rcen t o f t h e v o r l d ' s production. However, because most of t h e t r e e s a r e ove rage i n t h e s e two c o u n t r i t e , p roduc t ion has g r w n only s l w l y d u r i n g t h e p a s t 10 y e a r s (Table 12).
86. The f o l l w i n g e q u a t i o n vae used i n t h e model t o c a p t u r e t h e behavior o f world copra production.
Copra Supply: 1967-77
(1.9) COPS, = -2085.12 + 8.8262 COPPt-7 + 0.6697 COPSt-, (6.40) (7.57)
R~ = 0.94 S.E.L. = 176.4 D.W. = 1.67
where:
COPS = world product ion c f copra ( '000 mt)
COPP = p r i c e f o r copra , d e f l a t e d by t h e Index o f I n t e r n a t i o n a l I n f l a t i o n , CIP European p o r t s (1974 c o n s t a n t $/mt)
D677G = dummy v a r i a b l e s e t t o 1 f o r t h e yea r s : 1967 and 1974 *
D7176 = dummy v a r i a b l e s e t t o 1 f o r t h e years : 1971 and 1976 - - !
1/ Coconut palms need a t l e a s t PO t o 1 ,200 mm of wa te r a y e a r t o remain pro- - d u c t i v e . -
2/ On t h e ave rage , coconut palms y i e l d about 50 n u t s a yea r . This is - e q u i v a l e n t t o 10 ki lograms o f copra.
3/ Colr i s a f i b e r used f o r making rope a n d i n t h e manufacture of heavy mats. -

Table 12: COPdA PRODOCTION I N W O R PRODUCING COUNTRIES, FIVE-YeAR AVERAGES AND AVERAGE ANNUAL GROYra RATES
Production Growth r a t e r Country 1961-65 1966-70 1971-75 1961-651 1 9 6 6 7 0 1 1961-651
1966-70 1971-75 1971-75
India 290 Indonesia 735 Ualaysia 168 Hexicd 181 Hozab ique 56 Pspua New Guinea 117 P h i l i p p i n e s 1,398 S r i b n k a 289 Thailand 22
OTHER COUNTRIES 369 355 36 5 -0.8 0.6 -0.1
WORLD TOTAL 3,625 3,600 3,955 - -0.1 - 1.9 - 0 . 9
Source: PA0 s t a t i s t i c s .
87. Coconut O i l and Cake. Coconut o i l i e e x t r a c t e d f tom t h e copra, t h e d r i e d meat of t h e COCO'IU~, Yhich con ta ins b e t e e n 63 and 68 percent o i l . The r e m i n d e r i r copra cake and moirture.
88. Coconut o i l has a unique melting behavior. I t is a 'hard" o i l , t h a t is, i t i r a b r i t t l e r o l i d a t room temperature i n temperate zoner. It begins t o melt wi th in a temperature range of furt s few degreer , between 24O and 27O~. T h i r p e c u l i a r r a p i d melt ing behavior is a consequence of i t s f a t t y a c i d and g lycer ide corporitioa-l/ t h e molecular weight of i t s f a t t y a c i d s is lw, and i t -has a l a r g e p o r t i o n o f unsaturated f a t t y acids . I n t h i s r espec t coconut o i l is s i m i l a r t o cocoa b u t t e r and is used f o r sLnilar purposes, n-ly those which r e q u i r e qu ick melt ing, e.g., coa t ings of i c e cream b a r s . 3 Coconut o i l a l s o h a a l w e r v i r c o r i t y than o t h e r f a t e and o i l s t h a t makes it p a r t i c u l a r l y s u i t a b l e f o r t h e spray coa t ings f o r c e r e a l s and c rackers and a s a , l u b r i c a n t i n va r ious confect?ons such a s caramels and nougats. he the small p o r t i o n of unsaturated f a t t y a c i d s rakes coconut o i l h igh ly s t a b l e aga ins t
11 Coconut o i l con ta ins a u i d e v a r i e t y of f a t t y a c i d s which d b f f e r mainly i n - * a r weight r a t h e r than i n t h e i r dcgree of s a t u r a t i o n ) About 90 per-
t h e f a t t y a c i d s which make up cuconut o i l a r e sa tu ra ted .
2 1 The coa t ing i s hard on the bar, but mel ts quickly and completely I n t h e - mouth.

oxidat ion, i t i s a l s o dsed i n the preparat ion of f ry ing products t h a t require a long she l f l i f e . 1/ In addi t ion t o these spec ia l ized uses , coconut o i l i s used f o r t r a d i t i o n a l food and ncin-food uses, such a s margarines, confect ions , bakery products, soaps and detergsnts . Hwever, i t has a narrow p l a s t i c range, and i t i s impossible t o modify the physical p roper t ies of the oil--to any grea t extent--through hydrogenation. 21 Thus i t s use in ed ib le products is severely r e s t r i c t e d . Coconut o i l is therefore r a r e ly used a s a m j o r ingredient i n shortening (usual ly 5 percent o r l e s s ) , and is even undesirable f o r aurgarine. 11
89. Coconut o i l can be f ract ioned. The so l i d fraction--coconut stearine-- i e used i n preparing coatings fo r cookies and candies and a s confectioner'^ but ter . The l iqu id portion-coconut olein-contains most of the lou-molecular wejght and unsaturated f a t t y ac id s and has there fore a lower melting point than coconut o i l . I t is used i n i c e cream and t n the preparation of o ther food products.
90. Copra cake is used a s a p ro te in supplement i n the preparation of l ives tock feeds and a s f e r t i l i z e r . However, because of its lou pro te in content ( 2 2 ~ e r c e n t ) , i t plays only a minor r o l e i n t h e l ivestock feeds economy.
91. Equations 1.9.1 and 1.9.2 a r e t he estimated re la t ionsh ips fo r world exports of coconut o i l and copra meal.
Coconut O f 1 Exports: 1961-77 -
R' - 0.82 S.E.E. - 0.097 D.W. - 1.67
COPFOX a world exports of coconut o i l and copra-oil equivalent ( '000 m t )
COPFOS = ' world production of coconut o i l ('000 mt)
11 Although coconut o i l is an exce l len t f ry ing o i l by i t s e l f , i t foams badly - when blended with other o i l s f o r deep frying.,
2 / Hydrogenation does not change t he melting behavior and consistency of - coconut o i l .
3 / The disadvantage of coconut o i l i n the preparation of margarine is smaller - than i t is i n shortening, mainly because the consistency of margarine i s patterned a f t e r tha t of bu t t e r , which a l s o has a comparatively shor t plas t .1 c rang2.

D74 - dunmy v a r i a b l e set t o 1 f o r 1974
COPPOP - p r i c e o f coconut o i l , d e f l a t e d by t h e Index of I n t e r - n a t i o n a l I a f l a t i o a (1974 coaa t a a t $ / a t ) .
Copra Ueal Expor t r r 1961-77
R' - 0.98 S.E.E. - 24.31 D.U. 2.08
where:
C O M X - v o r l d r x p o r t r of copra cake and copra--wal r q u i v a l e n t ( '000 at)
C O M S - vor ld p r rduc t ion 0:: copra meal ('000 m t )
COPHLP - p r i c e f o r copra u l t e d e f l a t e d by t h r Index of I n t r r - m t i o m l I n f l a t i o n , CIP European p o r t r (1974 c o n r t a n t S/nt
07172 - d u r q v a r i o b l r cac to 1 f o r t h r y e a r r r 1971 and 1972
Animal F a t s and Xarine O i l 8
92. F i r h O i l . The producticrn of f i s h o i l i r c l o r e l y t i e d t o t h e commercial c a t c h of f i v e rpecierr h r r i n g , wnhadrn , p l i c b r d , r a t d i m and whale. During t h e f i r r t half of t h e 19608, t i r h a t c h &ad thur o i l productlon g r e v steeply--at a a average annual r a t e o f 8.2 percent . 'Lhrn, du r ing t h e la t ter p a r t of t h e 1960s, product ion of o i l l eve led o f f a t about 1 n t l l i o n t o n s , dropping s l i g h t l y dur ing t h e u r l y 1970 ... The sudden d e c l i n e i n t h e c a t c h of anchovies o f f t h e Peruvian c o a s t a c c w n t r f o r a p a r t of t h e drop i n production. Never thelees , Peru remains t h e l ead ing producer of f i s h o i l (Table 13).
93. Although com&rcial f i s h i n g r e q u i r e s s u b e t a n t i a l investment (boat , f i s h i n g gea r , process ing p l a n t s , etc.), f ishermen respond qu ick ly t o changes i n t h e p r i c e f o r f i s h . I n t h e f o l l w i n g equat ione f o r f i s h o i l and f i s h meal, 1agged:production emerged as s t r o n g explo - tory v a r i a b l e s .
' 9 F i s h o f 1 Supply: 1961-77 -
* 1 0 S t - 147.270 + 0.2285 FISFOPt-l + 0.6448 FISSt-l - (1.38) (9.53)
R 2 = 0.91 S.E.E. = 50.98 D.G. = 2.1;

where:
FISS world production of flsh 011 ('000 at)
FISFOP = price for f r s l . ;Ll, leflated by the Index of Inter- national Inflatlon, CIP Europe (1974 constant $ / a )
F1SM.P - price for fish r a l , deflated by the Index ef Intar- national Inflatlon, CIF Europe (1974 constant $/at)
0637273 * dummy variable set to 1 for the years: 1963, 1972 and 1973
06768 - dummy varlable set to 1 for the years: 1967 and 1968
Table 13: FISH OIL PROOUCTIOH IN . W O R PROOUCINC COUNTRIES, FIVE-YEAR A V E R X U AXD AVERACE ANNUAL CROUTH RATES
Production C r w r h Rater 1961-65 1946-70 1971-7 5 1961-65/ 196b-70/ 1971-65/'
IcelaaC 7 3 50 2 2 -7.3 -15.1 -11.3 N o w a y 96 242 18 2 20.3 -5.5 6.6 Peru 151 2 58 219 11.3 -3.2 3.8 South Africa 59 84 53 7.3 -8.6 -1.1 United States 9 6 7 5 10 5 -4.8 7 .O 0.9
Other Countrlcs 211 309 396 7.9 5.1 6.5
Source: USDA statistics.
pis!^ Heal Supply: 1961-77
(1.11) FISHLS, = 879.196 + 0.6986 FISHLSt-l + 1.0977 PISXLPt-l ' (9.73) (1.80)
R' - 0.91 S.E.E. = 247.0 D.U. - 3.04

vhc re :
FIStUS - world production of f l sh wc.1 ('000 m t )
F I S a P a prlce Ccr f l t h meal, deflated by the Index of inter- net lonal Znflat lon. C T P Eu:o?e (1976 constant S'mt)
W76870 - u c a a y variable- s e t t o 1 f c r the years: 1967, 1968 ana 1970
D7273 - duaty variable s6t t o 1 lo r the years: 1972 and 1973
94. Pldh O i l and Plnh --- *al. Fish uecd f o r thu extraction of f i sh 011 yields about 10-20 percent 011. The remaining so l id we;te i s f u ~ t h e r processed :eta f l ah m s l . Fish aenl is a l r o procarred from parts discarded in the pr~para t lor t of f t r h for food. Fish sat11 has tlta highest p ro te l l content c f a l l aajor high-proraln oealr and 1s an luportant lngredienr In tnuny livercock feeds.
35. The qual i ty t ~ f f i s h 011 l e qoe *w!u~ ' derlot t o chat of vhala o i l s tnce I t i s tendcred f r m the whole f i r h , vh1c.i contains large amounts of non- f a t mnter:als, rathar than f ~ o u selected f a t t y t lssues. 1; Compared t o whale o i l , f l s h 011 a l s o has a htgher colttent of f ree f a t t y acTds. 3 36. Fish o i l is "sed ,\w mainly for inedible pbrpooes, . . ~ c h as in the uanufac tur~ cf soaps, datcr8.-a's and lubrlcat ing greases. Because xnhydro- p,eneted f i s h 011s cxidize q*:-ckly and develop a fiehy flavor, manufacturers nf ebnrtonlng bave been re'ucra lt t o use f i s h -(.Is.
97. The f o l l o v l ~ g eqcrt;ons vece ueed i n tlie codel t o desccibe the tehavloc of world exports a f f i sh 011 2nd 516th metl.
F i s h O i l E x p ~ r t s : 1961-i3
(1.11.1; In FTSFOX = 1.5012 + 0.1490 In FISFOPt-l + 0.6190 I n FIS?OXt-, (1.80) (8.37)
- S.E.S. = O.C?O -
'3 D.U. = r.30
1.: Hawever, the f a t t y ~ i s s u e s (b lubber) of whales cor.taln about 713 p e r c c ~ i t - fat.
2 1 The r-hertical conyosi t ion of f l s h o t 1 and i ts degree of ea turacion depends -- l a r g e l y o n c h z spec ies .

where:
FISFOX = world p roduc t i on o f f l s h o i l ( '000 mt)
FISFOP p r i c e s f o r f i s h o i l c i c f l n t ed b:. t h e Index o f I n t e r n n t i o n a l I n f l a t i o n : CIF Europe (1974 c o n s t a n t $/mt)
D6768 dummy v a r i a b l e s e t t o 1 f o r t h e y e a r s : 1961 a , ~ d 1566
F i s h Hea l Expor t s : 1961-77 - (1.11.2) I n PIS)(LXt - -2.3240 + l.oe!9 I n PISHLSt - 0.5111 D73747677
(8.13) (7.84)
R' - 0.88
where:
D.W. - 2.11
FISHtX - u o r l d e x p o r t s o f f ah meaL ('OCO mt )
PISHLS - world p r o d u c t i o n o f f i s h meal ( '000 mt)
P1SX.P - p r i c e f o r f i s h meal d e f l a t e d by t h e Index o f I n t e r - n a t i o n a l I n f l a t i o n , C I P Eurape (1974 c o n s t a n t $/mt)
D73747677 = dummy v a r i a b l e set t o 1 f o r t h e yea r s : 1973, 1974, 1976 and 1977
Lard a n d T a l ' w
98. The f a t t y t i s s u e s of hogs p r o v i d e l a r d , t h o s e o f ca t t l e p r o v i d e tallw. Yiel-ds o f l a r d and tallw d i f f e r by b r eed o f hog and c a t t l e , 11 and p r o d u c t i o n of t h e s e two f a t s is t i e d c l o s e l y t o a n i m a l p roduc t ion . 6 s u m e r p r e f e r e n c e i n t h e Cniced S t a t e s and o t h e r i c d u s t r i a l i z e d c o u n t r i e s f o r l e a n e r pork and beef combined w i t h a d e c l i n e i n t h e firices f o r l a r d and t a l l o w r e l a t i v e t o t b o s e Eor pork and beef have p rov ided a s t r o n g i n c e z t i v e t o l i v e s t o c k p roduce r s t o raise s n i m a l s which would c o n v e r t l i v e s t o c ~ f eed i n t o more mat and less f a t . Thus, U.S. p r o d u c t i o n o f l a r d and t a l l o w has d e c l i n e d = s t e a d i l y s i n c e t h e e a r l y 19609, wh i l e p r o d u c t i o n of hogs ant3 c a t t l e has grown :Table 14) . However, l a r d and t a l l o w p r o d u c t i o n has i n c r e a s e d i n t h e USSR AND ! China. - - *
a 39. To o b t a i n a s u i t a b t e c o n s i s t e n c y f o r s h o r t e n i n g , h a r d and s o f r o i l s - a r e S l en?ed t o g e t h e r . O l e o s t e a r i n e and e d i b l e t a l l o w a r e t h e two n a t u r a l l y ha rd d i l s t h a t have keen most widely used i n t h e manufsr . ture of s h o r t e n i n g .
I / The l a t t y t i s s u e s c ~ f a r i m a l s ( r ' r e e from muscle o r bone) c o n t a i n between - 70 and 90 p e r c e n t I I+.; t h e r e s t is main ly w a t e r and c o n n e c t i v e r i s a u e .

Lard i s a f a t which does nc t require hydrogenation, and before the development of t he hydrogenation procese, it was t he main ingred ien t i n the mnufac ture of shortening. Hydrogenated vegetable o i l 8 have n w l a rge ly replaced l a rd i n t h i e end-use. In recent years , t a l l w ha8 been increae ing ly replaced by hydrogenated s o f t o i l s t o achieve the hardening e f f ec t . Because there i s a considerable v a r i a t i o n i n the hardness o f d l f f e r e n t l o t 8 of commercial e d i b l e t a l low, i t has been d i f f i c u l t t o produce shor ten ing wi th a uniform consistency
Table l ? : LARD PRODUCTION I N W O R PRODUCING COUNTRIES, FIVE-YEAR AVERAGES AND AVERAGE AHNUN. CROKTH RATES
Count w Product ion G r w t h Rater
1961-65 1966-70 1971-73 I 9 6 1 - 65/ 1961-651
Brazi l 8 8 China 380 Germany, Dep. Rep. 91 Germany, Fed. Rep. 295 Hunga rY 184 I t a l y 80 Japan 4 3 Poland 90 Romnia 47 US 1,087 USSR 518 Yugoslavia 133
Other Countries 497 571 693 2.8 3.9 3 .4
WORLD TOTAL 3,533 3,681 4,052 - 0.8 - 1.9 1.4 -
Source: FA0 s t a t i s t i c e .
when a l a r g e proportion of tal low is used. I n shor tenings which contain e i t h e r ta l low o r o l eos t ea r i ne , aay proport ion of the tallow-vegetable o i l blend may be replaced by la rd . - 100. For many years , tal low and l a r d were the main r a w ~ t e r i a l e used i n margarine. The f i r s t margarine was rnade from o l eo o i l , the l i qu id f r ac t i on of tallow. (The physical p roper t i es of oleo a r e very c lose t o those of bu t te r ; i t i s f i rm a t low temperatures, hrt melts r e ad i l y i n the mouth.) Later , p a r t of the o leo o i l was replaced by lard . With the development of the hydro- genation procesa, hydrogenated vegetable o i l s have increas ing ly replaced the t w o animal cat^. Table 15, whlch provides an overview of the world t a l l o v production, i l l u s t r a t e s the sloudovn i n the growth of t a l l w output .

101. The f o l l w i n g equa t ions (1.13) and (1.14) a r e t h e es t imated r e l a t i o n s h i p s f o r l a r d and t a l low suppl i e s .
Table 15: TA',LOW PRODUCTION IN PWOR PRODUCING COUNTRIES, FIVE-YEAR AVERACES AN3 AVERACE ANNUAL C R O m RATES
Count r~ Production Growth Rater
1961-65 1966-70 1971-75 1961-65/ 1966-70/ 1961-65/'
---- ( *om mt)----- --------- ( percent )--------
A u s t r a l i a 176 184 240 0.9 5.5 3.2 Canada 105 141 211 6.' 8.4 7.2 Ch i na 118 124 127 I .U 0.5 0.7 Prance 123 122 130 -0.2 1.3 0.6 U K 138 145 150 1 .O 0.7 0.8 U S 2,089 2,390 2,583 2.7 1.6 2.2 USSR 2 10 289 3 19 6.6 2 .O 4.3
Developing Coun t r i e s 306 344 379 2.4 2.0 2.2
Other Countr ies 374 452 497 3.9 1.9 2.9
WORLD TOTAL 3 .. .9 4,191 4,636 - 2.9 2.0 -. - - 2.5 -
Source: FA0 s t a c i s t Lcs.
Lard Supply: 1961-77
(1.13) LARS, = 1974.69 + 0.8840 LAWtd1 + 0.4099 + 4.6042 PORKPRI,-l
( 1.04) (4.80) (5.92)
+ 201.608 0717274 - 213.503 06476 = (6.22) (5.60) '9
R~ - 0.96 - S.E.E. = 47.54 *
uhe re : * C
L.=S = world production of l a r d ( '000 m t )
WRP = p r i c e f o r l a r d , d e f l a t e d by t h e Index o f I n t e r - n a t i o n a l I n f l a t i o n , CIF European p o r t s (1974 c o n s c a n t $/mt)

PORKPRI - p r i ce f o r pork, deflate.: by the Index of I n t e r na t i ona l I n f l a t i o n , CIF European p o r t r (1974 constant $/mt)
3717274 - dummy var iab le s e t t o 1 f o r the year8: 1971, 1972 and 1974
D6476 - dummy varf:ble s e t t o 1 f o r t h e years: 1964 and 1976
Tallow Suoply: 1961-77
TALS - vorld production of t a l l w ('000 m t )
BELFPRI - beef p r i c e (average of two 8eritr-Argentine frozen ~ n u f a c t u r i n g beef axportad t o EC-9, and Austra l ian oxen, uholerale , Brirbane)
TALP - p t i c e f o r t a l l w , de f l a t ed by the Index of I n t e m a t i o a a i I n f l a t i o n , CIP European p o r t r (1974 conr tan t $/mt)
D75 - dummy var iab le r a t t o 1 f o r 1975
102. The correeponding export supply equation8 f o r t he r e tm comnoditier a r e presented b e l w .
Lard Exports: 1961-77
-
R' = 0.83 S . E . E . = 0,$7-'t *
where: - - t L M = world exports of l a rd ( 400 m t )
D.W. - 2.14
WRS = world production of l a rd ('000 m t )
DG566 = dummy var iab le s e t t o 1 f o r t h e years: 1965 and 1966
LAW = l a rd p r ices , de f la ted by the Index of In te rna t iona l I n f l a t i o n (1974 constant S / m t )

Tallow E x ~ o r t s : 1961-77
S.E.E. = 0.059 D.W. = 1.68
where:
ThLX - world exports of tal low ('000 mt)
ThLS - world production of ta l low ('000 a t )
D74 - dummy var iab le s e t t o 1 f o r 1974
TALP - pr ice f o r t a l l w , de f l a t ed by the In t e rna t i ona l Pr ice Index, US bulk, bleachable fancy, CIP Rotterdam (1974 constant $ / a t
103. Butter continues t o occupy a prominent pos i t ion among the various f a t s and o i l s . Despite its comparatively high p r i c e and t he growing cocapetition from f a t products (e.g., oargar ine , shor tening, e tc . ) made from the ample supply of vegetable o i l s , t h e sha r e of b u t t e r i n the production of a l l f a t s and o i l s has decl ined only s l i g h t l y dur ing the past two decades. I n abso lu te t e r m , vor ld production has even increased-at an average annual r a t e of 1.1 percent a year during t h i s period (Table 16).
104, While the bulk of tbe w r l d production of b u t t e r is produced from cow's mllk, a s i g n i f i c a n t por t ion i s made f roo the milk of o the r animals such a s buffa lo and goats. I n i ndus t r i a l i z ed count r ies , bu t t e r is increasingly produced i n creameries r a t he r than f a r m . I n t h e United S t a t e s , f o r example, about 98 percent of t o t a l bu t t e r production is from creameries. Butter made on farms has a d i s t i n c t yellow color; the depth of t h i s co lo r va r i e s with the season of t h e year and the feed of the da i ry herds. L/ I n the t r op i ca l regions of Asia and Afr ica , b u t t e r is used mainly i n the form of bu t t e r f a t , which i s obtained by hea t ing dnd separa t ing the f a t from the milk serum of the bu t te r . The r e su l t i ng b u t t e r f a t is usuaJly re f ined t o dry b u t t e r ( i t s name i n India is ghee). I t keeps m ~ c h b e t t e r i n the c l ima t i c condi t ions of the t r op i c s than do ordinary bu t t e r and many o t h e r f a t s and o i l s , 2/ Butter, cream, milk o r i c e cream may be recons t i tu ted from dry b u t t e r Ky blending i t with f l u i d r i l k , skim milk pwder , water and o t h e r ingredients . - -
Z
1/ To a l a rge excent the feed of the da i ry herds determines the iodine number - and ccnsequently the consistency of b u t t e r f a t .
2 / Some dry b u t t e r is a l s o manufactured i n Aus t ra l i a and New Zealand, where - but te r o f t en has t o be shipped over Long d i s t ance s without proper cold s torage.

105 . Butter i e an e m l e i o n i n vhick _Cine f a t d r o p l e t e a r e diepereed i n water. The f a t con ten t of b u t t e r v a r i e e from country t o country and uerrally depende on l o c a l l e g a l requiremente. I n t h e United Stat- , the f a t content rangee from 80 t o 81 percent . I n a d d i t i o n t o f a t and water , b u t t e r a l e o conta ine phoephatidee A1 and Vitamins A and D.
106. The following equation8 a r e t h e eetimated r e l a t i o n e h i p r f o r b u t t e r euppl iee and exports.
But ter Supply: 1961-77
It2 - 0.86 S.B.E. - 139.7 D.V. - 2.04
vhe r e :
BUTS - world production of b u t t e r ('OW m t )
PFO - p r i c e index f o r f a t s and o i l s (1974-100)
D6473 - dummy v a r i a b l e set t o 1 f o r t h e years: 1964 and 1973
D6566 - dummy v a r i a b l e ne t t o 1 f o r t h e yeare: 1965 and 1966
But ter Exports: 1961-77
R~ = 0.85 S.E.E. = 0.101
vhere:
D.V. - 2.37
L
BUTX - world expor ts of b u t t e r ('000 mt)
BUTS = world production of b u t t e r ('000 mt)
D7073 = dunmy v a r i a b l e s e t t o 1 f o r t h e years: 1970 and 1973 - BUTP = b u t t e r p r i c e s , d e f l a t e d by t h e I n t e r n a t i o n a 1 Index of
Inf l a t f o n (1974 cons tan t $/mt)'
1/ Pro te ins and phosphatides a c t a s emuls i fying agents . They a l s o help - prevent t h e s p a t t e r i n g of b u t t e r when i t is heated by permit t ing t h e water t o escape slowly.

T a b l e 16: BUTTZR PRODUCTION I S HAJOR PRODUCING COUNTRIES: FIVE YFAR AVERAGES AND AVERAGE AYNUAL GROUTH RATES
Count rv P roduc t ion Growth Ratee
1961-65 1966-70 1971-75 1961-651 1966-701 1961-65/'
------- ( '000 mt)----- ----- ( p e r c e n t )-----
A u s t r a l i a 201 2 LO 184 0.9 -2.6 -0.9 Canada 167 156 127 -1.4 -4.0 -2.7 Czechos lovakia 7 7 90 106 3 .2 3.7 3.4 Denmark 162 150 136 -1.5 -1.9 -1.7 France 429 521 533 4 .O 0.5 2.2
Germany, Dern. Rep. 175 213 252 4.0 3.4 3.7 Germany, Fed. Rep. 481 516 503 1.4 -0.5 0.5 I n d i a 427 423 443 -0.2 0.9 0.4 Ne the r l ands 97 110 167 2.6 8.7 5.6 New Zealand 225 253 237 2.4 -1.3 0.5
P a k i s t a n Poland Turkey US USSR
Othe r C o u n t r i e s 1 ,073 1,168 1 ,223 1.7 0.9 1.3
WRLD TOTAL 5,566 5 ,941 6,187 - 1.3 - 0.8 - 1.1
Source: FA0 s t a t i s t i c s .
B. Demand E a u a t i o n s
m a r a c t e r i s t i c s o f F a t s and O i l s
107. Chemical S t r u c t u r e . A l l f a t s are g l y c e r i d e s , t h a t is, compounds of g l y c e r o l w i t h f a t t y a c i d s t h a t vary i n c h a i n l e n g t h a n d / o r i n t h e deg ree of u n s a t k r a t i o n . A p a r t i c u l a r n a t u r a l f a t w i l l c o n t a i n s e v e r a l g l y c e r i d e s which u i 1 l ' ~ i f f e r i n t h e i r f a t t y a c i d compos i t ion . These d i f f e r e n c e s a i f e c t t h e m e l t i n g c h a r a c t e r i s t t c s and o t h e r p r o p e r t i e s of t h e g l y c e r i d e s . The m e l t i n g - c h a r s t e r i s t i c s o f a n a t u r a l f a t a r e t h e r e s u l t o f t h e mix of g i y c r r i d e s i n i t
8 and B e o f fundamental importance t o t h e food u s e s of t h e f a t . For example, . t h e gTyce r ide s i n t a l l o w have a h i g h p r o p o r t i o n of s a t u r a t e d a c i d s of l ong c h a i n l e n g t h and h i g h m e l t i n g po in t . The u s e of ta l low a s a s o l e i n g r e d i e n t is l i m i t e d because i t does n o t m e l t a t body t empera tu re and l e a v e s a n u n p l e a s a n t f e e l i n g on t h e p a l a t e when e a t e n . B u t t e r on t h e o t h e r hand, though s o l i d enough t o be handled i n b l o c k s , is s o f t enough t o be s p r e a d e a s i l y and

melt.; r ead i ly i n the mouth. F i n a l l y , an o i l such a s soybean o r s u n f l w e r remains l i q u i d even i n co ld v t a t h e r , a l though on t h e i r ova they l ack some of the phys ica l p r o p e r t i e s required f o r food nuf facture. They a r e , houever, u s e f u l a r a s a l a d o i l . The food t echnolog i s t can choose a v a r i e t y of o i l s from those a v a i l a b l e on t h e market and blend them t o o b t a i n t h e p rec i se p r o p e r t i e s of the f a t product he requires .
108. Saturated and Unraturated Fa t ty Acidr. An important d i s t ingu i sh ing f e a t u r e of f a t s and o i l s is t h e degree t o which t h e i r f a t t y a c i d s a r e sa tu ra ted . O i l s with a high percentage of unsaturated f a t t y acids-roybean o i l , f o r example-are genera l ly l i q u i d a t room teapera tu re i n temperate c l imates and a r e thus c a l l e d "soft" o i l s . O i l r o r f a t s wi th a l a r g e propor t ion of s a t u r a t e d f a t t y a c i d s , such a s palm o i l , a r e u s u a l l y s o l i d o r semi-solid. In general , unsaturated f a t s and o i l r a r e used f o r the menufacture of l i q u i d f a t products ( sa lad and cooking o i l s ) . Satura ted f a t s and o i l s a r e the m i n ingred ien t s i n t h e m n u f a c t u r e of hard f a t products, such a s margarine, shor ten ing and soaps. Though palm o i l was used previour ly only f o r i n d u s t r i a l purposes, improved f r r c t i o n a t i o n t e c h n i ~ u e s n w a l l o v i t t o coapete wi th o t h e r f a t s and o i l s i n t h e lunufac tu re of a a r g a r i n e s , shor tenings , cooking f a t r , r a l a d 0118, confec t ionrry and ice cream. However, s o f t o i l s can be hardened through hydrogenation. Thir has expanded the range of f a t s and o i l s t h a t can s u b r t i t u t e f o r palm o i l and o t h e r hard ( sa tu ra ted) o i l s i n these end-user. Dehydrogenation-the t ransformat ion of sa tu ra ted f a t t y ac ids i n t o c h e l r unsaturated f o m - h a s not proved economic.
N u t r i t i o ~ l Aspect8 of Fa t s and O i l s
109. High Ca lor ie Food. Fats and o i l s con ta in more c a l o r i e s than any o t h e r food. They provide about 9 l a rge c a l o r i e a per gram, coopared t o about 4 c a l o r i e s from pro te ins and carbohydrates. F a t s have a l s o t h e highest c a l o r i e dens i ty of any food, s i n c e they a r e e s s e n t i a l l y water-free i n comparison with p ro te ins and carbohydrates, which conta in l a r g e q u a n t i t i e s o t va te r .
110. Fat Def ic iencies . Although carbohydrates f i l l t h e same bas ic need i n the d i e t a s f a t s and o i l s , they cannot be s u b s t i t u t e d t o a n unlimited extent . A s u b s t a n t i a l o r l a s t i n g reduct ion i n f a t in take l eads t o f a t hunger. This is then usual ly f o l l w e d by a period during which f .a t consumption increases sharply . This need f o r f a t i n the d i e t may be p a r t i a l l y explained by the f a c t t h a t f a t not only inc reases t h e p a l a t a b i l i t y of foods, it a l s o delays the d i g e s t i o n of food, prevent ing a preaa tu re s e n s a t i o n of hungar a f t e r ea t ing. L I
111. Fa t s and o i l s a r e not only an important source of energy, but c e r t a i n unsaturated f a t t y a c i d s a r e e s s e n t i a l components of a well-balanced d i e t . A lack of them r e s u l t s i n a fat-deficiency disease . Since some of these f a t t y a c i d s play a n important r o l e during:pregnancy and l a c t a t i o n , f a t d e f i c i e n c i e s a f f e c t uo-an and smal l c h i l d r e n mo* s e r i o u s l y than men. F i n a l l y , severa l vitamins a r e dissolved by f a t and a r e f requen t ly consumed with f a t t y foods, s o t h a t f a t d e f i c i e n c i e s may a l s o r e s d t i n a lack of these vitamins. * - 1/ In c a l o r i c - d e f i c i e n t s t t u a t t o n s , f a t s combined with carbohydrates can -
be s u b s t i t u t e d f o r prote in .

112. Impact of Fa t Consumption on Heal th . During t h e e a r l y 1950s, medical r e s e a r c h began t o s h i f t away from t h e well-known e f f e c t s of f a t d e f i c i e n c i e s - on human h e a l t h t o look more c l o s e l y a t t h c r e l a t i o n s h i p between consumption o f f a t s and o i l s and t h e inc idence o f c a r d l o v a s c u l a r d i s e a s e . Although a c l e a r cause and e f f e c t r e l a t i o n s h i p was never e s t a b l i s h e d , t h e r e s u l t s showed t h a t po lyunsa tu ra t ed f a t t y a c i d s , t h e main components of s o f t vegetable o i l s , a r e h e a l t h i e r than s a t u r a t e d f a t t y ac ids . These f i n d i n g s were wldcly publicized and c o n t r i b u t e d t o a s h l f t In consumption from ' ha rd" 011s t o "sof t" v e g e t a b l e o i 1s.
113, Thc op t ima l q u a n t i t y of f a t s l n t h e d i e t h a s been more d l f f l c u l t t o d e t e r a l n e . I t was well-known t h a t t h e body s t o r e s f a t i n t h e ad ipose t i s s u e s u n t i l needed a s a sou rce of c a l o r l e a . The noount of f a t s t o r e d depends on t h e c a l o r i c ba lance of t h e body. A l l c x c e s s c a l o r l e s , r e g n r d l e s s of whether they a r e i n t h e form of f a t , carbohydrates o r p r o t e i n , a r e s t o r e d a s f a t . Conscquent l y , n s u b s t a n t i o l p o r t i o n of t h e ca rbohydra t e s consumed, as wel l a s some p r o t e i n , a r e conver ted i n t o f a t . 11 When c n l o r i c needs exceed c a l o r i c i r t a k e , f a t i s r e l ensed from t h e ad ipose t i s s u e s a s f r e e Eacty d c l d s i n t o t h e blood and is d i s t r i b u t e d throughout t h e body. Thc i n t e r a c t i o n of t hese f r e e f a t t y a c i d s wi?h oxygen is t h e major s o u r c e of energy f o r t h e body. Although i t h a s no t been p o s s i b l e t o e s t a b l i s h a b s o l u t e q u a n t i t i e s f o r f a t i n t a k e , t h e f l n d l n g s liave l n d l c a t e d t h a t t h e aha re of Eat In t h e d i e t is i n v c r s e l y r e l a t e d t o t h e overage tempera ture of t h e environment. Thus, d i s r e g a r d i n g o t h e r f a c t o r s , p e r c a p i t a consumption of f a t s i n temperace c l i m a t e s w i l l exceed t h a t i n t r o p i c a l climates.
Non-Nutri t ional Uses of F a t s and O i l s
114. Ln a d d i t i o n t o be ing a food, f a t s and o i l s have s e v e r a l non- n u t r i t i o n a l uses . F a t s a r e used In f r y i n g t o t r a n s f e r h e a t r a p i d l y and uniformly o v e r t h e whole s u r f a c e o f t h e food. Compared t o o t h e r methods of cooking, f r y i n g has t h e advantage t h a t t h e cooking t a k e s p l a c e r ap id ly . S ince f r y i n g i n deep f a t does n o t i n c r e a s e t h e f a t c o n t e n t s u b s t a n t i n l l y , t h e t r a d i t i o n a l p re jud ice a d a i n s t f r y i n g i s f a d i n g away. Host fas t - food r e s t a u r a n t s u se deep f r y i n g as t h e i r major means of p r e p a r i n g meals. The s t eady i n c r e a s e i n t h e nunher of meals p e r fami ly e a t e n o u t of t h e house has ' c r d a t e d a s i z a b l e market f o r f r y i n g o i l s i n t h e Uni ted S t a t e s and o t h e r i n d u s t r i a l i z e d c o u n t r i e s . 21 -
115. Fa t is a l s o e s s e n t i a l f o r t h e uanufac tu re of bakery q o d s . I t is capab le of e n t r a p p i n g and ho ld ing a i r , which expands under t h - in f luence oE h e a t , t he reby c o n t r i b u t i n g t o leavening. - - *
11 Although a l l u sua l d i e t a r y f a t s a r e of equa l n u t r i t i o n a l va lue , c e r t a i n - po lyunsa tu ra t ed f a t t y a c i d s , such a s l i n o l e i c a c i d , cannot be made by t h e body 2nd mist be s u p p l i e d i n t h e d i e t .
2 / T h i s v z s one o f t h e r easons why t h e pe r c a p i t a consumption of f a t s and - o i l s i n i n d u s t r i a l i z e d c o u n t r i e s , once widely assumed t o have reached i t s s a t u r a t i o n l e v e l , cont inued t o c l imb.

116. Thus the use of f a t has tvo funct ions . F i r s t , i t enhances food value , and second, i t enables the product t o assume i ts c h a r a c t e r i s t i c form and tex tu re .
117 . A l l n a t u r a l f a t s and o i l s have d i s t i n c t i v e f l a v o r s which a f f e c t t h e f l a v o r of the foofla prepared wi th them. The demand f o r some o i l s (e.g., o l i v e o i l ) r e s t s l a r g e l y on the c h a r a c t e r i s t i c f l a v o r they give t o t h e food. Even deodorized and t a s t e l e s s o i l s b r ing ou t the n a t u r a l f l a v o r of foods. These o i l s can be used, the re fore , a s a "seasoning" f o r cooked vegetables , sa lads , sauces , g r a v i e s , e t c .
b i n User of Fa t s and O i l s
118. Only a small por t ion of the world's production of f a t s and o i l s is coneumed d i r e c t l y , w i thout f u r t h e r processing. The bulk of production reaches t h e consumer i n r o c processed form. F a t s and o i l s a r e a major ingredient i n a wide v a r i e t y of food and non-food products, 11 t h e m a t i a p o r t a n t being: ( a ) margarines; (b ) rher teninga f o r use i n tEe h o w ; ( c ) shor tenings f o r manufacturing bread, caker ~ f l b i s c u i t s ; (d) f r y i n g f u t s ; ( a ) sa lad o i l ; ( f ) f a t s f o r s p e c i a l i z e d food manufacture, confect ionary, i c e c r a m and imi ta t ion cream; (g ) soap and de te rgen t s ; (h ) p a i n t s ; and ( i ) chemical products.
Margarine
119. Margarine was t h e r e s u l t of a sea rch f o r an inexpensive s u b s t i t u t e f o r b u t t e r . The E i r s t success fu l a t tempt was t h a t of French chemist k g e - Hourieb !.n 1870. The o r i g i n a l proceer f o r making margarine required two major ingredients : beef f a t and milk. To prepare it , the beeE f a t war rendered a t a very low temperature and then separated i n t o Eract ionr wi th d i f f e r e n t p e l t i n g points . The o b j e c t i v e was t o o b t a i n a f a t wi th a lover p e l t i n g po in t than the o r i g i n a l beef f a t . This f r a c t i o n was then mixed wi th milk t o give it a bu t te r - l ike f lavor . 21 I n order t o a r r i v e a t a product wi th roughly the same consis tency a s b u G e r , the elaulsion of milk and l i q u i d f a t was slowly poured i n t o c h i l l e d water.
120. ' Early margarines had s e v e r a l disadvantages wheA conpared t o bu t te r . Apart from d i f f e r e n c e s i n t a s t e , a combination of milk and Ent a lone yielded a n emulsion which w a s much l e s s s t ab le . This became more obvious when margarine was used f o r f ry ing ; the rapid s e p a r a t i o n of i t s water and f a t components caused t h e margarine t o s p a t t e r and t:.e milk s o l i d s t o s t i c k t o t h e pan. This problem was overcome by adding vario;s emulsifying agents t o t h e mixture of milk and f a t . -
11 The p r i n c i p a l competi t ion t o f a t s and o f ' s i n the manufacture of non-food - products i s from s y n t h e t i c s .
2 1 The b u t t e r - l i k e f l a v o r could only have been der ived from the ac t ion of - b a c t e r i a i n the milk. I t was l a t e r discovered t h a t a more pronounced f l a v o r of b u t t e r could be obtained by sour ing o r r ipening the milk before mixing i t with the f a t .

121. - T a s t e . S i n c e t h e t a s t e of m a r g a r i n e s h o u l d r e s e m b l e t h a t o f b u t t e r as c l o s e l y a s p o s s i b l e , i t is i m p o r t a n t t h a t none o f t h e n a t u r a l f l a v o r s o f t h c f a t s ~ ~ s c d i n t h e p r o d u c t i o n of m a r g a r i n e a f f e c t t h e f l a v o r o f t h e f i n a l p r o d u c t . Thus t h c fa ts i ~ n d 01 1 s u s e d I n m1rgat1nr.s must be c o m p l e t e l y f lihvor l e s s .
122. w l t i n g B e h a v i o r . Y a r g a r l n c h a s t o melt r e a d i l y a n d c o m p l e t e l y v h e n consumed. I n t h i s r e s p e c t i t d i f f e r s f rom s h o r t e n l n g s , v h i c h a r e u s u a l l y consumed a l r e a d y m e l t e d ( I n h o t d l s h e s ) o r f i n e l y d i s p e r s e d ( i n p a s t r i e s a n d baked p r o d i i c t s ) . S i r g a r l n e is , o n t h e o t h e r h a n d , u s e d l i k e b u t t e r , namely d i r e c t l y , and u s u a l l y as a t a b l e s p r e a d . I f margarine v e r e n o t t o melt c o a p l c t e l y , i t v o u l d h a v e a n u n d e r s l r a b l c "pas ty" c h a r r c t e r l s t i c . T h e r e f o r e , Lt h a s t o be p l a s t l c a n d h a s t o s p r e a d f r e e l y a t room t c m p c r a t u r e s . I n g e n e r a l , t h e c o n s i s t e n c y a n d cmcltlng c h a r a c t e r l s t l c s o f good b r a n d s o f mr t rga r lnc r e s e m b l e t h o s e o f b u t t c r P C room and body t e m p e r a t u r e s . Hovever , m ~ r g a r l n e 1 s s u b s t n n t l a l l y s o f t e r i ~ n d c a n be s p r e a d more e a s i l y v h e n c o l d .
123. C o n s ! ~ t c n c y . The c o n s i s t e n c y o f o e r g n r l n c d e p e n d s l a r g e l y on t h e C o t s u s e d I n i ts m ~ n u f a c t u r e ; i t is a f f e c t e d l i t t l e by v a r i a t i o n e i n t h e methods o f s o l l d l f y l n g a n d e m l s l f y l n g . When h a r d o i l s s u c h a s c o c o n u t o i l , pa lm k e r n e l o i l o r l a r d a r e u s e d , t h e d e s i r e d c o n s i s t e n c y is u s u a l l y c o n t a i n e d i n t h e f a t s i n t h e p r o p e r p r o p o r t i o n . T h e s e v e r e t h e f a t s t r a d i t i o n a l l y u s e d I n m r g o r l n e . A f t e r t h e h y d r o g e n a t i o n p r o c e s s became c o a i m e r c i a l l y a v a i l a b l e , t h e p r o p e r consistency was o b t a i n e d by b l e n d i n g two o r more ( p a r t i a l l y ) h y d r o g e n a t e i v e g e t a b l e o i l s t o g e t h e r . I f a s o f t e r e n d p r o d u c t v a s d e s i r e d , l i q u i d v e g e t a b l e o i l s were o f t e n b l e n d e d w i t h h y d r o g e n a t e d o i ls .
124. F a t s Used i n t h e P r e p a r ~ c i o n o f M a r g a r i n e s . The f i r s t m a r g a r i n e s v e r e made f rom bee f f a t a n d oleo '011. The l a t t e r was l a t e r s u p p l e m e n t e d by l a r d . F o r a l o n g tLme, t h e s e t v o a n l a m 1 f a t s r emained t h e p r i n c i p a l r e v m a t e r i a l s i n t h c m a n u f a c t u r e o f m a r g a r i n e s . D u r i n g World War I , c o c o n u t o i l , palm k e r n e l o i l a n d b a b a s s u o i l v e r e u s e d i n i n c r e a s i n g q u a n t i t i e s i n m a r g a r i n e ; by t h e e a r l y 1930s t h e y made u p more t h a n 6 0 p e r c e n t of a l l f a t s a n d o i l s u s e d i n t h e m a r g a r i n e i n d u s t r y .
125. The d e v e l o p m e n t o f t h e h y d r o g e n a t Lon p r o c e s s made i t p o s s i b l e t o r e p l a c e c o c o n u t o i l v i t h c h e a p e r v e g e t a b l e o i l s , m a i n l y c o t t o n s e e d a n d s o y b e a n . I t was found t h a t m a r g a r i n e made f rom h y d r o g e n a t e d v e g e t a b l e o i 1 s was s u p e r i o r t o t h a t made f rom o l e o o i l , c o c o n u t o i l o r o t h e r h a r d o i l s . I n a d d i t i o n , h y d r o g e n a t i o n p e r m i t t e d t h e m a n u f a c t u r e o f f a t s t h a t were s t a b l e , f l a v o r l e s s and u n i f o r m i n c o n s i s t e n c y . 11 The b u l k o f t h e m a r g a r i n e p r o d u c e d
! nou i n t h e U n i t e d S t a t e s a n d E u r o p e is made f rom h y d r o g e n a t e d v e g e t a b l e o i l s . I n t h e U n i t e d S t a t e s , h y d r o g e n a t e d s o y b e a n o i l s a r e by f a r t_he mos t
1 / F i s h o i l s arc n o t s u i t e d f o r c!?e p r e p a r a t i o n o f h y d r o g e n a t e d f a c s ; t h e i r - f i s h y f l a v o r r e :u rns i f t h e y a r e n o t c o m p l e t e l y h y d r o g e n a t e d . I n t h i s r e s p e c t u h a l e o i l is g r e a t l y s u p e r i o r t o f i s h o i l a n d h d s b e e n e x t e n s i v e l y u s e d i n t h e m a n u f c t u r e o f m a r g a r i n e i n Europe .

impor tan t source . H w e v e r , t h e ? rend t o uhe more p o l y u n s a t u r a t e d f a t t y a c i d s h a s r e s u l t e d i n a s u b s t a n t i a l i : . ~ r e a s e i n t n e u se of c o r n o i l . - 11
126. - Milk. I n a d d i t i o n t o f a t s and o i l s , mi lk ( s k i 3 mi lk o r non fa t d r y d l k ) is t h e o t h e r majo r t n g r e d i e n t i n margar ines . The f l a v o r and aroma depend t o a l a r g e e x t e - - on t h e t r ea tmen t of t h e mi lk . Only t h e b e s t b a c t e r i a 1 c u l t u r e s , u~ t h proved f l a v o r and aroma-producing q u a l i t i e s , 6 .ould be used i n r i p e n i n g milk.
127. C o l s t r a i n t s on t h e Harket f o r U r g a r i n e . The development of margarine made i t p o s s i b l e t o p repa re a product s i m i l a r t o b u t t e r but made from f a t s and o i l s - and much less expens ive . Because of i t s low c o a t s of p roduc t ion , margar ine posed a s e r i o u s t h r e a t t o t h e d a i r y i n d u s t r y . 1n:enoive lobbying e f f o r t s by t h e d a i r y i n d u s t r y l e d to a s u b e t r n t i r l amount of l e g i s l a t i o n veakening t h e compe t i t i ve advantage o f margarine.
128. Like margar ine , s h o r t e n i n g is a s u b s t i t u t e f o r b u t t e r . Hweve r , i t is n o t consumed d i r e c t l y as a spread o r t a b l e f a t , bu t is used f o r cooking and baking i n p l ace of b u t t e r . 21 As t h e name "shor ten inq" i n d i c a t e s , i t g i v e s baked goods a "shor t" o r teTder q u a l i t y .
129. F a t s Used i n t h e P r e p a r a t i o n of Shor t en in@ Cons is tency , a e l t i n g behavior . t a s t e and o t h e r phys i ca l c t ta rac te r i8 t i : s o f s h o r t e n i n g a r e determined l a r g e l y by t h e f a i s and o i l s used i n i ts p r e p a r a t i o n ; I n t h i s r e s p e c t , t h e r e i s l i t t l e d i f f e r e n c e be tveen s h o r t e n i n g and margarine. O r i g i n a l l y , l a r d and o t h e r a n i a a l f a t s v e r e t h e p r i n c i p a l e d i b l e f a t s used. L a t e r , s o f t v e g e t a b l e o i l s (e.g., co t tonseed o i l ) r e p l a c e d p a r t of t h e an ima l f a t s . T h i s y i e l d e d a semi-so l id ("compound") s h o r t e n i n g .
130. The developirient of t h e hydrogenat ion g rocese r a d i c a l l y a l t e r e d t h e demand f o r f a t s and o i l s i n t h e s h 5 r t e a i n g i n d u s t r y . S h o r t e n i n g manufacture is no longe r r e s t r i c t e d b-1 t h e a v a i l a b i l i t y of an ima l f a t s . Host v e g e t a b l e o i l s c a n n w be used t o p repa re sho r t en ings . I n a d d i t i o n t o soybean o i l , which is by f a r t h e most impor tan t sou rce of o i l f o r s h o r t e n i n g , 31 o t - e r a a r e co t tonseed o i l , c o r n o i l , s a f f l o v e r o i l , s u n f l o v e r o i l and p i r n o i l . Host s h o r t e n i n g s a r e made from two o r more' hydrogenated v e g e t a b l e o i l h which a r e blended t o g e t h e r . I n a d d i t i o n , t h e e x t e n t of hyd rogena t ion of each o i l may be v a r f e d t~ g i v e t h e f i n a l product i t s d e s i r e d c h a r a c t e r i s t i c s . Thus t h e
11 Like s h o r t e n i n g n u f a c t u r e s , margarine producers have , s i n c e t he e a r l y - 1960s, i nc reased % e s h a r e of po lyunsa t r i ra ted f a t t y a c i d s i n t h e i r p roducts i n response t o medical r e s e a r c h s u g g e s t i n g t h e s u b s t i t u t i o n of t h e s e f a t s f o r more s a t u r a t e d ones. Ya rga r ines c o n t a i n f a t t y a c f d s ; i n s o r e product ; t h e s h a r e of t he se o i l 3 i s a s h i g h a s 65 p e r c e c t .
21 Shor t en ing f s a l s o sometimes used t o g e t h e r w i t h b u t t e r . -
31 I n t h e Wnited S t a t e s and Europe, most of t h e i s p o r t e d palm o i l is used - f o r t h e manufacture of sho r t en ing .

p o s s i b i l i t y of hydrogenation t o g e t h e r v l t h t h e a v a i l a b i l i t y of inexpensive vege tab le o i l s gave s h o r t e n i n g manufacturers g r e a c e r f : e x i b i l l t y i n choosing their raw m a t e r i a l s t h a n they had b e f o r e and , a t t h e same time, s t r e n ~ t h e n e d their compe t i t i ve p o s i t i o n v is -a-v is b u t t e r .
131. U n t i l t h e e a r l y 19600, mo-t o i l s used t n t h e ~ a n u f a c t u r e o f margarines w r e h igh ly s a t u r a . . d . They reduced t h e amount of hydrogecta t lon needed and y i e l d e d a s h o r t e n i n g that was h i g h l y s t a b l e . G r w i u g consumer aua renes r a b o t ~ t t h e r e l a t i o n s h i p k t u e e n c a r d i o v a s c u l a r d i s e a s e and t h e coasuap t ion of s a t u r a t e d f a t t y a c i d a l c d t o a s h a r p i n c r e a s e i n t h e u s e of po lyunsa tu ra t ed o i l s i n t h e o rnufac t u r e of s b o r t e n i n g s . Host shor t en rngs now c o a t a i n *bout 30 p e r c e n t po lyunra tu ra t ed f a t c y a c i d s .
132 Llquid S h o r t e n i n k I n r e c e n t y a a r r , s h o r t e n i n g u a n u f a c t u r c ~ have Cevelo,md a l i q u i d s h o r t e n i n 8 vh ich i r made from l i q u i d rnd only l i g h t l y hydrogenated (sof t ) r e g o t a b l a oils. There p r o d u c t r c o n t a i n betweea 30 and 50 pcrcen t po lyunsa tu ra t ed f a t t y acids. Liquid s h o r t e n i n g is m l n l y uded i n t h e c o o u r l c a l p roduc t ion o f bread and bakerr ' p roducts .
Prying P a t r
133. Prying f a ! ; have tuo funct ions . F i r s t , t h e y n t t a s a h e a t t r a n s f e r * d i m . I n deep fa^. f r y i n g , t h e f a t m y be a t 180°c o r above vhen t h e food is pu t La. Steam is cre>ced. cooking t h e f w d e f f i c i e n t l y and u s u a l l y producing a c r i s p t e x t u r e o n t h e m c s i d t . Second, a p r o p o r t i o n o f f a t is absorbed by the food, mainly i n t h e o u t e r l a y e r n 4.d t h e r e f o r e b e t o l u s a c o n s t i t u e n t of t h e f r i e d product . The propor t ion can 08 a a h i g h a s 35 - 40 per-.en:, a s i n p o t a t o chips .
134. A t f r y i n g tempera tures , it is i n e v i t a b l e t b q t a c e r t a i n amount of degrada t ion o t t h e o i l v i l l t a k e p l rce. A nrmber of chemical r e a c t i o n s occur , o f i d a t i o n and h y d r o l y s i s k i n g tw important oner.. A f t e r a pe r iod c f u se , t h e o i l a c q u i r e s a "fr ied-in" f l a v o r , vtrlch 10 s l i g h t l y d i f f e r e n r f o r each o i l . The o x i d a t i o n e f f e c t is p a r t i c u l a r l y marked when h i g h l y unsa tu ra t ed o l l s are =ed and soon results i n polymer iza t ion and unsatisfactory f l a v o r s . P a l n o i l -bas t he g r e a t advantage i n f r y i n g of a r e l a t l v e ' y lw l e v e l of unsacura t ion and t h e r e f o r e good s t a b i l i t y . I n soee cases . a palm o l e i n is p r e f e r r e d , c i c h e r because of l i d t a t i o n s of equi-nt o r because of improvcd product . c h a r a c t e r i s t i c s . I t o h a s advantages I n f r y i n g s i m l l a r t o pal- o i l . ' u 5 . Pa lm o i l . has been used f o r f r y i n g f o r aany y e a r s i n Eur3pe and r e c e n t l y h a s become e s t a b l i s h e d on t h e v e s t c o a s t o f t' % Uaited S t a t e s , irt campet i t i o n w i t h p a r t l y hydrogenated soybean 01 1.
136- In mny c o u n t r i e s , t r a d i t i o n a l cookery *r&ides a l a r g e markec f o r a L i q ~ i d o i l f o r domest ic purposes. Th i s o i l is used as a s a l a d d r e s s i n g , f o r f r y i n g and f o r o t h e r p u r y s e s . In t h e Heoi ter ranenn basil. , t h e t r a d i t i o n a l one &-as based on a l ~ * t e o i l , i n J2par. o n s o y a bean p l u s rapeseel! 0'1 In SQEE
5 s - e r n c o u n t r i e s on groundnut o ; l . The dol fcs t ic demand f o r ltquld o i l s of c h i s type is g r w i n g i n Europe and tire Unlted S t a t e s . Orle Impor ta .~ t c o n s u m e r cequfrement i n t h o s e a r e a s is chat t h e o i l r e m i n clear ever a t r e l a t i v e l y Lou d n t e r tempera tures . As formulated i n the Uni ted S t a t e s , t;*Ls requ. :ement is

cal led c5l? "cold ~ e s t " cn l s t a t e s chat no deposit mus: fora during 5 112 h o ~ r s ?toraze a t OOc. Some o i l b such a s cottonseed must be "uintf rizedl' beforr they be on for to' chat :st the deporllt which vould form a: low tempcrsturea haa tc\ be reac-vr . . m e glyce: Idea In palm o i l a l l have melting polnts of 1 9 ' ~ o r highe:. Therefore puLn olein c m o t nect tt.c Uni'ed Sta tes ' cold res: specif i ;a t ion, n'though a proportion my be useful in a salad o i l blend v i t h a more s ~ t u r ~ t e d o i l ~ U C ~ I a s sojbrsn 011.
?a t8 Ksed ft:r Cnr~fect Ionaries --- --- !37. rniong the u.ord npeclallzcd tood usea f ~ r f a t s , one of the m e t lntcrear tng 1s the use of pala 01: in confect lnnary. The lrniqrla ea t ing qun;Ir.les o f checolato a rc the reeu: t ,f ttia preclb* chealcal mkc-up of c o c o ~ tu t t a r . :c nnd P very h1p.h ~coyorc lon of t+a glyceclda palmito o l c o r t e a r i ~ ; (P3S), u h i c , ~ tapar t s t3 c!r.>:rllsta i t s hard b t l t t l r l texturd a t room tempera:rlre c,nd l t e sh . ? r~ meltlng pclnc balw body tcmpe~atcre. I t bo happenr that the 'nt content urad i n chocolota 1s hlghrt thnu the na tura l proportion of f a t
p l sin: I n the cccoa bean, aod t'rclrefore nddit ional cocns ba t te r has t o be unaq i n mnufncture. ,b A raeul t , there i r surplue cocoa pwdcr fron the proccss. ifhlch can ba aedo into n vety acceptable e ~ b s c i t u t e chocolate by usl:qb f a t from other s w r c e r w1:h a i o i l a r properties. Since coc,a but ter has alurrvn bcdn a very cxpc- jive f a t , many ef f o r t 3 have been rr Je LO develop subaA.l tutes , ail4 a nu . . f o r o d u ~ t s ore b'aiiable. S..me a r e btsed on he lour i c oils-coconut r . .;re p ~ l u kernel, ~ r s w l l y proceaacd by hydroger.ati,,n andlot f r ac~ . iona t ion. Or.h?ce, vbic t~ have technical advantages, a: 2 bee.' on Lqr f tact t o n a ~ i c n o i c i l s which conrnia glyccridea s imi lar or identicml with those t h a t gl ve coc6a hut ter its specirtl propertien. Palm o i l is a su i tab le source or some of t t . e s ~ glycerides, and ecveral potc-nte describe the prc?srnr!or~ uf' A ccapdtlb-e cccoa h t t t r subsr.i tutc from palm o i l .
6cn-Food Use9 >f Fats and O j .e
138. Soap 1s prcrduced by a r \ e d 21 reaction tetveen r a t with an ~ l k a l i . While h i s t c ~ l c a ) records s;rcd tna t t h i s process has been knoin f o r .iemrer3l tbc~sanc! yeats, ft remarns an :r: up t o t h i s day. Zarly soapmkers followed the :=dSous lroiedure ~f cxrract ing potassium cdrbonsce ;*om w,od ashes ("lcachicrg") , cacst tcLzing i t &it9 slakec ~ i m r - . , and us inq t 5 t caus l ic potash Ear saponficiation. To ~ b t s i n hard s o ~ p s , the da f t co-r;3nenta -f potash had t o be "sclied out" with cc:aon gait. I / - 1 3 (5 . The brs lc ~ r o c r 3 s of soappaklng has not chanzed mlch r.var t h e . The selectifin of f a t s and a i l s deyends l l r g e i y on the expected q t * a l t t i e a > ~ ti-e f ina l product, such 3n hzrdness, so l r :h i l i~y and e .se of lath: -Ing. R comon mixture for t o i l ~ t soaps is about 7 5 percent t a l l o v and 25 percent ce-onut o i l . Tie v a r i c y f a t s a re blenc !d tcgether befcre the actuc.1 s a p o ~ i ~ c a t i o n beg:ns Fat: w i t h a l a r ~ e port:-on ~f sa:uraced t a t t y acids a re usuaYy prefe. ' J in sonpaidking, s i r c z they z a ~ o q l f ' y mpre readily t.hsn unsacur;.ted Zatt; ' G s .
I / 5ai l ey ' s Indus t r i a l Oi? acd Fa: ?rr,du~:to ( r - c l . , Daniel SLI?::~, Ir.'_ers.c' ; E I I C ~ .- .- - - - -- -- Pqbltshers, New Yoric 'ondc~c, Syaincy 19cLj . p. 875 .

1LO. ~ f . c . 1 s i ~ p o n l f l r a t i o n h a s t a k e n b l a c e , t h e s o a p 1 s " q r ~ l n e d o u t " by a d d i n g S.I!L t o t h e b o l l l n ~ suss. T t ~ c f l n a l s t e p i s t h e " f l t t l n g " o p e r a t i o n , I n w h i c t ~ t h e h a t c h o f so.rp s c p ; ~ r : ~ t e s I n two d i s t i n c t l a y e r s : a n u p p e r l a y e r 01 '':\(?btl1 ; ; u , I ~ iind 'I th1n:lcr l i i yc r o f " n l g e r " s o a p . Thc a r t o f soap-maklno c o ~ ~ s l s t s t o ;I l a r g e extenc o f o t , t .~ i : \ l n ) : 3 s large a s h a r e o f t h c p u r i f l c d n!nt SO.:^ :IS poss lh l r : . l-/ T t ~ c " I I ~ K ~ ~ " c o n t ; \ l f ~ s tnil lnly d i r t , c o l o r i n g m t e r t n l s m t l t , ~ l l i r ; s a l t s a n d o t t ~ c r I r n p u r l t l c s . 30s; c o o a c r c l a l soap-mnklng p t o c e s s e . y l c l d ? b o u t 6 5 p e r c c n t "nca t " s o a p , w l t h t h e composl: lo: rnd tht: r e l a t i v e s h ~ r t s of "nea t " a n d " n l g e r " s n a p d c p c n d l n g l a r g e l y o n t h e p h y s i c a l p r o p e r t i e s o f t h c f i r t s w;,ich mlkc tip t h e s o a p s t o c k .
141 . Soap m i n u f a c t u r e i n h a t c h p r o c c s w e s I s tlme-consuming. 1'. r n k e e , o n t!rc. :tlrerrile(*, 5 t o 1 0 c l i t y ~ t~ prcpiitc. II h i ~ t c h o f f u l l - h n l l c d nonp. S c v c r n l con; ln t rous s ~ p o n l f l c n t l o n p r o c e a d c s hnvc b c c ~ i d e v c l o p e d and hnvc g r a d u n l l y r c p l i ~ c c d a 1 - ~ r g c nimbcr of t h e l e n g t h y o p c r n t l o n e r e q u i r e d u n d e r c o n v e n t l o n a l s o a p - b o l l l n g m 2 t h o d s ( i c t t : e p r o c e s s ) . H o s t o f t h e c o n t i n u o u s processes, s u c h a s t tv? s l \ :c rples r o c c s s , f o l l o w r c u g h l y t h c same s t c p s a n t h c t r a d i t l o ~ l 4 c t t lc p roccuu . c l w e v ~ ? r , t h c y u s e c c n t r l f u g e s t o s e p a r a t e "ncnt" a n d " n i g c r " s o a p , irnd I t t a k e s i c e s t h a n tw h o u r s f o r t h e f a t s t o be c o n v c r t c d i n t c n c a t s o a p . Thc p r o c e s s 1 s t 1 1 ~ h l y e f f i c i e n t nnd y l c l d n a b o u t 0.17 kg o f c o n p f o r o n e k l l o g r n ~ o of f n c . 2/
L42. G l y c e r i n e Kccovcry . An i m p o r t a n t b y p r o d u c t o f r.he s a p o n i f i c o t l o n p r o c e s s ( b o t h k c t t l c a n d r o n t ; n u o u s ) is g l y c e r i n e . G l y c e r i n e is r e c o v e r e d f rom t l ~ s ? c n t l y t s , wh lch c o r , t a i n f n o d d i t i o n t o 5 - 1 5 p e r c e n t g l y c e r l i \ e , a considerable a m c ~ n t o f s a l t anti a sun11 amount o f c a u s t i c s o d a .
C a n s u m n t i o ~ . P a t t a r n s f o r F a t s a n d O i l s 3/
1-3. V l s t b l e a n d I n v i s i b l e F a t Consumpt ion. F a t s a n d 011s c a n b c consumed directly i n t h e f o r m o f coo!ci:,g 011, m a r g a r i n e , s h o r t e n i n g , c tc . , o r i n d l r e c t 1:' t h r o u g h t h e c o n s u m p t i o n o f l i v e s t o c k p r o d u c t s and v e g e t a b l e s . The f i r s t t j p e o f f a t c o n s m p t i : n is u:ually r e f e r r e d to as " v i :b1e8', t h e s e c o n d a s " l n v l s i b l e . " I n t h e U n l t e d S t a t ? s , + i s i b l c c o n s u m p t l ~ n a c c o u n t s f o r a b o u t 40 p e r c e n t o f t h e t o t a l f a t i n t a k e ; t l ~ e r e m ~ i n i n g 6 0 p e r c e n t i n v o l v e s c o n s ~ . n p c l o n o f 0 1 1 s t h a t a r e c o n t a i n e d i n a n i m a l t l s s u e s (e.g. , m e a t , f i s h ,
I/ The f i t t i n g o p e r a t t o n is h i g h l y s r i t i c a i a n d r e q u i r e s a l l t h e s k i l l o f - :he s o a p b o i l e r . The r e l a t i v e s h a r e s o f r e a t s o d n l g e r s o a p depend on h l s s k i l l . -
2/ T h i s I:: o n l y 1 5 - 20 p e r c e n t o f t h e f r i t *eded i n t h e k e t t l e p r o c e s s . A - s l ~ i l a r s a v i n g is a l s o o b t a i n e d f o r t h e l y e .
3 / Tlte t e r m " f a t s a - ~ d o i l s " i s u s e d f o r a l l f a t s a n d o i l s g e n e r a l l y - c i a s s i t i e d a s " e r l i b l e l s o a p f a t s and o i l s " : t t , e s e i n c l u d e s o y b e a n , scln- f l o v e r s e e d , g r o u n d n u t , c o t - m s e e d , r a p e s e e d , o l i v e , c o c o n u t , palm k e r n e l u . ~ l c , f l s h , b i l i t c r , l ~ r ! . ~ n d :allo.:, f a t s ;nd 011s. I n r z c c n t y e a r s , : h e i r c o c b i n e d p r o d u c t l o n n a s a c c o . ~ n t e d f o r a b o u t 97 p e r c e n t of t i 2 t o t a l p r o d u c t i o n o f a l l m a j o r f a t s ar o i l s .

poul t ry and da i ry products) o r i n the form of o i l -bear ing crops (e.g., nu t s ) (Table 17). This paper r e f e r s only t o t h e v i s i b l e consuoption of f a t s and o i l s .
l L b , Ytr c a p i t a consumption of t o t s and o i l s depends l a rge ly on income. 111 s e v e r a l developing c o u n t r i e s , annual per c a p i t a consumption i e l e s s than 5 kg. In a o s t i n d u s t r i a l i z e d c o u n t r i e s , I t ranges f roo 25 t o 30 kg. S t a t i s t i c a l a n a l y s i s of t h e p a t t e r n s of consumpiion show9 t h a t demand increases rap id ly with incomes a t l o r i n c o m e l e v e l s . A t high-incow levels-- roughly those i n t h e 'Jnitcd S t a t e s and some European countries--the reeponsivenees of demand t o increases i n tncome l e s e l s off a t about 30 kg per c a p l t a . Chart 5 i l l u s t r a t e s t h i s r e l a t i o n s h i p .
145. Table 18 s h w s the per c a p i t a consunpticn f o r f a t s and o i l 8 i n t e r m o f f lve-year averages f o r se lec ted country groupings. Uhtle the d a t a i n t h i s t n b l c were based on the e s t l m t e d disappearance of f a t s and o i l s and not on a c t u a l consumption 6urvey8, they provide riove i n d i c a t i o n of level8 and r a t e s o f change i n ccnsuoption. I n d u s t r i a l i z e d c o u n t r i e s wi th t h e i r high per c a p i t a incomcs a l s o h ~ v e tho highest pet c a p l t a consumption of f a t s and o i l s .
146. The r e l o t t o n s h i p between consumption and income was uscd t o e s t i m t e per c a p i t a demand i n e i g h t replons. 1_l The es t imated coeff i c i e n t s a r e presented belov.
where:
P C C F O ~ - per c a p i t a consumption of a l l f a t s and o i l s , i n region ( I ) , i n kg.
PFO = pr ice index f o r f a t s and o i l s (1974=100)
C N P ~ = per c a p i t a GNP i n region ( i ) , i n US d o l l a r s
147. The use of t h i s r e l a t i o n s h i p has sever31 drawbacks. F i r s t , i t is based oa d a t a from a l l regions and does not a l low f o r d i f f e r e n t i a t i o n betyeen the unique consump t i o n p a t t e r n s t h a t might e x i s t i n d i f f e r e n t regions. Second, the es t imated dernand relatConsl.ip p o s t u l a t e s t h e same s a t ~ r a r ion leve 1 f o r a l l regions. -
- l? S u t r i t i o n i s t s d i f f e r i n t h e i r views about the e x a c t amount of Eat r e q u b e d -
i n the human d i e t . They agree , houevcr, t h a t t h e optimum amount may depend on c l imate , economic c i rcumsta~*ces and e a t i n g hab i t s . In the United S t a t e s , f a t s supply about 35-46 percent of t h e t o t a l per c a p i t a in take of c a l o r i e s ; i n Southeast Asian coun t r i es , they provide l e s s than 5 percent.
2 1 I n d u s t r i a l i z e d c o u n t r i e s , cent r a l l y planned economt ds, Lat in America, - North Afr ica , West Afr ica , East Afr ica , Asia and East Asia and P a c i f l c .


Vlsi . . . c Fats
But car 2.7 2.7 u r d ( d l r e c t uru) 4.0 3.5 b r ~ a r l n e 3.4 3.5 Shorranlng 5.7 5.8 Cooklng and Salad O i l s 3.9 4.2 nrhcr Edlble Farr and O l l r 1.2 0.9
TOTAL 20.9 20.6 - -
k l r y Products, Excl. Butter 8.7 7.9 Egg J 2.1 1.9 fienc, Poultry, Came and Fish 7 . 9 17.6 Dry Pear , Nuts, Soya Flour
and Cocoa 2.5 2.6 A l l F r u l t s and Vegetabler 0.5 0.5 Crnln Products 0.8 0.8
TOT hL I# 1) b& 4 1 32.5 31.3 31.3 )2.1 )t.r )1.) )2.4 32.L 33.2 - - - m T L D VISIBLE LVD IHVISLBLE FATS 153.C )l.P )l.P )L.O W.I 56.2 )1.3
Source: Institute of Shortening and Edlble 0118, Inc., August 1974.

148. As a r e s u l t , s e v e r a l a l t e r n a t i v e approaches f o r e s t i m a t i n g r e g i o n a l demand r e l a t i o n s h i p s f o r f a t s and o i l s were exp lo red . The r e s u l t s were i n most c a s e s u n s a t i s f a c t o r y ; not s u r p r i s i n g , c o n s i d e r i n g t h a t t h e informat ion on pe r c a p i t a consumption o f f a t s and o i l s is l a r g e l y based on "per c a p i t a d i sappea rances ."
Table 18: PER CAPITA CONSLMPTION OF FATS AND OILS BY REGION, FIVE-YEAR MIMCES AND A\;NUAL GROWTH RATES
Pe r Capi ta Consumption Growth Rates 1961-65 1966-70 1971-7s 1961-651 19661701 1961-651;
1966-70 1971-75 1971-75
I n d u s t r i a l i z e d Coun t r i e s 19.3 21.5 23.3
C e n t r a l l y Planned Economl es 7.1 7.6 9.1
L a t i n America 8.1 8.3 9.5
West Af r l c a 9.1 7.9 8.6
E a s t Af r i ca 3.5 4.1 5.2
North A f r i c a 6.7 7.5 9.6
South Aaia 5.9 6 .O 6.2
Eas t Asia-Pacif ic 3.6 3.7 4.6
--------- (pe rcen t I----
Source: E s t i ~ a t e d from USD.4 and FA0 s t a t i s t i c s .
L
11 The per c a p i t a d i sappea rance of f a t s and o i l s is computed a s fo l lows. - T o t a l p roduc t ion of o i l s e e d s is conve r t ed i n t o domes t i c a v a i l a b i l i t i e s by adding impor ts and s u b t r a c t i n g e x p o r t s ; t h e a v a i l a b l e q u a n t i t y of each o i l s e e d is then d i v i d e d i n t o a p o r t i o n t h a t is processed i n t o o i l and a p o r t i o n t h a t compr ises a l l o t h e r 5 s e s . By a p p l y i n g t h e cor responding o i l y i e l d t o t h e q u a n t i t y a l l o c a t e d f o r c rush ing , t o t a l domestic s u p p l i e s a r e obta ined . T o t a l s u p p l i e s a r e c o r r e c t e d a g a i a f o r changes r e s u l t i n g from o i l impor ts and e x p o r t s t o o b t a i n t o t a l domes t i c a v a i l a b i l i t y of t h e o i l . T h i s a v a i l a b i l i t y is expressed i n pe r c a p i t a teI-49. The weakness of t h i s c a l c u l a t i o n l i e s mainly i n t h e e s t i m a t i o n o f t h e s h a r e of t o t a l o i l s e e d a v a i l a b i l i t y t h a t fs processed i n t o o i l . L i t t l e i s known about t h e s e s h a r e s and how they change o v e r time. The consumption d a t a i n t h i s r e p o r t were based on s h a r e s publ i shed by FA0 f o r major o i l s e e d s and t h e i r main producing c o u n t r i e s .

149. Regional consumption p a t t e r n s f o r f a t s and o i l s genera l ly r e f l e c t r cg iona l production p a t t e r n s and n a t u r a l s t o r a g e c o n d i t i o n s (Tables 19 and 20). Economic p ro tec t ion and lover t r a n s p o r t c o s t s p lay an important r o l e i n the preference f o r l o c a l l y produced f a t s and o i l s . I n temperate zones, soybeans, cot tonseeds and sunflower seeds supply most of t h e o i l s needed i n the manufacture of margarine, shor tenings and o ther f a t products. I n t r o p i c a l and semi t rop ica l zones, coconut o i l and palm o i l dominate vegetable o i l consumption.
150. S h i f t t o Vegetable O i l s . Since t h e e a r l y 19608, vegetable o i l s have expanded t h e i r market share by about 10 percent (Table 19). The wrt dramatic increase took place i n t h e market share of vegetable o i l s made f tom o i l s e e d s , which increased by s l i g h t l y more than 14 percenc. The market share of o i l s from t r e e crops--all of which a r e hard o i l s , with t h e e x c e p t i m of o l i v e oi l - - decl ined by about 2 percent. Eurimal f a t s and marine o i l s l o s t about 14 percent of t h e i r market share i n the e a r l y 1960s. mainly because of the d e c l i n e i n l a r d scpp l ies .
Table 19: ESTMTED FATS AND OILS CONSUMPTION BY MCION, FIVE-YEAR AVERAGES, 1961-75
Region C o n s q L ien Ctovth Rates
1961-65 1 9 6 6 7 0 1971-75 1961-70 1966-75 1961-75
--- ('000 mt) - ----- (percent )----
I n d u s t r i a l i z e d Countries 13,689 16,119 18,318 3.3 2.6 3.0
Cent r a l l y Planned Economies 6,2&': 8,573 10,601 1.2 4.3 2.8
6
Lat in America 1,786 2,092 2,740 3.2 5 .6 4.4
East Afr ica 418 562 774 6.1 6.6 6.4 - - '? West Africa 978 965 1,176 -0.3 4 .O 1.9 - - North Af rica-Hiddle - * - East 829 1,075 1,572 5.3 7.9 6.6 .
South Asia 3,651 4,032 4,843 2 .O 3.7 2.9
East Asia-Pacific 766 916 1,278 3.6 L .9 5.3
'ce: Zstimated from USDA and FA0 s t a t i s t i c s .

I r a : O L l u d a G76zir s a t louor C o c t m d C r a r b u a Il.p-4
mru r m r OILS
I r a : OIlu+dm *b.- S m i l a r r Cot c o w e d C r d l r b p b 4
A V M TATS b WUT OILS
i r a : h e e r r L . r d 7.1 low
TWIN FAIS b O I U
h a t Afrlca S. AfrIca-Middle U s t h a t A s h - h c i f k 'IXIO mt rrrcrst 'IXIO u Percent 'ax, me Percent
StmRowrr Cot t o n u d Crambrut R . p e + c c d
Coconut Pala Palm Kerzel
A.3I?UL FATS ; ':=I= O I U
From: Bucter trrd Tal lov
KWTAL FATS & OILS
Source: T r O s r a r i a r l c s .

151. The inc rease i n soybean o i l s u p p l i e s and t h e d e c l i n e i n l a rd account f o r most c f the s h i f t i n t h e market eharee of i n d i v i d u a l f a t e and o i l s . Increased s u p p l i e s of soybean o i l r e f l e c t t h e rapid expaneion of demand f o r high-protein meals, m i n l y soybean meal. The g r w i n g demand f o r leaner meat products has been the main rcaeoa f o r e l w d w n i n t h e g r w t h of l a rd and t a l l o w supp l i es .
152. m e change i n the market s h a r e r of i n d i v i d u a l f a t e and o i l s is thus l a rge ly a supply-induced phenomenon. I t h a r l i t t l e t o do with the inc reas ing demand because of h e a l t h rearonr f o r r o f t vegetable o i l 8 which a r e l e s s s a t u r a t e d than both hard vegetable o i l r (coconut o i l , p a l m ke rne l o i l and palm o i l ) and animal f a t s .
Demnnd f o r Pats and O i l r
153. Worldwide, t h e demand f o r f a t r and o i l r har expanded e t c a d i l y dur ing t h e pas t two decaues a t a n average r a t e of 3.2 percent a year (Table 19). Largely because of the increaee i n population and t o a l e e e e r ex ten t because of t h e growth In per c a p i t a incomes, t h e annual increment i n the demand f o r f a t s and o i l s increased from about 830,000 ton8 dur ing t h e e a r l y 1960s t o about 1.3 m i l l i o n tons dur ing t h e l a t e 19708. I n d u s t r i a l i z e d coun t r i e s account f o r s l i g h t l y l e s s than hal f of world consumption of f a t s and o i l s , developing coun t r i ea f o r a l w s t 30 percent and c e n t r a l l y planned economies f o r about 25 percent. These s h a r e s have remair-ed remarkably s t a b l e dur ing the pas t tw decades; t h e s h a r e of the developing c o u n t r i e s , f o r exemple, has grown only by two percentage points , namely from 27.9 percent i n the e a r l y 1960s t o 29.9 percent i n t h e l a t e 1970s.
154. Charts 6 and 7 s h w t h e sha res i n consuaption of a l l f a t s and o i l s and of major f a t s and o i l s f o r i n d u s t r i a l i z e d c o u n t r i e s , developing c o u n t r i e s and c e n t r a l l y planned econodes . These c h a r t s i l l u s t r a t e t h e observat ion made e a r l i e r t h a t , predominantly, coun t r i e s tend t o consume t h e o i l a they produce.
Demand E q u t i o n s f o r High-Protein Heals - 155. To cap tu re t h e behavior of t h e f a t s and o i l s markets adequately, i t became necessary t o e s t i m t e the demand func t ions f o r high-protein meals a s w e l l . The demand f o r h igh-pro te in meals is l a r g e l y a r e f l e c t i o n of the demand f o r animal feeds by t h e l i v e s t o c k indust ry . Income is t h e main economic f a c t o r determining t n e demand f o r l i v e s t o c k productg, and i t was include3, toge the r with meal p r i c e s , i n the demand equat ion f q r high-protein meals. the demand equat ion f o r t h e i n d u s t r i a l i z e d c o u n t r i e s is*shown below. - - -
8 I n d u s t r i a l i z e d Countries: 1961-75 S . I
R' = 0.94 S.R.E. = 610.86 D.U. = 2.L0
where:
DHLIND = demand f o r high-protein meals r rote in equ iva len t ) i n i n d u s t r i a l i z e d c o u n t r i e s ( '000 m t )

Cl~srt 6: FATS AND OILS CONSUMPTION, BY REGION. 1961-75

Chu t 7: CONSUMPTION OF MAJOR FATS AND OILS, BY REGION, 1981-76
YEARS
SUNFLOWER OIL
-r
C O f T W E E D OIL GRWNDNUT OIL
1961 63 65 67 69 71 73 75
YEARS YEARS

RAPESEED OIL
PALM OIL
DEVELOPING
-
- -
1961 L3 65 67 69 7 1 73 75
YEARS
OLIVE OIL
imi w a 67 00 71 n ts YEARS
COCONUT OIL
YEARS

vx-m
c k t 7: bllthd)
P A M KERNEL U R D
TALLOW
lab DEVELOPING
r DEvELwING

PXL - price index for high-protein meals (1974-100)
CHPIKD = CNP in industcidlized countries (mi llion US$)
156. Uhile the jndustrialized countries are dcl'i~\itely the na ,-r market for high-protejn meals, demand has been increasing in centrally ?l-nncd econodes and to a lcsner extent in developing countries. me estimated relationships for high-protein meal demand in these regrons are prz~ented be lov . Ccnrrally Planned Econoolca: 1961-75
R~ - 0.82 S.E.E. - 703.62 D.W. - 1.44
vhere:
DXLCPE - d m n d for high-protein aealr (protcln equ'valent) In centrally planned econoder ('000 at)
GNPCPE m' CNP in centrally planned econonier (dlllon US$)
Latin America: 1961-75 - - 1
(3.3) M L U C t - 565.11 - 292.46 Ra, + 0-0025 CHYLACt (4-69) (2 40) PWLtWl _' (3.11)
- 0.554 D M U C t - l ( 2 .la)
R* = 0.65 S.E.E. = 129.2
. DW.tAC = d m n d for high-protein meals .;rro:eQn equivalent) in Latin W r i c a ('000 at)
PHL = price index for high-protein meals (1974=100) - - CNPLAC = GNP in u t t c hmerjfa'~nil1ion US$)

W - M f a ~ - p r o t e l n ~ 8 1 s (proteln equivalent) i n k r t L Africa Xlddle Cart ('000 mt)
Ri& - pt l cr ida for hllb-pratela w a l r (1974-100)
CIODV. - la l h t h Ammrica Xlddle h a t ( r i l l l o n US$)
Wi? - f a high-protein meals (protein equivalent) i n fut J f a c r ('000 mt)
Ra - prier iodtt f o r hl%-protein meals (1974-100)
QiRU - U P In Lrt, A f r i u (mil l lon US$) I
a2 - 0.42
d e r e :
- D.Y. = 2.24
I
WUAF = drrrrvr f a high-protein meals (protein equivalent) i n *st A f r i u ('000 rt)
= prlct ladclr for high-protein meals (1974-100)
mPU# = BOP in Yat Africa ( d l l i e 3 n US$)

South b i a : 1961-75
it2 - 0.74 s.e.e. - 179.77 D.V. - 2.08
W S A S - dcnand f o r high-protel : m \ l a ( p ro t e in equivalent) i n South k i a ('000 m t )
P)(L - pri:a i d a x f o r high-prota in wals (1974-100)
CNPSAS - CNP i n Soul\ k i a ( r l l l l o n USS)
East k i a S a c i f icr ,1961075
a2 - 0.85 s.t.e. - 24.20 D.V. - 1.70
OHLEAP - d a r a d f o r hlgh-prote in wals (p ro t e in equivalent) i n East Asia-Pacif ie ( 'OO m t )
PHL - p r i ce ladax f o r high-prote in w a l s (1974-100)
CNPEAP CNP i n t u t k i a - f a c i f i c ( a i l l i o n US$)
C, P r i c e Eqtut iop. f o r Fa t s and High-Protein Meals
157, The p r i c e s f o r o i b d and the{- products are deternice/ -hrc~p,h t he f r e e i n t e r a c t i o n of v r r k e t forces . Vith t he exception of o l i v t 01,. r 6 -
c o a o d l t y a g r e a e o t s i n t e r f e r 3 v l t h t h e determfnation of tsarket prices. P r i c e s f o r o i l s eeds r e f l e c t ;he r e l a t i v e a t r t n g t h of t h e markets f o r . o i l s and meals, Hence, i n t h e long r5.r. o i l s eed p r i c e s may be viewed as t he wxghted I l average of t h e o i l s and meals contained i n them, cor rec ted f o r the c o s t y f o'.l ex t r ac t i on ("crushing margin"), The following r e l a t i onsh ip w s used i n t.re model t o a e t e r r i n e o i l s eed pr ices :
1/ The c ~ i q h t v art= t b ~ oil and meal content of each oilseed. The crushing - margin d i f f e r s s l i g h t l y f o r each o i l seed and tends t o f l u c t u a t e over time.

where:
P O S ~ = price of .;.bed (1) (us$/u)
PFO' - .- 'ce of the o i l contained in oilreed (1) (US$/mt)
YPO' - o i l content of o i l r e d (1)
p a i = price of the u a l contaiaed in oilreed (1) (US$/mt)
= ma1 content of oilreed (1)
clti = c ru rh in~ -rain for oilreed (1)
Table 21 contains tbe variour wifits that w r e u s d in the price equations for the e l f i t oilreeds ioc1ub.d l a the model.
158. Price for o i l s d hlah-protein w a l s reflect their correrpoadi 8 r r k a t conditionr, in par t icuhr chrqer in inventory levelr. w e r in tbe da rnd for either o i l s or nab t b t lead to an i a c r u r e in tbe procerritq of oilreedr w i l l ra i re tbe level of invearorier of otber oilreed productr. Coruequeatly, rountitq i m n t o r i e r uiL' put prerrure on pricer.
159 The follouitq relationship for the price level of fa t r a d o i l s a r a aroup capturer cbir liaL k0m.n prices a d inventorier.
Price Equation for A l l Fats m d Oilrr 1961-75
In PVOt - 2.5 - 0.22 la I-?O - + 0.3 In PFOt,l DPO
PPO - price index for fats a d o i l r (1976100)
IPO = ending fnventorfes of fa t s and o i l s ('000 mt)
Dm - world h a d for fa t r and o i l s ('000 NL)
IU the model, a s i d l a r r e ~ t i o a r h i p determines the prices for high-piotein rcah as a group.
Price a m t i o n for ftigh-frotein Xeals: 1961-75 - -
PXL - price index for high-protein wale (1974-100)
IHL = ending inventories of high-protein meals ('000 mt)
DHL = wor ld demand f o r n i g h p r o t e i n meals ('000 m c )

Table 21: OIL AND YIELDS /a -
Oilseed Crop O i l Yield Heal Yield
(pe rcen t )
Soybeans Sunf lover Seeds Cot tonseeds Croundnuts Rapeseeds Copra Palm Kernels Linseeds
/a The same o i l and meal con ten t s were used t o conver t o l l r e e d supp l ies j n t o - t h e i r o i l and meal equivalents . Thus, vor ld f a t s and o i l s s u p p l i e s is t h e t o t a l of t h e o i l equ iva len t s of t h e warious o i l r e e d s and t h e vor ld s u p p l i e s of o i l s , such a r p a l m o i l o r o l i v e o i l , which are ea 'racted from a t a u u t e r i a l that bu no s i g n i f i c a n t meal component.
Source: O i l World Weekly.
160. Inventory Equatioar. I n o t n t ~ r r e r f o r f a t s and o i l s a r e d e t e d a e d as t h e r e s i d u a l between t h e c s t h t e d demand f o r o i l s o r -1s and t h e i r supply. These "inventory supply'' r e l a t i o n s h i p s not only d e t e d n e changes i n o i l and r a l inven tor ies , they are a l s o used formal ly t o c l o s e t h e rubmodels f o r o i l s and high-proteia r a l s .
161. The fol lowing r e l a t i o n s h i p s were used i n t h e model.
F a t s and O i l s Inven tor ies
where:
IFO = ending inven tor ies f o r f a t s and o i l s ('000 m t )
SF0 = world supp l ies of f a t s and o i l s ('030 n t )
DFO = deaand f o r f a t s a 4 o i l s ('000 m t ) 8 .
High-Protein Heals Inven tor ies

where :
Im - ending inventor ieo f o r high-protein me810 ('000 m t )
Sm - w r l d oupplieo of high-protein meal0 ('000 m t )
DM. - delvnd f o r high-prote in malo ('000 m t )
Pr iceo f o r Individual O i loeed Producto L/ 162 . An important c h a r a c t e r i o t i c of f a t o and 0110, but a l s o of high- p ro t e in m a l o , is t h e i r hi* dear re of in te rchan8eab i l i ty . 21 M o t en& producto ouch a s margarine, ohortenin8 o r ooap can be proceooed from a vide va r i e t y of f a t o and o i l o . I q r o v e r n t o i n r e f i n i n 8 techniqueo have fu r t he r increaoed t h e i r i n t e r c h a ~ u b i l i t y . S t i l l , they a r e f a r from being per fec t oubot i tu tao f o r one another.
163. I n c r e a o i q t he o u n l i e o of an i d i v i d u a l f a t o r o i l t e d o t o depreoo i t o p r l c e r e l a t i v e t o tbooe of o the r f a t o and o i l o . Thir 10 becauoe t h e demand schedule b e c o r o iacreaoingly i r u l a o t i c 80 t h e oupplieo f r a an ind iv idua l o i l i n c r u o e . B m v e r , t he r e i o 0- evidence that t h i o ochedule becomo more e l a o t i c over t i n i f t h e oupplieo of an o i l continue t o arm. Palm o i l provider an example. During t h e u r l y 19600 palm o i l b r a e ava i l ab l e i n increaoing qu rn t i t i eo , a d its p r i c e dropped oharply r e l a t i v e t o t h a t of ooybean o i l and o t&r coq . t i n8 f a t o and o i l o . Aornver, 80 the producero of f a t producto, ouch am urgariw, ohortening and ooap, adfuoted t h e f o r m l a t i o n o of t h e i r producto t o we more of t h e comparatively cheaper palm o i l , i t o p r i c e k g . n t o approach t h a t of competing o i l o . Today, palo o i l p r i c e s have reached-and a t t i w o even exceed-soybean o i l priceo.
164. The eaoe with which the variouo f a t o and o i l s can be interchanged i o r e f l e c t ed i n Qurt 8 which ohwo t h e p r i c e lovemento of major oiloeedo, o i l 0 and high-protein mealom Uith t he exception of bu t te r , f o r which d-d 10 unique i n t he f a t s and o i l o market, t h e p r i c e s of t h e o the r o i l s w v e c looely together. The co r r e l a t i on coef f ic ien to t h a t were estimated f o r o i l and meal p r i c e s (Tables 22 and 23) i l l u s t r a t e the c lo se r e l a t i onsh ip t h a t ex i s t 6 between t he p r i c e s wi th in these tvo c o d i t y groups.
165. Though techn ica l ly w o t f a t e aand o i l s a r e interchangeable, cos ta of r e f i n ing and s p e c i f i c end- l requirements l i m i t t h e range v i t h i n which ind iv idua l f a t s and o i l s a c t u a l l y a r e subs t i tu ted . The need f o r c e r t a i n chemlcal components (e.g., f a t t y ac ids ) o r c e r t a i n physical p roper t i es (e.g., - -
.? 0 - e * m
1/ The t e r n o i l s eed products r e f e r s t o both f a t s and o i l s and h i g h b r o t e i n - meals.
2 / Although t he discussion about in te rchangeab i l i ty i n t h i s sec t ion dea l s - main ly w i t h f a t s and o i l s , it a l s o app l i e s t o high-protein meals. The commodities which make up these two groups oE commodities can be ea s i l y f n t e r c h a n g ~ d f o r e a c h o t h e r i n t he v a r i o u s e n d u s e s .

'fl-77
Chwt 8: PRICE TRENDS FOR SELECfED FATS AND OILS, 1-t6
Y0.n
World U a n k - Z M


f l a v o r , c o l o r , rmell, m e l t i n g p o i n t ) i n a s p e c i f i c end-ure g i v e r t h e o i l o r f a t which ha8 t h e r e components o r p r o p e r t i e s a c o a p e t l t l v e advantage o v e r o t h e r f a t s and o i l s f o r that end-use ( " s p e c i f i c demand"). l! Thus, each o i l o r f a t h e r tw d l s t i ~ ~ c t u r k e t s : f i r s t , t h e market i n whi'h i t h a s a q u a l i t a t i v e advantage o v e r o t h e r f a t s and oils; and second, t h e market i n which 1: cornpetas d i r e c t l y w i t h o t h e r f a t s and o i l s . The s i z e of t h e f i r s t market o f a f a t u r o i l v a r i e s w i t h t h e d e u n d f o r t h e end-products which need its s p e c i a l p r o p e r t i e s . 'Ihe d m n d i n chi. market is less p r i c e - e l a s t i c t han d ~ n d i n t h e second market. I n t h e f i r s t , p r i c e s r e f l e c t t h e r e l a t i v e r t r e n g t h of demand and supp ly f o r t h e i n d i v i d u a l o i l r a t h e r t han t h e market s i t u a t i o n f o r a l l f a t s and o i l s .
166. The e s t i u t e d p r i c e e q u a t i o n s p r e s e n t e d k l w r e p r e s e n t (p r i ce - dependent) i q m r t demand equatioas. Toge the r v i t h t h e e x p o c t rupply e q u a t i o n s , t hey de t e rmine i n t e t l u c l o a r l p r i c e r and t r a d e f o r o i l s and malr. The basic s t r u c t u r e o f t h e e q u a t i o n s d e t e t l l n i a g t h e p r i c e s f o r i n d i v i d u a l f a t s and o i l s was d e r i v e d from t h e f o l l a r i n g t r a d i t i o n a l demand system:
where:
Qi - q u a n t i t y o f o i l o r f a t (i) demanded
Pi - p r i c e o f o i l o r f a t (i)
Zl - s a t of d a n d s h i f ters o f t h e ith demand e q u a i i o n
167. ~s is c o m n i n t h e e n t i n t i o n o f a g r i c u l t u r a l deaand models, t h e e q u a t i o n s c o u l d be r e w r i t t e n w i t h p r i c e s as t h e dependent va r i ab le . I n t h i r form, t h e e s t i m t e d c o e f f i c i e n t s r e p r e s e n t d i r e c t and c r o s s - p r i c e f l e x i b i l i t i e s . The h i g h deg ree of c o r r e l a t i o n t h a t e x i s t s between p r i c e s f o r i n d i v i d u a l f a t s a,nd o i l s has made i t d i f f i c u l t t o e s t i m a t e such a rystem o f demand equa t ions .
1/ S u b s t i t u t i o n is imposs ib le i f t h e end product r e q u i r e s a c e r t a i n f a t t y - acid. lnce rchangeab i l i cy is a l s o l i m i t e d by consumer tastes and p r e f e r e n c e s ; examples a r e o l i v e o i l and groundnut o i l , which are amrketed predominantly i n t h e i r pure form be-aure col.sumers p r e f e r t h e i r f l a v o r .

168. To avoid t h e e s t i u t i o n problems a s s o c i a t e d wi th a large nuaber of d t i c o l ~ n e a r p r i c e s e r i e s , p r i c e s f o r ind iv idua l f a t s and o i l s vere col lapsed i n t o a s i n g l e p r i c e iadex. L/
where :
Pi - pr1:- of o i l f o r f a t ( I ) i n year t
Q?O$ - q u a a t i t y of o i l o r f a t (1 ) a v a i l a b l e i n t h e f n t e r n a t i s ~ l u r k e t r & r i q year t
PrO - p r i c r iadax f o r a l l f a t s aad o i l s i n y r a r t
Tho r e l a t i o a r h i p above indicate. that t h e q u a n t i t y of expor t s of an ind iv idua l f a t o r o i l aad t h e p r i c r iadax f o r f a t s and o i l s a r e the major f a c t o r s d e t e r r i a i n 8 pr icer . l a 8ecura1, it vould k expected that t h e coef t l c i e n t a s s o c i a t a d v i t h t h e q u a a t i t ? of e x p o r t s vill be negat ive . 21 The e r t i u t e d c o e f f i c i e a t c a a k usod t o compute t h e p r i c e f l e x i b i l i t y v i t h respect t o expor ts . 3/ The p r i c e index f o r f a t s and o i l s could be i n t e r p r e t e d a s t h e p r i e r f o r t h e s u b s t i t u t e "fat. aad oils ." The e s t i p r t e d c o e f f i c i e n t s of t h i s v a r i a b l e should k ?omitive.
P r i c e E q u a t i o ~ r f o r t a t s and O i l .
S o y b u a O i l Price.: 1961-77
+ 0-1817 SOWOPt,l - 45.5854 D68 + 41.7266 D73 (4.611 (2.88) (2.59)
It2 - 0.99 S.E.E. - 13.59 D.W. - 2.44
1/ The r e s u l t s may be r l i g h t l y l i s t o r t e d s i n c e t h e p r i c e index (PFO) a l s o - c o n t a i n s informetion about 9 e p r i c e s vhich i t h e l p s t o determine. T h i s d i s t o r t i o a v i l l ba d i r e c t l y propor t ionate t o QFOXia which a r e t h e i m p l i c i t weights of t h e p r i c e index. =
* 21 The negat ive s i g n i q l i e s t M t t h e scope f o r s u b s t i t u t i o n among f a t s and -
o i l s is l imi ted. I n t e r ~ u r t i o n a l markets v i l l absorb increas ing s u p p l i e s of a given f a t o r o i l only a t dec l in ing prices-at l e a s t i n t h e s h o r t run. The es t imated p r i c e equat ions t h e r e f o r e r e f l e c t t h e import demand f o r t h i s f a t o r o i l .
1 The p r i c e f l e x i b i l i t y ind ica tes the percentage change In p r ice a s s o c i a t e d - v i t h a one percea t change i n t h e q u a n t i t y marketed, i n t h i s case , expor t s .

where:
SOYFOP - price8 for rqbean o i l , crude, US CI? Rotterdu, def;rted by the Index of I n t a r n r t i o ~ l Inf la t ion (1974 coeutant $ / r t 1.
SOYFOX - weld exportr of r q k n o i l and roybear.r--wal equivalent ( '000 U)
PID - price index for f a t r aad o i l r (1974,100)
W8 - variable met t o 1 for 1968
D73 - d v variable met t o 1 for 1973
Sunflouer O i l Pricerr 1961-77
S.E.E. m 27.32 0.W. - 2 035
SUNPOP - pricer for r d l a u e r o i l , any origin, e r taa l r Rotterdam, deflated by the Iodex of International Inflation (1974 consunt $/rt) .
SmmOX - m r l d exportr of a d l o u e r o i l and runflower r e e d - o i l equivalent ( '000 a)
TOTFOX - world exportr of fa t# and o i t ('000 rt)
PFO - price index for f a t# and oil. (1974-100)
TME - t h e trend '9
Cottonseed O i l Prices: 1961-77 6 - 0
3 -PC - -149.790 - 4650.09 (C~Xt / lOIPOXt) + 0.2kl COTFOPt-I . (4.19) (3.H)
R~ = 0.93 S.E.E. - 28.98 D.V. - 3.09

where:
COTFOP = p r i ce s f o r cottonseed o i l , US, PBSY, CIP Rotterdam, de f l a t ed by the Index of I n t e rna t i ona l I n f l a t i o n (1974 constant S/mt).
TOTWX - uorld exports of f a t s and o i l s ('000 a t )
COTFOX - vorld export8 of cot tonseed o i 1 and cot tonr ceds-oil equivalent ('000 m t )
PFO - p r i ce index f o r f a t s and o i l s (1974-100)
D6168 - dummy var iab le tret t o 1 f o r t he years: 1961 and 1968
077 - d v var iab le s e t t o 1 f o r t h e year 1977
Groundnut O i l Prices: 1961-77
(4.4) GROFOPt - 236.996 - 1948.01 (GROPOXt/TOTWXt) + 0.1111 GROPOPt-, (6.16) (1.73)
R2 - 0.96 S.E.E. 26.35 D.W. - 2.25
CROFOP - pr ices f o r q r a r d a u t o i l , any o r i g i n , CIP European ports, de f l a t ed by t h e Index of I n t e rna t i o m l In f l a t i on (1974 constant $/mt).
GBOFOX - world exports of grarodnut o i l and groundnuts-oil equiwalent ( '000 mt)
TOTFOX - uor ld exports of f a t s and o i l s ('000 mt)
PFO - p r i ce index f o r f a t s and o i l a (1974-100)
W174 - var iab le s e t tc 1 f o r t h e years: 1961 and 1974
W57073 - d m var iab le s e t t o 1 f o r t h e years: 1965, 1970 and 1973 -

Rapeseed O i l Prices: 1961-17
vhr re r
RAPPOP - prices f o r rapeseed o i l , Dutch, tOB e d l l , def l a t r d by the Index of I n t e r a r t i o ~ l la f l a t i o n (1974 constant S1.t) .
RAPPOX - w r l d exports of rapeseed o i l and rapeseeds--11 equivalent ('000 rt)
TMPOX - t o t a l exports of f a t s and o i l s ('000 rt)
PFO - price index f o r f a t s and o i l s (1974-100)
W177 - dummy variable s e t t o 1 f o r the years: 1961 and 1977
W8 - d v l p variable s e t t o 1 f o r the year 1968
Olive O i l Prices: 1961-77
vhere: - OLIP .# prices fo r o l ive o i l , Spanisb, edibel, 12, i n d m , - FOB Spanisb par t s , deflated by the Index of Internat ional
Inf la t ion (1974 constant $ / r t ) . - rn OLIFOX 8 w r l d exports of o l ive o i l ('000 rt)
OECDY = (XP i n OECD countr ies (mil l ion US$)
T M = tire trend

P a h O i l Prieerr 1961-77
?A)6 - price of p a l m 011, )(.l~yaiao, 52, CIF UX, drflatrd by rbr Iadrx of Iot r r rut ioar l Iof l r t lon (1974 cooltaot $/rt).
PUQOX - w e l d exportm of palm o i l (*OW m t )
TOT?tlX - world rrporta of f r t a aod oi la (*000 rt)
PIO - p r i u 1rd.x for t a u a d o i l . (1974-100)
TlW - tW trend
W8 - d variable a r t to 1 for 1968
Coconut O i l Pricea: 1961-77
R' - 0.93 S.X.X. - 43-49 D.W. = 1.1'
where:
COPlOP - prima for coconut o i l , Ph i l ipp i~r / Indoneshn , bulk C I I Rotterdam, deflated by t h e Index of International Inflat ion (1974 eonslant Q/rt).
i
COPFOX - uorld exporta of c&&ut o i l and copra-oil equivilent ('000 rt) 0
*
PFO - price index for fa teand 01,s (1974-100)
D75 - d . s l variable s e t to 1 for 1975
W8 - d u u y variable s e t co 1 for 1968

Palm Kernel O i l Pr ices : 1961-77
(4.9) PhKFOPt - -2'3.279 - 1914.25 (PAKFOXt/TOTPOXt) - 0.2146 PAW0Pt-, (1.37) (6.03)
uhc re:
P W 3 P - p r i c e f o r palm k e r n e l o i l , Wart Afr ican, CIP W, d a f l a t a d by t h e Index o f I n t e m t i o ~ r l I n f l a t i o n (1974 constant $/mt)
7AICPOX - world expor t s of palm k e r o e l o i l and pal . k a r n a l s - s i l equivalan t ( '000 m t )
TOTPOX - arid axpor t s of f a t s and o i l s ('000 m t )
PPO - p r i c e index f o r f a t s and o i l s (1974-100)
W 8 - d u u y v a r i a b l e s a t t o 1 f o r 1968
TMB - tiu trend
06970 - d u u y v a r i a b l e s a t t o 1 f o r t h e years: 1969 and 1970
Fish O i l Pr ices : 1961-77
- 139.294 Wl62 - 4.0468 TRfE (4.55) (1.90)
It2 = 0.90 S.E.E. = 28.79 D.W. = 1.91
where: - - PISPOP - pr ice# f o r f i s h o i l , any o r i g i n , crude, CIF Europe ( b l f o r e
W r c h 1973 t h e p r i c e s r e f e r r e d t o are Peruvian semi- - 8 f ined) , d e f l a t e d by t h e Index of I n t e r n a t i o n a l I n f l a t i o n
974 constant $/mt). * m
FISFOX = world expor ts of f i s h o f 1 ('000 m t )
TOTFOX = wr.10 ,-xports of f a t s hnd o i l s ('000 m t )
PFO - p r i c e index for facs and o: Ls (1974-100)
D6162 - dmmy var iab le set t o 1 f o r t h e years: 1961 and 1962
TIHE - time t rend

(4.11) LAW, - 174.863 - 0.1387 UIXt + 4.9124 PPOt - 64.7770 D68 (1.73) (10.80) (3.46)
LARP - prices for lard, XBC ref ia i ry quali ty, CI? UK (before I e b n u ~ 1973 pticer r e f e r n d to r r e US, 'tlme Steam, CI? VI), deflated by tbr Index of I a t a r Inflatlon (1974 C O ~ U A . C $/a).
LAUI - vorld exports of lard ('000 rt)
PPO - prica i d a x for f a t r rod o i l s (1974-100)
D68 - variable s e t t o 1 for 1968
D646566 - 4- vatlabla s a t to 1 for the yearst 1964, 1965 and 1966
butter Pricer: 1961-77
BUfP - prlces for butter, Dutch, bulk, uonalted, Ult rarke$s, deflated by the Index of I n t e r ~ t l o n a l Inflatlon (1974 coon tant $/a).
MTX = world exports of butter ( fa t equivalent) ('000 m t )
rOfPOX - world exports of f a t s and o i l 8 ('000 m t ) - TMg - tLw treed 8 .
D7b - drirp variable r e t t o 1 for 1974

T a l l w Pr ice r : 1961-77
R~ - 0.93
where t
TALP - p r i ce f o r t a l l w , US bulk, b leachable fancy, CIP Rotterdam, de f l a t ed by t h e Iadex of I n t e m n t i o l u l inflation (1974 constant $/mt).
TOTFOX - world expor t s of f a t r and o i l s ('000 mt)
T A U - world expor t s of t a l l a r ('000 rt)
PW - p r i ce index f o r f a t r and 0118 (1974-100)
D73 - dxmny va r i ab l e a e t t o 1 f o r 1973
W875 - d v va r i ab l e a e t t o 1 f o r t h e years: 1968 and 1975
D6576 - dumay va r i ab l e s e t t o 1 f o r t h e years: 1965 and 1976
'.inreed O i l Prices: 1961-77 -
+ 4.0933 PPO - 21.3059 TIHE + 255.251 D697071 + 175.379 D7S (2 -72) (6 -44) (6.79) (2.61)
I
R' = 0.93 S.E.E. - 54.21 D.W. = 2-04
'! LINPOP - price8 f o r l i n r eed o i l , CIF Europe, de f la ted a by t h e Index of I n t e r n a t i o n a l I n f l a t i o n C1974 cons t an t - s l m t 1 * - -
LINPOX = world exports of l i n r eed o i l ('000 m t )
LINF3S - world production of l i n seed o i l ('000 m t )
PPO = p r i ce index f o r i e t s and o i l s (1974-100)
TIUE - time t rend

W97071 = d-9 var iab le set t o 1 f o r the years: 1969, 1970 and 197 1
075 = dummy variable s e t t o 1 f o r 1975
Price @rut ioru f o r High-Proteln k a l s
Soybean Heal Prices: 1961-77
SO-P = price for soybean meal, US 442, CIF Rotterdam, def la ted by the Index of I n t e r m t i o m l In f l a t ion (1974 constant $/r t ) .
SOY)(Ll1 - world exports of soybean meal and soyhaas--meal equivalent ('000 rt)
TMI(LX = world exports of o i l reed meal8 and o i l s t t d e - m e a l equivalent ( '000 m t )
I PML = price index f o r high-protein meals (1974-100)
D63 = d u n y variable s e t t o 1 f o r 1963
Suaflouer Meal Pr ice s : 1962-77 b 6
(5.2) SUISaPt = 57.0968 - 71.1350 (SuNzaxt/TORltX,) + 1.1991 PnLt (0.36) (21.85)
0
S E E * 5.67 w D.U. = 2.80
SUNtaP = price of s u n f l w e r p e l l e t s , 37-382, ArgentinafUmguay, CIF Rotterdam, deflated by the Index of In terna t tonal Inf la t ion (1974 constant $/mt).
S U W - w r l d exports of sunf lover meal and sunflower seeds-- a e a l equivalent ('000 m t )

TOr)(W( - w e l d expor t r of o i l r e a d mealr and o i l reed- -wal equivalent ('000 rt)
PIU, - p r i c e indox f o r high-protein l a a l r (1974-100)
Raperead Meal Pr icer : 1963-77
S.E.E. - 3.93
where:
IUP)(LP - p r i c e f o r rapereed meal, 342 FOB e x 4 1 1 Hamburg, de f l a t ed by t h e Index of I n t e t c u t l o u a l I n f l a t i o n (1974 c o m t a n t $/=)
IUPI(W( - uorld export. of rapemeed meal and ropereads--wal equivalent ('000 rt)
T0lW.X - uorld export. of a11 h igh-pro te in w a l r ( i n t a m of p ro te in equivalent) ('000 rt)
P U - p r i ce index f o r h igh-pro te in meal8 (1974-100)
D686970 - drm]r va r i ab l e n e t t o 1 f o r t h e yearr: 1968, 1969 and 1970
Groundnut Wl Pricer: 1963-77
(5.4) CB#(LP, - 538.025 - 0.1595 + + (3.72)
3 - - + 1.6101 PWLt - 13.3886 T M E - 79.5691 D64 .t *
(6.98) (7.62) (2.93) - e
F? - 0.C3 ? S.E.E. - 23.70
where:
CROHLP = p r i ce f o r groundnut meal, SOX any o r i g in , CIP Luxembourg, de f l a t ed by t he Index of I n t e r a a t i o n a l I n f l a t i o n (1974 constant $/mt) .

GROKLX - world e x p o r t s o f groundnut wal and groundnutr--peal e q u i v a l e n t ('000 rt)
PtfL - p r i c e index f o r h igh-prote in meals (1974-100)
TIXY: - ti- t r end
W 4 - dummy v a r i a b l e s e t t o 1 f o r 1964
Cot toa rced Heal Pr i ces : 1963-77
C0THI.P = p r l a f o r co t to rueed , e x p e l l e r 432, CIF Europe, d e f l a t e d by t h e Index o f I n t r r ~ t i o l u l I n f l a t i o n (1974 c o n s t a n t S1.t 1.
CORaX = world e . p o r t r of co t tonseed r-xl and cottonseeds--a1 e q u i v a l e n t ( '000 rt )
P)IL - p r i c e index f o r h igh-prote in walm (1974-100)
TWX - t h e t r end
D63 = &uuy v a r i a b l e set t o 1 f o r 1963
Copra Heal Pr i ces : 1961-77
. S.E.E. = 12.44 D.V. - 1.32
COPMLP = pr ice f o r coconut e x p e l l e r p e l l e t s . 26%. P h i l i p p i n e s . CLF Hamburg, d e f l a t e d by the Index of I n r e r n a t i o n a l I n f l a t i o n (1974 c o a s t a n t Slmt ) .

C O R U - w r l d arportr of copra aaa l and c o p r a w a l equivalent ( '000 at)
T O W - w r l d axportr of a11 hi~h-prota ia w a l r ( i n t a m of protaia aquivalaat) ('000 at)
PKI, - pr ier iadax f o r hiah-protaia w a l r (1974-100)
TfW - tLu t r a d
W6 - dummy variable r a t t o 1 for 1966
D74 - d m variable r a t t o 1 f o r 1974
Coarirtaacy Batmen Price I a d u a d Pricar fo r Iadividual Fatr and O i l s
169. Tba price iadax a d tha pricar f o r iadividual aquationr are datarr inrd raparataly i n tha modal. t o u r u r a tha t the prica indax and pr icar war. colui r tant with u c h o t b r , tha pricar 6earrat.d by tha prica aquatioar f o r idivlbl f a t s aad o i l r uera adjurtad i n ouch a way that tha t o t a l v a l u of c u r n n t f a t s and o i l s axportr a q d l a d that i q l i a d by tha prica indax. LI Tba prica index w a d i n tha modal can ba v r i t t e n a0 f o l l w r r
PlQ - p r i c ~ i a d u of a11 f a t r aad o i l . i a y u r t
Pi74 - prica of o i l o r f a t (i) i n 1974
QIOX - roluw of vorld f a t s and o i l . exportr, i n year t
V?t+ - n h a of a11 f a t s and o i l s axports i n year t - valua'of a l l f a t s and a i l s axportk i n year t valued a t -" t h a i r 1974 p r i c u
To u k a prJcy coluis taa t with the price index, f i r r t the current value of OX ) ws coqwtad, wily tho ( m d j u r t e d ) prices deterriaed by the 8 a q p t i o l u . Tba tbe r a t i o b a t m n tha tn export n l u e a ,
(V?Oxt) and (WOX ) war applied t o adjur t th8 pricar. * t
11 Ia a a a a r l i a r *.toion of t h i s w d a l , price index and individual prices - uen obtainad r lu l taaeoualy . (See Norman L. Rick,, "The Si r l ink M e 1 of Trade and Growth f o r the Developing World," World Bank Staff Working Paper No. 220, O c t o k r 1975, Annex 11-9.)

111. WDEL SIMUUTIONS AND PROJECTIONS
A. Validat ion o f t h e W e 1
170. The es t imated equat ions -re t e s t e d by r i u l a t i n g t h e behavior of t h e ~ r l d f a t s and o i l s economy f o r t h e period 1970-77. I/ The s imulat ion s t a t i s t i c s o f t h e key v a r i a b l e s a r e smmarized i n TaTle 24.
~ a b 1 e 24 t SMT ~ ~ ~ S U L T S OF m EL SI)(U~ATIONS POR m D VARIABLES
)(.an# RHS Error /a Variable Actual Data Sfn. Data Absolute X
supply (SW) Denand (Dm) ?rice (PPO) Stoclt. (In)
Righ-Protein Ileal.
supply a a u r d (ma) Rice (PWL) Stock. ( M a )
/a RXS is t h e root-wan-square r i d a t i o n e r r o r . -
171. The s i u l a t i o n result. a r e q u i t e s a t i s f a c t o r y . The model c a p t u r e s t h e t r ends ,and last o f t h e turning p o i n t s i n term of s u p p l i e s , demand, p r i c e s and s t o c k s o f o i l s and meals w r l d v i d e . While some p a r t s of the model, such as t h e reg iona l breakdovr of t h e demand f o r f a t s and o i l s , need f u r t h e r refinement, t h e s i u l a t i o n r e s u l t s i n d i c a t e t h a t t h e s t r u c t u r e of t h e model is sound.
- i
!
I/ Since d a t a f o r nome of the key v a r i a b l e s e r e not a v a i l a b l e f o r t h e y e a r s - before 1961 and s o w vartables * e r e used with 12-year lags, I t was not p o s s i b l e t o s imula te t h e model before 1970.

8. Prorptctr f o r the Uorld Oilreed E c o a o q
172. The model v r r used t o deternine l ike ly d t v e l o p r a t r i n the w r l d o i l r eed economy. Table8 25 and 26 r h w the projected valuer f o r production, conrumption and pricer.
173. Tha project ionr c o a f i r r d the view tha t t he d e u a d f o r hfgh-protein wrlr v i l l grow famter than the demand f o r fa:. and 0110. Thir, i n turn, w i l l lead t o g r w i n g inventorler of f a t 8 a d 0118 and a decl ine l a their overa l l p r i ce leve l , which eventually (within an appropriate l ag ) w i l l depremr the upp ply of o i l reed0 with 8 high 011 CmteOt. ihe decl i - of ruppli80 f?# the re cropr, together with the g r w i n g demand f o r o i l from developin8 c m n t r i e r , w i l l then caure a d e c l i ~ i n the iavea tor ie r of fat. and 0110 and a r i r e i n the ove ra l l p r ice lave1 f o r f r t r and oil . toward the end of t he period being proj.ct?rd.

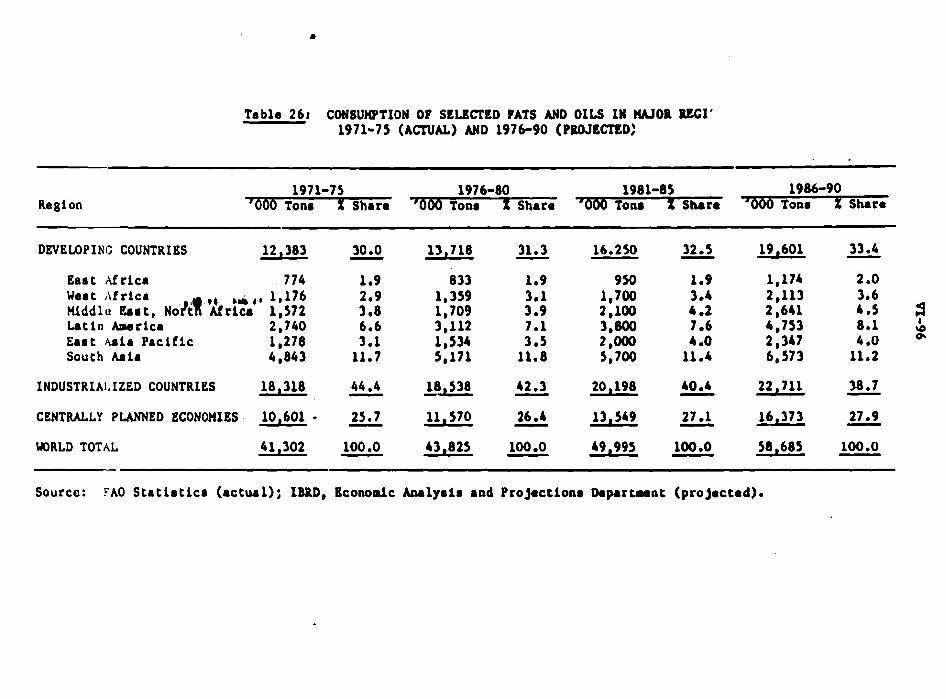
Table 261 CONSUWPTION OF SELECTED PATS AND OILS I N WOE =I' 1971-75 (ACTUAL) AND 197690 (POAIECTED:
Region 1971-75 1976-80 1981-85 1986-90
# 000 Tonr X Share -0~h.t. Tom 2 Share -000 Toar X Share
DEVEU)PINC COUNTRIES
Ear t ,ifrica 7 74 1 .9 833 1.9 950 1 .9 1,174 2 .O Wer t ~f r ica ,-,a 1,176 2 9 1,359 3.1 1,700 3.4 2,113 3.6 Mlddlu h a t , ~ o ~ ? i l % r i u 1,572 3 .8 1,709 3.9 2,100 4 .2 2,641 4.5 1 Latin Awrica 2,740 6.6 3,112 7.1 3,600 7 .6 4,753 8 1 I * Eart ~ e i a Pacif ic 1,278 3.1 1,534 3.5 2 moo0 4 .O 2,347 4 .O OI
South Aair 4,843 11.7 5,171 11.8 5,700 11.4 6,573 11.2
INDUSTRIALIZED COUNTRIES
CENTRALLY PLANNED ECONOHIES - 10,601 - 25.7 - 11.570 26.4 13,549 27.1 16,373 - 27 .9 - - WRLD TOTAL 41,302 100 .O 43,823 - 100 .O 49,995 100.0 58,685 - 100.0
Source: FA0 S t a t i r t i c r (actual); IBRD, Economic k u l y r i r aad Projection8 Departmeat (pro jecred).


TABU OF COm'm'rs
Page No . S m Y AM) CONCLUSIONS ...................................... VII-1
I . IrnDUCTION ............................................ VII-3
..................... XI . T1IW)RY AND m I 0 W BEUTIO#SEIPS
......... A . Datarrirunts of C m r c i a l energy Denad B . Data Availability ................................ C . ecoaowtric spacit ieatioa ........................
111 . DATA AHD ESTMATIONS m D S ...........................a
......................................... . A The Data B . The Sirult.neous E a t i u t i o n Hatbod ............... ................... C . Tho fuo-Step Barfmt ion Method D . A Brief Caaparisoa of the fuo Hatbods ............
V I . rn RESULTS .............................................

i. During the 19600, primary c m r c i a l energy demand f o r a11 &w;oping countries increased by about 72 annually, ae compared with s l igh t ly :-.a, St i n the industrialized countr ies ( e x c l u i w of cent ra l ly planned ecor~omler). During the 19700, the world energy c r i s i s affected the grovth of energy demand i n developing countr ies only mrglnal ly . Whereas fn Ladustrialired c o u n t r i u the increase in energy d e u a d &celerated t o an m u a l r a t e of about 2 1 b e t w e e 1970 and 1978, the r a t e of increase remained a t a high 6 t o 7% i n the developing countries.
11. I f r e a l energy pr ices rewain a t t h e i r 1975 18-1, energy deaand i n the dev8loping cormtries w i l l incrmue by about 6 t . a a u l l y Letueea 1978 aad 1985 and a t a s l i g h t l y biQber r a t e of about 7 t benreur 1985 and 1990, aaamiap tha t ecoaorlc w w t h and s t ruc tu ra l chang. f o l l a , the pat tern pro- jected i n the World ~ d ' r Vorld bwlopmmt Report 1979. A coartaat real erurgy price is, houewr, qu i t e m n a l t r t i c . I f it is u r u a a d , therefore, t ha t r e a l pr ices i n 1990 b i l l ba about 502 higher than in 1975, unrrpy demand ia the developing countr ies fa projected t o prov a t a l p about 52 uurrwlly brtveen 1978 and 1990, with t h r grauth r a t e rp t o 1985 s l i g h t l y lover than tha t betveen 1985 and 1990.
111. Energy demand In t he i n d u t r i d i z e d cormtries is expected t o grov a t consi&rably l w e r rates . Therefore, by 1990, energy demand in developing cornt r ie r rbould exceed tha t of Western and Northern Europe, and those cormtries rbould k e c o u the second larges t energy coaruasrs behind North America and Ocemir.
iv. The d e l on which these project ions a m b u e d haa been 8pecif:cally designed t o a. count fo r t h e l q a c t of s t r u c t u r a l change, a s v e l l an ecoaoade grauth md energy prices, on ene-gy d e n a d and t o d l w the w e of macro data p n ~ j e c t e d by the BmL'a sodel u exogenous variablce. The basic e s t i m t i o a equation in a l o g l f a e a r function of per capi ta energy deaumd dependent oa r e a l per cap i t a income, the real euergp price aud s t ruc tu ra l variables, defined as t he shares of agricul ture, d n g and c o ~ s t r u c t i o n , manufacturing uad e l e c t r i d t y , and the t ransport sec tor in Cmss Donestic Product. The c e t i m t i o n r hbve been mde f o r t o t a l primary conmrcrcial energy expressed tn thowmd retric toaa of coal equivdent . 'Ihe data a n tim s e r i e s , tanging from 1960 t o 1975, f o r 80 developing countries a d 16 indus t r ia l ized c a m t r i e s ,
v. ILo a l te rna t ive estimation oethods vere wed. In the simultaneous e & m a t i o n (SE) procedure, all parametera vere estimated f a one step. ~ t f u c t u r a l and pr ice e l r s t i c f t f e s vere based on the data f o r each of 14 co3try groups; the income e l a s t i c i t i e s vere based un the da ta of the - respective country. In the tvo-step (IS) pethod, the parannters ;f tke 8 s e t u r a l variable8 and the energy price vere estimated i n the f i r s t step. ' The inpact of the change i n e c o n d c s t ruc ta re and energy p-Ices was then deducted from the or ig ina l energy c o n s ~ t i o n data. The reduced er-ergy

cooru~pt ion w r l a b l r obtained by t h i r calculat ion v u n g r r r r r d a p i n r t r e a l per capi ta Lacow a r all cormtrier. lo t h i r v q c o u n t r p r p r d C i c iocom r l u t i c i t l u urro obtafmd tha t n f l r c t var la t loar i n onr rm d e w d vith n o p r c t t o chmgre i n i n c o n , a t t a r t h r *act o t r t ruc tura l e h m ~ aad rnrrgy p r i c r r oa rnrrgy d r m d h u brea a l l d n a t r d .
d. i h o projoctioar f o r tho corntry groupr v r r r obtalnod by addlog rg tho cormt rp rp rc i f i c projoctioar and than i n f l a t i n g tho aggnga t r by tho ra t e of mdercoorragr ( w a y oaly E U X o r =n of tho arorpr ' eaorgy mmmd u u covorrd by tho soplea).
oti. B u r d oo tho ruu l t r from thr two r r t i u t i o o mothob, t h r following coaclwioer ua be drmmt
- 'Ibr a t a t l o t i c a l f i t hardly differ. botvorn tho tvo matbob. I f mythina, tho SX wthod producu r l l ~ t l y bo t to r ruul tm. W a v e r , tho parameters of tho r t r u c t u t d o a r l a b l o a n r t a t l a t i c d l y s i ( n i f i m t r o r t l y v l t h the IS wthod, md r d y vitb tho SX wtbod. In t h r S t w t b d , a coort.ot t o m w u mod f o r ovary cornrtq; apparently i t q t u n d rrrh of tbo rtnrctural d f f f r t a rc ra b o ~ v u n corratrlrr, while rtrwtraal &PI- vithln comtr l aa l o too m u l l f o r pro- ducing r l g a i f i c m t p a r m t e ra.
- ibe TS wthod tar& t o q h u i z o tho ispact of r t r u c t u r a l &-a, u b o n u the S11 prthod probably producu r t ruc tu ra l p u m t e n that ara too lw, tho moul t of the co ru tmt t e r m . Ibr t rua r t n r c t u r d p a r u t e r r l l o romwhrn in b o n n r a thorr r r t i m t o d by thr tw metho&.
- Spadf ica t ioo o rpe r im~nts vith th. T3 mathod ahow t t a t the projectioru a re mmar5ubly a table v i th rarpect t o a l te rnat ive .pccif icat ioru (8.8. w i n g country . . d d u , o d t t h g varlablom, etc.).
- S t a b i l i t y t u t r of tho i n c m e l u t i c i t i r r indicate tha t s ~ e d f i u t i o o r vlth vari&le e l u t i c l t i o r a re not ruperlor t o those v i t h c m a t m t eluticitier.
- The aggregated amtimatea of a country group f l t the obrerved valaea w @ l even i f the f i t f o r the individual cormtr lu v u not good. Apparently, error. tend t o cmca l each o ther o u t tn the a w e g a t e . ..
viii. The p r o j e c t b f o r the individual countrier were dona ra ther schematically by applfing the output of the World Baak mdel and vi thout taking i n t o accomt the rpecia l circumatancar tha t prevail i n a b o r t every country. Iboy therefore rhould be w c d fo r dlscwaion only. Conmento by country s p e d a l l s t r that would enable w t o improve future project iom a r e welcaw .

DlFRCY DEHAND I N THE DEVELOPING WORLD: ESTIHATIONS AND PROJECfIONS
TO 1990 BY REGION M'D COUNTRY
1. The future energy nee& of the developing world have becor~a a matter of nujor concern of p o l i c y ~ k e r r i n developing countrier UI wel l ar i n industr ial ized oner. Uherear anergy dearod i n industr ial ized couat r ier is now being projected oo a regular ba r l r by nat ional and in ternat ional insci tut ione, i n par t icular the Laternatioaal Enargy Agency, much pre- ject ionr a re r t i l l lacking for the developing world. Thir paper ruporta on a m j o r f i r s t r t ep tauard bridging t h i s wp. L/ 2. A t p r e r a i t , the project iom a n cmfined t o t o t a l primary c-rdal energy--the rua of coal and l l lpl i te , petroleum, uatural and mmufactund gas, and e l e c t r i c i t y , a11 converted in to thourand w t r i c tour of coal equivalent. Ttte demand for nos-comucrci.1 energy, although qu i t e i w r t a n t i n may developing countries, i r not covered here, prlmnrily became o f a f o r d & b l e lack of data, but a l so became the concept of non-comercia1 energy r t i l l ham not bren c lar i f ied . The breakdown of commrdal energy demand by individual f w l r w i l l hopefully be achieved a t a l a t e r date.
3. Uhea chi. project w a r s t a r t ed , i t w a n soon realized tha t a v d l - able e s t h a t i o n m d project ion approaches were inadequate conceptually, a8 well as with respect t o available data. I t van therefore aecesrary to develop a su i table projection mthodology. In the course of the work, additional problem with data and e s t l ~ t i o r u nude several revision8 t o the method necessary. Section8 I1 t o IV of t h i . peper demcrfbe the theory underlying the method end the method i t s e l f .
4. Projections for the developing world as a vhole a re ne i the r very useful fo r the developing countries themselves, nor could they r e a m a b l y be assessed by others. From the beginning, therefore, the authom decided t o disaggregate the projections by region. ?'or technical reamonn out l lned belou, the regions coincide v i t h o r a r e rub-region. of thore used by t h e World Bank fo r its ~croecaaomlc projection frca~euorlt. Ibe projectionm a
were not , hwever, mdertaken f o r the regions a r e c t l y , but were built up from projections f o r individual countries. This approach, dictated by methodologica?. considerations, had the double advantage of pro_vidlng infonmtion fo r individual countries, as wel l u leaving the $gionrl aggregation c o q l e t e l p f lexible. One d i f f i c u l t y tha t should noted. however, is tha t the projections fo r some ccuntries are much @s r e l i a b l e than thosg for the regional aggregates. -
s rl I
- - --
1/ Research fo r t h i s papez was supported by the World Bank. Walter Oberhofer - of Regensburg University provided considerable help i n solving a nwber of i n t r i c a t e econo~letric problems. He a lso permitted the authors sub- s t a n t i a l l y mre time by taking aver a co.role cf t h e mre ti=-cor.auming coaiputer runs.

5. ihir paper ir thr f i r s t complrtr pnren ta t iou of thr rrrultr achirmd w u this nrv wthodology. k r w h , a r much informtion u porriblr h u bom pr0Pid.d i n both n t l l ~ l t i u l U I ~ graphical fora on the rxogmow u voll u rha oa tha t ad oarirblar . Tho method of p r u a n t r t i o n of tba nrul t r i a o u t l i ~ d b Sactiom V. 'Lbo raaul t r by corntry group appear in Sactloa VI , uhich dmo coatrLar tha n o u l t r f o r bd iv idua l c o m t r i u in th forrr of r r r s r ) trbler . badera primarily i a t e n r t a d in tba p ro j r c t l aw t h m a l ~ u cau p imadia t r ly t o Srctiou V I , cowultirrg Saction V f o r mlautioor of tb r tabla u neodrd.

6. Producer8 require energy to prodwe c m d i t i e r m d mewlcer; pr ivate howrholda require it f u r heating, eooklxq, lighting, t r a u p o r t a t i o n , etc. The d . rmd of produearm &pen& oa the -1- of t h e i r productioa, u well u oa the u t e n t t o vhich energy la w e d u m input , 8% c ~ a n d to o ther input r such u labor, c.pit.1. urd rrr rteri.1.8. '2hr r e l a t ioa rh ip bemeen inputr .nd output can be rrpreared by a productioa f m e t i o n which, fa i t r m a t general form, m y be w r i t t e n us
X - real output o f a r ec to r
t1 - mesw input
L - l abor input
C - u r p i t d input
R - rs, u t e r l a l input.
To obtafn a prodour ' s mergy requireaent, function (1) m y be molrrd f o r EX, i f posrible:
7. 'Ibis gmrrd f u n c t i d relationship doe8 not account f o r production technologies, but it in a s r m d that a (&am) met of technologiem exist8 t h a t can be t raced c q i r i c a l l y by testing altexnative m p e c i f i c a t i m of frmctiolr (2). IPput pr ices a l s o do not appear in (2) because it i. aarunud la equilibrium that a certain ! d r o a p r i o r l Mhrovo) r e l a t lomhip exiota between inputr and input pr icea .ad t h a t chmgaa in inputr inply cknger la laput p r i c b and vice vetma.
8. !kcatme of the l a t t e r anelaption, inputs and input p r i c a a r e interchangetble Ln a production function, and function (2) may therefore - as0 be written 88:
' ? 0 - (3) EI = f j (X. PLC' PEC. PgC) . * 8 - where: *
PtC - real p r i ce of labor i n terms of capi ta l I
PEC = r e a l pr ice of energy i n te-ma of capi ta l
PRC = r e a l pr ice of raw m a t e r i d e i n terms of c a p i t d

For tvo lnputr, ray energy and capi ta l , fmc t i oa (3) ccm be i l l ua t r r t ed by the foil-g f d i a r graph:
4 Capital
'Tba f i m m b a n tha t a cart& output (3, reprueatad by m i m q u t , and art& red am- p r l u FgC), u c t l y de t a r rku tho demand for =arm m. 9. Kuargy darmd by private howeholb follovm tha r m principle. A household caw- r o a m , f i r r t , on the b u i . of geaerd a b i l i t y to buy goo& u uprearad by red income, and, ~ c a a d , on the b u i a of tha prica of energy u colpuvd to othar canrrpar goods. fltrrca, t o coguta howehold a n e r a dermd, it i. only necessary t o subst i tu te in frmction (3) real incom for output m d the rea l price of energy in t e r r r of other consumer go& fo r tha real prfces of inputs:
EB - energy ccanmption by households - T - r e a l %a
4
PE - real eaerg price in t e r m of conscrcf goods. - r
Figure 1 applies t o function T b ) also. Income is expressed by the budget l i ne which is tangent t o an indifference curve; the gradient of the l ine represents the real energy price.

Data Av8i lab i l i ty
10. Civea the a v a i l a b i l i t y of da ta fo r developing t o m t r i e r , i t i r generally not por r ib le t o t r a u l a t e f r n r c t i o ~ (2) t o ( 4 ) i n t o e r t L u t i o a equatioru d i r ec t ly . Data problem r l r o e x l r t v i t h regard tor
- the q u m t i t i r r m d p r i ce r of energy coarumd by the varbum u t e p r i e s of i n d u r t r i r l m d m a - i a d u r t r i a l werr (Lrrdtmtrirl , howrholdm, e tc . ) ,
- tho q u ~ n t i t i e r m d p r i r e r of aoa-mew fac tor input.; and
- the rmd output8 of var iour i n d w t r i a l a c t i v l t i r r ,
11 , t v r a i f roar of t he d a t a could be obcalsud f o r a pa r t i cu l a r country, they umtully a n u u v a i l a b l e f o r a t i n period r u f f i c i e a t l y l o a t f o r regresoion e r t f m t e a . k lent am the re d a t a problems e r d r t , it i r n e c u r a r y t o coqtorl.8 beoreea uh.t L. i dea l ly required f o r utivtiag rpee i f ied fmretionr of t b t h e o r e t i e d n la t ioarh ip ic a d uhat can be e r t i u t e d vith the d a t a a t hand,
12. Tbe lack of &ta oa e ~ e r g y toarrnptiorr by d i f f e r en t u ra r r u k u it necerrarl, t o luq energy c o z u ~ t i c m f o r productive purporer, ar r ep ru raced , f o r I O r t a ~ e e , by frmction (3). u i t h t h a t of horuaholdr [frmction (4) 1.
13. The u t i u t i m of a r p e d f i c a t i o a f o r (3) require# & t a on output in real t e r m . Unforturutely, f o r mmy developfng cornrtrier, only t o t r l output, def iaed by Crorr Doatstic Pmduct 0). and not r e c t o r d outputs ( X I , a r e ava l lab le in real term. X 10, therefore, defined by:
14. I f i t l a ~ a m d t h a t i n f l a t i o n i n t o t a l nominal output doca not d i f f e r very much frum t h a t in aec to ra l nominal o .~ tpu t s , the a e c t o r a l aharea (u) calculated from n o d n a l values ~ h o u l d be reaeonable approrimations of the respect ive aharea in constor t prices, b e u w e i n f l a t i o n would cancel out in the ra t io .
rn I
15. A fur ther a i r p l i f i c a t i o n &a t o be nude with re8pect t o the p r i ce variables. It la assumed t h a t the two energy pr ices i n fmc t iona (3) and (4) move p a r a l l e l over t i ne , thm permitting uee of j u s t one p r i c e index (P . The pricea f o r o ther inputs a r e m w a i l a b l t and, t he r i fo re , have t o q e omitted. ' ?
16. ' Givm n sec to r s in the economy, the function f o r t o t a l energy demand (Y can n w be wr i t t en aa: r) . 0

.'.7. T r r d i t i o d l y , energy demand ha8 been e r t lna t ed u e h g rilnpler iunctiona, with the energy var iab le regrerred only against income o r income and pricer . I f income were the only axpluratory var iab le , the ertimated p a r u t e r of the ineom variable ought t o be the ram8 u i n a comparable spec i f ica t ion of (6). u long a0 the economic r t ruc tu re snd the rea l energy pr ice remain coas tmt . I f , on the other hand, r ea l energy pr icer f a l l , as they did i n the 19606, energy c o a r u ~ t i o n can be expected t o t i r e f a r t e r t h m otheruise, sad the parameter of Y i n the r i w l e r function w i l l t h e n f o r e be biared upvardr. I f there i r a r h i f t t w a r d highly energy-intearive Ladurtriea, a r ham been the c u e i n moat developing eouat r ie r , energy c o a r u q t i o n w i l l r foe f u t e r than o the lv i re , and the ptr.wter of Y vill a m i n b r b i u e d qwardo.
18. For projection purporer, rL.pler f m c t i o n r a n acceptable u long u i t can reuorrrbly be u r m d tha t r t r u c t u r a l chaagen vi l l f o l l w the rame trends am i n the p u t md t ha t the r e a l energy pr ice 10 c o a r t m t o r changer i n keeping with p u t treads. Given then. u ruqp t ion r , the estimated p a r m t e r a would not produce i n c o m c t project ions, though they vould be biased.
19 Both a tw~uqt ioru a re , hwever, q u c a t i o d l e , par t icu lar ly in the longer run. The ? r i ce of energy ham been m v h g a f t e r a decline in the 19500 and 19600, and r t r u c t u r a l chmg. h u bear tapering o f f a r comt r i ea reach cer ta in levalo of d e d o p w n t .
20. In the present exarcbe, the r t r u c t u r r l v a r i a b l u in fuaction (6) vere defined as t he rhare of m j o r r e c t o r r mch u agr icul ture , manufacturing, e tc . , i n n a t i a a l income, r a l r l n g the q w r t i o n of the l e d of aggregation a t vhich the r t r u c t u r a l var iab ler ought t o be &fined. Ideal ly, they should be d i r a~grega ted as u c h u porr ib le ln order t o capture all s t r u c t u r a l e f fec ts . In prac t ice , the a v a i l a b i l i t y of data nccesr i ta te r a c o q r o d s e .
21. Data are avai lable fo r major sec tors f o r b a t a l l countries from National Accouets a t a t i s t i c r . Any fu r the r disaggregation is d i f f i c u l t i f the estimates a r e t o be perforwd over a longer ti= period and f o r a l a rge r n u b e t of cormtries. Strout (1976). f o r lnstcmce, has propoaedr disaggregating m u f a c t u r l n g in to cnergy-intensive and non-energy-intmsive indus t r ies . This ce r t a in ly is desirable, but , as h i s calculat ions show, i t is only feas ib le f o r a l imited number of countr ies aud only f o r a feu, more recent years.
C. Econouetric Specif icat ion
2 2 . The econometric spec i f ica t ion is primarily 1 matter of convenience. For the estimation functions fo r production and demand, i t has become cormDon to use logarithmic spec i f ica t ions because they can account f o r non-l ineari t ies and therefore tend to produce b e t t e r s t a t i s t i c a l results than do unlogged f o m . I f the spec i f ica t ion is log-linear, the f a c t i o n s estimate e l a s t i c i t i e s d i r ec t ly , f a c i l i t a t i n g 1nterpre:ation.

23. The advantages of l oga r i t ha i c spec i f ica t ions , hwever , have t o be weighed againet t h e i r shortcomings. O a t problem is tha t f o r the l a rge r vducm, the deviation of obmerved from e8timated values tends t o be understated, and the coef f ic ien t of dttermlnation therefore la ovemtated. In ti- ser i tm analymim, which w u i l l y involves increaming f m c t i o n s , the deviat ions f o r t he momt recent yearn a r e generally understated. This r e s u l t is m d t s i r a b l e ar it is be l l e .nd t h a t the -re recent developrents a r e a t l e a s t ar Laportav':, i f not wre important, i n t he e r t l p r t i o ~ than a r e t he e a r l i e r values , fo r Lartance, when d f n g projectlone. While t heo re t i ca l ly tha problem could be molved by weighing the observations, i n prac t ice i t i m d i f f i c u l t to & t - W e the c o r n c t u g n i t u d e of the weights.
24. Another problem a r f s u with r u p e c t to aggregation, i f i t is pomtulated t h t the demand function f o r t o t a l energy cm be d l a g g r e g a t t d i n t o the functions of the user categories in such a way t h a t the p a r m t t r s of tha l a t t e r functions c r a be dis t inguished from the former. Such a pomtulate meriorrrly corutrataa the range of p e r r i s s i b l e spec i f ica t ions . La pa r t i cu l a r , it e x e l d e r all logari t lmic spec i f ica t ions , because such f\mctions generally cannot be &aggregated.
25. I n s p i t e of theee s h o r t c ~ g a , l o e l i n e a r spec i f ica t ion w o s chomen i n t h i s study, primarily because the s t r u c t u r a l variables do ehrage i n 8 n o t i l i n e a t faahion. From the work of Kutoets (1971). ~e l s /Scha tz /Uo l t e r (1971) and Chanergy/Syrquin (1975). i t is known t h a t the a t c t o r a l shares in Cross Domestic Product (C;DP) approach c e r t a i n ce i l i ngs v i t b r i s i n g per capi ta income und a t those pointm f o l l w a reverse trend.
26. The function a c t d l y used i n the u t i r r t i o r u ta:
B = population
R4S - - share of agr icu l ture i n GDP - RSS'? - share of mining in QP
R6SZ- share of construction i n CDP t
R7S '- share of manufacturing i n GDP
R8S - share of u t i l i t i e s i n GDP
R9S = share of transport i n CDP
P = e r r o r term.

27. fa function (7), the r h r u of mint and coortructicm, u v e l l u thore of lurrufacturing .jd utilities, a n 1-d towther nopectively, u they rmnat be obtained meparatrly for several couatrier. To amid that the CDP'r of o n l l .nd 1 . r ~ corntrim dodoate the rerultr, mrgy coruumptioa and QIP'r of all c o m t r i u uera divided by their population (B)

28. Function (7) was e s t i au t ed using pooled ti- ueries-crorr-section rampler, in which the t i n e s e r i e s f o r individual cornrtricr, vhich ranged from 1960 t o 1975, were l q c d together. t h e n were two poss ib le d i f f e r en t estimation =tho&. The f i r s t , vhich appears t o be m o t appropriate f o r pure project ions, is the rimultancous e r t i r l t ion mthod. The second, *ich ir probably Prore s u i t a b l e f a r simulations, .la. t w c s teps.
29. The appl icat ion of equation (7) t o a c o w t r y pool ia r tead of individual c o m t r j e s u u necersary f o r r e v e r d r e u o a s . F i r s t , t he -ximum rider of years avai lable fo r any country u u 16, too feu f o r the e r t i u t i o n of s t a t i s t i c a l l y r i g n i f i c m t parameters, given a multiple regression with s i x independent variables. Second, the s t r u c t u r a l changes within c o m t r i e s over a period of 16 yeam a r e generally too 8-11 l a d the apread of the rerpecti*m var iab les t h r e f o n too narruu, so t ha t , . g a b , r t a t i r t i u l l y s ign i f i can t parametera caunot be expected. Third, 8 t ~ c t u t d chmg. is a long.run pheno=enoa, bsr t explained by cross-section er t iutes tha t can ind ica t e long-rur adjustourto much b e t t e r thaa a n t h e rer fes .
A. ?he Data
30. The e s t i ~ t i o n of a furc t ioa rucb u (7) requires a s u b s t r a t i d amount of da ta which, fo r the -st p a r t , a r e not readfly ava i l ab l e f o r developing c o m t r i e s . The da ta w e d bare f o r the elcogurous var iab les o the r than p r i ce s were obtained from the da ta bunko of tba World Bank . The data f o r energy c o a s ~ t i m a r e from a tape of the United Natioar. lJ
31 Data on p r i ce s were obtaln(td i n p a r t from B.J. Choe of the Econodc Analysis and Project ions Department of the World 8m.k nnd i n pa r t were col lected by the authors. The pr ice r e r i e s f o r individual fue ls were used t o construct energy pr ice indices , taking a s weights the fue l consumption shares of the respect ive countr ies i n 1970. .That year was a l so chosen as tbe base year.
32. As inco- var iab les a r e expressed i n r e a l terme, the nominal pr ice ind ices a l so had t o be deflated. For t h i s def la t ion , e i t h e r the consumer p r i ce index, r e t a i l p r ice index, d o l e s a l e pr ice index, o r CDP de f l a to r were used, depending on data ava i l ab i l i t y .
33. The pr ice s e r i e s were converted i n t o ind ices because it appea irupossiblo, t o derive an average energy pr ice f o r one country t h a t would comparable t o t ha t of another. The consequence of the procedure adopted is tha t the estimated ;rice elasticities r e f l e c t only the impact of pr ice ' changes over time d ld not t h a t of intelccountry differences. S
m
1 Published as Uaited Nations, S t a t i s t i c a l Papers, Ser ies J, World Energy - Supplies, 1977 cont.

B. The Simtltlneour Ertimation Uthod
34. The rimultancow ertimatioa (SE) uad the tvo-rtep (IS) mathodm d i f f e r b u i c d l y i n t h e i r treatment of the n a c t i o a of dcmrnd t o chmger i n incomr, ILI v u argued above, the i-ct of r t r u c t u r d ch8age i r a long-run phenomon tha t can only be er t iau ted v i t h w r y long tima r e r l e r , vhich are not avai lable , o r v i t h a tfma rerler-crorr-aectioa rampla. Hovewr, tha t problem doer not apply t o er t imatiag the i w a c t of chuagu In Incomr, r e there changer a r e ce r t a in ly m u c h =re pronounced over ti- than a r e r t r u c t u r a l changu. Furtherxmre, energy d-d cua be expected t o n rpond t o changer i n income m r e imardiately than t o c h u q e r In the ecoaomy'r r t ruc tu re and the pr ice of energy. Hence, tiw r e r i e r u t i m t e r of the me-lacoar r e l a t ioa rh ip f o r i a d i v t d d co rn t r i e r a m l i k e l y t o produce r t a t i r t i c d l y r a t i r f ac to ry r e r u l t r . In addit ioa, e r t i u t i o g the enray-Inc- relat ioruhip f o r each corntry lndlvtdrul ly v i l l y ie ld tread. o w r tlsr f o r the variorrr countrler . 35 . The SK mthod dulr v l t h t h i r p r o b l u by Introducing M I n c m var iab le and a c o a r t ~ t t o m f o r every cormtry. Each h u a por l t i ve v a l w f o r tho rerpect ive country and a sr ro f o r dl other corn t r ie r . For a a m p l e of 1% corn t r i e r , the data am arrmged u f o l l o w (e r ro r term omltted) :
' "TI .'I . .
1
I 2 j E . In-
B2 / I I
I I '

36. Thir e r t i u t i o a producer parametera of the s t r u c t u r a l var iab ler and the p r i c e va r i ab l e f o r the group u a whole, a8 v e l l a s p a r m t e r r of the income var iab le and a ccmrtaat term f o r each country individually.
C. The Two-Step E r t i u t i o n Hethod
37. Vbrn the IS method i r u r d , equation (7) I8 f i r r t eat isaced u r h g a11 d a t a f o r a couatry sroup incorporating a l l da ta on incor r i n t o only one variable . Conreqwatly, there i r also only one conatant term. After t h i r atep i r completed, a reducad energy va r i ab l e is c a l c u h t e d by deducting I r a the o r ig ina l var iab le th 8tructur.l and t h e p r i ce e f f ec t r :
'fb. reduced energy va r i ab l e is tbea regreared f o r every couarry againr t the i n c a w variable:
vh t r a y - e r r o r term
The explained variance of th tvo-rtep e r t h a t i o n can be c a l c u h t e d u f o l l w r :
where f - t h e s a r i m c e of t he e r r o r term in equation (10). and Y
2 % - the v u i l n c e of the o r ig ina l energy var iab le u it appears on
t h e l e f t r i d e of (7j.
38. For a f w country groups, d u m i e s f o r individual countr ies vere added t o q u a t i o n (9) i f i t vas found tha t t he observed energy coammption of t he r e q e c t i v e country l a y e n t i r e l y abuve o r b e l w t h e regressioa line. There can'be r w e r a l reasoar f o r such d w i a t i o n s . I n some cases r i ch and t h e r e f o r e 9 u p energy source8 may be avai lable . The p r i c e var iab le used - here--a -ated indu-cannot capture such curer. In o thers , the compo- s i t i o n of eutputs v i t h i n indus t r ies may be unusual o r c l imat ic cmdi t ions . exceptional. However, in q u i t e a number of countr ies , in pa r t i cu l a r Africa.
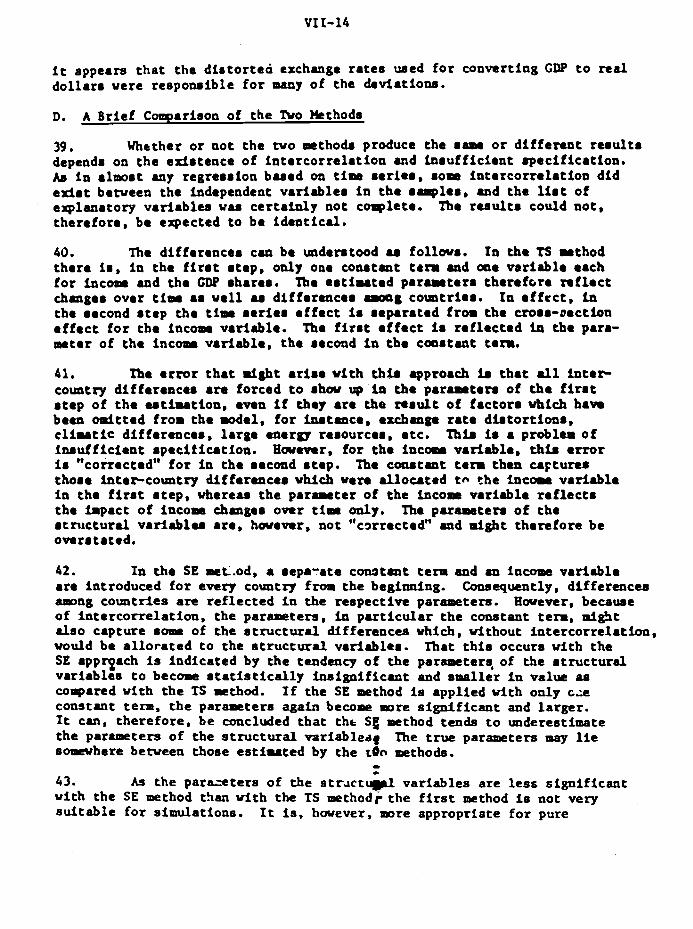
i t appears t h a t the d i r t o r t e a exchange r a t e s w e d f o r converting GDP t o real d o l l a r r were responrible f o r many of the deviat ionr .
D. A Brief Comparison of the Two ntthods
39. Whether o r not the two *tho& produce the r- o r d i f f e r e n t ruultr dependr on the ex l r tence of i n t e r co r r e l a t i on and l n r u f f i c i e n t rpec i f ica t ion . Aa i n a l w r t any regrerr ion based on tipa r e r i e r , roaa i n t e r c o r n l a t i o a d id e x l r t between the independent var iab le r i n t h e r q l e r , and the l i r t of explanatory var iable0 waa ce r t a in ly not c-lete. The reeultr could not , therefore , be expected t o be i den t i ca l .
40. The difference8 cur be m d e n t o o d u fol lour . I n the TS s r thod the re i r , i n the f i r r t r t ep , only one w a a t m t t a m urd oae var iab le each f o r incoma and the CDP rharer . The e r t i u t e d p a r u t e r r t h e n f c r e m f l e c t chmger over tima a r wel l u d i f f e r m c e r .wrog co rn t r i e r . I n e f f e c t , fn the recond r t e p t he tima r e r i e r e f f e c t i r reparated from the crorr-oectlon e f f e c t f o r t he incorm variable . The f i r r t e f f e c t i r r e f l ec t ed ln the para- meter of the i n c m var iab le , t he recond i n t he coa r tu r t term.
41. The e r r o r t h a t r i g h t a r i r e v i t h t h i r approach ir t h a t dl inter- country d i f fe rencer a n forced t o rhou up i n the p a r m t e n of the f i r r t r t e p of t h e u t h t i o a , evea i f they a r e tha # r d t of fac tor8 vhich h a m been o d t t e d from the m d e l , f o r i n r t m c e , exchmga r a t e d i r t o r t i o a r , c l imat ic d i f fe rencer , l a rge e n e r n rerourcer, e tc . Thir is a problem of i n ru f f i c i en t r p e c i f i u t i o n . Hwmr, fo r t he i ncom variable , thir error i r "corrected" f o r i n t he recaad r t ep . The c o n r t m t term then u F t u n s thore inter-country d i f fe rences vhfch vero a l l o u t e d t- the l n c m e v a r h b l e i n t he f i r s t r t e p , ubereaa t he parameter of the incorn var iab le r e f l e c t r the i r p a c t of i a c o m chmger over ti- only. The p u u w t e n o f t he r t n l c t u r a l v a r i a b l u a r e , houever, not "c9rrectedw and d g h t therefore be overr ta ted.
42. Ia the SE met.od, a repa-ate c m t m t term and m incoma var iab le a r e introduced f o r every country frvm the beginaing. Coosequently, differarcen m n g countr ies a n r e f l ec t ed i n the respect ive parametera. Hwever, because of i n t e r co r r e l a t i on , the parameters, La p u t i c u l a r t h e constant term, niat al so capture s- of the s t r u c t u r a l differences vhich, v l thout i n t e r co r r e l a t i on , would be a l l o r a t e d t o the s t r u c t u r a l var iabler . That t h i s occurs v i t h the SE appqach is indicated by t h e t e n d a c y of the par-terq of the r t r u c t u r a l var iables t o become s t a t i s t i c a l l y i n s ign i f i can t and s d l e r i n value as compand with t he 'IS method. I f the SE method i e appl ied v i t h only c z constant term, t h e parameters again b e a m =re s i g n i f i c a n t and la rger . It can, therefore , be ooac lded t h a t t h t Sg method tends t o underestimate t he parameters of t he s t r u c t u r a l var iablesq The t r u e p a r m t e r s may l i e somevhere between those e s t i u t e d by the tOo methods. - * 4 3 . As t he par-ters of t he s t r ~ c t w var iab les a r e l e s s s i g n i f i c a a t v i t h the SE mthod than v i t h the TS method* t h e f i r s t method i e not very s u i t a b l e f o r simulations. It is, hweve r , =re appropriate f o r pure

p r o j e c t i o ~ , s ince i t achiever u ove ra l l minimum of the devlationo, vhererr the TS mtbod e v m t u a l l y reacher onl- a p a r t i a l minim . 44. The l a t t e r i r li e l y t o occur i f the Lacobc var iab le and the s t r u c t u r a l v a r i a b l ~ r a t e in te teor re la ted . Thir m y be l l l u r t r r t e d ar fol lovr :
a 45.' I f the parameter of tile i n c m var iab le is 5 and tha t of a r t ruc-
t u r d var iab le a 2 - a s s d g f o r a mrtllt t h a t *ere is only one s t r u c t u r a l
var irblc-- i t i n possible t o druu boquau t s o f the sm of squared e r r o r s vhich is t o be minimized. In the f i r s t a tep o f t h e TS method, a Pin- i. obtained a t a* f o r an e s t h t e d average 3 (=at). I n the second s t ep , t he 2 country s p e c i f i c r, (-a;*) is u t L t e d f o r a$. po in t (a;*, a;) appareutly - 8 is not the oxmrall minimum. Thtr would only be the case i f the tuo variable6 were orthogonal to each o the r or , a t a ~ i r t i c a l l y speaking, not in te rcor re la ted . Then (a!*, a$) would coincide with the center point C.

46. The b u i c objec t ive in der ipnin l the project loo method v w t o construct an e a e w rode l tS r t could e u i l y be linked t o the Vorld Burlr m:ro mdr l . By talc- rr inputr i a t o t3e eaergy model the exogenour v r r i ab lc r u projected by the World Bank m c r o r~odel , i t v u porr ib le t o a m i d the roludaop, t u k o f developing another, coa r i r t an t vorld macro -&I. Uafurttaately, the lfnklng procerr v a r f a i r l y d i f f i c u l t because the output f r o r the Vorld Bank rodel war a t a higher leve l of rdgregatioa thar the faput needed for t h e e n e m oodel. It war chrrefore neceurr l , t o d i r r a r e w t r th. eaogeaow variabler u rupplied by the world I d .
47. Ihe B u k W r tgpl fed projected valuer f o r the f o l l m i n g v r r l ab le r f o r 14 world ngio(u r
- <;rou -tic Product i n ag r i cu l tu re a t 1975 p r i - r
- Crou Dorutlc Product in Lndurtry, vhich iacluder ha, a m t r o c t i o o , m u f a c t u r i n g and u t i l i t i e s a t -75 p r i e r ,
- C r o u -tic Product in rerv lcer , vhich a h o includer c r m r p o r t at 1975 prices.
118. The projectfmm derived in t h i s s t d y a r e based on equation (7); therefore, the d.te hd t o be &aggregated a t two levela. F i r s t , it w a e neccssarp t o s e p u z t e industry i n t o d n i n g and construction and in to wrr faccurlng tnd utilftiem, ad re rv ices i n t o t ransport and other oervicto. Second, the gmrg total. for populrtloa. QIP and s e c t o r d outpueo had t o be dfsaggregated in to country-spedfic vdueo . The procedures 'are demonstrated h a r e f a r Portpgal, w h i c h belongs t o c o w t r y yroup 1.
49. The first s t e p u u str dghtforvard and did not pose aLy amlor prublem. A p r c l i d n a r y project ion of the share of nvufac tu r ing and u t i l i t i e s i n FPdustxy f o r gosp 1 u u obtained from the following tread function, -ti- a t e d cv t r the period 1960-1975: -

Preliminary projaction:
1980 r 0.7306 1990: 0.7194
Sfmilarly , f o r tha rhara of t raraport In r a n d c a r of gmrrp 1 va h a w
Rs9 - - 0.1625 - 0.0010 tim 8
Prdi rLaary proj action:
Il.vi.ioru of thr ra pmjact ioor vat. mula in f w cuu vhrrr tha d l q p a g r t i o n in to countrpopacif ic vduro lad t o mrruorubl. nrultr.
50 . Iha racond rtap-th. & r i m t i o n of c o m t x y o p a d f f c valuer-10 b i t ron coql lca tad . h o u r , f o r Inrtaacr, t&t th. o b j a c t i w fo t o &rive tha r h a n of agricultura In CDP f o r P o r t u p l . IhL can ba doru In tha fo l l a r i ag v w r
R4 - Crore -tic Product In .8r icul tur r
P - Portugal
i = m y corntry in the gmrrp.
Ehpreaaion (14.3) w u b u a d on output f i g u r u from tbe World B d c mo&l f o r the projection yqaro. I n the c u a of tha other threa aectore, (14.3) v u represented by the valuaa &rived i n a tep 1 of the &aggregation proceduree.
51. Expreaaioar, (14.1) and (14.2) were f i r s t e s t i m t e d by l inear t- pen&. Ihe projected t r m d v a l u u were then croaa-checked by calculat ing a e scc to ra l a h a m in the GDP fo r each cormtry. I f i t turned out tha t a par t icular share ahowed a very m r e a s d l e m v e ~ ~ ~ t , i t waa adjueted on the Wis of plausibi l i ty. The aurplus o r d e f i c i t output of the group resul t ing + such an adjustmcllt w u then diatr lbuted proportionately over the rtnraiatng cormtrlea. In aome camen aeveral i t e r a t i v e adjustments were - necessary In order t o obtain reasonable abares f a r a11 sectora in all countries.

52. Ihe disaggregation procedure f o r per capi ta income was e l igh t ly d i f fe rent . F i r a t , trend v a l w e f o r the country-specific rharer i n t o t a l income and t o t a l population were estimated. I f the estimated rharen appeared unreasonable, ad,juotprentr were made. After the f i n a l round of adjwtmentr , the valuer of par capi ta income were calculated.
53. After all the exogenou variabler had been derived an dercribed above, the projections could be made by applying the r c ruc tu ra l and pr ice e l a s t i c i t i e r , a2 t o 16, an e e t i m t e d by equation (7). u well u the co t~ r t an t
term and the incow e l a n t i c i t y e s t i ~ t e d by equation (10).
34. Pour verr ionr were produced f o r every country a i d eouatry group. For each cf the two pa rme te r .at8 obtained with the SB mthod and the TS method, there 10 one projection period; a recond one war provided when i t war m r m d tha t tha r ea l pr ice i n c r r u e beoreen 1975 and 1990 vould amomt t o SOX, or an a w r a a . of 2.72 annually. Thr pr i ce i a c r a u e fo r the three f iw-yea r p r i o d a 1975 t o 1980, 1980 t o 1983, and 1985 t o 1990 were u r m e d t o be 10, 18 a d !5X respectively.
55. Ibe project ionr f o r the country groupr were obtained by rimply adding th r project iolu f o r the individual couatrier. In the care of per capi ta emrgy c o n r ~ t i o n , the energy and population p r o j e c t i o ~ of the va r iow countrier vere f i r o t added a d then divi&d by each other. Ibe aggteg.ter of the s t r u c t u r a l variablea were obtained by calculat ing weighted merru of the ccuntry-rpeclftc r t n r t u r n l var iab ler , v i t b the iaam sham serving as weights. In the u s e of a gmup'r per capi ta lncoua, t o t a l income an rupplied by the World Bank wu divided by t o t a l population.

V. PRESENTATION OF IIU RESULTS
56. There is a s e t of eight table0 f o r every corntry group. Tableo 1 t o 5 provide the ertfmater aad project ioar from the I S method, whereu Tables 6 t o 8 present r e r u l t r obtained with the SE mthod. The content of the eight tab les i r mumarired b e l w .
57. Table 1 l i r t r the pa rme te r r ertimated by equation (7). The coef f ic ien t of determifiation, the amber of obremat ioar .ad the P-value fo r t ha t function a r e a l r o rhoua. A. the coaf f ic iea t of deteralrration is biased i n log rd thmic r eg re r r iow ( w e I1.C above), the rtm of the aquared deviationr In abroluta t e r m in re l a t ion t o the o m of the rquared observatlonr i n abrolute t e r u w u added u a apn neu t ra l mauure of the gooQerr of f i t . Tbir r a t i o i r denoted by SW 1/SW 2. Itr a u r a t o r and denomfaator a r e a l r o rhovn. H a r l l y , the t ab le contaiar a U r t i n g of all cornt r ie r included i n each grow. Lo t he u r a of Southern Europe, there a re eight corn t r ie r .
58. The upper ha l f of Table 2 ohwr , In the f i rmt calm, t o t a l estimated conrumption of energy. Tbera da ta w e n obtained by multiplying the e r e h a t e d per capi ta valuer (~01- 3) by the population data (colunm 5). The recond c o l m g i m r a c t d energy conoroption, the fourth the respective per cap i t a v a l u u . Tha louer pa r t of the t ab le rhovr the time s e r i e r f o r tba r d a i n g eaPgaDouo v a r i a b l u . Tba p r i ce r e r i e r w a s calculated as the weighted average of the country-specific p r i ce I n d i c u , with currant energy conoumption valurs aa the weighto. (For the projection period estimated arergy consumption values were w e d an weights.)
59. Table 3 p l o t r actual , e s t h t e d (1960-1975) and projected (1980-1990) per capi ta c o n r q t i o n of energy.
60. Tables 4 and 5 p lo t the exogenous variables , except f o r population, i n order t o f a c i l i t a t e aaressment of t h e projectitma of these variables.
61. T s e s 6, 7 and 8 provide Information f o r t h e SE projections comparable t o tha t f o r the TS projectione in Tables 1, 2 and 3. It may be noted tha t Table 6 contains ne i ther an Income e l m t i c i t y nor a constant term because these values were dffferent for every country.
62. The main r e s u l t s f o r the Individual countries a r e summarized i n Tables A and B. -
i
63. .9 Table A shave the income e l a s t i c i t i e s and the constant t e m s obtained with the two methods. Heasures of the goodness of f i t a r e a l so givep. The coef f ic ien t of s h m f o r the SE method because the same f o r al a group and can be found in Table

64. Table B prerentr ac tual cowrqptioa of saergy by corntry betveca 1975 and 1978, u -11 u the projectifma for 1985 and 1990. For each of the two methob, a c u e with cowtant real energy pricer a d one with a SOX prlca i n c r e u a a ra ahom.
65. Tabla C r h w r unrual g tar th rat- fo r energl, tonr\nption for the c u e of constant r ea l m e w prices.

V I. THE RESULTS
66 When looking a t the r e s u l t s presented b e l w , i t should be kept i n d a d tha t the project ions of energy demand depend on the projected vrrluer of the exogenous variables. As mentioned e a r l i e r , the project ions of the emgenoua var iab les a re those underlying the World Development Report 1973 of the World Bank. The authora bel ieve tha t the projected gtovth r a t e s f o r GDP and its components a r e generally on the high side. Hwever, s ince all the estimated parameters a r e presented here, i t would be f a i r l y easy t o recalculate the pro j tc t ions of energy d e m d assuming lover grovth ratee.
67. The reader should a l so note tha t i n the case of the constant r e a l energy price, the year 1975 uaa used aa a baae. Hovever, the o i l p r i ce haa -re than doubled eince 1975, and r e a l emray pr ices Pight already h a w increased by aro;nd SOX i n qu i t e a n u d e r of developing countries. In general, therefore, the caae involving increased pr ices io probably c loser t o r e a l i t y t h m the one with constant prices. Thie M8WSB of couree, t h a t no fur t5er d r a s t i c increases i n pr ice w i l l occur ia the 1980s. Havever, i t is not i m p ? ~ w i b l e t h a t f o r a couple of years in f l a t ion w i l l keep pace with the r i s e i n o i l p r ices , s o tha t r e a l pr ices w i l l r e m i n roughly constant.
68. In a feu caaen the estimation uaa made with an a p r i o r i given value f o r a ce r t a in parameter. This w a r done i f in te rcorre la t ion between the independent var iab les led t o unrea~onable results.
Croup 1: Southern Europe
69. The coverage i n the sample f o r Southern Europe uae a l m e t 100%. Gibral tar was omitted.
70. The simultaneous estimation f i t s the da ta s igni f icant ly b e t t e r than does the tvo-step estimation. However, the difference i n the project ions f o r 1990 is only about 5X, a r a the r smnll variation.

' a e - I m D I C I IbdO'WlCICII O a a I W - I h t l b 0 - 3 r n ....... Y O O O O O O
8 8
N CI
n Cc 3 O h . 0 r. u O d P - . r. 0
cn Z
. a u
W t a a w 0 3 3 t x J O W 4 c n c n w
9 8 1 : 3 L

a m , - n o r n r m 4 m .no* - * * n r * * * r r c ..a a , o o o m
r l -a -*.*o n o m o o --s-• a 4 n a a Y I Y Y Y
I . . . . .
0 a a 0 0
snna a * * - *.*- - a 8 4 .r.r .c Y Y Y Y
I . . . .
0 0 o 0


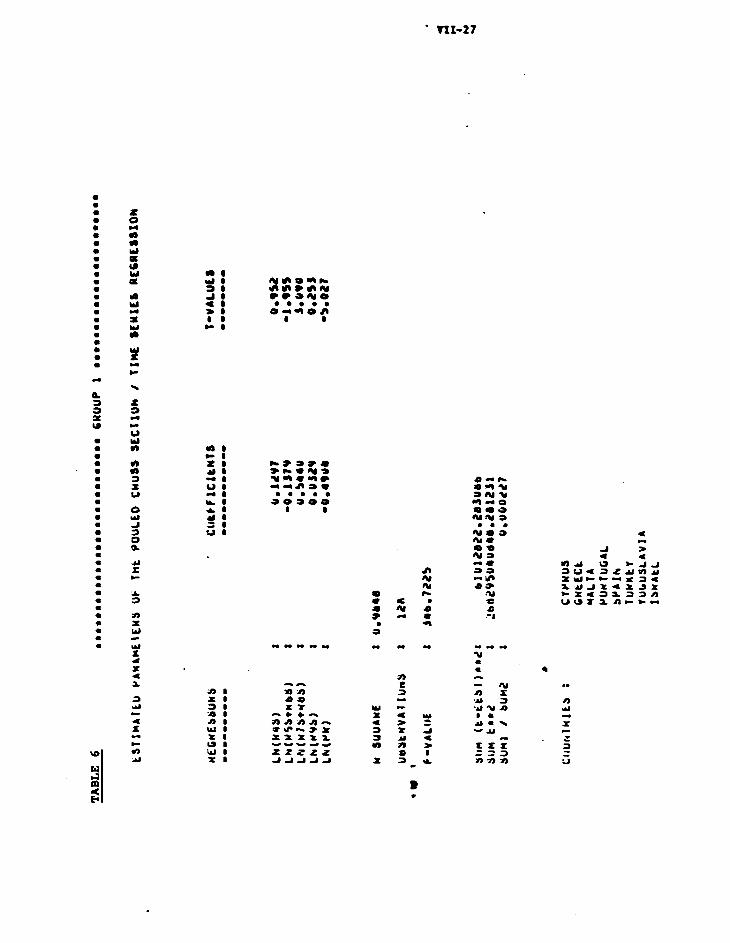

x - - % - Y r D I C Z = - % - . C : l i e & L O C C o o o - - r - s -
A t Z * Y J Z Z Z Z - 3 2 2 Y T Z ..


Groups 2 L 3: Pigb m d b p e r Hfddle l a c o m North Africa and Mddla Eaat
71. The coverage f o r t h i o group vim 77.42. T)te hi* i acom group 2 (c6pit.l rutplw o i l exporterr) and the tppar middlr iacomu group 3 h d t o be l t r~pad t c g e t b t r becaume i t u u not poroible t o obtain ou f f i c i ea t da ta r.rd oa t i r f ac to ry s t a t i o t ! c ~ l ruults f o r each group oe?arately. Lebanon, Bahrain, United A r r b W r r t e r , Qatar , Oman a i d K w a i t were omitted, the l a o t two beca*se of miooiog p r i c e &ta.
7?. Ia t he t v e o t e p m t h c d , th r h a n of agric:rlture u u omitted u an rxp lma to ry var iab le becswe in 00- c o m t r i u t he ag r i cu l tu ra l r e c t o r w a r e x t r r r l y o u l l . In a l o p r i ? h s i c n p e c i f i u t i o a , &urger i n vary #mall oharea h n n r r t m g Wac: oo t% explained va r i ab l e urd t he r r fo ro make the project ion r a the r w t a b l e . An a p r i o r l p a r t a r t e r of 0.3 v u w a d f o r tbe o h n of t rco lpor t .
73. Tbr f i t of the SF r s t h : i o a i r a g ~ i n b e t t e r thcn t h a t o f t he TS eotipution. Tbe p ~ j e c t 1 0 . 1 r f o r 1990 d i f f e r by &OIIC 102.


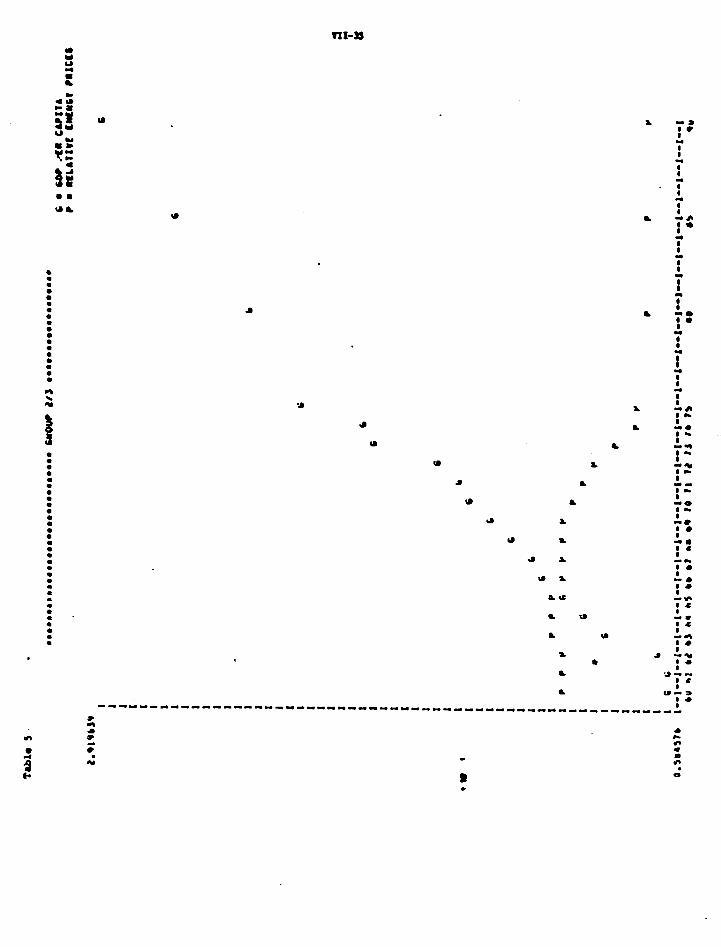


a - 1 - o e e * am-- ncnwo a a a a 0 0 0 0 . . . . O O D O

m-r

Group 4 : Lover Middle Income North Africa and Hiddle East
74. The coverage of t h i s group w a s 97.82. Ibe two Yel~cns were omitted. The share of ag r i cu l tu re was omitted f o r t h e same reasons as i n groups 2 and 3, and the same a p r i o r 1 parameter van introduced f o r t ransport .
75. The f i t of the SE astinration is b e t t e r than t h a t of the TS estimation. The pro jec t ioo . f o r 1990 w a i n d i f f e r by about 102.

............ H . .

m m o o m 0 . g ::to z::z
I....
-%*or g;zz r*..
oo,oo== =0000=0 r r * * * * e a q s r a o a a m - * a o a ??::5:? rrr .en ttt?r:t f f l 2 f f ;


m m s o m m m m m m m m m m m m - m m m m m m m m m m m m m m m m m - 0
I . . . . . .
r v n r n m m r r r a a * a m - - * r v r - m r 00 r - f r
O r y e O - a r o a w e r 3ZXf t z m a - m a a a a r - d d
I . . . . . .
m.. 0 0 0


Group 5A: Law Income West M r i c a
76. The World Bank had put t h e 21 cormtrier of low income M r i c a i n t o one group. For tha ertimationn in t h i r rtudy, tha group war rubdivided i n t o two regionr, the f i r r t (5A) containing 7 and tha recond (50) 8 cormtrier. Tha coveraga of both group8 together war 882. Somalia, Benin, Guinea, Lerotho, Comoror and Madagascar wera omitted. I f Benin and Cuinea had been included i n 5A and the o ther omitted countrier i n 50, the coveraga of SA would be 79t and tha t of 50 89.12.
77. The exogenour da ta f o r indur t ry rupplied by the Bank appeared t o be f a r too low. Not only w u i n d w t r i a l output in 1975 rub r t an t l a l ly lover than the correrpoading f igure i n the data f i l e of the rtudy, but the rhare of i n d w t r y i n CDP v u projected t o dec l i a r cont inwur ly up t o 1990, even though it had more than doubled r ince 1960. When the Bank projection w u w e d , there w u 8 rapid rime i n the share of re rv icer . For t h i r rtudy the r h u e of i ndwt ry v u adjusted up t o 301, 311 and 461 f o r the y a r r 1980, 1985 and 1990 rerpectively. Even with there rub r t an t i a l changer, the share of services r t i l l roee.
78. For t h i r country group, the f i t of the IS e r t i m t i o n i r s l i g h t l y b e t t e r than tha t of the SE estimation. The IS method producer s ign i f i can t ly higher r e ru l t r . The difference f o r 1990 w u n t r t o about 301.
79. The sharer of mining and conrtruction a r well M manufacturing and e l e c t r i c i t y wera omitted i n the I S e r t i m t i o n b a u u r e tha estimated parameters w e n very ins igni f icant .


.... r o n o O U L L
n m w n n n n e e * - * a n a * n n a r h Y 1 - AChO 0 0 0 0 0 0 9 P
I . . . . . .
0 . ~ 0 0 0


' 8 I)r ,I
)% 0
I),
' b CI


O C C O C ..... -----
C a 4 r - ~ e u a m o = C C b k v - 4 . b m - w a e O o ~ C I V
C C C C L C B u C - C o . I O e O a v . . . . . . . . . . . . . . . . . . . C 0 C e m b 4 - - - - O C C C C C C C
e o o o a P u S o m o v v S ~ 4 c - - u - . * r o O C O ~ ~ o . . o o o c a I v m - - - c * --- C C C C O C C C C C C O ~ C C C C C C C C C O O C C C C - C c.
C C C ... C C O w a s C v u a a e .a. 5.-
C C C C O ..... C C C C O o e u v w Y I I C . o m - . - - w --.
. r n C V C . .... C C C O C O O O C C C C C C C C C C C ................... 0 0 C Q C C C O O C C C C C C C C C C C
Y C C r L Y C * S L 4 4 4 * -- - - 0 - a e - a . L L C C . - & C . - 0 W - m L L S S U . C U I C W Z rnC I . .QV- .V .CCC a I C . - o C ~ L C - - r I C Y : -
C C Q C O C Q O C O C O O O C C ................ - - - - r - C I O C Q C C O C C - ~ I C C C C . m m - - . o o o w e Q C - C S s a A - - o o w C I C - w . * . C C e o U o m - - . - * o o v I C a m a a o C - - w . a o o w - m w w * & w w o B v . .... .


Grow 50: Low Incoma East Africa
e0 . See description under group 5A for oovera2e a d other details . n e TS estimation for this group f i t s the data better than the SE estimation dots, and i t once again produces higher results thaa t5e second. Hwevcr, the difference is about 172 smaller than for grow 5A.

a m - 0 0 4 * S O .. - v. m m o Y O 0 ... - 0 0 . bnn m a 0 s 0 0 -I- + 0
bn Pi

O O Q O O 0 0 0 0 0 o a o o o 0 0 - a 0 o s o o o -0C1*0
I . . . . . .
0 0 0 0 0 0


b Y - *
b a
0 I.) :- 0 - Y
b .r
a -- b .r
U - 0 0 -
.a -e 0 a
u L r 0 a
a -- I J
- a 8 a I
1 o m b a
.* : w # a
u-n 8 0
s:lA . o -
3 0 - I 0
8 3 - 3 . 1 0


... n o 0 --31 s t , ncc m m m ... m m a
e - m , : f m a r L c. c. o m - . . . m m m
I..............
I I I I I
m - 0 I e o n I - n C - I n Y r I w o e I
' a m - 0 e . 0 I
0 - n r I w r m I c 0 . u I
2 2 2 : I I I
o m 0 # 0 0 - I e e e a - - - I

uc - * m 8 urn

Group 6: Lover Uiddle Incomc Africa South of Sahara
81. Group8 6 and 7, fo r which reparate ertimatione a r e provided here, were a l r o dir t inguirhed by the World Bank, although i t r t i l l made i t a projections f o r the NO together. The coverage f o r group 6 WM 982. Cape Verde , Equatorial Guitea , Botsvana, Guiner-Birsau, Swaziland and Sao Tom and Principe were omitted.
82. Again, the f i t of :he TS er t imation i r b e t t e r than tha t of the SE astiemtion. Hwever, in t h i a ca r s the SE method produca higher reaul ta . The difference i r about 172.


--a o m a
, a - m ad.-
w o n m a *


r I n 9 - o w - o w w o o m o
0 . . . . . v I 1 1 7 * # 8 8
.... H.."..

r - m O W * 0 . . % I . w w * w e , 0 . .
D m -
- - - - - - - - - - ~-
o * o o * * * - - - - - - - I . . . . . . . . . . . . . .
S o o i o o i o o o o o o r
* v * n r - 0 - A. Y C C ? * ? r y v v
...... - ' I r a -
* * a E E C e - %
1. a 4 * 1 -. ? ? : - E e - L - - * a


Croup 7: Intermtdiate Middle Incooc Africa South of 'dtara
83. The coverage of t h i s group v u 92.52. Seychel. er, Ceuta, H t l i l l a and Namlbia vere onftted. The share of aLning and cons t ruc t ion . van omitted i n the TS e s t i ~ t i o n because i t w a s ins igni f icant .
84. The f i t of the SC e r t i u t i o n i r b e t t e r than t h a t of the TS estimation. The TS e r t i u t e r a r e about 172 higher than thore of the SE es t imat t s .
85. The ahare of r l n i n g m d coartruct ion had t o be omftted became it w u s t a t i r t i c a l l y i n ~ i p i f i c m t .
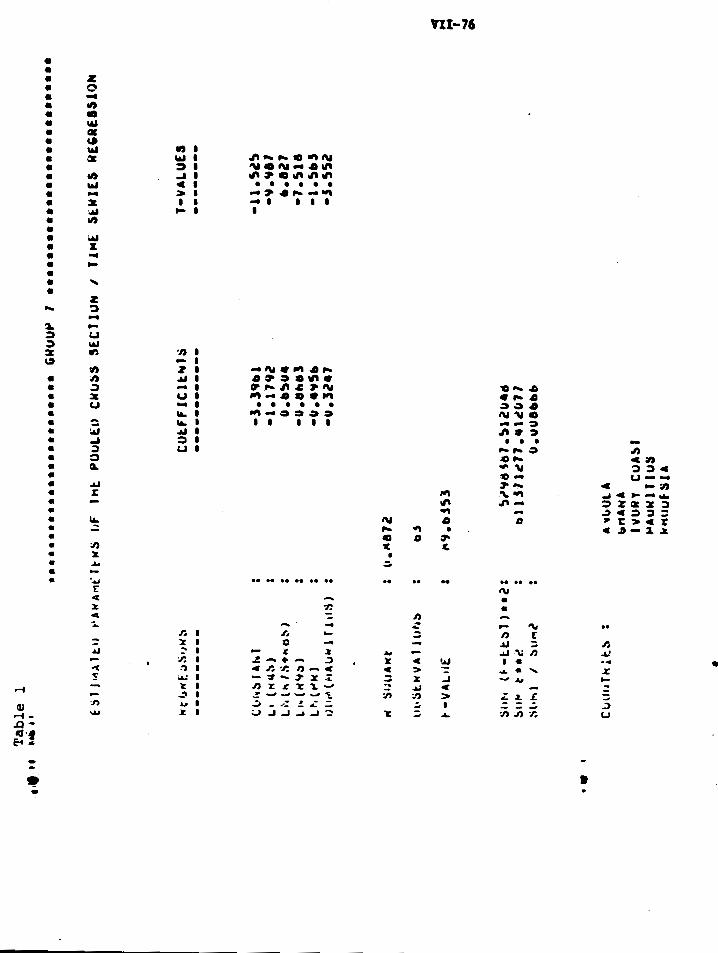

iiii
"rfj: 0-
==f 0 . .
m o o

m-n
*, - w @
a m -
! *


. . m e w w - . D W * *)e . o h - * * *
m a w - . .- *$$:- : o m . D D w * ) * ) * * ) n * 3 . m D * * * . * * * * * * * * * * * * m a o o ~ m w o o o o o o w o ~
- a n w a w w u m -01) s e a w a r ) * * * o w 0
e m * a u - a w m w e - a m - * r ) r )
I . . . 0 1 1
i * l l m r Z - w w m r r * e r n e - a n s m m - a s w a a n a w
* . a * . * W w o w s ~
* e 2 a s - * - 3 e n * ) 1-• - * I - . . . a e r ) 0 r ) < z I ) - * n n m

nt-u

Croup 8: Lm Incorn k i a
86. The c o o r r q e of t h b g row w u 94.72. Cambodia, Laor, Bhutan, Bmgladerh, l h l d i m r , Afghmirtsn and Viet N u were omitted. For q r i c u l t u n , an a pric t i p a r m t e r of -0.4 w u introduced.
87. It v u m d e n t o o d tha t the Bank projec t r a too rapid .' :line i n the rhare of a g r f c u l t u n l a CDP. H e n the ag r i cu l tu ra l output d r t r .#are therefore raiaed by l l f , l4 f and 172 fo r the y e a n 1960, 1985 .ad . . 1 r e rpec t ivdy . Eourolr, it r i g h t be m r e nasop .b le t o reduce CDP.
88. Tbr f i t of the TS e r t l u t i o a i r b e t t e r t h m t h a t of the SE er t ina- tioa. Both method, produced r a the r h t # t nrul t r . The nmul t of the TS e m t l u t i o a w u a r i g a i f i c m t l y 4Ot w a r t h m t h a t of the S t e r t i m t i o a . The ve- h i & rrmult of t h e TS wthod ir p a r t l y the rrmult of a high reducrd i acow e l u t i c i t y in India and r projected f a r t r t r u c t u r a l chu~ga.

*) b 'L) a a W 1
cn W, x I.) .o
a I.) r @ b
0


- - - -~ - - - - - - - - r r r r r r r r r r r d r roe ................ m m m m m m m m s * m * m * m m
* a * - - a h a 8 a m - * * - * -*-* 4 - 0 0 .... so30

I UUII n o currr cmmrto~ UUII n o currr trarr*rrroB

Croup 9: kwer Udl r md I n t r r r d b t a locow k i a
89. th e w e r a p of t h i r gmq w u 91.02. Solown Irlandr, S w r , T-, P r p u I.v W b u , Iln k b r l b , Cilbrrt I r l a n b , Republic of China (Taivm) a d P w i f i c I r lauio u r n ar i t tad.
90. Am uith Croup 8, t& projrcttr, &W LO thr ohare of rgricuftura in QIP rppund t o br coo rapid. W c u l t u r d output w u t hen fom rairad by 242, 32X a d 38S for rh yurm 1960, 1985 sad 1990 nrprccivrly, In @pita of t b a ~ rcrory l a c n r r r r , r t ructural wu r t i l l vary faat. nr projrctod rime La m r g y "'mA YU thormfot. . t o quftr hi*.
91 th f a t of rh T?l mrtiutiocr lo c l u r l y h t t r r thm that of tbr SE u t i r t f u u . 'Lb p r o j a c t i o ~ . w u IS urn a l ro highrr. Ewrwr , thr d i f f a t r o a x u d y door 102, not vary larye


31% r e - a m * L-*
0 0 0 0 m 0 m 0 * h ~ * m * m w ................ * m m o * o * m * m * m m r m o
Gw* w o n
n r o - 4 - * e m a n w .- * *I** ... 30-


an- -- a a e a -Do rLh . . a
0 * s

Croup 10: frrvrr Hddlr LDcoor Latin Amarica
92 The coverrge of t h i 8 group v u 94.62. Hai t i (low income), Grenada, St . Vincent, Dodnier, C u r t d a , S t . Lucia, S t . Utta-Uetrir, B r l i t e , Uiurrw rad Antigua v r r r o r i t t ed .
93. For ~ m u f a c t u r m m d r l r c t r i c i t y , ra 8 p r i o r i p a r r s r t r r of 0.3 v u introduced. la order t o avoid m i rplaumiblr d rc l ln r i n t h r mhrrr of iadumtry i n a nuabrr of cor~rrtrirm, projected i n d m t r i a l output v r r r d r e d by 15.8f, 16.U u d 15.32 f o r the 7 u r m 1980, 198S and 1990 r r rpec t ivr l7 .
94 . nr f i t of t h r S t r t h o d $8 b r t t r r than tha t of t h r TS method. Eaurwr , t h r dffferencr la the projrctioru--lrrr than 3X--ir mr8in.l.

o o n h CI n 3 0 0
r'o o 0 1 0

**; **; .-.t22: - m n ' . - * $ m a r - n m - * * - It?? :?:
-c - z : ..I *-
I . .
m - m e m m m - m a - - - - -**---* o m - - - - - -*--*-- r l o e r r - - ....... ann - .- t3:a 0 ~ - - 0 * 6
c"..;Xs:;;:
m- e- - m -- -- no
I . .
4- n-
2: 4 4
009 0 - I **- - m e r * m - m n
I . . .
=-a ,n*.- n-a as -
n m -
9 -a =J -- m n
I . .
-*I ' 0 - r* . nc. r r
no* r - r * n n *I-- m -- m


-0-0 1 0 1** -5-
nmn 2:2--- *I----- 111n-C ...... - m m m m m


Group 11: Upper Hiddle Income Latin America
95. The coverage of chi. group w# 86.42. Surinam, (Xudeloqe, Netherlacdn Anti l les , French Guiana, Tr iddad and Tobago, P w r t o Uco, Hartinique, Bahamar, Virgin I r l m d r , Betwdkll, Barbador and U ~ g u a y were omltted. Reasonable data could not be obtained fo r m y of the corwtrler. For transport , an a p r i o r i parameter of 0.3 war introduced i n the TS e a t i ~ t i o n .
96. The f i t of the SE e r t i u t i o a is b e t t e r than that oC the TS er t i aa t ion , but th reru l t r obtaloed with the two -tho& a re a h r t identical .
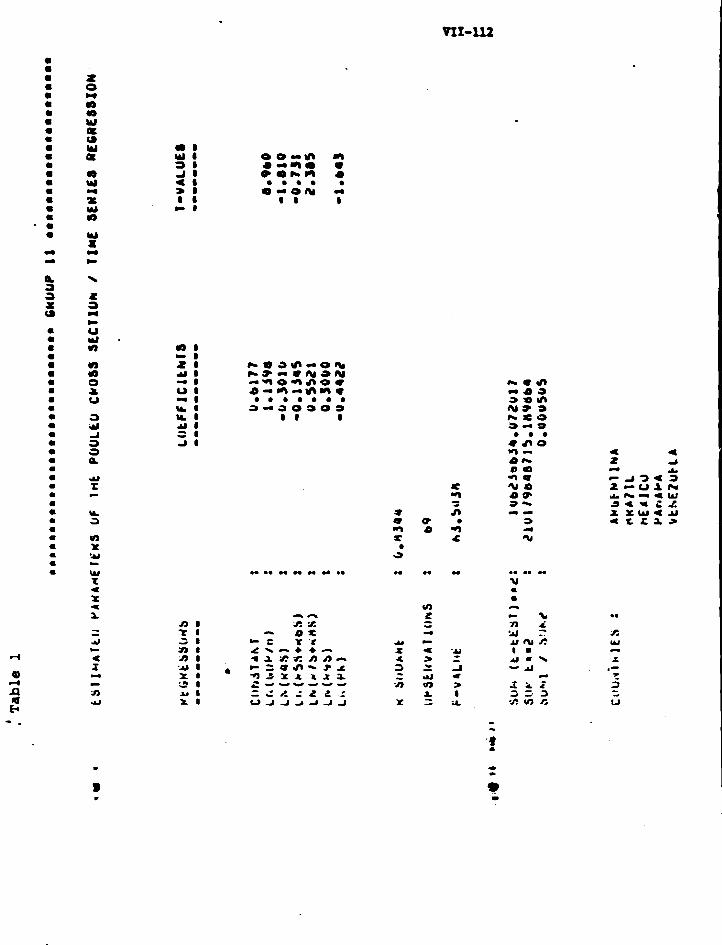
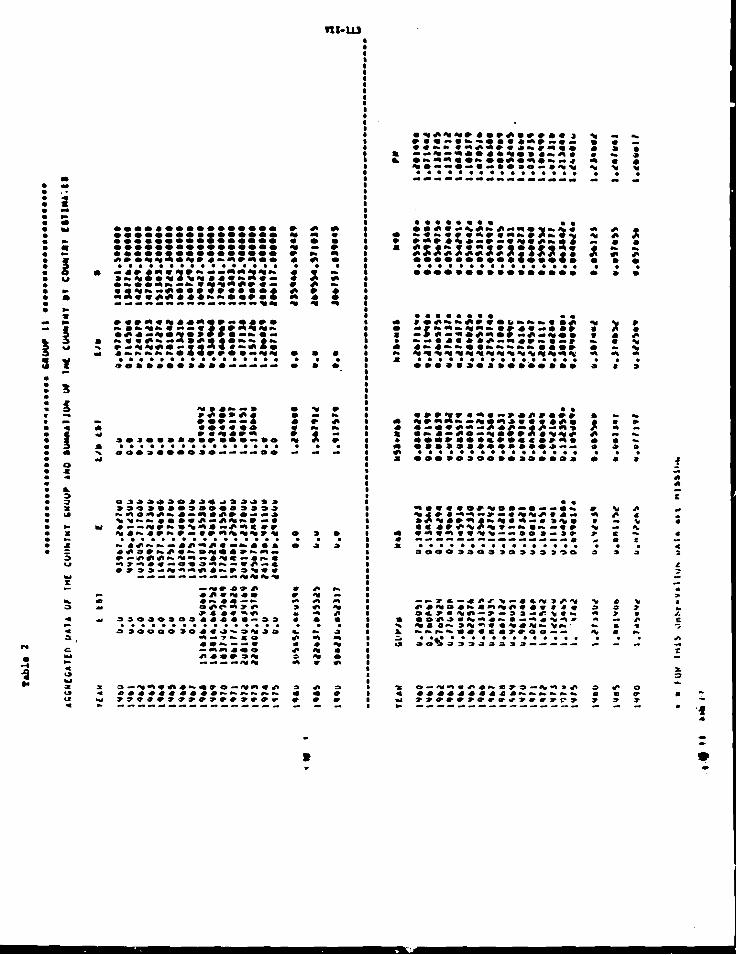
0-0 0-* 0-0 - m e orno **-
0 . . - l *a% e m - :%? -0 -
a 8 - m ~ . . O I Y m m r m ~ - m 4 2s- o - - - * - m m 1 e w a -
%.** a * . * - m s* . m e o e + * 9 4 * - n m r -.e O - m - w m W w - - m o .-a* - - - - - - - - r - - r o - r g ................ a 0 0 0 a a a a a s s 3 0 19-


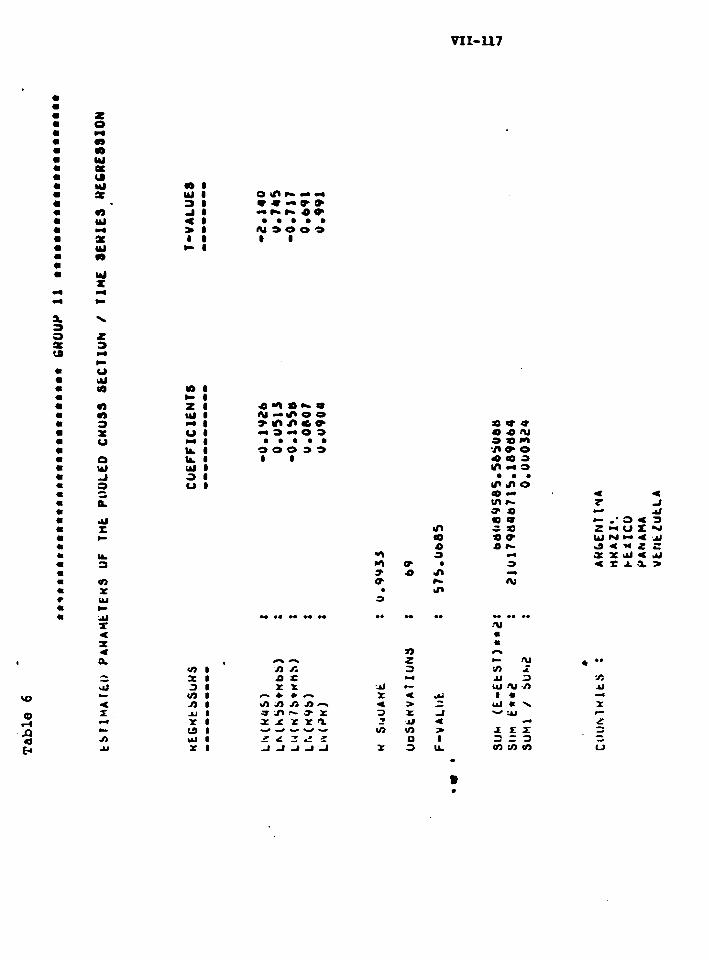

c m m 0 o 0 - m r - - L O - 6
8 - a m m 2 a m o - r r m r m
I.....
e - * ) w * m o r r r r r ...... m m m m m m
t:=: E 2 S t 0 m - m e m - - m o
I . . . . . .
m - - r m m

Y
d
I).
a
Y.

Group 12: Northern heerica and Oceani a
9 7 . The coverage of t h i r group w u 99.7Z. Oaly #w tealaad w u omitted. Struagely mough, it vu iq)oorible t o a r t h a t e a reaeonable price e l u t i c l t y f o r t h i r m~p. An u r i o r i pa ramtar of -0.4 war therefore introduced.
98. The f i t of the S t e r t i u t i o a i r r i g r i f i a t l y be t t e r than tha t of the TS e r t i r r t i o a . Bouever, kr both projectionr the f i n a l va lwr tom out ver7 high. Thir 10 part icularly trtn fo r the S t mehod, vhich produced a re ru l t 2 4 f above tbat obtalned with the TS method. The rather high re ru l t r are probably the rerul t of the h i@ t touth ur l l .g t ioar .

r r \ l - - n 2 4crn Y 9 3 4 2 d - 0 0
0 . . arc3 - Y u-l
3 a 0 8 7 V - S Y 9 Y' - & '? 0 'k Y. 2 a

i I
n I
O O * I . . . . o m . I
I :


Croup 13: Vestern urd Northern E w p a
99. The coverage of thio grow v u 97.62. Ireland, Iceland and Switzerland were orl t ted.
100. 'Tbe f i t of the tvo .rbodr is 8Isost idantic81, but the SE method producer oolwuhat higher rrr~1:r. 'Tbe difference i s about 42.
101. k wlth Cm-r 1 :, It w u f e l t tha t the demand proje~tloam t . 1 h i 8 trow were on the t ipn ..':. Iba CDP grovth ra ta projected by rba Bwi urs o i ~ i f i c ~ n t l y abom th ra te projected by OEQ). I f the OEQ) grout; ratan were uaed, demand f o r energy in a l l 1aduatri.l cormtrier fa 1990 would probably be r o u 10t lover thm sham here.
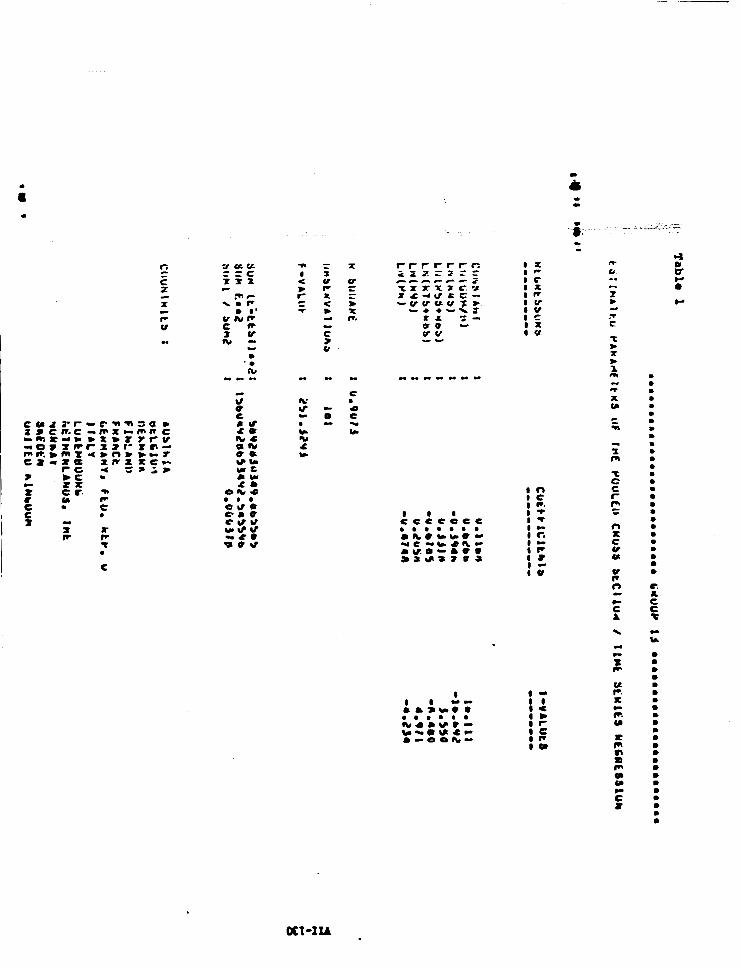

a * . - * a e** Y m a
a m 4 . Y D W O ...
u m * w L I
- a m - l m
I . .

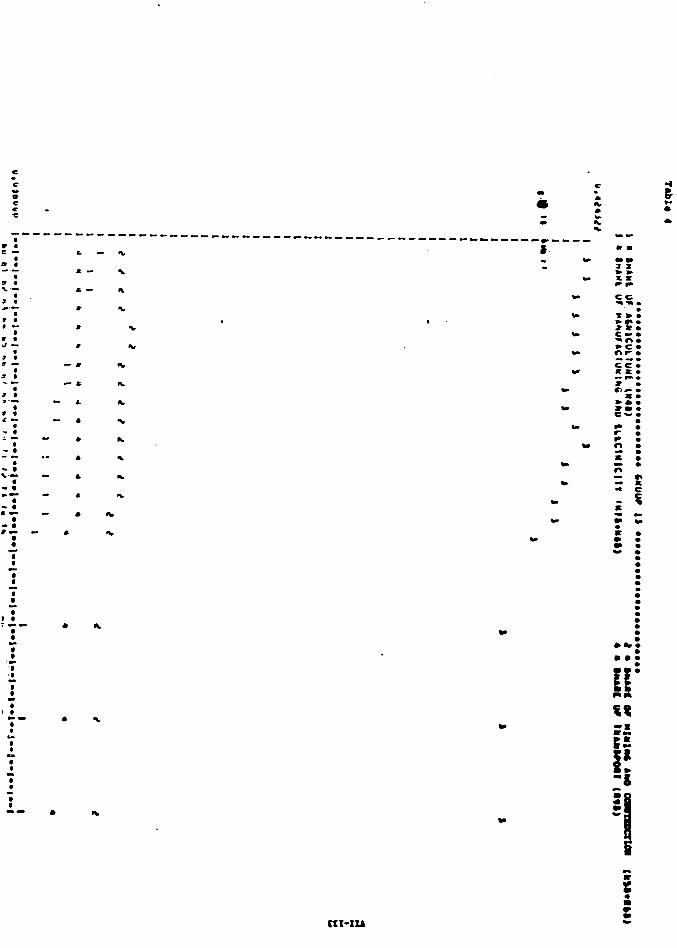
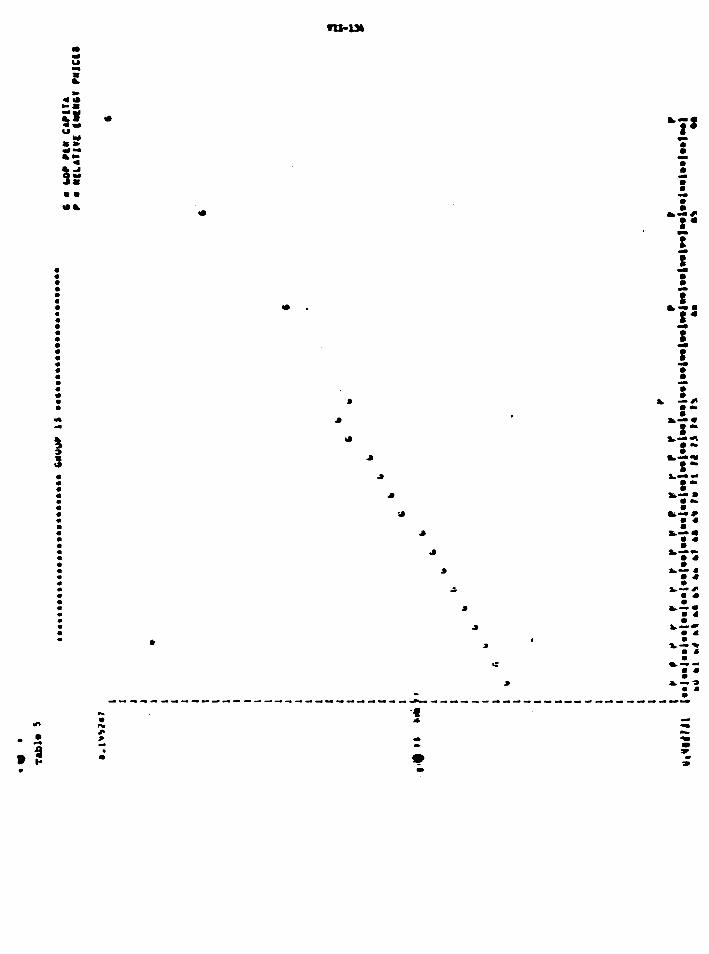
I. w U I.
r D
a m -I
f j * U
Y
3; 3: am.


i v r i r u d a v - w w w 4 *. s - , * v . . o o o o v C C C .......... e c - 5 0 n r e c c . . * a - c * c - - s = . r n &
C C C C C C C C t C C C t C C t ................ c e - - - - - D - - - r - - - -
. * ~ . B . C o a v Y C L w u u * * * * * * * * * . * * * . * . .'=: f o * v C e o . - 0 . 4 C r v r O r r e 0 O Y I C
. b ...I.. e . - . o - w e e - a m o w e - *
5 4 C
2 : : d a l * e m m e * * a * o m * - 0 . . w e m e . m e - L m *


Croupr 16, 17 6 18: Other Afrfu m d k i a
102. The m r a ~ of chi. p u p w u 76.U f o r haia and 68.92 fo r ~ f r i c a , excludirrg South Africa. For South Africa, a s l g l a u t r r p l a t i m w u u d a on p u t trend., u the required data were not a d a b l e orr the tape. I n Africa, &lmioo rad Djibouti wen or i t tad; ia hi., Wlcro, French Polynesia, bkv Caledoaia, Curo, Aarriem S.rocr rod B n a e i v r n d t t r d .
103. The f i t is be t ta r fo r the SE m t i u t i o n t b m for t& I3 e r t t u t i o a . The projectioru a n r l i & t l y h w r fo r the S t r t b o d . The differeaer i r almost 92.

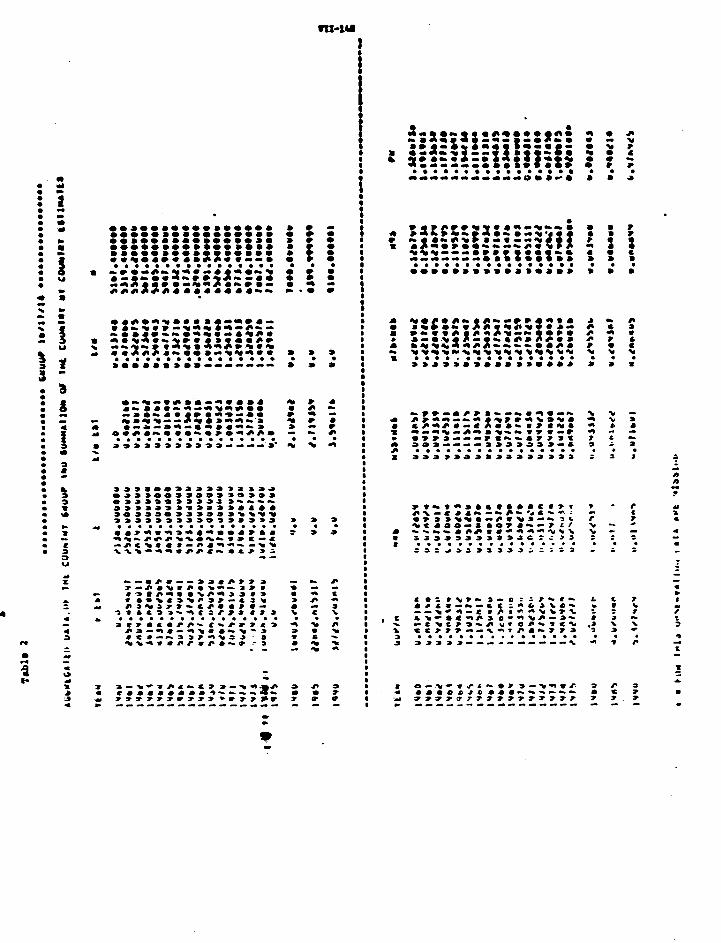
= 2; - 0 0 4
I . .
s a

nx-r


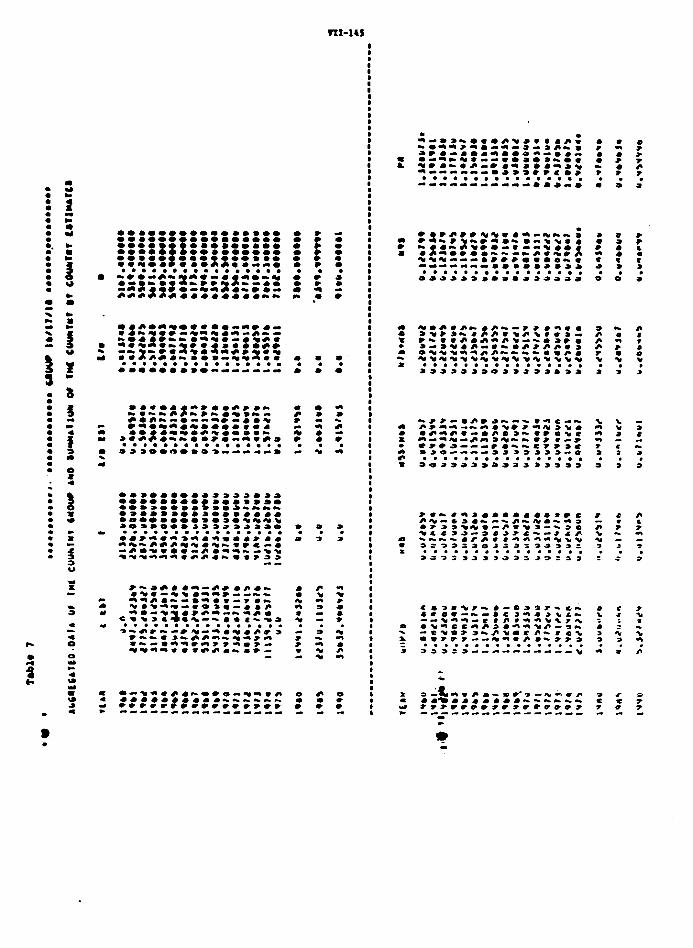

r ) .

The Country Results
104. The rerultr obtained for the individual countries are r-rized l a Tables A and 0. With regard to the ertlmated fncoum elar t lc l t les , the mjor c o a c l ~ l o a 1s that the e l u t l c l t y ertlmated by the SE ~ r t h o d la l a r s e r than that ertlmated by the TS method and that the overall lacopr e l u t f c l t y (the average grouth rate of per capita energy demaad l a relatloa to the average growth rate of CDP) is larger than both.
105. Table C shows the growth rater for energy corutmptloa by c o m t ~ group

N-IU
8-94 L I I 4.6s L I B LY 1.- as8 8.-
Ln 1.w 2.n LI6 1.0) I -Y
4 - 2 4 -an
I-*? 1.U- -
' Z

P m t ~ n m t ~ O w r d l Slm I/ tU I/
C o r t v lnrr Lrrr CUIC s u l 1 r . r b m t u t SU 2 P a r rt or P a * k 1cr T o n • 100 U a s t U l t y rur tot.1 '
8: b* 1.r- &s&
*rr 0 . H 1.15 (6.11 0. 12 0.51 0.19 a.1) 1.M 0.01 -1.11 1.61 ld aa 1 . u 0 . a (4.61 0. 11 0. Y 1.16 (6.2) I. co 0 . 0 . w 0.65
S.91 1.m (9.1) 0.11 S.91 6 . 1 . 1 1S.11 0.11 0 . 1 1 11.15 Z L 0 . Y 0.m (6.M 0.11 0.M 0.0 1.01 I .W ma L..L. 1 . n 1.m (4.n o. n 0.65 O.Q (0.1) 1.16 0 . a 0.66 I. Y
1.U 1.19 (4.9) 0.11 0.11 1.91 (1.2) 4.21 0 . n 0.W : .W
a- .I .a. 6 1urrlut. -
0.24 0.- (1.1) 4-u 0. n I 0 . 1 -0.11 0.01 0.08 0.52 2.. w. d 1 . P 0.15 tO.5) 4 . 1 4 I .Y 0 % 6 . 4 0.81 0.t) 0 . U 0. 16 mmmu I.U 0.91 ~ . I I 0. m 1 . u 1 .w (6.1) 0. LO 0.08 0 . w 0.4) nu--. 1.a 1 . u (to..) 0. m 1-68 1.15 (4.9) 0.11 0 .11 0 . a 0.59 hu-4 1. n 1.11 46.a) 0. Y I .%I 1.45 (m.w 1.1) o . ~ 0.91 0. 1%
Clr, lo1 Irr. .L1Q. 1- p r r m c u
W.lh(. 1.81 1.- (14.)) 0-85 0.16 1.04 16.6) 1 .9% 0.- 0.1% 0 . Y all. r . n 1.8s 0.3) 0.10 0.51 I.- (6.1) 1 . n O.S. 0.59 1.16 C d d Y 0 . 0 0.69 (4.4) 0.0s 0.16 0.- (13.6) 2-15 0.- 0.95 0 . 0 O.u B r a 1-01 1 . U (0.1) 0. U 0. P 1.51 (lP.6) 1.55 0.- 0.91 0.1) - w- 1 .Q 1.- (16.1) 0.05 l . W 1.0) (5 1) 1 .W o . n o . n 0.91 w 1.- 8-45 CI1.b) 0.0s 0. )I 0 . U 0 . 0 ) I . I 9 0.4. 0.91 0 . U n ~r3. . 1.- 1 . s ~ na.m 0.05 0. u 1.11 (6-6) 2.91 0.- 0.1) 0.61 - 0.16 0.0 0.05 0.11 0.- (1.1) 2.16 0.- 0.61 0.11 W u 2 . U 1.m (12.9) 0.0s 1 .O1 1.61 (S.3) 1.m 0 . m 0.W 0. U a k a 1.05 1.61 10.0) 0. U I .U 1-95 (1.5) 3-13 0.10 0.m I .U h r U 1.0) 1.15 (11.1) 0.05 @.LO 2-11 (5.9) 1.6V 0.- 0.02 0 .M hn 1 . 0 0.1) (5.5) 0.05 0. ID 1-02 (6.2) 2.M 0.11 0.85 0. Y
QI) I l r -rr -0 l M a p c h LIIlU
m* L.14 1.01 8.n -0.0% 0.Ib 0 . U (10.9) 0 . 0 0.09 O.w 0.08 t u S l 1.15 1.01 (e.9) 4 . 5 1 0.0) 1 . 9 . 4 C.17 0.06 0.87 0.)) kh 1.19 1-8s (6-11 4.- 0.ZJ 0.92 (1.5) 0.92 0.02 0.19 0 . U - I .n o o n 4.u 0.21 0.12 (6.)) 0.53 o . n 0.91 0. J) -10 I .n t e n (1.4) 4 - 1 1 0.14 0.41 (1.6) I 21 o . n o.w 0.11
ct.r I h -a. h b r . b..C
n r a a mu- - I- - a-. V d - w. d I t a l y -1 W s w m *v L..l LI1rl . -
(5.1) 0 . U 0 . U (2.5) 0. 14 0. P 9 . 1 -0.W 0.-
( Y . 0 -1.21 o..., (6.0) 0.1) o. n (9.1) 0.10 0 . Y
(21.2) -0.61 O..? 0.0 1.36 0. m
(12.1) -0.bl 0 - s l -0.19 0 . U -0.W 0.U 0.19 - -
2
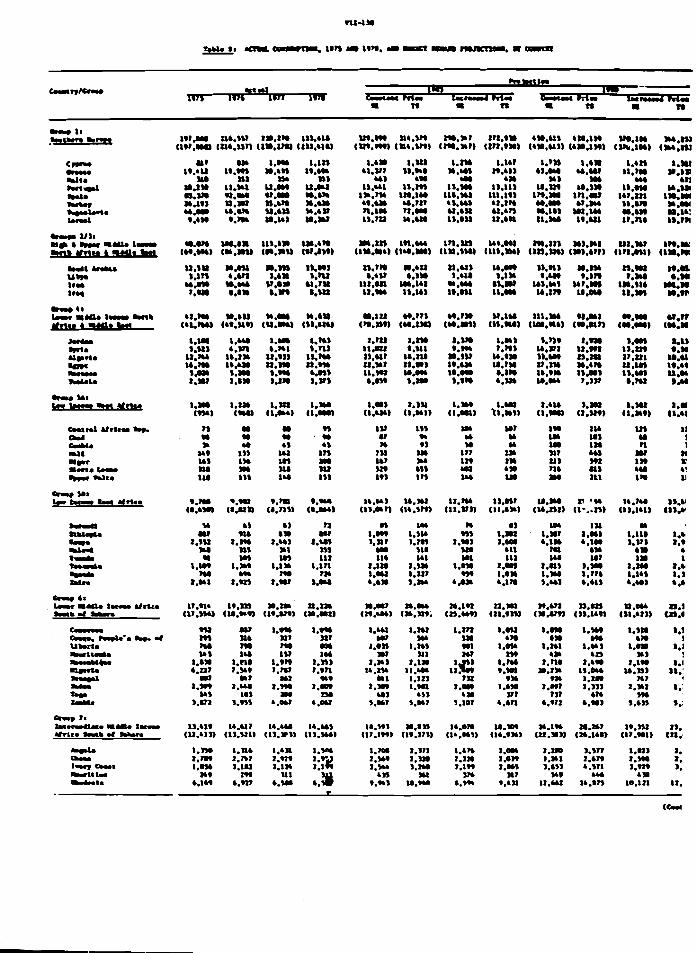
:.a t1.a
11 I 1
a r b! U
88.U t 1 B . u
1.b 1..
I 8.b 8.8 6 .a
m.1 (a,#
8 .l 
1.:
I.! 81..
t
1.:
s.:
aJ alb m
- u I- -1 U a l r m a .

-wu U S n.m I I . W Y. FIJI w.m m.8- -.I- - *..I, .S8...) .U.m .U.m Y W -LI 1 ~ r n . n I.-.-* I#.- IAI.W
k lh I*n.en ~. .rcaw 8.uv.u I.*W.UI
11.-.- *I-.- I8.-..W r l F . Y l I
-.u m.8n b.H b..L n.... Urn \.01 W.W U.Y U.-8 - a w n n =.ma ncs - LCY n I n.- n- m.*a ma- -.ow m.w - -I** S ' I ~ w.m m.1- h.8~ 8W.n) I . 1-m 1 0 . 4 = ..lu ... 9 S . Y s..-
-.em -.-I -.urn bans h -.vt nc1 LC* n.u LIC. wan I ~.III ?I.- -- - .**I - U.II P..U
CIC W N U a m u UN.. r* m w . m r u* .ns m a w
C*~-O oma..w 1m.m ~ i ~ b . w n ~ - u am 1.- m m a r
1.- n.v* can -.ut WC, -cl. ..m 3.- ...a * .UP - 8 .F b . 2 . *A- . - I-.. 1 - *b -- ..k Cmv- .r u v . 8 1 . n e . I- 8-- ~ . k

- - -
croup 1: ~ o u r l u t n torope 7.9 8.3 7.7 5.7 5.1 4.4 6.4 6.4
croup 2/31 ni* 6 oppar m a l o b c o a k r r b U r l c a & nla410 cas t 9.6 17.8 9.3 12 .O 1.1 6.1 7.4 6.6
Croup 4 8 Lowr Wddlr Iscar k r t b Afrlca & Hlddla m a t 3.9 5.4 12.0 8.7 5.6 3.5 6.8 5.7
Ctmp MI LOW I tnow Wac UI~C. 13.7 11.9 2.3 4 -2 4.0 7.9 6.0 6.6
Croup 68 Lowt Wd11a Iorow Urlu b o t h of - b r a 16.8 7.1 7.8 5.8 5.1 3.4 Sa7 4.7
Croup 71 Inca-*lato Wddlr Incoma A f r l u k t h of Irbsra 28.6 10.4 7.3 3.0 3.4 5.1 S.4 6.3
CCWP 88 Lou I#- hi8 5.9 3.9 6.1 8.1 1 8 4.7 5.4 8.7
Croup 9: lawr Xlddlo 6 Iatrr- . .d ia t~ IIU- &la 13.3 13.6 6.3 1.2 16.0 16.3 10.1 11.3
Crmp 108 Lowr Wddlo lorow b t i a A ~ ~ I U 6.3 7.3 4.4 3.3 3.9 3.6 6.3 6.2
Croup. lb/l7/188 O t k r A f r l c a ( I a c l d i q
Jooth U r l u ) & AIL. 3.7 3.9 6.0 6.7 3.6 3.6 5.9 5.3
A l l Derrloplas Cormtries 6 -9 7.4 6 .2 7 .O 3.9 6.1 6.9 7.6
Croup 12: lb r th Africa Oceania 4.5 5.9 1.8 2.5 5.1 4.4 4.0 0.6

List of P d c i p c n t s
Prof . F. Gerard Mam ' J n i v e r r i t y o t Pcano7lvania 3718 Locurt Walk CR Philadelphi., Pa. 19171 USA
nt. Takamas. Aki7.1~ UNCTAD C o d i t i r s D i v i s i o n P a l a i r d r r Natioao CH-1211 harm S u l t t r r l a n d
Prof . R ~ k t t I t n i w r r i t y o f Oxford I n r t i t u t e of Econor icr aad S t a t i s t l c r S t . Cro r r Bu i ld in8 )(.nor Road Oxford. OX1 3uL Iflt
Prof. J. Alan Dram U n i v e r r i t y o f Oxford I n s t i t u t e of ecoaoricr and S t a t i r t i c s S t . Crosr Bui ld ing )(.nor Road Oxford OX1 3rn Ult
Prof. Benning Bun ie l I a a t i t u c e of E c o a o d c s u n i v e r s i t ~ of A a r h OK-sOOO Aarhus C hmrk
Prof. C.P. C a m i d 0 a I n o t i t u t o d i Scfenze P o l i t i c h e U n i v e r s i t a d l Bologaa V i a Zarbonl 1 40125 Bologrra ITALY
nr. Choeng ~ h u - ~ W o r l d b n k 8 1818 R S t r e e t kY Washington. D.C. 20433 USA

Hr. S. Cole Science Policy Brsurch Unit Univerrity of Surmex Brighton UK
Xr. A.3. b u r a k i r Bra~enore College M o r d lm
X t . J. Cde UNCTAD C o d i t i e r Divirioa Pala i r der )(rtionr CR-I211 Gear*. Sul t z e r h n d
nr. -0 C r i l l l Confinduacria Viare dell ' k t r o a o d a 30 6m 00144 Ron 1t.1~
nt. FUdeo Earhimoto World Bank 1818 H Street R.U. Ulshington. D.C. 20433 USA
Prof. Dr. Imtz Bof f u n n UniPcrrity of Regearburg D-8400 R e g r n r b ~ Uoivermita t r r t rure 31 G a - 9 , P.R.
Prof. Svend Hylleberg Inmtitute of konorio UILIVerrlty of Aarhur DK-8COO A a r h C Denlcrk

Prof. Karsten Laursen I n s t i t u t e of Econoalcs Univvrs l ty of Aarhus OK-8300 4arhrcs C Den- rk
Zr. W t t h l a a Hots Univers i ty of Reganaburs 0-8400 Ibasnrburg U n l v e r s l t a r s r t r a r a s 31 C e m n y , P.R.
Hr. b u r l r l o 40 S l g r l a ?no C o d l t t s a and Trade Dlvlr lon Via dell. Tame d l C l r aca l l a 00100 Rors I t a l y
Prof. J a m Paeitnck htstharlaoda Ecaaomlca I a r t l t u t e Rotterdam 16 50 ? - a rg t rwe r t c r Oudlaan Ntthtrlandn
Prof. Hart :n Paldam I n r t l t u t t of E ~ O M ~ C S : r i v e r a f t y of A a t ' - a ~ s Dlt-8000 h r h u s C Denvrrls
Mr. Pe te r Po l lak Uorld Bank 1818 H S t r e e t N.U. Washlngtoo D.C. 2W33 USA
H r . Robert van de r Ssnde I u t e r n a t i o ~ l Irocl and S t e e l ' i n s t i t u t e Avenue Ramof r 14 6-1180 8r;rssels Belgium
6
Hr. %-=her Slngh Wqrld Bank 18l8 R S t r e e t N-U. u&hington, D.C. 20433 U S E - t -

Prof. Aha Mfntmc. Dap.rt~r=rt of App11.C kooomtc* Daivmtt i t~ ot habridge CubrlQ. UK
Mr. WlrQefq Y a y YarLC lknk 18i8 1 S t ~ u t RY ~ b l n ~ t o o , DOCo 20433 USA