Excessive commodity price volatility: Macroeconomic effects ...
Upload
khangminh22Category
view
1download
0
COMMODITY.* MARK<ETSl 3 1XANDTHE DEVELOPING COUNTRIES Vol 5 N' .1
November
Global economic prospects and developing countries
Oil prices expected to weaken
Grains lead declines in food prices
Metals and minerals post small declines
l
,R~~~~'
Pub
lic D
iscl
osur
e A
utho
rized
Pub
lic D
iscl
osur
e A
utho
rized
Pub
lic D
iscl
osur
e A
utho
rized
Pub
lic D
iscl
osur
e A
utho
rized
Pub
lic D
iscl
osur
e A
utho
rized
Pub
lic D
iscl
osur
e A
utho
rized
Pub
lic D
iscl
osur
e A
utho
rized
Pub
lic D
iscl
osur
e A
utho
rized

CONTENTS AND SUMMARY
SUMMARY PAGE 4 ture of speculative money from coffee mar-
kets. El Nifio affects supplies of IndonesianS 5 SPECIAL FEATURE and Colombian coffee, keeping prices from
6 ZU- _ * GLOBAL ECONOMIC PROSPECTS AND THE falling very far.* . DEVELOPING COUNTRIES PAGE 6 M TEA PAGE 15
* Developing country growth in 1996 was the London prices are 31 % higher than in the
* * * U highest so far this decade. The external envi- third quarter last year in real terms. Tightronment for developing countries is expect- world stocks, uncertain global weather con-
ed to remain broadly favorable over the com- ditions, and seasonal effects are likely to keeping decade. The challenge for policymakers world prices high.
in developing countries is to establish theconditions that attract more global produc- FOODtion and realize more of its benefits. FATS AND OILS
* FATS AND OILS PAGE 1 6ENERGY Although the regional effects of El Niino may
* COAL PAGE 9 be large, world supply of fats and oils is notWeak demand and rising supplies lead to expected to be severely affected. Declines in
lower prices this year. Prices are expected to the Southern hemisphere should be offset bydecline in 1998 with increasing production, increases in North America. EU reforms
greater competition, and growing reliance under Agenda 2000, if implemented, couldon spot markets by purchasers. further depress EU oilseed production.
* NATURAL GAS PAGE 9 * COCONUT OIL PAGE 16
US prices surge on strong demand for stor- Production is expected to increase slightly inage and flat production. Prices are expected 1997/98. The 1998/99 outlook is not asto decline in 1998 on higher production promising because of severe El Ninlo-related
CHANGE IN QUARTERLY from the Gulf of Mexico and rising imports drought in the Philippines.PRICES, 2Q97 TO 3Q97 from Canada later in the year. In Europe * PALM OIL PAGE 17Percent
Energy + 1.0 prices remain indexed to oil, but the intro- El Nifio-related droughts are expected toNonenergy -7.9 duction of UK spot gas into the continent in affect yields from 1998 on. Reduced yieldsTotal agriculture -9 7 late 1998 and ongoing liberalization of the and increased consumption in Indonesia and
Beverages -12.3Total food -7.8 gas sector will lead to lower real prices. Malaysia will push up prices.
Fats and oils -8.8 * PETROLEUM PAGE 10 * SOYBEAN OIL PAGE 17Grains -9 3Other food -5.6 The market balance is much improved from Prices remain unchanged while production
Raw materials -9.1 a year ago because of higher inventories, ris- is expected to rise. Stocks are decliningTimoer -11.5
Fertilizers -3.0 ing production, and renewed exports from sharply. While El Nifno is expected to affectMetals and minerals -1.9 Iraq. Higher production from OPEC and both Argentina and Brazil, favorable weath-
non-OPEC sources is expected to lower prices er in North America should offset any
next year. decline in production.
BEVERAGES GRAINS* COCOA PAGE 14 * GRAINS PAGE 18
The impact of El Ninio is intensifying the Large supplies and currency devaluations inrecent structural deficits in the cocoa mar- Asia cause grain prices to weaken during the
ket. Production is stagnant, and consump- quarter. World grain production is estimatedtion is growing. Prices are up accordingly. to be slightly above last year's level and 8.5%
* COFFEE PAGE 14 above levels in 1995/96. Stocks are expectedArabica prices fall sharply on expectations of to build, but still remain low by historicala large crop in Brazil next year and the depar- standards at 15.4% of total use.
2 COMMODITY MARKETS AND THE DEVELOPING COUNTRIES

CONTENTS AND SUMMARY
* MAIZE PAGE 18 * RUBBER PAGE 23
Prices strengthen from their mid-summer International prices slide, but producerlows. Production is expected to shrink 2.4%, prices improve following devaluations inand stocks are expected to drop 14%, keep- Asia. El Nifio's arrival ushers in drought anding the market tight and prices firm. threatens supplies.* RICE PAGE 19 * TIMBER PAGE 23
Devaluation of the baht reduces the US dol- Sluggish demand in Europe and Japan con-lar price of Thailand's rice exports by 15%. tributes to price declines for tropical timber.World production and stocks are projected Reduced housing starts, a stronger dollar,to rise slightly from last year's levels. The and the substitution of softwood logs forthree largest exporters are expecting good tropical logs are also depressing demand.
harvests and large supplies for export, whichshould keep prices from rising. FERTILIZERS* WHEAT PAGE 1 9 * FERTILIZERS PAGE 24
Prices fall to $146.2/ton for the third quar- Most prices remain strong, with the excep-
ter, from a high of $262/ton in May 1996. tion of urea. However, weak world grainWorld production for 1997/98 is expected to prices may drive fertilizer prices down.reach a record 603 million tons, up 3.4% * POTASSIUM CHLORIDE PAGE 24
from the previous year, putting year-ending Prices remain firm as supplies from Canadastocks up 18%. Prices should remain near have been limited. An increase in second-current levels until the spring of 1998, when half contract prices of $5/ton was sought andnew crop prospects begin to emerge. attained by some exporters. However, most
prices remained at $116.5/ton.OTHER FOOD * TSP PAGE 25
* BANANAS PAGE 20 Producers are operating at near capacity,Prices fall, and El Nifio threatens produc- and production is up 4% for the first half oftion. The WTO rejects the EU's appeal of its 1997. With such rapid production growth,banana export regime. demand is not likely to be strong enough to* SHRIMP PAGE 20 support prices at current levels.
Prices continue to rise, bringing the year's * UREA PAGE 25increase to 15%. Reasons include smaller Prices continue to fall, with the average downharvests in Thailand and increasing demand 11.1% from the second quarter. Furtherin major importing countries. declines will probably be limited in the near* SUGAR PAGE 21 term as demand begins to increase for thePrices remain firm, with world supplies spring plantings. However, supply remains wellexpected to decline. The US and Mexico con- ahead of demand, and more firms are cuttingtinue to quarrel over high-fructose corn production in response to building inventories.syrup.
METALS AND MINERALSAGRICULTURAL RAW * ALUMINUM PAGE 26
MATERIALS Consumption growth in Europe and the US* COTTON PAGE 22 and investment fund buying spur prices.Production and consumption remain in Consumption weakens in Asia, mainly as abalance. Declining Chinese imports may result of the recent currency crisis.offset any increase in prices stemming from * COPPER PAGE 26
El Nifio effects. State-owned textile indus- Increased demand in Western Europe andtries in China and India are undergoing North America is not enough to offset lowerreform. demand from Asia and worldwide growth in
NOVEMBER 1997 3

CONTENTS AND SUMMARY
copper supplies. Prices continue to fall to their IEA projections at the beginning of the year.
lowest levels of the year. OPEC production continued to edge up,
* GOLD PAGE 27 bringing output to 2.3 mb/d above quota.Prices continue to fall on central bank selling There are indications that OPEC may raise
and a loss of speculative interest. Prices aver- quotas at its November meeting, which would
age $323.6/toz for the quarter. At current lead to higher output from the Gulf countries.prices, mine closures are expected. Although a rollover of Iraq's oil-for-food deal in
* IRON ORE AND STEEL PAGE 28 December may be in doubt due to heightened
Despite high levels of production, the global tensions over weapons inspections, continued
iron ore market remains tight. Performance in Iraqi exports plus higher output from the rest
steel markets is more varied. Demand is up in of OPEC would likely tip the balance into sur-
Europe but way down in Southeast Asia plus. Non-OPEC supplies are projected to
because of the recent currency crisis. increase significantly in 1998. Thus oil pricesare projected to decline next year.
COMMODITY PRICES Coffee prices fell sharply as the risk of cold
* COMMODITY PRICE INDICES PAGE 5 weather in Brazil subsided and prospects for
* COMMODITY PRICE OUTLOOK PAGE 29 next year's crop brightened. Nevertheless,
prices for arabica were more than 50% higherSUMMARY than a year ago because of lower supplies.
The World Bank's index of energy prices Estimates for the 1997/98 crop have been low-
rose 1 % in the third quarter on strong ered more than 10% in both Brazil anddemand and lower than expected supplies. Colombia. Robusta prices, which had previ-Nonenergy prices fell nearly 8%, however, ously risen less than arabica prices, fell 12%,
with declines in all the main groups (table 1). reflecting good supply availability. There is
Beverage prices were down 12%, pulled down some nervousness in the market about possibleby an 18% drop in arabica coffee prices as ElNifno effects, but thus far the only large effect
Brazil's frost season ended. Tea and cocoa has been in Indonesia, where drought signifi-prices recorded moderate increases. Food cantly reduced production. Many Central and
prices fell 7.8%, with a 9.3% decrease in grains South American countries worry that recentand moderate declines in most other foods. dry weather will lower the quality of this year's
Metals and minerals prices fell only 2% for the crops and cause production declines next year.group, but there were larger drops in several Grains prices led the decline in foodindividual products. Timber prices fell 11.5% prices, with wheat off 13.8%, maize down
on sluggish demand, while rubber prices 6.8%, and rice down 3.9%.
plunged nearly 20%, in part a consequence of Metals and minerals prices posted thecurrency devaluations, which stimulated pro- smallest decline among the main commodityduction among South east Asian producers. groups, mostly because of a large increase in
Cotton and sugar prices remained firm. zinc prices and a moderate rise in aluminumPetroleum prices rose during the quarter, a prices due to strong demand in the US and
response to the temporary halt in Iraqi supplies Europe. Copper prices fell 9.4% on risingfrom May to August, continued shortfalls in stocks and weak demand. Price declines werenon-OPEC supplies, and strong demand, par- also recorded for nickel (down 8.1%), silver
ticularly for transport fuels in the US. However, (4.7%), and gold (5.7%). Iron ore marketsprices were 20% belowJanuary levels, reflect- remain tight, despite high production,ing the improved market balance. Stocks have because of strong demand. Steel demand
risen, particularly in North America and remains strong in the US construction sectorEurope. Non-OPEC supplies were 1.0 mb/d but is weakening in Asia following the recenthigher than a year earlier, but 0.8 mb/d below currency crises.
4 COMMODITY MARKETS AND THE DEVELOPING COUNTRIES

COMMODITY PRICE INDICES
FIGURE 1. WEIGHTED INDEX OF PRIMARY COMMODITY PRICES FOR LOW- AND MIDDLE-INCOMEECONOMIES
ENERGY (CRUDE OIL) NONENERGY COMMODITIESIndex: current VS dollars (1990=100) Index: current US dollars (1990=100)150 ^}130
25
130 Vs ll 120
110 115
90 105 i
70 ~~~ ~ ~~~~~~~~~~~~100 70 M 95
50 ~~~~~~~~~~~~~~~~~9085
30 8083 84 85 86 87 88 89 90 91 92 93 94 95 96 97 83 84 85 86 87 88 89 90 91 92 93 94 95 96 97
TOTAL FOOD METALS AND MINERALSIndex: current US dollars (I 990=100) Index: current US doilars (i990=100)130 A 140
120 120120
I MON A 1'. 1~~~~~~~~~~~00
90 ~~~~~~~~~~~~~~~~9080
80 70
70 6083 84 85 86 87 88 89 90 91 92 93 94 95 96 97 83 84 85 86 87 88 89 90 91 92 93 94 95 96 97
TABLE 1. WEIGHTED INDEX FOR PRIMARY COMMODITY PRICES FOR Low- AND MIDDLE-INCOMEECONOMIES IN CURRENT DOLLARS(I 990= 1 00)
Nonenergy Metalscommod- Total agri- Total Fats Other Total raw and
Energy ities culture Beverages food and oils Groins food materials Timber Fertilizers minerals(I00)a (100) (69.1) (16.9) (29.4) (i O) (6.9) (12.4) (22.8) (9.3) (2.7) (28.2)
Annual1994 69.4 111.6 123.3 148.8 106.8 125.9 102.1 93.9 125.8 156.6 93.4 84.61995 75.1 122.2 131.3 151.2 1 16.9 136.6 120.4 98.8 135.2 139.5 103.6 101.61996 89.3 1I 5.I 1 25.5 126.5 123.6 147.0 140.6 95.0 127.1 139.5 1 19.8 89.1
Quarterly1996Q3 90.8 1 13.1 124.7 126.6 123.2 147.7 139.6 94.0 125.2 141.1 121.1 83.81996Q4 101.4 1 10.8 120.7 124.0 1 16.8 147.8 118.4 90.5 123.3 139.9 123.0 85.11997Q1 91.8 1 19.3 130.0 150.7 122.5 154.5 122.7 96.3 124.4 140.2 124.2 92.51997Q2 80.4 126.0 139.6 197.8 119.5 151.8 1 16.5 94.8 122.4 140.5 120.0 93.11997Q3 81.1 116.0 126.0 173.6 1 10.2 138.5 105.7 89.5 1 11.3 124.3 116.4 91.3
Monthly1996 Sep 97.3 111.8 123.1 123.7 121.4 152.7 127.4 92.5 124.8 142.3 122.5 82.81996 Oct 103.2 109.9 121.1 126.6 116.1 145.4 120.0 89.9 123.4 142.4 123.0 81.31996 Nov 97.9 111.6 121.3 125.3 116.9 147.8 117.4 91.3 124.2 141.6 123.0 86.61996Dec 103.2 110.7 119.7 120.1 117.4 150.2 117.9 90.3 122.4 135.8 123.0 87.41997jan 101.5 115.0 124.2 129.4 121.4 152.0 123.7 95.1 123.8 139.0 124.5 91.61997 Feb 89.3 1 19.2 130.0 151.3 122.2 153.9 122.6 96.0 124.3 140.2 124.1 92.11997 Mar 84.5 123.7 135.9 171.3 123.9 157.5 121.6 97.7 125.1 141.2 124.1 93.71997Apr 78.2 124.0 137.4 179.8 124.7 158.0 119.4 100.4 122.4 140.0 122.5 91.21997May 84.7 129.8 144.7 219.7 119.3 152.9 118.7 92.2 122.0 140.5 118.8 94.21997Jun 78.3 124.2 136.7 193.8 114.6 144.4 111.4 91.9 123.0 141.0 118.8 94.01997Jul 80.1 117.5 127.6 173.4 110.2 137.7 106.6 89.8 116.1 133.8 117.9 92.61997Aug 81.7 116.2 125.9 173.0 110.0 136.5 106.2 90.6 111.4 123.9 115.7 92.51997Sep 81.6 114.3 124.6 174.2 110.3 141.3 104.2 88.3 106.3 115.2 115.7 88.8
Note: Weighted by average 1987-89 export values for Jov- and middle-income econormes.a. Crude oil index.Source: World Bank, Development Prospects Group.
NOVEMBER 1997 5

SPECIAL FEATURE
GLOBAL ECONOMIC regions where incomes fell in the past 10 years,
PROSPECTS AND THE are expected to achieve positive per capitaDEVELOPING COUNTRIES income growth (though the projected pace of
Developing country growth in 1996 was the about 1 percent would remain below that inhighest so far this decade, an estimated 5.6% high-income countries).
(excluding transition economies), and the In some of these countries basic political andmost rapid rate in 20 years. The integration of macroeconomic conditions for investor confi-
developing countries in the world economy dence are still lacking, and many enterprisesalso gained ground: foreign direct investment remain largely cut off from foreign markets and
in developing countries topped $100 billion competition because ofpolicyweaknesses, insti-
for the first time, approaching 2% of their tutional impediments, and inadequacies in
GDP. Their international trade volumes transport and communication services. Theexpanded at a robust 7%, despite a downturn same is true of some economies in Europe and
in overall world trade growth. Central Asia, although most of the countries in
The external environment for developing the region are expected to recover much of thecountries is expected to remain broadly favor- ground lost during the difficult transition from
able over the coming decade. World output a planned to a market economy.
growth in 1997-2006 is expected to average Developing countries in South Asia will3.4% a year, more than half a percentage point continue to show faster growth in output and
higher than during the past decade, with mod- investment and will further increase their
est inflation of about 2.5% in the Group of 7 share ofworld trade. Though there is still some(G-7) countries and real short-term interest way to go before finns in India are fullyrates of slightly more than 3%. In this setting exposed to international markets, recentdeveloping country growth is expected to aver- reforms there have proved resilient, and
age nearly 5.5%, double its pace in the pre- growth in the South Asia region is expected toceding decade, accompanied by mounting improve on historical trends. Countries in
capital inflows and solid increases in trade of Latin America, which have become consider-
7%-8% a year. ably more integrated into the world economy
Economic growth is expected to increase in over the past decade, should also experienceevery region except East Asia, where it should accelerated growth in the next decade, though
still remain high (table 2). Sub-Saharan Africa in some large countries the risk of macroeco-and the Middle East and North Africa, two nomic instability persists.
TABLE 2. WORLD GROWTH SUMMARYPercentage change per year in real GDP
Estimates Forecasts1 966-73 1974-80 198 1-90 1991-95 1996 1 997-06
World 5.1 3.3 3.1 2.0 2.9 3.4High-income countries 4.8 2.9 3.1 1.9 2.5 2.8OECD countries 4.7 2.8 3 1.8 2.3 2.7Non-OECD countries 9.3 7.7 6.5 6.6 5.8 5.6
Developing countries 6.4 4.7 3 2.3 4.5 5.4EastAsia 7.3 6.4 7.7 10.7 8.6 7.6South Asia 3.7 4 5.7 4.6 6.5 5.9Sub-Saharan Africa 4.5 2.8 1.9 1.3 3.8 4.1Latin America and the Caribbean 6.4 4.9 1.6 3.3 3.5 4.2Europe and Central Asia 6.6 4.8 2.5 -5.9 -0.3 4.5Middle East and North Africa 8.7 4.9 0.8 2.6 4.1 3.6
Memorandum itemsEastern Europe and former Soviet Union 6.7 4.9 2.3 7.6 -1.8 4.6Developing countries excluding
Eastern Europe and former Soviet Union 6.3 4.7 3.2 5 5.6 5.5
Note: GDP nneasured at market prices and expressed in 1 987 prices and exchange rates. Growth rates over historic intervals are computed us ng east squares method.Source: World Bank data and baseline projections, June 1997.
6 COMMODITY MARKETS AND THE DEVELOPING COUNTRIES

SPECIAL FEATURE
THE BIG 5 that fast growth in the Big 5 will generate sig-
Increased integration and faster growth in nificant increases in world food and energy
China, India, Indonesia, Brazil, and Russia- prices do not appear to be well founded.five countries that today account for half theworld's labor force but only 8-9% of its GDP OPENNESS AND GROWTH
or international trade-will likely redraw the Several trends in the world today are con-
economic map of the world over the next tributing to the expansion of cross-border
quarter century, although these countries' production by multinational enterprises and
share of world trade is barely one-quarter their networks of closely associated firms.
that of the European Union's today, it could, These include the liberalization of econom-under reasonably conservative assumptions, ic policies in most countries, continuing
be 50 percent larger by 2020. The share in reductions in the costs of transport and com-
world output of both the Big 5 and develop- munications, and the growing importance of
ing countries in general will nearly double, knowledge and other intangible assets inwith developing countries absorbing half the modern production and distribution. These
growth in industrial country exports over the forces are heightening the competitive pres-
next quarter century. sures on firms in both industrial and devel-
Model simulations for the world economy oping countries, while also facilitating theirin 2020 suggest that the emergence of the Big efforts to improve efficiency and gain access
5 will generate significant welfare gains for to new markets by reorganizing productionboth the industrial countries and most other processes on a global basis.
developing countries, resulting from broad- The challenge for policymakers in devel-er opportunities for specialization along oping countries is to establish the conditionslines of comparative advantage and from that help attract more global production and
improved terms of trade. The emergence of realize more of its benefits. These include
the Big 5 is expected to have a beneficial political and macroeconomic stability, openeffect on real wages for both skilled and trade and investment regimes, better trans-
unskilled workers in most countries and port and communication infrastructure, ade-regions. quate protection for property rights, and a
Among developing regions the Middle East predictable institutional environment with-
and North Africa, Sub-Saharan Africa, and out excessive red tape. Ensuring that foreignLatin America and the Caribbean derive the and domestic firms face a high degree oflargest welfare gains from the emergence of competition in host country markets is likelythe Big 5. Trade liberalization and increased to be important in maximizing the spiliover
participation by countries with abundant benefits of global production.unskilled labor, such as China and India, are There is growing evidence that increased
expected to lower relative prices for some openness and faster economic growth golabor-intensive products, generating some together, suggesting that the longer-term
pressure on unskilled wages in a few countries effects of trade liberalization on employ-with closely similar endowment structures. ment, wages, and income are likely to be
These countries will, however, have the strongly positive. To be effective, however,incentive and the ability to offset such pres- trade liberalization requires resources to besures by accelerating their own trade liberal- redeployed between sectors. In the process,ization (a policy tending to benefit their most workers in import-competing industries may
abundant factor of production, unskilled become unemployed for a time. The outputlabor) and by undertaking other reforms to losses suffered by the economy as a result-improve the efficiency of resource allocation the social costs of adjustment-are expected
and use. The analysis also suggests that fears to be temporary, and empirical estimates sug-
NOVEMBER 1997 7

SPECIAL FEATURE
gest that they tend to be small, especially rel- tor weaknesses that increase exposure and vul-
ative to benefits. nerability to external shocks. StrengtheningThe size of adjustment costs will never- the framework of institutions and improving
theless be affected by the policy environ- access to information to allow markets to workment, and there is indeed much that more effectively will be an important consid-
governments can do to minimize them. eration for development strategy in many-
Adjustment costs will be lower if macroeco- countries.' Growing competitive pressures and
nomic stability and other complementary rapid transformation of the world economypolicies strengthen the credibility of reforms along many dimensions will give unprece-
and support a quick and substantial increase dented weight to the ability to handle change.
in new private investment. Adjustment will Careful management of the transitional strains
be delayed and its costs will be higher if labor associated with global integration will be anand other factor markets are distorted and important task for all countries in the coming
inflexible. decades.
Trade reforms are undertaken because As to the risks to the natural environment
they yield large net social gains. By con- from faster growth, in the long run greater
tributing to improved growth in the longer reliance on market forces is likely to be reflect-
term, liberalization is likely to make a sub- ed in many countries in more efficient use ofstantial contribution to the reduction of natural resources such as energy. Demand for
poverty. And where unskilled labor is the rel- a cleaner environment rises with income, andatively abundant factor of production, it is so growth in developing countries will also be
likely to raise returns to this factor. associated with greater incentives for policy-
Nevertheless, the private costs of trade lib- makers to implement strong environmentaleralization for specific groups, such as capital- policies over time. Nevertheless, given the
ists and workers in the previously protected complexity and scope of this issue, it is clear
sectors of the economy, can sometimes be that analysis of the environmental implications
large. Given that these losses are usually more of global integration is an important task forconcentrated among a few groups than are the further research.larger but more widely diffused gains from
trade, the opposition to liberalization will This feature is drawn from World Bank,
often be more focused and better organized Global Economic Prospects and the Developing
politically than is support for it. Countries, Washington D.C., 1997. To pur-chase a copy, contact the World Bank
POVERTY AND THE ENVIRONMENT Bookstore at 202-473-2941 or visit the
Prospects for the global economy are World Bank's publication catalog at
among the most promising for growth and www.worldbank.org.poverty reduction in developing countries in 1. Joseph E. Stiglitz, "Agenda for Development
many decades. However, such encouraging in the Twenty-First Century," in Boris Pleskovic
projections must be qualified by significant and Joseph E. Stiglitz, eds., Annual World Bank
areas of risk for individual countries, including Conference on Development Economics 1997,
macroeconomic imbalances or financial sec- Washington D.C.: World Bank, forthcoming.
8 COMMODITY MARKETS AND THE DEVELOPING COUNTRIES

ENERGY
COAL Y NATURAL GAS Pising crude oilYEARLY (US doliars/mt) ~3.82 3.0 smcrdo
5650 US thermal, fo.b. Hompton DEC1981 Roods, Norfolk. 96 25 producfion and
2A0 stocks improve5 \/, market balance.
48.50 80 85 90 Sptcalpie1984 (US dollars/mmbtu) Spot coal prices
fall, but US gas2U8 prices surge on
43.10 96 strong demand980 °° k / /for storage.
997 2.0
36.17 38.48 97 1990 3 /001.84 ~~~~~~~~.891 987 1 MAR 101.4
96 97 1996Q4
WEAK DEMAND AND GROWING SUPPLIES LEAD TO US PRICES RISE SHARPLY ON STRONG STORAGE
LOWER PRICES DEMAND 91.8/997Spot coal prices fell significantly in the US natural gas prices rose strongly in the I
third quarter, with some shipments selling third quarter on heavy demand for storagefor a few dollars per ton below contract injection and flat domestic production, with
80.4 81.1prices. Modest demand growth, ample end-September prices 45%, or $1 per million 997 1997
stocks, and growing production contributed Btu (mmbtu), higher than end-June levels. Q2 Q3
to the lower prices. Given this weak pricing End-use gas consumption was weak, howev-environment, some buyers in Asia and er, in part because of mild summer weatherEurope are tendering for greater volumes on and fuel switching induced by sharply high-the spot market, hoping that low spot prices er prices. There is increased anxiety aboutwill influence current contract negotiations gas deliverability in the US, with the possibil-for next year. Producers will try to get at least ity of still higher prices during the winter ifa rollover of 1997 prices, but contract prices the weather turns sharply cold.are likely to be lower in 1998. Storage levels are estimated to approach
US coal prices fell as exports declined and 2,900 billion cubic feet (Bcf) at end-mild weather lowered electricity demand. October, some 100 Bcf higher than a yearThe coal industry received a boost in August, ago but well below prior year levels. Thehowever, when Ontario Hydro announced lower inventories reflect improved manage-that it will overhaul its production facilities, ment of storage, technological changes infollowing a critical report from the Nuclear facilities, and a more integrated transporta-Performance Advisory Group. The company tion network. However, higher and morewill idle several nuclear units over the next volatile prices have been associated withthree years, and US coal and oil imports will lower levels of storage, although other fac-fill most of the power generation gap. tors such as weather, deliverability, and
In 1998 US coal demand is expected to transportation bottlenecks also contributedrebound with a recovery in electricity con- to the price swings.sumption and lower hydroelectric output US gas production has been fairly stagnant(assuming normal weather rather than the wet because of delays in the flow of deepwater gasweather experienced in the Pacific Northeast from the Gulf of Mexico and an early pro-this year.) However, production increases and duction decline in the shallow water shelf ofderegulation of the power sector are expected the Gulf. Higher demand in California hasto contribute to lower prices. Productivity diverted supplies that normally would be trav-increases should help to increase producer eling east, and gas exports from Canadamargins hurt by lower prices. remain capped because of pipeline con-
NOVEMBER 1997 9

ENERGY
straints. Combinedwith these short-term sup- PETROLEUMply limitations, the pressure to inject gas into 23.61 (OS dollars/obl)
OCT Spot, oeerage of Brent,storage has led to the recent surge in natural 96 23.23 Duboi, cnd West Texos
JAN Intermnediote.gas prices. 97
Prices are expected to fall in 1998 withincreased production from the deepwaterGulf. Gas-related drilling has been high, and 1
new discoveries have been made in both the 97
shallow and deepwater Gulf. Pipeline expan- 40 \ .6
sions from Canada-Northern Border and 30 97
TransCanada-will be completed in late 1998 20
and will ease supply conditions for the 90
1998/99 winter season. A key element in thesupply equation is the shallow water shelf ofthe Gulf. RISING PRODUCTION AND INVENTORIES IMPROVE
Gas prices slipped in Europe because of MARKET BALANCE
lagged contract price indexingwith petroleum Oil prices were fairly flat for most of the
products. Gas demand has been sluggish this third quarter before rising sharply in late
year compared with last year's strong cold September and early October. The market
weather-induced growth. Despite the cyclical remained evenly balanced during the quar-
changes in demand, the power generation ter, aided by the resumption of Iraqi oilsector continues to grow, particularly in the exports in August and a strong US gasolineUK The conversion of household heating sys- market. Non-OPEC supplies continue totems to gas continues at a rapid rate, and the come in below expectations, which hasshare of gas in new residential and commer- helped put a floor on oil prices in the uppercial buildings remains high. After rising 8% in teens (dollars per barrel). Oil stocks have
1995 and 10% in 1996, gas demand is expect- risen appreciably this year, particularly in theedtoincreasejustl% thisyearand4% in 1998, US and Europe, and inventories headingassuming normal weather. into the peak-demand season are in much
On the supply side, imports from Algeria better shape than a year ago, especially heat-
and Norway have risen strongly, while sup- ing oil. Consequently, price spikes are lessplies from the Netherlands have contracted, likely to occur this winter, barring unfore-in part because mild weather has reduced seen circumstances. But stocks remain low bydemand. Imports from Algeria, Norway, historical standards, so any sudden loss of
and Russia are expected to increase in 1998, supply or surge in demand due to extreme
along with initial UK supplies through the weather could result in much higher prices.Interconnector pipeline, due to open in the Prices remained firm despite higherfourth quarter of 1998. OPEC production because of continued
The UK continues to make rapid progress strong growth in demand and shortfalls inin liberalizing its gas market. Gas prices are non-OPEC supplies. OPEC crude oil pro-
now decoupled from oil prices and are set duction averaged 27.30 million barrels perlargely by the forces of gas competition. The day (mb/d), up 0.47 mb/d from the secondgas futures market on the International quarter (table 3). Part of the increase was due
Petroleum Exchange (IPE) has been strug- to higher output from Iraq, but productiongling to generate sufficient liquidity, and also rose in Saudi Arabia and Venezuela and
trading is still dominated by a few companies. a number of other countries.Many more players are expected to enter the OPEC production was 2.3 mb/d over itsmarket once the contract develops. self-imposed quota, with all countries pro-
10 COMMODITY MARKETS AND THE DEVELOPING COUNTRIES

ENERGY
ducing above their assigned levels. Iraq was Soviet Union (FSU). While quarterly growthonly marginally over quota, while several was modest, production was 1.0 mb/d higherother countries were well above. Venezuela than a year ago. Despite significant growth,continues to have the highest over-quota pro- non-OPEC supplies continued to come in wellduction, with output approaching 0.9 mb/d. below expectations, with third-quarter outputNigeria followed with 0.41 mb/d above 0.8 mb/d less than projected by thequota, Saudi Arabia with 0.28 mb/d (includ- International EnergyAgency at the beginninging its half share of Neutral Zone produc- of the year. Much of the shortfall is the resulttion), and Qatar with 0.27 mb/d. There are of technical problems and delayed start-up ofindications that OPEC may raise quotas at its new fields in the North Sea and elsewhere.semi-annual meeting in November. Many of the new projects that involve new
Iraqi oil exports ceased between May and technologies-such as floating, production,August, providing some support to oil prices. storage and offshore loading (FPSOs)-haveIraq wanted an aid distribution plan to be been fast tracked, and slippages haveapproved by the UN before resuming its oil occurred. These and other projects will be
shipments under the second six-month oil- coming onstream in the near future, and non-for-food arrangement. The second $2 billion OPEC supplies are projected to increase sub-
deal is divided into two 90-day periods and is stantially in the coming year.scheduled to end in early December. Iraq was Oil demand rose an estimated 3% in the
permitted to capture some of the production third quarter, with increases in all the mainlost in the delayed start-up of the first period, regions. Total OECD demand was up an esti-and its output reached nearly 1.7 mb/d in mated 2%, reflecting strong US growth of 3%September. The decision on whether to renew but little growth in the rest of the OECD. Oilthe deal will affect the direction of prices over demand was up 5% in the developing coun-the winter. tries, with strong growth in Latin America and
Non-OPEC production rose 0.3 mb/d Asia. It is uncertain how the recent turmoil in(table 4), with much of the growth occurring Asian currency markets will affect near-termin the UK, Canada, and Latin America (main- oil demand growth, but some slowdown is like-ly Mexico). Norwegian production slowed for ly. The apparent increase in consumption inroutine summer maintenance programs, and the FSU also contributed to the growth inoutput also fell in the countries of the former world oil demand in the third-quarter.
TABLE 3. OPEC CRUDE OIL PRODUCTIONAND QUOTAS TABLE 4. NON-OPEC OIL SUPPLYMillions of barrels per day Millions of barrels per doy
1995 1996 2Q97 3Q97 Quotas Change
Algeria 0.76 0.82 0.85 0.85 0.750 1995 1996 2Q97 3Q97 2Q97 to 3Q97
Indonesia 1.34 1.39 1.38 1.38 .330 Unites States 8.61 8.59 8.64 8.60 -0.04Iran 3.65 3.67 3.62 3.65 3.600 Canada 2.40 2.46 2.37 2.53 0.16Iraq 0.55 0.58 1.05 1.22 1.200 United Kingdom 2.79 2.81 2.51 2.75 0.24Kuwait 1.84 1.81 1.81 1.83 2.000a Norway 2.91 3.23 3.35 3.20 -0.15L bya 1.41 1.39 1.43 1.43 1.390 Other OECD 1.31 1.35 1.40 1.43 0.03Neutral Zone 0.43 0.48 0.52 0.54 Latin America 6.08 6.54 6.81 6.95 0.14Nigeria 1.93 2.15 2.29 2.28 1.865 Africa 2.58 2.68 2.80 2.85 0.05Qatar 0.45 0.49 0.61 0.65 0.378 Middle East 1.87 1.92 1.89 1.85 -0.04Saudi Arabia 7.94 7.91 7.92 8.01 8.000a China 2.99 3.12 3.22 3.19 -0.03UAE 2.20 2.23 2.23 2.25 2.161 OtherAsia 2.14 2.11 2.11 2.11 0.00Venezuela 2.75 2.94 3.16 3.22 2.359 FSU 7.13 7.07 7.20 7.13 -0.07Total Crude 25.23 25.84 26.83 27.30 25.033 Eastern Europe 0.23 0.22 0.22 0.22 0.00NGLsb 2.42 2.61 2.77 2.83 Processing gain 1.46 1.52 1.56 1.56 0.00Total OPEC 27.66 28.45 29.60 30.13 Total non-OPEC 42.50 43.60 44.08 44.36 0.28
a. Quota ncludes half share of Neutra Zone. Note: Includes natural gas liquids (NGLs), nonconventiona, and other supplyb. Natural gas liquids. sources.Source: Internatonal Energy Agency and CPECNA Source International Energy Agency.
NOVEMBER 1997 11

ENERGY
A much improved stock picture is a An important uncertainty in the oil mar-major difference in the market over a year ket is whether Iraq's oil-for-food deal will be
ago. OECD oil stocks rose significantly in renewed by the UN. Escalating conflicts
August and September, particularly in between Iraq and the UN over weapons
Europe and North America and mainly for inspections could bring further UN-sanc-
petroleum products. Higher production of tioned oil exports to a halt and could even
crude and high refinery utilization rates result in renewed hostilities. While such
accounted for the buildup in product political developments are difficult to pre-
stocks. Inventories are above last year's lev- dict, it is becoming increasingly likely that aels in all OECD regions. Stocks are espe- third tranche of UN-sanctioned exports will
cially improved in the US and Europe, with be delayed. That in itself would help to sup-
improvements in the stocks of heating oil port prices.
particularly important entering the winter However, Saudi Arabia has come out inheating season. favor of raising OPEC production quotas at
The market is projected to be adequate- the organization's meeting in November, to
ly balanced for the fourth quarter, assuming move the ceiling closer to actual demand for
normal weather. Non-OPEC supplies are OPEC crude oil. Saudi Arabian Oil Ministerprojected to rise by 1.6 mb/d, but there is a Ibrahim al-Naimi has reportedly indicated
likelihood of further shortfalls that could that the Saudis are looking to increase mar-require a small stock draw, not untypical for ket share and that they would be willing to
the fourth quarter. step in to replace any lost Iraqi volumes if theThe market is in much better shape head- oil-for-food deal is not renewed in
ing into the winter than it was a year ago, December. There was no mention about howwhen extremely low stocks and the failure of new production levels would be set, but theIraqi crude exports to re-enter the market Saudis would want firm commitments to new
caused prices to surge. Only a mild winter quotas by all members. Kuwait has indicatedkept prices from soaring higher in the first that it wants a higher quota if new allocations
quarter of this year. Although improved are set.
inventories make a price spike less likely this While the three Gulf countries with sparewinter, stocks are still low by historical stan- production capacity-Saudi Arabia, Kuwait,
dards. Any disruption to supplies or strong and the United Arab Emirates-have kept
demand could cause prices to jump. production close to their quota levels the past
TABLE 5. OIL CONSUMPTION
Millions of barrels per day Percentage change
FSU and Developing FSU and DevelopingOECD Eastern Europe countries Toral OECD Eastern Europe countries Total
1990 38.3 9.9 18.2 66.3 0.4 -4.4 3.7 0.51991 38.3 9.4 19.0 66.7 0.2 -4.7 4.6 0.71992 39.0 8.2 20.1 67.3 1.7 -13.0 5.8 0.81993 39.2 7.0 21.5 67.7 0.5 -14.6 7.1 0.61994 40.2 6.0 22.5 68.6 2.4 -14.3 4.5 1.31995 40.6 5.9 23.6 70.1 1.0 -1.3 5.0 2.11996 41.3 5.6 24.9 71.8 1.9 -5.9 5.4 2.41 Q96 42.3 5.9 24.9 73.1 2.6 -6.3 5.2 2.7
2Q96 39.8 5.6 24.4 69.8 1.0 -1.8 5.2 2.23Q96 40.8 5.4 24.5 70.7 2.0 -3.6 5.1 2.64Q96 42.4 5.4 25.6 73.4 2.0 -1 1.5 6.1 2.21 Q97 42.0 5.7 26.2 73.9 -0.7 -3.4 5.2 1.1
2Q97 40.9 5.7 25.7 72.3 2.8 1.8 5.2 3.63Q97 41.7 5.6 25.7 73.0 2.1 3.7 5.0 3.3
Source International Energy Agency and World Bank.
12 COMMODITY MARKETS AND THE DEVELOPING COUNTRIES

ENERGY
few years, others like Venezuela, Nigeria, Should Iraqi exports fail to resume, SaudiAlgeria, and Qatar have allowed production to Arabia and others could make up for these
rise and appear to have no intention of letting lost volumes under the guise of higher quo-
this growth subside. While raising the overall tas. Prices would not necessarily weaken sub-OPEC quota by 2.0 mb/d would not neces- stantially if all producers, particularly the
sarily affect prices since output already Gulf countries, maintain production disci-
exceeds this amount, higher ceilings would be pline. However, if the non-OPEC supply pro-
granted to the three Gulf producers. Thus jections are reasonably accurate, higher
total OPEC production next year could rise OPEC production will likely tip the balance
considerably unless all members adhered to into surplus and lower prices.new allocations. This seems unlikely for many The call on OPEC crude next year will be
of the countries that are above quota now. partly determined by the severity of theThe 1998 projections for supply and weather this winter. Extreme conditions
demand leave little room for higher pro- could deplete inventories and necessitateduction from the three Gulf producers, or higher output from OPEC; but this is
from OPEC for that matter, according to unlikely to prevent prices from falling. A
the IEA (table 6). Non-OPEC supplies are new risk to the forecast may be weakerprojected to rise by 2.0 mb/d in 1997, due demand in Asia following the recent cur-
partly to the catch-up in delayed projects rency crises. While it is unclear to whatthis year. British Petroleum has announced extent economic activity and hence oilthat its output alone will increase by 0.4 demand will be affected, Asian oil demandmb/d over the coming 12 months. While is apt to slow next year.
the IEA forecast may again may be opti- The past couple of years have seen dis-mistic, any errors should be considerably appointments in new non-OPEC supplies,less than those for this year and last. necessitating higher output from OPEC
Prices are expected to weaken next year producers. Now OPEC may be set to raise its
due to rising supply, particularly if OPEC quotas just when demand for its crude hasraises quotas and Iraqi exports continue. temporarily stopped growing.
TABLE 6. WORLD PETROLEUM DEMAND AND SUPPLYMillions of barrels per day
1995 1996 IQ97 2Q97 3Q97 4Q97 1997 Q98 2Q98 3Q98 4Q98 / 998
DemandOECD 40.6 41.3 42.0 40.9 41.7 43. 41.9 42.7 40.9 42.0 43.7 42.3FSU 4.8 4.3 4.3 4.4 4.4 4.6 4.4 4.4 4.4 4.4 4.6 4.5Other 24.7 26.2 27.6 27.0 26.9 28.1 27.4 28.7 28.4 28.3 29.5 28.7Total 70.1 71.8 73.9 72.3 73.0 75.8 73.7 75.8 73.7 74.7 77.8 75.5
SupplyOECD 18.0 18.4 18.7 18.3 18.5 19.6 18.8 19.4 19.1 19.6 20.9 19.8FSU 7.1 7.1 7.0 7.2 7.1 7.2 7.1 7.2 7.3 7.3 7.3 7.3Other5 17.4 18.1 18.6 18.6 18.8 19.1 18.8 19.4 19.6 19.7 20.0 19.6OPEC b 27.7 28.5 29.6 29.6 30.1 30.1 29.7 30.2 30.2 30.2 30.2 30.2Tota 70.2 72.1 73.9 73.7 74.5 76.0 74.4 76.2 76.2 76.8 78.4 76.9
Stock chonge and miscellaneousOECD -0.3 -0.1 0.3 0.2 0.3Floating/transit 0.1 -0. i 0.1 0.5 0.4Other/miscellaneous 0.3 0.4 -0.5 0.7 0.8Total 0.1 0.3 0.0 1.4 1.5 0.2 0.7 0.4 2.5 2.1 0.6 1.4
Note: Includes natural gas liquids (NGLs), nonconvent onal, and other supply sources.a. Includes processing gains (1.5 mb/d in 1996).b. Includes NGLs (2.6 mb/d in 1996).Source: Intemational Energy Agency and World Bank.
NOVEMBER 1997 13
BEVERAGES
s I COCOA 1776 55 COFFEE 5892Y168.83 97 (US cents/kg) 97JUN ICO inJcato price, stneri 5 (US cents4g) 97 mild ctrobic Na, Ykrk
JCCC daily pace, and Bremen/lismburg.; * * * - New Yonk and Lodon.a
456.33APR97
418.59SEP
156.92 97MAY
147.70 97OCT96 300 500
329 - 250 400FE7.29/ p200 30
97 -_/Z 50 270.00 _ 200
80 85 90 95 808 96 0 95 100
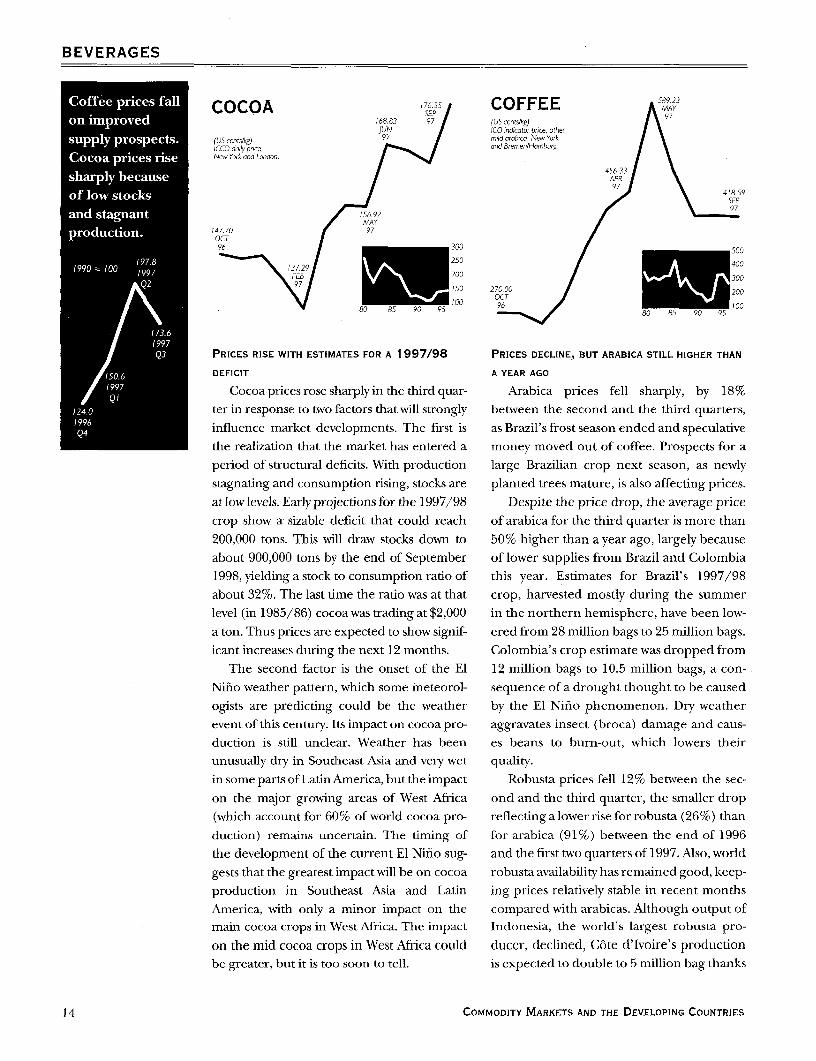
PRICES RISE WITH ESTIMATES FOR A 1997/98 PRICES DECLINE, BUT ARABICA STILL HIGHER THAN
DEFICIT A YEAR AGO
Cocoa prices rose sharply in the third quar- Arabica prices fell sharply, by 18%ter in response to two factors that will strongly between the second and the third quarters,
influence market developments. The first is as Brazil's frost season ended and speculativethe realization that the market has entered a money moved out of coffee. Prospects for aperiod of structural deficits. With production large Brazilian crop next season, as newlystagnating and consumption rising, stocks are planted trees mature, is also affecting prices.
at low levels. Early projections for the 1997/98 Despite the price drop, the average price
crop show a sizable deficit that could reach of arabica for the third quarter is more than
200,000 tons. This will draw stocks down to 50% higher than a year ago, largely becauseabout 900,000 tons by the end of September of lower supplies from Brazil and Colombia1998, yielding a stock to consumption ratio of this year. Estimates for Brazil's 1997/98about 32%. The last time the ratio was at that crop, harvested mostly during the summerlevel (in 1985/86) cocoa was trading at $2,000 in the northern hemisphere, have been low-
a ton. Thus prices are expected to show signif- ered from 28 million bags to 25 million bags.icant increases during the next 12 months. Colombia's crop estimate was dropped from
The second factor is the onset of the El 12 million bags to 10.5 million bags, a con-Nifo weather pattern, which some meteorol- sequence of a drought thought to be caused
ogists are predicting could be the weather by the El Nino phenomenon. Dry weatherevent of this century. Its impact on cocoa pro- aggravates insect (broca) damage and caus-duction is still unclear. Weather has been es beans to burn-out, which lowers theirunusually dry in Southeast Asia and very wet quality.
in some parts ofLatinAmerica, butthe impact Robusta prices fell 12% between the sec-
on the major growing areas of West Africa ond and the third quarter, the smaller drop(which account for 60% of world cocoa pro- reflecting a lower rise for robusta (26%) than
duction) remains uncertain. The timing of for arabica (91%) between the end of 1996the development of the current El Nifio sug- and the first two quarters of 1997. Also, worldgests that the greatest impact will be on cocoa robusta availability has remained good, keep-production in Southeast Asia and Latin ing prices relatively stable in recent monthsAmerica, with only a minor impact on the compared with arabicas. Although output ofmain cocoa crops in West Africa. The impact Indonesia, the world's largest robusta pro-
on the mid cocoa crops in West Africa could ducer, declined, Cote d'Ivoire's productionbe greater, but it is too soon to tell. is expected to double to 5 million bag thanks
14 COMMODITY MARKETS AND THE DEVELOPING COUNTRIES

BEVERAGES
to higher prices and good weather. Uganda's TEAoutput should remain stable at around 4 mil- (t
(US cents/kg) lion bags. Vietnam's production is expected 23o0.18oras. 230.78
overage for all tea.AP
to be up 7% from the previous year's record 9|
crop. 22.
There is considerable nervousness in the 97
world coffee market because of the possibleeffect of the El Nifio phenomenon on pro- 12 205.74
duction in a number of countries. Although 9 JUL97
the only significant effect so far seems to be 350
a large production reduction in Indonesia, 350
where drought has reduced crop expecta- OCT 200
tions by 30% from last year's bumper harvest 96 80 85 90 95 150
of 7 million bags, and to a lesser extent in
Colombia and Papua New Guinea. However, STRONG GLOBAL DEMAND KEEPS PRICES HIGH
many Central and South American countries Strong global demand and sharply
are concerned that recent dry weather will reduced Kenyan production kept tea prices
lower the quality of the coffee beans pro- high during the third quarter. London prices
duced this year and that next year's crops will averaged 226 ¢/kg for the quarter, 36% above
be substantially smaller. the same quarter last year in real terms. The
Papua New Guinea's crop also appears to rise has been sharpest in Mombassa-up 54%
be affected by the dry weather, but production in real terms in response to the short supplyis expected to decline no more than about 7% following the severe drought in the first quar-over last year. Costa Rica has declared a state ter. Even Colombo prices were up 9% in real
of emergency, but so far there are no reports terms, despite Sri Lanka's record crop.of any significant production declines. World supply has remained tight, mainly
Neighboring El Salvador has reported no dam- because of the 23% drop in production in the
age from El Niiio-related weather patterns. first eight months of this year over the samePrices in the next several months will period last year. Kenya produced a record
depend on prospects for next year's crops in 250,000 tons of black tea last year, making it
Brazil and other Latin American countries. the world's largest black tea exporter. That
One preliminary estimate puts Brazil's position is expected to revert to Sri Lanka this1998/99 crop at 30 million bags, some 20% year. Many parts ofIndonesiawere affected by
higher than the current crop. Uncertainty sur- the drought caused by El Nifno, thoughrounds other Latin American crops for next detailed information on the impact on tea is
year because of El Nifno. not yet available. Good rainfall boosted pro-For the longer-term, the high prices of duction in Malawi and South India.
the past four years are likely to affect pro- World demand has been strong, with con-
duction. Average production costs are esti- sumption up in all major tea consuming coun-
mated at around, 2200/kg for arabicas and, tries except the UK and the US. Consumption1300/kg for robustas, giving coffee growers has grown especially rapidly in Central Asia,in most producing countries large profits India, the Middle East, and Russia.over the past four years. At least some of Global demand is likely to continue to
these profits would have gone into new grow. Uncertain global weather conditionsplantings, which will result in large crops in and low stocks in producing and importing
three to five years' time. Thus, the past four countries are likely to increase concerns aboutyears could be the beginning of another tea availability. Prices should remain high at
boom and bust coffee cycle. least until early next year.
NOVEMBER 1997 15

FOOD
FATS AND OILS COCONUT OIL6. S ~~~~~~~~~~~~~~~~~~~~~~~~~~~~~~~~~~~~~~~~~(US doltor*/t)
PRODUCTION TO INCREASE SLIGHTLY DESPITE 77700 Phdippnes/ndonesion,a 1 EL NINO oalkiDEC buk c.f Rotterdam.
This year's severe El Nifno (with the latestTiT* - .* 6
indicators still alarming, and some meteo-rologists warning that the impact could be OCT 0
l*. E _ even worse than in 1982/83) looms large in 96
any discussion of the commodity outlook.65400 ~~~~6/L00
l K However, its impact on fats and oils prices 1,200 MAY SEP
for the rest of the year and into 1998 are _8 00 \ 97
uncertain. While output is expected to 600400
decline in the Pacific rim, it is expected to 200~~~~~~~~~~~~~~~~~~~~~~~~80 85 90 95increase in North America, so the net effect
on supply is a matter of relative effects. In PRICES CONTINUE TO DECLINE
terms of distribution, however, Southeast Prices suffered a further downturn from
Asian oil producers are expected to incur $667/ton last quarter to $592/ton this quarter,
substantial losses. down almost 21 % from a year ago ($746/ton).
The 1997/98 stocks to use ratio will As with all lauric oils, prices have been heavily
reach 10.4 for oilseeds, the second lowest in influenced by the major oilseed competitors.three decades. Current forecasts are for no World production of coconut oil is expect-more than a 2.3 million ton increase (to ed to increase slightly, from 3.1 million tons in100.8 million tons) in world production of 1996/97 to 3.2 million tons in 1997/98. While
fats and oils in 1997/98. Oil World reports production in the Philippines, the dominant
that once the harvest pressure subsides in coconut oil producer, will increase from 1.22
October, prices are expected to rise until to 1.33 million tons, production fromJanuary, with a possible temporary down- Indonesia (the second largest producer) isward reaction during the holiday season. expected to decline from 0.77 to 0.73 million
Reforms of the EU's Common tons. A small increase is expected in India (theAgricultural Policy, announced by the third largest producer), from 0.35 to 0.37 mil-Commission as Agenda 2000, call for cut- lion tons. The same pattern is reflected inting preferential area aid to oilseed farmers exports: they are expected to increase in the
(as defined in the 1992 EU reform) to the Philippines from 0.91 to 1.02 million tons and
same level as that for cereals. Before the to decline in Indonesia from 0.46 to 0.39 mil-1992 reform, EU farmers were selling their lion tons.oilseeds at what World Commodity Report The US and the EU, the dominant coconut
called "impossibly high prices." If the pro- oil importers, will absorb 0.49 and 0.61 millionposed reform materializes, oilseed produc- tons of coconut oil, more than two-thirds ofers may lose as much as 20% of their world exports (expected to reach 1.62 millionincome. tons in 1997/98). Coconut oil exports account
Now that an estimated 15% of this year's for slightly more than 3% of world trade in theUS soybean crop is of gene-modified origin, 10 major oils.buyers worldwide are increasingly con- Oil World reports that fromJune/July 1998
cerned about the safety of these products. onward, production of copra in theThe legal position of these products is not Philippines is expected to take another down-yet clear in the EU. Given that separation of turn, which is likely to become stronger in theconventional and modified crops would be second half of 1998, as production begins to
costly to maintain and monitor, the situa- show the effects of severe El Nifno-caused
tion is unlikely to be resolved soon. drought conditions in early 1997.
16 COMMODITY MARKETS AND THE DEVELOPING COUNTRIES

FOOD
PALM OIL SOYBEAN OIL 55700 FATSAND OL
580.00 DuSch, crude,/ Coconut andFEB rob. ex-roil]. }
9ob7e541m0 / palm oil pricesMA decline, while soy
/ \ 523 °° .0 8 00 0 V prices remain532 00 \>;7 OCT JUL flat.
96~~~~~~~~~~~~~~~~~~~~~~~~~~~~~~~~~~9
(US dollarslmt) \ mMalaysurn, 5% bulk, 498.00 1990 = 100cctf NWEumpe. JUL 1 5
800 97 154.5700 1997 151.6
600 600 QI\ 1997514.00 500 2Z
400 DEC96 400
200 300 80 85 90 95 80 85 90 95 300
1996PRICES HIT NEW LOWS PRODUCTION IS EXPECTED TO RISE Q4
Palm oil prices dropped to a new low of Prices averaged $545/ton in the third
$508/ton from $549/ton last quarter-the quarter, virtually unchanged from last quarter 13851997
previous low was $511/ton in the third quar- but slightly lower than the $561/ton in the Q3
ter of last year. Palm oil, which accounts for same quarter last year. The continued weak-
about 40% of world oil trade, is heavily influ- ness in prices reflects record-level production
enced by its three major competitors: soy, that Oil World predicts will reach 21.9 million
rapeseed, and sunflower. tons in 1997/98, almost 6% higher than theOil World revised its earlier forecast of a 20.7 million tons in 1996/97. This revival in
1.24 million ton increase in palm oil output the supply of soybeans is reflected in Chicagoto a 0.65 million ton increase. This downward soybean futures prices, which declined by as
revision reflects the El Nifio-caused droughts much as 20%, and is the main force behindat the end of 1996 and early 1997 in the fall in the prices of other oils.
Indonesia and Malaysia and other smaller Production in the US, the world's domi-producers. The droughts are expected to nant soybean oil producer, is expected to
lower yields, especially from 1998 on. reach a record 7.6 million tons, followed byStarting October 1, China further Brazil at 3.8 million tons, the EU at 2.9 million
reduced its in-quota tariff on palm oil tons, and Argentina at 2.1 million, all sub-imports from 18% to 9%. The tariffs had stantially higher than their 1996/97 levels.
already been lowered earlier this year, but on The three leading exporters, the US,a temporary basis. Exports of palm oil Brazil, and Argentina, will account for 4.5
increased sharply from Malaysia and million tons, almost three-fourths of worldIndonesia, because of their weakened cur- exports. China's imports are expected to passrencies. the 2 million ton mark, reflecting the increas-
Until last year palm was favored over other ing tightness of vegetable oil supplies.oilseeds because its crushing leaves negligible Current stocks of soybean oil are downmeal for the market. However, as demand for sharply from a year ago in the US, Argentina,
other meals increased, so did competition for and Brazil and in many importing countries,their oil by-products. According to World including China.
Commodity Report, whether palm oil prices con- Drought caused by El Nifio is expected totinue to fall will depend on whether expecta- affect both Argentina and Brazil leading totions of reduced rainfall next year pan out, some anomalies in soybean production.
cutting into supplies, and whether Malaysia, However, favorable weather conditions inthe main supplier, consumes increasingly North America are likely to offset any decline
more of its oil at home. in production.
NOVEMBER 1997 17

FOOD
GRAINS MAIZE 200
PRICES WEAKEN ON LARGE PRODUCTION AND CUR- - 5
RENCY DEVALUATIONS 97
Grain prices fell during the quarter, 80 85 90 95 50
weakened by large supplies and currencydevaluations in Asia. Prices were down
23.5% over the third quarter of 1996 for ,74
wheat, 37.3% for maize, and 14.3% for rice. NOV
Real grain prices, deflated by the manufac-
tures unit value index (MUV), have declined 97
sharply during the past several decades even (USdoIcrs/rt) n06)06
though grain stocks remain tight. Since USno 2yelf-o JUL
1974, when grain prices were at their recenthigh, real wheat prices have fallen 69.9%, STOCKS ARE EXPECTED TO REMAIN TIGHT AND
maize 70.2%, and rice 80.7%. PRICES FIRM
World grain production for 1997/98 Maize prices have strengthened from
* i U(June-July) is estimated at 2.05 billion tons, their mid-summer lows, with the third quar-
slightly above last year's level and 8.5% above ter average export price at $110.4/ton for USthat in 1995/96. Stocks are expected to build No 2. Prices fell to $106/ton duringJuly but
slightly, but at 15.4% of total use, they are still rose to $120/ton in October. World produc-low by historical standards. The lowest stock- tion was below last year's by 2.4%, and stocks
to-use ratio was reached in 1995/96, when are expected to fall 14%. This should keepending-year stocks fell to 14.2% of total use. the market tight and prices firm. Prices couldBefore that, the last time world grain stocks increase quickly, however, if larger than
had fallen that low was in 1972/ 73, when they expected imports emerge.
were 15.1%. World grain trade is expected to Prices have declined sharply from theirreach 208 million tons, about the same as last May 1996 highs of $204/ton, a decline
year, which would be roughly 10.0% of world greater than would be predicted from pro-production. duction increases or stock levels. Stocks are
Currency devaluations in Asia are affect- projected to end the current year at 103 mil-ing world grain markets in two ways. First, the lion tons, up from 95 million tons in mid-
devaluation of the Thai baht lowered the dol- 1996, according to the US Department oflar price of rice exports; since Thailand is the Agriculture (USDA). The difference is small
major rice exporter, this reduced world rice relative to the decline in prices. Trade levelsprices. Second, the currency devaluations in are expected to be nearly the same this yearseveral Asia countries are expected to lower as during the 1995/96 marketing year
grain imports because they will now be more (July-June). The stock to use ratio was 11.3%expensive and because of slower economic in 1995/96 and is projected to be 11.4% atgrowth now projected for these economies. the end of the current year. The recent cur-
Grain yields increased about 1 % over last rency devaluations in several Asian countries
year's and about 6.5% over 1995/96's. After may explain the low price. If the devaluations
stagnating for several years, yields are now result in slower economic growth as well asback to historical levels. Lower fertilizer prices higher import prices, import demand couldmay have contributed to the increase. Urea contract.
fertilizer prices fell sharply in 1997, reversing The largest coarse grain importers overthe trend of the past several years. Prices aver- the past three years have been Japan (22.3%
aged $151.9 a ton for the first three quarters of worldimports),RepublicofKorea (10.1%),
of 1997-well below 1995's $211.5 a ton. Mexico (6.9%), and Taiwan, China (6.7%).
18 COMMODITY MARKETS AND THE DEVELOPING COUNTRIES

FOOD
RICE (USdoDllrs/alt) 500 WHEAT 25 0Thai, 5% broken, white 400 (US dollurs,mt) 20ndicobve market survey 300 US no. I Hord Red Wmter,
pnce fo.b. ngkok. 200 Gulfport prompt pt nt. 183.49 APR
200AP356.00 1 0 0 97 100JAN 80 85 90 95 80 85 90 95
s \ ~~~ ~ ~ ~ ~~~~~~~~~OCT COARSE GRAIN STOCiCS\ \ ~~ ~ ~~~~~~~~~~~~~~96 1 72.35
97\ / FEB \ Market-yejr-ending stocks as %
312.75 \\ofconsumption292OCT 304.50 X \/_ p 1982887
270.60 19.4SEP 136.21 199219397 JUL
97 13.3
17.1 1997/98
THAI RICE PRICES FALL ON CURRENCY DEVALUATION PRICES STABILIZE AFTER DECLINING FROM 1996 /980/8/
Following the devaluation of the baht, the HIGHS 1983184
US dollar price of Thailand's rice exports fell Wheat prices averaged $146.2/ton for the 199S/6
about 15% in recent months. TheJuly export third quarter after falling from a high of
price for Thai 5% broken, white, milled rice, $262/ton in May 1996. World production for
f.o.b. Bangkok, was $320.0/ton. By August 1997/98 (June-July) is expected to reach a Morket-yeor-ending stocks s0%
the price was $285.0/ton and by October it record 603 million tons, up 3.4% from the pre- ofconsumptionwas ~~~~~~~~~~~~~~~~~~~~~~~~~~~~~~~~~~~~~~~~~~~~~17.7 18.0
was $265.8/ton. The decline was apparently viousyear. Worldyear-ending stocks are expect- 1980181 1984185
currency related since other market factors ed to be up 18% (to 128 million tons) over the 1990191
showed little change. World rice production recent low of 105 million tons in 1995. Stocks inand stocks are projected to rise slightly from the five largest wheat exporting countries arelast year's levels, as is world trade. The largest expected to increase about 6%. Trade shouldexporters-Thailand, the US, and remain near last year's 97 million tons. With the 14!
Viletnam-are expected to have good har- increase in stocks and trade unchanged, wheat 199219814.0
vests and large supplies for export, which prices should remain near current levels until 198/88 13.5
should keep prices from rising. The increase spring 1998, when information on new plant- 1994/95
in wheat production will also contribute to ings and crop prospects begins to emerge.the supply of foodgrains and buffer any Concern over possible weather disruptions wn 6I
increase in rice prices. because of El Nino remain, although the ofcorupendin
With extremely dry weather in Indonesia, impact on world wheat production has been 34.8
forecasts are for large rice imports in 1998. relatively small so far. Australian production is 1985186
However, USDA production estimates are well below last year's record crop of 23.6 mil-still pointing to a large rice harvest. Malaysia lion tons, but at an estimated 17.5 million tons
26.3and the Philippines could also face produc- it is above the average for 1993-95. India is 1992193
tion problems because of El Nino-induced expecting a record harvest of 69 million tons, 25.6
weather patterns, although just what those 11% above the previous year. China's wheat 2 20.8
impacts will be is not yet clear. India has har- production is up 9.4% over last year's for a 1989/90
vested a record 122 million ton paddy crop record high, and Russia's production is up 1899697
and is expected to export about 1.75 million 26%. The EU has a good, but not record crop, Note Data for 1997/98 are -snated
tons. China is also expected to harvest a and US production is 68.8 million tons. China Source: USDA FAS.
record 195 million tons of paddy rice and to is expected to import only 2 million tons of
export 1 million tons. Bangladesh, which has wheat in 1997/98, far below the 12.5 millionimported as much as 1.5 million tons in tons of 1995/96. Russia, a large importer in
recent years, is expected to be nearly self-suf- some years, is expected to import only 7 million
ficient with imports of about 100,000 tons. tons.
NOVEMBER 1997 19

FOOD
BANANAS 711.54 SHRIMP 557
(US dollars/mt) 97Centrel and SouthAmericon, importer'spnce, free-on-rcil((o.r), US1ports . (US dollars/kg)
1US, Gnifbnoern,heodless, 26-30count per pound,wholesale New York.
493.84JON97
42505 213.88JU6 600 FEB IS
3756397
300 2
96 ~~~~~~~~~~~~~~400 i3.1!
80 85 90 300 96 80 85 90 95
Low INVENTORY AND RISING DEMAND BUOY PRICES
FREE MARKET PRICES SLIP Shrimp prices continued to strengthen in
Free market banana prices continued the third quarter, putting them 15% highertheir seasonal decline during the third quar- than a year ago. Low inventories in the US
ter, falling more than 26% from the second andJapan; small harvests in Bangladesh,
quarter. Banana prices typically peak during India, and Thailand; and seasonally highFebruary and March, and further declines demand in major importing countries con-can be expected during the fourth quarter. tributed to the increase.
Still, fresh bananas are not readily storable, Prices were high in Japan and the USand supply disruptions can lead to rapid despite increasing shipments from Bangladeshprice increases. and India. The EU ban on seafood from
Analysts are watching banana producing Bangladesh and India (because their
countries that were most seriouly affected by seafood industries do not meet EU sanitary
earlier El Nifios, including Ecuador, the regulations) resulted in the larger ship-Philippines, and South Africa. Past El Nifios ments to Japan and the US. The ban has
have brought heavy rains and flooding to been in effect since August. The EU'sEcuador and droughts to southern Africa and seafood industry is actively seeking prod-
southeast Asia. Officials are concerned about ucts from other Asian countries to make upthe effects of El Nifio in Ecuador, where flood- for the loss of shrimp from the two coun-ing during the 1982-83 El Nifio wiped out tries. Bangladesh and India, in addition to
roads and transport systems. Producers in the increasing their exports to their traditionalPhilippines have already experienced some markets, are seeking new markets, such as
dryness, although it is too early to asses the China and South Africa.
impact. Producers in South Africa and So far, El Nifio has had a positive effect on
Zimbabwe produce primarily from irrigated world shrimp supply. Supply is increasing infields, and above average rains in the past three Ecuador, one of the largest shrimp producers.seasons have left water reserves high. Wild larvae, preferred by farm operators for
During the quarter the World Trade their high yields, are readily available. A possi-
Organization's (WTO) judges rejected the blenegativeeffectmightbetheinterferenceinEU's appeal of an earlier decision declaring transport caused by heavy rains, especially on
core components of the EU's banana import roads to and from the processors.regime inconsistent with Uruguay Round Given the production problems in many
obligations. No further appeal is available Asian exporting countries and increasingunder WTO rules, and the EU has said it will demand, shrimp prices are expected to stay
accept the ruling. strong for the coming months.
20 COMMODITY MARKETS AND THE DEVELOPING COUNTRIES

FOOD
SUGAR 80 Facing increased pressure from US and
(USAdIy,p,re 40 domestic high-fructose corn syrup produc-mHct ISA dodGrwersyUNCA)cnnoncerow, fo.b., stowd 20 ers, the Mexican National Association of
Cor,bbecn ports. __0 80 85 90 95 Sugarcane Growers (UNPCA) announced a
24.9} / \ verbal agreement between the sugar indus-APR try and the National Association of Soft
2452 A / 2S8 Drink Manufacturers to limit high-fructose
96 / \ / 97 corn syrup use to 350,000 tons a year for the
\4/2w next three years. Mexican domestic sugar\ /JUN prices are insulated from international
prices by NAFTA-based tariffs, but high-fruc-
JAN tose corn syrup imports from the US face
much lower tariffs. To counter the pricePRICES MOVE UP SLIGHTLY advantage of corn syrup over sugar, the
Prices inched upward during the quarter sugar industry will offer preferential priceson mixed news. In its first report on the to soft drink bottlers. Reports suggest dis-
1997/98 crop, the International Sugar Organ- counts as high as 20%. Earlier this year,
ization (ISO) said it expects a deficit of 1.69 Mexico imposed antidumping tariffs on USmillion tons-the first since 1993/94. The exports of high-fructose corn syrup. The US
ISO expects world production to fall slightly announced its intention to take the dispute(0.5%) as consumption continues to grow. to the WTO.
The stocks to consumption ratio is thus In September the Office of the US Trade
expected to drop from 36% to 33%. The ISO Representative released country allocationsreport follows recent upward revisions in esti- for an initial 1.2 million tons of sugar to be
mates of EU and Brazilian crops and a lower- imported under quota arrangements. Another
ing of expectations for India, Poland, and 600,000 tons may be added later. The quotasUkraine. allow countries to export sugar into the pro-
FO Licht reports that some analysts are pre- tected US market, where prices are nearly dou-
dicting production declines of as much as 20% ble world prices. The Dominican Republic,due to El Niiio's effects, though it is unclear Brazil, and the Philippines will receive the
that this will have much of an impact on sugar largest quota allocations.prices. The 1982-83 El Nifio hurt growing con- The Cuban government has agreed to let
ditions in several major sugar producers- foreign investors participate directly in theAustralia, Brazil, Cuba, India, Indonesia, sugar industry through a planned joint ven-Mexico, and Thailand. Production forecasts ture by Cubacol, a government sugar com-
have already been reduced for Indonesia and pany, and Vinumar and Thundergust ofThailand due to dry weather-a signature Spain. The new installation will producecharacteristic of El Nifno in the region. But con- 150,00 hectolitres of high quality alcohol per
ditions in Brazil and the Philippines illustrate year for export. Initial investments arethe type of puzzle analysts face. In Brazil weath- expected to be around $6.5 million.
er patterns will not affect sugar production The Peruvian sugar cooperatives Pomalkauntil the 1998/99 season. Meanwhile, analysts and Casa Grande are looking for strategic part-expect another record crop for 1997/98, help- ners according to the Peruvian Privatizationing to offset the drought-induced reductions Committee. Pomalka is looking for $30-$40
expected in Southeast Asia. In the Philippines million in new capital to upgrade its 7,000
the long dry season induced by El Nifio typi- hectare cane plantation, while Casa Grande
cally falls during the sugar harvesting season, seeks $100 million for its 20,000 hectarefacilitating higher recovery rates. operation.
NOVEMBER 1997 21

AGRICULTURAL RAW MATERIALS
COTTON I79.36 Cotton production is expected to increaseikLt3 ai_ (US cenrs/k) i97Cotton OutlookA 177.72 in Uzbekistan and Pakistan, primarilyIndex cif. Let pooI Aii " i _ xnd Europe.P 97 / \ because of higher yields due to favorable
weather. Production increases are also
175 58 expected in Francophone Africa, where the
97 higher prices received by farmers have appar-
APR /17392ently induced them to expand their cotton1 ~~~~~97
growing area. Substantial increases are also20 /expected in Paraguay and Brazil, partly
200 jbecause of expanded areas induced by the
__i 96 '58 higher prices received by farmers and partly
_ / ~~~~~~~~~~~80 85 90 95 0 because of government decisions to expandcredit and ensure the availability of produc-
tion inputs. Production may decline in
MARKET REMAINS IN BALANCE China, however, by as much as 10% from its
The International Cotton Advisory 1996/97 level, because of reduced areaCommittee (ICAC) estimates that world cot- planted to cotton following disappointment
ton production for 1997/98 will be about 19.7 over prices and buying terms in 1996/97.million tons, while consumption will climb to India may also experience some decline fol-19.4 million tons, keeping the market in rela- lowing the spread of a leaf virus in the north-
tively close balance. ern part of the country. AustralianThis expected balance in world demand production is expected to remain at its
and supply is reflected in the NewYork futures 1996/97 level.
contract, with current quotations for delivery Cotton Outlook reports some uncertaintyin October 1998 and March 1999 virtually the about the Chinese government plans to
same as today's spot prices. The medium sta- reform the state-owned textile sector within anplc cotton indicator price (Cotlook A Index) ambitious three-year time frame. China's fail-averaged 1780/kg, almost unchanged from ure to reform the textile sector could be a
last quarter's 1760/kg and about 5% higher major stumbling block to its membership in
than during the same quarter of 1996. the World Trade Organization. India faces aICAC projections suggest a moderate major challenge in trying to revive a large num-
increase in the A Index for the 1997/98 season ber of loss-making mills within the govern-and a drop to current levels for the 1998/99 sea- ment-run National Textile Corporation. The
son. The extent to which prices actually follow textiles minister indicated last month that
this path will depend largely on two factors: the some units may be transferred on advanta-
El Nifno effect and Chinese stock policies. World geous terms to the governments of the states in
Commodity Report maintains that prices will which the mills are located.remain somewhat higher than previously antic- The textile business in many parts ofipated because of the effects of El Ninlo. Southeast Asia continues to be affected by the
Changes in China's net trade (exports minus recent financial instability and its effect onimports) could have a greater effect on the A exchange rates. The higher increase in the
Index, however. ICAC has estimated that a cost ofimport goods has altered cost structures100,000 ton change in net exports of China in a region accustomed in recent years to
could result in a change in the price of cotton financial stability and currencies that moved inof as much as 2%. Recent domestic policies in concert with the US dollar. However, it is tooChina favor reductions in stocks (and hence in early to tell whether the financial crisis willimports), so this effect could offset any increase result in a structural change in the textile sec-
in prices due to El Nifio. tors of the affected countries.
22 COMMODITY MARKETS AND THE DEVELOPING COUNTRIES

AGRICULTURAL RAW MATERIALS
RUBBER TIMBER 25218
in200 ~~~LOGS 9
25267s G~~~~ OCTA124.12 80 85 90 95 96
\ 1 N.20 \ 242.04J\UN \/\ MA /
7~~~~~~~~~~~~~~9
235.16400 SEP
(US cents/kg) 300Mafaynan, RSS I 86.93 _200 (US dollrs/m3)prompt delivery, SEP Maloys,n, mernti, salesfo.b. Kuala Lumpur. 97 _00 pnce by eaporters, Tokyo.
80 85 90 95
PRICES SLIP ON CURRENCY DEVALUATION PRICES DECLINE ON SLUGGISH DEMAND
Despite a brief two-week rally inJuly, rubber Tropical log prices fell in Japan as hous-prices continue to slide. Policy considerations ing starts slowed and demand for logs for the
have dominated market movements. In July plywood industry was lower as well. At
Thai traders were selling in anticipation of a 113,495 units, housing starts in July were
devalued baht. By September currencies in down 27.8% over the same period in 1996.
neighboring Malaysia and Indonesia were Housing starts have been lower for the first
down more than 10%. Together, these three seven months of 1997 as well and will likelycountries produce about 73% of the world's register just over 1.2 million units for 1997,natural rubber. Generally, a devaluation the lowest level since 1991. In the first half of
improves incentives for producers, and this is the year consumption of tropical logs from
likely to be the case in all three countries. From Asia and Africa fell 1.7%, while consumption
the beginning of August to the first week of of softwood rose 27%. Demand for tropicalSeptember RSS1 prices in London slipped logs in the second half of 1997 is expected to
4.7% and TSR20 was down 4.1%. In the be 7% below demand in the same period lastMalaysian market, which is denominated in year. The weaker yen has further depressed
ringgits, similar grades were up 6.2% and 5%. log prices.In August the Thai government defaulted Demand for tropical timber is also weak in
on a previously agreed purchase aimed at Europe, resulting in lower prices. In Franceboosting domestic producer prices. The gov- housing starts were off some 8% earlier this
emnment chose to default to stem the scheme's year, and imports of tropical logs were also
rising costs, but it simultaneously announced down. In the U.K, sales of tropical timberan extension of the closing date. have been slack despite increasing housing
Dry weather has been reported in starts. In Germany the building sector
Indonesia and Thailand, and most analysts remains stagnant except in the eastern part ofexpect global weather disruptions stemming the country.from El Nifio to have a significant effect on There are reports that the Malaysianrubber production, though with a six-month National Forestry Council has decided to setlag. Further, falling exchange rates in the up a timber certification council, but the
three large producers has reduced the dol- Malaysian Timber Organization cautions thatlar price of rubber, offsetting the effects of its establishment should not be rushed.
anticipated supply shortfalls. Still, the Certification could help Malaysia regainregional concentration of global rubber sup- some of the market share lost as a result of
plies in Southeast Asia make the commodity restrictions on the use of tropical timber byparticularly vulnerable to El Ninio. some municipalities in Europe.
NOVEMBER 1997 23

FERTILIZERS
FERTILIZERS POTASSIUM CHLORIDEMOST PRICES REMAIN STRONG
Prices have remained strong for most fer- i1700^ ] l t tf;ES r ~~~ ~ ~~~~~~~~~~~~~~OCT 1680
tilizers, with the exception of urea. Urea prices 96 JAN
declined sharply because of building stocksI r. SO
and an import ban by China during the second 116.50 i 6.50
quarter. China is not expected to import any FEB SEP- R - (i)S dofllarsZt) 97 97
urea in the second half of 1997 as its domestic Muor,te of potesh, standardsupplies increase. grode, spot, fo.b. Vancouver
* supplies increase. _ 120
However, weak world grain prices may W 00
depress fertilizer prices over the next year. 80
Grain prices fell sharply during the third quar- 80 8S 9 60
ter, and fertilizer prices usually follow grain
prices. Prices fell 13.1% for wheat, 6.8% for PRICES REMAIN FIRM ON LIMITED SUPPLIES AND
maize, and 8.0% for rice during the third quar- STRONG IMPORT DEMAND
ter-and 23.5%, 37.3%, and 14.3% over ayear Potash prices remained firm on limitedago. Stocks remain relatively tight, and prices supplies from Canada. An increase in sec-
could rise if imports rose sharply, though this ond-half contract prices of $5/ton wasdoes not appear likely at this time. The cur- sought and attained by some exporters, butrency devaluations that have been spreading most prices remained at $116.5/ton.
throughout Asia are likely to weaken grain Canpotex, the Canadian potash exportimport demand over the next year, which association, and the International Potash
should keep grain prices from rising. Company, the monopoly supplier from Russia,Fertilizer use in Russia remains weak, atjust have formed ajoint venture to market potash
10% of the levels under Soviet rule. Only an in Malaysia. The new company, Bulk Logistics,estimated 20% of grain area receives fertilizer will be based in Singapore and will try to boostaccording to industry sources. Farmers lack prices from their recent low levels in this mar-the cash or credit needed to purchase fertiliz- ket. Prices in Malaysia have been consistently
er, and government programs targeting below those of other Asian markets.increased fertilizer use have been unable to Potacan's New Brunswick mine, which has
deliver because of large budget shortfalls. had severe flooding since June, may return to
Much of the local fertilizer production is production by year's end. Drilling to extractaimed at the export market, which further con- water from the flooded mines has been suc-tributes to the declining trend in fertilizer cessful. The 1.1 million ton a year mine has
prices. In the first half of 1997 Russia produced been closed since June.less nitrogen, phosphate, and potash than in China is expected to continue to importthe same period of 1996. The shift in produc- strongly during the second half of 1997, fol-tion was in response to opportunities in the lowing a 20% increase in imports in the firstexport market. Fertilizer applications for 1998 half of 1997. Import quotas for the second
appear unlikely to increase from 1997 levels. half of 1997 were issued in August for 3.7Rosprom, the consortium of Russian fertil- million tons of fertilizers. The quotas
izer producers, has reached an agreementwith exclude straight nitrogen but can be used
authorities in the Orel region in the black- for any other fertilizer, including NPKearth zone of Russia to provide fertilizer in blends. The announcement allows large
exchange for crops from the 1998 harvest If quantities of fertilizer to clear the ports andthe plan is successful, Rosprom is expected to enter the country. Imports of muriate of
expand the program to other major agricul- potash as ofJuly totaled 2.89 million tons, up
tural regions. from 2.22 million tons.
24 COMMODITY MARKETS AND THE DEVELOPING COUNTRIES

FERTILIZERS
TSP UREA 250
200IS{.00 20!.80MAR NOV 150
96 19<80 85 90 95
OCT96
(US dolVors/mt) \ (US dollsrs/mt)Tpesuperpot.bulk.fosph.b e UBogged, spot, fobspot, bob, fo.b US Guf W70E0rWpe.
200 MAY2096
i50163.50SEP
i00 97 125.5080 85 90 95 SEP
97
TSP PRICES WEAKEN, DAP PRICES REMAIN FIRM PRICES CONTINUE TO FALL
TSP prices are below their recent highs, Urea prices continued downward duringwhile DAP prices have remained firm due in the quarter, following the sharp decline that
part to strong US demand. However, pro- began in early 1997. The average price in the
ducers have been operating at near capacity, quarter was down 11.1% over the second
and production during the first half of 1997 quarter and down 36.4% from the third quar-was up 4%. With such rapid production ter of 1996. Prices in September fell to
growth, demand is not likely to be strong $125.5/ton, f.o.b. Western Europe, their low-enough to support prices at current levels. est level since the first quarter of 1994; urea
Brazilian fertilizer imports rose 23% during prices fell below $100/ton. Prices should sta-the first half of 1997. The increase included all bilize in the near term as demand begins tofertilizer imports except urea, which fell 31%. build for the spring plantings. Supply
Import tariffs of 2%-6% were applied onJune remains well ahead of demand, and more26 to urea, DAP, MAP, and TSP, as part of a firms are cutting production in response toprogram to liberalize trade. However, the rising inventories and falling prices. StocksMinistry of Industry and Commerce simulta- have built in the Black Sea and Arab Gulfneously imposed quotas on these products to region, and some producers have curtailed
protect the domestic industry. Above-quota production. In other regions, includingimports will pay full duty. Ukraine, production is expected to continue
Argentina's imports have slowed from last at current prices. New fertilizer production
year's record level and are expected to fall by facilities are about to come on-stream in the
15%-20.0%. Farmers responded to lower Caribbean, the Middle East, and Southeastwheat prices by planting about 15% less wheat, Asia, which will add to the overcapacity in thewhich translates into lower fertilizer demand. nitrogen fertilizer industry.Poor weather further dampened fertilizer China remains absent from the market
demand, with both drought and heavy rains following a policy change banning ureaaffecting plantings. imports during the second quarter. Imports
Agrium has decided to develop phosphate are not expected to resume any time soon.
rock deposits at Kapuskasing, Ontario. The site China's 1997 urea imports are expected to be
would yield an estimated 1 million tons a year half those of 1996, at around 3 million tons.for 10 years or more. The new mine, which will China's production of urea is forecast to rise
use conventional open pit techniques, is expect- to 23 million tons in 1997, an increase of 6ed to begin operation in 1999. Phosphate rock million tons over 1996 levels. Increased
will be transported by unit trains to Redwater domestic production further delays any deci-phosphate plants in Alberta. sion to open imports.
NOVEMBER 1 997 25

METALS AND MINERALS
~~~~~~~~~~~~ALUMINUM l ,U7iO58 COPPER 2 612 62
||t;-III"IIt;4'fSII 96 / \~~~~~~~~MA 2,434.95 9
sa m _ A A / \~~~~~~~~~~~~~~~~9 JAN/
Co~~~~9
Z"s;aEtlr ^1K S-/ \/ \/ ~~~ ~ ~ ~ ~~~~~~~~~~~~~SEP /2,3t
_ / 9~~~~~~~~~~~~~~~~~~~~~~~157.5 97 APR\
r _ _ * e (US doll(rs/mt)(US dollors/mt) LME, cthode
* LME, prmry ingots, and wire shpes,high grde, cash3./ settlementpnce. 3,000 2,107.30
2,500 ~~~~~~~~~~~~2,500 SE2,000 2,000 ~~~~~~~~~~~~~97
*~~ ! O C T * 0000| /~~~~~~~~~~~1,458.70 1'50 96 ij2 1 000 97
OCT 500 OCT 1~~~~~~~~~~~~~~~~~~~~~~~~~,000
96 80 85 90 95 96 80 85 90 95 ,
DEMAND HOLDS UP IN THE US AND EUROPE BUT LME STOCKS CONTINUE TO RISE, AND CASH TO
WEAKENS IN ASIA THREE-MONTH PRICE REACHES CONTANGO
Aluminum prices experienced a turbulent The increase in stocks and the decline inthird quarter. Prices rose more than $150 a copper prices established during the second
ton betweenJune and August to pass $1700 a quarter continued through much of theton, the highest price in the past two years. third quarter. LME stocks, which rose
Prices were lifted by strong growth in alu- 106,700 tons in July and 43,600 tons inminum consumption in Europe and the US August, continued upward in early October,and by investment funds and speculators try- buoyed recently by severely curtaileding to squeeze the market. After a peak in demand in Asia. Stocks rose from 128,000
August, prices slipped in September following tons at the end of June to 338,000 tons in
reports of stock increases. Weak demand in mid-October. Prices, meanwhile, have con-Asia in the aftermath of the currency crisis and tinued to fall since breaking the $2,700 a tonthe realization that the market squeeze was level in June. The LME copper price fell
not backed by market fundamentals con- nearly 25% from mid-June to mid-October-tributed to the price turnaround. By from $2,718 a ton to $2,060 a ton-reachingSeptember prices eased back into the a 10-month low of $2,055 a ton in late$1600-$1650 range, where several analysts September. Cash to three-month prices have
expect them to stay for the next 6 to 12 moved into contango and have remained inmonths. the $15-$30 a ton range since September.
In the growing US economy, a strong con- Much of the increase is connected to the cur-struction sector and more use of aluminum rency crisis in Asia and the continuedin cars and trucks are boosting demand for absence of significant Chinese buying.aluminum. In Europe, the gradual but steady Several Southeast Asian economies expe-
economic recovery is benefiting aluminum rienced severe currency turmoil toward theconsumption as well. In Asia, the outlook for end of summer, which eroded business con-
aluminum consumption is gloomy. In Japan fidence and reduced working capital. Thehigher consumption taxes and cutbacks in currency crisis is expected to have a disas-
government spending have hurt the con- trous effect on copper demand by reducingstruction sector, which accounts for a higher spending on infrastructure and construction
proportion of aluminum consumption than and curtailing the movement of foreign cap-it does in the US and Europe. The currency ital into the affected economies. Moreover,
crisis and the subsequent monetary tightness currency devaluations have produced sharpin several Asian countries is also cutting into increases in copper and other raw material
aluminum consumption. costs in the region.
26 COMMODITY MARKETS AND THE DEVELOPING COUNTRIES

METALS AND MINERALS
Thailand has been hit hardest. Estimates GOLD 600
suggest that copper consumption could drop 380C7 00
as much as 20% in the cable wire industry 96 0
and 40-50% for building wire in 1997. Also 80 85 90 95
hit by the currency turmoil, Indonesia and (USKd9llsr5trsy ounce)
Malaysia expect copper telecom orders to be
particularly weak. Some building is still
expected in the Philippines, though at a 340.76
much slower pace than originally forecast. 4 -5SUN
Vietnam is still expecting demand to rise 97
rapidly for most varieties of copper wire and 322 82
cable.Japan's economic growth is slowing.
Housing starts slid injuly for the seventh con- PRICES CONTINUE TO TUMBLE
secutive month, domestic auto sales were Gold prices continued downward on cen-down 10.3% from July to August, and the tral bank selling and loss of speculative inter-
construction industry continues to feel the est. Lower interest rates, continued low
effects of the 2% consumption tax hike in inflation, and expected weak demand fromApril and the reduction in public works Asian countries following the recent econom-
spending. All these factors have hurt copper ic disruptions contributed to lower prices.
consumption in the short term. In China Gold averaged $323.6/toz for the quarter,buying remains limited despite the tremen- down from $343/toz during the second quar- _________
dous drop in LME prices in recent months. ter. Prices continue to fall, breaking the Thousonds of metric tons
In contrast with Asia, consumption con- $300/toz level in November. Few analysts are 969
tinues to grow at a healthy pace in Europe predicting a rebound as the price seems 6 JA945
and the US. Demand in the wirerod, con- unable to rally from any level. The most opti-struction, and automotive sectors has mistic view is that prices may stabilize at JUL
96remained strong in the US. Demand is $300/toz. 824 732
expected to continue strong in the fourth At current prices mine closures are expect- 96 97
quarter with the greatest growth in the con- ed. Many companies have hedging strategies
struction and automotive sectors. that protect them from the full impact of the JUJL
Western Europe, with the exception of price declines and so will likely continue to 97
the UK, continues to benefit from strong operate until their hedges expire. A survey of SOUrCe. Mets1 6.uet.
export markets brought about by compara- Australian companies found that hedgingtively low exchange rate levels. Analysts strategies allowed them to receive an average
expect industrial production throughout price well above $400/toz. In South Africa and - -
Thousands of metric tonsEurope to increase 3.5% in 1997 following a the US priceswere lower, butwell above recent 303.6 3X i
weak 0.2% rise in 1996. In contrast, the level spot prices. Hedging strategies are normally 96 275.3 97
of construction activity remains mixed limited to several quarters, so if prices remain AUG
throughout Europe. low for an extended period, mines will begin FE
For the remainder of 1997 and into 1998, to reconsider their production strategies. 22
LME copper prices are expected to remain The recent rash of economic problems in 96
between $2040 and $2075 a ton. If con- Asia has not led to panic buying of gold, as 2
sumption picks up in China and the rest of some might have expected. Instead, the US 92.5 97
Asia, prices could rise above these levels. dollar seems to be the speculative instru- 96
But, if LME warehouse stocks continue to ment of choice. Demand for physical gold, Source. MetslBusSet,n
grow, LME prices could fall below the $2,000 while strong, has not been enough to offset
a ton level. the selling.
NOVEMBER 1997 27

METALS AND MINERALS
IRON ORE AND STEEL Increasing supplies as winter approaches will
IRON ORE 3325 further depress prices.32.50 Asian markets for sheet and long productsAz982 / \ are going nowhere as consumers wait to see
the effects of the recent currency devalua-
28.09 | \ / \ 28.88 tion. There has been little change in pricesi98, \ | \ r since August, except in hot-rolled and cold-
rolled products, which fell some $5-$10/ton.In the short term prices are expected to con-
\EARLY (us ce Fe)25.47 tinue downward in Asia, especially for longYEARLY (llS cents/mt Fe) \ 3 1994Braz,9on, cv contract pce products. In the long term Asian markets,to Germany. setme
23.50 especially sheet markets, are expected to1988
recover as the effects of the currency crisisIRON ORE MARKETS ARE TIGHT, STEEL PRICES become clearer and buyers return to the mar-STABILIZE ket. The strong US market has been attract-
During the first half of the year iron ore ing imports away from the ASEAN countries.demand reached 182 million tons-up 9.4% If the US market slows, these materials mayover last year. Production, approaching be diverted back to Southeast Asia, forcingrecord levels, is up 4% so far this year, prices lower.reflecting increased production from most Japanese sheet markets continue to showmajor suppliers. Output is up 21.8% at strength, bolstered by foreign automobileAustralia's Hamersley Iron and 7.4% at sales. The relatively weak yen helped liftBrazil's CVRD. It looks as though 1997 iron sales some 12% in the first half of the year.ore deliveries will surpass those of 1996 and Steel producers have experienced similar1995's record high of 402 million tons. export success-sheet exports inJune wereTransportation problems in Australia are up 38% over last year. Long products havealso contributing to market tightness and also been experiencing improved demand,have worsened port delays and reduced both at home and abroad. However, someinventories. With the improved financial sit- major Japanese steel companies haveuation in 1997, larger price movements can announced production cuts in an effort tobe expected in 1998. nudge prices upward. This move supports
The summer slowdown in Europe and expectations that demand will fall in theNorth America kept prices stable for most fourth quarter. The anticipated slump insteel products during the third quarter. The Southeast Asian imports will also add to thestrong US dollar has been a major factor downward pressure on demand.behind the recovery of the European mar- European sheet producers expect moder-ket, while in Asia the devaluation of region- ate price rises in the fourth quarter followingal currencies relative to the US dollar has heavy orders in July and August. Moreover,stalled consumption. Europe is a net the sustained growth of exports has stimulat-exporter of steel, Asia a net importer. ed domestic consumption. Much of the
The strong US market continues thanks to growth has come in steel sheet markets ingood consumption growth in construction. response to the largejump in consumer pur-Long product markets remain stable despite chases ofvehicles and durable goods. Growthdeclining prospects for a winter price hike. in long products has been more moderate asSheet prices are less stable. Resolution of the restrictions on government spending out-Wheeling-Pittsburgh strike and the slowdown lined in the qualification criteria for thein the automotive sector have resulted in a European Monetary Union have slowed$5-$10/ton drop in cold-rolled prices. activity in the construction sector.
28 COMMODITY MARKETS AND THE DEVELOPING COUNTRIES

COMMODITY PRICE OUTLOOK
COAL Prices expected to remoin weak on NATURAL GAS Increased competition will ENERGYhigher production and increased competition (EUROPE) gradually lead to lower prices
1990 dofr
W'20 1
* 1970 1980 i990
50f---r _. ..IPrice in current
dollars per nleri ton
2. h s 175V--- R --- 1 1 _1995 96 97 98 99 2000 1995 96 97 98 99 2000
NATURAL GAS US supply-demand PETROLEUM Prices expected to fall with(US) balance continues to improve higher production
_ _ /9 _ Iti'9 1 980 i 990
3i Price in urrentZ r7j3 doIdors.lmlros BTU
25 0 - .. .. .....25
21i 995 96 7 98 99 20 15 99
24 r 70pret__ 0 ecr
172
oPrice inccurren t
doll ars per ba
1995 96 97 98 99 2000 J1995 96 97 98 909 2000
COCOA Prices on the rise COFFEE Prices expected to decline BEVERAGES
970 f980 1990 200~~~0 pe tcern 790 18 9 00 cent
L. l .. ..........~~~~~~~~~~~~~~~~~~~~~~~~~~~~~~~~~~~~~~~~~~~~~~~~~~~~~~~~~~~~~~~~~~~~~~~~~~~~~~~~~~~~~~~~~~~~ ... .
1995 96 97 98 99 2000 1995 96 97 98 99 2000
NOVEMBER 1997 29

COMMODITY PRICE OUTLOOK
6.00; 70 percent 2,100i 70percent450 iprobrbbty p6 50os Pncecconstan j prob 95.3 00 dr,t/bvon .0 90d/no /nrtt1 50 1ce in constant/990 do/In'o 750
1970 980 /990 2000 2010 /970 /980 i 990 2000 2010
2.50t 1,000 ,_ Price in'current . Price in current
2.25 _ 800 _
.00 ~~~~~~~~~~~~~~600
f.75 ~~~~~~~00: - -
1.50 200 _ L-
1995 96 97 98 99 2000 1995 96 97 98 99 2000
FOOD _FATS AND OILS
70 percent 9.0 70 percenti,wabifity Prc rcretj|PiemPrice/n cootanot j probobit
I990 dolk,s~~~~~~~~~~~~~~~~~/90 olrsoe/oo
650rs2 P j~~~~~~~~~~~~~~~~~~~~5
5070 980 /990 20/0 1970 980 6 990 - t0
750 -- _ 900 _
Price in\ current E i : - 70percentPrice 8 crren t! dollars per metrnc ton ; gdollars er metr ton
80 200j~~~~~42
6501 63Q- 9 .
1 995 96 97 98 99 2000 _995 96 97 98 99 2000
250 C MARKETS 750
____ ___ ~~~~~~~~500
350 24300324----
/995 96 97 98 99 2000 1995 96 97 98 99 200
30CMMDTYMRKTGADTEAEELINGCUNRE

COMMODITY PRICE OUTLOOK
WHEAT Prices retreat from recent highs BANANAS Prices expected to fall OTHER FOODS
I 9 70 i 980
1995 96 97 98 99 2000 1995 96 97 98 99 2000
BEEF Prices continue to rise CITRUS Prices set to rise(ORANGES)
/995 96 97 98 99 2000 1995 96 97 98 99 2000
SHRIMP Prices likely to remaiin firm SUGAR Prices move up
1970 89o 19
I dollars per kilo amr cents per ki(ogrdmW.5L 1-'- 30o-- -----
14190 2&Ok-ol 5
20 --- _ _ -
-II gX
1995 96 97 98 99 2000 1995 96 97 98 99 2000
NOVEMBER 1997 31

COMMODITY PRICE OUTLOOK
AGRICUL- .
TURALR AWId 3 25 , pn bo b il 200 -g c s17 p0 cent205,stpccen
MATERIALS 175lPlrice re coestacPtre in con
MATERIALS 24990 reels 1980_1990 2000 20W 100 200
Price in current | Price in currentl
1995 9 97 9990 2000 1995 96 97 98 99 2000
_~~~~~~~~~ _
2 402000 E 1 6
500 70e perCet00rcurrent Price in current 7 pE4 centS dollas p > er 20 m 190 per su43oX
1990 defInes ~ ~ ~ 19
30 Ll
180 a 14i M 970 190 990 i 2000 2010
-r ~~- (6
150 10 l -i- __120. _ 00 .1995 96 97 98 99 2000 1995 96 97 98 99 2
000 COMMODis 70 percent 165I A P rim iTH 70tOPt pCnOb TIty
Pri0 in convo t prsLbbi,ty 709 ort perocent1990 d dol ors s,nc-tton i 990 ollar d,stibube
i970 980 99 200 2010 1~970 90 1990 2000 2Mj
dollars )er cubicCn0.meter dollars ermetri o
30o0 1 ---- 100-- 125-
1995 96 97 98 99 2000 1995 96 97 98 99 2000
32COMDIYMATESANLHEDVEOPNECUTRE

COMMODITY PRICE OUTLOOK
ALUMINUM Prices hold up with good COPPER Price erosion to continue METALS ANDdemand growth MINERALS
* _
_ _ ii _i_1_ _I
I _1 : ~~~~~~~~~~~~~~~~~~~~~~~~dollorsfirSQ_
1995 96 97 98 99 2000 1995 96 97 98 99 2000
GOLD Prices continue to slump IRON ORE Significant price movementsexpected in 1998
-I_40 _
Price ir current dollars
=1~~~~~~~~~~~~~~~~~ e m3 ic on ryw
30
20-.-
1 995 96 97 98 99 2000 1995 96 97 98 99 2000
NoVEMBER 1 997 33

COMMODITY PRICE OUTLOOK
TABLE Al. COMMODITY PRICES AND PRICE PROJECTIONS IN CONSTANT 1990 DOLLARS
Short-term Long-termActuol projections projections
Commodity Unit 1970 1980 1985 1990 1993 1994 1995 1996 1997 1998 2000 2005 2010
EnergyCoal, US $/mt .. 59.88 67.96 41.75 35.74 33.10 32.88 32.59 33.88 32.16 31.37 30.31 29.11Crudeoil, avg, spot $/bbl 4.82 51.22 39.62 22.88 15.84 14.41 14.41 17.88 17.82 16.30 14.94 14.22 13.81Natural gas, Europe $/mmbtu .. 4.72 5.39 2.55 2.51 2.22 2.29 2.49 2.55 2.45 2.30 2.17 2.07Natural gas, US $/mmbtu 0.68 2.15 3.57 1.70 1.99 1.74 1.45 2.39 2.37 1.99 1.75 1.74 1.74
BeveragesCocoa c/kg 269.1 361.7 328.6 126.7 105.0 126.7 120.2 127.5 151.3 163.0 159.6 157.2 150.3Coffee, other milds c/kg 457.2 481.6 470.9 197.2 46.7 300.1 279.6 235.9 373.2 249.1 206.6 190.1 180.9Coffee, robusta c/kg 362.8 450.6 386.0 1 18.2 108.9 237.7 232.4 158.1 165.2 159.4 150.3 144.5 131.6Tea, auctons, avg c/kg 358.8 250.4 263.5 205.1 157.7 143.1 128.1 147.9 189.6 175.4 157.9 149.9 144.2Tea,London,all c/kg 436.4 310.0 289.0 203.2 175.3 166.2 137.8 155.3 204.2 190.2 170.7 164.7 161.2
FoodFats and oilsCoconut oil $/mt 1,584 936.1 860.2 336.5 423.5 551.2 561.7 658.1 626.6 634.1 631.7 537.4 513.8Copra $/mt 896.5 629.0 562.6 230.7 277.8 378.7 367.9 428.1 441.0 412. 354.3 344.3 317.7Groundnutmeal $/mt 407.4 333.9 211.7 184.8 158.1 152.7 141.4 186.3 166.2 156.7 181.8 172.1 169.7Groundnut oil $/mt 1,509 1,193 1,319 963.7 695.1 928.0 831.3 785.7 928.3 769.9 657.3 537.4 476.9Palm oil $/mt 1,037 810.9 729.6 289.8 355.3 479.5 527.1 464.9 501.3 439.3 358.6 344.3 317.7Soybeanrmeal $/mt 409.0 364.6 229.1 200.2 /95.8 174.6 165.2 234.2 243.2 190.2 196.4 204.3 201.3Soybean oil $/mt 1,142 830.2 833.7 447.3 451.8 558.6 524.4 482.9 502.2 508.2 478.1 452.8 423.7Soybeans $/mt 466.2 41 1.5 327.1 246.8 239.9 228.5 217.5 266.9 265.5 235.5 239.0 247.0 243.4
GrainsMaize $/mt 232.9 174.0 163.6 109.3 96.0 97.6 103.6 145.2 1 10.5 108.7 105.9 100.3 94.7Rice, Thai, 5% $/mt 503.6 570.6 287.0 270.9 221.4 242.8 269.3 296.7 283.1 271.7 281.7 269.4 263.1Sorghum $/mt 206.5 179.0 150.1 103.9 93.1 94.3 99.8 131.4 107.1 105.4 102.7 97.3 91.9Wheat, US, HRW $/mt 218.9 240.0 198.0 135.5 131.9 135.9 148.5 181.8 148.5 144.9 140.0 128.7 121.7
Other foodBananas $/mt 662.2 524.1 551.0 540.9 416.7 399.1 373.4 411.2 460.5 429.4 414.0 386.2 414.5Beef, US c/kg 520.1 383.4 314.0 256.3 246.2 211.7 160.0 156.3 174.0 179.7 184.5 172.1 164.5Oranges $/mt 670.0 556.0 580.7 531.1 406.8 373.2 445.9 430.5 436.3 428.4 448.2 438.6 414.5Shrimp c/kg 1,108 1,421 1,529 1,079 1,071 1,186 1,136 1,149 1,383 1,322 1,263 1,160 1,085Sugar,world c/kg 32.79 87.75 13.04 27.67 20.78 24.22 24.56 23.08 22.92 22.96 21.29 22.53 22.53
Agricultural raw materialsTimberLogs, Malaysia $/cum 172.0 271.6 177.4 177.2 366.6 279.1 214.5 220.8 227.4 235.5 256.1 269.4 270.4Logs, Cameroon $/curm 171.5 349.7 253.4 343.5 291.9 299.7 284.8 237.8 238.6 251.8 273.2 306.9 320.4Sawnwood, Malaysia $/cum 697.8 550.2 447.5 533.0 713.1 745.0 620.8 649.2 640.6 661.2 700.0 733.5 731.5
Other raw moterialsCotton c/kg 269.7 286.5 192.1 181.9 120.4 160.0 178.5 155.3 163.4 162.1 162.2 148.2 143.4Rubber, RSSI, Malaysia c/kg 162.4 197.9 1 10.6 86.5 78.2 102.2 132.6 122.1 98.2 105.8 112.9 117.2 121.5Tobacco $/mt 4,290 3,162 3,807 3,392 2,535 2,395 2.214 2,671 3,249 3,080 2,774 2,530 2,335
FertilizersDAP $/mt 215.3 308.7 246.3 171.4 121.4 156.8 181.7 186.7 185.7 185.7 169.0 156.4 138.2Phosphate rock $/mt 43.9 64.9 49.4 40.5 31.0 29.9 29.4 34.2 38.1 37.5 35.9 32.9 30.3Potassium chloride' $/mt 127.6 160.8 122.4 98.1 101.0 95.9 98.8 102.4 108.4 106.9 106.7 89.8 90.1TSP $/mt 17 .5 250.4 176.9 131.8 105.3 119.9 125.5 154.0 159.7 144.9 130.6 118.3 117.1Urea $/mt 191.4 308.6 198.7 157.0 100.4 134.2 177.4 179.9 130.0 135.9 48.5 140.0 131.6
Metals and mineralsAluminum $/mt 2,217 2,023 1,517 1,639 1,071 1,340 1,5 5 1,318 1,495 1,486 1,468 1,437 1,360Copper $/mt 5,645 3,032 2,066 2,661 1,799 2,094 2,463 2,010 2,149 1,937 1,731 1,647 1,553Gold $/toz 143.5 844.7 463.4 383.5 338.4 348.4 322.3 339.5 311.0 312.5 311.6 291.9 263.1Iron ore c/dmtu 39.23 39.02 38.71 30.80 26.46 23.11 22.61 25.02 26.81 26.72 26.04 24.55 22.37Lead c/kg .20.8 125.8 57.0 81.1 38.2 49.7 52.9 67.8 59.4 58.0 55.9 51.0 46.1Nickel $/mt 11,348 9,056 7,140 8,864 4,978 5,752 6,903 6,568 6,591 6,612 6,573 5,838 5,394Silver c/toz 705.7 2.867 895.2 482.0 404.3 479.5 435.5 453.9 441.0 439.3 443.9 396.7 361.8Tin c/kg 1,465 2,330 1,682 608.5 485.4 495.8 521.3 539.9 524.5 518.1 519.1 469.3 425.6Zinc c/kg 118.0 105.8 114.2 151.4 90.5 90.5 86.5 89.8 126.3 117.8 97.3 88.3 83.6
.. Not available.Note: Computed from unrounded data and defated by MUV (1 990=100). Forecast as of October29 1997.a. Also known as muriate of potash.Source: World Bank, Development Economics, Development Prospects Group.
34 COMMODITY MARKETS AND THE DEVELOPING COUNTRIES

COMMODITY PRICE OUTLOOK
TABLE A2. COMMODITY PRICES AND PRICE PROJECTIONS IN CURRENT DOLLARS
Short-term Long-termActual projections projections
Commodity Umnt 1970 1980 1985 1990 1993 1994 1995 1996 1997 1998 2000 2005 20/0
EnergyCoal, US $/mt .. 43.10 46.63 41.75 38.00 36.48 39.19 37.21 36.50 35.50 36.75 40.50 44.25Crude oil, avg, spot $/bbl 1.21 36.87 27.18 22.88 16.84 15.89 17.17 20.42 19.20 18.00 17.50 19.00 21.00Natural gas. Europe $/mmbtu .. 3.40 3.70 2.55 2.67 2.44 2.73 2.84 2.75 2.70 2.70 2.90 3.15Natural gas, US $/mmbtu 0.17 1.55 2.45 1.70 2.12 1.92 [.72 2.73 2.55 2.20 2.05 2.33 2.65
BeveragesCocoa c/kg 67.5 260.4 225.4 126.7 111.7 139.6 143.2 145.6 63.0 180.0 187.0 210.0 228.4Coffee, other mids c/kg 114.7 346.6 323.1 197.2 [56.0 330.8 333.2 269.4 402.0 275.0 242.0 254.0 275.0Coffee, robusta c/kg 91.0 324.3 264.9 118.2 1 15.7 262.0 277.1 180.6 178.0 176.0 176.0 193.0 200.0Tea, aucdons, avg c/kg 90.0 180.2 180.8 205. 167.7 157.7 152.7 168.9 204.3 193.6 184.9 200.3 219.2Tea, London, all c/kg 109.5 223.1 198.3 203.2 186.4 183.2 164.3 177.4 220.0 210.0 200.0 220.0 245.0
FoodFats and oilsCoconut oil $/mt 397.2 673.8 590.2 336.5 450.3 607.5 669.6 751.6 675.0 700.0 740.0 718.0 781.0Copra $/mt 224.8 452.7 386.0 230.7 295.4 417.3 438.5 488.9 475.0 455.0 415.0 460.0 483.0Groundnutmeal $/mt 102.2 240.3 145.3 184.8 168.1 168.3 168.6 212.8 179.0 173.0 213.0 230.0 258.0Groundnut oil $/mt 378.6 858.8 904.9 963.7 739.1 1022.8 990.9 897.3 1000.0 850.0 770.0 718.0 725.0Palm oil $/mt 260.1 583.7 500.6 289.8 377.8 528.4 628.3 530.9 540.0 485.0 420.0 460.0 483.0Soybeanmea[ $/mt 102.6 262.4 157.2 200.2 208.2 192.4 196.9 267.5 262.0 210.0 230.0 273.0 306.0Soybean oil $/mt 286.3 597.6 572.0 447.3 480.4 615.6 625.1 551.5 541.0 561.0 560.0 605.0 644.0Soybeans $/mt 116.9 296.2 224.4 246.8 255.1 251.8 259.3 304.8 286.0 260.0 280.0 330.0 370.0
GrainsMaize $/mt 58.4 125.3 112.2 109.3 102.1 107.6 123.5 165.8 119.0 120.0 124.0 134.0 44.0Rice, Thai, 5% $/mt 126.3 410.7 196.9 270.9 235.4 267.6 321.0 338.9 305.0 300.0 330.0 360.0 400.0Sorghum $/mt 51.8 128.9 103.0 103.9 99.0 103.9 1 19.0 150.0 1 15.4 1 16.4 120.3 130.0 139.7Wheat, US, HRW $/mt 54.9 172.7 135.8 135.5 140.2 149.7 177.0 207.6 160.0 160.0 164.0 172.0 185.0
Other FoodBananas $/mt 166.1 377.3 378.1 540.9 443.0 439.8 445.1 469.6 496.0 474.0 485.0 516.0 630.0Beef, US c/kg 130.4 276.0 215.4 256.3 261.8 233.3 190.7 178.5 187.4 198.4 216.1 230.0 250.0Oranges $/mt 168.0 400.2 398.4 531.1 432.5 411.3 53 .5 491.7 470.0 473.0 525.0 586.0 630.0Shrimp c/kg 278.0 1,023 1,049 1,079 1,139 1,308 1,354 1.312 1490 1460 1480 1,550 1,650Sugar, world c/kg 8.22 63.16 8.95 27.67 22.10 26.70 29.28 26.36 24.69 25.35 24.94 30.10 34.25
Agricultural raw materialsTimberLogs, Malaysia $/cum 43.1 195.5 121.7 177.2 389.8 307.6 255.6 252.1 245.0 260.0 300.0 360.0 411.0Logs, Cameroon $/cum 43.0 251.7 173.9 343.5 310.3 330.3 339.5 271.6 257.0 278.0 320.0 410.0 487.0Sawnwood, Maaysia $/cum 175.0 396.0 307.0 533.0 758.3 821.0 740.0 741.4 690.0 730.0 820.0 980.0 1112.0
Other raw materilasCotton c/kg 67.6 206.2 131.8 181.9 128.0 176.3 212.8 177.3 176.0 179.0 190.0 198.0 218.0Rubber, RSSI, Malaysia c/kg 40.7 142.5 75.9 86.5 83.1 1 12.6 158.0 139.4 105.8 116.8 132.2 156.6 184.7Tobacco $/mt 1,076 2,276 2,612 3,392 2,695 2,639 2,639 3,051 3500 3400 3250 3,380 3,550
FertilizersDAP $/mt 54.0 222.2 169.0 171.4 129.1 172.8 216.6 213.2 200.0 205.0 198.0 209.0 210.0Phosphate rock $/mnt 1.0 46.7 33.9 40.5 33.0 33.0 35.0 39.0 41.0 41.4 42.0 44.0 46.0Potassium chloridea $/mt 32.0 115.7 84.0 98.1 107.4 105.7 117.8 116.9 116.8 118.0 125.0 120.0 137.0TSP $/mt 43.0 180.3 121.4 131.8 111.9 132.1 149.6 175.8 172.0 160.0 153.0 158.0 178.0Urea $/mt 48.0 222.1 136.3 157.0 106.8 147.9 211.5 205.5 140.0 150.0 174.0 187.0 200.0
Metals and mineralsAluminum $/mt 556 1,456 1,041 1,639 1,139 1,477 1,806 1,506 1,610 1,640 1,720 1.920 2,067Copper $/mt 1,416 2,182 1,417 2,661 1,913 2,307 2,936 2,295 2315 2138 2028 2,201 2,360Gold $/toz 36.0 608.0 317.9 383.5 359.8 384.0 384.2 387.7 335.0 345.0 365.0 390.0 400.0Iron ore c/dmtu 9.84 28.09 26.56 30.80 28.14 25.47 26.95 28.57 28.88 29.5 30.5 32.80 34.00Lead c/kg 30.3 90.6 39.1 81.1 40.6 54.8 63.1 77.4 64.0 64.0 65.5 68.1 70.0Nickel $/mt 2,846 6,519 4,899 8,864 5,293 6,340 8.228 7,501 7100 7300 7700 7,800 8,200Silver cAoz 177.0 2,064 614.2 482.0 429.8 528.4 519.1 518.3 475.0 485.0 520.0 530.0 550.0Tin c/kg 367.3 1,677 1,154 608.5 516.1 546.4 621.4 616.5 565.0 572.0 608.1 627.0 647.0Zinc c/kg 29.6 76.1 78.3 151.4 96.2 99.8 103.1 102.5 136.0 130.0 114.0 118.0 127.0
.. Not available.Note. Computed from unrounded data and deflated by M JV (I 990= 00). Forecast as of October 29, 1997.a. Also known as muriate of potash.Source: World Bank, Development Econom,cs, Development Prospects Group.
NOVEMBER 1 997 35

COMMODITY PRICE OUTLOOK
TABLE A3. WEIGHTED INDEX OF COMMODITY PRICES IN CURRENT DOLLARS AND IN CONSTANT 1990 DOLLARS1 990= 1 00
Agrnculture
Nonenergy Food Raw rnaterials Metalscommod- Total Total Other Total raw and
Energy ities agriculture Beverages food Fats and oils Grains foods materials Timber Fertilizers mineralsYear (100) (I 00) (69. i)0 (1 6.9)G (29.4)G (Io0, ) (6,9)0 (12.4)G (22.8)0 (9,3)G (2,7)G (28,2)0
Current dollars
1980 161.2 125.9 138.3 182.4 139.3 148.7 134.3 134.3 104.6 79.0 128.9 95.11985 118,8 91.4 100.2 164.1 86.3 113.0 89,2 62.8 70.8 59.1 89.0 70.2
1990 100.0 100.0 100.0 100.0 100.0 100.0 100.0 100.0 100.0 100.0 100.0 100.01991 84.7 95.3 97.6 92.9 99.2 104.5 101.7 93.4 99.2 104.2 102.4 88.91992 83.1 91.8 94.0 77.5 100.0 111.7 .101.7 89.5 98.3 114.5 95.8 86.11993 73.6 91.4 98.8 83.6 98.6 I 11.5 93.7 90.7 1 0.3 152.4 83.7 73.91994 69.4 111.6 123.3 148.8 106.8 125.9 102.1 93.9 125.8 156.6 93.4 84.61995 75.1 122.2 131.3 151.2 116.9 136.6 120.4 98.8 135.2 139.5 103.6 101.61996 89.3 115.1 125.5 126.5 123.6 147.0 40.6 95.0 127.1 139.5 119.8 89.11997 83.9 117.6 128.2 167.3 114.8 143.6 113.2 92.1 116.7 130.6 119.8 91.21998 78.7 111.5 120.1 135.4 109.5 127.2 112.7 93.2 122.6 138.2 114.4 90.0
2000 76.5 113.9 123.3 127.3 112.4 128.4 119.2 95.5 134.5 155.8 111.5 90.92005 83.0 125.7 137.2 137.2 123.7 144.6 128.3 104.0 154.5 186.4 115.8 98.32010 91.8 137.2 150.9 148.1 133.8 158.3 139.9 110.3 175.1 211.6 127.2 104.4
Constant 1990 dollars
1980 223,9 174.9 192.2 253.4 193.5 206.6 186.6 186.6 145.3 109.8 179.1 132.11985 173.2 133.3 146.0 239.2 125.8 164.7 130.1 91.5 103.3 86.1 129.8 102.3
1990 100.0 100.0 100.0 100.0 100.0 100.0 100.0 .00.0 100.0 100.0 100.0 100.0
1991 82.8 93.2 95.5 90.9 97.0 102.2 99.5 91.3 97.0 102.0 100.2 87.0
1992 78.0 86.1 88.1 72.6 93.8 104.7 95.4 84.0 92.2 107.3 89.8 80.81993 69.2 85.9 92.9 78.6 92.7 104.9 88.1 85.3 103.7 143.3 78.7 69.51994 63.0 101.3 111.9 135.0 96.9 114.3 92.6 85.2 114.2 142.1 84.7 76.81995 63.0 102.5 110.2 126.8 98.1 114.6 101.0 82.9 113.4 117.1 86.9 85.2996 78.3 101.0 110.1 110.9 108.5 129.0 123.3 83.3 111.5 122.4 105.1 78.2
1997 77.9 109.2 119.1 155.3 106.6 133.3 105.1 85,5 108.4 121.2 111.2 84.71998 71.3 101.0 108.8 122.6 99.2 115.2 102.1 84.5 1.1.0 125.2 103.6 81.5
2000 65.3 97.2 105.3 108.6 96.0 109.6 101.8 81.6 114.8 133.0 95.2 77.62005 62.2 94.0 102.7 102.7 92.6 108.2 96.0 77.8 115.6 139.5 86.6 73.6
2010 60.4 90.3 99.3 97.4 88.0 104.1 92.1 72.6 115.2 139.2 83.7 68.7
Note: F gures for 1997-2010 are projections Weights used are the average 1987-89 export values for low- and middle-income econom es. Forecast as of October 29, 1997.a. Percentage share of comrnmodity group in nonenergy ndex.Source: World Bank, Development Economics, Development Prospects Group.
TABLE A4. INFLATION INDICES FOR SELECTED YEARS
G-5 MUV index' US GDP deflator
Year 1990 = I 00 % change 1990 = I 00 0/0 change
1980 71.98 64.54
1985 68.61 -0.95 83.77 5.66
1990 100.00 7.83 100.00 3.611991 102.23 2.23 103.95 3.951992 106.64 4.31 106.84 2.781993 106.33 -0.29 109.62 2.601994 110.21 3.65 112.18 2.341995 119.21 8.17 1 14.96 2.481996 113.99 -4.38 117.20 1.951997 107,72 -5.50 119.66 2.101998 110.40 2.49 122.18 2.10
2000 117.14 3.01 127.11 2.00
2005 133.61 2.67 141.72 2.20
2010 152.01 2.61 158.01 2.20
Note: Figures for 1997-20 1 0 are projections. For 1996, US GDP deflator is actua; MUV s a preliminary est mate. Forecast as Of October 27. 1997. Growth ratesfor years 1985, 1 990. 2000. 2005 and 201 0 are compound annual rates of change between adjacent end-point years; all others are annual growth rates from theprevious year.a. Unk value index in US dollar terms of manufactures exported from the G-S countries (France, Germany, Japan, UK, and US), weighted propont onally to thecountries' exports to the developing countr es.Source: G-5 MLV index, G-5 GDP/GNP deflator, and G 7 CPI: World Bank. US GDP deflaor: U.S Department of Commerce.
36 COMMODITY MARKETS AND THE DEVELOPING COUNTRIES

COMMODITY PRICE OUTLOOK
TABLE A5. COMMODITY PRICE PROBABILITY DISTRIBUTIONS IN CONSTANT 1990 DOLLARS
70% probability distribution
Commodity Unit 1997 1998 2000 2005
EnergyCoal, US $/mt 32.26-35.51 26.27-38.04 23.48-39.27 19.46-41.16Crude oil, avg. spot $/bbl 16.94-18.80 12.68- 19.93 10.46-20.06 8.23-20.21Natural gas, Europe $/mmbtu 2.41-2.69 1.95-2.94 1.66-2.95 1.38-2.96Natural gas, US $/mmbtu 2.23-2.51 1.54-2.45 1.24-2.30 1.05-2.44
BeveragesCocoa ¢/kg 146-156 142-188 128-199 116-212Coffee, other milds ¢/kg 358-395 205-304 II-272 131-266Coffee. robusta ¢/kg 159 175 134 188 113-195 101-205Tea, auctions, avg. ¢/kg 182-197 156-195 126-189 117-183Tea, London, all ¢/kg 196-212 169-211 137-205 128-201
FoodFats and oilCoconut oil $/mt 564-690 539-729 474-790 376-698Copra $/mt 397-486 351-474 265-443 241-448Groundnut meal $/mt 149-183 133-180 137-227 120-224Groundnut oil $/mt 835-1,021 655-886 493-822 376-698Palm oil $/mt 451-551 373-505 269-448 241-448Soybean meal $/mt 219-267 162-219 148-246 143-266Soybean oil $/mt 452-552 432-584 359-598 317-589Soybeans $/mt 239-292 200-271 179-299 173-321
GrainsMaize $/mt 99-122 87-130 80-133 65-140Rice, Thai, 5% $/rmt 241-326 207-342 203-366 162-404Sorghum $/mt 96-1 18 84-127 78-129 63-136Wheat, US, HRW $/mt 137 160 110 183 101-182 77-184
Other foodBananas $/mt 428-484 372-478 33 I-488 240-510Beef, US f/kg 160-188 147-212 138-231 115-229Oranges $/mt 371-502 326-540 323-578 294-583Shrimp f/kg 1,341-1,425 1,177 1,481 1,036-1,542 905-1.566Sugar, world f/kg 21.78-24.07 21.43-25.42 17.88-24.70 15.32-29.74
Agricultural raw materialsTimberLogs, Malaysia $/cm 222-235 205-271 206-319 200-364Logs, Cameroon $/cm 233-247 219-290 219-340 227-414Sawnwood, Malaysia $/cm 623-656 575-761 562 872 543-990
Other raw materialsCotton f/kg 148-180 138-186 121-202 104-192Rubber. RSSI, Malaysia f/kg 88-1 10 92-122 93-137 76-176Tobacco $/mt 2,924-3,574 2,525-3,634 2,081-3,468 1,695-3,364
FertilizersDAP $/mt 167-204 141-234 122-220 102-21 1Phosphate rock $/mt 35-41 29-47 26-47 21-44Potassium chloride' $/mt 98- 119 81-135 77-139 54-126TSP $/mt 144-176 110-183 94-170 71-166Urea $/mt 117 143 103-171 107-193 84-196
Metals and mineralsAduminum $/mt 1.450-1,539 1,291-1,709 1,178-1,830 1,065-1,940Copper $/mt 2,1 13-2,233 1,684-2,228 1,390-2,158 1,220-2,224Goid $Aoz 274-348 238-394 224 402 175-423Iron ore ¢/dmtu 24.14-29.52 21.92-31.52 19.81-32.27 17.21-32.63Lead f/kg 52.27-65.35 44.02-73.01 40.29-72.14 33.90-68.78Nickel $/mt 5,932-7,250 5,025-8,332 4,733-8,480 3,503-8,173Silver ¢/toz 388-485 334-554 320-573 238-575Tin f/kg 472-577 394-653 374-670 282-610Zinc f/kg 1 14-139 89-148 70-126 59-118
Note: Forecast as of October 29,1997.a. Also known as munate of potash.Source: World Bank, Development Economics, Development Prospects Group.
NOVEMBER 1997 37

COMMODITY PRICE OUTLOOK
TABLE A6. COMMODITY PRICE PROBABILITY DISTRIBUTIONS IN CURRENT DOLLARS
70% probobility distribution
Commodity Unit 1997 1998 2000 2005
EnergyCoal, US $/mt 34.75-38.25 29.00-42.00 27.50-46.00 26.00-55.00Crude oil, avg. spot $/bbl 18.25-20.25 14.00-22.00 12.25 23.50 11.00-27.00Natural gas, Europe $/mmbtu 2.60 2.90 2.15-3.25 1.95-3.45 1.85-3.95Natural gas, US $/mmbtu 2.40-2.70 1.70-2.70 1.45 2.70 1.40-3.26
BeveragesCocoa ¢/kg 158-168 156-207 150-233 156-283Coffee, other milds ¢/kg 386-426 226-336 177-319 175-356Coffee, robust, ¢/kg 171-189 148-208 132-229 135-274Tea, auctions, avg. ¢/kg 196-212 172-215 148-222 156 244Tea, London, all ¢/kg 211-229 187-233 160-240 172-268
FoodFats and oilsCoconut oil $/mt 608-743 595-805 555-925 503-933Copra $/mt 428-523 387 523 311-519 322-598Groundnutmeal $/mt 161-197 147-199 160-266 161-299Groundnut oil $/mt 900- 1,100 723-978 578-963 503-933
Palm oil $/mt 486-594 412-558 315-525 322-598Soybean meal $/mt 236-288 179-242 173-288 191-355Soybean oil $/mt 487-595 477-645 420-700 424-787Soybeans $/mt 257-315 221-299 210-350 231-429
GrainsMaize $/mt 107 131 96-144 94-156 87-188Rice, Thai, 5% $/mt 259-351 228-378 238 429 216-540Sorghum $/mt 104-127 93-140 91-152 85-182Wheat, US, HRW $/mt 147-173 122-202 118-213 103-246
Other foodBananas $/mt 461-521 411-528 388-572 320-682Beef, US ¢/kg 172-202 163-234 162-270 154 306Oranges $/mt 400-541 360-596 378-677 393-779Shrimp ¢/kg 1,445-1,535 1,299-1,635 1,214-1,806 1,209-2,093Sugar, world ¢/kg 23.46-25.93 23.66-28.06 20.95-28.93 20.47-39.73
Agricultural raw materialsTimberLogs, Malaysia $/cm 239-254 226-299 241-374 267-486Logs, Cameroon $/cm 250-266 242 320 257-399 304-553Sawnwood, Malaysia $/cm 671-707 635-840 658-1,022 726-1,323
Other raw materialsCotton V/kg 159-194 152 205 142-237 139-257Rubber, R551, Malaysia ¢/kg 95-I 9 102-134 108-160 102-235Tobacco $/mt 3,150-3,850 2,788-4,012 2,438-4,063 2,265-4,495
FertilizersDAP $/mt 180-220 156-258 143-257 136-282Phosphate rock $/mt 38-44 32-52 30-55 29-59
Potassium chloride/a $/mt 105-129 90-149 90-163 72-168TSP $/mt 155-189 122-202 1 10-199 95-221Urea $/mt 126-154 114-189 125-226 112-262
Metals and mineralsAluminum $/mt 1,561-1,658 1,426-1,886 1,380 2,143 1,422 2,592Copper $/mt 2,276-2,405 1,859-2,460 1,628-2,527 1,631-2,971Gold $/toz 295-375 262-435 263-471 234-566Iron ore ¢/dmtu 26.00-31.80 24.20-34.80 23.20-37.80 23.Q0-43.60Lead ¢/kg 56-70 49-81 47-85 45-92Nickel $/mt 6,390-7,810 5,548-9,198 5,544-9,933 4,680-10,920Silver f/toz 418-523 369-611 374-671 3 18-769Tin ¢/kg 509-622 435-721 438-784 376-815Zinc ¢/kg 122 150 99-164 82-147 79-157
Note: Forecast as of October 29, 1997.a. Aso known as muriate of potash.Source: World Bank, Development Econom cs, Development Prospects Group.
38 COMMODITY MARKETS AND THE DEVELOPING COUNTRIES

COMMODITY PRICE OUTLOOK
TABLE A7. RECENT COMMODITY PRICES
Annual averages Quarterly averages Monthly averages
Jan-Dec Jan-Dec Jan-Sept Jul-Sep Oct-Dec Jan Mar Apr-Jun Jul-Sep jul Aug SepCommodity Unit 1995 1996 1997 1996 1996 1996 1996 1997 1997 1997 997
EnergyCoalAustralia $/mt 39.37 38.07 35.45 38.28 36.22 34.78 35.21 36.36 35.00 36.93 37.15US $/mt 39.19 37.21 36.66 37.60 37.38 37.80 36.84 35.35 35.18 35.18 35.68
Crude oil, average spot $/bbl 17.17 20.42 19.32 20.76 23.21 20.99 18.39 18.56 18.33 18.70 18.66Brent' $/bbl 17.07 20.65 19.25 20.93 23.57 21.17 18.05 18.52 18.40 18.71 18.45Dubai' $/bbl 16.11 18.54 18.17 18.94 21.41 19.32 17.52 17.67 17.29 17.77 17.95West Texas Int.' $/bbl 18.34 22.07 20.53 22.42 24.64 22.48 19.59 19.50 19.30 19.62 19.59
Natural gasEurope $/mmbtu 2.73 2.84 2.77 2.79 2.95 2.87 2.76 2.68 2.67 2.67 2.69US $/mmbtu 1.72 2.73 2.38 2.12 3.07 2.47 2.16 2.50 2.19 2.47 2.84
BeveragesCocoa' c/kg 143.2 145.6 158.3 149.1 147.3 144.1 161.0 169.9 167.8 165.3 176.6CoffeeOthermilds6 c/kg 333.2 269.4 431.9 270.0 268.4 364.5 511.7 419.7 419.8 420.6 418.6Robustab c/kg 277.1 180.6 174.4 169.8 151.5 163.8 190.9 168.5 175.6 164.1 165.7
TeaAuctions (4), averageb c/kg 152.7 168.9 201.8 175.0 171.7 176.4 206.7 222.3 215.4 229.6 222.0London auction' c/kg 164.3 177.4 216.3 172.9 190.2 198.8 224.1 225.9 205.7 244.8 227.3
FoodFats and OilsCoconut oilb $/mt 669.6 751.6 672.1 746.0 753.0 757.7 667.0 59 1.7 597.0 567.0 611.0Copra $/mt 438.5 488.9 443.0 501.3 479.7 497.0 436.3 395.7 399.0 385.0 403.0Groundnut meal $/mt 168.6 212.8 236.1 215.0 232.0 239.0 248.7 220.7 226.0 218.0 218.0Groundnut oilb $/mt 990.9 897.3 988.0 888.7 870.0 885.3 988.7 1090.0 1096.0 1093.0 1081.0Palm ol'b $/mt 628.3 530.9 542.1 51 1.3 547.7 568.7 549.3 508.3 498.0 504.0 523.0Soybean meal' $/mt 196.9 267.5 278.9 273.7 274.3 287.3 291.7 257.7 248.0 258.0 267.0Soybean oil' $/mt 625.1 551.5 541. 1 561.0 519.7 534.0 544.0 545.3 535.0 544.0 557.0Soybeansb $/mt 259.3 304.8 299.6 3 1 6.0 288.3 313.7 304.7 280.6 306.0 265.0 270.8
GrainsMaize' $/mt 123.5 165.8 117.1 176.2 121.1 122.5 118.4 110.4 106.1 112.9 112.2Rice,
Thai, 5 %b $/mt 321.0 338.9 3 17.1 340.6 315.7 342.1 317.4 291.9 320.0 285.0 270.6Thai, 35% $/mt 290.2 275.8 254.8 269.2 249.8 268.8 254.3 241.3 256.8 236.5 230.6Thai,AI.Special $/mt 262.8 232.7 217.3 218.9 206.3 225.0 217.8 209.3 215.8 209.3 202.8
Sorghumb $/mt 119.0 150.0 108.9 148.8 108.2 1 12.2 1 12.2 102.4 96.2 104.1 106.8Wheat
Canada $/mt 207.1 230.8 184.3 220.2 93.3 186.9 187.3 178.6 174.4 180.8 180.7US, HRWb $/mt 177.0 207.6 163.1 191.0 176.7 174.9 168.2 146.2 136.2 150.6 151.7US. SRW $/mt 167.4 187.4 145.1 175.3 158.4 150.5 147.6 137.3 127.8 140.9 143.2
Other FoodBananas' $/mt 445.1 469.6 533.4 409.0 426.1 615.0 567.1 418.2 417.8 420.6 416.1Beef' c/kg 190.7 178.5 186.8 173.9 181.2 191.2 189.3 180.0 180.1 182.6 177.4Fishmeal $/mt 495.0 586.0 575.6 550.7 588.0 562.7 551.0 613.0 581.0 621 .0 637.0Lamb c/kg 262.1 329.5 341.5 35 1.0 371.9 365.5 332.8 326.0 335.3 321.7 321.2Oranges' $/mt 531.5 491.7 471.8 527.7 460.9 417.0 453.7 544.7 515.5 571.5 547.1Shrimp c/kg 1353.7 1311.9 1462.9 1325.5 1353.3 1392.6 1464.4 1531.6 1491.8 1545.4 1557.6Sugar
EU, domestic' c/kg 68.80 68.31 63.47 68.48 68.08 66.3 1 63.59 60.49 63.29 59.90 58.28US, domestic, c/kg 50.82 49.29 48.31 48.88 48.93 48.19 47.81 48.93 48.59 49.07 49.14Worla' c/kg 29.28 26.36 24.66 27.26 23.94 23.96 24.86 25.17 24.74 25.79 24.98
Agricultural Raw MaterialsTimberLogs
Malaysia' $/cum 255.6 252.1 245.5 260.6 246.6 239.3 252.2 245.0 254.3 245.4 235.2Cameroon $/cum 339.5 271.6 258.2 267.4 286.8 268.1 259.6 246.8 248.2 241.7 250.4
Plywood c/sheet 584.4 529.5 502.5 532.4 523.3 495.0 508.0 504.4 512.3 500.4 500.4Sawnwood
Malaysia' $/cum 740.0 741.4 716.8 747.6 746.5 751.3 747.4 651.6 705.7 649.0 600.1Ghana $/cum 632.5 540.8 563.9 531.5 576. 548.9 576.6 566.4 590.2 554.9 554.0
Woodpulp $/mt 853.5 574.1 546.7 545.5 573.0 527.4 527.6 585.1 572.9 591.2 591.2
NOVEMBER 1 997 39

COMMODITY PRICE OUTLOOK
TABLE A7. RECENT COMMODITY PRICES (CONTINUED)
Annual overcges Quarterly averages Monthly overages
jan-Dec Jon-Dec Jon-Sep Jul-Sep Oct-Dec jon-Mar Apr-jun jul-Sep jul Aug SepCommodity Unit 1995 1996 1997 1996 1996 1996 1996 1997 1997 1997 1997
Other Raw MaterilasCotton' c/kg 212.8 177.3 176.8 170.1 169.5 177.0 175.5 178.0 179.4 179.0 175.6Jute $/mt 368.0 457.5 325.3 403.3 399.2 364.8 324.0 287.2 315.0 294.0 252.5RubberMalaysiab c/kg 158.0 139.4 108.6 132.0 125.6 122.6 112.3 90.8 93.9 91.6 86.9NY c/kg 181.4 160.7 127.7 153.4 146.1 139.7 128.6 114.9 114.6 115.6 114.3Singapore c/kg 160.0 140.9 107.7 131.8 126.2 121.3 111.0 90.8 91.1 92.3 88.9
Sisal $/mt 709.7 868.3 782.2 890.0 880.0 809.0 770.0 767.5 770.0 770.0 762.5Wool c/kg 488.3 416.3 436.1 412.4 412.0 424.4 442.6 441.4 446.2 444.1 433.8
FertilizersDAP $/mt 216.6 213.2 199.9 206.9 209.5 200.6 199.8 199.2 199.2 200.4 197.9Phosphaterockb $/mt 35.0 39.0 41.0 39.0 39.0 41.0 41.0 41.0 41.0 41.0 41.0Potassiumchloride $/mt 117.8 1 16.9 116.5 117.0 1 17.0 116.6 116.5 1 16.5 1 16.5 /1 6.5 116.5TSPO $/mt 149.6 175.8 173.0 178.6 182.5 181.3 172.5 165.1 168.2 163.5 163.5Urea $/mt 211.5 205.5 151.8 206.4 197.0 176.7 147.6 131.2 /37.4 /30.6 125.5
Metals and MineralsAluminum' $/mt /805.7 1505.7 1606.1 1443,2 1428.7 1595.7 1584.8 1637.7 1592.0 1710.6 1610.6Copper' $/mt 2935.6 2294.9 2398.8 1978.5 2153.4 2420.7 2506.0 2269.7 2450.5 2251.2 2107.3Gold $/toz 384.2 387.7 339.3 384.7 376.0 351.2 343.0 323.6 324.1 324.0 322.8Iron oreb c/dmtu 26.95 28.57 28.88 28.57 28.57 28.88 28.88 28.88 28.88 28.88 28.88Lead& c/kg 63.1 77.4 64.4 79.9 71.6 68.2 62.5 62.6 63.4 60.8 63.4Nickeib $/mt 8228.0 7500.8 7184.8 7192.0 6851.8 7567.3 7287.0 6700.2 6835.5 6761.3 6503.8Silver c/toz 519.1 518.3 476.9 504.8 484.9 501.7 475.6 453.3 436.0 451.4 472.7Steel products (8) index, 1990=100 106.7 96.3 90.7 95.1 92.1 90.1 91.3 90.7 90.9 91.4 89.9SteelCold rolled coilsheet $/mt 554.2 483.9 449.8 474.0 438.3 440.0 450.0 459.3 450.0 460.0 468.0Hot rolled coilsheet $/mt 440.8 365.6 339.7 367.3 331.7 33 1.7 340.0 347.3 350.0 350.0 342.0Rebar $/mt 381.7 360.2 331.3 360.7 356.7 330.0 340.0 324.0 320.0 330.0 322.0Wire rod $/mt 420.8 438.5 394.7 437.3 410.0 393.3 393.3 397.3 400.0 400.0 392.0
Tinb c/kg 621.4 616.5 567.0 615.4 592.3 589.0 566.4 545.6 544.3 542.8 549.6Zinc' c/kg 103.1 102.5 136.0 100.2 102.9 117.4 130.2 160.4 151.8 165.4 164.1
World Bank commodity price indices for low and middle income countries (1990 = 100)Petroleum 75.1 89.3 82.2 90.8 101.4 91.8 80.4 81.1 80.1 81.7 81.6Non-EnergyCommodities 122.2 1 I5.1 118.6 113.1 1/10.7 119.3 126.0 1 16.0 117.5 116.2 1 14.3Agriculture 131.3 125.5 129.4 124.7 120.7 130.0 139.6 126.0 127.6 125.9 124.6Beverages 151.2 126.5 166.2 126.6 124.0 150.7 197.8 173.6 173.4 173.0 174.2Food 1 16.9 123.6 115.8 123.2 1 16.8 122.5 1 19.5 1 10.2 1 10.2 1 10.0 1 10.3
FatsandOils 136.6 147.0 144.5 /47.7 147.8 154.5 151.8 138.5 137.7 136.5 141.3Grains 120.4 140.6 1 14.7 139.6 1/ 8.4 122.7 1 16.5 105.7 106.6 106.2 104.2Other Food 98.8 95.0 92.8 94.0 90.5 96.3 94.8 89.5 89.8 90.6 88.3
RawMaterials 135.2 127.1 119.9 125.2 123.3 124.4 122.4 111.3 116.1 1 I 1.5 106.3Timber 139.5 139.5 137.6 141.1 139.9 140.2 140.5 124.3 133.8 123.9 1 15.2OtherFRaw Materials 132.3 1 18.7 107.8 114.3 i 12.0 1 13.6 1 10.1 102.4 104.0 103.0 100.3
Fertilizers /03.6 1 19.8 119.5 121.1 123.0 124.2 120.0 1 16.4 117.9 115.7 115.7Metals and Minerals 101.6 89.1 91.8 83.8 85.1 92.5 93.1 91.3 92.6 92.5 88.8
Note: Prices as of October 29, 1997. Mnonthly updates of commodity prices are available on the internet at http://sww.worldbank.org/htmlteccpAeccp.htmla. Included in the petroleum index.b. Included n the nonenergy index.c. Steel not included in the nonenergy index.Source: World Bank, Development Economics, Development Prospects Groups.
40 COMMODITY MARKETS AND THE DEVELOPING COUNTRIES

COMMODITY PRICE OUTLOOK
COMMODITY DESCRIPTIONSEnergy Agricultural raw materialsCoal (Australian), thermal, 1 2,000 btuAb, less than 1.0% sulfur, 14% ash, f o.b. piers, Timber
Newcastle/Port Kembla Logs (Moloysion), meranti, Sarawak, sale price charged by importers, Tokyo; pnor toCoal (US), thermal, 12,000 btuAb, less than 1.0% sulfur, 12% ash, fo.b. piers, February 1993, average of Sabah and Sarawak weighted by Japanese import
Hampton Road/Norfolk volumesCrude ol, (spot), average spot pnce of Brent, Dubai and West Texas Intermediate, Logs (West African), sapelli, high quality (loyal and marchand), f.o.b. Cameroon
equally weighed Plywood (Southeast Asion), Lauan, 3-ply, extra, 91 cum x 182 cum x 4 mm, wholesaleCrude oil (spot), U.K. Brent 380 API, f.o.b. U.K ports price, spot TokyoCrude oil (spot), Dubai Fateh 320 API, f o.b. Dubai Sawnwood (Maloysian), dark red seraya/meranti, select and better quality, GeneralCrude oil (spot), West Texas Intermediate (WTI) 40° API, fo.b. Midland Texas Market Specification (GMS), width 6 inches or more, average 7 to 8 inches; lengthNatural Gas (Europe), average import border price 8 inches or more, average 1 2 to 14 inches; thickness I to 2 inch(es); kiln dry, c&fNatural Gas (U.S.), spot price at Henry Hub, Louisiana UK ports
Beverages Sawnwood (Ghanoion), sapele, bundled, fo.b. TakoradiCocoa (ICCO), International Cocoa Organization daily price, average of the first three Woodpulp (Swedish), softwood, sulphate, bleached, air-dry weight, c.i.f. North Sea
positions on the terminal markets of New York and London nearest three future pOrtstrading months ~~~~~~~~~~~~~~Other raw materialstrading months
Coffee (ICO), Intemational Coffee Organization indicator price, other mild Arabicas, Cotton (cotton oudook, A idex), middling 1-3/32 inch, c.i.f Europeaverage New York and Bremen/Hamburg markets, ex-dock Jute (Bangladesh), raw, white D, f o.b. Chttagong/Chalna
Coffee (ICO), International Coffee Organization indicator pnce, Robustas, average New Rubber (Malaysian), RSS no. I, in bales, Malaysian Rubber Exchange & LicensingYork and Le Havre/Marseilles markets, ex-dock Board, midday buyers' asking pnce for prompt or 30 days delivery, fo.b. Kuala
Tea (Auctions, overage), leaf at Calcutta auction, and all tea at Colombo, London, and LumpurRubber (any origin), RSS no. I, in bales, Rubber Traders Association (RTA), spot, NewNairobi/Mombassa auctions, arithmetic averages of weekly quotes York
Tea (London auctions), all tea, arithmetic averages of weekly quotes YrRubber (Asian), RSS no. I, in bales, Rubber Association of Singapore Commodity
Foods Exchange (PASCE)/ Singapore Commodity Exchange, midday buyers' asking priceFats and oils for prompt or 30 days delivery; pror to June 1992, spot, SingaporeCoconut oil (Philippines/lndonesian), bulk, c.i.f. Rotterdam Sisol (East African), UG (rejects), c.i.f. UKCopra (PhilippineslIndonesion), bulk, c.i.f. N.W. Europe Wool (Dominion), crossbred, 56's, clean, c.i.f. UKGroundnut meal (Argentine), 48/50%, c.i.f. Rotterdam Fertil.zersGroundnut oil (any origin), c.i.f. Rotterdam Fttlzr
onm oil (Malaysaon), 5% bulk c.i.f. N W Europe DAP (diammonium phosphate), bulk, spot, fo.b. US GulfSoybean meal (any origin), Argentine 45/46% extration, c.i.f. Rotterdam; prior to Potassum chtorade (muriat)e 7% ptLh), contract, fasp Casablanca
1990,on USl (Dutch) crude, f.o.b. ex-mill TSP (triple superphosphote), bulk, spot, fo.b. US GulfSoybean oil (Dutch), crude, fob. ex-mill Urea (varying origins), bagged, spot, fo.b. West EuropeSoybeans (US), c.if. RotterdamGrains Metals and mineralsMaize (US), no. 2, yellow, f.o.b. US Gulf ports Aluminum (LME) London Metal Exchange, unalloyed primary ingots, high grade, mini-Rice (Thai), 5% broken, WR, milled, indicative market price based on weekly surveys mum 99.7% purity, cash prce
of export transactions (indicative survey price), govemment standard, fo.b. Copper (LME), grade A, minimum 99.9935% purity, cathodes and wire bar shapes,Bangkok settlement prce
Rice (Thai), 35% broken, WR, milled, indicative survey prce, govemment standard, Gold (UK), 99.5% fine, London aftemoon fixing, average of daily ratesf o.b. Bangkok Iron ore (Brazilian), CVRD Southern System standard sinter fines (SSF), 64.2% Fe
Pice (Thai), 100% broken, A. I Special, broken kemel obtained from the milling of WR (iron) content (dry weight) ores, moisture content 6.5%, contract price to Europe,15%, 20%, and 25%, indicative survey price, government standard, f.o.b. f.o.b. Tubarao. Unit dry metric ton unit (dmtu) stands for mt 1% Fe-unit, To con-Bangkok vert price in cents/dmtu to $/dmt SSF (dry ore), muitiply by percent Fe content.
Sorghum (US), no. 2 milo yellow, f.o.b. Gulf ports For example, 28.88 cents/dmtu is $18.54 /dmt SSF. To convert to wet mt SSFWheat (Canadian), no. I, Westem Red Spring (CWRS), in store, St. Lawrence, export (natural or wet ore), muitiply by percent Fe content by (I minus percent moisture
price content). 28.88 cents/dmtu is $17.34 /Wet mt SSF. Iron ore in most countries isWheat (US), no. I, hard red winter, ordinary protein, export price delivered at the traded in terms of dry mt, and shipped in wet mt. For 1989-96, Fe content was
Gulf port for prompt or 30 days shipment 64.3% and moisture content 6.9%Wheat (US), no. 2, soft red winter, export prce delivered at the Gulf port for prompt Lead (LME), refined, 99.97% purity, settlement prce
or 30 days shipment Nickel (LME), cathodes, minimum 99.8% purity, official morning session, weekly aver-Other foods age bid/asked priceBananas (Central & South American), first-class quality tropical pack, importer's price to Silver (Handy & Harmon), 99.9% grade refined, New York
jobber or processor, f.o.r. US ports Steel products price index, 1990= 100, aapanese), composite price index for eightBeef (Australion/New Zealand), cow forequarters, frozen boneless, 85% chemical lean, selected steel products based on quotations f.o.b. Japan excluding shipments to
c.i.f. US port (East Coast), ex-dock the United States and China, weighted by product shares of apparent combinedFishmeal (any origin), 64-65%, c&f Hamburg, nfs consumption (volume of deliveries) at Germany, Japan and the United States. TheLamb (New Zealand), frozen whole carcasses, wholesale price, Smithfield market, eight products are as follows: rebar (concrete reinforcing bars), merch bar (mer-
London chant bars), wire rod, sedon (H-shape), plate (medium), hot rolled coil/sheet,Oranges (Mediterranean exporters) navel, EEC indicative import price, c.i.f. Pans cold rolled coil/sheet, and galvanized iron sheetShrimp (US), frozen, Gulf brown, shell-on, headless, 26 to 30 count per pound, Tin (LME), refined, 99.85% purity, settlement price
wholesale prce at New York Zinc (LME), special high grade, minimum 99.995% purity, weekly average bid/askedSugar (EU), European Union negotiated import price for raw unpackaged sugar from pnce, official morning session; prior to April 1990, high grade, minimum 99.95%
Afnrican, Caribbean and Pacific (ACP) under Lome Conventions c.i.f, European purity, settlement priceports
Sugar (US), import price, nearest future, c.i.f. New YorkSugar (worid), International Sugar Agreement (ISA) daily price, raw, fo.b. and stowed at
greater Caribbean ports
NOVEMBER 1997 41
COMMODITY0 MARKETSANDTHE DEVELOPING COUNTRIES
AWorld Bank Business Quarterly
Commodity Markets and the Developing Countriesis produced by the Development Prospects Group of
the Development Economics Vice Presidency of theWorld Bank. For information about the contents call
Donald Mitchell at 202-473-3854 or fax202-522-3564. The opinions expressed are those ofthe authors and should not be attributed in anymanner to the World Bank, to its Board of ExecutiveDirectors, or to the countries they represent. It is
published quarterly in February, May, August, andNovember. The annual subscription rate is $150.00.
Send subscription orders to World Bank
Publications, Box 7247-7956, Philadelphia, PA 19170
-7956, USA, telephone 201-476-2192 Am
© 1997 The International Bank for Reconstructionand Development/The World Bank1818 H Street, NW, Washington, DC 20433, USAAll rights reservedManufactured in the United States of AmericaVol. 5, no. I
ISSN 1020-0967ISBN 0-8213-4152-9
X Printed on recycled paper
Copyright © 2022 FDOKUMEN