Defining Medicine and Commodity Needs for the ...
90
Defining Medicine and Commodity Needs for the Management of Uncomplicated and Severe Malaria in Kenya’s Formal Sector Using Novel Space-Time Geostatistical Methods Peter W. Gething Abdisalan M. Noor Emelda A. Okiro Juliette J. Mutheu Victor A. Alegana Simon I. Hay Dorothy. Memusi Abdinasir A. Amin Gladys Tetteh Robert W. Snow September 2008 Strengthening Pharmaceutical Systems Center for Pharmaceutical Management Management Sciences for Health 4301 North Fairfax Drive, Suite 400 Arlington, VA 22203 USA Phone: 703.524.6575 Fax: 703.524.7898 E-mail: [email protected]
-
Upload
khangminh22 -
Category
Documents
-
view
1 -
download
0
Transcript of Defining Medicine and Commodity Needs for the ...

Defining Medicine and Commodity Needs for the Management of Uncomplicated and Severe Malaria in Kenya’s Formal Sector Using Novel Space-Time Geostatistical Methods Peter W. Gething Abdisalan M. Noor Emelda A. Okiro Juliette J. Mutheu Victor A. Alegana Simon I. Hay Dorothy. Memusi Abdinasir A. Amin Gladys Tetteh Robert W. Snow September 2008
Strengthening Pharmaceutical Systems Center for Pharmaceutical Management Management Sciences for Health 4301 North Fairfax Drive, Suite 400 Arlington, VA 22203 USA Phone: 703.524.6575 Fax: 703.524.7898 E-mail: [email protected]

Defining Medicine and Commodity Needs for the Management of Uncomplicated and Severe Malaria in Kenya’s Formal Sector Using Novel Space-Time Geostatistical Methods
ii
This report is made possible by the generous support of the American people through the U.S. Agency for International Development (USAID), under the terms of Cooperative Agreement #GHN-A-00-07-00002-00. The contents are the responsibility of Management Sciences for Health and do not necessarily reflect the views of USAID or the United States Government. About SPS The Strengthening Pharmaceutical Systems (SPS) Program strives to build capacity within developing countries to effectively manage all aspects of pharmaceutical systems and services. SPS focuses on improving governance in the pharmaceutical sector, strengthening pharmaceutical management systems and financing mechanisms, containing antimicrobial resistance, and enhancing access to and appropriate use of medicines. Recommended Citation This report may be reproduced if credit is given to SPS. Please use the following citation. Gething, P. W., A. M. Noor, E. A. Okiro, J. J. Mutheu, V. A. Alengana, S. I. Hay, D. Memusi, A. A. Amin, G. Tetteh, and R. W. Snow. 2008. Defining Medicine and Commodity Needs for the Management of Uncomplicated and Severe Malaria in Kenya’s Formal Sector Using Novel Space-Time Geostatistical Methods. Submitted to the U.S. Agency for International Development by the Strengthening Pharmaceutical Systems Program. Arlington, VA: Management Sciences for Health.
Strengthening Pharmaceutical Systems Center for Pharmaceutical Management
Management Sciences for Health 4301 North Fairfax Drive, Suite 400
Arlington, VA 22203 USA Telephone: 703.524.6575
Fax: 703.524.7898 E-mail: [email protected]
Web: www.msh.org/sps.org

iii
CONTENTS
ACRONYMS ............................................................................................................................. v
ACKNOWLEDGMENTS ....................................................................................................... vii
SECTION 1: CONTEXT ........................................................................................................... 1
SCOPE OF WORK .................................................................................................................... 3 Objective ................................................................................................................................ 3 Background ............................................................................................................................ 3 Activities ................................................................................................................................ 4
Task 1: Hospital Severe Malaria Management Needs Assessment ................................... 4 Task 2: Revising the Medicine Supply Needs for Management of Uncomplicated
Malaria in Kenya................................................................................................... 4
SECTION 2: CONSULTANTS’ REPORT ............................................................................... 7
EXECUTIVE SUMMARY ....................................................................................................... 7 Estimating National Requirements for AL in 2007 ............................................................... 7 Estimating Pediatric Inpatient Admissions for Malaria in 2007 .......................................... 10
BACKGROUND AND RATIONALE .................................................................................... 11 Current Status of Pharmaceutical Procurement ................................................................... 11 Previous Attempts at Estimating Medicine Demand ........................................................... 12 The Scope and Purpose of the Current Medicine Needs Estimate ...................................... 12
DATA DEVELOPMENT ........................................................................................................ 15 Database Sources and Assembly ......................................................................................... 15
National Health Facility Database ................................................................................... 15 Updating the National Health Facility Database in 2008 ................................................ 20 DOMC AL Consumption Data ........................................................................................ 24 KEMSA AL Distribution Data ........................................................................................ 24 Results of AL Consumption and Distribution Data ......................................................... 25
Assembling Hospital Location and Admissions Data ......................................................... 28 Accessing Central HMIS Records on Inpatient Case Burdens ........................................ 28 Reassembling Inpatient Case Data Directly from Hospitals............................................ 30
STATISTICAL METHODS AND RESULTS ........................................................................ 33 Predicting 2007 AL Consumption: Statistical Methods ...................................................... 33
Data Preprocessing: Consistency Checks and Standardization ....................................... 33 Data Availability through Time ....................................................................................... 34 Final Data Used in Modeling ........................................................................................... 35 Testing Potential Covariates ............................................................................................ 35 Predicting Missing Consumption Records Using Geostatistical Analysis ...................... 36 Variography and Kriging ................................................................................................. 37 Validation ......................................................................................................................... 37 Comparison of Results Using STK and Median Months ................................................ 38
Predicting 2007 AL Consumption: Results ......................................................................... 38 Predicted Consumption Totals ......................................................................................... 38
Defining Medicine and Commodity Needs for the Management of Uncomplicated and Severe Malaria in Kenya’s Formal Sector Using Novel Space-Time Geostatistical Methods
iv
Validation Results ............................................................................................................ 39 Comparison with Median Month Imputation .................................................................. 40
Predicting 2007 Pediatric Inpatient Admissions for Malaria: Statistical Methods .............. 40 Data Visualization and Exploratory Analysis .................................................................. 40 Testing Potential Covariates ............................................................................................ 42 Predicting Total Malaria Admissions across All Hospitals ............................................. 42 Disaggregation by Age Group ......................................................................................... 43 Validation Procedures ...................................................................................................... 43
Predicting 2007 Pediatric Inpatient Admissions for Malaria: Results ................................. 44 Predicted Malaria Inpatient Admissions .......................................................................... 44 Validation Results ............................................................................................................ 44
DISCUSSION .......................................................................................................................... 49
REFERENCES ........................................................................................................................ 53
ANNEX A: ADDITIONAL DATA TABLES AND VISUALIZATIONS OF HOSPITALS AND ADMISSIONS DATA ................................................................................ 57
ANNEX B. TESTING POTENTIAL COVARIATES OF AL CONSUMPTION: ADDITIONAL FIGURES ................................................................................... 69
ANNEX C. SPACE-TIME KRIGING .................................................................................... 71 Theory .................................................................................................................................. 71 Implementation .................................................................................................................... 72
ANNEX D. VALIDATION PROCEDURE ............................................................................ 73 Estimating the Variance of the Global Error Distribution ................................................... 73 Assessing the Effect of Aggregation on the Variance of Prediction Errors ........................ 73 Estimating the Prediction Error for Individual Space-Time Units ...................................... 75
ANNEX E: PREDICTED AL CONSUMPTION BY PACK SIZE, PROVINCE, FACILITY TYPE, AND SECTOR ......................................................................................... 77
ANNEX F. CONSTRUCTION OF EMPIRICAL VARIOGRAMS WITH MONTE CARLO NULL ENVELOPE FOR ASSESSING SPATIAL STRUCTURE IN PEDIATRIC ADMISSIONS DATA .................................................................... 79
ANNEX G. TESTING POTENTIAL COVARIATES OF ADMISSIONS DATA: ADDITIONAL FIGURE ...................................................................................... 81

v
ACRONYMS
ACT artemisinin-based combination therapy AL artemether-lumefantrine CBS Central Bureau of Statistics CI confidence interval DHMT District Health Management Team DOMC Division of Malaria Control DSM Drug Supply Management [subcommittee] GIS geographic information system GFATM Global Fund to Fight AIDS, TB and Malaria GoK Government of Kenya GPS global positioning system HMIS health management information system ILRI International Livestock Research Institute ITN insecticide-treated net KEMRI Kenya Medical Research Institute KEMSA Kenya Medical Supplies Agency KMD Kenya Medical Directory LA Local Authority MEDS Mission for Essential Drugs and Supplies MoH Ministry of Health MoRPW Ministry of Roads and Public Works MSH Management Sciences for Health NGO nongovernmental organizationNHFD National Health Facility Database OK ordinary kriging PSI Population Services International RDT rapid diagnostic test RPM Plus Rational Pharmaceutical Management Plus [Program] STK space-time kriging SPS Strengthening Pharmaceutical Systems [Program] WHO World Health Organization

Defining Medicine and Commodity Needs for the Management of Uncomplicated and Severe Malaria in Kenya’s Formal Sector Using Novel Space-Time Geostatistical Methods
vi

vii
ACKNOWLEDGMENTS The authors thank Priscilla Gikandi, Caroline Kabaria, Felicia Solomon, and Ahuma Tetteh for reconciling the KEMSA, MEDS, and DOMC databases and geolocation of health facilities. The following Health Records Information Officers, medical superintendents, and others based across the country are gratefully acknowledged for their help in assembling monthly admission data from their respective hospitals: Abdirahman Abdille, David M. Akech, Rajimbo Ali, Hebert Asenka, Jay Berkley, Mr. Jamin, Martin Kamau, Joseph Kariri, Simon Kavisi, James Kuya, Judy Machani, Puis Samuel Mulinda, Jeremiah Mumo, Silas Mureithi, Benson Mwai, Katana Ndegwa, Patrick Ngatia, Pauline Njeru, James Nokes, Cyrus Obaigwa, George Otieno Obop, Jedida Obure, Grace Omwanda, J.G. Oreko, Joseph Rimba, Ezekiel Sakuda, Franklyn Songok, and Gideon Yano. Rebecca Kiptui, Dorothy MemusiAndrew Wamari, of the Division of Malaria Control and Mercy Maina and Cecilia Muiva of MSH Kenya assisted in understanding the process of establishing the medicine consumption data and provided these data for analysis. Thanks to Paul Koske of Kenya Medical Supplies Agency for providing the artemether-lumefantrine distribution data and to James Mwenda of Mission for Essential Drugs and Supplies for help with identifying mission sector medicine distribution clients.

Defining Medicine and Commodity Needs for the Management of Uncomplicated and Severe Malaria in Kenya’s Formal Sector Using Novel Space-Time Geostatistical Methods
viii

1
SECTION 1: CONTEXT Since the change of first-line antimalarial medicine policy from sulfadoxine/sulfalene/ pyrimethamine to artemisinin-based combination therapies (ACTs) in Kenya, specifically artemether-lumefantrine (AL), the Drug Supply Management (DSM) subcommittee of the drug policy technical group of the Division of Malaria Control (DOMC) has undertaken two joint national quantification exercises and determined medicine needs to cover two procurement cycles, July 2007–June 2008 and July 2008–June 2009. The DSM has representation from the DOMC, the Division of Pharmacy, the Chief Pharmacist’s Office, the Pharmacy and Poisons Board, the National Quality Control Laboratory, the Kenya Medical Supplies Agency (KEMSA), the Global Fund Procurement and Supply Chain Management Consortium, the Mission for Essential Drugs and Supplies (MEDS), Management Sciences for Health (MSH)/Strengthening Pharmaceutical Systems (SPS) Program, John Snow, Inc., and the World Health Organization (WHO). The national quantification of antimalarial medicines has relied on triangulating consumption and morbidity methods with consensus built around key assumptions in the quantification process. Recommendations to the DOMC, donors, and partners are based on the best estimate given the data available and the effect of progressive intervention scale-up. From these quantification exercises and deliberations in the DSM’s monthly meetings, two key challenges in the national quantification of antimalarial medicines have repeatedly surfaced: (1) the gaps in consumption data resulting from poor reporting by health facilities, and (2) the lack of data on the case burden of severe malaria in Kenya. To fill these gaps, MSH/SPS commissioned Oxford Geo-information Limited of the United Kingdom as detailed in the following scope of work.

Defining Medicine and Commodity Needs for the Management of Uncomplicated and Severe Malaria in Kenya’s Formal Sector Using Novel Space-Time Geostatistical Methods
2

3
SCOPE OF WORK Objective This activity aims to strengthen the SPS approach to the national quantification of antimalarial medicines for uncomplicated and severe malaria using novel operational research techniques such as time-series analysis and space-time kriging (STK) in Kenya. Background The changing epidemiology of malaria transmission in Kenya is resulting in a declining incidence of hospitalization for severe malaria (Okiro et al. 2007). These declines have been attributed to the scaling up of insecticide-treated net (ITN) distribution and the transition to effective malaria medicine policies to support the management of uncomplicated malaria. In Kenya, more than 120 facilities provide traditional inpatient hospital care. In addition, a large but ill-defined number of health facilities provide minimal severe disease management. With a fully functioning, reliable, and timely health management information system (HMIS), the historical, temporal, and spatial needs of the health system can be adequately defined to support medicine and commodity supplies nationwide. Unfortunately, this ideal system is distal to reality. Although investments are being made in strengthening Kenya’s HMIS, an immediate need remains to quantify medicine and commodity needs to support the management of severe, complicated hospitalized malaria nationwide and to estimate how these needs might be projected over time (using time-series analysis) as the coverage of effective infection prevention strategies and peripheral case management increases. Previous attempts to model and estimate pharmaceutical commodity needs within the formal Government of Kenya (GoK) health sector were based on analysis of sampled outpatient department data, a geographic information system (GIS) platform of health providers against malaria risk, and imperfect HMIS data (Snow et al. 2003). This model failed to account for the spatial structure of the imperfect HMIS data, was not adjusted for temporal trends, and did not accommodate changing clinical practices following the introduction of improved guidelines with the rolling out of ACT. New, improved methodologies are available that better estimate combined health facility pharmaceutical supply needs from imperfect data by adjusting more robustly for differences in space and time (Gething et al. 2006; Gething, Atkinson et al. 2007b; Gething, Noor et al. 2007a). With the support of the MSH/Rational Pharmaceutical Management Plus (RPM Plus) Program, the DOMC instituted a short-term tracking system for ACT in 2006 along with the new policy roll-out. As is common with all HMISs, the reports from facilities on consumption of ACTs are often untimely, incomplete, inaccurate, or nonexistent. RPM Plus and SPS have previously used simple interpolation methods such as medians for missing data or simple averages of the previous month’s and the following month’s consumption to interpolate missing consumption values (Amin et al. 2007b). However, the Kenya Medical Research Institute (KEMRI)/Wellcome-Oxford collaboration has used a more sophisticated and robust interpolation method, space-time kriging, for incomplete data (Gething, Noor et al. 2007a).

Defining Medicine and Commodity Needs for the Management of Uncomplicated and Severe Malaria in Kenya’s Formal Sector Using Novel Space-Time Geostatistical Methods
4
Activities Task 1: Hospital Severe Malaria Management Needs Assessment 1. Sample 14 hospitals across Kenya, located in three dominant ecological classes: Lakeside
high transmission (Bondo, Siaya, Kisumu, Homa Bay, and Busia); acute seasonal highlands (Kericho, Kisii, and Narok); semi-arid areas (Makueni, Kitui, and Voi) and costal moderate transmission (Msambweni, Malindi, and Kilifi).
2. Monthly admission summaries of patient numbers admitted to the pediatric wards
structured by age (<1 year, 1–4 years, and 5–14 years) between January 1999 and June 2008 will be assembled from hospital registers.
3. Data will be subjected to simple time-series analysis to define seasonally adjusted trends
and projections of pediatric hospital burdens. 4. A sample of 10 additional hospitals will be visited for a more rapid review of case
burdens to serve as a sensitivity analysis on projected disease burdens across different endemic settings. These data will be triangulated with quarterly reports to HMIS at Afya House for the same years and extrapolated for additional sensitivity analysis for the 50 hospitals not included in the primary series for which crude HMIS data exist.
5. In at least 10 hospitals, the ratio of child-to-adult admissions will be computed and
corrected for “true” malaria based upon some limited hospital data in the adult age group. Malaria is more often a diagnosis of convenience made in febrile adults than a true diagnosis.
6. A GIS platform of all hospitals providing inpatient care will be developed against a
malaria risk map to define the universe of hospital settings requiring Global Fund to Fight AIDS, TB and Malaria (GFATM)-supported medicine and commodity supplies.
7. Simple and modeled interpolation from sampled, time-series data on admission burdens
will be made to estimate a single set of commodity and medicine needs for hospital settings across Kenya for 2009, 2010, and 2011.
Task 2: Revising the Medicine Supply Needs for Management of
Uncomplicated Malaria in Kenya 1. The National Health Facility Database (NHFD) developed in 2003 (Noor et al. 2003) will
be updated through district and central-level communications and opportunistic visits. 2. For a given review period for which a national quantification is necessary, data will be
abstracted from the current DOMC interim tracking system for ACT. 3. Missing data for both reporting and nonreporting facilities will be interpolated using STK
to arrive at overall national estimates of need for ACT, including measures of uncertainty around those estimates.
4. Imperfect ACT consumption data will be preprocessed and linked to the health facility
GIS platform.

Scope of Work
5
5. Space-time models of ACT consumption will be reconfigured using adaptations of models reported by Gething et al. 2007b.
6. Modeled projected age-structured needs of each pack size of AL at provincial levels will
be generated for the years 2009, 2010, and 2011 and aggregated to the national level for national quantification. Modeling other assumptions: It will be important to build in scenarios to the time-space models. These will include (a) changing patterns of ACT use, such as increased use caused by changing ACT policy in combination with declining use because of effective ITN coverage; (b) changing availability and adherence to better diagnostic coverage and guidelines; (c) scaled up use of other sources of ACT outside formal sectors—for example, over-the-counter availability; (d) scale-up of indoor residual spraying from the 16 epidemic prone districts to its phased introduction in endemic districts; and (e) general sensitivity analysis around completeness of health facility audit.
The results of the commissioned study are presented in Section 2 of this report.

Defining Medicine and Commodity Needs for the Management of Uncomplicated and Severe Malaria in Kenya’s Formal Sector Using Novel Space-Time Geostatistical Methods
6

7
SECTION 2: CONSULTANTS’ REPORT
EXECUTIVE SUMMARY Estimating National Requirements for AL in 2007 In 2004 Kenya’s malaria treatment policy changed to the use of the ACT artemether-lumefantrine as the first-line treatment. The first quantification of the number of treatments required for distribution of AL to all public health facilities nationwide for the initial procurement period July 2006–June 2007 used GIS-based interpolation to adjust incomplete outpatient data and estimated that over 7.4 million malaria diagnoses were made at the 2,074 GoK outpatient clinics across the country. The second quantification, conducted in 2007 for Year 2 of the ACT policy implementation, July 2007–June 2008, used limited facility-level data on consumption of AL and imputed missing data using observed median consumption to upregulate and estimate requirements nationwide across a projected 4,604 public health facilities. This exercise estimated a national requirement of approximately 17.1 million treatments of AL. In this report, AL consumption data and an updated spatial database of public health facilities nationwide are used, to which an improved space-time geostatistical interpolation methodology is applied to predict missing data, while taking into account spatial and temporal variation in consumption. Before any adjustments for buffer stock or losses and wastage, this approach has estimated that 25.3 million treatments of AL were required across the 5,456 government and mission facilities nationwide during 2007. Reasons for the discrepancy between this most recent estimate and that made in 2007 are threefold. First, the number of health facilities over which these estimates were made has increased by 20 percent, representing both a genuine expansion in the public health sector and the effort by the KEMRI/Wellcome Trust Programme, through this study, to identify, locate, and document health facilities nationwide. The updated 2008 iteration of the NHFD stands as a significant contribution in its own right to future health system auditing in Kenya. Second, more data were available to this project, using consumption data for all 12 months of 2007 rather than being limited to the first two quarters only. Third, the use of observed median monthly consumption to impute missing values is likely to underestimate true consumption nationwide given the highly skewed nature of the data. In contrast, the use of space-time geostatistical interpolation suffers no such bias and provides more accurate predictions by modeling spatial and temporal heterogeneity in consumption. As such, the figure of 25.3 million treatments presented here stands as the most reliable estimate of AL requirements across Kenya’s public health sector in 2007. The primary data used in this project consisted of monthly records of AL consumption across four pack sizes at individual health facilities. These data were generated by the AL tracking system operated by the DOMC. Using the set of 5,456 public health facilities as a baseline, this database contained only 6 percent of the expected monthly consumption records for 2007. The consumption database was integrated with the NHFD and subjected to extensive manual and automated error checks and cross-referencing.

Defining Medicine and Commodity Needs for the Management of Uncomplicated and Severe Malaria in Kenya’s Formal Sector Using Novel Space-Time Geostatistical Methods
8
A geostatistical interpolation technique called space-time kriging was implemented that used the 6 percent of available data to predict each missing monthly consumption record in the remaining 94 percent of the database. STK predicts missing records at a facility by combining data available from other months at that facility and other nearby facilities in a weighted average. The weighting scheme is based on observed characteristics of spatial and temporal variation in the data set to achieve a statistically optimum combination of weights. After each missing record was predicted individually, these records were recombined with the available data, and consumption requirements were tallied over districts, provinces, and nationally. Separate STK models were built for each broad class of facility (hospitals, health centers, dispensaries) and for each AL pack size (6 × 1, 6 × 2, 6 × 3, 6 × 4). Two secondary data sources were assembled and tested for their potential to act as covariates for predicting AL consumption. These were (a) data on the distribution of AL to facilities by KEMSA—effectively, a record of the quantity of medicines supplied to each facility, which contrasts with consumption data on the quantity actually used—and (b) outpatient data on malaria diagnoses from the HMIS for 1996–2004, which had been interpolated in a previous study (Gething et al. 2006). Neither data source was statistically correlated to AL consumption values; therefore, neither was used in the construction of the final model. Unlike previous quantification exercises, robust validation of modeled outputs was included to generate estimates of uncertainty around predictions: 25 percent of data was removed at random from the database, the model was rerun in full to predict these values using the remaining 75 percent, and the resulting predictions were compared to the removed values to obtain a sample of prediction errors. By modeling the size and characteristics of these errors, 95 percent confidence intervals (CIs) could be generated around the predicted district, provincial, and national consumption estimates of +/– 31 percent, +/– 5 percent and +/– 3 percent, respectively. The model was therefore likely to predict with reasonable precision the national AL requirement and how that is distributed across the eight Kenyan provinces. Because the accuracy of predictions becomes increasingly poor at finer levels of spatial aggregation, the model is unable to generate similarly reliable estimates for individual districts using data currently available. The approach and results presented in this report come with a number of limitations and caveats. First, regardless of the statistical models implemented, the precision and reliability of the final quantifications inevitably depend on the amount and quality of information available on consumption at individual health facilities. Sophisticated modeling such as that presented in this report should not be considered a replacement in the long term for a program of reliable, timely, and comprehensive routine data collection. Second, the estimates presented here relate specifically to 2007, and no attempt is made to model long-term trends in consumption or to predict future changes. If consistent reporting of consumption data can be sustained over a period of years, then such modeling may become feasible. In the interim, the aim has been to quantify medicine needs in 2007 as the most reliable metric for calibrating future requirements. Third, the heavy computational demand and statistical expertise required to implement the space-time geostatistical methods described mean that the approach cannot currently be rolled out as a stand-alone tool for use by health service managers. Making such a tool available does represent a longer-term goal, using simplified model code; however, such models remain critically dependent on a more complete, temporally consistent, and reliable data set, and acquiring that information must remain the initial priority of the DOMC and its partners.

Executive Summary
9
As such, the first recommendation remains that more information on medicine consumption must be collected more frequently from more facilities nationwide. Regardless of the level of sophistication, no statistical model can compensate fully for large proportions of missing data. It is discouraging to note that the use of data from the first half of 2008 in this analysis had to be abandoned because of a dramatic decline in reporting rates over these months to less than 2 percent nationwide. Given that AL supply for the latter half of 2008 was marred by procurement failures, the annual consumption data set for 2008 as a whole is inadequate to support a repeat of the procedure undertaken here for 2007. An immediate aim, therefore, should be to establish a reliable data collection system to provide sufficient information on medicine consumption in 2009 to allow projections for 2010. A number of new mechanisms for enhanced data collection are in development and should be explored as an urgent priority. The Phones for Health initiative seeks to exploit the proliferation of mobile phone networks to provide a rapid and efficient conduit for timely reporting of routine health information from facilities to national databases. By removing the reliance on paper reporting forms and their physical transportation from peripheral facilities, this initiative aims to substantially increase reporting rates nationwide. A second, and not mutually exclusive, consideration is the potential for establishing a system of sentinel facilities. This strategy would see investment in data collection at a subset of facilities to generate data that could be considered nationally representative and allow estimates of consumption requirements with known precision. The design and optimization of a sentinel system would require further research using spatial and temporal statistical techniques to assess how many sentinel facilities would be required for a given level of precision and where these facilities would be best located. The second recommendation of this report is that Kenya takes the figure of 26 million treatments, the upper 95 percent CI of the national estimate obtained in this study, as the most reliable estimate of AL consumption in the public sector in 2007. These values are given by pack size in table 1. Table 1. Upper 95 Percent CI Needs Estimates for AL
Pack Size Estimated 2007 Requirement
6 × 1 6,680,000 6 × 2 7,041,000 6 × 3 4,082,000 6 × 4 8,238,000 Total 26,041,000 These values are exclusive of any adjustments for buffer stock requirements, losses, or wastage. No attempt is made here to predict major changes in medicine requirements in future years. Potential changes in at least three major factors may affect future AL requirements. An increase in the use of rapid diagnostic tests (RDTs) to support diagnoses of outpatient malaria before treatment with first-line medicines could lead to a substantial reduction in this diagnosis and therefore a reduction in treatment with AL compared to currently widespread presumptive treatment practices. Second, the likely increase in availability of AL and other ACTs in the informal and private health sectors could lead to a reduction in demand from the public sector as individuals obtain treatment elsewhere.

Defining Medicine and Commodity Needs for the Management of Uncomplicated and Severe Malaria in Kenya’s Formal Sector Using Novel Space-Time Geostatistical Methods
10
Finally, an increase in the coverage of ITNs has already been associated with a reduction in malaria endemicity (Okiro et al. 2007) on the Kenyan coast, and it can be hoped that the continued scale-up of these and other interventions will result in more widespread reductions in malaria endemicity across the country. Whether these potential changes will translate into changing disease incidence in other parts of the country remains a moot point because none of these potential changes can currently be quantified or forecast nationally from existing data. Therefore, without appropriate information over time on any of these covariates, this report recommends that the 2007 estimates presented here should be used without assumptions about temporal trends and calibrated annually for AL requirements in future years using complete previous-year consumption data. Estimating Pediatric Inpatient Admissions for Malaria in 2007 The total number of pediatric admissions for malaria in public health facilities across Kenya in 2007 was predicted as 301,000 with a CI of +/– 8.6 percent. This total was divided between 201,000 (67 percent) at GoK facilities and 100,000 (33 percent) at mission sector facilities and consisted of 32 percent patients under 1 year of age, 47 percent between 1 and 4 years, and 21 percent between 5 and 14 years. The data used in this study were monthly records of malaria and all-cause pediatric admissions at 15 government hospitals across Kenya, along with all-cause data from a further 24 hospitals. The small size of the data set and the absence of spatial correlation in admissions values meant that the use of geostatistical methods such as STK was not feasible. As with the AL consumption analysis, various secondary data sources were tested as potential covariates but were not found to be useful. The approach used in this study defaulted to a pragmatic method of defining monthly mean admissions for each age group across the 15 sampled hospitals and applying this mean as an imputed value to the remaining 287 government and mission hospitals listed in the NHFD. This approach was then subjected to a series of internal and external validation procedures to infer the predictive performance of the model. This method allowed the generation of approximate 95 percent CIs to accompany the admissions estimates. Visits to the 15 sampled hospitals for this exercise have demonstrated that data on the admission of children for malaria are generally available at individual facilities but are not routinely communicated for assimilation in national databases. Given the relatively small number of public sector hospitals nationwide (302), complete admission data should be an attainable goal, with facilities communicating regular reports on age- and diagnosis-structured inpatient admissions. Investment in such data collection would surely pay dividends, not just for improved disease surveillance but also for fundamental auditing of requirements for inpatient care across Kenya.

11
BACKGROUND AND RATIONALE Current Status of Pharmaceutical Procurement The introduction of a new medicine into any health system poses many challenges. These are particularly acute in developing countries faced with limited resources and inadequate health information. Kenya decided to abandon a cheap, widely available, but increasingly ineffective medicine for the management of uncomplicated malaria—sulfadoxine/sulfalene/ pyrimethamine—for an effective, but limited and expensive, medicine combination, artemether-lumefantrine, in 2004. Following a protracted period of preparation, stakeholder discussion, and assembled donor financing, the revised policy was rolled out nationwide in September 2006 (Amin, Zurovac et al. 2007a). Funding was secured through an application to GFATM, and orders were made for AL through a special arrangement between WHO and Novartis Pharma AG. AL first arrived in Kenya in May 2006 (2.63 million treatment courses), was delivered to KEMSA, and was distributed to peripheral health facilities following in-service training on the revised guidelines between August and September 2006. The delivery for the next quarter was split into two with the first shipment of 1.30 million treatment courses arriving in the country in August 2006 and the second shipment of 1.11 million treatment courses arriving in November 2006. Because of a drop in the international prices of AL announced by Novartis Pharma AG in September 2006, the order for the second half of 2006/07 changed from the anticipated 5 million to 7.5 million treatment courses. The first part of the consignment (3.2 million treatment courses) arrived in January 2007, and the balance arrived in Kenya in February 2007. At the end of the first procurement cycle (July 2007–June 2008), the DOMC determined that approximately 17.7 million treatment doses of AL would be required for the procurement cycle July 2007–June 2008 (Amin, Tetteh et al. 2007b). The DSM subcommittee of the Drug Policy Technical Working Group validated the figures through a quantification workshop in late July 2007. An order of 17.7 million treatment doses was placed with WHO in August 2007 with scheduled call-downs from Novartis Pharma AG. In the schedule, four consignments of about 4.44 million treatment doses of AL per consignment were planned for July 2007, November 2007, February 2008, and June 2008. When the order was placed with WHO-Novartis, the GFATM made clear that the country needed to openly tender for AL and that the usual single-sourcing from Novartis would no longer be countenanced. The first consignment of AL (which came much later than scheduled, in December 2007) was therefore considered by the GFATM as an emergency procurement with the proviso that the remaining three-quarters of AL supply would be purchased through an open international tender. The tender process for the remaining three-quarters of AL supply was started toward the end of 2007, bids were opened on February 26, 2008, and technical and financial evaluations took until April 2008. The tender was finally awarded to Ajanta Pharmaceuticals of India in May 2008. The contract with Ajanta Pharmaceuticals was signed in June 2008. The first consignment of AL from Ajanta (about 5.8 million treatment doses) is expected in-country in October 2008. The tender process has understandably thrown medicine supply in the country into a tailspin with attendant massive stock-outs in peripheral health facilities and at the

Defining Medicine and Commodity Needs for the Management of Uncomplicated and Severe Malaria in Kenya’s Formal Sector Using Novel Space-Time Geostatistical Methods
12
central level. From a rapid survey across 118 GoK health facilities in three districts in August 2008, 33 percent of all facilities reported no AL in stock and only 17 percent reported that they had all pack sizes in stock on the survey day (Njogu et al. 2008). Donors such as the President’s Malaria Initiative have stepped in to fill the gap; one consignment of AL (397,890 treatment doses) from the initiative was received at KEMSA in July 2008 and another (883,830 treatment doses) was received in September. A further 3.8 million treatment doses directly procured from Novartis using GFATM funds were also received in September. Previous Attempts at Estimating Medicine Demand Notwithstanding the difficulties in basic procurement, the initial quantities of medicines required to roll out the national AL policy (July 2006–June 2007 procurement cycle) were estimated crudely. Numbers of people managed as malaria were computed from limited annual malaria diagnosis data collected at government and mission outpatient departments reported to the HMIS of the Ministry of Health (MoH) and upregulated to the estimated numbers of health facilities nationwide by computing missing facility information by malaria risk, age-specific, and facility-level-specific averaged data from facilities with data (Snow et al. 2003). The GIS interpolation model of HMIS malaria data suggested that on an average 12-month cycle between 1999 and 2001, over 7.4 million malaria diagnoses were probably made at the 2,074 GoK outpatient clinics across the country. Although it provided a semi-informed basis of medicine requirements, this simple model failed to account for the spatial structure of the imperfect HMIS data, was not adjusted for temporal trends, and did not accommodate changing clinical practices following the introduction of improved guidelines concomitant with the rolling out of AL. Similar models were used by applying medians for the second cycle of medicine needs estimation for the years 2007–2008; however, they were based not on outpatient disease burden but on limited consumption data, using medians for missing data to estimate national AL requirements (Amin, Tetteh et al. 2007b). This approach estimated that approximately 17.1 million treatment courses would be required for the period. The consumption method was compared with the morbidity method, which showed that 14.3 million treatment doses would be required. However, the consensus of the DSM subcommittee was that the higher figure yielded by the consumption method was the more realistic one. The Scope and Purpose of the Current Medicine Needs Estimate New, improved methodologies are available that better estimate combined health facility medicine supply needs from imperfect data by adjusting more robustly for differences in space and time (Gething et al. 2006; Gething, Atkinson et al. 2007b; Gething, Noor et al. 2007a). The purpose of the project reported here is to exploit the use of geospatial models that can accommodate temporal, seasonal, and spatial structures in incomplete information using space-time kriging (Gething, Noor et al. 2007a) to better estimate future requirements of AL for the management of uncomplicated malaria in the formal health sector. This revised quantification exercise is particularly important in light of the difficulties faced during the implementation phase of the new medicine policy. One of the least well defined areas in previous quantification exercises has been the medicines and supporting commodities required to manage severe malaria requiring

Background and Rationale
13
hospitalization. This figure is particularly difficult to estimate because of the reported declining admissions since 2004, coincident with the changing epidemiology of malaria transmission in Kenya (Okiro et al. 2007; O’Meara et al. 2008). These declines have been attributed to, among other things, the scaling up of ITN distribution and the transition to effective malaria medicine policies to support the management of uncomplicated malaria. The number of facilities providing inpatient care is currently unknown, and the admission burdens at the established GoK hospitals is available for only a few facilities. An urgent need exists to improve upon the basics of data collection on admission burdens managed as malaria across Kenya to better predict supply needs. The data assemblies, analysis, and narratives provided in this report represent a combination of efforts from the Malaria Public Health and Epidemiology Group, KEMRI, and the University of Oxford to support the DOMC in defining two main outcomes:
• How much AL is consumed nationwide in the management of uncomplicated malaria in 2007—so these figures can be used to calibrate future medicine orders
• What is the current inpatient, severe malaria burden—so these figures can be used to
estimate the medicine and commodity support necessary for this patient group in the government and mission sectors
These outcomes will be achieved through the use of space-time statistical methods. The report first describes the data assembly process, the next section is devoted to the statistical method and results, and the final section discusses the implications of the process and results for future applications to disease and medicine need mapping in Kenya.
Defining Medicine and Commodity Needs for the Management of Uncomplicated and Severe Malaria in Kenya’s Formal Sector Using Novel Space-Time Geostatistical Methods
14

15
DATA DEVELOPMENT Database Sources and Assembly This report has reassembled four principal sources of data necessary to undertake a geostatistical method for estimating commodity requirements through the formal health sector. These data sources, their ownership/stewardship, completeness, and inherent inadequacies are described below against a description of how the data have been reconciled and cleaned. National Health Facility Database Arguably, the single most important resource of any MoH is a detailed knowledge of how many service providers it manages, where they are located, and their broad requirements in terms of staff, support, and supplies. Paradoxically, this basic data resource has been the weakest for the Kenyan MoH. Until recently, the last available map of health service providers in Kenya was developed in 1959 (Butler 1959; figure 1). In 2002 the KEMRI/Wellcome Trust Collaborative Programme began an ambitious effort to reassemble a spatial description of all government, mission, nongovernmental organization (NGO), and private sector health service providers in Kenya (Noor et al. 2004; Noor 2005). This project formed the basis of research activities on the spatial determinants of health equity and was funded by the Wellcome Trust, UK. The project began by anticipating a single, definitive list of all service providers nationwide held centrally by the MoH. In practice, four operational lists existed that had been created at different times since 1998. They included a list held by the MoH-HMIS division (last updated in April 2001); an independent list created by the Family Planning and Logistics Management program, supporting the supply of commodities for the MoH’s Division of Reproductive Health (developed in October 1998); the GoK’s Gazette notice of officially recognized health service providers posted in August 1998; and the Kenya Service Provision Assessment report, which was conducted in 1999 by the MoH and the National Council for Population and Development. Careful matching of these lists for names and district location revealed considerable differences in their coverage and completeness, particularly with respect to private sector providers. By retaining the original HMIS codes, a unique listing of health facilities was reconstructed that included facilities found on the other key lists but not the HMIS list. These lists were then augmented through a number of different information sources and correspondence. First, the Central Bureau of Statistics (CBS) of the Ministry of Finance and Planning was contacted to obtain District Development Plans for 57 districts. These plans sometimes provided hand-drawn maps and lists of facilities located in each district (52 districts). Second, additional non-GoK lists of service providers developed in September 2000 were obtained from the Christian Health Association of Kenya, which provides umbrella support to the mission health sector in Kenya. This information was used to update the master list. Likewise, the Kenya Medical Association provided the Kenya Medical Directory (KMD) 2000 edition, which contained a list and addresses of the association’s national members practicing within the public and private sectors. Telephone directories were checked for each of the eight provinces to identify listed private practitioners. NGO and research organizations were

Defining Medicine and Commodity Needs for the Management of Uncomplicated and Severe Malaria in Kenya’s Formal Sector Using Novel Space-Time Geostatistical Methods
16
contacted to provide any annual reports or publications that might contain health facility lists and maps.
The map shows a total of 308 health facilities: 89 are MoH and mission hospitals, 114 are MoH, mission, and Local Authority dispensaries; 105 are Local Authority health centers. Source: Butler 1959, 28. Figure 1. A 1959 map of Kenya showing the distribution of health facilities (red dots),
digitized using ArcGIS 9.1

Data Development
17
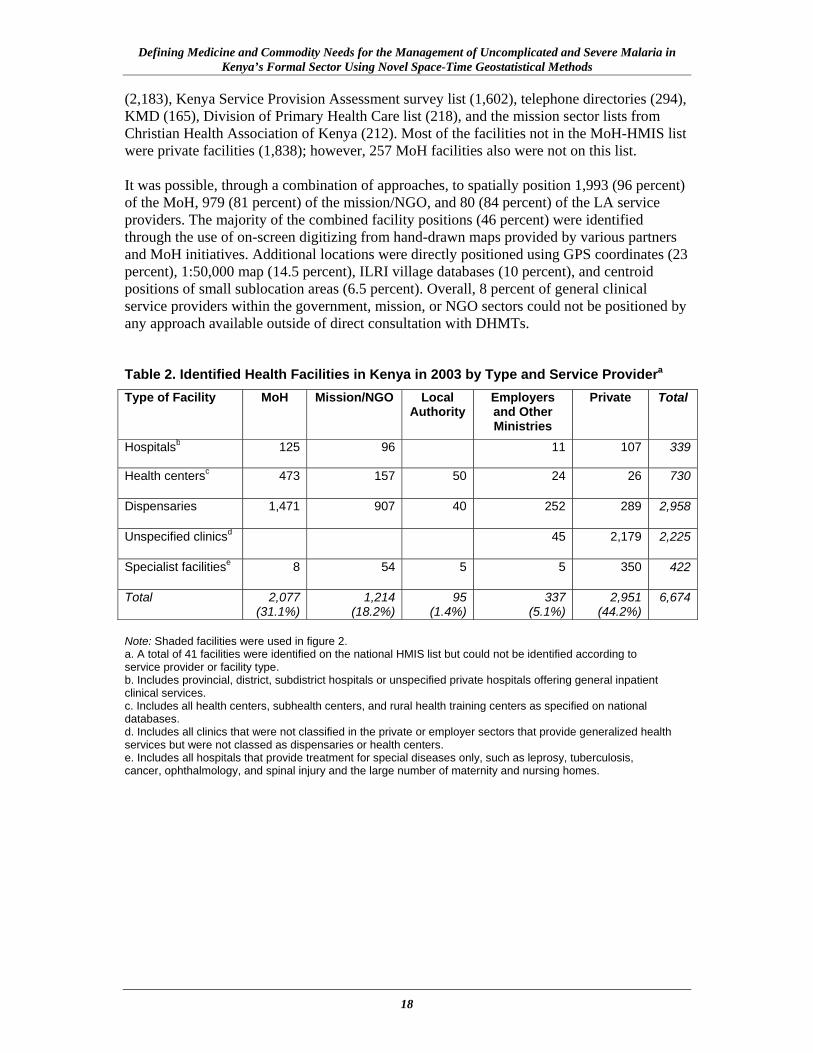
Data on facility name, district, address, and telephone numbers were listed in an Excel database. Lists of health facilities run by the MoH, mission, NGO, and Local Authorities (LAs) were abstracted from the main data and used as provisional lists that were checked in April 2003 by Provincial Health Information Officers to identify omissions, duplications, and correct facility status. The Coast and North Eastern Provinces were consulted more extensively during 2002. Developing Spatial Coordinates for Health Service Providers in 2003 A number of methods were used to provide a longitude and latitude for each health service provider identified during the process previously described. These included the use of global positioning systems (GPS) by various NGO and research groups; extraction and triangulation of coordinates from hand-drawn maps against GIS data on administrative boundaries and roads through a process of on-screen digitizing using Arcview (Version 3.2, ESRI Inc., USA); the use of 1:50,000 topographical maps; matching names of facilities to digital databases of village names and market centers created in 2001 by the International Livestock Research Institute (ILRI); and finally, matching facility names to fifth-level administrative boundary units where these units were small, and extracting a centroid position. Results of Facility Mapping in 2003 After two years of compiling various facility lists and checking on completeness, duplications, and positions, the final database contained 6,674 health service providers (table 2). The search and summaries did not include mobile clinics, community pharmacies, or village health posts, which represent a dynamic and transient grouping of lowest-level providers subject to NGO or District Health Management Team (DHMT) resources and support. The list did attempt to include private sector providers, a prolific grouping of health facilities widely used by the community but difficult to regulate by the MoH: 2,951 private sector facilities were identified, representing 44 percent of all service providers. These were principally identified through the KMD (20 percent), the Family Planning and Logistics Management list (19 percent), and telephone directories (17 percent); only 38 percent were found on the MoH-HMIS list. Among four districts intensively studied for health service providers (Noor et al. 2003), 50 percent of private sector providers were not recorded on any official list and were identified only through district-level investigation. The final public sector general clinical service provider list contained 2,069 facilities run by the MoH, 1,160 mission/NGO facilities, and 90 LA services in 2003 (table 2). The summary in table 2 shows specialist services such as maternity and nursing homes, ophthalmic centers, and tuberculosis, oncology, and other specialist investigation centers. It also shows the 337 service providers located among the industrial, agricultural, and education sectors and those run by or on behalf of the armed forces, prison, and other government services. Both service providers support special patient groups or targeted employed populations and their immediate families and were not a focus of attention in the reassemblies described in later sections of this report. The HMIS list of facilities, which was the primary MoH list that was used as the basis on which to build the comprehensive national database of facilities, contained 2,774 health facilities, of which 1,812 were run by the MoH, 873 by missions/NGOs, and 89 by LAs. The other lists used to incrementally improve the HMIS database contained varied numbers of facilities in the decreasing order of Family Planning and Logistics Management (2,244), GoK
Defining Medicine and Commodity Needs for the Management of Uncomplicated and Severe Malaria in Kenya’s Formal Sector Using Novel Space-Time Geostatistical Methods
18
(2,183), Kenya Service Provision Assessment survey list (1,602), telephone directories (294), KMD (165), Division of Primary Health Care list (218), and the mission sector lists from Christian Health Association of Kenya (212). Most of the facilities not in the MoH-HMIS list were private facilities (1,838); however, 257 MoH facilities also were not on this list. It was possible, through a combination of approaches, to spatially position 1,993 (96 percent) of the MoH, 979 (81 percent) of the mission/NGO, and 80 (84 percent) of the LA service providers. The majority of the combined facility positions (46 percent) were identified through the use of on-screen digitizing from hand-drawn maps provided by various partners and MoH initiatives. Additional locations were directly positioned using GPS coordinates (23 percent), 1:50,000 map (14.5 percent), ILRI village databases (10 percent), and centroid positions of small sublocation areas (6.5 percent). Overall, 8 percent of general clinical service providers within the government, mission, or NGO sectors could not be positioned by any approach available outside of direct consultation with DHMTs. Table 2. Identified Health Facilities in Kenya in 2003 by Type and Service Providera Type of Facility MoH Mission/NGO Local
Authority Employers and Other Ministries
Private Total
Hospitalsb 125 96 11 107 339
Health centersc 473 157 50 24 26 730
Dispensaries 1,471 907 40 252 289 2,958
Unspecified clinicsd 45 2,179 2,225
Specialist facilitiese 8 54 5 5 350 422
Total 2,077 (31.1%)
1,214(18.2%)
95(1.4%)
337(5.1%)
2,951 (44.2%)
6,674
Note: Shaded facilities were used in figure 2. a. A total of 41 facilities were identified on the national HMIS list but could not be identified according to service provider or facility type. b. Includes provincial, district, subdistrict hospitals or unspecified private hospitals offering general inpatient clinical services. c. Includes all health centers, subhealth centers, and rural health training centers as specified on national databases. d. Includes all clinics that were not classified in the private or employer sectors that provide generalized health services but were not classed as dispensaries or health centers. e. Includes all hospitals that provide treatment for special diseases only, such as leprosy, tuberculosis, cancer, ophthalmology, and spinal injury and the large number of maternity and nursing homes.

Data Development
19
Sources: Noor et al. 2004; Noor 2005. Note: The map does not reflect 267 (8 percent) of MoH, mission/NGO, and LA health facilities because their spatial coordinates were not available.
Figure 2. A 2003 district map of Kenya showing the distribution of 3,052 general health service facilities (hospitals, health centers, and dispensaries) supported by the MoH (1,993), missions or NGOs (979), and LAs (80), identified as operational between
1999 and 2002

Defining Medicine and Commodity Needs for the Management of Uncomplicated and Severe Malaria in Kenya’s Formal Sector Using Novel Space-Time Geostatistical Methods
20
Updating the National Health Facility Database in 2008 Between 2003 and 2008 dramatic changes have taken place in the health sector (Kimalu et al. 2004; MoH Kenya 2005). This period corresponds to a series of political and health system changes: the arrival of a new government in December 2002, a substantial increase in MoH funding for essential medicines during 2003 (MoH Kenya 2003), and the widespread media coverage in early 2003 of the Minister for Health’s announcements that the government was committed to the provision of free malaria care treatment and a general abolition of user fees for vulnerable groups. Coincidental with the elections in 2007 and in preparation for the national census of 2009, substantive changes have occurred also in the constituency and administrative boundaries. These have resulted in an increase in gazetted districts from 69 in 2005 to 149 in 2007. These boundary changes have changed the levels of service provision of existing facilities and have led to the expansion of new health facilities nationwide. Since 2004 the KEMRI/Wellcome Trust Research Programme has updated the assembled health facility database as previously described, notably through district-level research work in Kisii Central, Gucha, Bondo, Busia, Kwale, Kilifi, Makueni, Teso, and Butere/Mumias, and by maintaining an ITN sales database at facilities supplied by Population Services International (PSI). These updates have not been a nationwide effort and will have failed to capture the prolific growth in new facilities reported in Western and Eastern Provinces and changes in the designated level of services defined for each facility (i.e., the upgrading of health centers to hospitals following changes in district boundary definitions or the upgrading of dispensaries to health centers). As part of the current terms of reference, it has been necessary to revisit the current completeness of the NHFD. Because of the efforts required to be as comprehensive as possible, the approach taken here has been limited to sources used by various MoH, mission, and NGO agencies to supply providers in the periphery. Therefore, the reassembly of existing facilities still requires systematic checking at district levels, which is proposed as part of a wider initiative recently formed under the auspices of MoH-HMIS called the Master Facility List Working Group (Phones for Health/HMIS 2008). However, the consultants hope the information generated in the present exercise will serve as a useful entry point for upgrading the spatial information available for this health sector planning initiative. Four new sources of information have been used to update the 2003 health facility database: the KEMSA drug supplies list, a more systematic review of the PSI ITN distribution lists, the MEDS client list, and the DOMC health facility reporting lists for AL. Some of these sources are described in more detail below as sources of information on medicine requirements. Nevertheless, it should be stated here that none of the listings used had a common unique identifier, and therefore monthly supply listings had to be checked by four independent people to reconcile facility names and their location to the master list that contains the HMIS code and an additional unique code created by the consultants to ensure those without an HMIS number were also coded. This presents a perennial problem that must be addressed and to which this report returns later. A master list has been assembled in Excel that contains fields indicating the unique KEMRI code, HMIS code, PSI code, name of facility, province, district, location, longitude, latitude, source of geo-coordinates, level of facility (dispensary, health center, hospital, maternity and nursing homes, and specialist facilities), and who manages the service providers (MoH, mission, NGO, LA, other ministry, or private). Given the vagaries of trying to identify the private sector providers in 2003 and the enormous expansion in private sector providers since

Data Development
21
2002, this report has not attempted to systematically update that sector. Such updating would require a more systematic review of current KMD registries and extensive district-level work. While provincial boundaries have remained constant over time, district boundaries have changed substantially, although at present CBS has not completed the digitizing of all these boundaries. Therefore, this report has retained the original 69 district boundaries in the mapped presentation of the data. With accurate geopositioning, the realignment to new boundaries when these become available will be straightforward. This study began by reviewing the KEMSA medicine distribution lists from June 2006 to June 2008, covering 23 months of spreadsheet data providing names of facilities and their district location. These were matched to the existing master list where they appeared on both lists, and the level of facility was reconciled. Facilities that were not on the master list were updated in this list pending geolocation. This process was then repeated for the PSI provision monthly lists, the MEDS client list, and the DOMC medicine use reporting monthly lists. This exercise took two weeks and resulted in the identification of 996 new facilities from the KEMSA list (781 MoH, 213 mission, and 2 others). A further 152 facilities were located from the PSI monthly ITN sales lists (102 MoH and 50 mission/NGO). The MEDS clients list provided information on 157 additional facilities not on the original master list and not identified by the supplies listings of KEMSA or PSI. Finally, the DOMC reporting list revealed only an additional 133 facilities not identified through any other source. All sources were used to designate the most recent facility status (dispensary to hospital) as the most contemporary description of each facility in the master list. Several checks were then undertaken for name and provider similarity in the master list by district to identify possible duplicates. In total, from the multiple sources, 1,438 “new” facilities were identified that required geopositioning. The updated summary of current service providers is shown in table 3. Table 3. Identified Health Facilities in Kenya in 2008 by Type and Service Providera Type of Facility MoH Mission/NGO Local
Authority Employers and Other Ministries
Total
Hospitalsb 191 103 1 7 302Health centersc 686 228 53 15 982Dispensaries 2,733 1,165 47 148 4,093Unspecified clinicsd 7 5 12Specialist facilitiese 10 55 2 67Total
3,620 (66.3%)
1,558(28.6%)
103(1.9%)
175 (3.2%)
5,456
Note: Excludes the private sector; shaded facilities were used in figure 3. a. A total of 6 dispensaries were identified as new on the MEDS list but could not be identified according to district or province. b. Includes provincial, district, subdistrict hospitals or unspecified hospitals offering general inpatient clinical services. c. Includes all health centers, subhealth centers, and rural health training centers as specified on national databases. d. Includes all clinics that were not classified in the private or employer sectors that provide generalized health services but were not classed as dispensaries or health centers. e. Includes all hospitals that provide treatment for special diseases only, such as leprosy, tuberculosis, cancer, ophthalmology, and spinal injury and the large number of maternity and nursing homes.

Defining Medicine and Commodity Needs for the Management of Uncomplicated and Severe Malaria in Kenya’s Formal Sector Using Novel Space-Time Geostatistical Methods
22
Since 2004 three important additional sources of information have become available on the spatial location of communities and physical structures across Kenya. First, in 2004 the Ministry of Roads and Public Works (MoRPW) undertook a detailed GPS roads survey nationwide, positioning major landmarks (including health facilities) located close to transport routes. In addition, this source of information provides GIS data on physical access transport in shapefile format for use in an expanded GIS platform. Second, the Ministry of Education, with support from the World Bank, undertook a comprehensive audit (including GPS coordinates) of all schools nationwide in 2006–2007. Because health facility and school names are similar and closely located, this additional GPS source of information has been used to assist in the geolocation of facilities not positioned by any other means. Finally, the launch of Google Earth in June 2005 has meant that iteratively the satellite and radar imagery of Kenya has improved, allowing visualization of buildings and roads when streamed at high resolutions. This added capacity to locate structures in space has been used to triangulate crude coordinates provided from hand-drawn maps and other less reliable sources to find the actual buildings that are likely to be the health facilities. This study began by updating the geolocations of all facilities on the 2003 master health facility list that had not been confirmed using a GPS, using combinations of the MoRPW, Google Earth, and the schools database. Then, this study used the ILRI village and market center database, CBS village (enumeration area) centroids, and confirmation in Google Earth to geolocate the 1,128 new facilities identified as part of the varied supplies list reconciliation exercise. Overall, it was possible, through a revised combination of approaches, to spatially position 3,328 (92 percent) of the MoH, 1,378 (88 percent) of the mission/NGO, and 103 (100 percent) of the LA service providers. The majority of the combined facility positions 2,564 (47 percent) were identified through the use of ILRI and CBS databases. GPS coordinates were used to identify 2,091(38 percent) of public facilities provided, and 317 (6 percent) were identified through the use of 1:50,000 maps. Overall, 472 (9 percent) of general clinical service providers within the government, mission, or NGO sectors could not be positioned by any approach available outside direct consultation with DHMTs. Coordinates were also used as a further check on possible duplication within the database by running queries on spatial distances between facilities on the assumption that outside urban centers facilities managed by MoH are unlikely to be within 1 kilometer of each other. The distribution of services provided by MoH, mission/NGO, and LA (the shaded area of table 3) in 2008 is shown in figure 3.

Data Development
23
Note: The map does not reflect 472 (9 percent) of MoH, mission/NGO, and LA health facilities because their spatial coordinates were not available.
Figure 3. A 2008 district map of Kenya showing the distribution of 4,984 general health service facilities (hospitals, health centers, and dispensaries) supported by the
MoH (3,334), missions or NGOs (1,378), and LAs (103), identified as operational in 2008

Defining Medicine and Commodity Needs for the Management of Uncomplicated and Severe Malaria in Kenya’s Formal Sector Using Novel Space-Time Geostatistical Methods
24
DOMC AL Consumption Data Between March and April 2006, MSH appointed an informatics consultant (with funds from the U.S. Agency for International Development) to establish an AL tracking system for the DOMC so the DOMC could gauge the consumption of the four AL drug pack sizes at the periphery and use this information to regulate future supply from KEMSA to the facilities and to quantify future country requirements. Daily Activity Registers were developed and distributed along with the first consignment of AL to all mission and public health facilities. The distribution of AL consumption tracking tools did not involve any formal training of health facility workers on information management for malaria medicines. These daily consumption sheets are summarized monthly at the facility and relayed to the district headquarters, where they are summarized again into a district summary report and forwarded, often in the subsequent month, to the DOMC case management unit. Data entry clerks enter the data into a customized Microsoft Access database. The system does not replace existing bin-card/stock-recording systems already in place but is an additional data requirement for each facility. Anecdotally, the system has not been successful for all the obvious reasons, which include lack of training for health workers on information management, lack of facilitation for the information flow process, and lack of follow-up and feedback. The DOMC is considering replacing this data system on medicine consumption with a more harmonized approach within the health sector. Meanwhile, the DOMC consumption data represent the most comprehensive source of information on AL use by pack size since the launch of the AL supply in September 2006. Recently, KEMSA has revised its Standard Order Form to capture consumption of all essential medicines. Accurate consumption data for AL is unlikely to be picked up using this system because the KEMSA form is used only in parts of the country on the push system. Data were extracted from the DOMC Access database into an Excel format for 20 months between September 2006 and April 2008. The DOMC data were formatted without any unique codes or any coding used traditionally by HMIS but provided the facility name and the district. Each monthly summary was therefore manually coded against the master health facility database as described above to ensure a unique code existed between databases, in this case the KEMRI code. Data were then configured into four subsets of information related to each AL pack size by facility for each of the 20 months between September 2006 and April 2008. Within the monthly survey data assembled by the DOMC, approximately 200 duplicate entries were edited from the final cleaned and coded database. For all subsequent analysis, the pack size estimates represent the 6 × 1 (under 3 years), 6 × 2 (3–9 years), 6 × 3 (9–14 years), and 6 × 4 (15+ years) prepackaged tablet pack sizes. Data assembly and quantification modeling have been repeated separately for each prepackaged weight group. KEMSA AL Distribution Data KEMSA is a semi-autonomous MoH parastatal with a mandate to procure, warehouse, and distribute essential medicines and medical supplies to all public health facilities in Kenya. KEMSA operates an ICT system (Navision®) that comprises procurement, order processing, finance, and warehousing modules. The system runs on a Microsoft MYSQL database and was established in February 2006. It was designed by Akili Africa Ltd. and later by Coretec Systems Ltd. This system essentially manages information for both push- and pull-system

Data Development
25
facilities. The KEMSA issues data represent the end process of the pharmaceutical management cycle within the system. These data were assembled to serve as a possible covariate in the geostatistical modeling of the incomplete consumption data obtained from the DOMC. The data were provided in an Excel format with the name of the health facility, the shipment number, and the quantities of each AL pack size distributed for most months between June 2006 and June 2008 (23 months, both July 2006 and 2007 were missing because KEMSA undertakes inventory mostly in July). Again, no unique matching facility codes linked to other data sources or district names were included, making manual checking of the 23 months of data for 1,000–2,000 facilities each month time-consuming. After each month’s distribution list was checked, codes were entered to match to the master health facility database. Approximately 400 facility-month duplicate entries were identified during the cleaning process and excluded in the final, coded distribution database. Included in the KEMSA distribution list were entries titled “miscellaneous” or “district MoH offices” that occasionally represented large amounts of AL, which have been impossible to reconcile to specific facility distributions. It is plausible that these supplies represent buffer stock supplied to the district MoH for the entire district or medicines that could not be transported all the way to each facility and that were therefore left at the district headquarters for further distribution to the periphery. Distribution data per facility were separated in accordance with AL pack size. Results of AL Consumption and Distribution Data Of the 5,456 identified MoH, mission/NGO, and LA health facilities, only 1,273 (23.3 percent) reported any information on AL consumption to the DOMC. Of those that reported, none reported consumption for the full 20-month period, 63 percent (n = 802) reported more than or equal to 10 months’ information, 18 percent (n = 231) between 5–9 months’, and 20 percent (n = 270) 1–4 months’. Of all the facilities reporting, 1,228 (96 percent) were from facilities that could be geolocated. The spatial distribution of these reporting facilities is shown in figure 4. Coverage of distribution data was marginally more complete from the KEMSA database compared to the routine DOMC consumption data, indicating that knowing what was sent to—rather than what was used at—the facility level is easier. Documentation indicated 3,108 MoH, mission/NGO, and LA facilities received AL distributions over the 23 months of available data between June 2006 and June 2008. On average, 2,391 (77 percent) facilities were reported to have been supplied more than once, 2,002 (64 percent) three or more times, and 1,214 (39 percent) four or more times. Information on the numbers of AL treatments issued by pack size was captured in the Navision® database. It is not clear whether the remaining 356 MoH, mission/NGO, and LA health facilities on the master health facility database but not identified on the KEMSA distribution list received any AL or that distributions to “district” headquarters were subsequently drip fed down to facilities within these districts. Of the KEMSA distribution facilities matched to the health facility database, 3,058 (96 percent) were facilities that were geolocated, and these are shown in figure 5. Note that KEMSA did not report AL distribution data for 201 facilities with AL consumption data.

Defining Medicine and Commodity Needs for the Management of Uncomplicated and Severe Malaria in Kenya’s Formal Sector Using Novel Space-Time Geostatistical Methods
26
Note: Red circles represent reporting facilities and blue circles are nonreporting facilities; 50 reporting facilities could not be geolocated.
Figure 4. The location of 1,273 MoH, mission/NGO, and LA facilities reporting consumption data to the DOMC between September 2006 and April 2008

Data Development
27
Note: Red circles represent facilities reported as receiving AL; blue circles were not identified on the KEMSA distribution list; 110 facilities on the KEMSA list could not be geolocated. Figure 5. The location of 3,108 MoH, mission/NGO, and LA facilities where information
on AL distribution was available from KEMSA between June 2006 and June 2008
Defining Medicine and Commodity Needs for the Management of Uncomplicated and Severe Malaria in Kenya’s Formal Sector Using Novel Space-Time Geostatistical Methods
28
Assembling Hospital Location and Admissions Data In 2003, during the last careful assembly of hospital locations in Kenya (Noor et al. 2004; Noor 2005), a total of 125 government-run and 96 mission/NGO hospitals were identified as providing routine, nonspecialized inpatient care. This listing of hospitals has been revised during the reassembly of current facilities in Kenya using information provided by KEMSA, DOMC, district partners, and MEDS. Many higher-order health centers across Kenya have in recent years been upgraded to subdistrict or district hospital status following the gazetting of new district administrative boundaries and the expansion of basic health services during the first few years of the newly elected government in 2002. The present estimate of the extent of hospital services includes 198 government-run and 104 mission facilities (including three NGO-run services) providing routine inpatient critical care services. This list now includes six hospitals run by the armed forces, one hospital at the GoK prison at Shimo La Tewa, and one LA-managed hospital service, Pumwani Maternity Hospital (all included here as “government run”). Each facility’s geo-coordinates were rechecked using the MoRPW GPS database and validated using a screen search in Google Earth for areas not contaminated by cloud cover. Seven (7 percent) facilities providing hospital care within the mission sector could not be geolocated, and two (1 percent) MoH subdistrict hospitals in Kuria and Kakamega could not be positioned. The location of the facilities are shown in figure 6 and listed in Annex A by district. It has not been possible to confirm the “hospital” status of all the listed mission sector providers—other than the established hospitals and those confirmed as inpatient facilities by MEDS and DOMC. The government-run facilities that have in recent times been upgraded from health centers to subdistrict hospitals are an ambiguous series because again it is uncertain how much capacity they have to manage regular inpatient loads featured in established subdistrict hospitals. Accessing Central HMIS Records on Inpatient Case Burdens This study’s first attempt to quantify annualized hospital admissions by facility drew upon the HMIS inpatient returns for 2005 and 2006 provided by the management information system officers to Afya House. Records were available for only 38 of 302 (12.6 percent) designated hospital facilities in 2005 with only 18 providing information for four quarters. In 2006, 30 of 302 (9.9 percent) hospitals reported, and only 9 (3 percent) reported four complete quarters, all of which reported four complete quarters in 2005. No information was available for 2007. Of the 18 hospital reports covering four complete quarters in 2005, one was Mathare Mental Hospital in Nairobi and was excluded. Of the remaining 17 (5.6 percent of all hospitals who should report), 4 were located in Central Province, 6 in Rift Valley Province, 5 in Eastern Province, and 1 each in Nyanza and Western Provinces. According to these returns, an average of 8,900 diagnoses were made per year per hospital, ranging from 1,778 in Muriranjas Subdistrict Hospital (Muranga) to 17,539 at Embu Provincial District Hospital. A total of 28,043 malaria diagnoses were reported from these 17 hospitals in 2005, representing 18.6 percent of diagnoses made in all age groups and averaging 1,650 per hospital (data are not available from this source easily by age). This total ranged from 335 malaria diagnoses made at Muriranjas Subdistrict Hospital to 3,922 at Kapenguria District General Hospital in West Pokot. These reports are clearly an inadequate source of information to define hospital malaria case burdens; this information is included

Data Development
29
Figure 6. Distribution of 196 MoH/GoK-supported hospitals (2 could not be positioned) shown in red and 97 mission/NGO hospitals (7 could not be positioned) shown in
green across Kenya in 2008

Defining Medicine and Commodity Needs for the Management of Uncomplicated and Severe Malaria in Kenya’s Formal Sector Using Novel Space-Time Geostatistical Methods
30
here to demonstrate the serious limitations of current HMIS capacities to support even basic information requirements at the hospital level. Reassembling Inpatient Case Data Directly from Hospitals Despite the poor coverage of centralized HMIS data on inpatient case numbers, these data do exist at the facility level. They exist in several formats, ranging from the most complete ward admission books that document date of admission, age, residential location, and working diagnosis of the admitted patient to monthly ward summaries including bed occupancy, diagnosis, and outcome. These data vary in their completeness between hospitals but do have added value over summarized data provided quarterly to HMIS in that they represent patient-level rather than diagnosis-level information and can be assembled temporally to reflect seasonal trends. This study visited 25 government-run district hospitals in July 2007 from across the country to reassemble from ward registers the total monthly admissions to the pediatric ward between 2004 and 2007 (48 months). Medical records officers helped identify sequential admission registers for pediatric wards, and occasionally where children 12–15 years of age were admitted to adult male or female wards, these were also identified. Over several days, tallies were made of all entries by month of all admissions and where possible age (<1, 1–4, 5–14 years). Within this series, 15 hospitals were identified where two extra days were spent at each facility constructing information on diagnosis (malaria as primary reason for admission or not), age, and month of admission to examine the proportional age-diagnosis mix in each transmission site. The 15 hospitals covered the range of malaria transmission settings typical of Kenya (Omumbo and Snow 2004; Omumbo et al. 2005; Snow et al. 1998) and are listed along with their data summaries in table A1 (Annex A). The study focused only on pediatrics for several reasons: first, malaria should be an uncommon diagnosis among adult admissions living in malaria-endemic areas, and often diagnoses made of malaria in older patient populations admitted with a febrile illness are a diagnosis of convenience rather than based on careful clinical exclusion criteria (Makani et al. 2003); and second, improved diagnostics and evidence-based clinical guidelines should restrict the use of acute medical intervention for malaria among patients who do not have malaria, increasing their survival chances by being managed appropriately (Makani et al. 2003). Despite this focus on pediatrics, there will be a need to manage some older patients with acute, severe complications of malaria admitted to hospital, often those who are migrants from nonendemic to endemic areas, HIV immune-compromised patients, or pregnant women who live in low-endemic areas or those who reside in areas characterized by exceptionally low parasite exposure and subject to epidemics. Broadly, the overall pediatric admission burdens have remained relatively constant across the four years of observation at most hospital sites, with some years being higher than others but without any consistent pattern. Conversely, stronger evidence exists that hospital burden for children with a primary admission diagnosis of malaria has declined over the interval at several sites, notably at Msambweni, Kilifi, and Malindi (as described previously; Okiro et al. 2007), Voi, Kitui, Makueni, Kisii, Kericho, and Kisumu. The hospital sites at Siaya, Busia, Homa Bay, and Narok all showed a less convincing change in malaria admission burdens across the observation period. A more detailed summary of the monthly malaria versus nonmalaria disease burdens is shown in figure A1 (Annex A), arranged by province-clustered panels. It is notable that all-cause hospital burdens vary enormously between hospital sites of

Data Development
31
similar designations; for example, in Makueni the average annual number of pediatric admissions is only 883 compared to Kisii and Kilifi with over 4,500 each year. It is noticeable that despite the large variation in local endemicity between hospital catchments such as Meru compared to Bondo, the proportion of pediatric admissions diagnosed as malaria was approximately similar. In Kericho and Kisii, both areas of unstable, low seasonal malaria, the proportion of admissions diagnosed as malaria exceeded 40 percent. At Kilifi District Hospital, every child is routinely examined for the presence of P. falciparum at admission, and slide-negative patients are not diagnosed as malaria. The paradoxical similarity in proportional diagnoses on pediatric wards across such a wide swathe of transmission settings in Kenya is more a testament to poor diagnostic practices than a true reflection of the hospitalized malaria burden.

Defining Medicine and Commodity Needs for the Management of Uncomplicated and Severe Malaria in Kenya’s Formal Sector Using Novel Space-Time Geostatistical Methods
32

33
STATISTICAL METHODS AND RESULTS Predicting 2007 AL Consumption: Statistical Methods Data Preprocessing: Consistency Checks and Standardization The previous section describes the compilation and formatting of monthly facility-level data on consumption, stock-out, and distribution of AL. Before these data sets were used for further analysis, a series of automated checks was implemented for various inconsistencies. Where the number of days recorded as out of stock in a given monthly record exceeded the total number of days in that month, the entire record (i.e., both the stock-out and consumption value) was deemed unreliable and removed. Similarly, where every day in a month was recorded as out of stock, but the consumption value was non-zero, the entire record was removed. Finally, where a consumption record was present without an accompanying stock-out value, it was assumed that zero days were out of stock that month. The number of records dealt with in this way is summarized in table 4. Table 4. Number of Records Displaying Different Inconsistencies
Type of Inconsistency Pack Sizes 6 × 1 6 × 2 6 × 3 6 × 4
Days out of stock exceeded days in month 3 8 11 46Out of stock all month but nonzero consumption 17 13 16 45Consumption value but no stock-out value 512 526 490 444Outliers removed 7 14 21 13
In raw format, each monthly record of AL consumption refers to a nonstandard period of time. Even in the absence of stock-outs, calendar months contain different numbers of days, meaning records from different months are not directly comparable. A more serious problem is caused when months are partially out of stock, meaning that the records of consumption relate potentially to only a small fraction of the total month. To standardize the consumption data for both these factors, the total number of days that each consumption record related to was calculated simply by subtracting the number of days out of stock (if any) from the length of the month in days. Consumption records were then divided by these denominators to generate a standardized measure of per day consumption for each facility-month. The standardized consumption data were then examined for statistical outliers, that is, data sufficiently different from others in the set that they were likely to be erroneous. This proceeded in two stages: first, potential outliers were flagged if they exceeded a threshold of five times the within-facility-type and within-pack-size standard deviation. The individual histogram for every facility contributing a potential outlier was then checked manually, and values exceeding this threshold were retained if other similarly large values existed at that facility.

Defining Medicine and Commodity Needs for the Management of Uncomplicated and Severe Malaria in Kenya’s Formal Sector Using Novel Space-Time Geostatistical Methods
34
Data Availability through Time Changes in the quantity of consumption data reported through time were visualized via time-series for each facility type, showing for each month and pack size the number of records held in the AL consumption database following data checking and the removal of outliers. These time-series are shown in figure 7, and each displays a similar temporal pattern in availability of consumption data across the 20-month study period September 2006–April 2008: a period of low but consistent reporting of between 5 and 10 percent across all facility types, followed by a period of steep decline starting in June/July 2007. By the early months of 2008, reporting was negligible (<2 percent) across all facility types. Given this pattern of data availability, and that the aim of this exercise was the quantification of consumption across 2007 only, it was decided to limit data for analysis to the 12 months of 2007 only.
The percentage available of the total number of records that would be present with complete reporting is shown in each month during the study period for each pack size at each main facility type. Legend shown in top left plot is consistent throughout. Figure 7. Time-series showing patterns of changing reporting of AL consumption data

Statistical Methods and Results
35
Final Data Used in Modeling The final set of AL consumption data carried forward into the modeling stage, following removal of erroneous and outlying values and the decision to use only 2007 data, is summarized in table 5. The total number of records available across all facility types varied between pack sizes from 4,107 for the 6 × 2 pack size to 3,860 for the 6 × 4 pack size. Compared to the theoretical full set of 5,456 facilities reporting for 12 months (65,472 records), these totals represented overall 2007 reporting of 6.3 percent and 5.9 percent, respectively. Table 5. Summary of Final AL Consumption Data Used for Modeling Pack Size 6 × 1 6 × 2 6 × 3 6 × 4Facility Type
n (%) n (%) n (%) n (%)
Hospitals Expected 3,624 (100) 3,624 (100) 3,624 (100) 3,624 (100)Present 348 (10) 361 (10) 363 (10) 334 (9)Georef 348 (10) 361 (10) 363 (10) 333 (9)
Health centers
Expected 11,784 (100) 11,784 (100) 11,784 (100) 11,784 (100)Present 1,028 (9) 1,041 (9) 1,030 (9) 945 (8)Georef 990 (8) 1,003 (9) 993 (8) 907 (8)
Dispensaries Expected 49,116 (100) 49,116 (100) 49,116 (100) 49,116 (100)Present 2,710 (6) 2,694 (6) 2,656 (5) 2,570 (5)Georef 2,583 (5) 2,565 (5) 2,525 (5) 2,443 (5)
Othera Expected 948 (100) 948 (100) 948 (100) 948 (100)Present 11 (1) 11 (1) 10 (1) 11 (1)Georef 11 (1) 11 (1) 10 (1) 11 (1)
All facilities Expected 65,472 (100) 65,472 (100) 65,472 (100) 65,472 (100)Present 4,097 (6) 4,107 (6) 4,059 (6) 3,860 (6)Georef 3,932 (6) 3,940 (6) 3,891 (6) 3,694 (6)
Note: Only data from 2007 were used. For each pack size, the number of records expected is shown against the number actually present and georeferenced, disaggregated by facility type. a. See table 3 for full breakdown of facilities in this class. Testing Potential Covariates A useful covariate in the context of this study would be a variable that is both statistically correlated to AL consumption records and available to correspond spatially and/or temporally to those records that are missing. Two such potential data sources were tested. The first was the KEMSA AL distribution data detailed in the first section. Intuitively, information on the quantity of doses of each pack size delivered to a facility each month may inform on the quantity consumed. All monthly records containing both consumption and delivery data were identified, and linear regression was performed to assess any relationship between the quantity reported consumed (both before and after adjustment for stock-outs) and the quantity reported delivered (the same month, the month before, and the month following the consumption record). As an additional experiment, reported consumption over all of 2007 (i.e., before any adjustment for stock-outs or missing records) was tallied for each facility where records existed and compared to the corresponding total doses reported delivered to that facility over the year. The resulting scatter plots and regression models are shown in Annex B. Regardless of the configuration of AL consumption data (whether adjusted or

Defining Medicine and Commodity Needs for the Management of Uncomplicated and Severe Malaria in Kenya’s Formal Sector Using Novel Space-Time Geostatistical Methods
36
unadjusted for stock-outs) or distribution data (whether considered by month or year), no evidence was found of any substantial statistical correlation (R2 statistics less than 0.2 in all cases). Thus, it was decided to make no further use of the KEMSA AL distribution data for informing prediction of AL consumption. A second potential covariate was routine records of malaria diagnoses in outpatients as recorded by the HMIS. HMIS data for 2007 are available only at a similar level of completeness as the AL consumption data and were therefore of little direct use in building predictive models. However, earlier work (Gething et al. 2006) has resulted in a geostatistically completed data set for 1996–2004 over 2,421 MoH facilities. Although not temporally coincident, it was plausible that adjusted estimates of the monthly malaria case burden over this period could correlate with levels of AL consumption at the same facilities in 2007. This hypothesis was tested using linear regression between each month of the 2007 consumption data and the corresponding months of the 2005 HMIS data. The resulting 12 scatter plots and regression models are shown in Annex B. As with the distribution data, no evidence was found of any correlation between the HMIS outpatient and AL consumption data (maximum R2 = 0.25). Again, it was decided to make no further use of the HMIS data in this study. Predicting Missing Consumption Records Using Geostatistical Analysis A straightforward technique for predicting national or provincial AL consumption totals using the largely incomplete data set is to scale up the tally from available records in proportion to the number of missing data—approaches used previously by Snow et al. (2003) and Amin et al. (2007b) for AL requirements in Kenya. This simplistic approach ignores any variation in the pattern of consumption through space (at different facilities) and time (at different months). A more sophisticated approach is to predict each missing record individually from existing data. In the presence of spatial and temporal variation in consumption, it is important to allow data that are proximate to the record being predicted to have more influence on its prediction than those that are distant. Geostatistics is based on an established body of theory and statistical tools that have been developed to address these types of spatial modeling problems (Matheron 1971). It is used routinely across a wide range of disciplines and applications (Goovaerts 1997). In a traditional geostatistical approach, the nature of spatial heterogeneity in the variable of interest is modeled explicitly using a variogram function that relates dissimilarity (quantified using semi-variance) to spatial separation (termed lag) or more formally, models’ spatial autocorrelation structure. This function is then used to determine optimal data weightings in an interpolation exercise such as ordinary kriging (OK) that predicts missing values using a weighted average of proximate data. Space-time kriging is an extension of OK that considers simultaneously spatial and temporal heterogeneity and can provide more accurate predictions when the variable of interest is distributed through time as well as a space (Kyriakidis and Journel 1999). Separate analyses were conducted for each pack size (6 × 1, 6 × 2, 6 × 3, 6 × 4) and facility type (hospitals, health centers, dispensaries), leading to 12 separate procedures. Facilities that were not georeferenced or that belonged to a specialist facility class other than the three listed
Statistical Methods and Results
37
were not subject to geostatistical analysis, and prediction of their missing records is discussed subsequently. Variography and Kriging Empirical space-time variograms were computed for each pack size and facility type subset using the standardized per day consumption values for each available monthly record. Empirical variograms are an estimate of the true (and unknown) spatiotemporal autocorrelation structure, and a continuous mathematical function must be fitted if they are to be used for subsequent prediction through kriging. Exponential product-sum space-time variogram models (Iaco et al. 2001) were fitted to each empirical variogram using a weighted least-squares procedure (Cressie 1983). Full details of this procedure are included in Annex C. The fitted variogram models were used to define the input parameters to an STK algorithm developed as a bespoke script in the R programming language (R Development Core Team 2007). Again, this model was run separately for each pack size and facility type subset and used the standardized per day consumption variable. In simple terms, this procedure predicted each missing record by taking a weighted average of data that are nearby in space and in time, and larger weights are given to closer data than to those further away. STK exploits the information in the space-time variogram to determine what weights could be chosen that would give the best possible prediction of the missing value. A full description of this procedure is included in Annex C. The output of the procedure was a prediction of the standardized per day AL consumption for every missing record for each facility type and pack size. These standardized values were then back-transformed by multiplying by the appropriate number of days in each month to provide predictions of the count of AL doses for that month for each pack size. Predictions made in this way were then combined with the existing consumption data to create a completed data set. Missing records from those nongeoreferenced and specialist facilities not included in the geostatistical analysis were assigned the mean monthly value derived from the combined set of data and predictions for the relevant month, province, and pack size. Validation An empirical validation procedure was developed to assess the likely precision of predictions of AL consumption made at different levels of spatial aggregation. A validation set was defined by selecting records from the main data that were then held out while the modeling procedure was repeated in full using the remaining data. Records were eligible for selection only if they included data for all four pack sizes, and the validation set was drawn as a 25 percent sample (830 records) from the 3,320 records in that subset. A stratified random sampling scheme was used that ensured a representative proportion of records from hospitals (47), health centers (152), and dispensaries (631). This second model run was used to predict AL consumption for each pack size for the 830 records temporarily removed. The resulting predictions were then compared to the reference values to provide a set of known prediction errors that could be considered a sample of the (unknown) errors of the main prediction exercise. The total prediction error for the test set was calculated along with the mean and standard deviation error nationwide at the level of individual monthly records. However, the aim of this exercise was to predict not individual missing records but provincial and national total

Defining Medicine and Commodity Needs for the Management of Uncomplicated and Severe Malaria in Kenya’s Formal Sector Using Novel Space-Time Geostatistical Methods
38
consumption over the 12 months of 2007. As such, a method was required that could use the observed record-level errors to predict errors of aggregated predictions at the provincial or national level. This cannot be done directly because no “gold standard” totals exist at these levels with which to compare the predictions. However, under certain assumptions, theoretical models exist that allow these aggregated errors to be inferred. A vital consideration is that the likely range of errors is expected to shrink as individual predictions are combined to estimate aggregated totals because as more predictions are aggregated, the tendency is for over and underpredictions to cancel out, leading to large errors in the predicted sum becoming progressively less likely. To test this effect, a series of subsets was created from the validation set by aggregating records over space-time units (district-months, district-years, province-months, province-years, and so on), and the magnitude of errors in the predicted sums was compared between subsets. In accordance with theory, the variance of these errors was found to decrease in inverse proportion to the number of records aggregated in each subset (see figure D1 in Annex D). With the validity of this relationship established, it was used as a way of estimating the error variance associated with the actual predictions of AL consumption totals in the main prediction exercise. An algorithm was developed to generate for each district, provincial, and national predicted total a 95 percent confidence interval that took into account the error variance observed in the validation set for that pack size and the number of missing records that had to be predicted in generating that predicted total. The absolute magnitude of these CIs was then standardized by the predicted total to obtain intervals expressed as a percentage. This procedure is explained in full in Annex D. Comparison of Results Using STK and Median Months Previous efforts to quantify AL consumption in Kenya using incomplete data have adopted a parsimonious approach whereby the median monthly consumption was defined for each pack size and facility type and this median then used to impute all such missing records that month. To compare results with the main STK approach, this median month method was implemented in this study as both a full prediction and a validation run using the same validation set as used for the main analysis. Predicting 2007 AL Consumption: Results Predicted Consumption Totals The total number of doses required in public health facilities (MoH and mission) across Kenya in 2007 was predicted as 25,307,000, comprising 6,498,000 (26 percent), 6,829,000 (27 percent), 3,959,000 (16 percent), and 8,021,000 (32 percent) for the 6 × 1, 6 × 2, 6 × 3, and 6 × 4 pack sizes, respectively. Confidence intervals associated with the national total for those pack sizes ranged from +/– 2.7 percent to +/– 3.1 percent. Table 6 summarizes the predicted 2007 AL requirements further disaggregated by agency, facility type, and province. A full cross-tabulation of these totals is provided by table E1 (Annex E).

Statistical Methods and Results
39
Table 6. Predicted Total AL Consumption in 2007 by Pack Size, Disaggregated by Province, Sector, and Facility Type
Predicted Total Doses Consumed in 2007 (+/– %)
6 × 1 6 × 2 6 × 3 6 × 4
Province Central 608,000 (5.2) 596,000 (6.2) 380,000 (6.1) 753,000 (4.9) N. Eastern 362,000 (3.7) 464,000 (3.2) 225,000 (4.2) 450,000 (3.5) Coast 698,000 (3.7) 607,000 (4.4) 293,000 (5.7) 641,000 (4.5) Eastern 1,322,000 (3.2) 1,405,000 (3.6) 868,000 (3.3) 1,811,000 (2.6) Nairobi 350,000 (5.1) 331,000 (7.1) 107,000 (12.5) 329,000 (6.7) Nyanza 1,020,000 (3.8) 1,114,000 (3.8) 615,000 (4.2) 1,195,000 (3.7) Western 780,000 (2.8) 661,000 (3.8) 386,000 (4.1) 742,000 (3.6) Rift Valley 1,352,000 (4.8) 1,643,000 (4.3) 1,080,000 (4.5) 2,092,000 (3.4) All a 6,498,000 (2.8) 6,829,000 (3.1) 3,959,000 (3.1) 8,021,000 (2.7) Sector GoK 4,839,000 (3.2) 5,017,000 (3.3) 2,894,000 (3.2) 5,789,000 (2.7) Mission 1,659,000 (3.7) 1,812,000 (3.7) 1,065,000 (3.8) 2,233,000 (3.2) All 6,498,000 (2.8) 6,829,000 (3.1) 3,959,000 (3.1) 8,021,000 (2.7) Facility type
Hospital 1,018,000 (1.8) 993,000 (2.1) 532,000 (2.4) 1,490,000 (1.5) Health center
1,600,000 (2.4) 1,610,000 (3.1) 846,000 (3.5) 1,575,000 (3.1)
Dispensary 3,781,000 (3.7) 4,128,000 (4.0) 2,530,000 (3.8) 4,848,000 (3.1) All 6,498,000 (2.8) 6,829,000 (3.1) 3,959,000 (3.1) 8,021,000 (2.7) Note: Values are rounded to nearest 1,000. Approximate 95 percent CIs are also shown parenthetically as a percentage of each predicted total. a. Seven facilities could not be located to a specific province. Consumption from these facilities is included in the national total, meaning this exceeds slightly the sum of the eight provincial totals. Validation Results Table 7 summarizes the average range (95 percent CI) of percentage errors expected at different levels of spatial aggregation. As expected, these were smallest for the most aggregated level with an estimated magnitude of between +/– 2.7 percent and +/– 3.1 percent at the national level, between +/– 4.1 percent and +/– 5.5 percent at the province level, and between +/– 20.66 percent and +/– 40.96 percent at the district level. Table 7. Summary of the Relative Magnitude of Approximate CIs Associated with
Predictions of Total 2007 AL Requirements at Three Levels of Spatial Aggregation
Pack Size District Province National
6 × 1 +/– 22.97% +/– 4.04% +/– 2.8%6 × 2 +/– 40.96% +/– 4.55% +/– 3.1%6 × 3 +/– 38.39% +/– 5.55% +/– 3.1%6 × 4 +/– 20.66% +/– 4.11% +/– 2.7%Note: Intervals are expressed as a percentage of the associated predicted total.

Defining Medicine and Commodity Needs for the Management of Uncomplicated and Severe Malaria in Kenya’s Formal Sector Using Novel Space-Time Geostatistical Methods
40
Comparison with Median Month Imputation When the national totals predicted using the STK (present model) and median months (Amin et al. 2007b) methods were compared, the results differed dramatically, as shown in table 8. For all pack sizes, the median estimate was substantially smaller than the STK estimate. For the 6 × 4 pack size, the national total estimated using STK was 8,021,000 cases whereas that using median months was 4,381,000, a difference of some 3.6 million doses, or 45 percent. The largest difference is for the 6 × 2 pack size, where the median month estimate is 4.5 million doses (65 percent) smaller than the STK estimate. Such dramatic differences are not, however, unsurprising given the nature of the data. Because monthly consumption records display a strongly positively skewed distribution (with a large number of smaller values and a small number of larger values), the median is not representative of the range of likely values. By imputing a monthly median to missing records and then summing these records to predict provincial or national totals, the important influence of the larger values is not accounted for, which introduces a systematic bias in the estimates: a tendency to substantially underestimate, which is manifest in the much smaller predictions than are produced by STK, which does not suffer the same bias. Table 8. Comparison of National Total Consumption Predicted Using STK vs.
Imputation of Median Months, by Pack Size
Method 6 × 1 6 × 2 6 × 3 6 × 4
Prediction using STK 6,498,000 6,829,000 3,959,000 8,021,000
Prediction using monthly medians 3,423,000 2,344,000 1,454,000 4,381,000 Note: Values rounded to nearest 1,000.
Predicting 2007 Pediatric Inpatient Admissions for Malaria: Statistical Methods The “Data Development” section of this report describes the assembly of inpatient records of pediatric malaria and all-cause admissions for a sample of 15 hospitals across Kenya, and the additional assembly of records on only all-cause pediatric admission from a further 24 hospitals. These data sets represent relatively high-quality data obtained directly from the facilities, with few omissions. However, a set of just 15 facilities from the set of 302 public sector hospitals across Kenya represented a relatively small sample from which to generate and validate nationwide predictions. The availability of all-cause admission data from the additional 24 hospitals (shown in table A2 of Annex A) provided some opportunity for the development and external validation of modeling approaches. Data Visualization and Exploratory Analysis The STK methods applied to the prediction of AL consumption exploit the presence of spatial and temporal autocorrelation in those data to make predictions of missing records. As a preliminary step, a series of tests were carried out on the hospital admission data to explore the feasibility of a similar approach for the prediction of malaria admissions at unsampled hospitals. First, the data were visualized using proportional-area dot plots to examine the mean monthly tally of all-cause (figure 8) and, for the 15 sampled facilities, malaria admissions (figure 9) at each facility in relation to their location.

Statistical Methods and Results
41
Circles sizes are proportional to the mean monthly admissions at each facility in 2005–2007. The 15 facilities sample for both malaria and all-cause admissions is shown in red.
Figure 8. Proportional-area dot plot visualizing the spatial pattern of variation in all-cause pediatric inpatient admissions
Circles sizes are proportional to the mean monthly admissions at each facility in 2005–2007.
Figure 9. Proportional-area dot plot visualizing the spatial pattern of variation in pediatric inpatient admissions for malaria

Defining Medicine and Commodity Needs for the Management of Uncomplicated and Severe Malaria in Kenya’s Formal Sector Using Novel Space-Time Geostatistical Methods
42
As can be seen, the spatial pattern for all-cause admissions shows little evidence of spatial structure: there is no apparent tendency for proximate facilities to display similar values. For malaria admissions, evidence of weak structure exists, with values to the east and along the coast tending to be smaller than those to the west. Spatial structure was tested more formally using an empirical variogram and corresponding null envelope generated via Monte Carlo simulation (Diggle and Ribeiro 2007) (see figure F1, Annex F). This approach estimates a variogram from the available data and provides a boundary around the plotted values that describes the range of variograms that could be expected by chance in the absence of spatial structure. Because the plotted values lie entirely inside this null envelope, no evidence of statistically significant structure exists, thus negating the use of spatial approaches in the prediction of inpatient admissions Testing Potential Covariates Given the small sample size, the availability of a covariate that was available at all hospitals nationwide and that was correlated with pediatric malaria admissions would be particularly advantageous. No immediate covariates were available, however, that might inform on facility-level characteristics such as their size and catchment population characteristics. As for the AL consumption data, however, it was thought possible that the completed HMIS outpatient records described previously from 1996–2004 may be of use, and these were tested as a potential covariate. Although inpatient admissions and outpatient diagnosis events are distinct, the two variables conceivably may be correlated, given common drivers such as facility size, type, and endemicity setting. Mean monthly all-cause and malaria diagnosis counts were calculated from the competed HMIS data set and were matched to 14 of the 15 hospitals. Linear regression was carried out to assess the strength of relationship with these values and the corresponding mean monthly malaria and all-cause inpatient admission values at the same facilities. These scatter plots and regression models are shown in Annex G. No significant relationships were found between all-cause or malaria admission and either malaria or all-cause outpatient diagnoses (maximum R2 = 0.19). It was therefore concluded that the HMIS outpatient data could not be used to inform prediction of inpatient admissions in the current setting. Predicting Total Malaria Admissions across All Hospitals The absence of significant spatial structure in the malaria admissions data, along with the small sample size, precluded the application of geostatistical techniques to predict totals across all hospitals nationwide. Similarly, the absence of any significant relationships with potential covariates precluded the use of linear regression models to inform these totals. Given these factors, it was decided that the most pragmatic approach was the simple use of the per month mean to impute missing values. Unlike the use of a monthly median to impute unsampled values, the mean incorporates the influence of large values at the tail of a positively skewed distribution. Thus, when these imputed values are added together to estimate national or provincial totals, these sums are likely to be a reasonable approximation of the true sum with no systematic bias. For each of the 48 months of the study period, the mean across the 15 facilities was calculated, and this value assigned to all missing values across the remaining 287 facilities. From these values, aggregated totals were computed for 2007 disaggregated by province sector.

Statistical Methods and Results
43
Disaggregation by Age Group Predictions of pediatric malaria admission totals were required disaggregated into three age categories: <1 year old, 1–4 years old, and 5–14 years old. Because ages of patients admitted for malaria were recorded at the 15 sampled hospitals, sample proportions of admissions in each category could be generated that were then applied to provincial and national predictions. Rather than use a single set of age proportions across the whole country, data from the 15 hospitals were grouped into three classes by province according to broad similarities in malaria endemicity. Facilities in Central, Eastern, North Eastern, Rift Valley, and Nairobi Provinces represented low transmission areas; Nyanza and Western Provinces represented western high transmission areas; and Coast Province represented eastern high transmission areas. For each group, the age structure observed at the corresponding subset of the 15 sampled facilities was aggregated to generate a mean percentage of pediatric cases falling into each age category, as listed in table 9. These factors were then applied to the predicted totals described in the previous paragraph to provide age-disaggregated 2007 totals at the provincial and national levels. Table 9. Proportions of Pediatric Malaria Admissions in Three Age Categories
Provinces Proportion of Pediatric Malaria Admissions
<1 Year 1–4 Years 5–14 Years
Central, Eastern, North Eastern, Rift Valley, and Nairobi 31% 46% 23%
Nyanza and Western 37% 46% 17%
Coast 26% 54% 20%Note: Proportions observed at 15 facilities were aggregated by province into three groups of broadly similar malaria endemicity settings. Validation Procedures For the AL consumption analysis, the data were large enough to allow the removal of a validation set of sufficient size to provide an adequate sample of validation errors. In contrast, because the malaria admissions data represented just 15 facilities, they were considered too small to allow this partitioning. Instead, an internal validation (cross-validation) procedure was implemented. All data were removed from one of the 15 hospitals, and the model was rerun in full using all data from the remaining 14 to predict admission values at the removed facility. The error between the observed and predicted values was recorded. The removed facility was then returned to the set, a different facility was removed, and the process was repeated. By repeating this process for all 15 facilities, a set of errors was generated that was equal in size to the full data set. Cross-validation procedures such as this have a tendency to slightly underestimate the true errors that would be in the prediction of admissions at an unsampled facility. As a complementary approach, the prediction procedure applied to estimate total malaria admissions was applied in parallel to all-cause admissions. Because an external data set on all-cause admissions was available from the 24 additionally sampled facilities, it was possible

Defining Medicine and Commodity Needs for the Management of Uncomplicated and Severe Malaria in Kenya’s Formal Sector Using Novel Space-Time Geostatistical Methods
44
to carry out both an internal (predicting with the set of 15 using cross validation) and an external (predicting from the set of 15 to the separate set of 24) validation for this variable. Although all-cause and malaria-only admissions are clearly distinct variables, the assessment of prediction performance for the former was still thought a useful additional indicator of the performance for the latter. For all three validation procedures (malaria admissions internal, and all-cause internal and external), the result was a sample of known errors that could be considered representative of the full set of unknown errors associated with predicting admissions across facilities nationwide. Each validation set was summarized using the error mean and standard deviation. As with the AL consumption analysis, estimates were required of the error associated with predicted provincial and national totals. The same algorithm was applied (described in Annex D) that estimated for each provincial and national predicted total an approximate 95 percent CI accounting for the observed error variance and number of facilities over which a predicted total was being made. Predicting 2007 Pediatric Inpatient Admissions for Malaria: Results Predicted Malaria Inpatient Admissions The total number of pediatric admissions for malaria in public health facilities across Kenya in 2007 was predicted as 301,000 with a CI of +/– 8.6 percent. This total was divided between 201,000 (67 percent) at GoK facilities and 100,000 (33 percent) at mission sector facilities. Predictions and CIs for all provinces by sector along with summaries of data availability are provided on table 10. Across both sectors, the distribution by age was 96,000 (32 percent) admissions of children under 1 year of age, 141,000 (47 percent) of those 1 to 4 years, and 63,000 (21 percent) of those 5 to 14 years. Table 11 provides a full breakdown of predicted admissions by age group. Validation Results The likely range of error (95 percent CI) associated with the predicted national total malaria admissions was estimated as +/– 8.6 percent, and an average of +/– 13.9 percent was estimated for provincial totals. These estimates were based on the error variance estimated from the internal validation procedure for malaria admissions. As a comparison, equivalent CIs were derived for predictions of all-cause admissions based on both an internal and external validation using 24 additional facilities. As can be seen in table 12, CIs for all-cause predictions were generally smaller than those for malaria (+/– 5.5 percent for national total compared to +/– 8.6 percent), suggesting the former could be predicted marginally more precisely. Comparison between all-cause CIs based on the internal and external validation set reveals that the latter generated slightly larger intervals (+/– 6.7 percent for national total compared to +/– 5.5 percent). The external validation value is likely to be the more reliable because it was based on a larger sample of errors and an independent external data set. If a similar disparity existed for the malaria validation, then the stated national CI of +/– 8.6 percent based on the internal validation should be increased to around +/– 10.5 percent, and this seems prudent given the limitations of the internal procedure and the small sample size.

Statistical Methods and Results
45
Table 10. Summary of Data Availability for Predicting Total 2007 Inpatient Admissions across all 302 GoK and Mission Sector Hospitals and Resulting Predictions and Approximate CIs
Sector Province TotalFacility-Months
(n Facilities)
Records Available(% Available)
Predicted Admissions
ConfidenceInterval
GoK Central 216 (18) 0 (0.00) 18,000 +/– 16.6% Coast 228 (19) 48 (21.1) 17,000 +/– 16.1% Eastern 372 (31) 34 (9.1) 30,000 +/– 13.2% Nairobi 72 (6) 0 (0.0) 6,000 +/– 26.4% N. Eastern 156 (13) 0 (0.0) 13,000 +/– 18.7% Nyanza 504 (42) 60 (11.9) 44,000 +/– 11.0% Rift Valley 612 (51) 24 (3.9) 51,000 +/– 11.2% Western 264 (22) 12 (4.6) 23,000 +/– 14.0% National 2,424 (202) 178 (7.3) 201,000 +/– 8.7%
Mission Central 240 (20) 0 (0.0) 20,000 +/– 15.9% Coast 36 (3) 0 (0.0) 3,000 +/– 36.8% Eastern 288 (24) 0 (0.0) 24,000 +/– 15.2% Nairobi 60 (5) 0 (0.0) 5,000 +/– 28.6% N. Eastern 36 (3) 0 (0.0) 3,000 +/– 37.4% Nyanza 252 (21) 0 (0.0) 21,000 +/– 15.7% Rift Valley 192 (16) 0 (0.0) 16,000 +/– 17.0% Western 96 (8) 0 (0.0) 8,000 +/– 22.9% National 1,200 (100) 0 (0.0) 100,000 +/– 10.2%
All Central 456 (38) 0 (0.0) 38,000 +/– 12.9% Coast 264 (22) 48 (18.2) 20,000 +/– 15.1% Eastern 660 (55) 34 (5.2) 54,000 +/– 11.3% Nairobi 132 (11) 0 (0.0) 11,000 +/– 20.3% N. Eastern 192 (16) 0 (0.0) 16,000 +/– 16.9% Nyanza 756 (63) 60 (7.9) 65,000 +/– 10.3% Rift Valley 804 (67) 24 (3.0) 67,000 +/– 10.8% Western 360 (30) 12 (3.3) 31,000 +/– 13.2% National 3624 (302) 178 (4.9) 301,000 +/– 8.6%

Defining Medicine and Commodity Needs for the Management of Uncomplicated and Severe Malaria in Kenya’s Formal Sector Using Novel Space-Time Geostatistical Methods
46
Table 11. Predicted Total Pediatric Inpatient Admissions for Malaria in 2007 in GoK and Mission Sectors Disaggregated by Age Group and Province
Age Group Province GoK Mission AllUnder 1 year
Central 6,000 6,000 12,000Coast 4,000 1,000 5,000Eastern 9,000 7,000 17,000Nairobi 2,000 2,000 3,000North Eastern 4,000 1,000 5,000Nyanza 16,000 8,000 24,000Rift Valley 16,000 5,000 21,000Western 8,000 3,000 11,000National 64,000 32,000 96,000
1 to 4 years Central 8,000 9,000 17,000Coast 9,000 2,000 11,000Eastern 14,000 11,000 25,000Nairobi 3,000 2,000 5,000North Eastern 6,000 1,000 7,000Nyanza 20,000 10,000 30,000Rift Valley 23,000 7,000 31,000Western 11,000 4,000 14,000National 95,000 47,000 141,000
5 to 14 years Central 4,000 5,000 9,000Coast 3,000 1000 4,000Eastern 7,000 5,000 12,000Nairobi 1,000 1,000 3,000North Eastern 3,000 1000 4,000Nyanza 7,000 4,000 11,000Rift Valley 12,000 4,000 15,000Western 4,000 1,000 5,000National 42,000 21,000 63,000
All (0–14 years)
Central 18,000 20,000 38,000Coast 17,000 3,000 20,000Eastern 30,000 24,000 54,000Nairobi 6,000 5,000 11,000North Eastern 13,000 3,000 16,000Nyanza 44,000 21,000 65,000Rift Valley 51,000 16,000 67,000Western 21,000 8,000 31,000National 201,000 100,000 301,000
Note: Values rounded to nearest 1,000.

Statistical Methods and Results
47
Table 12. Summary of Approximate CIs for Predictions of Total Pediatric Inpatient Admissions in 2007
Province Malaria Admissions (Internal Validation)a
All-Cause Admissions (Internal Validation)b
All-Cause Admissions (External Validation)c
Central +/– 13.0% +/– 8.6% +/– 10.9%Coast +/– 15.3% +/– 9.0% +/– 12.2%Eastern +/– 11.5% +/– 7.5% +/– 9.4%Nairobi +/– 20.8% +/– 13.5% +/– 17.9%North Eastern +/– 16.9% +/– 11.7% +/– 15.2%Nyanza +/– 10.0% +/– 7.0% +/– 8.5%Rift Valley +/– 10.9% +/– 7.4% +/– 8.9%Western +/– 13.0% +/– 9.0% +/– 11.6%National +/– 8.4% +/– 5.5% +/– 6.7%
Expressed as percentage of estimated value for: a. malaria admissions obtained via cross validation; b. all-cause admissions obtained via cross validation; and c. all-cause admissions obtained via external validation.

Defining Medicine and Commodity Needs for the Management of Uncomplicated and Severe Malaria in Kenya’s Formal Sector Using Novel Space-Time Geostatistical Methods
48

49
DISCUSSION In 2004 Kenya’s malaria treatment policy changed to the use of the artemisinin-based combination therapy artemether-lumefantrine as the first-line treatment. The first exercise to quantify the number of treatments required for distribution of AL to all public health facilities nationwide for the initial procurement period July 2006–June 2007 used incomplete data reported to the MoH-HMIS on the number of outpatients treated for malaria at outpatient departments, upregulated to account for missing data using a GIS-based interpolation model (Snow et al. 2003). This exercise suggested that on an average 12-month cycle between 1999 and 2001, over 7.4 million malaria diagnoses were probably made at the 2,074 GoK outpatient clinics across the country. The second exercise conducted in 2007 for Year 2 of the ACT policy implementation, July 2007–June 2008, used limited facility-level data on consumption of AL with missing data imputed using observed median consumption to upregulate and estimate requirements nationwide across a projected 4,604 public health facilities. After various adjustments for stock-outs, losses and wastage, and buffer stock requirements, this exercise estimated a national requirement of approximately 17.1 million treatments of AL. The current project has used AL consumption data and an updated spatial database of public health facilities nationwide and applied an improved space-time geostatistical interpolation methodology to predict missing data while taking into account spatial and temporal variation in consumption. Before any adjustments for buffer stock or losses and wastage, this approach has estimated that 25.3 million treatments of AL were required across the 5,456 government and mission facilities nationwide during 2007. Reasons for the discrepancy between this most recent estimate and that made in 2007 are threefold. First, the number of health facilities over which these estimates were made has increased by 20 percent, representing both a genuine expansion in the public health sector and the fruits of a major effort by the KEMRI/Wellcome Trust Research Programme to identify, locate, and document health facilities nationwide. The production in this project of the updated 2008 iteration of the NHFD stands as a significant contribution in its own right to future health system auditing in Kenya. Second, more data were available to this project, using consumption data for all 12 months of 2007 rather than being limited to only the first two quarters. Third, the use of observed median monthly consumption to impute missing values is likely to underestimate true consumption nationwide given the nature of the data. Because consumption values were heavily positively skewed (with many records reporting small consumption values and a small number reporting large values), the median effectively disregards the influence of the large values. When this estimate is then scaled up nationally, the absence of any predictions of large values introduces a substantial overall bias in the predicted sum, which will tend to be substantially smaller than necessary. In contrast, the use of space-time geostatistical interpolation suffers no such bias and provides more accurate predictions by modeling spatial and temporal heterogeneity in consumption. As such, the figure of 25.3 million treatments presented here stands as the most reliable estimate of requirements of AL across the public health sector in Kenya in 2007. The geostatistical space-time methods presented here were predicted to generate estimates of AL requirements accurate to +/– 31 percent, +/– 5 percent, and +/– 3 percent, at the district, provincial, and national levels, respectively. The model was therefore likely to predict with reasonable precision the national AL requirement and how this is distributed across the eight Kenyan provinces. Because the accuracy of predictions becomes increasingly poor at finer levels of spatial aggregation, the model is unable to generate similarly reliable estimates for

Defining Medicine and Commodity Needs for the Management of Uncomplicated and Severe Malaria in Kenya’s Formal Sector Using Novel Space-Time Geostatistical Methods
50
individual districts using data currently available. This outcome raises important questions about the level at which information on AL requirements is needed. For procurement and long-term planning, estimates at the national level are likely to be appropriate. However, rational within-country distribution would benefit substantially from accurate metrics of need at the district level or finer. Data reporting and quality would need to be enhanced dramatically if reliable information was to be generated at that resolution. Data on AL distributed to health facilities by KEMSA was compared to consumption data as a possible covariate. The fact that no statistical association was found between the two metrics is both surprising and disconcerting. Although a certain degree of disparity is to be expected because of factors such as wastage, loss, and the lag between delivery and use, the complete absence of correlation suggests a lack of fidelity between what is reported as delivered to a facility and what is actually used. It is similarly surprising that the monthly predicted tally of outpatient diagnoses for malaria was not informative of AL consumption. Although the former metric was itself based on incomplete and adjusted data and related to 2004 rather than 2007, this lack of correspondence again suggests a disconnect either between diagnosis and treatment of malaria or in the way data on the two are recorded and assimilated. The approach and results presented in this report come with a number of limitations and caveats. First, regardless of the statistical models implemented, the precision and reliability of the final quantifications are inevitably dependent on the amount and quality of information available on consumption at individual health facilities. Sophisticated modeling such as that presented in this report should not be considered a replacement in the long term for a program of reliable, timely, and comprehensive routine data collection. Second, the estimates presented here relate specifically to 2007, and no attempt has been made to model long-term trends in consumption or to predict future changes. If consistent reporting of consumption data can be sustained over a period of years, then such modeling may become feasible. In the interim, the aim has been to quantify medicine needs in 2007 as the most reliable metric for calibrating future requirements. Third, the heavy computational demand and statistical expertise required to implement the space-time geostatistical methods described mean that the approach cannot currently be rolled out as a stand-alone tool for use by health service managers. Again, however, if more complete and reliable data could be guaranteed, then such a tool may become feasible using simpler methodologies. A fourth issue is the potential for error and inconsistency in the data themselves. The error checking and standardization procedures described in the section “Statistical Methods and Results” were likely to minimize the influence of straightforward errors and inconsistencies introduced at different stages of the data collection and assembly. It is impossible, however, given current data sources, to assess quantitatively the reliability of the consumption data. Random or systematic errors could feasibly be introduced at multiple points between the point of entry at facilities and the final data used for analysis. Such errors inevitably reduce the utility of the data for robust quantification of consumption and can only be quantified by comparison with an external “gold standard” data set that is not currently available. The first recommendation of this report is that more information on medicine consumption be collected more frequently from more facilities nationwide. Regardless of the level of sophistication, no statistical model can compensate fully for large proportions of missing data. It is discouraging to note that the use of data from the first half of 2008 in this analysis had to be abandoned because of a dramatic decline in reporting rates over these months to less than 2 percent nationwide. Given that AL supply for the latter half of 2008 was marred

Discussion
51
by procurement failures, the annual consumption data set for 2008 as a whole is likely to be entirely inadequate to support a repeat of the procedure undertaken here for 2007. An immediate aim, therefore, should be to establish a reliable data collection system to provide sufficient information on medicine consumption in 2009 to allow projections for 2010. A number of new mechanisms for enhanced data collection are in development and should be explored as an urgent priority. The Phones for Health initiative seeks to exploit the proliferation of mobile phone networks in Kenya and elsewhere to provide a rapid and efficient conduit for timely reporting of routine health information from facilities to national databases. By removing the reliance on paper reporting forms and their physical transportation from peripheral facilities, this initiative aims to substantially increase reporting rates nationwide. A second consideration is the potential for establishing a system of sentinel facilities. This strategy would see investment in data collection at a subset of facilities to generate data that could be considered nationally representative and allow estimates of consumption requirements with known precision. The design and optimization of a sentinel system would require further research using spatial and temporal statistical techniques to assess how many sentinel facilities would be required for a given level of precision and where these facilities would be best located. The second recommendation of this report is that Kenya takes the figure of 26 million treatments, the upper 95 percent confidence interval of the national estimate obtained in this study, as the most reliable estimate of AL consumption in the public sector in 2007. These values are given by pack size in table 13. Table 13. Estimated 2007 Requirements for AL by Pack Size,
Using the Upper Limit of the Predicted 95 Percent CI
Pack Size Estimated 2007 Requirement 6 × 1 6,680,0006 × 2 7,041,0006 × 3 4,082,0006 × 4 8,238,000Total 26,041,000
These values exclude any adjustments for buffer stock requirements, losses, or wastage. No attempt is made here to predict major changes in medicine requirements in future years. Potential changes in at least three major factors may affect future AL requirements. An increase in the use of RDTs to support diagnoses of outpatient malaria before treatment with first-line medicines could lead to a substantial reduction in this diagnosis and therefore treatment with AL compared to currently widespread presumptive treatment practices. Second, the likely increase in availability of AL and other ACTs in the informal and private health sectors could lead to a reduction in demand from the public sector as individuals obtain treatment elsewhere. Finally, an increase in the coverage of ITNs has already been associated with a reduction in malaria endemicity (Okiro et al. 2007) on the Kenyan coast, and it can be hoped that the continued scale-up of these and other interventions will result in more widespread reductions in malaria endemicity across the country. None of these potential changes can currently be quantified or forecast nationally from existing data. The recommendation of this study is that the 2007 estimates presented represent currently the most appropriate metric for calibrating AL requirements in future years.

Defining Medicine and Commodity Needs for the Management of Uncomplicated and Severe Malaria in Kenya’s Formal Sector Using Novel Space-Time Geostatistical Methods
52
The total number of pediatric admissions for malaria in public health facilities across Kenya in 2007 was predicted as 301,000 with a confidence interval of +/– 8.6 percent. This total was divided between 201,000 (67 percent) at GoK facilities and 100,000 (33 percent) at mission sector facilities and consisted of 32 percent of patients under 1 year of age, 47 percent between 1 and 4 years of age, and 21 percent between 5 and 14 years. The data used in this study consisted of monthly records of malaria and all-cause pediatric admissions at 15 government hospitals across Kenya, along with all-cause data from a further 24 hospitals. The small size of the data set and the absence of spatial correlation in admissions values meant that the use of geostatistical methods such as STK was infeasible. As with the AL consumption analysis, various secondary data sources were tested as potential covariates but were not found to be useful. The approach used in this study defaulted to a pragmatic approach of defining monthly mean admissions for each age group across the 15 sampled hospitals and applying this mean as an imputed value to the remaining 287 government and mission hospitals listed in the NHFD. Unlike previous exercises (Amin et al. 2007b), this approach was subjected to a series of internal and external validation procedures to infer the predictive performance of the model. This validation allowed the generation of approximate 95 percent confidence intervals to accompany the admissions estimates. By visiting the 15 sampled hospitals, this exercise has demonstrated that data on the admission of children for malaria are generally available at individual facilities but are not routinely communicated for assimilation in national databases. Given the relatively small number of public sector hospitals nationwide (302), it must be possible for all such facilities to generate and communicate regular routine reports on age and diagnosis-structured inpatient admissions. Investment in such data collection would surely pay dividends, not just for improved disease surveillance but also for fundamental auditing of requirements for inpatient care across Kenya.

53
REFERENCES Amin, A. A., G. Tetteh, D. Memusi, and W. S. Akwhale. 2007b. Quantification of Artemether-Lumefantrine and Other Antimalarial Medicine Requirements for Year 2 of ACT Policy Implementation in Kenya, July 2007. Submitted to the U.S. Agency for International Development by the Rational Pharmaceutical Management Plus Program. Arlington, VA: Management Sciences for Health. Amin, A. A., D. Zurovac, B. B. Kangwana, D. N. Otieno, W. S. Akhwale, J. Greenfield, and R. W. Snow. 2007a. “The Challenges of Changing National Malaria Drug Policy to Artemisinin-Based Combinations in Kenya.” Malaria Journal 6: 72. Butler, R. J. 1959. Atlas of Kenya: A Comprehensive Series of New and Authenticated Maps Prepared from the National Survey and Other Government Sources with Gazetteer and Notes on Pronunciation and Spelling. The Survey of Kenya, Nairobi, Kenya. Cressie, N. A. C. 1993. Statistics for Spatial Data. New York: Wiley. Diggle, P. J., and P. J. Ribeiro. 2007. Model-Based Geostatistics.” New York: Springer. Gething, P. W., P. Atkinson, A. M. Noor, P. Gikandi, S. I. Hay, and M. S. Nixon. 2007b. “A Local Space-Time Kriging Approach Applied to a National Outpatient Malaria Dataset.” Computers and Geosciences 33: 1337–50. Gething, P. W., A. M. Noor, P. Gikandi, E. Ogara, S. I. Hay, M. S. Nixon, R. W. Snow, and P. Atkinson. 2006. “Improving Imperfect Health Management Information System Data in Africa Using Geostatistics.” PLoS Medicine 3: e271. Gething, P. W., A. M. Noor, C. A. Goodman, P. Gikandi, S. I. Hay, S. K. Sharif, P. Atkinson, and R. W. Snow. 2007a. “Information for Decision Making from Imperfect National Data: Tracking Major Changes in Health Care Use in Kenya Using Geostatistics.” BMC Medicine 5: 37. Goovaerts, P. 1997. Geostatistics for Natural Resources Evaluation. New-York: Oxford University Press. Iaco, S., D. E. Myers, and D. Posa. 2001. “Space-Time Analysis Using a General Product-Sum Model.” Statistics and Probability Letters 52: 21–28. Kimalu, P. K., N. N. Nafula, D. K. Manda, G. Mwabu, and M. S. Kimenyi. “A Review of the Health Sector in Kenya.” Working Paper No. 11. Nairobi: Kenya Institute for Public Policy Research and Analysis (KIPPRA). Kyriakidis, P. C., and A. G. Journel. 1999. “Geostatistical Space-Time Models: A Review.” Mathematical Geology 31: 651–84. Makani, J., W. Matuja, E. Liyombo, R. W. Snow, K. Marsh, and D. A. Warrell. 2003. “The Diagnosis of Cerebral Malaria among Adults at a Referral Hospital in Dar es Salaam, Tanzania.” Quarterly Journal of Medicine 96: 355–62.

Defining Medicine and Commodity Needs for the Management of Uncomplicated and Severe Malaria in Kenya’s Formal Sector Using Novel Space-Time Geostatistical Methods
54
MoH Kenya. 2005. Rural Health Facility Unit Cost/Cost Sharing Review Study and the Impact of the 10:20 Policy. Nairobi: Ministry of Health, Republic of Kenya. MoH Kenya. 2003. Kenya National Health Accounts 2001–2002. Nairobi: Ministry of Health, Republic of Kenya. Matheron, G. 1971. “The Theory of Regionalized Variables and Its Applications.” Cahiers du Centre de Morphologie Mathématique de Fontainebleau, no. 5, Ecole des Mines de Paris. Fontainebleau, Paris. Njogu, J., W. Akhwale, D. H. Hamer, and D. Zurovac. 2008. “Health Facility and Health Worker Readiness to Deliver New National Treatment Policy for Malaria in Kenya.” East African Medical Journal 85 (5): 213–21. Noor, A. M. 2005. “Developing spatial models of health services access and utilization to define health equity in Kenya.” Diss. Milton Keynes (United Kingdom), Open University. Noor, A. M., P. W. Gikandi, S. I. Hay, R. O. Muga, and R. W. Snow. 2004. “Creating Spatially Defined Databases for Health Service Planning in Resource Poor Countries: The Example of Kenya.” Acta Tropica 91: 239–51. Noor, A. M., D. Zurovac, S. I. Hay, S. A. Ochola, and R. W. Snow. 2003. “Defining Equity in Physical Access to Clinical Services Using Geographic Information Systems as Part of Malaria Planning and Monitoring in Kenya.” Tropical Medicine & International Health 8: 927–32. Okiro, E. A., S. I. Hay, P. W. Gikandi, S. K. Sharif, A. M. Noor, N. Peshu, K. Marsh, and R. W. Snow. 2007. “The Decline in Paediatric Malaria Admissions on the Coast of Kenya.” Malaria Journal 6: 151. O’Meara, W. P., T. W. Mwangi, T. N. Williams, F. E. McKenzie, R. W. Snow, and K. Marsh. 2008. “Relationship between Exposure, Clinical Malaria, and Age in an Area of Changing Transmission Intensity.” American Journal of Tropical Medicine & Hygiene 79: 185–91. Omumbo, J. A., S. I. Hay, R. W. Snow, A. J. Tatem, and D. J. Rogers. 2005. “Modelling Malaria Risk in East Africa at High Spatial Resolution.” Tropical Medicine & International Health 10: 557–66. Omumbo, J. A., and R. W. Snow. 2004. “Plasmodium falciparum Prevalence in East Africa: A Review of Empirical Data 1927–2003.” East African Medical Journal 81: 649–56. Phones for Health/HMIS. 2008. Minutes of Master Facility List Working Meeting 2 Phones for Health / HMIS / Stakeholders, July 7. R Development Core Team. 2007. R: A Language and Environment for Statistical Computing. R Foundation for Statistical Computing, Vienna, Austria. http://www.R-project.org.

References
55
Snow, R. W., E. Gouws, J. Omumbo, B. Rapuoda, M. H. Craig, F. C. Tanser, D. le Sueur, and J. Ouma. 1998. “Models to Predict the Intensity of Plasmodium falciparum Transmission: Applications to the Burden of Disease in Kenya.” Transactions of Royal Society of Tropical Medicine & Hygiene 92: 601–6. Snow, R. W., A. M. Noor, P. W. Gikandi, G. Tetteh, and S. Ochola. 2003. Modeling the Anti-Malarial Drug Requirements for the Kenyan Government’s Formal Health Sector Using Imperfect Data. Report prepared for and on behalf of Division of Malaria Control, Ministry of Health, Government of Kenya, December.

Defining Medicine and Commodity Needs for the Management of Uncomplicated and Severe Malaria in Kenya’s Formal Sector Using Novel Space-Time Geostatistical Methods
56

57
ANNEX A: ADDITIONAL DATA TABLES AND VISUALIZATIONS OF HOSPITALS AND ADMISSIONS DATA
Table A1. Hospitals Selected to Summarize Malaria Admission Burdens over
48 Months between 2004 and 2007 Hospital Admissions
0–14 years 2004
(malaria)
Admissions0–14 years
2005 (malaria)
Admissions 0–14 years 2006
(malaria)
Admissions 0–14 years 2007
(malaria)
Average Admissions
2004–2007 p.a. (malaria)
[% of diagnoses = malaria]
Bondo DGH 1,230 (923)
1,427(930)
1,678(893)
1,336 (855)
1,418(900)
[63.5%]Busia DGH 3,640
(2,460) 3,650
(2,421)3,164
(2,225)3,087
(1,961) 3385
(2,267) [67.0%]
Homa Bay DGH
3,005 (1,953)1
2,938(1,999)
1,830(1,309)
2,133 (1,330)
2,477(1,648) [66.5%]
Kericho DGH
3,461 (2,203)
3,563(1,938)
3,273(1,777)
2,736 (1,436)
3258(1,839) [56.4%]
Kilifi DGH 4,844 (1,335)
4,493(904)
4,685(715)
4,316 (444)
4,585(850)
[18.5%]Kisii DGH 6,346
(3,032) 6,584
(4,109)6,535
(2,570)5,473
(1,591) 6,235
(2,826) [45.3%]
Kisumu DGH
5,004 (4,423)
5,355(4,432)
3,541(2,580)
2,065 (1,436)
3,991(3,218) [80.6%]
Kitui DGH 2,043 (1,131)
1,793(1,050)
1,860(843)
1,589 (490)
1,821(879)
[48.2%]Makueni DGH
934 (480)
857(338)
939(293)
803 (206)
883(329)
[37.3%]Malindi DGH 2,935
(1,052) 2464(583)
3,024(718)
2,024 (446)
2,612(700)
[26.8%]Meru DGH 2,576
(1,736) NA2 1,731
(823)1,9423
(1,089) 2,083
(1,216) [58.4%]
Msambweni DGH
1,664 (658)
1,053(414)
1,729(554)
1,895 (489)
1,585(529)
[33.4%]Narok DGH 1,193
(557) 1,365(616)
1,710(794)
1,654 (745)
1,481(678)
[45.8%]Siaya DGH 2,945
(1,913) 2,255
(1,477)2,266
(1,345)2,649
(1,799) 2,529
(1,634) [64.6%]
Voi DGH 1,323 (784)
1,212(705)
957(501)
1,005 (439)
1,124(607)
[54.0%]1. January 2004 missing; 2. August–Dec 2005 missing; 3. Nov–Dec 2007 missing.

Defining Medicine and Commodity Needs for the Management of Uncomplicated and Severe Malaria in Kenya’s Formal Sector Using Novel Space-Time Geostatistical Methods
58
Table A2. Hospitals Providing Additional Data on All-Cause Admission Burdens over 48 Months between 2004 and 2007
Hospital Site Average Admissions 2004–2007 p.a.
Coast General 8,983 Embu 5,640 Garissa 1,436 Hola 904 Kabarnet 363 Kapsabet 2,693 Kilgoris 485 Kinango 713 Kirinyaga 2,560 Kitale 4,877 Kwale 5,482 Kwale SDH 333 Mandera 710 Mbagathi 1,940 Moyale 1,237 Mwingi 863 Naivasha 2,610 Nakuru 5,482 Nandi Hills 2,183 Nyeri 5,000 Port Rietz MBSA 1,109 St Lukes Kilifi 381 Tharaka 759 Vihiga 2,410

Annex A: Additional Data Tables
59
Table A3. List of 302 Hospitals Identified during Assembly Process
Hospital Province District Agency
ACK MT. KENYA MISSION HOSPITAL CENTRAL KIRINYAGA MISS CONSOLATA MISSION HOSPITAL (MATHARI) CENTRAL NYERI MISS GAICHANJIRU MISSION HOSPITAL CENTRAL MARAGUA MISS GATUNDU SUB-DISTRICT HOSPITAL CENTRAL THIKA MOH GITHUMU MISSION HOSPITAL CENTRAL MARAGUA MISS KANGEMA SUB-DISTRICT HOSPITAL CENTRAL MURANGA MOH KARATINA DISTRICT HOSPITAL CENTRAL NYERI MOH KARIRA MISSION HOSPITAL CENTRAL KIRINYAGA MISS KERUGOYA DISTRICT HOSPITAL CENTRAL KIRINYAGA MOH KIAMBU DISTRICT HOSPITAL CENTRAL KIAMBU MOH KIJABE MISSION HOSPITAL CENTRAL KIAMBU MISS KILIMAMBOGO MISSION HOSPITAL CENTRAL THIKA MISS KIMBIMBI SUB-DISTRICT HOSPITAL (WANG'RU) CENTRAL KIRINYAGA MOH KINYAYA SUB-DISTRICT HOSPITAL CENTRAL KIRINYAGA MOH KIRIAINI MISSION HOSPITAL CENTRAL MURANGA MISS MARAGUA DISTRICT HOSPITAL CENTRAL MARAGUA MOH MARY HELP OF THE SICK MISSION HOSPITAL CENTRAL THIKA MISS MARY IMMACULATE MISSION HOSPITAL (MWEIGA) CENTRAL NYERI MISS MT. KENYA SUB-DISTRICT HOSPITAL CENTRAL NYERI MOH MUKURWENI SUB-DISTRICT HOSPITAL CENTRAL NYERI MOH MURANG'A DISTRICT HOSPITAL CENTRAL MURANGA MOH MURIRANJAS SUB-DISTRICT HOSPITAL CENTRAL MURANGA MOH MWEA MISSION HOSPITAL CENTRAL KIRINYAGA MISS NAZARETH MISSION HOSPITAL CENTRAL KIAMBU MISS NORTH KINANGOP CATHOLIC HOSPITAL CENTRAL NYANDARUA MISS NYAHURURU DISTRICT HOSPITAL CENTRAL NYANDARUA MOH NYERI PROVINCIAL GENERAL HOSPITAL CENTRAL NYERI MOH OAKLANDS MISSION HOSPITAL CENTRAL THIKA MISS OL'KALOU DISTRICT HOSPITAL CENTRAL NYANDARUA MOH OTHAYA SUB-DISTRICT HOSPITAL CENTRAL NYERI MOH PCEA KIKUYU HOSPITAL CENTRAL KIAMBU MISS ST LUKE'S MISSION HOSPITAL CENTRAL THIKA MISS ST. GABRIEL CATHOLIC HOSPITAL CENTRAL THIKA MISS ST. MULUMBA CATHOLIC HOSPITAL CENTRAL THIKA MISS THIKA DISTRICT HOSPITAL CENTRAL THIKA MOH THIKA MATERNITY MISSION HOSPITAL CENTRAL THIKA MISS TIGONI SUB-DISTRICT HOSPITAL CENTRAL KIAMBU MOH TUMUTUMU MISSION HOSPITAL CENTRAL NYERI MISS COAST PROVINCIAL GENERAL HOSPITAL COAST MOMBASA MOH
GK PRISON HOSPITAL(SHIMO LA TEWA) COAST MOMBASA OTHER MIN
HOLA DISTRICT HOSPITAL COAST TANA RIVER MOH KENYA NAVY HOSPITAL COAST MOMBASA AF KILIFI DISTRICT HOSPITAL COAST KILIFI MOH KINANGO DISTRICT HOSPITAL COAST KWALE MOH KWALE SUB-DISTRICT HOSPITAL COAST KWALE MOH LAMU DISTRICT HOSPITAL COAST LAMU MOH M.E.W.A MISSION HOSPITAL COAST MOMBASA MISS MALINDI DISTRICT HOSPITAL COAST MALINDI MOH MARIAKANI BARRACKS HOSPITAL COAST KILIFI AF

Defining Medicine and Commodity Needs for the Management of Uncomplicated and Severe Malaria in Kenya’s Formal Sector Using Novel Space-Time Geostatistical Methods
60
Hospital Province District Agency
MARIAKANI SUB-DISTRICT HOSPITAL COAST KILIFI MOH MOI DISTRICT HOSPITAL (VOI) COAST TAITA TAVETA MOH MPEKETONI SUB-DISTRICT HOSPITAL COAST LAMU MOH MPK SD MISSION HOSPITAL COAST LAMU MISS MSAMBWENI DISTRICT HOSPITAL COAST KWALE MOH MUKOWE HOSPITAL COAST LAMU MOH NGAO SUB-DISTRICT HOSPITAL COAST TANA RIVER MOH PORT REITZ DISTRICT HOSPITAL COAST MOMBASA MOH ST. LUKE'S KALOLENI HOSPITAL COAST KILIFI MISS TAVETA DISTRICT HOSPITAL COAST TAITA TAVETA MOH UKUMBUSHO CPK MISSION HOSPITAL COAST MOMBASA MISS WESU DISTRICT HOSPITAL COAST TAITA TAVETA MOH BISHOP U. KIOKO CATHOLIC HOSPITAL EASTERN MACHAKOS MISS CHAARIA MISSION HOSPITAL EASTERN MERU CENTRAL MISS CHUKA CONSOLATA COTTAGE HOSPITAL EASTERN MERU SOUTH MISS CHUKA DISTRICT HOSPITAL EASTERN MERU SOUTH MOH CONSOLATA MISSION HOSPITAL (KYENI) EASTERN EMBU MISS CONSOLATA NKUBU MISSION HOSPITAL EASTERN MERU CENTRAL MISS EMBU PROVINCIAL GENERAL HOSPITAL EASTERN EMBU MOH FRANCISCAN CONVENT HOSPITAL EASTERN MACHAKOS MISS GARBATULLA SUB-DISTRICT HOSPITAL EASTERN ISIOLO MOH GITHONGO SUB-DISTRICT HOSPITAL EASTERN MERU CENTRAL MOH IGOJI MISSION HOSPITAL EASTERN MERU CENTRAL MISS ISHIARA SUB-DISTRICT HOSPITAL EASTERN MBEERE MOH ISIOLO DISTRICT HOSPITAL EASTERN ISIOLO MOH KANGUNDO SUB-DISTRICT HOSPITAL EASTERN MACHAKOS MOH KANYAKINE SUB-DISTRICT HOSPITAL EASTERN MERU CENTRAL MOH KATHIANI SUB-DISTRICT HOSPITAL EASTERN MACHAKOS MOH KATULANI SUB-DISTRICT HOSPITAL EASTERN KITUI MOH KIKOKO MISSION HOSPITAL EASTERN MAKUENI MISS KIRUA COTTAGE HOSPITAL EASTERN MERU CENTRAL MISS KITUI DISTRICT HOSPITAL EASTERN KITUI MOH KYUSO SUB-DISTRICT HOSPITAL EASTERN MWINGI MOH LAISAMIS MISSION HOSPITAL (MARSABIT) EASTERN MARSABIT MISS MACHAKOS DISTRICT HOSPITAL EASTERN MACHAKOS MOH MAGUTUNI SUB-DISTRICT HOSPITAL EASTERN MERU SOUTH MOH MAKINDU SUB-DISTRICT HOSPITAL EASTERN MAKUENI MOH MAKUENI DISTRICT HOSPITAL EASTERN MAKUENI MOH MARSABIT DISTRICT HOSPITAL EASTERN MARSABIT MOH MATIRI MISSION HOSPITAL EASTERN THARAKA MISS MATUU SUB-DISTRICT HOSPITAL EASTERN MACHAKOS MOH MAUA METHODIST HOSPITAL EASTERN MERU NORTH MISS MBEERE DISTRICT HOSPITAL EASTERN MBEERE MOH MBOONI SUB-DISTRICT HOSPITAL EASTERN MAKUENI MOH MERU DISTRICT HOSPITAL EASTERN MERU CENTRAL MOH MIATHENE SUB-DISTRICT HOSPITAL EASTERN MERU NORTH MOH MIGWANI SUB-DISTRICT HOSPITAL EASTERN MWINGI MOH MIKINDURI COTTAGE HOSPITAL EASTERN MERU NORTH MISS MIKUMBUNE SUB-DISTRICT HOSPITAL EASTERN MERU CENTRAL MOH MOTHER OF MERCY CATHOLIC MISSION HOSPITAL EASTERN MACHAKOS MISS MOYALE DISTRICT HOSPITAL EASTERN MOYALE MOH

Annex A: Additional Data Tables
61
Hospital Province District Agency
MUTHALE MISSION HOSPITAL EASTERN KITUI MISS MUTITU SUB-DISTRICT HOSPITAL EASTERN KITUI MOH MUTOMO MISSION HOSPITAL EASTERN KITUI MISS MWEA COTTAGE HOSPITAL EASTERN MBEERE MISS MWINGI DISTRICT HOSPITAL EASTERN MWINGI MOH NUNGUNI SUB-DISTRICT HOSPITAL EASTERN MAKUENI MOH NYAMBENE DISTRICT HOSPITAL EASTERN MERU NORTH MOH PCEA CHOGORIA MISSION HOSPITAL EASTERN MERU SOUTH MISS RUNYENJES SUB-DISTRICT HOSPITAL EASTERN EMBU MOH SDA MISSION HOSPITAL (TALA) EASTERN MACHAKOS MISS SOLOLO MISSION HOSPITAL EASTERN MOYALE MISS ST. LUCIE'S MISSION HOSPITAL EASTERN MERU SOUTH MISS ST. LUKE COTTAGE HOSPITAL EASTERN MERU CENTRAL MISS ST. TERESA'S COTTAGE HOSP (MERU) EASTERN MERU CENTRAL MISS THARAKA DISTRICT HOSPITAL EASTERN THARAKA MOH TIGANIA CATHOLIC HOSPITAL EASTERN MERU NORTH MISS BUNA SUB-DISTRICT HOSPITAL N. EASTERN WAJIR MOH BUTE SUB-DISTRICT HOSPITAL N. EASTERN WAJIR MOH DAGAHALEY MISSION HOSPITAL N. EASTERN GARISSA MISS ELWAK SUB-DISTRICT HOSPITAL N. EASTERN MANDERA MOH GARISSA PROVINCIAL GENERAL HOSPITAL N. EASTERN GARISSA MOH HABASWEIN SUB-DISTRICT HOSPITAL N. EASTERN WAJIR MOH HAGADERA MISSION HOSPITAL N. EASTERN GARISSA MISS IFO MISSION HOSPITAL N. EASTERN GARISSA MISS IFTIN SUB-DISTRICT HOSP. N. EASTERN GARISSA MOH IJARA DISTRICT HOSPITAL (MASALANI) N. EASTERN IJARA MOH KHOROF HARAR SUB-DISTRICT HOSPITAL N. EASTERN WAJIR MOH MANDERA DISTRICT HOSPITAL N. EASTERN MANDERA MOH MODOGASHE SUB-DISTRICT HOSPITAL N. EASTERN GARISSA MOH NAGAHLEY HOSPITAL N. EASTERN GARISSA NGO RHAMU SUB-DISTRICT HOSPITAL N. EASTERN MANDERA MOH WAJIR DISTRICT HOSPITAL N. EASTERN WAJIR MOH ATTAT HOSPITAL NAIROBI NAIROBI MISS FORCES MEMORIAL HOSPITAL NAIROBI NAIROBI AF KAYOLE II SUB-DISTRICT HOSPITAL NAIROBI NAIROBI MOH KENYATTA NATIONAL HOSPITAL NAIROBI NAIROBI MOH MATER MISERICORDIAE MISSION HOSPITAL NAIROBI NAIROBI MISS MATHARI MENTAL HOSPITAL NAIROBI NAIROBI MOH MBAGATHI DISTRICT HOSPITAL NAIROBI NAIROBI MOH NKINGA HOSPITAL NAIROBI NAIROBI MISS NYANKUNDE HOSPITAL-C.M.E NAIROBI NAIROBI MISS PUMWANI MATERNITY HOSPITAL NAIROBI NAIROBI LA ST MARY'S MISSION HOSPITAL-NRB NAIROBI NAIROBI MISS AHERO SUB-DISTRICT HOSPITAL NYANZA NYANDO MOH AMBIRA SUB-DISTRICT HOSPITAL NYANZA SIAYA MOH ARO COMMUNITY HOSPITAL NYANZA BONDO NGO AWENDO SUB-DISTRCT HOSPITAL NYANZA MIGORI MOH BETHANIA H MISSION HOSPITAL NYANZA GUCHA MISS BONDO DISTRICT HOSPITAL NYANZA BONDO MOH CHRIST MARIANNE MISSION HOSPITAL NYANZA CENTRAL KISII MISS CHULAIMBO SUB-DISTRICT HOSPITAL NYANZA KISUMU MOH

Defining Medicine and Commodity Needs for the Management of Uncomplicated and Severe Malaria in Kenya’s Formal Sector Using Novel Space-Time Geostatistical Methods
62
Hospital Province District Agency
GENDIA MISSION HOSPITAL NYANZA RACHUONYO MISS GESUSU SUB-DISTRICT HOSPITAL NYANZA CENTRAL KISII MOH GUCHA DISTRICT HOSPITAL (OGEMBO) NYANZA GUCHA MOH HOMA BAY DISTRICT HOSPITAL NYANZA HOMA BAY MOH ISEBANIA SUB-DISTRICT HOSPITAL NYANZA KURIA MOH KARUNGA SUB-DISTRICT HOSPITAL NYANZA MIGORI MOH KEHANCHA DISTRICT HOSPITAL NYANZA KURIA MOH KENDU BAY MISSION HOSPITAL NYANZA RACHUONYO MISS KENDU BAY SUB-DISTRICT HOSPITAL NYANZA RACHUONYO MOH KENYENYA SUB-DISTRICT HOSPITAL NYANZA GUCHA MOH KEROKA SUB-DISTRICT HOSPITAL NYANZA NYAMIRA MOH KEUMBU SUB-DISTRICT HOSPITAL NYANZA CENTRAL KISII MOH KIBIRIGO MISSION HOSPITAL NYANZA NYAMIRA MISS KISEGI SUB-DISTRICT HOSPITAL NYANZA SUBA MOH KISII DISTRICT HOSPITAL NYANZA CENTRAL KISII MOH KISUMU DISTRICT HOSPITAL NYANZA KISUMU MOH KOMBEWA SUB-DISTRICT HOSPITAL NYANZA KISUMU MOH KURIA-SIRATI SUB-DISTRICT HOSPITAL NYANZA KURIA MOH LUMUMBA MISSION HOSPITAL NYANZA KISUMU MISS MACALDER SUB-DISTRICT HOSPITAL NYANZA MIGORI MOH MADIANY SUB-DISTRICT HOSPITAL NYANZA BONDO MOH MANGA SUB-DISTRICT HOSPITAL NYANZA NYAMIRA MOH MANYATTA SDA MISSION HOSPITAL NYANZA HOMA BAY MISS MASENO MISSION HOSPITAL NYANZA KISUMU MISS MASIMBA SUB-DISTRICT HOSPITAL NYANZA CENTRAL KISII MOH MATATA MISSION HOSPITAL NYANZA RACHUONYO MISS MBITA SUB-DISTRICT HOSPITAL NYANZA SUBA MOH MIGORI DISTRICT HOSPITAL NYANZA MIGORI MOH MUHORONI SUB-DISTRICT HOSPITAL NYANZA NYANDO MOH NDHIWA SUB-DISTRICT HOSPITAL NYANZA HOMA BAY MOH NDURU SUB-DISTRICT HOSPITAL NYANZA GUCHA MOH NYABONDO MISSION HOSPITAL NYANZA KISUMU MISS NYABONDO MISSION HOSPITAL NYANZA NYANDO MISS NYACHEKI SUB-DISTRICT HOSPITAL NYANZA GUCHA MOH NYAMACHE SUB-DISTRICT HOSPITAL NYANZA GUCHA MOH NYAMIRA DISTRICT HOSPITAL NYANZA NYAMIRA MOH NYANZA PROVINCIAL GENERAL HOSPITAL NYANZA KISUMU MOH OUR LADY OF LORDS MISSION HOSPITAL NYANZA GUCHA MISS PAP ONDITI (NYANDO) DISTRICT HOSPITAL NYANZA NYANDO MOH RACHUONYO DISTRICT HOSPITAL NYANZA RACHUONYO MOH RANGALA MISSION HOSPITAL NYANZA SIAYA MISS RONGO SUB-DISTRICT HOSPITAL NYANZA MIGORI MOH SEGA MISSION HOSPITAL NYANZA SIAYA MISS SIAYA DISTRICT HOSPITAL NYANZA SIAYA MOH ST. CAMILUS HOSPITAL KARUNGU NYANZA MIGORI MISS ST. ELIZABETH MISSION HOSPITAL (LWAK) NYANZA BONDO MISS ST. JOSEPH OMBO HOSPITAL NYANZA MIGORI MISS ST. MONICAS MISSION HOSPITAL NYANZA KISUMU MISS ST. VINCENT DE PONDS MISSION HOSPITAL NYANZA NYANDO MISS ST.BARNABAS MISSION HOSPITAL NYANZA MIGORI MISS SUBA DISTRICT HOSPITAL (SINDO RHDC AGG) NYANZA SUBA MOH

Annex A: Additional Data Tables
63
Hospital Province District Agency
TABAKA MISSION HOSPITAL NYANZA GUCHA MISS TOM MBOYA MEMORIAL DISTRICT HOSPITAL (MBITA) NYANZA SUBA MOH VICTORIA AMENITY HOSPITAL NYANZA KISUMU MOH YALA SUB-DISTRICT HOSPITAL NYANZA SIAYA MOH 5TH K.A.R. GILGIL REGIONAL HOSPITAL RIFT VALLEY NAKURU AF BARAGOI SUB-DISTRICT HOSPITAL RIFT VALLEY SAMBURU MOH CHEBIEMET SUB-DISTRICT HOSPITAL (MARAKWET) RIFT VALLEY MARAKWET MOH CHEMOLINGOT SUB-DISTRICT HOSPITAL RIFT VALLEY BARINGO MOH CHEPTALAL SUB-DISRICT HOSPITAL RIFT VALLEY BURET MOH CHEPTERWAI SUB-DISTRICT HOSPITAL RIFT VALLEY NANDI MOH ELBURGON DISTRICT HOSPITAL RIFT VALLEY NAKURU MOH ELDAMA RAVINE DISTRICT HOSPITAL RIFT VALLEY KOIBATEK MOH ENDEBESS SUB-DISTRICT HOSPITAL RIFT VALLEY TRANS NZOIA MOH GILGIL MENTAL HOSPITAL RIFT VALLEY NAKURU MOH GILGIL SUB-DISTRICT HOSPITAL RIFT VALLEY NAKURU MOH HURUMA DISTRICT HOSPITAL RIFT VALLEY UASIN GISHU MOH ICRC LOKICHOGGIO HOSPITAL RIFT VALLEY TURKANA NGO ITEN DISTRICT HOSPITAL RIFT VALLEY KEIYO MOH KABARNET DISTRICT HOSPITAL RIFT VALLEY BARINGO MOH KAIBOI MISSION HOSPITAL RIFT VALLEY NANDI MISS KAJIADO DISTRICT HOSPITAL RIFT VALLEY KAJIADO MOH KAKUMA MISSION HOSPITAL RIFT VALLEY TURKANA MISS KAPEDO SUB-DISTRICT HOSPITAL RIFT VALLEY BARINGO MOH KAPENGURIA DISTRICT HOSPITAL RIFT VALLEY WEST POKOT MOH KAPKATET DISTRICT HOSPITAL RIFT VALLEY BURET MOH KAPLONG CATHOLIC HOSPITAL RIFT VALLEY BURET MISS KAPSABET DISTRICT HOSPITAL RIFT VALLEY NANDI MOH KAPSOWAR AIC MISSION HOSPITAL RIFT VALLEY MARAKWET MISS KAPTARAKWA SUB-DISTRICT HOSPITAL RIFT VALLEY KEIYO MOH KERICHO DISTRICT HOSPITAL RIFT VALLEY KERICHO MOH KILGORIS DISTRICT HOSPITAL (TRANSMARA) RIFT VALLEY TRANS MARA MOH KIMININI (CATHOLIC) COTTAGE HOSPITAL RIFT VALLEY TRANS NZOIA MISS KIPCHIMCHIM MISSION HOSPITAL RIFT VALLEY KERICHO MISS KITALE DISTRICT HOSPITAL RIFT VALLEY TRANS NZOIA MOH KOBUJOI MISSION HOSPITAL RIFT VALLEY NANDI MISS KOCHOLWO SUB-DISTRICT HOSPITAL RIFT VALLEY KEIYO MOH KORDA MISSION HOSPITAL RIFT VALLEY TRANS MARA MISS LITEIN AIC MISSION HOSPITAL RIFT VALLEY BURET MISS LODWAR DISTRICT HOSPITAL RIFT VALLEY TURKANA MOH LOITOKITOK SUB-DISTRICT HOSPITAL RIFT VALLEY KAJIADO MOH LOKITAUNG SUB-DISTRICT HOSPITAL RIFT VALLEY TURKANA MOH LOLGORIEN SUB-DISTRICT HOSPITAL RIFT VALLEY TRANS MARA MOH LONDIANI SUB-DISTRICT HOSPITAL RIFT VALLEY KERICHO MOH LONGISA DISTRICT HOSPITAL RIFT VALLEY BOMET MOH LOPIDING LOKICHOGIO SUB-DISTRICT HOSPITAL RIFT VALLEY TURKANA MOH MARALAL DISTRICT HOSPITAL RIFT VALLEY SAMBURU MOH MARIGAT SUB-DISTRICT HOSPITAL RIFT VALLEY BARINGO MOH MERCY MISSION HOSPITAL RIFT VALLEY KOIBATEK MISS METEITEI SUB-DISTRICT HOSPITAL RIFT VALLEY NANDI MOH MILITARY R.S. HOSPITAL LANET RIFT VALLEY NAKURU AF MOI REFERRAL & TEACHING HOSPITAL (ELDORET) RIFT VALLEY UASIN GISHU MOH

Defining Medicine and Commodity Needs for the Management of Uncomplicated and Severe Malaria in Kenya’s Formal Sector Using Novel Space-Time Geostatistical Methods
64
Hospital Province District Agency
MOLO SUB-DISTRICT HOSPITAL RIFT VALLEY NAKURU MOH NAIVASHA SUB-DISTRICT DISTRICT HOSPITAL RIFT VALLEY NAKURU MOH NAKURU PGH ANNEX RIFT VALLEY NAKURU MOH NAKURU PROVINCIAL GENERAL HOSPITAL RIFT VALLEY NAKURU MOH NAKURU WAR MEMORIAL HOSPITAL RIFT VALLEY NAKURU AF NANDI HILLS DISTRICT HOSPITAL RIFT VALLEY NANDI MOH NANYUKI DISTRICT HOSPITAL RIFT VALLEY LAIKIPIA MOH NAROK DISTRICT HOSPITAL RIFT VALLEY NAROK MOH NGONG RAPHA HOSPITAL RIFT VALLEY KAJIADO MISS OLENGURUONE SUB-DISTRICT HOSPITAL RIFT VALLEY NAKURU MOH ORTUM CATHOLIC MISSION HOSPITAL RIFT VALLEY WEST POKOT MISS PCEA PLATEAU MISSION HOSPITAL RIFT VALLEY UASIN GISHU MISS SIGOR SUB-DISTRICT HOSPITAL RIFT VALLEY BOMET MOH SIGOWET NYAYO HOSPITAL RIFT VALLEY KERICHO MOH ST. JOSEPH MISSION HOSPITAL (KILGORIS) RIFT VALLEY TRANS MARA MISS TAMBACH SUB-DISTRICT HOSPITAL RIFT VALLEY KEIYO MOH TENWEK MISSION HOSPITAL RIFT VALLEY BOMET MISS WAMBA MISSION HOSPITAL RIFT VALLEY SAMBURU MISS ZIWA SUB-DISTRICT HOSPITAL RIFT VALLEY UASIN GISHU MOH ALUPES SUB-DISTRICT HOSPITAL WESTERN TESO MOH BUNGOMA DISTRICT HOSPITAL WESTERN BUNGOMA MOH BUSIA DISTRICT HOSPITAL WESTERN BUSIA MOH BUTERE-MUMIAS DISTRICT HOSPITAL WESTERN BUTERE/MUMIAS MOH KAIMOSI FRIENDS' MISSION HOSPITAL WESTERN VIHIGA MISS KAKAMEGA PROVINCIAL GENERAL HOSPITAL WESTERN KAKAMEGA MOH KHUNYANGU SUB-DISTRICT HOSPITAL WESTERN BUSIA MOH KIMA MISSION HOSPITAL WESTERN VIHIGA MISS KIMILILI SUB-DISTRICT HOSPITAL WESTERN BUNGOMA MOH LIKUYANI SUB-DISTRICT HOSPITAL WESTERN LUGARI MOH LUGULU MISSION HOSPITAL WESTERN BUNGOMA MISS LUMAKANDA DISTRICT HOSPITAL WESTERN LUGARI MOH LUMBOKA MEMORIAL HOSPITAL WESTERN BUNGOMA MOH MAIDUA SUB DISTRICT HOSPITAL WESTERN KAKAMEGA MOH MALAVA SUB-DISTRICT HOSPITAL WESTERN KAKAMEGA MOH MANYALA SUB-DISTRICT HOSPITAL WESTERN BUTERE/MUMIAS MOH MASENO MISSION HOSPITAL WESTERN VIHIGA MISS MAUTUMA SUB-DISTRICT HOSPITAL WESTERN LUGARI MOH MISIKHU HOSPITAL WESTERN BUNGOMA MOH MT. ELGON DISTRICT HOSPITAL (KAPSOKWONY) WESTERN MT ELGON MOH MUKUMU MISSION HOSPITAL WESTERN KAKAMEGA MISS MWIHILIA (COG) MISSION HOSPITAL (YALA) WESTERN BUTERE/MUMIAS MISS NANGINA MISSION HOSPITAL WESTERN BUSIA MISS NAVAKHOLO SUB-DISTRICT HOSPITAL WESTERN KAKAMEGA MOH PORT VICTORIA DISTRICT HOSPITAL WESTERN BUSIA MOH SIRISIA SUB-DISTRICT HOSPITAL WESTERN BUNGOMA MOH ST.MARY'S MISSION HOSPITAL (MUMIAS) WESTERN BUTERE/MUMIAS MISS TESO DISTRICT HOSPITAL (KOCHOLIA) WESTERN TESO MOH VIHIGA DISTRICT HOSPITAL WESTERN VIHIGA MOH WEBUYE DISTRICT HOSPITAL WESTERN BUNGOMA MOH Note: Those hospitals for which malaria admission data were available are highlighted in red, and those for which all-cause admission data only were available are marked in blue.

Annex A: Additional Data Tables
65
Figure A1. Hospital-specific monthly admission data arranged by province clusters a. Nyanza and Western Provinces
0
50
100
150
200
250
300
350
400
Jan
Feb
Mar
Apr
May
Jun
Jul
Aug
Sep
Oct
Nov
Dec
Jan
Feb
Mar
Apr
May
Jun
Jul
Aug
Sep
Oct
Nov
Dec
Jan
Feb
Mar
Apr
May
Jun
Jul
Aug
Sep
Oct
Nov
Dec
Jan
Feb
Mar
Apr
May
Jun
Jul
Aug
Sep
Oct
Nov
Dec
2004 2005 2006 2007
Number of Admissions
Siaya
0
100
200
300
400
500
600
700
800
Jan
Feb
Mar
Apr
May
Jun
Jul
Aug
Sep
Oct
Nov
Dec
Jan
Feb
Mar
Apr
May
Jun
Jul
Aug
Sep
Oct
Nov
Dec
Jan
Feb
Mar
Apr
May
Jun
Jul
Aug
Sep
Oct
Nov
Dec
Jan
Feb
Mar
Apr
May
Jun
Jul
Aug
Sep
Oct
Nov
Dec
2004 2005 2006 2007
Kisumu
0
100
200
300
400
500
600
700
800
900
Jan
Feb
Mar
Apr
May
Jun
Jul
Aug
Sep
Oct
Nov
Dec
Jan
Feb
Mar
Apr
May
Jun
Jul
Aug
Sep
Oct
Nov
Dec
Jan
Feb
Mar
Apr
May
Jun
Jul
Aug
Sep
Oct
Nov
Dec
Jan
Feb
Mar
Apr
May
Jun
Jul
Aug
Sep
Oct
Nov
Dec
2004 2005 2006 2007
Number of Admissions
Kisii
0
50
100
150
200
250
300
350
400
Jan
Feb
Mar
Apr
May
Jun
Jul
Aug
Sep
Oct
Nov
Dec
Jan
Feb
Mar
Apr
May
Jun
Jul
Aug
Sep
Oct
Nov
Dec
Jan
Feb
Mar
Apr
May
Jun
Jul
Aug
Sep
Oct
Nov
Dec
Jan
Feb
Mar
Apr
May
Jun
Jul
Aug
Sep
Oct
Nov
Dec
2004 2005 2006 2007
Homabay
Non‐MA
MA
0
100
200
300
400
500
600
Jan
Feb
Mar
Apr
May
Jun
Jul
Aug
Sep
Oct
Nov
Dec
Jan
Feb
Mar
Apr
May
Jun
Jul
Aug
Sep
Oct
Nov
Dec
Jan
Feb
Mar
Apr
May
Jun
Jul
Aug
Sep
Oct
Nov
Dec
Jan
Feb
Mar
Apr
May
Jun
Jul
Aug
Sep
Oct
Nov
Dec
2004 2005 2006 2007
Busia
Non‐MA
MA
0
50
100
150
200
250
300
Jan
Feb
Mar
Apr
May
Jun
Jul
Aug
Sep
Oct
Nov
Dec
Jan
Feb
Mar
Apr
May
Jun
Jul
Aug
Sep
Oct
Nov
Dec
Jan
Feb
Mar
Apr
May
Jun
Jul
Aug
Sep
Oct
Nov
Dec
Jan
Feb
Mar
Apr
May
Jun
Jul
Aug
Sep
Oct
Nov
Dec
2004 2005 2006 2007
Bondo

Defining Medicine and Commodity Needs for the Management of Uncomplicated and Severe Malaria in Kenya’s Formal Sector Using Novel Space-Time Geostatistical Methods
66
b. Rift Valley and Eastern Provinces
0
50
100
150
200
250
300
350
400
450
Jan
Feb
Mar
Apr
May
Jun
Jul
Aug
Sep
Oct
Nov
Dec
Jan
Feb
Mar
Apr
May
Jun
Jul
Aug
Sep
Oct
Nov
Dec
Jan
Feb
Mar
Apr
May
Jun
Jul
Aug
Sep
Oct
Nov
Dec
Jan
Feb
Mar
Apr
May
Jun
Jul
Aug
Sep
Oct
Nov
Dec
2004 2005 2006 2007
Number of Admissions
Kericho
0
20
40
60
80
100
120
140
160
180
200
Jan
Feb
Mar
Apr
May
Jun
Jul
Aug
Sep
Oct
Nov
Dec
Jan
Feb
Mar
Apr
May
Jun
Jul
Aug
Sep
Oct
Nov
Dec
Jan
Feb
Mar
Apr
May
Jun
Jul
Aug
Sep
Oct
Nov
Dec
Jan
Feb
Mar
Apr
May
Jun
Jul
Aug
Sep
Oct
Nov
Dec
2004 2005 2006 2007
Narok
0
20
40
60
80
100
120
140
160
180
Jan
Feb
Mar
Apr
May
Jun
Jul
Aug
Sep
Oct
Nov
Dec
Jan
Feb
Mar
Apr
May
Jun
Jul
Aug
Sep
Oct
Nov
Dec
Jan
Feb
Mar
Apr
May
Jun
Jul
Aug
Sep
Oct
Nov
Dec
Jan
Feb
Mar
Apr
May
Jun
Jul
Aug
Sep
Oct
Nov
Dec
2004 2005 2006 2007
Makueni
Non‐MA
MA
0
50
100
150
200
250
300
350
Jan
Feb
Mar
Apr
May
Jun
Jul
Aug
Sep
Oct
Nov
Dec
Jan
Feb
Mar
Apr
May
Jun
Jul
Aug
Sep
Oct
Nov
Dec
Jan
Feb
Mar
Apr
May
Jun
Jul
Aug
Sep
Oct
Nov
Dec
Jan
Feb
Mar
Apr
May
Jun
Jul
Aug
Sep
Oct
Nov
Dec
2004 2005 2006 2007
Number of Admissions
Kitui
0
50
100
150
200
250
300
350
400
450
500
Jan
Feb
Mar
Apr
May
Jun
Jul
Aug
Sep
Oct
Nov
Dec
Jan
Feb
Mar
Apr
May
Jun
Jul
Aug
Sep
Oct
Nov
Dec
Jan
Feb
Mar
Apr
May
Jun
Jul
Aug
Sep
Oct
Nov
Dec
Jan
Feb
Mar
Apr
May
Jun
Jul
Aug
Sep
Oct
Nov
Dec
2004 2005 2006 2007
Meru

Annex A: Additional Data Tables
67
c. Coast Province
0
100
200
300
400
500
600
700
Jan
Feb
Mar
Apr
MayJun
Jul
Aug
Sep
Oct
Nov
Dec
Jan
Feb
Mar
Apr
MayJun
Jul
Aug
Sep
Oct
Nov
Dec
Jan
Feb
Mar
Apr
MayJun
Jul
Aug
Sep
Oct
Nov
Dec
Jan
Feb
Mar
Apr
MayJun
Jul
Aug
Sep
Oct
Nov
Dec
2004 2005 2006 2007
Number of Admissions
Kilifi
0
50
100
150
200
250
300
350
400
Jan
Feb
Mar
Apr
MayJun
Jul
Aug
Sep
Oct
Nov
Dec
Jan
Feb
Mar
Apr
MayJun
Jul
Aug
Sep
Oct
Nov
Dec
Jan
Feb
Mar
Apr
MayJun
Jul
Aug
Sep
Oct
Nov
Dec
Jan
Feb
Mar
Apr
MayJun
Jul
Aug
Sep
Oct
Nov
Dec
2004 2005 2006 2007
Malindi
Non‐MA
MA
0
50
100
150
200
250
Jan
Feb
Mar
Apr
May Jun
Jul
Aug
Sep
Oct
Nov
Dec
Jan
Feb
Mar
Apr
May Jun
Jul
Aug
Sep
Oct
Nov
Dec
Jan
Feb
Mar
Apr
May Jun
Jul
Aug
Sep
Oct
Nov
Dec
Jan
Feb
Mar
Apr
May Jun
Jul
Aug
Sep
Oct
Nov
Dec
2004 2005 2006 2007
Number of Admissions
Kwale
0
20
40
60
80
100
120
140
160
180
200
Jan
Feb
Mar
Apr
MayJun
Jul
Aug
Sep
Oct
Nov
Dec
Jan
Feb
Mar
Apr
MayJun
Jul
Aug
Sep
Oct
Nov
Dec
Jan
Feb
Mar
Apr
MayJun
Jul
Aug
Sep
Oct
Nov
Dec
Jan
Feb
Mar
Apr
MayJun
Jul
Aug
Sep
Oct
Nov
Dec
2004 2005 2006 2007
Voi
Non‐MA
MA

Defining Medicine and Commodity Needs for the Management of Uncomplicated and Severe Malaria in Kenya’s Formal Sector Using Novel Space-Time Geostatistical Methods
68

69
ANNEX B. TESTING POTENTIAL COVARIATES OF AL CONSUMPTION: ADDITIONAL FIGURES
Figure B1. Monthly AL consumption at health facilities (not adjusted for stock-outs) plotted against the number of packs delivered to each facility in the same month (left), the previous month (center), and the following month (right). Also shown are regression lines and corresponding R2 values. All plots relate to the 6 × 1 pack size.
Figure B2. Monthly AL consumption at health facilities (standardized to adjust for stock-outs) plotted against the number of packs delivered to each facility in the same month (left), the previous month (center), and the following month (right). Also shown are regression lines and corresponding R2 values. All plots relate to the 6 × 1 pack size.

Defining Medicine and Commodity Needs for the Management of Uncomplicated and Severe Malaria in Kenya’s Formal Sector Using Novel Space-Time Geostatistical Methods
70
Figure B3. Comparison of the total recorded consumption and delivery of AL (6 × 1 pack size) at facilities for 2007. A regression line and corresponding R2 value is also shown.
Figure B4. Comparison by calendar month of 2007 AL consumption and HMIS outpatient malaria diagnoses for the 6 × 1 pack size. Regression lines and corresponding R2 value are shown.

71
ANNEX C. SPACE-TIME KRIGING Theory Consider a set of data distributed in space and time, z(uα,tα), of an attribute z at n locations (uα, tα), α = 1,2,…, n, where u is a vector of spatial coordinates and t is a point in time. A space-time geostatistical problem is to predict values of z at a set of m unobserved locations, (uo, to), z*(u o, to), o = 1,2,…, m, where the asterisk denotes a prediction. The cornerstone of geostatistics is the exploitation of autocorrelation between dispersed values of z to make predictions at unsampled points using techniques such as kriging. Along with the data, z(uα, tα), space-time kriging predictors require estimates of the spatio-temporal covariance between points separated by different spatial lags, hs, vectors of distance and direction, and temporal lags, ht, separations in time. These estimates are typically provided by first estimating the semivariance, γ, using the data at a series of regular spatial and temporal lags and fitting a continuous 2-D model to these estimates. The experimental space-time variogram is estimated by half the mean squared difference between data separated by a given spatial and temporal lag (hs, ht):
( ) ( ) ( ) ( )[ ]( )
∑=
++−=tsn
tsats
tsts tztzn
hh
huuh
h,
1
2, h,,
h,21h,ˆ
ααααγ (1)
A suitable 2-D function is then fitted to the experimental variogram and used as input into the STK algorithm to estimate a covariance value at any given space-time lag. The STK system predicts z*(u, t) as a linear combination of p data proximate in space and time:
),(),(),(*),(
1αα
ααλ tzttz
tp
uuuu
∑=
= (2)
The utility of kriging approaches lies in the ability to determine the weight, λα(u, t), assigned to each neighboring datum in order to minimize the prediction variance, ),(2 tE uσ :
)],(),(*[),(2 tztzVartE uuu −=σ (3) while maintaining unbiasedness of the estimator z*(u, t). In determining optimum weights, kriging takes into account both the covariance between each datum and the point to be estimated, and the covariances between data themselves.

Defining Medicine and Commodity Needs for the Management of Uncomplicated and Severe Malaria in Kenya’s Formal Sector Using Novel Space-Time Geostatistical Methods
72
Implementation The separate STK exercises to predict AL consumption for facilities in each sector by pack size were composed of the following methodological steps. (1) The space-time experimental variogram was estimated (Eq. 1) using a bespoke script written in the R language (R Development Core Team 2007). Variograms were modeled up to spatial lags of 2 decimal degrees and temporal lags of 8 months. (2) A general product-sum space-time variogram model (Iaco et al. 2001) was fitted to each sample variogram surface. This class of model was chosen because it guarantees invertability of the space-time covariance matrix (a fundamental step in the kriging system) and allows a straightforward method for model fitting. The necessary parameters of the product-sum model can be estimated by fitting a conventional 2-D variogram model, composed of the usual suite of valid models to each of the space- and time-marginal sample variograms, and by estimation of the space-time sill, which models semivariance at spatial and temporal lags beyond the range of spatio-temporal autocorrelation. The separate space- and time-marginal variograms were obtained from the space-time sample variogram by setting ht = 0 and hs = 0, respectively, and a single exponential model was fitted to each, along with a space-time nugget using weighted least squares. The objective function F(θ) minimized in the fitting procedure was calculated as a weighted sum of squared differences between the sample space-marginal variogram, )(ˆ iγ , at each i=1,2,…,n lags and the value of the variogram model under this parameter set, );(~ θiγ :
[ ]∑=
−⋅=n
iiiiwF
1
2);(~)(ˆ)()( θθ γγ (4)
The weighting scheme used to determine w(i) was defined as:
[ ]2);(~)()(θiimiw
γ= (5)
where m(i) is the number of data pairs used to estimate )(ˆ iγ . In this scheme, each variogram estimate )(ˆ iγ is weighted in approximately inverse proportion to its estimation variance (Cressie 1983). (3) Parameters for each space-time variogram model were input into a further script that implemented the STK algorithm to generate predicted AL consumption (standardized per day) for each missing record. These values were then multiplied by the number of days that month to convert the prediction to a monthly consumption value.

73
ANNEX D. VALIDATION PROCEDURE Estimating the Variance of the Global Error Distribution Validation procedures were undertaken to assess the performance of prediction models for both AL consumption and malaria and all-cause paediatric inpatient analysis. In each case the result was a set of sample errors of individual predictions
)),(()),(()),(( *iiiv tztzt uuu −=ε where { )),(( itz u ; i = 1,2,…,nv} denotes the validation set
and )),((*itz u the corresponding predictions. The set of prediction errors was then defined
as )),(( iv tuε with the v subscript used to denote the validation set. The set )),(( iv tuε was treated as a sample of )),(( βε tu u , the full set of (unknown) errors for predictions of missing data at the β=1,2,…,q unsampled facility-months, where the u subscript is used to denote the full set of unknown errors. The standard deviation, σu, of )),(( βε tu u was then estimated using the sample standard deviation sv (6) calculated from )),(( iv tuε :
( )∑=
−−
==vn
iviv
vvu Xt
ns
1
2)),((1
1ˆ uεσ (6)
Assessing the Effect of Aggregation on the Variance of Prediction Errors Equation (6) provides a way of estimating the variability in the precision of predictions for individual facility-months. In addition to this individual-level error, however, it was necessary to obtain estimates of the error associated with the sum of predicted values obtained from sets of predictions aggregated over different space-time units such as years, districts, provinces, and so on. Consider a set of j predictions aggregated together within a space-time unit a, { )),((*
jtz u ; j = 1,2,…, na}, which is a subset of the full set of predictions, )),((*
βtz u . The corresponding subset of prediction errors are denoted as )),(( ja tuε . The task was to estimate, for each such subset, the standard deviation of the mean error, [ ]aμσ where
[ ])),(( jaa tuεμμ = . If prediction errors are assumed to be independent and identically distributed (IID) then this value can be estimated from the estimated standard deviation of the global error distribution:
[ ]a
ua n
σμσˆˆˆ = (7)

Defining Medicine and Commodity Needs for the Management of Uncomplicated and Severe Malaria in Kenya’s Formal Sector Using Novel Space-Time Geostatistical Methods
74
The assumption of IID is rarely strictly valid when dealing with spatial and/or temporal data because of the presence of spatial and/or temporal autocorrelation. Before equation (7) could be used to estimate [ ]aμσ for each space-time unit, it was necessary to assess the validity of this assumption for the unknown error set )),(( βε tu u using the sample error set )),(( iv tuε . This was done by estimating directly the relationship between the size of each subset na and the standard deviation of its mean error [ ]aμσ using the sample error set )),(( iv tuε , and comparing this empirical relationship with the theoretical relationship presented in (7). This was done using the following steps: (1) A total of k = 1,2,…,m different aggregated subsets, )),((, jka tuε ,were created from the sample error set )),(( iv tuε by combining spatially and temporally proximate values. Each subset consisted of all elements of )),(( iv tuε that fell within a given space-time unit. The size of these subsets sets ranged from na = 2 to na = 830. (2) The mean error of each aggregated set was calculated as:
∑=
=a
1)),((1 n
jja
aa t
nuεμ (8)
(3) The list of m mean errors, maaa ,2,1, ,...,, μμμ , was then plotted against the corresponding list of set sizes maaa nnn ,2,1, ,...,, (figure D1). This plot provided an illustration of the central tendency and variation of the means of aggregated sets of errors of different sizes. (4) The list of m mean errors was subdivided into a series of b = 1,2,…, B “bins” according to the size of each set, such that each bin contained k = 1,2,…,mb mean errors
ka,μ calculated from sets of similar size. The standard deviation, σb, of the mb mean errors within each bin was then calculated:
∑ ∑=
⎟⎟⎠
⎞⎜⎜⎝
⎛⎟⎟⎠
⎞⎜⎜⎝
⎛−
−=
b bm
k
m
kka
bka
bb mm 1
2
,,1
11 μμσ (9)
(5) The value of σb for each bin was then plotted against the corresponding mean set size in each bin. The resulting plots (figure D1) provided an illustration of the effect of aggregation over successively larger space-time units on the standard deviation of the mean prediction error of those units. The theoretical relationship was also plotted for comparison.

Annex D: Validation Procedure
75
Figure D1: Left column: mean errors of spatially and temporally aggregated sets of predictions from the validation exercise for AL consumption plotted against the number of predictions in each set (black dots). The red line is a moving average (loess smoother) of these values illustrating their central tendency. Right column: The standard deviation of the same set of mean errors split into groups of progressively larger set size (black dots). The theoretical relationship between error standard deviation and set size is also plotted (black line). For both columns the four rows represent (top to bottom) the 6 x 1, 6 x 2, 6 x 3, and 6 x 4 pack sizes. Estimating the Prediction Error for Individual Space-Time Units Estimates were required of the error associated with predictions of the sum of AL consumption or pediatric malaria admissions in each space-time unit of interest across

Defining Medicine and Commodity Needs for the Management of Uncomplicated and Severe Malaria in Kenya’s Formal Sector Using Novel Space-Time Geostatistical Methods
76
Kenya. The units of interest were 2007 totals by district, province, and nationally. The results of the procedure described above suggested that the use of equation (7) as a model for the change in the standard deviation of mean error with aggregation was reasonable, given that the empirically observed relationship was very close to that described by this equation (figure D1). In this section, the procedure by which this model was used to estimate the error associated with predictions in each individual space-time unit is described. This was done in the following steps: (1) The total number of missing data (and hence predictions) in each k = 1,2,…,m space-time unit was determined (this value is denoted as nSTU where the subscript STU indicates that the statistic relates to a space-time unit). (2) The standard deviation of the error of the predicted sum [ ]STUΣσ was then estimated using the error standard deviation σ̂ and the number of predictions in the unit nSTU, based on the same theoretical relationship established above:
[ ] STUSTU ˆˆ nΣ σσ = (10) This process resulted in estimates of the error associated with predictions for all districts, provinces, and nationally for 2007. The estimated standard deviation of each predicted sum provided a quantification of the associated uncertainty. Assuming a Gaussian error distribution, the estimated standard deviation was be used to calculate indicators of this uncertainty such as a 95 percent confidence interval.

77
ANNEX E: PREDICTED AL CONSUMPTION BY PACK SIZE, PROVINCE, FACILITY TYPE, AND SECTOR

Pack Province GoK Mission All H HC D ALL (+/- %) H HC D ALL (+/- %) H HC D ALL (+/- %)
Central 72,058 122,158 205,771 403,756 (6.0) 74,206 17,413 109,183 204,570 (7.5) 146,264 139,572 314,954 608,325 (5.2)
N.Eastern 62,198 61,023 194,753 317,975 (4.0) 14,989 1,412 25,693 44,315 (10.1) 77,188 62,435 220,447 362,290 (3.7)
Coast 97,114 108,343 337,408 550,548 (3.6) 12,082 13,163 108,458 147,534 (7.4) 109,196 121,506 445,867 698,081 (3.7)
Eastern 98,927 168,105 614,162 886,450 (3.8) 90,877 38,861 299,057 435,129 (4.2) 189,804 206,966 913,218 1,321,579 (3.2)
1x6 Nairobi 32,715 173,986 35,605 265,534 (5.5) 17,985 18,516 43,493 83,582 (12.8) 50,700 192,503 79,098 349,116 (5.1)
Nyanza 126,584 166,324 520,146 815,576 (3.8) 51,639 53,861 89,835 204,167 (7.0) 178,223 220,184 609,981 1,019,743 (3.8)
Western 69,114 195,438 311,833 582,069 (3.4) 26,165 64,239 105,750 198,049 (5.1) 95,279 259,677 417,583 780,118 (2.8)
Rift Valley 131,341 300,588 576,264 1,017,505 (5.0) 39,841 96,536 197,567 334,790 (7.0) 171,182 397,124 773,831 1,352,295 (4.8)
National 690,051 1,295,966 2,795,942 4,839,414 (3.2) 327,785 304,001 985,515 1,658,614 (3.7) 1,017,836 1,599,967 3,781,458 6,498,027 (2.8)
Central 65,681 99,502 222,683 391,546 (7.6) 69,777 15,442 115,285 204,185 (8.8) 135,458 114,945 337,969 595,731 (6.2)
N.Eastern 28,569 52,319 329,487 410,375 (3.7) 6,132 1,375 43,099 53,401 (9.2) 34,701 53,694 372,586 463,776 (3.2)
Coast 55,702 95,902 316,393 474,648 (4.8) 10,277 11,689 98,603 132,542 (9.6) 65,979 107,590 414,996 607,191 (4.4)
Eastern 79,543 152,029 697,474 934,603 (3.8) 55,693 35,777 371,899 470,617 (4.8) 135,236 187,806 1,069,372 1,405,220 (3.6)
2x6 Nairobi 66,282 73,172 47,220 208,535 (7.5) 48,885 8,135 62,492 122,916 (10.6) 115,167 81,307 109,712 331,451 (7.1)
Nyanza 138,823 298,385 438,634 878,613 (4.3) 57,099 86,247 81,918 234,966 (6.6) 195,922 384,632 520,552 1,113,579 (3.8)
Western 74,368 255,604 169,021 503,841 (4.5) 31,732 66,889 57,362 157,599 (7.5) 106,100 322,493 226,383 661,440 (3.8)
Rift Valley 153,672 265,925 783,725 1,214,571 (5.2) 50,773 91,317 285,438 428,551 (6.0) 204,445 357,242 1,069,163 1,643,123 (4.3)
National 662,640 1,292,838 3,004,637 5,016,734 (3.3) 330,367 316,871 1,123,151 1,811,831 (3.7) 993,007 1,609,709 4,127,787 6,828,565 (3.1)
Central 48,591 42,166 152,601 245,706 (7.0) 47,641 6,975 77,265 134,228 (7.7) 96,232 49,141 229,866 379,934 (6.1)
N.Eastern 25,728 28,996 143,582 198,307 (4.3) 5,664 807 18,716 26,552 (11.4) 31,392 29,803 162,299 224,859 (4.2)
Coast 16,080 44,791 163,697 227,763 (6.3) 2,286 5,427 51,882 65,344 (11.7) 18,366 50,219 215,579 293,107 (5.7)
Eastern 57,031 94,056 411,094 565,625 (3.8) 66,273 23,407 208,398 302,132 (4.6) 123,303 117,463 619,492 867,757 (3.3)
3x6 Nairobi 20,374 21,366 19,318 68,576 (14.5) 10,466 2,264 24,684 38,515 (20.1) 30,840 23,630 44,002 107,091 (12.5)
Nyanza 52,737 133,913 299,671 487,844 (4.6) 23,502 42,530 55,930 127,292 (7.3) 76,238 176,443 355,601 615,135 (4.2)
Western 37,315 138,783 112,460 291,384 (4.5) 14,973 38,429 40,395 94,739 (7.8) 52,288 177,211 152,856 386,123 (4.1)
Rift Valley 80,315 164,429 556,488 808,593 (4.4) 23,141 58,067 189,743 271,621 (6.0) 103,456 222,496 746,231 1,080,213 (4.5)
National 338,171 668,500 1,858,912 2,893,796 (3.2) 193,946 177,905 671,330 1,064,738 (3.8) 532,117 846,405 2,530,242 3,958,535 (3.1)
Central 113,558 80,168 266,604 465,015 (6.2) 130,114 13,718 139,669 288,185 (5.8) 243,672 93,886 406,273 753,201 (4.9)
N.Eastern 54,474 38,361 294,125 386,960 (3.7) 19,217 1,495 39,883 63,324 (8.7) 73,692 39,856 334,008 450,284 (3.5)
Coast 78,650 91,892 326,767 504,339 (4.5) 9,771 9,798 104,238 136,461 (9.0) 88,421 101,690 431,005 640,800 (4.5)
Eastern 166,069 158,168 832,009 1,163,441 (3.3) 160,235 42,641 436,246 647,879 (3.4) 326,304 200,809 1,268,255 1,811,320 (2.6)
Nairobi 77,771 66,205 50,457 216,065 (6.7) 38,827 7,225 63,655 113,089 (12.2) 116,598 73,430 114,112 329,155 (6.7)
4x6 Nyanza 174,181 225,789 528,838 931,776 (3.9) 78,739 77,447 96,370 262,940 (5.9) 252,921 303,236 625,208 1,194,715 (3.7)
Western 87,527 174,970 278,568 546,476 (4.1) 36,274 60,573 96,747 195,397 (6.0) 123,801 235,542 375,315 741,873 (3.6)
Rift Valley 201,893 388,040 970,473 1,574,768 (3.7) 62,214 138,674 314,830 517,024 (5.2) 264,107 526,714 1,285,304 2,091,793 (3.4)
National 954,123 1,223,592 3,547,841 5,788,840 (2.7) 535,391 351,571 1,299,923 2,232,584 (3.2) 1,489,515 1,575,163 4,847,764 8,021,424 (2.7)

79
ANNEX F. CONSTRUCTION OF EMPIRICAL VARIOGRAMS WITH MONTE CARLO NULL ENVELOPE FOR ASSESSING SPATIAL STRUCTURE IN
PEDIATRIC ADMISSIONS DATA Empirical spatial variograms were calculated to examine the spatial structure present in malaria and all-cause admissions data. Empirical variograms represent the effect of separation distance (termed lag, ) on the expected difference between pairs of observed values (quantified using semi-variance, ). For these analyses, the sample semi-variogram was defined as:
(1)
where represents a monthly admission record observed at a facility at location and represents a record at different facility at a distance from the first. By discretizing
lags into a series of bins of width , such that each value of actually represents a distance interval , semi-variances are computed as the mean semi-variance among the set of pairs of records separated by distances within that interval. Following the procedure outlined by Diggle and Ribeiro (2007), this empirical variogram was compared to a Monte Carlo envelope computed from 99 random permutations of the same residual set. This envelope represents the range of variograms that could be expected by chance in the absence of any spatial structure. Where the semi-variogram of interest lies entirely within this envelope, it can be considered to display no significant spatial structure. As can be seen in figure F1, variograms for both malaria and all-cause admissions lie within their null envelope indicating no significant spatial structure.
Figure F1: Empirical variograms and corresponding Monte Carlo null enveloped illustrating the absence of spatial structure in both malaria and all-cause hospital admissions.

Defining Medicine and Commodity Needs for the Management of Uncomplicated and Severe Malaria in Kenya’s Formal Sector Using Novel Space-Time Geostatistical Methods
80

81
ANNEX G. TESTING POTENTIAL COVARIATES OF ADMISSIONS DATA: ADDITIONAL FIGURE
Figure G1: Scatter plots and regression lines illustrating relationship between pediatric malaria admissions and (a) HMIS outpatient malaria diagnoses and (b) HMIS outpatient all-cause diagnoses and between pediatric all-cause admissions and (c) HMIS outpatient malaria diagnoses and (d) HMIS outpatient all-cause diagnoses. R2 values are also shown for reference.

Defining Medicine and Commodity Needs for the Management of Uncomplicated and Severe Malaria in Kenya’s Formal Sector Using Novel Space-Time Geostatistical Methods
82