Community Needs Assessment
114
Community Needs Assessment: Ramsey and Washington Counties A Summary of Key Findings Authors: Daniel B Lee, Ph.D., Bunchung Ly, B.A., and Nicole MartinRogers, Ph.D. OCTOBER 2021
-
Upload
khangminh22 -
Category
Documents
-
view
3 -
download
0
Transcript of Community Needs Assessment

Community Needs Assessment: Ramsey and Washington Counties A Summary of Key Findings
Authors: Daniel B Lee, Ph.D., Bunchung Ly, B.A., and Nicole MartinRogers, Ph.D.
O C T O B E R 2 0 2 1

A Community Needs Assessment: Wilder Research, October2021 Ramsey and Washington Counties
Contents Executive summary ..............................................................................................................1
Greatest needs of people living with low incomes in Ramsey and Washington counties ........................................................................................................................... 2
Introduction ..........................................................................................................................3
Overview of methods ...........................................................................................................4
The greatest unmet needs of people living with low incomes in Ramsey and Washington counties ......................................................................................................5
Housing ........................................................................................................................... 5
Employment .................................................................................................................... 9
Adult education ............................................................................................................. 14
Childcare and early childhood education ...................................................................... 15
Transportation ............................................................................................................... 17
Healthcare ..................................................................................................................... 20
Food security ................................................................................................................. 22
Systemic racism ............................................................................................................ 24
Who are the people who are living with low incomes in Ramsey and Washington counties? ......................................................................................................................28
Who does Community Action serve? ................................................................................31
Opportunities to improve economic mobility of people living with low incomes in Ramsey and Washington counties ...............................................................................34
Increase community engagement .................................................................................. 34
Provide culturally-specific services for diverse communities ...................................... 35
Streamline applications for services ............................................................................. 36
Strengthen coordination among service providers ........................................................ 36
Next steps ...........................................................................................................................37
References ..........................................................................................................................38
Appendix ............................................................................................................................40
A. Methods and participants demographic overview ................................................... 40
B. Key informant interview protocol with service providers ....................................... 44
C. Focus group/interview protocols for residents ......................................................... 46
D. Community Action Participant Survey .................................................................... 49
E. Community Action Participant Survey Data Book .................................................. 66

A Community Needs Assessment: Wilder Research, October2021 Ramsey and Washington Counties
Figures Figure 1. Housing cost-burdened households ................................................................6
Figure 2. Housing-related expenses that Ramsey County and Washington County residents need help with ..................................................................................7
Figure 3. Patterns of unemployment ..............................................................................9
Figure 4. Community Action participants need for support with housing-related costs regardless of their employment status ..................................................10
Figure 5. Barriers to employment among Ramsey County and Washington County residents ........................................................................................................11
Figure 6. Educational needs and attainment .................................................................14
Figure 7. Barriers to adult educational opportunities ...................................................14
Figure 8. Quality and affordability of childcare and early childhood education in Ramsey and Washington counties ................................................................16
Figure 9. East Metro Pulse survey respondents’ transportation challenges .................18
Figure 10. Community Action survey participants’ challenges to accessing transportation ................................................................................................18
Figure 11. Percentage of households that lack health insurance ....................................20
Figure 12. Unmet healthcare needs ................................................................................20
Figure 13. Food assistance and food insecurity .............................................................23
Figure 14. Racial disparities among Community Action’s survey respondents ............24
Figure 15. Racism-related experiences ..........................................................................25
Figure 16. Ramsey and Washington county total population ........................................28
Figure 17. Poverty rates in Ramsey and Washington counties by race .........................29
Figure 18. Map of where Community Action service recipients live and the Social Vulnerability Index across all census tracts in Ramsey and Washington counties ..........................................................................................................30
Figure 19. Sociodemographic and health information of Community Action participants ....................................................................................................31

A Community Needs Assessment: 1 | Wilder Research, October 2021 Ramsey and Washington Counties
Executive summary The American Community Survey (ACS, 2019) estimates that 14% of Ramsey County (total population: 530,642) and 4% of Washington County residents (total population: 252,232) are living below the federal poverty level. BIPOC (Black, Indigenous, and People of Color) population groups are more likely to be living in poverty than the White population.
Poverty rates in Ramsey and Washington counties by race
Community Action Partnership of Ramsey and Washington Counties (Community Action) is a nonprofit agency dedicated to providing resources and services to help families in Ramsey and Washington counties overcome poverty. Community Action conducts a triennial community needs assessment as part of its federal funding requirements.
This summary presents the highlights from the 2021 community needs assessment, which illustrates the greatest needs of people living with low incomes in Ramsey and Washington counties. It is important to note that this community needs assessment was conducted during the global COVID pandemic. Much of the secondary data in this report is pre-pandemic and therefore does not reflect all of the impacts of the COVID pandemic on this community.
This report will be used by Community Action to inform their next strategic plan. This report can also be used by policymakers, service providers, and others who are interested in and working toward ending poverty and improving the economic mobility of residents of Ramsey and Washington counties.
40%
31%
23%
22%
21%
20%
10%
7%
20%
13%
4%
6%
10%
10%
5%
4%
American Indian/Alaska Native
Black/African American
Asian
Two or more races
Hispanic/Latinx
Other
Native Hawaiian/Other Pacific Islander
White
Ramsey Washington

A Community Needs Assessment: 2 | Wilder Research, October 2021 Ramsey and Washington Counties
Greatest needs of people living with low incomes in Ramsey and Washington counties The greatest needs keeping individuals and families who are living with low incomes are:
Housing: A significant proportion of Ramsey County (31%) and Washington County (22%) households are housing cost burdened. Housing cost-burdened households spend 30% or more of their income on housing-related costs.
Employment: A substantial proportion of Community Action participants (17%) indicated that no adult is employed in their household (i.e., full- or part-time), and 19% indicated that adults in their household were employed only part-time.
Adult education: Only 14% of Community Action survey participants have earned a bachelor’s degree or higher and 39% expressed interest in adult educational opportunities (GED, trade school, or college).
Childcare and early childhood education: 69% of Community Action participants reported that they need support in finding a summer-care or after-school program for their child, and 52% indicated that they need help getting their child ready for school.
Transportation: While the American Community Survey estimates that over 95% of households in Ramsey and Washington counties have access to a vehicle, 19% of Community Action participants reported being without a vehicle.
Access to healthcare: 17% of Community Action participants reported that they or someone who lives in their household did not have health insurance, and a sizeable proportion indicated that they could not afford dental care (17%), health insurance (15%), vision/hearing (10%), and mental health services (9%).
Food security: Nearly 1 in 5 Community Action participants (18%) reported routinely running out of food by the end of the month.
As identified by Community Action’s previous community needs assessments in 2018 and 2015, affordable housing, employment opportunities, and access to healthcare continue to be identified as some of the greatest unmet needs among individuals and families living with low incomes in Ramsey and Washington counties. Childcare is a newly emerging need, likely due in part to the COVID pandemic.
Systemic racism also plays a major role in sustaining and reinforcing poverty among individuals and families who identify as BIPOC and are living with low incomes in Ramsey and Washington counties.

A Community Needs Assessment: 3 | Wilder Research, October 2021 Ramsey and Washington Counties
Introduction Community Action Partnership of Ramsey and Washington Counties (Community Action) is a nonprofit agency dedicated to providing resources and services to help families in Ramsey and Washington counties overcome poverty.
This community needs assessment, conducted triennially by Community Action as part of its federal funding requirements, is an essential process for identifying needs that are not adequately being met for residents and families with low incomes. In 2021, as well as in in 2015 and 2012, Wilder Research was contracted by Community Action to conduct this community needs assessment.
This report provides key findings from the community needs assessment conducted in 2021. Guided by principles of Result Oriented Management and Accountability (ROMA; Community Action Partnership, 2019), the overarching research questions are to:
1. describe what poverty looks like in Ramsey and Washington counties;
2. identify needs keeping residents and families in poverty;
3. identify the barriers to overcoming poverty; and
4. identify opportunities in services and programs to better assist those living in poverty.
By conducting this comprehensive community assessment, Community Action aims to reveal critical insights into the needs of families and individuals who are living with low-incomes in Ramsey and Washington counties. The assessment results will be used to inform Community Action’s 2021-2024 strategic plan, which is currently being developed with Wilder Research.
This community needs assessment also can and should be used by policymakers, service providers, and others who are working to improve the economic mobility of people who are living with low incomes in Ramsey and Washington counties.

A Community Needs Assessment: 4 | Wilder Research, October 2021 Ramsey and Washington Counties
Overview of methods This community needs assessment consisted of a demographic overview, key informant interviews with social service providers (15 key informants), Community Action’s participant survey (340 respondents), and focus groups with people in Ramsey and Washington counties living with low incomes (see Appendix A for more detail).
For the demographic overview, multiple sources of data were compiled to understand the prevalence and severity of unmet needs in Ramsey and Washington counties (see Figure A1), including demographic information about Community Action’s current clientele (see Figure A2).
Through key informant interviews, social service providers offered important insights into what is needed to assist those living in poverty and what services and programs are currently available in the community to support people with low-incomes.
Community Action’s participant survey identified some of the key needs and concerns reinforcing and sustaining poverty in Ramsey and Washington counties.
Lastly, the focus groups of residents with low-incomes offered an in-depth understanding of the contributors to poverty, as well as the barriers to overcoming poverty.
Taken together, leveraging these methods will help describe what poverty looks like in Ramsey and Washington counties, and offer actionable insights for mitigating poverty in these counties.
It is important to note that this community needs assessment was conducted during the global COVID pandemic. Because many publicly available data sets such as the American Community Survey have a time lag, much of the secondary data in this report is pre-pandemic and therefore does not reflect the current situation of community residents who are living with low-incomes and does not reflect all of the recent and ongoing impacts of the COVID pandemic on this community.
It is also important to note that this study is descriptive in nature. We explored data from secondary, publicly available sources and gathered qualitative and quantitative information from Community Action participants and service providers. We did not complete experimental research or use other methods that would allow us to make claims about or “prove” which of the factors identified in this report caused poverty or which factors cause people to remain in poverty. However we can show with this type of descriptive study how these factors are related, for example, how racial disparities in the factors that contribute to poverty may be related to systemic racism.

A Community Needs Assessment: 5 | Wilder Research, October 2021 Ramsey and Washington Counties
The greatest unmet needs of people living with low incomes in Ramsey and Washington counties The greatest unmet needs identified in this report are based on a synthesis of data from the Community Action participant survey, focus group sessions, key informant interviews, and demographic overview. Each section of the report covers a separate need, although we acknowledge many of these needs are interrelated. This section of the report answers key questions to help Community Action, as well as other service providers and policymakers, learn more about the nuances within each of the areas of greatest need.
The greatest needs keeping individuals and families in poverty are: housing, employment, access to healthcare, access to transportation, and food security. Adult education and early childhood education and childcare were also identified as the greatest needs that keep individuals and families unemployed or underemployed, as well as factors that contribute to generational poverty. Data sources indicate that systemic racism plays a major role in sustaining and reinforcing poverty among individuals and families who identify as BIPOC and are living with low incomes in Ramsey and Washington counties.
Of note, many of these needs have persistently emerged as major contributors to poverty in Community Action’s earlier community needs assessments. Affordable housing, employment opportunities, and access to healthcare, which were all identified as greatest needs in 2018 and prior community needs assessments, continue to be identified as some of the greatest unmet needs among individuals and families living with low incomes in Ramsey and Washington counties. Childcare emerged as one of the greatest unmet needs in 2021, whereas it did not rise to the same level in the 2018 community needs assessment. Adult caregivers in the current needs assessment reported that disruptions to childcare, primarily due to the COVID pandemic, has been one of the greatest barriers to them obtaining needed job training and/or employment.
Housing
To what extent are residents of Ramsey and Washington counties burdened by the cost of housing?
The American Community Survey estimated that a significant proportion of Ramsey County (31%) and Washington County (22%) households are housing cost burdened. Housing cost-burdened households spend 30% or more of their income on housing-related costs (Figure 1). Per Ramsey County’s Economic Competitiveness and Inclusion Plan (Ramsey County, 2021), it was estimated that half of housing cost-burdened residents

A Community Needs Assessment: 6 | Wilder Research, October 2021 Ramsey and Washington Counties
from Ramsey County (49%) live in subsidized housing, and that 15,000 affordable housing units are needed to ensure that residents with low incomes have access to affordable housing.
Figure 1. Housing cost-burdened households
Ramsey County
Washington County
Note. Housing cost-burdened households spend 30% or more of their household income on housing-related costs. Source: American Community Survey, 2019
Per Community Action’s participant survey, approximately 1 in 3 respondents (32%) received assistance from government and/or nonprofit agencies to mitigate the financial burden of paying for housing. Moreover, 7% of respondents are living in another person’s home and 2% are living in a shelter or are homeless. These findings reflect the dire need for affordable housing options for individuals and families living with low incomes in Ramsey and Washington counties.
What are the specific housing-related costs that are burdening residents?
Common housing expenses include, but are not limited to, paying for rent or mortgage, utility bills, and home repairs. Per the East Metro Pulse resident survey, paying for property taxes and general upkeep and maintenance were the greatest housing-related concerns for residents of Ramsey and Washington counties in 2018. According to the Community Action participant survey, paying utility bills, rent and mortgage, and home repairs were the top three housing-related costs that individuals and families in Ramsey and Washington counties needed help with in 2021 (Figure 2). These results signal the need for programs and policies that provide financial assistance to address different types of housing-related expenses. In other words, affordable housing is needed but is not enough to address the needs of residents living with low incomes.
31% 22%

A Community Needs Assessment: 7 | Wilder Research, October 2021 Ramsey and Washington Counties
Figure 2. Housing-related expenses that Ramsey County and Washington County residents need help with East Metro Pulse (Unweighted N = 1,500)
Community Action Participant survey (N = 340)
Many focus group participants also mentioned rent or mortgage payments and utility bills as expenses that create a significant financial burden for their household. Several participants also reported that they were unable to pay housing-related bills on time. These focus group participants also shared that they or their families rely on federal and state financial assistance programs, as well as programs offered by Community Action, to mitigate the burden of paying for energy, heating, and other housing-related costs.
I used Community Action’s services to pay bills. I also got a grant last year. They helped me with funds for preventing eviction. – A focus group participant
[I used] the energy assistance to help me get caught up with my past due bill. – A focus group participant
[I have used] housing programs like the shelter and transitional housing and moving to Section 8. You have to meet those requirements to continue using those programs. – A focus group participant
What are the gaps in affordable housing?
Service providers who we interviewed identified multiple gaps in housing-related services for people living with low incomes in Ramsey and Washington counties. The limited number of affordable housing units, in particular, was identified as a major gap. Due to the limited number of affordable housing units, service providers noted that families living with lower-incomes compete with higher income families to secure housing, and families living with lower incomes are more likely to be placed on waitlists than higher income families.
28%
20%
15%
14%
Property taxes
General upkeep and maintenance
Rent or mortgage
Home repairs
44%
35%
18%
7%
4%
Paying utility bills
Rent or mortgage
Home repairs
Preventing foreclosures and evictions
Resolving issues with landlord

A Community Needs Assessment: 8 | Wilder Research, October 2021 Ramsey and Washington Counties
A few focus group participants also mentioned that they were on a waitlist for many years before being accepted for housing.
The low vacancy rate that was plaguing our system has been a challenge for our community for many years …we’ve had few openings and there is not enough affordable housing for people with low-incomes.…I read somewhere that even middle-income earners did not have enough affordable housing. – A service provider
Housing is so important in our community. …the housing we get is a maximum of three bedrooms. There are not always four or five [bedroom] units available. The section 8 voucher has not opened up since the pandemic. I have been on the waitlist for five years now. – A focus group participant
A few service providers who we interviewed highlighted the need to invest more in developing affordable housing units.
In terms of why the pandemic destabilized housing, a lot of it is rooted in the lack of investment in housing and social services. We need to make sure that instead of focusing on corporations, we should invest in people. – A service provider
Naturally occurring affordable housing (NOAH), which are affordable rental properties that are not subsidized by any federal program, are the most common affordable housing units in Ramsey County (Ramsey County, 2021). Yet, by 2030, over 3,000 Low Income Housing Tax Credits will expire, which will likely lead to a reduction in the number of NOAH units available. Many of the NOAH units are over 50 years old (61%) and may be unsafe to live in (e.g., exposure to health contaminants, in disrepair), and the preservation of NOAH is essential for maintaining the supply of affordable housing. However, the vast majority of NOAH units are studios and single bedroom apartments (69%), which can be a barrier for large families looking for affordable housing options.
What are the gaps in affordable housing-related amenities?
Service providers also mentioned a lack of handicap accessible housing as a critical service gap for elderly people and people with disabilities. Service providers mentioned that many affordable housing units in Ramsey and Washington counties are not wheelchair accessible. A study conducted by Minnesota Leadership Council on Aging (2019) indicated that housing is one of the primary needs for older adults that includes the lack of affordable housing, long-term care, and programs to help older adults remain in their homes. Therefore, finding a home that is both affordable and accessible can be a significant challenge for individuals and families who are living with low incomes and who use wheelchairs or need other accommodations.
[The community needs] accessible housing that would not only be accessible in the disability sense, but also in the financial sense. Houses, rental homes, or apartment complexes are typically not accessible. So if you’re a person that uses a wheelchair, for example, those houses are not designed around that. So it’s very difficult for a person with a disability to find a home they can live in that’s both accessible and affordable. – A service provider

A Community Needs Assessment: 9 | Wilder Research, October 2021 Ramsey and Washington Counties
Summary of key findings related to housing needs and service gaps
Housing costs and a lack of affordable housing are significant housing barriers for residents living with low incomes in Ramsey and Washington counties. Lack of affordable housing in particular is one of the greatest unmet needs in the community. Findings reveal that individuals and families who are living with low incomes may need additional assistance in paying for housing costs. Per the Community Action participant survey, although nearly 1 in 3 respondents received financial assistance to help defray some of their housing costs, a large proportion were still struggling with paying their utility bills, rent or mortgage, and home repair costs. Multiple focus group participants also indicated that they were behind in paying bills and other housing costs, which exacerbated their financial hardships. To address this unmet need, service providers posited the need for more affordable and handicap accessible housing units in Ramsey and Washington counties. They also indicated the need for more financial assistance programs to mitigate housing-related costs among individuals and families living with low incomes.
Employment What is the prevalence of unemployment and underemployment in Ramsey and Washington counties? Are employed households earning a living wage?
The rate of unemployment is approximately 5% and 4% in Ramsey and Washington counties, respectively. Not surprisingly, the rate of unemployment is even higher among residents and families living with low incomes. A substantial proportion of Community Action participant survey respondents (17%) indicated that no adult is employed in their household (i.e., full- or part-time), and 19% indicated that adults in their household were employed only part-time (Figure 3).
Figure 3. Patterns of unemployment
a Data is from Community Needs Assessment (2021, N = 275). b Data is from American Community Survey (2019). c Ramsey County N = 430,540 d Washington County N= 200,390.
17%
19%
Percentage of households that completedthe Community Action participant survey
with no adults employed
Percentage of households that completedthe Community Action participant survey
with adults employed only part-time a
a
5%
4%
Unemployment rate in Ramsey County
Unemployment rate in Washington County
b,c
b,d

A Community Needs Assessment: 10 | Wilder Research, October 2021 Ramsey and Washington Counties
Of the 17% of households with no adults employed in the household, 44% of Community Action survey respondents indicated that they needed assistance with paying their utility bills and 35% needed assistance with paying their rent or mortgage. Notably, Community Action clients with those who have one or more adults in their household who are employed full-time are no more or less likely to need help paying their housing-related expenses than Community Action participants who have no adults in their household who are employed. Participants who are employed part-time are most likely to need help paying their housing-related bills (Figure 4). The pattern of findings indicates that having a job is not enough to help families escape poverty. They need jobs that pay a living wage so they do not struggle to pay for basic needs while working.
Figure 4. Community Action participants need for support with housing-related costs regardless of their employment status
Research conducted by Prosperity Now (2020) with 2,252 lower-income households found that nearly half of low income households are unable to completely pay for at least one basic expense because of the economic toll from the COVID-19 pandemic. About 1 in 4 of their study respondents reported that they skipped paying bills or paid late and nearly 1 in 5 cannot afford to buy food they needed (Cantor & Landry, 2020).
What are the barriers to employment in Ramsey and Washington counties?
Our demographic overview and Community Action participant survey assessed multiple barriers to employment in Ramsey and Washington counties. East Metro Pulse survey data indicated that limited education and training and lack of access to better jobs were the greatest barriers to accessing employment in 2018 (i.e., 10% of Ramsey and Washington County residents). Nearly 2 in 5 Community Action participant survey respondents (38%) reported that they faced barriers to employment. The greatest barrier included not having access to childcare or eldercare. Other barriers included a limited number of good paying jobs, not being able to afford transportation, dealing with a health condition, lacking the required education, and not having the required work experience (Figure 5). In sum, compared the general population (per East Metro Pulse data), Community Action survey respondents are reporting greater needs and barriers to employment.
44%
54%
43%
35%
46%
34%
No adults employed in household (n = 48)
Adult(s) employed only part-time (n=52)
Adult(s) employed full-time and part-time (n = 175)
with utility bill paying rent or mortgageNeed help:

A Community Needs Assessment: 11 | Wilder Research, October 2021 Ramsey and Washington Counties
Figure 5. Barriers to employment among Ramsey County and Washington County residents East Metro Pulse (N = 1504)
Community Needs Assessment Survey (N = 340)
Some of the focus group participants reported that limited access to childcare, lack of affordable transportation, and lack of employment training are barriers to finding employment. Parents, in particular, shared that they had barriers to employment because they are unable to find affordable childcare. Similarly, a few participants who lack a reliable vehicle or who depend on public transportation reported that their commute to work is long and unpleasant. Lastly, with respect to job training, several focus group participants shared that their limited knowledge and skills in using technology (e.g., word processing or accounting/bookkeeping software) is a barrier to employment. Participants indicated that job training opportunities would help them get the jobs they want.
Parents can get more skills or a refresher to learn new skills to meet the demands [of the job] so that they can be more self-sufficient. Now that most of the things are online, getting themselves educated and being proactive about what to learn, like getting trained on how to use technology, is crucial. – A focus group participant
The main thing is that I’m not working full-time now because my kids are home for summer break. I am thinking about my youngest child because if I work full-time I would need to find a babysitter while I work. – A focus group participant
43%
35%
23%
22%
18%
13%
Need more/better education
No good job available
Transportation
Physical or mental health problems
Childcare
Discrimination by employer
23%
10%
10%
9%
8%
7%
Lack of access to childcare/eldercare
Limited number of good paying jobs
Not being able to afford transportation
Dealing with health problems
Lacking the required education
Not having the required work experience

A Community Needs Assessment: 12 | Wilder Research, October 2021 Ramsey and Washington Counties
According to the National Conference of State Legislatures (2019), “benefits cliffs” or “the cliff effect” are one of the barriers to employment for people with low-incomes. A benefit cliff is the sudden and often unexpected decrease in public benefits when people with low-incomes have a small increase in earnings. It is a disincentive to work for people with low-incomes because when they start earning too much income, they will lose public benefits—such as Supplemental Nutrition Assistance Program (SNAP), school nutrition programs, health insurance, and/or childcare assistance. However, with their small increase in income, many of these people still cannot afford to live without these public benefits.
To address unemployment in Ramsey and Washington counties, the service providers who we interviewed suggested focusing on stable housing, reliable and affordable transportation, affordable childcare, adult educational and career training opportunities, and access to technology.
Summary of key findings related to employment
Unemployment is one of the greatest unmet needs among residents living with low incomes in Ramsey and Washington counties. Approximately 1 in 6 households do not have any adults who are employed. Community Action participant survey and focus group participants indicated that limited access to adult education/career training, reliable and affordable transportation, and childcare are some of the greatest barriers to accessing employment.
How do adult education and training, childcare, and transportation contribute to unemployment and underemployment in Ramsey and Washington counties?
The service providers who we interviewed identified a number of service gaps that contribute to unemployment among residents in Ramsey and Washington counties. The first service gap pertains to limited access to affordable and reliable transportation options. Specifically, service providers noted that Ramsey and Washington residents with low incomes may rely on public transportation that has reduced routes and schedules at night and during the weekends, which can limit their employment opportunities.
[The community needs] adequate, affordable, dependable, and reliable transportation that works for people, that you don’t have to wait for hours or you don’t have to change from a big bus to short bus, or you don’t have to walk to the bus stop if you’re frail and use a walker. – A service provider
For employment, I believe as people start coming back [from the pandemic] and try to find work, if they don’t have stable housing and transportation, they will have a hard time finding a job. – A service provider

A Community Needs Assessment: 13 | Wilder Research, October 2021 Ramsey and Washington Counties
Additionally, limited access to affordable childcare programs is a service gap that can perpetuate unemployment. Without access to affordable childcare, caregivers may not be able to work. Service providers emphasized that affordable and safe childcare services are needed to address unemployment in Ramsey and Washington counties.
People can’t go back to work because they don’t have childcare… Some families have chosen not to put the children in childcare because of COVID. It’s not safe, and there are no vaccines for children. – A service provider
Obviously, parents need childcare to go to work. It is about affordable childcare, and it’s just so unaffordable at the moment. – A service provider
Lastly, the lack of adult education and job training opportunities is a service gap that creates barriers to employment. Some of the service providers we interviewed expressed the need for training to increase marketable skillsets among residents with low incomes in Ramsey and Washington counties. Moreover, a few service providers shared that career training opportunities should be made more accessible to caregivers (e.g., with flexible hours, self-paced). Limited access to technology (e.g., laptop, internet) was identified as an additional gap to accessing employment and employment training opportunities. Community members need to have access to a computer, word processing software, and the internet to complete job applications.
Employment training should be delivered in a way that allows a parent to still be around and parent their kids. Those are some of the immediate gaps that I can point to… Many residents don’t have technology. Everything has to be done online, which was very difficult when we also had social distancing and quarantine protocols in place due to increased breakouts among those affected. Those have been significant challenges. – A service provider
The next sections of this report talk about each of these barriers. There is also a need for the local economy to provide enough living wage jobs in fields in which adults in Ramsey and Washington counties are trained for. This study focuses on the needs of residents living with low-incomes and does not cover labor market supply and demand, although we know the availability of good jobs impacts the extent to which people living with low-incomes can secure living wage employment, which is a critical factor in moving toward self-sufficiency.
A Community Needs Assessment: 14 | Wilder Research, October 2021 Ramsey and Washington Counties
Adult education
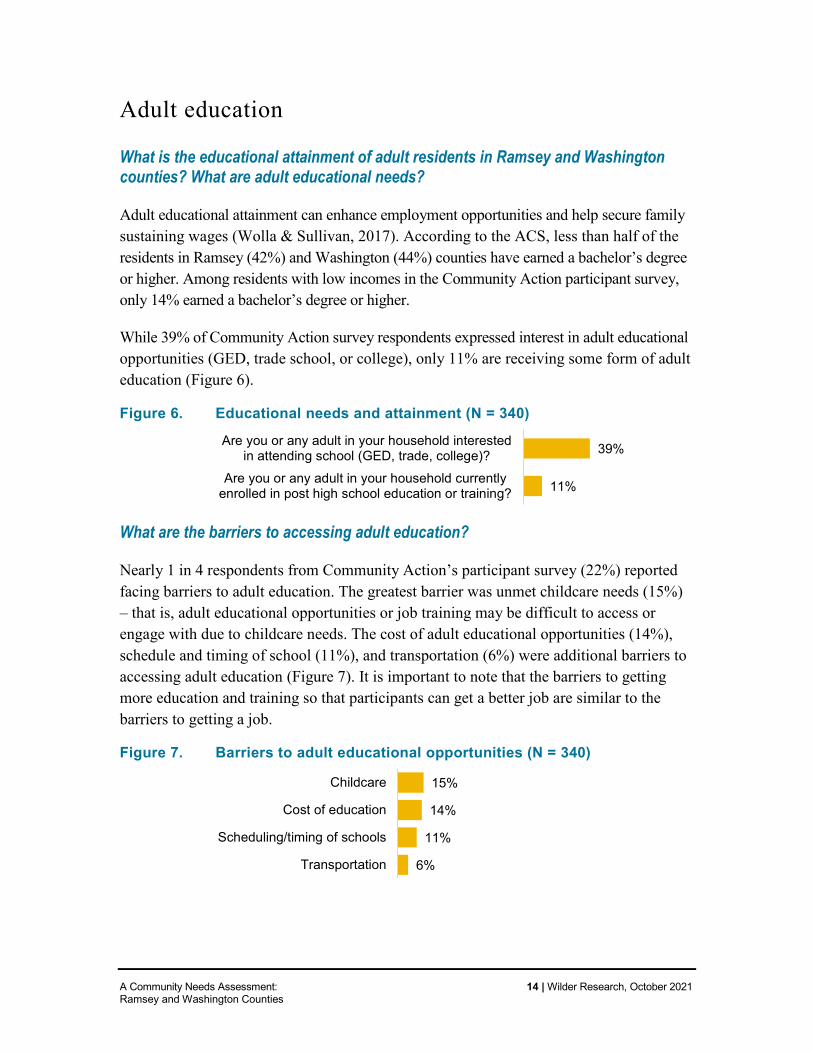
What is the educational attainment of adult residents in Ramsey and Washington counties? What are adult educational needs?
Adult educational attainment can enhance employment opportunities and help secure family sustaining wages (Wolla & Sullivan, 2017). According to the ACS, less than half of the residents in Ramsey (42%) and Washington (44%) counties have earned a bachelor’s degree or higher. Among residents with low incomes in the Community Action participant survey, only 14% earned a bachelor’s degree or higher.
While 39% of Community Action survey respondents expressed interest in adult educational opportunities (GED, trade school, or college), only 11% are receiving some form of adult education (Figure 6).
Figure 6. Educational needs and attainment (N = 340)
What are the barriers to accessing adult education?
Nearly 1 in 4 respondents from Community Action’s participant survey (22%) reported facing barriers to adult education. The greatest barrier was unmet childcare needs (15%) – that is, adult educational opportunities or job training may be difficult to access or engage with due to childcare needs. The cost of adult educational opportunities (14%), schedule and timing of school (11%), and transportation (6%) were additional barriers to accessing adult education (Figure 7). It is important to note that the barriers to getting more education and training so that participants can get a better job are similar to the barriers to getting a job.
Figure 7. Barriers to adult educational opportunities (N = 340)
39%
11%
Are you or any adult in your household interestedin attending school (GED, trade, college)?
Are you or any adult in your household currentlyenrolled in post high school education or training?
15%
14%
11%
6%
Childcare
Cost of education
Scheduling/timing of schools
Transportation

A Community Needs Assessment: 15 | Wilder Research, October 2021 Ramsey and Washington Counties
How does adult education contribute to better employment outcomes?
Service providers shared that there is a dire need to connect employees to adult educational opportunities and workforce training. Multiple service providers stressed that expanding adult educational programs is necessary to ensuring that adults in Ramsey and Washington counties are prepared to fill 21st century jobs. Others suggested that adult educational opportunities could play an important role in helping adults advance in their careers, which would reduce underemployment. In an effort to address barriers to employment, service providers recommended that adult educational opportunities should be self-paced and flexible.
We are looking into a holistic approach where we bring them closer to the employers and training. More money needs to be put into the workforce development and structure [so] that we can engage more folks into building their career. – A service provider
Summary of key findings related to adult education
Developing pathways for adults to obtain postsecondary education and workforce training can mitigate unemployment and underemployment (Ruiz-Quintanilla & Claes, 1996). Community Action’s participant survey importantly reveals that educational attainment is noticeably low among residents with low incomes. Many residents with low incomes also experience barriers in accessing adult education, with childcare being the greatest barrier. More flexible training options may help to mitigate some childcare and transportation barriers. Moreover, many adults in the area, and especially workers who identify as BIPOC, are not receiving a living wage. Thus, there is also a need to address the availability of living wage employment opportunities. These employment opportunities should be in close proximity to available, affordable housing. Also, the local economy has to provide training opportunities that are aligned with these job openings.
Childcare and early childhood education
How pervasive are needs related to childcare, early childhood education, and out-of-school time in Ramsey and Washington counties?
Per Community Action’s participant survey, 69% of respondents reported that they need support in finding a summer-care or after-school program for their child, and 52% indicated that they need support in getting their child ready for school.
With respect to the barriers to childcare, half of Ramsey and Washington County residents (50%) who completed the East Metro Pulse survey rated childcare as high quality, but unaffordable (Figure 8). Additionally, nearly 1 in 4 residents (27%) rated

A Community Needs Assessment: 16 | Wilder Research, October 2021 Ramsey and Washington Counties
early childhood education as high quality, but unaffordable, with nearly 1 in 3 residents rating early childhood education as unaffordable regardless of quality (35%). Thus, the biggest barrier to families living with low incomes obtaining childcare and early childhood education appears to be cost.
Figure 8. Quality and affordability of childcare and early childhood education in Ramsey and Washington counties
High quality and affordable
High quality but not
affordable
Not high quality, but affordable
Neither high quality, nor affordable
Childcare (N=271) 28% 50% 10% 13%
Early childhood education (N=280)
50% 27% 15% 8%
Source: East Metro Pulse (2018)
Childcare became an even greater need and concern as a result of the COVID-19 pandemic. Many focus group participants expressed facing difficulties with childcare during the COVID-19 pandemic – namely, lack of affordable childcare services and fear of their children becoming exposed to COVID-19 while in care.
A few participants also shared their concerns and frustrations with virtual learning, including that their children fell behind on their educational goals and that virtual learning created an additional burden on parents.
How do childcare needs contribute to unemployment and underemployment?
Service providers expressed that limited childcare services can contribute to unemployment and underemployment among adult parents and caregivers. Caregivers who need to work evening and weekend shifts may be unable to due to limited access to after-hours childcare. Other service providers mentioned that childcare is unaffordable for families living with low incomes. Unaffordable childcare disrupts employment, which makes obtaining childcare even further out of reach (Berry et al., 2007).
…parents need affordable childcare to go to work but it’s just so unaffordable right now. – A service provider
[The community needs] affordable, accessible, safe childcare that’s not just Monday through Friday, 7 to 5, like we have now. Most of our families are working evenings and weekends and overnights, and it’s really hard to find that good quality childcare, those type of hours. – A service provider
Research has also found that providing high quality early childhood education to BIPOC children and children from families with low incomes is a key strategy to reduce educational

A Community Needs Assessment: 17 | Wilder Research, October 2021 Ramsey and Washington Counties
achievement gaps that ultimately lead to employment disparities (García & Weiss, 2017). Therefore, high quality early childhood education programs like Head Start can address employment barriers for two generations of the family unit by providing care for children allowing their parents to work, and by preparing the child for later employment success.
What are the childcare and early childhood education-related service gaps?
In addition to childcare being unaffordable and inaccessible to low-income families, there are very few culturally-specific early childhood education programs. Community Action’s Head Start programs in Ramsey and Washington counties have started to employ more staff from the cultural communities of the children they serve and incorporate other activities to make the programs more relevant and appealing to specific cultural communities. One service provider who we interviewed indicated that they would like to collaborate with Community Action and other local agencies to develop culturally-specific Head Start programs.
Summary of key findings related to childcare and early childhood education
Affordable childcare and early childhood education are service gaps that may contribute to unemployment and underemployment among families living with low incomes in Ramsey and Washington counties. Many parents who participated in this study reported unmet childcare needs. Parents and caregivers in Ramsey and Washington counties need childcare services during the evenings and weekends; affordable, safe, and high quality early learning opportunities; and programs that are culturally specific.
Transportation
How do people living with low incomes in Ramsey and Washington counties get around?
While the American Community Survey estimates that over 95% of households in Ramsey and Washington counties have access to a vehicle, nearly 1 out of 5 residents (19%) who completed the Community Action survey reported being without a vehicle.
What are some of the key transportation challenges of people living with low incomes in Ramsey and Washington counties?
East Metro Pulse data reveals that residents in both counties have difficulty accessing social service agencies (20%), childcare (17%), work (12%), and school (10%) due to transportation-related needs (Figure 9).

A Community Needs Assessment: 18 | Wilder Research, October 2021 Ramsey and Washington Counties
Figure 9. East Metro Pulse survey respondents’ transportation challenges Hardships with getting to where you need to go, such as to…
Source: East Metro Pulse (2018)
According to Community Action’s participant survey, 1 out of 4 respondents reported transportation challenges. The cost of car ownership, such as paying for insurance and maintenance (17%), was the greatest transportation-related challenge. Next, the cost of public transit (9%), length of commute time (8%), the limited schedule and route of public transit (6%), and the distance from home to a public transit stop (6%) were other notable challenges to transportation (Figure 10).
Figure 10. Community Action survey participants’ challenges to accessing transportation (N = 340)
Some focus group participants also identified transportation-related difficulties such as paying car payments, car repair costs, and the overall cost of car ownership (e.g., insurance, registration) as barriers to transportation. To help cover the cost, some participants received assistance to finance their car and pay for car repairs.
What are the transportation-related service gaps in Ramsey and Washington counties?
The service providers we interviewed also identified transportation-related service gaps. First, service providers mentioned that public transportation was less accessible and reliable during nights and weekends, which can limit access to employment and basic
20%
17%
12%
11%
10%
Social service agencies (N=590)
Childcare (N=204)
Work (N=1,078)
Entertainment and recreation (N=1,464)
School (adult or child) (N=429)
17%
9%
8%
6%
6%
Cost of car ownership (insurance/maintenance/etc.)
Bus or light rail stop too far from home
Cost of public transportation (Bus/Light Rail fare)
Length/Time of commute
Bus or Light Rail schedule/route

A Community Needs Assessment: 19 | Wilder Research, October 2021 Ramsey and Washington Counties
needs (e.g., food shelves). Service providers also shared that residents, since the pandemic, have been hesitant to use public transportation due to their fear of being exposed to COVID-19.
They need transportation. They may be used to using the bus, but the bus stopped, and so there is no way they can go to their employment. They tried, but maybe the person who gives them ride is sick, or they don’t want to share the same car because of COVID. – A service provider
A few focus group participants also indicated that lack of car ownership limits their access to employment. One focus group participant mentioned that they had more employment opportunities and could pursue different types of jobs because they own a car.
Lastly, service providers mentioned there is a shortage of car repair assistance programs, which limits access to reliable transportation for people who are living with low incomes, especially those who live in suburban areas.
We don’t have enough car repair programs. Most people rely on public transportation. People who have not had access to transportation, they are completely shut in. – A service provider
We need more car repair programs, anything so that they can get their car working. – A service provider
I have received help with car payments… [It] depends on how much you put down, but they will help out. So I used this program a few years ago. – A focus group participant
A study from Minnesota Leadership Council on Aging (2019) reported that transportation is a pervasive need for older adults. The study found a need for more specialized transportation options rather than mass transit.
Summary of key findings for access to transportation
Access to transportation is an unmet need for at least 1 out of 4 residents living with low incomes in Ramsey and Washington counties. Residents are not able to access employment opportunities or vital services such as healthcare, childcare, and social services due to transportation barriers and service gaps. The greatest barriers to transportation are the costs associated with owning a car and the inaccessibility of public transportation especially during the weekends and at night. More programs to help people buy their own car and to help with the cost of car repairs were suggested by Community Action participants and service providers alike.

A Community Needs Assessment: 20 | Wilder Research, October 2021 Ramsey and Washington Counties
Healthcare
Do residents who are living with low incomes in Ramsey and Washington counties have adequate access to healthcare?
While the American Community Survey estimates that less than 5% of households in Ramsey and Washington counties lack access to health insurance, 17% of Community Action survey participants reported that they or someone who lives in their household did not have health insurance (Figure 11).
Figure 11. Percentage of households that lack health insurance
a Community Action participant survey, N = 340 b American Community Survey, 2019, N = 793,259
According to East Metro Pulse, a sizeable proportion of residents in both counties have delayed getting care or did not seek care for physical, mental, and dental health problems because they could not afford treatment (Figure 12). A notable percentage of respondents in the Community Action participant survey also indicated that they could not afford healthcare they need, including dental care, health insurance, vision/hearing support, and mental health services. More than 1 in 10 respondents indicated having difficulty paying for treatment, and nearly 1 in 10 indicated having difficulty paying for medication. Thus, these results suggest that a large proportion of individuals and families living with low incomes in Ramsey and Washington counties are unable to access and pay for healthcare services that they need.
Figure 12. Unmet healthcare needs
East Metro Pulse (N=1,496-1,500)
Community Needs assessment (N = 340)
Fourteen percent of Community Action survey respondents also reported that they or someone in their household used the emergency room three or more times in the past year. The overutilization of the emergency department may reflect that a proportion of residents with low incomes in Ramsey and Washington County have limited access to
5%
17%
Ramsey and Washington Counties overall population
Communciation Action service recipientsa
b
24%
19%
7%
Dental care
Physical health
Mental health
17%
15%
10%
9%
Dental care
Health insurance
Vision/hearing
Mental health

A Community Needs Assessment: 21 | Wilder Research, October 2021 Ramsey and Washington Counties
timely, primary care (possibly due to their lack of health insurance), or reside in environments that pose a significant threat to health and safety.
Moreover, according to the Centers for Disease Control and Prevention’s Behavioral Risk Factor Surveillance System, residents in Ramsey and Washington counties reported, on average, three to four mentally unhealthy days per month (CDC, 2020). Mentally unhealthy days are the number of days an individual feels that their mental health is “not good” in the past month. Based on this estimate, the average Ramsey and Washington County resident may experience over a month of mentally unhealthy days within a given year. The Minnesota Department of Health reported that Minnesotans without health insurance, on average, experience more mentally unhealthy days than the statewide average number of mentally unhealthy days (Minnesota Department of Health, 2019).
What are the healthcare-related service gaps?
Some focus group participants noted that Community Action and other organizations helped them and their families access services such as Medical Assistance and Medicaid to meet their healthcare needs. Because of the assistance they received, participants expressed that they could visit their primary care physician without worrying about cost. Because they received the care they needed, these participants are able to work, learn, and engage in activities that would help them overcome poverty.
Service providers who we interviewed identified several gaps in healthcare access for individuals and families living with low incomes in Ramsey and Washington counties, but did not mention reasons for the lack of health insurance. These providers also mentioned that there is a scarcity of culturally-specific health services. A lack of culturally-specific services can exacerbate medical mistrust and present as a barrier to accessing healthcare (Bazargan et al., 2021). There is a need for programs that provide funding, training, and additional resources to healthcare providers to ensure that healthcare is accessible and culturally responsive to diverse communities.
“[It is about] the ability to understand the culture and [create] trust. Trust can be created with the space where people are at. The space needs to be welcoming, and relevant. [For instance], people don't go to a county office because they don’t feel welcomed. – A service provider
I think counties need to stop throwing a one-size-fits-all blanket across BIPOC communities but instead tailor their approach. At the end of the day, the service may be the same, but the approach and who you’re going to partner with or how you’re going to deliver that outreach could make a big difference to build that trust and collaborative feeling. – A service provider
A Community Needs Assessment: 22 | Wilder Research, October 2021 Ramsey and Washington Counties
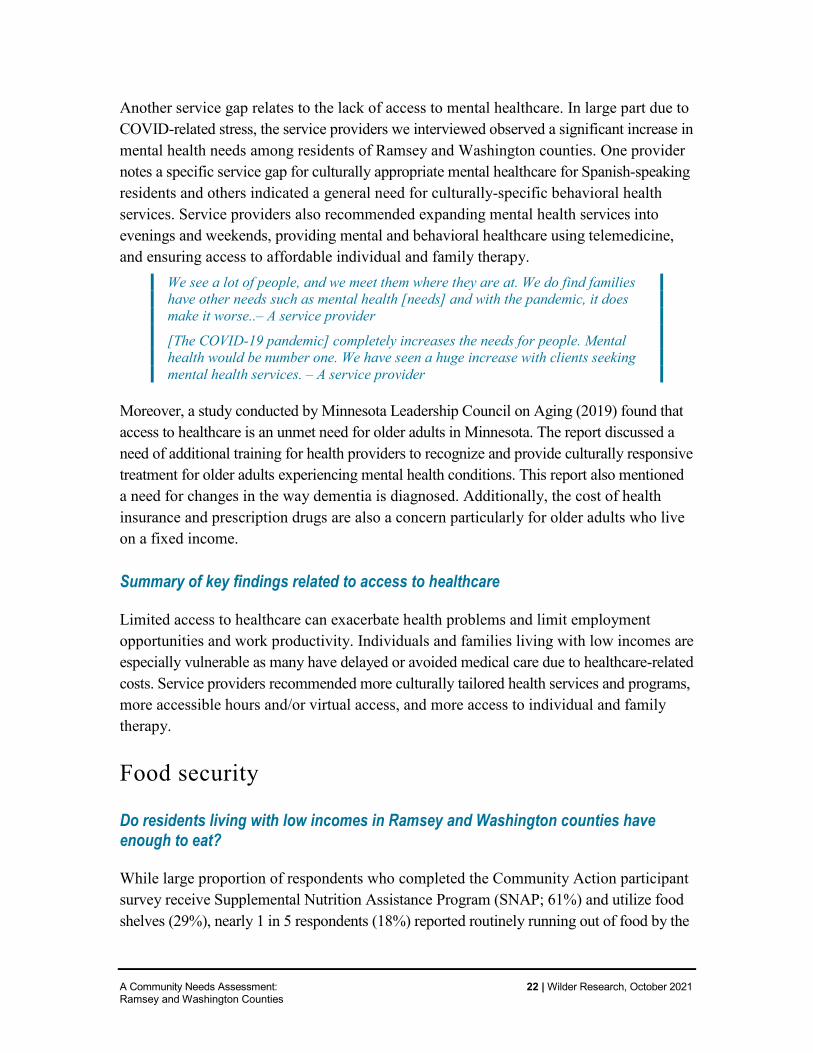
Another service gap relates to the lack of access to mental healthcare. In large part due to COVID-related stress, the service providers we interviewed observed a significant increase in mental health needs among residents of Ramsey and Washington counties. One provider notes a specific service gap for culturally appropriate mental healthcare for Spanish-speaking residents and others indicated a general need for culturally-specific behavioral health services. Service providers also recommended expanding mental health services into evenings and weekends, providing mental and behavioral healthcare using telemedicine, and ensuring access to affordable individual and family therapy.
We see a lot of people, and we meet them where they are at. We do find families have other needs such as mental health [needs] and with the pandemic, it does make it worse..– A service provider
[The COVID-19 pandemic] completely increases the needs for people. Mental health would be number one. We have seen a huge increase with clients seeking mental health services. – A service provider
Moreover, a study conducted by Minnesota Leadership Council on Aging (2019) found that access to healthcare is an unmet need for older adults in Minnesota. The report discussed a need of additional training for health providers to recognize and provide culturally responsive treatment for older adults experiencing mental health conditions. This report also mentioned a need for changes in the way dementia is diagnosed. Additionally, the cost of health insurance and prescription drugs are also a concern particularly for older adults who live on a fixed income.
Summary of key findings related to access to healthcare
Limited access to healthcare can exacerbate health problems and limit employment opportunities and work productivity. Individuals and families living with low incomes are especially vulnerable as many have delayed or avoided medical care due to healthcare-related costs. Service providers recommended more culturally tailored health services and programs, more accessible hours and/or virtual access, and more access to individual and family therapy.
Food security
Do residents living with low incomes in Ramsey and Washington counties have enough to eat?
While large proportion of respondents who completed the Community Action participant survey receive Supplemental Nutrition Assistance Program (SNAP; 61%) and utilize food shelves (29%), nearly 1 in 5 respondents (18%) reported routinely running out of food by the

A Community Needs Assessment: 23 | Wilder Research, October 2021 Ramsey and Washington Counties
end of the month. In addition, 11% often struggle finding the kinds of food they need, which indicates a need for culturally-specific food shelves and other food supports (Figure 13).
Figure 13. Food assistance and food insecurity Food assistance and food-related needs (N = 340)
Indicators of food insecurity (N = 340)
Many focus group participants identified food access as a pressing, unmet need for their family. Multiple participants indicated that food assistance programs were a critical line of defense against hunger. Food shelves and SNAP programs were the most utilized programs among the focus group participants. While SNAP and other food assistance programs ensure that family members have enough to eat, several focus group participants expressed their desire for healthier food options and food that reflects their culture.
I’ve been using the Department of Indian Work’s food shelf program. I’ve been going through them just to get by with food produce that they give, like the food produce giveaway days. – A focus group participant
I have used a food shelf through my children’s school at Battle Creek Elementary and the P-EBT SNAP through the school district. – A focus group participant
The school district did send boxes of food to our house weekly, but we don’t eat the kind of foods they sent like canned and food in boxes. We Latinos usually eat fresh foods that are homemade like beans, rice, tortillas, salsas and some type of meat. This is where I started to notice the types of foods they are feeding our kids at school that contain way too much sugar and [are] not healthy at all. – A focus group participant
What are the food security-related service gaps?
Results from the Community Action participant survey and focus groups indicate multiple service gaps related to food security. Even while using food assistance programs, a large proportion of individuals and families living with low incomes from Ramsey and Washington counties are running out food before the end of the month. Expanding the eligibility for food assistance programs and increasing access to emergency food assistance
61%
29%
SNAP
Food shelves
18%
18%
11%
Frequently run out of foodbefore the end of the month
Need information about eatinghealthy on a limited budget
Difficult to find thekinds of food we need

A Community Needs Assessment: 24 | Wilder Research, October 2021 Ramsey and Washington Counties
were identified as the biggest food-related needs. Secondly, a substantial proportion of survey respondents want information on eating healthy on a limited budget.
Summary of key findings related to food security
While many individuals and families living with low incomes in Ramsey and Washington counties are able to access to food assistance programs, they may still run out of food by the end of the month. Focus group participants also indicated that food assistance programs are a vital safety net program but are not sufficient to meet their nutritional and cultural needs.
Systemic racism
What is the extent of racial disparities in Ramsey and Washington counties? How do racial disparities relate to systemic racism?
Racial disparities in Ramsey and Washington counties are pervasive across a range of life outcomes related to poverty such as housing, employment, education, healthcare, and many other areas. In Community Action’s participant survey, the poverty rate was 67% for BIPOC households and 57% for White households (Figure 20). Likewise, the rate of poverty in Ramsey and Washington is higher among BIPOC than White households.
Respondents who identified as BIPOC were also more likely to drop out of high school (20% BIPOC vs. 5% White), and less likely to complete some college or more relative to White respondents (52% BIPOC vs. 63% White). The Community Action survey data also highlight disparities in access to early childhood education and healthcare (Figure 14).
Figure 14. Racial disparities among Community Action’s survey respondents
a BIPOC N = 252, White N = 35 b BIPOC N = 297, White N = 37
67%
20%
52%
56%
35%
57%
5%
63%
27%
8%
Household income below the federal poverty line
No high school diploma
Some college or more
Need support getting child ready for school
Lack of access to health insurance
BIPOC White
a
b
b
b
b

A Community Needs Assessment: 25 | Wilder Research, October 2021 Ramsey and Washington Counties
Ramsey County’s Economic Competitiveness and Inclusion Plan (Ramsey County, 2021) estimated that addressing the racial gap in educational attainment would contribute to 21,518 additional workers who with a bachelor’s degree or higher, and an additional earning of $124,475,884 per year in Ramsey County.
Racial disparities that are pervasive and persistent can be attributed to systemic racism (Conley, 2009). Systemic racism refers to cultural, institutional, historical, and interpersonal practices that give an unjust amount of resources and rights to Whites, while denying them to people of color (BIPOC). Systemic racism is another layer beyond the needs described above that keeps BIPOC families in poverty by limiting their access to healthcare, employment, and educational opportunities, as well as other vital needs for upward social mobility (Doubeni et al., 2021).
Do Ramsey and Washington County residents experience systemic racism and discrimination?
It is important to assess how racism and discrimination is experienced by residents who identify as BIPOC to understand how systemic racism affects racial disparities across unmet needs in Ramsey and Washington counties.
Residents who identify as BIPOC in Ramsey and Washington counties frequently experience discrimination, according to the Community Action participant survey. Approximately 1 in 10 BIPOC respondents (11%) indicated that they were unfairly denied: (1) a job offer or fired from an existing job; (2) a scholarship; (3) a bank loan; or (4) an opportunity to move into a neighborhood by a landlord. Unfair treatment within these institutional settings can lead to reduced access and unmet needs which can keep BIPOC individuals and families with low incomes in poverty.
Moreover, 1 in 4 respondents who identify as BIPOC (25%) reported that they took a major step (e.g., left a job, reported someone to authorities) during the past year to deal with one or more discriminatory events (Figure 15).
Figure 15. Racism-related experiences (N = 297)
11%
25%
Experienced unfair treatment due to race
Took a big step (e.g., leave a job, report someoneto authorities) to deal with a discriminatoryevent one or more times in the past year.

A Community Needs Assessment: 26 | Wilder Research, October 2021 Ramsey and Washington Counties
Focus group participants were also asked to share their experiences with unfair treatment from service providers based on their background. Although the majority of participants felt that they were treated the same as everyone else, some participants said they had felt discriminated against because of their race/ethnicity. When it came to services that they received, participants did not feel that their background impacted the services they were eligible for. However, a few participants indicated that some employees in some social service agencies may treat certain groups of people differently, and participants felt that this impacted the services they received.
For the most part we are treated fairly, but of course, there are some exceptions. – A focus group participant
It truly depends on who you meet. Some people just judge you based on your skin color. Sometimes they will say that you will need an interpreter, so come back the next day… I helped some people in my community with translation on the phone, and they were still rejected because I am not a professional translator. – A focus group participant
How does systemic racism contribute to poverty in Ramsey and Washington County?
Systemic racism is a major factor in producing the racial disparities we observe in in Ramsey and Washington counties, and it creates an additional layer of challenges that keep BIPOC individuals and families in poverty.
For instance, service providers talked about historic and contemporary racist written and unwritten policies or practices, such as redlining, the relocation act, or zoning laws. While outright discrimination based on race is no longer legal, the historical impact of racist policies diminished resources and assets in BIPOC communities (Rothstein, 2017). Contemporary practices such as discriminatory lending also persist, which contributes to racial wealth gaps (Quillian et al., 2020). According to the Ramsey County Economic Competitiveness and Inclusion Plan (2021), systemic racism keeps individuals who identify as BIPOC in poverty at a higher rate than White people, and it creates barriers to full participation in our economy.
We as a country and county have policies in place that do not provide opportunity for people of color like for the White community… It is our responsibility to make sure that we are looking at all of those [practices] and to do the best we can to understand what policies create barriers and make it hard for people of color to build wealth, get job opportunities and education… We cannot fix it until we acknowledge it first. – A service provider
From an historical context, we can think about redlining of where people can buy [a] home. Decisions about where highways can be built and the neighborhoods of Communities of Color tend to be impacted by that decision. It impacts the ability to make income and livelihood. When thinking about housing instability, it is just the zoning code which prohibits the building of multi-family housing. – A service provider

A Community Needs Assessment: 27 | Wilder Research, October 2021 Ramsey and Washington Counties
Service providers also expressed that there is a need for policies and laws to eradicate practices that keep BIPOC residents in poverty. For instance, stronger policies around tenant rights and protection may help prevent unlawful evictions, which disproportionately affects BIPOC community members.
The lack of policies can also be an issue. …there is no current law strengthening tenant rights and protection. We don’t have a designated budget for housing and every year advocates have to go to the capital to advocate for it. There is no permanent investment for housing and public transportation. – A service provider
What are some service opportunities for addressing the influence of systemic racism on poverty and disparities?
The service providers we interviewed highlighted the negative impacts of some policies or practices on the well-being of BIPOC communities. To help offset some of the negative impacts of racist policies and practices, service providers should put more efforts around improving the quality of life in BIPOC neighborhood by offering more affordable housing opportunities, improving community safety, and injecting more social programs that improve educational, employment, childcare, and transportation opportunities for residents who live in these affected neighborhoods.
Summary of key findings related to systemic racism
Systemic racism is prevalent and pernicious to the socioeconomic well-being of BIPOC residents, and it also negatively impacts the economy overall. From unfair treatment on an individual level to racist institutional policies and practices, systemic racism is a critical driver of racial disparities in unmet needs among residents in Ramsey and Washington counties. Policies and practices that sustain poverty tend to disproportionately impact BIPOC residents living with low-incomes. Thus, the results of this community needs assessment signal the need for strategies and approaches that addresses the root causes of systemic racism and eliminate disparities in opportunity across all institutions and many aspects of life in Ramsey and Washington counties.

A Community Needs Assessment: 28 | Wilder Research, October 2021 Ramsey and Washington Counties
Who are the people who are living with low incomes in Ramsey and Washington counties? The American Community Survey (ACS, 2019) defines poverty as when the household incomes falls below the official poverty threshold. Poverty, defined as lacking sufficient income to meet basic needs (e.g., childcare, food, and housing-related needs; Simpson Reeves et al., 2020), is often measured using the federal poverty line which is determined by household income and size (U.S. Census, 2019). However, the federal poverty line has been widely criticized for using outdated assumptions about family expenditures, inaccurate accounting of family resources, and not adjusting for variations in the cost of living state-by-state (Cauthen & Fass, 2008). The federal poverty line is also an absolute measure of poverty and offers virtually no information about the extent to which the basic needs of individuals living with low-incomes are being met. In 2021, a family of four that earned less than $26,500 was considered to be living in poverty.
The ACS estimates that 14% (74,112) and 4% (10,822) of Ramsey (total population: 530,642) and Washington County residents (total population: 252,232), respectively, are living below the federal poverty level (Figure 16). Among youth below age 18, 21% (25,722) and 5% (3,204) are experiencing poverty in Ramsey (total youth population: 125,104) and Washington counties (total youth population: 62,321), respectively. Among older adults age 65 and above, 8% (5,780) and 5% (1,641) are experiencing poverty in Ramsey (total older adult population: 74,055) and Washington counties (total older adult population: 36,206), respectively.
Figure 16. Ramsey and Washington county total population = 782,874
Ramsey County (N = 530,642)
Washington County (N = 252,232)
14%
86%
At or below poverty lineAbove poverty line
4%
96%
At or below poverty lineAbove poverty line

A Community Needs Assessment: 29 | Wilder Research, October 2021 Ramsey and Washington Counties
Rates of poverty also vary by race and ethnicity. Within each racial and ethnic group, 7% of non-Hispanic Whites (23,366 of 327,150), 40% of American Indian and Alaska Native (1,268 of 3,210), 31% of Black and African American (19,893 of 64,616), 23% of Asian (17,414 of 77,509), 21% of Hispanic or Latinx (8,249 of 39,953), and 10% of Native Hawaiian and other Pacific Islander (18 of 182) were living in poverty. Similar racial disparities in poverty are also observed in Washington County (Figure 17).
Figure 17. Poverty rates in Ramsey and Washington counties by race
Racial disparities in earning a living wage contributes to racial disparities in poverty rates in Ramsey and Washington counties. While 36% of the labor force in Ramsey County is paid less than a livable wage, Black residents (62%) are disproportionately more likely to work in jobs that pay below a livable wage. It is estimated that addressing this living wage gap would contribute to a $2,500,000,000 increase in annual earnings for primarily residents who identify as Black, Indigenous, and People of Color (BIPOC) in Ramsey County (Ramsey County, 2021).
Racial disparities in homelessness have also been documented in Ramsey County (Wilder Research, 2020). Of the 1,248 individuals living with homelessness in the 2018 Minnesota Homeless Study (www.mnhomeless.org), African Americans (46%), American Indians (6%), and the multi-racial group (9%) were disproportionately more likely to experience homelessness. Whites (28%), Africans (4%), and Asian/Pacific Islanders (4%) also experienced homelessness, but homelessness rates were lower than the percentage of these racial groups residing in Ramsey County. (In Washington County, fewer than 50 individuals participated in the same study so the data for this county cannot be broken out by race/ethnicity due to small sample size.)
40%
31%
23%
22%
21%
20%
10%
7%
20%
13%
4%
6%
10%
10%
5%
4%
American Indian/Alaska Native
Black/African American
Asian
Two or more races
Hispanic/Latinx
OtherNative Hawaiian/
Other Pacific IslanderWhite
Ramsey Washington

A Community Needs Assessment: 30 | Wilder Research, October 2021 Ramsey and Washington Counties
The vast majority of Community Action service recipients reside in socially vulnerable communities that are less resilient in their ability to respond to and recover from natural and human-made disasters compared to well-resourced communities (Agency for Toxic Substances and Disease Registry, 2018; Figure 18). Social vulnerability for each community is calculated at the census tract level by aggregating socioeconomic status, demographic factors (e.g., minority status), housing conditions (e.g., overcrowding), access to transportation, household composition (e.g., percentage of households with young children and the elderly), disability status (e.g., percentage of residents with a disability), and language use (e.g., percentage of limited English speakers). Communities scoring high on the social vulnerability index have less socioeconomic resources and assets to prevent human suffering and economic loss during a disaster, such as the COVID-19 pandemic.
Figure 18. Map of where Community Action service recipients live and the Social Vulnerability Index across all census tracts in Ramsey and Washington counties

A Community Needs Assessment: 31 | Wilder Research, October 2021 Ramsey and Washington Counties
Who does Community Action serve? From October 1, 2019, to September 31, 2020, Community Action supported 49,780 individuals with low incomes (approximately 59% of residents living below the federal poverty line) in Ramsey and Washington counties. Among Community Action program participants, 14% were infants/young children (ages 0-5), 22% were children (ages 6-13), 10% were adolescents (ages 14-17), 9% were young adults (ages 18-24), 35% were adults (ages 25-64), and 9% were older adults (ages 65+).
Over half of Community Action program participants (59%) who are 25 years or older did not graduate high school, and just 1 in 10 recipients (10%) completed a 2- or 4-year college.
Community Action has program participants from diverse racial and ethnic groups, including 40% Black/African American, 28% Asian, 25% White, 9% Hispanic, Latinx, Spanish origin, 4% multi-race, and 1% American Indian/Alaska Native.
Many recipients of Community Action’s services and programs rent their homes (70%).
Over half earn less than half of the area median income ($83,698) and almost all (95%) are living below the area median income.
Lastly, 17% of Community Action recipients suffer from a disabling health condition (Figure 19).
Further, rampant social isolation is another concern, especially during the COVID pandemic and for older adults and people with disabilities. Social isolation limits access to both instrumental support (e.g. family caregiver) and emotional support (e.g. socializing). Outreach that includes both awareness and transportation assistance is necessary in order to include the most isolated individuals. There is also a need for physical infrastructure, such as senior centers and coffee shops, where older adults can come to socialize (MN Leadership Council on Aging, 2019).
Figure 19. Sociodemographic and health information of Community Action participants
Age of CAPRW recipients (N = 49757)
14%
22%
10%
9%
36%
9%
0-5
6-13
14-17
18-24
25 to 64
65+

A Community Needs Assessment: 32 | Wilder Research, October 2021 Ramsey and Washington Counties
Figure 19. Sociodemographic and health information of Community Action participants (continued) Educational attainment (N = 22008)
Health (Disabling condition) (N = 49113)
Race (N = 46958)/ Ethnicity (N = 47185)
59%
27%
4%
10%
0%
Did not graduate high school
Graduated high school
Some post-secondary education
2 or 4 year college
Graduate or other post-secondary school
17%
83%
Yes
No
0%
1%
1%
4%
9%
25%
28%
40%
Native Hawaiian/Other Pacific Islander
American Indian/Alaskan Native
Other
Multi-race
Hispanic, Latinx,Spanish Origins
White
Asian
Black/African American

A Community Needs Assessment: 33 | Wilder Research, October 2021 Ramsey and Washington Counties
Figure 19. Sociodemographic and health information of Community Action participants (continued) Housing (N = 17127)
Level of income (based on area median income) (N = 16890)
0%
0%
30%
70%
Other
Homeless
Own
Rent
51%
28%
17%
5%
50% or less
51-75%
76-100%
101% and over

A Community Needs Assessment: 34 | Wilder Research, October 2021 Ramsey and Washington Counties
Opportunities to improve economic mobility of people living with low incomes in Ramsey and Washington counties The purpose of this community needs assessment is to inform Community Action and other nonprofit and government service providers, as well as advocates and policy-makers, about the needs of people living with low incomes in Ramsey and Washington counties. In this section of the report, we summarize what the service providers and Community Action participants who participated in this community needs assessment told us about their perceptions of the biggest opportunities to improve the economic mobility of people living with low incomes. The suggestions in this section do not imply that Community Action or other services providers are not already doing some of these things, but rather just that these are the things that study participants feel are most important to addressing economic mobility for people living with low incomes.
Increase community engagement Importantly, the service providers we interviewed highlighted that organizations and agencies should increase community engagement opportunities with individuals and families living with low incomes in Ramsey and Washington counties. For instance, service providers recommended that agencies such as Community Action should routinely reach out to community members and leaders to build awareness about its services.
[They should] really reach out to the community, community leaders, which is tough. It is possible to reach at least the main population in a broader sense, and identifying that, and engaging them in an ongoing basis, rather than once in a while. – A service provider
[They need to have] a better way of letting people know what services are out there. We don’t know anything unless we ask because no one is letting us know. We have to find out on our own. We call one number and they don’t know anything, we call another number and they don’t know anything, and we get the run around. – A focus group participant
Another form of engagement service providers have implemented within their own organizations is engaging community members by including them in advisory groups. They emphasized the importance of having board members who represent the interest and the people that they serve, like Community Action is required to do. By elevating the voices of community members in local agencies, strategic initiatives and the implementation of

A Community Needs Assessment: 35 | Wilder Research, October 2021 Ramsey and Washington Counties
services are more likely to effectively help individuals and families living with low incomes overcome poverty in Ramsey and Washington counties.
All of our grants are given out to communities of color or Indigenous communities, or for programs serving children and families of color. All of our work is trying to center equity and ensure that the kids who need the most, get the most. We have community board members. We hear from the community, we provide information to the community. The best thing we do is the community board members who actually can represent the interest of the community and decision-making. – A service provider
We deserve and require connection. We need relationship and trust. We need that core value of connection to build trust in every single program to the community. Without the connection, it will not be successful because people don’t feel like they are in the place that they are supported and cared for. – A service provider
Provide culturally-specific services for diverse communities Cultural responsiveness is necessary for anti-poverty work with diverse communities. Many of the existing services and programs that support individuals and families who are living with low incomes in Ramsey and Washington counties, however, are not tailored to support culturally diverse communities or provide culturally-specific service and resources. A few service providers highlighted that having staff who are from the same cultural community as program participants is a key to building relationship and trust. It is also important to ensure that service materials are translated and available to residents in their preferred language. Another recommendation from the service providers we interviewed was to provide culturally-specific training to staff who work with diverse program participants.
For the Native community, I think it’s important to have culturally-specific services and for the dominant culture that controls the resources and provides the services to have a better understanding of the need for cultural specificity with Native people. And so that may mean language, that might mean practices, or that may mean medicines that are traditional. – A service provider
I would say the language barriers. We need to make sure we have translation and materials in languages that they can understand. What we know about people is that personal connection is very important. When we operate our food shelf, it takes people a few times to feel comfortable and dignified to share about their lives. We need to build trusting relationship with the community. It makes sense that they don’t trust right away, so how do we create trusting relationship where people see community members as you and I and not someone who is a challenge or a problem? – A service provider
The information they have is mostly English and other languages. I use Amharic. So if they can have Amharic that would be helpful because it is easier for me to understand. – A focus group participant

A Community Needs Assessment: 36 | Wilder Research, October 2021 Ramsey and Washington Counties
Streamline applications for services The service providers we interviewed and focus group participants expressed their frustration with the onerous paperwork and requirements that residents with low incomes have to complete to access services. For instance, focus group participants shared that important services they needed were delayed or denied due to complex and confusing application processes. Streamlining applications for services, such as cutting down questions in the application, and avoiding asking residents to complete similar forms for different services can ensure that residents receive the services they need in a timely manner.
It is very difficult to get certain programs approved, particularly SNAP, when you are in need of them. It was because of the certain documents that were required. I tried to explain to them about my situation. Until I had to go through the separation document from my husband, that is when I was able to get services. – A focus group participant
Eligibility standards have been difficult. We have numerous types of ways you can qualify or be eligible for services. They are complicated and not easily understood by recipients of those services. The administration of the assessments for determining which service you qualify for is not consistent across assessors, or raters, or those who administer that. – A service provider
Strengthen coordination among service providers Service providers discussed the need for more coordination among community organizations and agencies to avoid the duplication of services. Some of the providers we interviewed emphasized that increased collaboration among organizations would streamline service delivery so that residents do not have to navigate multiple systems and agencies to address unmet needs. Also, service providers posited that collaboration among community organizations and agencies could encourage sharing lessons learned and data between partner organizations and agencies to better engage in anti-poverty efforts.
An example of service coordination would be home-delivered meals in Ramsey County. It is called the Ramsey County Consortium; that is, a consortium of maybe six or seven organizations that deliver meals for older adults at home, and they’ve worked together for many years, and that has been a good model as well. It reduces administrative burden on the participants, and it helps ensure that services are available across Ramsey County. – A service provider
I don’t know much about Washington County. But I would say that in Ramsey County, we work closely with other community organizations that do similar work in the community. There is more of that [kind of] collaboration that can happen. We can work more effectively together in terms of being clear about what each other’s resources are and who is doing what. It is challenging to do that in terms of trying to figure out who does what and where the biggest gaps are. That is why I think something like this study will help find those gaps. – A service provider

A Community Needs Assessment: 37 | Wilder Research, October 2021 Ramsey and Washington Counties
Next steps Going forward, Community Action will be using the results from this community needs assessment to inform their strategic plan for 2022-2024. We urge nonprofit and government agencies in Ramsey and Washington counties that are engaged in anti-poverty work to use this report to inform how to focus their efforts, too. The findings from this report promote a data-driven, information-based approach to identifying solutions to alleviate the effects of poverty, service gaps to inform programmatic priorities and investments, and ways for agencies like Community Action to improve program quality and service delivery. We also hope that the findings from this report will help develop and support new partnerships to tackle systemic, multi-sector issues including systemic racism.

A Community Needs Assessment: 38 | Wilder Research, October 2021 Ramsey and Washington Counties
References 2018 Minnesota homeless study: Ramsey County survey data. (2019). Wilder Research.
www.mnhomeless.org
Agency for Toxic Substances and Disease Registry. (2018). CDC/ATSDR social vulnerability index. https://www.atsdr.cdc.gov/placeandhealth/svi/index.html
Berry, A. A., Katras, M. J., Sano, Y., Lee, J., & Bauer, J. W. (2007). Job volatility of rural, low-income mothers: A mixed methods approach. Journal of Family and Economic Issues, 29(1), 5-22. https://doi.org/10.1007/s10834-007-9096-1
Bazargan, M., Cobb, S., & Assari, S. (2021). Discrimination and medical mistrust in a racially and ethnically diverse sample of California adults. The Annals of Family Medicine, 19(1), 4–15. https://doi.org/10.1370/afm.2632
Buvinić, M., & Gupta, G. R. (1997). Female-headed households and female-maintained families: Are they worth targeting to reduce poverty in developing countries? Economic Development and Cultural Change, 45(2), 259–280. https://doi.org/10.1086/452273
Cantor, G. & Landry, S. (2020). How Are the Most Vulnerable Households Navigating the Financial Impact of COVID-19? Prosperity Now. https://prosperitynow.org/sites/default/files/Prosperity%20Now%20Survey%20of%20Lower-Income%20Households_8.5.2020_final.pdf
Cauthen, N. K., & Fass, S. (2008). Measuring poverty in the United States (Fact Sheet). National Center for Children in Poverty. http://research.policyarchive.org/11236.pdf
Centers for Disease Control and Prevention. (2020). Behavioral Risk Factor Surveillance System Survey Data. U.S. Department of Health and Human Services. https://www.cdc.gov/brfss/about/brfss_faq.htm
Community Action Partnership. (2019). Results Oriented Management & Accountability (ROMA): Up-to-date ROMA training & resources. https://communityactionpartnership.com/publication_toolkit/roma-next-generation-resource-guide/
Conley, D. (2009). Being Black, living in the red: Race, wealth, and social policy in America. University of California Press.
Doubeni, C. A., Simon, M., & Krist, A. H. (2021). Addressing systemic racism through clinical preventive service recommendations from the US Preventive Services Task Force. JAMA, 325(7), 627-628. https://doi.org/10.1001/jama.2020.26188

A Community Needs Assessment: 39 | Wilder Research, October 2021 Ramsey and Washington Counties
García, E., & Weiss, E. (2017). Reducing and averting achievement gaps. Economic Policy Institute. https://www.epi.org/publication/reducing-and-averting-achievement-gaps/
Minnesota Leadership Council on Aging. (2019). Needs Assessment of Older Adults in Minnesota’s Diverse Communities. Perspectives from Minnesota’s Culturally Diverse Aging Service Providers. https://mn.gov/dhs/assets/MNLCOA-community-needs-assessment-culturally-diverse-aging-service-providers_tcm1053-439418.pdf
National Conference of State Legislatures. (2019). Addressing Benefits Cliffs. https://www.ncsl.org/research/human-services/addressing-benefits-cliffs.aspx
Quillian, L., Lee, J. J., & Honoré, B. (2020). Racial discrimination in the U.S. housing and mortgage lending markets: A quantitative review of trends, 1976–2016. Race and Social Problems, 12(1), 13–28. https://doi.org/10.1007/s12552-019-09276-x
Ramsey County. (2021). Ramsey County economic competitiveness and inclusion plan. https://www.ramseycounty.us/your-government/projects-initiatives/economic-development-initiatives/economic-competitiveness-inclusion-plan
Rothstein, R. (2017). The color of law: A forgotten history of how our government segregated America. Liveright.
Ruiz-Quintanilla, S. A., & Claes, R. (1996). Determinants of underemployment of young adults: A multi-country study. ILR Review, 49(3), 424-438. https://doi.org/10.1177/001979399604900303
Simpson Reeves, L., Parsell, C., & Liu, S. (2020). Towards a phenomenology of poverty: Defining poverty through the lived experiences of the ‘poor.’ Journal of Sociology, 56(3), 439–454. https://doi.org/10.1177/1440783319851204
Unhealthy days—A data short take. (2019, May). [Health Economics Program]. Minnesota Department of Health, Saint Paul, MN. https://www.health.state.mn.us/data/economics/docs/unhlthydays.pdf
U.S. Census Bureau. (2019). 2015-2019 American Community Survey 3-year Public Use Microdata Samples. Retrieved from https://data.census.gov/cedsci/table?q=poverty&g=0500000US27123,27163&tid=ACSST5Y2019.S1701&hidePreview=true&moe=false
Wolla, S. A., & Sullivan, J. (2017). Education, income, and wealth. Economic Research Federal Reserve Bank of St. Louis. https://research.stlouisfed.org/publications/page1-econ/2017/01/03/education-income-and-wealth/

A Community Needs Assessment in Ramsey and Washington Counties 40 | Wilder Research, October 2021
Appendix
A. Methods and participants demographic overview Wilder Research conducted a demographic overview to learn more about the residents of Ramsey and Washington counties (Community Action’s service area) who are living with low incomes. Demographic data was compiled from multiple data sources (Figure A1). In particular, we used publicly available data for the area to understand the prevalence and severity of unmet needs including, but not limited to, housing, transportation, food security, and adult education. Findings from the demographic overview were combined with the results from the other data sources (e.g., Community Action participant survey) to identify and characterize the greatest unmet needs among individuals and families living with low-incomes in Ramsey and Washington counties.
Figure A1. Demographic overview data sources
Year(s)
East Metro Pulse (source: https://www.wilder.org/wilder-research/research-library/east-metro-pulse)
2018
American Community Survey (https://www.census.gov/programs-surveys/acs/) 2019
Federal Reserve and Urban Institute (https://apps.urban.org/features/debt-interactive-map/downloadable-docs/debt_interactive_technical_appendix_2021.pdf)
2020
Centers for Disease and Control and Prevention (https://www.countyhealthrankings.org/app/minnesota/2021/measure/outcomes/42/datasource)
2020
Demographic Data of Community Action’s Clientele (provided by Community Action) 2019-2020 Ramsey County Economic Competitiveness and Inclusion Plan (https://www.ramseycounty.us/your-government/projects-initiatives/economic-development-initiatives/economic-competitiveness-inclusion-plan)
2021
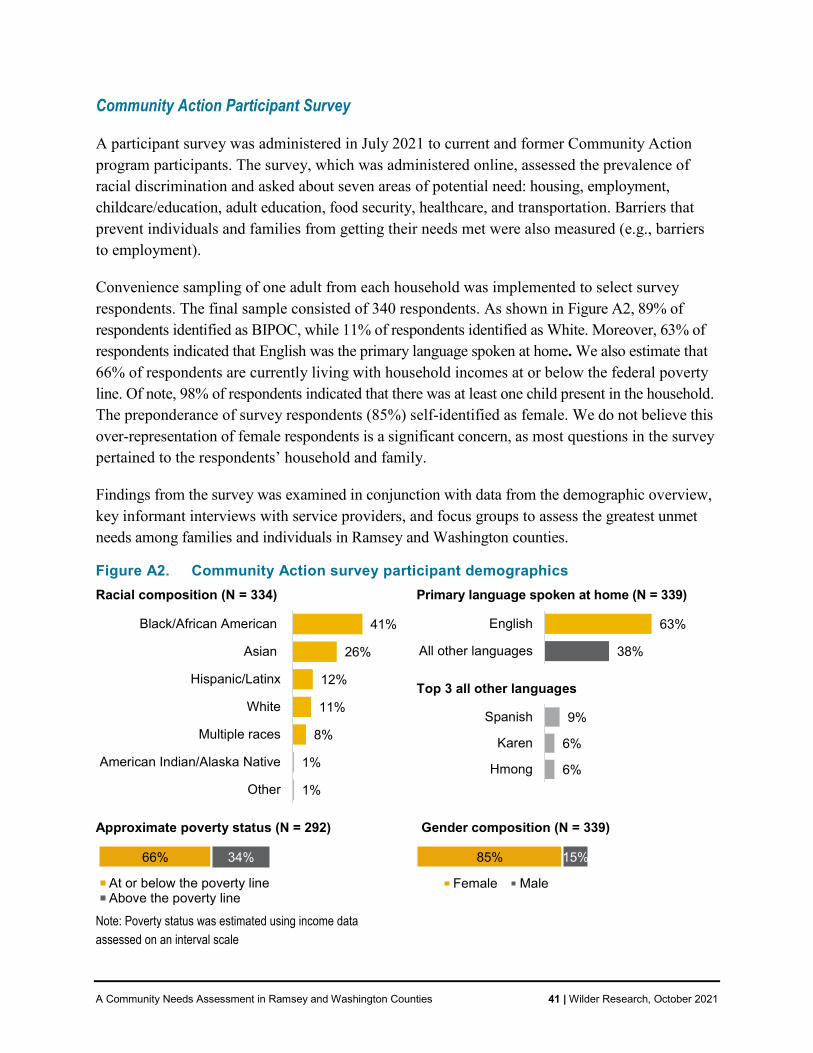
A Community Needs Assessment in Ramsey and Washington Counties 41 | Wilder Research, October 2021
Community Action Participant Survey
A participant survey was administered in July 2021 to current and former Community Action program participants. The survey, which was administered online, assessed the prevalence of racial discrimination and asked about seven areas of potential need: housing, employment, childcare/education, adult education, food security, healthcare, and transportation. Barriers that prevent individuals and families from getting their needs met were also measured (e.g., barriers to employment).
Convenience sampling of one adult from each household was implemented to select survey respondents. The final sample consisted of 340 respondents. As shown in Figure A2, 89% of respondents identified as BIPOC, while 11% of respondents identified as White. Moreover, 63% of respondents indicated that English was the primary language spoken at home. We also estimate that 66% of respondents are currently living with household incomes at or below the federal poverty line. Of note, 98% of respondents indicated that there was at least one child present in the household. The preponderance of survey respondents (85%) self-identified as female. We do not believe this over-representation of female respondents is a significant concern, as most questions in the survey pertained to the respondents’ household and family.
Findings from the survey was examined in conjunction with data from the demographic overview, key informant interviews with service providers, and focus groups to assess the greatest unmet needs among families and individuals in Ramsey and Washington counties.
Figure A2. Community Action survey participant demographics Racial composition (N = 334)
Primary language spoken at home (N = 339)
Top 3 all other languages
Approximate poverty status (N = 292)
Note: Poverty status was estimated using income data assessed on an interval scale
Gender composition (N = 339)
41%
26%
12%
11%
8%
1%
1%
Black/African American
Asian
Hispanic/Latinx
White
Multiple races
American Indian/Alaska Native
Other
63%
38%
English
All other languages
9%
6%
6%
Spanish
Karen
Hmong
66% 34%
At or below the poverty lineAbove the poverty line
85% 15%
Female Male
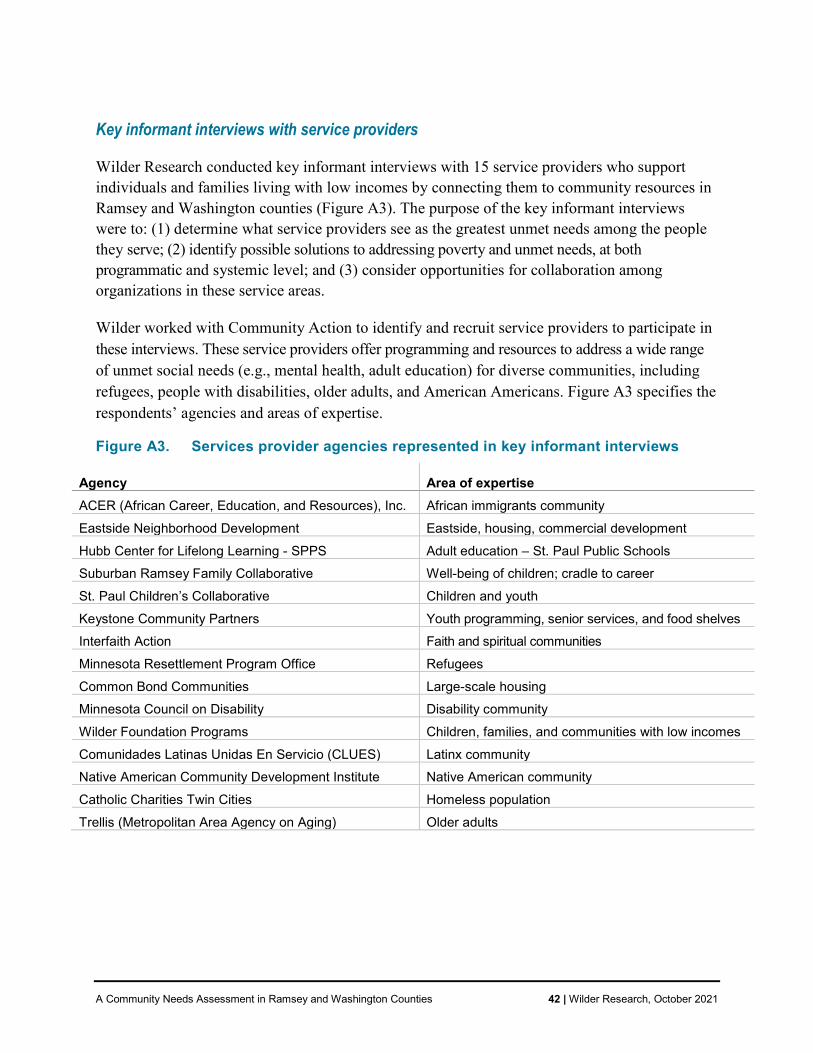
A Community Needs Assessment in Ramsey and Washington Counties 42 | Wilder Research, October 2021
Key informant interviews with service providers
Wilder Research conducted key informant interviews with 15 service providers who support individuals and families living with low incomes by connecting them to community resources in Ramsey and Washington counties (Figure A3). The purpose of the key informant interviews were to: (1) determine what service providers see as the greatest unmet needs among the people they serve; (2) identify possible solutions to addressing poverty and unmet needs, at both programmatic and systemic level; and (3) consider opportunities for collaboration among organizations in these service areas.
Wilder worked with Community Action to identify and recruit service providers to participate in these interviews. These service providers offer programming and resources to address a wide range of unmet social needs (e.g., mental health, adult education) for diverse communities, including refugees, people with disabilities, older adults, and American Americans. Figure A3 specifies the respondents’ agencies and areas of expertise.
Figure A3. Services provider agencies represented in key informant interviews
Agency Area of expertise ACER (African Career, Education, and Resources), Inc. African immigrants community
Eastside Neighborhood Development Eastside, housing, commercial development
Hubb Center for Lifelong Learning - SPPS Adult education – St. Paul Public Schools Suburban Ramsey Family Collaborative Well-being of children; cradle to career
St. Paul Children’s Collaborative Children and youth
Keystone Community Partners Youth programming, senior services, and food shelves Interfaith Action Faith and spiritual communities
Minnesota Resettlement Program Office Refugees
Common Bond Communities Large-scale housing Minnesota Council on Disability Disability community
Wilder Foundation Programs Children, families, and communities with low incomes
Comunidades Latinas Unidas En Servicio (CLUES) Latinx community Native American Community Development Institute Native American community
Catholic Charities Twin Cities Homeless population
Trellis (Metropolitan Area Agency on Aging) Older adults

A Community Needs Assessment in Ramsey and Washington Counties 43 | Wilder Research, October 2021
Key informant interviews lasted 45-60 minutes. The interview protocol was developed by Wilder Research and Community Action (Appendix A). All interviews were completed in June 2021.
Focus group sessions and interviews with community members
In order to gather more in-depth feedback from people who are living with low incomes in Ramsey and Washington counties, Wilder Research worked with Community Action to design and facilitate focus groups and individual interviews with Community Action participants.
We asked respondents on the Community Action participant survey if they were interested in participating in a focus group. In order to provide information about the focus group sessions, Wilder contacted respondents who expressed interest to provide information about the purpose and logistics of the focus group session. Recruitment flyers were created and translated into multiple languages (Hmong, Karen, and Spanish). Community Action shared these flyers with service recipients and partner organizations.
Wilder conducted six virtual focus groups via Zoom and eight individual interviews via phone, for a total of 27 participants. The focus groups each included participants from one cultural community served by Community Action: White, Latina/o/x, Black/African American, Hmong, African Native, and American Indian. We also attempted to recruit participants from the Karen community for a focus group and interviews, but despite multiple contact attempts, we were unable to recruit any participants from this community. The focus groups and interviews were conducted in the participants’ preferred language, and the facilitators were matched to participants’ cultural group.
Wilder developed a focus group/interview protocol in collaboration with Community Action. The protocol was translated into the languages needed for the target cultural communities (see Appendix B for protocol in English). Participants were asked to discuss their unmet needs during the COVID-19 pandemic, experience with using social service agencies and programs, and how services in the community could be improved to help residents of Ramsey and Washington counties overcome poverty. Participants were given a $25 gift card to thank them for their time.

A Community Needs Assessment in Ramsey and Washington Counties 44 | Wilder Research, October 2021
B. Key informant interview protocol with service providers Community Action Partnership of Ramsey & Washington Counties, or CAPRW, has contracted with Wilder Research to do a community needs assessment to better understand current needs of residents living with low incomes in Ramsey and Washington Counties. Part of the community needs assessment includes interviews with representatives from organizations and coalitions that work with people living with low incomes in these counties. The goal of these interviews is to learn about what organizations see as the greatest needs of the people they serve; identify possible solutions, at the both programmatic and systemic level; and consider opportunities for collaboration among organizations in these service areas. You were identified as someone who has valuable insight regarding these topics.
Your participation in this interview is voluntary. We may use some direct quotes from this interview, but your name will not be included in the report or will not linked to anything you say. With your permission, we may include the name of your organization in the final report in a list of participating organizations. Your organization’s name will not be linked with any direct quotes. Can we include your organization’s name in the list?
Yes No
Your responses will be combined with the responses of other interviewees and summarized in a report that will help CAPRW better serve their clients and think strategically about how they might work with organizations that serve clients similar to theirs.
The interview will take 60 min, depending on how much you have to say. I’d like to record the interview to make sure I capture everything you say accurately. The recording will only be used by Wilder Research staff and will be deleted after use. Do I have your permission to record?
Yes No
Do you have any questions before we get started?
1. First, please tell me about your organization and your role there. (Probes: What types of services do you provide? What populations do you serve?)
2. CAPRW’s work focuses on serving residents with low incomes of Ramsey and Washington counties. Are there any specific groups of people in Ramsey and Washington counties (such as older adults, families with young children, racial/ethnic groups, etc.) that you see as a “high priority” – or, in other words, are not currently receiving the services or the intensity of services they need? (Probe: Has the pandemic affected who is most impacted? If so, how?)
3. If you had to prioritize, what do you see as the three biggest needs of residents with low incomes that you work with right now? (Probes: Encourage key informants to be as specific as possible.)
a. How has the COVID-19 impacted these needs?
b. Do these needs vary by racial/ethnic communities? If so, how?
c. What do you think are the root causes of these needs? (Probe: Why do you think this issue has not been resolved yet?)

A Community Needs Assessment in Ramsey and Washington Counties 45 | Wilder Research, October 2021
4. What gaps in services or barriers to accessing existing services do you see for the residents with low incomes that you serve?
a. Do these vary for different racial/ethnic communities? If so, please describe. (Probes: Are there unique gaps in service or barriers to accessing services for specific communities? Are some gaps or barriers more pronounced for BIPOC communities?)
5. What current policies or laws have had the biggest role in contributing to poverty in the community? (Possible prompts: current policies at federal, state, county, city, organizations, eligibility standards, or historic policies)
a. What current policies or laws have had the biggest role in reducing poverty?
6. Thinking again of the three needs you mentioned before, what could be done to better meet the needs of residents with low incomes in Ramsey and Washington counties? (Probes: What changes to programs or services are needed? What changes in policies are needed?)
a. What considerations should be taken into account when adapting these solutions in working with different racial/ethnic communities?
7. To what extent are organizations in Ramsey and Washington counties working together to meet the needs of people living in poverty?
a. What can organizations learn from the successes or challenges of these efforts?
8. Ideally, how might organizations work together to meet the needs of people with low incomes in the future? (Probe: In your opinion, how willing are organizations in your community to partner with each other to meet the needs of people living with low incomes?)
9. In the past year, many organizations have recommitted to work addressing racial equity and reducing disparities. CAPRW is interested in learning from other organizations and exploring opportunities to leverage efforts. What work is your organization doing, if any, to address racial equity and reducing disparities in your work?
a. To what extent do you engage community members to inform your work? What strategies have you found to be effective?
b. Are you participating in or aware of any collaborations to address these issues in Ramsey or Washington counties?
10. What role do you think organizations like CAPRW can play in addressing racial equity and reducing disparities moving forward?
11. Please share any other comments or feedback.

A Community Needs Assessment in Ramsey and Washington Counties 46 | Wilder Research, October 2021
C. Focus group/interview protocols for residents Welcome! Thank you for joining us today. My name is _________________________ and I work for Wilder Research. We are a mission-driven, nonprofit research organization located in St. Paul. I will lead today’s conversation and ________________ is here to take notes.
The purpose of today’s conversation is to learn about your experience with services to meet your basic and long-term needs. We will talk about your needs during the COVID-19 pandemic and in recent months how programs in the community could be improved. Community Action is working with Wilder Research to host the listening sessions. You were invited to participate in this group with others from the same cultural community as you to talk about the needs and experiences of your community in a space that feels comfortable for you.
Community Action is committed to learning from people that use or could benefit from their services and will use what they learn from these discussions to improve their programs to better meet people’s needs.
Before we get started, I’d like to propose a few guidelines to follow for this discussion:
Because these are virtual focus groups, it can be harder to know when someone wants to jump in with a comment; feel free to try using the “raised hand” icon [show people where this is] if you’re not sure when to jump in. You may also just raise your hand if you have your video turned on.
We encourage you to keep your camera on and yourself unmuted as much as possible as we hope for this to be a conversation. However, if there’s significant background noise, please do use the mute function.
There are no right or wrong answers. You are the experts of your own experience and that is what we’re interested in hearing about today. We encourage you to talk to each other. This is not a group interview. We also ask that you be respectful of the thoughts and opinions of others. Our intent is to get different perspectives and points of view. Please take turns so everyone gets a chance to talk. You also do not have to answer all of the questions.
Refrain from repeating what you hear in this conversation outside of this group. To maintain confidentiality, when we report what we learned in from this conversation, we will do so by summarizing what was shared without including names or identifying anyone.
Finally, we want this to be a safe space for you to share your experience to the extent you feel comfortable, and we encourage you to do whatever you need to take of yourself, whether that’s taking a break or getting a glass of water, whatever you need. It is also okay to not answer any questions you would prefer not to answer.

A Community Needs Assessment in Ramsey and Washington Counties 47 | Wilder Research, October 2021
Your participation in this focus group will in no way affect current or future services that you receive from the Community Action or any other agencies. We will be putting together a summary of what we hear in these discussions for Community Action. We may use some direct quotes from this conversation, but will not include your name or anything that would identify you personally.
We would like to record today’s discussion in case we miss anything in the notes. The recording will be deleted after the notes are finalized. Is that okay with everyone? [Click the “recording” button if consent is obtained – NOTETAKER SHOULD SAVE TO YOUR COMPUTER INSTEAD OF THE CLOUD]
Are there any questions before we begin? Okay, let’s get started.
Icebreaker: To get to know who’s here a bit, let’s quick go around and share your first name and something you’ve enjoyed doing outside lately
1. What services have you or others in your household used to help you meet your basic needs?
a. For those who have used services through Community Action, what services or programs have you used?
2. What do you see as the 2-3 biggest immediate needs for you or your family? What do you see as the biggest long-term needs for you or your family?
3. During the past year and a half, how did the pandemic impact your ability to meet your basic needs? (Probes: How did it impact what needs you had? How did it impact how easy or hard it was to get the support you need?)
4. During the past year and a half, we all endured a lot of personal and environmental change. Our cities have had a lot of unrest, and there has been increased violence experienced in some of our communities. Did this create a need for additional services or support for you or your family? If so, how accessible were those services?
5. What concerns do you have about meeting your basic needs as we move into the next phase of re-opening from the pandemic?
6. What programs or services are the MOST helpful in making it easier for you to meet your basic needs? (Probes: What do you like about these programs? What makes them especially helpful?)
7. What makes it easy to use the services in your community?
8. What makes it hard to use the services in your community?
9. To what extent do you feel that current services are welcoming and responsive to (African, African-American, American Indian, Hmong, Karen, Latino) people from your community?
a. To what extent do you feel that you are fairly treated from service providers based on your cultural background?
b. How could services be more welcoming or responsive to your cultural background?

A Community Needs Assessment in Ramsey and Washington Counties 48 | Wilder Research, October 2021
10. What other ways could the current services be improved?
a. For those who have used Community Action’s services, how could they be improved?
11. What other programs or services would you like to see in your community to make it easier to meet your basic needs?
12. During the pandemic, Community Action and other agencies in the community used Zoom, the phone, or and other technology to serve people. As programs re-open, how would you prefer to meet with service providers and access programs? (Probes: What worked well this past year? What would you change?)
a. How easy or hard is it for you to access devices and reliable internet?
13. Community Action works to include participants in planning to better meet the needs of people they serve. They do that by discussions like this or involving people in advisory groups for their programs. What other ways, if any, would you be interested in being involved to shape programs? You will have the chance to enter their contact information in at the end of the focus group if they are interested in becoming more involved.
14. If you could tell local organizations and policy makers one thing about how to make it easier for people to meet their basic needs and achieve their goals, what would you want to tell them?
Those are all of the questions I have for today. Before we sign off, I want to make sure I have the correct information to send you a gift card.
[FACILITATOR SHOULD CHECK THE ATTENDANCE LIST AND MARK THE NAMES OF PEOPLE WHO ATTENDED]
FOR THESE INDIVIDUALS WHOSE NAMES ARE ON THE LIST:
Would you prefer a Target hard card or an e-card?
IF ECARD: Is the email address we used to confirm your attendance the same one we can use to send you a gift card? (IF NO: Please send me your email address in a private chat.)
IF HARD CARD: (If their address is not listed on the spreadsheet), please send me your mailing address in a private chat.
IF THEIR NAME IS NOT ON THE LIST:
Please send me your name, gift card preference (hard card or e-card) and email address or mailing address privately in the chat.
FOR ALL:
I know we also asked about whether you’d be interested in becoming more involved in shaping Community Action programs. Please let me know if you are interested in becoming involved, and I can mark it on the list so that someone from Community Action can follow up with you.
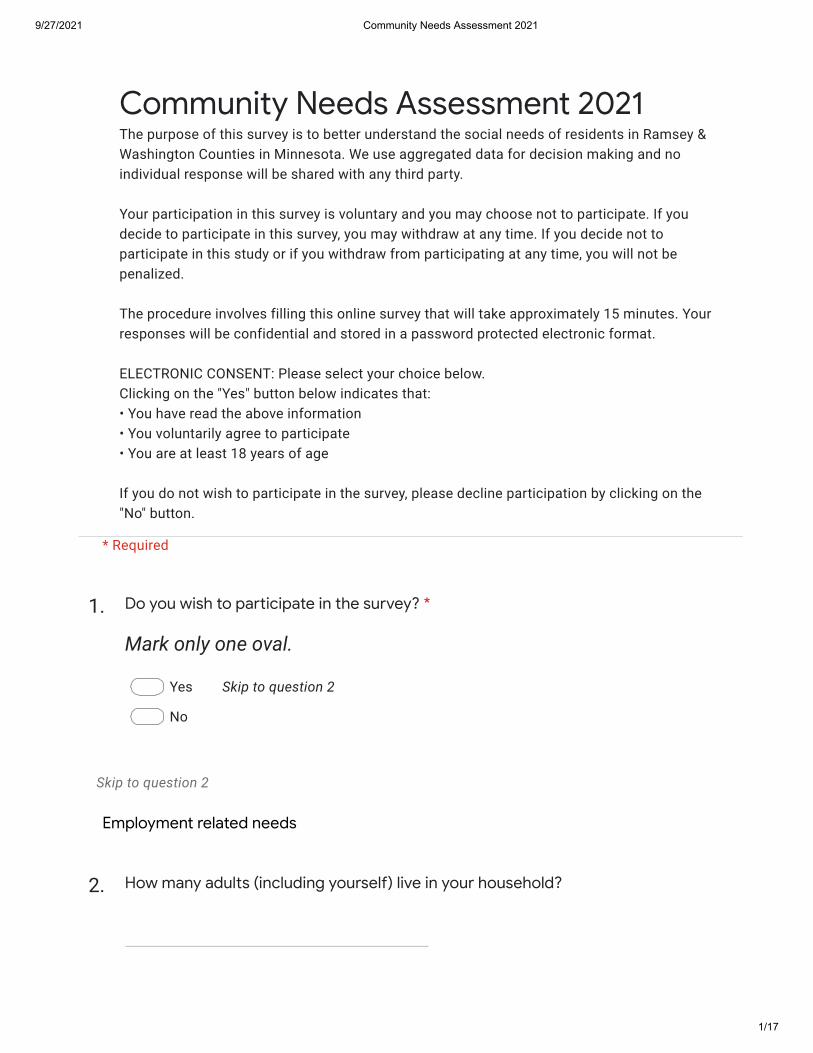
9/27/2021 Community Needs Assessment 2021
1/17
1.
Mark only one oval.
Yes Skip to question 2
No
Skip to question 2
Employment related needs
2.
Community Needs Assessment 2021The purpose of this survey is to better understand the social needs of residents in Ramsey & Washington Counties in Minnesota. We use aggregated data for decision making and no individual response will be shared with any third party.
Your participation in this survey is voluntary and you may choose not to participate. If you decide to participate in this survey, you may withdraw at any time. If you decide not to participate in this study or if you withdraw from participating at any time, you will not be penalized.
The procedure involves filling this online survey that will take approximately 15 minutes. Your responses will be confidential and stored in a password protected electronic format.
ELECTRONIC CONSENT: Please select your choice below. Clicking on the "Yes" button below indicates that: • You have read the above information• You voluntarily agree to participate• You are at least 18 years of age
If you do not wish to participate in the survey, please decline participation by clicking on the "No" button.
* Required
Do you wish to participate in the survey? *
How many adults (including yourself) live in your household?

9/27/2021 Community Needs Assessment 2021
2/17
3.Mark only one oval per row.
4.
Mark only one oval.
Yes Skip to question 5
No Skip to question 6
Skip to question 8
Employment related barriers
5.
Other:
Check all that apply.
Do not have required work experience.
Do not have required education.
Do not have affordable transportation.
Do not have required technical skills.
Do not have affordable childcare/eldercare.
Lack of available good paying jobs.
Medical/Health condition (including disability).
Difficulty writing/speaking English.
Skip to question 6
How many adults (including yourself) in your household are employed:
None 1 2 More than 2
Full-time (40 hours a week or more)
Part-time (Less than 40 hours)
Full-time (40 hours a week or more)
Part-time (Less than 40 hours)
Are you facing any barriers in attaining employment *
What are the barriers that you or any of your family members are facing in gettingemployed? Check all that apply.
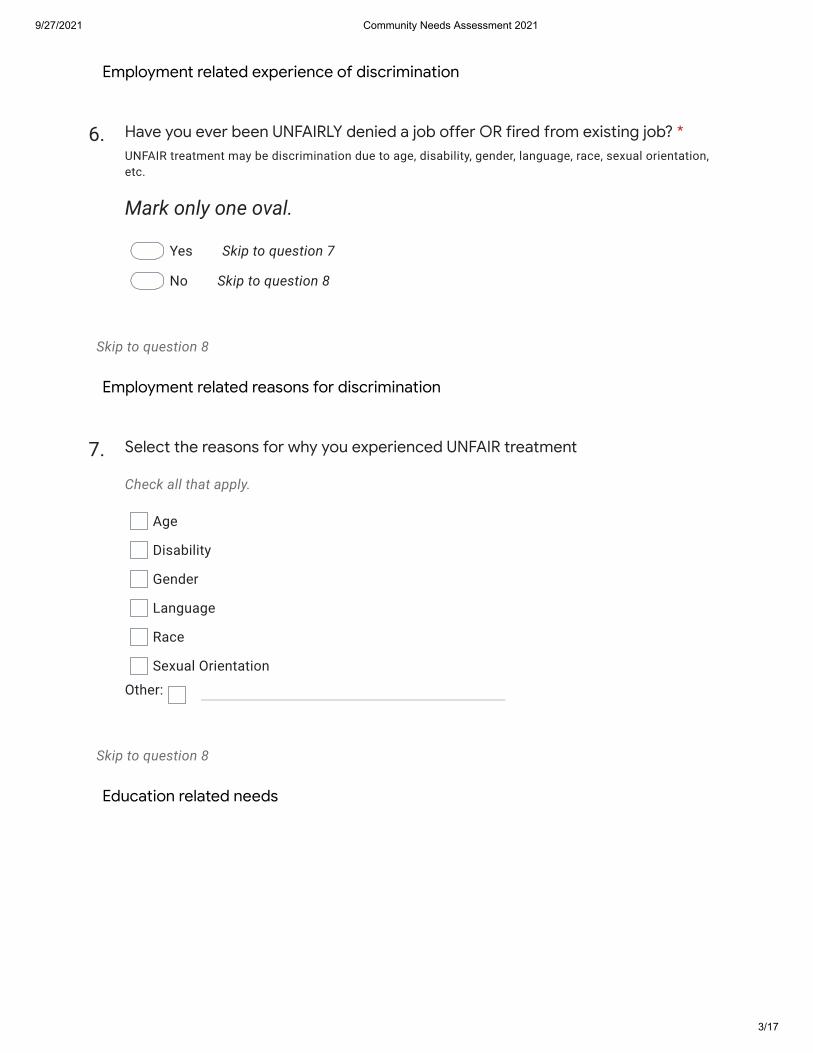
9/27/2021 Community Needs Assessment 2021
3/17
Employment related experience of discrimination
6.
Mark only one oval.
Yes Skip to question 7
No Skip to question 8
Skip to question 8
Employment related reasons for discrimination
7.
Other:
Check all that apply.
Age
Disability
Gender
Language
Race
Sexual Orientation
Skip to question 8
Education related needs
Have you ever been UNFAIRLY denied a job offer OR fired from existing job? *UNFAIR treatment may be discrimination due to age, disability, gender, language, race, sexual orientation,etc.
Select the reasons for why you experienced UNFAIR treatment
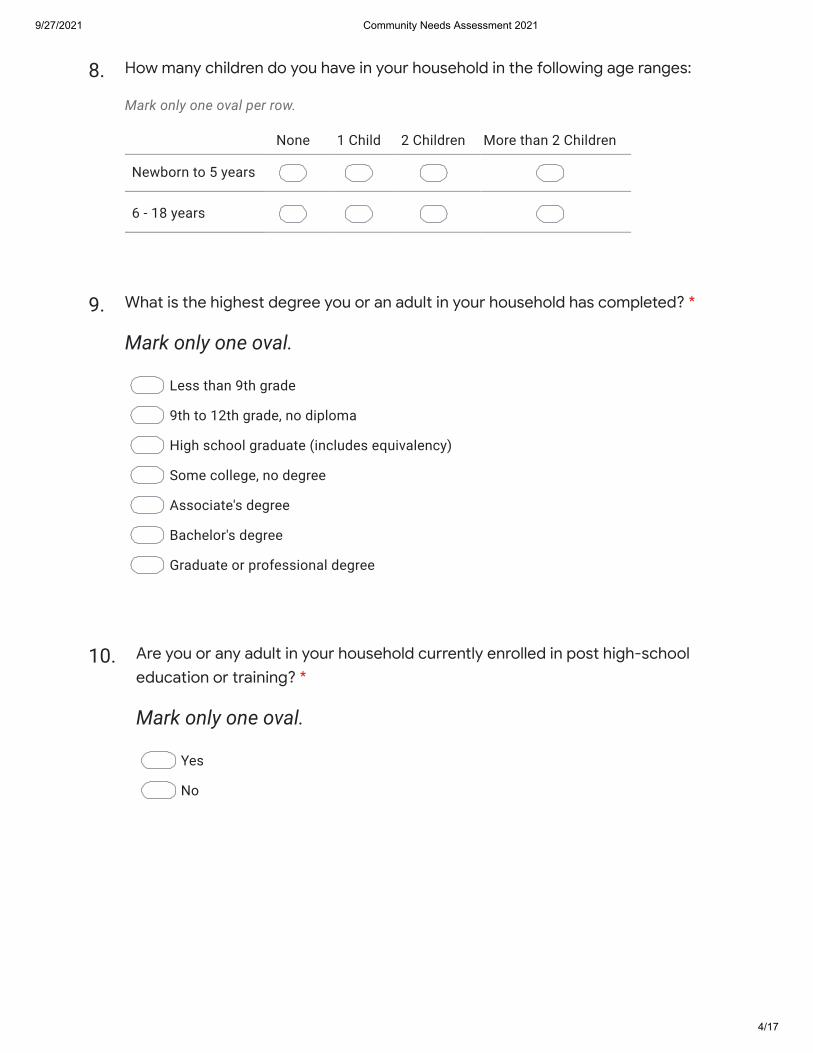
9/27/2021 Community Needs Assessment 2021
4/17
8.Mark only one oval per row.
9.
Mark only one oval.
Less than 9th grade
9th to 12th grade, no diploma
High school graduate (includes equivalency)
Some college, no degree
Associate's degree
Bachelor's degree
Graduate or professional degree
10.
Mark only one oval.
Yes
No
How many children do you have in your household in the following age ranges:
None 1 Child 2 Children More than 2 Children
Newborn to 5 years
6 - 18 years
Newborn to 5 years
6 - 18 years
What is the highest degree you or an adult in your household has completed? *
Are you or any adult in your household currently enrolled in post high-schooleducation or training? *

9/27/2021 Community Needs Assessment 2021
5/17
11.
Mark only one oval.
Yes
No
12.
Mark only one oval.
Yes
No
13.
Mark only one oval.
Yes
No
14.
Mark only one oval.
Yes Skip to question 15
No Skip to question 16
Skip to question 16
Education related barriers
Are you or any adult in your household interested in attending school (GED, Trade,College) *
Our family needs support services so our children are ready to start school (earlychildhood education, English language learning, other) *
Our children need after-school or summer care/activities. *
Are you or any adult in your household facing barriers in attaining post-highschool education or training? *

9/27/2021 Community Needs Assessment 2021
6/17
15.
Other:
Check all that apply.
Cost of education
Childcare
Transportation
Schedule/Timings of schools
Skip to question 16
Education related discrimination experience
16.
Mark only one oval.
Yes Skip to question 17
No Skip to question 18
Skip to question 18
Education related discrimination reason
What are the barriers that you or any adults in your household are facing inattaining educational goals? Check all that apply.
Have you ever been UNFAIRLY denied scholarship OR suspended from school? *UNFAIR treatment may be discrimination due to age, disability, gender, language, race, sexual orientation,etc.

9/27/2021 Community Needs Assessment 2021
7/17
17.
Other:
Check all that apply.
Age
Disability
Gender
Language
Race
Sexual Orientation
Skip to question 18
Transportation Section
18.
Other:
Check all that apply.
We drive our own vehicle.
We share rides with friends/relatives.
We take public transit (Light Rail, Metro bus etc.).
We walk or bike.
We take a taxi/cab/Uber/Lyft.
19.
Mark only one oval.
Yes Skip to question 20
No Skip to question 21
Skip to question 16
Transportation - Barriers
Select the reasons for why you experienced UNFAIR treatment
How do you and members of your household get to the places you need to go?
Are you facing any barriers in getting required transportation? *

9/27/2021 Community Needs Assessment 2021
8/17
20.
Other:
Check all that apply.
Length/Time of commute
Bus or Light rail stop too far from home.
Cost of public transportation (Bus/Light Rail fare)
Cost of car ownership (insurance, maintenance, etc.)
Bus or Light Rail schedule/route
Disabilities (physical, mental, etc.)
Skip to question 21
Transportation - Discrimination Experience
21.
Mark only one oval.
Yes Skip to question 22
No Skip to question 23
Skip to question 23
Transportation - Discrimination Reason
What makes it hard for your family to get around/to get where you need to go?(Check all that apply)
Have you ever been UNFAIRLY denied a bank loan (example - car loan, housingloan, etc.)? *UNFAIR treatment may be discrimination due to age, disability, gender, language, race, sexual orientation,etc.

9/27/2021 Community Needs Assessment 2021
9/17
22.
Other:
Check all that apply.
Age
Disability
Gender
Language
Race
Sexual Orientation
Skip to question 23
Housing related needs
23.
Mark only one oval.
Own your home.
Rent your home.
Living in another person’s home
Shelter/Homeless.
24.
Select the reasons for why you experienced UNFAIR treatment
What is your current housing status?
How much do you spend on housing every month (Rent or Mortgage; includingutilities like water, electricity, garbage disposal etc.)?

9/27/2021 Community Needs Assessment 2021
10/17
25.
Mark only one oval.
Yes
No
26.
Other:
Check all that apply.
We need help with paying rent/mortgage.
We need help with preventing foreclosure/eviction.
We need help with home repairs.
We need help with utility bills.
We experienced eviction in the past 12 months.
We need help resolving issues with our landlord.
27.
Mark only one oval.
Yes Skip to question 28
No Skip to question 29
Skip to question 29
Housing - Discrimination Reason
Do you receive financial assistance from government or any nonprofit agency forhousing?
Please check all that apply to your household
Have you ever been UNFAIRLY denied moving into a certain neighborhood by thelandlord? *UNFAIR treatment may be discrimination due to age, disability, gender, language, race, sexual orientation,etc.

9/27/2021 Community Needs Assessment 2021
11/17
28.
Other:
Check all that apply.
Age
Disability
Gender
Language
Race
Sexual Orientation
Skip to question 29
Health & Nutrition related needs
29.
Mark only one oval.
Yes
No
Some have it, some do not
Select the reasons for why you experienced UNFAIR treatment *
Do members in your household have health insurance?

9/27/2021 Community Needs Assessment 2021
12/17
30.Check all that apply.
We have a regular medical clinic.
We have a regular dental clinic.
We have difficulty paying for treatment.
We have difficulty paying for medication.
One or more members of your household have used the emergency room in past 12
months more than twice.
One or more members of our household have a chronic illness.
One or more members are receiving treatment for a chronic illness.
31.
Other:
Check all that apply.
Health Insurance
Dental
Vision/Hearing
Immunizations
Drug/Alcohol Abuse Help
Family planning
Mental Health/Counselling
Food Assistance
Prenatal
Medical Assistance
Please check all that apply to your household
Please check the services that one or more members of your household need, butcannot get
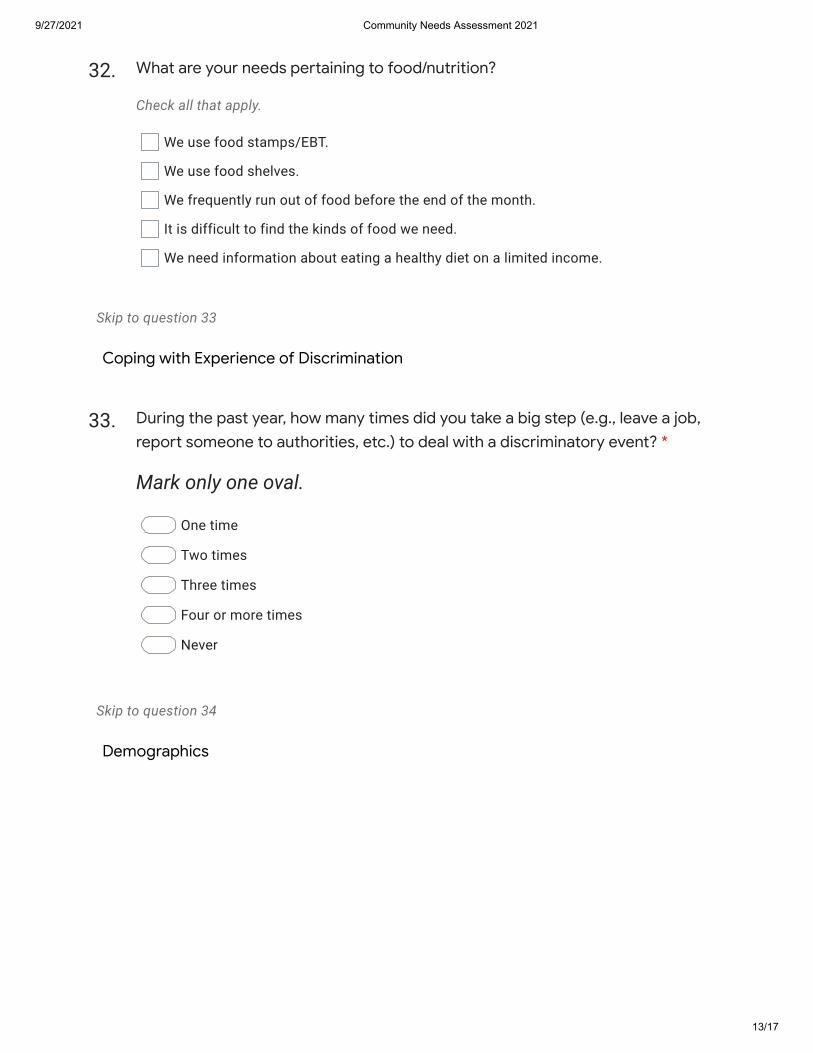
9/27/2021 Community Needs Assessment 2021
13/17
32.Check all that apply.
We use food stamps/EBT.
We use food shelves.
We frequently run out of food before the end of the month.
It is difficult to find the kinds of food we need.
We need information about eating a healthy diet on a limited income.
Skip to question 33
Coping with Experience of Discrimination
33.
Mark only one oval.
One time
Two times
Three times
Four or more times
Never
Skip to question 34
Demographics
What are your needs pertaining to food/nutrition?
During the past year, how many times did you take a big step (e.g., leave a job,report someone to authorities, etc.) to deal with a discriminatory event? *

9/27/2021 Community Needs Assessment 2021
14/17
34.
Other:
Check all that apply.
White
Black/African American
American Indian/Alaska Native
Asian
Native Hawaiian or Other Pacific Islander
Hispanic
Prefer not to answer
35.
Mark only one oval.
English
Hmong
Spanish
Amharic
Oromo
Mandarin
Vietnamese
Karen
Nepali
Arabic
Somali
Prefer not to answer
Other
Race *
What is the primary language of communication in your household? *

9/27/2021 Community Needs Assessment 2021
15/17
36.
Mark only one oval.
Male
Female
Transgender
Prefer not to answer
Another way
37.
38.
Mark only one oval.
Yes
No
Prefer not to answer
Gender *
ZIP code *
Are you a veteran of the US Military? *

9/27/2021 Community Needs Assessment 2021
16/17
39.
Mark only one oval.
$9,999 or less
$10,000 to under $20,000
$20,000 to under $30,000
$30,000 to under $40,000
$40,000 to under $50,000
$50,000 to under $60,000
$60,000 to under $70,000
$70,000 to under $80,000
$80,000 to under $90,000
$90,000 to under $100,000
$100,000 or more
Prefer not to answer
Skip to question 40
FocusGroupInterest
Are you interested in participating in a discussion with other Ramsey and Washington county residents to share more about your social needs (example - transportation, healthcare, etc.) and services that you used to help you meet these needs?
You will receive a $25 gift card if you are selected to participate in the focus group. Participation is optional and it will not affect the services you receive at CAPRW. Your name and contact information will only be used to contact you if you are selected to participate in the focus group session. Your name and contact information will be disconnected from your survey response.
Please indicate below if you are interested in participating in the focus group. If you mark “Yes” and click “Next”, you will have an opportunity to provide us your name, phone number, and email address.
Thank you!
What is the combined annual income of your household? *

9/27/2021 Community Needs Assessment 2021
17/17
40.
Mark only one oval.
Yes Skip to question 41
No
Focus Group ContactInformation
Your information will be confidential and will not be shared with any third party.
41.
42.
43.
This content is neither created nor endorsed by Google.
I wish to participate in the Focus Group *
Name
Phone Number
Email Address
Forms

1. How many adults (including yourself) in your household are employed full-time (40 hours aweek or more)?
0 1 2 3Number of
respondents
All respondents
Race / Ethnicity
White alone
BIPOC
Asian alone
Black / African American alone
Hispanic / Latinx alone
Multiple races / ethnicities
Gender
Female
Male
Household income
$9,999 or less
$10,000 - $19,999
$20,000 - $29,999
$30,000 - $39,999
$40,000 - $49,999
$50,000 or more
Approximated poverty status
At or below poverty line
Above poverty line
Highest degree completed in household
No high school diploma or GED
High school graduate or GED
Some college, no degree
Associate's degree
Bachelor's degree or higher
Primary language in household
English
All other languages
36% 45% 13% 5% 275
39% 42% 19% 0% 31
36% 46% 13% 5% 239
15% 58% 18% 9% 74
49% 41% 9% 1% 106
36% 52% 3% 9% 33
50% 27% 18% 5% 22
39% 43% 12% 6% 237
21% 58% 21% 0% 38
68% 25% 2% 5% 44
61% 31% 5% 3% 59
39% 50% 6% 6% 54
9% 80% 11% 0% 35
12% 64% 20% 4% 25
0% 44% 41% 15% 39
50% 39% 6% 4% 157
13% 57% 22% 7% 98
32% 49% 12% 7% 41
44% 41% 10% 5% 80
48% 38% 10% 4% 81
24% 62% 15% 0% 34
13% 51% 26% 10% 39
44% 41% 12% 2% 172
23% 52% 15% 10% 103

2. How many adults (including yourself) in your household are employed part-time (less than 40 hours)?
0 1 2 3Number of
respondents
All respondents
Race / Ethnicity
White alone
BIPOC
Asian alone
Black / African American alone
Hispanic / Latinx alone
Multiple races / ethnicities
Gender
Female
Male
Household income
$9,999 or less
$10,000 - $19,999
$20,000 - $29,999
$30,000 - $39,999
$40,000 - $49,999
$50,000 or more
Approximated poverty status
At or below poverty line
Above poverty line
Highest degree completed in household
No high school diploma or GED
High school graduate or GED
Some college, no degree
Associate's degree
Bachelor's degree or higher
Primary language in household
English
All other languages
63% 35% 2% 1% 275
81% 19% 0% 0% 31
61% 36% 2% 1% 239
69% 28% 1% 1% 74
58% 38% 4% 0% 106
45% 55% 0% 0% 33
64% 32% 0% 5% 22
61% 37% 1% 1% 237
74% 21% 5% 0% 38
55% 41% 2% 2% 44
64% 34% 0% 2% 59
65% 30% 4% 2% 54
71% 26% 3% 0% 35
48% 48% 4% 0% 25
67% 33% 0% 0% 39
61% 36% 2% 2% 157
66% 32% 2% 0% 98
66% 27% 5% 2% 41
59% 39% 1% 1% 80
64% 33% 2% 0% 81
65% 35% 0% 0% 34
62% 36% 0% 3% 39
63% 35% 1% 1% 172
61% 34% 4% 1% 103

3. How many adults (including yourself) in your household are not employed?
0 1 2 3 4 5Number of
respondents
All respondents
Race / Ethnicity
White alone
BIPOC
Asian alone
Black / African American alone
Hispanic / Latinx alone
Multiple races / ethnicities
Gender
Female
Male
Household income
$9,999 or less
$10,000 - $19,999
$20,000 - $29,999
$30,000 - $39,999
$40,000 - $49,999
$50,000 or more
Approximated poverty status
At or below poverty line
Above poverty line
Highest degree completed in household
No high school diploma or GED
High school graduate or GED
Some college, no degree
Associate's degree
Bachelor's degree or higher
Primary language in household
English
All other languages
41% 37% 9% 8% 4% 1% 275
35% 35% 26% 3% 0% 0% 31
41% 38% 7% 8% 5% 1% 239
34% 36% 7% 11% 11% 1% 74
49% 37% 7% 6% 2% 0% 106
36% 33% 6% 12% 6% 6% 33
27% 55% 9% 9% 0% 0% 22
42% 37% 10% 7% 4% 1% 237
34% 39% 5% 13% 8% 0% 38
34% 39% 11% 9% 7% 0% 44
34% 47% 14% 3% 2% 0% 59
39% 41% 6% 7% 6% 2% 54
46% 37% 3% 9% 6% 0% 35
52% 24% 4% 8% 8% 4% 25
51% 31% 10% 5% 0% 3% 39
34% 39% 11% 8% 7% 1% 157
52% 38% 5% 4% 0% 1% 98
37% 34% 5% 7% 15% 2% 41
40% 36% 10% 11% 3% 0% 80
40% 42% 12% 2% 2% 1% 81
47% 41% 3% 3% 6% 0% 34
44% 28% 10% 15% 0% 3% 39
44% 39% 9% 5% 2% 1% 172
35% 34% 10% 12% 9% 1% 103

4. Household-level employment status summary
Householdsthat have one or more full- or part-time employed
adults
Householdsthat have one or more full-
timeemployed
adults
Householdsthat have one or more part-time, but no
full-timeemployed
adults
Householdsthat have no full- or part-
timeemployed
adultsNumber of
respondents
All respondents
Race / Ethnicity
White alone
BIPOC
Asian alone
Black / African American alone
Hispanic / Latinx alone
Multiple races / ethnicities
Gender
Female
Male
Household income
$9,999 or less
$10,000 - $19,999
$20,000 - $29,999
$30,000 - $39,999
$40,000 - $49,999
$50,000 or more
Approximated poverty status
At or below poverty line
Above poverty line
Highest degree completed in household
No high school diploma or GED
High school graduate or GED
Some college, no degree
Associate's degree
Bachelor's degree or higher
Primary language in household
English
All other languages
83% 64% 19% 17% 275
68% 61% 6% 32% 31
85% 64% 21% 15% 239
93% 85% 8% 7% 74
77% 51% 26% 23% 106
97% 64% 33% 3% 33
68% 50% 18% 32% 22
81% 61% 20% 19% 237
89% 79% 11% 11% 38
66% 32% 34% 34% 44
66% 39% 27% 34% 59
85% 61% 24% 15% 54
94% 91% 3% 6% 35
100% 88% 12% 0% 25
100% 100% 0% 0% 39
76% 50% 26% 24% 157
93% 87% 6% 7% 98
85% 68% 17% 15% 41
81% 56% 25% 19% 80
73% 52% 21% 27% 81
88% 76% 12% 12% 34
97% 87% 10% 3% 39
77% 56% 21% 23% 172
92% 77% 16% 8% 103

5. Are you facing any barriers in attaining employment? If yes, please specify:
Do not have affordablechildcare / eldercare
Lack of available
good paying jobs
Do not have affordable
transportation
Medical / Health
condition(includingdisability)
Do not have requirededucation
Do not have required work
experience
Do not have requiredtechnical
skills
Difficultywriting / speakingEnglish
Other (no legal work
permit,criminal
background,etc.)
All respondents
Race / Ethnicity
White alone
BIPOC
Asian alone
Black / African American alone
Hispanic / Latinx alone
Multiple races / ethnicities
Gender
Female
Male
Household income
$9,999 or less
$10,000 - $19,999
$20,000 - $29,999
$30,000 - $39,999
$40,000 - $49,999
$50,000 or more
Approximated poverty status
At or below poverty line
Above poverty line
Highest degree completed in household
No high school diploma or GED
High school graduate or GED
Some college, no degree
Associate's degree
Bachelor's degree or higher
Primary language in household
English
All other languages
23% 10% 10% 9% 8% 7% 5% 4% 2% 1%
22% 11% 5% 32% 16% 11% 11% 3% 3% 3%
23% 9% 11% 6% 7% 6% 4% 4% 2% 1%
15% 5% 6% 5% 7% 6% 2% 5% 0% 2%
26% 10% 14% 4% 6% 6% 4% 2% 4% 1%
15% 13% 5% 8% 8% 5% 3% 10% 3% 0%
48% 15% 19% 19% 15% 15% 11% 0% 4% 0%
25% 10% 11% 9% 9% 8% 5% 4% 3% 1%
10% 6% 4% 8% 4% 2% 2% 4% 0% 2%
33% 19% 21% 18% 16% 14% 9% 9% 4% 4%
25% 10% 10% 14% 5% 7% 5% 3% 3% 0%
27% 9% 15% 6% 12% 4% 6% 1% 3% 4%
16% 2% 5% 2% 5% 2% 5% 7% 2% 0%
19% 6% 3% 3% 3% 3% 0% 3% 0% 0%
14% 9% 2% 11% 7% 7% 2% 2% 0% 0%
27% 11% 13% 11% 10% 7% 5% 4% 3% 3%
16% 7% 7% 6% 7% 7% 4% 3% 1% 0%
13% 5% 5% 5% 9% 6% 5% 9% 0% 2%
15% 14% 14% 9% 5% 3% 2% 3% 5% 1%
33% 14% 10% 14% 11% 10% 7% 1% 3% 2%
33% 3% 18% 8% 8% 8% 3% 3% 0% 0%
24% 8% 4% 8% 8% 8% 8% 4% 0% 2%
27% 13% 14% 14% 10% 8% 6% 1% 3% 1%
15% 4% 4% 2% 4% 5% 2% 7% 1% 2%

5. Are you facing any barriers in attaining employment? If yes, please specify: (continued)
Facingunspecified
barrier
Young / Special needs
children to care for
Not facing any barriers
Number of respondents
All respondents
Race / Ethnicity
White alone
BIPOC
Asian alone
Black / African American alone
Hispanic / Latinx alone
Multiple races / ethnicities
Gender
Female
Male
Household income
$9,999 or less
$10,000 - $19,999
$20,000 - $29,999
$30,000 - $39,999
$40,000 - $49,999
$50,000 or more
Approximated poverty status
At or below poverty line
Above poverty line
Highest degree completed in household
No high school diploma or GED
High school graduate or GED
Some college, no degree
Associate's degree
Bachelor's degree or higher
Primary language in household
English
All other languages
1% 1% 62% 340
3% 0% 43% 37
1% 1% 65% 297
2% 1% 77% 88
1% 1% 61% 136
0% 3% 73% 40
0% 4% 33% 27
1% 1% 59% 288
2% 0% 82% 51
4% 4% 40% 57
0% 1% 58% 73
4% 1% 54% 67
0% 0% 80% 44
0% 0% 74% 31
0% 0% 77% 44
3% 2% 55% 192
0% 1% 70% 100
2% 0% 77% 64
1% 2% 63% 95
2% 2% 49% 92
0% 0% 63% 40
2% 0% 65% 49
1% 0% 54% 212
2% 2% 76% 127

6. Have you ever been unfairly denied a job offer or fired from existing job? If yes, please select the reasons:
Race Disability Gender Age LanguageFalselyaccused
Personalappearance Childcare
Deniedunfairly for unspecified
reason(s)
All respondents
Race / Ethnicity
White alone
BIPOC
Asian alone
Black / African American alone
Hispanic / Latinx alone
Multiple races / ethnicities
Gender
Female
Male
Household income
$9,999 or less
$10,000 - $19,999
$20,000 - $29,999
$30,000 - $39,999
$40,000 - $49,999
$50,000 or more
Approximated poverty status
At or below poverty line
Above poverty line
Highest degree completed in household
No high school diploma or GED
High school graduate or GED
Some college, no degree
Associate's degree
Bachelor's degree or higher
Primary language in household
English
All other languages
5% 2% 2% 2% 1% 1% 1% 1% 0% 0%
0% 11% 3% 5% 0% 0% 3% 0% 0% 3%
6% 1% 2% 1% 1% 1% 0% 1% 0% 0%
1% 0% 1% 1% 1% 0% 0% 0% 1% 0%
9% 0% 1% 1% 1% 1% 1% 1% 0% 0%
5% 3% 3% 0% 5% 3% 0% 0% 0% 0%
11% 7% 7% 4% 0% 4% 0% 4% 0% 0%
6% 2% 2% 2% 2% 1% 1% 1% 0% 0%
2% 2% 0% 0% 0% 0% 0% 0% 0% 0%
4% 5% 4% 2% 4% 4% 2% 0% 0% 0%
10% 1% 3% 0% 1% 1% 0% 0% 0% 1%
4% 1% 3% 6% 0% 1% 0% 3% 0% 0%
5% 5% 0% 0% 0% 0% 0% 0% 0% 0%
0% 0% 0% 0% 0% 0% 3% 0% 0% 0%
5% 0% 2% 2% 5% 0% 0% 0% 0% 0%
7% 2% 3% 2% 2% 2% 1% 1% 0% 1%
2% 2% 1% 2% 2% 1% 1% 1% 0% 0%
2% 3% 0% 0% 5% 0% 0% 0% 0% 0%
3% 0% 2% 1% 0% 2% 1% 0% 1% 0%
5% 4% 4% 2% 0% 1% 1% 1% 0% 0%
8% 0% 0% 3% 0% 3% 0% 3% 0% 0%
12% 2% 2% 4% 4% 0% 0% 0% 0% 2%
8% 3% 3% 3% 0% 2% 1% 1% 0% 0%
2% 1% 0% 0% 3% 0% 0% 0% 1% 0%

6. Have you ever been unfairly denied a job offer or fired from existing job? If yes, please select the reasons: (continued)
Sexualorientation Religion Pregnant Got sick Weight Other
Neverunfairlydenied
Number of respondents
All respondents
Race / Ethnicity
White alone
BIPOC
Asian alone
Black / African American alone
Hispanic / Latinx alone
Multiple races / ethnicities
Gender
Female
Male
Household income
$9,999 or less
$10,000 - $19,999
$20,000 - $29,999
$30,000 - $39,999
$40,000 - $49,999
$50,000 or more
Approximated poverty status
At or below poverty line
Above poverty line
Highest degree completed in household
No high school diploma or GED
High school graduate or GED
Some college, no degree
Associate's degree
Bachelor's degree or higher
Primary language in household
English
All other languages
0% 0% 0% 0% 0% 1% 86% 340
3% 3% 0% 0% 3% 0% 78% 37
0% 0% 0% 0% 0% 1% 87% 297
0% 0% 1% 0% 0% 1% 95% 88
0% 0% 0% 1% 0% 2% 85% 136
0% 0% 0% 0% 0% 0% 85% 40
0% 0% 0% 0% 0% 0% 70% 27
0% 0% 0% 0% 0% 1% 84% 288
0% 0% 0% 0% 2% 2% 94% 51
0% 0% 0% 2% 0% 0% 79% 57
1% 0% 0% 0% 1% 1% 84% 73
0% 0% 1% 0% 0% 3% 82% 67
0% 0% 0% 0% 0% 0% 91% 44
0% 0% 0% 0% 0% 0% 97% 31
0% 2% 0% 0% 0% 2% 91% 44
1% 0% 1% 1% 1% 2% 83% 192
0% 1% 0% 0% 0% 0% 91% 100
0% 0% 0% 0% 0% 0% 92% 64
0% 0% 0% 1% 0% 0% 89% 95
0% 0% 0% 0% 0% 2% 84% 92
0% 3% 3% 0% 0% 3% 80% 40
2% 0% 0% 0% 2% 2% 80% 49
0% 0% 0% 0% 0% 1% 81% 212
0% 0% 1% 0% 0% 0% 94% 127

7. [BIPOC respondents only] Were you ever unfairly denied a job offer or fired from an existing job because of your race?
Yes
Unfairlydenied, but
not attributed to race
Never unfairly denied
Number of respondents
All respondents
Race / Ethnicity
White alone
BIPOC
Asian alone
Black / African American alone
Hispanic / Latinx alone
Multiple races / ethnicities
Gender
Female
Male
Household income
$9,999 or less
$10,000 - $19,999
$20,000 - $29,999
$30,000 - $39,999
$40,000 - $49,999
$50,000 or more
Approximated poverty status
At or below poverty line
Above poverty line
Highest degree completed in household
No high school diploma or GED
High school graduate or GED
Some college, no degree
Associate's degree
Bachelor's degree or higher
Primary language in household
English
All other languages
6% 7% 87% 297
0% 0% 0% 0
6% 7% 87% 297
1% 3% 95% 88
9% 6% 85% 136
5% 10% 85% 40
11% 19% 70% 27
7% 8% 85% 250
2% 2% 96% 46
4% 13% 83% 46
11% 5% 85% 66
5% 14% 81% 59
5% 3% 93% 40
0% 4% 96% 25
5% 3% 92% 39
8% 8% 85% 169
2% 6% 92% 83
2% 5% 93% 60
4% 9% 88% 82
6% 8% 86% 79
9% 9% 82% 33
14% 5% 81% 43
9% 9% 81% 170
2% 3% 95% 126
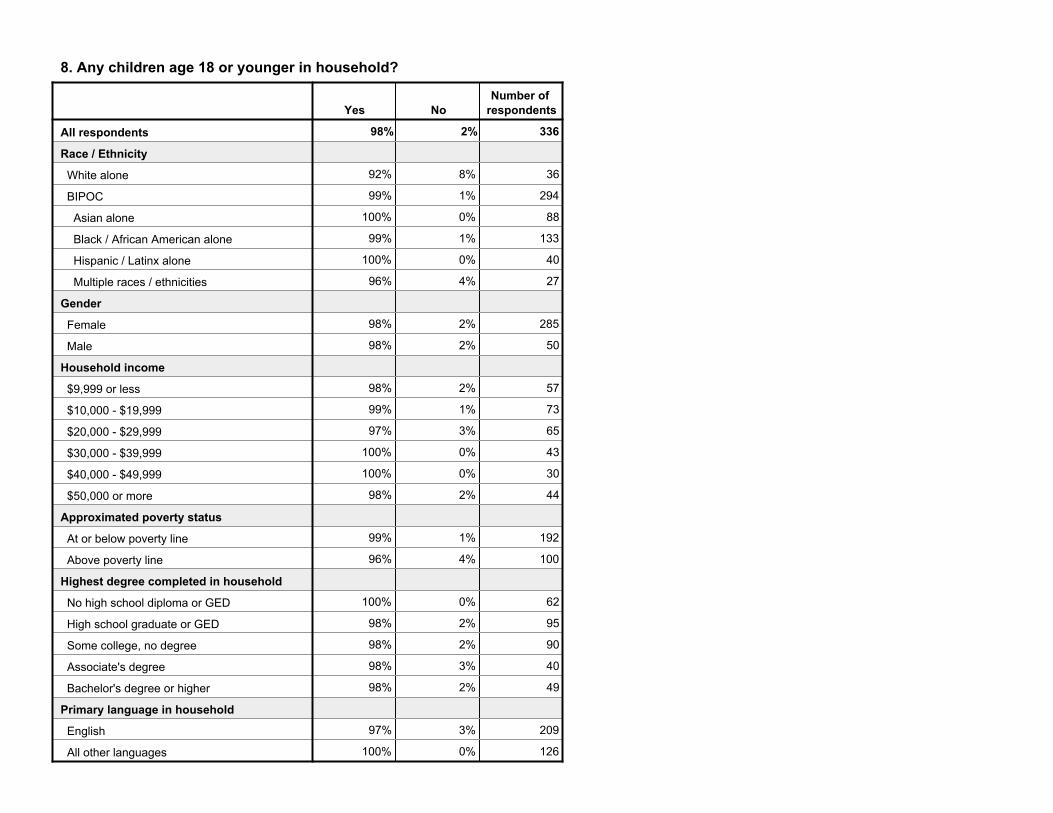
8. Any children age 18 or younger in household?
Yes NoNumber of
respondents
All respondents
Race / Ethnicity
White alone
BIPOC
Asian alone
Black / African American alone
Hispanic / Latinx alone
Multiple races / ethnicities
Gender
Female
Male
Household income
$9,999 or less
$10,000 - $19,999
$20,000 - $29,999
$30,000 - $39,999
$40,000 - $49,999
$50,000 or more
Approximated poverty status
At or below poverty line
Above poverty line
Highest degree completed in household
No high school diploma or GED
High school graduate or GED
Some college, no degree
Associate's degree
Bachelor's degree or higher
Primary language in household
English
All other languages
98% 2% 336
92% 8% 36
99% 1% 294
100% 0% 88
99% 1% 133
100% 0% 40
96% 4% 27
98% 2% 285
98% 2% 50
98% 2% 57
99% 1% 73
97% 3% 65
100% 0% 43
100% 0% 30
98% 2% 44
99% 1% 192
96% 4% 100
100% 0% 62
98% 2% 95
98% 2% 90
98% 3% 40
98% 2% 49
97% 3% 209
100% 0% 126

9. How many children age newborn to 5 years do you have in your household?
None 1 child 2 children3 or more children
Number of respondents
All respondents
Race / Ethnicity
White alone
BIPOC
Asian alone
Black / African American alone
Hispanic / Latinx alone
Multiple races / ethnicities
Gender
Female
Male
Household income
$9,999 or less
$10,000 - $19,999
$20,000 - $29,999
$30,000 - $39,999
$40,000 - $49,999
$50,000 or more
Approximated poverty status
At or below poverty line
Above poverty line
Highest degree completed in household
No high school diploma or GED
High school graduate or GED
Some college, no degree
Associate's degree
Bachelor's degree or higher
Primary language in household
English
All other languages
23% 33% 29% 16% 337
36% 42% 19% 3% 36
20% 32% 31% 18% 295
15% 28% 30% 27% 88
19% 34% 28% 18% 134
33% 28% 35% 5% 40
19% 33% 44% 4% 27
23% 34% 29% 14% 286
20% 28% 28% 24% 50
19% 37% 28% 16% 57
18% 36% 30% 16% 73
26% 31% 25% 18% 65
27% 20% 36% 16% 44
20% 37% 30% 13% 30
27% 32% 27% 14% 44
18% 33% 30% 20% 192
30% 34% 28% 8% 100
24% 24% 35% 17% 63
23% 36% 25% 16% 95
18% 38% 31% 13% 90
30% 25% 30% 15% 40
22% 35% 24% 18% 49
28% 37% 25% 10% 210
13% 26% 37% 24% 126

10. How many children age 6-18 years do you have in your household?
None 1 child 2 children3 or more children
Number of respondents
All respondents
Race / Ethnicity
White alone
BIPOC
Asian alone
Black / African American alone
Hispanic / Latinx alone
Multiple races / ethnicities
Gender
Female
Male
Household income
$9,999 or less
$10,000 - $19,999
$20,000 - $29,999
$30,000 - $39,999
$40,000 - $49,999
$50,000 or more
Approximated poverty status
At or below poverty line
Above poverty line
Highest degree completed in household
No high school diploma or GED
High school graduate or GED
Some college, no degree
Associate's degree
Bachelor's degree or higher
Primary language in household
English
All other languages
32% 27% 22% 19% 338
28% 39% 14% 19% 36
32% 26% 23% 19% 296
32% 27% 23% 18% 88
33% 25% 23% 19% 135
25% 20% 25% 30% 40
41% 33% 15% 11% 27
32% 28% 22% 18% 287
34% 22% 22% 22% 50
40% 30% 18% 12% 57
38% 19% 23% 19% 73
30% 18% 29% 23% 66
33% 30% 19% 19% 43
16% 35% 26% 23% 31
23% 34% 18% 25% 44
32% 21% 24% 22% 192
31% 35% 18% 16% 100
30% 21% 22% 27% 63
37% 31% 17% 16% 95
35% 26% 24% 14% 91
25% 30% 30% 15% 40
24% 27% 22% 27% 49
29% 28% 25% 19% 210
37% 26% 18% 19% 127

11. What is the highest degree you or an adult in your household has completed?
Less than 9th grade
9th to 12th grade, no diploma
High school graduate(includes
equivalency)Some college,
no degreeAssociate's
degreeBachelor's
degree
Graduate or professional
degreeNumber of
respondents
All respondents
Race / Ethnicity
White alone
BIPOC
Asian alone
Black / African American alone
Hispanic / Latinx alone
Multiple races / ethnicities
Gender
Female
Male
Household income
$9,999 or less
$10,000 - $19,999
$20,000 - $29,999
$30,000 - $39,999
$40,000 - $49,999
$50,000 or more
Approximated poverty status
At or below poverty line
Above poverty line
Highest degree completed in household
No high school diploma or GED
High school graduate or GED
Some college, no degree
Associate's degree
Bachelor's degree or higher
Primary language in household
English
All other languages
8% 11% 28% 27% 12% 9% 6% 340
0% 5% 32% 30% 16% 14% 3% 37
9% 11% 28% 27% 11% 8% 6% 297
11% 10% 28% 19% 15% 10% 6% 88
5% 11% 26% 32% 13% 5% 8% 136
20% 23% 30% 15% 5% 5% 3% 40
4% 4% 33% 37% 4% 15% 4% 27
7% 10% 29% 30% 11% 9% 5% 288
16% 18% 22% 14% 14% 6% 12% 51
7% 14% 40% 30% 5% 2% 2% 57
15% 11% 27% 29% 10% 4% 4% 73
4% 9% 24% 39% 15% 7% 1% 67
11% 18% 23% 20% 11% 7% 9% 44
10% 3% 19% 23% 19% 19% 6% 31
0% 7% 23% 14% 18% 20% 18% 44
10% 10% 31% 31% 10% 5% 3% 192
2% 12% 21% 22% 16% 18% 9% 100
42% 58% 0% 0% 0% 0% 0% 64
0% 0% 100% 0% 0% 0% 0% 95
0% 0% 0% 100% 0% 0% 0% 92
0% 0% 0% 0% 100% 0% 0% 40
0% 0% 0% 0% 0% 59% 41% 49
2% 6% 28% 35% 13% 10% 6% 212
18% 19% 28% 14% 9% 6% 6% 127

12. Are you or any adult in your household facing barriers in attaining post-high school education or training? If yes, please specify:
ChildcareCost of
education
Schedule / Timing of schools Transportation
Disability / chronicillness
Languagebarrier
Facingunspecified
barrierMentalhealth Work Felony Other
Not facing any barriers
Number of respondents
All respondents
Race / Ethnicity
White alone
BIPOC
Asian alone
Black / African American alone
Hispanic / Latinx alone
Multiple races / ethnicities
Gender
Female
Male
Household income
$9,999 or less
$10,000 - $19,999
$20,000 - $29,999
$30,000 - $39,999
$40,000 - $49,999
$50,000 or more
Approximated poverty status
At or below poverty line
Above poverty line
Highest degree completed in household
No high school diploma or GED
High school graduate or GED
Some college, no degree
Associate's degree
Bachelor's degree or higher
Primary language in household
English
All other languages
15% 14% 11% 6% 1% 1% 0% 0% 0% 0% 1% 78% 340
14% 8% 5% 0% 3% 0% 0% 0% 0% 0% 0% 86% 37
15% 15% 12% 7% 1% 1% 0% 0% 0% 0% 1% 77% 297
10% 10% 13% 3% 1% 1% 0% 1% 0% 0% 0% 84% 88
14% 14% 10% 10% 1% 0% 1% 0% 0% 1% 1% 76% 136
13% 15% 10% 8% 0% 3% 0% 0% 0% 0% 0% 80% 40
41% 30% 19% 11% 0% 0% 0% 0% 4% 0% 4% 56% 27
16% 14% 11% 7% 1% 0% 0% 0% 0% 0% 1% 78% 288
12% 14% 12% 2% 0% 2% 0% 0% 0% 0% 0% 80% 51
16% 16% 7% 9% 2% 0% 0% 0% 0% 0% 0% 79% 57
18% 15% 11% 10% 3% 0% 0% 1% 0% 0% 1% 71% 73
12% 15% 10% 3% 0% 1% 0% 0% 1% 0% 0% 82% 67
23% 20% 20% 14% 0% 0% 2% 0% 0% 2% 0% 70% 44
3% 3% 3% 0% 0% 3% 0% 0% 0% 0% 0% 94% 31
20% 16% 20% 5% 0% 0% 0% 0% 0% 0% 0% 73% 44
16% 15% 11% 8% 2% 1% 0% 1% 1% 0% 1% 77% 192
16% 15% 12% 5% 0% 0% 1% 0% 0% 0% 0% 77% 100
19% 11% 11% 9% 2% 2% 2% 2% 0% 0% 0% 69% 64
7% 5% 8% 4% 0% 1% 0% 0% 0% 1% 1% 87% 95
24% 24% 17% 11% 2% 0% 0% 0% 1% 0% 1% 68% 92
8% 10% 5% 3% 0% 0% 0% 0% 0% 0% 0% 90% 40
14% 18% 10% 2% 0% 0% 0% 0% 0% 0% 0% 82% 49
17% 16% 11% 7% 1% 0% 0% 0% 0% 0% 1% 76% 212
11% 9% 10% 6% 1% 2% 0% 0% 0% 0% 0% 82% 127

13. Have you ever been unfairly denied scholarship or suspended from school? If yes, please select the reasons:
Disability Income Race
Deniedunfairly for unspecified
reason(s) Language Age GenderNever unfairly
deniedNumber of
respondents
All respondents
Race / Ethnicity
White alone
BIPOC
Asian alone
Black / African American alone
Hispanic / Latinx alone
Multiple races / ethnicities
Gender
Female
Male
Household income
$9,999 or less
$10,000 - $19,999
$20,000 - $29,999
$30,000 - $39,999
$40,000 - $49,999
$50,000 or more
Approximated poverty status
At or below poverty line
Above poverty line
Highest degree completed in household
No high school diploma or GED
High school graduate or GED
Some college, no degree
Associate's degree
Bachelor's degree or higher
Primary language in household
English
All other languages
2% 1% 1% 0% 0% 0% 0% 96% 340
0% 0% 0% 0% 0% 0% 0% 100% 37
2% 1% 1% 0% 0% 0% 0% 96% 297
1% 1% 0% 0% 0% 0% 0% 98% 88
1% 0% 1% 1% 0% 1% 1% 96% 136
3% 3% 0% 0% 0% 0% 0% 95% 40
7% 0% 0% 0% 4% 0% 0% 89% 27
2% 1% 1% 0% 0% 0% 0% 96% 288
0% 0% 0% 0% 0% 0% 0% 100% 51
4% 0% 2% 0% 0% 0% 0% 95% 57
4% 0% 0% 1% 0% 0% 0% 95% 73
1% 3% 1% 0% 0% 1% 1% 94% 67
0% 0% 0% 0% 0% 0% 0% 100% 44
0% 0% 0% 0% 0% 0% 0% 100% 31
0% 0% 0% 0% 2% 0% 0% 98% 44
3% 1% 1% 1% 0% 1% 1% 95% 192
0% 1% 0% 0% 0% 0% 0% 99% 100
2% 0% 0% 0% 0% 0% 0% 98% 64
1% 0% 0% 0% 1% 0% 0% 98% 95
4% 1% 1% 1% 0% 1% 1% 92% 92
0% 3% 3% 0% 0% 0% 0% 95% 40
0% 0% 0% 0% 0% 0% 0% 100% 49
2% 0% 1% 0% 0% 0% 0% 96% 212
1% 1% 0% 0% 1% 0% 0% 98% 127

14. [BIPOC respondents only] Were you ever unfairly denied a scholarship or suspended from school because of your race?
Yes
Unfairlydenied, but
not attributed to race
Never unfairly denied
Number of respondents
All respondents
Race / Ethnicity
White alone
BIPOC
Asian alone
Black / African American alone
Hispanic / Latinx alone
Multiple races / ethnicities
Gender
Female
Male
Household income
$9,999 or less
$10,000 - $19,999
$20,000 - $29,999
$30,000 - $39,999
$40,000 - $49,999
$50,000 or more
Approximated poverty status
At or below poverty line
Above poverty line
Highest degree completed in household
No high school diploma or GED
High school graduate or GED
Some college, no degree
Associate's degree
Bachelor's degree or higher
Primary language in household
English
All other languages
1% 3% 96% 297
0% 0% 0% 0
1% 3% 96% 297
0% 2% 98% 88
1% 2% 96% 136
0% 5% 95% 40
0% 11% 89% 27
1% 4% 96% 250
0% 0% 100% 46
2% 4% 93% 46
0% 6% 94% 66
2% 5% 93% 59
0% 0% 100% 40
0% 0% 100% 25
0% 3% 97% 39
1% 4% 95% 169
0% 1% 99% 83
0% 2% 98% 60
0% 2% 98% 82
1% 8% 91% 79
3% 3% 94% 33
0% 0% 100% 43
1% 4% 95% 170
0% 2% 98% 126

15. How do you and members of your household get to the places you need to go?
We drive our own vehicle
We take public transit
(Light Rail, Metro bus,
etc.)
We share rides with friends / relatives
We walk or bike
We take a taxi / cab / Uber /
LyftMedical
transportationNumber of
respondents
All respondents
Race / Ethnicity
White alone
BIPOC
Asian alone
Black / African American alone
Hispanic / Latinx alone
Multiple races / ethnicities
Gender
Female
Male
Household income
$9,999 or less
$10,000 - $19,999
$20,000 - $29,999
$30,000 - $39,999
$40,000 - $49,999
$50,000 or more
Approximated poverty status
At or below poverty line
Above poverty line
Highest degree completed in household
No high school diploma or GED
High school graduate or GED
Some college, no degree
Associate's degree
Bachelor's degree or higher
Primary language in household
English
All other languages
81% 20% 18% 15% 13% 0% 338
84% 16% 16% 19% 14% 0% 37
80% 20% 18% 15% 13% 0% 295
91% 11% 15% 10% 5% 0% 88
74% 27% 20% 14% 21% 1% 134
85% 18% 20% 13% 5% 0% 40
70% 22% 22% 33% 15% 0% 27
79% 21% 20% 16% 15% 0% 286
92% 14% 10% 6% 4% 0% 51
67% 28% 25% 32% 25% 0% 57
71% 29% 22% 12% 16% 1% 73
83% 20% 18% 11% 14% 0% 66
86% 9% 16% 9% 5% 0% 43
97% 10% 6% 3% 3% 0% 31
98% 9% 14% 14% 2% 0% 44
76% 21% 21% 16% 15% 1% 191
89% 16% 14% 11% 8% 0% 100
73% 19% 16% 8% 6% 0% 63
75% 21% 18% 19% 13% 1% 95
80% 21% 23% 17% 21% 0% 92
92% 28% 18% 13% 15% 0% 39
94% 10% 14% 14% 6% 0% 49
77% 24% 20% 18% 19% 0% 210
87% 13% 15% 11% 3% 1% 127

16. Are you facing any barriers in getting required transportation? If yes, please specify:
Cost of car ownership
(insurance / maintenance /
etc.)
Cost of public transportation
(Bus / Light Rail fare)
Length / Time of commute
Bus or Light Rail schedule
/ route
Bus or Light Rail stop too far from home
Disabilities(physical /
mental / etc.)
Can't drive / not enough
cars
Facingunspecified
barrier
Cost of not having a car (paying for Lyft to work every day)
Not facing any barriers
Number of respondents
All respondents
Race / Ethnicity
White alone
BIPOC
Asian alone
Black / African American alone
Hispanic / Latinx alone
Multiple races / ethnicities
Gender
Female
Male
Household income
$9,999 or less
$10,000 - $19,999
$20,000 - $29,999
$30,000 - $39,999
$40,000 - $49,999
$50,000 or more
Approximated poverty status
At or below poverty line
Above poverty line
Highest degree completed in household
No high school diploma or GED
High school graduate or GED
Some college, no degree
Associate's degree
Bachelor's degree or higher
Primary language in household
English
All other languages
17% 9% 8% 6% 6% 4% 1% 1% 0% 75% 340
22% 3% 5% 5% 8% 14% 0% 0% 0% 73% 37
16% 9% 8% 6% 5% 2% 1% 1% 0% 76% 297
7% 3% 2% 2% 1% 0% 1% 1% 0% 90% 88
20% 14% 9% 9% 7% 4% 1% 0% 1% 69% 136
10% 0% 13% 5% 5% 0% 3% 3% 0% 78% 40
37% 19% 15% 11% 7% 4% 0% 0% 0% 59% 27
19% 9% 9% 7% 6% 4% 1% 1% 0% 72% 288
4% 2% 4% 2% 2% 2% 0% 0% 0% 94% 51
26% 19% 19% 14% 16% 12% 2% 0% 0% 56% 57
22% 12% 10% 11% 3% 5% 0% 1% 1% 66% 73
21% 6% 7% 6% 9% 0% 1% 1% 0% 73% 67
18% 2% 2% 0% 0% 2% 0% 0% 0% 80% 44
3% 3% 3% 0% 0% 0% 0% 0% 0% 94% 31
2% 5% 2% 2% 2% 0% 2% 0% 0% 93% 44
22% 10% 10% 10% 7% 6% 1% 1% 1% 68% 192
12% 6% 5% 1% 3% 1% 2% 0% 0% 83% 100
9% 6% 6% 8% 3% 2% 0% 2% 2% 78% 64
15% 9% 5% 6% 11% 6% 1% 1% 0% 76% 95
26% 10% 11% 7% 5% 4% 2% 0% 0% 66% 92
30% 15% 10% 10% 3% 3% 0% 0% 0% 70% 40
4% 2% 8% 0% 4% 0% 0% 0% 0% 88% 49
24% 12% 11% 8% 8% 6% 1% 0% 0% 67% 212
6% 2% 3% 4% 2% 0% 1% 2% 0% 87% 127

17. Have you ever been unfairly denied a bank loan (car loan, housing loan, etc.)? If yes, please select the reasons:
Race Bad credit Age
Deniedunfairly for unspecified
reason(s) Disability Income LanguageSexual
orientation Gender
Neverunfairlydenied
Number of respondents
All respondents
Race / Ethnicity
White alone
BIPOC
Asian alone
Black / African American alone
Hispanic / Latinx alone
Multiple races / ethnicities
Gender
Female
Male
Household income
$9,999 or less
$10,000 - $19,999
$20,000 - $29,999
$30,000 - $39,999
$40,000 - $49,999
$50,000 or more
Approximated poverty status
At or below poverty line
Above poverty line
Highest degree completed in household
No high school diploma or GED
High school graduate or GED
Some college, no degree
Associate's degree
Bachelor's degree or higher
Primary language in household
English
All other languages
2% 2% 2% 1% 1% 1% 1% 1% 0% 91% 340
0% 3% 0% 0% 3% 3% 0% 3% 0% 95% 37
2% 2% 2% 2% 1% 1% 1% 0% 0% 90% 297
1% 0% 1% 2% 0% 1% 1% 0% 0% 93% 88
4% 4% 3% 2% 1% 1% 0% 0% 1% 88% 136
3% 0% 0% 0% 0% 0% 5% 0% 0% 93% 40
0% 0% 4% 0% 11% 4% 0% 4% 0% 85% 27
2% 2% 2% 1% 1% 1% 1% 0% 0% 90% 288
2% 0% 0% 2% 0% 0% 0% 0% 0% 96% 51
4% 2% 2% 4% 5% 4% 4% 0% 0% 82% 57
1% 3% 1% 1% 1% 1% 1% 1% 0% 89% 73
4% 1% 3% 1% 0% 1% 0% 0% 1% 90% 67
2% 0% 2% 0% 0% 0% 0% 0% 0% 95% 44
0% 3% 0% 0% 0% 0% 0% 0% 0% 97% 31
0% 0% 0% 2% 2% 0% 0% 2% 0% 95% 44
3% 2% 2% 2% 2% 2% 2% 1% 1% 88% 192
1% 1% 1% 1% 0% 0% 0% 0% 0% 96% 100
2% 2% 3% 3% 2% 0% 2% 0% 0% 88% 64
1% 2% 1% 1% 1% 0% 2% 1% 0% 92% 95
3% 3% 3% 1% 3% 3% 0% 0% 1% 88% 92
5% 0% 0% 0% 0% 3% 0% 0% 0% 93% 40
0% 0% 0% 2% 0% 0% 0% 2% 0% 96% 49
2% 3% 2% 2% 2% 1% 0% 0% 0% 90% 212
2% 0% 2% 1% 1% 1% 2% 1% 0% 92% 127

18. [BIPOC respondents only] Were you ever unfairly denied a bank loan because of your race?
Yes
Unfairlydenied, but
not attributed to race
Never unfairly denied
Number of respondents
All respondents
Race / Ethnicity
White alone
BIPOC
Asian alone
Black / African American alone
Hispanic / Latinx alone
Multiple races / ethnicities
Gender
Female
Male
Household income
$9,999 or less
$10,000 - $19,999
$20,000 - $29,999
$30,000 - $39,999
$40,000 - $49,999
$50,000 or more
Approximated poverty status
At or below poverty line
Above poverty line
Highest degree completed in household
No high school diploma or GED
High school graduate or GED
Some college, no degree
Associate's degree
Bachelor's degree or higher
Primary language in household
English
All other languages
2% 8% 90% 297
0% 0% 0% 0
2% 8% 90% 297
1% 6% 93% 88
4% 9% 88% 136
3% 5% 93% 40
0% 15% 85% 27
2% 8% 89% 250
2% 2% 96% 46
4% 15% 80% 46
2% 9% 89% 66
5% 7% 88% 59
3% 3% 95% 40
0% 4% 96% 25
0% 5% 95% 39
3% 10% 87% 169
1% 4% 95% 83
2% 12% 87% 60
1% 9% 90% 82
4% 9% 87% 79
6% 3% 91% 33
0% 2% 98% 43
3% 9% 88% 170
2% 6% 92% 126

19. What is your current housing status?
Own your home
Rent your home
Living in anotherperson's
homeShelter / homeless
Number of respondents
All respondents
Race / Ethnicity
White alone
BIPOC
Asian alone
Black / African American alone
Hispanic / Latinx alone
Multiple races / ethnicities
Gender
Female
Male
Household income
$9,999 or less
$10,000 - $19,999
$20,000 - $29,999
$30,000 - $39,999
$40,000 - $49,999
$50,000 or more
Approximated poverty status
At or below poverty line
Above poverty line
Highest degree completed in household
No high school diploma or GED
High school graduate or GED
Some college, no degree
Associate's degree
Bachelor's degree or higher
Primary language in household
English
All other languages
21% 70% 7% 2% 339
22% 73% 5% 0% 37
21% 69% 7% 2% 296
39% 49% 11% 0% 87
13% 79% 5% 3% 136
15% 78% 5% 3% 40
11% 70% 11% 7% 27
18% 72% 8% 2% 287
39% 55% 4% 2% 51
7% 84% 5% 4% 57
10% 78% 10% 3% 72
15% 81% 1% 3% 67
27% 64% 7% 2% 44
26% 61% 13% 0% 31
59% 32% 9% 0% 44
15% 75% 7% 3% 191
34% 59% 7% 0% 100
20% 69% 9% 2% 64
13% 77% 9% 2% 94
18% 73% 5% 3% 92
23% 75% 0% 3% 40
41% 47% 12% 0% 49
17% 72% 8% 3% 212
28% 66% 6% 0% 126

20. How much do you spend on housing every month?
$500 or less $501-$1,000 $1,001-$1,250 $1,251-$1,500 $1,501-$2,000More than
$2,000Number of
respondents
All respondents
Race / Ethnicity
White alone
BIPOC
Asian alone
Black / African American alone
Hispanic / Latinx alone
Multiple races / ethnicities
Gender
Female
Male
Household income
$9,999 or less
$10,000 - $19,999
$20,000 - $29,999
$30,000 - $39,999
$40,000 - $49,999
$50,000 or more
Approximated poverty status
At or below poverty line
Above poverty line
Highest degree completed in household
No high school diploma or GED
High school graduate or GED
Some college, no degree
Associate's degree
Bachelor's degree or higher
Primary language in household
English
All other languages
14% 23% 17% 16% 16% 13% 317
24% 32% 14% 5% 16% 8% 37
13% 21% 17% 18% 17% 14% 274
10% 21% 16% 12% 22% 19% 81
15% 17% 19% 24% 15% 11% 124
5% 26% 21% 18% 18% 13% 39
32% 28% 12% 4% 12% 12% 25
15% 23% 17% 16% 16% 13% 270
9% 23% 15% 15% 21% 17% 47
23% 40% 15% 11% 8% 4% 53
28% 19% 13% 22% 13% 6% 69
5% 31% 20% 17% 23% 3% 64
5% 10% 32% 17% 12% 24% 41
4% 19% 11% 15% 22% 30% 27
7% 16% 7% 9% 26% 35% 43
18% 26% 15% 18% 15% 8% 180
6% 21% 18% 11% 19% 24% 99
11% 23% 23% 11% 16% 18% 57
16% 30% 16% 20% 9% 9% 88
17% 18% 17% 19% 23% 6% 88
8% 21% 18% 18% 16% 18% 38
15% 24% 9% 7% 20% 26% 46
17% 24% 17% 16% 15% 12% 200
10% 22% 16% 16% 19% 16% 116

21. Do you receive financial assistance from government or any nonprofit agency for housing?
Yes NoNumber of
respondents
All respondents
Race / Ethnicity
White alone
BIPOC
Asian alone
Black / African American alone
Hispanic / Latinx alone
Multiple races / ethnicities
Gender
Female
Male
Household income
$9,999 or less
$10,000 - $19,999
$20,000 - $29,999
$30,000 - $39,999
$40,000 - $49,999
$50,000 or more
Approximated poverty status
At or below poverty line
Above poverty line
Highest degree completed in household
No high school diploma or GED
High school graduate or GED
Some college, no degree
Associate's degree
Bachelor's degree or higher
Primary language in household
English
All other languages
32% 68% 338
41% 59% 37
31% 69% 295
20% 80% 86
35% 65% 136
18% 83% 40
59% 41% 27
34% 66% 286
24% 76% 51
54% 46% 57
48% 52% 73
32% 68% 66
25% 75% 44
6% 94% 31
14% 86% 44
43% 57% 191
17% 83% 100
30% 70% 64
32% 68% 93
49% 51% 92
23% 78% 40
12% 88% 49
40% 60% 212
19% 81% 125

22. Please check all that apply to your household.
We need help with utility bills
We need help with
paying rent / mortgage
We need help with
homerepairs
We need help with
preventingforeclosure /
eviction
We need help
resolvingissues with our landlord
Weexperiencedeviction in the past 12
months
We need help to move
to another house that's
for rentWe need child care
We need help for food
support Other
No help needed or
no help specified
Number of respondents
All respondents
Race / Ethnicity
White alone
BIPOC
Asian alone
Black / African American alone
Hispanic / Latinx alone
Multiple races / ethnicities
Gender
Female
Male
Household income
$9,999 or less
$10,000 - $19,999
$20,000 - $29,999
$30,000 - $39,999
$40,000 - $49,999
$50,000 or more
Approximated poverty status
At or below poverty line
Above poverty line
Highest degree completed in household
No high school diploma or GED
High school graduate or GED
Some college, no degree
Associate's degree
Bachelor's degree or higher
Primary language in household
English
All other languages
44% 35% 18% 7% 4% 3% 2% 1% 1% 1% 31% 340
35% 27% 16% 5% 5% 0% 0% 0% 0% 5% 38% 37
45% 36% 18% 7% 3% 4% 2% 1% 1% 1% 30% 297
39% 26% 28% 2% 2% 1% 0% 1% 1% 1% 41% 88
50% 42% 13% 9% 4% 5% 2% 2% 1% 1% 23% 136
45% 33% 13% 5% 3% 0% 3% 0% 0% 0% 40% 40
41% 37% 15% 15% 4% 11% 4% 0% 0% 0% 22% 27
47% 38% 18% 6% 3% 3% 2% 1% 1% 1% 28% 288
27% 22% 18% 10% 6% 2% 2% 0% 0% 0% 51% 51
49% 40% 18% 12% 7% 5% 4% 0% 0% 5% 18% 57
44% 40% 11% 0% 3% 4% 4% 1% 0% 0% 32% 73
46% 42% 16% 7% 3% 3% 0% 0% 1% 0% 36% 67
55% 34% 14% 5% 5% 0% 2% 0% 2% 0% 25% 44
29% 29% 16% 19% 3% 10% 0% 6% 0% 0% 45% 31
36% 20% 36% 5% 2% 0% 0% 0% 0% 0% 34% 44
47% 39% 17% 6% 4% 5% 3% 1% 1% 2% 28% 192
41% 34% 22% 9% 2% 2% 0% 0% 0% 0% 35% 100
34% 28% 11% 11% 5% 3% 2% 2% 2% 2% 34% 64
46% 31% 14% 5% 3% 3% 3% 0% 1% 3% 33% 95
50% 49% 18% 11% 4% 4% 1% 2% 0% 0% 23% 92
53% 30% 20% 3% 5% 3% 3% 3% 0% 0% 35% 40
33% 31% 31% 2% 2% 2% 0% 0% 0% 0% 37% 49
50% 40% 17% 8% 4% 4% 2% 1% 0% 1% 27% 212
34% 28% 19% 6% 3% 2% 2% 2% 1% 1% 39% 127

23. Have you ever been unfairly denied moving into a certain neighborhood by a landlord? If yes, please select the reasons:
Race Disability GenderDid not take
Section 8 Age
Deniedunfairly for unspecified
reason(s)Sexual
orientation Credit Other
Neverunfairlydenied
Number of respondents
All respondents
Race / Ethnicity
White alone
BIPOC
Asian alone
Black / African American alone
Hispanic / Latinx alone
Multiple races / ethnicities
Gender
Female
Male
Household income
$9,999 or less
$10,000 - $19,999
$20,000 - $29,999
$30,000 - $39,999
$40,000 - $49,999
$50,000 or more
Approximated poverty status
At or below poverty line
Above poverty line
Highest degree completed in household
No high school diploma or GED
High school graduate or GED
Some college, no degree
Associate's degree
Bachelor's degree or higher
Primary language in household
English
All other languages
4% 1% 1% 1% 1% 0% 0% 0% 1% 93% 340
0% 3% 0% 3% 0% 0% 3% 3% 0% 92% 37
4% 1% 1% 1% 1% 0% 0% 0% 1% 94% 297
0% 0% 0% 0% 0% 0% 0% 0% 0% 100% 88
6% 1% 1% 1% 1% 0% 0% 0% 1% 92% 136
0% 0% 3% 0% 0% 3% 0% 0% 3% 93% 40
15% 4% 4% 0% 4% 0% 0% 0% 0% 81% 27
4% 2% 1% 1% 1% 0% 0% 0% 1% 92% 288
0% 0% 0% 0% 0% 0% 0% 0% 0% 100% 51
4% 4% 4% 2% 2% 0% 0% 0% 2% 93% 57
7% 3% 1% 3% 0% 0% 1% 0% 1% 86% 73
4% 0% 0% 0% 0% 0% 0% 0% 1% 96% 67
2% 2% 0% 0% 2% 0% 0% 0% 0% 98% 44
0% 0% 0% 0% 0% 3% 0% 3% 0% 94% 31
5% 0% 2% 0% 0% 0% 0% 0% 0% 95% 44
5% 2% 2% 1% 1% 0% 1% 0% 2% 92% 192
0% 0% 0% 1% 0% 1% 0% 1% 0% 97% 100
0% 0% 0% 0% 2% 0% 0% 0% 2% 97% 64
2% 1% 2% 0% 1% 0% 0% 1% 1% 95% 95
8% 3% 1% 2% 1% 0% 0% 0% 1% 90% 92
8% 3% 3% 3% 0% 0% 0% 0% 0% 90% 40
2% 0% 0% 0% 0% 2% 2% 0% 0% 94% 49
6% 2% 1% 1% 1% 0% 0% 0% 1% 91% 212
1% 0% 1% 0% 1% 0% 0% 0% 1% 98% 127

24. [BIPOC respondents only] Were you ever unfairly denied moving into a certain neighborhood by a landlord because of your race?
Yes
Unfairlydenied, but
not attributed to race
Never unfairly denied
Number of respondents
All respondents
Race / Ethnicity
White alone
BIPOC
Asian alone
Black / African American alone
Hispanic / Latinx alone
Multiple races / ethnicities
Gender
Female
Male
Household income
$9,999 or less
$10,000 - $19,999
$20,000 - $29,999
$30,000 - $39,999
$40,000 - $49,999
$50,000 or more
Approximated poverty status
At or below poverty line
Above poverty line
Highest degree completed in household
No high school diploma or GED
High school graduate or GED
Some college, no degree
Associate's degree
Bachelor's degree or higher
Primary language in household
English
All other languages
4% 2% 94% 297
0% 0% 0% 0
4% 2% 94% 297
0% 0% 100% 88
6% 2% 92% 136
0% 8% 93% 40
15% 4% 81% 27
4% 3% 93% 250
0% 0% 100% 46
4% 2% 93% 46
6% 6% 88% 66
5% 0% 95% 59
3% 0% 98% 40
0% 4% 96% 25
5% 0% 95% 39
5% 2% 93% 169
0% 2% 98% 83
0% 3% 97% 60
2% 2% 95% 82
8% 1% 91% 79
9% 3% 88% 33
2% 2% 95% 43
6% 3% 91% 170
1% 2% 98% 126

25. [BIPOC respondents only] Were you ever denied a job offer or fired from a job, denied a scholarship or suspended from school, denied a bank loan, or denied moving into a neighborhood by a landlord in an unfair manner because of your race?
Yes
Has been unfairly
denied, but never
attributed to race
Never unfairly denied
Number of respondents
All respondents
Race / Ethnicity
White alone
BIPOC
Asian alone
Black / African American alone
Hispanic / Latinx alone
Multiple races / ethnicities
Gender
Female
Male
Household income
$9,999 or less
$10,000 - $19,999
$20,000 - $29,999
$30,000 - $39,999
$40,000 - $49,999
$50,000 or more
Approximated poverty status
At or below poverty line
Above poverty line
Highest degree completed in household
No high school diploma or GED
High school graduate or GED
Some college, no degree
Associate's degree
Bachelor's degree or higher
Primary language in household
English
All other languages
11% 13% 76% 297
0% 0% 0% 0
11% 13% 76% 297
2% 8% 90% 88
15% 13% 72% 136
8% 20% 73% 40
26% 19% 56% 27
12% 15% 73% 250
2% 4% 93% 46
13% 24% 63% 46
15% 18% 67% 66
12% 14% 75% 59
8% 5% 88% 40
0% 8% 92% 25
10% 3% 87% 39
13% 16% 71% 169
4% 10% 87% 83
3% 17% 80% 60
7% 13% 79% 82
15% 15% 70% 79
18% 9% 73% 33
14% 7% 79% 43
16% 15% 69% 170
4% 10% 87% 126

26. Do members in your household have health insurance?
YesSome have it, some do not No
Number of respondents
All respondents
Race / Ethnicity
White alone
BIPOC
Asian alone
Black / African American alone
Hispanic / Latinx alone
Multiple races / ethnicities
Gender
Female
Male
Household income
$9,999 or less
$10,000 - $19,999
$20,000 - $29,999
$30,000 - $39,999
$40,000 - $49,999
$50,000 or more
Approximated poverty status
At or below poverty line
Above poverty line
Highest degree completed in household
No high school diploma or GED
High school graduate or GED
Some college, no degree
Associate's degree
Bachelor's degree or higher
Primary language in household
English
All other languages
83% 11% 6% 339
92% 5% 3% 37
82% 11% 6% 296
94% 2% 3% 87
82% 10% 9% 136
50% 40% 10% 40
89% 11% 0% 27
83% 11% 6% 287
84% 12% 4% 51
81% 11% 9% 57
85% 10% 5% 73
84% 12% 4% 67
84% 7% 9% 44
87% 10% 3% 31
84% 16% 0% 44
82% 11% 6% 192
88% 9% 3% 100
77% 9% 14% 64
80% 15% 5% 94
88% 8% 4% 92
85% 10% 5% 40
86% 14% 0% 49
85% 9% 6% 212
79% 15% 6% 126

27. Please check all that apply to your household.
We have a regular
medical clinic
We have a regular dental
clinic
One or more members of
yourhousehold
have used the ER in past 12 months more
than twice
One or more members of
ourhousehold
have a chronicillness
We have difficulty
paying for treatment
One or more members are
receivingtreatment for
a chronic illness
We have difficulty
paying for medication None selected
Number of respondents
All respondents
Race / Ethnicity
White alone
BIPOC
Asian alone
Black / African American alone
Hispanic / Latinx alone
Multiple races / ethnicities
Gender
Female
Male
Household income
$9,999 or less
$10,000 - $19,999
$20,000 - $29,999
$30,000 - $39,999
$40,000 - $49,999
$50,000 or more
Approximated poverty status
At or below poverty line
Above poverty line
Highest degree completed in household
No high school diploma or GED
High school graduate or GED
Some college, no degree
Associate's degree
Bachelor's degree or higher
Primary language in household
English
All other languages
86% 64% 14% 14% 12% 11% 8% 6% 340
92% 68% 22% 27% 14% 19% 0% 3% 37
86% 64% 13% 12% 12% 10% 8% 7% 297
91% 77% 5% 8% 7% 6% 3% 8% 88
85% 59% 12% 10% 10% 11% 11% 6% 136
80% 60% 15% 5% 23% 5% 13% 8% 40
78% 48% 41% 41% 22% 30% 7% 7% 27
88% 64% 16% 15% 14% 12% 9% 6% 288
82% 69% 4% 4% 2% 6% 4% 10% 51
86% 63% 9% 14% 7% 12% 9% 7% 57
88% 53% 21% 14% 12% 12% 10% 1% 73
88% 69% 16% 15% 12% 10% 3% 7% 67
82% 59% 14% 16% 7% 11% 11% 9% 44
90% 81% 6% 3% 13% 0% 3% 6% 31
91% 82% 14% 14% 23% 14% 7% 2% 44
88% 62% 16% 14% 10% 12% 7% 5% 192
88% 75% 14% 13% 16% 9% 7% 5% 100
77% 53% 11% 6% 9% 8% 9% 6% 64
88% 63% 12% 11% 9% 7% 7% 11% 95
87% 60% 22% 20% 14% 17% 7% 5% 92
95% 83% 10% 18% 10% 13% 10% 3% 40
88% 76% 12% 14% 20% 8% 8% 4% 49
87% 65% 18% 18% 14% 14% 10% 6% 212
85% 64% 7% 6% 10% 6% 5% 8% 127

28. Please check the services that one or more members of your household need, but cannot get.
FoodAssistance Dental
HealthInsurance
Vision / hearing
MentalHealth /
CounsellingMedical
Assistance ImmunizationsFamily
planning Prenatal
All respondents
Race / Ethnicity
White alone
BIPOC
Asian alone
Black / African American alone
Hispanic / Latinx alone
Multiple races / ethnicities
Gender
Female
Male
Household income
$9,999 or less
$10,000 - $19,999
$20,000 - $29,999
$30,000 - $39,999
$40,000 - $49,999
$50,000 or more
Approximated poverty status
At or below poverty line
Above poverty line
Highest degree completed in household
No high school diploma or GED
High school graduate or GED
Some college, no degree
Associate's degree
Bachelor's degree or higher
Primary language in household
English
All other languages
19% 17% 15% 10% 9% 6% 3% 2% 2% 1%
11% 14% 3% 8% 5% 3% 3% 0% 0% 0%
20% 18% 16% 9% 9% 6% 3% 2% 2% 1%
17% 8% 10% 5% 3% 5% 1% 1% 1% 0%
23% 17% 15% 10% 9% 7% 4% 3% 1% 1%
18% 45% 40% 28% 18% 10% 3% 5% 3% 3%
11% 11% 4% 0% 11% 0% 7% 0% 4% 0%
20% 18% 16% 10% 9% 6% 2% 2% 2% 1%
14% 12% 10% 10% 2% 4% 4% 4% 0% 0%
25% 16% 14% 11% 5% 5% 0% 0% 2% 0%
12% 29% 18% 15% 15% 7% 4% 4% 3% 0%
16% 16% 16% 12% 4% 3% 6% 1% 1% 0%
23% 16% 11% 9% 5% 11% 0% 2% 0% 0%
16% 6% 16% 3% 3% 3% 3% 3% 0% 0%
20% 14% 7% 5% 16% 5% 2% 2% 5% 5%
16% 20% 16% 13% 8% 6% 4% 2% 2% 0%
22% 12% 9% 8% 9% 5% 0% 3% 2% 2%
27% 30% 27% 17% 6% 8% 9% 3% 2% 0%
13% 19% 15% 8% 6% 5% 2% 1% 0% 1%
23% 12% 8% 7% 13% 5% 2% 3% 2% 0%
13% 10% 13% 15% 5% 8% 0% 0% 0% 0%
18% 14% 14% 6% 10% 4% 0% 4% 6% 2%
21% 15% 11% 9% 10% 6% 3% 3% 2% 0%
16% 21% 20% 11% 6% 6% 3% 2% 1% 1%

28. Please check the services that one or more members of your household need, but cannot get. (continued)
Drug / Alcohol
Abuse Help Child careHelp paying medical bills
Care for injury Other
Noneneeded or
nonespecified
Number of respondents
All respondents
Race / Ethnicity
White alone
BIPOC
Asian alone
Black / African American alone
Hispanic / Latinx alone
Multiple races / ethnicities
Gender
Female
Male
Household income
$9,999 or less
$10,000 - $19,999
$20,000 - $29,999
$30,000 - $39,999
$40,000 - $49,999
$50,000 or more
Approximated poverty status
At or below poverty line
Above poverty line
Highest degree completed in household
No high school diploma or GED
High school graduate or GED
Some college, no degree
Associate's degree
Bachelor's degree or higher
Primary language in household
English
All other languages
1% 1% 0% 0% 1% 57% 340
0% 0% 3% 0% 3% 68% 37
1% 1% 0% 0% 1% 56% 297
0% 0% 0% 0% 1% 67% 88
1% 1% 0% 0% 0% 53% 136
3% 0% 0% 0% 3% 33% 40
0% 0% 0% 4% 0% 70% 27
1% 1% 0% 0% 1% 56% 288
0% 0% 0% 0% 0% 67% 51
0% 0% 0% 0% 2% 58% 57
0% 1% 0% 1% 0% 55% 73
0% 0% 0% 0% 1% 66% 67
0% 0% 0% 0% 2% 55% 44
0% 0% 0% 0% 0% 61% 31
5% 0% 2% 0% 0% 55% 44
0% 1% 0% 1% 1% 61% 192
2% 0% 1% 0% 0% 56% 100
0% 2% 0% 0% 2% 38% 64
1% 0% 0% 0% 2% 60% 95
0% 1% 0% 1% 0% 62% 92
0% 0% 3% 0% 0% 68% 40
2% 0% 0% 0% 0% 59% 49
0% 0% 0% 0% 0% 60% 212
1% 2% 0% 0% 2% 51% 127

29. What are your needs pertaining to food/nutrition?
We use food stamps / EBT
We use food shelves
We need informationabout eating a healthy diet on a limited
income
We frequently run out of
food before the end of the
month
It is difficult to find the
kinds of food we need
No needs specified
Number of respondents
All respondents
Race / Ethnicity
White alone
BIPOC
Asian alone
Black / African American alone
Hispanic / Latinx alone
Multiple races / ethnicities
Gender
Female
Male
Household income
$9,999 or less
$10,000 - $19,999
$20,000 - $29,999
$30,000 - $39,999
$40,000 - $49,999
$50,000 or more
Approximated poverty status
At or below poverty line
Above poverty line
Highest degree completed in household
No high school diploma or GED
High school graduate or GED
Some college, no degree
Associate's degree
Bachelor's degree or higher
Primary language in household
English
All other languages
61% 29% 18% 18% 11% 16% 340
65% 54% 8% 19% 8% 16% 37
61% 25% 20% 17% 11% 15% 297
57% 22% 18% 10% 11% 23% 88
61% 23% 22% 21% 9% 13% 136
55% 23% 8% 10% 13% 20% 40
81% 48% 33% 33% 22% 0% 27
62% 31% 19% 19% 12% 14% 288
55% 14% 16% 8% 6% 25% 51
75% 37% 14% 21% 5% 9% 57
84% 27% 21% 16% 18% 7% 73
67% 37% 12% 16% 6% 7% 67
48% 16% 16% 18% 9% 27% 44
26% 39% 16% 23% 6% 35% 31
36% 16% 34% 18% 20% 23% 44
76% 33% 17% 18% 11% 8% 192
37% 25% 19% 18% 11% 29% 100
61% 11% 13% 5% 6% 22% 64
69% 32% 12% 21% 6% 13% 95
62% 36% 25% 22% 15% 10% 92
55% 33% 23% 25% 5% 13% 40
47% 29% 22% 16% 22% 27% 49
63% 36% 19% 24% 14% 13% 212
57% 17% 17% 8% 6% 20% 127

30. During the past year, how many times did you take a big step (e.g. leave a job, report someone to authorities, etc.) to deal with a discriminatory event?
Never One time Two times Three timesFour or more
timesNumber of
respondents
All respondents
Race / Ethnicity
White alone
BIPOC
Asian alone
Black / African American alone
Hispanic / Latinx alone
Multiple races / ethnicities
Gender
Female
Male
Household income
$9,999 or less
$10,000 - $19,999
$20,000 - $29,999
$30,000 - $39,999
$40,000 - $49,999
$50,000 or more
Approximated poverty status
At or below poverty line
Above poverty line
Highest degree completed in household
No high school diploma or GED
High school graduate or GED
Some college, no degree
Associate's degree
Bachelor's degree or higher
Primary language in household
English
All other languages
75% 11% 5% 4% 4% 340
76% 14% 8% 0% 3% 37
75% 11% 5% 5% 4% 297
84% 6% 5% 3% 2% 88
68% 14% 7% 6% 4% 136
73% 15% 3% 3% 8% 40
74% 15% 0% 7% 4% 27
74% 13% 4% 5% 4% 288
84% 2% 12% 0% 2% 51
74% 14% 2% 7% 4% 57
74% 12% 4% 4% 5% 73
70% 12% 10% 3% 4% 67
80% 11% 5% 0% 5% 44
71% 10% 6% 10% 3% 31
84% 9% 2% 2% 2% 44
75% 13% 4% 5% 4% 192
78% 9% 6% 3% 4% 100
80% 11% 5% 3% 2% 64
76% 9% 4% 7% 3% 95
70% 12% 10% 4% 4% 92
83% 13% 0% 3% 3% 40
73% 14% 4% 0% 8% 49
70% 13% 7% 5% 5% 212
83% 9% 2% 2% 2% 127

31. Race / ethnicity
White alone BIPOC
AmericanIndian / Native
Americanalone Asian alone
Black / African
Americanalone
Hispanic / Latinx alone
Other race / ethnicity
aloneMultiple races
/ ethnicitiesNumber of
respondents
All respondents
Gender
Female
Male
Household income
$9,999 or less
$10,000 - $19,999
$20,000 - $29,999
$30,000 - $39,999
$40,000 - $49,999
$50,000 or more
Approximated poverty status
At or below poverty line
Above poverty line
Highest degree completed in household
No high school diploma or GED
High school graduate or GED
Some college, no degree
Associate's degree
Bachelor's degree or higher
Primary language in household
English
All other languages
11% 89% 1% 26% 41% 12% 1% 8% 334
11% 89% 0% 23% 42% 13% 1% 9% 282
10% 90% 2% 43% 35% 8% 0% 2% 51
16% 84% 0% 18% 45% 11% 4% 5% 55
8% 92% 0% 18% 47% 18% 0% 8% 72
12% 88% 1% 27% 39% 12% 0% 9% 67
7% 93% 0% 30% 44% 12% 0% 7% 43
19% 81% 3% 29% 32% 10% 0% 6% 31
9% 91% 0% 40% 28% 9% 5% 9% 43
11% 89% 0% 25% 43% 13% 1% 7% 189
15% 85% 2% 27% 34% 13% 2% 7% 98
3% 97% 0% 31% 35% 27% 0% 3% 62
13% 87% 0% 27% 38% 13% 0% 10% 94
12% 88% 1% 19% 48% 7% 2% 11% 90
15% 85% 0% 33% 44% 5% 0% 3% 39
12% 88% 2% 29% 37% 6% 4% 10% 49
18% 82% 1% 14% 48% 6% 2% 12% 207
0% 100% 0% 47% 29% 22% 0% 2% 126

32. What is the primary language of communication in your household?
English Spanish Karen Hmong Other Somali Nepali Amharic Oromo Mandarin ArabicNumber of
respondents
All respondents
Race / Ethnicity
White alone
BIPOC
Asian alone
Black / African American alone
Hispanic / Latinx alone
Multiple races / ethnicities
Gender
Female
Male
Household income
$9,999 or less
$10,000 - $19,999
$20,000 - $29,999
$30,000 - $39,999
$40,000 - $49,999
$50,000 or more
Approximated poverty status
At or below poverty line
Above poverty line
Highest degree completed in household
No high school diploma or GED
High school graduate or GED
Some college, no degree
Associate's degree
Bachelor's degree or higher
63% 9% 6% 6% 5% 4% 3% 3% 1% 0% 0% 339
100% 0% 0% 0% 0% 0% 0% 0% 0% 0% 0% 37
57% 9% 7% 6% 6% 5% 3% 3% 2% 0% 0% 296
32% 0% 22% 22% 13% 0% 10% 0% 0% 1% 0% 87
73% 0% 0% 0% 5% 11% 0% 7% 4% 0% 1% 136
30% 70% 0% 0% 0% 0% 0% 0% 0% 0% 0% 40
93% 0% 7% 0% 0% 0% 0% 0% 0% 0% 0% 27
66% 9% 6% 5% 5% 5% 2% 2% 0% 0% 0% 288
44% 6% 8% 8% 10% 4% 4% 6% 8% 2% 0% 50
70% 11% 7% 4% 4% 4% 0% 0% 2% 0% 0% 57
59% 14% 1% 5% 5% 8% 1% 3% 1% 0% 1% 73
64% 7% 6% 9% 6% 3% 1% 1% 0% 1% 0% 67
64% 7% 11% 2% 2% 7% 2% 2% 2% 0% 0% 44
74% 3% 6% 3% 0% 3% 3% 3% 3% 0% 0% 31
53% 7% 7% 9% 5% 2% 7% 7% 2% 0% 0% 43
63% 10% 6% 6% 5% 6% 1% 1% 1% 1% 1% 192
64% 6% 6% 6% 3% 2% 5% 5% 3% 0% 0% 100
27% 27% 14% 3% 6% 9% 6% 5% 3% 0% 0% 64
62% 7% 5% 5% 9% 3% 3% 3% 0% 1% 0% 95
80% 3% 1% 5% 2% 3% 1% 2% 1% 0% 0% 92
70% 3% 10% 10% 5% 3% 0% 0% 0% 0% 0% 40
71% 2% 4% 6% 2% 4% 2% 2% 4% 0% 2% 48

33. Gender
Female MaleNumber of
respondents
All respondents
Race / Ethnicity
White alone
BIPOC
Asian alone
Black / African American alone
Hispanic / Latinx alone
Multiple races / ethnicities
Household income
$9,999 or less
$10,000 - $19,999
$20,000 - $29,999
$30,000 - $39,999
$40,000 - $49,999
$50,000 or more
Approximated poverty status
At or below poverty line
Above poverty line
Highest degree completed in household
No high school diploma or GED
High school graduate or GED
Some college, no degree
Associate's degree
Bachelor's degree or higher
Primary language in household
English
All other languages
85% 15% 339
86% 14% 37
84% 16% 296
75% 25% 88
87% 13% 136
90% 10% 40
96% 4% 26
91% 9% 57
89% 11% 73
87% 13% 67
80% 20% 44
81% 19% 31
74% 26% 43
89% 11% 192
81% 19% 100
73% 27% 64
88% 12% 94
92% 8% 92
83% 18% 40
82% 18% 49
90% 10% 212
78% 22% 126

34. Are you a veteran of the US Military?
Yes NoNumber of
respondents
All respondents
Race / Ethnicity
White alone
BIPOC
Asian alone
Black / African American alone
Hispanic / Latinx alone
Multiple races / ethnicities
Gender
Female
Male
Household income
$9,999 or less
$10,000 - $19,999
$20,000 - $29,999
$30,000 - $39,999
$40,000 - $49,999
$50,000 or more
Approximated poverty status
At or below poverty line
Above poverty line
Highest degree completed in household
No high school diploma or GED
High school graduate or GED
Some college, no degree
Associate's degree
Bachelor's degree or higher
Primary language in household
English
All other languages
1% 99% 335
3% 97% 36
1% 99% 293
2% 98% 84
1% 99% 136
3% 98% 40
0% 100% 27
1% 99% 285
4% 96% 49
0% 100% 55
1% 99% 72
3% 97% 67
0% 100% 43
0% 100% 31
2% 98% 43
2% 98% 189
1% 99% 99
0% 100% 63
0% 100% 94
0% 100% 91
8% 92% 39
4% 96% 48
1% 99% 209
2% 98% 125

35. What is the combined annual income of your household?
$9,999 or less
$10,000 to under
$20,000
$20,000 to under
$30,000
$30,000 to under
$40,000
$40,000 to under
$50,000
$50,000 to under$60,000
$60,000 to under
$70,000
$70,000 to under
$80,000
$80,000 to under
$90,000
$90,000 to under
$100,000Number of
respondents
All respondents
Race / Ethnicity
White alone
BIPOC
Asian alone
Black / African American alone
Hispanic / Latinx alone
Multiple races / ethnicities
Gender
Female
Male
Approximated poverty status
At or below poverty line
Above poverty line
Highest degree completed in household
No high school diploma or GED
High school graduate or GED
Some college, no degree
Associate's degree
Bachelor's degree or higher
Primary language in household
English
All other languages
18% 23% 21% 14% 10% 6% 3% 2% 2% 1% 316
25% 17% 22% 8% 17% 8% 3% 0% 0% 0% 36
17% 24% 21% 15% 9% 5% 4% 2% 2% 1% 275
13% 16% 23% 16% 11% 9% 4% 1% 5% 3% 80
20% 27% 21% 15% 8% 4% 3% 2% 1% 0% 126
15% 33% 21% 13% 8% 3% 3% 5% 0% 0% 39
13% 25% 25% 13% 8% 4% 4% 4% 0% 4% 24
19% 24% 22% 13% 9% 5% 3% 2% 1% 0% 267
10% 17% 19% 19% 13% 10% 4% 2% 4% 2% 48
30% 38% 25% 6% 2% 0% 0% 0% 0% 0% 192
0% 1% 14% 25% 21% 16% 9% 6% 6% 2% 100
20% 32% 15% 22% 7% 3% 0% 0% 2% 0% 60
27% 24% 19% 12% 7% 7% 4% 0% 0% 1% 85
20% 24% 30% 10% 8% 0% 2% 2% 2% 0% 86
8% 18% 26% 13% 15% 10% 8% 0% 0% 3% 39
4% 13% 13% 15% 17% 13% 7% 9% 7% 2% 46
20% 22% 22% 14% 12% 5% 5% 1% 2% 0% 200
15% 26% 21% 14% 7% 7% 2% 3% 3% 3% 115

36. Approximated poverty status
At or below poverty line
Above poverty line
Number of respondents
All respondents
Race / Ethnicity
White alone
BIPOC
Asian alone
Black / African American alone
Hispanic / Latinx alone
Multiple races / ethnicities
Gender
Female
Male
Household income
$9,999 or less
$10,000 - $19,999
$20,000 - $29,999
$30,000 - $39,999
$40,000 - $49,999
$50,000 or more
Highest degree completed in household
No high school diploma or GED
High school graduate or GED
Some college, no degree
Associate's degree
Bachelor's degree or higher
Primary language in household
English
All other languages
66% 34% 292
57% 43% 35
67% 33% 252
65% 35% 74
71% 29% 114
65% 35% 37
67% 33% 21
68% 32% 252
53% 48% 40
100% 0% 57
99% 1% 73
77% 23% 62
31% 69% 36
16% 84% 25
0% 100% 39
74% 26% 53
74% 26% 81
73% 27% 82
54% 46% 35
34% 66% 41
65% 35% 185
66% 34% 107
Note. Poverty status could not be directly computed because income was provided in ranges. If the majority of the income range selected by the respondent fell below the HHS poverty guideline as determined by household size, the household was considered to be in poverty.

37. Are you or any adult in your household currently enrolled in posthigh-school education or training?
Yes NoNumber of
respondents
All respondents
Race / Ethnicity
White alone
BIPOC
Asian alone
Black / African American alone
Hispanic / Latinx alone
Multiple races / ethnicities
Gender
Female
Male
Household income
$9,999 or less
$10,000 - $19,999
$20,000 - $29,999
$30,000 - $39,999
$40,000 - $49,999
$50,000 or more
Approximated poverty status
At or below poverty line
Above poverty line
Highest degree completed in household
No high school diploma or GED
High school graduate or GED
Some college, no degree
Associate's degree
Bachelor's degree or higher
Primary language in household
English
All other languages
11% 89% 340
14% 86% 37
11% 89% 297
6% 94% 88
13% 87% 136
15% 85% 40
7% 93% 27
11% 89% 288
10% 90% 51
19% 81% 57
11% 89% 73
9% 91% 67
9% 91% 44
3% 97% 31
11% 89% 44
12% 88% 192
10% 90% 100
19% 81% 64
6% 94% 95
13% 87% 92
8% 93% 40
8% 92% 49
9% 91% 212
13% 87% 127

38. Are you or any adult in your household interested in attending school (GED, Trade, College)?
Yes NoNumber of
respondents
All respondents
Race / Ethnicity
White alone
BIPOC
Asian alone
Black / African American alone
Hispanic / Latinx alone
Multiple races / ethnicities
Gender
Female
Male
Household income
$9,999 or less
$10,000 - $19,999
$20,000 - $29,999
$30,000 - $39,999
$40,000 - $49,999
$50,000 or more
Approximated poverty status
At or below poverty line
Above poverty line
Highest degree completed in household
No high school diploma or GED
High school graduate or GED
Some college, no degree
Associate's degree
Bachelor's degree or higher
Primary language in household
English
All other languages
39% 61% 340
32% 68% 37
40% 60% 297
27% 73% 88
43% 57% 136
50% 50% 40
52% 48% 27
39% 61% 288
41% 59% 51
49% 51% 57
33% 67% 73
39% 61% 67
45% 55% 44
23% 77% 31
45% 55% 44
41% 59% 192
37% 63% 100
42% 58% 64
29% 71% 95
49% 51% 92
35% 65% 40
41% 59% 49
39% 61% 212
40% 60% 127

39. How many adults (including yourself) live in your household?
1 2 3-4 5+Number of
respondents
All respondents
Race / Ethnicity
White alone
BIPOC
Asian alone
Black / African American alone
Hispanic / Latinx alone
Multiple races / ethnicities
Gender
Female
Male
Household income
$9,999 or less
$10,000 - $19,999
$20,000 - $29,999
$30,000 - $39,999
$40,000 - $49,999
$50,000 or more
Approximated poverty status
At or below poverty line
Above poverty line
Highest degree completed in household
No high school diploma or GED
High school graduate or GED
Some college, no degree
Associate's degree
Bachelor's degree or higher
Primary language in household
English
All other languages
36% 41% 16% 8% 290
33% 48% 18% 0% 33
36% 40% 15% 9% 252
16% 47% 21% 16% 75
50% 38% 9% 4% 114
29% 32% 21% 18% 34
39% 35% 26% 0% 23
40% 37% 16% 7% 251
8% 67% 15% 10% 39
48% 31% 15% 6% 48
55% 31% 11% 3% 62
44% 36% 12% 8% 59
28% 56% 8% 8% 36
16% 48% 20% 16% 25
0% 62% 26% 13% 39
43% 33% 14% 10% 167
24% 55% 15% 6% 100
30% 39% 14% 18% 44
37% 40% 17% 6% 84
47% 35% 16% 2% 88
29% 53% 9% 9% 34
20% 45% 25% 10% 40
47% 36% 14% 3% 184
16% 49% 20% 15% 106

40. Household size
1 2-3 4-5 6-7 8+Number of
respondents
All respondents
Race / Ethnicity
White alone
BIPOC
Asian alone
Black / African American alone
Hispanic / Latinx alone
Multiple races / ethnicities
Gender
Female
Male
Household income
$9,999 or less
$10,000 - $19,999
$20,000 - $29,999
$30,000 - $39,999
$40,000 - $49,999
$50,000 or more
Approximated poverty status
At or below poverty line
Above poverty line
Highest degree completed in household
No high school diploma or GED
High school graduate or GED
Some college, no degree
Associate's degree
Bachelor's degree or higher
Primary language in household
English
All other languages
1% 26% 43% 21% 9% 288
6% 41% 34% 16% 3% 32
1% 24% 43% 22% 10% 251
0% 9% 47% 28% 16% 75
1% 32% 45% 16% 6% 113
0% 24% 35% 26% 15% 34
0% 35% 39% 26% 0% 23
2% 28% 40% 22% 8% 250
0% 13% 58% 16% 13% 38
2% 42% 29% 21% 6% 48
2% 34% 44% 18% 3% 62
4% 21% 46% 18% 12% 57
0% 19% 50% 25% 6% 36
0% 24% 36% 16% 24% 25
0% 13% 49% 26% 13% 39
1% 25% 40% 24% 11% 167
3% 30% 46% 14% 7% 100
0% 16% 48% 20% 16% 44
0% 32% 46% 17% 5% 84
2% 30% 41% 20% 7% 86
3% 24% 44% 24% 6% 34
3% 18% 33% 33% 15% 40
2% 35% 40% 19% 4% 182
0% 11% 47% 25% 16% 106

41. Our family needs support services so our children are ready to start school (early childhood education, English language learning, ...
Yes NoNumber of
respondents
All respondents
Race / Ethnicity
White alone
BIPOC
Asian alone
Black / African American alone
Hispanic / Latinx alone
Multiple races / ethnicities
Gender
Female
Male
Household income
$9,999 or less
$10,000 - $19,999
$20,000 - $29,999
$30,000 - $39,999
$40,000 - $49,999
$50,000 or more
Approximated poverty status
At or below poverty line
Above poverty line
Highest degree completed in household
No high school diploma or GED
High school graduate or GED
Some college, no degree
Associate's degree
Bachelor's degree or higher
Primary language in household
English
All other languages
52% 48% 340
27% 73% 37
56% 44% 297
51% 49% 88
57% 43% 136
65% 35% 40
59% 41% 27
52% 48% 288
49% 51% 51
54% 46% 57
53% 47% 73
52% 48% 67
50% 50% 44
48% 52% 31
48% 52% 44
54% 46% 192
46% 54% 100
66% 34% 64
55% 45% 95
49% 51% 92
43% 57% 40
41% 59% 49
46% 54% 212
61% 39% 127
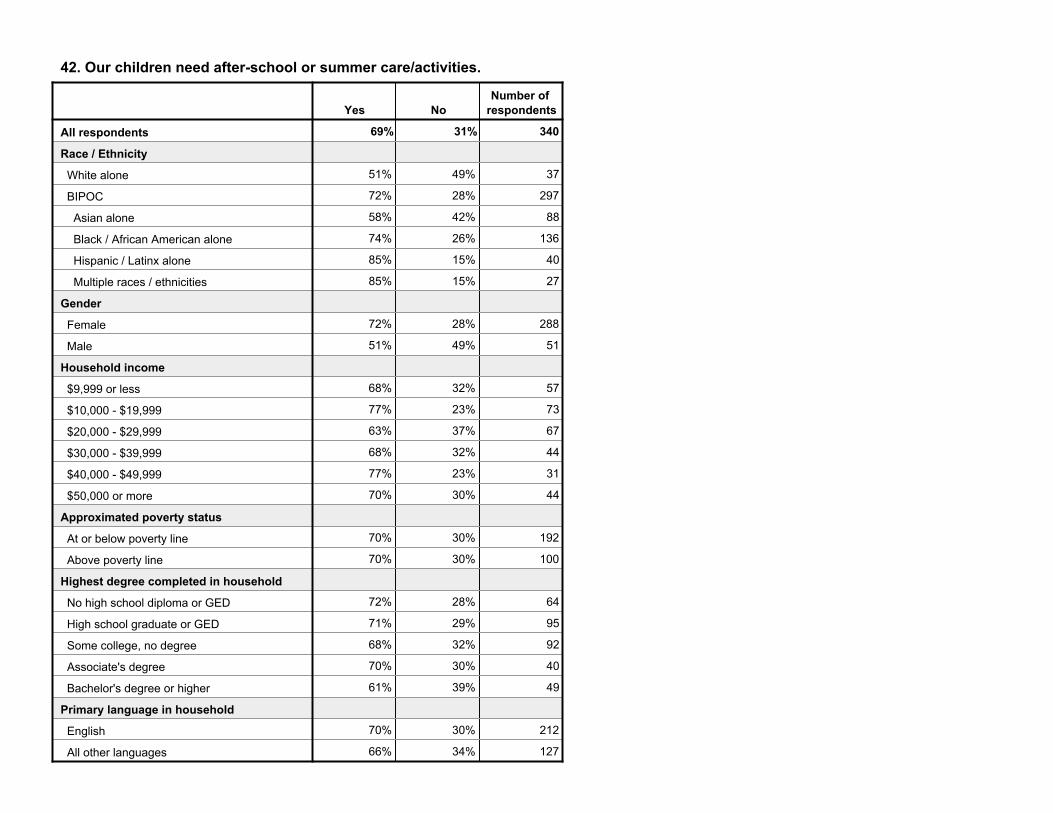
42. Our children need after-school or summer care/activities.
Yes NoNumber of
respondents
All respondents
Race / Ethnicity
White alone
BIPOC
Asian alone
Black / African American alone
Hispanic / Latinx alone
Multiple races / ethnicities
Gender
Female
Male
Household income
$9,999 or less
$10,000 - $19,999
$20,000 - $29,999
$30,000 - $39,999
$40,000 - $49,999
$50,000 or more
Approximated poverty status
At or below poverty line
Above poverty line
Highest degree completed in household
No high school diploma or GED
High school graduate or GED
Some college, no degree
Associate's degree
Bachelor's degree or higher
Primary language in household
English
All other languages
69% 31% 340
51% 49% 37
72% 28% 297
58% 42% 88
74% 26% 136
85% 15% 40
85% 15% 27
72% 28% 288
51% 49% 51
68% 32% 57
77% 23% 73
63% 37% 67
68% 32% 44
77% 23% 31
70% 30% 44
70% 30% 192
70% 30% 100
72% 28% 64
71% 29% 95
68% 32% 92
70% 30% 40
61% 39% 49
70% 30% 212
66% 34% 127

Acknowledgements
The authors of this report would like to extend deep appreciation for each focus group participant and key informant interviewee for their willingness to share their candid experiences, thoughts and opinions, particularly given the sensitivity of the topic.
The authors would like to extend a special thank you to Cassidy Titcomb, Catherine Fair, Gina Iliev, Ahnket Bangar, Caitlin Duncan, and the staff and board members from the planning and evaluation committee, as well as the full staff leadership team and board of directors from Community Action for their guidance throughout this project.
Wilder Research, a division of Amherst H. Wilder Foundation, is a nationally respected nonprofit research and evaluation group. For more than 100 years, Wilder Research has gathered and interpreted facts and trends to help families and communities thrive, get at the core of community concerns, and uncover issues that are overlooked or poorly understood.
451 Lexington Parkway North Saint Paul, Minnesota 55104 651-280-2700 | www.wilderresearch.org