Towner County Community Health Needs Assessment: Towner County Medical Center, Cando, N.D.
132
-
Upload
academyadmissions -
Category
Documents
-
view
0 -
download
0
Transcript of Towner County Community Health Needs Assessment: Towner County Medical Center, Cando, N.D.


_____________________________________________________________________________________________
_____________________________________________________________________________________________ Community Health Needs Assessment 2
Table of Contents
Introduction .....................................................................................................................................3
Towner County Medical Center ...................................................................................................4
Community, Health Care Facilities, and Other Resources .......................................................6
Assessment Methodology ..............................................................................................................7
Demographic Information .............................................................................................................11
Health Conditions, Behaviors, and Outcomes ............................................................................13
Survey Results .................................................................................................................................23
Findings of Key Informant Interviews .........................................................................................58
Priority of Health Needs ................................................................................................................61
Summary ..........................................................................................................................................62
Appendix A – Survey Instruments ...............................................................................................64
Appendix B – Community Group Members and Key Informants Participating in
Interviews .........................................................................................................................................84
Appendix C – County Health Rankings Model .........................................................................85
Appendix D – Definitions of Health Variables ...........................................................................86
Appendix E – Towner County Public Health District Community Profile ............................87
Appendix F – Lake Region District Health Unit Community Profile .....................................97
Appendix G – County Analysis by North Dakota Health Care Review, Inc. ........................124
Appendix H – Prioritization of Community’s Health Needs ...................................................132
_____________________________________________________________________________________________
_____________________________________________________________________________________________ Community Health Needs Assessment 3
Introduction
To help inform future decisions and strategic planning, Towner County Medical Center
(TCMC) in Cando, N.D., conducted a community health needs assessment. Through a
joint effort, Towner County Medical Center and the Center for Rural Health at the
University of North Dakota School of Medicine and Health Sciences analyzed
community health-related data and solicited input from community members and
health care professionals. The Center for Rural Health’s involvement was funded
through its Medicare Rural Hospital Flexibility (Flex) Program. The Flex Program is
federally funded by the Office of Rural Health Policy and as such associated costs of the
assessment were covered by a federal grant.
To gather feedback from the community, residents of the health care service area and
local health care professionals were given the chance to participate in a survey.
Additional information was collected through a Community Group comprised of
community members as well as through key informant interviews with community
leaders.
The purpose of conducting a community health needs assessment is to describe the
health of local people, identify use of local health care services, identify and prioritize
community needs, and help health care leaders begin to identify action needed to
address the future delivery of health care in the defined area. A health needs assessment
benefits the community by: 1) collecting timely input from the local community,
providers, and staff; 2) providing an analysis of secondary data related to health
conditions, risks, and outcomes; 3) compiling and organizing information to guide
decision making, education, and marketing efforts, and to facilitate the development of a
strategic plan; 4) engaging community members about the future of health care delivery;
and 5) allowing the community hospital to meet federal regulatory requirements of the
Affordable Care Act, which requires not-for-profit hospitals to complete a community
health needs assessment at least every three years.

_____________________________________________________________________________________________
_____________________________________________________________________________________________ Community Health Needs Assessment 4
Towner County Medical Center
Towner County Medical Center is 20-bed, critical access hospital located in Cando,
North Dakota. As a hospital and accredited level V trauma center, TCMC provides
comprehensive care for a wide range of medical and emergency situations. TCMC offers
many services, including inpatient and outpatient hospital care, long-term care, clinical
services, a partial hospital/medically monitored outpatient treatment facility, retirement
housing, and child care. With approximately 170 employees, TCMC is one of the largest
employers in the region, and has an estimated economic impact on the community of
approximately $6.85 million.1
The original Towner County Memorial Hospital was a 26-bed hospital built in 1952 with
funds raised by the people of Towner County and the Order of the Sisters of St. Francis.
The hospital nearly doubled in size in 1968 with an addition that included new patient
rooms, an ambulance garage, an emergency room, a new laboratory, and a radiology
room. In 1992, the ownership and direction of the hospital changed based on a
community initiative, and physical changes to the facility were made in 1995 to ensure
handicapped accessibility. Also added were a new medical clinic, dental clinic,
emergency room, a drive-through emergency garage, x-ray suite, physical therapy room,
nursing station, laboratory, medical records area, and birthing room.
Towner County Medical Center defines its mission as follows:
Towner County Medical Center (TCMC) provides: total quality comprehensive
healthcare; caring and compassionate health services for patients, residents,
families and healthcare workers; medical care for all life stages delivered by a
professional and expert healthcare team; and a commitment to our communities
to maintain and ensure the ongoing provision of quality health services.
1 Economic impact data were estimated using economic multipliers derived from MIG 2007
IMPLAN data.
_____________________________________________________________________________________________
_____________________________________________________________________________________________ Community Health Needs Assessment 5
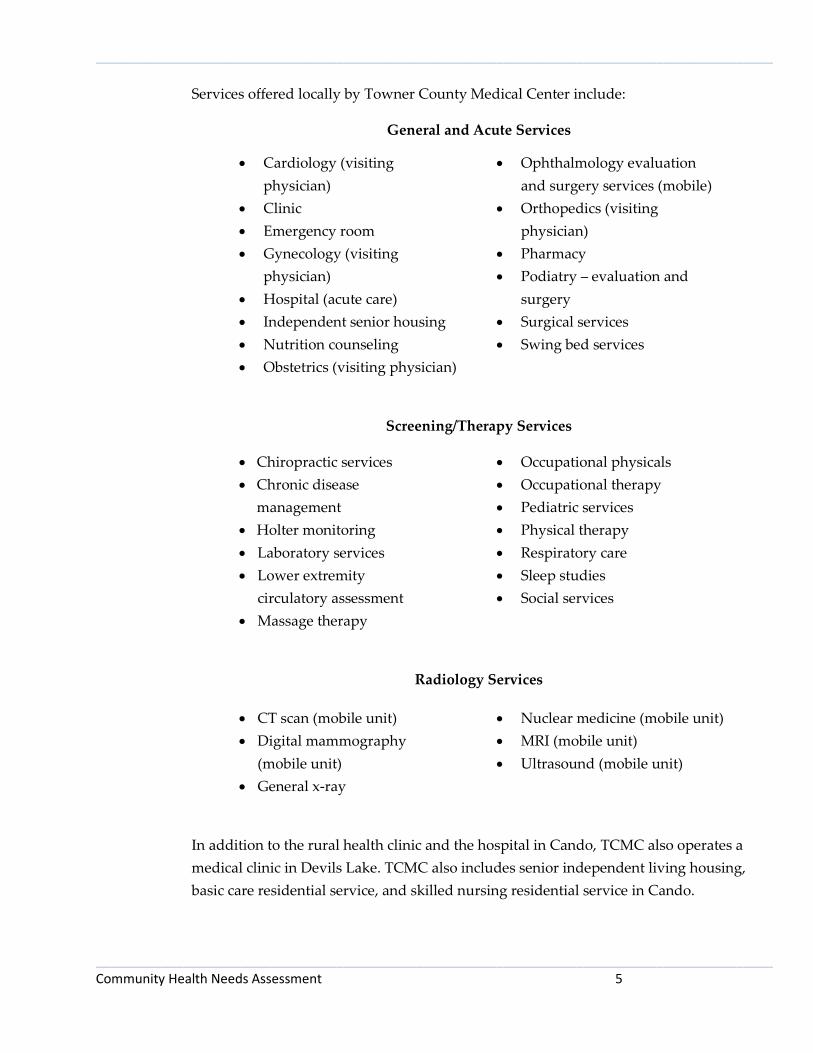
Services offered locally by Towner County Medical Center include:
General and Acute Services
Cardiology (visiting
physician)
Clinic
Emergency room
Gynecology (visiting
physician)
Hospital (acute care)
Independent senior housing
Nutrition counseling
Obstetrics (visiting physician)
Ophthalmology evaluation
and surgery services (mobile)
Orthopedics (visiting
physician)
Pharmacy
Podiatry – evaluation and
surgery
Surgical services
Swing bed services
Screening/Therapy Services
Chiropractic services
Chronic disease
management
Holter monitoring
Laboratory services
Lower extremity
circulatory assessment
Massage therapy
Occupational physicals
Occupational therapy
Pediatric services
Physical therapy
Respiratory care
Sleep studies
Social services
Radiology Services
CT scan (mobile unit)
Digital mammography
(mobile unit)
General x-ray
Nuclear medicine (mobile unit)
MRI (mobile unit)
Ultrasound (mobile unit)
In addition to the rural health clinic and the hospital in Cando, TCMC also operates a
medical clinic in Devils Lake. TCMC also includes senior independent living housing,
basic care residential service, and skilled nursing residential service in Cando.

_____________________________________________________________________________________________
_____________________________________________________________________________________________ Community Health Needs Assessment 6
Community, Health Care Facilities, and Other Resources
Cando, located in northeastern North Dakota, is the county seat of the largest durum
wheat-producing county in the world. Access to major cities is within a reasonable
driving distance of Cando. Winnipeg, Manitoba, is less than three hours away, while
access to major shopping and medical facilities in North Dakota is within 40 miles. The
Cando public school system prepares students for vocational and post-secondary
training. Adult education courses also are offered.
Numerous recreational activities are available for residents of Cando with its city parks,
participatory and observational sports, athletic fields, a swimming pool and a nine-hole
golf course. Its city parks include facilities for tennis, baseball, volleyball, basketball, and
horseshoes. The Cando All Seasons Arena offers skating and hockey. Some of the state’s
best fishing may be found within 40 miles, and the area is abundant with waterfowl,
geese, and deer.
Health care facilities and services in the area (Benson, Ramsey, and Towner counties)
include the following:
Basic care facilities
Cando – 10-bed basic care facility
Devils Lake – 43-bed, 13-bed, and seven-bed basic care facilities
Edmore – 20-bed basic care facility
Maddock – 25-bed basic care facility
Nursing homes
Cando – 40-bed nursing home
Devils Lake – 52-bed and 74-bed nursing homes
Rural health clinics
Cando
Maddock
Pharmacies
Cando – one retail pharmacy in addition to the TCMC pharmacy

_____________________________________________________________________________________________
_____________________________________________________________________________________________ Community Health Needs Assessment 7
Devils Lake – three retail pharmacies in addition to the hospital and clinic pharmacies
Maddock
Assessment Methodology
Towner County Medical Center serves an area in northeastern North Dakota. Because a
large portion of the medical center’s patients come from the counties of Benson, Ramsey,
and Towner, this assessment focuses on data from those counties. In addition to Cando,
located in those counties are the North Dakota communities of Bisbee, Devils Lake,
Edmore, Esmond, Leeds, Maddock, Minnewaukan, Rocklake, and Starkweather.
Figure 1: Counties Included in Towner County Medical Center’s Service Area:
Benson, Ramsey, and Towner
The Center for Rural Health provided substantial support to Towner County Medical
Center in conducting this needs assessment. Center for Rural Health representatives
collected data for the assessment in a variety of ways: (1) a survey solicited feedback
from area residents; (2) another version of the survey gathered input from health care
professionals who work at Towner County Medical Center; (3) community leaders
representing the broad interests of the community took part in one-on-one key
informant interviews; (4) a Community Group comprised of community members and
_____________________________________________________________________________________________
_____________________________________________________________________________________________ Community Health Needs Assessment 8
health care professionals was convened to prioritize area health needs; and (5) a wide
range of secondary sources of data was examined, providing information on a multitude
of measures including demographics; health conditions, indicators, and outcomes; rates
of preventive measures; rates of disease; and at-risk activities.
The Center for Rural Health is one of the nation’s most experienced organizations
committed to providing leadership in rural health. Its mission is to connect resources
and knowledge to strengthen the health of people in rural communities. The Center
serves as a resource to health care providers, health organizations, citizens, researchers,
educators, and policymakers across the state of North Dakota and the nation. Activities
are targeted toward identifying and researching rural health issues, analyzing health
policy, strengthening local capabilities, developing community-based alternatives, and
promoting rural concerns.
As the federally designated State Office of Rural Health (SORH) for the state and the
home to the North Dakota Medicare Rural Hospital Flexibility (Flex) program, the
Center connects the School of Medicine and Health Sciences and the University of North
Dakota to rural communities and their health institutions to facilitate developing and
maintaining rural health delivery systems. In this capacity the Center works both at a
national level and at state and community levels.
Detailed below are the methods undertaken to gather data for this assessment by
convening a Community Group, conducting key informant interviews, soliciting
feedback about health needs via a survey, and researching secondary data.
Community Group
A Community Group consisting of 17 community members was convened and met on
June 17, 2013. During this Community Group meeting, group members learned about
the needs assessment process and reviewed basic demographic information about
Towner County. The group was then presented with survey results, findings from key
informant interviews, and a wide range of secondary data relating to the general health
of the population in the Towner County Medical Center service area. The group was
then tasked with identifying and prioritizing the community’s health needs. Members of
the Community Group are listed in Appendix B.
Interviews
One-on-one interviews with key informants were conducted by telephone on April 29,
2013 and May 1, 2013. A representative of the Center for Rural Health conducted the
_____________________________________________________________________________________________
_____________________________________________________________________________________________ Community Health Needs Assessment 9
interviews. Interviews were held with seven key informants who could provide insights
into the community’s health needs. Included among the informants was a public health
nurse with special knowledge in public health acquired through several years of direct
care experience in the community, including working with medically underserved, low
income, and minority populations, as well as with populations with chronic diseases.
Key informants represented the broad interests of the community, and included
representatives from agriculture, the business community, the faith community, law
enforcement, and social services. Those taking part in interviews are listed in Appendix
B.
Topics covered during the interviews included the general health needs of the
community, delivery of health care by local providers, awareness of health services
offered locally, barriers to using local services, perceptions about collaboration within
the community, local health care delivery concerns, broader community concerns,
reasons community members use local health care providers, and reasons community
members use other facilities for health care.
Survey
A survey was disseminated to gather feedback from the community. The survey was not
intended to be a scientific or statistically valid sampling of the population. Rather, it was
designed to be an additional tool for collecting qualitative data from the community at
large – specifically, information related to community-perceived health needs.
Two versions of a survey tool were distributed to two different audiences: (1)
community members and (2) health care professionals. Copies of both survey
instruments are included in Appendix A.
Community Member Survey
The community member survey was available to all residents of the Cando area. The
survey tool was designed to:
Understand community awareness about services provided by the local health
system and whether consumers are using local services;
Understand the community’s need for services and concerns about the delivery
of health care in the community;
Learn about broad areas of community and health concerns;
Learn of residents’ perceptions about community assets;

_____________________________________________________________________________________________
_____________________________________________________________________________________________ Community Health Needs Assessment 10
Determine preferences for using local health care versus traveling to other
facilities; and
Solicit suggestions and help identify any gaps in services.
Specifically, the survey covered the following topics: community assets, community
concerns, awareness and utilization of local health services, barriers to using local
services, perceptions about collaboration within the community, local health care
delivery concerns, reasons consumers use Towner County Medical Center and reasons
they seek care elsewhere, travel time to the nearest clinic and to TCMC, awareness and
support of TCMC’s foundation, support for exploring the possibility of TCMC merging
with a larger health system, demographics (gender, age, marital status, employment
status, income, and insurance status), and respondents’ current health conditions or
diseases.
The survey was available for completion online by all residents in the TCMC service
area. The survey was publicized by the hospital and in the local newspaper. Those
taking the survey remained anonymous, as the survey did not collect any identifying
information. The survey period ran for more than a month, beginning on April 29, 2013.
Fifty-five community member surveys were completed online.
Health Care Professional Survey
Employees of Towner County Medical Center were encouraged to complete a version of
the survey geared to health care professionals. Like the community member version, this
health care professional version of the survey was administered online only, and 30
surveys were completed. The version of the survey for health care professionals covered
the same topics as the consumer survey, although it sought less demographic
information and did not ask whether health care professionals were aware of the
services offered locally. Including both versions of the survey, 85 residents in the area
took part in the survey process.
Secondary Research
Secondary data were collected and analyzed to provide a snapshot of the area’s overall
health conditions, behaviors, and outcomes. Information was collected from a variety of
sources including the U.S. Census Bureau; the North Dakota Department of Health; the
Robert Wood Johnson Foundation’s County Health Rankings (which pulls data from 16
primary data sources); North Dakota Health Care Review, Inc. (NDHCRI); the National
Survey of Children’s Health Data Resource Center; the Centers for Disease Control and
_____________________________________________________________________________________________
_____________________________________________________________________________________________ Community Health Needs Assessment 11
Prevention; the North Dakota Behavioral Risk Factor Surveillance System; and the
National Center for Health Statistics.
Demographic Information
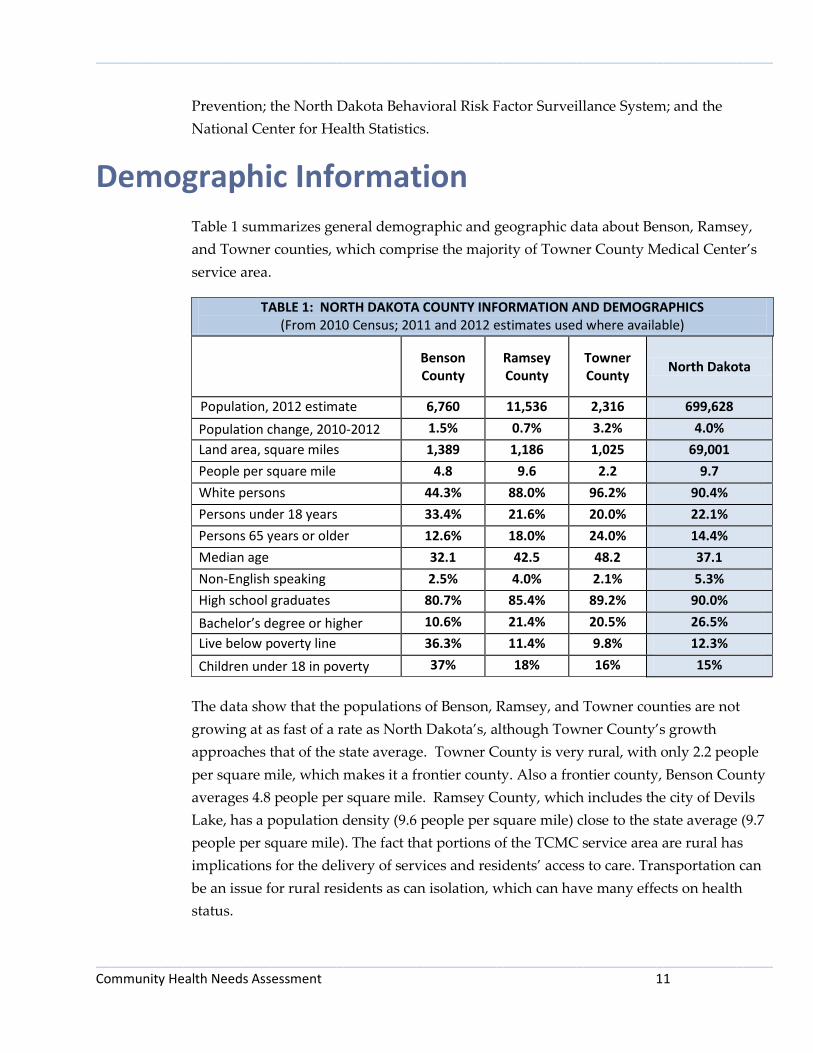
Table 1 summarizes general demographic and geographic data about Benson, Ramsey,
and Towner counties, which comprise the majority of Towner County Medical Center’s
service area.
TABLE 1: NORTH DAKOTA COUNTY INFORMATION AND DEMOGRAPHICS (From 2010 Census; 2011 and 2012 estimates used where available)
Benson County
Ramsey County
Towner County
North Dakota
Population, 2012 estimate 6,760 11,536 2,316 699,628
Population change, 2010-2012 1.5% 0.7% 3.2% 4.0%
Land area, square miles 1,389 1,186 1,025 69,001
People per square mile 4.8 9.6 2.2 9.7
White persons 44.3% 88.0% 96.2% 90.4%
Persons under 18 years 33.4% 21.6% 20.0% 22.1%
Persons 65 years or older 12.6% 18.0% 24.0% 14.4%
Median age 32.1 42.5 48.2 37.1
Non-English speaking 2.5% 4.0% 2.1% 5.3%
High school graduates 80.7% 85.4% 89.2% 90.0%
Bachelor’s degree or higher 10.6% 21.4% 20.5% 26.5%
Live below poverty line 36.3% 11.4% 9.8% 12.3%
Children under 18 in poverty 37% 18% 16% 15%
The data show that the populations of Benson, Ramsey, and Towner counties are not
growing at as fast of a rate as North Dakota’s, although Towner County’s growth
approaches that of the state average. Towner County is very rural, with only 2.2 people
per square mile, which makes it a frontier county. Also a frontier county, Benson County
averages 4.8 people per square mile. Ramsey County, which includes the city of Devils
Lake, has a population density (9.6 people per square mile) close to the state average (9.7
people per square mile). The fact that portions of the TCMC service area are rural has
implications for the delivery of services and residents’ access to care. Transportation can
be an issue for rural residents as can isolation, which can have many effects on health
status.

_____________________________________________________________________________________________
_____________________________________________________________________________________________ Community Health Needs Assessment 12
The data indicate that both Ramsey and Towner counties have a higher percentage of
individuals aged 65 or older than the North Dakota average, with nearly one in four
residents in Towner County, and nearly one in five residents in Ramsey County, aged 65
and older. Additionally, Ramsey and Towner counties both report a median age that is
higher than the state median, with Towner County’s median age more than 10 years
older than the state median. This may indicate a need for greater health care services to
attend to the aging population. Benson County, on the other hand, has a lower
percentage of people aged 65 or older than the state average, as well as a median age
that is five years younger than the state median.
In terms of poverty, Ramsey and Towner counties have poverty rates that are lower than
the North Dakota average rate, with Towner County’s rate being 2.5% lower than the
state average. Benson County had a substantially higher poverty rate than the state
average – nearly three times the state average. Children under 18 were more likely to be
in poverty in all three counties as compared to the rest of North Dakota, with Benson
County having a rate of children in poverty that was two and one-half times the state
average (37% vs. 15%).
The area tended to have a less educated workforce than the rest of North Dakota. The
educational backgrounds of area residents can affect a health care facility’s ability to find
qualified staff members. Towner County, home to the TCMC hospital, had a rate of
residents with a bachelor’s degree or higher that was six percentage points lower than
the state average (20.5% vs. 26.5%), while Ramsey County’s rate was five percentage
points lower and Benson County’s rate was 15 percentage points lower.
_____________________________________________________________________________________________
_____________________________________________________________________________________________ Community Health Needs Assessment 13
Health Conditions, Behaviors, and Outcomes As noted above, several sources were reviewed to inform this assessment. This data is
presented below in four categories: (1) County Health Rankings, (2) public health
community profiles, (3) preventive care data, and (4) children’s health. One other source
of information, the Gallup-Healthways Well-Being Index, shows that North Dakota
ranked 19th nationally in well-being during 2012. The index is an average of six sub-
indexes, which individually examine life evaluation, emotional health, work
environment, physical health, healthy behaviors, and access to basic necessities.
County Health Rankings
The Robert Wood Johnson Foundation, in collaboration with the University of
Wisconsin Population Health Institute, has developed the County Health Rankings to
illustrate community health needs and provide guidance for actions toward improved
health. In this report, counties are compared to national benchmark data and state rates
in various topics ranging from individual health behaviors to the quality of health care.
The data used in the 2013 County Health Rankings are pulled from 16 primary data
sources and then are compiled to create county rankings. Counties in each of the 50
states are ranked according to summaries of a variety of health measures. Those having
high ranks, such as 1 or 2, are considered to be the “healthiest.” Counties are ranked on
both health outcomes and health factors. Below is a breakdown of the variables that
influence a county’s rank. A model of the 2013 County Health Rankings – a flow chart of
how a county’s rank is determined – may be found in Appendix C. For further
information, visit the County Health Rankings website at
http://www.countyhealthrankings.org.
_____________________________________________________________________________________________
_____________________________________________________________________________________________ Community Health Needs Assessment 14
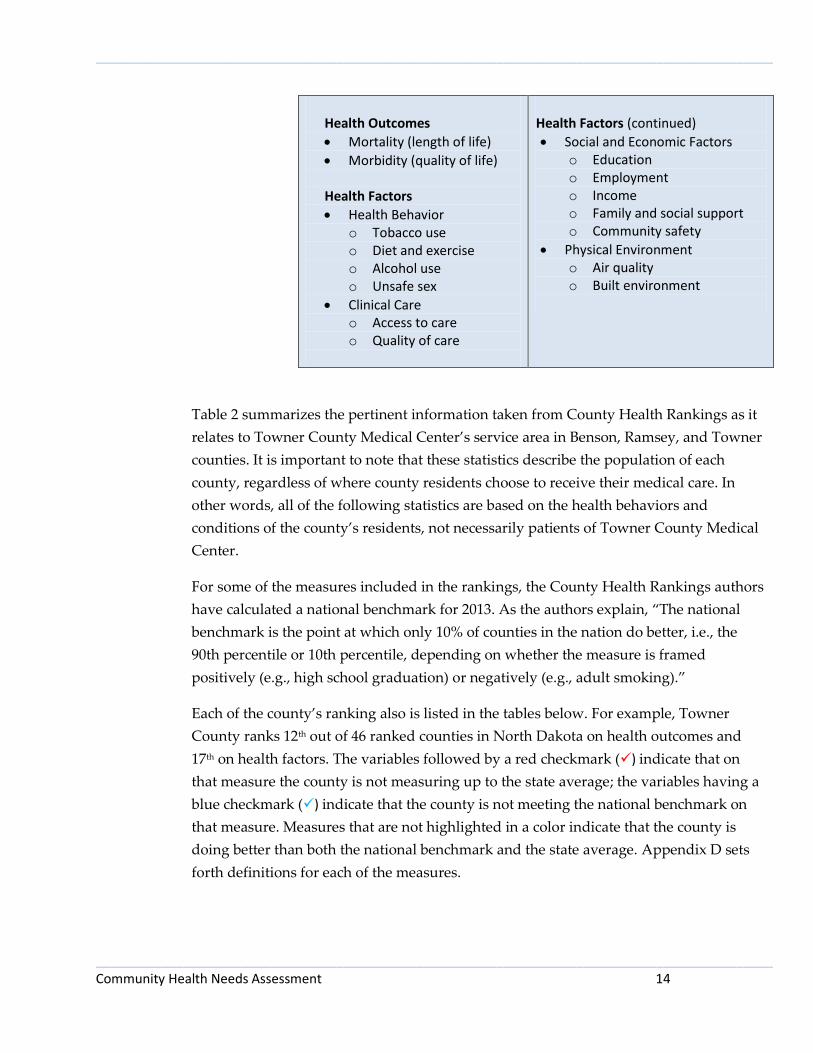
Health Outcomes
Mortality (length of life)
Morbidity (quality of life)
Health Factors
Health Behavior o Tobacco use o Diet and exercise o Alcohol use o Unsafe sex
Clinical Care o Access to care o Quality of care
Health Factors (continued)
Social and Economic Factors o Education o Employment o Income o Family and social support o Community safety
Physical Environment o Air quality o Built environment
Table 2 summarizes the pertinent information taken from County Health Rankings as it
relates to Towner County Medical Center’s service area in Benson, Ramsey, and Towner
counties. It is important to note that these statistics describe the population of each
county, regardless of where county residents choose to receive their medical care. In
other words, all of the following statistics are based on the health behaviors and
conditions of the county’s residents, not necessarily patients of Towner County Medical
Center.
For some of the measures included in the rankings, the County Health Rankings authors
have calculated a national benchmark for 2013. As the authors explain, “The national
benchmark is the point at which only 10% of counties in the nation do better, i.e., the
90th percentile or 10th percentile, depending on whether the measure is framed
positively (e.g., high school graduation) or negatively (e.g., adult smoking).”
Each of the county’s ranking also is listed in the tables below. For example, Towner
County ranks 12th out of 46 ranked counties in North Dakota on health outcomes and
17th on health factors. The variables followed by a red checkmark () indicate that on
that measure the county is not measuring up to the state average; the variables having a
blue checkmark () indicate that the county is not meeting the national benchmark on
that measure. Measures that are not highlighted in a color indicate that the county is
doing better than both the national benchmark and the state average. Appendix D sets
forth definitions for each of the measures.

_____________________________________________________________________________________________
_____________________________________________________________________________________________ Community Health Needs Assessment 15
TABLE 2: SELECTED MEASURES FROM COUNTY HEALTH RANKINGS – NORTH DAKOTA COUNTIES
Benson County
Ramsey County
Towner County
National
Benchmark
North Dakota
Ranking: Outcomes 45th 41st 12th (of 46)
Premature death 20,202 8,425 - 5,317 6,244
Poor or fair health 20% 12% 10% 10% 12% Poor physical health days (in past 30 days)
3.1 2.9 1.8 2.6 2.7
Poor mental health days (in past 30 days)
3.0 2.8 1.6 2.3 2.4
% Diabetic 11% 8% 10% - 8%
Ranking: Factors 45th 37th 17th (of 46) Health Behaviors
Adult smoking 34% 26% 13% 13% 19% Adult obesity 33% 32% 30% 25% 30%
Physical inactivity 34% 26% 27% 21% 26%
Excessive drinking 22% 29% 14% 7% 22%
Motor vehicle crash death rate
64 15 - 10 17
Sexually transmitted infections
1,457 376 223 92 357
Teen birth rate 93 45 - 21 28 Clinical Care
Uninsured 18% 12% 17% 11% 11%
Primary care physician ratio - 765:1 - 1,067:1 1,297:1
Mental health provider ratio - 2,294:1 - - 2,546:1 Preventable hospital stays 95 63 47 47 59 Diabetic screening 89% 89% 78% 90% 86%
Mammography screening 71% 76% 81% 73% 71% Physical Environment
Limited access to healthy foods
22% 6% 31% 1% 9%
Access to recreational facilities
15 17 0 16 12
Fast food restaurants - 48% 25% 27% 44%
Health Outcomes
With respect to health outcomes, Towner County generally was fairing favorably when
compared to the rest of North Dakota (except in terms of diabetes), while Benson and
Ramsey counties generally were fairing poorer than state averages. Both Benson and
Towner counties reported higher rates of diabetes than the state average, while Ramsey
_____________________________________________________________________________________________
_____________________________________________________________________________________________ Community Health Needs Assessment 16
County’s rate matched the state average. Benson County had a rate of premature death
that was more than three times the state average, and one in five adults in the county
reported being in poor or only fair health.
In terms of self-reported days per month of poor physical or mental health, Benson and
Ramsey counties showed elevated rates. Residents in these counties reported on average
more days each of month of poor physical and poor mental health than the state
averages. Towner County, on the other hand, showed rates of self-reported poor
physical or mental health days that beat the national benchmarks, placing it in the top
10% of counties nationally on these measures.
Health Factors In examining health factors, which include health behaviors, clinical care measures, and
the physical environment, several patterns emerge in the region served by TCMC. All
three counties were performing worse than the state averages in terms of rates of
physical inactivity of the counties’ residents and the number of uninsured residents.
Benson and Ramsey counties tended overall to perform more poorly on measures of
health behaviors than Towner County. Below is a more detailed examination of the
health factor measures for each of the counties.
Towner County
With respect to health factors, Towner County was not measuring up to the state
averages in several categories. Towner County showed results that were worse than the
state average (as well as the national benchmark) on the following measures:
Physical inactivity
Level of uninsured residents
Diabetic screening
Limited access to healthy foods
Access to recreational facilities
Of these measures, the gap between the county rate and the state average was the most
pronounced in terms of uninsured residents, limited access to healthy foods, and access
to recreational facilities. The number of uninsured residents in Towner County was
approximately 50% higher than the state average. In examining the physical
environment of those living in Towner County, County Health Rankings makes clear

_____________________________________________________________________________________________
_____________________________________________________________________________________________ Community Health Needs Assessment 17
that options for healthy food and wellness and fitness activities are limited. As explained
below, this latter concern was echoed in the survey results, with health care
professionals ranking as the number one broad community concern the lack of sufficient
facilities for exercise and well-being.
Additionally, Towner County was not meeting the national benchmarks on the
following measures:
Adult obesity
Excessive drinking
Sexually transmitted infections
The rate of excessive drinking (a measure that includes both binge drinking and heavy
drinking) in Towner County was twice the national benchmark, while the level of
sexually transmitted infections was more than twice the national benchmark. On the
positive side, the county was meeting the national benchmark – meaning it was
performing in the top 10% of counties nationally – in terms of adult smoking,
preventable hospital stays, mammography screening, and the prevalence of fast food
restaurants.
Benson County
Of the three counties, Benson County was performing worse than the state averages on
the most measures of health factors, often by a substantial amount. The county was
performing worse than the state average on:
Adult smoking
Adult obesity
Physical inactivity
Motor vehicle crash death rate
Sexually transmitted infections
Teen birth rate
Uninsured residents
Preventable hospital stays
Limited access to healthy foods
The most alarming gaps between the county rate and the state averages were in the
category of health behaviors. Benson County had a smoking rate 15 percentage points
higher than the state rate, a physical inactivity rate eight points higher than the state
average, a motor vehicle crash death rate more than three times the state average, a level

_____________________________________________________________________________________________
_____________________________________________________________________________________________ Community Health Needs Assessment 18
of sexually transmitted infections four times the state rate, and a teen birth rate more
than three times the North Dakota average. On a positive note, the county was besting
the state averages on the measures of diabetic screening, mammography screening, and
access to recreational facilities.
Ramsey County
Of the three counties, Ramsey County had the worst rate of excessive drinking and fast
food restaurant prevalence. It had the best rate of physical inactivity, percentage of
uninsured residents, and access to recreational facilities. Factors on which the county
was doing worse than the state average were:
Adult smoking
Adult obesity
Excessive drinking
Sexually transmitted infections
Teen birth rate
Uninsured residents
Preventable hospital stays
Prevalence of fast food restaurants
The county was meeting the state average but not measuring up to national benchmarks
in terms of physical inactivity, motor vehicle crash death rate, diabetic screening, and
limited access to healthy foods. The county was meeting or besting the national
benchmarks (meaning it was performing in the top ten percent of counties nationally) on
the measures of primary care physician ratio, mammography screening, and access to
recreational facilities.
Public Health Community Health Profile
Included as Appendix E is the North Dakota Department of Health’s community health
profile for the Towner County Public Health District. Appendix F is the community
health profile for the Lake Region District Health Unit, which includes Benson and
Ramsey counties, among others. Data about leadings causes of death are from 2004 to
2008.
In Towner County, the leading cause of death for children aged 1 to 14 is suicides.
Unintentional injuries is the leading cause of death for those aged 25 to 44, while cancer
is the leading cause of death for those aged 45 to 74. Among the elderly, the leading
_____________________________________________________________________________________________
_____________________________________________________________________________________________ Community Health Needs Assessment 19
causes of death are heart-related and cancer for those in the 75 to 84 age bracket, and
heart-related for those aged 85 years and older. Other common causes of death include
cirrhosis, stroke, chronic obstructive pulmonary disease, diabetes, and hypertension. A
graph illustrating leading causes of death in various age groups in the public health unit
may be found in Appendix E.
In Benson County the leading causes of death for infants and children are anomalies for
those aged 0 to 4 and suicide for those aged 5 to 14. Unintentional injury is the most
common cause of death for those in the 15 to 34 age bracket, while cirrhosis the leading
cause of death of those aged 35 to 44. Heart disease tops the list of causes of death for
those aged 45 to 54 and those aged 85 and older. Cancer is the leading cause of death for
those aged 55 to 84. Other common causes of death include sudden infant death
syndrome, diabetes, stroke, chronic obstructive pulmonary disease,
pneumonia/influenza, and newborn respiratory distress. A graph illustrating leading
causes of death in various age groups in the county may be found in Appendix F.
In Ramsey County the leading cause of death for infants and children aged 0 to 4 is
prematurity. Suicide is the number one cause of death for those in the 15 to 34 age
bracket, while cancer claims the most lives in the 45 to 84 age group. Heart-related
deaths are most common for those aged 35 to 44 and those 85 years and older. Other
common causes of death include sudden infant death syndrome, unintentional injury,
cirrhosis, chronic obstructive pulmonary disease, and stroke. A graph illustrating
leading causes of death in various age groups in the county may be found in Appendix
F.
In assessing the region’s health needs, attention also should be paid to other information
provided in the public health profiles about quality of life issues and conditions such as
arthritis, asthma, cardiovascular disease, cholesterol, crime, drinking habits, fruit and
vegetable consumption, health insurance, health screening, high blood pressure, mental
health, obesity, physical activity, smoking, stroke, tooth loss, and vaccination.
Preventive Care Data
North Dakota Health Care Review, Inc., the state’s quality improvement organization,
reports rates related to preventive care. They are summarized Table 3 for Benson,

_____________________________________________________________________________________________
_____________________________________________________________________________________________ Community Health Needs Assessment 20
Ramsey, and Towner counties.2 For a comparison with other counties in the state, see the
respective maps for each variable found in Appendix G.
Those rates highlighted below in red signify that county is doing worse than the state
average on that measure.
TABLE 3: SELECTED PREVENTIVE MEASURES
Benson County
Ramsey County
Towner County
North Dakota
Colorectal cancer screening rates 45.1% 54.1% 53.2% 55.5%
Pneumococcal pneumonia vaccination rates
31.7% 52.7% 43.6% 51.3%
Influenza vaccination rates 41.4% 59.1% 57.7% 50.4%
Annual hemoglobin A1C screening rates for patients with diabetes
94.3% 95.7% 93.4% 92.2%
Annual lipid testing screening rates for patients with diabetes
86.3% 90.4% 75.4% 81.0%
Annual eye examination screening rates for patients with diabetes
62.1% 68.9% 77.0% 72.5%
PIM (potentially inappropriate medication) rates
10.0% 9.3% 11.9% 11.1%
DDI (drug-drug interaction) rates 7.6% 9.0% 12.2% 9.8%
The data indicate that the region comprising Towner County Medical Center’s service
area is generally fairing adequately as compared to the rest of North Dakota in terms of
certain indicators of preventive care. As the table above indicates, the area is doing
better than the state average on slightly more than half of the measures studied. All
three of the counties lagged the state average on colorectal cancer screening rates, and
two of the three counties were not measuring up to the state averages on pneumococcal
pneumonia vaccination rates and annual eye examination screening rates for diabetics.
Especially concerning was that Benson County was in the bottom quintile (bottom 20%)
of counties in the state on three of the measures: colorectal cancer screening rate,
2 The rates were measured using Medicare claims data from 2009 to 2010 for colorectal screenings, and
using all claims through 2010 for pneumococcal pneumonia vaccinations, A1C screenings, lipid test screenings, and eye exams. The influenza vaccination rates are based on Medicare claims data between March 2009 and March 2010 while the potentially inappropriate medication rates and the percent of drug-drug interactions are determined through analysis of Medicare part D data between January and June of 2010.

_____________________________________________________________________________________________
_____________________________________________________________________________________________ Community Health Needs Assessment 21
pneumococcal pneumonia vaccination rate, and annual eye examination screening rate
for diabetics.
Children’s Health The National Survey of Children’s Health touches on multiple intersecting aspects of
children’s lives. Data are not available at the county level; listed below is information
about children’s health in North Dakota. The full survey includes physical and mental
health status, access to quality health care, and information on the child’s family,
neighborhood, and social context. Data are from 2011-12. More information about the
survey may be found at: www.childhealthdata.org/learn/NSCH.
Key measures of the statewide data are summarized below. The rates highlighted in red
signify that the state is faring worse on that measure than the national average.
TABLE 4: SELECTED MEASURES REGARDING CHILDREN’S HEALTH (For children aged 0-17 unless noted otherwise)
Measure North Dakota National
Children currently insured 93.5% 94.5%
Children whose current insurance is not adequate to
meet child’s needs 23.8% 23.5%
Children who had preventive medical visit in past year 78.6% 84.4%
Children who had preventive dental visit in past year 74.6% 77.2%
Children aged 10-17 whose weight status is at or above
the 85th percentile for Body Mass Index 35.8% 31.3%
Children aged 6-17 who engage in daily physical activity 30.4% 28.0%
Children who live in households where someone smokes 29.8% 24.1%
Children aged 6-17 who missed 11 or more days of
school in the past year due to illness/injury 4.6% 6.2%
Young children (10 mos.-5 yrs.) receiving standardized
screening for developmental or behavioral problems 20.7% 30.8%
Children aged 2-17 who received needed mental health
treatment or counseling in last year 86.3% 61.0%
The data on children’s health and conditions reveals that while North Dakota is doing
better than the national averages on a few measures, it is not measuring up to the
national averages with respect to the percentages of children insured and children
_____________________________________________________________________________________________
_____________________________________________________________________________________________ Community Health Needs Assessment 22
whose insurance is adequate, preventive medical and dental visits, children at the 85th
percentile of Body Mass Index, children living in smokers’ households, and children
receiving standardized screening for developmental behavioral problems.
Importantly, more than 20% of the state’s children are not receiving an annual
preventive medical visit or a preventive dental visit. Lack of preventive care now affects
these children’s future health status. While the state is faring well compared to the rest
of the country in terms of children who received needed mental health care or
counseling, anecdotal evidence from the Center for Rural Health indicates that children
living in rural areas may be going without care due to the lack of mental health
providers in those areas.
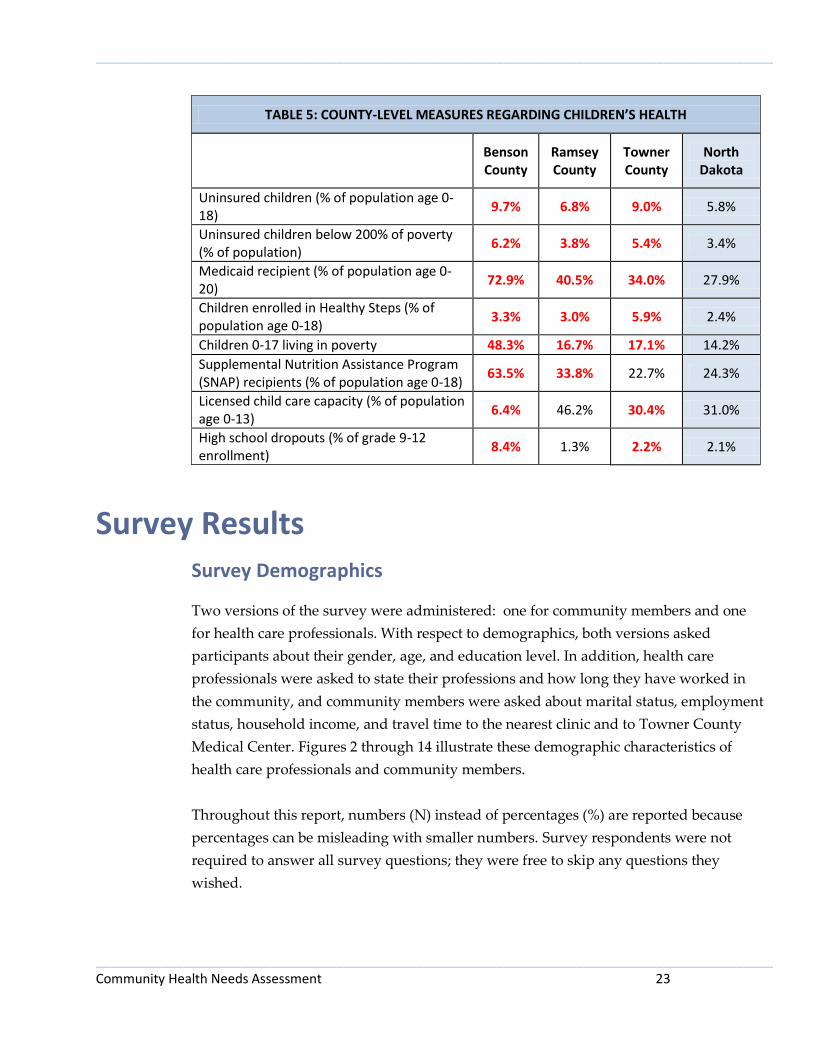
Table 5 includes selected county-level measures regarding children’s health in North
Dakota. The data come from North Dakota KIDS COUNT, a national and state-by-state
effort to track the status of children, sponsored by the Annie E. Casey Foundation. KIDS
COUNT data focus on main components of children’s well-being; more information
about KIDS COUNT is available at www.ndkidscount.org. The measures highlighted in
red in the table are those on which the county is doing worse than the state average.
Data are from 2011.
As is apparent from the summary table, the TCMC service area is lagging behind state
averages on the examined measures relating to child well-being. Of the eight measures
examined for this assessment, all three counties were performing worse than the state
average on five of the measures, and two of the three counties were faring worse than
the state average on the remaining three measures. These measures show that there are
high percentages of children who are in poverty, are uninsured, and who rely on
governmental assistance. In Benson County, almost half of children aged 0-17 live in
poverty, compared to a state average of 14.2%. Almost three-quarters of the county’s
children are Medicaid recipients and more than 60% are beneficiaries of the
Supplemental Nutrition Assistance Program (SNAP). The rates of children in poverty in
Ramsey and Towner counties also exceed the state average, but not nearly to the degree
as in Benson County.
_____________________________________________________________________________________________
_____________________________________________________________________________________________ Community Health Needs Assessment 23
TABLE 5: COUNTY-LEVEL MEASURES REGARDING CHILDREN’S HEALTH
Benson County
Ramsey County
Towner County
North Dakota
Uninsured children (% of population age 0-18)
9.7% 6.8% 9.0% 5.8%
Uninsured children below 200% of poverty (% of population)
6.2% 3.8% 5.4% 3.4%
Medicaid recipient (% of population age 0-20)
72.9% 40.5% 34.0% 27.9%
Children enrolled in Healthy Steps (% of population age 0-18)
3.3% 3.0% 5.9% 2.4%
Children 0-17 living in poverty 48.3% 16.7% 17.1% 14.2%
Supplemental Nutrition Assistance Program (SNAP) recipients (% of population age 0-18)
63.5% 33.8% 22.7% 24.3%
Licensed child care capacity (% of population age 0-13)
6.4% 46.2% 30.4% 31.0%
High school dropouts (% of grade 9-12 enrollment)
8.4% 1.3% 2.2% 2.1%
Survey Results Survey Demographics
Two versions of the survey were administered: one for community members and one
for health care professionals. With respect to demographics, both versions asked
participants about their gender, age, and education level. In addition, health care
professionals were asked to state their professions and how long they have worked in
the community, and community members were asked about marital status, employment
status, household income, and travel time to the nearest clinic and to Towner County
Medical Center. Figures 2 through 14 illustrate these demographic characteristics of
health care professionals and community members.
Throughout this report, numbers (N) instead of percentages (%) are reported because
percentages can be misleading with smaller numbers. Survey respondents were not
required to answer all survey questions; they were free to skip any questions they
wished.
_____________________________________________________________________________________________
_____________________________________________________________________________________________ Community Health Needs Assessment 24
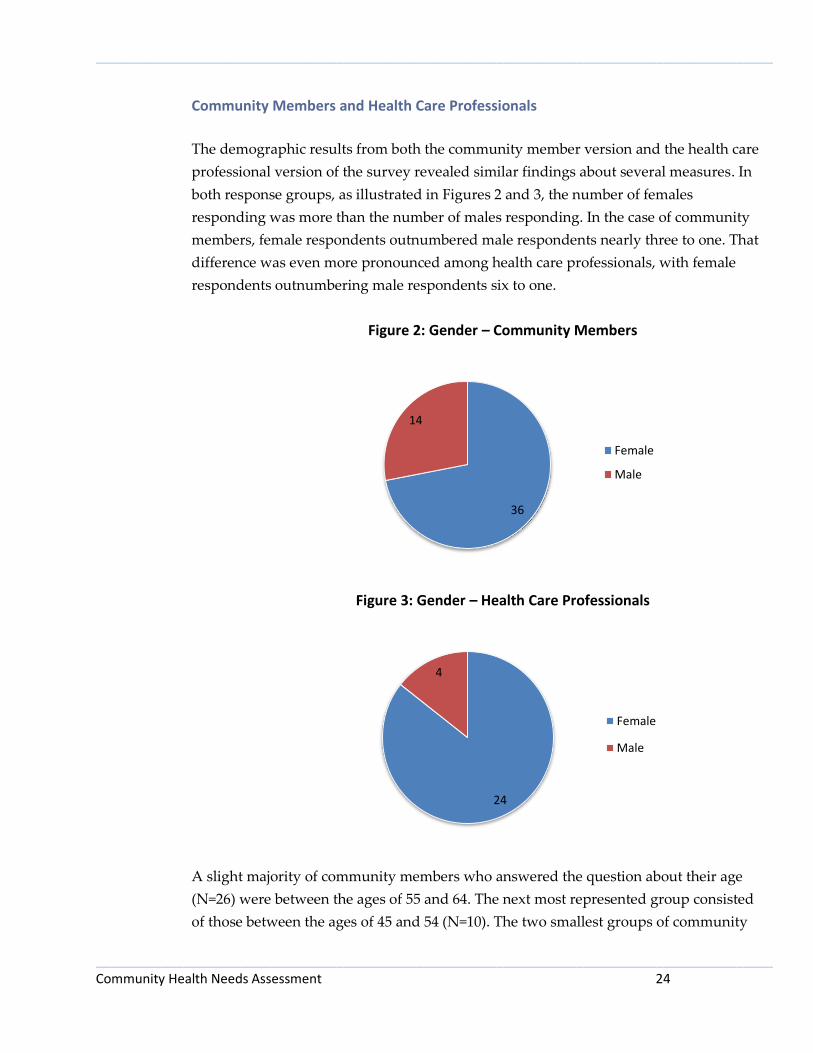
Community Members and Health Care Professionals
The demographic results from both the community member version and the health care
professional version of the survey revealed similar findings about several measures. In
both response groups, as illustrated in Figures 2 and 3, the number of females
responding was more than the number of males responding. In the case of community
members, female respondents outnumbered male respondents nearly three to one. That
difference was even more pronounced among health care professionals, with female
respondents outnumbering male respondents six to one.
Figure 2: Gender – Community Members
Figure 3: Gender – Health Care Professionals
A slight majority of community members who answered the question about their age
(N=26) were between the ages of 55 and 64. The next most represented group consisted
of those between the ages of 45 and 54 (N=10). The two smallest groups of community
36
14
Female
Male
24
4
Female
Male

_____________________________________________________________________________________________
_____________________________________________________________________________________________ Community Health Needs Assessment 25
members responding were the oldest and youngest sets, with no responses from those
75 years and older or those less than 25 years old. With respect to health care
professionals, the largest age group consisted of those aged 45 to 54 (N=10), followed by
those aged 25 to 34 (N=6). Figures 4 and 5 illustrate respondents’ ages.
Figure 4: Age – Community Members
Figure 5: Age – Health Care Professionals
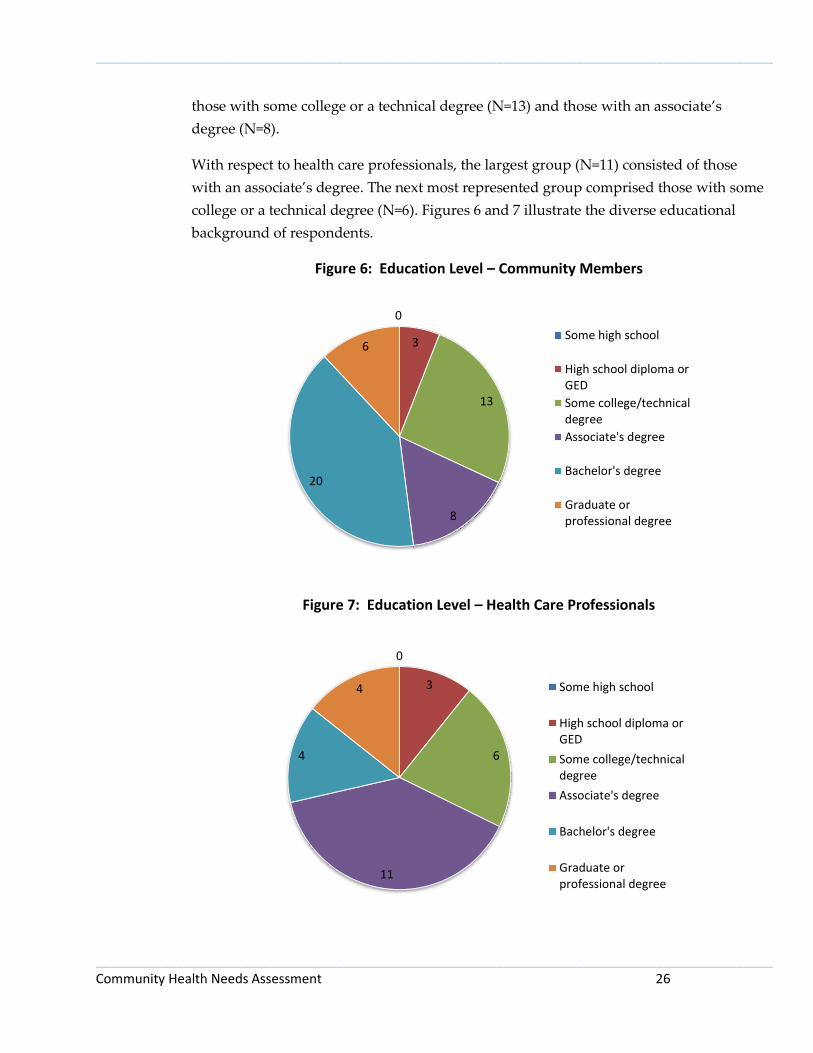
Community members represented a wide range of educational backgrounds, with the
largest group (N=20) having a bachelor’s degree. The next largest groups consisted of
0
7
3
10
26
4
0
Less than 25 years
25 to 34 years
35 to 44 years
45 to 54 years
55 to 64 years
65 to 74 years
75 years and older
3
6
3 10
5
1
0
Less than 25 years
25 to 34 years
35 to 44 years
45 to 54 years
55 to 64 years
65 to 74 years
75 years and older
_____________________________________________________________________________________________
_____________________________________________________________________________________________ Community Health Needs Assessment 26
those with some college or a technical degree (N=13) and those with an associate’s
degree (N=8).
With respect to health care professionals, the largest group (N=11) consisted of those
with an associate’s degree. The next most represented group comprised those with some
college or a technical degree (N=6). Figures 6 and 7 illustrate the diverse educational
background of respondents.
Figure 6: Education Level – Community Members
Figure 7: Education Level – Health Care Professionals
0
3
13
8
20
6 Some high school
High school diploma orGED
Some college/technicaldegree
Associate's degree
Bachelor's degree
Graduate orprofessional degree
0
3
6
11
4
4 Some high school
High school diploma orGED
Some college/technicaldegree
Associate's degree
Bachelor's degree
Graduate orprofessional degree
_____________________________________________________________________________________________
_____________________________________________________________________________________________ Community Health Needs Assessment 27
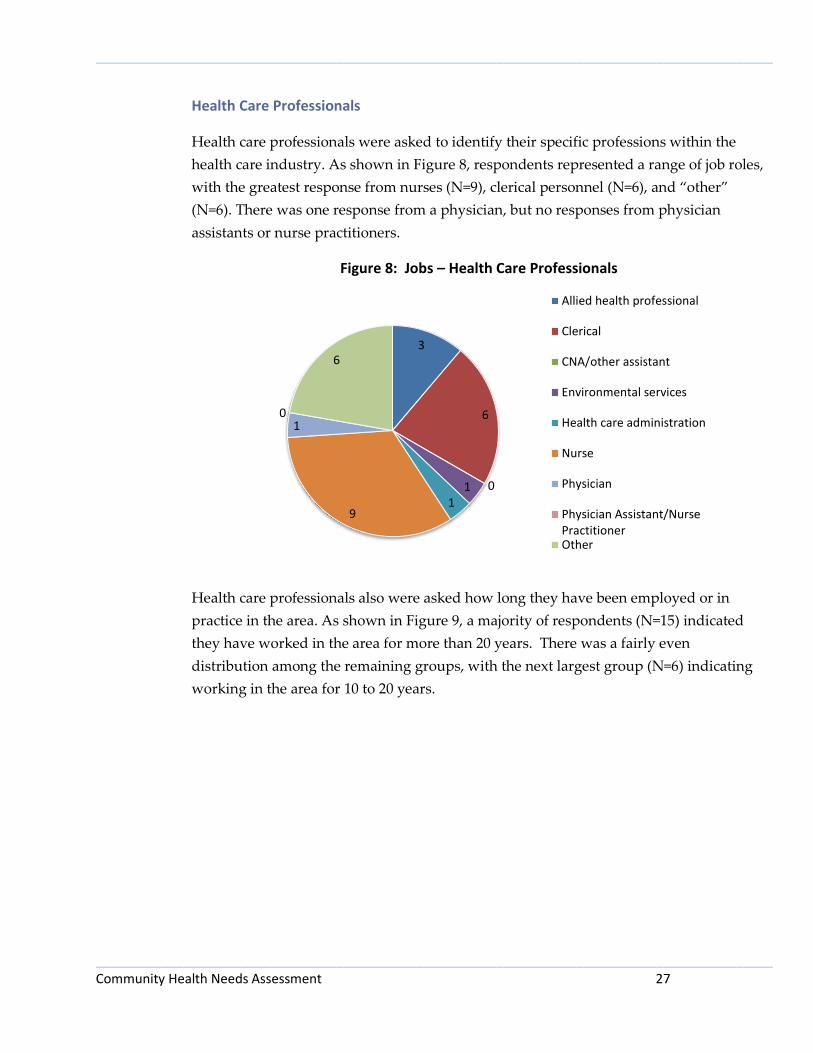
Health Care Professionals
Health care professionals were asked to identify their specific professions within the
health care industry. As shown in Figure 8, respondents represented a range of job roles,
with the greatest response from nurses (N=9), clerical personnel (N=6), and “other”
(N=6). There was one response from a physician, but no responses from physician
assistants or nurse practitioners.
Figure 8: Jobs – Health Care Professionals
Health care professionals also were asked how long they have been employed or in
practice in the area. As shown in Figure 9, a majority of respondents (N=15) indicated
they have worked in the area for more than 20 years. There was a fairly even
distribution among the remaining groups, with the next largest group (N=6) indicating
working in the area for 10 to 20 years.
3
6
0 1 1
9
1 0
6
Allied health professional
Clerical
CNA/other assistant
Environmental services
Health care administration
Nurse
Physician
Physician Assistant/NursePractitionerOther

_____________________________________________________________________________________________
_____________________________________________________________________________________________ Community Health Needs Assessment 28
Figure 9: Length of Employment or Practice in Area – Health Care Professionals
Community Members
Community members were asked additional demographic information not asked of
health care professionals. This additional information included marital status,
employment status, household income, and their proximity to the nearest clinic and to
Towner County Medical Center.
A large majority of community members (N=46) identified themselves as married, as
exhibited in Figure 10.
Figure 10: Marital Status – Community Members
4
3
6
15
Less than 3 years
3 to 9 years
10 to 20 years
More than 20 years
0
46
2 1
Divorced/separated
Married
Single/never married
Widowed
_____________________________________________________________________________________________
_____________________________________________________________________________________________ Community Health Needs Assessment 29
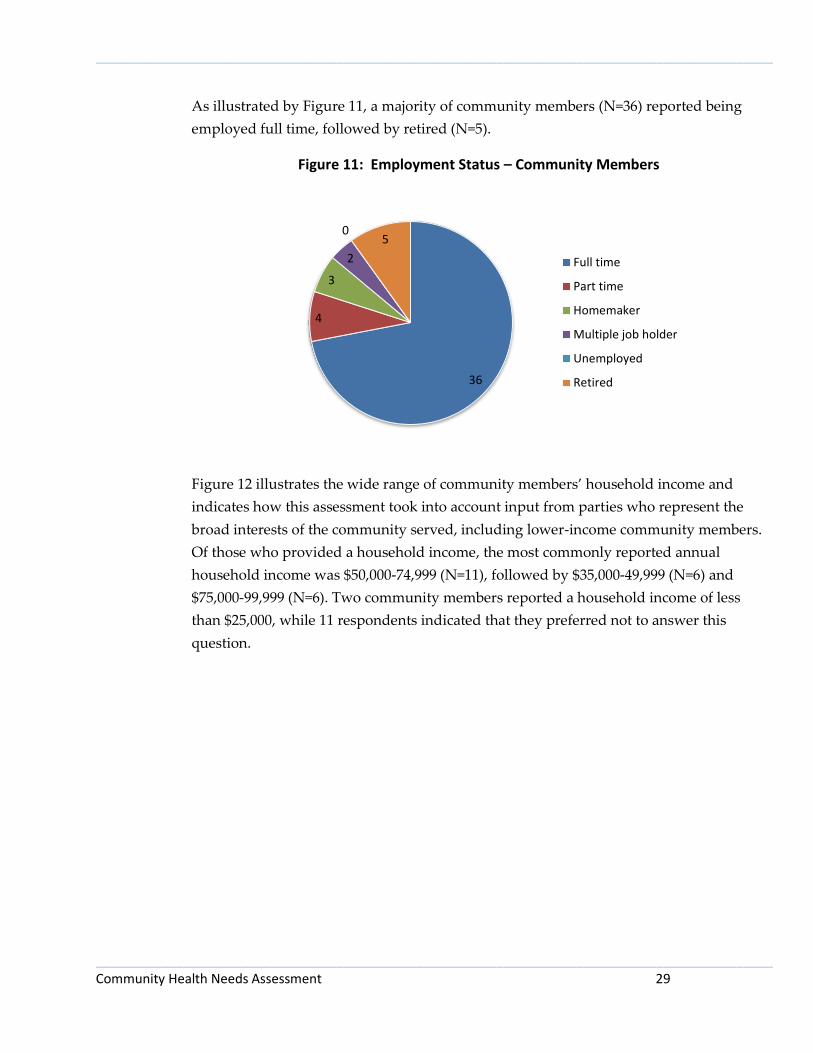
As illustrated by Figure 11, a majority of community members (N=36) reported being
employed full time, followed by retired (N=5).
Figure 11: Employment Status – Community Members
Figure 12 illustrates the wide range of community members’ household income and
indicates how this assessment took into account input from parties who represent the
broad interests of the community served, including lower-income community members.
Of those who provided a household income, the most commonly reported annual
household income was $50,000-74,999 (N=11), followed by $35,000-49,999 (N=6) and
$75,000-99,999 (N=6). Two community members reported a household income of less
than $25,000, while 11 respondents indicated that they preferred not to answer this
question.
36
4
3
2
0 5
Full time
Part time
Homemaker
Multiple job holder
Unemployed
Retired

_____________________________________________________________________________________________
_____________________________________________________________________________________________ Community Health Needs Assessment 30
Figure 12: Annual Household Income – Community Members
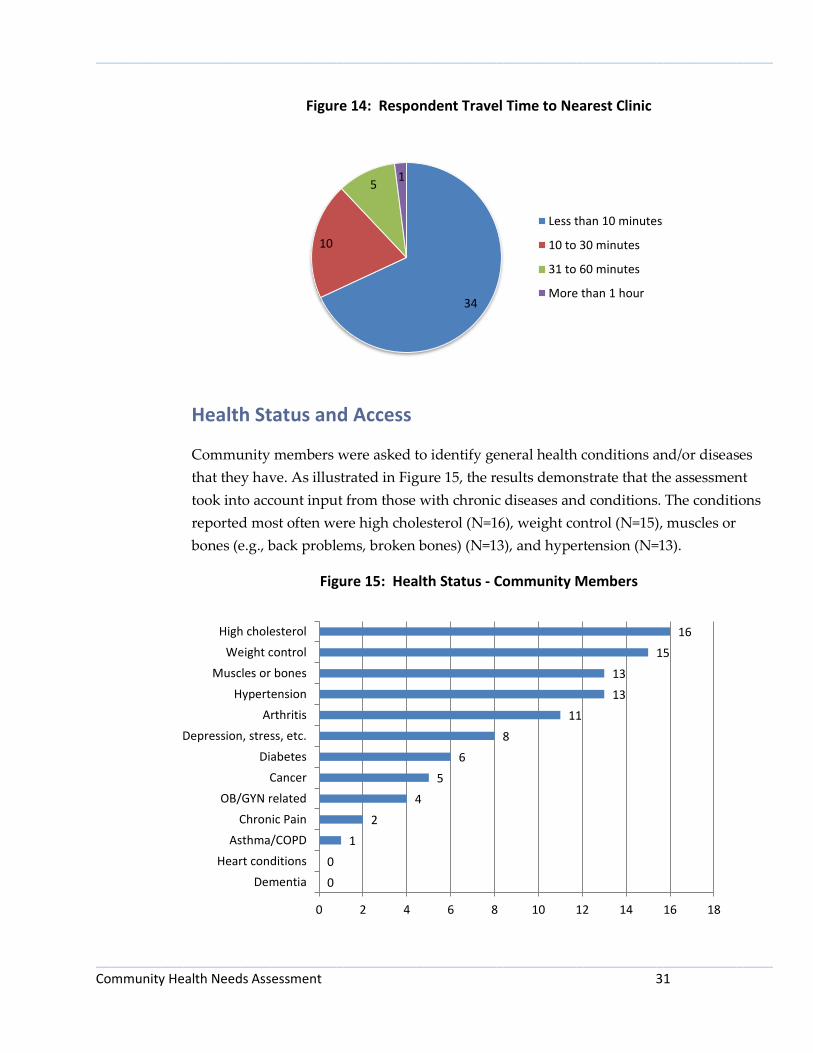
Community members were asked how far they lived from Towner County Medical
Center in Cando and how far they lived from the nearest clinic. As shown in Figure 13, a
large majority of respondents answering this question (N=36) reported living within 10
minutes of Towner County Medical Center. A fifth of respondents (N=11) reported
living 10 to 30 minutes from TCMC. With respect to distance to the nearest clinic, as
shown in Figure 14, the results closely mirrored the results of the question about
distance from TCMC. Again, a large majority (N=34) respondents indicated living within
10 minutes from the nearest clinic, with another 10 respondents living 10 to 30 minutes
from the nearest clinic.
Figure 13: Respondent Travel Time to Towner County Medical Center
0
2 2
6
11
6 5
3
4
11
$0 to $14,999
$15,000 to $24,999
$25,000 to $34,999
$35,000 to $49,999
$50,000 to $74,999
$75,000 to $99,999
$100,000 to $149,999
$150,000 to $199,999
$200,000 and over
Prefer not to answer
36
11
2 1
Less than 10 minutes
10 to 30 minutes
31 to 60 minutes
More than 1 hour
_____________________________________________________________________________________________
_____________________________________________________________________________________________ Community Health Needs Assessment 31
Figure 14: Respondent Travel Time to Nearest Clinic
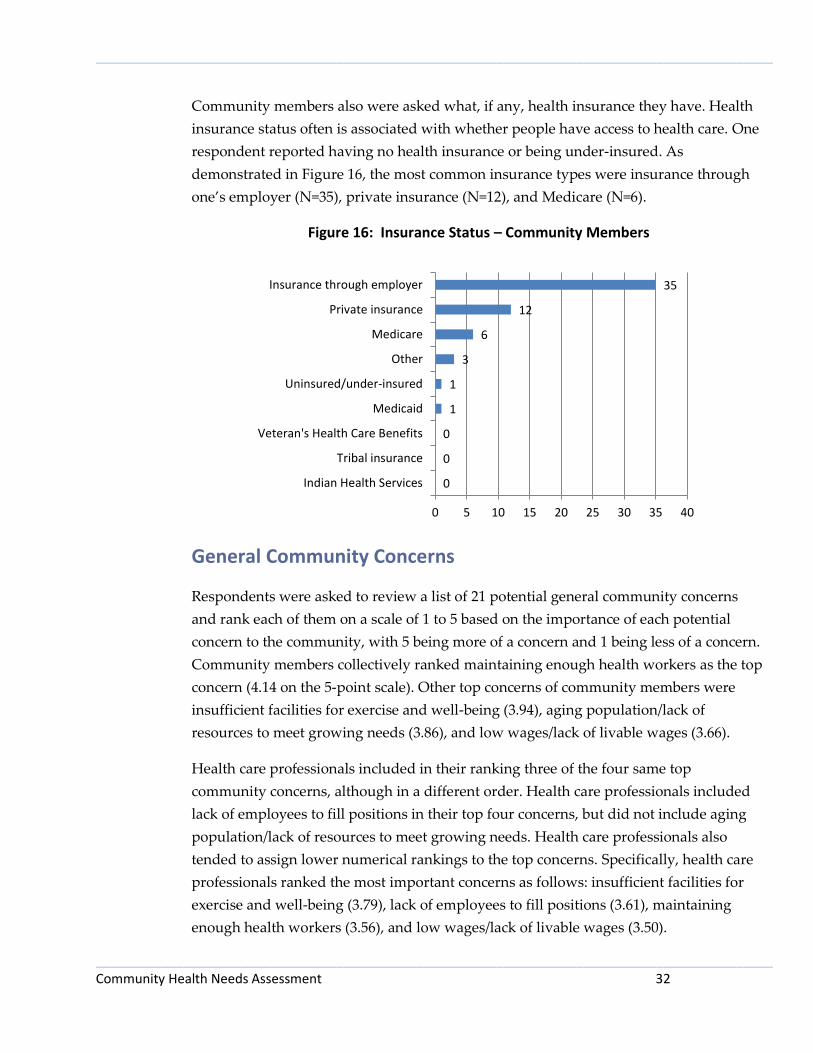
Health Status and Access
Community members were asked to identify general health conditions and/or diseases
that they have. As illustrated in Figure 15, the results demonstrate that the assessment
took into account input from those with chronic diseases and conditions. The conditions
reported most often were high cholesterol (N=16), weight control (N=15), muscles or
bones (e.g., back problems, broken bones) (N=13), and hypertension (N=13).
Figure 15: Health Status - Community Members
34
10
5 1
Less than 10 minutes
10 to 30 minutes
31 to 60 minutes
More than 1 hour
0
0
1
2
4
5
6
8
11
13
13
15
16
0 2 4 6 8 10 12 14 16 18
Dementia
Heart conditions
Asthma/COPD
Chronic Pain
OB/GYN related
Cancer
Diabetes
Depression, stress, etc.
Arthritis
Hypertension
Muscles or bones
Weight control
High cholesterol
_____________________________________________________________________________________________
_____________________________________________________________________________________________ Community Health Needs Assessment 32
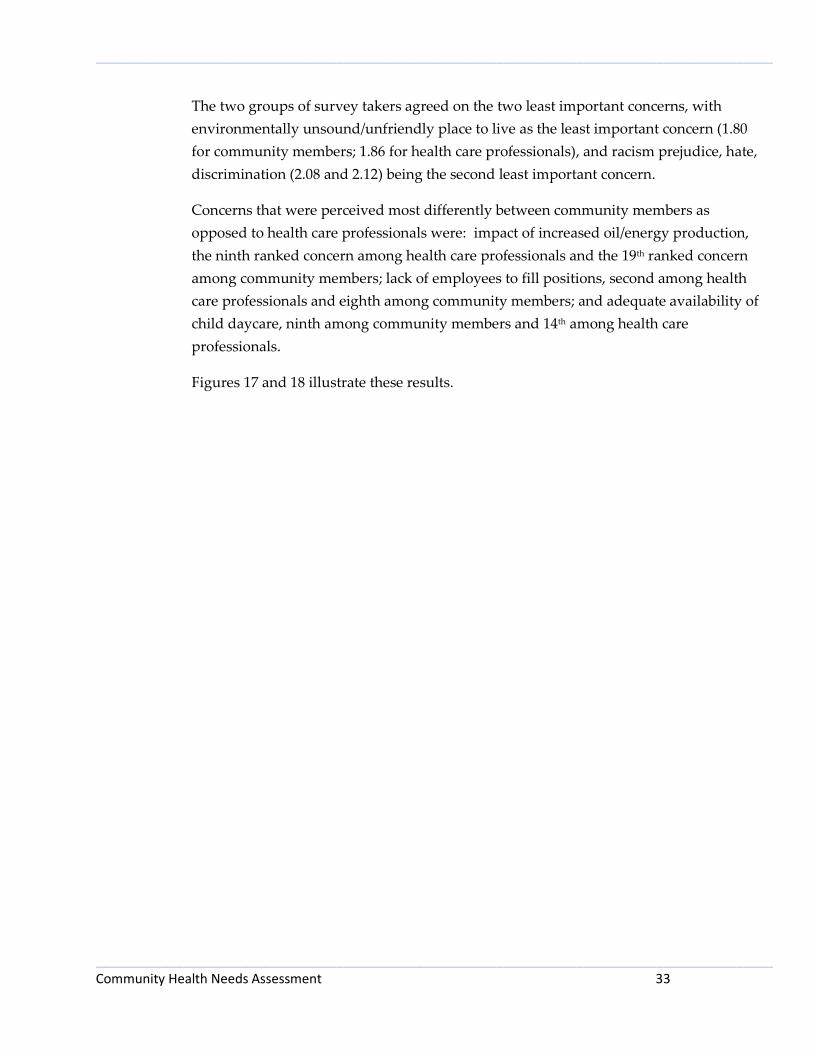
Community members also were asked what, if any, health insurance they have. Health
insurance status often is associated with whether people have access to health care. One
respondent reported having no health insurance or being under-insured. As
demonstrated in Figure 16, the most common insurance types were insurance through
one’s employer (N=35), private insurance (N=12), and Medicare (N=6).
Figure 16: Insurance Status – Community Members
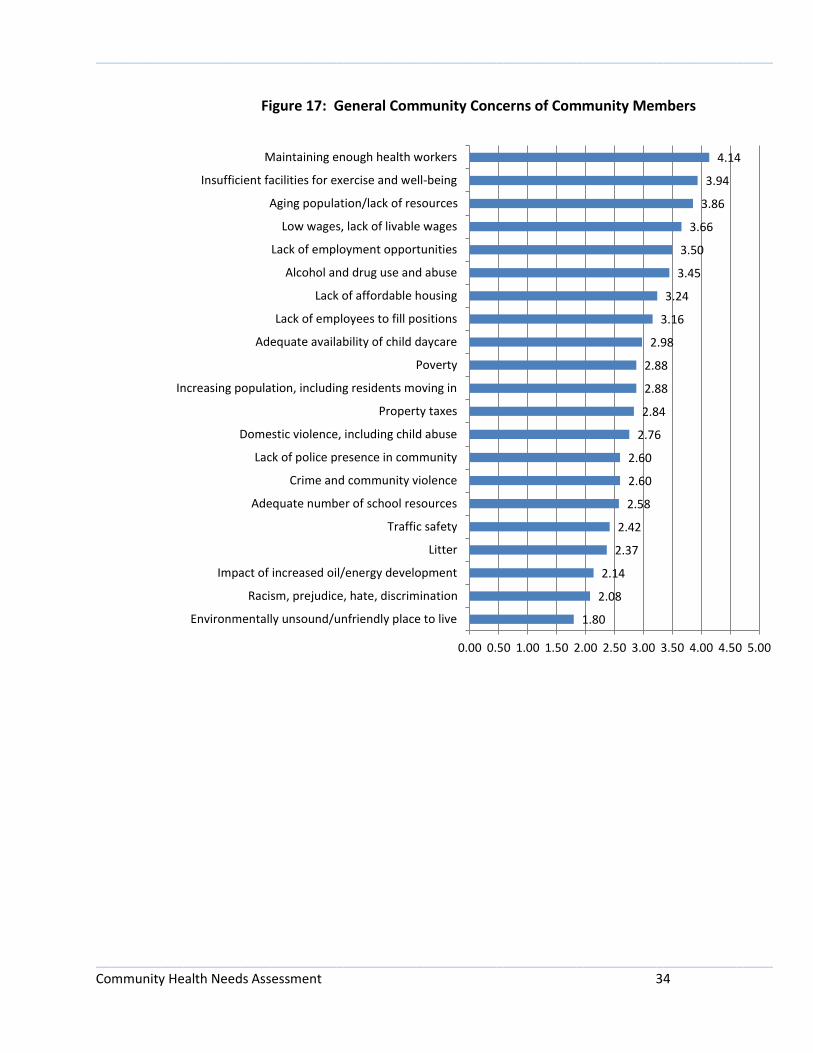
General Community Concerns
Respondents were asked to review a list of 21 potential general community concerns
and rank each of them on a scale of 1 to 5 based on the importance of each potential
concern to the community, with 5 being more of a concern and 1 being less of a concern.
Community members collectively ranked maintaining enough health workers as the top
concern (4.14 on the 5-point scale). Other top concerns of community members were
insufficient facilities for exercise and well-being (3.94), aging population/lack of
resources to meet growing needs (3.86), and low wages/lack of livable wages (3.66).
Health care professionals included in their ranking three of the four same top
community concerns, although in a different order. Health care professionals included
lack of employees to fill positions in their top four concerns, but did not include aging
population/lack of resources to meet growing needs. Health care professionals also
tended to assign lower numerical rankings to the top concerns. Specifically, health care
professionals ranked the most important concerns as follows: insufficient facilities for
exercise and well-being (3.79), lack of employees to fill positions (3.61), maintaining
enough health workers (3.56), and low wages/lack of livable wages (3.50).
0
0
0
1
1
3
6
12
35
0 5 10 15 20 25 30 35 40
Indian Health Services
Tribal insurance
Veteran's Health Care Benefits
Medicaid
Uninsured/under-insured
Other
Medicare
Private insurance
Insurance through employer
_____________________________________________________________________________________________
_____________________________________________________________________________________________ Community Health Needs Assessment 33
The two groups of survey takers agreed on the two least important concerns, with
environmentally unsound/unfriendly place to live as the least important concern (1.80
for community members; 1.86 for health care professionals), and racism prejudice, hate,
discrimination (2.08 and 2.12) being the second least important concern.
Concerns that were perceived most differently between community members as
opposed to health care professionals were: impact of increased oil/energy production,
the ninth ranked concern among health care professionals and the 19th ranked concern
among community members; lack of employees to fill positions, second among health
care professionals and eighth among community members; and adequate availability of
child daycare, ninth among community members and 14th among health care
professionals.
Figures 17 and 18 illustrate these results.
_____________________________________________________________________________________________
_____________________________________________________________________________________________ Community Health Needs Assessment 34
Figure 17: General Community Concerns of Community Members
1.80
2.08
2.14
2.37
2.42
2.58
2.60
2.60
2.76
2.84
2.88
2.88
2.98
3.16
3.24
3.45
3.50
3.66
3.86
3.94
4.14
0.00 0.50 1.00 1.50 2.00 2.50 3.00 3.50 4.00 4.50 5.00
Environmentally unsound/unfriendly place to live
Racism, prejudice, hate, discrimination
Impact of increased oil/energy development
Litter
Traffic safety
Adequate number of school resources
Crime and community violence
Lack of police presence in community
Domestic violence, including child abuse
Property taxes
Increasing population, including residents moving in
Poverty
Adequate availability of child daycare
Lack of employees to fill positions
Lack of affordable housing
Alcohol and drug use and abuse
Lack of employment opportunities
Low wages, lack of livable wages
Aging population/lack of resources
Insufficient facilities for exercise and well-being
Maintaining enough health workers
_____________________________________________________________________________________________
_____________________________________________________________________________________________ Community Health Needs Assessment 35
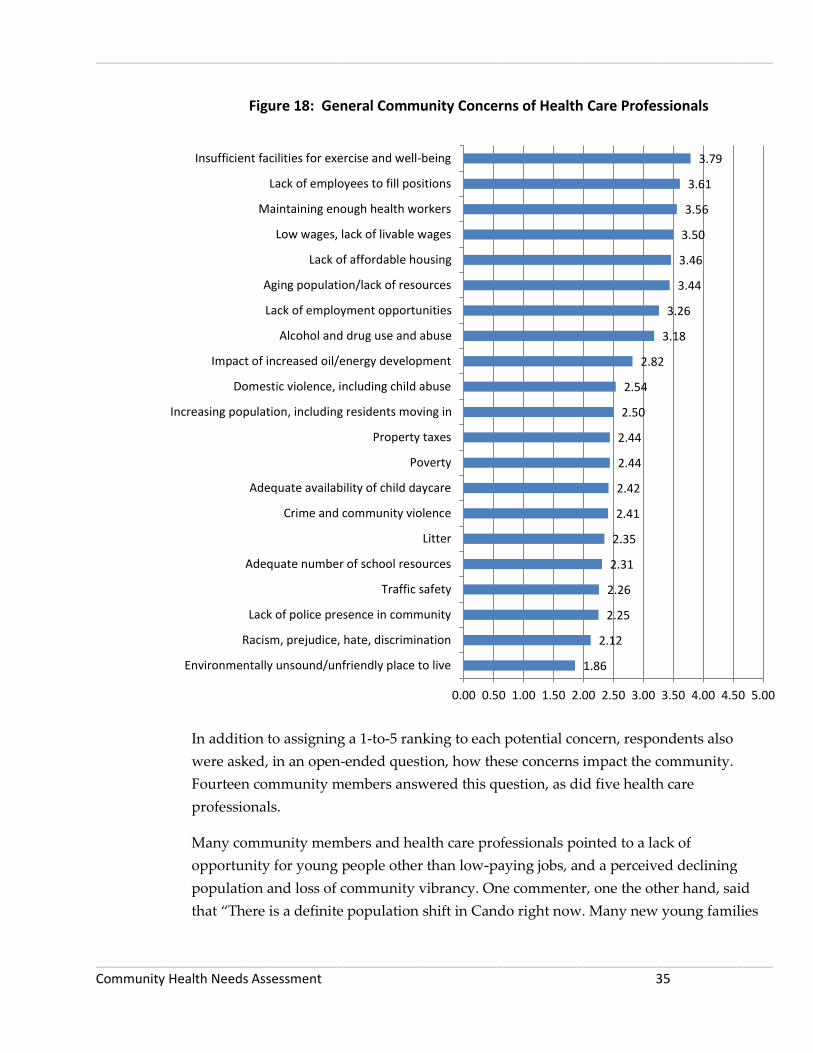
Figure 18: General Community Concerns of Health Care Professionals
In addition to assigning a 1-to-5 ranking to each potential concern, respondents also
were asked, in an open-ended question, how these concerns impact the community.
Fourteen community members answered this question, as did five health care
professionals.
Many community members and health care professionals pointed to a lack of
opportunity for young people other than low-paying jobs, and a perceived declining
population and loss of community vibrancy. One commenter, one the other hand, said
that “There is a definite population shift in Cando right now. Many new young families
1.86
2.12
2.25
2.26
2.31
2.35
2.41
2.42
2.44
2.44
2.50
2.54
2.82
3.18
3.26
3.44
3.46
3.50
3.56
3.61
3.79
0.00 0.50 1.00 1.50 2.00 2.50 3.00 3.50 4.00 4.50 5.00
Environmentally unsound/unfriendly place to live
Racism, prejudice, hate, discrimination
Lack of police presence in community
Traffic safety
Adequate number of school resources
Litter
Crime and community violence
Adequate availability of child daycare
Poverty
Property taxes
Increasing population, including residents moving in
Domestic violence, including child abuse
Impact of increased oil/energy development
Alcohol and drug use and abuse
Lack of employment opportunities
Aging population/lack of resources
Lack of affordable housing
Low wages, lack of livable wages
Maintaining enough health workers
Lack of employees to fill positions
Insufficient facilities for exercise and well-being

_____________________________________________________________________________________________
_____________________________________________________________________________________________ Community Health Needs Assessment 36
are moving in and that is reflected in the enrollment numbers at the school. The
elementary students are outgrowing their building.”
Specific comments about these dynamics in the community included:
Lack of high quality, or educated employees to fill positions. Some of these low
paying jobs have brought some negative things to the area. (Drugs, making
people feel unsafe, kids who struggle or cause problems at school and are not
trusted in the community, strangers in town and kids hanging around
unsupervised, people living in sub-par housing.)
Low wages generally keep families in poverty and they cannot work their way
out.
Our community is less attractive to newcomers than it was 15 years ago. There
are really very few incentives to keep youth in the area when they finish their
educational years.
People move away or don't encourage others to move here.
Some potential job providers/industries, etc., have come into the community only
to pay a wage just at the poverty line. This does not contribute to community
growth and widens the gap between the haves and have-nots. It puts additional
pressure on social service and law enforcement personnel as well.
The low paying jobs attract many strangers to town. I think this contributes to
more drug flow in the community and that affects our safety. Also there seems to
be more people that come that do not work, but the system supports them (tax
payers support them). I am sure these people moving in and out must affect the
school and the need for more special education services.
The need for a STABLE increase in population will be vital for the community to
keep existing services available.
The poverty brings in several things that impact the community including: low
value housing options, crime, not knowing your neighbor, students at school
without parent support or students that are behind the other students in skills,
drugs, and many young people living off the system and not trying to work.
Basically it impacts the needs at the school and safety of the community.
We need to be able to keep the young generation here with paying jobs.
Community Health Concerns
Similar to the question about general community concerns, respondents were asked to
review a list of potential community health concerns and rank them on a scale of 1 to 5
based on the importance of each potential concern to the community, with 5 being more
_____________________________________________________________________________________________
_____________________________________________________________________________________________ Community Health Needs Assessment 37
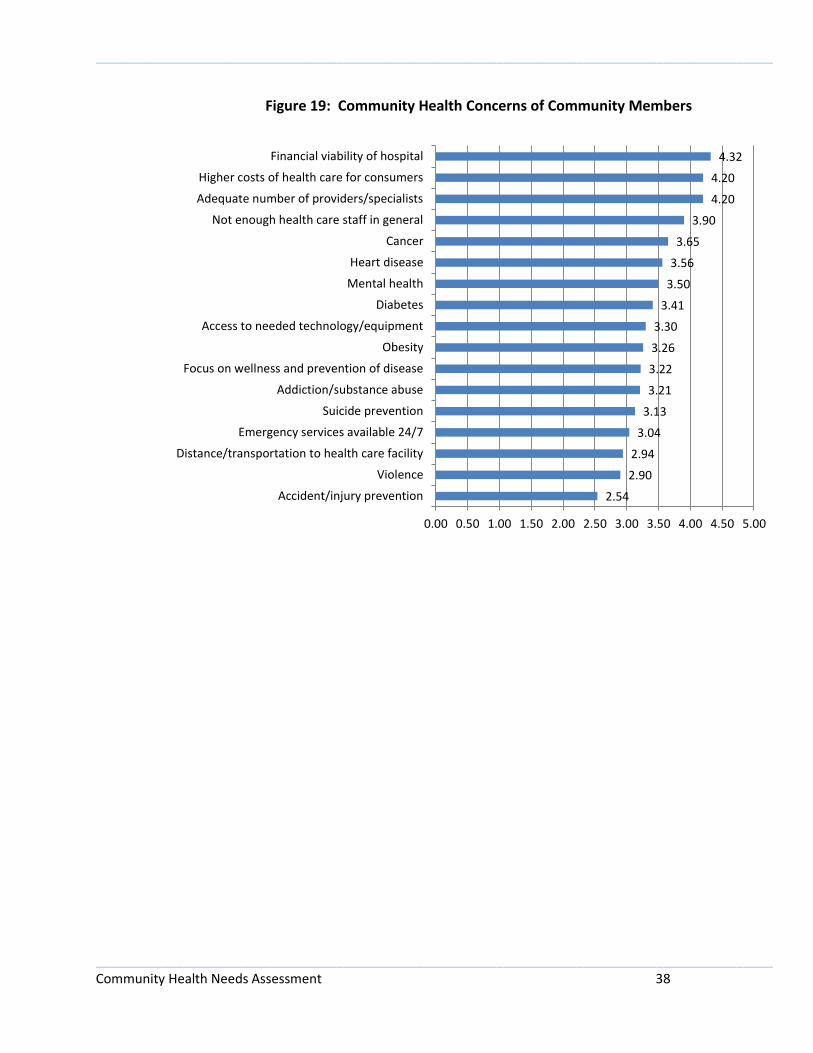
of a concern and 1 being less of a concern. There was fairly strong alignment among
community members and health care professionals when ranking health concerns, with
both groups choosing the same top three concerns, although in a slightly different order.
Community members ranked as the top four health concerns the financial viability of
the hospital (4.32), higher costs of health care for consumers (4.20), adequate number of
providers/specialists (also 4.20), and not enough health care staff in general (3.90).
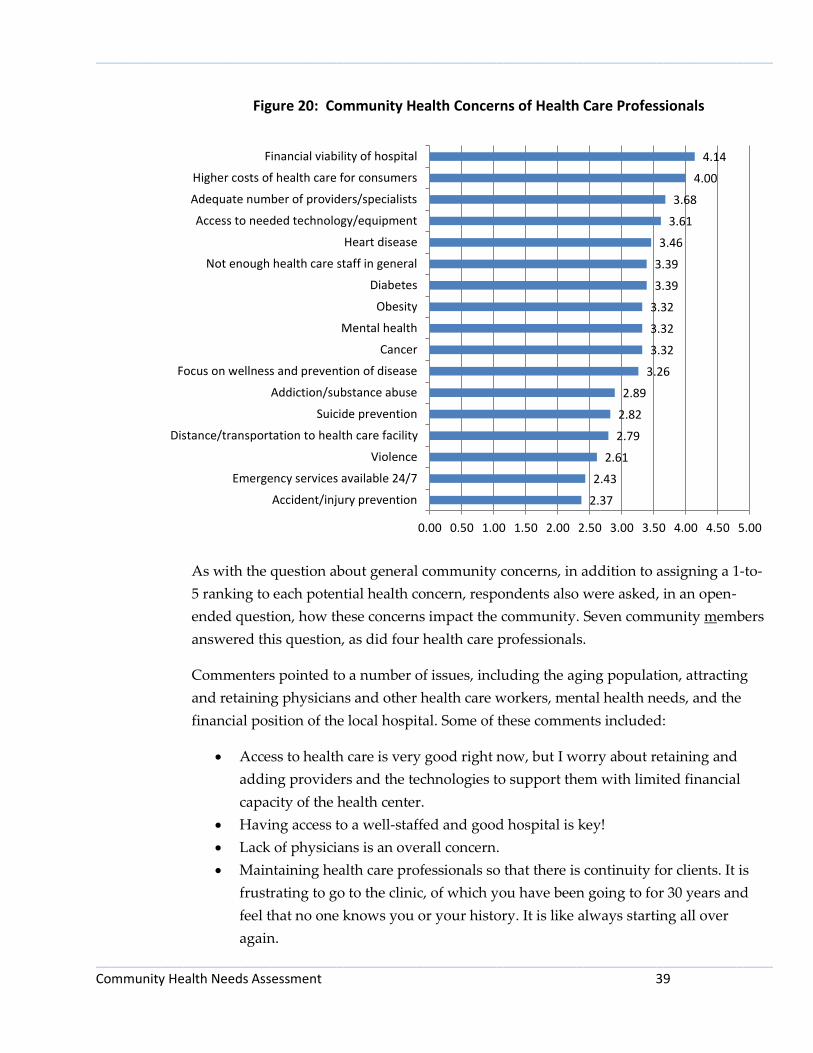
Health care professionals chose the same top three concerns and slotted in the fourth
spot access to needed technology/equipment. Specifically, the average rankings
provided by health care professionals were: financial viability of the hospital (4.14),
higher costs of health care for consumers (4.00), adequate number of
providers/specialists (3.68), and access to needed technology/equipment (3.61).
The two groups of survey-takers were in alignment with respect to the least important
concern. Both groups collectively ranked accident/injury prevention and the least
important concern (2.54 for community members and 2.37 for health care professionals).
Concerns that were perceived most differently between the two groups were: cancer,
which was the fifth highest ranked concern among community members and 10th among
health care professionals; and access to needed technology/equipment, fourth among
health care professionals and ninth among community members.
Figures 19 and 20 illustrate these results.
_____________________________________________________________________________________________
_____________________________________________________________________________________________ Community Health Needs Assessment 38
Figure 19: Community Health Concerns of Community Members
2.54
2.90
2.94
3.04
3.13
3.21
3.22
3.26
3.30
3.41
3.50
3.56
3.65
3.90
4.20
4.20
4.32
0.00 0.50 1.00 1.50 2.00 2.50 3.00 3.50 4.00 4.50 5.00
Accident/injury prevention
Violence
Distance/transportation to health care facility
Emergency services available 24/7
Suicide prevention
Addiction/substance abuse
Focus on wellness and prevention of disease
Obesity
Access to needed technology/equipment
Diabetes
Mental health
Heart disease
Cancer
Not enough health care staff in general
Adequate number of providers/specialists
Higher costs of health care for consumers
Financial viability of hospital
_____________________________________________________________________________________________
_____________________________________________________________________________________________ Community Health Needs Assessment 39
Figure 20: Community Health Concerns of Health Care Professionals
As with the question about general community concerns, in addition to assigning a 1-to-
5 ranking to each potential health concern, respondents also were asked, in an open-
ended question, how these concerns impact the community. Seven community members
answered this question, as did four health care professionals.
Commenters pointed to a number of issues, including the aging population, attracting
and retaining physicians and other health care workers, mental health needs, and the
financial position of the local hospital. Some of these comments included:
Access to health care is very good right now, but I worry about retaining and
adding providers and the technologies to support them with limited financial
capacity of the health center.
Having access to a well-staffed and good hospital is key!
Lack of physicians is an overall concern.
Maintaining health care professionals so that there is continuity for clients. It is
frustrating to go to the clinic, of which you have been going to for 30 years and
feel that no one knows you or your history. It is like always starting all over
again.
2.37
2.43
2.61
2.79
2.82
2.89
3.26
3.32
3.32
3.32
3.39
3.39
3.46
3.61
3.68
4.00
4.14
0.00 0.50 1.00 1.50 2.00 2.50 3.00 3.50 4.00 4.50 5.00
Accident/injury prevention
Emergency services available 24/7
Violence
Distance/transportation to health care facility
Suicide prevention
Addiction/substance abuse
Focus on wellness and prevention of disease
Cancer
Mental health
Obesity
Diabetes
Not enough health care staff in general
Heart disease
Access to needed technology/equipment
Adequate number of providers/specialists
Higher costs of health care for consumers
Financial viability of hospital
_____________________________________________________________________________________________
_____________________________________________________________________________________________ Community Health Needs Assessment 40
Mental health care services are few and when a family needs help it is too
difficult to get adequate and timely help.
Patients and families may have to travel over two hours for assessments and
treatments that may be inaccessible due to physician/ staff shortages locally.
People leave town to get health care and other things not available here. Then
while one is in Grand Forks they shop and eat and take away from several
businesses in town.
Preventive medicine is the best medicine. A fitness center would promote better
emotional, mental, and physical for all who use the resource.
We are an aging community. Many older people leave the community to be
closer to consistent specialized medical care.
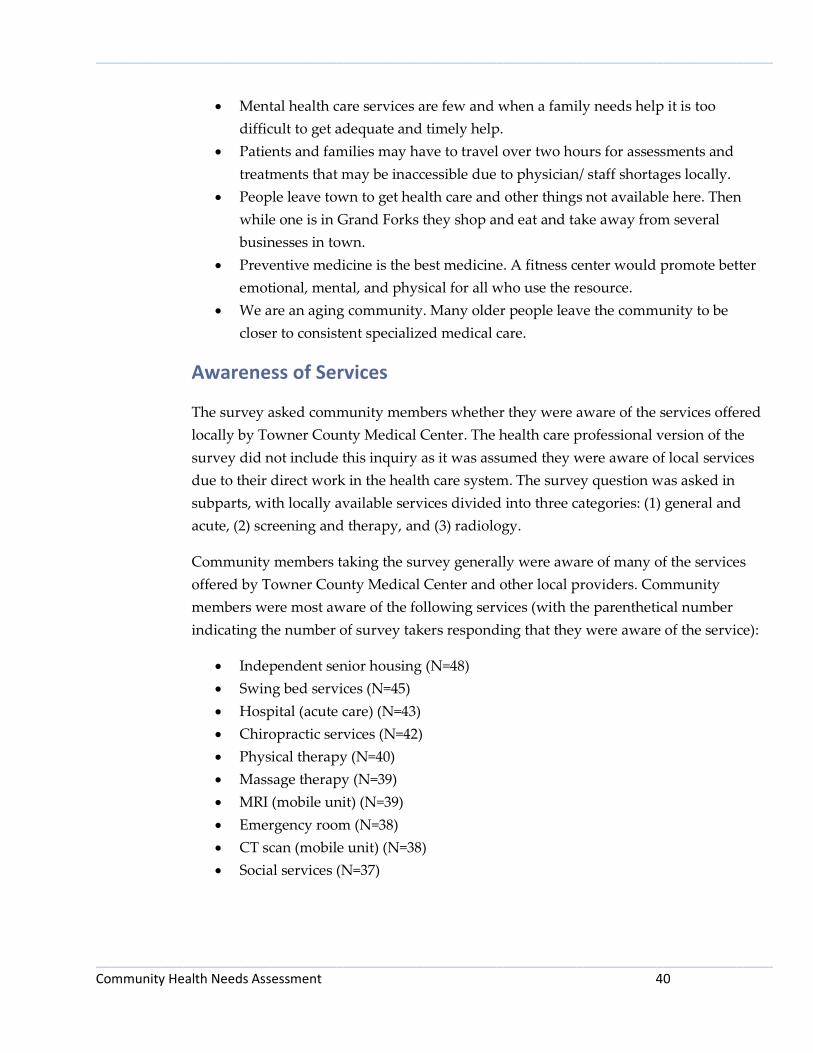
Awareness of Services
The survey asked community members whether they were aware of the services offered
locally by Towner County Medical Center. The health care professional version of the
survey did not include this inquiry as it was assumed they were aware of local services
due to their direct work in the health care system. The survey question was asked in
subparts, with locally available services divided into three categories: (1) general and
acute, (2) screening and therapy, and (3) radiology.
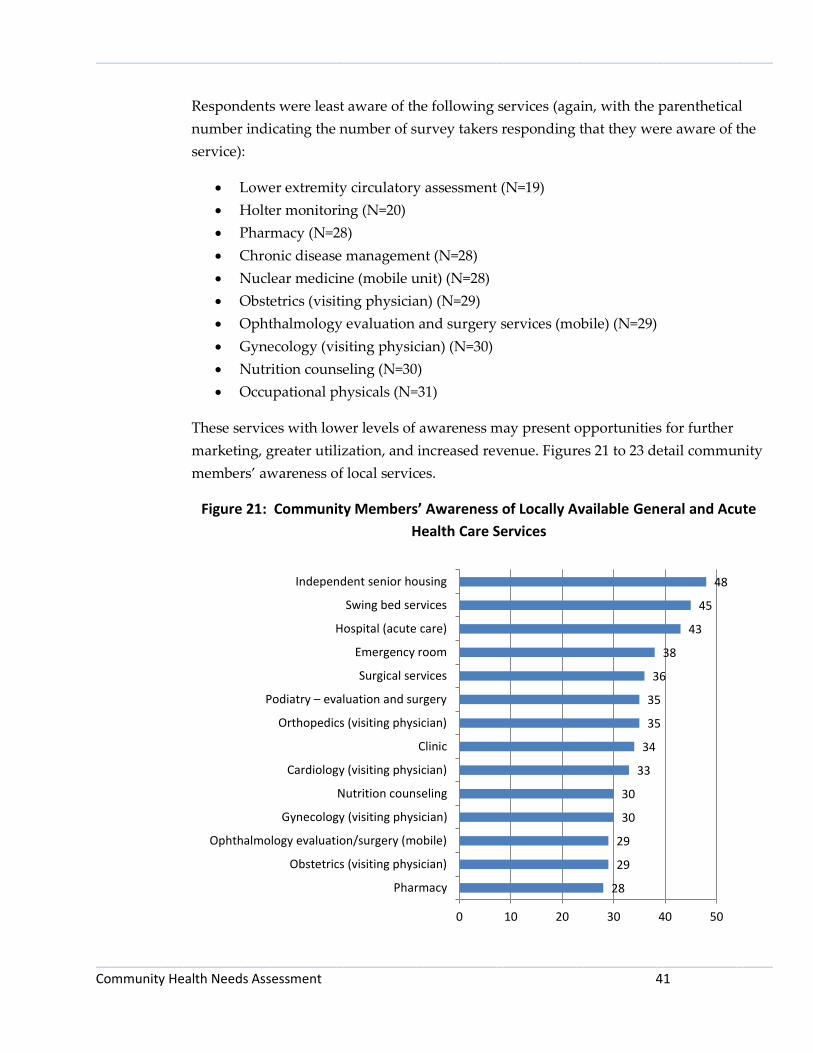
Community members taking the survey generally were aware of many of the services
offered by Towner County Medical Center and other local providers. Community
members were most aware of the following services (with the parenthetical number
indicating the number of survey takers responding that they were aware of the service):
Independent senior housing (N=48)
Swing bed services (N=45)
Hospital (acute care) (N=43)
Chiropractic services (N=42)
Physical therapy (N=40)
Massage therapy (N=39)
MRI (mobile unit) (N=39)
Emergency room (N=38)
CT scan (mobile unit) (N=38)
Social services (N=37)
_____________________________________________________________________________________________
_____________________________________________________________________________________________ Community Health Needs Assessment 41
Respondents were least aware of the following services (again, with the parenthetical
number indicating the number of survey takers responding that they were aware of the
service):
Lower extremity circulatory assessment (N=19)
Holter monitoring (N=20)
Pharmacy (N=28)
Chronic disease management (N=28)
Nuclear medicine (mobile unit) (N=28)
Obstetrics (visiting physician) (N=29)
Ophthalmology evaluation and surgery services (mobile) (N=29)
Gynecology (visiting physician) (N=30)
Nutrition counseling (N=30)
Occupational physicals (N=31)
These services with lower levels of awareness may present opportunities for further
marketing, greater utilization, and increased revenue. Figures 21 to 23 detail community
members’ awareness of local services.
Figure 21: Community Members’ Awareness of Locally Available General and Acute
Health Care Services
28
29
29
30
30
33
34
35
35
36
38
43
45
48
0 10 20 30 40 50
Pharmacy
Obstetrics (visiting physician)
Ophthalmology evaluation/surgery (mobile)
Gynecology (visiting physician)
Nutrition counseling
Cardiology (visiting physician)
Clinic
Orthopedics (visiting physician)
Podiatry – evaluation and surgery
Surgical services
Emergency room
Hospital (acute care)
Swing bed services
Independent senior housing
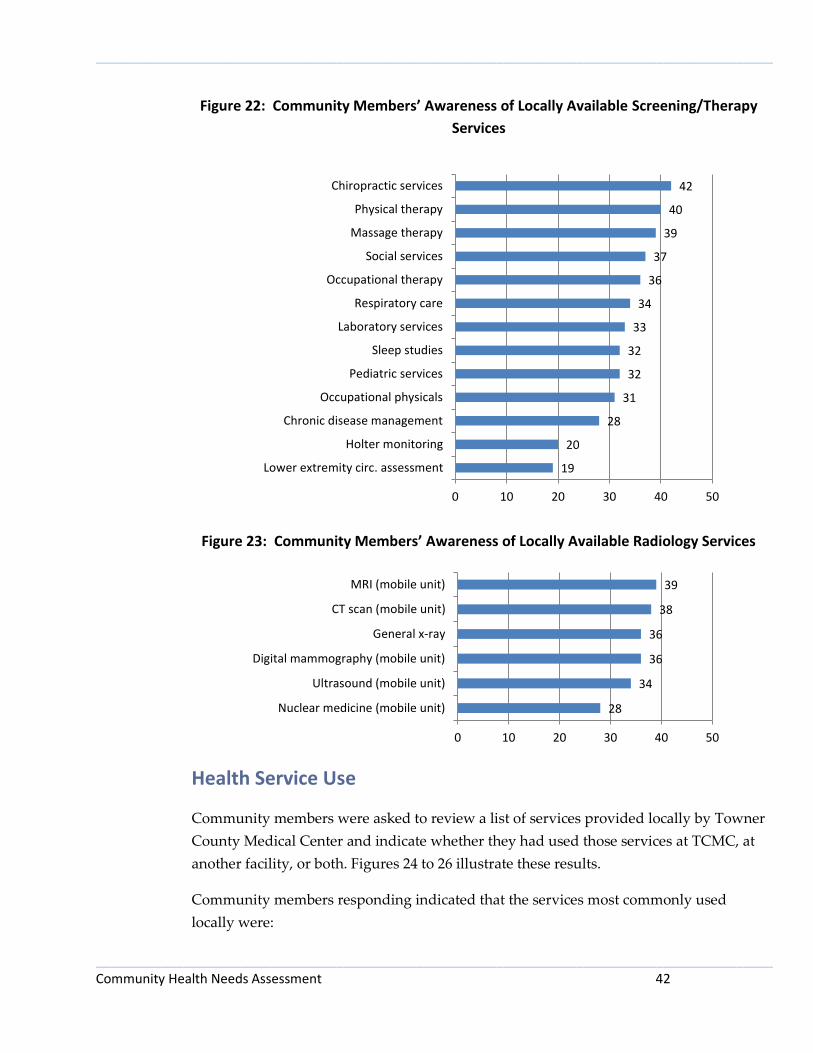
_____________________________________________________________________________________________
_____________________________________________________________________________________________ Community Health Needs Assessment 42
Figure 22: Community Members’ Awareness of Locally Available Screening/Therapy
Services
Figure 23: Community Members’ Awareness of Locally Available Radiology Services
Health Service Use
Community members were asked to review a list of services provided locally by Towner
County Medical Center and indicate whether they had used those services at TCMC, at
another facility, or both. Figures 24 to 26 illustrate these results.
Community members responding indicated that the services most commonly used
locally were:
19
20
28
31
32
32
33
34
36
37
39
40
42
0 10 20 30 40 50
Lower extremity circ. assessment
Holter monitoring
Chronic disease management
Occupational physicals
Pediatric services
Sleep studies
Laboratory services
Respiratory care
Occupational therapy
Social services
Massage therapy
Physical therapy
Chiropractic services
28
34
36
36
38
39
0 10 20 30 40 50
Nuclear medicine (mobile unit)
Ultrasound (mobile unit)
Digital mammography (mobile unit)
General x-ray
CT scan (mobile unit)
MRI (mobile unit)

_____________________________________________________________________________________________
_____________________________________________________________________________________________ Community Health Needs Assessment 43
Clinic (N=42)
Laboratory services (N=36)
General x-ray (N=35)
Chiropractic services (N=27)
Emergency room (N=25)
Digital mammography (mobile unit) (N=23)
Ultrasound (mobile unit) (N=21)
Massage therapy (N=19)
Physical therapy (N=17)
CT scan (mobile unit) (N=12)
Pharmacy (N=11)
MRI (mobile unit) (N=11)
Respondents indicated that the services they most commonly sought out of the area
were:
Pharmacy (N=14)
Gynecology (N=12)
Clinic (N=11)
Hospital (acute care) (N=11)
Surgical services (N=9)
Ophthalmology evaluation and surgery services (N=9)
Laboratory services (N=8)
CT scan (N=8)
General x-ray (N=6)
Emergency room (N=6)
Orthopedics (N=6)
As with low-awareness services, these services – for which community members are
going elsewhere – may provide opportunities for additional education about their
availability from the local health system and potential greater utilization of local
services.

_____________________________________________________________________________________________
_____________________________________________________________________________________________ Community Health Needs Assessment 44
Figure 24: Community Member Use of Locally Available General and Acute Health
Care Services
Figure 25: Community Member Use of Locally Available Screening/Therapy Services
0
0
0
2
2
5
5
6
6
6
9
11
25
42
1
9
1
2
5
5
6
12
5
9
11
14
6
11
0 20 40 60
Independent senior housing
Ophthalmology evaluation/surgery (mobile)
Swing bed services
Nutrition counseling
Obstetrics (visiting physician)
Cardiology (visiting physician)
Orthopedics (visiting physician)
Gynecology (visiting physician)
Podiatry – evaluation and surgery
Surgical services
Hospital (acute care)
Pharmacy
Emergency room
Clinic
Used atTCMC
Used atAnotherFacility
0
1
1
1
2
5
5
6
9
17
19
27
36
1
1
2
1
3
1
2
1
2
2
3
5
8
0 20 40 60
Social services
Holter monitoring
Lower extremity circulatory assessment
Respiratory care
Chronic disease management
Pediatric services
Sleep studies
Occupational therapy
Occupational physicals
Physical therapy
Massage therapy
Chiropractic services
Laboratory services
Used atTCMC
Used atAnotherFacility
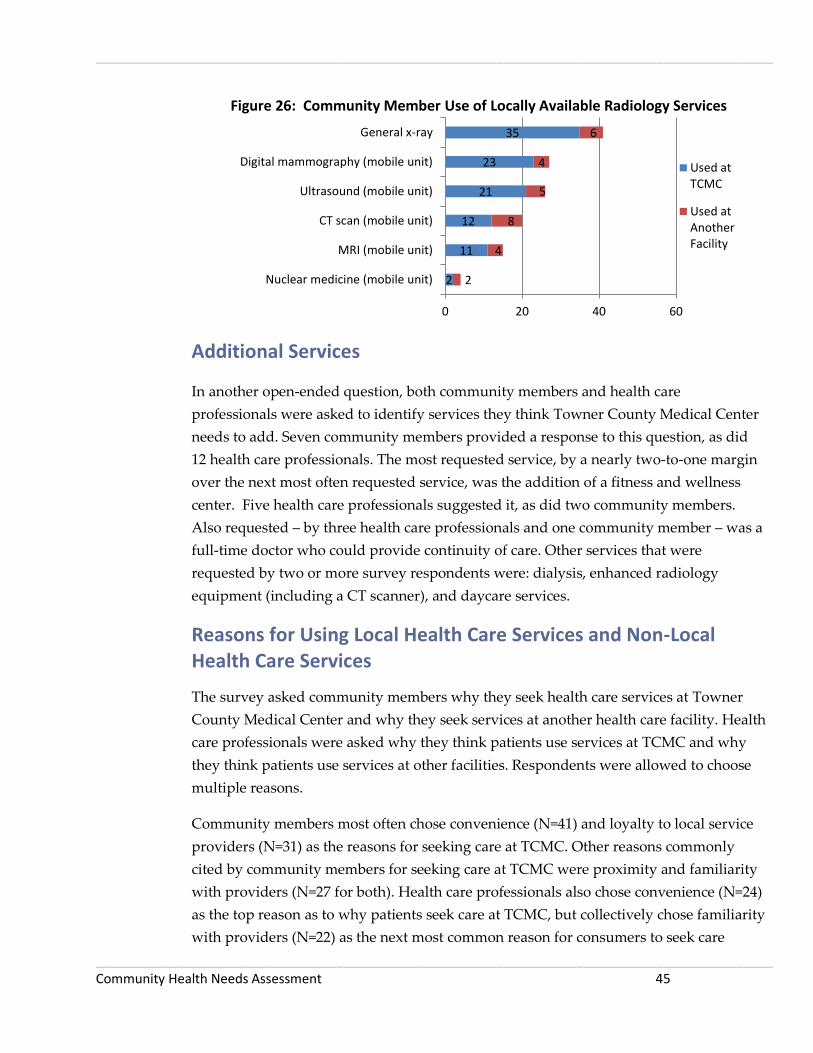
_____________________________________________________________________________________________
_____________________________________________________________________________________________ Community Health Needs Assessment 45
Figure 26: Community Member Use of Locally Available Radiology Services
Additional Services
In another open-ended question, both community members and health care
professionals were asked to identify services they think Towner County Medical Center
needs to add. Seven community members provided a response to this question, as did
12 health care professionals. The most requested service, by a nearly two-to-one margin
over the next most often requested service, was the addition of a fitness and wellness
center. Five health care professionals suggested it, as did two community members.
Also requested – by three health care professionals and one community member – was a
full-time doctor who could provide continuity of care. Other services that were
requested by two or more survey respondents were: dialysis, enhanced radiology
equipment (including a CT scanner), and daycare services.
Reasons for Using Local Health Care Services and Non-Local Health Care Services
The survey asked community members why they seek health care services at Towner
County Medical Center and why they seek services at another health care facility. Health
care professionals were asked why they think patients use services at TCMC and why
they think patients use services at other facilities. Respondents were allowed to choose
multiple reasons.
Community members most often chose convenience (N=41) and loyalty to local service
providers (N=31) as the reasons for seeking care at TCMC. Other reasons commonly
cited by community members for seeking care at TCMC were proximity and familiarity
with providers (N=27 for both). Health care professionals also chose convenience (N=24)
as the top reason as to why patients seek care at TCMC, but collectively chose familiarity
with providers (N=22) as the next most common reason for consumers to seek care
2
11
12
21
23
35
2
4
8
5
4
6
0 20 40 60
Nuclear medicine (mobile unit)
MRI (mobile unit)
CT scan (mobile unit)
Ultrasound (mobile unit)
Digital mammography (mobile unit)
General x-ray
Used atTCMC
Used atAnotherFacility

_____________________________________________________________________________________________
_____________________________________________________________________________________________ Community Health Needs Assessment 46
locally. Health care professionals chose loyalty to local service providers (N=17) as the
third top reason as to why they think patients seek care locally at TCMC. Figures 27 and
28 illustrate these responses.
Figure 27: Reasons Community Members Seek Services at Towner County Medical
Center
1
4
5
6
8
10
13
15
22
22
27
27
31
41
0 10 20 30 40 50
Disability access
Other
Transportation is readily available
Less costly
They take new patients
Access to specialist
Confidentiality
Open at convenient times
High quality of care
They take my insurance
Familiarity with providers
Proximity
Loyalty to local service providers
Convenience

_____________________________________________________________________________________________
_____________________________________________________________________________________________ Community Health Needs Assessment 47
Figure 28: Reasons Health Care Professionals Believe Community Members Seek
Services at Towner County Medical Center
With respect to the reasons community members seek health care services at other
facilities, community members and health care professionals were in agreement that the
primary motivator for seeking care elsewhere was, by a considerable margin, that
another facility has a needed specialist (N=38 for community members; N=24 for health
care professionals). Other oft-cited reasons for seeking care elsewhere were high quality
care (N=21 for community members and N=13 for health care professionals) and
confidentiality (N=19; N=8). These results are illustrated in Figures 29 and 30.
1
5
5
5
6
7
8
11
13
15
16
17
22
24
0 5 10 15 20 25
Other
Access to specialist
Disability access
Less costly
Transportation is readily available
Confidentiality
We take many types of insurance
Open at convenient times
Proximity
We take new patients
High quality of care
Loyalty to local service providers
Familiarity with providers
Convenience

_____________________________________________________________________________________________
_____________________________________________________________________________________________ Community Health Needs Assessment 48
Figure 29: Reasons Community Members Seek Services at Other Health Care Facilities
Figure 30: Reasons Health Care Professionals Believe Community Members Seek
Services at Other Health Care Facilities
0
0
2
3
4
5
5
6
6
6
9
19
21
38
0 10 20 30 40 50
Disability access
Transportation is readily available
Proximity
Loyalty to local service providers
They take new patients
Less costly
Other
Convenience
Familiarity with providers
Open at convenient times
They take my insurance
Confidentiality
High quality of care
Access to specialist
1
1
2
2
3
3
5
6
6
7
7
8
13
24
0 5 10 15 20 25
Transportation is readily available
Other
Disability access
Loyalty to service providers
Less costly
They take new patients
Convenience
Open at convenient times
Proximity
Familiarity with providers
They take many types of insurance
Confidentiality
High quality of care
Access to specialist
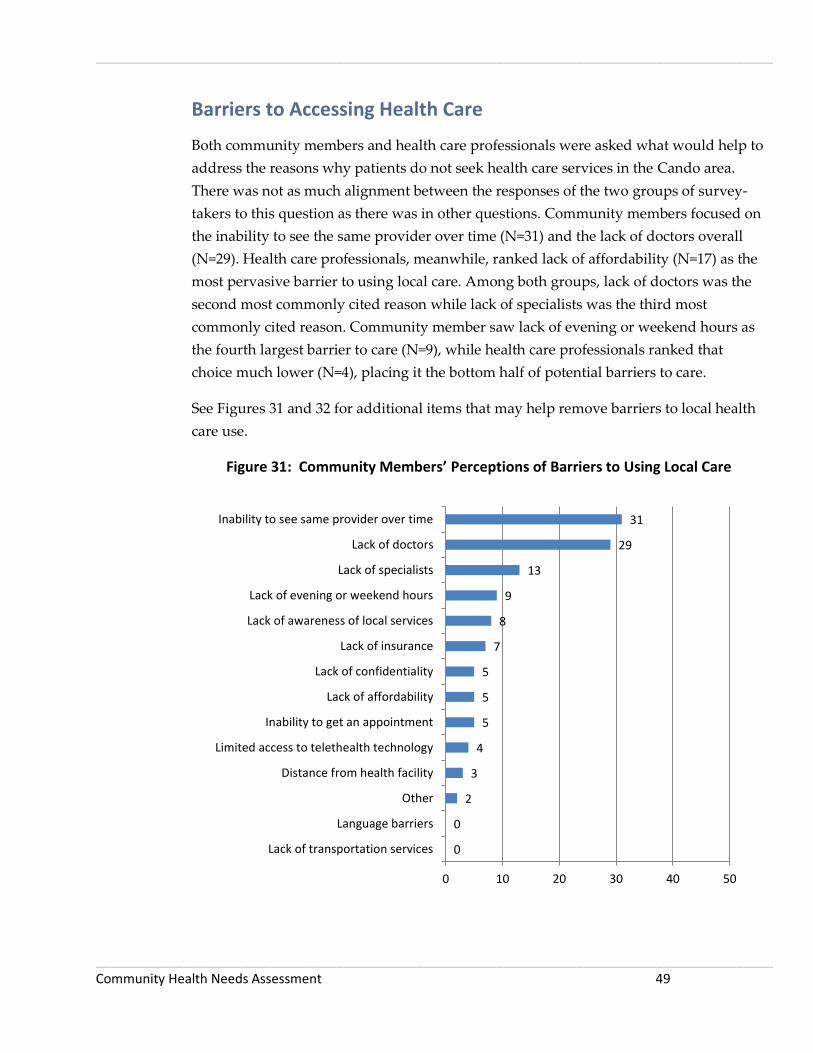
_____________________________________________________________________________________________
_____________________________________________________________________________________________ Community Health Needs Assessment 49
Barriers to Accessing Health Care
Both community members and health care professionals were asked what would help to
address the reasons why patients do not seek health care services in the Cando area.
There was not as much alignment between the responses of the two groups of survey-
takers to this question as there was in other questions. Community members focused on
the inability to see the same provider over time (N=31) and the lack of doctors overall
(N=29). Health care professionals, meanwhile, ranked lack of affordability (N=17) as the
most pervasive barrier to using local care. Among both groups, lack of doctors was the
second most commonly cited reason while lack of specialists was the third most
commonly cited reason. Community member saw lack of evening or weekend hours as
the fourth largest barrier to care (N=9), while health care professionals ranked that
choice much lower (N=4), placing it the bottom half of potential barriers to care.
See Figures 31 and 32 for additional items that may help remove barriers to local health
care use.
Figure 31: Community Members’ Perceptions of Barriers to Using Local Care
0
0
2
3
4
5
5
5
7
8
9
13
29
31
0 10 20 30 40 50
Lack of transportation services
Language barriers
Other
Distance from health facility
Limited access to telethealth technology
Inability to get an appointment
Lack of affordability
Lack of confidentiality
Lack of insurance
Lack of awareness of local services
Lack of evening or weekend hours
Lack of specialists
Lack of doctors
Inability to see same provider over time
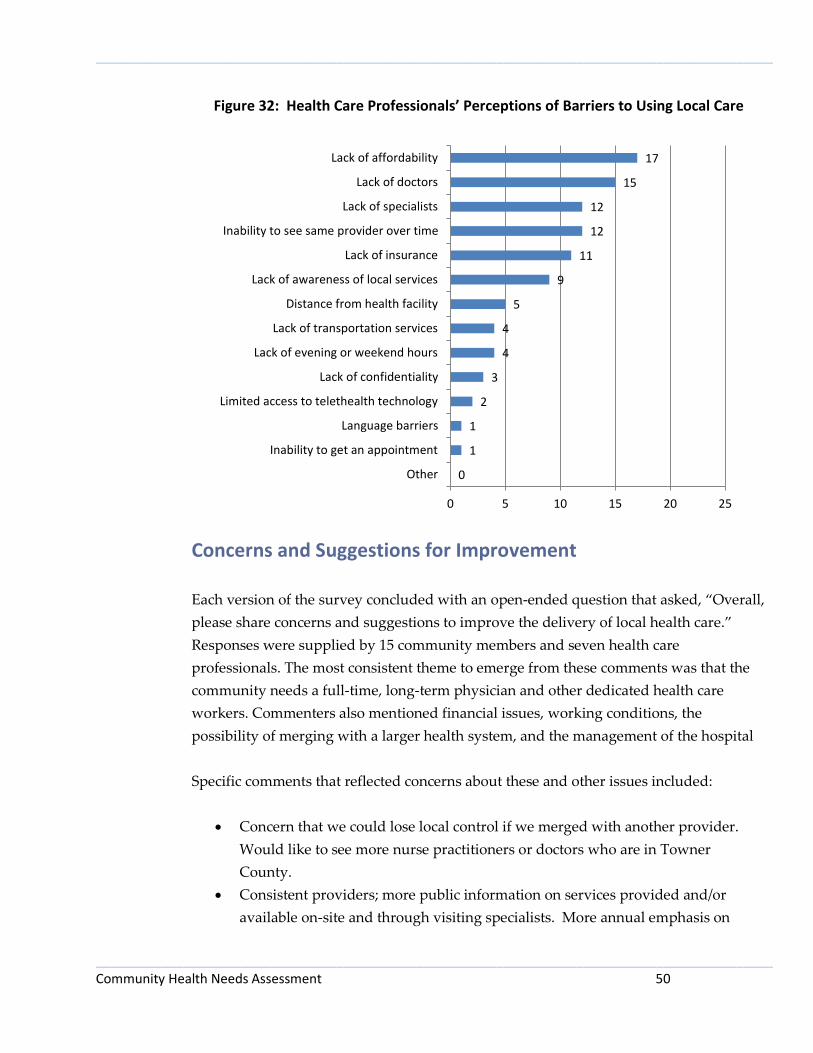
_____________________________________________________________________________________________
_____________________________________________________________________________________________ Community Health Needs Assessment 50
Figure 32: Health Care Professionals’ Perceptions of Barriers to Using Local Care
Concerns and Suggestions for Improvement
Each version of the survey concluded with an open-ended question that asked, “Overall,
please share concerns and suggestions to improve the delivery of local health care.”
Responses were supplied by 15 community members and seven health care
professionals. The most consistent theme to emerge from these comments was that the
community needs a full-time, long-term physician and other dedicated health care
workers. Commenters also mentioned financial issues, working conditions, the
possibility of merging with a larger health system, and the management of the hospital
Specific comments that reflected concerns about these and other issues included:
Concern that we could lose local control if we merged with another provider.
Would like to see more nurse practitioners or doctors who are in Towner
County.
Consistent providers; more public information on services provided and/or
available on-site and through visiting specialists. More annual emphasis on
0
1
1
2
3
4
4
5
9
11
12
12
15
17
0 5 10 15 20 25
Other
Inability to get an appointment
Language barriers
Limited access to telethealth technology
Lack of confidentiality
Lack of evening or weekend hours
Lack of transportation services
Distance from health facility
Lack of awareness of local services
Lack of insurance
Inability to see same provider over time
Lack of specialists
Lack of doctors
Lack of affordability

_____________________________________________________________________________________________
_____________________________________________________________________________________________ Community Health Needs Assessment 51
giving through foundation. Presence of providers, staff and others in the
community.
Doctors.
Getting providers who stay and are scheduled on a dependable basis. Keep
trying to bring in whatever services we can to continue bringing patients here.
Once a patient has been sent to a specialist, let them know we can follow-up that
care here-bring them back once we send them to someone else.
Having at least one full time doctor.
Having qualified doctors on staff in case of emergency.
I believe that there is an issue with higher administration. There is such a
turnover in staff there because of this, and because other businesses in Cando can
offer better pay, and better working environments.
I have confidentiality issues with some of the clinic nurses. I know (because I
have heard them myself) that they talk to outside people about others' health
conditions and share their opinions about people regarding their health issues.
I think if a new patient comes in and has no insurance they should pay at least
half the amount if not the full price.
I think merging with another facility would not be a bad idea, I have major
concerns that we may cost them too much and they shut down the facility.
I think that TCMC would be greatly improved with the access to 24/7 CT
scanning.
I think Towner County Medical Center does a good job of providing good,
accessible care.
If the viability of our clinic/hospital is in question, merging with a larger
provider to keep the doors open would be a very good thing. I don't think
people realize how much they appreciate having a clinic/hospital in the
community until it is gone. I hope this is something that never happens in this
community.
Keep trying to add new permanent providers. Provide some consistency for the
area.
Keeping a CEO for a longer period of time and keeping the same doctors in the
Cando clinic so you can go to the same physician each time would help a lot.
More genuine doctors and family nurse practitioners there to assist and help.
Need good doctors and dedicated hard working nurses.
Need more permanent doctors or physician assistants with regular working
hours, not just staff that works one day a week or month.
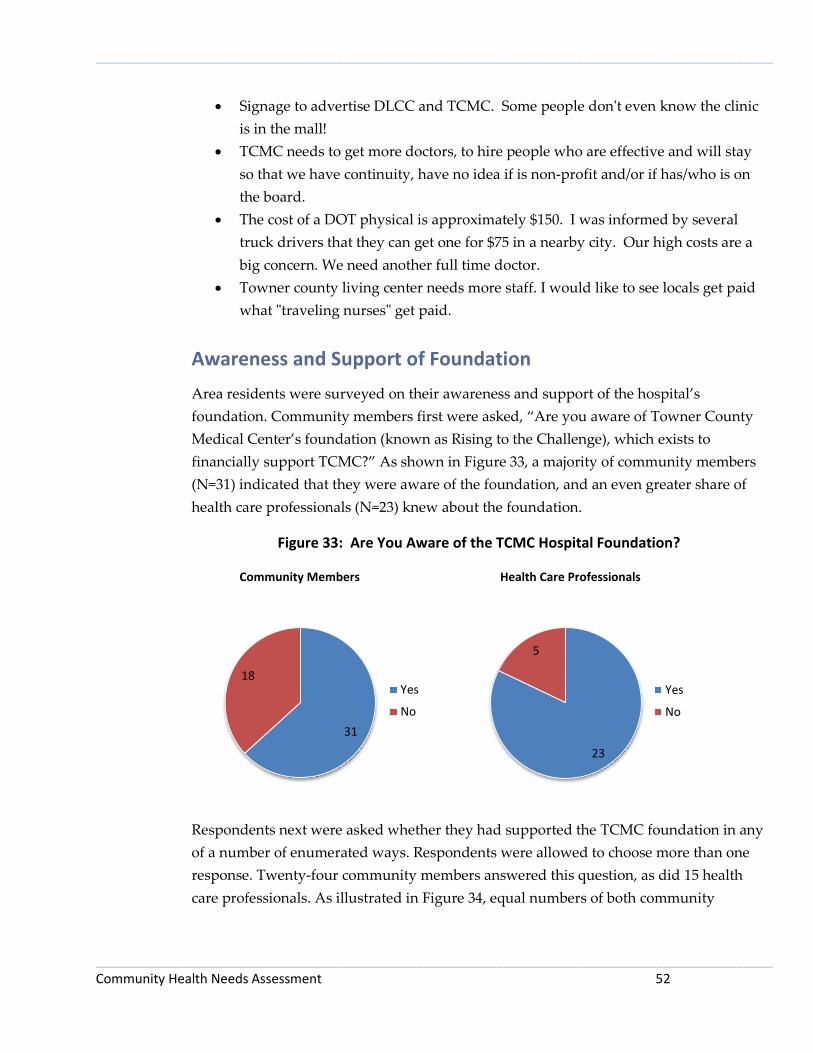
_____________________________________________________________________________________________
_____________________________________________________________________________________________ Community Health Needs Assessment 52
Signage to advertise DLCC and TCMC. Some people don't even know the clinic
is in the mall!
TCMC needs to get more doctors, to hire people who are effective and will stay
so that we have continuity, have no idea if is non-profit and/or if has/who is on
the board.
The cost of a DOT physical is approximately $150. I was informed by several
truck drivers that they can get one for $75 in a nearby city. Our high costs are a
big concern. We need another full time doctor.
Towner county living center needs more staff. I would like to see locals get paid
what "traveling nurses" get paid.
Awareness and Support of Foundation
Area residents were surveyed on their awareness and support of the hospital’s
foundation. Community members first were asked, “Are you aware of Towner County
Medical Center’s foundation (known as Rising to the Challenge), which exists to
financially support TCMC?” As shown in Figure 33, a majority of community members
(N=31) indicated that they were aware of the foundation, and an even greater share of
health care professionals (N=23) knew about the foundation.
Figure 33: Are You Aware of the TCMC Hospital Foundation?
Community Members Health Care Professionals
Respondents next were asked whether they had supported the TCMC foundation in any
of a number of enumerated ways. Respondents were allowed to choose more than one
response. Twenty-four community members answered this question, as did 15 health
care professionals. As illustrated in Figure 34, equal numbers of both community
31
18 Yes
No
23
5
Yes
No
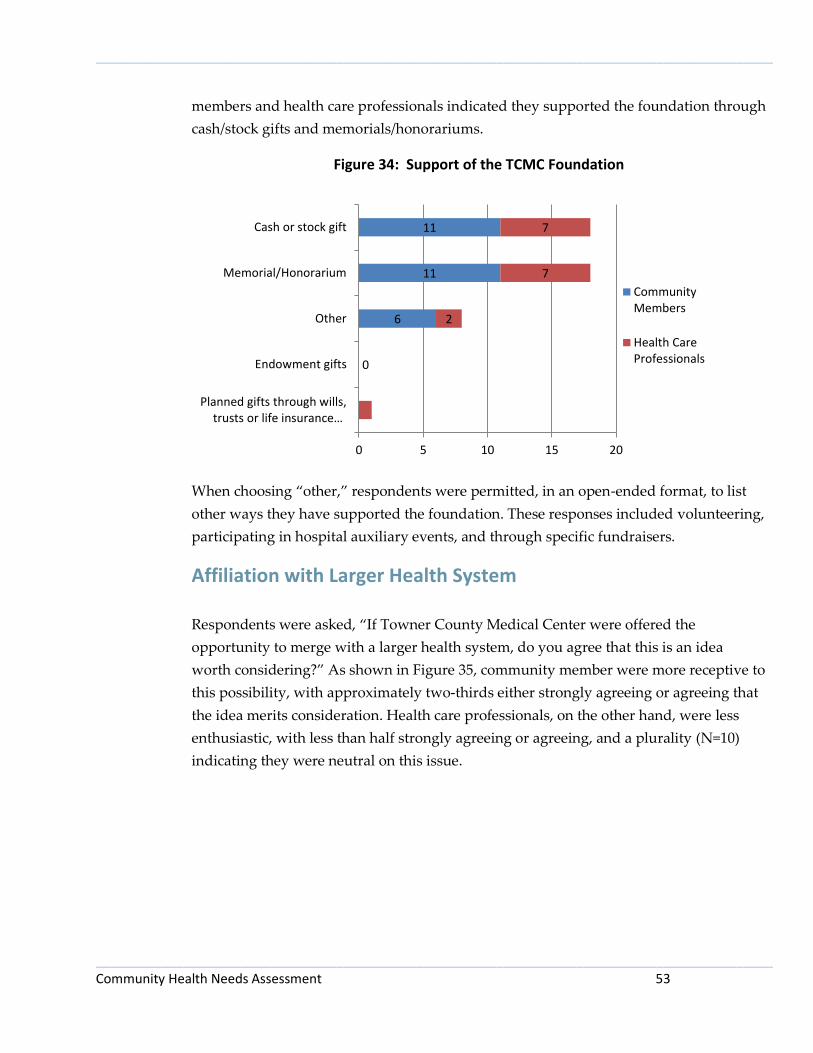
_____________________________________________________________________________________________
_____________________________________________________________________________________________ Community Health Needs Assessment 53
members and health care professionals indicated they supported the foundation through
cash/stock gifts and memorials/honorariums.
Figure 34: Support of the TCMC Foundation
When choosing “other,” respondents were permitted, in an open-ended format, to list
other ways they have supported the foundation. These responses included volunteering,
participating in hospital auxiliary events, and through specific fundraisers.
Affiliation with Larger Health System Respondents were asked, “If Towner County Medical Center were offered the
opportunity to merge with a larger health system, do you agree that this is an idea
worth considering?” As shown in Figure 35, community member were more receptive to
this possibility, with approximately two-thirds either strongly agreeing or agreeing that
the idea merits consideration. Health care professionals, on the other hand, were less
enthusiastic, with less than half strongly agreeing or agreeing, and a plurality (N=10)
indicating they were neutral on this issue.
0
6
11
11
2
7
7
0 5 10 15 20
Planned gifts through wills,trusts or life insurance…
Endowment gifts
Other
Memorial/Honorarium
Cash or stock gift
CommunityMembers
Health CareProfessionals

_____________________________________________________________________________________________
_____________________________________________________________________________________________ Community Health Needs Assessment 54
6
6 10
2
1 3
Health Care Professionals
Strongly Agree
Agree
Neutral
Disagree
Strongly Disagree
Don't Know
Figure 35: Do You Agree that TCMC’s Merger with a Larger Health System is an Idea
Worth Considering?
Collaboration
Respondents were asked whether Towner County Medical Center could improve its
levels of collaboration with other local entities, such as schools, economic development
organizations, local businesses and industry, public health, other providers, and
hospitals in other cities. Of the three answer choices (“Yes,” “No, it’s fine as is,” “Don’t
know”), both community members and health care professionals were more likely to
choose “Yes” than “No, it’s fine as it is” – in some cases by fairly substantial margins –
with respect all categories of potential collaborators. Community members were most
likely to see a need for collaboration between TCMC and hospitals and clinics in other
cities, other local health providers, and local job and economic development
organizations. Health care professionals saw the most need for collaboration with local
job and economic development organizations, hospitals and clinics in other cities, and
public health. Figures 36 and 37 illustrate these results.
11
22
9
3
1 4
Community Members
StronglyAgreeAgree
Neutral
Disagree
StronglyDisagreeDon't Know

_____________________________________________________________________________________________
_____________________________________________________________________________________________ Community Health Needs Assessment 55
Figure 36: Community Members – Could Towner County Medical Center Improve
Collaboration?
Figure 37: Health Care Professionals – Could Towner County Medical Center Improve
Collaboration?
Community Assets
Both community members and health care professionals were asked what they
perceived as the best things about their community in five categories: people, services
and resources, quality of life, geographic setting, and activities. In each category,
respondents were given a list of choices and asked to pick the top three. Respondents
occasionally chose less than three or more than three choices within each category. The
results indicate that residents view as community assets (those items garnering more
than 50 responses) things such as friendly and helpful people, quality schools and youth
programs, health care, a family-friendly environment, safety and safe places to live, and
22
24
27
28
28
30
16
9
9
8
11
13
9
13
11
10
9
7
0 20 40 60
Public Health
Schools
Business and industry
Local job/economic development
Other local health providers
Hospitals and clinics in other cities
Yes
No, it's fine as is
Don't know
12
13
14
14
15
18
10
7
9
9
9
6
4
6
3
3
2
2
0 10 20 30
Schools
Business and industry
Other local health providers
Public Health
Hospitals and clinics in other cities
Local job/economic development
Yes
No, it's fine as is
Don't know

_____________________________________________________________________________________________
_____________________________________________________________________________________________ Community Health Needs Assessment 56
the relatively small size and scale of the community. Figures 38 to 42 illustrate the
results of these questions.
Figure 38: Best Things about the PEOPLE in Your Community
Figure 39: Best Things about the SERVICES AND RESOURCES in Your Community
2
6
7
11
14
19
28
42
6
4
0
5
8
9
20
24
0 20 40 60 80 100
Tolerance, inclusion, open-mindedness
Sense that you can make a difference -government is accessible
Other
Forward-thinking ideas (e.g. social values,government)
Community is socially and culturallydiverse and/or becoming more diverse
People aware of/engaged in social, civic,or political issues
Sense of community/feeling connectedto people who live here
People are friendly, helpful, supportive
CommunityMembers
Health CareProfessionals
4
6
7
8
10
15
34
38
2
3
1
4
6
8
24
18
0 20 40 60 80 100
Restaurants and food
Downtown and shopping
Other
Academic opportunities andinstitutions
Transportation
Public services and amenities
Health care
Quality school systems/educationalinstitutions/youth programs
CommunityMembers
Health CareProfessionals

_____________________________________________________________________________________________
_____________________________________________________________________________________________ Community Health Needs Assessment 57
Figure 40: Best Things about the QUALITY OF LIFE in Your Community
Figure 41: Best Things about the GEOGRAPHIC SETTING of Your Community
0
0
3
27
30
35
42
1
0
3
10
16
21
25
0 20 40 60 80 100
Other
Hustle and bustle of oil patch
Economic/employment opportunities
Informal, simple, laidback lifestyle
Healthy place to live
Safety and safe places to live, little/nocrime
Family-friendly environment; good placeto raise kids
CommunityMembers
Health CareProfessionals
0
2
9
11
11
22
24
29
37
0
4
2
5
1
13
17
18
22
0 20 40 60 80 100
Other
Waterfront, rivers, lakes, and/or beaches
Mix of rural and city areas
General beauty of environment and/orscenery
Climate and seasons
Natural setting: outdoors and nature
General proximity to work and activities(e.g., short commute, convenient access)
Cleanliness of area (e.g., fresh air, lack ofpollution and litter)
Relatively small size and scale ofcommunity
CommunityMembers
Health CareProfessionals
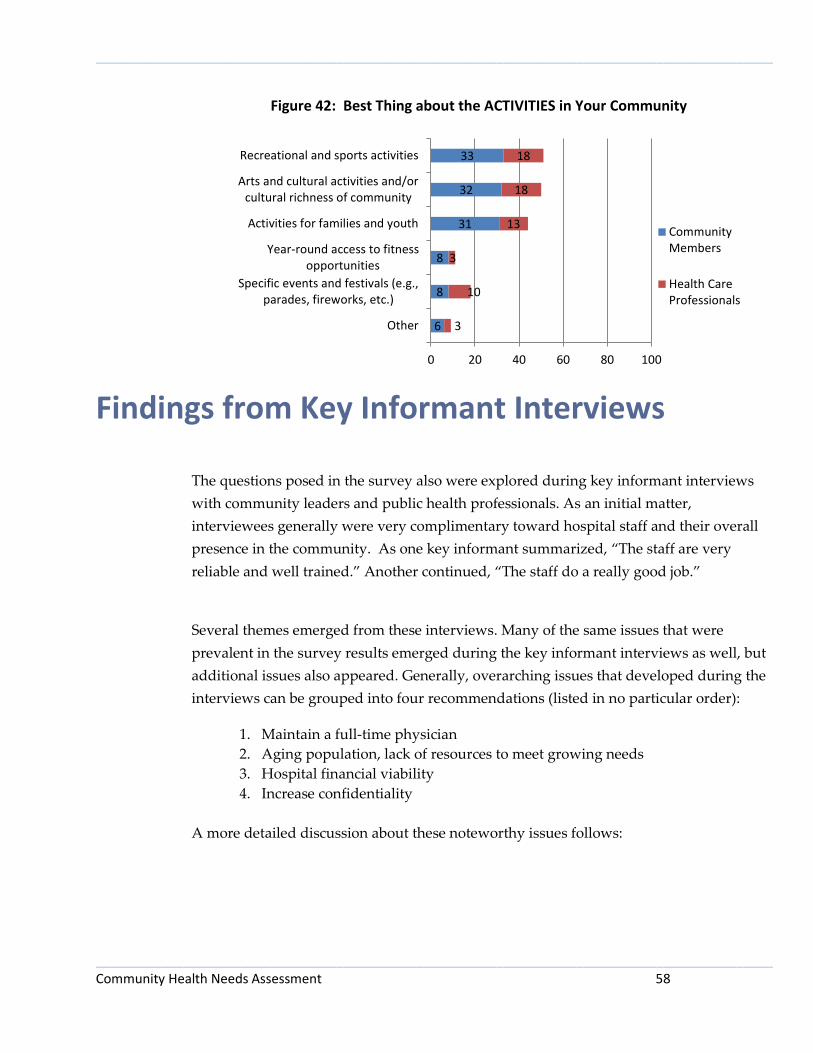
_____________________________________________________________________________________________
_____________________________________________________________________________________________ Community Health Needs Assessment 58
Figure 42: Best Thing about the ACTIVITIES in Your Community
Findings from Key Informant Interviews The questions posed in the survey also were explored during key informant interviews
with community leaders and public health professionals. As an initial matter,
interviewees generally were very complimentary toward hospital staff and their overall
presence in the community. As one key informant summarized, “The staff are very
reliable and well trained.” Another continued, “The staff do a really good job.”
Several themes emerged from these interviews. Many of the same issues that were
prevalent in the survey results emerged during the key informant interviews as well, but
additional issues also appeared. Generally, overarching issues that developed during the
interviews can be grouped into four recommendations (listed in no particular order):
1. Maintain a full-time physician
2. Aging population, lack of resources to meet growing needs
3. Hospital financial viability
4. Increase confidentiality
A more detailed discussion about these noteworthy issues follows:
6
8
8
31
32
33
3
10
3
13
18
18
0 20 40 60 80 100
Other
Specific events and festivals (e.g.,parades, fireworks, etc.)
Year-round access to fitnessopportunities
Activities for families and youth
Arts and cultural activities and/orcultural richness of community
Recreational and sports activities
CommunityMembers
Health CareProfessionals

_____________________________________________________________________________________________
_____________________________________________________________________________________________ Community Health Needs Assessment 59
1. Maintain a full-time physician
A majority of respondents expressed concern about the lack of continuity of care with
their primary care physician. The inconsistency of health care providers has negatively
impacted patients as they may be more likely to travel elsewhere to have the assurance
of a regular provider. As one participant expressed, “You see a different person every
time you have a need.”
Respondents expressed that the inability to keep a doctor on staff creates larger
problems. Residents can’t make a relationship with the doctor and the high turnover
rate results in a lack of trust. Additionally, people may avoid care because they don’t
know which provider they may get. It was reported that some residents “drag their feet”
or delay care because they don’t know the provider. The uncertainty of who a patient
may see on a particular day creates fear, which is especially problematic for elderly
patients. Older patients are also reported to not feel comfortable seeing a Physician
Assistant (PA). They want to see “a real doctor” and they are willing to travel outside of
Cando to do so. There also is a perception that mid-level health care providers like PAs
do not feel comfortable treating serious health conditions and will issue a referral.
Patients may skip seeing the local provider altogether if they know that traveling will be
the end result.
While residents are aware that recruiting a doctor in a small town is difficult, there was a
strong desire for the stability of a full time physician. Some interviewees were unsure if
TCMC even had a physician on staff or on an everyday basis. One commented, “there
are no doctors.” Some respondents said that TCMC did have a physician but explained
that he wanted to retire. To keep public informed of new services and changes, it was
recommended that TCMC advertise in the local newspaper.
Along the lines of maintaining a full time physician was the request to retain people in
interim positions. In addition to continuity in physicians, a desire also was expressed for
continuity with respect to those in leadership roles.
2. Aging population, lack of resources to meet growing needs
Respondents were well aware of the aging population in Towner County. An elderly
population has unique health care needs that interviewees tapped into such as
transportation services. Senior residents need specialized treatment for which they have
to travel outside of the community to receive, and obtaining transportation is

_____________________________________________________________________________________________
_____________________________________________________________________________________________ Community Health Needs Assessment 60
problematic for some. Another concern was that the nursing home doesn’t have the
ability to care for those with Alzheimer’s. Finally, respondents suggested that programs
that cater to the elderly like Meals on Wheels need to be expanded to the surrounding
communities.
3. Hospital financial viability
Appreciation for the hospital was repeatedly expressed. The hospital is perceived as a
huge community asset, valued both for its economic impact as well as its health services.
It is perceived as key to vitality in the community in terms of opportunities for
employment, growth and the future. Some specific comments attesting to this value are:
Great for the city—lots of jobs.
Strong community commitment.
Hometown touch care—superior care and service.
Makes you feel secure to have care here.
Rural hospitals are so important; we are so fortunate.
Hospital is key to vitality in community.
Because of the importance people place on the hospital there is grave concern about its
financial viability. There is a large concern that the hospital cannot make ends meet.
Along with that concern comes the fear that the hospital will close and a large number of
employment opportunities will be lost.
4. Increase confidentiality
There is a community perception that TCMC is not a good place to work nor a good
employer, which has caused a high turnover rate amongst health care providers. There
is some animosity towards the hospital pertaining to what is perceived as its sub-par
facility and inadequate service. Rumors have spread that the hospital has run off doctors
and even though the rumors may be false, one respondent commented “they might as
well be true as they hold a lot of stock in a small town.” Breaches in confidentiality
among staff were mentioned as well as the high visibility of seeking services in a small
town. As one respondent said, “everyone knows if you are there.” It was urged that the
staff needs to limit “gossiping” and increase confidentiality. There also is a perception
that TCMC charges more, billing at a higher level than other facilities for the same
services.

_____________________________________________________________________________________________
_____________________________________________________________________________________________ Community Health Needs Assessment 61
Additional Issues
An theme that emerged from the interviews was a consensus on adding local
dentistry services. When asked what specific services to you think TCMC needs
to add, dental services was the leading response.
The availability of child care also was deemed as inadequate. There is a need for
more evening child care, especially for single mothers who work nights.
A very specific request was made to fix the outside door. A new air seal is
needed as the door is too heavy to open.
Priority of Health Needs
The Community Group, consisting of 17 members, met on June 17, 2013. While the
community at large was invited to attend the meeting, most of the group members were
employees of TCMC. A representative from the Center for Rural Health presented the
group with a summary of this report’s findings, including background and explanation
about the secondary data, highlights from the results of the survey (including perceived
community health and community concerns, why patients seek care at TCMC,
community collaboration, and barriers to care), and findings from key informant
interviews.
Following the presentation of the assessment findings, and after careful consideration of
and discussion about the findings, all members of the group were asked to identify on a
ballot what they perceived as the top five community health needs. Group members
were advised they could consider a number of criteria when prioritizing needs, such as a
need’s burden, scope, severity, or urgency, as well as disparities associated with the
need and the overall importance the community places on addressing the need. The
results were totaled, and the concerns most often cited were:
Financial viability of the hospital (14 votes)
Access to needed technology and equipment (9 votes)
Elevated rate of diabetics (8 votes)
Elevated rate of uninsured residents (8 votes)
Lack of a stable, full-time physician (8 votes)
Based on the Community Group’s feedback about the prioritization of community
health needs, the needs were categorized into four groups: those receiving eight or
more votes (listed above), those receiving three to seven votes, those receiving one or

_____________________________________________________________________________________________
_____________________________________________________________________________________________ Community Health Needs Assessment 62
two votes, and those receiving no votes. A summary of this prioritization may be found
in Appendix H.
Summary
This study took into account input from approximately 110 community members and
health care professionals from the area served by Towner County Medical Center. This
input represented the broad interests of the community. Together with secondary data
gathered from a wide range of sources, the information gathered presents a snapshot of
health needs and concerns in the community.
An analysis of secondary data reveals that a large part of the Towner County Medical
Center service area – Towner and Ramsey counties – has a higher percentage of adults
over the age of 65 than the state average and higher median age than the state median,
with nearly one in four residents aged 65 or older in Towner County, and nearly one in
five residents aged 65 or older in Ramsey County. This likely indicates increased need
for medical services to attend to an aging population. The area is very rural: While
North Dakota has an average of 9.7 people per square mile, Towner County has on
average only 2.2 people per square mile and Benson County has on average 4.8 people
per square mile.
The data compiled by County Health Rankings show that with respect to health
outcomes, Towner County was generally faring favorably when compared to the rest of
North Dakota, except in terms of diabetes. Benson and Ramsey counties, on the other
hand, were generally faring poorly as compared to other North Dakota counties. An
examination of health factors, which include health behaviors, clinical care measures,
and physical environment, revealed several patterns in the region. All three counties
were performing worse than the state averages in terms of the rates of physical inactivity
of the counties’ residents and the number of uninsured residents. Benson and Ramsey
counties were performing worse than the state averages on a large number of the
measures, while Towner County was performing somewhat better.
In Towner County, where TCMC is based, the county was not measuring up to the state
averages with respect to physical activity, level of uninsured residents, diabetic
screening, limited access to healthy foods, and access to recreational facilities. Of these
measures, the gap between the county rate and the state average was most pronounced
in terms of uninsured residents, limited access to healthy foods, and access to
recreational facilities. The number of uninsured residents in Towner County was nearly

_____________________________________________________________________________________________
_____________________________________________________________________________________________ Community Health Needs Assessment 63
50% higher than the state average. On the positive side, the county was scoring in the
top 10% of counties nationally on the measures of adult smoking, preventable hospital
stays, mammography screening, and the prevalence of fast food restaurants.
Results from the survey revealed that among community members the top four
community health concerns were: (1) financial viability of the hospital, (2) higher costs
of health care for consumers, (3) having adequate numbers of health care providers and
specialists, and (4) not enough health care staff in general. Health care professionals
agreed with community members as far as ranking the top three community health
concerns. Health care professionals slotted in the fourth position access to needed
technology and equipment.
When asked about potential broader community needs, community members and health
care professionals were in alignment on three of the top four concerns, although not
necessarily in the same order. Community members ranked as their top four concerns:
(1) maintaining enough health care workers, (2) insufficient facilities for exercise and
well-being, (3) aging population/lack of resources to meet growing needs, and (4) low
wages/lack of livable wages. Health care professionals’ top community concerns were:
(1) insufficient facilities for exercise and well-being, (2) lack of employees to fill
positions, (3) maintaining enough health care workers, and (4) low wages/lack of livable
wages.
The survey also revealed generally good awareness of locally available health care
services and that residents choose to receive care locally due to convenience, loyalty to
local service providers, proximity, and familiarity with providers. Residents travel out of
the area for service primarily for access to necessary specialists and because of perceived
high quality care.
Input from Community Group members and community leaders provided via key
informant interviews echoed many of the concerns raised by survey respondents.
Thematic concerns emerging from these interviews were (1) maintaining a full-time
physician, (2) aging population and a lack of resources to meet growing needs, (3) the
financial viability of the hospital, and (4) a need for increased confidentiality.
Following careful consideration of the results and findings of this assessment,
Community Group members determined that the top health needs or issues in the
community are the financial viability of the hospital, access to needed technology and
equipment, elevated rate of diabetics, elevated rate of uninsured residents, and the lack
of a stable, full-time physician.

_____________________________________________________________________________________________
_____________________________________________________________________________________________ Community Health Needs Assessment 64
Appendix A1 – Community Member Survey Instrument

_____________________________________________________________________________________________
_____________________________________________________________________________________________ Community Health Needs Assessment 65

_____________________________________________________________________________________________
_____________________________________________________________________________________________ Community Health Needs Assessment 66

_____________________________________________________________________________________________
_____________________________________________________________________________________________ Community Health Needs Assessment 67
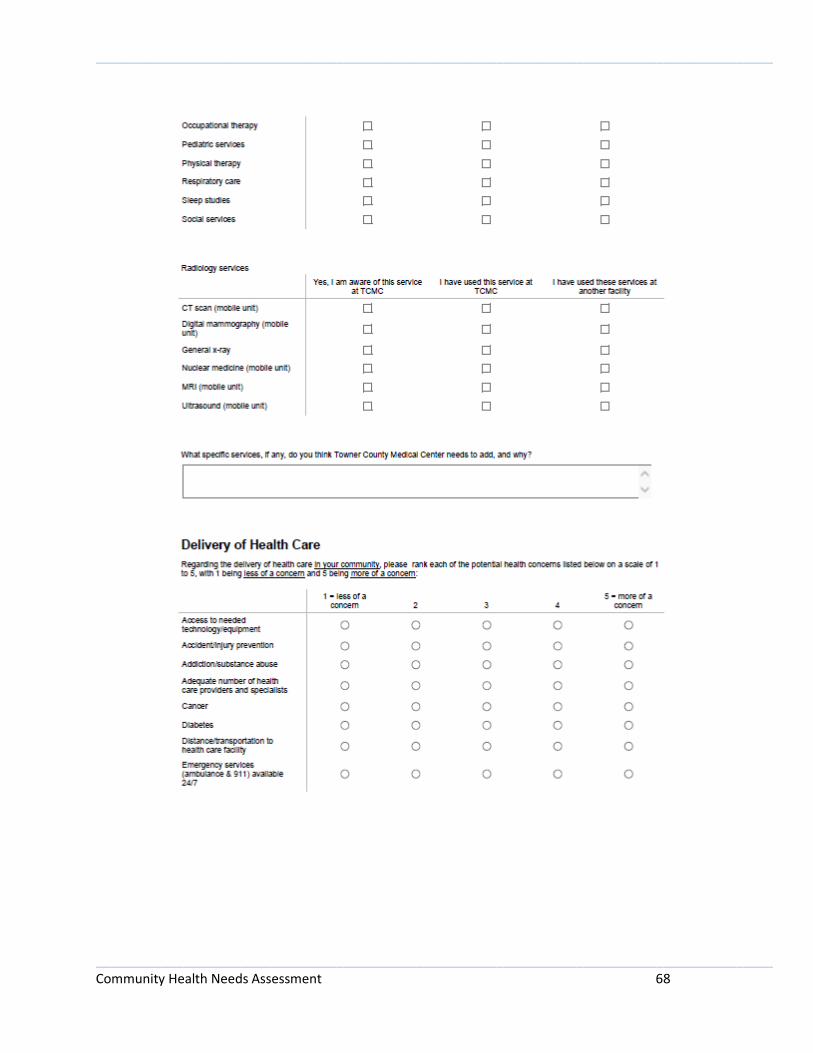
_____________________________________________________________________________________________
_____________________________________________________________________________________________ Community Health Needs Assessment 68

_____________________________________________________________________________________________
_____________________________________________________________________________________________ Community Health Needs Assessment 69

_____________________________________________________________________________________________
_____________________________________________________________________________________________ Community Health Needs Assessment 70
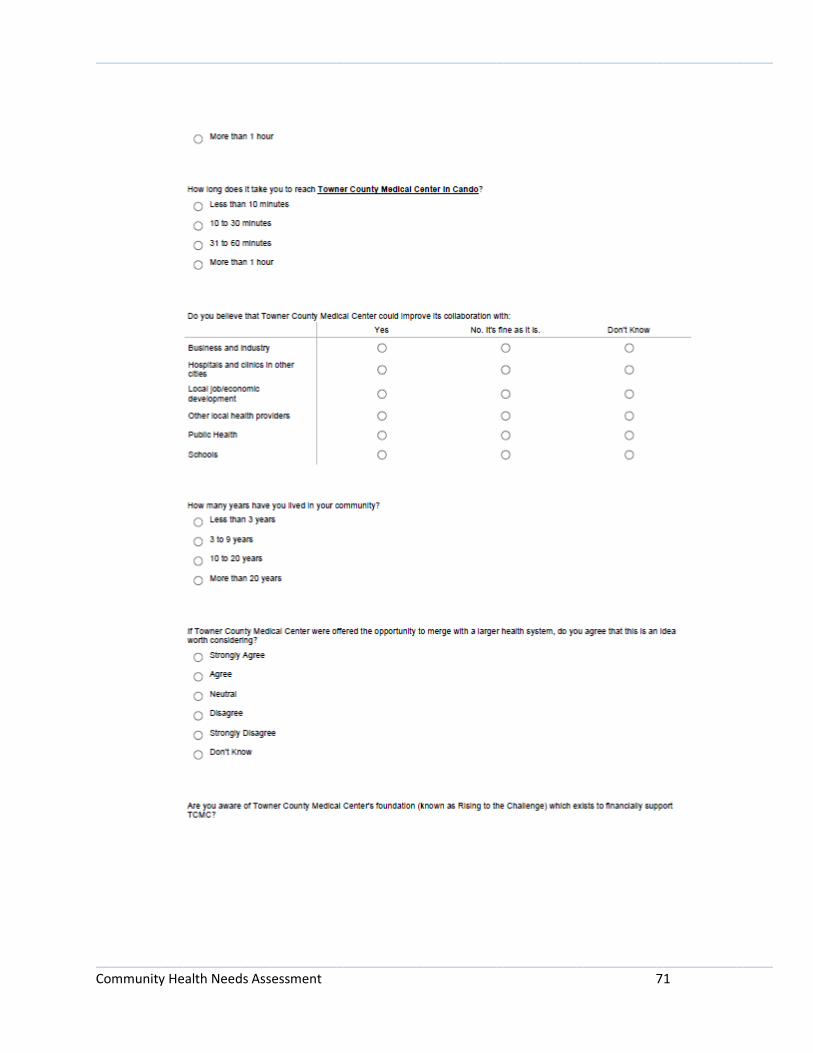
_____________________________________________________________________________________________
_____________________________________________________________________________________________ Community Health Needs Assessment 71
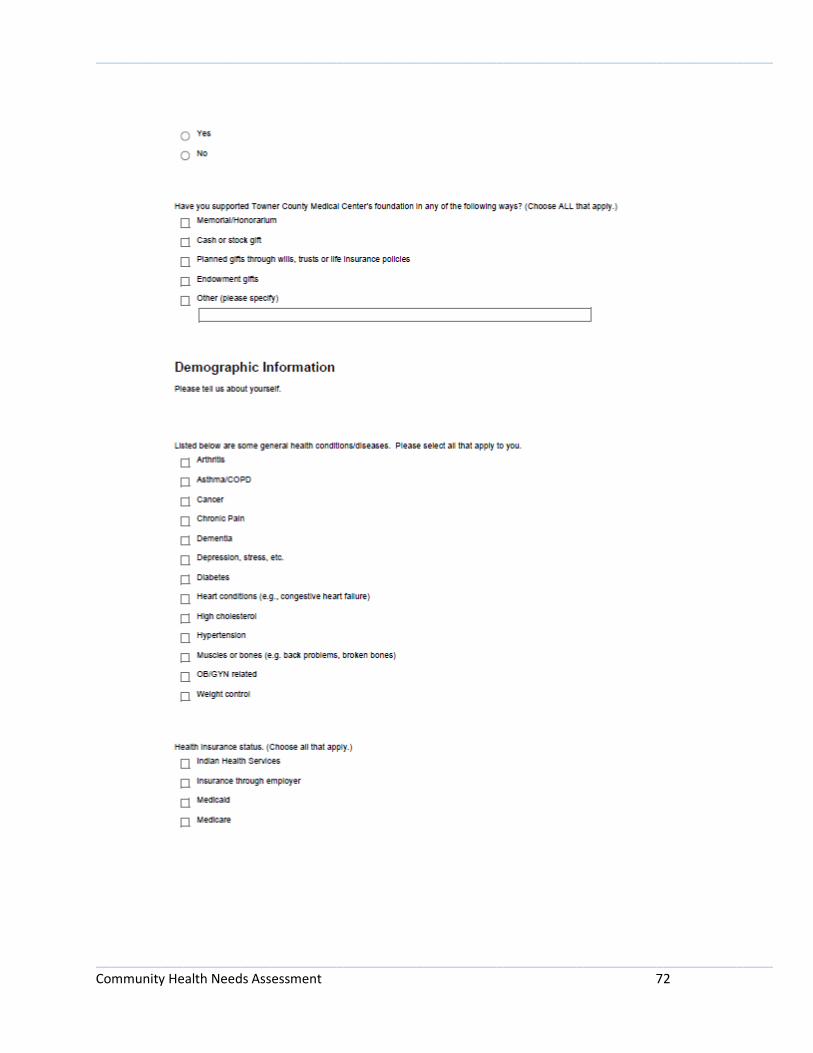
_____________________________________________________________________________________________
_____________________________________________________________________________________________ Community Health Needs Assessment 72
_____________________________________________________________________________________________
_____________________________________________________________________________________________ Community Health Needs Assessment 73

_____________________________________________________________________________________________
_____________________________________________________________________________________________ Community Health Needs Assessment 74
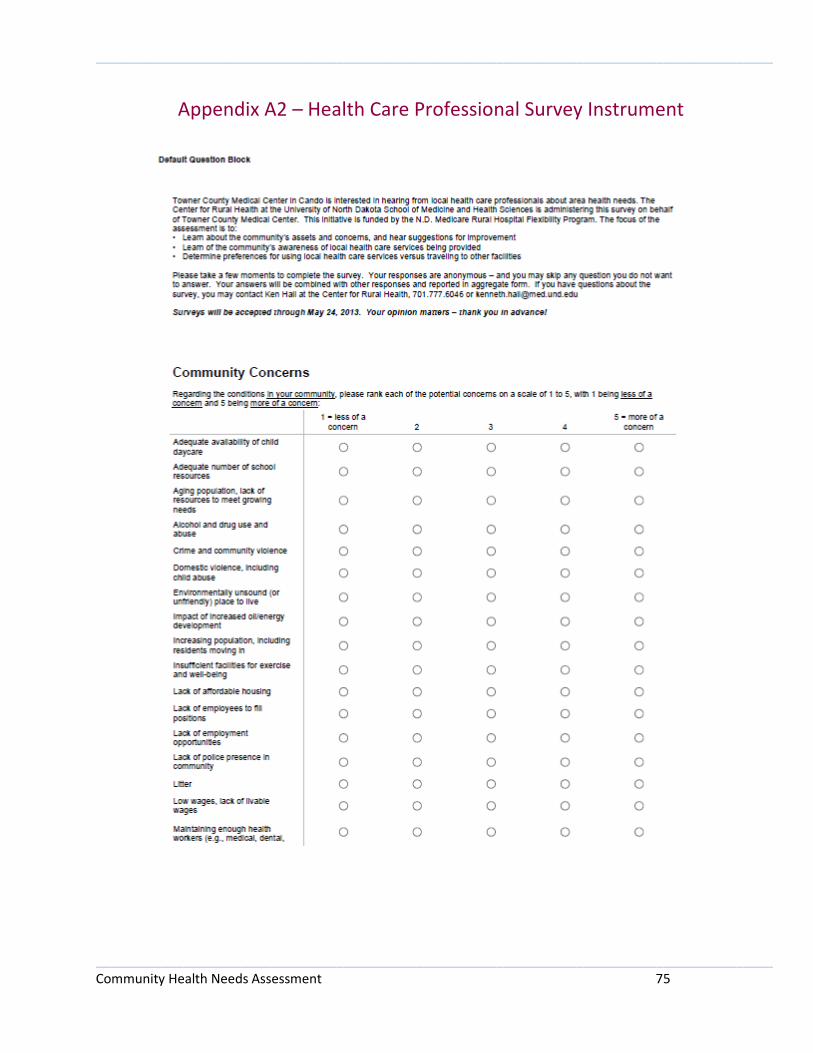
_____________________________________________________________________________________________
_____________________________________________________________________________________________ Community Health Needs Assessment 75
Appendix A2 – Health Care Professional Survey Instrument
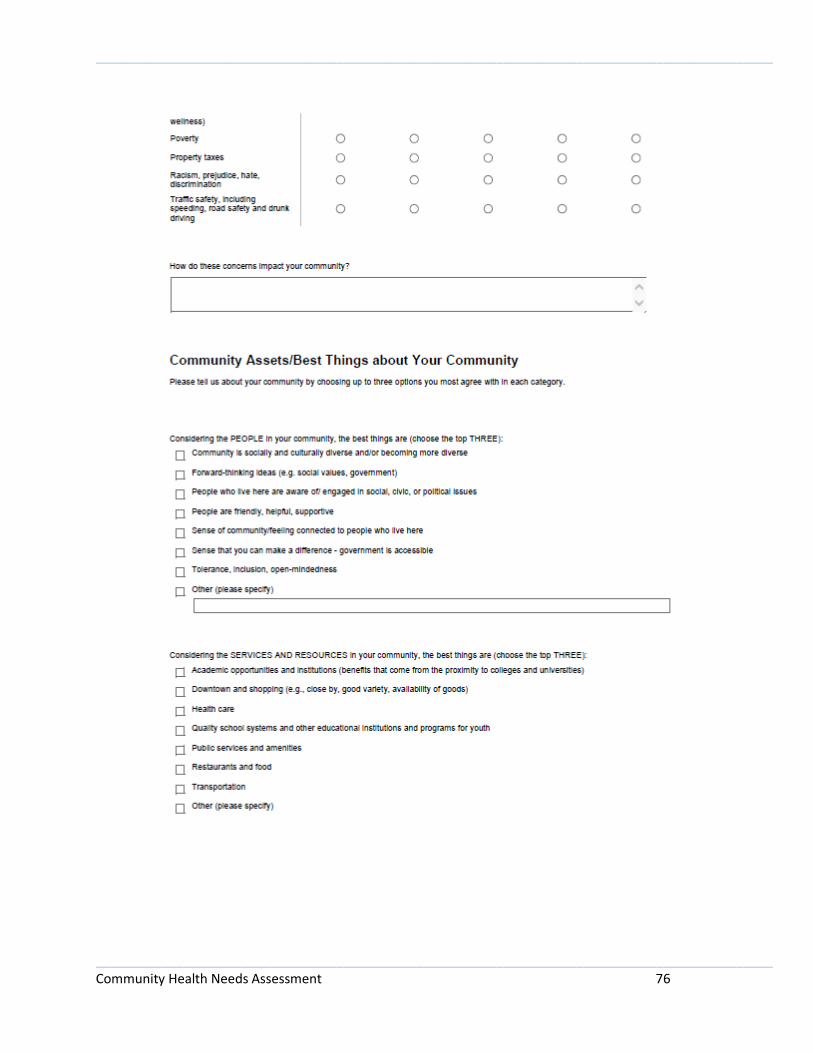
_____________________________________________________________________________________________
_____________________________________________________________________________________________ Community Health Needs Assessment 76
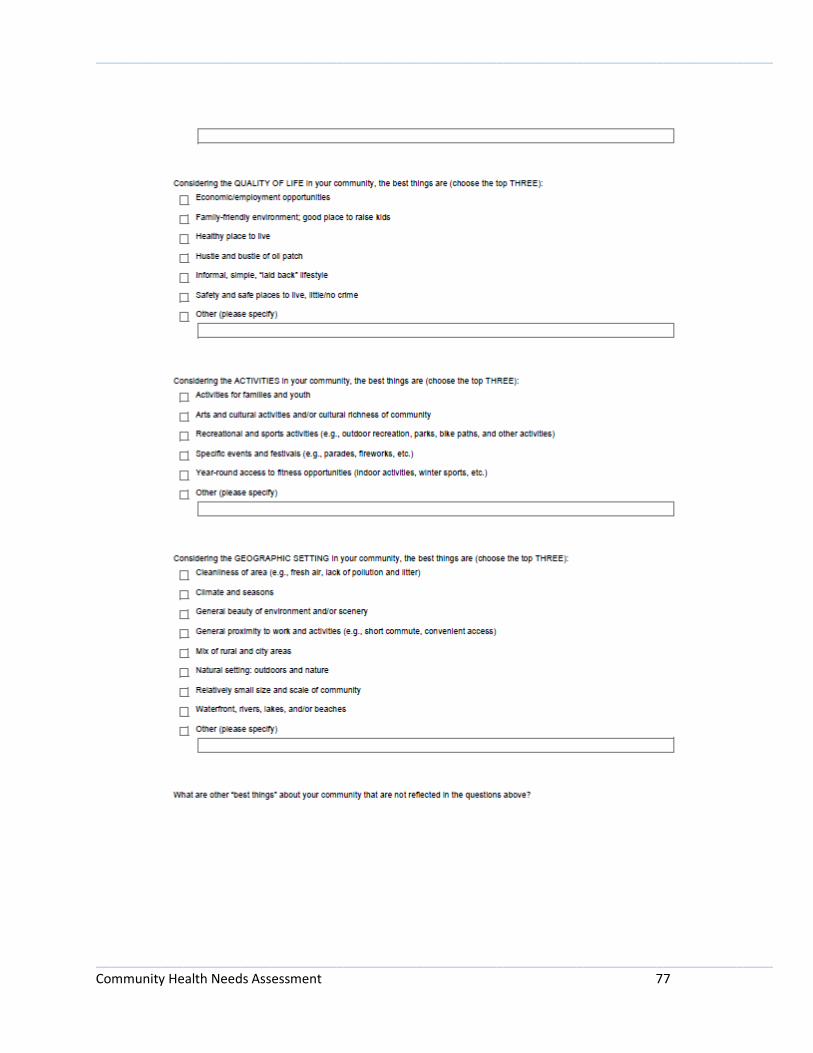
_____________________________________________________________________________________________
_____________________________________________________________________________________________ Community Health Needs Assessment 77
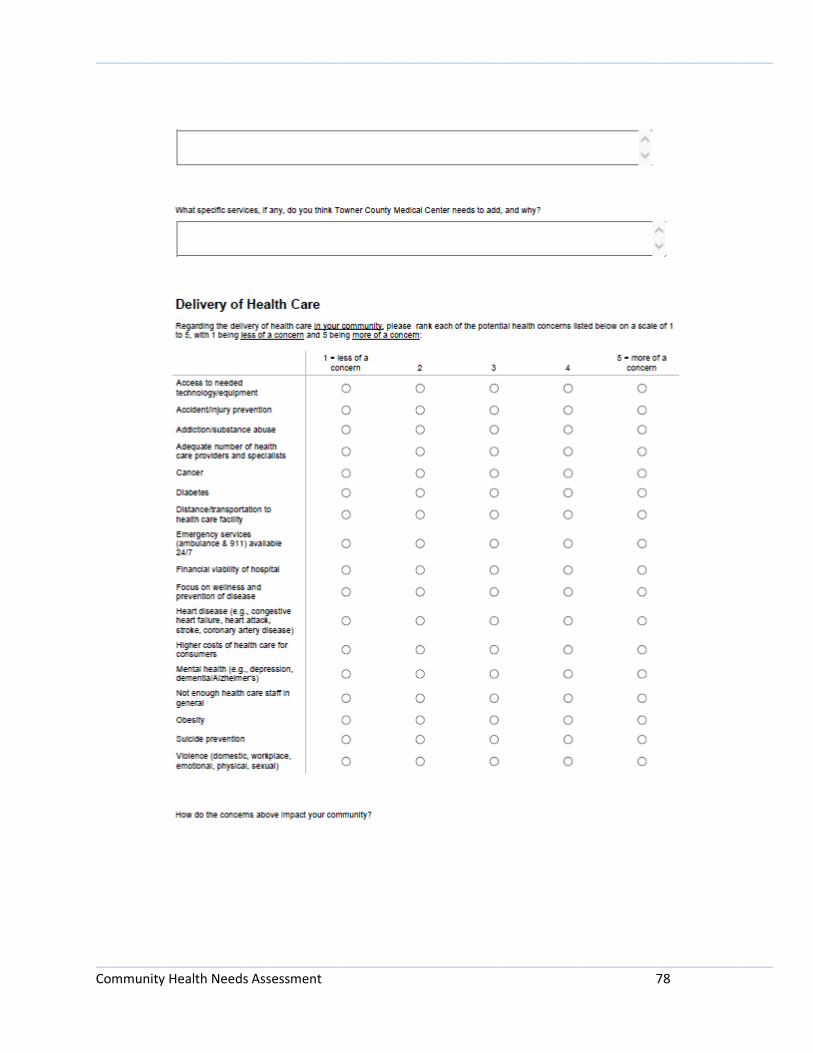
_____________________________________________________________________________________________
_____________________________________________________________________________________________ Community Health Needs Assessment 78

_____________________________________________________________________________________________
_____________________________________________________________________________________________ Community Health Needs Assessment 79
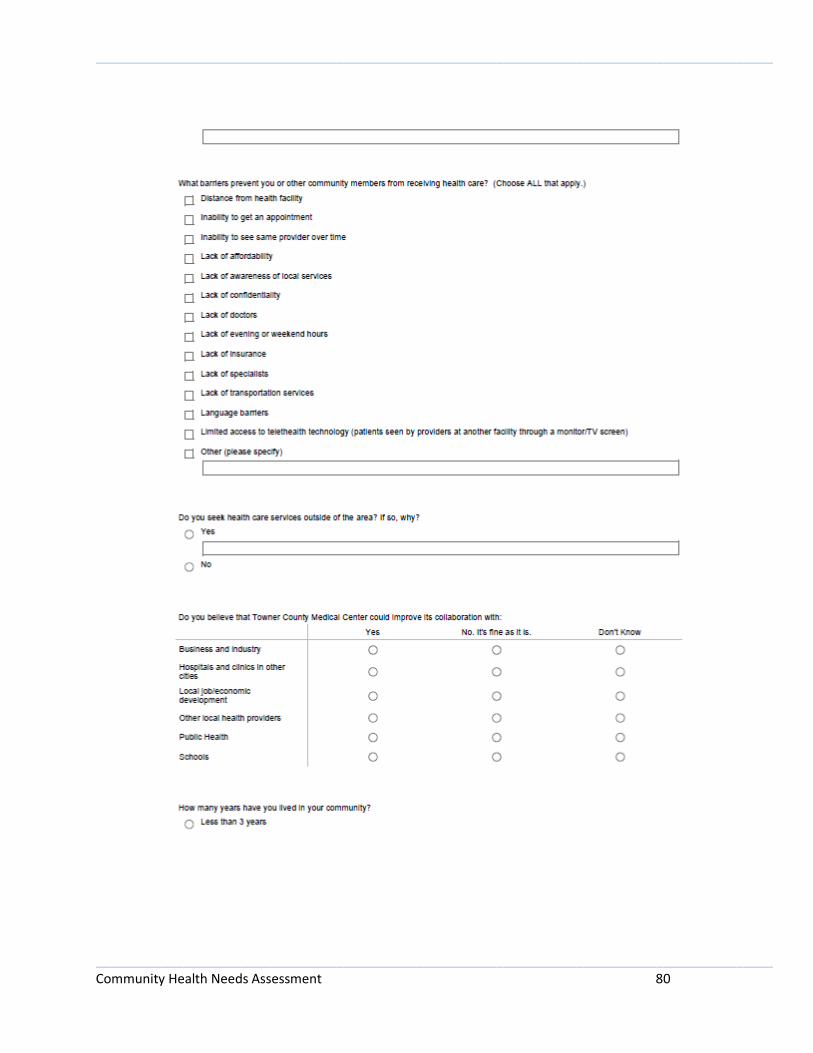
_____________________________________________________________________________________________
_____________________________________________________________________________________________ Community Health Needs Assessment 80
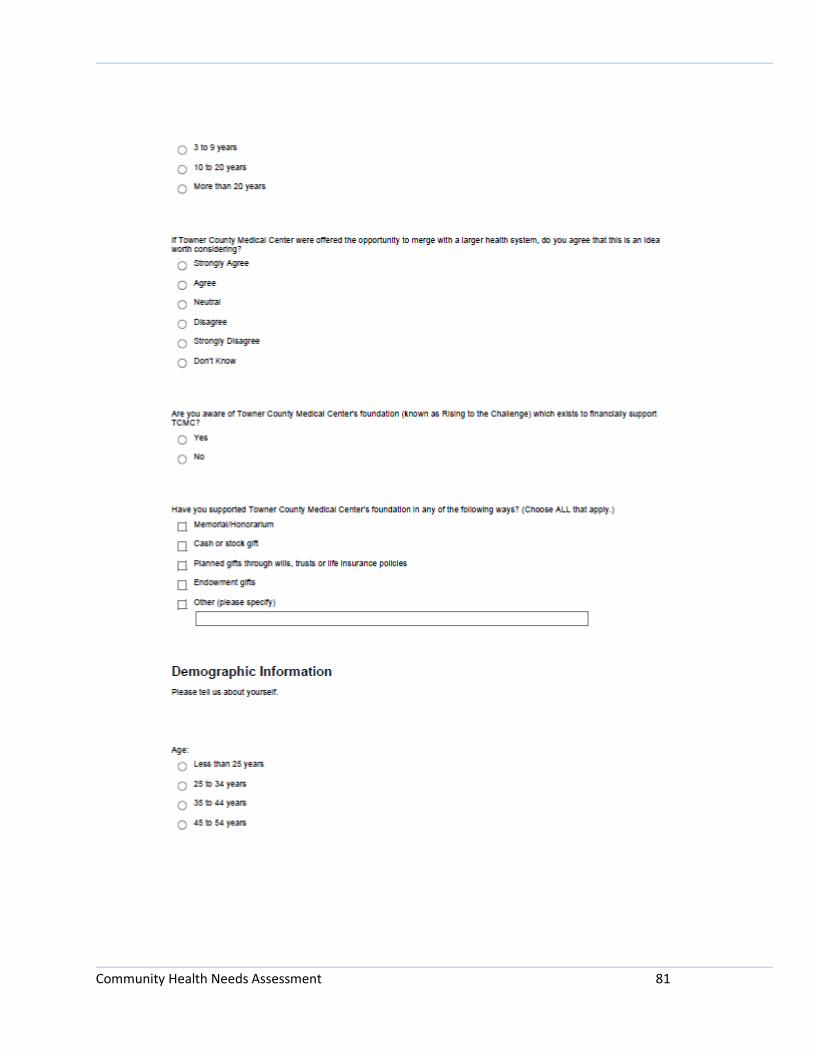
_____________________________________________________________________________________________
_____________________________________________________________________________________________ Community Health Needs Assessment 81

_____________________________________________________________________________________________
_____________________________________________________________________________________________ Community Health Needs Assessment 82

_____________________________________________________________________________________________
_____________________________________________________________________________________________ Community Health Needs Assessment 83

_____________________________________________________________________________________________
_____________________________________________________________________________________________ Community Health Needs Assessment 84
Appendix B – Community Group Members and Key Informants
NAME TITLE ORGANIZATION
Kim Belzer Board member TCEDC
Cyndi Bennington Director Lakes Social Service District
Brad Bergdahl Board member TCEDC
Nancy Baerwald Vice President CountyBank USA
Lori Dunham Vice President First State Bank of Cando
Rosemary Goeser Medical records TCMC
Heidi Halverson RN TCMC
Michael Halverson Maintenance director TCMC
Tabitha Halvorson Lab supervisor TCMC
Ruth Ann Held Pharmacist TCMC
Pat Klingenberg Human resources TCMC
Nicki Kvislen Housekeeping supervisor TCMC
Carol Lang LPN TCMC
Tammy Larson Chief Financial Officer TCMC
Jeff Miller Farmer
Ivan Mitchell Chief Executive Officer TCMC
Lori Murchie Nutrition services director TCMC
Darrin Roberts Towner County Deputy
Sheriff
Towner County Sheriff’s Office
Charlene Ryan Chief Nursing Officer TCMC
Lynette Shock Clinic nursing manager TCMC
Robin Spencer Reception supervisor TCMC
Sherry Walters Executive Director Towner County Public Health
District
Bonnie Weaver Pastor Cando Lutheran Church
Nadine Weippert Business office manager TCMC
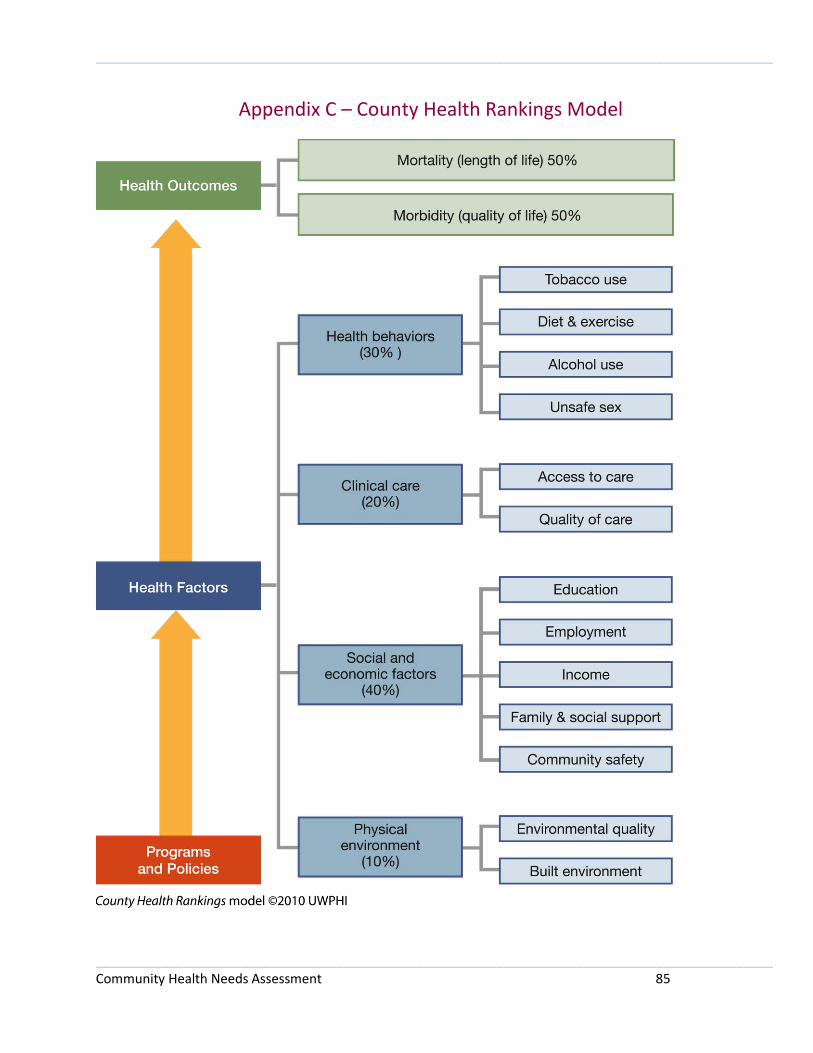
_____________________________________________________________________________________________
_____________________________________________________________________________________________ Community Health Needs Assessment 85
Appendix C – County Health Rankings Model
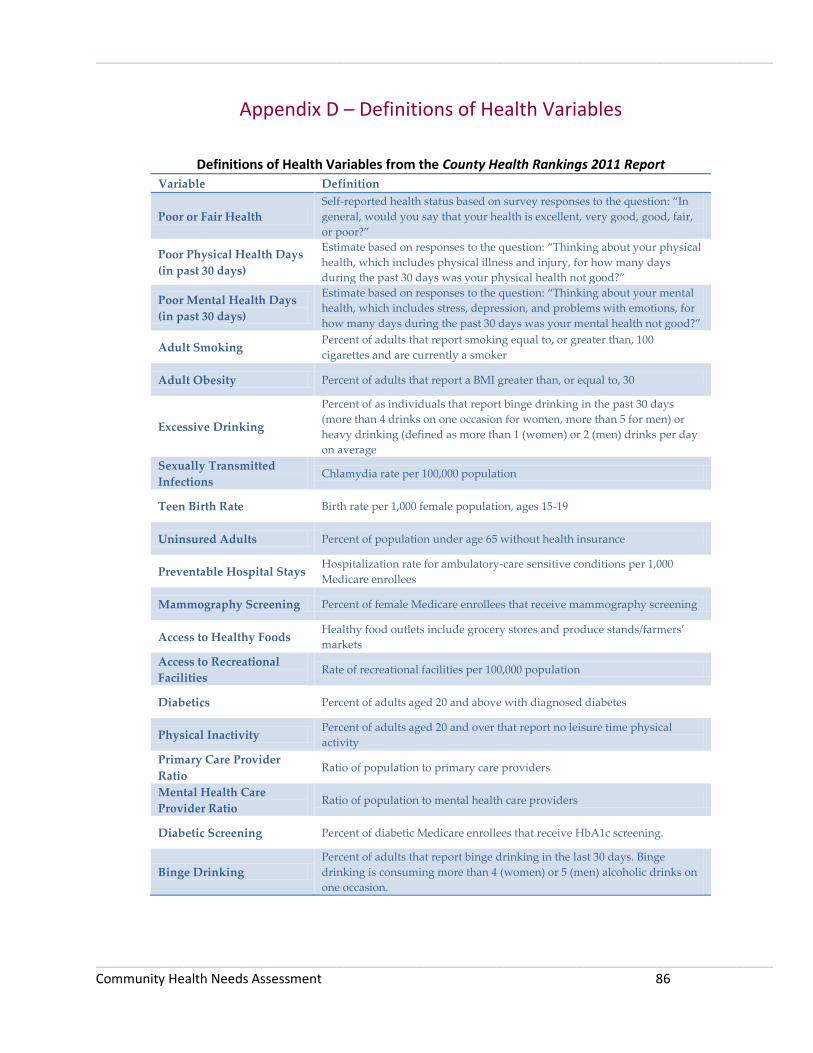
_____________________________________________________________________________________________
_____________________________________________________________________________________________ Community Health Needs Assessment 86
Appendix D – Definitions of Health Variables
Definitions of Health Variables from the County Health Rankings 2011 Report
Variable Definition
Poor or Fair Health
Self-reported health status based on survey responses to the question: “In
general, would you say that your health is excellent, very good, good, fair,
or poor?”
Poor Physical Health Days
(in past 30 days)
Estimate based on responses to the question: “Thinking about your physical
health, which includes physical illness and injury, for how many days
during the past 30 days was your physical health not good?”
Poor Mental Health Days
(in past 30 days)
Estimate based on responses to the question: “Thinking about your mental
health, which includes stress, depression, and problems with emotions, for
how many days during the past 30 days was your mental health not good?”
Adult Smoking Percent of adults that report smoking equal to, or greater than, 100
cigarettes and are currently a smoker
Adult Obesity Percent of adults that report a BMI greater than, or equal to, 30
Excessive Drinking
Percent of as individuals that report binge drinking in the past 30 days
(more than 4 drinks on one occasion for women, more than 5 for men) or
heavy drinking (defined as more than 1 (women) or 2 (men) drinks per day
on average
Sexually Transmitted
Infections Chlamydia rate per 100,000 population
Teen Birth Rate Birth rate per 1,000 female population, ages 15-19
Uninsured Adults Percent of population under age 65 without health insurance
Preventable Hospital Stays Hospitalization rate for ambulatory-care sensitive conditions per 1,000
Medicare enrollees
Mammography Screening Percent of female Medicare enrollees that receive mammography screening
Access to Healthy Foods Healthy food outlets include grocery stores and produce stands/farmers’
markets
Access to Recreational
Facilities Rate of recreational facilities per 100,000 population
Diabetics Percent of adults aged 20 and above with diagnosed diabetes
Physical Inactivity Percent of adults aged 20 and over that report no leisure time physical
activity
Primary Care Provider
Ratio Ratio of population to primary care providers
Mental Health Care
Provider Ratio Ratio of population to mental health care providers
Diabetic Screening Percent of diabetic Medicare enrollees that receive HbA1c screening.
Binge Drinking
Percent of adults that report binge drinking in the last 30 days. Binge
drinking is consuming more than 4 (women) or 5 (men) alcoholic drinks on
one occasion.
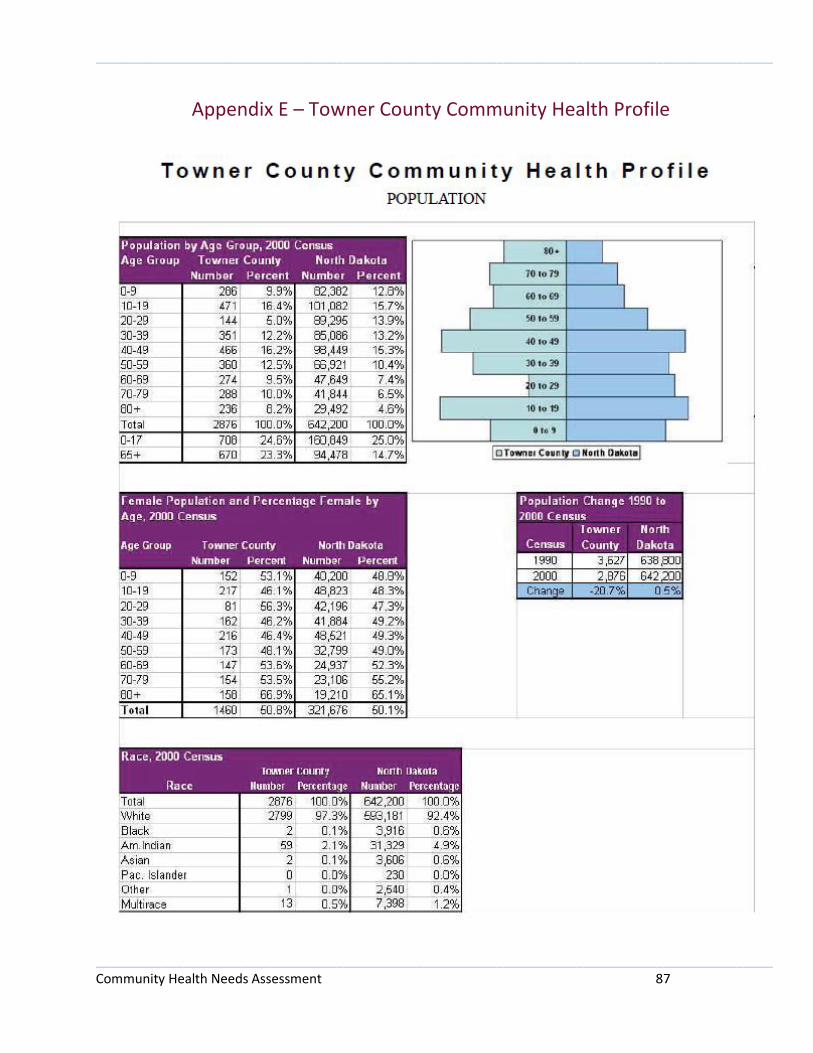
_____________________________________________________________________________________________
_____________________________________________________________________________________________ Community Health Needs Assessment 87
Appendix E – Towner County Community Health Profile
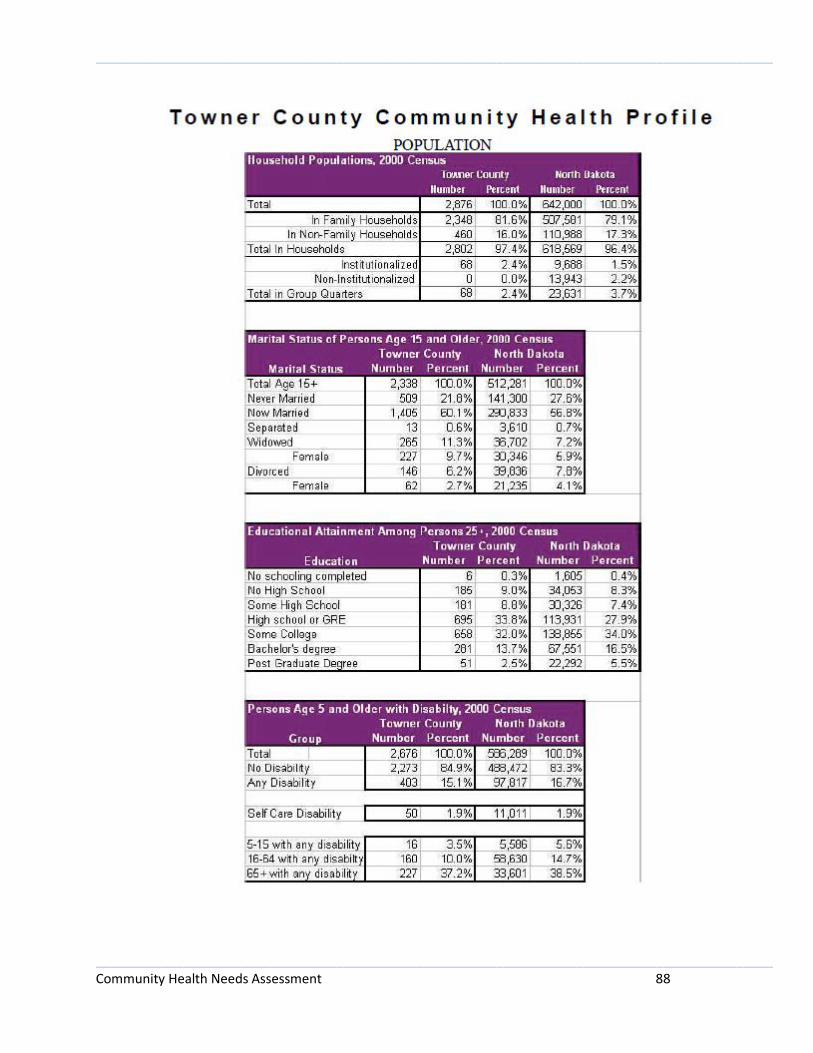
_____________________________________________________________________________________________
_____________________________________________________________________________________________ Community Health Needs Assessment 88
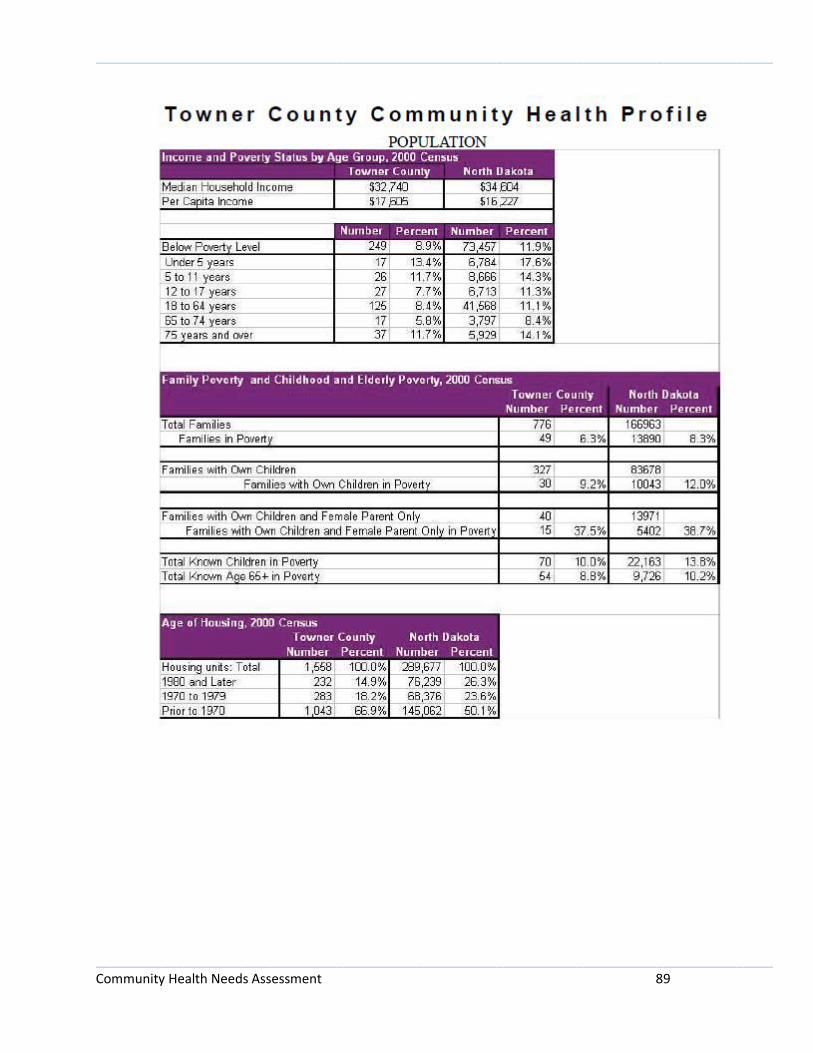
_____________________________________________________________________________________________
_____________________________________________________________________________________________ Community Health Needs Assessment 89
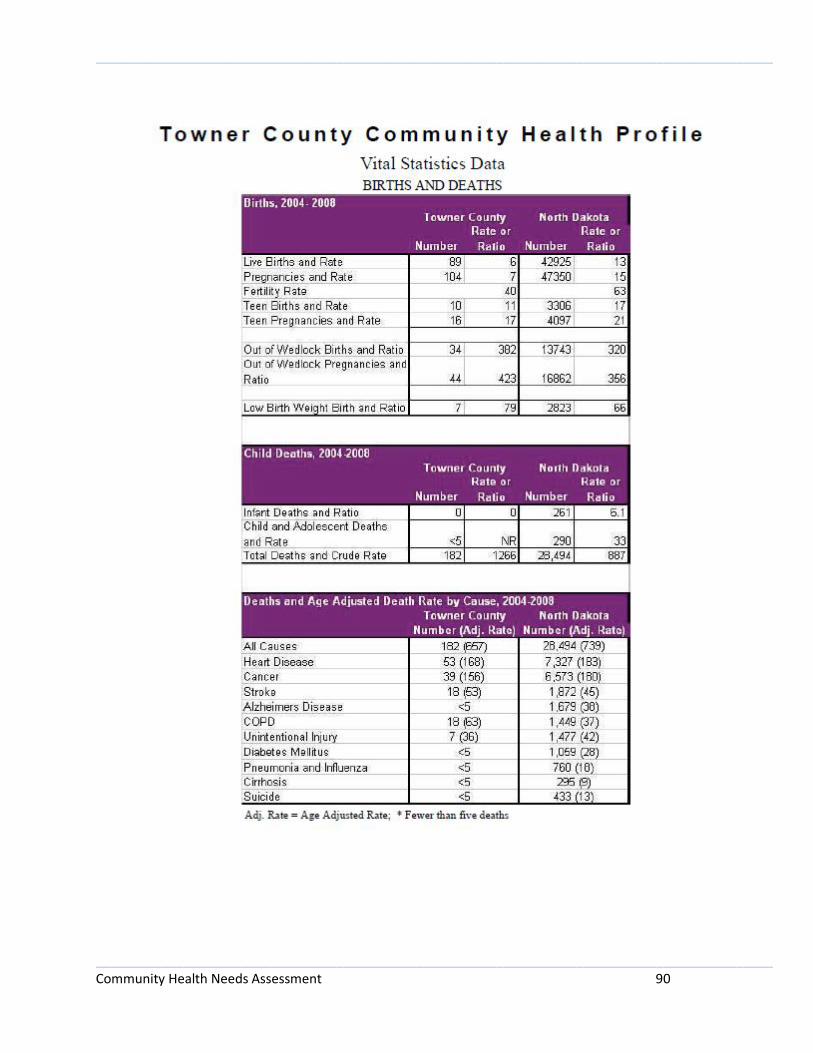
_____________________________________________________________________________________________
_____________________________________________________________________________________________ Community Health Needs Assessment 90
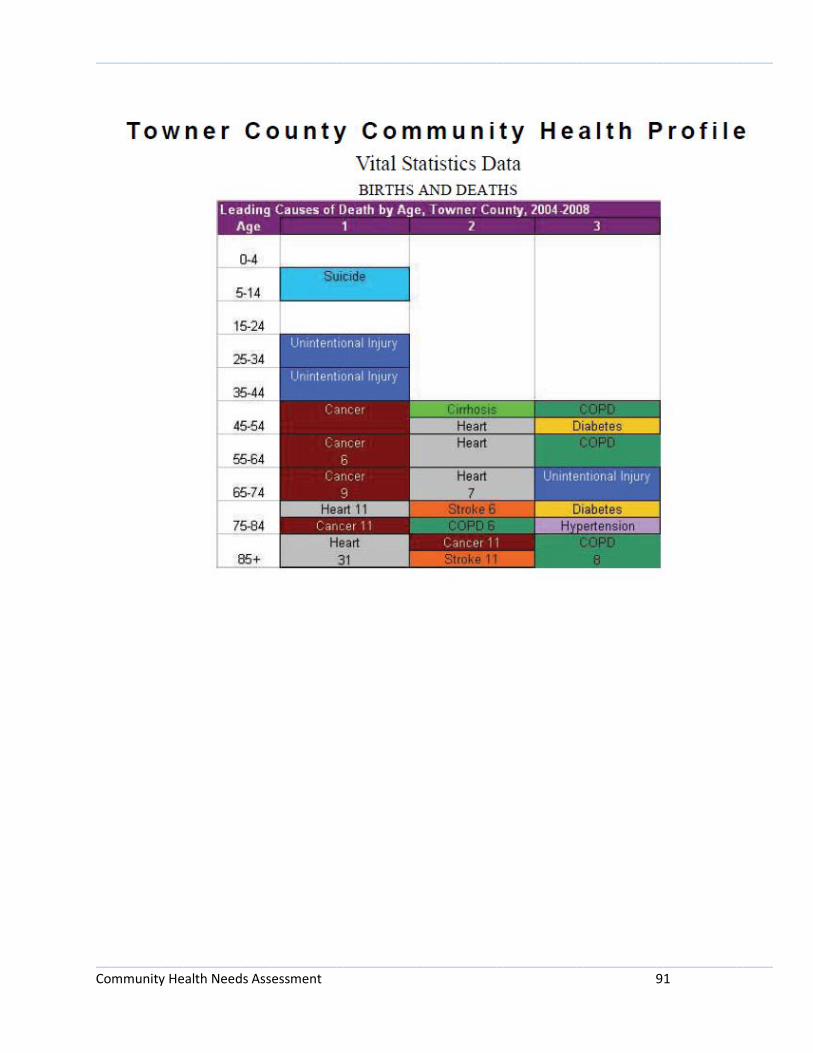
_____________________________________________________________________________________________
_____________________________________________________________________________________________ Community Health Needs Assessment 91
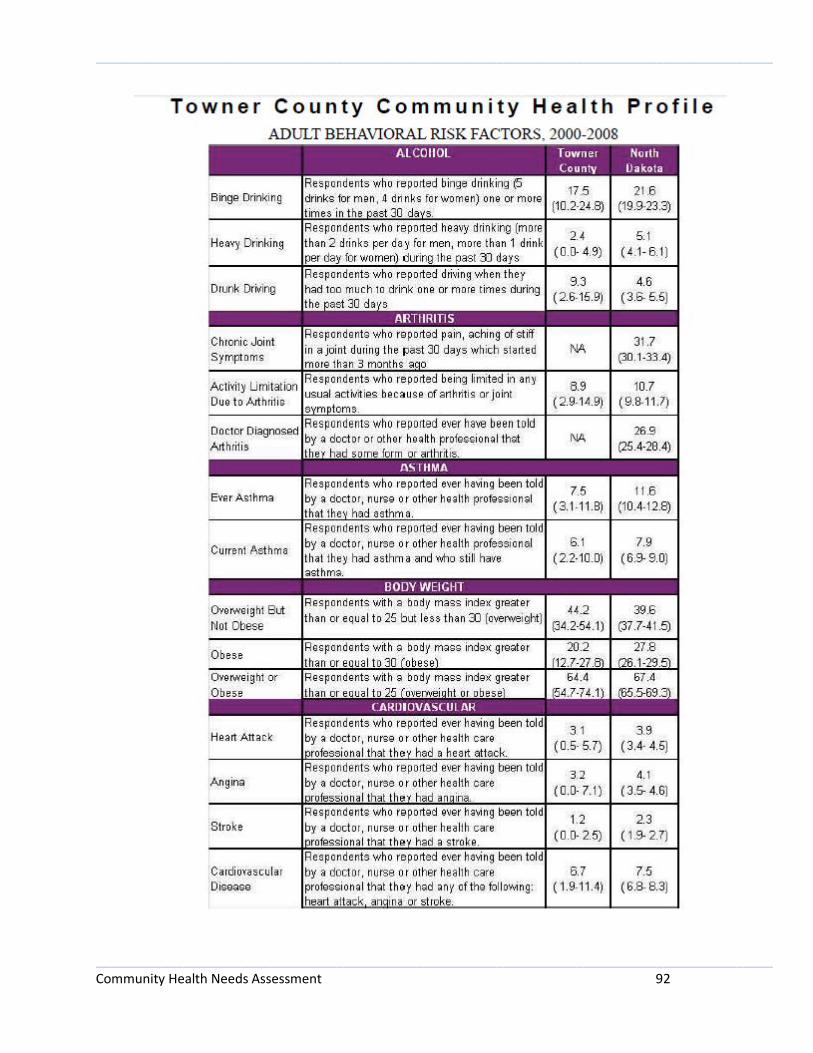
_____________________________________________________________________________________________
_____________________________________________________________________________________________ Community Health Needs Assessment 92
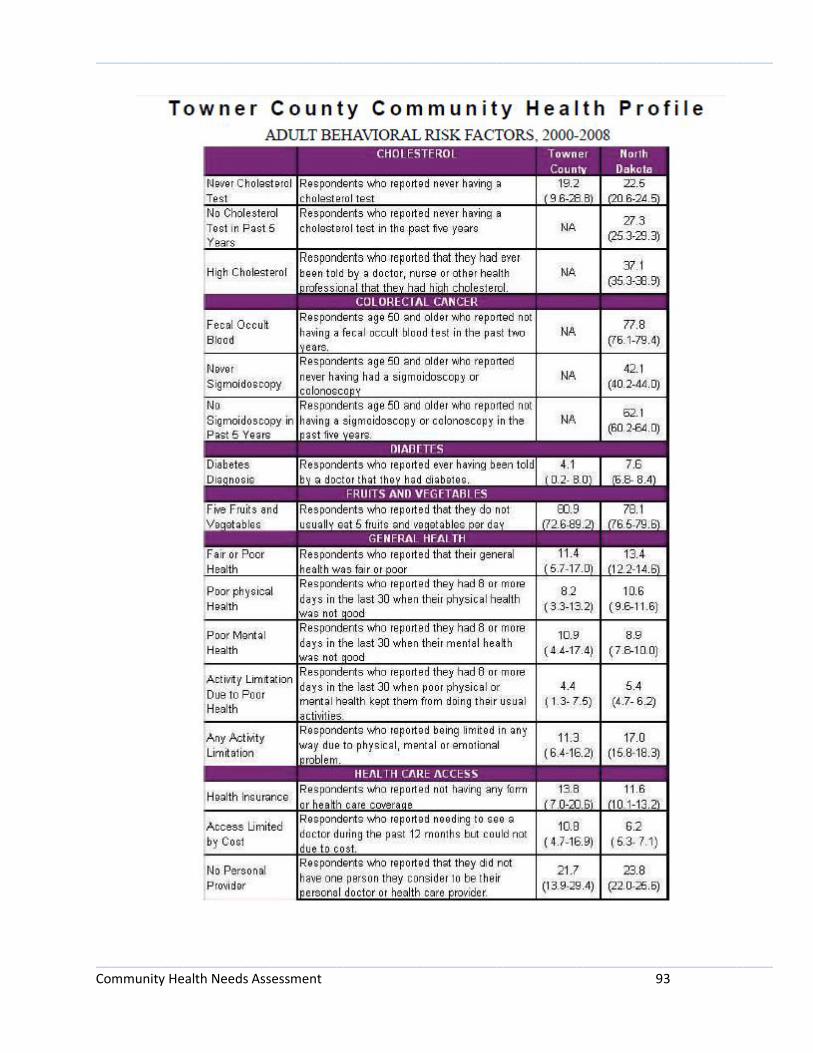
_____________________________________________________________________________________________
_____________________________________________________________________________________________ Community Health Needs Assessment 93

_____________________________________________________________________________________________
_____________________________________________________________________________________________ Community Health Needs Assessment 94
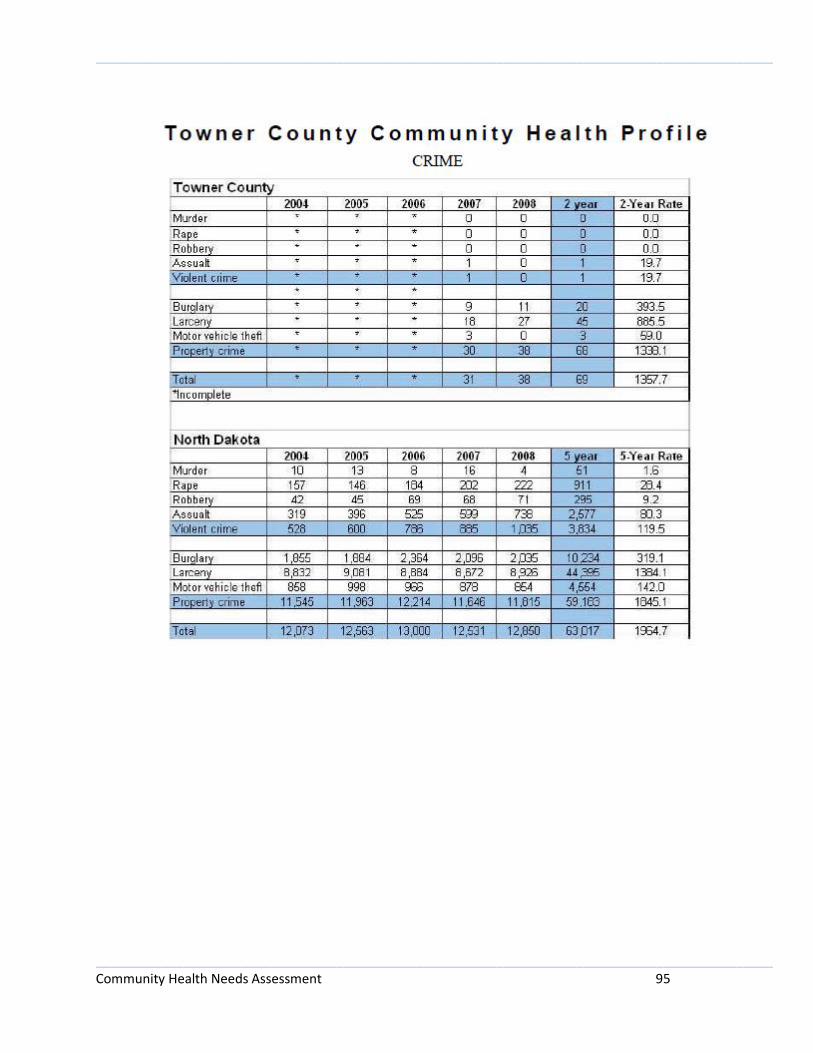
_____________________________________________________________________________________________
_____________________________________________________________________________________________ Community Health Needs Assessment 95

_____________________________________________________________________________________________
_____________________________________________________________________________________________ Community Health Needs Assessment 96

_____________________________________________________________________________________________
_____________________________________________________________________________________________ Community Health Needs Assessment 97
Appendix F – Lake Region Community Health Profile
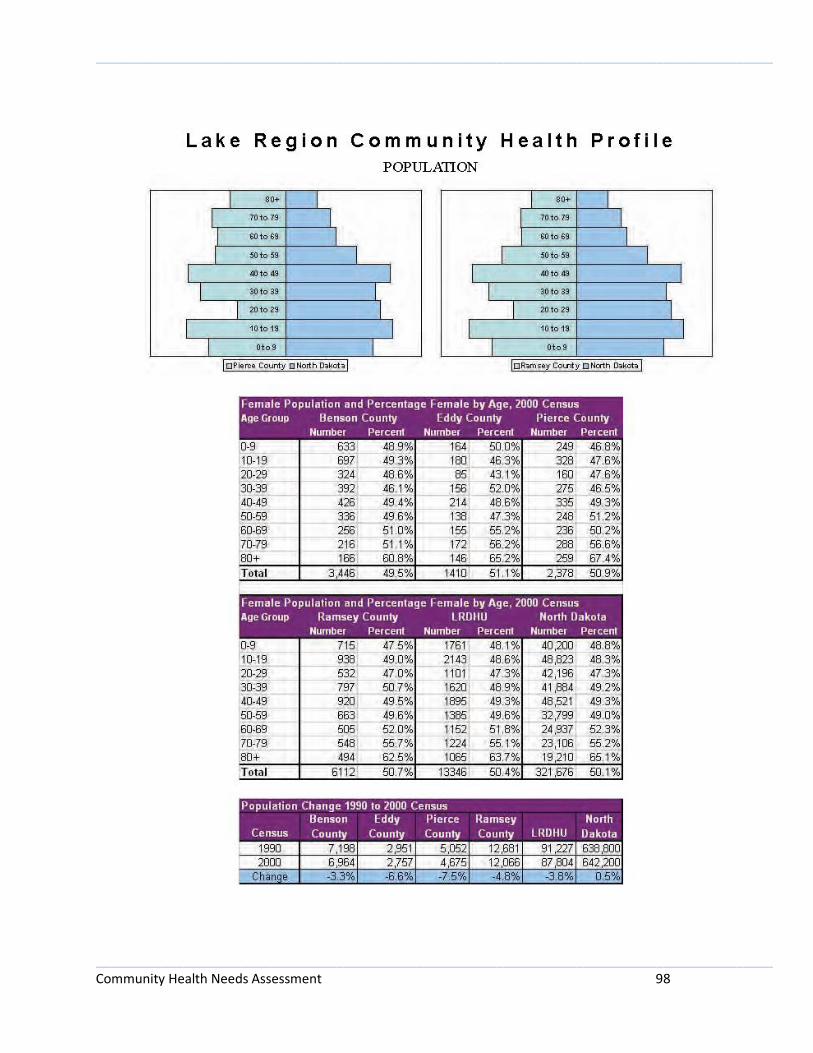
_____________________________________________________________________________________________
_____________________________________________________________________________________________ Community Health Needs Assessment 98

_____________________________________________________________________________________________
_____________________________________________________________________________________________ Community Health Needs Assessment 99
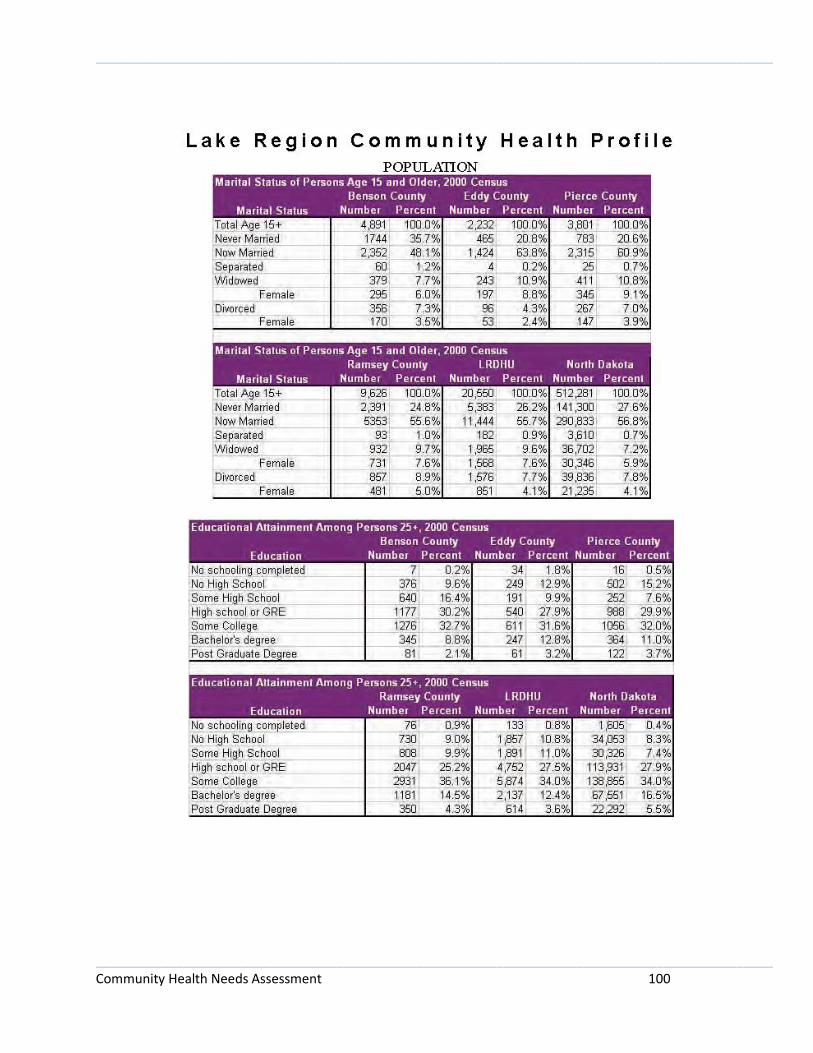
_____________________________________________________________________________________________
_____________________________________________________________________________________________ Community Health Needs Assessment 100
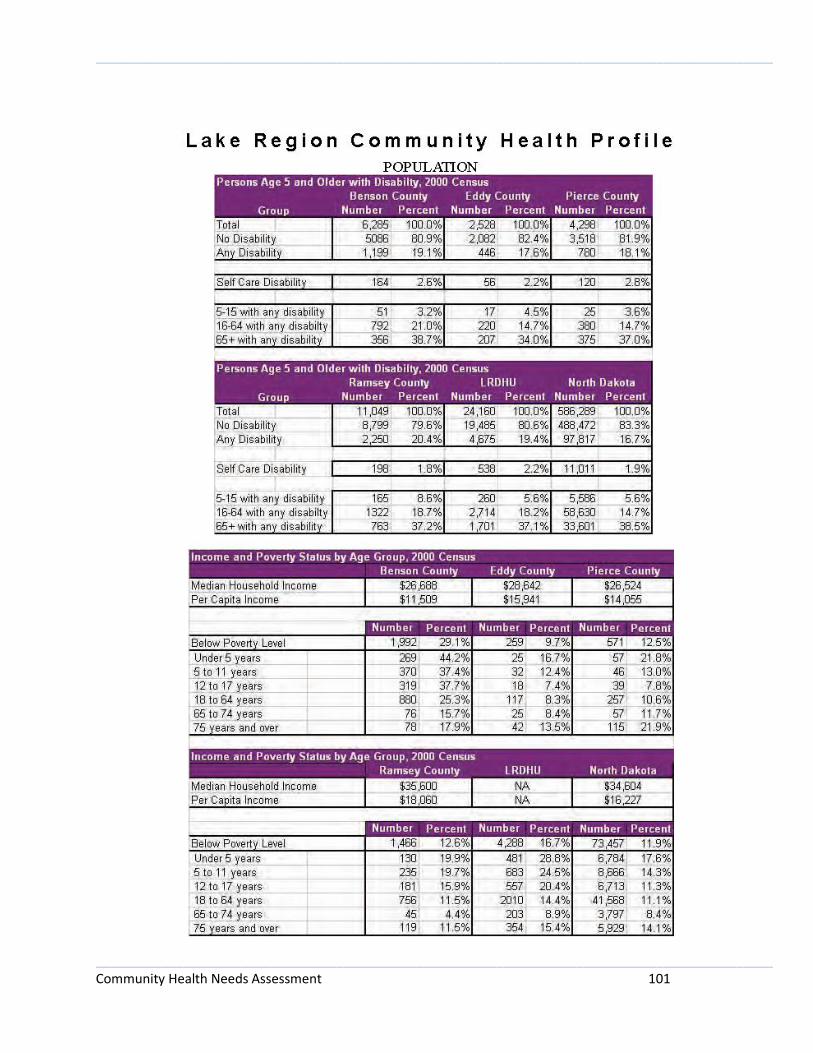
_____________________________________________________________________________________________
_____________________________________________________________________________________________ Community Health Needs Assessment 101

_____________________________________________________________________________________________
_____________________________________________________________________________________________ Community Health Needs Assessment 102

_____________________________________________________________________________________________
_____________________________________________________________________________________________ Community Health Needs Assessment 103
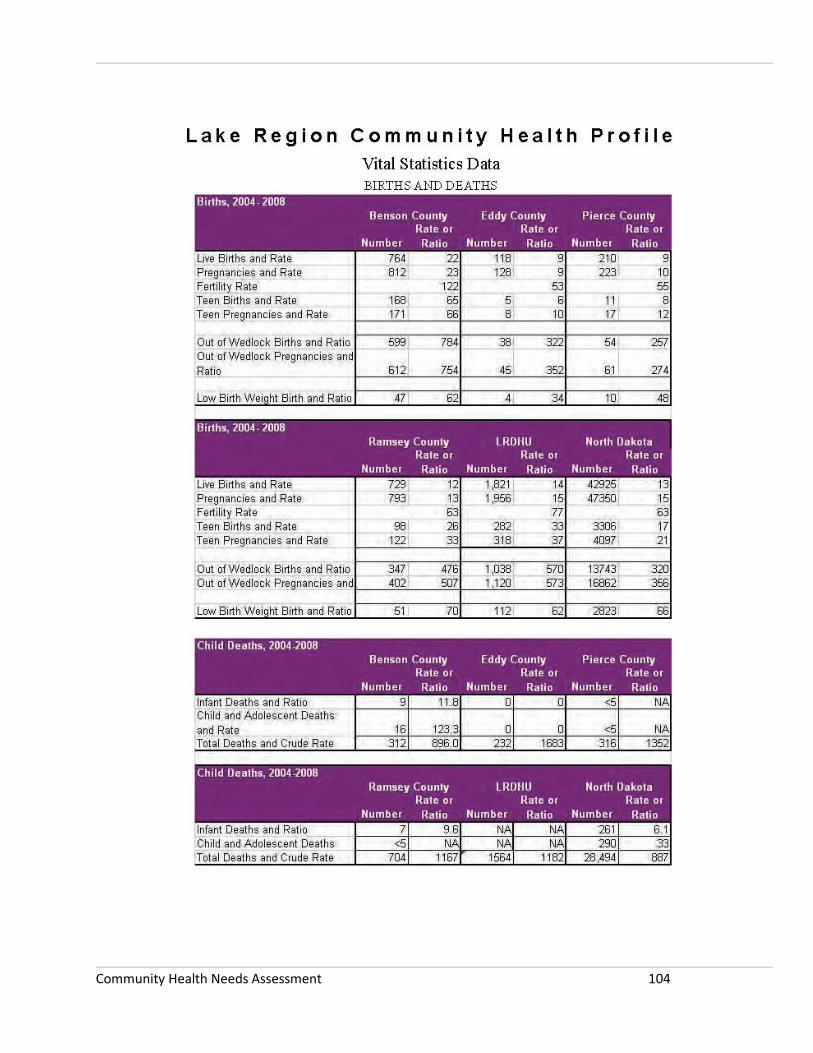
_____________________________________________________________________________________________
_____________________________________________________________________________________________ Community Health Needs Assessment 104

_____________________________________________________________________________________________
_____________________________________________________________________________________________ Community Health Needs Assessment 105

_____________________________________________________________________________________________
_____________________________________________________________________________________________ Community Health Needs Assessment 106
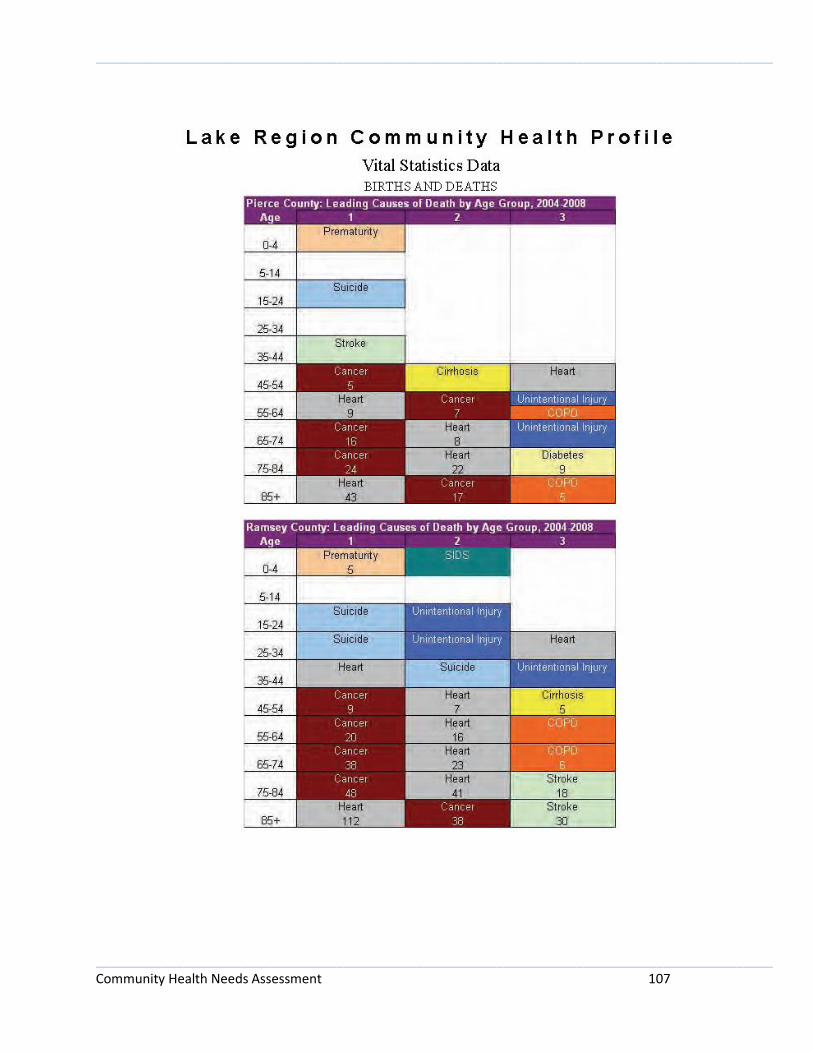
_____________________________________________________________________________________________
_____________________________________________________________________________________________ Community Health Needs Assessment 107
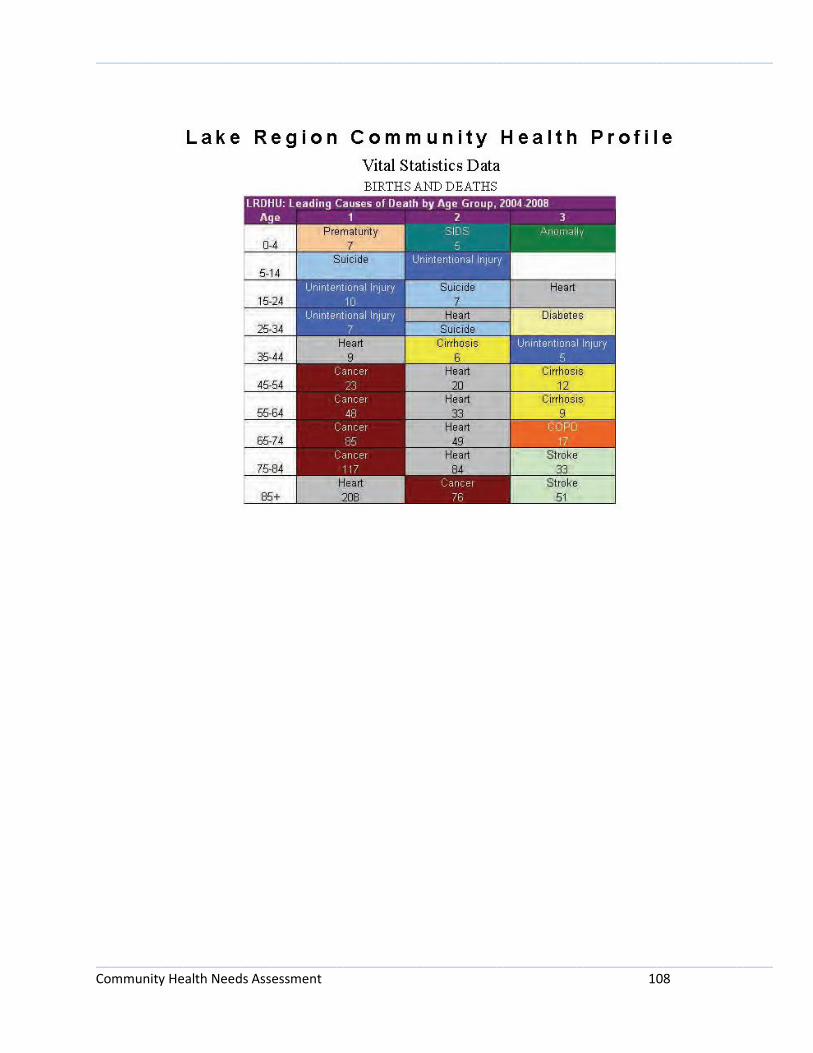
_____________________________________________________________________________________________
_____________________________________________________________________________________________ Community Health Needs Assessment 108

_____________________________________________________________________________________________
_____________________________________________________________________________________________ Community Health Needs Assessment 109

_____________________________________________________________________________________________
_____________________________________________________________________________________________ Community Health Needs Assessment 110

_____________________________________________________________________________________________
_____________________________________________________________________________________________ Community Health Needs Assessment 111
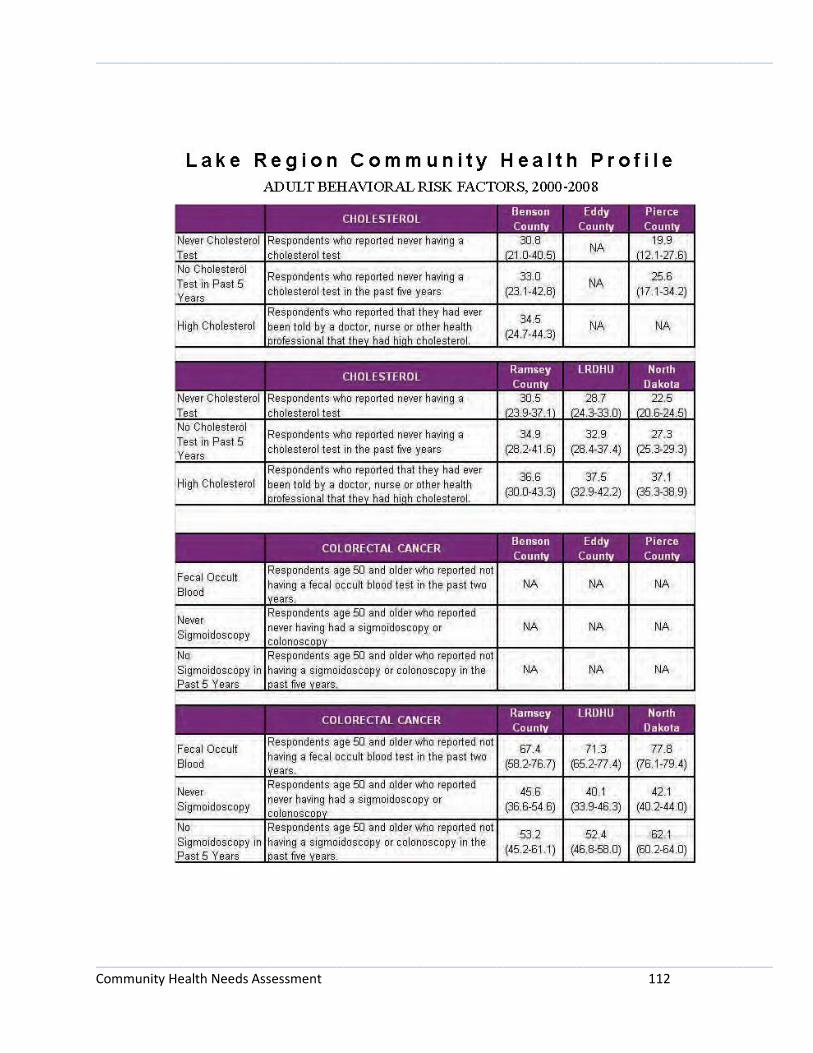
_____________________________________________________________________________________________
_____________________________________________________________________________________________ Community Health Needs Assessment 112

_____________________________________________________________________________________________
_____________________________________________________________________________________________ Community Health Needs Assessment 113

_____________________________________________________________________________________________
_____________________________________________________________________________________________ Community Health Needs Assessment 114

_____________________________________________________________________________________________
_____________________________________________________________________________________________ Community Health Needs Assessment 115

_____________________________________________________________________________________________
_____________________________________________________________________________________________ Community Health Needs Assessment 116
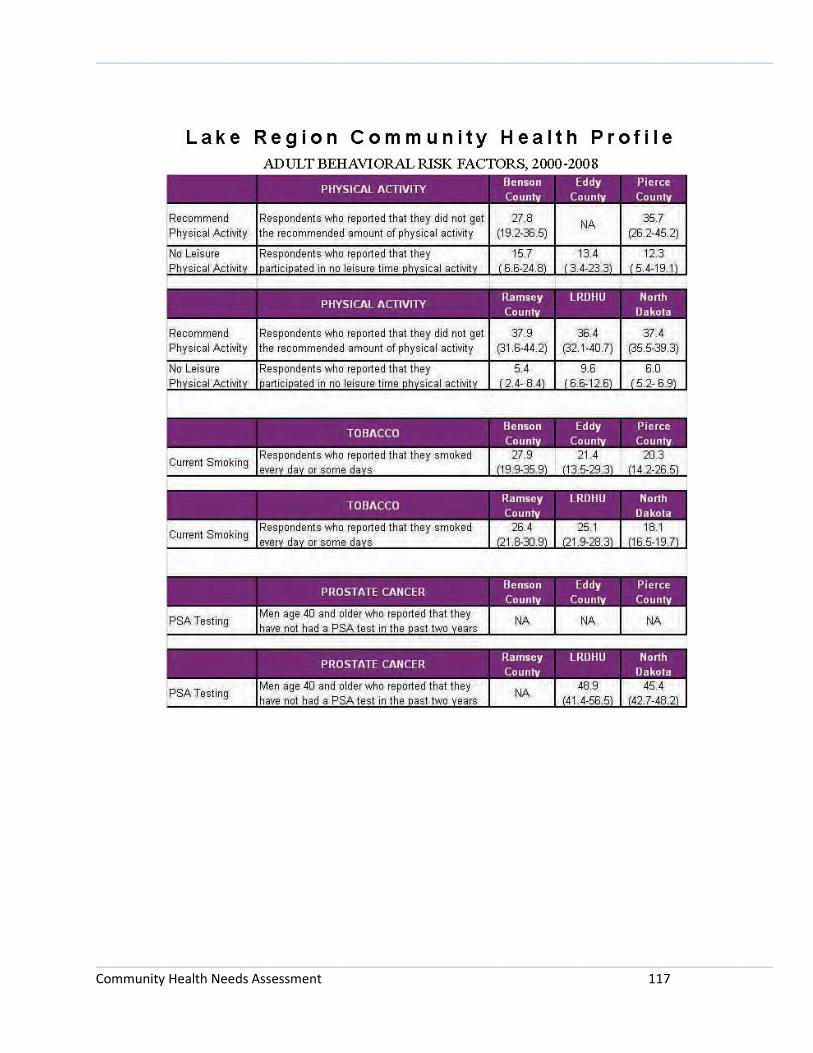
_____________________________________________________________________________________________
_____________________________________________________________________________________________ Community Health Needs Assessment 117
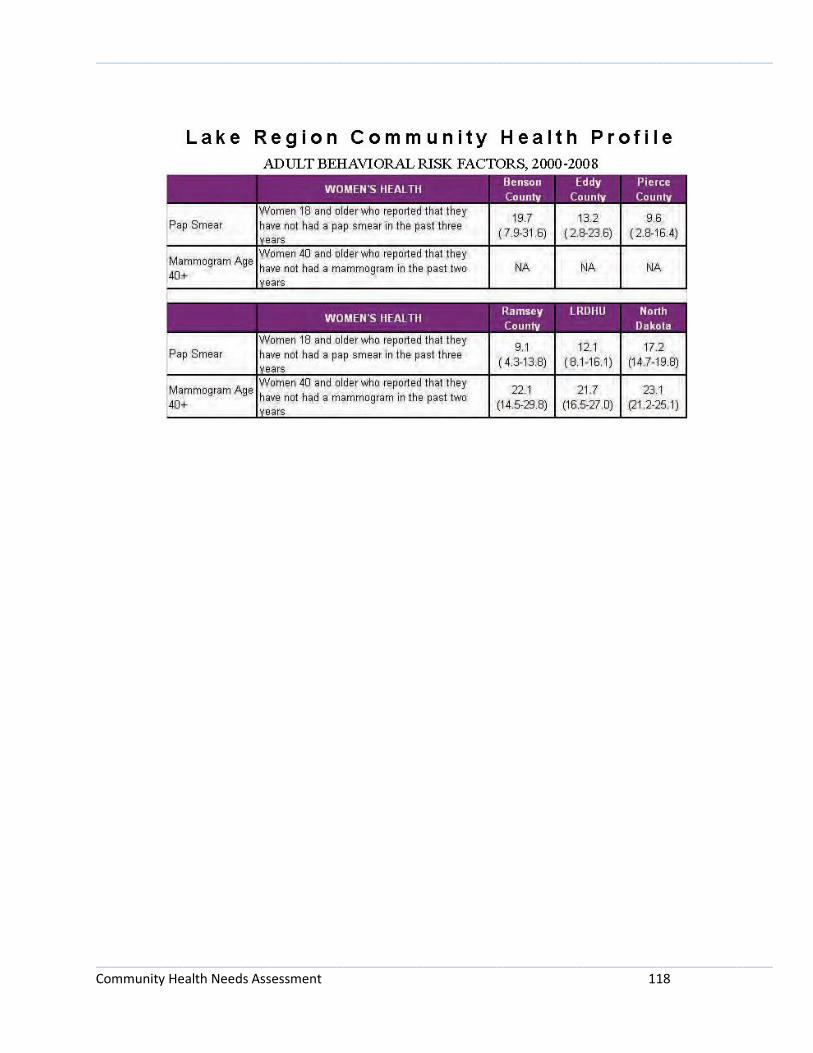
_____________________________________________________________________________________________
_____________________________________________________________________________________________ Community Health Needs Assessment 118
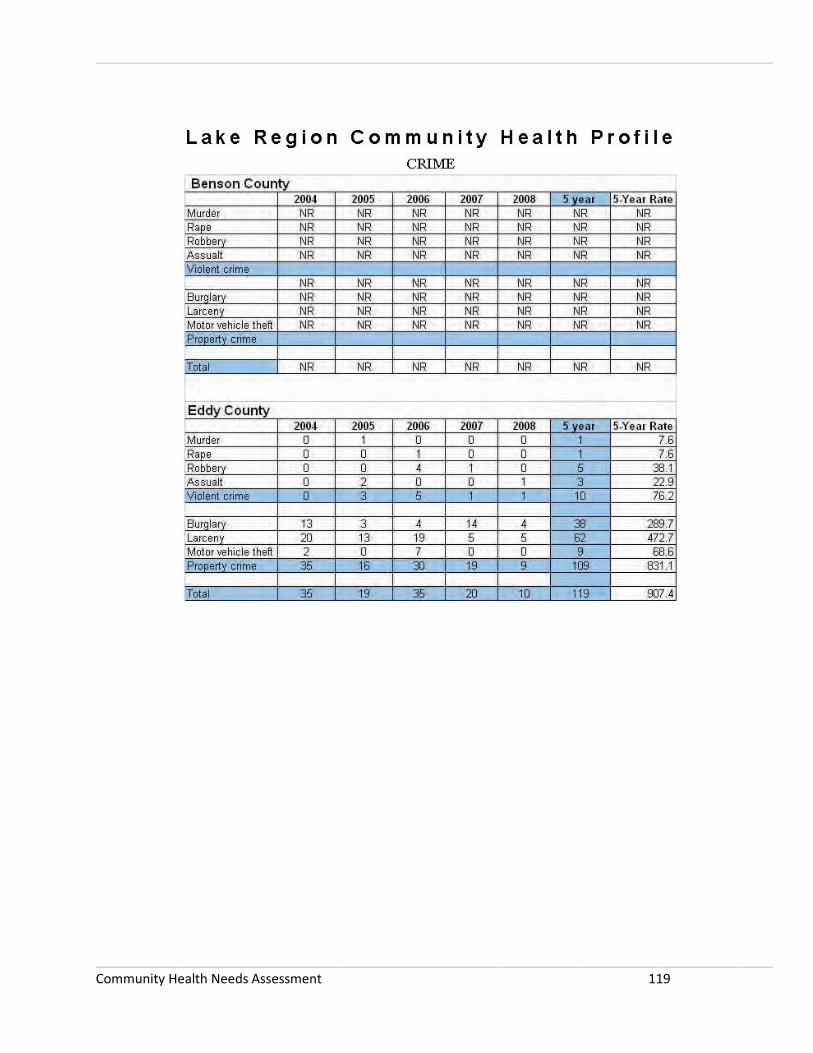
_____________________________________________________________________________________________
_____________________________________________________________________________________________ Community Health Needs Assessment 119
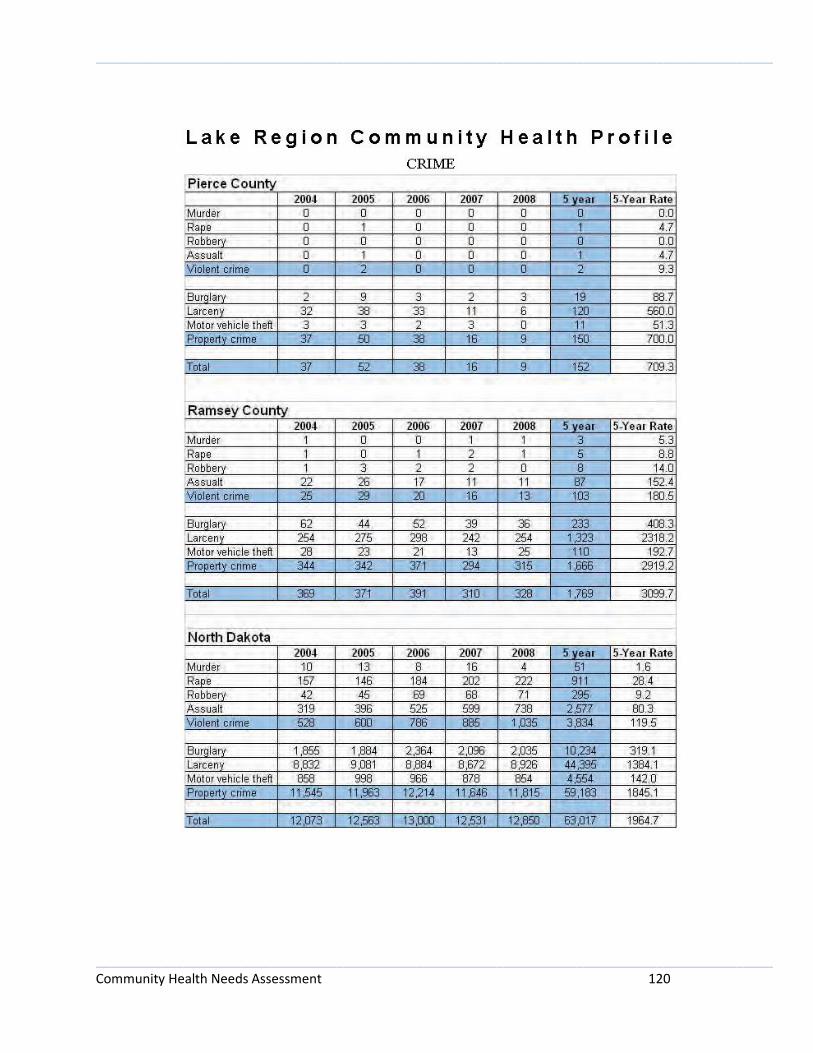
_____________________________________________________________________________________________
_____________________________________________________________________________________________ Community Health Needs Assessment 120

_____________________________________________________________________________________________
_____________________________________________________________________________________________ Community Health Needs Assessment 121
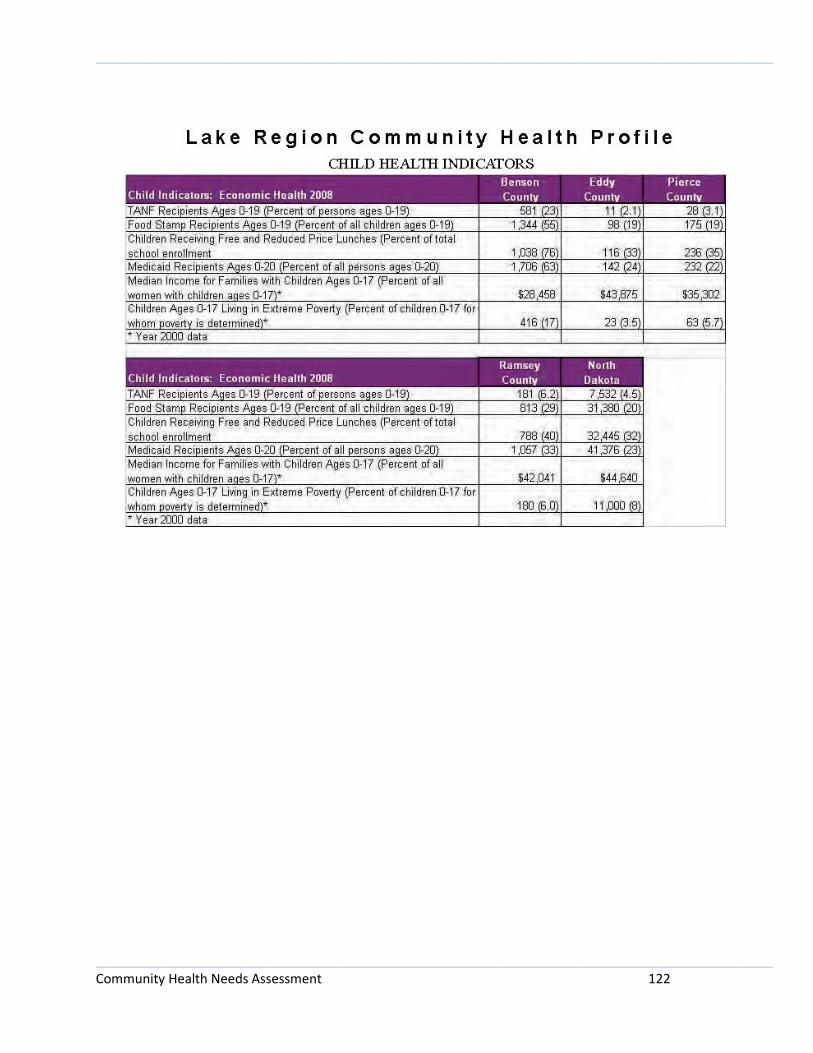
_____________________________________________________________________________________________
_____________________________________________________________________________________________ Community Health Needs Assessment 122

_____________________________________________________________________________________________
_____________________________________________________________________________________________ Community Health Needs Assessment 123
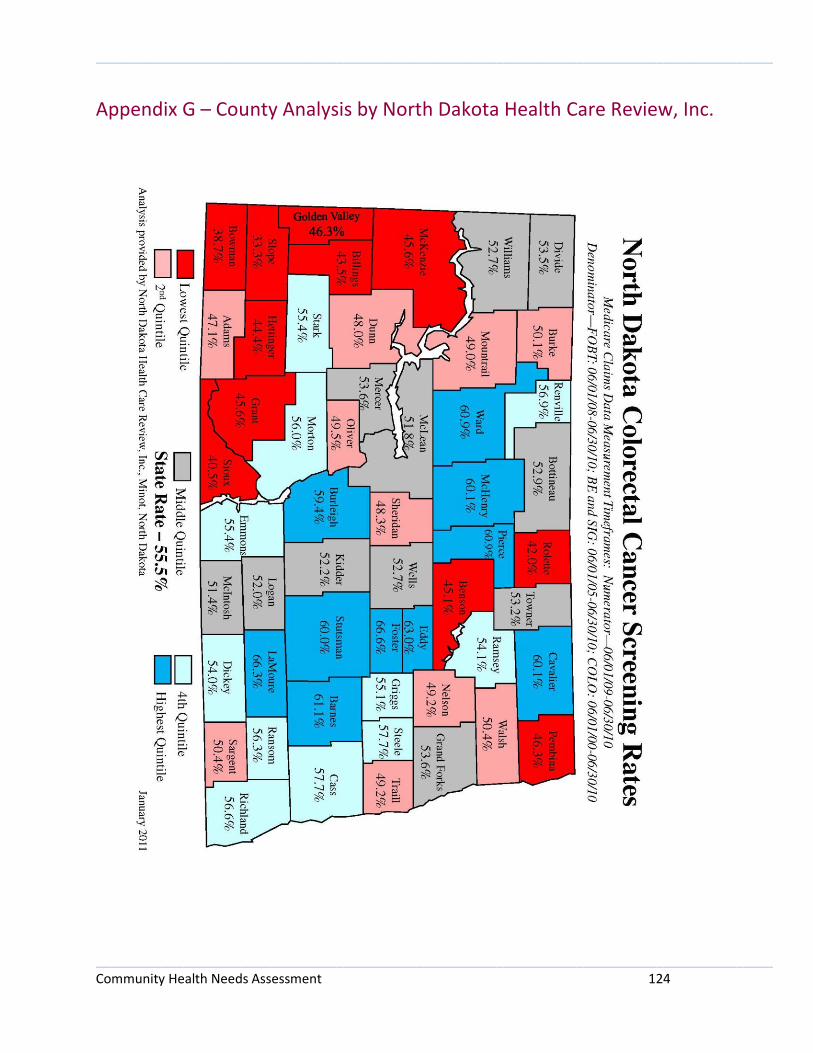
_____________________________________________________________________________________________
_____________________________________________________________________________________________ Community Health Needs Assessment 124
Appendix G – County Analysis by North Dakota Health Care Review, Inc.
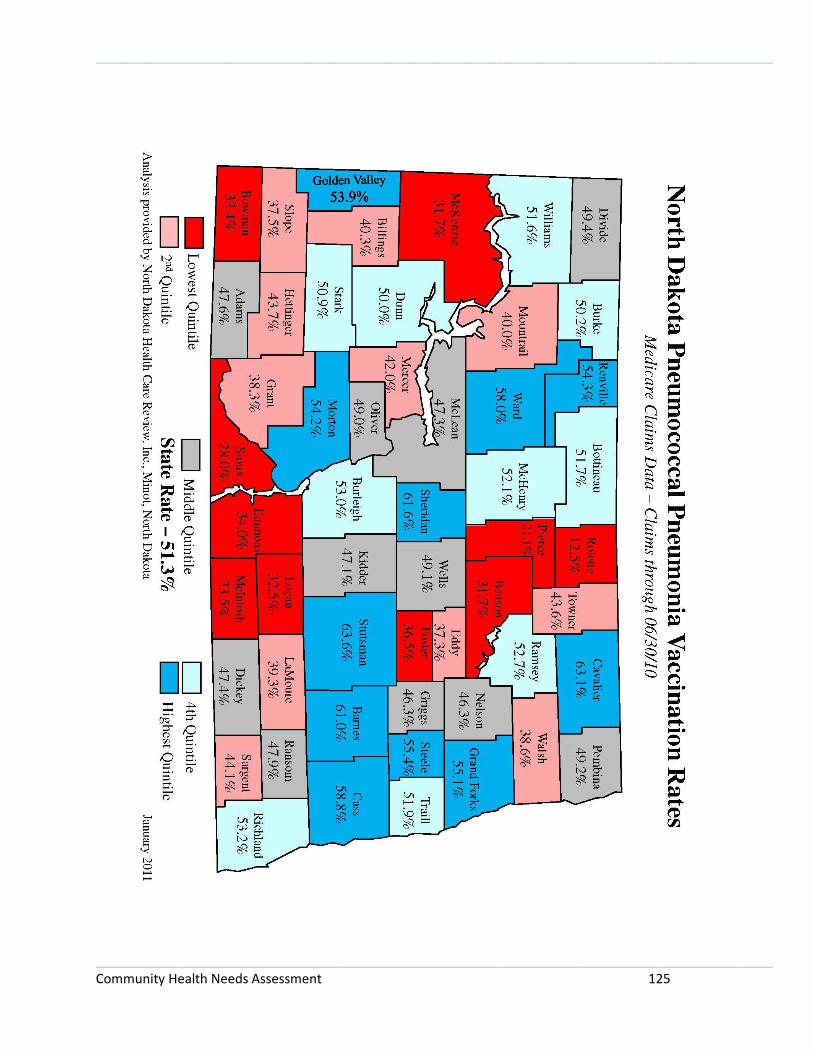
_____________________________________________________________________________________________
_____________________________________________________________________________________________ Community Health Needs Assessment 125
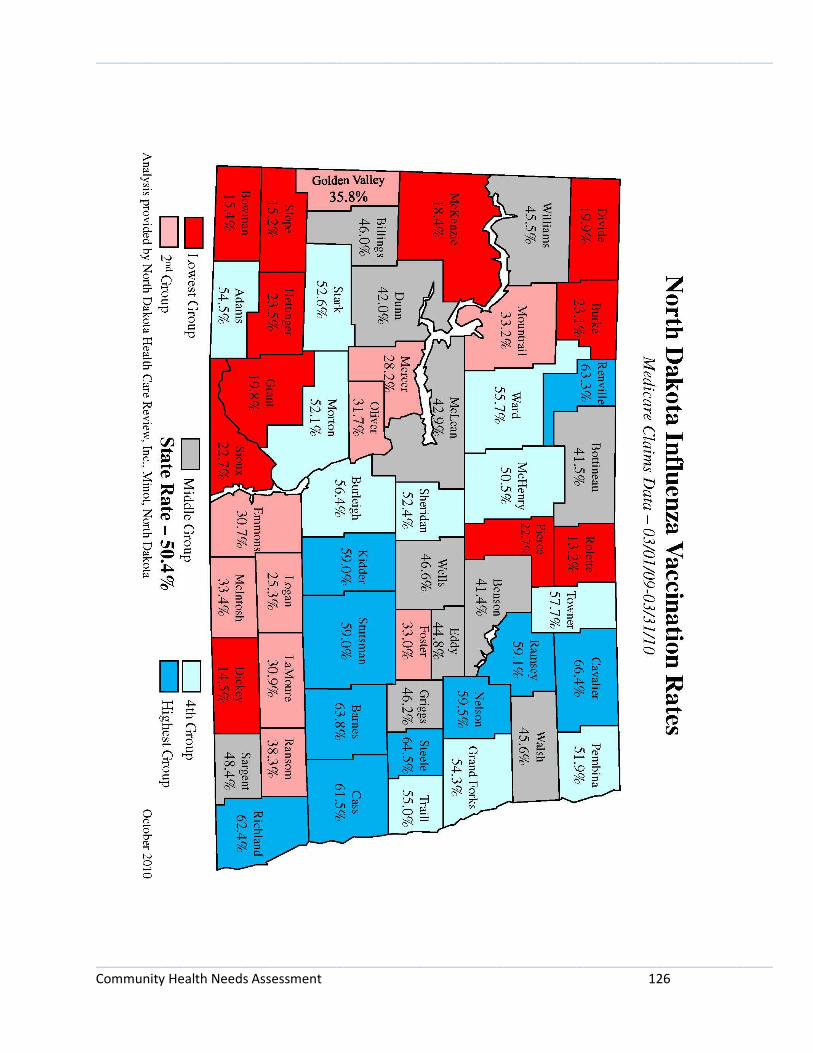
_____________________________________________________________________________________________
_____________________________________________________________________________________________ Community Health Needs Assessment 126

_____________________________________________________________________________________________
_____________________________________________________________________________________________ Community Health Needs Assessment 127
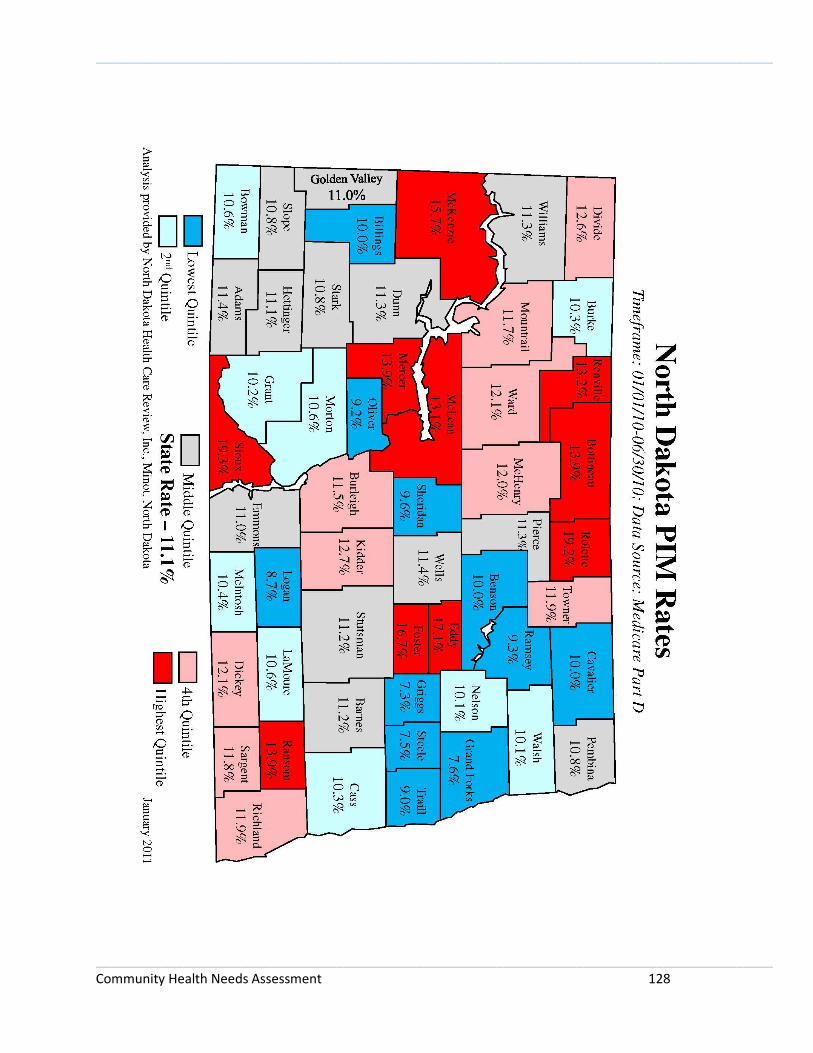
_____________________________________________________________________________________________
_____________________________________________________________________________________________ Community Health Needs Assessment 128
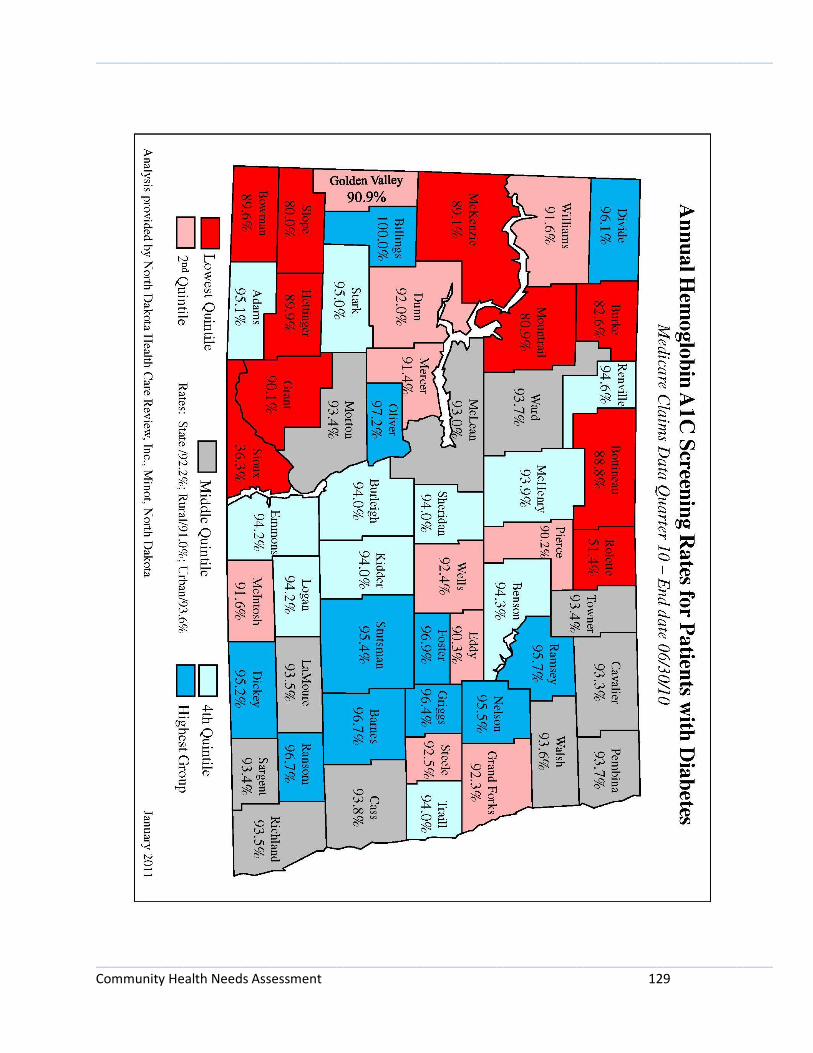
_____________________________________________________________________________________________
_____________________________________________________________________________________________ Community Health Needs Assessment 129
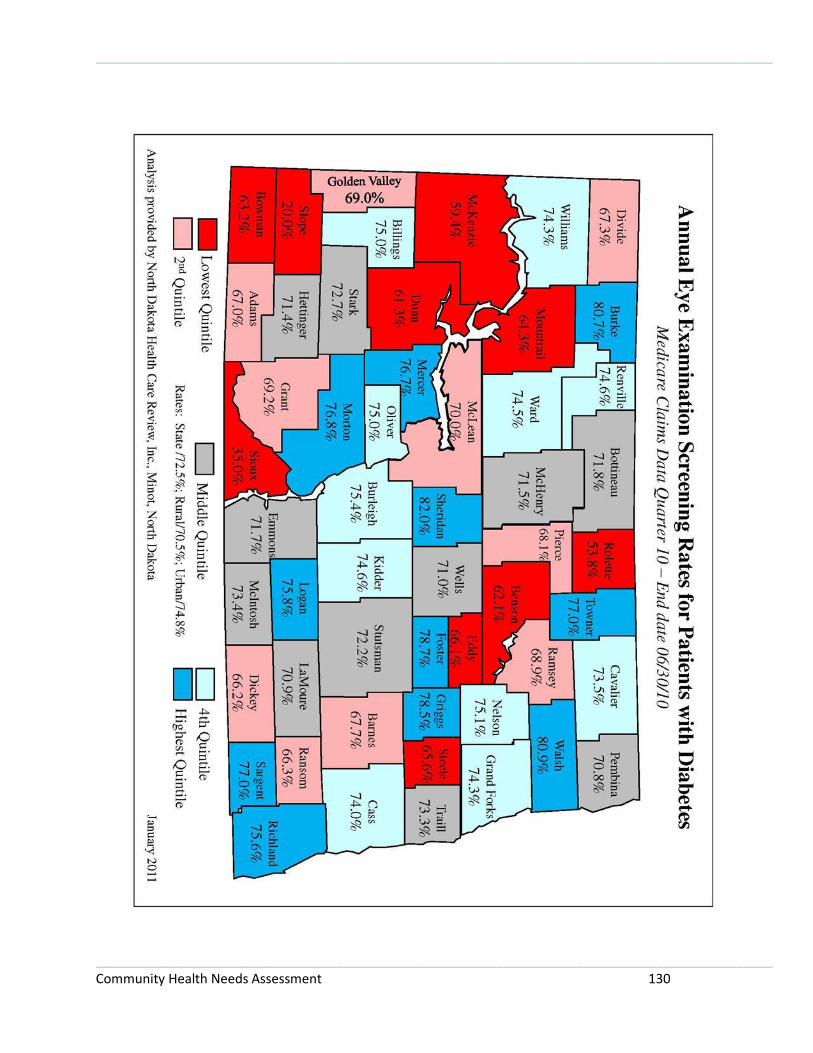
_____________________________________________________________________________________________
_____________________________________________________________________________________________ Community Health Needs Assessment 130
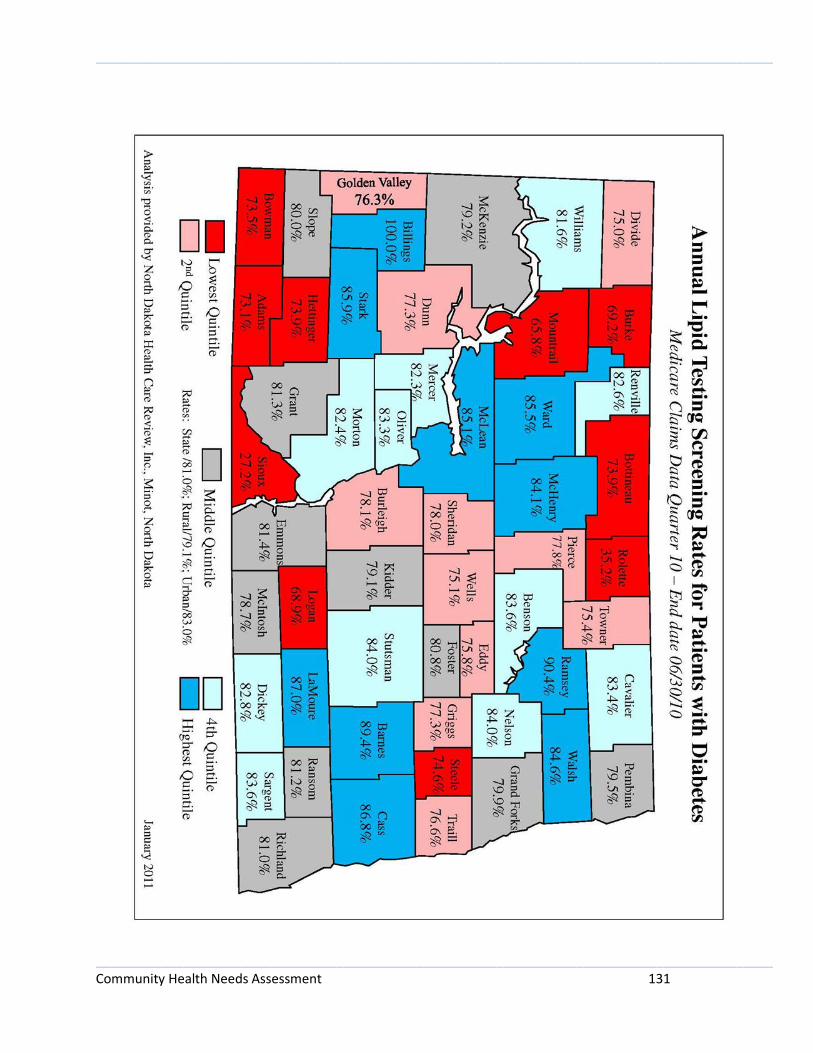
_____________________________________________________________________________________________
_____________________________________________________________________________________________ Community Health Needs Assessment 131

_____________________________________________________________________________________________
_____________________________________________________________________________________________ Community Health Needs Assessment 132
Appendix H – Prioritization of Community’s Health Needs
Tier 1
Financial viability of the hospital (14 votes)
Access to needed technology and equipment (9 votes)
Elevated rate of diabetics (8 votes)
Elevated rate of uninsured residents (8 votes)
Lack of a stable, full-time physician (8 votes)
Tier 2
Elevated rate of physical inactivity (7 votes)
Limited access to recreational facilities (5 votes)
Elevated rate of adult obesity (4 votes)
Lack of employees to fill positions (4 votes)
Higher costs of health care for consumers (3 votes)
Tier 3
Elevated level of sexually transmitted infections (2 votes)
Decreased rates of preventive screening (diabetic screening) (2 votes)
Limited access to healthy foods (2 votes)
Elevated level of uninsured children/children in poverty (2 votes)
Adequate number of health care providers and specialists (2 votes)
Not enough health care staff in general/maintaining enough health workers (2 votes)
Aging population/lack of resources to meet needs (2 votes)
Low wages, lack of livable wages (2 votes)
Need for improved collaboration (1 vote)
(No Votes)
Elevated rate of adult smoking – in surrounding counties
Elevated rate of excessive drinking
Elevated motor vehicle crash death rate – in surrounding counties
Elevated teen birth rate – in surrounding counties
Increase confidentiality