Lancaster County Community Health Needs Assessment
47
MAY 2013 Lancaster County Community Health Needs Assessment Overview of a Community Dashboard for Lancaster County, Pennsylvania SM SM SM Sponsored by:
-
Upload
khangminh22 -
Category
Documents
-
view
0 -
download
0
Transcript of Lancaster County Community Health Needs Assessment
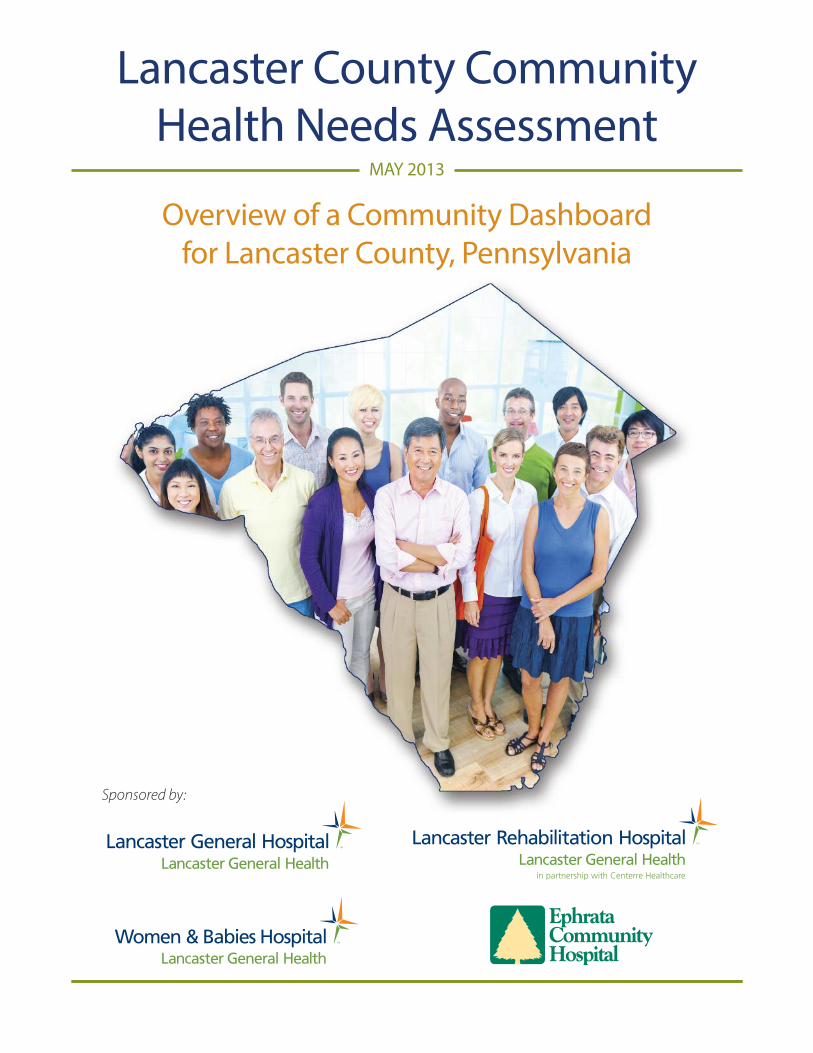
MAY 2013
Lancaster County CommunityHealth Needs Assessment
Overview of a Community Dashboardfor Lancaster County, Pennsylvania
SM
SM
SM
Sponsored by:
22012 Summary Report
Lancaster County Community Health Needs Assessment 2012
AbstractThis document provides an overview of findings from a community health needs assessment (CHNA)conducted on behalf of Lancaster General Hospital, Lancaster Rehabilitation Hospital, Women & BabiesHospital and Ephrata Community Hospital. The assessment was conducted for Lancaster County, whichis the targeted population for all four hospitals. The assessment uses information from secondary datasources to identify health issues of consequence to the community. Estimates are presented for selecteddemographic and health indicators, including access to health care, health-related behavioral risks,prevention behaviors, health conditions, and vital statistics related to cancer, communicable disease,maternal health, mental health, mortality, and hospitalizations. Selected economic, education,environment, public safety, and transportation estimates are also presented. The CHNA presentsLancaster County as a community with notable strengths, not the least of which is a strong health careinfrastructure and a healthy economy. But weaknesses are also evident. The assessment finds thatLancaster County’s physical environment may contribute to poor health and that cancer rates are a bithigher than in other US counties. The assessment also shows that even some indicators that, at firstglance, put the county in a favorable position must be considered problems. For example, although thecounty rate for being obese is comparatively good, there are still far too many obese county residentsconsidering the costs associated with obesity. The same is true for tobacco use, binge drinking, exerciseand diet, each of which contributes significantly to chronic disease. Community-level policyinterventions are recommended to address these issues.
This overview was written by Berwood Yost, Floyd Institute for Public Policy, Franklin and Marshall College. The Floyd Institute comprises theCenter for Opinion Research, the Center for Politics and Public Affairs, and the Local Economy Center. The Center for Opinion Researchprovides comprehensive survey research services to both the college and outside organizations, including educational institutions,government agencies, the media, private corporations, and nonprofit groups. These capabilities encompass all aspects of survey and marketresearch, including survey design and administration, data collection and analysis, program evaluation, and focus group facility rental andrecruiting services.
The Center’s expertise covers a wide range of research areas, including healthcare, public policy, education, marketing and advertising, andhuman behavior. Drawing on a deep knowledge of the various policy areas, they offer informed and thoughtful opinions about what surveyresults mean, guiding clients as they use the information to answer important questions and make strategic decisions.
Over the years, the Center has established a reputation for outstanding accuracy and reliability and insightful data analysis. They arerecognized as a particularly valuable source of information for those involved in public policy, and have become a primary resource forgovernment agencies and media organizations seeking objective information about the major issues facing the Commonwealth ofPennsylvania. They are the home to the nationally recognized Franklin & Marshall College Poll, the oldest Pennsylvania statewide pollexclusively directed and produced in the state1.
1 Information about the Floyd Institute for Public Policy was retrieved from Franklin & MarshallCollege’s website and can be found at www.fandm.edu/opinionresearch.
32012 Summary Report
Table of Contents
IntroductionOverview of Findings/Community Served/Information Gaps . . . . . . . . . . . . . . . . . . . . 4Defining Community Need . . . . . . . . . . . . . . . . . . . . . . . . . . . . . . . . . . . . . . . . . . . . . . . . . . . . . 7Residents Effected . . . . . . . . . . . . . . . . . . . . . . . . . . . . . . . . . . . . . . . . . . . . . . . . . . . . . . . . . . . . . 8Health Risks . . . . . . . . . . . . . . . . . . . . . . . . . . . . . . . . . . . . . . . . . . . . . . . . . . . . . . . . . . . . . . . . . . . . 9A Community Approach to Health . . . . . . . . . . . . . . . . . . . . . . . . . . . . . . . . . . . . . . . . . . . . . 10
Selected HighlightsDemographic Change . . . . . . . . . . . . . . . . . . . . . . . . . . . . . . . . . . . . . . . . . . . . . . . . . . . . . . . . 11Population Growth . . . . . . . . . . . . . . . . . . . . . . . . . . . . . . . . . . . . . . . . . . . . . . . . . . . . . . . . . . . 11Age . . . . . . . . . . . . . . . . . . . . . . . . . . . . . . . . . . . . . . . . . . . . . . . . . . . . . . . . . . . . . . . . . . . . . . . . . . 12Poverty . . . . . . . . . . . . . . . . . . . . . . . . . . . . . . . . . . . . . . . . . . . . . . . . . . . . . . . . . . . . . . . . . . . . . . . 12
Health IndicatorsAccess . . . . . . . . . . . . . . . . . . . . . . . . . . . . . . . . . . . . . . . . . . . . . . . . . . . . . . . . . . . . . . . . . . . . . . . . 13Behaviors . . . . . . . . . . . . . . . . . . . . . . . . . . . . . . . . . . . . . . . . . . . . . . . . . . . . . . . . . . . . . . . . . . . . . 14Conditions . . . . . . . . . . . . . . . . . . . . . . . . . . . . . . . . . . . . . . . . . . . . . . . . . . . . . . . . . . . . . . . . . . . 16Vital Statistics . . . . . . . . . . . . . . . . . . . . . . . . . . . . . . . . . . . . . . . . . . . . . . . . . . . . . . . . . . . . . . . . . 18Economy and Environment . . . . . . . . . . . . . . . . . . . . . . . . . . . . . . . . . . . . . . . . . . . . . . . . . . . 20
Conclusion and Recommendations . . . . . . . . . . . . . . . . . . . . . . . . . . . . . . . . . . . . . . . . . . . . . . . 21
About HCI Provided Data . . . . . . . . . . . . . . . . . . . . . . . . . . . . . . . . . . . . . . . . . . . . . . . . . . . . . . . . . 22
Appendix A, Data Tables . . . . . . . . . . . . . . . . . . . . . . . . . . . . . . . . . . . . . . . . . . . . . . . . . . . . . . . . . . 25
Appendix B, Expert Input . . . . . . . . . . . . . . . . . . . . . . . . . . . . . . . . . . . . . . . . . . . . . . . . . . . . . . . . . 33
Appendix C, About Ephrata Community Hospital . . . . . . . . . . . . . . . . . . . . . . . . . . . . . . . . . 46
42012 Summary Report
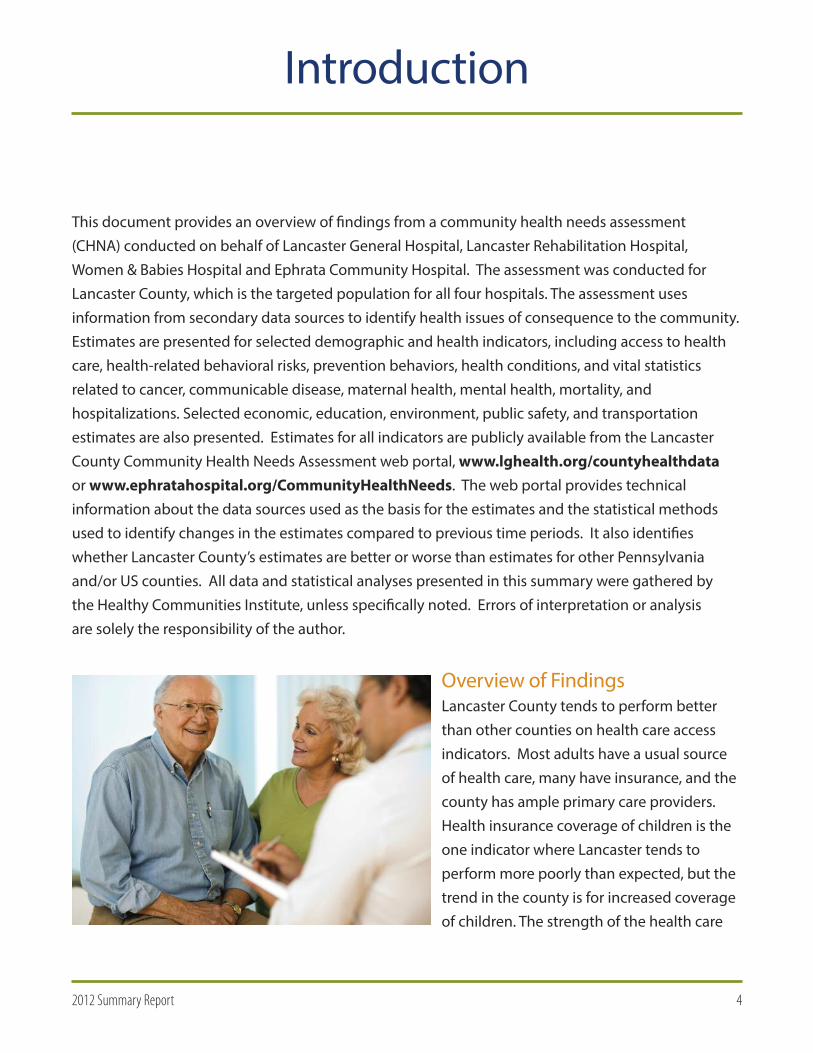
This document provides an overview of findings from a community health needs assessment (CHNA) conducted on behalf of Lancaster General Hospital, Lancaster Rehabilitation Hospital,Women & Babies Hospital and Ephrata Community Hospital. The assessment was conducted forLancaster County, which is the targeted population for all four hospitals. The assessment usesinformation from secondary data sources to identify health issues of consequence to the community.Estimates are presented for selected demographic and health indicators, including access to healthcare, health-related behavioral risks, prevention behaviors, health conditions, and vital statisticsrelated to cancer, communicable disease, maternal health, mental health, mortality, andhospitalizations. Selected economic, education, environment, public safety, and transportationestimates are also presented. Estimates for all indicators are publicly available from the LancasterCounty Community Health Needs Assessment web portal, www.lghealth.org/countyhealthdataor www.ephratahospital.org/CommunityHealthNeeds. The web portal provides technicalinformation about the data sources used as the basis for the estimates and the statistical methodsused to identify changes in the estimates compared to previous time periods. It also identifieswhether Lancaster County’s estimates are better or worse than estimates for other Pennsylvaniaand/or US counties. All data and statistical analyses presented in this summary were gathered by the Healthy Communities Institute, unless specifically noted. Errors of interpretation or analysis are solely the responsibility of the author.
Overview of FindingsLancaster County tends to perform betterthan other counties on health care accessindicators. Most adults have a usual sourceof health care, many have insurance, and thecounty has ample primary care providers.Health insurance coverage of children is theone indicator where Lancaster tends toperform more poorly than expected, but thetrend in the county is for increased coverageof children. The strength of the health care
Introduction
52012 Summary Report
infrastructure is confirmed by several recent studies that place access and affordability for LancasterCounty in the top quartile of all health referral regions in the United States2 and Pennsylvania.3
The county and its residents have fewer negative health behaviors, at least from a comparativestandpoint, than residents of other counties. Fewer county residents smoke or drink compared tothe state and nation, and rates of obesity are comparable to state and national rates. TheCommonwealth Fund report places the county within its top quartile for the potential to lead healthylives and the 2012 County Health Rankings place Lancaster 7th out of 67 Pennsylvania counties for itscitizens’ positive health behaviors.
Cancer incidence and cancer andstroke death rates may be thegreatest comparative healthconcern for county residents. Theall-cancer incidence rate of 469.6per 100,000 places LancasterCounty in the third quartile of UScounties, with specific cancerincidence rates (for breast cancer,cervical cancer, colorectal cancer,and prostate cancer) and cancer
death rates (for breast cancer and colorectal cancer) also falling within the third quartile. The age-adjusted death rate for stroke, 43.8 per 100,000, is also in the third quartile. The county meets noneof the Healthy People 2020 targets for cancer, heart disease, or stroke death rates. The county trendsfor these rates are stable, signaling no significant improvement in recent years. The one cancerscreening measure included in the CHNA data, colon cancer screening for those over 50 years of age,places Lancaster in the worst quartile of Pennsylvania counties.
The county ranks in the best half of Pennsylvania counties on most maternal, fetal and infant healthmeasures, most prevention and safety measures, and most immunization and infectious diseasemeasures. There are two areas of relative concern within this category of indicators. First, the countyhas among the highest Chlamydia and gonorrhea incidence rates in the state. Second, it also has oneof the lowest early prenatal care rates among the state’s counties, well below the Healthy People2020 target for this indicator.
2 The Commonwealth Fund. Rising to the Challenge: Results from a Scorecard on Local Health System Performance, March 2012. 3 Robert Wood Johnson Foundation. County Health Rankings and Roadmaps. 2012 County Health Rankings.
62012 Summary Report
Lancaster County appears strong economically, but shows some weakness on environmental andsocial measures. Economic measures place Lancaster County among the best fifty percent of UScounties in terms of unemployment rates, incomes, foreclosures, poverty, and educationalattainment. However, the county scores among the worst quartile of US counties in terms of its airpollution. Lancaster County also falls below other US counties on food access for its low-incomeresidents. The 2012 county health rankings place Lancaster 64th out of Pennsylvania’s 67 counties forits physical environment. This includes measures of air pollution and access to healthy foods,
recreational facilities, and fast foodrestaurants.
Community health needsassessments normally includesome discussion of healthdisparities (i.e., gaps in access,conditions, or behaviors that arelarger for some demographic
groups than for others). Unfortunately, the data gathered for the community dashboard provideslimited information about such disparities because it provides data only by age, race, and gender.This leaves out, for instance, disparity analyses for those living in poverty or with low-incomes –attributes that normally reveal differential outcomes related to health care access, health conditions,and prevention behaviors. The limited data on health disparities provided in the communitydashboard is included in Appendix A. Generally speaking, the data show that health care access,health behaviors, and health conditions often have different rates for different age, gender, and racialgroups. As such, health priorities and intervention strategies should be created with at least someconsideration of the differential effects these characteristics may have on providing better health.However, many partners who assisted in the development of this report represent most of theminority populations (see experts listed in appendix B).
Each of the hospitals will complete a health improvement plan that describes how they intend toaddress the needs, the reasons those needs were selected, and the strategies by which the hospitalplans to address the selected needs. The plans will be posted on each hospital’s website and thehospitals will have hard copies available upon request, by July 1, 2013.
72012 Summary Report
Defining Community Health NeedsConducting a community health needs assessment to identify a community’s strengths andweaknesses is appealing because it affirms a community-spirited, can-do attitude that says we canknow the problems our communities face and offer solutions that solve them. But which needsshould a community address given limited resources? Should it consider those problems where thecommunity performs poorly relative to other communities? Should it consider those problems thataffect the most people? Should it consider those problems that adversely affect some groups morethan others? Should it consider those problems that contribute most to wasted lives and dollars?
The community health needs assessment was conducted in partnership with Lancaster HealthImprovement Partnership (LHIP) and its partner organizations. Experts in the various aspects ofpublic health provided comments and recommendations based on county data and the clients theyrepresent. Appendix B lists the LHIP partners.
The next few paragraphs consider setting priorities based on the number of people affected by thesehealth problems and those preventable health problems that contribute most to years of life lost andwasted dollars. This section does not discuss setting priorities based on relative performance sincethe preceding data and the analyses that follow in the Selected Highlights and Appendix provide
detailed information aboutLancaster County’s performancerelative to other counties.
82012 Summary Report
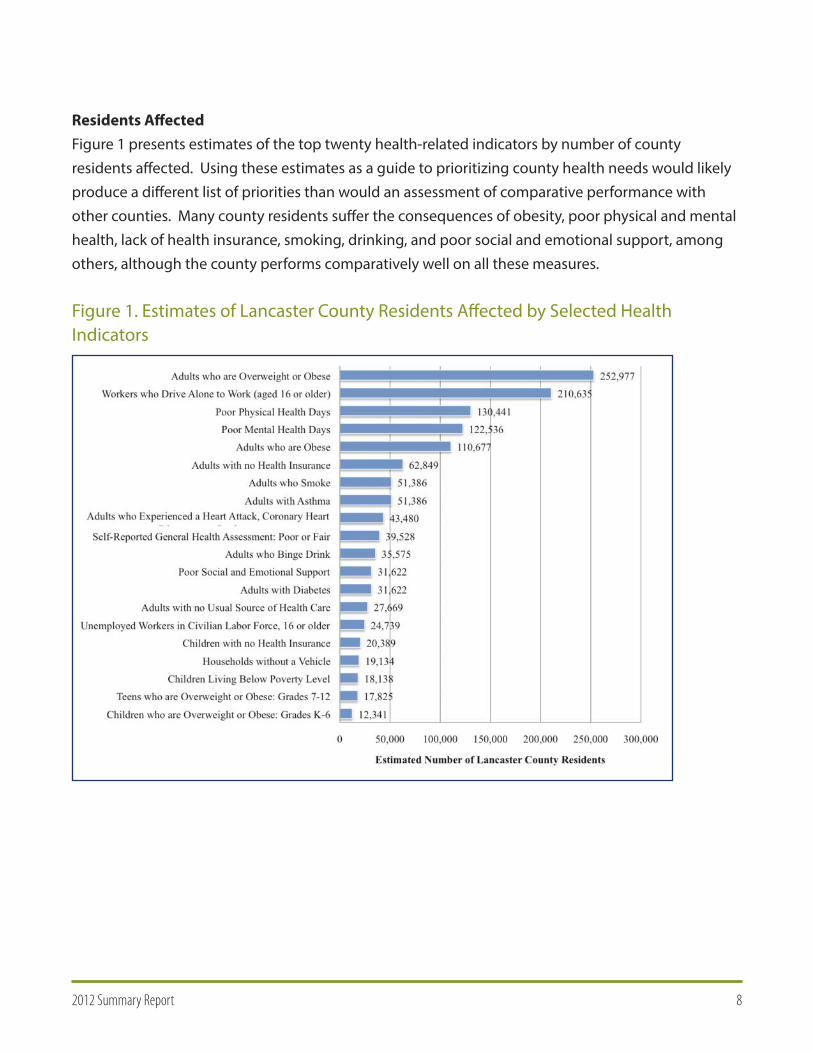
Residents AffectedFigure 1 presents estimates of the top twenty health-related indicators by number of countyresidents affected. Using these estimates as a guide to prioritizing county health needs would likelyproduce a different list of priorities than would an assessment of comparative performance withother counties. Many county residents suffer the consequences of obesity, poor physical and mentalhealth, lack of health insurance, smoking, drinking, and poor social and emotional support, amongothers, although the county performs comparatively well on all these measures.
Figure 1. Estimates of Lancaster County Residents Affected by Selected HealthIndicators
92012 Summary Report
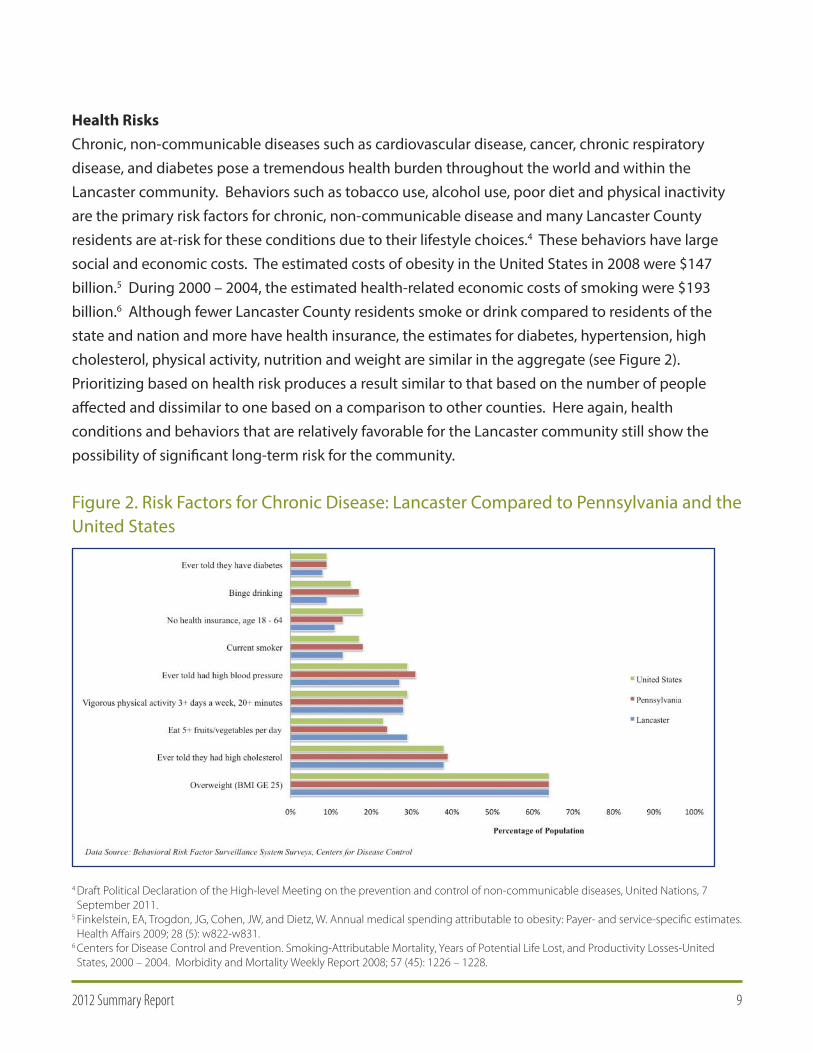
Health RisksChronic, non-communicable diseases such as cardiovascular disease, cancer, chronic respiratorydisease, and diabetes pose a tremendous health burden throughout the world and within theLancaster community. Behaviors such as tobacco use, alcohol use, poor diet and physical inactivityare the primary risk factors for chronic, non-communicable disease and many Lancaster Countyresidents are at-risk for these conditions due to their lifestyle choices.4 These behaviors have largesocial and economic costs. The estimated costs of obesity in the United States in 2008 were $147billion.5 During 2000 – 2004, the estimated health-related economic costs of smoking were $193billion.6 Although fewer Lancaster County residents smoke or drink compared to residents of thestate and nation and more have health insurance, the estimates for diabetes, hypertension, highcholesterol, physical activity, nutrition and weight are similar in the aggregate (see Figure 2).Prioritizing based on health risk produces a result similar to that based on the number of peopleaffected and dissimilar to one based on a comparison to other counties. Here again, healthconditions and behaviors that are relatively favorable for the Lancaster community still show thepossibility of significant long-term risk for the community.
Figure 2. Risk Factors for Chronic Disease: Lancaster Compared to Pennsylvania and theUnited States
4 Draft Political Declaration of the High-level Meeting on the prevention and control of non-communicable diseases, United Nations, 7September 2011.
5 Finkelstein, EA, Trogdon, JG, Cohen, JW, and Dietz, W. Annual medical spending attributable to obesity: Payer- and service-specific estimates.Health Affairs 2009; 28 (5): w822-w831.
6 Centers for Disease Control and Prevention. Smoking-Attributable Mortality, Years of Potential Life Lost, and Productivity Losses-UnitedStates, 2000 – 2004. Morbidity and Mortality Weekly Report 2008; 57 (45): 1226 – 1228.
102012 Summary Report
A Community Approach to HealthThe data included in this community health assessment primarily focus on individuals, the incidenceand prevalence of specific diseases, conditions, attitudes, and behaviors present within the localcommunity, but such data represent only part of the story. There are multiple influences oncommunity health and multiple barriers to health improvement. Identifying, documenting, andaddressing these multiple influences and barriers are as necessary for improving a community’shealth as is understanding individual-level data. This means that communities must address multiplefactors impacting health through policy interventions that emphasize the undeniable interactionbetween individual characteristics and environmental context influencing health behaviors. Forexample, efforts to educate people on the importance of exercise will do little to change behaviors ifpeople lack safe, affordable, and accessible places to exercise.
Lancaster County is fortunate to have been awarded a Community Transformation Grant (CTG) fromthe Centers for Disease Control and Prevention (CDC) that is designed to create community solutionsto the problems created by chronic disease and their underlying risk factors. The national goal of theCommunity Transformation Grant program is to create healthier communities by making healthyliving easier and more affordable.
The Lancaster County CTG programis focused on improving weight,nutrition, and physical activity;reducing tobacco use; andproviding access to quality clinicalpreventive services throughcommunity-level, policy-basedinterventions. The CommunityTransformation Grant providesLancaster County with support and
guidance to engage organizations that represent the entire community, including education,transportation, business, government, and faith-based organizations, to implement policy, systems,and environmental change that should improve health outcomes among all community members.
112012 Summary Report
Demographic ChangeThe data in this section of the report for 2000 – 2010 come from data available through the USCensus Bureau unless otherwise noted. Demographic data provided on the CHNA web portal and for2012 in this summary were provided by Claritas, Inc.
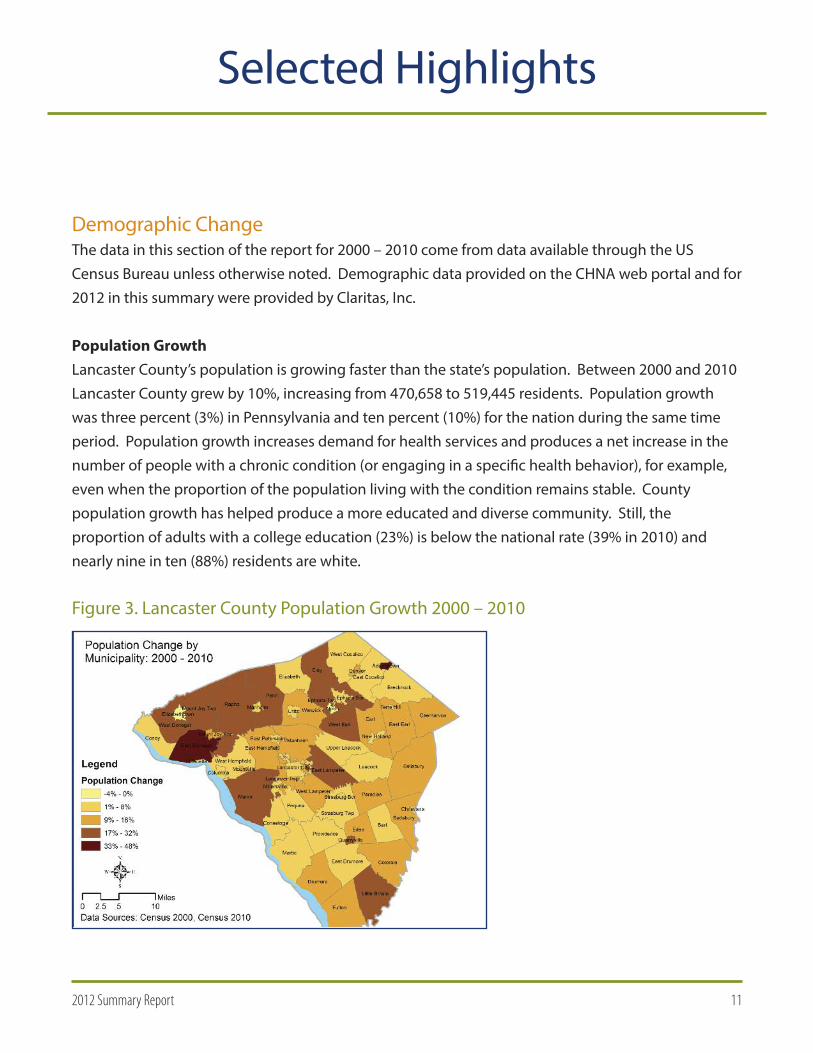
Population GrowthLancaster County’s population is growing faster than the state’s population. Between 2000 and 2010Lancaster County grew by 10%, increasing from 470,658 to 519,445 residents. Population growthwas three percent (3%) in Pennsylvania and ten percent (10%) for the nation during the same timeperiod. Population growth increases demand for health services and produces a net increase in thenumber of people with a chronic condition (or engaging in a specific health behavior), for example,even when the proportion of the population living with the condition remains stable. Countypopulation growth has helped produce a more educated and diverse community. Still, theproportion of adults with a college education (23%) is below the national rate (39% in 2010) andnearly nine in ten (88%) residents are white.
Figure 3. Lancaster County Population Growth 2000 – 2010
Selected Highlights
122012 Summary Report
AgeThe population in Lancaster County is slightly older in 2012 than it was in 2000. The median age forLancaster County increased from 36.1 years in 2000 to 37.8 years in 2012. Children younger than 18years of age are a larger share of the population in 2012 (34%) than in 2000 (27%) while theproportion of residents 65 years of age or older increased slightly from 14% to 14.6%. An olderpopulation generally means increased demand for health care services and increasing prevalence ofchronic conditions.
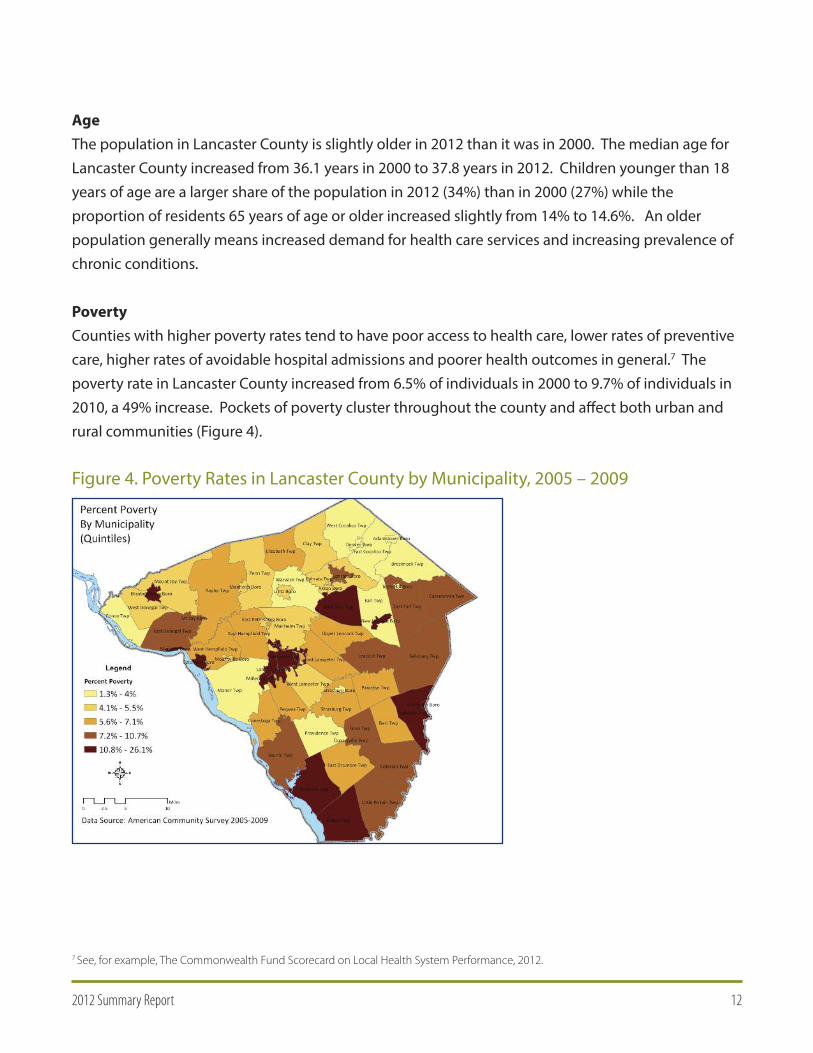
PovertyCounties with higher poverty rates tend to have poor access to health care, lower rates of preventivecare, higher rates of avoidable hospital admissions and poorer health outcomes in general.7 Thepoverty rate in Lancaster County increased from 6.5% of individuals in 2000 to 9.7% of individuals in2010, a 49% increase. Pockets of poverty cluster throughout the county and affect both urban andrural communities (Figure 4).
Figure 4. Poverty Rates in Lancaster County by Municipality, 2005 – 2009
7 See, for example, The Commonwealth Fund Scorecard on Local Health System Performance, 2012.
132012 Summary Report
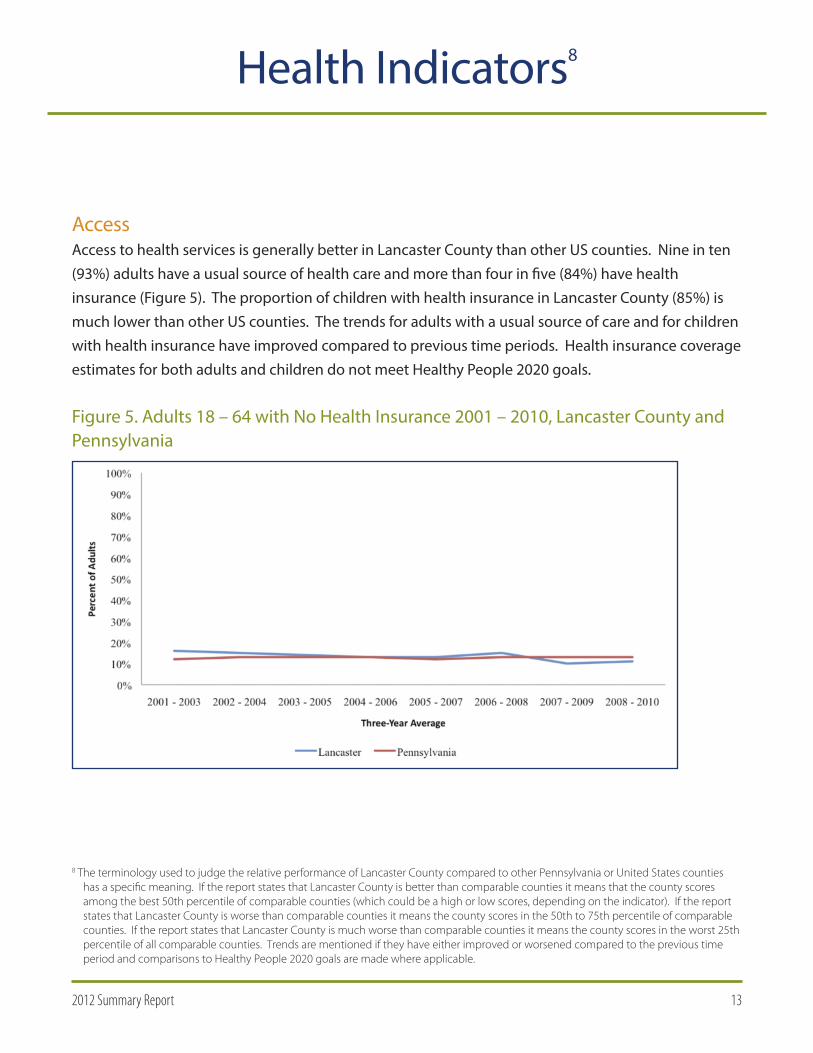
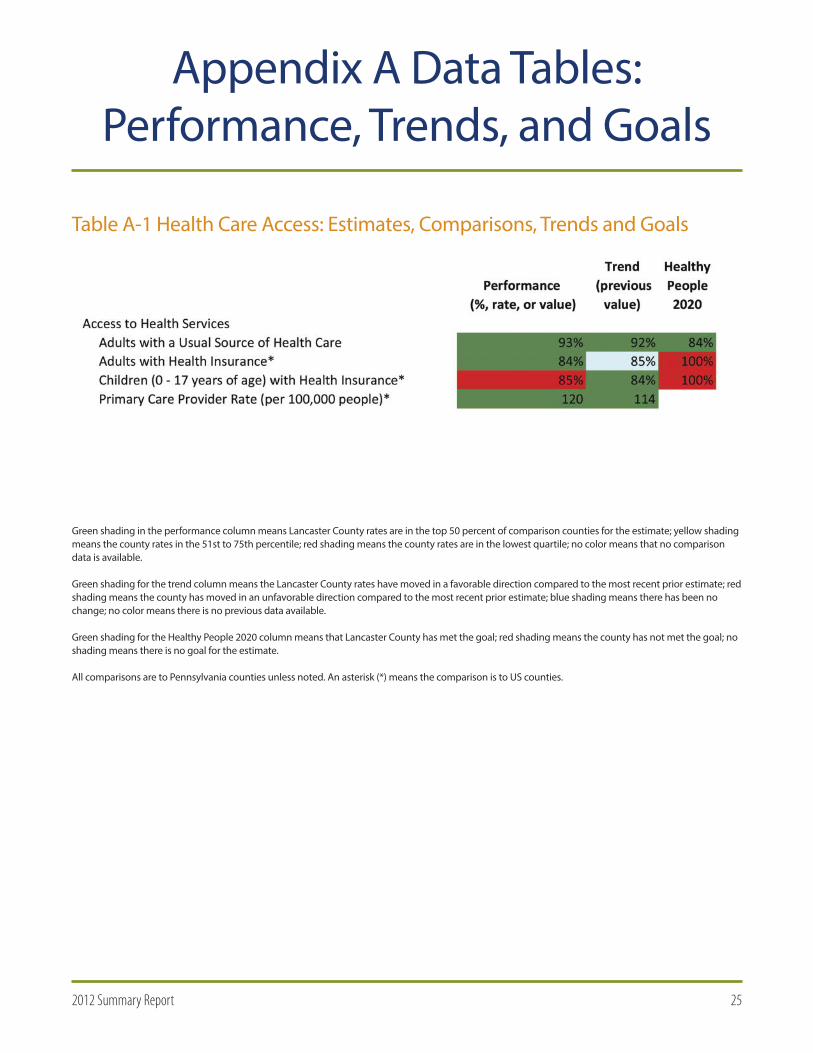
AccessAccess to health services is generally better in Lancaster County than other US counties. Nine in ten(93%) adults have a usual source of health care and more than four in five (84%) have healthinsurance (Figure 5). The proportion of children with health insurance in Lancaster County (85%) ismuch lower than other US counties. The trends for adults with a usual source of care and for childrenwith health insurance have improved compared to previous time periods. Health insurance coverageestimates for both adults and children do not meet Healthy People 2020 goals.
Figure 5. Adults 18 – 64 with No Health Insurance 2001 – 2010, Lancaster County andPennsylvania
8 The terminology used to judge the relative performance of Lancaster County compared to other Pennsylvania or United States countieshas a specific meaning. If the report states that Lancaster County is better than comparable counties it means that the county scoresamong the best 50th percentile of comparable counties (which could be a high or low scores, depending on the indicator). If the reportstates that Lancaster County is worse than comparable counties it means the county scores in the 50th to 75th percentile of comparablecounties. If the report states that Lancaster County is much worse than comparable counties it means the county scores in the worst 25thpercentile of all comparable counties. Trends are mentioned if they have either improved or worsened compared to the previous timeperiod and comparisons to Healthy People 2020 goals are made where applicable.
Health Indicators8
142012 Summary Report
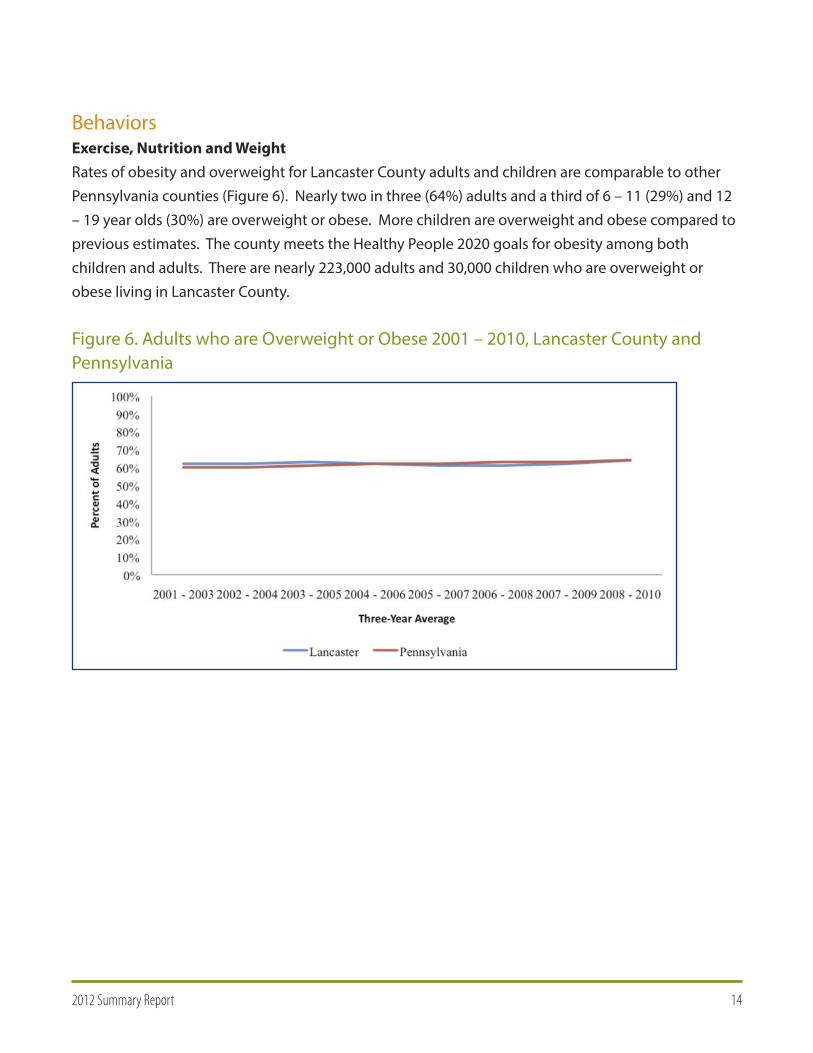
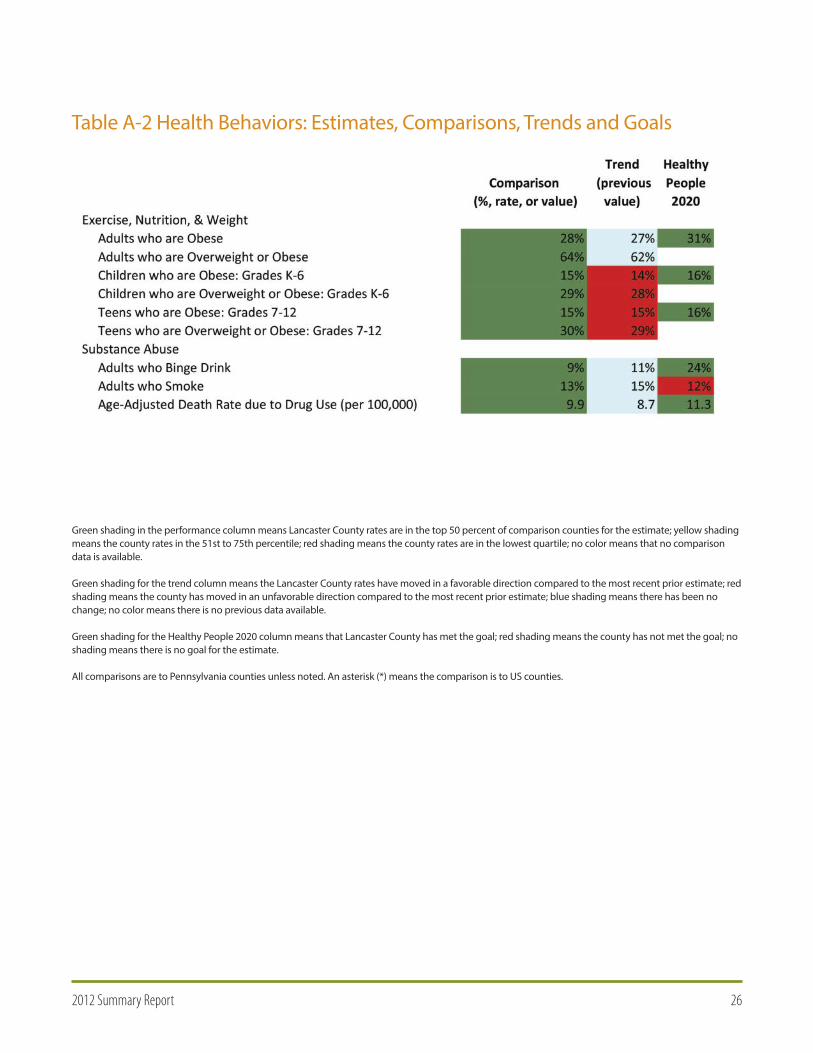
BehaviorsExercise, Nutrition and WeightRates of obesity and overweight for Lancaster County adults and children are comparable to otherPennsylvania counties (Figure 6). Nearly two in three (64%) adults and a third of 6 – 11 (29%) and 12– 19 year olds (30%) are overweight or obese. More children are overweight and obese compared toprevious estimates. The county meets the Healthy People 2020 goals for obesity among bothchildren and adults. There are nearly 223,000 adults and 30,000 children who are overweight orobese living in Lancaster County.
Figure 6. Adults who are Overweight or Obese 2001 – 2010, Lancaster County andPennsylvania
152012 Summary Report
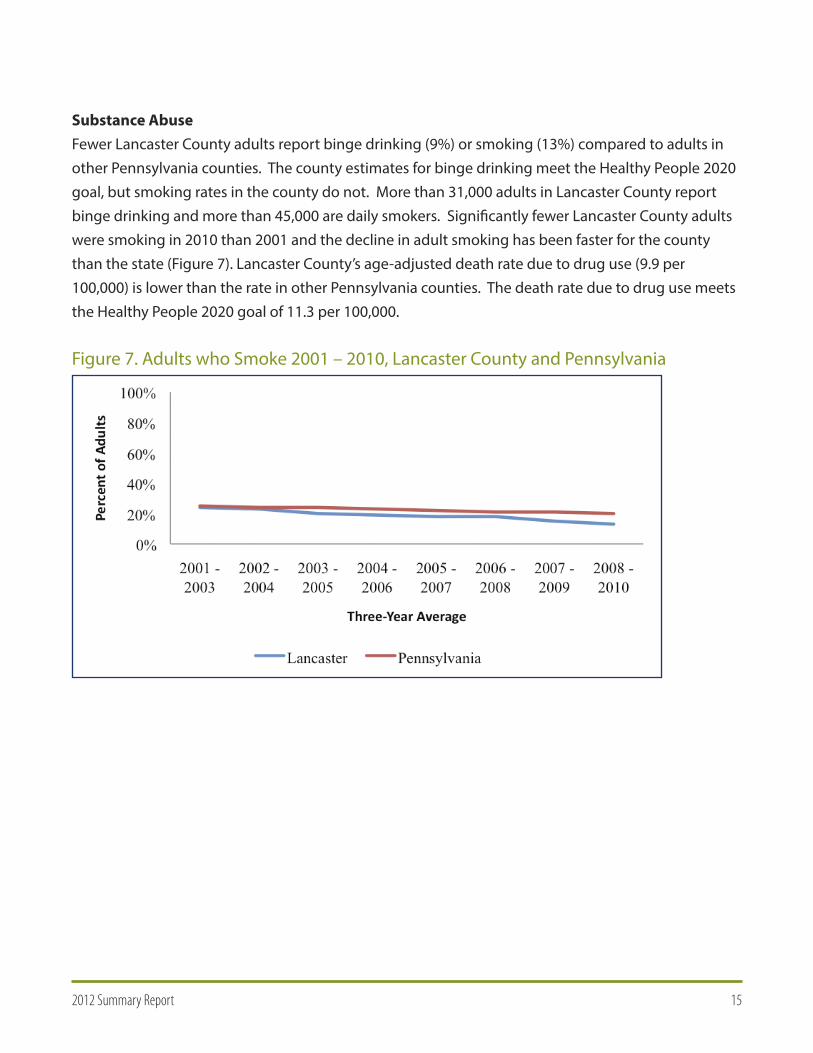
Substance AbuseFewer Lancaster County adults report binge drinking (9%) or smoking (13%) compared to adults inother Pennsylvania counties. The county estimates for binge drinking meet the Healthy People 2020goal, but smoking rates in the county do not. More than 31,000 adults in Lancaster County reportbinge drinking and more than 45,000 are daily smokers. Significantly fewer Lancaster County adultswere smoking in 2010 than 2001 and the decline in adult smoking has been faster for the countythan the state (Figure 7). Lancaster County’s age-adjusted death rate due to drug use (9.9 per100,000) is lower than the rate in other Pennsylvania counties. The death rate due to drug use meetsthe Healthy People 2020 goal of 11.3 per 100,000.
Figure 7. Adults who Smoke 2001 – 2010, Lancaster County and Pennsylvania
162012 Summary Report
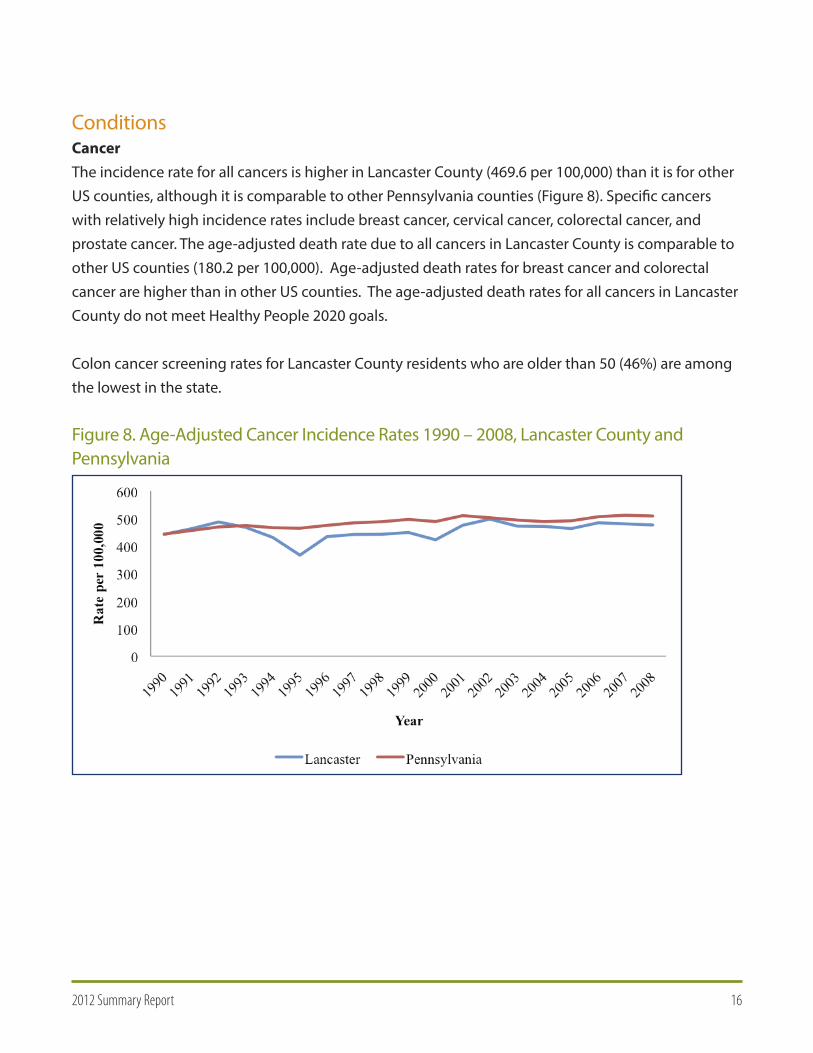
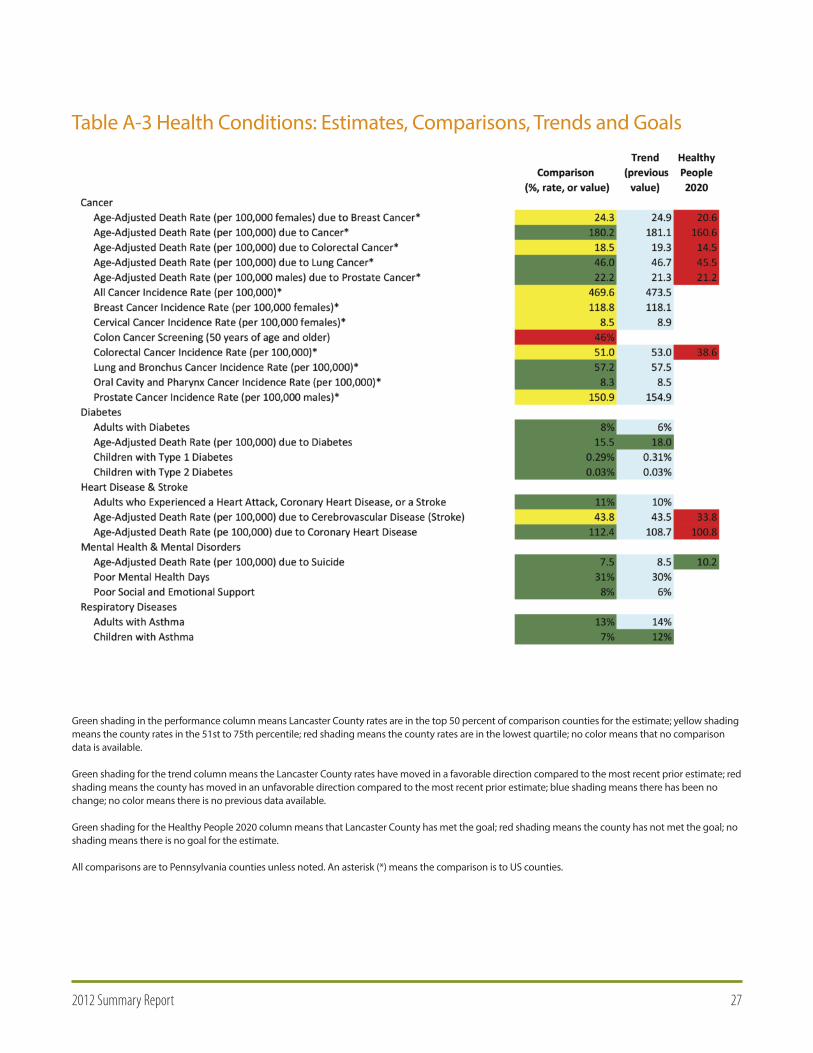
ConditionsCancerThe incidence rate for all cancers is higher in Lancaster County (469.6 per 100,000) than it is for otherUS counties, although it is comparable to other Pennsylvania counties (Figure 8). Specific cancerswith relatively high incidence rates include breast cancer, cervical cancer, colorectal cancer, andprostate cancer. The age-adjusted death rate due to all cancers in Lancaster County is comparable toother US counties (180.2 per 100,000). Age-adjusted death rates for breast cancer and colorectalcancer are higher than in other US counties. The age-adjusted death rates for all cancers in LancasterCounty do not meet Healthy People 2020 goals.
Colon cancer screening rates for Lancaster County residents who are older than 50 (46%) are amongthe lowest in the state.
Figure 8. Age-Adjusted Cancer Incidence Rates 1990 – 2008, Lancaster County andPennsylvania
172012 Summary Report
DiabetesDiabetes rates among children and adults in Lancaster are lower than other Pennsylvania counties.The age-adjusted death rate due to diabetes is also lower than other Pennsylvania counties.
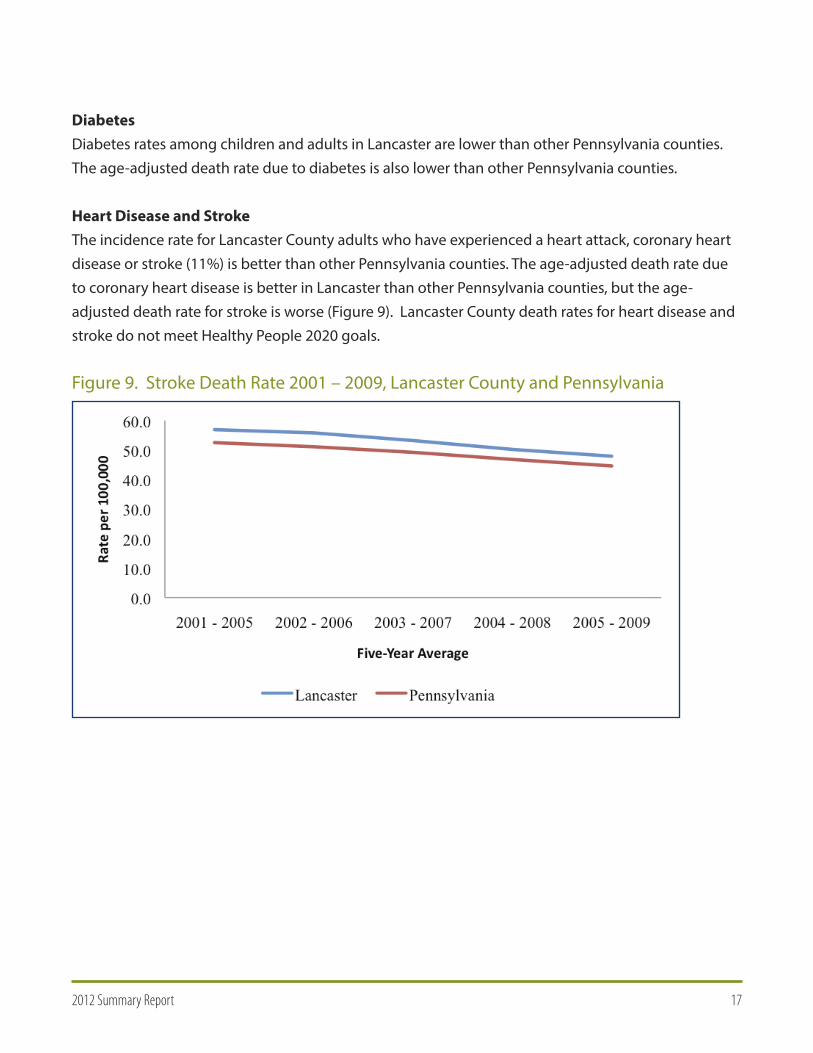
Heart Disease and StrokeThe incidence rate for Lancaster County adults who have experienced a heart attack, coronary heartdisease or stroke (11%) is better than other Pennsylvania counties. The age-adjusted death rate dueto coronary heart disease is better in Lancaster than other Pennsylvania counties, but the age-adjusted death rate for stroke is worse (Figure 9). Lancaster County death rates for heart disease andstroke do not meet Healthy People 2020 goals.
Figure 9. Stroke Death Rate 2001 – 2009, Lancaster County and Pennsylvania
182012 Summary Report
Mental Health and Mental DisordersThe age-adjusted death rate due to suicide (7.5 per 100,000) is lower in Lancaster County than inother Pennsylvania counties. Pennsylvania meets the Healthy People 2020 goals of 10.2 per 100,000deaths due to suicide.
Lancaster County adults have fewer poor mental health days and better social support than residentsof other Pennsylvania counties.
Respiratory DiseasesLancaster County has a smaller proportion of adults (13%) and children (7%) with asthma than otherPennsylvania counties. Fewer children have asthma compared to 2007 – 2008.
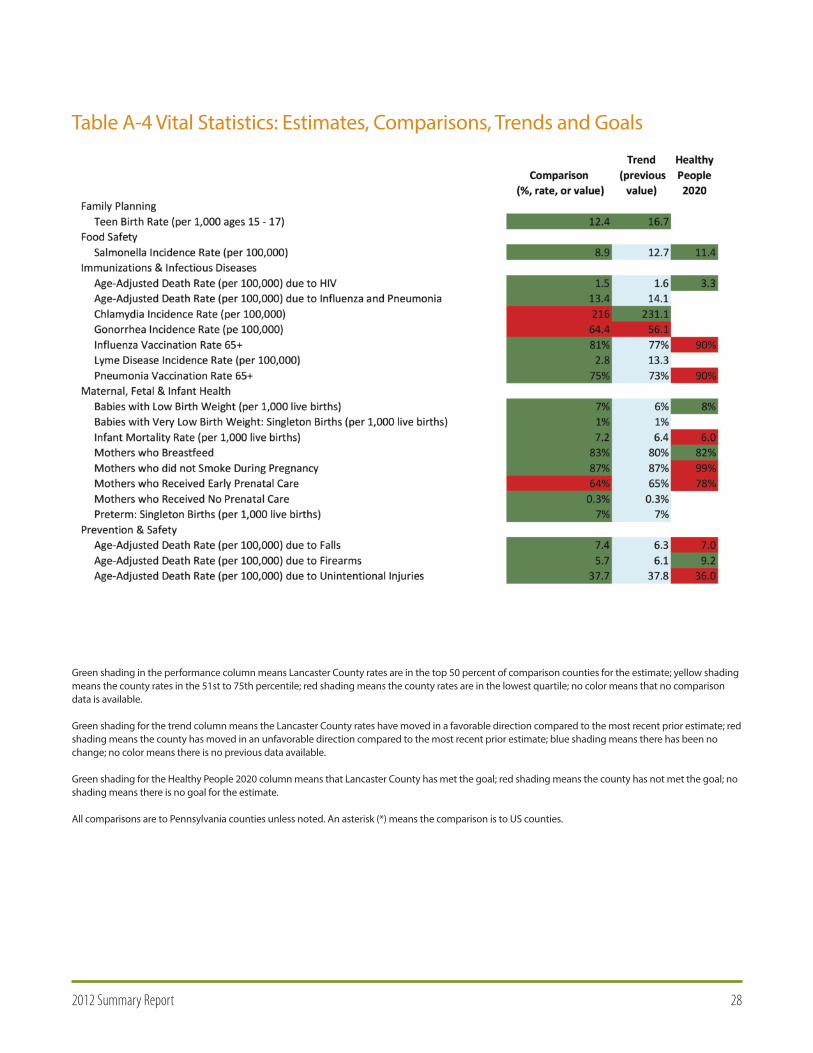
Vital StatisticsImmunizations and Infectious DiseasesLancaster County has lower death rates due to HIV (1.5 per 100,000) and influenza and pneumonia(13.4 per 100,000) than other Pennsylvania counties. Lancaster County’s HIV death rate meets theHealthy People 2020 goal of 3.3 per 100,000.
Lancaster County has much higher rates ofChlamydia and gonorrhea compared to otherPennsylvania counties. The Chlamydia rate islower compared to 2008 but the gonorrhea rateis higher.
The pneumonia vaccination rate (75%) andinfluenza vaccination rate (81%) for LancasterCounty adults over 65 years of age are higherthan in other Pennsylvania counties. Neitherrate meets the Healthy People 2020 target of90% for pneumonia and influenza vaccination.
192012 Summary Report
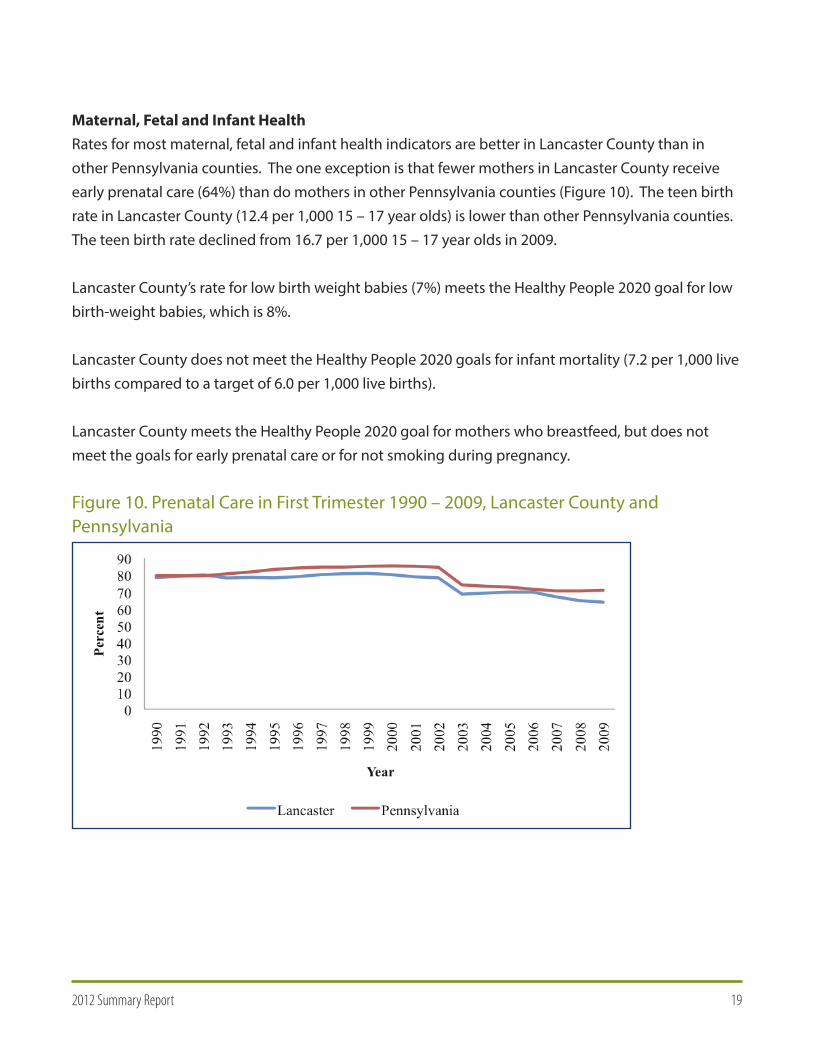
Maternal, Fetal and Infant HealthRates for most maternal, fetal and infant health indicators are better in Lancaster County than inother Pennsylvania counties. The one exception is that fewer mothers in Lancaster County receiveearly prenatal care (64%) than do mothers in other Pennsylvania counties (Figure 10). The teen birthrate in Lancaster County (12.4 per 1,000 15 – 17 year olds) is lower than other Pennsylvania counties.The teen birth rate declined from 16.7 per 1,000 15 – 17 year olds in 2009.
Lancaster County’s rate for low birth weight babies (7%) meets the Healthy People 2020 goal for lowbirth-weight babies, which is 8%.
Lancaster County does not meet the Healthy People 2020 goals for infant mortality (7.2 per 1,000 livebirths compared to a target of 6.0 per 1,000 live births).
Lancaster County meets the Healthy People 2020 goal for mothers who breastfeed, but does notmeet the goals for early prenatal care or for not smoking during pregnancy.
Figure 10. Prenatal Care in First Trimester 1990 – 2009, Lancaster County andPennsylvania
202012 Summary Report
Prevention and SafetyDeath rates due to falls (7.4 per 100,000), firearms (5.7 per 100,000), and unintentional injuries (37.7per 100,000) in Lancaster County are lower than in other Pennsylvania counties. The death rate dueto firearms meets the Healthy People 2020 goal (9.2 per 100,000), but the death rates due to falls andunintentional injuries do not.
Economy and EnvironmentEconomyLancaster County tends to have strong economic indicators. Rates of unemployment (6%),foreclosure (2%), homeownership (67%), and poverty (10%) are better than US other counties.Lancaster County has a higher rate of households with public assistance (2%) compared to other UScounties. Compared to residents of other US counties, fewer county residents eligible for publicassistance participate in the federal Supplemental Nutrition Assistance Program (SNAP).
EnvironmentLancaster County has much higher rates of annual ozone air quality days (5) and annual particlepollution days (4) than other US counties, both indicators of poor air quality. Annual releases ofcarcinogens and persistent, bio-accumulative, and toxic chemicals (PBTs) in Lancaster Countydeclined compared to 2009.
Public SafetyThe violent crime rate (182.1 per 100,000) and child abuse rate (6.9 per 1,000 children under 18) inLancaster County are below the rates in other Pennsylvania counties. The child abuse rate inLancaster County has increased since 2009. The child abuse rate in Lancaster County meets theHealthy People 2020 goal of 8.5 per 1,000 children.
TransportationThe proportion of Lancaster County households without a car and more than one mile from a grocerystore (4%) is higher than other US counties. The number of SNAP certified stores per 1,000 residents islower than in other US counties. The proportion of Lancaster County households without a privatevehicle is much higher than in other US counties. One in ten Lancaster County households (10%) doesnot own a private vehicle. The rate of private vehicle ownership is the same as it was in 2000. Thenumber of workers in Lancaster County who walk to work (4%) is higher than other US counties andexceeds the Healthy People 2020 target of 3%. Few workers in Lancaster County use publictransportation (1%) for their commute which is well below the Healthy People 2020 target of 6%.
212012 Summary Report
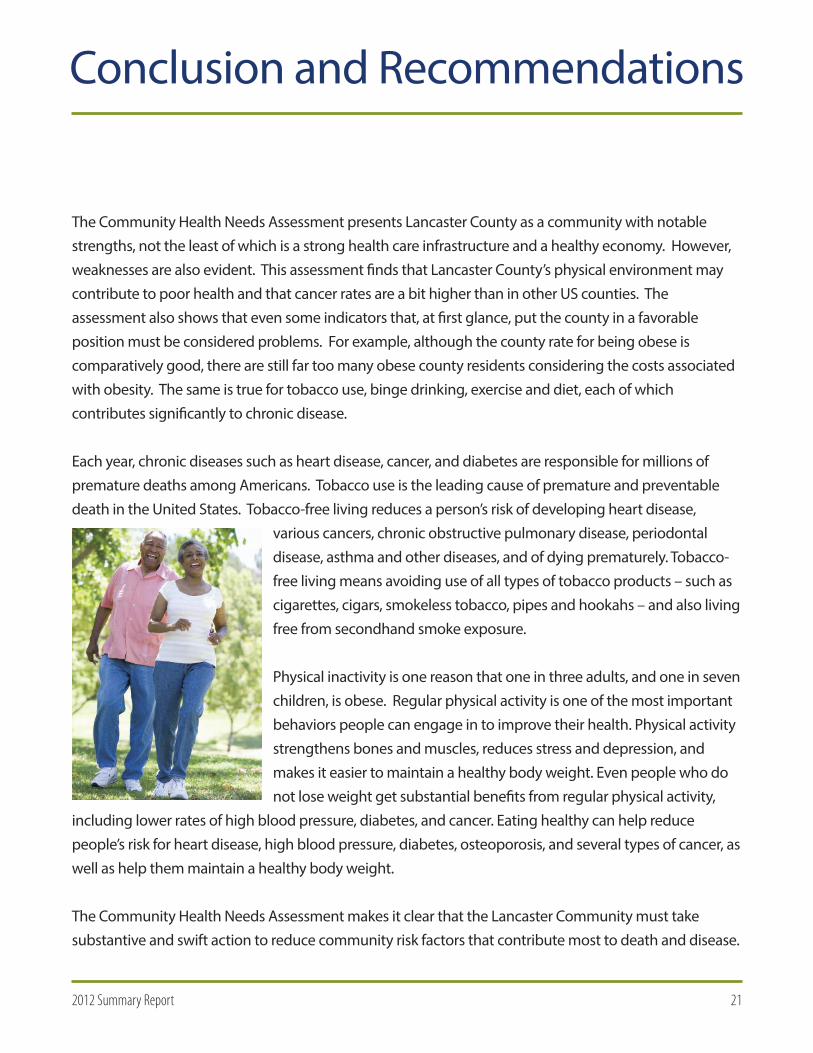
The Community Health Needs Assessment presents Lancaster County as a community with notablestrengths, not the least of which is a strong health care infrastructure and a healthy economy. However,weaknesses are also evident. This assessment finds that Lancaster County’s physical environment maycontribute to poor health and that cancer rates are a bit higher than in other US counties. Theassessment also shows that even some indicators that, at first glance, put the county in a favorableposition must be considered problems. For example, although the county rate for being obese iscomparatively good, there are still far too many obese county residents considering the costs associatedwith obesity. The same is true for tobacco use, binge drinking, exercise and diet, each of whichcontributes significantly to chronic disease.
Each year, chronic diseases such as heart disease, cancer, and diabetes are responsible for millions ofpremature deaths among Americans. Tobacco use is the leading cause of premature and preventabledeath in the United States. Tobacco-free living reduces a person’s risk of developing heart disease,
various cancers, chronic obstructive pulmonary disease, periodontaldisease, asthma and other diseases, and of dying prematurely. Tobacco-free living means avoiding use of all types of tobacco products – such ascigarettes, cigars, smokeless tobacco, pipes and hookahs – and also livingfree from secondhand smoke exposure.
Physical inactivity is one reason that one in three adults, and one in sevenchildren, is obese. Regular physical activity is one of the most importantbehaviors people can engage in to improve their health. Physical activitystrengthens bones and muscles, reduces stress and depression, andmakes it easier to maintain a healthy body weight. Even people who donot lose weight get substantial benefits from regular physical activity,
including lower rates of high blood pressure, diabetes, and cancer. Eating healthy can help reducepeople’s risk for heart disease, high blood pressure, diabetes, osteoporosis, and several types of cancer, aswell as help them maintain a healthy body weight.
The Community Health Needs Assessment makes it clear that the Lancaster Community must takesubstantive and swift action to reduce community risk factors that contribute most to death and disease.
Conclusion and Recommendations
222012 Summary Report
Healthy Communities Institute (HCI) provides demographic and secondary data on health, healthdeterminants, and quality of life topics. Data is typically presented in comparison to the distributionof counties, state average, national average, or Healthy People 2020 targets. Data is primarily derivedfrom state and national public health sources.
About HCI Provided Data1
Healthy Communities Institute (HCI) provides demographic and secondary data on health, healthdeterminants, and quality of life topics. Data is typically presented in comparison to the distributionof counties, state average, national average, or Healthy People 2020 targets. Data is primarily derivedfrom state and national public health sources. HCI also provides a database of promising practicesfrom a variety of sources, including the Centers for Disease Control and Prevention.
Framework for Indicator/Data and Topic Selection2
The framework for indicator selection within the Health category is based on the Department ofHealth and Human Services (DHHS) Healthy People initiative. Healthy People establishes science-based national objectives for improving the health of the nation. The initiative establishesbenchmarks every ten years and tracks progress toward these achievable goals. This frameworkencourages collaboration across sectors and allows communities to track important health andquality of life indicators focusing on general health status, health-related quality of life and well-being, determinants of health and disparities.
The Health subcategories are based on the Healthy People framework, and multiple indicators acrossthe health sub-topics that correspond with Healthy People targets have been chosen (based on dataavailability, reliability and validity from the source).
About HCI Provided Data
1 Provided by Healthy Communities Institute (www.healthycommunitiesinstitute.com)2 Provided by Healthy Communities Institute (www.healthycommunitiesinstitute.com)
232012 Summary Report
Hospital utilization indicators are based on the Agency for Healthcare Research and Quality (AHRQ)’sPrevention Quality Indicators (PQIs), which are a set of definitions for preventable causes ofadmission. These measures can be used with hospital inpatient discharge data to identify quality ofcare for “ambulatory care sensitive conditions.” These indicators are important for communities toidentify where prevention needs to be focused and can help lead to evidence-based communitybenefit planning. Ambulatory care sensitive conditions are also tracked by Healthy People.
Indicators in the other categories were selected according to national consensus and feedback froma wide set of advisors, public health officials, health departments, and local stakeholders from varioussectors in the community. For example, the education indicators are based on the National Center forHealth Research and Statistics and United Way of America, and the standards and goals they set forthto help track educational attainment in the U.S. Economic indicators were selected in conjunctionwith economic development and chamber of commerce input. All of the selected indicators havegone through a vetting process where HCI’s advisory board, as well as stakeholders in communitieswho have implemented HCI systems, provide feedback to refine the core indicators in order to bestreflect local priorities.
The indicator selection process evolves over time with changing health priorities, new researchmodels and national benchmarks. HCI continues to incorporate models and standards fromnationally recognized institutions such HHS’s Healthy People, AHRQ’s PQI’s, EPA Air Quality standards,National Center for Education Research and Statistics’ priorities, United Way, and United StatesDepartment of Agriculture’s Food Atlas, among many others.
These sources include, but are not limited to, the following:• AIRNow• American Community Survey• American Lung Association• Annie E. Casey Foundation• County Health Rankings• National Cancer Institute• National Center for Education Statistics• Pennsylvania Behavioral Risk Factor Surveillance System• Pennsylvania Department of Education
242012 Summary Report
• Pennsylvania Department of Health, Bureau of Community Health Systems, Division of School Health
• Pennsylvania Department of Health, Bureau of Health Statistics and Research• Pennsylvania Uniform Crime Reporting System• U.S. Bureau of Labor Statistics • U.S Department of Agriculture- Food Environment Atlas• U.S. Department of Housing and Urban Development• U.S. Environmental Protection Agency
HCI also provides a database of promising practices from a variety of sources, including the Centersfor Disease Control and Prevention.
All of the HCI content is presented in a public web platform that also serves as a publishing tool forcomponents of the Community Health Needs Assessment.
252012 Summary Report
Green shading in the performance column means Lancaster County rates are in the top 50 percent of comparison counties for the estimate; yellow shadingmeans the county rates in the 51st to 75th percentile; red shading means the county rates are in the lowest quartile; no color means that no comparisondata is available.
Green shading for the trend column means the Lancaster County rates have moved in a favorable direction compared to the most recent prior estimate; redshading means the county has moved in an unfavorable direction compared to the most recent prior estimate; blue shading means there has been nochange; no color means there is no previous data available.
Green shading for the Healthy People 2020 column means that Lancaster County has met the goal; red shading means the county has not met the goal; noshading means there is no goal for the estimate.
All comparisons are to Pennsylvania counties unless noted. An asterisk (*) means the comparison is to US counties.
Appendix A Data Tables: Performance, Trends, and Goals
Table A‐1 Health Care Access: Estimates, Comparisons, Trends and Goals
262012 Summary Report
Green shading in the performance column means Lancaster County rates are in the top 50 percent of comparison counties for the estimate; yellow shadingmeans the county rates in the 51st to 75th percentile; red shading means the county rates are in the lowest quartile; no color means that no comparisondata is available.
Green shading for the trend column means the Lancaster County rates have moved in a favorable direction compared to the most recent prior estimate; redshading means the county has moved in an unfavorable direction compared to the most recent prior estimate; blue shading means there has been nochange; no color means there is no previous data available.
Green shading for the Healthy People 2020 column means that Lancaster County has met the goal; red shading means the county has not met the goal; noshading means there is no goal for the estimate.
All comparisons are to Pennsylvania counties unless noted. An asterisk (*) means the comparison is to US counties.
Table A‐2 Health Behaviors: Estimates, Comparisons, Trends and Goals
272012 Summary Report
Green shading in the performance column means Lancaster County rates are in the top 50 percent of comparison counties for the estimate; yellow shadingmeans the county rates in the 51st to 75th percentile; red shading means the county rates are in the lowest quartile; no color means that no comparisondata is available.
Green shading for the trend column means the Lancaster County rates have moved in a favorable direction compared to the most recent prior estimate; redshading means the county has moved in an unfavorable direction compared to the most recent prior estimate; blue shading means there has been nochange; no color means there is no previous data available.
Green shading for the Healthy People 2020 column means that Lancaster County has met the goal; red shading means the county has not met the goal; noshading means there is no goal for the estimate.
All comparisons are to Pennsylvania counties unless noted. An asterisk (*) means the comparison is to US counties.
Table A‐3 Health Conditions: Estimates, Comparisons, Trends and Goals
282012 Summary Report
Table A‐4 Vital Statistics: Estimates, Comparisons, Trends and Goals
Green shading in the performance column means Lancaster County rates are in the top 50 percent of comparison counties for the estimate; yellow shadingmeans the county rates in the 51st to 75th percentile; red shading means the county rates are in the lowest quartile; no color means that no comparisondata is available.
Green shading for the trend column means the Lancaster County rates have moved in a favorable direction compared to the most recent prior estimate; redshading means the county has moved in an unfavorable direction compared to the most recent prior estimate; blue shading means there has been nochange; no color means there is no previous data available.
Green shading for the Healthy People 2020 column means that Lancaster County has met the goal; red shading means the county has not met the goal; noshading means there is no goal for the estimate.
All comparisons are to Pennsylvania counties unless noted. An asterisk (*) means the comparison is to US counties.
292012 Summary Report
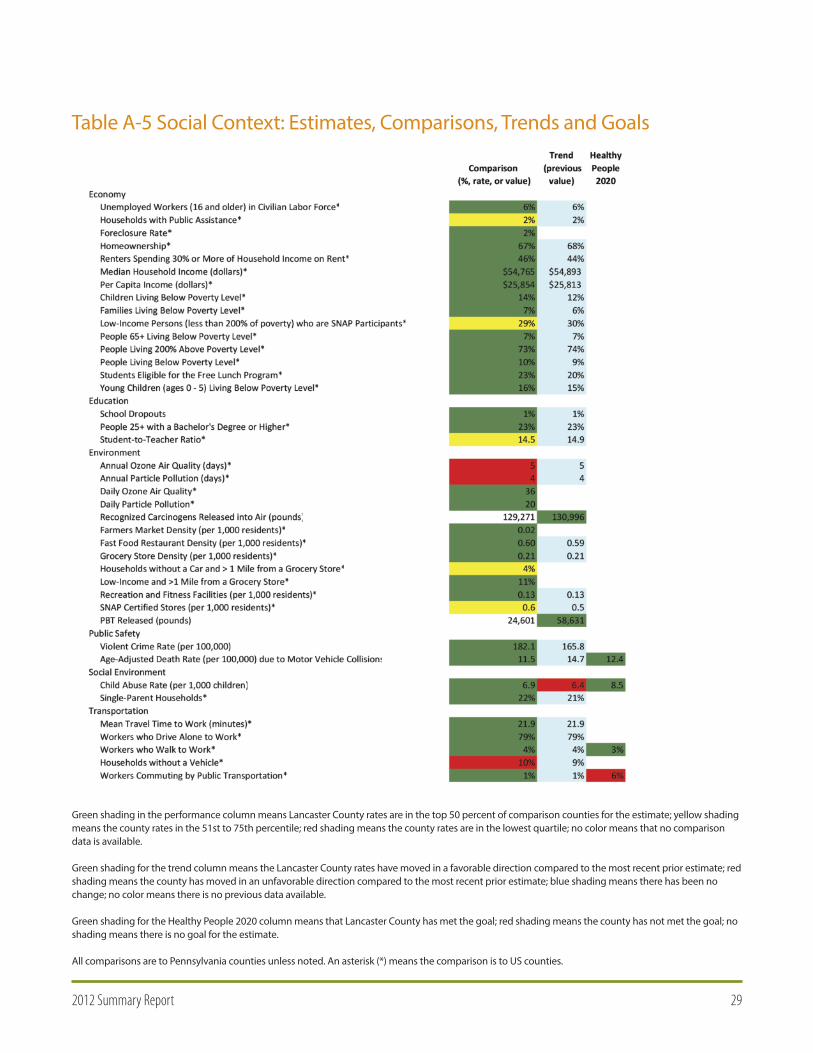
Table A‐5 Social Context: Estimates, Comparisons, Trends and Goals
Green shading in the performance column means Lancaster County rates are in the top 50 percent of comparison counties for the estimate; yellow shadingmeans the county rates in the 51st to 75th percentile; red shading means the county rates are in the lowest quartile; no color means that no comparisondata is available.
Green shading for the trend column means the Lancaster County rates have moved in a favorable direction compared to the most recent prior estimate; redshading means the county has moved in an unfavorable direction compared to the most recent prior estimate; blue shading means there has been nochange; no color means there is no previous data available.
Green shading for the Healthy People 2020 column means that Lancaster County has met the goal; red shading means the county has not met the goal; noshading means there is no goal for the estimate.
All comparisons are to Pennsylvania counties unless noted. An asterisk (*) means the comparison is to US counties.
302012 Summary Report
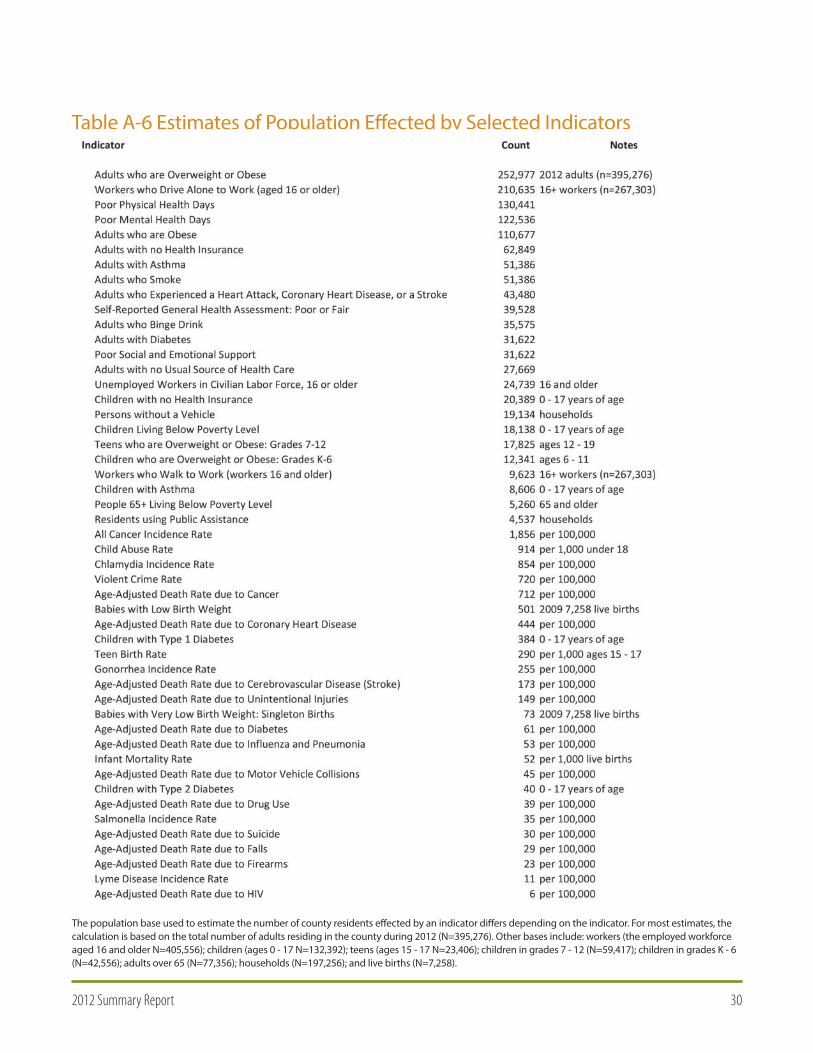
Table A‐6 Estimates of Population Effected by Selected Indicators
The population base used to estimate the number of county residents effected by an indicator differs depending on the indicator. For most estimates, thecalculation is based on the total number of adults residing in the county during 2012 (N=395,276). Other bases include: workers (the employed workforceaged 16 and older N=405,556); children (ages 0 ‐ 17 N=132,392); teens (ages 15 ‐ 17 N=23,406); children in grades 7 ‐ 12 (N=59,417); children in grades K ‐ 6(N=42,556); adults over 65 (N=77,356); households (N=197,256); and live births (N=7,258).
312012 Summary Report
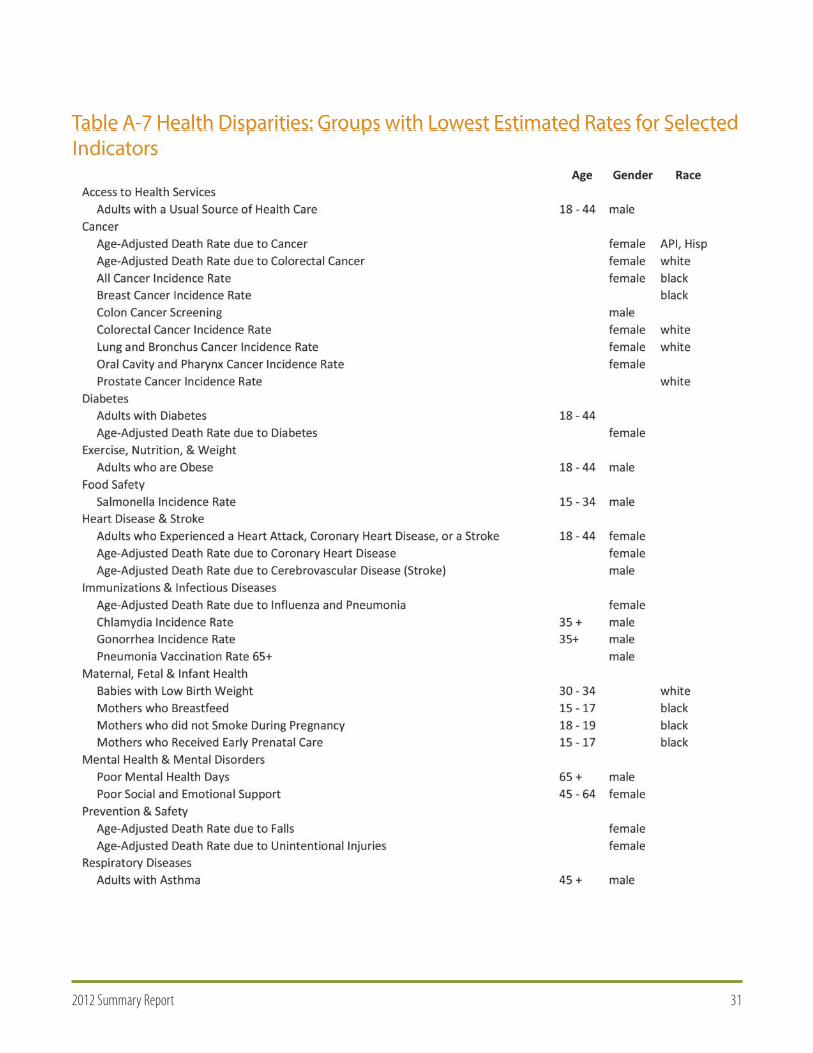
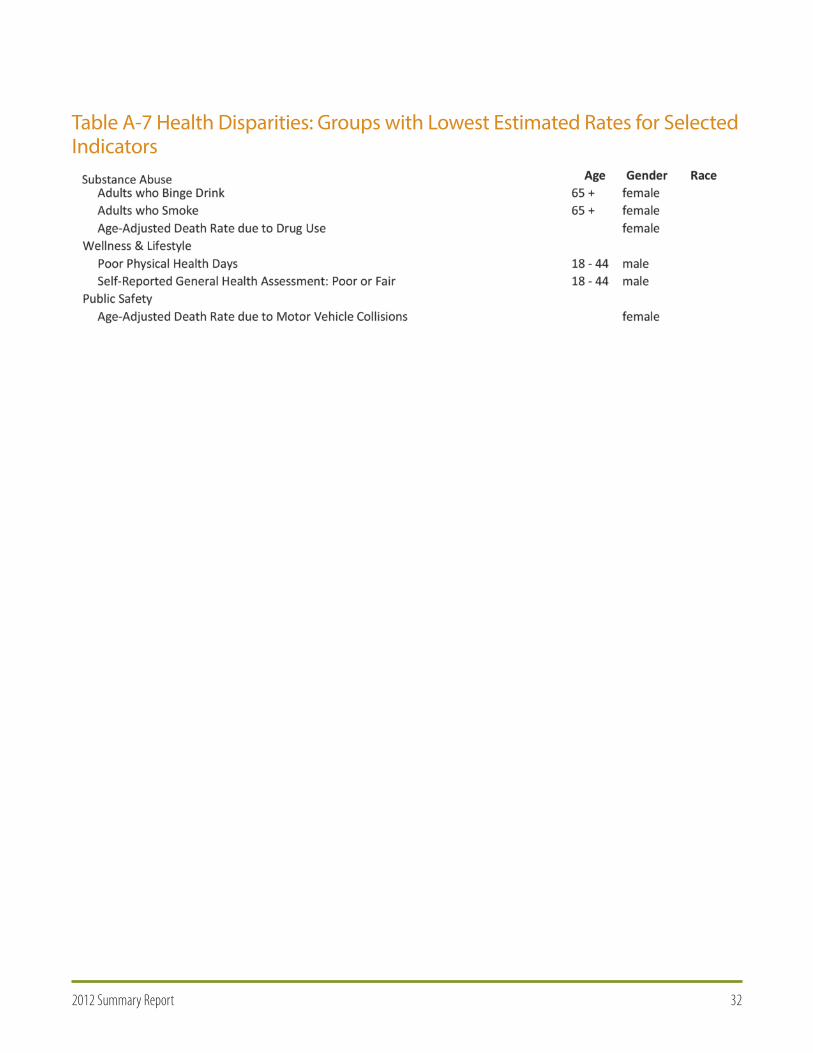
Table A‐7 Health Disparities: Groups with Lowest Estimated Rates for SelectedIndicators
322012 Summary Report
Table A‐7 Health Disparities: Groups with Lowest Estimated Rates for SelectedIndicators
332012 Summary Report
Appendix B:Expert Input
Jan Baily, Executive Director, Mental Health America of Lancaster County (Mental Health)Mental Health America of Lancaster County (MHALC) is part of a nation-wide voluntary organizationdedicated to promoting mental health, preventing mental illness and contributing to the quality oflife of persons suffering from mental and emotional problems2. This organization works withindividuals of all ages, races, and socioeconomic statuses to address their mental health needs.
Trisha Banker, Human Resources Program Coordinator, County of Lancaster (County Government)The County of Lancaster works to improve the health and well-being of all Lancaster County residents.
Scott Martin, County Commissioner, County of Lancaster The County acts as an agent of the Commonwealth for those functions which are specified by Statelaw. To carry out those functions, three County Commissioners are elected every four years3. TheCounty of Lancaster works to improve the health and well-being of all Lancaster County residents.
Steve Batchelor, MS, Director of Wellness Services, Ephrata Community Hospital (Hospital) Ephrata Community Hospital, a nonprofit hospital in Lancaster County, Pennsylvania, strives to assurecommunity access to quality, compassionate, and cost-effective health care. The hospital's primaryservice area is northern Lancaster County. The Wellness Center focuses on health and wellnessservices to reduce chronic disease.
John Porter, President & Chief Executive Officer, Ephrata Community Hospital (Hospital)Ephrata Community Hospital, a nonprofit hospital in Lancaster County, Pennsylvania, strives to assurecommunity access to quality, compassionate, and cost-effective health care. The hospital's primaryservice area is northern Lancaster County.
Jeff Blystone, Acting Director, Bureau of Community Health Systems, Pennsylvania Department of Health (Health Department) The Pennsylvania Department of Health works to improve the health of all residents of Pennsylvaniaand works to support halt and wellness efforts in Lancaster County.
2 Mental Health America: www.mhalancaster.org3 Lancaster County: www.co.lancaster.pa.us/lanco/cwp/view.asp?a=513&q=518430&lancoNav=|
342012 Summary Report
Susan Sines, RN BSN MSN (c) Community Health Nurse, Pennsylvania Department of Health(Health Department) The Pennsylvania Department of Health works to improve the health of all residents of Pennsylvaniaand works to support health and wellness efforts in Lancaster County.
Cynthia Sears, RN BSN, Community Health Nurse, Pennsylvania Department of Health (Health Department)The Pennsylvania Department of Health works to improve the health of all residents of Pennsylvaniaand works to support health and wellness efforts in Lancaster County.
Ken Culton, RN, Community Health Nurse HIV/AIDS/STD, Pennsylvania Department of Health(Health Department)The Pennsylvania Department of Health works to improve the health of all residents of Pennsylvaniaand works to support health and wellness efforts in Lancaster County, specifically SexuallyTransmitted Diseases.
Steve Fuhs, Southeast District Executive Director, Pennsylvania Department of Health (HealthDepartment)The Pennsylvania Department of Health works to improve the health of all residents of Pennsylvaniaand works to support health and wellness efforts in Lancaster County.
Zoe Bracci, Marketing and Education Coordinator, Albright Life (Elderly)Albright Care Services is a faith-based non-profit corporation serving Pennsylvania’s entireSusquehanna Valley. Albright Care Services provides services to Lancaster through the new LIFE(Living Independently for Elders) Centers. LIFE is Pennsylvania’s version of the nationally recognizedProgram of All-Inclusive Care for the Elderly (PACE)4. Albright Life focuses on the health and well-beingof the elderly population in Lancaster County.
4 Albright Life: www.albrightcare.org/page.asp?tid=78&name=About‐Albright
352012 Summary Report
Eboni Bryant, MS MBA, Lancaster County Community Transformation Grant Manager (Public Health)The Centers for Disease Control and Prevention (CDC) continues its long-standing dedication toimproving the health and wellness of all Americans through the Community Transformation Grant(CTG) Program. CTG supports state and local government agencies, tribes and territories, nonprofitorganizations, and communities across the country5. The Lancaster County CommunityTransformation Grant works to reduce chronic disease in Lancaster County among all residents,especially those of low income and the despaired populations.
Jacqueline Burch, MSW LSW, Executive Director, Lancaster County Office of Aging (Elderly)The Lancaster County Office of Aging works with the elderly population in Lancaster County.
Gail Dennis, Grants Program Manager, Lancaster General Health (Hospital)The Grants Department at Lancaster General Health works with community organizations to writeand secure grant funding for health and wellness initiatives in Lancaster County.
Alice Yoder, RN MSN, Director of Community Health, Lancaster General Health (Health-System)Lancaster General Health, a non-profit health system in Lancaster County, Pennsylvania, strives toimprove the health and wellness of all Lancaster County residents. The wellness center works to servelow-income, despaired populations, to reduce chronic disease in Lancaster County.
Jan Bergen, President of LG Health Network, Lancaster General Health (Health System)Lancaster General Health, a non-profit health system in Lancaster County, Pennsylvania, strives toimprove the health and wellness of all Lancaster County residents. The wellness center works to servelow-income, despaired populations, to reduce chronic disease in Lancaster County.
5 Centers for Disease Control and Prevention Community Transformation Grant: www.cdc.gov/communitytransformation
362012 Summary Report
Susan C. Eckert, Project Manager, Partnership for Public Health (Public Health)The Partnership for Public Health in Lancaster County exists to find unique local solutions to the publichealth challenges the county faces. In the face of increasing threats of disease outbreaks, municipalitiesstruggling to resolve sewer challenges, and decreasing resources from State departments to provideservices in our county, the Partnership is committed to a public/private partnership that reducesfragmentation and improves the health of residents. The Partnership relies on the engagement of diverseorganizations that provide the underlying support needed to ensureits success6. The Partnership for PublicHealth works to improve the health of the despaired populations in Lancaster County.
Colleen Elmer, BSW MSW MBA, Executive Director, Water Street Health Services (Homelessness)Water Street Health Services focuses on one segment of this population: the working poor orhomeless. These individuals and families often make less than $150 per week and cannot afford theco-payments at other safety net providers. Water Street Health Services is the only free clinic inLancaster City where residents living in poverty with an income too high to receive public healthinsurance and yet not enough to buy private health insurance find relief from pain for their medicalor dental crisis7. Water Street Health Services works with the despaired, low-income individuals inLancaster County, especially those living in Lancaster City.
Miora Gaul, MPH, Director of Lancaster City Services, Susquehanna Valley Pregnancy Services(Pregnancy Services)Susquehanna Valley Pregnancy Services exists to share the gospel of Jesus Christ and uphold thesanctity of human life through sexual integrity education, unplanned pregnancy intervention, andpost-abortion restoration8. Susquehanna Valley Pregnancy services works especially with women.
Vicki Gillmore, RN PhD NHA, Executive Director, Masonic Village at Elizabethtown (Elderly)Masonic Village at Elizabethtown is more than a continuing care retirement community. In additionto serving more than 1,700 individuals, they also operate a children's home and numerous othercommunity services. On-campus amenities and activities include lifelong learning programs, awellness center, an art studio/club, the Grey Lions of Elizabethtown (a Penn State Alumni InterestGroup), religious programs and services, and a travel club. While their villages are built upon andstrengthened by Masonic values, their communities are committed to serving Masons and non-Masons alike. Regardless of an individual’s financial situation, there is an affordable option for mostindividuals9. Masonic Villages works with the wellness of their residents, who are mostly elderly.
6 Partnership for Public Health: www.partnershipforpublichealth.org/partnership.html7 Water Street Health Services: www.wsm.org/healthservices8 Susquehanna Valley Pregnancy Services: www.svps.org/AboutUs.aspx9 Masonic Villages: www.masonicvillagespa.org/elizabethtown
372012 Summary Report
Stacy Schroder, M.Ed CEASI, Wellness Director, Masonic Village at Elizabethtown (Elderly)Masonic Village at Elizabethtown is more than a continuing care retirement community. In additionto serving more than 1,700 individuals, they also operate a children's home and numerous othercommunity services. On-campus amenities and activities include lifelong learning programs, awellness center, an art studio/club, the Grey Lions of Elizabethtown (a Penn State Alumni InterestGroup), religious programs and services, and a travel club. While their villages are built upon andstrengthened by Masonic values, their communities are committed to serving Masons and non-Masons alike. Regardless of an individual’s financial situation, there is an affordable option for mostindividuals10. Masonic Villages works with the wellness of their residents, who are mostly elderly.
Esther Good, River of Life Health Center (Faith Based- Low Income)River of Life Health Center provides primary healthcare services, with dignity and respect, tounderserved, uninsured and underinsured residents of regions within Pennsylvania with the help ofqualified health volunteers and staff, and has the vision to empower local churches in othercommunities to do the same11. River of Life Health Center works to provide care to the despairedpopulations in Lancaster County, including those who are of low-income, under and uninsured.
Phil Goropoulos, MNM Certificate of LGBT Health, President/CEO, Alder Health Services (HIV)Alder Health Services is dedicated to improving the health of individuals living with HIV/AIDS,members of the lesbian, gay, bisexual and transgender community and those struggling withaddiction in the South Central Pennsylvania region. All HIV-related services are provided at no-cost tothe participant. Primary medical care and mental health counseling services are available on a slidingfee scale. While many insurance plans are accepted, insurance is not necessary to access the servicesof Alder Health12.
Rick Kastner, Executive Director, Lancaster County Drug & Alcohol Commission (Drug & Alcohol)The Lancaster County Drug and Alcohol Commission has been serving the community for more than35 years, fulfilling our mission to provide access to high quality, community-based drug and alcoholprevention/education services for all citizens and treatment services to uninsured and under-insured,low-income citizens in an efficient and cost effective manner in the County of Lancaster, PA13.Lancaster County Drug & Alcohol Commission works with individuals struggling with addiction.
10 Masonic Villages: www.masonicvillagespa.org/elizabethtown11 River of Life Health Center: www.facebook.com/RiverOfLifeHealth#!/RiverOfLifeHealth/info12 Alder Health Services: www.alderhealth.org/index.php?pID=313 Lancaster County Drug & Alcohol Commission: www.co.lancaster.pa.us/lanco/cwp/view.asp?q=379662&lanconav_GID=991
382012 Summary Report
Melody Keim, VP, Programs & Initiatives, Lancaster County Community Foundation(Philanthropy)The Community Foundation invests in the future of our community. Since 1924 they have beenhelping people establish permanent funds for the causes they care about and making grantinvestments to organizations that create a stronger and more vibrant quality of life for all of us. Todaythey hold nearly $70 million dollars in community assets that help support Lancaster every year.These resources are unique because they mean that this year, and every year, the CommunityFoundation will invest a portion of this money back into community benefit organizations and theemerging needs of Lancaster County. Their mission is to advance the vitality and well-being of thepeople of Lancaster County by inspiring generosity and by being responsible stewards of gifts fortoday and tomorrow and vision is to create extraordinary community through inspired giving forsustainable, meaningful impact. The Community Foundation works to provide funding and resourcesto organizations that improve the health of Lancaster County residents14.
Dave Koser, Program Associate, Lancaster County Community Foundation (Philanthropy)The Community Foundation invests in the future of our community. Since 1924 they have beenhelping people establish permanent funds for the causes they care about and making grantinvestments to organizations that create a stronger and more vibrant quality of life for all of us. Todaythey hold nearly $70 million dollars in community assets that help support Lancaster every year.These resources are unique because they mean that this year, and every year, the CommunityFoundation will invest a portion of this money back into community benefit organizations and theemerging needs of Lancaster County. Their mission is to advance the vitality and well-being of thepeople of Lancaster County by inspiring generosity and by being responsible stewards of gifts fortoday and tomorrow and vision is to create extraordinary community through inspired giving forsustainable, meaningful impact. The Community Foundation works to provide funding and resourcesto organizations that improve the health of Lancaster County residents15.
14 15 Lancaster County Community Foundation: www.lancfound.org/about-us/
392012 Summary Report
Carol Kuntz, Chief Operating Director/COO, Compass Mark (Drug & Alcohol)Since 1966, Compass Mark has been leading the way in all aspects of substance abuse education,prevention and intervention as the Council on Drug & Alcohol Abuse. Compass Mark continues theircommitment to guide individuals and families on a journey toward lives free from substance abuseand full of promise. From those personally struggling with addiction, to those seeking help for othersor looking to prevent problems in the first place, Compass Mark has the resources to help directchildren, teens and adults on a healthy, successful life path. Compass Mark has customized skill-building programs that can be taken anywhere there is a demand. All programs are designed to helpindividuals face life’s challenges with the strength to make positive decisions that lead to unshakablefamilies, productive workplaces and safe, flourishing communities16. Compass Mark works withindividuals of all ages living in Lancaster County.
Mary LeVasseur, Chair Person, Tobacco-Free CoalitionTobacco-Free Coalition of Lancaster County is a group of people united by common concern overtobacco use in Lancaster County, PA. Their mission is to prevent young people from using tobacco, toprovide resources for people to quit their tobacco use, and eliminate of tobacco-smoke pollution.The Tobacco-Free Coalition of Lancaster County works with the individuals in Lancaster Countyimpacted by tobacco use.
Janeen Maxwell, MPH CHES, Health & Human Services Consultant, Holleran (Data Analysis)Holleran’s mission is to provide research services to not-for-profit organizations to help them betterunderstand the perceptions and needs of their stakeholders so they can achieve their mission ofexcellence17. Holleran works to improve the health of all Lancaster County residents.
Lisa McCraken, MA, President, Holleran (Data Analysis)Holleran’s mission is to provide research services to not-for-profit organizations to help them betterunderstand the perceptions and needs of their stakeholders so they can achieve their mission ofexcellence18. Holleran works to improve the health of all Lancaster County residents.
Kirk Miller, MS PhD, Professor of Biology, Franklin & Marshall College (Public Health)Franklin & Marshall College is a private liberal arts college in Lancaster County. Franklin & Marshallworks to improve the health of students and to prepare students for a career in public health andmedicine.
16 Compass Mark: www.compassmark.org/about_us.html17 18 Holleran: www.holleranconsult.com/about‐us.php
402012 Summary Report
Berwood Yost, Director, Floyd Institute for Public Policy, Franklin & Marshall College (Data Analysis)The Floyd Institute for Public Policy and Analysis was created to provide students with anopportunity to apply skills they gain in public policy and research methods courses to significantquestions of public policy at the national, state or local levels19. The Floyd Institute works todetermine health needs of Lancaster County residents.
Linda Aleci, PhD, Coordinator, Local Economy Center, Franklin & Marshall CollegeThe Franklin & Marshall Local Economy Center (LEC) serves the research needs of the Lancastercommunity and the curricular needs of Franklin & Marshall students. It provides learningopportunities for students interested in studying local economies and supports the economicdevelopment work of the community. It is the mission of the Center to offer students opportunitiesfor primary research on the Lancaster economy and to enable the community's diverseconstituencies to work together toward effective, inclusive, and sustainable economic-developmentstrategies. Through its activities and publications, the center: Promotes community awareness ofeconomic development matters, enlists students and faculty to meet the research needs of thecommunity's economic development constituencies, and brings the best available thinking andpractices to the attention of the community20.
Jaime G. Quinn, Community Resource Navigator, American Cancer Society (Cancer Prevention)The American Cancer Society in Lancaster County works to prevent Lancaster County residents fromdeveloping cancer, and providing assistance to residents impacted by cancer.
Bonnie Reid, Community Health Liaison, AmeriHealth Mercy Health Plan (Health Plan- Low Income)AmeriHealth Mercy Health Plan is a Medical Assistance (Medicaid) managed care health plan workingto improve the health of those individuals on medical assistance.
Sean Reynolds, MS CFRE, President & CEO, St. Joseph Health Ministries (Faith Based and Children)St. Joseph Health Ministries was formed in 2000 to continue and build upon the health ministry thatwas unwavering since the founding of St. Joseph Hospital. For the last 13 years, St. Joseph HealthMinistries has been driven by this mission to help those who need help the most – children fromeconomically disadvantaged families whose healthcare needs have not been fulfilled.
19 The Floyd Institute for Public Policy: www.fandm.edu/the-floyd-institute-for-public-policy-and-analysis20 Local Economy Center: www.fandm.edu/lec
412012 Summary Report
Lisa Riffanacht, Executive Director, Project Access Lancaster County (Low-Income)Project Access Lancaster County (PALCO), a program of the Lancaster County Medical foundation,began in 2007 out of a concern of the local medical community for the uninsured in LancasterCounty. PALCO’s mission is to provide a coordinated healthcare network of volunteer physicians, otherhealth care providers, hospital services, diagnostic services and pharmaceutical assistance for the lowincome uninsured residents of Lancaster County. PALCO provides a health care bridge for people whocannot afford health insurance, but who do not qualify for Medical Assistance, Veterans Benefits, orMedicare. In the first four years of operation, PALCO has served over 3,400 participants21.
Karen Schloer, CEO, Boys & Girls Club of Lancaster (Low-Income Children)The Boys & Girls Club of Lancaster has been a premier provider of youth services in Lancaster since1939. The Mission of Boys & Girls Club of Lancaster is to enable all young people, especially those whoneed them most, to become productive, caring, responsible adults. They provide an environmentwhere members can achieve: positive self-identity, a healthy lifestyle, a strong character, educationalsuccess, and social competency22.
Jim Schmucker, Executive Director, Lancaster County Business Group on HealthLancaster County Business Group on Health works to improve the health of businesses in LancasterCounty.
Kelly Schober, EExecutive Director, Lancaster City & County Medical Society (Health)The Lancaster City and County Medical Society addresses the issues facing the medical professiontoday and works to preserve the physician-patient relationship. They work with the healthcareproviders to improve the health of the Lancaster County residents they serve.
Beth Koser Schwartz, BSN MSN (c), Facilitator, Lighten Up Lancaster CountyLighten Up Lancaster County is a group of concerned individuals whose members include stay-at-home parents, students, educators, wellness professionals, healthcare providers, local governmentofficials, food service employees, recreation/fitness facilities, non-profits and businesses. Eachmember brings different experiences and perspectives to the table, but their unifying purpose is todevelop, implement, and promote local policies and programs that make being healthy easy. LightenUp Lancaster County works to improve the health of Lancaster County residents as it relates to beingat a healthy weight.
21 Project Access Lancaster County: www.palcolancaster.org/home.html22 Boys & Girls Club Lancaster: www.bgclanc.org/
422012 Summary Report
Hilda Shirk, PhD MSW, CEO, SouthEast Lancaster Health Services (Low-Income)Their mission is to provide medical and dental care to all members of our community–moms, dads,children, grandparents, adults, teens, and babies who have no insurance, who have little or noincome and those who cannot find affordable healthcare elsewhere. When a fellow Lancastrian isvulnerable and sick, SouthEast Lancaster Health is honored to restore their wellness23. SouthEast is aFederally Qualified Health Center (FQHC) focused on serving the underserved in Lancaster County.
Donita Sturgis, BSN MSN, President, Hope Within Ministries (Faith-Based)Hope Within Ministries, incorporated in 2002, is a Christian, faith-based, non-profit organization. Themission of Hope Within is to demonstrate the love and proclaim the Gospel of Jesus Christ. Throughthe operation of Hope Within Community Health Center, their first major endeavor, they deliver freeprimary healthcare services to the medically uninsured of Lancaster and Dauphin Counties inPennsylvania24.
Joanne Sullivan, Executive Director, Pennsylvania Immunization CoalitionThe Pennsylvania Immunization Coalition (PAIC) is an organization of volunteers consisting ofindividuals and organizations that have an interest in advancing the mission of timely and effectiveimmunizations for all Pennsylvania residents25.
Terri Trimble, CEO, Welsh Mountain Health Centers (Low-Income)Welsh Mountain Health Centers was founded in 1972 and incorporated in 1973 to “provide quality,family-centered health services to all members of the community, especially those who encounterbarriers to care”. Welsh Mountain Medical & Dental Center is a Federally Qualified Health Center(FQHC) receiving annual support from the United States Department of Health & Human Services26.
Sandra Valdez, Associate Director, Spanish American Civic Association (SACA)/Nuestra Clinica(Latino Community)The Spanish American Civic Association (SACA), SACA Development Corporation and SACA BroadcastingCorporation have long been committed to the empowerment of the Latino community through astrenuous process of self-help and self-development and throughout that process, the betterment of theentire Lancaster community. Now more than ever, the Latino community needs to invest in itself and thegeneral community is encouraged to invest in our efforts at community development27.
23 SouthEast Lancaster Health Services: www.selhs.org/about-us/24 Hope Within Ministries: www.hopewithin.com/about.htm25 Pennsylvania Immunization Coalition: www.immunizepa.org/about/mission-vision-goals26 Welsh Mountain Health Centers: www.welshmountain.com/index.html27 Spanish American Civic Association: www.sacapa.org/about.html
432012 Summary Report
Allison Weber, Director of Community Relations and Education, Spanish American CivicAssociation (SACA) (Latino Community)The Spanish American Civic Association (SACA), SACA Development Corporation and SACABroadcasting Corporation have long been committed to the empowerment of the Latino communitythrough a strenuous process of self-help and self-development and throughout that process, thebetterment of the entire Lancaster community. Now more than ever, the Latino community needs toinvest in itself and the general community is encouraged to invest in our efforts at communitydevelopment27.
Carlos Graupera, President, Spanish American Civic Association (Latino Community)The Spanish American Civic Association (SACA), SACA Development Corporation and SACABroadcasting Corporation have long been committed to the empowerment of the Latino communitythrough a strenuous process of self-help and self-development and throughout that process, thebetterment of the entire Lancaster community. Now more than ever, the Latino community needs toinvest in itself and the general community is encouraged to invest in our efforts at communitydevelopment28.
Sharon Wasneuski, Women Infants & Children Director, CAP-WIC (Low-Income)The WIC Program provides nutritious foods, nutrition education and health screenings to income-eligible pregnant, postpartum and breastfeeding women, and to infants and children up to age fivewho are at nutritional risk. All program participants receive nutrition education regardingappropriate foods to eat during pregnancy, breastfeeding, infancy and childhood to promoteoptional growth and development29. WIC focuses on the health of women, infants, and children inLancaster County.
Tamara Worst, HIV Provider Relations Manager, Family Health Council of Central Pennsylvania(HIV)The Family Health Council of Central Pennsylvania is a private, not-for-profit organization dedicatedto improving health, preventing disease, and promoting wellness. Founded in 1973, the Counciloversees and supports a diverse, 28-county network of organizations providing a range of vitalservices and care to thousands of women, men, children and adolescents each year. Services includewomen’s health care, cancer screening and education, nutrition advice and healthy foods, andHIV/AIDS support services30.
27 Spanish American Civic Association: www.sacapa.org/about.html28 Spanish American Civic Association: www.sacapa.org/about.html29 Women Infants & Children: www.bm‐cap.org/wic.htm30 Family Health Council of Central Pennsylvania: www.fhccp.org/about.shtml
442012 Summary Report
Tom Baldrige, President, Lancaster Chamber of Commerce (Employees)The Lancaster Chamber of Commerce & Industry is a dynamic membership organization rich in historyand comprised of nearly 2,400 community-minded businesses totaling to nearly 115,000 employeescollectively working to make Lancaster County a great place to live, work and do business. TheChamber boasts an impressive menu of services aimed at helping business leaders and professionalsconnect, learn and grow, while leveraging the collective power of this group to weigh in on legislativeand community issues that affect Lancaster County’s business climate and quality of life31.
Cynthia Burkhart, PhD, Executive Director, Lancaster-Lebanon Intermediate Unit 13 (Schools)Lancaster-Lebanon Intermediate Unit 13 (IU 13) strives to improve student learning by providing bothdirect educational services and educational support services for Lancaster and Lebanon counties’ 22 schooldistricts, as well as for adult education students, nonpublic schools, and preschoolers and their families32.
Rev. Lou Butcher, President/CEO, Bright Side Baptist Church (Faith-Based- African American)The mission of Bright Side Baptist Church is to present the Gospel of Jesus Christ to all; To fulfillreligious and educational needs; to allow for the continued spiritual and physical growth of ourChurch body and to provide outreach programs and services to the community. With the help of Godand our brothers and sisters, we shall also endeavor to donate time, energy and necessary funding tocarry out the ministries of our Church33.
Paul Casale, MD, President, Lancaster City & County Medical Society (Health)The Lancaster City and County Medical Society addresses the issues facing the medical professiontoday and works to preserve the physician-patient relationship. They work with the healthcareproviders to improve the health of the Lancaster County residents they serve.
Al Duncan, Chief Executive Officer, Thomas E Strauss Inc (Employer)Thomas E Strauss Inc. owns and operates multi restaurant and hotel establishments.
Ralph Goodno, President & CEO, Lancaster County ConservancyThe mission of the Lancaster County Conservancy is to save and steward the ecosystems andlandscapes upon which we depend for food, clean water and air, economic and public health, andthe restoration of soul and spirit34.
31 Lancaster Chamber of Commerce: www.lancasterchamber.com/32 Lancaster Lebanon Intermediate Unit 13: www.iu13.org/Pages/default.aspx33 Bright Side Baptist Church: www.brightsidebc.org/34 Lancaster Conservancy: www.lancasterconservancy.org/vision.htm
452012 Summary Report
Richard Gray, Mayor, City of Lancaster (City Government)
Cheryl Holland-Jones, Executive Director, Crispus Attucks Community Center (African-American, Low-Income)The mission of Crispus Attucks Community Center is to improve the quality of life for youth andfamilies in Lancaster by providing services that promote community prosperity, physical and mentalhealth, and by offering programs and cultural events which preserve the African American heritage35.
Patrick Jinks, President, United Way of Lancaster County (Social Service)United Way of Lancaster County is run by a partnership of dedicated staff and volunteers who worktogether to make our community a better place to live. Coming from all backgrounds and walks oflife, our staff and volunteer leadership are helping to lead Lancaster County to a brighter future36.
James Machado, FACHE, Administrator, Heart of Lancaster Regional Medical Center (Hospital)Heart of Lancaster Regional Medical Center, a for-profit hospital in Lancaster County, Pennsylvania,strives to improve the health and wellness of all Lancaster County residents.
Bob Moore, FACHE, Chief Executive Officer, Lancaster Regional Medical Center (Hospital)Lancaster Regional Medical Center, a for-profit hospital in Lancaster County, Pennsylvania, strives toimprove the health and wellness of all Lancaster County residents.
35 Crispus Attucks Community Center: www.cacc‐lancaster.org/?page_id=2836 United Way of Lancaster County: www.uwlanc.org/who‐we‐are
462012 Summary Report
ABOUT EPHRATA COMMUNITY HOSPITAL:
Ephrata Community Hospital is a non-profit health services organization providing preventative services, primary care, diagnostic services, acute care, and rehabilitation services. The hospital is licensed to accommodate 122 acute care patients and eight Acute Rehabilitation patients.
Ephrata Community Hospital’s primary service area is northern Lancaster County and the surrounding communities. Although predominantly suburban, the region served also includes a significant portion of Lancaster County’s farming community. Ephrata Community Hospital provides service through a main campus in Ephrata Borough and freestanding outpatient centers in Stevens, Ephrata, New Holland, Leola, Lititz, Rothsville, Brownstown, Adamstown, and Lancaster. Additionally, the hospital operates a freestanding Cancer Center in Ephrata. With new facilities in communities beyond the primary service area, Ephrata Community Hospital services are increasingly utilized by patients from across Lancaster County as well as those living in nearby Berks, Chester and Lebanon Counties.
Independently developed over 65 years ago to serve local needs, Ephrata Community Hospital’s primary purpose is to assure community access to health care that is high in quality, compassionate, and cost-effective. In cooperation with a qualified and diversified medical staff, the hospital attends to the personal needs of all patients with courtesy, efficiency, and professionalism. Ephrata Community Hospital is noted for its distinct ability to combine medical technology with the friendly, personalized care the community has come to expect from physicians and Hospital staff alike.
Offering a full range of inpatient and outpatient services, the Hospital strives to meet the needs of its community. Inpatient services include medical/surgical care, critical care, maternity care, pediatric care, and behavioral health care. Outpatient services range from comprehensive diagnostic testing to emergency care facilities, a cancer care center and rehabilitative services. A wellness center provides a range of wellness and health education programs designed to promote healthy lifestyles and disease prevention. Other services available include a women's health services center, a home healthcare program, and medical equipment retail stores.
Appendix C:Ephrata Community Hospital
Appendix C is authored by representatives from Ephrata Community Hospital.
472012 Summary Report
EVALUATING NEEDS:
Appendix B of this document outlines the expert input received during the community health needsassessment process. Many of those noted sources are members of the Lancaster HealthImprovement Partnership, a coalition comprised of over 25 mostly non-profit health & human serviceorganizations. This partnership acts as stakeholders in the needs assessment process and has beeninstrumental with county-wide needs assessments for a number of years. The group meets regularlythroughout the year to discuss the community’s most pressing health issues.
A sub-group of the Lancaster Health Improvement Partnership plans the annual Lancaster HealthSummit. The health summit is a community forum to educate, share ideas, communicate data andresults to key constituents. The summit is a collaborative effort with the Lancaster County BusinessGroup on Health and draws over 300 participants.
Actively participating in these groups and other similar coalitions and collaborative efforts within thecounty has afforded Ephrata Community Hospital greater insight into the community’s health status.This engagement has been beneficial as the hospital undertook the process to evaluate needs.
Ephrata Community Hospital formed an internal committee that included representatives fromseveral departments including Administration, Community Relations, Wellness, Financial Services,Strategic Planning and the Northern Lancaster County Medical Group, a group of physician practicesowned by the hospital. The committee was tasked with reviewing the community health needsassessment data, identifying priority areas and selecting which needs to address. Utilizing a prioritysetting matrix, indicators were weighted based on their prevalence in the community, their impacton health, and their ability to be influenced by a health intervention or strategy. Based on thesecriteria the two primary goals that will be addressed in the Ephrata Community Hospital’sImplementation Plan will be:1. To promote tobacco use cessation.2. To promote a decrease in the incidence of obesity/overweight in the community.