Riley County Community Needs Assessment
94
1 FEBRUARY 2020 Assessment conducted by the Center for Applied Research and Evaluation (CARE) Riley County Community Needs Assessment COORDINATED BY
-
Upload
khangminh22 -
Category
Documents
-
view
4 -
download
0
Transcript of Riley County Community Needs Assessment
1
FEBRUARY 2020
Assessment conducted by the Center for Applied Research and Evaluation (CARE)
Riley County Community Needs Assessment
COORDINATED BY
2
The authors of this report and leaders of the CARE Research Team are: Tara Gregory, Ph.D. Sarah Jolley, Ph.D.
Other CARE Researchers who supported this project are:Nicole Freund, Ph.D. Corina Tillman, B.A. Jaime Gilliland, M.A. Paigton Mayes, M.A. Ciara Mould, B.A. Hana Shahin, M.A.
PHONE | 316.978.3843TOLL FREE IN KS | 800.445.0116FAX | 316.978.3593OFFICE LOCATION | 238 N. Mead, Wichita KS 67202
3
Table of Contents
Executive Summary | 4Acknowledgments | 7Riley County Community Profile | 8Community Needs Assessment Purpose and Introduction | 8Design | 10Secondary Data | 10Survey Methodology | 11
Sample Selection | 11Geographic Distribution of Survey Participants | 12Sample Characteristics | 13
Interview Methodology | 17Focus Group Methodology | 18Riley County Secondary and Survey Data Results | 19
Quality of Life | 19Physical Health | 22
Secondary Physical Health Data | 23Physical Health Survey Data | 24Physical Activity | 27Nutrition | 28Tobacco/Smoking | 29
Mental Health | 29Secondary Mental Health Data | 29Mental Health Survey Data | 30
Social Issues | 32Secondary Social Issues Data | 32Social Issues Survey Data | 33
Children and Youth | 37Secondary Children and Youth Data | 38
Children and Youth Survey Data | 39Education | 45
Secondary Education Data | 45Education Survey Data | 46
Aging | 48Secondary Aging Data | 48Aging Survey Data | 48Older Adult Needs Assessment | 50
Housing | 52Secondary Housing Data | 52Housing Survey Data | 52
Transportation | 55Secondary Transportation Data | 55Transportation Survey Data | 55
Economics and Personal Finance | 58Secondary Economics and PersonalFinance Data | 58Economics and Personal FinanceSurvey Data | 59
Interviews and Focus Groups | 63
Appendix A: Subsample Analysis of Survey Data | A1Appendix B: Riley County Community Needs Assessment Survey | A2Appendix C: Community Member Interview Questions | A25Appendix D: Focus Group Questions | A25Appendix E: Additional Comments | A25Appendix F: Sources of Data | A26
4
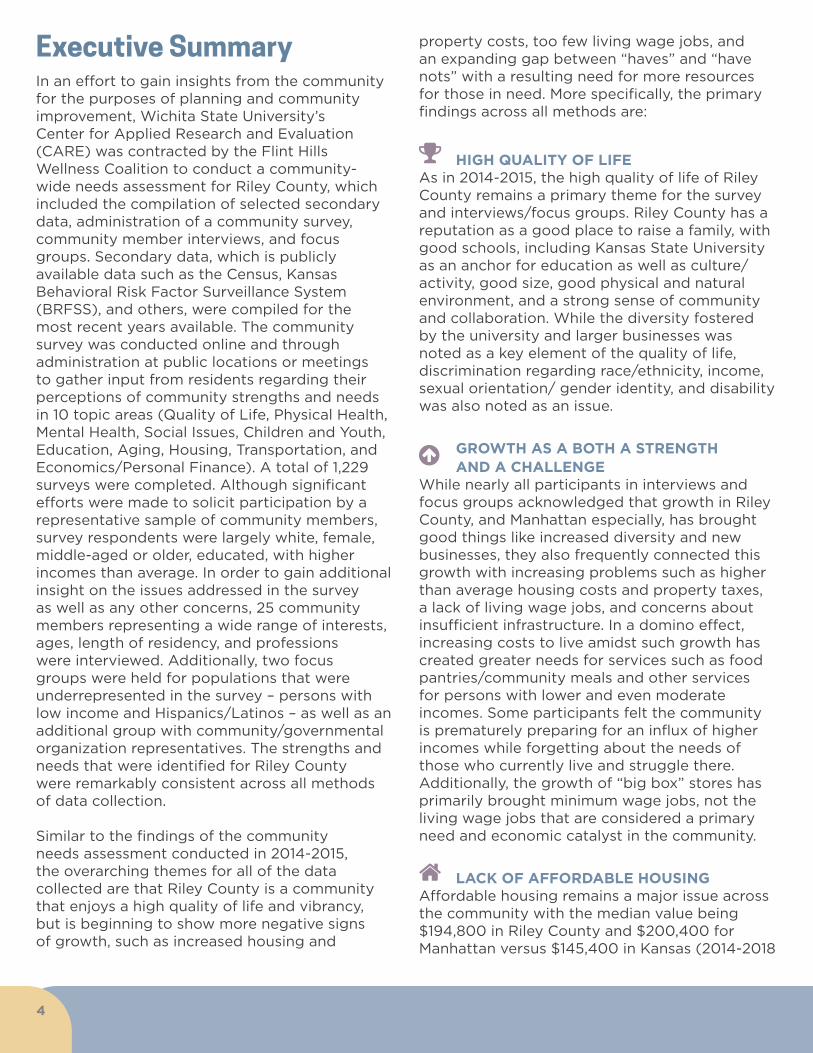
Executive Summary In an effort to gain insights from the community for the purposes of planning and community improvement, Wichita State University’s Center for Applied Research and Evaluation (CARE) was contracted by the Flint Hills Wellness Coalition to conduct a community-wide needs assessment for Riley County, which included the compilation of selected secondary data, administration of a community survey, community member interviews, and focus groups. Secondary data, which is publicly available data such as the Census, Kansas Behavioral Risk Factor Surveillance System (BRFSS), and others, were compiled for the most recent years available. The community survey was conducted online and through administration at public locations or meetings to gather input from residents regarding their perceptions of community strengths and needs in 10 topic areas (Quality of Life, Physical Health, Mental Health, Social Issues, Children and Youth, Education, Aging, Housing, Transportation, and Economics/Personal Finance). A total of 1,229 surveys were completed. Although significant efforts were made to solicit participation by a representative sample of community members, survey respondents were largely white, female, middle-aged or older, educated, with higher incomes than average. In order to gain additional insight on the issues addressed in the survey as well as any other concerns, 25 community members representing a wide range of interests, ages, length of residency, and professions were interviewed. Additionally, two focus groups were held for populations that were underrepresented in the survey – persons with low income and Hispanics/Latinos – as well as an additional group with community/governmental organization representatives. The strengths and needs that were identified for Riley County were remarkably consistent across all methods of data collection.
Similar to the findings of the community needs assessment conducted in 2014-2015, the overarching themes for all of the data collected are that Riley County is a community that enjoys a high quality of life and vibrancy, but is beginning to show more negative signs of growth, such as increased housing and
property costs, too few living wage jobs, and an expanding gap between “haves” and “have nots” with a resulting need for more resources for those in need. More specifically, the primary findings across all methods are:
HIGH QUALITY OF LIFEAs in 2014-2015, the high quality of life of Riley County remains a primary theme for the survey and interviews/focus groups. Riley County has a reputation as a good place to raise a family, with good schools, including Kansas State University as an anchor for education as well as culture/activity, good size, good physical and natural environment, and a strong sense of community and collaboration. While the diversity fostered by the university and larger businesses was noted as a key element of the quality of life, discrimination regarding race/ethnicity, income, sexual orientation/ gender identity, and disability was also noted as an issue.
GROWTH AS A BOTH A STRENGTH AND A CHALLENGE
While nearly all participants in interviews and focus groups acknowledged that growth in Riley County, and Manhattan especially, has brought good things like increased diversity and new businesses, they also frequently connected this growth with increasing problems such as higher than average housing costs and property taxes, a lack of living wage jobs, and concerns about insufficient infrastructure. In a domino effect, increasing costs to live amidst such growth has created greater needs for services such as food pantries/community meals and other services for persons with lower and even moderate incomes. Some participants felt the community is prematurely preparing for an influx of higher incomes while forgetting about the needs of those who currently live and struggle there. Additionally, the growth of “big box” stores has primarily brought minimum wage jobs, not the living wage jobs that are considered a primary need and economic catalyst in the community.
LACK OF AFFORDABLE HOUSINGAffordable housing remains a major issue across the community with the median value being $194,800 in Riley County and $200,400 for Manhattan versus $145,400 in Kansas (2014-2018

5
estimate). The current median rent is $938 for Riley County and $908 for Manhattan ($831 for Kansas). As noted above, many participants feel the cost of housing is being driven by current or expected growth, which is in turn increasing property taxes and the need for services to help those who are falling behind economically due to these costs. Additionally, residents are finding that new housing is primarily for those with higher incomes while those with moderate or lower incomes are priced out of the market, even for older or less desirable properties. A lack of accountability for landlords is also an issue as deficient properties are not properly addressed, but are often the only affordable options for students and those with lower incomes.
LACK OF ACCESSIBLE & AFFORDABLE
MENTAL HEALTH SERVICES In the 2014-2015 assessment, mental health services emerged as one of the primary issues. Although the lack of mental health services remains a concern, the recent addition of the Pawnee Mental Health Crisis Stabilization Center has helped address at least some of the need. However, the lack of adequate and affordable healthcare has risen to the top for 2019-2020, most particularly related to the hospital. A number of participants noted the limited services offered through the hospital means that many Riley residents must travel or be transported to other hospitals for issues as common as heart attacks. Additionally, it was noted that the community lacks specialists and affordable options for those with lower incomes. Although
participants in focus groups noted a few clinics that provide affordable, accessible services, an issue still remains with some providers requiring full payment for services up front, which is typically not an option for lower income persons.
LACK OF LIVING WAGE JOBSAs noted previously, this issue is tied to growth, housing, and the expanding need for services for persons with low income in the community. This issue was brought up across all data collection methods, and a number of interview participants noted the difficulty of keeping talented people in Manhattan unless they are being brought in for the National Bio and Agro-defense Facility (NBAF) or similar high-paying, but highly targeted positions. And even though there may be a reasonable number of job opportunities in the community, a large number are minimum wage or are filled by students. This leaves few employment options beyond entry level and which allow people to have a decent standard of living.
A Note About Students in the CommunityIn Appendix A, CARE has provided an analysis of data that was designed to account for discrepancies between the survey respondent demographics and Census data for Riley County. In particular, few persons under 25 responded to this survey, yet that age group (18-24 year olds) is the largest population in Riley County due to the presence of K-State. A more detailed

6
description of this analysis is in Appendix A. The general findings are that when the top needs were analyzed to determine if the preponderance of persons older than age 25 skewed the results, the answer was no; the results stayed basically the same when controlling for the lack of younger respondents. And when the responses of younger persons were analyzed separately, they largely matched those of all respondents. Additionally, there have been concerns that although 18-24 year olds make up a significant population in the community, their needs are often not considered or are discounted because they are students. The following provides a brief overview of the issues that face young people in the community. It underscores that the top issues for Riley County (i.e., lack of affordable housing, lack of affordable mental and physical healthcare, poverty, lack of living wage jobs, and a need for expanded services) are equally concerning and require investment in services, just as they do for those who are older.
• According to the U. S. Census American Community Survey estimates (ACS 2013-2017), the unemployment rate (those who are unemployed but are looking for work) for 16-19 year olds accounts for the bulk of the overall rate for Riley County (19.7% for 16-19 year olds vs. 5.6% for the county). Excluding 16-19 year olds, the unemployment rate for 20-24 year olds (5.7%) is higher than all other age groups except those 30-34 years old (5.9%).
• In general, 22% of the residents in Riley County are considered under the federal poverty level. For those who are 18-34 years old, the percentage is 37.1% (ACS 2013-2017). No other age group, including those age 60 and over, has a higher poverty rate.
• According to U.S. Census Quick Facts (2014-2018), the average rent in Riley County ($938 per month) and Manhattan ($908) is higher than the state average ($831).
• In Kansas, 17.2% of adults reported binge drinking (2017 BRFSS). Riley County has one of the highest rates of binge drinking in Kansas (24.9%), along with Douglas County (26.2%), which is likely due to the large college population.
• According to the Robert Wood Johnson Foundation (RWJF) County Health Rankings (2019), the percentage of driving deaths with alcohol involvement in Riley County (22%) is higher than the state average (13%).
• The incidence of sexually transmitted infections (STIs) in Riley County is much higher than in Kansas overall (683.1 versus 417.6 per 100,000) according to the 2019 RWJF County Health Rankings.
COMMUNITY FEEDBACK ON PRELIMINARY RESULTSA report of preliminary findings from all methods of this assessment was created and released for online public comment from December 23, 2019, to January 9, 2020. The comments supported the findings, including concerns regarding housing costs, living wage jobs, and physical and mental healthcare. A number of commenters shared personal experiences supporting the findings. One questioned whether housing had risen to the top of community concerns due to recent grassroot efforts on this issue. However, that person also concurred that living wage jobs and housing costs are linked.
7
AcknowledgmentsThis assessment was conducted by Wichita State University’s Center for Applied Research and Evaluation (CARE) at the Community Engagement Institute and was coordinated by the Flint Hills Wellness Coalition. However, this community needs assessment was the culmination of a collaborative effort by multiple persons and organizations.
We would like to thank the individuals who participated in the community needs assessment survey, interviews, and focus groups. They provided us with insight into the needs of our communities and what is important to the quality of their lives.
We would like to thank the agencies that funded the Riley and Pottawatomie Counties Community Needs Assessments:
• Ascension Via Christi Hospital - Manhattan• Caroline F. Peine Charitable Foundation• City of Manhattan• Greater Manhattan Community Foundation• Kansas State University• Konza Prairie Community Health Center• Konza United Way• Manhattan Surgical Hospital• Riley County Health Department
We would also like to thank the agencies that participated as members of the design team to complete a draft of the assessment:
• Ascension Via Christi Hospital - Manhattan• City of Manhattan• Greater Manhattan Community Foundation• Kansas State University• Konza United Way• Riley County Health Department
Finally, we would like to thank the following partners that provided input regarding the draft assessment and/or were instrumental in encouraging the community to complete the survey or in disseminating and collecting surveys in Riley County. Because many organizations participated in disseminating or collecting surveys, our apologies to
any that were inadvertently omitted from this list.
Ascension Via Christi Hospital - ManhattanBig Lakes Developmental Center, Inc.Boys & Girls Club of ManhattanCity of LeonardvilleCity of ManhattanCity of OgdenCity of RandolphCity of RileyCatholic Charities of Northern KansasCommon TableCommunity Health Ministry – WamegoDowntown Manhattan Inc.Flint Hills Area Transportation AgencyFlint Hills BreadbasketFlint Hills Community ClinicFlint Hills Human Rights ProjectFlint Hills Job CorpsFlint Hills Metropolitan Planning OrganizationFlint Hills Volunteer Center
Food & Farm CouncilFriendship Meals ProgramGirls on the RunGreater Manhattan Community FoundationHomecare & HospiceKansas Guardianship ProgramKansas Legal ServicesKansas State UniversityKansas State University Public Health ProgramKonza Prairie Community Health CenterKonza United WayKSNT NewsLafene Student Health CenterLeague of Women Voters of Manhattan/Riley CountyManhattan Alliance for Peace & JusticeManhattan Area Chamber of CommerceManhattan Area Habitat for HumanityManhattan Area Housing
PartnershipManhattan Arts CenterManhattan Emergency Shelter, Inc.Manhattan Housing AuthorityManhattan Medical GroupManhattan Public LibraryManhattan Surgical HospitalMeadowlarkMorningstar CRONews Radio KMANNorth Central Flint Hills Area Agency on AgingNortheast Kansas Community Action ProgramPawnee Mental Health Services Inc.Region ReimaginedRiley CountyRiley County Council on AgingRiley County Council of Social Service AgenciesRiley County Department of Community CorrectionsRiley County Emergency Medical Services
Riley County ExtensionRiley County Health DepartmentRiley County Police DepartmentRiley County Seniors’ Service CenterSalvation ArmyShepherd’s CrossingStormont Vail HealthSunflower CASA ProjectThe Crisis Center Inc.The FIT ClosetThe Manhattan MercuryThrive! FlinthillsUFM Community Learning CenterUSD 320 WamegoUSD 332 Rock CreekUSD 378 RileyUSD 383 Manhattan/OgdenUSD 384 Blue ValleyWamego Chamber of CommerceWamego Health CenterWamego Smoke SignalWIBW NewsWonder Workshop

8
Riley County Community ProfileAccording to the 2010 Census, Riley County encompasses 609.77 square miles in Northeast Kansas with approximately 117 persons per square mile (compared to an average of 35 persons per square mile across Kansas). The total population of Riley County in 2018 was estimated at 73,703. Manhattan is the largest city in the county with a population of 54,959 (2018 Census estimate) that includes over 21,000 Kansas State University students (2018 enrollment) and a large number of Fort Riley soldiers and their families. Riley County is slightly more diverse than the norm for the state with approximately 84% white, 7% African American, 9% Hispanic or Latino, 5% Asian, 4% two or more races, less than 1% American Indian and Alaskan Native, and less than 1% Native American or Pacific Islander. Due to the large number of Kansas State University (K-State) students, the population tends to be younger than the state average (24.9 in Riley county and 36.3 in Kansas overall). Although agriculture plays a large role in the economy and culture of Riley County, the largest employers are Fort Riley (military and civilian employees), Kansas State University, and the Manhattan/Ogden Unified School District (USD 383). Manhattan is also home to the National Bio and Agro-defense Facility (NBAF), which brings revenue and additional (albeit highly specialized) employment. Riley County typically experiences lower rates of unemployment, crime, and a number of other indicators that negatively impact quality of life as compared to state averages and is rated the fifth healthiest county in Kansas according to the 2019 Robert Wood Johnson Foundation County Health Rankings and Roadmaps.
Community Needs Assessment Purpose and Introduction Needs assessments are a valuable tool in determining community perceptions, strengths, and concerns for the purposes of planning and community improvement. Community assessments are also helpful or required for accreditation for local health departments and hospitals. Before 2014-2015, Riley County had not undertaken a comprehensive community assessment that covers multiple areas of community life since 1997. In 2014, a number of community organizations came together to commission CARE (at that time called the
Center for Community Support and Research) to conduct a community needs assessment, the results of which were used extensively by various groups for organizational and community planning and positive change. In 2019, CARE was again requested to conduct a community needs assessment using the same methods, including a slightly revised community survey. The purpose in 2019, as in 2014-2015, was to gather information from multiple sources, including publicly available data and community members themselves, in order to highlight community strengths and needs for use by local individuals and organizations to guide efforts to address issues, gauge progress, and plan for the future.

9
Community needs assessments involve the key elements of convening stakeholders for planning (e.g., determining areas of focus for the assessment, reviewing instruments, identifying the target population and avenues for dissemination), administration of a community survey and/or use of qualitative methods (i.e., interviews, focus groups) to gather public perceptions, analysis of data, and reporting to key partners and the community. Community needs assessments typically use the approach of gathering data from a convenience sample, which is defined as those most easily accessible and interested in the topic or community. This method differs from basic laboratory research methods in which samples are recruited or randomly selected. For the purpose of gathering responses from a broad cross-section of the community, the partners and supporters of the Riley County community needs assessment solicited participation from people of all ages, ethnicities, income brackets, professions, and other qualifiers that might impact one’s experience and perception of the community. Every effort was made to gather input from a representative sample that is consistent with Census data for Riley County. As is noted in the demographics section below, despite all efforts, populations such as younger adults, Latino/Hispanic persons, and persons with lower incomes are not proportionately represented; however, this is a common limitation of a convenience sample because the response rate and demographics are dependent upon the willingness of community members to respond. As noted in the section on the Subsample Analysis (Appendix A), this limitation was addressed through an analysis of a random subsample of survey responses that reflect the Census data for Riley County relative to age.
The following report includes detailed information about the methodology of the community survey, demographics of respondents, and survey data for Riley County. An overview of relevant secondary data (i.e., data available through public sources such as the most recent Census, Kansas Behavioral Risk Factor Surveillance System (BRFSS), Kansas Department for Children and Families, Kansas Kids Count, Kansas Communities That Care, etc.) has also been included to provide comparison
points. Additionally, this report contains the qualitative findings from key informant interviews and focus groups. Survey data regarding Quality of Life is presented first followed by sections on Physical Health, Mental Health, Social Issues, Children and Youth, Education, Aging, Housing, Transportation, and Economics/Personal Finance. As noted, each topic section except Quality of Life begins with the related secondary data. Survey data are from the Community Needs Assessment survey that was completed (at least partially) by 1,229 Riley County residents. The survey was administered via the internet, and hard copies were distributed through community events and organizations. The survey was offered in Spanish online and in hard copy. A postcard was mailed to a random sample of addresses in Manhattan and Riley County to encourage recipients to take the survey. The survey was open from September through November 2019.
In order to gather further information on community perceptions, especially with underrepresented populations, community member interviews and focus groups were conducted with 25 community members representing a diverse range of ages, professions, and interests (e.g., non-profit, ecumenical, educational, business, healthcare, retired, volunteer) during October and November 2019. Two focus groups were conducted with persons from populations that were underrepresented in the community survey (i.e., Spanish-speakers and persons with low incomes) and with representatives of non-profit, educational, and governmental organizations. Thirty-five (35) persons participated across all groups. The qualitative data from the interviews and focus groups help add richness to the secondary and survey findings as well as providing confirmation as to whether the quantitative data are truly descriptive of the experiences of persons in the community, particularly those who may not have been well-represented among survey respondents.

10
DesignAs noted, CARE revised the survey used in 2014-2015 with input from community members. The original survey was based on questions that were common in other community needs assessments, and community members were also involved at that time in reviewing and suggesting changes. The changes made for the 2019 survey were primarily focused on:
• Removing questions that were covered in a recent community survey of Manhattan residents that focused on infrastructure and community services
• Removing questions that did not provide useful information in 2014-2015 (e.g., questions about where people purchase various items or services)
• Reorganizing the survey, such as combining Physical and Mental Health, and better identifying topics of subsections to make it easier to follow
• Adding questions and/or definitions to better quantify issues such as healthy eating, social isolation, custodial care of grandchildren, percentage of income spent on housing, etc.
• Adding a question regarding the neighborhood/area in which Manhattan residents live was added to better determine localized issues (CARE did not perform this analysis but has provided the data set to the Flint Hills Wellness Coalition)
Once CARE revised the survey based on initial feedback from a small design team, community partners were then invited to a community meeting to provide input. After the design team approved the final survey, CARE submitted the survey and information regarding methodology to the Wichita State University Institutional Review Board (IRB). Because the survey was not meant to be used for research purposes and no individually identifiable or sensitive information was to be collected from participants, the IRB determined this survey to not require their oversight.
As opposed to the 2014-2015 assessment, in which key informants from community and governmental organizations were interviewed,
community members were invited to complete the 2019 interview. Information about the interviews was distributed through social media and other community mechanisms. A total of 25 semi-structured interviews were conducted with those who volunteered. Questions allowed interviewees to provide information regarding their general perceptions of the community, specific needs/concerns, specific strengths, and any suggestions on addressing issues or enhancing strengths.
Three focus groups were held with a total of 35 participants. The focus group questions were designed with a similar purpose as the interviews, but also allowed participants to provide feedback as to whether findings from the survey results were reflective of their own experiences.
The elements of this community needs assessment were designed to provide triangulation in three areas: triangulation of methods, triangulation of sources, and triangulation of analysts (Patton, 1999). These are recommended methods for increasing the likelihood that the data gathered and findings provided are accurate and truly representative of perceptions of the entire community. Triangulation of methods was achieved through the use of secondary data sources, survey data, and qualitative data from interviews and focus groups. Triangulation of sources involved gathering input from the general public through the survey and interviews, from key community leaders and service providers through one of the focus groups, and from members of groups that were underrepresented in other methods through two focus groups. Finally, three primary researchers led this project, reviewed each other’s work, and provided reliability checks on the qualitative analysis.
Secondary DataSecondary data are typically collected by large institutions or organizations and made available publicly. The most well-known example of a secondary data source is the U. S. Census. For the purposes of this community assessment,
11
CARE compiled relevant pieces of secondary data to complement and compare to the survey, interview, and focus group data. The most recent secondary data available were used whenever possible; however, these data can often be several years old due to the arduousness of collection across large populations. Additionally, some secondary data are not available on a county level due to limitations in data collection or ethical issues in reporting on issues that affect a small number of persons in a given community. Given that multiple entities publish data on the same issues, it is also possible to find differences in what appears to be similar data. This is often due to slight differences in the reporting period, characteristics of the sample, method of data collection, or other variables. This report includes secondary data that are 1) easily understandable, 2) most relevant to the general community, and 3) from credible, well-respected sources. All data reported include the exact source and year from which the numbers were taken.
Survey Methodology
Sample Selection A convenience sample was used for online and hard copy surveys. This means that the survey was promoted widely across the community but participants were not targeted due to particular traits, location, or other factors. Anyone who wanted to complete the survey was considered part of the sample. The same survey was used for both online and hard copy versions. A postcard was mailed to a random sample of addresses in Manhattan and Riley County to encourage participation. However, the responses are still considered to be a convenience sample since participation was not limited to those who received a card. A total of 1,229 useable surveys (i.e., respondents answered more than demographics questions) for Riley County were gathered across both methods of administration (1,189 online, 40 hard copies).
Online SurveyThe online survey was created and administered in Qualtrics and posted on a dedicated website,
http://www.rileycountycommunityneedsassessment.org/. The Chair of the Flint Hills Wellness Coalition worked closely with the survey sponsors to create a roster of community partners across Riley County who would assist with disseminating the survey website. The community partners were asked to promote and distribute the website via their own websites, social media accounts, internal staff email, and other regular media outlets. The list of community partners can be seen under the Acknowledgments. The survey was opened on September 22, 2019 and closed on Nov. 18, 2019. The online survey was offered in English and Spanish, but only 3 surveys were completed in Spanish. Surveys with only demographics completed were removed because they did not offer substantive information about community needs. A total of 1,189 online surveys were used for analysis.
Paper SurveyThe paper survey was made available at multiple locations throughout the community through the efforts of the community partners. Surveys were collected by a designated person at the site/location and sent in bulk back to CARE. Special efforts were made to administer surveys at community events and/or at organizations that cater to populations that tend to be underrepresented in community discussions and planning (i.e., Latino, older adults, youth, persons with disabilities, etc.). The paper survey was offered in English and Spanish, but no Spanish surveys were submitted. All 40 paper surveys submitted to CARE were included for analysis.
Postcard MailingDr. Josie Shaffer of the University of Omaha created a random sample of addresses for Manhattan and Riley County using lists provided by the city and county governments. Postcards were mailed to 814 Manhattan and 400 Riley County residents. One hundred seventy-seven (177) postcards were returned as undeliverable across Manhattan and Riley County. The corresponding addresses were removed from the list and reminder postcards were sent to the remaining addresses in early November.
12
Table 1. How did you find out about this survey?
Notification Method Frequency %
Postcard with web address 67 5.5
Through an organization I work with 280 22.8
Media 508 41.3
Word of Mouth 112 9.1
Other 139 11.3
Not Answered 123 10.0
Geographic Distribution of Survey Participants For the data in this section and those that follow, most percentages are figured based on surveys from 1229 persons (i.e., N=1229) unless otherwise specified. Particularly for demographics, the number and percentage of the total who did not answer the question is included with the data.
Table 2. Is this county your permanent residence?
Notification Method Frequency %
Yes 998 81.2
No 24 2.0
Not answered 207 16.8
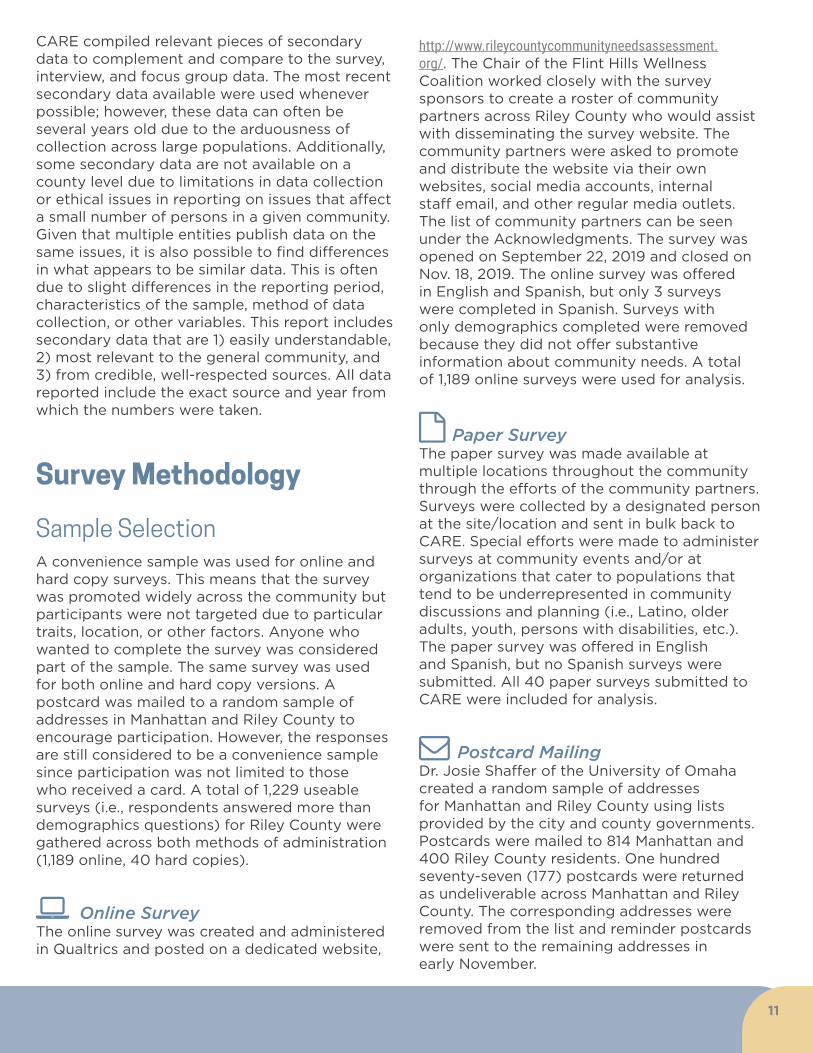
Figure 1. Survey Type for Riley County
96.8%
3.2%PaperOnline
(n=1247)Almost all of the surveys were completed online.
Figure 2. Survey Language for Riley County
.2%
99.8%
SpanishEnglish
Less than 1% (.2%) of responses were completed in Spanish.
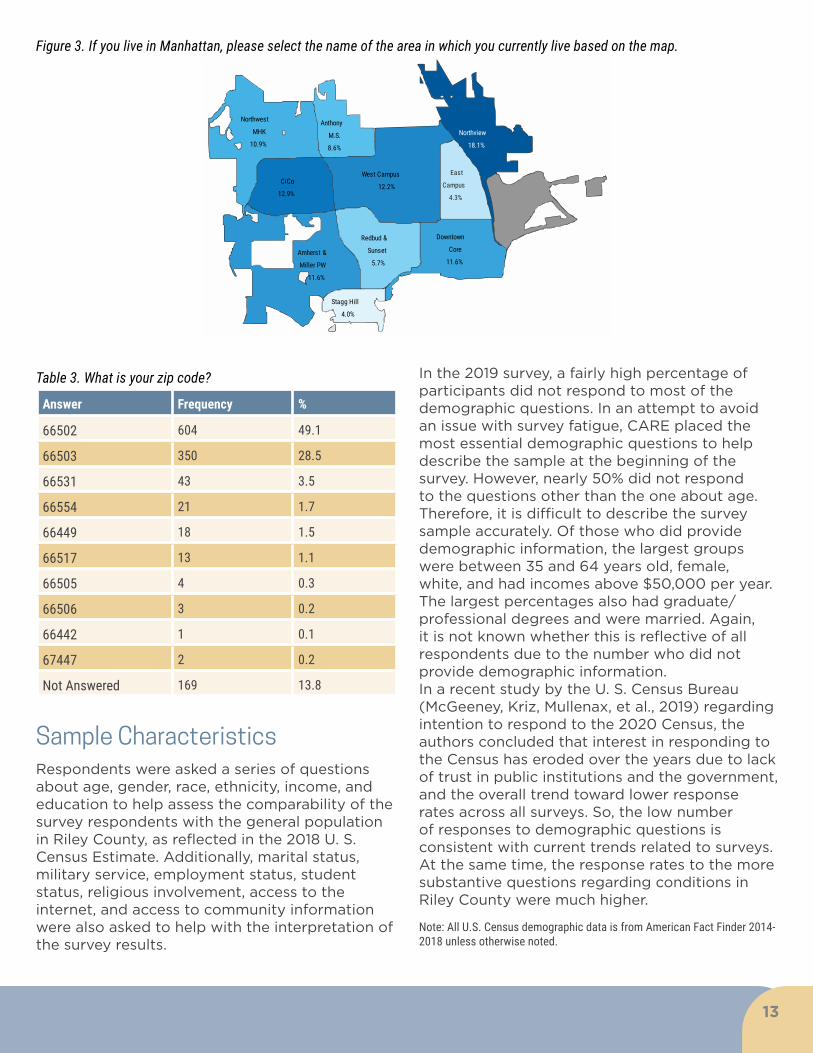
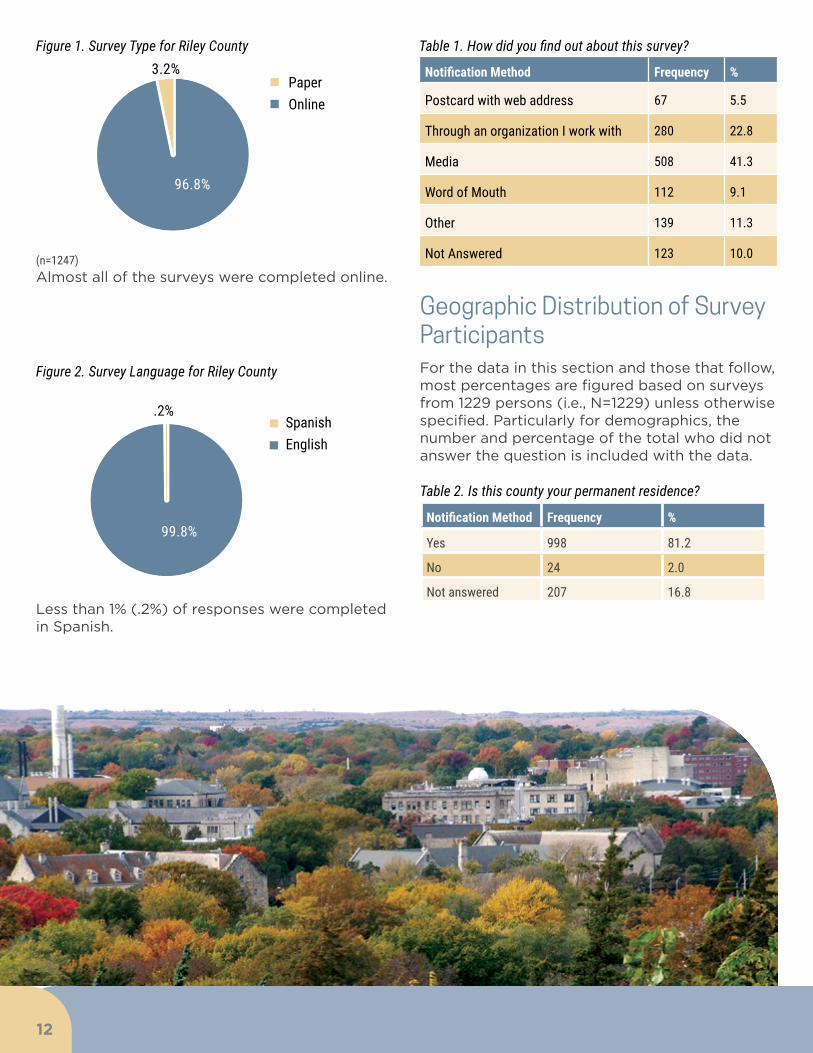
Figure 3. If you live in Manhattan, please select the name of the area in which you currently live based on the map.
Northwest
MHK
10.9%
Anthony
M.S.
8.6%
West Campus
12.2%
East
Campus
4.3%
Northview
18.1%
Downtown
Core
11.6%
Redbud &
Sunset
5.7%
CiCo
12.9%
Amherst &
Miller PW
11.6%
Stagg Hill
4.0%
Table 3. What is your zip code?
Answer Frequency %
66502 604 49.1
66503 350 28.5
66531 43 3.5
66554 21 1.7
66449 18 1.5
66517 13 1.1
66505 4 0.3
66506 3 0.2
66442 1 0.1
67447 2 0.2
Not Answered 169 13.8
Sample CharacteristicsRespondents were asked a series of questions about age, gender, race, ethnicity, income, and education to help assess the comparability of the survey respondents with the general population in Riley County, as reflected in the 2018 U. S. Census Estimate. Additionally, marital status, military service, employment status, student status, religious involvement, access to the internet, and access to community information were also asked to help with the interpretation of the survey results.
In the 2019 survey, a fairly high percentage of participants did not respond to most of the demographic questions. In an attempt to avoid an issue with survey fatigue, CARE placed the most essential demographic questions to help describe the sample at the beginning of the survey. However, nearly 50% did not respond to the questions other than the one about age. Therefore, it is difficult to describe the survey sample accurately. Of those who did provide demographic information, the largest groups were between 35 and 64 years old, female, white, and had incomes above $50,000 per year. The largest percentages also had graduate/professional degrees and were married. Again, it is not known whether this is reflective of all respondents due to the number who did not provide demographic information. In a recent study by the U. S. Census Bureau (McGeeney, Kriz, Mullenax, et al., 2019) regarding intention to respond to the 2020 Census, the authors concluded that interest in responding to the Census has eroded over the years due to lack of trust in public institutions and the government, and the overall trend toward lower response rates across all surveys. So, the low number of responses to demographic questions is consistent with current trends related to surveys. At the same time, the response rates to the more substantive questions regarding conditions in Riley County were much higher.
Note: All U.S. Census demographic data is from American Fact Finder 2014-2018 unless otherwise noted.
13

14
AGE
Figure 4. Age
7.4%
12.4%
26.8%
30.2%
19.2%
4.0%
Survey Age
25.1%
4.8%
11.2%
12.3%
17.6%
33.4%
Census Age
18 to 24 years
25 to 34 years
35 to 49 years
50 to 64 years
65 to 74 years
75 years and over
Not answered: n=77Source: https://data.census.gov/cedsci/table?q=riley%20County,%20Kansas%20population&g=0500000US20161&tid=ACSST1Y2018.S0101&vintage=2018
GENDER
Figure 5. Gender
26.9%
73.1%
Survey Gender
52.5%
47.5%
Census Gender
Female
Male
Not Answered: n=524 Source: https://data.census.gov/cedsci/table?q=Riley%20County,%20Kan-sas&g=0500000US20161&tid=ACSST1Y2018.S0101&vintage=2018
Note: The U.S. Census only includes two categories for sex/gender. The categories transgender male, transgender female, and gender variant/non-conforming were included in the survey sample but were not selected by any participants.
RACE AND ETHNICITY
Figure 6. Race and Ethnicity
1.9%
0.1%
1.3%
1.8%
1.9%
2.8%
90.1%
Survey Race (Select all that apply)
0.8%
0.1%
4.8%
4.7%
0.1%
6.4%
83.0%
Census Race (Select one)
White
African American/Black
American Indian/Alaska Native
Multiracial
Asian
Native Hawaiian/Pacific Islander
Other
Hispanic/Latino
3.2%
Hispanic/Latino
8.5%
Not answered: n=509 (race) and 581 (ethnicity)Source: https://data.census.gov/cedsci/table?q=riley%20County,%20Kansas%20race&g=0500000US20161&tid=ACSDP1Y2018.DP05
INCOME
Figure 7. What was your total household income last year, before taxes?
1.7%3.0%
6.9%7.7%
11.7%21.8%
19.9%20.2%
7.1%
Less than $10,000$10,000 to $14,999
15,000 to $24,999$25,000 to $34,999$35,000 to $49,999$50,000 to $74,999$75,000 to $99,999
$100,000 to $199,999$200,000 or more
Table 4. How many people does this income support?
Notification Method Frequency % Mean
1 104 8.5
2.6
2 230 18.7
3 67 5.5
4 84 6.8
5 34 2.8
6 11 0.9
7 6 0.5
15
EDUCATION
Table 5. What is the highest level of school, college or vocational training that you have finished?
Answer Frequency %
Less than 9th grade 0 0.0
9-12th grade, no diploma 6 0.5
High school graduate (or GED/equivalent) 44 3.6
Associate’s degree or vocational training 63 5.1
Some college (no degree) 86 7.0
Bachelor’s degree 201 16.4
Graduate or professional degree 306 24.9 Figure 8. Education level comparison across survey sample, state, and nation
43.3%
28.5%
8.9%
12.2%
6.2%
0.8%
20.8%
25.1%
7.7%
23.5%
18.5%
2.8%
1.4%Less than 9th grade
9-12th grade,no diploma
High school graduate(or GED/equivalent)
Some college(no degree)
Associate's degree or vocational training
Graduate or professional degree
Bachelor's degree
HS graduateor higher
99.1%
HS graduateor higher 95.8%
Survey Highest Level of Education
Census Highest Level of Education
Source: https://data.census.gov/cedsci/table?q=riley%20county,%20kan-sas&g=0500000US20161&tid=ACSST1Y2018.S1501&vintage=2018
OTHER DEMOGRAPHICS
Table 6. What best describes your current marital status?
Answer Frequency %
Married 478 38.9
Single, never married 73 5.9
Divorced 73 5.9
Answer Frequency %
Widowed 46 3.7
Not married, but living together 25 2.0
Domestic partnership or civil union 9 0.7
Not Answered 525 42.7
Table 7. Have you been a member of the Armed Services/Military?
Answer Frequency %
Yes 77 6.3
No 623 50.7
Not Answered 529 43.0
Table 8. If “yes” to being a member of the Armed Services/Military: What is your current status?
Answer Frequency %
Retired 32 2.6
Inactive 29 2.4
Disabled or Injured 9 0.7
Active 4 0.3
Table 9. What is your employment status?
Answer Frequency %
Self-employed 42 3.4
Working more than one job 74 6.0
Employed full-time (one job) 308 25.1
Employed part-time 65 5.3
Homemaker 20 1.6
Retired 160 13.0
Disabled 19 1.5
Unemployed for 1 year or less 9 0.7
Unemployed for more than 1 year 6 0.5
Not Answered 526 42.8
Table 6. Continued
16
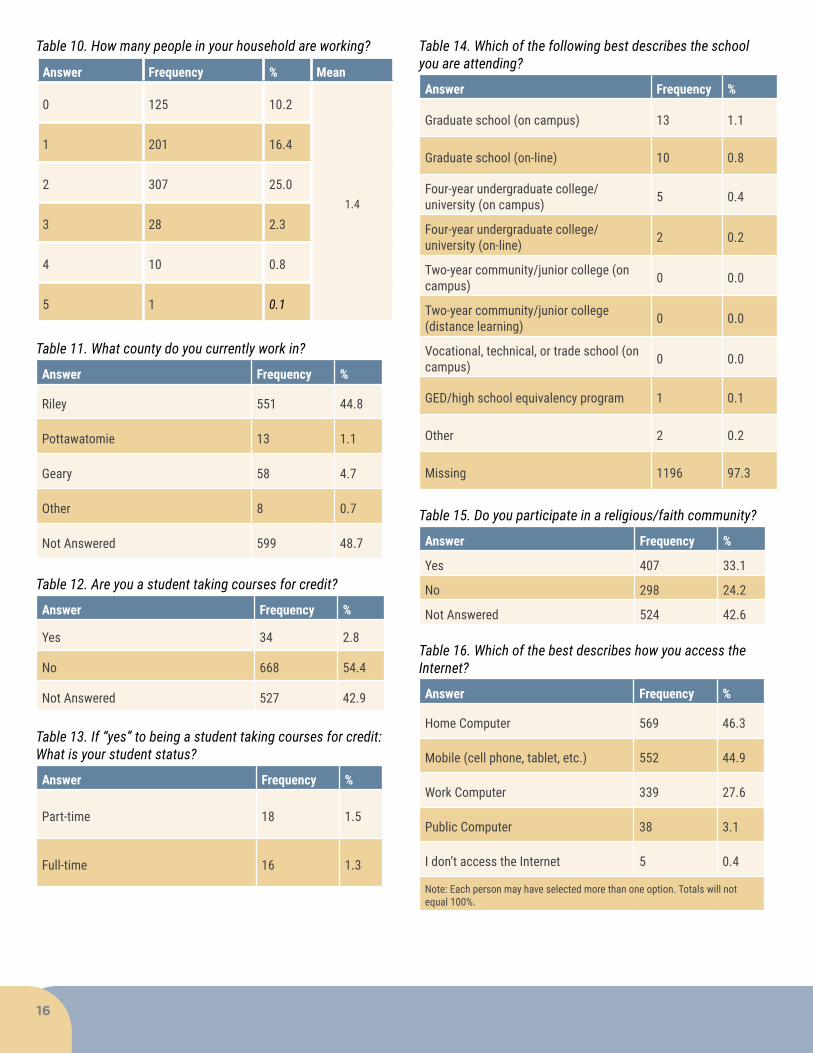
Table 14. Which of the following best describes the school you are attending?
Answer Frequency %
Graduate school (on campus) 13 1.1
Graduate school (on-line) 10 0.8
Four-year undergraduate college/university (on campus) 5 0.4
Four-year undergraduate college/university (on-line) 2 0.2
Two-year community/junior college (on campus) 0 0.0
Two-year community/junior college (distance learning) 0 0.0
Vocational, technical, or trade school (on campus) 0 0.0
GED/high school equivalency program 1 0.1
Other 2 0.2
Missing 1196 97.3
Table 15. Do you participate in a religious/faith community?
Answer Frequency %
Yes 407 33.1
No 298 24.2
Not Answered 524 42.6
Table 16. Which of the best describes how you access the Internet?
Answer Frequency %
Home Computer 569 46.3
Mobile (cell phone, tablet, etc.) 552 44.9
Work Computer 339 27.6
Public Computer 38 3.1
I don’t access the Internet 5 0.4
Note: Each person may have selected more than one option. Totals will not equal 100%.
Table 10. How many people in your household are working?
Answer Frequency % Mean
0 125 10.2
1.4
1 201 16.4
2 307 25.0
3 28 2.3
4 10 0.8
5 1 0.1
Table 11. What county do you currently work in?
Answer Frequency %
Riley 551 44.8
Pottawatomie 13 1.1
Geary 58 4.7
Other 8 0.7
Not Answered 599 48.7
Table 12. Are you a student taking courses for credit?
Answer Frequency %
Yes 34 2.8
No 668 54.4
Not Answered 527 42.9
Table 13. If “yes” to being a student taking courses for credit: What is your student status?
Answer Frequency %
Part-time 18 1.5
Full-time 16 1.3
17
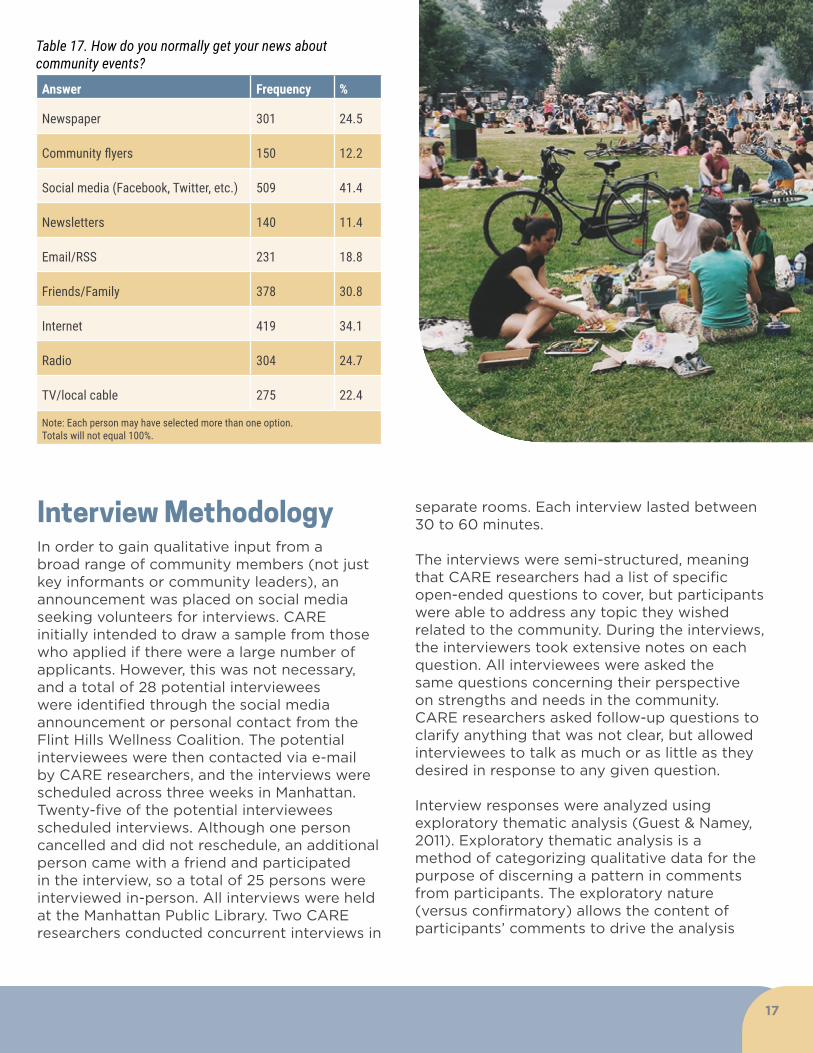
Interview Methodology In order to gain qualitative input from a broad range of community members (not just key informants or community leaders), an announcement was placed on social media seeking volunteers for interviews. CARE initially intended to draw a sample from those who applied if there were a large number of applicants. However, this was not necessary, and a total of 28 potential interviewees were identified through the social media announcement or personal contact from the Flint Hills Wellness Coalition. The potential interviewees were then contacted via e-mail by CARE researchers, and the interviews were scheduled across three weeks in Manhattan. Twenty-five of the potential interviewees scheduled interviews. Although one person cancelled and did not reschedule, an additional person came with a friend and participated in the interview, so a total of 25 persons were interviewed in-person. All interviews were held at the Manhattan Public Library. Two CARE researchers conducted concurrent interviews in
separate rooms. Each interview lasted between 30 to 60 minutes.
The interviews were semi-structured, meaning that CARE researchers had a list of specific open-ended questions to cover, but participants were able to address any topic they wished related to the community. During the interviews, the interviewers took extensive notes on each question. All interviewees were asked the same questions concerning their perspective on strengths and needs in the community. CARE researchers asked follow-up questions to clarify anything that was not clear, but allowed interviewees to talk as much or as little as they desired in response to any given question.
Interview responses were analyzed using exploratory thematic analysis (Guest & Namey, 2011). Exploratory thematic analysis is a method of categorizing qualitative data for the purpose of discerning a pattern in comments from participants. The exploratory nature (versus confirmatory) allows the content of participants’ comments to drive the analysis
Table 17. How do you normally get your news about community events?
Answer Frequency %
Newspaper 301 24.5
Community flyers 150 12.2
Social media (Facebook, Twitter, etc.) 509 41.4
Newsletters 140 11.4
Email/RSS 231 18.8
Friends/Family 378 30.8
Internet 419 34.1
Radio 304 24.7
TV/local cable 275 22.4
Note: Each person may have selected more than one option. Totals will not equal 100%.
18
Hispanics/Latinos. The focus group with persons with low income was set up through the Manhattan First United Methodist Church, and the focus group with Spanish-speaking Hispanics/Latinos was arranged through Manhattan-Ogden USD 383. The Chair of the Flint Hills Wellness Coalition invited community and governmental organization representatives to the third focus group.
Focus groups were conducted in November. Eleven persons participated in the group for persons with low income, six participated in the focus group for Hispanics/Latinos, and 18 participated in the group for community/governmental organizations. Each focus group lasted between 50 and 90 minutes.
CARE researchers designed the focus group questions to allow participants to provide feedback on findings from all sources of data collected to date (i.e., secondary data, community survey, and interviews) as well as add their own input on primary strengths and needs of the community. CARE researchers wrote down all comments on a flipchart so participants could provide correction if needed.
As with key informant interviews, CARE researchers used exploratory thematic analysis (Guest & Namey, 2011) to identify themes in participant comments. The same process as was used for interviews was also used to theme focus group comments. The two researchers who conducted the groups identified themes, and a third researcher who had not participated in the focus groups reviewed the notes and developed her own themes. Consensus was reached regarding the final themes. The comments from each group were analyzed separatelyand collectively in order to identify any unique issues by group as well as those that occur across populations.
rather than being directed by the hypothesis of the researcher. Using this method, the two CARE researchers identified themes across their individual interviews, then compared and came to consensus on themes present across all interviews. A third researcher who did not conduct any of the interviews reviewed the notes from all interviews and created her own list of themes. The list from the third researcher was reviewed by the other two researchers. Any differences were discussed, and the final list of themes was developed. This technique was used as a way of verifying the accuracy of the analysis and can be considered a form of inter-rater reliability (Creswell, 2007).
Focus Group Methodology Although every effort was taken to ensure that respondents to the survey were representative of the population of Riley County, participants tended to be female, Caucasian, middle-aged or older, and have higher income than average. This is a typical issue for community surveys that deal with a large range of topics for which it is not appropriate to target particular populations. To compensate for this limitation, focus groups were conducted with persons from populations that were underrepresented in the survey, namely Spanish-speaking Hispanics/Latinos and persons with low income. It is acknowledged that the limited number of persons in a focus group cannot adequately speak for the group they represent; however, gathering input from at least a few persons from a population can provide a foundation for confirming whether the survey data can be considered reflective of the bulk of the community. An additional focus group was arranged with community and governmental organization representatives.
CARE provided data to representatives of sponsoring organizations regarding demographics of survey respondents. Based on this information and knowledge of the community, representatives from the sponsoring organizations identified which groups to target for participation in focus groups. A representative from the sponsoring organizations set up the two focus groups, one with persons with low income and one with Spanish-Speaking
19
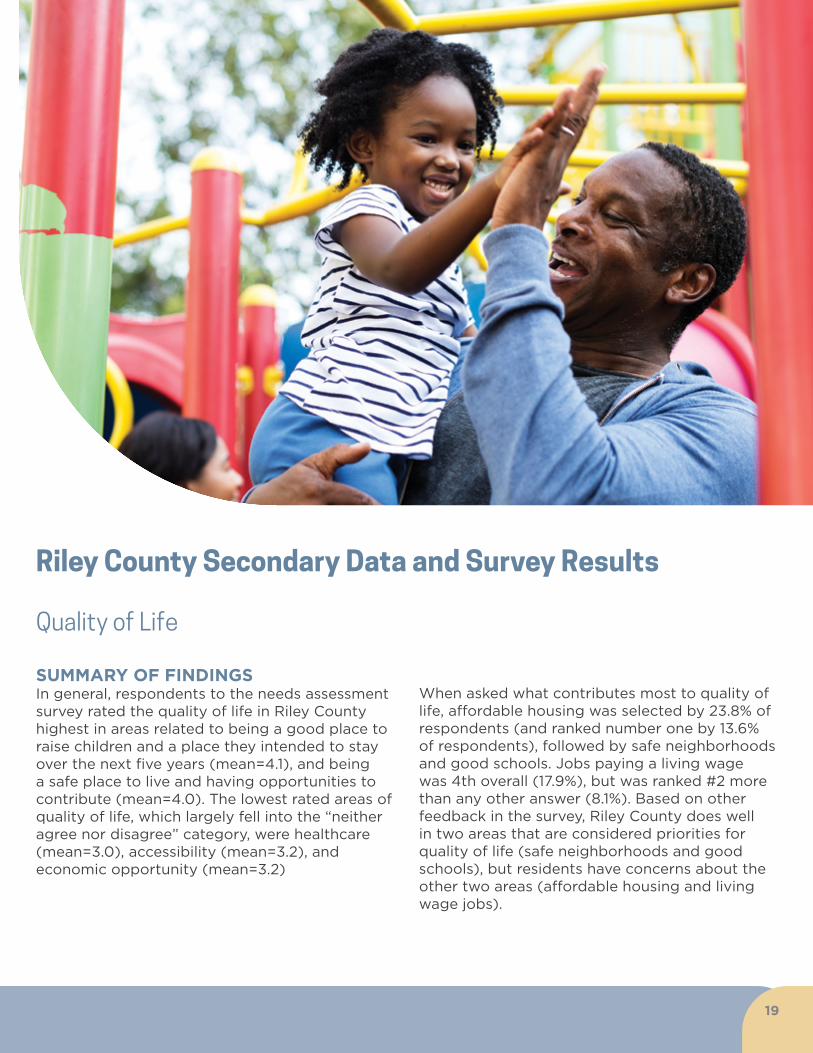
Quality of Life
SUMMARY OF FINDINGS In general, respondents to the needs assessment survey rated the quality of life in Riley County highest in areas related to being a good place to raise children and a place they intended to stay over the next five years (mean=4.1), and being a safe place to live and having opportunities to contribute (mean=4.0). The lowest rated areas of quality of life, which largely fell into the “neither agree nor disagree” category, were healthcare (mean=3.0), accessibility (mean=3.2), and economic opportunity (mean=3.2)
When asked what contributes most to quality of life, affordable housing was selected by 23.8% of respondents (and ranked number one by 13.6% of respondents), followed by safe neighborhoods and good schools. Jobs paying a living wage was 4th overall (17.9%), but was ranked #2 more than any other answer (8.1%). Based on other feedback in the survey, Riley County does well in two areas that are considered priorities for quality of life (safe neighborhoods and good schools), but residents have concerns about the other two areas (affordable housing and living wage jobs).
Riley County Secondary Data and Survey Results

20
Quality of Life Survey
Table 18. Please rate the following statements about the quality of life in the community based on your experiences. (1=Strongly Disagree, 5=Strongly Agree)
Answer N%Strongly Disagree
%Disagree
%Neither Agree nor Disagree
%Agree
%Strongly Agree
Mean (Range1-5)
The community is a good place to raise children. 883 1.1 2.8 14.9 51.3 29.8 4.1
I intend to stay in the community over the next five years. 880 3.0 4.3 11.8 38.0 43.0 4.1
This is a safe place to live. 881 0.8 5.0 13.7 53.0 27.5 4.0
There are volunteer opportunities in the community. 882 0.7 3.6 13.9 53.5 28.2 4.0
I can make the community a better place to live. 878 0.8 1.8 19.4 53.3 24.7 4.0
The community is strengthened by its diversity. 878 2.3 6.8 18.0 43.5 29.4 3.9
I am satisfied with the quality of life in the community. 882 1.9 8.7 11.9 58.6 18.8 3.8
I am satisfied with the local schools in the community. 881 1.8 8.4 25.0 47.2 17.6 3.7
My community is a good place to retire. 882 3.6 11.3 21.7 43.0 20.4 3.7
There are networks of support for individuals during times of need in the community.
876 5.1 15.3 28.1 42.1 9.4 3.4
There are networks of support for families during times of need in the community. 876 4.2 12.4 30.6 44.1 8.7 3.4
There are plenty of recreational activities in the community. 880 6.0 18.5 18.2 41.6 15.7 3.4
I am satisfied with the local government in the community. 882 6.8 15.6 28.8 41.8 6.9 3.3
There is economic opportunity in the community. 876 8.1 18.0 27.1 36.8 10.0 3.2
I am satisfied with accessibility in this community for persons with disabilities. 876 4.9 15.4 43.4 27.7 8.6 3.2
I am satisfied with the health care system in the community. 884 9.5 28.4 21.0 33.3 7.8 3.0

21
Table 19. What are the three most important factors contributing to the quality of life in the community?
AnswerOverall Frequency (any ranking)
Overall %(any ranking)
%Ranked 1st
% Ranked2nd
% Ranked 3rd
Affordable housing 293 23.8 13.6 6.0 4.2
Safe neighborhoods 243 19.8 6.1 7.2 6.4
Good schools 229 18.6 5.5 6.8 6.3
Jobs paying a living wage 220 17.9 5.5 8.1 4.3
Low crime 208 16.9 3.7 6.7 6.5
Good place to raise children 200 16.3 6.8 5.5 4.0
Healthy economy 158 12.9 3.7 4.1 5.0
Parks and recreation 115 9.4 1.1 2.3 6.0
Arts and cultural events 102 8.3 1.7 2.6 4.0
Strong family life 97 7.9 2.6 2.7 2.6
Access to affordable health insurance 86 7.0 2.8 1.7 2.4
Religious or spiritual values 83 6.8 2.7 2.5 1.5
Healthy behaviors and lifestyles 65 5.3 1.4 1.4 2.5
Other 45 3.7 1.9 0.4 1.4
Equality 42 3.4 1.0 1.1 1.4
Resources for parents 17 1.4 0.2 0.3 0.8
Physical access to public facilities 15 1.2 0.1 0.5 0.7
Low level of child abuse 12 1.0 0.2 0.4 0.3
Low disease rates 4 0.3 0.1 0.1 0.2
Figure 9. Top three most important factors contributing to the quality of life in the community.
23.8%
19.8%
18.6%
Affordable housing
Safe neighborhoods
Good schools
22
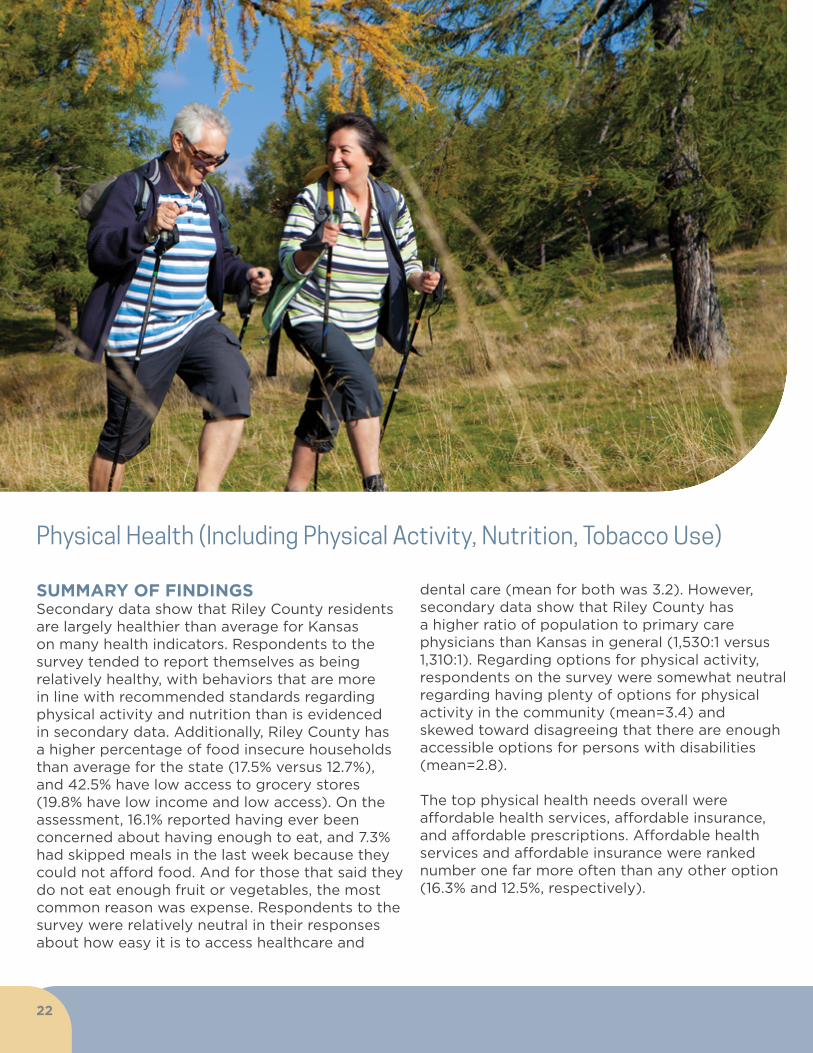
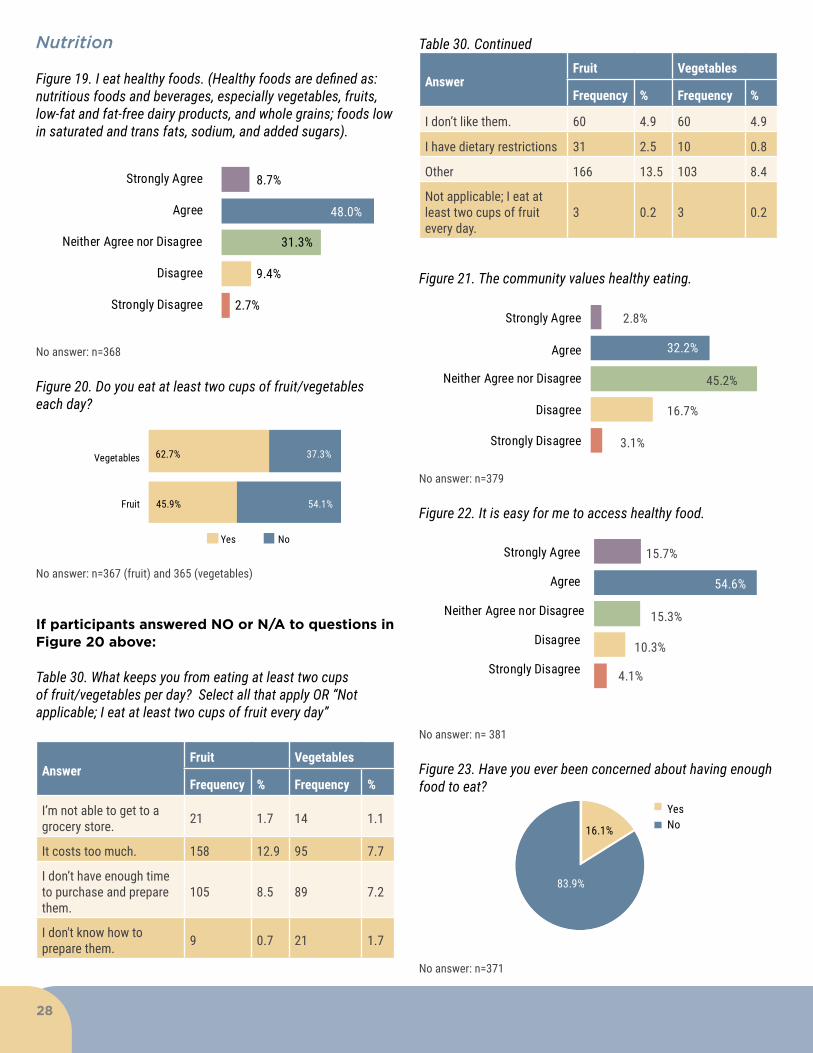
SUMMARY OF FINDINGSSecondary data show that Riley County residents are largely healthier than average for Kansas on many health indicators. Respondents to the survey tended to report themselves as being relatively healthy, with behaviors that are more in line with recommended standards regarding physical activity and nutrition than is evidenced in secondary data. Additionally, Riley County has a higher percentage of food insecure households than average for the state (17.5% versus 12.7%), and 42.5% have low access to grocery stores (19.8% have low income and low access). On the assessment, 16.1% reported having ever been concerned about having enough to eat, and 7.3% had skipped meals in the last week because they could not afford food. And for those that said they do not eat enough fruit or vegetables, the most common reason was expense. Respondents to the survey were relatively neutral in their responses about how easy it is to access healthcare and
dental care (mean for both was 3.2). However, secondary data show that Riley County has a higher ratio of population to primary care physicians than Kansas in general (1,530:1 versus 1,310:1). Regarding options for physical activity, respondents on the survey were somewhat neutral regarding having plenty of options for physical activity in the community (mean=3.4) and skewed toward disagreeing that there are enough accessible options for persons with disabilities (mean=2.8).
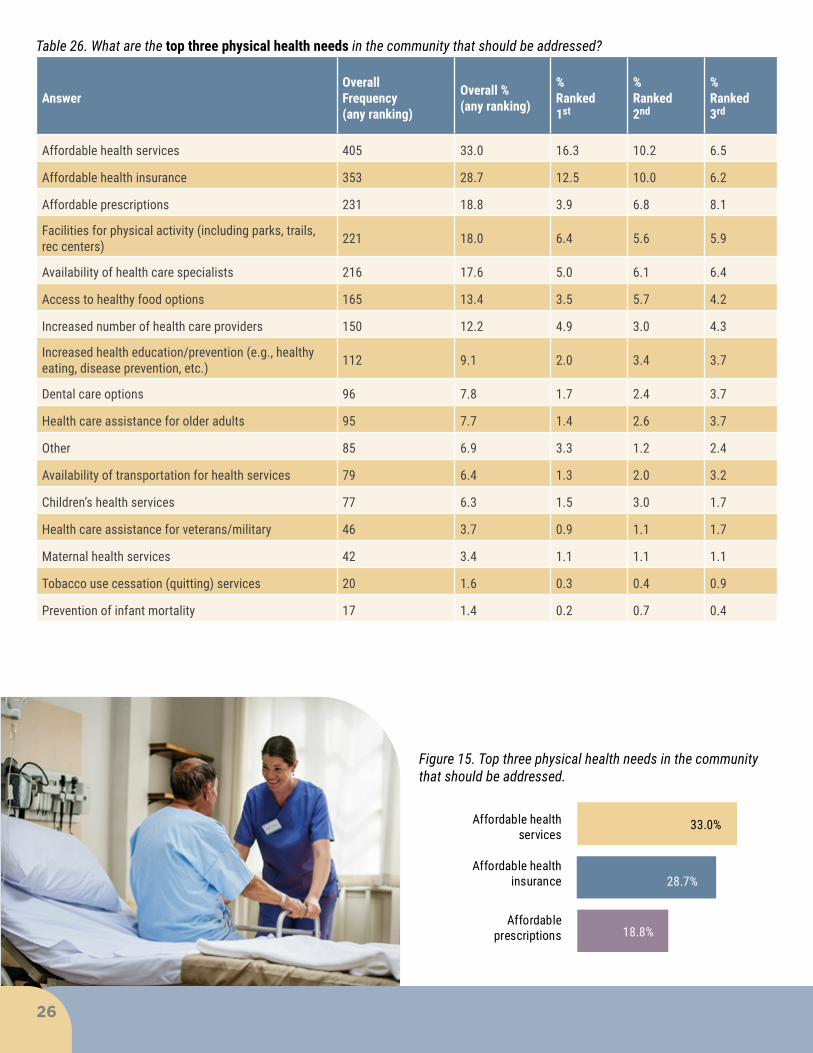
The top physical health needs overall were affordable health services, affordable insurance, and affordable prescriptions. Affordable health services and affordable insurance were ranked number one far more often than any other option (16.3% and 12.5%, respectively).
Physical Health (Including Physical Activity, Nutrition, Tobacco Use)
23
Secondary Physical Health, Physical Activity, Nutrition, and Tobacco Use Data
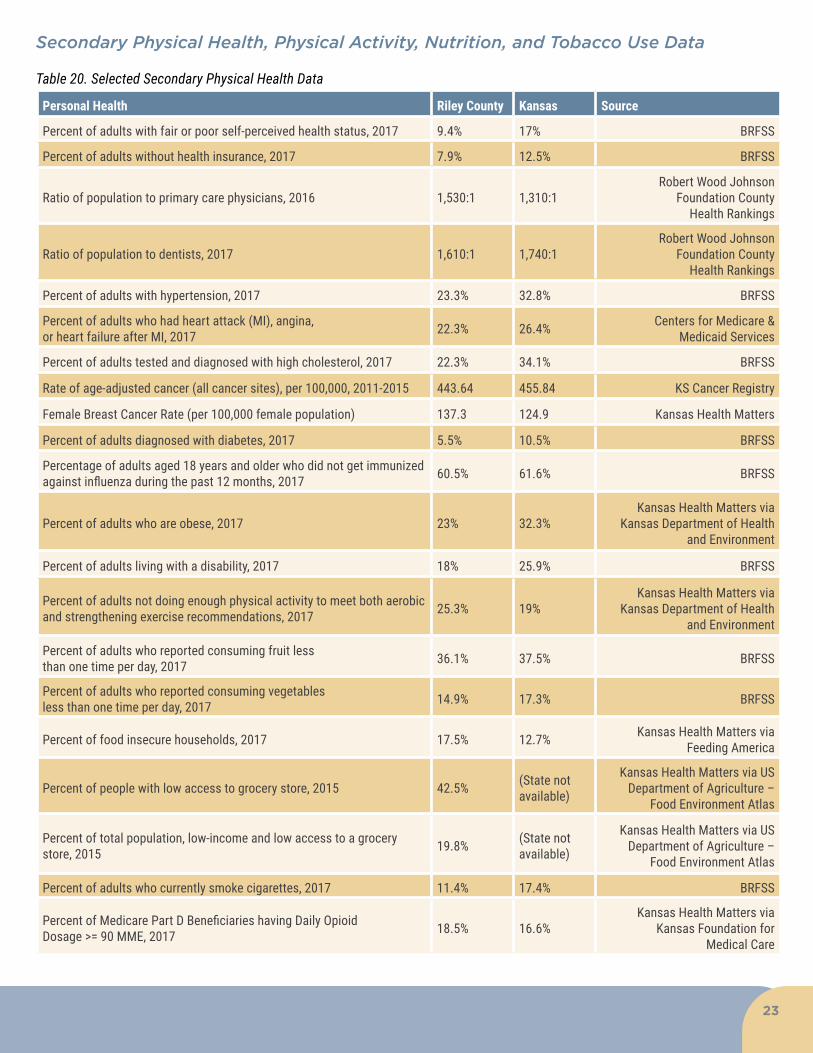
Table 20. Selected Secondary Physical Health Data
Personal Health Riley County Kansas Source
Percent of adults with fair or poor self-perceived health status, 2017 9.4% 17% BRFSS
Percent of adults without health insurance, 2017 7.9% 12.5% BRFSS
Ratio of population to primary care physicians, 2016 1,530:1 1,310:1Robert Wood Johnson
Foundation County Health Rankings
Ratio of population to dentists, 2017 1,610:1 1,740:1Robert Wood Johnson
Foundation County Health Rankings
Percent of adults with hypertension, 2017 23.3% 32.8% BRFSS
Percent of adults who had heart attack (MI), angina, or heart failure after MI, 2017 22.3% 26.4% Centers for Medicare &
Medicaid Services
Percent of adults tested and diagnosed with high cholesterol, 2017 22.3% 34.1% BRFSS
Rate of age-adjusted cancer (all cancer sites), per 100,000, 2011-2015 443.64 455.84 KS Cancer Registry
Female Breast Cancer Rate (per 100,000 female population) 137.3 124.9 Kansas Health Matters
Percent of adults diagnosed with diabetes, 2017 5.5% 10.5% BRFSS
Percentage of adults aged 18 years and older who did not get immunized against influenza during the past 12 months, 2017 60.5% 61.6% BRFSS
Percent of adults who are obese, 2017 23% 32.3%Kansas Health Matters via
Kansas Department of Health and Environment
Percent of adults living with a disability, 2017 18% 25.9% BRFSS
Percent of adults not doing enough physical activity to meet both aerobic and strengthening exercise recommendations, 2017 25.3% 19%
Kansas Health Matters via Kansas Department of Health
and Environment
Percent of adults who reported consuming fruit less than one time per day, 2017 36.1% 37.5% BRFSS
Percent of adults who reported consuming vegetables less than one time per day, 2017 14.9% 17.3% BRFSS
Percent of food insecure households, 2017 17.5% 12.7% Kansas Health Matters via Feeding America
Percent of people with low access to grocery store, 2015 42.5% (State not available)
Kansas Health Matters via US Department of Agriculture –
Food Environment Atlas
Percent of total population, low-income and low access to a grocery store, 2015 19.8% (State not
available)
Kansas Health Matters via US Department of Agriculture –
Food Environment Atlas
Percent of adults who currently smoke cigarettes, 2017 11.4% 17.4% BRFSS
Percent of Medicare Part D Beneficiaries having Daily Opioid Dosage >= 90 MME, 2017 18.5% 16.6%
Kansas Health Matters via Kansas Foundation for
Medical Care
24
Physical Health Survey Data
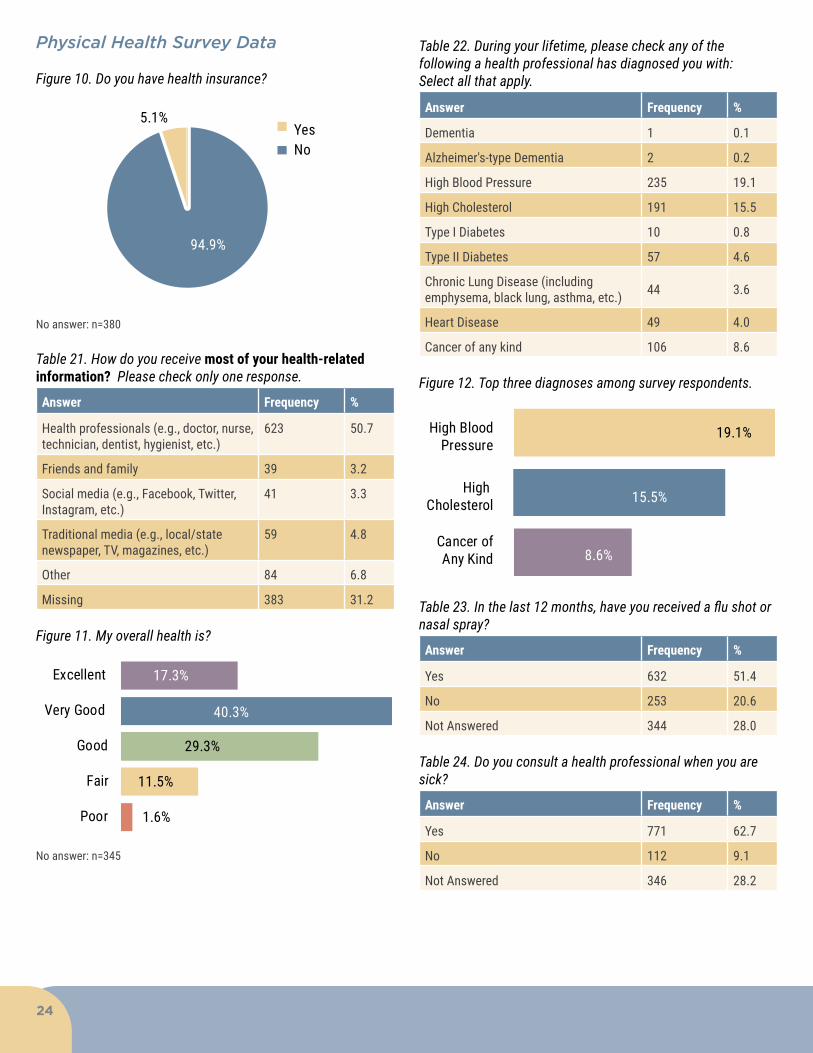
Figure 10. Do you have health insurance?
94.9%
5.1%
NoYes
No answer: n=380
Table 21. How do you receive most of your health-related information? Please check only one response.
Answer Frequency %
Health professionals (e.g., doctor, nurse, technician, dentist, hygienist, etc.)
623 50.7
Friends and family 39 3.2
Social media (e.g., Facebook, Twitter, Instagram, etc.)
41 3.3
Traditional media (e.g., local/state newspaper, TV, magazines, etc.)
59 4.8
Other 84 6.8
Missing 383 31.2
Figure 11. My overall health is?
1.6%
11.5%
29.3%
40.3%
17.3%
Poor
Fair
Good
Very Good
Excellent
No answer: n=345
Table 22. During your lifetime, please check any of the following a health professional has diagnosed you with: Select all that apply.
Answer Frequency %
Dementia 1 0.1
Alzheimer's-type Dementia 2 0.2
High Blood Pressure 235 19.1
High Cholesterol 191 15.5
Type I Diabetes 10 0.8
Type II Diabetes 57 4.6
Chronic Lung Disease (including emphysema, black lung, asthma, etc.) 44 3.6
Heart Disease 49 4.0
Cancer of any kind 106 8.6
Figure 12. Top three diagnoses among survey respondents.
19.1%
15.5%
8.6%
High BloodPressure
High Cholesterol
Cancer ofAny Kind
Table 23. In the last 12 months, have you received a flu shot or nasal spray?
Answer Frequency %
Yes 632 51.4
No 253 20.6
Not Answered 344 28.0
Table 24. Do you consult a health professional when you are sick?
Answer Frequency %
Yes 771 62.7
No 112 9.1
Not Answered 346 28.2
25
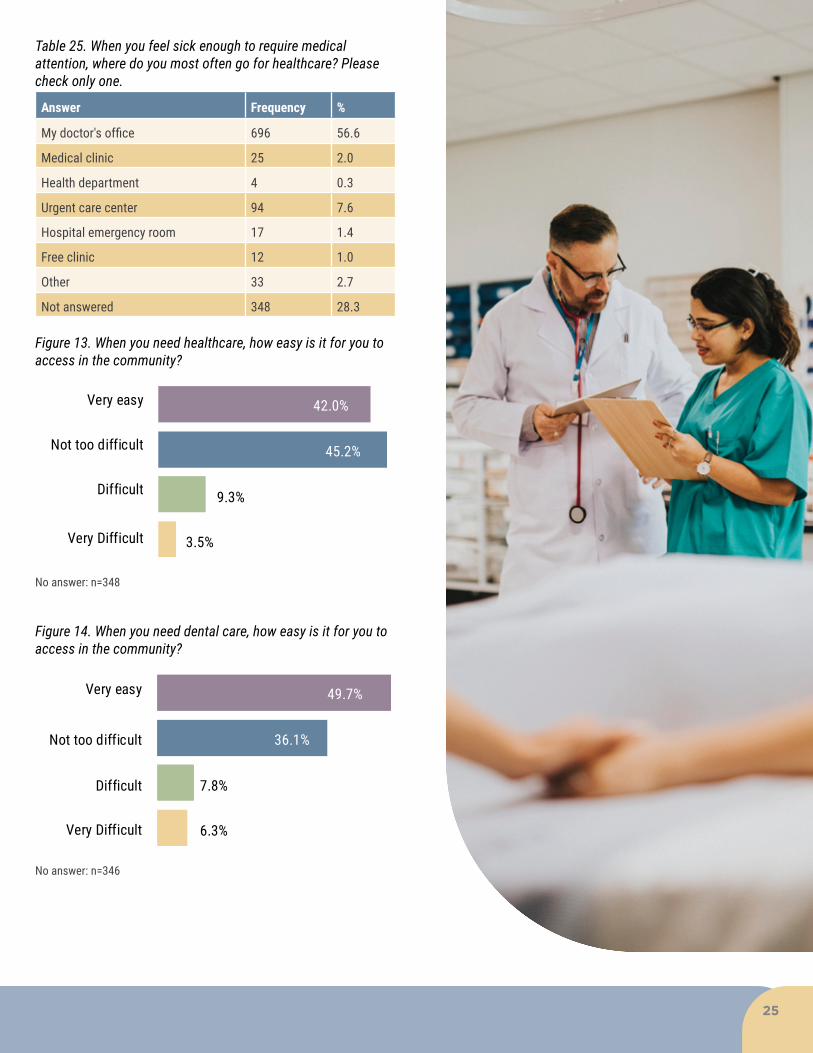
Table 25. When you feel sick enough to require medical attention, where do you most often go for healthcare? Please check only one.
Answer Frequency %
My doctor's office 696 56.6
Medical clinic 25 2.0
Health department 4 0.3
Urgent care center 94 7.6
Hospital emergency room 17 1.4
Free clinic 12 1.0
Other 33 2.7
Not answered 348 28.3
Figure 13. When you need healthcare, how easy is it for you to access in the community?
3.5%
9.3%
45.2%
42.0%
Very Difficult
Difficult
Not too difficult
Very easy
No answer: n=348
Figure 14. When you need dental care, how easy is it for you to access in the community?
6.3%
7.8%
36.1%
49.7%
Very Difficult
Difficult
Not too difficult
Very easy
No answer: n=346
26
Table 26. What are the top three physical health needs in the community that should be addressed?
AnswerOverall Frequency (any ranking)
Overall %(any ranking)
%Ranked 1st
% Ranked2nd
% Ranked 3rd
Affordable health services 405 33.0 16.3 10.2 6.5
Affordable health insurance 353 28.7 12.5 10.0 6.2
Affordable prescriptions 231 18.8 3.9 6.8 8.1
Facilities for physical activity (including parks, trails, rec centers) 221 18.0 6.4 5.6 5.9
Availability of health care specialists 216 17.6 5.0 6.1 6.4
Access to healthy food options 165 13.4 3.5 5.7 4.2
Increased number of health care providers 150 12.2 4.9 3.0 4.3
Increased health education/prevention (e.g., healthy eating, disease prevention, etc.) 112 9.1 2.0 3.4 3.7
Dental care options 96 7.8 1.7 2.4 3.7
Health care assistance for older adults 95 7.7 1.4 2.6 3.7
Other 85 6.9 3.3 1.2 2.4
Availability of transportation for health services 79 6.4 1.3 2.0 3.2
Children’s health services 77 6.3 1.5 3.0 1.7
Health care assistance for veterans/military 46 3.7 0.9 1.1 1.7
Maternal health services 42 3.4 1.1 1.1 1.1
Tobacco use cessation (quitting) services 20 1.6 0.3 0.4 0.9
Prevention of infant mortality 17 1.4 0.2 0.7 0.4
Figure 15. Top three physical health needs in the community that should be addressed.
33.0%
28.7%
18.8%
Affordable healthservices
Affordable health insurance
Affordableprescriptions

Physical Activity
Table 27. How many hours a week, on average, do you engage in physical activity or exercise that is not job related?
Answer Frequency %
None 28 2.3
Less than 1 hour 136 11.1
1-2 hours 185 15.1
2-3 hours 194 15.8
3 hours or more 325 26.4
Not Answered 361 29.4
Table 28. Where do you go to exercise? Select all that apply.
Answer Frequency %
A school 38 3.1
Private gym/studio 190 15.5
Park 291 23.7
Neighborhoods 361 29.4
Home 464 37.8
Public Recreation Center 67 5.5
Other 126 10.3
Table 29. If you don’t exercise, what are the reasons? Select all that apply.
Answer Frequency %
I don't like to exercise 10 0.8
It costs too much to exercise 10 0.8
I don't have enough time 8 0.7
I have physical limitations that don’t allow me to exercise
7 0.6
Other 6 0.5
I don’t have anyone with whom to exercise
5 0.4
I don’t have child care 4 0.3
My job involves physical labor 4 0.3
Exercise is not important to me 4 0.3
The only place where I can exercise is unsafe
1 0.1
Figure 16. There are plenty of options for exercise in this community.
5.3%
17.6%
20.7%
42.2%
14.2%
Strongly Disagree
Disagree
Neither Agree nor Disagree
Agree
Strongly Agree
No answer: n=364
Figure 17. There are enough accessible physical activity/recreation options in this community for persons with physical disabilities
8.5%
22.8%
53.0%
11.7%
4.1%
Strongly Disagree
Disagree
Neither Agree nor Disagree
Agree
Strongly Agree
No answer: n=363
Figure 18. This community values exercise.
2.7%
9.4%
31.3%
48.0%
8.7%
Strongly Disagree
Disagree
Neither Agree nor Disagree
Agree
Strongly Agree
No answer: n=363
27
28
Nutrition
Figure 19. I eat healthy foods. (Healthy foods are defined as: nutritious foods and beverages, especially vegetables, fruits, low-fat and fat-free dairy products, and whole grains; foods low in saturated and trans fats, sodium, and added sugars).
2.7%
9.4%
31.3%
48.0%
8.7%
Strongly Disagree
Disagree
Neither Agree nor Disagree
Agree
Strongly Agree
No answer: n=368
Figure 20. Do you eat at least two cups of fruit/vegetables each day?
45.9%
62.7%
54.1%
37.3%
Fruit
Vegetables
Yes No
No answer: n=367 (fruit) and 365 (vegetables)
If participants answered NO or N/A to questions in Figure 20 above:
Table 30. What keeps you from eating at least two cups of fruit/vegetables per day? Select all that apply OR “Not applicable; I eat at least two cups of fruit every day”
AnswerFruit Vegetables
Frequency % Frequency %
I’m not able to get to a grocery store. 21 1.7 14 1.1
It costs too much. 158 12.9 95 7.7
I don’t have enough time to purchase and prepare them.
105 8.5 89 7.2
I don't know how to prepare them. 9 0.7 21 1.7
AnswerFruit Vegetables
Frequency % Frequency %
I don’t like them. 60 4.9 60 4.9
I have dietary restrictions 31 2.5 10 0.8
Other 166 13.5 103 8.4
Not applicable; I eat at least two cups of fruit every day.
3 0.2 3 0.2
Figure 21. The community values healthy eating.
3.1%
16.7%
45.2%
32.2%
2.8%
Strongly Disagree
Disagree
Neither Agree nor Disagree
Agree
Strongly Agree
No answer: n=379
Figure 22. It is easy for me to access healthy food.
Strongly Disagree
Disagree
Neither Agree nor Disagree
Agree
Strongly Agree
15.3%
54.6%
15.7%
4.1%
10.3%
No answer: n= 381
Figure 23. Have you ever been concerned about having enough food to eat?
16.1%
83.9%
NoYes
No answer: n=371
Table 30. Continued
29
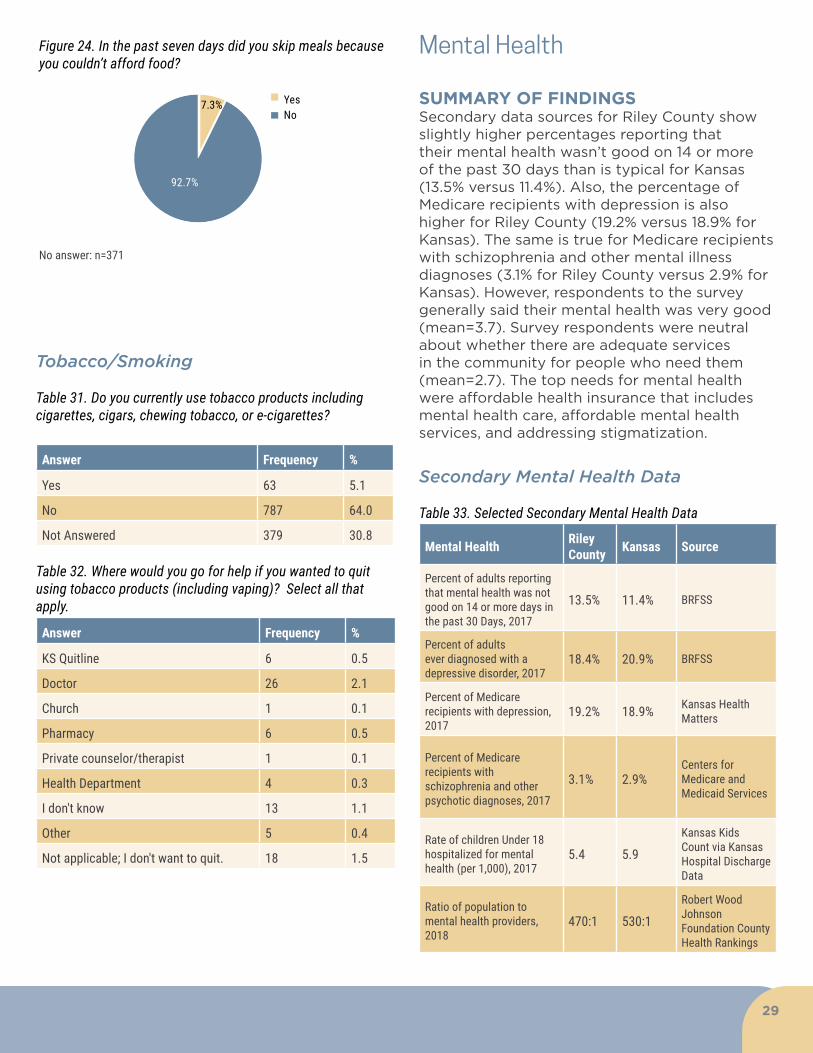
Mental Health
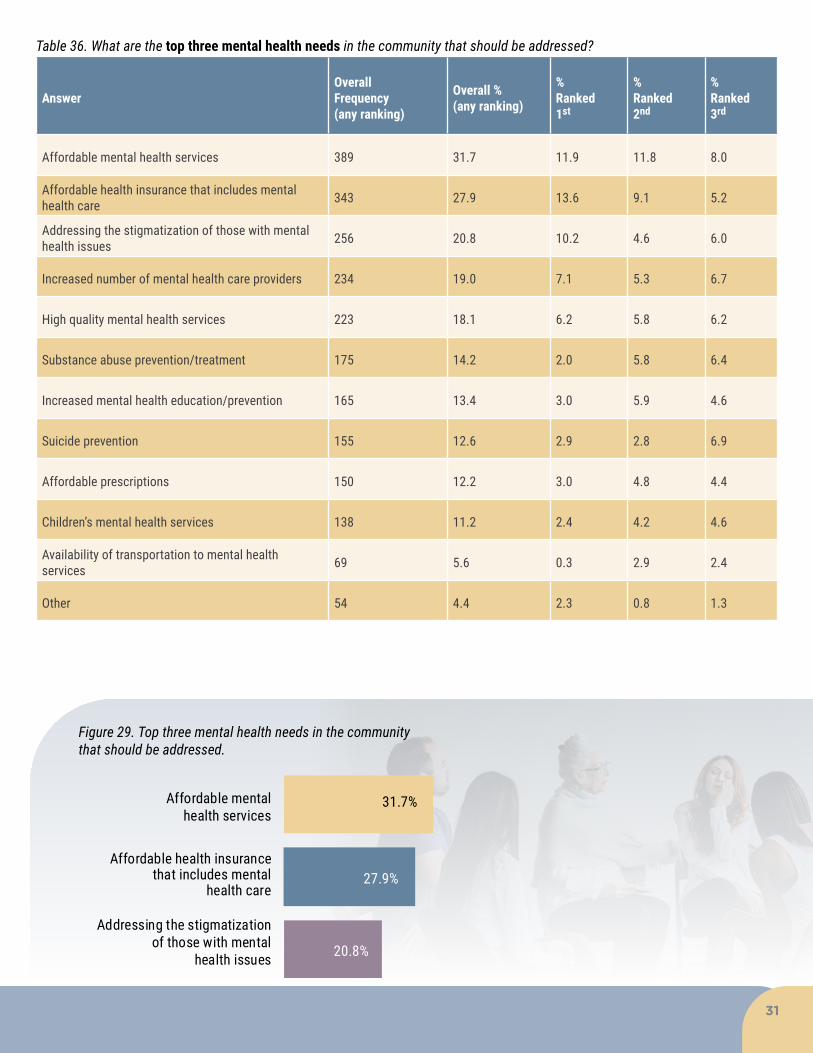
SUMMARY OF FINDINGSSecondary data sources for Riley County show slightly higher percentages reporting that their mental health wasn’t good on 14 or more of the past 30 days than is typical for Kansas (13.5% versus 11.4%). Also, the percentage of Medicare recipients with depression is also higher for Riley County (19.2% versus 18.9% for Kansas). The same is true for Medicare recipients with schizophrenia and other mental illness diagnoses (3.1% for Riley County versus 2.9% for Kansas). However, respondents to the survey generally said their mental health was very good (mean=3.7). Survey respondents were neutral about whether there are adequate services in the community for people who need them (mean=2.7). The top needs for mental health were affordable health insurance that includes mental health care, affordable mental health services, and addressing stigmatization.
Secondary Mental Health Data
Table 33. Selected Secondary Mental Health Data
Mental Health Riley County Kansas Source
Percent of adults reporting that mental health was not good on 14 or more days in the past 30 Days, 2017
13.5% 11.4% BRFSS
Percent of adults ever diagnosed with a depressive disorder, 2017
18.4% 20.9% BRFSS
Percent of Medicare recipients with depression, 2017
19.2% 18.9% Kansas Health Matters
Percent of Medicare recipients with schizophrenia and other psychotic diagnoses, 2017
3.1% 2.9%Centers for Medicare and Medicaid Services
Rate of children Under 18 hospitalized for mental health (per 1,000), 2017
5.4 5.9
Kansas Kids Count via Kansas Hospital Discharge Data
Ratio of population to mental health providers, 2018
470:1 530:1
Robert Wood Johnson Foundation County Health Rankings
Tobacco/Smoking
Table 31. Do you currently use tobacco products including cigarettes, cigars, chewing tobacco, or e-cigarettes?
Answer Frequency %
Yes 63 5.1
No 787 64.0
Not Answered 379 30.8
Table 32. Where would you go for help if you wanted to quit using tobacco products (including vaping)? Select all that apply.
Answer Frequency %
KS Quitline 6 0.5
Doctor 26 2.1
Church 1 0.1
Pharmacy 6 0.5
Private counselor/therapist 1 0.1
Health Department 4 0.3
I don't know 13 1.1
Other 5 0.4
Not applicable; I don't want to quit. 18 1.5
Figure 24. In the past seven days did you skip meals because you couldn’t afford food?
7.3%
92.7%
NoYes
No answer: n=371
30
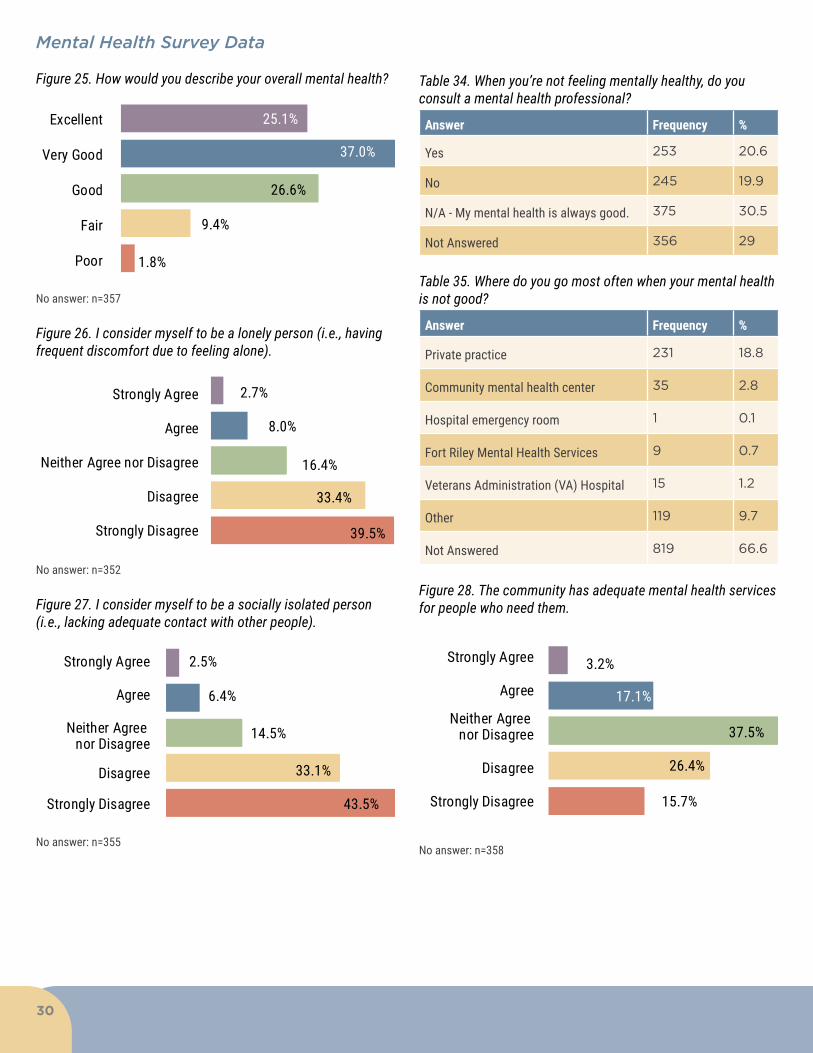
Mental Health Survey Data
Figure 25. How would you describe your overall mental health?
1.8%
9.4%
26.6%
37.0%
25.1%
Poor
Fair
Good
Very Good
Excellent
No answer: n=357
Figure 26. I consider myself to be a lonely person (i.e., having frequent discomfort due to feeling alone).
39.5%
33.4%
16.4%
8.0%
2.7%
Strongly Disagree
Disagree
Neither Agree nor Disagree
Agree
Strongly Agree
No answer: n=352
Figure 27. I consider myself to be a socially isolated person (i.e., lacking adequate contact with other people).
43.5%
33.1%
14.5%
6.4%
2.5%
Strongly Disagree
Disagree
Neither Agree nor Disagree
Agree
Strongly Agree
No answer: n=355
Table 34. When you’re not feeling mentally healthy, do you consult a mental health professional?
Answer Frequency %
Yes 253 20.6
No 245 19.9
N/A - My mental health is always good. 375 30.5
Not Answered 356 29
Table 35. Where do you go most often when your mental health is not good?
Answer Frequency %
Private practice 231 18.8
Community mental health center 35 2.8
Hospital emergency room 1 0.1
Fort Riley Mental Health Services 9 0.7
Veterans Administration (VA) Hospital 15 1.2
Other 119 9.7
Not Answered 819 66.6
Figure 28. The community has adequate mental health services for people who need them.
Neither Agree nor Disagree
15.7%
26.4%
37.5%
17.1%
3.2%
Strongly Disagree
Disagree
Agree
Strongly Agree
No answer: n=358
31
Table 36. What are the top three mental health needs in the community that should be addressed?
AnswerOverall Frequency (any ranking)
Overall %(any ranking)
%Ranked 1st
% Ranked2nd
% Ranked 3rd
Affordable mental health services 389 31.7 11.9 11.8 8.0
Affordable health insurance that includes mental health care 343 27.9 13.6 9.1 5.2
Addressing the stigmatization of those with mental health issues 256 20.8 10.2 4.6 6.0
Increased number of mental health care providers 234 19.0 7.1 5.3 6.7
High quality mental health services 223 18.1 6.2 5.8 6.2
Substance abuse prevention/treatment 175 14.2 2.0 5.8 6.4
Increased mental health education/prevention 165 13.4 3.0 5.9 4.6
Suicide prevention 155 12.6 2.9 2.8 6.9
Affordable prescriptions 150 12.2 3.0 4.8 4.4
Children’s mental health services 138 11.2 2.4 4.2 4.6
Availability of transportation to mental health services 69 5.6 0.3 2.9 2.4
Other 54 4.4 2.3 0.8 1.3
Figure 29. Top three mental health needs in the community that should be addressed.
31.7%
27.9%
20.8%
Affordable mentalhealth services
Affordable health insurance that includes mental
health care
Addressing the stigmatizationof those with mental
health issues
32
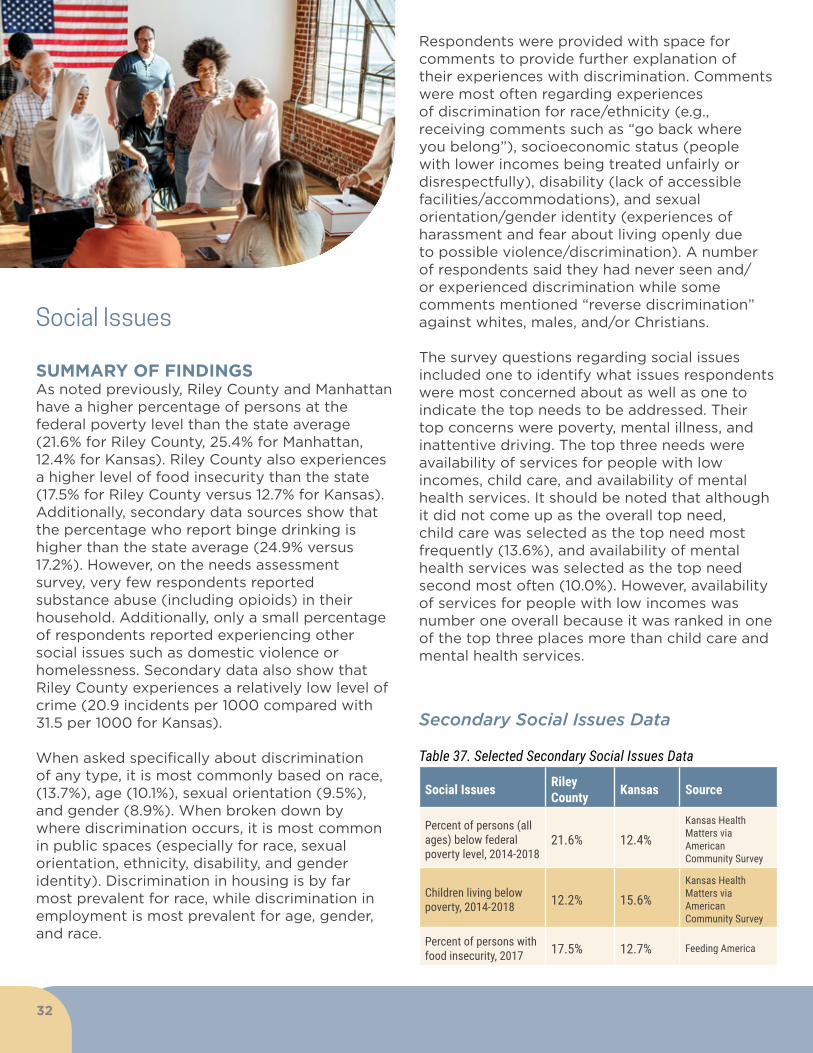
Social Issues
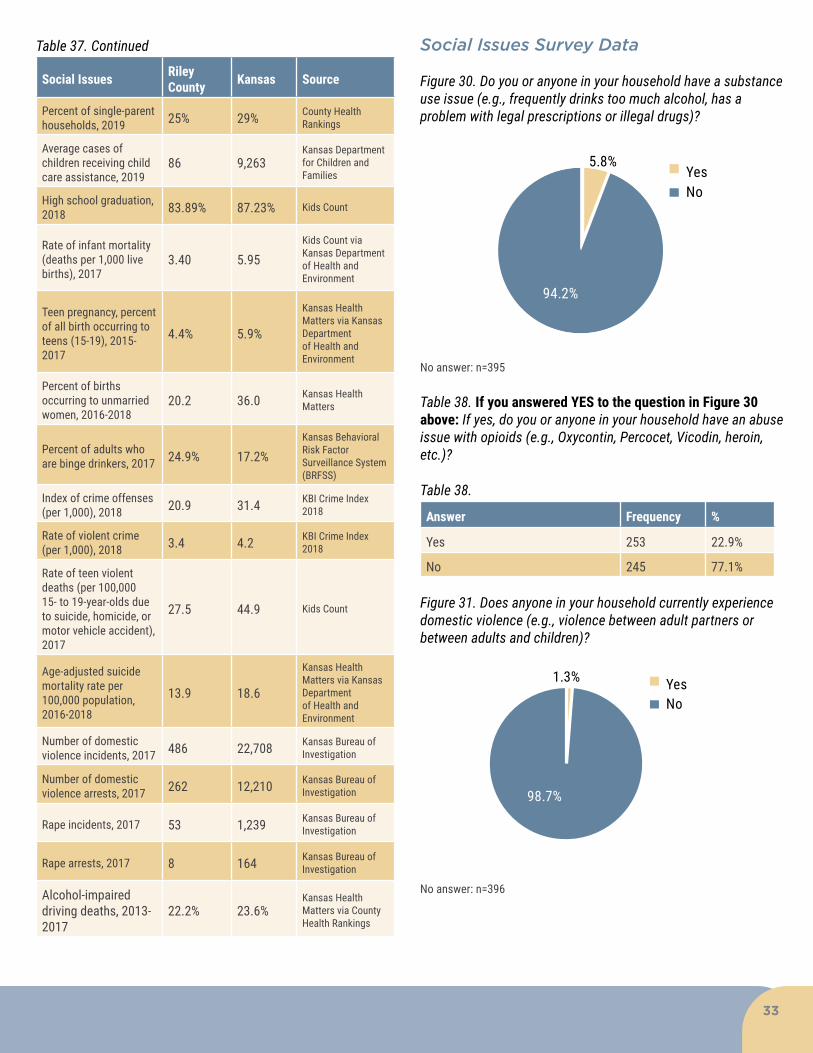
SUMMARY OF FINDINGS As noted previously, Riley County and Manhattan have a higher percentage of persons at the federal poverty level than the state average (21.6% for Riley County, 25.4% for Manhattan, 12.4% for Kansas). Riley County also experiences a higher level of food insecurity than the state (17.5% for Riley County versus 12.7% for Kansas). Additionally, secondary data sources show that the percentage who report binge drinking is higher than the state average (24.9% versus 17.2%). However, on the needs assessment survey, very few respondents reported substance abuse (including opioids) in their household. Additionally, only a small percentage of respondents reported experiencing other social issues such as domestic violence or homelessness. Secondary data also show that Riley County experiences a relatively low level of crime (20.9 incidents per 1000 compared with 31.5 per 1000 for Kansas).
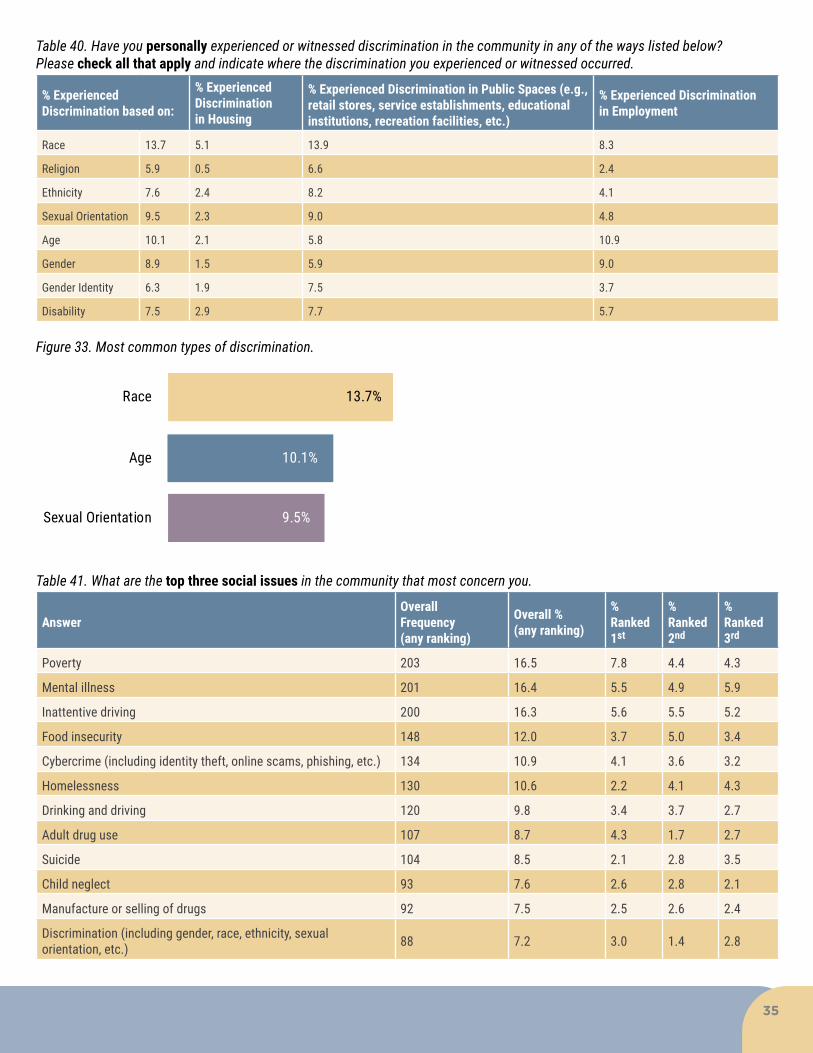
When asked specifically about discrimination of any type, it is most commonly based on race, (13.7%), age (10.1%), sexual orientation (9.5%), and gender (8.9%). When broken down by where discrimination occurs, it is most common in public spaces (especially for race, sexual orientation, ethnicity, disability, and gender identity). Discrimination in housing is by far most prevalent for race, while discrimination in employment is most prevalent for age, gender, and race.
Respondents were provided with space for comments to provide further explanation of their experiences with discrimination. Comments were most often regarding experiences of discrimination for race/ethnicity (e.g., receiving comments such as “go back where you belong”), socioeconomic status (people with lower incomes being treated unfairly or disrespectfully), disability (lack of accessible facilities/accommodations), and sexual orientation/gender identity (experiences of harassment and fear about living openly due to possible violence/discrimination). A number of respondents said they had never seen and/or experienced discrimination while some comments mentioned “reverse discrimination” against whites, males, and/or Christians.
The survey questions regarding social issues included one to identify what issues respondents were most concerned about as well as one to indicate the top needs to be addressed. Their top concerns were poverty, mental illness, and inattentive driving. The top three needs were availability of services for people with low incomes, child care, and availability of mental health services. It should be noted that although it did not come up as the overall top need, child care was selected as the top need most frequently (13.6%), and availability of mental health services was selected as the top need second most often (10.0%). However, availability of services for people with low incomes was number one overall because it was ranked in one of the top three places more than child care and mental health services.
Secondary Social Issues Data
Table 37. Selected Secondary Social Issues Data
Social Issues Riley County Kansas Source
Percent of persons (all ages) below federal poverty level, 2014-2018
21.6% 12.4%Kansas Health Matters via American Community Survey
Children living below poverty, 2014-2018 12.2% 15.6%
Kansas Health Matters via American Community Survey
Percent of persons with food insecurity, 2017 17.5% 12.7% Feeding America
33
Social Issues Riley County Kansas Source
Percent of single-parent households, 2019 25% 29% County Health
Rankings
Average cases of children receiving child care assistance, 2019
86 9,263Kansas Department for Children and Families
High school graduation, 2018 83.89% 87.23% Kids Count
Rate of infant mortality (deaths per 1,000 live births), 2017
3.40 5.95Kids Count via Kansas Department of Health and Environment
Teen pregnancy, percent of all birth occurring to teens (15-19), 2015-2017
4.4% 5.9%
Kansas Health Matters via Kansas Department of Health and Environment
Percent of births occurring to unmarried women, 2016-2018
20.2 36.0 Kansas Health Matters
Percent of adults who are binge drinkers, 2017 24.9% 17.2%
Kansas Behavioral Risk Factor Surveillance System (BRFSS)
Index of crime offenses (per 1,000), 2018 20.9 31.4 KBI Crime Index
2018
Rate of violent crime (per 1,000), 2018 3.4 4.2 KBI Crime Index
2018
Rate of teen violent deaths (per 100,000 15- to 19-year-olds due to suicide, homicide, or motor vehicle accident), 2017
27.5 44.9 Kids Count
Age-adjusted suicide mortality rate per 100,000 population, 2016-2018
13.9 18.6
Kansas Health Matters via Kansas Department of Health and Environment
Number of domestic violence incidents, 2017 486 22,708 Kansas Bureau of
Investigation
Number of domestic violence arrests, 2017 262 12,210 Kansas Bureau of
Investigation
Rape incidents, 2017 53 1,239 Kansas Bureau of Investigation
Rape arrests, 2017 8 164 Kansas Bureau of Investigation
Alcohol-impaired driving deaths, 2013-2017
22.2% 23.6%Kansas Health Matters via County Health Rankings
Social Issues Survey Data
Figure 30. Do you or anyone in your household have a substance use issue (e.g., frequently drinks too much alcohol, has a problem with legal prescriptions or illegal drugs)?
5.8%
94.2%
NoYes
No answer: n=395
Table 38. If you answered YES to the question in Figure 30 above: If yes, do you or anyone in your household have an abuse issue with opioids (e.g., Oxycontin, Percocet, Vicodin, heroin, etc.)?
Table 38.
Answer Frequency %
Yes 253 22.9%
No 245 77.1%
Figure 31. Does anyone in your household currently experience domestic violence (e.g., violence between adult partners or between adults and children)?
1.3%
98.7%
NoYes
No answer: n=396
Table 37. Continued

34
Figure 32. Excluding mental health issues, do you or anyone in your household have a physical or developmental disability?
NoYes
82.6%
17.4% 6.4%
Physical Developmental
93.6%
No answer: n=396 (physical) and 399 (developmental)
Table 39. Are you or anyone in your immediate family currently homeless (e.g., no permanent place to live on a daily basis)?
Answer Frequency %
Yes 7 0.6
No 826 67.2
Not Answered 396 32.2
Discrimination most often occurs in public spaces, especially for race, sexual orientation, ethnicity, disability, and gender identity.
35
Table 40. Have you personally experienced or witnessed discrimination in the community in any of the ways listed below? Please check all that apply and indicate where the discrimination you experienced or witnessed occurred.
% Experienced Discrimination based on:
% Experienced Discrimination in Housing
% Experienced Discrimination in Public Spaces (e.g., retail stores, service establishments, educational institutions, recreation facilities, etc.)
% Experienced Discrimination in Employment
Race 13.7 5.1 13.9 8.3
Religion 5.9 0.5 6.6 2.4
Ethnicity 7.6 2.4 8.2 4.1
Sexual Orientation 9.5 2.3 9.0 4.8
Age 10.1 2.1 5.8 10.9
Gender 8.9 1.5 5.9 9.0
Gender Identity 6.3 1.9 7.5 3.7
Disability 7.5 2.9 7.7 5.7
Figure 33. Most common types of discrimination.
13.7%
10.1%
9.5%
Race
Age
Sexual Orientation
Table 41. What are the top three social issues in the community that most concern you.
AnswerOverall Frequency (any ranking)
Overall %(any ranking)
%Ranked 1st
% Ranked2nd
% Ranked 3rd
Poverty 203 16.5 7.8 4.4 4.3
Mental illness 201 16.4 5.5 4.9 5.9
Inattentive driving 200 16.3 5.6 5.5 5.2
Food insecurity 148 12.0 3.7 5.0 3.4
Cybercrime (including identity theft, online scams, phishing, etc.) 134 10.9 4.1 3.6 3.2
Homelessness 130 10.6 2.2 4.1 4.3
Drinking and driving 120 9.8 3.4 3.7 2.7
Adult drug use 107 8.7 4.3 1.7 2.7
Suicide 104 8.5 2.1 2.8 3.5
Child neglect 93 7.6 2.6 2.8 2.1
Manufacture or selling of drugs 92 7.5 2.5 2.6 2.4
Discrimination (including gender, race, ethnicity, sexual orientation, etc.) 88 7.2 3.0 1.4 2.8

36
AnswerOverall Frequency (any ranking)
Overall %(any ranking)
%Ranked 1st
% Ranked2nd
% Ranked 3rd
Violent crime (including assault, rape, murder) 78 6.3 1.5 2.5 2.3
Domestic violence 76 6.2 1.4 2.4 2.4
Child sexual abuse 71 5.8 2.6 2.0 1.1
Adult alcohol use 64 5.2 2.5 1.6 1.1
Youth tobacco (all products including vaping) use 62 5.0 2.1 1.5 1.4
Property crime 57 4.6 0.8 1.4 2.4
Youth drug use 52 4.2 1.3 1.4 1.5
Child physical abuse 49 4.0 1.5 1.8 0.7
Other 47 3.8 1.4 1.1 1.4
Youth alcohol use 34 2.8 0.7 1.1 1.0
Persistent hunger 25 2.0 0.4 0.7 0.9
Adult tobacco (all products) use 20 1.6 0.4 0.7 0.5
Elder abuse 16 1.3 0.1 0.4 0.8
Teen pregnancy 5 0.4 0.0 0.2 0.2
Table 42. What are the top three needs related to social issues in the community that should be addressed?
AnswerOverall Frequency (any ranking)
Overall %(any ranking)
%Ranked 1st
% Ranked2nd
% Ranked 3rd
Availability of services for people with low incomes 309 25.1 7.9 8.3 9.0
Child care 293 23.8 13.6 5.1 5.1
Availability of mental health services 278 22.6 10.0 7.6 5.0
Availability of employment 196 15.9 5.0 6.2 4.7
Housing options for homeless persons 187 15.2 3.8 6.3 5.1
Positive activities for youth 183 14.9 3.8 6.3 4.8
Services for older adults 121 9.8 3.8 2.5 3.5
Better enforcement of laws 109 8.9 3.0 2.9 2.9
Substance abuse prevention or treatment 103 8.4 1.6 3.2 3.6
Services to veterans/military 98 8.0 2.2 2.8 3.0
Services for persons with disabilities 81 6.6 2.1 2.2 2.3
Options for arts and entertainment activities 81 6.6 1.1 2.0 3.6
Other 69 5.6 2.3 1.2 2.1
Services for domestic/sexual violence survivors 65 5.3 1.1 1.9 2.4
Availability of support groups/peer support 62 5.0 0.7 2.5 1.8
Changing local laws 44 3.6 1.1 1.3 1.2
Table 41. Continued
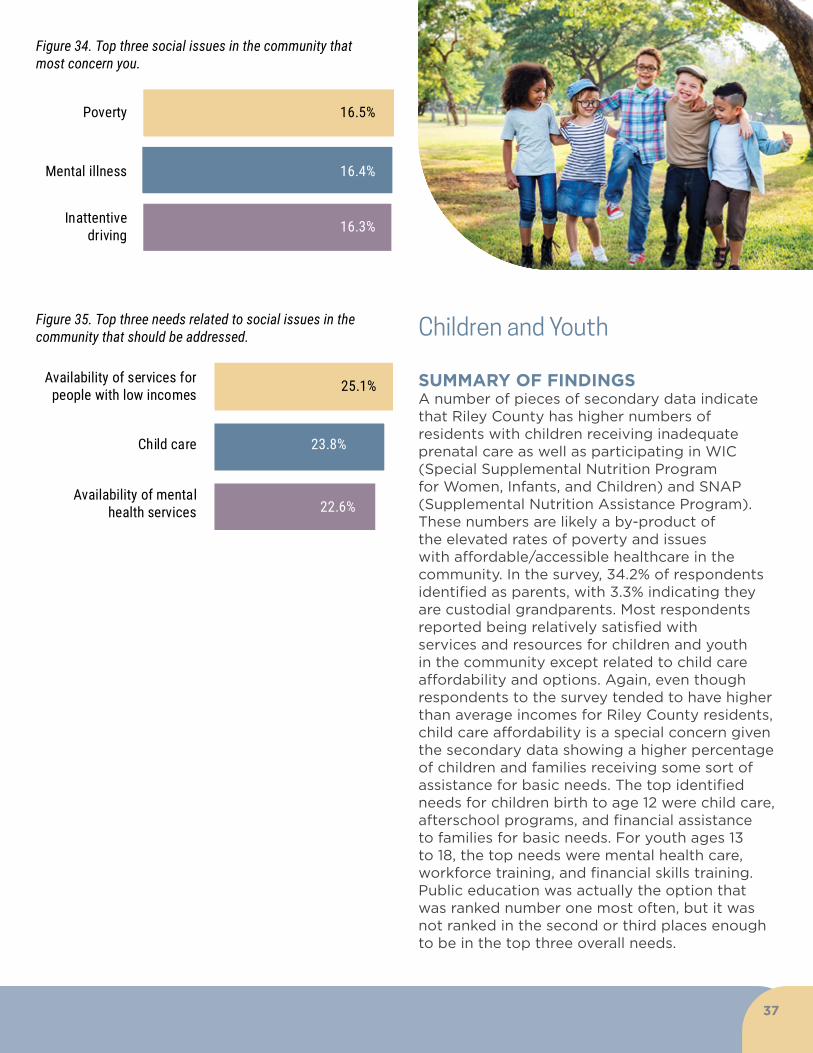
37
Figure 34. Top three social issues in the community that most concern you.
16.5%
16.4%
16.3%
Poverty
Mental illness
Inattentivedriving
Figure 35. Top three needs related to social issues in the community that should be addressed.
25.1%
23.8%
22.6%
Child care
Availability of services for people with low incomes
Availability of mental health services
Children and Youth
SUMMARY OF FINDINGS A number of pieces of secondary data indicate that Riley County has higher numbers of residents with children receiving inadequate prenatal care as well as participating in WIC (Special Supplemental Nutrition Program for Women, Infants, and Children) and SNAP (Supplemental Nutrition Assistance Program). These numbers are likely a by-product of the elevated rates of poverty and issues with affordable/accessible healthcare in the community. In the survey, 34.2% of respondents identified as parents, with 3.3% indicating they are custodial grandparents. Most respondents reported being relatively satisfied with services and resources for children and youth in the community except related to child care affordability and options. Again, even though respondents to the survey tended to have higher than average incomes for Riley County residents, child care affordability is a special concern given the secondary data showing a higher percentage of children and families receiving some sort of assistance for basic needs. The top identified needs for children birth to age 12 were child care, afterschool programs, and financial assistance to families for basic needs. For youth ages 13 to 18, the top needs were mental health care, workforce training, and financial skills training. Public education was actually the option that was ranked number one most often, but it was not ranked in the second or third places enough to be in the top three overall needs.
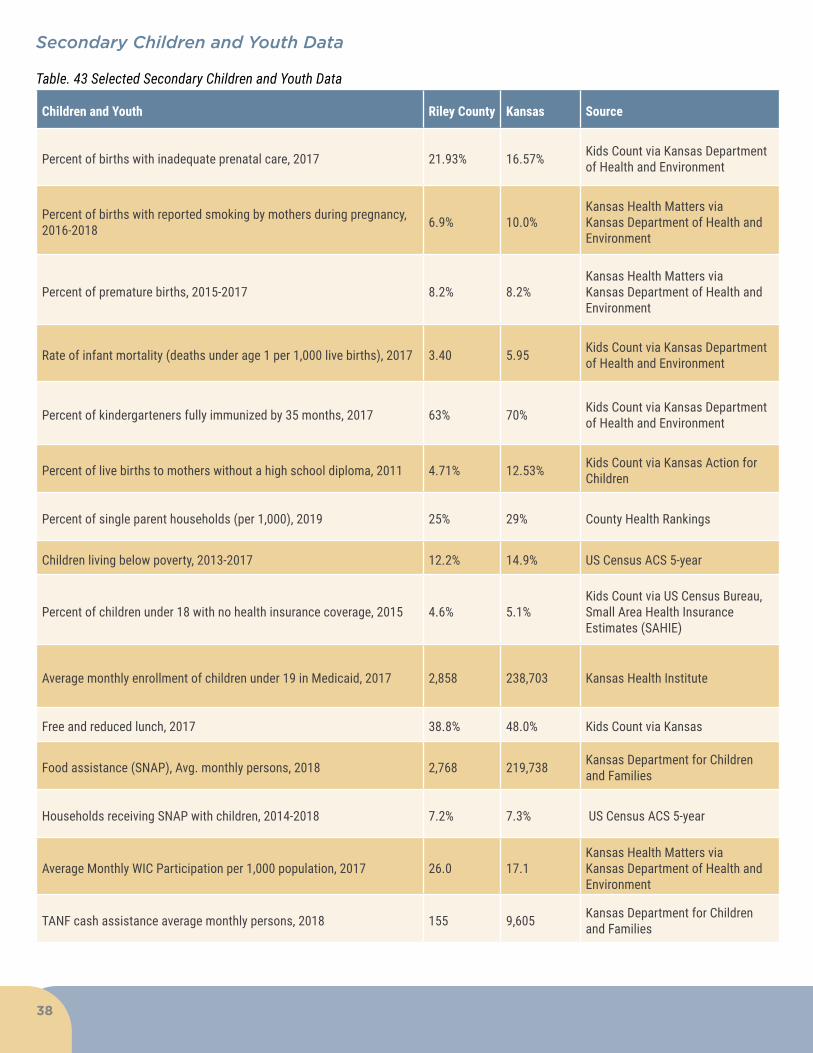
38
Secondary Children and Youth Data
Table. 43 Selected Secondary Children and Youth Data
Children and Youth Riley County Kansas Source
Percent of births with inadequate prenatal care, 2017 21.93% 16.57% Kids Count via Kansas Department of Health and Environment
Percent of births with reported smoking by mothers during pregnancy, 2016-2018 6.9% 10.0%
Kansas Health Matters via Kansas Department of Health and Environment
Percent of premature births, 2015-2017 8.2% 8.2%Kansas Health Matters via Kansas Department of Health and Environment
Rate of infant mortality (deaths under age 1 per 1,000 live births), 2017 3.40 5.95 Kids Count via Kansas Department of Health and Environment
Percent of kindergarteners fully immunized by 35 months, 2017 63% 70% Kids Count via Kansas Department of Health and Environment
Percent of live births to mothers without a high school diploma, 2011 4.71% 12.53% Kids Count via Kansas Action for Children
Percent of single parent households (per 1,000), 2019 25% 29% County Health Rankings
Children living below poverty, 2013-2017 12.2% 14.9% US Census ACS 5-year
Percent of children under 18 with no health insurance coverage, 2015 4.6% 5.1%Kids Count via US Census Bureau, Small Area Health Insurance Estimates (SAHIE)
Average monthly enrollment of children under 19 in Medicaid, 2017 2,858 238,703 Kansas Health Institute
Free and reduced lunch, 2017 38.8% 48.0% Kids Count via Kansas
Food assistance (SNAP), Avg. monthly persons, 2018 2,768 219,738 Kansas Department for Children and Families
Households receiving SNAP with children, 2014-2018 7.2% 7.3% US Census ACS 5-year
Average Monthly WIC Participation per 1,000 population, 2017 26.0 17.1Kansas Health Matters via Kansas Department of Health and Environment
TANF cash assistance average monthly persons, 2018 155 9,605 Kansas Department for Children and Families
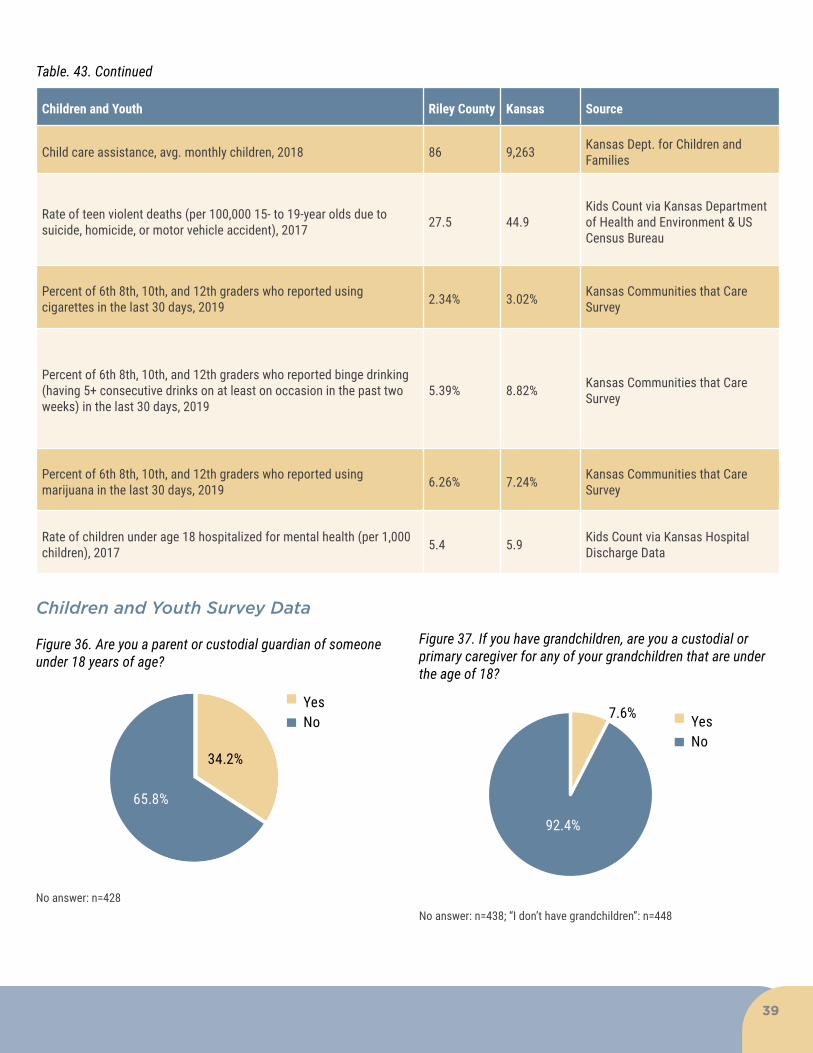
39
Children and Youth Riley County Kansas Source
Child care assistance, avg. monthly children, 2018 86 9,263 Kansas Dept. for Children and Families
Rate of teen violent deaths (per 100,000 15- to 19-year olds due to suicide, homicide, or motor vehicle accident), 2017 27.5 44.9
Kids Count via Kansas Department of Health and Environment & US Census Bureau
Percent of 6th 8th, 10th, and 12th graders who reported using cigarettes in the last 30 days, 2019 2.34% 3.02% Kansas Communities that Care
Survey
Percent of 6th 8th, 10th, and 12th graders who reported binge drinking (having 5+ consecutive drinks on at least on occasion in the past two weeks) in the last 30 days, 2019
5.39% 8.82% Kansas Communities that Care Survey
Percent of 6th 8th, 10th, and 12th graders who reported using marijuana in the last 30 days, 2019 6.26% 7.24% Kansas Communities that Care
Survey
Rate of children under age 18 hospitalized for mental health (per 1,000 children), 2017 5.4 5.9 Kids Count via Kansas Hospital
Discharge Data
Children and Youth Survey Data
Figure 36. Are you a parent or custodial guardian of someone under 18 years of age?
34.2%
65.8%
NoYes
No answer: n=428
Figure 37. If you have grandchildren, are you a custodial or primary caregiver for any of your grandchildren that are under the age of 18?
7.6%
92.4%
NoYes
No answer: n=438; “I don’t have grandchildren”: n=448
Table. 43. Continued
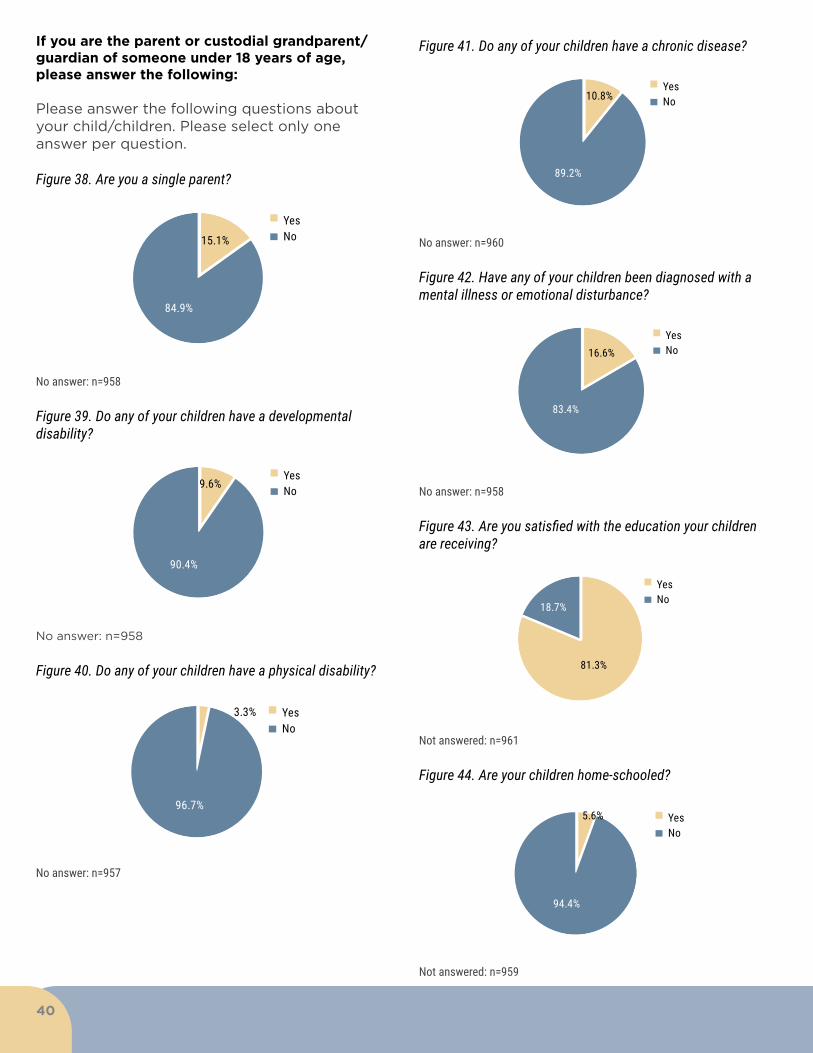
40
If you are the parent or custodial grandparent/guardian of someone under 18 years of age, please answer the following:
Please answer the following questions about your child/children. Please select only one answer per question.
Figure 38. Are you a single parent?
15.1%
84.9%
NoYes
No answer: n=958
Figure 39. Do any of your children have a developmental disability?
9.6%
90.4%
NoYes
No answer: n=958
Figure 40. Do any of your children have a physical disability?
3.3%
96.7%
NoYes
No answer: n=957
Figure 41. Do any of your children have a chronic disease?
10.8%
89.2%
NoYes
No answer: n=960
Figure 42. Have any of your children been diagnosed with a mental illness or emotional disturbance?
16.6%
83.4%
NoYes
No answer: n=958
Figure 43. Are you satisfied with the education your children are receiving?
81.3%
18.7%NoYes
Not answered: n=961
Figure 44. Are your children home-schooled?
5.6%
94.4%
NoYes
Not answered: n=959
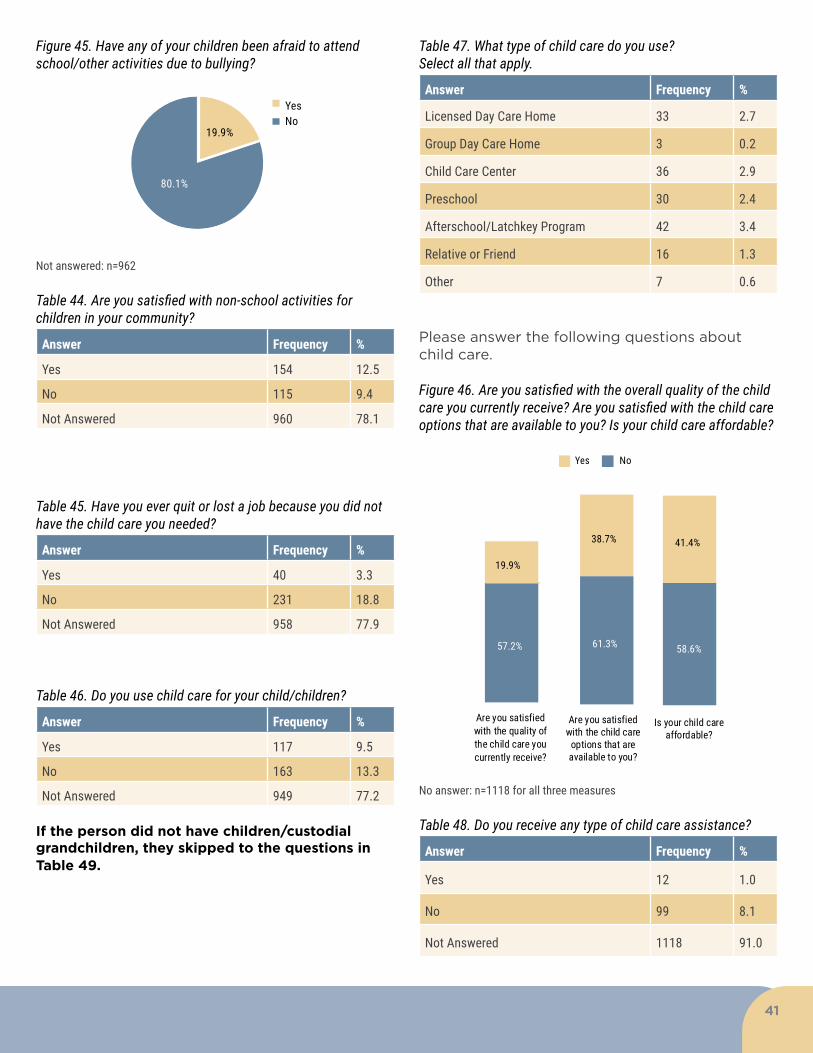
41
Figure 45. Have any of your children been afraid to attend school/other activities due to bullying?
19.9%
80.1%
NoYes
Not answered: n=962
Table 44. Are you satisfied with non-school activities for children in your community?
Answer Frequency %
Yes 154 12.5
No 115 9.4
Not Answered 960 78.1Table 45. Have you ever quit or lost a job because you did not
Table 45. Have you ever quit or lost a job because you did not have the child care you needed?
Answer Frequency %
Yes 40 3.3
No 231 18.8
Not Answered 958 77.9
Table 46. Do you use child care for your child/children?
Answer Frequency %
Yes 117 9.5
No 163 13.3
Not Answered 949 77.2
If the person did not have children/custodial grandchildren, they skipped to the questions in Table 49.
Table 47. What type of child care do you use? Select all that apply.
Answer Frequency %
Licensed Day Care Home 33 2.7
Group Day Care Home 3 0.2
Child Care Center 36 2.9
Preschool 30 2.4
Afterschool/Latchkey Program 42 3.4
Relative or Friend 16 1.3
Other 7 0.6
Please answer the following questions about child care.
Figure 46. Are you satisfied with the overall quality of the child care you currently receive? Are you satisfied with the child care options that are available to you? Is your child care affordable?
41.4%38.7%
61.3% 58.6%
Yes No
Are you satisfied with the child care
options that are available to you?
Is your child care affordable?
19.9%
57.2%
Are you satisfied with the quality of the child care you currently receive?
No answer: n=1118 for all three measures
Table 48. Do you receive any type of child care assistance?
Answer Frequency %
Yes 12 1.0
No 99 8.1
Not Answered 1118 91.0
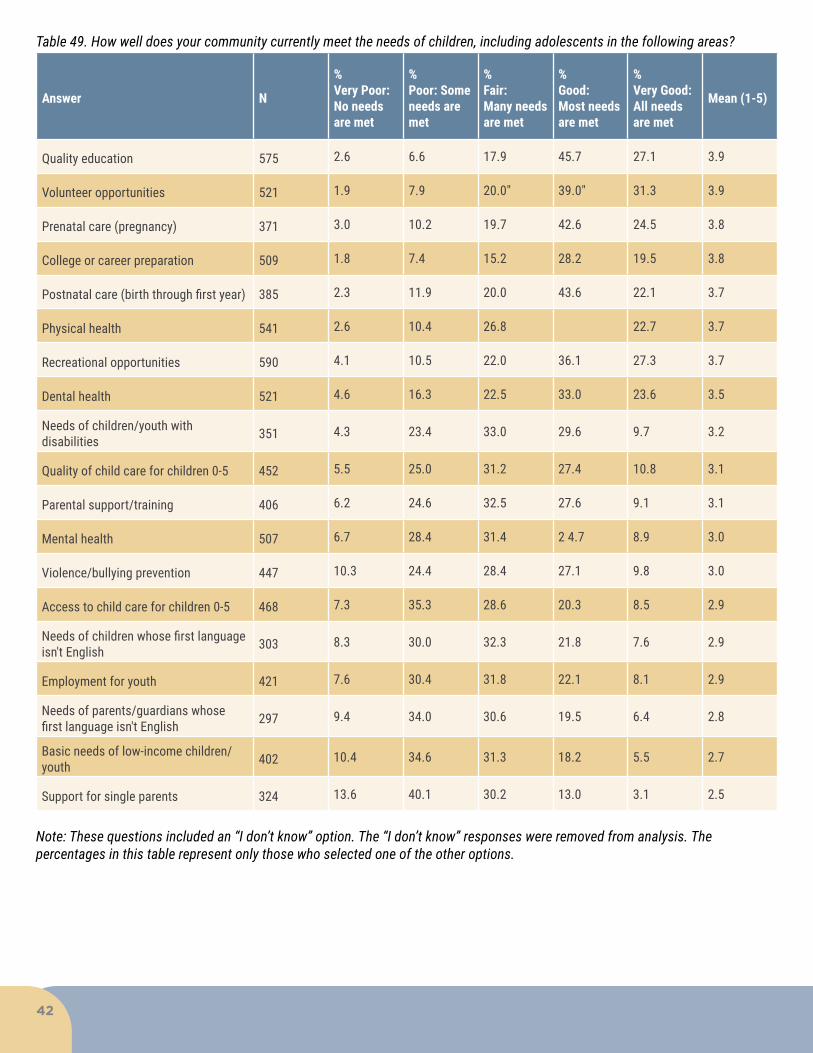
42
Table 49. How well does your community currently meet the needs of children, including adolescents in the following areas?
Answer N
%Very Poor:No needs are met
%Poor: Some needs are met
%Fair:Many needs are met
%Good:Most needs are met
%Very Good:All needs are met
Mean (1-5)
Quality education 575 2.6 6.6 17.9 45.7 27.1 3.9
Volunteer opportunities 521 1.9 7.9 20.0" 39.0" 31.3 3.9
Prenatal care (pregnancy) 371 3.0 10.2 19.7 42.6 24.5 3.8
College or career preparation 509 1.8 7.4 15.2 28.2 19.5 3.8
Postnatal care (birth through first year) 385 2.3 11.9 20.0 43.6 22.1 3.7
Physical health 541 2.6 10.4 26.8 22.7 3.7
Recreational opportunities 590 4.1 10.5 22.0 36.1 27.3 3.7
Dental health 521 4.6 16.3 22.5 33.0 23.6 3.5
Needs of children/youth with disabilities 351 4.3 23.4 33.0 29.6 9.7 3.2
Quality of child care for children 0-5 452 5.5 25.0 31.2 27.4 10.8 3.1
Parental support/training 406 6.2 24.6 32.5 27.6 9.1 3.1
Mental health 507 6.7 28.4 31.4 2 4.7 8.9 3.0
Violence/bullying prevention 447 10.3 24.4 28.4 27.1 9.8 3.0
Access to child care for children 0-5 468 7.3 35.3 28.6 20.3 8.5 2.9
Needs of children whose first language isn't English 303 8.3 30.0 32.3 21.8 7.6 2.9
Employment for youth 421 7.6 30.4 31.8 22.1 8.1 2.9
Needs of parents/guardians whose first language isn't English 297 9.4 34.0 30.6 19.5 6.4 2.8
Basic needs of low-income children/youth 402 10.4 34.6 31.3 18.2 5.5 2.7
Support for single parents 324 13.6 40.1 30.2 13.0 3.1 2.5
Note: These questions included an “I don’t know” option. The “I don’t know” responses were removed from analysis. The percentages in this table represent only those who selected one of the other options.
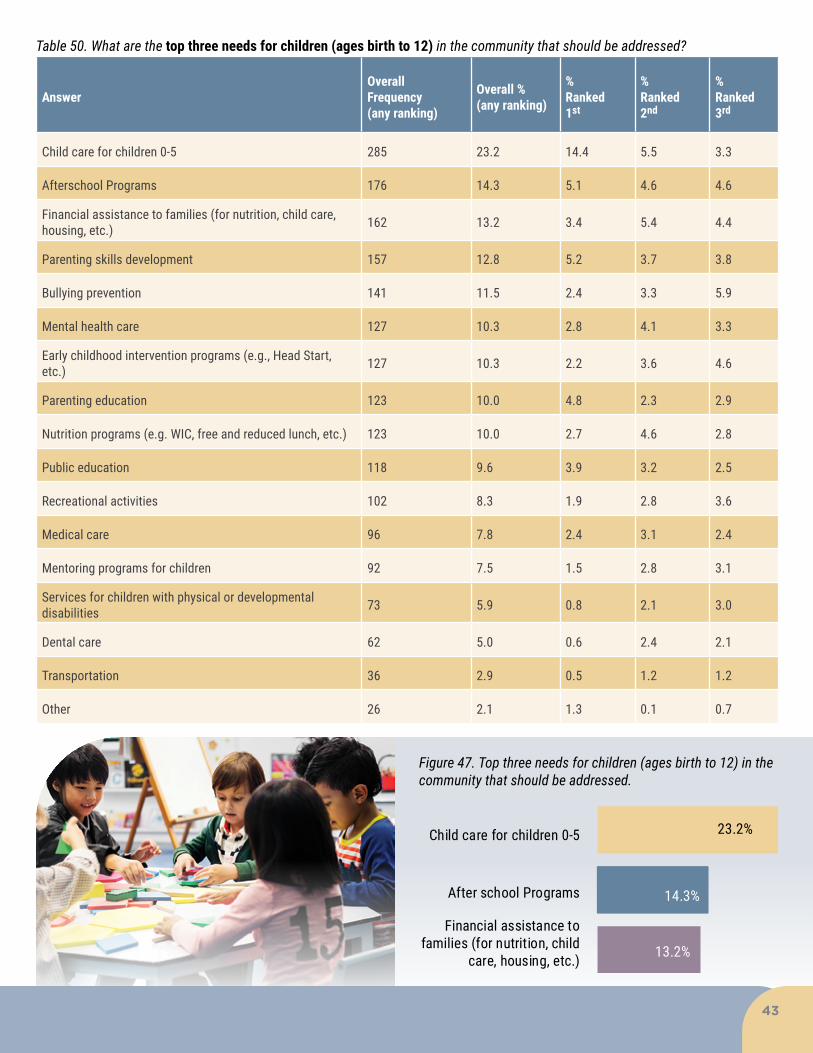
43
Table 50. What are the top three needs for children (ages birth to 12) in the community that should be addressed?
AnswerOverall Frequency (any ranking)
Overall %(any ranking)
%Ranked 1st
% Ranked2nd
% Ranked 3rd
Child care for children 0-5 285 23.2 14.4 5.5 3.3
Afterschool Programs 176 14.3 5.1 4.6 4.6
Financial assistance to families (for nutrition, child care, housing, etc.) 162 13.2 3.4 5.4 4.4
Parenting skills development 157 12.8 5.2 3.7 3.8
Bullying prevention 141 11.5 2.4 3.3 5.9
Mental health care 127 10.3 2.8 4.1 3.3
Early childhood intervention programs (e.g., Head Start, etc.) 127 10.3 2.2 3.6 4.6
Parenting education 123 10.0 4.8 2.3 2.9
Nutrition programs (e.g. WIC, free and reduced lunch, etc.) 123 10.0 2.7 4.6 2.8
Public education 118 9.6 3.9 3.2 2.5
Recreational activities 102 8.3 1.9 2.8 3.6
Medical care 96 7.8 2.4 3.1 2.4
Mentoring programs for children 92 7.5 1.5 2.8 3.1
Services for children with physical or developmental disabilities 73 5.9 0.8 2.1 3.0
Dental care 62 5.0 0.6 2.4 2.1
Transportation 36 2.9 0.5 1.2 1.2
Other 26 2.1 1.3 0.1 0.7
Figure 47. Top three needs for children (ages birth to 12) in the community that should be addressed.
23.2%
14.3%
13.2%
Child care for children 0-5
After school Programs
Financial assistance to families (for nutrition, child
care, housing, etc.)
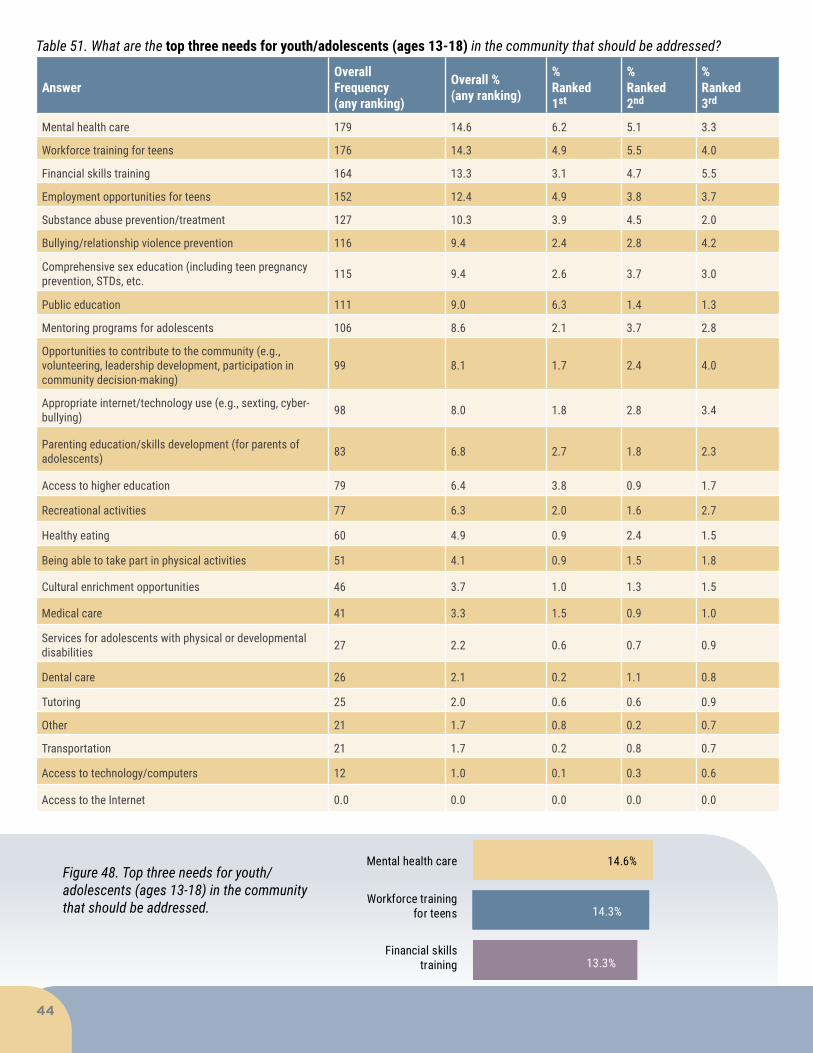
44
Figure 48. Top three needs for youth/adolescents (ages 13-18) in the community that should be addressed.
Table 51. What are the top three needs for youth/adolescents (ages 13-18) in the community that should be addressed?
AnswerOverall Frequency (any ranking)
Overall %(any ranking)
%Ranked 1st
% Ranked2nd
% Ranked 3rd
Mental health care 179 14.6 6.2 5.1 3.3
Workforce training for teens 176 14.3 4.9 5.5 4.0
Financial skills training 164 13.3 3.1 4.7 5.5
Employment opportunities for teens 152 12.4 4.9 3.8 3.7
Substance abuse prevention/treatment 127 10.3 3.9 4.5 2.0
Bullying/relationship violence prevention 116 9.4 2.4 2.8 4.2
Comprehensive sex education (including teen pregnancy prevention, STDs, etc. 115 9.4 2.6 3.7 3.0
Public education 111 9.0 6.3 1.4 1.3
Mentoring programs for adolescents 106 8.6 2.1 3.7 2.8
Opportunities to contribute to the community (e.g., volunteering, leadership development, participation in community decision-making)
99 8.1 1.7 2.4 4.0
Appropriate internet/technology use (e.g., sexting, cyber-bullying) 98 8.0 1.8 2.8 3.4
Parenting education/skills development (for parents of adolescents) 83 6.8 2.7 1.8 2.3
Access to higher education 79 6.4 3.8 0.9 1.7
Recreational activities 77 6.3 2.0 1.6 2.7
Healthy eating 60 4.9 0.9 2.4 1.5
Being able to take part in physical activities 51 4.1 0.9 1.5 1.8
Cultural enrichment opportunities 46 3.7 1.0 1.3 1.5
Medical care 41 3.3 1.5 0.9 1.0
Services for adolescents with physical or developmental disabilities 27 2.2 0.6 0.7 0.9
Dental care 26 2.1 0.2 1.1 0.8
Tutoring 25 2.0 0.6 0.6 0.9
Other 21 1.7 0.8 0.2 0.7
Transportation 21 1.7 0.2 0.8 0.7
Access to technology/computers 12 1.0 0.1 0.3 0.6
Access to the Internet 0.0 0.0 0.0 0.0 0.0
14.6%
14.3%
13.3%
Mental health care
Workforce trainingfor teens
Financial skillstraining
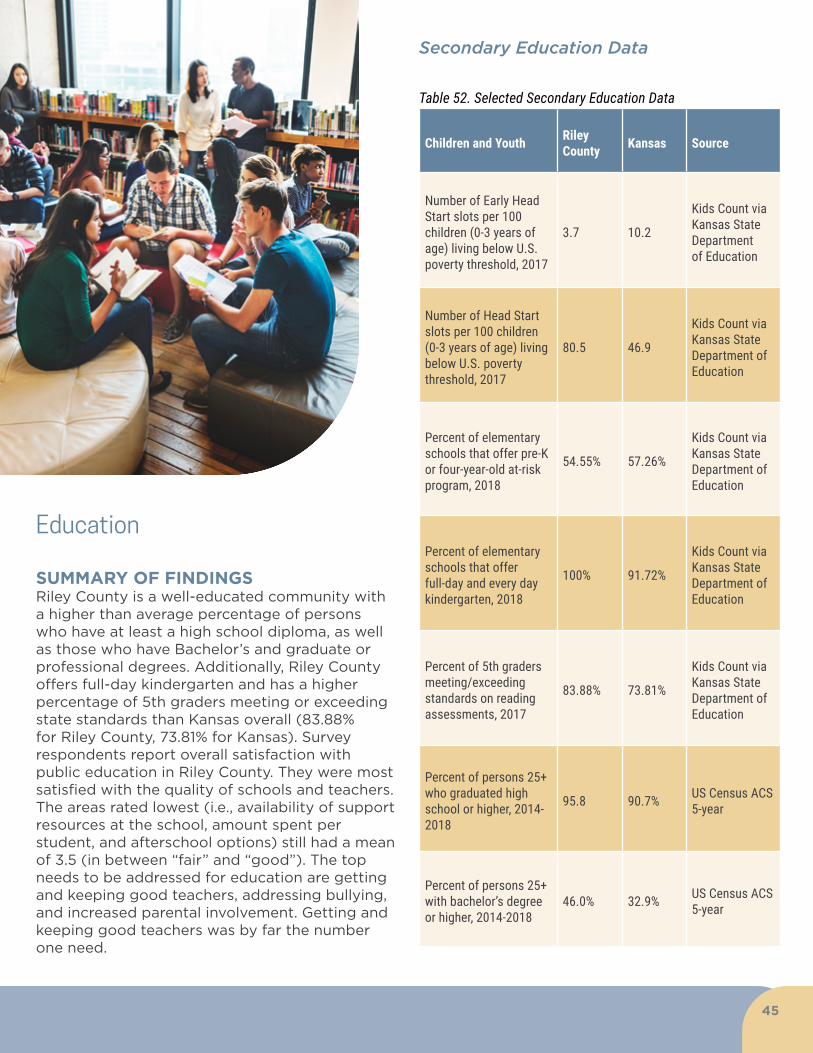
45
Education
SUMMARY OF FINDINGSRiley County is a well-educated community with a higher than average percentage of persons who have at least a high school diploma, as well as those who have Bachelor’s and graduate or professional degrees. Additionally, Riley County offers full-day kindergarten and has a higher percentage of 5th graders meeting or exceeding state standards than Kansas overall (83.88% for Riley County, 73.81% for Kansas). Survey respondents report overall satisfaction with public education in Riley County. They were most satisfied with the quality of schools and teachers. The areas rated lowest (i.e., availability of support resources at the school, amount spent per student, and afterschool options) still had a mean of 3.5 (in between “fair” and “good”). The top needs to be addressed for education are getting and keeping good teachers, addressing bullying, and increased parental involvement. Getting and keeping good teachers was by far the number one need.
Table 52. Selected Secondary Education Data
Children and Youth Riley County Kansas Source
Number of Early Head Start slots per 100 children (0-3 years of age) living below U.S. poverty threshold, 2017
3.7 10.2
Kids Count via Kansas State Department of Education
Number of Head Start slots per 100 children (0-3 years of age) living below U.S. poverty threshold, 2017
80.5 46.9
Kids Count via Kansas State Department of Education
Percent of elementary schools that offer pre-K or four-year-old at-risk program, 2018
54.55% 57.26%
Kids Count via Kansas State Department of Education
Percent of elementary schools that offer full-day and every day kindergarten, 2018
100% 91.72%
Kids Count via Kansas State Department of Education
Percent of 5th graders meeting/exceeding standards on reading assessments, 2017
83.88% 73.81%
Kids Count via Kansas State Department of Education
Percent of persons 25+ who graduated high school or higher, 2014-2018
95.8 90.7% US Census ACS 5-year
Percent of persons 25+ with bachelor’s degree or higher, 2014-2018
46.0% 32.9% US Census ACS 5-year
Secondary Education Data
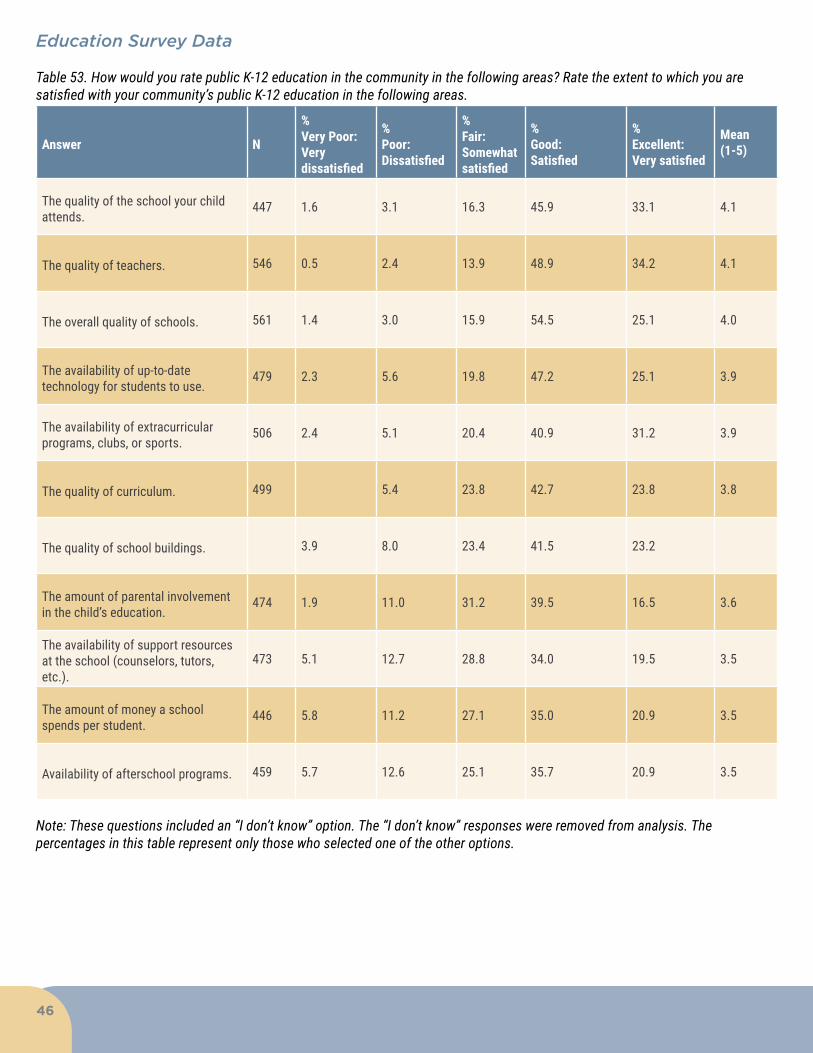
46
Education Survey Data
Table 53. How would you rate public K-12 education in the community in the following areas? Rate the extent to which you are satisfied with your community’s public K-12 education in the following areas.
Answer N
%Very Poor: Very dissatisfied
%Poor:Dissatisfied
%Fair: Somewhat satisfied
%Good:Satisfied
%Excellent:Very satisfied
Mean (1-5)
The quality of the school your child attends.
447 1.6 3.1 16.3 45.9 33.1 4.1
The quality of teachers. 546 0.5 2.4 13.9 48.9 34.2 4.1
The overall quality of schools. 561 1.4 3.0 15.9 54.5 25.1 4.0
The availability of up-to-date technology for students to use.
479 2.3 5.6 19.8 47.2 25.1 3.9
The availability of extracurricular programs, clubs, or sports.
506 2.4 5.1 20.4 40.9 31.2 3.9
The quality of curriculum. 499 5.4 23.8 42.7 23.8 3.8
The quality of school buildings. 3.9 8.0 23.4 41.5 23.2
The amount of parental involvement in the child’s education.
474 1.9 11.0 31.2 39.5 16.5 3.6
The availability of support resources at the school (counselors, tutors, etc.).
473 5.1 12.7 28.8 34.0 19.5 3.5
The amount of money a school spends per student.
446 5.8 11.2 27.1 35.0 20.9 3.5
Availability of afterschool programs. 459 5.7 12.6 25.1 35.7 20.9 3.5
Note: These questions included an “I don’t know” option. The “I don’t know” responses were removed from analysis. The percentages in this table represent only those who selected one of the other options.
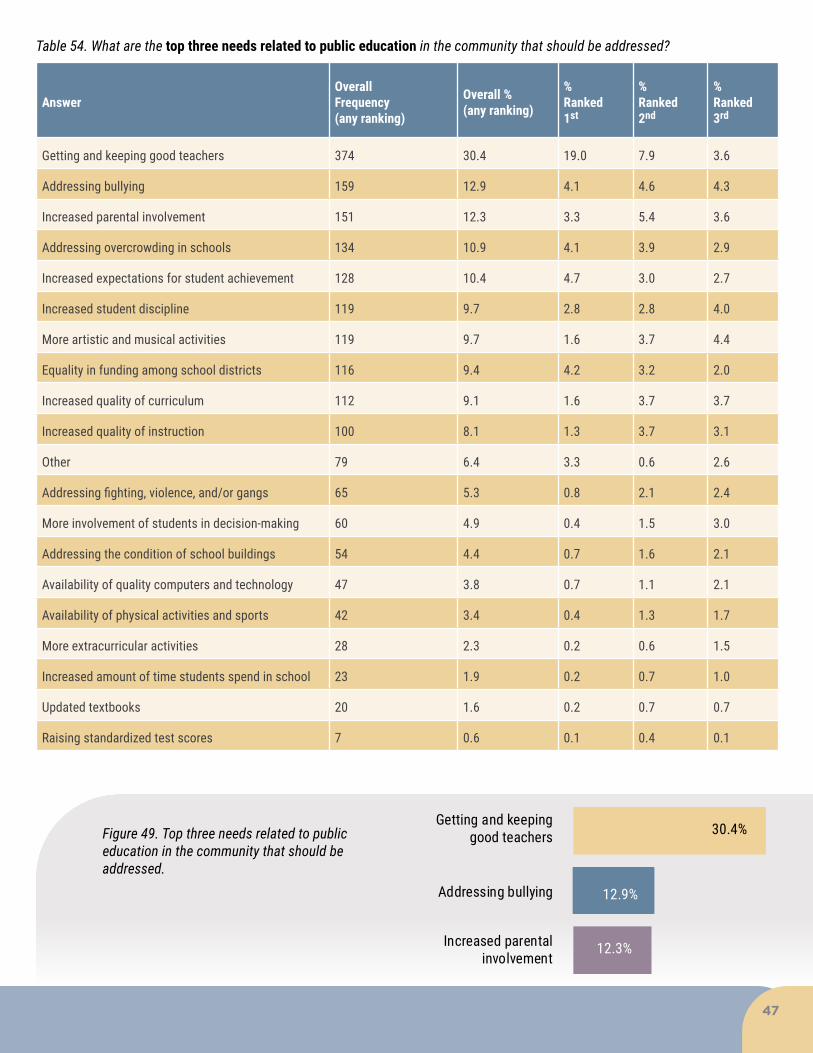
47
Table 54. What are the top three needs related to public education in the community that should be addressed?
AnswerOverall Frequency (any ranking)
Overall %(any ranking)
%Ranked 1st
% Ranked2nd
% Ranked 3rd
Getting and keeping good teachers 374 30.4 19.0 7.9 3.6
Addressing bullying 159 12.9 4.1 4.6 4.3
Increased parental involvement 151 12.3 3.3 5.4 3.6
Addressing overcrowding in schools 134 10.9 4.1 3.9 2.9
Increased expectations for student achievement 128 10.4 4.7 3.0 2.7
Increased student discipline 119 9.7 2.8 2.8 4.0
More artistic and musical activities 119 9.7 1.6 3.7 4.4
Equality in funding among school districts 116 9.4 4.2 3.2 2.0
Increased quality of curriculum 112 9.1 1.6 3.7 3.7
Increased quality of instruction 100 8.1 1.3 3.7 3.1
Other 79 6.4 3.3 0.6 2.6
Addressing fighting, violence, and/or gangs 65 5.3 0.8 2.1 2.4
More involvement of students in decision-making 60 4.9 0.4 1.5 3.0
Addressing the condition of school buildings 54 4.4 0.7 1.6 2.1
Availability of quality computers and technology 47 3.8 0.7 1.1 2.1
Availability of physical activities and sports 42 3.4 0.4 1.3 1.7
More extracurricular activities 28 2.3 0.2 0.6 1.5
Increased amount of time students spend in school 23 1.9 0.2 0.7 1.0
Updated textbooks 20 1.6 0.2 0.7 0.7
Raising standardized test scores 7 0.6 0.1 0.4 0.1
Figure 49. Top three needs related to public education in the community that should be addressed.
30.4%
12.9%
12.3%
Addressing bullying
Increased parentalinvolvement
Getting and keeping good teachers
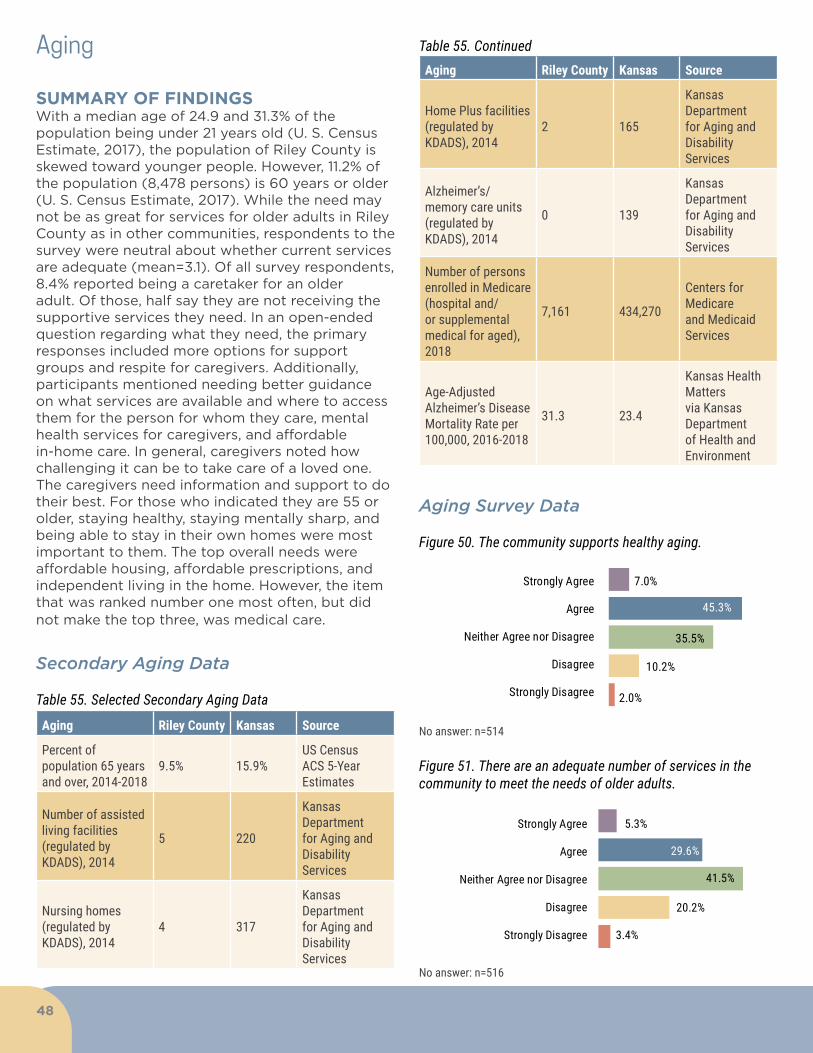
48
Aging
SUMMARY OF FINDINGS With a median age of 24.9 and 31.3% of the population being under 21 years old (U. S. Census Estimate, 2017), the population of Riley County is skewed toward younger people. However, 11.2% of the population (8,478 persons) is 60 years or older (U. S. Census Estimate, 2017). While the need may not be as great for services for older adults in Riley County as in other communities, respondents to the survey were neutral about whether current services are adequate (mean=3.1). Of all survey respondents, 8.4% reported being a caretaker for an older adult. Of those, half say they are not receiving the supportive services they need. In an open-ended question regarding what they need, the primary responses included more options for support groups and respite for caregivers. Additionally, participants mentioned needing better guidance on what services are available and where to access them for the person for whom they care, mental health services for caregivers, and affordable in-home care. In general, caregivers noted how challenging it can be to take care of a loved one. The caregivers need information and support to do their best. For those who indicated they are 55 or older, staying healthy, staying mentally sharp, and being able to stay in their own homes were most important to them. The top overall needs were affordable housing, affordable prescriptions, and independent living in the home. However, the item that was ranked number one most often, but did not make the top three, was medical care.
Secondary Aging Data
Table 55. Selected Secondary Aging Data
Aging Riley County Kansas Source
Percent of population 65 years and over, 2014-2018
9.5% 15.9%US Census ACS 5-Year Estimates
Number of assisted living facilities (regulated by KDADS), 2014
5 220
Kansas Department for Aging and Disability Services
Nursing homes (regulated by KDADS), 2014
4 317
Kansas Department for Aging and Disability Services
Aging Riley County Kansas Source
Home Plus facilities (regulated by KDADS), 2014
2 165
Kansas Department for Aging and Disability Services
Alzheimer’s/memory care units (regulated by KDADS), 2014
0 139
Kansas Department for Aging and Disability Services
Number of persons enrolled in Medicare (hospital and/or supplemental medical for aged), 2018
7,161 434,270
Centers for Medicare and Medicaid Services
Age-Adjusted Alzheimer’s Disease Mortality Rate per 100,000, 2016-2018
31.3 23.4
Kansas Health Matters via Kansas Department of Health and Environment
Aging Survey Data
Figure 50. The community supports healthy aging.
2.0%
10.2%
35.5%
45.3%
7.0%
Strongly Disagree
Disagree
Neither Agree nor Disagree
Agree
Strongly Agree
No answer: n=514
Figure 51. There are an adequate number of services in the community to meet the needs of older adults.
3.4%
20.2%
41.5%
29.6%
5.3%
Strongly Disagree
Disagree
Neither Agree nor Disagree
Agree
Strongly Agree
No answer: n=516
Table 55. Continued

49
Table 56. What are the top three needs for older adults in the community that should be addressed?
AnswerOverall Frequency (any ranking)
Overall %(any ranking)
%Ranked 1st
% Ranked2nd
% Ranked 3rd
Affordable housing 205 16.7 7.2 6.2 3.3
Affordable prescriptions 190 15.5 7.1 5.4 3.0
Independent living in the home 189 15.4 7.9 4.6 2.8
Medical care 185 15.1 10.7 1.8 2.6
Home health care options 110 9.0 2.0 4.0 3.0
Assisted living options 98 8.0 2.0 3.2 2.8
Ease of mobility in the community 83 6.8 1.1 2.1 3.5
Health insurance 78 6.3 1.9 2.1 2.4
Finances/Income 67 5.5 0.9 2.0 2.5
Long term care facility options 63 5.1 1.2 1.6 2.3
Access to daily meals 59 4.8 1.0 1.6 2.2
Respite services for caregivers 58 4.7 0.7 1.9 2.2
Transportation 58 4.7 1.5 1.5 1.7
Memory care options/dementia support 52 4.2 1.1 2.0 1.2
Mental health services 52 4.2 0.9 1.8 1.5
Day programs 51 4.1 0.7 1.7 1.8
Personal care services 50 4.1 0.8 1.0 2.3
Independent living in a retirement community 45 3.7 0.9 1.8 1.0
Dental care 44 3.6 0.7 2.2 0.7
Other 36 2.9 1.5 0.2 1.1
Caregiver support groups 31 2.5 0.4 0.8 1.3
Safety 27 2.2 0.3 0.4 1.5
Employment 25 2.0 0.3 0.7 1.0
Vision care 20 1.6 0.2 2.2 0.7
Elder abuse 15 1.2 0.2 0.3 0.7
Legal services 14 1.1 0.2 0.2 0.7
Utility assistance 10 0.8 0.2 0.2 0.4
Hospice care 9 0.7 0.0 0.3 0.4
Substance abuse 9 0.7 0.0 0.1 0.7

50
Older Adult Needs Assessment
Figure 55. Are you 55 years or older?
47.3%52.7%
NoYes
No answer: n=498
Note: At this point in the survey, persons who were not 55 or over were skipped to the Housing section.
Figure 52. Top three needs for older adults in the community.
16.7%
15.5%
15.4%
Affordable housing
Affordable prescriptions
Independent livingin the home
Figure 53. Are you a caregiver of an older adult (spouse, parent, grandparent, etc.)?
8.4%
91.6%
NoYes
No answer: n=503
Figure 54. If you are the caregiver of an older adult, are you receiving the supportive services you need?
48.3%51.7%
NoYes
No answer: n=1171
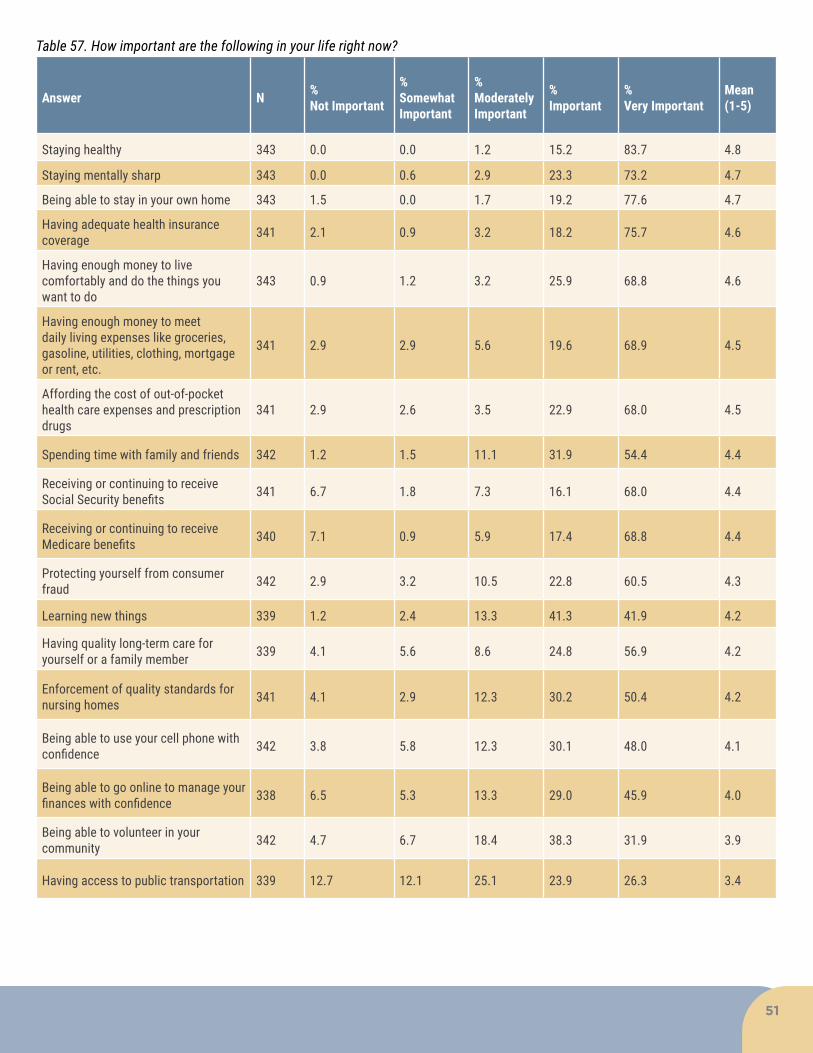
51
Table 57. How important are the following in your life right now?
Answer N %Not Important
%Somewhat Important
%Moderately Important
%Important
%Very Important
Mean (1-5)
Staying healthy 343 0.0 0.0 1.2 15.2 83.7 4.8
Staying mentally sharp 343 0.0 0.6 2.9 23.3 73.2 4.7
Being able to stay in your own home 343 1.5 0.0 1.7 19.2 77.6 4.7
Having adequate health insurance coverage 341 2.1 0.9 3.2 18.2 75.7 4.6
Having enough money to live comfortably and do the things you want to do
343 0.9 1.2 3.2 25.9 68.8 4.6
Having enough money to meet daily living expenses like groceries, gasoline, utilities, clothing, mortgage or rent, etc.
341 2.9 2.9 5.6 19.6 68.9 4.5
Affording the cost of out-of-pocket health care expenses and prescription drugs
341 2.9 2.6 3.5 22.9 68.0 4.5
Spending time with family and friends 342 1.2 1.5 11.1 31.9 54.4 4.4
Receiving or continuing to receive Social Security benefits 341 6.7 1.8 7.3 16.1 68.0 4.4
Receiving or continuing to receive Medicare benefits 340 7.1 0.9 5.9 17.4 68.8 4.4
Protecting yourself from consumer fraud 342 2.9 3.2 10.5 22.8 60.5 4.3
Learning new things 339 1.2 2.4 13.3 41.3 41.9 4.2
Having quality long-term care for yourself or a family member 339 4.1 5.6 8.6 24.8 56.9 4.2
Enforcement of quality standards for nursing homes 341 4.1 2.9 12.3 30.2 50.4 4.2
Being able to use your cell phone with confidence 342 3.8 5.8 12.3 30.1 48.0 4.1
Being able to go online to manage your finances with confidence 338 6.5 5.3 13.3 29.0 45.9 4.0
Being able to volunteer in your community 342 4.7 6.7 18.4 38.3 31.9 3.9
Having access to public transportation 339 12.7 12.1 25.1 23.9 26.3 3.4
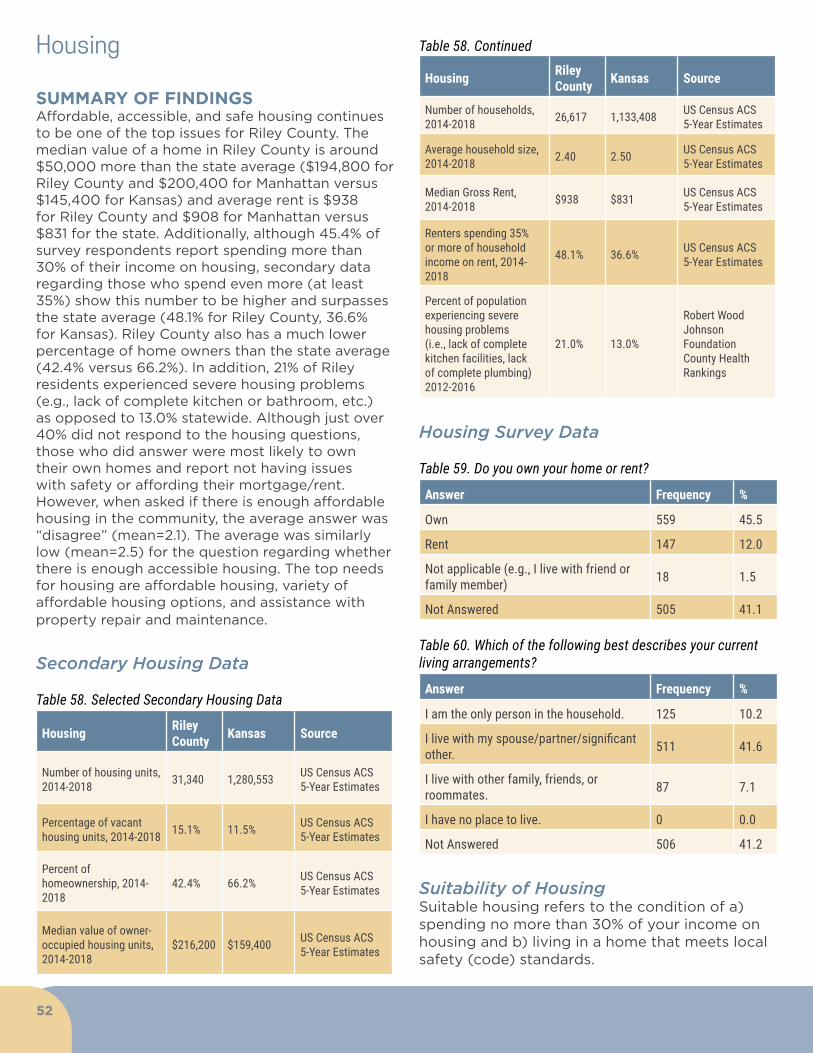
52
Housing
SUMMARY OF FINDINGS Affordable, accessible, and safe housing continues to be one of the top issues for Riley County. The median value of a home in Riley County is around $50,000 more than the state average ($194,800 for Riley County and $200,400 for Manhattan versus $145,400 for Kansas) and average rent is $938 for Riley County and $908 for Manhattan versus $831 for the state. Additionally, although 45.4% of survey respondents report spending more than 30% of their income on housing, secondary data regarding those who spend even more (at least 35%) show this number to be higher and surpasses the state average (48.1% for Riley County, 36.6% for Kansas). Riley County also has a much lower percentage of home owners than the state average (42.4% versus 66.2%). In addition, 21% of Riley residents experienced severe housing problems (e.g., lack of complete kitchen or bathroom, etc.) as opposed to 13.0% statewide. Although just over 40% did not respond to the housing questions, those who did answer were most likely to own their own homes and report not having issues with safety or affording their mortgage/rent. However, when asked if there is enough affordable housing in the community, the average answer was “disagree” (mean=2.1). The average was similarly low (mean=2.5) for the question regarding whether there is enough accessible housing. The top needs for housing are affordable housing, variety of affordable housing options, and assistance with property repair and maintenance.
Secondary Housing Data
Table 58. Selected Secondary Housing Data
Housing Riley County Kansas Source
Number of housing units, 2014-2018 31,340 1,280,553 US Census ACS
5-Year Estimates
Percentage of vacant housing units, 2014-2018 15.1% 11.5% US Census ACS
5-Year Estimates
Percent of homeownership, 2014-2018
42.4% 66.2% US Census ACS 5-Year Estimates
Median value of owner-occupied housing units, 2014-2018
$216,200 $159,400 US Census ACS 5-Year Estimates
Housing Riley County Kansas Source
Number of households, 2014-2018 26,617 1,133,408 US Census ACS
5-Year Estimates
Average household size, 2014-2018 2.40 2.50 US Census ACS
5-Year Estimates
Median Gross Rent, 2014-2018 $938 $831 US Census ACS
5-Year Estimates
Renters spending 35% or more of household income on rent, 2014-2018
48.1% 36.6% US Census ACS 5-Year Estimates
Percent of population experiencing severe housing problems (i.e., lack of complete kitchen facilities, lack of complete plumbing) 2012-2016
21.0% 13.0%
Robert Wood Johnson Foundation County Health Rankings
Housing Survey Data
Table 59. Do you own your home or rent?
Answer Frequency %
Own 559 45.5
Rent 147 12.0
Not applicable (e.g., I live with friend or family member) 18 1.5
Not Answered 505 41.1
Table 60. Which of the following best describes your current living arrangements?
Answer Frequency %
I am the only person in the household. 125 10.2
I live with my spouse/partner/significant other. 511 41.6
I live with other family, friends, or roommates. 87 7.1
I have no place to live. 0 0.0
Not Answered 506 41.2
Suitability of Housing Suitable housing refers to the condition of a) spending no more than 30% of your income on housing and b) living in a home that meets local safety (code) standards.
Table 58. Continued
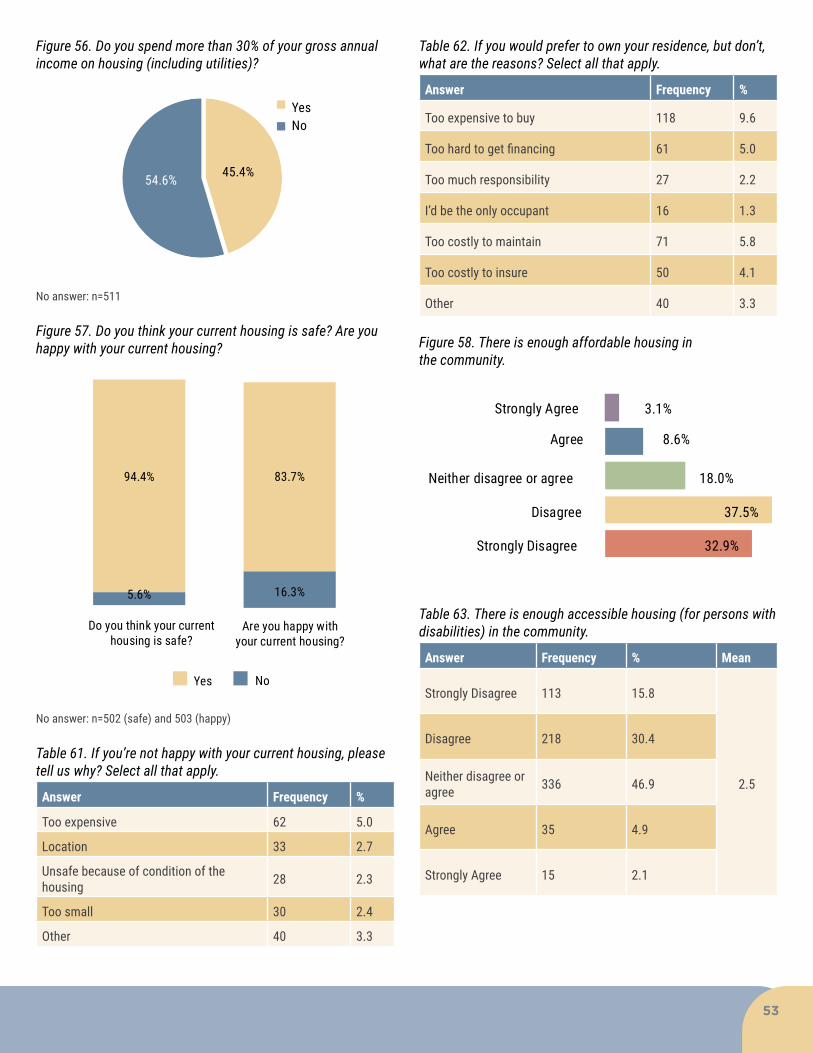
53
Figure 56. Do you spend more than 30% of your gross annual income on housing (including utilities)?
45.4%54.6%
NoYes
No answer: n=511
Figure 57. Do you think your current housing is safe? Are you happy with your current housing?
16.3%
83.7%
Yes No
5.6%
94.4%
Are you happy with your current housing?
Do you think your current housing is safe?
No answer: n=502 (safe) and 503 (happy)
Table 61. If you’re not happy with your current housing, please tell us why? Select all that apply.
Answer Frequency %
Too expensive 62 5.0
Location 33 2.7
Unsafe because of condition of the housing 28 2.3
Too small 30 2.4
Other 40 3.3
Table 62. If you would prefer to own your residence, but don’t, what are the reasons? Select all that apply.
Answer Frequency %
Too expensive to buy 118 9.6
Too hard to get financing 61 5.0
Too much responsibility 27 2.2
I’d be the only occupant 16 1.3
Too costly to maintain 71 5.8
Too costly to insure 50 4.1
Other 40 3.3
Figure 58. There is enough affordable housing in the community.
32.9%
37.5%
18.0%
8.6%
3.1%
Strongly Disagree
Disagree
Neither disagree or agree
Agree
Strongly Agree
Table 63. There is enough accessible housing (for persons with disabilities) in the community.
Answer Frequency % Mean
Strongly Disagree 113 15.8
2.5
Disagree 218 30.4
Neither disagree or agree 336 46.9
Agree 35 4.9
Strongly Agree 15 2.1
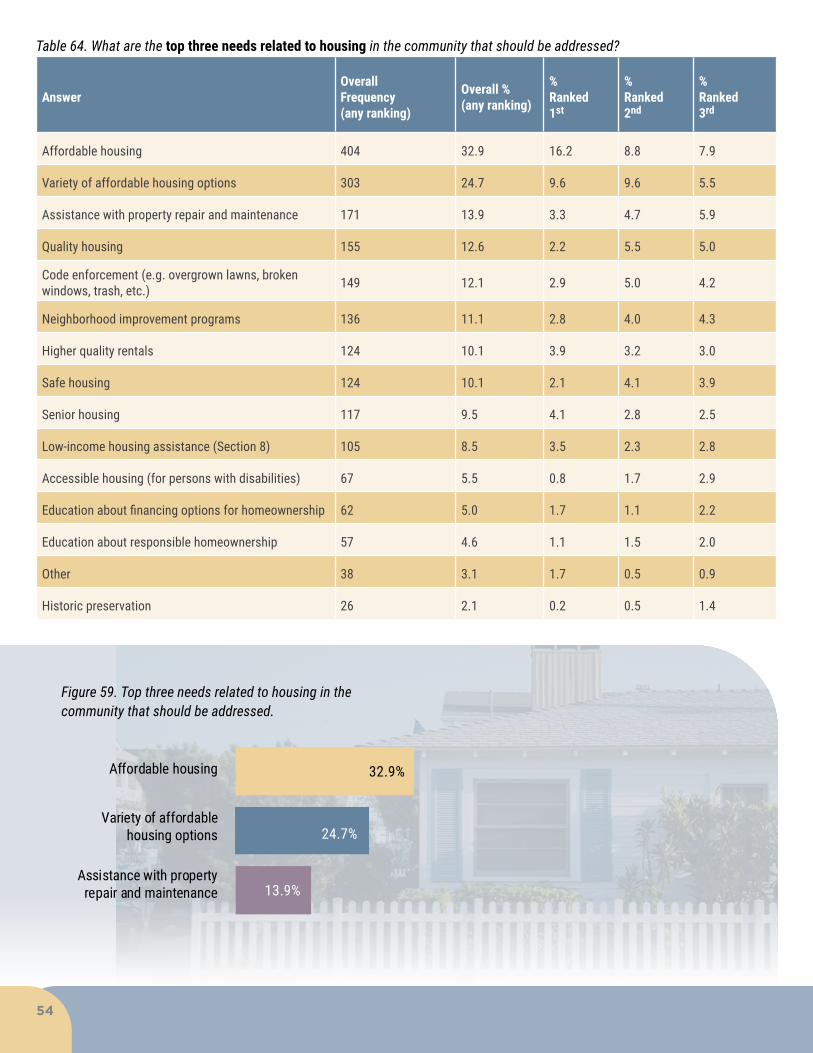
54
Figure 59. Top three needs related to housing in the community that should be addressed.
13.9%
24.7%
32.9%
Variety of affordablehousing options
Affordable housing
Assistance with property repair and maintenance
Table 64. What are the top three needs related to housing in the community that should be addressed?
AnswerOverall Frequency (any ranking)
Overall %(any ranking)
%Ranked 1st
% Ranked2nd
% Ranked 3rd
Affordable housing 404 32.9 16.2 8.8 7.9
Variety of affordable housing options 303 24.7 9.6 9.6 5.5
Assistance with property repair and maintenance 171 13.9 3.3 4.7 5.9
Quality housing 155 12.6 2.2 5.5 5.0
Code enforcement (e.g. overgrown lawns, broken windows, trash, etc.) 149 12.1 2.9 5.0 4.2
Neighborhood improvement programs 136 11.1 2.8 4.0 4.3
Higher quality rentals 124 10.1 3.9 3.2 3.0
Safe housing 124 10.1 2.1 4.1 3.9
Senior housing 117 9.5 4.1 2.8 2.5
Low-income housing assistance (Section 8) 105 8.5 3.5 2.3 2.8
Accessible housing (for persons with disabilities) 67 5.5 0.8 1.7 2.9
Education about financing options for homeownership 62 5.0 1.7 1.1 2.2
Education about responsible homeownership 57 4.6 1.1 1.5 2.0
Other 38 3.1 1.7 0.5 0.9
Historic preservation 26 2.1 0.2 0.5 1.4

55
Transportation
SUMMARY OF FINDINGS Secondary data regarding transportation show a higher percentage of Riley County residents having no vehicle available than the state average (7.3% versus 5.3%). Those who responded to survey questions in this section largely use their own vehicles and have relatively few issues with transportation. However, 22.6% of survey respondents answered “no” to the statement “there are multiple transportation options in the community.” The top needs regarding transportation were providing maintenance and improvement to existing roadways, improve public transit, and address texting and driving.
Secondary Transportation Data
Table 65. Selected Secondary Transportation Data
Transportation Riley County Kansas Source
Percent of adults who reported they do not always wear a seatbelt when they drive or ride in a care, 2017
12.9% 16.6% BRFSS
Motor vehicle crash death (mortality) rate, per 100,000 population, 2010-2016
7 14 County Health Rankings
Alcohol-impaired driving deaths, 2013-2017 22.2% 23.6%
Kansas Health Matters via County Health Rankings
Motor vehicle crash deaths, 2011-2017 36
National Highway Traffic Safety Administration
Percent having no vehicle available, 2014-2018
7.3% 5.3%US Census Bureau ACS 5-Year Estimate
Percent who drive more than 30 minutes to work per day (i.e., long commute), 2011
11% 20%
Robert Wood Johnson Foundation County Health Rankings
Commute time to work an hour or more, 2014-2018
2.6% 3.3%US Census Bureau ACS 5-Year Estimate
Transportation Survey Data
Table 66. Which of the following types of transportation do you use to get around your community? Select all that apply.
Answer Frequency %
A car, truck, or motorcycle you own or have use of 701 57.0
Walk 307 25.0
Bicycle 135 11.0
A friend or relative 82 6.7
One of the ride services, Uber or Lyft 75 6.1
Public transportation (e.g., bus, van, etc.) 58 4.7
Ride sharing (i.e., vanpool or carpool) 35 2.8
Taxi 11 0.9
Other 7 0.6
Horse 1 0.1
N/A – I don’t need transportation 1 0.1
Table 67. Of the transportation types above, which one do you use most frequently? Select one.
Answer Frequency %
A car, truck, or motorcycle you own or have use of 665 54.1
Bicycle 19 1.5
Walk 9 0.7
A friend or relative 7 0.6
Public transportation (e.g., bus, van, etc.) 2 0.2
Ride sharing (i.e., vanpool or carpool) 1 0.1
One of the ride services, Uber or Lyft 1 0.1
Taxi 1 0.1
N/A – I don’t need transportation 1 0.1
Horse 0 0.0
Other 0 0.0

56
Table 68. Estimate how often you have reliable transportation to get you to the places you want to go.
Answer Frequency % Mean
None of the time 3 0.4
3.8Some of the time 16 2.3
Most of the time 98 14.0
All of the time 583 83.3
Figure 60. There are multiple transportation options in the community.
66.2%22.6%
10.7% Yes
No
N/A - I don't need transportation
No answer: n=518
Table 69. I have access to the transportation I need to get around the community.
Answer Frequency %
Yes 590 48.0
No 33 2.7
N/A – I don’t need transportation 88 7.2
Not Answered 518 42.1
Figure 61. Do transportation issues regularly prevent you from doing what you need or want to do?
4.2%
95.8%
NoYes
No answer: n=517

57
AnswerOverall Frequency (any ranking)
Overall %(any ranking)
% Ranked 1st
% Ranked 2nd
% Ranked 3rd
Provide maintenance and improvements to existing roadways (including intersections or interchanges, pavement of gravel roads, potholes, bridge repairs, etc.)
445 36.2 21.6 7.1 7.5
Develop a pedestrian friendly transportation system to make areas more walkable (improve sidewalks, crosswalks, signals, etc.)
307 25.0 5.5 12.0 7.5
Improve public transit service (including increased service hours, shorter wait times, more routes, bus shelters, benches, etc.)
288 23.4 10.6 6.3 6.5
Address texting and driving 218 17.7 5.0 6.8 5.9
Expand and improve the bike route system (bike paths, bike lanes) to increase the number of people who bike as a form of transportation
212 17.2 4.8 6.0 6.4
Increase specialized transportation services for people with disabilities and/or special needs 103 8.4 1.2 3.2 4.0
Widen existing roads 89 7.2 2.1 2.7 2.4
Improve driver education 76 6.2 1.1 2.5 2.6
Improve traffic signals 56 4.6 0.7 2.0 2.0
Other 56 4.6 2.0 1.1 1.5
Increase options for overnight public parking 51 4.1 0.6 1.7 1.9
Build new roads 40 3.3 0.8 1.1 1.4
Expand local taxi services 39 3.2 0.2 1.2 1.8
Figure 62. Top three needs related to transportation in your community that should be addressed.
23.4%
25.0%
36.2%
Improve public transit service
Provide maintenanceand improvements
to existing roadways
Develop a pedestrian friendly transportation
system to makeareas more walkable
Table 70. What are the top three needs related to transportation in your community that should be addressed?
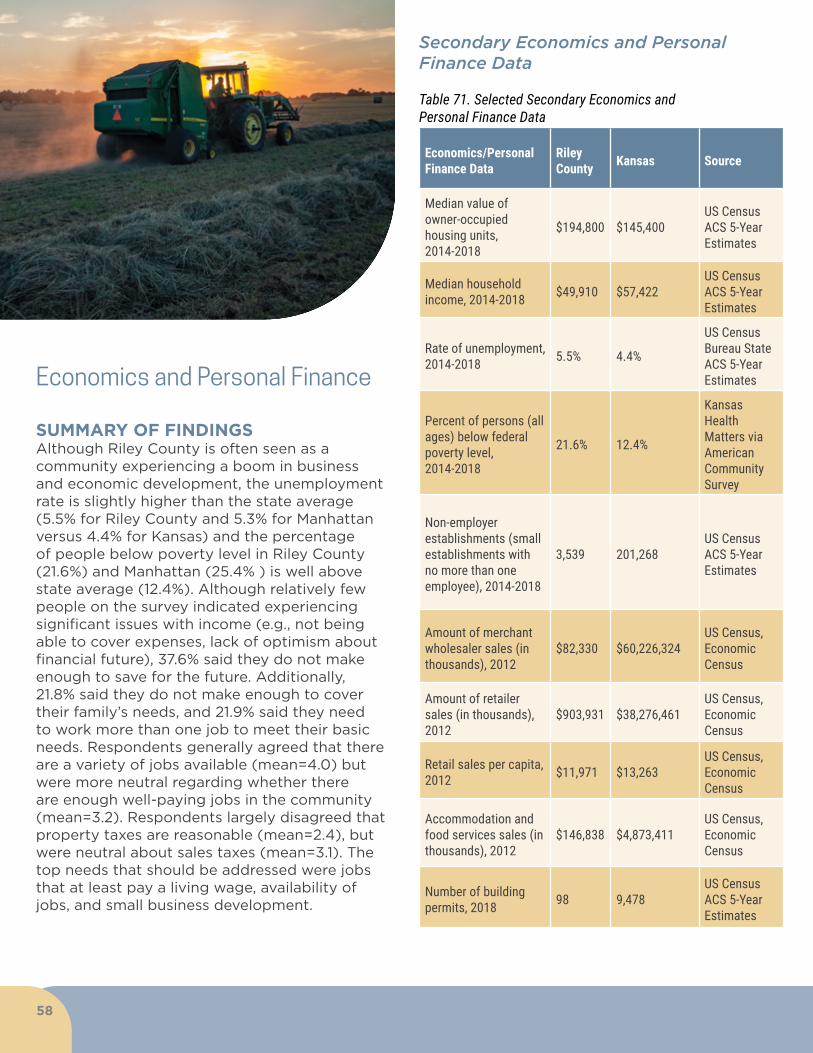
58
Secondary Economics and Personal Finance Data
Table 71. Selected Secondary Economics and Personal Finance Data
Economics/Personal Finance Data
Riley County Kansas Source
Median value of owner-occupied housing units, 2014-2018
$194,800 $145,400US Census ACS 5-Year Estimates
Median household income, 2014-2018 $49,910 $57,422
US Census ACS 5-Year Estimates
Rate of unemployment, 2014-2018 5.5% 4.4%
US Census Bureau State ACS 5-Year Estimates
Percent of persons (all ages) below federal poverty level, 2014-2018
21.6% 12.4%
Kansas Health Matters via American Community Survey
Non-employer establishments (small establishments with no more than one employee), 2014-2018
3,539 201,268US Census ACS 5-Year Estimates
Amount of merchant wholesaler sales (in thousands), 2012
$82,330 $60,226,324US Census, Economic Census
Amount of retailer sales (in thousands), 2012
$903,931 $38,276,461US Census, Economic Census
Retail sales per capita, 2012 $11,971 $13,263
US Census, Economic Census
Accommodation and food services sales (in thousands), 2012
$146,838 $4,873,411US Census, Economic Census
Number of building permits, 2018 98 9,478
US Census ACS 5-Year Estimates
Economics and Personal Finance
SUMMARY OF FINDINGS Although Riley County is often seen as a community experiencing a boom in business and economic development, the unemployment rate is slightly higher than the state average (5.5% for Riley County and 5.3% for Manhattan versus 4.4% for Kansas) and the percentage of people below poverty level in Riley County (21.6%) and Manhattan (25.4% ) is well above state average (12.4%). Although relatively few people on the survey indicated experiencing significant issues with income (e.g., not being able to cover expenses, lack of optimism about financial future), 37.6% said they do not make enough to save for the future. Additionally, 21.8% said they do not make enough to cover their family’s needs, and 21.9% said they need to work more than one job to meet their basic needs. Respondents generally agreed that there are a variety of jobs available (mean=4.0) but were more neutral regarding whether there are enough well-paying jobs in the community (mean=3.2). Respondents largely disagreed that property taxes are reasonable (mean=2.4), but were neutral about sales taxes (mean=3.1). The top needs that should be addressed were jobs that at least pay a living wage, availability of jobs, and small business development.
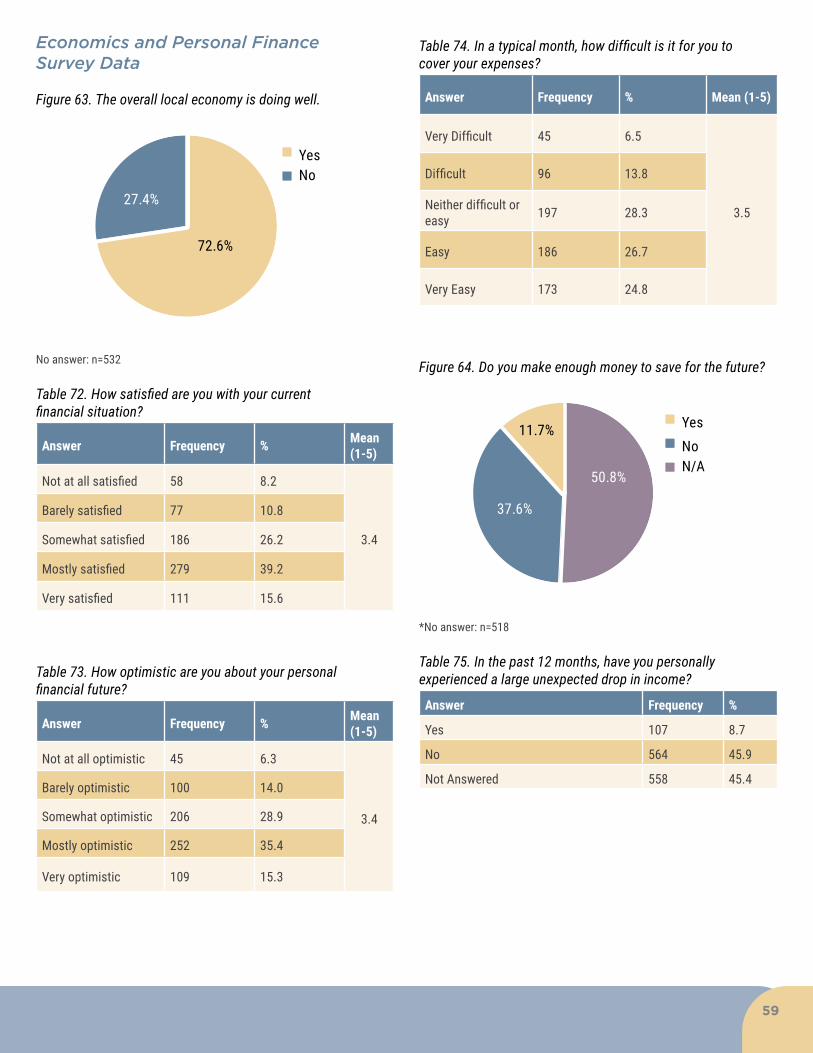
59
Economics and Personal Finance Survey Data
Figure 63. The overall local economy is doing well.
72.6%
27.4%NoYes
No answer: n=532
Table 72. How satisfied are you with your current financial situation?
Answer Frequency % Mean (1-5)
Not at all satisfied 58 8.2
3.4
Barely satisfied 77 10.8
Somewhat satisfied 186 26.2
Mostly satisfied 279 39.2
Very satisfied 111 15.6
Table 73. How optimistic are you about your personal financial future?
Answer Frequency % Mean (1-5)
Not at all optimistic 45 6.3
3.4
Barely optimistic 100 14.0
Somewhat optimistic 206 28.9
Mostly optimistic 252 35.4
Very optimistic 109 15.3
Table 74. In a typical month, how difficult is it for you to cover your expenses?
Answer Frequency % Mean (1-5)
Very Difficult 45 6.5
3.5
Difficult 96 13.8
Neither difficult or easy 197 28.3
Easy 186 26.7
Very Easy 173 24.8
Figure 64. Do you make enough money to save for the future?
50.8%
37.6%
11.7%
N/ANoYes
*No answer: n=518
Table 75. In the past 12 months, have you personally experienced a large unexpected drop in income?
Answer Frequency %
Yes 107 8.7
No 564 45.9
Not Answered 558 45.4
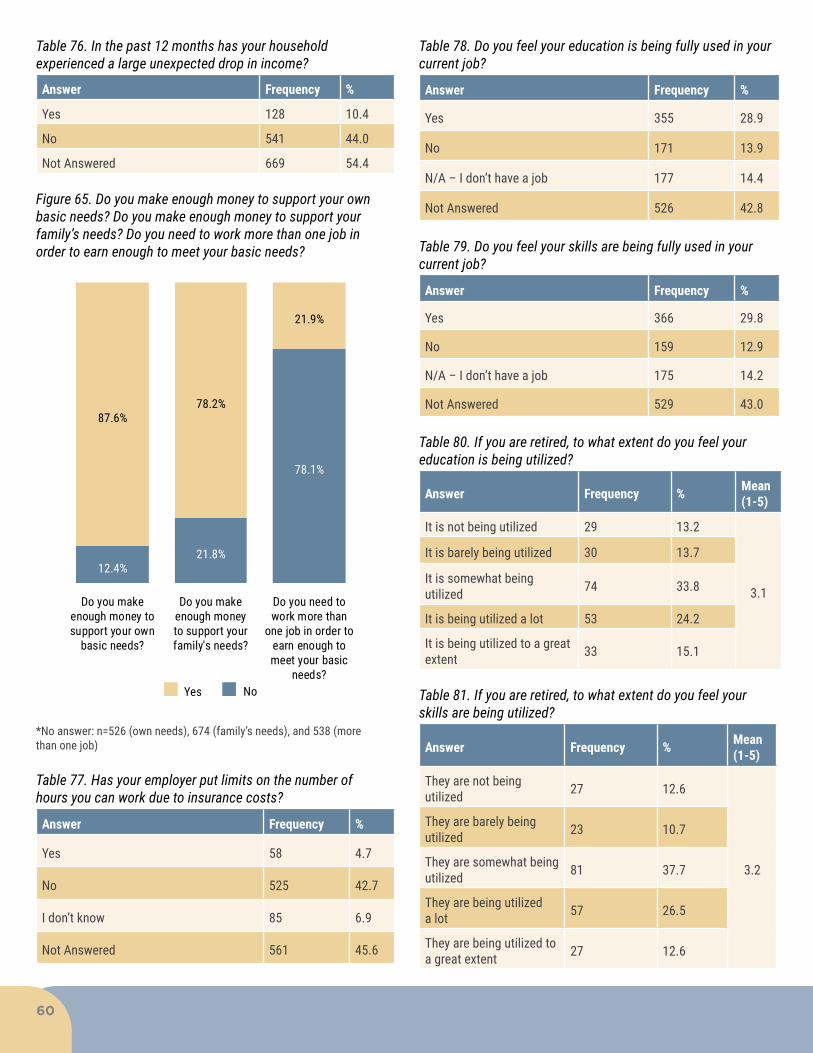
60
Table 76. In the past 12 months has your household experienced a large unexpected drop in income?
Answer Frequency %
Yes 128 10.4
No 541 44.0
Not Answered 669 54.4
Figure 65. Do you make enough money to support your own basic needs? Do you make enough money to support your family’s needs? Do you need to work more than one job in order to earn enough to meet your basic needs?
12.4%
87.6%
Yes No
Do you make enough money to support your own
basic needs?
78.1%
21.9%
Do you need to work more than
one job in order to earn enough to meet your basic
needs?
21.8%
78.2%
Do you make enough money to support your family's needs?
*No answer: n=526 (own needs), 674 (family’s needs), and 538 (more than one job)
Table 77. Has your employer put limits on the number of hours you can work due to insurance costs?
Answer Frequency %
Yes 58 4.7
No 525 42.7
I don’t know 85 6.9
Not Answered 561 45.6
Table 78. Do you feel your education is being fully used in your current job?
Answer Frequency %
Yes 355 28.9
No 171 13.9
N/A – I don’t have a job 177 14.4
Not Answered 526 42.8
Table 79. Do you feel your skills are being fully used in your current job?
Answer Frequency %
Yes 366 29.8
No 159 12.9
N/A – I don’t have a job 175 14.2
Not Answered 529 43.0
Table 80. If you are retired, to what extent do you feel your education is being utilized?
Answer Frequency % Mean (1-5)
It is not being utilized 29 13.2
3.1
It is barely being utilized 30 13.7
It is somewhat being utilized 74 33.8
It is being utilized a lot 53 24.2
It is being utilized to a great extent 33 15.1
Table 81. If you are retired, to what extent do you feel your skills are being utilized?
Answer Frequency % Mean (1-5)
They are not being utilized 27 12.6
3.2
They are barely being utilized 23 10.7
They are somewhat being utilized 81 37.7
They are being utilized a lot 57 26.5
They are being utilized to a great extent 27 12.6

61
Table 82. There are a variety of jobs available in my community.
Answer Frequency % Mean (1-5)
Strongly Disagree 52 7.4
4.0
Disagree 161 23
Neither disagree or agree 207 29.6
Agree 246 35.2
Strongly Agree 33 4.7
Not Answered 530 43.1
Table 83. There are enough well-paying jobs in my community.
Answer Frequency % Mean (1-5)
Strongly Disagree 150 21.3
3.2
Disagree 245 34.9
Neither disagree or agree 203 28.9
Agree 92 13.1
Strongly Agree 13 1.8
Not Answered 526 42.8
Table 84. There are opportunities in my community for increasing my job skills.
Answer Frequency % Mean (1-5)
Strongly Disagree 60 8.6
4.0
Disagree 132 18.9
Neither disagree or agree 245 35.2
Agree 228 32.7
Strongly Agree 32 4.6
Not Answered 532 43.3
Table 85. Property taxes are reasonable.
Answer Frequency % Mean (1-5)
Strongly Disagree 209 32.5
2.4
Disagree 209 32.5
Neither disagree or agree 124 19.3
Agree 94 14.6
Strongly Agree 8 1.2
Not Answered 585 47.6
Table 86. Sales taxes are reasonable.
Answer Frequency % Mean (1-5)
Strongly Disagree 201 28.4
3.1
Disagree 254 35.9
Neither disagree or agree 137 19.4
Agree 109 15.4
Strongly Agree 7 1.0
Not Answered 521 42.4
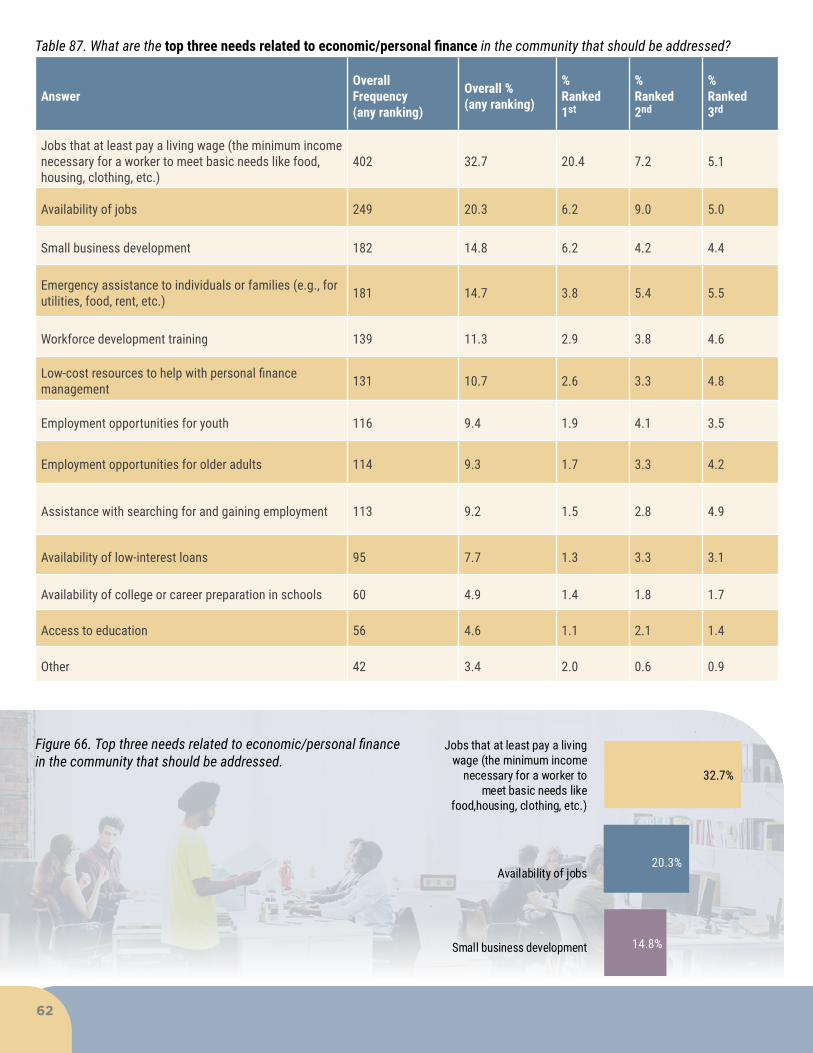
62
Table 87. What are the top three needs related to economic/personal finance in the community that should be addressed?
AnswerOverall Frequency (any ranking)
Overall %(any ranking)
%Ranked 1st
% Ranked2nd
% Ranked 3rd
Jobs that at least pay a living wage (the minimum income necessary for a worker to meet basic needs like food, housing, clothing, etc.)
402 32.7 20.4 7.2 5.1
Availability of jobs 249 20.3 6.2 9.0 5.0
Small business development 182 14.8 6.2 4.2 4.4
Emergency assistance to individuals or families (e.g., for utilities, food, rent, etc.) 181 14.7 3.8 5.4 5.5
Workforce development training 139 11.3 2.9 3.8 4.6
Low-cost resources to help with personal finance management 131 10.7 2.6 3.3 4.8
Employment opportunities for youth 116 9.4 1.9 4.1 3.5
Employment opportunities for older adults 114 9.3 1.7 3.3 4.2
Assistance with searching for and gaining employment 113 9.2 1.5 2.8 4.9
Availability of low-interest loans 95 7.7 1.3 3.3 3.1
Availability of college or career preparation in schools 60 4.9 1.4 1.8 1.7
Access to education 56 4.6 1.1 2.1 1.4
Other 42 3.4 2.0 0.6 0.9
Figure 66. Top three needs related to economic/personal finance in the community that should be addressed.
32.7%
20.3%
14.8%
Availability of jobs
Small business development
Jobs that at least pay a living wage (the minimum income
necessary for a worker to meet basic needs like
food,housing, clothing, etc.)
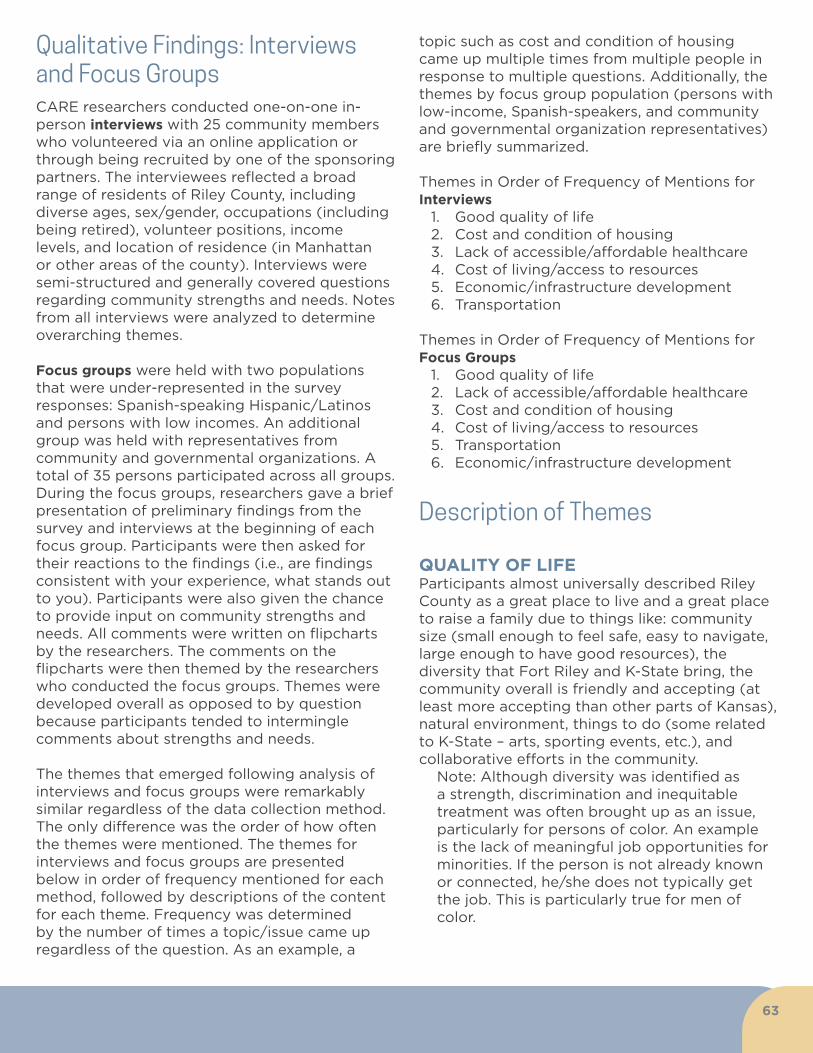
63
Qualitative Findings: Interviews and Focus GroupsCARE researchers conducted one-on-one in-person interviews with 25 community members who volunteered via an online application or through being recruited by one of the sponsoring partners. The interviewees reflected a broad range of residents of Riley County, including diverse ages, sex/gender, occupations (including being retired), volunteer positions, income levels, and location of residence (in Manhattan or other areas of the county). Interviews were semi-structured and generally covered questions regarding community strengths and needs. Notes from all interviews were analyzed to determine overarching themes.
Focus groups were held with two populations that were under-represented in the survey responses: Spanish-speaking Hispanic/Latinos and persons with low incomes. An additional group was held with representatives from community and governmental organizations. A total of 35 persons participated across all groups. During the focus groups, researchers gave a brief presentation of preliminary findings from the survey and interviews at the beginning of each focus group. Participants were then asked for their reactions to the findings (i.e., are findings consistent with your experience, what stands out to you). Participants were also given the chance to provide input on community strengths and needs. All comments were written on flipcharts by the researchers. The comments on the flipcharts were then themed by the researchers who conducted the focus groups. Themes were developed overall as opposed to by question because participants tended to intermingle comments about strengths and needs.
The themes that emerged following analysis of interviews and focus groups were remarkably similar regardless of the data collection method. The only difference was the order of how often the themes were mentioned. The themes for interviews and focus groups are presented below in order of frequency mentioned for each method, followed by descriptions of the content for each theme. Frequency was determined by the number of times a topic/issue came up regardless of the question. As an example, a
topic such as cost and condition of housing came up multiple times from multiple people in response to multiple questions. Additionally, the themes by focus group population (persons with low-income, Spanish-speakers, and community and governmental organization representatives) are briefly summarized.
Themes in Order of Frequency of Mentions for Interviews
1. Good quality of life 2. Cost and condition of housing3. Lack of accessible/affordable healthcare4. Cost of living/access to resources 5. Economic/infrastructure development 6. Transportation
Themes in Order of Frequency of Mentions for Focus Groups
1. Good quality of life 2. Lack of accessible/affordable healthcare 3. Cost and condition of housing 4. Cost of living/access to resources 5. Transportation 6. Economic/infrastructure development
Description of Themes
QUALITY OF LIFEParticipants almost universally described Riley County as a great place to live and a great place to raise a family due to things like: community size (small enough to feel safe, easy to navigate, large enough to have good resources), the diversity that Fort Riley and K-State bring, the community overall is friendly and accepting (at least more accepting than other parts of Kansas), natural environment, things to do (some related to K-State – arts, sporting events, etc.), and collaborative efforts in the community.
Note: Although diversity was identified as a strength, discrimination and inequitable treatment was often brought up as an issue, particularly for persons of color. An example is the lack of meaningful job opportunities for minorities. If the person is not already known or connected, he/she does not typically get the job. This is particularly true for men of color.
64
Cost and condition of housing Housing was mentioned as an issue due to reasons like high rent, an excess of higher priced newly-built homes, lack of reasonably-priced houses for middle-class buyers, lack of low-income housing, multiple houses or apartments in disrepair in certain neighborhoods/issues with the quality of rental properties, and lack of accountability for landlords. A number of participants also connected high property taxes, homelessness, and even food insecurity to the high cost of housing. Participants who had lived in the community for many years, especially Manhattan, were concerned about how expensive the market is for newcomers and also noted that they would personally have difficulty affording a new house in the current market if they sold theirs.
Lack of accessible/affordable healthcare A number of participants noted that the local hospital is not equipped to deal with a number of medical issues, which results in patients being sent to other hospitals for care. Most participants felt that a community the size of Manhattan should have better access to care at the hospital. More specifically, participants felt the hospital needs to improve quality and increase staffing (more doctors and nurses), increase services (including emergency services), and access to specialists. Additionally, while the clinics in Riley County provide quality services, persons with lower incomes cannot afford to pay costs for services upfront as is required by some healthcare providers. Other issues related to healthcare in the community included the need for affordable dental care, more specialists, increased emergency services, and more mental/behavioral health services (even though they acknowledged this particular service has increased over the last few years).
Cost of living/access to resources Cost of living was often linked to the high cost of housing, but also included issues like lack of living wage jobs, high property and sales taxes, and expensive childcare. Some participants said they could not afford to move to Manhattan now if they were not already established there. Overall, Manhattan is seen as a place that is becoming too expensive for most low to middle-income persons to live. Participants identified a
growing income disparity between the “haves” and the “have nots.” Those with lower incomes have a particularly difficult time with the cost of living, which increases the need for services and resources to address concerns like hunger/food insecurity and homelessness. And while most participants acknowledged the many valuable community services to assist those with lower incomes, these services do not fully meet the need and can be difficult for some to access (due to location, requirement of upfront payment or a permanent address). As one participant noted “everything becomes expensive when you’re poor.” Another said “too many people [are] trying to live on too little.”
Economic/infrastructure development Most interviewees mentioned the National Bio and Agro-defense Facility (NBAF) as a question mark in terms of whether it will be a true boon to economic and community development or will tax the current infrastructure in a way that could change Riley County for the worse. Some are concerned the influx of NBAF employees will exacerbate the issue with affordable housing. Others had concerns regarding whether schools and services will be adequate to meet the needs of NBAF staff who will expect resources commonly found in larger cities. Other issues related to economic development included concerns about decreased enrollment at K-State impacting the local economy as well as high rents and the influx of “big box” stores contributing to the loss of small businesses. The lack of entry-level living wage jobs for young people was also mentioned. Additionally, participants brought up flooding specifically as an increasing infrastructure issue over the past few years. They noted that this isn’t just a Riley County problem; regional coordination is needed to address flooding that threatens homes and livelihoods.
Transportation While public transportation has improved over the past few years with the addition of aTa bus routes and services, many noted that service is still limited in regard to hours and locations. Additionally, there is a need for sheltered bus stops. A number of participants mentioned the bus system as a strength in the community, and they see the value of this service even though
65
there are areas for improvement. Otherwise, participants felt the area is easy to navigate if you have access to reliable transportation. However, they also mentioned consistent parking and traffic challenges in the areas around campus and Aggieville. Some connected parking and traffic issues with concerns about community infrastructure.
THEMES BY FOCUS GROUP POPULATION
Spanish-speaking Hispanics/Latinos1. Good quality of life2. Lack of accessible/affordable healthcare3. Transportation4. Cost and condition of housing5. Cost of living/access to resources
Members of this group were largely positive about their experiences in Riley County. As noted in the descriptions above, they appreciate the resources available in the community (most particularly programs at the library and at the recreation centers). But, they also noted difficulty in accessing affordable healthcare in the community, including dental care, especially when the provider requires full payment in advance. They felt that the bus is a valuable community asset, but routes could be expanded. Housing is more expensive in Manhattan than elsewhere, as is the general cost of living. They did mention discrimination against and lack of resources for those who speak Spanish, including in workplaces (e.g., Hispanics/Latinos do not get paid as well as their white counterparts) and the lack of interpreters for healthcare as examples.
Persons with low incomes1. Good quality of life2. Cost of living/access to resources3. Cost and condition of housing4. Lack of accessible/affordable healthcare5. Transportation
It should be noted that a number of the persons in this group identified as homeless. Many of their comments related to good quality of life were focused on resources available in the community, especially at churches, such as the Common Table meals and availability of showers.
They expressed that churches are typically “welcoming and diplomatic” and do more than some other social services in the community. On the downside related to quality of life, they feel a great deal of discrimination because of being poor or homeless, including being sent away from businesses, not being seen as potential resources in the community, and not having bus services in some of the lower income areas as examples. In terms of access to resources, they mentioned barriers such as having no centralized location for needed services, which requires people without reliable transportation and little money to go from place to place around town to get what they need. They acknowledged collaboration efforts among organizations, but encouraged more to help those in need. Additionally, they suggested increased access to life skills education (how to fill out applications, make change, how to access resources, etc.) and greater availability of living wage jobs. As with other groups, housing is an issue, but lack of accountability of landlords and the need for more/better shelter options were additional concerns. Regarding healthcare, they noted the need for more mental/behavioral health services, specifically related to adverse childhood experiences (ACEs) and trauma.
Community and governmental organizations
1. Good Quality of Life2. Lack of accessible/affordable healthcare3. Cost and condition of housing4. Cost of living/lack of resources5. Economic/infrastructure development
As with other groups, good quality of life was the top theme for representatives from community and governmental organizations. They mentioned such things as diversity, the resources of the university, outdoor spaces, a variety of activities, collaboration among agencies, and the reputation of the community as factors. Several concurred that the community is “big enough and small enough.” Again, some mentioned discrimination as a concern regarding quality of life. They echoed concerns about a sustainable healthcare system, including the lack of services at the hospital and affordable dental and mental health care. Although there was some discussion as to whether the cost
of housing is just a perception or reality, most felt it is a true concern, with a great need for affordable, accessible, and safe family housing as well as increased efforts to maintain properties appropriately. Concerns about a lack of living wage jobs were also discussed along with the connected issues of hunger, homelessness, generally needing more services for those with low incomes, and more affordable childcare. Finally, they noted the need for increased attention to infrastructure, including land use, investment in downtown and Aggieville, accessible sidewalks and crosswalks, and solutions to flooding.
Appendix A: Subsample Analysis of Survey DataA subsample of the survey data was created to further examine the findings of the survey and understand any differences between the total sample and the subsample, which reflects more closely the age demographics as reported by the Census.
METHODOLOGYThe subsample was created to match the exact age proportions based on the U. S. Census. Since 40.2% of Riley County is 18-24 years old, all of the total survey participants (n=46) were used to create a random subsample. SPSS was used to pull random selections from each of the other age groups based on the U. S. Census age proportions to create a random subsample reflective of the population based on age. Once the subsample was created, questions related to physical health, mental health, social issues, housing, and economics were analyzed using SPSS.
SUMMARY OF FINDINGSIn general, many of the things found to be important to the entire sample were also important to the subsample. The differences within each domain tended to be in terms of how frequently each concern or need was ranked. Overall, the broad agreement between samples suggests that including a higher proportion of young adults does not substantially change how the community views its priorities, though there are some exceptions. Below is a description of the differences, where they occur between the total sample and the subsample.
TOP NEEDS/ISSUES ACROSS SAMPLES
Physical HealthThe domain of physical health saw the greatest amount of agreement across samples. Both the total sample and the subsample ranked the same three things as a first priority in the same order of frequency: Affordable Health Services, Affordable Health Insurance, and Facilities for Physical Activity. The only difference was that the third most frequent need overall (including a ranking of either first, second, or third priority) was identified as Affordable Prescriptions for the total sample and Facilities for Physical Activity for the subsample.
Mental HealthThere was also a great deal of agreement in the domain of Mental Health. For the overall needs, there was total agreement in both the needs identified most frequently and for the order in which they were prioritized. The only difference was the order of how frequently the three needs (Affordable Mental Health Services, Affordable Health Insurance that Includes Mental Health, and Addressing Stigmatization of Those with Mental Health Issues) were ranked first.
Social IssuesSimilar to the Mental Health domain, the top three issues ranked as important concerns were the same for both samples: Poverty, Mental Illness, and Inattentive Driving. For the issues ranked as a first priority, Poverty remained the most frequent issue, but the total sample ranked Inattentive Driving then Mental Illness as a first priority while the subsample ranked Drinking and Driving and Child Neglect as a first priority more frequently.
When it came to social needs, Availability of Services for People with Low Incomes and Child Care filtered to the top of overall rankings for both samples; however, the total sample ranked Availability of Mental Health Services as a top three need while the subsample ranked Housing Options for Homeless Persons. The frequency of needs that were ranked first most often were shared between the two samples, but the order of importance was slightly different.
HousingThe primary difference between the two samples in the Housing came down to a difference between affordable housing and quality housing. Both samples rank Affordable Housing as a need overall and as a first priority most often, but when it came to second
A1
and third rankings there were distinctions that tended to lean towards affordability on the side of the total sample and quality on the side of the subsample.
Economics and Personal FinanceThe Economics domain saw prioritization of Jobs that at Least Pay a Living Wage as the most important overall need as well as the need ranked first most often. Differences occur in secondary ranked needs where the subsample tended to identify assistance for others more often than availability of jobs or small business development as identified by the total sample.
Appendix B: Riley County Community Needs Assessment SurveyThe following survey was used for online, and hard copy administration. The survey was translated into Spanish. The consent form was also translated and used for all versions. The sections included in this Appendix are those for which data is provided in the previous report (i.e., Quality of Life, Physical Health (including physical activity, nutrition, and tobacco use/smoking), Mental Health, Social Issues, Children and Youth, Education, Aging, Housing, Transportation, and Economics and Personal Finance, and Demographics).
Welcome to the Riley County Community Needs Assessment
Thank you for your interest in taking the Riley County Community Needs Assessment Survey. Anyone who lives in Riley County is invited to take this survey. The purposes of this survey are:
1) to get your input on the quality of life in the community and
2) to identify the unmet needs in the community.
Some questions ask you about your personal experiences in the community and some ask for your opinions about the community in general.
This survey is completely anonymous and confidential. We do not need your name or any identifying information, so please feel free to be completely honest. We would like you to answer every question as completely and honestly as possible.
This survey will take about 30 minutes to complete and you may stop at any time without penalty. If you are using a public computer or a mobile device (i.e. phones or tablets), you need to complete the survey all at once. If you are using a personal computer, you may stop taking the survey at any point and come back to it later as long as you use the same computer. You just need to complete the survey within 2 weeks. Please take the survey only once. How did you find out about this survey?
☐ I received a postcard with the web address
☐ I heard about it through an organization I’m involved with
☐ I heard about it through media (radio, newspaper, social media)
☐ Word of mouth (someone else told me about it)
☐ Other
Demographics
1. What is your age?
○ Under 18 years
○ 18 to 24 years
○ 25 to 34 years
○ 35 to 49 years
○ 50 to 64 years
○ 65 to 74 years
○ 75 years and over
2. In what county do you currently live?
○ Riley County
○ Pottawatomie
3. Is this county your permanent residence?
○ Yes
○ No
4. What is your zip code?
○ 66449
○ 66502
○ 66503
○ 66505
○ 66506
○ 66517
○ 66531
○ 66554
○ Other (please specify) ________
A2
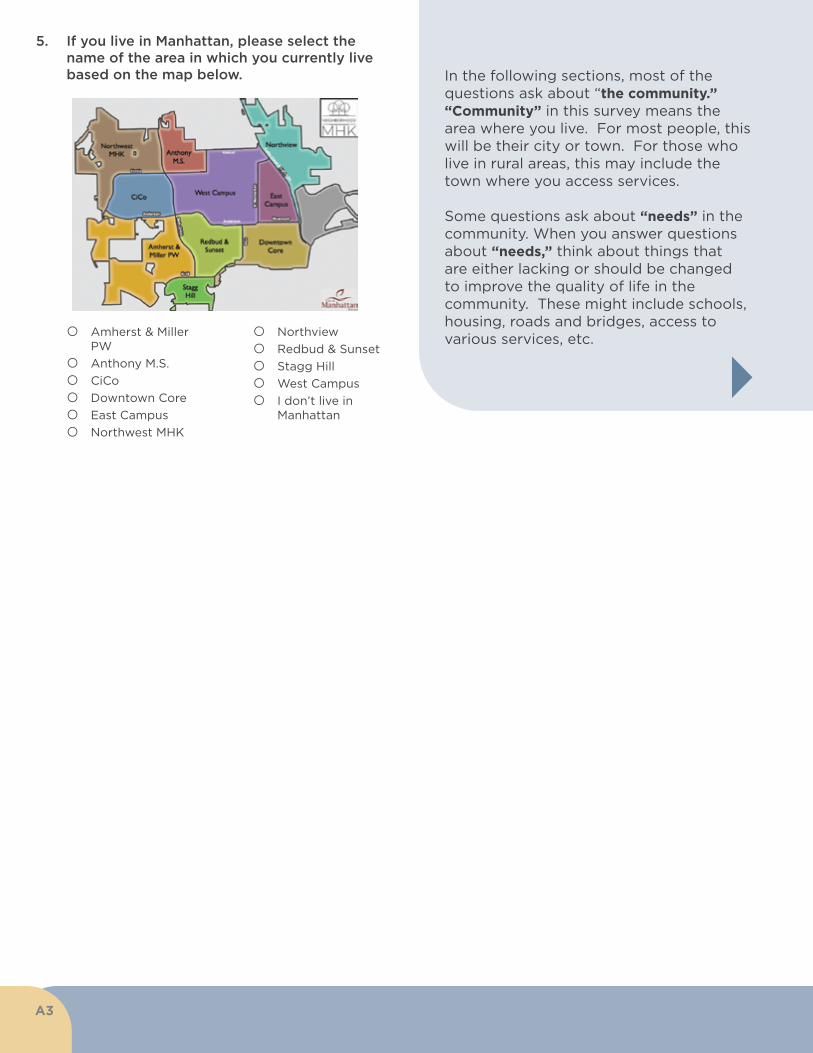
5. If you live in Manhattan, please select the name of the area in which you currently live based on the map below. In the following sections, most of the
questions ask about “the community.” “Community” in this survey means the area where you live. For most people, this will be their city or town. For those who live in rural areas, this may include the town where you access services.
Some questions ask about “needs” in the community. When you answer questions about “needs,” think about things that are either lacking or should be changed to improve the quality of life in the community. These might include schools, housing, roads and bridges, access to various services, etc.
A3
○ Amherst & Miller PW
○ Anthony M.S.
○ CiCo
○ Downtown Core
○ East Campus
○ Northwest MHK
○ Northview
○ Redbud & Sunset
○ Stagg Hill
○ West Campus
○ I don’t live in Manhattan
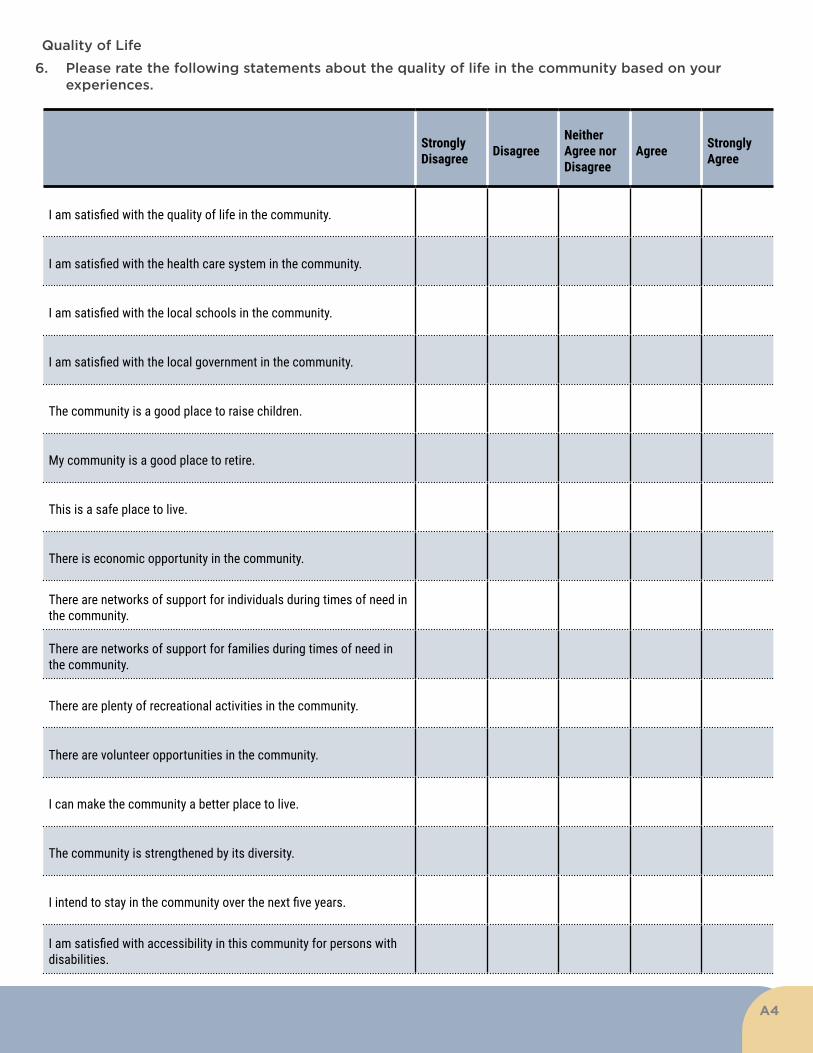
Strongly Disagree Disagree
Neither Agree nor Disagree
Agree Strongly Agree
I am satisfied with the quality of life in the community.
I am satisfied with the health care system in the community.
I am satisfied with the local schools in the community.
I am satisfied with the local government in the community.
The community is a good place to raise children.
My community is a good place to retire.
This is a safe place to live.
There is economic opportunity in the community.
There are networks of support for individuals during times of need in the community.
There are networks of support for families during times of need in the community.
There are plenty of recreational activities in the community.
There are volunteer opportunities in the community.
I can make the community a better place to live.
The community is strengthened by its diversity.
I intend to stay in the community over the next five years.
I am satisfied with accessibility in this community for persons with disabilities.
Quality of Life
6. Please rate the following statements about the quality of life in the community based on your experiences.
A4
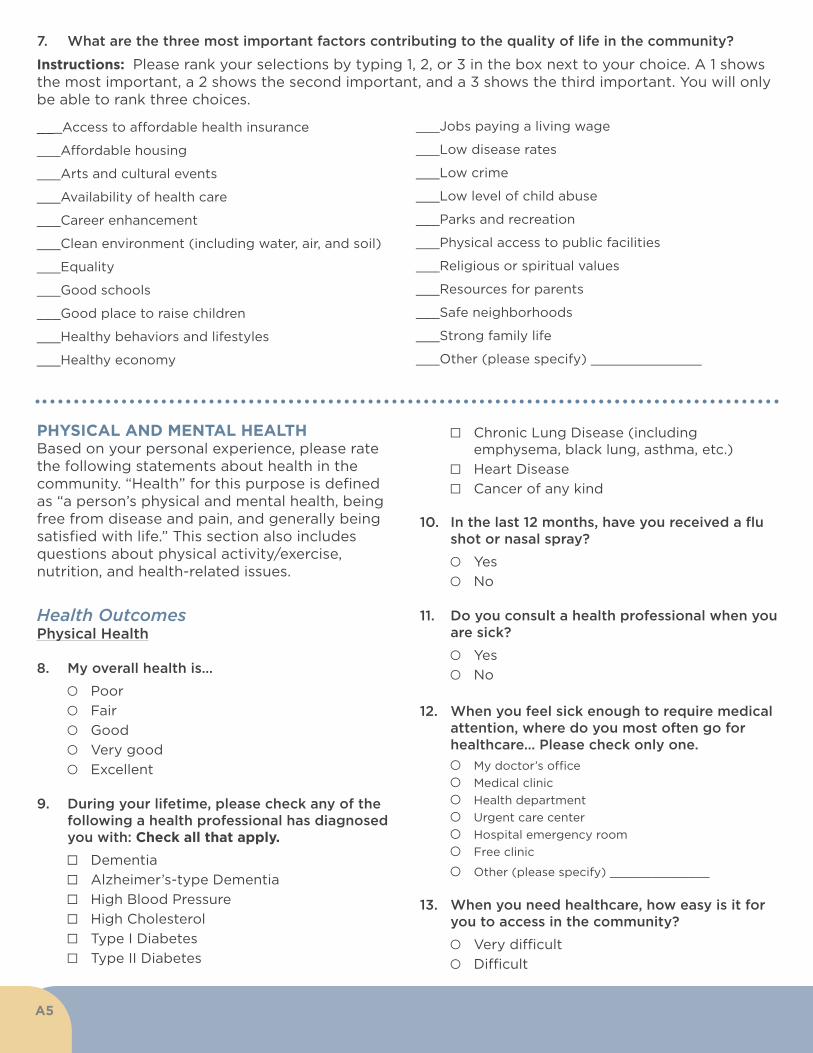
7. What are the three most important factors contributing to the quality of life in the community?
Instructions: Please rank your selections by typing 1, 2, or 3 in the box next to your choice. A 1 shows the most important, a 2 shows the second important, and a 3 shows the third important. You will only be able to rank three choices.
___Access to affordable health insurance
___Affordable housing
___Arts and cultural events
___Availability of health care
___Career enhancement
___Clean environment (including water, air, and soil)
___Equality
___Good schools
___Good place to raise children
___Healthy behaviors and lifestyles
___Healthy economy
___Jobs paying a living wage
___Low disease rates
___Low crime
___Low level of child abuse
___Parks and recreation
___Physical access to public facilities
___Religious or spiritual values
___Resources for parents
___Safe neighborhoods
___Strong family life
___Other (please specify) ______________
PHYSICAL AND MENTAL HEALTH Based on your personal experience, please rate the following statements about health in the community. “Health” for this purpose is defined as “a person’s physical and mental health, being free from disease and pain, and generally being satisfied with life.” This section also includes questions about physical activity/exercise, nutrition, and health-related issues.
Health OutcomesPhysical Health
8. My overall health is…
○ Poor
○ Fair
○ Good
○ Very good
○ Excellent
9. During your lifetime, please check any of the following a health professional has diagnosed you with: Check all that apply.
☐ Dementia
☐ Alzheimer’s-type Dementia
☐ High Blood Pressure
☐ High Cholesterol
☐ Type I Diabetes
☐ Type II Diabetes
☐ Chronic Lung Disease (including emphysema, black lung, asthma, etc.)
☐ Heart Disease
☐ Cancer of any kind
10. In the last 12 months, have you received a flu shot or nasal spray?
○ Yes
○ No
11. Do you consult a health professional when you are sick?
○ Yes
○ No
12. When you feel sick enough to require medical attention, where do you most often go for healthcare… Please check only one.
○ My doctor’s office
○ Medical clinic
○ Health department
○ Urgent care center
○ Hospital emergency room
○ Free clinic
○ Other (please specify) ______________
13. When you need healthcare, how easy is it for you to access in the community?
○ Very difficult
○ Difficult
A5

○ Not too difficult
○ Very easy
14. When you need dental care, how easy is it for you to access in the community?
○ Very difficult
○ Difficult
○ Not too difficult
○ Very easy
Mental Health
15. How would you describe your overall mental health?
○ Poor
○ Fair
○ Good
○ Very Good
○ Excellent
16. I consider myself to be a lonely person (i.e., having frequent discomfort due to feeling alone).
○ Strongly disagree
○ Disagree
○ Neither disagree nor agree
○ Agree
○ Strongly agree
17. I consider myself to be a socially isolated person (i.e., lacking adequate contact with other people).
○ Strongly disagree
○ Disagree
○ Neither disagree nor agree
○ Agree
○ Strongly agree
18. When you’re not feeling mentally healthy, do you consult a mental health professional?
○ Yes
○ No
○ N/A - My mental health is always good.
19. Where do you go most often when your mental health is not good?
○ Private practice
○ Community mental health center
○ Hospital emergency room
○ Fort Riley Mental Health Services
○ Veterans Administration (VA) Hospital
○ Other (please specify) ______________
20. The community has adequate mental health services for people who need them.
○ Strongly Disagree
○ Disagree
○ Neither disagree or agree
○ Agree
○ Strongly Agree
Health BehaviorsPhysical Activity
21. How many hours a week, on average, do you engage in physical activity or exercise that is not job related?
○ None
○ Less than 1 hour
○ 1-2 hours
○ 2-3 hours
○ 3 hours or more
22. Where do you go to exercise? Select all that apply.
☐ A school
☐ Private gym/studio
☐ Park
☐ Neighborhoods
☐ Home
☐ Public Recreation Center
☐ Other (please specify) _____________
23. If you don’t exercise, what are the reasons? Select all that apply.
☐ My job involves physical labor
☐ Exercise is not important to me
☐ I don’t have enough time
☐ I don’t have child care
☐ I don’t have anyone with whom to exercise
☐ I don’t like to exercise
☐ It costs too much to exercise
☐ The only place where I can exercise is unsafe
☐ I have physical limitations that don’t allow me to exercise
☐ Other (please specify) ______________
A6
24. There are plenty of options for exercise in this community.
○ Strongly Disagree
○ Disagree
○ Neither disagree or agree
○ Agree
○ Strongly Agree
25. There are enough accessible physical activity/recreation options in this community for persons with physical disabilities.
○ Strongly Disagree
○ Disagree
○ Neither disagree or agree
○ Agree
○ Strongly Agree
26. This community values exercise.
○ Strongly Disagree
○ Disagree
○ Neither disagree or agree
○ Agree
○ Strongly Agree
Nutrition
27. I eat healthy foods. (Healthy foods are defined as: nutritious foods and beverages, especially vegetables, fruits, low-fat and fat-free dairy products, and whole grains; foods low in saturated and trans fats, sodium, and added sugars).
○ Strongly Disagree
○ Disagree
○ Neither Agree nor Disagree
○ Agree
○ Strongly Agree
28. Do you eat at least two cups of fruit each day?
○ Yes
○ No
○ N/A – I don’t eat fruit.
IF you answered NO or N/A to question 28:29. What keeps you from eating at least two cups
of fruit per day? Select all that apply OR “Not applicable; I eat at least two cups of fruit every day”
☐ I’m not able to get to a grocery store.
☐ It costs too much.
☐ I don’t have enough time to purchase and prepare them.
☐ I don’t know how to prepare them.
☐ I don’t like them.
☐ I have dietary restrictions
☐ Other (please specify) ______________
☐ Not applicable; I eat at least two cups of fruit every day.
30. Do you eat at least two cups of vegetables each day?
○ Yes
○ No
○ N/A - I don’t eat vegetables
IF you answered NO or N/A to question 30:31. What keeps you from eating at least two cups
of vegetables per day? Select all that apply OR “Not applicable; I eat at least two cups of vegetables every day”
☐ I’m not able to get to a grocery store.
☐ It costs too much.
☐ I don’t have enough time to purchase and prepare them.
☐ I don’t know how to prepare them.
☐ I don’t like them.
☐ I have dietary restrictions
☐ Other (please specify) ______________
☐ Not applicable; I eat at least two cups of vegetables every day.
32. The community values healthy eating.
○ Strongly Disagree
○ Disagree
○ Neither disagree or agree
○ Agree
○ Strongly Agree
33. It is easy for me to access healthy food.
○ Strongly Disagree
○ Disagree
A7

○ Neither disagree nor agree
○ Agree
○ Strongly Agree
34. Have you ever been concerned about having enough food to eat?
○ Yes
○ No
35. In the past seven days did you skip meals because you couldn’t afford food?
○ Yes
○ No
Smoking/Tobacco
36. Do you currently use tobacco products including cigarettes, cigars, chewing tobacco, or e-cigarettes?
○ Yes
○ No
37. Where would you go for help if you wanted to quit using tobacco products (including vaping)? Select all that apply.
○ KS Quitline
○ Doctor
○ Church
○ Pharmacy
○ Private counselor/therapist
○ Health Department
○ I don’t know
○ Other (please specify) _______________
○ Not applicable; I don’t want to quit.
Access to Insurance and Health Information
38. Do you have health insurance?
○ Yes
○ No39. How do you receive most of your health-
related information? Please check only one
response.
○ Health professionals (e.g., doctor, nurse, technician, dentist, hygienist, etc.)
○ Friends and family
○ Social media (e.g., Facebook, Twitter, Instagram, etc.)
○ Traditional media (e.g., local/state newspaper, TV, magazines, etc.)
○ Other (please specify) ____________
Overall Health Needs in the CommunityPhysical Health
40. What are the top three physical health needs in the community that should be addressed?
Instructions: Please rank your selections by typing 1, 2, or 3 in the box next to your choice. A 1 shows the most important, a 2 shows the second important, and a 3 shows the third important. You will only be able to rank three choices.___Affordable health services
___Affordable health insurance
___Increased number of health care providers
___Maternal health services
___Children’s health services
___Prevention of infant mortality
___Access to healthy food options
___Increased health education/prevention (e.g., healthy eating, disease prevention, etc.)
___Facilities for physical activity (including parks, trails, rec centers)
___Tobacco use cessation (quitting) services
___Availability of transportation for health services
___Affordable prescriptions
___Dental care options
___Health care assistance for older adults
___Health care assistance for veterans/military
___Availability of health care specialists
___Other (please specify) ___________________
Mental Health
41. What are the top three mental health needs in
A8

the community that should be addressed?
Instructions: Please rank your selections by typing 1, 2, or 3 in the box next to your choice. A 1 shows the most important, a 2 shows the second important, and a 3 shows the third important. You will only be able to rank three choices.
___Affordable health insurance that includes mental health care
___Affordable mental health services
___Affordable prescriptions
___Availability of transportation to mental health services
___Children’s mental health services
___Adolescents’ mental health services
___Young adults’ mental health services
___Older adults’ mental health services
___High quality mental health services
___Increased mental health education/prevention
___Increased number of mental health care providers
___Substance abuse prevention/treatment
___Addressing the stigmatization of those with mental health issues
___Suicide prevention
___Other (please specify) ___________________
SOCIAL ISSUESSocial issues are a broad range of concerns that affect individuals but can also have a significant impact on the health and safety of the community. They’re often described as public health issues. This section includes questions on issues such as substance abuse, domestic/sexual violence and abuse, homelessness, discrimination, etc. Please remember that your answers are anonymous and will never be reported individually. You may also choose not to answer questions that are uncomfortable. But, your responses to these questions are important in addressing community needs.
42. Do you or anyone in your household have a substance use issue (e.g., frequently drinks too much alcohol, has a problem with legal
prescriptions or illegal drugs)?
○ Yes
○ No
IF you answered YES to question 42:43. If yes, do you or anyone in your household
have an abuse issue with opioids (e.g., Oxycontin, Percocet, Vicodin, heroin, etc.)?
○ Yes
○ No
44. Does anyone in your household currently experience domestic violence (e.g., violence between adult partners or between adults and children)?
○ Yes
○ No
45. Excluding mental health issues, do you or anyone in your household have a physical disability?
○ Yes
○ No
46. Excluding mental health issues, do you or anyone in your household have a developmental disability?
○ Yes
○ No
47. Are you or anyone in your immediate family currently homeless (e.g., no permanent place to live on a daily basis)?
○ Yes
○ No
A9
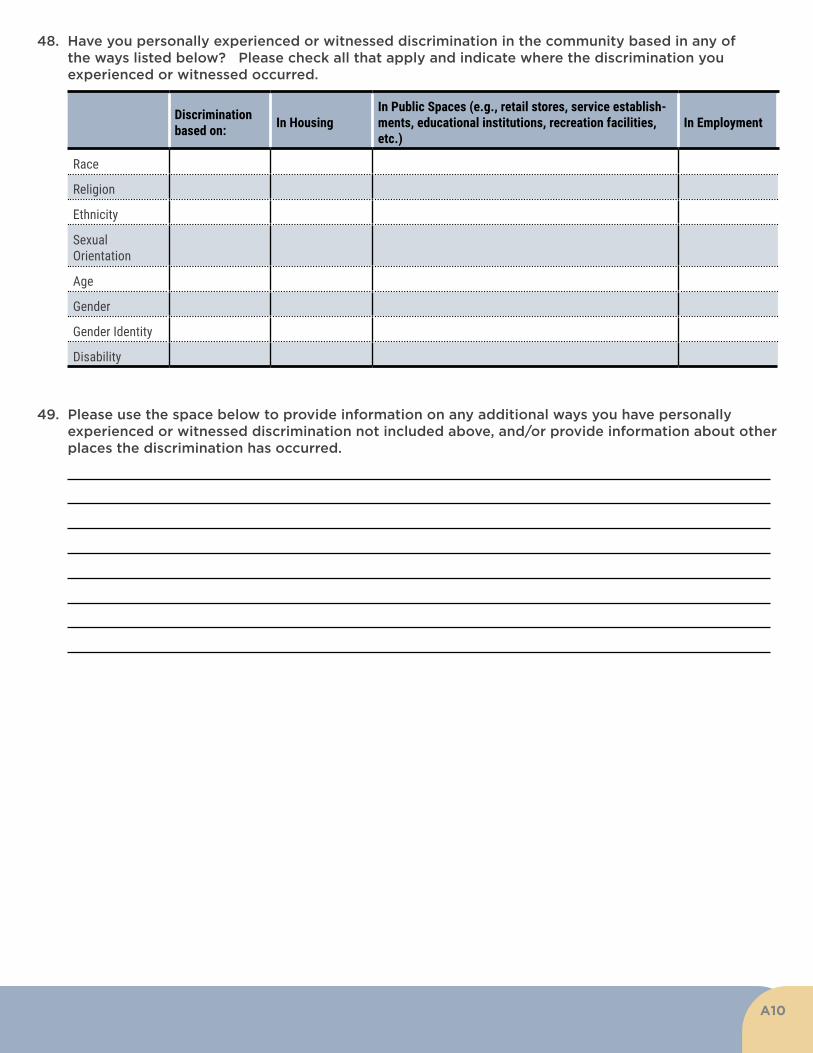
48. Have you personally experienced or witnessed discrimination in the community based in any of the ways listed below? Please check all that apply and indicate where the discrimination you experienced or witnessed occurred.
Discrimination based on: In Housing
In Public Spaces (e.g., retail stores, service establish-ments, educational institutions, recreation facilities, etc.)
In Employment
Race
Religion
Ethnicity
Sexual Orientation
Age
Gender
Gender Identity
Disability
49. Please use the space below to provide information on any additional ways you have personally experienced or witnessed discrimination not included above, and/or provide information about other places the discrimination has occurred.
A10
50. What are the top three social issues in the community that most concern you.
Instructions: Please rank your selections by typing 1, 2, or 3 in the box next to your choice. A 1 shows the most important, a 2 shows the second important, and a 3 shows the third important. You will only be able to rank three choices.
___Adult drug use
___Adult alcohol use
___Adult tobacco (all products) use
___Child physical abuse
___Child sexual abuse
___Child abuse
___Child neglect
___Cybercrime (including identity theft, online scams, phishing, etc.)
___Discrimination (including gender, race, ethnicity, sexual orientation, etc.)
___Domestic violence
___Drinking and driving
___Drug use and driving
___Elder abuse
___Homelessness
___Food insecurity
___Persistent hunger
___Inattentive driving
___Manufacture or selling of drugs
___Mental illness
___Poverty
___Property crime
___Suicide
___Teen pregnancy
___Violent crime (including assault, rape, murder)
___Youth drug use
___Youth alcohol use
___Youth tobacco (all products including vaping) use
___Youth/gang violence
___Other (please specify) ______________
___Child care
___Services for older adults
___Services for persons with disabilities
___Availability of mental health services
___Better enforcement of laws
___Changing local laws
___Options for arts and entertainment activities
___Positive activities for youth
___Availability of employment
___Availability of support groups/peer support
___Substance abuse prevention or treatment
___Housing options for homeless persons
___Availability of services for people with low incomes
___Services for domestic/sexual violence survivors
___Services to veterans/military
___Other (please specify) ______________
51. What are the top three needs related to social issues in the community that should be addressed?
Instructions: Please rank your selections by typing 1, 2, or 3 in the box next to your choice. A 1 shows the most important, a 2 shows the second important, and a 3 shows the third important. You will only be able to rank three choices.
A11
CHILDREN This section focuses on issues that affect children (0-12 years old) and youth (13-18 years old) and their families. You DO NOT have to have children/youth to be affected by conditions in the community that
impact children and families. A few questions in this section are just for those who have children or grandchildren. Otherwise, please answer the questions whether you have children/grandchildren or not.
This section includes questions on child care, education, medical/dental care, support for parents/families, etc.
52. Are you a parent or custodial guardian of someone under 18 years of age?
○ Yes
○ No
53. If you have grandchildren, are you a custodial or primary caregiver for any of your grandchildren that are under the age of 18?
○ Yes
○ No
If you are not the parent or custodial grandparent/guardian of someone under 18 years of age please skip to question 58.
If you are the parent or custodial grandparent/guardian of someone under 18 years of age, please answer the following:
54. Please answer the following questions about your child/children. Please select only one answer per question.
Yes No
Are you a single parent?
Do any of your children have a developmental disability?
Do any of your children have a physical disability?
Yes No
Do any of your children have a chronic disease?
Have any of your children been diagnosed with a mental illness or emotional disturbance?
Are you satisfied with the education your children are receiving?
Are your children home-schooled?
Have any of your children been afraid to attend school/other activities due to bullying?
Are you satisfied with non-school activities for children in your community?
Have you ever quit or lost a job because you did not have the child care you needed?
55. Do you use child care for your child/children?
○ Yes
○ No
If you do not use any type of child care for your child/children please skip to question 58.
56. What type of child care do you use? Check all that apply.
☐ Licensed Day Care Home
☐ Group Day Care Home
☐ Child Care Center
☐ Preschool
☐ Afterschool/Latchkey Program
☐ Relative or Friend
☐ Other (please specify) ______________
A12
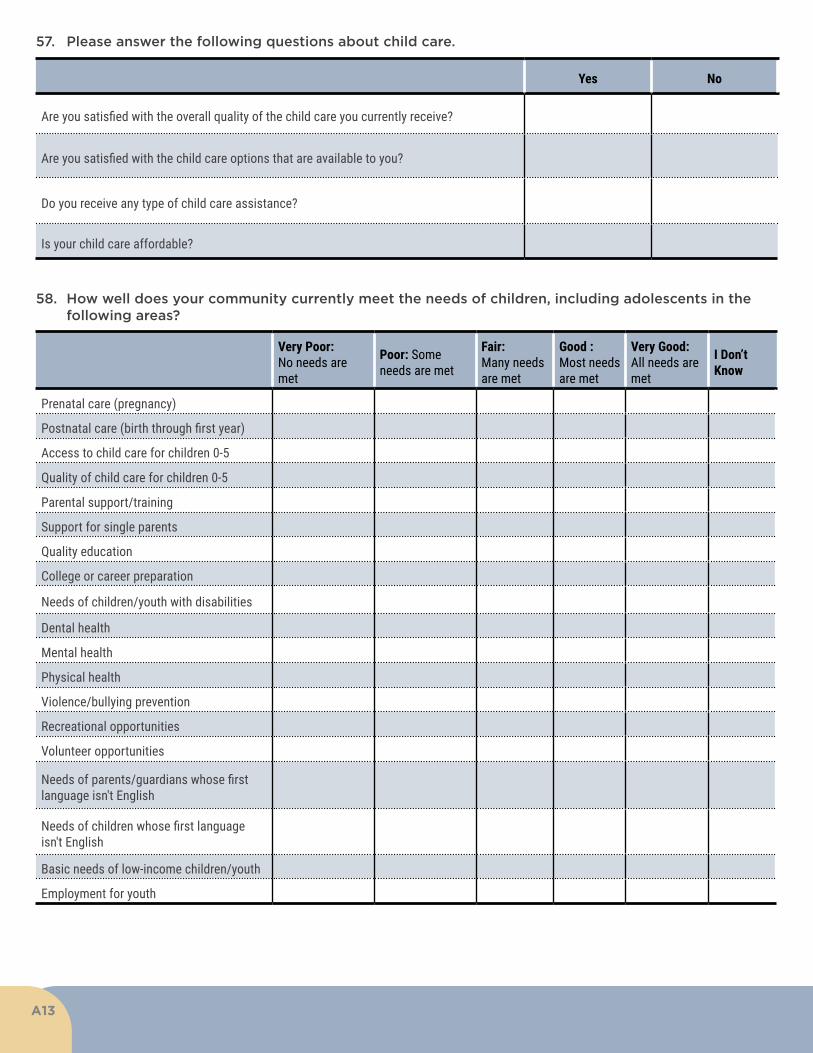
Very Poor:No needs are met
Poor: Some needs are met
Fair:Many needs are met
Good :Most needs are met
Very Good:All needs are met
I Don’t Know
Prenatal care (pregnancy)
Postnatal care (birth through first year)
Access to child care for children 0-5
Quality of child care for children 0-5
Parental support/training
Support for single parents
Quality education
College or career preparation
Needs of children/youth with disabilities
Dental health
Mental health
Physical health
Violence/bullying prevention
Recreational opportunities
Volunteer opportunities
Needs of parents/guardians whose first language isn't English
Needs of children whose first language isn't English
Basic needs of low-income children/youth
Employment for youth
58. How well does your community currently meet the needs of children, including adolescents in the following areas?
57. Please answer the following questions about child care.
Yes No
Are you satisfied with the overall quality of the child care you currently receive?
Are you satisfied with the child care options that are available to you?
Do you receive any type of child care assistance?
Is your child care affordable?
A13

59. What are the top three needs for children (ages birth to 12) in the community that should be addressed?
Instructions: Please rank your selections by typing 1, 2, or 3 in the box next to your choice. A 1 shows the most important, a 2 shows the second important, and a 3 shows the third important. You will only be able to rank three choices.
60. What are the top three needs for youth/adolescents (ages 13-18) in the community that should be addressed?
Instructions: Please rank your selections by typing 1, 2, or 3 in the box next to your choice. A 1 shows the most important, a 2 shows the second important, and a 3 shows the third important. You will only be able to rank three choices.
___Parenting education
___Parenting skills development
___Afterschool Programs
___Mentoring programs for children
___Child care for children 0-5
___Mental health care
___Nutrition programs (e.g. WIC, free and reduced lunch, etc.)
___Recreational activities
___Transportation
___Public education
___Financial assistance to families (for nutrition, child care, housing, etc.)
___Medical care
___Dental care
___Early childhood intervention programs (e.g., Head Start, etc.)
___Services for children with physical or developmental disabilities
___Bullying prevention
___Other (please specify) ________________
___Access to higher education
___Public education
___Employment opportunities for teens
___Workforce training for teens
___Substance abuse prevention/treatment
___Parenting education/skills development (for parents of adolescents)
___Mental health care
___Mentoring programs for adolescents
___Comprehensive sex education (including teen pregnancy prevention, STDs, etc.
___Healthy eating
___Being able to take part in physical activities
___Cultural enrichment opportunities
___Transportation
___Appropriate internet/technology use (e.g., sexting, cyber-bullying, etc.)
___Services for adolescents with physical or developmental disabilities
___Tutoring
___Recreational activities
___Access to technology/computers
___Access to the Internet
___Financial skills training
___Opportunities to contribute to the community (e.g., volunteering, leadership development, participation in community decision-making)
___Medical care
___Dental care
___Bullying/relationship violence prevention
___Other (please specify) ________________
A14
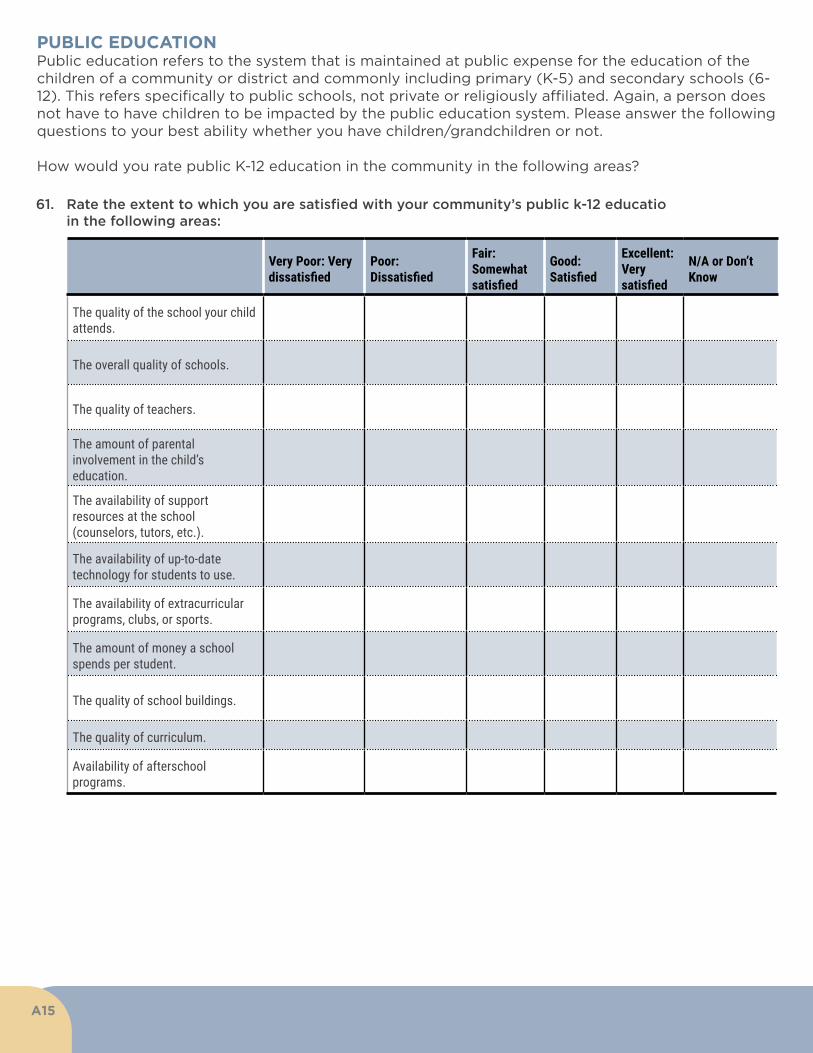
PUBLIC EDUCATIONPublic education refers to the system that is maintained at public expense for the education of the children of a community or district and commonly including primary (K-5) and secondary schools (6-12). This refers specifically to public schools, not private or religiously affiliated. Again, a person does not have to have children to be impacted by the public education system. Please answer the following questions to your best ability whether you have children/grandchildren or not.
How would you rate public K-12 education in the community in the following areas?
61. Rate the extent to which you are satisfied with your community’s public k-12 educatio in the following areas:
Very Poor: Very dissatisfied
Poor: Dissatisfied
Fair:Somewhat satisfied
Good:Satisfied
Excellent:Very satisfied
N/A or Don’t Know
The quality of the school your child attends.
The overall quality of schools.
The quality of teachers.
The amount of parental involvement in the child’s education.
The availability of support resources at the school (counselors, tutors, etc.).
The availability of up-to-date technology for students to use.
The availability of extracurricular programs, clubs, or sports.
The amount of money a school spends per student.
The quality of school buildings.
The quality of curriculum.
Availability of afterschool programs.
A15
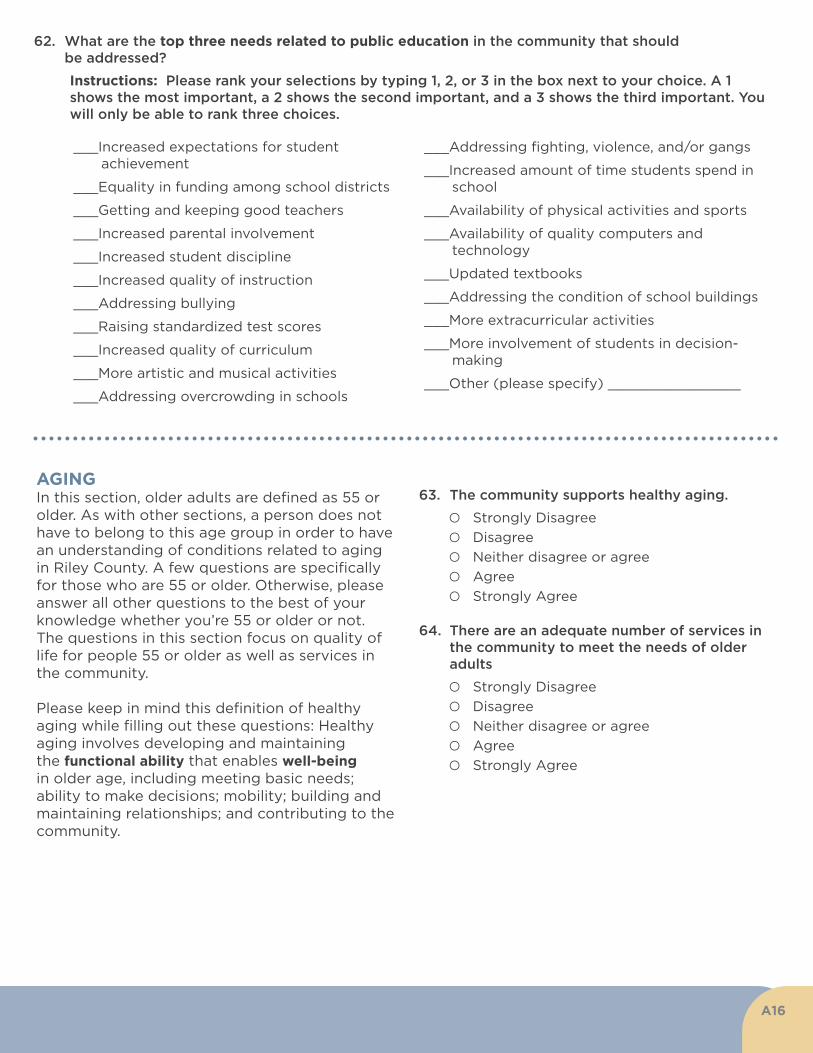
___Increased expectations for student achievement
___Equality in funding among school districts
___Getting and keeping good teachers
___Increased parental involvement
___Increased student discipline
___Increased quality of instruction
___Addressing bullying
___Raising standardized test scores
___Increased quality of curriculum
___More artistic and musical activities
___Addressing overcrowding in schools
___Addressing fighting, violence, and/or gangs
___Increased amount of time students spend in school
___Availability of physical activities and sports
___Availability of quality computers and technology
___Updated textbooks
___Addressing the condition of school buildings
___More extracurricular activities
___More involvement of students in decision-making
___Other (please specify) ________________
62. What are the top three needs related to public education in the community that should be addressed?
Instructions: Please rank your selections by typing 1, 2, or 3 in the box next to your choice. A 1 shows the most important, a 2 shows the second important, and a 3 shows the third important. You will only be able to rank three choices.
AGINGIn this section, older adults are defined as 55 or older. As with other sections, a person does not have to belong to this age group in order to have an understanding of conditions related to aging in Riley County. A few questions are specifically for those who are 55 or older. Otherwise, please answer all other questions to the best of your knowledge whether you’re 55 or older or not. The questions in this section focus on quality of life for people 55 or older as well as services in the community.
Please keep in mind this definition of healthy aging while filling out these questions: Healthy aging involves developing and maintaining the functional ability that enables well-being in older age, including meeting basic needs; ability to make decisions; mobility; building and maintaining relationships; and contributing to the community.
63. The community supports healthy aging.
○ Strongly Disagree
○ Disagree
○ Neither disagree or agree
○ Agree
○ Strongly Agree
64. There are an adequate number of services in the community to meet the needs of older adults
○ Strongly Disagree
○ Disagree
○ Neither disagree or agree
○ Agree
○ Strongly Agree
A16

65. What are the top three needs for older adults in the community that should be addressed?
Instructions: Please rank your selections by typing 1, 2, or 3 in the box next to your choice. A 1 shows the most important, a 2 shows the second important, and a 3 shows the third important. You will only be able to rank three choices.
___Medical care
___Dental care
___Vision care
___Affordable prescriptions
___Independent living in the home
___Independent living in a retirement community
___Assisted living options
___Long term care facility options
___Memory care options/dementia support
___Home health care options
___Affordable housing
___Day programs
___Caregiver support groups
___Health insurance
___Mental health services
___Legal services
___Personal care services
___Respite services for caregivers
___Access to daily meals
___Utility assistance
___Safety
___Employment
___Finances/Income
___Ease of mobility in the community
___Transportation
___Hospice care
___Elder abuse
___Substance abuse
___Other (please specify) ______________
66. Are you a caregiver of an older adult (spouse, parent, grandparent, etc.)? If NO, skip to question 69.
○ Yes
○ No
67. If you are the caregiver of an older adult, are you receiving the supportive services you need?
○ Yes
○ No
68. If you are not receiving the services that could support you in your caregiver role what services do you need? Please write in your response.
_____________________________________________________________________________________________________________________________________________________________________________________________________________
A17
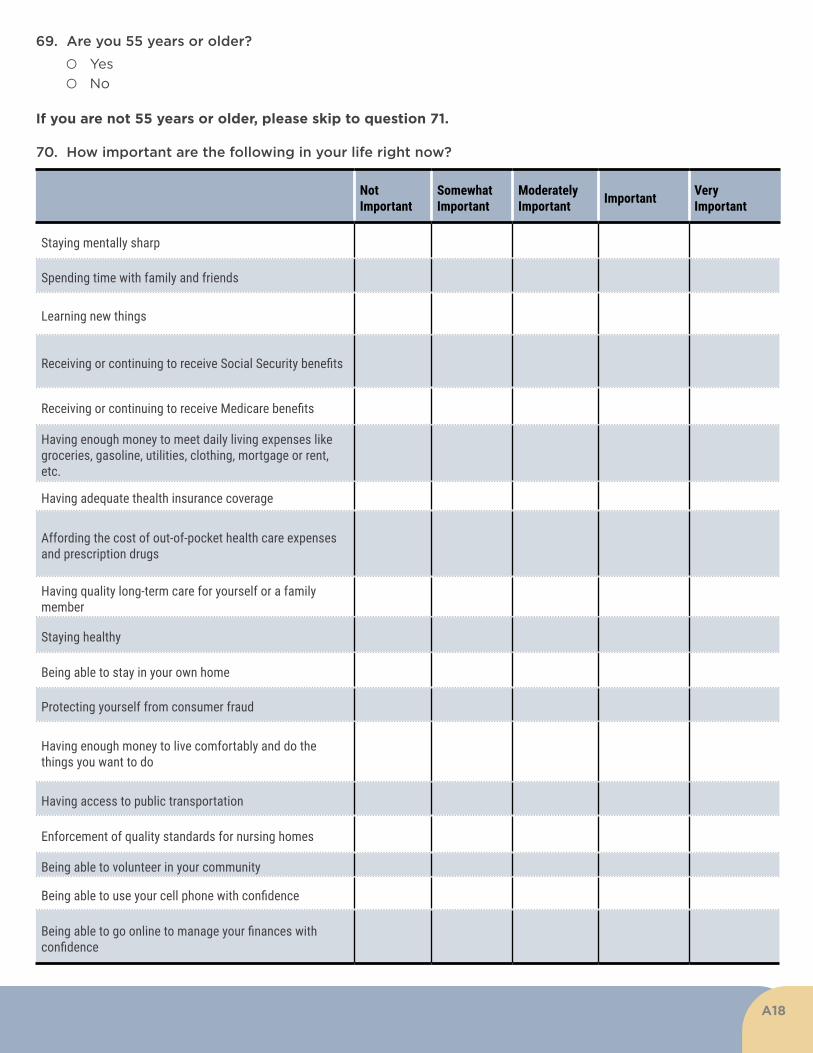
69. Are you 55 years or older?
○ Yes
○ No
If you are not 55 years or older, please skip to question 71.
70. How important are the following in your life right now?
Not Important
Somewhat Important
Moderately Important Important Very
Important
Staying mentally sharp
Spending time with family and friends
Learning new things
Receiving or continuing to receive Social Security benefits
Receiving or continuing to receive Medicare benefits
Having enough money to meet daily living expenses like groceries, gasoline, utilities, clothing, mortgage or rent, etc.
Having adequate thealth insurance coverage
Affording the cost of out-of-pocket health care expenses and prescription drugs
Having quality long-term care for yourself or a family member
Staying healthy
Being able to stay in your own home
Protecting yourself from consumer fraud
Having enough money to live comfortably and do the things you want to do
Having access to public transportation
Enforcement of quality standards for nursing homes
Being able to volunteer in your community
Being able to use your cell phone with confidence
Being able to go online to manage your finances with confidence
A18
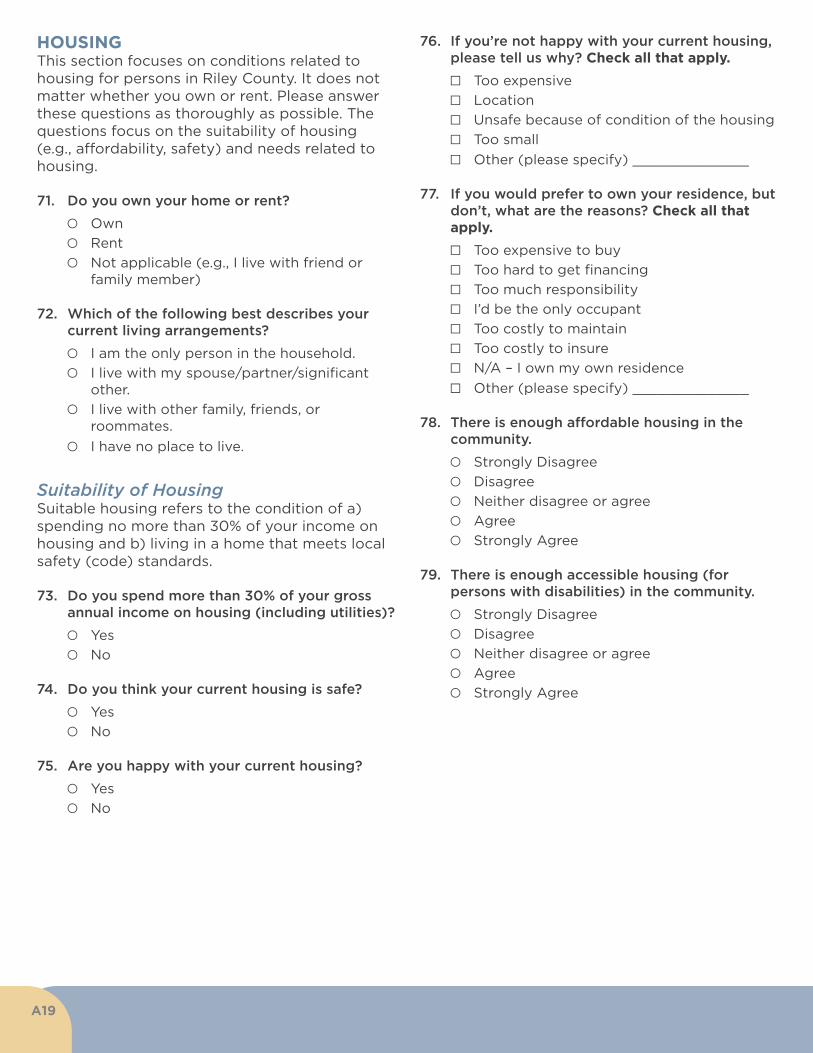
HOUSINGThis section focuses on conditions related to housing for persons in Riley County. It does not matter whether you own or rent. Please answer these questions as thoroughly as possible. The questions focus on the suitability of housing (e.g., affordability, safety) and needs related to housing.
71. Do you own your home or rent?
○ Own
○ Rent
○ Not applicable (e.g., I live with friend or family member)
72. Which of the following best describes your current living arrangements?
○ I am the only person in the household.
○ I live with my spouse/partner/significant other.
○ I live with other family, friends, or roommates.
○ I have no place to live.
Suitability of HousingSuitable housing refers to the condition of a) spending no more than 30% of your income on housing and b) living in a home that meets local safety (code) standards.
73. Do you spend more than 30% of your gross annual income on housing (including utilities)?
○ Yes
○ No
74. Do you think your current housing is safe?
○ Yes
○ No
75. Are you happy with your current housing?
○ Yes
○ No
76. If you’re not happy with your current housing, please tell us why? Check all that apply.
☐ Too expensive
☐ Location
☐ Unsafe because of condition of the housing
☐ Too small
☐ Other (please specify) ______________
77. If you would prefer to own your residence, but don’t, what are the reasons? Check all that apply.
☐ Too expensive to buy
☐ Too hard to get financing
☐ Too much responsibility
☐ I’d be the only occupant
☐ Too costly to maintain
☐ Too costly to insure
☐ N/A – I own my own residence
☐ Other (please specify) ______________
78. There is enough affordable housing in the community.
○ Strongly Disagree
○ Disagree
○ Neither disagree or agree
○ Agree
○ Strongly Agree
79. There is enough accessible housing (for persons with disabilities) in the community.
○ Strongly Disagree
○ Disagree
○ Neither disagree or agree
○ Agree
○ Strongly Agree
A19

TRANSPORTATIONThis section focuses on the availability and use of transportation in Riley County. It includes questions that ask about your own transportation options and those in the community as well as overall needs.
81. Which of the following types of transportation do you use to get around your community: Check all that apply.
☐ A car, truck, or motorcycle you own or have use of
☐ Ride sharing (i.e., vanpool or carpool)
☐ Public transportation (e.g., bus, van, etc.)
☐ One of the ride services, Uber or Lyft
☐ Taxi
☐ Horse
☐ A friend or relative
☐ Bicycle
☐ Walk
☐ Other (please specify)___________________
☐ N/A – I don’t need transportation
82. Of the transportation types above, which one do you use most frequently? Check ONLY one.
○ A car, truck, or motorcycle you own or have use of
○ Ride sharing (i.e., vanpool or carpool)
○ Public transportation (e.g., bus, van, etc.)
○ One of the ride services, Uber or Lyft
○ Taxi
○ Horse
○ A friend or relative
○ Bicycle
○ Walk
○ Other (please specify)_______________
○ N/A – I don’t need transportation
83. Estimate how often you have reliable transportation to get you to the places you want to go
○ None of the time
○ Some of the time
○ Most of the time
○ All of the time
○ I don’t need transportation
80. What are the top three needs related to housing in the community that should be addressed?
Instructions: Please rank your selections by typing 1, 2, or 3 in the box next to your choice. A 1 shows the most important, a 2 shows the second important, and a 3 shows the third important. You will only be able to rank three choices.
___Education about responsible homeownership
___Education about financing options for homeownership
___Higher quality rentals
___Senior housing
___Low-income housing assistance (Section 8)
___Neighborhood improvement programs
___Code enforcement (e.g. overgrown lawns, broken windows, trash, etc.)
___Assistance with property repair and maintenance
___Variety of affordable housing options
___Historic preservation
___Quality housing
___Safe housing
___Affordable housing
___Accessible housing (for persons with disabilities)
___Other (please specify) ___________________
A20

84. There are multiple transportation options in the community
○ Yes
○ No
○ N/A – I don’t need transportation
85. I have access to the transportation I need to get around the community
○ Yes
○ No
○ N/A – I don’t need transportation
86. Do transportation issues regularly prevent you from doing what you need or want to do?
○ Yes
○ No
87. What are the top three needs related to transportation in your community that should be addressed?
Instructions: Please rank your selections by typing 1, 2, or 3 in the box next to your choice. A 1 shows the most important, a 2 shows the second important, and a 3 shows the third important. You will only be able to rank three choices.
___Widen existing roads
___Build new roads
___Provide maintenance and improvements to existing roadways (including intersections or interchanges, pavement of gravel roads, potholes, bridge repairs, etc.)
___Improve traffic signals
___Improve public transit service (including increased service hours, shorter wait times, more routes, bus shelters, benches, etc.)
___Improve driver education
___Develop a pedestrian friendly transportation system to make areas more walkable (improve sidewalks, crosswalks, signals, etc.)
___Expand and improve the bike route system (bike paths, bike lanes) to increase the number of people who bike as a form of transportation
___Increase specialized transportation services for people with disabilities and/or special needs
___Address texting and driving
___Increase options for overnight public parking
___Expand local taxi services
___Other___________________
ECONOMICS AND PERSONAL FINANCES This section focuses on your perceptions of your own economic and financial situation as well as within the community in general. It also includes questions about employment and taxes as well as needs related to economics and personal finance.
88. The overall local economy is doing well.
○ Yes
○ No
89. How satisfied are you with your current financial situation?
○ Not at all satisfied
○ Barely satisfied
○ Somewhat satisfied
○ Mostly satisfied
○ Very satisfied
90. How optimistic are you about your personal financial future?
○ Not at all optimistic
○ Barely optimistic
○ Somewhat optimistic
○ Mostly optimistic
○ Very optimistic
91. In a typical month, how difficult is it for you to cover your expenses?
○ Very Difficult
○ Difficult
○ Neither difficult or easy
○ Easy
○ Very Easy
○ N/A
92. Do you make enough money to save for the future?
○ Yes
○ No
○ N/A – I don’t work
A21
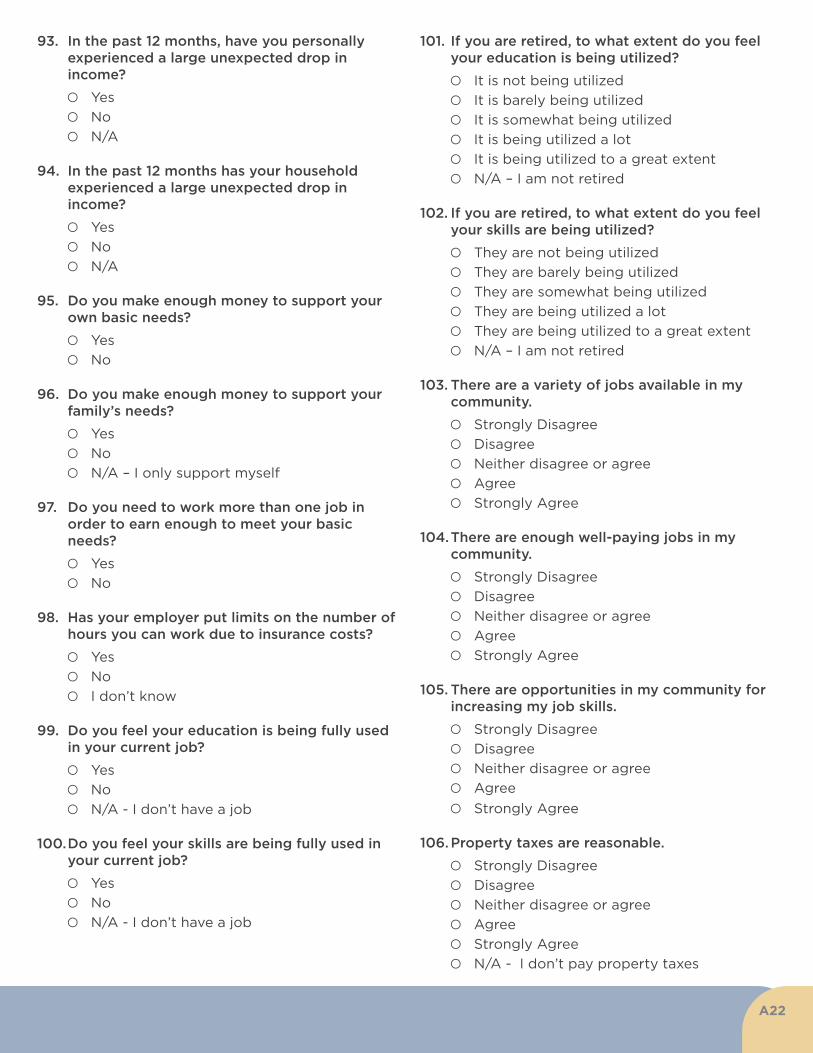
93. In the past 12 months, have you personally experienced a large unexpected drop in income?
○ Yes
○ No
○ N/A
94. In the past 12 months has your household experienced a large unexpected drop in income?
○ Yes
○ No
○ N/A
95. Do you make enough money to support your own basic needs?
○ Yes
○ No
96. Do you make enough money to support your family’s needs?
○ Yes
○ No
○ N/A – I only support myself
97. Do you need to work more than one job in order to earn enough to meet your basic needs?
○ Yes
○ No
98. Has your employer put limits on the number of hours you can work due to insurance costs?
○ Yes
○ No
○ I don’t know
99. Do you feel your education is being fully used in your current job?
○ Yes
○ No
○ N/A - I don’t have a job
100. Do you feel your skills are being fully used in your current job?
○ Yes
○ No
○ N/A - I don’t have a job
101. If you are retired, to what extent do you feel your education is being utilized?
○ It is not being utilized
○ It is barely being utilized
○ It is somewhat being utilized
○ It is being utilized a lot
○ It is being utilized to a great extent
○ N/A – I am not retired
102. If you are retired, to what extent do you feel your skills are being utilized?
○ They are not being utilized
○ They are barely being utilized
○ They are somewhat being utilized
○ They are being utilized a lot
○ They are being utilized to a great extent
○ N/A – I am not retired
103. There are a variety of jobs available in my community.
○ Strongly Disagree
○ Disagree
○ Neither disagree or agree
○ Agree
○ Strongly Agree
104. There are enough well-paying jobs in my community.
○ Strongly Disagree
○ Disagree
○ Neither disagree or agree
○ Agree
○ Strongly Agree
105. There are opportunities in my community for increasing my job skills.
○ Strongly Disagree
○ Disagree
○ Neither disagree or agree
○ Agree
○ Strongly Agree 106. Property taxes are reasonable.
○ Strongly Disagree
○ Disagree
○ Neither disagree or agree
○ Agree
○ Strongly Agree
○ N/A - I don’t pay property taxes
A22
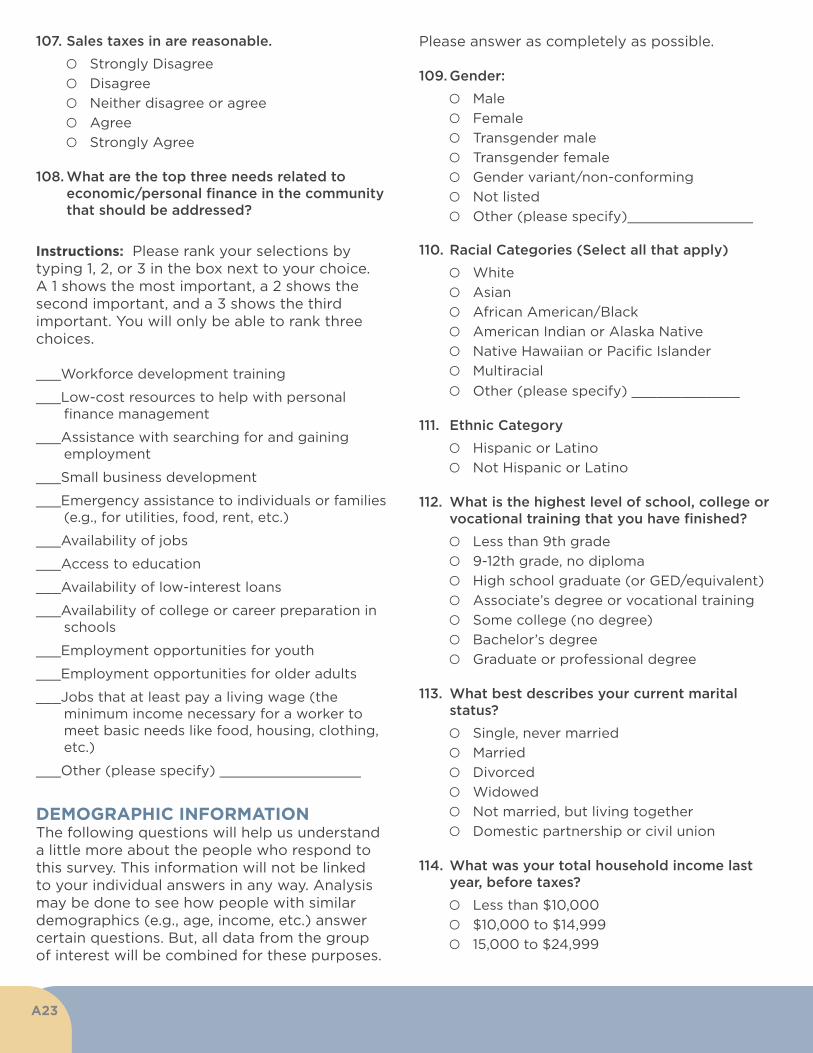
107. Sales taxes in are reasonable.
○ Strongly Disagree
○ Disagree
○ Neither disagree or agree
○ Agree
○ Strongly Agree
108. What are the top three needs related to economic/personal finance in the community that should be addressed?
Instructions: Please rank your selections by typing 1, 2, or 3 in the box next to your choice. A 1 shows the most important, a 2 shows the second important, and a 3 shows the third important. You will only be able to rank three choices.
___Workforce development training
___Low-cost resources to help with personal finance management
___Assistance with searching for and gaining employment
___Small business development
___Emergency assistance to individuals or families (e.g., for utilities, food, rent, etc.)
___Availability of jobs
___Access to education
___Availability of low-interest loans
___Availability of college or career preparation in schools
___Employment opportunities for youth
___Employment opportunities for older adults
___Jobs that at least pay a living wage (the minimum income necessary for a worker to meet basic needs like food, housing, clothing, etc.)
___Other (please specify) _________________
DEMOGRAPHIC INFORMATIONThe following questions will help us understand a little more about the people who respond to this survey. This information will not be linked to your individual answers in any way. Analysis may be done to see how people with similar demographics (e.g., age, income, etc.) answer certain questions. But, all data from the group of interest will be combined for these purposes.
Please answer as completely as possible.
109. Gender:
○ Male
○ Female
○ Transgender male
○ Transgender female
○ Gender variant/non-conforming
○ Not listed
○ Other (please specify)_______________
110. Racial Categories (Select all that apply)
○ White
○ Asian
○ African American/Black
○ American Indian or Alaska Native
○ Native Hawaiian or Pacific Islander
○ Multiracial
○ Other (please specify) _____________
111. Ethnic Category
○ Hispanic or Latino
○ Not Hispanic or Latino
112. What is the highest level of school, college or vocational training that you have finished?
○ Less than 9th grade
○ 9-12th grade, no diploma
○ High school graduate (or GED/equivalent)
○ Associate’s degree or vocational training
○ Some college (no degree)
○ Bachelor’s degree
○ Graduate or professional degree 113. What best describes your current marital
status?
○ Single, never married
○ Married
○ Divorced
○ Widowed
○ Not married, but living together
○ Domestic partnership or civil union
114. What was your total household income last year, before taxes?
○ Less than $10,000
○ $10,000 to $14,999
○ 15,000 to $24,999
A23
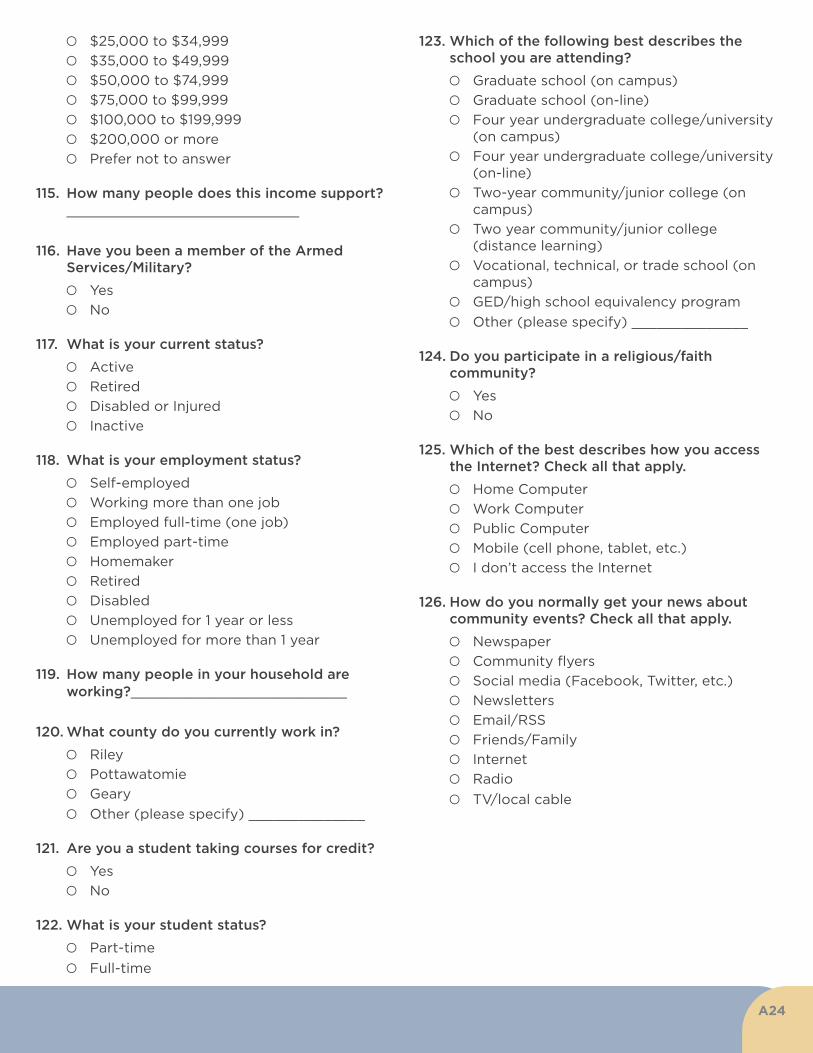
○ $25,000 to $34,999
○ $35,000 to $49,999
○ $50,000 to $74,999
○ $75,000 to $99,999
○ $100,000 to $199,999
○ $200,000 or more
○ Prefer not to answer
115. How many people does this income support? ____________________________
116. Have you been a member of the Armed Services/Military?
○ Yes
○ No
117. What is your current status?
○ Active
○ Retired
○ Disabled or Injured
○ Inactive 118. What is your employment status?
○ Self-employed
○ Working more than one job
○ Employed full-time (one job)
○ Employed part-time
○ Homemaker
○ Retired
○ Disabled
○ Unemployed for 1 year or less
○ Unemployed for more than 1 year
119. How many people in your household are working?__________________________
120. What county do you currently work in?
○ Riley
○ Pottawatomie
○ Geary
○ Other (please specify) ______________
121. Are you a student taking courses for credit?
○ Yes
○ No
122. What is your student status?
○ Part-time
○ Full-time
123. Which of the following best describes the school you are attending?
○ Graduate school (on campus)
○ Graduate school (on-line)
○ Four year undergraduate college/university (on campus)
○ Four year undergraduate college/university (on-line)
○ Two-year community/junior college (on campus)
○ Two year community/junior college (distance learning)
○ Vocational, technical, or trade school (on campus)
○ GED/high school equivalency program
○ Other (please specify) ______________
124. Do you participate in a religious/faith community?
○ Yes
○ No
125. Which of the best describes how you access the Internet? Check all that apply.
○ Home Computer
○ Work Computer
○ Public Computer
○ Mobile (cell phone, tablet, etc.)
○ I don’t access the Internet
126. How do you normally get your news about community events? Check all that apply.
○ Newspaper
○ Community flyers
○ Social media (Facebook, Twitter, etc.)
○ Newsletters
○ Email/RSS
○ Friends/Family
○ Internet
○ Radio
○ TV/local cable
A24
Other Comments
Please share any additional comments about the community here:_____________________________________________________________________________________________________________________________________________________________________________________________________________
Thank you for your participation.
Appendix C: Interview Questions
1. Please provide us with some background on how you’re engaged in your community (i.e., how involved are you, in what roles?).
2. Are you mainly involved in Manhattan or in other communities in Riley Co?
3. How would you describe Riley County as a place to live and work?
4. What are the strengths?
5. What are concerns/challenges?
6. When you think about the future of Riley County what opportunities do you see?
7. When you think about the future of Riley County what concerns you the most?
8. Over the next five years, what do you think could be done to address this?
9. If you had to identify the number one need in Riley County, what would it be and what would you want to be done about it?
10. Anything else you’d like to tell us about the current state of Riley County or needs in the community?
Appendix D: Focus Group Questions1. Are these findings/results consistent with
your experiences in the community? What similarities/differences are there between your experiences and what is presented here?
2. What stands out to you in these findings/results?
3. Based on these findings and/or your experience, what do you see as the biggest strengths in the community?
4. Based on these findings and/or your experience, what do you see as the biggest needs in the community?
Appendix E: Additional CommentsRespondents to the survey were given space to offer any additional comments about Riley County needs. A total of 219 participants left comments in this space. Some were about the survey itself, noting it’s lengthiness or concerns about whether respondents would be representative of the community. Otherwise, after theming all comments by noting each issue mentioned within an entry (e.g., if someone wrote about taxes, healthcare, and schools, those would be included as three separate issues), the following are the top concerns from this open-ended question. These comments largely reflect the overall findings from the survey, interviews, and focus groups.
1. The cost of living is too high, which is driven by high sales and property taxes, lack of living wage jobs, expensive housing, and too much government spending on such things as bringing in new “big box” businesses rather than on infrastructure, supporting local businesses, and repairing/upgrading roads and/or sidewalks.
2. High quality of life, which includes safety, good schools, and recreation/entertainment options. However, it was noted that the quality of life is good for those with money but not so for those who have lower incomes.
A25
3. Concerns about children and youth, including overly expensive childcare, lack of afterschool activities, and the need for improvements in schools (e.g., overcrowding, need for mental health and other services for students, and addressing bullying and substance abuse).
4. Need for improved or more available physical and mental health care, including higher quality and more services through the hospital, access to specialists, and increased availability of mental health services for children and adults.
5. Need for recreation options including an indoor pool, community recreation center, or other low cost physical activities that are accessible to anyone.
6. Need for more and better coordinated services for persons with low incomes or other needs. This includes increased services for persons with disabilities or mental health issues and those who are homeless or are non-English speaking or undocumented.
7. Other issues that were mentioned frequently were: increased/improved law enforcement, including for traffic laws and drunkenness; improved access to services in the county, especially ambulance and other medical services; increased/improved services for older adults, including respite for caregivers and more middle-income retirement communities; and expanded public transportation, including more routes later in the evening and into the county.
Finally, the following were mentioned less than five times each and didn’t readily fit into the themes above:
• Clean up Aggieville (e.g., curb drinking events such as Fake Paddies day, make it a more attractive environment)
• Flooding
• Harassment in workplaces and of LGBTQ persons
• Manhattan is an “Old Boys Club” where progress is stopped
• Decline in enrollment at KSU
• Need more diversity, especially in government
• Need a summer theater program
• Need to support healthy marriages/families
• Need to teach financial literacy
• Need more neighborhood programs
• Need better access to local news and information about the community
• Need to address climate change
• Need more grocery stores
• Manhattan is more than a college town and other resources should be recognized
• Need more trees
• There’s no place to hunt
• There’s too much political correctness
Appendix F: Sources of Data and ReferencesThe following online sources were used in the compilation of secondary data. The references listed below were cited to support methodological approaches.
DATA SOURCES
BRFSS (Behavioral Risk Factor Surveillance System)
• http://www.kdheks.gov/brfss/BRFSS2013/index.html
Centers for and Medicaid Services
• http://www.cms.gov/Research-Statistics-Data-and-Systems/Statistics-Trends-and-Reports/Chronic-Conditions/CC_Main.html
• http://www.cms.gov/Research-Statistics-Data-and-Systems/Statistics-Trends-and-Reports/MedicareEnrpts/Downloads/County2012.pdf
• County Health Rankings
• https://www.countyhealthrankings.org
Feeding America
A26
• https://www.countyhealthrankings.org
Kansas Bureau of Investigation
• http://www.kansas.gov/kbi/stats/stats.shtml
Kansas Communities that Care Survey
• http://kctcdata.org/domain.aspx?code=10081
Kansas Department for Children and Families
• http://www.dcf.ks.gov/Pages/default.aspx
Kansas Health Institute
• https://www.khi.org
Kansas Health Matters
• http://www.kansashealthmatters.org
Kansas Department for Aging and Disability Services
• https://www.kdads.ks.gov
KBI Crime Index 2018
• http://www.kansas.gov/kbi/stats/stats_crime.shtml
Kansas Health Matters
• http://www.kansashealthmatters.org/modules.php?op=modload&name=NS-Indicator&file=index&topic=0&topic1=County&topic2=Riley&group=category®name=Riley
Kansas Kids Count
• http://kac.org/county-fact-sheets/ Kids Count Data Center
• http://datacenter.kidscount.org/data#KS/5/0
KS Cancer Registry
• http://www.kumc.edu/kcr/zsearch.aspx
National Highway Traffic Safety Administration
• https://www.nhtsa.gov
Robert Wood Johnson Foundation County Health Rankings
• http://www.countyhealthrankings.org/app/kansas/2014/rankings/riley/county/outcomes/overall/snapshot
US Census Bureau American Community Survey
• data.census.gov
US Census Bureau State and County QuickFacts
• https://www.census.gov/quickfacts/fact/table/US/PST045219
ReferencesCreswell, J.W., Hanson, W.E., Clark Plano, V.L., & Morales, A. (2007). Qualitative research designs selection and implementation. The Counseling Psychologist, 35, 236-264.
Guest, G., MacQueen, K.M. & Namey, E.E. (2011) Applied thematic analysis. Sage Publications, Incorporated, Thousand Oaks.
McGeeney, K., Kriz, B., Mullenax, S., Kail, L.,…Trejo, Y. G. (2019). 2020 Census Barriers, Attitudes, and Motivators Study Survey Report : A New Design for the 21st Century (Version 2.0). Retrieved from: https://www2.census.gov/programs-surveys/decennial/2020/program-management/final-analysis-reports/2020-report-cbams-study-survey.pdf
Patton, M.Q. (1999). Enhancing the quality and credibility of qualitative analysis. Health services research, 34, 1189 - 1208.About the Community Engagement Institute
A27

A28

About the Community Engagement Institute
Wichita State University’s Community Engagement Institute is dedicated to improving the health of Kansans through leadership development, research and evaluation, organizational capacity building, community collaboration, and public health and behavioral health initiatives. The Community Engagement Institute maintains six Centers with skilled staff that work directly with community coalitions, nonprofits, government entities, health and human services organizations, and support groups. The Centers are:
• Center for Applied Research and Evaluation
• Center for Behavioral Health Initiatives
• Center for Leadership Development
• Center for Organizational Development and Collaboration
• Center for Public Health Initiatives
• IMPact Center
Want to know more about this report? Contact Dr. Tara Gregory at [email protected]