hotel needs assessment report
94
HOTEL NEEDS ASSESSMENT REPORT Proposed Burk's Falls Hotel Burk’s Falls, Ontario CBRE File No. :: 17-APPRHOTELS-0002 Prepared for: David Gray Community Economic Development Officer 172 Ontario Street Burk's Falls, Ontario, P0A 1C0
-
Upload
khangminh22 -
Category
Documents
-
view
2 -
download
0
Transcript of hotel needs assessment report

HOTEL NEEDS ASSESSMENT REPORT
Proposed Burk's Falls Hotel Burk’s Falls, Ontario CBRE File No. :: 17-APPRHOTELS-0002
Prepared for: David Gray Community Economic Development Officer 172 Ontario Street Burk's Falls, Ontario, P0A 1C0


CBRE Limited Valuation & Advisory Services 145 King St. W., Suite 1100 Toronto, ON, M5H 1J8 647.943.3740 Tel 416.362.8085 Fax www.cbre.ca CBRE File No. :: 17-APPRHOTELS-0002
March 10, 2017 Mr. David Gray Community Economic Development Officer 172 Ontario Street Burk's Falls, Ontario, P0A 1C0 RE: Hotel Needs Assessment, Proposed Hotel, Burk's Falls
Dear Mr. Gray,
At your request and authorization, CBRE Limited has completed the research and analysis relating to the preliminary assessment of the potential for new hotel development in Burk's Falls, Ontario. At this time Burk's Falls & Area Community Economic Development (the ‘Client’), is looking to understand the economic viability of new hotel development in Burk's Falls with an interest in attracting third party developers should new hotel development be economically feasible.
The purpose and intended use of this report is to determine the level of market and economic support for a potential hotel development within Burk's Falls, Ontario.
This report is for public consumption and may be distributed by the Community Economic Development Office to interested parties. The intended use of the report is to assist the Client, in attracting potential hotel/accommodation investment. As the conclusions offered in this report are preliminary in nature, and are subject to change should a specific site and hotel development program be identified; the report cannot be relied upon, by any person or entity other than the Client, without the express prior written consent of CBRE, and the individual(s) who authored the Advisory Report. The report is subject to the Assumptions and Limiting Conditions in Addendum A.
The projections are based on a review of market information and interviews with market participants. The entire study, including all findings and conclusions, pertains to the Burk's Falls market area and is based on our knowledge and information with respect to current and projected economic data, expected growth in the supply of and demand for hotel accommodation, proposed construction of facilities, which could be deemed to be competitive, and the status of the competitive market as at the completion of our field work on January 27, 2017. Our conclusions presented in this report are reflective of this fieldwork date.

As in all studies of this type, the projected operating results are based on competent and efficient management and presume no significant change in the competitive position of the accommodation industry in the immediate area except as set forth in this report. The estimates are subject to uncertainty and variation and we do not represent them as results that will be achieved. They have, however, been conscientiously prepared on the basis of available information and our experience in the industry.
The purpose and intended use of this report is to determine the level of market and economic support for a potential hotel development in Burk's Falls, Ontario. The conclusions offered in this report are preliminary in nature, and could be subject to change should a specific site and hotel development program be identified.
If you have any further questions concerning our analysis, or if CBRE Limited can be of further assistance to you, please contact us.
Respectfully submitted,
Brian Stanford, CMC, ISHC Senior Managing Director CBRE Hotels Valuation & Advisory Services CBRE Limited Phone: 647.943.3741

TABLE OF CONTENTS
Introduction ...............................................................................................4
Executive Summary .....................................................................................8
Project Overview ..................................................................................... 14 Project overview 15
Economic Overview ................................................................................. 17 Province of Ontario Economic Overview 18 District of Parry Sound Economic Overview 22 Burk’s Falls Economic Overview 23 Regional Map 29
Competitive Market Analysis..................................................................... 30 Provincial Market Analysis 31 Local Area Accommodation Market 32 Competitive Market Analysis 38 Market Segmentation Analysis 42
Future Demand Factors ........................................................................... 46 Future Demand Factors 47
Development Overview ............................................................................ 50 Development Overview 51 Map of Potential Locations 54
Competitive Market Projections ................................................................. 59 Competitive Market Projections 60
Subject Property Projections ...................................................................... 63 Subject Property Occupancy and Rate Projections 64 Projected Operating Results 72
Investment Analysis ................................................................................. 82 Investment Analysis 83 Implications 84

Introduction
Intr
od
uct
ion
: Pr
op
ose
d B
urk
's F
alls
Ho
tel

Proposed Hotel, Burk's Falls, Ontario
INTRODUCTION 5
VALUATION & ADVISORY SERVICES
INTRODUCTION
In December 2016, CBRE Hotels was retained by the Burk's Falls & Area Community Economic Development to prepare a Market Study in order to assess the market potential for a hotel development in Burk's Falls, Ontario.
Through our initial consultation with Community Economic Development officials, it was clearly communicated that community members have consistently expressed a need for a hotel located immediately within the Village or Burk’s Falls or the surrounding area. Public consultation resulted in qualitative feedback that noted numerous circumstances for which a lodging facility in the immediate area would satisfy the local need for accommodation generated by various demand sources such as local corporate businesses, visiting family or friends, sporting events, tourists, or meetings and events.
With much of the existing lodging demand currently utilizing accommodations in nearby communities – most notably Huntsville - there was a consensus among council and community members that a hotel development within Burk’s Falls, Armour or Ryerson would help to capture the revenue and potential tourist spending being lost due to the current lack of satisfactory overnight accommodations in the immediate area.
In our experience a hotel development can provide meaningful economic impact for communities, by generating more spending in the local market, providing jobs, enhancing the attractiveness of a community and thereby increasing visitation or spurring on other forms of commercial/retail development. Given the growing level of civic commentary on this issue, it was pertinent for the community to undertake an independent study to determine the viability and market support for a hotel development in Burk’s Falls or the surrounding area at this time.
Typically, if a community is going to be successful in attracting private sector hotel investment, a comprehensive and independent third party assessment of the opportunity is required. The hotel investment community is exposed to a wide range of projects, and has many communities soliciting their development interest. They are looking for formal independent confirmation that a project has merit. Typical hotel investors have several key criteria they consider when determining how/where to invest their funds, the most important of which are:
1. Return on Investment: Return on Investment measures the gain or loss generated on an investment relative to the amount of money invested. Hospitality property is considered to be a secondary form of real estate investment due to its specialized nature, requirement for strong management and higher risk associated with the income stream. Investors require a higher rate of return on hospitality property as compared to more traditional real estate investments. Our experience in the industry indicates that typical hotel investors expect a return on investment in the range of 10% to 15%, far higher than what is characteristic of other real estate classes.

Proposed Hotel, Burk's Falls, Ontario
INTRODUCTION 6
VALUATION & ADVISORY SERVICES
2. Availability and Likelihood of Financing: The availability and cost of financing has a direct impact on the value of a hotel, and hence hotel financing parameters play an integral role in the feasibility of new hotels. In today’s lending environment, obtaining financing on a non-branded asset is highly challenging. The support of large, well run international brand reduces the performance risk of an asset with the premier brands almost always outperforming second tier brands or independent hotels. In addition, the support of a large brand / reservation system and national marketing network, also makes a hotel asset much less vulnerable to new supply. Further, when considering construction financing on new build assets, lenders will finance on the lower of capital cost or estimated market value ~ which directly impacts the level of equity required to move a project forward. In the most idea situation, capital cost and estimated market value are equal.
3. Liquidity/Exit Strategy: Both lenders and developers consider the ultimate exit strategy when
evaluating a hotel investment opportunity. Research shows that branding also helps to reduce the liquidity risk of an asset, in the sense that there would be more potential purchasers for product carrying strong brands that are not specific to one owner/operator/developer.
These are critical factors that influence a hotel developer’s investment decision and these should be considered when evaluating the opportunity for attracting hotel development to any community. Throughout the engagement CBRE consistently evaluated the potential for hotel development in Burk’s Falls bearing in mind these “typical” development and investment parameters. All recommendations, such as the size of the project, the nature of the hotel (i.e. branded vs. un-branded) were based on what our experience in the industry has shown would give the community the best means for attracting an interested developer, and ensuring a development with the most long term potential for success is developed, all related to the market and investment factors related to Burk’s Falls.
Base on the factors noted above, and on our market research, it was determined that a 60-80 room branded limited service hotel would be the appropriate option for the community. Based on the critical lender and investment criteria noted above; a branded project of this size/scope/nature would carry the highest likelihood of financing for a potential investor. While development of smaller sized or independent project may be possible, these types of projects are not viewed as “safe” by the lending community overall, as they carry greater risk – particularly with respect to liquidity - which ultimately softens the appeal to private developers who require conventional mortgage financing. Further, a smaller property would do little to enhance the overnight accommodation needs of the community during peak periods.
Based on the study findings, it was determined that there is demand and community support for a hotel development in the community. However, as a result of the seasonality of visitation and the current lack of significant corporate demand generators in the immediate area, the hotel is not projected to generate strong enough cash flow to allow for an investor to generate typical levels of return. Hotels are viewed to be a higher risk class of real estate and as a result, typical hotel investors expect a return on investment in the range of 10% to 15%. Based on the projected stabilized cash flow for the potential hotel development, the Burk’s Falls hotel would generate a return on investment of approximately 5.8% - far below the returns sought by most investors with the means to pursue this level of development. As detailed in the report,

Proposed Hotel, Burk's Falls, Ontario
INTRODUCTION 7
VALUATION & ADVISORY SERVICES
while the potential hotel property is expected to be profitable, the “Supportable Value off Cash Flow” of $3.9 million would also leave a significant shortfall between the expected capital costs of a project of this scope of approximately $7.2 million. This represents a minimum funding gap of approximately $3.3 million, which results in a much higher equity contribution required on behalf of the developer. Overall, the risk-reward element of the project is prohibitive for a potential developer at this time. Should the community continue to grow, and the level of hotel demand be enhanced through an increase in the Village’s corporate base or through enhanced tourism initiatives that extend tourist demand in the shoulder season, it would be worthwhile to explore the impacts on a potential hotel development at that time.
A more detailed overview of the project is summarized in the Executive Summary that follows and in the detailed report.

Executive Summary
Exec
utive
Su
mm
ary
: Pr
op
ose
d B
urk
's F
alls
Ho
tel

Proposed Hotel, Burk's Falls, Ontario
EXECUTIVE SUMMARY 9
VALUATION & ADVISORY SERVICES
EXECUTIVE SUMMARY
Project Overview:
1. CBRE Limited was retained by the Burk's Falls & Area Community Economic Development to prepare a preliminary assessment of the potential for new hotel development in Burk's Falls, Ontario. (Page 15)
2. To assess the feasibility of accommodation development we first considered various forms of accommodation development that might be possible in order to determine the most suitable accommodation product for further analysis. Independent hotel/motel and inn developments were considered, as well as resorts, smaller scale hotels, mid-scale branded hotels and upper scale branded hotels. Our determination of the most suitable product to be considered for development was based on factors which would best satisfy local demand while at the same time would lead to the greatest level of investor interest and support from the traditional lending community. By conducting our analysis on the product type that would have the greatest appeal to the traditional hotel investment market, this allows the community the greatest potential of attracting a serious developer/investor with the capabilities and knowledge to develop a successful hotel operation. (Page 15)
3. For the purposes of this analysis it is assumed that the hotel property would be developed and fully operational by January 1, 2020. (Page 15)
Competitive Market Overview
4. To assess the potential performance of the proposed hotel we have considered a regional competitive market including the communities of North Bay, Parry Sound, and Huntsville. The Village of Burk’s Falls is centrally located between these three markets and would compete within this regional area. This market includes approximately 2,009 rooms and is comprised of focused service, limited service, and full service or boutique/inn properties, as well as some resort properties. (Page 39)
5. Demand for hotels in the competitive market is dominated by the corporate and leisure segments, which combined, generate an estimated 72.5% of occupied room nights. The market does have a solid base of government/crew demand with this segment generating about 14% of occupied room nights. The meeting/conference market accounts for an estimated 13.5% of annual occupied room nights. (Page 42)
6. Major corporate demand generators in some of these competitive markets include manufacturing plants, corporation and local business headquarters, and other commercial and industrial businesses. In addition, North Bay is home to a number of mining and natural resource extraction based businesses and a military base. (Page 43)
7. The tourist/leisure market segment is the most significant driver of occupied room night demand within the regional competitive market. This demand is generated primarily by recreational tourism in both the summer and winter seasons and is supported in large part by the outdoor recreational activities that are offered in the area. (Page 44)
8. Annual occupancy for the competitive market has fluctuated over the past five years from a low of 50.4% to a high of 56.4%. Occupancy levels have been improving in recent years, with most of this increase driven by the leisure market. The significant strengthening of the US dollar in recent years has had a positive impact on domestic travel in Canada. Canadians that would have travelled to the US for vacation are increasingly making plans to travel domestically. Given that Ontarians have a high propensity to travel within their home province, this trend has had a positive impact on hotel performance in many markets including the subject regional market. Average Daily Rates for the competitive market have followed a similar pattern as occupied room night demand, and has also increased strongly in the last two years. (Page 40)

Proposed Hotel, Burk's Falls, Ontario
EXECUTIVE SUMMARY 10
VALUATION & ADVISORY SERVICES
Development Overview:
9. Based on information gathered from our research and stakeholder interviews, it is our opinion that the most appropriate development for the community of Burk’s Falls would be a smaller sized (60 rooms to 80 rooms), branded, limited service hotel. (Page 56)
10. This type of accommodation development is likely to appeal to the greatest range of travelers and capture demand from a wide variety of market segments. This type of accommodation is also very appealing to the traditional investor and lending community, which typically consider the investment risk and liquidity of a project and are much less likely to finance an unbranded development. In addition, a branded hotel property offers a number of other benefits including brand awareness and loyalty, and the use of a central reservation system which can generate as much as 60% to 70% of total room nights. Branded hotels also offer design and construction prototypes which can lead to lower construction costs. A property in the range of 60 to 80 rooms also allows for the greatest operational efficiencies at the property level. The overhead or fixed costs at the property such as the salaries, property taxes, and marketing costs exist regardless of the size of the property and having a larger number of rooms, and therefore a larger number of occupied rooms and stronger revenue generation, helps to generate stronger cash flow and profits than a smaller operation would. (Page 56)
11. Our analysis contemplates the development of a branded, 60-room Limited Service hotel. Burk's Falls and the surrounding regional area currently contains a variety of demand sources, ranging from construction/work crews and sports teams, to families and couples travelling for recreational purposes, to corporate travelers. These demand sources can vary in terms of the types of services and amenities they would expect in a hotel and how price sensitive they may be. A branded, Limited Service hotel would appeal to the greatest variety of demand sources. (Page 56)
12. The hotel development contemplated herein would offer a mix of guestrooms, a breakfast area, a fitness room, and a convenience market, as well as meeting space to accommodate approximately 30 people. (Page 57)
13. Potential branding options for the proposed hotel would include but are not limited to; Best Western, Comfort Inn, and Microtel Inn & Suites. (Page 56)
YearRooms
Available%
ChangeRooms
Occupied%
ChangeOccupancy Change ADR
% Change
RevPAR%
Change
2012 727,080 - 366,438 - 50.4% - $122.29 - $61.63 -
2013 734,196 1.0% 380,063 3.7% 51.8% 1.4 $118.94 -2.7% $61.57 -0.1%
2014 738,395 0.6% 375,803 -1.1% 50.9% -0.9 $120.28 1.1% $61.21 -0.6%
2015 733,285 -0.7% 387,628 3.1% 52.9% 2.0 $127.22 5.8% $67.25 9.9%
2016 733,285 413,568 6.7% 56.4% 3.5 $129.33 1.7% $72.94 8.5%Compounded Annual
Growth Rate 0.2% 3.1% 2.9% 1.4% 4.3%
Competitive Market Performance Results
Source: CBRE Hotels

Proposed Hotel, Burk's Falls, Ontario
EXECUTIVE SUMMARY 11
VALUATION & ADVISORY SERVICES
14. In recent years, construction costs for assets of this size and scope have fallen in the range of $120,000 to $140,000 per room inclusive of land, which would equate to total costs in the range of $7,200,000 to $8,400,000 for this project (Page 85)
Subject Projections:
15. Based on current and expected market supply/demand dynamics, the proposed hotel, as a Limited Service hotel is projected to achieve the following top line results: (Page 70)
16. The success of transient hotels (like the proposed subject development), is highly contingent on a strong base of Sunday to Thursday demand. In urban centres, the corporate demand segment can account for as much as 50% to 60% of all occupied room nights. While the Village of Burk’s Falls and the surrounding area does have a limited number of corporate, industrial and manufacturing businesses, research indicates that the immediate area lacks significant corporate demand generators. This segment is projected to account for about 20% of occupied room nights, which equates to about 8 to 12 corporate room nights per day over the key 200-250 primary corporate demand days annually upon stabilization. A greater number of corporate demand generators such as major processing and manufacturing facilities in the immediate area would be needed to allow the hotel the opportunity to capture a greater number of occupied room nights from this segment of demand, and to support weekday occupancy levels, particularly during the shoulder seasons. (Page 64)
17. With the exception of the primary resorts like Deerhurst, Grandview and Hidden Valley, few of the competitive hotels in the regional market offer significant levels of meeting space. As a result, there is a limited amount of Meeting/Conference demand within the regional market. Research did indicate that there is a need for event space in the local area for both meetings and social catering events. In addition, there are times when lodging is difficult to find for locally hosted events at the Burks Falls Arena, or the local Legion Hall. The subject hotel is projected to generate demand from both in house meetings/functions as well as from those held at venues off-site. Upon stabilization the hotel is projected to generate an estimated 607 room nights per year from the Meeting/Conference Segment. (Page 65)
18. The Village of Burk’s Falls and the surrounding area has a strong base of recreational leisure tourism demand. As such, the hotel is expected to capture reasonable levels of demand from leisure demand sources and this segment is projected to account for about 56% of total demand. Leisure demand is highly seasonal and tends to be concentrated on weekends and in the summer
Year 1 Year 2 Year 3 Year 4 Year 5 Year 601-Jan-20 01-Jan-21 01-Jan-22 01-Jan-23 01-Jan-24 01-Jan-25
SUBJECT ROOM DEMAND BY SEGMENTCORPORATE 2,134 2,292 2,375 2,375 2,375 2,375 % of Demand 19.04% 19.75% 19.94% 19.94% 19.94% 19.94%MEETING 510 558 607 607 607 607 % of Demand 4.55% 4.81% 5.09% 5.09% 5.09% 5.09%LEISURE 6,420 6,560 6,677 6,677 6,677 6,677 % of Demand 57.27% 56.53% 56.06% 56.06% 56.06% 56.06%OTHER 2,146 2,194 2,252 2,252 2,252 2,252 % of Demand 19.15% 18.91% 18.91% 18.91% 18.91% 18.91%Total Subject Demand 11,210 11,605 11,910 11,910 11,910 11,910 SUBJECT OCCUPANCY 51.2% 53.0% 54.4% 54.4% 54.4% 54.4%Total Rooms Revenue $1,356,363 $1,432,238 $1,499,385 $1,529,372 $1,559,960 $1,591,159SUBJECT ADR $121.00 $123.42 $125.89 $128.41 $130.97 $133.59SUBJECT RevPAR $61.93 $65.40 $68.47 $69.83 $71.23 $72.66Source: CBRE Hotels
Proposed Burk's Falls Hotel Segmentation

Proposed Hotel, Burk's Falls, Ontario
EXECUTIVE SUMMARY 12
VALUATION & ADVISORY SERVICES
months. As a result, the hotel will be limited in the amount of leisure demand it can reasonably capture by its functional capacity in the peak demand periods; however, this segment will still be the strongest source of demand for the property. Upon stabilization, the hotel will attract about 45 to 55 leisure room nights per day over the key 100-150 primary leisure demand days annually. (Page 66)
19. Government/Other demand is projected to represent approximately 19% of total demand for the proposed hotel. Demand sources within this segment include government sources, extended stay guests (5 nights or more) and crews. This segment also captures “walk-in” demand that includes guests that choose to stay at the hotel due to inclement weather conditions, or those that are driving through the area and need a place to stay for the night. Upon stabilization the hotel will attract about 8 to 12 “other” room nights per day over the key 200-250 primary “other” demand days annually. (Page 68)
20. Overall, occupancy for the proposed hotel development is projected to be 51% in Year 1 and to improve to a stabilized occupancy of 54% by Year 3. Average Daily Rate (ADR) for the hotel is projected to be $121 in the first year of operations, increasing to $126 by Year 3. The hotel’s rate positioning is predicated on the hotel being branded as a limited service hotel including but not limited to; Best Western, Comfort Inn, or Microtel Inn & Suites. (Page 70)
21. The proposed hotel is projected to achieve strong weekend occupancy levels in the spring and summer. However, mid-week occupancy, particularly in the off peak periods, will present a significant challenge in achieving sustainable business levels. (Page 70)
22. When evaluating the top line or “occupancy” performance of a new build limited service or focused service hotel traditional hotel operators will most often look for projects with expected annual occupancy at or above 70%. Occupancy results at this level provide a clear indication of adequate demand levels year round and that the property will reasonably be able to capture a adequate number of occupied room nights year-round. (Page 84)
23. The proposed hotel is expected to generate positive cash flow each year over the projection horizon, with Earnings before Interest, Taxes and Amortization (EBITA) ranging from $336,706 in Year 1 to $425,661 by Year 5. As shown in the table below, the hotel is expected to generate profit margins ranging from 24% to 27% after the application of a Management Fee and Reserve for Asset Replacement, which is a typical requirement for hospitality real estate underwriting. (Page 77). While profitable, the profit margins projected for the subject hotel, fall below industry norms for limited service hotels which tend to be in the mid 30% to 40% range. (Page 81)
TOTAL DEMAND occupied room nights 11,910
% demand 100.0%period occupancy 54.4%
Sun-Thur Fri-Sat Sun-Thur Fri-Sat Sun-Thur Fri-Sat Sun-Thur Fri-Satoccupied room nights 11,910 1,604 796 1,719 1,205 2,837 1,257 1,638 884
% demand 100.0% 67% 33% 59% 41% 69% 31% 40% 60%period occupancy 41% 51% 44% 77% 73% 81% 42% 57%
Source: CBRE Hotels
44% 54% 46%20% 25% 34% 21%
2,400 2,923 4,095 2,523
Seasonality and Capacity AnalysisWinter (Jan-Mar) Spring (Apr-Jun) Summer (Jul-Sep) Fall (Oct-Dec)
74%
2020 2021 2022 2023 2024
Gross Revenue $1,395,597 $1,472,719 $1,541,034 $1,571,854 $1,603,291Total Expenes $1,058,891 $1,096,838 $1,131,902 $1,154,540 $1,177,630EBITA $336,706 $375,882 $409,132 $417,315 $425,661
Profit Margin (% Revenue) 24% 26% 27% 27% 27%*Profit Margin = EBITA/Gross Revenue
Proposed Hotel, Burk's Falls - Summary of EBITA

Proposed Hotel, Burk's Falls, Ontario
EXECUTIVE SUMMARY 13
VALUATION & ADVISORY SERVICES
24. Utilizing the projected cash flow, CBRE completed a discounted cash flow analysis (DCF) to estimate the total investment the project could support using market driven investment parameters. Based on the DCF analysis, the project is estimated to be able to support total investment in the range of $3,900,000 or $64,400 per room in 2020 dollars. As noted, in recent years, construction costs for assets of this size and scope have exceeded this level, falling in the range $7.2 Million to $8.4 million, indicating a minimum funding gap of approximately $3.3 million. In effect, should a developer be successful in obtaining financing at a 60% Loan to Value ratio (60% X $3.9 million), the developer would be required to fund the balance of the cost of the project, investing a total of close to $4.9 million (Page 86).
25. As noted, typical hotel investors expect a return on investment in the range of 10% to 15%, taking into consideration the increased levels of risk associated with a hotel operation. From a return perspective, while the project is profitable, the projected cash flows are expected to generate a lower than typical return in the range of 6% by Year 5. (Page 84)
26. A lack of significant Corporate demand generators in the surrounding area will limit the hotel’s ability to capture weekday demand during off-peak periods such as the winter, spring, and fall. The seasonal nature of leisure demand will limit the number of occupied room nights the hotel can reasonably expect to capture from leisure demand sources, as it is highly concentrated on weekends and in the summer months. The viability of the proposed hotel project is questionable in the near-term, due in large part to the lack of a concentration of corporate demand sources and off-peak weekday demand sources. (Page 71)
27. There is also a lack of a “critical mass” of complimentary amenities/services available in the community of Burk’s Falls itself. Generally speaking, hotel developments are often best suited to a location that is in close proximity to support amenities such as restaurants and shopping. Given the greater proportion of these types of services in the competitive communities located within an hour drive of Burk’s Falls, attracting guests – both leisure and corporate – to stay in the subject hotel vs. those in Huntsville or elsewhere will also be a challenge for the property operator.
28. Based on the preceding discussions, although the proposed hotel is projected to operate at similar levels to that of the surrounding market, and will generate a positive cash flow beginning in its first year, the high level of investment required and low level of returns indicated may be deter traditional development interest. At a future point in time, when Sunday to Thursday Corporate/Commercial demand and off-peak midweek Leisure demand levels improve, new hotel development may be able to achieve viable and sustainable occupancy levels (70%+) and generate sufficient cash flows to cover debt service. While it is unlikely that a new hotel development project in Burk’s Falls will be able to attract sufficient development interest at this time, it will be worthwhile to continue to explore this option in the future as market conditions can change. (Page 84)

Project Overview
Pro
ject
Ove
rvie
w:
Pro
po
sed
Bu
rk's
Fa
lls H
ote
l

Proposed Burk's Falls Hotel
INTRODUCTION 15
VALUATION & ADVISORY SERVICES
PROJECT OVERVIEW
In December 2016, CBRE Hotels was retained by the Burk's Falls & Area Community Economic Development to prepare a Market Study in order to assess the market potential for a hotel development in Burk's Falls, Ontario.
It is our understanding that the Burk's Falls & Area Community Economic Development is interested in assessing the market and economic potential for a hotel development with the objective of attracting third party development interest if the project is warranted.
This report presents the research and analysis pertaining to the economic and market potential of a proposed hotel. The analysis herein has assumed an opening date for the subject hotel of January 1, 2020.
The objectives of this assignment have been to:
1. Evaluate the market potential for a proposed hotel development;
2. Recommend a facility program for the proposed subject hotel; and,
3. Project the future occupancy and average daily room rate of the proposed subject hotel over the period of January 1, 2020 to December 31, 2024, allowing for economic conditions as well as supply and demand growth prospects.
In order to complete our analysis, we have undertaken the following steps:
4. A review of economic conditions affecting the demand for accommodation in the market area;
5. A review of accommodation demand trends in the market area;
6. A review of the existing accommodation market in the regional market, including an assessment of the existing facilities and the market demand segmentation;
7. Interviews with local and regional stakeholders;
8. A review of the site considerations to assist in evaluating the suitability for a hotel development from a market perspective;
9. An estimate of future growth in supply of, and demand for, hotel accommodation in the competitive market area;
10. Preparation of room night demand by market segment, occupancy and Average Daily Rate (ADR) projections for a proposed hotel over the projection period of January 1, 2020 to December 31, 2024, based on the recommended facilities, and market orientation;
11. Average daily room rate projections for the subject proposed hotel, over the projection period from January 1, 2020 to December 31, 2024;

Proposed Burk's Falls Hotel
INTRODUCTION 16
VALUATION & ADVISORY SERVICES
12. Preparation of a pro forma operating statement for the project commencing January 1, 2020; and,
13. Documentation of study research, findings and conclusions.
The following pages present a summary of our research and analysis as it relates to the proposed hotel development.

Economic Overview Provincial Economic Overview Local Economic Overview Competitive Market Analysis Supply Demand Analysis
Eco
no
mic
Ove
rvie
w:
Pro
po
sed
Bu
rk's
Fa
lls H
ote
l

Proposed Burk's Falls Hotel
ECONOMIC OVERVIEW 18
VALUATION & ADVISORY SERVICES
PROVINCE OF ONTARIO ECONOMIC OVERVIEW
Ontario is located in Central Canada, bordered by the Great Lakes, Hudson Bay and James Bay. It is Canada's second largest province in total land area. The largest border is with the province of Manitoba to the west and then the province of Quebec to the east. Ontario also shares borders with the U.S. states of Minnesota to the west, New York to the south east, and Michigan to the south west.
Population
The largest concentration of people and cities is in the "Golden Horseshoe" along the western end of Lake Ontario including the Greater Toronto Area, Hamilton, and Niagara Falls. The “Greater Golden Horseshoe” describes the metropolitan area outside the core region and which includes Kitchener-Waterloo area, Barrie, and Peterborough.
In northern Ontario, smaller municipalities have evolved at strategic points along the original railway lines that opened up the wilderness to mining and logging. The cities that have evolved include Kenora, Sudbury, North Bay, Sault Ste. Marie, Thunder Bay and Timmins.
Ontario’s demographics are summarized below:
Ontario Economic Profile
Demographics
Population 2016 Estimate
% of Canadian Total
% Change 2011-2016
Average Annual Growth Rate
2011-2016 13,925,380 38.42% 5.00% 1.00%
Household Income – 2016 Average
% Above/Below National Average
Total Income 2016 Estimate
% Canadian Total
Per Capita
Hhlds. $100,000+
5.84% Above $538,680,878,000 39.01% $38,683 35.30%
Household Spending – 2016 Average % Above/Below National
Average Total Household Spending
2016 Estimate % Canadian
Total Per
Capita Per
Household
10.80% Above $651,214,658,227 40.84% $47,764 $121,720 Source: Sitewise, 2016

Proposed Burk's Falls Hotel
ECONOMIC OVERVIEW 19
VALUATION & ADVISORY SERVICES
Transportation
More than 16,500 km of provincial highways link Ontario's cities and towns, including the Queen Elizabeth Way (QEW) and the 400 series of highways. Highway 401 stretches 820 km from Windsor to the Quebec border, and is one of the busiest roads in the world.
The railways were largely responsible for opening up northern Ontario, beginning in the 1880s when copper and nickel were discovered. Today, railways are important for both passenger and freight service.
The St. Lawrence Seaway makes it possible for freighters to travel between Thunder Bay and the Atlantic Ocean, carrying goods to and from overseas markets.
Ontario is an important province to the Canadian economy, contributing about 41% of Canada's Gross Domestic Product (the total value of all goods and services produced in Canada). In addition, Ontario accounts for almost 60% of all manufactured exports coming out of Canada. Ontario leads the provinces as Canada's manufacturing heartland.
Economic Overview
Notable highlights regarding Ontario’s economic environment are provided below and have been sourced from the Conference Board of Canada, Autumn 2016 Outlook:
1. Ontario consumers are expected to drive growth in the province over the next two years. With
stronger labour markets and employment increasing by 1.1% significant gains in household
disposable income is expected. Wages and salary rates are expected to rise at a rate two-thirds
higher than the Canadian average and an increase in consumer spending and residential
2013 2014 2015 2016F 2017F 2018F 2019F 2020F
Real GDP Growth at Basic Price ($2007) 585,642 600,094 615,300 632,184 646,536 659,913 673,493 688,666 Annual % Change 1.2% 2.5% 2.5% 2.7% 2.3% 2.1% 2.1% 2.3%Population (Thousands) 13,534 13,665 13,782 13,930 14,075 14,220 14,356 14,493 Annual % Change 1.1% 1.0% 0.9% 1.1% 1.0% 1.0% 1.0% 1.0%Employment (Thousands) 6,823 6,877 6,923 7,003 7,104 7,176 7,246 7,317 Annual % Change 1.8% 0.8% 0.7% 1.2% 1.4% 1.0% 1.0% 1.0%Unemployment Rate 7.6% 7.3% 6.8% 6.6% 6.2% 5.9% 5.6% 5.5%Personal Income Per Capita ($) $42,236 $43,275 $44,636 $45,833 $47,036 $48,263 $49,674 $51,113Retail Sales ($ millions) $168,253 $176,719 $184,143 $193,678 $200,663 $207,619 $215,352 $222,841Annual % Change 2.3% 5.0% 4.2% 5.2% 3.6% 3.5% 3.7% 3.5%CPI (Annual Change) 1.1% 2.3% 1.2% 1.9% 2.0% 2.0% 2.1% 2.0%Source: Conference Board of Canada, Autumn 2016
ONTARIO ECONOMIC INDICATORS

Proposed Burk's Falls Hotel
ECONOMIC OVERVIEW 20
VALUATION & ADVISORY SERVICES
construction is expected to occur as a result. Consumer spending was expected to account for over
60% of GDP growth in Ontario in 2016 and 2017.
2. In 2016 weak domestic demand for goods were expected to force Ontario exporters to rely more
heavily on international consumers, which was expected to drive real international exports up by
5.4% in 2016 followed by growth of 2.4% in 2017. As U.S. vehicle sales are believed to have reached their peak in 2015 and are expected to decline over the mid-term, Ontario motor vehicle
production, which exports 90% of its products to the U.S., will feel the impacts of this stagnating
demand. However, the continued low Canadian dollar is expected to continue to provide a boost
to Ontario exporters.
3. Government spending is expected to be weak in Ontario is fiscal austerity measures continue. Real
government spending growth was expected to be constrained to 1.1% in 2016 and 1.5% in 2017
to meet the targeted budget. This is expected to result in weak growth in education spending and health care output.
4. Weak investment intentions and a general weakness in corporate profits was expected to contribute
to a 2.2% decline in real business non-residential investment in 2016. Despite low interest rates,
low corporate profits are limiting the ability of Canadian businesses to make investments. In 2017
as a number of new major office developments begin in Toronto, non-residential investment is
expected to improve and add an estimated $2.2 billion to the provincial economy.
Overall, the Ontario economy was expected to grow by 2.7% in 2016, driven mainly by household consumption. GDP growth is then expected to slow slightly at 2.3% in 2017 as a result of greater weaknesses in auto sector exports. Tourism
In the Autumn of 2016, the Conference Board of Canada released the most recent Travel Market Outlooks for the 2016 to 2020 period. The projections are summarized below.

Proposed Burk's Falls Hotel
ECONOMIC OVERVIEW 21
VALUATION & ADVISORY SERVICES
1. Overnight visits to Ontario are poised for another strong year, with tourism activity supported by gains in consumer spending and the weak exchange rate. An additional boost will be provided by sport events such as the 13th FINA World Swimming Championship and the World Junior Hockey Championships.
2. This year, pleasure travel should benefit from events celebrating the 150th anniversary of Confederation and sports events in different parts of the province. Overall, overnight visits are projected to expand by 2.9% in 2017.
3. Over the forecast horizon, visits to Ontario should benefit from the increased funding for festivals and events across the province.
4. Overseas arrivals to the province are expected to benefit from increased air capacity from emerging source markets.
5. The significant strengthening of the US dollar in recent years has had a positive impact on domestic travel in Canada and Ontario. Canadians that would have travelled to the US for vacation are increasingly making plans to travel domestically. Given that Ontarians have a high propensity to travel within their home province, this trend has had a positive impact on hotel performance and is continued to drive continued growth in the near future.
Ontar io 2016f 2017f 2018f 2019f 2020fTotal ('000s overnight province visits) 54,244 55,804 57,179 58,451 59,646
3.5 2.9 2.5 2.2 2.0Domestic 45,040 46,200 47,231 48,219 49,182
2.6 2.6 2.2 2.1 2.0Business 3,014 3,086 3,157 3,223 3,288
2.1 2.4 2.3 2.1 2.0Pleasure 17,976 18,492 18,934 19,348 19,743
3.0 2.9 2.4 2.2 2.0United States 6,506 6,747 6,936 7,081 7,188
8.1 3.7 2.8 2.1 1.5Overseas 2,698 2,857 3,012 3,150 3,277
8.8 5.9 5.4 4.6 4.0Total Expenditures ($ millions overnight) 16,895 17,890 18,818 19,691 20,560
7.0 5.9 5.2 4.6 4.4Travel Price Index 2.10 2.25 2.05 1.99 2.05Source: The Conference Board of Canada
PROVINCIAL TRAVEL MARKET OUTLOOK

Proposed Burk's Falls Hotel
ECONOMIC OVERVIEW 22
VALUATION & ADVISORY SERVICES
DISTRICT OF PARRY SOUND ECONOMIC OVERVIEW
The Village of Burk’s Falls is located within the District of Parry Sound which is a census division in Ontario. The District covers a land area of approximately 9,300 square kilometers and is bordered by Muskoka to the south, Sudbury District to the north, Nipissing District and North Bay in the east and Algonquin Park to the northeast. The District is bordered by Georgian Bay to the west.
Data relating to the local economy are included on the following table.
The District of Parry Sound is a territorial division and does not have an upper level of municipal administration; all municipalities within the district are governed locally.
The Parry Sound District is considered to be part of Ontario’s cottage country, along with Muskoka and Haliburton, and is a popular recreational destination. The district is divided into West Parry Sound and East Parry Sound, the eastern portion is most commonly referred to as Almaguin Highlands.
The Almaguin Highlands region covers approximately 5,200 square kilometers and primarily serves as a marketing region for East Parry Sound. The region is generally divided into North, Central, and South subdivisions, of which the Village of Burk’s Falls, the Township of Armour, and the Town of Kearney, Township of McMurrich/Monteith, Township of Perry, and Township of Ryerson belong to the South. As of the 2011 census there were 23,570 residents living in the Almaguin Highlands region, accounting for approximately 56% of the population of the District of Parry Sound.
Population % of Canadian % Change
2016 Estimate Total 2011-201643,971 0.12% 1.70%
% Above/Below National Average
Total Income 2016 Estimate
% Canadian Total Per Capita Hhlds. $100,000+
10.55% $1,650,975,000 0.12% $37,547 27.30%Above
% Above/Below National Average
Total Household Spending% Canadian Total Per Capita Per Household
2016 Estimate16.37% $1,811,127,329 0.11% $41,189 $94,393Above
Source: Sitewise, 2016
District of Parry Sound Economic ProfileDemographics
Household Spending – 2016 Average
Average Annual Growth Rate
2011-20160.34%
Household Income – 2016 Average
Proposed Burk's Falls Hotel
ECONOMIC OVERVIEW 23
VALUATION & ADVISORY SERVICES
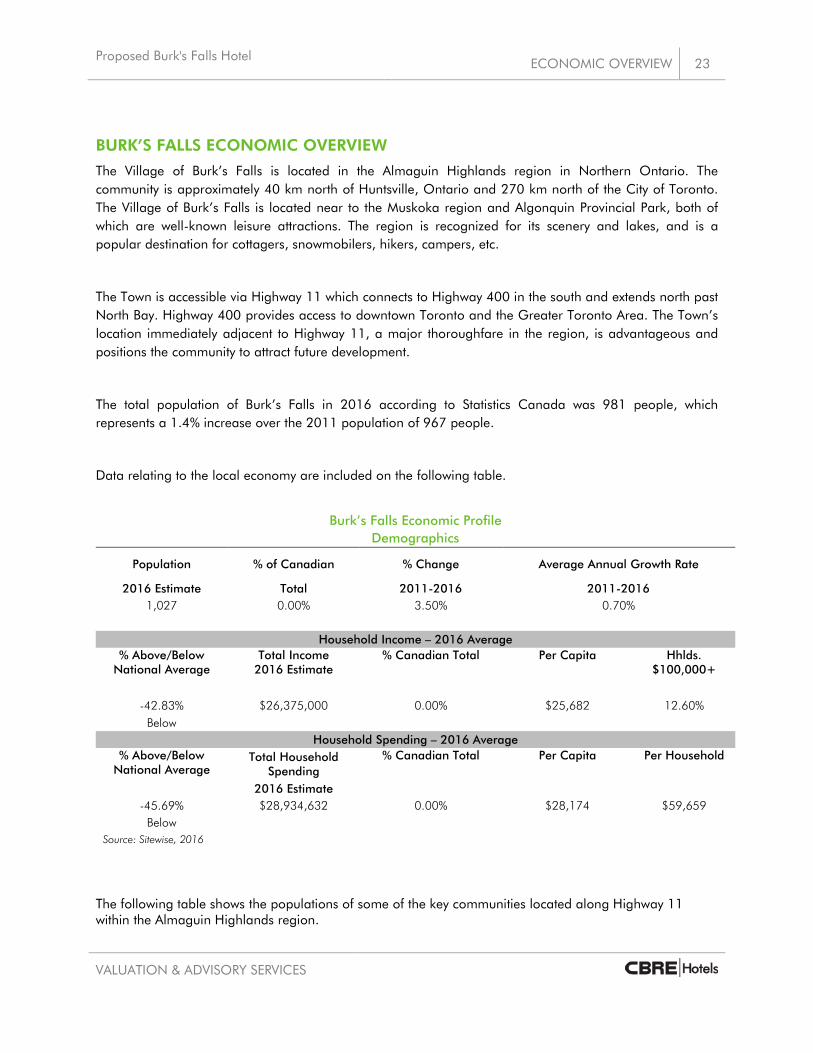
BURK’S FALLS ECONOMIC OVERVIEW
The Village of Burk’s Falls is located in the Almaguin Highlands region in Northern Ontario. The community is approximately 40 km north of Huntsville, Ontario and 270 km north of the City of Toronto. The Village of Burk’s Falls is located near to the Muskoka region and Algonquin Provincial Park, both of which are well-known leisure attractions. The region is recognized for its scenery and lakes, and is a popular destination for cottagers, snowmobilers, hikers, campers, etc.
The Town is accessible via Highway 11 which connects to Highway 400 in the south and extends north past North Bay. Highway 400 provides access to downtown Toronto and the Greater Toronto Area. The Town’s location immediately adjacent to Highway 11, a major thoroughfare in the region, is advantageous and positions the community to attract future development.
The total population of Burk’s Falls in 2016 according to Statistics Canada was 981 people, which represents a 1.4% increase over the 2011 population of 967 people.
Data relating to the local economy are included on the following table.
Burk’s Falls Economic Profile
Demographics
Population % of Canadian % Change Average Annual Growth Rate
2016 Estimate Total 2011-2016 2011-2016 1,027 0.00% 3.50% 0.70%
Household Income – 2016 Average
% Above/Below National Average
Total Income 2016 Estimate
% Canadian Total Per Capita Hhlds. $100,000+
-42.83% $26,375,000 0.00% $25,682 12.60% Below
Household Spending – 2016 Average
% Above/Below National Average
Total Household Spending
% Canadian Total Per Capita Per Household
2016 Estimate
-45.69% $28,934,632 0.00% $28,174 $59,659 Below
Source: Sitewise, 2016
The following table shows the populations of some of the key communities located along Highway 11 within the Almaguin Highlands region.

Proposed Burk's Falls Hotel
ECONOMIC OVERVIEW 24
VALUATION & ADVISORY SERVICES
Highway 11 Almaguin Highlands Communities Community Population (2016)
Perry 2,454 Armour 1,414
Sundridge 961 South River 1,114
Strong 1,439 Powassan 3,455
Source: Google As shown, the communities in the immediate area have populations in the range of approximately 960 to 3,450 people as of 2016.
Economy
The Village of Burk’s Falls and the surrounding communities of Armour and Ryerson are located west of Algonquin Park within cottage country. The primary economic base in the immediate area relies on manufacturing, tourism, and the services industry.
The following table shows the largest industries in Burk’s Falls, Armour, and Ryerson by percentage of employment based on 2014 data, the most current information available.
Largest Sectors by Labour Force – Burk’s Falls, Armour, and Ryerson
Sector % of Labour Force Management 9%
Business and Finance 11% Natural and Applied Sciences 0%
Health 3% Social Science, Education, and Government 9%
Art, Culture, Recreation and Sport 1% Sales and Service 25%
Trades, Transport and Operators 28% Fish, Farm, and Forest 3%
Processing, Manufacturing, and Utilities 9% Other 1%
Source: Burk’s Falls, Armour, and Ryerson Community Profile March 2014
As shown, trades, transport, and operators is the largest industry sector by number of employees, followed by sales and service, and business and finance. Burk’s Falls, Armour, and Ryerson have a combined labour force of 1,471 people. The largest private sector employer in the Village of Burk’s Falls is Lofthouse Brass, a manufacturing facility which employs 185 people.
Burk’s Falls is the only community between Huntsville and Powassan to have both a water and a sewer system and as such it is potentially an attractive location for future business expansion and investment.

Proposed Burk's Falls Hotel
ECONOMIC OVERVIEW 25
VALUATION & ADVISORY SERVICES
Results of the Business Retention and Expansion Survey, which was published in August 2016, indicated that 28% of businesses in Burk’s Falls are looking to hire new employees within the next 18 months, while 40% of businesses stated that they have difficulty finding qualified applicants. This represents an opportunity for businesses to attract qualified employees from outside the area and potentially increase the local population. In addition, 41% of the businesses surveyed indicated that they had plans for expansion within the next 18 months. The majority of local businesses are small, with between 1 and 4 employees, and most are locally owned and operated.
The following table summarizes the occupational wage data for the Northeast Ontario Economic Region, which includes Burk’s Falls.
Occupational Wage Data – Northeast Ontario Economic Region Sector Wage Rate Utilities $28.81
Forestry, fishing, mining, oil & gas $27.69 Construction $22.56
Manufacturing $27.18 Wholesale trade $14.74 Transportation $21.66
Information and cultural industries $20.07 Goods producers $26.21
Professional, scientific, technical $24.53 Management $15.02
Finance, insuarnce, real estate $21.80 Educational services $31.43
Healthcare and social assistance $25.17 Accommodation and food services $11.94
Other services $16.40 Public administration $28.14
Source: Statistics Canada, Labour Force Survey, 2010
Tourism
The Village of Burk’s Falls is located approximately 60 km west of Algonquin Park in the heart of northern Ontario cottage country. The area is a popular tourist destination in both the summer and winter months and offers numerous outdoor recreational opportunities including swimming, boating, camping, canoeing, fishing, snowmobiling, snowshoeing, and dog sledding. There are many established tour operators in the area that offer canoe and kayak excursions, camping basecamps and equipment outfitting, and dogsled expeditions. The table below summarized the vast number of trip activities participated in by tourists to the region.

Proposed Burk's Falls Hotel
ECONOMIC OVERVIEW 26
VALUATION & ADVISORY SERVICES
Source: OTMPC
The community offers a number of public parks and public water access points including boat launches at Three Mile Lake, Jack Lake, Pickerel Lake, and Doe Lake. The Doe Lake Park and Beach is located in the nearby Village of Katrine and other popular local beaches include Kent Road Park Beach, Doe Lake Beach, and Rainy Lake Beach.
The Village of Burk’s Falls Welcome Centre provides seasonal tourist information and a cafe and picnic area overlooking the Magnetawan River and the falls for which the village is named. The community also contains a covered footbridge and a Heritage River Walk, which is a well groomed walking system that follows the Magnetawan River.
Local area attractions also include a number of museums and arts facilities including the Midlothian Castle and Gallery, the well-known ‘Screaming Heads’ art exhibit, the Burk’s Falls and District Museum, the Burk’s Falls Arts and Crafts Club, Petra’s Pottery, and the Circling Hawks Centre.
The local area also has numerous festivals and events throughout the year, the largest of which are the Drag at the Mag snowmobiling event, and the Kearney Dog Sled Races. Other notable festivals include the Sundridge Sunflower Festival, the Country Jamboree, the Katrine Winter Carnival, and the Burk’s Falls Agricultural Fair.

Proposed Burk's Falls Hotel
ECONOMIC OVERVIEW 27
VALUATION & ADVISORY SERVICES
Algonquin Provincial Park is the oldest provincial park in Canada and covers an area of 7,653 square kilometers. There are three access points to Algonquin Provincial Park in the immediate area; Rain Lake, Tim River, and Magnetawan Lake. In 2015, Algonquin Park welcomed 919,546 visitors. The average length of stay was 3.6 days and the average party size 4.1 people, with over 88% of total visitation coming from within Ontario, 4% from elsewhere in Canada, and 8% from the U.S. and other international destinations. In July and August the park operates at 80% capacity.
Burk’s Falls and the surrounding area is part of the Almaguin Highlands region, which together with Algonquin Park, Loring-Restoule, Muskoka, and Parry Sound form the Regional Tourism Organization 12. The following image shows the performance index for a number of key indicators in the region for 2015. The base year used for the index is 2013.
Source: RTO12 Annual Report, 2015

Proposed Burk's Falls Hotel
ECONOMIC OVERVIEW 28
VALUATION & ADVISORY SERVICES
As shown, all indexes were up in 2015 driven largely by increased leisure travel to the region. A combination of good weather with high temperatures in the summer and a low amount of precipitation, and the low Canadian dollar has prompted an increased amount of international visitation and encouraged many Canadians to travel within the country.
In June 2016 a third-party report was released that examined the potential to obtain security screening at Muskoka Regional Airport in order to attract a commercial airline service to the airport. There is interest from the community and tourism officials to see commercial air service established at the airport to serve the needs of international travelers. It is intended that air service will be offered twice weekly (one weekday flight and one weekend flight) year round beginning in the summer of 2017. There has currently been no announcement made about a confirmed airline service. Conclusion
Burk’s Falls has a population of approximately 1,000 people with the majority of employment in the trades, transports, and operators, and sales and service industries. The area has a high seasonal population and is home to many cottagers and tourists in the summer months. The natural beauty of the area as well as the presence of Algonquin Provincial Park make the Almaguin Highlands region a popular destination for tourists and leisure travelers in both the summer and winter months.
The location of Burk’s Falls within the Almaguin Highlands region of northern Ontario allows the community the opportunity to capitalize on the strong leisure and tourist travel to the area. As demonstrated in the high level of activities visitors engage in while visiting the Region, the Village is well positioned as an easily accessed community in what is an established tourist destination.
Burk’s Falls and area provide a number of attractions and amenities and the strong tourist season in the local and regional area supports the potential for future hotel development. However, Burk’s Falls and the surrounding area does lack a significant number of corporate/commercial and industrial businesses, which typically help to generate demand for accommodations during non-peak tourism times.

Proposed Burk's Falls Hotel
DEVELOPMENT OVERVIEW 29
VALUATION & ADVISORY SERVICES
REGIONAL MAP

Competitive Market Analysis Provincial and Regional Market Analysis Competitive Market Analysis
Co
mp
etitiv
e M
ark
et A
na
lysi
s: P
rop
ose
d B
urk
's F
alls
Ho
tel

Proposed Burk's Falls Hotel
COMPETITIVE MARKET ANALYSIS 31
VALUATION & ADVISORY SERVICES
PROVINCIAL MARKET ANALYSIS
Data compiled and published by CBRE relating to the Ontario accommodation market is summarized as follows:
1. Occupancy levels hovered in the 62% to 63% range over the 2005 to 2007 period. ADR improved over this period, increasing from $120.91 to $126.20.
2. Provincial occupancy levels started to decline in 2008, falling to 61.4%. Results were impacted by a softening in the global economy, particularly in the 4th quarter of that year. In an effort to attract/maintain demand, many hotels across the province implemented discounting strategies, which resulted in an overall decline in ADR of 5.6%.
3. The 2009 results reflect the continued impact of the weak economy and challenges in key areas such as the auto sector. The Province saw a decline in occupancy to a low of 57.1%. ADR continued to decline, particularly due to the fall off in corporate and M&C travel, with ADR declining 3.8% to $114.62.
4. Occupancy and ADR have improved since 2010. Hotel Supply/Demand fundamentals have remained solid in Ontario, with modest levels of new hotel supply, and continued increases in demand. As the global economy recovered, and the Ontario economy in particular improved, the hotel sector in the Province has benefitted.
5. Provincial occupancy reached a new high in 2015 of 65.2%. Healthy demand levels, buoyed in part by major sporting events across the province, as well as the general health in the economy, also supported a healthy 13.2% lift in ADR to $138.62 last year.
6. 2016 results indicate strong performance in Ontario over the year with occupancy up 2.4 points and ADR seeing 5.0% growth. Overall, RevPAR increased 9.0% in Ontario.
7. Continued strength is anticipated for the Ontario accommodation market in the short to mid-term as a result of the economic growth and increasing domestic travel.
Year Occupancy ADRADR % Growth RevPAR
RevPAR % Growth
2005 62.1% $120.91 - $75.09 -2006 63.0% $124.79 3.2% $78.62 4.7%2007 62.8% $126.20 1.1% $79.25 0.8%2008 61.4% $119.13 -5.6% $73.15 -7.7%2009 57.1% $114.62 -3.8% $65.45 -10.5%2010 60.4% $117.65 2.6% $71.06 8.6%2011 61.0% $119.08 1.2% $72.64 2.2%2012 61.6% $120.26 1.0% $74.08 2.0%2013 62.3% $119.69 -0.5% $74.57 0.7%2014 64.1% $122.41 2.3% $78.46 5.2%2015 65.2% $138.62 13.2% $90.38 15.2%2016 67.6% $146.05 5.0% $98.79 9.0%CAGR 0.8% 1.7% 2.5%
Source: CBRE Hotels
Ontario Market Performance Results

32 COMPETITIVE MARKET ANALYSIS Proposed Burk's Falls Hotel
VALUATION & ADVISORY SERVICES
LOCAL AREA ACCOMMODATION MARKET
In assessing the competitive environment for the proposed hotel development, CBRE initially examined the existing inventory of lodging operations within a 50 km radius of Burk’s Falls.
The following map identifies a 50 km radius from the Village of Burk’s Falls. As shown, there are a number of communities located within a 50 km radius of Burk’s Falls including Sundridge, Magnetawan, Huntsville, Kearney, South River, and Seguin Falls, among others.

Proposed Burk's Falls Hotel
COMPETITIVE MARKET ANALYSIS 33
VALUATION & ADVISORY SERVICES
Burk’s Falls Radius Map
The following tables provide a summary of the inventory of the various lodging establishments located within a 50 km radius of Burk’s Falls.

34 COMPETITIVE MARKET ANALYSIS Proposed Burk's Falls Hotel
VALUATION & ADVISORY SERVICES
Burk’s Falls Accommodation Inventory – 50 km Radius
Traditional Hotel/Motel/Lodge/In
n RoomsCottages/Cabins Campsites Other
1 Ye Olde Cutter Camp Burk's Falls, ON 0 3 N/A 1 Campground 1 km $20-$110 $70-$1102 Doeview Cottages Katrine, ON 0 10 0 0 Cottage Resort 5 km $160-$220 $140-$1803 Doe Lake Campground Rizzort Katrine, ON 0 3 105 0 Campground 6 km $49-$125 $140-$1604 Lawton's Cove Cottages Katrine, ON 0 6 0 0 Cottage Resort 7 km $130-$160 -5 Dayspring Cottages Katrine, ON 0 12 0 0 Cottage Resort 8 km $140-$325 Per Season Only6 Lillie Kup Trailer & Tent Campground Burk's Falls, ON 0 0 76 0 Campground 8 km $33-$35 -7 Almaguin Campground Katrine, ON 0 2 115 0 Campground 9 km $50-$150 $40-$1258 Birch Crest Resort Burk's Falls, ON 0 4 0 0 Cottage Resort 10 km $85-$112 -9 Birchwood Camp Burk's Falls, ON 0 6 N/A 0 Cottage Resort 12 km $25-$140 -10 Duins Pine Ridge Resort Burk's Falls, ON 0 3 89 0 Campground 12 km $35-$160 $130-$15011 Lake Bernard Park Sundridge, ON 0 0 250 0 Campground 13 km $23-$35 -12 Pickerel Lake Cottage Resort Burk's Falls, ON 0 4 0 0 Cottage Resort 13 km $25-$146 $150-$17013 The Northridge Inn & Resort Sundridge, ON 20 4 0 5 Resort 13 km $200-$400 $200-$40014 Brimanard Bay B&B Sundridge, ON 3 0 0 0 B&B 15 km $110-$120 $110-$12015 Maijac Cottages and Marine Burk's Falls, ON 0 10 0 0 Cottage Resort 17 km $130-$160 $115-$14516 Penbrook Resort Emsdale, ON 0 8 N/A 0 Cottage Resort 17 km $110-$138 -17 Clearview Cottages Emsdale, ON 0 6 0 0 Cottage Resort 18 km $190-$210 $170-$19018 Lynwood Resort Emsdale, ON 0 8 1 0 Cottage Resort 18 km $35-$120 $25-$8219 Allen's Landing Cottages Emsdale, ON 0 5 0 0 Cottage Resort 19 km $150 $13520 Cutter's Cove Cottages Emsdale, ON 0 9 0 0 Cottage Resort 19 km $150-$200 $150-$18521 Maple Brae Lakeside Cottages Muskoka, ON 0 13 0 0 Cottage Resort 19 km $140-$250 $140-$18022 Algonquin Woods Cottage Resort Emsdale, ON 0 10 0 0 Cottage Resort 20 km $175 $155-$19523 Booker's Clear Lake Cottages Emsdale, ON 0 12 5 0 Cottage/Camp 20 km $120-$180 $125-$20024 Caswell Resort Hotel Sundridge, ON 37 0 0 0 Hotel 20 km $55-$90 $55-$9025 Edgewater Park Lodge Kearney, ON 5 14 7 0 Cottage Resort 23 km $50-$183 $152-$190
Accommodation Market - Burk's Falls 50 km Radius
High Season Pricing
Low Season PricingNo. Name Location
Rooms
TypeDriving Distance from Burk's Falls

Proposed Burk's Falls Hotel
COMPETITIVE MARKET ANALYSIS 35
VALUATION & ADVISORY SERVICES
Burk’s Falls Accommodation Inventory – 50 km Radius
Traditional Hotel/Motel/Lodge/In
n RoomsCottages/Cabins Campsites Other
26 Fern Glen Inn Bed & Breakfast Emsdale, ON 5 0 0 0 B&B 23 km $110-$160 $110-$16027 A Touch of Grace Bed & Breakfast Magnetawan, ON 3 0 0 0 B&B 24 km $110 $8828 Woodland Echoes Resort Magnetawan, ON 0 9 0 0 Cottage Resort 24 km $178-$518 $187-$44529 Algonquin Motel South River, ON 14 0 0 0 Motel 27 km $69-$107 $69-$10730 Granite Ridge Wilderness Campground Kearney, ON 0 0 N/A 0 Campground 27 km $40-$55 -31 Tanner's Inn & Dining Magnetawan, ON 0 4 0 0 Cottage Resort 29 km Long-term year
round tenants32 Camp Klahanie Magnetawan, ON 0 0 69 0 Campground 30 km $32-$37 -33 Quiet Bay Log Motel & Café Magnetawan, ON 11 1 0 0 Motel 30 km $69-$150 $69-$15034 Black's Guest House South River, ON 0 3 0 0 Cottage Resort 31 km N/A N/A35 Knoepfli Inn Magnetawan, ON 0 6 0 0 Cottage Resort 31 km $75 -36 Sand Lake Cottages & Inn Kearney, ON 0 8 0 0 Cottage Resort 32 km $160-$225 $160-$22537 Ahmic Lake Resort Ahmic Harbour, ON 0 10 N/A 0 Cottage/Camp 33 km $40-$500 $140-$46038 Sandhurst Family Resort Kearney, ON N/A N/A N/A N/A Cottage Resort 33 km N/A N/A39 Echo Ridge Farm Guesthouse Kearney, ON 3 0 0 0 B&B 34 km $95 $9540 Tulip Inn Huntsville, ON 18 1 0 0 Motel 35 km $95-$155 $65-$10041 Arrowhead Inn Huntsville, ON 12 0 0 0 Motel 35 km $125 $6542 Ahmic Harbour Hotel Magnetawan, ON 5 0 0 0 Hotel 36 km $75 $7543 Lighthouse Cottages and Camping Sprucedale, ON 0 4 N/A 0 Cottage Resort 36 km $25-$250 -44 Rainbow Bay Resort South River, ON 0 5 0 0 Cottage Resort 36 km $100-$120 -45 Warbler's Roost South River, ON 6 0 0 0 Inn 36 km $60-$90 $60-$9046 Bear Lake Resort Sprucedale, ON 0 5 0 0 Cottage Resort 39 km $120-$135 $125-$13547 Duck Rock Resort Dunchurch, ON 0 5 0 0 Cottage Resort 43 km $80-$125 -48 TJ's Motel & Restaurant Trout Creek, ON 7 0 0 0 Motel 45 km N/A N/A49 Cedar Grove Lodge Huntsville, ON 0 19 0 0 Cottage Resort 49 km $126-$149 $160-$16550 Colonial Bay Cottage Resort Huntsville, ON 3 8 0 0 Cottage Resort 49 km $250-$299 $109-$29551 Tally-Ho Inn Huntsville, ON 9 13 0 0 Cottage Resort 50 km $75-$190 $75-$190
Total 161 253 717 6* Does not include campsites, campgrounds, and cabin/cottage/yurt accommodations within Algonquin Park
High Season Pricing
Low Season Pricing
Accommodation Market - Burk's Falls 50 km Radius
No. Name Location
Rooms
TypeDriving Distance from Burk's Falls

36 COMPETITIVE MARKET ANALYSIS Proposed Burk's Falls Hotel
VALUATION & ADVISORY SERVICES
No. Name Location Rooms Type
Total Meeting
Space (SF)
Meeting Space SF per
Room Rest
aura
nt
Loun
ge
Brea
kfas
t Se
rver
y
Swim
min
g Po
ol
Fitn
ess
Cen
tre
Busi
ness
C
entr
e
1 Deerhurst Resort Huntsville Huntsville, ON 337 Resort 45,000 133.5 X X X X X X2 Comfort Inn Huntsville Huntsville, ON 69 Limited Service - - X3 Hidden Valley Resort Huntsville Huntsville, ON 93 Resort 4,000 43.0 X X X X4 Motel 6 Huntsville Huntsville, ON 85 Limited Service - -5 Econolodge Huntsville Huntsville, ON 34 Limited Service 0.0 X6 Holiday Inn Express Huntsville Huntsville, ON 87 Focused Service 1,000 11.5 X X X X7 Knights Inn Huntsville Huntsville, ON 23 Limited Service - - X8 Best Western Plus Muskoka Inn Huntsville, ON 63 Focused Service - - X X X X9 Super 8 Huntsville Huntsville, ON 38 Limited Service - - X10 Highland Court Motel Huntsville, ON 16 Limited Service - -11 Grandview Resort Huntsville, ON 123 Resort 17,600 143.1 X X X X X12 Huntsville Inn Huntsville, ON 16 Limited Service - -13 Rainbow Inn Huntsville, ON 18 Limited Service - -14 Rodeway Inn King William Huntsville, ON 32 Limited Service - - X
Total 1,034 67,600
Huntsville Traditional Accommodation Market

Proposed Burk's Falls Hotel
COMPETITIVE MARKET ANALYSIS 37
VALUATION & ADVISORY SERVICES
Burk’s Falls Accommodation Inventory – 50 km Radius
As summarized in the preceding tables, there are a considerable number of accommodation options within a 50 km radius of Burk’s Falls. Approximately 51 properties have been identified, as well as a further 12 traditional hotel-style accommodations within the Huntsville market (shown separately).
Excluding the accommodation supply within Huntsville, there are approximately 161 hotel/motel rooms within 50 km of Burk’s Falls and approximately 253 cottages. There are approximately 717 campsites within the area and 6 other accommodation types, which includes yurts and structured tent accommodations. The majority of accommodations in the area are cottage resorts, many of which include a limited number of campsites or lodge style rooms. Other accommodations offered within the 50 km radius include bed and breakfasts, campgrounds, and hotels and motels. While all campsites in the area are seasonal, the majority of cottages and hotel/motels operate in the winter subject to demand for accommodations.
Pricing within the local area varies based on the level of services and type of accommodation offered, but is typically highest in peak season (July/August) and lowest in the shoulder and low seasons. Many cottages and campgrounds require a minimum stay of one week in July and August and a 2-3 night minimum stay in May/June and September/October. Minimum stay requirements vary significantly based on the type of operation and the preferences of the operator. In addition, numerous accommodation operators within the local 50 km area offer accommodations on a seasonal rental basis resulting in few campsites being available for rental for shorter periods of times. Most of these sites and many of the cottages are booked ahead for the following season further demonstrating the strength of the destination from a tourist perspective. As a result, during the tourist season there are few campsites and limited cottages that are available for transient use.
Within the Huntsville accommodation market there is approximately 1,034 traditional hotel/motel rooms including both branded and non-branded properties. These properties range in the level of service and amenities offered from full service resort properties to economy motel properties. There is a total of 67,600 square feet of meeting space within the market, of which 45,000 square feet is located at Deerhurst Resort and 17,600 square feet is located at Grandview Resort.
Given the nature of the proposed development as a branded, limited service hotel – it is our opinion that the potential hotel development would not directly compete for demand from the overall inventory of accommodation facilities noted above. Cottages/campgrounds/lodges/B&Bs and motels tend to attract a clientele that is looking for an experience and price point that is far different than that of a traditional hotel. As such, while the traditional hotels/resorts located in Huntsville would be considered primary and direct competition for the potential hotel development, the balance of the competitive market would be those traditional accommodation operations located in the communities located within an hour of Burk’s Falls, namely Parry Sound and North Bay. The following section provides a comprehensive market analysis for the potential hotel development.

38 COMPETITIVE MARKET ANALYSIS Proposed Burk's Falls Hotel
VALUATION & ADVISORY SERVICES
COMPETITIVE MARKET ANALYSIS
In order to more precisely identify hotel market trends as they relate to the potential hotel development, CBRE has prepared a market specific analysis using data collected by CBRE Hotels. CBRE Hotels collects top line (occupancy and average daily rate) data on close to 1,900 properties across Canada representing over 60% of the Canadian industry’s 370,000 rooms. Our database is considered a standard source of reliable data for most markets.
The proposed hotel would compete within the regional area for occupied room night demand, and would primarily compete against the branded hotel properties located in Huntsville/Gravenhurst, North Bay, and Parry Sound. The proposed hotel would also compete with the unbranded hotel/motel, inn, and resort operations in the surrounding area; however, to a much lesser extent.
For the purposes of our analysis we have identified a competitive market comprised of 2,009 rooms or 733,285 annual available room nights for which CBRE Hotels tracks the top-line performance within our Trends database.

Proposed Burk's Falls Hotel
COMPETITIVE MARKET ANALYSIS 39
VALUATION & ADVISORY SERVICES
Market Performance
The competitive market has achieved the following results in recent years.
Actual Actual Actual Actual Forecast 1 Huntsville/Gravenhurst 2 Parry Sound2012 2013 2014 2015 2016 October 2016 YTD October 2017 YTD
3 North Bay
Actual Actual Actual Actual Forecast2012 2013 2014 2015 2016 October 2016 YTD October 2017 YTD
Available Room Nights - 1.0% 0.6% -0.7% - -1.5%Occupied Room Nights - 3.7% -1.1% 3.1% 6.7% - 4.4%Average Daily Rate - -2.7% 1.1% 5.8% 1.7% - 1.2%RevPAR - -0.1% -0.6% 9.9% 8.5% - 7.2%
Source: CBRE Hotels
5.8%18.4%
Total Growth2012 to 2016
0.9%12.9%
Rooms 1,992 2,006 2,023 2,009 2,009
58.0%
$131.41
RevPAR $61.63 $61.57 $61.21 $67.25 $72.94 $71.02
40.8%14.1%
HISTORIC COMPETITIVE MARKET PERFORMANCE SUMMARY
4.3%1.4%3.1%
Market Growth Total Growth
0.2%
CAGR2012 to 2016
Competitive Market
2,014 1,983
Annual Occupancy 50.4% 51.8% 50.9% 52.9% 56.4% 54.7%
$129.89
Total Competitive Market
$76.16
Average Daily Rate $122.29 $118.94 $120.28 $127.22
%
Room Revenues $44,812,332 $45,203,108 $45,199,762 $49,314,303
733,285 614,270 604,815
Occupied Room Nights 366,438 380,063 375,803 387,628 413,568 335,840 350,549
$129.33
$53,488,693 $43,623,246 $46,065,349
LEISURE
727,080 734,196 738,395 733,285
Market Segmentation
Competitive MarketSegement
Available Room Nights
100.0%413,568TOTALOTHER
ORN
130,75656,109
168,61658,087
CORPORATEMEETING
31.6%13.6%
$54.00
$56.00
$58.00
$60.00
$62.00
$64.00
$66.00
$68.00
$70.00
$72.00
$74.00
2012 2013 2014 2015 2016
Market - RevPAR
Market
32%
13%41%
14%
Market Segmentation
CORPORATE MEETING LEISURE OTHER

40 COMPETITIVE MARKET ANALYSIS Proposed Burk's Falls Hotel
VALUATION & ADVISORY SERVICES
1. Between 2012 and 2013 occupancy improved by 1.2 points within the competitive set, with the addition of approximately 94 new rooms in this period.
2. Between 2013 and 2014 occupied room night demand declined by 1.0% resulting in a decline in occupancy from 51.8% to 50.9%.
3. Market occupancy has then shown stronger growth in 2015 and 2016, increasing by 3.1% and 6.7%, respectively as a result of positive economic growth within Ontario and the regional market, and increasing domestic and leisure travel.
4. Between 2014 and 2016 occupancy is on track to improve from 50.9% to 56.4%.
5. Average daily rates decreased in 2013 by 3.5% followed by growth of 1.1% in 2014, 5.8% in 2015, and 1.7% in 2016.
6. Within the last five years, the competitive Huntsville/Gravenhurst, North Bay, and Parry Sound market has not surpassed 57% occupancy and average daily rates have ranged between $119 and $129.
7. Located within a 30 minute drive, Huntsville is the closest competitive market to the Village of Burk’s Falls and would compete most directly with the proposed hotel.
8. Competitive market performance in Huntsville has generally followed a similar pattern of demand as the overall regional market in recent years. However, the Huntsville market typically operates 3-4 points lower than the regional market in terms of occupancy and $20 to $25 higher in terms of average daily rate.
9. These differences are a reflection of the nature of demand in Huntsville, which is primarily seasonal leisure demand, whereas North Bay has a number of off-peak corporate demand generators. In addition, the type of accommodations currently available in Huntsville includes some resort and extended stay properties which can attract a higher rate.
The following table summarizes the performance of the Huntsville/Gravenhurst, Parry Sound, and North Bay markets in 2016.
2016
Occupancy ADR RevPAR Huntsville/Gravenhurst 52.7% $153.56 $80.88 Parry Sound 57.4% $107.88 $61.97 North Bay 60.0% $112.14 $67.25 Source: CBRE Hotels
Data compiled by CBRE relating to the seasonality of the competitive regional market is summarized in the following chart.

Proposed Burk's Falls Hotel
COMPETITIVE MARKET ANALYSIS 41
VALUATION & ADVISORY SERVICES
As shown, the competitive regional market experiences fluctuations in demand and average daily rates on a monthly basis. Peak demand occurs in July and August when occupancies approach 80%, with softer demand in the shoulder periods of May/June, and September/October, and the lowest monthly occupancy occurring in the winter months where occupancy falls as low as 35%. Fluctuations in demand levels also limit the ability of properties within the competitive market to achieve higher average daily rates. The lowest rates are typically seen in the weaker demand months, with the strongest rates achieved in July and August.
$0
$20
$40
$60
$80
$100
$120
$140
$160
$180
0%
10%
20%
30%
40%
50%
60%
70%
80%
90%
Jan-16 Feb-16 Mar-16 Apr-16 May-16 Jun-16 Jul-16 Aug-16 Sep-16 Oct-16 Nov-16 Dec 16
Huntsville/Gravenhurst, Parry Sound, and North Bay Market Seasonality
Occupancy ADR

Proposed Burk's Falls Hotel
COMPETITIVE MARKET ANALYSIS 42
VALUATION & ADVISORY SERVICES
MARKET SEGMENTATION ANALYSIS
In most markets, overall demand varies based on the nature of travel. Lodging demand is typically generated from four different segments: Corporate, Meeting/Conference, Leisure, and Other.
On the basis of CBRE Hotels market research, and discussions with local hoteliers the estimated market segmentation for the competitive market in 2016 is presented below:
While most of the demand captured within the competitive market likely originates locally, there is also a significant portion of demand captured within the competitive set that is comprised of people travelling within the region who choose to stay in one of the locations as a result of the availability of branded accommodations.
32%
13%41%
14%
Market Segmentation
CORPORATE MEETING LEISURE OTHER
Segment Room Night Demand %
CORPORATE 130,756 31.6%
MEETING 56,109 13.6%
LEISURE 168,616 40.8%
OTHER 58,087 14.1%
Compiled by CBRE Hotels
Demand Segmentation - Competitive Market 2016

Proposed Burk's Falls Hotel
COMPETITIVE MARKET ANALYSIS 43
VALUATION & ADVISORY SERVICES
The following section provides details on various segments of demand growth for the regional market.
Corporate Segment
Corporate travelers are defined as business people attracted by businesses in the area. Commercial transient demand includes individuals visiting the companies in the immediate area or passing through town. Corporate volume demand is generated by local firms and includes employees of the company or others doing business with the firm. Most demand from the corporate segment is generated between Monday and Thursday nights, declines Friday and Saturday nights, and increases somewhat on Sundays. This equates to approximately 200-250 key Corporate demand days throughout the year. The typical duration of occupancy is one to three days and is characterized by single occupancy. Historically, this demand segment has been somewhat less price sensitive than other segments. Rates are often pre-negotiated with the hotel and are sometimes discounted in return for a high number of occupied rooms. Often, these types of travelers are influenced by quality of the hotel, brand loyalty, and location. Overall, the corporate segment is highly desirable as it provides a solid base of demand and tends to pay higher room rates than other segments.
In 2016, this segment generated approximately 130,756 occupied room nights or 31.6% of demand within the competitive market. The North Bay market is the strongest corporate market in the regional area as it has a larger number of major companies and businesses and a strong base of resource sector companies. Corporate demand in the local area would also be generated by a number of the smaller corporate and manufacturing companies. As previously noted, the proportion of Corporate demand in Huntsville is lower than the overall regional market at approximately 26% of total demand.
Meeting/Conference
Group and Meeting travelers are defined as any group occupying five or more rooms on a given night. This segment includes corporate groups, associations, SMERF (social, military, educational, religious, and fraternal) groups. This segment is typically attracted by a hotel's meeting facilities and recreational amenities in the area. Demand from corporate groups is typically generated between Sunday and Thursday nights, and can include corporate functions, holiday parties, incentive groups, etc. Often, corporate groups pay high rates, especially incentive groups, where companies “wine and dine” their top salesman and upscale/luxury hotels. Corporate groups tend to have a high level of single occupancy, while other groups tend to have more double occupancy. Associations and SMERF groups have a more varied occupancy pattern and often hold weekend meetings. This demand segment tends to be somewhat price sensitive. The typical stay for group demand is between two and five days. There is a perception (often true) that by occupying a block of rooms, a volume discount should be given. Tour group demand is also included within this segment.
Group/meeting travelers have a tendency to stay at full-service hotels and resorts and utilize a hotel's food and beverage facilities. This segment is seasonal, and repeat business on an annual basis is not guaranteed. Overall, the group/meeting segment is desirable as it provides for a full utilization of hotel facilities.

Proposed Burk's Falls Hotel
COMPETITIVE MARKET ANALYSIS 44
VALUATION & ADVISORY SERVICES
In 2016, the group/meetings segment generated approximately 56,109 occupied room nights or 13.6% of demand within the competitive market. Meeting/conference demand within the competitive market is primarily generated by the resorts in the region that offer significant meeting space. Deerhurst Resort, Grandview Resort, and Hidden Valley Resort in Huntsville are popular meeting and conference venues and offer a significant amount of meeting space. As a result, the Huntsville market generally has a higher share of Meeting/Conference demand than the regional area. Meeting/Conference demand within the local area would also be generated by events taking place at local facilities such as the Burk’s Falls Arena or the Royal Canadian Legion.
Leisure Segment
Leisure travelers generally include vacationers or travelers passing through the area. This category effectively includes all non-commercial related travellers too small to be defined as a group. This segment is typically attracted by a hotel's location relative to area attractions (including friends/relatives). Demand from leisure travelers is typically generated throughout the week during peak periods, with more weekend demand in shoulder seasons. This equates to approximately 100 to 150 key leisure demand days throughout the year, including holidays. Leisure travelers tend to have a high level of double occupancy. This demand segment tends to be less price sensitive. The typical stay for leisure travelers is between one and four nights.
In 2016, this segment generated approximately 168,616 occupied room nights or 40.8% of demand within the competitive market. The leisure travel segment represents a significant source of demand for the competitive market. The regional area is a popular destination for cottagers and those looking to participate in outdoor recreational activities such as swimming, hiking, camping, canoeing, snowshoeing, snowmobiling, and dog sledding. The Huntsville market is a central location for those wishing to visit the surrounding area and as such, captures a higher proportion of leisure demand than other locations in the regional area. An estimated 47% of all room nights in Huntsville are generated by the leisure segment.
Other / Contract
Other/Contract demand includes any airline contracts or construction and maintenance crew business as well as rooms generated online through third party providers such as Hot Wire, Expedia, Priceline, etc and by brand loyalty redemptions or associate stays. Government demand is also included in this segment. Demand in this segment is typically represented by sources, which are highly rate sensitive and are normally provided with significantly discounted room rates. Demand within this segment typically occurs during the Sunday to Thursday period, although a portion of this demand is also likely to occur on the weekends. Overall, this equates to approximately 200-250 key Other demand days throughout the year.
In 2016, the other/contract segment generated approximately 58,087 occupied room nights or 14.1% of demand within the competitive market. Other demand within the competitive market is generated by government sources, crew business (construction and work crews) and by other discounted sub-segments such as third party online bookings from online travel agents such as Booking.com or Expedia. North Bay

Proposed Burk's Falls Hotel
COMPETITIVE MARKET ANALYSIS 45
VALUATION & ADVISORY SERVICES
contains a number of government services and military bases including the 22 Wing/Canadian Forces Base North Bay and The Algonquin Regiment. As a result, North Bay typically captures a higher proportion of government demand than the rest of the competitive market.

Future Demand Factors
Futu
re D
ema
nd
Fa
cto
rs:
Pro
po
sed
Bu
rk's
Fa
lls H
ote
l

47 FUTURE DEMAND FACTORS Proposed Burk's Falls Hotel
VALUATION & ADVISORY SERVICES
FUTURE DEMAND FACTORS
In order to gain a better understanding of the existing or future demand which may exist for the potential hotel development, we conducted interviews with stakeholders such as local industrial/commercial businesses, local hotel/motel operators as well as local sports and event facilities, tour operators, and festival and event organizers. This is in addition to discussions we had with representatives of the Village of Burk’s Falls, Township of Armour, and Township of Ryerson.
The businesses contacted as part of our research program are listed below along with a summary of the key insights gained from these interviews.
Stakeholder Interviews
Contacted (Interview Conducted)
Contacted (No Response/Interview
Declined) Almaguin Highlands Arts Council Algonquin Motel Miller Investments
Royal Canadian Legion Tanner’s Inn Royal LePage Coldwell Banker GGB Exhaust Edgewater Park Lodge Lofthouse Brass Doe Lake Campground Rizzort Algonquin West ATV Club
Explorers Edge (RTO 12) Gray/Hall Productions Burk’s Falls Arts and Crafts Centre Drag at the Mag & Victory Airfield Investor Centric Northern Edge Algonquin
Almaguin Camground Almaguin District Snowmobile Club Camp Glen Bernard Almaguin Chamber of Commerce Waveform Plastics Smoke ‘N Spurs Rodeo Powassan
Kearney Dog Sled Races Ontario Graphite (Kearney Mine) South River FSC Chocpaw Expeditions Algonquin Provincial Park Burk’s Falls FSC
Powassan Maple Syrup Festival The Bear Chair Company Ltd. Almaguin Hockey Association Algonquin Base Camp Quiet Bay Motel & Cafe Near North Industrial
Northern Ontario School of Medicine Burk’s Falls Arena Burk’s Falls Agricultural Society Northridge Inn & Resort
Caswell Resort Hotel
The Village of Burk’s Falls and the surrounding area is generating a limited amount of Corporate and Commercial hotel demand. A number of the companies that were contacted did indicate that they require overnight accommodation as part of their normal course of business; these needs range from 5 to 600 rooms per year for a small number of companies. These companies are currently utilizing hotels in Huntsville or local/regional motels and it is reasonable to expect that a new hotel development would be able to capture a portion of this existing demand. However, a number of businesses in the regional area did indicate that a potential hotel in Burk’s Falls may not be suitable or include all the amenities and local entertainment that their guests desire and they would continue to use Huntsville area hotels.
Discussions with Ontario Graphite indicated that the re-opening of the mine and the commencement of operations at the facility is likely to occur within the next year. The potential re-opening of the Kearney Mine could possibly generate an important source of corporate demand for local hotel accommodations; however the timing and expected re-opening of the mine has not yet been publically announced and it is difficult to determine when and if the facility may re-open.

48 FUTURE DEMAND FACTORS Proposed Burk's Falls Hotel
VALUATION & ADVISORY SERVICES
Burk’s Falls is well located along Highway 11, approximately 50 km north of Huntsville, 90 km south of North Bay, and 80 km east of Parry Sound. The community is centrally located and has the opportunity to serve the needs of a number of the surrounding communities. While it is not feasible to survey businesses in every community within this area, based on our research and field work, it is our opinion that some corporate accommodation demand does exist within this regional area and a new hotel would be expected to capture demand from these neighbouring communities. The local area is lacking in quality, branded accommodation. In addition, interviews with local hotel and motel operators indicated that there is some level of construction and crew demand generated primarily in the spring, summer, and fall periods as a result of construction, hydro, and road crews working in the regional area.
The Almaguin Highlands regional area is a strong tourist and leisure destination. The region is adjacent to Algonquin Provincial Park which sees over 900,000 visitors each year. The Almaguin Highlands and Muskoka regions are also strong summer tourism destination for cottagers and those looking to experience the lakes and activities that the region has to offer. Winter recreational activities are also popular and include snowshoeing, snowmobiling, ice fishing, and dog sledding. Snowmobiling represents a significant source of winter tourist demand with an estimated 750 to 1,000 snowmobilers passing through Burk’s Falls on a peak snowmobiling day (peak days being a weekend with good weather and ideal snow and trail conditions). There are a number of tourism operators in the regional area that offer canoe and kayak trips, camping outfitting, snowshoe and snowmobile expeditions, and dog-sledding. The Village of Burk’s Falls is well located to capture tourist demand in both the summer and winter periods as it is in close proximity to a number of well-known tour operators such as Chocpaw Expeditions, as well as near to the Tim River, Rain Lake, and Magnetawan Lake access points to Algonquin Park.
Interviews with local accommodation and campground operators also indicated that there is strong demand for accommodations in the local area as a result of leisure and recreational travel. Our research indicated that the majority of hotel and motel accommodations and campgrounds operate at or near full capacity in the peak summer months of July and August. Demand declines during the shoulder periods of October/November, and March/April, but increases again in the peak winter months as the conditions for winter sporting improve. It should be noted that numerous non-traditional (cottage, campground, resort/inn) operators indicated that they impose a minimum booking length of between 3 and 7 nights in the peak July and August period, and a 2-3 day minimum booking period in busy periods from May/June/September, and January/February. Respondents indicated that they often receive inquiries for shorter stays during these times that they are not able to accommodate. This indicates an opportunity for a potential hotel development that would not require a minimum length of stay to accommodate shorter term stays.
Weddings and other family events such as funerals and reunions are also expected to generate some demand for local hotel accommodations. Based on discussions with local wedding venues, the wedding market is highly seasonal with the majority of celebrations taking place in the summer months. The Northridge Inn has indicated that they are generally fully booked for the wedding season and numerous venues indicated that wedding organizers have difficulty finding appropriate accommodations for family and guests during peak periods.

49 FUTURE DEMAND FACTORS Proposed Burk's Falls Hotel
VALUATION & ADVISORY SERVICES
In addition, there are a number of festivals and events that take place in the Almaguin Highlands region that generate a need for local hotel accommodations. Some of the most significant local events are the Drag at the Mag snowmobiling event which takes place in February and attracts over 2,000 spectators and 300 registered racers, and the Kearney Dog Sled Races which sees over 4,000 spectators and 80 registered teams each February. In the summer months there are a number of local and regional events including the Sundridge Sunflower Festival, the Burk’s Falls Agricultural Fair, the Country Jamboree, and a number of others that generally attract people from the local and regional area.
Discussions with the Burk’s Falls Arena also indicated that there are a number of hockey and softball tournaments currently occurring that generate demand for hotel accommodations. Our research indicated that while some of this demand is being accommodated in local accommodations, the majority is not being accommodated and is instead leaving the market to find accommodations in Huntsville or North Bay or returning home. It is reasonable to expect that a newly built, branded hotel would capture some of this existing demand that is currently leaving the market or staying at the unbranded facilities in the local area. However, it is important to note that hockey and softball tournaments are typically hosted on weekends in the summer and winter over a 2 to 3 day period and the capacity limits of any hotel will impact the amount of demand the property could reasonably expect to capture from this demand segment. In addition, sports tournaments that occur on summer weekends are taking place during a time when tourist and leisure travel demand is high, and sports teams may have difficulty securing rooms during these peak periods.
Based on discussions with local stakeholders, it is also expected that Visiting Friends and Relatives (VFR) would provide some level of additional demand for the proposed hotel. There is a large seasonal population in the local area and respondents indicated a need in the community for hotel accommodations to support local reunions, parties, weddings, funerals, and other celebrations.
Explorer’s Edge is pursuing the implementation of a commercial airline to serve the Muskoka Airport. The group hopes to have commercial air service to the Muskoka region providing twice weekly flights by the summer of 2017. However, no formal plans or airline schedules have yet been announced and it is uncertain at this time if the airport will see commercial air service. Should a commercial airline begin service to the region in the near future it could have a positive impact on the local tourism industry and potentially the Almaguin Highlands region. However, the Muskoka Airport is located near Gravenhurst, approximately 82 km south of Burk’s Falls and would likely have only a minimal impact on travel activity in and around Burk’s Falls. Until a regular commercial air service is established or formally announced it is difficult to quantify or assess the potential impact.

Development Overview Locational Analysis Development Concept
Dev
elo
pm
ent
Ove
rvie
w:
Pro
po
sed
Bu
rk's
Fa
lls H
ote
l

Proposed Burk's Falls Hotel
DEVELOPMENT OVERVIEW 51
VALUATION & ADVISORY SERVICES
DEVELOPMENT OVERVIEW
Location Overview
The Village of Burk’s Falls is located in the Almaguin Highlands region in Northern Ontario. The community is approximately 40 km north of Huntsville, Ontario and 270 km north of the City of Toronto. The Village of Burk’s Falls is located near to the popular Muskoka cottage region and Algonquin Provincial Park, both of which are strong leisure attractions. The region is well known for its scenery and lakes, and is a popular destination for cottagers, snowmobilers, hikers, campers, etc.
The Town is accessible via Highway 11 which connects to Highway 400 in the south and extends to North Bay to the north. Highway 400 provides access to downtown Toronto and the Greater Toronto Area. The Village of Burk’s Falls is located in a popular outdoor recreational area and contains a mix of local businesses, food service outlets, retail and residential development.
Location Considerations
When determining the optimum location and site for a hotel development, the following characteristics should be considered.
1. Access – An optimal hotel development site should be easily accessible and ideally situated in a convenient location with easy access to and from major arterial roadways.
2. Ingress/Egress – An optimal hotel site should have simple, easily accessible routes of ingress and egress.
3. Visibility – An optimal hotel development site should allow for the hotel to be oriented in such a way that the building could be seen by traffic in all directions. It would still be necessary to supplement the building visibility with appropriate signage along major roadways and on the building and site itself.
4. Proximity to demand generators – An optimal hotel development site should be reasonably proximate to the local demand generators such as major businesses or industrial parks as well as recreation and leisure attractions.
5. Proximity to support amenities – An optimal hotel development site should be within walking distance or reasonably proximate to a concentration of support amenities such as restaurants, entertainment, and retail.
In addition, the optimum location for a hotel development would ideally include existing access to the water and sewer systems. It is generally not feasible for a hotel development to be built on private water and sewer services and the additional cost to connect to municipally provided services could impact the economic viability of any development.
In general, leisure travelers place a higher value on having amenities within walking distance, while corporate travelers and meeting/conference guests would expect business and industrial parks to be within a short driving distance.

52 DEVELOPMENT OVERVIEW Proposed Burk's Falls Hotel
VALUATION & ADVISORY SERVICES
If the location characteristics for a prospective hotel development are not optimized it would have an impact on the proposed hotel’s ability to achieve the projections contained herein.

Proposed Burk's Falls Hotel
DEVELOPMENT OVERVIEW 53
VALUATION & ADVISORY SERVICES
Development Area Review
While the Village of Burk’s Falls has identified a number of potential sites within the Village of Burk’s Falls and Township of Armour, it is our understanding that the sites are predominantly privately owned.
As such, rather than comment on specific parcels, we have reviewed a number of areas within the community that would likely be considered by hotel developers. The following map identifies the three primary areas, which have been considered:
1. South Burk’s Falls
2. North Burk’s Falls
3. Downtown Burk’s Falls

54 DEVELOPMENT OVERVIEW Proposed Burk's Falls Hotel
VALUATION & ADVISORY SERVICES
MAP OF POTENTIAL LOCATIONS

Proposed Burk's Falls Hotel
DEVELOPMENT OVERVIEW 55
VALUATION & ADVISORY SERVICES
The following identifies the strengths and weaknesses of each of these areas.
Strengths Weaknesses No. 1 South Burk’s Falls 1. Good highway visibility
2. Close proximity to retail stores and newer commercial developments
3. Proximity to quick service restaurant
4. Not within downtown Burk’s Falls and less proximate to associated attractions and amenities
5. Greater distance to significant corporate demand generators within community
6. Greater distance from Burk’s Falls Arena
7. Access to water and sewer services not currently available
No. 2 North Burk’s Falls 8. Good highway visibility
9. Reasonably proximate to corporate demand generators
10. Some retail and restaurants within walking distance
11. Not visible from Highway 11 12. Not within downtown Burk’s Falls and
less proximate to associated attractions and amenities
13. Access to water and sewer services not currently available
No. 3 Downtown Burk’s Falls
14. Close to Burk’s Falls Arena 15. Walking distance to a number of
restaurants and attractions, including visitor centre and Falls
16. Access to water and sewer services currently available
17. No highway visibility
Conclusion
While there are several possible locations for a proposed hotel development within the Village of Burk’s Falls, each area has distinct pros and cons. Overall, the location in south Burk’s Falls is the preferred location for a hotel development. A site in this general area would have good highway visibility, and would be well located relative to the foodservice and retail developments in the immediate area. While this location is not within downtown Burk’s Falls, it could be reached by car or within a 15 to 20 minute walk. The most significant drawback of this location is that some sites located in this area would not have immediate access to water and sewer services.

56 DEVELOPMENT OVERVIEW Proposed Burk's Falls Hotel
VALUATION & ADVISORY SERVICES
Development Concept
Based on our review of the existing accommodation product within the competitive local and regional markets, the historic market performance, the nature of local demand generators and the economic operating conditions for hotels in Canada, we have recommended the following development option for a proposed hotel in Burk's Falls.
To assess the feasibility of accommodation development we first considered various forms of accommodation development that might be possible in order to determine the most suitable accommodation product for further analysis. Independent hotel/motel and inn developments were considered, as well as resorts, smaller scale hotels, mid-scale branded hotels and upper scale branded hotels. Our determination of the most suitable product to be considered for development was based on factors which best meet market demand and would also lead to the greatest level of investor interest and support from the traditional lending community. By conducting our analysis on the product type that would have the greatest appeal to the traditional hotel investment market, this allows the community the greatest chance of attracting a serious developer/investor with the capabilities and knowledge to develop a successful hotel operation.
It is our opinion that the development of a branded, 60-unit, Limited Service hotel would be most appropriate for development in Burk's Falls, Ontario. Examples of brands that could be considered for such a development include, but are not limited to, Comfort Inn, Microtel Inn & Suites, and Best Western. Branding is recommended in that it will not only enhance the marketability of the project, but will also enhance the potential for project financing.
This type of accommodation development is likely to appeal to the greatest range of travelers and capture demand from a wide variety of market segments. This type of accommodation is also very appealing to the traditional investor and lending community, which typically consider the investment risk and liquidity of a project and are much less likely to finance an unbranded product. In addition, a branded hotel property offers a number of other benefits including brand awareness and loyalty, and the use of a central reservation system which can generate as much as 60% to 70% of total room nights. Branded hotels also offer design and construction prototypes which can lead to lower construction costs. A property in the range of 60 to 80 rooms also allows for the greatest operational efficiencies at the property level. The overhead or fixed costs at the property such as the salaries, property taxes, and marketing costs exist regardless of the size of the property and having a larger number of rooms, and therefore a larger number of occupied rooms and stronger revenue generation, helps to generate stronger cash flow and profits than a smaller operation would.
This product positioning is based on these primary factors:
1. This level of hotel can appeal to a broad range of guests and types of travelers.
2. The design prototypes for these brands are of strong quality.

Proposed Burk's Falls Hotel
DEVELOPMENT OVERVIEW 57
VALUATION & ADVISORY SERVICES
3. This level of hotel is more cost effective to develop relative to other higher service level hotels.
4. This level of hotel is more cost effective to operate relative to other higher service hotels.
The proposed hotel in Burk's Falls is expected to be a branded, Limited Service hotel and would include a comprehensive offering of amenities for both business and leisure travelers. Hotels of this nature typically feature a variety of guestrooms, including standard one or two bedded rooms, and a mixture of suite configurations. Guestrooms within this tier of hotels typically include amenities such as a desk or work space, high-speed internet and/or wireless internet access, and in-room coffee making facilities. The proposed development program should include a variety of room types as dictated by the brand development standards. Based on discussions with local stakeholders, it is recommended that the proposed hotel include an appropriate number of suites that include kitchenettes and are suitable for longer term stays.
Other services that would be available at the proposed hotel would include a breakfast area, 350 square feet of meeting space, a fitness room, and a convenience market. The inclusion of a sufficient amount of meeting space to accommodate a capacity of approximately 30 people would allow the hotel to attract additional meeting/conference business. The meeting space would be suitable to host small corporate meetings and social gatherings.
Branded, Limited Service hotels of this size and nature typically offer a complimentary continental breakfast to overnight guests. The proposed facility program includes a small breakfast area within the lobby and public areas. Any banqueting and food services needs would be provided by a third party; however, small meetings requiring snacks, coffee, and tea could likely be serviced by the in-house facilities.
Based on our experience in the industry and knowledge of comparable hotel construction projects, the proposed hotel development would require approximately 1.0-1.5 acres of land, including the appropriate surface parking coverage.
The following table outlines a possible facility program for the proposed hotel.

58 DEVELOPMENT OVERVIEW Proposed Burk's Falls Hotel
VALUATION & ADVISORY SERVICES
Conclusion
Overall, the most suitable location for a hotel development would be in the south end of Burk’s Falls near to Highway 11 and the newer commercial and retail developments in the area.
Based on a review of the existing hotel product, and on our research on the various sources of market demand, a Limited Service product is considered to be a good fit for the market.
GUESTROOMS % of Room Mix Keys Sq. Ft./Rm Total GFASingle Queen 11% 7 190 1,244Double Queen 68% 40 260 10,520Suite 16% 10 340 3,237Accessible 5% 3 350 350Total 100% 60 252 15,000
Seats Sq. Ft./Rm Total GFA30 6 33530 6 335
Capacity Sq. Ft./Rm Total GFA30 6 35030 6 350
Sq. Ft./Rm Total GFA6 35020 1,20088 5,265
378 22,500Source: CBRE Hotels
Lobby / Public Spaces / Mini MarketBOH / CirculationTotal Hotel GFA
TotalOTHERFitness Room
MEETING/CONFERENCE FACILITIESMeeting Room 1
Total Breakfast Area
PROPOSED HOTEL FACILITY PROGRAM
FOOD & BEVERAGE / BANQUETS

Competitive Market Projections Supply Projections Market Demand and ADR Projections
Co
mp
etitiv
e M
ark
et P
roje
ctio
ns:
Pro
po
sed
Bu
rk's
Fa
lls H
ote
l

Proposed Burk's Falls Hotel
COMPETITIVE MARKET PROJECTIONS 60
VALUATION & ADVISORY SERVICES
COMPETITIVE MARKET PROJECTIONS
Room Supply Changes
CBRE Hotels includes the following factors in determining which additions to supply may affect the competitive market:
1. Distance from the subject hotel
2. The type of facilities and amenities to be offered
3. Information from hotel operators on “who” would be considered a primary competitor
It should be noted that information regarding proposed hotel developments may vary once the planning department grants approvals or hotel development financing is finalized. While CBRE Hotels has made attempts to determine the level of new supply entering the market, it is impossible to determine every hotel that will be developed in the future, when they will be completed or their potential impact on the subject hotel. The inherent risk of any future new hotel supply has been implicitly considered in the selection of a stabilized occupancy level for the subject property.
Between 2012 and 2016 competitive supply has remained relatively stable with only minor fluctuations in the total number of available rooms.
Based on information available, discussions with hotel operators and our general knowledge of the industry there is one new hotel expected to enter the competitive regional market within the projection period.
1. The 100-room Homewood Suites is currently under construction at the corner of Oak
Street and Memorial Drive in North Bay. It is expected that the hotel will be completed in the spring or summer of 2017.
Over the projection period we have accounted for a net increase in supply of 160 rooms to enter the competitive market, reflecting the opening of the subject hotel and the Homewood Suites in North Bay; resulting in a 7.8% increase in rooms supply between the 2017 and 2020 period.
1 Proposed Burk's Falls Hotel 60 100% Limited Service Hotel 1-Jan-20 PROPOSED
2 Homewood Suites North Bay 100 100% Extended Stay 1-Jul-17 UNDER CONSTRUCTION
Total 160
Summary of Proposed New Supply

Proposed Burk's Falls Hotel
COMPETITIVE MARKET PROJECTIONS 61
VALUATION & ADVISORY SERVICES
Market Demand and ADR Projections
The demand projections prepared for the competitive market are based on the economic and tourism outlook for the Province and local area, as well as on current market dynamics and anticipated changes in demand patterns throughout the projection period. The following summarizes our projections for future room demand and ADR growth.
1. Demand growth is projected to be 3.3% in 2017 as a result of the increased market capacity with the opening of the Homewood Suites in North Bay in July, as well as an increase in travel that may be realized as a result of increased domestic travel in celebration of Canada’s 150th birthday.
2. In 2018, demand is projected to increase by a further 2.4% as the balance of the Homewood Suites hotel rooms impact the market.
3. Market demand is then projected to increase at 1.0% in 2019, before increasing by 1.2% in 2020 with the opening of the proposed subject property.
4. Market demand is then projected to increase between 0.9% and 1.0% per annum between 2019 and 2024, before the market stabilizes at 58.6% occupancy in 2024.
5. The potential Burk’s Falls hotel development is expected to satisfy previously unaccommodated demand in the region during peak demand periods. The balance of demand for the proposed hotel is expected to be captured through the penetration of the competitive market and by existing demand within the local and regional markets. The proposed hotel is expected to capture a share of the existing demand that had been travelling elsewhere to find accommodations due to the lack of available room supply in the immediate area.
6. The seasonality and functional capacity limits of the competitive regional market will limit the ability of the performance of the overall market to surpass these levels. Hotels generally operate at full capacity during peak periods and in the absence of any new significant off-peak demand generators, the market is expected to see limited occupancy growth over the projection period.
7. In terms of Average Daily Rate (ADR), based on historic market performance the market is projected to achieve 2.0% ADR growth throughout the projection period.
1 Projection Projection Projection Year 1 Year 2 Year 3 Year 4 Year 5 Year 6$1 2017 2018 2019 2020 2021 2022 2023 2024 2025
ROOM DEMAND 3.3% 2.4% 1.0% 1.2% 1.0% 1.0% 0.9% 0.9% 0.0%ADR 2.0% 2.0% 2.0% 2.0% 2.0% 2.0% 2.0% 2.0% 2.0%Source: CBRE Hotels
Market Room Demand and ADR Growth Projections by Segment

Proposed Burk's Falls Hotel
COMPETITIVE MARKET PROJECTIONS 62
VALUATION & ADVISORY SERVICES
Projection Projection Projection Year 1 Year 2 Year 3 Year 4 Year 5 Year 62017 2018 2019 2020 2021 2022 2023 2024 2025
Available Room Nights 751,535 769,785 769,785 791,685 791,685 791,685 791,685 791,685 791,685Occupied Room Nights 427,126 437,302 441,675 447,025 451,495 456,010 460,136 464,303 464,303Market Occupancy 56.8% 56.8% 57.4% 56.5% 57.0% 57.6% 58.1% 58.6% 58.6%Demand Growth 3.3% 2.4% 1.0% 1.2% 1.0% 1.0% 0.9% 0.9% 0.0%Market Average Daily Rate $131.92 $134.56 $137.25 $140.00 $142.80 $145.65 $148.56 $151.54 $154.57Rate Growth 2.0% 2.0% 2.0% 2.0% 2.0% 2.0% 2.0% 2.0% 2.0%Source: CBRE Hotels
Overall Accommodation Demand for Competitive Market

Subject Property Projections Occupancy and Rate Projections
Sub
ject
Pro
per
ty P
roje
ctio
ns:
Pro
po
sed
Bu
rk's
Fa
lls H
ote
l

64 SUBJECT PROPERTY ANALYSIS Proposed Burk's Falls Hotel
VALUATION & ADVISORY SERVICES
SUBJECT PROPERTY OCCUPANCY AND RATE PROJECTIONS
The subject property projections examine the future occupancy and Average Daily Rate (ADR) for the subject hotel based on numerous factors including economic influences and the actual and projected supply/demand relationship in the competitive markets.
Projected Subject Occupancy and Average Daily Rate
The following analysis assesses the projected market position/occupancy, average rate, and RevPAR levels for the subject property. The projections are based on numerous factors including the economic influences, the projected supply/demand relationship in the competitive market, interviews with local stakeholders and expected growth in demand for accommodations in the local area.
It is assumed that there are no significant changes in the market over the projection period that would impact the current status of the competitive rooms supply other than as currently identified.
The average daily rate and the overall occupancy of a lodging facility are the foundation for the property’s financial performance. While a property’s other revenue components (food and beverage, telephone, spa, other income, etc.) are crucial to the operation of the hotel, they are dependent on the overall number of occupied rooms. Furthermore, the occupancy and average daily rate of a hotel are highly correlated. In reality, one cannot make a projection of one without a projection of the other.
The following section presents our projections of demand for the subject property by market segment.
Corporate/Commercial Segment
The Corporate/Commercial market segment consists of rooms’ demand, which is generated by, and specifically related to, business and corporate activity. Within this market, both individual and volume (or preferred) corporate accounts are included.
The proposed subject hotel is projected to capture approximately 2,400 occupied room nights within the Corporate/Commercial segment in its stabilized year, 2022, representing 20% of the hotel’s total demand. The majority of these occupied room nights within the Corporate/Commercial segment will be captured over the Sunday through Thursday period throughout the year.
Hotels within the competitive market typically capture approximately 32% of total demand, or approximately 4,000 occupied room nights at comparably sized hotels from the Corporate/Commercial demand segment. The proposed hotel is projected to capture less than is typical within the competitive market. Projections in this segment are based on the following:

Proposed Burk's Falls Hotel SUBJECT PROPERTY ANALYSIS 65
VALUATION & ADVISORY SERVICES
1. The proposed hotel will be a newly built, branded hotel, which is expected to help in attracting some local corporate demand.
2. The proposed hotel is also expected to benefit from its potential location along Highway 11 and would capture a portion of Corporate demand generated from business travelers as a result of its proximity to the highway.
3. The Village of Burk’s Falls contains a few industrial and manufacturing businesses, but lacks a deep base of major corporate demand generators such as head offices or large-scale manufacturing or processing facilities. The limited number of large corporate demand generators in the area will make it difficult for the property to attract a significant number of room nights in this segment.
4. Stakeholder interviews indicated that while a number of businesses would utilize a local hotel if such a facility existed, a number of respondents did indicate that their clients and customers would still prefer to stay in a larger town such as Huntsville to take advantage of the amenities and attractions there.
5. The proposed hotel is also projected to capture a portion of demand from the regional area, such as business demand that is being generated by neighbouring or nearby communities.
6. The proposed hotel is not expected to induce Corporate demand into the market, rather it will re-capture a portion of existing demand that was either being accommodated in non-traditional accommodations or in the surrounding towns.
The proposed hotel’s projected performance within the Corporate/Commercial demand segment is summarized below.
Corporate/Commercial Segmentation 2020 2021 2022 2023 2024
Occupied Room Nights 2,134 2,292 2,375 2,375 2,375 Ratio to Total Demand 19.0% 19.8% 19.9% 19.9% 19.9%
Source: CBRE Hotels
Upon stabilization the hotel will attract about 8-12 corporate room nights per day over the key 200-250 primary corporate demand days annually.
Meeting/Conference Segment
The Meeting/Conference market segment typically consists of rooms’ demand generated for the purpose of attending meetings and/or conferences internally within area hotels, which offer public assembly facilities. Conference delegates who may be attending a meeting elsewhere in the vicinity may also generate demand.
Hotels within the competitive market typically capture approximately 14% of their total demand, equating to approximately 1,700 occupied room nights for a comparably sized hotel, from the Meeting/Conference demand segment. It is important to note that while almost all of the hotels in the market capture some level

66 SUBJECT PROPERTY ANALYSIS Proposed Burk's Falls Hotel
VALUATION & ADVISORY SERVICES
of demand from this segment, the majority of the Meeting/Conference demand in the competitive market is generated by Deerhurst Resort, Hidden Valley Resort, and Grandview Resort in Huntsville as they offer a significant amount of on-site meeting space.
The proposed hotel is projected to generate a lower proportion of annual demand from this segment, at 5% of total demand or 607 occupied room nights upon stabilization in 2022. Projections in this segment are based on the following:
1. The proposed hotel will be a newly built, branded hotel, and will contain approximately 350 square feet of meeting space with a maximum capacity of approximately 30 people.
2. The proposed hotel is expected to attract a number of in house meetings each year, of which a proportion will generate occupied room night demand for the hotel, as well as capture demand from meetings and events in the local area.
3. The local area lacks a significant amount of newly constructed meeting and event facilities that can accommodate people for social events such as weddings, holiday celebrations, birthdays, anniversaries, and religious events and corporate events such as training and annual meetings. However, the proposed hotel is expected to capture some Meeting/Conference demand that would be generated by the events held at the Royal Canadian Legion and the Burk’s Falls Arena.
The proposed hotel’s projected performance within the Meeting/Conference demand segment is summarized below.
Meeting/Conference Segmentation 2020 2021 2022 2023 2024
Occupied Room Nights 510 558 607 607 607 Ratio to Total Demand 4.6% 4.8% 5.1% 5.1% 5.1%
Source: CBRE Hotels
The subject hotel is projected to generate demand from both in house meetings/functions as well as from those held at venues off-site. Upon stabilization the hotel is projected to generate an estimated 607 room nights per year from the Meeting/Conference Segment. This would equate to 1 to 2 meetings per month hosting 15 to 20 delegates over 1 to 2 nights.
Leisure/Tourist Segment
The Leisure/Tourist market segment consists of rooms’ demand generated by independent tourists, group tours, and a variety of sports teams/events throughout the year. It includes individuals and families visiting as tourists, the “VFR” market (visiting friends or relatives). This market also consists of demand generated by groups whose primary purpose is of a leisure or transient nature and not related to corporate business.

Proposed Burk's Falls Hotel SUBJECT PROPERTY ANALYSIS 67
VALUATION & ADVISORY SERVICES
Occupied room night demand within the Leisure/Tourist segment will be generated from a variety of sources including, sports tournaments, cultural events and festivals, and recreational and pleasure travel to Burk's Falls and the surrounding area, as well as visiting friends and family.
Hotels within the competitive market typically capture approximately 41% of their total annual demand, or in the range of 6,000 to 7,000 occupied room nights for comparably sized hotels, from the Leisure demand segment. The proposed hotel is projected to capture a higher proportion of demand from this segment, at 56% of total demand or 6,677 occupied room nights upon stabilization in 2022, the third year of operations. Projections in this segment are based on the following:
1. The proposed hotel will be a newly built, branded hotel.
2. The proposed hotel is expected to be an attractive accommodation choice for sports groups traveling to the Burk’s Falls Arena, visitors to the nearby Algonquin Park access points, and those visiting friends and relatives in Burk’s Falls and the surrounding area.
3. Sports tourism and festival/event demand is expected to generate a significant amount of occupied room nights for the hotel; however it will be limited by seasonal and functional capacity issues as these events are typically concentrated over a 2 to 3 day period.
4. Given that much of the leisure demand in the competitive market is highly seasonal, and concentrated on weekends and in the summer season, the capacity limits of the hotel will impact the amount of demand the property can reasonably expect to capture from this demand segment.
5. The Town and regional area is a popular destination for outdoor recreational activity, particularly in the summer months. The local area has a number of attractions and amenities including local shops and restaurants, and recreational trails.
6. There is a lack of quality, branded accommodation in the regional area, with the closest hotels located approximately 40 km south in Huntsville, or 90 km north in North Bay.
It is expected that the proposed hotel would be able to re-capture a portion of Leisure demand that was previously staying outside of Burk's Falls as a result of the lack of suitable accommodations. The proposed hotel’s projected performance within the Leisure demand segment is summarized below.
Leisure/Tourist Segmentation 2020 2021 2022 2023 2024
Occupied Room Nights 6,420 6,560 6,677 6,677 6,677 Ratio to Total Demand 57.3% 56.5% 56.1% 56.1% 56.1%
Source: CBRE Hotels
Upon stabilization the hotel will attract about 45-55 leisure room nights per day over the key 100-150 primary leisure demand days annually.

68 SUBJECT PROPERTY ANALYSIS Proposed Burk's Falls Hotel
VALUATION & ADVISORY SERVICES
Government/Other Segment
The Government/Other market segment consists of demand generated by crew contracts, government officials, travel agents, hotel employees, and to a lesser extent, smaller specialty markets. Demand in this segment is typically represented by sources, which are highly rate sensitive and are normally provided with significantly discounted room rates.
It is expected that the hotel would benefit from some demand from local work and construction crews that are working throughout the region, in addition to some extended stay demand that exists within the market. However, this segment of demand is typically highly rate sensitive and while it is reasonable to expect the proposed hotel to capture a portion of this existing demand, it would be at a lower rate. The proposed hotel is also expected to utilize online travel websites to capture demand within the ‘Other’ segment. This segment of demand is also typically offered at a highly discounted rate.
Hotels within the competitive market typically capture approximately 14% of their total demand, or in the range of 2,000 to 2,500 occupied room nights for comparably sized hotels, from the Government/Other demand segment. The proposed hotel is projected to capture a higher proportion of occupied room nights from this segment, at 19% of total demand or 2,252 occupied room nights in 2022, the third year of operations. Projections in this segment are based on the following:
1. The proposed hotel will be a newly built, branded hotel.
2. The proposed hotel is expected to be an attractive accommodation choice for crew demand generated by road and hydro work within the local area.
3. Stakeholder interviews indicated that there is some demand in the local market for extended stay hotel accommodations and the proposed hotel is expected to capture some demand from extended stay guests; albeit at a lower rate.
4. The proposed hotel is expected to make use of online travel agency websites to fill rooms during lower demand periods.
The proposed hotel’s projected performance within the Government/Other demand segment is summarized below.
Government/Other Segmentation 2020 2021 2022 2023 2024
Occupied Room Nights 2,146 2,194 2,252 2,252 2,252 Ratio to Total Demand 19.2% 18.9% 18.9% 18.9% 18.9%
Source: CBRE Hotels
Upon stabilization, the hotel will attract about 8 to 12 “other” room nights per day over the key 200-250 primary “other” demand days annually.

Proposed Burk's Falls Hotel SUBJECT PROPERTY ANALYSIS 69
VALUATION & ADVISORY SERVICES
Subject Hotel Average Daily Rate Projections
In terms of Average Daily Rate (ADR), the ADR for the proposed subject hotel is projected to be $121 in its opening year, 2020. The subject hotel is projected to achieve an ADR slightly below similar hotel assets within the competitive regional market, taking into consideration the proposed facilities program and Limited Service brand affiliation.
Subject Property Average Daily Rate Penetration
2020 2021 2022 2023 2024 Subject Average Daily Rate $121.00 $123.42 $125.89 $128.41 $130.97
Source: CBRE Hotels
The proposed hotel’s ADR is expected to be at a slight discount to that of the properties in the surrounding major markets. The proposed hotel’s location is removed from some of the larger demand generators in the region and the Village of Burk’s Falls does not necessarily have the same appeal and access to support amenities as accommodations located in the larger towns of Parry Sound, North Bay, and Huntsville.

70 SUBJECT PROPERTY ANALYSIS Proposed Burk's Falls Hotel
VALUATION & ADVISORY SERVICES
Summary of Property Projections
Projections by segment of demand for the proposed hotel including occupancy, ADR, and RevPAR are shown below:
Seasonality of Demand
The following graph presents the monthly seasonality of demand and capacity analysis for the proposed hotel based on the above projections for each demand segment.
The proposed hotel is expected to follow a similar pattern of seasonality as the regional market. Peak demand will occur in July and August when leisure travel demand is highest, with softer demand levels seen in the shoulder periods. Winter will generally be the slowest season with the lowest demand levels expected to occur in December and January. The popularity of winter sports and the leisure travel
Year 1 Year 2 Year 3 Year 4 Year 5 Year 601-Jan-20 01-Jan-21 01-Jan-22 01-Jan-23 01-Jan-24 01-Jan-25
SUBJECT ROOM DEMAND BY SEGMENTCORPORATE 2,134 2,292 2,375 2,375 2,375 2,375 % of Demand 19.04% 19.75% 19.94% 19.94% 19.94% 19.94%MEETING 510 558 607 607 607 607 % of Demand 4.55% 4.81% 5.09% 5.09% 5.09% 5.09%LEISURE 6,420 6,560 6,677 6,677 6,677 6,677 % of Demand 57.27% 56.53% 56.06% 56.06% 56.06% 56.06%OTHER 2,146 2,194 2,252 2,252 2,252 2,252 % of Demand 19.15% 18.91% 18.91% 18.91% 18.91% 18.91%Total Subject Demand 11,210 11,605 11,910 11,910 11,910 11,910 SUBJECT OCCUPANCY 51.2% 53.0% 54.4% 54.4% 54.4% 54.4%Total Rooms Revenue $1,356,363 $1,432,238 $1,499,385 $1,529,372 $1,559,960 $1,591,159SUBJECT ADR $121.00 $123.42 $125.89 $128.41 $130.97 $133.59SUBJECT RevPAR $61.93 $65.40 $68.47 $69.83 $71.23 $72.66Source: CBRE Hotels
Proposed Burk's Falls Hotel Segmentation
$0
$20
$40
$60
$80
$100
$120
$140
$160
0%
10%
20%
30%
40%
50%
60%
70%
80%
Jan-22 Feb-22 Mar-22 Apr-22 May-22 Jun-22 Jul-22 Aug-22 Sep-22 Oct-22 Nov-22 Dec 22
Proposed Burk's Falls Hotel - Seasonality of Demand
Occupancy ADR

Proposed Burk's Falls Hotel SUBJECT PROPERTY ANALYSIS 71
VALUATION & ADVISORY SERVICES
associated with this will see slightly higher demand levels occur in February. Average daily rates are expected to fluctuate in line with demand throughout the year, with the highest rates achieved in July and August and the lowest rates in November and December.
Overall, Summer is expected to be the busiest season for the proposed hotel, with 34% of total demand and an average occupancy of approximately 74% between July and September. This is followed by spring, which is expected to represent approximately 25% of demand and occupancy of approximately 54%. Fall and winter represent the lowest periods of demand at approximately 20% of total demand each, and occupancies in the range of 44% to 46%. As shown, the proposed hotel is projected to achieve strong weekend and weekday occupancy in the summer when leisure travel demand is high and many people take weekday vacations. Weekend occupancy will be strong in the spring season and relatively weak in the fall period. Both weekday and weekend occupancy will be weaker in the winter season. Mid-week occupancy, particularly in the off peak periods, presents a significant challenge in achieving sustainable business levels.
The following presents the seasonality implications for each of the demand segments:
1. Corporate – Corporate travel in the region is concentrated in the spring, summer, and fall months; however, some corporate demand does exist in the winter months as well. The seasonal nature of business travel within the area presents a challenge for capturing corporate demand during the winter months. Corporate demand is typically concentrated between Sunday and Thursday.
2. Meeting/Conference – Meeting and Conference demand provides a relatively consistent source of demand throughout the year, with slightly higher demand periods in the spring and fall. Meeting and conference demand typically occurs between Sunday and Thursday.
3. Leisure – Leisure demand is typically concentrated throughout the summer months when travelers are more likely to book vacations, add vacation time onto a business trip or conference, host a wedding or event, or visit friends and relatives. In this market, there is also a fair amount of winter recreational travel, which would generate some demand in the winter and shoulder periods. Leisure demand generally occurs on weekends; however, in the summer months weekday leisure demand increases.
4. Government/Other – Government/Other demand provides a relatively consistent source of demand throughout the year. Demand within this segment is typically concentrated throughout the week.
TOTAL DEMAND occupied room nights 11,910
% demand 100.0%period occupancy 54.4%
Sun-Thur Fri-Sat Sun-Thur Fri-Sat Sun-Thur Fri-Sat Sun-Thur Fri-Satoccupied room nights 11,910 1,604 796 1,719 1,205 2,837 1,257 1,638 884
% demand 100.0% 67% 33% 59% 41% 69% 31% 40% 60%period occupancy 41% 51% 44% 77% 73% 81% 42% 57%
Source: CBRE Hotels
44% 54% 46%20% 25% 34% 21%
2,400 2,923 4,095 2,523
Seasonality and Capacity AnalysisWinter (Jan-Mar) Spring (Apr-Jun) Summer (Jul-Sep) Fall (Oct-Dec)
74%

72 SUBJECT PROPERTY ANALYSIS Proposed Burk's Falls Hotel
VALUATION & ADVISORY SERVICES
PROJECTED OPERATING RESULTS
Given that the potential hotel development would be a newly constructed asset, a review of historic results is not possible. Rather to estimate the revenues and expenses of the hotel, the pro forma assumptions have been based on a review of the operating performance of similar and like hotels as tracked through the in-house CBRE Canadian Hotel Trends database. The CBRE Hotel database of financial statements annually includes over 650 properties across Canada. This database, which provides insight into the operating performance of other directly competitive and comparable hotels, includes a sample of select service hotels. The comparative hotels were selected based on their size, facility program and market mix.
The Uniform System of Accounts for Hotels, recommended by the American Hotel and Lodging Association and in general use throughout the hotel industry in Canada, has been used to classify income and expenses in this report. In conformity with this system, only direct operating expenses are charged to operating departments of the hotel. The general overhead items, which are applicable to operations as a whole, are classified as undistributed and include administrative and general expenses, IT, marketing, property operations and maintenance, and energy costs.
Based on our review of the market, and upon the discussion of projected occupancies and average daily rates, a projection of operating results has been prepared for the potential hotel development as a 60-room branded, limited service property. The projections assume an opening date of January 1, 2020.
Outlined in this section is a discussion on each of the hotel’s major income and expense categories. Revenue and expenses have been forecasted using the Uniform System of Accounts.
Expenses have been projected with consideration given to the level of fixed versus variable costs in each department. Fixed costs are those that are not normally affected by changes in occupancy levels or sales volumes, such as property taxes, certain administrative payroll positions, or fixed internet and phone plans. Variable expenses however, are tied directly to occupancy levels and sales volumes and include items such as the cost of housekeeping supplies or food and beverage purchases. Revenues and expenses have been inflated at 2% per year unless otherwise noted. The following table summarized level of fixed versus variable expense projected by hotel department:

Proposed Burk's Falls Hotel SUBJECT PROPERTY ANALYSIS 73
VALUATION & ADVISORY SERVICES
The underlying rationale and assumptions used in preparing the proforma estimates are summarized in the following pages.
Rooms Revenue
Occupancy and Average Room Rate
The proposed hotel’s projected revenues for this department as a percentage of total revenue on a per available room basis and on a per occupied room basis are summarized as follows:
Other Operating Departments
Other Operating Departments include telecommunications revenue which is generated by charges to hotel guests for use of the hotels communications system. Telephone revenues for hotels have declined in recent years due to an increase in cell phone and internet usage. Revenue from Other Operating Departments
DEPARTMENT % FIXED % VARIABLE
DEPARTMENTAL EXPENSESGUEST ROOMS 40% 60%
TELECOMMUNICATIONS AND OTHER OPERATING DEPARTMENTS 70% 30%
UNDISTRIBUTED EXPENSESADMINISTRATION & GENERAL 80% 20%
IT SYSTEMS 80% 20%
SALES & MARKETING180% 20%
PROPERTY OPERATIONS & MAINTENANCE 90% 10%
UTILITIES 90% 10%
FIXED CHARGES
PROPERTY AND OTHER TAXES 100% 0%
INSURANCE 100% 0%1 excludes franchise fees
Source: CBRE Hotels
EXPENSE ANALYSIS - F IXED VS. VARIABLE ANALYSIS
Year Occupancy ADRTotal $ (000's)
% Total SalesPer Available
RoomPer Occupied
RoomYear 1 51.2% $121.00 $1,356 97.2% $22,606 $121Year 3 54.4% $125.89 $1,499 97.3% $24,990 $126Deflated Year 3 54.4% $114.02 $1,358 97.3% $22,634 $114
Ontario Limited Service 70.6% $110.07 $3,035 96.9% $28,365 $110Northern Ontario Limited Service 64.3% $100.68 $2,032 90.6% $23,630 $101
ROOMS REVENUE
Source: CBRE Hotels

74 SUBJECT PROPERTY ANALYSIS Proposed Burk's Falls Hotel
VALUATION & ADVISORY SERVICES
also includes revenue generated by on-site ancillary sales, meeting room rentals, parking, and any Food & Beverage commissions charged, and other miscellaneous sources.
The proposed hotel is also projected to generate revenue from a la carte services, such as the sale of small convenience items and movie rentals. Net revenue from the provision of these services is also included in Other Operating Departments.
The proposed hotel’s projected revenues for this department as a percentage of total revenues, on a per available room basis, and on a per occupied room basis are summarized as follows:
Year One has been projected at $3 per occupied room night. Projections are based on a review of comparable limited service properties in Ontario and Northern Ontario. Overall, the projected revenues are deemed to be reasonable given the size, quality and nature of the subject hotel.
Miscellaneous Revenue
Miscellaneous Revenue includes income from resort/destination marketing fees, non-room package revenue, foreign exchange gains and losses, vending machines, movies, etc. Miscellaneous Revenue is typically reported as a net amount.
The proposed hotel’s revenues for this department as a percentage of total revenues, on a per available room basis, and on a per occupied room basis are summarized as follows:
Projections are in line with comparable properties and industry norms.
Year Total $ (000's) % Total Sales Per Available Room Per Occupied Room
Year 1 $28 2.0% $467 $3
Year 3 $30 1.9% $495 $2
Deflated Year 3 $27 1.9% $448 $2
Ontario Limited Service $36 1.2% $337 $1Northern Ontario Limited Service $10 0.5% $120 $1Source: CBRE Hotels
OTHER OPERATING DEPARTMENTS REVENUE
Year Total $ (000's) % Total Sales Per Available Room Per Occupied RoomYear 1 $11 0.8% $187 $1Year 3 $12 0.8% $199 $1
MISCELLANEOUS REVENUE
Source: CBRE Hotels

Proposed Burk's Falls Hotel SUBJECT PROPERTY ANALYSIS 75
VALUATION & ADVISORY SERVICES
Departmental Expenses
Departmental expenses are typically occupancy sensitive and directly related to an associated revenue source. These expenses are therefore compared and estimated as a percentage of departmental revenues.
Rooms Expenses include labour costs such as salaries and wages for front desk, housekeeping, reservations, bell staff and laundry, plus employee benefits. Also included are linens, cleaning supplies, guest supplies, uniforms, equipment leases and travel agent commissions. Payroll costs are typically the largest component. Overall, wages typically account for 50% to 60% of the total departmental expense. The comparable data and projections for the proposed hotel are summarized as follows:
Projections have been based on a review of comparable properties and industry norms. Rooms expenses are projected to be 24.3% of revenue or $29 per occupied room night in Year One. Costs decline to 23.7% by Year Three as occupancy level/hotel revenues improve. Costs appear reasonable based on the comparable data – as a percentage of revenue and on a cost per occupied room basis.
Other Operating Departments’ Expenses are those expenses which offset the revenue generated by other operated departments, such as guest laundry, athletic facilities and gift shop, as well as rental activity. The comparable data and projections for the subject are summarized as follows:
Expenses are projected to be 52% of revenues in Year One, and are expected to hold at this level throughout the investment horizon. Projections are based on comparable properties and industry norms and are deemed reasonable for the subject hotel.
Year Total $ (000's) % Sales Per Available Room Per Occupied Room
Year 1 $329 24.3% $5,489 $29
Year 3 $355 23.7% $5,924 $30
Deflated Year 3 $322 23.7% $5,366 $27
Ontario Limited Service $835 27.5% $7,808 $30Northern Ontario Limited Service $513 25.2% $5,962 $25
ROOMS EXPENSES
Source: CBRE Hotels
Year Total $ (000's) % Sales Per Available Room Per Occupied Room
Year 1 $15 52.0% $243 $1
Year 3 $15 52.0% $257 $1
Deflated Year 3 $14 52.0% $233 $1
Ontario Limited Service $16 44.2% $149 $1Northern Ontario Limited Service $7 67.2% $81 $0
OTHER OPERATING DEPARTMENTS EXPENSES
Source: CBRE Hotels

76 SUBJECT PROPERTY ANALYSIS Proposed Burk's Falls Hotel
VALUATION & ADVISORY SERVICES
Undistributed Expenses
Undistributed operating expenses are typically not directly related to an associated revenue source, but can be compared on the basis of total revenues for similar types of hotels. These expenses are therefore compared and estimated as a percentage of total revenues.
Administrative and General Costs include payroll and related expenses for the general manager, human resources and training, security, clerical staff, controller and accounting staff. Other expenses include office supplies, computer services, accounting and legal fees, cash overages and shortages, travel insurance, credit card commissions, transportation (non-guest) and travel and entertainment. The comparable data and projections for the proposed hotel are summarized as follows:
Administration and General Expenses are projected to be 8.4% of revenue or $1,965 per available room in Year One. As the hotel stabilizes and revenues increase, A&G expenses are projected to decline to 8.1% by Year Three. Overall the projections are deemed to be reasonable given the size, location and nature of the proposed hotel.
Information & Technology Systems expenses include the costs of calls, equipment rental, labour cost of operators and other related expenses. The comparable data and projections for the proposed hotel are summarized as follows:
Year Total $ (000's) % Sales Per Available Room Per Occupied Room
Year 1 $118 8.4% $1,965 $11
Year 3 $124 8.1% $2,070 $10
Deflated Year 3 $112 8.1% $1,875 $9
Ontario Limited Service $158 5.0% $1,473 $6Northern Ontario Limited Service $163 7.3% $1,899 $8
ADMINISTRATION AND GENERAL EXPENSES
Source: CBRE Hotels
Year Total $ (000's) % Sales Per Available Room Per Occupied RoomYear 1 $17 0.4% $287 $1Year 3 $18 0.3% $299 $1Deflated Year 3 $16 0.3% $271 $1Ontario Limited Service $19 0.6% $181 $1
Northern Ontario Limited Service $13 0.6% $152 $1
IT EXPENSES
Source: CBRE Hotels

Proposed Burk's Falls Hotel SUBJECT PROPERTY ANALYSIS 77
VALUATION & ADVISORY SERVICES
IT Expenses are projected to be 0.4% of revenue or $287 per available room in Year One. IT expenses are expected to decline to 0.3% of total revenues by Year Three. Overall the projections are deemed to be reasonable given the size, location and nature of the proposed hotel.
Sales & Marketing Expenses include payroll and related expenses for the sales and marketing staff, direct sales expenses, advertising and promotion, travel expenses for the sales staff and civic and community projects. This category may also include a national advertising fee or assessment paid to the franchise company, plus the cost of frequent guest stay programs. The comparable data and projections for the proposed hotel are summarized as follows:
Sales and marketing expenses are projected to be 2.1% in Year 1 ($500 per available room). This cost includes cost of onsite marketing but does not include any fees paid to a brand as part of the hotels’ franchise agreement. Expenses are projected to hold within this range over the balance of the projection period. Projections are based on the comparable properties and industry norms and are deemed to be reasonable given the asset’s proposed orientation and branding.
Franchise Fees include all Royalty and Program Fees charged by the brand as part of the hotels’ franchise agreement. These fees have been projected based on our understanding of the fees for Limited Service hotel brands in Canada, which typically range from 8% to 10% of gross rooms revenue.
Royalty Fees, assessed as a percentage of Gross Rooms Revenue, are projected to 5.5% and a Program Fee of 3.5% of Gross Rooms Revenue is expected. This results in total Franchise Fees of 9.0% of Gross Rooms Revenue, in line with the range of typical Limited Service hotel brand fees.
Property Operations & Maintenance Expense includes all payroll and related expenses for maintenance personnel, cost of maintenance supplies, cost of repairs and maintenance of the building, furniture and equipment, the grounds and the removal of waste matter. The comparable data and projections for the proposed hotel are summarized as follows:
Year Total $ (000's) % Sales Per Available Room Per Occupied Room
Year 1 $30 2.1% $500 $3
Year 3 $32 2.1% $527 $3
Deflated Year 3 $29 2.1% $477 $2
Quebec Limited Service $71 3.0% $905 $3Northern Ontario Limited Service $42 1.9% $490 $2Source: CBRE Hotels
SALES AND MARKETING EXPENSES

78 SUBJECT PROPERTY ANALYSIS Proposed Burk's Falls Hotel
VALUATION & ADVISORY SERVICES
Costs are estimated to be $1,200 per available room in Year 1 (5.2% of revenue), declining to 4.9% by Year 3. The property will be newly constructed and will be in excellent condition. Our estimate will allow for the hotel to be maintained and to make ongoing repairs.
This cost is in addition to the 4.0% FF&E Reserve used in our forecast.
Utility Expenses typically include electricity, fuel (oil and gas) and water. This category also includes any central plant and energy management systems. The comparable data and projections for the proposed hotel are summarized as follows:
Utility costs appear reasonable on a per available room basis and costs are in line with industry norms on a per available room basis.
Other Expenses
Management Fees are estimated at 3.0% of gross revenues, which is in line with industry averages for this type of hotel.
Year Total $ (000's) % Sales Per Available Room Per Occupied Room
Year 1 $72 5.2% $1,200 $6
Year 3 $75 4.9% $1,256 $6
Deflated Year 3 $68 4.9% $1,138 $6
Ontario Limited Service $130 4.2% $1,215 $5Northern Ontario Limited Service $90 4.0% $1,048 $4Source: CBRE Hotels
PROPERTY OPERATIONS AND MAINTENANCE EXPENSES
Year Total $ (000's) % Sales Per Available Room Per Occupied Room
Year 1 $99 7.1% $1,650 $9
Year 3 $104 6.7% $1,727 $9
Deflated Year 3 $94 6.7% $1,564 $8
Ontario Limited Service $145 4.6% $1,353 $5Northern Ontario Limited Service $117 5.2% $1,364 $6
UTILITIES EXPENSES
Source: CBRE Hotels

Proposed Burk's Falls Hotel SUBJECT PROPERTY ANALYSIS 79
VALUATION & ADVISORY SERVICES
Fixed Charges
Municipal Taxes and Insurance is largely comprised of realty taxes. This cost is based on the comparable sample of limited service properties in Northern Ontario, as well as expected commercial tax rates for the Village of Burk’s Falls.
Taxes and insurance costs are calculated at $2,500 and $150 respectively, per room in Year One. Tax expense is estimated only and actual assessment and taxes for the hotel could differ from our estimate once the hotel is developed.
Reserve for Replacement
Reserve for Capital Replacement includes structural reserve and FF&E reserve. Structural reserves account for the replacement of short-lived items, including the roof, building systems, and parking lot. FF&E reserves for replacement are typically included in hotel expense projections to account for the periodic replacement of the furniture, fixtures and equipment (FF&E). It does not reflect the value of existing FF&E. It is solely an expense to reflect future replacements of short-lived items. This expense can be based on the actual replacement cost of the FF&E, its projected economic life and a reasonable reinvestment rate for the reserve funds (essentially a sinking fund account).
An alternative and more widely utilized method is to estimate FF&E reserves based on a percentage of total revenues. Typically market participants calculate reserves at 4.0%.
Summary
To verify the reasonableness of the projected expenses, we compared the proposed hotel’s expenses to industry results as compiled by CBRE Hotels. Operating expenses are compared to a sample of comparable hotels identified in the chart below.
Year Total $ (000's) % Sales Per Available Room Per Occupied Room
Year 1 $159 11.4% $2,650 $14
Year 3 $165 10.7% $2,757 $14
Deflated Year 3 $150 10.7% $2,497 $13
Ontario Limited Service $219 7.0% $2,047 $8Northern Ontario Limited Service $182 8.1% $2,113 $9Source: CBRE Hotels
REAL ESTATE TAXES AND INSURANCE

80 SUBJECT PROPERTY ANALYSIS Proposed Burk's Falls Hotel
VALUATION & ADVISORY SERVICES
As shown above, the proposed hotel is expected to operate at ratios similar to industry norms.
Projected Operating Results
Outlined on the following page are the projected results for the Proposed Burk's Falls Hotel, assuming an opening date of January 1, 2020.
Nor
ther
n O
ntar
io
Lim
ited
Serv
ice
Ont
ario
Li
mite
d Se
rvic
e
Subj
ect
Year
O
ne
Rooms Department Cost
% of Room Revenue
Food & Beverage Cost% of Food & Beverage RevenueAdministration and General
% of Room RevenueMarketing
% of Gross RevenueMaintenance
$ per Available RoomEnergy$ per Available RoomRealty Tax & Insurance$ per Available RoomSource: CBRE Hotels, Trends 2015 Canadian Edition and Smith Travel Research, Host
$1,650
$2,113 $2,047 $2,650
$1,364 $1,353
2.15%
$1,048 $1,215 $1,200
1.88% 3.62%
8.45%
71.92% -
7.28% 5.03%
-
Proposed Burk's Falls Hotel - Expense Comparison
25.23% 27.53% 24.28%

Proposed Burk's Falls Hotel
SUBJECT PROPERTY ANALYSIS 81
VALUATION & ADVISORY SERVICES
Proposed Hotel, Burk's FallsFor Period Beginning
PERIOD Year 1 % Sales PAR/POR Year 2 % Sales PAR/POR Year 3 % Sales PAR/POR Year 4 % Sales PAR/POR Year 5 % Sales PAR/POR Year 6 % Sales PAR/POR
No. of Rooms 60 60 60 60 60 60ANNUAL AVAILABLE ROOMS 21,900 21,900 0.0% 21,900 0.0% 21,900 0.0% 21,900 0.0% 21,900 0.0%
ROOMS SOLD 11,210 11,605 3.5% 11,910 2.6% 11,910 0.0% 11,910 0.0% 11,910 0.0%
OCCUPANCY 51.2% 53.0% 3.5% 54.4% 2.6% 54.4% 0.0% 54.4% 0.0% 54.4% 0.0%
AVERAGE RATE $121.00 $123.42 2.0% $125.89 2.0% $128.41 2.0% $130.97 2.0% $133.59 2.0%
RevPAR $61.93 $65.40 5.6% $68.47 4.7% $69.83 2.0% $71.23 2.0% $72.66 2.0%
OPERATING REVENUEGuest Rooms $1,356 97.2% $121.00 $1,432 97.3% $123.42 $1,499 97.3% $125.89 $1,529 97.3% $128.41 $1,560 97.3% $130.97 $1,591 97.3% $133.59
Miscellaneous Income $11 0.8% $1.00 $12 0.8% $1.00 $12 0.8% $1.00 $12 0.8% $1.02 $12 0.8% $1.04 $13 0.8% $1.06
Telecommunications and Other Operating Departments
$28 2.0% $2.50 $29 2.0% $2.49 $30 1.9% $2.49 $30 1.9% $2.54 $31 1.9% $2.59 $32 1.9% $2.65
Total Operating Revenue $1,396 100.0% $124.50 $1,473 100.0% $126.91 $1,541 100.0% $129.39 $1,572 100.0% $131.97 $1,603 100.0% $134.61 $1,635 100.0% $137.30
DEPARTMENTAL EXPENSESGuest Rooms $329 24.3% $29.38 $343 24.0% $29.56 $355 23.7% $29.84 $363 23.7% $30.44 $370 23.7% $31.05 $377 23.7% $31.67
Telecommunications and Other Operating Departments
$15 52.0% $1.30 $15 52.0% $1.29 $15 52.0% $1.30 $16 52.0% $1.32 $16 52.0% $1.35 $16 52.0% $1.38
Total Departmental Expenses $344 24.6% $30.68 $358 24.3% $30.86 $371 24.1% $31.14 $378 24.1% $31.76 $386 24.1% $32.40 $394 24.1% $33.05
TOTAL DEPARTMENTAL INCOME $1,052 75.4% $93.82 $1,115 75.7% $96.05 $1,170 75.9% $98.25 $1,194 75.9% $100.21 $1,217 75.9% $102.21 $1,242 75.9% $104.26
UNDISTRIBUTED EXPENSESAdministration & General $118 8.4% $1,965 $121 8.2% $2,019 $124 8.1% $2,070 $127 8.1% $2,111 $129 8.1% $2,153 $132 8.1% $2,197
IT Systems $17 1.2% $288 $18 1.2% $294 $18 1.2% $300 $18 1.2% $306 $19 1.2% $312 $19 1.2% $318
Sales & Marketing $30 2.1% $500 $31 2.1% $514 $32 2.1% $527 $32 2.1% $537 $33 2.1% $548 $34 2.1% $559
Franchise Fees $122 9.0% $2,035 $129 9.0% $2,148 $135 9.0% $2,249 $138 9.0% $2,294 $140 9.0% $2,340 $143 9.0% $2,387
Property Operations & Maintenance $72 5.2% $1,200 $74 5.0% $1,228 $75 4.9% $1,256 $77 4.9% $1,281 $78 4.9% $1,307 $80 4.9% $1,333
Utilities $99 7.1% $1,650 $101 6.9% $1,689 $104 6.7% $1,727 $106 6.7% $1,762 $108 6.7% $1,797 $110 6.7% $1,833
Total Undistribu ted Expenses $458 32.8% $7,638 $473 32.2% $7,892 $488 31.6% $8,129 $497 31.6% $8,291 $507 31.6% $8,457 $518 31.6% $8,626
GROSS OPERATING PROFIT $593 42.5% $9,890 $641 43.5% $10,686 $682 44.3% $11,374 $696 44.3% $11,601 $710 44.3% $11,833 $724 44.3% $12,070
Management Fees $42 3.0% $698 $44 3.0% $736 $46 3.0% $771 $47 3.0% $786 $48 3.0% $802 $49 3.0% $818
INCOME BEFORE FIXED CHARGES $552 39.5% $9,192 $597 40.5% $9,950 $636 41.3% $10,603 $649 41.3% $10,815 $662 41.3% $11,032 $675 41.3% $11,252
NON-OPERATING INCOME AND EXPENSESProperty and Other Taxes $150 10.7% $2,500 $153 10.4% $2,550 $156 10.1% $2,601 $159 10.1% $2,653 $162 10.1% $2,706 $166 10.1% $2,760
Insurance $9 0.6% $150 $9 0.6% $153 $9 0.6% $156 $10 0.6% $159 $10 0.6% $162 $10 0.6% $166
Total Non-Operating Income and Expenses $159 11.4% $2,650 $162 11.0% $2,703 $165 10.7% $2,757 $169 10.7% $2,812 $172 10.7% $2,868 $176 10.7% $2,926
EBITDA $393 28.1% $6,542 $435 29.5% $7,247 $471 30.5% $7,846 $480 30.5% $8,003 $490 30.5% $8,163 $500 30.5% $8,326
Less: Reserve for Replacement $56 4.0% $930 $59 4.0% $982 $62 4.0% $1,027 $63 4.0% $1,048 $64 4.0% $1,069 $65 4.0% $1,090
EBITDA after Reserve for Replacement $337 24.1% $5,612 $376 25.5% $6,265 $409 26.5% $6,819 $417 26.5% $6,955 $426 26.5% $7,094 $434 26.5% $7,236
Source: CBRE Hotels
January 2020 (Numbers in 000's)
ForecastForecast Forecast Forecast Forecast Forecast

Investment Analysis Investment Analysis Implications
Inve
stm
ent
An
aly
sis:
Pro
po
sed
Bu
rk's
Fa
lls H
ote
l

83 INVESTMENT ANALYSIS Proposed Burk's Falls Hotel
VALUATION & ADVISORY SERVICES
INVESTMENT ANALYSIS
The purpose and intended use of this report is to determine the level of market and economic support for a potential hotel development in Burks’s Falls, Ontario.
The conclusions offered in this report are preliminary in nature, and could be subject to change should a specific site and hotel development program be identified.
We have utilized the Discounted Cash Flow (DCF) methodology in order to quantify the level of investment that could be reasonably supported based on the operating projections for the potential hotel as presented in this report.
The detailed DCF calculations are shown at the end of this section and indicate that the hotel could support a total investment in the range of $3,900,000 or $63,500 per room in 2020$.
In recent years, construction costs for assets of this size and scope have exceeded this level, falling in the range of $120,000 to $140,000 per room inclusive of land. This per unit costs would also include the cost of fixtures, furniture and equipment; as well as typical soft costs associated with hotel development such as architectural and engineering fees, legal fees, management costs, etc.
While it is our opinion that a branded property would be best suited for this development as it would have the opportunity for the greatest level of success and would facilitate project financing, we have considered the implications of operating the property without brand affiliation. This would result in the elimination of associated franchise fees, but would require a more intensive property specific marketing effort/costs. While we believe there would be some erosion in operating performance, even at the currently projected occupancy and average daily rates, the supportable level of investment would increase from $3.9 million to $4.8 million, still representing a significant shortfall.

84 INVESTMENT ANALYSIS Proposed Burk's Falls Hotel
VALUATION & ADVISORY SERVICES
IMPLICATIONS
The competitive accommodation market has shown an improvement in both occupancy and rate performance in the last five years. However, even in 2016, the market’s strongest performance in the last five years, occupancy only reached 56.4% and ADR was $129.33. While this level of performance is generally in line with that of the regional Parry Sound/North Bay/Huntsville market, it is lower than the accommodation market performance for overall Ontario which saw occupancy of 67.6% and ADR of $146.05 in 2016. The competitive market has historically performed below that of both the provincial and national average as a result of the seasonality of the local area. In addition, the competitive accommodation market is particularly vulnerable to economic recessions and declines discretionary spending as it is heavily reliant on leisure tourism.
Overall, given the varying sources of demand, we are recommending the development of a limited service branded hotel such as Comfort Inn, Microtel, or Best Western would best meet the needs of the Burk’s Falls and surrounding regional market and the various sources of demand. Assets of this type would cater to a wide variety of demand sources, while being a strong compliment to the amenities and services offered in the local area. In addition, a branded hotel development would have the greatest appeal to the traditional investor and lender community and would be the most attractive option for generating interest amongst experienced investors and developers. A 60-unit property is considered the most appropriate size for the proposed hotel as it allows the hotel to capitalize on high levels of demand during peak periods, and allows for greater operating efficiencies in comparison to a smaller property.
While leisure demand for the potential hotel is expected to be strong, a lack of significant Corporate demand generators and limitations caused by seasonality of demand are expected to present a challenge for the hotel operation. The proposed hotel is expected to operate at peak occupancy levels on weekends and in peak leisure demand periods such as the summer and during festivals or events. Without the ability to attract stronger demand in off-peak periods and on weekdays, the hotel is projected to stabilize at an annual occupancy of 54%. The hotel is projected to achieve an ADR of approximately $126 by its third year of operations, which is slightly below that of the overall market. The proposed hotel’s location is removed from some of the larger demand generators in the region and the Village of Burk’s Falls does not necessarily have the same appeal and access to support amenities as accommodations located in the larger towns of Parry Sound, North Bay, and Huntsville.
Typical hotel investors expect a return on investment in the range of 10% to 15%, taking into consideration the increased levels of risk associated with a hotel operation. Traditional investors and lenders also look for a hotel development to generate significant cash flow to cover debt service. In addition, traditional hotel operators typically look for an annual occupancy at or above 70%, which indicates that the property operates at a stabilized level and is able to capture a reasonable number of occupied room nights year-round. Lastly, profit margin expectations are typically at or above 30%, which indicates that the property is generating significant cash flow to cover all operating expenses and generate a return for the investor.
The hotel is projected to generate a profit margin (revenues less costs) of 24% in the first year of operations, improving to 27% by the third year. This indicates that the proposed hotel will be a profitable

85 INVESTMENT ANALYSIS Proposed Burk's Falls Hotel
VALUATION & ADVISORY SERVICES
operation. However, the total development cost for the proposed hotel is estimated to be in the range of $120,000 to $140,000 per room, or a total of $7.2 to $8.4 million. The “Supportable Value off Cashflow” of $3.9 million is generally not supportive of the level of investment required to construct the hotel at this time as this represents a minimum funding gap of approximately $3.3 million. The proposed hotel development, although profitable, would likely not meet the return expectations based on traditional investment parameters that typical investor and lenders would be seeking. Overall, the risk-reward element of the project is prohibitive for a potential developer at this time.
Based on the preceding discussions, until Sunday to Thursday Corporate/Commercial demand and off-peak midweek Leisure demand levels improve, for a new hotel development to achieve viable and sustainable occupancy levels (70%+), it is unlikely that a new hotel development project in Burk’s Falls will be able to attract sufficient development interest at this time. Should any significant new demand generators be introduced to the market the potential for hotel development should be re-evaluated.
Overall, while the proposed hotel development does generate reasonable cash flow which may be adequate for a private owner/operator, the projected occupancy and performance levels of the proposed hotel would not likely be attractive to the traditional hotel investment and lending community at this time. However, Burks’ Falls is a growing community and future economic growth in Northern Ontario is expected. Should significant new corporate or off-peak demand generators be introduced within the local market, Burk’s Falls is well positioned to attract hotel development interest.
It is important to note that the scope of this engagement relates to evaluating the most suitable hotel development program for the Village of Burk’s Falls. As such, we have identified the development of a 60-room limited service property as we feel this type of hotel product would have the broadest market and investor appeal, taking into consideration the needs of the various segments of hotel demand. Should a specific site be identified or a specific development be proposed, further analysis would be required to determine the economic viability of any specific project.
This discussion of project viability, including the level of investment which could be supported, should not be construed as an opinion of market value. This could only be determined with the completion of a full AACI/CUSPAP compliant appraisal.
The report is subject to the Assumptions and Limiting Conditions in Addendum A.

86 INVESTMENT ANALYSIS Proposed Burk's Falls Hotel
VALUATION & ADVISORY SERVICES
DISCOUNTED CASH FLOW ANALYSISProposed Hotel, Burk's Falls
Rooms: 60
Scenario: DCF - 10 yr
Discounted Annually
Year Cash Flow 11.00% 11.50% 12.00% 12.50% 13.00%
1 $336,706 $303,339 $301,979 $300,630 $299,294 $297,970
2 $375,882 $305,074 $302,344 $299,651 $296,993 $294,370
3 $409,132 $299,154 $295,147 $291,212 $287,347 $283,549
4 $417,315 $274,898 $270,000 $265,211 $260,528 $255,947
5 $425,661 $252,609 $246,996 $241,532 $236,212 $231,032
6 $434,174
Reversion rate:
10.00% $4,341,743 $2,576,613 $2,519,357 $2,463,621 $2,409,359 $2,356,524
Plus Cashflow $1,435,074 $1,416,466 $1,398,236 $1,380,373 $1,362,868
Total Present Value $4,011,687 $3,935,823 $3,861,857 $3,789,732 $3,719,392
Present Value Per Room $66,861 $65,597 $64,364 $63,162 $61,990
RESALE - CAP RATE MATRIXProposed Hotel, Burk's Falls
PV @ PV @ PV @ PV @ PV @11.00% 11.50% 12.00% 12.50% 13.00%
9.75% $4,453,069 $4,077,754 $4,000,422 $3,925,027 $3,851,510 $3,779,81610.00% $4,341,743 $4,011,687 $3,935,823 $3,861,857 $3,789,732 $3,719,39210.25% $4,235,847 $3,948,843 $3,874,376 $3,801,769 $3,730,967 $3,661,916
Net Proceeds From SaleFor the Cap Rates

Addendum “A” Assumptions and Limiting Conditions
Ad
den
du
m “
A”:
Pro
po
sed
Bu
rk's
Fa
lls H
ote
l


A1 ADDENDUM “A” Proposed Burk's Falls Hotel
VALUATION & ADVISORY SERVICES
ASSUMPTIONS AND LIMITING CONDITIONS
1. This Advisory Report prepared by CBRE, is intended for the exclusive use of the Client, and is not intended to be relied upon, by any other person or entity, without the express prior written consent of CBRE, and the individual(s) who authored the Advisory Report.
2. It is assumed that all factual data furnished by the client, property owner, owner’s representative, or persons designated by the client or owner to supply said data are accurate and correct unless otherwise specifically noted in the report. Unless otherwise specifically noted in the report, CBRE has no reason to believe that any of the data furnished contain any material error. Information and data referred to in this paragraph include, without being limited to, numerical street addresses, lot and block numbers, land dimensions, square footage area of the land, dimensions of the improvements, gross building areas, net rentable areas, usable areas, unit count, room count, rent schedules, income data, historical operating expenses, budgets, and related data. Any material error in any of the above data could have a substantial impact on the conclusions reported. Thus, CBRE reserves the right to amend conclusions reported if made aware of any such error. Accordingly, the client-addressee should carefully review all assumptions, data, relevant calculations, and conclusions within 30 days after the date of delivery of this report and should immediately notify CBRE of any questions or errors. CBRE does not make any representation or warranty, express or implied, as to the accuracy or completeness of the information or the state of affairs of the real property furnished by the Client to CBRE and contained in any report prepared by CBRE.
3. The date to which any of the conclusions and opinions expressed in this report apply, is set forth in the Letter of Transmittal. Further, that the dollar amount of any opinion herein rendered is based upon the purchasing power of the Canadian Dollar on that date. This advisory report is based on market conditions existing as of the date of this report. Under the terms of the engagement, we will have no obligation to revise this report to reflect events or conditions which occur subsequent to the date of the report. However, CBRE will be available to discuss the necessity for revision resulting from changes in economic or market factors affecting the subject.
4. The conclusions, which may be defined within the body of this report, are subject to change with market fluctuations over time.
5. Any cash flows included in the analysis are forecasts of estimated future operating characteristics are predicated on the information and assumptions contained within the report. Any projections of income, expenses and economic conditions utilized in this report are not predictions of the future. Rather, they are estimates of current market expectations of future income and expenses. The achievement of the financial projections will be affected by fluctuating economic conditions and is dependent upon other future occurrences that cannot be assured. Actual results may vary from the projections considered herein. CBRE does not warrant these forecasts will occur. Projections may be affected by circumstances beyond the current realm of knowledge or control of CBRE.
6. Unless specifically set forth in the body of the report, nothing contained herein shall be construed to represent any direct or indirect recommendation of CBRE to buy, sell, or hold the properties. Such decisions involve substantial investment strategy questions and must be specifically addressed in consultation form.
7. The report has been prepared at the request of the client, and for the exclusive (and confidential) use of the client. The report may not be duplicated in whole or in part without the specific written consent of CBRE nor may this report or copies hereof be disclosed to third parties without said written consent,

B2 ADDENDUM “B” Proposed Burk's Falls Hotel
VALUATION & ADVISORY SERVICES
which consent CBRE reserves the right to deny. If consent is given, it will be on condition that CBRE will be provided with an Indemnification Agreement and/or Non-Reliance letter, in a form and content satisfactory to CBRE, by a party satisfactory to CBRE. Exempt from this restriction is duplication for the internal use of the client-addressee and/or transmission to attorneys, accountants, or advisors of the client-addressee. Also exempt from this restriction is transmission of the report to any court, governmental authority, or regulatory agency having jurisdiction over the party/parties for whom this appraisal was prepared, provided that this report and/or its contents shall not be published, in whole or in part, in any public document without the express written consent of CBRE which consent CBRE reserves the right to deny. Finally, this report shall not be advertised to the public or otherwise used to induce a third party to purchase the property or to make a “sale” or “offer for sale” of any “security”. Any third party which may possess this report is advised that they should rely on their own independently secured advice for any decision in connection with this property. CBRE shall have no accountability or responsibility to any third party.
8. The maps, plans, sketches, graphs, photographs and exhibits included in this report are for illustration purposes only and are to be utilized only to assist in visualizing matters discussed within this report. Except as specifically stated, data relative to size or area of the subject and comparable properties has been obtained from sources deemed accurate and reliable. None of the exhibits are to be removed, reproduced, or used apart from this report.
9. No opinion is intended to be expressed on matters which may require legal expertise or specialized investigation or knowledge beyond that customarily employed by real estate advisors.
10. Acceptance and/or use of this report constitutes full acceptance of the Contingent and Limiting Conditions and special assumptions set forth in this report. It is the responsibility of the Client, or client’s designees, to read in full, comprehend and thus become aware of the aforementioned contingencies and limiting conditions. Neither the Advisor nor CBRE assumes responsibility for any situation arising out of the Client’s failure to become familiar with and understand the same. The Client is advised to retain experts in areas that fall outside the scope of the real estate appraisal/consulting profession if so desired.
11. CBRE assumes that the subject property analyzed herein will be under prudent and competent management and ownership; neither inefficient nor super-efficient.
12. It is assumed that there is full compliance with all applicable federal, provincial, and local environmental regulations and laws unless noncompliance is stated, defined and considered in the report.
13. Because market conditions, including economic, social and political factors, change rapidly and, on occasion, without notice or warning, the herein, as of the effective date of this appraisal, cannot be relied upon as of any other date without subsequent advice of CBRE.
14. Client shall indemnify and hold CBRE fully harmless against any loss, damages, claims, or expenses of any kind whatsoever (including costs and reasonable attorneys’ fees), sustained or incurred by a third party as a result of the negligence or intentional acts or omissions of Client, and for which recovery is sought against CBRE by that third party.

Addendum “B” Glossary of Industry Terms
Ad
den
du
m “
A”:
Pro
po
sed
Bu
rk's
Fa
lls H
ote
l

B2 ADDENDUM “B” Proposed Burk's Falls Hotel
VALUATION & ADVISORY SERVICES
Supply: Available Room Nights (ARNs)
Available Rooms Nights refers to the total number of rooms at a property multiplied by the total number of nights the property is open during a given operating season. For example, a 25-room property open year-round (365 nights) would have 9,125 Available Room Nights.
Demand: Occupied Room Nights (ORNs)
Occupied Rooms Nights refers to the sum of the number of nights that each available unit was occupied at a given property during one operating season.
Occupancy Rate
Occupied Rooms refer to the total number of rooms occupied by transient, group and contract guests, without consideration to the number of guests in each room. Occupancy Rate is expressed as the percentage of rooms occupied out of the total rooms available at a property. The calculation is:
Occupancy Rate (%) = (Rooms Occupied / Rooms Available) x 100
Average Daily Rate (ADR)
Although room rates may vary seasonally, by market segment, or by room type within a property, most properties calculate an overall average daily rate (ADR). This rate reveals the average rate charged per occupied room and is calculated by dividing total rooms revenue for a period (usually one year), by the number of rooms occupied during that period. The calculation is as follows:
ADR = Total Rooms Revenue / Rooms Occupied
Rooms Revenue per Available Room (RevPAR)
RevPAR measures the rooms revenue yield a property achieves, relative to the rooms available in the property for a period of time (usually one year). The metric is influenced by 2 factors – occupancy and overall average daily rates (ADR). RevPAR can be used to compare rooms revenue results with prior period results or to compare actual to budgeted results. In additional, since the rooms revenue is scaled by the number of rooms at the property, it can be used as one comparison of the rooms revenue yield of a property to its competitors or comparable properties. The calculation is as follows:
RevPAR = Total Rooms Revenue / Rooms Available
Market Segmentation
Refers to the subdividing of a market into distinct subsets of users that behave in the same way or have similar needs. The hotel market segments most commonly used are Corporate, Meeting/Conference, Leisure, and Government/Other.