Joint Strategic Needs Assessment 2021 - Oxfordshire Insight |
376
Oxfordshire Health and Wellbeing Joint Strategic Needs Assessment 2021
-
Upload
khangminh22 -
Category
Documents
-
view
3 -
download
0
Transcript of Joint Strategic Needs Assessment 2021 - Oxfordshire Insight |

Oxfordshire Health and WellbeingJoint Strategic Needs Assessment 2021

Behavioural
determinants of
health
Health
conditions and
causes of death
Population groups
and protected
characteristics
Population
Wider
determinants of
health
Service Use Local researchExecutive
summary
The Oxfordshire Joint Strategic Needs Assessment identifies the current and future health and wellbeing needs of our local population.
This pack summarises the main findings from a strategic review of evidence about the health and wellbeing of Oxfordshire’s residents, based on research carried out between November 2020 and February 2021
The annual JSNA report is provided to the Oxfordshire Health and Wellbeing Board and underpins the Health and Wellbeing strategy
Other JSNA resources include:
Inequalities indicators small area level dashboard
Community Health and Wellbeing Profiles
Health Needs Assessments
JSNA Bitesize
JSNA 2021 lead authors:
Philippa Dent, Public Health, Oxfordshire County CouncilMargaret Melling, Research & Insight, Cherwell District and Oxfordshire County CouncilAlick Bird, Research & Insight, Cherwell District and Oxfordshire County Council
We would like to thank the very many contributors of data and commentary from organisations across Oxfordshire including:
Oxfordshire County Council, NHS Oxfordshire Clinical Commissioning Group and NHS South, Central and West Commissioning Support Unit, Oxford Health NHS FT, Thames Valley Police, Citizen’s Advice Oxfordshire, Age UK Oxfordshire, Healthwatch Oxfordshire, Cherwell District Council, Oxford City Council, South Oxfordshire District Council, Vale of White Horse District Council, West Oxfordshire District Council
Thanks also to members of the JSNA Steering Group for their oversight and guidance:
Oxfordshire County Council, NHS Oxfordshire Clinical Commissioning Group, Cherwell District Council, Oxford City Council, South Oxfordshire District Council, Vale of White Horse District Council, West Oxfordshire District Council, Healthwatch Oxfordshire, Oxford University
Original date of publication: 31st March 2021
Amendments 18/06/2021
Slide 227 – Note added on confidence intervalsSlide 320 – Troubled Families programme renamed ‘Supporting Families’Community safety services section (slide 334) – Victims data has been changed from non-unique victim counts to unique victim counts.
2Oxfordshire Joint Strategic Needs Assessment 2021
web: insight.oxfordshire.gov.uk/jsna email: [email protected]

Behavioural
determinants of
health
Health
conditions and
causes of death
Population groups
and protected
characteristics
Population
Wider
determinants of
health
Service Use Local researchExecutive
summary
Chapter 1: Executive summary includes a short overview of findings, the JSNA summary “snake” of key data by life-stage, and an inequalities data “tartan rug” for Oxfordshire showing health and wellbeing indicators at Middle Layer Super Output Area level
Chapter 2: Population with data on the population of Oxfordshire, the latest Office for National Statistics estimates, past trends and future projections/forecasts.
Chapter 3: Population groups and protected characteristics summarises data on residents in selected population groups in Oxfordshire including “protected characteristics” as defined under the Equality Act of 2010.
Chapter 4: Health conditions and causes of death includes information on health conditions and causes of deaths in Oxfordshire, including some information on coronavirus (COVID-19) for 2020.
Chapter 5: Behavioural determinants of health provides data on behavioural factors that affect health and wellbeing, such as healthy weight and physical activity, smoking and alcohol, and sexual and reproductive health.
Chapter 6: Wider determinants of health covers conditions in which people are born, grow, live work and age, social, cultural, political, economic, commercial and environmental factors.
Chapter 7: Service use provides an overview of trends from data collected by providers of health, social care and related services in Oxfordshire including Local Authorities, Health service providers, Police and Voluntary sector organisations.
Chapter 8: Local research includes research carried out by organisations in Oxfordshire of relevance to the topics covered by the Joint Strategic Needs Assessment.
3Oxfordshire Joint Strategic Needs Assessment 2021
How this report is organised
Information in this report is
organised into 8 chapters
You can click between
chapters using the tabs at the
top of each page
Within each chapter this left-
hand sidebar has a clickable
contents list

Behavioural
determinants of
health
Health
conditions and
causes of death
Population groups
and protected
characteristics
Population
Wider
determinants of
health
Service Use Local researchExecutive
summary
Executive Summary
Oxfordshire Joint Strategic Needs Assessment 2021 4
Chapter 1

Behavioural
determinants of
health
Health
conditions and
causes of death
Population groups
and protected
characteristics
Population
Wider
determinants of
health
Service Use Local researchExecutive
summary
This chapter provides a short summary of the main findings from the 2021 Oxfordshire Joint Strategic Needs Assessment.
It includes:
An introduction to Oxfordshire
A one-page summary of the data that we have been able to include in this update showing early indications of the impact of COVID-19 on health and wellbeing in Oxfordshire
One-page summaries for the JSNA overall and for young people, for working age adults and for older people
A JSNA visual summary “snake” showing data by life-stage
A JSNA inequalities data “tartan rug” for Oxfordshire showing health and wellbeing indicators at Middle Layer Super Output Area level and highlighting which areas rank as worse or better than the England averages
Introduction
Oxfordshire Joint Strategic Needs Assessment 2021 5
Introduction
COVID-19
Health and wellbeing overall
Summary – young people
Summary – working age adults
Summary – older people
JSNA data by life-stage
JSNA data by small area

Behavioural
determinants of
health
Health
conditions and
causes of death
Population groups
and protected
characteristics
Population
Wider
determinants of
health
Service Use Local researchExecutive
summary
As of mid-2019, Oxfordshire was the most rural county in the South East and home to an estimated 691,667 people
Oxfordshire’s population
Oxfordshire Joint Strategic Needs Assessment 2021 6
Introduction
COVID-19
Health and wellbeing overall
Summary – young people
Summary – working age adults
Summary – older people
JSNA data by life-stage
JSNA data by small area
Almost a quarter (22%) of the county’s population are resident in Oxford City and 38% in Oxfordshire’s main towns. The remaining 40% live in smaller towns and villages.
Population density
new

Behavioural
determinants of
health
Health
conditions and
causes of death
Population groups
and protected
characteristics
Population
Wider
determinants of
health
Service Use Local researchExecutive
summary
According to the Indices of Multiple Deprivation (IMD 2019), Oxfordshire was ranked the 10th least deprived of 151 upper-tier local authorities in England (up from 11th in 2015).
Oxfordshire had 1 out of 407 Lower Super Output Areas (LSOAs) ranked within the 10% most deprived areas nationally, part of Northfield Brook ward, south east Oxford.
A further 16 areas were ranked in the 20% most deprived areas nationally, 9 in Oxford City, 6 in Banbury and 1 in Abingdon.
Deprivation
Oxfordshire Joint Strategic Needs Assessment 2021 7
Introduction
COVID-19
Health and wellbeing overall
Summary – young people
Summary – working age adults
Summary – older people
JSNA data by life-stage
JSNA data by small area
Explore deprivation data using our interactive dashboard on Oxfordshire Insight
MHCLG English indices of deprivation 2019
new
Behavioural
determinants of
health
Health
conditions and
causes of death
Population groups
and protected
characteristics
Population
Wider
determinants of
health
Service Use Local researchExecutive
summary
National data reports a deterioration in mental health of young people with existing mental health needs in lockdown, particularly linked to increased loneliness and anxiety.
There has been an increase in young people Not in Education, Employment or Training and a significant reduction in advertised Apprenticeships in Oxfordshire during 2020.
In 2020 (Jan-Dec), police recorded increases in the number of victims of domestic abuse, elder abuse, rape, modern slavery and child sexual exploitation in Oxfordshire.
The number of scams related to “bogus selling” reported by Oxfordshire residents has increased significantly since the start of the COVID-19 pandemic.
All types of hospital activity and use of mental health services dropped significantly as a result of the first wave of the pandemic in 2020.
Between March and May 2020, over 15,000 volunteers were recorded in Oxfordshire as available to help vulnerable people who were socially isolating during the Covid-19 pandemic.
Early indications of the impact of COVID-19 on Health and Wellbeing in Oxfordshire
Oxfordshire Joint Strategic Needs Assessment 2021 8
Introduction
COVID-19
Health and wellbeing overall
Summary – young people
Summary – working age adults
Summary – older people
JSNA data by life-stage
JSNA data by small area
From Jan-Dec 2020 there were over 19,000 confirmed cases of COVID-19 in people living in Oxfordshire and approximately 700 deaths with COVID-19 on the death certificate in Oxfordshire in 2020.
National data shows that COVID-19 has had a disproportionate impact on ethnic minority communities and that the mortality rates from COVID-19 in the most deprived areas were more than double the least deprived areas.
Around 21,600 people in Oxfordshire (3% of the population) were identified as Clinically Extremely Vulnerable (Feb21) and at highest risk from COVID-19.
As a result of the COVID-19 lockdown in early 2020, the number of people claiming unemployment-related benefits in Oxfordshire increased significantly. This has particularly affected Oxford City and Cherwell and the younger age group.
In May 2020, a Good Food Oxford survey found the number of users of Community Food Services had increased by 3 times since the start of COVID-19.
The first lockdown of 2020 saw a significant fall in car use nationally and an increase in cycling. Cycling and walking fell in Oxford City in 2020, likely to be a result of more people working from home, less student travel and a drop in tourism visits.
new

Behavioural
determinants of
health
Health
conditions and
causes of death
Population groups
and protected
characteristics
Population
Wider
determinants of
health
Service Use Local researchExecutive
summary
Oxfordshire is the most rural county in the South East region.
Oxfordshire’s population is relatively healthy.
Oxfordshire does better or similar to the national average on most Public Health indicators.
Life expectancy and healthy life expectancy in Oxfordshire are each significantly higher than national and regional averages for both males and females.
Oxfordshire’s population is ageing, a trend that is forecast to continue.
House prices are continuing to increase and the cost of renting remains well above average.
The future growth of the population (especially the numbers of young people) is very dependent on levels of house building in future and will vary across the county.
Air pollution causes more harm than passive smoking, and is linked to asthma, heart disease and stroke. Transport now makes up the largest share of carbon emissions in Oxfordshire.
Health and wellbeing in Oxfordshire overall
Oxfordshire Joint Strategic Needs Assessment 2021 9
Introduction
COVID-19
Health and wellbeing overall
Summary – young people
Summary – working age adults
Summary – older people
JSNA data by life-stage
JSNA data by small area
For 2017 to 2019, cancer was the leading cause of death in Oxfordshire, followed by Heart Disease and stroke for males and Dementia for females.
Levels of reported anxiety in Oxfordshire appear to have increased and remain above the England average.
Mental health rates of diagnosis and referrals are continuing to increase.
Despite Oxfordshire’s relative affluence there are wide inequalities in health and wellbeing. Males living in the more affluent areas of the county are expected to live around 11 years longer than those in poorer areas. For females the gap in life expectancy is around 12 years.
Explore Public Health indicators for Oxfordshire, see Public Health England Oxfordshire Public Health profile
updated

Behavioural
determinants of
health
Health
conditions and
causes of death
Population groups
and protected
characteristics
Population
Wider
determinants of
health
Service Use Local researchExecutive
summary
After removing housing costs, 1 in 5 children in Oxfordshire are estimated to be living in poverty – within Oxford City this figure rises to a quarter of children (2018/19).
The number of pupils with Special Educational Needs support in Oxfordshire has increased at double the England rate (to Jan20).
The gap in early years development between lower income pupils and other pupils in Oxfordshire had increased for the second year in a row (up to 2019).
Average GCSE attainment in Oxfordshire (2019/20) was below the regional average and similar to the national average.
The persistent absence rate for pupils in Oxfordshire secondary schools was above (worse than) the national average (2018/19).
The proportion of Oxfordshire’s cared for children who were placed more than 20 miles from their home and outside Oxfordshire increased from 33% as at 31 March 2019 to 36% as at December 2020.
The % of Oxfordshire’s care leavers in employment, education or training was below (worse than) the national average (2019/20).
Health and wellbeing in Oxfordshire – young people
Oxfordshire Joint Strategic Needs Assessment 2021 10
Introduction
COVID-19
Health and wellbeing overall
Summary – young people
Summary – working age adults
Summary – older people
JSNA data by life-stage
JSNA data by small area
The proportion of all young people Not in Education, Employment or Training has increased significantly (from 1.6% in Dec19 to 2.6% in Dec20) and the COVID-19 lockdowns have reduced advertised apprenticeship opportunities in Oxfordshire for young people.
There has been a significant increase in the number of police recorded domestic abuse crimes in Oxfordshire involving children (2019/20).
The number of mental health referrals for young people has increased significantly over the past 5 years.
Rates of self-harm hospital admissions in younger people (aged 10-24 years) have increased over time. The rate in Oxfordshire is similar to England.
Alcohol-specific admissions for females under 18 in Oxfordshire remain higher than national and regional averages (2016/17 to 2018/19).
Excess weight in children has remained high. As of 2019/20, 18.6% aged 4 or 5, and 29% in aged 10 or 11 were overweight or obese.
42% of children in Oxfordshire were not meeting the daily physical activity guidelines (2019/20).
See also Public Health England Child Health Profiles
updated

Behavioural
determinants of
health
Health
conditions and
causes of death
Population groups
and protected
characteristics
Population
Wider
determinants of
health
Service Use Local researchExecutive
summary
Earnings of Oxfordshire residents have remained above the South East and national averages.
As a result of the COVID-19 lockdown in early 2020, the number of people claiming unemployment-related benefits in Oxfordshire increased significantly. This has particularly affected Oxford City and Cherwell and the younger age group.
The number of people from overseas registering for a National Insurance number in Oxfordshire has continued to decline.
In 2017-19 there were over 3,500 deaths in those aged under 75, from cancers, cardiovascular disease, liver disease and respiratory disease. 1,540 (43%) of these deaths in under 75s were considered to be preventable.
Over half of Oxfordshire adults are classified as overweight or obese. Prevalence is higher in males, older people, some ethnic groups and more deprived areas.
Health and wellbeing in Oxfordshire – working age adults
Oxfordshire Joint Strategic Needs Assessment 2021 11
Introduction
COVID-19
Health and wellbeing overall
Summary – young people
Summary – working age adults
Summary – older people
JSNA data by life-stage
JSNA data by small area
A slightly higher percentage of Oxfordshire adults meets recommended physical activity guideline (150 minutes per week) than national and regional figures, but 1 in 4 adults do not meet the guidelines
Around 15% of the population suffer with a musculoskeletal condition. Depression and anxiety are more common in people with persistent pain.
Learning Disabilities
People with learning disabilities (LD) have a lower life expectancy than average and are likely to have much higher rates of certain health conditions than the general population.
Rates of Epilepsy are 29 times higher for people with LD.
People with LD are more than twice as likely to have diabetes (non-type 1) than the general population and much more likely to be measured as obese (40% compared with 29%).
new
See also Public Health England Learning Disability Profiles

Behavioural
determinants of
health
Health
conditions and
causes of death
Population groups
and protected
characteristics
Population
Wider
determinants of
health
Service Use Local researchExecutive
summary
Oxfordshire’s population is ageing, with a substantial recent and predicted growth in the number of older people.
People aged 65+ made up 20% of the population of Oxfordshire’s four rural districts, compared with 12% of the population of Oxford City (18% overall).
For people aged 75+, cancer remains the leading cause of death. Between 2013 and 2019 there was a significant increase in deaths recorded as a result of Dementia and Alzheimer’s disease.
The Dementia Oxfordshire service, which mainly takes referrals from memory clinics and GPs, saw a big drop in referrals during the first COVID-19 lockdown in 2020. These have since recovered.
Falls are the largest cause of emergency hospital admissions for older people (65+); Oxford City has a rate consistently significantly worse than England.
Fear of falls is the top concern among older users of adult social care services.
The proportion of older people offered reablement services has remained below the national and statistical neighbour averages (2019/20).
Health and wellbeing in Oxfordshire – older people
Oxfordshire Joint Strategic Needs Assessment 2021 12
Introduction
COVID-19
Health and wellbeing overall
Summary – young people
Summary – working age adults
Summary – older people
JSNA data by life-stage
JSNA data by small area
By district, the highest number of older people being supported with long-term social care services as of April 2020 was Cherwell and the highest rate per population was Oxford City.
Alcohol-related hospital admissions are highest in men aged 65+ (2018/19)
In 2020 (Jan-Dec) Thames Valley Police recorded 555 older victims (aged 65 and over) of crimes of violence or sexual offences in Oxfordshire*. This was a significant increase on 2019 and has continued an increasing trend at above the overall growth in the older population.
Wide areas of rural Oxfordshire are ranked poorly on geographical access to services.
Isolation and loneliness have been found to be a significant health risk and a cause of increased use of health services.
Before the pandemic, use of the internet by older people was increasing nationally and is likely to have increased further in 2020.
See also Public Health England Productive Healthy Ageing Profiles
updated
*NOTE: Victims data includes unique recorded victims for the 12 month
period.

Behavioural
determinants of
health
Health
conditions and
causes of death
Population groups
and protected
characteristics
Population
Wider
determinants of
health
Service Use Local researchExecutive
summary
Oxfordshire Health and wellbeing facts and figures 2021
Oxfordshire Joint Strategic Needs Assessment 2021 13
Introduction
COVID-19
Health and wellbeing overall
Summary – young people
Summary – working age adults
Summary – older people
JSNA data by life-stage
JSNA data by small area
Icons designed by Freepik from FlaticonNOTE that data used in this graphic is the latest available, but not all will be from 2020, please refer to the main report for details updated

Behavioural
determinants of
health
Health
conditions and
causes of death
Population groups
and protected
characteristics
Population
Wider
determinants of
health
Service Use Local researchExecutive
summary
Health inequalities –small area overview
Oxfordshire Joint Strategic Needs Assessment 2021 14
Data by Middle Layer Super Output Area (86 MSOAs in Oxfordshire)from Public Health England Fingertips Local Health
Introduction
COVID-19
Health and wellbeing overall
Summary – young people
Summary – working age adults
Summary – older people
JSNA data by life-stage
JSNA data by small area
Significantly worse
than England
Statistically similar
to England
Significantly better
than England
The table shows health indicators for small areas in Oxfordshire grouped by district
Overall, most indicators are ranked as significantly better or similar to the England average
Areas that are ranked as significantly worse tend to be concentrated in Oxford City and Banbury
Explore this data using our inequalities dashboard
newC
herw
ell
Oxfo
rd C
ity
South
Oxfo
rdsh
ire
Vale
of
Whit
e
Hors
e
West
Oxfo
rd-
shir
e
<= Indicators of health and wellbeing =>

Behavioural
determinants of
health
Health
conditions and
causes of death
Population groups
and protected
characteristics
Population
Wider
determinants of
health
Service Use Local researchExecutive
summary
Population
Oxfordshire Joint Strategic Needs Assessment 2021 15
Chapter 2

Behavioural
determinants of
health
Health
conditions and
causes of death
Population groups
and protected
characteristics
Population
Wider
determinants of
health
Service Use Local researchExecutive
summary
Oxfordshire Joint Strategic Needs Assessment 2021 16
This chapter provides data on the population of Oxfordshire, the latest Office for National Statistics estimates (as of mid-2019), past trends and future projections/forecasts.
Further JSNA resources are available via the JSNA page of Oxfordshire Insight
Assessing the impact of COVID-19
This chapter includes the most recent population estimates and related datasets accessed in January 2021.
The latest date for the majority is mid-2019.
This means that this chapter will not reflect the impact of the COVID-19 pandemic (from early 2020) on population change or life expectancy.
This chapter..Introduction
Summary
Oxfordshire’s location
Oxfordshire’s resident population
Rural County
GP registered patients
Population by age
Births and deaths
Migration
Ethnicity
Predicted growth in population
Life Expectancy
Finding out more

Behavioural
determinants of
health
Health
conditions and
causes of death
Population groups
and protected
characteristics
Population
Wider
determinants of
health
Service Use Local researchExecutive
summary
Oxfordshire Joint Strategic Needs Assessment 2021 17
Oxfordshire has a central England location and is the most rural county in the South East region.
The majority (60%) of Oxfordshire’s population are resident in Oxford City and the county's main towns. The remaining 40% live in smaller towns and villages.
As of mid-2019:
The count of GP registered patients in the Oxfordshire Clinical Commissioning Group (CCG) area was 773,409.
The ONS estimate of the resident population of Oxfordshire was 691,700.
In urban areas there is a higher proportion of those aged 0-4, while in rural Oxfordshire there is a higher rate of people aged 85+.
All districts - other than Oxford City - have seen a significant increase in the older (aged 65+) population and relatively little change in the number of young people aged 0-15.
SummaryIntroduction
Summary
Oxfordshire’s location
Oxfordshire’s resident population
Rural County
GP registered patients
Population by age
Births and deaths
Migration
Ethnicity
Predicted growth in population
Life Expectancy
Finding out more
Between mid-2018 and mid-2019 there was an estimated net inward migration to Oxfordshire.
The Oxfordshire County Council housing-led forecasts (interim, Sept20) predict a total county population of 801,700 by 2028, a growth of 110,400 (16%) since 2018. Over the same period the ONS projections show an increase of +5%.
Differences in these estimates are particularly apparent for the younger and working age groups.
For older people aged 65 and over, the predicted growth is similar.
The number of years females spend in poor health has improved from 16.6 years to 13 years. For males the gap has stayed at a similar level (13 years).
There are clear inequalities in Life Expectancy across Oxfordshire. The gap in LE between the lowest and highest areas (MSOAs) for males was 10.9 years and for females was 12.4 years.
updated

Behavioural
determinants of
health
Health
conditions and
causes of death
Population groups
and protected
characteristics
Population
Wider
determinants of
health
Service Use Local researchExecutive
summary
Oxfordshire Joint Strategic Needs Assessment 2021 18
Oxfordshire’s central location in southern EnglandIntroduction
Summary
Oxfordshire’s location
Oxfordshire’s resident population
Rural County
GP registered patients
Population by age
Births and deaths
Migration
Ethnicity
Predicted growth in population
Life Expectancy
Finding out more

Behavioural
determinants of
health
Health
conditions and
causes of death
Population groups
and protected
characteristics
Population
Wider
determinants of
health
Service Use Local researchExecutive
summary
Oxfordshire Joint Strategic Needs Assessment 2021 19
The latest Office for National Statistics (ONS) mid-2019 estimate of the resident population of Oxfordshire county area was 691,700.
22% of Oxfordshire’s population are resident in Oxford City and 38% in the county’s main towns. The remaining 40% live in smaller towns and villages.
Oxfordshire’s resident population
ONS mid-year ward level population estimates from nomis
Introduction
Summary
Oxfordshire’s location
Oxfordshire’s resident population
Rural County
GP registered patients
Population by age
Births and deaths
Migration
Ethnicity
Predicted growth in population
Life Expectancy
Finding out more
Oxfordshire Residents (mid-2019, sum of wards)
Oxfordshire
691,700
Cherwell
150,500West
Oxfordshire
110,600
Vale of
White Horse
136,000
South
Oxfordshire
142,100
Oxford City
152,500
Oxfordshire county and districts
resident population (ONS mid-2019
estimate)
updated
Behavioural
determinants of
health
Health
conditions and
causes of death
Population groups
and protected
characteristics
Population
Wider
determinants of
health
Service Use Local researchExecutive
summary
Oxfordshire Joint Strategic Needs Assessment 2021 20
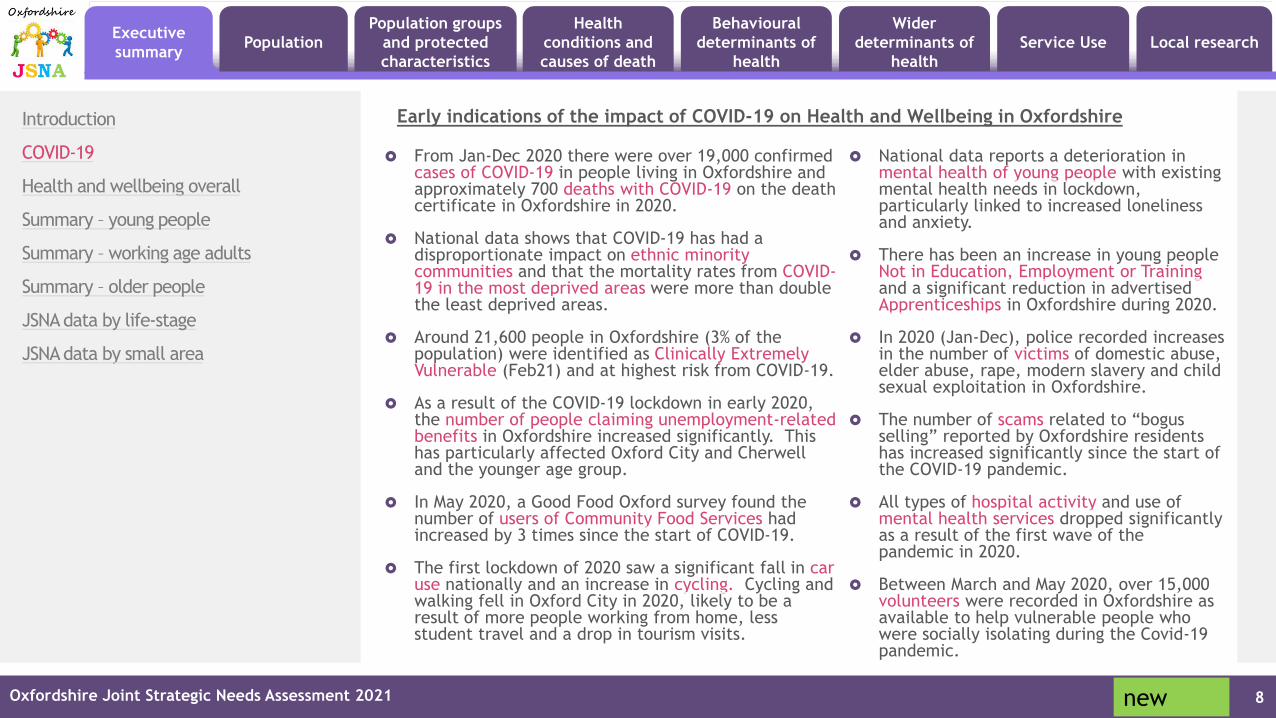
Oxfordshire is the most rural county in the South East at 2.7 people per hectare (compared with 4.8 across the region), by district the density in mid-2019 was:
Cherwell 2.6 people per hectare
Oxford City 33.4
South Oxfordshire 2.1
Vale of White Horse 2.4
West Oxfordshire 1.5
The higher density areas of Oxfordshire are in the urban centres of:
Banbury, Bicester and Kidlington
Oxford City
Didcot, Thame and Henley-on-Thames
Abingdon and Wantage & Grove
Carterton and Witney
Rural countyIntroduction
Summary
Oxfordshire’s location
Oxfordshire’s resident population
Rural County
GP registered patients
Population by age
Births and deaths
Migration
Ethnicity
Predicted growth in population
Life Expectancy
Finding out more
ONS mid-year population estimates from nomis
updated

Behavioural
determinants of
health
Health
conditions and
causes of death
Population groups
and protected
characteristics
Population
Wider
determinants of
health
Service Use Local researchExecutive
summary
Oxfordshire Joint Strategic Needs Assessment 2021 21
The official Oxfordshire Clinical Commissioning Group area is slightly smaller than the Oxfordshire county area. However the patient count remains above the estimated population and the gap has increased.
As of mid-2019, the count of OCCG registered patients was 773,400 compared with an ONS estimate of Oxfordshire’s population (county) of 691,700.
Population of Oxfordshire vs NHS Oxfordshire patient count - 1
ONS mid-year population estimates from nomisNHS Digital Patients registered at a GP practice
Introduction
Summary
Oxfordshire’s location
Oxfordshire’s resident population
Rural County
GP registered patients
Population by age
Births and deaths
Migration
Ethnicity
Predicted growth in population
Life Expectancy
Finding out more
Count of registered patients in Oxfordshire CCG vs
ONS estimate of resident population for Oxfordshire
OCCG and county boundary
OCCG boundary
County boundary
Areas in Oxfordshire
county but outside
Oxfordshire CCG
updated

Behavioural
determinants of
health
Health
conditions and
causes of death
Population groups
and protected
characteristics
Population
Wider
determinants of
health
Service Use Local researchExecutive
summary
Oxfordshire Joint Strategic Needs Assessment 2021 22
0-17 18-24 25-64 65+ TOTAL
NHS patients registered within Oxfordshire CCG area
149,864 80,279 413,164 130,102 773,409
ONS estimate of population within the Oxfordshire CCG area*
142,659 65,956 342,559 124,997 676,171
Difference (CCG area) 7,205 14,323 70,605 5,105 97,238
ONS as % of OCCG NHS patients 95% 82% 83% 96% 87%
ONS estimate of total Oxfordshire (county boundary)
146,123 66,807 350,611 128,126 691,667
Population of Oxfordshire vs NHS Oxfordshire patient count - 2
NHS Digital GP registered patients 1 July 2019 and ONS mid-year 2019 population estimates from nomis by LSOA
*LSOAs lookup to OCCG area from ONS open geography portal. Number of LSOAs in Oxfordshire county = 407, number of LSOAs in OCCG area = 398 (difference = 9)
Introduction
Summary
Oxfordshire’s location
Oxfordshire’s resident population
Rural County
GP registered patients
Population by age
Births and deaths
Migration
Ethnicity
Predicted growth in population
Life Expectancy
Finding out more
Oxfordshire’s population by broad age mid-2019
Within the OCCG boundary area* the ONS estimate of the resident population was 13% below the number of registered patients (mid-2019). The difference is greatest in the age group 18 to 24.
This difference is important to note when considering the rate of health conditions which have been calculated as % of the total population or % of patients.
updated

Behavioural
determinants of
health
Health
conditions and
causes of death
Population groups
and protected
characteristics
Population
Wider
determinants of
health
Service Use Local researchExecutive
summary
Population by age
Oxfordshire Joint Strategic Needs Assessment 2021 23
Introduction
Summary
Oxfordshire’s location
Oxfordshire’s resident population
Rural County
GP registered patients
Population by age
Births and deaths
Migration
Ethnicity
Predicted growth in population
Life Expectancy
Finding out more

Behavioural
determinants of
health
Health
conditions and
causes of death
Population groups
and protected
characteristics
Population
Wider
determinants of
health
Service Use Local researchExecutive
summary
Oxfordshire Joint Strategic Needs Assessment 2021 24
Rural districts have a much higher proportion of older people than Oxford City
In 2019, older people aged 65+ made up 20% of the estimated population of Oxfordshire’s four rural districts, compared with 12% of the population of Oxford City
Oxford City had a much higher proportion of people in younger age groups (including students) and a higher number of people aged 20-24 than living in Oxfordshire’s four rural districts
Age profile – Oxford City vs rural Oxfordshire
ONS mid-year 2019 population estimates from nomis
Introduction
Summary
Oxfordshire’s location
Oxfordshire’s resident population
Rural County
GP registered patients
Population by age
Births and deaths
Migration
Ethnicity
Predicted growth in population
Life Expectancy
Finding out more
Population by age mid-2019, Oxford City vs
Rural districts (Cherwell, South Oxfordshire,
Vale of White Horse, West Oxfordshire)
updated

Behavioural
determinants of
health
Health
conditions and
causes of death
Population groups
and protected
characteristics
Population
Wider
determinants of
health
Service Use Local researchExecutive
summary
Oxfordshire Joint Strategic Needs Assessment 2021 25
The median* age of Oxfordshire increased slightly from 39.7 years as of mid-2017 to 40.1 years at mid-2019.
In mid-2019, the median age was lowest in Oxford City (28.9) and highest in West Oxfordshire (44.7)
At a small area level, wide areas of rural Oxfordshire had a median age above 49 years
Median age across OxfordshireIntroduction
Summary
Oxfordshire’s location
Oxfordshire’s resident population
Rural County
GP registered patients
Population by age
Births and deaths
Migration
Ethnicity
Predicted growth in population
Life Expectancy
Finding out more
2017 2018 2019
Cherwell 41 41.1 41.2
Oxford 29.7 29 28.9
South Oxfordshire 44.1 44.3 44.4
Vale of White Horse 42.7 42.6 42.5
West Oxfordshire 44.2 44.4 44.7
Oxfordshire 39.7 39.8 40.1
England 39.8 39.9 40.0
Median age (years) by district
ONS mid-year population estimates from nomis*Median age is the mid-point, where half the population is aged under and half aged over the value
updated

Behavioural
determinants of
health
Health
conditions and
causes of death
Population groups
and protected
characteristics
Population
Wider
determinants of
health
Service Use Local researchExecutive
summary
Oxfordshire Joint Strategic Needs Assessment 2021 26
Higher rates of 0-4s in urban areas Higher rates of 85+ in rural OxfordshireIntroduction
Summary
Oxfordshire’s location
Oxfordshire’s resident population
Rural County
GP registered patients
Population by age
Births and deaths
Migration
Ethnicity
Predicted growth in population
Life Expectancy
Finding out more
Population by Lower Super Output Area mid-2019, ONS mid-year population estimates from nomis
updated

Behavioural
determinants of
health
Health
conditions and
causes of death
Population groups
and protected
characteristics
Population
Wider
determinants of
health
Service Use Local researchExecutive
summary
Oxfordshire Joint Strategic Needs Assessment 2021 27
Over the past 20 years (between 1999 and 2019), there was an increase in the population of Oxfordshire from 603,800 to 691,700, a growth of 87,900 (+15%)
The younger age group, aged 0-15, increased by 10%
The older age group, aged 65+, increased by 49%
Change in younger and older populations – Oxfordshire
ONS mid-year population estimates from nomis
Introduction
Summary
Oxfordshire’s location
Oxfordshire’s resident population
Rural County
GP registered patients
Population by age
Births and deaths
Migration
Ethnicity
Predicted growth in population
Life Expectancy
Finding out more
next slide for charts by district
Change in count of older and younger residents
updated

Behavioural
determinants of
health
Health
conditions and
causes of death
Population groups
and protected
characteristics
Population
Wider
determinants of
health
Service Use Local researchExecutive
summary
Oxfordshire Joint Strategic Needs Assessment 2021 28
All districts - other than Oxford City - have seen a significant increase in the older 65+ population and relatively little change in the number of young people aged 0-15
For South Oxfordshire, Vale of White Horse and West Oxfordshire, the number of 65+ now exceeds the number of 0-15s
Change in younger and older populations – Oxfordshire’s districts
ONS mid-year population estimates from nomis
Introduction
Summary
Oxfordshire’s location
Oxfordshire’s resident population
Rural County
GP registered patients
Population by age
Births and deaths
Migration
Ethnicity
Predicted growth in population
Life Expectancy
Finding out more
Change in count of older and younger residents by district
updated

Behavioural
determinants of
health
Health
conditions and
causes of death
Population groups
and protected
characteristics
Population
Wider
determinants of
health
Service Use Local researchExecutive
summary
Oxfordshire Joint Strategic Needs Assessment 2021 29
Between 1999 and 2019 the population aged 16 to 64 in Oxfordshire increased by 9% (from 397,800 to 432,200, +34,400).
The increases were greatest in Oxford City (+11%) and Vale of White Horse (+12%) and lowest in South Oxfordshire (+3%), West Oxfordshire (8%) and Cherwell (9%).
Change in working age population
ONS mid-year population estimates from nomis
Introduction
Summary
Oxfordshire’s location
Oxfordshire’s resident population
Rural County
GP registered patients
Population by age
Births and deaths
Migration
Ethnicity
Predicted growth in population
Life Expectancy
Finding out more
Change in count of residents aged 16 to 64
updated

Behavioural
determinants of
health
Health
conditions and
causes of death
Population groups
and protected
characteristics
Population
Wider
determinants of
health
Service Use Local researchExecutive
summary
Births, deaths and migration
Oxfordshire Joint Strategic Needs Assessment 2021 30
Introduction
Summary
Oxfordshire’s location
Oxfordshire’s resident population
Rural County
GP registered patients
Population by age
Births and deaths
Migration
Ethnicity
Predicted growth in population
Life Expectancy
Finding out more

Behavioural
determinants of
health
Health
conditions and
causes of death
Population groups
and protected
characteristics
Population
Wider
determinants of
health
Service Use Local researchExecutive
summary
Oxfordshire Joint Strategic Needs Assessment 2021 31
Between mid-2018 and mid-2019 there were 7,284 births and 5,449 deaths in Oxfordshire. This is a “natural change” increase of 1,835 people
The natural change increase was greatest in Oxford followed by Cherwell
In West Oxfordshire the number of births was similar to the number of deaths
Births and deaths
ONS mid-year population estimates components of change
Introduction
Summary
Oxfordshire’s location
Oxfordshire’s resident population
Rural County
GP registered patients
Population by age
Births and deaths
Migration
Ethnicity
Predicted growth in population
Life Expectancy
Finding out more
Births DeathsNatural change
Cherwell 1,791 1,218 573
Oxford 1,607 907 700
South Oxfordshire 1,377 1,206 171
Vale of White Horse 1,446 1,108 338
West Oxfordshire 1,063 1,010 53
Oxfordshire 7,284 5,449 1,835
By district: births, deaths and natural change
mid-2018 to mid-2019
updated
Live births (2019)

Behavioural
determinants of
health
Health
conditions and
causes of death
Population groups
and protected
characteristics
Population
Wider
determinants of
health
Service Use Local researchExecutive
summary
Oxfordshire Joint Strategic Needs Assessment 2021 32
Between mid-2018 and mid-2019 there was an estimated (net) inward migration of 2,235 people moving into Oxfordshire.
This consisted of 632 net internal migrants – those from elsewhere in the UK – and 1,603 international net migrants (the majority of these to Oxford City).
Note that Oxfordshire County Council population modelling has highlighted issues with ONS estimates of migration for those aged in their twenties in Oxford City – likely to be due to the transient nature of this population. It is expected that data from the 2021 Census will provide some clarity in this area.
Migration estimates
ONS mid-year population estimates components of change
Introduction
Summary
Oxfordshire’s location
Oxfordshire’s resident population
Rural County
GP registered patients
Population by age
Births and deaths
Migration
Ethnicity
Predicted growth in population
Life Expectancy
Finding out moreInternal (net)
International (net)
Total net migration
Cherwell 997 -132 865
Oxford -4,076 1,486 -2,590
South Oxfordshire 1,390 -2 1,388
Vale of White Horse 1,680 248 1,928
West Oxfordshire 641 3 644
Oxfordshire 632 1603 2,235
By district: Net internal and international
migration mid-2018 to mid-2019
0
updated

Behavioural
determinants of
health
Health
conditions and
causes of death
Population groups
and protected
characteristics
Population
Wider
determinants of
health
Service Use Local researchExecutive
summary
Ethnicity
Oxfordshire Joint Strategic Needs Assessment 2021 33
Introduction
Summary
Oxfordshire’s location
Oxfordshire’s resident population
Rural County
GP registered patients
Population by age
Births and deaths
Migration
Ethnicity
Predicted growth in population
Life Expectancy
Finding out more

Behavioural
determinants of
health
Health
conditions and
causes of death
Population groups
and protected
characteristics
Population
Wider
determinants of
health
Service Use Local researchExecutive
summary
Oxfordshire Joint Strategic Needs Assessment 2021 34
According to Public Health England, ethnic identity influences health outcomes via multiple routes. For example, experiences of discrimination and exclusion, as well as the fear of such negative incidents, have been shown to have a significant impact on mental and physical health. Health-related practices, including healthcare-seeking behaviours, also vary importantly between ethnic groups.Some minority ethnic groups appear to have much better health status than the White British population and some much worse. Some ethnic minority groups have higher rates of diabetes.
According to the ONS Census 2011 survey, 16% of the total resident population of Oxfordshire was from an ethnic minority background, compared with 20% across England.
The majority of the ethnic minority population in Oxfordshire is based in urban areas of Oxford and Banbury.
Oxford City has a very diverse range of ethnic minority groups.
The map shows the out of term time (i.e. excluding students) non white British population as % of all residents.
EthnicityIntroduction
Summary
Oxfordshire’s location
Oxfordshire’s resident population
Rural County
GP registered patients
Population by age
Births and deaths
Migration
Ethnicity
Predicted growth in population
Life Expectancy
Finding out more
ONS Census 2011 table LC2101 and table OT201EW from nomis, mapped by Lower Super Output AreaPublic Health England Local action on health inequalities: understanding and reducing ethnic inequalities in health
No update available

Behavioural
determinants of
health
Health
conditions and
causes of death
Population groups
and protected
characteristics
Population
Wider
determinants of
health
Service Use Local researchExecutive
summary
Oxfordshire Joint Strategic Needs Assessment 2021 35
Between 2011 and 2020 the diversity of Oxfordshire’s pupils increased
As of January 2020, 27% of pupils at state primary schools (in years 1 to 6) and 25% of pupils (years 7-11) in state secondary schools in Oxfordshire were from ethnic minority backgrounds.
The proportion of pupils of ethnic minority backgrounds of all pupils years 1 to 11 by district was:
Cherwell 26%
Oxford 55%
South Oxfordshire 16%
Vale of White Horse 20%
West Oxfordshire 13%
Oxford City has a very wide range of languages spoken (as a first language) by primary school pupils.
Ethnicity of Oxfordshire’s school pupils
Oxfordshire County Council from pupil census data. Pupils at state schools (not including independent schools)
Introduction
Summary
Oxfordshire’s location
Oxfordshire’s resident population
Rural County
GP registered patients
Population by age
Births and deaths
Migration
Ethnicity
Predicted growth in population
Life Expectancy
Finding out more
Ethnic Minority (non-white British) as % of those with recorded
ethnicity
Primary pupils, years 1 to 6
Secondary pupils, years 7 to 11
updated

Behavioural
determinants of
health
Health
conditions and
causes of death
Population groups
and protected
characteristics
Population
Wider
determinants of
health
Service Use Local researchExecutive
summary
Predicted growth in population
Oxfordshire Joint Strategic Needs Assessment 2021 36
Introduction
Summary
Oxfordshire’s location
Oxfordshire’s resident population
Rural County
GP registered patients
Population by age
Births and deaths
Migration
Ethnicity
Predicted growth in population
Life Expectancy
Finding out more

Behavioural
determinants of
health
Health
conditions and
causes of death
Population groups
and protected
characteristics
Population
Wider
determinants of
health
Service Use Local researchExecutive
summary
Oxfordshire Joint Strategic Needs Assessment 2021 37
There are two alternative scenarios for the future change in population: (1) Oxfordshire County Council’s housing-led forecasts which incorporate district council plans for a higher rate of house building than in the recent past and (2) ONS projections based on past trends.
The OCC housing-led forecasts (interim, Sept20) predict a total population in Oxfordshire of 801,700 by 2028, a growth of 110,400 (16%) since 2018. Over the same period the ONS projections show an increase of +5%.
Population growth – housing-led vs ONS trend-basedIntroduction
Summary
Oxfordshire’s location
Oxfordshire’s resident population
Rural County
GP registered patients
Population by age
Births and deaths
Migration
Ethnicity
Predicted growth in population
Life Expectancy
Finding out more
Oxfordshire County Council interim population forecasts (released September 2020); ONS 2018-based subnational population projections
Please note that this set of interim OCC forecasts have
been created at a time of greater than usual uncertainty
around the economy and housing. They contain a modelled
county-wide adjustment relative to planned district
housing trajectories as of 31 March 2020, to account for
the potential impact of COVID on housebuilding and they
exclude sites in draft plans at that date.
Further modelling work is underway on the basis of revised
population assumptions (migration, fertility, mortality)
and the latest local intelligence on planned housing growth
and housing mix. An update to these interim forecasts will
be published as soon as possible (publication date to be
confirmed).
It is important to note that the rate of housebuilding is an
input to the model and the outputs reflect the expected
population if that level of housebuilding takes place. The
forecasts, therefore, are not indicative of housing need,
and should not be used or interpreted as such.
Total population
OCC
ONS
updated

Behavioural
determinants of
health
Health
conditions and
causes of death
Population groups
and protected
characteristics
Population
Wider
determinants of
health
Service Use Local researchExecutive
summary
Oxfordshire Joint Strategic Needs Assessment 2021 38
Differences are particularly apparent for the younger and working age groups.
For older people aged 65 and over, the predicted growth is similar.
Trend by ageIntroduction
Summary
Oxfordshire’s location
Oxfordshire’s resident population
Rural County
GP registered patients
Population by age
Births and deaths
Migration
Ethnicity
Predicted growth in population
Life Expectancy
Finding out more
Oxfordshire County Council interim population forecasts (released September 2020); ONS 2018-based subnational population projections
OCC
ONS
OCC
ONS
OCC
ONS
updated

Behavioural
determinants of
health
Health
conditions and
causes of death
Population groups
and protected
characteristics
Population
Wider
determinants of
health
Service Use Local researchExecutive
summary
Oxfordshire Joint Strategic Needs Assessment 2021 39
The oldest age group, those aged 85 and over, is predicted to increase from 17,847 in mid 2018 to 22,020 by mid 2028, an increase of 4,173 people (+23%)
The areas with the greatest growth in the number of people aged 85 and over are expected to be:
Rural areas of South Oxfordshire and Vale of White Horse
Parts of Witney and surrounding areas
Parts of Abingdon
Bicester West
Growth in the oldest populationIntroduction
Summary
Oxfordshire’s location
Oxfordshire’s resident population
Rural County
GP registered patients
Population by age
Births and deaths
Migration
Ethnicity
Predicted growth in population
Life Expectancy
Finding out more
Oxfordshire County Council population forecasts (released September 2020)
updated

Behavioural
determinants of
health
Health
conditions and
causes of death
Population groups
and protected
characteristics
Population
Wider
determinants of
health
Service Use Local researchExecutive
summary
Life Expectancy
Oxfordshire Joint Strategic Needs Assessment 2021 40
Introduction
Summary
Oxfordshire’s location
Oxfordshire’s resident population
Rural County
GP registered patients
Population by age
Births and deaths
Migration
Ethnicity
Predicted growth in population
Life Expectancy
Finding out more

Behavioural
determinants of
health
Health
conditions and
causes of death
Population groups
and protected
characteristics
Population
Wider
determinants of
health
Service Use Local researchExecutive
summary
Oxfordshire Joint Strategic Needs Assessment 2021 41
Life Expectancy (LE) and Healthy Life Expectancy (HLE) has increased for males and females in Oxfordshire.
Between 2009-11 and 2017-19 (combined years) the difference between LE and HLE, years spent in poor health in Oxfordshire, for females appears to have improved from 16.5 years to 15.5 years, for males the gap appears to have worsened from 13.1 to 14.2 years (although neither change is significant).
Life Expectancy and Healthy Life Expectancy
ONS Health state life expectancy, all ages, UK Note that vertical axes do not start at zero
Introduction
Summary
Oxfordshire’s location
Oxfordshire’s resident population
Rural County
GP registered patients
Population by age
Births and deaths
Migration
Ethnicity
Predicted growth in population
Life Expectancy
Finding out more
years
updated
Life Expectancy and Healthy Life Expectancy at birth in Oxfordshire

Behavioural
determinants of
health
Health
conditions and
causes of death
Population groups
and protected
characteristics
Population
Wider
determinants of
health
Service Use Local researchExecutive
summary
Oxfordshire Joint Strategic Needs Assessment 2021 42
Oxfordshire was (statistically) better than each of the South East and England averages on both Life Expectancy and Healthy Life Expectancy at birth.
Females in Oxfordshire are expected to live for 15.5 years in poorer health, compared with 18.4 years in the South East and 19.9 years in England.
Males in Oxfordshire are expected to live for 14.2 years in poorer health, compared with 15.5 years in the South East and 16.6 years in England
Life Expectancy better than average
Health state life expectancy, all ages, UK - Office for National Statistics (ons.gov.uk)
Introduction
Summary
Oxfordshire’s location
Oxfordshire’s resident population
Rural County
GP registered patients
Population by age
Births and deaths
Migration
Ethnicity
Predicted growth in population
Life Expectancy
Finding out more
Life Expectancy and Healthy Life Expectancy at birth 2017-2019
updated

Behavioural
determinants of
health
Health
conditions and
causes of death
Population groups
and protected
characteristics
Population
Wider
determinants of
health
Service Use Local researchExecutive
summary
Oxfordshire Joint Strategic Needs Assessment 2021 43
Introduction
Summary
Oxfordshire’s location
Oxfordshire’s resident population
Rural County
GP registered patients
Population by age
Births and deaths
Migration
Ethnicity
Predicted growth in population
Life Expectancy
Finding out more
new
Explore inequalities data using our interactive dashboard
Gap
between
lowest and
highest =
10.9 years

Behavioural
determinants of
health
Health
conditions and
causes of death
Population groups
and protected
characteristics
Population
Wider
determinants of
health
Service Use Local researchExecutive
summary
Oxfordshire Joint Strategic Needs Assessment 2021 44
Introduction
Summary
Oxfordshire’s location
Oxfordshire’s resident population
Rural County
GP registered patients
Population by age
Births and deaths
Migration
Ethnicity
Predicted growth in population
Life Expectancy
Finding out more
Explore inequalities data using our interactive dashboard
new
Gap
between
lowest and
highest =
12.4 years

Behavioural
determinants of
health
Health
conditions and
causes of death
Population groups
and protected
characteristics
Population
Wider
determinants of
health
Service Use Local researchExecutive
summary
Oxfordshire Joint Strategic Needs Assessment 2021 45
There are clear inequalities in Life Expectancy across Oxfordshire, with people in the more deprived areas having significantly lower Life Expectancy compared with the less deprived.
Data for the combined years 2017 to 2019 shows that for males there was a gap of almost 7 years between the most and least deprived areas. For females the gap was just under 5 years.
Inequalities in Life Expectancy – by areas of deprivation
PHE Health Inequalities Dashboard (accessed March 2021 - when last updated date was February 2021)
Introduction
Summary
Oxfordshire’s location
Oxfordshire’s resident population
Rural County
GP registered patients
Population by age
Births and deaths
Migration
Ethnicity
Predicted growth in population
Life Expectancy
Finding out more
Oxfordshire Life Expectancy at birth by deprivation: males and females, 2017-19
Most
deprived
Least
deprived
FemalesMales
Oxfordshire
averageOxfordshire
average
updated
Most
deprived
Least
deprived

Behavioural
determinants of
health
Health
conditions and
causes of death
Population groups
and protected
characteristics
Population
Wider
determinants of
health
Service Use Local researchExecutive
summary
Oxfordshire Joint Strategic Needs Assessment 2021 46
Inequalities in Life Expectancy – people with Learning Disabilities - national
NHS Digital Health and Care of People with learning disabilities, experimental statistics 2017-18
Introduction
Summary
Oxfordshire’s location
Oxfordshire’s resident population
Rural County
GP registered patients
Population by age
Births and deaths
Migration
Ethnicity
Predicted growth in population
Life Expectancy
Finding out more
2018/19
Females
Life expectancy 83
Females with Learning Disabilities 65
Difference = 18 years
Males
Life expectancy 80
Males with Learning Disabilities 66
Difference = 14 years
People with a learning disability aged 0-74 were between 3.87 and 4.11 times more likely to die in the period 2016-19 than people in the general population in the same age and sex group
2017/18
Latest data from NHS Digital is Health and Care of
People with Learning Disabilities Experimental
Statistics 2019 to 2020 but NB this does not include
life expectancy or mortality data (as of 8 Feb 2021)
The way that NHS Digital measures life expectancy difference for people with Learning Disabilities has changed.
NHS Digital Health and Care of People with
Learning Disabilities 2018/19 (Jan2020)
new

Behavioural
determinants of
health
Health
conditions and
causes of death
Population groups
and protected
characteristics
Population
Wider
determinants of
health
Service Use Local researchExecutive
summary
Oxfordshire Joint Strategic Needs Assessment 2021 47
Oxfordshire County Council population forecasts are published on the Oxfordshire Insight Population page (see “future population change”)
ONS population estimates and population projections for county and districts are available from www.nomisweb.co.uk
ONS Life Expectancy data is available from:
ONS National Life Tables
Public Health England Fingertips
PHE Health Inequalities Dashboard
ONS Migration flows
ONS interactive tool internal migration
Finding out moreIntroduction
Summary
Oxfordshire’s location
Oxfordshire’s resident population
Rural County
GP registered patients
Population by age
Births and deaths
Migration
Ethnicity
Predicted growth in population
Life Expectancy
Finding out more

Behavioural
determinants of
health
Health
conditions and
causes of death
Population groups
and protected
characteristics
Population
Wider
determinants of
health
Service Use Local researchExecutive
summary
Population groups and protected characteristics
Oxfordshire Joint Strategic Needs Assessment 2021 48
Chapter 3

Behavioural
determinants of
health
Health
conditions and
causes of death
Population groups
and protected
characteristics
Population
Wider
determinants of
health
Service Use Local researchExecutive
summary
Oxfordshire Joint Strategic Needs Assessment 2021 49
This chapter provides data on residents in selected population groups in Oxfordshire including “protected characteristics” as defined under the Equality Act of 2010.
The format is a series of factsheets giving the latest data – some of which is from the Census 2011 survey.
In some cases local data is unavailable, so figures for Oxfordshire have been estimated from national surveys and local population data.
There is also information for practitioners on carrying out an equity audit
Further JSNA resources are available via the JSNA page of Oxfordshire Insight
Assessing the impact of COVID-19
This chapter includes the most recent datasets accessed in January 2021.
Most data is either as of mid-2019, from the Census 2011 survey or up to March 2020.
This means that this chapter will not reflect the impact of the COVID-19 pandemic (from early 2020).
This Chapter..Introduction
Summary
Carrying out an equity audit
Age and sex
Students
Disability
Gender identity
Marriage and civil partnership
Pregnancy and maternity
Ethnicity
Travellers
Religion or belief
Sexual orientation
Carers
Armed forces
Finding out more
updated

Behavioural
determinants of
health
Health
conditions and
causes of death
Population groups
and protected
characteristics
Population
Wider
determinants of
health
Service Use Local researchExecutive
summary
Oxfordshire Joint Strategic Needs Assessment 2021 50
Summary – Oxfordshire in NumbersIntroduction
Summary
Carrying out an equity audit
Age and sex
Students
Disability
Gender identity
Marriage and civil partnership
Pregnancy and maternity
Ethnicity
Travellers
Religion or belief
Sexual orientation
Carers
Armed forces
Finding out more
Population group Count Source
Total population 691,667 ONS mid-2019
Aged 0-15 131,373 ONS mid-2019
Aged 16-64 432,168 ONS mid-2019
Aged 65+ 128,120 ONS mid-2019
Full time students (Oxford Uni, Oxford Brookes)
32,930 HESA 2018-19
Part time students (Oxford Uni, Oxford Brookes)
9,125 HESA 2018-19
Estimated people with a disability 131,400FRS 2018-19 and ONS pop
Claiming Personal Independent Payments
14,146 May 2020, DWP
Claiming Attendance Allowance (over state pension age)
12,622 May 2020, DWP
Adults with Learning Difficulties supported by Adult Social Care
1,672Oxfordshire County Council 1Apr 20
Pupils with Learning Difficulties in state primary, secondary and special schools
6,391DfE January 2020
Pupils with Autism in state primary, secondary and special schools
1,938DfE January 2020
Population group Count Source
Married households 128,400 ONS Census 2011
Households in registered same-sex civil partnership
682 ONS Census 2011
Live births 7,287 ONS 2019
Ethnic minority (non white British) 107,000 ONS Census 2011
Born outside UK 92,500 ONS Census 2011
Gypsy or Irish Traveller 623 ONS Census 2011
With a religion 422,576 ONS Census 2011
Estimated Lesbian, Gay or Bisexual 12,887 ONS UK 2018
Carers registered with GP practices 18,682 OCCG 30-Sept-20
Adult carers receiving health and social care support
4,540NHS Digital 2019-20
Young carers receiving support 323Oxfordshire County Council (Dec 2020)
Regular armed forces 9,360 MoD 1-Apr-20
Residents in receipt of an Armed Forces pension, War pension and Armed Forces compensation scheme
6,623 MoD 31-Mar-20
updated

Behavioural
determinants of
health
Health
conditions and
causes of death
Population groups
and protected
characteristics
Population
Wider
determinants of
health
Service Use Local researchExecutive
summary
Agree partners and
issues
Equity profile to
identify the gap
Agree high impact local
action to narrow the
gap
Secure changes in investment and service
delivery
Review progress and
assess impact
Oxfordshire Joint Strategic Needs Assessment 2021 51
Data from this JSNA chapter can be used as part of an equity audit
Carrying Out an Equity Audit
See also Evidence, resources and guidance from Public Health England and partners to help support national, regional and local areas to reduce health inequalities.
Introduction
Summary
Carrying out an equity audit
Age and sex
Students
Disability
Gender identity
Marriage and civil partnership
Pregnancy and maternity
Ethnicity
Travellers
Religion or belief
Sexual orientation
Carers
Armed forces
Finding out morea
Choose issues with
high impact, e.g. CVD.
Take opportunities
where changes are
planned and under
review.
Use data to
compare service
provision with
need, access,
use and
outcome
Evidence-based
practice with high
impact, targeted to
the communities
identified in the gap
analysis
Move resources
and develop
services to
match need
identified.
Ensure effective
monitoring systems
are in place and
review progress.
Identify groups or
areas where more
action is required.
Health
Equity Audit
Cycle
Use data on Health
Inequalities to support
decisions at all levels.
Make appropriate
comparisons by age, area,
ethnicity, sex etc.
unchanged

Behavioural
determinants of
health
Health
conditions and
causes of death
Population groups
and protected
characteristics
Population
Wider
determinants of
health
Service Use Local researchExecutive
summary
Oxfordshire Joint Strategic Needs Assessment 2021 52
Age Male Female Total % EnglandPercentage
Point Difference
0-4 20,433 18,999 39,432 5.7% 5.9% -0.2
5-9 22,122 20,794 42,916 6.2% 6.3% -0.1
10-14 20,945 20,250 41,195 6.0% 6.0% 0.0
15-19 20,390 19,746 40,136 5.8% 5.5% 0.3
20-24 25,826 23,425 49,251 7.1% 6.2% 0.9
25-29 24,359 20,810 45,169 6.5% 6.8% -0.3
30-34 21,620 20,578 42,198 6.1% 6.8% -0.7
35-39 22,233 22,852 45,085 6.5% 6.6% -0.1
40-44 20,780 21,325 42,105 6.1% 6.1% 0.0
45-49 22,337 23,401 45,738 6.6% 6.6% 0.0
50-54 23,725 24,317 48,042 6.9% 6.9% 0.0
55-59 22,295 22,739 45,034 6.5% 6.5% 0.0
60-64 18,296 18,944 37,240 5.4% 5.5% -0.1
65-69 15,881 17,336 33,217 4.8% 5.0% -0.2
70-74 16,199 17,590 33,789 4.9% 4.9% 0.0
75-79 11,212 13,177 24,389 3.5% 3.4% 0.1
80-84 8,251 10,058 18,309 2.6% 2.6% 0.0
85+ 7,126 11,296 18,422 2.7% 2.5% 0.2
Total 344,030 347,637 691,667 100%
Age and Sex
ONS mid-year population estimates from nomis
Male and Female Oxfordshire residents, count
and proportion of total vs England (mid-2019) As of mid-2019 there were 344,030 (49.7%)
males and 347,637 (50.3%) females living in Oxfordshire, a total of 691,667 residents.
Compared with England, Oxfordshire had a higher proportion of residents aged 15-19 and 20-24 and a lower proportion of 25-29 and 30-34 year olds.
The number of students resident in Oxford City affects this age profile (see following slide)
Introduction
Summary
Carrying out an equity audit
Age and sex
Students
Disability
Gender identity
Marriage and civil partnership
Pregnancy and maternity
Ethnicity
Travellers
Religion or belief
Sexual orientation
Carers
Armed forces
Finding out more
Percentage Point Difference is the numerical difference between the percentage of the population groups in Oxfordshire and England
updated

Behavioural
determinants of
health
Health
conditions and
causes of death
Population groups
and protected
characteristics
Population
Wider
determinants of
health
Service Use Local researchExecutive
summary
Oxfordshire Joint Strategic Needs Assessment 2021
Oxford’s two universities – Oxford Brookes and the University of Oxford - had 32,930 full time students and 9,125 part time students enrolled for the academic year 2018-19.
Between 2008/09 and 2018/19 the undergraduate population declined by 2,200 (-7%) and the postgraduate population increased by 2,325 (+20%). This has resulted in a similar number of students and an older age profile.
The majority of University of Oxford students live within Oxford City although some part-time students might not be Oxford residents. Oxford Brookes has a campus in Headington, two campuses close to Oxford (in Wheatley and Harcourt Hill, Botley) and a campus in Swindon.
StudentsIntroduction
Summary
Carrying out an equity audit
Age and sex
Students
Disability
Gender identity
Marriage and civil partnership
Pregnancy and maternity
Ethnicity
Travellers
Religion or belief
Sexual orientation
Carers
Armed forces
Finding out more
Student enrolments (full time and part time), Oxford Brookes and University of Oxford
HESA Where do HE students study?
53updated

Behavioural
determinants of
health
Health
conditions and
causes of death
Population groups
and protected
characteristics
Population
Wider
determinants of
health
Service Use Local researchExecutive
summary
Oxfordshire Joint Strategic Needs Assessment 2021 54
Disability
Introduction
Summary
Carrying out an equity audit
Age and sex
Students
Disability
Gender identity
Marriage and civil partnership
Pregnancy and maternity
Ethnicity
Travellers
Religion or belief
Sexual orientation
Carers
Armed forces
Finding out more

Behavioural
determinants of
health
Health
conditions and
causes of death
Population groups
and protected
characteristics
Population
Wider
determinants of
health
Service Use Local researchExecutive
summary
Oxfordshire Joint Strategic Needs Assessment 2021 55
Disability – Oxfordshire Estimates from National Survey Data
Department for Work and Pensions, Family Resources Survey 2018/19 (released 26 March 2020) scaled by ONS mid-2019 population estimates from nomis.See also: Register of disabled children
The Family Resources Survey provides national disability estimates annually which can be scaled to Oxfordshire using population numbers.
In 2018/19 around 19% of people in the South East region have a disability, equating to an estimated 131,400 people in Oxfordshire.
The top impairment types were social/behavioural for children and mobility for adults with estimated numbers for Oxfordshire below.
Aged 0-16 Aged 17-64 Aged 65+
Introduction
Summary
Carrying out an equity audit
Age and sex
Students
Disability
Gender identity
Marriage and civil partnership
Pregnancy and maternity
Ethnicity
Travellers
Religion or belief
Sexual orientation
Carers
Armed forces
Finding out more
800
900
1,200
1,400
2,300
2,600
2,700
3,000
3,800
4,700
Hearing
Vision
Dexterity
Memory
Mobility
Other
Stamina/breathing/…
Mental health
Learning
Social/behavioural
5,600
6,500
7,300
11,300
12,100
16,100
19,400
25,800
31,500
32,300
Hearing
Vision
Social/behavioural
Learning
Memory
Other
Dexterity
Stamina/breathing/…
Mental health
Mobility
1,700
4,500
5,100
9,000
10,100
10,100
13,000
19,200
24,800
37,800
Social/behavioural
Learning
Mental health
Other
Memory
Vision
Hearing
Dexterity
Stamina/breathing/…
Mobility
updated

Behavioural
determinants of
health
Health
conditions and
causes of death
Population groups
and protected
characteristics
Population
Wider
determinants of
health
Service Use Local researchExecutive
summary
May-18 May-19 May-20
Incapacity Benefit and Severe Disablement Allowance
386 284 251
Employment and Support Allowance 12,347 11,064 10,562
Disability Living Allowance 13,623 11,872 11,578
Personal Independence Payment 9,943 12,705 14,146
Attendance Allowance 12,958 13,101 12,622
Total 49,257 49,026 49,159
Oxfordshire Joint Strategic Needs Assessment 2021 56
Employment and Support Allowance (ESA) supports those with a disability or health condition that affects work. ESA has replaced Incapacity Benefit (IB) and Severe Disablement Allowance (SDA).
Personal Independence Payment (PIP) helps with extra costs for working age adults with long term ill-health or a disability. From 2013, PIP has replaced Disability Living Allowance (DLA) for working age adults, but DLA still applies for young people aged under 16.
Attendance Allowance helps with extra costs for care and supervision due to a disability for state pension age residents who do not receive DLA/PIP
In May 2020 there was a total of 49,159 disability-related benefits claimed in Oxfordshire
Disability – Benefits Claimants
Descriptions from Gov.uk and data from DWP Stat-Xplore using cases with entitlement for DLA, PIP and Attendance Allowance (which includes those in receipt of an allowance and those with entitlement where pay has been temporarily suspended, for example if they are in hospital)
Introduction
Summary
Carrying out an equity audit
Age and sex
Students
Disability
Gender identity
Marriage and civil partnership
Pregnancy and maternity
Ethnicity
Travellers
Religion or belief
Sexual orientation
Carers
Armed forces
Finding out more
Disability-related benefits claimed in Oxfordshire to May 2020
updated

Behavioural
determinants of
health
Health
conditions and
causes of death
Population groups
and protected
characteristics
Population
Wider
determinants of
health
Service Use Local researchExecutive
summary
Oxfordshire Joint Strategic Needs Assessment 2021 57
According to NHS Digital:
People with a learning disability aged 0-74 were between 3.87 and 4.11 times more likely to die in the period 2016-19 than people in the general population in the same age and sex group.
Epilepsy is 26 times more common in people with learning disabilities than those without.
As of 1 April 2020 there was a total 1,672 adults receiving long term social care for learning disabilities in Oxfordshire from Oxfordshire County Council Adult Social Care services.
In 2019-20 there were a total of 3,025 people with learning disabilities (all ages) registered with GP practices in Oxfordshire Clinical Commissioning Group
According to the school census (January 2020) in Oxfordshire there was a total of 6,391pupils with learning difficulties (including specific, moderate, severe, profound and multiple) in schools in Oxfordshire:
2,900 pupils with learning difficulties in state primary schools (5.3% of pupils) and
2,906 pupils with learning difficulties in state secondary schools (7.2% of pupils)
585 pupils with learning difficulties in special schools (49% of pupils)
For data on health, health checks and screening of people with learning disabilities see JSNA bitesize Health and Care of People with Learning Disabilities
Disability – Learning disabilities
NHS Digital, Health and Care of People with Learning Disabilities, Experimental Statistics: 2018 to 2019NHS Digital, Quality and Outcomes Framework 2019-20Department for Education, Special educational needs in England: 2019/2020
Introduction
Summary
Carrying out an equity audit
Age and sex
Students
Disability
Gender identity
Marriage and civil partnership
Pregnancy and maternity
Ethnicity
Travellers
Religion or belief
Sexual orientation
Carers
Armed forces
Finding out more
updated

Behavioural
determinants of
health
Health
conditions and
causes of death
Population groups
and protected
characteristics
Population
Wider
determinants of
health
Service Use Local researchExecutive
summary
Oxfordshire Joint Strategic Needs Assessment 2021 58
In January 2020, there were 1,938 pupils in Oxfordshire registered with their primary/main type of need as Autism Spectrum Disorder, 2.0% of all pupils
Of these, 674 were in state-funded primary schools, 903 were in state-funded secondary schools and 361 were in special schools
Disability - Autism
DfE, Special educational needs in England: 2020
Autism is a lifelong, developmental disability that affects how a person communicates with
and relates to other people, and how they experience the world around them. The common
diagnostic term for autism is 'autism spectrum disorder' (ASD). Autism as a spectrum condition
means that autistic people share certain difficulties, but being autistic will affect them in
different ways. Some autistic people also have learning disabilities, mental health issues or
other conditions
Jan 2018 Jan 2019 Jan 2020 England Jan 2020
Primary schools 1.0% 1.1% 1.2% 1.2%
Secondary schools 1.7% 2.0% 2.2% 1.4%
Special schools 28.9% 31.2% 30.3% 31.2%
Total 1.7% 1.9% 2.0% 1.8%
Percentage of total pupils in Oxfordshire with
primary type of need as Autism Spectrum Disorder
This is an increase in the number of registrations, with 1,732 in January 2019 and 1,548 pupils in January 2018.
The proportion of pupils with autism was well above the England average in Oxfordshire’s state-funded secondary schools (2.2% compared with 1.4%)
Introduction
Summary
Carrying out an equity audit
Age and sex
Students
Disability
Gender identity
Marriage and civil partnership
Pregnancy and maternity
Ethnicity
Travellers
Religion or belief
Sexual orientation
Carers
Armed forces
Finding out more
updated

Behavioural
determinants of
health
Health
conditions and
causes of death
Population groups
and protected
characteristics
Population
Wider
determinants of
health
Service Use Local researchExecutive
summary
Oxfordshire Joint Strategic Needs Assessment 2021 59
Gender identity is a personal internal perception of oneself and, as such, the gender category with which a person identifies may not match the sex they were registered at birth. In contrast, sex is biologically determined.
Gender identity can have important links with health and wellbeing and being transgender is linked to a greater risk of self-harm and thoughts of suicide1
There is limited information on gender identity and data at a local level is not available
During the 2019-20 financial year there were 445 applications for gender recognition certificates in the UK, an increase of 66 from 2018-19 (379).2
Gender identity - National
1. LGBT Public Health Outcomes Framework Companion Document2. Ministry of Justice Tribunal Statistics Quarterly: July to September 2020
Introduction
Summary
Carrying out an equity audit
Age and sex
Students
Disability
Gender identity
Marriage and civil partnership
Pregnancy and maternity
Ethnicity
Travellers
Religion or belief
Sexual orientation
Carers
Armed forces
Finding out more
updated

Behavioural
determinants of
health
Health
conditions and
causes of death
Population groups
and protected
characteristics
Population
Wider
determinants of
health
Service Use Local researchExecutive
summary
Oxfordshire Joint Strategic Needs Assessment 2021 60
Same-sex civil partnerships were introduced in the UK in December 2005 and same-sex marriage became legal in March 2014.
At the time of the Census 2011 survey there were 128,400 married households in Oxfordshire and 682 households in a registered same-sex civil partnership.
The proportion of households married or in a same-sex civil partnership in Oxfordshire was above the rate for England as a whole.
In 2017 in Oxfordshire there were:
3,224 marriages of opposite-sex couples of which 2,240 (69.4%) were both of their first and most were aged 25-34 (49.8% male, 56.0% female).
79 same-sex marriages (40 males, 39 females). The percentage of same-sex marriages (of all marriages) was lower in Oxfordshire than in England (2.4% in Oxfordshire compared to 2.9% in England).
Marriage and Civil Partnership
ONS Census 2011 table KS103EW from nomis and ONS Marriages in England and Wales 2017 (released April 2020)Note: from 28/3/2019 to 16/9/2019 there was a data issue with the bride and groom age figures for the 2016 data. This only affected the age of bridge, age of groom and age difference figures for 2016 and has now been rectified
Introduction
Summary
Carrying out an equity audit
Age and sex
Students
Disability
Gender identity
Marriage and civil partnership
Pregnancy and maternity
Ethnicity
Travellers
Religion or belief
Sexual orientation
Carers
Armed forces
Finding out more
updated

Behavioural
determinants of
health
Health
conditions and
causes of death
Population groups
and protected
characteristics
Population
Wider
determinants of
health
Service Use Local researchExecutive
summary
There were 7,287 live births in Oxfordshire in 2019.
Oxfordshire had an above-average proportion of births to older mothers.
The trend in fertility in Oxfordshire follows the national trend of an increase between 2000 and 2011, followed by a decrease from 2011 to 2019.
Oxfordshire’s general fertility rate* in 2019 was 56.6 and in Oxford City was 40.9. This low rate in Oxford means that the county average was below the England average of 57.7.
Oxfordshire Joint Strategic Needs Assessment 2021 61
Pregnancy and Maternity
*live births per 1,000 female population aged 15 to 44
ONS Births characteristics 2019 and Nomistheme “life events”
General
fertility rate
Live births
Cherwell 67.6 1,810
Oxford 40.9 1,541
South Oxfordshire 61.3 1,400
Vale of White Horse 63.8 1,501
West Oxfordshire 57.7 1,035
Oxfordshire 56.6 7,287
England 59.2 610,505
Fertility rate and births
Proportion of births by mother’s age 2019Introduction
Summary
Carrying out an equity audit
Age and sex
Students
Disability
Gender identity
Marriage and civil partnership
Pregnancy and maternity
Ethnicity
Travellers
Religion or belief
Sexual orientation
Carers
Armed forces
Finding out more
0.0%
10.0%
20.0%
30.0%
40.0%
under20
20-24 25-29 30-34 35-39 40-44 over 44
Live
bir
ths
Age group
Oxfordshire England
updated

Behavioural
determinants of
health
Health
conditions and
causes of death
Population groups
and protected
characteristics
Population
Wider
determinants of
health
Service Use Local researchExecutive
summary
Oxfordshire Joint Strategic Needs Assessment 2021 62
Oxfordshire 2001
Oxfordshire 2011
Oxfordshire 2001 to 2011
England 2001 to
2011
White: British 544,572 546,801 2,229 0% -1%
All ethnic minority 60,916 (10%) 106,997 (16%)
46,081 76% 68%
Irish 7,525 6,291 -1,234 -16% -17%
Other White 23,947 40,912 16,965 71% 90%
Mixed ethnic background 7,103 13,233 6,130 86% 85%
Indian 4,068 8,140 4,072 100% 36%
Pakistani 4,007 7,846 3,839 96% 57%
Bangladeshi 1,184 2,491 1,307 110% 59%
Other Asian 1,221 7,562 6,341 519% 245%
Black Caribbean 2,453 3,070 617 25% 5%
Black African 2,046 7,039 4,993 244% 105%
Other Black 503 1,315 812 161% 191%
Chinese 3,849 5,618 1,769 46% 72%
Other ethnic group 3,010 3,480 470 16% 156%
TOTAL 605,488 653,798 48,310 8% 8%
Ethnicity
In 2011, there were 107,000 people in Oxfordshire of an ethnic minority background (non white British) up from 60,900 in 2001
The proportion of the population from ethnic minority backgrounds in Oxfordshire increased to 16% in 2011, remaining below the England average (20%)
The greatest number of additional residents was in the “Other White” group (17,000 additional people) an increase of 71%. This group increased by 90% across England.
Country of birth data from the Census shows that there were 92,500 people born outside the UK living in Oxfordshire in 2011
30,400 people in Oxfordshire were born in EU countries (not including the UK) of which 17,200 were member countries in 2011 and 13,200 were accession countries including Poland and Romania
Outside the EU, the largest non-UK born groups were United States (5,700), India (5,000) and South Africa (3,700)
Introduction
Summary
Carrying out an equity audit
Age and sex
Students
Disability
Gender identity
Marriage and civil partnership
Pregnancy and maternity
Ethnicity
Travellers
Religion or belief
Sexual orientation
Carers
Armed forces
Finding out more
ONS Census 2011 tables KS201EW and KS203EW from nomis
Population by ethnic group (Census 2011)
unchanged

Behavioural
determinants of
health
Health
conditions and
causes of death
Population groups
and protected
characteristics
Population
Wider
determinants of
health
Service Use Local researchExecutive
summary
Oxfordshire Joint Strategic Needs Assessment 2021 63
At the time of the 2011 Census, there were 623 people living in Oxfordshire identifying as Gypsy or Irish Traveller.
The district with both the highest count and rate was West Oxfordshire.
51.5% live in rural parts of Oxfordshire compared to 24.0% nationally.
Travellers
ONS Census 2011 table KS201EW from nomis
Gypsy or Irish Travellers
Rate per 10,000 residents
Cherwell 105 7.4
Oxford 92 6.1
South Oxfordshire 135 10.1
Vale of White Horse 109 9.0
West Oxfordshire 182 17.4
Oxfordshire 623 9.5
England 54,895 10.4
Gypsy or Irish Travellers
Rate per 10,000 residents
Hailey, Minster Lovell and Leafield
36 88.7
Banbury Ruscote 29 34.2
Sandford 27 106.8
Standlake, Aston and Stanton Harcourt
27 64.2
Wards with most Travellers (Census 2011)
Number and rate of Travellers in Oxfordshire
(Census 2011)Introduction
Summary
Carrying out an equity audit
Age and sex
Students
Disability
Gender identity
Marriage and civil partnership
Pregnancy and maternity
Ethnicity
Travellers
Religion or belief
Sexual orientation
Carers
Armed forces
Finding out more
unchanged

Behavioural
determinants of
health
Health
conditions and
causes of death
Population groups
and protected
characteristics
Population
Wider
determinants of
health
Service Use Local researchExecutive
summary
Oxfordshire Joint Strategic Needs Assessment 2021 64
Cherwell Oxford South Oxfordshire
Vale of White Horse
West Oxfordshire
Oxfordshire England
All residents 141,868 151,906 134,257 120,988 104,779 653,798 53,012,456
Has religion 96,063 89,021 87,833 79,496 70,163 422,576 36,094,120
% has religion 68% 59% 65% 66% 67% 65% 68%
Christian 90,564 72,924 85,292 76,589 68,537 393,906 31,479,876
Buddhist 563 1,431 467 462 334 3,257 238,626
Hindu 575 2,044 472 566 221 3,878 806,199
Jewish 164 1,072 281 196 180 1,893 261,282
Muslim 3,196 10,320 710 1,073 435 15,734 2,660,116
Sikh 438 434 106 177 37 1,192 420,196
Religion not stated 9,739 12,611 10,026 8,987 7,515 48,878 3,804,104
% Religion not stated 7% 8% 8% 7% 7% 7% 7%
No religion 36,066 50,274 36,398 32,505 27,101 182,344 13,114,232
% no religion 25% 33% 27% 27% 26% 28% 25%
Religion or Belief
Oxfordshire England
Christian 93.2% 87.2%
Muslim 3.7% 7.4%
Hindu 0.9% 2.2%
Buddhist 0.8% 0.7%
Other religion 0.6% 0.6%
Jewish 0.4% 0.7%
Sikh 0.3% 1.2%
2011 Census question on religion
The question on religion in the 2011 Census survey was voluntary.
The proportion of residents in Oxfordshire stating a religion was 65%, just below the national average (68%).
Of those stating a religion, a higher than average proportion were Christian (93% Oxfordshire compared with 87% national).
The largest non-Christian group was Muslim with 15,700 residents in the county, the majority living in Oxford City.
Most frequently stated
religions as % of total
ONS Census 2011 table KS209EW from nomis
Introduction
Summary
Carrying out an equity audit
Age and sex
Students
Disability
Gender identity
Marriage and civil partnership
Pregnancy and maternity
Ethnicity
Travellers
Religion or belief
Sexual orientation
Carers
Armed forces
Finding out more
Religion or Belief (Census 2011)
unchanged

Behavioural
determinants of
health
Health
conditions and
causes of death
Population groups
and protected
characteristics
Population
Wider
determinants of
health
Service Use Local researchExecutive
summary
Oxfordshire Joint Strategic Needs Assessment 2021 65
Sexual Orientation
Introduction
Summary
Carrying out an equity audit
Age and sex
Students
Disability
Gender identity
Marriage and civil partnership
Pregnancy and maternity
Ethnicity
Travellers
Religion or belief
Sexual orientation
Carers
Armed forces
Finding out more

Behavioural
determinants of
health
Health
conditions and
causes of death
Population groups
and protected
characteristics
Population
Wider
determinants of
health
Service Use Local researchExecutive
summary
Oxfordshire Joint Strategic Needs Assessment 2021 66
There remains very limited data on sexual orientation – people identifying as heterosexual/straight, gay/lesbian, bisexual or another sexual orientation.
One indicator is the number of people in a same-sex registered partnership, which for Oxfordshire in 2011 was around 1,400 people. This will be, however, a significant undercount of the total lesbian, gay or bisexual (LGB) population.
ONS experimental statistics on sexual identity found that:
In 2018, 2.3% of the UK population identified themselves as lesbian, gay or bisexual (LGB), similar to 2017. The South East region shows a similar trend, at 2.2% of the population.
UK figures show that the population aged 16 to 24 were the age group most likely to identify as LGB in 2018 (4.4%, up from 4.3% in 2017).
More males (2.5%) than females (2.0%) identified themselves as LGB in 2018.
The population who identified as LGB in 2018 were most likely to be single, never married or civil partnered, at 69.0%.
Sexual Orientation – Estimated from National Data
ONS Sexual orientation UK 2018 (released March 2020) and ONS mid year population estimates from nomis
Using the proportion of LGB population by age from this research, it is estimated that there was a total of 12,887 people aged 16+ in Oxfordshire identifying as lesbian, gay or bisexual in 2018.
Introduction
Summary
Carrying out an equity audit
Age and sex
Students
Disability
Gender identity
Marriage and civil partnership
Pregnancy and maternity
Ethnicity
Travellers
Religion or belief
Sexual orientation
Carers
Armed forces
Finding out more
updated

Behavioural
determinants of
health
Health
conditions and
causes of death
Population groups
and protected
characteristics
Population
Wider
determinants of
health
Service Use Local researchExecutive
summary
Oxfordshire Joint Strategic Needs Assessment 2021 67
In February 2019, ONS published detailed data from a major online survey on LGBT experience. Responses from over 100,000 LGBT people in the UK showed that: LGBT respondents are less satisfied with their life
than the general UK population (rating satisfaction 6.5 on average out of 10 compared with 7.7). Trans respondents had particularly low scores (around 5.4 out of 10).
More than two thirds of LGBT respondents said they avoid holding hands with a same-sex partner for fear of a negative reaction from others.
At least two in five respondents had experienced an incident because they were LGBT, such as verbal harassment or physical violence, in the 12 months preceding the survey. However, more than nine in ten of the most serious incidents went unreported, often because respondents thought ‘it happens all the time’.
2% of respondents had undergone conversion or reparative therapy in an attempt to ‘cure’ them of being LGBT, and a further 5% had been offered it.
24% of respondents had accessed mental health services in the 12 months preceding the survey.
Sexual Orientation - Experience
In July 2017, the Government launched a survey to gather more information about the experiences of LGBT people in the UK. The survey response was unprecedented – over 108,000 people participated, making it the largest national survey of LGBT people in the world to date. In 2019, ONS published a detailed research reporton the headline findings and a summary report. These focus on the experiences of LGBT people in the areas of safety, health, education and the workplace.
For charts and data by question see data viewer
Introduction
Summary
Carrying out an equity audit
Age and sex
Students
Disability
Gender identity
Marriage and civil partnership
Pregnancy and maternity
Ethnicity
Travellers
Religion or belief
Sexual orientation
Carers
Armed forces
Finding out more
unchanged

Behavioural
determinants of
health
Health
conditions and
causes of death
Population groups
and protected
characteristics
Population
Wider
determinants of
health
Service Use Local researchExecutive
summary
Oxfordshire Joint Strategic Needs Assessment 2021 68
A report published by the Women and Equalities Committee found that too often LGBT people are expected to fit into systems that assume they are straight and cisgender. The Committee has found that deep inequalities exist in health outcomes for these communities and that treating them “the same” as non-LGBT people will not address these poor outcomes.
The report talks about the disparities in health and social care that is experienced by LGBT people. Services need to understand where the disparities are in order to formulate strategies to tackle them. This is especially true for the transgender population, where the LGBT Survey found that some of the greatest health disparities exist.
Inequalities in Health Outcomes – Lesbian, Gay, Bisexual and Trans (LGBT) Communities
“Unacceptable inequalities in health outcomes” for LGBT people “glare out wherever you look” October 2019
Introduction
Summary
Carrying out an equity audit
Age and sex
Students
Disability
Gender identity
Marriage and civil partnership
Pregnancy and maternity
Ethnicity
Travellers
Religion or belief
Sexual orientation
Carers
Armed forces
Finding out more
unchanged

Behavioural
determinants of
health
Health
conditions and
causes of death
Population groups
and protected
characteristics
Population
Wider
determinants of
health
Service Use Local researchExecutive
summary
Oxfordshire Joint Strategic Needs Assessment 2021 69
Carers
Introduction
Summary
Carrying out an equity audit
Age and sex
Students
Disability
Gender identity
Marriage and civil partnership
Pregnancy and maternity
Ethnicity
Travellers
Religion or belief
Sexual orientation
Carers
Armed forces
Finding out more

Behavioural
determinants of
health
Health
conditions and
causes of death
Population groups
and protected
characteristics
Population
Wider
determinants of
health
Service Use Local researchExecutive
summary
Oxfordshire Joint Strategic Needs Assessment 2021 70
Census 2011 survey1
According to the Census 2011 survey: 61,100 residents of Oxfordshire were providing unpaid care.
17,400 residents of Oxfordshire were providing 20 or more hours of unpaid care, of whom a third (34%) were aged 65 or over.
4,200 residents were combining full time work with providing 20 or more hours per week of unpaid care.
Carers known to Social Care2
In 2019-20, there was a total of 4,540 carers in Oxfordshire who were registered and receiving a service in the form of a carers assessment or direct payment from a pooled budget (health and social care). This was 0.83% of the adult population, above the regional average (0.74%) and just below national average (0.84%).
Around 48% of registered carers receiving services, were aged 65 and over.
Carers known to GP practices3
As of 30 September 2020, there were 18,682 carers reported by 66 GP practices in Oxfordshire Clinical Commissioning Group.
This was 611 above the previous year (18,071 reported by 66 practices as of 30/09/2019).
Carers - Numbers
[1] ONS Census 2011 table LC3304 from nomis ; [2] Adult Social Care Activity and Finance Report, England -2019-20 ; [3] Oxfordshire Clinical Commissioning Group
Introduction
Summary
Carrying out an equity audit
Age and sex
Students
Disability
Gender identity
Marriage and civil partnership
Pregnancy and maternity
Ethnicity
Travellers
Religion or belief
Sexual orientation
Carers
Armed forces
Finding out more
updated

Behavioural
determinants of
health
Health
conditions and
causes of death
Population groups
and protected
characteristics
Population
Wider
determinants of
health
Service Use Local researchExecutive
summary
Oxfordshire Joint Strategic Needs Assessment 2021 71
Census data suggests that there were around 1,300 young people aged under 16 providing unpaid care in Oxfordshire in 2011.
Oxfordshire County Council’s children’s services is supporting 323 young carers (December 2020)
Young Carers
ONS Census 2011 table LC3304 from nomis ; Oxfordshire County Council
Introduction
Summary
Carrying out an equity audit
Age and sex
Students
Disability
Gender identity
Marriage and civil partnership
Pregnancy and maternity
Ethnicity
Travellers
Religion or belief
Sexual orientation
Carers
Armed forces
Finding out more
Number of aged 0-15 providing unpaid care
Percentage of aged 0-15 providing unpaid care compared to population
Cherwell 288 1.0%
Oxford 353 1.4%
South Oxfordshire 268 1.0%
Vale of White Horse 196 0.8%
West Oxfordshire 197 1.0%
Oxfordshire 1,302 1.1%
England 1.1%
Young Carers in Oxfordshire (Census 2011)
updated

Behavioural
determinants of
health
Health
conditions and
causes of death
Population groups
and protected
characteristics
Population
Wider
determinants of
health
Service Use Local researchExecutive
summary
Oxfordshire Joint Strategic Needs Assessment 2021 72
The latest survey of Adult Carers (2018-19) found that..
An above average and increasing proportion of carers in Oxfordshire reported feelings of stress and financial difficulties.
The proportion of carers in Oxfordshire who say that caring had caused them feelings of stress has increased from 58.7% in 2016-17 to 63.5% in 2018-19 (+4.8). Across England this increased from 58.7% to 60.6% (+1.9).
The proportion of carers in Oxfordshire who say that caring had caused “some” or “a lot” of financial difficulties has increased from 44.8% in 2016-17 to 51.0% in 2018-19 (+6.2). Across England this increased from 45.6% to 46.6% (+1.0).
Carers – Experience
Oxfordshire Carers Survey 2018-19 JSNA briefing and ONS research on sandwich carers
Just under a third of carer respondents (31%) in Oxfordshire reported that they have had to see their own GP in the last 12 months because of their caring role, above the national average of 29%.
The rate has fallen since the last survey, particularly in the upper age groups.
There appears to have been a large increase for carers aged 18 to 49 (from a small sample).
This may be an indication of younger carers in poorer health than the previous survey and/or an indication this age group are now more likely to seek support from their GP.
ONS research shows that “sandwich carers” –those who care for both sick, disabled or older relatives and dependent children – are more likely to report symptoms of mental ill-health, feel less satisfied with life, and struggle financially compared with the general population.
Introduction
Summary
Carrying out an equity audit
Age and sex
Students
Disability
Gender identity
Marriage and civil partnership
Pregnancy and maternity
Ethnicity
Travellers
Religion or belief
Sexual orientation
Carers
Armed forces
Finding out more
unchanged

Behavioural
determinants of
health
Health
conditions and
causes of death
Population groups
and protected
characteristics
Population
Wider
determinants of
health
Service Use Local researchExecutive
summary
Oxfordshire Joint Strategic Needs Assessment 2021 73
Current personnel
As of 1 April 2020 there were 9,360 regular armed forces (military and civilian) personnel stationed in Oxfordshire (although not necessarily all resident in the county).
This was a slight decrease compared to the previous year (9,550 on 1 April 2019) and well below the number as of April 2012 (11,610).
Ex-personnel
As of 31 March 2020 there were 6,623 recipients of pensions/compensation under the Armed Forces Pension Scheme, War Pension Scheme and Armed Forces Compensation Scheme.
This continues the trend of a gradual increase in recipients since 2014.
Armed Forces
Ministry of Defence, Location of UK regular service and civilian personnel annual statistics: 2020 and Location of armed forces pension and compensation recipients 2020
31-Mar-19
31-Mar-20
2019 to 2020
Cherwell 1,314 1,335 21 1.6%
Oxford 262 248 -14 -5.3%
South Oxon 1,185 1,203 18 1.5%
Vale of WH 1,647 1,651 4 0.2%
West Oxon 2,184 2,186 2 0.09%
Oxfordshire 6,592 6,623 31 0.5%
Armed Forces Personnel stationed in
Oxfordshire, 2012 to 2020
Armed Forces pension and compensation
recipients in Oxfordshire 2018 to 2020
Introduction
Summary
Carrying out an equity audit
Age and sex
Students
Disability
Gender identity
Marriage and civil partnership
Pregnancy and maternity
Ethnicity
Travellers
Religion or belief
Sexual orientation
Carers
Armed forces
Finding out more
11,610
9,550 9,360
10,070
8,550 8,360
1,540 1,010 1,000
0
2,000
4,000
6,000
8,000
10,000
12,000
2012 2013 2014 2015 2016 2017 2018 2019 2020
Num
ber
of
pers
onnel
Year
Total Military Civilian
updated

Behavioural
determinants of
health
Health
conditions and
causes of death
Population groups
and protected
characteristics
Population
Wider
determinants of
health
Service Use Local researchExecutive
summary
Oxfordshire Joint Strategic Needs Assessment 2021 74
For further information on population and disability it may be useful to reference other sections of the JSNA, for example Chapter 1: Population and Chapter 4: Health conditions and causes of death
Office for National Statistics provides national survey data (for example the Family Resources Survey) and population estimates
Further data, including at ward level, on claimants of benefits is available from DWP Stat-Xplore
Additional data on pupils is available from Department for Education DfE Schools, Pupils and their characteristics
Oxfordshire Public Health dashboard on ethnicity with district data
A wide range of Census 2011 data is available from nomis
Finding out moreIntroduction
Summary
Carrying out an equity audit
Age and sex
Students
Disability
Gender identity
Marriage and civil partnership
Pregnancy and maternity
Ethnicity
Travellers
Religion or belief
Sexual orientation
Carers
Armed forces
Finding out more
updated

Behavioural
determinants of
health
Health
conditions and
causes of death
Population groups
and protected
characteristics
Population
Wider
determinants of
health
Service Use Local researchExecutive
summary
Health conditions and causes of death
Oxfordshire Joint Strategic Needs Assessment 2021 75
Chapter 4

Behavioural
determinants of
health
Health
conditions and
causes of death
Population groups
and protected
characteristics
Population
Wider
determinants of
health
Service Use Local researchExecutive
summary
Oxfordshire Joint Strategic Needs Assessment 2021 76
This chapter provides information on health conditions and causes of deaths in Oxfordshire.
It includes information on the premature deaths in people under 75 years which are considered to be preventable.
Further JSNA resources are available via the JSNA page of Oxfordshire Insight
Assessing the impact of COVID-19
This chapter presents the most recent datasets accessed in January 2021.
This includes some data on coronavirus (COVID-19) cases and mortality for the 2020 calendar year. Most other data is 2019/20 financial year or earlier.
This means that, for the most part, this chapter will not reflect the impact of the COVID-19 pandemic and lockdowns (from early 2020).
This chapter..Introduction
Summary
COVID-19
Health conditions
Cancer
Cardiovascular disease
Musculoskeletal conditions
Multi-morbidity
Sensory impairment
Learning Disabilities
Personal wellbeing & Mental health
Self-harm
Hospital admissions due to falls
Causes of death
Leading causes of death
Mortality and inequalities
Avoidable mortality
Deaths at home
Stillbirths and neonatal mortality
Suicide and deaths from drug misuse
Road casualties
Finding out more

Behavioural
determinants of
health
Health
conditions and
causes of death
Population groups
and protected
characteristics
Population
Wider
determinants of
health
Service Use Local researchExecutive
summary
Oxfordshire Joint Strategic Needs Assessment 2021 77
COVID-19
From Jan-Dec 2020 there were over 19,000 confirmed cases of COVID-19 in people living in Oxfordshire and approximately 700 deaths with COVID-19 on the death certificate.
National data shows that:
COVID-19 has had a disproportionate impact on ethnic minority communities.
the mortality rates from COVID-19 in the most deprived areas were more than double the least deprived areas.
Around 21,600 people in Oxfordshire (3% of the population) were identified as Clinically Extremely Vulnerable (Feb21) and at highest risk from COVID-19
Health conditions
The health conditions with the greatest number of GP-registered patients in Oxfordshire were:
Hypertension (high blood pressure): 97,600 patients
Depression: 73,600 patients
Asthma: 48,100 patients
Diabetes: 32,000 patients
Around 15% of the population suffer with a musculoskeletal condition. Depression and anxiety are more common in people with persistent pain.
There are over 137,000 people of all ages with two or more chronic conditions in Oxfordshire. Prevalence increases as age increases.
Prevalence of depression is increasing in Oxfordshire.
National data reports deterioration in mental health of
young people with existing mental health needs in
lockdown, particularly linked to increased loneliness
and anxiety.
Falls are the largest cause of emergency hospital admissions for older people (65+); Oxford City has a rate consistently significantly worse than England.
Introduction
Summary
COVID-19
Health conditions
Cancer
Cardiovascular disease
Musculoskeletal conditions
Multi-morbidity
Sensory impairment
Learning Disabilities
Personal wellbeing & Mental health
Self-harm
Hospital admissions due to falls
Causes of death
Leading causes of death
Mortality and inequalities
Avoidable mortality
Deaths at home
Stillbirths and neonatal mortality
Suicide and deaths from drug misuse
Road casualties
Finding out more
updated
Summary – COVID-19 and Health conditions

Behavioural
determinants of
health
Health
conditions and
causes of death
Population groups
and protected
characteristics
Population
Wider
determinants of
health
Service Use Local researchExecutive
summary
Oxfordshire Joint Strategic Needs Assessment 2021 78
In 2017-19, cancer was the leading cause of death in Oxfordshire, followed by Heart Disease and stroke for males and Dementia for females.
National data show that premature mortality is closely associated with deprivation.
In 2017-19 there were over 3,500 deaths in those aged under 75, from cancers, cardiovascular disease, liver disease and respiratory disease.
1,540 (43%) of these deaths in under 75s were considered to be preventable.
An increasing number and proportion of deaths in Oxfordshire happen at home.
Some wards experience significantly higher mortality rates from certain conditions than England.
Summary – Causes of deathIntroduction
Summary
COVID-19
Health conditions
Cancer
Cardiovascular disease
Musculoskeletal conditions
Multi-morbidity
Sensory impairment
Learning Disabilities
Personal wellbeing & Mental health
Self-harm
Hospital admissions due to falls
Causes of death
Leading causes of death
Mortality and inequalities
Avoidable mortality
Deaths at home
Stillbirths and neonatal mortality
Suicide and deaths from drug misuse
Road casualties
Finding out more
updated

Behavioural
determinants of
health
Health
conditions and
causes of death
Population groups
and protected
characteristics
Population
Wider
determinants of
health
Service Use Local researchExecutive
summary
Coronavirus (COVID-19)
Oxfordshire Joint Strategic Needs Assessment 2021 79
Introduction
Summary
COVID-19
Health conditions
Cancer
Cardiovascular disease
Musculoskeletal conditions
Multi-morbidity
Sensory impairment
Learning Disabilities
Personal wellbeing & Mental health
Self-harm
Hospital admissions due to falls
Causes of death
Leading causes of death
Mortality and inequalities
Avoidable mortality
Deaths at home
Stillbirths and neonatal mortality
Suicide and deaths from drug misuse
Road casualties
Finding out more

Behavioural
determinants of
health
Health
conditions and
causes of death
Population groups
and protected
characteristics
Population
Wider
determinants of
health
Service Use Local researchExecutive
summary
Oxfordshire Joint Strategic Needs Assessment 2021 80
In 2020, there were 19,200 confirmed cases of COVID-19 in people living in Oxfordshire, equivalent to a rate of 2,776 cases per 100,000 population.
The majority of these cases were in the working age population.
NOTE: This is for the 2020 calendar year only. For more recent data, see sources below.
Coronavirus (COVID-19)
Gov.uk Coronavirus (COVID-19) in the UKFor more information about COVID-19, see Finding out more – coronavirus (COVID-19)
Area name Total casesRate per 100,000
population
Cherwell 4,929 3,275
Oxford 5,490 3,601
South Oxfordshire 3,440 2,422
Vale of White Horse 2,882 2,119
West Oxfordshire 2,457 2,221
Oxfordshire 19,198 2,776
South East 3,355
England 4,075
Count of confirmed cases of
COVID-19 by 5-year age band,
Oxfordshire, 2020
Confirmed cases of COVID-19, Oxfordshire, 2020
new
Introduction
Summary
COVID-19
Health conditions
Cancer
Cardiovascular disease
Musculoskeletal conditions
Multi-morbidity
Sensory impairment
Learning Disabilities
Personal wellbeing & Mental health
Self-harm
Hospital admissions due to falls
Causes of death
Leading causes of death
Mortality and inequalities
Avoidable mortality
Deaths at home
Stillbirths and neonatal mortality
Suicide and deaths from drug misuse
Road casualties
Finding out more
0 500 1,000 1,500 2,000 2,500
0-45-9
10-1415-1920-2425-2930-3435-3940-4445-4950-5455-5960-6465-6970-7475-7980-8485-89
90+
5-y
ear
age
ban
d

Behavioural
determinants of
health
Health
conditions and
causes of death
Population groups
and protected
characteristics
Population
Wider
determinants of
health
Service Use Local researchExecutive
summary
Oxfordshire Joint Strategic Needs Assessment 2021 81
When this data was analysed, the majority of testing had been offered to those in hospital with a medical need. Confirmed cases therefore represent the population of people with severe disease, rather than all of those who get infected. This is important because disparities between diagnoses rates may reflect differences in the risk of getting the infection, in presenting to hospital with a medical need and in the likelihood of being tested.
People who live in deprived areas have higher diagnosis rates and death rates than those living in less deprived areas.
National data shows that COVID-19 has had a disproportionate impact on ethnic minority communities. People from Black ethnic groups were most likely to be diagnosed. Given that the best data available for ethnicity at a local level is from the Census 2011 and now ten years old, we can infer what the national data mean for Oxfordshire but cannot be certain.
Early reports suggested that occupational exposure accounts for some infections, with healthcare workers being particularly at risk of infection. Other occupations, such as those working in the emergency services (police, fire, ambulance), social care and educators, and other occupations such as bar staff and hairdressers, also have close contact with others but are less likely to be exposed to people with the disease when compared to health care workers.
Among workers in occupations that are more likely to be in frequent contact with people and exposed to disease, 3 in 4 are women and one in 5 are from BAME groups.
Coronavirus (COVID-19) cases inequalities - national
PHE COVID-19: understanding the impact on BAME communities
new
Introduction
Summary
COVID-19
Health conditions
Cancer
Cardiovascular disease
Musculoskeletal conditions
Multi-morbidity
Sensory impairment
Learning Disabilities
Personal wellbeing & Mental health
Self-harm
Hospital admissions due to falls
Causes of death
Leading causes of death
Mortality and inequalities
Avoidable mortality
Deaths at home
Stillbirths and neonatal mortality
Suicide and deaths from drug misuse
Road casualties
Finding out more

Behavioural
determinants of
health
Health
conditions and
causes of death
Population groups
and protected
characteristics
Population
Wider
determinants of
health
Service Use Local researchExecutive
summary
Oxfordshire Joint Strategic Needs Assessment 2021 82
As of 15th February 2021, there were 21,598 people who had been identified as Clinically Extremely Vulnerable (CEV) and at highest risk from COVID-19 across Oxfordshire (3.12% of population)
The district with the highest rate of CEV per population was West Oxfordshire
The map shows how CEV varies across Oxfordshire, with dots showing locations of care homes
Clinically Extremely Vulnerable Population
Oxfordshire County Council, 15th February 2021NHS list of categories of people at high risk (clinically extremely vulnerable; denominator: ONS mid-2019 population estimates
District CountProportion of
population
Cherwell 5,011 3.33%
Oxford 3,926 2.58%
South Oxfordshire 4,677 3.29%
Vale of White Horse 4,117 3.03%
West Oxfordshire 3,853 3.48%
new
Introduction
Summary
COVID-19
Health conditions
Cancer
Cardiovascular disease
Musculoskeletal conditions
Multi-morbidity
Sensory impairment
Learning Disabilities
Personal wellbeing & Mental health
Self-harm
Hospital admissions due to falls
Causes of death
Leading causes of death
Mortality and inequalities
Avoidable mortality
Deaths at home
Stillbirths and neonatal mortality
Suicide and deaths from drug misuse
Road casualties
Finding out more

Behavioural
determinants of
health
Health
conditions and
causes of death
Population groups
and protected
characteristics
Population
Wider
determinants of
health
Service Use Local researchExecutive
summary
Oxfordshire Joint Strategic Needs Assessment 2021 83
Of the 21,598 people identified as Clinically Extremely Vulnerable (CEV) in Oxfordshire and at highest risk from COVID-19, over half (55%) were older people aged 65+
926 were children and young people aged 0-24 (4% of the total)
2,242 of the CEV group were also receiving long term health and social care services from the pooled budget, 10.4% of the total
Clinically Extremely Vulnerable by age and overlap with health and social care
Oxfordshire County Council, February 2021NHS list of categories of people at high risk (clinically extremely vulnerable)
Oxfordshire CEV as a % of population by
single year of age
new
Clinically Extremely Vulnerable
21,598
Supported by Social Care services*
15,744
Both2,242
*People open to social care or
open to health services paid via
social care, e.g. continuing
healthcare or funded nursing care
Introduction
Summary
COVID-19
Health conditions
Cancer
Cardiovascular disease
Musculoskeletal conditions
Multi-morbidity
Sensory impairment
Learning Disabilities
Personal wellbeing & Mental health
Self-harm
Hospital admissions due to falls
Causes of death
Leading causes of death
Mortality and inequalities
Avoidable mortality
Deaths at home
Stillbirths and neonatal mortality
Suicide and deaths from drug misuse
Road casualties
Finding out more

Behavioural
determinants of
health
Health
conditions and
causes of death
Population groups
and protected
characteristics
Population
Wider
determinants of
health
Service Use Local researchExecutive
summary
Oxfordshire Joint Strategic Needs Assessment 2021 84
According to the Office for National Statistics, the total number of deaths (including COVID-19 and other causes) in the 12 months between January 2020 and December 2020 in Oxfordshire was 6,150.
This was a rate of 48 deaths per 1000 population aged 65+* in 2020, compared with 43.6 (per 1000 65+ pop) in 2019.
By district, the highest rates of total deaths per population (as % of those aged 65+) were in Cherwell (52.9) and Oxford (52.4), followed by West Oxfordshire (47.9), Vale of White Horse (45.5) and South Oxfordshire (43.1).
Total deaths in Oxfordshire by month
ONS, Deaths registered monthly in England and Wales
new
Introduction
Summary
COVID-19
Health conditions
Cancer
Cardiovascular disease
Musculoskeletal conditions
Multi-morbidity
Sensory impairment
Learning Disabilities
Personal wellbeing & Mental health
Self-harm
Hospital admissions due to falls
Causes of death
Leading causes of death
Mortality and inequalities
Avoidable mortality
Deaths at home
Stillbirths and neonatal mortality
Suicide and deaths from drug misuse
Road casualties
Finding out more
*Note: death rate is
calculated as a rate of
total deaths (all ages)
per 1000 population
aged 65+. This is
because deaths tend to
be in the older age
group and to give a
more reasonable
comparator for Oxford
City (i.e. excluding the
large student-age
population)

Behavioural
determinants of
health
Health
conditions and
causes of death
Population groups
and protected
characteristics
Population
Wider
determinants of
health
Service Use Local researchExecutive
summary
Oxfordshire Joint Strategic Needs Assessment 2021 85
According to the Office for National Statistics*, there were approximately 700 deaths with COVID-19 on the death certificate in Oxfordshire in 2020.
By count, deaths were relatively evenly spread across Oxfordshire’s districts, however the rate was lower in Oxford than in the other districts.
The majority of deaths involving COVID-19 were registered with hospital or care home as the place of death.
Deaths from coronavirus (COVID-19)
ONS, Deaths registrations and occurrences by Local Authority and Health Board *Accessed 26.01.2021For more information about COVID-19, see Finding out more – coronavirus (COVID-19)
Registered deaths by week of occurrence, Oxfordshire, 2020
new
Introduction
Summary
COVID-19
Health conditions
Cancer
Cardiovascular disease
Musculoskeletal conditions
Multi-morbidity
Sensory impairment
Learning Disabilities
Personal wellbeing & Mental health
Self-harm
Hospital admissions due to falls
Causes of death
Leading causes of death
Mortality and inequalities
Avoidable mortality
Deaths at home
Stillbirths and neonatal mortality
Suicide and deaths from drug misuse
Road casualties
Finding out more

Behavioural
determinants of
health
Health
conditions and
causes of death
Population groups
and protected
characteristics
Population
Wider
determinants of
health
Service Use Local researchExecutive
summary
National data show that people who live in deprived areas have higher diagnosis rates and death rates than those living in less deprived areas. The mortality rates from COVID-19 in the most deprived areas were more than double the least deprived areas.
Poor outcomes from COVID-19 infection in deprived areas remain after adjusting for age, sex, region and ethnicity, but the role of comorbidities requires further investigation.
Oxfordshire Joint Strategic Needs Assessment 2021 86
Inequality in deaths from coronavirus (COVID-19) - national
PHE Disparities in the risk and outcomes of COVID-19 (August 2020)For more information about COVID-19, see Finding out more – coronavirus (COVID-19)
Death rate in confirmed COVID-19 cases by
deprivation and sex, as of 13 May 2020, England
Age-standardised mortality rate per 100,000 population
Quintile 1
Most deprived
Quintile 5
Least deprived
Quintile 2
Quintile 3
Quintile 4
Risk of dying among those diagnosed with COVID-
19 was also higher in males than females and
higher in those in Black, Asian and Minority Ethnic
(BAME) groups than in White ethnic groups.
This is greater than the inequality seen in
mortality rates in previous years, indicating
greater inequality in death rates from COVID-19.
These inequalities largely replicate existing
inequalities in mortality rates in previous years,
except for BAME groups, as mortality was
previously higher in White ethnic groups.
High diagnosis rates may be due to geographic
proximity to infections or a high proportion of
workers in occupations that are more likely to be
exposed.
new
Introduction
Summary
COVID-19
Health conditions
Cancer
Cardiovascular disease
Musculoskeletal conditions
Multi-morbidity
Sensory impairment
Learning Disabilities
Personal wellbeing & Mental health
Self-harm
Hospital admissions due to falls
Causes of death
Leading causes of death
Mortality and inequalities
Avoidable mortality
Deaths at home
Stillbirths and neonatal mortality
Suicide and deaths from drug misuse
Road casualties
Finding out more

Behavioural
determinants of
health
Health
conditions and
causes of death
Population groups
and protected
characteristics
Population
Wider
determinants of
health
Service Use Local researchExecutive
summary
Health conditions
Oxfordshire Joint Strategic Needs Assessment 2021 87
Introduction
Summary
COVID-19
Health conditions
Cancer
Cardiovascular disease
Musculoskeletal conditions
Multi-morbidity
Sensory impairment
Learning Disabilities
Personal wellbeing & Mental health
Self-harm
Hospital admissions due to falls
Causes of death
Leading causes of death
Mortality and inequalities
Avoidable mortality
Deaths at home
Stillbirths and neonatal mortality
Suicide and deaths from drug misuse
Road casualties
Finding out more

Behavioural
determinants of
health
Health
conditions and
causes of death
Population groups
and protected
characteristics
Population
Wider
determinants of
health
Service Use Local researchExecutive
summary
Introduction
Summary
COVID-19
Health conditions
Cancer
Cardiovascular disease
Musculoskeletal conditions
Multi-morbidity
Sensory impairment
Learning Disabilities
Personal wellbeing & Mental health
Self-harm
Hospital admissions due to falls
Causes of death
Leading causes of death
Mortality and inequalities
Avoidable mortality
Deaths at home
Stillbirths and neonatal mortality
Suicide and deaths from drug misuse
Road casualties
Finding out more
Oxfordshire Joint Strategic Needs Assessment 2021 88
The health conditions with the greatest number of GP-registered patients in Oxfordshire were:
Hypertension (high blood pressure): 97,600 patients
Depression: 73,600 patients
Asthma: 48,100 patients
Diabetes: 32,000 patients
Four health conditions in Oxfordshire were above the England average:
Cancer
Cardiovascular disease
Depression
Osteoporosis
Health conditions – Oxfordshire CCG and England
NHS Digital, QOF data for GP Practices
Oxfordshire CCG
updated

Behavioural
determinants of
health
Health
conditions and
causes of death
Population groups
and protected
characteristics
Population
Wider
determinants of
health
Service Use Local researchExecutive
summary
Oxfordshire Joint Strategic Needs Assessment 2021 89
In 2019-20 there were 31,982 people, aged 17 years or older who had been diagnosed with diabetes in Oxfordshire CCG.
The Oxfordshire prevalence of 5.05% was well below the England average of 7.08%.
The latest prevalence of diagnosed and undiagnosed diabetes in Oxfordshire (2017), was an estimated 7.2% (England 8.5%).
Estimates from 2018-19 show that Type 1 diabetes particularly affects younger people, while type 2 affects older people.
Diabetes
Public Health England Diabetes profile
Distribution of people with type 1 and
type 2 diabetes in Oxfordshire by age
(2018-19)
updated
Introduction
Summary
COVID-19
Health conditions
Cancer
Cardiovascular disease
Musculoskeletal conditions
Multi-morbidity
Sensory impairment
Learning Disabilities
Personal wellbeing & Mental health
Self-harm
Hospital admissions due to falls
Causes of death
Leading causes of death
Mortality and inequalities
Avoidable mortality
Deaths at home
Stillbirths and neonatal mortality
Suicide and deaths from drug misuse
Road casualties
Finding out more

Behavioural
determinants of
health
Health
conditions and
causes of death
Population groups
and protected
characteristics
Population
Wider
determinants of
health
Service Use Local researchExecutive
summary
Oxfordshire Joint Strategic Needs Assessment 2021 90
In 2018/19, there were 3,782 people in Oxfordshire diagnosed with new cases of cancer.
This is equivalent to a rate of 499 per 100,000 population, significantly lower than England (529) and the South East Region (561).
New cases of cancer* diagnosed at stage 1 and 2 (shown as a proportion of all new cases of cancer diagnosed) have improved in Oxfordshire.
In 2017, 1,492 new cases of cancer were diagnosed at stage 1 or 2 in Oxfordshire.
*Note - this indicator is labelled as experimental because of variation in data quality: the indicator values primarily represent variation in completeness of staging information.
Cancer incidence
Public Health England Cancer Profile, Public Health Outcomes Framework
Crude incidence rate of cancer (new cases
per 100,000 population)
Cancer diagnosed at an early stage
Oxfordshire
England
updated
Introduction
Summary
COVID-19
Health conditions
Cancer
Cardiovascular disease
Musculoskeletal conditions
Multi-morbidity
Sensory impairment
Learning Disabilities
Personal wellbeing & Mental health
Self-harm
Hospital admissions due to falls
Causes of death
Leading causes of death
Mortality and inequalities
Avoidable mortality
Deaths at home
Stillbirths and neonatal mortality
Suicide and deaths from drug misuse
Road casualties
Finding out more

Behavioural
determinants of
health
Health
conditions and
causes of death
Population groups
and protected
characteristics
Population
Wider
determinants of
health
Service Use Local researchExecutive
summary
This chart shows disability adjusted life years (DALYs)* for risk factors of cancer in Oxfordshire in 2019. The risk factor contributing to the most DALYs for cancer is tobacco use, which accounted for over 8,000 DALYs. Tobacco is the top risk factor in all adult age groups.
*Disability adjusted life years (DALY) are the sum of years of potential life lost due to premature death, and the years of productive life lost due to disability. DALYs are used to measure the combined quantity and quality of life of a population.
Oxfordshire Joint Strategic Needs Assessment 2021 91
Cancer – risk factors
IHME Global Burden of Disease tool
Top risk factors for disability-adjusted life-years
(DALY) for Cancer in 2019, Oxfordshire, all ages
updated
Introduction
Summary
COVID-19
Health conditions
Cancer
Cardiovascular disease
Musculoskeletal conditions
Multi-morbidity
Sensory impairment
Learning Disabilities
Personal wellbeing & Mental health
Self-harm
Hospital admissions due to falls
Causes of death
Leading causes of death
Mortality and inequalities
Avoidable mortality
Deaths at home
Stillbirths and neonatal mortality
Suicide and deaths from drug misuse
Road casualties
Finding out more

Behavioural
determinants of
health
Health
conditions and
causes of death
Population groups
and protected
characteristics
Population
Wider
determinants of
health
Service Use Local researchExecutive
summary
Oxfordshire Joint Strategic Needs Assessment 2021 92
Cardiovascular disease (CVD) refers to disease of the heart or blood vessels. CVD also includes stroke and high blood pressure.
Coronary heart disease (CHD)
There were 17,940 people (all ages) registered with CHD among Oxfordshire GP practices in 2019-20 (2.32% of all patients, compared to 3.09% nationally)
In 2019-20 the hospital admission rate for CHD in Oxfordshire CCG was 349.2 per 100,000 people (2,250 admissions). This is significantly lower than the England rate (469.9).
Inequalities - two wards in Oxfordshire - Banbury Ruscote and Blackbird Leys in Oxford -were significantly worse than the England average for emergency hospital admissions for CHD (combined years 2013/14 to 2017/18)
Stroke
13,417 patients at Oxfordshire GP practices in 2019-20 had recorded stroke or transient ischaemic attack (TIA). This is 1.73% of all Oxfordshire patients, just below the national average (1.8%)
In 2019-20 the admission rate for stroke in NHS Oxfordshire CCG was 128.8 for every 100,000 people in the population (850 admissions). This is significantly lower than England (170.2). Between 2004/05 and 2019/20 the admission rate for stroke in the CCG decreased by 29.5%.
Inequalities - two wards in Oxfordshire - Blackbird Leys and Banbury Grimsbury & Hightown - were significantly worse than the England average for emergency hospital admissions for stroke (combined years 2013/14 to 2017/18)
Cardiovascular disease
Public Health England Heart Disease and Stroke Profile Reports, Local Health accessed 30 Dec 20
updated
Introduction
Summary
COVID-19
Health conditions
Cancer
Cardiovascular disease
Musculoskeletal conditions
Multi-morbidity
Sensory impairment
Learning Disabilities
Personal wellbeing & Mental health
Self-harm
Hospital admissions due to falls
Causes of death
Leading causes of death
Mortality and inequalities
Avoidable mortality
Deaths at home
Stillbirths and neonatal mortality
Suicide and deaths from drug misuse
Road casualties
Finding out more

Behavioural
determinants of
health
Health
conditions and
causes of death
Population groups
and protected
characteristics
Population
Wider
determinants of
health
Service Use Local researchExecutive
summary
Good musculoskeletal health (MSK) is an important component of maintaining a person’s functional abilities throughout the life course. MSK conditions affect the bones, joints, muscles and spine, and are a common cause of severe long-term pain and physical disability. There are three groups:
Inflammatory conditions e.g. rheumatoid arthritis;
Conditions of MSK pain e.g. osteoarthritis and back pain;
Osteoporosis and fragility fractures, e.g. a fracture after a fall from standing height.
Each year, 20% of people see a doctor in the UK about a MSK problem.
In Oxfordshire, there are an estimated 15.1% of people with a long term MSK condition.
Oxfordshire Joint Strategic Needs Assessment 2021 93
Musculoskeletal conditions
Public Health England Applying all our healthPublic Health England Profile MSK ConditionsConfidence intervals (CIs) on the chart show the range within which the estimate could fall.
Percentage reporting a long-term MSK problem 2020 (districts in Oxfordshire)
updated
Introduction
Summary
COVID-19
Health conditions
Cancer
Cardiovascular disease
Musculoskeletal conditions
Multi-morbidity
Sensory impairment
Learning Disabilities
Personal wellbeing & Mental health
Self-harm
Hospital admissions due to falls
Causes of death
Leading causes of death
Mortality and inequalities
Avoidable mortality
Deaths at home
Stillbirths and neonatal mortality
Suicide and deaths from drug misuse
Road casualties
Finding out more

Behavioural
determinants of
health
Health
conditions and
causes of death
Population groups
and protected
characteristics
Population
Wider
determinants of
health
Service Use Local researchExecutive
summary
Oxfordshire Joint Strategic Needs Assessment 2021 94
Depression and anxiety is four times more common among people in persistent pain compared to those without pain. Data from the GP Patient Survey is used to estimate the percentage of people aged 18+ years reporting an MSK condition, either long term back pain or long term joint pain, who also report feeling depressed or anxious.
Percentage of people aged 18+ years reporting an MSK condition, either long term back pain or long term joint pain, who also report feeling depressed or anxious 2016/17
Musculoskeletal conditions and depression / anxiety
Public Health England Profile MSK Conditions last accessed 30Dec20
No update available
Introduction
Summary
COVID-19
Health conditions
Cancer
Cardiovascular disease
Musculoskeletal conditions
Multi-morbidity
Sensory impairment
Learning Disabilities
Personal wellbeing & Mental health
Self-harm
Hospital admissions due to falls
Causes of death
Leading causes of death
Mortality and inequalities
Avoidable mortality
Deaths at home
Stillbirths and neonatal mortality
Suicide and deaths from drug misuse
Road casualties
Finding out more

Behavioural
determinants of
health
Health
conditions and
causes of death
Population groups
and protected
characteristics
Population
Wider
determinants of
health
Service Use Local researchExecutive
summary
Oxfordshire Joint Strategic Needs Assessment 2021 95
Multimorbidity means more than two illnesses or diseases occurring in the same person at the same time.
It is estimated that in 2011 there were over 137,000 people with 2 or more chronic conditions (multimorbidity) in Oxfordshire. Prevalence within each age-group increases as age increases.
Multi-morbidity
Public Health England Multi-morbidity prevalence estimates at region, local authority and ward level (2019) published on Public Health England's 'National Intelligence Knowledge Hub’ website (need to register).
Males Females
Prevalence of 2 or more chronic conditions
in Oxfordshire by age group and gender
No update available
Introduction
Summary
COVID-19
Health conditions
Cancer
Cardiovascular disease
Musculoskeletal conditions
Multi-morbidity
Sensory impairment
Learning Disabilities
Personal wellbeing & Mental health
Self-harm
Hospital admissions due to falls
Causes of death
Leading causes of death
Mortality and inequalities
Avoidable mortality
Deaths at home
Stillbirths and neonatal mortality
Suicide and deaths from drug misuse
Road casualties
Finding out more

Behavioural
determinants of
health
Health
conditions and
causes of death
Population groups
and protected
characteristics
Population
Wider
determinants of
health
Service Use Local researchExecutive
summary
Oxfordshire Joint Strategic Needs Assessment 2021 96
One in every five people in the UK will start to live with sight loss in their lifetime. The main causes of sight loss are uncorrected refracted error, age-related macular degeneration, cataract, glaucoma and diabetic eye disease.
In Oxfordshire, there are an estimated 22,900 (3.2% of total population) living with sight loss, including 19,780 people living with partial sight and 3,060 people living with blindness. It is estimated that there will be 29,000 people in Oxfordshire living with sight loss by 2030.
There are 1,300 people registered blind, 10 of which are children; a further 1,060 are registered as partially sighted, 30 of which are children.
National data from RNIB’s Understanding Society survey show that only 35% of people with sight loss of working age are in employment. People with sight loss were twice as likely to have difficulty managing financially than the general population (16% compared to 7%).
Compared to the UK average, people with sight loss reported significantly reduced wellbeing.
The most common form of transport for people with sight loss was by car. Nearly half of people with sight loss reported travelling by car at least a few times each week. They were also twice as likely to live in a household that doesn’t own a car compared to the UK average. People with sight loss were more likely to travel by bus; but just as likely to travel by train compared to the UK average.
People with sight loss were more likely to smoke tobacco than the UK average.
Sensory Impairment - Sight loss
RNIB Sight Loss Data Tool Version 4, Understanding Society: comparing the circumstances of people with sight loss to the UK population
For information, see RNIB’s report Living with Sight Loss Through Lockdown
updated
Introduction
Summary
COVID-19
Health conditions
Cancer
Cardiovascular disease
Musculoskeletal conditions
Multi-morbidity
Sensory impairment
Learning Disabilities
Personal wellbeing & Mental health
Self-harm
Hospital admissions due to falls
Causes of death
Leading causes of death
Mortality and inequalities
Avoidable mortality
Deaths at home
Stillbirths and neonatal mortality
Suicide and deaths from drug misuse
Road casualties
Finding out more

Behavioural
determinants of
health
Health
conditions and
causes of death
Population groups
and protected
characteristics
Population
Wider
determinants of
health
Service Use Local researchExecutive
summary
Oxfordshire Joint Strategic Needs Assessment 2021 97
Hearing loss is a major public health issue that now affects over 9 million people in England. Due to our ageing population and the increasing prevalence of age-related hearing loss, this is set to grow to 13 million by 2035.
NHS England estimates that the prevalence of hearing loss in Oxfordshire will increase from 20% in 2015 to 26% in 2035.
Estimated prevalence (%) of hearing loss of 25dBHL* or more in the adult population(18+ years)
The estimated number in 2020 is over 120,000 – 35% of these are aged 51-70 and over 50% of these are over 71 years of age.
The number of people with hearing loss is estimated to increase to 160,000 by 2035.
*Hearing tests use pure tone audiometry where a person is presented with different frequencies (measured in decibels hearing level (dBHL) A threshold of 25dBHL indicates a hearing loss and threshold of 65dBHL indicates a severe hearing loss.
Sensory Impairment - Hearing loss
NHS England Hearing Loss Data Tool
2015 2020 2025 2030 2035
Oxfordshire 20 22 23 25 26
South East 22 23 25 26 27
England 21 22 23 24 25
No update available
Introduction
Summary
COVID-19
Health conditions
Cancer
Cardiovascular disease
Musculoskeletal conditions
Multi-morbidity
Sensory impairment
Learning Disabilities
Personal wellbeing & Mental health
Self-harm
Hospital admissions due to falls
Causes of death
Leading causes of death
Mortality and inequalities
Avoidable mortality
Deaths at home
Stillbirths and neonatal mortality
Suicide and deaths from drug misuse
Road casualties
Finding out more

Behavioural
determinants of
health
Health
conditions and
causes of death
Population groups
and protected
characteristics
Population
Wider
determinants of
health
Service Use Local researchExecutive
summary
Oxfordshire Joint Strategic Needs Assessment 2021 98
Experimental statistics (not including all GP practices) show that, as of 31 March 2020, there were 2,687 patients recorded on their GP’s Learning Disabilities (LD) register in Oxfordshire Clinical Commissioning Group
Patients with LD made up 0.37% of the total patient register in Oxfordshire (0.5% in England)
By gender and age, the OCCG LD register included more males than females and more people aged 18 to 49:
1,560 males (58%)
1,127 females (42%)
1,457 people aged 18 to 49 (54%)
785 people aged 50+ (29%)
Learning Disabilities by gender and age
Health and Care of People with Learning Disabilities Experimental Statistics 2019 to 2020 - NHS DigitalNotes from NHS Digital: The outbreak of Coronavirus (COVID-19) has led to unprecedented changes in the work and behaviour of GP practices and consequently the data in this publication may have been impacted, including indicators and contextual data from patients registered at a GP Practice.The 2019/20 dataset supersedes and is not comparable with previous versions due to changes to the code clusters used to identify patients with a learning disability
Number of patients recorded on
their general practice’s QOF learning
disabilities register, Oxfordshire CCG
as at 31 March 2020
new
Introduction
Summary
COVID-19
Health conditions
Cancer
Cardiovascular disease
Musculoskeletal conditions
Multi-morbidity
Sensory impairment
Learning Disabilities
Personal wellbeing & Mental health
Self-harm
Hospital admissions due to falls
Causes of death
Leading causes of death
Mortality and inequalities
Avoidable mortality
Deaths at home
Stillbirths and neonatal mortality
Suicide and deaths from drug misuse
Road casualties
Finding out more

Behavioural
determinants of
health
Health
conditions and
causes of death
Population groups
and protected
characteristics
Population
Wider
determinants of
health
Service Use Local researchExecutive
summary
Oxfordshire Joint Strategic Needs Assessment 2021 99
People with learning disabilities (LD) are likely to have much higher rates of certain health conditions than the general population
Rates of Epilepsy are 29 times as high for people with LD
People with LD are more than twice as likely to have diabetes than the general population and less likely to have cancer
Learning Disabilities and health conditions
Health and Care of People with Learning Disabilities Experimental Statistics 2019 to 2020 - NHS DigitalInteractive data visualisationSPR = Standardised Prevalence Ratio XX times as likely as the populationTo make a valid comparison, the number of cases in people with learning disabilities is shown as a percentage of the number expected if the general population age and sex specific rates had been applied to them.A figure of more than 1 means the condition occurs more often than expected in people with learning disabilities, e.g. SPR = 2 means the condition is twice as common as expected in people with learning disabilities
Introduction
Summary
COVID-19
Health conditions
Cancer
Cardiovascular disease
Musculoskeletal conditions
Multi-morbidity
Sensory impairment
Learning Disabilities
Personal wellbeing & Mental health
Self-harm
Hospital admissions due to falls
Causes of death
Leading causes of death
Mortality and inequalities
Avoidable mortality
Deaths at home
Stillbirths and neonatal mortality
Suicide and deaths from drug misuse
Road casualties
Finding out more
Disease category SPR* Observed Expected
Epilepsy 29.2 458 16
Autism 19.8 589 30
Mental Health 6.3 143 23
ADHD 5.9 132 22
Dementia 5.8 45 8
Hypothyroidism 2.9 212 72
Diabetes – non-Type 1 2.2 166 75
Diabetes – Type 1 2.1 24 11
Stroke 1.9 49 26
Heart Failure 1.5 17 12
Asthma 1.4 233 161
Blood pressure 1.4 2,191 1,545
Hypertension 1.1 269 235
Depression 1.1 388 355
Cancer 0.8 55 66
Oxfordshire CCG 2019-20
new

Behavioural
determinants of
health
Health
conditions and
causes of death
Population groups
and protected
characteristics
Population
Wider
determinants of
health
Service Use Local researchExecutive
summary
Oxfordshire Joint Strategic Needs Assessment 2021 100
In Oxfordshire, between the years ending March 2019 and March 2020, the mean score for feeling “worthwhile” increased slightly. However life satisfaction and happiness have each decreased slightly.
Levels of reported anxiety in Oxfordshire appear to have increased and remain above the England average.
Personal wellbeing
ONS Personal wellbeing in the UK note that vertical scales do not start at zero The personal wellbeing estimates are from the Annual Population Survey (APS), which provides a representative sample of those living in private residential households in the UK. People living in communal establishments (such as care homes) or other non-household situations are not represented in this survey and this may be important in interpreting the findings in relation to those people reporting lower personal wellbeing.
Trend in average wellbeing scores in
Oxfordshire to year ending March 2020
Anxiety
Trend in average level of Anxiety to year
ending March 2020, Oxfordshire vs England
updated
Introduction
Summary
COVID-19
Health conditions
Cancer
Cardiovascular disease
Musculoskeletal conditions
Multi-morbidity
Sensory impairment
Learning Disabilities
Personal wellbeing & Mental health
Self-harm
Hospital admissions due to falls
Causes of death
Leading causes of death
Mortality and inequalities
Avoidable mortality
Deaths at home
Stillbirths and neonatal mortality
Suicide and deaths from drug misuse
Road casualties
Finding out more

Behavioural
determinants of
health
Health
conditions and
causes of death
Population groups
and protected
characteristics
Population
Wider
determinants of
health
Service Use Local researchExecutive
summary
Oxfordshire Joint Strategic Needs Assessment 2021 101
In 2019, the OxWell School Survey collected pupils’ responses to questions on a range of health and wellbeing-related issues. 4,390 pupils at Oxfordshire schools took part. The OxWell School survey 2020 collected data from 19,000 children and young people at schools in six counties in the south of England.
In 2019, it was found that primary school pupils scored numerically higher in wellbeing compared to secondary and FE college students in Oxfordshire, and there were more students in year 12 than in years 8&10 with low mental wellbeing. This overall pattern fits with adolescence being a critical age for the onset of mental health problems.
In 2020, the survey of six counties asked about the effect of lockdown on happiness and loneliness:
Mental wellbeing in schools
Oxford University,Preliminary Summary Report from the OxWell School Survey 2020, Oxfordshire OxWell School Survey 2019
Effect of lockdown on general happiness Effect of lockdown on feeling lonely
new
Introduction
Summary
COVID-19
Health conditions
Cancer
Cardiovascular disease
Musculoskeletal conditions
Multi-morbidity
Sensory impairment
Learning Disabilities
Personal wellbeing & Mental health
Self-harm
Hospital admissions due to falls
Causes of death
Leading causes of death
Mortality and inequalities
Avoidable mortality
Deaths at home
Stillbirths and neonatal mortality
Suicide and deaths from drug misuse
Road casualties
Finding out more

Behavioural
determinants of
health
Health
conditions and
causes of death
Population groups
and protected
characteristics
Population
Wider
determinants of
health
Service Use Local researchExecutive
summary
Oxfordshire Joint Strategic Needs Assessment 2021 102
The Department for Education ”State of the Nation” report was first published in October 2018 and integrates available evidence on the state of children and young people’s wellbeing, to provide an accessible narrative on current evidence to guide discourse and action.
The October 2020 DfE State of the Nation report found that:
Children and young people have been worried about the coronavirus (COVID-19), particularly the potential that friends or family could catch the virus. Other relatively common worries about the disease and its consequences are of catching the disease themselves and missing school.
There are indications that, during the lockdown, some children have had increased difficulty with behaviour and restlessness or attention. Evidence on increased symptoms of anxiety during this time is mixed, with different studies finding that anxiety was at normal levels or that it was elevated.
Access to NHS mental health services has been maintained for many children and young people, and although referrals to mental health services were low in April and May 2020, an increase was seen in June in line with the easing of restrictions.
Between a quarter and just under a half of older young people (those aged 16 and over) reported the pandemic affecting their relationships over this time, peaking in May, and seeming to be driven more by the experiences of females and the older (20 to 24 years) age group. Data also indicates that for this age group loneliness may also be a greater concern than for older adults.
Children and Young People’s wellbeing – national
Department for Education State of the Nation 2020
updated
Introduction
Summary
COVID-19
Health conditions
Cancer
Cardiovascular disease
Musculoskeletal conditions
Multi-morbidity
Sensory impairment
Learning Disabilities
Personal wellbeing & Mental health
Self-harm
Hospital admissions due to falls
Causes of death
Leading causes of death
Mortality and inequalities
Avoidable mortality
Deaths at home
Stillbirths and neonatal mortality
Suicide and deaths from drug misuse
Road casualties
Finding out more

Behavioural
determinants of
health
Health
conditions and
causes of death
Population groups
and protected
characteristics
Population
Wider
determinants of
health
Service Use Local researchExecutive
summary
Oxfordshire Joint Strategic Needs Assessment 2021 103
ONS COVID-19 analysis has found….
The proportion of children (aged 5-16) experiencing a probable mental disorder increased from one in nine in 2017 to one in six in July 2020
Children and young people with a probable mental disorder were more likely to say that lockdown had made their life worse
Mental health, COVID-19 and young people - national
ONS Coronavirus (COVID-19) Review: data and analysis, March to October 2020, Impact on Mental HealthYoungMinds Coronavirus: Impact on young people with mental health needs, Summer 2020
A YoungMinds report, June/July 2020, reported significant deterioration in mental health of young people with existing mental health needs, particularly linked to increased loneliness and anxiety. This often led to increased condition-specific coping strategies, including:
greater levels of food restriction in respondents with eating disorders;
worsening of rituals/‘checking’ in respondents with OCD; and
an increase in self-harm amongst those already self-harming prior to the pandemic.
new
Introduction
Summary
COVID-19
Health conditions
Cancer
Cardiovascular disease
Musculoskeletal conditions
Multi-morbidity
Sensory impairment
Learning Disabilities
Personal wellbeing & Mental health
Self-harm
Hospital admissions due to falls
Causes of death
Leading causes of death
Mortality and inequalities
Avoidable mortality
Deaths at home
Stillbirths and neonatal mortality
Suicide and deaths from drug misuse
Road casualties
Finding out more

Behavioural
determinants of
health
Health
conditions and
causes of death
Population groups
and protected
characteristics
Population
Wider
determinants of
health
Service Use Local researchExecutive
summary
Oxfordshire Joint Strategic Needs Assessment 2021 104
The measure below shows the number of pupils with SEN support or an Education, Health and Care plan where the primary need is social, emotional and mental health, expressed as a percentage of all school pupils. It is likely that there are pupils with social, emotional and mental health needs that are not reflected in this dataset. The National Clinical Practice Guidelines published by the British Psychological Society state that children with learning or physical disabilities have a higher risk of developing a mental health problem compared to the national population.
Similar to the national trend, Oxfordshire has an increasing percentage of children with social, emotional and mental health needs, with a higher prevalence in boys.
Department of Education, Special Education Needs in England: January 2020
Social, emotional and mental health needs in school pupils with Special Educational Needs
Percentage of school
children with social,
emotional and mental
health needs -
Oxfordshire and
England
updated
Introduction
Summary
COVID-19
Health conditions
Cancer
Cardiovascular disease
Musculoskeletal conditions
Multi-morbidity
Sensory impairment
Learning Disabilities
Personal wellbeing & Mental health
Self-harm
Hospital admissions due to falls
Causes of death
Leading causes of death
Mortality and inequalities
Avoidable mortality
Deaths at home
Stillbirths and neonatal mortality
Suicide and deaths from drug misuse
Road casualties
Finding out more

Behavioural
determinants of
health
Health
conditions and
causes of death
Population groups
and protected
characteristics
Population
Wider
determinants of
health
Service Use Local researchExecutive
summary
Oxfordshire Joint Strategic Needs Assessment 2021 105
Depression affects different people in different ways but it can include some or all of the following symptoms: feelings of sadness and hopelessness; losing interest in things; feeling tearful; feeling constantly tired, sleeping badly, having no appetite. It can result in significantly reduced quality of life for the patient their family and carers.
In 2019/20 there were 73,648 patients (aged 18 or over) with a diagnosis of depression registered by Oxfordshire’s GP practices. This is a higher number than the previous year; rates of depression are increasing, year on year.
Mental Health - Depression
Public Health England Mental Health and Wellbeing JSNA and NHS Digital QOF
Prevalence of diagnosed depression, percentage of patients
aged 18+ 2013/14 to 2019/20
updated
Introduction
Summary
COVID-19
Health conditions
Cancer
Cardiovascular disease
Musculoskeletal conditions
Multi-morbidity
Sensory impairment
Learning Disabilities
Personal wellbeing & Mental health
Self-harm
Hospital admissions due to falls
Causes of death
Leading causes of death
Mortality and inequalities
Avoidable mortality
Deaths at home
Stillbirths and neonatal mortality
Suicide and deaths from drug misuse
Road casualties
Finding out more

Behavioural
determinants of
health
Health
conditions and
causes of death
Population groups
and protected
characteristics
Population
Wider
determinants of
health
Service Use Local researchExecutive
summary
Oxfordshire Joint Strategic Needs Assessment 2021 106
Some sub-groups are more exposed and vulnerable to unfavourable social, economic, and environmental circumstances. These subgroups, interrelated with ethnicity, gender and age, are at higher risk of mental health problems.
The following groups are identified as being of high risk of mental health problems
black and minority ethnic groups
people living with physical disabilities
people living with learning disabilities
people with alcohol and/or drug dependence
prison population, offenders and victims of crime
LGBT (lesbian, gay, bisexual and transgender) people
Carers
People with sensory impairment
Homeless people
Refugees and asylum seekers
There are other examples of high risk groups
Those associated with poverty and socio-economic disadvantage
At various points across the life course e.g. pregnancy, motherhood, people with poor physical health, isolated older people or those in living in care homes.
Mental health – high risk groups
Public Health England Mental Health: Population Factors
No update available
Introduction
Summary
COVID-19
Health conditions
Cancer
Cardiovascular disease
Musculoskeletal conditions
Multi-morbidity
Sensory impairment
Learning Disabilities
Personal wellbeing & Mental health
Self-harm
Hospital admissions due to falls
Causes of death
Leading causes of death
Mortality and inequalities
Avoidable mortality
Deaths at home
Stillbirths and neonatal mortality
Suicide and deaths from drug misuse
Road casualties
Finding out more

Behavioural
determinants of
health
Health
conditions and
causes of death
Population groups
and protected
characteristics
Population
Wider
determinants of
health
Service Use Local researchExecutive
summary
Oxfordshire Joint Strategic Needs Assessment 2021 107
Self-harm results in approximately 110,000 inpatient admissions to hospital each year in England, 99% are emergency admissions.
Self-harm is an expression of personal distress and there are varied reasons for a person to harm themselves irrespective of the purpose of the act. There is a significant and persistent risk of future suicide following an episode of self harm.
Oxfordshire’s rate of hospital admissions for self-harm has increased since 2010/11. In 2019/20 there were 1,365 hospital admissions, equivalent to a rate of 192.1 per 100,000 population, similar to England but significantly lower than the South East average.
In Oxfordshire rates of self-harm hospital admissions in children and young people (aged 10-24 years) have remained relatively steady over time. In 2019/20 there were 600 admissions, equivalent to a rate of 462.1 per 100,000 population. This is similar to England.
Self Harm
PHE Mental Health & Wellbeing Profile
Oxfordshire
Hospital admissions as a result of self-
harm (10-24 years)
Hospital admissions as a result of self-
harm (all ages)
Oxfordshire
England
England
updated
Introduction
Summary
COVID-19
Health conditions
Cancer
Cardiovascular disease
Musculoskeletal conditions
Multi-morbidity
Sensory impairment
Learning Disabilities
Personal wellbeing & Mental health
Self-harm
Hospital admissions due to falls
Causes of death
Leading causes of death
Mortality and inequalities
Avoidable mortality
Deaths at home
Stillbirths and neonatal mortality
Suicide and deaths from drug misuse
Road casualties
Finding out more

Behavioural
determinants of
health
Health
conditions and
causes of death
Population groups
and protected
characteristics
Population
Wider
determinants of
health
Service Use Local researchExecutive
summary
Oxfordshire Joint Strategic Needs Assessment 2021 108
Inequalities – hospital stays for self-harm
19 of Oxfordshire’s 86 Middle Layer Super Output Areas (MSOAs) had significantly higher rates of hospital stays for self-harm than England (combined 5 years of data 2013/4 to 2017/18)
The areas with the highest rates for self-harm were Greater Leys, Barton, Littlemore & Rose Hill, Iffley Fields, Blackbird Leys, Banbury Grimsbury and Chalgrove, Stadhampton & Dorchester
From Public Health England Local HealthExplore inequalities data using our interactive dashboard
Introduction
Summary
COVID-19
Health conditions
Cancer
Cardiovascular disease
Musculoskeletal conditions
Multi-morbidity
Sensory impairment
Learning Disabilities
Personal wellbeing & Mental health
Self-harm
Hospital admissions due to falls
Causes of death
Leading causes of death
Mortality and inequalities
Avoidable mortality
Deaths at home
Stillbirths and neonatal mortality
Suicide and deaths from drug misuse
Road casualties
Finding out more
new

Behavioural
determinants of
health
Health
conditions and
causes of death
Population groups
and protected
characteristics
Population
Wider
determinants of
health
Service Use Local researchExecutive
summary
Oxfordshire Joint Strategic Needs Assessment 2021 109
Falls are the largest cause of emergency hospital admissions for older people, and significantly impact on long term outcomes, for example being one reason why people move from their own home to long-term nursing or residential care.
In 2019/20 there were 3,165 hospital admissions due to falls in people aged 65 and over in Oxfordshire. The rate of hospital admissions for falls in older people is higher than national rate (2,331 per 100,00 population in Oxon compared to 2,222 in England).
The five district areas in Oxfordshire have similar counts of hospital admissions (500-800 per district), however over the last ten years, the rate has been consistently higher in Oxford City.
Emergency hospital admissions due to falls
Public Health England Productive Healthy Ageing Profile
Emergency hospital admissions due to falls in people aged 65 and over
updated
Introduction
Summary
COVID-19
Health conditions
Cancer
Cardiovascular disease
Musculoskeletal conditions
Multi-morbidity
Sensory impairment
Learning Disabilities
Personal wellbeing & Mental health
Self-harm
Hospital admissions due to falls
Causes of death
Leading causes of death
Mortality and inequalities
Avoidable mortality
Deaths at home
Stillbirths and neonatal mortality
Suicide and deaths from drug misuse
Road casualties
Finding out more

Behavioural
determinants of
health
Health
conditions and
causes of death
Population groups
and protected
characteristics
Population
Wider
determinants of
health
Service Use Local researchExecutive
summary
Causes of death
Oxfordshire Joint Strategic Needs Assessment 2021 110
Introduction
Summary
COVID-19
Health conditions
Cancer
Cardiovascular disease
Musculoskeletal conditions
Multi-morbidity
Sensory impairment
Learning Disabilities
Personal wellbeing & Mental health
Self-harm
Hospital admissions due to falls
Causes of death
Leading causes of death
Mortality and inequalities
Avoidable mortality
Deaths at home
Stillbirths and neonatal mortality
Suicide and deaths from drug misuse
Road casualties
Finding out more

Behavioural
determinants of
health
Health
conditions and
causes of death
Population groups
and protected
characteristics
Population
Wider
determinants of
health
Service Use Local researchExecutive
summary
Oxfordshire Joint Strategic Needs Assessment 2021 111
For the combined years 2017 to 2019, Cancer was the leading cause of death in males and females in Oxfordshire, accounting for 33%of male deaths and 27% of female deaths.
This reflected the main cause of death in England.
In females, the second maincause of death was Dementia and Alzheimer Diseases (20%). In males Heart Disease remained the second main cause of death (12%).
Dementia & Alzheimer accounted for 11% of male deaths.
Leading causes of death (all ages)
Data extracted from NOMIS. Data does not cover 2020 and the COVID-19 pandemic.
Leading causes of death, Oxfordshire (2017-19)
updated
Introduction
Summary
COVID-19
Health conditions
Cancer
Cardiovascular disease
Musculoskeletal conditions
Multi-morbidity
Sensory impairment
Learning Disabilities
Personal wellbeing & Mental health
Self-harm
Hospital admissions due to falls
Causes of death
Leading causes of death
Mortality and inequalities
Avoidable mortality
Deaths at home
Stillbirths and neonatal mortality
Suicide and deaths from drug misuse
Road casualties
Finding out more

Behavioural
determinants of
health
Health
conditions and
causes of death
Population groups
and protected
characteristics
Population
Wider
determinants of
health
Service Use Local researchExecutive
summary
Deaths from heart disease in those aged 75+ have reduced over the period 2013-2019 from 12% of all deaths in 2013 to 8% in 2019.
Stroke deaths in older people have also slightly reduced over this time period (from 8% to 7%).
Oxfordshire Joint Strategic Needs Assessment 2021 112
Leading cause of death in people aged 75 years and over
Data extracted from NOMIS. Data does not cover 2020 and the COVID-19 pandemic.
Cancers remain the leading cause of death amongst the 75+ age group.
After increasing throughout 2013-2018, deaths due to Dementia and Alzheimer’s disease (in those aged 75+ years) decreased for the first time.
This slight decrease also occurred nationally and regionally.
updated
Introduction
Summary
COVID-19
Health conditions
Cancer
Cardiovascular disease
Musculoskeletal conditions
Multi-morbidity
Sensory impairment
Learning Disabilities
Personal wellbeing & Mental health
Self-harm
Hospital admissions due to falls
Causes of death
Leading causes of death
Mortality and inequalities
Avoidable mortality
Deaths at home
Stillbirths and neonatal mortality
Suicide and deaths from drug misuse
Road casualties
Finding out more

Behavioural
determinants of
health
Health
conditions and
causes of death
Population groups
and protected
characteristics
Population
Wider
determinants of
health
Service Use Local researchExecutive
summary
Oxfordshire Joint Strategic Needs Assessment 2021 113
Oxfordshire is significantly better than the England values on 11 of 14 key public health outcomes indicators related to mortality.
Oxfordshire is similar to average for the remaining 3 indicators:
Mortality from communicable diseases (including influenza)
Suicide rate
Excess winter deaths
Public Health England Public Health Outcomes Framework Data does not cover 2020 and the COVID-19 pandemic.
Mortality indicators from Public Health Outcomes Framework
updated
Introduction
Summary
COVID-19
Health conditions
Cancer
Cardiovascular disease
Musculoskeletal conditions
Multi-morbidity
Sensory impairment
Learning Disabilities
Personal wellbeing & Mental health
Self-harm
Hospital admissions due to falls
Causes of death
Leading causes of death
Mortality and inequalities
Avoidable mortality
Deaths at home
Stillbirths and neonatal mortality
Suicide and deaths from drug misuse
Road casualties
Finding out more

Behavioural
determinants of
health
Health
conditions and
causes of death
Population groups
and protected
characteristics
Population
Wider
determinants of
health
Service Use Local researchExecutive
summary
Oxfordshire Joint Strategic Needs Assessment 2021 114
Premature mortality attributable to socioeconomic inequality
Under 75 mortality rate from all causes (2017-2019), England
Public Health England Mortality Profile. Data does not cover 2020 and the COVID-19 pandemic.
The under 75 mortality rate for a District or Unitary Authority in England is closely associated with its level of deprivation, with more deprived areas experiencing higher premature mortality rates in general.
Deprivation deciles are based on the Index of Multiple Deprivation 2019 local authority score.
updated
Introduction
Summary
COVID-19
Health conditions
Cancer
Cardiovascular disease
Musculoskeletal conditions
Multi-morbidity
Sensory impairment
Learning Disabilities
Personal wellbeing & Mental health
Self-harm
Hospital admissions due to falls
Causes of death
Leading causes of death
Mortality and inequalities
Avoidable mortality
Deaths at home
Stillbirths and neonatal mortality
Suicide and deaths from drug misuse
Road casualties
Finding out more
Overall England
average

Behavioural
determinants of
health
Health
conditions and
causes of death
Population groups
and protected
characteristics
Population
Wider
determinants of
health
Service Use Local researchExecutive
summary
Oxfordshire Joint Strategic Needs Assessment 2021 115
Mortality and inequalities
Public Health England Local Health
new
Introduction
Summary
COVID-19
Health conditions
Cancer
Cardiovascular disease
Musculoskeletal conditions
Multi-morbidity
Sensory impairment
Learning Disabilities
Personal wellbeing & Mental health
Self-harm
Hospital admissions due to falls
Causes of death
Leading causes of death
Mortality and inequalities
Avoidable mortality
Deaths at home
Stillbirths and neonatal mortality
Suicide and deaths from drug misuse
Road casualties
Finding out moreExplore inequalities data using our interactive dashboard
Some areas of Oxfordshire experience significantly higher standard mortality ratios (SMR) than the average. The charts below show the Middle Layer Super Output Areas (MSOAs) with the highest rates of deaths from cancer and deaths from circulatory diseases for people aged under 75.

Behavioural
determinants of
health
Health
conditions and
causes of death
Population groups
and protected
characteristics
Population
Wider
determinants of
health
Service Use Local researchExecutive
summary
Oxfordshire Joint Strategic Needs Assessment 2021 116
Mortality and inequalities
Public Health England Local Health
new
Introduction
Summary
COVID-19
Health conditions
Cancer
Cardiovascular disease
Musculoskeletal conditions
Multi-morbidity
Sensory impairment
Learning Disabilities
Personal wellbeing & Mental health
Self-harm
Hospital admissions due to falls
Causes of death
Leading causes of death
Mortality and inequalities
Avoidable mortality
Deaths at home
Stillbirths and neonatal mortality
Suicide and deaths from drug misuse
Road casualties
Finding out moreExplore inequalities data using our interactive dashboard
The charts below show the Middle Layer Super Output Areas (MSOAs) with the highest rates of deaths from respiratory diseases and deaths from stroke (all ages).

Behavioural
determinants of
health
Health
conditions and
causes of death
Population groups
and protected
characteristics
Population
Wider
determinants of
health
Service Use Local researchExecutive
summary
Oxfordshire Joint Strategic Needs Assessment 2021 117
The Office for National Statistics (ONS) defines avoidable mortality as..
Avoidable mortality – an introduction
ONS, Avoidable mortality in the UK (2018)
Avoidable mortality:
refers to deaths that are preventable or treatable.
Treatable mortality:refers to causes of death that can be mainly
avoided through timely and effective healthcare interventions, including
secondary prevention and treatment (that is, after the onset of disease, to reduce case-
fatality).
Preventable mortality:refers to causes of death that can be mainly avoided through effective public health and primary prevention interventions (that is, before the onset of diseases or injuries, to reduce incidence). Examples could include deaths associated with risk factors such as
obesity, inactivity, smoking and alcohol consumption.
updated
Introduction
Summary
COVID-19
Health conditions
Cancer
Cardiovascular disease
Musculoskeletal conditions
Multi-morbidity
Sensory impairment
Learning Disabilities
Personal wellbeing & Mental health
Self-harm
Hospital admissions due to falls
Causes of death
Leading causes of death
Mortality and inequalities
Avoidable mortality
Deaths at home
Stillbirths and neonatal mortality
Suicide and deaths from drug misuse
Road casualties
Finding out more

Behavioural
determinants of
health
Health
conditions and
causes of death
Population groups
and protected
characteristics
Population
Wider
determinants of
health
Service Use Local researchExecutive
summary
Oxfordshire Joint Strategic Needs Assessment 2021 118
Preventable mortality
Public Health England Mortality Profile Data does not cover 2020 and the COVID-19 pandemic.
All deaths under 75 years Deaths considered preventable
By cause Males Females Total Males Females Total
All cardiovascular diseases 598 292 890 239 106 345
All cancers 1,097 885 1,982 490 252 742
Liver disease 147 100 247 128 88 216
Respiratory disease 250 180 430 137 100 237
Total of these four disease groups 2,092 1,457 3,549 994 546 1,540
% considered preventable 48% 37% 43%
updated
Introduction
Summary
COVID-19
Health conditions
Cancer
Cardiovascular disease
Musculoskeletal conditions
Multi-morbidity
Sensory impairment
Learning Disabilities
Personal wellbeing & Mental health
Self-harm
Hospital admissions due to falls
Causes of death
Leading causes of death
Mortality and inequalities
Avoidable mortality
Deaths at home
Stillbirths and neonatal mortality
Suicide and deaths from drug misuse
Road casualties
Finding out more
Cancer is the leading cause of death in people under 75 years of age (1,982 deaths between 2017 and 2019) in Oxfordshire. Over a third of these are considered preventable (742).
Between 2017 and 2019 there were a total of 3,549 deaths in those under 75 years of age, from all cancers, cardiovascular disease, liver disease and respiratory disease. 43% of these (1,540) were considered to be preventable.
There is a slight gender difference, with males having a higher percentage (48% of preventable deaths) than females (37%).

Behavioural
determinants of
health
Health
conditions and
causes of death
Population groups
and protected
characteristics
Population
Wider
determinants of
health
Service Use Local researchExecutive
summary
Oxfordshire Joint Strategic Needs Assessment 2021 119
An increasing proportion of deaths in Oxfordshire (and nationally) happen at home*.
In people of all ages in Oxfordshire, the proportion of all deaths that happen at home has increased from 21% of the total in 2009 to 23% of the total in 2019.
In older people (85+ years), the proportion of deaths at home has increased from 14% of the total in 2009 to 18% of the total in 2019.
Deaths occurring at home
Public Health England Palliative and End of Care Life Profile. Data does not cover 2020 and the COVID-19 pandemic.
Deaths at home, people aged 85+ years*’Home’ is defined as a person’s
usual place of residence, excluding
care homes or other establishments
where people live communally, for
example monasteries, hostels,
prisons and children’s homes. It is
important to recognise that the ‘at
home’ group does not include the
many very old people who die in a
care home and who may have been
long-term residents of that care
home.
updated
Introduction
Summary
COVID-19
Health conditions
Cancer
Cardiovascular disease
Musculoskeletal conditions
Multi-morbidity
Sensory impairment
Learning Disabilities
Personal wellbeing & Mental health
Self-harm
Hospital admissions due to falls
Causes of death
Leading causes of death
Mortality and inequalities
Avoidable mortality
Deaths at home
Stillbirths and neonatal mortality
Suicide and deaths from drug misuse
Road casualties
Finding out more

Behavioural
determinants of
health
Health
conditions and
causes of death
Population groups
and protected
characteristics
Population
Wider
determinants of
health
Service Use Local researchExecutive
summary
Oxfordshire Joint Strategic Needs Assessment 2021 120
Stillbirth rates have decreased during the time period 2010-12 to 2017-19. There were 90 stillbirths between 2017 and 2019 in Oxfordshire.
Neonatal mortality includes stillbirths and deaths under 28 days. Latest data for 2018 indicates there were 42 incidences of neonatal mortality in Oxfordshire.
Infant mortality rates measures infant deaths under 1 years of age (per 1000 live births). There were 54 infant deaths during 2017-19 in Oxfordshire.
In 2018, infant mortality rates were higher in most deprived areas than in least deprived areas in England (5.3 deaths per 1,000 in most deprived areas compared with 2.7 per 1,000 live births in least deprived).
Stillbirth and neonatal mortality
Public Health England Child & Maternal Health Profile ; Public Health Outcomes Framework; Child and infant mortality in England and Wales: 2018
Infant mortality in Oxfordshire districts
2017-19
updated
Introduction
Summary
COVID-19
Health conditions
Cancer
Cardiovascular disease
Musculoskeletal conditions
Multi-morbidity
Sensory impairment
Learning Disabilities
Personal wellbeing & Mental health
Self-harm
Hospital admissions due to falls
Causes of death
Leading causes of death
Mortality and inequalities
Avoidable mortality
Deaths at home
Stillbirths and neonatal mortality
Suicide and deaths from drug misuse
Road casualties
Finding out more

Behavioural
determinants of
health
Health
conditions and
causes of death
Population groups
and protected
characteristics
Population
Wider
determinants of
health
Service Use Local researchExecutive
summary
Oxfordshire Joint Strategic Needs Assessment 2021 121
In Oxfordshire, there were 162 deaths from suicide between 2017 and 2019, 133 (82%) of which were male.
The suicide rate in Oxfordshire males is similar to the England rate, although the rate for females is significantly lower than the national rate. The Districts of Oxfordshire have similar rates.
Deaths from suicide
PHE Mental Health & Wellbeing ProfilePHE Public Health Outcomes FrameworkOxfordshire Clinical Commissioning Group Oxfordshire Suicide and Self-Harm Prevention Strategy
Suicide rate per 100,000 population
In 2018, local analysis identified the following most common contributing factors to deaths from suicide in Oxfordshire: relationship issues; bereavement; financial problems; alcohol; chronic physical health conditions.
In England, in 2016, it was estimated that among young people aged 12-17 for 1 suicide, 370 young people present at hospital with self-harm, and 3,900 young people self-harm in the community.
updated
Introduction
Summary
COVID-19
Health conditions
Cancer
Cardiovascular disease
Musculoskeletal conditions
Multi-morbidity
Sensory impairment
Learning Disabilities
Personal wellbeing & Mental health
Self-harm
Hospital admissions due to falls
Causes of death
Leading causes of death
Mortality and inequalities
Avoidable mortality
Deaths at home
Stillbirths and neonatal mortality
Suicide and deaths from drug misuse
Road casualties
Finding out more

Behavioural
determinants of
health
Health
conditions and
causes of death
Population groups
and protected
characteristics
Population
Wider
determinants of
health
Service Use Local researchExecutive
summary
Oxfordshire Joint Strategic Needs Assessment 2021 122
National data show that people born in the 1960s and 1970s are dying from suicide or drug poisoning in greater numbers than any other generation.
ONS data for England and Wales has shown that in the late 1980s to early 1990s, the age at which most people died by taking their own lives or drug poisoning was concentrated around this generation, when they were in their 20s.
Since that time, deaths from these two causes have continued to affect the same generation, who are currently in their 40s and 50s to a higher degree than any other. A similar effect is seen in the USA and Canada.
Local data show that Oxfordshire has one of the lowest rates of deaths from drug misuse in the South East region and is significantly lower than the England rate.
However there were still 55 deaths (directly standardised rate of 2.7 per 100,000) from drug misuse between 2017 and 2019 in Oxfordshire, compared to 1,025 in South East (rate 3.9).
24 of Oxfordshire’s deaths (44%) were in Oxford City.
Suicide and deaths from drug misuse
Public Health England Mortality Profile,ONS Middle-aged generation most likely to die by suicide and drug poisoning,Samaritans
updated
Introduction
Summary
COVID-19
Health conditions
Cancer
Cardiovascular disease
Musculoskeletal conditions
Multi-morbidity
Sensory impairment
Learning Disabilities
Personal wellbeing & Mental health
Self-harm
Hospital admissions due to falls
Causes of death
Leading causes of death
Mortality and inequalities
Avoidable mortality
Deaths at home
Stillbirths and neonatal mortality
Suicide and deaths from drug misuse
Road casualties
Finding out more

Behavioural
determinants of
health
Health
conditions and
causes of death
Population groups
and protected
characteristics
Population
Wider
determinants of
health
Service Use Local researchExecutive
summary
In 2019 there were a total of 1,389 road casualties in Oxfordshire, 23 of which were fatal and 208 of which were serious. This includes pedestrians and cyclists as well as motor vehicle occupants.
The number of people killed or seriously injured (KSI) has fallen over time.
Casualties for adult pedal cyclists have increased by 5.9% since 2018 (255 in 2018 to 270 in 2019). Over half of pedal cyclist casualties (158) were in Oxford City.
0
500
1000
1500
2000
2500
3000
3500
Oxfordshire total road casualties
KSI Slight
Oxfordshire Joint Strategic Needs Assessment 2021 123
Oxfordshire Road Casualties
Oxfordshire County Council Road Casualty ReportAlso see Crashmap.co.uk
Casualties in adult pedal cyclists, 2019
Oxford59%
Cherwell14%
South Oxfordshire
11%
Vale of White Horse
10%
West Oxfordshire
6%
updated
Introduction
Summary
COVID-19
Health conditions
Cancer
Cardiovascular disease
Musculoskeletal conditions
Multi-morbidity
Sensory impairment
Learning Disabilities
Personal wellbeing & Mental health
Self-harm
Hospital admissions due to falls
Causes of death
Leading causes of death
Mortality and inequalities
Avoidable mortality
Deaths at home
Stillbirths and neonatal mortality
Suicide and deaths from drug misuse
Road casualties
Finding out more

Behavioural
determinants of
health
Health
conditions and
causes of death
Population groups
and protected
characteristics
Population
Wider
determinants of
health
Service Use Local researchExecutive
summary
Oxfordshire Joint Strategic Needs Assessment 2021 124
Oxfordshire road casualties by district
Oxfordshire County Council Road Casualty Report
Fatal and serious injuries from road accidents for the districts in Oxfordshire in 2019 are shown in the table below.
Cherwell had the highest number of serious injuries (66). Oxford City had no fatal accidents during 2019.
Pedestrian Pedal cycle Motor cycle Car Other total
Cherwell Fatal 1 0 0 2 3 6
Serious 6 6 14 35 5 66
Oxford Fatal 0 0 0 0 0 0
Serious 8 20 2 3 0 33
South Oxfordshire Fatal 1 0 2 5 2 10
Serious 5 9 10 20 0 44
Vale of White Horse Fatal 1 1 0 4 0 6
Serious 5 3 7 16 1 32
West Oxfordshire Fatal 0 0 1 0 0 1
Serious 4 6 9 8 0 27
Number of people killed or seriously injured in road accidents 2019
updated
Introduction
Summary
COVID-19
Health conditions
Cancer
Cardiovascular disease
Musculoskeletal conditions
Multi-morbidity
Sensory impairment
Learning Disabilities
Personal wellbeing & Mental health
Self-harm
Hospital admissions due to falls
Causes of death
Leading causes of death
Mortality and inequalities
Avoidable mortality
Deaths at home
Stillbirths and neonatal mortality
Suicide and deaths from drug misuse
Road casualties
Finding out more

Behavioural
determinants of
health
Health
conditions and
causes of death
Population groups
and protected
characteristics
Population
Wider
determinants of
health
Service Use Local researchExecutive
summary
Oxfordshire Joint Strategic Needs Assessment 2021 125
Public Health England Oxfordshire Health Profile
Oxfordshire JSNA Health Inequalities Dashboard
Prevention concordat for better mental health (includes various Oxfordshire organisations listed as signatories).
Mental health statistics: prevalence, services and funding in England
Children and young people mental health prevention evidence from PHE
Live Well Oxfordshire contains a range of support services across Oxfordshire for adults (18+), families and carers.
NHS Digital Health Survey for England
Global Burden of Disease Tool provides a tool to quantify health loss from hundreds of diseases, injuries, and risk factors, so that health systems can be improved and disparities can be eliminated.
Public Health England Mortality Profile
Mortality data available from the Office for National Statistics
NHS Digital General Practice data hub
Crashmap.co.uk contains information about reported crashes from 1999 onwards and is completely free to view details about collision locations, dates, times, and the number of casualties and vehicles associated.
Finding out more
updated
Introduction
Summary
COVID-19
Health conditions
Cancer
Cardiovascular disease
Musculoskeletal conditions
Multi-morbidity
Sensory impairment
Learning Disabilities
Personal wellbeing & Mental health
Self-harm
Hospital admissions due to falls
Causes of death
Leading causes of death
Mortality and inequalities
Avoidable mortality
Deaths at home
Stillbirths and neonatal mortality
Suicide and deaths from drug misuse
Road casualties
Finding out more

Behavioural
determinants of
health
Health
conditions and
causes of death
Population groups
and protected
characteristics
Population
Wider
determinants of
health
Service Use Local researchExecutive
summary
Oxfordshire Joint Strategic Needs Assessment 2021 126
Frequently updated data sources: Oxfordshire's COVID-19 Dashboard
Gov.uk Coronavirus (COVID-19) in the UK
Gov.UK (Daily) Deaths within 28 days of positive test
ONS (Weekly) Death registrations and occurrences by local authority and health board
ONS (Weekly) Number of deaths in care homes notified to the CQC
NHS Digital (Daily) Deaths of patients who have died in hospitals in England
ONS data and analysis on COVID-19 and its effect on the economy and society
PHE Wider Impacts of COVID-19 on Health (WICH) monitoring tool
Further analysis: British Red Cross COVID-19 vulnerability index
PHE SARS-CoV-2 confirmed England deaths: report
PHE COVID-19: deaths of people with learning disabilities
PHE COVID-19: pre-existing health conditions and ethnicity
PHE COVID-19: review of disparities in risks and outcomes
PHE COVID-19: understanding the impact on BAME communities
PHE Beyond the data: understanding the impact of COVID-19 on BAME groups
PHE COVID-19: mental health and wellbeing surveillance report
ONS Coronavirus (COVID-19) related deaths by occupation, England and Wales
ONS Deaths involving COVID-19 by local area and socioeconomic deprivation
IFS COVID-19 and Inequalities
Institute of Health Equity Build Back Fairer: The COVID-19 Marmot Review
Finding out more – coronavirus (COVID-19)
new
Introduction
Summary
COVID-19
Health conditions
Cancer
Cardiovascular disease
Musculoskeletal conditions
Multi-morbidity
Sensory impairment
Learning Disabilities
Personal wellbeing & Mental health
Self-harm
Hospital admissions due to falls
Causes of death
Leading causes of death
Mortality and inequalities
Avoidable mortality
Deaths at home
Stillbirths and neonatal mortality
Suicide and deaths from drug misuse
Road casualties
Finding out more
Behavioural
determinants of
health
Health
conditions and
causes of death
Population groups
and protected
characteristics
Population
Wider
determinants of
health
Service Use Local researchExecutive
summary
Behavioural determinants of health
Oxfordshire Joint Strategic Needs Assessment 2021 127
Chapter 5

Behavioural
determinants of
health
Health
conditions and
causes of death
Population groups
and protected
characteristics
Population
Wider
determinants of
health
Service Use Local researchExecutive
summary
Oxfordshire Joint Strategic Needs Assessment 2021 128
This chapter provides data on behavioural factors that affect health and wellbeing, such as healthy weight and physical activity, smoking and alcohol, and sexual and reproductive health
In many cases local data are unavailable, so national data have been used instead
For some topics it may be useful to refer to other JSNA chapters. For example, for healthy weight and physical activity, it may be useful to look at the Wider Determinants of Health chapter, which includes active travel, healthy place-shaping, and availability of healthy food
For other topics in this chapter it may be useful to look at the Service Use chapter which includes information on Public Health commissioned services including smoking cessation, and specialist sexual health services
Further JSNA resources are available via the JSNA page of Oxfordshire Insight
Assessing the impact of COVID-19
This chapter includes the most recent datasets accessed in January 2021.
With the exception of national data on children’s physical activity, and local data on volunteering during 2020, all datasets report on time periods before the COVID-19 pandemic.
This means that this chapter will not always reflect the impact of the COVID-19 pandemic and lockdowns (from early 2020).
This chapter…Introduction
Summary
Behavioural risk factors of disease
Smoking
E-cigarette use
Alcohol consumption
Alcohol-related hospital admissions
Drug use
Drug misuse related hospital admissions
Dietary risk factors
Overweight and obesity – adult
Overweight and obesity - child
Physical activity – adult
Physical activity - child
Sexual health
Teenage conceptions
Breastfeeding & low birth weight
Oral health
Volunteering
Gambling
Finding out more
updated

Behavioural
determinants of
health
Health
conditions and
causes of death
Population groups
and protected
characteristics
Population
Wider
determinants of
health
Service Use Local researchExecutive
summary
Oxfordshire Joint Strategic Needs Assessment 2021 129
Behavioural risk factors account for a large proportion of the local burden of disease
Smoking prevalence in Oxfordshire remains below national and regional averages. It does, however, disproportionately affect people from some ethnic groups, nationalities and occupation groups
E-cigarettes are increasingly being used by smokers to help quit smoking- over half of e-cigarette users use vaping as an aid to quit smoking
The proportion of men and women who drink alcohol is highest amongst people aged 55 to 74. Adults in the highest income households are more likely to drink over 14 units per week than those in lower income households
Hospital admission episodes for alcohol-specific and alcohol-related conditions are significantly lower than national and regional rates
In adult age groups, males have higher rates of alcohol-related admission episodes than females. Admissions in under 18s are higher in females than males
Younger people are more likely to have taken illicit drugs than older people. The higher rates of drug use were associated with higher frequency of visits to pubs, bars and nightclubs
The rate of hospital admissions for poisoning by drug misuse in Oxfordshire is similar to regional and national rates
Dietary risk factors accounted for over 11,500 lost years of healthy life (DALYs) in 2019
Leading dietary risk factors include low whole grains, low fruit, low nuts and seeds, high processed meat, high red meat, high sodium
Summary (1)Introduction
Summary
Behavioural risk factors of disease
Smoking
E-cigarette use
Alcohol consumption
Alcohol-related hospital admissions
Drug use
Drug misuse related hospital admissions
Dietary risk factors
Overweight and obesity – adult
Overweight and obesity - child
Physical activity – adult
Physical activity - child
Sexual health
Teenage conceptions
Breastfeeding & low birth weight
Oral health
Volunteering
Gambling
Finding out more
updated

Behavioural
determinants of
health
Health
conditions and
causes of death
Population groups
and protected
characteristics
Population
Wider
determinants of
health
Service Use Local researchExecutive
summary
Oxfordshire Joint Strategic Needs Assessment 2021 130
Over half of Oxfordshire adults are classified as overweight or obese. Prevalence is higher in males, older people, some ethnic groups and more deprived areas
Similar to previous years, excess weight in children has remained high. One in five children in Reception, and one in three children in Year 6 was overweight or obese
Obesity prevalence is higher in boys than in girls in Oxfordshire, and the disparity increases between Reception and Year 6
National data show that prevalence of healthy weight varies by ethnic group, and decreases as deprivation increases
A slightly higher percentage of Oxfordshire adults meets recommended physical activity guideline (150 minutes per week) than national and regional figures, but 1 in 4 adults do not meet the guidelines
More Oxfordshire children and young people are achieving enough physical activity per day than the national average, but there could be 37,600 children who do not
The rate of new Sexually Transmitted Infection (STI) diagnoses (excluding chlamydia in under 25s) in Oxfordshire is significantly lower than national, and similar to the regional rate
The rate of teenage conceptions in Oxfordshire is significantly lower than the national average and is decreasing broadly in line with national and regional trends
The percentage of babies with low birth weight in Oxfordshire remains lower than national levels, and breastfeeding prevalence stays high in the county, well above national levels
One in five 5-year old children is affected by dental decay
Between March and May 2020, over 15,000 volunteers were recorded in Oxfordshire as available to help vulnerable people who were socially isolating during the Covid-19 pandemic.
Summary (2)Introduction
Summary
Behavioural risk factors of disease
Smoking
E-cigarette use
Alcohol consumption
Alcohol-related hospital admissions
Drug use
Drug misuse related hospital admissions
Dietary risk factors
Overweight and obesity – adult
Overweight and obesity - child
Physical activity – adult
Physical activity - child
Sexual health
Teenage conceptions
Breastfeeding & low birth weight
Oral health
Volunteering
Gambling
Finding out more
updated

Behavioural
determinants of
health
Health
conditions and
causes of death
Population groups
and protected
characteristics
Population
Wider
determinants of
health
Service Use Local researchExecutive
summary
Oxfordshire Joint Strategic Needs Assessment 2021 131
In Oxfordshire, it was estimated that health-related behaviours accounted for a quarter (26%) of the total burden of disease in 2019
This is equivalent to 47,600 years of healthy life lost (measured using Disability Adjusted Life Years (DALYs) –see note below for more information)
The leading behavioural risk factors were:
Tobacco
Dietary risks and High BMI
Alcohol use
Drug use
Behavioural risk factors of disease
One Disability Adjusted Life Year (DALY) can be thought of as one lost year of "healthy" life. DALYs arecalculated as the sum of the Years of Life Lost (YLL) due to premature mortality in the population and the YearsLost due to Disability (YLD) for people living with the health condition or its consequences.The sum of DALYs for a population is a measurement of the gap between current health status and the situationwhere the entire population lives to an advanced age, free of disease and disability.
Institute for Health Metrics and Evaluation (IHME), GBD Compare. (Accessed 11.01.20) World Health Organisation, Metrics: Disability Adjusted Life Year (DALY)
Introduction
Summary
Behavioural risk factors of disease
Smoking
E-cigarette use
Alcohol consumption
Alcohol-related hospital admissions
Drug use
Drug misuse related hospital admissions
Dietary risk factors
Overweight and obesity – adult
Overweight and obesity - child
Physical activity – adult
Physical activity - child
Sexual health
Teenage conceptions
Breastfeeding & low birth weight
Oral health
Volunteering
Gambling
Finding out more
Oxfordshire DALYs by risk factor, all causes,
2019
updated

Behavioural
determinants of
health
Health
conditions and
causes of death
Population groups
and protected
characteristics
Population
Wider
determinants of
health
Service Use Local researchExecutive
summary
Smoking, alcohol and drugs
Oxfordshire Joint Strategic Needs Assessment 2021 132

Behavioural
determinants of
health
Health
conditions and
causes of death
Population groups
and protected
characteristics
Population
Wider
determinants of
health
Service Use Local researchExecutive
summary
Oxfordshire Joint Strategic Needs Assessment 2021 133
Smoking is the leading cause of preventable ill health and premature mortality in the UK, withabout half of all life-long smokers dying prematurely, losing on average about 10 years of life.
It is a major risk factor for many diseases, such as lung cancer, chronic obstructive pulmonarydisease (COPD) and heart disease. It is also associated with cancers in other organs, includinglip, mouth, throat, bladder, kidney, stomach, liver and cervix. Smoking still accounts for 1 in 6of all deaths in England, and there are huge inequalities in smoking and smoking relateddeaths. Reducing smoking rates is the single biggest thing we can do to improve the nation’shealth.
Smoking prevalence is decreasing nationally
Public Health England, Local Tobacco Control ProfilesOffice for National Statistics, Adults smoking habits in the UK: 2018
Introduction
Summary
Behavioural risk factors of disease
Smoking
E-cigarette use
Alcohol consumption
Alcohol-related hospital admissions
Drug use
Drug misuse related hospital admissions
Dietary risk factors
Overweight and obesity – adult
Overweight and obesity - child
Physical activity – adult
Physical activity - child
Sexual health
Teenage conceptions
Breastfeeding & low birth weight
Oral health
Volunteering
Gambling
Finding out more
The adult smoking rate in England is continuing to declineyear on year and is now at a record low
In 2019, an estimated 12% of adults in Oxfordshire were smokers, down from 16.2% in 2011 and statistically similar to the England average of 13.9%. This is equivalent to approximately 65,000 adults in Oxfordshire
Smoking prevalence in all of Oxfordshire’s districts isstatistically similar to the national average, though this is partly due to wide confidence intervals
In order of highest prevalence: Oxford (13.5%), South Oxfordshire (12.4%), Cherwell (11.8%), Vale of White Horse (11.6%), West Oxfordshire (10.3%)
Smoking prevalence, 2011 - 2019
updated
%

Behavioural
determinants of
health
Health
conditions and
causes of death
Population groups
and protected
characteristics
Population
Wider
determinants of
health
Service Use Local researchExecutive
summary
Oxfordshire Joint Strategic Needs Assessment 2021 134
Smoking prevalence varies across demographic groups - nationalIntroduction
Summary
Behavioural risk factors of disease
Smoking
E-cigarette use
Alcohol consumption
Alcohol-related hospital admissions
Drug use
Drug misuse related hospital admissions
Dietary risk factors
Overweight and obesity – adult
Overweight and obesity - child
Physical activity – adult
Physical activity - child
Sexual health
Teenage conceptions
Breastfeeding & low birth weight
Oral health
Volunteering
Gambling
Finding out more
Smoking prevalence by age group,
England 2019
National data show that smoking prevalence is highest in the 25-29 age group, and generally decreases as age increases
There is also variation by ethnicity and country of birth:
Smoking prevalence is highest in Mixed (19.5%), Other ethnicity (15.6%) and White (14.4%) ethnic groups
Smoking prevalence by country of birth ranges from 23.9% in those born in Poland, to 5.4% in those born in India
Data for Oxfordshire show that smoking prevalence is similar in males and females, with 12.1% (32,500) men and 11.9% (32,600) women in Oxfordshire currently smoking
Public Health England, Local Tobacco Control Profiles
updated

Behavioural
determinants of
health
Health
conditions and
causes of death
Population groups
and protected
characteristics
Population
Wider
determinants of
health
Service Use Local researchExecutive
summary
Oxfordshire Joint Strategic Needs Assessment 2021 135
In 2018, 5% of school pupils aged 11-15 in England were classified as current smokers. Though not significantly different from the surveys in 2014 and 2016 (6%), the proportion has generally declined over time since 1996, when 22% of pupils were current smokers
In Oxfordshire, this is equivalent to around 2,000 pupils aged 11-15 currently smoking
Current smoking prevalence was highest among white pupils (6%), and lowest among Asian (2%) and black (1%) pupils
Likelihood of being a current smoker increased with age, drinking alcohol, drug use, e-cigarette use, having played truant, number of current smokers at home and having friends who smoke
For non-smokers, the most popular beliefs about why people their own age smoke were “to look cool in front of their friends” (80%), “they are addicted to cigarettes” (71%) and “their friends pressure them into it” (69%)
However, for those who were regular smokers, the most popular answers were “it helps them cope with stress in their life” (95%), “it helps them relax” (82%) and “they are addicted to cigarettes” (80%)
National data show a decline in children smoking
NHS Digital, Smoking, Drinking and Drug Use among Young People in England 2018
Introduction
Summary
Behavioural risk factors of disease
Smoking
E-cigarette use
Alcohol consumption
Alcohol-related hospital admissions
Drug use
Drug misuse related hospital admissions
Dietary risk factors
Overweight and obesity – adult
Overweight and obesity - child
Physical activity – adult
Physical activity - child
Sexual health
Teenage conceptions
Breastfeeding & low birth weight
Oral health
Volunteering
Gambling
Finding out more
No update available

Behavioural
determinants of
health
Health
conditions and
causes of death
Population groups
and protected
characteristics
Population
Wider
determinants of
health
Service Use Local researchExecutive
summary
For Oxfordshire adults in routine and manual occupations, smoking prevalence is 22.5%, over two times higher than in the managerial and professional group (10%). Prevalence in the routine and manual group has decreased from 33% in 2015.
National data show that:
in 2018, the proportion of current smokers was significantly higher in people who identified as gay or lesbian (22.2%) than among heterosexual (straight) people (15.5%)
a significantly lower proportion of those who own their property outright (7.9%) or with a mortgage (10.1%) currently smoke, compared with those who rent (29.8% of local authority or housing association renters, and 22.2% of private renters)
in Great Britain, more than half (52.7%) of people aged 16 years and above who currently smoked said they wanted to quit
Oxfordshire Joint Strategic Needs Assessment 2021 136
Smoking prevalence is more concentrated among more disadvantaged communities
Public Health England, Local Tobacco Control ProfilesOffice for National Statistics, Adults smoking habits in the UK: 2019See also: ASH, Health inequalities resource pack and Smoking and poverty report 2019
Introduction
Summary
Behavioural risk factors of disease
Smoking
E-cigarette use
Alcohol consumption
Alcohol-related hospital admissions
Drug use
Drug misuse related hospital admissions
Dietary risk factors
Overweight and obesity – adult
Overweight and obesity - child
Physical activity – adult
Physical activity - child
Sexual health
Teenage conceptions
Breastfeeding & low birth weight
Oral health
Volunteering
Gambling
Finding out more
Smoking Prevalence in adults (18-64) by socioeconomic group, Oxfordshire, 2019
updated
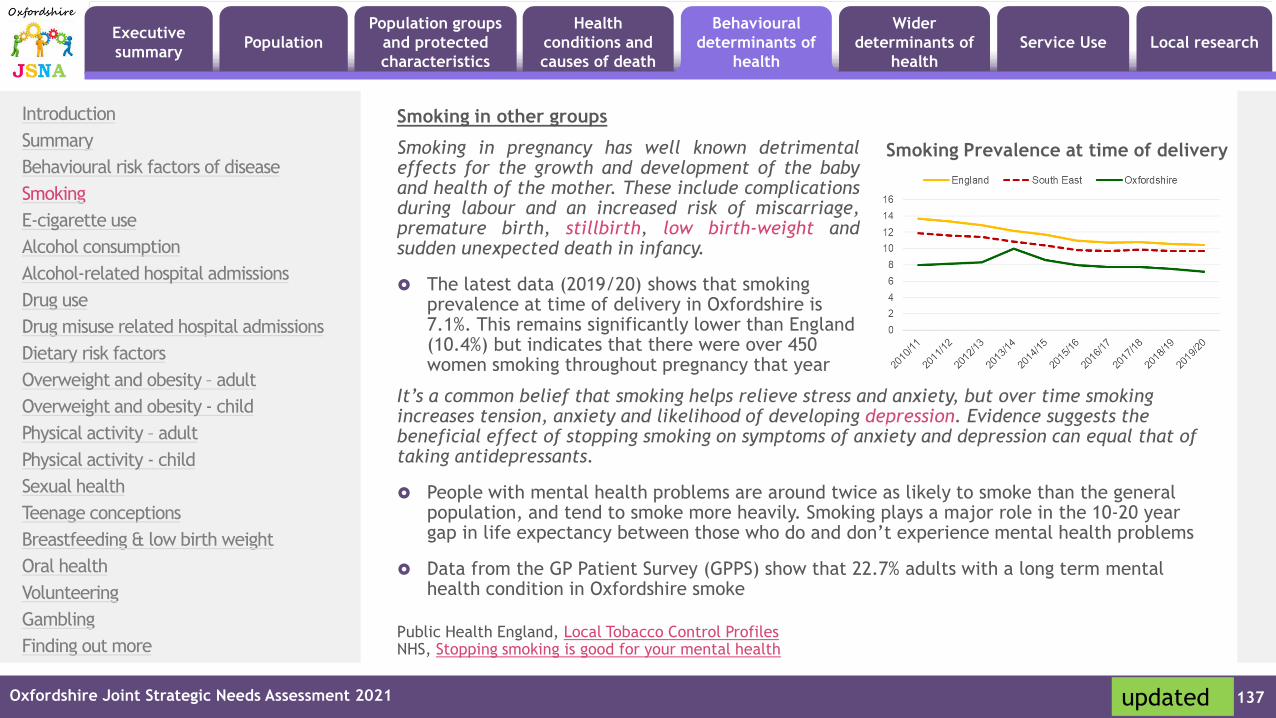
Behavioural
determinants of
health
Health
conditions and
causes of death
Population groups
and protected
characteristics
Population
Wider
determinants of
health
Service Use Local researchExecutive
summary
Oxfordshire Joint Strategic Needs Assessment 2021 137
Smoking in pregnancy has well known detrimentaleffects for the growth and development of the babyand health of the mother. These include complicationsduring labour and an increased risk of miscarriage,premature birth, stillbirth, low birth-weight andsudden unexpected death in infancy.
The latest data (2019/20) shows that smoking prevalence at time of delivery in Oxfordshire is 7.1%. This remains significantly lower than England (10.4%) but indicates that there were over 450 women smoking throughout pregnancy that year
Smoking in other groups
Public Health England, Local Tobacco Control ProfilesNHS, Stopping smoking is good for your mental health
Introduction
Summary
Behavioural risk factors of disease
Smoking
E-cigarette use
Alcohol consumption
Alcohol-related hospital admissions
Drug use
Drug misuse related hospital admissions
Dietary risk factors
Overweight and obesity – adult
Overweight and obesity - child
Physical activity – adult
Physical activity - child
Sexual health
Teenage conceptions
Breastfeeding & low birth weight
Oral health
Volunteering
Gambling
Finding out more
It’s a common belief that smoking helps relieve stress and anxiety, but over time smoking increases tension, anxiety and likelihood of developing depression. Evidence suggests the beneficial effect of stopping smoking on symptoms of anxiety and depression can equal that of taking antidepressants.
People with mental health problems are around twice as likely to smoke than the general population, and tend to smoke more heavily. Smoking plays a major role in the 10-20 year gap in life expectancy between those who do and don’t experience mental health problems
Data from the GP Patient Survey (GPPS) show that 22.7% adults with a long term mental health condition in Oxfordshire smoke
Smoking Prevalence at time of delivery
updated

Behavioural
determinants of
health
Health
conditions and
causes of death
Population groups
and protected
characteristics
Population
Wider
determinants of
health
Service Use Local researchExecutive
summary
National data show that those who have ‘bad’ or ‘very bad’ self-rated health are more likely to be smokers than those with ‘good’ or ‘very good’ health
In the three-year period 2016-18, there were 2,044 deaths attributable to smoking in Oxfordshire, including 166 deaths from heart disease and 62 deaths from stroke. In the same period, there were 8,176 potential years of life lost due to smoking related illness
Oxfordshire Joint Strategic Needs Assessment 2021 138
Smoking as a cause of ill-health
Public Health England, Local Tobacco Control Profiles
Introduction
Summary
Behavioural risk factors of disease
Smoking
E-cigarette use
Alcohol consumption
Alcohol-related hospital admissions
Drug use
Drug misuse related hospital admissions
Dietary risk factors
Overweight and obesity – adult
Overweight and obesity - child
Physical activity – adult
Physical activity - child
Sexual health
Teenage conceptions
Breastfeeding & low birth weight
Oral health
Volunteering
Gambling
Finding out more
Self-rated health by smoking status, England 2019
Other related causes of mortality in Oxfordshire, though not specifically attributable to smoking, include 742 deaths from lung cancer, 77 deaths from oral cancer, 710 deaths from COPD, 90 stillbirths and 35 deaths at under 28 days over the three-year period 2017-19
In Oxfordshire over the three years 2016-18, there were 1,213 lung cancer registrations, 241 oral cancer registrations, and 251 oesophageal cancer registrations
updated

Behavioural
determinants of
health
Health
conditions and
causes of death
Population groups
and protected
characteristics
Population
Wider
determinants of
health
Service Use Local researchExecutive
summary
Although not risk-free, e-cigarettes are far less harmful than smoking. Using a nicotine-containing e-cigarette makes it much more likely someone will quit successfully than relying on willpower alone, but it’s important to use regulated e-liquids and never risk vaping home-made or illicit e-liquids or adding substances. PHE’s advice is that:
For smokers: You should stop smoking completely. Getting expert support combined with using an e-cigarette doubles your chances of quitting successfully.
For people who vape nicotine: if you are still smoking, you should stop and switch completely to vaping, then come off nicotine when you are confident you won’t relapse to smoking.
If you have never smoked: Don’t vape.
E-cigarettes are increasingly being used by smokers to help quit smoking - in 2019, 5.7% of people in Great Britain reported currently using an e-cigarette
Vaping was most common among current cigarette smokers (15.5%) and ex-cigarette smokers (11.7%); only 0.4% of people who have never smoked reported that they currently vape
The most common reason given for vaping was as an aid to stop smoking, with approximately half (50.6%) of vapers reporting using e-cigarettes for that purpose in 2019.
Data for school pupils aged 11-15 show that 1.3% of girls and 2.9% of boys are regular e-cigarette users. 48% of pupils say their usual source of e-cigarette being given them by someone; 37% say they usually buy them from a shop
Oxfordshire Joint Strategic Needs Assessment 2021 139
E-cigarette use and vaping – national
PHE, Vaping and lung disease in the US: PHE’s adviceOffice for National Statistics, Adults smoking habits in the UK: 2019NHS Digital, Smoking, Drinking and Drug Use among Young People in England 2018See also: ASH, Use of e-cigarettes among adults, Use of e-cigarettes among young people in Great Britain 2019
Introduction
Summary
Behavioural risk factors of disease
Smoking
E-cigarette use
Alcohol consumption
Alcohol-related hospital admissions
Drug use
Drug misuse related hospital admissions
Dietary risk factors
Overweight and obesity – adult
Overweight and obesity - child
Physical activity – adult
Physical activity - child
Sexual health
Teenage conceptions
Breastfeeding & low birth weight
Oral health
Volunteering
Gambling
Finding out more
updated

Behavioural
determinants of
health
Health
conditions and
causes of death
Population groups
and protected
characteristics
Population
Wider
determinants of
health
Service Use Local researchExecutive
summary
Number of days on which drank alcohol in the last week,
by age and sex
Oxfordshire Joint Strategic Needs Assessment 2021 140
Alcohol consumption is a contributing factor to hospital admissions and deaths from a diverse range of conditions. Alcohol misuse is estimated to cost the NHS about £3.5 billion per year and society as a whole £21 billion annually. The Chief Medical Officers’ guideline for adults who drink regularly or frequently (i.e. most weeks) is that it is safest not to drink more than 14 units per week on a regular basis.
Alcohol consumption – national
Public Health England, Local Alcohol Profiles for EnglandNHS Digital, Health Survey for England 2019 Department of Health and Social Care, Alcohol consumption: advice on low risk drinking
Introduction
Summary
Behavioural risk factors of disease
Smoking
E-cigarette use
Alcohol consumption
Alcohol-related hospital admissions
Drug use
Drug misuse related hospital admissions
Dietary risk factors
Overweight and obesity – adult
Overweight and obesity - child
Physical activity – adult
Physical activity - child
Sexual health
Teenage conceptions
Breastfeeding & low birth weight
Oral health
Volunteering
Gambling
Finding out more
National survey data show that 59% of men and 50% of women had drunk alcohol in the last week.
The proportion drinking in the last week increased with age from 41% of 16-24 year olds to 62% of those aged 55-74 years old, but decreased in the oldest age group.
10% of people reported drinking alcohol on five or more days. This ranged from 2% in 16-24 year olds up to 13% women aged 65-74 and 23% men aged 65-74 years old.
updated

Behavioural
determinants of
health
Health
conditions and
causes of death
Population groups
and protected
characteristics
Population
Wider
determinants of
health
Service Use Local researchExecutive
summary
A higher proportion of men than women drank at increasing risk of harm (over 14 units a week); 30% of men and 15% of women.
5% of men drank over 50 units a week and 3% of women drank over 35 units a week (higher risk).
The proportions of men and women who reported drinking over 14 units of alcohol weekly increased with household income.
In the highest income households 44% of men and 25% of women drank at this level, compared with 22% of men and 9% of women in the lowest income households.
The proportion of non-drinkers increased as the household income decreased from 10% of non-drinkers in the highest income quintile to 33% in the lowest income quintile.
Oxfordshire Joint Strategic Needs Assessment 2021 141
Alcohol consumption – national
NHS Digital, Health Survey for England 2019
Introduction
Summary
Behavioural risk factors of disease
Smoking
E-cigarette use
Alcohol consumption
Alcohol-related hospital admissions
Drug use
Drug misuse related hospital admissions
Dietary risk factors
Overweight and obesity – adult
Overweight and obesity - child
Physical activity – adult
Physical activity - child
Sexual health
Teenage conceptions
Breastfeeding & low birth weight
Oral health
Volunteering
Gambling
Finding out more
Proportion of adults drinking over 14 units
a week, by household income and sex
Proportion of adults drinking over 14 units
a week, by age and sex
%
%
Highest 2nd 3rd 4th Lowest
Equivalised household income quintile
Men Women
Age group
updated

Behavioural
determinants of
health
Health
conditions and
causes of death
Population groups
and protected
characteristics
Population
Wider
determinants of
health
Service Use Local researchExecutive
summary
Oxfordshire Joint Strategic Needs Assessment 2021 142
6% of all pupils aged 11-15 said they usually drank alcohol at least once per week
a further 11% of pupils said they usually drank between once a fortnight and once a month, meaning a total of 17% who said they usually drank alcohol at least once a month
The proportion usually drinking once a week increased with age, from 1% of 11 year olds to 14% of 15 year olds
White pupils were most likely to have had an alcoholic drink in the last week, with 13% having done so
This compares to 7% of Mixed ethnicity pupils, 3% of Black pupils and only 1% of Asian pupils
Alcohol drinking in young people – national
NHS Digital, Smoking, Drinking and Drug Use among Young People in England 2018
Introduction
Summary
Behavioural risk factors of disease
Smoking
E-cigarette use
Alcohol consumption
Alcohol-related hospital admissions
Drug use
Drug misuse related hospital admissions
Dietary risk factors
Overweight and obesity – adult
Overweight and obesity - child
Physical activity – adult
Physical activity - child
Sexual health
Teenage conceptions
Breastfeeding & low birth weight
Oral health
Volunteering
Gambling
Finding out more
Usual frequency of drinking by school pupils, by age
Had an alcoholic drink in the last week, by ethnicity
No update available

Behavioural
determinants of
health
Health
conditions and
causes of death
Population groups
and protected
characteristics
Population
Wider
determinants of
health
Service Use Local researchExecutive
summary
Oxfordshire Joint Strategic Needs Assessment 2021 143
In 2018/19, there were 3,114 admission episodes for alcohol-specific conditions in Oxfordshire, equivalent to 472 admissions per 100,000 population
This is significantly lower than national and regional rates
This was made up of 2,029 admissions in males and 1,085 admissions in females
These include admissions to hospital where the primary diagnosis or any of the secondary diagnoses are an alcohol-specific (wholly attributable) condition code only
There were 3,316 admission episodes for alcohol-related conditions in Oxfordshire, equivalent to 497 admissions per 100,000 population
This is significantly lower than national and regional rates
This was made up of 2,099 admissions in males and 1,217 admissions in females
These include admissions to hospital where the primary diagnosis is an alcohol-related condition, or a secondary diagnosis is an alcohol-related external cause
When a broader definition is used, there were 11,822 admission episodes for alcohol-related conditions, equivalent to a rate of 1,802 admissions per 100,000 population
This is significantly lower than national and regional rates
This was made up of 7,682 admissions in males and 4,140 admissions in females
These include admissions to hospital where the primary diagnosis or any of the secondary diagnoses are an alcohol-attributable code
Alcohol-related hospital admissions
Public Health England, Local Alcohol Profiles for England
Introduction
Summary
Behavioural risk factors of disease
Smoking
E-cigarette use
Alcohol consumption
Alcohol-related hospital admissions
Drug use
Drug misuse related hospital admissions
Dietary risk factors
Overweight and obesity – adult
Overweight and obesity - child
Physical activity – adult
Physical activity - child
Sexual health
Teenage conceptions
Breastfeeding & low birth weight
Oral health
Volunteering
Gambling
Finding out more
No update available

Behavioural
determinants of
health
Health
conditions and
causes of death
Population groups
and protected
characteristics
Population
Wider
determinants of
health
Service Use Local researchExecutive
summary
Oxfordshire Joint Strategic Needs Assessment 2021 144
Overall, males continue to have higher rates than females for alcohol-related admission episodes
Although admissions in Oxfordshire are significantly lower than England in all adult age groups for both males and females, between 2017/18 and 2018/19 there has been an increase in admissions for both males and females across all three age groups
National data show that these admissions tend to be more prevalent in more deprived groups
Alcohol-related hospital admissions by age groupIntroduction
Summary
Behavioural risk factors of disease
Smoking
E-cigarette use
Alcohol consumption
Alcohol-related hospital admissions
Drug use
Drug misuse related hospital admissions
Dietary risk factors
Overweight and obesity – adult
Overweight and obesity - child
Physical activity – adult
Physical activity - child
Sexual health
Teenage conceptions
Breastfeeding & low birth weight
Oral health
Volunteering
Gambling
Finding out more
Admission episodes for alcohol-related conditions, directly standardised
rate per 100,000 people, Oxfordshire males and females by age
Public Health England, Local Alcohol Profiles for EnglandDefinition: Admissions to hospital where the primary diagnosis is an alcohol-attributable code or a secondary diagnosis is an alcohol-attributable external cause code. (narrow)
No update available

Behavioural
determinants of
health
Health
conditions and
causes of death
Population groups
and protected
characteristics
Population
Wider
determinants of
health
Service Use Local researchExecutive
summary
Oxfordshire Joint Strategic Needs Assessment 2021 145
There were 165 admissions of people aged under 18 in Oxfordshire due to alcohol-specific conditions in the three year period 2016/17 to 2018/19
This is equivalent to a rate of 38.3 admissions per 100,000 population, significantly higher than the England and South East averages
Unlike the older age groups, admissions are higher in females than males. In the most recent data, the rate per 100,000 in Oxfordshire was 27.2 in males (similar to England and South East) and 49.9 in females (significantly worse than England and South East)
Alcohol specific hospital admissions in under 18s
Public Health England, Local Alcohol Profile for EnglandDefinition: Persons admitted to hospital due to alcohol-specific conditions – under 18 year olds, crude rate per 100,000 population. Number of persons under 18 admitted to hospital due to alcohol-specific conditions divided by the under 18 population of the area and multiplied by 100,000.
Introduction
Summary
Behavioural risk factors of disease
Smoking
E-cigarette use
Alcohol consumption
Alcohol-related hospital admissions
Drug use
Drug misuse related hospital admissions
Dietary risk factors
Overweight and obesity – adult
Overweight and obesity - child
Physical activity – adult
Physical activity - child
Sexual health
Teenage conceptions
Breastfeeding & low birth weight
Oral health
Volunteering
Gambling
Finding out more
Under 18s admitted to hospital due to alcohol-
specific conditions – under 18 year olds, crude
rate per 100,000 population
No update available

Behavioural
determinants of
health
Health
conditions and
causes of death
Population groups
and protected
characteristics
Population
Wider
determinants of
health
Service Use Local researchExecutive
summary
In 2018/19, there were nearly 6,000 hospital admissions for alcohol-related cardiovascular disease in Oxfordshire (rate 916 per 100,000 population, significantly lower than national average). In the same year, there were 761 admissions for alcoholic liver disease; 952 for alcohol-related unintentional injuries; 227 for intentional self-poisoning from alcohol; and 315 for mental and behavioural disorders due to use of alcohol.
Oxfordshire Joint Strategic Needs Assessment 2021 146
Alcohol-related conditions - other impacts
For more information about these conditions, see Health Conditions and causes of deathPublic Health England, Local Alcohol Profiles for England
Introduction
Summary
Behavioural risk factors of disease
Smoking
E-cigarette use
Alcohol consumption
Alcohol-related hospital admissions
Drug use
Drug misuse related hospital admissions
Dietary risk factors
Overweight and obesity – adult
Overweight and obesity - child
Physical activity – adult
Physical activity - child
Sexual health
Teenage conceptions
Breastfeeding & low birth weight
Oral health
Volunteering
Gambling
Finding out more
No update available

Behavioural
determinants of
health
Health
conditions and
causes of death
Population groups
and protected
characteristics
Population
Wider
determinants of
health
Service Use Local researchExecutive
summary
Oxfordshire Joint Strategic Needs Assessment 2021 147
National data show that around 1 in 11 (9.4%) people aged 16 to 59 had taken an illicit drug in the last year, indicating an increase since the 2015/16 survey (8.3%)
1 in 20 (5%) had taken a drug in the last month
Illicit drug use – national
Home Office, Drugs Misuse: Findings from the 2018/19 Crime Survey for England and Wales
Introduction
Summary
Behavioural risk factors of disease
Smoking
E-cigarette use
Alcohol consumption
Alcohol-related hospital admissions
Drug use
Drug misuse related hospital admissions
Dietary risk factors
Overweight and obesity – adult
Overweight and obesity - child
Physical activity – adult
Physical activity - child
Sexual health
Teenage conceptions
Breastfeeding & low birth weight
Oral health
Volunteering
Gambling
Finding out more
Younger people are more likely to have taken drugs than older people
Around 1 in 5 (20.3%) people aged 16-24 had taken a drug in the last year, with an apparent increase since the 2015/16 survey (18.0%)
1 in 9 (11.4%) had taken a drug in the last month
1 in 25 (3.7%) people aged 16-59 years reported taking a Class A drug in the last year, following a generally upward trend since 2011/12
This increase was driven primarily by use of powder cocaine and ecstasy in 16-24 year olds
1 in 11 (8.7%) 16-24 year olds had taken a Class A drug in the last year
Proportion of 16 to 59 year olds using any illicit
drug in the last year by age group, 1996 to
2018/19
No update available
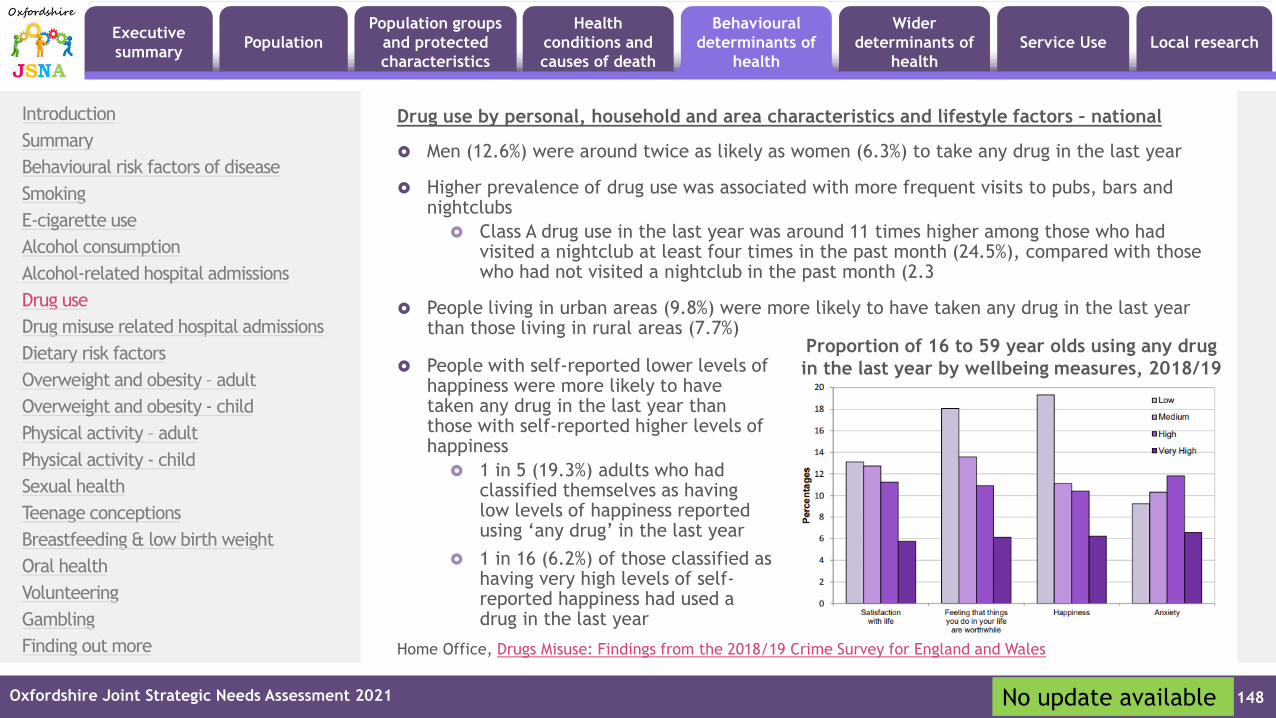
Behavioural
determinants of
health
Health
conditions and
causes of death
Population groups
and protected
characteristics
Population
Wider
determinants of
health
Service Use Local researchExecutive
summary
Oxfordshire Joint Strategic Needs Assessment 2021 148
Men (12.6%) were around twice as likely as women (6.3%) to take any drug in the last year
Higher prevalence of drug use was associated with more frequent visits to pubs, bars and nightclubs
Class A drug use in the last year was around 11 times higher among those who had visited a nightclub at least four times in the past month (24.5%), compared with those who had not visited a nightclub in the past month (2.3
People living in urban areas (9.8%) were more likely to have taken any drug in the last year than those living in rural areas (7.7%)
Drug use by personal, household and area characteristics and lifestyle factors – national
Home Office, Drugs Misuse: Findings from the 2018/19 Crime Survey for England and Wales
Introduction
Summary
Behavioural risk factors of disease
Smoking
E-cigarette use
Alcohol consumption
Alcohol-related hospital admissions
Drug use
Drug misuse related hospital admissions
Dietary risk factors
Overweight and obesity – adult
Overweight and obesity - child
Physical activity – adult
Physical activity - child
Sexual health
Teenage conceptions
Breastfeeding & low birth weight
Oral health
Volunteering
Gambling
Finding out more
People with self-reported lower levels of happiness were more likely to have taken any drug in the last year than those with self-reported higher levels of happiness
1 in 5 (19.3%) adults who had classified themselves as having low levels of happiness reported using ‘any drug’ in the last year
1 in 16 (6.2%) of those classified as having very high levels of self-reported happiness had used a drug in the last year
Proportion of 16 to 59 year olds using any drug
in the last year by wellbeing measures, 2018/19
No update available

Behavioural
determinants of
health
Health
conditions and
causes of death
Population groups
and protected
characteristics
Population
Wider
determinants of
health
Service Use Local researchExecutive
summary
Oxfordshire Joint Strategic Needs Assessment 2021 149
In 2018, 24% of pupils reported they had ever taken drugs, the same as in 2016
17% of pupils said that they had taken drugs in the last year, compared to 18% in 2016 (not a statistically significant difference)
Drug use in school pupils aged 11-15 – national
NHS Digital, Smoking, Drinking and Drug Use among Young People in England 2018
Introduction
Summary
Behavioural risk factors of disease
Smoking
E-cigarette use
Alcohol consumption
Alcohol-related hospital admissions
Drug use
Drug misuse related hospital admissions
Dietary risk factors
Overweight and obesity – adult
Overweight and obesity - child
Physical activity – adult
Physical activity - child
Sexual health
Teenage conceptions
Breastfeeding & low birth weight
Oral health
Volunteering
Gambling
Finding out more
Pupils who have taken drugs in the last year,
2001 to 2018
The difference in prevalence between the proportion of boys (18%) and girls (16%) who had taken drugs in the last year was not statistically significant
The likelihood of having taken drugs in the last year increased with age, from 5% of 11 year olds to 31% of 15 year olds
Asian pupils were less likely than other ethnic groups to have taken drugs in the last year; 13%, compared to 23% of mixed ethnicity pupils, 18% of Black pupils, and 17% of White pupils
No update available

Behavioural
determinants of
health
Health
conditions and
causes of death
Population groups
and protected
characteristics
Population
Wider
determinants of
health
Service Use Local researchExecutive
summary
Oxfordshire Joint Strategic Needs Assessment 2021 150
In 2018/19, there were 40 admissions for drug-related mental and behavioural disorders in Oxfordshire. This equates to 6 admissions per 100,000 population, lower than the regional (7 per 100,000) and national (13 per 100,000) rates
In the same period, there were 795 admissions where drug-related mental and behavioural disorders were a factor, which equates to 116 admissions per 100,000, higher than the regional rate (110 per 100,000) but lower than the national rate (175 per 100,000)
There were 185 admissions (27 per 100,000) for poisoning by drug misuse in Oxfordshire in 2018/19, compared to 26 per 100,000 in the region and 33 per 100,000 in England
National data show that more men than women were admitted to hospital for drug related mental and behavioural disorders (74% male), but similar proportions for admissions due to poisoning by drug misuse (49% male)
Admissions for drug related mental and behavioural disorders, and for poisoning by drug misuse, show similar age profiles. Levels are highest for younger people (apart from those under 16), peaking between ages 25 and 34. Admissions for drug related mental and behavioural disorders are very uncommon in those aged under 16 and over 64. Although admissions amongst older people are low, numbers are rising most in those aged over 45
Admission rates for both drug related mental and behavioural disorders, and for poisoning by drug misuse increase with the level of deprivation
See also: drug-related deaths
Hospital admissions related to drug misuse
NHS Digital, Statistics on Drug Misuse, England, 2019 and data visualisation tool
Introduction
Summary
Behavioural risk factors of disease
Smoking
E-cigarette use
Alcohol consumption
Alcohol-related hospital admissions
Drug use
Drug misuse related hospital admissions
Dietary risk factors
Overweight and obesity – adult
Overweight and obesity - child
Physical activity – adult
Physical activity - child
Sexual health
Teenage conceptions
Breastfeeding & low birth weight
Oral health
Volunteering
Gambling
Finding out more
No update available

Behavioural
determinants of
health
Health
conditions and
causes of death
Population groups
and protected
characteristics
Population
Wider
determinants of
health
Service Use Local researchExecutive
summary
Diet, overweight and physical activity
Oxfordshire Joint Strategic Needs Assessment 2021 151

Behavioural
determinants of
health
Health
conditions and
causes of death
Population groups
and protected
characteristics
Population
Wider
determinants of
health
Service Use Local researchExecutive
summary
Oxfordshire Joint Strategic Needs Assessment 2021 152
Dietary risk factors
One Disability Adjusted Life Year (DALY) can be thought of as one lost year of "healthy" life. DALYs are calculated as the sum ofthe Years of Life Lost (YLL) due to premature mortality in the population and the Years Lost due to Disability (YLD) for peopleliving with the health condition or its consequences. The sum of DALYs for a population is a measurement of the gap betweencurrent health status and the situation where the entire population lives to an advanced age, free of disease and disability.
Institute for Health Metrics and Evaluation (IHME), GBD Compare. (Accessed 12.01.21)
Introduction
Summary
Behavioural risk factors of disease
Smoking
E-cigarette use
Alcohol consumption
Alcohol-related hospital admissions
Drug use
Drug misuse related hospital admissions
Dietary risk factors
Overweight and obesity – adult
Overweight and obesity - child
Physical activity – adult
Physical activity - child
Sexual health
Teenage conceptions
Breastfeeding & low birth weight
Oral health
Volunteering
Gambling
Finding out more
Oxfordshire DALYs by dietary risk factor,
all causes, 2019
In 2019, dietary risk factors accounted for over 11,500 lost years of healthy life (DALYs) due to cardiovascular diseases, diabetes and kidney disease, and neoplasms
There is some uncertainty over the effects of specific foods, but current evidence suggests the leading dietary risk factors are:
Having a diet low in whole grains, fruit, nuts, seeds and legumes
Having a diet high in processed meat, red meat and sodium
See also: affordability of healthy food
There is a lack of reliable data on people’s food choices in Oxfordshire; the following data show the effect of dietary risk factors on the total burden of disease (DALYs) in Oxfordshire
updated

Behavioural
determinants of
health
Health
conditions and
causes of death
Population groups
and protected
characteristics
Population
Wider
determinants of
health
Service Use Local researchExecutive
summary
Oxfordshire Joint Strategic Needs Assessment 2021 153
The economic costs of obesityIntroduction
Summary
Behavioural risk factors of disease
Smoking
E-cigarette use
Alcohol consumption
Alcohol-related hospital admissions
Drug use
Drug misuse related hospital admissions
Dietary risk factors
Overweight and obesity – adult
Overweight and obesity - child
Physical activity – adult
Physical activity - child
Sexual health
Teenage conceptions
Breastfeeding & low birth weight
Oral health
Volunteering
Gambling
Finding out more

Behavioural
determinants of
health
Health
conditions and
causes of death
Population groups
and protected
characteristics
Population
Wider
determinants of
health
Service Use Local researchExecutive
summary
Oxfordshire Joint Strategic Needs Assessment 2021 154
Excess weight in adults is a complex problem with multiple causes and significant implications for health and beyond. It is recognised as a major determinant of premature mortality and avoidable ill health. Adults are defined as overweight (including obese) if their body mass index (BMI) is greater than or equal to 25kg/m2. Obesity is defined as a BMI greater than or equal to 30.
An estimated 55.2% of people aged 18 or over in Oxfordshire are classified as overweight or obese (2018/19), significantly lower than the average for England (62.3%) and the South East (60.9%)
This percentage for Oxfordshire is similar to the percentage in 2015/16 (54.5%)
Adult overweight and obesity
Public Health England, Physical Activity Profile , Whole systems approach to obesity
Introduction
Summary
Behavioural risk factors of disease
Smoking
E-cigarette use
Alcohol consumption
Alcohol-related hospital admissions
Drug use
Drug misuse related hospital admissions
Dietary risk factors
Overweight and obesity – adult
Overweight and obesity - child
Physical activity – adult
Physical activity - child
Sexual health
Teenage conceptions
Breastfeeding & low birth weight
Oral health
Volunteering
Gambling
Finding out more
Percentage of adults (18+) classified as overweight or obese, 2018/19
updated

Behavioural
determinants of
health
Health
conditions and
causes of death
Population groups
and protected
characteristics
Population
Wider
determinants of
health
Service Use Local researchExecutive
summary
Oxfordshire Joint Strategic Needs Assessment 2021 155
72% of GP registered adults (aged 18+) with Learning Disabilities in Oxfordshire had a BMI test in 2018/19 (68% in England)
Of those people with Learning Disabilities and having a BMI test, 40% were measured as obese (39% in England)
Obesity of Adults with Learning Disabilities
NHS Digital Health and Care of People with Learning Disabilities 2018/19 (Jan2020); note that more recent data for 2019/20 is missing the indicator for the number of people with Learning Disabilities who had a BMI check
Introduction
Summary
Behavioural risk factors of disease
Smoking
E-cigarette use
Alcohol consumption
Alcohol-related hospital admissions
Drug use
Drug misuse related hospital admissions
Dietary risk factors
Overweight and obesity – adult
Overweight and obesity - child
Physical activity – adult
Physical activity - child
Sexual health
Teenage conceptions
Breastfeeding & low birth weight
Oral health
Volunteering
Gambling
Finding out more
% of adults (aged 18+) with BMI check
who were measured as obese (2018/19)
new

Behavioural
determinants of
health
Health
conditions and
causes of death
Population groups
and protected
characteristics
Population
Wider
determinants of
health
Service Use Local researchExecutive
summary
Introduction
Summary
Behavioural risk factors of disease
Smoking
E-cigarette use
Alcohol consumption
Alcohol-related hospital admissions
Drug use
Drug misuse related hospital admissions
Dietary risk factors
Overweight and obesity – adult
Overweight and obesity - child
Physical activity – adult
Physical activity - child
Sexual health
Teenage conceptions
Breastfeeding & low birth weight
Oral health
Volunteering
Gambling
Finding out more
National data show that overweight and obesity prevalence tends to be higher in older age groups, ranging from 35.4% in the 18-24 years age group to 71.9% in the 65-74 years age group
White British and Black ethnic groups have significantly higher prevalence than the national average (62.3%); prevalence in all other ethnic groups is significantly lower
Prevalence is higher in males (68.5%) than in females (56.1%)
Obesity increases with deprivation, with 65.0% people living in the most deprived areas experiencing overweight or obesity, compared to 57.7% people living in the least deprived areas
71% of those who were disabled are overweight or obese, compared to 61% of those who are not disabled
Obesity prevalence also decreases as education level increases
% adults overweight or obese,
England 2018/19
Oxfordshire Joint Strategic Needs Assessment 2021 156
Inequalities in adult overweight and obesity - national
Public Health England, Physical Activity Profile
%
updated

Behavioural
determinants of
health
Health
conditions and
causes of death
Population groups
and protected
characteristics
Population
Wider
determinants of
health
Service Use Local researchExecutive
summary
Oxfordshire Joint Strategic Needs Assessment 2021 157
Excess weight in children
Public Health England, NCMP and Child Obesity ProfilePublic Health England, Childhood Obesity: applying all our health
Introduction
Summary
Behavioural risk factors of disease
Smoking
E-cigarette use
Alcohol consumption
Alcohol-related hospital admissions
Drug use
Drug misuse related hospital admissions
Dietary risk factors
Overweight and obesity – adult
Overweight and obesity - child
Physical activity – adult
Physical activity - child
Sexual health
Teenage conceptions
Breastfeeding & low birth weight
Oral health
Volunteering
Gambling
Finding out more
Reception
Year 6
Obesity is associated with poor psychological and emotional health. Obese children are more likely to become obese adults with a higher risk of morbidity, disability and premature mortality in adulthood.
The majority of measured children in Oxfordshire are a healthy weight (8 out of 10 Reception children; 7 in 10 Year 6 children).
Since 2007/08, overweight or obesity prevalence has remained relatively stable in Oxfordshire for both reception and year 6.
In 2019/20, around 18.6% of Reception year children, aged 4 or 5, in Oxfordshire were overweight or obese. This included 6.7% of all children who were obese, and 1.5% who were severely obese.
Overweight and obesity prevalence increases over the course of primary school - in Year 6, aged 10 or 11, 29.4% of children were overweight or obese. This included 16.1% of all children who were obese, and 3.0% of children who were severely obese.
Prevalence of underweight is also higher by Year 6: 1.0% in Reception compared to 1.5% in Year 6
The National Child Measurement Programme (NCMP) measures the height and weight of children in Reception year and Year 6 attending participating state maintained schools in England. The 2019/20 NCMP data collection stopped in March 2020 when schools were closed due to the Covid-19 pandemic. In a usual NCMP collection year, national participation rates are around 95% of all eligible children, however in 2019/20 the number of children measured was around 75% of previous years.
updated

Behavioural
determinants of
health
Health
conditions and
causes of death
Population groups
and protected
characteristics
Population
Wider
determinants of
health
Service Use Local researchExecutive
summary
Oxfordshire Joint Strategic Needs Assessment 2021 158
Childhood obesity - inequalities
Public Health England, NCMP and Child Obesity Profile
Introduction
Summary
Behavioural risk factors of disease
Smoking
E-cigarette use
Alcohol consumption
Alcohol-related hospital admissions
Drug use
Drug misuse related hospital admissions
Dietary risk factors
Overweight and obesity – adult
Overweight and obesity - child
Physical activity – adult
Physical activity - child
Sexual health
Teenage conceptions
Breastfeeding & low birth weight
Oral health
Volunteering
Gambling
Finding out more
Obesity prevalence is higher in boys than in girls in Oxfordshire, and the disparity increases between Reception and Year 6
In Reception, 7.5% of boys were obese compared to 6.9% of girls
This difference is not statistically significant
By Year 6, 18.1% of boys were obese, compared to 14.2% of girls
This difference is statistically significant
National data show that ethnicity has an effect on obesity prevalence in both Year 6 and Reception boys and girls
Obesity prevalence by age and gender,
Oxfordshire, 2015/16-19/20 combined
Obesity prevalence is highest in children from Black, Pakistani, and Bangladeshi ethnic groups
Ethnic disparities in obesity prevalence are in general greater in Year 6 than in Reception
updated

Behavioural
determinants of
health
Health
conditions and
causes of death
Population groups
and protected
characteristics
Population
Wider
determinants of
health
Service Use Local researchExecutive
summary
Oxfordshire Joint Strategic Needs Assessment 2021 159
Inequalities in childhood obesity - national
Public Health England, NCMP and Child Obesity Profile
Introduction
Summary
Behavioural risk factors of disease
Smoking
E-cigarette use
Alcohol consumption
Alcohol-related hospital admissions
Drug use
Drug misuse related hospital admissions
Dietary risk factors
Overweight and obesity – adult
Overweight and obesity - child
Physical activity – adult
Physical activity - child
Sexual health
Teenage conceptions
Breastfeeding & low birth weight
Oral health
Volunteering
Gambling
Finding out more
Weight categories of children across deprivation deciles, England 2019/20
National data show that prevalence of healthy weight decreases as deprivation increases
In Reception, 27% of children in the most deprived decile are overweight (including obese), compared to 17% of children in the least deprived decile
In Year 6, 42% of children in the most deprived decile are overweight (including obese), compared to 25% of children in the least deprived decile
% %
Least
deprived
Most
deprived
updated

Behavioural
determinants of
health
Health
conditions and
causes of death
Population groups
and protected
characteristics
Population
Wider
determinants of
health
Service Use Local researchExecutive
summary
Oxfordshire Joint Strategic Needs Assessment 2021 160
At small area level, numbers of children measured are small so data are reported for years 2017/18 to 2019/20 combined. Additionally, the 2019/20 NCMP data collection stopped in March 2020 when schools were closed due to the Covid-19 pandemic, which means data for some areas is not robust and has not been published. Data is available at ward level, but has been suppressed to a higher degree than data at MSOA level; for this reason we have reported data by MSOA.
The prevalence of obesity varies within Oxfordshire.
In Reception (aged 4 or 5), obesity prevalence ranges from 3.6% in Botley and Kennington to 12.5% in Kingston Bagpuize & East Hanney.
Areas (MSOAs) that have a significantly higher obesity prevalence than the Oxfordshire average include: Littlemore & Rose Hill; Cowley North; Bicester West; Abingdon South; Chalgrove, Stadhampton & Dorchester; Banbury Ruscote; Blackbird Leys.
Childhood obesity map - ReceptionIntroduction
Summary
Behavioural risk factors of disease
Smoking
E-cigarette use
Alcohol consumption
Alcohol-related hospital admissions
Drug use
Drug misuse related hospital admissions
Dietary risk factors
Overweight and obesity – adult
Overweight and obesity - child
Physical activity – adult
Physical activity - child
Sexual health
Teenage conceptions
Breastfeeding & low birth weight
Oral health
Volunteering
Gambling
Finding out morePublic Health England, Childhood obesity and excess weight: small area level data
updated

Behavioural
determinants of
health
Health
conditions and
causes of death
Population groups
and protected
characteristics
Population
Wider
determinants of
health
Service Use Local researchExecutive
summary
Oxfordshire Joint Strategic Needs Assessment 2021 161
Childhood obesity – Reception trends in areas significantly higher than Oxfordshire average
Public Health England, Childhood obesity and excess weight: small area level data
Introduction
Summary
Behavioural risk factors of disease
Smoking
E-cigarette use
Alcohol consumption
Alcohol-related hospital admissions
Drug use
Drug misuse related hospital admissions
Dietary risk factors
Overweight and obesity – adult
Overweight and obesity - child
Physical activity – adult
Physical activity - child
Sexual health
Teenage conceptions
Breastfeeding & low birth weight
Oral health
Volunteering
Gambling
Finding out more
The charts below show trends in obesity for MSOAs that have significantly higher prevalence of obesity than the Oxfordshire average
updated
Prevalence of obesity among Reception Year children in MSOA compared to Oxfordshire
and England, NCMP 2008/09 to 2019/20
95%
confidence
interval
95%
confidence
interval
Key:

Behavioural
determinants of
health
Health
conditions and
causes of death
Population groups
and protected
characteristics
Population
Wider
determinants of
health
Service Use Local researchExecutive
summary
Oxfordshire Joint Strategic Needs Assessment 2021 162
Childhood obesity – Reception trends in areas significantly higher than Oxfordshire averageIntroduction
Summary
Behavioural risk factors of disease
Smoking
E-cigarette use
Alcohol consumption
Alcohol-related hospital admissions
Drug use
Drug misuse related hospital admissions
Dietary risk factors
Overweight and obesity – adult
Overweight and obesity - child
Physical activity – adult
Physical activity - child
Sexual health
Teenage conceptions
Breastfeeding & low birth weight
Oral health
Volunteering
Gambling
Finding out more
Prevalence of obesity among Reception Year children in MSOA compared to
Oxfordshire and England, NCMP 2008/09 to 2019/20
Public Health England, Childhood obesity and excess weight: small area level data
updated

Behavioural
determinants of
health
Health
conditions and
causes of death
Population groups
and protected
characteristics
Population
Wider
determinants of
health
Service Use Local researchExecutive
summary
Oxfordshire Joint Strategic Needs Assessment 2021 163
Childhood obesity – Reception trends in areas significantly higher than Oxfordshire averageIntroduction
Summary
Behavioural risk factors of disease
Smoking
E-cigarette use
Alcohol consumption
Alcohol-related hospital admissions
Drug use
Drug misuse related hospital admissions
Dietary risk factors
Overweight and obesity – adult
Overweight and obesity - child
Physical activity – adult
Physical activity - child
Sexual health
Teenage conceptions
Breastfeeding & low birth weight
Oral health
Volunteering
Gambling
Finding out more
Prevalence of obesity among Reception Year children in MSOA compared to
Oxfordshire and England, NCMP 2008/09 to 2019/20
Public Health England, Childhood obesity and excess weight: small area level data
updated

Behavioural
determinants of
health
Health
conditions and
causes of death
Population groups
and protected
characteristics
Population
Wider
determinants of
health
Service Use Local researchExecutive
summary
Oxfordshire Joint Strategic Needs Assessment 2021 164
At small area level, numbers of children measured are small so data are reported for years 2017/18 to 2019/20 combined. Additionally, the 2019/20 NCMP data collection stopped in March 2020 when schools were closed due to the Covid-19 pandemic, which means data for some areas is not robust and has not been published. Data is available at ward level, but has been suppressed to a higher degree than data at MSOA level; for this reason we have reported data by MSOA.
In Year 6 (aged 10 or 11), obesity prevalence ranges from 7.4% in North Central Oxford to 27.6% in Didcot South East
Areas (MSOAs) that have a significantly higher prevalence than the Oxfordshire average include: Didcot South East
Banbury Ruscote
Blackbird Leys
Greater Leys
Faringdon & Stanford
Cowley North
Banbury Neithrop
Begbroke, Yarnton & Water Eaton
Childhood obesity map – Year 6Introduction
Summary
Behavioural risk factors of disease
Smoking
E-cigarette use
Alcohol consumption
Alcohol-related hospital admissions
Drug use
Drug misuse related hospital admissions
Dietary risk factors
Overweight and obesity – adult
Overweight and obesity - child
Physical activity – adult
Physical activity - child
Sexual health
Teenage conceptions
Breastfeeding & low birth weight
Oral health
Volunteering
Gambling
Finding out more Public Health England, Childhood obesity and excess weight: small area level data
updated

Behavioural
determinants of
health
Health
conditions and
causes of death
Population groups
and protected
characteristics
Population
Wider
determinants of
health
Service Use Local researchExecutive
summary
Oxfordshire Joint Strategic Needs Assessment 2021 165
Childhood obesity – Year 6 trends in areas significantly higher than Oxfordshire averageIntroduction
Summary
Behavioural risk factors of disease
Smoking
E-cigarette use
Alcohol consumption
Alcohol-related hospital admissions
Drug use
Drug misuse related hospital admissions
Dietary risk factors
Overweight and obesity – adult
Overweight and obesity - child
Physical activity – adult
Physical activity - child
Sexual health
Teenage conceptions
Breastfeeding & low birth weight
Oral health
Volunteering
Gambling
Finding out more
Prevalence of obesity among Year 6 children in MSOA compared to Oxfordshire
and England, NCMP 2008/09 to 2019/20
Public Health England, Childhood obesity and excess weight: small area level data
updated

Behavioural
determinants of
health
Health
conditions and
causes of death
Population groups
and protected
characteristics
Population
Wider
determinants of
health
Service Use Local researchExecutive
summary
Oxfordshire Joint Strategic Needs Assessment 2021 166
Childhood obesity – Year 6 trends in areas significantly higher than Oxfordshire averageIntroduction
Summary
Behavioural risk factors of disease
Smoking
E-cigarette use
Alcohol consumption
Alcohol-related hospital admissions
Drug use
Drug misuse related hospital admissions
Dietary risk factors
Overweight and obesity – adult
Overweight and obesity - child
Physical activity – adult
Physical activity - child
Sexual health
Teenage conceptions
Breastfeeding & low birth weight
Oral health
Volunteering
Gambling
Finding out more
Prevalence of obesity among Year 6 children in MSOA compared to Oxfordshire
and England, NCMP 2008/09 to 2019/20
Public Health England, Childhood obesity and excess weight: small area level data
updated

Behavioural
determinants of
health
Health
conditions and
causes of death
Population groups
and protected
characteristics
Population
Wider
determinants of
health
Service Use Local researchExecutive
summary
Oxfordshire Joint Strategic Needs Assessment 2021 167
In general, the more time spent being physically active, the greater the health benefits
Improvements in health are especially significant for those currently doing the lowest levels of activity (fewer than 30 minutes per week), as the gains per additional minute of physical activity will be proportionately greater
In 2019, Low Physical Activity caused 121 (2.2% of total) deaths and 676 years lived with disability (YLDs) in Oxfordshire, due to cardiovascular diseases, diabetes and kidney disease, and neoplasms
Physical activity
Institute for Health Metrics and Evaluation (IHME), GBD Compare (Accessed 12.1.21)Department of Health and Social Care, UK Chief Medical Officers' Physical Activity Guidelines
Introduction
Summary
Behavioural risk factors of disease
Smoking
E-cigarette use
Alcohol consumption
Alcohol-related hospital admissions
Drug use
Drug misuse related hospital admissions
Dietary risk factors
Overweight and obesity – adult
Overweight and obesity - child
Physical activity – adult
Physical activity - child
Sexual health
Teenage conceptions
Breastfeeding & low birth weight
Oral health
Volunteering
Gambling
Finding out more
Dose-response curve of physical activity and health benefits
updated

Behavioural
determinants of
health
Health
conditions and
causes of death
Population groups
and protected
characteristics
Population
Wider
determinants of
health
Service Use Local researchExecutive
summary
Oxfordshire Joint Strategic Needs Assessment 2021 168
CMO guidelines are for adults to achieve at least 150 minutes of moderate intensity activity per week
Guidelines can also be met by doing 75 minutes of vigorous activity per week, or a combination of moderate and vigorous
There are also specific guidelines for disabled adults, pregnant women, and women after childbirth – though these all aim for 150 minutes moderate intensity activity every week
Chief Medical Officer (CMO) guidelines for adults’ physical activity
Department of Health and Social Care, UK Chief Medical Officers' Physical Activity Guidelines
Introduction
Summary
Behavioural risk factors of disease
Smoking
E-cigarette use
Alcohol consumption
Alcohol-related hospital admissions
Drug use
Drug misuse related hospital admissions
Dietary risk factors
Overweight and obesity – adult
Overweight and obesity - child
Physical activity – adult
Physical activity - child
Sexual health
Teenage conceptions
Breastfeeding & low birth weight
Oral health
Volunteering
Gambling
Finding out more

Behavioural
determinants of
health
Health
conditions and
causes of death
Population groups
and protected
characteristics
Population
Wider
determinants of
health
Service Use Local researchExecutive
summary
Oxfordshire Joint Strategic Needs Assessment 2021 169
A slightly higher percentage of Oxfordshire adults meets the physical activity guideline than national and regional figures, but 1 in 4 Oxfordshire adults do not
Nationally, the data show that participation in physical activity is lower in older age groups, more deprived groups, unemployed or economically inactive groups, routine and manual workers, those who had never worked or were unemployed, and people with disability
Percentage of physically active adults was lower in Asian, Black, and Chinese ethnic groups than the average
A higher percentage of males were physically active than females
See also: active travel (walking and cycling)
Physical activity in adults - overall
Public Health England, Physical Activity Profile
Introduction
Summary
Behavioural risk factors of disease
Smoking
E-cigarette use
Alcohol consumption
Alcohol-related hospital admissions
Drug use
Drug misuse related hospital admissions
Dietary risk factors
Overweight and obesity – adult
Overweight and obesity - child
Physical activity – adult
Physical activity - child
Sexual health
Teenage conceptions
Breastfeeding & low birth weight
Oral health
Volunteering
Gambling
Finding out more
% of Oxfordshire adults (19+) meeting physical activity recommendations, 2018/19
updated

Behavioural
determinants of
health
Health
conditions and
causes of death
Population groups
and protected
characteristics
Population
Wider
determinants of
health
Service Use Local researchExecutive
summary
Oxfordshire Joint Strategic Needs Assessment 2021 170
These estimates are calculated using the same data as local authority figures (previous page), but use adults aged 16+ as their population. They report the proportion of people meeting CMO physical activity guidelines for adults (150 minutes per week). Current CMO guidelines for 16-18 year olds recommend at least 60 minutes and up to several hours of physical activity per day
These estimates indicate that the proportion of people aged 16+ meeting adult physical activity guidelines tends to be higher in more affluent areas of the county
Percentages are lowest in the south of Oxford (Blackbird Leys, Northfield Brook, Littlemore), Banbury (Ruscote and Neithrop), Bicester and Kidlington
Physical activity in adults - mapIntroduction
Summary
Behavioural risk factors of disease
Smoking
E-cigarette use
Alcohol consumption
Alcohol-related hospital admissions
Drug use
Drug misuse related hospital admissions
Dietary risk factors
Overweight and obesity – adult
Overweight and obesity - child
Physical activity – adult
Physical activity - child
Sexual health
Teenage conceptions
Breastfeeding & low birth weight
Oral health
Volunteering
Gambling
Finding out more Sport England, Small area estimates
No update available

Behavioural
determinants of
health
Health
conditions and
causes of death
Population groups
and protected
characteristics
Population
Wider
determinants of
health
Service Use Local researchExecutive
summary
Oxfordshire Joint Strategic Needs Assessment 2021 171
Guidelines for children aged between 5 and 18 are to achieve 60 minutes physical activity per day. This can be an average of 60 minutes per day across the week
For children under 5 years the guidelines are for 180 minutes activity per day
Keeping active can help to build confidence and social skills; develop coordination; improve concentration and learning; strengthen muscles and bones; improve health and fitness; maintain healthy weight; sleep better
CMO guidelines for children’s physical activity
Department of Health and Social Care, UK Chief Medical Officers' Physical Activity Guidelines
Introduction
Summary
Behavioural risk factors of disease
Smoking
E-cigarette use
Alcohol consumption
Alcohol-related hospital admissions
Drug use
Drug misuse related hospital admissions
Dietary risk factors
Overweight and obesity – adult
Overweight and obesity - child
Physical activity – adult
Physical activity - child
Sexual health
Teenage conceptions
Breastfeeding & low birth weight
Oral health
Volunteering
Gambling
Finding out more

Behavioural
determinants of
health
Health
conditions and
causes of death
Population groups
and protected
characteristics
Population
Wider
determinants of
health
Service Use Local researchExecutive
summary
In the academic year 2019/20, 58.4% of children and young people in Oxfordshire were achieving an average of 60 minutes of physical activity per day, higher than the national average of 44.9%
Although encouraging, and a significant increase since 2017/18, this means that there could be 37,600 children in Oxfordshire schools not doing enough physical activity
Oxfordshire Joint Strategic Needs Assessment 2021 172
Physical activity in childrenIntroduction
Summary
Behavioural risk factors of disease
Smoking
E-cigarette use
Alcohol consumption
Alcohol-related hospital admissions
Drug use
Drug misuse related hospital admissions
Dietary risk factors
Overweight and obesity – adult
Overweight and obesity - child
Physical activity – adult
Physical activity - child
Sexual health
Teenage conceptions
Breastfeeding & low birth weight
Oral health
Volunteering
Gambling
Finding out more
Sport and Physical Activity levels of Children and
Young People in school years 1-11 These estimates include the
activities of walking, cycling, dance, fitness activities, sporting activities, riding a scooter, and active play and informal activities
Active – Doing an average of 60 minutes or more a day across the week (420+ minutes pw)
Fairly active – Doing an average of 30-59 minutes a day across the week (210-419 minutes a week)
Less active – Doing less than an average of 30 minutes a day across the week (less than 210 minutes a week)
Sport England, Active Lives Children and Young people Survey 2019/20
updated

Behavioural
determinants of
health
Health
conditions and
causes of death
Population groups
and protected
characteristics
Population
Wider
determinants of
health
Service Use Local researchExecutive
summary
Oxfordshire Joint Strategic Needs Assessment 2021 173
National data show that a higher proportion of boys (47.1%) are active than girls (42.7%)
Physical activity is highest in White and Mixed ethnic groups, but splitting by gender shows that this is not always the case
Inequalities in children’s physical activity - nationalIntroduction
Summary
Behavioural risk factors of disease
Smoking
E-cigarette use
Alcohol consumption
Alcohol-related hospital admissions
Drug use
Drug misuse related hospital admissions
Dietary risk factors
Overweight and obesity – adult
Overweight and obesity - child
Physical activity – adult
Physical activity - child
Sexual health
Teenage conceptions
Breastfeeding & low birth weight
Oral health
Volunteering
Gambling
Finding out more
Sport and Physical Activity levels of Children and Young People,
school years 1-11, 2019/20
Sport England, Active Lives Children and Young people Survey 2019/20
updated

Behavioural
determinants of
health
Health
conditions and
causes of death
Population groups
and protected
characteristics
Population
Wider
determinants of
health
Service Use Local researchExecutive
summary
Oxfordshire Joint Strategic Needs Assessment 2021 174
Analysis by Sport England compared activity in the summer term (mid-May to late-July) 2020 to the summer term in 2019.
The proportion of children and young people reporting they were active during mid-May to late-July (the summer term) fell by 2.3 percentage points (pp) compared to the same period 12 months earlier.
Whilst activity levels in all groups have been impacted, the impact was greater for some groups than others:
Boys saw a notable drop in activity levels: down 6.4pp to 51% in 2020
Girls saw activity levels increase: up 2.4pp to 52% in 2020
Whilst activity levels did not change amongst those from the least affluent families, they remain lower than for those from the most affluent families
Activity levels have fallen for children and young people from Asian, Black, Mixed and Other ethnic groups, but those drops are of a greater magnitude amongst boys from Mixed ethnicities and all children and young people from Black, and Other ethnic groups.
Children’s physical activity and COVID-19- national
Sport England, Active Lives Children and Young People Survey Coronavirus (covid-19) Report
Introduction
Summary
Behavioural risk factors of disease
Smoking
E-cigarette use
Alcohol consumption
Alcohol-related hospital admissions
Drug use
Drug misuse related hospital admissions
Dietary risk factors
Overweight and obesity – adult
Overweight and obesity - child
Physical activity – adult
Physical activity - child
Sexual health
Teenage conceptions
Breastfeeding & low birth weight
Oral health
Volunteering
Gambling
Finding out more
new

Behavioural
determinants of
health
Health
conditions and
causes of death
Population groups
and protected
characteristics
Population
Wider
determinants of
health
Service Use Local researchExecutive
summary
Walking, cycling and fitness saw increases compared to the same period 12 months earlier. More children and young people reported going for a walk (+22.2 percentage points (pp)), doing fitness activities (+22.1 pp) and cycling for fun or fitness (+18.4 pp)
Oxfordshire Joint Strategic Needs Assessment 2021 175
Children’s physical activity and COVID-19- national
Sport England, Active Lives Children and Young People Survey Coronavirus (covid-19) Report
Introduction
Summary
Behavioural risk factors of disease
Smoking
E-cigarette use
Alcohol consumption
Alcohol-related hospital admissions
Drug use
Drug misuse related hospital admissions
Dietary risk factors
Overweight and obesity – adult
Overweight and obesity - child
Physical activity – adult
Physical activity - child
Sexual health
Teenage conceptions
Breastfeeding & low birth weight
Oral health
Volunteering
Gambling
Finding out more
Participation in activities in the last week, years 1-11, summer term
new

Behavioural
determinants of
health
Health
conditions and
causes of death
Population groups
and protected
characteristics
Population
Wider
determinants of
health
Service Use Local researchExecutive
summary
Oxfordshire Joint Strategic Needs Assessment 2021 176
The number of people children and young people could meet from outside their household was restricted during this period and this impacted the activities they could do.
Large decreases were seen in team sports (-24.4%) and swimming (-23.5%).
Children’s physical activity and COVID-19- national
Sport England, Active Lives Children and Young People Survey Coronavirus (covid-19) Report
Introduction
Summary
Behavioural risk factors of disease
Smoking
E-cigarette use
Alcohol consumption
Alcohol-related hospital admissions
Drug use
Drug misuse related hospital admissions
Dietary risk factors
Overweight and obesity – adult
Overweight and obesity - child
Physical activity – adult
Physical activity - child
Sexual health
Teenage conceptions
Breastfeeding & low birth weight
Oral health
Volunteering
Gambling
Finding out more
Participation in activities in the last week, years 1-11, summer term
new

Behavioural
determinants of
health
Health
conditions and
causes of death
Population groups
and protected
characteristics
Population
Wider
determinants of
health
Service Use Local researchExecutive
summary
Sexual and reproductive health
Oxfordshire Joint Strategic Needs Assessment 2021 177

Behavioural
determinants of
health
Health
conditions and
causes of death
Population groups
and protected
characteristics
Population
Wider
determinants of
health
Service Use Local researchExecutive
summary
Oxfordshire Joint Strategic Needs Assessment 2021 178
STIs are a major public health concern, which may seriously impact the health and wellbeingof affected individuals, as well as being costly to healthcare services. If left undiagnosed anduntreated, common STIs can cause a range of complications and long-term health problems,from adverse pregnancy outcomes to neonatal and infant infections, and cardiovascular andneurological damage.
Sexually Transmitted Infections
Public Health England, Sexual and Reproductive Health Profiles and Health Matters: Preventing STIsSee also: Oxfordshire Sexual Health Needs Assessment 2018 and Spotlight on Sexually transmitted infections in the South East
Introduction
Summary
Behavioural risk factors of disease
Smoking
E-cigarette use
Alcohol consumption
Alcohol-related hospital admissions
Drug use
Drug misuse related hospital admissions
Dietary risk factors
Overweight and obesity – adult
Overweight and obesity - child
Physical activity – adult
Physical activity - child
Sexual health
Teenage conceptions
Breastfeeding & low birth weight
Oral health
Volunteering
Gambling
Finding out more
In 2019, the rate of new STI diagnoses (excluding chlamydia in under 25s) in Oxfordshire was 706 diagnoses per 100,000 people aged 15-64 – significantly lower than the England average (900 per 100,000), and similar to the rate in the South East (714 per 100,000).
Oxfordshire’s rate has decreased since 2012 and has consistently been significantly below the England average in this period.
Oxfordshire’s rate is equivalent to approximately 3,100 new diagnoses in 2019. The number of diagnoses is related to the number of tests taken – in the same year, 75,095 tests were taken by people in Oxfordshire.
New STI diagnoses (excluding chlamydia
in under 25s) per 100,000 population
updated

Behavioural
determinants of
health
Health
conditions and
causes of death
Population groups
and protected
characteristics
Population
Wider
determinants of
health
Service Use Local researchExecutive
summary
Oxfordshire Joint Strategic Needs Assessment 2021 179
Chlamydia diagnoses in 15-24 year olds are measured separately. In 2019, the rate of these diagnoses was 1,186 per 100,000 people in Oxfordshire, significantly lower than the South East (1,777) and England (2,043) rates. This may be influenced by the uptake of chlamydia testing.
The rate in Oxfordshire females was 1,388 per 100,000, significantly higher than the rate in males (751 per 100,000).
Reflecting national trends, STIs in Oxfordshire disproportionately affect young people (women in particular), Men who have Sex with Men (MSM), people of black ethnicity and those from more deprived backgrounds. Data on other high risk and hard to reach groups is lacking. Known inequalities in STI diagnosis rates affecting risk groups are greatest in Cherwell (compared to other districts).
Sexually Transmitted Infections
Public Health England, Sexual and Reproductive Health Profiles and Health Matters: Preventing STIs and Oxfordshire Sexual Health Needs Assessment 2018
Introduction
Summary
Behavioural risk factors of disease
Smoking
E-cigarette use
Alcohol consumption
Alcohol-related hospital admissions
Drug use
Drug misuse related hospital admissions
Dietary risk factors
Overweight and obesity – adult
Overweight and obesity - child
Physical activity – adult
Physical activity - child
Sexual health
Teenage conceptions
Breastfeeding & low birth weight
Oral health
Volunteering
Gambling
Finding out more
updated

Behavioural
determinants of
health
Health
conditions and
causes of death
Population groups
and protected
characteristics
Population
Wider
determinants of
health
Service Use Local researchExecutive
summary
Oxfordshire Joint Strategic Needs Assessment 2021 180
Research evidence, particularly from longitudinal studies, shows that teenage pregnancy is associated with poorer outcomes for both young parents and their children
The rate of teenage conceptions in Oxfordshire is significantly lower than the national average, and has been decreasing broadly in line with national and regional trends since the early 2000s. This has largely been driven by decreases in Oxford City.
In 2018/19, 0.3% of all Oxfordshire births were to mothers aged under 18
Teenage conceptions
This indicator measures all conceptions in females under 18 whether the pregnancy ends in birth or terminationPublic Health England, Sexual and Reproductive Health Profile
Introduction
Summary
Behavioural risk factors of disease
Smoking
E-cigarette use
Alcohol consumption
Alcohol-related hospital admissions
Drug use
Drug misuse related hospital admissions
Dietary risk factors
Overweight and obesity – adult
Overweight and obesity - child
Physical activity – adult
Physical activity - child
Sexual health
Teenage conceptions
Breastfeeding & low birth weight
Oral health
Volunteering
Gambling
Finding out more
Number and rate (per 1,000) of conceptions to females aged under 15-17 years
Area2017 2018 Recent
trendCount Rate Count Rate
Cherwell 24 9.5 22 8.8
Oxford 30 14.4 32 14.9
South Oxon 32 13.5 18 7.5
VoWH 18 8.5 19 9.2
West Oxon 17 9.5 19 10.7
Oxfordshire 121 11.1 110 10.1
South East 13.9 13.5
England 17.8 16.7
updated

Behavioural
determinants of
health
Health
conditions and
causes of death
Population groups
and protected
characteristics
Population
Wider
determinants of
health
Service Use Local researchExecutive
summary
Oxfordshire Joint Strategic Needs Assessment 2021 181
Breast milk provides the ideal nutrition for infants in the first stages of life. There is evidencethat babies who are breast fed experience lower levels of infection and child obesity, as wellas encouraging a strong bond between mother and baby. Breastfeeding initiation within 48hours of delivery is recorded in hospital, and is recorded again at the Health Visitor check at6-8 weeks after delivery.
In 2018/19, 98.7% of babies born to Oxfordshire mothers had a first feed of breastmilk, significantly higher than the average in England (67.4%), and the highest percentage in the South East region (72.7% regional average).
In 2019/20, prevalence of breastfeeding at 6-8 weeks in Oxfordshire was 61.2%, significantly higher than the prevalence in England overall (48%).
Low birth weight increases the risk of childhood mortality and has an influence on future adult health status. Risk factors for low birth weight include the health of the mother, particularly during the pregnancy including maternal smoking, substance misuse, nutritional status and maternal weight. Ethnicity, genetics, socioeconomic status, age and multiple pregnancy are also factors.
In 2018, 2.2% of live births at full term (at least 37 weeks gestational age) in Oxfordshire had a recorded birth weight under 2500g – statistically similar to the regional average (2.4%) and significantly lower than the national average (2.9%).
National data show that the proportion of births with low birth weight is highest in more deprived areas.
Breastfeeding and low birth weight
Public Health England, Child and Maternal Health profile
Introduction
Summary
Behavioural risk factors of disease
Smoking
E-cigarette use
Alcohol consumption
Alcohol-related hospital admissions
Drug use
Drug misuse related hospital admissions
Dietary risk factors
Overweight and obesity – adult
Overweight and obesity - child
Physical activity – adult
Physical activity - child
Sexual health
Teenage conceptions
Breastfeeding & low birth weight
Oral health
Volunteering
Gambling
Finding out more
updated

Behavioural
determinants of
health
Health
conditions and
causes of death
Population groups
and protected
characteristics
Population
Wider
determinants of
health
Service Use Local researchExecutive
summary
Oral health
Oxfordshire Joint Strategic Needs Assessment 2021 182

Behavioural
determinants of
health
Health
conditions and
causes of death
Population groups
and protected
characteristics
Population
Wider
determinants of
health
Service Use Local researchExecutive
summary
Oxfordshire Joint Strategic Needs Assessment 2021 183
Tooth decay is a predominantly preventable disease. Significant levels remain, resulting in pain, sleep loss, time off school and in some cases, treatment under general anaesthetic. High levels of consumption of sugar-containing food and drink is also a contributory factor to other issues of public health concern in children – for example, childhood obesity.
Oral health: one in five Oxfordshire children has tooth decay by age fiveIntroduction
Summary
Behavioural risk factors of disease
Smoking
E-cigarette use
Alcohol consumption
Alcohol-related hospital admissions
Drug use
Drug misuse related hospital admissions
Dietary risk factors
Overweight and obesity – adult
Overweight and obesity - child
Physical activity – adult
Physical activity - child
Sexual health
Teenage conceptions
Breastfeeding & low birth weight
Oral health
Volunteering
Gambling
Finding out more
% of 5 year olds with decayed, missing or filled teeth 21.3% of 5 year olds in Oxfordshire
had decay experience in 2019, lower (better) than the national average of 23.3%, though this difference is not statistically significant.
None of the districts were significantly different from the Oxfordshire or national figure.
The percentage in Oxford is significantly higher than the South East average.*
Those children with decay experience had an average of 3.2 decayed, missing, or filled teeth
National Dental Epidemiology Programme for England, Oral Health Survey of five-year-old children* Excludes Isle of Wight; Portsmouth; Southampton; Surrey; West Sussex
updated

Behavioural
determinants of
health
Health
conditions and
causes of death
Population groups
and protected
characteristics
Population
Wider
determinants of
health
Service Use Local researchExecutive
summary
Volunteering
Oxfordshire Joint Strategic Needs Assessment 2021 184

Behavioural
determinants of
health
Health
conditions and
causes of death
Population groups
and protected
characteristics
Population
Wider
determinants of
health
Service Use Local researchExecutive
summary
Oxfordshire Joint Strategic Needs Assessment 2021 185
In March 2020, the NHS advised over 20,000 clinically vulnerable residents in Oxfordshire to socially isolate for 3 months. In addition, many individuals who did not meet the criteria of being clinically vulnerable were otherwise vulnerable and chose to isolate. This resulted in immediate support requirements for food, social, and medical care.
To assist with these requirements, Oxfordshire NHS, CARE, councils, charities, and voluntary support groups set up a collaborate network of support. Between March and May 2020, over 15,000 volunteers were recorded as available to help.
Between March and May 2020, over 33,000 volunteering tasks had been recorded, including:
Medication deliveries
Emergency food boxes
Food shopping
Essential hygiene supplies
Check in and chat calls
Welfare checks
Wellness support from the street champions
Find out more at Oxfordshire All In (Oxfordshire) and Oxford Together (Oxford City).
Volunteering during the Covid-19 pandemic
VCSE/CSG Community Resilience report, 2020
Introduction
Summary
Behavioural risk factors of disease
Smoking
E-cigarette use
Alcohol consumption
Alcohol-related hospital admissions
Drug use
Drug misuse related hospital admissions
Dietary risk factors
Overweight and obesity – adult
Overweight and obesity - child
Physical activity – adult
Physical activity - child
Sexual health
Teenage conceptions
Breastfeeding & low birth weight
Oral health
Volunteering
Gambling
Finding out more
new

Behavioural
determinants of
health
Health
conditions and
causes of death
Population groups
and protected
characteristics
Population
Wider
determinants of
health
Service Use Local researchExecutive
summary
Oxfordshire Joint Strategic Needs Assessment 2021 186
There are many perceived benefits of volunteering, including:
enjoyment
personal achievement
making a difference
meeting new people, and contact with people from different backgrounds and cultures
broadening experience and skills
improved confidence, mental health and wellbeing
Research using the British Household Panel Study has also shown that volunteering in secondary school and college has a positive effect on first employment, and in turn on salaries later in life
It also showed that volunteering helps people return to work more rapidly after a break e.g. raising children or unemployment
Volunteering – national
NCVO, Time Well Spent survey 2019Social Science Research, The economic benefits of volunteering and social class
Introduction
Summary
Behavioural risk factors of disease
Smoking
E-cigarette use
Alcohol consumption
Alcohol-related hospital admissions
Drug use
Drug misuse related hospital admissions
Dietary risk factors
Overweight and obesity – adult
Overweight and obesity - child
Physical activity – adult
Physical activity - child
Sexual health
Teenage conceptions
Breastfeeding & low birth weight
Oral health
Volunteering
Gambling
Finding out more
No update available

Behavioural
determinants of
health
Health
conditions and
causes of death
Population groups
and protected
characteristics
Population
Wider
determinants of
health
Service Use Local researchExecutive
summary
Oxfordshire Joint Strategic Needs Assessment 2021 187
There is a lack of reliable data on volunteering rates in Oxfordshire. National data show that people living in the south of England were more likely to be recent volunteers than the England average (42% vs 38%) - they were also more likely to volunteer frequently (28% vs 25%)
Those educated to a higher level are more likely to have volunteered recently. Separating by working status, those working part-time (less than 8 hours a week) are most likely to have volunteered recently
Volunteering – national
NCVO, Time Well Spent survey 2019
Introduction
Summary
Behavioural risk factors of disease
Smoking
E-cigarette use
Alcohol consumption
Alcohol-related hospital admissions
Drug use
Drug misuse related hospital admissions
Dietary risk factors
Overweight and obesity – adult
Overweight and obesity - child
Physical activity – adult
Physical activity - child
Sexual health
Teenage conceptions
Breastfeeding & low birth weight
Oral health
Volunteering
Gambling
Finding out more
Proportion of recent volunteers, recent and frequent volunteers, and
those who have never volunteered (% of age group)
No update available

Behavioural
determinants of
health
Health
conditions and
causes of death
Population groups
and protected
characteristics
Population
Wider
determinants of
health
Service Use Local researchExecutive
summary
Gambling
Oxfordshire Joint Strategic Needs Assessment 2021 188

Behavioural
determinants of
health
Health
conditions and
causes of death
Population groups
and protected
characteristics
Population
Wider
determinants of
health
Service Use Local researchExecutive
summary
Gambling is a leisure activity enjoyed by many, and the majority of those who gamble appear to do so without signs of problematic behaviour. There are however some individuals who experience significant harm as a result of their gambling. Great Britain has one of the most accessible gambling markets in the world; opportunities to gamble exist on most high streets and, with the spread of the internet, in virtually every home.
In 2018, 54% of adults had participated in some form of gambling in the past 12 months. The proportion was highest in the 45-54 age group at 60%, and lowest in 16-24s with 39% NB most forms of gambling are illegal for under 18s which will affect gambling prevalence in the 16-24 age group
Participation in any online gambling in
the last 12 months by age and sex
Oxfordshire Joint Strategic Needs Assessment 2021 189
Gambling behaviour – national
NHS Digital, Health Survey for England 2018Gambling Commission, Gambling-related harm as a public health issue
Introduction
Summary
Behavioural risk factors of disease
Smoking
E-cigarette use
Alcohol consumption
Alcohol-related hospital admissions
Drug use
Drug misuse related hospital admissions
Dietary risk factors
Overweight and obesity – adult
Overweight and obesity - child
Physical activity – adult
Physical activity - child
Sexual health
Teenage conceptions
Breastfeeding & low birth weight
Oral health
Volunteering
Gambling
Finding out more
15% of men had participated in online gambling in the previous 12 months, compared with 4% of women
Unlike gambling overall, online gambling peaks in the 25-34 age group, then declines with age for both sexes. 28% of the 25-34 age group for men had participated in online gambling, compared with less than 5% of those aged 65 and over. Similarly, 9% of women in the 25 to 34 age group had participated in online gambling.
No update available

Behavioural
determinants of
health
Health
conditions and
causes of death
Population groups
and protected
characteristics
Population
Wider
determinants of
health
Service Use Local researchExecutive
summary
Oxfordshire Joint Strategic Needs Assessment 2021 190
For problem gamblers, harm can include higher levels of physical and mental illness, debt problems, relationship breakdown and, in some cases, criminality. It can also be associated with substance misuse. Younger males, and people from certain social and ethnic groups, are potentially more vulnerable than others.
The Health Survey for England 2018 identified at risk or problematic gambling in its population:
The Problem Gambling Severity Index (PGSI) consists of nine items ranging from ‘chasing losses’ to ‘gambling causing health problems’ to ‘feeling guilty about gambling’. Each item is scored and summed to create a total ranging from 0 to 27. A PGSI score of 8 or more represents a problem gambler.
The PGSI scores showed 0.4% of adults were identified as problem gamblers (score 8+) and 3.6% as problem or at-risk gamblers (score 1+)
The proportion of men identified as problem or at-risk gamblers is substantially higher than women, with 6% of men and 2% of women identified
The proportion of problem or at-risk gamblers decreases with age from between 5% and 7% in those age 16 to 44 to 1% of those age 75+
Problem gambling – national
Gambling Commission, Gambling-related harm as a public health issueNHS Digital, Health Survey for England 2018
Introduction
Summary
Behavioural risk factors of disease
Smoking
E-cigarette use
Alcohol consumption
Alcohol-related hospital admissions
Drug use
Drug misuse related hospital admissions
Dietary risk factors
Overweight and obesity – adult
Overweight and obesity - child
Physical activity – adult
Physical activity - child
Sexual health
Teenage conceptions
Breastfeeding & low birth weight
Oral health
Volunteering
Gambling
Finding out more
No update available

Behavioural
determinants of
health
Health
conditions and
causes of death
Population groups
and protected
characteristics
Population
Wider
determinants of
health
Service Use Local researchExecutive
summary
Oxfordshire Joint Strategic Needs Assessment 2021 191
The most common type of gambling activity that young people are taking part in is private bets for money (e.g. with friends) (5%) with a further 3% playing cards with friends for money; 4% of 11-16 year olds report playing on fruit or slot machines in the past seven days
Young people who say they have gambled in the past seven days spent an average of £17 on gambling during this period
Gambling in young people aged 11-16 - national
Gambling Commission, Young People and Gambling Survey 2019
Introduction
Summary
Behavioural risk factors of disease
Smoking
E-cigarette use
Alcohol consumption
Alcohol-related hospital admissions
Drug use
Drug misuse related hospital admissions
Dietary risk factors
Overweight and obesity – adult
Overweight and obesity - child
Physical activity – adult
Physical activity - child
Sexual health
Teenage conceptions
Breastfeeding & low birth weight
Oral health
Volunteering
Gambling
Finding out more
74% of 11-16 year olds say they know who they would go to for help if they had problems with gambling
No update available

Behavioural
determinants of
health
Health
conditions and
causes of death
Population groups
and protected
characteristics
Population
Wider
determinants of
health
Service Use Local researchExecutive
summary
Oxfordshire Joint Strategic Needs Assessment 2021 192
More information on many of these topics is available from Public Health England Fingertips tool, Health Survey for England, and Office for National Statistics. Other JSNA resources are available from Oxfordshire Insight
Explore obesity and related data with our Health Weight Story map
More specific resources and fact sheets are also available for:
Smoking: Action on Smoking and Health (ASH)
Alcohol: Alcohol Change UK, Alcohol Health Alliance UK, drinkaware, PHE alcohol dependence prevalence estimates, PHE evidence review, ONS alcohol specific deaths
Drug misuse: Crime Survey for England and Wales, PHE Drug health harms: national intelligence
Obesity: PHE obesity and the food environment, OECD: The heavy burden of obesity, CMO special report: Time to solve childhood obesity, Guys & St Thomas charity reports, PHE Childhood obesity: applying all our health, NHS Digital
Physical activity: UK CMO physical activity guidelines, PHE Physical Activity: Applying all our health, see also Wider Determinants of Health chapter for information about active and healthy travel, and healthy place-shaping
Sexual Health: PHE Health matters: preventing STIs, Spotlight on STIs in the South East, HIV in the UK, Women and HIV in the UK
Volunteering: NCVO research, Oxfordshire Community and Voluntary Action (OCVA), Oxfordshire All In
Gambling: Gambling Commission statistics and research
Other: Association for Young People's Health
Finding out moreIntroduction
Summary
Behavioural risk factors of disease
Smoking
E-cigarette use
Alcohol consumption
Alcohol-related hospital admissions
Drug use
Drug misuse related hospital admissions
Dietary risk factors
Overweight and obesity – adult
Overweight and obesity - child
Physical activity – adult
Physical activity - child
Sexual health
Teenage conceptions
Breastfeeding & low birth weight
Oral health
Volunteering
Gambling
Finding out more

Behavioural
determinants of
health
Health
conditions and
causes of death
Population groups
and protected
characteristics
Population
Wider
determinants of
health
Service Use Local researchExecutive
summary
Wider determinants of health
Oxfordshire Joint Strategic Needs Assessment 2021 193
Chapter 6

Behavioural
determinants of
health
Health
conditions and
causes of death
Population groups
and protected
characteristics
Population
Wider
determinants of
health
Service Use Local researchExecutive
summary
Oxfordshire Joint Strategic Needs Assessment 2021 194
This chapter provides data on economic and environmental factors that affect health and wellbeing, such as unemployment, poverty, housing, education and the environment.
Further JSNA resources are available via the JSNA page of Oxfordshire Insight.
Assessing the impact of COVID-19
This chapter includes the most recent datasets accessed in January 2021.
It has not always been possible to include data for 2020, in some cases as a result of delays in publication (e.g. Active Lives survey) or because the lockdowns meant that data was not collected (e.g. some education statistics).
IntroductionSummary
Work and income
Poverty and deprivation
Child poverty
Older People and poverty
Fuel poverty
Food poverty
Housing and Homelessness
Isolation and loneliness
Education and qualifications
Special Educational Needs
Early years
GCSE
Persistent absence
NEET and Apprenticeships
Healthy Place Shaping
Active travel
Air pollution
Green space
Climate change
Finding out more

Behavioural
determinants of
health
Health
conditions and
causes of death
Population groups
and protected
characteristics
Population
Wider
determinants of
health
Service Use Local researchExecutive
summary
Oxfordshire Joint Strategic Needs Assessment 2021 195
No single aspect of people’s lives determines their health and wellbeing. Factors as varied as employment status, transport options, quality of housing and access to green space all affect people’s health outcomes.
The wider determinants of health are the conditions in which people are born, grow, live work and age. They include social, cultural, political, economic, commercial and environmental factors.
The strongest influences on people’s health are social determinants such as their level of education, income, quality of housing and employment.
Wider Determinants of Health
The Health Foundation, Reframing the conversation on social determinants
Summary
Work and income
Poverty and deprivation
Child poverty
Older People and poverty
Fuel poverty
Food poverty
Housing and Homelessness
Isolation and loneliness
Education and qualifications
Special Educational Needs
Early years
GCSE
Persistent absence
NEET and Apprenticeships
Healthy Place Shaping
Active travel
Air pollution
Green space
Climate change
Finding out more

Behavioural
determinants of
health
Health
conditions and
causes of death
Population groups
and protected
characteristics
Population
Wider
determinants of
health
Service Use Local researchExecutive
summary
Oxfordshire Joint Strategic Needs Assessment 2021 196
Work, income and deprivation
Earnings of Oxfordshire residents have remained above the South East and national averages.
As a result of the COVID-19 lockdown in early 2020, the number of people claiming unemployment-related benefits in Oxfordshire increased significantly. This has particularly affected Oxford City and Cherwell and the younger age group.
The number of people from overseas registering for a National Insurance number in Oxfordshire has continued to decline.
There remain higher rates of child poverty in parts of Banbury and Oxford City.
After housing costs, 1 in 5 children in Oxfordshire are estimated to be living in poverty – within the city of Oxford this figure rises to 1 in 4.
In May 2020, a Good Food Oxford survey found the number of users of Community Food Services had increased by 3 times since the start of COVID-19.
Summary - 1
Housing and homelessness
House prices in Oxfordshire have continued to increase.
The housing affordability ratio has improved slightly in Oxfordshire (cheaper market housing had become more affordable for lower earners) but the county remains much less affordable than the England average.
The cost of renting privately in Oxfordshire remains well above the South East and national averages.
Isolation and loneliness have been found to be a significant health risk and a cause of increased use of health services.
Summary
Work and income
Poverty and deprivation
Child poverty
Older People and poverty
Fuel poverty
Food poverty
Housing and Homelessness
Isolation and loneliness
Education and qualifications
Special Educational Needs
Early years
GCSE
Persistent absence
NEET and Apprenticeships
Healthy Place Shaping
Active travel
Air pollution
Green space
Climate change
Finding out more
updated

Behavioural
determinants of
health
Health
conditions and
causes of death
Population groups
and protected
characteristics
Population
Wider
determinants of
health
Service Use Local researchExecutive
summary
Oxfordshire Joint Strategic Needs Assessment 2021 197
Education and qualifications
Schools in Oxford City have a diverse set of pupils with at least 100 different languages spoken in primary schools.
The number of pupils attending schools with Special Educational Needs support in Oxfordshire has increased at double the England rate.
A above-average proportion of pupils in Oxfordshire achieved good GCSE grades (grade 5-9) in 2019/20. Oxford City was below average.
In 2020, there was an increase in the rate of young people classified as Not in Education, Employment or Training in every district in Oxfordshire. The proportion in Cherwell more than doubled.
In 2020 the number of advertised vacancies for Apprenticeships in Oxfordshire fell significantly.
Summary -2
Physical and social environment
Healthy Place Shaping (HPS) is a strategic priority for Oxfordshire’s Health and Wellbeing Board and, in 2020, was embedded into the work of the Oxfordshire Growth Board.
The first lockdown of 2020 saw a significant fall in car use nationally and an increase in cycling.
Traffic sensors, mainly in Oxford City, showed a drop in cycling and walking in 2020, likely to have been a result of more people working from home, less student travel and a drop in tourism visits.
Climate change is expected to have a wide range of impacts on the health of the population.
Registrations of ultra low emission vehicles in Oxfordshire are increasing rapidly.
Summary
Work and income
Poverty and deprivation
Child poverty
Older People and poverty
Fuel poverty
Food poverty
Housing and Homelessness
Isolation and loneliness
Education and qualifications
Special Educational Needs
Early years
GCSE
Persistent absence
NEET and Apprenticeships
Healthy Place Shaping
Active travel
Air pollution
Green space
Climate change
Finding out more
updated

Behavioural
determinants of
health
Health
conditions and
causes of death
Population groups
and protected
characteristics
Population
Wider
determinants of
health
Service Use Local researchExecutive
summary
Work, unemployment and income
Oxfordshire Joint Strategic Needs Assessment 2021 198
Summary
Work and income
Poverty and deprivation
Child poverty
Older People and poverty
Fuel poverty
Food poverty
Housing and Homelessness
Isolation and loneliness
Education and qualifications
Special Educational Needs
Early years
GCSE
Persistent absence
NEET and Apprenticeships
Healthy Place Shaping
Active travel
Air pollution
Green space
Climate change
Finding out more

Behavioural
determinants of
health
Health
conditions and
causes of death
Population groups
and protected
characteristics
Population
Wider
determinants of
health
Service Use Local researchExecutive
summary
England £31,766
South East£34,219
Oxfordshire£35,738
£15,000
£20,000
£25,000
£30,000
£35,000
£40,000
Oxfordshire Joint Strategic Needs Assessment 2021 199
The latest year of earnings data (2020) shows Oxfordshire remaining (statistically) above the South East average on median pay of full-time workers.
Oxfordshire’s resident earnings increased from £34,600 in 2019 to £35,700 in 2020 (+£1,100). Across the South East, earnings grew from £33,400 to £33,200 (+£800).
Earnings of Oxfordshire residents
Annual Survey of Hours and Earnings April 2020 from nomis; Note: earnings data has not been adjusted for inflation.The median is the data value at which 50% of data values are above it and 50% of data values are below it.Note vertical axis does not start at zero; chart does not show confidence intervals
Median, gross annual pay of full time workers
updated
Summary
Work and income
Poverty and deprivation
Child poverty
Older People and poverty
Fuel poverty
Food poverty
Housing and Homelessness
Isolation and loneliness
Education and qualifications
Special Educational Needs
Early years
GCSE
Persistent absence
NEET and Apprenticeships
Healthy Place Shaping
Active travel
Air pollution
Green space
Climate change
Finding out more

Behavioural
determinants of
health
Health
conditions and
causes of death
Population groups
and protected
characteristics
Population
Wider
determinants of
health
Service Use Local researchExecutive
summary
Oxfordshire Joint Strategic Needs Assessment 2021 200
In 2020, median full time earnings of males was £38,989 and females was £31,797, a gap of £7,192.
This was the biggest gender pay gap (amount) in Oxfordshire in any year since 2008.
The gap between male and female full time earnings
Annual Survey of Hours and Earnings April 2020 from nomis. Note: earnings data has not been adjusted for inflation.The median is the data value at which 50% of data values are above it and 50% of data values are below it.
The gender pay gap in Oxfordshire has remained below the regional and national averages.
Full time pay of males was 23% more than females in Oxfordshire, compared with 18% in the South East and 25% in England.
Median gross full time annual pay of males and females
in Oxfordshire showing confidence intervals
0
5,000
10,000
15,000
20,000
25,000
30,000
35,000
40,000
45,000
£
Male Full Time
Female Full Time
Summary
Work and income
Poverty and deprivation
Child poverty
Older People and poverty
Fuel poverty
Food poverty
Housing and Homelessness
Isolation and loneliness
Education and qualifications
Special Educational Needs
Early years
GCSE
Persistent absence
NEET and Apprenticeships
Healthy Place Shaping
Active travel
Air pollution
Green space
Climate change
Finding out more
updated

Behavioural
determinants of
health
Health
conditions and
causes of death
Population groups
and protected
characteristics
Population
Wider
determinants of
health
Service Use Local researchExecutive
summary
76.3 82.5
70.4
76.2
505560657075808590
%
Oxfordshire
England
Oxfordshire Joint Strategic Needs Assessment 2021 201
According to the ONS Annual Population Survey, there has been an apparent increase in the rate of employment in Oxfordshire over 10 years from 76.3% of people aged 16-64 (Jul08-Jun09) to 82.5 (Jul19-Jun20), the difference is not statistically significant.
The latest data to June 2020, shows Oxfordshire’s employment rate remaining significantly above the England average.
Oxfordshire’s employment rate
Annual Population Survey from nomis. Note that district level data is based on a small sample and, therefore, subject to wider confidence intervals. Vertical axis does not start at zero. Chart shows confidence intervals; overlapping error bars means the difference is not statistically significant.
Employment rate in Oxfordshire and England, people aged 16-64
Summary
Work and income
Poverty and deprivation
Child poverty
Older People and poverty
Fuel poverty
Food poverty
Housing and Homelessness
Isolation and loneliness
Education and qualifications
Special Educational Needs
Early years
GCSE
Persistent absence
NEET and Apprenticeships
Healthy Place Shaping
Active travel
Air pollution
Green space
Climate change
Finding out more
updated

Behavioural
determinants of
health
Health
conditions and
causes of death
Population groups
and protected
characteristics
Population
Wider
determinants of
health
Service Use Local researchExecutive
summary
Oxfordshire Joint Strategic Needs Assessment 2021 202
In April 2020 and May 2020 there were significant increases in the number of people claiming unemployment related benefits in Oxfordshire (and nationally) as a result of the COVID-19 lockdown.
Claimant count data for December 2020 shows the number of people claiming unemployment-related benefits in Oxfordshire was 16,420, up from 6,230 in December 2019.
Unemployment trend
DWP from nomis For further information see Economy page on Oxfordshire Insight
Note that this does not include people on the Coronavirus Job Retention scheme.
As of 31 October 2020, there were 21,400 furloughed employments in Oxfordshire, a take-up of 6% compared with 7% take-up across England.
Summary
Work and income
Poverty and deprivation
Child poverty
Older People and poverty
Fuel poverty
Food poverty
Housing and Homelessness
Isolation and loneliness
Education and qualifications
Special Educational Needs
Early years
GCSE
Persistent absence
NEET and Apprenticeships
Healthy Place Shaping
Active travel
Air pollution
Green space
Climate change
Finding out more
new

Behavioural
determinants of
health
Health
conditions and
causes of death
Population groups
and protected
characteristics
Population
Wider
determinants of
health
Service Use Local researchExecutive
summary
Oxfordshire Joint Strategic Needs Assessment 2021 203
The breakdown of unemployment claimants by age shows the greatest numbers of new claimants are in the younger age groups.
Between December 2019 and December 2020 there was an increase of 2,105 in the number of young people aged 16-24 claiming unemployment benefits in Oxfordshire.
Unemployment by age
DWP from nomis For further information see Economy page on Oxfordshire Insight
Increase in Oxfordshire Claimants
Dec19 to Dec20 by age
Age group Dec-19 Dec-20 Change
16-17 15 30 +15 (+100%)
18-21 540 1,545 +1,005 (+186%)
22-24 395 1,475 +1,080 (+273%)
Total 16-24 950 3,050 +2,100 (+221%)
Increase in Oxfordshire
Claimants Dec19 to Dec20
youngest age group 16-24
Summary
Work and income
Poverty and deprivation
Child poverty
Older People and poverty
Fuel poverty
Food poverty
Housing and Homelessness
Isolation and loneliness
Education and qualifications
Special Educational Needs
Early years
GCSE
Persistent absence
NEET and Apprenticeships
Healthy Place Shaping
Active travel
Air pollution
Green space
Climate change
Finding out more
new

Behavioural
determinants of
health
Health
conditions and
causes of death
Population groups
and protected
characteristics
Population
Wider
determinants of
health
Service Use Local researchExecutive
summary
Oxfordshire Joint Strategic Needs Assessment 2021 204
The district with the highest number of unemployment claimants in December 2020 in Oxfordshire was Oxford City (4,795), followed by Cherwell (3,775).
Between December 2019 and December 2020, Cherwell had the greatest percentage point change in the unemployment (claimant) rate per population.
Unemployment by district
Dec-19 countRate per pop aged 16-64
Dec-20 countRate per pop aged 16-64
Dec-19 to Dec-20 ppt
change
Cherwell 1,275 1.4% 3,775 4.1% 2.69
Oxford 2,040 1.9% 4,705 4.4% 2.51
South Oxfordshire 1,010 1.2% 2,890 3.4% 2.22
Vale of White Horse 1,030 1.3% 2,695 3.3% 2.02
West Oxfordshire 875 1.3% 2,360 3.6% 2.25
Oxfordshire 6,230 1.4% 16,420 3.8% 2.36
England 2.9% 6.4% 3.51
DWP from nomis and ONS mid-2019 population estimates For further information see Economy page on Oxfordshire Insight
Count of unemployment claimants by district
Summary
Work and income
Poverty and deprivation
Child poverty
Older People and poverty
Fuel poverty
Food poverty
Housing and Homelessness
Isolation and loneliness
Education and qualifications
Special Educational Needs
Early years
GCSE
Persistent absence
NEET and Apprenticeships
Healthy Place Shaping
Active travel
Air pollution
Green space
Climate change
Finding out more
new

Behavioural
determinants of
health
Health
conditions and
causes of death
Population groups
and protected
characteristics
Population
Wider
determinants of
health
Service Use Local researchExecutive
summary
Oxfordshire Joint Strategic Needs Assessment 2021 205
The map shows the change in rates of unemployment across Oxfordshire between December 2019 and December 2020.
This is expressed as a percentage point difference between claimants (as a percentage of 16-64 population) in Dec-19 and the percentage in Dec-20.
Areas with the greatest increases in claimant rates are parts of Oxford, Oxfordshire’s main towns and a small number of rural areas.
To explore the latest unemployment data by local area in Oxfordshire please visit our unemployment dashboard.
Unemployment by area
DWP from nomis For further information see Economy page on Oxfordshire Insight
Summary
Work and income
Poverty and deprivation
Child poverty
Older People and poverty
Fuel poverty
Food poverty
Housing and Homelessness
Isolation and loneliness
Education and qualifications
Special Educational Needs
Early years
GCSE
Persistent absence
NEET and Apprenticeships
Healthy Place Shaping
Active travel
Air pollution
Green space
Climate change
Finding out more
new

Behavioural
determinants of
health
Health
conditions and
causes of death
Population groups
and protected
characteristics
Population
Wider
determinants of
health
Service Use Local researchExecutive
summary
Oxfordshire Joint Strategic Needs Assessment 2021 206
Just under 10% of Learning Disabled adults supported by long-term social care services in Oxfordshire were in employment in 2019/20 (9.3%)
This was above the regional (6.9%) and national (5.6%) averages
Employment of people with Learning Disabilities
NHS Digital Adult Social Care Outcomes Framework to 2019-20
Summary
Work and income
Poverty and deprivation
Child poverty
Older People and poverty
Fuel poverty
Food poverty
Housing and Homelessness
Isolation and loneliness
Education and qualifications
Special Educational Needs
Early years
GCSE
Persistent absence
NEET and Apprenticeships
Healthy Place Shaping
Active travel
Air pollution
Green space
Climate change
Finding out more
Proportion of working age (18-64) social care service users who
received long-term support during the year with a primary support
reason of learning disability support, who are in paid employment (%)
new

Behavioural
determinants of
health
Health
conditions and
causes of death
Population groups
and protected
characteristics
Population
Wider
determinants of
health
Service Use Local researchExecutive
summary
Oxfordshire Joint Strategic Needs Assessment 2021 207
The number of people from overseas registering for a NI number is an indication of inward migration for work
Between 2018-19 and 2019-20, National Insurance number registrations from overseas nationals (NINo) in Oxfordshire fell from 9,064 to 7,889 (-13%). This decline was equal to England, but less of a decline than the South East (-17%).
Overseas registrations for a National Insurance number
DWP National Insurance number allocations to adult overseas nationals entering the UK
National Insurance Number registrations by overseas nationals
Oxford City accounted for 54% of the Oxfordshire total in 2019-20 and Cherwell a further 19%.
Oxford City has decreased by 36% from its peak in 2015.
59% of overseas registrations in 2019-20 in Oxfordshire were from EU nationals.
Oxford City
Cherwell
1,8111,517
4,922
4,290
0
1,000
2,000
3,000
4,000
5,000
6,000
7,000
2014 2015 2016 2017 2018 2019 2020
Num
ber
of
regis
trati
ons
Year to June period
Cherwell
Oxford
South Oxfordshire
Vale of White Horse
West Oxfordshire
Summary
Work and income
Poverty and deprivation
Child poverty
Older People and poverty
Fuel poverty
Food poverty
Housing and Homelessness
Isolation and loneliness
Education and qualifications
Special Educational Needs
Early years
GCSE
Persistent absence
NEET and Apprenticeships
Healthy Place Shaping
Active travel
Air pollution
Green space
Climate change
Finding out more
updated

Behavioural
determinants of
health
Health
conditions and
causes of death
Population groups
and protected
characteristics
Population
Wider
determinants of
health
Service Use Local researchExecutive
summary
Poverty and deprivation
Oxfordshire Joint Strategic Needs Assessment 2021 208
Summary
Work and income
Poverty and deprivation
Child poverty
Older People and poverty
Fuel poverty
Food poverty
Housing and Homelessness
Isolation and loneliness
Education and qualifications
Special Educational Needs
Early years
GCSE
Persistent absence
NEET and Apprenticeships
Healthy Place Shaping
Active travel
Air pollution
Green space
Climate change
Finding out more

Behavioural
determinants of
health
Health
conditions and
causes of death
Population groups
and protected
characteristics
Population
Wider
determinants of
health
Service Use Local researchExecutive
summary
According to the Indices of Multiple Deprivation (IMD 2019), Oxfordshire was ranked the 10th least deprived of 151 upper-tier local authorities in England (up from 11th in 2015).
Oxfordshire had 1 out of 407 Lower Super Output Areas (LSOAs) ranked within the 10% most deprived areas nationally, part of Northfield Brook ward, south east Oxford.
A further 16 areas were ranked in the 20% most deprived areas nationally, 9 in Oxford City, 6 in Banbury and 1 in Abingdon.
Deprivation
Oxfordshire Joint Strategic Needs Assessment 2021 209
Summary
Work and income
Poverty and deprivation
Child poverty
Older People and poverty
Fuel poverty
Food poverty
Housing and Homelessness
Isolation and loneliness
Education and qualifications
Special Educational Needs
Early years
GCSE
Persistent absence
NEET and Apprenticeships
Healthy Place Shaping
Active travel
Air pollution
Green space
Climate change
Finding out more
Explore deprivation data using our interactive dashboard on Oxfordshire Insight
English indices of deprivation 2019 - GOV.UK (www.gov.uk)
new

Behavioural
determinants of
health
Health
conditions and
causes of death
Population groups
and protected
characteristics
Population
Wider
determinants of
health
Service Use Local researchExecutive
summary
Oxfordshire Joint Strategic Needs Assessment 2021 210
There are a number of sources of statistics on child poverty in local authority areas:
End Child Poverty statistics, published October 2020. These new estimates use HMRC and DWP estimates of child poverty before housing costs alongside household survey data and statistics on private rent to produce local estimates of children in poverty after housing costs.
HMRC and DWP: Starting in March 2020 (latest data), HMRC and DWP now produce joint local area estimates of the numbers of children in low income families. These estimates are based primarily on income data derived from tax, tax credit, and benefit records.
Indices of Deprivation, Income Deprivation Affecting Children Index, IMD 2019,datasets as of August 2015 from DWP and HMRC. August 2015 was chosen to allow a consistent definition of income deprivation and uses a combination of Universal Credit and legacy benefits (see IMD 2019 technical report).
This report includes child poverty statistics from all of the above sources.
NOTE on changes to measuring child povertySummary
Work and income
Poverty and deprivation
Child poverty
Older People and poverty
Fuel poverty
Food poverty
Housing and Homelessness
Isolation and loneliness
Education and qualifications
Special Educational Needs
Early years
GCSE
Persistent absence
NEET and Apprenticeships
Healthy Place Shaping
Active travel
Air pollution
Green space
Climate change
Finding out more
updated

Behavioural
determinants of
health
Health
conditions and
causes of death
Population groups
and protected
characteristics
Population
Wider
determinants of
health
Service Use Local researchExecutive
summary
Oxfordshire Joint Strategic Needs Assessment 2021 211
According to End Child Poverty estimates (2018-19), Oxford City was ranked 27th highest (higher rate of child poverty) out of 64 Local Authorities in the South East on child poverty after housing costs, above other districts in Oxfordshire.
After removing housing costs, 1 in 5 children in Oxfordshire are estimated to be living in poverty – within Oxford City this figure rises to a quarter of children.
Child Poverty statistics
ECP child poverty after housing costs* 2018/19 (count and % of
children)
DWP & HMRC children in relative low income families before
housing costs 2018/19 (count and % of children)
Oxford 7,061 26% 3,680 14%
Cherwell 7,077 24% 3,825 13%
West Oxfordshire 4,058 20% 2,084 10%
Vale of White Horse 4,768 18% 2,387 9%
South Oxfordshire 4,913 18% 2,451 9%
Oxfordshire 27,877 21% 14,427 11%
England 3,273,227 31% 2,414,092 22%
DWP & HMRC Children in low income families: local area statistics 2014/15 to 2018/19End child poverty statistics October 2020
Child poverty measures for Oxfordshire districtsNote: End Child Poverty
estimates (produced by
Loughborough University) are
based on the probability of
children living in households
with income less than 60% of
the median (mid-point). Both
the ECP and DWP & HMRC
estimates are only for children
under the age of 16.
*Households are living in
poverty if their household
income (adjusted to account for
household size,) is less than 60%
of the median (mid-point).
Summary
Work and income
Poverty and deprivation
Child poverty
Older People and poverty
Fuel poverty
Food poverty
Housing and Homelessness
Isolation and loneliness
Education and qualifications
Special Educational Needs
Early years
GCSE
Persistent absence
NEET and Apprenticeships
Healthy Place Shaping
Active travel
Air pollution
Green space
Climate change
Finding out more
updated

Behavioural
determinants of
health
Health
conditions and
causes of death
Population groups
and protected
characteristics
Population
Wider
determinants of
health
Service Use Local researchExecutive
summary
Oxfordshire Joint Strategic Needs Assessment 2021 212
According to the 2019 Income Deprivation Affecting Children Index (IDACI) there was a total of 11,990 children in poverty in Oxfordshire.
4 areas of Oxfordshire were in the most deprived 10% nationally, down from 7 areas ranked as most deprived in 2015.
The most deprived areas on the IDACI 2019, were in parts of Banbury Ruscote, Blackbird Leys, Littlemore and Rose Hill & Iffleywards.
IMD: Income Deprivation Affecting Children
The Income Deprivation Affecting Children Index (IDACI) is the
proportion of all children aged 0 to 15 living in income deprived
families, that either receive Income Support or income-based
benefits or families in receipt of Working Tax Credit or Child Tax
Credit with an equivalised income (excluding housing benefit)
below 60 per cent of the national median before housing costs.
Child asylum seekers are not included in the IDACI. Data is as of
2015/16.
LSOAs are Lower Super Output Areas, a statistical geography with
an average population in Oxfordshire of 1,600 residents
Ministry of Housing, Communities & Local Government indices of deprivation – income deprivation affecting children index
Summary
Work and income
Poverty and deprivation
Child poverty
Older People and poverty
Fuel poverty
Food poverty
Housing and Homelessness
Isolation and loneliness
Education and qualifications
Special Educational Needs
Early years
GCSE
Persistent absence
NEET and Apprenticeships
Healthy Place Shaping
Active travel
Air pollution
Green space
Climate change
Finding out more
updated

Behavioural
determinants of
health
Health
conditions and
causes of death
Population groups
and protected
characteristics
Population
Wider
determinants of
health
Service Use Local researchExecutive
summary
Oxfordshire Joint Strategic Needs Assessment 2021 213
According to the 2019 Income Deprivation Affecting Older People Index (IDAOPI) there was a total of 11,725 older people in poverty in Oxfordshire.
4 areas of Oxfordshire were in the most deprived 10% nationally, up from 1 area ranked as most deprived in 2015.
The most deprived areas on the IDAOPI 2019, were in parts of Banbury Grimsbury & Hightown ward and in Carfax, Rose Hill & Iffley and St. Clement's wards.
The Income Deprivation Affecting Older People Index (IDAOPI) is the
proportion of all those aged 60 or over who experience income
deprivation: adults aged 60 or over receiving Income Support or
income-based benefits or families not in receipt of these benefits
but in receipt of Working Tax Credit or Child Tax Credit with an
equivalised income (excluding housing benefit) below 60 per cent of
the national median before housing costs.
Data is as of 2015/16.
LSOAs are Lower Super Output Areas, a statistical geography with
an average population in Oxfordshire of 1,600 residents
IMD: Income Deprivation Affecting Older People
Ministry of Housing, Communities & Local Government indices of deprivation – income deprivation affecting older people index
Summary
Work and income
Poverty and deprivation
Child poverty
Older People and poverty
Fuel poverty
Food poverty
Housing and Homelessness
Isolation and loneliness
Education and qualifications
Special Educational Needs
Early years
GCSE
Persistent absence
NEET and Apprenticeships
Healthy Place Shaping
Active travel
Air pollution
Green space
Climate change
Finding out more
updated

Behavioural
determinants of
health
Health
conditions and
causes of death
Population groups
and protected
characteristics
Population
Wider
determinants of
health
Service Use Local researchExecutive
summary
8.0
11.9
7.9 7.9 7.68.7 9.0
7.4
10.5
7.3 6.9 7.4 8.0 7.9
0
2
4
6
8
10
12
14
Cherwell Oxford SouthOxfordshire
Vale of WhiteHorse
WestOxfordshire
Oxfordshire South East% h
ou
seh
old
s in
fu
el p
ove
rty
2014 2015 2016 2017 2018Oxfordshire 2018
average
Oxfordshire Joint Strategic Needs Assessment 2021 214
A household is considered to be fuel poor if fuel costs are above average and, were they to spend that amount, they would be left with a residual income below official poverty line. Fuel poverty is distinct from general poverty; some households could be pushed into fuel poverty if they have high energy costs.
Between 2017 and 2018, the number of households in Oxfordshire classified as “fuel poor” reduced from 23,400 to 22,100 (-1,300, -6%).
As of 2018, Oxford City remains significantly worse than the national average on fuel poverty. Other Oxfordshire districts are each significantly better than average. All districts show a reducing number of households in fuel poverty over time.
Fuel poverty
Percentage of households in fuel poverty (2014 to 2018)
Dept for Business, Energy and Industrial Strategy Sub-regional fuel poverty 2018 data published April 2020
Summary
Work and income
Poverty and deprivation
Child poverty
Older People and poverty
Fuel poverty
Food poverty
Housing and Homelessness
Isolation and loneliness
Education and qualifications
Special Educational Needs
Early years
GCSE
Persistent absence
NEET and Apprenticeships
Healthy Place Shaping
Active travel
Air pollution
Green space
Climate change
Finding out more
updated

Behavioural
determinants of
health
Health
conditions and
causes of death
Population groups
and protected
characteristics
Population
Wider
determinants of
health
Service Use Local researchExecutive
summary
Dept for Business, Energy and Industrial Strategy Sub-regional fuel poverty 2018 data published April 2020
Oxfordshire Joint Strategic Needs Assessment 2021 215
Fuel poverty
A household is considered to be fuel poor if fuel costs are
above average and, were they to spend that amount, they
would be left with a residual income below official poverty
line. Fuel poverty is distinct from general poverty; some
households could be pushed into fuel poverty if they have
high energy costs.
LSOAs are Lower Super Output Areas, a statistical geography
with an average population in Oxfordshire of 1,600 residents
Of the 22,100 households classified as fuel poor in Oxfordshire in 2018, 66% were in urban areas and 34% in rural areas.
Areas with higher rates of fuel poverty within Oxford include parts of St Clement’s, St Mary’s, Churchill, Iffley Fields, Rose Hill & Iffley and Jericho & Osney wards.
Outside of Oxford, the areas with higher rates of fuel poverty include parts of: Witney Central, Banbury Ruscote, Banbury Grimsbury & Hightown Fringford & Heyfords and Abingdon Caldecott wards.
Summary
Work and income
Poverty and deprivation
Child poverty
Older People and poverty
Fuel poverty
Food poverty
Housing and Homelessness
Isolation and loneliness
Education and qualifications
Special Educational Needs
Early years
GCSE
Persistent absence
NEET and Apprenticeships
Healthy Place Shaping
Active travel
Air pollution
Green space
Climate change
Finding out more
updated

Behavioural
determinants of
health
Health
conditions and
causes of death
Population groups
and protected
characteristics
Population
Wider
determinants of
health
Service Use Local researchExecutive
summary
Oxfordshire Joint Strategic Needs Assessment 2021 216
Food banks provide emergency food and support to people experiencing poverty.
Research by the Independent Food Bank Network has found around 2,400 food bank centres across the UK, of which the majority were operated by the Trussell Trust.
According to the Trussell Trust:
Between 2018/19 and 2019/20, the Trussell Trust network saw an 18% increase1 across the UK in the volume of three-day emergency food supplies provided to people in crisis. Just over a third of the total 1.9m supplies in 2019/20 (year ending 31 March) went to children.
The top three reasons for referral to a food bank in Trussell Trust network in 2019/20 were: income not covering essential costs, benefit delays, and benefit changes.
Food poverty and Food banks – national
Independent Food Banks Network – food banks map accessed January 2021
Trussell Trust End of Year Statistics to 31 March 2020; [1] based on volume of 3-day emergency food supplies rather than unique users. On average each person needed around two food bank referrals in the year
Top three reasons for referral to a
food bank in a Trussell Trust
network 2019/20
39%
17%15%
Summary
Work and income
Poverty and deprivation
Child poverty
Older People and poverty
Fuel poverty
Food poverty
Housing and Homelessness
Isolation and loneliness
Education and qualifications
Special Educational Needs
Early years
GCSE
Persistent absence
NEET and Apprenticeships
Healthy Place Shaping
Active travel
Air pollution
Green space
Climate change
Finding out more
updated

Behavioural
determinants of
health
Health
conditions and
causes of death
Population groups
and protected
characteristics
Population
Wider
determinants of
health
Service Use Local researchExecutive
summary
Community Food Services in Oxfordshire
Oxfordshire Joint Strategic Needs Assessment 2021 217
In May 2020, Good Food Oxford carried out a survey of Community Food Services across Oxfordshire.
The key findings included:
Community Food Services have experienced significant increases in users (x3), meals (x8), and food parcels (x6) since the start of COVID-19.
89% of respondents cite financial difficulties as the most common reason for people accessing Community Food Services.
Over half (58%) of respondents reported a significant increase in usage from families with children.
Community Food Services report that COVID-19 restrictions have hampered services’ ability to meet nutritional needs and preferences.
Since the start of COVID-19, 60% of services report that more than half of their users are entirely new.
Good Food Oxford study May 2020
Summary
Work and income
Poverty and deprivation
Child poverty
Older People and poverty
Fuel poverty
Food poverty
Housing and Homelessness
Isolation and loneliness
Education and qualifications
Special Educational Needs
Early years
GCSE
Persistent absence
NEET and Apprenticeships
Healthy Place Shaping
Active travel
Air pollution
Green space
Climate change
Finding out more
new

Behavioural
determinants of
health
Health
conditions and
causes of death
Population groups
and protected
characteristics
Population
Wider
determinants of
health
Service Use Local researchExecutive
summary
Oxfordshire Joint Strategic Needs Assessment 2021 218
Community Food Services by type and district in Oxfordshire
Good Food Oxford has identified 100 community food services across Oxfordshire, operated by 74 organisations (as of May 2020), almost half in Oxford City.
Definition Cherwell City South Vale West Total
Emergency FoodbankAccess limited to particular communities of need. May require referral from another organisation.
9 11 6 6 7 39
Community Larder
Typically a membership scheme. Members receive regular food supplies for minimal cost - food is donated, fees cover operational costs.
3 4 3 1 3 14
Community Fridge or Cupboard
Typically no charges, open to all to take or donate food, helps those in need and reduces food waste.
3 3 2 3 2 13
Community Kitchen/ Prepared Meal Service
Typically provide meals for communities with identified needs.
2 25 0 0 0 27
OtherMay include community shop and other settings were food is shared e.g. growing projects.
0 6 0 0 1 7
Total 17 49 11 10 13 100
Highlighted values (in pink) show the highest number in each row Good Food Oxford study May 2020
Summary
Work and income
Poverty and deprivation
Child poverty
Older People and poverty
Fuel poverty
Food poverty
Housing and Homelessness
Isolation and loneliness
Education and qualifications
Special Educational Needs
Early years
GCSE
Persistent absence
NEET and Apprenticeships
Healthy Place Shaping
Active travel
Air pollution
Green space
Climate change
Finding out more
new

Behavioural
determinants of
health
Health
conditions and
causes of death
Population groups
and protected
characteristics
Population
Wider
determinants of
health
Service Use Local researchExecutive
summary
Oxfordshire Joint Strategic Needs Assessment 2021 219
Healthy Start is a government public health scheme that provides a nutritional safety net for pregnant women, new mums and young children in very low-income families. Healthy Start Vouchers are provided to women who are 10 weeks pregnant or have a child under four years and who are claiming income-related benefits. A voucher is worth £3.10 and can be spent on milk, fruit or vegetables.
As of January 2021 there were 1,801 recipients of Health Start vouchers in Oxfordshire out of 3,899 eligible, a take up of 46%. This was below the England average of 52%.
There appears to have been a slight fall in the number of those taking up Healthy Start vouchers in Oxfordshire from 51% in Oct-19 to 46% in Jan-21, perhaps affected by the COVID-19 pandemic and lockdowns.
Healthy Start Vouchers
Healthy Start data accessed 20 Jan 21Due to a system postcode refresh uptake data is not available for Feb20
Oxfordshire take-
up: registered and
receiving Healthy
Start vouchers as
% of those eligible
to apply
Summary
Work and income
Poverty and deprivation
Child poverty
Older People and poverty
Fuel poverty
Food poverty
Housing and Homelessness
Isolation and loneliness
Education and qualifications
Special Educational Needs
Early years
GCSE
Persistent absence
NEET and Apprenticeships
Healthy Place Shaping
Active travel
Air pollution
Green space
Climate change
Finding out more
updated

Behavioural
determinants of
health
Health
conditions and
causes of death
Population groups
and protected
characteristics
Population
Wider
determinants of
health
Service Use Local researchExecutive
summary
Oxfordshire Joint Strategic Needs Assessment 2021 220
Free school meals are available to pupils in receipt of, or whose parents are in receipt of, one or more of the following benefits:
− Universal Credit (provided you have an annual net earned income of no more than £7,400, as assessed by earnings from up to three of your most recent assessment periods)
− Income Support; Income-based Jobseeker’s Allowance; Income-related Employment and Support Allowance
− Support under Part VI of the Immigration and Asylum Act 1999
− The guarantee element of Pension Credit
− Child Tax Credit (provided you’re not also entitled to Working Tax Credit and have an annual gross income of no more than £16,190)
− Working Tax Credit run-on – paid for four weeks after you stop qualifying for Working Tax Credit.
As of January 2020, there were 10,127 pupils “known to be eligible” for Free School Meals and 7,616 FSM “eligible pupils taking free school meals” in Oxfordshire.
Free School Meals
Department for Education Free school meals: guidance for schools and local authorities;January 2020 School Census
“Known to be eligible” is for all state funded schools and for all pupils of any age
Note that, since 1 April 2018, transitional protections have been in place which will continue to be in place during
the roll out of Universal Credit. This has meant that pupils eligible for free school meals on or after 1 April 2018
retain their free school meals eligibility even if their circumstances change. This has been the main driver in the
increase in the proportion of pupils eligible for free school meals as pupils continue to become eligible but fewer
people stop being eligible
Summary
Work and income
Poverty and deprivation
Child poverty
Older People and poverty
Fuel poverty
Food poverty
Housing and Homelessness
Isolation and loneliness
Education and qualifications
Special Educational Needs
Early years
GCSE
Persistent absence
NEET and Apprenticeships
Healthy Place Shaping
Active travel
Air pollution
Green space
Climate change
Finding out more
updated

Behavioural
determinants of
health
Health
conditions and
causes of death
Population groups
and protected
characteristics
Population
Wider
determinants of
health
Service Use Local researchExecutive
summary
Oxfordshire Joint Strategic Needs Assessment 2021 221
The burden of obesity is falling hardest on children in low income families. One of the main risk factors for obesity is the food and drink environment.
The Food Foundation 2019 Children’s Future Food Inquiry Report found that one in three children (4.1 million) are living in poverty in the UK; for their families to be able to afford the Government's recommended diet, they would have to spend an estimated 35% of their income on food, once their housing costs have been taken care of.
Affordability of healthy food – national
Finding out more
PHE Health matters
Food Foundation
Children’s Future Food Inquiry
Healthy Start Vouchers
Summary
Work and income
Poverty and deprivation
Child poverty
Older People and poverty
Fuel poverty
Food poverty
Housing and Homelessness
Isolation and loneliness
Education and qualifications
Special Educational Needs
Early years
GCSE
Persistent absence
NEET and Apprenticeships
Healthy Place Shaping
Active travel
Air pollution
Green space
Climate change
Finding out more
Not updated

Behavioural
determinants of
health
Health
conditions and
causes of death
Population groups
and protected
characteristics
Population
Wider
determinants of
health
Service Use Local researchExecutive
summary
Relationship
between fast
food outlets
and deprivation
by local
authority
(excludes City
of London data)
Oxfordshire Joint Strategic Needs Assessment 2021 222
Fast food outlets
Public Health England, density of fast food outlets; 2019 review of the use of the planning system to regulate hot food takeaway outlets
In December 2020 there were 479 fast food outlets across Oxfordshire - the highest number of these were in Cherwell and Oxford
Nationally, local authorities that are ranked as more deprived also have a greater density of fast food outlets
National planning guidance states: “Planning policies and decisions should aim to … support healthy lifestyles… – for example through the provision of … access to healthier food”
Summary
Work and income
Poverty and deprivation
Child poverty
Older People and poverty
Fuel poverty
Food poverty
Housing and Homelessness
Isolation and loneliness
Education and qualifications
Special Educational Needs
Early years
GCSE
Persistent absence
NEET and Apprenticeships
Healthy Place Shaping
Active travel
Air pollution
Green space
Climate change
Finding out more
updated

Behavioural
determinants of
health
Health
conditions and
causes of death
Population groups
and protected
characteristics
Population
Wider
determinants of
health
Service Use Local researchExecutive
summary
Housing and homelessness
Oxfordshire Joint Strategic Needs Assessment 2021 223
Summary
Work and income
Poverty and deprivation
Child poverty
Older People and poverty
Fuel poverty
Food poverty
Housing and Homelessness
Isolation and loneliness
Education and qualifications
Special Educational Needs
Early years
GCSE
Persistent absence
NEET and Apprenticeships
Healthy Place Shaping
Active travel
Air pollution
Green space
Climate change
Finding out more

Behavioural
determinants of
health
Health
conditions and
causes of death
Population groups
and protected
characteristics
Population
Wider
determinants of
health
Service Use Local researchExecutive
summary
229,173
312,313
Jun-10287,466
Jun-20415,233
0
50,000
100,000
150,000
200,000
250,000
300,000
350,000
400,000
450,000England Oxfordshire
Oxfordshire Joint Strategic Needs Assessment 2021 224
Between year ending June 2019 and year ending June 2020, average house prices in Oxfordshire increased from £414,827 to £415,233. The change of +1% in Oxfordshire was below the increase across England of 2.7%.
Above-average increase in house prices
ONS Mean house prices for administrative geographies: HPSSA dataset 12, released 09 December 2020
Average house prices (all dwellings), year ending Dec 1996 to year ending Jun 2020
Summary
Work and income
Poverty and deprivation
Child poverty
Older People and poverty
Fuel poverty
Food poverty
Housing and Homelessness
Isolation and loneliness
Education and qualifications
Special Educational Needs
Early years
GCSE
Persistent absence
NEET and Apprenticeships
Healthy Place Shaping
Active travel
Air pollution
Green space
Climate change
Finding out more
updated

Behavioural
determinants of
health
Health
conditions and
causes of death
Population groups
and protected
characteristics
Population
Wider
determinants of
health
Service Use Local researchExecutive
summary
2014 2015 2016 2017 2018 2019
Cherwell 9.45 10.21 11.14 10.51 11.14 11.05
Oxford 10.41 11.36 12.23 12.17 12.07 11.91
South Oxfordshire 10.97 11.00 12.67 13.00 13.93 13.31
Vale of White Horse 8.83 9.45 10.27 10.88 11.27 10.56
West Oxfordshire 9.97 10.15 12.52 12.56 12.54 12.01
Oxfordshire 9.64 10.14 11.12 11.40 11.47 11.22
England 6.91 7.11 7.16 7.26 7.29 7.27
Oxfordshire Joint Strategic Needs Assessment 2021 225
The ratio of the cheapest market housing (lower quartile) to lower earnings in Oxfordshire was 11.22 in 2019, remaining much less affordable than the England average (7.27).
Four out of five districts in Oxfordshire had a lower quartile affordability ratio over 11 times lower earnings, Vale of White Horse had a ratio just below 11.
House price to earnings ratio
ONS House prices to workplace earnings ratio
1. House price data are taken from
ONS House Price Statistics for Small
Areas for the year ending September.
2. Earnings data are taken from the
Annual Survey of Hours and Earnings.
These figures are estimates of gross
workplace-based individual full-time
annual earnings where available.
3. Data for annual earnings are not
available for some areas since 1999.
For these areas the ratio of house
prices to earnings has been calculated
using annualised weekly earnings.
These are recorded in bold grey
italics. Annualised weekly earnings are
not produced on an identical basis to
annual earnings and are therefore not
directly comparable.
Ratio of lower quartile house price to lower quartile
gross annual (where available) workplace-based earnings
2014 to 2019
Summary
Work and income
Poverty and deprivation
Child poverty
Older People and poverty
Fuel poverty
Food poverty
Housing and Homelessness
Isolation and loneliness
Education and qualifications
Special Educational Needs
Early years
GCSE
Persistent absence
NEET and Apprenticeships
Healthy Place Shaping
Active travel
Air pollution
Green space
Climate change
Finding out more
updated

Behavioural
determinants of
health
Health
conditions and
causes of death
Population groups
and protected
characteristics
Population
Wider
determinants of
health
Service Use Local researchExecutive
summary
Oxfordshire Joint Strategic Needs Assessment 2021 226
Cost of renting in Oxfordshire
Valuation Office Agency Private rental market summary statistics
Median monthly private rents for 2 bed property
As of 2019-20 the median (mid-point) private rent for a 2 bed property in Oxfordshire was £995, well above the average for the South East (£895) and England (£695).
In Oxford the median was £1,250 per month, 19% higher than in 2014-15.
England 2019-20
average
£775
£1,050
£850 £850 £825
£595
£890
£1,250
£975£900 £875
£695
Cherwell Oxford South Oxfordshire Vale of WhiteHorse
West Oxfordshire England
2014-15 2019-20
Summary
Work and income
Poverty and deprivation
Child poverty
Older People and poverty
Fuel poverty
Food poverty
Housing and Homelessness
Isolation and loneliness
Education and qualifications
Special Educational Needs
Early years
GCSE
Persistent absence
NEET and Apprenticeships
Healthy Place Shaping
Active travel
Air pollution
Green space
Climate change
Finding out more
updated

Behavioural
determinants of
health
Health
conditions and
causes of death
Population groups
and protected
characteristics
Population
Wider
determinants of
health
Service Use Local researchExecutive
summary
Oxfordshire Joint Strategic Needs Assessment 2021 227
ONS estimates that, in 2018, the proportion of homes being rented privately was above the England average in Oxford City, West Oxfordshire and Vale of White Horse.
Between 2017 to 2018 it seems as if there was a slight decline in the % rented homes in all districts in Oxfordshire.
Proportion of homes rented privately
ONS Subnational dwelling stock by tenure estimates to 2018; Data release as of January 2021
Note that confidence intervals apply to this data (not shown). Estimates for South Oxfordshire and Cherwell in 2018 are considered unreliable for practical purposes.
% of homes rented privately 2012 to 2018
2012 2013 2014 2015 2016 2017 2018
Oxford City 27.21 29.25 32.03 32.46 32.13 31.74 30.25
West Oxfordshire 18.92 18.04 18.44 19.36 22.58 24.15 22.16
Vale of White Horse 15.7 16.58 16.14 18.74 22.56 22.02 21.27
England 18.54 19.22 19.78 20.27 20.36 20.03 19.89
South East 16.9 17 17.27 17.39 17.49 17.49 17.4
Cherwell 13.54 16.5 18.41 18.37 17.41 16.35 15.11
South Oxfordshire 16.3 15.88 14.56 15.2 16.85 15.12 11.53
0
5
10
15
20
25
30
35Oxford City
West Oxfordshire
Vale of White Horse
England
South East
Cherwell
South Oxfordshire
Summary
Work and income
Poverty and deprivation
Child poverty
Older People and poverty
Fuel poverty
Food poverty
Housing and Homelessness
Isolation and loneliness
Education and qualifications
Special Educational Needs
Early years
GCSE
Persistent absence
NEET and Apprenticeships
Healthy Place Shaping
Active travel
Air pollution
Green space
Climate change
Finding out more
No update available

Behavioural
determinants of
health
Health
conditions and
causes of death
Population groups
and protected
characteristics
Population
Wider
determinants of
health
Service Use Local researchExecutive
summary
Oxfordshire Joint Strategic Needs Assessment 2021 228
According to the English Housing Survey, in 2019-20, 9% of social renters and 7% of private renters lived in overcrowded accommodation.
In the social rented sector, overcrowding has increased from 8% in 2017-18 to its current rate of 9% of households, the highest it has been since 1995-96 when data collection began.
Overcrowding also increased in the private rented sector, from 6% in 2017-18 to 7% in 2019-20, also the highest it has been since 1995-96.
Overcrowding - national
English Housing Survey 2019-20
Summary
Work and income
Poverty and deprivation
Child poverty
Older People and poverty
Fuel poverty
Food poverty
Housing and Homelessness
Isolation and loneliness
Education and qualifications
Special Educational Needs
Early years
GCSE
Persistent absence
NEET and Apprenticeships
Healthy Place Shaping
Active travel
Air pollution
Green space
Climate change
Finding out more
Base: all households
An overcrowded home has fewer bedrooms
than needed to avoid undesirable sharing
(given the number, ages and relationship of
the household members)
Data are based on three year averages,
which are the average of the three years up
to and including the labelled date
Overcrowding by tenure
England 1995-96 to
2019-20
new

Behavioural
determinants of
health
Health
conditions and
causes of death
Population groups
and protected
characteristics
Population
Wider
determinants of
health
Service Use Local researchExecutive
summary
Oxfordshire Joint Strategic Needs Assessment 2021 229
According to the English Housing Survey: in 2019, 17% of homes failed to meet the Decent Homes Standard, down from 30% in 2009.
Private rented dwellings had the highest proportion of non-decent homes (23%) while the social rented sector had the lowest (12%). Among owner occupied homes, 16% failed to meet the Decent Homes Standard in 2019.
Non-decent homes – national
Decent home guidance English Housing Survey 2019-20
Non-decent homes by tenure, 2009 to 2019
England
Summary
Work and income
Poverty and deprivation
Child poverty
Older People and poverty
Fuel poverty
Food poverty
Housing and Homelessness
Isolation and loneliness
Education and qualifications
Special Educational Needs
Early years
GCSE
Persistent absence
NEET and Apprenticeships
Healthy Place Shaping
Active travel
Air pollution
Green space
Climate change
Finding out more
updated
Base: all dwellings
A decent home meets the
following four criteria (a)
meets the current statutory
minimum standard for
housing; (b) is in a
reasonable state of repair;
(c) has reasonably modern
facilities and services; (d)
provides a reasonable
degree of thermal comfort
(insulation and heating).

Behavioural
determinants of
health
Health
conditions and
causes of death
Population groups
and protected
characteristics
Population
Wider
determinants of
health
Service Use Local researchExecutive
summary
Oxfordshire Joint Strategic Needs Assessment 2021 230
There is evidence that insulating homes is associated with a health improvements, most notably for respiratory disease
A major New Zealand study using linked datasets for over 200,000 homes, found that a national home insulation intervention was associated with reduced hospital admissions, supporting previous research, which found an improvement in self-reported health.
The research summary[1] also noted that:
Excess winter mortality and morbidity are often greater in countries with relatively mild climates than in countries with colder climates
This paradox has been linked to poorer thermal efficiency of housing in temperate countries leading to colder indoor temperatures and creating an environment more susceptible to damp and mould
The English Housing survey 2019-20[2] found that 2% of homes had problems with condensation and mould, 1% were affected by rising damp and 1% by penetrating damp.
Damp problems were more prevalent in the rented sectors. 7% of private rented dwellings had some type of damp problem, compared with 4% of social rented dwellings and 2% of owner occupied dwellings.
Housing insulation and health - national
[1] Association between home insulation and hospital admission rates: retrospective cohort study using linked data from a national intervention programme, BMJ 2020; 371:m4571[2] English Housing Survey 2019-20
Summary
Work and income
Poverty and deprivation
Child poverty
Older People and poverty
Fuel poverty
Food poverty
Housing and Homelessness
Isolation and loneliness
Education and qualifications
Special Educational Needs
Early years
GCSE
Persistent absence
NEET and Apprenticeships
Healthy Place Shaping
Active travel
Air pollution
Green space
Climate change
Finding out more
new

Behavioural
determinants of
health
Health
conditions and
causes of death
Population groups
and protected
characteristics
Population
Wider
determinants of
health
Service Use Local researchExecutive
summary
Oxfordshire Joint Strategic Needs Assessment 2021 231
The homeless population is difficult to see and measure but represents a broad group with diverse needs.. The best guess of the number of rough sleepers at any one time comes from estimates based on street counts.
A health needs assessment of the adult street homeless population in Oxfordshire in 2019 estimated that, on any one night, 100-150 people sleep rough somewhere in the county and between 350-400 homeless adults sleep in some form of supported accommodation each night.
It is estimated that 600-700 people sleep rough somewhere in Oxfordshire in the course of a year, and around 600-650 homeless adults are accommodated in some form of supported accommodation in the course of a year.
By combining annual estimates of rough sleepers (~600-700) with those in supported accommodation (~600-650), and then discounting the overlap between these groups (~200-300), it is estimated that around 1,000 homeless adults sleep rough or in supported accommodation in the course of a year. Around 500 homeless adults either sleep rough (~100-150) or in supported accommodation (~350-400) on any given night.
Around 80% of homeless adults are male, but the proportion of women has increased in recent years. Most homeless adults are aged between 30 and 50, but the proportion of young people has increased in recent years.
Rough sleeping
Oxfordshire County Council, A health needs assessment of the adult street homeless population in Oxfordshire
Summary
Work and income
Poverty and deprivation
Child poverty
Older People and poverty
Fuel poverty
Food poverty
Housing and Homelessness
Isolation and loneliness
Education and qualifications
Special Educational Needs
Early years
GCSE
Persistent absence
NEET and Apprenticeships
Healthy Place Shaping
Active travel
Air pollution
Green space
Climate change
Finding out more
Not updated

Behavioural
determinants of
health
Health
conditions and
causes of death
Population groups
and protected
characteristics
Population
Wider
determinants of
health
Service Use Local researchExecutive
summary
Oxfordshire Joint Strategic Needs Assessment 2021 232
According to Crisis (Nov2020) there has been a continued new flow of people experiencing homelessness since the start of the pandemic.
Towards the start of the pandemic the increase was driven by those already experiencing homelessness who became more visible as their living situations forced them to access help.
Towards the second wave of the pandemic, there have been bigger increases from people who are experiencing homelessness for the first time, people who have been furloughed and those who are newly unemployed.
Survey data show that in both waves, support needs highlighted were around mental health, loneliness and isolation.
Rough sleeping and COVID-19 - national
Crisis, The impact of COVID-19 on people facing homelessness and service provision across Great Britain (2020)
Summary
Work and income
Poverty and deprivation
Child poverty
Older People and poverty
Fuel poverty
Food poverty
Housing and Homelessness
Isolation and loneliness
Education and qualifications
Special Educational Needs
Early years
GCSE
Persistent absence
NEET and Apprenticeships
Healthy Place Shaping
Active travel
Air pollution
Green space
Climate change
Finding out more
new
Top 5 reported challenges related to supporting people
currently housed and at risk of homelessness, 2020

Behavioural
determinants of
health
Health
conditions and
causes of death
Population groups
and protected
characteristics
Population
Wider
determinants of
health
Service Use Local researchExecutive
summary
Oxfordshire Joint Strategic Needs Assessment 2021 233
Isolation and loneliness have been found to be a significant health risk and a cause of increased use of health services:
Loneliness can be as harmful for our health as smoking 15 cigarettes a day.
Lonely individuals are more likely to visit their GP, have higher use of medication, higher incidence of falls and increased risk factors for long term health care.
Analysis by Age UK showed that factors more associated with a higher prevalence of loneliness were health and household type.
From Age UK’s 2015 loneliness analysis, the following areas are in the highest risk quintile of all neighbourhoods in England
Cherwell: Banbury, Bicester Town
Oxford: Blackbird Leys, Wood Farm, Barton, St Clements, Jericho, Cowley
South Oxfordshire: Didcot South
ONS has developed recommended indicators of loneliness and is implementing a harmonised approach to measuring loneliness across government.
Isolation and loneliness
Age UK, Loneliness Heat Map Holt-Lunstad, et al. 2010, Social relationships and mortality risk: a meta-analytic review , Cohen, et al. 2006, The impact of professionally conducted cultural programs on the physical health, mental health, and social functioning of older adults
Summary
Work and income
Poverty and deprivation
Child poverty
Older People and poverty
Fuel poverty
Food poverty
Housing and Homelessness
Isolation and loneliness
Education and qualifications
Special Educational Needs
Early years
GCSE
Persistent absence
NEET and Apprenticeships
Healthy Place Shaping
Active travel
Air pollution
Green space
Climate change
Finding out more
updated

Behavioural
determinants of
health
Health
conditions and
causes of death
Population groups
and protected
characteristics
Population
Wider
determinants of
health
Service Use Local researchExecutive
summary
Education and qualifications
Oxfordshire Joint Strategic Needs Assessment 2021 234
Summary
Work and income
Poverty and deprivation
Child poverty
Older People and poverty
Fuel poverty
Food poverty
Housing and Homelessness
Isolation and loneliness
Education and qualifications
Special Educational Needs
Early years
GCSE
Persistent absence
NEET and Apprenticeships
Healthy Place Shaping
Active travel
Air pollution
Green space
Climate change
Finding out more

Behavioural
determinants of
health
Health
conditions and
causes of death
Population groups
and protected
characteristics
Population
Wider
determinants of
health
Service Use Local researchExecutive
summary
Oxfordshire Joint Strategic Needs Assessment 2021 235
Oxfordshire
2019 2020 2019 to 2020
2020 % of total
Oxfordshire England
State-funded nursey 517 509 -8 -1.5% 0.4% 0.5%
State-funded primary 54,374 54,246 -128 -0.2% 47.6% 53.0%
State-funded secondary 39,360 40,466 1106 2.8% 35.5% 38.3%
Special – state 1,152 1,191 39 3.4% 1.0% 1.4%
Special – non maintained 79 75 -4 -5.1% 0.1% 0.0%
Pupil referral units 57 44 -13 -22.8% 0.0% 0.2%
Independent 17,176 17,357 181 1.1% 15.2% 6.5%
All schools 112,715 113,888 1,173 1.0% 100.0% 100.0%
Pupils in Oxfordshire schools
Department for Education, Schools, pupils and their characteristics: January 2020
Count and percentage of pupils at types of schools in Oxfordshire
There was a total of 113,888 pupils in schools in Oxfordshire (January 2020), up from 112,715 in January 2019 (+1,173, +1.0%).
Of these, 84.7% were attending state-funded schools (nursery, primary, secondary, special).
As of January 2020, 15.2% of pupils in Oxfordshire attended independent schools. This was over double the national average (6.5%) and a similar proportion to the Oxfordshire figure recorded in January 2011 (15.1%).
Summary
Work and income
Poverty and deprivation
Child poverty
Older People and poverty
Fuel poverty
Food poverty
Housing and Homelessness
Isolation and loneliness
Education and qualifications
Special Educational Needs
Early years
GCSE
Persistent absence
NEET and Apprenticeships
Healthy Place Shaping
Active travel
Air pollution
Green space
Climate change
Finding out more
updated

Behavioural
determinants of
health
Health
conditions and
causes of death
Population groups
and protected
characteristics
Population
Wider
determinants of
health
Service Use Local researchExecutive
summary
Oxfordshire Joint Strategic Needs Assessment 2021 236
The top first languages (other than English) of primary school pupils across Oxfordshire were: Polish (1,139 pupils), Urdu (526), Portuguese (462) and Arabic (373).
Oxford City has a very wide range of languages spoken (as a first language) by primary school pupils.
As of January 2020, in Oxford City, there were at least 100 different languages spoken and 41 of these were spoken by 10 or more primary school pupils.
First language of Oxfordshire’s primary school pupils
Oxfordshire County Council, School census January 2020
Portuguese
462
Urdu
526
Arabic
373
Polish
1,139
Number of first languages (other than English)
spoken by primary school pupils (January 2020)
Summary
Work and income
Poverty and deprivation
Child poverty
Older People and poverty
Fuel poverty
Food poverty
Housing and Homelessness
Isolation and loneliness
Education and qualifications
Special Educational Needs
Early years
GCSE
Persistent absence
NEET and Apprenticeships
Healthy Place Shaping
Active travel
Air pollution
Green space
Climate change
Finding out more
updated

Behavioural
determinants of
health
Health
conditions and
causes of death
Population groups
and protected
characteristics
Population
Wider
determinants of
health
Service Use Local researchExecutive
summary
Oxfordshire Joint Strategic Needs Assessment 2021 237
As of January 2020, there were 19,300 pupils attending schools in Oxfordshire with Special Educational Needs (SEN) support or with an Education, Health and Care (EHC) Plan. This was up from 17,900 in January 2017 (+1,400, +8%). The percentage increase was double the increase across England (+4%).
The % of pupils with SEN support at schools in Oxfordshire is now 2.2 percentage points above the percentage for England.
Pupils with Special Educational Needs Support
Special educational needs in England: Jan20, Department for Education, based on where child attends school
% Pupils with Special Educational Needs support, Oxfordshire vs England
Summary
Work and income
Poverty and deprivation
Child poverty
Older People and poverty
Fuel poverty
Food poverty
Housing and Homelessness
Isolation and loneliness
Education and qualifications
Special Educational Needs
Early years
GCSE
Persistent absence
NEET and Apprenticeships
Healthy Place Shaping
Active travel
Air pollution
Green space
Climate change
Finding out more
updated

Behavioural
determinants of
health
Health
conditions and
causes of death
Population groups
and protected
characteristics
Population
Wider
determinants of
health
Service Use Local researchExecutive
summary
Oxfordshire Joint Strategic Needs Assessment 2021 238
The proportion of pupils aged 5 achieving a good level of development in Early Learning Goals in Oxfordshire and Oxford City has improved each year since 2015.
In academic year ending 2019, results were above the South East average in South Oxfordshire and West Oxfordshire but below average in Cherwell, Oxford and Vale of White Horse.
Early Years Foundation Stage overall trend
Early years foundation stage profile results, Department for Education, based on area of pupil residency Not collected in 2020 as a result of COVID-19
The Early Years Foundation Stage
Profile is an assessment of children’s
development at the end of the
academic year in which the child
turns 5.
There are 17 Early Learning Goals
including health and self-care,
reading, numbers, making
relationships and being imaginative.
Practitioners’ assessments are based
on observing a child’s daily activities
and events.
A new set of Early Learning Goals
will be in use from September 2020.
% achieving a good level of development in all Early
Learning Goals to academic year ending in 2019
Summary
Work and income
Poverty and deprivation
Child poverty
Older People and poverty
Fuel poverty
Food poverty
Housing and Homelessness
Isolation and loneliness
Education and qualifications
Special Educational Needs
Early years
GCSE
Persistent absence
NEET and Apprenticeships
Healthy Place Shaping
Active travel
Air pollution
Green space
Climate change
Finding out more
No update available

Behavioural
determinants of
health
Health
conditions and
causes of death
Population groups
and protected
characteristics
Population
Wider
determinants of
health
Service Use Local researchExecutive
summary
Oxfordshire Joint Strategic Needs Assessment 2021 239
The gap in early years development between pupils eligible for Free School Meals (FSM) and other pupils in Oxfordshire has increased for the second year in a row from 24 to 26 points.
Early Years Foundation Stage inequalities
Early years foundation stage profile results, Department for Education, based on area of pupil residency; Not collected in 2020 as a result of COVID-19
% achieving a good level of early years development by
Free School Meals and gender, Oxfordshire vs England The early years
achievement by FSM boys in Oxfordshire has fallen for the second year in a row and is well below the average for FSM boys in England.
Early years achievement by FSM girls in Oxfordshire has increased.
% achieving a good level of early years
development Oxfordshire by Free School Meals
Summary
Work and income
Poverty and deprivation
Child poverty
Older People and poverty
Fuel poverty
Food poverty
Housing and Homelessness
Isolation and loneliness
Education and qualifications
Special Educational Needs
Early years
GCSE
Persistent absence
NEET and Apprenticeships
Healthy Place Shaping
Active travel
Air pollution
Green space
Climate change
Finding out more
No update available

Behavioural
determinants of
health
Health
conditions and
causes of death
Population groups
and protected
characteristics
Population
Wider
determinants of
health
Service Use Local researchExecutive
summary
Oxfordshire Joint Strategic Needs Assessment 2021 240
Between 2018 and 2019, the early results for pupils with Special Educational Needs support (SEN) increased from 19% to 25% and the gap with other pupils in Oxfordshire decreased from 58 to 53 percentage points.
Early Years Foundation Stage and Special Educational Needs
Early years foundation stage profile results, Department for Education, based on area of pupil residency; Not collected in 2020 as a result of COVID-19
% achieving a good level of early years development Oxfordshire by SEN
5352
5855 55
Summary
Work and income
Poverty and deprivation
Child poverty
Older People and poverty
Fuel poverty
Food poverty
Housing and Homelessness
Isolation and loneliness
Education and qualifications
Special Educational Needs
Early years
GCSE
Persistent absence
NEET and Apprenticeships
Healthy Place Shaping
Active travel
Air pollution
Green space
Climate change
Finding out more
No update available

Behavioural
determinants of
health
Health
conditions and
causes of death
Population groups
and protected
characteristics
Population
Wider
determinants of
health
Service Use Local researchExecutive
summary
Oxfordshire Joint Strategic Needs Assessment 2021 241
In 2019, 65% of the 7,435 eligible 10-11 year old pupils in Oxfordshire attained at least the expected standard at Key Stage 2 in reading, writing and mathematics, similar to the national average.
Primary results (Key Stage 2) Percentage of pupils achieving at least the
expected standard at Key Stage 2, Oxfordshire
vs England
Percentage of pupils achieving at least the expected
standard at Key Stage 2, Oxfordshire, by FSM and gender
5968 70 73
2941 41 44
0
20
40
60
80
2016 2017 2018 2019
Non-FSM FSM
5060 62 62
2334 33 35
0
20
40
60
80
2016 2017 2018 2019
Non-FSM FSM
Between 2018 and 2019, the attainment gap, between those eligible for FSM and those who were not, remained similar for girls (29 point difference) and decreased for boys (from 29 point gap to 27).
GIRLS BOYS
Summary
Work and income
Poverty and deprivation
Child poverty
Older People and poverty
Fuel poverty
Food poverty
Housing and Homelessness
Isolation and loneliness
Education and qualifications
Special Educational Needs
Early years
GCSE
Persistent absence
NEET and Apprenticeships
Healthy Place Shaping
Active travel
Air pollution
Green space
Climate change
Finding out more Department for Education, National curriculum assessments: key stage 2, 2019 (revised) Not collected in 2020 as a result of COVID-19
No update available

Behavioural
determinants of
health
Health
conditions and
causes of death
Population groups
and protected
characteristics
Population
Wider
determinants of
health
Service Use Local researchExecutive
summary
Oxfordshire Joint Strategic Needs Assessment 2021 242
Due to the COVID-19 pandemic, the summer GCSE exam series was cancelled in 2020.
Pupils scheduled to sit GCSE exams in 2020 were awarded either a centre assessment grade or their calculated grade using a model developed by Ofqual - whichever was the higher of the two.
As a result, the 2019/20 data should not be directly compared to attainment data from previous years for the purposes of measuring changes in student performance.
Oxford City has remained below the national score.
GCSE results – Attainment 8
DfE Final data released 6 February 2020
Attainment 8 score per pupil, 2017/18-2019/20
[1] A pupil's Attainment 8 score is calculated by adding
up the points for their 8 subjects (with English and
Maths counted twice), and dividing by 10. A Local
Authority Attainment 8 score is the average of all of its
eligible pupils' scores.
Average Attainment 8 score per pupil, 2019/20
2017/18 2018/19 2019/20
Oxfordshire 46.7 47.4 50.2
England (state funded) 46.4 46.7 50.2
Oxfordshire ranking (national)
Joint 58th Joint 52nd Joint 60th
2nd Quartile
2nd Quartile
2nd Quartile
2019/20 data should not be directly compared to attainment
data from previous years for the purposes of measuring changes
in student performance.
Summary
Work and income
Poverty and deprivation
Child poverty
Older People and poverty
Fuel poverty
Food poverty
Housing and Homelessness
Isolation and loneliness
Education and qualifications
Special Educational Needs
Early years
GCSE
Persistent absence
NEET and Apprenticeships
Healthy Place Shaping
Active travel
Air pollution
Green space
Climate change
Finding out more
updated

Behavioural
determinants of
health
Health
conditions and
causes of death
Population groups
and protected
characteristics
Population
Wider
determinants of
health
Service Use Local researchExecutive
summary
Oxfordshire Joint Strategic Needs Assessment 2021 243
Pupils in Oxfordshire achieved a higher proportion of good (grades 5-9) results in English and Mathematics GCSE’s, than the national average, the rate was similar to the average across the South East.
Across the Districts of Oxfordshire, the pattern in achievement is similar to the Attainment 8 pattern: South Oxfordshire reporting the highest proportion of pupils achieving good GCSE results, and Oxford City reporting a proportion lower than that for England.
Good GCSE results
DfE Final data released 6 February 2020
Summary
Work and income
Poverty and deprivation
Child poverty
Older People and poverty
Fuel poverty
Food poverty
Housing and Homelessness
Isolation and loneliness
Education and qualifications
Special Educational Needs
Early years
GCSE
Persistent absence
NEET and Apprenticeships
Healthy Place Shaping
Active travel
Air pollution
Green space
Climate change
Finding out more
% of pupils achieving grades 5 or above in
English and Mathematics GCSE, 2019/20
As with the Attainment 8 data, the 2019/20 GCSE results data should not be directly compared to data from previous years for the purposes of measuring changes in student performance. See previous slide for more details on how the COVID-19 pandemic affected GCSEs.
new

Behavioural
determinants of
health
Health
conditions and
causes of death
Population groups
and protected
characteristics
Population
Wider
determinants of
health
Service Use Local researchExecutive
summary
2016/17 2017/18 2018/19
Oxfordshire 0.00 -0.01 0.07
England (state funded) -0.03 -0.02 -0.03
Oxfordshire ranking (national)
Joint 61st 64th Joint 41st
2nd Quartile
2nd Quartile
2nd Quartile
Oxfordshire Joint Strategic Needs Assessment 2021 244
Progress 8 scores were not published for 2019/20, because of examination disruption due to the Covid-19 pandemic1. The latest data for this measure is therefore from the 2018/19 academic year.
In 2018/19 the overall Progress 8 score2 per pupil in Oxfordshire was +0.07 and was (statistically) significantly above the national average.
Progress 8 scores were above average in South Oxfordshire and Oxford City and similar (overlapping confidence intervals) to the national average in Cherwell, Vale of White Horse and West Oxfordshire.
GCSE results - Progress
DfE Final data released 6 February 2020
Progress 8 score per pupil, trend
Average Progress 8 score per pupil, 2018/19
[1] KS4 performance: ‘About this release’
[2] A Progress 8 score of +1 means pupils are
achieving an average of 1 grade more than similar
pupils elsewhere. A score of -1 means pupils are
achieving an average of 1 grade less. -0.5 is the
minimum standard expected.
Summary
Work and income
Poverty and deprivation
Child poverty
Older People and poverty
Fuel poverty
Food poverty
Housing and Homelessness
Isolation and loneliness
Education and qualifications
Special Educational Needs
Early years
GCSE
Persistent absence
NEET and Apprenticeships
Healthy Place Shaping
Active travel
Air pollution
Green space
Climate change
Finding out more
No update available

Behavioural
determinants of
health
Health
conditions and
causes of death
Population groups
and protected
characteristics
Population
Wider
determinants of
health
Service Use Local researchExecutive
summary
Oxfordshire Joint Strategic Needs Assessment 2021 245
The most recent release of statistics on the proportion of pupils classified as persistently absent1 shows that between 2017-18 and 2018-19:
The rate of persistent absence for primary school pupils in Oxfordshire declined slightly from 7.4 to 7.1 (-0.3pp). The national rate also declined, from 8.7 to 8.2 (-0.5pp);
The rate of persistent absence for secondary school pupils in Oxfordshire increased slightly from 14.6 to 14.7 (+0.1pp). In contrast, the national rate decreased slightly, from 13.9 to 13.7 (-0.2pp).
Persistent absence from school
DfE Pupil Absence statistics (2019/20 data not available until March 2021)
[1] Pupil enrolments missing 10 percent or more of their
own possible sessions (due to authorised or unauthorised
absence) are classified as persistent absentees.
Persistent absence (%) in
Secondary Schools
Persistent absence (%) in
Primary Schools
EnglandOxfordshire
England
Oxfordshire
Summary
Work and income
Poverty and deprivation
Child poverty
Older People and poverty
Fuel poverty
Food poverty
Housing and Homelessness
Isolation and loneliness
Education and qualifications
Special Educational Needs
Early years
GCSE
Persistent absence
NEET and Apprenticeships
Healthy Place Shaping
Active travel
Air pollution
Green space
Climate change
Finding out more
No update available

Behavioural
determinants of
health
Health
conditions and
causes of death
Population groups
and protected
characteristics
Population
Wider
determinants of
health
Service Use Local researchExecutive
summary
Oxfordshire Joint Strategic Needs Assessment 2021 246
As of December 2020, in the age range 16 to 18 (school year 12-13), there was a total of 334 (2.6%) young people in Oxfordshire who were classified as Not in Education, Employment or Training (NEET). This was well above the rate in December 2019 (1.6%).
The district with the highest rate of young people classified as NEET was Oxford City (3.7%).
Between December 2019 and December 2020 there was an increase in the rate of young people classified as NEET in every district in Oxfordshire. The proportion in Cherwell more than doubled.
Young people Not in Education, Employment or Training (NEET)
Oxfordshire County Council
Note* in 2013 and 2014 Local Authorities had to track and support a wider range of young people (years 12 to 14) which could account for higher NEET in those years
Proportion of young people aged 16-18 who are Not in Education, Employment or Training
Summary
Work and income
Poverty and deprivation
Child poverty
Older People and poverty
Fuel poverty
Food poverty
Housing and Homelessness
Isolation and loneliness
Education and qualifications
Special Educational Needs
Early years
GCSE
Persistent absence
NEET and Apprenticeships
Healthy Place Shaping
Active travel
Air pollution
Green space
Climate change
Finding out more
updated

Behavioural
determinants of
health
Health
conditions and
causes of death
Population groups
and protected
characteristics
Population
Wider
determinants of
health
Service Use Local researchExecutive
summary
Oxfordshire Joint Strategic Needs Assessment 2021 247
Data to December 2020 shows that the COVID-19 pandemic and lockdowns have reduced advertised apprenticeship opportunities in Oxfordshire for young people.
Between May and December 2020 there was an average of 79 vacancies for apprenticeship schemes in Oxfordshire being advertised on www.oxme.info
This was about 50% below the average of 120 advertised schemes prior to this period.
Apprenticeships
Oxfordshire Apprenticeship vacancies advertised May to December 2020
NOTE: In this update we have chosen to show apprenticeship vacancy data to illustrate the change in this type of opportunity for young people in 2020, and the impact of the COVID-19 lockdowns.We believe that DfE counts of apprenticeships are currently inflated - many apprenticeships that would have ended naturally without COVID-19 lockdowns have had contracts extended or those young people put on furlough, these still count as being in an apprenticeship. In addition, the introduction of the apprenticeship levy means that money can be spent on current members of staff and so counts do not reflect new people starting in apprenticeship (particularly affects higher level apprenticeships).Oxfordshire County Council based on vacancies on www.oxme.info (counts by month not available for previous years)
Summary
Work and income
Poverty and deprivation
Child poverty
Older People and poverty
Fuel poverty
Food poverty
Housing and Homelessness
Isolation and loneliness
Education and qualifications
Special Educational Needs
Early years
GCSE
Persistent absence
NEET and Apprenticeships
Healthy Place Shaping
Active travel
Air pollution
Green space
Climate change
Finding out more
updated – new indicator

Behavioural
determinants of
health
Health
conditions and
causes of death
Population groups
and protected
characteristics
Population
Wider
determinants of
health
Service Use Local researchExecutive
summary
Oxfordshire Joint Strategic Needs Assessment 2021 248
National data shows that some of the most vulnerable members of society have the least access to the training and learning that could help improve their career prospects
The proportion of the economically active population in Oxfordshire with no qualifications (2.9%) was below the national average (4.7%) in the period Jan-Dec 2019.
Since 2004, the proportion of adults with no qualifications in Oxfordshire has decreased, in line with the national trend.
Adults without qualifications
Proportion of the economically active population (aged
16-64) with no qualifications
ONS analysis of Adult Education Survey 2016 and ONS Annual Population Survey from nomis
Summary
Work and income
Poverty and deprivation
Child poverty
Older People and poverty
Fuel poverty
Food poverty
Housing and Homelessness
Isolation and loneliness
Education and qualifications
Special Educational Needs
Early years
GCSE
Persistent absence
NEET and Apprenticeships
Healthy Place Shaping
Active travel
Air pollution
Green space
Climate change
Finding out more
updated

Behavioural
determinants of
health
Health
conditions and
causes of death
Population groups
and protected
characteristics
Population
Wider
determinants of
health
Service Use Local researchExecutive
summary
Healthy Place Shaping
Oxfordshire Joint Strategic Needs Assessment 2021 249
Summary
Work and income
Poverty and deprivation
Child poverty
Older People and poverty
Fuel poverty
Food poverty
Housing and Homelessness
Isolation and loneliness
Education and qualifications
Special Educational Needs
Early years
GCSE
Persistent absence
NEET and Apprenticeships
Healthy Place Shaping
Active travel
Air pollution
Green space
Climate change
Finding out more

Behavioural
determinants of
health
Health
conditions and
causes of death
Population groups
and protected
characteristics
Population
Wider
determinants of
health
Service Use Local researchExecutive
summary
Oxfordshire Joint Strategic Needs Assessment 2021 250
Healthy Place Shaping is a practical mechanism for creating healthier communities through unifying health and planning. It is based on:
Shaping the built environment, promoting access to green spaces and health enabling infrastructure at a local level to improve health and wellbeing.
Working with local people and local organisations, schools etc to engage them in creating healthy places, services and communities through ‘community activation’.
Re-shaping health, wellbeing and care services (and the infrastructure which supports them) to promote prevention. This includes health services, social care, leisure and recreation services, community centres etc.
Healthy Place Shaping is not just about new developments; it applies to any community experiencing significant health inequalities, change or growth.
Healthy Place Shaping
Oxfordshire Growth BoardNHS England Healthy New TownsImages from Healthy Place Shaping presentation Rosie Rowe
Summary
Work and income
Poverty and deprivation
Child poverty
Older People and poverty
Fuel poverty
Food poverty
Housing and Homelessness
Isolation and loneliness
Education and qualifications
Special Educational Needs
Early years
GCSE
Persistent absence
NEET and Apprenticeships
Healthy Place Shaping
Active travel
Air pollution
Green space
Climate change
Finding out more
updated

Behavioural
determinants of
health
Health
conditions and
causes of death
Population groups
and protected
characteristics
Population
Wider
determinants of
health
Service Use Local researchExecutive
summary
Oxfordshire Joint Strategic Needs Assessment 2021 251
Healthy Place Shaping (HPS) was adopted as a strategic priority for Oxfordshire’s Health and Wellbeing Board in September 2018 and responsibility for monitoring its implementation across the county was delegated to the Health Improvement Board.
In 2020, Health Place Shaping activities across Oxfordshire included:
Embedding Health Place Shaping into the work of the Oxfordshire Growth Board.
Supporting active travel and communities in response to Covid-19.
Scaling up of HPS in each of Oxfordshire’s districts, with funding from Sport England, monitored by a steering group led by Active Oxfordshire.
With the Growth Board, HPS work has:
Helped to shape the Strategic Vision for Sustainable Development for Oxfordshire.
Developed a new Health Place Shaping policy for use by local planning authorities.
Ensured that HPS principles are part of the Local Transport and Connectivity Plan (LTCP5), the refresh of the Oxfordshire Infrastructure Strategy (OXIS) and Oxfordshire’s Local Industrial Strategy.
Produced a toolkit for Health Impact Assessments for Local Plans and major developments.
Healthy Place Shaping in OxfordshireSummary
Work and income
Poverty and deprivation
Child poverty
Older People and poverty
Fuel poverty
Food poverty
Housing and Homelessness
Isolation and loneliness
Education and qualifications
Special Educational Needs
Early years
GCSE
Persistent absence
NEET and Apprenticeships
Healthy Place Shaping
Active travel
Air pollution
Green space
Climate change
Finding out more
updated

Behavioural
determinants of
health
Health
conditions and
causes of death
Population groups
and protected
characteristics
Population
Wider
determinants of
health
Service Use Local researchExecutive
summary
Oxfordshire Joint Strategic Needs Assessment 2021 252
Cherwell
Sustaining Healthy Bicester programme. An early evaluation of health place shaping in Bicester found higher proportions of respondents in good health, lower use of GP services and people adopting healthier lifestyles.
Extending healthy place shaping to Kidlington and Banbury. Close partnership working with business networks and GP practices.
Oxford City
Working across Oxford City to improve cycling and walking infrastructure and local partnership working on healthy place shaping in Barton and Blackbird Leys localities.
Oxford Local Plan includes a policy on Health, wellbeing, and Health Impact Assessments.
South Oxfordshire and Vale of White Horse
Vale Local Plan and South Local Plan each include a policy to require housing developments to first carry out a Health Impact Assessment. Design guides promote active travel and planning for a healthy environment.
West Oxfordshire district
West Oxfordshire Local Plan includes facilitating healthy lifestyles and better wellbeing.
Healthy Place Shaping principles incorporated into the Area Action Plan for Eynsham Garden Village and a Health Impact Assessment supports the outline planning application for the area.
Healthy Place Shaping in Oxfordshire’s districtsSummary
Work and income
Poverty and deprivation
Child poverty
Older People and poverty
Fuel poverty
Food poverty
Housing and Homelessness
Isolation and loneliness
Education and qualifications
Special Educational Needs
Early years
GCSE
Persistent absence
NEET and Apprenticeships
Healthy Place Shaping
Active travel
Air pollution
Green space
Climate change
Finding out more
updated

Behavioural
determinants of
health
Health
conditions and
causes of death
Population groups
and protected
characteristics
Population
Wider
determinants of
health
Service Use Local researchExecutive
summary
132,352
7,450
79,926
14,837
51,143
Cherwell
Oxford
South Oxfordshire
Vale of White Horse
West Oxfordshire
Oxfordshire Joint Strategic Needs Assessment 2021 253
In November 2020, the Department for Transport announced funding for Oxfordshire to improve active travel options and support local economic recovery.
The £2.98 million allocation will support five active travel schemes across the county.
Oxford (3 schemes) to improve the quality of cycling and walking infrastructure including Low Traffic Neighbourhoods and traffic filters.
Bicester (1 scheme) to deliver a network of cycle routes across the town by 2031 and increase walking and cycling.
Witney (1 scheme) to implement an active travel corridor and encourage a shift away from car journeys.
In addition there is ongoing work to encourage school children to walk and cycle across theCounty, including the launch of StreetTag a digital app that turns walking and cycling into agame, with over 70 schools signed up in Oxfordshire.
Healthy Place Shaping, Active Travel and COVID-19 recovery
Street Tag: Miles walked Oct-Dec 2020*
*Street Tag started 5 October 2020 for all districts
other than Cherwell which pioneered use of the
app from 1 August 2020
End date: 31/12/2020
Summary
Work and income
Poverty and deprivation
Child poverty
Older People and poverty
Fuel poverty
Food poverty
Housing and Homelessness
Isolation and loneliness
Education and qualifications
Special Educational Needs
Early years
GCSE
Persistent absence
NEET and Apprenticeships
Healthy Place Shaping
Active travel
Air pollution
Green space
Climate change
Finding out more
updated

Behavioural
determinants of
health
Health
conditions and
causes of death
Population groups
and protected
characteristics
Population
Wider
determinants of
health
Service Use Local researchExecutive
summary
Active travel
Oxfordshire Joint Strategic Needs Assessment 2021 254
Summary
Work and income
Poverty and deprivation
Child poverty
Older People and poverty
Fuel poverty
Food poverty
Housing and Homelessness
Isolation and loneliness
Education and qualifications
Special Educational Needs
Early years
GCSE
Persistent absence
NEET and Apprenticeships
Healthy Place Shaping
Active travel
Air pollution
Green space
Climate change
Finding out more

Behavioural
determinants of
health
Health
conditions and
causes of death
Population groups
and protected
characteristics
Population
Wider
determinants of
health
Service Use Local researchExecutive
summary
Oxfordshire Joint Strategic Needs Assessment 2021 255
Impact of COVID-19 on car use and cycling –national
Department for Transport Transport use during the COVID-19 epidemicCar use based on around 275 automatic traffic count sites across Great BritainThe daily road traffic estimates are suitable as an indication of traffic change rather than actual traffic volumes. The data provided is indexed to the first week of February and the comparison is to the same day of the week, i.e., 100 would mean that traffic is the same as the equivalent day in the first week of February. Over the course of the year, normal traffic can vary by +/– 20%.Cycling use is from telecoms data from O2, National Travel Survey results, DfT traffic counts, sources of cycling use data including automatic cycling counters and camera-based estimatesCycling levels have been historically lower in colder, wetter months, which may influence lower cycle usage over the winter
Summary
Work and income
Poverty and deprivation
Child poverty
Older People and poverty
Fuel poverty
Food poverty
Housing and Homelessness
Isolation and loneliness
Education and qualifications
Special Educational Needs
Early years
GCSE
Persistent absence
NEET and Apprenticeships
Healthy Place Shaping
Active travel
Air pollution
Green space
Climate change
Finding out more
Car use in Great Britain fell sharply in the first COVID-19 lockdown to a low in mid-April of 22% of the equivalent day in February 2020
Cycling (for travel and recreation) in England increased significantly between April and November (compared with the first week of March 2020)
new
Car use in GB as % of the equivalent day in
the first week of February 2020
Cycling in England as % of the equivalent
day in the first week of March 2020

Behavioural
determinants of
health
Health
conditions and
causes of death
Population groups
and protected
characteristics
Population
Wider
determinants of
health
Service Use Local researchExecutive
summary
Oxfordshire Joint Strategic Needs Assessment 2021 256
Impact of Coronavirus on Active Travel –national
Summary
Work and income
Poverty and deprivation
Child poverty
Older People and poverty
Fuel poverty
Food poverty
Housing and Homelessness
Isolation and loneliness
Education and qualifications
Special Educational Needs
Early years
GCSE
Persistent absence
NEET and Apprenticeships
Healthy Place Shaping
Active travel
Air pollution
Green space
Climate change
Finding out more
Most business premises and offices closed during the first lockdown in 2020
The Active Lives survey shows the impact on active travel nationally. Comparing the mid-March to mid-May period in 2019 and 2020..
Adults walking for travel decreased by 46%
Adults cycling for travel decreased by 26%
At the same time inactivity levels rose by 7.4%.
The proportion of children and young people walking “to get places” increased as the use of public transport was discouraged.
Sport England Active Lives Adult Survey Coronavirus (Covid-19) Report, Active Lives Children and Young People Survey Coronavirus (Covid-19) Report
Adults walking or cycling for travel:
2019 vs 2020 mid-March to mid-May
Children and young people walking or cycling
for travel: 2019 vs 2020 mid-March to mid-May
new

Behavioural
determinants of
health
Health
conditions and
causes of death
Population groups
and protected
characteristics
Population
Wider
determinants of
health
Service Use Local researchExecutive
summary
Oxfordshire Joint Strategic Needs Assessment 2021 257
The latest Sport England data for Oxfordshire and districts (November 2018/19) shows that Oxfordshire had the highest proportion of adults (43.3%) participating in active travel (at least twice in the last 28 days) of all of England’s counties – Cambridgeshire was second (43.0%).
Oxford City had a high proportion of adults participating in active travel (62.8%). West Oxfordshire (31.8%) was well below the national average (37.5%).
Active travel (pre-COVID)
Sport England, Active Lives Survey latest data as at 27 January 2021PHE Cycling and walking for individual & and population health benefits
Nov 2017/18 Nov 2018/19 Change
Cherwell 33.3% 37.4% 4.10%
Oxford 64.4% 62.8% -1.60%
South Oxfordshire 36.8% 37% 0.20%
Vale of White Horse 42.1% 43.1% 1.00%
West Oxfordshire 35.8% 31.8% -4.00%
Oxfordshire 43.3% 43.3% 0.00%
England 36.8% 37.5% 0.70%
Proportion of adults who participated in active travel at
least twice in the last 28 days
Summary
Work and income
Poverty and deprivation
Child poverty
Older People and poverty
Fuel poverty
Food poverty
Housing and Homelessness
Isolation and loneliness
Education and qualifications
Special Educational Needs
Early years
GCSE
Persistent absence
NEET and Apprenticeships
Healthy Place Shaping
Active travel
Air pollution
Green space
Climate change
Finding out more
updated

Behavioural
determinants of
health
Health
conditions and
causes of death
Population groups
and protected
characteristics
Population
Wider
determinants of
health
Service Use Local researchExecutive
summary
Oxfordshire Joint Strategic Needs Assessment 2021 258
The aim of the Oxfordshire Cycle Survey 2019 was to understand cyclists’ choices when making cycle journeys
The survey was carried out online from June to August 2019 and was completed by over 3,700 people
The results showed that people in Oxford tend to cycle as a mode of travel and recreation, whereas those outside Oxford use the cycle predominantly for recreation.
The differences are particularly clear for high frequency journeys, such as travelling to work 84% (Oxford cyclists) vs 56% (non-Oxford cyclists), shopping 65% (Oxford cyclists) vs 35% (non-Oxford cyclists) and going into the town centre 78% (Oxford cyclists) vs 41% (non-Oxford cyclists).
Cycling survey in Oxfordshire 2019
Choice Oxford Cyclists Non Oxford cyclists
1st Exercise/health 58% Exercise/health 85%
2nd Quickest time 51% Enjoy cycling 65%
3rd Environment 49% Environment 53%
4th Convenient 39% Convenient 22%
5th Enjoy cycling 34% Quickest time 14%
Summary
Work and income
Poverty and deprivation
Child poverty
Older People and poverty
Fuel poverty
Food poverty
Housing and Homelessness
Isolation and loneliness
Education and qualifications
Special Educational Needs
Early years
GCSE
Persistent absence
NEET and Apprenticeships
Healthy Place Shaping
Active travel
Air pollution
Green space
Climate change
Finding out more
Why do cyclists choose to cycle?
Oxfordshire County Council
Oxfordshire Cycle Survey 2019
Note each respondent could choose 3 reasons.
Showing top 5 choices only
In contrast, a greater percentage of non-Oxford cyclists make recreational cycle journeys (78%), such as cycling for fun or fitness.
new

Behavioural
determinants of
health
Health
conditions and
causes of death
Population groups
and protected
characteristics
Population
Wider
determinants of
health
Service Use Local researchExecutive
summary
Summary
Work and income
Poverty and deprivation
Child poverty
Older People and poverty
Fuel poverty
Food poverty
Housing and Homelessness
Isolation and loneliness
Education and qualifications
Special Educational Needs
Early years
GCSE
Persistent absence
NEET and Apprenticeships
Healthy Place Shaping
Active travel
Air pollution
Green space
Climate change
Finding out more
Oxfordshire Joint Strategic Needs Assessment 2021 259
Impact of Coronavirus on Active Travel (cycling and walking)
iHUB (Environment & Economy, Oxfordshire County Council)
0
100
200
300
400
500
600
700
800
Cyclist
Pedestrian
Lockdown 1 (23rd March)
Lockdown easing (25th May)
Lockdown 1 end (4th July)
Lockdown 2 (5th November)
During the last week of April (27/04/20), road user sensors recorded a 63% decrease in cyclists and pedestrians on Oxfordshire roads (sensors mainly in Oxford City) compared with the same time in 2019.
This is likely to have been a result of more people working from home, less student travel and a drop in tourism visits.
Cyclists and pedestrians on Oxfordshire roads (mainly
Oxford City) April 2019 to December 2020
new
Oxfordshire County Council’s ‘Vivacity
Lab’ (VL) smart detection system sensors
use machine learning software which
locates and classifies road users within
the field of view (of the sensor).
There are 73 active VL sensors in
Oxfordshire, of which 64 are in Oxford
City. The chart uses VL data to show
weekly averaged data for pedestrians
and cyclists across Oxfordshire based on
peak time only (7am-10am & 4pm-7pm
Monday to Friday).

Behavioural
determinants of
health
Health
conditions and
causes of death
Population groups
and protected
characteristics
Population
Wider
determinants of
health
Service Use Local researchExecutive
summary
Summary
Work and income
Poverty and deprivation
Child poverty
Older People and poverty
Fuel poverty
Food poverty
Housing and Homelessness
Isolation and loneliness
Education and qualifications
Special Educational Needs
Early years
GCSE
Persistent absence
NEET and Apprenticeships
Healthy Place Shaping
Active travel
Air pollution
Green space
Climate change
Finding out more
Oxfordshire Joint Strategic Needs Assessment 2021 260
Active Travel in Oxfordshire – Bikes for Key Workers project
Active Oxfordshire
Bikes For Key Workers was a project run by a team of partner organisations and volunteers. Refurbished bikes were given free of charge to key workers across Oxfordshire. Based on the idea of the Windrush Bike Project in Witney, the project reached key workers who either self-referred or referred through Oxford University Hospitals and Oxford Health.
According to Active Oxfordshire:
In 2020 over 450 bikes were given out via the campaign
There was a 10% increase in bike recipients meeting the Chief Medical Officers recommended daily exercise figures
68% of recipients said they would now cycle to work instead of using public transport
55% of recipients said they had not cycled consistently since their childhood
There was an 8.6% reduction in sedentary behaviour
new

Behavioural
determinants of
health
Health
conditions and
causes of death
Population groups
and protected
characteristics
Population
Wider
determinants of
health
Service Use Local researchExecutive
summary
Summary
Work and income
Poverty and deprivation
Child poverty
Older People and poverty
Fuel poverty
Food poverty
Housing and Homelessness
Isolation and loneliness
Education and qualifications
Special Educational Needs
Early years
GCSE
Persistent absence
NEET and Apprenticeships
Healthy Place Shaping
Active travel
Air pollution
Green space
Climate change
Finding out more
Oxfordshire Joint Strategic Needs Assessment 2021 261
Living Streets, the UK charity for everyday walking, has the stated ambition: “Every child that can, walks to school”
The challenge is a behavioural change programme that incentivises primary school children, their parents and teachers to travel actively all or part of the way to school. Every day pupils record how they get to school on the WOW Travel Tracker. Children who walk at least once per week for a month are rewarded with themed badges.
Between Sept 2019 and March 2020, there were 35 schools using the WOW Travel Tracker in Oxfordshire. Tracker data shows:
57% of ALL recorded journeys included solely walking (n.50,092)
87% were active journeys (n.75,715)
4 in every 10 car journeys were swapped for more active travel options
Active travel to school
Living Streets UK Wow Activity Tracker Note that this data is mainly pre-COVID
new

Behavioural
determinants of
health
Health
conditions and
causes of death
Population groups
and protected
characteristics
Population
Wider
determinants of
health
Service Use Local researchExecutive
summary
Air pollution
Oxfordshire Joint Strategic Needs Assessment 2021 262
Summary
Work and income
Poverty and deprivation
Child poverty
Older People and poverty
Fuel poverty
Food poverty
Housing and Homelessness
Isolation and loneliness
Education and qualifications
Special Educational Needs
Early years
GCSE
Persistent absence
NEET and Apprenticeships
Healthy Place Shaping
Active travel
Air pollution
Green space
Climate change
Finding out more

Behavioural
determinants of
health
Health
conditions and
causes of death
Population groups
and protected
characteristics
Population
Wider
determinants of
health
Service Use Local researchExecutive
summary
Air pollution is the largest environmental health risk in the UK. It causes more harm than passive smoking. Conditions exacerbated by air pollution include asthma, chronic bronchitis, chronic heart disease (CHD), and strokes. For most people, the health benefits of walking and cycling far outweigh the risks of roadside exposure to air pollution. Aside from the health benefits of the additional exercise, it has the potential to reduce exposure to air pollution –this is because air quality inside a car or van can be worse than it is outside.
Oxfordshire Joint Strategic Needs Assessment 2021 263
Air pollution and health – national
Department for Environment, Food & Rural Affairs, Clean Air Strategy 2019
Not updated
Summary
Work and income
Poverty and deprivation
Child poverty
Older People and poverty
Fuel poverty
Food poverty
Housing and Homelessness
Isolation and loneliness
Education and qualifications
Special Educational Needs
Early years
GCSE
Persistent absence
NEET and Apprenticeships
Healthy Place Shaping
Active travel
Air pollution
Green space
Climate change
Finding out more

Behavioural
determinants of
health
Health
conditions and
causes of death
Population groups
and protected
characteristics
Population
Wider
determinants of
health
Service Use Local researchExecutive
summary
Consistent exposure to air pollution is a known cause of breathing difficulties and other long-term conditions in the lungs and the heart.
ONS data show that more than one-third (35%) of deaths involving COVID-19 in England up to the end of June 2020 had a respiratory or cardiovascular disease as the main pre-existing health condition.
ONS analysis found that “polluted areas initially had higher rates of COVID-19 deaths, but this trend decreased as the death toll rose”.
Oxfordshire Joint Strategic Needs Assessment 2021 264
Air pollution and COVID-19 deaths – national data
ONS Does exposure to air pollution increase the risk of dying from the coronavirus (COVID-19)? 2020
Analysis includes 46,471 deaths involving COVID-19 among usual residents of England between 7 March 2020 and 12 June 2020, registered by 22 June 2020.
High
correlation
Correlation between COVID-19 deaths in England
and 10-year exposure to nitrogen dioxide (NO2) and
fine particulate matter (PM2.5)
PM2.5
NO2
Summary
Work and income
Poverty and deprivation
Child poverty
Older People and poverty
Fuel poverty
Food poverty
Housing and Homelessness
Isolation and loneliness
Education and qualifications
Special Educational Needs
Early years
GCSE
Persistent absence
NEET and Apprenticeships
Healthy Place Shaping
Active travel
Air pollution
Green space
Climate change
Finding out more
new

Behavioural
determinants of
health
Health
conditions and
causes of death
Population groups
and protected
characteristics
Population
Wider
determinants of
health
Service Use Local researchExecutive
summary
IHME, Global Burden of Disease tool, accessed 26.01.2021PHE, Estimation of costs to the NHS And social care due to the health impact of air pollution
PM2.5 is particularly harmful because the particles are very small and can travel deep into the lungs where they can cause damage to the tissue. Exposure has been linked to a range of health outcomes including asthma, respiratory disease, coronary heart disease, stroke, and lung cancer, with emerging evidence showing impacts on diabetes and low birth weight.
Inhaling NO2 affects our health by diffusing into the cells which line the respiratory tract. This can cause effects such as tightening of the airways in the lungs (causing wheezing, coughing, shortness of breath), inflammation, and a reduced immune response. NO2 has been associated with causing asthma, and lung cancer, with emerging evidence showing impacts on type 2 diabetes, low birth weight and dementia. NO2 can also exacerbate existing conditions, especially asthma.
Oxfordshire Joint Strategic Needs Assessment 2021 265
Health Impacts of Air Pollution
Oxfordshire DALYs from ambient
particulate matter, by cause, 2019 In Oxfordshire, it was estimated that over 2,300
years of healthy life (DALYs) were lost due to ambient particulate matter in 2019. These were mainly attributed to cardiovascular diseases, diabetes and kidney diseases, and chronic respiratory diseases.
One Disability Adjusted Life Year (DALY) can be thought of as onelost year of "healthy" life. DALYs are calculated as the sum of theYears of Life Lost (YLL) due to premature mortality in thepopulation and the Years Lost due to Disability (YLD) for peopleliving with the health condition or its consequences.The sum of DALYs for a population is a measurement of the gapbetween current health status and the situation where the entirepopulation lives to an advanced age, free of disease and disability.
Summary
Work and income
Poverty and deprivation
Child poverty
Older People and poverty
Fuel poverty
Food poverty
Housing and Homelessness
Isolation and loneliness
Education and qualifications
Special Educational Needs
Early years
GCSE
Persistent absence
NEET and Apprenticeships
Healthy Place Shaping
Active travel
Air pollution
Green space
Climate change
Finding out more
updated

Behavioural
determinants of
health
Health
conditions and
causes of death
Population groups
and protected
characteristics
Population
Wider
determinants of
health
Service Use Local researchExecutive
summary
Oxfordshire Joint Strategic Needs Assessment 2021 266
Research by King’s College London highlights some of the impacts of air pollution in Oxford.
Each year on average, higher air pollution days in Oxford are responsible for: 6 more cardiac arrests outside hospital.
4 more hospital admissions for stroke.
5 more people to hospital for cardiovascular disease than lower air pollution days.
Roadside air pollution in Oxford stunts lung growth in children by 14.1%.
In Oxford, an extra 1 adult and 1 child are hospitalised with asthma on days where air pollution is high compared to days where air pollution is low on average each year.
On high air pollution days, 4 more children with asthma in Oxford experience asthma symptoms than on lower pollution days.
Cutting air pollution in Oxford by one fifth would result in: 83 fewer cases of coronary heart disease each year.
28 fewer cases of lung cancer each year.
77 fewer children with low lung function each year.
38 fewer asthmatic children with bronchitic symptoms each year.
31 fewer children with a chest infection (acute bronchitis) each year.
1 less baby born underweight each year.
an increase in children’s lung capacity by around 2.8%.
Health Impacts of Air Pollution in Oxford
King's College London and Clean Air Fund
Not updated
Summary
Work and income
Poverty and deprivation
Child poverty
Older People and poverty
Fuel poverty
Food poverty
Housing and Homelessness
Isolation and loneliness
Education and qualifications
Special Educational Needs
Early years
GCSE
Persistent absence
NEET and Apprenticeships
Healthy Place Shaping
Active travel
Air pollution
Green space
Climate change
Finding out more

Behavioural
determinants of
health
Health
conditions and
causes of death
Population groups
and protected
characteristics
Population
Wider
determinants of
health
Service Use Local researchExecutive
summary
Summary
Work and income
Poverty and deprivation
Child poverty
Older People and poverty
Fuel poverty
Food poverty
Housing and Homelessness
Isolation and loneliness
Education and qualifications
Special Educational Needs
Early years
GCSE
Persistent absence
NEET and Apprenticeships
Healthy Place Shaping
Active travel
Air pollution
Green space
Climate change
Finding out more
Oxfordshire Joint Strategic Needs Assessment 2021 267
Air pollution - Oxfordshire
Oxfordshire has 13 designated Air Quality Management Areas where air quality objectives are not being met.
Oxford City is planning to become the world’s first Zero Emission Zone by 2035. This project will begin by banning petrol and diesel vehicles from the city centre in August 2021, expanding further by 2022-2025 and ultimately covering the whole city by 2035.
Over the past 5 years, the sites with the highest readings for Nitrogen Dioxide (NO2) in Oxfordshire have generally seen a declining trend.
NO2 (μg/m³) annual mean at selected sites in Oxfordshire
(showing the highest readings in each district)
40 μg/m³ target
updated
Data provided by Oxfordshire District Data Analysis ServiceOxfordshire Air Quality, Air Quality Management Areas, EU Air Quality Standards Nitrogen dioxide and nitric oxide are referred to together as oxides of nitrogen (NOx).

Behavioural
determinants of
health
Health
conditions and
causes of death
Population groups
and protected
characteristics
Population
Wider
determinants of
health
Service Use Local researchExecutive
summary
Oxfordshire Joint Strategic Needs Assessment 2021 268
Access to public green space
ONS Access to gardens and public green space in Great Britain
Summary
Work and income
Poverty and deprivation
Child poverty
Older People and poverty
Fuel poverty
Food poverty
Housing and Homelessness
Isolation and loneliness
Education and qualifications
Special Educational Needs
Early years
GCSE
Persistent absence
NEET and Apprenticeships
Healthy Place Shaping
Active travel
Air pollution
Green space
Climate change
Finding out more
The COVID-19 lockdown has emphasised the importance of access to public green space and gardens.
According to ONS, the average distance to Parks, Public Gardens or Playing Fields (Greenspace) varies across Oxfordshire, with the greater distances in rural areas (as might be expected).
By district, average distances were lowest in Oxford City and greatest in Vale of White Horse.
new
Average distance to Greenspace (m)
April 2020
Cherwell 440
Oxford 290
South Oxfordshire 475
Vale of White Horse 533
West Oxfordshire 462
South East 394
England 385

Behavioural
determinants of
health
Health
conditions and
causes of death
Population groups
and protected
characteristics
Population
Wider
determinants of
health
Service Use Local researchExecutive
summary
Climate change
Oxfordshire Joint Strategic Needs Assessment 2021 269
Summary
Work and income
Poverty and deprivation
Child poverty
Older People and poverty
Fuel poverty
Food poverty
Housing and Homelessness
Isolation and loneliness
Education and qualifications
Special Educational Needs
Early years
GCSE
Persistent absence
NEET and Apprenticeships
Healthy Place Shaping
Active travel
Air pollution
Green space
Climate change
Finding out more

Behavioural
determinants of
health
Health
conditions and
causes of death
Population groups
and protected
characteristics
Population
Wider
determinants of
health
Service Use Local researchExecutive
summary
Oxfordshire Joint Strategic Needs Assessment 2021 270
Carbon dioxide emissions
Department for Business, Energy and Industrial Strategy, Local authority and regional carbon dioxide emissionsincludes all sources, latest data as of Jan21
updated
Summary
Work and income
Poverty and deprivation
Child poverty
Older People and poverty
Fuel poverty
Food poverty
Housing and Homelessness
Isolation and loneliness
Education and qualifications
Special Educational Needs
Early years
GCSE
Persistent absence
NEET and Apprenticeships
Healthy Place Shaping
Active travel
Air pollution
Green space
Climate change
Finding out more
Carbon Emissions by type 2018
Oxfordshire Districts
CO2 emissions per capita across the UK and in Oxfordshire have declined. The main driver of the decrease in UK emissions in 2018 was a change in the fuel mix for electricity generation, with a decrease in the use of coal and more use of renewables.
Between 2008 and 2018 Oxfordshire’s total carbon emissions fell by 27% overall with the greatest decline in Industry & Commercial followed by Domestic.
Transport now makes up the largest share with 46% of total emissions and has remained at a similar level of emissions for the past 10 years.
Oxford City and West Oxfordshire have the lowest CO2 emissions of districts in Oxfordshire, mainly as a result of lower emissions from transport.
Oxfordshire Carbon Emissions
2008 to 2018

Behavioural
determinants of
health
Health
conditions and
causes of death
Population groups
and protected
characteristics
Population
Wider
determinants of
health
Service Use Local researchExecutive
summary
Oxfordshire Joint Strategic Needs Assessment 2021 271
Between 2009 and 2019, the number of registered cars in Oxfordshire increased by 18%. The number of diesel cars increased by 67% and in 2019 made up 40% of the total number of registered cars in the county.
Registration of ultra low emission numbers have increased significantly across Oxfordshire in the last 8 years, from 233 in 2012 to 5,196 in 2020.
Low emission vehicles
Department for Transport and DVLA, All vehicles
Ultra low emission vehicles registered in Oxfordshire, 2012 to 2020
Summary
Work and income
Poverty and deprivation
Child poverty
Older People and poverty
Fuel poverty
Food poverty
Housing and Homelessness
Isolation and loneliness
Education and qualifications
Special Educational Needs
Early years
GCSE
Persistent absence
NEET and Apprenticeships
Healthy Place Shaping
Active travel
Air pollution
Green space
Climate change
Finding out more
updated

Behavioural
determinants of
health
Health
conditions and
causes of death
Population groups
and protected
characteristics
Population
Wider
determinants of
health
Service Use Local researchExecutive
summary
Oxfordshire Joint Strategic Needs Assessment 2021 272
The Natural Environment Research Council has published a series of papers on the impact of climate change on health in the UK.
It is predicted that in the future changes could be seen in: Temperature: All areas of the UK are expected to warm, more so in summer than in
winter. Changes in summer mean temperatures are expected to be greatest in parts of southern England. Winter nights are also expected to become milder.
Heatwaves: The frequency and intensity of extreme heatwaves are both expected to increase over this century.
Rainfall: Whilst annual average rainfall may not change much, regional and seasonal changes may occur. There will be an increased chance of summers having lower rainfall, particularly in southern England, but downpours may become heavier when they occur.
Sea level: Sea levels will continue to rise and are likely to do so at a faster rate than observed in the last century, leading to higher peak sea levels during extreme events.
Solar radiation: This may increase on average across the UK, with the greatest increase expected in southern England.
Humidity: Relative humidity may decrease by 5 - 10% in summer with the greatest reductions in Southern England.
High winds: Changes to atmospheric circulation may shift storm tracks north or south but changes in wind speeds are uncertain.
The delivery of health and social care is disrupted by extreme weather such as floods, storms, heatwaves and severe winters.
Climate change
Natural Environment Research Council, Climate change impacts report cards
Not updated
Summary
Work and income
Poverty and deprivation
Child poverty
Older People and poverty
Fuel poverty
Food poverty
Housing and Homelessness
Isolation and loneliness
Education and qualifications
Special Educational Needs
Early years
GCSE
Persistent absence
NEET and Apprenticeships
Healthy Place Shaping
Active travel
Air pollution
Green space
Climate change
Finding out more

Behavioural
determinants of
health
Health
conditions and
causes of death
Population groups
and protected
characteristics
Population
Wider
determinants of
health
Service Use Local researchExecutive
summary
Oxfordshire Joint Strategic Needs Assessment 2021 273
Ambient temperature is the most important weather factor to health, and temperatures do not need to be particularly extreme before the risk of death and illness is heightened.
Mean temperatures in the UK are projected to increase and heatwaves are likely to become more frequent.
Days with hot weather and heatwaves increase the risk of deaths in some groups among the UK population.
The elderly are most at risk of heat-related deaths, along with people who have a pre-existing chronic disease. The growing number of older people means more of the population will become vulnerable to hot weather.
Risk of injury or death may increase among some groups of workers (such as drivers and construction workers) due to occupational heat exposure.
During hot weather, there is a small increase in the use of health services (e.g. in emergency admissions for respiratory diseases and injuries).
Acute exposure to allergenic pollen is associated with a range of health effects, such as hay fever, eczema and asthma episodes in susceptible individuals.
Individuals vary in their susceptibility to different pollens.
Timing, abundance and distribution of pollen release are affected by vegetation cover and environmental conditions, including climate.
Changes in climate may influence the capacity of some species of pollen to cause allergic reactions; the impact of climate change on the length of the pollen season and on the total burden of pollen-related ill-health is very uncertain.
Health impacts of climate change
Natural Environment Research Council, Climate change impacts report cards
Summary
Work and income
Poverty and deprivation
Child poverty
Older People and poverty
Fuel poverty
Food poverty
Housing and Homelessness
Isolation and loneliness
Education and qualifications
Special Educational Needs
Early years
GCSE
Persistent absence
NEET and Apprenticeships
Healthy Place Shaping
Active travel
Air pollution
Green space
Climate change
Finding out more
Not updated

Behavioural
determinants of
health
Health
conditions and
causes of death
Population groups
and protected
characteristics
Population
Wider
determinants of
health
Service Use Local researchExecutive
summary
Oxfordshire Joint Strategic Needs Assessment 2021 274
Flooding has a range of possible effects on human health. River flooding is expected to increase in magnitude and frequency through the
century.
Flooding has a range of effects on human health including deaths from drowning, injuries and mental health impacts; floods increase the rates of self-reported depression, anxiety and post-traumatic stress disorder (PTSD) in affected populations.
Flooding has also been associated with cases of carbon monoxide poisoning in post-flood clean up phase.
Future flood risk is also determined by the construction and maintenance of flood defences, environmental management and the number of people that are living in flood risk zones.
Climate change may affect the risk of emerging infectious diseases. It is possible that native insect and tick species could become more capable of
transmitting diseases that affect humans.
Several vector-borne diseases have emerged in Europe in recent years e.g. vivax malaria, West Nile fever, dengue fever, Lyme disease and tick-borne encephalitis. Some of these diseases are linked to increase in transport of people and goods.
The incidence of Lyme disease will continue increasing, and climate change will enable it to spread to higher altitude.
The impact of climate change on infectious respiratory diseases requires further study.
Health impacts of climate change
Natural Environment Research Council, Climate change impacts report cards
Summary
Work and income
Poverty and deprivation
Child poverty
Older People and poverty
Fuel poverty
Food poverty
Housing and Homelessness
Isolation and loneliness
Education and qualifications
Special Educational Needs
Early years
GCSE
Persistent absence
NEET and Apprenticeships
Healthy Place Shaping
Active travel
Air pollution
Green space
Climate change
Finding out more
Not updated

Behavioural
determinants of
health
Health
conditions and
causes of death
Population groups
and protected
characteristics
Population
Wider
determinants of
health
Service Use Local researchExecutive
summary
Oxfordshire Joint Strategic Needs Assessment 2021 275
Take up of low-carbon solutions. People and businesses will choose to adopt low-carbon solutions, as high carbon options are progressively phased out. By the early 2030s all new cars and vans and all boiler replacements in homes and other buildings are low-carbon – largely electric.
Expansion of low-carbon energy supplies. UK electricity production is zero carbon by 2035. Offshore wind becomes the backbone of the whole UK energy system, growing from the Prime Minister’s promised 40GW in 2030 to 100GW or more by 2050.
Reducing demand for carbon-intensive activities. Diets change, reducing our consumption of high-carbon meat and dairy products by 20% by 2030, with further reductions in later years.
Land and greenhouse gas removals. By 2035, 460,000 hectares of new mixed woodland are planted to remove CO2 and deliver wider environmental benefits. 260,000 hectares of farmland shifts to producing energy crops.
Climate change – The Sixth Carbon Budget
The Climate Change Committee, The Sixth Carbon Budget report 2020
The Sixth Carbon Budget report sets out the main changes that would need to take place for the
UK government to reach their emission targets by 2035:
Summary
Work and income
Poverty and deprivation
Child poverty
Older People and poverty
Fuel poverty
Food poverty
Housing and Homelessness
Isolation and loneliness
Education and qualifications
Special Educational Needs
Early years
GCSE
Persistent absence
NEET and Apprenticeships
Healthy Place Shaping
Active travel
Air pollution
Green space
Climate change
Finding out more
new

Behavioural
determinants of
health
Health
conditions and
causes of death
Population groups
and protected
characteristics
Population
Wider
determinants of
health
Service Use Local researchExecutive
summary
Summary
Work and income
Poverty and deprivation
Child poverty
Older People and poverty
Fuel poverty
Food poverty
Housing and Homelessness
Isolation and loneliness
Education and qualifications
Special Educational Needs
Early years
GCSE
Persistent absence
NEET and Apprenticeships
Healthy Place Shaping
Active travel
Air pollution
Green space
Climate change
Finding out more
Oxfordshire Joint Strategic Needs Assessment 2021 276
PHE Fingertips Wider Determinants of Health profile
PHE A-Z of the root causes of ill health
Healthy New Towns
NHS England, Healthy New Towns
King’s Fund Supporting the Healthy New Towns programme
Town and County Planning Association reports
LGA Shaping Healthy Places: exploring the district council role in health
WHO Healthy environments for healthier populations
Rojas-Rueda et al. Green spaces and mortality: a systematic review and meta-analysis of cohort studies
Climate change
Oxfordshire County Council Climate action in Oxfordshire
Oxfordshire Districts Air Quality Air Quality
Climate Change Committee Climate change advice
Finding out more

Behavioural
determinants of
health
Health
conditions and
causes of death
Population groups
and protected
characteristics
Population
Wider
determinants of
health
Service Use Local researchExecutive
summary
Service use
Oxfordshire Joint Strategic Needs Assessment 2021 277
Chapter 7

Behavioural
determinants of
health
Health
conditions and
causes of death
Population groups
and protected
characteristics
Population
Wider
determinants of
health
Service Use Local researchExecutive
summary
Oxfordshire Joint Strategic Needs Assessment 2021 278
This chapter provides an overview of trends from data collected by providers of health, social care and related services in Oxfordshire including Local Authorities, Health service providers, Police and Voluntary sector organisations.
With thanks to the analysts and service experts who worked with us and provided advice and data extracts for this chapter.
Further JSNA resources are available via the JSNA page of Oxfordshire Insight.
Assessing the impact of COVID-19
This chapter presents the most recent datasets available in January 2021
Where possible, local providers of the data have included statistics covering the full year 2020 to show the impact (in that year) of the COVID-19 pandemic and lockdown.
This chapter…Introduction
Summary
Primary health care
Secondary health care
Mental health services
Register of disabled children
Children’s social care
Adult social care
Community safety services
Health support and preventing ill-health
Access to services
Population Health Management
Finding out more

Behavioural
determinants of
health
Health
conditions and
causes of death
Population groups
and protected
characteristics
Population
Wider
determinants of
health
Service Use Local researchExecutive
summary
Oxfordshire Joint Strategic Needs Assessment 2021 279
Oxford Health Community Services also saw a decrease in activity levels from early 2020 as a result of COVID-19 when some staff were redeployed.
Mental health services
In the four year period, 2016/17 to 2019/20, the number of Oxfordshire patients referred to Oxford Health for mental health services increased by 38% overall, by +83% for people aged 0-9 and by +58% for people aged 10-19.
Monthly data to December 2020 shows a drop in Oxfordshire patients referred to Oxford Health mental health services from March to May 2020, during the first lockdown.
From June 2020 there was a recovery in referrals to similar levels as in 2019.
Children’s social care
Between the 2018/19 and 2019/20 financial years, the yearly rate of referrals to children’s social care increased.
Between Mar19 and Mar20, the rate of children subject of a child protection plan and the rate of cared for children decreased slightly.
The % of Oxfordshire’s care leavers in employment, education or training remains below the national average and the gap has widened.
Summary (1)
Primary health care
At the start of the COVID-19 pandemic, a new appointment system was set up and the public were advised to call 111.
Following the first rise of COVID-19 cases in early 2020, the number of face to face GP appointments in Oxfordshire dropped sharply, accompanied by an increase in the number of telephone appointments.
Between Apr20 and Aug20, more GP appointments were carried out by telephone than face to face.
An online consultation platform used by most GP practices in Oxfordshire has regularly had over 10,000 requests submitted per month.
Secondary health care
From April 2020, as a result of the COVID-19 pandemic, the monthly average of all types of hospital admissions, unplanned and planned, were well below the previous year.
Comparing the Q3 periods Oct-Dec 2019 and Oct-Dec 2020, shows the greatest reduction in A&E attendances per population by age were people in the younger age group (0-19).
Introduction
Summary
Primary health care
Secondary health care
Mental health services
Register of disabled children
Children’s social care
Adult social care
Community safety services
Health support and preventing ill-health
Access to services
Population Health Management
Finding out more
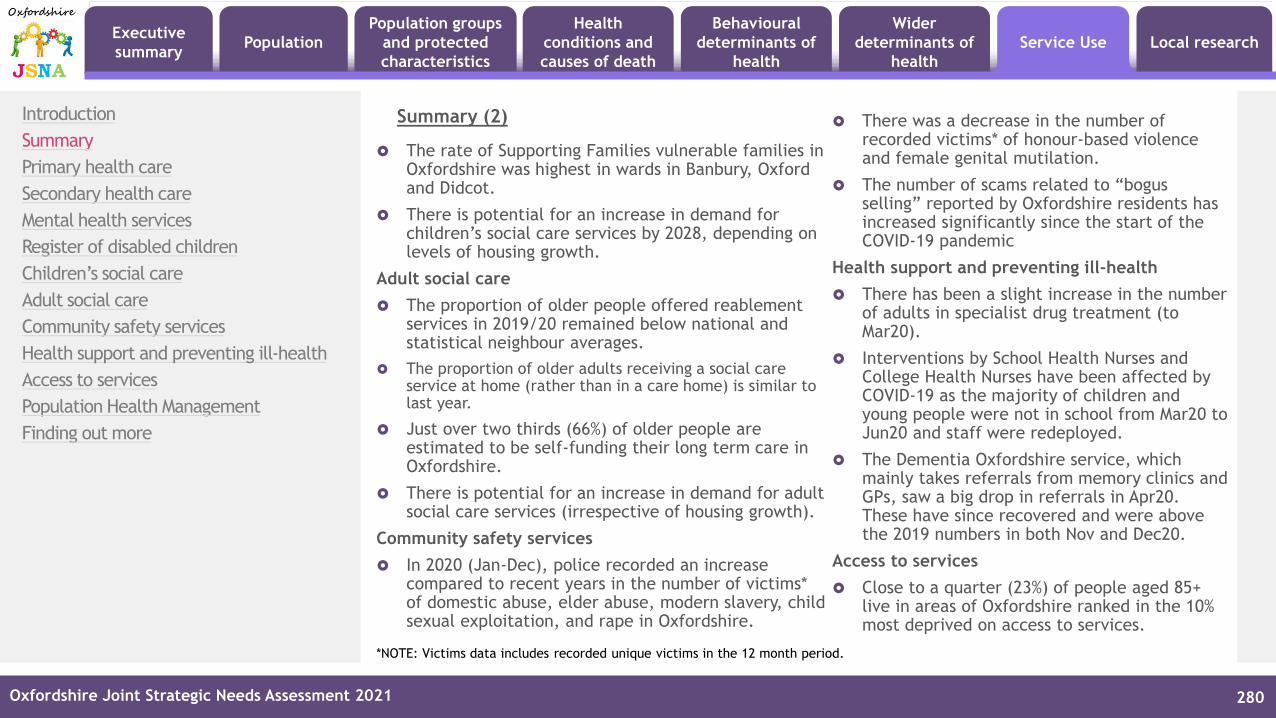
Behavioural
determinants of
health
Health
conditions and
causes of death
Population groups
and protected
characteristics
Population
Wider
determinants of
health
Service Use Local researchExecutive
summary
Oxfordshire Joint Strategic Needs Assessment 2021 280
The rate of Supporting Families vulnerable families in Oxfordshire was highest in wards in Banbury, Oxford and Didcot.
There is potential for an increase in demand for children’s social care services by 2028, depending on levels of housing growth.
Adult social care
The proportion of older people offered reablement services in 2019/20 remained below national and statistical neighbour averages.
The proportion of older adults receiving a social care service at home (rather than in a care home) is similar to last year.
Just over two thirds (66%) of older people are estimated to be self-funding their long term care in Oxfordshire.
There is potential for an increase in demand for adult social care services (irrespective of housing growth).
Community safety services
In 2020 (Jan-Dec), police recorded an increase compared to recent years in the number of victims* of domestic abuse, elder abuse, modern slavery, child sexual exploitation, and rape in Oxfordshire.
Summary (2) There was a decrease in the number of recorded victims* of honour-based violence and female genital mutilation.
The number of scams related to “bogus selling” reported by Oxfordshire residents has increased significantly since the start of the COVID-19 pandemic
Health support and preventing ill-health
There has been a slight increase in the number of adults in specialist drug treatment (to Mar20).
Interventions by School Health Nurses and College Health Nurses have been affected by COVID-19 as the majority of children and young people were not in school from Mar20 to Jun20 and staff were redeployed.
The Dementia Oxfordshire service, which mainly takes referrals from memory clinics and GPs, saw a big drop in referrals in Apr20. These have since recovered and were above the 2019 numbers in both Nov and Dec20.
Access to services
Close to a quarter (23%) of people aged 85+ live in areas of Oxfordshire ranked in the 10% most deprived on access to services.
Introduction
Summary
Primary health care
Secondary health care
Mental health services
Register of disabled children
Children’s social care
Adult social care
Community safety services
Health support and preventing ill-health
Access to services
Population Health Management
Finding out more
*NOTE: Victims data includes recorded unique victims in the 12 month period.

Behavioural
determinants of
health
Health
conditions and
causes of death
Population groups
and protected
characteristics
Population
Wider
determinants of
health
Service Use Local researchExecutive
summary
Primary health care
Oxfordshire Joint Strategic Needs Assessment 2021 281
Introduction
Summary
Primary health care
Secondary health care
Mental health services
Register of disabled children
Children’s social care
Adult social care
Community safety services
Health support and preventing ill-health
Access to services
Population Health Management
Finding out more

Behavioural
determinants of
health
Health
conditions and
causes of death
Population groups
and protected
characteristics
Population
Wider
determinants of
health
Service Use Local researchExecutive
summary
Oxfordshire Joint Strategic Needs Assessment 2021 282
Primary care services provide the first point of contact in the healthcare system, acting as the ‘front door’ of the NHS. Primary care includes general practice, community pharmacy, dental, and optometry (eye health) services1.
In Oxfordshire there are: 67 GP practices, 85 General Dental practices, 8 Orthodontic practices and 105 Community Pharmacies (March 2021)
As of February 2021, the number of patients registered at GP practices in Oxfordshire ranges from 40,155 (Banbury Cross Health Centre) to 476 (Luther Street Medical Practice*, Oxford).
Primary health care
[1] NHS England, Primary care services NHS Digital, Patients Registered at a GP Practice February 2021
new
Introduction
Summary
Primary health care
Secondary health care
Mental health services
Register of disabled children
Children’s social care
Adult social care
Community safety services
Health support and preventing ill-health
Access to services
Population Health Management
Finding out more
Oxfordshire Clinical
Commissioning
Group GP practices,
by number of
registered patients
Orange line =
median (10,468
patients)
* Luther Street Medical Practice provides healthcare to people experiencing homelessness in Oxford City.

Behavioural
determinants of
health
Health
conditions and
causes of death
Population groups
and protected
characteristics
Population
Wider
determinants of
health
Service Use Local researchExecutive
summary
Oxfordshire Joint Strategic Needs Assessment 2021 283
The NHS Long Term Plan set out priorities for healthcare over the next 10 years with a focus on preventing ill-health, improving care, supporting staff and investing in new technology.
As part of the plan, Primary Care Networks (PCNs) were established across England in 2019 and continue to evolve as groups of GP practices serving patient population of 30-50,000.
Oxfordshire’s 20 PCNs continue to deliver the NHS Long Term Plan commitments including:
Improved access for patients including a core digital offer,
During 2020/21 PCN service specifications included structured medication review and medicines optimisation, enhanced health in care homes, supporting early cancer diagnosis and social prescribing.
PCNs are funded by a Directed Enhanced Service (DES) – a voluntary add-on to the core GP contract. They receive allocations for some core costs plus supporting care homes.
Most of their funding is to employ additional staff, currently:
clinical pharmacists and pharmacy technicians
social prescribing link workers, care co-ordinators and health and wellbeing coaches
physician associates
first contact physiotherapists, occupational therapists, dietitians, podiatrists
nursing associates and trainees
From April 2021: community paramedics and mental health practitioners
Primary Care Networks
NHS England, Investment and Evolution: Update to the GP contract agreement 2020/21 – 2023/24NHS England, A five-year framework for GP contract reform to implement The NHS Long Term Plan
updated
Introduction
Summary
Primary health care
Secondary health care
Mental health services
Register of disabled children
Children’s social care
Adult social care
Community safety services
Health support and preventing ill-health
Access to services
Population Health Management
Finding out more

Behavioural
determinants of
health
Health
conditions and
causes of death
Population groups
and protected
characteristics
Population
Wider
determinants of
health
Service Use Local researchExecutive
summary
Oxfordshire Joint Strategic Needs Assessment 2021 284
There are 20 Primary Care Networks in Oxfordshire providing for between 27,000 and 52,000 (GP patient population)
Oxfordshire’s Primary Care Networks showing
boundaries based on GP practice catchment areasPrimary Care Networks in Oxfordshire
Oxfordshire CCG Primary Care NetworksSibford Surgery is not covered by a PCN
Dots show
location of
GP practices
PCNs as of December 2020
Northern Oxfordshire Oxford
Banbury Cross City - East Oxford
Banbury Alliance City - OX3+
NORA (North Oxfordshire
Rural Alliance)Oxford Central
BicesterHealthier City Oxford
Network
KIWY (Kidlington, Islip,
Woodstock, Yarnton)SEOxHA
Eynsham & Witney
Rural West
Southern Oxfordshire
Henley SonNet Abingdon Central
Thame Abingdon & District
Wallingford & Surrounds Wantage
Didcot White Horse Botley
updated
Introduction
Summary
Primary health care
Secondary health care
Mental health services
Register of disabled children
Children’s social care
Adult social care
Community safety services
Health support and preventing ill-health
Access to services
Population Health Management
Finding out more

Behavioural
determinants of
health
Health
conditions and
causes of death
Population groups
and protected
characteristics
Population
Wider
determinants of
health
Service Use Local researchExecutive
summary
Oxfordshire Joint Strategic Needs Assessment 2021 285
As of September 2020, Oxfordshire CCG had a ratio of..
51 GPs per 100,000 patients, above the average of 46 for England
23 nurses per 100,000 patients, below the average of 28 for England
23 direct patient care staff per 100,000 patients, similar to the average of 24 for England
98 admin staff per 100,000 patients below the average of 114 for England
GP workforce to patient ratio
NHS Digital General Practice Workforce selected CCG information from dashboard September 2020
Staff Full Time Equivalent per 100,000 patients,
Oxfordshire Clinical Commissioning Group
updated
Introduction
Summary
Primary health care
Secondary health care
Mental health services
Register of disabled children
Children’s social care
Adult social care
Community safety services
Health support and preventing ill-health
Access to services
Population Health Management
Finding out more

Behavioural
determinants of
health
Health
conditions and
causes of death
Population groups
and protected
characteristics
Population
Wider
determinants of
health
Service Use Local researchExecutive
summary
Oxfordshire Joint Strategic Needs Assessment 2021 286
Of the 329,260 appointments with NHS Oxfordshire Clinical Commissioning Group GP practices in November 2020, 54% were carried out by GPs, just above the regional (51%) and national (50%) proportions.
This is small change compared to November 2019 (Oxfordshire CCG 53% vs 51% in the South East and 50% in England).
Proportion of primary care appointments by health care professional type
NHS Digital Appointments in General Practice November 2020
Appointments in General Practice by Health
Care Professional Type - November 2020
updated
Introduction
Summary
Primary health care
Secondary health care
Mental health services
Register of disabled children
Children’s social care
Adult social care
Community safety services
Health support and preventing ill-health
Access to services
Population Health Management
Finding out more

Behavioural
determinants of
health
Health
conditions and
causes of death
Population groups
and protected
characteristics
Population
Wider
determinants of
health
Service Use Local researchExecutive
summary
Oxfordshire Joint Strategic Needs Assessment 2021 287
Of the 329,260 appointments with NHS Oxfordshire Clinical Commissioning Group GP practices in November 2020, 49% were carried out over the phone compared with 40% both regionally and nationally.
This is an increase compared to November 2019 (telephone appointments = 21% OCCG, 16% SE, and 13% England) - largely due to the COVID-19 pandemic and the introduction of total triage1.
Proportion of appointments carried out by telephone
NHS Digital Appointments in General Practice November 2020[1] Total triage is the system by which every patient contacting a practice is first triaged before deciding what steps need to be taken to support that patient
Appointments in General Practice by Mode, November 2020The mode of the appointment shows
the setting of the consultation. Some
video conference appointments may
be logged by the practice as face-to-
face.
Most face-to-face time is booked as
individual appointment time,
typically with one patient attending
each time slot. By contrast, many
telephone triage and home visits
appear as one long blocked period of
time which are not booked to
individual patients.
Unless home visits and telephone
triage are logged as individual
appointments and booked to a
patient they will not appear in this
publication.
updated
Introduction
Summary
Primary health care
Secondary health care
Mental health services
Register of disabled children
Children’s social care
Adult social care
Community safety services
Health support and preventing ill-health
Access to services
Population Health Management
Finding out more

Behavioural
determinants of
health
Health
conditions and
causes of death
Population groups
and protected
characteristics
Population
Wider
determinants of
health
Service Use Local researchExecutive
summary
Oxfordshire Joint Strategic Needs Assessment 2021 288
Following the first rise of COVID-19 cases in early 2020, the number of face to face GP appointments in Oxfordshire dropped sharply, accompanied by an increase in the number of telephone appointments.
Between April and August 2020, more GP appointments were carried out by telephone than face to face.
Proportion of appointments carried out by telephone: trend over time
NHS Digital Appointments in General Practice November 2020
new
Introduction
Summary
Primary health care
Secondary health care
Mental health services
Register of disabled children
Children’s social care
Adult social care
Community safety services
Health support and preventing ill-health
Access to services
Population Health Management
Finding out more

Behavioural
determinants of
health
Health
conditions and
causes of death
Population groups
and protected
characteristics
Population
Wider
determinants of
health
Service Use Local researchExecutive
summary
GP practices committed to giving all patients the right to online consultations by April 2020 and video consultations by April 2021[1]. This process was accelerated in response to COVID-19 and the introduction of total triage [2].
Since April 2020, the online consultation platform used by most GP practices in Oxfordshire has regularly had over 10,000 requests submitted per month [3]. The video consultation platform most commonly used has regularly facilitated over 1,000 consultations per month.
Oxfordshire Joint Strategic Needs Assessment 2021 289
Online and video consultations
Oxfordshire Clinical Commissioning Group. [1] NHS Digital First Primary Care[2] NHS Oxfordshire CCG Online-Consultations. Total triage is the system by which every patient contacting a practice is first triaged before deciding what steps need to be taken to support that patient.[3] Online consultations may result in a different type of appointment (e.g. face to face, telephone).
Note: data prior to April 2020 not shown, because practices were then still in the process of adopting eConsult.
new
Introduction
Summary
Primary health care
Secondary health care
Mental health services
Register of disabled children
Children’s social care
Adult social care
Community safety services
Health support and preventing ill-health
Access to services
Population Health Management
Finding out more

Behavioural
determinants of
health
Health
conditions and
causes of death
Population groups
and protected
characteristics
Population
Wider
determinants of
health
Service Use Local researchExecutive
summary
Oxfordshire Joint Strategic Needs Assessment 2021 290
The NHS app allows people to access a range of NHS services on their smartphone or tablet (including ordering repeat prescriptions, checking symptoms, and viewing their medical record, amongst other services). Online consultations via eConsult are now also available through the app [1].
NHS app registrations
Oxfordshire Clinical Commissioning Group.[1] NHS app homepage
Since April 2020, the ongoing increase in the percentage of GP patients in Oxfordshire registered for the app accelerated. As of June 2020, 1.42% of GP patients in Oxfordshire were registered for the app.
new
Introduction
Summary
Primary health care
Secondary health care
Mental health services
Register of disabled children
Children’s social care
Adult social care
Community safety services
Health support and preventing ill-health
Access to services
Population Health Management
Finding out more

Behavioural
determinants of
health
Health
conditions and
causes of death
Population groups
and protected
characteristics
Population
Wider
determinants of
health
Service Use Local researchExecutive
summary
Oxfordshire Joint Strategic Needs Assessment 2021 291
According to the 2020 GP patient survey, based on their last GP appointment, Oxfordshire patients were (statistically) more likely to rate their GP practice healthcare professional as good (or very good) at:
Giving you enough time (89% vs 86% nationally),
Listening to you (91% vs 88%) and
Treating you with care and concern (90% vs 87%)
Oxfordshire patients were also more likely to agree that they had enough support from local services or organisations to help manage their long term health condition (79% vs 77% nationally)
43% of Oxfordshire patients with long term health conditions had had a conversation with their GP practice about what is important when managing their health (40% nationally). Of these 61% had a plan. 93% of those with a plan found it very or fairly helpful.
Satisfaction of GP patients
NHS GP Patient Survey 2020 (fieldwork Jan-April 2020, July 2020 publication) questions 16,28,40,41,42
updated
Introduction
Summary
Primary health care
Secondary health care
Mental health services
Register of disabled children
Children’s social care
Adult social care
Community safety services
Health support and preventing ill-health
Access to services
Population Health Management
Finding out more

Behavioural
determinants of
health
Health
conditions and
causes of death
Population groups
and protected
characteristics
Population
Wider
determinants of
health
Service Use Local researchExecutive
summary
Oxfordshire Joint Strategic Needs Assessment 2021 292
Of the respondents who said they had tried to contact an NHS service when their GP practice was closed in the past 12 months, a higher proportion than average in Oxfordshire made contact with an NHS service or healthcare professional by phone.
Out of hours, phone, digital access
Considering all of the services you contacted
when your GP practice was closed, which of the
following happened on that occasion? (multiple
responses possible)
A slightly higher than average proportion of Oxfordshire patients ordered repeat prescriptions online (21% vs 19% nationally) and accessed medical records online (9% vs 6%).
NHS GP Patient Survey 2020 (fieldwork Jan-April 2020, July 2020 publication) questions 45 and 5
updated
Introduction
Summary
Primary health care
Secondary health care
Mental health services
Register of disabled children
Children’s social care
Adult social care
Community safety services
Health support and preventing ill-health
Access to services
Population Health Management
Finding out more

Behavioural
determinants of
health
Health
conditions and
causes of death
Population groups
and protected
characteristics
Population
Wider
determinants of
health
Service Use Local researchExecutive
summary
Secondary health care
Oxfordshire Joint Strategic Needs Assessment 2021 293
Introduction
Summary
Primary health care
Secondary health care
Mental health services
Register of disabled children
Children’s social care
Adult social care
Community safety services
Health support and preventing ill-health
Access to services
Population Health Management
Finding out more

Behavioural
determinants of
health
Health
conditions and
causes of death
Population groups
and protected
characteristics
Population
Wider
determinants of
health
Service Use Local researchExecutive
summary
Oxfordshire Joint Strategic Needs Assessment 2021 294
At the start of the COVID-19 pandemic a new appointment system was set up and the public were advised to call 111
Urgent medical care in Oxfordshire is provided by:
Accident and Emergency departments of the John Radcliffe Hospital in Oxford and Horton Hospital in Banbury (Oxford University Hospitals NHS Trust)
Minor Injuries Unit (MIU) in Henley, Witney and Abingdon (Oxford Health NHS FT). MIUs have X-Ray facilities and are for injuries, such as deep cuts, eye injuries, broken bones, severe sprains, minor head injury, minor burns and scalds1.
First Aid Unit (FAU) Chipping Norton and Bicester (Oxford Health NHS FT). FAUs are also for minor injuries but do not have X-Ray facilities1. The Wallingford FAU is closed temporarily (website accessed Jan21)
In addition, GPs can refer Oxfordshire patients to:
Emergency Multidisciplinary Units (EMU) providing sub-acute care based at Abingdon and Witney community hospitals (Oxford Health NHS FT)
Rapid Access Care Unit (RACU) for non bed-based care, Townlands Hospital Henley (Oxford Health NHS FT)
Medical provision in Oxfordshire
[1] NHS Oxford Health NHS Foundation Trust Minor Injuries Units and First Aid Units
updated
Introduction
Summary
Primary health care
Secondary health care
Mental health services
Register of disabled children
Children’s social care
Adult social care
Community safety services
Health support and preventing ill-health
Access to services
Population Health Management
Finding out more

Behavioural
determinants of
health
Health
conditions and
causes of death
Population groups
and protected
characteristics
Population
Wider
determinants of
health
Service Use Local researchExecutive
summary
Oxfordshire Joint Strategic Needs Assessment 2021 295
The number of advertised vacancies for staff at NHS organisations in Oxfordshire dropped significantly at the start of the COVID-19 pandemic and has since risen to close to pre-pandemic levels.
In September 2020 there were 544 advertised vacancy full-time equivalents by NHS Oxfordshire Clinical Commissioning Group, Oxford University Hospitals NHS FT and Oxford Health NHS FT, just below the number in September 2019 (594).
NHS job vacancies
Advertised FTE in England by NHS England region, organisation -NHS Digital
Number of advertised vacancy full-time equivalents in Oxfordshire Clinical
Commissioning Group, Oxford University Hospitals NHS FT and Oxford Health NHS FT
Total
updated
Introduction
Summary
Primary health care
Secondary health care
Mental health services
Register of disabled children
Children’s social care
Adult social care
Community safety services
Health support and preventing ill-health
Access to services
Population Health Management
Finding out more

Behavioural
determinants of
health
Health
conditions and
causes of death
Population groups
and protected
characteristics
Population
Wider
determinants of
health
Service Use Local researchExecutive
summary
Oxfordshire Joint Strategic Needs Assessment 2021 296
Comparing the average monthly counts in Apr-Dec 2018 and Apr-Dec 2019 of hospital attendance/admissions data for Oxfordshire Clinical Commissioning Group (CCG) patients, shows increases in both unplanned (A&E and non-elective) and planned (elective and day case) and an increase in outpatient attendances
From April 2020, as a result of the COVID-19 pandemic, the monthly average of all types of admissions, unplanned and planned, were well below the previous year
*Note that OUH started recording additional Diagnostic Imaging in 2020. Without this change in recording, the First Outpatient activity would be approximately 25% lower
Planned and unplanned hospital attendances and admissions
Average monthly count of unplanned and planned hospital attendances and admissions
(April to December in each year)
Oxfordshire CCG Apr-Dec 2018 Apr-Dec 2019% change 2018 to
2019Apr-Dec 2020
% change 2019 to 2020
UnplannedA&E (All) 15,101 16,172 7.1% 11,667 -27.9%
Non-Elective 5,785 6,001 3.7% 5,075 -15.4%
Planned
Ord Elective 832 833 0.1% 475 -43.0%
Day Case 4,965 5,072 2.2% 3,064 -39.6%
All Elective 5,797 5,905 1.9% 3,539 -40.1%
Outpatients First Attendance
17,673 18,204 3.0% 19,514 7.2%*
Outpatients Follow-Up 25,757 26,599 3.3% 22,955 -13.7%
Oxfordshire Clinical Commissioning Group provided by NHS South, Central and West Commissioning Support Unit, NCDR data A Non-Elective Admission is one that has not been arranged in advance. It may be an emergency admission, a maternity admission or a transfer from a Hospital Bed in another Health Care Provider.
updated
Introduction
Summary
Primary health care
Secondary health care
Mental health services
Register of disabled children
Children’s social care
Adult social care
Community safety services
Health support and preventing ill-health
Access to services
Population Health Management
Finding out more

Behavioural
determinants of
health
Health
conditions and
causes of death
Population groups
and protected
characteristics
Population
Wider
determinants of
health
Service Use Local researchExecutive
summary
Oxfordshire Joint Strategic Needs Assessment 2021 297
Between April 2015 and December 2019, before the COVID-19 pandemic, rates of attendance at A&E in Oxfordshire had been increasing in all age groups
In Mar-May 2020 (Q1 2020-21), the rate of attendance fell significantly for all ages – with the greatest reduction in the youngest age group, age 0-19
Comparing the Q3 periods Oct-Dec 2019 and Oct-Dec 2020, shows reductions in attendances per population of people aged 0-19 of -40%, and in people aged 65+ of -20%
Rate per population of A&E patients by age
Oxfordshire Clinical Commissioning Group provided by NHS South, Central and West Commissioning Support Unit
A&E Type 1 attendances Oxfordshire CCG, rate by broad age
group per 100 GP patient population per quarter
updated
Introduction
Summary
Primary health care
Secondary health care
Mental health services
Register of disabled children
Children’s social care
Adult social care
Community safety services
Health support and preventing ill-health
Access to services
Population Health Management
Finding out more

Behavioural
determinants of
health
Health
conditions and
causes of death
Population groups
and protected
characteristics
Population
Wider
determinants of
health
Service Use Local researchExecutive
summary
Oxfordshire Joint Strategic Needs Assessment 2021 298
A number of staff were redeployed from Oxford Health Community Services from March 2020 to help with COVID efforts around the healthcare system
Between Apr-Dec 2019 and Apr-Dec 2020, the monthly average count of appointments with Oxford Health’s top Community Services decreased by 7%
Services showing the greatest change in average monthly counts were Podiatry (-40%), District Nursing (-2.8%) and the Community Therapy Service (+20%)
Oxford Health Community ServicesOxford Health NHS FT, top community services
attended appointment, as a monthly average for
April to December
updated
Introduction
Summary
Primary health care
Secondary health care
Mental health services
Register of disabled children
Children’s social care
Adult social care
Community safety services
Health support and preventing ill-health
Access to services
Population Health Management
Finding out more
Oxfordshire Clinical Commissioning Group provided by NHS South, Central and West Commissioning Support Unit
Specialty (monthly average Apr-Dec)
Apr-Dec 2019
Apr-Dec 2020
difference
District Nursing 23,979 23,307 -672 -2.8%
Podiatry 7,360 4,442 -2,918 -39.7%
Community Therapy Service CH 2,440 2,917 478 19.6%
Oxon Integrated Therapies Paediatric (SALT)
1,835 1,857 23 1.2%
Respiratory Home Oxygen and Pulmonary Rehab
1,436 1,303 -133 -9.3%
Cardiology Service 657 986 329 50.1%
Childrens Community Nursing 789 851 62 7.9%
Oxon Integrated Therapies Paediatric OT
1,084 737 -346 -31.9%
Phlebotomy 647 695 48 7.4%
Diabetes Service 576 662 86 14.9%
Oxon Integrated Therapies Paediatric Physio
712 604 -107 -15.1%
Oxon Speech and Language Therapy 744 560 -184 -24.7%
Falls and Care Home Support Service 273 509 236 86.7%
Bladder and Bowel Service 357 356 -1 -0.4%
TOTAL 42,887 29,787 -3,100 -7.2%

Behavioural
determinants of
health
Health
conditions and
causes of death
Population groups
and protected
characteristics
Population
Wider
determinants of
health
Service Use Local researchExecutive
summary
Oxfordshire Joint Strategic Needs Assessment 2021 299
Publication of national delayed transfers of care statistics was suspended from March 2020 due to COVID-19
Locally collated data is showing a large reduction in delayed transfers of care in Oxfordshire between March 2020 and the period June 2020 to early January 2021
Delayed transfers of care
Data provided by Oxfordshire Clinical Commissioning Group from local providers, Oxford Heath, Oxford University Hospitals and Royal Berkshire Hospital; excludes out of county patients
Delayed transfers of care - weekly average of the number of delays
# Missing data was not
collected due to COVID-19
#
updated
Introduction
Summary
Primary health care
Secondary health care
Mental health services
Register of disabled children
Children’s social care
Adult social care
Community safety services
Health support and preventing ill-health
Access to services
Population Health Management
Finding out more

Behavioural
determinants of
health
Health
conditions and
causes of death
Population groups
and protected
characteristics
Population
Wider
determinants of
health
Service Use Local researchExecutive
summary
Mental health services
Oxfordshire Joint Strategic Needs Assessment 2021 300
Introduction
Summary
Primary health care
Secondary health care
Mental health services
Register of disabled children
Children’s social care
Adult social care
Community safety services
Health support and preventing ill-health
Access to services
Population Health Management
Finding out more

Behavioural
determinants of
health
Health
conditions and
causes of death
Population groups
and protected
characteristics
Population
Wider
determinants of
health
Service Use Local researchExecutive
summary
Oxfordshire Joint Strategic Needs Assessment 2021 301
Improving Access to Psychological Therapies programme (IAPT) is run by the NHS in England and offers NICE-approved therapies for treating people with depression or anxiety.
Between April 2019 and March 2020, 16,795 Oxfordshire Clinical Commissioning Group patients were referred to IAPT services and 11,760 (70%) started treatment. This is a slight improvement on the England average, where 69% of referrals started treatment.
Of the OCCG patients who entered treatment: 91% were aged 18 to 64
67% were female
9% were from an ethnic minority group (compared with 16% ethnic minority in Oxfordshire county1)
3% were ex-armed forces
6,670 finished a course of IAPT treatment and 3,155 moved to recovery (i.e. they were no longer classed as having a clinical case of a mental health problem).
4,345 showed a reliable improvement in their condition after finishing a course of IAPT treatment.
People accessing talking therapies
Data used here is taken from Psychological Therapies, Report on the use of IAPT servicesSee also NHS Mental Health dashboard with quarterly data for Oxfordshire CCG[1] Census 2011, table KS201 ethnic minority = all groups other than white British (all ages)
updated
Introduction
Summary
Primary health care
Secondary health care
Mental health services
Register of disabled children
Children’s social care
Adult social care
Community safety services
Health support and preventing ill-health
Access to services
Population Health Management
Finding out more

Behavioural
determinants of
health
Health
conditions and
causes of death
Population groups
and protected
characteristics
Population
Wider
determinants of
health
Service Use Local researchExecutive
summary
Oxfordshire Joint Strategic Needs Assessment 2021 302
The number of Oxfordshire CCG patients referred to IAPT services fell in March and April 2020 at the start of the first COVID-19 lockdown, before increasing back to a level similar to 2019 in July.
The number of referrals in April 2020 was down 48% on the number reported in April 2019.
People accessing talking therapies in 2019 and 2020
NHS Digital: Psychological Therapies, Report on the use of IAPT services (latest report accessed: for November 2020)
OCCG referrals to IAPT services August 2019 to August 2020
new
Introduction
Summary
Primary health care
Secondary health care
Mental health services
Register of disabled children
Children’s social care
Adult social care
Community safety services
Health support and preventing ill-health
Access to services
Population Health Management
Finding out more

Behavioural
determinants of
health
Health
conditions and
causes of death
Population groups
and protected
characteristics
Population
Wider
determinants of
health
Service Use Local researchExecutive
summary
Oxfordshire Joint Strategic Needs Assessment 2021 303
In the four year period, 2016/17 to 2019/20, the number of referrals of Oxfordshire patients to Oxford Health for mental health services increased by 38% overall and by:
+83% for people aged 0-9 +58% for people aged 10-19
+36% for people aged 20-24 +22% for people aged 25 and over
Referrals for mental health services by age to 2019/20
Oxfordshire CCG referrals to Oxford Health mental health services by age
updated
Introduction
Summary
Primary health care
Secondary health care
Mental health services
Register of disabled children
Children’s social care
Adult social care
Community safety services
Health support and preventing ill-health
Access to services
Population Health Management
Finding out more
Oxford Health NHS FT; all Oxfordshire CCG patients including those living outside Oxfordshire. Includes Adult Mental Health; Complex Needs Service; Older Adult Mental Health; Psychological Services; CAMHS; Eating Disorders; Learning Disabilities; Perinatal; Forensics

Behavioural
determinants of
health
Health
conditions and
causes of death
Population groups
and protected
characteristics
Population
Wider
determinants of
health
Service Use Local researchExecutive
summary
Oxfordshire Joint Strategic Needs Assessment 2021 304
The districts in Oxfordshire with the highest numbers of referrals of patients to Oxford Health for mental health services in 2019/20 were Cherwell and Oxford City
The rate of referrals was 4.3% of the Oxfordshire population (for residents with a postcode within Oxfordshire)
The rates of referrals per population were highest in Oxford City, Cherwell and West Oxfordshire and lowest in Vale of White Horse
Mental health referrals by district to 2019/20
Number of referrals of Oxfordshire residents to
Oxford Health mental health services
Oxfordshire districts 2019/20
CountRate per pop
2019/20
Cherwell 6,698 4.45%
Oxford City 7,339 4.81%
South Oxfordshire 5,696 4.01%
Vale of White Horse 5,403 3.97%
West Oxfordshire 4,716 4.26%
Oxfordshire 29,852 4.32%
updated
Introduction
Summary
Primary health care
Secondary health care
Mental health services
Register of disabled children
Children’s social care
Adult social care
Community safety services
Health support and preventing ill-health
Access to services
Population Health Management
Finding out more
Oxford Health NHS FT; includes Adult Mental Health; Complex Needs Service; Older Adult Mental Health; Psychological Services; CAMHS; Eating Disorders; Learning Disabilities; Perinatal; Forensicsrate uses ONS mid-2019 population estimates (all ages) from nomis

Behavioural
determinants of
health
Health
conditions and
causes of death
Population groups
and protected
characteristics
Population
Wider
determinants of
health
Service Use Local researchExecutive
summary
Oxfordshire Joint Strategic Needs Assessment 2021 305
Monthly data to December 2020 shows a drop in Oxfordshire CCG referrals to Oxford Health mental health services from March to May 2020, during the first lockdown.
From June 2020 there was a recovery in referrals to similar levels as in 2019
Patients referred for mental health services in 2020
Oxfordshire referrals to Oxford Health mental health services – by
month, 2017 to 2020
Introduction
Summary
Primary health care
Secondary health care
Mental health services
Register of disabled children
Children’s social care
Adult social care
Community safety services
Health support and preventing ill-health
Access to services
Population Health Management
Finding out more
new
Oxford Health NHS FT; all Oxfordshire CCG patients including those living outside Oxfordshire. Includes Adult Mental Health; Complex Needs Service; Older Adult Mental Health; Psychological Services; CAMHS; Eating Disorders; Learning Disabilities; Perinatal; Forensics

Behavioural
determinants of
health
Health
conditions and
causes of death
Population groups
and protected
characteristics
Population
Wider
determinants of
health
Service Use Local researchExecutive
summary
Oxfordshire Joint Strategic Needs Assessment 2021 306
The median number of days of all children and young people waiting for CAMHS appointments peaked in August 2019 at 169 and had dropped to 36 by December 2020
Median Waiting Days for the Neuro-developmental Diagnostic Clinic* have been increasing throughout 2020
Access to Child and Adolescent Mental Health Services (CAMHS)
Oxfordshire Health NHS FT *The Neuro-developmental Diagnostic Clinic (NDC) is one of the specialist Child and Adolescent Mental Health Services (CAMHS). The NDC offers diagnostic assessment of autism and attention deficit hyperactivity disorder (ADHD), as well as other neuro-developmental conditions
updated – new indicators
Introduction
Summary
Primary health care
Secondary health care
Mental health services
Register of disabled children
Children’s social care
Adult social care
Community safety services
Health support and preventing ill-health
Access to services
Population Health Management
Finding out more

Behavioural
determinants of
health
Health
conditions and
causes of death
Population groups
and protected
characteristics
Population
Wider
determinants of
health
Service Use Local researchExecutive
summary
Oxfordshire Joint Strategic Needs Assessment 2021 307
Section 136 of the Mental Health Act enables the police to act if they believe that someone is suffering from a mental illness and needs immediate treatment or care. The police may take that person from a public place to a place of safety, either for their own protection or for the protection of others. This is known as a Section 136 detention.
Between 2019 and 2020 (Jan-Dec), there was an increase in section 136 detentions in Oxfordshire, from 328 to 349 (+21, +6%).
The greatest increase was in Vale of White Horse district (+24, +39%)
In 2020, Oxford City accounted for a third of S136 detentions across Oxfordshire
Police detentions under S136 of mental health act
Thames Valley Police Crime Recording System - NICHE RMS & Mental Health Master
Count of Section 136 detentions by district 2016 to 2020 (Jan-Dec)
updated
Introduction
Summary
Primary health care
Secondary health care
Mental health services
Register of disabled children
Children’s social care
Adult social care
Community safety services
Health support and preventing ill-health
Access to services
Population Health Management
Finding out more

Behavioural
determinants of
health
Health
conditions and
causes of death
Population groups
and protected
characteristics
Population
Wider
determinants of
health
Service Use Local researchExecutive
summary
Register of disabled children
Oxfordshire Joint Strategic Needs Assessment 2021 308
Introduction
Summary
Primary health care
Secondary health care
Mental health services
Register of disabled children
Children’s social care
Adult social care
Community safety services
Health support and preventing ill-health
Access to services
Population Health Management
Finding out more

Behavioural
determinants of
health
Health
conditions and
causes of death
Population groups
and protected
characteristics
Population
Wider
determinants of
health
Service Use Local researchExecutive
summary
Oxfordshire Joint Strategic Needs Assessment 2021 309
The Oxfordshire County Council register of disabled children is compiled from three sources:
Short Breaks
Social Care Children cases with a disability
MAX Cards (had a discount card for SEN or disabled child)
As of 31 March 2020 there were 4,049 children and young people aged 0-24 (up to 25) on the register
Register of Disabled Children
Oxfordshire County Council Disability Register Data 31 Mar 2020 (Danny Hearn)Social Care Children data from April 2013; Short Breaks data since April 2012
Register
(31 Mar 20)
4,049
Short
breaks
2,685
MAX cards
1,122
Social
care
1,595
updated
Introduction
Summary
Primary health care
Secondary health care
Mental health services
Register of disabled children
Children’s social care
Adult social care
Community safety services
Health support and preventing ill-health
Access to services
Population Health Management
Finding out more

Behavioural
determinants of
health
Health
conditions and
causes of death
Population groups
and protected
characteristics
Population
Wider
determinants of
health
Service Use Local researchExecutive
summary
Oxfordshire Joint Strategic Needs Assessment 2021 310
Short breaks more likely to be taken up in Vale and West
Social care more likely in Vale
MAX card more likely to be taken up in South and Vale
Disability register by district
Source: Oxfordshire County Council Disability Register Data 31 Mar 2020 (Danny Hearn); excludes out of county (112) and not mapped (25). *Denominator is ONS mid 2019 age 0-24 minus communal establishment population (Census 2011)
Disability register 31 March 2020
Count of records by source and by district
Rate per 1,000 population aged 0-24*
updated
Introduction
Summary
Primary health care
Secondary health care
Mental health services
Register of disabled children
Children’s social care
Adult social care
Community safety services
Health support and preventing ill-health
Access to services
Population Health Management
Finding out more

Behavioural
determinants of
health
Health
conditions and
causes of death
Population groups
and protected
characteristics
Population
Wider
determinants of
health
Service Use Local researchExecutive
summary
Oxfordshire Joint Strategic Needs Assessment 2021 311
Disability register by district and age
Source: Oxfordshire County Council Disability Register Data 31 Mar 2020
Count of young people on disability register (31 Mar 2020)
Age Group Cherwell OxfordSouth
OxfordshireVale of White
HorseWest
OxfordshireOxfordshire
age 0 to 4 34 37 24 29 21 145
age 5 to 10 215 198 169 221 122 925
age 11 to 15 238 310 235 298 208 1,289
age 16 to 17 116 158 101 108 88 571
age 18 to 24 183 210 194 248 147 982
age 0 to 24 786 913 723 904 586 3,912
Of the total of 3,912 children and young people on the disability register in Oxfordshire as of 31 March 2020, a third (33%) were aged 11 to 15. Around a quarter were aged 5-10 and a quarter aged 18-24.
updated
Introduction
Summary
Primary health care
Secondary health care
Mental health services
Register of disabled children
Children’s social care
Adult social care
Community safety services
Health support and preventing ill-health
Access to services
Population Health Management
Finding out more

Behavioural
determinants of
health
Health
conditions and
causes of death
Population groups
and protected
characteristics
Population
Wider
determinants of
health
Service Use Local researchExecutive
summary
Oxfordshire Joint Strategic Needs Assessment 2021 312
Research by Contact a Family in 2012, and cited by Public Health England, estimated that it costs three times as much to raise a disabled child[1]
Areas of Oxfordshire ranked as more deprived on child poverty also have higher rates of children and young people on the Oxfordshire disability register
Disability register by child poverty index
Disability register Oxfordshire County Council as of 31 March 2020 MHCLG IMD 2019 Income Deprivation Affecting Children decile Denominator used is children aged 0-17 from ONS mid year population estimate by LSOA as of mid 2018[1] Public Health England Disabilities in Children and Young People in London September 20171Contact a Family (2012) Counting the Costs 2012: The Financial reality for families with disabled children UK
4.6%4.2%
3.4% 3.3%3.1% 3.1%
2.5% 2.4% 2.3% 2.1%
2.7%
10%most
deprived
2 3 4 5 6 7 8 9 10%least
deprived
Rate of children and
young people on
disability register
(31 Mar 2020) per
population by decile
of child poverty
(Income Deprivation
Affecting Children
Index of IMD 2019)
average
updated
Introduction
Summary
Primary health care
Secondary health care
Mental health services
Register of disabled children
Children’s social care
Adult social care
Community safety services
Health support and preventing ill-health
Access to services
Population Health Management
Finding out more

Behavioural
determinants of
health
Health
conditions and
causes of death
Population groups
and protected
characteristics
Population
Wider
determinants of
health
Service Use Local researchExecutive
summary
Children’s social care
Oxfordshire Joint Strategic Needs Assessment 2021 313
Introduction
Summary
Primary health care
Secondary health care
Mental health services
Register of disabled children
Children’s social care
Adult social care
Community safety services
Health support and preventing ill-health
Access to services
Population Health Management
Finding out more

Behavioural
determinants of
health
Health
conditions and
causes of death
Population groups
and protected
characteristics
Population
Wider
determinants of
health
Service Use Local researchExecutive
summary
Oxfordshire Joint Strategic Needs Assessment 2021 314
Between the 2018/19 and 2019/20 financial years, the yearly rate of referrals to children’s social care increased.
Between March 2019 and March 2020, the rate of children subject of a child protection plan declined again (after ~10 years of growth prior to 2017/18). The rate of cared for children has also decreased, for the first time after 7 years of growth.
Children’s social care - summary
Rate per 10,000 children aged0-17 2017/18 2018/19 2019/20
2018/19 to 2019/20 % change
Yearly rate of referrals to Children’s Social Care 475 468.2 513.4 45.2 9.7%
Rate of children who were the subject of a child protection plan(as of March 2020)
47.9 40.9 37.2 -3.7 -9.0%
Rate of cared for children(as of March 2020)
48 54 52 -2 -3.7%
Change over time in rates of children recorded by children’s social care
Department for Education Statistics on Looked After ChildrenDepartment for Education, downloaded from Local Authority Interactive tool.
updated
Introduction
Summary
Primary health care
Secondary health care
Mental health services
Register of disabled children
Children’s social care
Adult social care
Community safety services
Health support and preventing ill-health
Access to services
Population Health Management
Finding out more

Behavioural
determinants of
health
Health
conditions and
causes of death
Population groups
and protected
characteristics
Population
Wider
determinants of
health
Service Use Local researchExecutive
summary
Oxfordshire Joint Strategic Needs Assessment 2021 315
During 2019-2020 there were 7,502 referrals to children’s social care in Oxfordshire related to 6,790 children. This was an increase on last year of 11% and 10% respectively (6,779 referrals and 6,177 children), and also corresponded to increases in the rates (see chart below).
A slightly higher proportion of referrals than nationally resulted in no further action (7% in Oxfordshire compared with 6% nationally).
The most recent data held by Oxfordshire County Council (not published) shows that at the end of December 2020, there had been 5,074 referrals to children’s social care. Based on this number, it is estimated that there will be 6,765 referrals for the full 2020-2021 period.
Referrals to Children’s social care
Department for Education Characteristics of children in need: 2019 to 2020 . Statistical neighbours include: Hertfordshire, Buckinghamshire, Wiltshire, West Berkshire, West Sussex, Bath and North East Somerset, Bracknell Forest, Cambridgeshire, Hampshire, and Gloucestershire.
Rates of
referrals to
Children’s
Social Care
per 10,000
children
aged 0-17
updated
Introduction
Summary
Primary health care
Secondary health care
Mental health services
Register of disabled children
Children’s social care
Adult social care
Community safety services
Health support and preventing ill-health
Access to services
Population Health Management
Finding out more

Behavioural
determinants of
health
Health
conditions and
causes of death
Population groups
and protected
characteristics
Population
Wider
determinants of
health
Service Use Local researchExecutive
summary
Oxfordshire Joint Strategic Needs Assessment 2021 316
The number of children on child protection plans in Oxfordshire declined between 31 March 2019 and 31 March 2020, from 592 to 543 (-49, -8%). This decline is also present in the rate of children on child protection plans, a continued reversal of the growth that occurred between 2007/08 and 2017/18.
The data as of 31 March 2020 shows Oxfordshire below the national rate.
The most recent data held by Oxfordshire County Council (not published) shows that at the end of December 2020, the number of children on child protection plans had decreased slightly further, to 525 (not shown on chart).
Children on child protection plans
Department for Education Characteristics of children in need: 2018 to 2019
Rate of children
who were the
subject of a child
protection plan
(as at 31 March
each year) per
10,000 children
aged 0-17
updated
Introduction
Summary
Primary health care
Secondary health care
Mental health services
Register of disabled children
Children’s social care
Adult social care
Community safety services
Health support and preventing ill-health
Access to services
Population Health Management
Finding out more

Behavioural
determinants of
health
Health
conditions and
causes of death
Population groups
and protected
characteristics
Population
Wider
determinants of
health
Service Use Local researchExecutive
summary
Oxfordshire Joint Strategic Needs Assessment 2021 317
At the end of March 2020 there were 767 cared for children in Oxfordshire, down slightly from 779 as of 31 March 2019 (-12, -1.5%).
At the end of December 2020, this had increased slightly to 771 cared for children (not shown on chart).
The latest published data (for 31 March 20) shows Oxfordshire below the national rate and similar to regional rate.
Children we care for
Department for Education Statistics on Looked After Children
Rates of cared for children (as at 31 March each year) per 10,000 children aged 0-17
For the year 2020 there were 51 cared for children who were unaccompanied asylum-seeking children in Oxfordshire, just below the number for 2019 (64).
A cared for child is a child in the
care of a Local Authority (for more
than 24 hours) either through a Care
Order made by a Court or by
voluntary agreement with their
parent(s).
updated
Introduction
Summary
Primary health care
Secondary health care
Mental health services
Register of disabled children
Children’s social care
Adult social care
Community safety services
Health support and preventing ill-health
Access to services
Population Health Management
Finding out more
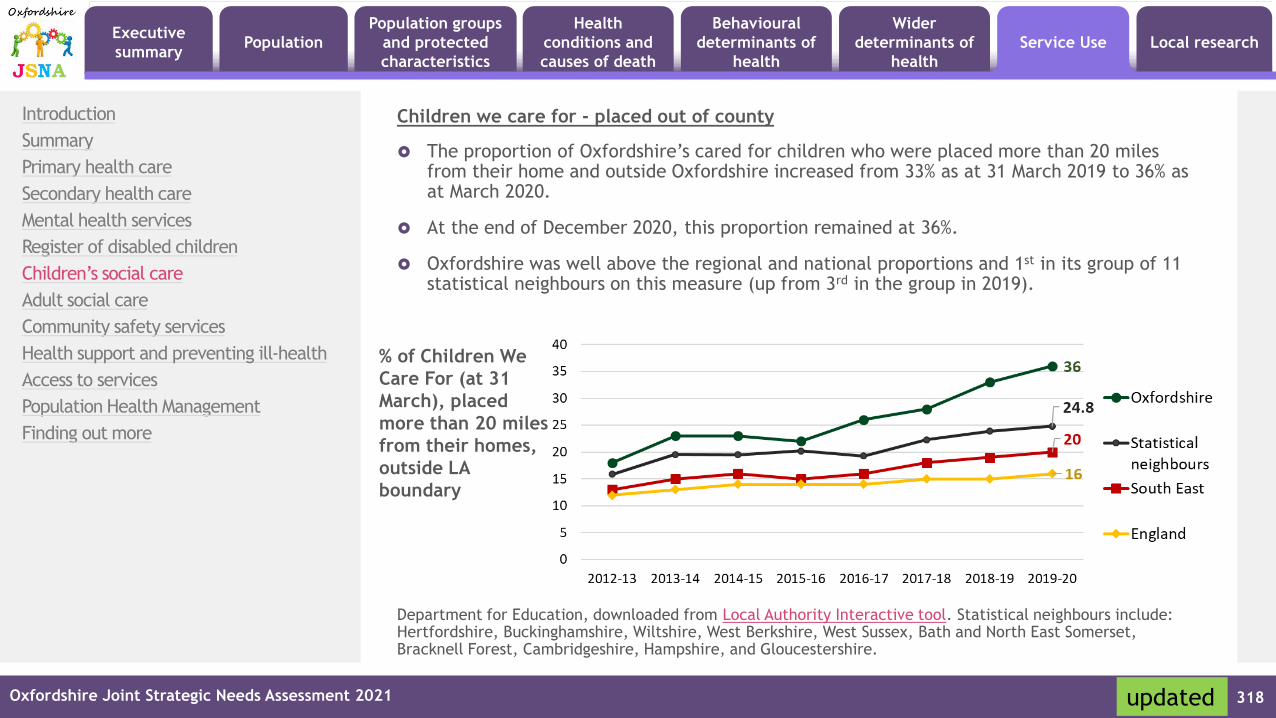
Behavioural
determinants of
health
Health
conditions and
causes of death
Population groups
and protected
characteristics
Population
Wider
determinants of
health
Service Use Local researchExecutive
summary
Oxfordshire Joint Strategic Needs Assessment 2021 318
The proportion of Oxfordshire’s cared for children who were placed more than 20 miles from their home and outside Oxfordshire increased from 33% as at 31 March 2019 to 36% as at March 2020.
At the end of December 2020, this proportion remained at 36%.
Oxfordshire was well above the regional and national proportions and 1st in its group of 11 statistical neighbours on this measure (up from 3rd in the group in 2019).
Children we care for - placed out of county
Department for Education, downloaded from Local Authority Interactive tool. Statistical neighbours include: Hertfordshire, Buckinghamshire, Wiltshire, West Berkshire, West Sussex, Bath and North East Somerset, Bracknell Forest, Cambridgeshire, Hampshire, and Gloucestershire.
% of Children We
Care For (at 31
March), placed
more than 20 miles
from their homes,
outside LA
boundary
updated
Introduction
Summary
Primary health care
Secondary health care
Mental health services
Register of disabled children
Children’s social care
Adult social care
Community safety services
Health support and preventing ill-health
Access to services
Population Health Management
Finding out more

Behavioural
determinants of
health
Health
conditions and
causes of death
Population groups
and protected
characteristics
Population
Wider
determinants of
health
Service Use Local researchExecutive
summary
Oxfordshire Joint Strategic Needs Assessment 2021 319
Young people leaving care tend to be particularly vulnerable to poor health and wellbeing. For example, national research shows that they are at greater risk of social exclusion, unemployment, health problems, and offending.
As of 31 March 2020, there were 291 care leavers1 in Oxfordshire. Of these, 133 (46%) were in education, employment or training, 120 were Not in Employment, Education or Training (NEET) and the status of a further 38 was unknown.
Oxfordshire has remained below (worse than) the regional and national averages on this measure and the gap has widened.
Care leavers in employment, education or training
Department for Education Statistics on Looked After ChildrenNOTE: [1] Care leavers now aged 19, 20 and 21 who were looked after for a total of at least 13 weeks after their 14th birthday including some time after their 16th birthday
Percentage of
Care leavers
aged 19-21 in
education,
employment
or training
updated
Introduction
Summary
Primary health care
Secondary health care
Mental health services
Register of disabled children
Children’s social care
Adult social care
Community safety services
Health support and preventing ill-health
Access to services
Population Health Management
Finding out more

Behavioural
determinants of
health
Health
conditions and
causes of death
Population groups
and protected
characteristics
Population
Wider
determinants of
health
Service Use Local researchExecutive
summary
Oxfordshire Joint Strategic Needs Assessment 2021 320
From Jan-Dec 2020, there were 1,745 families identified in Oxfordshire that met two or more of the six Supporting Families criteria1.
This was a rate of 24.6 families per 1,000 families in Oxfordshire., Oxford City has the highest rate amongst Oxfordshire’s Districts.
The majority of wards in Oxfordshire (74%) have 20 or fewer vulnerable families identified by the programme. The wards with the highest numbers were mainly in Oxford, Banbury, and Didcot.
Supporting Families programme
[1] The six Supporting Families criteria are: health; education; crime/ASB; children needing help; domestic violence and abuse; worklessnessOxfordshire County Council, rate calculated using ONS Census 2011 households with dependent children.Source for this slide
For background on the programme see
Troubled families House of Commons
briefing paper January 2020 (renamed
“Supporting Families programme” in March
2021)
Families identified in Supporting Families
programme 2020, rate per 1,000 families
Wards in
Oxfordshire with
the highest
numbers of
families identified
as part of the
Supporting
Families
programme (2020)
Ward count
Blackbird Leys 61
Northfield Brook 60
Banbury Ruscote 59
Didcot South 44
Didcot West 42
Banbury Cross and Neithrop 42
Banbury Hardwick 42
Lye Valley 40
Rose Hill and Iffley 38
Witney Central 38
updated
Introduction
Summary
Primary health care
Secondary health care
Mental health services
Register of disabled children
Children’s social care
Adult social care
Community safety services
Health support and preventing ill-health
Access to services
Population Health Management
Finding out more

Behavioural
determinants of
health
Health
conditions and
causes of death
Population groups
and protected
characteristics
Population
Wider
determinants of
health
Service Use Local researchExecutive
summary
Oxfordshire Joint Strategic Needs Assessment 2021 321
There are two sources of predicted population growth for Oxfordshire: (1) Oxfordshire County Council forecasts which include assumptions on housing development (2) ONS projections based on past trends
National ONS projections suggests a slight fall in the population of children aged 0-17, whereas Oxfordshire County Council’s local forecasts predict an increase.
Applying the current rate of referrals to child social care (i.e. assuming no change in prevalence) to population forecasts/projections gives a potential change by 2028 of:
+800 (7,500 to 8,300, rounded) from 2020 to 2028 based on Oxfordshire County
Council population forecasts including housing growth
-100 (7,500 to 7,400, rounded) from 2020 to 2028 based on ONS trend-based
population projections
Estimate of future demand
Oxfordshire County Council; OCC forecasts; ONS 2018-based population projections
updated
Introduction
Summary
Primary health care
Secondary health care
Mental health services
Register of disabled children
Children’s social care
Adult social care
Community safety services
Health support and preventing ill-health
Access to services
Population Health Management
Finding out more

Behavioural
determinants of
health
Health
conditions and
causes of death
Population groups
and protected
characteristics
Population
Wider
determinants of
health
Service Use Local researchExecutive
summary
Adult social care
Oxfordshire Joint Strategic Needs Assessment 2021 322
Introduction
Summary
Primary health care
Secondary health care
Mental health services
Register of disabled children
Children’s social care
Adult social care
Community safety services
Health support and preventing ill-health
Access to services
Population Health Management
Finding out more

Behavioural
determinants of
health
Health
conditions and
causes of death
Population groups
and protected
characteristics
Population
Wider
determinants of
health
Service Use Local researchExecutive
summary
Oxfordshire Joint Strategic Needs Assessment 2021 323
Between April 2019 and March 2020, 2,601 people in Oxfordshire received reablement.
Of these, 1,461 were helped to leave hospital, 366 were diverted from hospital and 774 were supported via a community referral.
In the same period 3,425 people who made requests for support in Oxfordshire received equipment or Occupational Therapy (OT) support.
This is equivalent to a rate of 628 per 100,000 population, above the average for Oxfordshire’s nearest neighbours (594) and below the England rate (668*).
In 2019-20, 1.6% of older people (aged 65+) in Oxfordshire who left hospital were supported via reablement compared to 2.6% nationally (see following slide).
Reablement and short term social care interventions
Oxfordshire County Council, Department of Health SALT return STS001 tables 1a and 1b, “low level support” (equipment). *Oxfordshire is expected to be lower than the England average given the health and income profile of the county.
updated
Introduction
Summary
Primary health care
Secondary health care
Mental health services
Register of disabled children
Children’s social care
Adult social care
Community safety services
Health support and preventing ill-health
Access to services
Population Health Management
Finding out more

Behavioural
determinants of
health
Health
conditions and
causes of death
Population groups
and protected
characteristics
Population
Wider
determinants of
health
Service Use Local researchExecutive
summary
Oxfordshire Joint Strategic Needs Assessment 2021 324
As of 2019-20, Oxfordshire was ranked 13th in its group of 16 statistical neighbours on the % of older people offered reablement services following discharge from hospital.
Oxfordshire has remained below the national average.
Reablement
Measures from the Adult Social Care Outcomes Framework, England 2019-20
Percentage of people aged 65 and over offered
reablement services following discharge from hospital,
Oxfordshire and Statistical Neighbours (2019-20)
Percentage of people aged 65 and over
offered reablement services following
discharge from hospital - trend
updated
Introduction
Summary
Primary health care
Secondary health care
Mental health services
Register of disabled children
Children’s social care
Adult social care
Community safety services
Health support and preventing ill-health
Access to services
Population Health Management
Finding out more

Behavioural
determinants of
health
Health
conditions and
causes of death
Population groups
and protected
characteristics
Population
Wider
determinants of
health
Service Use Local researchExecutive
summary
Oxfordshire Joint Strategic Needs Assessment 2021 325
As of 1 April 2020 there were 6,197 adults in Oxfordshire receiving on-going long-term social care from Oxfordshire County Council, down from 6,310 at 3 April 2019 (-1.8%).
The majority (60%) of Oxfordshire’s on-going long-term social care clients were older people aged 65 and over. 15% were aged 90 or over.
Just over a quarter (27%) of people receiving social care support are people with learning disabilities.
Adults provided with long-term social care
Oxfordshire County Council CONTROCC system
Learning
Disability
Physical/
MentalTotal %
TOTAL 1672 4525 6197 100%
% of Total 27% 73% 100%
aged 65 and over 170 3536 3706 60%
aged 18 to 49 1069 456 1525 25%
aged 50 to 59 315 307 622 10%
aged 60 to 69 186 473 659 11%
aged 70 to 79 84 821 905 15%
aged 80 to 89 15 1511 1526 25%
aged 90 and over 3 957 960 15%
Number of adults
provided with long-
term social care
services by
Oxfordshire County
Council as of 1 April
2020
updated
Introduction
Summary
Primary health care
Secondary health care
Mental health services
Register of disabled children
Children’s social care
Adult social care
Community safety services
Health support and preventing ill-health
Access to services
Population Health Management
Finding out more

Behavioural
determinants of
health
Health
conditions and
causes of death
Population groups
and protected
characteristics
Population
Wider
determinants of
health
Service Use Local researchExecutive
summary
Oxfordshire Joint Strategic Needs Assessment 2021 326
Older social care clients supported at home
Oxfordshire County Council CONTROCC system
The proportion of older adults receiving a social care service at home (rather than in a care home) is similar to last year.
At the beginning of April 2020, 56% of older adult social care clients were receiving a service at home, slightly down from 57% the previous year. This proportion remains higher than that in April 2012 (44%).
Number of older clients (65+) of long-term
social care services provided by
Oxfordshire County Council receiving
services at home vs in a care home (3 April
2012-19, 1 April 2020)
updated
Introduction
Summary
Primary health care
Secondary health care
Mental health services
Register of disabled children
Children’s social care
Adult social care
Community safety services
Health support and preventing ill-health
Access to services
Population Health Management
Finding out more

Behavioural
determinants of
health
Health
conditions and
causes of death
Population groups
and protected
characteristics
Population
Wider
determinants of
health
Service Use Local researchExecutive
summary
Oxfordshire Joint Strategic Needs Assessment 2021 327
Older people supported by social care services by district
Care home count
RateAt
home count
RateTOTAL count
rate
Cherwell 321 11.7 517 18.8 838 30.5
Oxford 260 13.7 418 22.0 678 35.6
South Oxfordshire 266 8.9 399 13.3 665 22.2
Vale of White Horse 301 11.0 385 14.0 686 25.0
West Oxfordshire 358 14.8 365 15.1 723 29.9
Oxfordshire 1,506 11.8 2,084 16.3 3,590 28.0
Outside Oxfordshire 109 7 116
Total 1,615 2,091 37,06
By district, the highest number of older people being supported with long-term social care services as of April 2020 was Cherwell and the highest rate (per 1,000 population aged 65+) was Oxford City.
Care support is means tested, so if an area has a higher proportion of its older population living in more deprived areas, it is more likely that a higher proportion of the older population will qualify for care.
South Oxfordshire had the lowest rates of people supported either in a care home or at home.
Older clients (65+)
of long-term social
care services
provided by
Oxfordshire
County Council by
setting: count and
rate per 1,000
aged 65+
population as of 1
April 2020
Oxfordshire County Council CONTROCC system; ONS 2019 mid-year estimates
updated
Introduction
Summary
Primary health care
Secondary health care
Mental health services
Register of disabled children
Children’s social care
Adult social care
Community safety services
Health support and preventing ill-health
Access to services
Population Health Management
Finding out more

Behavioural
determinants of
health
Health
conditions and
causes of death
Population groups
and protected
characteristics
Population
Wider
determinants of
health
Service Use Local researchExecutive
summary
Oxfordshire Joint Strategic Needs Assessment 2021 328
As of 2 November 2020, there were 118 care homes in Oxfordshire providing 5,393 care home beds for older people of which 4,147 (77%) included nursing care.
As a proportion of the number of residents aged 85 and over, the rate of care home beds for older people in Oxfordshire was 29.3 per 100, just below the South East (29.9) and England (29.5) averages.
Cherwell and West Oxfordshire were each above the national, regional and county rates.
Care home beds for older people in Oxfordshire
Source: Care Quality Commission (with filters) as of 2 November 2020. ONS 2019 population estimates from nomis
Care home beds for older people in Oxfordshire
(as of 2 Nov 2020)
Care homesBeds for older
peopleBeds with
nursingBeds per pop
aged 85+
Cherwell 27 1,326 1,049 35
Oxford City 16 703 423 23
South Oxfordshire 24 1,080 936 26
Vale of White Horse 25 1,055 782 27
West Oxfordshire 26 1,229 957 34
Oxfordshire 118 5,393 4,147 29
updated
Introduction
Summary
Primary health care
Secondary health care
Mental health services
Register of disabled children
Children’s social care
Adult social care
Community safety services
Health support and preventing ill-health
Access to services
Population Health Management
Finding out more

Behavioural
determinants of
health
Health
conditions and
causes of death
Population groups
and protected
characteristics
Population
Wider
determinants of
health
Service Use Local researchExecutive
summary
Oxfordshire Joint Strategic Needs Assessment 2021 329
Older adult social care users are more likely to be living in urban areas of Oxfordshire than the general older population.
71% of older (aged 65+) adult social care users in Oxfordshire live in urban areas compared with 65% in urban areas of the total 65+ population. This higher concentration in urban areas is especially true of adult social care users supported at home (73%).
Areas of rural Oxfordshire with higher rates of social care users aged 65+ include Chipping Norton and Enstone, the Shrivenham area and areas around Bicester.
Distribution of adult social care users
Oxfordshire County Council, adult social care users (aged 65+) as at 1 April 2020, 2011 rural-urban classification, analysis based on classification by output areas. ONS 2019 mid-year population estimates
updated
Introduction
Summary
Primary health care
Secondary health care
Mental health services
Register of disabled children
Children’s social care
Adult social care
Community safety services
Health support and preventing ill-health
Access to services
Population Health Management
Finding out more

Behavioural
determinants of
health
Health
conditions and
causes of death
Population groups
and protected
characteristics
Population
Wider
determinants of
health
Service Use Local researchExecutive
summary
Oxfordshire Joint Strategic Needs Assessment 2021 330
Adult Social Care Users Survey
Source: Personal Social Services Adult Social Care Survey, England – 2019-20, question 8a and 17Note: The Adult Social Care User Survey is a national survey run annually, 2019-20 was sent out in Feb 2020. The survey covers individuals who were in receipt of a local authority funded long term support service. 563 out of a sample of 2284 responded (24.6%)
According to the Adult Social Care Survey 2019-20, 44% of care user respondents have as much social contact as they would like, below the South East (46%) and England (46%) averages.
60% of care user respondents in Oxfordshire believe their home is designed to meet their needs “very well”. This is just above the average for the South East (57%) and above the England average (55%).
updated
Introduction
Summary
Primary health care
Secondary health care
Mental health services
Register of disabled children
Children’s social care
Adult social care
Community safety services
Health support and preventing ill-health
Access to services
Population Health Management
Finding out more

Behavioural
determinants of
health
Health
conditions and
causes of death
Population groups
and protected
characteristics
Population
Wider
determinants of
health
Service Use Local researchExecutive
summary
Oxfordshire Joint Strategic Needs Assessment 2021 331
The top worries about safety for older Oxfordshire social care users (aged 65 and over) were: falling over inside the house, falling over outside and uneven, dangerous pavements.
Older social care users worries about safety
Adult Social Care Users Survey 2019-20, Oxfordshire County Council, Q25Note – this was a locally added question which means the data is for Oxfordshire only
Oxfordshire Social Care User Survey
2019-20, people aged 65+
If you worry about your safety, which things concern you most?
% agreeing
Falling over inside the house 47%
Falling over outside 35%
Uneven, dangerous pavements 25%
Too many changes in care staff 16%
Care staff not arriving 13%
Silent phone calls 9%
Tripping over shoes or rugs 8%
Feeling not noticed in a wheelchair 6%
Knowing who to call/ phone when needing help 6%
Not having the right equipment to keep you safe 5%
Is there anything else that makes you feel unsafe? 5%
Local Crime 4%
Intimidation by people who are drunk in public 3%
Local groups of youths 2%
Intimidation by members of the public 2%
Other residents in the care home 2%
Being harmed by someone who cares for me 1%
BASE 325
updated
Introduction
Summary
Primary health care
Secondary health care
Mental health services
Register of disabled children
Children’s social care
Adult social care
Community safety services
Health support and preventing ill-health
Access to services
Population Health Management
Finding out more

Behavioural
determinants of
health
Health
conditions and
causes of death
Population groups
and protected
characteristics
Population
Wider
determinants of
health
Service Use Local researchExecutive
summary
Oxfordshire Joint Strategic Needs Assessment 2021 332
Estimate of older people self-funding long term care in Oxfordshire
Oxfordshire County Council estimate. *adults supported by social care aged 65+ only (i.e. not including people aged 18-64 with learning difficulties or other care needs; Age UK paying for care
Estimate of older people who are self-funding long
term care in Oxfordshire (1 April 2020)
Count
1. OCC and NHS continuing healthcare funded care home beds
1.1 People aged 65+ in Care homes* who are OCC funded (as of 1 April 2020)
1,506
1.2 Care home beds funded through NHS continuing healthcare (April 2020)
261
2. Total care home beds
2.1 Total care home beds for older people (CQC as of 1 April 2020)
5,278
2.2 Estimate of total care home beds in use (OCC estimate 90%)
4,750
Estimate of care home beds occupied by self-funders (rounded)
3,000
3. Care at home
3.1 People aged 65+ receiving OCC funded care in own home (as of 1 April 2020)
2,091
3.2 Ratio of self-funders at home VS self-funders in care homes (data from national seminar on Funding Reform July 2013)
1.55
Estimate of people self-funding care at home 4,650
TOTAL self-funding (rounded) 7,700
TOTAL supported by OCC or NHS (rounded) 3,900
People with an assessed care need and income and savings below £14,250 will have their care paid by the Local Authority. Between £14,250 and £23,250 is shared payment. Above the £23,250 threshold requires people to pay for their own care (self-fund).
As of 1 April 2020, around 3,900* older people (aged 65+) were supported by Oxfordshire County Council or NHS continuing healthcare either in care home beds or in their own home.
Using the information on numbers of care home beds and a national ratio of self funders at home vs in care homes gives an estimate of 7,700 older people self-funding long term care in Oxfordshire (66% of the total).
updated
Introduction
Summary
Primary health care
Secondary health care
Mental health services
Register of disabled children
Children’s social care
Adult social care
Community safety services
Health support and preventing ill-health
Access to services
Population Health Management
Finding out more

Behavioural
determinants of
health
Health
conditions and
causes of death
Population groups
and protected
characteristics
Population
Wider
determinants of
health
Service Use Local researchExecutive
summary
Oxfordshire Joint Strategic Needs Assessment 2021 333
There are two sources of predicted population growth for Oxfordshire: (1) Oxfordshire County Council forecasts which include assumptions on housing development (2) ONS projections based on past trends
Applying the current rate of older people (aged 65+) provided with long-term social care (i.e. assuming no change in prevalence) to population forecasts/projections gives a potential change by 2028 of:
+800 (3,600 to 4,400, rounded) from 2020 to 2028 based on Oxfordshire County
Council population forecasts including housing growth
+700 (3,600 to 4,300, rounded) from 2020 to 2028 based on ONS trend-based
population projections
Estimate of future demand
Oxfordshire County Council; OCC forecasts; ONS 2018-based population projections
updated
Introduction
Summary
Primary health care
Secondary health care
Mental health services
Register of disabled children
Children’s social care
Adult social care
Community safety services
Health support and preventing ill-health
Access to services
Population Health Management
Finding out more

Behavioural
determinants of
health
Health
conditions and
causes of death
Population groups
and protected
characteristics
Population
Wider
determinants of
health
Service Use Local researchExecutive
summary
Community safety services
Oxfordshire Joint Strategic Needs Assessment 2021 334
Introduction
Summary
Primary health care
Secondary health care
Mental health services
Register of disabled children
Children’s social care
Adult social care
Community safety services
Health support and preventing ill-health
Access to services
Population Health Management
Finding out more

Behavioural
determinants of
health
Health
conditions and
causes of death
Population groups
and protected
characteristics
Population
Wider
determinants of
health
Service Use Local researchExecutive
summary
Oxfordshire Joint Strategic Needs Assessment 2021 335
Comparing year ending December 2020 with the average of the previous 3 years (2017 to 2019), shows an increase in the number of police recorded victims of domestic abuse, elder abuse, rape, modern slavery and child sexual exploitation in Oxfordshire.
There was a decrease in the number of recorded victims of honour-based violence and female genital mutilation.
Abuse and exploitation - summary
Thames Valley Police Crime Recording System - Niche RMS; * count is of total recorded unique victims in the 12 month period, whether or not individuals have been a victim more than once
Number of police recorded victims* of abuse and
exploitation in Oxfordshire 2018, 2019 and 2020 (Jan-Dec)
updated
Introduction
Summary
Primary health care
Secondary health care
Mental health services
Register of disabled children
Children’s social care
Adult social care
Community safety services
Health support and preventing ill-health
Access to services
Population Health Management
Finding out more
Recorded victims of.. 2017 2018 2019 2020
Change from
average of 2017-19 to 2020
domestic abuse 6,986 7,163 7,285 7,851 +706 +10%
elder abuse 250 403 410 555 +198 +55%
rape crimes 428 473 508 503 +33 +7%
modern slavery 99 124 132 149 +31 +26%
child sexual exploitation 83 106 60 94 +11 +13%
honour-based violence 47 33 34 24 -14 -37%
female genital
mutilation5 6 2 1 -3 -77%

Behavioural
determinants of
health
Health
conditions and
causes of death
Population groups
and protected
characteristics
Population
Wider
determinants of
health
Service Use Local researchExecutive
summary
Oxfordshire Joint Strategic Needs Assessment 2021 336
The rate (per 1,000 population) of domestic abuse victims, for year ending December 2020, was highest in Cherwell (13.4 per 1,000 population)
Cherwell district’s rate per 1000 population in 2020 was above the Thames Valley rate (13.0), the Oxfordshire rate (11.4) and above Oxford (12.6), Vale of White Horse (10.8), West Oxfordshire (9.7), and South Oxfordshire (9.7).
Domestic abuse
Thames Valley Police Crime Recording System - Niche RMS; * count is of total recorded unique victims in the 12 month period, whether or not individuals have been a victim more than once
Police recorded victims* of domestic abuse
(all occurrences), rate per 1,000 population
In year ending December 2020 in Oxfordshire, the overall age profile of victims and perpetrators (as % of total) shows some differences, with perpetrators more likely to be in the broad age range 25 to 44.
updated
Introduction
Summary
Primary health care
Secondary health care
Mental health services
Register of disabled children
Children’s social care
Adult social care
Community safety services
Health support and preventing ill-health
Access to services
Population Health Management
Finding out more

Behavioural
determinants of
health
Health
conditions and
causes of death
Population groups
and protected
characteristics
Population
Wider
determinants of
health
Service Use Local researchExecutive
summary
Oxfordshire Joint Strategic Needs Assessment 2021 337
There has been a consistent and significant upward trend in the number of police recorded domestic abuse crimes in Oxfordshire involving children.
This may be a result of a genuine increase, or changes in recording practice or both.
The district with the highest rate per population in 2019/20 was Cherwell.
Q3 Oct-Dec 2020 saw a drop in both DA incidents and crimes involving children.
Domestic abuse affecting children
Thames Valley Police Crime Recording System - Niche RMS
ONS mid-2019 population estimates from nomis
Number of police recorded domestic abuse incidents and
crimes involving children, Oxfordshire per quarter
2018/19
2019/20
2018/19 to 2019/20
Per pop
Cherwell 726 884 158 22% 0.59%
Oxford 735 767 32 4% 0.50%
South Oxfordshire 470 574 104 22% 0.40%
Vale of White Horse 481 533 52 11% 0.39%
West Oxfordshire 447 480 33 7% 0.43%
Oxfordshire 2859 3238 379 13% 0.47%
Police recorded domestic crimes involving
children, by district per year
updated
Introduction
Summary
Primary health care
Secondary health care
Mental health services
Register of disabled children
Children’s social care
Adult social care
Community safety services
Health support and preventing ill-health
Access to services
Population Health Management
Finding out more

Behavioural
determinants of
health
Health
conditions and
causes of death
Population groups
and protected
characteristics
Population
Wider
determinants of
health
Service Use Local researchExecutive
summary
Oxfordshire Joint Strategic Needs Assessment 2021 338
Rape
Thames Valley Police Crime Recording System - Niche RMS. Year is Jan-Dec. NOTE: that police recorded rape is at the time of reporting rather than time of offence. * Total recorded unique victims in the 12 month period, whether or not individuals have been a victim more than once
Crime Related Occurrence: This term is used to
describe a record of an incident which has
come to the attention of the police, which, on
the Balance of Probabilities would normally
amount to a notifiable crime, but a resultant
crime has not been recorded. The specific
circumstances where this would happen are
1. The incident is reported by a third party and
either
The alleged victim declines to confirm the
crime or
The alleged victim cannot be traced
2. The incident is being dealt with by another
police force
3. The National Crime Recording Standard or
Home Office Counting Rules for Recording
Crime direct that a crime should not be
recorded
Recorded victims* of Rape (Crime and
Crime related occurrences)
In 2020 (Jan-Dec) Thames Valley Police recorded a total of 503 victims of rape crimes in Oxfordshire. This was 7% above the 3 year average (for the years 2017 to 2019), with the greatest increases in Vale of White Horse (+25%) and Cherwell (+10%)
91% of victims were female; 54% of victims were aged under 25
NOTE: that police recorded rape is at the time of reporting rather than time of offence.
updated
Introduction
Summary
Primary health care
Secondary health care
Mental health services
Register of disabled children
Children’s social care
Adult social care
Community safety services
Health support and preventing ill-health
Access to services
Population Health Management
Finding out more

Behavioural
determinants of
health
Health
conditions and
causes of death
Population groups
and protected
characteristics
Population
Wider
determinants of
health
Service Use Local researchExecutive
summary
Oxfordshire Joint Strategic Needs Assessment 2021 339
In 2020 (Jan-Dec) Thames Valley Police recorded a total of:
1 victim of Female Genital Mutilation in Oxfordshire, down from 2 in 2019;
No victims of forced marriage in Oxfordshire (none in 2018 and 2019);
24 victims of honour-based violence in Oxfordshire, mainly in Cherwell and Oxford (see table below). This was well below the number in 2019 (34).
Female genital mutilation, forced marriage and honour based violence
Thames Valley Police Crime Recording System - Niche RMS Note: The above HBV data is for all victims of offences where either the HBV Latest or HBV Finalisation qualifier has been used or the Occurrence Type or Classification has been recorded as Honour Based Violence - Non Crime Occurrence; *NOTE: All data includes duplicate people, so if someone has been a victim of an offence multiple times, they will be counted in the data multiple times
Note: According to the Crown Prosecution
Service guidance:
There is no specific offence of "honour-
based crime". It is an umbrella term to
encompass various offences covered by
existing legislation. Honour-based
violence (HBV) can be described as a
collection of practices, which are used to
control behaviour within families or other
social groups to protect perceived
cultural and religious beliefs and/or
honour. Such violence can occur when
perpetrators perceive that a relative has
shamed the family and/or community by
breaking their honour code.
Recorded victims* of Honour-based violence
(Crime and non Crime)
updated
Introduction
Summary
Primary health care
Secondary health care
Mental health services
Register of disabled children
Children’s social care
Adult social care
Community safety services
Health support and preventing ill-health
Access to services
Population Health Management
Finding out more
2016 2017 2018 2019 20202019 to
2020
Cherwell 13 7 10 18 10 -8
Oxford 28 33 19 11 13 2
South Oxfordshire 1 3 0 2 0 -2
Vale Of White
Horse8 2 2 2 1 -1
West Oxfordshire 0 2 2 1 0 -1
Oxfordshire 50 47 33 34 24 -10

Behavioural
determinants of
health
Health
conditions and
causes of death
Population groups
and protected
characteristics
Population
Wider
determinants of
health
Service Use Local researchExecutive
summary
Oxfordshire Joint Strategic Needs Assessment 2021 340
In 2020 (Jan-Dec) Thames Valley Police recorded a total of 149 victims of Modern Slavery in Oxfordshire.
This was 26% above the 3 year average (for the years 2017 to 2019), with the greatest increases in Oxford City (+57%) and Cherwell (+20%)
Modern Slavery
Thames Valley Police Crime Recording System - Niche RMS. The above data is for a count of unique victims of Modern Slavery and Trafficking offences. Modern Slavery offences have been identified where either the HO Category Number is 106 or the Modern Slavery Finalisation Qualifier has been used. Trafficking offences have been identified where either the classification or Occurrence Type has been recorded as trafficking for exploitation or sexual exploitation, into, out of or within the UK. * Total recorded unique victims in the 12 month period, whether or not individuals have been a victim more than once
Recorded victims* of Modern Slavery and Trafficking -
All Occurrences (Crime and Non Crime)
According to the Home Office Modern
Slavery awareness booklet Modern Slavery
is a serious and often hidden crime in
which people are exploited for criminal
gain. The impact can be devastating for
the victims.
Modern slavery comprises slavery,
servitude, forced and compulsory labour
and human trafficking.
There were an estimated 40 million
people in slavery globally in 2016 and
10,000 –13,000 potential victims in the UK,
however many victims are not identified
or reported.
updated
Introduction
Summary
Primary health care
Secondary health care
Mental health services
Register of disabled children
Children’s social care
Adult social care
Community safety services
Health support and preventing ill-health
Access to services
Population Health Management
Finding out more

Behavioural
determinants of
health
Health
conditions and
causes of death
Population groups
and protected
characteristics
Population
Wider
determinants of
health
Service Use Local researchExecutive
summary
Oxfordshire Joint Strategic Needs Assessment 2021 341
In 2020 (Jan-Dec) Thames Valley Police recorded a total of 94 victims of Child Sexual Exploitation in Oxfordshire.
This was 13% above the 3 year average (for the years 2017 to 2019), with the greatest increases in West Oxfordshire (+112%), Cherwell (+57%) and Vale of White Horse (+50%).
Child Sexual Exploitation
Thames Valley Police Crime Recording System - Niche RMS. The above CSE data is for all victims of offences where either the 'Child Sexual Exploitation' qualifier has been used or the Occurrence Type has been recorded as 'Suspected CSE - Non Crime Incident’ *Total recorded unique victims in the 12 month period, whether or not individuals have been a victim more than once
Note: The definition of Child Sexual
Exploitation from government guidance is:
Child sexual exploitation is a form of child
sexual abuse. It occurs where an individual or
group takes advantage of an imbalance of
power to coerce, manipulate or deceive a
child or young person under the age of 18
into sexual activity (a) in exchange for
something the victim needs or wants, and/or
(b) for the financial advantage or increased
status of the perpetrator or facilitator. The
victim may have been sexually exploited
even if the sexual activity appears
consensual. Child sexual exploitation does
not always involve physical contact; it can
also occur through the use of technology.
Recorded victims* of Child Sexual Exploitation All
Occurrences (Crime and Non Crime)
updated
Introduction
Summary
Primary health care
Secondary health care
Mental health services
Register of disabled children
Children’s social care
Adult social care
Community safety services
Health support and preventing ill-health
Access to services
Population Health Management
Finding out more

Behavioural
determinants of
health
Health
conditions and
causes of death
Population groups
and protected
characteristics
Population
Wider
determinants of
health
Service Use Local researchExecutive
summary
Oxfordshire Joint Strategic Needs Assessment 2021 342
In 2020 (Jan-Dec) Thames Valley Police recorded a total of 555 older victims (aged 65 and over) of crimes of violence or sexual offences in Oxfordshire.
This was 57% above the 3 year average (for the years 2017 to 2019), above the increase across Thames Valley (+45%) and with the greatest increases in Cherwell (+81%), South Oxfordshire (+57%) and Oxford City (+56%)
The increase is above the growth in the older population in Oxfordshire.
The rate of older victims of abuse per 1,000 population aged 65+ was highest in Oxford City (6.9 compared with 4.3 in Oxfordshire and 4.8 across Thames Valley)
Abuse of older people
Thames Valley Police Crime Recording System - Niche RMS. *Total recorded unique victims in the 12 month period, whether or not individuals have been a victim more than once
Recorded victims*
aged 65 or over of
violence against the
person or sexual
offences (crimes)
updated
Introduction
Summary
Primary health care
Secondary health care
Mental health services
Register of disabled children
Children’s social care
Adult social care
Community safety services
Health support and preventing ill-health
Access to services
Population Health Management
Finding out more

Behavioural
determinants of
health
Health
conditions and
causes of death
Population groups
and protected
characteristics
Population
Wider
determinants of
health
Service Use Local researchExecutive
summary
Oxfordshire Joint Strategic Needs Assessment 2021 343
In 2019-20 there were 346 dwelling fires in Oxfordshire down from 402 in 2018-19 (-56, -14%).
There were 54 recorded injuries due to fire* (up from 47 in 2018-19) and 1 fire-related fatality. *Includes all injuries confirmed as fire related or not known excludes fatalities
Victims of fires
Oxfordshire County Council Fire and Rescue Services
Injuries 2011-12 2012-13 2013-14 2014-15 2015-16 2016-17 2017-18 2018-19 2019-20
age 0-20 9 11 5 7 8 5 3 6 14
age 21 to 60 26 32 (+2) 31 22 (+1) 20 12 (+1) 7 24 26
age 61+ 17 (+1) 11 (+2) 10 (+2) 9 9 (+2) 9 (+3) 5 17 (+1) 14 (+1)
unknown 0 (+1) 13 (+4) 21 (+2) 4 (+2) 17 (+2) 20 (+4) 9 0 (+1) 0 (+1)
Total 52 (+2) 67 (+8) 67 (+4) 42 (+3) 54 (+4) 46 (+8) 24 47 (+2) 54 (+2)
Number of victims of fire related injuries and fatalities in pink by broad age group
updated
Introduction
Summary
Primary health care
Secondary health care
Mental health services
Register of disabled children
Children’s social care
Adult social care
Community safety services
Health support and preventing ill-health
Access to services
Population Health Management
Finding out more

Behavioural
determinants of
health
Health
conditions and
causes of death
Population groups
and protected
characteristics
Population
Wider
determinants of
health
Service Use Local researchExecutive
summary
Oxfordshire Joint Strategic Needs Assessment 2021 344
In 2019-20 there were 212 victims of doorstep crime or rogue traders in Oxfordshire, down from 277 in the previous year, a fall of 23% (-65).
The majority of victims continue to be elderly residents.
Victims of doorstep crime
2012-13 2013-14 2014-15 2015-16 2016-17 2017-18 2018-19 2019-20 2018-19 to 2019-20
Cherwell 78 99 80 83 80 58 58 31 -27 -47%
Oxford City 67 66 115 85 101 58 50 28 -22 -38%
South Oxfordshire 83 97 42 63 73 62 67 48 -19 -31%
Vale of White Horse 97 89 56 80 58 44 55 44 -11 -25%
West Oxfordshire 48 79 50 49 53 36 45 33 -12 -33%
SUM of districts 373 430 343 360 365 258 275 184 -91 -35%
Not recorded 20 197 34 19 12 26 2 28 26 100%
TOTAL Oxfordshire 393 627 377 379 377 284 277 212 -65 -23%
Oxfordshire County Council Trading Standards
Count of victims of doorstep crime and rogue traders in Oxfordshire
*The category ‘product selling’ refers mostly to ‘Nottingham knockers’ who
target mostly elderly/ vulnerable residents to sell cleaning or kitchen
products. This is often linked to burglaries.
Roofing34%
Driveways and Patios
24%
Building15%
Garden and Landscaping (including tree care)
15%
Product Selling
12%
Top 5 Goods Service Areas used by
rogue traders in Oxfordshire 2019-20
updated
Introduction
Summary
Primary health care
Secondary health care
Mental health services
Register of disabled children
Children’s social care
Adult social care
Community safety services
Health support and preventing ill-health
Access to services
Population Health Management
Finding out more

Behavioural
determinants of
health
Health
conditions and
causes of death
Population groups
and protected
characteristics
Population
Wider
determinants of
health
Service Use Local researchExecutive
summary
Oxfordshire Joint Strategic Needs Assessment 2021 345
Nationally, unscrupulous criminals are exploiting fears about COVID-19 to prey on members of the public, particularly older and vulnerable people who are isolated from family and friends. Initially, criminals exploited COVID-19 earlier this year by offering the fraudulent sale of fake PPE, hand sanitiser and testing kits. Between September 2019 and September 2020, Action Fraud received just over 17,000 reports of investment fraud, amounting to £657.4m in reported losses. This is a 28% increase when compared to the same period in 2019.
Victims of scams
Action Fraud, National Trading Standards, Citizens Advice data for ‘bogus selling’ Oxfordshire consumers
Oxfordshire residents reporting scams The number of scams
reported by Oxfordshire residents has increased significantly since the start of the COVID-19 pandemic
These scams relate to ‘bogus selling’ which can be via unsolicited phone call, unsolicited mail or email.
0
5
10
15
20
25
30
35
40
45
Jan Mar May Jul Sep Nov Jan Mar May Jul Sep Nov Jan Mar May Jul Sep Nov
2018 2019 2020
updated
Introduction
Summary
Primary health care
Secondary health care
Mental health services
Register of disabled children
Children’s social care
Adult social care
Community safety services
Health support and preventing ill-health
Access to services
Population Health Management
Finding out more

Behavioural
determinants of
health
Health
conditions and
causes of death
Population groups
and protected
characteristics
Population
Wider
determinants of
health
Service Use Local researchExecutive
summary
Oxfordshire Joint Strategic Needs Assessment 2021 346
Call blockers are offered to Oxfordshire’s most vulnerable residents, and can help to tackle nuisance and unwanted calls by preventing selected numbers from getting through. They are often offered to victims of scams.
In Oxfordshire, as of 31st December 2020, 158 units have been installed since 19/05/2015 to protect vulnerable residents from nuisance and scam phone calls, of which 91 have been active within December 2020. In total, 129,105 nuisance calls were received, of which 128,313 were blocked (over 95%).
As of 31/12/20, it is estimated that call blockers in Oxfordshire have saved individuals £40,320 in scams (based on financial year 2020/21).
Call Blockers for vulnerable residents and scam victims
Trading Standards – Community Safety Team trueCall *Data up until 31st December 2020
Financial Year Units installed Nuisance calls received
Nuisance calls blocked
Estimated savings for the individual
Estimated savings in costs for social care,
NHS, etc
2015/16 19 2,805 2,788 £5,889 £5,329
2016/17 30 15,956 15,800 £33,498 £30,314
2017/18 24 24,895 24,633 £52,264 £47,296
2018/19 35 31,638 31,490 £66,420 £60,107
2019/20 28 32,588 32,479 £68,415 £61,911
*2020/21 *22 *21,223 *21,123 *£44,555 *£40,320
Call Blockers installed in Oxfordshire by financial year
updated
Introduction
Summary
Primary health care
Secondary health care
Mental health services
Register of disabled children
Children’s social care
Adult social care
Community safety services
Health support and preventing ill-health
Access to services
Population Health Management
Finding out more

Behavioural
determinants of
health
Health
conditions and
causes of death
Population groups
and protected
characteristics
Population
Wider
determinants of
health
Service Use Local researchExecutive
summary
Oxfordshire Joint Strategic Needs Assessment 2021 347
In 2020 (Jan-Dec) Thames Valley Police recorded 1,817 alcohol-related crimes in Oxfordshire below the number in 2019 (2,221). Alcohol-related crimes were 4% of all crimes in the county.
Between 2019 and 2020, alcohol-related crime increased slightly in Vale of White Horse and declined in other districts.
Alcohol-related crime
Thames Valley Police Crime Recording System - Niche RMS
Alcohol-related crimes in OxfordshireNote: This data is for
all recorded crimes in
Oxfordshire where
the substance use
field has been
recorded as 'Alcohol'
related. 2018 data
has also had the new
qualifiers of 'Alcohol
related - crime
suspect' and 'Alcohol
related - crime
victim' added to the
report.
updated
Introduction
Summary
Primary health care
Secondary health care
Mental health services
Register of disabled children
Children’s social care
Adult social care
Community safety services
Health support and preventing ill-health
Access to services
Population Health Management
Finding out more

Behavioural
determinants of
health
Health
conditions and
causes of death
Population groups
and protected
characteristics
Population
Wider
determinants of
health
Service Use Local researchExecutive
summary
Health support and preventing ill-health
Oxfordshire Joint Strategic Needs Assessment 2021 348
Introduction
Summary
Primary health care
Secondary health care
Mental health services
Register of disabled children
Children’s social care
Adult social care
Community safety services
Health support and preventing ill-health
Access to services
Population Health Management
Finding out more

Behavioural
determinants of
health
Health
conditions and
causes of death
Population groups
and protected
characteristics
Population
Wider
determinants of
health
Service Use Local researchExecutive
summary
Oxfordshire Joint Strategic Needs Assessment 2021 349
Adults
In 2019/20 there were 1,945 adults (aged 18 and over) in specialist drug treatment in Oxfordshire. This is up by 4% from last year.
The majority of those in drug treatment were aged between 30 to 49 (1,381 people, 71%)
The number of adults in treatment for alcohol only in Oxfordshire in 2019/20 was 574, the majority of whom (78%) were aged 30 to 59.
Young people
In 2019/20 the number of young people (aged under 18 years) in specialist substance misuse services in Oxfordshire was 155, down by 16% from last year.
75 began using their main substance before they reached 15 years of age
74 were using two or more substance (this includes Alcohol)
28 reported being affected by others’ substance misuse
63 Identified as having a mental health treatment need
55 Receiving treatment for their mental health needs
Referrals were predominantly from education services (31%) and children and family services (43%).
Drug and alcohol services
Oxfordshire County Council, Public Health team
updated
Introduction
Summary
Primary health care
Secondary health care
Mental health services
Register of disabled children
Children’s social care
Adult social care
Community safety services
Health support and preventing ill-health
Access to services
Population Health Management
Finding out more

Behavioural
determinants of
health
Health
conditions and
causes of death
Population groups
and protected
characteristics
Population
Wider
determinants of
health
Service Use Local researchExecutive
summary
Oxfordshire Joint Strategic Needs Assessment 2021 350
Pregnant mothers are seen during the antenatal period, and again at 6-8 weeks after birth to receive a maternal mood assessment. Babies are seen and checked at least by 14 days old, at 6-8 weeks and at 1 year and 2 years.
In 2019/20, there were 7,041 births to Oxfordshire residents.
In the same year, health visitors had 102,823 direct contacts and 11,842 indirect contacts.
98.1% of mothers received a maternal mood assessment.
The Family Nurse Partnership (FNP) supports first time mothers aged up to 19 years. It focuses on supporting young mothers for a healthy pregnancy, improving child’s health and development and improving parents’ economic self-sufficiency. Oxfordshire has 200 places available. Once the child reaches 2 years they transition into the Health Visitor Service and receive ongoing advice and support.
Averaging the caseload across the year, 185 of 200 places were filled. This is broken down by district areas with individuals in Vale of White Horse occupying the most places, closely followed by Oxford City and Cherwell. South Oxfordshire and West Oxfordshire have fewer places. This does fluctuate during the year as families do move locations.
68.2% of mothers are recruited before 16 weeks of pregnancy in line with the licence, the national figure is 37.4%.
Health Visiting and Family Nurse Partnership
Oxfordshire County Council
updated
Introduction
Summary
Primary health care
Secondary health care
Mental health services
Register of disabled children
Children’s social care
Adult social care
Community safety services
Health support and preventing ill-health
Access to services
Population Health Management
Finding out more

Behavioural
determinants of
health
Health
conditions and
causes of death
Population groups
and protected
characteristics
Population
Wider
determinants of
health
Service Use Local researchExecutive
summary
Oxfordshire Joint Strategic Needs Assessment 2021 351
The School Health Nursing (SHN) Service is for children and young people aged 5-19 years.
During the academic year 2019/20 there were 9,586 face to face contacts. This was impacted by COVID-19 as the majority of children and young people were not in school from March to July 2020, and staff from the service were redeployed to support the NHS response to the pandemic. There were also 12,467 non-face to face contacts.
Top areas for intervention were:
Primary school:
Maximising learning
Safeguarding
Improving lifestyles
Secondary school:
Maximising learning
Resilience and emotional wellbeing
Safeguarding
Improving lifestyles
Health Nurse Services
Oxfordshire County CouncilAreas for intervention for the SHN & CN service can be found at:PHE Supporting public health: children, young people and families
College:
Maximising learning
Improving lifestyles
Reducing risky behaviours
Introduction
Summary
Primary health care
Secondary health care
Mental health services
Register of disabled children
Children’s social care
Adult social care
Community safety services
Health support and preventing ill-health
Access to services
Population Health Management
Finding out more
updated

Behavioural
determinants of
health
Health
conditions and
causes of death
Population groups
and protected
characteristics
Population
Wider
determinants of
health
Service Use Local researchExecutive
summary
Oxfordshire Joint Strategic Needs Assessment 2021 352
It is estimated that approximately 30% of smokers every year make a serious attempt to quit. Most are unsuccessful with only 5% of smokers achieving a successful attempt at stopping smoking. Of the people who quit, 2% do so through a Local Stop Smoking Service.
Oxfordshire County Council currently commission a Local Stop Smoking Service, known as Smokefreelife Oxfordshire, to help smokers to quit with the use of pharmacotherapy and behavioural support.
The Oxfordshire Tobacco Control Strategy sets out the aim to reduce smoking prevalence in the adult population, and in the following priority populations:
People in routine and manual occupation group
People with serious mental illness
Pregnant women
Children and young people
During 2019/20, 1,952 smokers in Oxfordshire successfully stopped, of which 868 were from routine and manual occupations.
Stop Smoking Services
Oxfordshire County Council, The Final Push: A Tobacco Control Strategy for a smokefree society in Oxfordshire 2020-2025NHS Digital, Statistics on NHS Stop Smoking Services in England
updated
Introduction
Summary
Primary health care
Secondary health care
Mental health services
Register of disabled children
Children’s social care
Adult social care
Community safety services
Health support and preventing ill-health
Access to services
Population Health Management
Finding out more

Behavioural
determinants of
health
Health
conditions and
causes of death
Population groups
and protected
characteristics
Population
Wider
determinants of
health
Service Use Local researchExecutive
summary
Oxfordshire Joint Strategic Needs Assessment 2021 353
The Oxfordshire Sexual Health Service provides free STI testing and treatment, notification of sexual partners of infected persons and free provision of contraception across clinics, tiered from Level 1-3 (set by the British Association for Sexual Health and HIV (BASHH):
Level 1 - for asymptomatic services users
Level 2 - for symptomatic service users
Level 3 - for service users with complex/specialist needs
During 2019/20, there were 37,893 contacts for STI testing and treatment with 99% offered an appointment within 48 hours of contacting the service. In addition, there were 4,447 STI test kits requested via online pathways and self-managed care.
During 2019/20, there were 21,870 contacts for contraception with the Oxfordshire Sexual Health Service with 100% of women having access to emergency contraceptive services within 48 hours of contacting the Service. In addition, there were over 30,000 free condoms distributed to under 25s
Specialist Sexual Health Services
Oxfordshire County Council BASHH Standards for the management of sexually transmitted infections (STIs)
updated
Introduction
Summary
Primary health care
Secondary health care
Mental health services
Register of disabled children
Children’s social care
Adult social care
Community safety services
Health support and preventing ill-health
Access to services
Population Health Management
Finding out more

Behavioural
determinants of
health
Health
conditions and
causes of death
Population groups
and protected
characteristics
Population
Wider
determinants of
health
Service Use Local researchExecutive
summary
Oxfordshire Joint Strategic Needs Assessment 2021 354
The Long Acting Reversible Contraception (LARC) Service in GP Practice settings provides further access to methods of birth control that provide effective contraception for an extended period of time without requiring user action. The provision of services fitting LARCs is seen as essential health care in preventing unplanned pregnancies.
During 2019/20, there were 5,571 LARCs fitted (excluding injections) by GP Practices. For 2019, the rate of GP prescribed LARC (excluding injections) was 45.3 per 1,000 resident female population aged 15-44 years, an increase from 41.5 in 2018. This is greater than both the South East (40.7) and England (30.2) averages
Access to emergency contraception comes in the form of a Emergency Hormonal Contraception (EHC) Service, commonly known as the ‘morning after pill’, and can be accessed within Community Pharmacy settings. The aim of the service is to reduce the risk of unintended and unwanted pregnancy in young women.
During 2019/20, there were 1,714 consultations to provide EHC, for free, for women aged 21 years and under where there was unprotected sexual intercourse (where pregnancy was not desired), or in the event of contraceptive failure (e.g. a spilt condom).
Contraception Services in primary care
Oxfordshire County Council
updated
Introduction
Summary
Primary health care
Secondary health care
Mental health services
Register of disabled children
Children’s social care
Adult social care
Community safety services
Health support and preventing ill-health
Access to services
Population Health Management
Finding out more

Behavioural
determinants of
health
Health
conditions and
causes of death
Population groups
and protected
characteristics
Population
Wider
determinants of
health
Service Use Local researchExecutive
summary
Oxfordshire Joint Strategic Needs Assessment 2021 355
Nationally, GP data shows that the COVID-19 pandemic has had a significant impact on referrals by GPs to memory clinics for dementia assessment.
The rate of referrals fell in February 2020, and again in March and (more steeply) in April 2020, during time of the first national lockdown.
By September and October 2020, rates had recovered, but remained around 15% below the average for the 2018-19 baseline.
Data for November shows another drop as the second national lockdown started (from 5 Nov20).
The Dementia Oxfordshire service, which mainly takes referrals from memory clinics and GPs, also saw a big drop in referrals in April 2020. These have since recovered and were above the 2019 numbers in November and December 2020.
The total number of referrals in 2020 was around 8% below that in 2019.
COVID-19 and dementia services
Wider Impacts of COVID-19 (phe.gov.uk)Dementia Oxfordshire Note that, due to the difficulty in diagnosing during COVID-19, Dementia Oxfordshire now take referrals for Mild Cognitive Impairment from GPs and the Memory Clinics where the clinician thinks a dementia diagnosis is likely to follow. See also JSNA Bitesize COVID-19 and dementia
Dementia and Alzheimer's disease
record of a referral to a memory clinic
(aged 65 years and over) per 1,000,000
Count of referrals to Dementia
Oxfordshire
new
Introduction
Summary
Primary health care
Secondary health care
Mental health services
Register of disabled children
Children’s social care
Adult social care
Community safety services
Health support and preventing ill-health
Access to services
Population Health Management
Finding out more

Behavioural
determinants of
health
Health
conditions and
causes of death
Population groups
and protected
characteristics
Population
Wider
determinants of
health
Service Use Local researchExecutive
summary
Oxfordshire Joint Strategic Needs Assessment 2021 356
Of the 1,341 enquiries to the general Age UK Oxfordshire helpline from January to December 2019:
64.5% were female, 35% male (0.5% withheld),
42% had a long term illness, disability or memory issues,
21% were recorded as living alone,
14% had an informal carer living with them,
7% were carers.
Age UK Oxfordshire helpline
Age UK Oxfordshire. Note that data relates to the general Age UK Oxfordshire helpline. Full demographic details are not always recorded from each enquirer, e.g. if the enquiry is unrelated to disability then the disability status of the caller may not be recorded. Enquiries may cover more than one topic.
The top reasons for contacting the helpline were: benefits, including disability-related, housing options and community care.
Top reasons for contacting the
Age UK Oxfordshire general
helpline Jan-Dec 2019
Not updated
Introduction
Summary
Primary health care
Secondary health care
Mental health services
Register of disabled children
Children’s social care
Adult social care
Community safety services
Health support and preventing ill-health
Access to services
Population Health Management
Finding out more

Behavioural
determinants of
health
Health
conditions and
causes of death
Population groups
and protected
characteristics
Population
Wider
determinants of
health
Service Use Local researchExecutive
summary
Oxfordshire Joint Strategic Needs Assessment 2021 357
Around 24,400 people, 3.5% of Oxfordshire’s population, accessed Citizens Advice services in 2018-19. Of those accessing advice about housing, employment, benefits and debt there were:
Significantly more people from an ethnic minority background than the general population
A higher proportion of females (57% vs 43% males)
Just under half of people accessing Citizens Advice Oxfordshire services were recorded as living with a disability. Of these, 57% had a long term condition, 15% physical disability, 10% mental health problem and 10% learning/cognitive difficulty.
Citizens Advice
Citizens Advice agencies Oxfordshire
Citizens Advice clients (count) by recorded disability (2018-19)Oxfordshire has open-door
Citizens Advice services based
in offices in Abingdon, Banbury,
Bicester, Didcot, Henley,
Thame, Oxford, and Witney.
Citizens Advice also runs
outreach services in Brackley,
Carterton, Chipping Norton,
Farringdon, Kidlington, RAF
Benson, RAF Brize Norton,
South Abingdon, Shipton-under-
Wychwood, Wallingford,
Watlington, and Woodcote.
Introduction
Summary
Primary health care
Secondary health care
Mental health services
Register of disabled children
Children’s social care
Adult social care
Community safety services
Health support and preventing ill-health
Access to services
Population Health Management
Finding out more
Not updated

Behavioural
determinants of
health
Health
conditions and
causes of death
Population groups
and protected
characteristics
Population
Wider
determinants of
health
Service Use Local researchExecutive
summary
Social Prescribing Champions/ Volunteers
Light touch support, information &
signposting
Community Link Worker
Tailored support
Oxfordshire Joint Strategic Needs Assessment 2021 358
Social prescribing link workers, working for Primary Care Networks, connect people to wider community support, which can help to improve their health and wellbeing and engage and deal with some of their underlying causes of ill health1.
Social prescribing
[1] NHS England: Delivering universal personalised care NHS England Social PrescribingLocal data expected to be published from April/May 2021 (to be confirmed)
The Oxfordshire Social Prescribing Client Journey model provides different types of service according to the level of support needed.
Social prescribing services are now available across Oxfordshire and information on social prescribing activities and outcomes in Oxfordshire will be included in future versions of the JSNA.
PCN Link Worker
Tailored support
Patients not needing support to
address social issues
High
support
Low
support
Oxfordshire Social Prescribing
Client Journey
updated
Introduction
Summary
Primary health care
Secondary health care
Mental health services
Register of disabled children
Children’s social care
Adult social care
Community safety services
Health support and preventing ill-health
Access to services
Population Health Management
Finding out more

Behavioural
determinants of
health
Health
conditions and
causes of death
Population groups
and protected
characteristics
Population
Wider
determinants of
health
Service Use Local researchExecutive
summary
Access to services
Oxfordshire Joint Strategic Needs Assessment 2021 359
Introduction
Summary
Primary health care
Secondary health care
Mental health services
Register of disabled children
Children’s social care
Adult social care
Community safety services
Health support and preventing ill-health
Access to services
Population Health Management
Finding out more

Behavioural
determinants of
health
Health
conditions and
causes of death
Population groups
and protected
characteristics
Population
Wider
determinants of
health
Service Use Local researchExecutive
summary
Oxfordshire Joint Strategic Needs Assessment 2021 360
85 out of 407 lower super output areas (LSOAs) in Oxfordshire are ranked within the most deprived 10% nationally on the geographical access to services sub-domain (road distance to post office, primary school, GP and supermarket) of the 2019 IMD.
By district the number of LSOAs ranked within the 10% most deprived are: Cherwell: 22 out of 93
Oxford: 1 out of 83
South Oxfordshire: 25 out of 89
Vale of White Horse: 24 out of 76
West Oxfordshire: 13 out of 66
Areas ranked poorly on geographical access to services (within worst 10%) include: 21% of the total population
27,600 (21%) people aged 0-15
30,100 (24%) people aged 65+ and
4,000 (23%) people aged 85+
Geographical access to services
English indices of deprivation 2019, MCLG
No change
Introduction
Summary
Primary health care
Secondary health care
Mental health services
Register of disabled children
Children’s social care
Adult social care
Community safety services
Health support and preventing ill-health
Access to services
Population Health Management
Finding out more

Behavioural
determinants of
health
Health
conditions and
causes of death
Population groups
and protected
characteristics
Population
Wider
determinants of
health
Service Use Local researchExecutive
summary
Oxfordshire Joint Strategic Needs Assessment 2021 361
Note: the data on this slide was collected before March 2020, and therefore will not reflect any changes due to the COVID-19 pandemic.
According to (national) 2019 ONS data1 on internet use:
The generation gap is closing in terms of recent (in last 3 months) internet use..
in the 65 to 74 age group, increasing from 52% in 2011 to 83% in 2019.
in those aged 75+, increasing from 20% in 2011 to 47% in 2019.
18% of disabled adults had never used the internet in 2019, down from 20% in 2018.
Based on this dataset, it is estimated that 37,200 older people (aged 65+) living in Oxfordshire have never used the internet.
According to (national) 2020 ONS data2 on internet use:
In January to February 2020, 96% of households in Great Britain had internet access, up from 93% in 2019 and 57% in 2006 when comparable records began.
Internet connections in households with one adult aged 65 years and over have increased by seven percentage points since 2019 to 80%.
These households still had the lowest proportion of internet connections.
Internet use (national)
Source: [1] Internet users, UK: 2019; ONS 2019 mid-year population estimate[2] Internet access – households and individuals, Great Britain: 2020
updated
Introduction
Summary
Primary health care
Secondary health care
Mental health services
Register of disabled children
Children’s social care
Adult social care
Community safety services
Health support and preventing ill-health
Access to services
Population Health Management
Finding out more

Behavioural
determinants of
health
Health
conditions and
causes of death
Population groups
and protected
characteristics
Population
Wider
determinants of
health
Service Use Local researchExecutive
summary
Oxfordshire Joint Strategic Needs Assessment 2021 362
The November 2020 community transport directory (information as of 2019) lists a total of 86 schemes in Oxfordshire offering a very wide range of services – some are local and others cover the whole county.
Of these, there were:
15 in Cherwell
5 in Oxford
24 in South Oxfordshire
19 in Vale of White Horse
21 in West Oxfordshire
2 that cover the entire county
Community transport schemes operate throughout Oxfordshire
Location of Community
Transport schemes
offering services in
Oxfordshire (2019)*
From CT directory, Oxfordshire County Council and Community First Oxfordshire*Map excludes 2 county-wide services and 2 services specific to West Oxfordshire
Bus
Car
updated
Introduction
Summary
Primary health care
Secondary health care
Mental health services
Register of disabled children
Children’s social care
Adult social care
Community safety services
Health support and preventing ill-health
Access to services
Population Health Management
Finding out more

Behavioural
determinants of
health
Health
conditions and
causes of death
Population groups
and protected
characteristics
Population
Wider
determinants of
health
Service Use Local researchExecutive
summary
Population Health Management
Oxfordshire Joint Strategic Needs Assessment 2021 363
Introduction
Summary
Primary health care
Secondary health care
Mental health services
Register of disabled children
Children’s social care
Adult social care
Community safety services
Health support and preventing ill-health
Access to services
Population Health Management
Finding out more

Behavioural
determinants of
health
Health
conditions and
causes of death
Population groups
and protected
characteristics
Population
Wider
determinants of
health
Service Use Local researchExecutive
summary
Oxfordshire Joint Strategic Needs Assessment 2021 364
From NHS England Population Health Management
Population Health Management
The NHS Population Health Management programme (part of the NHS Long Term Plan) encompasses health, the wider determinants of health (social, economic, environmental) and the crucial role of communities and local people.
Only 20% of a person’s health outcomes are attributed to access to good quality health care.
Factors affecting health outcomes
Our environment
10% housing
quality, natural and
built environment
Social and economic
factors
40% education,
employment, income,
family/social support,
community safety
Our behaviours
30% smoking, diet,
exercise, alcohol &
drug use, sexual
health
Health care
20% access to
good quality care
new
Introduction
Summary
Primary health care
Secondary health care
Mental health services
Register of disabled children
Children’s social care
Adult social care
Community safety services
Health support and preventing ill-health
Access to services
Population Health Management
Finding out more

Behavioural
determinants of
health
Health
conditions and
causes of death
Population groups
and protected
characteristics
Population
Wider
determinants of
health
Service Use Local researchExecutive
summary
Oxfordshire Joint Strategic Needs Assessment 2021
Oxfordshire is developing linked datasets for Population Health analytics
NHS Oxfordshire Clinical Commissioning Group
Understanding
of social and
clinical risk
factors to
health
Segmentation
by patient
complexity and
vulnerability
Tailored care
Health Analytics
tools
The Person
(population based on GP
registered lists)
General Practice
Acute
Mental Health
Local Authority
Others(police,
housing, ambulance,
111 + others)
Wider
Determinants
Community
new
Introduction
Summary
Primary health care
Secondary health care
Mental health services
Register of disabled children
Children’s social care
Adult social care
Community safety services
Health support and preventing ill-health
Access to services
Population Health Management
Finding out more
365

Behavioural
determinants of
health
Health
conditions and
causes of death
Population groups
and protected
characteristics
Population
Wider
determinants of
health
Service Use Local researchExecutive
summary
Oxfordshire Joint Strategic Needs Assessment 2021 366
Indices of Deprivation 2019
Care Quality Commission surveys
Live Well Oxfordshire
NHS Mental Health dashboard with quarterly data for Oxfordshire CCG
Public Health England Fingertips
Finding out moreIntroduction
Summary
Primary health care
Secondary health care
Mental health services
Register of disabled children
Children’s social care
Adult social care
Community safety services
Health support and preventing ill-health
Access to services
Population Health Management
Finding out more

Behavioural
determinants of
health
Health
conditions and
causes of death
Population groups
and protected
characteristics
Population
Wider
determinants of
health
Service Use Local researchExecutive
summary
Local research
Oxfordshire Joint Strategic Needs Assessment 2021 367
Chapter 8

Behavioural
determinants of
health
Health
conditions and
causes of death
Population groups
and protected
characteristics
Population
Wider
determinants of
health
Service Use Local researchExecutive
summary
Oxfordshire Joint Strategic Needs Assessment 2021 368
This chapter provides an overview of research carried out by organisations in Oxfordshire of relevance to the topics covered by the Joint Strategic Needs Assessment.
This is not an exhaustive list of local research for Oxfordshire, rather a collection of reports that have come to our attention since the publication of the last JSNA report.
Reports have been published by the authors and are available via their websites.
Note that reports and findings are the responsibility of the individual authors/organisations and any enquiries should be directed to them.
Older reports can be found in the previous (2020) JSNA Local Research chapter, and a full list of health needs assessments is available on Oxfordshire Insight.
IntroductionIntroduction
Reports by Healthwatch Oxfordshire
Reports by the Oxfordshire Community
Foundation
Good Food Oxford research
Oxfordshire OxWell School Survey
VOXY ‘Be Supported’ Questionnaire 2020
Finding out more

Behavioural
determinants of
health
Health
conditions and
causes of death
Population groups
and protected
characteristics
Population
Wider
determinants of
health
Service Use Local researchExecutive
summary
Oxfordshire Joint Strategic Needs Assessment 2021 369
Healthwatch Oxfordshire is an independent watchdog, established in 2012 under the Health and Social Care Act.
Healthwatch Oxfordshire listens to the experiences of people in Oxfordshire using health and social care services through thematic and geographical research, outreach and engagement, with the aim of ensuring these voices are heard by those that design and deliver services.
Healthwatch Oxfordshire has produced a number of reports during 2020-21, including:
Oxfordshire military families experiences of health services in Oxfordshire (March 2020)
Listening to Care Homes during the Covid pandemic (July 2020)
Patient Participation Group activity during Covid (July 2020)
Let’s Talk about mental health- mental healthcare in Oxfordshire (July 2020)
GP’s supporting patients during Covid (Sept 2020)
Emotional wellbeing in 0-5 year olds in Oxfordshire (Sept 2020)
Social care in Oxfordshire - how did local people experience the council’s change in contributions policy (Aug 2020)
Oxford’s new and emerging communities views on wellbeing (Jan 2021)
Adult unpaid carers in Oxfordshire are they getting the support when needed? (Feb 2021)
Recent reports by Healthwatch Oxfordshire
Healthwatch Oxfordshire
updated
Introduction
Reports by Healthwatch Oxfordshire
Reports by the Oxfordshire Community
Foundation
Good Food Oxford research
Oxfordshire OxWell School Survey
VOXY ‘Be Supported’ Questionnaire 2020
Finding out more

Behavioural
determinants of
health
Health
conditions and
causes of death
Population groups
and protected
characteristics
Population
Wider
determinants of
health
Service Use Local researchExecutive
summary
Oxfordshire Joint Strategic Needs Assessment 2021 370
Recent reports published by Oxfordshire Community Foundation
Oxfordshire Community Foundation
January 2021 report showing maps and data from the Local Insight tool highlighting the variation in loneliness and isolation across Oxfordshire.
November 2020 report with maps and data from the Local Insight tool showing unemployment, jobs, poverty and food vulnerability
updated
Introduction
Reports by Healthwatch Oxfordshire
Reports by the Oxfordshire Community
Foundation
Good Food Oxford research
Oxfordshire OxWell School Survey
VOXY ‘Be Supported’ Questionnaire 2020
Finding out more

Behavioural
determinants of
health
Health
conditions and
causes of death
Population groups
and protected
characteristics
Population
Wider
determinants of
health
Service Use Local researchExecutive
summary
Oxfordshire Joint Strategic Needs Assessment 2021 371
Research carried out by Good Food Oxford into use of food banks and other community food services in Oxfordshire (May 2020)
Some of the key findings are:
There are an estimated 100 community food services operated by 74 organisations across Oxfordshire
Since the start of COVID-19, there has been a 3-fold increase in the number of users of Community Food Services. Estimated to be between 5,140 and 5,560 users.
60% of services report that more than 50% of their users are ‘new’ users since COVID-19
58% of services reported a significant increase in usage from families with children.
COVID-19 restrictions have hampered services’ ability to meet nutritional needs and preferences.
Good Food Oxford research
Good Food Oxford Food research
new
This May 2020 GFO research report is
also referenced in the section on
food poverty in the Wider
Determinants of Health chapter of
this report.
Introduction
Reports by Healthwatch Oxfordshire
Reports by the Oxfordshire Community
Foundation
Good Food Oxford research
Oxfordshire OxWell School Survey
VOXY ‘Be Supported’ Questionnaire 2020
Finding out more

Behavioural
determinants of
health
Health
conditions and
causes of death
Population groups
and protected
characteristics
Population
Wider
determinants of
health
Service Use Local researchExecutive
summary
Oxfordshire Joint Strategic Needs Assessment 2021 372
This report summarises preliminary findings from Oxfordshire's first Online Pupil Survey.
The OxWell School Survey asked questions on a range of health and wellbeing-related issues to pupils at participating schools in Oxfordshire. The aim of the survey is to inform individual schools and Oxfordshire County Council, as well as to contribute to academic research into improving the wellbeing and mental health of children and adolescents.
The data summarised in this report were collected between May and July 2019 in year groups 4, 5, 6, 8, 10 and 12 in 36 Oxfordshire schools. Data from 4,222 pupils are included in the summary presented in this report.
More detailed results and statistical tests will be included in manuscripts intended for publication in scientific journals.
This study is a University of Oxford and Oxfordshire County Council Project.
Oxfordshire OxWell School Survey 2019 Summary Report
Available via Oxfordshire Insight
new
Introduction
Reports by Healthwatch Oxfordshire
Reports by the Oxfordshire Community
Foundation
Good Food Oxford research
Oxfordshire OxWell School Survey
VOXY ‘Be Supported’ Questionnaire 2020
Finding out more

Behavioural
determinants of
health
Health
conditions and
causes of death
Population groups
and protected
characteristics
Population
Wider
determinants of
health
Service Use Local researchExecutive
summary
Oxfordshire Joint Strategic Needs Assessment 2021 373
A report of Preliminary Findings has been published with results from the OxWell School Survey in 2020
The survey responses are published to help to understand the impact of the Covid-19 pandemic on the wellbeing of young people during the school closure period of May to July 2020, and help schools adapt as pupils return to in person lessons.
The study findings in this report cover around 19,000 respondents from 6 counties in the south of England including Oxfordshire
Findings include the self-reported effect of lockdown on happiness, loneliness, sleep, exercise, seeking mental health support and managing school work
OxWell School Survey 2020 Preliminary Report
new
Introduction
Reports by Healthwatch Oxfordshire
Reports by the Oxfordshire Community
Foundation
Good Food Oxford research
Oxfordshire OxWell School Survey
VOXY ‘Be Supported’ Questionnaire 2020
Finding out more
OxWell survey 2020 Preliminary Mansfield KL, Jindra C, Fazel M: The OxWell School Survey 2020
Report of Preliminary Findings. 8 Sept 2020

Behavioural
determinants of
health
Health
conditions and
causes of death
Population groups
and protected
characteristics
Population
Wider
determinants of
health
Service Use Local researchExecutive
summary
Oxfordshire Joint Strategic Needs Assessment 2021 374
VOXY is a youth-led countywide forum which provides a voice for all young people in Oxfordshire (aged 11 – 18 and up to 25 with additional needs), so they can have their say about the issues that matter the most to them.
Results from the 2020 survey showed that:
79% said they knew who to speak to when they needed support
69% said they felt listened to and believed
61% said they were able to access information in a way which suited them best
47% said they had inspiring role models
70% said that when they speak to staff they feel they are experienced and caring.
61% said that overall they felt supported enough by the services they used
VOXY ‘Be Supported’ 2020 Questionnaire
new
Introduction
Reports by Healthwatch Oxfordshire
Reports by the Oxfordshire Community
Foundation
Good Food Oxford research
Oxfordshire OxWell School Survey
VOXY ‘Be Supported’ Questionnaire 2020
Finding out more
VOXY Full report for 2020 YouSaidWeDid2020

Behavioural
determinants of
health
Health
conditions and
causes of death
Population groups
and protected
characteristics
Population
Wider
determinants of
health
Service Use Local researchExecutive
summary
Oxfordshire Joint Strategic Needs Assessment 2021 375
For more local health needs assessments, browse the JSNA web pages
Finding out moreIntroduction
Reports by Healthwatch Oxfordshire
Reports by the Oxfordshire Community
Foundation
Good Food Oxford research
Oxfordshire OxWell School Survey
VOXY ‘Be Supported’ Questionnaire 2020
Finding out more

Behavioural
determinants of
health
Health
conditions and
causes of death
Population groups
and protected
characteristics
Population
Wider
determinants of
health
Service Use Local researchExecutive
summary
Related JSNA resources for Oxfordshire are published alongside this report on Oxfordshire Insight, including:
Inequalities indicators small area level dashboard
Community Health and Wellbeing Profiles
Health Needs Assessments
JSNA Bitesize
Public Health England provides a wide range of health indicators and profiles on Fingertips
ONS population estimates and population projections for county and districts, benefits claimants and the annual population survey are available from www.nomisweb.co.uk
Oxfordshire County Council population forecasts are published on Oxfordshire Insight
Icons by Freepik from Flaticon unless stated otherwise
376Oxfordshire Joint Strategic Needs Assessment 2021
web: insight.oxfordshire.gov.uk/jsna email: [email protected]
Finding out more