Oxfordshire County Council Statement of Accounts 2018/2019
163
Oxfordshire County Council Statement of Accounts 2018/2019
-
Upload
khangminh22 -
Category
Documents
-
view
3 -
download
0
Transcript of Oxfordshire County Council Statement of Accounts 2018/2019

Oxfordshire County Council
Statement of Accounts
2018/2019
1
Contents
Narrative Report by the Director of Finance 3
Statement of Responsibilities for the Statement of Accounts 20
Expenditure and Funding Analysis 21
Comprehensive Income and Expenditure Statement 22
Movement in Reserves Statement 23
Balance Sheet 24
Cash Flow Statement 25
Notes to the Core Financial Statements (see table on next page) 26
Independent Auditor’s Report to the Members of Oxfordshire County Council 131 Annual Governance Statement 138
Trust Funds 158 Glossary 159
The Local Government Pension Fund Accounts 101
The Fire-fighters’ Pension Fund Accounts 128

2
Notes to the Core Financial Statements
1. Summary of significant accounting policies 2. Critical judgements in applying accounting policies
3. Assumptions made about the future and other sources of estimation
uncertainty 4. Adjustments in the Expenditure and Funding Analysis
5. Analysis of income and expenditure by nature
6. Adjustments between accounting basis and funding basis under
regulations 7. Dedicated Schools Grant (DSG)
8. Partnership Schemes under section 75 of the National Health
Service Act 2006 9. Members’ Allowances
10. Audit and Inspection Fee
11. Senior Officers’ Remuneration 12. Exit Packages
13. Operating Leases
14. Other operating expenditure
15. Financing and Investment Expenditure
16. Transition to IFRS9 Financial Instruments
17. Financial Instruments – Income, Expenses, Gains and Losses
18. Retirement Benefits 19. Taxation and Non – Specific Grants
20. Grant Income
21. Related Party Transactions 22. Movement in the value of Property, Plant & Equipment
23. Investment Properties
24. Movement in the value of assets held for sale
25. Movement in the value of intangible assets 26. Heritage Assets
27. Valuation of non – current assets
28. Private Finance Initiative (PFI) and similar contracts – Homes for Older People
29. Capital Spending 30. Capital Financing
31. Capital Financing Requirement
32. Capital Commitments 33. Financial Instrument Carrying Values
34. Financial Instrument Fair Values
35. Long Term Debtors
36. Debtors 37. Cash and Cash Equivalents
38. Risks arising from financial instruments
39. Creditors 40. Provisions
41. Deferred Income
42. Capital Grants Receipts in Advance 43. County Fund Balance
44. Earmarked Reserves
45. Useable Capital Receipts
46. Capital Grants and Contributions Unapplied
47. Unusable Reserves
48. Available for Sale Reserve
49. Revaluation Reserve 50. Capital Adjustment Account
51. Collection Fund Adjustment Account
52. Accumulated Absences Account 53. Cash Flow Statement – Non–cash Movements
54. Cash Flow Statement – Operating Activities
55. Cash Flow Statement – Investing Activities
56. Cash Flow Statement – Financing Activities 57. Contingent Liabilities and Assets
58. Material Post Balance Sheet Events
59. Changes in Accounting Policy 60. Authorisation of the Accounts

3
Narrative Report by the Director of Finance
Introduction
The purpose of the Narrative Statement is to provide information on the
Council, its main objectives and strategies and the principal risks it faces. It
sets out information to help readers understand the Council’s financial position and performance during 2018-19.
Oxfordshire County Council provides services to residents, businesses and
communities across the whole county. We are responsible for around 80% of
local government spending in Oxfordshire. The following core services are
provided by the Council:
• children’s services including some education services
• adult social care
• services for public health including mental health
• fire and rescue
• roads and transport planning
• waste disposal
• libraries and museums
• coroners’ and registration services
• trading standards
The Council either provides these services directly or commissions them
from other organisations. Most of these services are statutory – things we are obliged by law to do.
Five district and city councils in Oxfordshire also provide services to residents
in their geographic areas, such as housing and benefits, local planning, street
cleaning, waste collection and electoral registration.
In Oxfordshire, parishes and town councils also play an important role in the
local community, looking after local amenities, and providing a vital link to
district and county councils on local issues.
4
Narrative Report by the Director of Finance
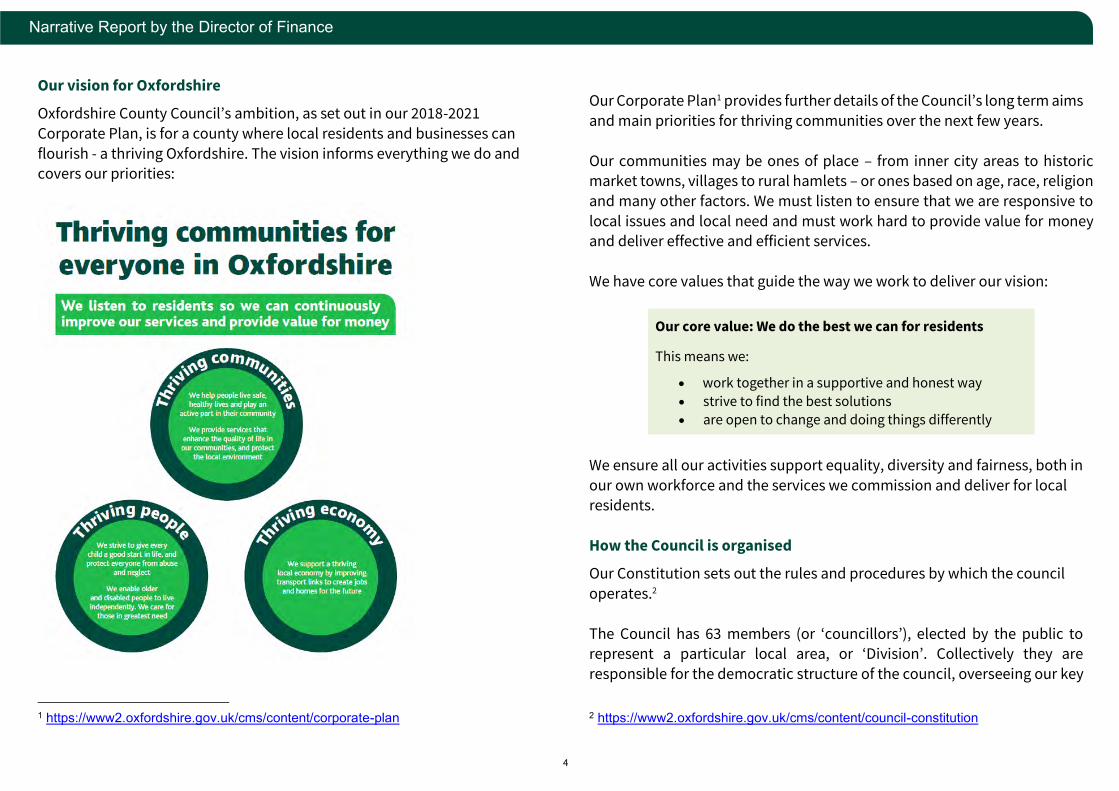
Our vision for Oxfordshire
Oxfordshire County Council’s ambition, as set out in our 2018-2021
Corporate Plan, is for a county where local residents and businesses can
flourish - a thriving Oxfordshire. The vision informs everything we do and covers our priorities:
1 https://www2.oxfordshire.gov.uk/cms/content/corporate-plan
Our Corporate Plan1 provides further details of the Council’s long term aims
and main priorities for thriving communities over the next few years.
Our communities may be ones of place – from inner city areas to historic market towns, villages to rural hamlets – or ones based on age, race, religion
and many other factors. We must listen to ensure that we are responsive to
local issues and local need and must work hard to provide value for money and deliver effective and efficient services.
We have core values that guide the way we work to deliver our vision:
Our core value: We do the best we can for residents
This means we:
• work together in a supportive and honest way
• strive to find the best solutions
• are open to change and doing things differently
We ensure all our activities support equality, diversity and fairness, both in
our own workforce and the services we commission and deliver for local residents.
How the Council is organised
Our Constitution sets out the rules and procedures by which the council
operates.2
The Council has 63 members (or ‘councillors’), elected by the public to represent a particular local area, or ‘Division’. Collectively they are
responsible for the democratic structure of the council, overseeing our key
2 https://www2.oxfordshire.gov.uk/cms/content/council-constitution

5
Narrative Report by the Director of Finance
policies and services and setting the council’s annual budget and capital programme. More information can be found on our website.3
The Full Council chooses a Leader (Cllr Ian Hudspeth), who in turn appoints a Cabinet, responsible for key decisions to manage the Council’s business.
Details of Cabinet members and their responsibilities can be found on our
website.4
Other members of the Council may also serve on committees or groups
fulfilling the Council’s responsibilities and functions such as scrutiny or
audit.
Employees (‘officers’) support Cabinet and Council in their work and
manage the Council’s services and operations. The Chief Executive (Yvonne Rees) leads the most senior group of officers, the Chief Executive’s Direct
Reports (CEDR).5 CEDR advises councillors on policy and implements their
decisions.
Partnership working between Oxfordshire County Council and Cherwell
District Council developed during the year. The two councils share a Chief
Executive; other senior staff work across both councils, and Councillor Ian Corkin works jointly for the county council’s Cabinet and district council’s
Executive, chairing a committee of both councils to explore joint working.
The partnership offers long-term opportunities to join up services for residents and reduce the costs of providing services.
We work collaboratively with partners in the public, private and voluntary
sector to achieve the best outcomes for our residents. Further details of how
3 https://www.oxfordshire.gov.uk/cms/public-site/about-your-council 4 https://www2.oxfordshire.gov.uk/cms/content/cabinet
the Council works, both internally and with external partners, can be found in our Annual Governance Statement on page 129.
The council is structured around several directorates, each responsible for a
group of services and functions. They work both individually and jointly
towards the Council’s vision and outcomes set out in the Corporate Plan. CEDR (our senior management group) provides oversight and high-level co-
ordination of the directorates, which are:
People
• Children, Education and Families
• Adult Social Care
• Public Health
Communities
• Community Operations (infrastructure and cultural services)
• Planning and Place
• Community Safety (including Oxfordshire Fire & Rescue Service)
Resources
• Resources (including Finance, Human Resources and ICT)
Directorates are responsible for setting their strategies and business
objectives for the year ahead and the longer term, in support of ambitions
and commitments set out in the Corporate Plan. This includes setting measures and indicators by which progress towards their ambitions can be
measured and reported on.
Common approaches to performance reporting, risk management and assurance are in place to ensure consistency and cohesive business
management across the council. The performance dashboards later in this
Narrative Statement are one of the visible outputs of this approach.
5 https://www.oxfordshire.gov.uk/council/about-your-council/managers-and-salaries/senior-managers
6
Narrative Report by the Director of Finance
The Council’s Transformation Programme is a long-term programme of fundamental change to how we are structured and how we operate. The
programme aims to ensure that the council is sustainable, resilient and can
achieve better outcomes for local residents. It also addresses the financial pressures we face as an organisation, making substantial financial savings
and helping us to invest in dealing with rising demand for services.
The programme will also play a key role in delivering the Council’s vision by empowering residents to resolve their own issues, enhancing service
performance, empowering staff to help us deliver our ambitions and
positioning us to exploit the local advantages Oxfordshire possesses
Our financial operating model
The Council sets a revenue budget, medium-term financial plan (MTFP) and capital programme in the February preceding the start of the financial year.
These are underpinned by a Financial Strategy, Capital & Investment
Strategy, Treasury Management Strategy and a risk assessment of the level
of balances required. Construction of the budget and budget proposals are
subject to challenge by the Council’s Leadership Team and the Director of
Finance. Councillors have the opportunity to question and challenge the
proposals through engagement sessions and member presentations. The Performance Scrutiny Committee scrutinises the budget proposals at its
meeting in December before Cabinet propose the budget, MTFP and capital
programme in January. Throughout the year, regular financial monitoring reports are presented to Cabinet.
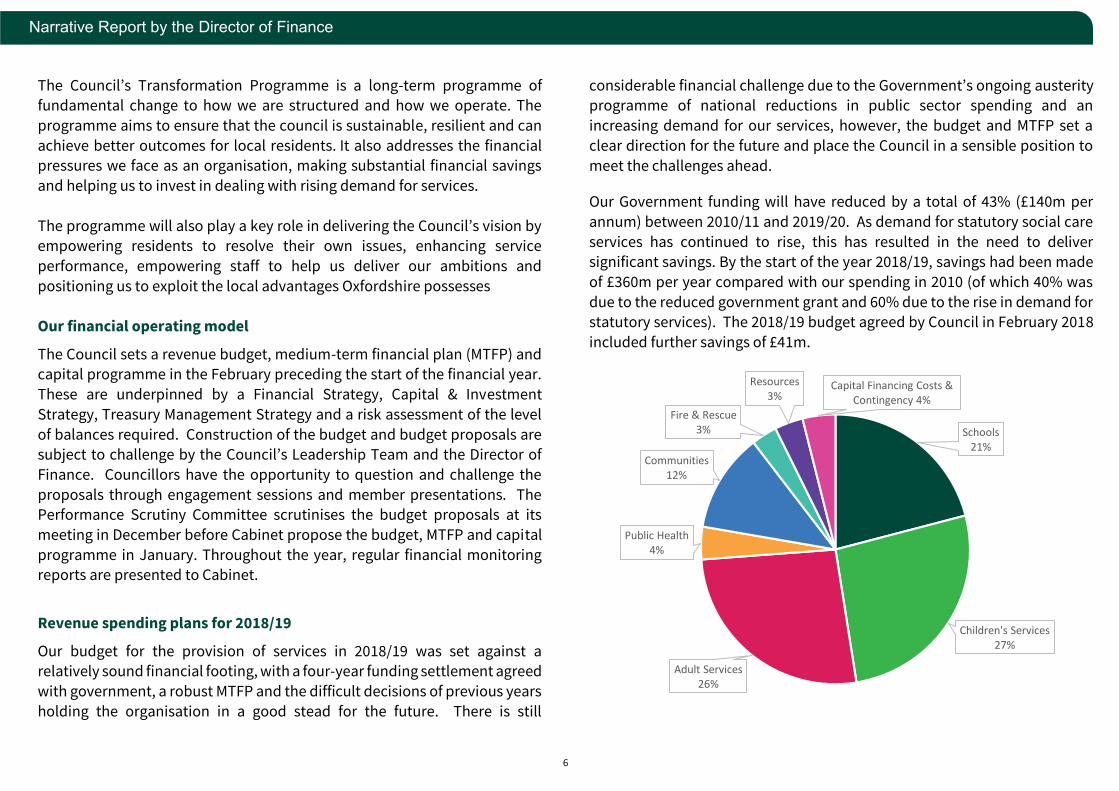
Revenue spending plans for 2018/19
Our budget for the provision of services in 2018/19 was set against a relatively sound financial footing, with a four-year funding settlement agreed
with government, a robust MTFP and the difficult decisions of previous years
holding the organisation in a good stead for the future. There is still
considerable financial challenge due to the Government’s ongoing austerity programme of national reductions in public sector spending and an
increasing demand for our services, however, the budget and MTFP set a
clear direction for the future and place the Council in a sensible position to
meet the challenges ahead.
Our Government funding will have reduced by a total of 43% (£140m per
annum) between 2010/11 and 2019/20. As demand for statutory social care
services has continued to rise, this has resulted in the need to deliver
significant savings. By the start of the year 2018/19, savings had been made
of £360m per year compared with our spending in 2010 (of which 40% was
due to the reduced government grant and 60% due to the rise in demand for statutory services). The 2018/19 budget agreed by Council in February 2018
included further savings of £41m.
Schools 21%
Children's Services27%
Adult Services26%
Public Health4%
Communities12%
Fire & Rescue3%
Resources3%
Capital Financing Costs & Contingency 4%
7
Narrative Report by the Director of Finance
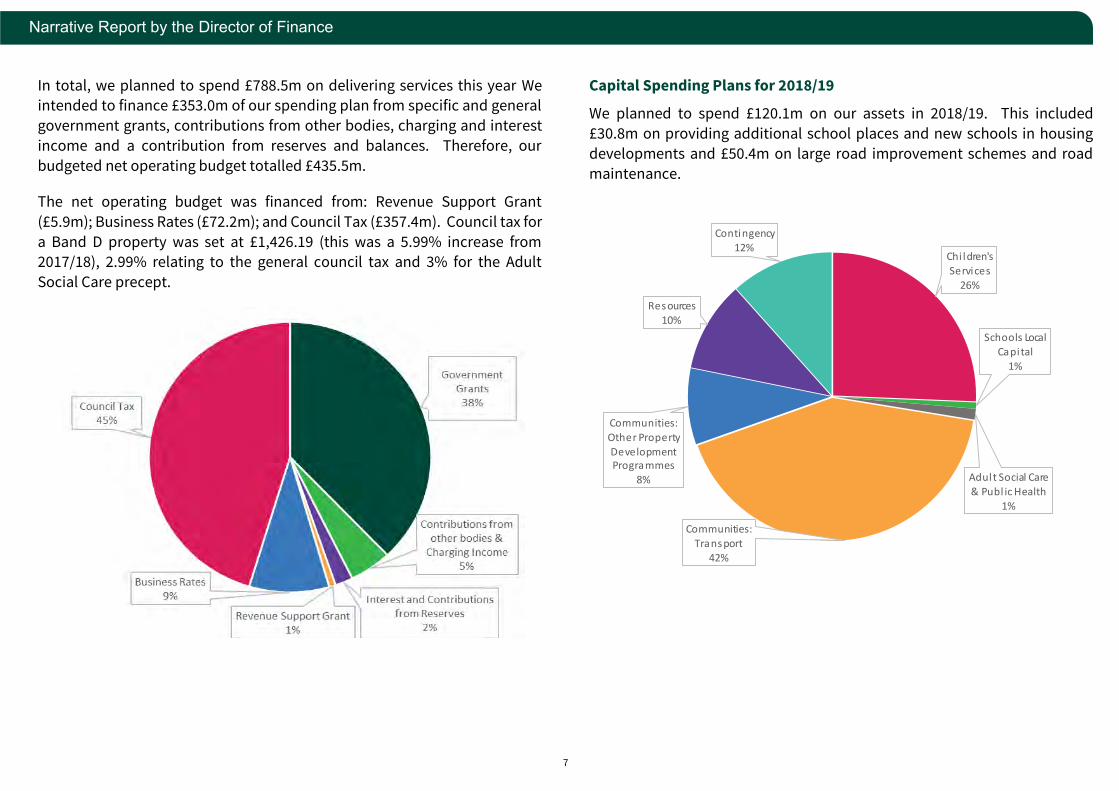
In total, we planned to spend £788.5m on delivering services this year We intended to finance £353.0m of our spending plan from specific and general
government grants, contributions from other bodies, charging and interest
income and a contribution from reserves and balances. Therefore, our
budgeted net operating budget totalled £435.5m.
The net operating budget was financed from: Revenue Support Grant
(£5.9m); Business Rates (£72.2m); and Council Tax (£357.4m). Council tax for
a Band D property was set at £1,426.19 (this was a 5.99% increase from
2017/18), 2.99% relating to the general council tax and 3% for the Adult
Social Care precept.
Capital Spending Plans for 2018/19
We planned to spend £120.1m on our assets in 2018/19. This included
£30.8m on providing additional school places and new schools in housing
developments and £50.4m on large road improvement schemes and road
maintenance.
Chi ldren's Services
26%
Schools Local Capital
1%
Adult Social Care & Publ ic Health
1%
Communities:
Transport42%
Communities:
Other Property Development Programmes
8%
Resources10%
Contingency12%
8
Narrative Report by the Director of Finance
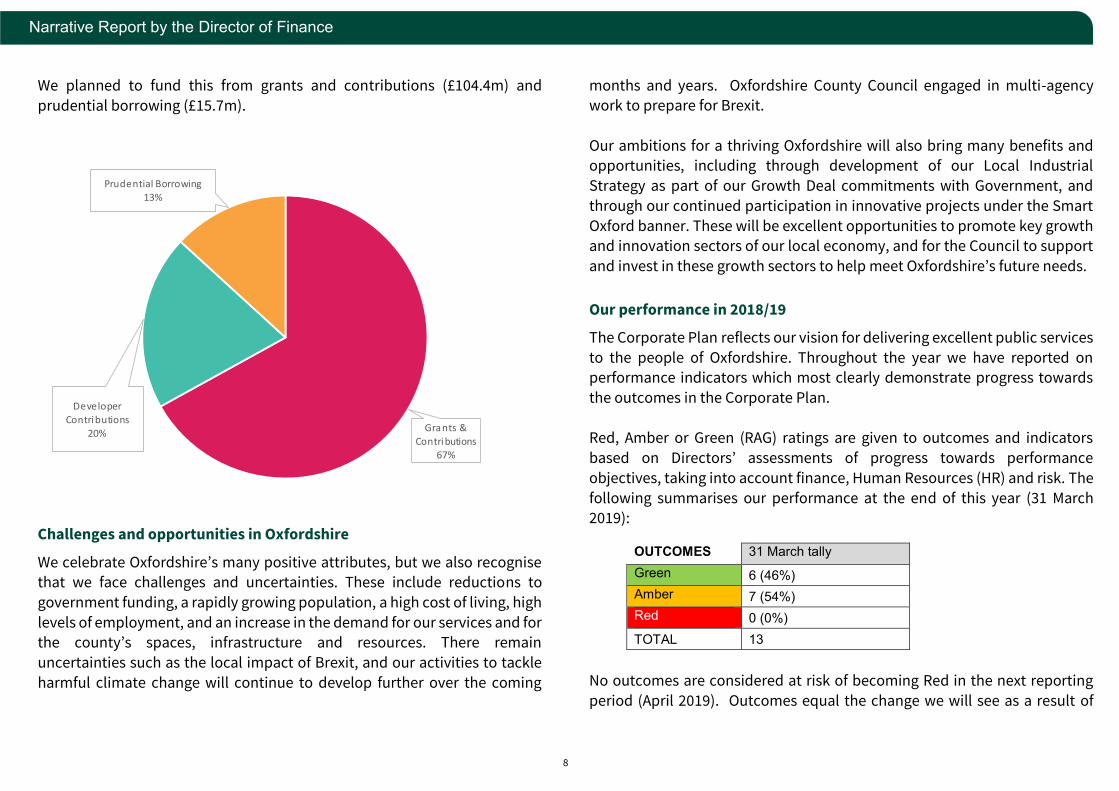
We planned to fund this from grants and contributions (£104.4m) and
prudential borrowing (£15.7m).
Challenges and opportunities in Oxfordshire
We celebrate Oxfordshire’s many positive attributes, but we also recognise that we face challenges and uncertainties. These include reductions to
government funding, a rapidly growing population, a high cost of living, high
levels of employment, and an increase in the demand for our services and for the county’s spaces, infrastructure and resources. There remain
uncertainties such as the local impact of Brexit, and our activities to tackle
harmful climate change will continue to develop further over the coming
months and years. Oxfordshire County Council engaged in multi-agency work to prepare for Brexit.
Our ambitions for a thriving Oxfordshire will also bring many benefits and opportunities, including through development of our Local Industrial
Strategy as part of our Growth Deal commitments with Government, and
through our continued participation in innovative projects under the Smart
Oxford banner. These will be excellent opportunities to promote key growth and innovation sectors of our local economy, and for the Council to support
and invest in these growth sectors to help meet Oxfordshire’s future needs.
Our performance in 2018/19
The Corporate Plan reflects our vision for delivering excellent public services
to the people of Oxfordshire. Throughout the year we have reported on performance indicators which most clearly demonstrate progress towards
the outcomes in the Corporate Plan.
Red, Amber or Green (RAG) ratings are given to outcomes and indicators
based on Directors’ assessments of progress towards performance
objectives, taking into account finance, Human Resources (HR) and risk. The
following summarises our performance at the end of this year (31 March 2019):
OUTCOMES 31 March tally Green 6 (46%) Amber 7 (54%) Red 0 (0%) TOTAL 13
No outcomes are considered at risk of becoming Red in the next reporting
period (April 2019). Outcomes equal the change we will see as a result of
Grants & Contributions
67%
Developer Contributions
20%
Prudential Borrowing
13%
9
Narrative Report by the Director of Finance
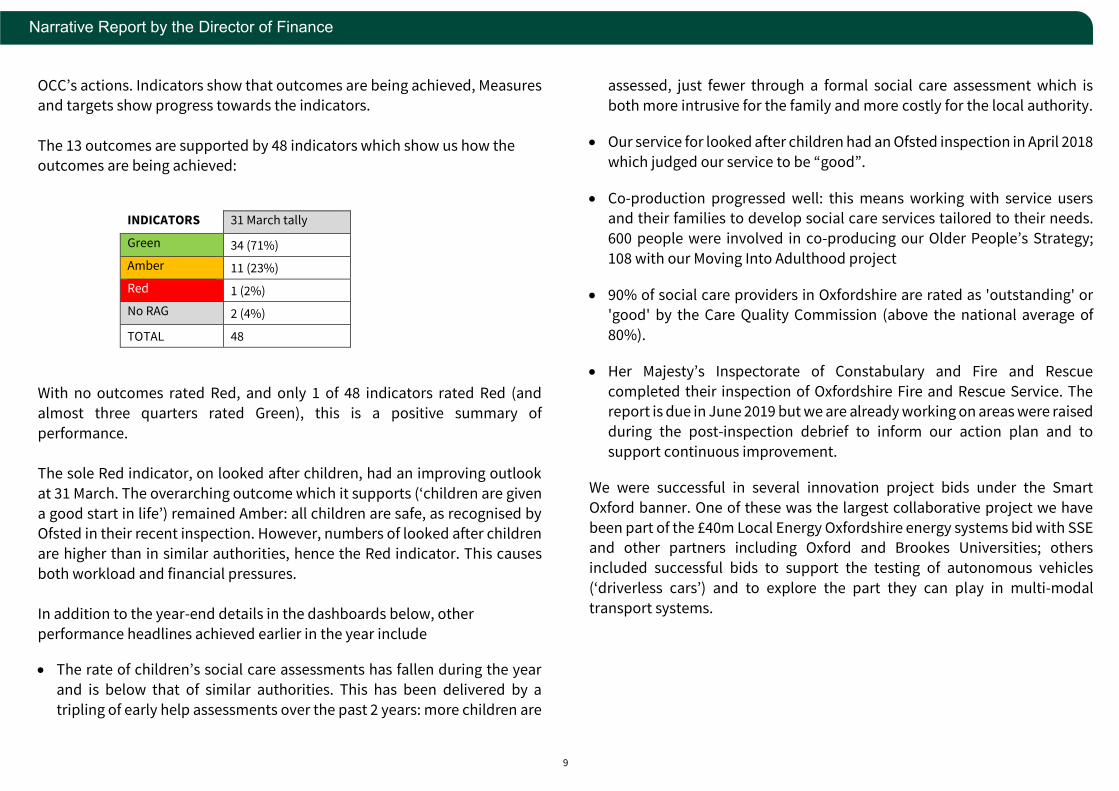
OCC’s actions. Indicators show that outcomes are being achieved, Measures and targets show progress towards the indicators.
The 13 outcomes are supported by 48 indicators which show us how the outcomes are being achieved:
With no outcomes rated Red, and only 1 of 48 indicators rated Red (and
almost three quarters rated Green), this is a positive summary of
performance.
The sole Red indicator, on looked after children, had an improving outlook
at 31 March. The overarching outcome which it supports (‘children are given
a good start in life’) remained Amber: all children are safe, as recognised by Ofsted in their recent inspection. However, numbers of looked after children
are higher than in similar authorities, hence the Red indicator. This causes
both workload and financial pressures.
In addition to the year-end details in the dashboards below, other
performance headlines achieved earlier in the year include • The rate of children’s social care assessments has fallen during the year
and is below that of similar authorities. This has been delivered by a
tripling of early help assessments over the past 2 years: more children are
assessed, just fewer through a formal social care assessment which is
both more intrusive for the family and more costly for the local authority.
• Our service for looked after children had an Ofsted inspection in April 2018
which judged our service to be “good”.
• Co-production progressed well: this means working with service users and their families to develop social care services tailored to their needs.
600 people were involved in co-producing our Older People’s Strategy;
108 with our Moving Into Adulthood project
• 90% of social care providers in Oxfordshire are rated as 'outstanding' or 'good' by the Care Quality Commission (above the national average of
80%).
• Her Majesty’s Inspectorate of Constabulary and Fire and Rescue
completed their inspection of Oxfordshire Fire and Rescue Service. The report is due in June 2019 but we are already working on areas were raised
during the post-inspection debrief to inform our action plan and to
support continuous improvement.
We were successful in several innovation project bids under the Smart
Oxford banner. One of these was the largest collaborative project we have
been part of the £40m Local Energy Oxfordshire energy systems bid with SSE and other partners including Oxford and Brookes Universities; others
included successful bids to support the testing of autonomous vehicles
(‘driverless cars’) and to explore the part they can play in multi-modal
transport systems.
INDICATORS 31 March tally
Green 34 (71%)
Amber 11 (23%)
Red 1 (2%)
No RAG 2 (4%)
TOTAL 48
10
Narrative Report by the Director of Finance
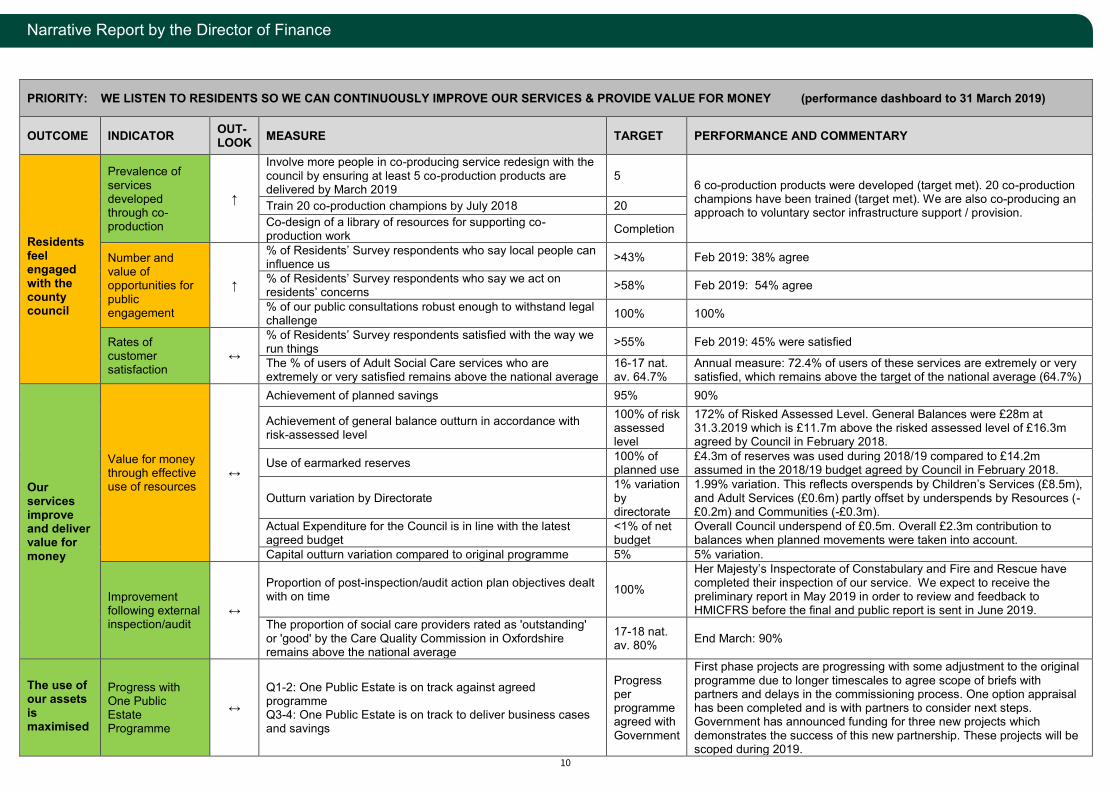
PRIORITY: WE LISTEN TO RESIDENTS SO WE CAN CONTINUOUSLY IMPROVE OUR SERVICES & PROVIDE VALUE FOR MONEY (performance dashboard to 31 March 2019)
OUTCOME INDICATOR OUT-LOOK MEASURE TARGET PERFORMANCE AND COMMENTARY
Residents feel engaged with the county council
Prevalence of services developed through co-production
↑
Involve more people in co-producing service redesign with the council by ensuring at least 5 co-production products are delivered by March 2019
5 6 co-production products were developed (target met). 20 co-production champions have been trained (target met). We are also co-producing an approach to voluntary sector infrastructure support / provision. Train 20 co-production champions by July 2018 20
Co-design of a library of resources for supporting co-production work Completion
Number and value of opportunities for public engagement
↑
% of Residents’ Survey respondents who say local people can influence us >43% Feb 2019: 38% agree
% of Residents’ Survey respondents who say we act on residents’ concerns >58% Feb 2019: 54% agree
% of our public consultations robust enough to withstand legal challenge 100% 100%
Rates of customer satisfaction
↔
% of Residents’ Survey respondents satisfied with the way we run things >55% Feb 2019: 45% were satisfied
The % of users of Adult Social Care services who are extremely or very satisfied remains above the national average
16-17 nat. av. 64.7%
Annual measure: 72.4% of users of these services are extremely or very satisfied, which remains above the target of the national average (64.7%)
Our services improve and deliver value for money
Value for money through effective use of resources
↔
Achievement of planned savings 95% 90%
Achievement of general balance outturn in accordance with risk-assessed level
100% of risk assessed level
172% of Risked Assessed Level. General Balances were £28m at 31.3.2019 which is £11.7m above the risked assessed level of £16.3m agreed by Council in February 2018.
Use of earmarked reserves 100% of planned use
£4.3m of reserves was used during 2018/19 compared to £14.2m assumed in the 2018/19 budget agreed by Council in February 2018.
Outturn variation by Directorate 1% variation by directorate
1.99% variation. This reflects overspends by Children’s Services (£8.5m), and Adult Services (£0.6m) partly offset by underspends by Resources (-£0.2m) and Communities (-£0.3m).
Actual Expenditure for the Council is in line with the latest agreed budget
<1% of net budget
Overall Council underspend of £0.5m. Overall £2.3m contribution to balances when planned movements were taken into account.
Capital outturn variation compared to original programme 5% 5% variation.
Improvement following external inspection/audit
↔
Proportion of post-inspection/audit action plan objectives dealt with on time 100%
Her Majesty’s Inspectorate of Constabulary and Fire and Rescue have completed their inspection of our service. We expect to receive the preliminary report in May 2019 in order to review and feedback to HMICFRS before the final and public report is sent in June 2019.
The proportion of social care providers rated as 'outstanding' or 'good' by the Care Quality Commission in Oxfordshire remains above the national average
17-18 nat. av. 80% End March: 90%
The use of our assets is maximised
Progress with One Public Estate Programme
↔
Q1-2: One Public Estate is on track against agreed programme Q3-4: One Public Estate is on track to deliver business cases and savings
Progress per programme agreed with Government
First phase projects are progressing with some adjustment to the original programme due to longer timescales to agree scope of briefs with partners and delays in the commissioning process. One option appraisal has been completed and is with partners to consider next steps. Government has announced funding for three new projects which demonstrates the success of this new partnership. These projects will be scoped during 2019.
11
Narrative Report by the Director of Finance
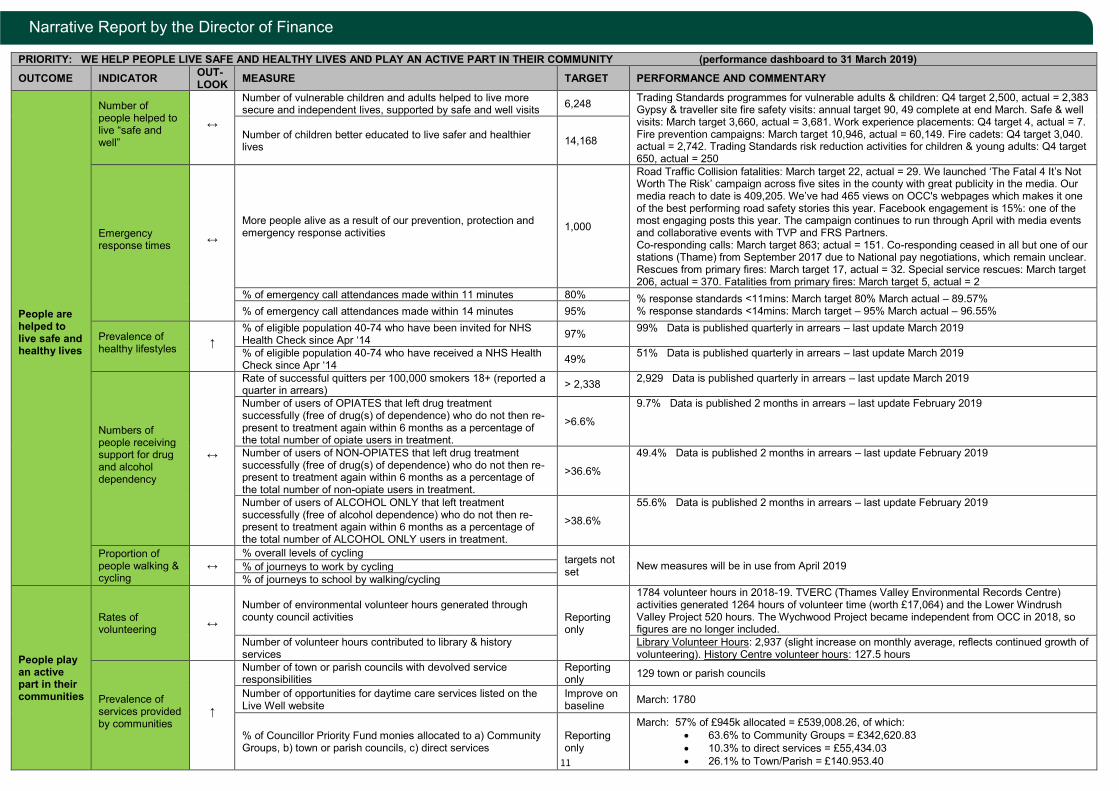
PRIORITY: WE HELP PEOPLE LIVE SAFE AND HEALTHY LIVES AND PLAY AN ACTIVE PART IN THEIR COMMUNITY (performance dashboard to 31 March 2019) OUTCOME INDICATOR OUT-
LOOK MEASURE TARGET PERFORMANCE AND COMMENTARY
People are helped to live safe and healthy lives
Number of people helped to live “safe and well”
↔
Number of vulnerable children and adults helped to live more secure and independent lives, supported by safe and well visits 6,248 Trading Standards programmes for vulnerable adults & children: Q4 target 2,500, actual = 2,383
Gypsy & traveller site fire safety visits: annual target 90, 49 complete at end March. Safe & well visits: March target 3,660, actual = 3,681. Work experience placements: Q4 target 4, actual = 7. Fire prevention campaigns: March target 10,946, actual = 60,149. Fire cadets: Q4 target 3,040. actual = 2,742. Trading Standards risk reduction activities for children & young adults: Q4 target 650, actual = 250
Number of children better educated to live safer and healthier lives 14,168
Emergency response times ↔
More people alive as a result of our prevention, protection and emergency response activities 1,000
Road Traffic Collision fatalities: March target 22, actual = 29. We launched ‘The Fatal 4 It’s Not Worth The Risk’ campaign across five sites in the county with great publicity in the media. Our media reach to date is 409,205. We’ve had 465 views on OCC's webpages which makes it one of the best performing road safety stories this year. Facebook engagement is 15%: one of the most engaging posts this year. The campaign continues to run through April with media events and collaborative events with TVP and FRS Partners. Co-responding calls: March target 863; actual = 151. Co-responding ceased in all but one of our stations (Thame) from September 2017 due to National pay negotiations, which remain unclear. Rescues from primary fires: March target 17, actual = 32. Special service rescues: March target 206, actual = 370. Fatalities from primary fires: March target 5, actual = 2
% of emergency call attendances made within 11 minutes 80% % response standards <11mins: March target 80% March actual – 89.57% % response standards <14mins: March target – 95% March actual – 96.55% % of emergency call attendances made within 14 minutes 95%
Prevalence of healthy lifestyles ↑
% of eligible population 40-74 who have been invited for NHS Health Check since Apr ‘14 97% 99% Data is published quarterly in arrears – last update March 2019
% of eligible population 40-74 who have received a NHS Health Check since Apr ‘14 49% 51% Data is published quarterly in arrears – last update March 2019
Numbers of people receiving support for drug and alcohol dependency
↔
Rate of successful quitters per 100,000 smokers 18+ (reported a quarter in arrears) > 2,338 2,929 Data is published quarterly in arrears – last update March 2019
Number of users of OPIATES that left drug treatment successfully (free of drug(s) of dependence) who do not then re-present to treatment again within 6 months as a percentage of the total number of opiate users in treatment.
>6.6%
9.7% Data is published 2 months in arrears – last update February 2019
Number of users of NON-OPIATES that left drug treatment successfully (free of drug(s) of dependence) who do not then re-present to treatment again within 6 months as a percentage of the total number of non-opiate users in treatment.
>36.6%
49.4% Data is published 2 months in arrears – last update February 2019
Number of users of ALCOHOL ONLY that left treatment successfully (free of alcohol dependence) who do not then re-present to treatment again within 6 months as a percentage of the total number of ALCOHOL ONLY users in treatment.
>38.6%
55.6% Data is published 2 months in arrears – last update February 2019
Proportion of people walking & cycling
↔ % overall levels of cycling targets not
set New measures will be in use from April 2019 % of journeys to work by cycling % of journeys to school by walking/cycling
People play an active part in their communities
Rates of volunteering ↔
Number of environmental volunteer hours generated through county council activities Reporting
only
1784 volunteer hours in 2018-19. TVERC (Thames Valley Environmental Records Centre) activities generated 1264 hours of volunteer time (worth £17,064) and the Lower Windrush Valley Project 520 hours. The Wychwood Project became independent from OCC in 2018, so figures are no longer included.
Number of volunteer hours contributed to library & history services
Library Volunteer Hours: 2,937 (slight increase on monthly average, reflects continued growth of volunteering). History Centre volunteer hours: 127.5 hours
Prevalence of services provided by communities
↑
Number of town or parish councils with devolved service responsibilities
Reporting only 129 town or parish councils
Number of opportunities for daytime care services listed on the Live Well website
Improve on baseline March: 1780
% of Councillor Priority Fund monies allocated to a) Community Groups, b) town or parish councils, c) direct services
Reporting only
March: 57% of £945k allocated = £539,008.26, of which: • 63.6% to Community Groups = £342,620.83 • 10.3% to direct services = £55,434.03 • 26.1% to Town/Parish = £140.953.40
12
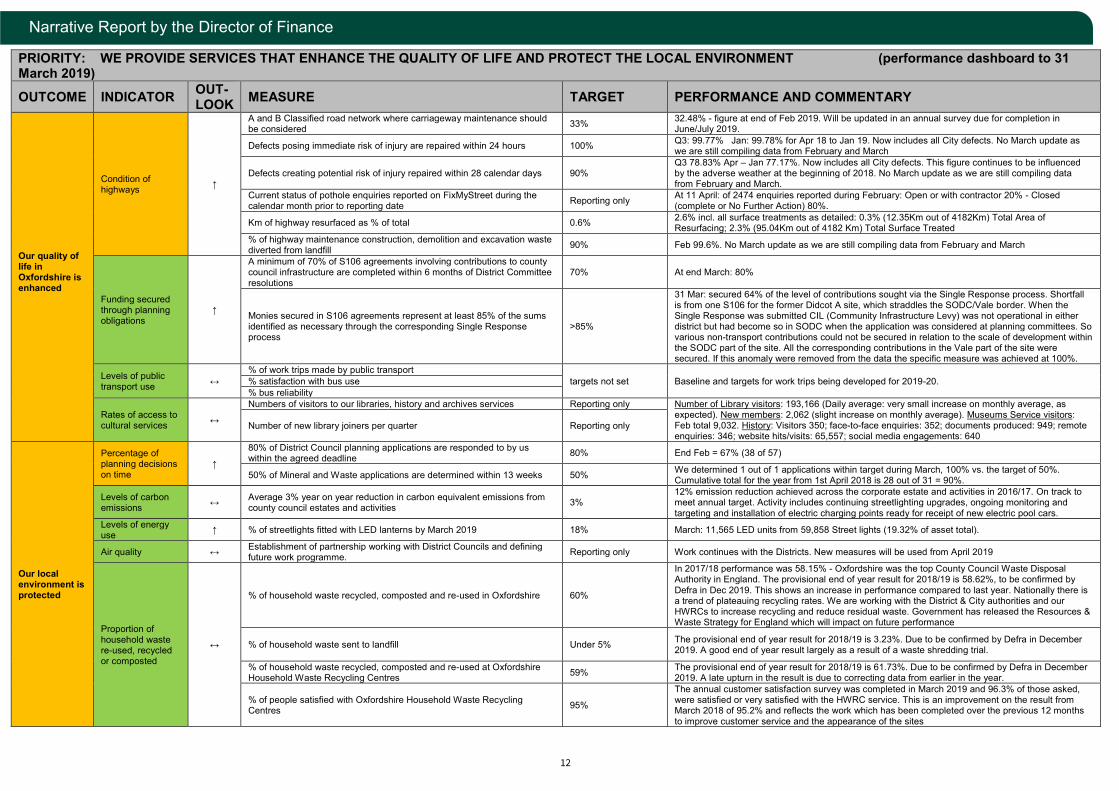
Narrative Report by the Director of Finance
PRIORITY: WE PROVIDE SERVICES THAT ENHANCE THE QUALITY OF LIFE AND PROTECT THE LOCAL ENVIRONMENT (performance dashboard to 31 March 2019) OUTCOME INDICATOR OUT-
LOOK MEASURE TARGET PERFORMANCE AND COMMENTARY
Our quality of life in Oxfordshire is enhanced
Condition of highways ↑
A and B Classified road network where carriageway maintenance should be considered 33% 32.48% - figure at end of Feb 2019. Will be updated in an annual survey due for completion in
June/July 2019.
Defects posing immediate risk of injury are repaired within 24 hours 100% Q3: 99.77% Jan: 99.78% for Apr 18 to Jan 19. Now includes all City defects. No March update as we are still compiling data from February and March
Defects creating potential risk of injury repaired within 28 calendar days 90% Q3 78.83% Apr – Jan 77.17%. Now includes all City defects. This figure continues to be influenced by the adverse weather at the beginning of 2018. No March update as we are still compiling data from February and March.
Current status of pothole enquiries reported on FixMyStreet during the calendar month prior to reporting date Reporting only At 11 April: of 2474 enquiries reported during February: Open or with contractor 20% - Closed
(complete or No Further Action) 80%.
Km of highway resurfaced as % of total 0.6% 2.6% incl. all surface treatments as detailed: 0.3% (12.35Km out of 4182Km) Total Area of Resurfacing; 2.3% (95.04Km out of 4182 Km) Total Surface Treated
% of highway maintenance construction, demolition and excavation waste diverted from landfill 90% Feb 99.6%. No March update as we are still compiling data from February and March
Funding secured through planning obligations
↑
A minimum of 70% of S106 agreements involving contributions to county council infrastructure are completed within 6 months of District Committee resolutions
70% At end March: 80%
Monies secured in S106 agreements represent at least 85% of the sums identified as necessary through the corresponding Single Response process
>85%
31 Mar: secured 64% of the level of contributions sought via the Single Response process. Shortfall is from one S106 for the former Didcot A site, which straddles the SODC/Vale border. When the Single Response was submitted CIL (Community Infrastructure Levy) was not operational in either district but had become so in SODC when the application was considered at planning committees. So various non-transport contributions could not be secured in relation to the scale of development within the SODC part of the site. All the corresponding contributions in the Vale part of the site were secured. If this anomaly were removed from the data the specific measure was achieved at 100%.
Levels of public transport use ↔
% of work trips made by public transport targets not set Baseline and targets for work trips being developed for 2019-20. % satisfaction with bus use
% bus reliability
Rates of access to cultural services ↔
Numbers of visitors to our libraries, history and archives services Reporting only Number of Library visitors: 193,166 (Daily average: very small increase on monthly average, as expected). New members: 2,062 (slight increase on monthly average). Museums Service visitors: Feb total 9,032. History: Visitors 350; face-to-face enquiries: 352; documents produced: 949; remote enquiries: 346; website hits/visits: 65,557; social media engagements: 640
Number of new library joiners per quarter Reporting only
Our local environment is protected
Percentage of planning decisions on time
↑
80% of District Council planning applications are responded to by us within the agreed deadline 80% End Feb = 67% (38 of 57)
50% of Mineral and Waste applications are determined within 13 weeks 50% We determined 1 out of 1 applications within target during March, 100% vs. the target of 50%. Cumulative total for the year from 1st April 2018 is 28 out of 31 = 90%.
Levels of carbon emissions ↔ Average 3% year on year reduction in carbon equivalent emissions from
county council estates and activities 3% 12% emission reduction achieved across the corporate estate and activities in 2016/17. On track to meet annual target. Activity includes continuing streetlighting upgrades, ongoing monitoring and targeting and installation of electric charging points ready for receipt of new electric pool cars.
Levels of energy use ↑ % of streetlights fitted with LED lanterns by March 2019 18% March: 11,565 LED units from 59,858 Street lights (19.32% of asset total).
Air quality ↔ Establishment of partnership working with District Councils and defining future work programme. Reporting only Work continues with the Districts. New measures will be used from April 2019
Proportion of household waste re-used, recycled or composted
↔
% of household waste recycled, composted and re-used in Oxfordshire 60%
In 2017/18 performance was 58.15% - Oxfordshire was the top County Council Waste Disposal Authority in England. The provisional end of year result for 2018/19 is 58.62%, to be confirmed by Defra in Dec 2019. This shows an increase in performance compared to last year. Nationally there is a trend of plateauing recycling rates. We are working with the District & City authorities and our HWRCs to increase recycling and reduce residual waste. Government has released the Resources & Waste Strategy for England which will impact on future performance
% of household waste sent to landfill Under 5% The provisional end of year result for 2018/19 is 3.23%. Due to be confirmed by Defra in December 2019. A good end of year result largely as a result of a waste shredding trial.
% of household waste recycled, composted and re-used at Oxfordshire Household Waste Recycling Centres 59% The provisional end of year result for 2018/19 is 61.73%. Due to be confirmed by Defra in December
2019. A late upturn in the result is due to correcting data from earlier in the year.
% of people satisfied with Oxfordshire Household Waste Recycling Centres 95%
The annual customer satisfaction survey was completed in March 2019 and 96.3% of those asked, were satisfied or very satisfied with the HWRC service. This is an improvement on the result from March 2018 of 95.2% and reflects the work which has been completed over the previous 12 months to improve customer service and the appearance of the sites
13
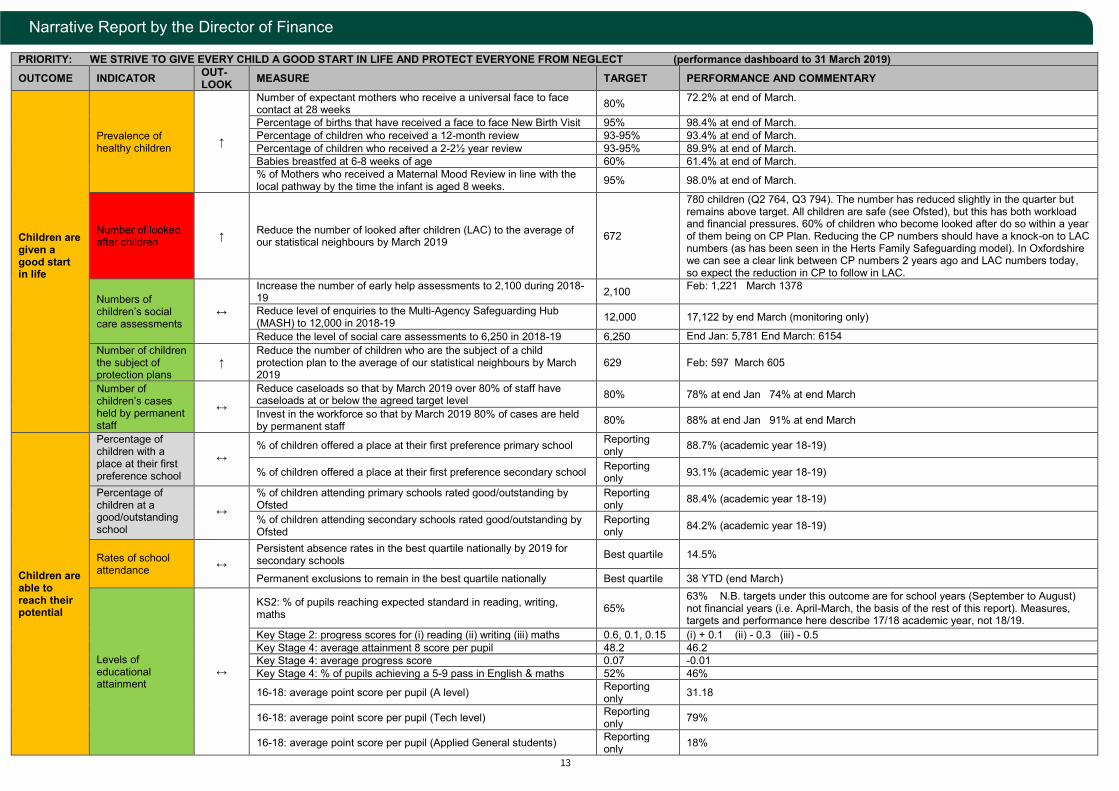
Narrative Report by the Director of Finance
PRIORITY: WE STRIVE TO GIVE EVERY CHILD A GOOD START IN LIFE AND PROTECT EVERYONE FROM NEGLECT (performance dashboard to 31 March 2019) OUTCOME INDICATOR OUT-
LOOK MEASURE TARGET PERFORMANCE AND COMMENTARY
Children are given a good start in life
Prevalence of healthy children ↑
Number of expectant mothers who receive a universal face to face contact at 28 weeks 80% 72.2% at end of March.
Percentage of births that have received a face to face New Birth Visit 95% 98.4% at end of March. Percentage of children who received a 12-month review 93-95% 93.4% at end of March. Percentage of children who received a 2-2½ year review 93-95% 89.9% at end of March. Babies breastfed at 6-8 weeks of age 60% 61.4% at end of March. % of Mothers who received a Maternal Mood Review in line with the local pathway by the time the infant is aged 8 weeks. 95% 98.0% at end of March.
Number of looked after children ↑ Reduce the number of looked after children (LAC) to the average of
our statistical neighbours by March 2019 672
780 children (Q2 764, Q3 794). The number has reduced slightly in the quarter but remains above target. All children are safe (see Ofsted), but this has both workload and financial pressures. 60% of children who become looked after do so within a year of them being on CP Plan. Reducing the CP numbers should have a knock-on to LAC numbers (as has been seen in the Herts Family Safeguarding model). In Oxfordshire we can see a clear link between CP numbers 2 years ago and LAC numbers today, so expect the reduction in CP to follow in LAC.
Numbers of children’s social care assessments
↔
Increase the number of early help assessments to 2,100 during 2018-19 2,100 Feb: 1,221 March 1378
Reduce level of enquiries to the Multi-Agency Safeguarding Hub (MASH) to 12,000 in 2018-19 12,000 17,122 by end March (monitoring only)
Reduce the level of social care assessments to 6,250 in 2018-19 6,250 End Jan: 5,781 End March: 6154 Number of children the subject of protection plans
↑ Reduce the number of children who are the subject of a child protection plan to the average of our statistical neighbours by March 2019
629 Feb: 597 March 605
Number of children’s cases held by permanent staff
↔
Reduce caseloads so that by March 2019 over 80% of staff have caseloads at or below the agreed target level 80% 78% at end Jan 74% at end March
Invest in the workforce so that by March 2019 80% of cases are held by permanent staff 80% 88% at end Jan 91% at end March
Children are able to reach their potential
Percentage of children with a place at their first preference school
↔ % of children offered a place at their first preference primary school Reporting
only 88.7% (academic year 18-19)
% of children offered a place at their first preference secondary school Reporting only 93.1% (academic year 18-19)
Percentage of children at a good/outstanding school
↔
% of children attending primary schools rated good/outstanding by Ofsted
Reporting only 88.4% (academic year 18-19)
% of children attending secondary schools rated good/outstanding by Ofsted
Reporting only 84.2% (academic year 18-19)
Rates of school attendance ↔
Persistent absence rates in the best quartile nationally by 2019 for secondary schools Best quartile 14.5%
Permanent exclusions to remain in the best quartile nationally Best quartile 38 YTD (end March)
Levels of educational attainment
↔
KS2: % of pupils reaching expected standard in reading, writing, maths 65%
63% N.B. targets under this outcome are for school years (September to August) not financial years (i.e. April-March, the basis of the rest of this report). Measures, targets and performance here describe 17/18 academic year, not 18/19.
Key Stage 2: progress scores for (i) reading (ii) writing (iii) maths 0.6, 0.1, 0.15 (i) + 0.1 (ii) - 0.3 (iii) - 0.5 Key Stage 4: average attainment 8 score per pupil 48.2 46.2 Key Stage 4: average progress score 0.07 -0.01 Key Stage 4: % of pupils achieving a 5-9 pass in English & maths 52% 46%
16-18: average point score per pupil (A level) Reporting only 31.18
16-18: average point score per pupil (Tech level) Reporting only 79%
16-18: average point score per pupil (Applied General students) Reporting only 18%
14
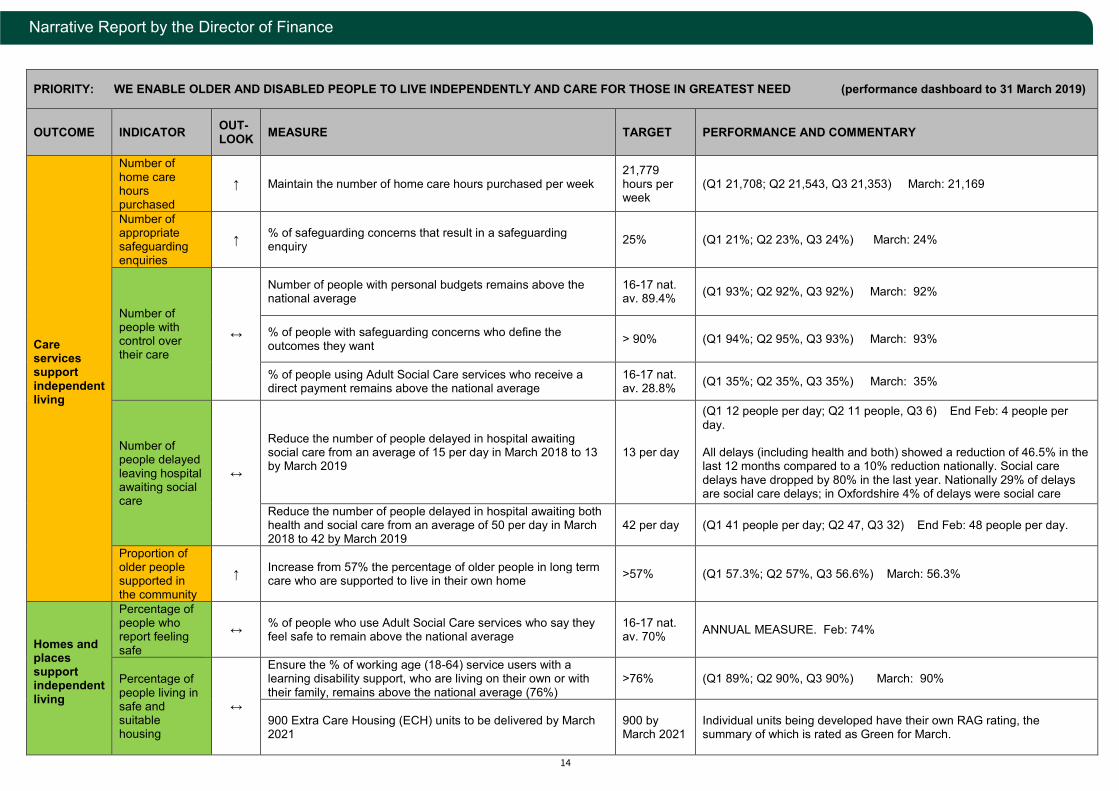
Narrative Report by the Director of Finance
PRIORITY: WE ENABLE OLDER AND DISABLED PEOPLE TO LIVE INDEPENDENTLY AND CARE FOR THOSE IN GREATEST NEED (performance dashboard to 31 March 2019)
OUTCOME INDICATOR OUT-LOOK MEASURE TARGET PERFORMANCE AND COMMENTARY
Care services support independent living
Number of home care hours purchased
↑ Maintain the number of home care hours purchased per week 21,779 hours per week
(Q1 21,708; Q2 21,543, Q3 21,353) March: 21,169
Number of appropriate safeguarding enquiries
↑ % of safeguarding concerns that result in a safeguarding enquiry 25% (Q1 21%; Q2 23%, Q3 24%) March: 24%
Number of people with control over their care
↔
Number of people with personal budgets remains above the national average
16-17 nat. av. 89.4% (Q1 93%; Q2 92%, Q3 92%) March: 92%
% of people with safeguarding concerns who define the outcomes they want > 90% (Q1 94%; Q2 95%, Q3 93%) March: 93%
% of people using Adult Social Care services who receive a direct payment remains above the national average
16-17 nat. av. 28.8% (Q1 35%; Q2 35%, Q3 35%) March: 35%
Number of people delayed leaving hospital awaiting social care
↔
Reduce the number of people delayed in hospital awaiting social care from an average of 15 per day in March 2018 to 13 by March 2019
13 per day
(Q1 12 people per day; Q2 11 people, Q3 6) End Feb: 4 people per day. All delays (including health and both) showed a reduction of 46.5% in the last 12 months compared to a 10% reduction nationally. Social care delays have dropped by 80% in the last year. Nationally 29% of delays are social care delays; in Oxfordshire 4% of delays were social care
Reduce the number of people delayed in hospital awaiting both health and social care from an average of 50 per day in March 2018 to 42 by March 2019
42 per day (Q1 41 people per day; Q2 47, Q3 32) End Feb: 48 people per day.
Proportion of older people supported in the community
↑ Increase from 57% the percentage of older people in long term care who are supported to live in their own home >57% (Q1 57.3%; Q2 57%, Q3 56.6%) March: 56.3%
Homes and places support independent living
Percentage of people who report feeling safe
↔ % of people who use Adult Social Care services who say they feel safe to remain above the national average
16-17 nat. av. 70% ANNUAL MEASURE. Feb: 74%
Percentage of people living in safe and suitable housing
↔
Ensure the % of working age (18-64) service users with a learning disability support, who are living on their own or with their family, remains above the national average (76%)
>76% (Q1 89%; Q2 90%, Q3 90%) March: 90%
900 Extra Care Housing (ECH) units to be delivered by March 2021
900 by March 2021
Individual units being developed have their own RAG rating, the summary of which is rated as Green for March.
15
Narrative Report by the Director of Finance
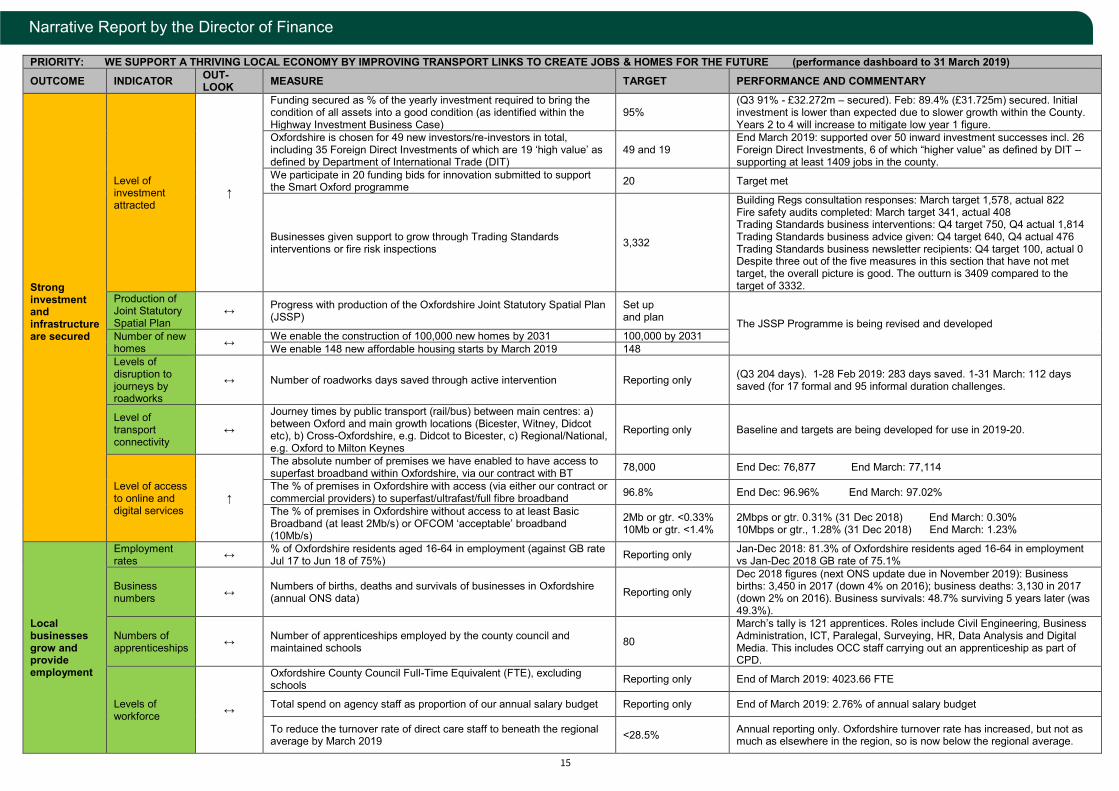
PRIORITY: WE SUPPORT A THRIVING LOCAL ECONOMY BY IMPROVING TRANSPORT LINKS TO CREATE JOBS & HOMES FOR THE FUTURE (performance dashboard to 31 March 2019) OUTCOME INDICATOR OUT-
LOOK MEASURE TARGET PERFORMANCE AND COMMENTARY
Strong investment and infrastructure are secured
Level of investment attracted
↑
Funding secured as % of the yearly investment required to bring the condition of all assets into a good condition (as identified within the Highway Investment Business Case)
95% (Q3 91% - £32.272m – secured). Feb: 89.4% (£31.725m) secured. Initial investment is lower than expected due to slower growth within the County. Years 2 to 4 will increase to mitigate low year 1 figure.
Oxfordshire is chosen for 49 new investors/re-investors in total, including 35 Foreign Direct Investments of which are 19 ‘high value’ as defined by Department of International Trade (DIT)
49 and 19 End March 2019: supported over 50 inward investment successes incl. 26 Foreign Direct Investments, 6 of which “higher value” as defined by DIT – supporting at least 1409 jobs in the county.
We participate in 20 funding bids for innovation submitted to support the Smart Oxford programme 20 Target met
Businesses given support to grow through Trading Standards interventions or fire risk inspections 3,332
Building Regs consultation responses: March target 1,578, actual 822 Fire safety audits completed: March target 341, actual 408 Trading Standards business interventions: Q4 target 750, Q4 actual 1,814 Trading Standards business advice given: Q4 target 640, Q4 actual 476 Trading Standards business newsletter recipients: Q4 target 100, actual 0 Despite three out of the five measures in this section that have not met target, the overall picture is good. The outturn is 3409 compared to the target of 3332.
Production of Joint Statutory Spatial Plan
↔ Progress with production of the Oxfordshire Joint Statutory Spatial Plan (JSSP)
Set up and plan The JSSP Programme is being revised and developed
Number of new homes ↔ We enable the construction of 100,000 new homes by 2031 100,000 by 2031
We enable 148 new affordable housing starts by March 2019 148 Levels of disruption to journeys by roadworks
↔ Number of roadworks days saved through active intervention Reporting only (Q3 204 days). 1-28 Feb 2019: 283 days saved. 1-31 March: 112 days saved (for 17 formal and 95 informal duration challenges.
Level of transport connectivity
↔
Journey times by public transport (rail/bus) between main centres: a) between Oxford and main growth locations (Bicester, Witney, Didcot etc), b) Cross-Oxfordshire, e.g. Didcot to Bicester, c) Regional/National, e.g. Oxford to Milton Keynes
Reporting only Baseline and targets are being developed for use in 2019-20.
Level of access to online and digital services
↑
The absolute number of premises we have enabled to have access to superfast broadband within Oxfordshire, via our contract with BT 78,000 End Dec: 76,877 End March: 77,114
The % of premises in Oxfordshire with access (via either our contract or commercial providers) to superfast/ultrafast/full fibre broadband 96.8% End Dec: 96.96% End March: 97.02%
The % of premises in Oxfordshire without access to at least Basic Broadband (at least 2Mb/s) or OFCOM ‘acceptable’ broadband (10Mb/s)
2Mb or gtr. <0.33% 10Mb or gtr. <1.4%
2Mbps or gtr. 0.31% (31 Dec 2018) End March: 0.30% 10Mbps or gtr., 1.28% (31 Dec 2018) End March: 1.23%
Local businesses grow and provide employment
Employment rates ↔ % of Oxfordshire residents aged 16-64 in employment (against GB rate
Jul 17 to Jun 18 of 75%) Reporting only Jan-Dec 2018: 81.3% of Oxfordshire residents aged 16-64 in employment vs Jan-Dec 2018 GB rate of 75.1%
Business numbers ↔ Numbers of births, deaths and survivals of businesses in Oxfordshire
(annual ONS data) Reporting only
Dec 2018 figures (next ONS update due in November 2019): Business births: 3,450 in 2017 (down 4% on 2016); business deaths: 3,130 in 2017 (down 2% on 2016). Business survivals: 48.7% surviving 5 years later (was 49.3%).
Numbers of apprenticeships ↔ Number of apprenticeships employed by the county council and
maintained schools 80
March’s tally is 121 apprentices. Roles include Civil Engineering, Business Administration, ICT, Paralegal, Surveying, HR, Data Analysis and Digital Media. This includes OCC staff carrying out an apprenticeship as part of CPD.
Levels of workforce ↔
Oxfordshire County Council Full-Time Equivalent (FTE), excluding schools Reporting only End of March 2019: 4023.66 FTE
Total spend on agency staff as proportion of our annual salary budget Reporting only End of March 2019: 2.76% of annual salary budget
To reduce the turnover rate of direct care staff to beneath the regional average by March 2019 <28.5% Annual reporting only. Oxfordshire turnover rate has increased, but not as
much as elsewhere in the region, so is now below the regional average.
16
Narrative Report by the Director of Finance
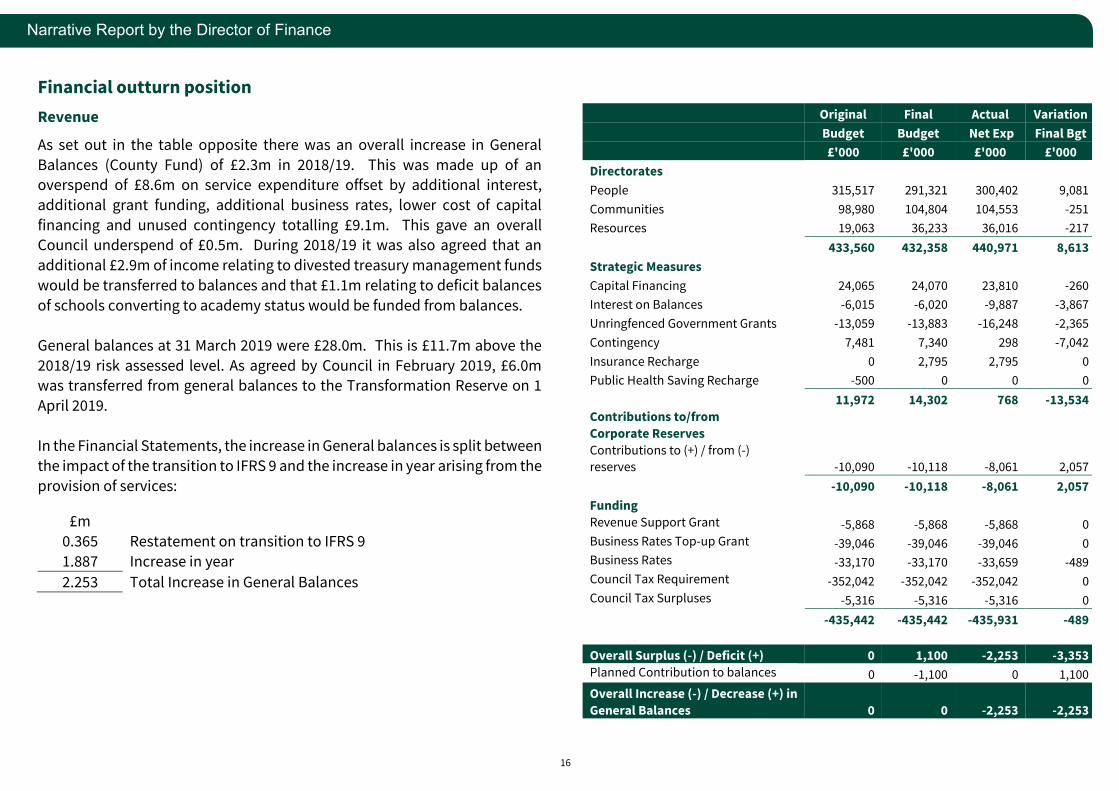
Financial outturn position
Revenue
As set out in the table opposite there was an overall increase in General
Balances (County Fund) of £2.3m in 2018/19. This was made up of an overspend of £8.6m on service expenditure offset by additional interest,
additional grant funding, additional business rates, lower cost of capital
financing and unused contingency totalling £9.1m. This gave an overall Council underspend of £0.5m. During 2018/19 it was also agreed that an
additional £2.9m of income relating to divested treasury management funds
would be transferred to balances and that £1.1m relating to deficit balances
of schools converting to academy status would be funded from balances.
General balances at 31 March 2019 were £28.0m. This is £11.7m above the
2018/19 risk assessed level. As agreed by Council in February 2019, £6.0m was transferred from general balances to the Transformation Reserve on 1
April 2019.
In the Financial Statements, the increase in General balances is split between
the impact of the transition to IFRS 9 and the increase in year arising from the
provision of services:
£m
0.365 Restatement on transition to IFRS 9
1.887 Increase in year
2.253 Total Increase in General Balances
Original Final Actual Variation
Budget Budget Net Exp Final Bgt
£'000 £'000 £'000 £'000
Directorates
People 315,517 291,321 300,402 9,081
Communities 98,980 104,804 104,553 -251
Resources 19,063 36,233 36,016 -217
433,560 432,358 440,971 8,613
Strategic Measures
Capital Financing 24,065 24,070 23,810 -260
Interest on Balances -6,015 -6,020 -9,887 -3,867
Unringfenced Government Grants -13,059 -13,883 -16,248 -2,365
Contingency 7,481 7,340 298 -7,042
Insurance Recharge 0 2,795 2,795 0
Public Health Saving Recharge -500 0 0 0
11,972 14,302 768 -13,534
Contributions to/from
Corporate Reserves
Contributions to (+) / from (-)
reserves -10,090 -10,118 -8,061 2,057
-10,090 -10,118 -8,061 2,057
Funding
Revenue Support Grant -5,868 -5,868 -5,868 0
Business Rates Top-up Grant -39,046 -39,046 -39,046 0
Business Rates -33,170 -33,170 -33,659 -489
Council Tax Requirement -352,042 -352,042 -352,042 0
Council Tax Surpluses -5,316 -5,316 -5,316 0
-435,442 -435,442 -435,931 -489
Overall Surplus (-) / Deficit (+) 0 1,100 -2,253 -3,353
Planned Contribution to balances 0 -1,100 0 1,100
Overall Increase (-) / Decrease (+) in
General Balances 0 0 -2,253 -2,253
17
Narrative Report by the Director of Finance
There was an overspend of £8.5m on Children’s Services of which £4.6m relates to Children’s Social Care. This is in the context of an additional £9.5m
budget in 2018/19 to meet the significant increase in demand. Despite this,
demand for Children’s Social Care continues to rise beyond expectations, both locally and nationally. In addition, there was a £3.4m overspend on
Special Educational Needs (SEN) Home to School transport. Student
numbers have increased by around 18% in the last 12 months and the
number of lone or lower occupancy (5 or less students) has increased significantly. This is due to an increase in the number of students with higher
complex needs who need to travel alone or in small groups.
There was also a £5.0m overspend on the Dedicated School Grant (DSG) –
High Needs Block. This is mainly due to increasing demand for special school
places and the need to place children at independent non-maintained schools. This overspend will be met by using the DSG reserves.
The Adult Services budget overspent by £0.6m. A £1.6m overspend on the
Better Care Fund Pool and a £2.9m overspend on the Adults with Care and
Support Needs Pool was partly offset by a £3.7m underspend on non-pool
services and a £0.3m underspend on Commissioning.
The Communities directorate underspent by £0.3m. Underspends of £1.4m
on Community Operations and £0.5m on Community Safety were offset by
an overspend of £1.6m on Property & Investment.
Reserves have reduced from £96.6m to £92.3m at 31 March 2019. Capital The total capital programme expenditure for the year 2018/19 was £102.5m. This was funded by £89.6m of capital grants and other external
contributions, £11.2m of developer contributions, £1.4m of revenue
contributions and £0.2m of prudential borrowing.
Expenditure incurred during 2018/19 includes 4 completed basic need projects creating almost 500 additional pupil places across primary,
secondary and Special Educational Needs (SEN) provision. Work is on site
for the expansion of two secondary schools, which are forecasted to be completed within 2019/20 and will create 450 additional pupil places.
Within the Transport programme, £31.0m was spent on structural highways
maintenance and £6.2m on projects in and around Headington to improve access. 3.8km of towpath improvements were carried out from Grandpont
Nature Reserve to Hinksey Stream funded through Cycle City Ambition and
Oxfordshire Growth Deal. Outlook
The 2019/20 budget and Medium Term Financial Plan to 2022/23 agreed by
Council on 12 February 2019 addresses the demand pressures that are expected to continue into the medium term. The Children’s Social Care
budget has been increased by £8.6m to address the pressure from 2018/19
and allow for 10% growth in the number of looked after children. An
additional £1.6m was also agreed for the SEN Home to School Transport budget in 2019/20 and as the overspend increased significantly towards the
end of the Service & Resource Planning process, corporate contingency was
also increased by £2.2m to meet the increasing demand.
There are further savings and funding increases in the agreed MTFP which
are to be delivered up to 2022/23 totalling £63.7m. Of this, £44.8m savings
relate to transformation, and £18.9m relate to non-transformation savings
and funding increases. Funding of £13.5m has been made available to
support the costs associated with delivering transformation savings from
2019/20. Further funding will be needed to meet the full implementation costs over the programme period, including costs of redundancies. This will
need to be considered as part of the Service & Resource Planning process for
18
Narrative Report by the Director of Finance
2020/21 and will need to be found from reserves, other one-off funding sources, or as a first call against expected savings.
The risks in the budget largely relate to the demand led budgets in particular children’s social care, SEN Home to School Transport and services for
children with special educational needs and disabilities (funded from the
High Needs Block of DSG). There is also a range of pressures and
uncertainties in adult social care, particularly in relation to growing demand and the potential consequences of pressures on the health system. To help
mitigate these risks, a contingency budget of £7.6m, has been built into the
2019/20 budget, which will provide some degree of a safety net.
The level of the Council’s total reserves is sufficient to provide both general
balances to manage the impact of unexpected events in line with the risk assessment; and the setting aside of earmarked reserves to meet known or
anticipated liabilities.
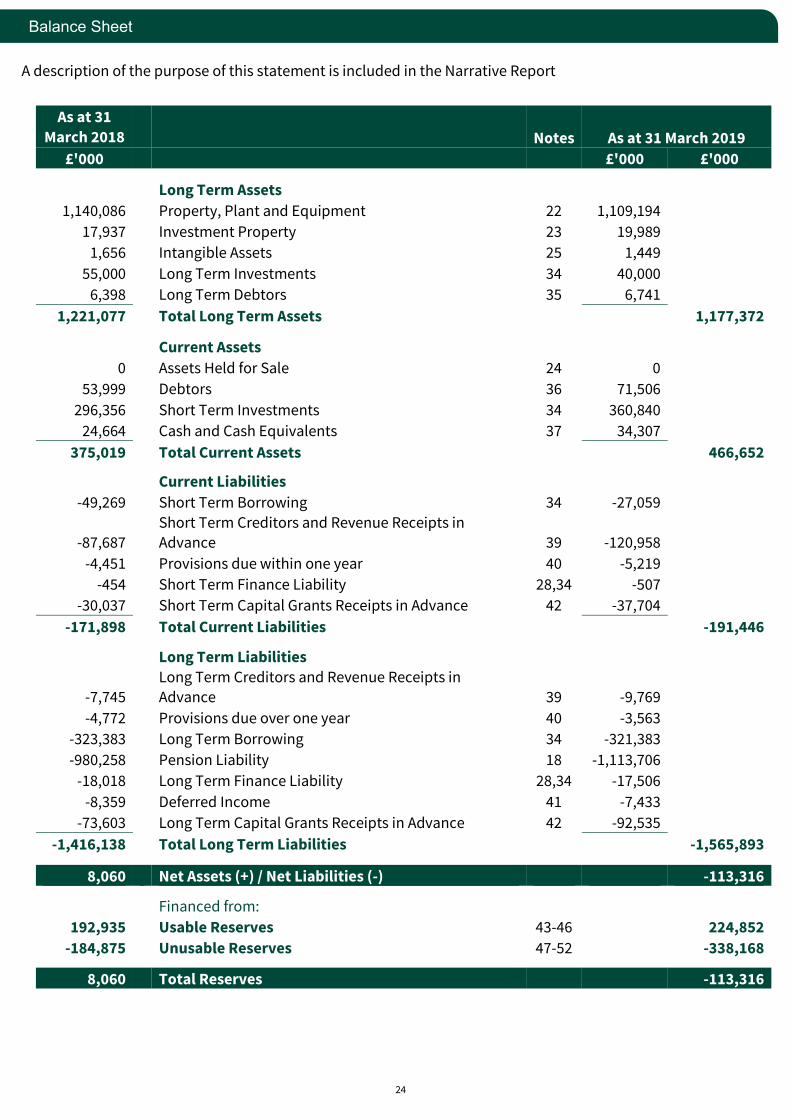
Balance Sheet
At 31 March 2019 the liabilities of the County Council were more than its
assets, resulting in negative net assets of £113.3m. This negative position is
a result of a large increase in the pension liability which is explained in more detail on Note 18 (Retirements Benefits).
Basis of Preparation and Presentation
The council produces a Statement of Accounts to provide transparency
about the council’s finances, to give assurance to stakeholders that public
money has been properly accounted for and that the financial standing of
the council is on a secure basis.
The accounts (including notes to the accounts) for 2018/19 are set out on
pages 26 to 100.
The accounts bring together all the council’s financial statements for the year 2018/19 and show its financial position as at 31 March 2019. The
statements reflect both revenue and capital elements for the General Fund,
including transactions relating to joint operations with other local authorities and health bodies. The County Council is the administering
authority for the Oxfordshire Local Government Pension Fund. As such, the
Fund accounts are included as a disclosure within the Council’s accounts.
The Statement of Accounts must provide a ‘true and fair’ view of the
Council’s financial position at 31st March 2019 and of its income and
expenditure for the 2018/19 financial year. When preparing the accounts consideration is given to the materiality of information. Disclosure of
information is made where omitting it could be misleading or inhibit the true
and fair view. Expenditure and Funding Analysis
The objective of the Expenditure and Funding Analysis is to demonstrate to
council tax payers how the funding available to the authority (ie government
grants, council tax and business rates) for the year has been used in providing services in comparison with those resources consumed or earned by
authorities in accordance with generally accepted accounting practices. The
Expenditure and Funding Analysis also shows how this expenditure is allocated for decision making purposes between council’s directorates.
Income and expenditure accounted for under generally accepted accounting
practices is presented more fully in the Comprehensive Income and
Expenditure Statement.

19
Narrative Report by the Director of Finance
Financial Statements
Notes to the accounts
The Notes to the Accounts explain and provide further detail behind the key
items and entries within the Financial Statements. They consist of:
• Expenditure and Funding Analysis – Compares the net expenditure as funded by taxation with the accounting cost of providing services as
presented in the Comprehensive Income and Expenditure Statement.
• Notes to the Accounts – Which explain some of the key items and
disclosures in the accounts.
• Pension Fund Accounts – These are the accounts of the Pension Fund,
which is operated for employees of the County Council, district
councils and other bodies.
• Statement of Responsibilities for the Statement of Accounts – Outlines the key responsibilities in respect of the accounts, together
with statements from the Chief Finance Officer and Chairman of the
Audit & Governance Committee.
Compre-
hensive
Income and
Expenditure
Statement
Shows the accounting cost in the year of providing services in accordance with
generally accepted accounting practices rather than the amount to be funded from
taxation. Authorities raise taxation to cover expenditure in accordance with
statutory requirements; this may be different from the accounting cost. The taxation
position is shown in both the Expenditure and Funding Analysis and the Movement
in Reserves Statement.
Movement
in Reserves
Statement
Shows the movement from the start of the year to the end on the different reserves
held by the authority, analysed into ‘useable reserves’ (ie those that can be applied
to fund expenditure or reduce local taxation) and other ‘unusable reserves’ (for
example the Revaluation Reserve which holds unrealised gains and losses or the
Capital Adjustment Account which holds adjustments between the accounting basis
and funding basis under regulations). This statement shows how the movements in
year of the authority’s reserves are broken down between gains and losses incurred
in accordance with generally accepted accounting practices and the statutory
adjustments required to return to the amounts chargeable to council tax for the
year. The Net Increase/Decrease line shows the statutory General Fund Balance in
the year following those adjustments.
Balance
Sheet
The balance sheet shows the values as at 31 March 2019 of the assets and liabilities
recognised by the authority. The net assets of the authority (assets less liabilities)
are matched by the reserves held by the authority, analysed between ‘useable’ and
‘unusable’ reserves.
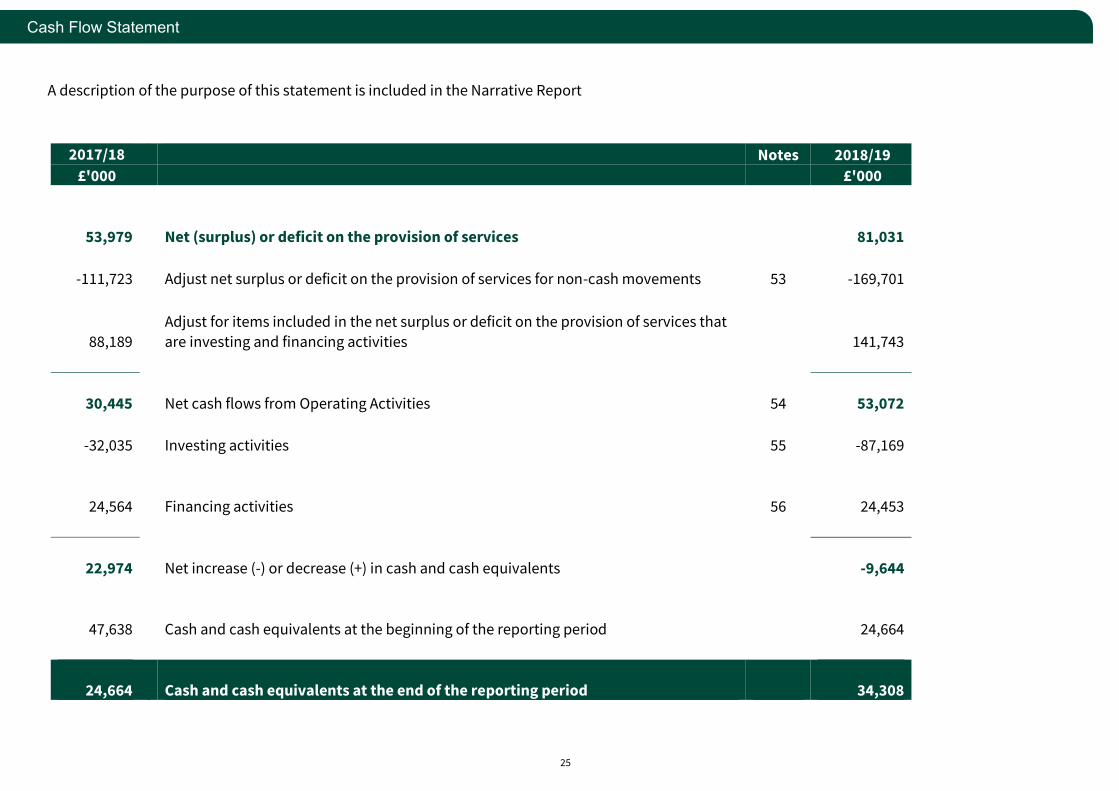
Cash Flow
Statement
This summarises the changes in cash and cash equivalents during 2018/19. The
statement shows how the authority generates and uses cash and cash equivalents
by classifying cash flows as operating, investing and financing activities. The
amount of net cash flows arising from operating activities is a key indicator of the
extent to which the operations of the authority are funded by way of taxation and
grant income or from the recipients of services provided by the authority. Investing
activities represent the extent to which cash flows have been made for resources
which are intended to contribute to the authority’s future service delivery. Cash
flows arising from financing activities are useful in predicting claims on future cash
flows by providers of capital (ie borrowing) to the authority.
20
Statement of Responsibilities for the Statement of Accounts
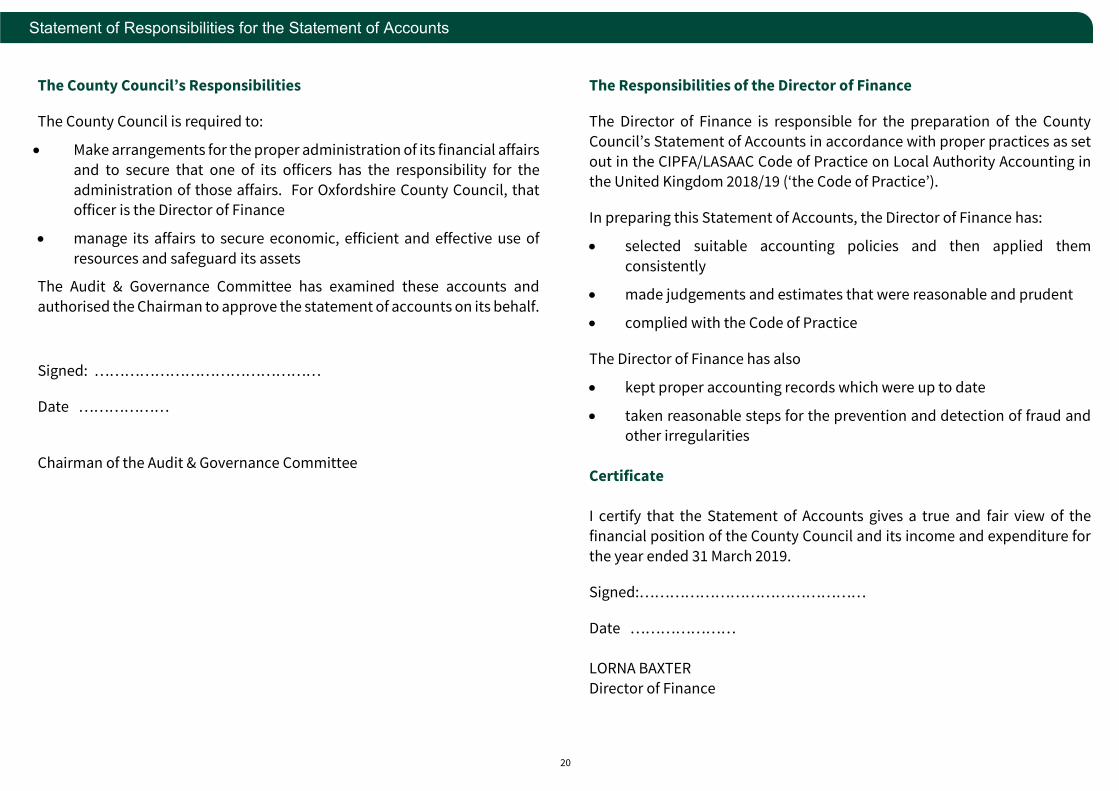
The County Council’s Responsibilities
The County Council is required to:
• Make arrangements for the proper administration of its financial affairs
and to secure that one of its officers has the responsibility for the
administration of those affairs. For Oxfordshire County Council, that officer is the Director of Finance
• manage its affairs to secure economic, efficient and effective use of
resources and safeguard its assets
The Audit & Governance Committee has examined these accounts and
authorised the Chairman to approve the statement of accounts on its behalf.
Signed: ………………………………………
Date ………………
Chairman of the Audit & Governance Committee
The Responsibilities of the Director of Finance
The Director of Finance is responsible for the preparation of the County
Council’s Statement of Accounts in accordance with proper practices as set
out in the CIPFA/LASAAC Code of Practice on Local Authority Accounting in the United Kingdom 2018/19 (‘the Code of Practice’).
In preparing this Statement of Accounts, the Director of Finance has:
• selected suitable accounting policies and then applied them
consistently
• made judgements and estimates that were reasonable and prudent
• complied with the Code of Practice
The Director of Finance has also
• kept proper accounting records which were up to date
• taken reasonable steps for the prevention and detection of fraud and other irregularities
Certificate
I certify that the Statement of Accounts gives a true and fair view of the
financial position of the County Council and its income and expenditure for
the year ended 31 March 2019.
Signed:………………………………………
Date …………………
LORNA BAXTER
Director of Finance
21
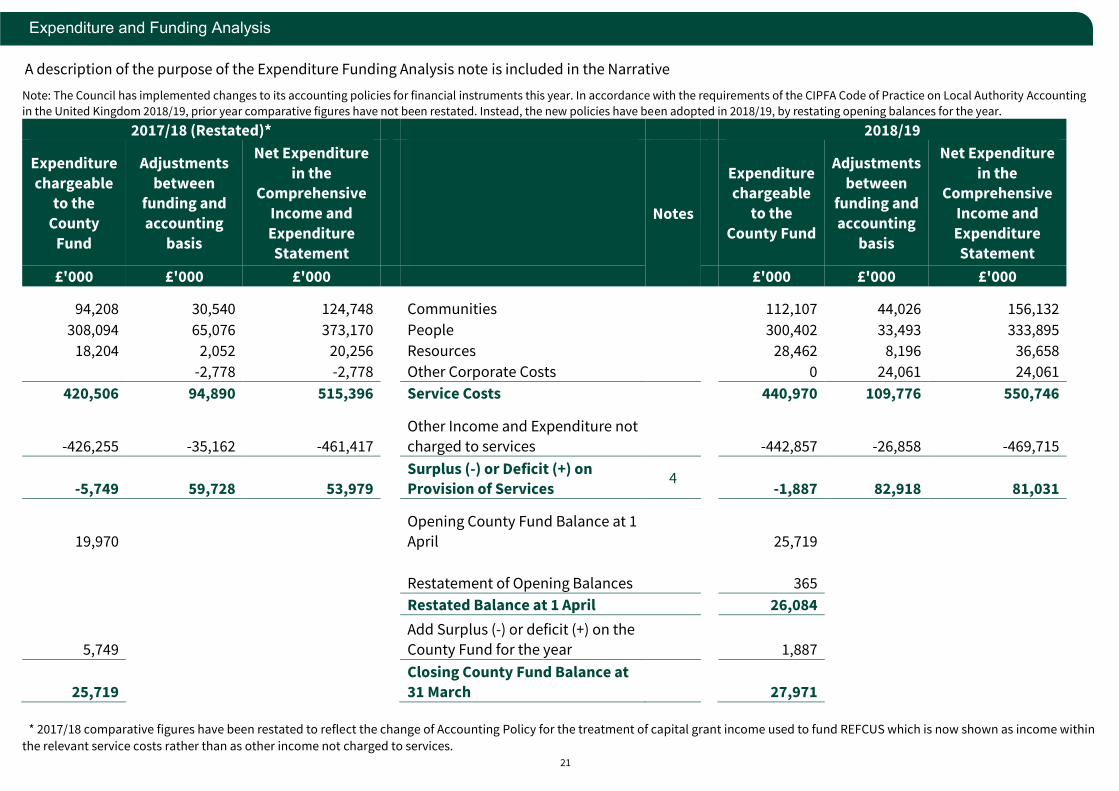
Expenditure and Funding Analysis
Note: The Council has implemented changes to its accounting policies for financial instruments this year. In accordance with the requirements of the CIPFA Code of Practice on Local Authority Accounting
in the United Kingdom 2018/19, prior year comparative figures have not been restated. Instead, the new policies have been adopted in 2018/19, by restating opening balances for the year.
2017/18 (Restated)* 2018/19
Expenditure
chargeable to the
County
Fund
Adjustments
between funding and
accounting
basis
Net Expenditure
in the Comprehensive
Income and
Expenditure
Statement
Notes
Expenditure chargeable
to the
County Fund
Adjustments
between funding and
accounting
basis
Net Expenditure
in the Comprehensive
Income and
Expenditure
Statement
£'000 £'000 £'000 £'000 £'000 £'000
94,208 30,540 124,748 Communities 112,107 44,026 156,132
308,094 65,076 373,170 People 300,402 33,493 333,895
18,204 2,052 20,256 Resources 28,462 8,196 36,658
-2,778 -2,778 Other Corporate Costs 0 24,061 24,061
420,506 94,890 515,396 Service Costs 440,970 109,776 550,746
-426,255 -35,162 -461,417
Other Income and Expenditure not
charged to services
-442,857 -26,858 -469,715
-5,749 59,728 53,979
Surplus (-) or Deficit (+) on Provision of Services
4 -1,887 82,918 81,031
19,970
Opening County Fund Balance at 1
April 25,719
Restatement of Opening Balances 365
Restated Balance at 1 April 26,084
5,749
Add Surplus (-) or deficit (+) on the
County Fund for the year
1,887
25,719
Closing County Fund Balance at 31 March 27,971
f * 2017/18 comparative figures have been restated to reflect the change of Accounting Policy for the treatment of capital grant income used to fund REFCUS which is now shown as income within
the relevant service costs rather than as other income not charged to services.
A description of the purpose of the Expenditure Funding Analysis note is included in the Narrative
Report.
22
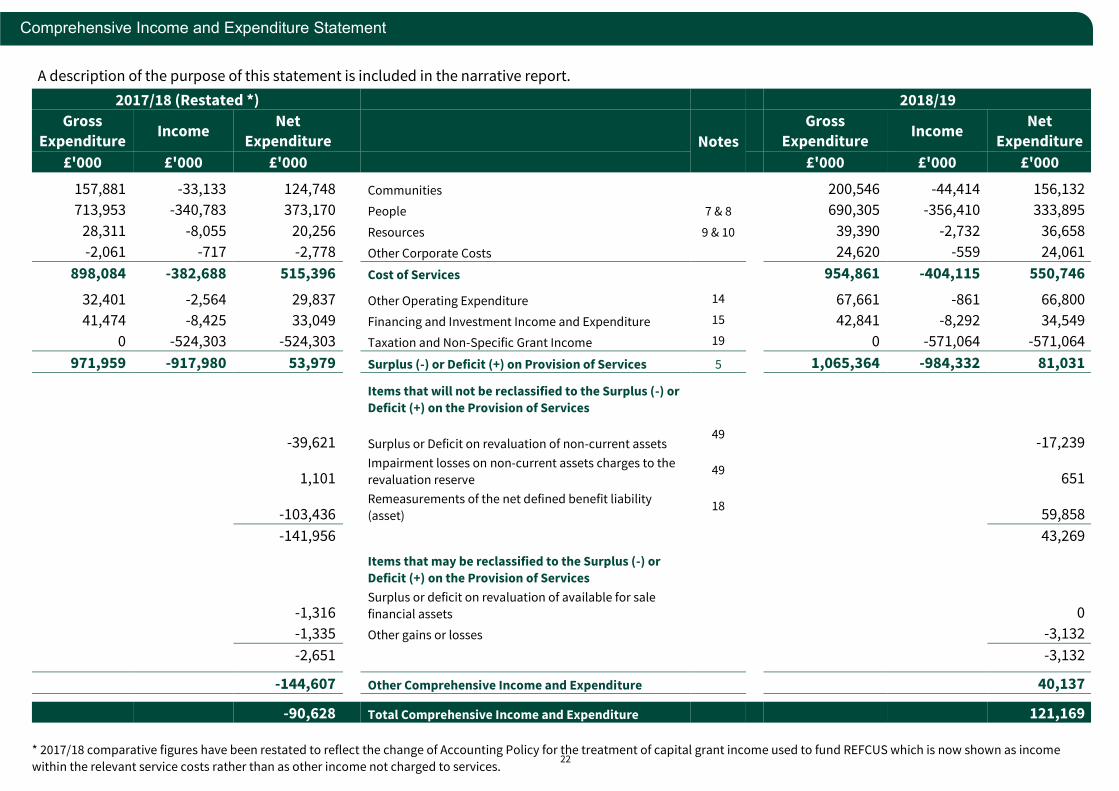
Comprehensive Income and Expenditure Statement
2017/18 (Restated *) 2018/19
Gross
Expenditure Income
Net
Expenditure
Notes
Gross
Expenditure Income
Net
Expenditure
£'000 £'000 £'000 £'000 £'000 £'000
157,881 -33,133 124,748 Communities
200,546 -44,414 156,132
713,953 -340,783 373,170 People 7 & 8 690,305 -356,410 333,895
28,311 -8,055 20,256 Resources 9 & 10 39,390 -2,732 36,658
-2,061 -717 -2,778 Other Corporate Costs 24,620 -559 24,061
898,084 -382,688 515,396 Cost of Services 954,861 -404,115 550,746
32,401 -2,564 29,837 Other Operating Expenditure 14 67,661 -861 66,800
41,474 -8,425 33,049 Financing and Investment Income and Expenditure 15 42,841 -8,292 34,549
0 -524,303 -524,303 Taxation and Non-Specific Grant Income 19 0 -571,064 -571,064
971,959 -917,980 53,979 Surplus (-) or Deficit (+) on Provision of Services 5 1,065,364 -984,332 81,031
Items that will not be reclassified to the Surplus (-) or
Deficit (+) on the Provision of Services
-39,621 Surplus or Deficit on revaluation of non-current assets 49
-17,239
1,101
Impairment losses on non-current assets charges to the
revaluation reserve 49
651
-103,436
Remeasurements of the net defined benefit liability
(asset) 18
59,858
-141,956
43,269
Items that may be reclassified to the Surplus (-) or
Deficit (+) on the Provision of Services
-1,316
Surplus or deficit on revaluation of available for sale
financial assets
0
-1,335 Other gains or losses
-3,132
-2,651
-3,132
-144,607 Other Comprehensive Income and Expenditure 40,137
-90,628 Total Comprehensive Income and Expenditure 121,169
* 2017/18 comparative figures have been restated to reflect the change of Accounting Policy for the treatment of capital grant income used to fund REFCUS which is now shown as income
within the relevant service costs rather than as other income not charged to services.
A description of the purpose of this statement is included in the narrative report.
23
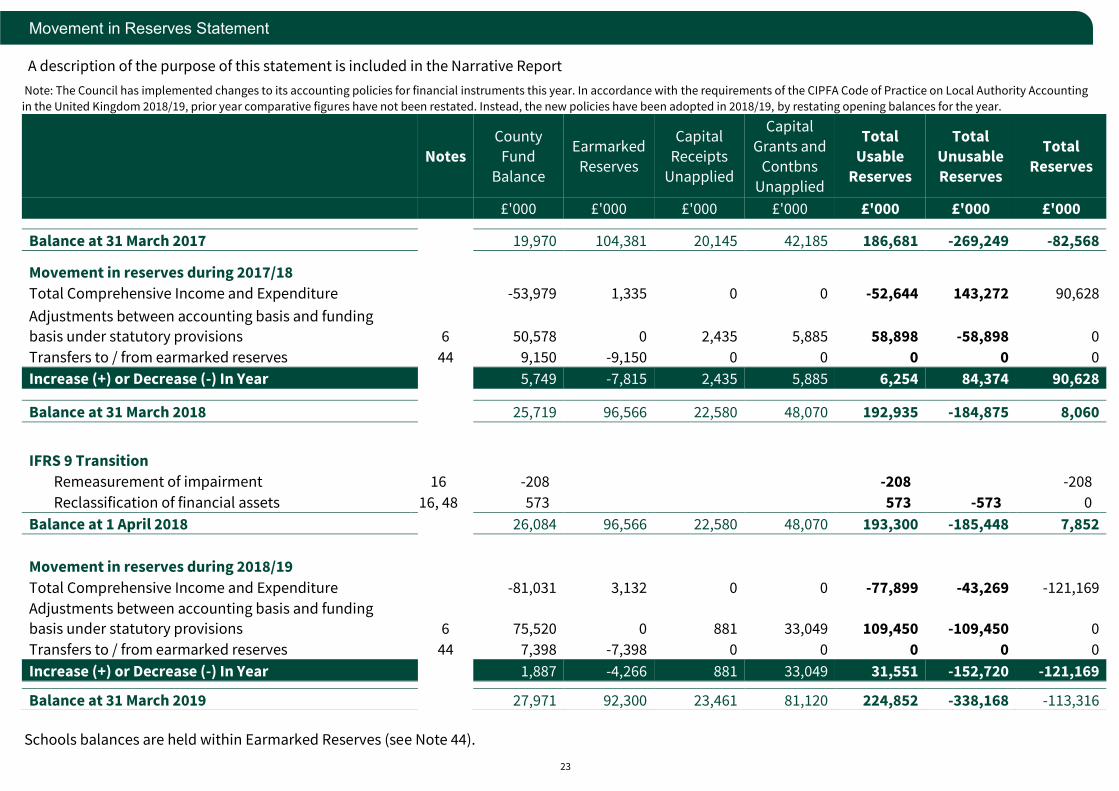
Movement in Reserves Statement
Note: The Council has implemented changes to its accounting policies for financial instruments this year. In accordance with the requirements of the CIPFA Code of Practice on Local Authority Accounting
in the United Kingdom 2018/19, prior year comparative figures have not been restated. Instead, the new policies have been adopted in 2018/19, by restating opening balances for the year.
Notes
County
Fund
Balance
Earmarked
Reserves
Capital
Receipts
Unapplied
Capital
Grants and
Contbns
Unapplied
Total
Usable
Reserves
Total
Unusable
Reserves
Total
Reserves
£'000 £'000 £'000 £'000 £'000 £'000 £'000
Balance at 31 March 2017 19,970 104,381 20,145 42,185 186,681 -269,249 -82,568
Movement in reserves during 2017/18
Total Comprehensive Income and Expenditure -53,979 1,335 0 0 -52,644 143,272 90,628
Adjustments between accounting basis and funding
basis under statutory provisions 6 50,578 0 2,435 5,885 58,898 -58,898 0
Transfers to / from earmarked reserves 44 9,150 -9,150 0 0 0 0 0
Increase (+) or Decrease (-) In Year 5,749 -7,815 2,435 5,885 6,254 84,374 90,628
Balance at 31 March 2018 25,719 96,566 22,580 48,070 192,935 -184,875 8,060
IFRS 9 Transition
Remeasurement of impairment 16 -208 -208 -208
Reclassification of financial assets 16, 48 573 573 -573 0
Balance at 1 April 2018 26,084 96,566 22,580 48,070 193,300 -185,448 7,852
Movement in reserves during 2018/19
Total Comprehensive Income and Expenditure -81,031 3,132 0 0 -77,899 -43,269 -121,169
Adjustments between accounting basis and funding
basis under statutory provisions 6 75,520 0 881 33,049 109,450 -109,450 0
Transfers to / from earmarked reserves 44 7,398 -7,398 0 0 0 0 0
Increase (+) or Decrease (-) In Year 1,887 -4,266 881 33,049 31,551 -152,720 -121,169
Balance at 31 March 2019 27,971 92,300 23,461 81,120 224,852 -338,168 -113,316
A description of the purpose of this statement is included in the Narrative Report
Schools balances are held within Earmarked Reserves (see Note 44).
Page 24
24
Balance Sheet
As at 31
March 2018
Notes As at 31 March 2019
£'000 £'000 £'000
Long Term Assets
1,140,086 Property, Plant and Equipment 22 1,109,194 17,937 Investment Property 23 19,989
1,656 Intangible Assets 25 1,449 55,000 Long Term Investments 34 40,000
6,398 Long Term Debtors 35 6,741 1,221,077 Total Long Term Assets 1,177,372
Current Assets
0 Assets Held for Sale 24 0 53,999 Debtors 36 71,506
296,356 Short Term Investments 34 360,840 24,664 Cash and Cash Equivalents 37 34,307
375,019 Total Current Assets 466,652
Current Liabilities
-49,269 Short Term Borrowing 34 -27,059
-87,687
Short Term Creditors and Revenue Receipts in Advance 39 -120,958
-4,451 Provisions due within one year 40 -5,219 -454 Short Term Finance Liability 28,34 -507
-30,037 Short Term Capital Grants Receipts in Advance 42 -37,704 -171,898 Total Current Liabilities -191,446
Long Term Liabilities
-7,745
Long Term Creditors and Revenue Receipts in Advance 39 -9,769
-4,772 Provisions due over one year 40 -3,563 -323,383 Long Term Borrowing 34 -321,383 -980,258 Pension Liability 18 -1,113,706
-18,018 Long Term Finance Liability 28,34 -17,506 -8,359 Deferred Income 41 -7,433
-73,603 Long Term Capital Grants Receipts in Advance 42 -92,535 -1,416,138 Total Long Term Liabilities -1,565,893
8,060 Net Assets (+) / Net Liabilities (-) -113,316
Financed from:
192,935 Usable Reserves 43-46 224,852
-184,875 Unusable Reserves 47-52 -338,168
8,060 Total Reserves -113,316
A description of the purpose of this statement is included in the Narrative Report
25
Cash Flow Statement
A description of the purpose of this statement is included in the Narrative Report
2017/18 Notes 2018/19
£'000 £'000
53,979 Net (surplus) or deficit on the provision of services
81,031
-111,723 Adjust net surplus or deficit on the provision of services for non-cash movements 53 -169,701
88,189
Adjust for items included in the net surplus or deficit on the provision of services that
are investing and financing activities
141,743
30,445 Net cash flows from Operating Activities 54
53,072
-32,035 Investing activities 55 -87,169
24,564 Financing activities 56
24,453
22,974 Net increase (-) or decrease (+) in cash and cash equivalents -9,644
47,638 Cash and cash equivalents at the beginning of the reporting period
24,664
24,664 Cash and cash equivalents at the end of the reporting period
34,308
26
Notes to the Core Financial Statements
1. Summary of Significant Accounting Policies
General
The Statement of Accounts summarises the County Council’s transactions for the 2018/19 financial year and its position at the year-end 31 March 2019.
It has been compiled in accordance with The Code of Practice on Local
Authority Accounting in the United Kingdom 2018/19 (the Code), published by
the Chartered Institute of Public Finance and Accountancy (CIPFA).
Except where specifically stated otherwise, the Statement of Accounts is
prepared on a historic cost basis, modified by the revaluation of certain
categories of assets and financial instruments. The accounts have been
prepared on a going concern basis, that is, the accounts have been prepared
on the assumption that the functions of the County Council will continue in
operational existence for the foreseeable future.
Accruals of Income and Expenditure
Activity is accounted for in the year that it takes place, not simply when the
cash payments are made or received.
Where income and expenditure has been recognised, but the cash has not
been received or paid, a debtor or creditor for the relevant amount is
recognised in the Balance Sheet. Where it is doubtful that debts will be settled, the balance of debtors is reduced and a charge is made to revenue
for the income that might not be recoverable.
Government Grants and Contributions
Government grants and third party contributions are accounted for on an accrual basis and are recognised in the Statement of Accounts when there is
reasonable assurance that the County Council will comply with the
conditions attached to their payment and that the grants or contributions
will be received.
Grants and contributions relating to capital and revenue expenditure are
recognised immediately in the Comprehensive Income and Expenditure Statement as income, except to the extent that the grant or contribution has
a condition that the County Council has not satisfied. Conditions are
stipulations that require the grant or contribution to be returned to the
provider if the terms of the grant or contribution are not met.
Monies advanced as grants or contributions for which conditions have not
been satisfied are carried in the Balance Sheet as creditors (capital monies
within Capital Grants Receipts in Advance). When conditions are satisfied, the grant or contribution is credited to the relevant directorate line
(attributable revenue grants and contributions) or Taxation and Non-
Specific Grant Income line (un-ringfenced revenue grants and all capital
grants and contributions) in the Comprehensive Income and Expenditure
Statement.
Capital grants and contributions credited to the Comprehensive Income and
Expenditure Statement are reversed out of the County Fund Balance in the Movement in Reserves Statement - where the grant/contribution has yet to
be used to finance capital expenditure, it is posted to the Capital Grants
Unapplied reserve; where it has been applied, it is posted to the Capital Adjustment Account. Amounts in the Capital Grants Unapplied reserve are
transferred to the Capital Adjustment Account once they have been applied
to fund capital expenditure.
Government grants and third-party contributions and donations are
recognised as due to the Council when there is reasonable assurance that
the Council will comply with any conditions that would require repayment
of the grant or contribution if not met, and the grants and contributions will
be received.
Grants and contributions are credited to the Comprehensive Income and
Expenditure Statement when recognised as due to the Council (i.e. specific revenue grants and contributions are credited to the relevant service line in
the Cost of Services, and capital grants and contributions and non ring-
fenced grants are credited to Taxation and Non Specific Grant Income and
Expenditure).
27
Notes to the Core Financial Statements
Where specific revenue grants and contributions are credited to the Comprehensive Income and Expenditure Statement, but the associated
expenditure has not yet been incurred, the grant is set aside in an Earmarked
Revenue Reserve so that it can be matched with the expenditure in a
subsequent year.
Capital grants and contributions are reversed out of the General Fund
Balance in the Movement in Reserves Statement and are transferred to the
Capital Adjustment Account (if the grant eligible expenditure has been
incurred); or to the Capital Grants Unapplied Account.
Revenue grants and contributions that have been credited to the relevant
directorate line in the Comprehensive Income and Expenditure Statement that remain unapplied as at the Balance Sheet Date and are required to meet
committed expenditure in future years are transferred to an earmarked
reserve through the Movement in Reserves Statement.
Council tax and business rates income
The council tax and business rates income included in the Comprehensive
Income and Expenditure Statement (CIES) for the year is the accrued income
for the year. The difference between the income included in the CIES and the amount required by regulation to be credited to the County Fund is taken to
the Collection Fund Adjustment Account and included as an adjusting item
in the Movement in Reserves Statement.
The district councils in Oxfordshire are acting as agents of the County
Council in collecting council tax and business rates. The cash collected from
council tax payers and business rates payers belongs proportionately to the
district councils and the major preceptors. There is therefore a
debtor/creditor position between each district council and the County
Council to recognise that the net cash paid to the County Council in the year
is not the same as its share of cash collected. The County Council recognises its share of council tax and business rates debtor and creditor balances,
impairment allowances for doubtful debts and provisions for losses on
appeal in its Balance Sheet. The Cash Flow Statement of the County Council includes the net council tax and business rates cash received from the
Collection Fund in the year.
Employee Benefits Benefits Payable during Employment
Short-term employee benefits are recognised as an expense in the year in
which employees render service to the Council.
Termination Benefits
Termination benefits are charged, on an accruals basis, to the relevant
service line in the Comprehensive Income and Expenditure Statement at the
earlier of when the Council can no longer withdraw the offer of those
benefits or when the Council recognises costs for a restructuring.
Post-Employment Benefits
The County Council participates in four pension schemes:
• The Local Government Pension Scheme;
• The Fire-fighters’ Pension Scheme;
• The Teachers’ Pension Scheme; and
• The NHS Pension Scheme.
These schemes provide defined benefits to members. However, the arrangements for the teachers’ pension scheme and the NHS pension
scheme mean that liabilities for these benefits cannot be identified to the
County Council. These schemes are therefore accounted for as if they are
defined contributions schemes – no liability for future payment of benefits is
recognised in the Balance Sheet and the relevant service lines in the
Comprehensive Income and Expenditure Statement are charged with the
employer’s contributions payable in the year.
The County Council also has restricted powers to make discretionary awards
of retirement benefits in the event of early retirements. Any liabilities
28
Notes to the Core Financial Statements
estimated to arise as a result of an award are accounted for on the same
basis as defined benefit schemes.
For the schemes treated as defined benefit schemes the Cost of Services
includes:
• Current service cost – the increase in the present value of a scheme’s liabilities resulting from employee service in the current period. This
is included in the relevant directorate line within the Cost of Services.
• Past service cost – the increase in the present value of the scheme
liabilities for employee service in prior periods, resulting from a
scheme amendment or curtailment. This is included in Other
Corporate Costs within the Cost of Services.
• Gain/loss on settlement – changes in liabilities relating to actions that relieve the County Council of primary responsibility for a pension
obligation. This is included in Other Corporate Costs within the Cost
of Services.
The net interest on the defined benefit liability (asset) – the change during
the period in the net defined benefit liability (asset) that arises from the
passage of time - is included in the Financing and Investment Income and
Expenditure line of the Comprehensive Income and Expenditure Statement. Remeasurements comprising actuarial gains and losses – changes in the net
pensions liability that arise because events have not coincided with
assumptions made at the last actuarial valuation or because the actuary has updated their assumptions – and the return on scheme assets, excluding
amounts included in net interest on the net defined liability (asset), are
recognised in Other Comprehensive Income and Expenditure within the
Comprehensive Income and Expenditure Statement.
Scheme assets attributable to the County Council are measured at fair value
as at the Balance Sheet date. Scheme liabilities attributable to the County
Council are measured on an actuarial basis using the projected unit method.
The net pensions liability is recognised in the Balance Sheet.
The amount chargeable to the County Fund for providing pensions for employees is the amount payable for the year in accordance with the
statutory requirements governing each particular pension scheme. Where
this amount does not match the amount charged to the Surplus or Deficit on the Provision of Services for the year the difference is taken to the Pensions
Reserve via the Movement in Reserves Statement.
Fire-fighters injury awards are disability benefits paid by the County Council
that do not form part of the fire-fighters pension scheme. However, the
measurement of these long-term benefits is subject to the same degree of
uncertainty as the measurement of fire-fighters post-employment benefits
and therefore they are accounted for in the same way as fire-fighters post-
employment benefits.
Property, Plant and Equipment
Assets that have a physical substance and are held for use in the production or supply of goods or services, or for administrative purposes and that are
expected to be used during more than one financial year are classified as
Property, Plant and Equipment. These include operational land and
buildings, vehicles, plant and equipment, surplus assets, assets under
construction and infrastructure.
Expenditure on the acquisition, creation or enhancement of Property, Plant
and Equipment is capitalised on an accruals basis, provided that it is probable that future economic benefits or service potential associated with
the item will flow to the County Council and the cost of the item can be
measured reliably. This excludes expenditure on routine repairs and
maintenance, which is charged directly to service revenue accounts as an
expense when incurred.
Assets are initially measured at cost, comprising:
• The purchase price
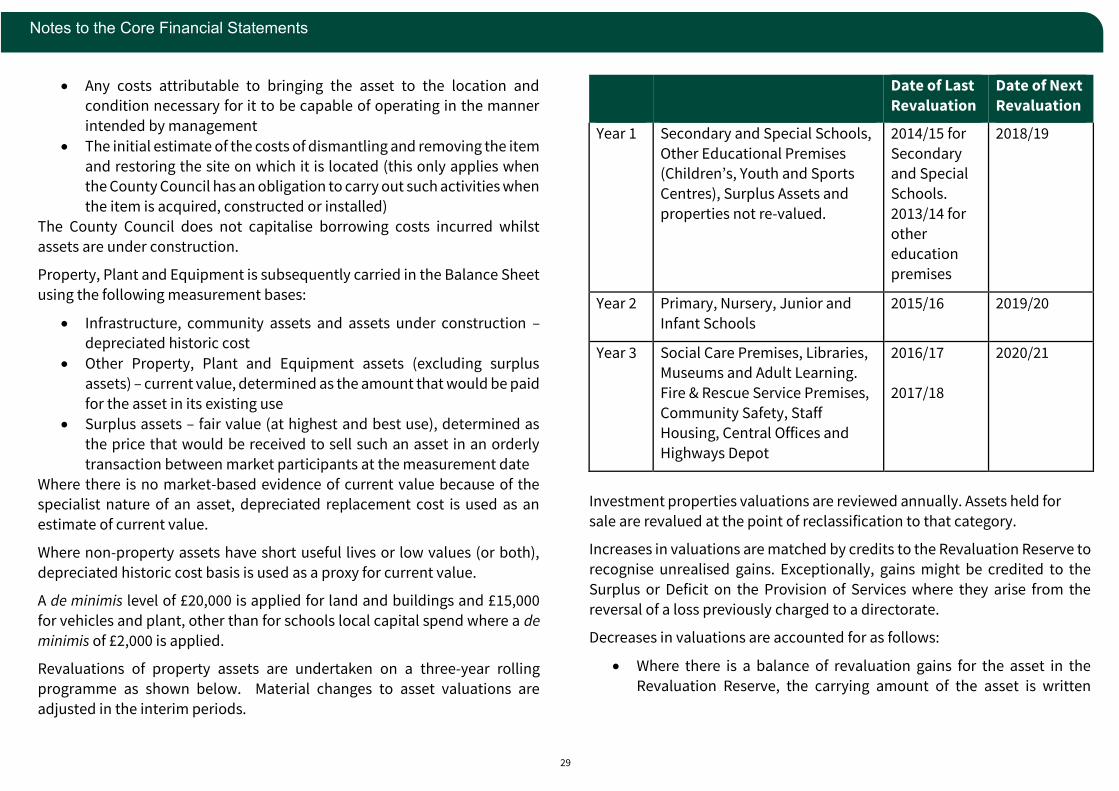
29
Notes to the Core Financial Statements
• Any costs attributable to bringing the asset to the location and condition necessary for it to be capable of operating in the manner
intended by management
• The initial estimate of the costs of dismantling and removing the item
and restoring the site on which it is located (this only applies when the County Council has an obligation to carry out such activities when
the item is acquired, constructed or installed)
The County Council does not capitalise borrowing costs incurred whilst
assets are under construction.
Property, Plant and Equipment is subsequently carried in the Balance Sheet
using the following measurement bases:
• Infrastructure, community assets and assets under construction – depreciated historic cost
• Other Property, Plant and Equipment assets (excluding surplus
assets) – current value, determined as the amount that would be paid
for the asset in its existing use
• Surplus assets – fair value (at highest and best use), determined as
the price that would be received to sell such an asset in an orderly
transaction between market participants at the measurement date
Where there is no market-based evidence of current value because of the specialist nature of an asset, depreciated replacement cost is used as an
estimate of current value.
Where non-property assets have short useful lives or low values (or both),
depreciated historic cost basis is used as a proxy for current value.
A de minimis level of £20,000 is applied for land and buildings and £15,000
for vehicles and plant, other than for schools local capital spend where a de
minimis of £2,000 is applied.
Revaluations of property assets are undertaken on a three-year rolling
programme as shown below. Material changes to asset valuations are
adjusted in the interim periods.
Date of Last
Revaluation
Date of Next
Revaluation
Year 1 Secondary and Special Schools,
Other Educational Premises (Children’s, Youth and Sports
Centres), Surplus Assets and
properties not re-valued.
2014/15 for
Secondary and Special
Schools.
2013/14 for
other
education
premises
2018/19
Year 2 Primary, Nursery, Junior and
Infant Schools
2015/16 2019/20
Year 3 Social Care Premises, Libraries, Museums and Adult Learning.
Fire & Rescue Service Premises,
Community Safety, Staff
Housing, Central Offices and
Highways Depot
2016/17
2017/18
2020/21
Investment properties valuations are reviewed annually. Assets held for
sale are revalued at the point of reclassification to that category.
Increases in valuations are matched by credits to the Revaluation Reserve to
recognise unrealised gains. Exceptionally, gains might be credited to the
Surplus or Deficit on the Provision of Services where they arise from the
reversal of a loss previously charged to a directorate.
Decreases in valuations are accounted for as follows:
• Where there is a balance of revaluation gains for the asset in the
Revaluation Reserve, the carrying amount of the asset is written
30
Notes to the Core Financial Statements
down against that balance (up to the amount of the accumulated gains)
• Where there is no balance in the Revaluation Reserve or an
insufficient balance, the carrying amount of the asset is written down
against the relevant directorate in the Comprehensive Income and
Expenditure Statement
Assets are assessed each year as to whether there is an indication of
impairment. Where indications exist and the recoverable amount of the
asset is materially lower than the carrying amount, an impairment loss is
recognised for the shortfall. Where impairment losses are identified they are
accounted for in the same way as decreases in valuations.
Where an impairment loss is reversed subsequently, the reversal is credited
to the relevant directorate, up to the amount of the original loss, adjusted
for depreciation that would have been charged if the loss had not been
recognised.
Depreciation of Property, Plant and Equipment
Depreciation is provided for on all Property, Plant and Equipment with a
finite life, which is determined at acquisition or revaluation. Assets in the course of construction are not depreciated until they are brought into use.
Depreciation is an estimation technique that is calculated using the straight-
line method with the following asset lives:
• Buildings: 60 years (or less if specified by
the valuer)
• Vehicles, plant and equipment: between 5 and 30 years
• IT equipment and infrastructure: between 3 and 5 years
• Infrastructure (roads and bridges): 35 years
Land is determined to have an infinite life and is not depreciated.
Where an item of Property, Plant and Equipment asset has major components whose cost is significant in relation to the total cost of the item,
the components are depreciated separately.
Revaluation gains are also depreciated, with an amount equal to the difference between current value depreciation charged on assets and the
depreciation that would have been chargeable based on their historic cost
being transferred each year from the Revaluation Reserve to the Capital
Adjustment Account.
Charges to Revenue for Property, Plant and Equipment
Services, support services and trading accounts are charged with a capital
charge for all Property, Plant and Equipment used in the provision of services. The charge covers the annual provision for depreciation and
revaluation and impairment losses where there are no accumulated gains in
the Revaluation Reserve against which the losses can be written off.
The County Council is not required to raise council tax to fund depreciation
or revaluation/impairment losses. However, it is required to make an annual
contribution from revenue towards the reduction in its overall borrowing
requirement (referred to as Minimum Revenue Provision (MRP)). Depreciation and revaluation/impairment losses are therefore replaced by
the MRP contribution in the County Fund Balance by way of an adjusting
transaction with the Capital Adjustment Account in the Movement in
Reserves Statement.
Disposals and Non-current Assets Held for Sale
When it becomes probable that the carrying amount of an asset will be
recovered principally through a sale transaction rather than through its
continuing use, it is reclassified as an Asset Held for Sale. To be classified as
an Asset Held for Sale the asset must meet the following criteria:
• Available for immediate sale in its present condition
• The sale must be highly probable
• Actively marketed at a reasonable sale price
31
Notes to the Core Financial Statements
• The sale should be expected to be completed within 1 year
Assets Held for Sale are measured at the lower of their carrying value and fair
value less costs to sell at initial reclassification. Gains in fair value are
recognised only up to the amount of any previously recognised losses in the
Surplus or Deficit on the Provision of Services. Decreases in fair value less costs to sell are recognised in Other Operating Expenditure in the
Comprehensive Income and Expenditure Statement. Depreciation is not
charged on Assets Held for Sale.
If assets no longer meet the criteria to be classified as Assets Held for Sale,
they are reclassified back to Property, Plant and Equipment and valued at
the lower of their carrying amount before they were classified as held for sale (adjusted for depreciation or revaluations that would have been recognised
had they not been classified as Held for Sale) and their recoverable amount
at the date of the decision not to sell.
Assets that are to be abandoned or scrapped are not reclassified as Assets
Held for Sale.
When an asset is disposed of, the carrying amount of the asset in the Balance
Sheet is written off to Other Operating Expenditure in the Comprehensive Income and Expenditure Statement as part of the gain or loss on disposal.
Receipts from disposals are credited to the same line in the Comprehensive
Income and Expenditure Statement as part of the gain or loss on disposal. Any revaluation gains in the Revaluation Reserve are transferred to the
Capital Adjustment Account.
Receipts from the disposal of assets in excess of £10,000 are categorised as
capital receipts. Capital receipts are appropriated to the Capital Receipts Unapplied reserve from the County Fund Balance in the Movement in
Reserves Statement.
The written off value of assets disposed of is appropriated to the Capital Adjustment Account from the County Fund Balance in the Movement in
Reserves Statement so that there is no charge against the Council Tax.
Investment Property Investment properties are those that are used solely to earn rentals and/or
for capital appreciation.
Investment properties are measured initially at cost and subsequently at fair value (at highest and best use), being the price that would be received to sell
such an asset in an orderly transaction between market participants at the
measurement date. Investment properties are not depreciated and are
revalued annually according to market conditions. Gains and losses on
revaluation are posted to the Financing and Investment Income and
Expenditure line in the Comprehensive Income and Expenditure Statement.
Gains and losses on disposal are posted to Other Operating Expenditure. The gains and losses are reversed out of the County Fund Balance to the Capital
Adjustment Account (or Capital Receipts Unapplied for disposal receipts
over £10,000) in the Movement in Reserves Statement so that they do not
impact on Council Tax.
Revenue Expenditure Funded from Capital Under Statute
Capital expenditure on non-current assets not owned by the County Council
and grants given by the County Council for capital purposes are charged to
the relevant directorate in the Comprehensive Income and Expenditure
Statement. In accordance with statutory provisions this expenditure is
transferred from the County Fund Balance to the Capital Adjustment Account in the Movement in Reserves Statement, such that there is no
impact on council tax.
Private Finance Initiative (PFI) and similar contracts (service
concession arrangements)
PFI type contracts involve a private sector entity (the operator) constructing
or enhancing property used in the provision of a public service, and
operating and maintaining that property for a specified period of time. The operator is paid for its services over the period of the arrangement. Where
the County Council controls or regulates the services provided by the
operator and controls the residual interest in the property at the end of the
32
Notes to the Core Financial Statements
term of the arrangement the contract meets the tests for accounting as a
service concession arrangement.
Properties used in service concession arrangements are recognised as
Property, Plant and Equipment of the County Council. The original recognition of the assets at fair value (based on the cost to purchase the
assets) is matched by the recognition of liabilities for amounts due to the
operators to pay for the assets and deferred income where the operator part
funds the assets from income from third parties. Once recognised on the
Balance Sheet these assets are revalued and depreciated in the same way as
other Property, Plant and Equipment owned by the County Council.
The amounts payable to the service concession arrangement operators each
year are analysed into five elements:
• The value of services received during the year – charged to the
relevant directorate in the Comprehensive Income and Expenditure
Statement
• Finance costs – an interest charge on the outstanding finance liability
– charged to the Financing and Investment Income and Expenditure
line in the Comprehensive Income and Expenditure Statement
• Payments towards the finance liability – applied to write down the Balance Sheet liability towards the operator
• Contingent rents – inflationary increases in the amounts to be paid
for the property arising during the contract – charged to the
Financing and Investment Income and Expenditure line in the Comprehensive Income and Expenditure Statement. Note for the
County Council’s current service concession arrangement there is no
inflation applied to the elements of the contract payments relating to
the property build costs and therefore no contingent rents.
• Lifecycle replacement costs – recognised as a capital prepayment in
the Balance Sheet and transferred to Property, Plant and Equipment
when capital works are undertaken.
Deferred income is released to the relevant directorate in the Comprehensive Income and Expenditure Statement on a straight line basis
over the service concession period.
Leases Leases are classified as finance leases where the terms of the lease transfer
substantially all the risks and rewards incidental to ownership of the
property, plant or equipment from the lessor to the lessee. All other leases
are classified as operating leases.
Where a property lease covers both land and buildings, the land and
buildings elements are considered separately for lease classification.
Arrangements that do not have the legal status of a lease but convey a right to use an asset in return for payment are accounted for under this policy
where fulfilment of the arrangement is dependent on the use of specific
assets.
Where the County Council is the lessee, property, plant and equipment held
under a finance lease is recognised on the Balance Sheet at the
commencement of the lease at its fair value at the lease’s inception (or the
present value of the minimum lease payments, if lower). The asset recognised is matched by a liability for the obligation to pay the lessor.
Premiums paid on entry into a lease are applied to writing down the lease
liability. Contingent rents are charged as expenses in the periods in which they are incurred. The lease payments are apportioned between a charge for
the acquisition of the interest in the asset – applied to writing down the
liability, and a finance charge – charged to the Financing and Investment
Income and Expenditure line in the Comprehensive Income and Expenditure
Statement. Once recognised on the Balance Sheet, assets recognised under
finance leases are accounted for in the same way as other Property, Plant
and Equipment, subject to depreciation being charged over the lease term if
this is shorter than the asset’s estimated useful life.
33
Notes to the Core Financial Statements
Rentals paid by the Council under operating leases are charged to the relevant directorate in the Comprehensive Income and Expenditure
Statement on a straight-line basis over the lease period except where the
contractual payment terms are considered to be a more systematic and
appropriate basis.
Where the County Council leases an asset to others under a finance lease,
the asset is written out of the Balance Sheet as a disposal. At the
commencement of the lease, the carrying amount of the asset is written off
to the Other Operating Expenditure line in the Comprehensive Income and
Expenditure Statement as part of the gain or loss on disposal. A gain,
representing the County Council’s net investment in the lease, is credited to the same line in the Comprehensive Income and Expenditure Statement as
part of the gain or loss on disposal, matched by a long-term debtor in the
Balance Sheet. Finance lease rentals receivable are apportioned between a charge for the acquisition of the interest in the property – applied to write
down the long-term debtor (together with any premiums received), and
finance income credited to the Financing and Investment Income and
Expenditure line in the Comprehensive Income and Expenditure Statement.
The gain credited to the Comprehensive Income and Expenditure Statement
on disposal is required under statute to be treated as a capital receipt. Where
a premium has been received, this is posted out of the County Fund Balance to the Capital Receipts Unapplied reserve in the Movement in Reserves
Statement. Where the amount due in relation to the lease asset is to be
settled by the payment of rentals in future years, this is posted out of the County Fund Balance to the Deferred Capital Receipts Reserve in the
Movement in Reserves Statement. When the future rentals are received, the
element for the capital receipt for the disposal of the asset is used to write
down the long-term debtor and the deferred capital receipts are transferred to the Capital Receipts Unapplied reserve. The written-off carrying amount
of the asset on disposal is appropriated to the Capital Adjustment Account
from the County Fund Balance in the Movement in Reserves Statement so
that there is no impact on Council Tax.
Where the County Council leases an asset to others under an operating lease,
the asset is retained on the Balance Sheet. Rental income is credited to the relevant directorate in the Comprehensive Income and Expenditure
Statement on a straight-line basis over the lease period (including any
premiums received at the commencement of the lease).
Cash and Cash Equivalents
Cash is represented by cash in hand and bank deposits repayable without
penalty on notice of not more than 24 hours. Cash equivalents are short-
term, highly liquid investments that are readily convertible to known amounts of cash and which are subject to an insignificant risk of changes in
value. The County Council treats the following as cash equivalents:
• Instant Access Call Accounts
• Instant Access Short Term Funds
• Deposits with one working day to maturity from date of deposit
Financial Assets
The Council’s business model is to hold investments to collect contractual
cash flows. Financial assets are therefore classified as amortised cost, except for those whose contractual payments are not solely payment of
principal and interest (ie where the cash flows do not take the form of a basic
debt instrument).
Financial assets are classified into three types:
• Amortised cost – assets that have fixed or determinable payments but
are not quoted in an active market
• Financial assets at fair value through Other Comprehensive Income – assets that have a quoted market price and/or do not have fixed or
determinable payments

34
Notes to the Core Financial Statements
• Financial assets at fair value through profit or loss – assets that are part of a portfolio of identified financial instruments that are managed
together and for which there is evidence of a recent actual pattern of
short-term profit taking
Amortised cost are initially measured at fair value and carried in the Balance Sheet at their amortised cost. Credits to the Financing and Investment
Income and Expenditure line of the Comprehensive Income and Expenditure
Statement for external interest receivable are based on the carrying amount
of the asset, multiplied by the effective interest rate for the instrument. For
the majority of the County Council’s investments, the effective interest rate
is the same as the actual interest receivable in accordance with the loan agreement. Short duration receivables with no stated interest rates (e.g.
debtors) are measured at original invoice amount.
The Council recognises expected credit losses on all of its financial assets
held at amortised cost.
Impairment losses are calculated to reflect the expectation that the future
cash flows might not take place because the borrower could default on their
obligations. Credit risk plays a crucial part in assessing losses. Where risk has increased significantly since an instrument was initially recognised, losses
are assessed on a lifetime basis.
Where risk has not increased significantly or remains low, losses are
assessed on the basis of 12-month expected losses.
The expected credit loss model also applies to lease receivables. Lifetime
losses are recognised for trade receivables (debtors) held by the Council.
The County Council has made a number of loans to clients and other organisations at less than market interest rates or zero rate (referred to in
the Code as soft loans). For the County Council there are no material
differences between the fair value and the nominal value of such loans and
no adjustments are made on initial recognition of these loans.
Where assets are identified as impaired because of a likelihood arising from a past event that payments due under the contract will not be made, the
carrying value of the asset is reduced through the use of an allowance
account and a charge made to the Financing and Investment Income and
Expenditure line in the Comprehensive Income and Expenditure Statement.
Any gains and losses arising on the derecognition of assets are
credited/debited to the Financing and Investment Income and Expenditure
line in the Comprehensive Income and Expenditure Statement.
Financial assets at fair value through Other Comprehensive Income are
initially measured and carried in the Balance Sheet at fair value. Where the
asset has fixed or determinable payments, credits to the Financing and Investment Income and Expenditure line in the Comprehensive Income and
Expenditure Statement for interest receivable are based on the amortised
cost of the asset multiplied by the effective interest rate for the instrument. Where there are no fixed or determinable payments, income is credited to
the Comprehensive Income and Expenditure Statement when it becomes
receivable.
Assets are maintained in the Balance Sheet at fair value. Values are based
on:
• Instruments with quoted market prices – the market price
• Other instruments with fixed and determinable payments –
discounted cash flow analysis
The inputs to the measurement techniques are categorised in accordance
with the following three levels:
• Level 1 inputs - quoted prices (unadjusted) in active markets for
identical assets that the County Council can access at the measurement date
• Level 2 inputs – inputs other than quoted prices included within Level
1 that are observable for the asset, either directly or indirectly
35
Notes to the Core Financial Statements
• Level 3 inputs – unobservable inputs for the asset
Changes in fair value are balanced by an entry in the Financial Instruments
Revaluation Reserve and the gain/loss recognised in Other Comprehensive
Income and Expenditure (except for impairment losses).
Where assets are identified as impaired because of a likelihood arising from a past event that payments due under the contract will not be made, the
asset is written down through the use of an allowance account and a charge
made to the Financing and Investment Income and Expenditure line in the
Comprehensive Income and Expenditure Statement.
Any gains and losses arising on the derecognition of assets are
credited/debited to the Financing and Investment Income and Expenditure line in the Comprehensive Income and Expenditure Statement, along with
any accumulated gains/losses recognised in the Financial Instruments
Revaluation Reserve.
Financial assets at fair value through profit or loss are initially measured and
carried in the Balance Sheet at fair value. Movements in fair value are
balanced by posting gains and losses to the Financing and Investment
Income and Expenditure line in the Comprehensive Income and Expenditure Statement as they arise. Any residual gains and losses arising on
derecognition are also credited/debited to the Comprehensive Income and
Expenditure Statement. The basis of fair value and the inputs to the measurement techniques is the same as for Financial assets at fair value
through Other Comprehensive Income.
The carrying amounts of individual financial assets are separated into their
current (short-term) and non-current (long-term) elements for presentation
within the Balance Sheet.
Financial Liabilities
Financial liabilities are recognised on the Balance Sheet when the Council becomes a party to the contractual provisions of the financial instrument.
Financial liabilities are initially measured at fair value and are carried at their
amortised cost.
Interest is charged to the Financing and Investment Income and Expenditure
line in the Comprehensive Income and Expenditure Statement, based on the carrying amount of the liabilities, multiplied by the effective rate of interest
for the instruments. This means that:
• The amount included in the Balance Sheet is the outstanding
principal repayable, plus accrued interest; and
• Interest charged to the Comprehensive Income and Expenditure
Statement is the amount payable for the year according to the loan
agreement.
Financial liabilities are de-recognised when the obligation is discharged,
cancelled or expires.
Debt Redemption
The County Council complies with legislation to charge a Minimum Revenue
Provision (MRP) to the County Fund revenue account for the repayment of
debt by making a straight-line charge of the outstanding pre-2008 capital
expenditure as at 1 April 2017 calculated over a 50-year period and making provision for repayment of prudential borrowing in equal instalments over
the estimated life of the asset for which the borrowing is undertaken. In
addition, the provision for repayment of debt includes an amount equal to
the amount that is taken to the Balance Sheet to reduce the liabilities in respect of PFI and similar contracts and for the prepayment of lifecycle costs
relating to these contracts, and an amount equal to the amount that is taken
to the Balance Sheet to reduce liabilities in respect of finance leases.
Provisions
Provisions are made where the County Council has a present obligation
(legal or constructive) as a result of a past event that probably requires
settlement by a transfer of economic benefits or service potential, and a
reliable estimate can be made of the amount of the obligation. Provisions

36
Notes to the Core Financial Statements
are reviewed annually and are adjusted to reflect the current best estimate against the appropriate directorate in the Comprehensive Income and
Expenditure Statement. When payments are eventually made they are
charged directly to the provision.
Insurance
The County Council has a policy of self-insurance of claims across its main
insurance categories. In accordance with the Code the insurance provision
is set aside to cover insurance claims actually received and awaiting
resolution that have been advised to the County Council and which it has
been decided to be insured internally rather than externally. Subject to
identified contingent liabilities there are no significant unfunded risks.
Contingent liabilities and contingent assets
The County Council discloses contingent liabilities in the notes to the
accounts. Contingent liabilities are possible obligations arising from past events and whose existence will be confirmed by one or more uncertain
events occurring in the future and are not wholly under the County Council’s
control. Contingent liabilities also arise in circumstances where a provision
would otherwise be made but either it is not probable that there will be a
transfer of economic benefits or where the obligation cannot be measured
with sufficient reliability.
Financial guarantee contracts come under the definition of financial instruments and are initially recognised in the accounts at fair value. This
only applies to guarantees entered into after 1 April 2006. Any entered into
before that date continue to be recognised as contingent liabilities. If
payment under the guarantee becomes probable the liability would be
determined in accordance with the requirement for provisions.
The County Council discloses contingent assets in the notes to the accounts.
Contingent assets are possible assets that arise from past events and whose existence will be confirmed only by the occurrence or non-occurrence of one
or more uncertain future events not wholly within the control of the County
Council.
Reserves
A reserve, whether capital or revenue, results from events that have allowed monies to be set aside, surpluses, or decisions causing anticipated
expenditure to have been postponed or cancelled. These can be spent or
earmarked at the discretion of the County Council. Earmarked revenue
reserves can be used to set aside available monies for major anticipated
capital schemes, for projects or service arrangements that the County
Council may wish to carry out, business unit surpluses, service efficiency
savings and contingent liabilities where a provision is not required.
Reserves are established and used for different reasons. These include:
• Usable reserves - reserves that can be used at the County Council’s
discretion to fund either revenue or capital spend
• Unusable reserves - reserves relating to unrealised gains, such as the Revaluation Reserve, that are not “cash backed” and cannot be used
to fund future capital or revenue spending and reserves relating to
differences between accounting policy and statutory requirements, such as the Capital Adjustment Account.
Earmarked reserves are created by appropriating amounts from the County
Fund Balance in the Movement in Reserves Statement. When expenditure to be financed from a reserve is incurred it is charged to the appropriate
directorate. The reserve is then appropriated back into the County Fund
Balance in the Movement in Reserves Statement so that there is no net charge against Council Tax for the expenditure.
Group Accounts The County Council is required to prepare group accounts where it has
interests in subsidiaries, associates and/or joint ventures, subject to
consideration of materiality. For 2018/19 the County Council did not have
37
Notes to the Core Financial Statements
any such interests that are considered material and therefore prepared these
accounts only as a single entity rather than as group accounts.
The County Council participates in a number of joint operations (e.g. pooled
budget arrangements with the health sector and Oxfordshire Local Enterprise Partnership). The County Council accounts directly (in its single
entity accounts) for its part of the assets, liabilities, income, expenditure and
cash flows held within or arising from such an arrangement.
There are a number of circumstances where the County Council exercises
limited influence and these are disclosed as related parties. Under these
circumstances, transactions with these bodies are charged against the
appropriate service in the Comprehensive Income and Expenditure Statement, and balances owed by them or to them are included in debtors
and creditors.
Schools Under the Code, local authority maintained schools are considered to be
separate entities with the balance of control lying with the Council. The Code
requires that the income, expenditure, assets and liabilities of maintained
schools be accounted for in the single entity accounts of the Council rather
than requiring consolidation in the Group Accounts.
In accordance with the Education Reform Act 1988, the scheme of Local
Management of Schools provides for the carry forward of individual school surpluses and deficits. These are held as usable earmarked reserves and are
committed to be spent on schools.
Taxation The County Council is exempt from income tax, corporation tax and from
capital gains tax.
Value Added Tax is excluded from both revenue and capital in terms of both
income and expenditure except where the County Council is not able to
recover VAT on expenditure.
The County Council incurs landfill tax, which is charged on a tonnage basis
to the County Council by its waste disposal contractors.
In addition, the County Council incurs stamp duty land tax on the acquisition
of property freeholds and leaseholds, climate change levy on its energy bills and insurance premium tax on its insurance costs. Also, the County Council
incurs employer’s national insurance contributions based on a percentage
of staff salaries.
Where the County Council incurs tax, this cost is charged to directorates in
the Comprehensive Income and Expenditure Statement.
Rounding
In preparing the Statement of Accounts all numbers, including totals, have been rounded independently to avoid unacceptable rounding errors. This
may mean that some tables do not cross cast.
2. Critical judgements in applying accounting policies
In applying the accounting policies set out in Note 1, the County Council has
had to make certain judgements about complex transactions or those involving uncertainty about future events. The critical judgements made in
the Statement of Accounts are:
• The County Council has made an assessment of the balance sheet
treatment of schools' non-current assets in accordance with IAS 16
Property, Plant and Equipment and IAS17 Leases. Where assets are
owned by the Council and used by maintained schools, the economic benefits and service potential of the asset is considered to be within the
control of the Council and therefore the assets are recognised on the
Council’s balance sheet. Where they are owned by trustees and used by maintained schools (in most cases Voluntary Aided and Voluntary
Controlled schools) the Council has assessed that the trustees permit the
assets to be used for voluntary education and have not reassigned rights
38
Notes to the Core Financial Statements
to the assets to the school or governing body. Therefore the assets are not recognised on the Council’s balance sheet. In some cases school
sites are part owned by the Council and part by trustees. These assets are
treated in line with the above. In accordance with the Schools Standards and Framework Act 1998, ownership of playing fields rests with the
Council and these are therefore recognised on the Council’s balance
sheet (subject to de-minimis valuations). The property valuers, Capita,
are informed of changes to the ownership of Council assets by the Council’s Legal Services department, and any adjustments to the value
of assets as a consequence are reflected in the Council’s balance sheet.
• School land and buildings that have transferred to academy trusts under
125 year leases (or where the freehold has transferred) have been written
out of the County Council's Balance Sheet based on an assessment in
accordance with IAS17 Leases and IAS16 Property, Plant and Equipment. Newly constructed School land and buildings that are the subject of
short-term lease/license agreements with academy trusts but are
expected to transfer under 125 year leases have also been written out of the County Council's Balance Sheet based on this assessment.
• An assessment under IFRIC 12 Service Concession Arrangements
concluded that the County Council controls the residential care services provided under the agreement with Oxfordshire Care Partnership (OCP)
and the residual value of all but one of the homes at the end of the
agreement. This includes Chilterns Court Care Centre which came into
operation during 2016/17. Except for the home where the residual value
at the end of the contract rests with OCP, the accounting policies for PFI
and similar contracts have been applied to the arrangement and the homes (valued at £32.315m as at 31 March 2019) are recognised as
Property, Plant and Equipment on the Balance Sheet. A finance liability
has been recognised on the Balance Sheet for the amounts due to be paid
under the contract for the new homes built by OCP.
• The County Council is acting as the Accountable Body for the Oxfordshire Local Enterprise Partnership (OxLEP). OxLEP became a company Limited
by Guarantee (Not for Profit) in April 2015 (Company Registration
Number 09519056). It is a business led organisation that works for all of
its stakeholders in business, academia and local authorities. The Board of 18 members is led by a private sector Chairman and Deputy Chairman,
supported by the Oxfordshire Growth Board Chairman; a Joint
Committee which brings together Local Authority partners in a collective decision-making structure. The Leader of the County Council is a member
of the OxLEP Board. The Business representation comes from across all
sectors and all sizes of business. It exists to drive the economic growth of Oxfordshire and the creation of Jobs for our communities.
• In accounting for OxLEP it has been assessed that the County Council is
acting as the principal in accordance with IAS 18 Revenue and therefore transactions have been included in the County Council's
accounts. OxLEP’s expenditure is largely funded by government grants
for which the County Council is the accountable body and the Council remains exposed to risks such as the repayment of grants in the event of
non-compliance. In addition, the council plans to undertake borrowing
in 2019/20 on behalf of OxLEP in advance of receipt of Business Rates in
the Enterprise Zone, to deliver planned infrastructure improvements. This generates a requirement to increase the Council’s Capital Financing
Requirement. This means that the Council is not simply acting as an
intermediary by passporting funds to OxLEP and is acting beyond the
remit of an agent. The Council received £11.813m Local Growth Fund in
2018/19 on behalf of OxLEP, which was applied to capital expenditure
during the year. In respect of revenue, the Council received £0.700m core funding from MHCLG, £0.773m relating to European Regional
Development Fund grants from MHCLG, £0.205m from the Department
for Business, Energy and Industrial Strategy and £0.075m from the
Department for Education. OxLEP is preparing financial accounts for
39
Notes to the Core Financial Statements
2018/19, along with the Letter of Representation, which are expected to be considered by the OxLEP Board on 25 June 2019. The Board expects
to formally adopt these financial accounts at the company’s Annual
General Meeting in September 2019.
• Based on an assessment in accordance with IFRS 10 Consolidated
Financial Statements and IFRS 11 Joint Arrangements, and taking into
account materiality, the County Council has concluded that it does not have control or joint control of any other entities and therefore has no
associates. There is therefore no requirement to prepare joint financial
statements for 2018/19. The County Council is party to some joint operations with other local authorities / health bodies and accounts for
these as part of single entity financial statements.
• The County Council has two pooled budgets with the Oxfordshire Clinical Commissioning Group (OCCG) and one with Oxford Health NHS
Foundation Trust. These pooled budgets operate to deliver better
outcomes for people supported by Adult Social Care within the People Directorate. Based on an assessment in accordance with IFRS 11 Joint
Arrangements and IAS 15 Revenue (in relation to principal and agent
transactions), the Pooled Budgets are considered to be joint operations.
This means that only expenditure and income attributable to the County Council (and equal to the authority’s contribution as set out in Note 8) is
included in the Council’s accounts.
• The OCCG is the Accountable Body for Oxfordshire's allocation of the Better Care Fund and will be held to account by NHS England for the
appropriate use of the resources locally. The Better Care Fund allocation
received by OCCG forms part of its contribution to the Better Care Fund Pooled Budget and as such is reported within the OCCG’s accounts.
• In accordance with IAS 32 Financial Instruments: Presentation, the County Council determines the short term/long term categorisation of
borrowing by reference to the earliest date on which the lender can
require payment. The right to increase the interest rate payable without
limit, as in a 'Lender Option, Borrower Option' (LOBO) loan, is treated as a right to require repayment. Consequently, LOBOs are classified as
short-term where option dates are due within 12 months of the balance
sheet date.
3. Assumptions made about the future and other major sources of
estimation uncertainty
The Statement of Accounts contains estimated figures that are based on
assumptions made by the County Council about the future or that are
otherwise uncertain. Estimates are made taking into account historical experience, current trends and other relevant factors. However, because
balances cannot be determined with certainty, actual results could be
materially different from the assumptions and estimates made.
The items in the County Council's Balance Sheet as at 31 March 2019 for
which there is significant risk of material adjustment in the forthcoming year are as follows:
Property, Plant and Equipment
The financial year 2018/19 was year one of a three-year cycle, a total of
£168.298m Property, Plant & Equipment assets were re-valued by Greg Stacy
MRICS and Carter Jonas. As at 31 March 2019 the County Council had
£603.298m of operational land and buildings on its Balance Sheet. The Council’s Property, Plant and Equipment have been valued on one of the
following three bases under IFRS: Fair Value (Existing Use Value (EUV)) –
method used to value operational property assets other than specialised property assets. Depreciated Replacement Cost (DRC) - method used to
40
Notes to the Core Financial Statements
value operational property assets of a specialised nature. Fair Value (Market Value) – method used to value property assets held as investments, surplus
or for sale. Due to valuation techniques used a 1% Movement in values since
the last valuation date would change the reported value of other land and buildings and surplus assets by £6.033m (£5.812m in 2017/18). Buildings are
depreciated over useful lives that are dependent on assumptions about the
level of repairs and maintenance of those buildings. Reductions in the
budget for repairs and maintenance spending brings into doubt the useful lives assigned to buildings. If the useful life of buildings is reduced,
depreciation increases and the carrying amount of the building falls. It is
estimated that the annual depreciation charge for buildings would increase by £0.130m for every year that useful lives had to be reduced.
Pensions Liability Estimation of the net liability to pay pensions (£1,113.706m) as at 31 March
2019) depends on a number of complex judgements relating to the discount
rate used, the rate at which salaries and pensions are projected to increase
and mortality rates. The assumptions used are set out in the Retirement
Benefits Note 18. The County Council uses a firm of actuaries, Hymans
Robertson LLP, to provide expert advice about the assumptions to be
applied. The discount rate used is based on corporate bond yields that reflect the duration of the employer's liabilities.
The effects on the net pension liability of changes in the discount rate or mortality rates are provided in the sensitivity analysis table in the Retirement
Benefits note. However, the assumptions interact in complex ways. During
2018/19, the County Council's actuaries advised that the net pension liability
had decreased by £48.799m as a result of the return on plan assets and increased by £106.957m attributable to updating of the assumptions relating
to pensions liabilities.
Further uncertainty has been created by the Court of Appeal Judgements in the cases of McCloud and Sergeant regarding age discrimination arising
from pension scheme transition arrangements. This has an impact on the
net pension liability for the LGPS and Fire Fighter Pension Scheme. The actuary has made assumptions regarding the impact and this has been
included in the valuation of the County Council’s net liability.
When the LGPS benefit structure was reformed in 2014, transitional protections were applied to certain older members close to normal
retirement age. The benefits accrued from 1 April 2014 by these members
are subject to an ‘underpin’ which means that they cannot be lower than what they would have received under the previous benefit structure. The
underpin ensures that these members do not lose out from the introduction
of the new scheme, by effectively giving them the better of the benefits from the old and new schemes.
In December 2018 the Court of Appeal upheld a ruling (“McCloud/Sargeant”)
that similar transitional protections in the Judges’ and Firefighters’ Pension
Schemes were unlawful on the grounds of age discrimination. The
implications of the ruling are expected to apply to the LGPS (and other public
service schemes) as well. The UK Government requested leave to appeal to the Supreme Court but this was denied at the end of June 2019. LGPS
benefits accrued from 2014 may therefore need to be enhanced so that all
members, regardless of age, will benefit from the underpin. Alternatively, restitution may be achieved in a different way, for example by paying
compensation. In either case, the clear expectation is that many more
members would see an enhanced benefit rather than just those currently
subject to these protections. There will therefore be a retrospective increase to members’ benefits, which in turn will give rise to a past service cost for the
Fund employers.
41
Notes to the Core Financial Statements
Quantifying the impact of the judgement at this stage is very difficult because it will depend on the compensation awarded, members’ future
salary increases, length of service and retirement age, and whether (and
when) members withdraw from active service. Salary increases in particular can vary significantly from year to year and from member to member
depending on factors such as budget restraint, job performance and career
progression. The Government Actuary’s Department (GAD) has estimated
that the impact for the LGPS as a whole could be to increase active member liabilities by 3.2%, based on a given set of actuarial assumptions. A full
description of the data, methodology and assumptions underlying these
estimates is given in GAD’s paper, dated 10 June 2019.
The Fund’s actuary has adjusted GAD’s estimate to better reflect the
Oxfordshire County Council Pension Fund’s local assumptions, particularly salary increases and withdrawal rates. The revised estimate as it applies to
Oxfordshire County Council is that total liabilities (i.e. the increase in active
members’ liabilities expressed in terms of the employer’s total membership)
could be 0.73% higher as at 31 March 2019, an increase of approximately
£14.4m.
These numbers are high level estimates based on scheme level calculations and depend on several key assumptions.
The impact on employers’ funding arrangements will likely be dampened by the funding arrangements they have in place. However, if the judgement is
upheld then there will be unavoidable upward pressure on contributions in
future years.
There is also uncertainty regarding the impact of Guaranteed Minimum Pension (GMP) requirements. This arises where a pension scheme was
‘contracted out’ of additional state pension arrangements. If the contracted
out pensions benefits are less than the pensioner would have received if the contracting out had not applied the pension scheme would be required to
increase the pension paid to reach the GMP.
The UK government website states that : “Defined benefit pensions schemes that were Contracted-out Salary Related
(COSR) schemes before contracting-out ended on 6 April 2016 need to
provide a Guaranteed Minimum Pension (GMP) to members for contracted-out service between 6 April 1978 and 5 April 1997. The GMP is payable at age
60 for a woman and at age 65 for a man.”
The GMP will be recognised at a ‘past service cost’. The actuary has made
an assessment for this, and as at 31 March 2019 and has concluded that all
GMP increases have already been valued within the liabilities and do not
require any further adjustments.
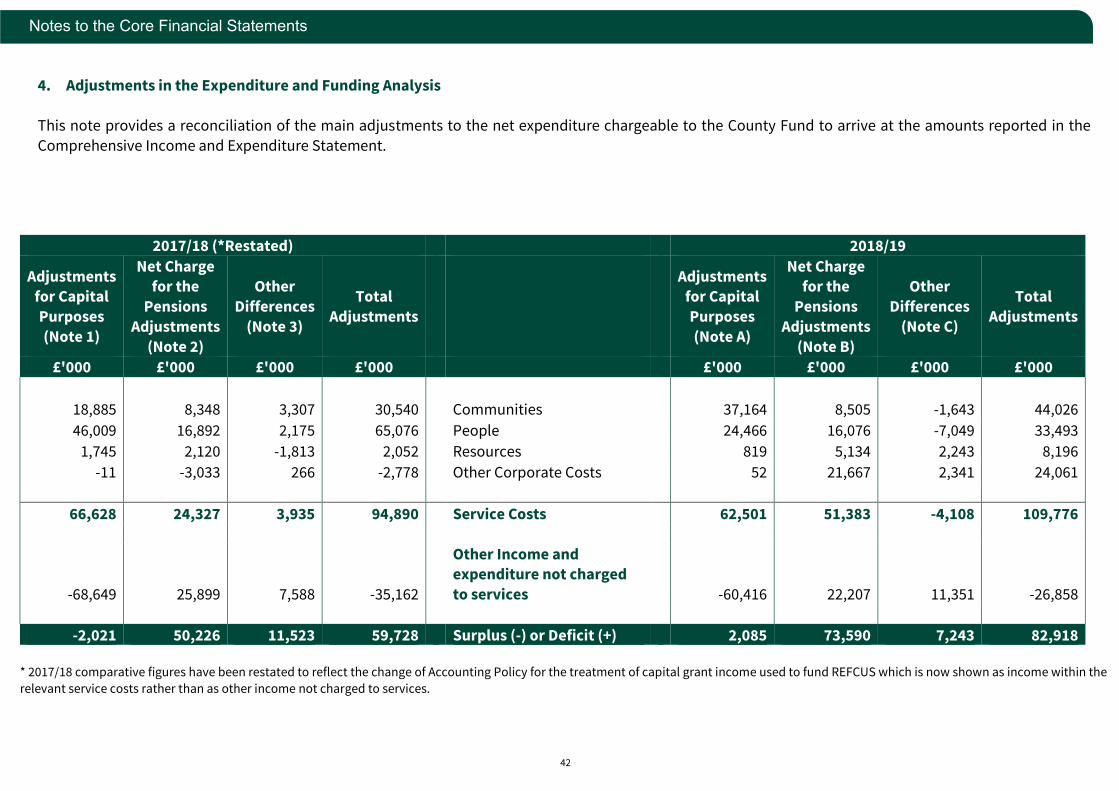
42
Notes to the Core Financial Statements
4. Adjustments in the Expenditure and Funding Analysis
This note provides a reconciliation of the main adjustments to the net expenditure chargeable to the County Fund to arrive at the amounts reported in the
Comprehensive Income and Expenditure Statement.
2017/18 (*Restated) 2018/19
Adjustments for Capital
Purposes
(Note 1)
Net Charge for the
Pensions
Adjustments
(Note 2)
Other
Differences
(Note 3)
Total
Adjustments
Adjustments for Capital
Purposes
(Note A)
Net Charge for the
Pensions
Adjustments
(Note B)
Other
Differences
(Note C)
Total
Adjustments
£'000 £'000 £'000 £'000 £'000 £'000 £'000 £'000
18,885 8,348 3,307 30,540 Communities 37,164 8,505 -1,643 44,026
46,009 16,892 2,175 65,076 People 24,466 16,076 -7,049 33,493
1,745 2,120 -1,813 2,052 Resources 819 5,134 2,243 8,196
-11 -3,033 266 -2,778 Other Corporate Costs 52 21,667 2,341 24,061
66,628 24,327 3,935 94,890 Service Costs 62,501 51,383 -4,108 109,776
-68,649 25,899 7,588 -35,162
Other Income and expenditure not charged
to services -60,416 22,207 11,351 -26,858
-2,021 50,226 11,523 59,728 Surplus (-) or Deficit (+) 2,085 73,590 7,243 82,918 * 2017/18 comparative figures have been restated to reflect the change of Accounting Policy for the treatment of capital grant income used to fund REFCUS which is now shown as income within the
relevant service costs rather than as other income not charged to services.
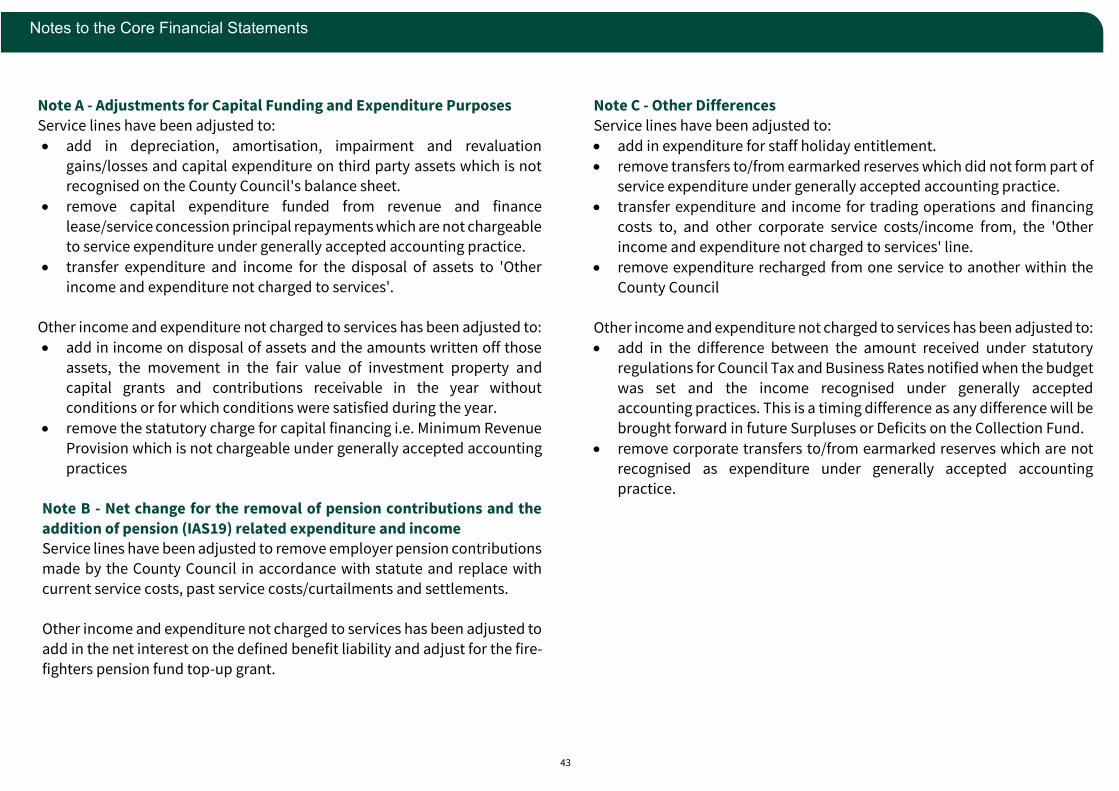
43
Notes to the Core Financial Statements
Note A - Adjustments for Capital Funding and Expenditure Purposes
Service lines have been adjusted to:
• add in depreciation, amortisation, impairment and revaluation
gains/losses and capital expenditure on third party assets which is not recognised on the County Council's balance sheet.
• remove capital expenditure funded from revenue and finance
lease/service concession principal repayments which are not chargeable to service expenditure under generally accepted accounting practice.
• transfer expenditure and income for the disposal of assets to 'Other
income and expenditure not charged to services'.
Other income and expenditure not charged to services has been adjusted to:
• add in income on disposal of assets and the amounts written off those
assets, the movement in the fair value of investment property and
capital grants and contributions receivable in the year without conditions or for which conditions were satisfied during the year.
• remove the statutory charge for capital financing i.e. Minimum Revenue
Provision which is not chargeable under generally accepted accounting
practices
Note B - Net change for the removal of pension contributions and the
addition of pension (IAS19) related expenditure and income Service lines have been adjusted to remove employer pension contributions
made by the County Council in accordance with statute and replace with
current service costs, past service costs/curtailments and settlements.
Other income and expenditure not charged to services has been adjusted to
add in the net interest on the defined benefit liability and adjust for the fire-
fighters pension fund top-up grant.
Note C - Other Differences
Service lines have been adjusted to:
• add in expenditure for staff holiday entitlement.
• remove transfers to/from earmarked reserves which did not form part of service expenditure under generally accepted accounting practice.
• transfer expenditure and income for trading operations and financing
costs to, and other corporate service costs/income from, the 'Other
income and expenditure not charged to services' line.
• remove expenditure recharged from one service to another within the
County Council
Other income and expenditure not charged to services has been adjusted to:
• add in the difference between the amount received under statutory
regulations for Council Tax and Business Rates notified when the budget
was set and the income recognised under generally accepted accounting practices. This is a timing difference as any difference will be
brought forward in future Surpluses or Deficits on the Collection Fund.
• remove corporate transfers to/from earmarked reserves which are not
recognised as expenditure under generally accepted accounting practice.
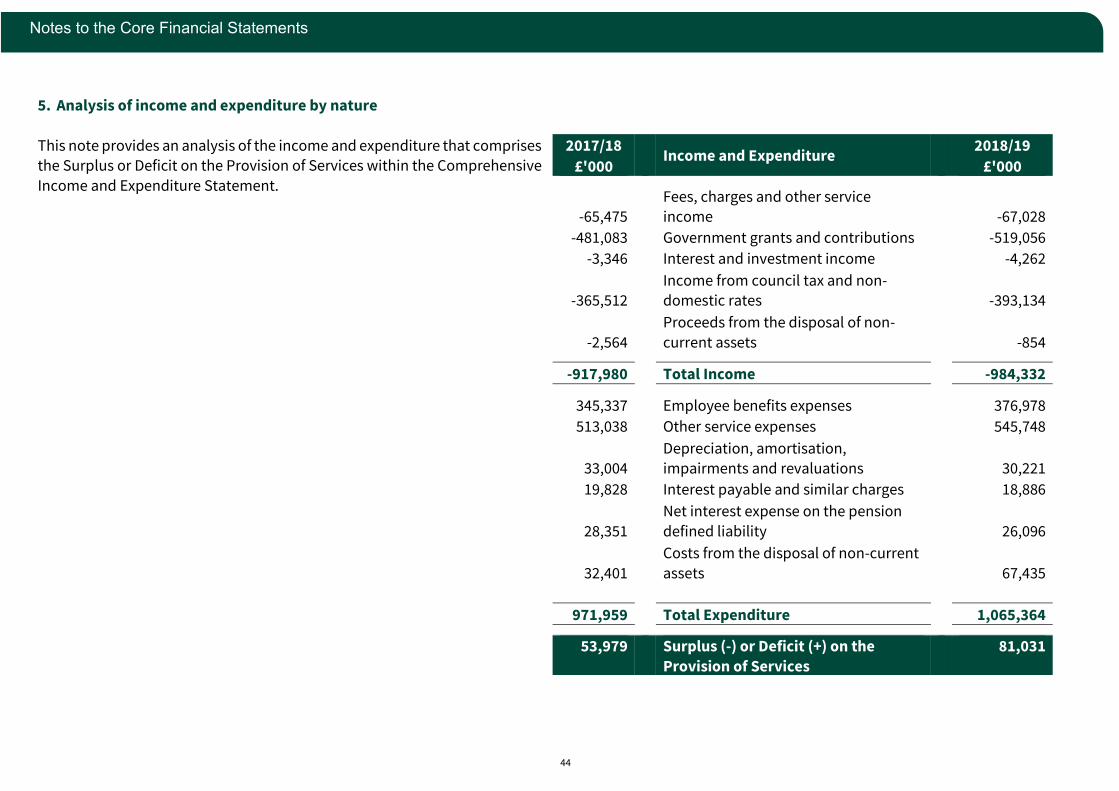
44
Notes to the Core Financial Statements
5. Analysis of income and expenditure by nature
This note provides an analysis of the income and expenditure that comprises the Surplus or Deficit on the Provision of Services within the Comprehensive
Income and Expenditure Statement.
2017/18 Income and Expenditure
2018/19
£'000 £'000
-65,475
Fees, charges and other service income -67,028
-481,083 Government grants and contributions -519,056
-3,346 Interest and investment income -4,262
-365,512
Income from council tax and non-domestic rates -393,134
-2,564
Proceeds from the disposal of non-
current assets -854
-917,980 Total Income -984,332
345,337 Employee benefits expenses 376,978
513,038 Other service expenses 545,748
33,004
Depreciation, amortisation, impairments and revaluations 30,221
19,828 Interest payable and similar charges 18,886
28,351
Net interest expense on the pension
defined liability 26,096
32,401
Costs from the disposal of non-current
assets 67,435
971,959 Total Expenditure 1,065,364
53,979 Surplus (-) or Deficit (+) on the
Provision of Services
81,031
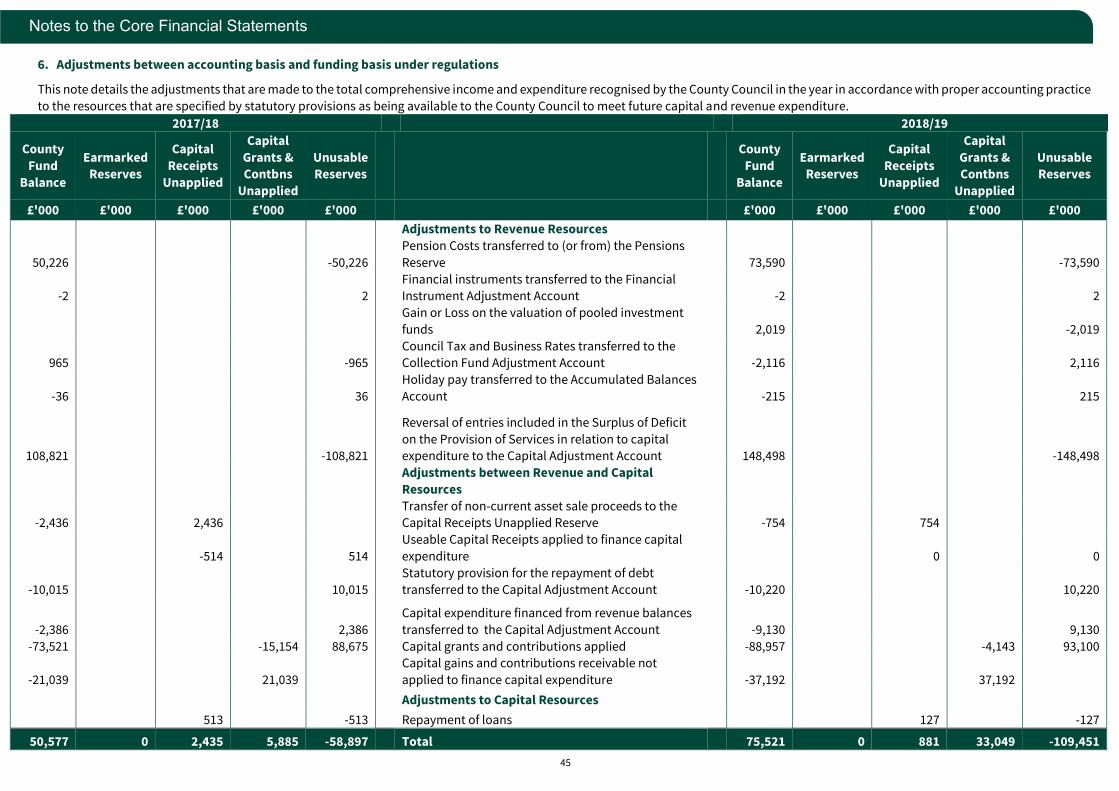
45
Notes to the Core Financial Statements
6. Adjustments between accounting basis and funding basis under regulations
This note details the adjustments that are made to the total comprehensive income and expenditure recognised by the County Council in the year in accordance with proper accounting practice
to the resources that are specified by statutory provisions as being available to the County Council to meet future capital and revenue expenditure.
2017/18 2018/19
County
Fund
Balance
Earmarked
Reserves
Capital
Receipts
Unapplied
Capital
Grants &
Contbns
Unapplied
Unusable
Reserves
County
Fund
Balance
Earmarked
Reserves
Capital
Receipts
Unapplied
Capital
Grants &
Contbns
Unapplied
Unusable
Reserves
£'000 £'000 £'000 £'000 £'000 £'000 £'000 £'000 £'000 £'000
Adjustments to Revenue Resources
50,226 -50,226
Pension Costs transferred to (or from) the Pensions
Reserve 73,590 -73,590
-2 2
Financial instruments transferred to the Financial
Instrument Adjustment Account -2 2
Gain or Loss on the valuation of pooled investment
funds 2,019 -2,019
965 -965
Council Tax and Business Rates transferred to the
Collection Fund Adjustment Account -2,116 2,116
-36 36
Holiday pay transferred to the Accumulated Balances
Account -215 215
108,821 -108,821
Reversal of entries included in the Surplus of Deficit
on the Provision of Services in relation to capital
expenditure to the Capital Adjustment Account 148,498 -148,498
Adjustments between Revenue and Capital
Resources
-2,436 2,436
Transfer of non-current asset sale proceeds to the
Capital Receipts Unapplied Reserve -754 754
-514 514
Useable Capital Receipts applied to finance capital
expenditure 0 0
-10,015 10,015
Statutory provision for the repayment of debt
transferred to the Capital Adjustment Account -10,220 10,220
-2,386 2,386
Capital expenditure financed from revenue balances
transferred to the Capital Adjustment Account -9,130 9,130
-73,521 -15,154 88,675 Capital grants and contributions applied -88,957 -4,143 93,100
-21,039 21,039
Capital gains and contributions receivable not
applied to finance capital expenditure -37,192 37,192
Adjustments to Capital Resources
513 -513 Repayment of loans 127 -127
50,577 0 2,435 5,885 -58,897 Total 75,521 0 881 33,049 -109,451
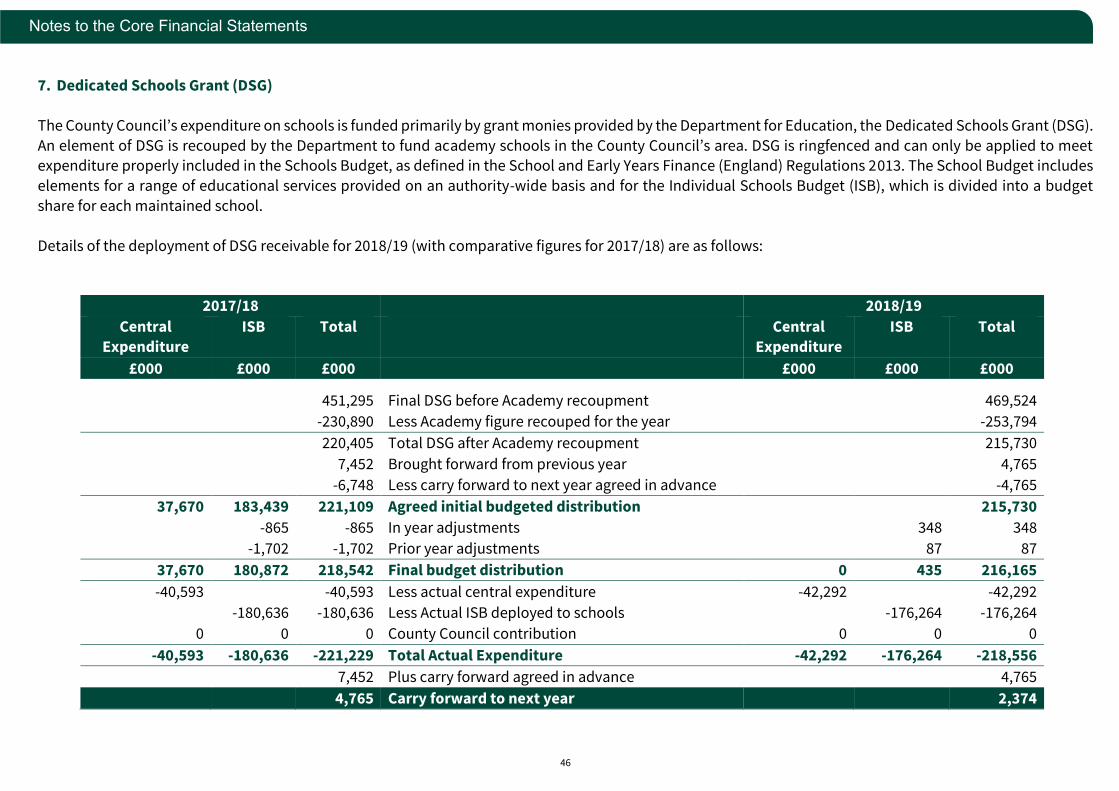
46
Notes to the Core Financial Statements
7. Dedicated Schools Grant (DSG)
The County Council’s expenditure on schools is funded primarily by grant monies provided by the Department for Education, the Dedicated Schools Grant (DSG).
An element of DSG is recouped by the Department to fund academy schools in the County Council’s area. DSG is ringfenced and can only be applied to meet expenditure properly included in the Schools Budget, as defined in the School and Early Years Finance (England) Regulations 2013. The School Budget includes
elements for a range of educational services provided on an authority-wide basis and for the Individual Schools Budget (ISB), which is divided into a budget
share for each maintained school.
Details of the deployment of DSG receivable for 2018/19 (with comparative figures for 2017/18) are as follows:
2017/18 2018/19
Central
Expenditure
ISB Total Central
Expenditure
ISB Total
£000 £000 £000 £000 £000 £000
451,295 Final DSG before Academy recoupment
469,524
-230,890 Less Academy figure recouped for the year -253,794
220,405 Total DSG after Academy recoupment
215,730
7,452 Brought forward from previous year
4,765
-6,748 Less carry forward to next year agreed in advance -4,765
37,670 183,439 221,109 Agreed initial budgeted distribution
215,730 -865 -865 In year adjustments
348 348
-1,702 -1,702 Prior year adjustments 87 87
37,670 180,872 218,542 Final budget distribution 0 435 216,165
-40,593
-40,593 Less actual central expenditure -42,292
-42,292 -180,636 -180,636 Less Actual ISB deployed to schools
-176,264 -176,264
0 0 0 County Council contribution 0 0 0
-40,593 -180,636 -221,229 Total Actual Expenditure -42,292 -176,264 -218,556
7,452 Plus carry forward agreed in advance 4,765
4,765 Carry forward to next year 2,374
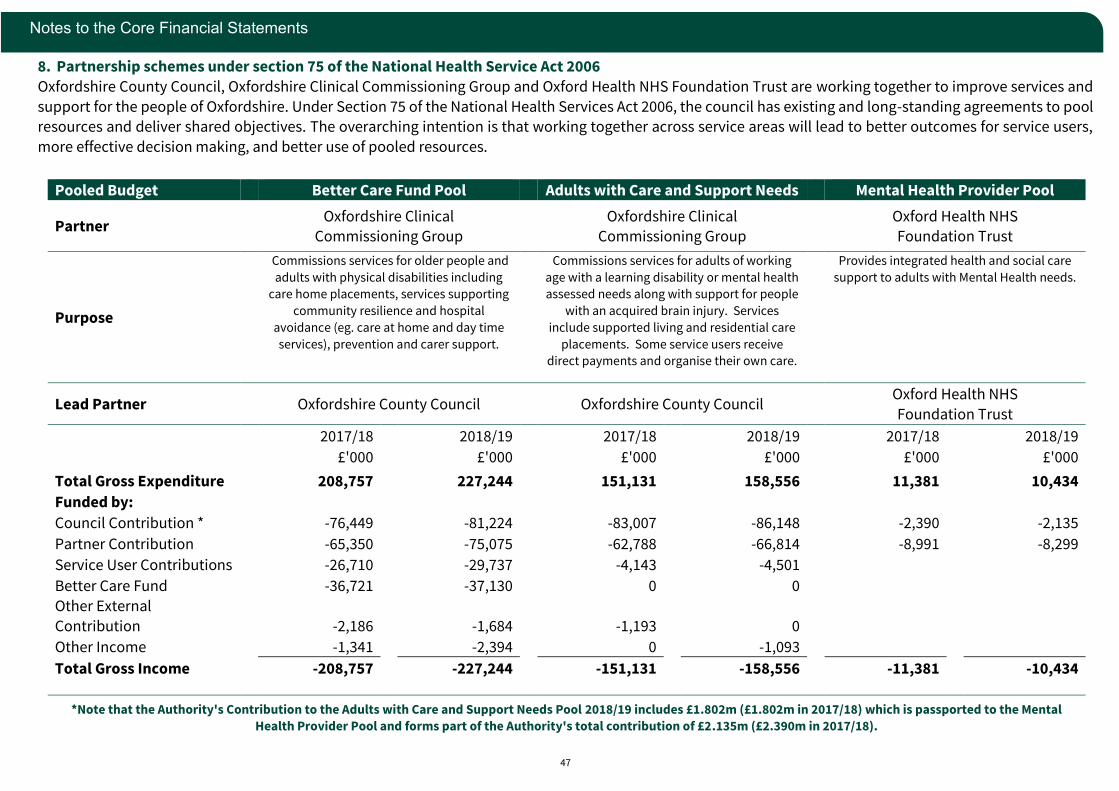
47
Notes to the Core Financial Statements
8. Partnership schemes under section 75 of the National Health Service Act 2006
Oxfordshire County Council, Oxfordshire Clinical Commissioning Group and Oxford Health NHS Foundation Trust are working together to improve services and
support for the people of Oxfordshire. Under Section 75 of the National Health Services Act 2006, the council has existing and long-standing agreements to pool resources and deliver shared objectives. The overarching intention is that working together across service areas will lead to better outcomes for service users,
more effective decision making, and better use of pooled resources.
Pooled Budget Better Care Fund Pool Adults with Care and Support Needs Mental Health Provider Pool
Partner Oxfordshire Clinical
Commissioning Group
Oxfordshire Clinical Commissioning Group
Oxford Health NHS Foundation Trust
Purpose
Commissions services for older people and
adults with physical disabilities including
care home placements, services supporting
community resilience and hospital
avoidance (eg. care at home and day time
services), prevention and carer support.
Commissions services for adults of working
age with a learning disability or mental health
assessed needs along with support for people
with an acquired brain injury. Services
include supported living and residential care
placements. Some service users receive
direct payments and organise their own care.
Provides integrated health and social care
support to adults with Mental Health needs.
Lead Partner Oxfordshire County Council Oxfordshire County Council Oxford Health NHS
Foundation Trust
2017/18 2018/19 2017/18 2018/19 2017/18 2018/19
£'000 £'000 £'000 £'000 £'000 £'000
Total Gross Expenditure 208,757 227,244 151,131 158,556 11,381 10,434
Funded by:
Council Contribution * -76,449 -81,224 -83,007 -86,148 -2,390 -2,135
Partner Contribution -65,350 -75,075 -62,788 -66,814 -8,991 -8,299
Service User Contributions -26,710 -29,737 -4,143 -4,501
Better Care Fund -36,721 -37,130 0 0
Other External
Contribution -2,186 -1,684 -1,193 0
Other Income -1,341 -2,394 0 -1,093
Total Gross Income -208,757 -227,244 -151,131 -158,556 -11,381 -10,434
*Note that the Authority's Contribution to the Adults with Care and Support Needs Pool 2018/19 includes £1.802m (£1.802m in 2017/18) which is passported to the Mental
Health Provider Pool and forms part of the Authority's total contribution of £2.135m (£2.390m in 2017/18).
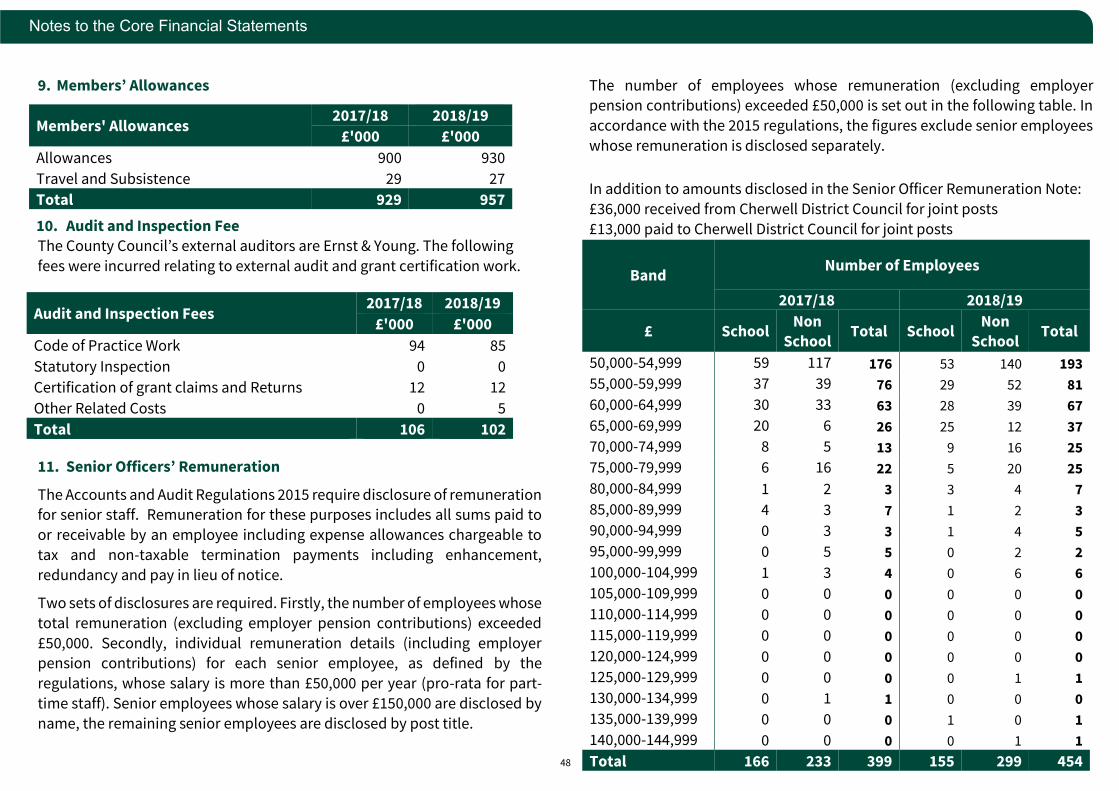
48
Notes to the Core Financial Statements
9. Members’ Allowances
10. Audit and Inspection Fee The County Council’s external auditors are Ernst & Young. The following
fees were incurred relating to external audit and grant certification work.
11. Senior Officers’ Remuneration
The Accounts and Audit Regulations 2015 require disclosure of remuneration for senior staff. Remuneration for these purposes includes all sums paid to
or receivable by an employee including expense allowances chargeable to
tax and non-taxable termination payments including enhancement,
redundancy and pay in lieu of notice.
Two sets of disclosures are required. Firstly, the number of employees whose
total remuneration (excluding employer pension contributions) exceeded
£50,000. Secondly, individual remuneration details (including employer pension contributions) for each senior employee, as defined by the
regulations, whose salary is more than £50,000 per year (pro-rata for part-
time staff). Senior employees whose salary is over £150,000 are disclosed by
name, the remaining senior employees are disclosed by post title.
The number of employees whose remuneration (excluding employer pension contributions) exceeded £50,000 is set out in the following table. In
accordance with the 2015 regulations, the figures exclude senior employees
whose remuneration is disclosed separately.
In addition to amounts disclosed in the Senior Officer Remuneration Note:
£36,000 received from Cherwell District Council for joint posts
£13,000 paid to Cherwell District Council for joint posts
Band Number of Employees
2017/18 2018/19
£ School Non
School Total School
Non School
Total
50,000-54,999 59 117 176 53 140 193
55,000-59,999 37 39 76 29 52 81
60,000-64,999 30 33 63 28 39 67
65,000-69,999 20 6 26 25 12 37
70,000-74,999 8 5 13 9 16 25
75,000-79,999 6 16 22 5 20 25
80,000-84,999 1 2 3 3 4 7
85,000-89,999 4 3 7 1 2 3
90,000-94,999 0 3 3 1 4 5
95,000-99,999 0 5 5 0 2 2
100,000-104,999 1 3 4 0 6 6
105,000-109,999 0 0 0 0 0 0
110,000-114,999 0 0 0 0 0 0
115,000-119,999 0 0 0 0 0 0
120,000-124,999 0 0 0 0 0 0
125,000-129,999 0 0 0 0 1 1
130,000-134,999 0 1 1 0 0 0
135,000-139,999 0 0 0 1 0 1
140,000-144,999 0 0 0 0 1 1
Total 166 233 399 155 299 454
Audit and Inspection Fees 2017/18 2018/19
£'000 £'000
Code of Practice Work 94 85
Statutory Inspection 0 0
Certification of grant claims and Returns 12 12
Other Related Costs 0 5
Total 106 102
Members' Allowances 2017/18 2018/19
£'000 £'000
Allowances 900 930
Travel and Subsistence 29 27
Total 929 957

49
Notes to the Core Financial Statements
The Chief Executive (*), Assistant Chief Executive (*) and the Director of Law and Governance (**) are joint posts under the Partnership Agreement with
Cherwell District Council. The Chief Executive and Assistant Chief Executive are employed by Cherwell District Council and the County Council is charged a
share of their salary costs. This share is 61.2% and 70% respectively. The Director of Law and Governance is employed by the County Council and a charge is
made to Cherwell District Council for 20% of the salary costs.
£ £ £ £ £ £ £
Chief Executive - Yvonne Rees (from Oct 2018)* 74,817 74,817
Chief Executive - Peter Clark (to Sept 2019) 185,347 0 154,048 339,394 17,761 357,155 357,155 0
Strategic Director for People & Director for Public
Health - (to Jan 2019) 138,357 0 0 138,357 16,797 155,154 155,154
Director for Children's Services 128,775 0 0 128,775 25,626 154,401 154,401
Director for Adult Services 128,775 0 0 128,775 25,626 154,401 154,401
Deputy Director for Public Health
(Interim Director from Feb 2019) 110,370 0 0 110,370 15,783 126,153 126,153
Strategic Director for Communities 144,228 0 0 144,228 28,701 172,929 172,929
Director for Planning and Place 115,600 0 0 115,600 23,004 138,604 138,604
Director for Infrastructure Delivery 115,600 0 0 115,600 23,004 138,604 138,604
Director for Property, Assets and Investment 102,421 0 0 102,421 21,273 123,694 123,694
Director for Community Safety
and Chief Fire Officer 137,799 0 0 137,799 29,902 167,702 167,702
Strategic Director of Resources (Interim)
and Director of Law & Governance** 132,149 0 0 132,149 26,298 158,446 -13,954 144,492
Director of Finance 126,109 0 0 126,109 25,096 151,205 151,205 0
Assistant Chief Executive (Interim from Nov 2018)* 43,969 43,969
Total 1,565,529 0 154,048 1,719,576 278,872 1,998,448 104,832 2,103,280
Compensation
for Loss of
Employment
Salary
(Including Fees
& Allowances)
Expense
Allowances
and Other
Emoluments
2018/19
Post Holder Information
Total
Remuneration
Excluding Pension
Contributions
Employers
Pension
Contribution
Total
Remuneration
Including
Pension
Contributions
Cost to
Oxfordshire
County Council
Contribution to
(+) from (-)
Cherwell
District Council
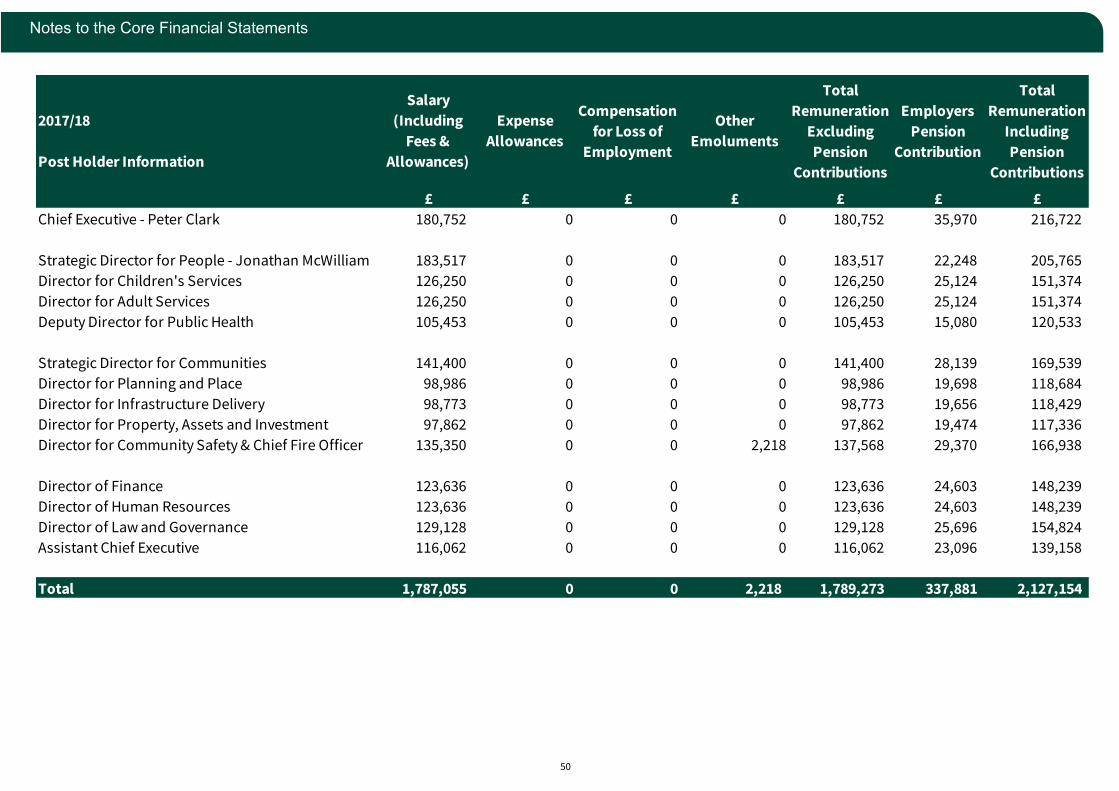
50
Notes to the Core Financial Statements
£ £ £ £ £ £ £
Chief Executive - Peter Clark 180,752 0 0 0 180,752 35,970 216,722
Strategic Director for People - Jonathan McWilliam 183,517 0 0 0 183,517 22,248 205,765
Director for Children's Services 126,250 0 0 0 126,250 25,124 151,374
Director for Adult Services 126,250 0 0 0 126,250 25,124 151,374
Deputy Director for Public Health 105,453 0 0 0 105,453 15,080 120,533
Strategic Director for Communities 141,400 0 0 0 141,400 28,139 169,539
Director for Planning and Place 98,986 0 0 0 98,986 19,698 118,684
Director for Infrastructure Delivery 98,773 0 0 0 98,773 19,656 118,429
Director for Property, Assets and Investment 97,862 0 0 0 97,862 19,474 117,336
Director for Community Safety & Chief Fire Officer 135,350 0 0 2,218 137,568 29,370 166,938
Director of Finance 123,636 0 0 0 123,636 24,603 148,239
Director of Human Resources 123,636 0 0 0 123,636 24,603 148,239
Director of Law and Governance 129,128 0 0 0 129,128 25,696 154,824
Assistant Chief Executive 116,062 0 0 0 116,062 23,096 139,158
Total 1,787,055 0 0 2,218 1,789,273 337,881 2,127,154
Employers
Pension
Contribution
Total
Remuneration
Including
Pension
Contributions
2017/18
Post Holder Information
Salary
(Including
Fees &
Allowances)
Expense
Allowances
Compensation
for Loss of
Employment
Other
Emoluments
Total
Remuneration
Excluding
Pension
Contributions
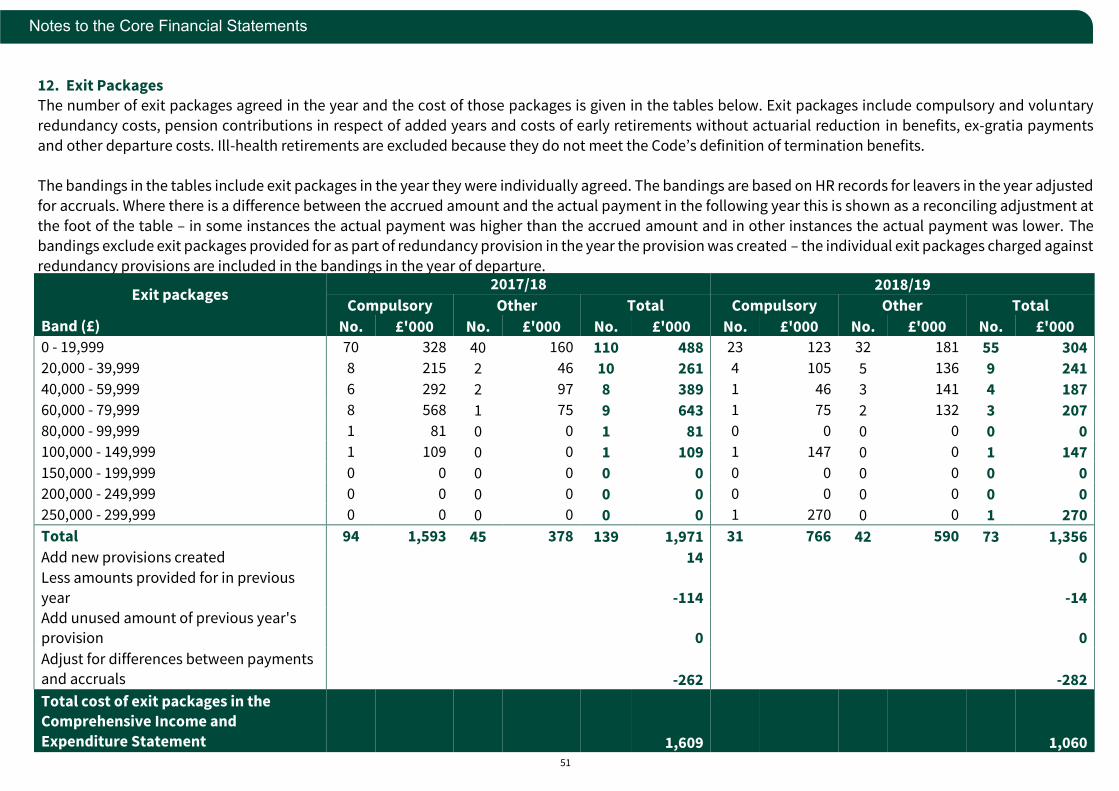
51
Notes to the Core Financial Statements
12. Exit Packages The number of exit packages agreed in the year and the cost of those packages is given in the tables below. Exit packages include compulsory and voluntary
redundancy costs, pension contributions in respect of added years and costs of early retirements without actuarial reduction in benefits, ex-gratia payments
and other departure costs. Ill-health retirements are excluded because they do not meet the Code’s definition of termination benefits.
The bandings in the tables include exit packages in the year they were individually agreed. The bandings are based on HR records for leavers in the year adjusted
for accruals. Where there is a difference between the accrued amount and the actual payment in the following year this is shown as a reconciling adjustment at
the foot of the table – in some instances the actual payment was higher than the accrued amount and in other instances the actual payment was lower. The bandings exclude exit packages provided for as part of redundancy provision in the year the provision was created – the individual exit packages charged against
redundancy provisions are included in the bandings in the year of departure.
Exit packages 2017/18 2018/19
Compulsory Other Total Compulsory Other Total
Band (£) No. £'000 No. £'000 No. £'000 No. £'000 No. £'000 No. £'000
0 - 19,999 70 328 40 160 110 488 23 123 32 181 55 304
20,000 - 39,999 8 215 2 46 10 261 4 105 5 136 9 241
40,000 - 59,999 6 292 2 97 8 389 1 46 3 141 4 187
60,000 - 79,999 8 568 1 75 9 643 1 75 2 132 3 207
80,000 - 99,999 1 81 0 0 1 81 0 0 0 0 0 0
100,000 - 149,999 1 109 0 0 1 109 1 147 0 0 1 147
150,000 - 199,999 0 0 0 0 0 0 0 0 0 0 0 0
200,000 - 249,999 0 0 0 0 0 0 0 0 0 0 0 0
250,000 - 299,999 0 0 0 0 0 0 1 270 0 0 1 270
Total 94 1,593 45 378 139 1,971 31 766 42 590 73 1,356
Add new provisions created 14 0
Less amounts provided for in previous
year
-114
-14
Add unused amount of previous year's provision
0
0
Adjust for differences between payments and accruals
-262
-282
Total cost of exit packages in the Comprehensive Income and
Expenditure Statement
1,609
1,060
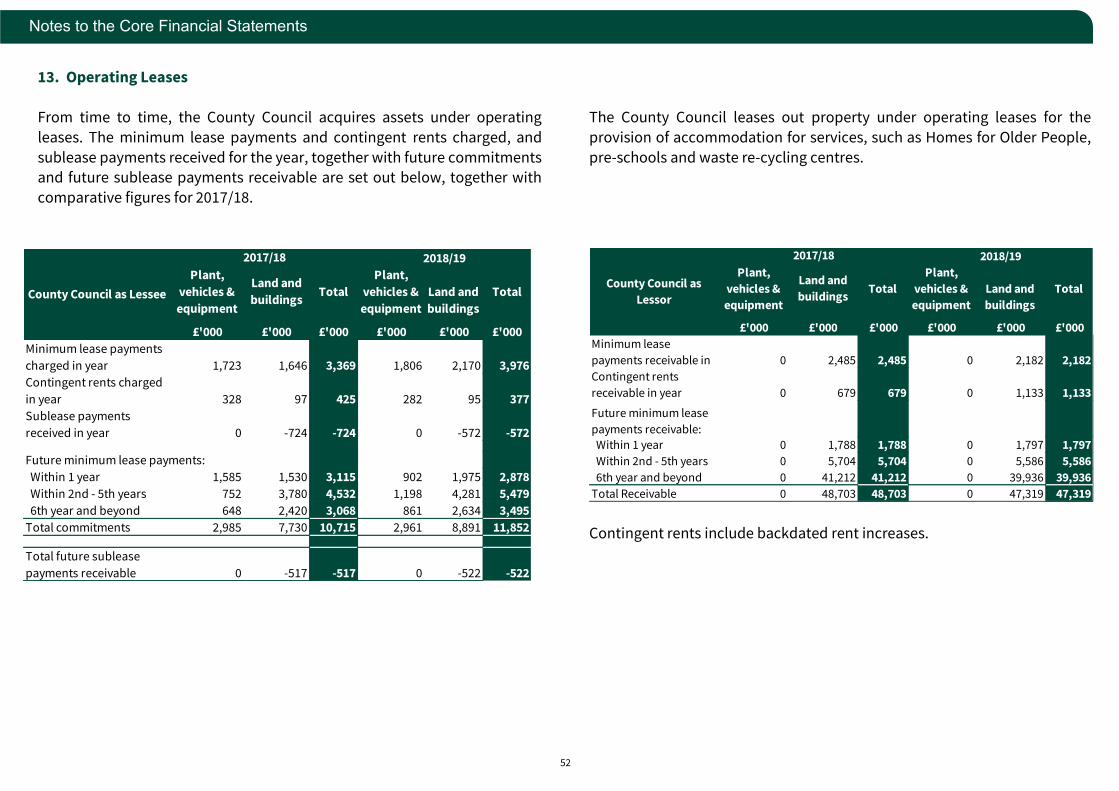
52
Notes to the Core Financial Statements
13. Operating Leases
From time to time, the County Council acquires assets under operating
leases. The minimum lease payments and contingent rents charged, and
sublease payments received for the year, together with future commitments and future sublease payments receivable are set out below, together with
comparative figures for 2017/18.
The County Council leases out property under operating leases for the
provision of accommodation for services, such as Homes for Older People,
pre-schools and waste re-cycling centres.
Contingent rents include backdated rent increases.
Plant,
vehicles &
equipment
Land and
buildingsTotal
Plant,
vehicles &
equipment
Land and
buildings
Total
£'000 £'000 £'000 £'000 £'000 £'000
Minimum lease
payments receivable in 0 2,485 2,485 0 2,182 2,182
Contingent rents
receivable in year 0 679 679 0 1,133 1,133
Future minimum lease
payments receivable:
Within 1 year 0 1,788 1,788 0 1,797 1,797
Within 2nd - 5th years 0 5,704 5,704 0 5,586 5,586
6th year and beyond 0 41,212 41,212 0 39,936 39,936
Total Receivable 0 48,703 48,703 0 47,319 47,319
2018/19
County Council as
Lessor
2017/18
Plant,
vehicles &
equipment
Land and
buildingsTotal
Plant,
vehicles &
equipment
Land and
buildings
Total
£'000 £'000 £'000 £'000 £'000 £'000
Minimum lease payments
charged in year 1,723 1,646 3,369 1,806 2,170 3,976
Contingent rents charged
in year 328 97 425 282 95 377
Sublease payments
received in year 0 -724 -724 0 -572 -572
Future minimum lease payments:
Within 1 year 1,585 1,530 3,115 902 1,975 2,878
Within 2nd - 5th years 752 3,780 4,532 1,198 4,281 5,479
6th year and beyond 648 2,420 3,068 861 2,634 3,495
Total commitments 2,985 7,730 10,715 2,961 8,891 11,852
Total future sublease
payments receivable 0 -517 -517 0 -522 -522
County Council as Lessee
2017/18 2018/19
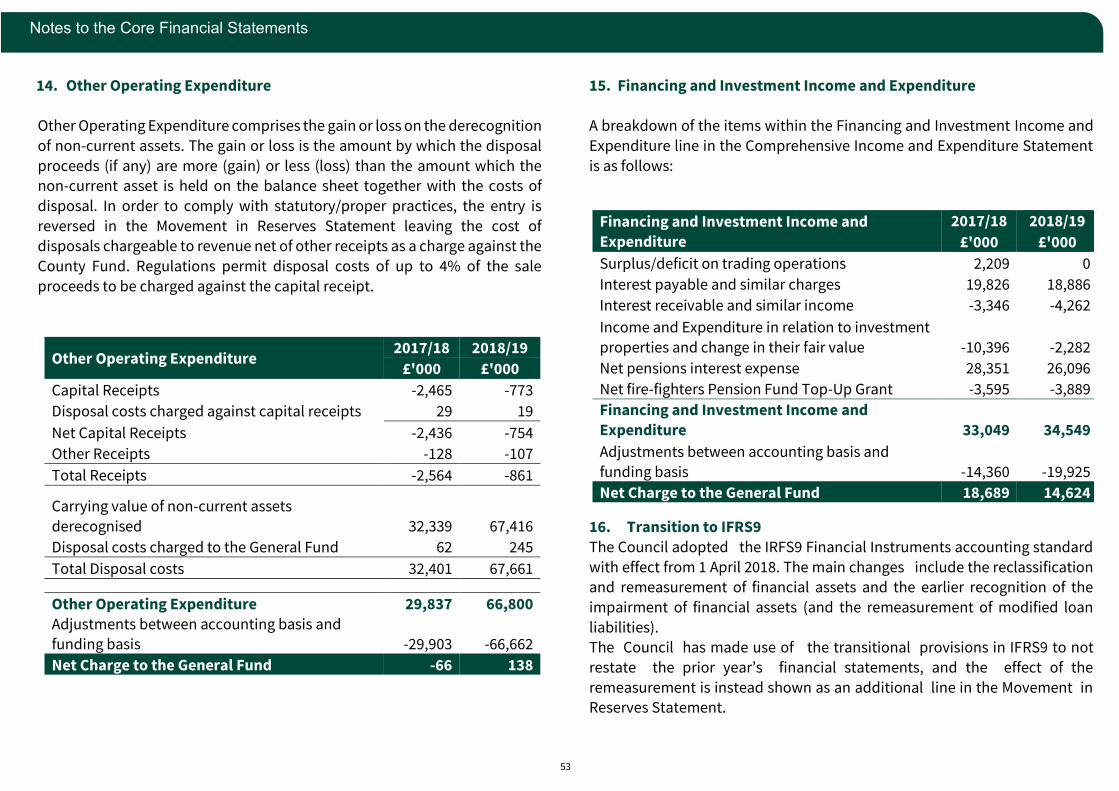
53
Notes to the Core Financial Statements
14. Other Operating Expenditure
Other Operating Expenditure comprises the gain or loss on the derecognition
of non-current assets. The gain or loss is the amount by which the disposal
proceeds (if any) are more (gain) or less (loss) than the amount which the non-current asset is held on the balance sheet together with the costs of
disposal. In order to comply with statutory/proper practices, the entry is
reversed in the Movement in Reserves Statement leaving the cost of disposals chargeable to revenue net of other receipts as a charge against the
County Fund. Regulations permit disposal costs of up to 4% of the sale
proceeds to be charged against the capital receipt.
15. Financing and Investment Income and Expenditure
A breakdown of the items within the Financing and Investment Income and
Expenditure line in the Comprehensive Income and Expenditure Statement
is as follows:
16. Transition to IFRS9
The Council adopted the IRFS9 Financial Instruments accounting standard
with effect from 1 April 2018. The main changes include the reclassification
and remeasurement of financial assets and the earlier recognition of the
impairment of financial assets (and the remeasurement of modified loan
liabilities). The Council has made use of the transitional provisions in IFRS9 to not
restate the prior year’s financial statements, and the effect of the
remeasurement is instead shown as an additional line in the Movement in Reserves Statement.
Other Operating Expenditure 2017/18 2018/19
£'000 £'000
Capital Receipts -2,465 -773
Disposal costs charged against capital receipts 29 19
Net Capital Receipts -2,436 -754
Other Receipts -128 -107
Total Receipts -2,564 -861
Carrying value of non-current assets
derecognised 32,339 67,416
Disposal costs charged to the General Fund 62 245
Total Disposal costs 32,401 67,661
Other Operating Expenditure 29,837 66,800
Adjustments between accounting basis and funding basis -29,903 -66,662
Net Charge to the General Fund -66 138
Financing and Investment Income and
Expenditure
2017/18 2018/19
£'000 £'000
Surplus/deficit on trading operations 2,209 0
Interest payable and similar charges 19,826 18,886
Interest receivable and similar income -3,346 -4,262
Income and Expenditure in relation to investment
properties and change in their fair value -10,396 -2,282
Net pensions interest expense 28,351 26,096
Net fire-fighters Pension Fund Top-Up Grant -3,595 -3,889
Financing and Investment Income and
Expenditure 33,049 34,549
Adjustments between accounting basis and
funding basis -14,360 -19,925
Net Charge to the General Fund 18,689 14,624

54
Notes to the Core Financial Statements
IAS 39
31 March 2018 Reclassification Remeasurement Impairment
IFRS 9 1 April 2019
£'000 £'000 £'000 £'000 £'000
Financial Assets
Investments
Loans & Receivables /Amortised cost 283,632 0 0 0 283,632
Available for sale 57,687 -57,687 0 0 0
Fair Value through Other Comprehensive Income 0 0 0 0 0
Fair Value Through Profit and Loss 10,038 57,687 0 0 67,725
Total investments 351,357 0 0 0 351,357
Debtors
Loans & Receivables /Amortised cost 28,638 -208 28,430
Total debtors 28,638 0 0 -208 28,430
Cash & cash equivalents
Loans & Receivables /Amortised cost -1,991 -1,991
Available for sale 26,655 -26,655 0 0
Fair Value Through Profit and Loss 0 26,655 0 26,655
Total cash & equivalents 24,664 0 0 0 24,664
Total Financial Assets 404,659 0 0 -208 404,451
Financial Liabilities
Borrowing
Amortised cost -372,652 0 0 0 -372,652
Creditors
Amortised cost -65,661 0 0 0 -65,661
Other long-term liabilities
Amortised cost -18,472 0 0 0 -18,472
Total Financial Liabilities -456,785 0 0 0 -456,785
Net Financial Assets -52,126 0 0 -208 -52,334
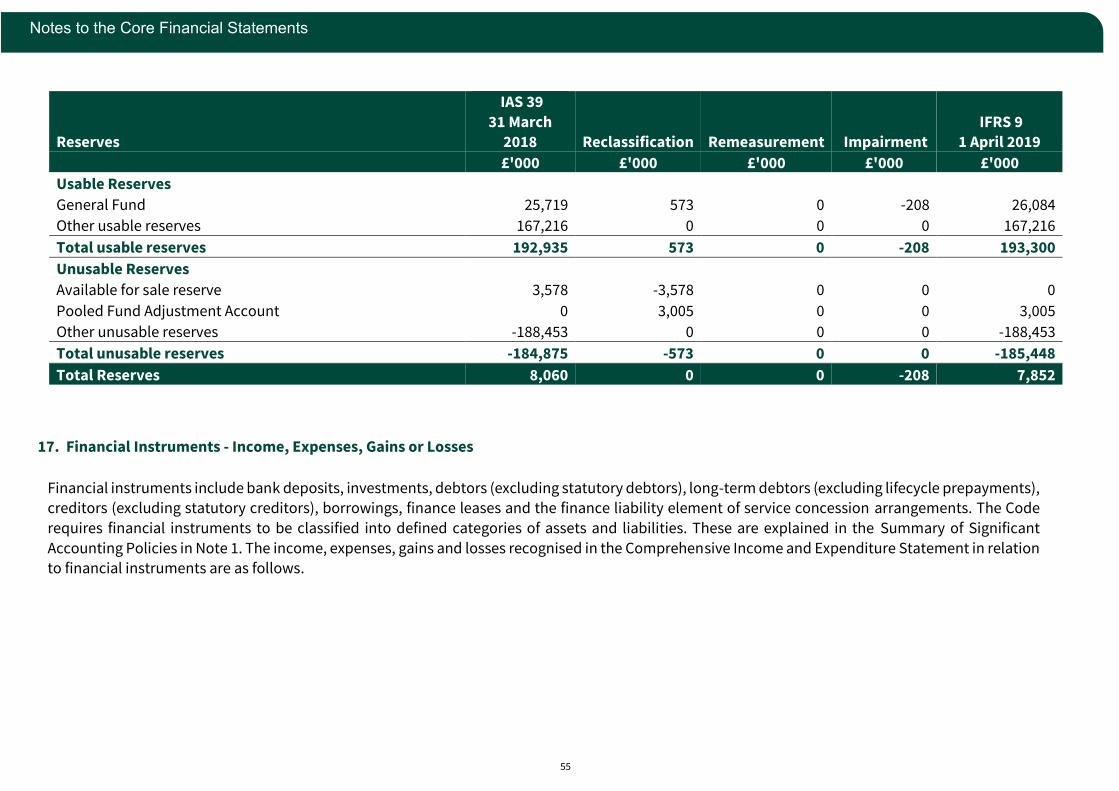
55
Notes to the Core Financial Statements
17. Financial Instruments - Income, Expenses, Gains or Losses
Reserves
IAS 39
31 March 2018
Reclassification
Remeasurement Impairment
IFRS 9 1 April 2019
£'000 £'000 £'000 £'000 £'000
Usable Reserves
General Fund 25,719 573 0 -208 26,084
Other usable reserves 167,216 0 0 0 167,216
Total usable reserves 192,935 573 0 -208 193,300
Unusable Reserves
Available for sale reserve 3,578 -3,578 0 0 0
Pooled Fund Adjustment Account 0 3,005 0 0 3,005
Other unusable reserves -188,453 0 0 0 -188,453
Total unusable reserves -184,875 -573 0 0 -185,448
Total Reserves 8,060 0 0 -208 7,852
Financial instruments include bank deposits, investments, debtors (excluding statutory debtors), long-term debtors (excluding lifecycle prepayments), creditors (excluding statutory creditors), borrowings, finance leases and the finance liability element of service concession arrangements. The Code
requires financial instruments to be classified into defined categories of assets and liabilities. These are explained in the Summary of Significant
Accounting Policies in Note 1. The income, expenses, gains and losses recognised in the Comprehensive Income and Expenditure Statement in relation to financial instruments are as follows.

56
Notes to the Core Financial Statements
2017/18 2017/18 2018/19 2018/19
Financial
Liabilities
Financial Assets
Total
Financial
Liabilities
Financial Assets
Total
Liabilities at
amortised
cost
Loans and
Receivables
Available
for sale
assets
Assets at
fair value
through
profit and
loss
Liabilities
at
amortised
cost
Assets at
amortised
cost
Assets at fair
value through
Other
Comprehensive
Income
Assets at
fair value
through
profit
and loss
£'000 £'000 £'000 £'000 £'000 £'000 £'000 £'000 £'000 £'000
19,388 19,388 Interest Expense 18,183 18,183
0 Reductions in fair value 0
439 439 Impairment Losses 911 911
182 182 Fee expense 0 178 178
19,388 439 182 0 20,009
Total expense in Surplus or
Deficit on the Provision of
Services 18,183 911 0 178 19,271
0
-2,216 -2,216 Interest Income -3,960 -3,960
0
Interest income accrued on
impaired financial assets 0
0 Increases in fair value 0 -301 -301
-1,130 -1,130 Gain/losses on derecognition 0 0 0
0 Fee income 0
0 -2,216 -1,130 0 -3,346 Total income in Surplus or Deficit
on the Provision of Services 0 -3,960 0 -301 -4,262
-1,316 -1,316 Gain/losses on revaluation 0 0
0 Amounts recycled to the Surplus or
Deficit on the Provision of Services 0
0 0 -1,316 0 -1,316
Surplus / deficit arising on
revaluation of financial assets in
Other Comprehensive Income and
Expenditure 0 0 0 0 0
15,347 Net gain (-) / loss (+) for the year 15,009
57
Notes to the Core Financial Statements
18. Retirement Benefits
As part of the terms and conditions of employment of its employees, the
County Council offers retirement benefits. Although these benefits will not actually be payable until employees retire, the County Council has a
commitment to make the payments that need to be disclosed at the time
that employees earn their future entitlement.
The County Council participates in four pension schemes. Only a small
number of Public Health staff that transferred from the NHS when the service
became a County Council function in April 2013 participate in the NHS
Pension Scheme and this is therefore excluded from the disclosures below.
The Local Government Pension Scheme (LGPS) This is a defined benefit statutory scheme administered in accordance with
the Local Government Pension Scheme Regulations 2013 (as amended) and provides benefits based on final salary and length of service on retirement
(for benefits accrued up to 31 March 2014) and career average revalued
salary (for benefits accrued from 1 April 2014).
The County Council is the Administering Authority for the Fund. The Pension
Fund Committee oversees the management of the Fund whilst the day to day
fund administration is undertaken by teams within the County Council.
Where appropriate some functions are delegated to the Fund’s professional advisers. The accounts of the Oxfordshire Local Government Pension Fund
are set out on pages 141 onwards.
As Administering Authority to the Fund, the County Council, after consultation with the Fund Actuary (Hymans Robertson LLP) and other
relevant parties, is responsible for the preparation and maintenance of the
Funding Strategy Statement and the Statement of Investment Principles. These are amended when appropriate based on the Fund’s performance and
funding.
The LGPS is a funded scheme, meaning that the County Council and
employees pay contributions into a Fund, calculated at a level intended to balance the pension liabilities with investment assets. The County Council
may also grant additional benefits to LGPS members on retirement under the
Discretionary Payment Regulations which are not paid from the Fund – these are referred to as LGPS unfunded benefits below.
Employer contributions are set every 3 years as a result of the actuarial
valuation of the Fund required by regulations. The actuarial valuation at 31
March 2016 set the contribution rates for the period 1 April 2017 to 31 March 2020. There are no minimum funding requirements in the LGPS but the
contributions are generally set to target a funding level of 100% using the
actuarial valuation assumptions. The total contributions expected to be made by the County Council to the Local Government Pension Scheme
(LGPS) in 2019/20 are £31.126m for funded benefits (£27.516m was expected
for 2018/19). For 2018/19 the estimated duration of the County Council’s
liabilities is 16.7 years for funded benefits and 3-5 years for unfunded benefits
(16.7 years and 3-5 years respectively for 2017/18).
The County Council currently participates in the Oxfordshire County Council
pool with 40 other employers with admissions agreements in order to share experience of risks they are exposed to in the Fund. At the 2016 valuation, the
deficit on the whole pool was calculated and allocated to each employer,
along with the costs of future benefits of the combined membership of the pool, such that all employers within the pool shared the same overall
contribution rate. The next re-allocation will be carried out at the 2019
valuation, should the employer remain in the pool.
Should the County Council’s withdraw from the Fund, a cessation value
would be carried out in accordance with Regulation 64 of the LGPS
Regulations 2013 which would determine the termination contribution due
by the County Council, on a set of assumptions deemed appropriate by the Fund Actuary.
58
Notes to the Core Financial Statements
Curtailment costs arise as a result of the payment of unreduced pensions on
early retirement. The capitalised cost of the additional benefits relative to those reserved for under IAS19 is £0.040m for 2018/19 (£0.130m for 2017/18).
As a result of some members of the Oxfordshire Pension Fund transferring
to/from another employer over the year, liabilities have been settled at a cost different to the amount reserved for under IAS19. The capitalised gain of this
settlement is £3.319m (£2.823m for 2017/18).
The fire-fighters Pension Schemes There are five separate schemes relating to fire-fighters pensions – the 1992
scheme, the 2006 scheme, the 2015 scheme, the Retained Modified scheme
and the fire-fighters compensation scheme for injury benefits and ill health retirements. Each of these are defined benefit statutory schemes
administered in accordance with the Firefighters’ Pension Scheme
Regulations 2014 and Fire Pension Orders 1992 and 2006 and provide benefits based on final salary and length of service on retirement, other than
the 2015 scheme which provides benefits accrued from 1 April 2015 based on
career average revalued salaries.
The County Council is the Administering Authority for each of the schemes. The day to day administration is undertaken by teams within the County
Council. Where appropriate some functions are delegated to the schemes’
professional advisers.
The 1992, 2006, 2015 and the Retained Modified schemes are unfunded
schemes, meaning that there are no investment assets built up to meet the
pensions liabilities and cash has to be generated to meet actual pension payments as they fall due. The County Council and employees pay
contributions into a fund account and where these are not sufficient to meet
pension payments for the year, the deficit is met by central government top-
up grant. Any surplus in the pension fund in the year is paid back to central government. The Fire-fighters Pension Fund Accounts are set out at on pages
129 to 130. Employer contributions are set every four years as a result of the
combined actuarial valuation of the fire-fighters’ pension schemes required
by the Home Office on behalf of the Secretary of State. The contributions for the period from 1 April 2015 to 31 March 2019 were set by the actuarial
valuation at 31 March 2012. The actuarial valuation as at 31 March 2016 has
been completed and sets new rates from 1 April 2019.
The fire-fighters’ compensation scheme injury benefits and ill health
retirements are paid on a pay as you go basis. There are no assets held to
back the liabilities of the scheme.
For ease of presentation the figures for all the fire-fighters schemes have been combined within the tables in this note. Most of the firefighters defined
benefits liabilities relate to the 2015 scheme.
The total of contributions (including government top-up grant) and injury/ill health retirement benefit payments expected to be made by the County
Council in 2019/20 is £5.000m (£5.700m in 2018/19). The estimated duration
of the County Council’s combined liabilities for the fire-fighters’ scheme for 2018/19 is 18.7 years (18.2 years for 2017/18). There are no curtailments or
settlements to report relating to the fire-fighters pension schemes.
The Teachers’ Pension Scheme
This is a defined benefit scheme administered in accordance with the Teachers’ Pensions Regulations 2014 and provides benefits based on final
salary and length of service (for benefits accrued up to 31 March 2015) and
career average revalued salary (for benefits accrued from 1 April 2015). The Scheme is administered by Capita on behalf of the Department for
Education.
The Scheme is an unfunded pension scheme, in which payments from the
Scheme are funded by contributions from current employees and employers
with the difference between these contributions and Scheme expenditure
financed by the Exchequer.
59
Notes to the Core Financial Statements
The County Council contributes towards the costs of the scheme by making
contributions based on a percentage of members’ pensionable salaries as set by the Secretary of State for Education, taking advice from the Scheme’s
actuary. The employer contribution rate for 2018/19 was 16.48% (in 2017/18
16.48%). The total expected payments to beneficiaries for 2019/20 is £3.693m (£3.765m 2017/18).
The Teachers’ Pension Scheme is a defined benefit scheme, but because of
the way the scheme is centrally managed the County Council is unable to
identify its share of the underlying assets and liabilities of the scheme and it is therefore classified as a defined contribution scheme for accounting
purposes. Charges are included in the Surplus or Deficit in the Provision of
Services but there are no liabilities to disclose in the Balance Sheet with the exception of all pension payments relating to added years which the County
Council has awarded to teachers under the Discretionary Payment
Regulations. As the County Council is responsible for funding these added years payments on a pay as you go basis they are treated as a defined benefit
scheme.
The County Council is exposed to a number of risks from participating in the pension schemes accounted for as defined benefit schemes outlined above.
Risks common to all of the schemes are:
• Interest rate risk – the liabilities are assessed using market yields on high quality corporate bonds to discount the liabilities. Given the
volatile nature of market yields the yield on high quality corporate
bonds could fall leading to an increase in the liabilities.
• Inflation risk – the benefits are linked to inflation and so increased
costs may emerge if inflation is higher than expected.
• Longevity risk – in the event that the members live longer than
assumed more benefits will be paid out than expected. There are also other demographic risks.
As a funded scheme, the LGPS gives exposure to other additional risks:
• Investment risk – The Fund holds investment in asset classes, such as equities, which have volatile market values and while these assets
are expected to provide real returns over the long-term, the short-
term volatility can cause additional funding to be required if a deficit emerges.
• Interest rate risk – The Fund’s liabilities are assessed using market
yields on high quality corporate bonds to discount the liabilities. As
the Fund holds assets such as equities the value of assets and liabilities may not move in the same way.
• Inflation risk – deficits may emerge to the extent that the assets are
not linked to inflation.
In addition, as many unrelated employers participate in the Oxfordshire
County Council Pension Fund, there is an ‘orphan liability risk’ where
employers leave the Fund but with insufficient assets to cover their pension
obligations so that the difference may fall on the remaining employers.
All of the risks above may also benefit the County Council, for example higher than expected investment returns or employers leaving the funds with
excess assets which would eventually get inherited by the remaining
employers, market yields may rise or inflation be less than expected reducing the value of the liabilities and ongoing cost of benefit accrual.
The cost of retirement benefits arising from defined benefit schemes are
recognised in the Cost of Services when they are earned by employees rather than when the benefits are eventually paid as pensions. However, the charge
the County Council is required to make against the County Fund (and hence
Council Tax) is based on cash payable in the year so the real cost of pension
benefits is reversed out in the Movement in Reserves Statement. The
following table sets out the transactions that have been made in the
accounts:
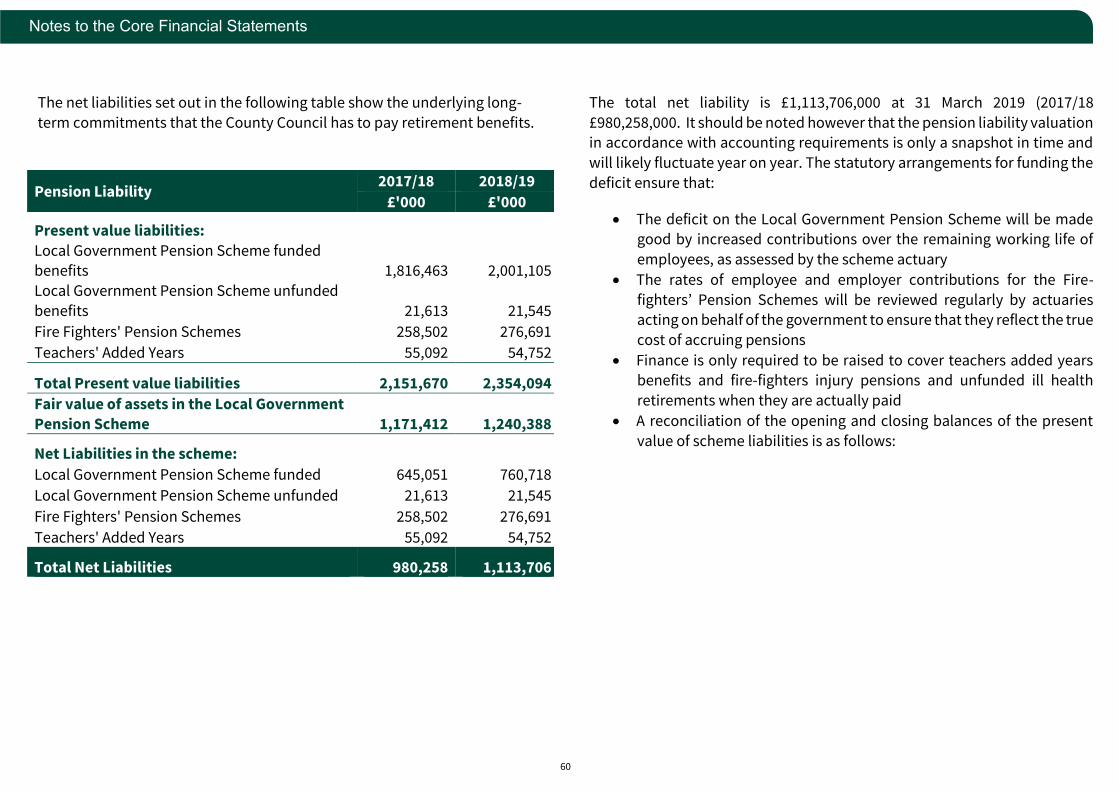
60
Notes to the Core Financial Statements
The net liabilities set out in the following table show the underlying long-
term commitments that the County Council has to pay retirement benefits.
The total net liability is £1,113,706,000 at 31 March 2019 (2017/18
£980,258,000. It should be noted however that the pension liability valuation in accordance with accounting requirements is only a snapshot in time and
will likely fluctuate year on year. The statutory arrangements for funding the
deficit ensure that:
• The deficit on the Local Government Pension Scheme will be made good by increased contributions over the remaining working life of
employees, as assessed by the scheme actuary
• The rates of employee and employer contributions for the Fire-
fighters’ Pension Schemes will be reviewed regularly by actuaries acting on behalf of the government to ensure that they reflect the true
cost of accruing pensions
• Finance is only required to be raised to cover teachers added years benefits and fire-fighters injury pensions and unfunded ill health
retirements when they are actually paid
• A reconciliation of the opening and closing balances of the present
value of scheme liabilities is as follows:
Local Government Pension Fire Fighters' Pension
Pension Liability 2017/18 2018/19
£'000 £'000
Present value liabilities:
Local Government Pension Scheme funded benefits 1,816,463 2,001,105
Local Government Pension Scheme unfunded
benefits 21,613 21,545
Fire Fighters' Pension Schemes 258,502 276,691
Teachers' Added Years 55,092 54,752
Total Present value liabilities 2,151,670 2,354,094
Fair value of assets in the Local Government
Pension Scheme 1,171,412 1,240,388
Net Liabilities in the scheme:
Local Government Pension Scheme funded 645,051 760,718
Local Government Pension Scheme unfunded 21,613 21,545
Fire Fighters' Pension Schemes 258,502 276,691
Teachers' Added Years 55,092 54,752
Total Net Liabilities 980,258 1,113,706
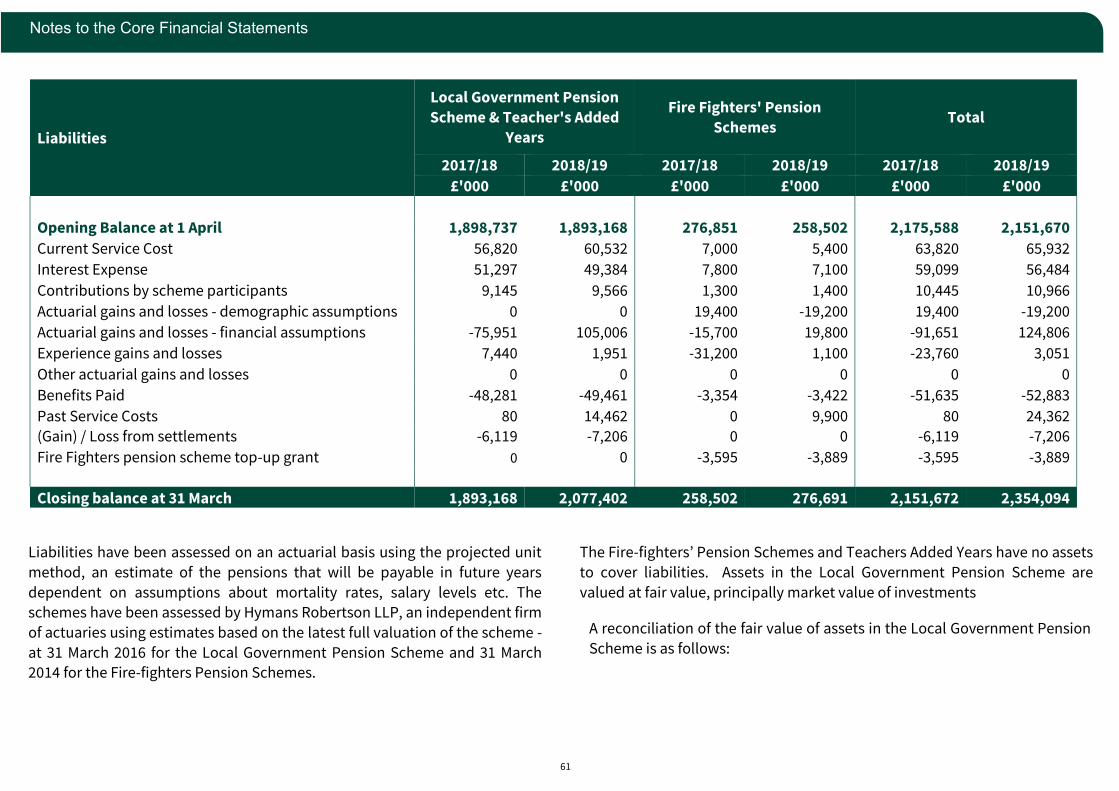
61
Notes to the Core Financial Statements
Liabilities have been assessed on an actuarial basis using the projected unit
method, an estimate of the pensions that will be payable in future years
dependent on assumptions about mortality rates, salary levels etc. The schemes have been assessed by Hymans Robertson LLP, an independent firm
of actuaries using estimates based on the latest full valuation of the scheme -
at 31 March 2016 for the Local Government Pension Scheme and 31 March 2014 for the Fire-fighters Pension Schemes.
The Fire-fighters’ Pension Schemes and Teachers Added Years have no assets
to cover liabilities. Assets in the Local Government Pension Scheme are
valued at fair value, principally market value of investments
A reconciliation of the fair value of assets in the Local Government Pension
Scheme is as follows:
Liabilities
Local Government Pension
Scheme & Teacher's Added
Years
Fire Fighters' Pension
Schemes Total
2017/18 2018/19 2017/18 2018/19 2017/18 2018/19
£'000 £'000 £'000 £'000 £'000 £'000
Opening Balance at 1 April 1,898,737 1,893,168 276,851 258,502 2,175,588 2,151,670
Current Service Cost 56,820 60,532 7,000 5,400 63,820 65,932
Interest Expense 51,297 49,384 7,800 7,100 59,099 56,484
Contributions by scheme participants 9,145 9,566 1,300 1,400 10,445 10,966
Actuarial gains and losses - demographic assumptions 0 0 19,400 -19,200 19,400 -19,200
Actuarial gains and losses - financial assumptions -75,951 105,006 -15,700 19,800 -91,651 124,806
Experience gains and losses 7,440 1,951 -31,200 1,100 -23,760 3,051
Other actuarial gains and losses 0 0 0 0 0 0
Benefits Paid -48,281 -49,461 -3,354 -3,422 -51,635 -52,883
Past Service Costs 80 14,462 0 9,900 80 24,362
(Gain) / Loss from settlements -6,119 -7,206 0 0 -6,119 -7,206
Fire Fighters pension scheme top-up grant 0 0 -3,595 -3,889 -3,595 -3,889
Closing balance at 31 March 1,893,168 2,077,402 258,502 276,691 2,151,672 2,354,094
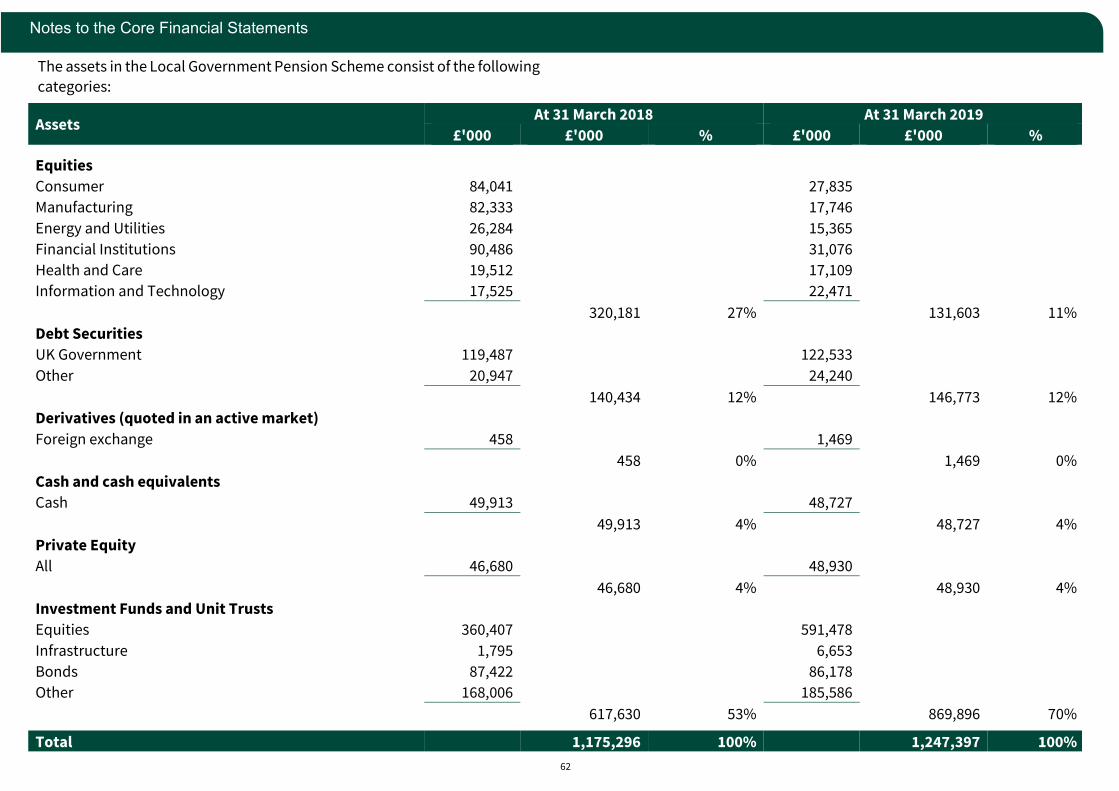
62
Notes to the Core Financial Statements
The assets in the Local Government Pension Scheme consist of the following
categories:
Assets At 31 March 2018 At 31 March 2019
£'000 £'000 % £'000 £'000 %
Equities
Consumer 84,041 27,835
Manufacturing 82,333 17,746
Energy and Utilities 26,284 15,365
Financial Institutions 90,486 31,076
Health and Care 19,512 17,109
Information and Technology 17,525 22,471
320,181 27% 131,603 11%
Debt Securities
UK Government 119,487 122,533
Other 20,947 24,240
140,434 12% 146,773 12%
Derivatives (quoted in an active market)
Foreign exchange 458 1,469
458 0% 1,469 0%
Cash and cash equivalents
Cash 49,913 48,727
49,913 4% 48,727 4%
Private Equity
All 46,680 48,930
46,680 4% 48,930 4%
Investment Funds and Unit Trusts
Equities 360,407 591,478
Infrastructure 1,795 6,653
Bonds 87,422 86,178
Other 168,006 185,586
617,630 53% 869,896 70%
Total 1,175,296 100% 1,247,397 100%
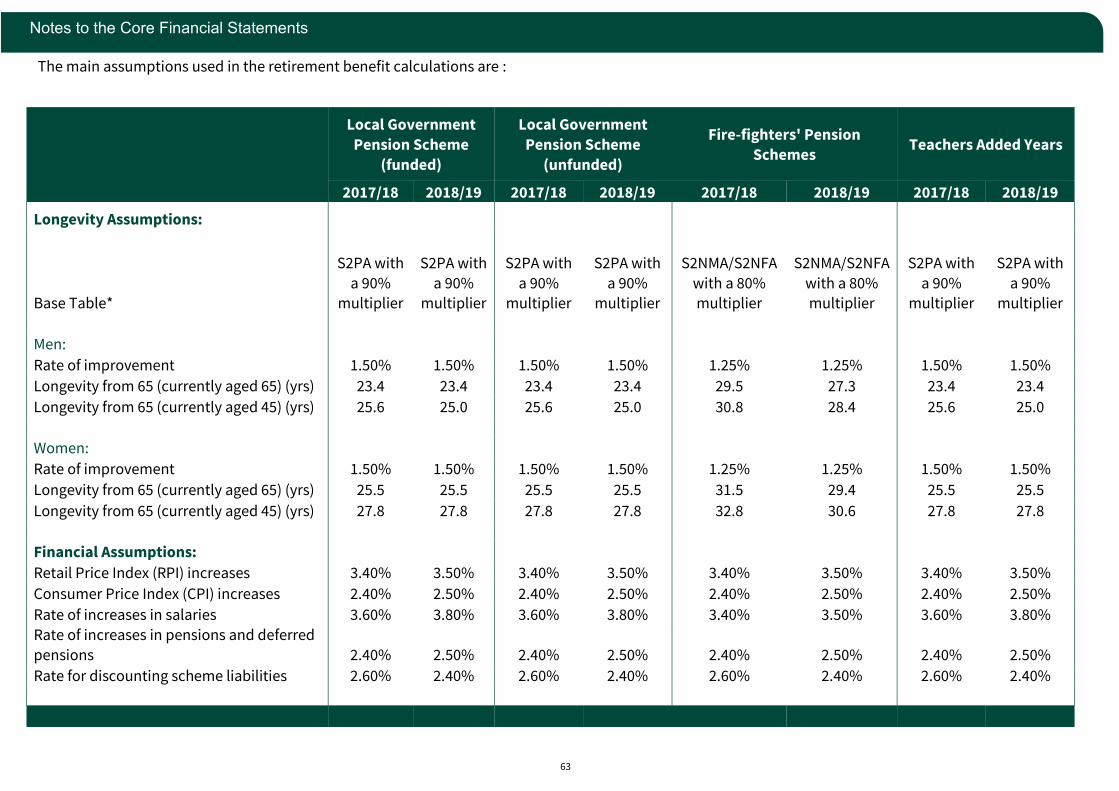
63
Notes to the Core Financial Statements
The main assumptions used in the retirement benefit calculations are :
Local Government
Pension Scheme
(funded)
Local Government
Pension Scheme
(unfunded)
Fire-fighters' Pension
Schemes Teachers Added Years
2017/18 2018/19 2017/18 2018/19 2017/18 2018/19 2017/18 2018/19
Longevity Assumptions:
Base Table*
S2PA with
a 90% multiplier
S2PA with
a 90% multiplier
S2PA with
a 90% multiplier
S2PA with
a 90% multiplier
S2NMA/S2NFA
with a 80% multiplier
S2NMA/S2NFA
with a 80% multiplier
S2PA with
a 90% multiplier
S2PA with
a 90% multiplier
Men:
Rate of improvement 1.50% 1.50% 1.50% 1.50% 1.25% 1.25% 1.50% 1.50%
Longevity from 65 (currently aged 65) (yrs) 23.4 23.4 23.4 23.4 29.5 27.3 23.4 23.4
Longevity from 65 (currently aged 45) (yrs) 25.6 25.0 25.6 25.0 30.8 28.4 25.6 25.0
Women:
Rate of improvement 1.50% 1.50% 1.50% 1.50% 1.25% 1.25% 1.50% 1.50%
Longevity from 65 (currently aged 65) (yrs) 25.5 25.5 25.5 25.5 31.5 29.4 25.5 25.5
Longevity from 65 (currently aged 45) (yrs) 27.8 27.8 27.8 27.8 32.8 30.6 27.8 27.8
Financial Assumptions:
Retail Price Index (RPI) increases 3.40% 3.50% 3.40% 3.50% 3.40% 3.50% 3.40% 3.50%
Consumer Price Index (CPI) increases 2.40% 2.50% 2.40% 2.50% 2.40% 2.50% 2.40% 2.50%
Rate of increases in salaries 3.60% 3.80% 3.60% 3.80% 3.40% 3.50% 3.60% 3.80%
Rate of increases in pensions and deferred
pensions 2.40% 2.50% 2.40% 2.50% 2.40% 2.50% 2.40% 2.50%
Rate for discounting scheme liabilities 2.60% 2.40% 2.60% 2.40% 2.60% 2.40% 2.60% 2.40%
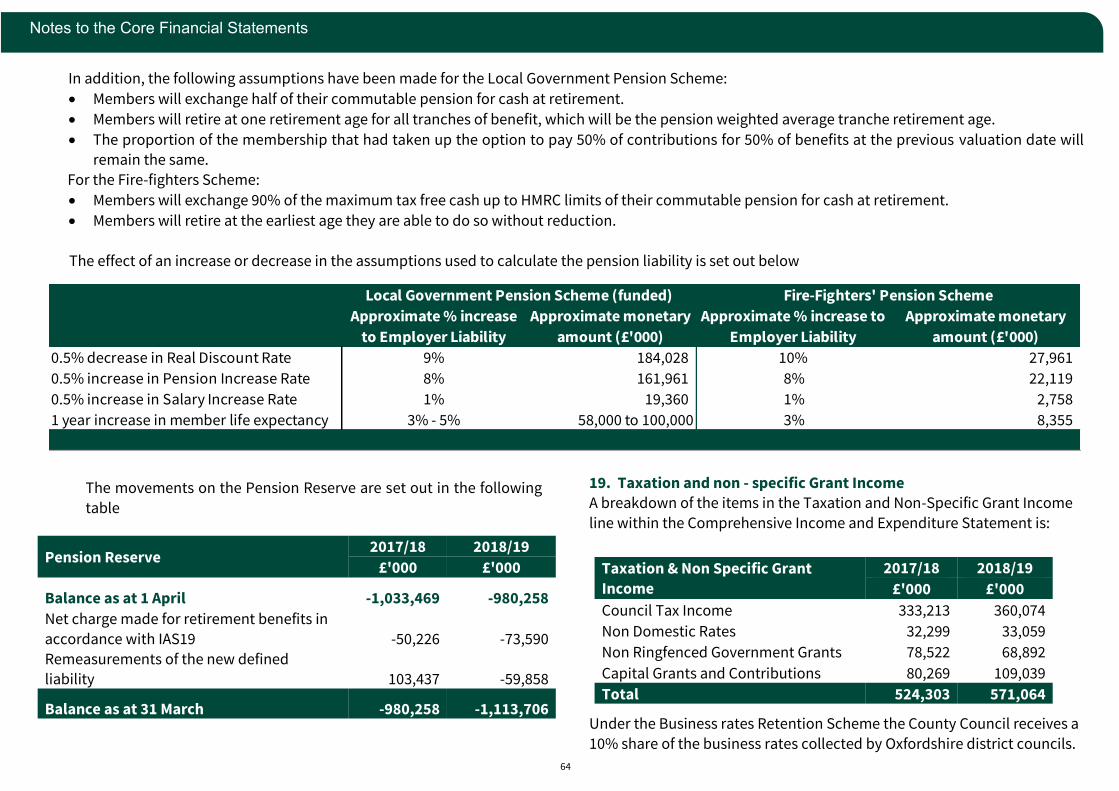
64
Notes to the Core Financial Statements
The movements on the Pension Reserve are set out in the following
table
Pension Reserve 2017/18 2018/19
£'000 £'000
Balance as at 1 April -1,033,469 -980,258
Net charge made for retirement benefits in
accordance with IAS19 -50,226 -73,590
Remeasurements of the new defined liability 103,437 -59,858
Balance as at 31 March -980,258 -1,113,706
19. Taxation and non - specific Grant Income A breakdown of the items in the Taxation and Non-Specific Grant Income
line within the Comprehensive Income and Expenditure Statement is:
Under the Business rates Retention Scheme the County Council receives a
10% share of the business rates collected by Oxfordshire district councils.
In addition, the following assumptions have been made for the Local Government Pension Scheme:
• Members will exchange half of their commutable pension for cash at retirement.
• Members will retire at one retirement age for all tranches of benefit, which will be the pension weighted average tranche retirement age.
• The proportion of the membership that had taken up the option to pay 50% of contributions for 50% of benefits at the previous valuation date will remain the same.
For the Fire-fighters Scheme:
• Members will exchange 90% of the maximum tax free cash up to HMRC limits of their commutable pension for cash at retirement.
• Members will retire at the earliest age they are able to do so without reduction.
The effect of an increase or decrease in the assumptions used to calculate the pension liability is set out below
Taxation & Non Specific Grant
Income
2017/18 2018/19
£'000 £'000
Council Tax Income 333,213 360,074
Non Domestic Rates 32,299 33,059
Non Ringfenced Government Grants 78,522 68,892
Capital Grants and Contributions 80,269 109,039
Total 524,303 571,064
Approximate % increase
to Employer Liability
Approximate monetary
amount (£'000)
Approximate % increase to
Employer Liability
Approximate monetary
amount (£'000)
0.5% decrease in Real Discount Rate 9% 184,028 10% 27,961
0.5% increase in Pension Increase Rate 8% 161,961 8% 22,119
0.5% increase in Salary Increase Rate 1% 19,360 1% 2,758
1 year increase in member life expectancy 3% - 5% 58,000 to 100,000 3% 8,355
Local Government Pension Scheme (funded) Fire-Fighters' Pension Scheme
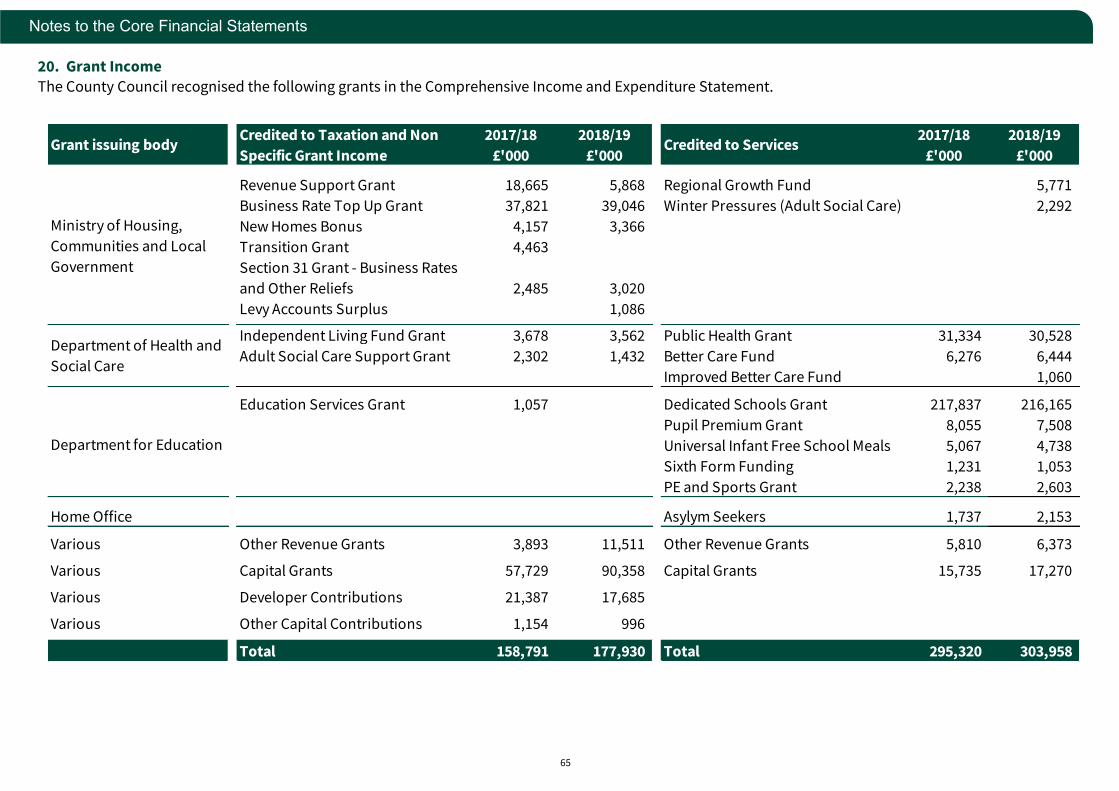
65
Notes to the Core Financial Statements
20. Grant Income
The County Council recognised the following grants in the Comprehensive Income and Expenditure Statement.
2017/18 2018/19 2017/18 2018/19
£'000 £'000 £'000 £'000
Revenue Support Grant 18,665 5,868 Regional Growth Fund 5,771
Business Rate Top Up Grant 37,821 39,046 Winter Pressures (Adult Social Care) 2,292
New Homes Bonus 4,157 3,366
Transition Grant 4,463
Section 31 Grant - Business Rates
and Other Reliefs 2,485 3,020
Levy Accounts Surplus 1,086
Independent Living Fund Grant 3,678 3,562 Public Health Grant 31,334 30,528
Adult Social Care Support Grant 2,302 1,432 Better Care Fund 6,276 6,444
Improved Better Care Fund 1,060
Education Services Grant 1,057 Dedicated Schools Grant 217,837 216,165
Pupil Premium Grant 8,055 7,508
Universal Infant Free School Meals 5,067 4,738
Sixth Form Funding 1,231 1,053
PE and Sports Grant 2,238 2,603
Home Office Asylym Seekers 1,737 2,153
Various Other Revenue Grants 3,893 11,511 Other Revenue Grants 5,810 6,373
Various Capital Grants 57,729 90,358 Capital Grants 15,735 17,270
Various Developer Contributions 21,387 17,685
Various Other Capital Contributions 1,154 996
Total 158,791 177,930 Total 295,320 303,958
Credited to Services
Department for Education
Grant issuing body
Ministry of Housing,
Communities and Local
Government
Credited to Taxation and Non
Specific Grant Income
Department of Health and
Social Care
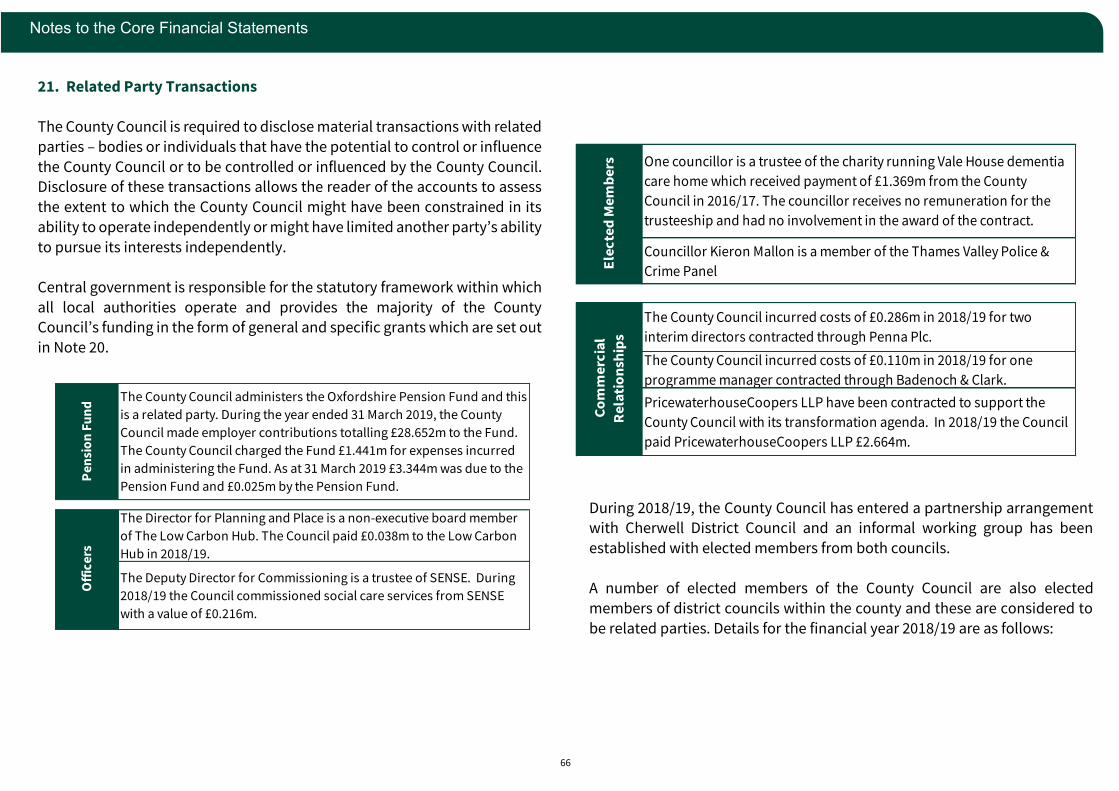
66
Notes to the Core Financial Statements
21. Related Party Transactions
The County Council is required to disclose material transactions with related
parties – bodies or individuals that have the potential to control or influence
the County Council or to be controlled or influenced by the County Council. Disclosure of these transactions allows the reader of the accounts to assess
the extent to which the County Council might have been constrained in its
ability to operate independently or might have limited another party’s ability
to pursue its interests independently.
Central government is responsible for the statutory framework within which
all local authorities operate and provides the majority of the County Council’s funding in the form of general and specific grants which are set out
in Note 20.
During 2018/19, the County Council has entered a partnership arrangement with Cherwell District Council and an informal working group has been
established with elected members from both councils.
A number of elected members of the County Council are also elected
members of district councils within the county and these are considered to
be related parties. Details for the financial year 2018/19 are as follows:
Co
mm
erc
ial
Re
lati
on
ship
s
The County Council incurred costs of £0.286m in 2018/19 for two
interim directors contracted through Penna Plc.
The County Council incurred costs of £0.110m in 2018/19 for one
programme manager contracted through Badenoch & Clark.
PricewaterhouseCoopers LLP have been contracted to support the
County Council with its transformation agenda. In 2018/19 the Council
paid PricewaterhouseCoopers LLP £2.664m.
Ele
cte
d M
em
be
rs One councillor is a trustee of the charity running Vale House dementia
care home which received payment of £1.369m from the County
Council in 2016/17. The councillor receives no remuneration for the
trusteeship and had no involvement in the award of the contract.
Councillor Kieron Mallon is a member of the Thames Valley Police &
Crime Panel
Pen
sio
n F
un
dO
ffic
ers
The Director for Planning and Place is a non-executive board member
of The Low Carbon Hub. The Council paid £0.038m to the Low Carbon
Hub in 2018/19.
The Deputy Director for Commissioning is a trustee of SENSE. During
2018/19 the Council commissioned social care services from SENSE
with a value of £0.216m.
The County Council administers the Oxfordshire Pension Fund and this
is a related party. During the year ended 31 March 2019, the County
Council made employer contributions totalling £28.652m to the Fund.
The County Council charged the Fund £1.441m for expenses incurred
in administering the Fund. As at 31 March 2019 £3.344m was due to the
Pension Fund and £0.025m by the Pension Fund.
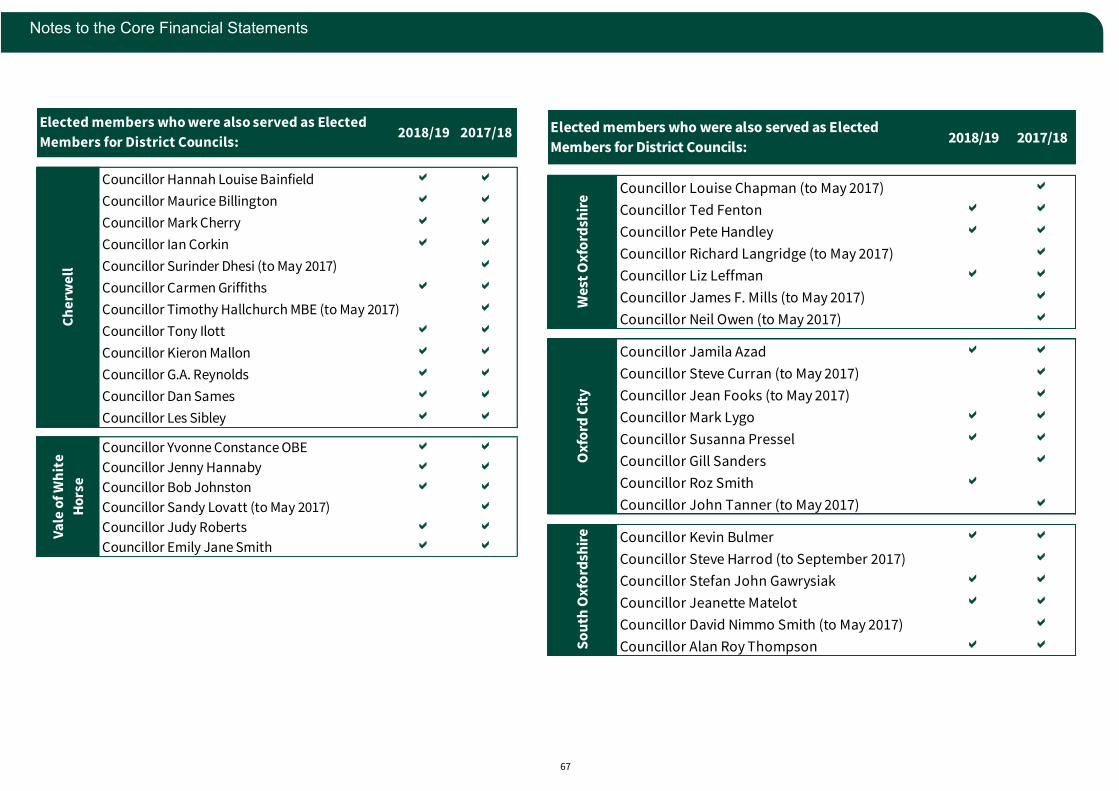
67
Notes to the Core Financial Statements
2018/19 2017/18
Councillor Louise Chapman (to May 2017)
Councillor Ted Fenton
Councillor Pete Handley
Councillor Richard Langridge (to May 2017)
Councillor Liz Leffman
Councillor James F. Mills (to May 2017)
Councillor Neil Owen (to May 2017)
Councillor Jamila Azad
Councillor Steve Curran (to May 2017)
Councillor Jean Fooks (to May 2017)
Councillor Mark Lygo
Councillor Susanna Pressel
Councillor Gill Sanders
Councillor Roz Smith
Councillor John Tanner (to May 2017)
Councillor Kevin Bulmer
Councillor Steve Harrod (to September 2017)
Councillor Stefan John Gawrysiak
Councillor Jeanette Matelot
Councillor David Nimmo Smith (to May 2017)
Councillor Alan Roy Thompson
Wes
t O
xfo
rdsh
ire
Oxf
ord
Cit
yS
ou
th O
xfo
rdsh
ire
Elected members who were also served as Elected
Members for District Councils:
2018/19 2017/18
Councillor Hannah Louise Bainfield
Councillor Maurice Billington
Councillor Mark Cherry
Councillor Ian Corkin
Councillor Surinder Dhesi (to May 2017)
Councillor Carmen Griffiths
Councillor Timothy Hallchurch MBE (to May 2017)
Councillor Tony Ilott
Councillor Kieron Mallon
Councillor G.A. Reynolds
Councillor Dan Sames
Councillor Les Sibley
Councillor Yvonne Constance OBE
Councillor Jenny Hannaby
Councillor Bob Johnston
Councillor Sandy Lovatt (to May 2017)
Councillor Judy Roberts
Councillor Emily Jane Smith
Ch
erw
ell
Va
le o
f W
hit
e
Ho
rse
Elected members who were also served as Elected
Members for District Councils:

68
Notes to the Core Financial Statements
22. Movement in the value of Property, Plant and Equipment
2018/19Other Land &
Buildings
Vehicles, Plant,
Furniture &
Equipment
Infrastructure
Assets
Surplus
Assets
Assets Under
Construction
Total
Property
Plant &
Equipment
Service
Concession
assets included
in PPE
£'000 £'000 £'000 £'000 £'000 £'000 £'000
Cost or valuation as at 1 April 584,191 113,475 604,952 3,484 28,318 1,334,421 30,856
Additions 2,890 2,192 31,807 14 18,852 55,755 1,872
Donation 0 0 0 0 0 0 0
Revaluation increases (decreases) recognised in the Revaluation Reserve 18,854 0 0 -2,065 0 16,789 0Revaluation increases (decreases) recognised in the Surplus / Deficit on the Provision
of Services 670 0 0 -684 0 -13 0
Derecognition - disposals 0 -179 0 0 0 -179 0
Derecognition - other -66,539 -3,977 0 0 -5,984 -76,500 -412
Assets reclassified to / from Held for Sale 0 0 0 0 0 0 0
Assets reclassified to / from Investment Properties 0 0 0 0 0 0 0
Assets reclassified to / from Intangible assets 0 0 0 0 0 0 0
Transfers * 82,368 -83,864 1,327 3,340 -3,172 0 0
Other movements in cost or valuation 0 0 0 0 0 0 0
Cost or valuation as at 31 March 622,435 27,647 638,086 4,090 38,014 1,330,272 32,315
Depreciation and Impairment as at 1 April -3,022 -20,829 -170,479 -4 0 -194,335 0
Depreciation charge -9,782 -2,860 -18,222 -38 0 -30,903 -467
Depreciation and impairment written out to the Revaluation Reserve 447 0 0 3 0 450 0Depreciation and impairment written out to the Surplus / Deficit on Provision of
Services 965 0 0 1 0 966 0
Impairment losses / (reversals) recognised in the Revaluation Reserve -637 0 0 -14 0 -651 0Impairment losses / (reversals) recognised in the Surplus / Deficit on Provision of
Services -64 0 0 0 0 -64 0
Derecognition - disposals 0 162 0 0 0 162 0
Derecognition - other 1,703 1,592 0 0 0 3,295 0
Assets reclassified to / from Held for Sale 0 0 0 0 0 0 0
Assets reclassified to / from Investment Properties 0 0 0 0 0 0 0
Transfers -8,747 8,738 0 8 0 0 0
Other movements in depreciation and impairment 0 0 0 0 0 0 0
Depreciation and impairment as at 31 March -19,137 -13,197 -188,702 -43 0 -221,079 -467
Net book Value at 31 March 2018 581,169 92,647 434,473 3,480 28,318 1,140,086 30,856
Net book Value at 31 March 2019 603,297 14,451 449,385 4,047 38,014 1,109,194 31,849
* Componentisation threshold was increased to £8m in 2018/19 resulting in all of the Plant & Equipment, falling below the componentisation threshold, to be absorbed into the related building asset.
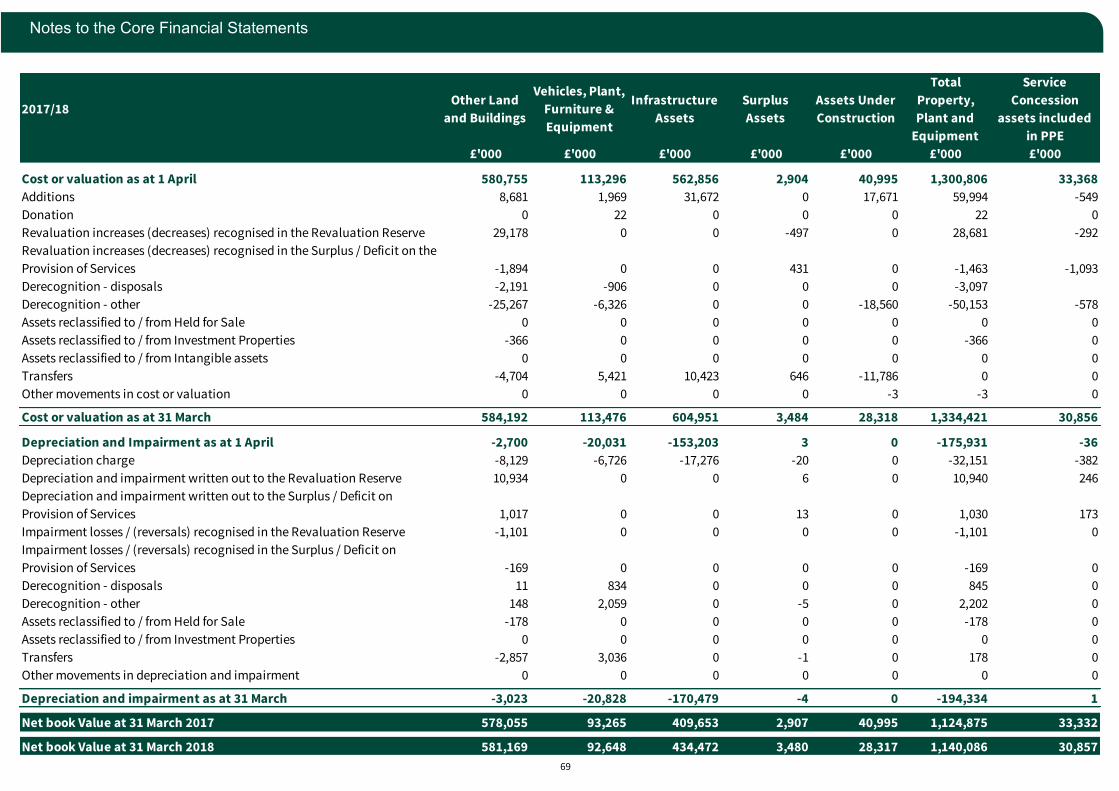
69
Notes to the Core Financial Statements
2017/18Other Land
and Buildings
Vehicles, Plant,
Furniture &
Equipment
Infrastructure
Assets
Surplus
Assets
Assets Under
Construction
Total
Property,
Plant and
Equipment
Service
Concession
assets included
in PPE
£'000 £'000 £'000 £'000 £'000 £'000 £'000
Cost or valuation as at 1 April 580,755 113,296 562,856 2,904 40,995 1,300,806 33,368
Additions 8,681 1,969 31,672 0 17,671 59,994 -549
Donation 0 22 0 0 0 22 0
Revaluation increases (decreases) recognised in the Revaluation Reserve 29,178 0 0 -497 0 28,681 -292
Revaluation increases (decreases) recognised in the Surplus / Deficit on the
Provision of Services -1,894 0 0 431 0 -1,463 -1,093
Derecognition - disposals -2,191 -906 0 0 0 -3,097
Derecognition - other -25,267 -6,326 0 0 -18,560 -50,153 -578
Assets reclassified to / from Held for Sale 0 0 0 0 0 0 0
Assets reclassified to / from Investment Properties -366 0 0 0 0 -366 0
Assets reclassified to / from Intangible assets 0 0 0 0 0 0 0
Transfers -4,704 5,421 10,423 646 -11,786 0 0
Other movements in cost or valuation 0 0 0 0 -3 -3 0
Cost or valuation as at 31 March 584,192 113,476 604,951 3,484 28,318 1,334,421 30,856
Depreciation and Impairment as at 1 April -2,700 -20,031 -153,203 3 0 -175,931 -36
Depreciation charge -8,129 -6,726 -17,276 -20 0 -32,151 -382
Depreciation and impairment written out to the Revaluation Reserve 10,934 0 0 6 0 10,940 246
Depreciation and impairment written out to the Surplus / Deficit on
Provision of Services 1,017 0 0 13 0 1,030 173
Impairment losses / (reversals) recognised in the Revaluation Reserve -1,101 0 0 0 0 -1,101 0
Impairment losses / (reversals) recognised in the Surplus / Deficit on
Provision of Services -169 0 0 0 0 -169 0
Derecognition - disposals 11 834 0 0 0 845 0
Derecognition - other 148 2,059 0 -5 0 2,202 0
Assets reclassified to / from Held for Sale -178 0 0 0 0 -178 0
Assets reclassified to / from Investment Properties 0 0 0 0 0 0 0
Transfers -2,857 3,036 0 -1 0 178 0
Other movements in depreciation and impairment 0 0 0 0 0 0 0
Depreciation and impairment as at 31 March -3,023 -20,828 -170,479 -4 0 -194,334 1
Net book Value at 31 March 2017 578,055 93,265 409,653 2,907 40,995 1,124,875 33,332
Net book Value at 31 March 2018 581,169 92,648 434,472 3,480 28,317 1,140,086 30,857
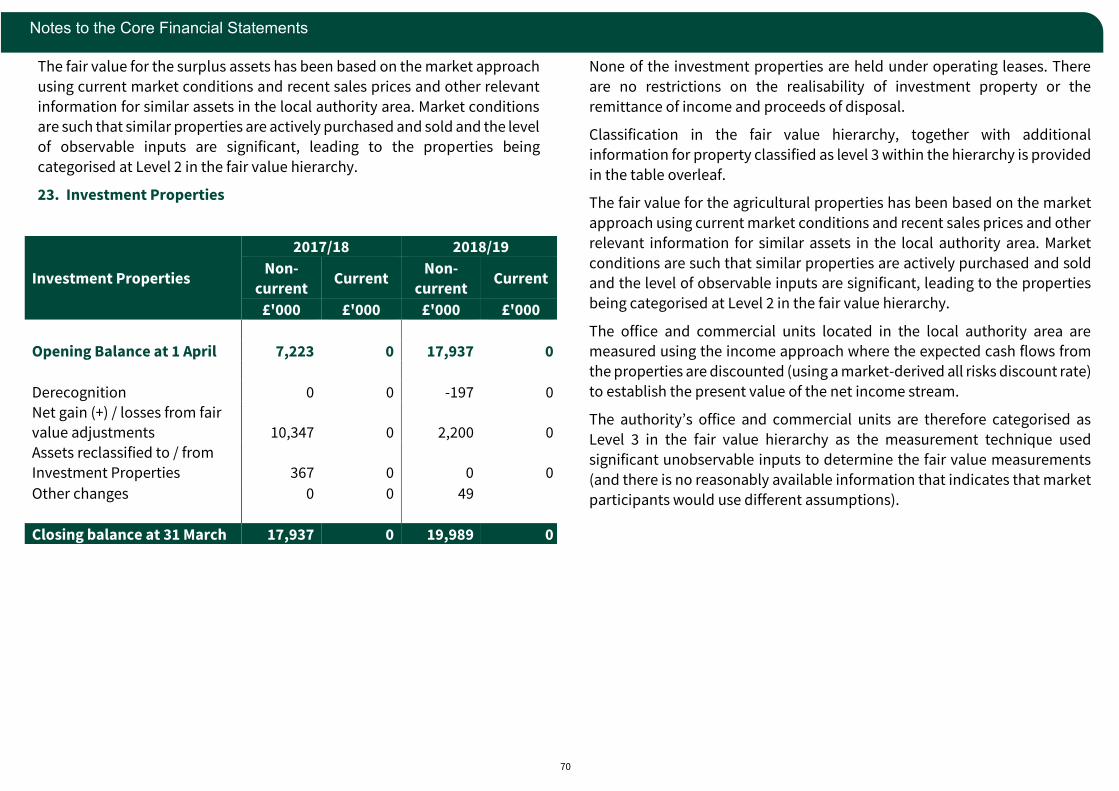
70
Notes to the Core Financial Statements
The fair value for the surplus assets has been based on the market approach
using current market conditions and recent sales prices and other relevant
information for similar assets in the local authority area. Market conditions are such that similar properties are actively purchased and sold and the level
of observable inputs are significant, leading to the properties being
categorised at Level 2 in the fair value hierarchy.
23. Investment Properties
None of the investment properties are held under operating leases. There
are no restrictions on the realisability of investment property or the
remittance of income and proceeds of disposal.
Classification in the fair value hierarchy, together with additional
information for property classified as level 3 within the hierarchy is provided
in the table overleaf.
The fair value for the agricultural properties has been based on the market
approach using current market conditions and recent sales prices and other
relevant information for similar assets in the local authority area. Market
conditions are such that similar properties are actively purchased and sold and the level of observable inputs are significant, leading to the properties
being categorised at Level 2 in the fair value hierarchy.
The office and commercial units located in the local authority area are measured using the income approach where the expected cash flows from
the properties are discounted (using a market-derived all risks discount rate)
to establish the present value of the net income stream.
The authority’s office and commercial units are therefore categorised as
Level 3 in the fair value hierarchy as the measurement technique used
significant unobservable inputs to determine the fair value measurements
(and there is no reasonably available information that indicates that market
participants would use different assumptions).
Investment Properties
2017/18 2018/19
Non-
current Current
Non-
current Current
£'000 £'000 £'000 £'000
Opening Balance at 1 April 7,223 0 17,937 0
Derecognition 0 0 -197 0
Net gain (+) / losses from fair
value adjustments 10,347 0 2,200 0
Assets reclassified to / from
Investment Properties 367 0 0 0
Other changes 0 0 49
Closing balance at 31 March 17,937 0 19,989 0

71
Notes to the Core Financial Statements
The movement for investment properties categorised at level 3 in the
hierarchy as follows:
The fair value of the authority's investment property is measured annually at each reporting date. All valuations are carried out internally, in
accordance with the methodologies and bases for estimation set out in the
professional standards of the Royal Institution of Chartered Surveyors. The authority's valuations experts work closely with finance officers reporting
directly to the chief financial officer on a regular basis regarding all valuation
matters.
Level 3 2017/18 2018/19
£'000 £'000
Balance at 1 April 971 1,675
Net gains (+) / losses (-) from fair
value adjustments 102 -148
Transfers to / from Level 3 0 3,264
Additions 601 0
1,674 4,791
Fair
Value
Level
Fair Value at 31
March
2019
£'000
Additional Information for level 3 properties
Valuation technique Unobservable
inputs
Range (weighted
average used)
Sensitivity
Agricultural
units & other
level 2 assets 2 15,198
Office units 3 442 Income approach using an all risks
discount rate to asses
capital value
Discount Rate 8% - 11% (10%)
Significant changes in
market conditions will effect the discount
rate and will result in
a significantly lower or higher fair value
Commercial
units 3 4,350 Discount Rate 5% - 6% (5%)
19,990
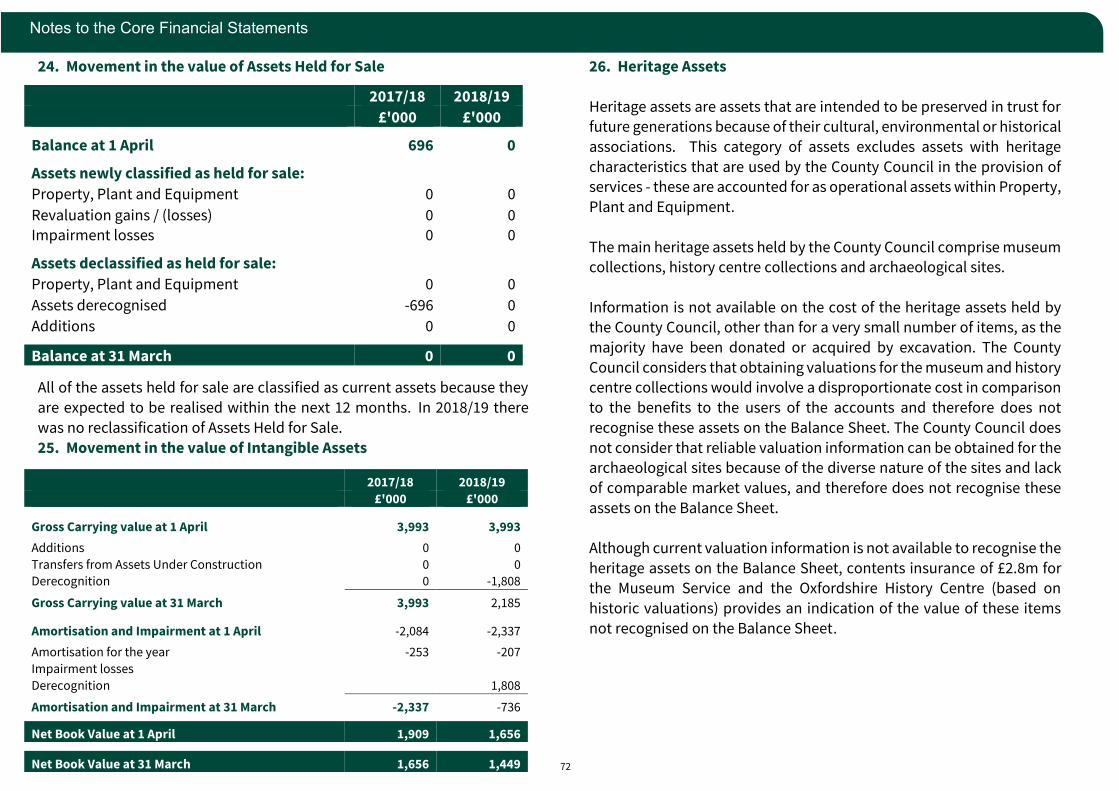
72
Notes to the Core Financial Statements
24. Movement in the value of Assets Held for Sale
All of the assets held for sale are classified as current assets because they
are expected to be realised within the next 12 months. In 2018/19 there
was no reclassification of Assets Held for Sale.
25. Movement in the value of Intangible Assets
26. Heritage Assets
Heritage assets are assets that are intended to be preserved in trust for future generations because of their cultural, environmental or historical
associations. This category of assets excludes assets with heritage
characteristics that are used by the County Council in the provision of services - these are accounted for as operational assets within Property,
Plant and Equipment.
The main heritage assets held by the County Council comprise museum collections, history centre collections and archaeological sites.
Information is not available on the cost of the heritage assets held by the County Council, other than for a very small number of items, as the
majority have been donated or acquired by excavation. The County
Council considers that obtaining valuations for the museum and history centre collections would involve a disproportionate cost in comparison
to the benefits to the users of the accounts and therefore does not
recognise these assets on the Balance Sheet. The County Council does
not consider that reliable valuation information can be obtained for the archaeological sites because of the diverse nature of the sites and lack
of comparable market values, and therefore does not recognise these
assets on the Balance Sheet.
Although current valuation information is not available to recognise the
heritage assets on the Balance Sheet, contents insurance of £2.8m for
the Museum Service and the Oxfordshire History Centre (based on
historic valuations) provides an indication of the value of these items
not recognised on the Balance Sheet.
2017/18 2018/19
£'000 £'000
Balance at 1 April 696 0
Assets newly classified as held for sale:
Property, Plant and Equipment 0 0
Revaluation gains / (losses) 0 0 Impairment losses 0 0
Assets declassified as held for sale:
Property, Plant and Equipment 0 0
Assets derecognised -696 0
Additions 0 0
Balance at 31 March 0 0
2017/18 2018/19
£'000 £'000
Gross Carrying value at 1 April 3,993 3,993
Additions 0 0
Transfers from Assets Under Construction 0 0
Derecognition 0 -1,808
Gross Carrying value at 31 March 3,993 2,185
Amortisation and Impairment at 1 April -2,084 -2,337
Amortisation for the year -253 -207
Impairment losses Derecognition 1,808
Amortisation and Impairment at 31 March -2,337 -736
Net Book Value at 1 April 1,909 1,656
Net Book Value at 31 March 1,656 1,449
73
Notes to the Core Financial Statements
27. Valuation of non-current assets
It is the policy of the County Council to revalue land, buildings and
component assets within Property, Plant and Equipment on a three-year rolling programme, as follows:
Year 1: Secondary and special schools, Other educational premises (including children’s, youth and sports centres), surplus assets and
other properties not re-valued within the past 3 years
Year 2: Primary, nursery, junior and infant schools
Year 3: Social care premises, libraries, museums and adult learning premises, Fire & Rescue Service and Community Safety premises, staff
housing, central offices and highways depots
In addition, material changes in asset valuations are adjusted for in the
interim periods.
Investment properties valuations are reviewed annually. Assets held for
sale are revalued at the point of reclassification to that category.
Property valuations are conducted by the County Council’s internal and external property valuers. They provide an annual valuation report and
valuation certificate which give details of their opinion of the value of
specific assets, basis of valuation, assumptions made and details of the rolling programme, additional and ad-hoc valuations. Valuations have
been undertaken in accordance with the RICS Valuation Standards
published by the Royal Institution of Chartered Surveyors. The basis of
valuations is set out in Note 1.
As part of the rolling programme Secondary and special schools, Other
educational premises (including children’s, youth and sports centres), surplus assets and other properties not re-valued within the past 3 years
were revalued as at 1 April 2018.
28. Private Finance Initiative (PFI and similar contracts – Homes for
Older People
The County Council has one PFI type contract (service concession arrangement) with an external operator, The Oxfordshire Care
Partnership, relating to the provision of residential care homes and care
services. The Cabinet Member for Adult Social Care represents the Council’s interests as a director of the Partnership.
Provision of residential care services was originally in 19 homes across
Oxfordshire under a 25 year contract with The Oxfordshire Care Partnership which came into operation in 2001. The County Council had
an average of 70% of the beds in these homes. Under this arrangement,
nine of the homes are subject to long term leases and these assets had previously been excluded from the County Council's Balance Sheet. A
further ten homes were transferred to the contractor but with short
term leases as the homes did not meet required property standards. These have now all been reprovided through a redevelopment
programme.
The operator has built nine new homes and four extra care housing schemes through the redevelopment programme, whilst eleven homes
have been closed. The Oxfordshire Care Partnership also operate the
new Chilterns Court Care Centre built by the County Council, which was completed in 2016/17 and replaces the former care home in Henley.
Under the Code, the County Council is required to recognise homes that
meet tests in respect of control of services and control of the residual
interest in property on its Balance Sheet. All homes under the contract
are included on the County Council's Balance Sheet, with exception of
one home that does not meet the control tests specified in the Code. At
the end of the contract, all properties currently on the Balance Sheet revert to County Council ownership.
The council’s original 25 year agreement with Oxfordshire Care Partnership will end in 2026/27, however The Oxfordshire Care
Partnership will continue to operate the homes until the end of 2031/32.

74
Notes to the Core Financial Statements
There is no requirement for the County Council to purchase a set
number or value of beds during the years 2027/28 to 2031/32 other than
the obligation of both parties to maintain existing placements as at 31 March 2028. After 2026/27 all services will be purchased as spot
contracts and numbers will vary, so there will be no further payments
under this service concession arrangement.
The value of assets recognised under service concession arrangements
at each Balance Sheet date and the movements in value during the year
are provided as a memorandum to the movement in Property Plant and Equipment (Note 22).
The financial liabilities arising from the service concession arrangement and an analysis of movements in the year are set out below:
The service concession arrangement forms part of the finance liability
recorded on the Balance Sheet, together with finance leases and forward
deals on investments. A reconciliation of the service concession liability to the total finance liability is as follows:
Details of payments due to be made under the service concession arrangement are as follows, with comparative figures for 2017/18
following on.
2017/18 2018/19
£'000 £'000
Balance at 1 April 24,850 18,339
Increase in liability in the year 0
Transfer to Deferred Income -6,154 0
Liability repaid in the year -356 -402
Balance at 31 March 18,340 17,937
Long-Term Current
At 31 March
2018
At 31 March
2019
At 31 March
2018
At 31 March
2019
£'000 £'000 £'000 £'000
Service Concession
Arrangement 17,938 17,483 402 454
Finance Leases 80 23 52 53 Investments - Forward Deal 0 0 0 0
Total Finance Liability 18,018 17,506 454 507
Service Costs Principal Repayments Interest Costs Lifecycle Replacement Payments Total
£'000 £'000 £'000 £'000 £'000
2018/19
Within 1 year 20307 454 2,355 890 24,006
2-5 years 84318 2,487 8,750 3,931 99,486
6-10 years 66617 14,997 5,581 3,380 90,575 Total 171242 17,937 16,687 8,201 214,067
2017/18
Within 1 year 15,960 402 2,407 856 19,625
2-5 years 66,472 2,202 9,036 3,780 81,490 6-10 years 58,683 15,736 7,651 4,421 86,491
Total 141,115 18,340 19,094 9,057 187,606
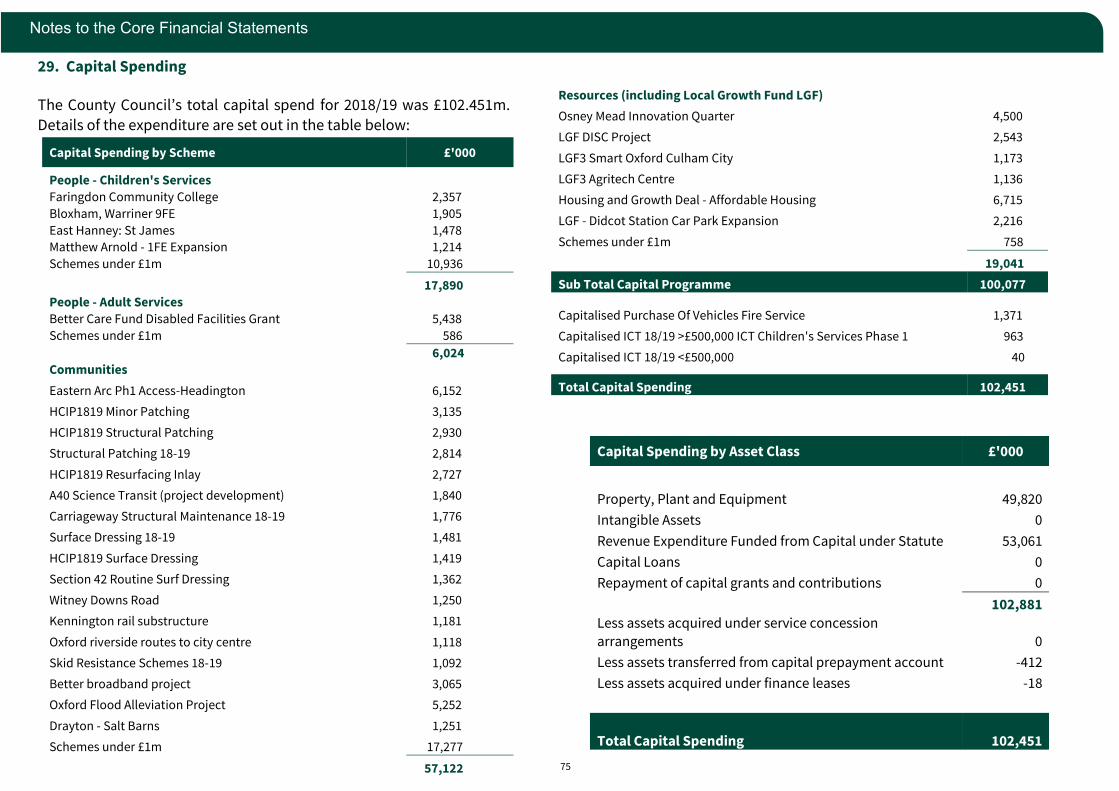
75
Notes to the Core Financial Statements
29. Capital Spending The County Council’s total capital spend for 2018/19 was £102.451m.
Details of the expenditure are set out in the table below:
Capital Spending by Scheme £'000
People - Children's Services Faringdon Community College 2,357
Bloxham, Warriner 9FE 1,905
East Hanney: St James 1,478
Matthew Arnold - 1FE Expansion 1,214
Schemes under £1m 10,936
17,890
People - Adult Services Better Care Fund Disabled Facilities Grant 5,438
Schemes under £1m 586
6,024
Communities
Eastern Arc Ph1 Access-Headington 6,152
HCIP1819 Minor Patching 3,135
HCIP1819 Structural Patching 2,930
Structural Patching 18-19 2,814
HCIP1819 Resurfacing Inlay 2,727
A40 Science Transit (project development) 1,840
Carriageway Structural Maintenance 18-19 1,776
Surface Dressing 18-19 1,481
HCIP1819 Surface Dressing 1,419
Section 42 Routine Surf Dressing 1,362
Witney Downs Road 1,250
Kennington rail substructure 1,181
Oxford riverside routes to city centre 1,118
Skid Resistance Schemes 18-19 1,092
Better broadband project 3,065
Oxford Flood Alleviation Project 5,252
Drayton - Salt Barns 1,251
Schemes under £1m 17,277
57,122
Resources (including Local Growth Fund LGF)
Osney Mead Innovation Quarter 4,500
LGF DISC Project 2,543
LGF3 Smart Oxford Culham City 1,173
LGF3 Agritech Centre 1,136
Housing and Growth Deal - Affordable Housing 6,715
LGF - Didcot Station Car Park Expansion 2,216
Schemes under £1m 758
19,041
Sub Total Capital Programme 100,077
Capitalised Purchase Of Vehicles Fire Service 1,371
Capitalised ICT 18/19 >£500,000 ICT Children's Services Phase 1 963
Capitalised ICT 18/19 <£500,000 40
Total Capital Spending 102,451
Capital Spending by Asset Class £'000
Property, Plant and Equipment 49,820
Intangible Assets 0
Revenue Expenditure Funded from Capital under Statute 53,061
Capital Loans 0
Repayment of capital grants and contributions 0
102,881
Less assets acquired under service concession arrangements 0
Less assets transferred from capital prepayment account -412
Less assets acquired under finance leases -18
Total Capital Spending
102,451
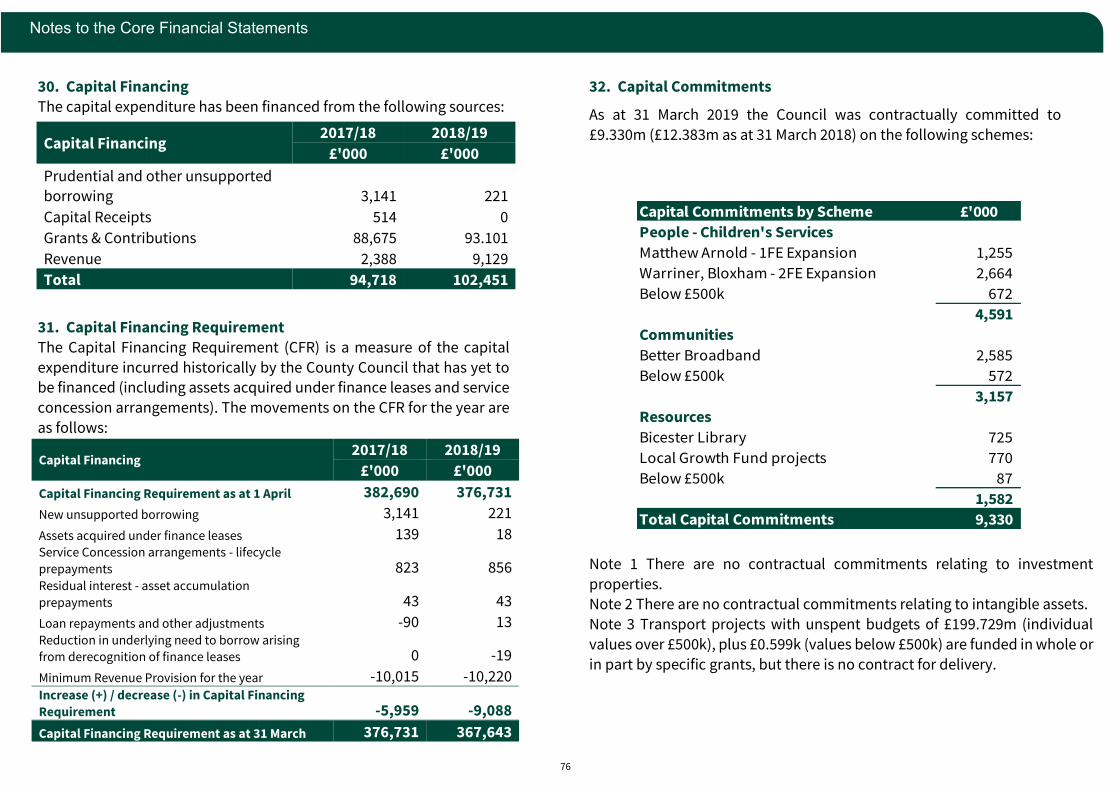
76
Notes to the Core Financial Statements
30. Capital Financing
The capital expenditure has been financed from the following sources:
31. Capital Financing Requirement
The Capital Financing Requirement (CFR) is a measure of the capital
expenditure incurred historically by the County Council that has yet to be financed (including assets acquired under finance leases and service
concession arrangements). The movements on the CFR for the year are
as follows:
32. Capital Commitments
As at 31 March 2019 the Council was contractually committed to
£9.330m (£12.383m as at 31 March 2018) on the following schemes:
Note 1 There are no contractual commitments relating to investment
properties.
Note 2 There are no contractual commitments relating to intangible assets.
Note 3 Transport projects with unspent budgets of £199.729m (individual
values over £500k), plus £0.599k (values below £500k) are funded in whole or
in part by specific grants, but there is no contract for delivery.
Capital Financing 2017/18 2018/19
£'000 £'000
Prudential and other unsupported borrowing 3,141 221
Capital Receipts 514 0
Grants & Contributions 88,675 93.101
Revenue 2,388 9,129
Total 94,718 102,451
Capital Financing 2017/18 2018/19
£'000 £'000
Capital Financing Requirement as at 1 April 382,690 376,731
New unsupported borrowing 3,141 221
Assets acquired under finance leases 139 18 Service Concession arrangements - lifecycle
prepayments 823 856 Residual interest - asset accumulation
prepayments 43 43
Loan repayments and other adjustments -90 13 Reduction in underlying need to borrow arising
from derecognition of finance leases 0 -19
Minimum Revenue Provision for the year -10,015 -10,220 Increase (+) / decrease (-) in Capital Financing
Requirement -5,959 -9,088
Capital Financing Requirement as at 31 March 376,731 367,643
Capital Commitments by Scheme £'000
People - Children's Services
Matthew Arnold - 1FE Expansion 1,255
Warriner, Bloxham - 2FE Expansion 2,664
Below £500k 672
4,591
Communities
Better Broadband 2,585
Below £500k 572
3,157
Resources
Bicester Library 725
Local Growth Fund projects 770
Below £500k 87
1,582
Total Capital Commitments 9,330

77
Notes to the Core Financial Statements
33. Financial Instrument Carrying Values
Financial assets comprise long-term and short-term investments, long-
term and short-term debtors (excluding statutory debtors and capital prepayments) and cash & cash equivalents. Financial liabilities
comprise long-term and short-term borrowing, creditors (excluding
statutory creditors), finance leases, the finance liability element of service concession arrangements and forward deals on investments.
The Code specifies the categorisation of these assets (see pages 33 – 34
of Note 1 Summary of Significant Accounting Policies). For each
category, the financial instruments disclosed in the Balance Sheet are carried at the following values:
Statutory debtors and creditors, receipts in advance and the capital
prepayment account are not considered to be financial instruments and are therefore excluded from the above carrying values.
The County Council has £6.651m of loans and receivables as at 31 March
2019 secured on property (£7.009m at 31 March 2018). Of this, £1.000m
was new in 2018/19 (£1.231m in 2017/18). The County Council is not permitted to sell or re-pledge this collateral.
The County Council has not pledged any collateral for liabilities or contingent liabilities and, as at 31 March 2019, there were no defaults or
breaches relating to loans payable.
Soft loans given by the County Council are accounted for within the balances for long-term and short-term debtors. A reconciliation of the
opening and closing balance for soft loans is as follows:
The soft loans comprise key worker loans for assistance with the
purchase of housing, loans under the Children’s Act relating to foster
care accommodation, loans under the Chronically Sick and Disabled
Persons Act for adaptations to homes and deferred payment agreements for clients’ care costs entered into prior to the national
mandatory scheme introduced from 1 April 2015. The nominal value of
the soft loans as at 31 March 2019 was £3.961m (£4.706m at 31 March 2018).
Long-Term Current
At 31
March
2018
At 31
March
2019
At 31
March
2018
At 31
March
2019
£'000 £'000 £'000 £'000
Financial assets at
Amortised Cost 57,769 42,625 252,510 295,894
Available for Sale Financial
Assets 0 84,342 0 Financial assets at fair
value through profit and
loss 0 0 10,038 140,550
Total Financial assets 57,769 42,625 346,890 436,444
Financial Liabilities at
amortised cost 341,401 338,889 115,384 120,256
Total Financial Liabilities 341,401 338,889 115,384 120,256
2017/18 2018/19
£'000 £'000
Balance at 1 April 4,482 4,706
Nominal value of new loans granted 153 0
Fair value adjustment on initial recognition 0 0
Loans repaid during the year -162 -696
Impairment losses recognised -51 0
Interest credited to the Surplus / Deficit on Provision of Services 0 0
Other changes 284 -49
Balance at 31 March 4,706 3,961
78
Notes to the Core Financial Statements
34. Financial Instrument Fair Values
Fair value is the price that would be received to sell an asset or paid to transfer a liability in an orderly transaction between market
participants at the measurement date. Financial assets classified as fair
value through profit and loss and all derivative assets and liabilities are carried in the Balance Sheet at fair value. For most assets, including
shares in money market funds and other pooled funds, the fair value is
taken from the market price. Financial assets classified as amortised
cost and all non-derivative financial liabilities are carried in the Balance Sheet at amortised cost. Their fair values have been estimated by
calculating the net present value of the remaining contractual cash
flows at 31 March 2018, using the following methods and assumptions:
• Loans borrowed by the Council have been valued by discounting
the contractual cash flows over the whole life of the instrument at
the appropriate market rate for local authority loans.
• The value of “Lender’s Option Borrower’s Option” (LOBO) loans
have been increased by the value of the embedded options.
Lenders’ options to propose an increase to the interest rate on the loan have been valued according to a proprietary model for
Bermudan cancellable swaps. Borrower’s contingent options to
accept the increased rate or repay the loan have been valued at zero, on the assumption that lenders will only exercise their options
when market rates have risen above the contractual loan rate.
• The fair values of other long-term loans and investments have
been discounted at the market rates for similar instruments with similar remaining terms to maturity on 31st March.
• The fair values of finance lease liabilities and of service concession liabilities have been calculated by discounting the contractual
cash flows (excluding service charge elements) at the rate for new
PWLB borrowing.
• No early repayment or impairment is recognised for any financial instrument, other than short-term debtors.
• The fair value of short-term instruments, including trade payables
and receivables, is assumed to approximate to the carrying amount given the low and stable interest rate environment.
Fair values are shown in the table below, split by their level in the fair
value hierarchy:
Level 1 – fair value is only derived from quoted prices in active markets
for identical assets or liabilities, e.g. bond prices
Level 2 – fair value is calculated from inputs other than quoted prices
that are observable for the asset or liability, e.g. interest rates or yields for similar instruments
Level 3 – fair value is determined using unobservable inputs, e.g. non-market data such as cash flow forecasts or estimated creditworthiness

79
Notes to the Core Financial Statements
*For the purpose of fair value comparison accrued interest in relation to long term PWLB & LOBO/money market loans has been included in the long term
balance sheet total.
**The fair value of short-term financial liabilities including trade payables is
assumed to approximate to the carrying amount.
*** Prior year comparator corrected in 2018/19.
The fair value of financial liabilities held at amortised cost is higher than their balance sheet carrying amount because the authority’s portfolio
of loans includes a number of loans where the interest rate payable is
higher than the current rates available for similar loans as at the Balance Sheet date. Similarly the discount rate implied in the service concession
arrangement and finance leases is higher than the rates available for
new borrowing at the Balance Sheet date.
Financial Liabilities Fair Balance Sheet Fair Value Balance Sheet Fair Value
Value At 31 March 2018 At 31 March 2018 At 31 March 2019 At 31 March 2019
Level £'000 £'000 £'000 £'000
Financial liabilities held at amortised cost:
Long-term loans from PWLB* 2 297,525 382,952 295,516 380,299
Long-term LOBO/money market loans* 2 30,444 49,652 30,361 80,973
Finance lease payables & service concession liabilities *** 3 18,018 33,320 18,013 31,108
Total 345,987 465,924 343,891 492,381
Liabilities for which fair value is not disclosed ** 110,798 115,255
Total Financial Liabilities 456,785 459,145
Recorded on balance sheet as:
Short-term creditors 65,661 92,690
Short-term borrowing 49,269 27,059
Short-term finance liabilities 453 507
Long-term borrowing 323,383 321,383
Long-term finance liabilities 18,019 17,506
Total Financial Liabilities 456,785 459,145
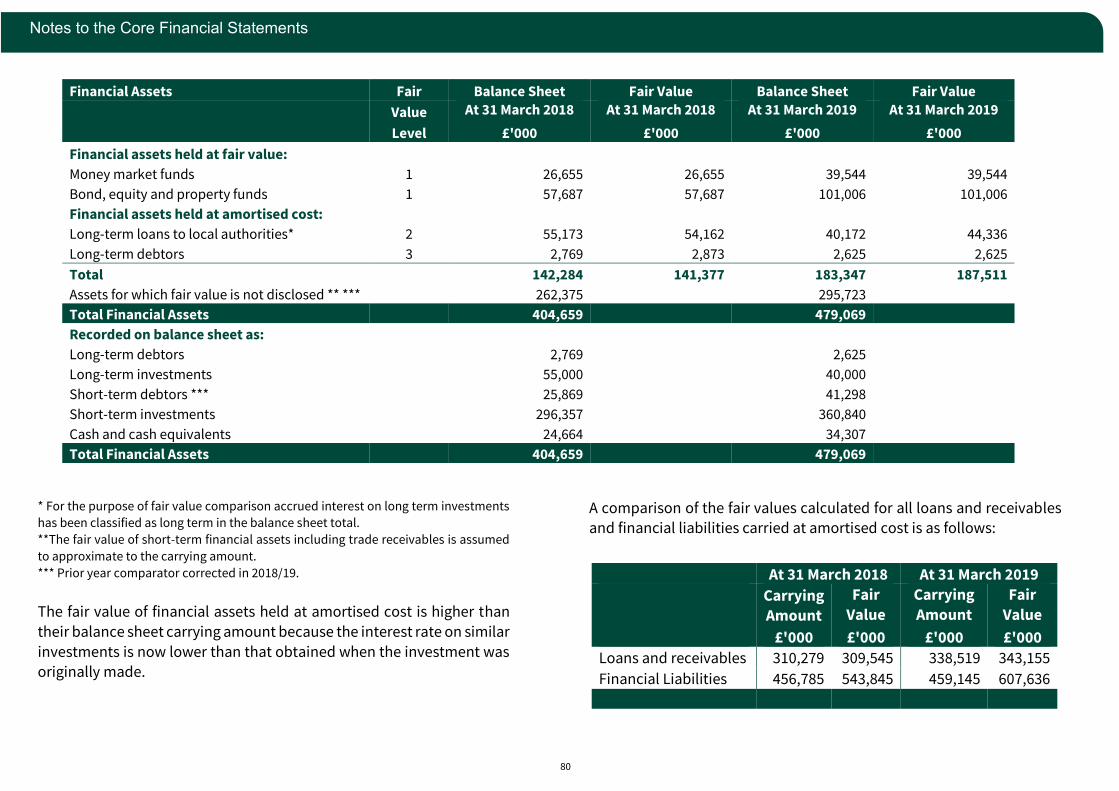
80
Notes to the Core Financial Statements
* For the purpose of fair value comparison accrued interest on long term investments
has been classified as long term in the balance sheet total.
**The fair value of short-term financial assets including trade receivables is assumed
to approximate to the carrying amount.
*** Prior year comparator corrected in 2018/19.
The fair value of financial assets held at amortised cost is higher than
their balance sheet carrying amount because the interest rate on similar
investments is now lower than that obtained when the investment was originally made.
A comparison of the fair values calculated for all loans and receivables and financial liabilities carried at amortised cost is as follows:
Financial Assets Fair Balance Sheet Fair Value Balance Sheet Fair Value
Value At 31 March 2018 At 31 March 2018 At 31 March 2019 At 31 March 2019
Level £'000 £'000 £'000 £'000
Financial assets held at fair value:
Money market funds 1 26,655 26,655 39,544 39,544
Bond, equity and property funds 1 57,687 57,687 101,006 101,006
Financial assets held at amortised cost:
Long-term loans to local authorities* 2 55,173 54,162 40,172 44,336
Long-term debtors 3 2,769 2,873 2,625 2,625
Total 142,284 141,377 183,347 187,511
Assets for which fair value is not disclosed ** *** 262,375 295,723
Total Financial Assets 404,659 479,069
Recorded on balance sheet as:
Long-term debtors 2,769 2,625
Long-term investments 55,000 40,000
Short-term debtors *** 25,869 41,298
Short-term investments 296,357 360,840
Cash and cash equivalents 24,664 34,307
Total Financial Assets 404,659 479,069
At 31 March 2018 At 31 March 2019
Carrying Amount
Fair
Value
Carrying
Amount
Fair
Value
£'000 £'000 £'000 £'000
Loans and receivables 310,279 309,545 338,519 343,155
Financial Liabilities 456,785 543,845 459,145 607,636
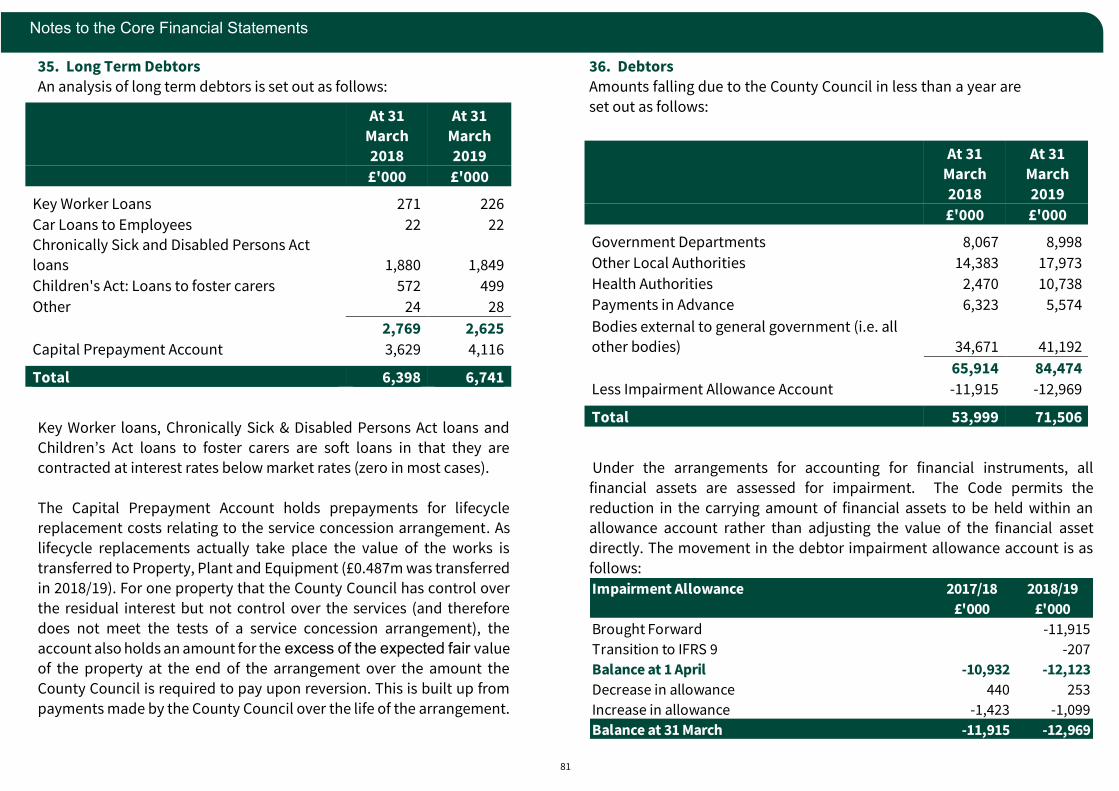
81
Notes to the Core Financial Statements
35. Long Term Debtors
An analysis of long term debtors is set out as follows:
Key Worker loans, Chronically Sick & Disabled Persons Act loans and
Children’s Act loans to foster carers are soft loans in that they are contracted at interest rates below market rates (zero in most cases).
The Capital Prepayment Account holds prepayments for lifecycle replacement costs relating to the service concession arrangement. As
lifecycle replacements actually take place the value of the works is
transferred to Property, Plant and Equipment (£0.487m was transferred
in 2018/19). For one property that the County Council has control over
the residual interest but not control over the services (and therefore
does not meet the tests of a service concession arrangement), the
account also holds an amount for the excess of the expected fair value of the property at the end of the arrangement over the amount the
County Council is required to pay upon reversion. This is built up from
payments made by the County Council over the life of the arrangement.
36. Debtors
Amounts falling due to the County Council in less than a year are
set out as follows:
Under the arrangements for accounting for financial instruments, all
financial assets are assessed for impairment. The Code permits the
reduction in the carrying amount of financial assets to be held within an allowance account rather than adjusting the value of the financial asset
directly. The movement in the debtor impairment allowance account is as
follows:
Impairment Allowance 2017/18 2018/19
£'000 £'000
Brought Forward -11,915
Transition to IFRS 9 -207
Balance at 1 April -10,932 -12,123
Decrease in allowance 440 253
Increase in allowance -1,423 -1,099
Balance at 31 March -11,915 -12,969
At 31
March 2018
At 31
March 2019
£'000 £'000
Key Worker Loans 271 226
Car Loans to Employees 22 22
Chronically Sick and Disabled Persons Act
loans 1,880 1,849
Children's Act: Loans to foster carers 572 499
Other 24 28
2,769 2,625
Capital Prepayment Account 3,629 4,116
Total 6,398 6,741
At 31
March
2018
At 31
March
2019
£'000 £'000
Government Departments 8,067 8,998
Other Local Authorities 14,383 17,973
Health Authorities 2,470 10,738
Payments in Advance 6,323 5,574
Bodies external to general government (i.e. all
other bodies) 34,671 41,192
65,914 84,474
Less Impairment Allowance Account -11,915 -12,969
Total 53,999 71,506
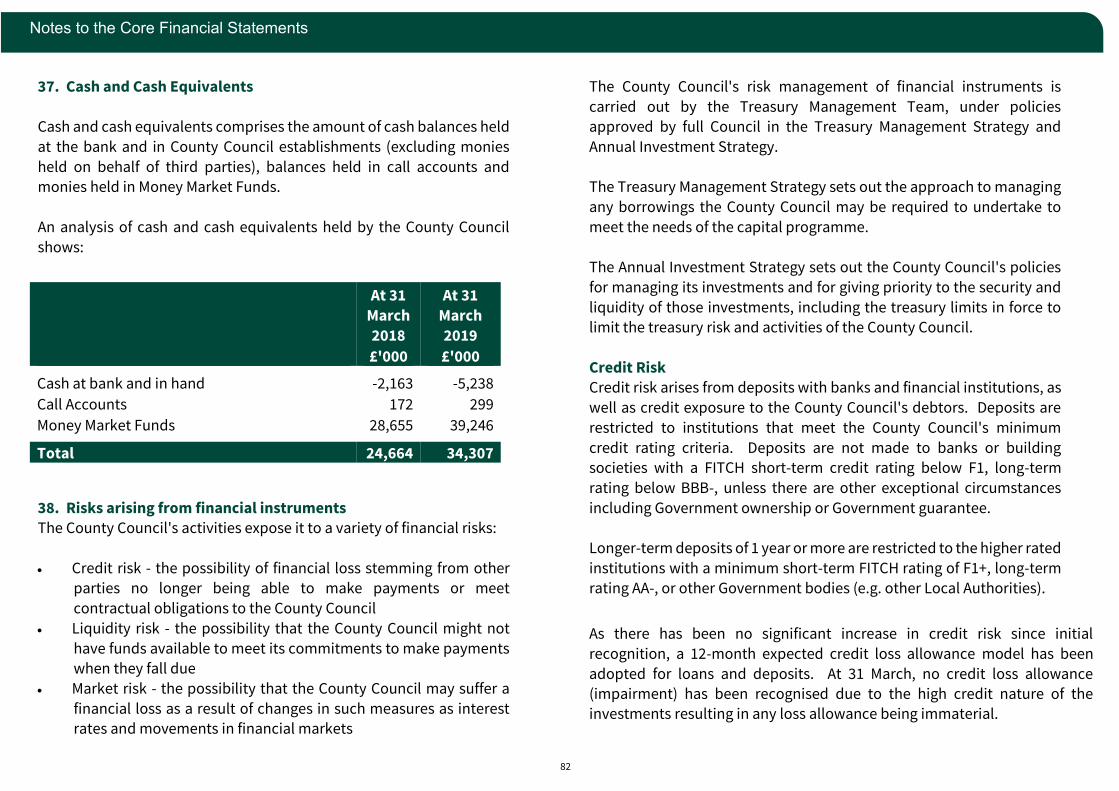
82
Notes to the Core Financial Statements
37. Cash and Cash Equivalents
Cash and cash equivalents comprises the amount of cash balances held
at the bank and in County Council establishments (excluding monies
held on behalf of third parties), balances held in call accounts and monies held in Money Market Funds.
An analysis of cash and cash equivalents held by the County Council
shows:
38. Risks arising from financial instruments The County Council's activities expose it to a variety of financial risks:
• Credit risk - the possibility of financial loss stemming from other
parties no longer being able to make payments or meet
contractual obligations to the County Council
• Liquidity risk - the possibility that the County Council might not
have funds available to meet its commitments to make payments when they fall due
• Market risk - the possibility that the County Council may suffer a
financial loss as a result of changes in such measures as interest rates and movements in financial markets
The County Council's risk management of financial instruments is
carried out by the Treasury Management Team, under policies approved by full Council in the Treasury Management Strategy and
Annual Investment Strategy.
The Treasury Management Strategy sets out the approach to managing
any borrowings the County Council may be required to undertake to
meet the needs of the capital programme.
The Annual Investment Strategy sets out the County Council's policies
for managing its investments and for giving priority to the security and
liquidity of those investments, including the treasury limits in force to limit the treasury risk and activities of the County Council.
Credit Risk Credit risk arises from deposits with banks and financial institutions, as
well as credit exposure to the County Council's debtors. Deposits are
restricted to institutions that meet the County Council's minimum
credit rating criteria. Deposits are not made to banks or building societies with a FITCH short-term credit rating below F1, long-term
rating below BBB-, unless there are other exceptional circumstances
including Government ownership or Government guarantee.
Longer-term deposits of 1 year or more are restricted to the higher rated
institutions with a minimum short-term FITCH rating of F1+, long-term
rating AA-, or other Government bodies (e.g. other Local Authorities).
As there has been no significant increase in credit risk since initial
recognition, a 12-month expected credit loss allowance model has been
adopted for loans and deposits. At 31 March, no credit loss allowance
(impairment) has been recognised due to the high credit nature of the investments resulting in any loss allowance being immaterial.
At 31
March
2018
At 31
March
2019
£'000 £'000
Cash at bank and in hand -2,163 -5,238
Call Accounts 172 299
Money Market Funds 28,655 39,246
Total 24,664 34,307

83
Notes to the Core Financial Statements
No credit loss allowance is recognised for investments in MMFs and pooled
funds as these funds are held at market value.
Loss allowances on trade and lease receivables have been calculated by reference to the Council’s historic experience of default. At the balance sheet
date, the Council considered that there are no factors which indicate that the
future expected loss will be materially different to the historic rate.
Receivables are determined to have suffered a significant increase in credit risk where they are 90 or more days past due for Corporate debtors and 120
or more days past due for Adult Social Care debtors.
Receivables are collectively assessed for credit risk in the following groupings:
The following receivables are individually assessed for impairment:
The next table summarises the nominal value (excluding accrued interest) of the Council’s investment portfolio at 31 March 2019 and
confirms that all investments were made in line with the Council’s
approved credit rating criteria at the time of placing the investment. The table includes money market funds and call accounts classed as cash &
cash equivalents at 31 March 2019.
Gross
Receivable
£000
Loss
allowance
£000
Gross
Receivable
£000
Loss
allowance
£000
Corporate Debtors:
Trade receivables
under £10k after 120
days 60% 517 313 280 148
517 313 280 148
Adult Social Care
debtors:
Debtors with an
account balance
under £20k after 6
months
50% of total
customer
balance 1,893 1,484 1,516 898
1,893 1,484 1,516 898
Total 2,410 1,797 1,796 1,046
Allowance
set aside
based on
historic rate
At 1 April 2018 At 31 Marach 2019
Gross
Receivable
£000
Loss
allowance
£000
Gross
Receivable
£000
Loss
allowance
£000
Corporate Debtors:
321 321 262 258
978 529 1,576 297
1,299 850 1,838 555
Adult Social Care debtors:
902 472 2,258 1,714
902 472 2,258 1,714
Total 2,201 1,322 4,096 2,269
Organisations - all debts over £10k
after 120 days
Adult social care debtors with an
account balance over £20k after 6
months
At 1 April 2018 At 31 Marach 2019
Individuals and sole traders - all
debts over £10k after 120 days
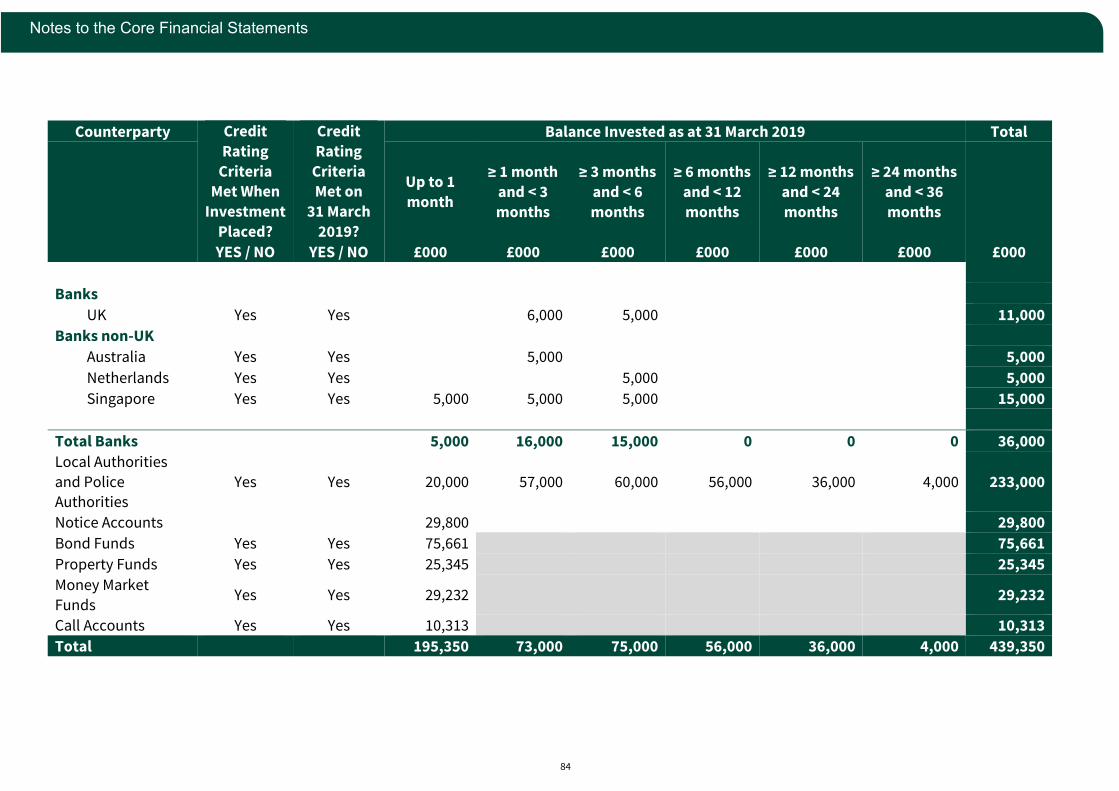
84
Notes to the Core Financial Statements
Counterparty Credit
Rating
Criteria Met When
Investment
Placed?
Credit
Rating
Criteria Met on
31 March
2019?
Balance Invested as at 31 March 2019 Total
Up to 1
month
≥ 1 month
and < 3
months
≥ 3 months
and < 6
months
≥ 6 months
and < 12
months
≥ 12 months
and < 24
months
≥ 24 months
and < 36
months
YES / NO YES / NO £000 £000 £000 £000 £000 £000 £000
Banks
UK Yes Yes 6,000 5,000 11,000
Banks non-UK
Australia Yes Yes 5,000 5,000
Netherlands Yes Yes 5,000 5,000
Singapore Yes Yes 5,000 5,000 5,000 15,000
Total Banks 5,000 16,000 15,000 0 0 0 36,000
Local Authorities
and Police Authorities
Yes Yes 20,000 57,000 60,000 56,000 36,000 4,000 233,000
Notice Accounts 29,800 29,800
Bond Funds Yes Yes 75,661 75,661
Property Funds Yes Yes 25,345 25,345
Money Market
Funds Yes Yes 29,232 29,232
Call Accounts Yes Yes 10,313 10,313
Total 195,350 73,000 75,000 56,000 36,000 4,000 439,350

85
Notes to the Core Financial Statements
The above analysis shows that all deposits outstanding as at 31 March 2019
met the County Council’s credit rating criteria at that date.
Within the £84.474m short-term debtors classified at amortised cost,
£26.770m were past due at 31 March 2019 (£17.456m at 31 March 2018). The past due amount can be analysed by age as follows:
None of these past-due short-term debtors have been individually impaired. An impairment allowance of £3.314m has been provided for past due debtors
that are financial instruments based on past and current experience
(£2.911m at 31 March 2018). This is the County Council's estimate of maximum exposure to uncollectability. £2.884m of the debtor impairment
allowance is based on collective assessments of debtors with similar
characteristics. Individual impairment allowances have been provided for
monies owed from a home support provider that went into liquidation
(£0.184m), overpaid allowances to foster carers (£0.117m) and for overdue
library fines (£0.130m). Debt collection rates have stabilised following the
initial period of transition to the new arrangements with the Hampshire County Council Integrated Business Centre, however the current estimate of
uncollectability remains higher than the average for the previous 5 years. The
past due debtors analysis and impairment allowance quoted above exclude those for statutory debtors as these are not considered to be financial
instruments.
The key worker, CSDP Act and Children's Act loans are secured on property.
Details of this collateral are provided in Note 33.
Liquidity Risk
As the County Council has access to borrowings from the Public Works Loans Board, there is no significant risk that it will be unable to raise finance to meet
its commitments under financial instruments. Instead, the risk is that the
County Council may be bound to replenish a significant proportion of its
borrowings at a time of unfavourable interest rates. The strategy is to spread the maturity dates of fixed debt so that a significant proportion of the
portfolio does not mature in any one year.
The maturity analysis of borrowing and financial liabilities is as follows:
All trade and other payables are due to be paid in less than one year.
Aged Debtors At 31 March
2018
At 31 March
2019
£000 £000
Less than 1 month 5,078 13,101
Between 1 and 3 months 2,781 2,758
Between 3 and 6 months 1,725 2,222
Between 6 month and 1 year 2,242 2,775
Between 1 and 3 years 3,974 3,973
Over 3 years 1,656 1,943
Total 17,456 26,770
Amount
at 31 March
2018
Amount at 31 March 2019
Fixed Rate
Variable Rate
Other
Finance Liabilities Total
£000 £000 £000 £000 £000
49,724 Less than 1 year 6,142 20,917
507 27,566
7,512
Between 1 and
2 years 6,000 5,000
525 11,525
56,769 Between 2 and 5 years 31,000 20,000
1,985 52,985
92,736 Between 5 and 10 years 83,000 0
14,997 97,997
184,383
More than 10
years 176,383 0 0 176,383
391,124 302,525 45,917 18,013 366,456
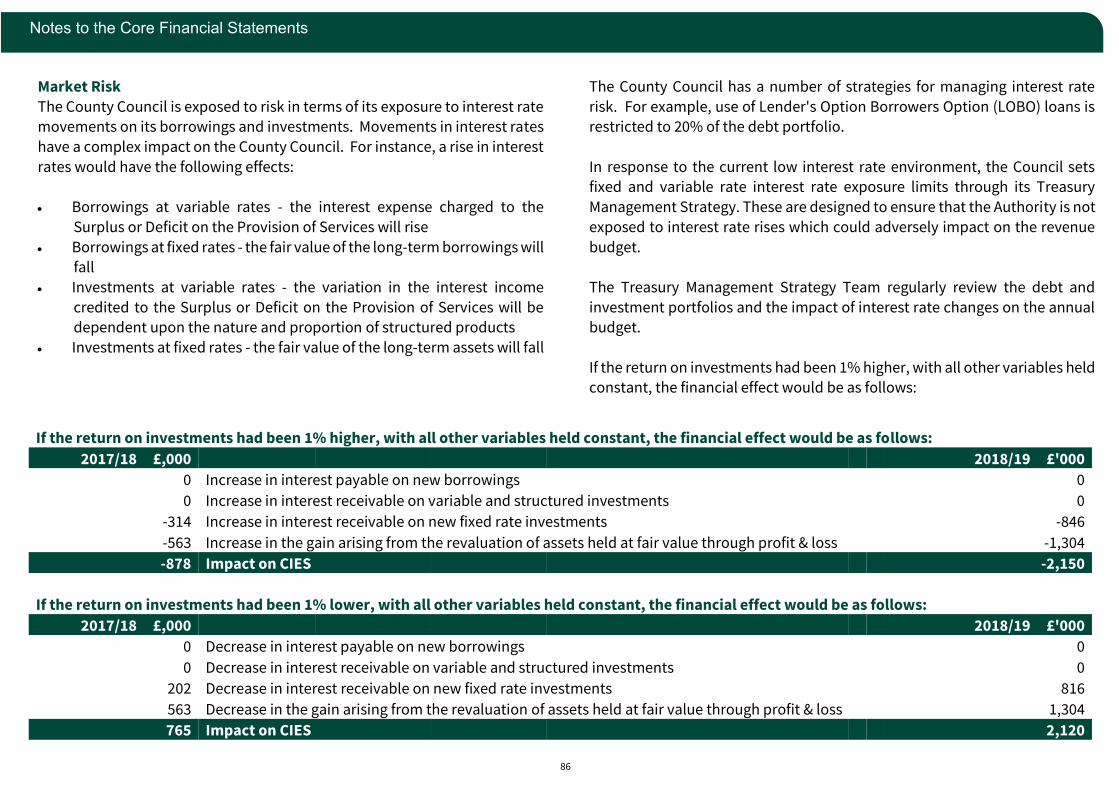
86
Notes to the Core Financial Statements
Market Risk
The County Council is exposed to risk in terms of its exposure to interest rate movements on its borrowings and investments. Movements in interest rates
have a complex impact on the County Council. For instance, a rise in interest
rates would have the following effects:
• Borrowings at variable rates - the interest expense charged to the
Surplus or Deficit on the Provision of Services will rise
• Borrowings at fixed rates - the fair value of the long-term borrowings will fall
• Investments at variable rates - the variation in the interest income
credited to the Surplus or Deficit on the Provision of Services will be dependent upon the nature and proportion of structured products
• Investments at fixed rates - the fair value of the long-term assets will fall
The County Council has a number of strategies for managing interest rate
risk. For example, use of Lender's Option Borrowers Option (LOBO) loans is restricted to 20% of the debt portfolio.
In response to the current low interest rate environment, the Council sets fixed and variable rate interest rate exposure limits through its Treasury
Management Strategy. These are designed to ensure that the Authority is not
exposed to interest rate rises which could adversely impact on the revenue
budget.
The Treasury Management Strategy Team regularly review the debt and
investment portfolios and the impact of interest rate changes on the annual budget.
If the return on investments had been 1% higher, with all other variables held constant, the financial effect would be as follows:
If the return on investments had been 1% higher, with all other variables held constant, the financial effect would be as follows:
2017/18 £,000 2018/19 £'000
0 Increase in interest payable on new borrowings 0
0 Increase in interest receivable on variable and structured investments 0
-314 Increase in interest receivable on new fixed rate investments -846
-563 Increase in the gain arising from the revaluation of assets held at fair value through profit & loss -1,304
-878 Impact on CIES -2,150
If the return on investments had been 1% lower, with all other variables held constant, the financial effect would be as follows:
2017/18 £,000 2018/19 £'000
0 Decrease in interest payable on new borrowings 0
0 Decrease in interest receivable on variable and structured investments 0
202 Decrease in interest receivable on new fixed rate investments 816
563 Decrease in the gain arising from the revaluation of assets held at fair value through profit & loss 1,304
765 Impact on CIES 2,120
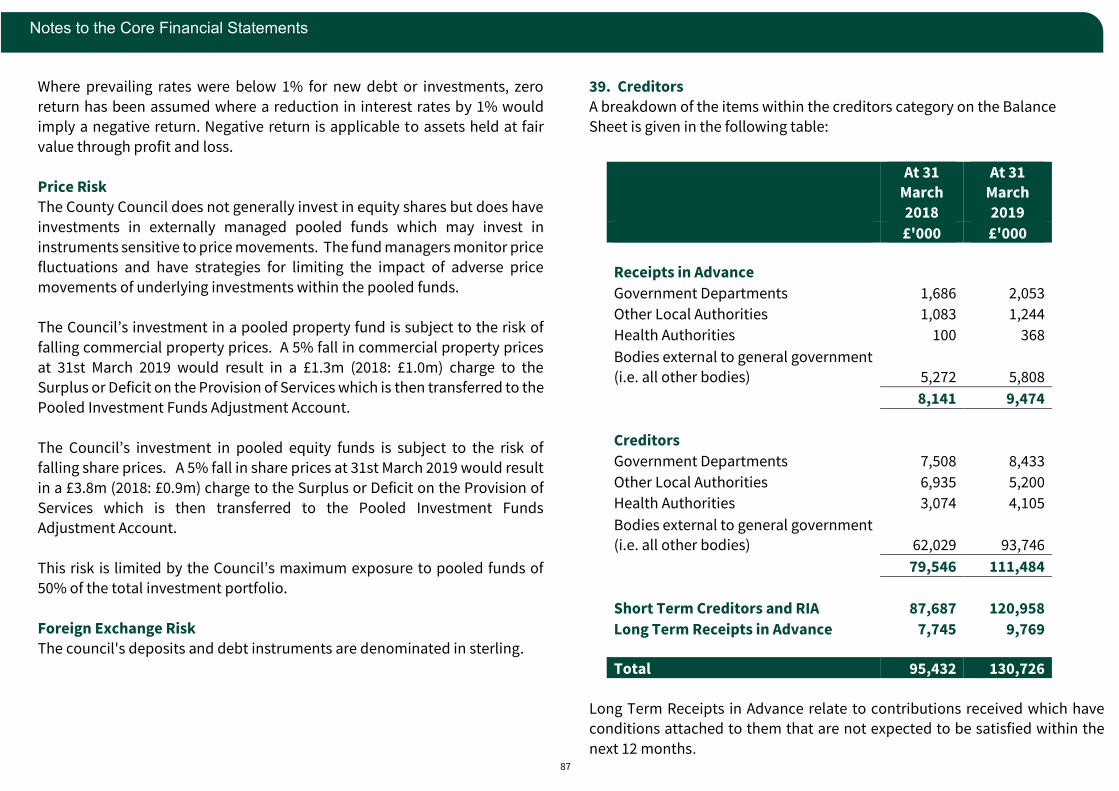
87
Notes to the Core Financial Statements
Where prevailing rates were below 1% for new debt or investments, zero
return has been assumed where a reduction in interest rates by 1% would imply a negative return. Negative return is applicable to assets held at fair
value through profit and loss.
Price Risk
The County Council does not generally invest in equity shares but does have
investments in externally managed pooled funds which may invest in
instruments sensitive to price movements. The fund managers monitor price fluctuations and have strategies for limiting the impact of adverse price
movements of underlying investments within the pooled funds.
The Council’s investment in a pooled property fund is subject to the risk of
falling commercial property prices. A 5% fall in commercial property prices
at 31st March 2019 would result in a £1.3m (2018: £1.0m) charge to the Surplus or Deficit on the Provision of Services which is then transferred to the
Pooled Investment Funds Adjustment Account.
The Council’s investment in pooled equity funds is subject to the risk of falling share prices. A 5% fall in share prices at 31st March 2019 would result
in a £3.8m (2018: £0.9m) charge to the Surplus or Deficit on the Provision of
Services which is then transferred to the Pooled Investment Funds Adjustment Account.
This risk is limited by the Council’s maximum exposure to pooled funds of
50% of the total investment portfolio.
Foreign Exchange Risk
The council's deposits and debt instruments are denominated in sterling.
39. Creditors
A breakdown of the items within the creditors category on the Balance Sheet is given in the following table:
Long Term Receipts in Advance relate to contributions received which have conditions attached to them that are not expected to be satisfied within the
next 12 months.
At 31 March
2018
At 31 March
2019
£'000 £'000
Receipts in Advance
Government Departments 1,686 2,053
Other Local Authorities 1,083 1,244
Health Authorities 100 368
Bodies external to general government
(i.e. all other bodies) 5,272 5,808
8,141 9,474
Creditors
Government Departments 7,508 8,433
Other Local Authorities 6,935 5,200
Health Authorities 3,074 4,105
Bodies external to general government (i.e. all other bodies) 62,029 93,746
79,546 111,484
Short Term Creditors and RIA 87,687 120,958
Long Term Receipts in Advance 7,745 9,769
Total 95,432 130,726

88
Notes to the Core Financial Statements
40. Provision
Balance at 31 March 2018
Reclassification between short and
long term
Additional provisions made in
2018/19
Amounts used in 2018/19
Unused amounts reversed in 2018/19
Balance at 31 March 2019
£’000 £’000 £’000 £’000 £’000 £’000
Provision due within 1 year
Insurance 847 2,579 924 -619 -2,880 851 Pooled Budgets 0 0 0 0 0 0 Redundancy 14 0 0 -14 0 0 MMI Scheme of Arrangement 54 0 34 -16 -71 1 Business Rates 3,537 0 4,316 0 -3,537 4,316 Other 0 0 51 0 0 51
4,452 2,579 5,325 -649 -6,487 5,219
Provision due after 1 year
Insurance 4,772 -2,579 2,107 -490 -249 3,563 4,772 -2,579 2,107 -490 -249 3,563
Total 9,224 0 7,432 -1,138 -6,736 8,782
Balance at 31 March 2017
Reclassification between short and
long term
Additional provisions made in
2017/18
Amounts used in 2017/18
Unused amounts reversed in 2017/18
Balance at 31 March 2018
£’000 £’000 £’000 £’000 £’000 £’000
Provision due within 1 year
Insurance 726 1,665 1,082 -946 -1,680 847
Pooled Budgets 436 0 1,039 -1,475 0 0
Redundancy 114 0 14 -114 0 14 MMI Scheme of Arrangement 180 0 45 -95 -76 54
Business Rates 2,776 0 3,537 0 -2,776 3,537 4,232 1,665 5,717 -2,630 -4,532 4,452
Provision due after 1 year
Insurance 4,678 -1,665 2,040 -219 -62 4,772 4,678 -1,665 2,040 -219 -62 4,772
Total 8,910 0 7,757 -2,849 -4,594 9,224
A breakdown of the items within the Provisions category on the Balance Sheet is set out below, analysed between those due within 1 year and those due
after 1 year, together with the movements for the year is as follows:
89
Notes to the Core Financial Statements
Details of the provisions held at 31 March 2019 are as follows:
• Insurance claims are managed by the County Council's Insurance
Team, working with external insurers and legal advisors to achieve a
satisfactory outcome. The time required to settle these claims will depend upon the complexity of each case and the approach adopted
by each claimant but the expectation is that these cases will be settled
within 18 months to two years. In a small number of cases where the final liability is dependent on a long term medical prognosis, the claim
may take longer to settle to ensure all the medical facts are known.
• The County Council has claims outstanding with Municipal Mutual Insurance Plc. (MMI). In November 2012 the directors of MMI triggered
a process to wind up the business. This means the County Council
may have to repay all or part of the insurance claims settled since the company ceased to trade, as well as fund any outstanding claims. A
levy of 15% has been paid since 2012, and this was increased to 25%
in 2016. A provision of £0.001m has been allocated as per the actuary's
report of April 2019 and adjustment for updated outstanding claims figures.
• Under the Business Rates Retention Scheme the County Council is required to account for its share of the billing authorities’ provision
for appeals on business rates valuations.
41. Deferred Income
The deferred income balance of £7.433m at 31 March 2019 (£8.359m at 31
March 2018) relates to lease premiums received under the service concession arrangement with Oxfordshire Care Partnership and in relation to two other
leases, which are being released to the Comprehensive Income and
Expenditure Statement over the lives of the arrangements.
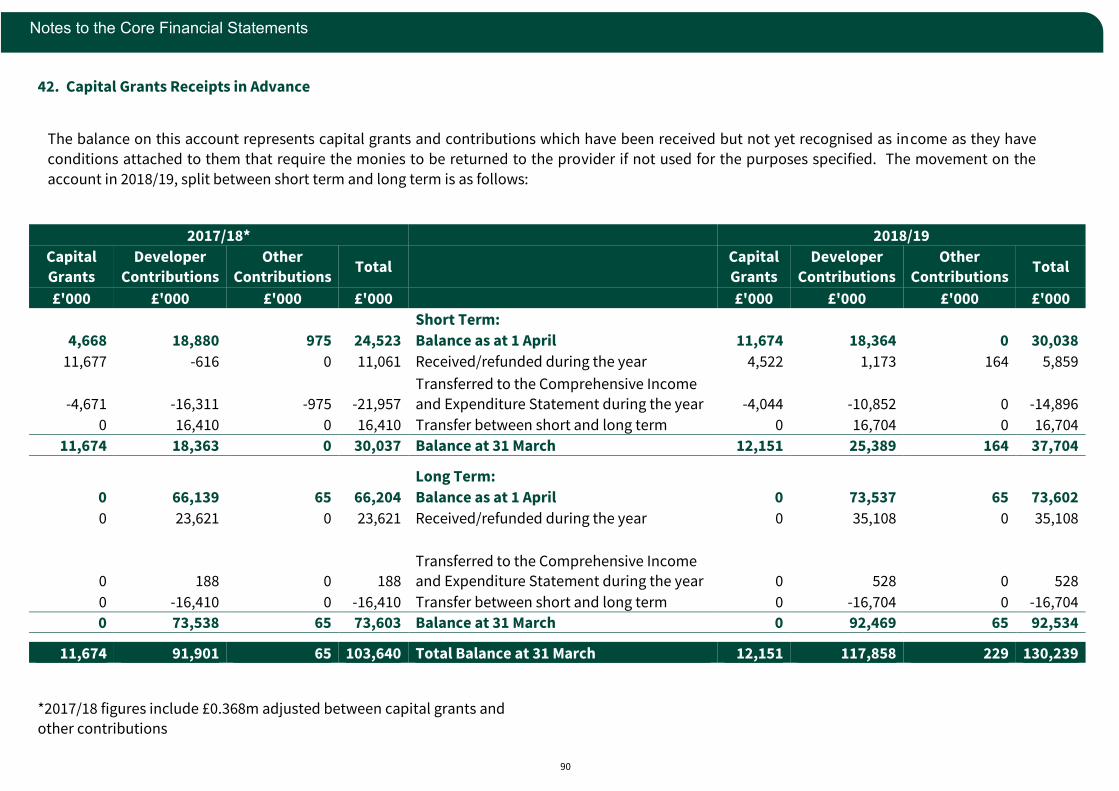
90
Notes to the Core Financial Statements
42. Capital Grants Receipts in Advance
*2017/18 figures include £0.368m adjusted between capital grants and other contributions
2017/18* 2018/19
Capital
Grants
Developer
Contributions
Other
Contributions Total
Capital
Grants
Developer
Contributions
Other
Contributions Total
£'000 £'000 £'000 £'000 £'000 £'000 £'000 £'000
Short Term:
4,668 18,880 975 24,523 Balance as at 1 April 11,674 18,364 0 30,038
11,677 -616 0 11,061 Received/refunded during the year 4,522 1,173 164 5,859
-4,671 -16,311 -975 -21,957
Transferred to the Comprehensive Income
and Expenditure Statement during the year -4,044 -10,852 0 -14,896
0 16,410 0 16,410 Transfer between short and long term 0 16,704 0 16,704
11,674 18,363 0 30,037 Balance at 31 March 12,151 25,389 164 37,704
Long Term:
0 66,139 65 66,204 Balance as at 1 April 0 73,537 65 73,602
0 23,621 0 23,621 Received/refunded during the year 0 35,108 0 35,108
0 188 0 188 Transferred to the Comprehensive Income and Expenditure Statement during the year 0 528 0 528
0 -16,410 0 -16,410 Transfer between short and long term 0 -16,704 0 -16,704
0 73,538 65 73,603 Balance at 31 March 0 92,469 65 92,534
11,674 91,901 65 103,640 Total Balance at 31 March 12,151 117,858 229 130,239
The balance on this account represents capital grants and contributions which have been received but not yet recognised as income as they have
conditions attached to them that require the monies to be returned to the provider if not used for the purposes specified. The movement on the
account in 2018/19, split between short term and long term is as follows:
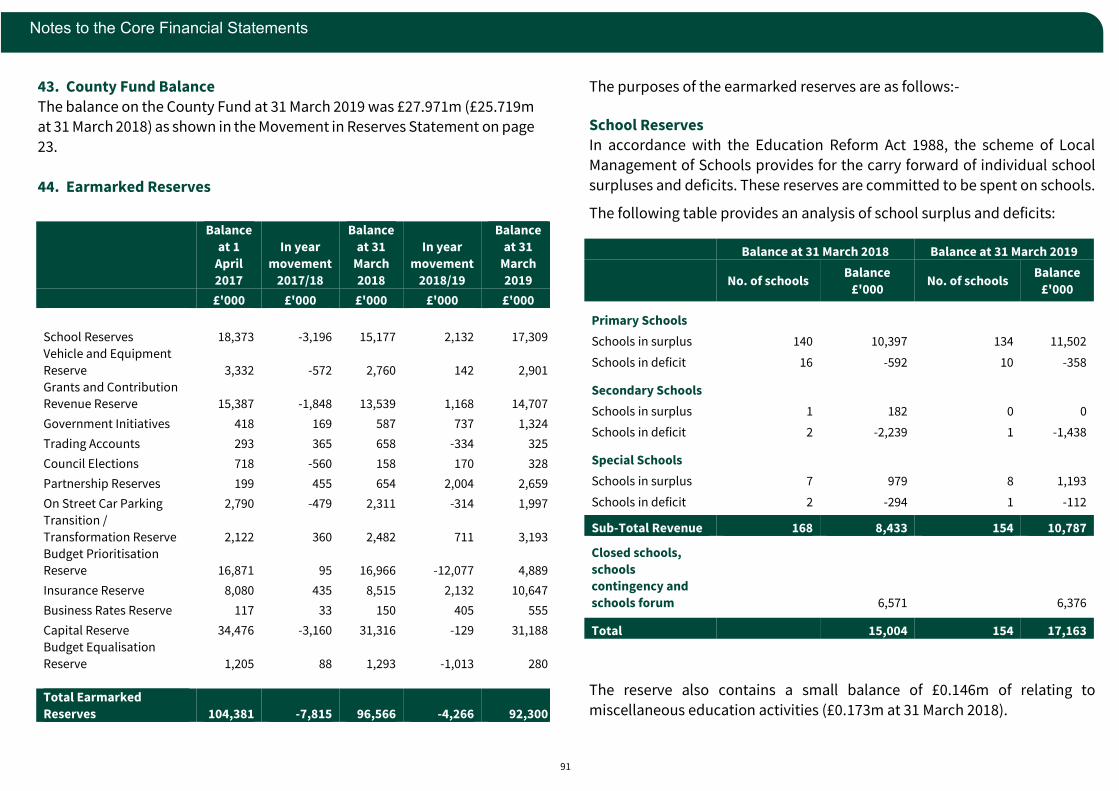
91
Notes to the Core Financial Statements
43. County Fund Balance
The balance on the County Fund at 31 March 2019 was £27.971m (£25.719m at 31 March 2018) as shown in the Movement in Reserves Statement on page
23.
44. Earmarked Reserves
The purposes of the earmarked reserves are as follows:-
School Reserves In accordance with the Education Reform Act 1988, the scheme of Local
Management of Schools provides for the carry forward of individual school
surpluses and deficits. These reserves are committed to be spent on schools.
The following table provides an analysis of school surplus and deficits:
The reserve also contains a small balance of £0.146m of relating to
miscellaneous education activities (£0.173m at 31 March 2018).
Balance at 31 March 2018 Balance at 31 March 2019
No. of schools
Balance
£'000 No. of schools
Balance
£'000
Primary Schools
Schools in surplus 140 10,397 134 11,502
Schools in deficit 16 -592 10 -358
Secondary Schools
Schools in surplus 1 182 0 0
Schools in deficit 2 -2,239 1 -1,438
Special Schools
Schools in surplus 7 979 8 1,193
Schools in deficit 2 -294 1 -112
Sub-Total Revenue 168 8,433 154 10,787
Closed schools,
schools
contingency and
schools forum 6,571 6,376
Total 15,004 154 17,163
Balance
at 1
April
2017
In year
movement
2017/18
Balance
at 31
March
2018
In year
movement
2018/19
Balance
at 31
March
2019
£'000 £'000 £'000 £'000 £'000
School Reserves 18,373 -3,196 15,177 2,132 17,309
Vehicle and Equipment
Reserve 3,332 -572 2,760 142 2,901
Grants and Contribution
Revenue Reserve 15,387 -1,848 13,539 1,168 14,707
Government Initiatives 418 169 587 737 1,324
Trading Accounts 293 365 658 -334 325
Council Elections 718 -560 158 170 328
Partnership Reserves 199 455 654 2,004 2,659
On Street Car Parking 2,790 -479 2,311 -314 1,997
Transition /
Transformation Reserve 2,122 360 2,482 711 3,193
Budget Prioritisation
Reserve 16,871 95 16,966 -12,077 4,889
Insurance Reserve 8,080 435 8,515 2,132 10,647
Business Rates Reserve 117 33 150 405 555
Capital Reserve 34,476 -3,160 31,316 -129 31,188
Budget Equalisation
Reserve 1,205 88 1,293 -1,013 280
Total Earmarked
Reserves 104,381 -7,815 96,566 -4,266 92,300

92
Notes to the Core Financial Statements
Vehicle and Equipment Reserve
This reserve is to fund future replacements of vehicles and equipment.
Grants and Contributions Reserve
This reserve has been set up to hold unspent grants and contributions committed to be spent in future years. £2.374m of the balance at 31 March
2019 relates to the Dedicated Schools Grant.
Government Initiatives Reserve This reserve is used to hold underspends on budgets funded by unringfenced
grants held that relate to specific agreed outcomes or the implementation of
Government initiatives.
Trading Accounts
This reserve holds funds relating to traded activities to help manage
investment.
Council Elections Reserve
This reserve has been established to meet the cost of County Council
Elections.
Partnership Reserves
This reserve holds funds relating to partnership arrangements.
On-Street Car Parking Reserve
This surplus has arisen under the operation of the Road Traffic Regulation Act 1984 (Section 55). The purposes for which these monies can be used are
defined by statute.
Insurance Reserve This reserve covers the County Council for insurance claims that, based on the
previous experience of the County Council, are likely to be received, as well
as a number of insurance related issues.
An independent actuary, Arthur J Gallagher, carries out a full valuation of the County Council’s employers and public liability, motor, property and
personal accident liability every three years using generally accepted
actuarial methods. Interim valuations take place annually in between. The
last full valuation was completed as at 31 March 2017.
The actuaries projected the standard claims arising in future years in respect
of the period up to 31 March 2019 at £1.881m. In addition to these claims the
actuaries have also highlighted an amount in respect of Municipal Mutual Insurance Plc (MMI) clawback and non-standard claims (for example
exceptional and latent claims) which in total has been assessed at £1.786m.
The sum of £0.519m has been included in the reserves to cover MMI clawback
noted as a contingent liability.
Business Rates Reserve
This reserve is being used to smooth out any volatility in the business rates
collected by the District Councils on behalf of the County Council.
At 31
March 2018
At 31
March 2019
£'000 £'000
Standard claims likely to be received as at 31 March 1,753 1,881 Additional IBNR/Latent claims as assessed by Actuarial review 1,807 1,786
MMI clawback as assessed by actuarial review 849 519
Risk management 4,106 6,461
Total 8,515 10,647

93
Notes to the Core Financial Statements
Capital Reserve
This reserve has been established for the purpose of financing capital
expenditure in future years. Budget Equalisation Reserve
This reserve is used to manage the cash flow implications of variations to the
Medium Term Financial Plan. Budget Prioritisation Reserve
This reserve is to help support the implementation of directorate business
strategies and the Medium Term Financial Plan. Transition/Transformation Reserve This reserve was established as part of the 2016/17 budget process to utilise
one-off grant funding from the Government to fund the Council’s Fit for the
Future transformation programme. 45. Usable Capital Receipts
This reserve has been established for the purpose of financing capital
expenditure in future years. Unutilised capital receipts at 31 March 2019 have
been earmarked for future schemes.
An analysis of the net capital receipts from the sale of assets is set out in the
following table:
46. Capital Grants and Contributions Unapplied
The balance on this account represents grants and contributions which have
been recognised as income in the Comprehensive Income and Expenditure
Statement but not yet applied to finance capital expenditure.
2017/18 2018/19
£'000 £'000
Balance at 1 April 20,145 22,580
Net receipts from sale of assets 2,436 754
Net receipts from repayment of loans 513 127
Receipts applied to finance capital expenditure -514 0
Balance at 31 March 22,580 23,461
Net Capital Receipts from the sale of assets 2017/18 2018/19
£'000 £'000
St Edburg's primary school site 1,417 Other receipts from the sale of assets under £500,000 1,019 754
Total 2,436 754
2017/18 2018/19
£'000 £'000
Balance at 1 April 42,185 48,070
Applied during the year -15,154 -4,479
Recognised as income but not applied during the year 21,039 37,528
Balance at 31 March 48,070 81,120
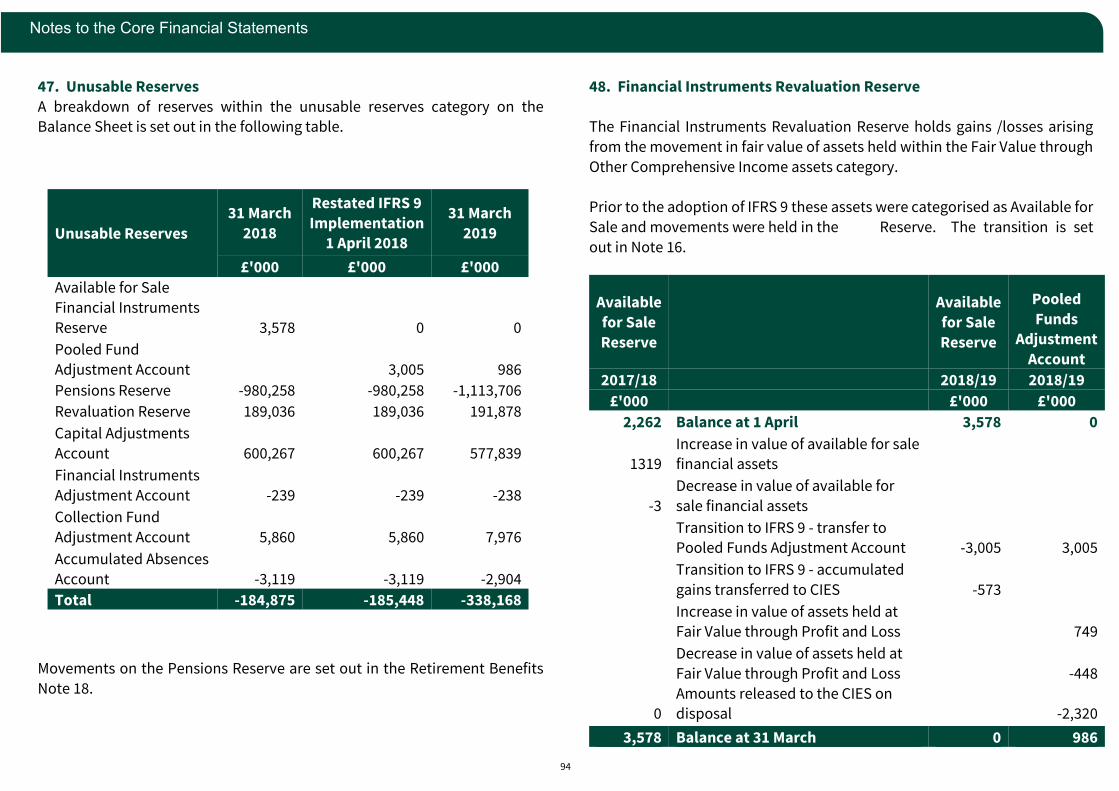
94
Notes to the Core Financial Statements
47. Unusable Reserves
A breakdown of reserves within the unusable reserves category on the Balance Sheet is set out in the following table.
Movements on the Pensions Reserve are set out in the Retirement Benefits
Note 18.
48. Financial Instruments Revaluation Reserve
The Financial Instruments Revaluation Reserve holds gains /losses arising
from the movement in fair value of assets held within the Fair Value through
Other Comprehensive Income assets category.
Prior to the adoption of IFRS 9 these assets were categorised as Available for
Sale and movements were held in the Reserve. The transition is set
out in Note 16.
Available
for Sale
Reserve
Available
for Sale
Reserve
Pooled
Funds Adjustment
Account
2017/18 2018/19 2018/19
£'000 £'000 £'000
2,262 Balance at 1 April 3,578 0
1319 Increase in value of available for sale financial assets
-3
Decrease in value of available for
sale financial assets
Transition to IFRS 9 - transfer to Pooled Funds Adjustment Account -3,005 3,005
Transition to IFRS 9 - accumulated
gains transferred to CIES -573
Increase in value of assets held at Fair Value through Profit and Loss 749
Decrease in value of assets held at
Fair Value through Profit and Loss -448
0 Amounts released to the CIES on disposal -2,320
3,578 Balance at 31 March 0 986
Unusable Reserves
31 March
2018
Restated IFRS 9
Implementation 1 April 2018
31 March
2019
£'000 £'000 £'000
Available for Sale
Financial Instruments
Reserve 3,578 0 0
Pooled Fund
Adjustment Account 3,005 986
Pensions Reserve -980,258 -980,258 -1,113,706
Revaluation Reserve 189,036 189,036 191,878
Capital Adjustments
Account 600,267 600,267 577,839
Financial Instruments
Adjustment Account -239 -239 -238
Collection Fund
Adjustment Account 5,860 5,860 7,976
Accumulated Absences
Account -3,119 -3,119 -2,904
Total -184,875 -185,448 -338,168

95
Notes to the Core Financial Statements
49. Revaluation Reserve
The Revaluation Reserve contains the gains made by the County Council arising from increases in the value of Property, Plant and Equipment. The
balance is reduced when assets with accumulated gains are revalued
downwards or impaired, consumed through depreciation or disposed. The Reserve contains only revaluation gains accumulated since 1 April 2007,
when the Reserve was created. Accumulated gains arising before that date
are consolidated into the balance on the Capital Adjustment Account
50. Capital Adjustment Account
The Capital Adjustment Account absorbs the timing differences between accounting for the consumption of non-current assets and for financing the
acquisition, construction or enhancement of those assets under statutory
provisions. The account is debited with the cost of acquisition, construction or enhancement as depreciation, impairment losses and amortisations are
charged to the Comprehensive Income and Expenditure Statement (with
reconciling postings from the Revaluation Reserve to convert fair value
figures to a historical cost basis). The account is credited with the amounts set aside by the County Council as finance for the costs of acquisition,
construction or enhancement. The account also contains revaluation gains
accumulated on Property, Plant and Equipment before 1 April 2007, the date the Revaluation Reserve was created to hold such gains.
2017/18 Revaluation Reserve 2018/19
£'000 £'000 £'000 £'000
158,413 Balance as at 1 April 189,036
28,681 Revaluation of assets 16,789
-1,101 Impairment of assets -651
9,388
Write back of accumulated depreciation on
revaluations 261
1,552
Write back of accumulated impairment on
revaluations 189
38,520
Surplus or deficit on revaluation of non current
assets not posted to the Surplus or Deficit on
the Provision of Services 16,589
-3,220
Difference between fair value depreciation and
historical cost depreciation -3,455
-4,677 Accumulated gains on assets sold or scrapped -10,292
-7,897
Amounts written off to the Capital Adjustment
Account -13,747
189,036 Total Balance at 31 March 191,878
2017/18 Capital Adjustment Account 2018/19
£'000 £'000 £'000 £'000
600,115 Balance as at 1 April 600,267
Reversal of Items relating to capital
expenditure debited or credited to the
Comprehensive Income and Expenditure
Statement (CIES):
-32,151
Charges for depreciation for non-current
assets -30,903
-169
Charges for impairment for non-current
assets -64
-433
Revaluation losses / subsequent gains on
Property, Plant and Equipment 953 -253 Amortisation of Intangible Assets -207
-53,823
Revenue Expenditure funded from capital
under statute -53,061
-31,643
Amounts of non-current assets written off on
disposal or sale as part of the gain/ loss on
derecognition -67,238
0
Removal of finance liability on
derecognition of assets held under finance
leases 19
-118,472 -150,501
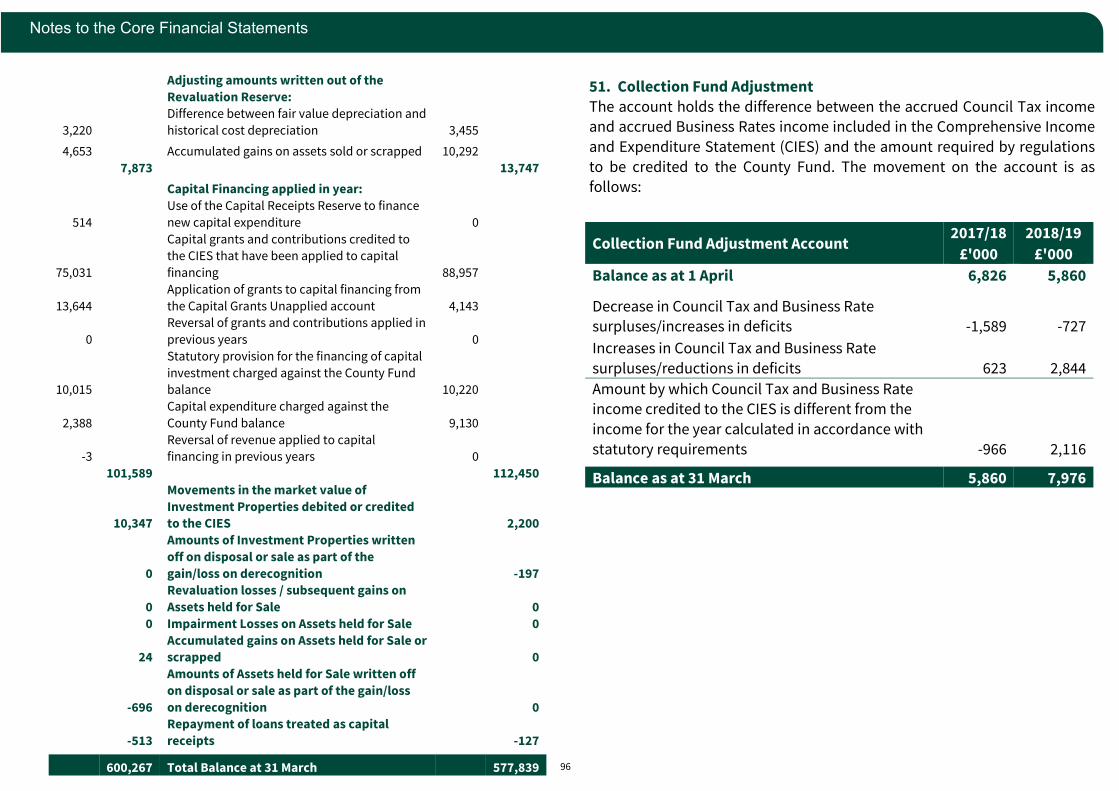
96
Notes to the Core Financial Statements
51. Collection Fund Adjustment
The account holds the difference between the accrued Council Tax income and accrued Business Rates income included in the Comprehensive Income
and Expenditure Statement (CIES) and the amount required by regulations
to be credited to the County Fund. The movement on the account is as follows:
Adjusting amounts written out of the
Revaluation Reserve:
3,220
Difference between fair value depreciation and
historical cost depreciation 3,455
4,653 Accumulated gains on assets sold or scrapped 10,292
7,873 13,747
Capital Financing applied in year:
514
Use of the Capital Receipts Reserve to finance
new capital expenditure 0
75,031
Capital grants and contributions credited to
the CIES that have been applied to capital
financing 88,957
13,644
Application of grants to capital financing from
the Capital Grants Unapplied account 4,143
0
Reversal of grants and contributions applied in
previous years 0
10,015
Statutory provision for the financing of capital
investment charged against the County Fund
balance 10,220
2,388
Capital expenditure charged against the
County Fund balance 9,130
-3
Reversal of revenue applied to capital
financing in previous years 0
101,589 112,450
10,347
Movements in the market value of
Investment Properties debited or credited
to the CIES 2,200
0
Amounts of Investment Properties written
off on disposal or sale as part of the
gain/loss on derecognition -197
0
Revaluation losses / subsequent gains on
Assets held for Sale 0
0 Impairment Losses on Assets held for Sale 0
24
Accumulated gains on Assets held for Sale or
scrapped 0
-696
Amounts of Assets held for Sale written off
on disposal or sale as part of the gain/loss
on derecognition 0
-513
Repayment of loans treated as capital
receipts -127
600,267 Total Balance at 31 March 577,839
Collection Fund Adjustment Account 2017/18 2018/19
£'000 £'000
Balance as at 1 April 6,826 5,860
Decrease in Council Tax and Business Rate surpluses/increases in deficits -1,589 -727
Increases in Council Tax and Business Rate
surpluses/reductions in deficits 623 2,844
Amount by which Council Tax and Business Rate income credited to the CIES is different from the
income for the year calculated in accordance with
statutory requirements -966 2,116
Balance as at 31 March 5,860 7,976
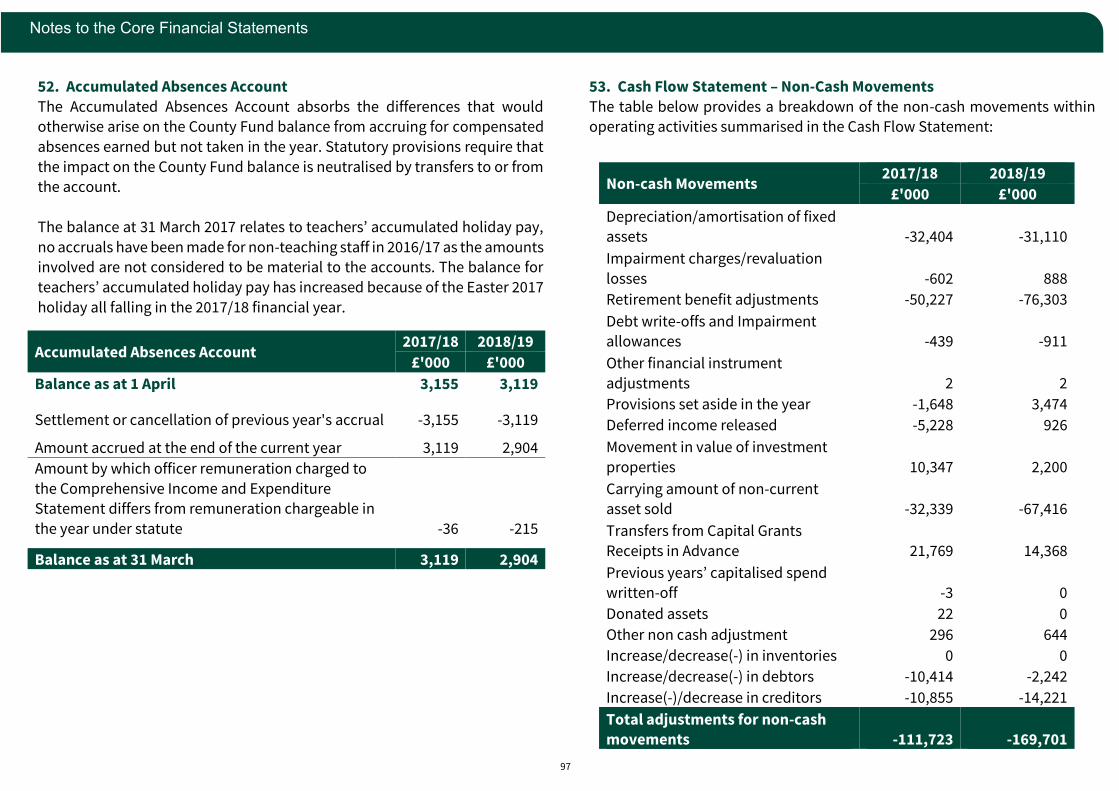
97
Notes to the Core Financial Statements
52. Accumulated Absences Account
The Accumulated Absences Account absorbs the differences that would otherwise arise on the County Fund balance from accruing for compensated
absences earned but not taken in the year. Statutory provisions require that
the impact on the County Fund balance is neutralised by transfers to or from the account.
The balance at 31 March 2017 relates to teachers’ accumulated holiday pay,
no accruals have been made for non-teaching staff in 2016/17 as the amounts involved are not considered to be material to the accounts. The balance for
teachers’ accumulated holiday pay has increased because of the Easter 2017
holiday all falling in the 2017/18 financial year.
53. Cash Flow Statement – Non-Cash Movements
The table below provides a breakdown of the non-cash movements within operating activities summarised in the Cash Flow Statement:
Accumulated Absences Account 2017/18 2018/19
£'000 £'000
Balance as at 1 April 3,155 3,119
Settlement or cancellation of previous year's accrual -3,155 -3,119
Amount accrued at the end of the current year 3,119 2,904
Amount by which officer remuneration charged to
the Comprehensive Income and Expenditure Statement differs from remuneration chargeable in
the year under statute -36 -215
Balance as at 31 March 3,119 2,904
Non-cash Movements 2017/18 2018/19
£'000 £'000
Depreciation/amortisation of fixed assets -32,404 -31,110
Impairment charges/revaluation
losses -602 888
Retirement benefit adjustments -50,227 -76,303
Debt write-offs and Impairment allowances -439 -911
Other financial instrument
adjustments 2 2
Provisions set aside in the year -1,648 3,474
Deferred income released -5,228 926
Movement in value of investment
properties 10,347 2,200
Carrying amount of non-current asset sold -32,339 -67,416
Transfers from Capital Grants
Receipts in Advance 21,769 14,368
Previous years’ capitalised spend
written-off -3 0
Donated assets 22 0
Other non cash adjustment 296 644
Increase/decrease(-) in inventories 0 0
Increase/decrease(-) in debtors -10,414 -2,242
Increase(-)/decrease in creditors -10,855 -14,221
Total adjustments for non-cash movements -111,723 -169,701
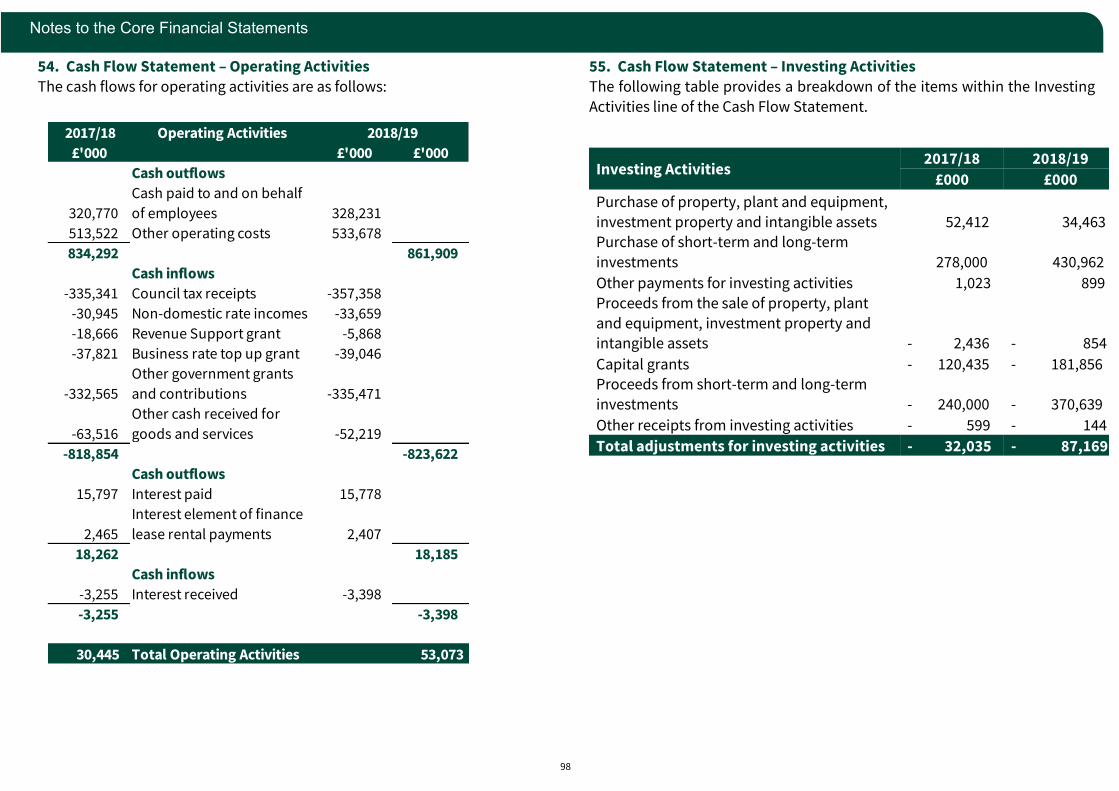
98
Notes to the Core Financial Statements
54. Cash Flow Statement – Operating Activities
The cash flows for operating activities are as follows:
55. Cash Flow Statement – Investing Activities
The following table provides a breakdown of the items within the Investing
Activities line of the Cash Flow Statement.
Investing Activities 2017/18 2018/19
£000 £000
Purchase of property, plant and equipment,
investment property and intangible assets 52,412 34,463 Purchase of short-term and long-term
investments 278,000 430,962
Other payments for investing activities 1,023 899
Proceeds from the sale of property, plant
and equipment, investment property and intangible assets - 2,436 - 854
Capital grants - 120,435 - 181,856 Proceeds from short-term and long-term
investments - 240,000 - 370,639
Other receipts from investing activities - 599 - 144
Total adjustments for investing activities - 32,035 - 87,169
2017/18 Operating Activities
£'000 £'000 £'000
Cash outflows
320,770
Cash paid to and on behalf
of employees 328,231
513,522 Other operating costs 533,678
834,292 861,909
Cash inflows
-335,341 Council tax receipts -357,358
-30,945 Non-domestic rate incomes -33,659
-18,666 Revenue Support grant -5,868
-37,821 Business rate top up grant -39,046
-332,565
Other government grants
and contributions -335,471
-63,516
Other cash received for
goods and services -52,219
-818,854 -823,622
Cash outflows
15,797 Interest paid 15,778
2,465
Interest element of finance
lease rental payments 2,407
18,262 18,185
Cash inflows
-3,255 Interest received -3,398
-3,255 -3,398
30,445 Total Operating Activities 53,073
2018/19

99
Notes to the Core Financial Statements
56. Cash Flow Statement – Financing Activities
A breakdown of the items within the Financing Activities line in the Cash Flow
Statement is as follows:
57. Contingent Liabilities
Nettlebed School Land
In 2006 children at Nettlebed School moved to a new school site and the old
premises were sold. The Council used the sale proceeds of £1.355m to meet
some of the costs of the new school (£2m).
The land was originally given by the late Robert Fleming in 1914 and in 1928
to provide for the Primary School under the School Site’s Act 1841. Mr Fleming died in the 1930s and his beneficiaries have brought a claim against
the Council arguing that the money received from the sale of the School
should go back to them on the basis that, under the act, the land had to be used for the statutory purpose of providing education and if it ceased to be
used for that purpose it would revert to the estate of the person/trust who
gave the land in the first place.
The Act does allow you to sell/exchange the land and use the money to buy another school and in 2018 the High Court accepted that this could be viewed
as one composite transaction and the land did not revert to Mr Fleming’s
family. However, the Court of Appeal held a different view. They say, when
the children moved off site in 2006 then the land reverted to the beneficiaries.
The Council has now lodged an appeal with the Supreme Court. If the appeal
is not successful, the Council will need to pay the sale proceeds to the
beneficiaries. As the income from the sale was recognised as a capital receipt, this will be funded from the Capital Receipts Unapplied Reserve and
will reduce the funding available for the capital programme.
Municipal Mutual Insurance Plc The County Council has claims outstanding with Municipal Mutual Insurance
(MMI) Plc. In November 2012 the directors of MMI triggered a process to wind
up the business. This means the County Council may have to repay all or part of the insurance claims settled since the company ceased to trade, as well as
fund any outstanding claims. The current levy of 25% has been paid against
settled claims, therefore as at 30 September 2018 the Council has a potential liability of £3.505m remaining on previously settled claims, plus the value of
any outstanding and future claims. On Actuarial advice a further 15% of the
total known liability has been secured against future clawback over the
longer term. This is in addition to the small short-term provision of £0.001m recognised at year end for the 15% levy which will be due on outstanding
claims figures. Mandatory Relief for NHS Trusts Along with other NHS Trusts across the Country, the Oxford Health NHS
Foundation Trust has made a claim for backdated mandatory relief of
business rates (NNDR). Business rates are collected by the District Councils and pooled with the County Council and Central Government. The County
receives 10% of the rates collected and would be liable for 10% of the claim.
The claim period is from February 2012 to 2019 and exceeds £25m. If the
claim is successful, the County Council has a potential liability in excess of £2.5m and would see a future reduction in annual income from NNDR of
about £0.400m.
Financing Activities 2017/18 2018/19
£'000 £'000
Cash receipts of short- and long-term borrowing 0 0
Other receipts from financing activities 0 0
Cash payments for the reduction of the
outstanding liabilities relating to finance leases
and on-balance sheet service concession
arrangements 6,564 453
Repayments of short- and long-term borrowing 18,000 24,000
Other payments for financing activities 0 0
Total adjustments for financing activities 24,564 24,453
100
Notes to the Core Financial Statements
58. Material Post Balance Sheet Events
Events after the balance sheet date have been considered up until 31 May 2019, when the accounts were authorised for issue.
Two schools converted to academy status since 31 March 2019, none of which are recognised on the County Council's balance sheet.
These are non-adjusting events.
Events after the Balance Sheet date are those events, favourable or
unfavourable, that occur between the end of the reporting period (31 March
2018) and the date the Statement of Accounts is authorised for issue. There are two types of event:
• those that provide evidence of conditions that existed at the Balance
Sheet date – the Statement of Accounts is adjusted to reflect such events
• those that are indicative of conditions that arose after the Balance
Sheet date – the Statement of Accounts is not adjusted to reflect such
events, but a disclosure is made if the event has a material effect.
59. Changes in accounting policy
The County Council is required to disclose information relating to the impact of an accounting change on the financial statements as a result of the
adoption by the Code of Practice on Local Authority Accounting in the United
Kingdom 2019/20 (the Code) of a new standard that has been issued but is not yet required to be adopted by the County Council for the current
reporting year (2018/19).
New standards that have been adopted by the Code for 2019/20 which will apply from 1 April 2019 are as follows:
• Amendments to IAS 40 Investment Property: Transfers of Investment Property
• Annual Improvements to IFRS Standards 2014 - 2016 Cycle
• IFRIC 22 Foreign Currency Transactions and Advance Consideration
• IFRIC 23 Uncertainty over Income Tax Treatments
• Amendments to IFRS 9 Financial Instruments: Prepayment Features with Negative Compensation
Assessments of the impact of the of accounting standards to be adopted in 2019/20 have found that they are not expected to have a material impact.
Prior period adjustments may arise as a result of a change in accounting
policies or to correct a material error. Changes in accounting estimates are accounted for prospectively, ie in the current and future years affected by the
change and do not give rise to a prior period adjustment.
Changes in accounting policies are only made when required by proper
accounting practices or the change provides more reliable or relevant
information about the effect of transactions, other events and conditions on
the authority’s financial position or financial performance. Where a change
is made, it is applied retrospectively (unless stated otherwise) by adjusting
opening balances and comparative amounts for the prior period as if the new
policy had always been applied.
Material errors discovered in prior period figures are corrected
retrospectively by amending opening balances and comparative amounts for the prior period.
60. Authorisation of the Accounts The draft Statement of Accounts was authorised for issue by Lorna Baxter,
Director of Finance on 29 May 2019.
These statements may be subject to amendment following the conclusion of the audit.
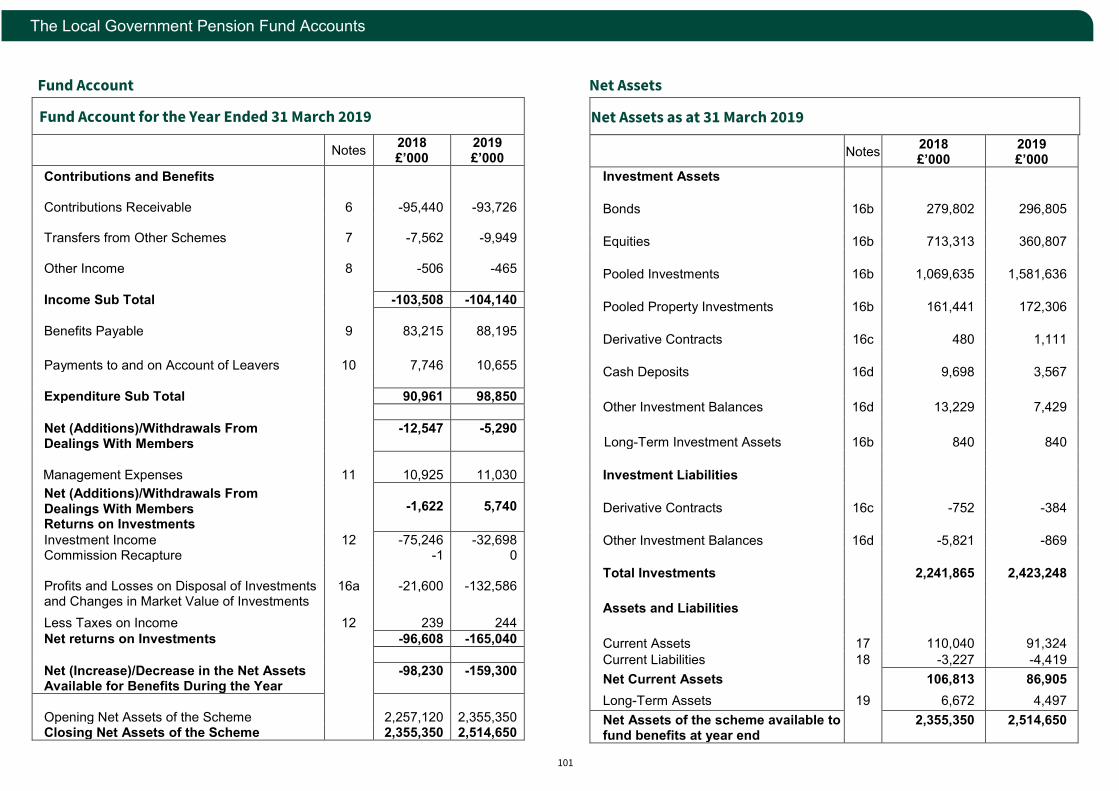
101
The Local Government Pension Fund Accounts
Fund Account
Net Assets Fund Account for the Year Ended 31 March 2019
Notes 2018 £’000
2019 £’000
Contributions and Benefits Contributions Receivable 6 -95,440 -93,726
Transfers from Other Schemes 7 -7,562 -9,949 Other Income
8
-506
-465
Income Sub Total -103,508 -104,140
Benefits Payable 9 83,215 88,195
Payments to and on Account of Leavers 10 7,746 10,655 Expenditure Sub Total 90,961 98,850
Net (Additions)/Withdrawals From Dealings With Members
-12,547 -5,290
Management Expenses
11
10,925
11,030
Net (Additions)/Withdrawals From Dealings With Members Returns on Investments
-1,622
5,740
Investment Income 12 -75,246 -32,698 Commission Recapture -1 0
Profits and Losses on Disposal of Investments and Changes in Market Value of Investments
16a -21,600 -132,586
Less Taxes on Income 12 239 244 Net returns on Investments -96,608 -165,040
Net (Increase)/Decrease in the Net Assets Available for Benefits During the Year
-98,230 -159,300
Opening Net Assets of the Scheme 2,257,120 2,355,350 Closing Net Assets of the Scheme 2,355,350 2,514,650
Net Assets as at 31 March 2019 Notes 2018
£’000 2019 £’000
Investment Assets
Bonds 16b 279,802 296,805
Equities 16b 713,313 360,807
Pooled Investments 16b 1,069,635 1,581,636
Pooled Property Investments 16b 161,441 172,306
Derivative Contracts 16c 480 1,111 Cash Deposits 16d 9,698 3,567 Other Investment Balances 16d 13,229 7,429 Long-Term Investment Assets 16b 840 840
Investment Liabilities
Derivative Contracts 16c -752 -384 Other Investment Balances 16d -5,821 -869 Total Investments 2,241,865 2,423,248
Assets and Liabilities
Current Assets 17 110,040 91,324 Current Liabilities 18 -3,227 -4,419 Net Current Assets 106,813 86,905 Long-Term Assets 19 6,672 4,497 Net Assets of the scheme available to fund benefits at year end
2,355,350 2,514,650
102
The Local Government Pension Fund Accounts
The Fund’s financial statements do not take account of liabilities to pay
pensions and other benefits after the period end. The actuarial present value
of promised retirement benefits is disclosed at Note 26.
Note 1 – Description of the fund
This description of the Fund is a summary only. Further details are available in the Fund’s 2018/19 Annual Report and in the underlying statutes.
General
The Oxfordshire County Council Pension Fund is part of the Local
Government Pension Scheme which is a statutory, funded, defined benefit
pension scheme. Oxfordshire County Council is the administering body for
this pension fund. The scheme covers eligible employees and elected members of the County Council, District Councils within the county area and
employees of other bodies eligible to join the Scheme.
The scheme is governed by the Public Service Pensions Act 2013 and is
administered in accordance with the following secondary legislation:
• The Local Government Pension Scheme Regulations 2013 (as amended)
• The Local Government Pension Scheme (Transitional Provisions, Savings and Amendment) Regulations 2014 (as amended)
• The Local Government Pension Scheme (Management and Investment
of Funds) Regulations 2016.
This defined benefit scheme provides benefits related to salary for its
members. Pensions paid to retired employees, their dependants, and
deferred benefits are subject to mandatory increases in accordance with
annual pension increase legislation. The amount is determined by the Secretary of State.
Membership The majority of fund employers are required to automatically enrol eligible
jobholders into the LGPS under the government’s auto-enrolment
legislation, employees may then choose to opt-out of the scheme. Some
employers will have the option of whether to auto-enrol eligible jobholders
into the LGPS or another qualifying scheme.
Members are made up of three main groups. Firstly, the contributors - those
who are still working and paying money into the Fund. Secondly, the pensioners - those who are in receipt of a pension and thirdly, by those who
have left their employment with an entitlement to a deferred benefit on
reaching pensionable age.
Organisations participating in the Oxfordshire County Council Pension Fund
include:
• Scheduled Bodies – Local authorities and similar bodies, such as academies, whose staff are automatically entitled to become members
of the Fund.
• Admitted Bodies – Organisations that participate in the Fund under an
admission agreement between the Fund and the organisation. Admitted
bodies include voluntary, charitable and similar bodies or private
contractors undertaking a local authority function following
outsourcing to the private sector.
• Admitted Bodies can be split in to two groups: Community Admission Bodies – these are typically employers that
provide a public service on a not-for-profit basis and often have links
to scheduled bodies already in the Fund. Housing Corporations fall under this category.
Transferee Admission Bodies – these are bodies that provide a
service or asset in connection with the exercise of a function of a
scheme employer. Typically this will be when a service is transferred from a scheme employer and is to allow continuing membership for
staff still involved in the delivery of the service transferred.
Full definitions are contained in The Local Government Pension Scheme
(Administration) Regulations 2008.
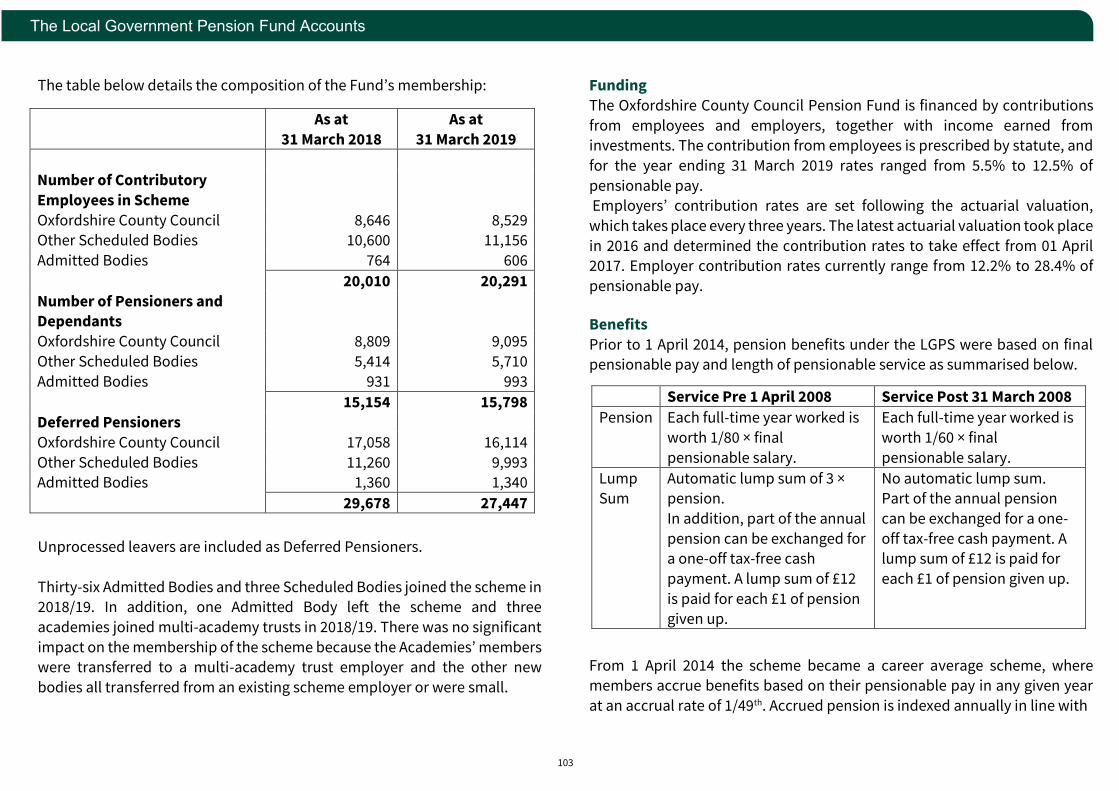
103
The Local Government Pension Fund Accounts
The table below details the composition of the Fund’s membership:
Unprocessed leavers are included as Deferred Pensioners.
Thirty-six Admitted Bodies and three Scheduled Bodies joined the scheme in 2018/19. In addition, one Admitted Body left the scheme and three
academies joined multi-academy trusts in 2018/19. There was no significant
impact on the membership of the scheme because the Academies’ members were transferred to a multi-academy trust employer and the other new
bodies all transferred from an existing scheme employer or were small.
Funding
The Oxfordshire County Council Pension Fund is financed by contributions
from employees and employers, together with income earned from investments. The contribution from employees is prescribed by statute, and
for the year ending 31 March 2019 rates ranged from 5.5% to 12.5% of
pensionable pay. Employers’ contribution rates are set following the actuarial valuation,
which takes place every three years. The latest actuarial valuation took place
in 2016 and determined the contribution rates to take effect from 01 April
2017. Employer contribution rates currently range from 12.2% to 28.4% of
pensionable pay. Benefits
Prior to 1 April 2014, pension benefits under the LGPS were based on final pensionable pay and length of pensionable service as summarised below.
From 1 April 2014 the scheme became a career average scheme, where
members accrue benefits based on their pensionable pay in any given year
at an accrual rate of 1/49th. Accrued pension is indexed annually in line with
As at
31 March 2018
As at
31 March 2019
Number of Contributory
Employees in Scheme
Oxfordshire County Council 8,646 8,529 Other Scheduled Bodies 10,600 11,156
Admitted Bodies 764 606
20,010 20,291
Number of Pensioners and Dependants
Oxfordshire County Council 8,809 9,095
Other Scheduled Bodies 5,414 5,710
Admitted Bodies 931 993
15,154 15,798
Deferred Pensioners
Oxfordshire County Council 17,058 16,114
Other Scheduled Bodies 11,260 9,993 Admitted Bodies 1,360 1,340
29,678 27,447
Service Pre 1 April 2008 Service Post 31 March 2008
Pension Each full-time year worked is
worth 1/80 × final
pensionable salary.
Each full-time year worked is
worth 1/60 × final
pensionable salary.
Lump Sum
Automatic lump sum of 3 × pension.
In addition, part of the annual
pension can be exchanged for a one-off tax-free cash
payment. A lump sum of £12
is paid for each £1 of pension given up.
No automatic lump sum. Part of the annual pension
can be exchanged for a one-
off tax-free cash payment. A lump sum of £12 is paid for
each £1 of pension given up.
From 1 April 2014 the scheme became a career average scheme, where members accrue benefits based on their pensionable pay in any given year at an accrual rate of 1/49th. Accrued pension is indexed annually in line with the Consumer Prices Index. The normal retirement age is linked to each individual member’s State Pension Age. There are a range of other benefits provided under the scheme including early retirement, disability pensions and death benefits. Scheme

104
The Local Government Pension Fund Accounts
the Consumer Prices Index. The normal retirement age is linked to each
individual member’s State Pension Age.
There are a range of other benefits provided under the scheme including
early retirement, disability pensions and death benefits. Scheme members
are now also able to opt to pay 50% of the standard contributions in return for 50% of the pension benefit.
Note 2 – Basis of Preparation
The accounts have been prepared in accordance with the requirements of
the Code of Practice on Local Authority Accounting in the United Kingdom
2018/19.
Regulation 5(2)(c) of the Pension Scheme (Management and Investment of
Funds) Regulations 1998 (SI 1998 No 1831) prohibits administering
authorities from crediting Additional Voluntary Contributions to the Pension Fund. In consequence Additional Voluntary Contributions are excluded from
the Net Assets Statement and are disclosed separately in Note 23.
The accounts summarise the transactions of the Pension Fund and detail the
net assets of the Fund. The accounts do not take account of the obligation to
pay future benefits which fall due after the year-end. The Code gives
administering authorities the option to disclose this information in the net assets statement, in the notes to the accounts or by appending an actuarial
report prepared for this purpose. The pension fund has opted to disclose this
information in Note 26.
The accounts have been prepared on a going concern basis.
Note 3 – Summary of Significant Accounting Policies
Investments 1. Investments are shown in the accounts at market value, which has been
determined as follows:
(a) The majority of listed investments are stated at the bid price or where the bid price is not available, the last listed traded price, as at 31 March
2019.
(b) Unlisted securities are included at fair value, estimated by having regard
to the latest dealings, professional valuations, asset values and other
appropriate financial information;
(c) Pooled Investment Vehicles are stated at bid price for funds with
bid/offer spreads, or single price where there are no bid/offer spreads, as provided by the investment manager.
(d) Where appropriate, investments held in foreign currencies have been
valued on the relevant basis and translated into sterling at the rate ruling on 31 March 2019.
(e) Fixed Interest stocks are valued on a ‘clean’ basis (i.e. the value of
interest accruing from the previous interest payment date to the valuation date has been included within the amount receivable for
accrued income).
(f) Derivatives are stated at market value. Exchange traded derivatives are
stated at market values determined using market quoted prices. For exchange traded derivative contracts which are assets, market value is
based on quoted bid prices. For exchange traded derivative contracts
which are liabilities, market value is based on quoted offer prices. (g) Forward foreign exchange contracts are valued by determining the gain
or loss that would arise from closing out the contract at the reporting
date by entering into an equal and opposite contract at that date. (h) All gains and losses arising on derivative contracts are reported within
‘Changes in Market Value of Investments

105
The Local Government Pension Fund Accounts
Foreign Currencies
2. Balances denominated in foreign currencies are translated at the
rate ruling at the net assets statement date. Asset and liability balances are translated at the bid and offer rates respectively.
Transactions denominated in foreign currencies are translated at
the rate ruling at the date of transaction. Differences arising on investment balance translation are accounted for in the change in
market value of investments during the year.
Contributions
3. Employee normal contributions are accounted for when deducted
from pay. Employer normal contributions that are expressed as a
rate of salary are accounted for on the same basis as employees’ contributions, otherwise they are accounted for in the period they
are due under the Schedule of Contributions. Employer deficit
funding contributions are accounted for on the due dates on which they are payable in accordance with the Schedule of Contributions
and recovery plan under which they are being paid or on receipt if
earlier than the due date.
Employers’ pensions strain contributions are accounted for in the
period in which the liability arises. Any amount due in year but
unpaid will be classed as a current financial asset. Amounts not due until future years are classed as long-term financial assets.
The Actuary determines the contribution rate for each employer during the triennial valuations of the Fund’s assets and liabilities.
Employees’ contributions have been included at rates required by
the Local Government Pension Scheme Regulations.
Benefits, Refunds of Contributions and Transfer Values
4. Benefits payable and refunds of contributions have been brought
into the accounts on the basis of all amounts known to be due at the
end of the financial year. Any amounts due but unpaid are disclosed
in the net assets statement as current liabilities. Transfer values are
those sums paid to, or received from, other pension schemes and relate to periods of previous pensionable employment. Transfer
values have been included in the accounts on the basis of the date
when agreements were concluded.
In the case of inter-fund adjustments provision has only been made
where the amount payable or receivable was known at the year-end.
Group transfers are accounted for in accordance with the terms of
the transfer agreement.
Investment Income 5. Dividends and interest have been accounted for on an accruals
basis. Dividends from quoted securities are accounted for when the
security is declared ex-div. Interest is accrued on a daily basis. Investment income is reported net of attributable tax credits but
gross of withholding taxes. Irrecoverable withholding taxes are
reported separately as a tax charge. In the majority of cases, investment income arising from the underlying investments of the
Pooled Investment Vehicles is reinvested within the Pooled
Investment Vehicles and reflected in the unit price. It is reported
within ‘Changes in Market Value of Investments’. Foreign income has been translated into sterling at the date of the transaction.
Income due at the year-end was translated into sterling at the rate
ruling at 31 March 2019.
Investment Management and Scheme Administration
6. A proportion of relevant County Council officers’ salaries, including salary on-costs, have been charged to the Fund on the basis of time
spent on scheme administration and investment related business.
The fees of the Fund’s general investment managers have been
accounted for on the basis contained within their management
106
The Local Government Pension Fund Accounts
agreements. Investment management fees are accounted for on an
accruals basis.
Expenses
7. Expenses are accounted for on an accruals basis.
Cash
8. Cash held in bank accounts and other readily accessible cash funds
is classified under cash balances as it is viewed that these funds are
not held for investment purposes but to allow for effective cash
management. Cash that has been deposited for a fixed period and
as such as an investment, has been included under cash deposits.
Listed Private Equity
9. The fund holds a number of investments in listed private equity
companies. These are included under equities as the investment is in a company that undertakes private equity related activities rather
than an investment in a specific fund that makes private equity
investments. This is consistent with the treatment of other equity investments as the fund does not split out any other categories from
within equities, for example retail stocks.
Management Fees 10. Management fees have been accounted for based on the latest
guidance from the Chartered Institute of Public Finance &
Accountancy. Fees have been accounted for where the pension fund has a direct contractual obligation to pay them. This means where
fees are deducted in a pooled fund they have been accounted for,
but in a fund of funds the fees for the underlying funds are not included, only those the pension fund pays to the fund of funds
manager.
Note 4 – Critical Judgements in Applying Accounting Policies
Unquoted Private Equity Investments Determining the fair value of unquoted private equity investments is highly
subjective in nature. Unquoted private equity investments are valued by the
investment managers using various valuation techniques and this involves the use of significant judgements by the managers. The value of unquoted
private equity and infrastructure investments at 31 March 2019 was
£93.621m (£75.443m at 31 March 2018).
Pension Fund Liability
The pension fund liability is calculated every three years by the Fund’s
actuary, with annual updates in the intervening years. Methods and assumptions consistent with IAS19 are used in the calculations. Assumptions
underpinning the valuations are agreed with the actuary and are
summarised in Note 26. The estimate of the liability is therefore subject to significant variances based on changes to the assumptions used.
Note 5 – Assumptions Made About the Future and Other Major Sources of Estimation Uncertainty
The preparation of financial statements requires management to make
judgements, estimates and assumptions that affect the amounts reported for assets and liabilities as at the balance sheet date, and the amounts
reported for the revenues and expenses during the year. However, the nature
of estimation means that actual outcomes could differ from those estimates.
The key judgements and estimation uncertainties that have a significant risk
of causing material adjustments to the carrying amounts of assets and liabilities within the next financial year are:-

107
The Local Government Pension Fund Accounts
Note 6 – Contributions
Deficit recovery contributions are paid by employers based on the maximum 22 year recovery period set out in the Funding Strategy Statement. Where
appropriate, the Actuary has shortened the recovery period for some
employers to maintain as near stable contribution rates for those employers, in line with the Regulations.
*Local Government Scheme Additional Employees contributions are
invested within the Fund, unlike AVCs which are held separately, as disclosed
in Note 23.
Item Uncertainties Potential Impact
Actuarial
Present Value of Promised
Retirement Benefits
Estimation of the net liability
to pay pensions depends on a number of complex judgements relating to the
discount rate used, the rate at which salaries are
projected to increase, changes in retirement ages,
mortality rates and expected returns on fund assets. The
fund engages an actuarial firm to provide expert advice on the assumptions to be
applied.
The actuarial present value of
promised retirement benefits included in the financial statements is £4,134m. There is a risk that this
figure is under, or overstated in Note 26 to the accounts.
Sensitivities to the key assumptions
are as follows: A 0.5% p.a. increase in the pension
increase rate would result in an approximate 8% increase to liabilities (£345m).
A 0.5% p.a. increase in the salary increase rate would result in an
approximate increase to liabilities of 1% (£54m).
A 0.5% decrease in the real discount rate would result in an approximate
10% increase to liabilities (£424m). A one-year increase in member life expectancy would approximately
increase the liabilities by 3-5%.
Unquoted Private
Equity
Unquoted private equity and infrastructure investments
are valued at fair value using
recognised valuation
techniques. Due to the
assumptions involved in this process there is a degree of estimation involved in the
valuation.
Unquoted private equity and infrastructure investments included in
the financial statements total
£93.621m. There is a risk these
investments are under, or overstated
in the accounts. The Pension Fund relies on specialists to perform the valuations and does not have the
information (i.e. the assumptions that
were used in each case) to produce sensitivity calculations.
2017/18 2018/19 £’000 £’000
Employers
Normal -50,903 -53,554
Augmentation 0 0 Deficit Funding -21,099 -15,821
Costs of Early Retirement -1,417 -1,320
-73,419 -70,695
Members Normal -21,771 -22,709
Additional * -250 -322
-22,021 -23,031
Total -95,440 -93,726
Employer Contributions
Members Contributions
2017/18 2018/19 2017/18 2018/19
£’000 £’000 £’000 £’000 Oxfordshire County Council
Scheduled Bodies
-28,920
-41,098
-28,652
-33,409
-8,943
-11,872
-9,360
-11,124 Resolution Bodies -862 -4,868 -250 -1,558 Community Admission Bodies Transferee Admission Bodies
-956 -1,583
-2,034 -1,732
-387 -569
-385 -604
Total 73,419 -70,695 -22,021 -23,031

108
The Local Government Pension Fund Accounts
Note 7 – Transfers In
Note 8 – Other Income
Other Income for 2018/19 of £0.465m (2017/18 £0.506m) includes £0.192m
(2017/18 £0.253m) reflecting the interest resulting from the unwinding of the
discount for the long-term receivable recognised for transfers to Magistrates’
Courts. The long-term receivable was calculated on a discounted cash flow
basis. This resulted in a charge to the fund account in the year the long-term receivable was originally recognised representing the value of the discount.
The discount is being written down over a ten-year period. Further
information regarding the deferred asset is included in Note 19.
Note 9 – Benefits
Note 10 – Payment to and on account of leavers
Note 11 – Management Expenses
Within oversight and governance costs are fees paid to the Pension Fund’s
external auditors of £0.030m (2017/18 £0.045m) for the audit of the Pension Fund’s Annual Report and Accounts. No other external audit fees were paid
in 2018/19.
A further breakdown of Investment Management Expenses is in Note 13.
2017/18 2018/19
£’000 £’000
Individual Transfers In from other schemes -7,562 -7,868
Group Transfers In from other schemes 0 -2,081
Total -7,562 -9,949
2017/18 2018/19
£’000 £’000
Pensions Payable
Lump Sums – Retirement Grants
67,756
13,866
71,839
13,132 Lump Sums – Death Grants 1,593 3,224
Total 83,215 88,195
Pensions Payable Lump Sums
2017/18 2018/19 2017/18 2018/19
£’000 £’000 £’000 £’000
Oxfordshire County Council
Scheduled Bodies
33,541
29,841
35,222
31,745
6,523
7,273
6,980
7,128
Resolution Bodies 560 630 254 712
Community Admission Bodies
Transferee Admission Bodies
3,225
589
3,451
791
682
727
669
867
Total 67,756 71,839 15,459 16,356
2017/18 2018/19 £’000 £’000
Refunds of Contributions 375 651
Payments for members joining state scheme -17 -19
Group Transfers Out to other schemes Individual Transfers Out to other schemes
1,671 5,717
0 10,023
Total 7,746 10,655
2017/18 2018/19 £’000 £’000
Administrative Costs 2,013 2,242
Investment Management Expenses 8,186 7,334
Oversight & Governance Costs 726 1,454
Total 10,925 11,030
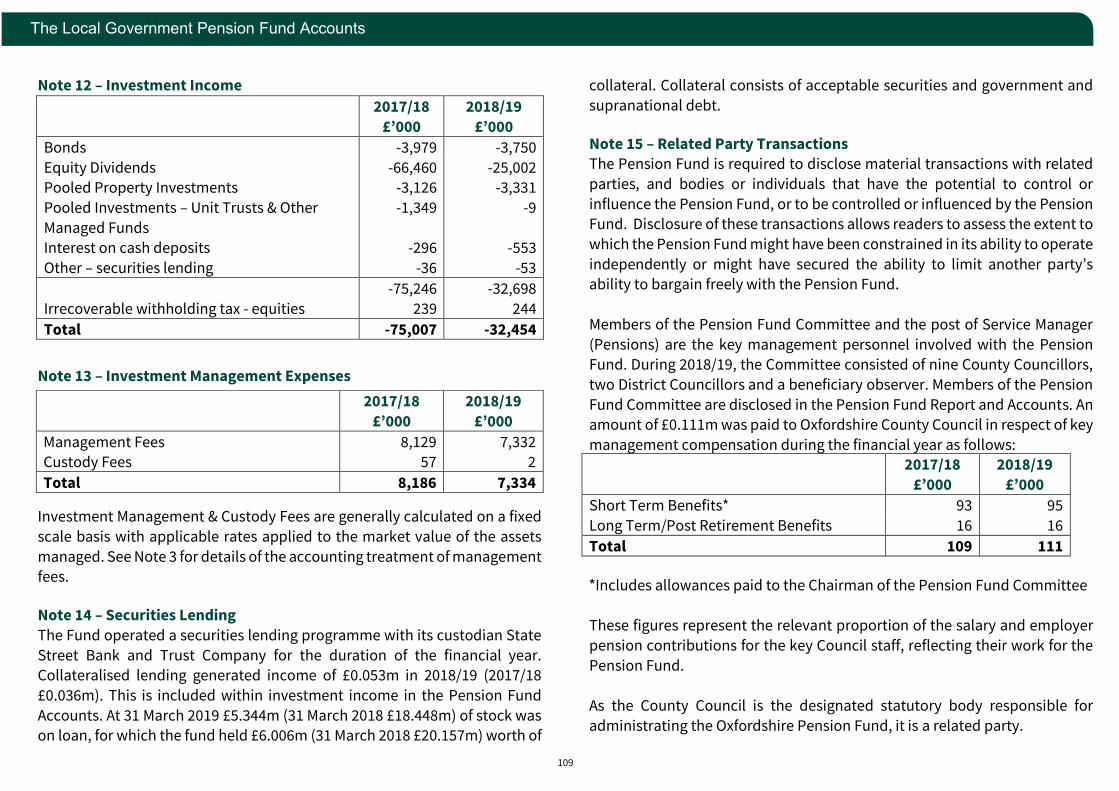
109
The Local Government Pension Fund Accounts
Note 12 – Investment Income
Note 13 – Investment Management Expenses
Investment Management & Custody Fees are generally calculated on a fixed
scale basis with applicable rates applied to the market value of the assets
managed. See Note 3 for details of the accounting treatment of management fees. Note 14 – Securities Lending
The Fund operated a securities lending programme with its custodian State
Street Bank and Trust Company for the duration of the financial year. Collateralised lending generated income of £0.053m in 2018/19 (2017/18
£0.036m). This is included within investment income in the Pension Fund
Accounts. At 31 March 2019 £5.344m (31 March 2018 £18.448m) of stock was on loan, for which the fund held £6.006m (31 March 2018 £20.157m) worth of
collateral. Collateral consists of acceptable securities and government and
supranational debt. Note 15 – Related Party Transactions The Pension Fund is required to disclose material transactions with related
parties, and bodies or individuals that have the potential to control or
influence the Pension Fund, or to be controlled or influenced by the Pension Fund. Disclosure of these transactions allows readers to assess the extent to
which the Pension Fund might have been constrained in its ability to operate
independently or might have secured the ability to limit another party’s ability to bargain freely with the Pension Fund.
Members of the Pension Fund Committee and the post of Service Manager
(Pensions) are the key management personnel involved with the Pension Fund. During 2018/19, the Committee consisted of nine County Councillors,
two District Councillors and a beneficiary observer. Members of the Pension
Fund Committee are disclosed in the Pension Fund Report and Accounts. An
amount of £0.111m was paid to Oxfordshire County Council in respect of key
management compensation during the financial year as follows:
*Includes allowances paid to the Chairman of the Pension Fund Committee
These figures represent the relevant proportion of the salary and employer
pension contributions for the key Council staff, reflecting their work for the
Pension Fund.
As the County Council is the designated statutory body responsible for
administrating the Oxfordshire Pension Fund, it is a related party.
2017/18 2018/19
£’000 £’000
Bonds -3,979 -3,750
Equity Dividends Pooled Property Investments
Pooled Investments – Unit Trusts & Other
Managed Funds
Interest on cash deposits
Other – securities lending
-66,460 -3,126
-1,349
-296
-36
-25,002 -3,331
-9
-553
-53
Irrecoverable withholding tax - equities
-75,246
239
-32,698
244
Total -75,007 -32,454
2017/18 2018/19
£’000 £’000
Management Fees Custody Fees
8,129 57
7,332 2
Total 8,186 7,334
2017/18 2018/19
£’000 £’000
Short Term Benefits* 93 95
Long Term/Post Retirement Benefits 16 16
Total 109 111

110
The Local Government Pension Fund Accounts
For the 12 months ended 31 March 2019, employer contributions to the
Pension Fund from the County Council were £28.652m (2017/18 £28.920m).
At 31 March 2019 there were receivables in respect of contributions due from the County Council of £3.344m (2017/18 £3.232m) and payables due to the
County Council of £0.025m (2017/18 £0.221m) for support services.
The County Council was reimbursed £1.441m (2017/18 £1.301m) by the
Pension Fund for administration costs incurred by the County Council on
behalf of the Pension Fund. Brunel Pension Partnership Ltd (Company Number 10429110)
Brunel Pension Partnership Ltd (BPP Ltd) was formed on the 14 October 2016
and oversees the investment of pension fund assets for the following LGPS
funds: Avon, Buckinghamshire, Cornwall, Devon, Dorset, Environment Agency, Gloucestershire, Oxfordshire, Somerset, and Wiltshire.
Each of the nine Administering Authorities, including Oxfordshire County
Council, and the Environment Agency own 10% of BPP Ltd. Pension Fund
transactions with BPP Ltd are as follows:
Note 16 – Investments
2017/18 2018/19 £’000 £’000
Income -235 0
Expenditure
Receivables
Payables
840
235
0
685
263
0
Value at 31
March 2018
Value at 31
March 2019 £’000
£’000
Investment Assets
Bonds 279,802 296,805
Equities 713,313 360,807
Pooled Investments 1,069,635 1,581,636
Pooled Property Investments 161,441 172,306 Derivatives:
- Forward Currency Contracts 480 1,111
Cash Deposits 9,698 3,567
Long-Term Investments 840 840 Investment Income Due 5,076 3,966
Amounts Receivable for Sales 8,153 3,463
Total Investment Assets 2,248,438 2,424,501
Investment Liabilities Derivatives:
- Forward Currency Contracts -752 -384
Management Expenses Due -4,347 -869 Amounts Payable for Purchases -1,474 0
Total Investment Liabilities -6,573 -1,253
Net Investment Assets 2,241,865 2,423,248
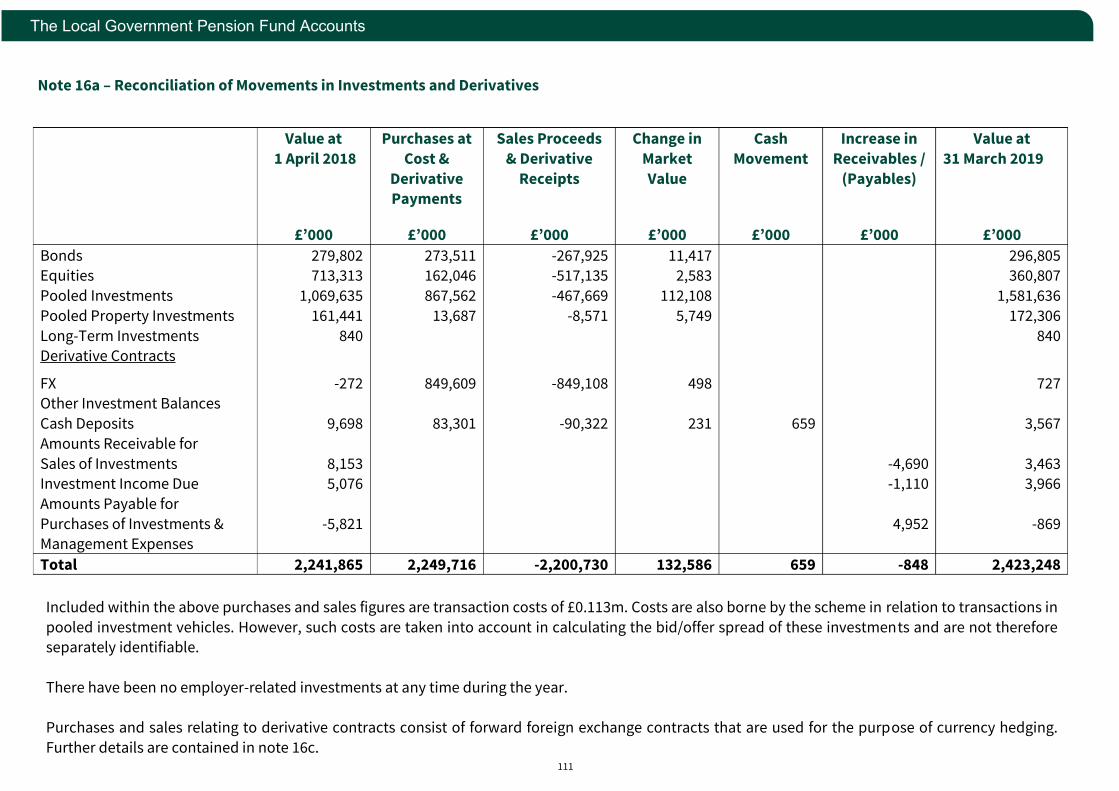
111
The Local Government Pension Fund Accounts
Note 16a – Reconciliation of Movements in Investments and Derivatives
Value at
1 April 2018
Purchases at
Cost &
Derivative Payments
Sales Proceeds
& Derivative
Receipts
Change in
Market
Value
Cash
Movement
Increase in
Receivables /
(Payables)
Value at
31 March 2019
£’000 £’000 £’000 £’000 £’000 £’000 £’000
Bonds 279,802 273,511 -267,925 11,417 296,805 Equities 713,313 162,046 -517,135 2,583 360,807
Pooled Investments 1,069,635 867,562 -467,669 112,108 1,581,636
Pooled Property Investments 161,441 13,687 -8,571 5,749 172,306
Long-Term Investments 840 840 Derivative Contracts
FX -272 849,609 -849,108 498 727 Other Investment Balances
Cash Deposits 9,698 83,301 -90,322 231 659 3,567
Amounts Receivable for
Sales of Investments
8,153
-4,690
3,463 Investment Income Due 5,076 -1,110 3,966
Amounts Payable for
Purchases of Investments & Management Expenses
-5,821
4,952
-869
Total 2,241,865 2,249,716 -2,200,730 132,586 659 -848 2,423,248
Included within the above purchases and sales figures are transaction costs of £0.113m. Costs are also borne by the scheme in relation to transactions in
pooled investment vehicles. However, such costs are taken into account in calculating the bid/offer spread of these investments and are not therefore separately identifiable.
There have been no employer-related investments at any time during the year.
Purchases and sales relating to derivative contracts consist of forward foreign exchange contracts that are used for the purpose of currency hedging.
Further details are contained in note 16c.
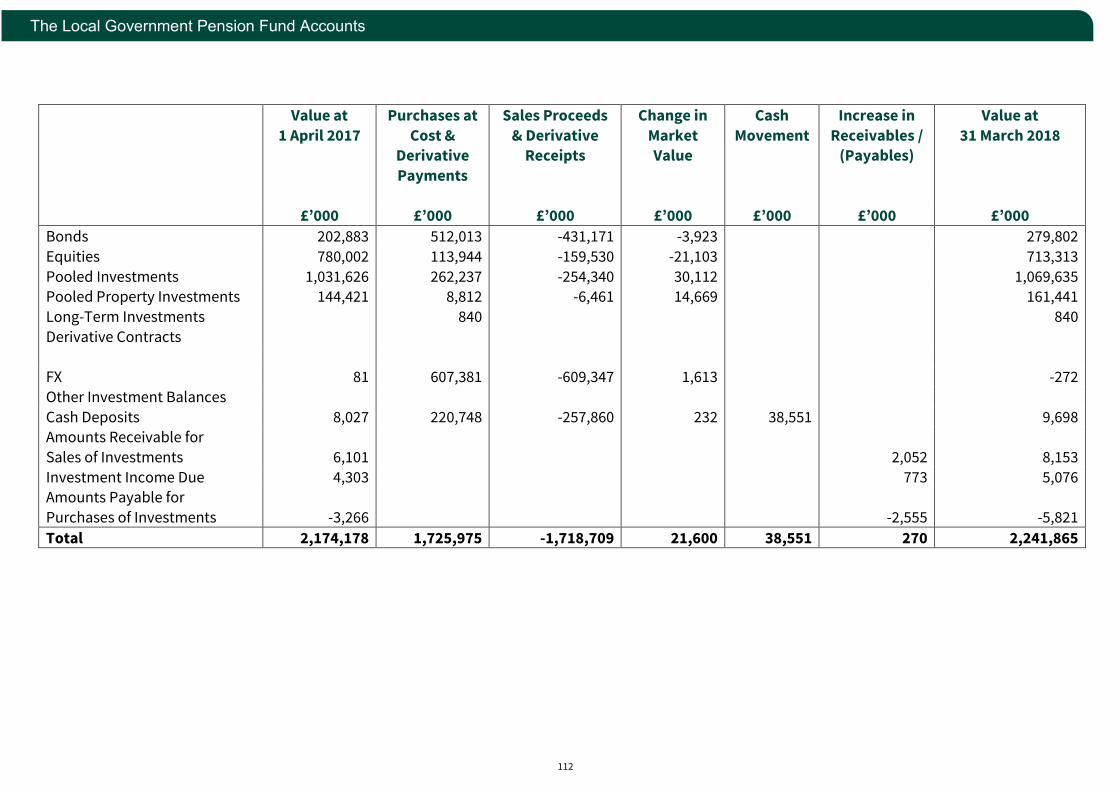
112
The Local Government Pension Fund Accounts
Value at
1 April 2017
Purchases at
Cost & Derivative
Payments
Sales Proceeds
& Derivative Receipts
Change in
Market Value
Cash
Movement
Increase in
Receivables / (Payables)
Value at
31 March 2018
£’000 £’000 £’000 £’000 £’000 £’000 £’000
Bonds 202,883 512,013 -431,171 -3,923 279,802
Equities 780,002 113,944 -159,530 -21,103 713,313
Pooled Investments 1,031,626 262,237 -254,340 30,112 1,069,635 Pooled Property Investments 144,421 8,812 -6,461 14,669 161,441
Long-Term Investments
Derivative Contracts
840 840
FX 81 607,381 -609,347 1,613 -272
Other Investment Balances
Cash Deposits 8,027 220,748 -257,860 232 38,551 9,698 Amounts Receivable for
Sales of Investments
6,101
2,052
8,153
Investment Income Due 4,303 773 5,076 Amounts Payable for
Purchases of Investments
-3,266
-2,555
-5,821
Total 2,174,178 1,725,975 -1,718,709 21,600 38,551 270 2,241,865

113
The Local Government Pension Fund Accounts
Note 16b – Analysis of Investments (excluding Derivative Contracts, Cash
Deposits and Other Investment Balances)
Long-Term Investment Assets
Bonds Equity Investments
Pooled Investment Vehicles Total Investments (excluding Derivative Contracts, Cash Deposits and
Other Investment Balances)
2017/18
£’000
2018/19
£’000
Brunel Pension Partnership Ltd 840 840
Total 840 840
2017/18
£’000
2018/19
£’000
UK Public Sector
UK Other Overseas Public Sector
UK Public Sector Index Linked
101,440
- 41,106
137,256
90,463
- 56,335
150,007
Total 279,802 296,805
2017/18
£’000
2018/19 £’000
UK Equities
Overseas Listed Equities:
North America Japan
Europe
Pacific Basin Emerging Markets
490,007
149,110 13,952
49,614
0 10,630
112,286
166,787 9,947
49,621
0 22,166
Total 713,313 360,807
2017/18
£’000 2018/19
£’000
UK Registered Managed Funds – Property 29,184 36,649
Non UK Registered Managed Funds –
Property
21,536 19,522
UK Registered Managed Funds – Other 589,352 1,053,116
Non UK Registered Managed Funds – Other 189,157 209,540
UK Registered Property Unit Trusts 87,015 90,716 Non UK Registered Property Unit Trusts 23,706 25,418
Non UK Registered Unit Linked Insurance
Fund
291,126 318,981
Total 1,231,076 1,753,942
2017/18
£’000
2018/19
£’000
2,225,031 2,412,394

114
The Local Government Pension Fund Accounts
Note 16c – Derivative Contracts
Objectives and policies
The Pension Fund Committee have authorised the use of derivatives by some
of their Investment Managers as part of the investment strategy for the
pension scheme. The main objectives and policies followed during the year are summarised
as follows:
Forward Foreign Exchange – in order to maintain appropriate diversification
of investments within the portfolio and take advantage of overseas
investment returns, a proportion of the underlying investment portfolio is
invested overseas. To balance the risk of investing in foreign currencies
whilst having an obligation to settle benefits in Sterling, a currency hedging programme, using forward foreign exchange contracts, has been put in place
to reduce the currency exposure of these overseas investments to the
targeted level.
Forward Foreign Exchange (FX) The scheme had open FX contracts at the year-end as follows:
Contract Settlement Date Currency Bought
£’000
Currency Sold
£’000
Asset value at year end
£’000
Liability value at year end
£’000
Net Forward currency Contracts
£’000
Forward OTC 3 months 25,184 GBP 29,310 EUR -141
Forward OTC 1 month 27,237 GBP 30,961 EUR 556 -12
Forward OTC 1 month 9,546 EUR 100,000 SEK 101 -148
Forward OTC 1 month 13,880 GBP 18,007 USD 97 -25
Forward OTC 1 month 75 GBP 873 SEK 3
Forward OTC 1 month 969 GBP 1,750 AUD 15
Forward OTC 1 month 15,359 GBP 26,537 CAD 135 -14
Forward OTC 1 month 8,781 GBP 1,236,500 JPY 204
Forward OTC 1 month 6,200 EUR 5,361 GBP -16
Forward OTC 1 month 6,070 USD 4,682 GBP -28
Forward Currency Contracts at 31 March 2019 1,111 -384 727
Prior Year Comparative
Forward Currency contracts at 31 March 2018 480 -752 -272

115
The Local Government Pension Fund Accounts
Note 16d – Other Investment Balances
Cash Deposits
The following investments represent more than 5% of the net assets of the
scheme
Note 17 – Current Assets
2017/18 2018/19 £’000 £’000
Receivables
Sale of Investments 8,153 3,463
Dividend & Interest Accrued 5,007 3,742 Inland Revenue 69 224
Other 0 0
13,229 7,429
Payables
Purchase of Investments -1,474 0
Management Fees -4,335 -850 Custodian Fees -12 -19
-5,821 -869
Total 7,408 6,560
2017/18 2018/19
£’000 £’000
Non-Sterling Cash Deposits 9,698 3,567
Total 9,698 3,567
2017/18 % of Total
Fund
2018/19 % of Total
Fund
£’000 £’000 UBS Life Global Equities All
Countries Fund 291,126 12.36 318,980 12.68
L&G World (ex-UK) Equity
Index 212,755 9.03 0 0.00
L&G World Developed
Equity Index Fund 0 0.00 252,406 10.04
L&G UK FTSE All-Share
Equity Index 182,948 7.77 179,064 7.12
L&G Core Plus Bond Fund 176,716 7.50 183,473 7.30 Brunel UK Equity Fund 0 0.00 438,172 17.42
2017/18 2018/19
£’000 £’000
Receivables: Employer Contributions 7,625 7,922
Employee Contributions 1,844 1,930
Rechargeable Benefits 1,045 1,113 Transferred Benefits 1,116 1,832
Cost of Early Retirement 707 724
Inland Revenue Other
Cash Balances
185 746
96,772
78 566
77,159
Total 110,040 91,324
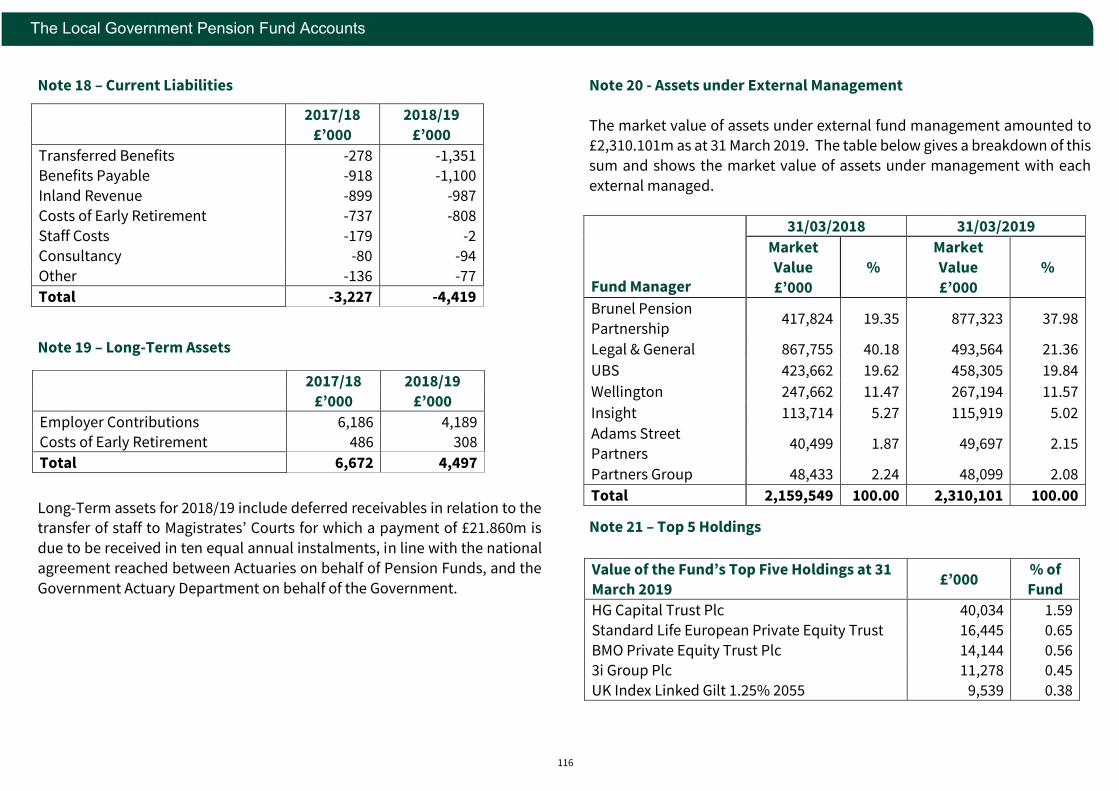
116
The Local Government Pension Fund Accounts
Note 18 – Current Liabilities
Note 19 – Long-Term Assets
Long-Term assets for 2018/19 include deferred receivables in relation to the transfer of staff to Magistrates’ Courts for which a payment of £21.860m is
due to be received in ten equal annual instalments, in line with the national
agreement reached between Actuaries on behalf of Pension Funds, and the
Government Actuary Department on behalf of the Government.
Note 20 - Assets under External Management
The market value of assets under external fund management amounted to £2,310.101m as at 31 March 2019. The table below gives a breakdown of this
sum and shows the market value of assets under management with each
external managed.
Note 21 – Top 5 Holdings
2017/18 2018/19
£’000 £’000
Transferred Benefits -278 -1,351 Benefits Payable -918 -1,100
Inland Revenue -899 -987
Costs of Early Retirement -737 -808
Staff Costs -179 -2
Consultancy -80 -94
Other -136 -77
Total -3,227 -4,419
2017/18 2018/19
£’000 £’000
Employer Contributions 6,186 4,189 Costs of Early Retirement 486 308
Total 6,672 4,497
Fund Manager
31/03/2018 31/03/2019
Market
Value
£’000
%
Market
Value
£’000
%
Brunel Pension
Partnership 417,824 19.35 877,323 37.98
Legal & General 867,755 40.18 493,564 21.36
UBS 423,662 19.62 458,305 19.84
Wellington 247,662 11.47 267,194 11.57
Insight 113,714 5.27 115,919 5.02
Adams Street
Partners 40,499 1.87 49,697 2.15
Partners Group 48,433 2.24 48,099 2.08
Total 2,159,549 100.00 2,310,101 100.00
Value of the Fund’s Top Five Holdings at 31
March 2019 £’000
% of
Fund
HG Capital Trust Plc 40,034 1.59
Standard Life European Private Equity Trust 16,445 0.65
BMO Private Equity Trust Plc 14,144 0.56 3i Group Plc 11,278 0.45
UK Index Linked Gilt 1.25% 2055 9,539 0.38
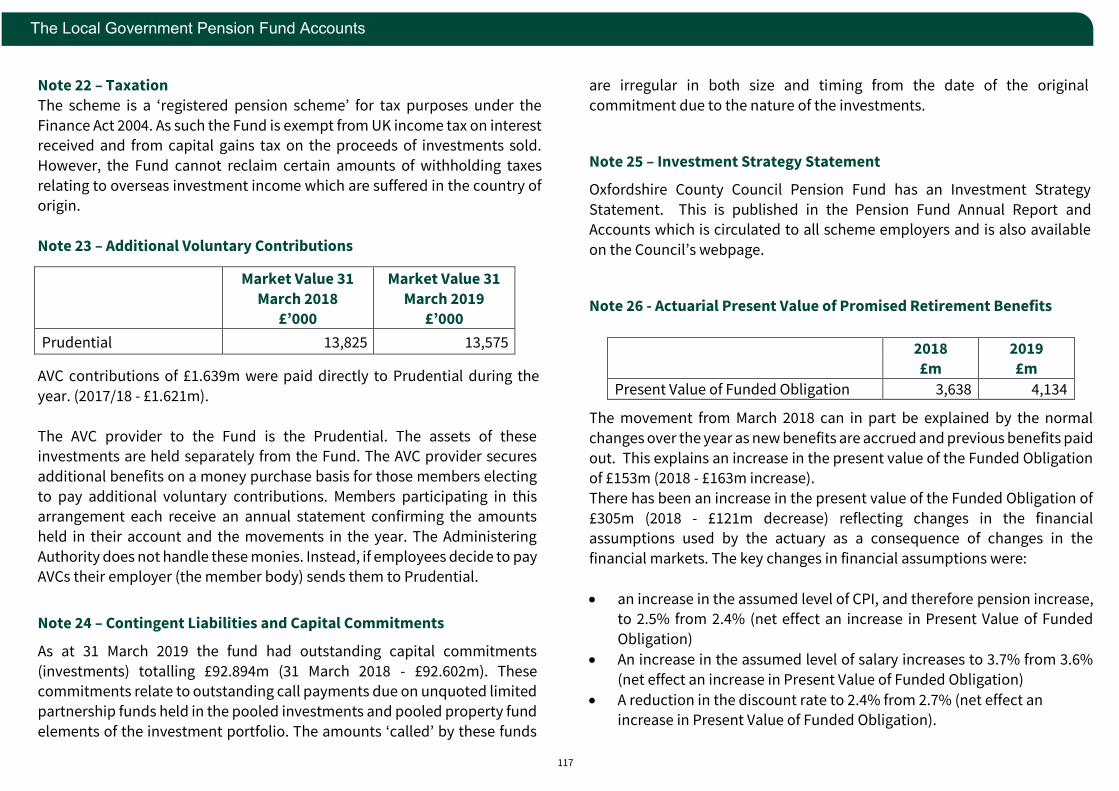
117
The Local Government Pension Fund Accounts
Note 22 – Taxation
The scheme is a ‘registered pension scheme’ for tax purposes under the
Finance Act 2004. As such the Fund is exempt from UK income tax on interest received and from capital gains tax on the proceeds of investments sold.
However, the Fund cannot reclaim certain amounts of withholding taxes
relating to overseas investment income which are suffered in the country of origin.
Note 23 – Additional Voluntary Contributions AVC contributions of £1.639m were paid directly to Prudential during the
year. (2017/18 - £1.621m).
The AVC provider to the Fund is the Prudential. The assets of these investments are held separately from the Fund. The AVC provider secures
additional benefits on a money purchase basis for those members electing
to pay additional voluntary contributions. Members participating in this arrangement each receive an annual statement confirming the amounts
held in their account and the movements in the year. The Administering
Authority does not handle these monies. Instead, if employees decide to pay AVCs their employer (the member body) sends them to Prudential. Note 24 – Contingent Liabilities and Capital Commitments
As at 31 March 2019 the fund had outstanding capital commitments
(investments) totalling £92.894m (31 March 2018 - £92.602m). These commitments relate to outstanding call payments due on unquoted limited
partnership funds held in the pooled investments and pooled property fund
elements of the investment portfolio. The amounts ‘called’ by these funds
are irregular in both size and timing from the date of the original
commitment due to the nature of the investments.
Note 25 – Investment Strategy Statement
Oxfordshire County Council Pension Fund has an Investment Strategy
Statement. This is published in the Pension Fund Annual Report and Accounts which is circulated to all scheme employers and is also available
on the Council’s webpage.
Note 26 - Actuarial Present Value of Promised Retirement Benefits
The movement from March 2018 can in part be explained by the normal
changes over the year as new benefits are accrued and previous benefits paid
out. This explains an increase in the present value of the Funded Obligation of £153m (2018 - £163m increase).
There has been an increase in the present value of the Funded Obligation of
£305m (2018 - £121m decrease) reflecting changes in the financial assumptions used by the actuary as a consequence of changes in the
financial markets. The key changes in financial assumptions were:
• an increase in the assumed level of CPI, and therefore pension increase, to 2.5% from 2.4% (net effect an increase in Present Value of Funded
Obligation)
• An increase in the assumed level of salary increases to 3.7% from 3.6%
(net effect an increase in Present Value of Funded Obligation)
• A reduction in the discount rate to 2.4% from 2.7% (net effect an increase in Present Value of Funded Obligation).
Market Value 31
March 2018 £’000
Market Value 31
March 2019 £’000
Prudential 13,825 13,575
2018 2019 £m £m
Present Value of Funded Obligation 3,638 4,134

118
The Local Government Pension Fund Accounts
When the LGPS benefit structure was reformed in 2014, transitional
protections were applied to certain older members close to normal
retirement age. The benefits accrued from 1 April 2014 by these members are subject to an ‘underpin’ which means that they cannot be lower than
what they would have received under the previous benefit structure. The
underpin ensures that these members do not lose out from the introduction of the new scheme, by effectively giving them the better of the benefits from
the old and new schemes.
In December 2018 the Court of Appeal upheld a ruling (“McCloud/Sargeant”)
that similar transitional protections in the Judges’ and Firefighters’ Pension
Schemes were unlawful on the grounds of age discrimination. The
implications of the ruling are expected to apply to the LGPS (and other public service schemes) as well. The UK Government requested leave to appeal to
the Supreme Court but this was denied at the end of June 2019. LGPS
benefits accrued from 2014 may therefore need to be enhanced so that all members, regardless of age, will benefit from the underpin. Alternatively,
restitution may be achieved in a different way, for example by paying
compensation. In either case, the clear expectation is that many more members would see an enhanced benefit rather than just those currently
subject to these protections. There will therefore be a retrospective increase
to members’ benefits, which in turn will give rise to a past service cost for the
Fund employers.
Quantifying the impact of the judgement at this stage is very difficult because
it will depend on the compensation awarded, members’ future salary increases, length of service and retirement age, and whether (and when)
members withdraw from active service. Salary increases in particular can
vary significantly from year to year and from member to member depending on factors such as budget restraint, job performance and career progression.
The Government Actuary’s Department (GAD) has estimated that the impact
for the LGPS as a whole could be to increase active member liabilities by
3.2%, based on a given set of actuarial assumptions. A full description of the
data, methodology and assumptions underlying these estimates is given in
GAD’s paper, dated 10 June 2019.
The Fund’s actuary has adjusted GAD’s estimate to better reflect the
Oxfordshire County Council Pension Fund’s local assumptions, particularly
salary increases and withdrawal rates. The revised estimate is that total liabilities (i.e. the increase in active members’ liabilities expressed in terms
of the employer’s total membership) could be 0.92% higher as at 31 March
2019, an increase of approximately £37.9m.
These numbers are high level estimates based on scheme level calculations
and depend on several key assumptions.
The impact on employers’ funding arrangements will likely be dampened by
the funding arrangements they have in place. However, if the judgement is
upheld then there will be unavoidable upward pressure on contributions in future years
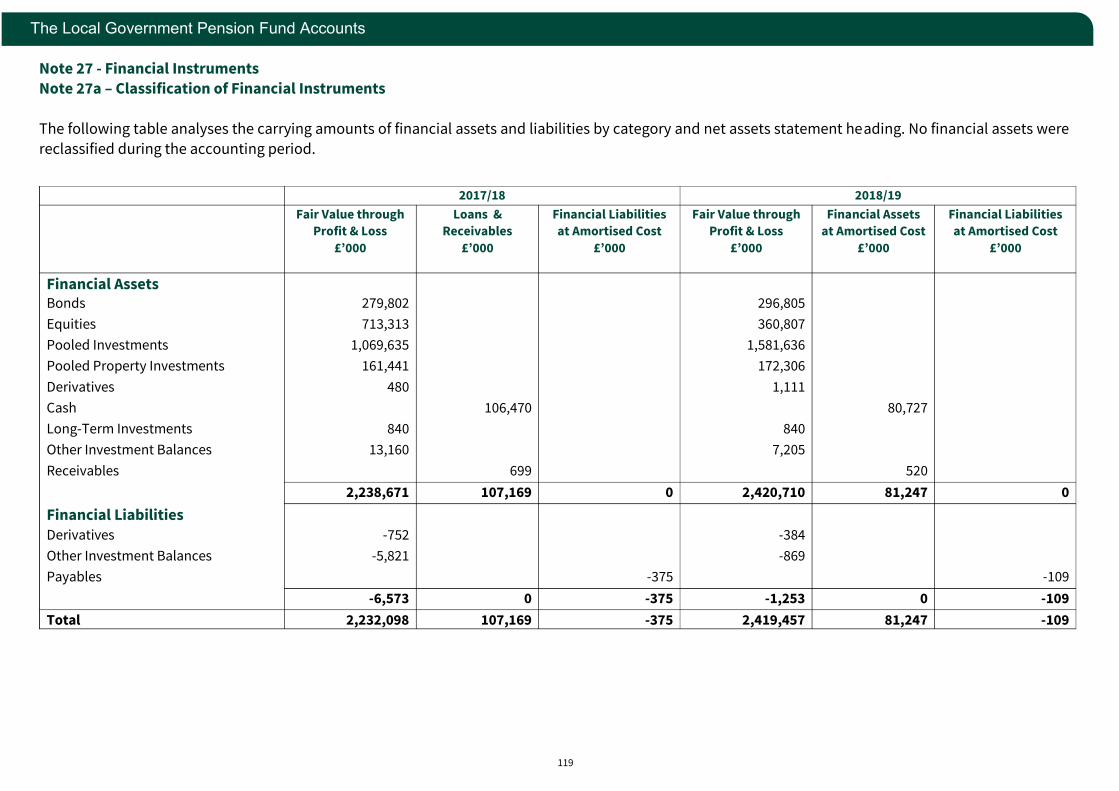
119
The Local Government Pension Fund Accounts
Note 27 - Financial Instruments Note 27a – Classification of Financial Instruments
The following table analyses the carrying amounts of financial assets and liabilities by category and net assets statement heading. No financial assets were
reclassified during the accounting period.
2017/18 2018/19
Fair Value through
Profit & Loss
Loans &
Receivables
Financial Liabilities
at Amortised Cost
Fair Value through
Profit & Loss
Financial Assets
at Amortised Cost
Financial Liabilities
at Amortised Cost
£’000
£’000 £’000 £’000 £’000 £’000
Financial Assets
Bonds 279,802 296,805
Equities 713,313 360,807
Pooled Investments 1,069,635 1,581,636
Pooled Property Investments 161,441 172,306
Derivatives 480 1,111
Cash 106,470 80,727
Long-Term Investments 840 840
Other Investment Balances 13,160 7,205
Receivables 699 520
2,238,671 107,169 0 2,420,710 81,247 0
Financial Liabilities
Derivatives -752 -384
Other Investment Balances -5,821 -869
Payables -375 -109
-6,573 0 -375 -1,253 0 -109
Total 2,232,098 107,169 -375 2,419,457 81,247 -109
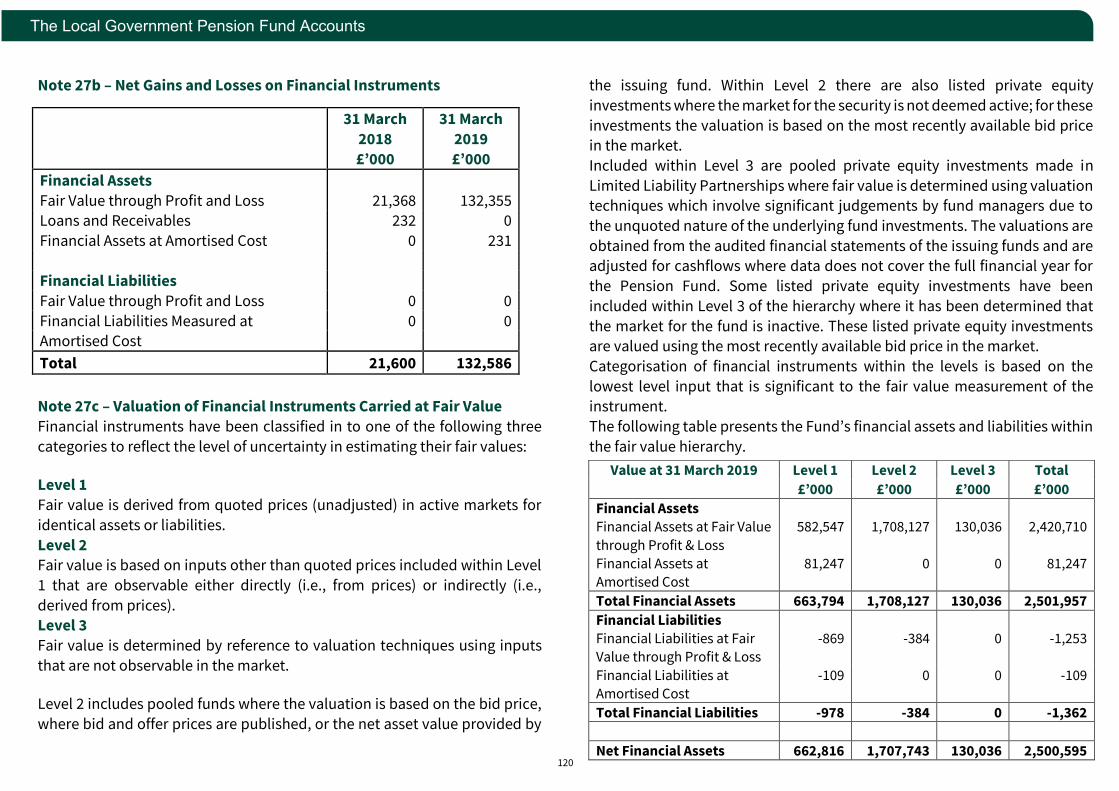
120
The Local Government Pension Fund Accounts
Note 27b – Net Gains and Losses on Financial Instruments
Note 27c – Valuation of Financial Instruments Carried at Fair Value
Financial instruments have been classified in to one of the following three
categories to reflect the level of uncertainty in estimating their fair values: Level 1
Fair value is derived from quoted prices (unadjusted) in active markets for
identical assets or liabilities.
Level 2 Fair value is based on inputs other than quoted prices included within Level
1 that are observable either directly (i.e., from prices) or indirectly (i.e.,
derived from prices). Level 3
Fair value is determined by reference to valuation techniques using inputs
that are not observable in the market. Level 2 includes pooled funds where the valuation is based on the bid price,
where bid and offer prices are published, or the net asset value provided by
the issuing fund. Within Level 2 there are also listed private equity
investments where the market for the security is not deemed active; for these
investments the valuation is based on the most recently available bid price in the market.
Included within Level 3 are pooled private equity investments made in
Limited Liability Partnerships where fair value is determined using valuation techniques which involve significant judgements by fund managers due to
the unquoted nature of the underlying fund investments. The valuations are
obtained from the audited financial statements of the issuing funds and are
adjusted for cashflows where data does not cover the full financial year for
the Pension Fund. Some listed private equity investments have been
included within Level 3 of the hierarchy where it has been determined that
the market for the fund is inactive. These listed private equity investments are valued using the most recently available bid price in the market.
Categorisation of financial instruments within the levels is based on the
lowest level input that is significant to the fair value measurement of the instrument.
The following table presents the Fund’s financial assets and liabilities within
the fair value hierarchy.
31 March
2018
£’000
31 March
2019
£’000
Financial Assets
Fair Value through Profit and Loss 21,368 132,355 Loans and Receivables 232 0
Financial Assets at Amortised Cost 0 231
Financial Liabilities
Fair Value through Profit and Loss 0 0
Financial Liabilities Measured at 0 0 Amortised Cost
Total 21,600 132,586
Value at 31 March 2019 Level 1 Level 2 Level 3 Total
£’000 £’000 £’000 £’000
Financial Assets
Financial Assets at Fair Value
through Profit & Loss
582,547 1,708,127 130,036 2,420,710
Financial Assets at
Amortised Cost
81,247 0 0 81,247
Total Financial Assets 663,794 1,708,127 130,036 2,501,957
Financial Liabilities Financial Liabilities at Fair Value through Profit & Loss
-869 -384 0 -1,253
Financial Liabilities at Amortised Cost
-109 0 0 -109
Total Financial Liabilities -978 -384 0 -1,362
Net Financial Assets 662,816 1,707,743 130,036 2,500,595
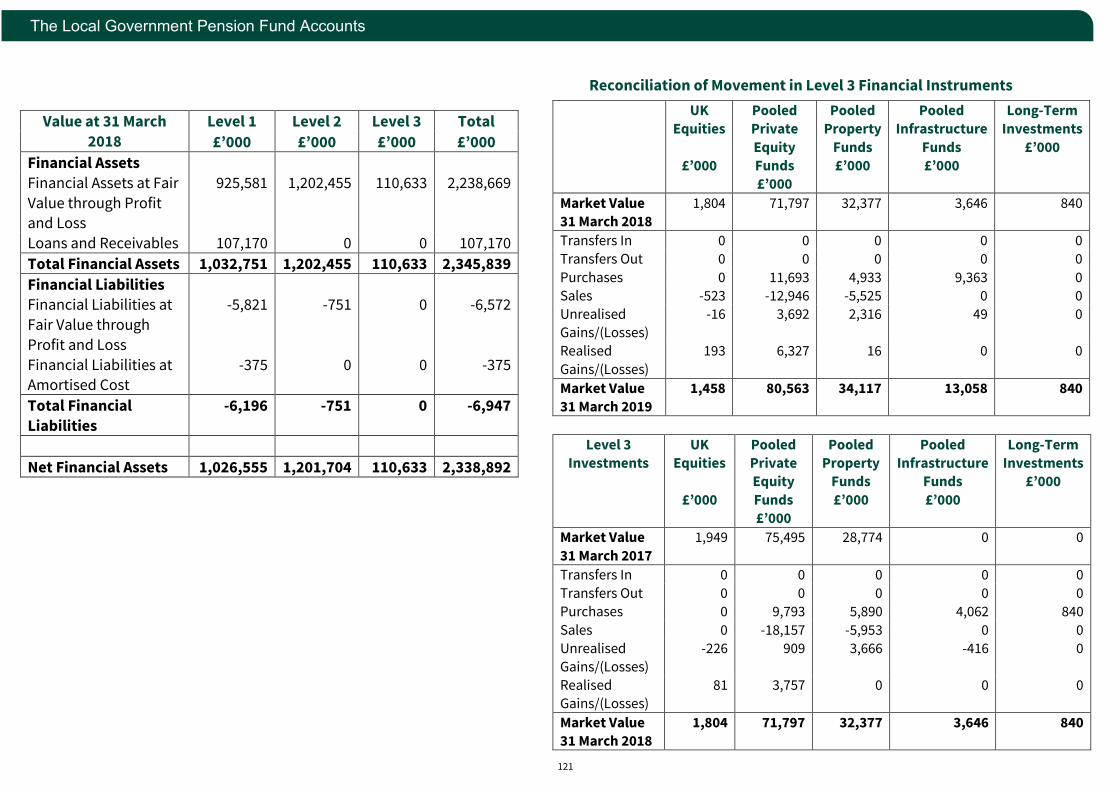
121
The Local Government Pension Fund Accounts
Reconciliation of Movement in Level 3 Financial Instruments
Value at 31 March
2018
Level 1 Level 2 Level 3 Total
£’000 £’000 £’000 £’000
Financial Assets
Financial Assets at Fair
Value through Profit and Loss
925,581 1,202,455 110,633 2,238,669
Loans and Receivables 107,170 0 0 107,170
Total Financial Assets 1,032,751 1,202,455 110,633 2,345,839
Financial Liabilities Financial Liabilities at
Fair Value through
Profit and Loss
-5,821 -751 0 -6,572
Financial Liabilities at Amortised Cost
-375 0 0 -375
Total Financial
Liabilities
-6,196 -751 0 -6,947
Net Financial Assets 1,026,555 1,201,704 110,633 2,338,892
UK Equities
£’000
Pooled Private
Equity Funds
£’000
Pooled Property
Funds £’000
Pooled Infrastructure
Funds £’000
Long-Term Investments
£’000
Market Value 31 March 2018
1,804 71,797 32,377 3,646 840
Transfers In 0 0 0 0 0
Transfers Out 0 0 0 0 0
Purchases 0 11,693 4,933 9,363 0
Sales -523 -12,946 -5,525 0 0 Unrealised Gains/(Losses)
-16 3,692 2,316 49 0
Realised
Gains/(Losses)
193 6,327 16 0 0
Market Value
31 March 2019
1,458 80,563 34,117 13,058 840
Level 3
Investments
UK
Equities
£’000
Pooled
Private Equity
Funds
£’000
Pooled
Property Funds
£’000
Pooled
Infrastructure Funds
£’000
Long-Term
Investments £’000
Market Value
31 March 2017
1,949 75,495 28,774 0 0
Transfers In 0 0 0 0 0
Transfers Out 0 0 0 0 0
Purchases 0 9,793 5,890 4,062 840
Sales 0 -18,157 -5,953 0 0 Unrealised Gains/(Losses)
-226 909 3,666 -416 0
Realised Gains/(Losses)
81 3,757 0 0 0
Market Value 31 March 2018
1,804 71,797 32,377 3,646 840
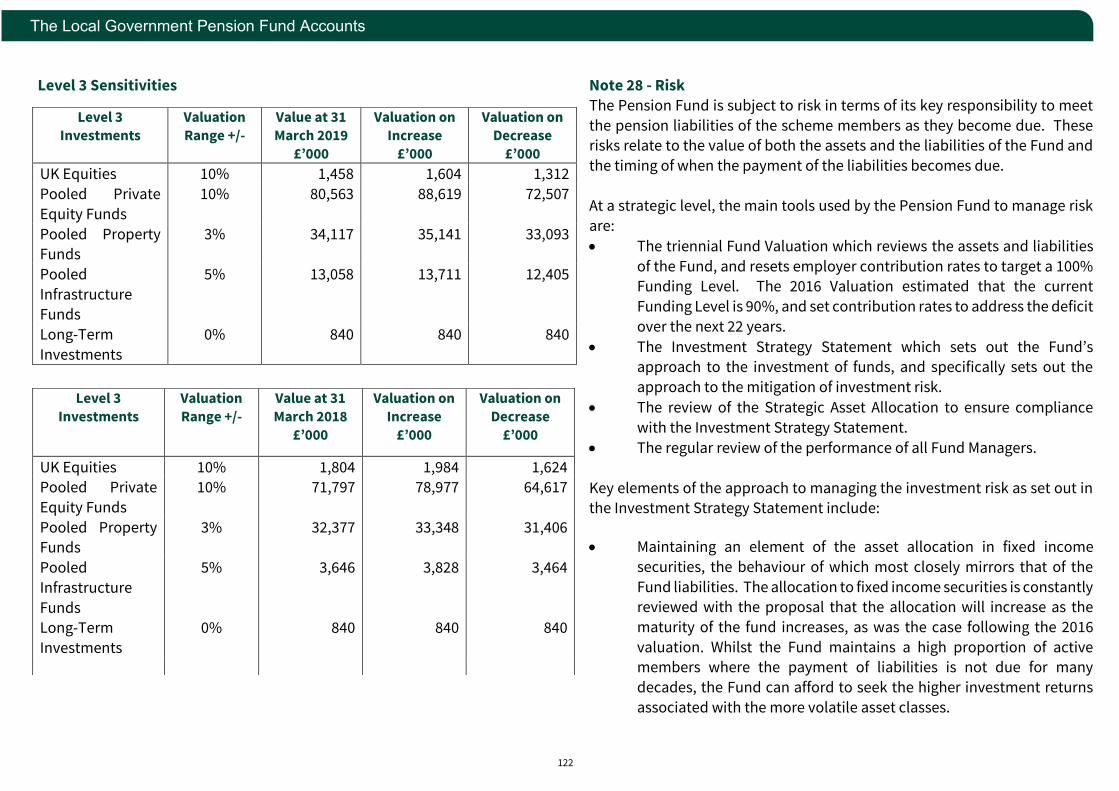
122
The Local Government Pension Fund Accounts
Level 3 Sensitivities
Note 28 - Risk
The Pension Fund is subject to risk in terms of its key responsibility to meet
the pension liabilities of the scheme members as they become due. These risks relate to the value of both the assets and the liabilities of the Fund and
the timing of when the payment of the liabilities becomes due.
At a strategic level, the main tools used by the Pension Fund to manage risk
are:
• The triennial Fund Valuation which reviews the assets and liabilities
of the Fund, and resets employer contribution rates to target a 100% Funding Level. The 2016 Valuation estimated that the current
Funding Level is 90%, and set contribution rates to address the deficit
over the next 22 years.
• The Investment Strategy Statement which sets out the Fund’s approach to the investment of funds, and specifically sets out the
approach to the mitigation of investment risk.
• The review of the Strategic Asset Allocation to ensure compliance
with the Investment Strategy Statement.
• The regular review of the performance of all Fund Managers.
Key elements of the approach to managing the investment risk as set out in the Investment Strategy Statement include: • Maintaining an element of the asset allocation in fixed income
securities, the behaviour of which most closely mirrors that of the
Fund liabilities. The allocation to fixed income securities is constantly reviewed with the proposal that the allocation will increase as the
maturity of the fund increases, as was the case following the 2016
valuation. Whilst the Fund maintains a high proportion of active members where the payment of liabilities is not due for many
decades, the Fund can afford to seek the higher investment returns
associated with the more volatile asset classes.
Level 3
Investments
Valuation
Range +/-
Value at 31
March 2019 £’000
Valuation on
Increase £’000
Valuation on
Decrease £’000
UK Equities 10% 1,458 1,604 1,312
Pooled Private
Equity Funds
10% 80,563 88,619 72,507
Pooled Property
Funds
3% 34,117 35,141 33,093
Pooled
Infrastructure Funds
5% 13,058 13,711 12,405
Long-Term
Investments
0%
840 840 840
Level 3
Investments
Valuation
Range +/-
Value at 31
March 2018 £’000
Valuation on
Increase £’000
Valuation on
Decrease £’000
UK Equities 10% 1,804 1,984 1,624 Pooled Private
Equity Funds
10% 71,797 78,977 64,617
Pooled Property Funds
3% 32,377 33,348 31,406
Pooled
Infrastructure
Funds Long-Term
Investments
5%
0%
3,646
840
3,828
840
3,464
840
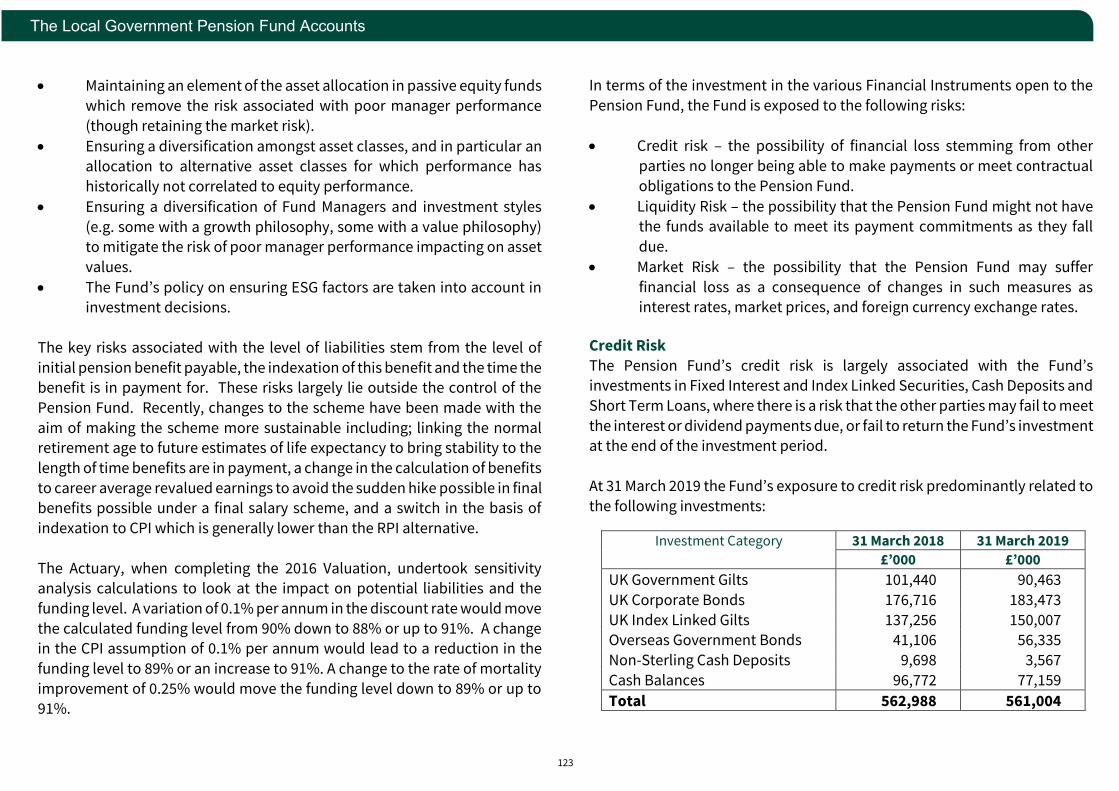
123
The Local Government Pension Fund Accounts
• Maintaining an element of the asset allocation in passive equity funds
which remove the risk associated with poor manager performance
(though retaining the market risk).
• Ensuring a diversification amongst asset classes, and in particular an allocation to alternative asset classes for which performance has
historically not correlated to equity performance.
• Ensuring a diversification of Fund Managers and investment styles
(e.g. some with a growth philosophy, some with a value philosophy) to mitigate the risk of poor manager performance impacting on asset
values.
• The Fund’s policy on ensuring ESG factors are taken into account in investment decisions.
The key risks associated with the level of liabilities stem from the level of
initial pension benefit payable, the indexation of this benefit and the time the benefit is in payment for. These risks largely lie outside the control of the
Pension Fund. Recently, changes to the scheme have been made with the
aim of making the scheme more sustainable including; linking the normal retirement age to future estimates of life expectancy to bring stability to the
length of time benefits are in payment, a change in the calculation of benefits
to career average revalued earnings to avoid the sudden hike possible in final benefits possible under a final salary scheme, and a switch in the basis of
indexation to CPI which is generally lower than the RPI alternative.
The Actuary, when completing the 2016 Valuation, undertook sensitivity
analysis calculations to look at the impact on potential liabilities and the
funding level. A variation of 0.1% per annum in the discount rate would move
the calculated funding level from 90% down to 88% or up to 91%. A change in the CPI assumption of 0.1% per annum would lead to a reduction in the
funding level to 89% or an increase to 91%. A change to the rate of mortality
improvement of 0.25% would move the funding level down to 89% or up to 91%.
In terms of the investment in the various Financial Instruments open to the
Pension Fund, the Fund is exposed to the following risks:
• Credit risk – the possibility of financial loss stemming from other
parties no longer being able to make payments or meet contractual
obligations to the Pension Fund.
• Liquidity Risk – the possibility that the Pension Fund might not have the funds available to meet its payment commitments as they fall
due.
• Market Risk – the possibility that the Pension Fund may suffer
financial loss as a consequence of changes in such measures as interest rates, market prices, and foreign currency exchange rates.
Credit Risk
The Pension Fund’s credit risk is largely associated with the Fund’s investments in Fixed Interest and Index Linked Securities, Cash Deposits and
Short Term Loans, where there is a risk that the other parties may fail to meet
the interest or dividend payments due, or fail to return the Fund’s investment at the end of the investment period.
At 31 March 2019 the Fund’s exposure to credit risk predominantly related to
the following investments:
Investment Category 31 March 2018 31 March 2019
£’000 £’000
UK Government Gilts 101,440 90,463
UK Corporate Bonds 176,716 183,473
UK Index Linked Gilts 137,256 150,007 Overseas Government Bonds 41,106 56,335
Non-Sterling Cash Deposits 9,698 3,567
Cash Balances 96,772 77,159
Total 562,988 561,004
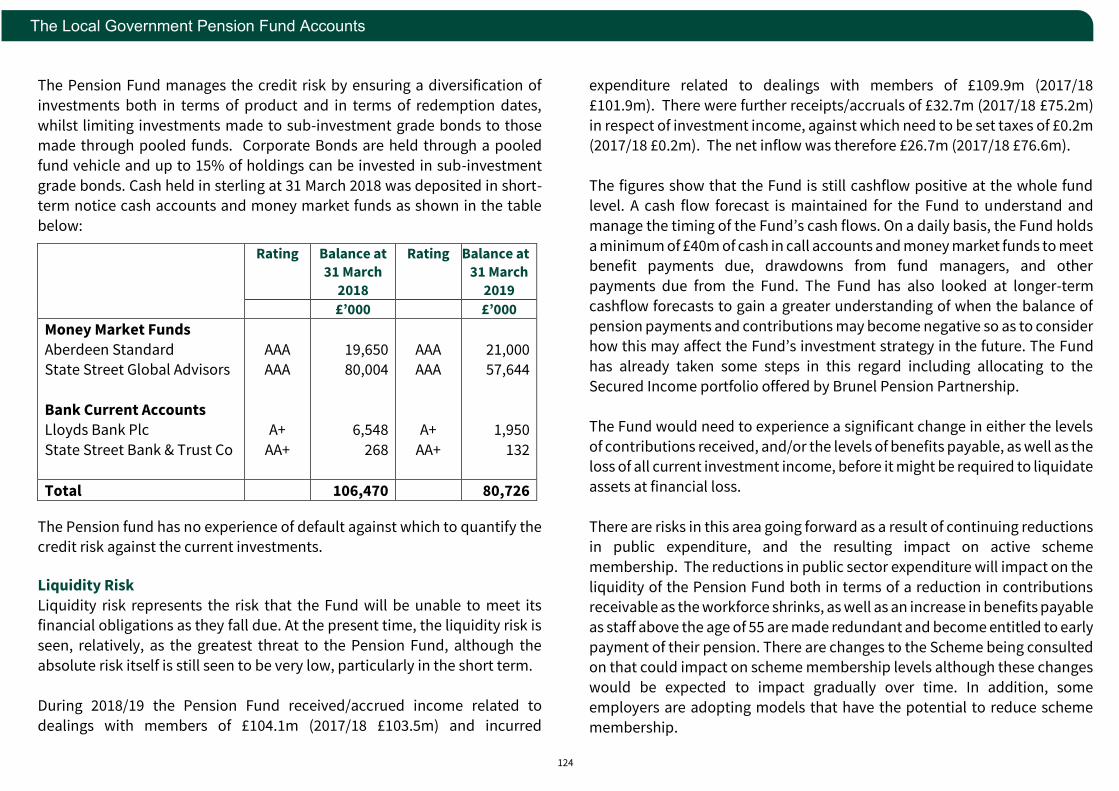
124
The Local Government Pension Fund Accounts
The Pension Fund manages the credit risk by ensuring a diversification of
investments both in terms of product and in terms of redemption dates,
whilst limiting investments made to sub-investment grade bonds to those made through pooled funds. Corporate Bonds are held through a pooled
fund vehicle and up to 15% of holdings can be invested in sub-investment
grade bonds. Cash held in sterling at 31 March 2018 was deposited in short-term notice cash accounts and money market funds as shown in the table
below:
The Pension fund has no experience of default against which to quantify the credit risk against the current investments. Liquidity Risk
Liquidity risk represents the risk that the Fund will be unable to meet its financial obligations as they fall due. At the present time, the liquidity risk is
seen, relatively, as the greatest threat to the Pension Fund, although the
absolute risk itself is still seen to be very low, particularly in the short term.
During 2018/19 the Pension Fund received/accrued income related to
dealings with members of £104.1m (2017/18 £103.5m) and incurred
expenditure related to dealings with members of £109.9m (2017/18
£101.9m). There were further receipts/accruals of £32.7m (2017/18 £75.2m)
in respect of investment income, against which need to be set taxes of £0.2m (2017/18 £0.2m). The net inflow was therefore £26.7m (2017/18 £76.6m).
The figures show that the Fund is still cashflow positive at the whole fund level. A cash flow forecast is maintained for the Fund to understand and
manage the timing of the Fund’s cash flows. On a daily basis, the Fund holds
a minimum of £40m of cash in call accounts and money market funds to meet
benefit payments due, drawdowns from fund managers, and other
payments due from the Fund. The Fund has also looked at longer-term
cashflow forecasts to gain a greater understanding of when the balance of
pension payments and contributions may become negative so as to consider how this may affect the Fund’s investment strategy in the future. The Fund
has already taken some steps in this regard including allocating to the
Secured Income portfolio offered by Brunel Pension Partnership.
The Fund would need to experience a significant change in either the levels
of contributions received, and/or the levels of benefits payable, as well as the loss of all current investment income, before it might be required to liquidate
assets at financial loss.
There are risks in this area going forward as a result of continuing reductions in public expenditure, and the resulting impact on active scheme
membership. The reductions in public sector expenditure will impact on the
liquidity of the Pension Fund both in terms of a reduction in contributions receivable as the workforce shrinks, as well as an increase in benefits payable
as staff above the age of 55 are made redundant and become entitled to early
payment of their pension. There are changes to the Scheme being consulted on that could impact on scheme membership levels although these changes
would be expected to impact gradually over time. In addition, some
employers are adopting models that have the potential to reduce scheme
membership.
Rating Balance at
31 March 2018
Rating Balance at
31 March 2019
£’000 £’000
Money Market Funds
Aberdeen Standard State Street Global Advisors
Bank Current Accounts
Lloyds Bank Plc
State Street Bank & Trust Co
AAA AAA
A+
AA+
19,650 80,004
6,548
268
AAA AAA
A+
AA+
21,000 57,644
1,950
132
Total 106,470 80,726
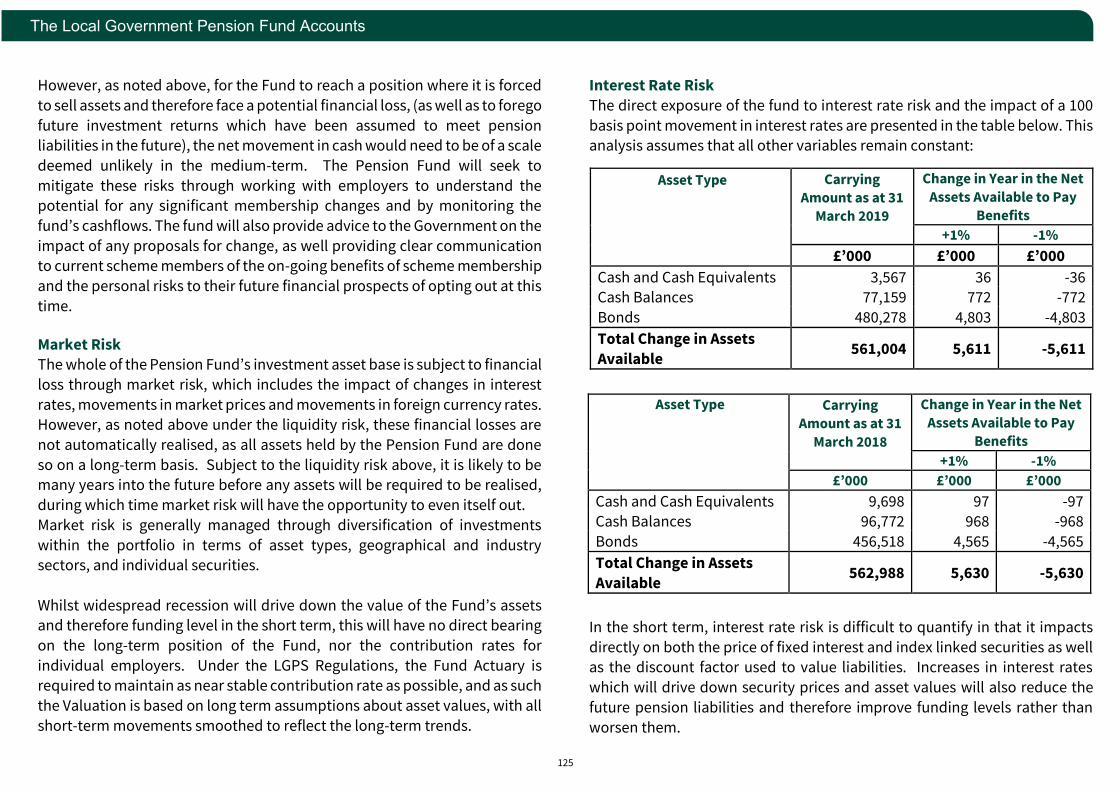
125
The Local Government Pension Fund Accounts
However, as noted above, for the Fund to reach a position where it is forced
to sell assets and therefore face a potential financial loss, (as well as to forego
future investment returns which have been assumed to meet pension liabilities in the future), the net movement in cash would need to be of a scale
deemed unlikely in the medium-term. The Pension Fund will seek to
mitigate these risks through working with employers to understand the potential for any significant membership changes and by monitoring the
fund’s cashflows. The fund will also provide advice to the Government on the
impact of any proposals for change, as well providing clear communication
to current scheme members of the on-going benefits of scheme membership
and the personal risks to their future financial prospects of opting out at this
time. Market Risk The whole of the Pension Fund’s investment asset base is subject to financial
loss through market risk, which includes the impact of changes in interest
rates, movements in market prices and movements in foreign currency rates.
However, as noted above under the liquidity risk, these financial losses are
not automatically realised, as all assets held by the Pension Fund are done
so on a long-term basis. Subject to the liquidity risk above, it is likely to be many years into the future before any assets will be required to be realised,
during which time market risk will have the opportunity to even itself out.
Market risk is generally managed through diversification of investments
within the portfolio in terms of asset types, geographical and industry sectors, and individual securities.
Whilst widespread recession will drive down the value of the Fund’s assets and therefore funding level in the short term, this will have no direct bearing
on the long-term position of the Fund, nor the contribution rates for
individual employers. Under the LGPS Regulations, the Fund Actuary is
required to maintain as near stable contribution rate as possible, and as such
the Valuation is based on long term assumptions about asset values, with all
short-term movements smoothed to reflect the long-term trends.
Interest Rate Risk
The direct exposure of the fund to interest rate risk and the impact of a 100
basis point movement in interest rates are presented in the table below. This analysis assumes that all other variables remain constant:
In the short term, interest rate risk is difficult to quantify in that it impacts
directly on both the price of fixed interest and index linked securities as well as the discount factor used to value liabilities. Increases in interest rates
which will drive down security prices and asset values will also reduce the
future pension liabilities and therefore improve funding levels rather than
worsen them.
Asset Type Carrying Amount as at 31
March 2019
Change in Year in the Net
Assets Available to Pay Benefits
+1% -1%
£’000 £’000 £’000
Cash and Cash Equivalents 3,567 36 -36 Cash Balances 77,159 772 -772
Bonds 480,278 4,803 -4,803
Total Change in Assets
Available 561,004 5,611 -5,611
Asset Type Carrying
Amount as at 31
March 2018
Change in Year in the Net
Assets Available to Pay
Benefits
+1% -1%
£’000 £’000 £’000
Cash and Cash Equivalents 9,698 97 -97 Cash Balances 96,772 968 -968
Bonds 456,518 4,565 -4,565
Total Change in Assets
Available 562,988 5,630 -5,630
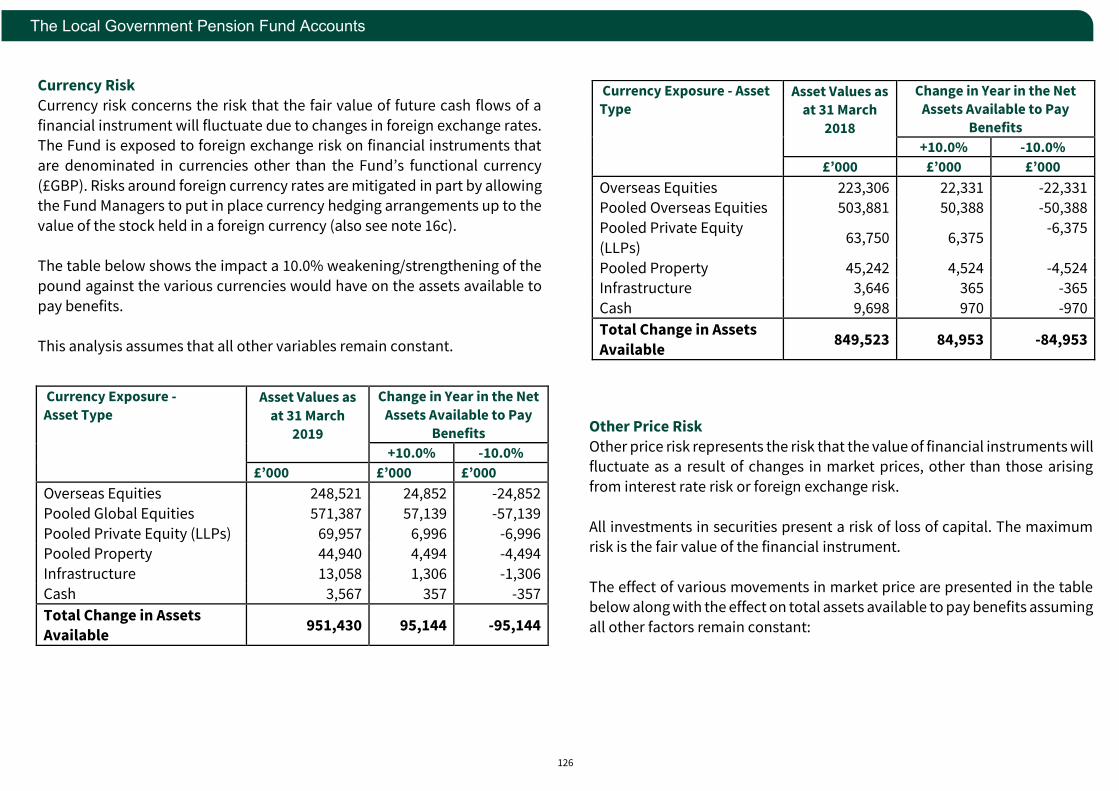
126
The Local Government Pension Fund Accounts
Currency Risk
Currency risk concerns the risk that the fair value of future cash flows of a
financial instrument will fluctuate due to changes in foreign exchange rates. The Fund is exposed to foreign exchange risk on financial instruments that
are denominated in currencies other than the Fund’s functional currency
(£GBP). Risks around foreign currency rates are mitigated in part by allowing the Fund Managers to put in place currency hedging arrangements up to the
value of the stock held in a foreign currency (also see note 16c).
The table below shows the impact a 10.0% weakening/strengthening of the
pound against the various currencies would have on the assets available to
pay benefits.
This analysis assumes that all other variables remain constant.
Other Price Risk
Other price risk represents the risk that the value of financial instruments will fluctuate as a result of changes in market prices, other than those arising
from interest rate risk or foreign exchange risk.
All investments in securities present a risk of loss of capital. The maximum risk is the fair value of the financial instrument.
The effect of various movements in market price are presented in the table below along with the effect on total assets available to pay benefits assuming
all other factors remain constant:
Currency Exposure -
Asset Type Asset Values as
at 31 March
2019
Change in Year in the Net
Assets Available to Pay
Benefits
+10.0% -10.0%
£’000 £’000 £’000
Overseas Equities 248,521 24,852 -24,852
Pooled Global Equities 571,387 57,139 -57,139
Pooled Private Equity (LLPs) 69,957 6,996 -6,996 Pooled Property 44,940 4,494 -4,494
Infrastructure 13,058 1,306 -1,306
Cash 3,567 357 -357
Total Change in Assets Available
951,430 95,144 -95,144
Currency Exposure - Asset Type
Asset Values as
at 31 March
2018
Change in Year in the Net Assets Available to Pay
Benefits
+10.0% -10.0%
£’000 £’000 £’000
Overseas Equities 223,306 22,331 -22,331 Pooled Overseas Equities 503,881 50,388 -50,388
Pooled Private Equity
(LLPs) 63,750 6,375
-6,375
Pooled Property 45,242 4,524 -4,524 Infrastructure 3,646 365 -365
Cash 9,698 970 -970
Total Change in Assets
Available 849,523 84,953 -84,953
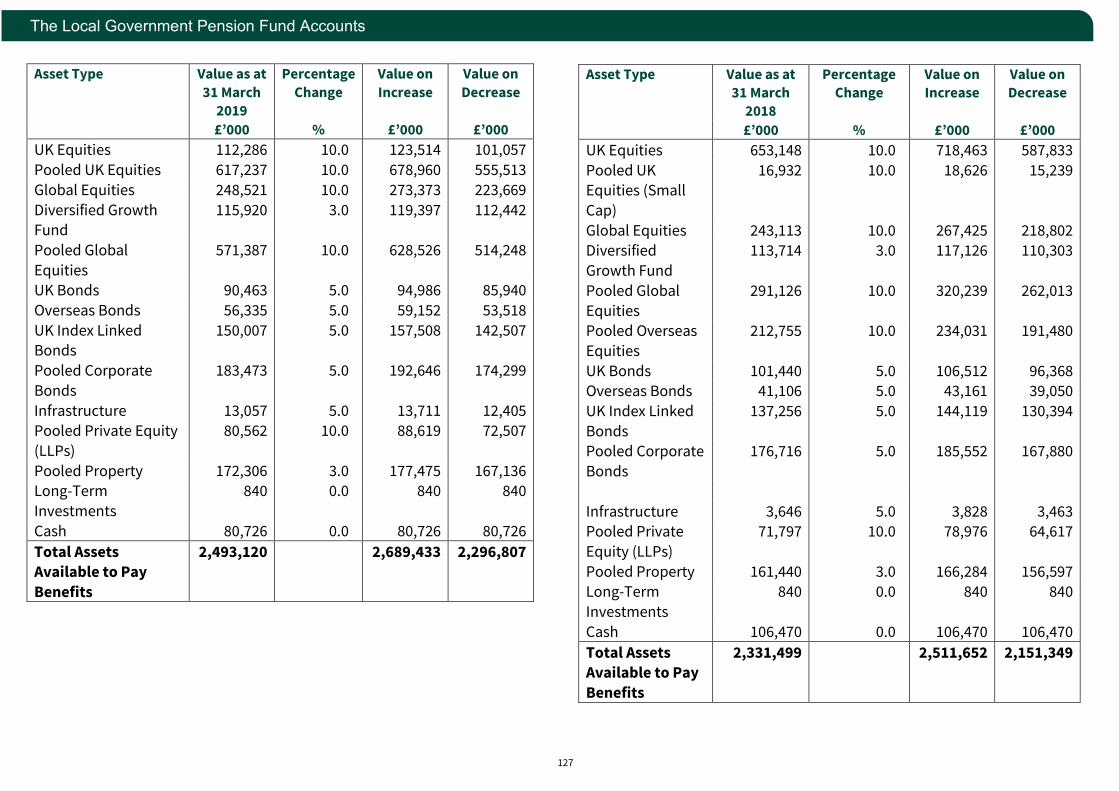
127
The Local Government Pension Fund Accounts
Asset Type Value as at
31 March 2019
Percentage
Change
Value on
Increase
Value on
Decrease
£’000 % £’000 £’000
UK Equities 112,286 10.0 123,514 101,057
Pooled UK Equities 617,237 10.0 678,960 555,513
Global Equities 248,521 10.0 273,373 223,669
Diversified Growth Fund
115,920 3.0 119,397 112,442
Pooled Global
Equities
571,387 10.0 628,526 514,248
UK Bonds 90,463 5.0 94,986 85,940
Overseas Bonds 56,335 5.0 59,152 53,518
UK Index Linked Bonds
150,007 5.0 157,508 142,507
Pooled Corporate
Bonds
183,473 5.0 192,646 174,299
Infrastructure 13,057 5.0 13,711 12,405
Pooled Private Equity
(LLPs)
80,562 10.0 88,619 72,507
Pooled Property 172,306 3.0 177,475 167,136 Long-Term
Investments
840 0.0 840 840
Cash 80,726 0.0 80,726 80,726
Total Assets Available to Pay
Benefits
2,493,120 2,689,433 2,296,807
Asset Type Value as at
31 March 2018
Percentage
Change
Value on
Increase
Value on
Decrease
£’000 % £’000 £’000
UK Equities 653,148 10.0 718,463 587,833
Pooled UK Equities (Small
Cap)
16,932 10.0 18,626 15,239
Global Equities 243,113 10.0 267,425 218,802
Diversified
Growth Fund
113,714 3.0 117,126 110,303
Pooled Global
Equities
291,126 10.0 320,239 262,013
Pooled Overseas
Equities
212,755 10.0 234,031 191,480
UK Bonds 101,440 5.0 106,512 96,368 Overseas Bonds 41,106 5.0 43,161 39,050
UK Index Linked
Bonds
137,256 5.0 144,119 130,394
Pooled Corporate
Bonds
176,716 5.0 185,552 167,880
Infrastructure 3,646 5.0 3,828 3,463 Pooled Private
Equity (LLPs)
71,797 10.0 78,976 64,617
Pooled Property 161,440 3.0 166,284 156,597
Long-Term
Investments
840 0.0 840 840
Cash 106,470 0.0 106,470 106,470
Total Assets Available to Pay
Benefits
2,331,499 2,511,652 2,151,349
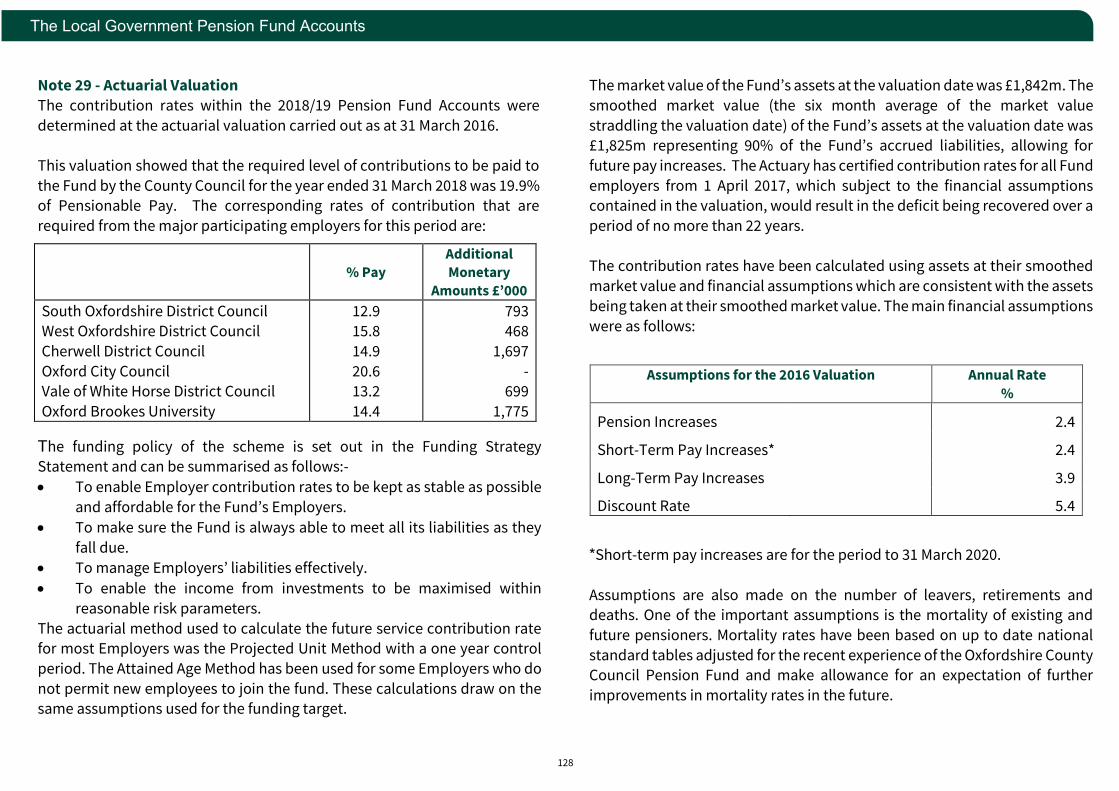
128
The Local Government Pension Fund Accounts
Note 29 - Actuarial Valuation
The contribution rates within the 2018/19 Pension Fund Accounts were
determined at the actuarial valuation carried out as at 31 March 2016.
This valuation showed that the required level of contributions to be paid to
the Fund by the County Council for the year ended 31 March 2018 was 19.9% of Pensionable Pay. The corresponding rates of contribution that are
required from the major participating employers for this period are:
The funding policy of the scheme is set out in the Funding Strategy Statement and can be summarised as follows:-
• To enable Employer contribution rates to be kept as stable as possible
and affordable for the Fund’s Employers.
• To make sure the Fund is always able to meet all its liabilities as they
fall due.
• To manage Employers’ liabilities effectively.
• To enable the income from investments to be maximised within
reasonable risk parameters.
The actuarial method used to calculate the future service contribution rate for most Employers was the Projected Unit Method with a one year control
period. The Attained Age Method has been used for some Employers who do
not permit new employees to join the fund. These calculations draw on the same assumptions used for the funding target.
The market value of the Fund’s assets at the valuation date was £1,842m. The
smoothed market value (the six month average of the market value
straddling the valuation date) of the Fund’s assets at the valuation date was £1,825m representing 90% of the Fund’s accrued liabilities, allowing for
future pay increases. The Actuary has certified contribution rates for all Fund
employers from 1 April 2017, which subject to the financial assumptions contained in the valuation, would result in the deficit being recovered over a
period of no more than 22 years.
The contribution rates have been calculated using assets at their smoothed
market value and financial assumptions which are consistent with the assets
being taken at their smoothed market value. The main financial assumptions
were as follows:
*Short-term pay increases are for the period to 31 March 2020.
Assumptions are also made on the number of leavers, retirements and deaths. One of the important assumptions is the mortality of existing and
future pensioners. Mortality rates have been based on up to date national
standard tables adjusted for the recent experience of the Oxfordshire County Council Pension Fund and make allowance for an expectation of further
improvements in mortality rates in the future.
% Pay
Additional Monetary
Amounts £’000
South Oxfordshire District Council West Oxfordshire District Council
Cherwell District Council
Oxford City Council Vale of White Horse District Council
Oxford Brookes University
12.9 15.8
14.9
20.6 13.2
14.4
793 468
1,697
- 699
1,775
Assumptions for the 2016 Valuation Annual Rate
%
Pension Increases 2.4
Short-Term Pay Increases* 2.4
Long-Term Pay Increases 3.9
Discount Rate 5.4

129
Fire Fighter’s Pension Fund
2017/18 2018/19
£'000 £'000
Contributions Receivable
From Employer:
Normal -1,600 -1,589
Early Retirements 0 0
Other (ill health retirement contribution) -59 -55
From members -1,356 -1,392
-3015 -3,037
Transfers In -1 0
Benefits Payable
Pensions 5,211 5,463
Commutations & lump sum retirement benefits 1,192 1,256
Lump sum death benefits 0 0
Other (ill health lump sums) 90 12
6,493 6,730
Payments to and on account of leavers
Individual transfers out to other schemes 0 0
Miscellaneous
Annual Allowance Charge 84 195
Interest Payments 28 0
Refunds due to employee contribution holiday
(including interest) 6 0
118 196
Net amount paybale/receivable for the year
before top-up grant receivable / payable to
sponsoring department 3,595 3,889
Top-up grant receivable -3,595 -3,889
Net amount payable / receivable for the year 0 0
Fund Account Net Assets Statement 2017/18 2018/19
£'000 £'000
Net Current Assets and Liabilities
Contributions due from employer 0 0
Pension top-up grant receivable form
sponsoring department 0 0
Other current Assets 0 0
Pension top-up grant payable to sponsoring
department 1,317 419
Other current liabilities (other than liabilities to
pay pensions and other benefits in the future) 25 13
Cash balance -1,342 -432
Total 0 0
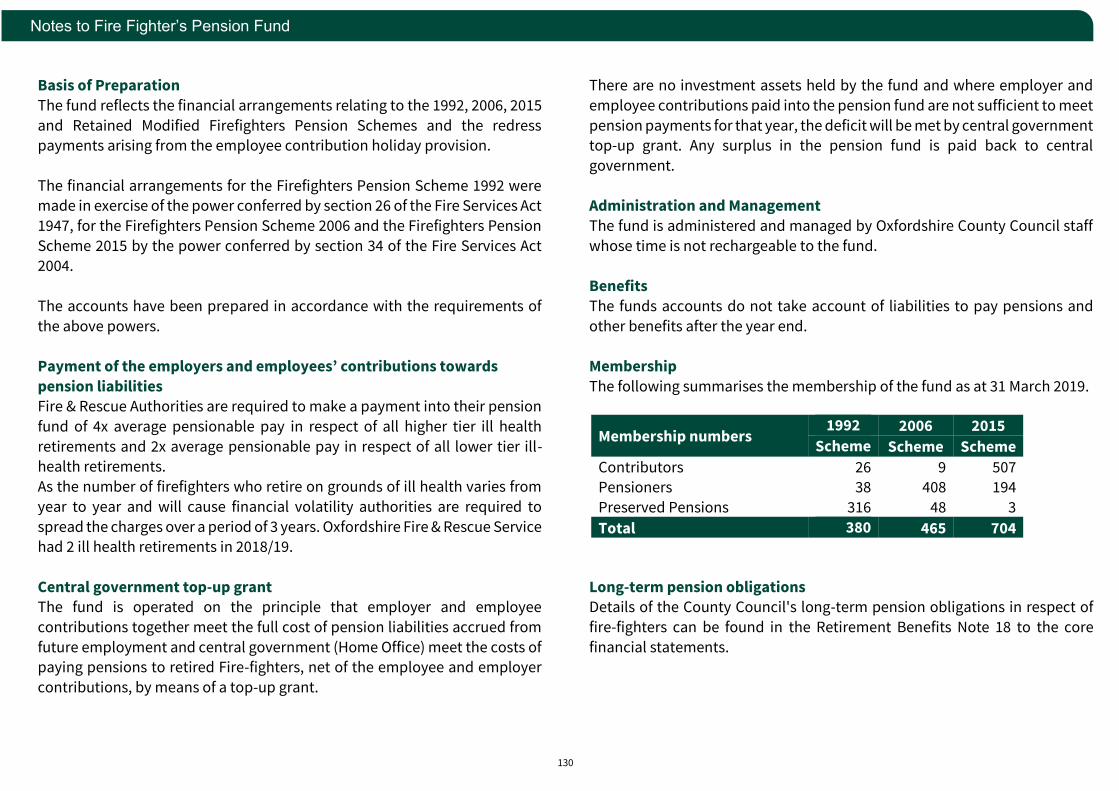
130
Notes to Fire Fighter’s Pension Fund
Basis of Preparation
The fund reflects the financial arrangements relating to the 1992, 2006, 2015
and Retained Modified Firefighters Pension Schemes and the redress payments arising from the employee contribution holiday provision.
The financial arrangements for the Firefighters Pension Scheme 1992 were made in exercise of the power conferred by section 26 of the Fire Services Act
1947, for the Firefighters Pension Scheme 2006 and the Firefighters Pension
Scheme 2015 by the power conferred by section 34 of the Fire Services Act
2004.
The accounts have been prepared in accordance with the requirements of
the above powers.
Payment of the employers and employees’ contributions towards
pension liabilities Fire & Rescue Authorities are required to make a payment into their pension
fund of 4x average pensionable pay in respect of all higher tier ill health
retirements and 2x average pensionable pay in respect of all lower tier ill-health retirements.
As the number of firefighters who retire on grounds of ill health varies from
year to year and will cause financial volatility authorities are required to
spread the charges over a period of 3 years. Oxfordshire Fire & Rescue Service had 2 ill health retirements in 2018/19.
Central government top-up grant The fund is operated on the principle that employer and employee
contributions together meet the full cost of pension liabilities accrued from
future employment and central government (Home Office) meet the costs of paying pensions to retired Fire-fighters, net of the employee and employer
contributions, by means of a top-up grant.
There are no investment assets held by the fund and where employer and
employee contributions paid into the pension fund are not sufficient to meet
pension payments for that year, the deficit will be met by central government top-up grant. Any surplus in the pension fund is paid back to central
government.
Administration and Management
The fund is administered and managed by Oxfordshire County Council staff
whose time is not rechargeable to the fund.
Benefits
The funds accounts do not take account of liabilities to pay pensions and
other benefits after the year end.
Membership
The following summarises the membership of the fund as at 31 March 2019.
Long-term pension obligations Details of the County Council's long-term pension obligations in respect of
fire-fighters can be found in the Retirement Benefits Note 18 to the core
financial statements.
Membership numbers 1992 2006 2015
Scheme Scheme Scheme
Contributors 26 9 507 Pensioners 38 408 194
Preserved Pensions 316 48 3
Total 380 465 704

131
Independent Auditor’s Report to Members of Oxfordshire County Council
INDEPENDENT AUDITOR’S REPORT TO THE MEMBERS OF OXFORDSHIRE
COUNTY COUNCIL
Opinion
We have audited the financial statements and the firefighters’ pension fund financial statements of Oxfordshire County Council for the year ended 31
March 2019 under the Local Audit and Accountability Act 2014. The financial
statements comprise the:
• Movement in Reserves Statement,
• Comprehensive Income and Expenditure Statement,
• Balance Sheet,
• Cash Flow Statement,
• Notes 1 to 60 and the Expenditure and Funding Analysis,
• Firefighters’ Pension Fund financial statements comprising the Fund Account, the Net Assets Statement and the related notes.
The financial reporting framework that has been applied in their preparation is applicable law and the CIPFA/LASAAC Code of Practice on
Local Authority Accounting in the United Kingdom 2018/19.
In our opinion the financial statements:
• give a true and fair view of the financial position of Oxfordshire
County Council as at 31 March 2019 and of its expenditure and
income for the year then ended; and
• have been prepared properly in accordance with the CIPFA/LASAAC
Code of Practice on Local Authority Accounting in the United
Kingdom 2018/19.
Basis for opinion
We conducted our audit in accordance with International Standards on Auditing (UK) (ISAs (UK)) and applicable law. Our responsibilities under those standards are
further described in the Auditor’s responsibilities for the audit of the financial
statements section of our report below. We are independent of Oxfordshire County
Council in accordance with the ethical requirements that are relevant to our audit of the financial statements in the UK, including the FRC’s Ethical Standard and the Comptroller and Auditor General’s (C&AG) AGN01, and we have fulfilled our other
ethical responsibilities in accordance with these requirements.
We believe that the audit evidence we have obtained is sufficient and
appropriate to provide a basis for our opinion.
Conclusions relating to going concern
We have nothing to report in respect of the following matters in relation to
which the ISAs (UK) require us to report to you where:
• the Director of Finance’s use of the going concern basis of accounting in the preparation of the financial statements is not appropriate; or
• the Director of Finance has not disclosed in the financial statements any
identified material uncertainties that may cast significant doubt about
the Authority’s ability to continue to adopt the going concern basis of accounting for a period of at least twelve months from the date when
the financial statements are authorised for issue.
Other information
The other information comprises the information included in the statement of accounts, other than the financial statements and our auditor’s report
thereon. The Director of Finance is responsible for the other information.

132
Independent Auditor’s Report to Members of Oxfordshire County Council
Our opinion on the financial statements does not cover the other
information and, except to the extent otherwise explicitly stated in this
report, we do not express any form of assurance conclusion thereon.
In connection with our audit of the financial statements, our responsibility
is to read the other information and, in doing so, consider whether the other information is materially inconsistent with the financial statements or our
knowledge obtained in the audit or otherwise appears to be materially
misstated. If we identify such material inconsistencies or apparent material
misstatements, we are required to determine whether there is a material
misstatement in the financial statements or a material misstatement of the
other information. If, based on the work we have performed, we conclude
that there is a material misstatement of the other information, we are required to report that fact.
We have nothing to report in this regard.
Opinion on other matters prescribed by the Local Audit and
Accountability Act 2014
Arrangements to secure economy, efficiency and effectiveness in the use
of resources
In our opinion, based on the work undertaken in the course of the audit,
having regard to the guidance issued by the Comptroller and Auditor
General (C&AG) in November 2017, we are satisfied that, in all significant respects, Oxfordshire County Council put in place proper arrangements to
secure economy, efficiency and effectiveness in its use of resources for the
year ended 31 March 2019.
Matters on which we report by exception
We report to you if:
• in our opinion the annual governance statement is misleading or
inconsistent with other information forthcoming from the audit or
our knowledge of the Council;
• we issue a report in the public interest under section 24 of the Local Audit and Accountability Act 2014;
• we make written recommendations to the audited body under
Section 24 of the Local Audit and Accountability Act 2014;
• we make an application to the court for a declaration that an item of
account is contrary to law under Section 28 of the Local Audit and
Accountability Act 2014;
• we issue an advisory notice under Section 29 of the Local Audit and
Accountability Act 2014; or
• we make an application for judicial review under Section 31 of the
Local Audit and Accountability Act 2014.
We have nothing to report in these respects.
Responsibility of the Director of Finance
As explained more fully in the Statement of the Director of Finance’s
Responsibilities set out on page 20, the Director of Finance is responsible for the preparation of the Statement of Accounts, which includes the
Authority financial statements and the firefighters’ pension fund financial
statements, in accordance with proper practices as set out in the
CIPFA/LASAAC Code of Practice on Local Authority Accounting in the United Kingdom 2018/19, and for being satisfied that they give a true and fair view.
In preparing the financial statements, the Director of Finance is responsible for assessing the Authority’s ability to continue as a going concern,
disclosing, as applicable, matters related to going concern and using the
going concern basis of accounting unless the Authority either intends to cease operations, or have no realistic alternative but to do so.
133
Independent Auditor’s Report to Members of Oxfordshire County Council
The Authority is responsible for putting in place proper arrangements to
secure economy, efficiency and effectiveness in its use of resources, to
ensure proper stewardship and governance, and to review regularly the adequacy and effectiveness of these arrangements.
Auditor’s responsibilities for the audit of the financial statements
Our objectives are to obtain reasonable assurance about whether the
financial statements as a whole are free from material misstatement,
whether due to fraud or error, and to issue an auditor’s report that includes
our opinion. Reasonable assurance is a high level of assurance, but is not a
guarantee that an audit conducted in accordance with ISAs (UK) will always detect a material misstatement when it exists. Misstatements can arise
from fraud or error and are considered material if, individually or in the
aggregate, they could reasonably be expected to influence the economic decisions of users taken on the basis of these financial statements.
A further description of our responsibilities for the audit of the financial
statements is located on the Financial Reporting Council’s website at
https://www.frc.org.uk/auditorsresponsibilities. This description forms
part of our auditor’s report.
Scope of the review of arrangements for securing economy, efficiency and
effectiveness in the use of resources
We have undertaken our review in accordance with the Code of Audit Practice, having regard to the guidance on the specified criterion issued by
the Comptroller and Auditor General (C&AG) in November 2017, as to
whether Oxfordshire County Council had proper arrangements to ensure it took properly informed decisions and deployed resources to achieve
planned and sustainable outcomes for taxpayers and local people. The
Comptroller and Auditor General determined this criterion as that necessary for us to consider under the Code of Audit Practice in satisfying
ourselves whether Oxfordshire County Council put in place proper
arrangements for securing economy, efficiency and effectiveness in its use
of resources for the year ended 31 March 2019.
We planned our work in accordance with the Code of Audit Practice. Based
on our risk assessment, we undertook such work as we considered necessary to form a view on whether, in all significant respects, Oxfordshire
County Council had put in place proper arrangements to secure economy,
efficiency and effectiveness in its use of resources.
We are required under Section 20(1)(c) of the Local Audit and Accountability
Act 2014 to satisfy ourselves that the Authority has made proper
arrangements for securing economy, efficiency and effectiveness in its use of resources. The Code of Audit Practice issued by the National Audit Office
(NAO) requires us to report to you our conclusion relating to proper
arrangements.
We report if significant matters have come to our attention which prevent
us from concluding that the Authority has put in place proper arrangements for securing economy, efficiency and effectiveness in its use of resources.
We are not required to consider, nor have we considered, whether all
aspects of the Authority’s arrangements for securing economy, efficiency
and effectiveness in its use of resources are operating effectively.
Delay in certification of completion of the audit
We cannot formally conclude the audit and issue an audit certificate until we have completed the work necessary to issue our assurance statement in
respect of the Authority’s Whole of Government Accounts consolidation
pack. We are satisfied that this work does not have a material effect on the financial statements or on our value for money conclusion.
134
Independent Auditor’s Report to Members of Oxfordshire County Council
Until we have completed these procedures we are unable to certify that we
have completed the audit of the accounts in accordance with the
requirements of the Local Audit and Accountability Act 2014 and the Code of Audit Practice issued by the National Audit Office.
Use of our report
This report is made solely to the members of Oxfordshire County Council, as
a body, in accordance with Part 5 of the Local Audit and Accountability Act
2014 and for no other purpose, as set out in paragraph 43 of the Statement
of Responsibilities of Auditors and Audited Bodies published by Public
Sector Audit Appointments Limited. To the fullest extent permitted by law,
we do not accept or assume responsibility to anyone other than the Authority and the Authority’s members as a body, for our audit work, for
this report, or for the opinions we have formed.
Janet Dawson (Key Audit Partner) Ernst & Young LLP (Local Auditor)
London
31st July 2019
The maintenance and integrity of the Oxfordshire County Council web site
is the responsibility of the directors; the work carried out by the auditors
does not involve consideration of these matters and, accordingly, the auditors accept no responsibility for any changes that may have occurred to
the financial statements since they were initially presented on the web site.
Legislation in the United Kingdom governing the preparation and dissemination of financial statements may differ from legislation in other
jurisdictions.

135
Independent Auditor’s Report to Members of Oxfordshire County Council
INDEPENDENT AUDITOR’S REPORT TO THE MEMBERS OF OXFORDSHIRE
COUNTY COUNCIL – Pension Fund
Opinion
We have audited the pension fund financial statements for the year ended
31 March 2019 under the Local Audit and Accountability Act 2014. The
pension fund financial statements comprise the Fund Account, the Net
Assets Statement and the related notes 1 to 29. The financial reporting
framework that has been applied in their preparation is applicable law and
the CIPFA/LASAAC Code of Practice on Local Authority Accounting in the
United Kingdom 2018/19.
In our opinion the pension fund financial statements:
• give a true and fair view of the financial transactions of the pension
fund during the year ended 31 March 2019 and the amount and
disposition of the fund’s assets and liabilities as at 31 March 2019;
and
• have been properly prepared in accordance with the CIPFA/LASAAC Code of Practice on Local Authority Accounting in the United
Kingdom 2018/19.
Basis for opinion We conducted our audit in accordance with International Standards on Auditing
(UK) (ISAs (UK)) and applicable law. Our responsibilities under those standards are
further described in the Auditor’s responsibilities for the audit of the financial statements section of our report below. We are independent of the pension fund in accordance with the ethical requirements that are relevant to our audit of the
financial statements in the UK, including the FRC’s Ethical Standard and the
Comptroller and Auditor General’s (C&AG) AGN01, and we have fulfilled our other ethical responsibilities in accordance with these requirements.
We believe that the audit evidence we have obtained is sufficient and
appropriate to provide a basis for our opinion.
Conclusions relating to going concern
We have nothing to report in respect of the following matters in relation to which
the ISAs (UK) require us to report to you where:
• the Director of Finance’s use of the going concern basis of accounting in
the preparation of the financial statements is not appropriate; or
• the Director of Finance has not disclosed in the financial statements any identified material uncertainties that may cast significant doubt about
the pension fund’s ability to continue to adopt the going concern basis
of accounting for a period of at least twelve months from the date when the financial statements are authorised for issue.
Other information
The other information comprises the information included in the
Oxfordshire County Council Statement of Accounts 2018/19 other than the
financial statements and our auditor’s report thereon. The Director of Finance is responsible for the other information.
Our opinion on the financial statements does not cover the other information and, except to the extent otherwise explicitly stated in this
report, we do not express any form of assurance conclusion thereon.
In connection with our audit of the financial statements, our responsibility is to read the other information and, in doing so, consider whether the other
information is materially inconsistent with the financial statements or our
knowledge obtained in the audit or otherwise appears to be materially misstated. If we identify such material inconsistencies or apparent material
misstatements, we are required to determine whether there is a material
misstatement in the financial statements or a material misstatement of the
136
Independent Auditor’s Report to Members of Oxfordshire County Council
other information. If, based on the work we have performed, we conclude
that there is a material misstatement of the other information, we are
required to report that fact.
We have nothing to report in this regard.
Matters on which we report by exception
We report to you if:
• we issue a report in the public interest under section 24 of the Local Audit and Accountability Act 2014;
• we make written recommendations to the audited body under
Section 24 of the Local Audit and Accountability Act 2014;
• we make an application to the court for a declaration that an item of account is contrary to law under Section 28 of the Local Audit and
Accountability Act 2014;
• we issue an advisory notice under Section 29 of the Local Audit and
Accountability Act 2014; or
• we make an application for judicial review under Section 31 of the
Local Audit and Accountability Act 2014.
We have nothing to report in these respects.
Responsibility of the Director of Finance
As explained more fully in the Statement of the Director of Finance’s
Responsibilities set out on page 20, the Director of Finance is responsible
for the preparation of the Authority’s Statement of Accounts, which includes the pension fund financial statements, in accordance with proper
practices as set out in the CIPFA/LASAAC Code of Practice on Local
Authority Accounting in the United Kingdom 2018/19, and for being
satisfied that they give a true and fair view.
In preparing the financial statements, the Director of Finance is responsible
for assessing the Pension Fund’s ability to continue as a going concern,
disclosing, as applicable, matters related to going concern and using the going concern basis of accounting unless the Pension Fund either intends to cease operations, or have no realistic alternative but to do so.
Auditor’s responsibilities for the audit of the financial statements
Our objectives are to obtain reasonable assurance about whether the
financial statements as a whole are free from material misstatement,
whether due to fraud or error, and to issue an auditor’s report that includes our opinion. Reasonable assurance is a high level of assurance, but is not a
guarantee that an audit conducted in accordance with ISAs (UK) will always
detect a material misstatement when it exists. Misstatements can arise from fraud or error and are considered material if, individually or in the
aggregate, they could reasonably be expected to influence the economic
decisions of users taken on the basis of these financial statements.
A further description of our responsibilities for the audit of the financial
statements is located on the Financial Reporting Council’s website at https://www.frc.org.uk/auditorsresponsibilities. This description forms
part of our auditor’s report.
Use of our report
This report is made solely to the members of Oxfordshire County Council, as a body, in accordance with Part 5 of the Local Audit and Accountability Act
2014 and for no other purpose, as set out in paragraph 43 of the Statement
of Responsibilities of Auditors and Audited Bodies published by Public Sector Audit Appointments Limited. To the fullest extent permitted by law,
we do not accept or assume responsibility to anyone other than the
Authority and the Authority’s members as a body, for our audit work, for this report, or for the opinions we have formed.
137
Independent Auditor’s Report to Members of Oxfordshire County Council
Kevin Suter (Key Audit Partner) Ernst & Young LLP (Local Auditor)
Southampton
31 July 2019
The maintenance and integrity of the Oxfordshire County Council Pension
Fund web site is the responsibility of the directors; the work carried out by
the auditors does not involve consideration of these matters and,
accordingly, the auditors accept no responsibility for any changes that may have occurred to the financial statements since they were initially
presented on the web site.
Legislation in the United Kingdom governing the preparation and dissemination of financial statements may differ from legislation in other
jurisdictions.
138
Annual Governance Statement 2018/19
INTRODUCTION
1. This is Oxfordshire County Council’s Annual Governance Statement
for 2018/19. It provides:
• An opinion on the Council’s governance arrangements from the
Council’s senior managers and the leader of the Council
• A review of the effectiveness of the Council’s governance arrangements during 2018/19
• A conclusion in relation to the effectiveness
• A review of the action plan from last year’s statement
• An action plan for 2019/20
• An annex summarising our governance framework
2. The Statement will be published on the Council’s website and will
also form part of the Council’s Statement of Accounts. The Annual
Governance Statement is required by Regulation 6(1) (b) of the Accounts and Audit (England) Regulations 2015. This statement
covers all services including the Fire & Rescue Service. However, the
Fire & Rescue Service are required to produce a separate Statement of Assurance which will supplement this statement. A copy of the Fire
and Rescue Service Annual Statement of Assurance for 2018/19 can
also be found on our public website here.
STATEMENT OF OPINION
It is our opinion that the Council’s governance arrangements in 2018/19 were sound and provide a robust platform for achieving the Council’s priorities and
challenges in 2019/20.
SIGNATURES
Signed on behalf of Oxfordshire County Council:
………………………………. Date ………. ……………………………….
Yvonne Rees Lorna Baxter
Chief Executive Chief Finance Officer
………………………………. Date ………. ……………………………….
Councillor Ian Hudspeth Nicholas Graham
Leader of the Council Monitoring Officer

139
Annual Governance Statement 2018/19
APRIL 2018
SIGNIFICANT GOVERNANCE ISSUES
Progress in 2018/19
3. This is a review of the progress on the priorities for 2018/19:
Actions that were planned for 2018/19
Original Timescale
Outcome
Mental Health:
Carry out the remaining governance actions
identified in the follow-
up audit (March 2018)
March 2019 Actions to improve the delivery of services to people who require support from a mental health
perspective are ongoing, having made considerable progress. The difficulties identified in the shared delivery of services, and in the commissioning, quality and purchasing processes identified by the audit
in 2016/2017 are being addressed as required through the Action Plan. Seven agreed management actions
are fully implemented, the remaining five were on target for implementation by the end of April 2019.
The mental health service is delivered through a section 75 partnership agreement with Oxford Health NHS Foundation Trust, with some shared commissioning and transactional work delivered from finance
and commissioning teams within the County Council. In 2017, officers carried out a strategic review of the
Section 75 arrangements to consider how service users' needs are best met and to ensure that our
statutory duties are being delivered.
Following the review, a decision was taken to move staff in the older adults’ mental health service back
into the County Council where they are now currently working as a separate team. This arrangement enables a single point of access for social care mental health ensuring social care is delivered for the whole
population to a single set of standards, processes and procedures in line with the social work provision in
the locality teams. The adults of working age mental health service is still provided by Oxford Health and
will be governed by a variation to the section 75 agreement. A draft of that agreement has been produced but is not yet finalised as it is affected by the proposed changes to mental health budgets. The Council
and Oxford Health are working closely together to determine the future of Working Age Adults’ service.
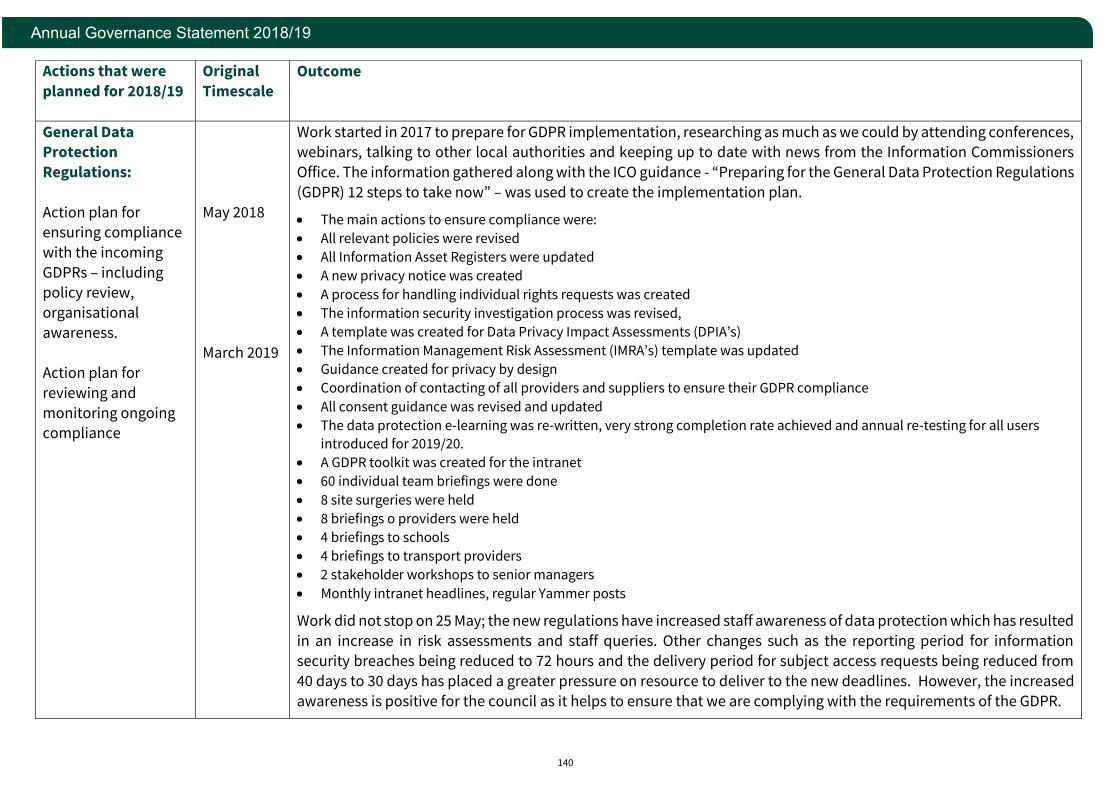
140
Annual Governance Statement 2018/19
Actions that were
planned for 2018/19
Original
Timescale
Outcome
General Data Protection
Regulations:
Action plan for ensuring compliance
with the incoming
GDPRs – including policy review,
organisational
awareness.
Action plan for
reviewing and
monitoring ongoing
compliance
May 2018
March 2019
Work started in 2017 to prepare for GDPR implementation, researching as much as we could by attending conferences, webinars, talking to other local authorities and keeping up to date with news from the Information Commissioners
Office. The information gathered along with the ICO guidance - “Preparing for the General Data Protection Regulations
(GDPR) 12 steps to take now” – was used to create the implementation plan.
• The main actions to ensure compliance were:
• All relevant policies were revised
• All Information Asset Registers were updated
• A new privacy notice was created
• A process for handling individual rights requests was created
• The information security investigation process was revised,
• A template was created for Data Privacy Impact Assessments (DPIA’s)
• The Information Management Risk Assessment (IMRA’s) template was updated
• Guidance created for privacy by design
• Coordination of contacting of all providers and suppliers to ensure their GDPR compliance
• All consent guidance was revised and updated
• The data protection e-learning was re-written, very strong completion rate achieved and annual re-testing for all users introduced for 2019/20.
• A GDPR toolkit was created for the intranet
• 60 individual team briefings were done
• 8 site surgeries were held
• 8 briefings o providers were held
• 4 briefings to schools
• 4 briefings to transport providers
• 2 stakeholder workshops to senior managers
• Monthly intranet headlines, regular Yammer posts
Work did not stop on 25 May; the new regulations have increased staff awareness of data protection which has resulted
in an increase in risk assessments and staff queries. Other changes such as the reporting period for information
security breaches being reduced to 72 hours and the delivery period for subject access requests being reduced from
40 days to 30 days has placed a greater pressure on resource to deliver to the new deadlines. However, the increased
awareness is positive for the council as it helps to ensure that we are complying with the requirements of the GDPR.
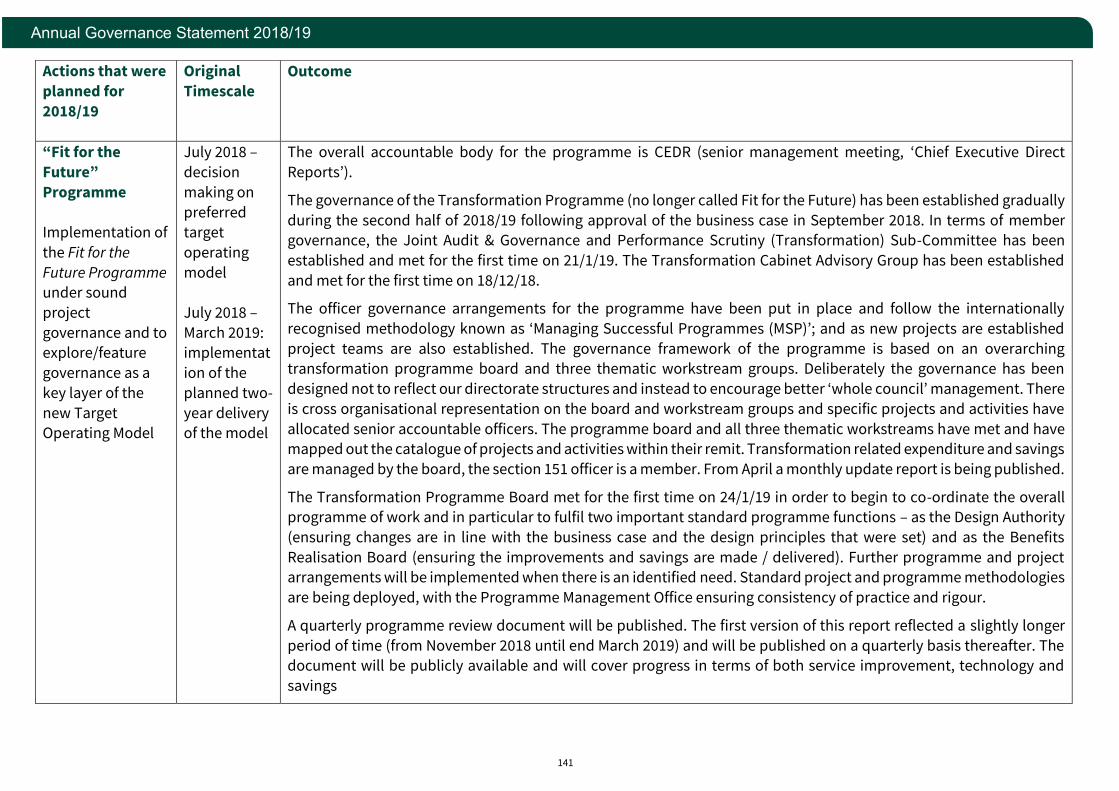
141
Annual Governance Statement 2018/19
Actions that were
planned for
2018/19
Original
Timescale
Outcome
“Fit for the
Future”
Programme
Implementation of
the Fit for the
Future Programme under sound
project
governance and to explore/feature
governance as a
key layer of the
new Target
Operating Model
July 2018 –
decision
making on
preferred target
operating
model
July 2018 –
March 2019: implementat
ion of the
planned two-
year delivery
of the model
The overall accountable body for the programme is CEDR (senior management meeting, ‘Chief Executive Direct
Reports’).
The governance of the Transformation Programme (no longer called Fit for the Future) has been established gradually
during the second half of 2018/19 following approval of the business case in September 2018. In terms of member governance, the Joint Audit & Governance and Performance Scrutiny (Transformation) Sub-Committee has been
established and met for the first time on 21/1/19. The Transformation Cabinet Advisory Group has been established
and met for the first time on 18/12/18.
The officer governance arrangements for the programme have been put in place and follow the internationally
recognised methodology known as ‘Managing Successful Programmes (MSP)’; and as new projects are established
project teams are also established. The governance framework of the programme is based on an overarching transformation programme board and three thematic workstream groups. Deliberately the governance has been
designed not to reflect our directorate structures and instead to encourage better ‘whole council’ management. There
is cross organisational representation on the board and workstream groups and specific projects and activities have
allocated senior accountable officers. The programme board and all three thematic workstreams have met and have mapped out the catalogue of projects and activities within their remit. Transformation related expenditure and savings
are managed by the board, the section 151 officer is a member. From April a monthly update report is being published.
The Transformation Programme Board met for the first time on 24/1/19 in order to begin to co-ordinate the overall programme of work and in particular to fulfil two important standard programme functions – as the Design Authority
(ensuring changes are in line with the business case and the design principles that were set) and as the Benefits
Realisation Board (ensuring the improvements and savings are made / delivered). Further programme and project arrangements will be implemented when there is an identified need. Standard project and programme methodologies
are being deployed, with the Programme Management Office ensuring consistency of practice and rigour.
A quarterly programme review document will be published. The first version of this report reflected a slightly longer
period of time (from November 2018 until end March 2019) and will be published on a quarterly basis thereafter. The document will be publicly available and will cover progress in terms of both service improvement, technology and
savings
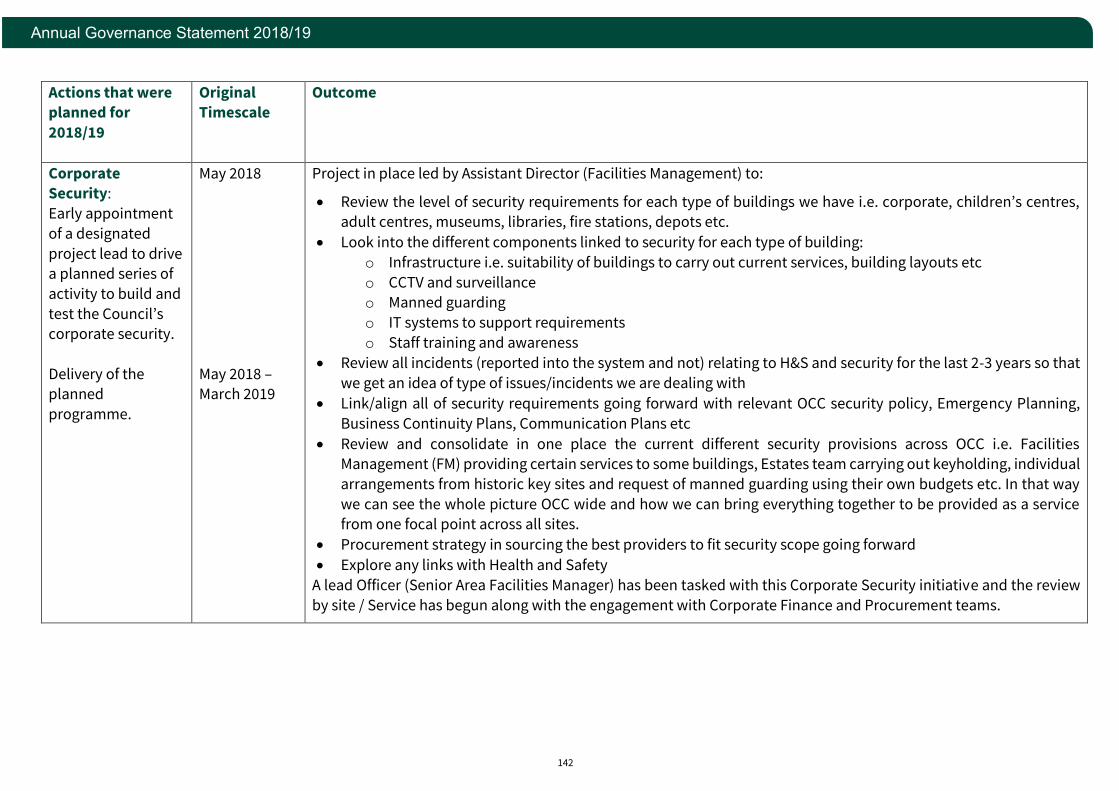
142
Annual Governance Statement 2018/19
Actions that were planned for
2018/19
Original Timescale
Outcome
Corporate Security:
Early appointment
of a designated
project lead to drive a planned series of
activity to build and
test the Council’s corporate security.
Delivery of the planned
programme.
May 2018
May 2018 – March 2019
Project in place led by Assistant Director (Facilities Management) to:
• Review the level of security requirements for each type of buildings we have i.e. corporate, children’s centres, adult centres, museums, libraries, fire stations, depots etc.
• Look into the different components linked to security for each type of building:
o Infrastructure i.e. suitability of buildings to carry out current services, building layouts etc
o CCTV and surveillance o Manned guarding
o IT systems to support requirements
o Staff training and awareness
• Review all incidents (reported into the system and not) relating to H&S and security for the last 2-3 years so that
we get an idea of type of issues/incidents we are dealing with
• Link/align all of security requirements going forward with relevant OCC security policy, Emergency Planning,
Business Continuity Plans, Communication Plans etc
• Review and consolidate in one place the current different security provisions across OCC i.e. Facilities Management (FM) providing certain services to some buildings, Estates team carrying out keyholding, individual
arrangements from historic key sites and request of manned guarding using their own budgets etc. In that way
we can see the whole picture OCC wide and how we can bring everything together to be provided as a service from one focal point across all sites.
• Procurement strategy in sourcing the best providers to fit security scope going forward
• Explore any links with Health and Safety
A lead Officer (Senior Area Facilities Manager) has been tasked with this Corporate Security initiative and the review
by site / Service has begun along with the engagement with Corporate Finance and Procurement teams.

143
Annual Governance Statement 2018/19
Actions that were
planned for 2018/19
Original
Timescale
Outcome
Financial
Management: Deliver a detailed
refresh of the
assurance framework
to ensure its
effectiveness; and to
follow through the
‘case for change’ under the Fit for the
Future Programme in
respect of streamlining systems
and processes.
April 2018 –
March 2019
In July -October 2018, the CIPFA Financial Management Toolkit was used to undertake a self-assessment of Financial
Management across the council. This confirmed that Financial Management was adequate but from the feedback from
respondents there were a number of areas highlighted for improvement.
An action plan was established and was originally scheduled to be completed by the end of March 2019. The Financial
Management improvement is now included as one of the workstreams under the Finance Review, part of the
Transformation Programme, which is due to conclude on 31 May 2019.
Extending the deadline and aligning the work within the overall Finance Review is enabling additional activity, looking
at financial management structures and behaviours. The outcome of that work will be to strengthen the governance
and framework that underpins Financial Management, and the principle of self service.
Property
Deliver property compliance project
to review, monitor
and prioritise via Key
Performance Indicators.
April 2018 –
March 2019
Significant progress has been made in relation to achieving full statutory compliance across the corporate estate. Early
last year audits to establish our compliance position post Carillion took place and identified substantial gaps (i.e. non-compliance). Compliance programmes were subsequently put in place to ensure full statutory compliance in these
areas. A full set of compliance KPIs is in place covering all the main compliance areas.
Much higher levels of statutory compliance have been achieved across the corporate estate, particularly in non-leased
properties with some compliance areas at or close to 100% statutorily compliant. Several compliance programmes are still in place to bring the corporate estate up to full compliance (e.g. water hygiene risk assessments, electrical
fixed wire safety and a Radon safety programme).
In addition, work is also underway to ensure a robust management of an increasingly large number of remedial recommendations arising out of recent and historic risk assessments, safety certificates and surveys (all with target
BAU dates between Jan and March 2019 to comply with end of April 2019 target date). A framework of remedial KPIs is
being put in place to track progress in this area.
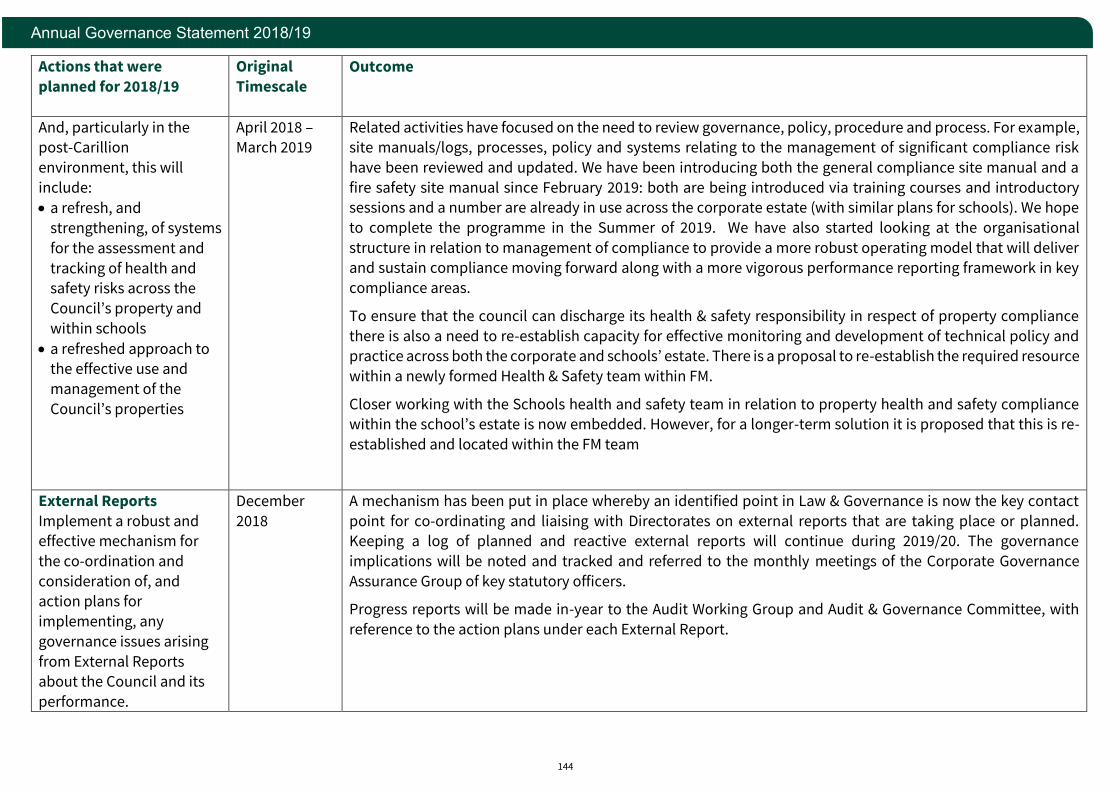
144
Annual Governance Statement 2018/19
Actions that were
planned for 2018/19
Original
Timescale
Outcome
And, particularly in the post-Carillion
environment, this will
include:
• a refresh, and
strengthening, of systems
for the assessment and
tracking of health and safety risks across the
Council’s property and
within schools
• a refreshed approach to the effective use and
management of the
Council’s properties
April 2018 – March 2019
Related activities have focused on the need to review governance, policy, procedure and process. For example, site manuals/logs, processes, policy and systems relating to the management of significant compliance risk
have been reviewed and updated. We have been introducing both the general compliance site manual and a
fire safety site manual since February 2019: both are being introduced via training courses and introductory sessions and a number are already in use across the corporate estate (with similar plans for schools). We hope
to complete the programme in the Summer of 2019. We have also started looking at the organisational
structure in relation to management of compliance to provide a more robust operating model that will deliver and sustain compliance moving forward along with a more vigorous performance reporting framework in key
compliance areas.
To ensure that the council can discharge its health & safety responsibility in respect of property compliance
there is also a need to re-establish capacity for effective monitoring and development of technical policy and practice across both the corporate and schools’ estate. There is a proposal to re-establish the required resource
within a newly formed Health & Safety team within FM.
Closer working with the Schools health and safety team in relation to property health and safety compliance
within the school’s estate is now embedded. However, for a longer-term solution it is proposed that this is re-
established and located within the FM team
External Reports
Implement a robust and effective mechanism for
the co-ordination and
consideration of, and
action plans for
implementing, any
governance issues arising
from External Reports
about the Council and its
performance.
December
2018
A mechanism has been put in place whereby an identified point in Law & Governance is now the key contact
point for co-ordinating and liaising with Directorates on external reports that are taking place or planned. Keeping a log of planned and reactive external reports will continue during 2019/20. The governance
implications will be noted and tracked and referred to the monthly meetings of the Corporate Governance
Assurance Group of key statutory officers.
Progress reports will be made in-year to the Audit Working Group and Audit & Governance Committee, with
reference to the action plans under each External Report.
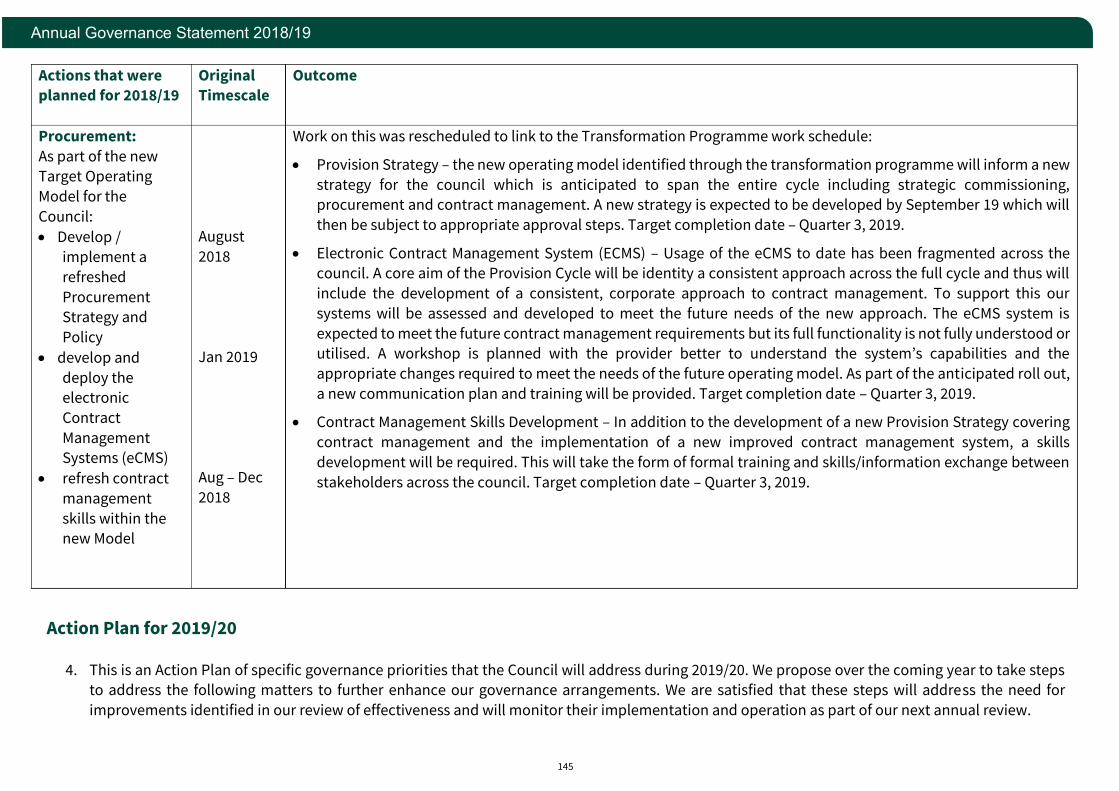
145
Annual Governance Statement 2018/19
Actions that were planned for 2018/19
Original Timescale
Outcome
Procurement:
As part of the new Target Operating
Model for the
Council:
• Develop / implement a
refreshed
Procurement Strategy and
Policy
• develop and
deploy the electronic
Contract
Management Systems (eCMS)
• refresh contract
management
skills within the new Model
August
2018
Jan 2019
Aug – Dec
2018
Work on this was rescheduled to link to the Transformation Programme work schedule:
• Provision Strategy – the new operating model identified through the transformation programme will inform a new
strategy for the council which is anticipated to span the entire cycle including strategic commissioning, procurement and contract management. A new strategy is expected to be developed by September 19 which will
then be subject to appropriate approval steps. Target completion date – Quarter 3, 2019.
• Electronic Contract Management System (ECMS) – Usage of the eCMS to date has been fragmented across the council. A core aim of the Provision Cycle will be identity a consistent approach across the full cycle and thus will
include the development of a consistent, corporate approach to contract management. To support this our
systems will be assessed and developed to meet the future needs of the new approach. The eCMS system is
expected to meet the future contract management requirements but its full functionality is not fully understood or utilised. A workshop is planned with the provider better to understand the system’s capabilities and the
appropriate changes required to meet the needs of the future operating model. As part of the anticipated roll out,
a new communication plan and training will be provided. Target completion date – Quarter 3, 2019.
• Contract Management Skills Development – In addition to the development of a new Provision Strategy covering
contract management and the implementation of a new improved contract management system, a skills
development will be required. This will take the form of formal training and skills/information exchange between
stakeholders across the council. Target completion date – Quarter 3, 2019.
Action Plan for 2019/20
4. This is an Action Plan of specific governance priorities that the Council will address during 2019/20. We propose over the coming year to take steps to address the following matters to further enhance our governance arrangements. We are satisfied that these steps will address the need for
improvements identified in our review of effectiveness and will monitor their implementation and operation as part of our next annual review.
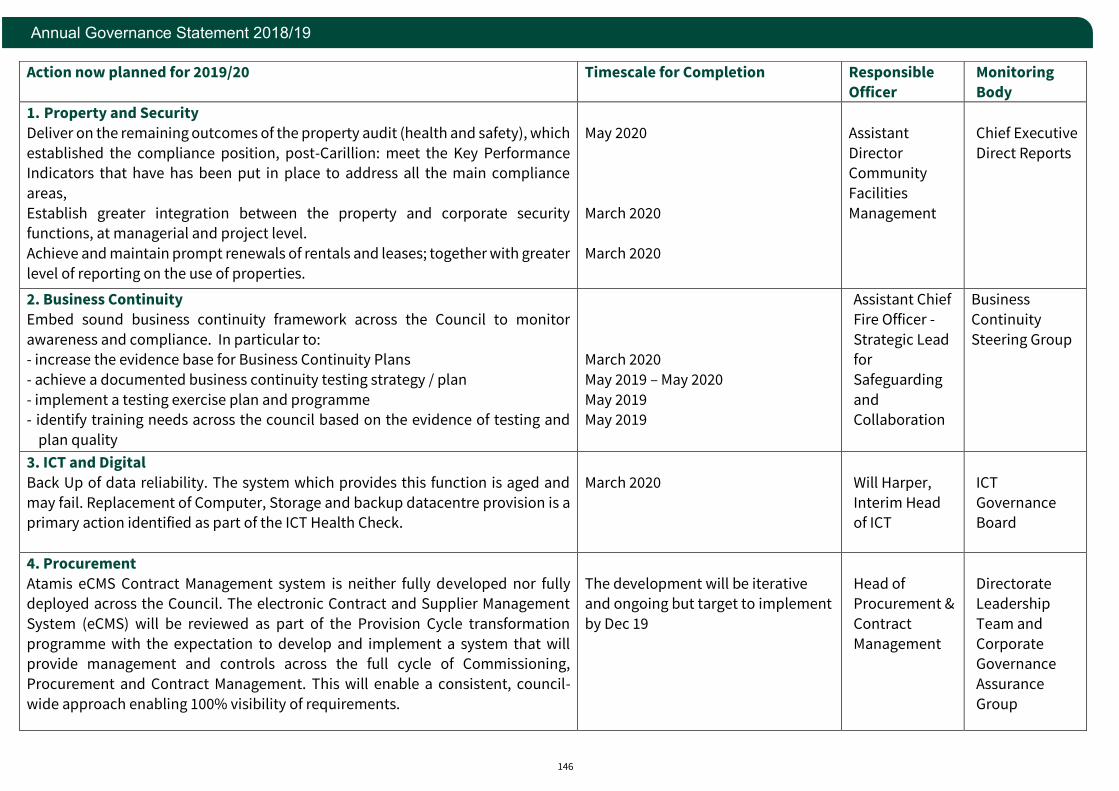
146
Annual Governance Statement 2018/19
Action now planned for 2019/20
Timescale for Completion
Responsible
Officer
Monitoring
Body
1. Property and Security
Deliver on the remaining outcomes of the property audit (health and safety), which
established the compliance position, post-Carillion: meet the Key Performance Indicators that have has been put in place to address all the main compliance
areas,
Establish greater integration between the property and corporate security functions, at managerial and project level.
Achieve and maintain prompt renewals of rentals and leases; together with greater
level of reporting on the use of properties.
May 2020
March 2020
March 2020
Assistant
Director Community
Facilities
Management
Chief Executive
Direct Reports
2. Business Continuity
Embed sound business continuity framework across the Council to monitor
awareness and compliance. In particular to: - increase the evidence base for Business Continuity Plans
- achieve a documented business continuity testing strategy / plan
- implement a testing exercise plan and programme
- identify training needs across the council based on the evidence of testing and
plan quality
March 2020
May 2019 – May 2020
May 2019
May 2019
Assistant Chief
Fire Officer -
Strategic Lead for
Safeguarding
and
Collaboration
Business
Continuity
Steering Group
3. ICT and Digital
Back Up of data reliability. The system which provides this function is aged and
may fail. Replacement of Computer, Storage and backup datacentre provision is a primary action identified as part of the ICT Health Check.
March 2020
Will Harper,
Interim Head of ICT
ICT
Governance Board
4. Procurement
Atamis eCMS Contract Management system is neither fully developed nor fully
deployed across the Council. The electronic Contract and Supplier Management
System (eCMS) will be reviewed as part of the Provision Cycle transformation
programme with the expectation to develop and implement a system that will provide management and controls across the full cycle of Commissioning,
Procurement and Contract Management. This will enable a consistent, council-
wide approach enabling 100% visibility of requirements.
The development will be iterative
and ongoing but target to implement
by Dec 19
Head of
Procurement &
Contract
Management
Directorate
Leadership
Team and
Corporate Governance
Assurance
Group

147
Annual Governance Statement 2018/19
REVIEWING OUR EFFECTIVENESS
1. We have reviewed our overall effectiveness. Key points are that we have
made progress on implementing our Action Plan for 2018/19.
2. In overview, our formal decision taking processes remain clear; i. Key management roles have continued to be defined and to operate
as part of the council’s leadership team - Head of Paid Service, Chief
Finance Officer, Monitoring Officer and Chief Internal Auditor, even during times of change (such as the partnership with Cherwell District
Council, mentioned below)
ii. The council operates within a budget that included a modest council tax increase and delivers year on year savings despite significant
financial pressures.
iii. Financial management systems and processes are subject to regular
review and actions taken where areas for improvement are identified to ensure good value for money is achieved.
iv. We monitored key governance issues through a system of Corporate
Lead Officers reporting into a Corporate Governance Assurance Group of senior officers and to the council’s Audit & Governance
Committee,
v. Through the governance assurance framework, issues and unacceptable risk exposures are being highlighted with action plans
devised and implementation monitored on a timely basis. This will
ensure that the level of risk is returned to acceptable levels as soon as
possible.
3. The effectiveness of the Council’s governance has been further
demonstrated by the Council’s active project-planning to meet in-year governance issues. For instance, clear governance has been essential to
the following notable matters in 2018/19.
Partnership with Cherwell District Council (‘Section 113 Agreement’)
4. During the year the Council formally entered into a partnership arrangement with Cherwell District Council. A ‘Section 113 Agreement’
(under the Local Government Act 1972) was entered into to define the
purpose and governance of the arrangement. A Section 113 Agreement effectively expresses each Council’s willingness to put its staff at the
disposal of the other for certain agreed purposes.
5. This Agreement and the suite of governance policies to which it gave rise,
were endorsed by this Council’s Audit and Governance Committee and
Full Council. The Partnership appointed a shared Chief Executive, Yvonne
Rees, and joint Monitoring Officer, Nick Graham. It expressed an ambition to achieve a Joint Management Team. Certain other joint appointments
have been made. The governance arrangements to deliver and support
these arrangements included:
• A Chief Executive’s Protocol
• Protocol on managing interests
• Ethical walls procedure
6. A Partnership Working Group of members of both councils was set up under the S113 Agreement to make recommendations to the respective
authorities on the areas of potential joint working. A Joint Shared
Services and Personnel Committee was also set up to take forward any employment-related issues. Terms of reference of each body was agreed
by the Audit & Governance Committee and Full Council.
7. The governance arrangements are working well so far in facilitating the project (in terms of the first appointments and implementation of the
first sharing of services). The arrangements also have the balance of
member and officer involvement. The Audit & Governance Committee intend to review the governance arrangements at its meeting on 8 May
2019.
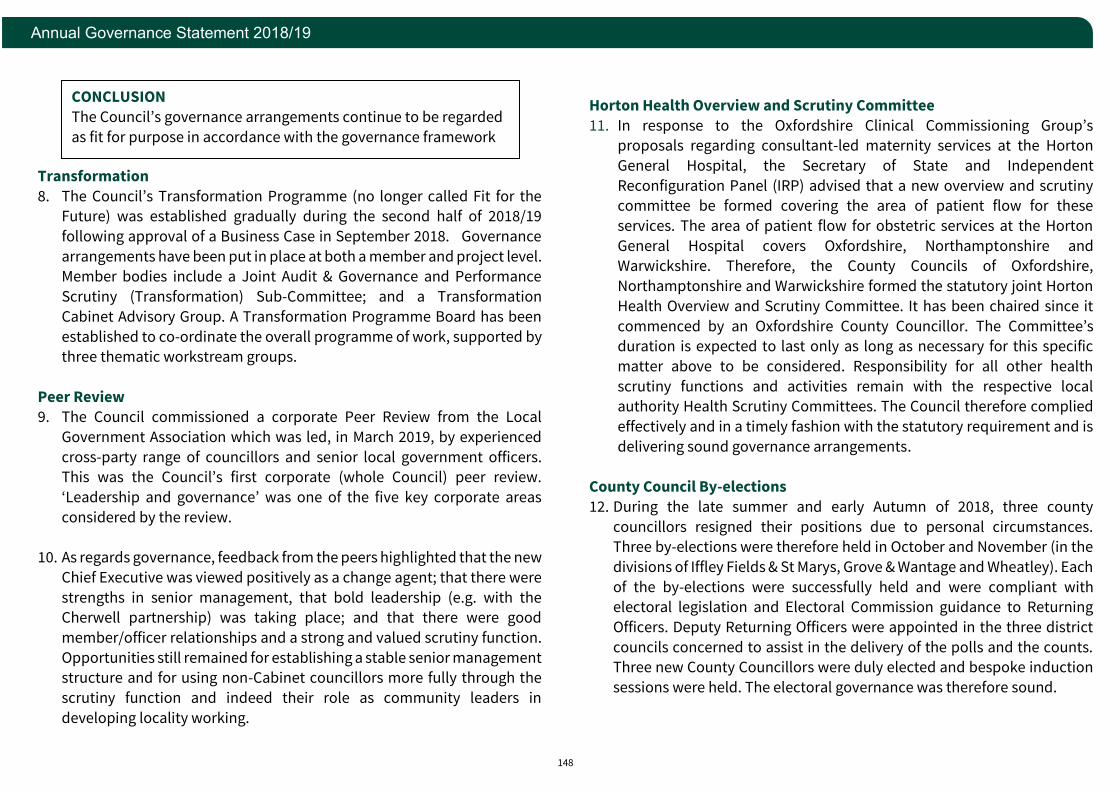
148
Annual Governance Statement 2018/19
Transformation
8. The Council’s Transformation Programme (no longer called Fit for the Future) was established gradually during the second half of 2018/19
following approval of a Business Case in September 2018. Governance
arrangements have been put in place at both a member and project level. Member bodies include a Joint Audit & Governance and Performance
Scrutiny (Transformation) Sub-Committee; and a Transformation
Cabinet Advisory Group. A Transformation Programme Board has been
established to co-ordinate the overall programme of work, supported by three thematic workstream groups.
Peer Review
9. The Council commissioned a corporate Peer Review from the Local
Government Association which was led, in March 2019, by experienced
cross-party range of councillors and senior local government officers. This was the Council’s first corporate (whole Council) peer review.
‘Leadership and governance’ was one of the five key corporate areas
considered by the review.
10. As regards governance, feedback from the peers highlighted that the new
Chief Executive was viewed positively as a change agent; that there were
strengths in senior management, that bold leadership (e.g. with the Cherwell partnership) was taking place; and that there were good
member/officer relationships and a strong and valued scrutiny function.
Opportunities still remained for establishing a stable senior management
structure and for using non-Cabinet councillors more fully through the
scrutiny function and indeed their role as community leaders in
developing locality working.
Horton Health Overview and Scrutiny Committee
11. In response to the Oxfordshire Clinical Commissioning Group’s proposals regarding consultant-led maternity services at the Horton
General Hospital, the Secretary of State and Independent
Reconfiguration Panel (IRP) advised that a new overview and scrutiny committee be formed covering the area of patient flow for these
services. The area of patient flow for obstetric services at the Horton
General Hospital covers Oxfordshire, Northamptonshire and
Warwickshire. Therefore, the County Councils of Oxfordshire,
Northamptonshire and Warwickshire formed the statutory joint Horton
Health Overview and Scrutiny Committee. It has been chaired since it
commenced by an Oxfordshire County Councillor. The Committee’s duration is expected to last only as long as necessary for this specific
matter above to be considered. Responsibility for all other health
scrutiny functions and activities remain with the respective local authority Health Scrutiny Committees. The Council therefore complied
effectively and in a timely fashion with the statutory requirement and is
delivering sound governance arrangements.
County Council By-elections
12. During the late summer and early Autumn of 2018, three county
councillors resigned their positions due to personal circumstances. Three by-elections were therefore held in October and November (in the
divisions of Iffley Fields & St Marys, Grove & Wantage and Wheatley). Each
of the by-elections were successfully held and were compliant with electoral legislation and Electoral Commission guidance to Returning
Officers. Deputy Returning Officers were appointed in the three district
councils concerned to assist in the delivery of the polls and the counts. Three new County Councillors were duly elected and bespoke induction
sessions were held. The electoral governance was therefore sound.
CONCLUSION
The Council’s governance arrangements continue to be regarded
as fit for purpose in accordance with the governance framework
149
Annual Governance Statement
Governance Review Task Group on involving councillors
13. The cross-party group of County Councillors met during 2018/19 to work up proposals for Cabinet on ways in which constituency councillors
(particularly those not on the Council’s executive) could be further
informed about and involved in the Council’s policy formulation and decision making. A survey and a whole council workshop were arranged,
and the Group conducted visits to a range of authorities operating
differing decision-making structures. A report was produced, considered
by Cabinet. It was determined that with the Council undertaking a
Transformation programme it made sense to review the Group’s
recommendations when that programme was further advanced. The
Peer Review (above) also reflected that further emphasis should be given to developing a closer integration of members and their locality
perspective.
Independent Remuneration Panel on Members’ Allowances
14. The Council convened its Independent Remuneration Panel during the
last quarter of 2018/19 to gain recommendations from it regarding three specific matters, two about special responsibility allowances and one
regarding the application of an index for uprating members’ allowances.
The Panel met and considered the issues in line relevant regulations and
comparative evidence. Council was then able to receive the recommendations and decide upon them at its meeting in April 2019.
The Remuneration Panel processes were therefore sound and compliant
with Regulations,
General Data Protection Regulations
15. The General Data Protection Regulations came into force during the year and the Council’s advance planning and project management, informed
by the Information Commissioner’s guidance, has ensured effective
compliance through the transition. All related policies and asset
registers were updated. A mandatory e-learning course for staff, along
with briefing sessions for staff and councillors also increased awareness
as evidenced through an increase in risk assessments and queries.
Property and Security
16. During the year the Council has made progress to achieving full statutory
compliance as regards health and safety, across the corporate property estate, particularly since the ending of the Carillion contract. Audits
established the compliance position, post-Carillion, identified gaps and
full set of Key Performance Indicators has been put in place to address all
the main compliance areas. The updated priority action of 2018/19 sets
out some of the detail. However, the Corporate Governance Assurance
Group is of the view that this area of work should continue to have the
visibility and emphasis of inclusion in the priority Actions for 2019/20, as on page 12 above.
17. There are of course links with the Council’s work on ensuring corporate security of the Council’s estate. In that regard a settled senior
management lead for corporate security (Assistant Director for Facilities
Management) and project lead (Senior Area Facilities Manager) have been achieved to drive improvements. This is also reflected under the
priority Action for 2019/20 as on page 12 to ensure visibility of this
workstream as it is embedded.
Measuring and Managing Service Performance 18. Oxfordshire County Council has used a performance management
framework, centred on quarterly reporting and an exception-based escalation of issues. Priorities are identified in the Corporate Plan and
related performance indicators are agreed with directorates, as part of
the service and resource planning process. Progress is reported by the use of dashboards with Red, Amber or Green (RAG) ratings.
19. Accountability for performance runs from the individual to corporate
level through directorate leadership teams and then on to the Council’s
150
Annual Governance Statement
senior management group – Chief Executive Direct Reports (CEDR) Public
reports are made to Performance Scrutiny Committee and Cabinet.
Performance Scrutiny Committee met 7 times in 2018/19 to consider performance across the Council focusing on a directorate in detail at
each meeting. The Committee can call for additional reports from
directors and examine issues in detail to ensure that improvements are made. The Committee also challenges proposed indicators and targets
to ensure they are realistic and in line with strategic priorities.
Compliance, Risks and Complaints & Whistleblowing
Compliance 20. The County Council has used a range of measures to ensure compliance
with established policies, procedures, laws and regulations including:
• Notification of changes in the law, regulations and practice to
directorates by Legal Officers;
• Induction training for officers and managers on key governance responsibilities
• Specific training carried out by Legal Officers and external experts;
• The drawing up and circulation of guidance and advice on key
procedures, policies and practices;
• Proactive monitoring of compliance by relevant key officers including
the Chief Finance Officer, the Monitoring Officer and the Chief Internal
Auditor;
• ‘Protocol for Implementing New Legislation’ ensures that there are
Directorate Leads who have a specific obligation to ensure appropriate
dissemination of legal, policy and professional information within their
Directorates.
21. Guidance and advice on all our key policies and procedures are reviewed
and updated on an ongoing basis. All policies and guidance have been
given visibility on the Intranet within the Corporate Governance Library
as well as separate pages for Human Resources and Finance, Budgets
and Procurement and news items
22. Compliance with our policies was monitored by the relevant corporate
lead officers. Their assessment was incorporated in the year end
‘Certificate of assurance’ signed off by each corporate lead officer.
23. Under Section 5 of the Local Government and Housing Act 1989, the
Monitoring Officer is required to report to the County Council where, in
his opinion, a proposal, decision or omission by the County Council, its
Members or Officers is or is likely to be unlawful and also to report on any
investigation by the Local Government Ombudsman. No such reports
have been necessary in 2018/19.
24. The Monitoring Officer provides an report annually to the Audit &
Governance Committee on his view on the Council’s governance arrangements. This review was formally reported to, and endorsed by,
the Audit & Governance Committee in September 2018.
Risks
25. Oxfordshire County Council has a Risk Management Strategy which aims
to ensure that there is continuous improvement in the arrangements for
managing risk across all directorates. The Chief Finance Officer was the CEDR Risk Champion during 2018/19.
26. Oxfordshire County Council has in place a process for identifying, assessing, managing and reviewing the key areas of risk that could
impact on the achievement of County Council’s objectives and service
priorities. Reports to committees to support key policy decisions or major projects include an assessment of both opportunities and risks.
27. A strategic risk register is in place that is owned and reviewed by CEDR. In
most parts of the Council risk registers were owned at directorate level
151
Annual Governance Statement
and reviewed by each Director with their management teams on a
quarterly basis. Additional risk registers were also held and managed at
service, team or project level according to business needs. An escalation process is in place to report significant service risks upwards as
necessary, including up to CEDR as part of the quarterly performance
reporting process and separately to the Audit Working Group. The Strategic Risk Register has been established in 2018/19 and each risk is
owned by a member of CEDR. CEDR has begun reviewing the risk register
quarterly.
28. Risk Management in projects is required in our Corporate Project
Management Framework. It includes the requirement for risk registers to
be maintained as part of the project management process.
Complaints & Whistleblowing
29. Oxfordshire County Council has continued to operate formal complaints and whistleblowing procedures which has allowed staff, service users,
contractors, suppliers and the public to confidentially raise concerns
about any aspect of service provision or the conduct of staff, elected councillors or other people acting on behalf of the Council.
30. An annual review of reports and incidents of whistleblowing was
undertaken by the Monitoring Officer and reported to the Audit & Governance Committee via the report of the Audit Working Group.
Internal audit 31. In 2010 CIPFA issued a Statement on the “Role of the Head of Internal
Audit in public service organisations”. This outlines the principles that
define the core activities and behaviours that belong to the role of the ‘Head of Internal Audit’ and the governance requirements needed to
support them. The Council's arrangements conform with the
governance requirements of the CIPFA statement as our Chief Internal Auditor:
• Objectively assesses the adequacy of governance and management
of existing risks, commenting on responses to emerging risks and
proposed developments;
• Gives an objective and evidence-based opinion on all aspects of governance, risk management and internal control;
• Is a Senior Manager with regular and open engagement across the
organisation, including the Council’s Leadership Team (CEDR – Chief
Executive Direct Reports) and the Audit & Governance Committee; and
• Leads and directs an internal audit service that is resourced to be fit
for purpose; and is professionally qualified and suitably experienced.
32. The Monitoring Officer sought feedback on the quality and effectiveness
of the Internal Audit Service from Senior Managers across the council,
reporting back to the Audit and Governance Committee. The conclusion from the survey was that management find the internal audit service
effective in fulfilling its role.
33. The Internal Audit Service operates in accordance with the Public Sector
Internal Audit Standards (PSIAS). The annual self-assessment against the
standards is completed on an annual basis. It is a requirement of the PSIAS for an external assessment of internal audit to be completed at
least every five years. This took place in November 2017 and the results
were reported to the Audit & Governance Committee in January 2018.
This confirmed that the “service is highly regarded within the Council and
provides useful assurance on its underlying systems and processes”.
34. The Chief Internal Auditor prepared an Annual Report on the work of Internal Audit which concludes for the 12 months ended 31 March 2019,
there is satisfactory assurance regarding Oxfordshire County Council's
overall control environment and the arrangements for governance, risk management and control. Where weaknesses have been identified
152
Annual Governance Statement
through internal audit review, they have worked with management to
agree appropriate corrective action and timescale for improvement.
35. As part of governance arrangements developed when Oxfordshire
County Council joined the Hampshire Partnership in July 2015 it was
agreed that the Southern Internal Audit Partnership, (SIAP), would provide an annual assurance statement to Oxfordshire County Council on
the adequacy and effectiveness of the framework of governance, risk
management and control from the work carried out by Hampshire. The
Chief Internal Auditor takes account of the assurance obtained from SIAP,
when forming the overall assurance opinion. For 2018/19 the statement
of assurance report received from SIAP concluded that the framework of
governance, risk management and management control is ‘Adequate’ and audit testing has demonstrated controls to be working in practice.
36. Where Internal Audit identifies areas for improvement, management action plans are in place and are routinely monitored by the Internal
Audit team and the Audit Working Group. Managers are required to
provide positive assurance that actions have been implemented; performance on implementation is high, demonstrating that control
weaknesses identified by Internal Audit are being addressed on a timely
basis.
Checking the Effectiveness of our Governance 37. Oxfordshire County Council has responsibility for conducting, at least
annually, a review of the effectiveness of its governance framework including the system of internal control. The review of effectiveness has
been informed by the work of the senior managers within the County
Council who have responsibility for the development and maintenance of the governance environment, the Chief Internal Auditor’s annual
report, whistleblowing reports and comments made by the external
auditors and other review agencies and inspectorates. A report on the
effectiveness of Internal Audit was received and endorsed by the Audit &
Governance Committee in March 2019.
Audit & Governance Committee
38. The Chairman of our Audit & Governance Committee produced an Annual
Report to Council. The Annual Report also covers the work of the Audit Working Group. This group has met regularly throughout the year and
reviewed specific areas of governance, risk and control, reporting any
significant issues identified to the Committee. The Chairman’s report for
2018/19 is scheduled for consideration by Full Council in May 2019.
Scrutiny Committees
39. Oxfordshire County Council has four scrutiny committees. They cover the following areas: Education; Performance; Joint Health Overview
including district council and co-opted lay members; and Joint Horton
Health Overview and Scrutiny Committee with members from Oxfordshire, Northamptonshire and Warwickshire County Councils
40. The good governance of the council has been further enhanced by the work of the Cabinet Advisory Groups. These groups can be set up to
examine topics selected by Cabinet which align to corporate council
priorities.
41. CIPFA guidance indicated that Audit Committees ‘should have clear
reporting lines and rights of access to…. for example scrutiny committees’.
The Chairman of the Performance Scrutiny Committee has had a standing invitation to attend our Audit & Governance Committee to
provide advice in relation to the work of the Scrutiny Committees.
Similarly, the Chairman of Audit & Governance Committee has a reciprocal standing invitation to attend the meetings of the Performance
Scrutiny Committee. An annual report on the key achievements of all
Scrutiny Committees is considered by our Audit & Governance
Committee in draft and submitted for agreement by Council. Full Council

153
Annual Governance Statement
considered the annual report of scrutiny committees in May 2017.
Scrutiny and Audit Committee Chairmen meet regularly to coordinate
their work and forward plans.
Corporate Governance Assurance Group (CGAG)
42. This Group has monitored the corporate governance framework. It reviewed the Annual Governance Statement action plan, as well as
monitoring and challenging the assurance framework owned by
designated Corporate Leads. The Group has been reconstituted to
comprise only the Council’s most senior governance officers with a view
to liaising with governance contacts/leads within services. The Group
continues to identify, challenge and track improvements to any
weaknesses in the internal control environment. It has primary responsibility for collating all of the evidence and producing the first
draft of the Annual Governance Statement.
Key Deliverables
43. Updates on projects are reported quarterly, with information reported
through existing quarterly business management (performance / risk / projects) reporting procedures. The forecast financial position is
reported monthly to Leadership Teams and through the regular Financial
Monitoring and Business Strategy Delivery Reports to Cabinet which are
considered by the County Leadership Team (CLT).
44. Further to these monitoring arrangements, the Chief Finance Officer and
the meets with senior managers. They review the delivery of budget savings, check progress on the delivery of projects and ensure that
support is targeted to projects as necessary. The policy and finance
teams work with service areas to monitor delivery of agreed savings and escalate issues for consideration to the Council’s Extended Leadership
Team as required.
Other external reviews
45. Oxfordshire County Council receives external reports and inspections
from a range of sources that can provide assurance or indicate any issues related to internal control and governance. These are generally ad-hoc
and are reported to CGAG so that governance issues can be reported to
Audit & Governance Committee. However, following a steer from the Audit & Governance Committee, a centralised record is made of the
governance requirements or recommendations arising from external
reports so that these can be co-ordinated and reported to the
Committee. For completeness Directors are also asked to set out
feedback from external reviews in their annual Statement of Assurance.
154
Annual Governance Statement 2018/19
ANNEX
SUMMARY OF OUR GOVERNANCE FRAMEWORK
A vision for Oxfordshire 1. Oxfordshire County Council’s ambition, as set out in the updated 2019-
2022 Corporate Plan, is for a county where local residents and businesses
can flourish - a thriving Oxfordshire.
Equalities 2. Oxfordshire County Council is committed to making Oxfordshire a fair
and equal place in which to live, work and visit. We want our services to
effectively meet the needs of all local residents, including those in rural areas and areas of deprivation. The Council has an Equalities Policy and
we aim to ensure that our staff are equipped with the knowledge and
skills to meet the diverse needs of customers, that our services are accessible, and to encourage supportive and cohesive communities
through our service delivery. A public consultation has been held to
inform the review of the Equalities Policy and to inform the Equalities
Policy 2018-2022.
Consultation and Communication 3. The council ensures it meets its statutory consultation duty by using a
consistent approach to consulting service users and other stakeholders
about proposed service change.
4. We also have well established consultation and involvement
arrangements to specifically engage the community and its staff. There
is a council-wide Consultation & Involvement Strategy, a research governance framework covering consultation, evaluation and research
with adult social care customers and a dedicated engagement team
working with children and young people and vulnerable adults.
Decision making structures 5. Oxfordshire County Council’s Constitution sets out the roles of and
relationships between the full Council, the Cabinet, Scrutiny and other Committees in the budget setting and policy and decision-making
processes. It notes the legal requirements. The County Council's
Corporate Plan supplements our Policy Framework. These formal policies are approved by full Council in accordance with the provisions of
Oxfordshire County Council's Constitution.
6. The Constitution also sets out a scheme of delegation. The Chief Finance
Officer approves the financial scheme and the Monitoring Officer
approves the decision-making scheme. The Constitution also records
what responsibility each Oxfordshire County Council body or individual delegate (councillor or officer) has for particular types of decisions or
areas or functions. The Constitution requires that all decisions taken by
or on behalf of the County Council are made in accordance with given principles.
7. The Constitution also sets out how the public can take part in the decision-making process. The Cabinet’s Forward Plan alerts the public
to what business the Cabinet will be undertaking to give members of the
public the right to make representations before a decision is taken. Some
of the responsibilities of the County Council committees require statutory consultation to precede a decision being taken.
representations before a decision is taken. Some of the responsibilities
of the County Council committees require statutory consultation to precede a decision being taken
8. The Constitution is reviewed annually by the Monitoring Officer with recommendations of changes being made to Full Council for
consideration and adoption.
155
Annual Governance Statement
9. Oxfordshire County Council has an Audit & Governance Committee which
operates in accordance with the CIPFA guidance 2013 and normally
meets six times a year. The County Council also operates an Audit Working Group, made up of members of the Committee and Senior
Officers, chaired by a co-opted member of the Audit & Governance
Committee. The Audit Working Group looks in detail at specific areas of governance, risk or control under the direction of the Audit & Governance
Committee.
10. The Monitoring Officer monitors and reviews the operation of the
Constitution to ensure that its aims, principles and requirements are
given full effect and makes recommendations on any necessary
amendments to it to Full Council.
Senior Management 11. The Chief Executive (as Head of Paid Service) is responsible for co-
ordinating the different functions of the council, staff appointment,
organisation, management, numbers and grades. Additional
responsibilities are set out in the Constitution include supporting councillors and the democratic process, overall corporate management
and promoting our objectives, performance management, strategic
partnership, the community strategy, media and communications.
12. Our Chief Finance Officer holds the statutory role of ‘Chief Financial
Officer’ within the Council. Our Chief Finance Officer is professionally
qualified and suitably experienced.
13. The Financial Procedure Rules are part of the Constitution and are
published on the Council’s website. These ‘Rules’ and the supporting Financial Regulations are reviewed by the Chief Finance Officer. Schemes
of Financial Delegation and Delegation of Powers are reviewed and
updated each year.
14. Oxfordshire has a Director of Law and Governance who is also the
Monitoring Officer. His role, in summary, includes meeting all legal
requirements, ensuring effective administration and compliance with statutory responsibilities around the councillors’ code of conduct and
the ethical standards of officers.
Controls on Information, Projects and ICT 15. The Council has a Data Protection Group comprising the key statutory
information governance leads. Reporting into this is an Information Governance Group which reviews and implements corporate policies,
including the new Information Governance Policy, the Data Sharing
Policy and new tools and methods of work evaluated by ICT Business
Delivery to improve the security of data transfer.
16. Oxfordshire County Council requires projects to be managed using their
Project Management Framework which gives a comprehensive structure, standard paperwork and defined processes. Progress of Major
Programmes is reported to DLTs and to the Delivery Board, and the Chief
Executive.
Codes of Conduct 17. Oxfordshire County Council has developed and adopted separate Codes
of Conduct for Councillors and Officers; both Codes define the standards
of behaviour expected by the County Council and the duty owed to the
public. Training on the requirements of the codes is provided by the
Council’s Monitoring Officer for both Councillors and Officers. Both codes form part of the County Council’s Constitution and are readily
accessible via the council’s Internet and Intranet websites.
18. Each Council must adopt a local Code of Conduct and have arrangements
in place to investigate complaints made against Members. Our Council
has agreed to include standards within the terms of reference of the Audit
& Governance Committee.

156
Annual Governance Statement
19. During 2018-2019, the Council’s Audit & Governance Committee engaged
with the consultation from the Committee on Standards in Public Life on
Ethical Standards in Local Government and the outcomes of that report were considered by the Council’s Committee with a view to
implementing appropriate actions. The Monitoring Officers of
Oxfordshire’s County and District Councils met regularly throughout the year and the sharing of best practice as regards ethical standards is part
of this Group’s remit.
WORKING WITH OTHERS
Schools 20. Section 48 of the Schools Standards and Framework Act 1998 requires
the authority to prepare a scheme setting out the financial framework for
local authority-maintained schools, known as the Scheme for Financing
Schools.
21. It is the responsibility of each school’s governing body to set down and
oversee proper governance arrangements for the school. The governing
body in maintained schools is accountable to the local authority for the way the school is run.
22. Academies are legally separate entities and therefore their effective governance does not fall within the control or responsibilities of the
County Council. The County Council retains responsibilities including
ensuring that special educational needs are met, safeguarding, and
that the free entitlement to early year’s education is provided by academies where applicable.
Partnerships 23. Oxfordshire County Council works together with other bodies and
organisations, in a number of different partnerships governed by specific terms of reference. Overall accountability for partnership working rests
with Council which is responsible for examining formal and informal
feedback mechanisms. Each partnership presents an annual report and a yearly summary of the work of the partnerships set out below is
discussed at the September meeting of the County Council. This is also
considered by Performance Scrutiny Committee.
24. During 2018/19, the Council specifically entered into a formal
partnership with Cherwell District Council. This is referenced in the
Council’s Annual Governance Statement.
25. The key partnerships that Oxfordshire County Council is part of and
plays a formal role in are:
• Cherwell-Oxfordshire Partnership
• Oxfordshire Partnership
• Oxfordshire Local Enterprise Partnership (OxLEP)
• Oxfordshire Skills Board
• Oxfordshire Growth Board
• Oxfordshire Local Transport Board.
• Oxfordshire Safeguarding Children Board (OSCB),
• Oxfordshire Safeguarding Adults Board
• Oxfordshire Health and Wellbeing Board
• Oxfordshire Stronger Communities Alliance Oxfordshire Safer
Communities Partnership
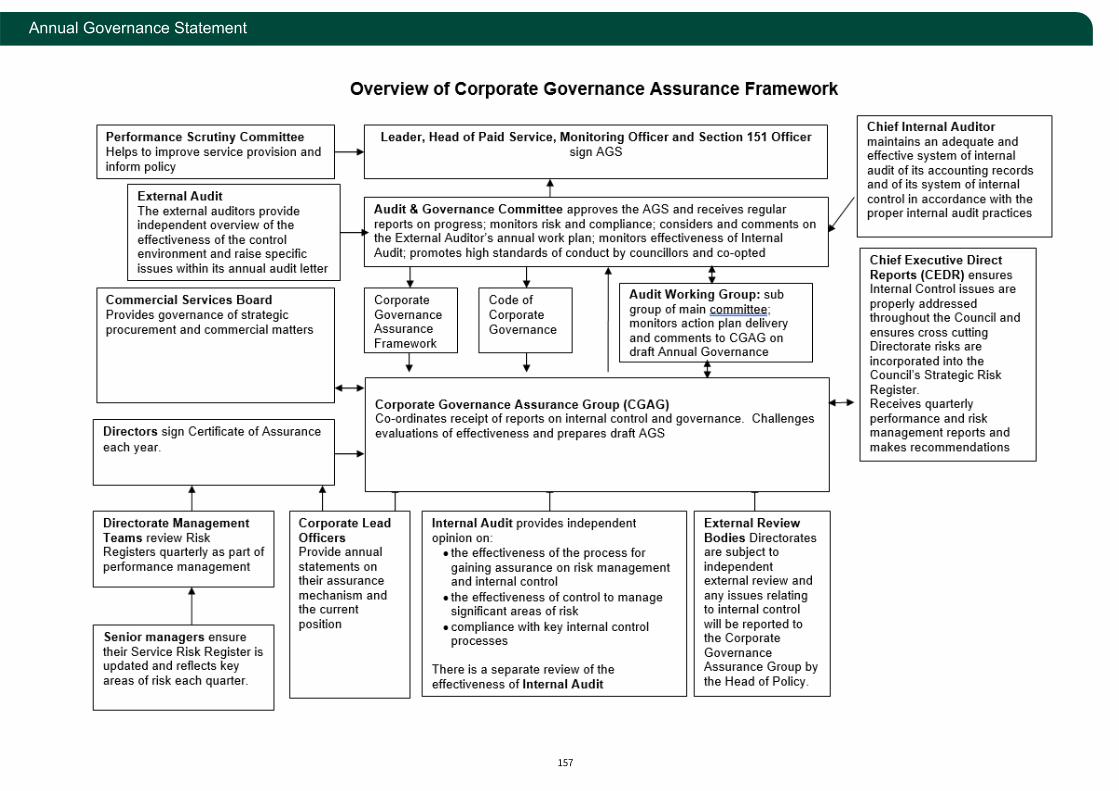
157
Annual Governance Statement
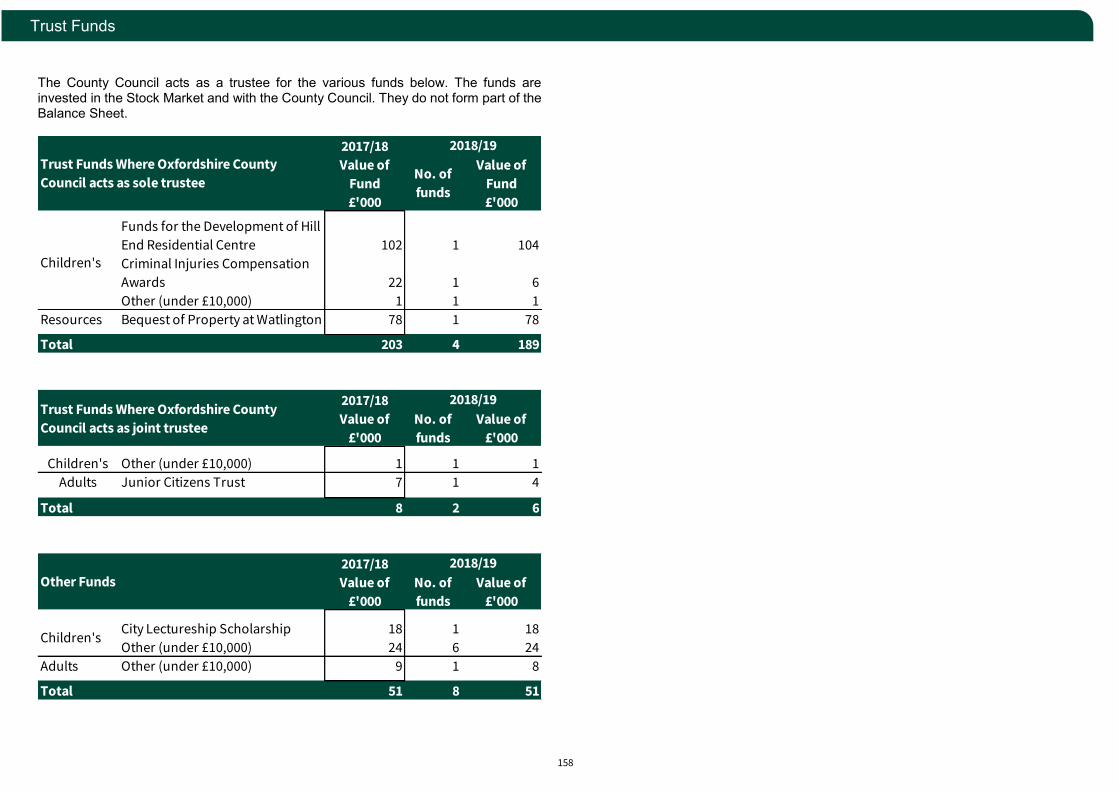
158
Trust Funds
The County Council acts as a trustee for the various funds below. The funds are invested in the Stock Market and with the County Council. They do not form part of the Balance Sheet.
2017/18
Value of
Fund
Value of
Fund
£'000 £'000
Funds for the Development of Hill
End Residential Centre 102 1 104
Criminal Injuries Compensation
Awards 22 1 6
Other (under £10,000) 1 1 1
Resources Bequest of Property at Watlington 78 1 78
Total 203 4 189
2017/18
Value of Value of
£'000 £'000
Children's Other (under £10,000) 1 1 1
Adults Junior Citizens Trust 7 1 4
Total 8 2 6
2017/18
Value of Value of
£'000 £'000
City Lectureship Scholarship 18 1 18
Other (under £10,000) 24 6 24
Adults Other (under £10,000) 9 1 8
Total 51 8 51
Other Funds
2018/19
No. of
funds
Children's
2018/19
Trust Funds Where Oxfordshire County
Council acts as sole trusteeNo. of
funds
Children's
Trust Funds Where Oxfordshire County
Council acts as joint trustee
2018/19
No. of
funds
159
Glossary
Actuarial gains and losses
These are changes in deficits or surpluses that arise because either actual
experience or events have not been exactly the same as the assumptions adopted at the previous valuation (experience gains and losses) or the
actuarial assumptions have changed.
Amortised
Written off over a period of time.
Bond Fund
A fund primarily invested in government and corporate bonds. The value of the investment changes as the market value of assets held by the fund
changes.
Call Account
A call account is a deposit account with a financial institution without a fixed
maturity date.
Capital Receipts
Receipts from the sale of capital assets.
Cash Equivalent
Short-term, highly liquid investments that are readily convertible to known
amounts of cash and which are subject to an insignificant risk of changes in
value.
Cash Flow
The movement of money into or out of the County Council during the
financial year.
Collection Fund
A fund maintained by each district council to receive all income raised
through the Council Tax and Business Rates. The County Council precepts
the district councils to receive its share of Council Tax receipts.
Commutation Factor
Factor used to determine the amount of lump sum payable from the amount
of annual pension commuted.
Contingent Asset
A possible asset arising from past events and whose existence will be
confirmed only by the occurrence of one or more uncertain future events not
wholly within the County Council’s control.
Contingent Liability
A condition which exists at the balance sheet date, where the outcome will be confirmed only by the occurrence or non-occurrence of one or more
uncertain future events not wholly within the County Council’s control, or
where it is not probable that an outflow of resources will be required to settle
the obligation.
Contingent Rent
The portion of a lease payment that is not fixed at the start of the lease but
is based on the future amount of a factor that changes other than with the
passage of time (e.g. amount of future use, future price indices).
County Fund
The main revenue fund of the County Council into which precept income and
Government grants are paid and from which day-to-day payments are made.
Creditors
Amounts owed by the County Council for work done, goods received or services rendered within the financial year for which payment has not yet
been made.
Current Asset
An asset which will be used up during the next accounting period e.g. cash.
Curtailment
Early retirement costs calculated in accordance with accounting standard
IAS19.
Debtors
Amounts owed to the County Council for services carried out during the
financial year but not yet received.
160
Glossary
Deferred Income
Prepaid income credited to the Balance Sheet and amortised to the
Comprehensive Income and Expenditure Statement to match the benefit of
the receipts over the term of the contractual arrangement.
Depreciation
The systematic write-off of the reduction in value of a tangible fixed asset due to wear and tear, passing of time and technological changes over its
economic useful life.
Derecognition
Removal of an asset or liability from the Balance Sheet.
Equity instrument
A contract such as an equity share in a company.
Fair value Fair value is defined as the price that would be received to sell an asset or
paid to transfer a liability in an orderly transaction between market
participants at the measurement date
Financial asset
A right to future economic benefits controlled by the County Council that is
represented by cash, an equity instrument of another entity, a contractual right to receive cash (or another financial asset) from another entity or a
contractual right to exchange financial assets/liabilities with another entity
under conditions that are potentially favourable to the County Council.
Financial liability
An obligation to transfer economic benefits controlled by the County Council
that is represented by a contractual obligation to deliver cash (or another
financial asset) to another entity, or a contractual obligation to exchange financial assets/liabilities with another entity under conditions that are
potentially unfavourable to the County Council.
Financial instruments
A financial instrument is any contract that gives rise to a financial asset of
one entity and a financial liability or equity instrument of another. Financial instruments include bank deposits, investments, debtors, long-term
debtors, creditors, temporary loans and borrowings.
Financial Year The County Council’s accounts cover the period from 1 April in one year to
31 March in the next year.
Fixed Asset A tangible asset that yields benefit to the County Council and the services it
provides for a period of more than one year.
General Government Grants
These are general grants paid by central government in aid of local authority services as opposed to specific grants which may only be used for a specific
purpose. The main general grant is Revenue Support Grant.
Hedge Fund
A hedge fund is a form of investment partnership.
Impairment
A reduction in the carrying value of an asset arising from physical damage,
obsolescence or a significant decline in market value.
Inventories
Raw materials and stores which the County Council has bought and holds in
stock for use as required.
Intangible Asset
An asset that does not have physical substance but is identifiable and
controlled by the organisation through custody or legal rights e.g. software
licenses.
International Financial Reporting Standards (IFRS)
These are issued by the International Accounting Standards Board and
provide standards for the preparation of financial statements.

161
Glossary
Lease
A method of financing capital expenditure where a rental charge is paid for
an asset for a specified period of time.
Lessee
A party to a lease agreement who makes payment to use an asset.
Lessor
A party to a lease agreement who receives payment for the use of an asset.
Liabilities
Amounts owed by the County Council which will be paid at some time in the
future.
Limited Liability Partnership
A partnership in which some or all partners have limited liabilities.
Long Term Investments
Investments that are not due to mature within the next 12 months.
Money Market Fund
Funds are invested in short dated assets including certificates of deposits, government securities and commercial papers making them highly liquid.
Money Market Funds must be AAAmf rated, invest in high credit quality
assets and maintain a weighted average maturity of 60 days or fewer. Investments have a stable net asset value and dividends are paid to
investors on their investment.
Mortality Assumptions – Abbreviations
S1NA, S1PA and S2PA - mortality tables issued as part of the "S1" and “S2”
series of mortality tables produced by the Continuous Mortality
Investigation. The "S1" mortality tables are based on mortality experience
from UK self-administered pension schemes between 2000 and 2006. The “S2” mortality tables are based on mortality experience from UK self-
administered pension schemes between 2004 and 2011.
Net Debt
The County Council’s borrowings and finance liabilities less cash and liquid
resources.
Net Operating Expenditure
The amount which it costs to provide services after any specific grants
and/or income from fees and charges is taken into account, but ignoring
general government grant and local taxation.
Non-current Asset
A long-term asset that is not expected to be used up or realised within the
next 12 months e.g. Property, Plant and Equipment.
Non Domestic Rate
A levy on businesses based on a national rate in the pound set by the
government multiplied by the ‘rateable value’ of the premises they occupy.
Pooled Fund
Funds from individual investors are aggregated for the purposes of
investment and returns are apportioned between investors according to the
size of the investment.
Pooling
Where services benefit larger areas than the local authorities which provide them, the expenditure is sometimes pooled according to a formula which
reflects usage of the service.
Precept
The levy made by the precepting authority (the County Council) on billing
authorities (the district councils in Oxfordshire) requiring the latter to collect
income from council taxpayers on their behalf.
Private Finance Initiative (PFI) A scheme to encourage private sector investment in the public sector.
Typically these involve a private sector operator building or enhancing
property and operating services on behalf of a public sector organisation.

162
Glossary
Professional Fees
The fees paid by the County Council for professional services such as those
of architects and quantity surveyors.
Provision
An amount of money put aside in the accounts for anticipated liabilities
which cannot be accurately estimated e.g. insurance provision for claims
awaiting resolution.
Public Works Loan Board (PWLB)
A central government agency which provides long and shorter term loans to local authorities at interest rates slightly higher than those at which the
government itself can borrow. Local authorities are able to borrow a
proportion of their requirement to finance capital spending from this source.
Reserves Amounts of money put aside to meet certain categories of expenditure in
order to avoid fluctuations in the charge to the County Fund.
Revenue Expenditure The County Council’s day-to-day expenditure on items which include wages,
supplies and services and interest charges.
Revenue Expenditure Funded from Capital Under Statute Capital expenditure as defined by statute that does not result in the
acquisition, creation or enhancement of fixed assets and is charged to the
Comprehensive Income & Expenditure Statement in accordance with the
accounting policy.
RIA
Receipts received in advance.
Segregated Mandate Fund Funds from individual investors are invested on a segregated basis so that
the holdings can be directly attributed to investors.
Settlement (Retirement Benefits)
Settlement relates to a bulk transfer out of the Fund as a result of functions
transferring to another organisation. It reflects the difference between the liability transferred (calculated in accordance with accounting standard
IAS19) and the assets transferred to settle the liability.
Specific Grants
Grants paid by the Government in respect of specific services.
Strategic Measures
This comprises interest on balances and capital financing charges. The former involves surplus cash from the County Fund which is either invested
or used to reduce the need to borrow externally. The interest received is
credited to the County Fund. Capital financing charges include the minimum
revenue provision required and interest on outstanding debt, together with
a general revenue contribution to finance capital spending.