NIGERIA Post-Disaster Needs Assessment 2012 Floods
188
NIGERIA Post-Disaster Needs Assessment 2012 Floods A report by The Federal Government of Nigeria With Technical Support from the World Bank, EU, UN, and Other Partners June 2013 With financial support from:
-
Upload
khangminh22 -
Category
Documents
-
view
0 -
download
0
Transcript of NIGERIA Post-Disaster Needs Assessment 2012 Floods
NIGERIAPost-Disaster Needs Assessment 2012 FloodsA report byThe Federal Government of NigeriaWith Technical Support from the World Bank, EU, UN, and Other Partners
June 2013
With financial support from:
Germany
Spain
NIGERIAPost-Disaster Needs Assessment 2012 FloodsA report byThe Federal Government of NigeriaWith Technical Support from the World Bank, EU, UN, and Other Partners
June 2013
With financial support from:
NIGERIA Post-Disaster Needs Assessment 2012 Floodsii
Photo: Thinkstock.com
iiiFOREWORD
FOREWORD
Floods are the most common and recurring disaster in Nigeria. The frequency, severity, and spread of these floods are increasing. Beginning in July 2012, heavy rains struck the entire country. The impact of the 2012 flooding was very high in
terms of human, material, and production loss, with 363 people killed, 5,851 injured, 3,891,314 affected, and 3,871,53 displaced.
We are pleased to present the findings of the Post-Disaster Needs Assessment (PDNA), conducted at the request and direction of the Federal Republic of Nigeria with techni-cal support from the World Bank , the European Union, and the United Nations. The PDNA provides a comprehensive and thorough assessment of both economic and social impacts caused by the flooding, as well as recommendations for immediate recovery and long-term resilience building in the country. The analysis of the damage and loss assessment has identified the needs and quantified financial requirements that will facilitate formulating comprehensive early recovery actions, medium-term recovery and reconstruction plans, and a long-term risk management and reduction strategy. This should be formulated, adopted, and implemented to reduce the impact of future disasters, which are likely to be more intense due to climate change.
The PDNA report was prepared jointly by the Government of Nigeria and its key ministries under the coordination of the National Emergency Management Agency (NEMA).
We are grateful for the efforts of the government agencies, private sector, civil society organizations, and international development partners who were involved in prepar-ing the PDNA, and we look forward to working together to address the needs of those affected by the flood disaster and to develop programs to reduce the country’s exposure to disaster risk.
iv NIGERIA Post-Disaster Needs Assessment 2012 Floods
This Post-Disaster Needs Assessment (PDNA) re-port was prepared by a joint team working under the guidance of the National Emergency Man-
agement Agency (NEMA) and consisting of represen-tatives of the federal government of the Republic of Nigeria and members of the international community. The joint team was led by the World Bank (WB), pri-marily on Damage and Loss Assessment (DaLA) and by the United Nations (UN) with respect to Human Re-covery and Needs Assessment (HRNA). The team was supported by the Global Facility for Disaster Reduction and Recovery (GFDRR), the European Union (EU), and Japanese International Cooperation Agency (JICA).
The joint team is grateful to Nigerian government policymakers and senior officials for their leadership throughout the assessment, particularly: Alhaji Mu-hammad Sani Sadi, Director General, National Emer-gency Management Agency (NEMA); Aliyu Baffale Sambo, Deputy Director (NEMA); members of the Presidential Committee on Flood Relief and Rehabili-tation, co-chaired by Aliko Dangote and Olisa Agba-koba and including Alhaji Karami Isiaku Rabiu, Alhaji Mohammed Indimi, Ngo Hannatu Cholum, Folorunsho Alakija, Dora Akunyili, and Tony Elumelu. The team equally thanks the Secretary-General of the Nigerian Red Cross, representatives of the Christian Association of Nigeria (CAN), the National Supreme Council of Is-lamic Affairs (NSCIA), the United Nations Development Program (UNDP), the European Union (EU), the Depart-ment for International Development (DFID), and the United States Agency for International Development (USAID). Similarly indispensable were contributions from the permanent secretaries of the Federal Minis-tries of Environment, Water Resources, Works, Agri-culture, Health, Finance, and National Planning, along with those of the Ecological Funds Office, the Acting Commissioner of the National Commission for Refu-gees, the Chairman of the Senate Committee on Spe-
cial Duties, the Chairman of the House Committee on Environment, representatives from the Nigerian Union of Journalists (NUJ) and from the National Council of Women’s Societies (NCWS), Tunde Lemo of the Central Bank of Nigeria (CBN), Fatima Wali, Frank Nweke Jr., and Senator Florence Ita-Giwa.
The joint team would also like to acknowledge the financial support of the EU and the Ministry of For-eign Affairs of the Grand Duchy of Luxembourg. EU financial support was made possible through the Afri-can, Caribbean and Pacific-European Union (ACP-EU) Natural Disaster Risk Reduction Program, which is fully financed by the European Union in the framework of the 10th European Development Fund’s Intra-ACP Co-operation Strategy (2008-2013) and managed by the GFDRR.
The international community team for Damage and Loss Assessment (DaLA) was led by Doekle Wielinga (Senior Disaster Risk Management Specialist, WB) with support from a core team consisting of Amos Abu (Senior Environmental Specialist, WB), Joseph Ese Ak-pokodje (Senior Environmental Institutional Specialist, WB), Asmita Tiwari (Disaster Risk Management Special-ist, WB), and Sajid Anwar (Disaster Risk Management Specialist, World Bank). The team members with their respective responsibilities are: (i) Education: Olatunde Adekola (Sr. Education Specialist, WB); (ii) Health: Dinesh Nair (Senior Health Specialist); (iii) Agriculture, livestock and fisheries: Sheu Salau (Consultant, WB); (iv) Livelihoods: Roberto Jovel, Consultant, World Bank and Antonio Cruciani (ILO); (v) Trade and commerce: Richard Sandall (Private Sector Development Specialist, WB); (vi) Energy: Edouard Ereño Blanchet (Disaster Risk Management Analyst, WB); (vii) Water and hydromet: Katsuhito Miyake (Senior Disaster Risk Management Specialist, WB) and Kitamura (Consultant, JICA); (viii) Disaster risk management: Asmita Tiwari (Disaster Risk
ACKNOWLEDGEMENTS
vACKNOWLEDGEMENTS
Management Specialist, WB); (ix) Disaster risk reduc-tion investment: Stephen Danyo (Natural Resources Specialist, WB); (x) Environment: Joseph Ese Akpokodje (Senior Environmental Institutional Specialist, WB); and (xi) Macroeconomic impact assessment: Roberto Jovel (Consultant, WB) and Olayinka Babalola (Economist, World Bank). Roberto Jovel (DaLA Expert, Consultant, WB) and Asha kambon (DaLA Expert, Consultant, WB) provided DaLA methodology training and support throughout the assessment. Keiko Saito, (Disaster Risk Management Specialist, WB/GFDRR) provided spatial assessment and mapping support in the assessment. Asmita Tiwari (Disaster Risk Management Specialist, WB), and Sajid Anwar (Disaster Risk Management Spe-cialist, World Bank) coordinated trainings, multi-sec-toral teams and supported compilation and finalization of the report. Nnaemeka Chukwuone (consultant, WB) provided support in compiling and editing the PDNA report. Rami Quttaineh (Senior Disaster Risk Manage-ment Specialist, WB) provided support in training and Laetitia Barnier (consultant, WB) supported data man-agement. Omezikam Onuoha (consultant, WB) and Abiodun Elufioye (Program Assistant, WB) provided support in coordination and logistical arrangements.
The WB team worked under management guidance from Marie Francoise Marie-Nelly (Country Director, Nigeria, WB); Jamal Saghir (Sector Director, Sustain-able Development, WB); Benoit Bosquet (Sector Man-ager, Environment and Disaster Risk Management, WB); Christoph Pusch (Practice leader, Africa Disaster Risk Management, WB), Francis Ghesquiere (Manager, GFDRR) and Raja Rehan Arshad (Lead Disaster Risk Management Specialist, GFDRR).
The international community team from the UN sys-tem was led by SethVordzorgbe along with Jantho-mas Hiemstra and Rita Missal. The team members with their respective responsibilities in HRNA are: (i) Agriculture, Fisheries and Livestock: Rabe Mani (FAO), Femi Amure (WFP) and Francois Mkovonga (WFP); (ii) DRR: Alao Mathew (UNDP), Datius Rutashobya (WMO) and Kathrin Schweppe (UNDP); (iii) Educa-tion: Oluseyi Soremekun (UNESCO), Annelies Ollievz (UNICEF), Judith Giwa-Amu (UNICEF), and George
Igelegbai(UNICEF); (iv) Employment: Chinyere Emeka-Anuna (ILO), Antonio Cruciani (ILO), and Dennis Zulu (ILO); (v) Energy: Alhaji Mustapha (UNIDO); Environ-ment: Muyiwa Odele (UNDP); (vi) Gender: Joy Micheal (UNFPA) and Gloria Enueze (UNFPA); (vii) Governance and Public Infrastructure: Andrew David Adejo (UNDP); (viii) Health: Godwin Asuquo (UNFPA), Idowu Araony-ibo (UNFPA), Saratu Yunusa (UNICEF), Andrew Griek-spoor (WHO), Dr Irene Isibor (WHO), and Dr Emmanuel Musa (WHO); (ix) Shelter and housing: Kabir M. Yari (UN Habitat); and (x) WASH: Ajibade Olokun (UNICEF). Prof. Edwin Iguisi, Prof Samuel Arokoyu, Prof Umar Maryah, Dr. Kingsley Ogboi, Prof Ola Asimiyu Jinadu, and Dr.Ibidun Adelekan coordinated interviews and surveys in affected states.
Many Government officials from the local authori-ties and line ministries participated in the assessment, including: from the Ministry of Education, Ihekwaba Obiageli, Deputy Director; Folake Olatunji-David, Assis-tant Director; Mary A. Ameh, Assistant Director; Vera Okoli-Etolue, Assistant Director; O. N. Anyaoku, Assis-tant Director; A. H. Onehi, Assistant Chief Education Officer; and Oluwasegun Sobogun, Chief Education Officer; from the Ministry of Lands, Housing and Ur-ban Development, Anene Chimezie, Deputy Director; Mathias J. Akasseh, Assistant Chief Land Officer; from the Ministry of Health, S. Belgore, Deputy Director, Nigerian Centre for Disease Control; K. Fadahunsi, Medical Officer; and Ismalia Shinkafi, Assistant Chief Scientific Officer; from the Ministry of Agriculture and Rural Development, O. O. Oshadiya, Assistant Director; J. O. Babatunde, Assistant Director; and E. A. Kosoko-King, Assistant Director; from the Ministry of Com-merce and Industry, Nkem Anucha, Senior Executive Officer; and Hassan Usman Gwandu, Administrative Officer 1; from the Ministry of Power, Shanu R. Adeshi-na, Principal Technical Officer I; Philip Abel, Electrical Engineer II.; Francis C. Metu, Electrical Engineer I; and from the Ministry of Works, Paul A. Chidawa , Chief Technical Officer; Usman Yakubu, Principal Civil Engi-neer; Edward Onokpasa , Executive Engineer II; Uche-chukwu G. Osuji., Executive Engineer II; and Edmond Onyechokwa, Principal Engineer; from the Ministry of Water Resources, A. Edu Folorunso, Geologist I; Ve-
NIGERIA Post-Disaster Needs Assessment 2012 Floodsvi
ronica N. Obuzor, Principal Technical Officer; Marga-ret Annahyafi, Principal Scientific Officer; and Charles Mbama, Scientific Officer I; from the Ministry of Labour and Productivity, Frank Uko Daniel, Assistant Director; C. D. Archibong, Assistant Director, Statistics; Joseph Akpan, Chief Labour Officer; A. C. Aprezi, Chief La-bour Officer; Murna Joy Loma, Principal Labour Offi-cer; Yunusa Abdulkareem, Labour Officer; and Imeh Rhoda Ogedi, Statistician; from the Ministry of Women Affairs and Social Development, Friya Kimda Bulus, As-sistant Director; Nkechi Onwukwe, Assistant Director; and Samalia Adamu, Chief Community Development Officer; from the Ministry of Environment, M. A. Oy-eleke, Deputy Director; G. B. Jegede, Assistant Director; Engr. M. A. Kopada, Assistant Director; Musa Labaran, Principal Engineer; Hanson Ifiok, Environmental Health Scientific Officer I; and Bankole Babalola, Consultant. Additional support was offered by the Ministry of Fi-nance. Other contributors include, from the National Emergency Management Agency, Musa Abdulrazaq, Principal Disaster Risk Reduction Officer; Edward S. Dimas, Assistant Chief Disaster Risk Reduction Offi-cer; Akiode Saheed, Assistant Chief Training Officer; Amina Saleh, Senior Disaster Risk Reduction Officer; Fred Anusim, Principal Disaster Risk Reduction Officer; Garki I. Abbani, Principal Disaster Risk Reduction Offi-cer; Raji Adejoke, Senior Planning Officer; Ann Nwitte-eze, Senior Disaster Risk Reduction Officer; Shafiu Sidi, Disaster Risk Reduction Officer I; Amina Aro-Lambo, Disaster Risk Reduction Unit; and Mercy Ufondu, Di-saster Risk Reduction Unit; from the Nigerian Hydro-logical Services Agency, Michael I. Nwabufo, Deputy Director; Bashir Sulaiman, Assistant Director, Hydro Geologist; Fashe Francisca, Assistant Director, Hydro Geologist; J. B. Bisong, Assistant Director; P.T. Kunsuk, Assistant Chief Hydrologist; D. Amodu, Assistant Chief
Hydrologist; and A. U. Usoroh, Chief Technical Officer; from the National Space Research and Development Agency, Olabamiji Olojo, Senior Scientific Officer; Ab-dulkareem Isa, Scientific Officer; and Asma T. Ibrahim, Chief Scientific Officer; from the Nigerian Metrologi-cal Agency, S. M. Wilson, General Manager; from the National Oil Spill Detection and Response Agency, Chi-bunna O. Igwe, Senior Environmental Scientist; Ifeoma Ani, Environmental Scientist I; and Folusho Ayodele, Principal Statistical Officer; from the National Planning Commission, Lanre Adekanye, Assistant Director; Philip Obasi , Principal Planning Officer; and Thomas Ochepa, Planning Officer; from the National Population Com-mission, Vandu Stephen Tsakma, Deputy Director; and Moses C. John, Deputy Director; from the Nigerian Bureau of Statistics, Ngozi Nwokedi, Assistant Direc-tor; and Sanusi Ahmed, Statistician; from the Budget Office, Tochukwu Nwachukwu, Economist; from the Office of the Chief Economic Adviser to the President, Eme Dada, Economist; and from the Power Holding Company of Nigeria, A. Abdulkareem, Officer II.
The guidance and inputs of many state and local gov-ernment ministries, departments and agencies have contributed greatly towards the completion of this report. The PDNA team wishes to acknowledge and thank the people interviewed in the states surveyed for the time and insights they provided to the team, as well as state and local government officials that pro-vided technical expertise and support during the field work phase. The PDNA team gratefully acknowledges the hard work of everyone that contributed to this re-port, including the support staff that helped manage trainings and other logistical arrangements for field trips and group sessions. n
vii
TABLE OF CONTENTS
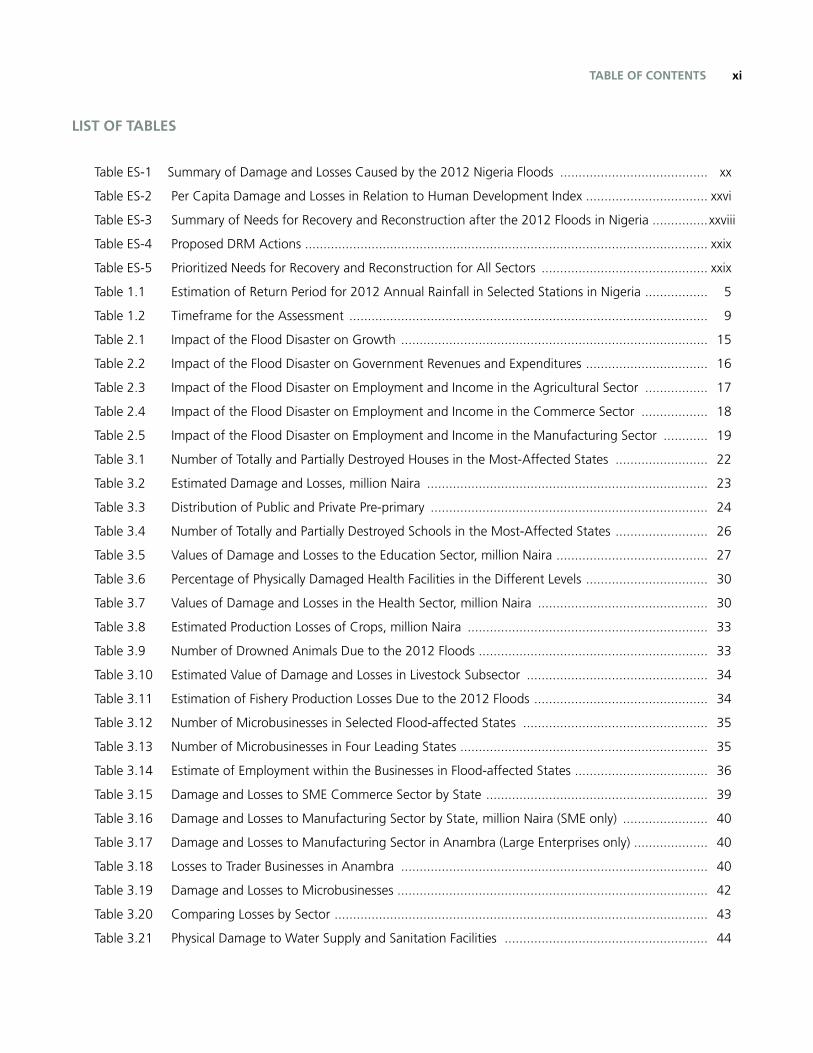
LIST OF TABLES ............................................................................................................................................... xi
LIST OF FIGURES ............................................................................................................................................. xiii
ACKNOWLEDGEMENTS ................................................................................................................................ iii
FOREWORD ...................................................................................................................................................... iv
ACRONYMS AND ABBREVIATIONS ............................................................................................................. xiv
EXECUTIVE SUMMARY .................................................................................................................................. xix
CHAPTER 1: INTRODUCTION ............................................................................................................. 1
1.1 Overview of 2012 Floods in Nigeria ........................................................................................................ 1
1.2 Nigeria’s Social, Economic, and Political Context ..................................................................................... 1
1.3 First Responses by Government and Development Partners to the Flood Disaster.................................... 3
1.4 Hydro-Meteorological Analyses .............................................................................................................. 4
1.4.1 Nigerian Weather Conditions in 2012 .......................................................................................... 4
1.4.2 Rainfall Conditions in 2012 ......................................................................................................... 5
1.4.3 Runoff and Peak River Discharge in 2012 ..................................................................................... 6
1.5 PDNA Process and Methodology ............................................................................................................ 7
1.5.1 PDNA Process .............................................................................................................................. 7
1.5.2 Assessment Methodology ............................................................................................................ 10
1.5.3 Geographical Scope .................................................................................................................... 11
1.5.4 Maximum inundation extent mapping for the PDNA.................................................................... 11
1.5.5 Guidance for estimating damage and losses in selected sectors ................................................... 11
1.5.6 Limitation and Gaps in the Nigeria Flood PDNA ........................................................................... 12
CHAPTER 2: MACRO-ECONOMIC AND PERSONAL INCOME IMPACTS ................................................ 15
2.1 Macroeconomic Impact .......................................................................................................................... 15
2.1.1 Impact on economic growth ........................................................................................................ 15
2.1.2 Impact on balance of payments ................................................................................................... 15
2.1.3 Impact on inflation ...................................................................................................................... 15
2.1.4 Impact on the fiscal sector ........................................................................................................... 16
2.2 Impact on Personal Income .................................................................................................................... 16
2.2.1 Impact on Employment and Income of Workers in the Agriculture Sector .................................... 16
NIGERIA Post-Disaster Needs Assessment 2012 Floodsviii
2.2.2 Impact on Employment and Income of Workers in the Commerce Sector .................................... 17
2.2.3 Impact on Employment and Income of Workers in the Manufacturing Sector .............................. 17
CHAPTER 3: DAMAGE AND LOSSES ........................................................................................................... 21
3.1 Social sector........................................................................................................................................... 21
3.1.1 Housing ...................................................................................................................................... 21
3.1.2 Education .................................................................................................................................... 24
3.1.3 Health ......................................................................................................................................... 28
3.2. Productive Sectors .................................................................................................................................. 31
3.2.1 Agriculture .................................................................................................................................. 31
3.2.2 Manufacturing and commerce .................................................................................................... 34
3.3 Infrastructure sectors ............................................................................................................................. 43
3.3.1 Water and sanitation ................................................................................................................... 43
3.3.2 Electricity ..................................................................................................................................... 44
3.3.3 Transport sector ........................................................................................................................... 46
3.4. Cross-cutting Issues ............................................................................................................................... 48
3.4.1 Environment ................................................................................................................................ 48
CHAPTER 4: HUMAN RECOVERY NEEDS ASSESSMENT ......................................................................... 53
4.1 Affected population ............................................................................................................................... 53
4.1.1 Total affected population ............................................................................................................. 53
4.1.2 Vulnerable groups in affected households .................................................................................... 53
4.2 Effects on household demographics ....................................................................................................... 55
4.2.1 Age dynamics .............................................................................................................................. 55
4.2.2 Gender of household head .......................................................................................................... 55
4.3. Sector effects ......................................................................................................................................... 55
4.3.1 Water and sanitation ................................................................................................................... 55
4.3.2 Health ......................................................................................................................................... 55
4.3.3 Education .................................................................................................................................... 56
4.3.4 Shelter and settlement................................................................................................................. 57
4.3.5 Household energy ....................................................................................................................... 58
4.3.6 Transport and communication ..................................................................................................... 58
4.4 Disruption and restoration of institutions and services (governance) ....................................................... 58
4.5 Effects on income, food security and livelihoods ..................................................................................... 59
4.5.1 Livelihoods .................................................................................................................................. 59
ixTABLE OF CONTENTS
4.5.2 Household income ...................................................................................................................... 59
4.5.3 Food security ............................................................................................................................... 60
4.6 How the affected communities are coping with the livelihood and income effects of the disaster ........... 60
4.6.1 Post-flood income coping and food security strategies ................................................................. 60
4.6.2 Child labor .................................................................................................................................. 61
4.7 Other human impacts .................................................................................................................. 61
4.7.1 Psychosocial, safety, and protection considerations ...................................................................... 61
4.7.2 Disaster-induced conflict .............................................................................................................. 62
4.8 Likely impacts on human development indicators and MDGs ................................................................. 62
4.8.1 Eradication of extreme poverty and hunger (MDG 1) ................................................................... 62
4.8.2 Universal primary education (MDG 2) .......................................................................................... 63
4.8.3 Infant mortality, maternal health and diseases (MDGs 4, 5, 6) ...................................................... 63
4.9 Implications for recovery ........................................................................................................................ 63
4.9.1 Communities’ recovery efforts: auto-recovery .............................................................................. 63
4.9.2 Communities’ subjective expressions of priority recovery assistance needs ................................... 63
4.9.3 Communities’ subjective expressions of priorities in reducing future flood disasters ...................... 65
CHAPTER 5: RECOVERY AND RECONSTRUCTION NEEDS ....................................................................... 67
5.1. Introduction ........................................................................................................................................... 67
5.2 Social Sector .......................................................................................................................................... 67
5.2.1 Personal Income Recovery............................................................................................................ 67
5.2.2 Housing ...................................................................................................................................... 67
5.2.3 Education .................................................................................................................................... 68
5.2.4 Health ......................................................................................................................................... 71
5.3 Productive Sectors .................................................................................................................................. 71
5.3.1 Agriculture .................................................................................................................................. 71
5.3.2 Trade and Manufacturing ............................................................................................................ 71
5.4 Infrastructure ......................................................................................................................................... 72
5.4.1 Water and sanitation ................................................................................................................... 72
5.4.2 Electricity ..................................................................................................................................... 72
5.4.3 Transport Sector .......................................................................................................................... 72
5.5 Cross-Cutting Issues ............................................................................................................................... 75
5.5.1 Environment ................................................................................................................................ 75
NIGERIA Post-Disaster Needs Assessment 2012 Floodsx
CHAPTER 6: DISASTER RISK MANAGEMENT IN NIGERIA ...................................................................... 77
6.1 Disaster profile ....................................................................................................................................... 77
6.2 Understanding Disaster Risk in Nigeria ................................................................................................... 78
6.3 Disaster risk management in Nigeria ...................................................................................................... 81
6.3.1 DRR as a development priority .................................................................................................... 81
6.3.2 Risk identification, assessment and monitoring, and early warning .............................................. 83
6.3.3 Disaster information, knowledge, and innovation ........................................................................ 84
6.3.4 Key interventions to reduce underlying risk .................................................................................. 85
6.3.5 Preparedness for effective response at all levels ............................................................................ 87
6.4. Achieving disaster and climate resilience ................................................................................................ 88
6.4.1 Strengthen DRM and Climate Change Adaptation ...................................................................... 88
6.4.2 Build Community Resilience ........................................................................................................ 89
6.4.3 Disaster and Climate Change Resilience in Key Sectors ............................................................... 90
CHAPTER 7: TRANSITIONAL RECOVERY, AND RECONSTRUCTION FRAMEWORK ............................ 99
7.1 Introduction ........................................................................................................................................... 99
7.2 Guiding Principles for Recovery, Reconstruction and Resilience in Nigeria................................................ 100
7.3 Institutional Capacity Analysis ................................................................................................................ 104
7.4 Action Plan ............................................................................................................................................ 109
7.5 Next Steps ............................................................................................................................................. 120
ANNEXES
Annex 1: Breakdown of 2012 Flooding Situation in Nigeria - NEMA .............................................................. 123
Annex 2: Post-Disaster Needs Assessment (PDNA) Team composition ............................................................. 127
Annex 3: Agenda for Nigeria 2012 Floods Post-Disaster Needs Assessment Training ...................................... 131
Annex 4: List of Participants .......................................................................................................................... 134
Annex 5: Description of the HRNA Community Consultation and Validation Survey ....................................... 154
xiTABLE OF CONTENTS
LIST OF TABLES
Table ES-1 Summary of Damage and Losses Caused by the 2012 Nigeria Floods ........................................ xx
Table ES-2 Per Capita Damage and Losses in Relation to Human Development Index ................................. xxvi
Table ES-3 Summary of Needs for Recovery and Reconstruction after the 2012 Floods in Nigeria ............... xxviii
Table ES-4 Proposed DRM Actions ............................................................................................................. xxix
Table ES-5 Prioritized Needs for Recovery and Reconstruction for All Sectors ............................................. xxix
Table 1.1 Estimation of Return Period for 2012 Annual Rainfall in Selected Stations in Nigeria ................. 5
Table 1.2 Timeframe for the Assessment ................................................................................................. 9
Table 2.1 Impact of the Flood Disaster on Growth ................................................................................... 15
Table 2.2 Impact of the Flood Disaster on Government Revenues and Expenditures ................................. 16
Table 2.3 Impact of the Flood Disaster on Employment and Income in the Agricultural Sector ................. 17
Table 2.4 Impact of the Flood Disaster on Employment and Income in the Commerce Sector .................. 18
Table 2.5 Impact of the Flood Disaster on Employment and Income in the Manufacturing Sector ............ 19
Table 3.1 Number of Totally and Partially Destroyed Houses in the Most-Affected States ......................... 22
Table 3.2 Estimated Damage and Losses, million Naira ............................................................................ 23
Table 3.3 Distribution of Public and Private Pre-primary ........................................................................... 24
Table 3.4 Number of Totally and Partially Destroyed Schools in the Most-Affected States ......................... 26
Table 3.5 Values of Damage and Losses to the Education Sector, million Naira ......................................... 27
Table 3.6 Percentage of Physically Damaged Health Facilities in the Different Levels ................................. 30
Table 3.7 Values of Damage and Losses in the Health Sector, million Naira .............................................. 30
Table 3.8 Estimated Production Losses of Crops, million Naira ................................................................. 33
Table 3.9 Number of Drowned Animals Due to the 2012 Floods .............................................................. 33
Table 3.10 Estimated Value of Damage and Losses in Livestock Subsector ................................................. 34
Table 3.11 Estimation of Fishery Production Losses Due to the 2012 Floods ............................................... 34
Table 3.12 Number of Microbusinesses in Selected Flood-affected States .................................................. 35
Table 3.13 Number of Microbusinesses in Four Leading States ................................................................... 35
Table 3.14 Estimate of Employment within the Businesses in Flood-affected States .................................... 36
Table 3.15 Damage and Losses to SME Commerce Sector by State ............................................................ 39
Table 3.16 Damage and Losses to Manufacturing Sector by State, million Naira (SME only) ....................... 40
Table 3.17 Damage and Losses to Manufacturing Sector in Anambra (Large Enterprises only) .................... 40
Table 3.18 Losses to Trader Businesses in Anambra ................................................................................... 40
Table 3.19 Damage and Losses to Microbusinesses .................................................................................... 42
Table 3.20 Comparing Losses by Sector ..................................................................................................... 43
Table 3.21 Physical Damage to Water Supply and Sanitation Facilities ....................................................... 44
NIGERIA Post-Disaster Needs Assessment 2012 Floodsxii
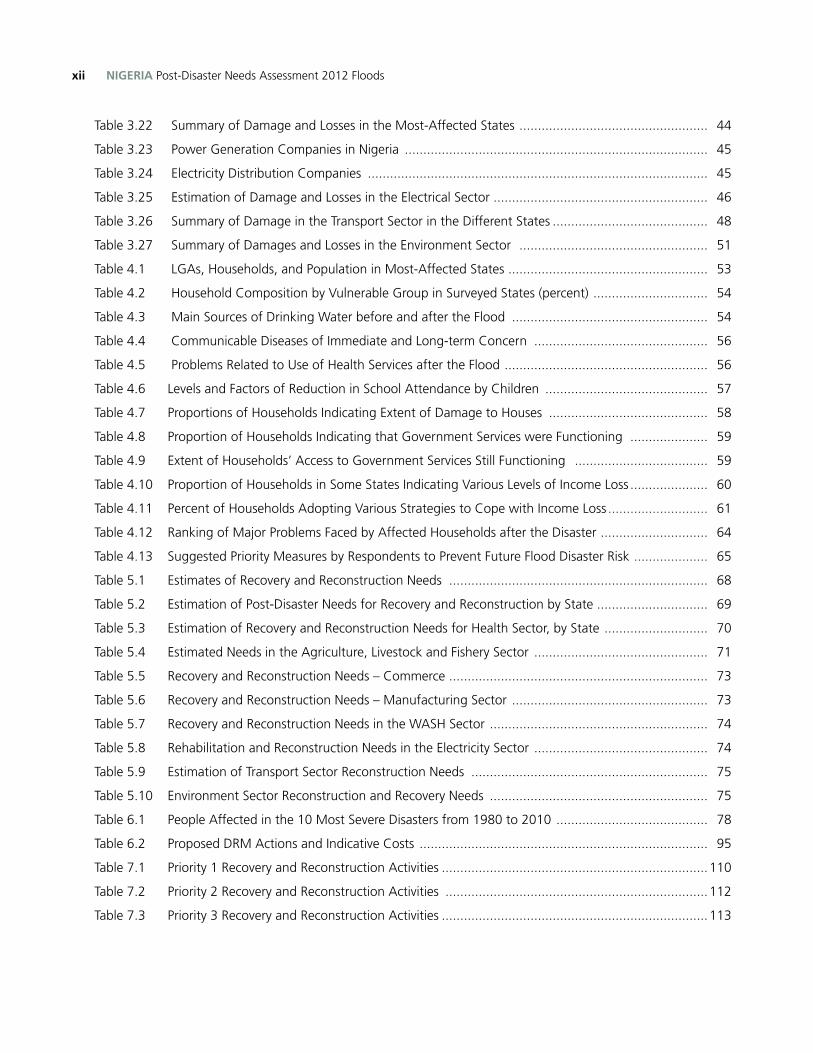
Table 3.22 Summary of Damage and Losses in the Most-Affected States ................................................... 44
Table 3.23 Power Generation Companies in Nigeria .................................................................................. 45
Table 3.24 Electricity Distribution Companies ............................................................................................ 45
Table 3.25 Estimation of Damage and Losses in the Electrical Sector .......................................................... 46
Table 3.26 Summary of Damage in the Transport Sector in the Different States .......................................... 48
Table 3.27 Summary of Damages and Losses in the Environment Sector ................................................... 51
Table 4.1 LGAs, Households, and Population in Most-Affected States ...................................................... 53
Table 4.2 Household Composition by Vulnerable Group in Surveyed States (percent) ............................... 54
Table 4.3 Main Sources of Drinking Water before and after the Flood ..................................................... 54
Table 4.4 Communicable Diseases of Immediate and Long-term Concern ............................................... 56
Table 4.5 Problems Related to Use of Health Services after the Flood ....................................................... 56
Table 4.6 Levels and Factors of Reduction in School Attendance by Children ............................................ 57
Table 4.7 Proportions of Households Indicating Extent of Damage to Houses ........................................... 58
Table 4.8 Proportion of Households Indicating that Government Services were Functioning ..................... 59
Table 4.9 Extent of Households’ Access to Government Services Still Functioning .................................... 59
Table 4.10 Proportion of Households in Some States Indicating Various Levels of Income Loss ..................... 60
Table 4.11 Percent of Households Adopting Various Strategies to Cope with Income Loss ........................... 61
Table 4.12 Ranking of Major Problems Faced by Affected Households after the Disaster ............................. 64
Table 4.13 Suggested Priority Measures by Respondents to Prevent Future Flood Disaster Risk .................... 65
Table 5.1 Estimates of Recovery and Reconstruction Needs ...................................................................... 68
Table 5.2 Estimation of Post-Disaster Needs for Recovery and Reconstruction by State .............................. 69
Table 5.3 Estimation of Recovery and Reconstruction Needs for Health Sector, by State ............................ 70
Table 5.4 Estimated Needs in the Agriculture, Livestock and Fishery Sector ............................................... 71
Table 5.5 Recovery and Reconstruction Needs – Commerce ...................................................................... 73
Table 5.6 Recovery and Reconstruction Needs – Manufacturing Sector ..................................................... 73
Table 5.7 Recovery and Reconstruction Needs in the WASH Sector ........................................................... 74
Table 5.8 Rehabilitation and Reconstruction Needs in the Electricity Sector ............................................... 74
Table 5.9 Estimation of Transport Sector Reconstruction Needs ................................................................ 75
Table 5.10 Environment Sector Reconstruction and Recovery Needs ........................................................... 75
Table 6.1 People Affected in the 10 Most Severe Disasters from 1980 to 2010 ......................................... 78
Table 6.2 Proposed DRM Actions and Indicative Costs .............................................................................. 95
Table 7.1 Priority 1 Recovery and Reconstruction Activities ........................................................................ 110
Table 7.2 Priority 2 Recovery and Reconstruction Activities ....................................................................... 112
Table 7.3 Priority 3 Recovery and Reconstruction Activities ........................................................................ 113

xiiiTABLE OF CONTENTS
LIST OF FIGURES
Figure ES-1 Breakdown of Total Flood Effects ......................................................................................... xxi
Figure ES-2 Breakdown of Total Flood Effects According to Private and Public Entities ............................. xxi
Figure ES-3 Time Variation of Damage and Losses Caused by the 2012 Floods in Nigeria ........................ xxii
Figure ES-4 Breakdown of Damage and Losses among Main Sectors of Economic Activity ....................... xxii
Figure ES-5 Breakdown of Damage and Losses among Individual Sectors of Economic Activity ............... xxxiii
Figure ES-6 Spatial Distribution of Damage and Losses Caused by the 2012 Floods ................................ xxiv
Figure ES-7 Map Showing the Most-Affected States ............................................................................... xxiv
Figure ES-8 Graph Showing the Spatial Distribution of Per Capita Damage and Losses by State .............. xxv
Figure ES-9 Map Showing the Spatial Distribution of Per Capita Damage and Losses by State .................. xxv
Figure 1.1 Pictures of Flood Disasters in Adamawa State ...................................................................... 1
Figure 1.2 Submerged Housing Units in Anambra State ......................................................................... 1
Figure 1.3 ITD Positions in 2012 ........................................................................................................... 5
Figure 1.4 Peak Discharge Distribution Using Data from River Gauging Stations across Nigeria ............... 6
Figure 1.5 Annual Peak Discharge Recorded at Lokoja, Kogi State, between 1914 and 2012 ................. 7
Figure 1.6 Maximum Daily Discharge Recorded at Lokoja, Kogi State for the Four Most Recent Flood Events ......................................................................................................................... 7
Figure 1.7 Multisectoral PDNA Team ..................................................................................................... 9
Figure 1.8 Maximum Inundation Extent ................................................................................................. 12
Figure 1.9 Land Use/Land Cover Map that Shows the Cultivated Areas in Taraba State .......................... 13
Figure 1.10 Road Network Map .............................................................................................................. 13
Figure 3.1 Aerial View of Submerged Housing Units in Delta, Anambra, Bayelsa and Rivers States ......... 22
Figure 3.2 Proportion of Damaged Houses in the Most-Affected States ................................................. 23
Figure 3.3 A Submerged Road at Dougirei Area of Yola Adamawa State ................................................ 48
Figure 3.4 Nigerian Ecological Zones ..................................................................................................... 49
Figure 6.1 Occurrence of Disasters per Disaster Type from 1980 to 2010 ............................................... 78
Figure 6.2 Factors Contributing to Disaster Risk .................................................................................... 78
Figure 6.3 Flood Risk Map of Nigeria, Depicting Mortality Risk Index ...................................................... 79
Figure 7.1 Questions That a Recovery and Reconstruction Framework Can Help Answer ........................ 100
NIGERIA Post-Disaster Needs Assessment 2012 Floodsxiv
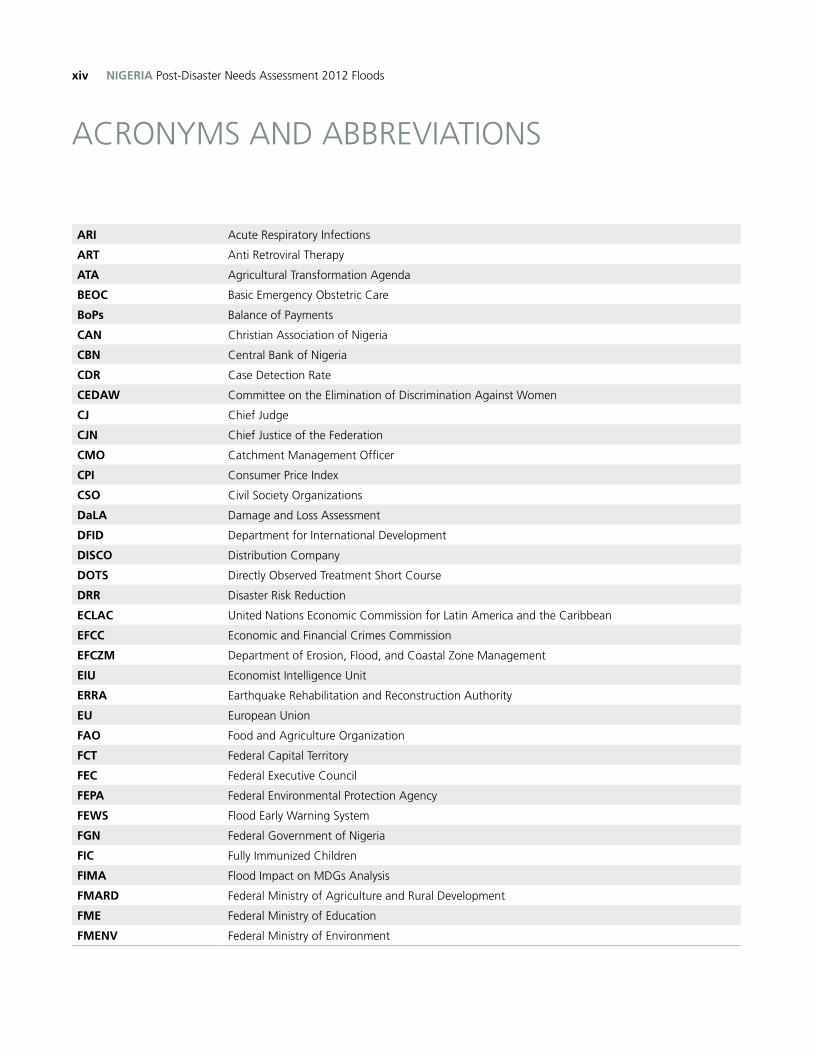
ACRONYMS AND ABBREVIATIONS
ARI Acute Respiratory Infections
ART Anti Retroviral Therapy
ATA Agricultural Transformation Agenda
BEOC Basic Emergency Obstetric Care
BoPs Balance of Payments
CAN Christian Association of Nigeria
CBN Central Bank of Nigeria
CDR Case Detection Rate
CEDAW Committee on the Elimination of Discrimination Against Women
CJ Chief Judge
CJN Chief Justice of the Federation
CMO Catchment Management Officer
CPI Consumer Price Index
CSO Civil Society Organizations
DaLA Damage and Loss Assessment
DFID Department for International Development
DISCO Distribution Company
DOTS Directly Observed Treatment Short Course
DRR Disaster Risk Reduction
ECLAC United Nations Economic Commission for Latin America and the Caribbean
EFCC Economic and Financial Crimes Commission
EFCZM Department of Erosion, Flood, and Coastal Zone Management
EIU Economist Intelligence Unit
ERRA Earthquake Rehabilitation and Reconstruction Authority
EU European Union
FAO Food and Agriculture Organization
FCT Federal Capital Territory
FEC Federal Executive Council
FEPA Federal Environmental Protection Agency
FEWS Flood Early Warning System
FGN Federal Government of Nigeria
FIC Fully Immunized Children
FIMA Flood Impact on MDGs Analysis
FMARD Federal Ministry of Agriculture and Rural Development
FME Federal Ministry of Education
FMENV Federal Ministry of Environment
xvACRONYMS AND ABBREVIATIONS
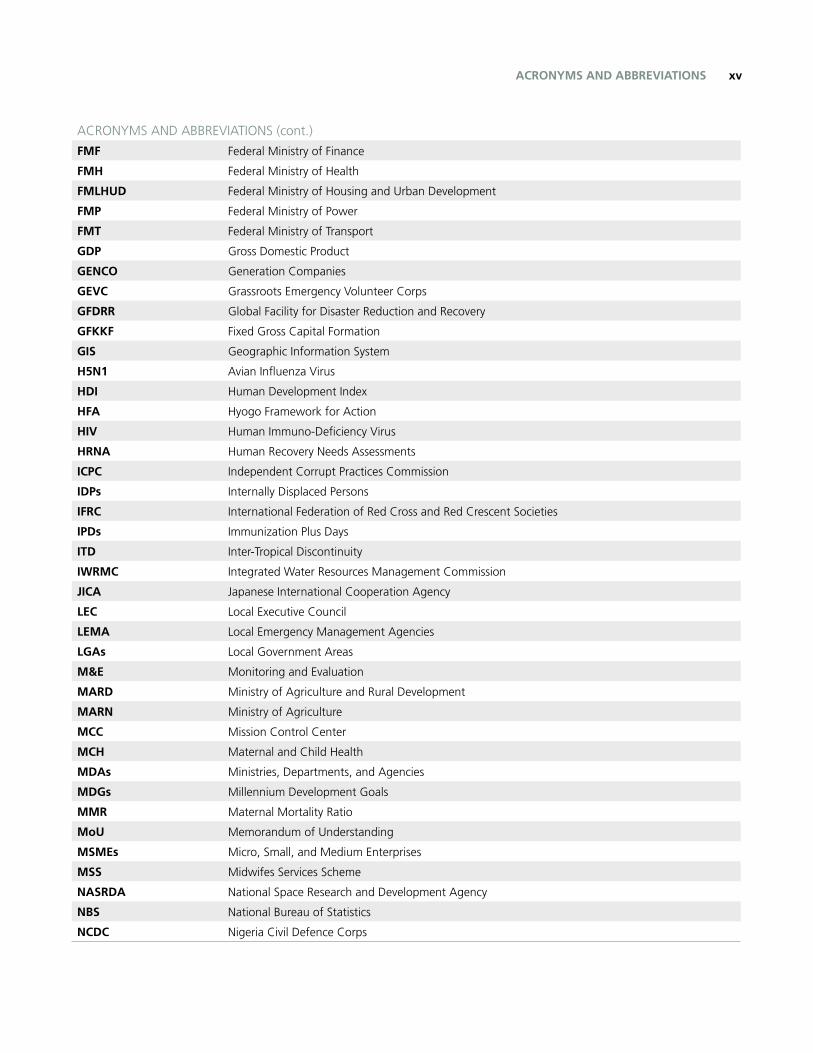
ACRONYMS AND ABBREVIATIONS (cont.)
FMF Federal Ministry of Finance
FMH Federal Ministry of Health
FMLHUD Federal Ministry of Housing and Urban Development
FMP Federal Ministry of Power
FMT Federal Ministry of Transport
GDP Gross Domestic Product
GENCO Generation Companies
GEVC Grassroots Emergency Volunteer Corps
GFDRR Global Facility for Disaster Reduction and Recovery
GFKKF Fixed Gross Capital Formation
GIS Geographic Information System
H5N1 Avian Influenza Virus
HDI Human Development Index
HFA Hyogo Framework for Action
HIV Human Immuno-Deficiency Virus
HRNA Human Recovery Needs Assessments
ICPC Independent Corrupt Practices Commission
IDPs Internally Displaced Persons
IFRC International Federation of Red Cross and Red Crescent Societies
IPDs Immunization Plus Days
ITD Inter-Tropical Discontinuity
IWRMC Integrated Water Resources Management Commission
JICA Japanese International Cooperation Agency
LEC Local Executive Council
LEMA Local Emergency Management Agencies
LGAs Local Government Areas
M&E Monitoring and Evaluation
MARD Ministry of Agriculture and Rural Development
MARN Ministry of Agriculture
MCC Mission Control Center
MCH Maternal and Child Health
MDAs Ministries, Departments, and Agencies
MDGs Millennium Development Goals
MMR Maternal Mortality Ratio
MoU Memorandum of Understanding
MSMEs Micro, Small, and Medium Enterprises
MSS Midwifes Services Scheme
NASRDA National Space Research and Development Agency
NBS National Bureau of Statistics
NCDC Nigeria Civil Defence Corps
NIGERIA Post-Disaster Needs Assessment 2012 Floodsxvi
ACRONYMS AND ABBREVIATIONS (cont.)
NCWS National Council of Women’s Societies
NDMF National Disaster Management Framework
NEMA National Emergency Management Agency
NEWMAP Nigeria Erosion and Watershed Management Project
NFIs Non-Food Items
NGI Norwegian Geotechnical Institute
NGOs Non-Governmental Organizations
NIHSA Nigeria Hydrological Services Agency
NIMET Nigerian Meteorological Agency
NIRSAL Nigeria Incentive-based Risk-sharing System for Agriculture Lending
NISS National Influenza Sentinel Surveillance
NIWRMC Nigeria Integrated Water Resources Management Commission
NPA Nigerian Port Authority
NPC National Population Commission
NSCIA National Supreme Council of Islamic Affairs
NSHDP National Strategic Health Development Plan
NUJ Nigerian Union of Journalists
NWRI National Water Resources Institute
OCHA Office for the Coordination of Humanitarian Affairs
ODPs Other Development Partners
PDNA Post-Disaster Needs Assessment
PHC Primary Health Care
PHCN Power Holding Company of Nigeria
RBDA River Basin Development Authorities
SEC State Executive Council
SEMA State Emergency Management Agencies
SGF Secretary to the Federal Government
SMEDAN Small and Medium Enterprises Development Agency of Nigeria
SOP Standard Operating Procedure
SSG Secretary to the State Government
TRANSYSCO Transmission Company
UN United Nations
UNDP United Nations Development Program
UN-ECLAC United Nations Economic Commission for Latin America and the Caribbean
UNEP United Nations Environment Program
UNESCO United Nations Education Scientific and Cultural Organization
UNICEF United Nations Children’s Fund
UNISDR United Nations International Strategy for Disaster Reduction
USAID United States Agency for International Development
VCA Vulnerability and Capacity Analysis
xviiACRONYMS AND ABBREVIATIONS
ACRONYMS AND ABBREVIATIONS (cont.)
WAEC West African Examination Council
WASH Water Supply, Sanitation, and Hygiene
WB World Bank
WFP World Food Program
WHO World Health Organization
Weights and Measures Currency and EquivalentskWh Kilowatts Currency Unit = Nigerian Nairakm Kilometer US$ = N160km2 Square KilometerMW Megawattmm Millimeter
Abbreviations of Professional Titles
ACDRR Assistant Chief Disaster Risk Reduction Officer
ACEO Assistant Chief Education Officer
ACSO Assistant Chief Scientific Officer
CCDO Chief Community Development Officer
CEO Chief Education Officer
CLO Chief Labor Officer
CSO Chief Scientific Officer
CTO Chief Technical Officer
DRR Disaster Risk Reduction Unit
DRRO Disaster Risk Reduction Officer
EE Engr. Electrical Engineer II
EE II Executive Engineer II
EHS 1 Environmental Health Scientific Officer I
ES II Environmental Scientist II
ESI Environmental Scientist I
Geo 1 Geologist 1
GM General Manager
HG1 Hydro Geologist
MO Medical Officer
PCE Principal Civil Engineer
PDRRO Principal Disaster Risk Reduction Officer
PLO Principal Labor Officer
PPO Principal Planning Officer
PST Principal Statistical Officer
PTO 1 Principal Technical Officer 1
SDRRO Senior Disaster Risk Reduction Officer
SEO Senior Executive Officer
SES Senior Environmental Scientist
SO Scientific Officer
SPO Senior Planning Officer
STAT Statistics
NIGERIA Post-Disaster Needs Assessment 2012 Floodsxviii
Lagos, Nigeria. Photo: Thinkstock.com
xixEXECUTIVE SUMMARY
EXECUTIVE SUMMARY
Floods are the most common and recurring disaster in Nigeria. While they im-pact the country each year, the damage and losses from the 2012 floods were unprecedented. Heavy rains between July and October 2012 combined with
rising water levels resulting from the runoff contributed to the flooding of human settlements located downstream of the Kainji, Shiroro, and Jebba dams on the Niger River; the Lagdo dam in Cameroun on the Benue River; the Kiri dam on the Gongola River; and several other irrigation dams. In some cases, the dams were damaged; in others, water had to be released at full force to avert an overflow. According to the National Emergency Management Agency (NEMA), 363 people were killed, 5,851 injured, 3,891,314 affected, and 3,871,53 displaced due to the resulting floods.
To determine the impact of the floods and the resulting post-disaster recovery, recon-struction, and resilience needs, a Post-Disaster Needs Assessment (PDNA) was un-dertaken from November to December 2012. The main objectives of the PDNA were to: (i) assess the damage and losses caused by the disasters; (ii) estimate the overall impact of the 2012 floods on the socio-economic development of the country at the national level and on affected states and communities; (iii) develop a Recovery and Reconstruction Framework presenting the early-, medium- and long-term recovery and reconstruction needs, with costs and a timeline in one consolidated report; (iv) ensure that strategies for recovery integrate concepts of disaster risk reduction and “build back better,” plus address gender and environmental concerns; and (v) recom-mend and define a strategy for Disaster Risk Management in the country.
The PDNA methodology combines two distinct and complementary methods of as-sessing the disaster effects, impact and needs: 1. The time-proven Damage, Loss and Needs Assessment (DaLA) methodology, originally developed by the United Na-tions Economic Commission for Latin America and the Caribbean (UN-ECLAC)1 in the early 1970s and further updated and expanded by the World Bank’s Global Facility for Disaster Reduction and Recovery (GFDRR);2 and 2. The Human Recovery Needs Assessment (HRNA) methodology that is under further elaboration by the United Nations System. The DaLA portion of the PDNA estimated the following three items: (i) Damage, which refers to the monetary replacement value of the completely or
1 Economic Commission for Latin America and the Caribbean, Handbook for Estimating the Socio-economic and Environmental Impact of Disasters, United Nations, Santiago, 2003.
2 Global Facility for Disaster Reduction and Recovery, Guidance Notes for Damage, Loss and Needs Assessment; Volume 1, How to conduct a damage, loss and needs assessment, Volume 1, 2010; How to estimate sectoral damage and losses, Volume 2, 2010; How to estimate post-disaster needs for economic recovery and reconstruction, Volume 3, 2010; How to estimate disaster impact at macro-economic and at personal levels, Volume 4 (In preparation), The World Bank, Washington, D.C.
NIGERIA Post-Disaster Needs Assessment 2012 Floodsxx
partially destroyed durable assets; (ii) Losses, which consist of changes in the flows of goods and services in the economy and include reductions in production and increases in expenditure that may arise as a result of the disaster; and (iii) Recovery and Reconstruction Needs, which are the financial amounts required to achieve recovery of the economy at macro-economic, sectoral, and personal or household levels, as well as the financing required to rebuild with disaster-resilient features in order to reduce future risk. The Human Re-covery Needs Assessments (HRNA) measured, through qualitative and quantitative data, the micro- and me-so-level impacts of a disaster on affected sectors and cross-cutting areas of gender, age(including infants, young children, adolescents, adults, and older people),
environment, disaster risk reduction and governance).
Estimated Value of Damage and Losses
The total value of destroyed physical and durable assets caused by the 2012 floods in the most affected states
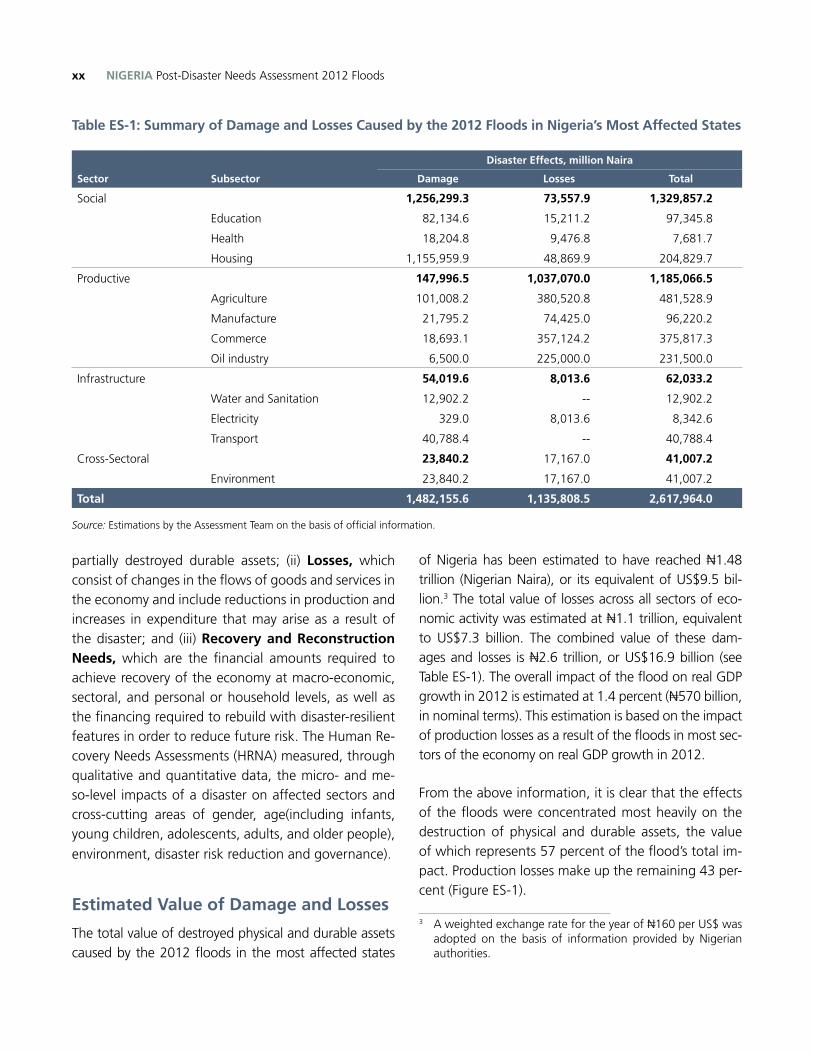
of Nigeria has been estimated to have reached N1.48 trillion (Nigerian Naira), or its equivalent of US$9.5 bil-lion.3 The total value of losses across all sectors of eco-nomic activity was estimated at N1.1 trillion, equivalent to US$7.3 billion. The combined value of these dam-ages and losses is N2.6 trillion, or US$16.9 billion (see Table ES-1). The overall impact of the flood on real GDP growth in 2012 is estimated at 1.4 percent (N570 billion, in nominal terms). This estimation is based on the impact of production losses as a result of the floods in most sec-tors of the economy on real GDP growth in 2012.
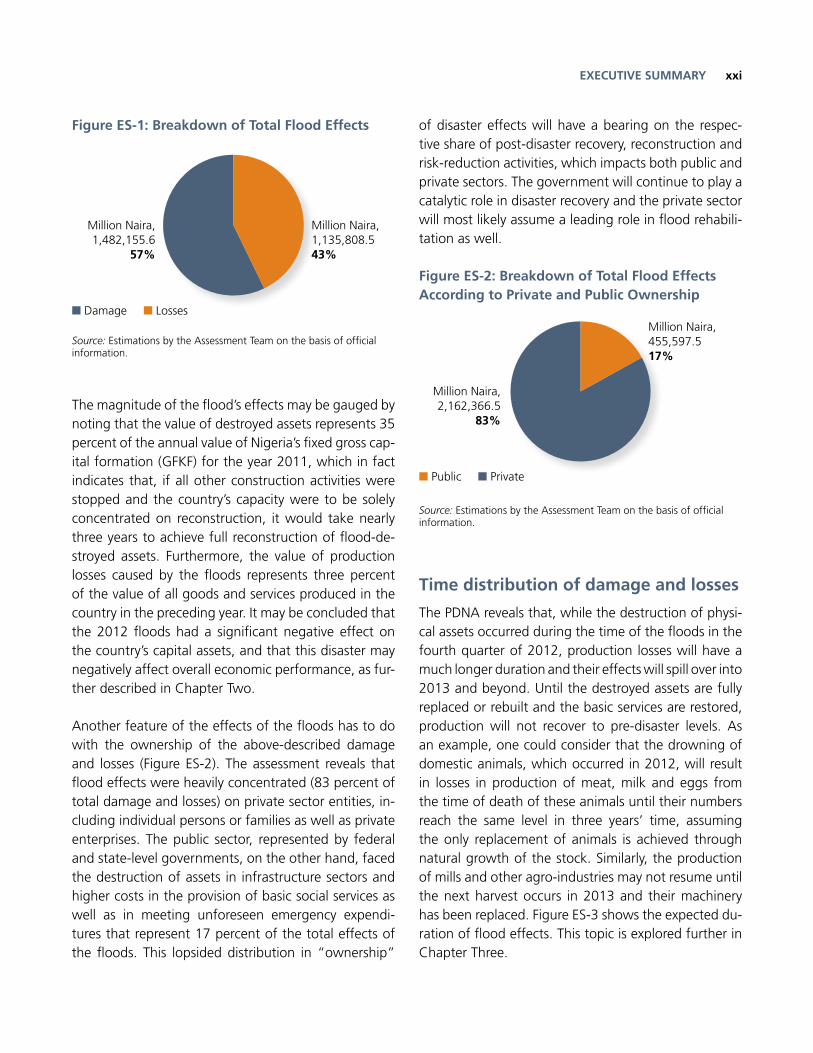
From the above information, it is clear that the effects of the floods were concentrated most heavily on the destruction of physical and durable assets, the value of which represents 57 percent of the flood’s total im-pact. Production losses make up the remaining 43 per-cent (Figure ES-1).
3 A weighted exchange rate for the year of N160 per US$ was adopted on the basis of information provided by Nigerian authorities.
Table ES-1: Summary of Damage and Losses Caused by the 2012 Floods in Nigeria’s Most Affected States
Sector Subsector
Disaster Effects, million Naira
Damage Losses Total
Social 1,256,299.3 73,557.9 1,329,857.2
Education 82,134.6 15,211.2 97,345.8
Health 18,204.8 9,476.8 7,681.7
Housing 1,155,959.9 48,869.9 204,829.7
Productive 147,996.5 1,037,070.0 1,185,066.5
Agriculture 101,008.2 380,520.8 481,528.9
Manufacture 21,795.2 74,425.0 96,220.2
Commerce 18,693.1 357,124.2 375,817.3
Oil industry 6,500.0 225,000.0 231,500.0
Infrastructure 54,019.6 8,013.6 62,033.2
Water and Sanitation 12,902.2 -- 12,902.2
Electricity 329.0 8,013.6 8,342.6
Transport 40,788.4 -- 40,788.4
Cross-Sectoral 23,840.2 17,167.0 41,007.2
Environment 23,840.2 17,167.0 41,007.2
Total 1,482,155.6 1,135,808.5 2,617,964.0
Source: Estimations by the Assessment Team on the basis of official information.
xxiEXECUTIVE SUMMARY
Figure ES-1: Breakdown of Total Flood Effects
Source: Estimations by the Assessment Team on the basis of official information.
The magnitude of the flood’s effects may be gauged by noting that the value of destroyed assets represents 35 percent of the annual value of Nigeria’s fixed gross cap-ital formation (GFKF) for the year 2011, which in fact indicates that, if all other construction activities were stopped and the country’s capacity were to be solely concentrated on reconstruction, it would take nearly three years to achieve full reconstruction of flood-de-stroyed assets. Furthermore, the value of production losses caused by the floods represents three percent of the value of all goods and services produced in the country in the preceding year. It may be concluded that the 2012 floods had a significant negative effect on the country’s capital assets, and that this disaster may negatively affect overall economic performance, as fur-ther described in Chapter Two.
Another feature of the effects of the floods has to do with the ownership of the above-described damage and losses (Figure ES-2). The assessment reveals that flood effects were heavily concentrated (83 percent of total damage and losses) on private sector entities, in-cluding individual persons or families as well as private enterprises. The public sector, represented by federal and state-level governments, on the other hand, faced the destruction of assets in infrastructure sectors and higher costs in the provision of basic social services as well as in meeting unforeseen emergency expendi-tures that represent 17 percent of the total effects of the floods. This lopsided distribution in “ownership”
of disaster effects will have a bearing on the respec-tive share of post-disaster recovery, reconstruction and risk-reduction activities, which impacts both public and private sectors. The government will continue to play a catalytic role in disaster recovery and the private sector will most likely assume a leading role in flood rehabili-tation as well.
Figure ES-2: Breakdown of Total Flood Effects According to Private and Public Ownership
Source: Estimations by the Assessment Team on the basis of official information.
Time distribution of damage and losses
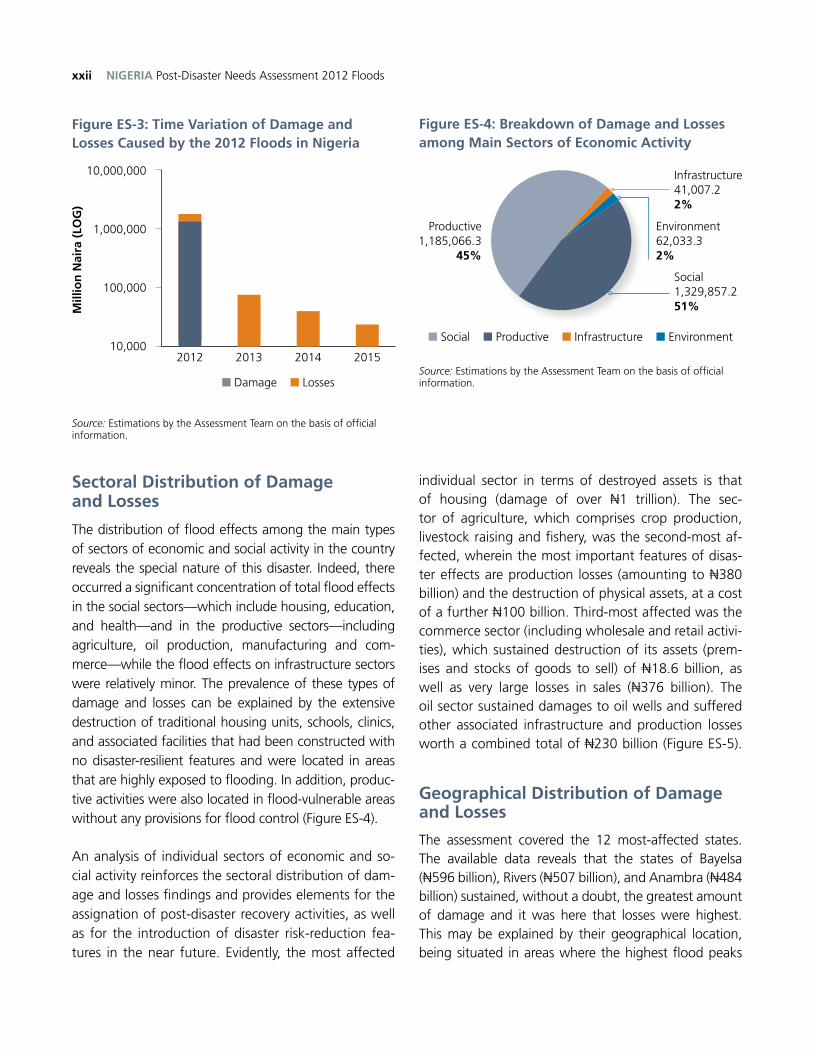
The PDNA reveals that, while the destruction of physi-cal assets occurred during the time of the floods in the fourth quarter of 2012, production losses will have a much longer duration and their effects will spill over into 2013 and beyond. Until the destroyed assets are fully replaced or rebuilt and the basic services are restored, production will not recover to pre-disaster levels. As an example, one could consider that the drowning of domestic animals, which occurred in 2012, will result in losses in production of meat, milk and eggs from the time of death of these animals until their numbers reach the same level in three years’ time, assuming the only replacement of animals is achieved through natural growth of the stock. Similarly, the production of mills and other agro-industries may not resume until the next harvest occurs in 2013 and their machinery has been replaced. Figure ES-3 shows the expected du-ration of flood effects. This topic is explored further in Chapter Three.
Million Naira, 1,135,808.5 43%
Million Naira, 455,597.5 17%
Million Naira, 1,482,155.6
57%
Million Naira,2,162,366.5
83%
n Damage n Losses
n Public n Private
NIGERIA Post-Disaster Needs Assessment 2012 Floodsxxii
Figure ES-4: Breakdown of Damage and Losses among Main Sectors of Economic Activity
Source: Estimations by the Assessment Team on the basis of official information.
Figure ES-3: Time Variation of Damage and Losses Caused by the 2012 Floods in Nigeria
Source: Estimations by the Assessment Team on the basis of official information.
Sectoral Distribution of Damage and Losses
The distribution of flood effects among the main types of sectors of economic and social activity in the country reveals the special nature of this disaster. Indeed, there occurred a significant concentration of total flood effects in the social sectors—which include housing, education, and health—and in the productive sectors—including agriculture, oil production, manufacturing and com-merce—while the flood effects on infrastructure sectors were relatively minor. The prevalence of these types of damage and losses can be explained by the extensive destruction of traditional housing units, schools, clinics, and associated facilities that had been constructed with no disaster-resilient features and were located in areas that are highly exposed to flooding. In addition, produc-tive activities were also located in flood-vulnerable areas without any provisions for flood control (Figure ES-4).
An analysis of individual sectors of economic and so-cial activity reinforces the sectoral distribution of dam-age and losses findings and provides elements for the assignation of post-disaster recovery activities, as well as for the introduction of disaster risk-reduction fea-tures in the near future. Evidently, the most affected
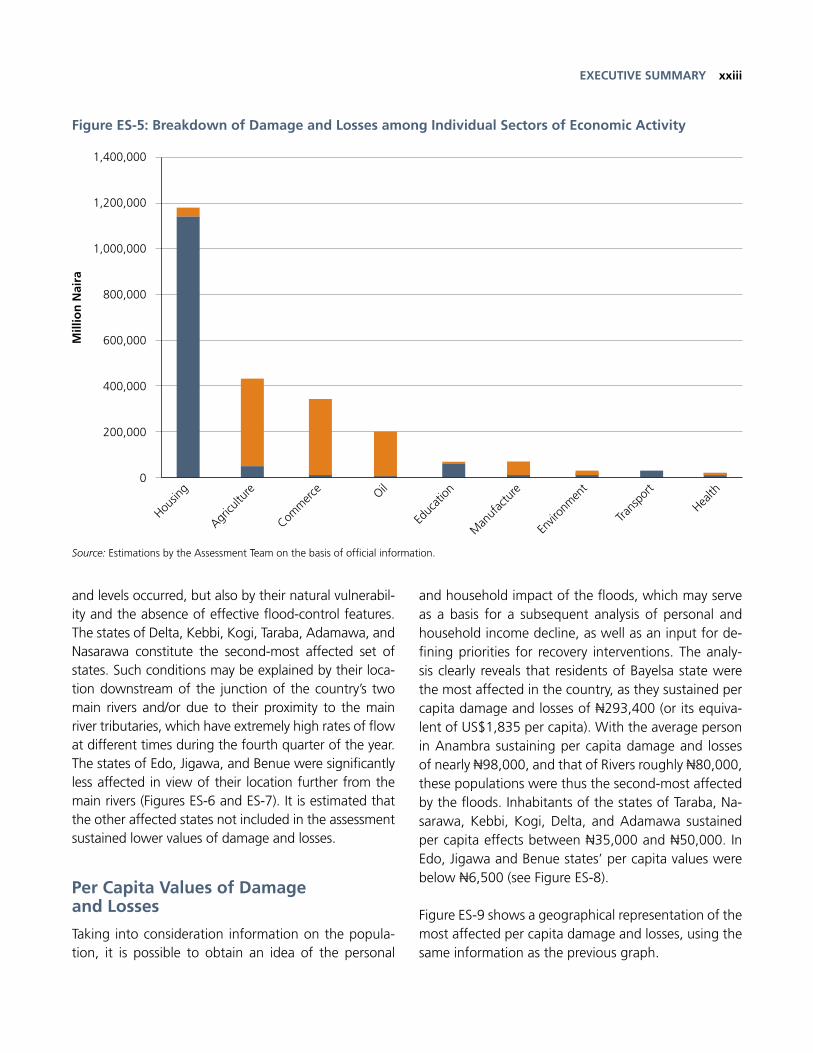
individual sector in terms of destroyed assets is that of housing (damage of over N1 trillion). The sec-tor of agriculture, which comprises crop production, livestock raising and fishery, was the second-most af-fected, wherein the most important features of disas-ter effects are production losses (amounting to N380 billion) and the destruction of physical assets, at a cost of a further N100 billion. Third-most affected was the commerce sector (including wholesale and retail activi-ties), which sustained destruction of its assets (prem-ises and stocks of goods to sell) of N18.6 billion, as well as very large losses in sales (N376 billion). The oil sector sustained damages to oil wells and suffered other associated infrastructure and production losses worth a combined total of N230 billion (Figure ES-5).
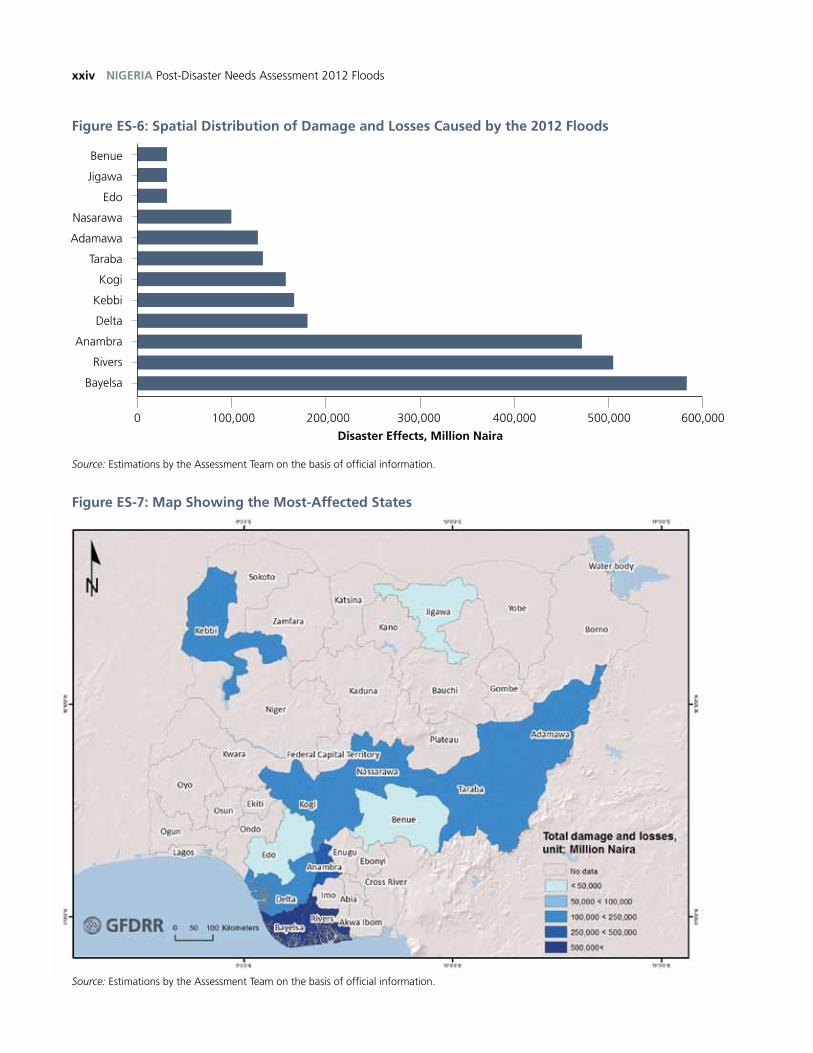
Geographical Distribution of Damage and Losses
The assessment covered the 12 most-affected states. The available data reveals that the states of Bayelsa (N596 billion), Rivers (N507 billion), and Anambra (N484 billion) sustained, without a doubt, the greatest amount of damage and it was here that losses were highest. This may be explained by their geographical location, being situated in areas where the highest flood peaks
10,000,000
1,000,000
100,000
10,0002012 20142013 2015
n Damage n Losses
n Social n Productive n Infrastructure n Environment
Mill
ion
Nai
ra (
LOG
)
Infrastructure41,007.22%
Environment62,033.32%
Productive1,185,066.3
45%
Social1,329,857.251%
xxiiiEXECUTIVE SUMMARY
and levels occurred, but also by their natural vulnerabil-ity and the absence of effective flood-control features. The states of Delta, Kebbi, Kogi, Taraba, Adamawa, and Nasarawa constitute the second-most affected set of states. Such conditions may be explained by their loca-tion downstream of the junction of the country’s two main rivers and/or due to their proximity to the main river tributaries, which have extremely high rates of flow at different times during the fourth quarter of the year. The states of Edo, Jigawa, and Benue were significantly less affected in view of their location further from the main rivers (Figures ES-6 and ES-7). It is estimated that the other affected states not included in the assessment sustained lower values of damage and losses.
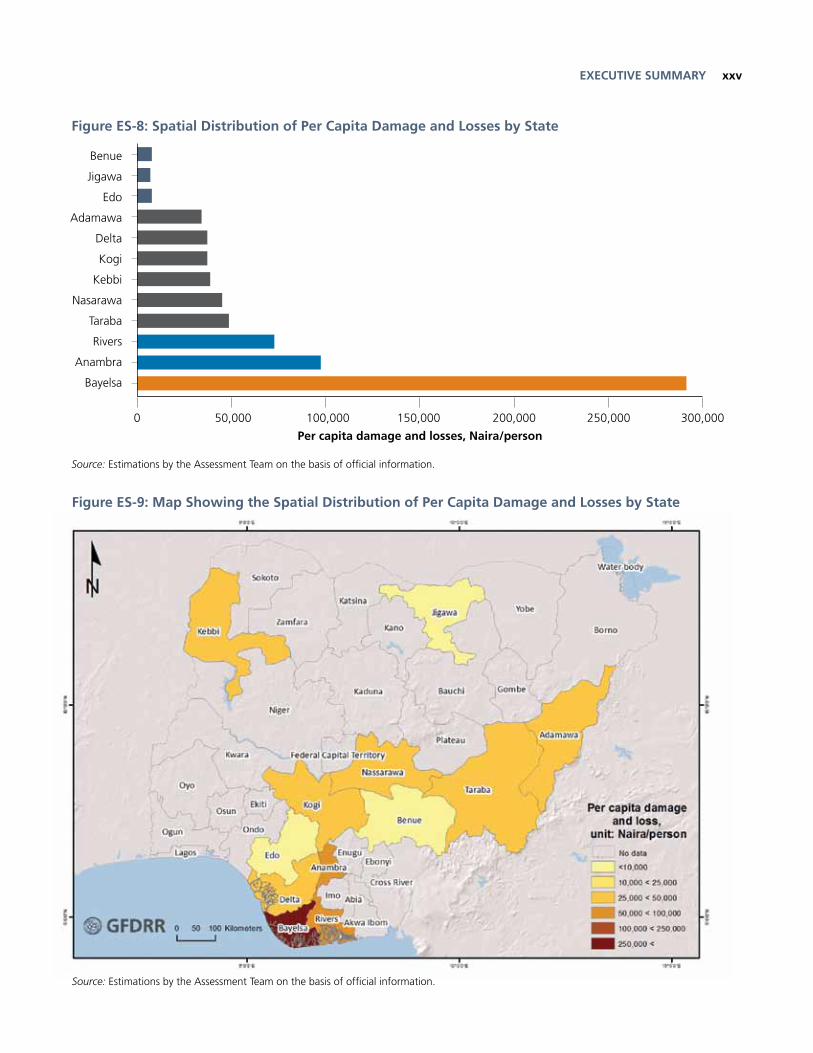
Per Capita Values of Damage and Losses
Taking into consideration information on the popula-tion, it is possible to obtain an idea of the personal
and household impact of the floods, which may serve as a basis for a subsequent analysis of personal and household income decline, as well as an input for de-fining priorities for recovery interventions. The analy-sis clearly reveals that residents of Bayelsa state were the most affected in the country, as they sustained per capita damage and losses of N293,400 (or its equiva-lent of US$1,835 per capita). With the average person in Anambra sustaining per capita damage and losses of nearly N98,000, and that of Rivers roughly N80,000, these populations were thus the second-most affected by the floods. Inhabitants of the states of Taraba, Na-sarawa, Kebbi, Kogi, Delta, and Adamawa sustained per capita effects between N35,000 and N50,000. In Edo, Jigawa and Benue states’ per capita values were below N6,500 (see Figure ES-8).
Figure ES-9 shows a geographical representation of the most affected per capita damage and losses, using the same information as the previous graph.
Figure ES-5: Breakdown of Damage and Losses among Individual Sectors of Economic Activity
Source: Estimations by the Assessment Team on the basis of official information.
Housin
g
Agricu
lture
Educ
ation
Man
ufac
ture
Envir
onm
ent
Health
Trans
port
Comm
erce Oil
1,400,000
1,200,000
1,000,000
800,000
600,000
400,000
200,000
0
Mill
ion
Nai
ra
NIGERIA Post-Disaster Needs Assessment 2012 Floodsxxiv
200,000 400,000100,000 300,000 500,000 600,000
Figure ES-6: Spatial Distribution of Damage and Losses Caused by the 2012 Floods
Source: Estimations by the Assessment Team on the basis of official information.
Disaster Effects, Million Naira
0
Benue
Jigawa
Edo
Nasarawa
Adamawa
Taraba
Kogi
Kebbi
Delta
Anambra
Rivers
Bayelsa
Figure ES-7: Map Showing the Most-Affected States
Source: Estimations by the Assessment Team on the basis of official information.
xxvEXECUTIVE SUMMARY
100,000 200,00050,000 150,000 250,000 300,000
Figure ES-8: Spatial Distribution of Per Capita Damage and Losses by State
Source: Estimations by the Assessment Team on the basis of official information.
Per capita damage and losses, Naira/person
0
Benue
Jigawa
Edo
Adamawa
Delta
Kogi
Kebbi
Nasarawa
Taraba
Rivers
Anambra
Bayelsa
Figure ES-9: Map Showing the Spatial Distribution of Per Capita Damage and Losses by State
Source: Estimations by the Assessment Team on the basis of official information.
NIGERIA Post-Disaster Needs Assessment 2012 Floodsxxvi
Relationship between Flood Effects and Human Development
The above-described values of per capita damage and losses were compared to the most recent values of the Human Development Index (HDI), as developed by United Nations Development Programme (UNDP) in cooperation with the Government of Nigeria.4 It was found that four states with an HDI below 0.5 (this represents where human development is lower in the country) sustained above-average values of per capita damage and losses. These occurred in the states of Anambra, Taraba, Kebbi, and Kogi. The results of the assessment are presented in Table ES-2.
Table ES-2: Per Capita Damage and Losses in Relation to Human Development Index
State Per capita damage and losses, Naira/person
Human Development Index
Anambra 98,200 0.441
Taraba 50,000 0.361
Kebbi 41,700 0.388
Kogi 38,900 0.422
Source: Estimations by the Assessment Team using official information.
This finding should not come as a surprise, since the poor often live in areas that are more vulnerable to di-sasters of natural origin and thus face a higher disaster risk. This dictum is well known to disaster risk man-agement practitioners throughout the world, though the quantitative information on which to base such a statement has often proved elusive. Furthermore, this evidence-based finding provides an indication that poverty numbers may have increased in the affected states as personal and household income declined, due to the production losses induced by the floods. This finding is further explored in Chapter Four.
4 See UNDP, Human Development Report Nigeria 2008-2009, Abuja, 2010.
Overall Economic and Personal Income Impact of the 2012 Flood
The flood affected several sectors of the economy; its overall impact on real GDP growth in 2012 is estimated at 1.4 percent (N570 billion, in nominal terms). This estimation is based on the impact of production losses and of extraordinary spending after the disaster on real GDP growth in most sectors of the economy in 2012. Balance of payment projections for 2012 by the Cen-tral Bank of Nigeria (CBN) indicate that, prior to the floods, the current account balance was in surplus and was projected to improve by about 1.2 percent of GDP in 2012, mainly due to a projected increase in oil ex-ports. However, in view of the losses associated with the flood, the current account surplus will improve by only about 0.6 percent of GDP in 2012.
The repercussion of the floods on inflation was miti-gated by the government’s efforts to address their short-term impact through the release of grains from the strategic food reserves and the distribution of high-yielding and flood-resistant grain varieties to affected farmers for mid-season planting, once the flood wa-ters receded. Nevertheless, the average inflation rate is likely to remain in the double digits into 2013 but should trend downwards slightly compared to 2012 levels given the continued focus on fiscal consolidation by the federal government and the activist monetary policy stance of the CBN.
The current forecast of the floods’ impact on the fiscal sector takes into consideration losses in tax revenues that could result from a decline in economic activities, as well as the corresponding increase in expenditure as a result of reconstruction activities. A decline of N280.6 billion is expected from the productive sectors, broken down as follows: N225 billion from the oil industry, N50.8 billion from the commerce subsector, and N4.8 billion from the manufacturing subsector. This may re-sult in a N27.75 billion decline in tax revenue, or 0.07 percent of GDP in 2012.
Concerning equivalent employment losses and im-puted personal income decline of workers in the pro-
xxviiEXECUTIVE SUMMARY
ductive sectors—namely, agriculture, commerce, and manufacturing—the findings show that the workers lost a total of 27,602,524 working days in the agri-culture sector, amounting to N9,917 million. Also, a total of 211,500 working days were lost in the trade SMEs, amounting to N93.9 million, while a total of 42,670,440 working days amounting to N28,418.5 was lost in micro-trade. The total number of working days lost in the manufacturing sector—including days lost by SME employees, days lost by microenterprise owners, and days lost by microenterprise workers—is 20,259,720, amounting to N16,904.0 million.
Estimates of Post-Disaster Recovery and Reconstruction Needs
General Considerations
After the values of destroyed physical assets and of pro-duction losses and the resulting macro-economic and household impacts have been estimated, it is possible to estimate the finances required to achieve recovery of the economy to at least pre-flood levels, as well as those needed to reconstruct destroyed assets using improved, disaster-resilient standards under a “building-back-bet-ter” strategy. From the outset, it must be indicated that requirements for economic recovery include the amounts of financing needed to ensure that private sector entities and individuals obtain sufficient working capital to re-ini-tiate their productive activities and the amounts required by the government, at the federal and state levels, to meet the increased demands of current expenditures in the service sectors under its purview. In that sense, the value of recovery needs is usually a fraction of the value of production losses and higher costs of services that vary among sectors depending on their characteristics.
The needs for reconstruction, however, represent the amounts required to rebuild destroyed assets to meet improved standards of quality and modernization, the relocation of selected assets into safer areas, as well as the adoption of disaster-resilient norms to reduce risk. Thus, their value will often exceed those of the estimated value of damage, once these improved stan-dards have been factored in.
Recovery and reconstruction needs refer to both the private and public sectors, as both were affected by the disaster and do not include any type of compensa-tion from the government to the affected populations. Rather, the estimated needs represent the amounts of financing that are required to achieve recovery and reconstruction. Portions of these needs are to be pro-vided as cash grants or in-kind donations to the poor, while others will be provided as soft-term credit (as ap-propriate under post-disaster conditions), channeled through development and private banks for affected credit-worthy individuals and private enterprises.
Full particulars on the estimation of post-disaster needs for economic recovery and disaster-resilient reconstruc-tion are given in the Guidance Notes for Conducting Post-Disaster Needs Assessment, prepared by the World Bank’s Global facility for Disaster Reduction and Recovery (GFDRR).5
Summary of Recovery and Reconstruction Needs
The total financial requirements for post-disaster eco-nomic recovery and disaster-resilient reconstruction in connection with the 2012 Nigerian floods have been estimated for all affected sectors of economic and so-cial activity in the twelve most affected states. Human development recovery needs at the community level and disaster risk reduction (DRR) needs are to be add-ed to these recovery and reconstruction requirements. A total amount of N1,138 billion (or its equivalent of US$7.1 billion) is required to cover these needs. Of that amount, N253.8 billion (US$1.6 billion) is required to ensure economic recovery in all affected sectors and N884 billion (US$5.5 billion) more are required to fi-nance disaster-resilient reconstruction of assets that were destroyed, as shown in Table ES-3. A combination of domestic funding and international support may be required to meet these financial requirements.
5 See Damage, Loss and Needs Assessment Guidance Notes, Volume 3, Global Facility for Disaster Reduction and Recovery (GFDRR), The World Bank, Washington, DC, 2010.
NIGERIA Post-Disaster Needs Assessment 2012 Floodsxxviii
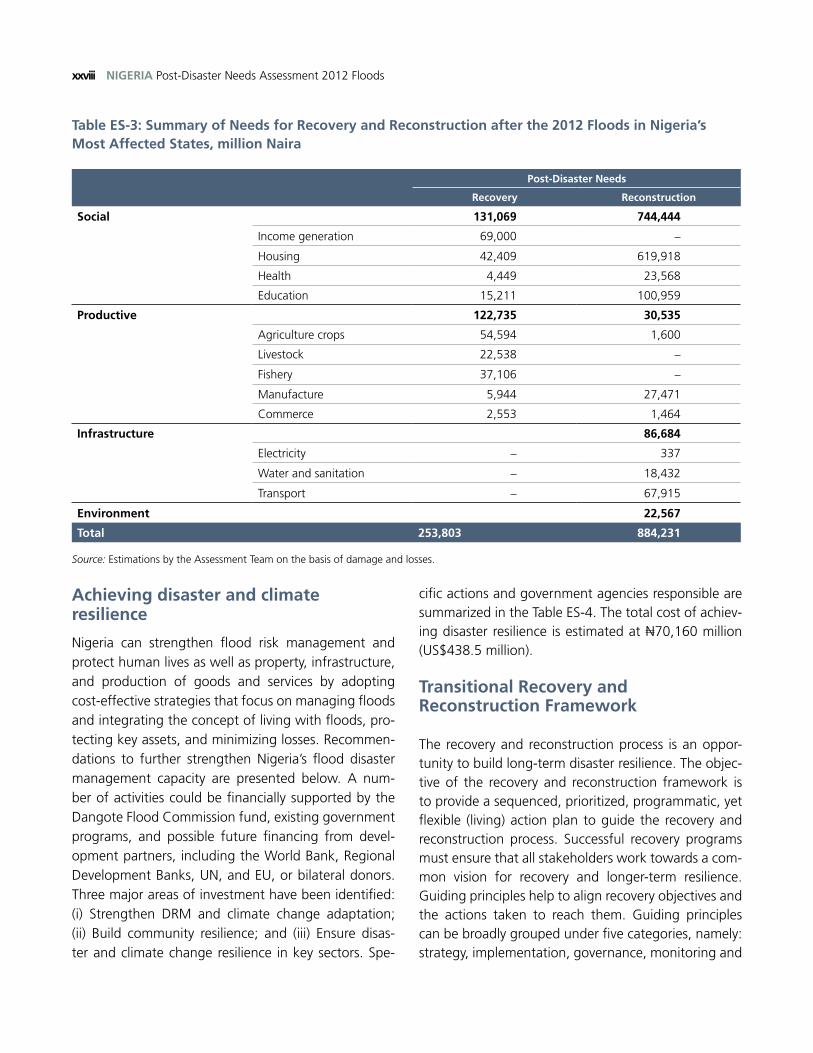
Table ES-3: Summary of Needs for Recovery and Reconstruction after the 2012 Floods in Nigeria’s Most Affected States, million Naira
Post-Disaster Needs
Recovery Reconstruction
Social 131,069 744,444
Income generation 69,000 –
Housing 42,409 619,918
Health 4,449 23,568
Education 15,211 100,959
Productive 122,735 30,535
Agriculture crops 54,594 1,600
Livestock 22,538 –
Fishery 37,106 –
Manufacture 5,944 27,471
Commerce 2,553 1,464
Infrastructure 86,684
Electricity – 337
Water and sanitation – 18,432
Transport – 67,915
Environment 22,567
Total 253,803 884,231
Source: Estimations by the Assessment Team on the basis of damage and losses.
Achieving disaster and climate resilience
Nigeria can strengthen flood risk management and protect human lives as well as property, infrastructure, and production of goods and services by adopting cost-effective strategies that focus on managing floods and integrating the concept of living with floods, pro-tecting key assets, and minimizing losses. Recommen-dations to further strengthen Nigeria’s flood disaster management capacity are presented below. A num-ber of activities could be financially supported by the Dangote Flood Commission fund, existing government programs, and possible future financing from devel-opment partners, including the World Bank, Regional Development Banks, UN, and EU, or bilateral donors. Three major areas of investment have been identified: (i) Strengthen DRM and climate change adaptation; (ii) Build community resilience; and (iii) Ensure disas-ter and climate change resilience in key sectors. Spe-
cific actions and government agencies responsible are summarized in the Table ES-4. The total cost of achiev-ing disaster resilience is estimated at N70,160 million (US$438.5 million).
Transitional Recovery and Reconstruction Framework
The recovery and reconstruction process is an oppor-tunity to build long-term disaster resilience. The objec-tive of the recovery and reconstruction framework is to provide a sequenced, prioritized, programmatic, yet flexible (living) action plan to guide the recovery and reconstruction process. Successful recovery programs must ensure that all stakeholders work towards a com-mon vision for recovery and longer-term resilience. Guiding principles help to align recovery objectives and the actions taken to reach them. Guiding principles can be broadly grouped under five categories, namely: strategy, implementation, governance, monitoring and
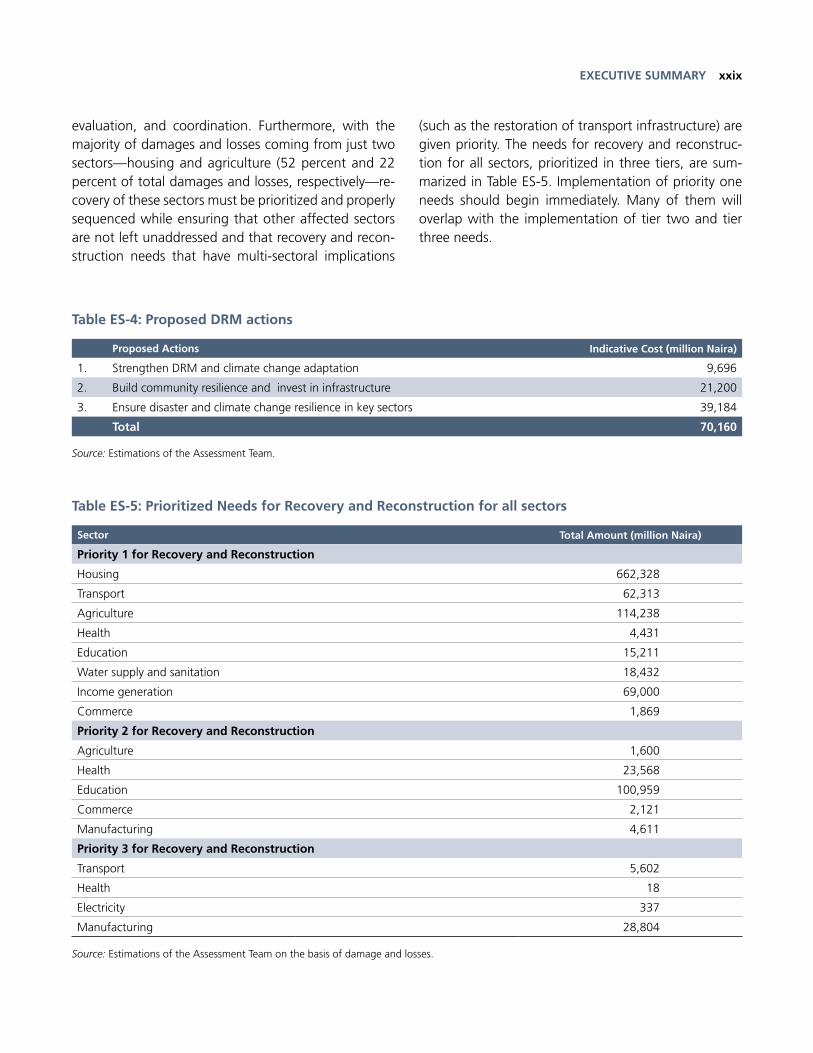
xxixEXECUTIVE SUMMARY
evaluation, and coordination. Furthermore, with the majority of damages and losses coming from just two sectors—housing and agriculture (52 percent and 22 percent of total damages and losses, respectively—re-covery of these sectors must be prioritized and properly sequenced while ensuring that other affected sectors are not left unaddressed and that recovery and recon-struction needs that have multi-sectoral implications
(such as the restoration of transport infrastructure) are given priority. The needs for recovery and reconstruc-tion for all sectors, prioritized in three tiers, are sum-marized in Table ES-5. Implementation of priority one needs should begin immediately. Many of them will overlap with the implementation of tier two and tier three needs.
Table ES-4: Proposed DRM actions
Proposed Actions Indicative Cost (million Naira)
1. Strengthen DRM and climate change adaptation 9,696
2. Build community resilience and invest in infrastructure 21,200
3. Ensure disaster and climate change resilience in key sectors 39,184
Total 70,160
Source: Estimations of the Assessment Team.
Table ES-5: Prioritized Needs for Recovery and Reconstruction for all sectors
Sector Total Amount (million Naira)
Priority 1 for Recovery and Reconstruction
Housing 662,328
Transport 62,313
Agriculture 114,238
Health 4,431
Education 15,211
Water supply and sanitation 18,432
Income generation 69,000
Commerce 1,869
Priority 2 for Recovery and Reconstruction
Agriculture 1,600
Health 23,568
Education 100,959
Commerce 2,121
Manufacturing 4,611
Priority 3 for Recovery and Reconstruction
Transport 5,602
Health 18
Electricity 337
Manufacturing 28,804
Source: Estimations of the Assessment Team on the basis of damage and losses.
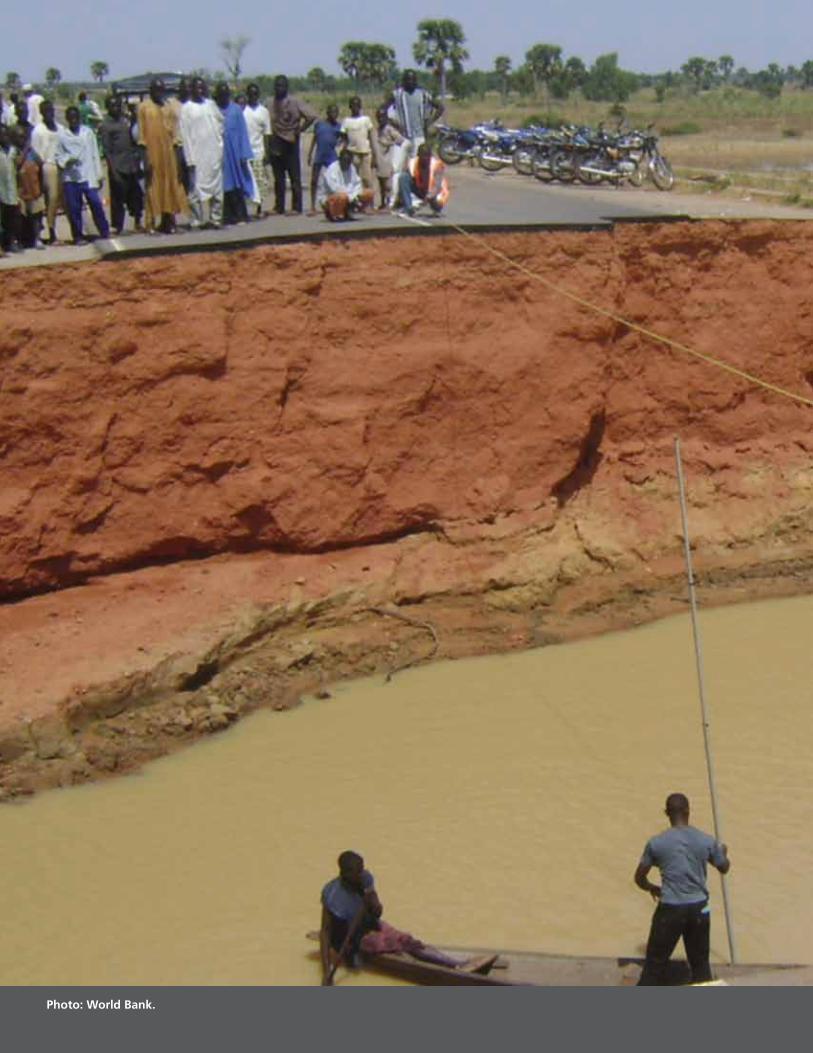
NIGERIA Post-Disaster Needs Assessment 2012 Floodsxxx
Photo: World Bank.
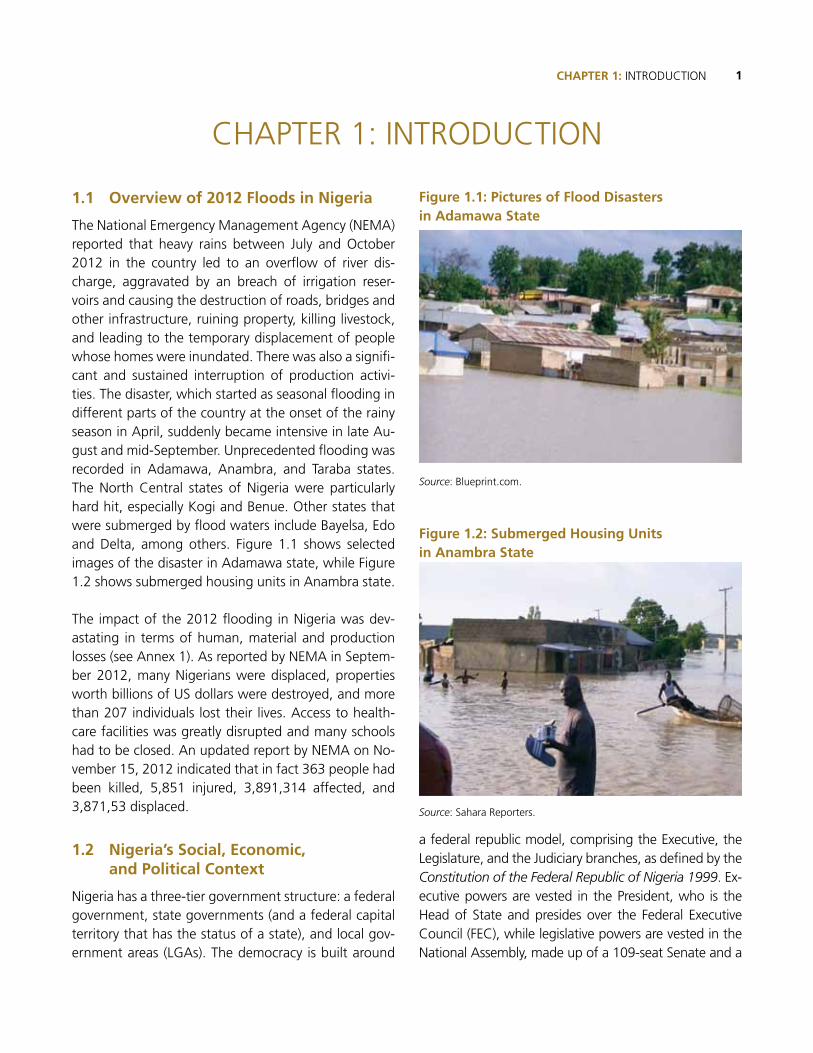
1CHAPTER 1: INTRODUCTION
1.1 Overview of 2012 Floods in Nigeria
The National Emergency Management Agency (NEMA) reported that heavy rains between July and October 2012 in the country led to an overflow of river dis-charge, aggravated by an breach of irrigation reser-voirs and causing the destruction of roads, bridges and other infrastructure, ruining property, killing livestock, and leading to the temporary displacement of people whose homes were inundated. There was also a signifi-cant and sustained interruption of production activi-ties. The disaster, which started as seasonal flooding in different parts of the country at the onset of the rainy season in April, suddenly became intensive in late Au-gust and mid-September. Unprecedented flooding was recorded in Adamawa, Anambra, and Taraba states. The North Central states of Nigeria were particularly hard hit, especially Kogi and Benue. Other states that were submerged by flood waters include Bayelsa, Edo and Delta, among others. Figure 1.1 shows selected images of the disaster in Adamawa state, while Figure 1.2 shows submerged housing units in Anambra state.
The impact of the 2012 flooding in Nigeria was dev-astating in terms of human, material and production losses (see Annex 1). As reported by NEMA in Septem-ber 2012, many Nigerians were displaced, properties worth billions of US dollars were destroyed, and more than 207 individuals lost their lives. Access to health-care facilities was greatly disrupted and many schools had to be closed. An updated report by NEMA on No-vember 15, 2012 indicated that in fact 363 people had been killed, 5,851 injured, 3,891,314 affected, and 3,871,53 displaced.
1.2 Nigeria’s Social, Economic, and Political Context
Nigeria has a three-tier government structure: a federal government, state governments (and a federal capital territory that has the status of a state), and local gov-ernment areas (LGAs). The democracy is built around
Figure 1.1: Pictures of Flood Disasters in Adamawa State
Source: Blueprint.com.
Figure 1.2: Submerged Housing Units in Anambra State
Source: Sahara Reporters.
a federal republic model, comprising the Executive, the Legislature, and the Judiciary branches, as defined by the Constitution of the Federal Republic of Nigeria 1999. Ex-ecutive powers are vested in the President, who is the Head of State and presides over the Federal Executive Council (FEC), while legislative powers are vested in the National Assembly, made up of a 109-seat Senate and a
CHAPTER 1: INTRODUCTION
NIGERIA Post-Disaster Needs Assessment 2012 Floods2
360-seat House of Representatives. Judicial powers rest with the courts, the highest of which is the Supreme Court of Nigeria; others are the Appellate Court and the Federal High Courts of Justice. The Federal Judiciary is headed by the Chief Justice of the Federation (CJN). The executive and legislative arms are elected by popular vote for a term of four years. State governments consist of an elected governor, deputy governor, and a directly elected State House of Assembly. A minister appointed by the President heads the Federal Capital Territory. The Federal Executive Council (FEC) is the highest decision-making organ of government and is supported by a fed-eral civil service. The federal civil service has line ministries and parastatals principally responsible for implementing the policy decisions of the FEC. The Secretary to the Fed-eral Government (SGF) is the secretary of the FEC. The Federal Legislature is bi-cameral, consisting of a Senate (members of which are elected on the basis of equality of states), and a Federal House of Representatives, (where members are elected on the basis of population size).
At the state level, the Executive Council (SEC) is com-posed of the Governor and State Commissioners. The SEC’s policy decisions are implemented by a supportive state civil service, composed of line ministries and para-statals. The Secretary to the State Government (SSG) is the secretary of the SEC. The State Legislature is unicam-eral, having only a House of Assembly, to which members are elected on the basis of population. The State Judiciary is made up of High Courts of Justice, Magistrate Courts, and the Customary Courts. The State Judiciary is headed by the State Chief Judge (CJ). At the Local Government Area (LGA) level, the executive (LEC) is composed of the Chairman and Supervisory Councilors, supported by an LGA civil service. The LGA Legislature is unicameral, be-ing composed of an LGA Legislative Council made up of councilors elected on population basis.
The security of lives and property and corruption are the main social issues confronting Nigeria. Corruption is said to have eaten deep into the fabric of the Nigeri-an economy, as it not only truncates economic growth but also creates a negative impression of the country in the comity of nations. However, the federal govern-ment is making a tremendous effort to fight corrup-
tion, especially with the help of institutions established for this specific purpose, namely the Independent Cor-rupt Practices Commission (ICPC) and Economic and Financial Crimes Commission (EFCC).
Population and Poverty
Nigeria is the most populous country in Africa, with population of 160 million people. Although the Nige-rian economy is growing, the proportion of Nigerians living in poverty is increasing every year and poverty is widespread. In 2004, Nigeria’s relative poverty mea-surement stood at 54.4 percent, but increased to 69 percent (or 112,518,507 Nigerians) in 2010 (NBS 2010). The North West and North East geo-political zones recorded the highest poverty rates in the coun-try, with 77.7 percent and 76.3 percent respectively in 2010, while the South West geo-political zone record-ed the lowest, at 59.1 percent.
Nigeria’s Economic Profile
Available data on Nigeria’s economy shows that the primary production activities of agriculture and mining and quarrying (including crude oil and gas) account for around 65 percent of the real gross output and provide over 80 percent of government revenues. In addition, primary production activities account for over 90 percent of foreign exchange earnings and 75 percent of employ-ment. In contrast, secondary activities such as manufac-turing and building and construction—which traditionally have greater potential for broadening the productive base of the economy and generating sustainable foreign exchange earnings and government revenues—account for a mere 4.1 percent and 2.0 percent of gross output respectively. The low income-earning labor force consti-tutes about 39.6 percent of the population, with women making up less than 37 percent of that force. Notably too, traditional agriculture, the service sector, and trading re-main the main generators of primary income. Nigeria re-portedly is pursuing the ambitious goal of becoming one of the top twenty economies in the world by 2020. GDP growth in Nigeria was estimated at 5.5 percent in 2010 and is expected to remain strong in the coming years. According to the Economist Intelligence Unit (EIU), GDP
3CHAPTER 1: INTRODUCTION
growth in Nigeria will average 6.5 percent between 2010 and 2015. This growth will be driven by an increase in oil production, largely supplied by offshore production wells, as well as by a commitment from the Federal Govern-ment to emphasize much-needed infrastructure improve-ments in the coming years. The expenditure on the gross domestic product (GDP) stood at N37,936,747.89 million in 2011 from N34,494,582.71 million, N25,236,056.37 million, N24,665,244.17 million and N20,940,910.90 million recorded in 2010, 2009, 2008, and 2007, respec-tively. The annual rate of inflation is now projected at 10.5 percent.
Nigeria has one of the fastest growing telecommu-nications markets in the world, with major emerging market operators (such as Mobile Telephone Netwrok (MTN), Etisalat, Airtel, and Globacom) establishing their largest and most profitable centers in the coun-try. The government has recently begun expanding this infrastructure to space-based communications. Nigeria has a space satellite that is monitored at the Nigerian National Space Research and Development Agency (NASRDA) Headquarters in Abuja. Nigeria also has a wide array of underexploited mineral re-sources, which include natural gas, coal, bauxite, tan-talite, gold, tin, iron ore, limestone, niobium, lead and zinc.. Despite having huge deposits of these natural resources, the mining industry in Nigeria is still in its infancy. Main cottage industries around the country produce confectionery, woodwork, leather, textile and plastic products.
1.3 First Responses by Government and Development Partners to the Flood Disaster
The 2012 flood disaster that ravaged many states in Nigeria drew responses from the public, federal, state and local governments, civil society organizations, and international development partners. The responses were generally in the form of immediate humanitarian assis-tance, spontaneous recovery, and organized recovery.
At the onset of the disaster, the State Emergency Man-agement Agencies (SEMA), the National Emergency
Management Agency (NEMA), civil society organiza-
tions such as the Red Cross, along with international
development agencies—particularly the World Bank
and the United Nations working with the Office for
the Coordination of Humanitarian Affairs (OCHA)—
provided emergency humanitarian assistance to the
affected population. Some humanitarian responses in-
clude the following:
■n Immediate evacuation of the affected population
away from flooded areas;
■n Relocation of the affected population (Internally
Displaced Persons - IDPs) in temporary shelters/
accommodation, mainly schools and other public
buildings;
■n Provision of non-food items (NFIs) such as mats,
blankets, and bedding to the affected population;
■n Provision of food, medical and other humanitarian
assistance;
■n Re-opening of roads to link the towns/settlements
that were cut off; and
■n Erection of temporary shelters, at higher grounds, by
the affected people themselves.
For example, the International Federation of Red Cross
and Red Crescent Societies distributed non-food and
emergency shelter items (buckets, blankets, sleep-
ing mats, jerry cans, tarpaulins, shelter kits) to a total
of 11,977 beneficiaries; conducted sensitization cam-
paigns in 11 targeted states (Adamawa, Taraba, Plateau,
Benue, Kogi, Niger, Edo, Anambra, Delta, Bayelsa, and
Rivers) in an effort to prevent epidemics and promote
better health; distributed 2,245 mosquito nets to 15
communities located in Edo, Kogi, Jigawa, Katsina, and
other states; mobilized and distributed 338 Low Flow
Dispensary filters (for hand washing) in Illushi, Ifeku Is-
land, and Udaba communities (Edo state); distributed
8,926 pieces of soap in nine states as well as 7,608
Aquatabs in six states, among others (IFRC 2012) .6
6 International Federation of Red Cross and Red Crescent Societies (IFRC). 2012. Emergency Appeal: Nigeria Floods.
NIGERIA Post-Disaster Needs Assessment 2012 Floods4
Some of the schools in the affected areas that were sit-uated in relatively safe locations were eventually used as temporary camps for Internally Displaced Persons (IDPs). Clinics were established in IDP settlements. Also, measles vaccination campaigns were carried out in IDP settlements and IDPs received long lasting insecticidal nets, household water filters, and basic water kits. The federal government subsequently announced the im-mediate closure of affected roads and the diversion of traffic to alternative routes, such as Ilorin-Jebba-Mok-wa Road for southwest/northern-bound motorists and the Makurdi-Lafia-Akwanga-Abuja Road for the south-east/northern-bound vehicular traffic, and vice versa. The government further embarked on the immediate construction of a bypass road to the flooded Abuja-Lokoja highway. The Federal Ministry of Agriculture and Rural Development, as part of the federal govern-ment’s food relief program meant to cushion the effect of the flood disaster, distributed 40,000 metric tons of assorted foods in the country’s different states.
In tackling the immediate negative effects on educa-tion, a number of states temporarily integrated pupils from schools affected by flooding into other schools. In other cases, the state governments provided alter-native buildings or rented accommodations for school-ing. To identify schools that had been affected and possible actions to be taken, some states initiated the formation of flood relief distribution committees in the state Ministries of Education. Also, some state govern-ments released funds for the fumigation of affected school buildings to avert disease outbreaks. In addi-tion, some non-governmental organizations contrib-uted to the education response. The United Nations Children’s Fund (UNICEF) provided school tents, plastic chairs, mats, and tables for the establishment of tem-porary learning spaces and equipped them with teach-ing, learning, and recreational materials.
Furthermore, President Jonathan declared the 2012 floods a national disaster in a nationwide broadcast, during which he announced the setting aside of N17.6 billion (roughly US$110 million) as direct cash aid to affected states. In addition, a Committee on Flood Relief and Rehabilitation was inaugurated. The Chair-
man, a highly respected industrialist, has pledged that the committee has set for itself a target of raising N100 billion from the public and private sectors to assist the government in dealing with the effects of the floods. Affected states have also set up special committees.
Furthermore, the federal government contacted experts on disaster management through the World Bank, the United Nations, and other organizations to train Nigeri-ans in the modalities of conducting a Post–Disaster Needs Assessment (PDNA), to assist the country in achieving recovery and reconstruction. The training sessions were conducted by experts from the aforementioned organi-zations, under the supervision of NEMA. Trainees were then sent to the various states affected by the disaster to collect available information concerning its effects.
1.4 Hydro-Meteorological Analyses
1.4.1 Nigerian Weather Conditions in 2012
Synoptic features indicated dominance of the subtropi-cal high-pressure systems at the beginning of the year, leading to the rising of dust particles to the surface of the Sahara Desert and their subsequent transportation toward the south, resulting in the reduction of hori-zontal visibility across the country. The southwesterly winds gained momentum at the coast and progressive-ly moved inland at the end of the first quarter of the year. The monsoon trough remained very active across the country until the end of the third quarter, which brought about enhanced rainfall and thunderstorms, flash flooding, and its associated impact.
The Inter-Tropical Discontinuity (ITD), which is the line where dry and moist winds meet, maintained an aver-age position of latitude 7.2oN in January and moved northwards thereafter to latitude 11.1oN by the end of February, instead of taking a climatologically south-ward movement. This development contributed to February’s destructive storm over Lagos and adjoining areas in Ogun state. From March 2012, the ITD com-menced its seasonal northward movement and reached the north limit of latitude 18.8oN in the second dekad of August, retreating southwards to attain an average position of latitude 7.6oN in December (see Figure 1.3).
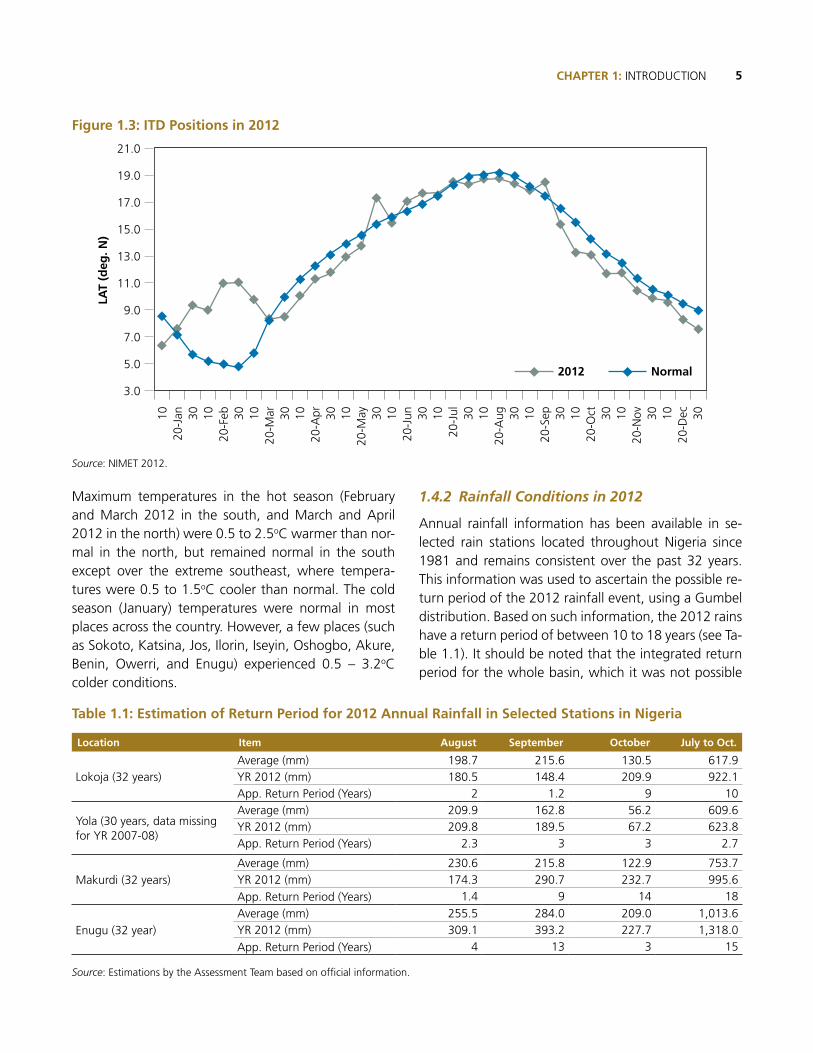
5CHAPTER 1: INTRODUCTION
Figure 1.3: ITD Positions in 2012
Source: NIMET 2012.
Maximum temperatures in the hot season (February and March 2012 in the south, and March and April 2012 in the north) were 0.5 to 2.5oC warmer than nor-mal in the north, but remained normal in the south except over the extreme southeast, where tempera-tures were 0.5 to 1.5oC cooler than normal. The cold season (January) temperatures were normal in most places across the country. However, a few places (such as Sokoto, Katsina, Jos, Ilorin, Iseyin, Oshogbo, Akure, Benin, Owerri, and Enugu) experienced 0.5 – 3.2oC colder conditions.
1.4.2 Rainfall Conditions in 2012
Annual rainfall information has been available in se-lected rain stations located throughout Nigeria since 1981 and remains consistent over the past 32 years. This information was used to ascertain the possible re-turn period of the 2012 rainfall event, using a Gumbel distribution. Based on such information, the 2012 rains have a return period of between 10 to 18 years (see Ta-ble 1.1). It should be noted that the integrated return period for the whole basin, which it was not possible
21.0
19.0
17.0
15.0
13.0
11.0
9.0
7.0
5.0
3.0
1020
-Jan 30 10
20-F
eb 30 1020
-Mar 30 10
20-A
pr 30 1020
-May 30 10
20-J
un 30 1020
-Jul 30 10
20-A
ug 30 1020
-Sep 30 10
20-O
ct 30 1020
-Nov 30 10
20-D
ec 30
2012 Normal
LAT
(deg
. N)
Table 1.1: Estimation of Return Period for 2012 Annual Rainfall in Selected Stations in Nigeria
Location Item August September October July to Oct.
Lokoja (32 years)Average (mm) 198.7 215.6 130.5 617.9YR 2012 (mm) 180.5 148.4 209.9 922.1App. Return Period (Years) 2 1.2 9 10
Yola (30 years, data missing for YR 2007-08)
Average (mm) 209.9 162.8 56.2 609.6YR 2012 (mm) 209.8 189.5 67.2 623.8App. Return Period (Years) 2.3 3 3 2.7
Makurdi (32 years)Average (mm) 230.6 215.8 122.9 753.7YR 2012 (mm) 174.3 290.7 232.7 995.6
App. Return Period (Years) 1.4 9 14 18
Enugu (32 year) Average (mm) 255.5 284.0 209.0 1,013.6YR 2012 (mm) 309.1 393.2 227.7 1,318.0
App. Return Period (Years) 4 13 3 15
Source: Estimations by the Assessment Team based on official information.
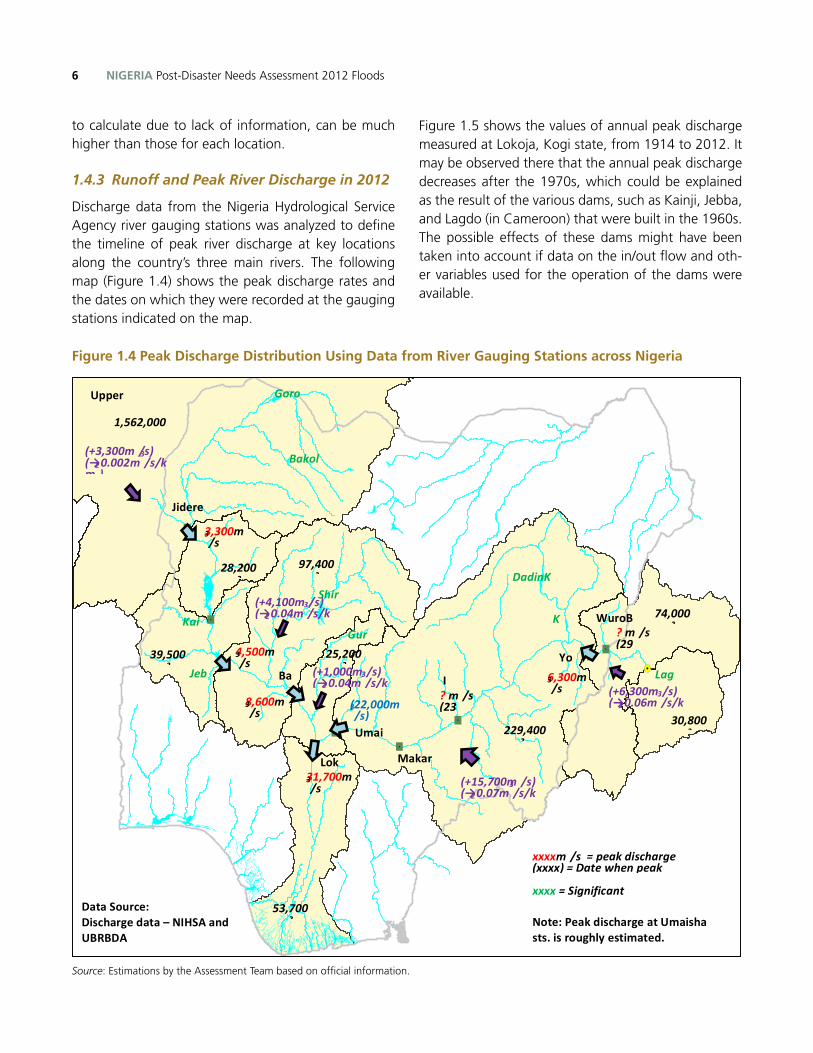
NIGERIA Post-Disaster Needs Assessment 2012 Floods6
to calculate due to lack of information, can be much higher than those for each location.
1.4.3 Runoff and Peak River Discharge in 2012
Discharge data from the Nigeria Hydrological Service Agency river gauging stations was analyzed to define the timeline of peak river discharge at key locations along the country’s three main rivers. The following map (Figure 1.4) shows the peak discharge rates and the dates on which they were recorded at the gauging stations indicated on the map.
Figure 1.5 shows the values of annual peak discharge measured at Lokoja, Kogi state, from 1914 to 2012. It may be observed there that the annual peak discharge decreases after the 1970s, which could be explained as the result of the various dams, such as Kainji, Jebba, and Lagdo (in Cameroon) that were built in the 1960s. The possible effects of these dams might have been taken into account if data on the in/out flow and oth-er variables used for the operation of the dams were available.
Jidere Bode
Kainji
Shiroro
DadinKowa
Jebba
Lagdo
WuroBoki
Yola I
b
Makarudi
Umaisha
Lokoja
Baro
1,562,000k
28,200km
2
97,400km
2
39,500km
2
3,300m3/s (9 Sep)
4,500m3/s (14
8,600m3/s (25
25,200km
2
Gurara
Goronyo
Bakolori
Kir
229,400km
2
74,000km
2
30,800km
2
53,700km
2
6,300m3/s (?)
? m3/s
(29 Aug)
? m3/s
(23 Sep)
(22,000m3/s) (?)
(+1,000m3/s)
(→0.04m3/s/k
m2)
(+4,100m3/s)
(→0.04m3/s/k
m2)
31,700m3/s (29 Sep)
(+15,700m
3/s)
(→0.07m3/s/k
m2)
(+6,300m3/s)
(→0.06m3/s/k
m2)
(+3,300m3/s)
(→0.002m3/s/k
m2)
Upper Niger
xxxxm3/s = peak discharge
(xxxx) = Date when peak discharge occur xxxx = Significant reservoir Note: Peak discharge at Umaisha sts. is roughly estimated.
Data Source: Discharge data – NIHSA and UBRBDA Catchment area – JICA
Figure 1.4 Peak Discharge Distribution Using Data from River Gauging Stations across Nigeria
Source: Estimations by the Assessment Team based on official information.
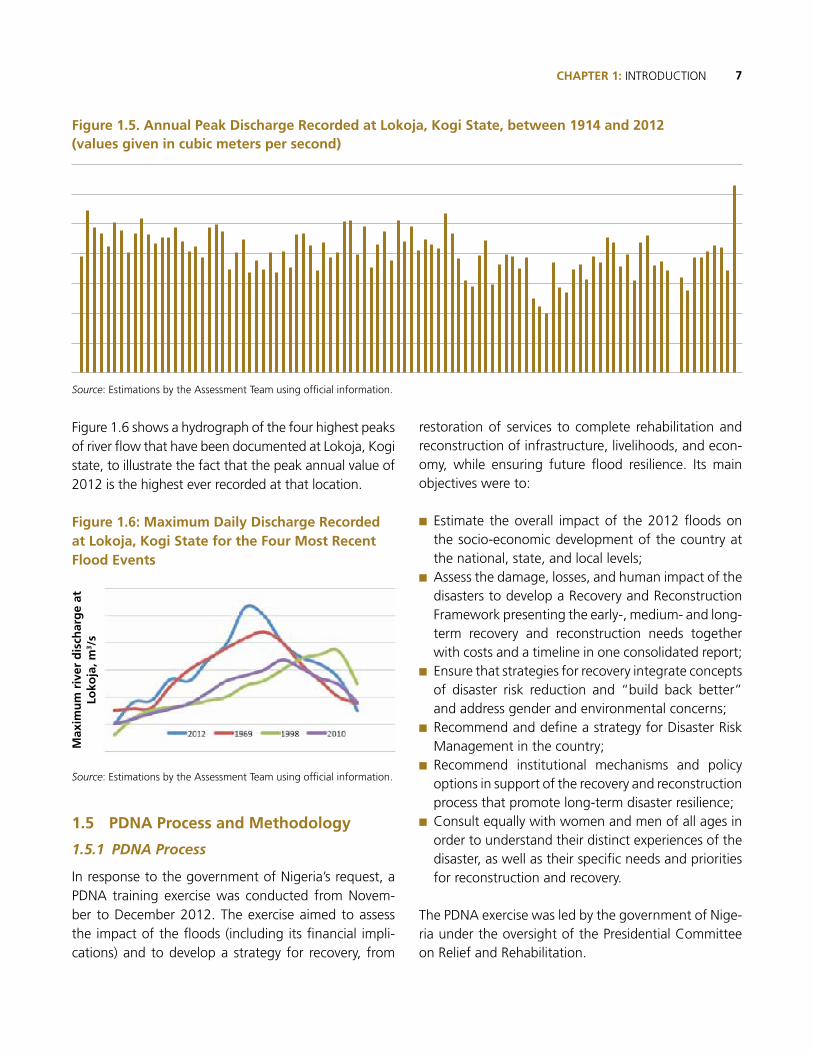
7CHAPTER 1: INTRODUCTION
Figure 1.5. Annual Peak Discharge Recorded at Lokoja, Kogi State, between 1914 and 2012(values given in cubic meters per second)
Source: Estimations by the Assessment Team using official information.
Figure 1.6 shows a hydrograph of the four highest peaks of river flow that have been documented at Lokoja, Kogi state, to illustrate the fact that the peak annual value of 2012 is the highest ever recorded at that location.
Figure 1.6: Maximum Daily Discharge Recorded at Lokoja, Kogi State for the Four Most Recent Flood Events
Source: Estimations by the Assessment Team using official information.
1.5 PDNA Process and Methodology
1.5.1 PDNA Process
In response to the government of Nigeria’s request, a PDNA training exercise was conducted from Novem-ber to December 2012. The exercise aimed to assess the impact of the floods (including its financial impli-cations) and to develop a strategy for recovery, from
restoration of services to complete rehabilitation and reconstruction of infrastructure, livelihoods, and econ-omy, while ensuring future flood resilience. Its main objectives were to:
■n Estimate the overall impact of the 2012 floods on the socio-economic development of the country at the national, state, and local levels;
■n Assess the damage, losses, and human impact of the disasters to develop a Recovery and Reconstruction Framework presenting the early-, medium- and long-term recovery and reconstruction needs together with costs and a timeline in one consolidated report;
■n Ensure that strategies for recovery integrate concepts of disaster risk reduction and “build back better” and address gender and environmental concerns;
■n Recommend and define a strategy for Disaster Risk Management in the country;
■n Recommend institutional mechanisms and policy options in support of the recovery and reconstruction process that promote long-term disaster resilience;
■n Consult equally with women and men of all ages in order to understand their distinct experiences of the disaster, as well as their specific needs and priorities for reconstruction and recovery.
The PDNA exercise was led by the government of Nige-ria under the oversight of the Presidential Committee on Relief and Rehabilitation.
Max
imu
m r
iver
dis
char
ge
at
Loko
ja, m
3 /s
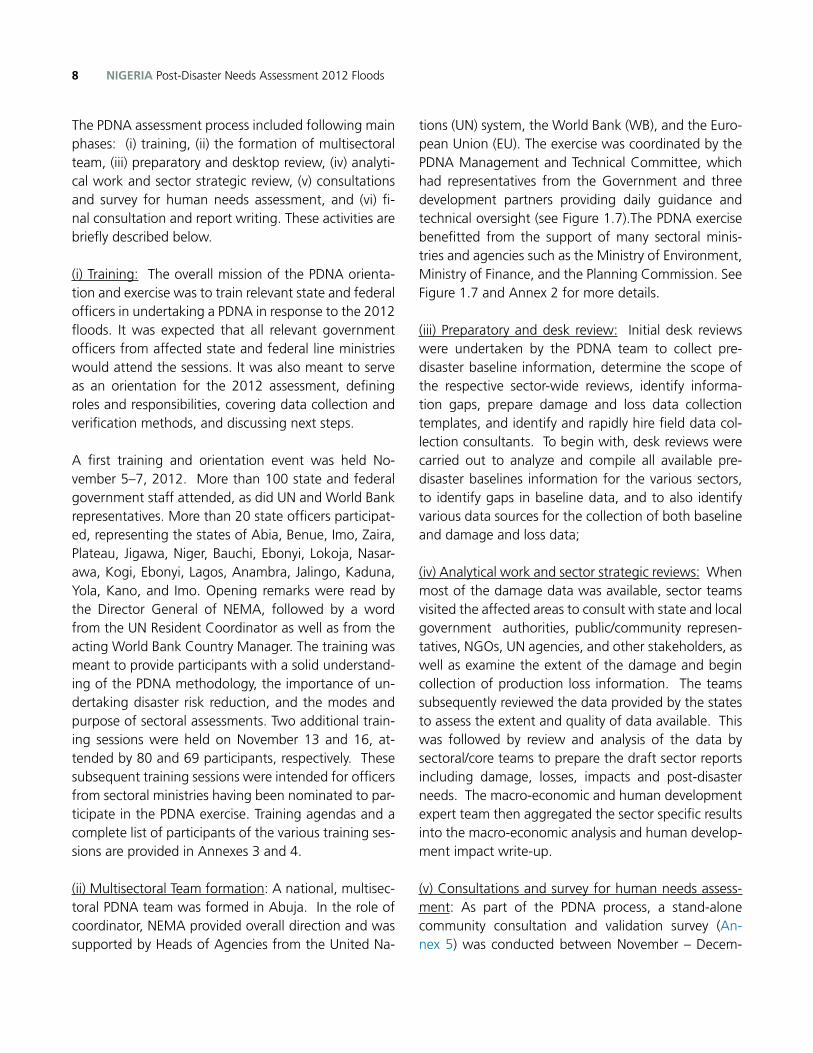
NIGERIA Post-Disaster Needs Assessment 2012 Floods8
The PDNA assessment process included following main phases: (i) training, (ii) the formation of multisectoral team, (iii) preparatory and desktop review, (iv) analyti-cal work and sector strategic review, (v) consultations and survey for human needs assessment, and (vi) fi-nal consultation and report writing. These activities are briefly described below.
(i) Training: The overall mission of the PDNA orienta-tion and exercise was to train relevant state and federal officers in undertaking a PDNA in response to the 2012 floods. It was expected that all relevant government officers from affected state and federal line ministries would attend the sessions. It was also meant to serve as an orientation for the 2012 assessment, defining roles and responsibilities, covering data collection and verification methods, and discussing next steps.
A first training and orientation event was held No-vember 5–7, 2012. More than 100 state and federal government staff attended, as did UN and World Bank representatives. More than 20 state officers participat-ed, representing the states of Abia, Benue, Imo, Zaira, Plateau, Jigawa, Niger, Bauchi, Ebonyi, Lokoja, Nasar-awa, Kogi, Ebonyi, Lagos, Anambra, Jalingo, Kaduna, Yola, Kano, and Imo. Opening remarks were read by the Director General of NEMA, followed by a word from the UN Resident Coordinator as well as from the acting World Bank Country Manager. The training was meant to provide participants with a solid understand-ing of the PDNA methodology, the importance of un-dertaking disaster risk reduction, and the modes and purpose of sectoral assessments. Two additional train-ing sessions were held on November 13 and 16, at-tended by 80 and 69 participants, respectively. These subsequent training sessions were intended for officers from sectoral ministries having been nominated to par-ticipate in the PDNA exercise. Training agendas and a complete list of participants of the various training ses-sions are provided in Annexes 3 and 4.
(ii) Multisectoral Team formation: A national, multisec-toral PDNA team was formed in Abuja. In the role of coordinator, NEMA provided overall direction and was supported by Heads of Agencies from the United Na-
tions (UN) system, the World Bank (WB), and the Euro-pean Union (EU). The exercise was coordinated by the PDNA Management and Technical Committee, which had representatives from the Government and three development partners providing daily guidance and technical oversight (see Figure 1.7).The PDNA exercise benefitted from the support of many sectoral minis-tries and agencies such as the Ministry of Environment, Ministry of Finance, and the Planning Commission. See Figure 1.7 and Annex 2 for more details.
(iii) Preparatory and desk review: Initial desk reviews were undertaken by the PDNA team to collect pre-disaster baseline information, determine the scope of the respective sector-wide reviews, identify informa-tion gaps, prepare damage and loss data collection templates, and identify and rapidly hire field data col-lection consultants. To begin with, desk reviews were carried out to analyze and compile all available pre-disaster baselines information for the various sectors, to identify gaps in baseline data, and to also identify various data sources for the collection of both baseline and damage and loss data;
(iv) Analytical work and sector strategic reviews: When most of the damage data was available, sector teams visited the affected areas to consult with state and local government authorities, public/community represen-tatives, NGOs, UN agencies, and other stakeholders, as well as examine the extent of the damage and begin collection of production loss information. The teams subsequently reviewed the data provided by the states to assess the extent and quality of data available. This was followed by review and analysis of the data by sectoral/core teams to prepare the draft sector reports including damage, losses, impacts and post-disaster needs. The macro-economic and human development expert team then aggregated the sector specific results into the macro-economic analysis and human develop-ment impact write-up.
(v) Consultations and survey for human needs assess-ment: As part of the PDNA process, a stand-alone community consultation and validation survey (An-nex 5) was conducted between November – Decem-
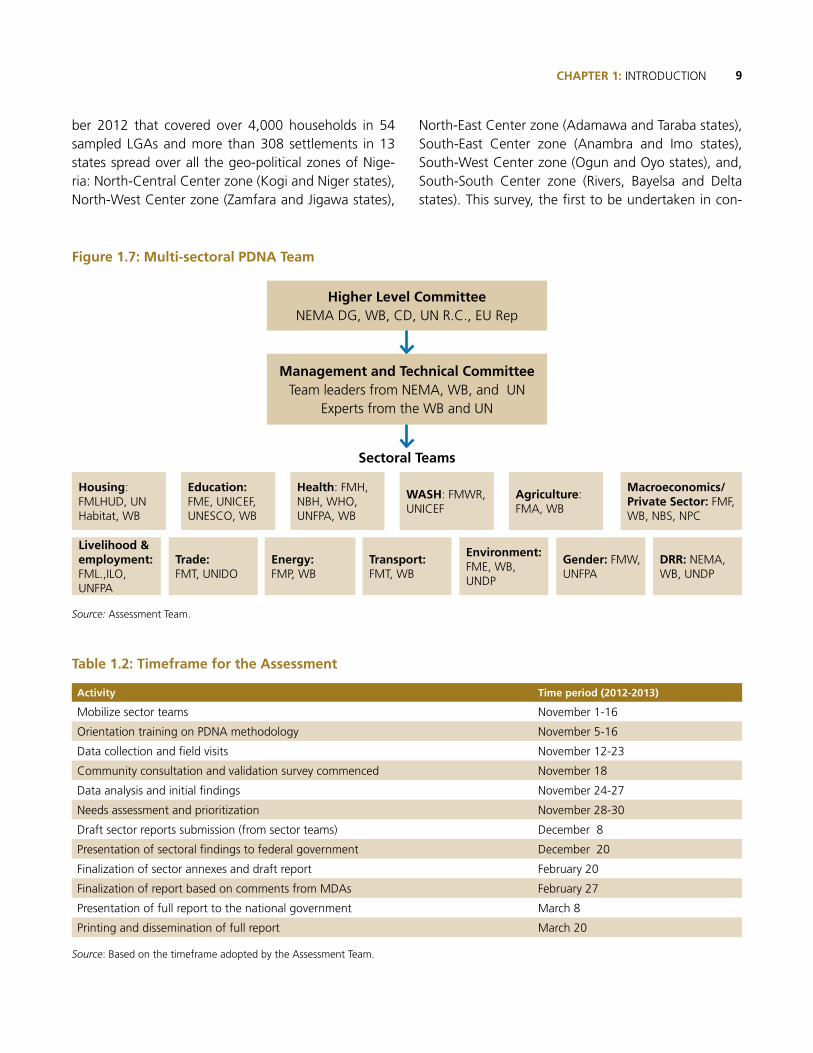
9CHAPTER 1: INTRODUCTION
ber 2012 that covered over 4,000 households in 54 sampled LGAs and more than 308 settlements in 13 states spread over all the geo-political zones of Nige-ria: North-Central Center zone (Kogi and Niger states), North-West Center zone (Zamfara and Jigawa states),
North-East Center zone (Adamawa and Taraba states), South-East Center zone (Anambra and Imo states), South-West Center zone (Ogun and Oyo states), and, South-South Center zone (Rivers, Bayelsa and Delta states). This survey, the first to be undertaken in con-
Macroeconomics/Private Sector: FMF, WB, NBS, NPC
Gender: FMW, UNFPA
DRR: NEMA, WB, UNDP
WASH: FMWR, UNICEF
Transport:FMT, WB
Education: FME, UNICEF, UNESCO, WB
Trade:FMT, UNIDO
Agriculture: FMA, WB
Environment: FME, WB, UNDP
Health: FMH, NBH, WHO, UNFPA, WB
Energy:FMP, WB
Housing: FMLHUD, UN Habitat, WB
Livelihood & employment: FML.,ILO, UNFPA
Higher Level CommitteeNEMA DG, WB, CD, UN R.C., EU Rep
Management and Technical CommitteeTeam leaders from NEMA, WB, and UN
Experts from the WB and UN
Sectoral Teams
Figure 1.7: Multi-sectoral PDNA Team
Source: Assessment Team.
Table 1.2: Timeframe for the Assessment
Activity Time period (2012-2013)
Mobilize sector teams November 1-16
Orientation training on PDNA methodology November 5-16
Data collection and field visits November 12-23
Community consultation and validation survey commenced November 18
Data analysis and initial findings November 24-27
Needs assessment and prioritization November 28-30
Draft sector reports submission (from sector teams) December 8
Presentation of sectoral findings to federal government December 20
Finalization of sector annexes and draft report February 20
Finalization of report based on comments from MDAs February 27
Presentation of full report to the national government March 8
Printing and dissemination of full report March 20
Source: Based on the timeframe adopted by the Assessment Team.
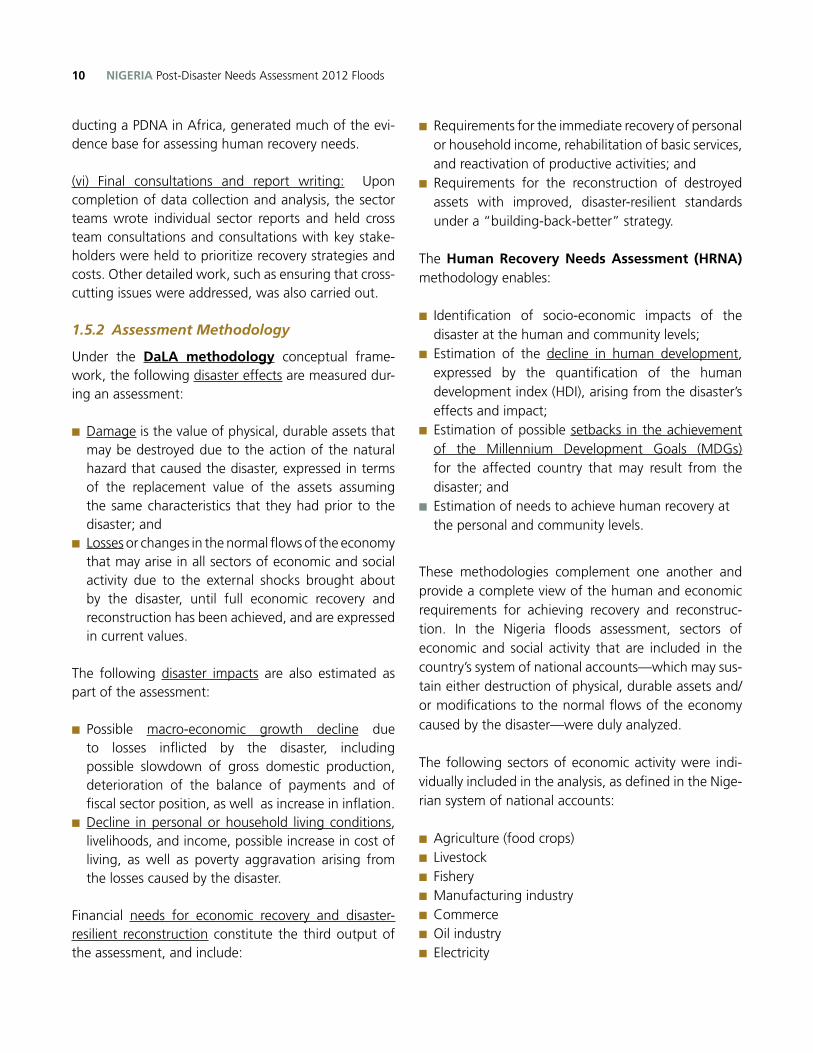
NIGERIA Post-Disaster Needs Assessment 2012 Floods10
ducting a PDNA in Africa, generated much of the evi-dence base for assessing human recovery needs.
(vi) Final consultations and report writing: Upon completion of data collection and analysis, the sector teams wrote individual sector reports and held cross team consultations and consultations with key stake-holders were held to prioritize recovery strategies and costs. Other detailed work, such as ensuring that cross-cutting issues were addressed, was also carried out.
1.5.2 Assessment Methodology
Under the DaLA methodology conceptual frame-work, the following disaster effects are measured dur-ing an assessment:
■n Damage is the value of physical, durable assets that may be destroyed due to the action of the natural hazard that caused the disaster, expressed in terms of the replacement value of the assets assuming the same characteristics that they had prior to the disaster; and
■n Losses or changes in the normal flows of the economy that may arise in all sectors of economic and social activity due to the external shocks brought about by the disaster, until full economic recovery and reconstruction has been achieved, and are expressed in current values.
The following disaster impacts are also estimated as part of the assessment:
■n Possible macro-economic growth decline due to losses inflicted by the disaster, including possible slowdown of gross domestic production, deterioration of the balance of payments and of fiscal sector position, as well as increase in inflation.
■n Decline in personal or household living conditions, livelihoods, and income, possible increase in cost of living, as well as poverty aggravation arising from the losses caused by the disaster.
Financial needs for economic recovery and disaster-resilient reconstruction constitute the third output of the assessment, and include:
■n Requirements for the immediate recovery of personal or household income, rehabilitation of basic services, and reactivation of productive activities; and
■n Requirements for the reconstruction of destroyed assets with improved, disaster-resilient standards under a “building-back-better” strategy.
The Human Recovery Needs Assessment (HRNA) methodology enables:
■n Identification of socio-economic impacts of the disaster at the human and community levels;
■n Estimation of the decline in human development, expressed by the quantification of the human development index (HDI), arising from the disaster’s effects and impact;
■n Estimation of possible setbacks in the achievement of the Millennium Development Goals (MDGs) for the affected country that may result from the disaster; and
■n Estimation of needs to achieve human recovery at the personal and community levels.
These methodologies complement one another and provide a complete view of the human and economic requirements for achieving recovery and reconstruc-tion. In the Nigeria floods assessment, sectors of economic and social activity that are included in the country’s system of national accounts—which may sus-tain either destruction of physical, durable assets and/or modifications to the normal flows of the economy caused by the disaster—were duly analyzed.
The following sectors of economic activity were indi-vidually included in the analysis, as defined in the Nige-rian system of national accounts:
■n Agriculture (food crops)■n Livestock■n Fishery■n Manufacturing industry■n Commerce■n Oil industry■n Electricity
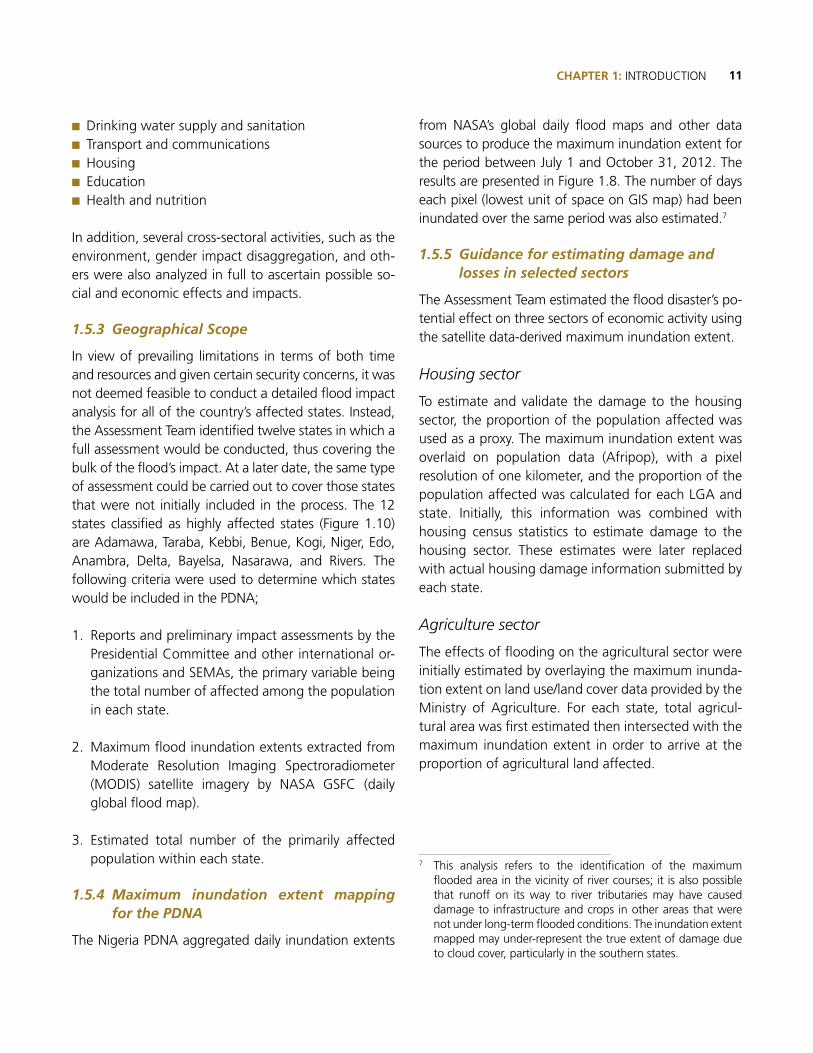
11CHAPTER 1: INTRODUCTION
■n Drinking water supply and sanitation■n Transport and communications■n Housing■n Education ■n Health and nutrition
In addition, several cross-sectoral activities, such as the environment, gender impact disaggregation, and oth-ers were also analyzed in full to ascertain possible so-cial and economic effects and impacts.
1.5.3 Geographical Scope
In view of prevailing limitations in terms of both time and resources and given certain security concerns, it was not deemed feasible to conduct a detailed flood impact analysis for all of the country’s affected states. Instead, the Assessment Team identified twelve states in which a full assessment would be conducted, thus covering the bulk of the flood’s impact. At a later date, the same type of assessment could be carried out to cover those states that were not initially included in the process. The 12 states classified as highly affected states (Figure 1.10) are Adamawa, Taraba, Kebbi, Benue, Kogi, Niger, Edo, Anambra, Delta, Bayelsa, Nasarawa, and Rivers. The following criteria were used to determine which states would be included in the PDNA;
1. Reports and preliminary impact assessments by the Presidential Committee and other international or-ganizations and SEMAs, the primary variable being the total number of affected among the population in each state.
2. Maximum flood inundation extents extracted from Moderate Resolution Imaging Spectroradiometer (MODIS) satellite imagery by NASA GSFC (daily global flood map).
3. Estimated total number of the primarily affected population within each state.
1.5.4 Maximum inundation extent mapping for the PDNA
The Nigeria PDNA aggregated daily inundation extents
from NASA’s global daily flood maps and other data sources to produce the maximum inundation extent for the period between July 1 and October 31, 2012. The results are presented in Figure 1.8. The number of days each pixel (lowest unit of space on GIS map) had been inundated over the same period was also estimated.7
1.5.5 Guidance for estimating damage and losses in selected sectors
The Assessment Team estimated the flood disaster’s po-tential effect on three sectors of economic activity using the satellite data-derived maximum inundation extent.
Housing sector
To estimate and validate the damage to the housing sector, the proportion of the population affected was used as a proxy. The maximum inundation extent was overlaid on population data (Afripop), with a pixel resolution of one kilometer, and the proportion of the population affected was calculated for each LGA and state. Initially, this information was combined with housing census statistics to estimate damage to the housing sector. These estimates were later replaced with actual housing damage information submitted by each state.
Agriculture sector
The effects of flooding on the agricultural sector were initially estimated by overlaying the maximum inunda-tion extent on land use/land cover data provided by the Ministry of Agriculture. For each state, total agricul-tural area was first estimated then intersected with the maximum inundation extent in order to arrive at the proportion of agricultural land affected.
7 This analysis refers to the identification of the maximum flooded area in the vicinity of river courses; it is also possible that runoff on its way to river tributaries may have caused damage to infrastructure and crops in other areas that were not under long-term flooded conditions. The inundation extent mapped may under-represent the true extent of damage due to cloud cover, particularly in the southern states.
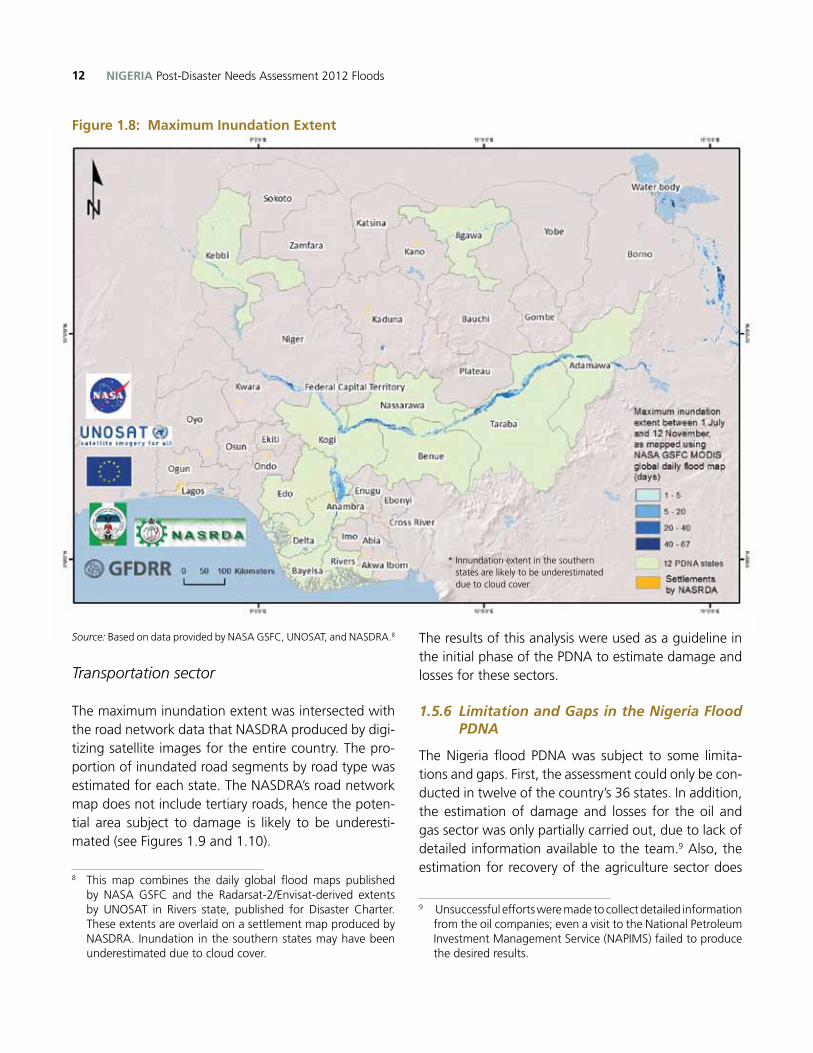
12 NIGERIA Post-Disaster Needs Assessment 2012 Floods
Figure 1.8: Maximum Inundation Extent
* Innundation extent in the southern states are likely to be underestimated due to cloud cover.
Source: Based on data provided by NASA GSFC, UNOSAT, and NASDRA.8
Transportation sector
The maximum inundation extent was intersected with the road network data that NASDRA produced by digi-tizing satellite images for the entire country. The pro- portion of inundated road segments by road type was estimated for each state. The NASDRA’s road network map does not include tertiary roads, hence the poten-tial area subject to damage is likely to be underesti-mated (see Figures 1.9 and 1.10).
8 This map combines the daily global flood maps published by NASA GSFC and the Radarsat-2/Envisat-derived extents by UNOSAT in Rivers state, published for Disaster Charter. These extents are overlaid on a settlement map produced by NASDRA. Inundation in the southern states may have been underestimated due to cloud cover.
The results of this analysis were used as a guideline in the initial phase of the PDNA to estimate damage and losses for these sectors.
1.5.6 Limitation and Gaps in the Nigeria Flood PDNA
The Nigeria flood PDNA was subject to some limita-tions and gaps. First, the assessment could only be con-ducted in twelve of the country’s 36 states. In addition, the estimation of damage and losses for the oil and gas sector was only partially carried out, due to lack of detailed information available to the team.9 Also, the estimation for recovery of the agriculture sector does
9 Unsuccessful efforts were made to collect detailed information from the oil companies; even a visit to the National Petroleum Investment Management Service (NAPIMS) failed to produce the desired results.
13CHAPTER 1: INTRODUCTION
not include the cost of food assistance to farmers hav-ing lost food stocks, since this figure was not deter-mined (nor was it made available to the Assessment Team). Moreover, the differential effects of the floods on women and children were not fully captured in the report, again due to the unavailability of timely data. Despite these limitations, the assessment represents the efforts of all stakeholders, including various federal government ministries and development partners (the EU, JICA, UN), to evaluate the impacts of the Nigerian flood disaster in a timely manner.
Figure 1.9: Land Use/Land Cover Map that Shows the Cultivated Areas in Taraba State
Figure 1.10: Road Network Map
Source: Ministry of Agriculture.
Source: NASDRA.
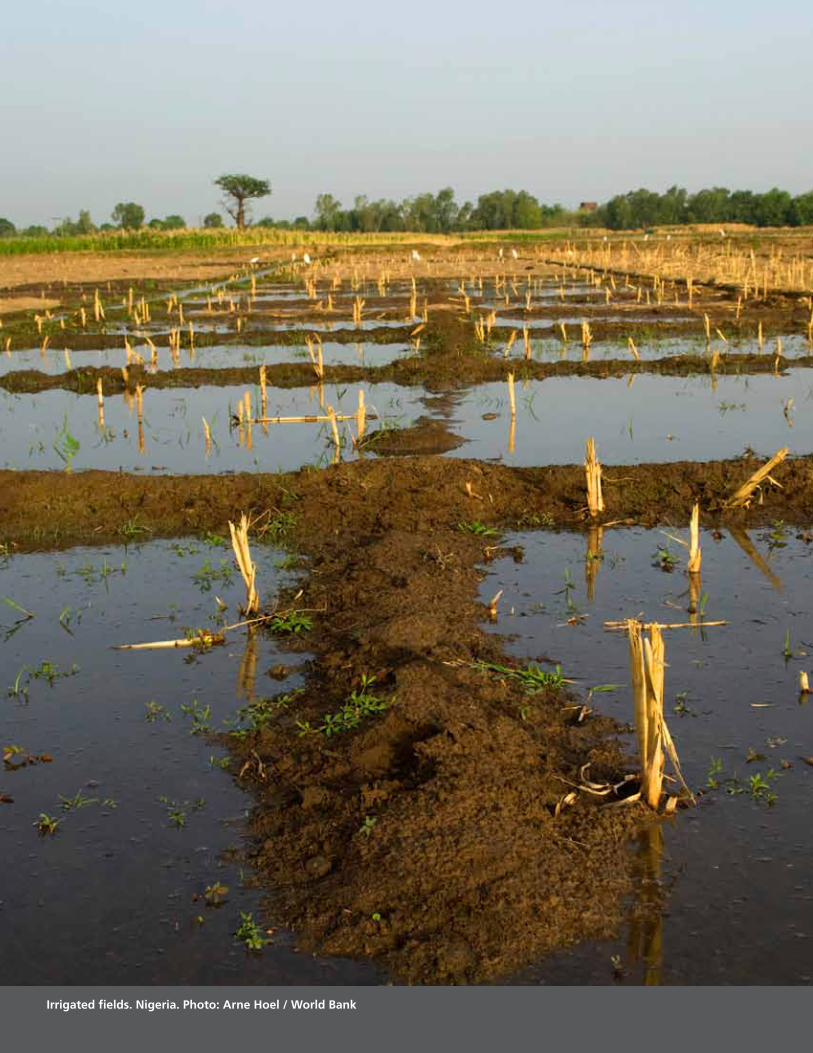
NIGERIA Post-Disaster Needs Assessment 2012 Floods14
Irrigated fields. Nigeria. Photo: Arne Hoel / World Bank
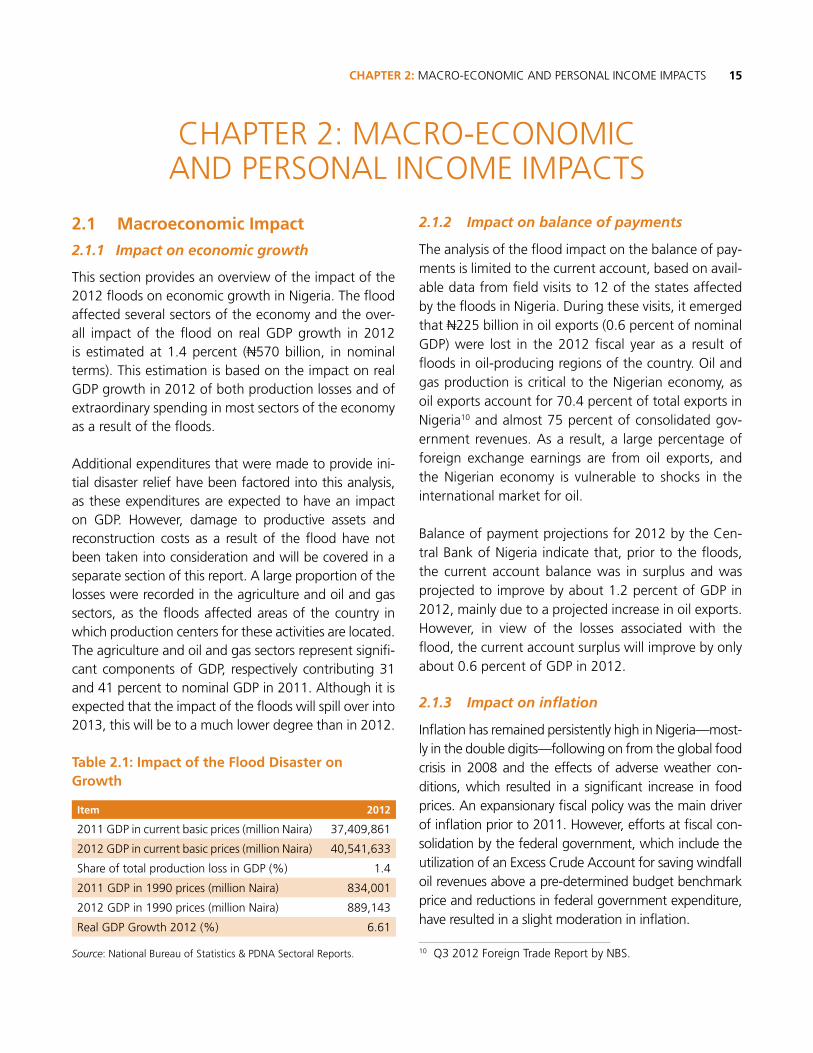
15CHAPTER 2: MACRO-ECONOMIC AND PERSONAL INCOME IMPACTS
2.1 Macroeconomic Impact
2.1.1 Impact on economic growth
This section provides an overview of the impact of the 2012 floods on economic growth in Nigeria. The flood affected several sectors of the economy and the over-all impact of the flood on real GDP growth in 2012 is estimated at 1.4 percent (N570 billion, in nominal terms). This estimation is based on the impact on real GDP growth in 2012 of both production losses and of extraordinary spending in most sectors of the economy as a result of the floods.
Additional expenditures that were made to provide ini-tial disaster relief have been factored into this analysis, as these expenditures are expected to have an impact on GDP. However, damage to productive assets and reconstruction costs as a result of the flood have not been taken into consideration and will be covered in a separate section of this report. A large proportion of the losses were recorded in the agriculture and oil and gas sectors, as the floods affected areas of the country in which production centers for these activities are located. The agriculture and oil and gas sectors represent signifi-cant components of GDP, respectively contributing 31 and 41 percent to nominal GDP in 2011. Although it is expected that the impact of the floods will spill over into 2013, this will be to a much lower degree than in 2012.
Table 2.1: Impact of the Flood Disaster on Growth
Item 2012
2011 GDP in current basic prices (million Naira) 37,409,861
2012 GDP in current basic prices (million Naira) 40,541,633
Share of total production loss in GDP (%) 1.4
2011 GDP in 1990 prices (million Naira) 834,001
2012 GDP in 1990 prices (million Naira) 889,143
Real GDP Growth 2012 (%) 6.61
Source: National Bureau of Statistics & PDNA Sectoral Reports.
2.1.2 Impact on balance of payments
The analysis of the flood impact on the balance of pay-ments is limited to the current account, based on avail-able data from field visits to 12 of the states affected by the floods in Nigeria. During these visits, it emerged that N225 billion in oil exports (0.6 percent of nominal GDP) were lost in the 2012 fiscal year as a result of floods in oil-producing regions of the country. Oil and gas production is critical to the Nigerian economy, as oil exports account for 70.4 percent of total exports in Nigeria10 and almost 75 percent of consolidated gov-ernment revenues. As a result, a large percentage of foreign exchange earnings are from oil exports, and the Nigerian economy is vulnerable to shocks in the international market for oil.
Balance of payment projections for 2012 by the Cen-tral Bank of Nigeria indicate that, prior to the floods, the current account balance was in surplus and was projected to improve by about 1.2 percent of GDP in 2012, mainly due to a projected increase in oil exports. However, in view of the losses associated with the flood, the current account surplus will improve by only about 0.6 percent of GDP in 2012.
2.1.3 Impact on inflation
Inflation has remained persistently high in Nigeria—most-ly in the double digits—following on from the global food crisis in 2008 and the effects of adverse weather con-ditions, which resulted in a significant increase in food prices. An expansionary fiscal policy was the main driver of inflation prior to 2011. However, efforts at fiscal con-solidation by the federal government, which include the utilization of an Excess Crude Account for saving windfall oil revenues above a pre-determined budget benchmark price and reductions in federal government expenditure, have resulted in a slight moderation in inflation.
10 Q3 2012 Foreign Trade Report by NBS.
CHAPTER 2: MACRO-ECONOMIC AND PERSONAL INCOME IMPACTS
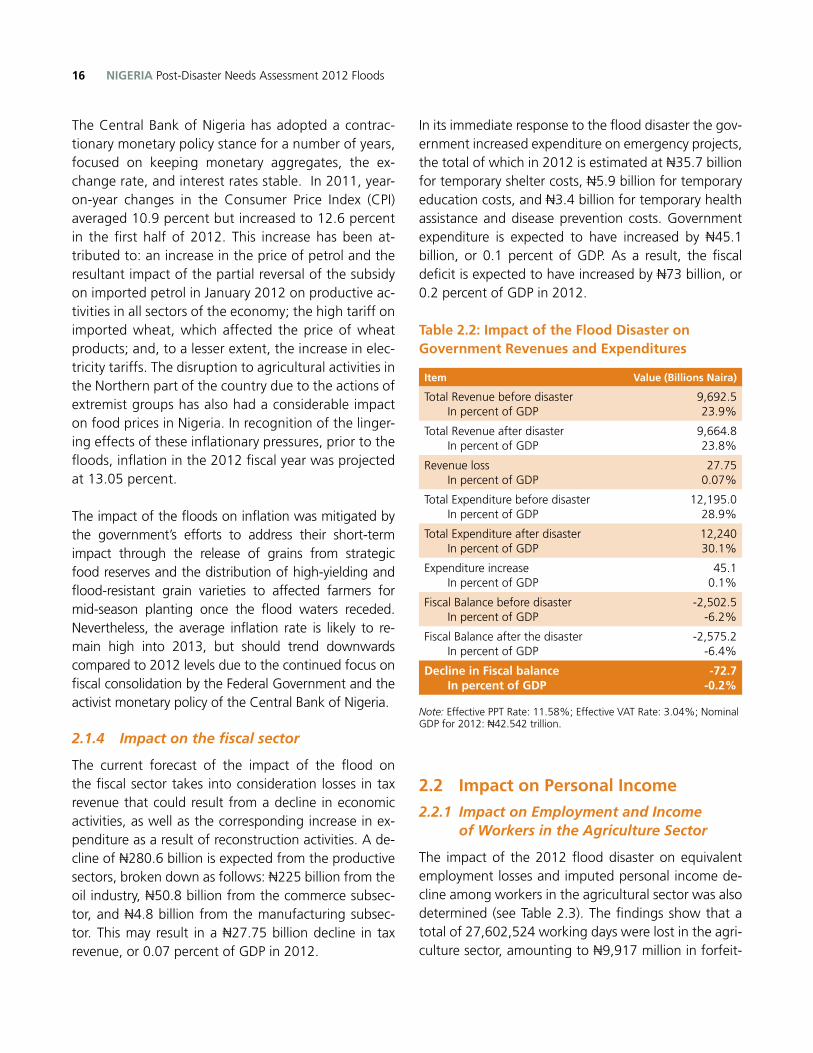
16 NIGERIA Post-Disaster Needs Assessment 2012 Floods
The Central Bank of Nigeria has adopted a contrac-tionary monetary policy stance for a number of years, focused on keeping monetary aggregates, the ex-change rate, and interest rates stable. In 2011, year-on-year changes in the Consumer Price Index (CPI) averaged 10.9 percent but increased to 12.6 percent in the first half of 2012. This increase has been at-tributed to: an increase in the price of petrol and the resultant impact of the partial reversal of the subsidy on imported petrol in January 2012 on productive ac-tivities in all sectors of the economy; the high tariff on imported wheat, which affected the price of wheat products; and, to a lesser extent, the increase in elec-tricity tariffs. The disruption to agricultural activities in the Northern part of the country due to the actions of extremist groups has also had a considerable impact on food prices in Nigeria. In recognition of the linger-ing effects of these inflationary pressures, prior to the floods, inflation in the 2012 fiscal year was projected at 13.05 percent.
The impact of the floods on inflation was mitigated by the government’s efforts to address their short-term impact through the release of grains from strategic food reserves and the distribution of high-yielding and flood-resistant grain varieties to affected farmers for mid-season planting once the flood waters receded. Nevertheless, the average inflation rate is likely to re-main high into 2013, but should trend downwards compared to 2012 levels due to the continued focus on fiscal consolidation by the Federal Government and the activist monetary policy of the Central Bank of Nigeria.
2.1.4 Impact on the fiscal sector
The current forecast of the impact of the flood on the fiscal sector takes into consideration losses in tax revenue that could result from a decline in economic activities, as well as the corresponding increase in ex-penditure as a result of reconstruction activities. A de-cline of N280.6 billion is expected from the productive sectors, broken down as follows: N225 billion from the oil industry, N50.8 billion from the commerce subsec-tor, and N4.8 billion from the manufacturing subsec-tor. This may result in a N27.75 billion decline in tax revenue, or 0.07 percent of GDP in 2012.
In its immediate response to the flood disaster the gov-ernment increased expenditure on emergency projects, the total of which in 2012 is estimated at N35.7 billion for temporary shelter costs, N5.9 billion for temporary education costs, and N3.4 billion for temporary health assistance and disease prevention costs. Government expenditure is expected to have increased by N45.1 billion, or 0.1 percent of GDP. As a result, the fiscal deficit is expected to have increased by N73 billion, or 0.2 percent of GDP in 2012.
Table 2.2: Impact of the Flood Disaster on Government Revenues and Expenditures
Item Value (Billions Naira)
Total Revenue before disaster In percent of GDP
9,692.523.9%
Total Revenue after disaster In percent of GDP
9,664.823.8%
Revenue loss In percent of GDP
27.750.07%
Total Expenditure before disaster In percent of GDP
12,195.028.9%
Total Expenditure after disaster In percent of GDP
12,24030.1%
Expenditure increase In percent of GDP
45.10.1%
Fiscal Balance before disaster In percent of GDP
-2,502.5-6.2%
Fiscal Balance after the disaster In percent of GDP
-2,575.2-6.4%
Decline in Fiscal balance In percent of GDP
-72.7-0.2%
Note: Effective PPT Rate: 11.58%; Effective VAT Rate: 3.04%; Nominal GDP for 2012: N42.542 trillion.
2.2 Impact on Personal Income
2.2.1 Impact on Employment and Income of Workers in the Agriculture Sector
The impact of the 2012 flood disaster on equivalent employment losses and imputed personal income de-cline among workers in the agricultural sector was also determined (see Table 2.3). The findings show that a total of 27,602,524 working days were lost in the agri-culture sector, amounting to N9,917 million in forfeit-
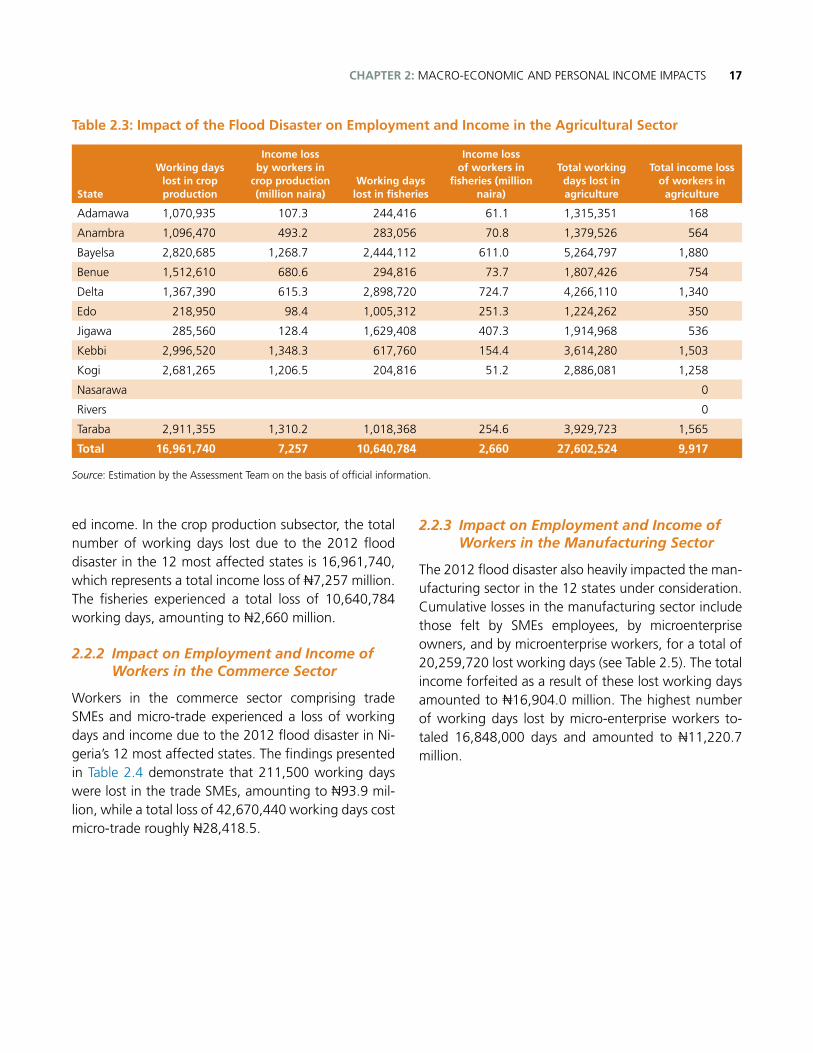
17CHAPTER 2: MACRO-ECONOMIC AND PERSONAL INCOME IMPACTS
ed income. In the crop production subsector, the total number of working days lost due to the 2012 flood disaster in the 12 most affected states is 16,961,740, which represents a total income loss of N7,257 million. The fisheries experienced a total loss of 10,640,784 working days, amounting to N2,660 million.
2.2.2 Impact on Employment and Income of Workers in the Commerce Sector
Workers in the commerce sector comprising trade SMEs and micro-trade experienced a loss of working days and income due to the 2012 flood disaster in Ni-geria’s 12 most affected states. The findings presented in Table 2.4 demonstrate that 211,500 working days were lost in the trade SMEs, amounting to N93.9 mil-lion, while a total loss of 42,670,440 working days cost micro-trade roughly N28,418.5.
2.2.3 Impact on Employment and Income of Workers in the Manufacturing Sector
The 2012 flood disaster also heavily impacted the man-ufacturing sector in the 12 states under consideration. Cumulative losses in the manufacturing sector include those felt by SMEs employees, by microenterprise owners, and by microenterprise workers, for a total of 20,259,720 lost working days (see Table 2.5). The total income forfeited as a result of these lost working days amounted to N16,904.0 million. The highest number of working days lost by micro-enterprise workers to-taled 16,848,000 days and amounted to N11,220.7 million.
Table 2.3: Impact of the Flood Disaster on Employment and Income in the Agricultural Sector
State
Working days lost in crop production
Income loss by workers in
crop production (million naira)
Working days lost in fisheries
Income loss of workers in
fisheries (million naira)
Total working days lost in agriculture
Total income loss of workers in
agriculture
Adamawa 1,070,935 107.3 244,416 61.1 1,315,351 168
Anambra 1,096,470 493.2 283,056 70.8 1,379,526 564
Bayelsa 2,820,685 1,268.7 2,444,112 611.0 5,264,797 1,880
Benue 1,512,610 680.6 294,816 73.7 1,807,426 754
Delta 1,367,390 615.3 2,898,720 724.7 4,266,110 1,340
Edo 218,950 98.4 1,005,312 251.3 1,224,262 350
Jigawa 285,560 128.4 1,629,408 407.3 1,914,968 536
Kebbi 2,996,520 1,348.3 617,760 154.4 3,614,280 1,503
Kogi 2,681,265 1,206.5 204,816 51.2 2,886,081 1,258
Nasarawa 0
Rivers 0
Taraba 2,911,355 1,310.2 1,018,368 254.6 3,929,723 1,565
Total 16,961,740 7,257 10,640,784 2,660 27,602,524 9,917
Source: Estimation by the Assessment Team on the basis of official information.
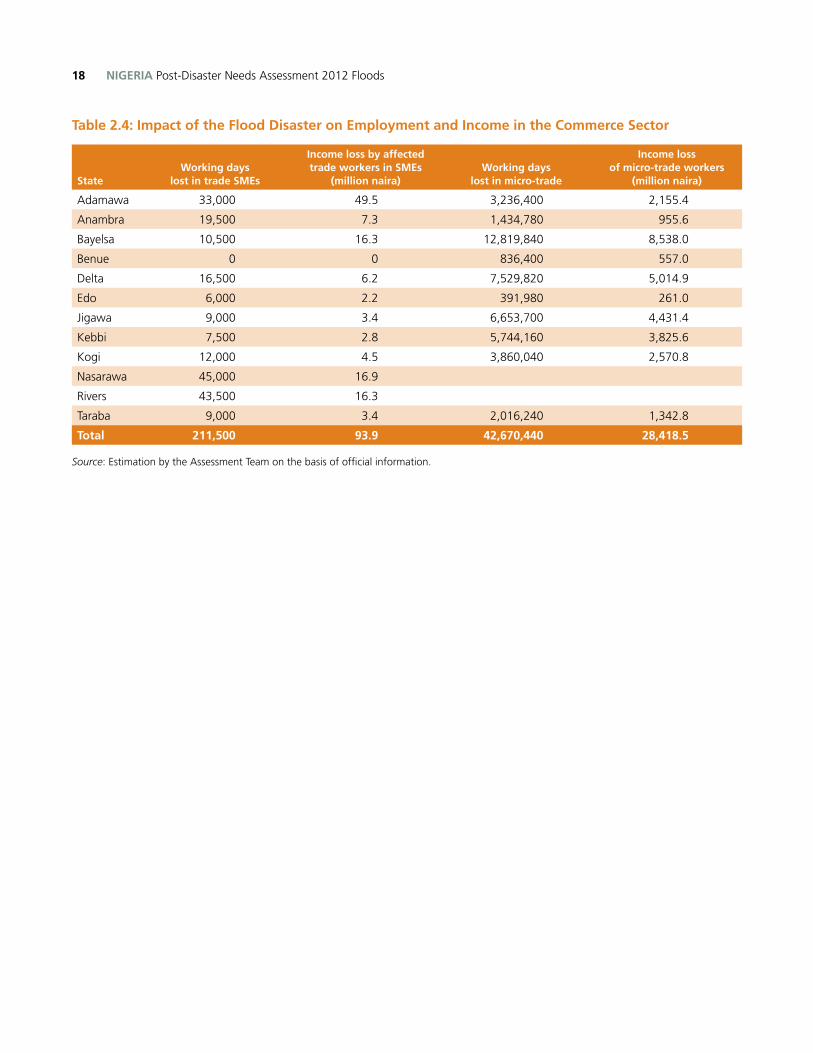
NIGERIA Post-Disaster Needs Assessment 2012 Floods18
Table 2.4: Impact of the Flood Disaster on Employment and Income in the Commerce Sector
StateWorking days
lost in trade SMEs
Income loss by affected trade workers in SMEs
(million naira)Working days
lost in micro-trade
Income loss of micro-trade workers
(million naira)
Adamawa 33,000 49.5 3,236,400 2,155.4
Anambra 19,500 7.3 1,434,780 955.6
Bayelsa 10,500 16.3 12,819,840 8,538.0
Benue 0 0 836,400 557.0
Delta 16,500 6.2 7,529,820 5,014.9
Edo 6,000 2.2 391,980 261.0
Jigawa 9,000 3.4 6,653,700 4,431.4
Kebbi 7,500 2.8 5,744,160 3,825.6
Kogi 12,000 4.5 3,860,040 2,570.8
Nasarawa 45,000 16.9
Rivers 43,500 16.3
Taraba 9,000 3.4 2,016,240 1,342.8
Total 211,500 93.9 42,670,440 28,418.5
Source: Estimation by the Assessment Team on the basis of official information.
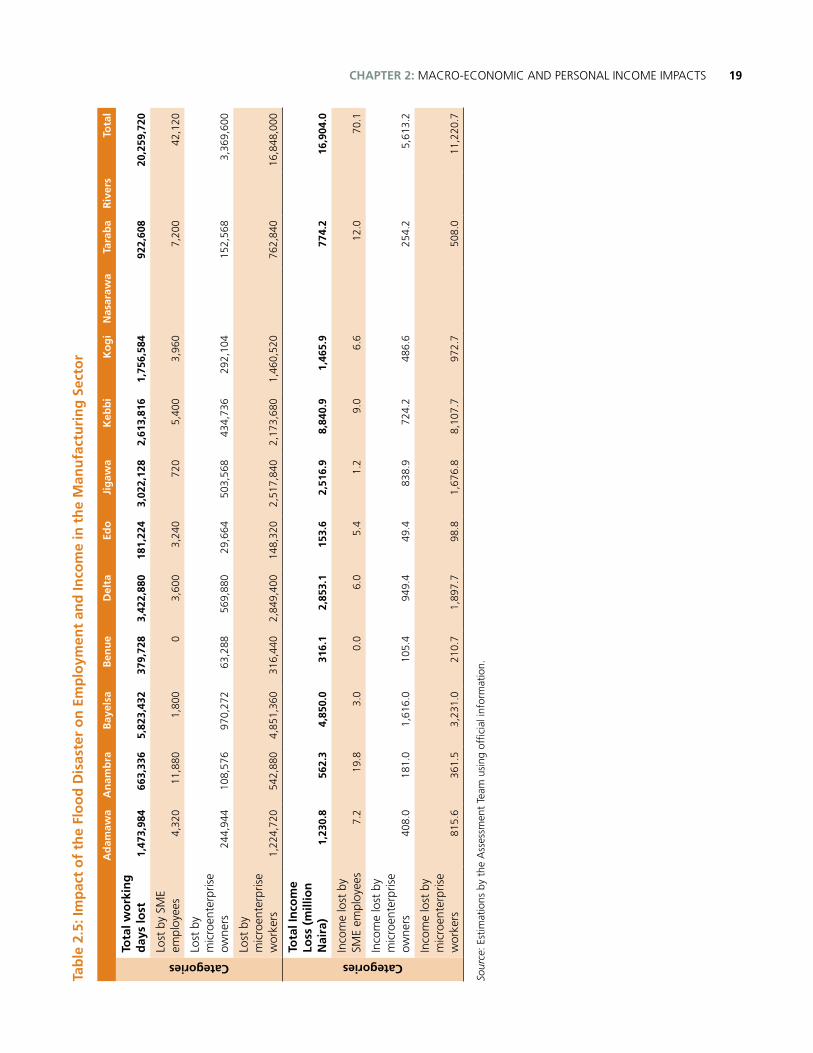
19CHAPTER 2: MACRO-ECONOMIC AND PERSONAL INCOME IMPACTSTa
ble
2.5
: Im
pac
t o
f th
e Fl
oo
d D
isas
ter
on
Em
plo
ymen
t an
d In
com
e in
th
e M
anu
fact
uri
ng
Sec
tor
Ad
amaw
aA
nam
bra
Bay
elsa
Ben
ue
Del
taEd
oJi
gaw
aK
ebb
iK
og
iN
asar
awa
Tara
ba
Riv
ers
Tota
l
Categories
Tota
l wo
rkin
g
day
s lo
st1,
473,
984
663,
336
5,82
3,43
237
9,72
83,
422,
880
181,
224
3,02
2,12
82,
613,
816
1,75
6,58
492
2,60
820
,259
,720
Lost
by
SME
empl
oyee
s4,
320
11,8
801,
800
03,
600
3,24
072
05,
400
3,96
07,
200
42,1
20
Lost
by
mic
roen
terp
rise
owne
rs24
4,94
410
8,57
697
0,27
263
,288
569,
880
29,6
6450
3,56
843
4,73
629
2,10
415
2,56
83,
369,
600
Lost
by
mic
roen
terp
rise
wor
kers
1,22
4,72
0 5
42,8
804,
851,
360
316
,440
2,8
49,4
00 1
48,3
20 2
,517
,840
2,1
73,6
80 1
,460
,520
7
62,8
40
16,8
48,0
00
Categories
Tota
l In
com
e Lo
ss (
mill
ion
N
aira
)
1,2
30.8
56
2.3
4,85
0.0
316.
12,
853.
115
3.6
2,51
6.9
8,84
0.9
1,46
5.9
7
74.2
16,9
04.0
Inco
me
lost
by
SME
empl
oyee
s7.
219
.83.
00.
06.
05.
41.
29.
06.
6
12.0
70
.1
Inco
me
lost
by
mic
roen
terp
rise
owne
rs40
8.0
181.
01,
616.
010
5.4
949.
449
.483
8.9
724.
248
6.6
254.
25,
613.
2
Inco
me
lost
by
mic
roen
terp
rise
wor
kers
815.
636
1.5
3,23
1.0
210.
71,
897.
798
.81,
676.
88,
107.
797
2.7
508.
011
,220
.7
Sour
ce: E
stim
atio
ns b
y th
e A
sses
smen
t Te
am u
sing
offi
cial
info
rmat
ion.
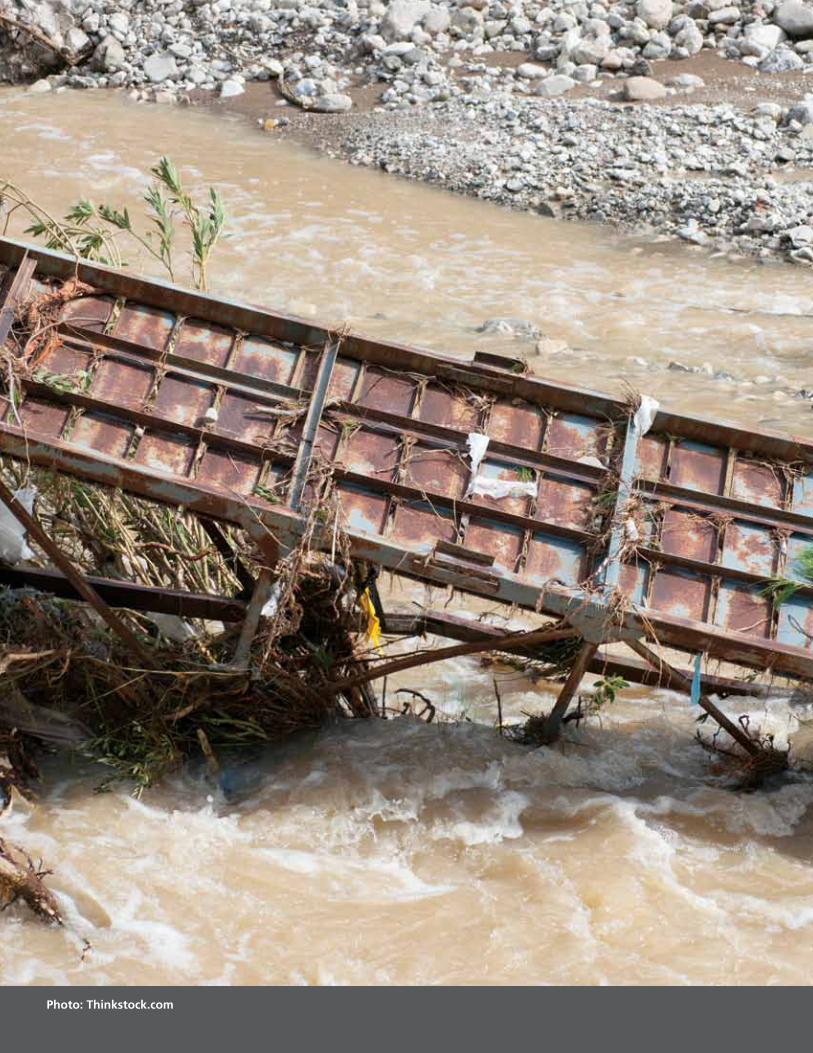
NIGERIA Post-Disaster Needs Assessment 2012 Floods20
Photo: Thinkstock.com
21CHAPTER 3: DAMAGE AND LOSSES
3.1 Social Sector
Social sector includes housing, education, and health. Damages and losses under these sectors are discussed below.
3.1.1 Housing
Situation before the Flood Disaster
Nigeria, with a population of 160 million people, is known for its difficult housing situation. The country is characterized by an inadequate quantity and quality of sustainable housing units to meet the needs of its teeming population. Available records show that Nige-ria has a housing deficit of between 14 and 16 million units, and 25 million households do not have homes.
Dwellings in Nigeria can be categorized into three broad types. These are:
■n Informal housing, constructed of corrugated iron sheets or cheap, locally sourced scrap materials.
■n Traditional housing, made of mud, mud blocks, wooden or bamboo walls with thatch or corrugated iron roofing.
■n Modern solid housing, made of bricks or cement blocks, stabilized by earth blocks and/or steel or iron reinforcement.
Approximately 69.9 percent of households in Nigeria procure their own housing through private resourc-es and initiatives.11 A few meet their housing needs through formal institutional providers. Traditional housing, which constitutes approximately 70 percent of rural dwellings in the north and 17 percent in the south, is constructed by individual households using locally available building materials (NPC 2009).12 Tra-
11 See General Household Survey 2007, National Bureau of Statistics, Abuja.
12 National Population Commission (NPC). 2009. 2006 population and housing census of the Federal Republic of Nigeria. Priority Table, Volume II; Abuja, NPC.
ditional housing is generally vulnerable to flooding, as these structures are built of mud—susceptible to damage. Modern housing, on the other hand, is less susceptible to the sort of damage caused by flooding, being constructed from solid, reinforced materials.
Effects of Flooding on Housing
The effects of Nigeria’s recent floods on housing were enormous. In some instances, flood waters rose to a height of 2 meters (6 feet 6inches) and higher, pulling down a great percentage of traditional (mud) hous-es, affecting sandcrete houses and fenced walls, and destroying household goods. These events rendered many of the residents homeless and left them in dis-tress. Assessment of the flood impact in the 12 most affected states shows that a total of 1,337,450 houses were either fully or partially destroyed. Out of these, 73 percent (or 1,007,367) of those destroyed were tra-ditional dwellings, while only 27 percent of modern sandcrete homes were affected. Rivers state saw the largest number of houses destroyed (243,521), fol-lowed by Adamawa state (177,364). The state with the fewest homes destroyed was Jigawa (17,135). Fig-ure 3.1 shows the aerial view of submerged housing in Delta, Anambra, Bayelsa, and Rivers states. Table 3.1 shows the impact of flooding on the housing sector.
CHAPTER 3: DAMAGE AND LOSSES
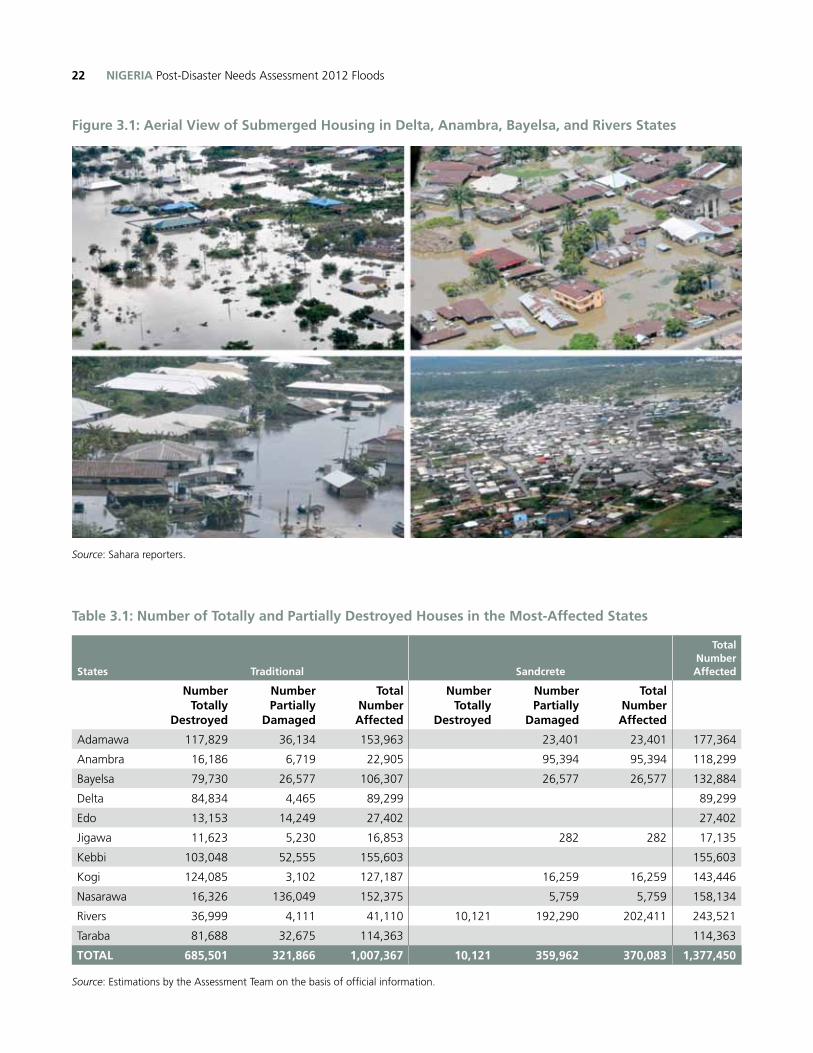
NIGERIA Post-Disaster Needs Assessment 2012 Floods22
Figure 3.1: Aerial View of Submerged Housing in Delta, Anambra, Bayelsa, and Rivers States
Source: Sahara reporters.
Table 3.1: Number of Totally and Partially Destroyed Houses in the Most-Affected States
States Traditional Sandcrete
Total NumberAffected
NumberTotally
Destroyed
Number Partially
Damaged
TotalNumberAffected
Number Totally
Destroyed
Number Partially
Damaged
Total Number Affected
Adamawa 117,829 36,134 153,963 23,401 23,401 177,364
Anambra 16,186 6,719 22,905 95,394 95,394 118,299
Bayelsa 79,730 26,577 106,307 26,577 26,577 132,884
Delta 84,834 4,465 89,299 89,299
Edo 13,153 14,249 27,402 27,402
Jigawa 11,623 5,230 16,853 282 282 17,135
Kebbi 103,048 52,555 155,603 155,603
Kogi 124,085 3,102 127,187 16,259 16,259 143,446
Nasarawa 16,326 136,049 152,375 5,759 5,759 158,134
Rivers 36,999 4,111 41,110 10,121 192,290 202,411 243,521
Taraba 81,688 32,675 114,363 114,363
TOTAL 685,501 321,866 1,007,367 10,121 359,962 370,083 1,377,450
Source: Estimations by the Assessment Team on the basis of official information.
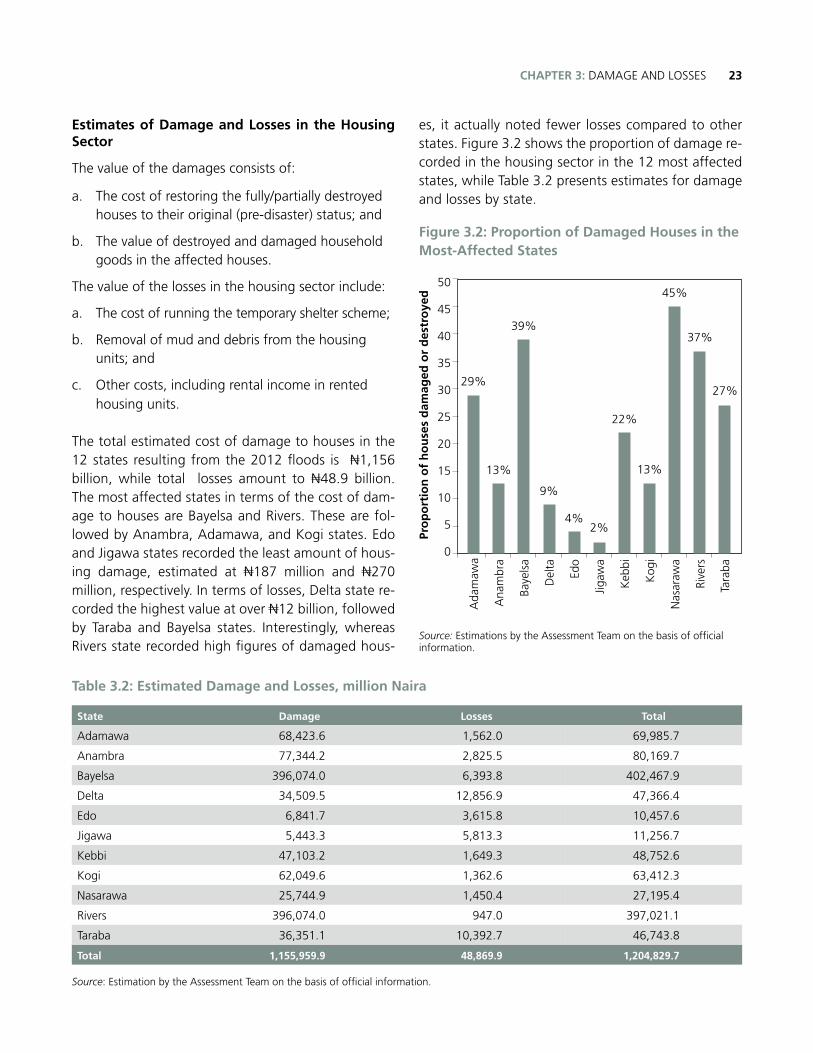
23CHAPTER 3: DAMAGE AND LOSSES
Estimates of Damage and Losses in the Housing Sector
The value of the damages consists of:
a. The cost of restoring the fully/partially destroyed houses to their original (pre-disaster) status; and
b. The value of destroyed and damaged household goods in the affected houses.
The value of the losses in the housing sector include:
a. The cost of running the temporary shelter scheme;
b. Removal of mud and debris from the housing units; and
c. Other costs, including rental income in rented housing units.
The total estimated cost of damage to houses in the 12 states resulting from the 2012 floods is N1,156 billion, while total losses amount to N48.9 billion. The most affected states in terms of the cost of dam-age to houses are Bayelsa and Rivers. These are fol-lowed by Anambra, Adamawa, and Kogi states. Edo and Jigawa states recorded the least amount of hous-ing damage, estimated at N187 million and N270 million, respectively. In terms of losses, Delta state re-corded the highest value at over N12 billion, followed by Taraba and Bayelsa states. Interestingly, whereas Rivers state recorded high figures of damaged hous-
es, it actually noted fewer losses compared to other states. Figure 3.2 shows the proportion of damage re-corded in the housing sector in the 12 most affected states, while Table 3.2 presents estimates for damage and losses by state.
Figure 3.2: Proportion of Damaged Houses in the Most-Affected States
Source: Estimations by the Assessment Team on the basis of official information.
50
45
40
35
30
25
20
15
10
5
0
Pro
po
rtio
n o
f h
ou
ses
dam
aged
or
des
tro
yed
Ada
maw
a
29%
Ana
mbr
a
13%
Baye
lsa
39%
Del
ta
9%
Edo
4%
Jigaw
a
2%
Keb
bi
22%
Kog
i
13%
Nas
araw
a
45%
Rive
rs
37%
Tara
ba
27%
Table 3.2: Estimated Damage and Losses, million Naira
State Damage Losses Total
Adamawa 68,423.6 1,562.0 69,985.7
Anambra 77,344.2 2,825.5 80,169.7
Bayelsa 396,074.0 6,393.8 402,467.9
Delta 34,509.5 12,856.9 47,366.4
Edo 6,841.7 3,615.8 10,457.6
Jigawa 5,443.3 5,813.3 11,256.7
Kebbi 47,103.2 1,649.3 48,752.6
Kogi 62,049.6 1,362.6 63,412.3
Nasarawa 25,744.9 1,450.4 27,195.4
Rivers 396,074.0 947.0 397,021.1
Taraba 36,351.1 10,392.7 46,743.8
Total 1,155,959.9 48,869.9 1,204,829.7
Source: Estimation by the Assessment Team on the basis of official information.
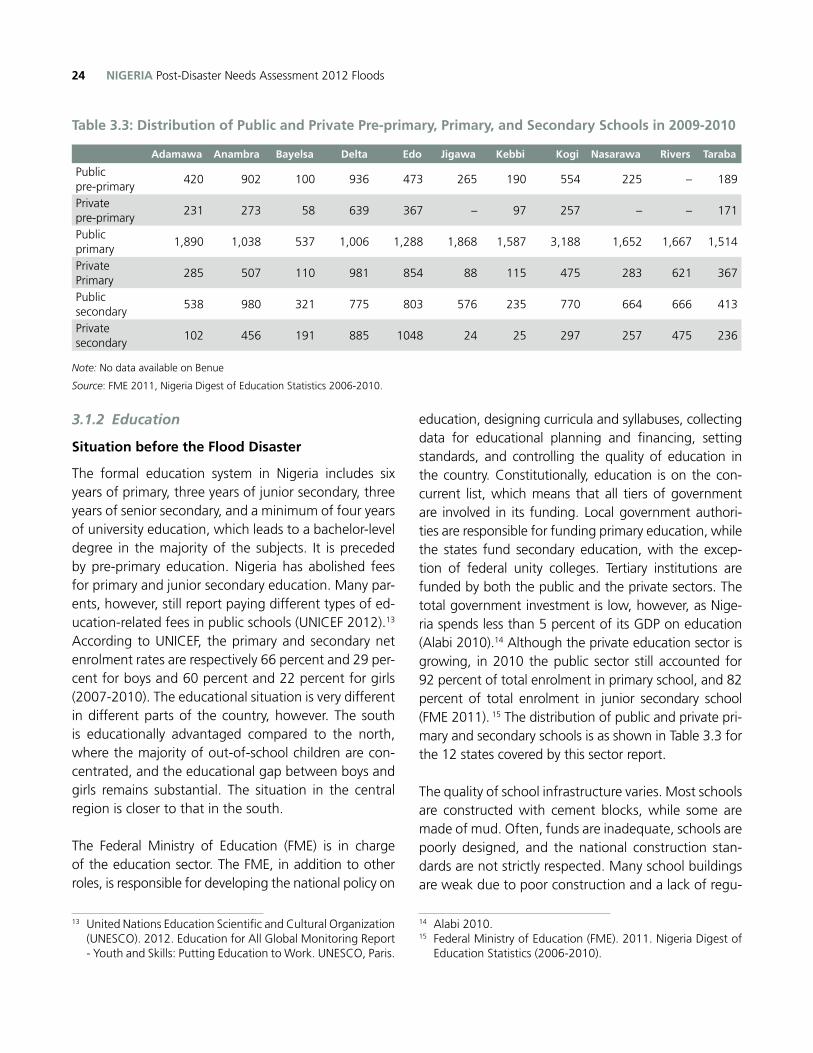
NIGERIA Post-Disaster Needs Assessment 2012 Floods24
3.1.2 Education
Situation before the Flood Disaster
The formal education system in Nigeria includes six years of primary, three years of junior secondary, three years of senior secondary, and a minimum of four years of university education, which leads to a bachelor-level degree in the majority of the subjects. It is preceded by pre-primary education. Nigeria has abolished fees for primary and junior secondary education. Many par-ents, however, still report paying different types of ed-ucation-related fees in public schools (UNICEF 2012).13 According to UNICEF, the primary and secondary net enrolment rates are respectively 66 percent and 29 per-cent for boys and 60 percent and 22 percent for girls (2007-2010). The educational situation is very different in different parts of the country, however. The south is educationally advantaged compared to the north, where the majority of out-of-school children are con-centrated, and the educational gap between boys and girls remains substantial. The situation in the central region is closer to that in the south.
The Federal Ministry of Education (FME) is in charge of the education sector. The FME, in addition to other roles, is responsible for developing the national policy on
13 United Nations Education Scientific and Cultural Organization (UNESCO). 2012. Education for All Global Monitoring Report - Youth and Skills: Putting Education to Work. UNESCO, Paris.
education, designing curricula and syllabuses, collecting data for educational planning and financing, setting standards, and controlling the quality of education in the country. Constitutionally, education is on the con-current list, which means that all tiers of government are involved in its funding. Local government authori-ties are responsible for funding primary education, while the states fund secondary education, with the excep-tion of federal unity colleges. Tertiary institutions are funded by both the public and the private sectors. The total government investment is low, however, as Nige-ria spends less than 5 percent of its GDP on education (Alabi 2010).14 Although the private education sector is growing, in 2010 the public sector still accounted for 92 percent of total enrolment in primary school, and 82 percent of total enrolment in junior secondary school (FME 2011). 15 The distribution of public and private pri-mary and secondary schools is as shown in Table 3.3 for the 12 states covered by this sector report.
The quality of school infrastructure varies. Most schools are constructed with cement blocks, while some are made of mud. Often, funds are inadequate, schools are poorly designed, and the national construction stan-dards are not strictly respected. Many school buildings are weak due to poor construction and a lack of regu-
14 Alabi 2010.15 Federal Ministry of Education (FME). 2011. Nigeria Digest of
Education Statistics (2006-2010).
Table 3.3: Distribution of Public and Private Pre-primary, Primary, and Secondary Schools in 2009-2010
Adamawa Anambra Bayelsa Delta Edo Jigawa Kebbi Kogi Nasarawa Rivers Taraba
Public pre-primary
420 902 100 936 473 265 190 554 225 – 189
Private pre-primary
231 273 58 639 367 – 97 257 – – 171
Public primary
1,890 1,038 537 1,006 1,288 1,868 1,587 3,188 1,652 1,667 1,514
PrivatePrimary
285 507 110 981 854 88 115 475 283 621 367
Public secondary
538 980 321 775 803 576 235 770 664 666 413
Private secondary
102 456 191 885 1048 24 25 297 257 475 236
Note: No data available on Benue
Source: FME 2011, Nigeria Digest of Education Statistics 2006-2010.
25CHAPTER 3: DAMAGE AND LOSSES
lar maintenance. In recent years, many schools have reported that they do not have enough classrooms, and that a number of the existing ones need repairs. In 2007-2008, in the 12 states that experienced the high-est levels of flooding and which are under review, only 25 percent of the public primary schools had electricity, and only 61 percent had drinking water (FME 2011).
The Strategic Plan for the Development of the Educa-tion Sector 2011-2015 signifies the readiness of the FME to tackle the challenges preventing the education system from fully playing its key national development role. The Plan covers six focal areas: 1) Strengthening the institutional management of education; 2) Ac-cess and equity; 3) Standard and quality assurance; 4) Teacher education and development; 5) Technical and vocational education and training; and 6) Funding, partnerships and resource mobilization. In line with the goals of the federal government’s Transformation Agenda, the Plan sets the stage so that, by the end of the Plan period, the education system will be capa-ble of effectively supporting Nigeria’s human capacity needs and meeting its developmental objectives.
Some of the key programs in the Plan are the back-to-school programs aimed at boys that have dropped out of school, the Almajiri program for children in quranic schools merging western and quranic education, and the girls’ education program—all aimed at increasing access to education among disadvantaged groups. These programs have greatly contributed to the prog-ress made toward reaching Millennium Development Goal 2, which aims to achieve universal primary educa-tion. Regional differences remain significant, however, and if the target is to be met, progress in the north must be accelerated.
Effects of the 2012 Flood on Education
The floods hampered the education sector’s ability to deliver on its objectives. In many states, schools were closed for at least two months. State ministries of edu-cation officially closed schools because they were flood-ed, because access roads to the schools were blocked by floods, and due to the high risk of students drown-ing in the flooded school area. Some schools attempted
to operate in a rented building or a tent, which is not necessarily conducive to learning and thus affects the quality of education. In addition, those children who at-tend classes outdoors or in a tent are more vulnerable to health risks, such as the common cold or more severe re-lated diseases, such as pneumonia. Many of the schools that have reopened lost all of their furniture, along with teaching and learning materials, which makes it difficult for both teachers and students to resume their normal education routines, thus further compromising quality.
Demand for education was also impeded as certain children whose schools remained open temporarily dropped out because either they or their parents did not want to risk crossing the flood waters to reach the school. Now that many schools have reopened, physi-cal access to schools remains an issue, with families reporting that children are not attending classes due to road conditions. In addition, many children find them-selves without school uniforms and learning materials, including notebooks and pens, as these were destroyed in the flooding. Considering the fact that many public schools lost their teaching materials and equipment, it is possible that schools may have to levy compensa-tory fees in the future. This might further discourage children—particularly those from poor families living in rural areas—from attending, causing them to stay at home to help their parents instead.
Some schools were used as temporary shelters for fami-lies whose houses were submerged or destroyed. In the six states that reported on this issue, more than 200 schools were, at the time of the assessment, being used as temporary shelters. Some of them (it is unclear how many) consequently sustained damage due to the over-use. It was even reported that in some schools, internally displaced people (IDP) used school benches as firewood.
Estimates of Damage and Losses in the Education Sector
The value of damage was estimated based on the number of different types of schools (primary and sec-ondary) that were partially or totally destroyed by the floods, combined with the unit values of repair and construction prevailing in the period just prior to the
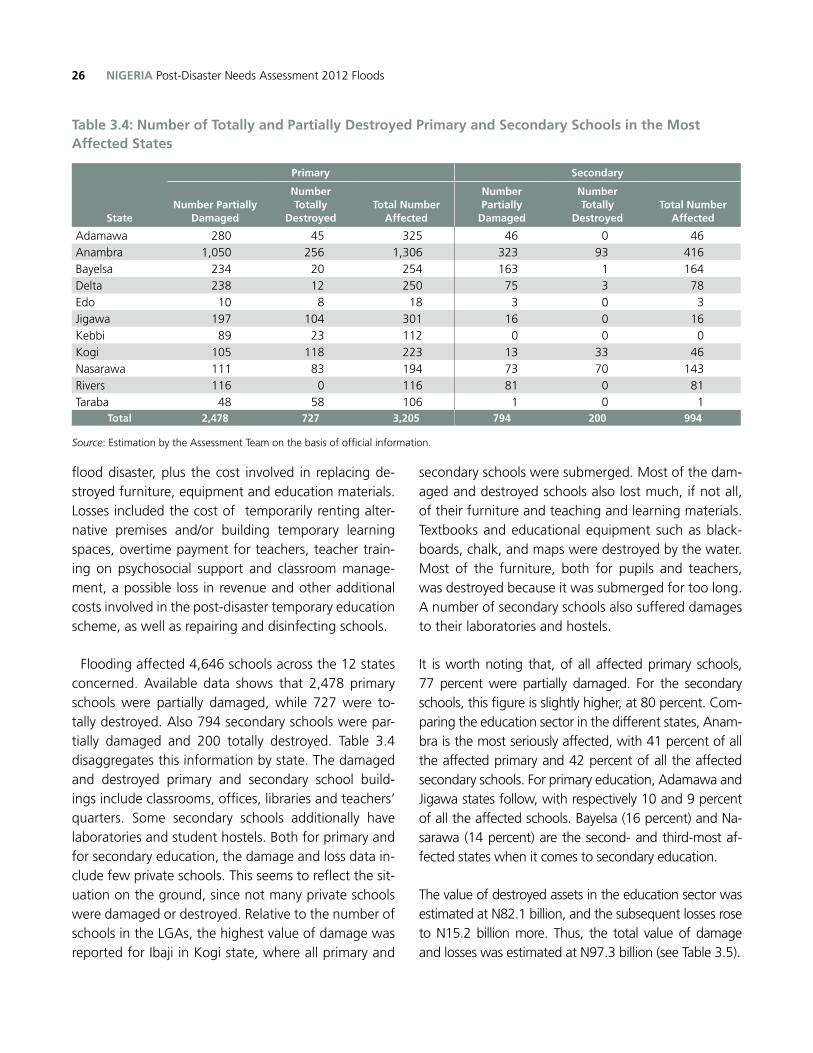
NIGERIA Post-Disaster Needs Assessment 2012 Floods26
flood disaster, plus the cost involved in replacing de-stroyed furniture, equipment and education materials. Losses included the cost of temporarily renting alter-native premises and/or building temporary learning spaces, overtime payment for teachers, teacher train-ing on psychosocial support and classroom manage-ment, a possible loss in revenue and other additional costs involved in the post-disaster temporary education scheme, as well as repairing and disinfecting schools.
Flooding affected 4,646 schools across the 12 states concerned. Available data shows that 2,478 primary schools were partially damaged, while 727 were to-tally destroyed. Also 794 secondary schools were par-tially damaged and 200 totally destroyed. Table 3.4 disaggregates this information by state. The damaged and destroyed primary and secondary school build-ings include classrooms, offices, libraries and teachers’ quarters. Some secondary schools additionally have laboratories and student hostels. Both for primary and for secondary education, the damage and loss data in-clude few private schools. This seems to reflect the sit-uation on the ground, since not many private schools were damaged or destroyed. Relative to the number of schools in the LGAs, the highest value of damage was reported for Ibaji in Kogi state, where all primary and
secondary schools were submerged. Most of the dam-aged and destroyed schools also lost much, if not all, of their furniture and teaching and learning materials. Textbooks and educational equipment such as black-boards, chalk, and maps were destroyed by the water. Most of the furniture, both for pupils and teachers, was destroyed because it was submerged for too long. A number of secondary schools also suffered damages to their laboratories and hostels.
It is worth noting that, of all affected primary schools, 77 percent were partially damaged. For the secondary schools, this figure is slightly higher, at 80 percent. Com-paring the education sector in the different states, Anam-bra is the most seriously affected, with 41 percent of all the affected primary and 42 percent of all the affected secondary schools. For primary education, Adamawa and Jigawa states follow, with respectively 10 and 9 percent of all the affected schools. Bayelsa (16 percent) and Na-sarawa (14 percent) are the second- and third-most af-fected states when it comes to secondary education.
The value of destroyed assets in the education sector was estimated at N82.1 billion, and the subsequent losses rose to N15.2 billion more. Thus, the total value of damage and losses was estimated at N97.3 billion (see Table 3.5).
Table 3.4: Number of Totally and Partially Destroyed Primary and Secondary Schools in the Most Affected States
State
Primary Secondary
Number Partially Damaged
NumberTotally
DestroyedTotal Number
Affected
Number Partially
Damaged
NumberTotally
DestroyedTotal Number
Affected
Adamawa 280 45 325 46 0 46Anambra 1,050 256 1,306 323 93 416Bayelsa 234 20 254 163 1 164Delta 238 12 250 75 3 78Edo 10 8 18 3 0 3Jigawa 197 104 301 16 0 16Kebbi 89 23 112 0 0 0Kogi 105 118 223 13 33 46Nasarawa 111 83 194 73 70 143Rivers 116 0 116 81 0 81Taraba 48 58 106 1 0 1
Total 2,478 727 3,205 794 200 994
Source: Estimation by the Assessment Team on the basis of official information.
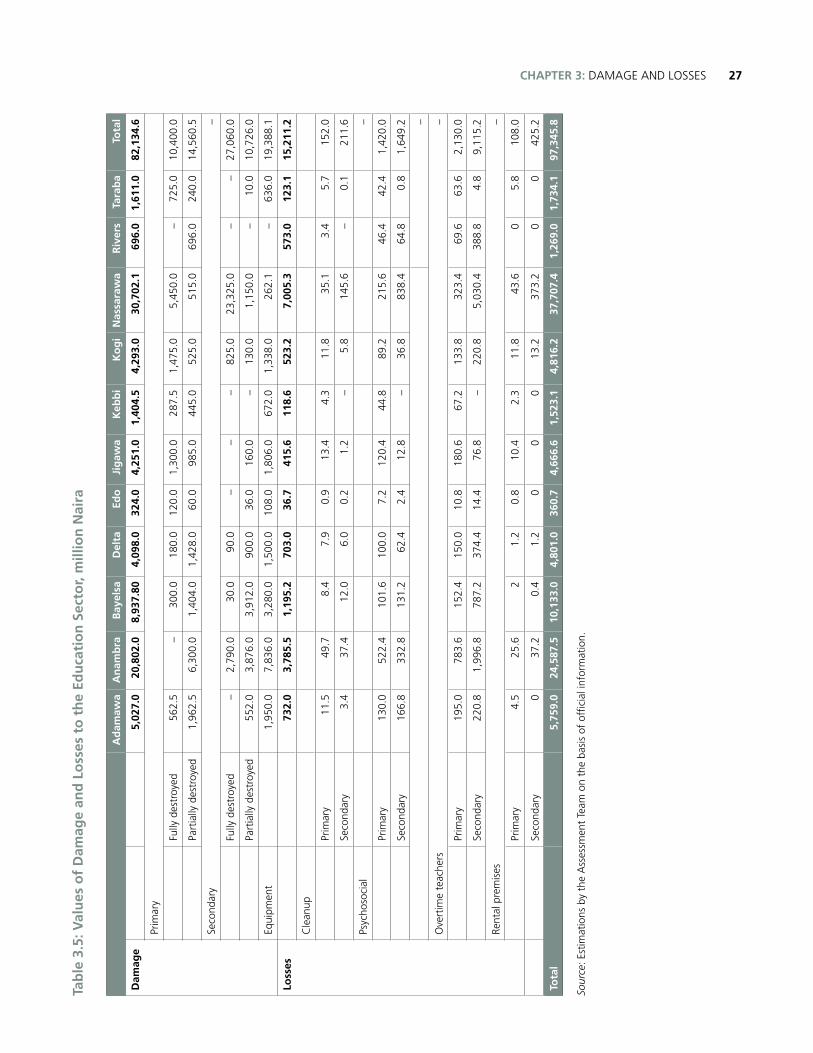
27CHAPTER 3: DAMAGE AND LOSSESTa
ble
3.5
: Val
ues
of
Dam
age
and
Lo
sses
to
th
e Ed
uca
tio
n S
ecto
r, m
illio
n N
aira
Sour
ce: E
stim
atio
ns b
y th
e A
sses
smen
t Te
am o
n th
e ba
sis
of o
ffici
al in
form
atio
n.
A
dam
awa
An
amb
raB
ayel
saD
elta
Edo
Jig
awa
Keb
bi
Ko
gi
Nas
sara
wa
Riv
ers
Tara
ba
Tota
l
Dam
age
5,0
27.0
2
0,80
2.0
8,9
37.8
0 4
,098
.0
324
.0
4,2
51.0
1
,404
.5
4,2
93.0
3
0,70
2.1
696
.0
1,61
1.0
82,
134.
6
Prim
ary
Fu
lly d
estr
oyed
562
.5
–
300
.0
180
.0
120
.0
1,3
00.0
2
87.5
1
,475
.0
5,4
50.0
–
7
25.0
1
0,40
0.0
Pa
rtia
lly d
estr
oyed
1,9
62.5
6
,300
.0
1,4
04.0
1
,428
.0
60.
0 9
85.0
4
45.0
5
25.0
5
15.0
6
96.0
2
40.0
1
4,56
0.5
Seco
ndar
y
–
Fu
lly d
estr
oyed
–
2,7
90.0
3
0.0
90.
0 –
–
–
8
25.0
2
3,32
5.0
–
–
27,
060.
0
Pa
rtia
lly d
estr
oyed
552
.0
3,8
76.0
3
,912
.0
900
.0
36.
0 1
60.0
–
1
30.0
1
,150
.0
–
10.
0 1
0,72
6.0
Equi
pmen
t
1,9
50.0
7
,836
.0
3,2
80.0
1
,500
.0
108
.0
1,8
06.0
6
72.0
1
,338
.0
262
.1
–
636
.0
19,
388.
1
Loss
es
732
.0
3,7
85.5
1
,195
.2
703
.0
36.
7 4
15.6
1
18.6
5
23.2
7
,005
.3
573
.0
123
.1
15,
211.
2
Cle
anup
Pr
imar
y 1
1.5
49.
7 8
.4
7.9
0
.9
13.
4 4
.3
11.
8 3
5.1
3.4
5
.7
152
.0
Se
cond
ary
3.4
3
7.4
12.
0 6
.0
0.2
1
.2
–
5.8
1
45.6
–
0
.1
211
.6
Psyc
hoso
cial
–
Pr
imar
y 1
30.0
5
22.4
1
01.6
1
00.0
7
.2
120
.4
44.
8 8
9.2
215
.6
46.
4 4
2.4
1,4
20.0
Se
cond
ary
166
.8
332
.8
131
.2
62.
4 2
.4
12.
8 –
3
6.8
838
.4
64.
8 0
.8
1,6
49.2
–
Ove
rtim
e te
ache
rs
–
Pr
imar
y 1
95.0
7
83.6
1
52.4
1
50.0
1
0.8
180
.6
67.
2 1
33.8
3
23.4
6
9.6
63.
6 2
,130
.0
Se
cond
ary
220
.8
1,9
96.8
7
87.2
3
74.4
1
4.4
76.
8 –
2
20.8
5
,030
.4
388
.8
4.8
9
,115
.2
Rent
al p
rem
ises
–
Pr
imar
y4.
525
.62
1.2
0.8
10.4
2.3
11.8
43.6
05.
8 1
08.0
Seco
ndar
y0
37.2
0.4
1.2
00
013
.237
3.2
00
425
.2
Tota
l
5
,759
.0
24,
587.
5 1
0,13
3.0
4,8
01.0
3
60.7
4
,666
.6
1,5
23.1
4
,816
.2
37,
707.
4 1
,269
.0
1,73
4.1
97,
345.
8

NIGERIA Post-Disaster Needs Assessment 2012 Floods28
3.1.3 Health
Situation before the Flood Disaster
The health network in Nigeria is based on a typical Pri-mary Health Care approach, with community-based services, as well as primary, secondary and tertiary care levels. Community level includes, among others, drug shops and homes for traditional birth attendants. The primary care level includes Primary Health Centers, Dispensaries, maternity homes, and Health posts. The secondary care level includes General Hospitals, State Hospitals, and Cottage Hospitals. The tertiary level in-cludes Teaching Hospitals, Federal Medical Centers and Specialist Centers.
The Nigerian health sector is guided by the National Strategic Health Development Plan (NSHDP) 2010–2015. The NSHDP was developed in accordance with extant national health policies and legislation, and in-ternational declarations and goals to which Nigeria is a signatory, namely; MDGs, the Ouagadougou Declara-tion on PHC and the Paris Declaration on Aid Effective-ness. Nigeria is a signatory to the International Health Partnerships Global Compact (May 28, 2008). The vi-sion is “To reduce the morbidity and mortality rates due to communicable diseases to the barest minimum; reverse the increasing prevalence of non-communica-ble diseases; meet global targets on the elimination and eradication of diseases; and significantly increase the life expectancy and quality of life of Nigerians.” The overarching goal of the NSHDP is to significantly improve the health status of Nigerians through the de-velopment of a strengthened and sustainable health care delivery system.
While progress is being made, the health sector in Nigeria still faces several challenges, as described in the 2011 sector review. Life expectancy at birth has increased from 48 in 1990 to 54 in 2009. There has been a progressive increase in the percentage of fully immunized children (FIC) aged 12–23 months, over a 6-year period from 12 percent in 2003 to 18 percent in 2006 and up to 53 percent in 2010. National measles vaccination coverage is sub-optimal to prevent trans-mission among the population of the flood-affected
areas. Since January 1, 2012, 3,463 measles cases have been reported in Nigeria. Polio is endemic in the country with 97 cases reported as of October 2012, which constitutes an increase of 36 over the past year. Immunization Plus Days (IPDs) were conducted in 11 high-risk states in the north of the country from Octo-ber 6-9, 2012. A baseline survey of primary healthcare services in 2010 reported that only 5.7 percent of pub-lic health facilities provide all components of the Ward Minimum Healthcare package.16 The overall HIV preva-lence rate in the population is estimated to be 4.1 per-cent, with 3.1 million people living with the virus. As of 2011, 852,846 were receiving antiretroviral therapy (ART).17 Approximately 21 states are either experienc-ing progressively rising HIV prevalence, a sudden rise in HIV prevalence, or state HIV prevalence higher than the national median of 4.1 percent. The Tuberculosis case detection rate (CDR) under directly observed treatment short course (DOTS) doubled from 20 percent in 2010 to 43 percent in 2011.
Malaria prevalence among children under 5 based on microscopy testing was 42 percent.18 According to the latest data (FMH 2010), there has been a five-fold in-crease of children under 5 sleeping under insecticide-treated nets (ITN), from a baseline of 6 percent to 29 percent. The NDHS 2008 reported the overall maternal mortality ratio (MMR) in Nigeria as 545/100,000 live births. While 70 percent of PHC facilities visited during the 2011 Joint Annual Review exhibited many compo-nents of Basic Emergency Obstetric Care (BEOC), none of them offered the complete package.
Furthermore, based on NDHS 2008, 39 percent of births were assisted by a skilled health worker. In 2011, despite some variation, virtually all the states reported a measure of improvement on their baseline figures. Ongoing high-impact interventions, such as the Mid-wifes Services Scheme (MSS), are expected to deliver
16 NACA 2011. Baseline survey of primary healthcare service and utilization in Nigeria.
17 http://naca.gov.ng/content/view/417/lang,en/18 Federal Ministry of Health (FMH) 2010. Nigeria Malaria
Indicator Survey (NMIS) – National Malaria Control Programme; Abuja, FMH.
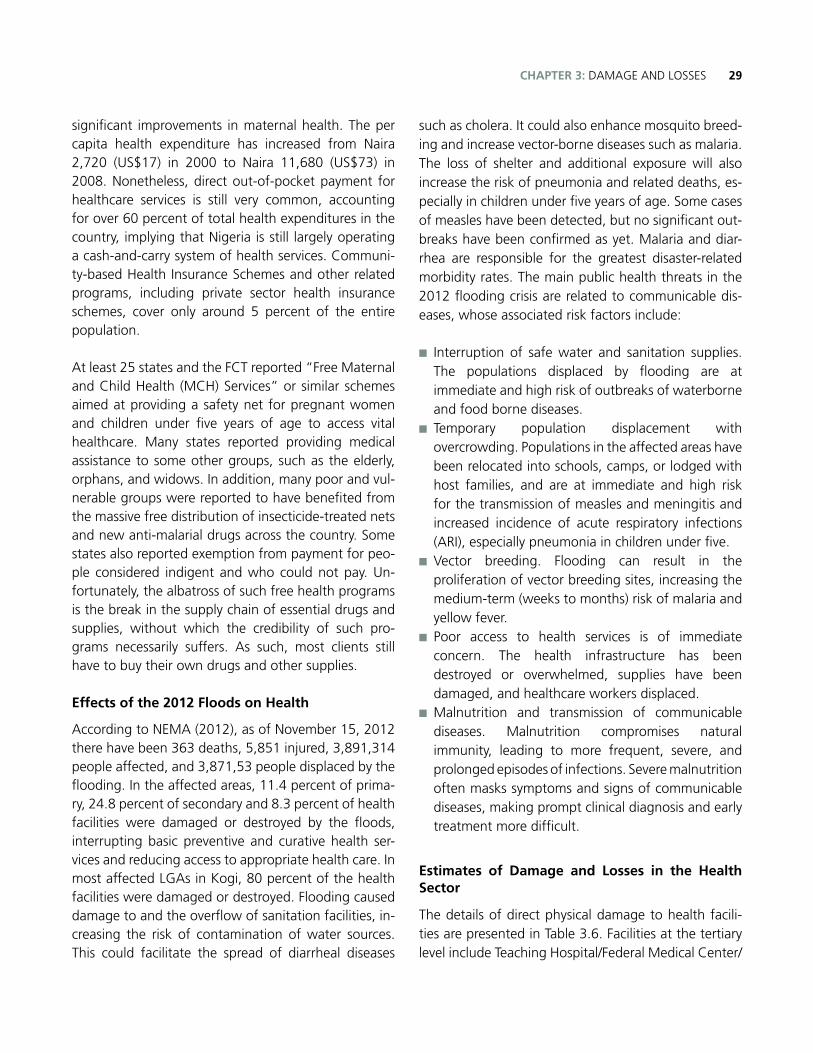
29CHAPTER 3: DAMAGE AND LOSSES
significant improvements in maternal health. The per capita health expenditure has increased from Naira 2,720 (US$17) in 2000 to Naira 11,680 (US$73) in 2008. Nonetheless, direct out-of-pocket payment for healthcare services is still very common, accounting for over 60 percent of total health expenditures in the country, implying that Nigeria is still largely operating a cash-and-carry system of health services. Communi-ty-based Health Insurance Schemes and other related programs, including private sector health insurance schemes, cover only around 5 percent of the entire population.
At least 25 states and the FCT reported “Free Maternal and Child Health (MCH) Services” or similar schemes aimed at providing a safety net for pregnant women and children under five years of age to access vital healthcare. Many states reported providing medical assistance to some other groups, such as the elderly, orphans, and widows. In addition, many poor and vul-nerable groups were reported to have benefited from the massive free distribution of insecticide-treated nets and new anti-malarial drugs across the country. Some states also reported exemption from payment for peo-ple considered indigent and who could not pay. Un-fortunately, the albatross of such free health programs is the break in the supply chain of essential drugs and supplies, without which the credibility of such pro-grams necessarily suffers. As such, most clients still have to buy their own drugs and other supplies.
Effects of the 2012 Floods on Health
According to NEMA (2012), as of November 15, 2012 there have been 363 deaths, 5,851 injured, 3,891,314 people affected, and 3,871,53 people displaced by the flooding. In the affected areas, 11.4 percent of prima-ry, 24.8 percent of secondary and 8.3 percent of health facilities were damaged or destroyed by the floods, interrupting basic preventive and curative health ser-vices and reducing access to appropriate health care. In most affected LGAs in Kogi, 80 percent of the health facilities were damaged or destroyed. Flooding caused damage to and the overflow of sanitation facilities, in-creasing the risk of contamination of water sources. This could facilitate the spread of diarrheal diseases
such as cholera. It could also enhance mosquito breed-ing and increase vector-borne diseases such as malaria. The loss of shelter and additional exposure will also increase the risk of pneumonia and related deaths, es-pecially in children under five years of age. Some cases of measles have been detected, but no significant out-breaks have been confirmed as yet. Malaria and diar-rhea are responsible for the greatest disaster-related morbidity rates. The main public health threats in the 2012 flooding crisis are related to communicable dis-eases, whose associated risk factors include:
■n Interruption of safe water and sanitation supplies. The populations displaced by flooding are at immediate and high risk of outbreaks of waterborne and food borne diseases.
■n Temporary population displacement with overcrowding. Populations in the affected areas have been relocated into schools, camps, or lodged with host families, and are at immediate and high risk for the transmission of measles and meningitis and increased incidence of acute respiratory infections (ARI), especially pneumonia in children under five.
■n Vector breeding. Flooding can result in the proliferation of vector breeding sites, increasing the medium-term (weeks to months) risk of malaria and yellow fever.
■n Poor access to health services is of immediate concern. The health infrastructure has been destroyed or overwhelmed, supplies have been damaged, and healthcare workers displaced.
■n Malnutrition and transmission of communicable diseases. Malnutrition compromises natural immunity, leading to more frequent, severe, and prolonged episodes of infections. Severe malnutrition often masks symptoms and signs of communicable diseases, making prompt clinical diagnosis and early treatment more difficult.
Estimates of Damage and Losses in the Health Sector
The details of direct physical damage to health facili-ties are presented in Table 3.6. Facilities at the tertiary level include Teaching Hospital/Federal Medical Center/
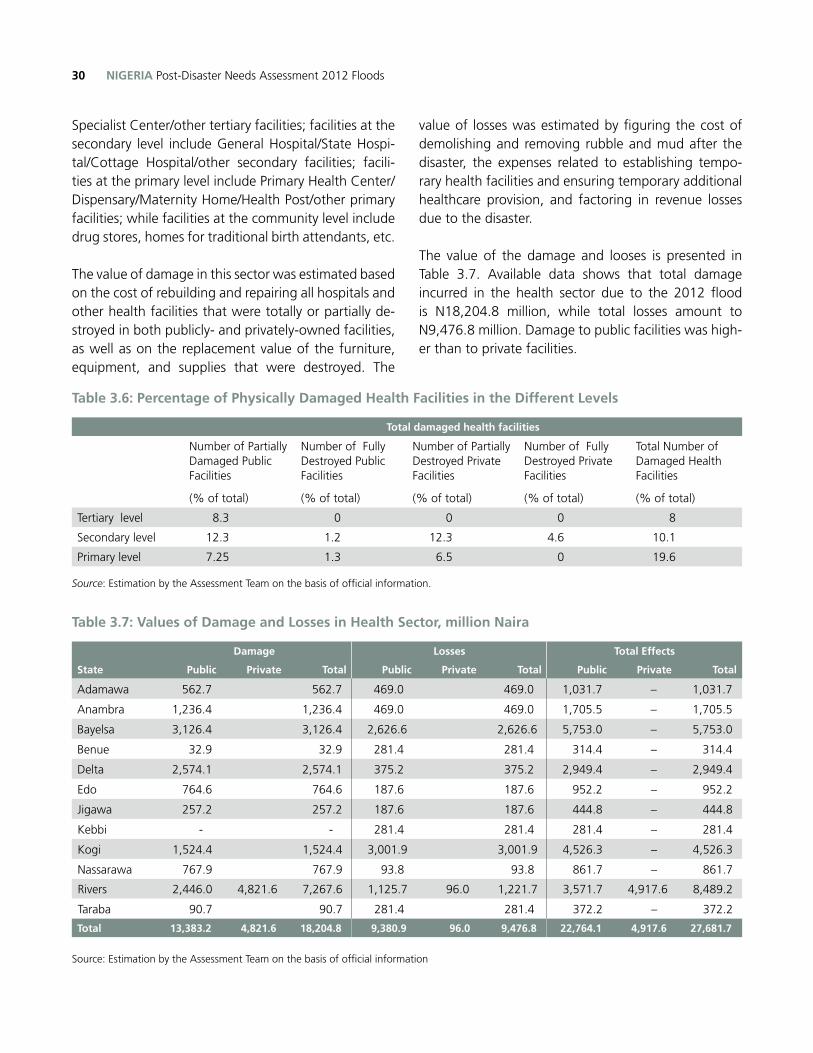
NIGERIA Post-Disaster Needs Assessment 2012 Floods30
Specialist Center/other tertiary facilities; facilities at the secondary level include General Hospital/State Hospi-tal/Cottage Hospital/other secondary facilities; facili-ties at the primary level include Primary Health Center/Dispensary/Maternity Home/Health Post/other primary facilities; while facilities at the community level include drug stores, homes for traditional birth attendants, etc.
The value of damage in this sector was estimated based on the cost of rebuilding and repairing all hospitals and other health facilities that were totally or partially de-stroyed in both publicly- and privately-owned facilities, as well as on the replacement value of the furniture, equipment, and supplies that were destroyed. The
value of losses was estimated by figuring the cost of demolishing and removing rubble and mud after the disaster, the expenses related to establishing tempo-rary health facilities and ensuring temporary additional healthcare provision, and factoring in revenue losses due to the disaster.
The value of the damage and looses is presented in Table 3.7. Available data shows that total damage incurred in the health sector due to the 2012 flood is N18,204.8 million, while total losses amount to N9,476.8 million. Damage to public facilities was high-er than to private facilities.
Table 3.6: Percentage of Physically Damaged Health Facilities in the Different Levels
Total damaged health facilities
Number of Partially Damaged Public Facilities
(% of total)
Number of Fully Destroyed Public Facilities
(% of total)
Number of Partially Destroyed Private Facilities
(% of total)
Number of Fully Destroyed Private Facilities
(% of total)
Total Number of Damaged Health Facilities
(% of total)
Tertiary level 8.3 0 0 0 8
Secondary level 12.3 1.2 12.3 4.6 10.1
Primary level 7.25 1.3 6.5 0 19.6
Source: Estimation by the Assessment Team on the basis of official information.
Table 3.7: Values of Damage and Losses in Health Sector, million Naira
Damage Losses Total Effects
State Public Private Total Public Private Total Public Private Total
Adamawa 562.7 562.7 469.0 469.0 1,031.7 – 1,031.7
Anambra 1,236.4 1,236.4 469.0 469.0 1,705.5 – 1,705.5
Bayelsa 3,126.4 3,126.4 2,626.6 2,626.6 5,753.0 – 5,753.0
Benue 32.9 32.9 281.4 281.4 314.4 – 314.4
Delta 2,574.1 2,574.1 375.2 375.2 2,949.4 – 2,949.4
Edo 764.6 764.6 187.6 187.6 952.2 – 952.2
Jigawa 257.2 257.2 187.6 187.6 444.8 – 444.8
Kebbi - - 281.4 281.4 281.4 – 281.4
Kogi 1,524.4 1,524.4 3,001.9 3,001.9 4,526.3 – 4,526.3
Nassarawa 767.9 767.9 93.8 93.8 861.7 – 861.7
Rivers 2,446.0 4,821.6 7,267.6 1,125.7 96.0 1,221.7 3,571.7 4,917.6 8,489.2
Taraba 90.7 90.7 281.4 281.4 372.2 – 372.2
Total 13,383.2 4,821.6 18,204.8 9,380.9 96.0 9,476.8 22,764.1 4,917.6 27,681.7
Source: Estimation by the Assessment Team on the basis of official information
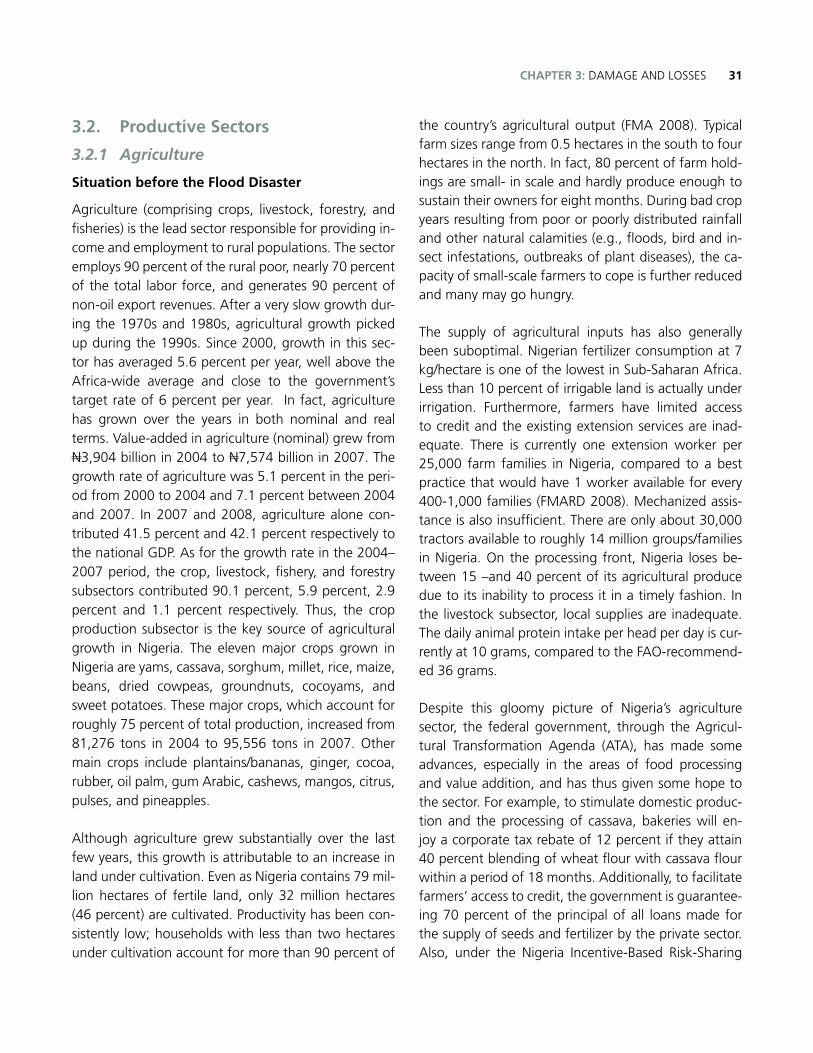
31CHAPTER 3: DAMAGE AND LOSSES
3.2. Productive Sectors
3.2.1 Agriculture
Situation before the Flood Disaster
Agriculture (comprising crops, livestock, forestry, and fisheries) is the lead sector responsible for providing in-come and employment to rural populations. The sector employs 90 percent of the rural poor, nearly 70 percent of the total labor force, and generates 90 percent of non-oil export revenues. After a very slow growth dur-ing the 1970s and 1980s, agricultural growth picked up during the 1990s. Since 2000, growth in this sec-tor has averaged 5.6 percent per year, well above the Africa-wide average and close to the government’s target rate of 6 percent per year. In fact, agriculture has grown over the years in both nominal and real terms. Value-added in agriculture (nominal) grew from N3,904 billion in 2004 to N7,574 billion in 2007. The growth rate of agriculture was 5.1 percent in the peri-od from 2000 to 2004 and 7.1 percent between 2004 and 2007. In 2007 and 2008, agriculture alone con-tributed 41.5 percent and 42.1 percent respectively to the national GDP. As for the growth rate in the 2004–2007 period, the crop, livestock, fishery, and forestry subsectors contributed 90.1 percent, 5.9 percent, 2.9 percent and 1.1 percent respectively. Thus, the crop production subsector is the key source of agricultural growth in Nigeria. The eleven major crops grown in Nigeria are yams, cassava, sorghum, millet, rice, maize, beans, dried cowpeas, groundnuts, cocoyams, and sweet potatoes. These major crops, which account for roughly 75 percent of total production, increased from 81,276 tons in 2004 to 95,556 tons in 2007. Other main crops include plantains/bananas, ginger, cocoa, rubber, oil palm, gum Arabic, cashews, mangos, citrus, pulses, and pineapples.
Although agriculture grew substantially over the last few years, this growth is attributable to an increase in land under cultivation. Even as Nigeria contains 79 mil-lion hectares of fertile land, only 32 million hectares (46 percent) are cultivated. Productivity has been con-sistently low; households with less than two hectares under cultivation account for more than 90 percent of
the country’s agricultural output (FMA 2008). Typical farm sizes range from 0.5 hectares in the south to four hectares in the north. In fact, 80 percent of farm hold-ings are small- in scale and hardly produce enough to sustain their owners for eight months. During bad crop years resulting from poor or poorly distributed rainfall and other natural calamities (e.g., floods, bird and in-sect infestations, outbreaks of plant diseases), the ca-pacity of small-scale farmers to cope is further reduced and many may go hungry.
The supply of agricultural inputs has also generally been suboptimal. Nigerian fertilizer consumption at 7 kg/hectare is one of the lowest in Sub-Saharan Africa. Less than 10 percent of irrigable land is actually under irrigation. Furthermore, farmers have limited access to credit and the existing extension services are inad-equate. There is currently one extension worker per 25,000 farm families in Nigeria, compared to a best practice that would have 1 worker available for every 400-1,000 families (FMARD 2008). Mechanized assis-tance is also insufficient. There are only about 30,000 tractors available to roughly 14 million groups/families in Nigeria. On the processing front, Nigeria loses be-tween 15 –and 40 percent of its agricultural produce due to its inability to process it in a timely fashion. In the livestock subsector, local supplies are inadequate. The daily animal protein intake per head per day is cur-rently at 10 grams, compared to the FAO-recommend-ed 36 grams.
Despite this gloomy picture of Nigeria’s agriculture sector, the federal government, through the Agricul-tural Transformation Agenda (ATA), has made some advances, especially in the areas of food processing and value addition, and has thus given some hope to the sector. For example, to stimulate domestic produc-tion and the processing of cassava, bakeries will en-joy a corporate tax rebate of 12 percent if they attain 40 percent blending of wheat flour with cassava flour within a period of 18 months. Additionally, to facilitate farmers’ access to credit, the government is guarantee-ing 70 percent of the principal of all loans made for the supply of seeds and fertilizer by the private sector. Also, under the Nigeria Incentive-Based Risk-Sharing
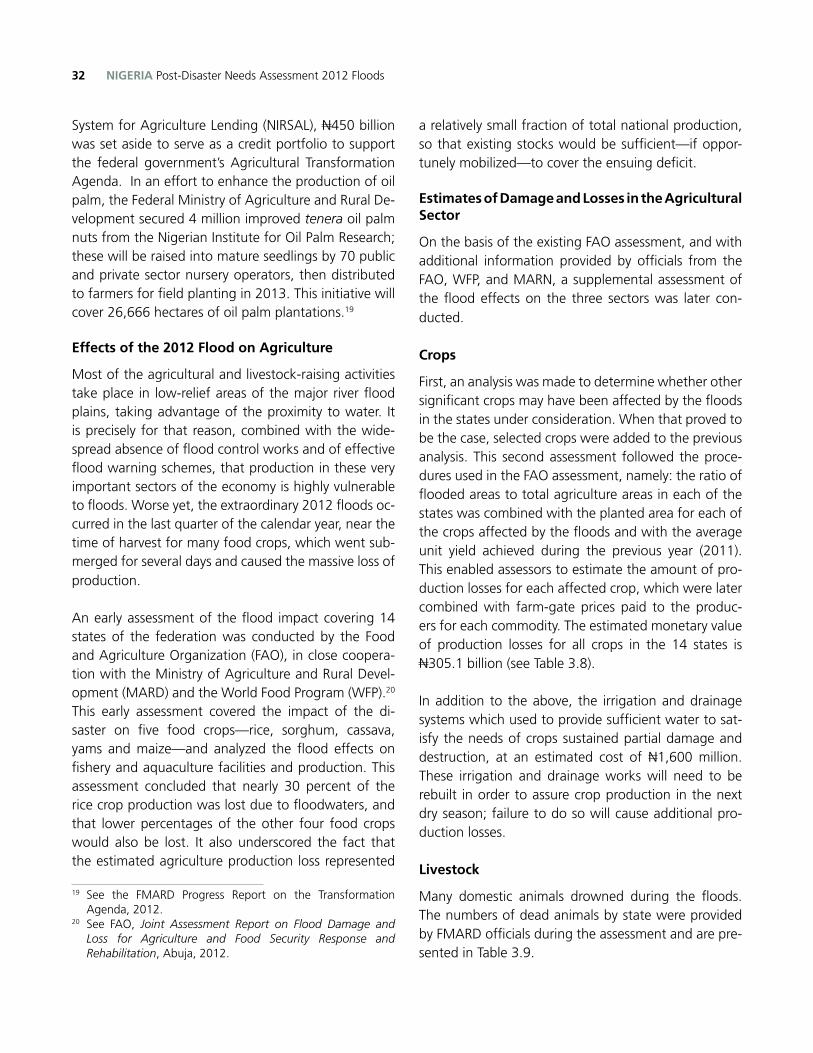
NIGERIA Post-Disaster Needs Assessment 2012 Floods32
System for Agriculture Lending (NIRSAL), N450 billion was set aside to serve as a credit portfolio to support the federal government’s Agricultural Transformation Agenda. In an effort to enhance the production of oil palm, the Federal Ministry of Agriculture and Rural De-velopment secured 4 million improved tenera oil palm nuts from the Nigerian Institute for Oil Palm Research; these will be raised into mature seedlings by 70 public and private sector nursery operators, then distributed to farmers for field planting in 2013. This initiative will cover 26,666 hectares of oil palm plantations.19
Effects of the 2012 Flood on Agriculture
Most of the agricultural and livestock-raising activities take place in low-relief areas of the major river flood plains, taking advantage of the proximity to water. It is precisely for that reason, combined with the wide-spread absence of flood control works and of effective flood warning schemes, that production in these very important sectors of the economy is highly vulnerable to floods. Worse yet, the extraordinary 2012 floods oc-curred in the last quarter of the calendar year, near the time of harvest for many food crops, which went sub-merged for several days and caused the massive loss of production.
An early assessment of the flood impact covering 14 states of the federation was conducted by the Food and Agriculture Organization (FAO), in close coopera-tion with the Ministry of Agriculture and Rural Devel-opment (MARD) and the World Food Program (WFP).20 This early assessment covered the impact of the di-saster on five food crops—rice, sorghum, cassava, yams and maize—and analyzed the flood effects on fishery and aquaculture facilities and production. This assessment concluded that nearly 30 percent of the rice crop production was lost due to floodwaters, and that lower percentages of the other four food crops would also be lost. It also underscored the fact that the estimated agriculture production loss represented
19 See the FMARD Progress Report on the Transformation Agenda, 2012.
20 See FAO, Joint Assessment Report on Flood Damage and Loss for Agriculture and Food Security Response and Rehabilitation, Abuja, 2012.
a relatively small fraction of total national production, so that existing stocks would be sufficient—if oppor-tunely mobilized—to cover the ensuing deficit.
Estimates of Damage and Losses in the Agricultural Sector
On the basis of the existing FAO assessment, and with additional information provided by officials from the FAO, WFP, and MARN, a supplemental assessment of the flood effects on the three sectors was later con-ducted.
Crops
First, an analysis was made to determine whether other significant crops may have been affected by the floods in the states under consideration. When that proved to be the case, selected crops were added to the previous analysis. This second assessment followed the proce-dures used in the FAO assessment, namely: the ratio of flooded areas to total agriculture areas in each of the states was combined with the planted area for each of the crops affected by the floods and with the average unit yield achieved during the previous year (2011). This enabled assessors to estimate the amount of pro-duction losses for each affected crop, which were later combined with farm-gate prices paid to the produc-ers for each commodity. The estimated monetary value of production losses for all crops in the 14 states is N305.1 billion (see Table 3.8).
In addition to the above, the irrigation and drainage systems which used to provide sufficient water to sat-isfy the needs of crops sustained partial damage and destruction, at an estimated cost of N1,600 million. These irrigation and drainage works will need to be rebuilt in order to assure crop production in the next dry season; failure to do so will cause additional pro-duction losses.
Livestock
Many domestic animals drowned during the floods. The numbers of dead animals by state were provided by FMARD officials during the assessment and are pre-sented in Table 3.9.
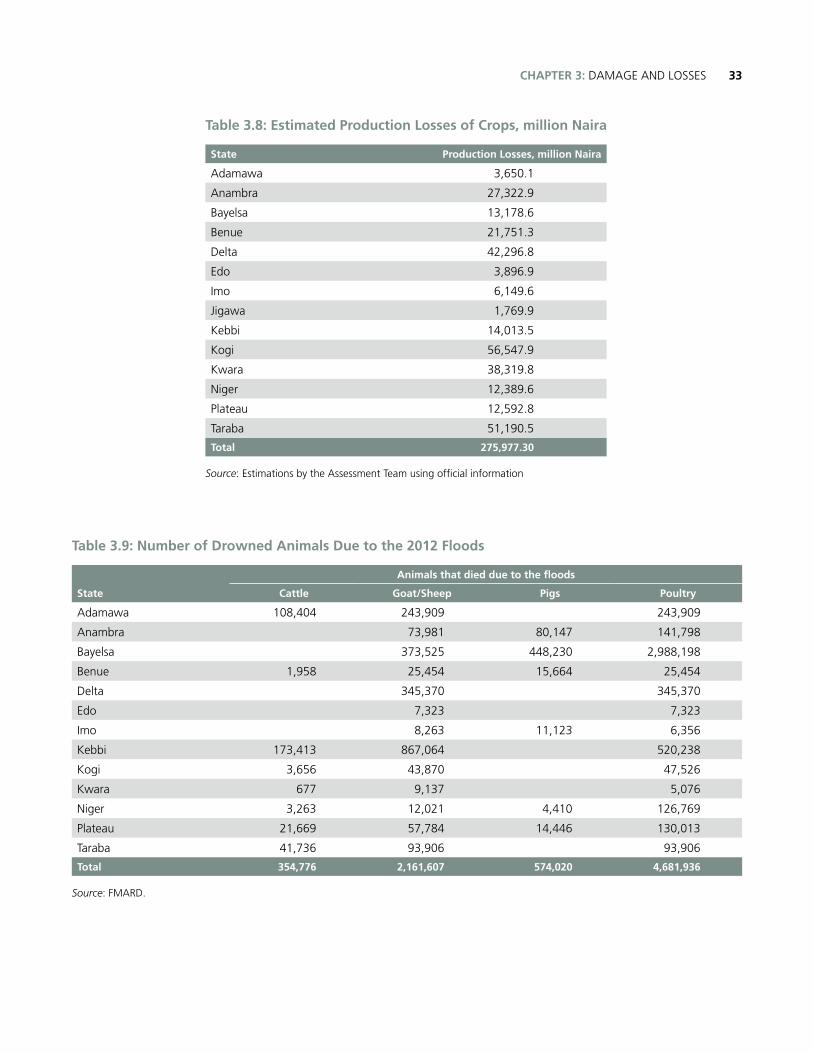
33CHAPTER 3: DAMAGE AND LOSSES
Table 3.8: Estimated Production Losses of Crops, million Naira
State Production Losses, million Naira
Adamawa 3,650.1
Anambra 27,322.9
Bayelsa 13,178.6
Benue 21,751.3
Delta 42,296.8
Edo 3,896.9
Imo 6,149.6
Jigawa 1,769.9
Kebbi 14,013.5
Kogi 56,547.9
Kwara 38,319.8
Niger 12,389.6
Plateau 12,592.8
Taraba 51,190.5
Total 275,977.30
Source: Estimations by the Assessment Team using official information
Table 3.9: Number of Drowned Animals Due to the 2012 Floods
Animals that died due to the floods
State Cattle Goat/Sheep Pigs Poultry
Adamawa 108,404 243,909 243,909
Anambra 73,981 80,147 141,798
Bayelsa 373,525 448,230 2,988,198
Benue 1,958 25,454 15,664 25,454
Delta 345,370 345,370
Edo 7,323 7,323
Imo 8,263 11,123 6,356
Kebbi 173,413 867,064 520,238
Kogi 3,656 43,870 47,526
Kwara 677 9,137 5,076
Niger 3,263 12,021 4,410 126,769
Plateau 21,669 57,784 14,446 130,013
Taraba 41,736 93,906 93,906
Total 354,776 2,161,607 574,020 4,681,936
Source: FMARD.
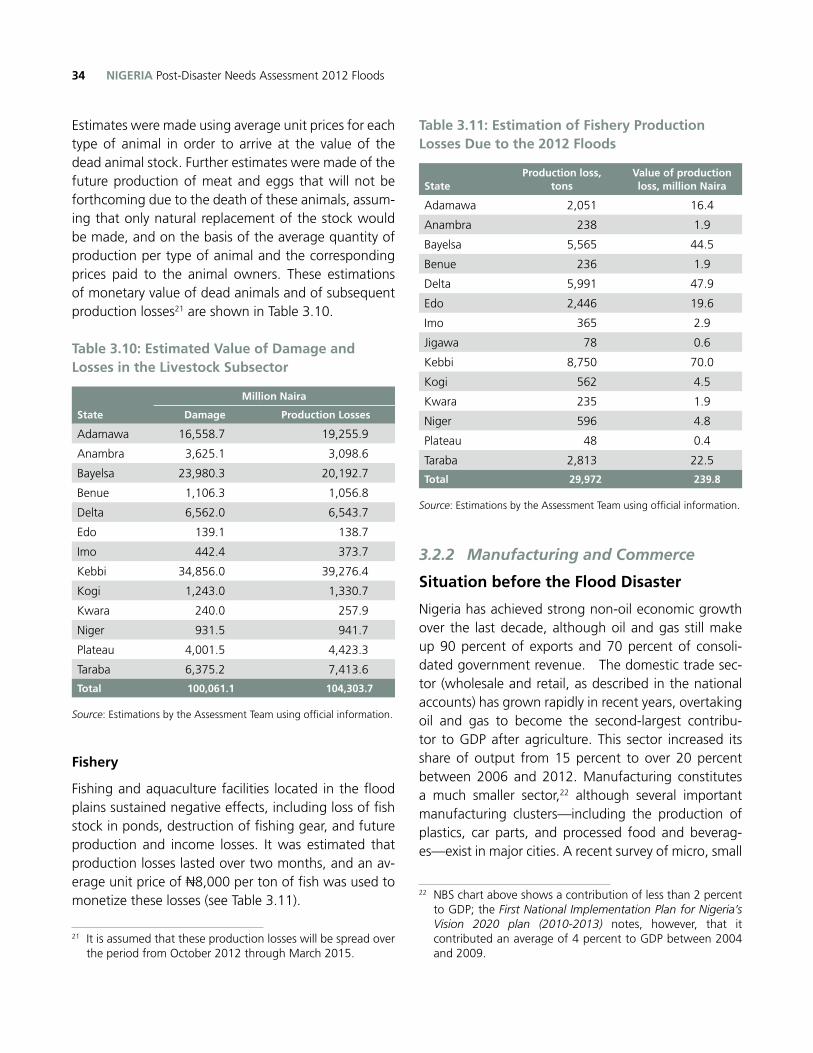
NIGERIA Post-Disaster Needs Assessment 2012 Floods34
Estimates were made using average unit prices for each type of animal in order to arrive at the value of the dead animal stock. Further estimates were made of the future production of meat and eggs that will not be forthcoming due to the death of these animals, assum-ing that only natural replacement of the stock would be made, and on the basis of the average quantity of production per type of animal and the corresponding prices paid to the animal owners. These estimations of monetary value of dead animals and of subsequent production losses21 are shown in Table 3.10.
Table 3.10: Estimated Value of Damage and Losses in the Livestock Subsector
State
Million Naira
Damage Production Losses
Adamawa 16,558.7 19,255.9
Anambra 3,625.1 3,098.6
Bayelsa 23,980.3 20,192.7
Benue 1,106.3 1,056.8
Delta 6,562.0 6,543.7
Edo 139.1 138.7
Imo 442.4 373.7
Kebbi 34,856.0 39,276.4
Kogi 1,243.0 1,330.7
Kwara 240.0 257.9
Niger 931.5 941.7
Plateau 4,001.5 4,423.3
Taraba 6,375.2 7,413.6
Total 100,061.1 104,303.7
Source: Estimations by the Assessment Team using official information.
Fishery
Fishing and aquaculture facilities located in the flood plains sustained negative effects, including loss of fish stock in ponds, destruction of fishing gear, and future production and income losses. It was estimated that production losses lasted over two months, and an av-erage unit price of N8,000 per ton of fish was used to monetize these losses (see Table 3.11).
21 It is assumed that these production losses will be spread over the period from October 2012 through March 2015.
Table 3.11: Estimation of Fishery Production Losses Due to the 2012 Floods
StateProduction loss,
tonsValue of production loss, million Naira
Adamawa 2,051 16.4
Anambra 238 1.9
Bayelsa 5,565 44.5
Benue 236 1.9
Delta 5,991 47.9
Edo 2,446 19.6
Imo 365 2.9
Jigawa 78 0.6
Kebbi 8,750 70.0
Kogi 562 4.5
Kwara 235 1.9
Niger 596 4.8
Plateau 48 0.4
Taraba 2,813 22.5
Total 29,972 239.8
Source: Estimations by the Assessment Team using official information.
3.2.2 Manufacturing and Commerce
Situation before the Flood Disaster
Nigeria has achieved strong non-oil economic growth over the last decade, although oil and gas still make up 90 percent of exports and 70 percent of consoli-dated government revenue. The domestic trade sec-tor (wholesale and retail, as described in the national accounts) has grown rapidly in recent years, overtaking oil and gas to become the second-largest contribu-tor to GDP after agriculture. This sector increased its share of output from 15 percent to over 20 percent between 2006 and 2012. Manufacturing constitutes a much smaller sector,22 although several important manufacturing clusters—including the production of plastics, car parts, and processed food and beverag-es—exist in major cities. A recent survey of micro, small
22 NBS chart above shows a contribution of less than 2 percent to GDP; the First National Implementation Plan for Nigeria’s Vision 2020 plan (2010-2013) notes, however, that it contributed an average of 4 percent to GDP between 2004 and 2009.
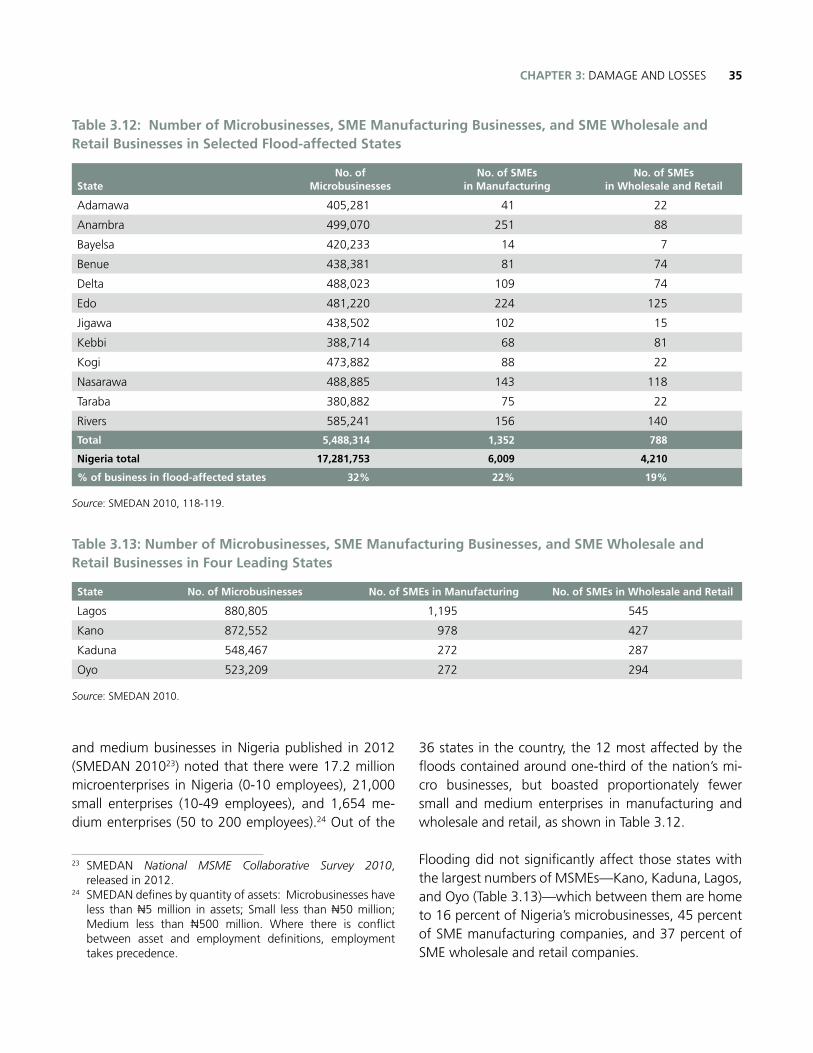
35CHAPTER 3: DAMAGE AND LOSSES
and medium businesses in Nigeria published in 2012 (SMEDAN 201023) noted that there were 17.2 million microenterprises in Nigeria (0-10 employees), 21,000 small enterprises (10-49 employees), and 1,654 me-dium enterprises (50 to 200 employees).24 Out of the
23 SMEDAN National MSME Collaborative Survey 2010, released in 2012.
24 SMEDAN defines by quantity of assets: Microbusinesses have less than N5 million in assets; Small less than N50 million; Medium less than N500 million. Where there is conflict between asset and employment definitions, employment takes precedence.
36 states in the country, the 12 most affected by the floods contained around one-third of the nation’s mi-cro businesses, but boasted proportionately fewer small and medium enterprises in manufacturing and wholesale and retail, as shown in Table 3.12.
Flooding did not significantly affect those states with the largest numbers of MSMEs—Kano, Kaduna, Lagos, and Oyo (Table 3.13)—which between them are home to 16 percent of Nigeria’s microbusinesses, 45 percent of SME manufacturing companies, and 37 percent of SME wholesale and retail companies.
Table 3.12: Number of Microbusinesses, SME Manufacturing Businesses, and SME Wholesale and Retail Businesses in Selected Flood-affected States
StateNo. of
MicrobusinessesNo. of SMEs
in ManufacturingNo. of SMEs
in Wholesale and Retail
Adamawa 405,281 41 22
Anambra 499,070 251 88
Bayelsa 420,233 14 7
Benue 438,381 81 74
Delta 488,023 109 74
Edo 481,220 224 125
Jigawa 438,502 102 15
Kebbi 388,714 68 81
Kogi 473,882 88 22
Nasarawa 488,885 143 118
Taraba 380,882 75 22
Rivers 585,241 156 140
Total 5,488,314 1,352 788
Nigeria total 17,281,753 6,009 4,210
% of business in flood-affected states 32% 22% 19%
Source: SMEDAN 2010, 118-119.
Table 3.13: Number of Microbusinesses, SME Manufacturing Businesses, and SME Wholesale and Retail Businesses in Four Leading States
State No. of Microbusinesses No. of SMEs in Manufacturing No. of SMEs in Wholesale and Retail
Lagos 880,805 1,195 545
Kano 872,552 978 427
Kaduna 548,467 272 287
Oyo 523,209 272 294
Source: SMEDAN 2010.
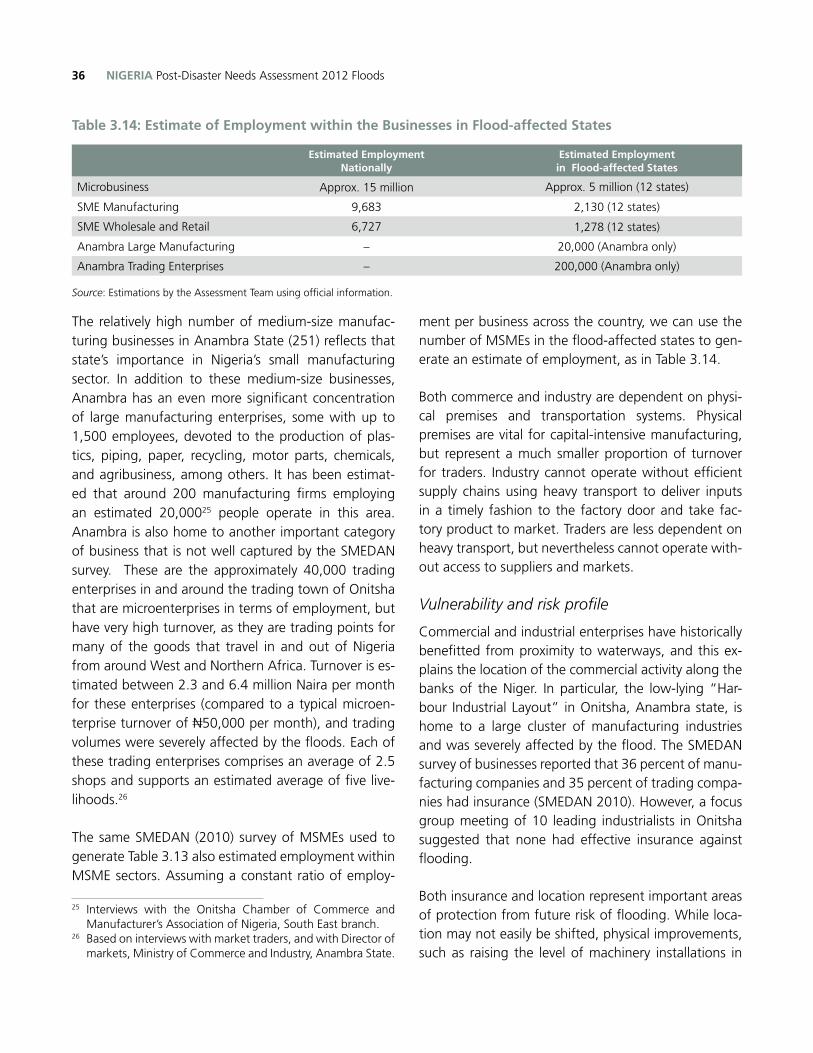
NIGERIA Post-Disaster Needs Assessment 2012 Floods36
The relatively high number of medium-size manufac-turing businesses in Anambra State (251) reflects that state’s importance in Nigeria’s small manufacturing sector. In addition to these medium-size businesses, Anambra has an even more significant concentration of large manufacturing enterprises, some with up to 1,500 employees, devoted to the production of plas-tics, piping, paper, recycling, motor parts, chemicals, and agribusiness, among others. It has been estimat-ed that around 200 manufacturing firms employing an estimated 20,00025 people operate in this area. Anambra is also home to another important category of business that is not well captured by the SMEDAN survey. These are the approximately 40,000 trading enterprises in and around the trading town of Onitsha that are microenterprises in terms of employment, but have very high turnover, as they are trading points for many of the goods that travel in and out of Nigeria from around West and Northern Africa. Turnover is es-timated between 2.3 and 6.4 million Naira per month for these enterprises (compared to a typical microen-terprise turnover of N50,000 per month), and trading volumes were severely affected by the floods. Each of these trading enterprises comprises an average of 2.5 shops and supports an estimated average of five live-lihoods.26
The same SMEDAN (2010) survey of MSMEs used to generate Table 3.13 also estimated employment within MSME sectors. Assuming a constant ratio of employ-
25 Interviews with the Onitsha Chamber of Commerce and Manufacturer’s Association of Nigeria, South East branch.
26 Based on interviews with market traders, and with Director of markets, Ministry of Commerce and Industry, Anambra State.
ment per business across the country, we can use the number of MSMEs in the flood-affected states to gen-erate an estimate of employment, as in Table 3.14.
Both commerce and industry are dependent on physi-cal premises and transportation systems. Physical premises are vital for capital-intensive manufacturing, but represent a much smaller proportion of turnover for traders. Industry cannot operate without efficient supply chains using heavy transport to deliver inputs in a timely fashion to the factory door and take fac-tory product to market. Traders are less dependent on heavy transport, but nevertheless cannot operate with-out access to suppliers and markets.
Vulnerability and risk profile
Commercial and industrial enterprises have historically benefitted from proximity to waterways, and this ex-plains the location of the commercial activity along the banks of the Niger. In particular, the low-lying “Har-bour Industrial Layout” in Onitsha, Anambra state, is home to a large cluster of manufacturing industries and was severely affected by the flood. The SMEDAN survey of businesses reported that 36 percent of manu-facturing companies and 35 percent of trading compa-nies had insurance (SMEDAN 2010). However, a focus group meeting of 10 leading industrialists in Onitsha suggested that none had effective insurance against flooding.
Both insurance and location represent important areas of protection from future risk of flooding. While loca-tion may not easily be shifted, physical improvements, such as raising the level of machinery installations in
Table 3.14: Estimate of Employment within the Businesses in Flood-affected States
Estimated Employment Nationally
Estimated Employment in Flood-affected States
Microbusiness Approx. 15 million Approx. 5 million (12 states)
SME Manufacturing 9,683 2,130 (12 states)
SME Wholesale and Retail 6,727 1,278 (12 states)
Anambra Large Manufacturing – 20,000 (Anambra only)
Anambra Trading Enterprises – 200,000 (Anambra only)
Source: Estimations by the Assessment Team using official information.
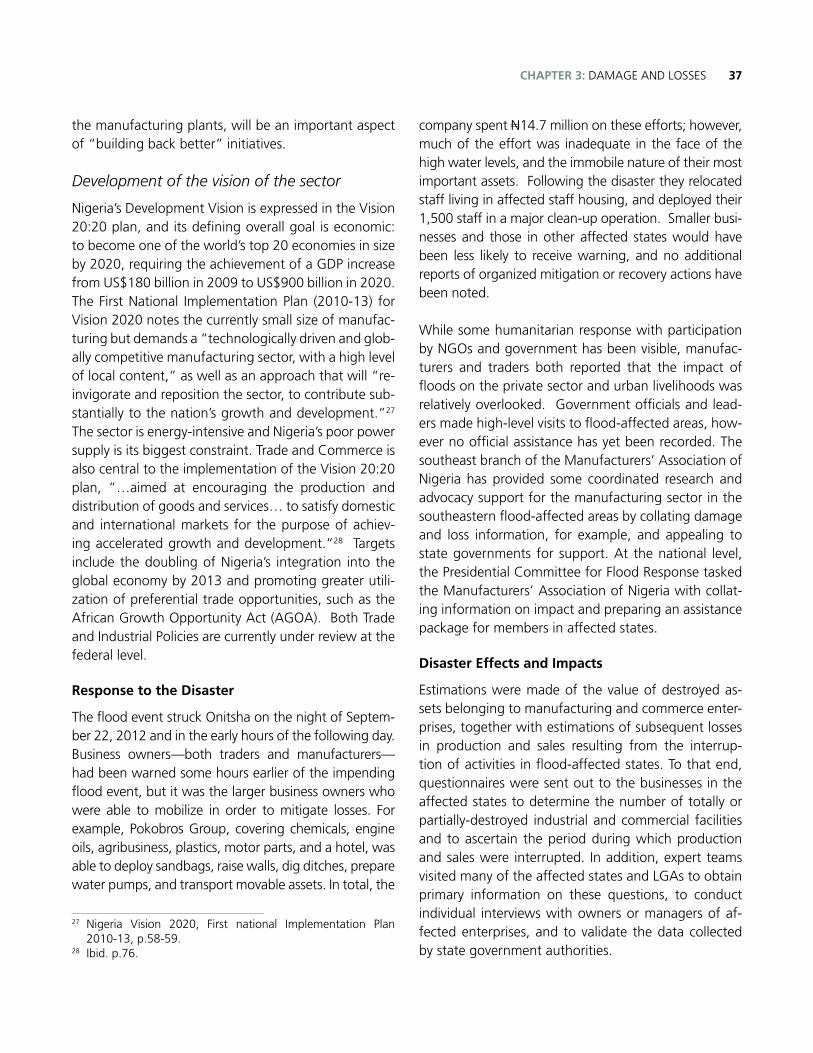
37CHAPTER 3: DAMAGE AND LOSSES
the manufacturing plants, will be an important aspect of “building back better” initiatives.
Development of the vision of the sector
Nigeria’s Development Vision is expressed in the Vision 20:20 plan, and its defining overall goal is economic: to become one of the world’s top 20 economies in size by 2020, requiring the achievement of a GDP increase from US$180 billion in 2009 to US$900 billion in 2020. The First National Implementation Plan (2010-13) for Vision 2020 notes the currently small size of manufac-turing but demands a “technologically driven and glob-ally competitive manufacturing sector, with a high level of local content,” as well as an approach that will “re-invigorate and reposition the sector, to contribute sub-stantially to the nation’s growth and development.”27 The sector is energy-intensive and Nigeria’s poor power supply is its biggest constraint. Trade and Commerce is also central to the implementation of the Vision 20:20 plan, “…aimed at encouraging the production and distribution of goods and services… to satisfy domestic and international markets for the purpose of achiev-ing accelerated growth and development.”28 Targets include the doubling of Nigeria’s integration into the global economy by 2013 and promoting greater utili-zation of preferential trade opportunities, such as the African Growth Opportunity Act (AGOA). Both Trade and Industrial Policies are currently under review at the federal level.
Response to the Disaster
The flood event struck Onitsha on the night of Septem-ber 22, 2012 and in the early hours of the following day. Business owners—both traders and manufacturers—had been warned some hours earlier of the impending flood event, but it was the larger business owners who were able to mobilize in order to mitigate losses. For example, Pokobros Group, covering chemicals, engine oils, agribusiness, plastics, motor parts, and a hotel, was able to deploy sandbags, raise walls, dig ditches, prepare water pumps, and transport movable assets. In total, the
27 Nigeria Vision 2020, First national Implementation Plan 2010-13, p.58-59.
28 Ibid. p.76.
company spent N14.7 million on these efforts; however, much of the effort was inadequate in the face of the high water levels, and the immobile nature of their most important assets. Following the disaster they relocated staff living in affected staff housing, and deployed their 1,500 staff in a major clean-up operation. Smaller busi-nesses and those in other affected states would have been less likely to receive warning, and no additional reports of organized mitigation or recovery actions have been noted.
While some humanitarian response with participation by NGOs and government has been visible, manufac-turers and traders both reported that the impact of floods on the private sector and urban livelihoods was relatively overlooked. Government officials and lead-ers made high-level visits to flood-affected areas, how-ever no official assistance has yet been recorded. The southeast branch of the Manufacturers’ Association of Nigeria has provided some coordinated research and advocacy support for the manufacturing sector in the southeastern flood-affected areas by collating damage and loss information, for example, and appealing to state governments for support. At the national level, the Presidential Committee for Flood Response tasked the Manufacturers’ Association of Nigeria with collat-ing information on impact and preparing an assistance package for members in affected states.
Disaster Effects and Impacts
Estimations were made of the value of destroyed as-sets belonging to manufacturing and commerce enter-prises, together with estimations of subsequent losses in production and sales resulting from the interrup-tion of activities in flood-affected states. To that end, questionnaires were sent out to the businesses in the affected states to determine the number of totally or partially-destroyed industrial and commercial facilities and to ascertain the period during which production and sales were interrupted. In addition, expert teams visited many of the affected states and LGAs to obtain primary information on these questions, to conduct individual interviews with owners or managers of af-fected enterprises, and to validate the data collected by state government authorities.
NIGERIA Post-Disaster Needs Assessment 2012 Floods38
Data obtained thanks to this two-pronged approach was combined with baseline information on micro-, small- and medium-sized enterprises available in the 2010 MSME Collaborative Survey29 that provides the most recent nationwide and state-disaggregated data on the number of establishments, value of capital and assets, monthly turnover, and number of employed persons in the different sectors of economic activity. In isolated cases in which the number of flood-affected establishments in a state could not be ascertained, the destruction ratio of housing (i.e., the number of hous-es destroyed versus the amount of housing stock per state) was applied to estimate the number of establish-ments destroyed. This formed the basis of damage and loss to small- and medium-sized commercial enterpris-es (Table 3.15), small- and medium-sized manufactur-ing enterprises (Table 3.16), and microbusinesses (Table 3.19) across the 12 flood-affected states.
Additional attention was given to Anambra state, where a significant cluster of manufacturing companies sus-tained severe damage, and where a large cluster of trad-ing enterprises experienced significant trading losses. Damage and losses to large manufacturers in Anambra state (Table 3.17) were estimated on the basis of inter-views with the Onitsha Chamber of Commerce and a focus group of 10 leading industrial companies that were affected. Two companies supplied detailed dam-age reports and an estimate for the level of damage per hundred employees was developed, then multiplied by the estimated size of the sector (200 companies with an average of 100 employees each).
The losses to Anambra’s commercial sector (Table 3.18) were estimated on the basis of a survey of 200 traders, undertaken by the Anambra State Ministry of Com-merce and Industry in November 2012 and used to ascertain typical and flood-affected monthly turnover figures, which form the basis of loss estimations. A baseline of the total number of trading enterprises was drawn from a recent enumeration in Anambra state.
29 Survey report on micro, small and medium enterprises in Nigeria, National Bureau of Statistics (NBS) and Small and Medium Enterprises Development Agency of Nigeria (SMEDAN), Abuja, Nigeria, 2011.
The period of interruption of activities for the manu-facturing sector has been assumed to be three months for SME Manufacturing and 12 months for Large Manufacturing enterprises. For the commerce sector, the period of interruption is estimated at 2.5 months, corresponding to the time required to rebuild the de-stroyed assets and to obtain working capital for each entrepreneur. In the case of agro-industries, however, production losses are expected to occur over a longer time period that will only end at with the following year’s harvest.
Tables 3.15 and 3.16 on the following pages set out es-timates of damage and losses for the SME Commerce sector and the SME Manufacturing sector. SME Com-merce losses included the destruction of shops and storage areas and damage to stock. Damage was rela-tively more severe in the case of manufacturing com-panies, as expensive machinery was also destroyed, with longer-term impacts on operational losses. Table 3.17 focuses on the manufacturing sector in Onitsha, Anambra state, and Table 3.18 on the trading sector in that state. Table 3.19 provides information on the mi-crosector across the 12 flood-affected states in which it is estimated that around 20 percent of the 5 million microenterprises were affected.
Social impacts
The social impact of the damages and losses discussed above are concentrated in two key areas: employment and income losses. In general, it is likely that the very large number of people involved in micro and trading enterprises will not suffer unemployment as a result of the flood. Experience has shown that small traders are able to recover relatively quickly from this sort of disaster and resume trade. However, income decline is likely to be severe in the short term. Assuming each microenterprise supports at least one livelihood, we can estimate that at least one million livelihoods will be affected by this event through the loss of around 2.5 months’ income (Table 3.19). Some traders and small business owners have seen their premises and impor-tant equipment destroyed (at a rate ranging from 2 percent in Jigawa to 45 percent in Nasarawa), which
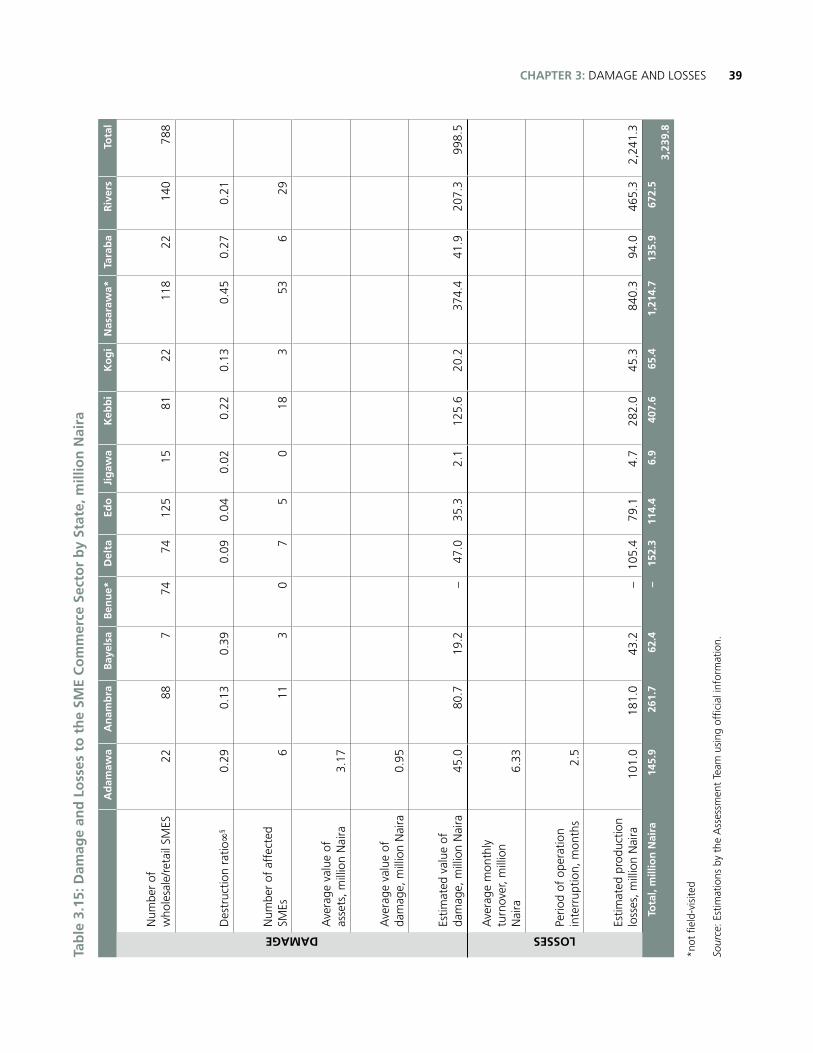
39CHAPTER 3: DAMAGE AND LOSSESTa
ble
3.1
5: D
amag
e an
d L
oss
es t
o t
he
SME
Co
mm
erce
Sec
tor
by
Stat
e, m
illio
n N
aira
Ad
amaw
aA
nam
bra
Bay
elsa
Ben
ue*
Del
taEd
oJi
gaw
aK
ebb
iK
og
iN
asar
awa*
Tara
ba
Riv
ers
Tota
lDAMAGE
Num
ber
of
who
lesa
le/r
etai
l SM
ES22
887
7474
125
1581
2211
822
140
788
Des
truc
tion
ratio
∞§
0.29
0.13
0.39
0.
090.
040.
020.
220.
130.
450.
270.
21
Num
ber
of a
ffec
ted
SMEs
611
30
75
018
353
629
Ave
rage
val
ue o
f as
sets
, mill
ion
Nai
ra
3.17
Ave
rage
val
ue o
f da
mag
e, m
illio
n N
aira
0.
95
Estim
ated
val
ue o
f da
mag
e, m
illio
n N
aira
45.0
80
.7
19.2
–
47.0
35
.3
2.
1
125.
6
20.2
3
74.4
41
.9
20
7.3
99
8.5
LOSSES
Ave
rage
mon
thly
tu
rnov
er, m
illio
n N
aira
6.
33
Perio
d of
ope
ratio
n in
terr
uptio
n, m
onth
s2.
5
Estim
ated
pro
duct
ion
loss
es, m
illio
n N
aira
10
1.0
18
1.0
43.2
–
105.
4
79
.1
4.
7
282.
0
45.3
8
40.3
94
.0
46
5.3
2,24
1.3
To
tal,
mill
ion
Nai
ra14
5.9
261
.7
62.4
–
152.
3 11
4.4
6.9
407.
6 65
.4
1
,214
.7
135.
9 67
2.5
3,23
9.8
*not
fiel
d-vi
site
d
Sour
ce: E
stim
atio
ns b
y th
e A
sses
smen
t Te
am u
sing
offi
cial
info
rmat
ion.
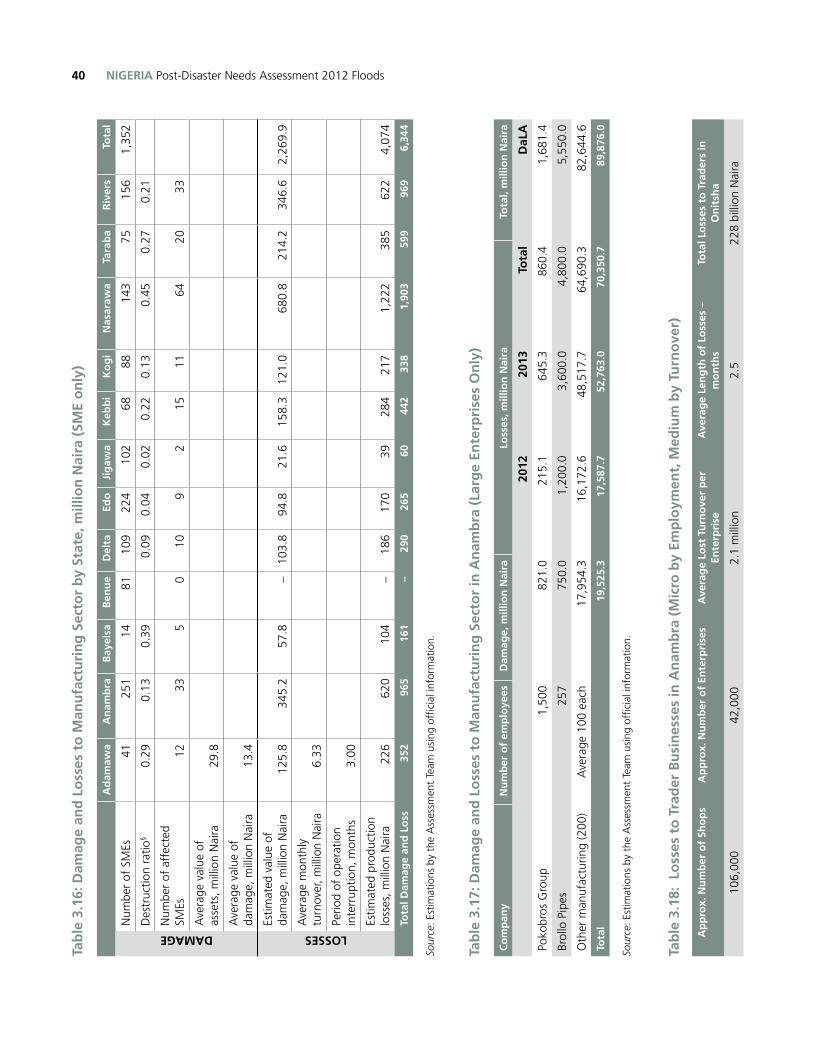
NIGERIA Post-Disaster Needs Assessment 2012 Floods40Ta
ble
3.1
6: D
amag
e an
d L
oss
es t
o M
anu
fact
uri
ng
Sec
tor
by
Stat
e, m
illio
n N
aira
(SM
E o
nly
)
Ad
amaw
aA
nam
bra
Bay
elsa
Ben
ue
Del
taEd
oJi
gaw
aK
ebb
iK
og
iN
asar
awa
Tara
ba
Riv
ers
Tota
lDAMAGE
Num
ber
of S
MEs
4125
114
8110
922
410
268
8814
375
156
1,35
2
Des
truc
tion
ratio
§0.
290.
130.
39
0.09
0.04
0.02
0.22
0.13
0.45
0.27
0.21
Num
ber
of a
ffec
ted
SMEs
1233
50
109
215
1164
2033
Ave
rage
val
ue o
f as
sets
, mill
ion
Nai
ra29
.8
Ave
rage
val
ue o
f da
mag
e, m
illio
n N
aira
13.4
LOSSES
Estim
ated
val
ue o
f da
mag
e, m
illio
n N
aira
12
5.8
34
5.2
57.8
–
10
3.8
94
.8
21
.6
158.
3
12
1.0
680.
8
21
4.2
346.
6
2,
269.
9
Ave
rage
mon
thly
tu
rnov
er, m
illio
n N
aira
6.33
Perio
d of
ope
ratio
n in
terr
uptio
n, m
onth
s3.
00
Estim
ated
pro
duct
ion
loss
es, m
illio
n N
aira
226
620
104
–
18
6
170
39
28
4
217
1,22
2
385
62
2
4,07
4
Tota
l Dam
age
and
Lo
ss
352
965
16
1 –
290
265
60
442
338
1,90
3
5
99
969
6,34
4
Sour
ce: E
stim
atio
ns b
y th
e A
sses
smen
t Te
am u
sing
offi
cial
info
rmat
ion.
Tab
le 3
.17:
Dam
age
and
Lo
sses
to
Man
ufa
ctu
rin
g S
ecto
r in
An
amb
ra (
Larg
e En
terp
rise
s O
nly
)
Co
mp
any
Nu
mb
er o
f em
plo
yees
Dam
age,
mill
ion
Nai
raLo
sses
, mill
ion
Nai
raTo
tal,
mill
ion
Nai
ra
20
1220
13To
tal
DaL
A
Poko
bros
Gro
up1,
500
821
.0
215.
164
5.3
860.
4
1,
681.
4
Brol
lo P
ipes
257
750
.0
1,20
0.0
3,60
0.0
4,80
0.0
5,55
0.0
Oth
er m
anuf
actu
ring
(200
)A
vera
ge 1
00 e
ach
1
7,95
4.3
1
6,17
2.6
4
8,51
7.7
6
4,69
0.3
8
2,64
4.6
Tota
l
1
9,52
5.3
1
7,58
7.7
5
2,76
3.0
7
0,35
0.7
8
9,87
6.0
Sour
ce: E
stim
atio
ns b
y th
e A
sses
smen
t Te
am u
sing
offi
cial
info
rmat
ion.
Tab
le 3
.18:
Lo
sses
to
Tra
der
Bu
sin
esse
s in
An
amb
ra (
Mic
ro b
y Em
plo
ymen
t, M
ediu
m b
y Tu
rno
ver)
Ap
pro
x. N
um
ber
of
Sho
ps
Ap
pro
x. N
um
ber
of
Ente
rpri
ses
Ave
rag
e Lo
st T
urn
ove
r p
er
Ente
rpri
seA
vera
ge
Len
gth
of
Loss
es –
m
on
ths
Tota
l Lo
sses
to
Tra
der
s in
O
nit
sha
106,
000
42,0
002.
1 m
illio
n2.
522
8 bi
llion
Nai
ra
41CHAPTER 3: DAMAGE AND LOSSES
will mean that their losses will be greater than just three months’ income.
Employment impacts are therefore far less widely felt than are income losses, but the impact on individuals will be more severe, and the localized social and po-litical effects may also be more clearly felt. Anecdotal evidence from a focus group of 10 leading industrial-ists in Onitsha suggests that large numbers of staff will become redundant. At the time of this discussion (late November 2012), most business owners were trying to retain staff despite their inability to pay them. This situ-ation is unsustainable, however, and given the length of time before plants can reopen (likely up to a year, if they are not closed permanently in the meantime) means that the majority of staff will become unem-
ployed. This not only represents a loss to those indi-
viduals, but to the human capital of the manufacturing
cluster as well, who have invested significantly in the
skills of their workforce. It is estimated that around
200 firms averaging 100 employees each have been
affected, representing a workforce of 20,000 people.
These people have already lost almost three months’
income, and many are likely to become unemployed
in 2013. Such a large shock to the local labor market
cannot easily be absorbed, especially when all other
economic sectors continue to suffer the aftereffects
of the flood. The SMEDAN Survey of MSMEs suggests
that 42 percent of microbusinesses are female-owned
and 30 percent of employees in the SME manufactur-
ing sector are female.
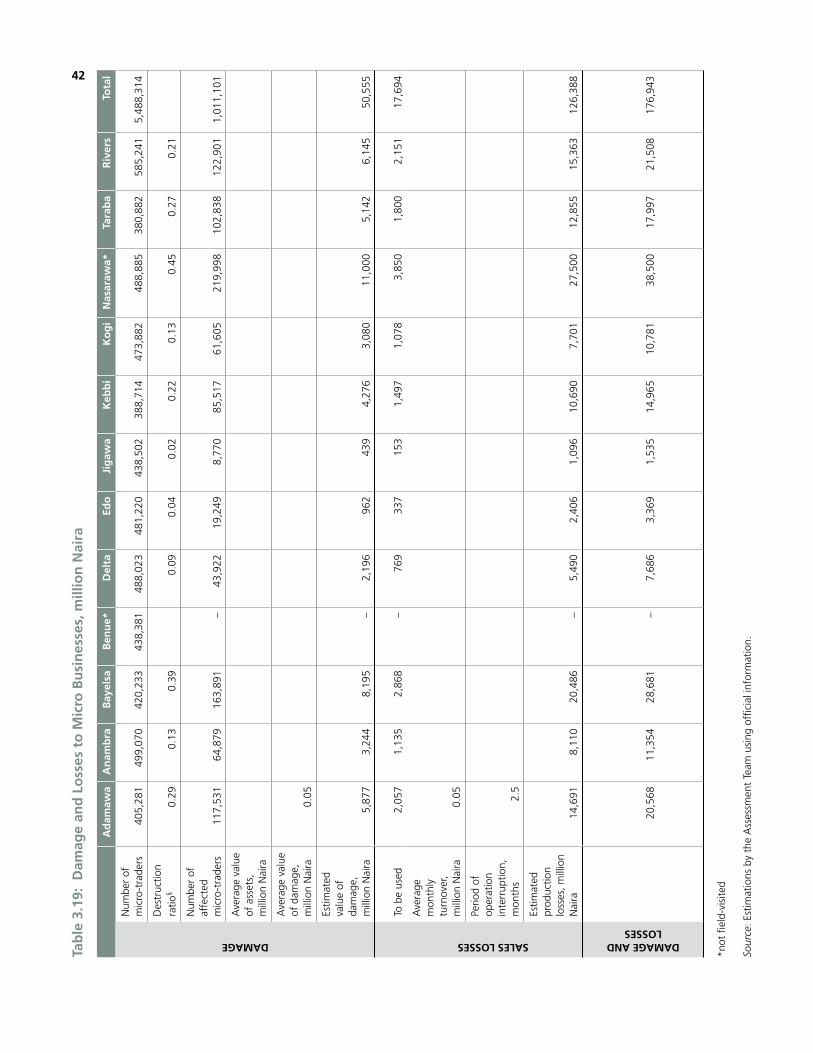
42Ta
ble
3.1
9: D
amag
e an
d L
oss
es t
o M
icro
Bu
sin
esse
s, m
illio
n N
aira
Ad
amaw
aA
nam
bra
Bay
elsa
Ben
ue*
Del
taEd
oJi
gaw
aK
ebb
iK
og
iN
asar
awa*
Tara
ba
Riv
ers
Tota
lDAMAGE
Num
ber
of
mic
ro-t
rade
rs
405,
281
49
9,07
0
420,
233
43
8,38
1
488,
023
48
1,22
0
438,
502
38
8,71
4
473,
882
48
8,88
5
380,
882
58
5,24
1 5
,488
,314
Des
truc
tion
ratio
§
0.29
0.
13
0.39
0.09
0.
04
0.02
0.
22
0.13
0.
45
0.27
0.
21
Num
ber
of
affe
cted
m
icro
-tra
ders
11
7,53
1
64,8
79
16
3,89
1
–
43
,922
19,2
49
8,77
0
85,5
17
61
,605
219,
998
10
2,83
8
122,
901
1,01
1,10
1
Ave
rage
val
ue
of a
sset
s,
mill
ion
Nai
ra
Ave
rage
val
ue
of d
amag
e,
mill
ion
Nai
ra
0.05
Estim
ated
va
lue
of
dam
age,
m
illio
n N
aira
5,87
7
3,
244
8,19
5
–
2,19
6
962
43
9
4,
276
3,08
0
11,0
00
5,14
2
6,
145
50,5
55
To
be
used
2,05
7
1,
135
2,86
8
–
76
9
337
15
3
1,
497
1,07
8
3,8
50
1,80
0
2,
151
17,6
94
SALES LOSSES
Ave
rage
m
onth
ly
turn
over
, m
illio
n N
aira
0.
05
Perio
d of
op
erat
ion
inte
rrup
tion,
m
onth
s2.
5
Estim
ated
pr
oduc
tion
loss
es, m
illio
n N
aira
14,6
91
8,11
0
20,4
86
–
5,
490
2,40
6
1,
096
10
,690
7,
701
27
,500
12,8
55
15
,363
126,
388
DAMAGE AND LOSSES
20
,568
11,3
54
28
,681
–
7,68
6
3,
369
1,53
5
14,9
65
10
,781
38,5
00
17
,997
21,5
08
17
6,94
3
*not
fiel
d-vi
site
d
Sour
ce: E
stim
atio
ns b
y th
e A
sses
smen
t Te
am u
sing
offi
cial
info
rmat
ion.
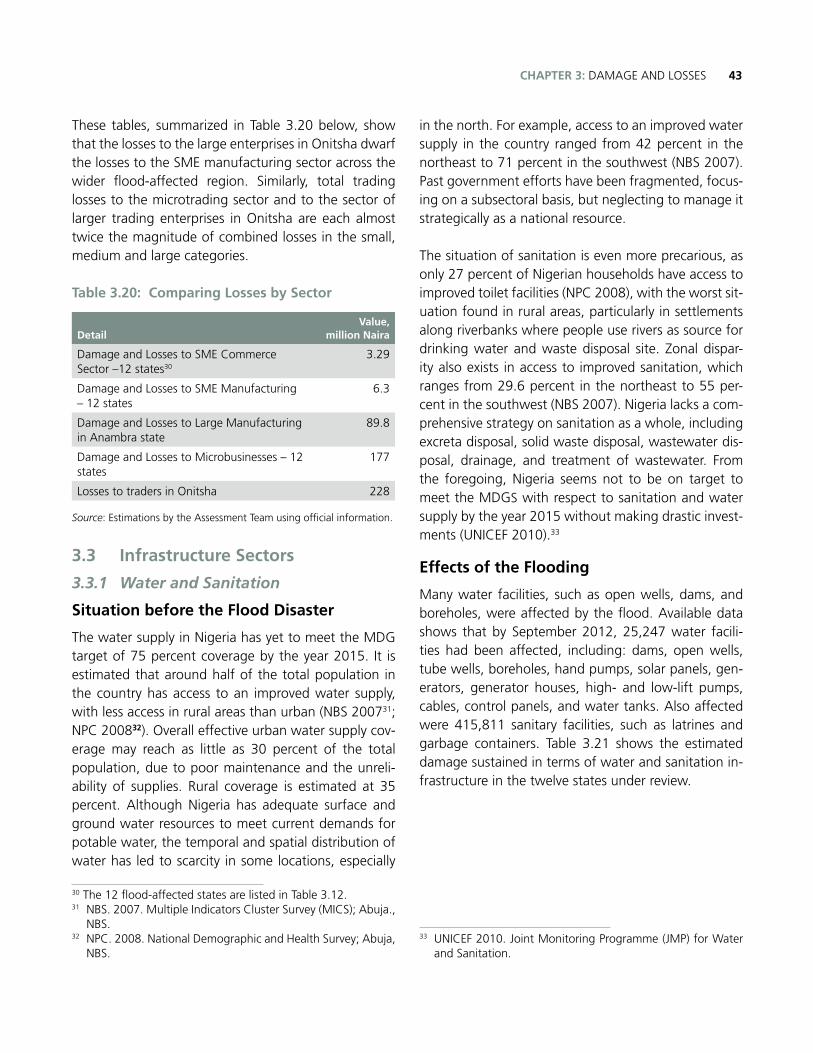
43CHAPTER 3: DAMAGE AND LOSSES
These tables, summarized in Table 3.20 below, show that the losses to the large enterprises in Onitsha dwarf the losses to the SME manufacturing sector across the wider flood-affected region. Similarly, total trading losses to the microtrading sector and to the sector of larger trading enterprises in Onitsha are each almost twice the magnitude of combined losses in the small, medium and large categories.
Table 3.20: Comparing Losses by Sector
DetailValue,
million Naira
Damage and Losses to SME Commerce Sector –12 states30
3.29
Damage and Losses to SME Manufacturing – 12 states
6.3
Damage and Losses to Large Manufacturing in Anambra state
89.8
Damage and Losses to Microbusinesses – 12 states
177
Losses to traders in Onitsha 228
Source: Estimations by the Assessment Team using official information.
3.3 Infrastructure Sectors
3.3.1 Water and Sanitation
Situation before the Flood Disaster
The water supply in Nigeria has yet to meet the MDG target of 75 percent coverage by the year 2015. It is estimated that around half of the total population in the country has access to an improved water supply, with less access in rural areas than urban (NBS 200731; NPC 200832). Overall effective urban water supply cov-erage may reach as little as 30 percent of the total population, due to poor maintenance and the unreli-ability of supplies. Rural coverage is estimated at 35 percent. Although Nigeria has adequate surface and ground water resources to meet current demands for potable water, the temporal and spatial distribution of water has led to scarcity in some locations, especially
30 The 12 flood-affected states are listed in Table 3.12. 31 NBS. 2007. Multiple Indicators Cluster Survey (MICS); Abuja.,
NBS.32 NPC. 2008. National Demographic and Health Survey; Abuja,
NBS.
in the north. For example, access to an improved water supply in the country ranged from 42 percent in the northeast to 71 percent in the southwest (NBS 2007). Past government efforts have been fragmented, focus-ing on a subsectoral basis, but neglecting to manage it strategically as a national resource.
The situation of sanitation is even more precarious, as only 27 percent of Nigerian households have access to improved toilet facilities (NPC 2008), with the worst sit-uation found in rural areas, particularly in settlements along riverbanks where people use rivers as source for drinking water and waste disposal site. Zonal dispar-ity also exists in access to improved sanitation, which ranges from 29.6 percent in the northeast to 55 per-cent in the southwest (NBS 2007). Nigeria lacks a com-prehensive strategy on sanitation as a whole, including excreta disposal, solid waste disposal, wastewater dis-posal, drainage, and treatment of wastewater. From the foregoing, Nigeria seems not to be on target to meet the MDGS with respect to sanitation and water supply by the year 2015 without making drastic invest-ments (UNICEF 2010).33
Effects of the Flooding
Many water facilities, such as open wells, dams, and boreholes, were affected by the flood. Available data shows that by September 2012, 25,247 water facili-ties had been affected, including: dams, open wells, tube wells, boreholes, hand pumps, solar panels, gen-erators, generator houses, high- and low-lift pumps, cables, control panels, and water tanks. Also affected were 415,811 sanitary facilities, such as latrines and garbage containers. Table 3.21 shows the estimated damage sustained in terms of water and sanitation in-frastructure in the twelve states under review.
33 UNICEF 2010. Joint Monitoring Programme (JMP) for Water and Sanitation.
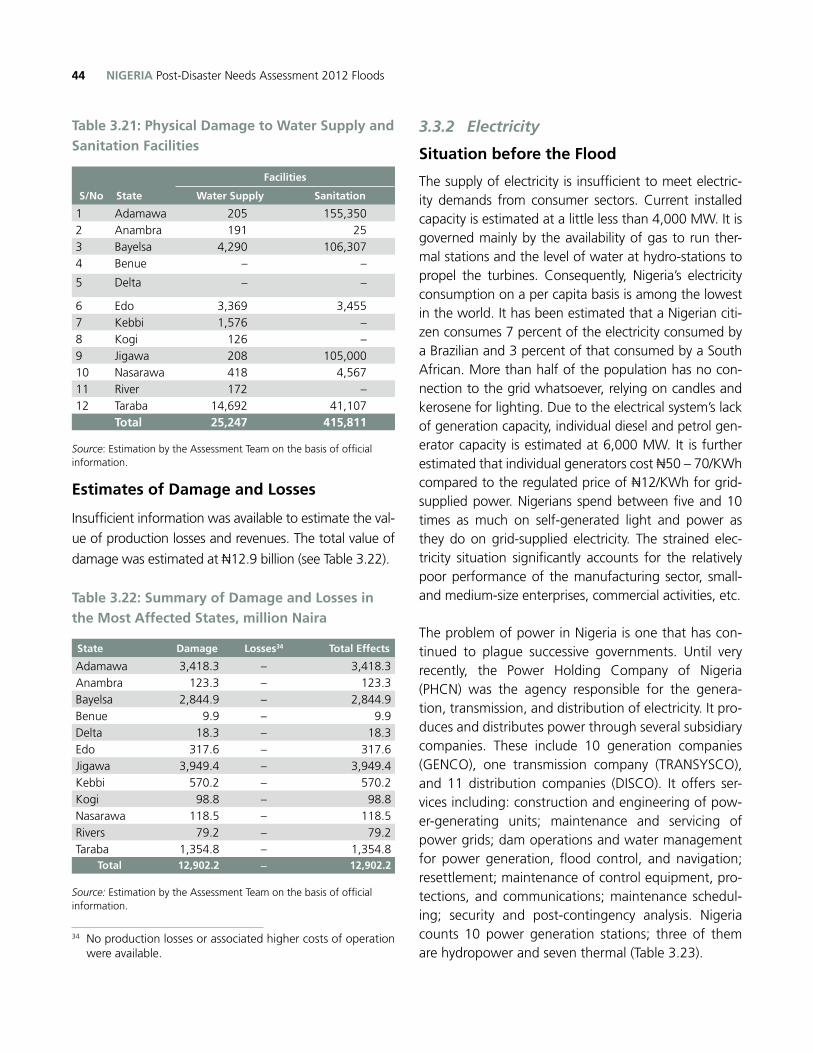
NIGERIA Post-Disaster Needs Assessment 2012 Floods44
Table 3.21: Physical Damage to Water Supply and Sanitation Facilities
S/No State
Facilities
Water Supply Sanitation
1 Adamawa 205 155,3502 Anambra 191 253 Bayelsa 4,290 106,3074 Benue – –
5 Delta – –
6 Edo 3,369 3,4557 Kebbi 1,576 –8 Kogi 126 –9 Jigawa 208 105,00010 Nasarawa 418 4,56711 River 172 –12 Taraba 14,692 41,107
Total 25,247 415,811
Source: Estimation by the Assessment Team on the basis of official information.
Estimates of Damage and Losses
Insufficient information was available to estimate the val-
ue of production losses and revenues. The total value of
damage was estimated at N12.9 billion (see Table 3.22).
Table 3.22: Summary of Damage and Losses in the Most Affected States, million Naira
State Damage Losses34 Total Effects
Adamawa 3,418.3 – 3,418.3Anambra 123.3 – 123.3 Bayelsa 2,844.9 – 2,844.9Benue 9.9 – 9.9Delta 18.3 – 18.3Edo 317.6 – 317.6Jigawa 3,949.4 – 3,949.4Kebbi 570.2 – 570.2Kogi 98.8 – 98.8Nasarawa 118.5 – 118.5Rivers 79.2 – 79.2Taraba 1,354.8 – 1,354.8
Total 12,902.2 – 12,902.2
Source: Estimation by the Assessment Team on the basis of official information.
34 No production losses or associated higher costs of operation were available.
3.3.2 Electricity
Situation before the Flood
The supply of electricity is insufficient to meet electric-ity demands from consumer sectors. Current installed capacity is estimated at a little less than 4,000 MW. It is governed mainly by the availability of gas to run ther-mal stations and the level of water at hydro-stations to propel the turbines. Consequently, Nigeria’s electricity consumption on a per capita basis is among the lowest in the world. It has been estimated that a Nigerian citi-zen consumes 7 percent of the electricity consumed by a Brazilian and 3 percent of that consumed by a South African. More than half of the population has no con-nection to the grid whatsoever, relying on candles and kerosene for lighting. Due to the electrical system’s lack of generation capacity, individual diesel and petrol gen-erator capacity is estimated at 6,000 MW. It is further estimated that individual generators cost N50 – 70/KWh compared to the regulated price of N12/KWh for grid-supplied power. Nigerians spend between five and 10 times as much on self-generated light and power as they do on grid-supplied electricity. The strained elec-tricity situation significantly accounts for the relatively poor performance of the manufacturing sector, small- and medium-size enterprises, commercial activities, etc.
The problem of power in Nigeria is one that has con-tinued to plague successive governments. Until very recently, the Power Holding Company of Nigeria (PHCN) was the agency responsible for the genera-tion, transmission, and distribution of electricity. It pro-duces and distributes power through several subsidiary companies. These include 10 generation companies (GENCO), one transmission company (TRANSYSCO), and 11 distribution companies (DISCO). It offers ser-vices including: construction and engineering of pow-er-generating units; maintenance and servicing of power grids; dam operations and water management for power generation, flood control, and navigation; resettlement; maintenance of control equipment, pro-tections, and communications; maintenance schedul-ing; security and post-contingency analysis. Nigeria counts 10 power generation stations; three of them are hydropower and seven thermal (Table 3.23).
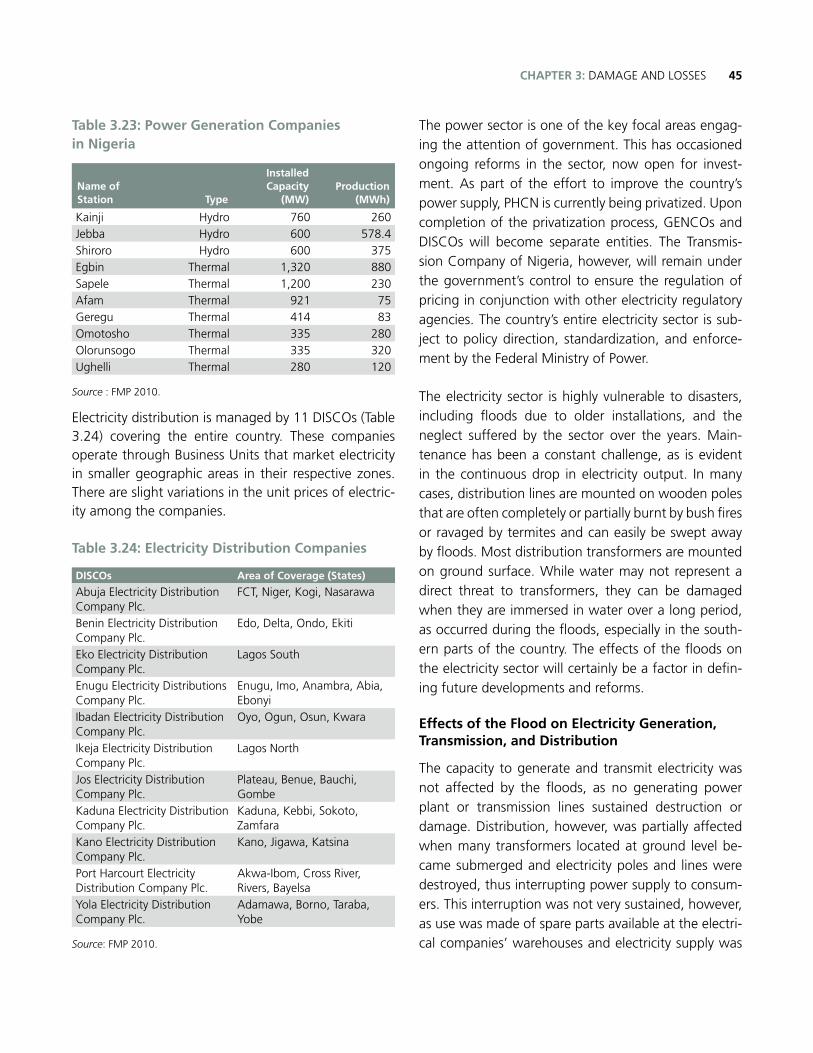
45CHAPTER 3: DAMAGE AND LOSSES
Table 3.23: Power Generation Companies in Nigeria
Name of Station Type
Installed Capacity
(MW)Production
(MWh)
Kainji Hydro 760 260Jebba Hydro 600 578.4Shiroro Hydro 600 375Egbin Thermal 1,320 880Sapele Thermal 1,200 230Afam Thermal 921 75Geregu Thermal 414 83Omotosho Thermal 335 280Olorunsogo Thermal 335 320Ughelli Thermal 280 120
Source : FMP 2010.
Electricity distribution is managed by 11 DISCOs (Table 3.24) covering the entire country. These companies operate through Business Units that market electricity in smaller geographic areas in their respective zones. There are slight variations in the unit prices of electric-ity among the companies.
Table 3.24: Electricity Distribution Companies
DISCOs Area of Coverage (States)
Abuja Electricity Distribution Company Plc.
FCT, Niger, Kogi, Nasarawa
Benin Electricity Distribution Company Plc.
Edo, Delta, Ondo, Ekiti
Eko Electricity Distribution Company Plc.
Lagos South
Enugu Electricity Distributions Company Plc.
Enugu, Imo, Anambra, Abia, Ebonyi
Ibadan Electricity Distribution Company Plc.
Oyo, Ogun, Osun, Kwara
Ikeja Electricity Distribution Company Plc.
Lagos North
Jos Electricity Distribution Company Plc.
Plateau, Benue, Bauchi, Gombe
Kaduna Electricity Distribution Company Plc.
Kaduna, Kebbi, Sokoto, Zamfara
Kano Electricity Distribution Company Plc.
Kano, Jigawa, Katsina
Port Harcourt Electricity Distribution Company Plc.
Akwa-Ibom, Cross River, Rivers, Bayelsa
Yola Electricity Distribution Company Plc.
Adamawa, Borno, Taraba, Yobe
Source: FMP 2010.
The power sector is one of the key focal areas engag-ing the attention of government. This has occasioned ongoing reforms in the sector, now open for invest-ment. As part of the effort to improve the country’s power supply, PHCN is currently being privatized. Upon completion of the privatization process, GENCOs and DISCOs will become separate entities. The Transmis-sion Company of Nigeria, however, will remain under the government’s control to ensure the regulation of pricing in conjunction with other electricity regulatory agencies. The country’s entire electricity sector is sub-ject to policy direction, standardization, and enforce-ment by the Federal Ministry of Power.
The electricity sector is highly vulnerable to disasters, including floods due to older installations, and the neglect suffered by the sector over the years. Main-tenance has been a constant challenge, as is evident in the continuous drop in electricity output. In many cases, distribution lines are mounted on wooden poles that are often completely or partially burnt by bush fires or ravaged by termites and can easily be swept away by floods. Most distribution transformers are mounted on ground surface. While water may not represent a direct threat to transformers, they can be damaged when they are immersed in water over a long period, as occurred during the floods, especially in the south-ern parts of the country. The effects of the floods on the electricity sector will certainly be a factor in defin-ing future developments and reforms.
Effects of the Flood on Electricity Generation, Transmission, and Distribution
The capacity to generate and transmit electricity was not affected by the floods, as no generating power plant or transmission lines sustained destruction or damage. Distribution, however, was partially affected when many transformers located at ground level be-came submerged and electricity poles and lines were destroyed, thus interrupting power supply to consum-ers. This interruption was not very sustained, however, as use was made of spare parts available at the electri-cal companies’ warehouses and electricity supply was
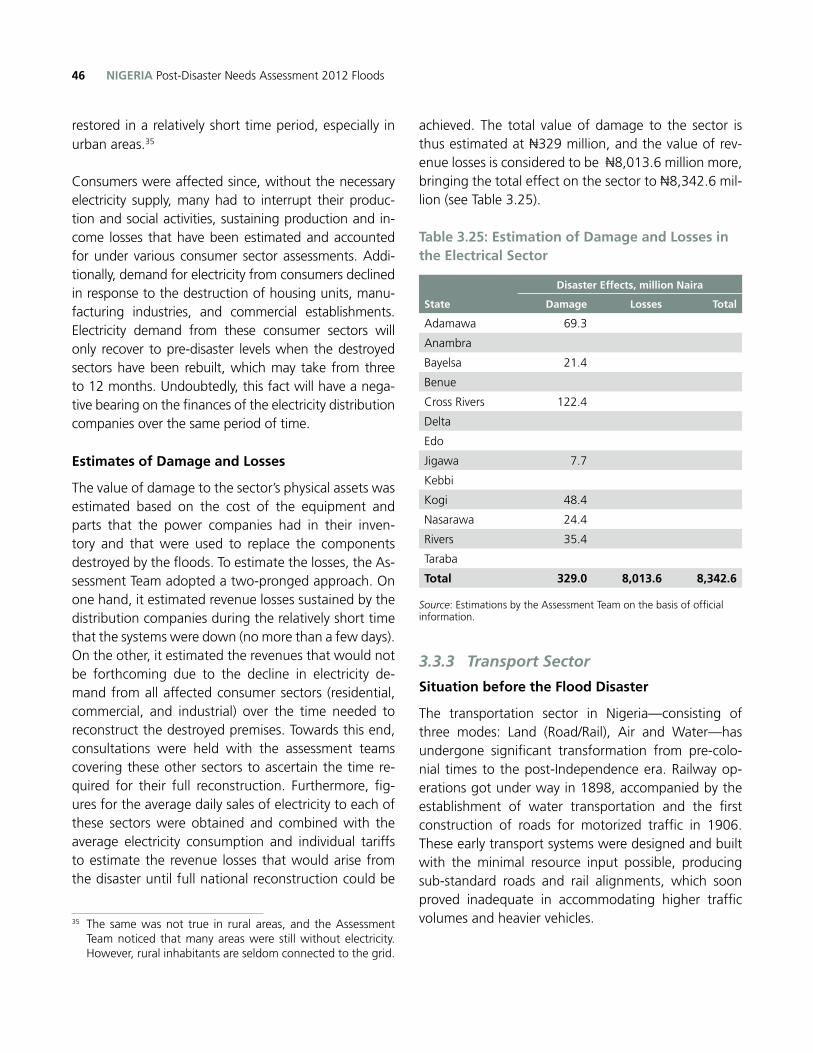
NIGERIA Post-Disaster Needs Assessment 2012 Floods46
restored in a relatively short time period, especially in urban areas.35
Consumers were affected since, without the necessary electricity supply, many had to interrupt their produc-tion and social activities, sustaining production and in-come losses that have been estimated and accounted for under various consumer sector assessments. Addi-tionally, demand for electricity from consumers declined in response to the destruction of housing units, manu-facturing industries, and commercial establishments. Electricity demand from these consumer sectors will only recover to pre-disaster levels when the destroyed sectors have been rebuilt, which may take from three to 12 months. Undoubtedly, this fact will have a nega-tive bearing on the finances of the electricity distribution companies over the same period of time.
Estimates of Damage and Losses
The value of damage to the sector’s physical assets was estimated based on the cost of the equipment and parts that the power companies had in their inven-tory and that were used to replace the components destroyed by the floods. To estimate the losses, the As-sessment Team adopted a two-pronged approach. On one hand, it estimated revenue losses sustained by the distribution companies during the relatively short time that the systems were down (no more than a few days). On the other, it estimated the revenues that would not be forthcoming due to the decline in electricity de-mand from all affected consumer sectors (residential, commercial, and industrial) over the time needed to reconstruct the destroyed premises. Towards this end, consultations were held with the assessment teams covering these other sectors to ascertain the time re-quired for their full reconstruction. Furthermore, fig-ures for the average daily sales of electricity to each of these sectors were obtained and combined with the average electricity consumption and individual tariffs to estimate the revenue losses that would arise from the disaster until full national reconstruction could be
35 The same was not true in rural areas, and the Assessment Team noticed that many areas were still without electricity. However, rural inhabitants are seldom connected to the grid.
achieved. The total value of damage to the sector is thus estimated at N329 million, and the value of rev-enue losses is considered to be N8,013.6 million more, bringing the total effect on the sector to N8,342.6 mil-lion (see Table 3.25).
Table 3.25: Estimation of Damage and Losses in the Electrical Sector
State
Disaster Effects, million Naira
Damage Losses Total
Adamawa 69.3
Anambra
Bayelsa 21.4
Benue
Cross Rivers 122.4
Delta
Edo
Jigawa 7.7
Kebbi
Kogi 48.4
Nasarawa 24.4
Rivers 35.4
Taraba
Total 329.0 8,013.6 8,342.6
Source: Estimations by the Assessment Team on the basis of official information.
3.3.3 Transport Sector
Situation before the Flood Disaster
The transportation sector in Nigeria—consisting of three modes: Land (Road/Rail), Air and Water—has undergone significant transformation from pre-colo-nial times to the post-Independence era. Railway op-erations got under way in 1898, accompanied by the establishment of water transportation and the first construction of roads for motorized traffic in 1906. These early transport systems were designed and built with the minimal resource input possible, producing sub-standard roads and rail alignments, which soon proved inadequate in accommodating higher traffic volumes and heavier vehicles.
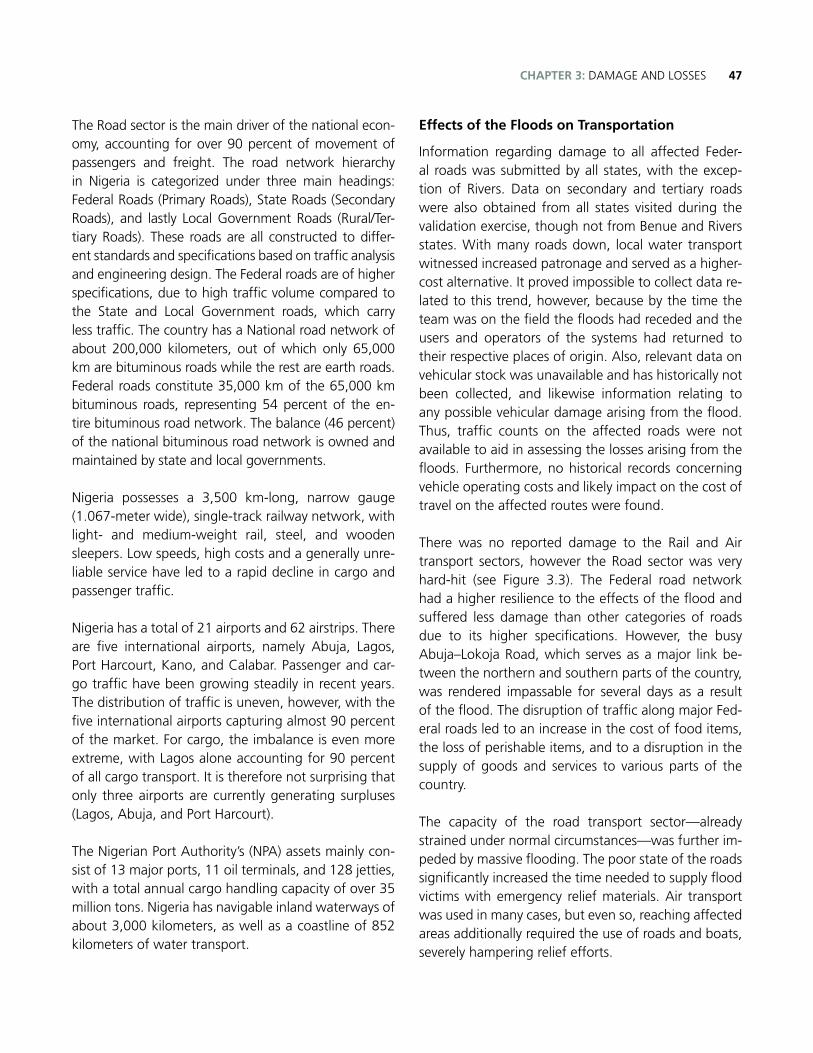
47CHAPTER 3: DAMAGE AND LOSSES
The Road sector is the main driver of the national econ-omy, accounting for over 90 percent of movement of passengers and freight. The road network hierarchy in Nigeria is categorized under three main headings: Federal Roads (Primary Roads), State Roads (Secondary Roads), and lastly Local Government Roads (Rural/Ter-tiary Roads). These roads are all constructed to differ-ent standards and specifications based on traffic analysis and engineering design. The Federal roads are of higher specifications, due to high traffic volume compared to the State and Local Government roads, which carry less traffic. The country has a National road network of about 200,000 kilometers, out of which only 65,000 km are bituminous roads while the rest are earth roads. Federal roads constitute 35,000 km of the 65,000 km bituminous roads, representing 54 percent of the en-tire bituminous road network. The balance (46 percent) of the national bituminous road network is owned and maintained by state and local governments.
Nigeria possesses a 3,500 km-long, narrow gauge (1.067-meter wide), single-track railway network, with light- and medium-weight rail, steel, and wooden sleepers. Low speeds, high costs and a generally unre-liable service have led to a rapid decline in cargo and passenger traffic.
Nigeria has a total of 21 airports and 62 airstrips. There are five international airports, namely Abuja, Lagos, Port Harcourt, Kano, and Calabar. Passenger and car-go traffic have been growing steadily in recent years. The distribution of traffic is uneven, however, with the five international airports capturing almost 90 percent of the market. For cargo, the imbalance is even more extreme, with Lagos alone accounting for 90 percent of all cargo transport. It is therefore not surprising that only three airports are currently generating surpluses (Lagos, Abuja, and Port Harcourt).
The Nigerian Port Authority’s (NPA) assets mainly con-sist of 13 major ports, 11 oil terminals, and 128 jetties, with a total annual cargo handling capacity of over 35 million tons. Nigeria has navigable inland waterways of about 3,000 kilometers, as well as a coastline of 852 kilometers of water transport.
Effects of the Floods on Transportation
Information regarding damage to all affected Feder-al roads was submitted by all states, with the excep-tion of Rivers. Data on secondary and tertiary roads were also obtained from all states visited during the validation exercise, though not from Benue and Rivers states. With many roads down, local water transport witnessed increased patronage and served as a higher-cost alternative. It proved impossible to collect data re-lated to this trend, however, because by the time the team was on the field the floods had receded and the users and operators of the systems had returned to their respective places of origin. Also, relevant data on vehicular stock was unavailable and has historically not been collected, and likewise information relating to any possible vehicular damage arising from the flood. Thus, traffic counts on the affected roads were not available to aid in assessing the losses arising from the floods. Furthermore, no historical records concerning vehicle operating costs and likely impact on the cost of travel on the affected routes were found.
There was no reported damage to the Rail and Air transport sectors, however the Road sector was very hard-hit (see Figure 3.3). The Federal road network had a higher resilience to the effects of the flood and suffered less damage than other categories of roads due to its higher specifications. However, the busy Abuja–Lokoja Road, which serves as a major link be-tween the northern and southern parts of the country, was rendered impassable for several days as a result of the flood. The disruption of traffic along major Fed-eral roads led to an increase in the cost of food items, the loss of perishable items, and to a disruption in the supply of goods and services to various parts of the country.
The capacity of the road transport sector—already strained under normal circumstances—was further im-peded by massive flooding. The poor state of the roads significantly increased the time needed to supply flood victims with emergency relief materials. Air transport was used in many cases, but even so, reaching affected areas additionally required the use of roads and boats, severely hampering relief efforts.
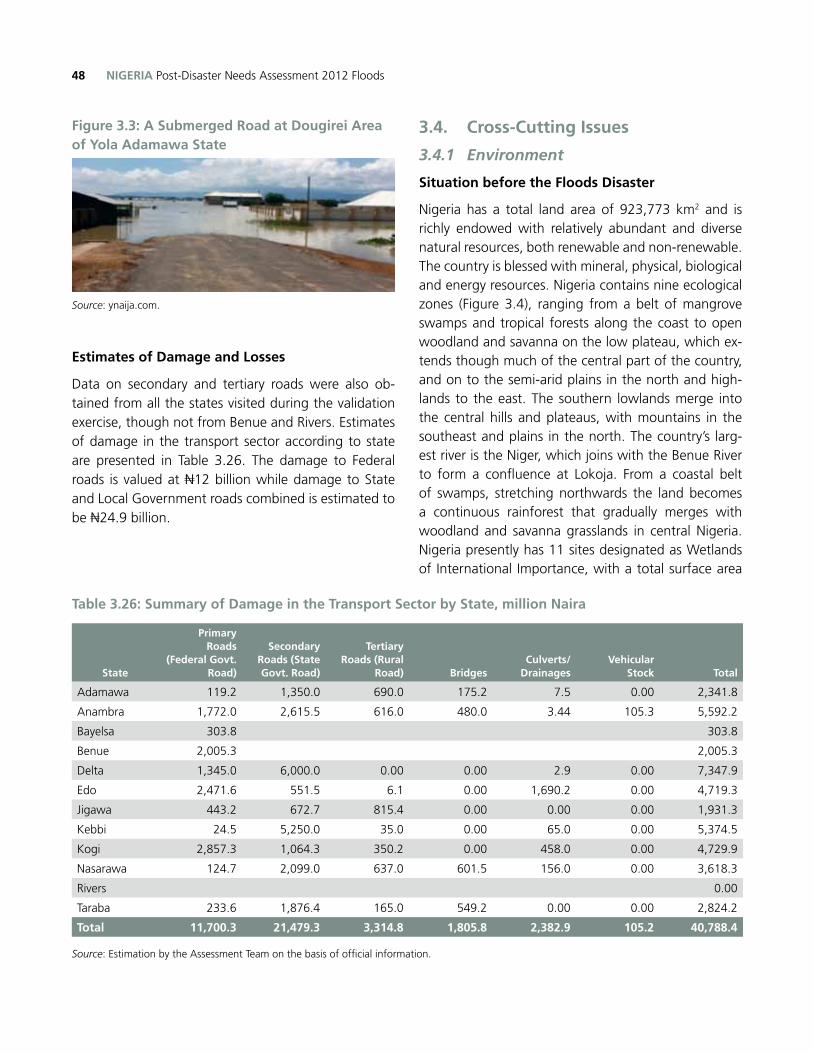
NIGERIA Post-Disaster Needs Assessment 2012 Floods48
Figure 3.3: A Submerged Road at Dougirei Area of Yola Adamawa State
Source: ynaija.com.
Estimates of Damage and Losses
Data on secondary and tertiary roads were also ob-tained from all the states visited during the validation exercise, though not from Benue and Rivers. Estimates of damage in the transport sector according to state are presented in Table 3.26. The damage to Federal roads is valued at N12 billion while damage to State and Local Government roads combined is estimated to be N24.9 billion.
3.4. Cross-Cutting Issues
3.4.1 Environment
Situation before the Floods Disaster
Nigeria has a total land area of 923,773 km2 and is richly endowed with relatively abundant and diverse natural resources, both renewable and non-renewable. The country is blessed with mineral, physical, biological and energy resources. Nigeria contains nine ecological zones (Figure 3.4), ranging from a belt of mangrove swamps and tropical forests along the coast to open woodland and savanna on the low plateau, which ex-tends though much of the central part of the country, and on to the semi-arid plains in the north and high-lands to the east. The southern lowlands merge into the central hills and plateaus, with mountains in the southeast and plains in the north. The country’s larg-est river is the Niger, which joins with the Benue River to form a confluence at Lokoja. From a coastal belt of swamps, stretching northwards the land becomes a continuous rainforest that gradually merges with woodland and savanna grasslands in central Nigeria. Nigeria presently has 11 sites designated as Wetlands of International Importance, with a total surface area
Table 3.26: Summary of Damage in the Transport Sector by State, million Naira
State
PrimaryRoads
(Federal Govt. Road)
SecondaryRoads (State Govt. Road)
TertiaryRoads (Rural
Road) BridgesCulverts/
DrainagesVehicular
Stock Total
Adamawa 119.2 1,350.0 690.0 175.2 7.5 0.00 2,341.8
Anambra 1,772.0 2,615.5 616.0 480.0 3.44 105.3 5,592.2
Bayelsa 303.8 303.8
Benue 2,005.3 2,005.3
Delta 1,345.0 6,000.0 0.00 0.00 2.9 0.00 7,347.9
Edo 2,471.6 551.5 6.1 0.00 1,690.2 0.00 4,719.3
Jigawa 443.2 672.7 815.4 0.00 0.00 0.00 1,931.3
Kebbi 24.5 5,250.0 35.0 0.00 65.0 0.00 5,374.5
Kogi 2,857.3 1,064.3 350.2 0.00 458.0 0.00 4,729.9
Nasarawa 124.7 2,099.0 637.0 601.5 156.0 0.00 3,618.3
Rivers 0.00
Taraba 233.6 1,876.4 165.0 549.2 0.00 0.00 2,824.2
Total 11,700.3 21,479.3 3,314.8 1,805.8 2,382.9 105.2 40,788.4
Source: Estimation by the Assessment Team on the basis of official information.
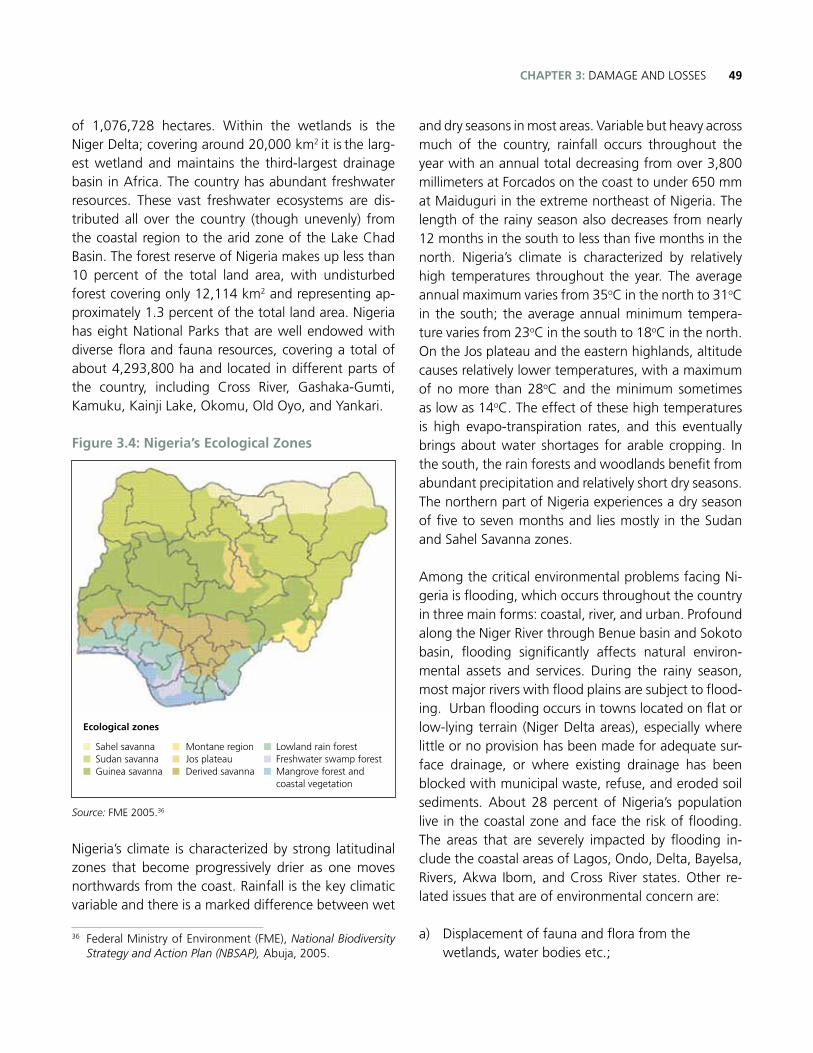
49CHAPTER 3: DAMAGE AND LOSSES
of 1,076,728 hectares. Within the wetlands is the Niger Delta; covering around 20,000 km2 it is the larg-est wetland and maintains the third-largest drainage basin in Africa. The country has abundant freshwater resources. These vast freshwater ecosystems are dis-tributed all over the country (though unevenly) from the coastal region to the arid zone of the Lake Chad Basin. The forest reserve of Nigeria makes up less than 10 percent of the total land area, with undisturbed forest covering only 12,114 km2 and representing ap-proximately 1.3 percent of the total land area. Nigeria has eight National Parks that are well endowed with diverse flora and fauna resources, covering a total of about 4,293,800 ha and located in different parts of the country, including Cross River, Gashaka-Gumti, Kamuku, Kainji Lake, Okomu, Old Oyo, and Yankari.
Figure 3.4: Nigeria’s Ecological Zones
Source: FME 2005.36
Nigeria’s climate is characterized by strong latitudinal zones that become progressively drier as one moves northwards from the coast. Rainfall is the key climatic variable and there is a marked difference between wet
36 Federal Ministry of Environment (FME), National Biodiversity Strategy and Action Plan (NBSAP), Abuja, 2005.
and dry seasons in most areas. Variable but heavy across much of the country, rainfall occurs throughout the year with an annual total decreasing from over 3,800 millimeters at Forcados on the coast to under 650 mm at Maiduguri in the extreme northeast of Nigeria. The length of the rainy season also decreases from nearly 12 months in the south to less than five months in the north. Nigeria’s climate is characterized by relatively high temperatures throughout the year. The average annual maximum varies from 35oC in the north to 31oC in the south; the average annual minimum tempera-ture varies from 23oC in the south to 18oC in the north. On the Jos plateau and the eastern highlands, altitude causes relatively lower temperatures, with a maximum of no more than 28oC and the minimum sometimes as low as 14oC. The effect of these high temperatures is high evapo-transpiration rates, and this eventually brings about water shortages for arable cropping. In the south, the rain forests and woodlands benefit from abundant precipitation and relatively short dry seasons. The northern part of Nigeria experiences a dry season of five to seven months and lies mostly in the Sudan and Sahel Savanna zones.
Among the critical environmental problems facing Ni-geria is flooding, which occurs throughout the country in three main forms: coastal, river, and urban. Profound along the Niger River through Benue basin and Sokoto basin, flooding significantly affects natural environ-mental assets and services. During the rainy season, most major rivers with flood plains are subject to flood-ing. Urban flooding occurs in towns located on flat or low-lying terrain (Niger Delta areas), especially where little or no provision has been made for adequate sur-face drainage, or where existing drainage has been blocked with municipal waste, refuse, and eroded soil sediments. About 28 percent of Nigeria’s population live in the coastal zone and face the risk of flooding. The areas that are severely impacted by flooding in-clude the coastal areas of Lagos, Ondo, Delta, Bayelsa, Rivers, Akwa Ibom, and Cross River states. Other re-lated issues that are of environmental concern are:
a) Displacement of fauna and flora from the wetlands, water bodies etc.;
Ecological zones
n Sahel savanna n Montane region n Lowland rain forestn Sudan savanna n Jos plateau n Freshwater swamp forestn Guinea savanna n Derived savanna n Mangrove forest and
coastal vegetation
NIGERIA Post-Disaster Needs Assessment 2012 Floods50
b) Presence of physico-chemical and microbial indicators of fecal and effluent in rivers;
c) Stress resulting from the displacement of indigenous aquatic species;
d) Disruption of settlements in close proximity to water bodies, as well as the importing of debris into water bodies; and
e) Discharge of hazardous effluents, medical, and municipal wastes in water bodies and thereafter impacting unrestricted areas of human habitat.
Effects of the 2012 Floods on the Environment
The recent floods have devastated much of the land-scape of affected communities and cities. The health of waterways was negatively impacted as many rivers, creeks, and Niger Delta tributaries were eroded, con-taminated, and littered with debris. The erosion of riv-er banks and flood plains is of particular concern for freshwater resources. Many riparian zones were dam-aged from rapid-flowing water, which stripped away vegetation and exposed soils, making them more prone to rapid erosion from future rains. Soils and waterways may have been contaminated by chemi-cals from nearby industrial and commercial premises, oil-producing facilities, etc. The high volumes of fresh
water, sediments, nutrients, pesticides, and other con-taminants in waterways pose a huge threat to marine life. Mangrove habitats are particularly susceptible as they act as nets, catching sediment and all sorts of debris, often causing damage to their root systems. Moreover, the impact of floods has considerable en-vironmental and health consequences, in particular given the very specific vulnerability of domestic water supplies and the physical infrastructure necessary for sanitation. The disruption of water distribution and sewage systems during floods contribute greatly to financial and health risks.
Estimates of Damage and Losses in the Environment Sector
The value of damage to environmental assets was ob-tained by determining the extent of forest resources destroyed by the disaster. Losses occurred in biodiver-sity protection, timber production, carbon fixing, rec-reation, and erosion. Table 3.27 shows the summary of damages and losses sustained by the natural envi-ronment due to the 2012 floods. Estimates of envi-ronment-related flood damage and losses amount to N23.8 billion and N13.5 billion, respectively.
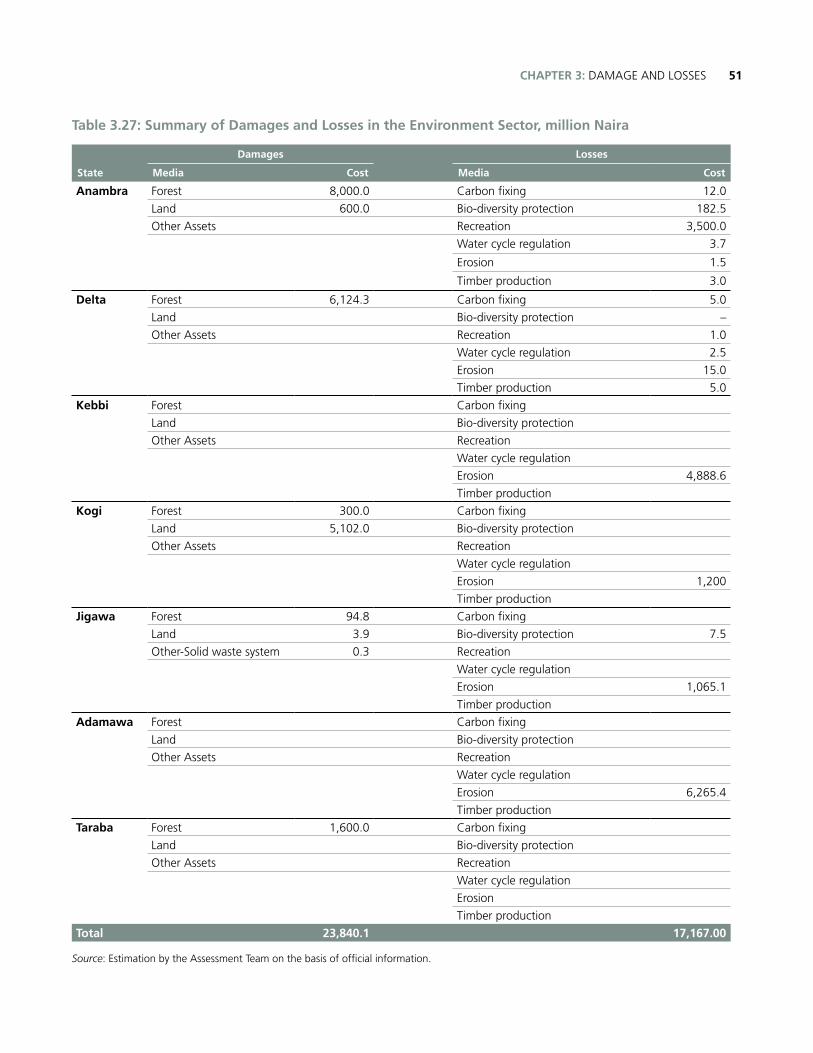
51CHAPTER 3: DAMAGE AND LOSSES
Table 3.27: Summary of Damages and Losses in the Environment Sector, million Naira
State
Damages Losses
Media Cost Media Cost
Anambra Forest 8,000.0 Carbon fixing 12.0
Land 600.0 Bio-diversity protection 182.5
Other Assets Recreation 3,500.0
Water cycle regulation 3.7
Erosion 1.5
Timber production 3.0
Delta Forest 6,124.3 Carbon fixing 5.0
Land Bio-diversity protection –
Other Assets Recreation 1.0
Water cycle regulation 2.5
Erosion 15.0
Timber production 5.0
Kebbi Forest Carbon fixing
Land Bio-diversity protection
Other Assets Recreation
Water cycle regulation
Erosion 4,888.6
Timber production
Kogi Forest 300.0 Carbon fixing
Land 5,102.0 Bio-diversity protection
Other Assets Recreation
Water cycle regulation
Erosion 1,200
Timber production
Jigawa Forest 94.8 Carbon fixing
Land 3.9 Bio-diversity protection 7.5
Other-Solid waste system 0.3 Recreation
Water cycle regulation
Erosion 1,065.1
Timber production
Adamawa Forest Carbon fixing
Land Bio-diversity protection
Other Assets Recreation
Water cycle regulation
Erosion 6,265.4
Timber production
Taraba Forest 1,600.0 Carbon fixing
Land Bio-diversity protection
Other Assets Recreation
Water cycle regulation
Erosion
Timber production
Total 23,840.1 17,167.00
Source: Estimation by the Assessment Team on the basis of official information.
NIGERIA Post-Disaster Needs Assessment 2012 Floods52
Photo: Curt Carnemark / World Bank
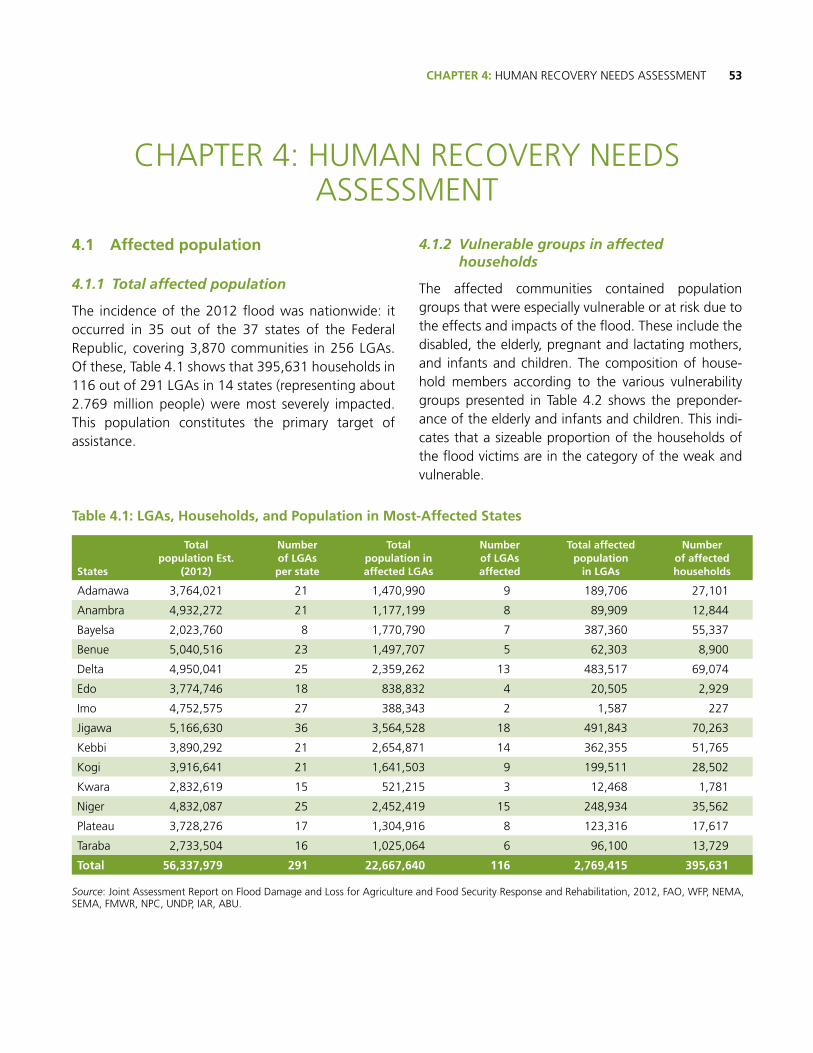
53CHAPTER 4: HUMAN RECOVERY NEEDS ASSESSMENT
4.1 Affected population
4.1.1 Total affected population
The incidence of the 2012 flood was nationwide: it occurred in 35 out of the 37 states of the Federal Republic, covering 3,870 communities in 256 LGAs. Of these, Table 4.1 shows that 395,631 households in 116 out of 291 LGAs in 14 states (representing about 2.769 million people) were most severely impacted. This population constitutes the primary target of assistance.
4.1.2 Vulnerable groups in affected households
The affected communities contained population groups that were especially vulnerable or at risk due to the effects and impacts of the flood. These include the disabled, the elderly, pregnant and lactating mothers, and infants and children. The composition of house-hold members according to the various vulnerability groups presented in Table 4.2 shows the preponder-ance of the elderly and infants and children. This indi-cates that a sizeable proportion of the households of the flood victims are in the category of the weak and vulnerable.
CHAPTER 4: HUMAN RECOVERY NEEDS ASSESSMENT
Table 4.1: LGAs, Households, and Population in Most-Affected States
States
Total population Est.
(2012)
Number of LGAs per state
Total population in affected LGAs
Number of LGAs affected
Total affected population
in LGAs
Number of affected households
Adamawa 3,764,021 21 1,470,990 9 189,706 27,101
Anambra 4,932,272 21 1,177,199 8 89,909 12,844
Bayelsa 2,023,760 8 1,770,790 7 387,360 55,337
Benue 5,040,516 23 1,497,707 5 62,303 8,900
Delta 4,950,041 25 2,359,262 13 483,517 69,074
Edo 3,774,746 18 838,832 4 20,505 2,929
Imo 4,752,575 27 388,343 2 1,587 227
Jigawa 5,166,630 36 3,564,528 18 491,843 70,263
Kebbi 3,890,292 21 2,654,871 14 362,355 51,765
Kogi 3,916,641 21 1,641,503 9 199,511 28,502
Kwara 2,832,619 15 521,215 3 12,468 1,781
Niger 4,832,087 25 2,452,419 15 248,934 35,562
Plateau 3,728,276 17 1,304,916 8 123,316 17,617
Taraba 2,733,504 16 1,025,064 6 96,100 13,729
Total 56,337,979 291 22,667,640 116 2,769,415 395,631
Source: Joint Assessment Report on Flood Damage and Loss for Agriculture and Food Security Response and Rehabilitation, 2012, FAO, WFP, NEMA, SEMA, FMWR, NPC, UNDP, IAR, ABU.
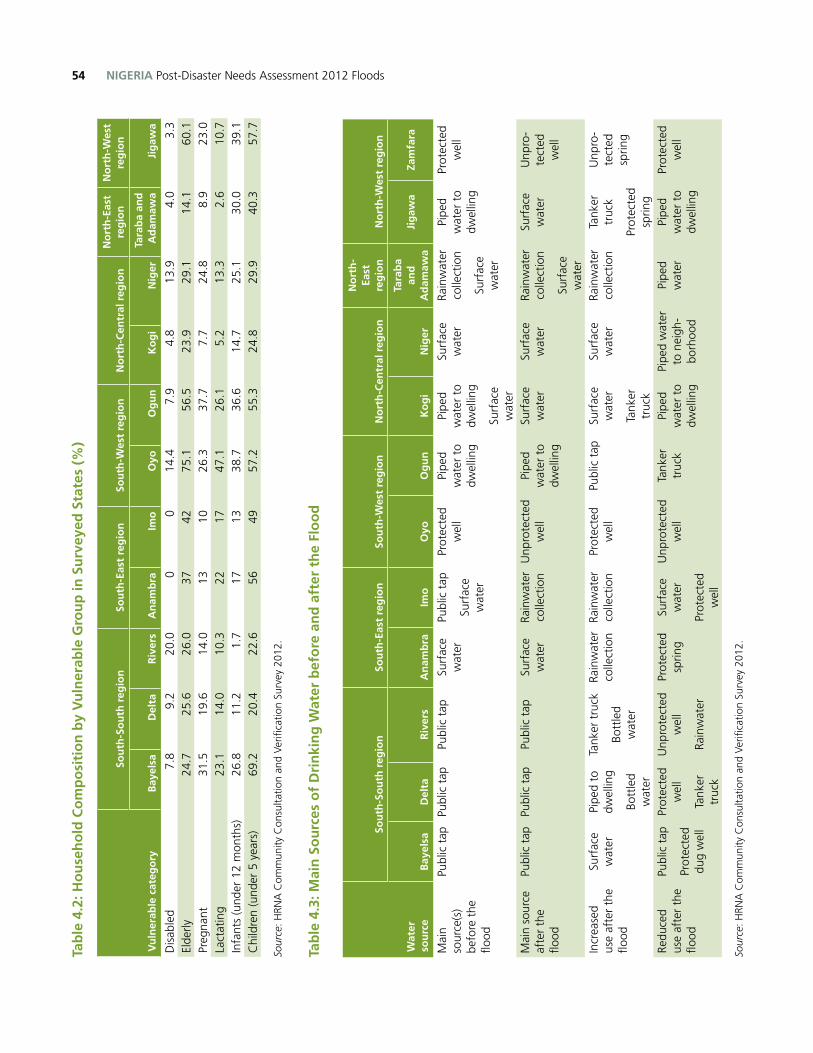
NIGERIA Post-Disaster Needs Assessment 2012 Floods54Ta
ble
4.2
: Ho
use
ho
ld C
om
po
siti
on
by
Vu
lner
able
Gro
up
in S
urv
eyed
Sta
tes
(%)
Vu
lner
able
cat
ego
ry
Sou
th-S
ou
th r
egio
nSo
uth
-Eas
t re
gio
nSo
uth
-Wes
t re
gio
nN
ort
h-C
entr
al r
egio
nN
ort
h-E
ast
reg
ion
No
rth
-Wes
t re
gio
n
Bay
elsa
Del
taR
iver
sA
nam
bra
Imo
Oyo
Og
un
Ko
gi
Nig
erTa
rab
a an
d
Ad
amaw
aJi
gaw
a
Dis
able
d7.
89.
220
.00
014
.47.
94.
813
.94.
03.
3El
derly
24.7
25.6
26.0
3742
75.1
56.5
23.9
29.1
14.1
60.1
Preg
nant
31.5
19.6
14.0
1310
26.3
37.7
7.7
24.8
8.9
23.0
Lact
atin
g23
.114
.010
.322
1747
.126
.15.
213
.32.
610
.7In
fant
s (u
nder
12
mon
ths)
26.8
11.2
1.7
1713
38.7
36.6
14.7
25.1
30.0
39.1
Chi
ldre
n (u
nder
5 y
ears
)69
.220
.422
.656
4957
.255
.324
.829
.940
.357
.7
Sour
ce: H
RNA
Com
mun
ity C
onsu
ltatio
n an
d Ve
rifica
tion
Surv
ey 2
012.
Tab
le 4
.3: M
ain
So
urc
es o
f D
rin
kin
g W
ater
bef
ore
an
d a
fter
th
e Fl
oo
d
Wat
er
sou
rce
Sou
th-S
ou
th r
egio
nSo
uth
-Eas
t re
gio
nSo
uth
-Wes
t re
gio
nN
ort
h-C
entr
al r
egio
n
No
rth
-Ea
st
reg
ion
No
rth
-Wes
t re
gio
n
Bay
elsa
Del
taR
iver
sA
nam
bra
Imo
Oyo
Og
un
Ko
gi
Nig
er
Tara
ba
and
A
dam
awa
Jig
awa
Zam
fara
Mai
n so
urce
(s)
befo
re t
he
flood
Publ
ic t
apPu
blic
tap
Publ
ic t
apSu
rfac
e w
ater
Publ
ic t
ap
Surf
ace
wat
er
Prot
ecte
d w
ell
Pipe
d w
ater
to
dwel
ling
Pipe
d w
ater
to
dwel
ling
Surf
ace
wat
er
Surf
ace
wat
erRa
inw
ater
co
llect
ion
Surf
ace
wat
er
Pipe
d w
ater
to
dwel
ling
Prot
ecte
d w
ell
Mai
n so
urce
af
ter
the
flood
Publ
ic t
apPu
blic
tap
Publ
ic t
apSu
rfac
e w
ater
Rain
wat
er
colle
ctio
nU
npro
tect
ed
wel
lPi
ped
wat
er t
o dw
ellin
g
Surf
ace
wat
erSu
rfac
e w
ater
Rain
wat
er
colle
ctio
n
Surf
ace
wat
er
Surf
ace
wat
erU
npro
-te
cted
w
ell
Incr
ease
d us
e af
ter
the
flood
Surf
ace
wat
erPi
ped
to
dwel
ling
Bott
led
wat
er
Tank
er t
ruck
Bott
led
wat
er
Rain
wat
er
colle
ctio
nRa
inw
ater
co
llect
ion
Prot
ecte
d w
ell
Publ
ic t
apSu
rfac
e w
ater
Tank
er
truc
k
Surf
ace
wat
erRa
inw
ater
co
llect
ion
Tank
er
truc
k
Prot
ecte
d sp
ring
Unp
ro-
tect
ed
sprin
g
Redu
ced
use
afte
r th
e flo
od
Publ
ic t
ap
Prot
ecte
d du
g w
ell
Prot
ecte
d
wel
l
Tank
er
truc
k
Unp
rote
cted
w
ell
Rain
wat
er
Prot
ecte
d sp
ring
Surf
ace
wat
er
Prot
ecte
d w
ell
Unp
rote
cted
w
ell
Tank
er
truc
kPi
ped
wat
er t
o dw
ellin
g
Pipe
d w
ater
to
nei
gh-
borh
ood
Pipe
d w
ater
Pipe
d w
ater
to
dwel
ling
Prot
ecte
d w
ell
Sour
ce: H
RNA
Com
mun
ity C
onsu
ltatio
n an
d Ve
rifica
tion
Surv
ey 2
012.
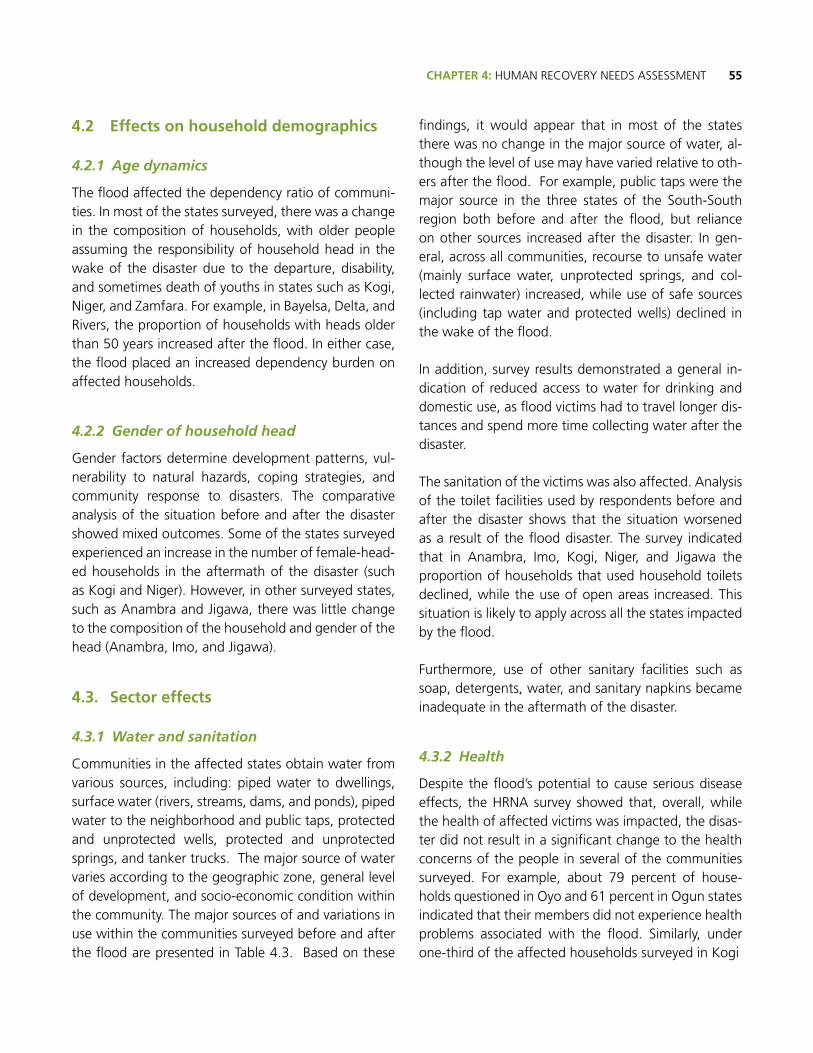
55CHAPTER 4: HUMAN RECOVERY NEEDS ASSESSMENT
4.2 Effects on household demographics
4.2.1 Age dynamics
The flood affected the dependency ratio of communi-ties. In most of the states surveyed, there was a change in the composition of households, with older people assuming the responsibility of household head in the wake of the disaster due to the departure, disability, and sometimes death of youths in states such as Kogi, Niger, and Zamfara. For example, in Bayelsa, Delta, and Rivers, the proportion of households with heads older than 50 years increased after the flood. In either case, the flood placed an increased dependency burden on affected households.
4.2.2 Gender of household head
Gender factors determine development patterns, vul-nerability to natural hazards, coping strategies, and community response to disasters. The comparative analysis of the situation before and after the disaster showed mixed outcomes. Some of the states surveyed experienced an increase in the number of female-head-ed households in the aftermath of the disaster (such as Kogi and Niger). However, in other surveyed states, such as Anambra and Jigawa, there was little change to the composition of the household and gender of the head (Anambra, Imo, and Jigawa).
4.3. Sector effects
4.3.1 Water and sanitation
Communities in the affected states obtain water from various sources, including: piped water to dwellings, surface water (rivers, streams, dams, and ponds), piped water to the neighborhood and public taps, protected and unprotected wells, protected and unprotected springs, and tanker trucks. The major source of water varies according to the geographic zone, general level of development, and socio-economic condition within the community. The major sources of and variations in use within the communities surveyed before and after the flood are presented in Table 4.3. Based on these
findings, it would appear that in most of the states there was no change in the major source of water, al-though the level of use may have varied relative to oth-ers after the flood. For example, public taps were the major source in the three states of the South-South region both before and after the flood, but reliance on other sources increased after the disaster. In gen-eral, across all communities, recourse to unsafe water (mainly surface water, unprotected springs, and col-lected rainwater) increased, while use of safe sources (including tap water and protected wells) declined in the wake of the flood.
In addition, survey results demonstrated a general in-dication of reduced access to water for drinking and domestic use, as flood victims had to travel longer dis-tances and spend more time collecting water after the disaster.
The sanitation of the victims was also affected. Analysis of the toilet facilities used by respondents before and after the disaster shows that the situation worsened as a result of the flood disaster. The survey indicated that in Anambra, Imo, Kogi, Niger, and Jigawa the proportion of households that used household toilets declined, while the use of open areas increased. This situation is likely to apply across all the states impacted by the flood.
Furthermore, use of other sanitary facilities such as soap, detergents, water, and sanitary napkins became inadequate in the aftermath of the disaster.
4.3.2 Health
Despite the flood’s potential to cause serious disease effects, the HRNA survey showed that, overall, while the health of affected victims was impacted, the disas-ter did not result in a significant change to the health concerns of the people in several of the communities surveyed. For example, about 79 percent of house-holds questioned in Oyo and 61 percent in Ogun states indicated that their members did not experience health problems associated with the flood. Similarly, under one-third of the affected households surveyed in Kogi
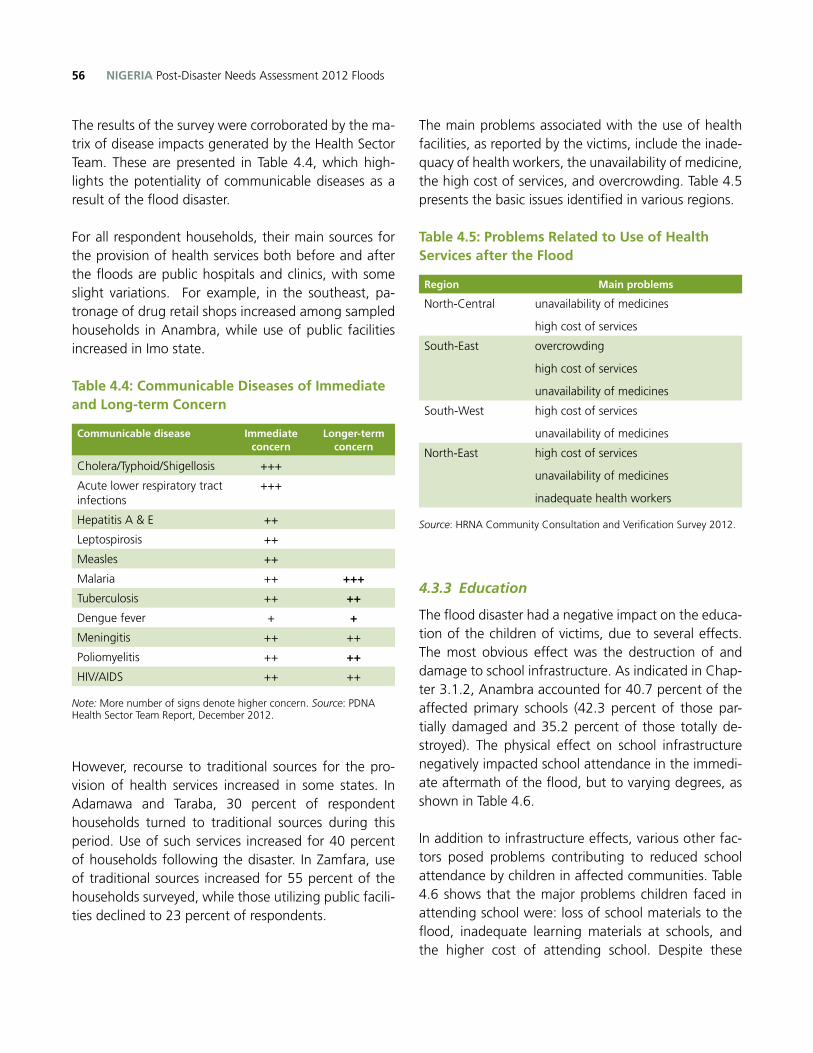
NIGERIA Post-Disaster Needs Assessment 2012 Floods56
The results of the survey were corroborated by the ma-trix of disease impacts generated by the Health Sector Team. These are presented in Table 4.4, which high-lights the potentiality of communicable diseases as a result of the flood disaster.
For all respondent households, their main sources for the provision of health services both before and after the floods are public hospitals and clinics, with some slight variations. For example, in the southeast, pa-tronage of drug retail shops increased among sampled households in Anambra, while use of public facilities increased in Imo state.
Table 4.4: Communicable Diseases of Immediate and Long-term Concern
Communicable disease Immediate concern
Longer-term concern
Cholera/Typhoid/Shigellosis +++
Acute lower respiratory tract infections
+++
Hepatitis A & E ++
Leptospirosis ++
Measles ++
Malaria ++ +++
Tuberculosis ++ ++
Dengue fever + +
Meningitis ++ ++
Poliomyelitis ++ ++
HIV/AIDS ++ ++
Note: More number of signs denote higher concern. Source: PDNA Health Sector Team Report, December 2012.
However, recourse to traditional sources for the pro-vision of health services increased in some states. In Adamawa and Taraba, 30 percent of respondent households turned to traditional sources during this period. Use of such services increased for 40 percent of households following the disaster. In Zamfara, use of traditional sources increased for 55 percent of the households surveyed, while those utilizing public facili-ties declined to 23 percent of respondents.
The main problems associated with the use of health facilities, as reported by the victims, include the inade-quacy of health workers, the unavailability of medicine, the high cost of services, and overcrowding. Table 4.5 presents the basic issues identified in various regions.
Table 4.5: Problems Related to Use of Health Services after the Flood
Region Main problems
North-Central unavailability of medicines
high cost of services
South-East overcrowding
high cost of services
unavailability of medicines
South-West high cost of services
unavailability of medicines
North-East high cost of services
unavailability of medicines
inadequate health workers
Source: HRNA Community Consultation and Verification Survey 2012.
4.3.3 Education
The flood disaster had a negative impact on the educa-tion of the children of victims, due to several effects. The most obvious effect was the destruction of and damage to school infrastructure. As indicated in Chap-ter 3.1.2, Anambra accounted for 40.7 percent of the affected primary schools (42.3 percent of those par-tially damaged and 35.2 percent of those totally de-stroyed). The physical effect on school infrastructure negatively impacted school attendance in the immedi-ate aftermath of the flood, but to varying degrees, as shown in Table 4.6.
In addition to infrastructure effects, various other fac-tors posed problems contributing to reduced school attendance by children in affected communities. Table 4.6 shows that the major problems children faced in attending school were: loss of school materials to the flood, inadequate learning materials at schools, and the higher cost of attending school. Despite these
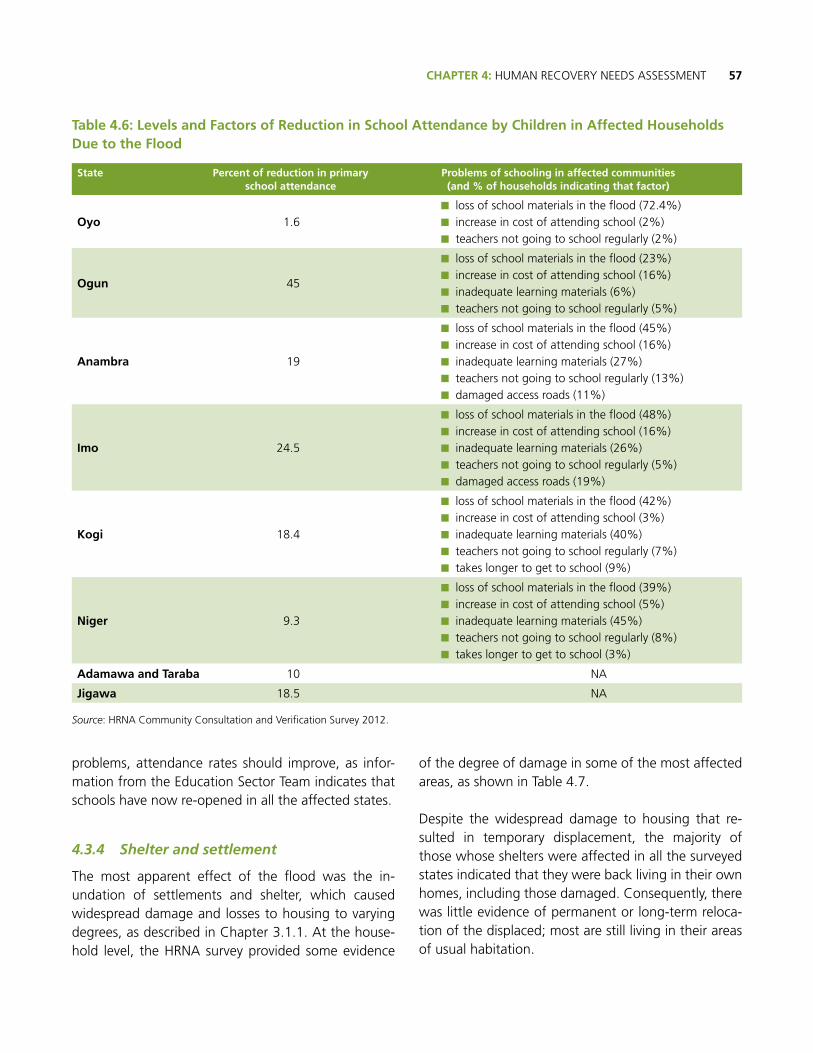
57CHAPTER 4: HUMAN RECOVERY NEEDS ASSESSMENT
problems, attendance rates should improve, as infor-mation from the Education Sector Team indicates that schools have now re-opened in all the affected states.
4.3.4 Shelter and settlement
The most apparent effect of the flood was the in-undation of settlements and shelter, which caused widespread damage and losses to housing to varying degrees, as described in Chapter 3.1.1. At the house-hold level, the HRNA survey provided some evidence
of the degree of damage in some of the most affected areas, as shown in Table 4.7.
Despite the widespread damage to housing that re-sulted in temporary displacement, the majority of those whose shelters were affected in all the surveyed states indicated that they were back living in their own homes, including those damaged. Consequently, there was little evidence of permanent or long-term reloca-tion of the displaced; most are still living in their areas of usual habitation.
Table 4.6: Levels and Factors of Reduction in School Attendance by Children in Affected Households Due to the Flood
State Percent of reduction in primary school attendance
Problems of schooling in affected communities(and % of households indicating that factor)
Oyo 1.6■n loss of school materials in the flood (72.4%)■n increase in cost of attending school (2%)■n teachers not going to school regularly (2%)
Ogun 45
■n loss of school materials in the flood (23%)■n increase in cost of attending school (16%)■n inadequate learning materials (6%)■n teachers not going to school regularly (5%)
Anambra 19
■n loss of school materials in the flood (45%)■n increase in cost of attending school (16%)■n inadequate learning materials (27%)■n teachers not going to school regularly (13%)■n damaged access roads (11%)
Imo 24.5
■n loss of school materials in the flood (48%)■n increase in cost of attending school (16%)■n inadequate learning materials (26%)■n teachers not going to school regularly (5%)■n damaged access roads (19%)
Kogi 18.4
■n loss of school materials in the flood (42%)■n increase in cost of attending school (3%)■n inadequate learning materials (40%)■n teachers not going to school regularly (7%)■n takes longer to get to school (9%)
Niger 9.3
■n loss of school materials in the flood (39%)■n increase in cost of attending school (5%)■n inadequate learning materials (45%)■n teachers not going to school regularly (8%)■n takes longer to get to school (3%)
Adamawa and Taraba 10 NA
Jigawa 18.5 NA
Source: HRNA Community Consultation and Verification Survey 2012.
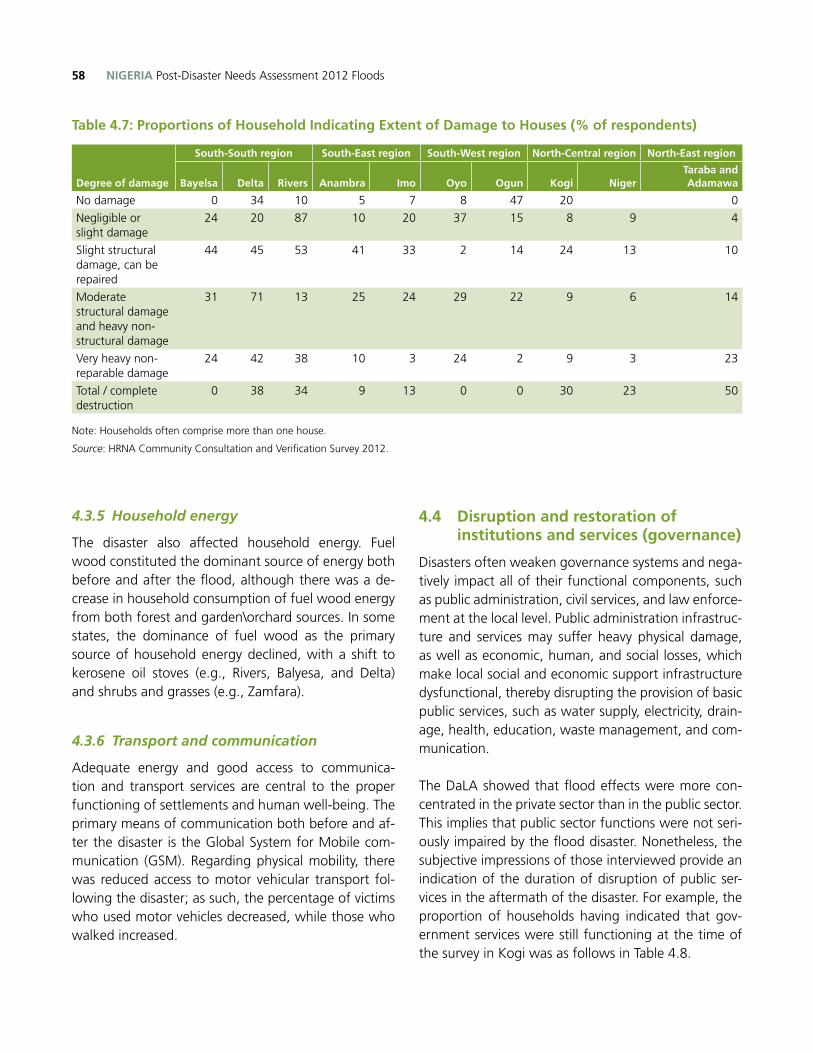
NIGERIA Post-Disaster Needs Assessment 2012 Floods58
4.3.5 Household energy
The disaster also affected household energy. Fuel wood constituted the dominant source of energy both before and after the flood, although there was a de-crease in household consumption of fuel wood energy from both forest and garden\orchard sources. In some states, the dominance of fuel wood as the primary source of household energy declined, with a shift to kerosene oil stoves (e.g., Rivers, Balyesa, and Delta) and shrubs and grasses (e.g., Zamfara).
4.3.6 Transport and communication
Adequate energy and good access to communica-tion and transport services are central to the proper functioning of settlements and human well-being. The primary means of communication both before and af-ter the disaster is the Global System for Mobile com-munication (GSM). Regarding physical mobility, there was reduced access to motor vehicular transport fol-lowing the disaster; as such, the percentage of victims who used motor vehicles decreased, while those who walked increased.
4.4 Disruption and restoration of institutions and services (governance)
Disasters often weaken governance systems and nega-tively impact all of their functional components, such as public administration, civil services, and law enforce-ment at the local level. Public administration infrastruc-ture and services may suffer heavy physical damage, as well as economic, human, and social losses, which make local social and economic support infrastructure dysfunctional, thereby disrupting the provision of basic public services, such as water supply, electricity, drain-age, health, education, waste management, and com-munication.
The DaLA showed that flood effects were more con-centrated in the private sector than in the public sector. This implies that public sector functions were not seri-ously impaired by the flood disaster. Nonetheless, the subjective impressions of those interviewed provide an indication of the duration of disruption of public ser-vices in the aftermath of the disaster. For example, the proportion of households having indicated that gov-ernment services were still functioning at the time of the survey in Kogi was as follows in Table 4.8.
Table 4.7: Proportions of Household Indicating Extent of Damage to Houses (% of respondents)
Degree of damage
South-South region South-East region South-West region North-Central region North-East region
Bayelsa Delta Rivers Anambra Imo Oyo Ogun Kogi NigerTaraba and Adamawa
No damage 0 34 10 5 7 8 47 20 0
Negligible or slight damage
24 20 87 10 20 37 15 8 9 4
Slight structural damage, can be repaired
44 45 53 41 33 2 14 24 13 10
Moderate structural damage and heavy non-structural damage
31 71 13 25 24 29 22 9 6 14
Very heavy non-reparable damage
24 42 38 10 3 24 2 9 3 23
Total / complete destruction
0 38 34 9 13 0 0 30 23 50
Note: Households often comprise more than one house.
Source: HRNA Community Consultation and Verification Survey 2012.
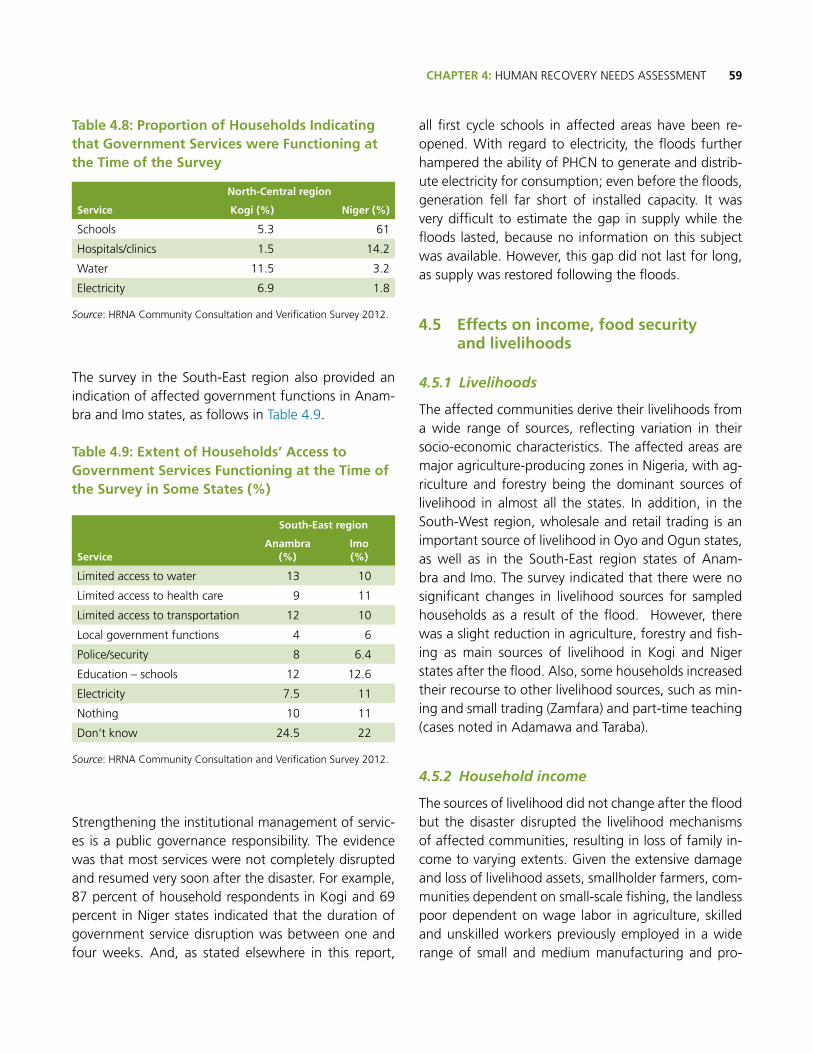
59CHAPTER 4: HUMAN RECOVERY NEEDS ASSESSMENT
Table 4.8: Proportion of Households Indicating that Government Services were Functioning at the Time of the Survey
Service
North-Central region
Kogi (%) Niger (%)
Schools 5.3 61
Hospitals/clinics 1.5 14.2
Water 11.5 3.2
Electricity 6.9 1.8
Source: HRNA Community Consultation and Verification Survey 2012.
The survey in the South-East region also provided an indication of affected government functions in Anam-bra and Imo states, as follows in Table 4.9.
Table 4.9: Extent of Households’ Access to Government Services Functioning at the Time of the Survey in Some States (%)
Service
South-East region
Anambra (%)
Imo (%)
Limited access to water 13 10
Limited access to health care 9 11
Limited access to transportation 12 10
Local government functions 4 6
Police/security 8 6.4
Education – schools 12 12.6
Electricity 7.5 11
Nothing 10 11
Don’t know 24.5 22
Source: HRNA Community Consultation and Verification Survey 2012.
Strengthening the institutional management of servic-es is a public governance responsibility. The evidence was that most services were not completely disrupted and resumed very soon after the disaster. For example, 87 percent of household respondents in Kogi and 69 percent in Niger states indicated that the duration of government service disruption was between one and four weeks. And, as stated elsewhere in this report,
all first cycle schools in affected areas have been re-opened. With regard to electricity, the floods further hampered the ability of PHCN to generate and distrib-ute electricity for consumption; even before the floods, generation fell far short of installed capacity. It was very difficult to estimate the gap in supply while the floods lasted, because no information on this subject was available. However, this gap did not last for long, as supply was restored following the floods.
4.5 Effects on income, food security and livelihoods
4.5.1 Livelihoods
The affected communities derive their livelihoods from a wide range of sources, reflecting variation in their socio-economic characteristics. The affected areas are major agriculture-producing zones in Nigeria, with ag-riculture and forestry being the dominant sources of livelihood in almost all the states. In addition, in the South-West region, wholesale and retail trading is an important source of livelihood in Oyo and Ogun states, as well as in the South-East region states of Anam-bra and Imo. The survey indicated that there were no significant changes in livelihood sources for sampled households as a result of the flood. However, there was a slight reduction in agriculture, forestry and fish-ing as main sources of livelihood in Kogi and Niger states after the flood. Also, some households increased their recourse to other livelihood sources, such as min-ing and small trading (Zamfara) and part-time teaching (cases noted in Adamawa and Taraba).
4.5.2 Household income
The sources of livelihood did not change after the flood but the disaster disrupted the livelihood mechanisms of affected communities, resulting in loss of family in-come to varying extents. Given the extensive damage and loss of livelihood assets, smallholder farmers, com-munities dependent on small-scale fishing, the landless poor dependent on wage labor in agriculture, skilled and unskilled workers previously employed in a wide range of small and medium manufacturing and pro-

NIGERIA Post-Disaster Needs Assessment 2012 Floods60
cessing enterprises all lost income-earning opportuni-ties for some period of time.
The PDNA estimated employment and income impacts of the flood in the most affected states, which show that income losses are highest for the trade and com-merce sector, relative to those in agriculture and the fisheries. This has implications for the gender impacts of the flood. The negative impacts on female entre-preneurship will be significant, as 42 percent of micro businesses are female-owned and 30 percent of em-ployees in the SME manufacturing sector are female. Significant proportions of surveyed households lost their income as a result of the flood ( See Table 4.10).
4.5.3 Food security
These levels of income impacts had negative conse-quences for the food security status of households. Prior to the disaster, the majority of those surveyed ob-tained their food and other sources of livelihood from their own farm produce. In the post-disaster period, however, market purchase became the main source of food for between 60 and 98 percent of the affected households sampled in all the states, while between 1 and 10 percent relied on food assistance from the government, donors, and their neighbors.
In the aftermath of the disaster, increases in market prices of commodities were also reported by nearly
all of the respondents. This commodity price inflation and the following factors exacerbated the food inse-curity of impacted populations: (a) crop and livestock losses; (b) loss of stored food; (c) increased reliance on market for food (reduced own-produce consumption), and greater recourse to government assistance; (d) re-duced access to markets, (e) reduced duration of do-mestic food reserves from about one to six months to under one to two months (for those still maintaining reserves); and (f) loss of livelihood to provide income to access food.
4.6 How the affected communities are coping with the livelihood and income effects of the disaster
4.6.1 Post-flood income coping and food security strategies
Communities and households have developed various coping and survival mechanisms along with strategies to manage a wide range of vulnerabilities within the rural milieu. These vary by source of stress, agro-cli-matic zone of adoption, level of incidence of the mea-sures (individual, household, community), or type of response (risk minimization or avoidance).
Financial coping strategies adopted to cope with the loss of household income as a result of the flood, as shown in Table 4.11.
Table 4.10: Proportion of Households in Some States Indicating Various Levels of Income Loss (%)
Category of loss
South-East region South-West region North-Central regionNorth-East
region
Anambra Imo Oyo Ogun Kogi NigerTaraba and Adamawa
Completely lost 31 40 0.0 0.2 63.2 48.0 28.6
About 76% lost (most) 25 27 0.0 3.7 23.9 17.6
51-75% lost (a large proportion) 21 19 32.9 0.6 9.0 17.9 19.2
26-50% (some, nearly half) 21 14 44.2 25.7 0.0 10.4 7.9
1-25% (a little) 2 0 3.1 54.9 3.9 3.7 15.0
None 0 0 19.5 14.9 0 0 12.5*
*16.9 of households indicated they did not know the extent of income loss.
Source: HRNA Community Consultation and Verification Survey 2012
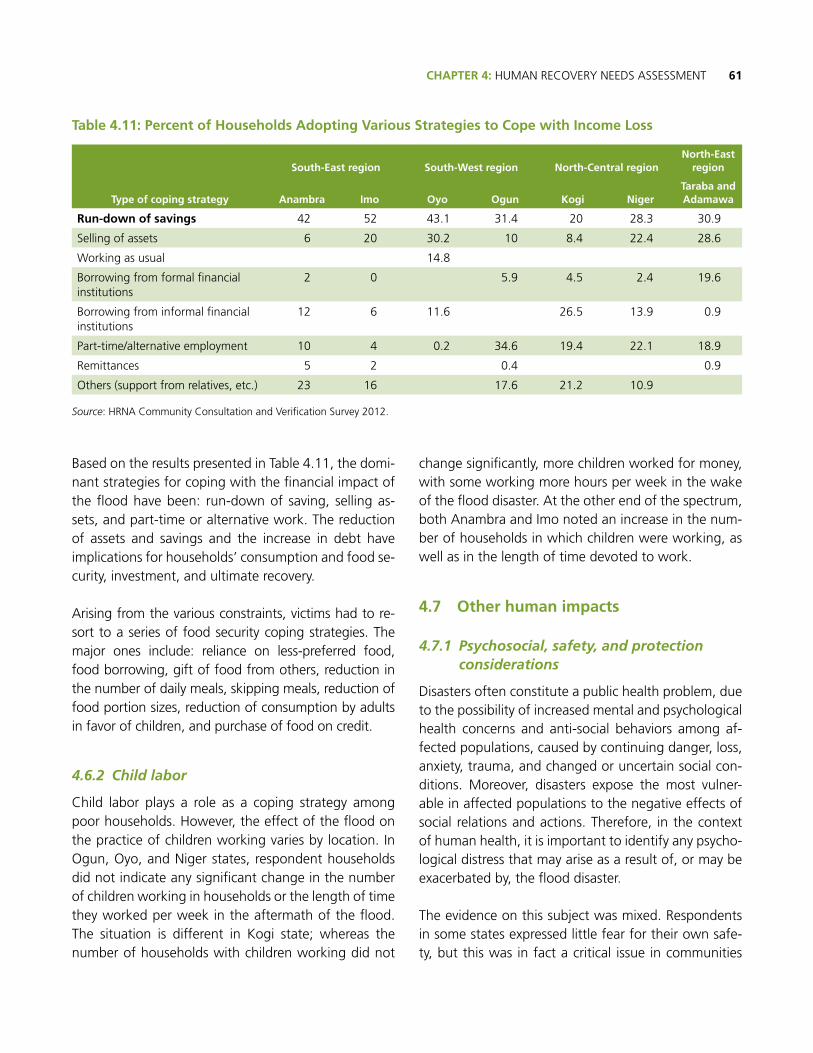
61CHAPTER 4: HUMAN RECOVERY NEEDS ASSESSMENT
Based on the results presented in Table 4.11, the domi-nant strategies for coping with the financial impact of the flood have been: run-down of saving, selling as-sets, and part-time or alternative work. The reduction of assets and savings and the increase in debt have implications for households’ consumption and food se-curity, investment, and ultimate recovery.
Arising from the various constraints, victims had to re-sort to a series of food security coping strategies. The major ones include: reliance on less-preferred food, food borrowing, gift of food from others, reduction in the number of daily meals, skipping meals, reduction of food portion sizes, reduction of consumption by adults in favor of children, and purchase of food on credit.
4.6.2 Child labor
Child labor plays a role as a coping strategy among poor households. However, the effect of the flood on the practice of children working varies by location. In Ogun, Oyo, and Niger states, respondent households did not indicate any significant change in the number of children working in households or the length of time they worked per week in the aftermath of the flood. The situation is different in Kogi state; whereas the number of households with children working did not
change significantly, more children worked for money, with some working more hours per week in the wake of the flood disaster. At the other end of the spectrum, both Anambra and Imo noted an increase in the num-ber of households in which children were working, as well as in the length of time devoted to work.
4.7 Other human impacts
4.7.1 Psychosocial, safety, and protection considerations
Disasters often constitute a public health problem, due to the possibility of increased mental and psychological health concerns and anti-social behaviors among af-fected populations, caused by continuing danger, loss, anxiety, trauma, and changed or uncertain social con-ditions. Moreover, disasters expose the most vulner-able in affected populations to the negative effects of social relations and actions. Therefore, in the context of human health, it is important to identify any psycho-logical distress that may arise as a result of, or may be exacerbated by, the flood disaster.
The evidence on this subject was mixed. Respondents in some states expressed little fear for their own safe-ty, but this was in fact a critical issue in communities
Table 4.11: Percent of Households Adopting Various Strategies to Cope with Income Loss
Type of coping strategy
South-East region South-West region North-Central regionNorth-East
region
Anambra Imo Oyo Ogun Kogi NigerTaraba and Adamawa
Run-down of savings 42 52 43.1 31.4 20 28.3 30.9
Selling of assets 6 20 30.2 10 8.4 22.4 28.6
Working as usual 14.8
Borrowing from formal financial institutions
2 0 5.9 4.5 2.4 19.6
Borrowing from informal financial institutions
12 6 11.6 26.5 13.9 0.9
Part-time/alternative employment 10 4 0.2 34.6 19.4 22.1 18.9
Remittances 5 2 0.4 0.9
Others (support from relatives, etc.) 23 16 17.6 21.2 10.9
Source: HRNA Community Consultation and Verification Survey 2012.
NIGERIA Post-Disaster Needs Assessment 2012 Floods62
where affected households felt more insecure in their homes after the flood (Anambra and Imo, Oyo, Ogun, Kogi, and Niger). The reasons adduced by respondents for their insecurity were gendered. Men attributed their sense of insecurity to the perceived possible col-lapse of a damaged house, a poor housing environ-ment, fear of future economic uncertainty, recurrence of the flood, and increase in reptiles in the community. Women attributed their fear to the prevalence of dis-ease, poor housing conditions, inadequate access to food, and trauma. As for children, their sense of inse-curity was attributed to poor housing conditions (e.g., falling walls of damaged houses), reptiles, and trauma. In Ogun state, uneasiness among the few households having expressed such concerns had more to do with the fear of robbery than with the effects of the disas-ter per se. In Kogi state, 60 percent of the households questioned showed deep anxiety about the security of their possessions, particularly as most respondents (91 percent in Oyo, at least 60 percent in Adamawa and Taraba, 61 percent in Ogun, 37 percent in Kogi, 19 percent in Niger) indicated that they had lost various important documents due to the flood.
Another social dimension of the flood’s impact was the incidence of behavioral changes, noted particularly in the South-South region. Changes in the behavior of children (noted in 47 percent of households in Anam-bra and 28 percent in Imo states) were attributed to flood-induced trauma, deterioration in the living en-vironment, and disruptions in food intake. These factors, in addition to the frustration caused by their inability to provide for their households, accounted for noticeable changes in the behavior of adults in 22 per-cent of households in Anambra and 35 percent in Imo.
4.7.2 Disaster-induced conflict
Conflicts often arise in the wake of natural disasters and due to environmental factors, such as limited re-sources. They tend to exacerbate the effects of natu-ral hazards by further weakening populations already under stress, thereby increasing disaster-related risks. An exception to this trend was noted in the context of the flood disaster, as respondent households reported
little evidence of increased conflict (e.g. Rivers, Balyesa, Delta, Kogi, Niger). This experience was not universal, however; 56 percent of respondents in Oyo and 61 percent in Adamawa and Taraba reported increased conflict due to the flood. Sources of tension included disputes over the distribution of donated items, family quarrels, differences over business interests, and con-flicts over the use of land that was not flooded.
4.8 Likely impacts on human development indicators and MDGs
Assessment of the impact of disasters on various indi-ces of human development constitutes a key element of HRNA in PDNAs. This HRNA did not explicitly un-dertake Flood Impact on MDGs Analysis (FIMA). None-theless, it is possible to discern some potential impacts on key MDGs, such as those relating to poverty and hunger (MDG1), universal primary education (MDG2), child mortality (MDG4), and the incidence of diseases (MDG 6).
4.8.1 Eradication of extreme poverty and hunger (MDG 1)
Floods reduced access to food supply at the household level due to damage to shelter, savings, household food stocks, productive assets, and roads connecting people to markets. This contributed to undernourish-ment at least in the short to medium term. There is also the risk of an increased severity in undernourish-ment for those already malnourished, partly due to the effect of increased prices as a result of the floods. Price effects are also likely to accentuate this. To the extent the price level for staples remains inflated over the short to medium term, nutritional status, health, and overall economic productivity would likely be neg-atively impacted, thereby exacerbating food insecurity. Furthermore, the flood had negative direct employ-ment impacts. As shown in the HRNA survey, the flood disrupted the livelihoods of affected people. The DaLA estimated that equivalent employment losses due to damages and losses amounted to nearly 400,000 em-ployment years of both salaried and self-employed workers in the 12 states visited.
63CHAPTER 4: HUMAN RECOVERY NEEDS ASSESSMENT
4.8.2 Universal primary education (MDG 2)
As noted by the Education Sector Team, the floods have reduced the effectiveness of the education sys-tem, mainly due to inadequate learning environments resulting from the loss of classrooms. Regarding sur-vival rates, the Nigeria 2010 MDG Report noted that, while gross and net enrolment rates are increasing, survival rates are dropping. The flood would not have helped this situation, as some children have dropped out partly due to damaged school buildings, their in-ability to use roads leading to schools, and the loss of uniforms and learning materials. Also, some are likely to drop out due to loss of teaching time, which could affect their progress.
4.8.3 Infant mortality, maternal health and diseases (MDGs 4, 5, 6)
As indicated in the Health Sector report, the floods would have likely affected the achievement of MDGs in impacted states, as malaria was expected to increase and the interruption of services for days or weeks would cause serious setbacks to patients receiving chronic treatment for TB and HIV. Also, access to obstetrics care in affected areas would be reduced, given the damage to facilities, resulting in longer referral times.
4.9 Implications for recovery
4.9.1 Communities’ recovery efforts: auto-recovery
Affected populations are not waiting for government support before returning to their homes; they have ei-ther already returned or are planning to in the near fu-ture. It is therefore imperative that they receive support now, in order to rebuild and recover their houses and livelihoods, and to permit them access to basic services that were disrupted by the flood disaster.
However, the survey showed that victims are making few recovery efforts. Current actions being taken by the victims to recover from the disaster include seeking alternative jobs (38.7 percent), rehabilitating destroyed
houses (16.0 percent), relocating (6.1 percent), and
seeking assistance from relatives and friends (16.0 per-
cent). However, it was determined that roughly 23.3
percent of the victims are doing nothing to recover
from the disaster, indicating the need for external as-
sistance. Also, a high proportion of the victims (60.0
percent) reported that they are not doing anything to
prevent future flood disasters, while 21.2 percent do
not know what to do at all. The relatively slow pace of
auto-recovery underscores the need for programmed
recovery assistance.
4.9.2 Communities’ subjective expressions of priority recovery assistance needs
Assistance is needed to enable the victims to recover
quickly from the impact of the disaster. This assistance
must be partly based on the subjective perceptions of
the impacted populations. The survey elicited these
perceptions.
Findings show that the floods had negative impacts
on the lives, assets, and livelihoods of the victims. The
array of problems they face in the aftermath of the
disaster is varied and diverse. It includes water short-
age, poor sanitation and toilet facilities, transportation
problems, lack of access to markets and healthcare fa-
cilities, food shortages, poor and inadequate shelter,
inability to repair damage shelter, inadequate clothing\
footwear, as well as loss of livelihood, among others.
The overall recovery needs to be addressed should be
keyed to these major problems faced by victims of the
flood. Table 4.12 shows the relative ranking of the
major problems as identified by surveyed households.
The unavailability of adequate potable water and food
were the most pressing problems identified at the time
of the survey. Transportation was the top-most prob-
lem identified by those surveyed in Delta and the sec-
ond in Rivers state.
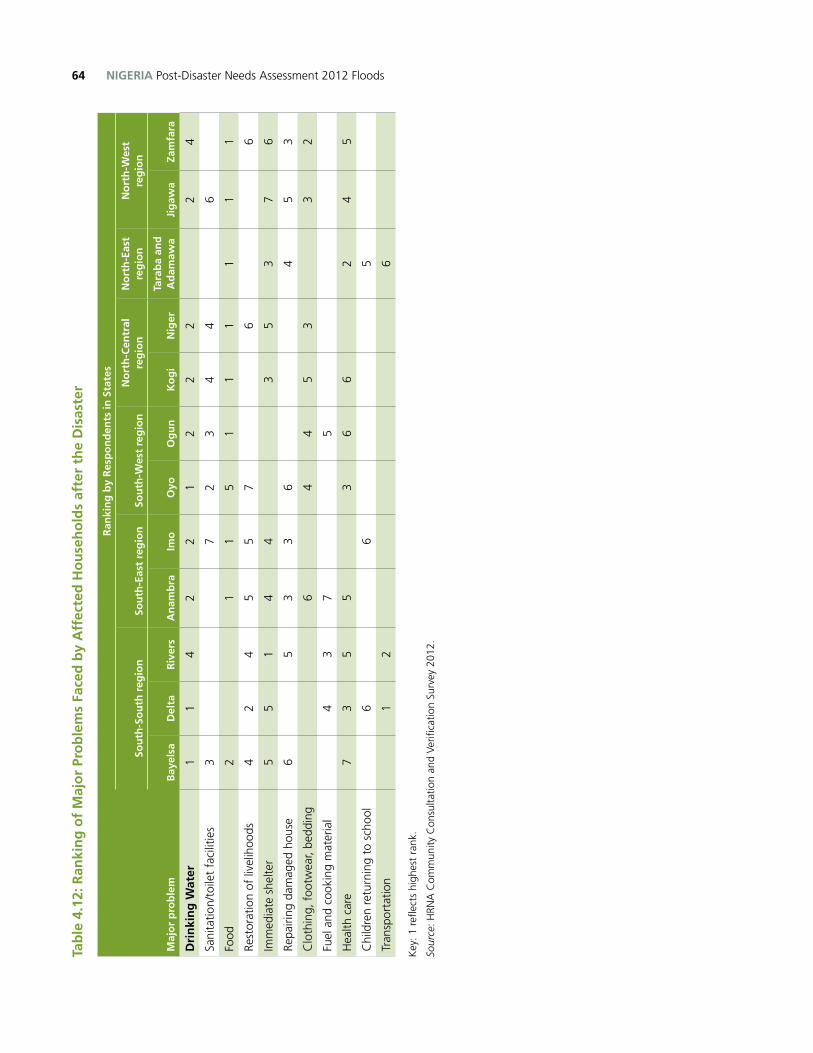
NIGERIA Post-Disaster Needs Assessment 2012 Floods64Ta
ble
4.1
2: R
anki
ng
of
Maj
or
Pro
ble
ms
Face
d b
y A
ffec
ted
Ho
use
ho
lds
afte
r th
e D
isas
ter
Maj
or
pro
ble
m
Ran
kin
g b
y R
esp
on
den
ts in
Sta
tes
Sou
th-S
ou
th r
egio
nSo
uth
-Eas
t re
gio
nSo
uth
-Wes
t re
gio
nN
ort
h-C
entr
al
reg
ion
No
rth
-Eas
t re
gio
nN
ort
h-W
est
reg
ion
Bay
elsa
Del
taR
iver
sA
nam
bra
Imo
Oyo
Og
un
Ko
gi
Nig
erTa
rab
a an
d
Ad
amaw
aJi
gaw
aZa
mfa
ra
Dri
nki
ng
Wat
er1
14
22
12
22
24
Sani
tatio
n/to
ilet
faci
litie
s3
72
34
46
Food
21
15
11
11
11
Rest
orat
ion
of li
velih
oods
42
45
57
66
Imm
edia
te s
helte
r5
51
44
35
37
6
Repa
iring
dam
aged
hou
se6
53
36
45
3
Clo
thin
g, f
ootw
ear,
bedd
ing
64
45
33
2
Fuel
and
coo
king
mat
eria
l4
37
5
Hea
lth c
are
73
55
36
62
45
Chi
ldre
n re
turn
ing
to s
choo
l6
65
Tran
spor
tatio
n1
26
Key
: 1 r
eflec
ts h
ighe
st r
ank.
Sour
ce: H
RNA
Com
mun
ity C
onsu
ltatio
n an
d Ve
rifica
tion
Surv
ey 2
012.
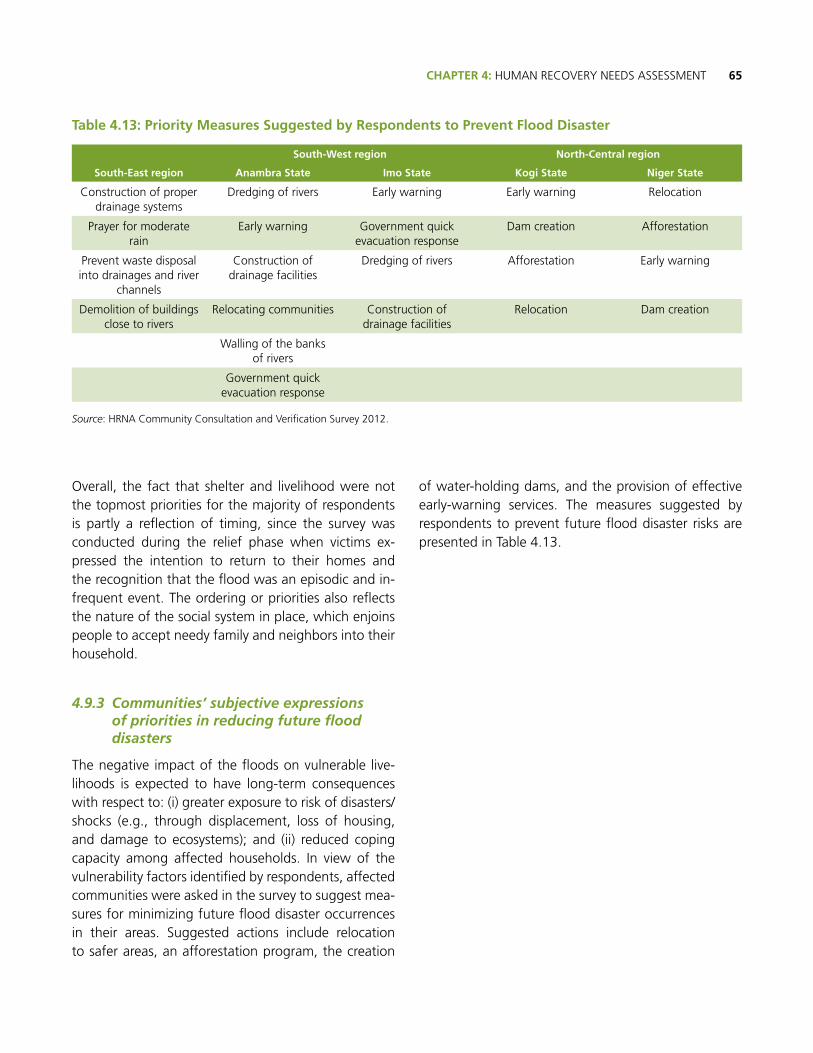
65CHAPTER 4: HUMAN RECOVERY NEEDS ASSESSMENT
Overall, the fact that shelter and livelihood were not the topmost priorities for the majority of respondents is partly a reflection of timing, since the survey was conducted during the relief phase when victims ex-pressed the intention to return to their homes and the recognition that the flood was an episodic and in-frequent event. The ordering or priorities also reflects the nature of the social system in place, which enjoins people to accept needy family and neighbors into their household.
4.9.3 Communities’ subjective expressions of priorities in reducing future flood disasters
The negative impact of the floods on vulnerable live-lihoods is expected to have long-term consequences with respect to: (i) greater exposure to risk of disasters/shocks (e.g., through displacement, loss of housing, and damage to ecosystems); and (ii) reduced coping capacity among affected households. In view of the vulnerability factors identified by respondents, affected communities were asked in the survey to suggest mea-sures for minimizing future flood disaster occurrences in their areas. Suggested actions include relocation to safer areas, an afforestation program, the creation
of water-holding dams, and the provision of effective early-warning services. The measures suggested by respondents to prevent future flood disaster risks are presented in Table 4.13.
Table 4.13: Priority Measures Suggested by Respondents to Prevent Flood Disaster
South-East region
South-West region North-Central region
Anambra State Imo State Kogi State Niger State
Construction of proper drainage systems
Dredging of rivers Early warning Early warning Relocation
Prayer for moderate rain
Early warning Government quick evacuation response
Dam creation Afforestation
Prevent waste disposal into drainages and river
channels
Construction of drainage facilities
Dredging of rivers Afforestation Early warning
Demolition of buildings close to rivers
Relocating communities Construction of drainage facilities
Relocation Dam creation
Walling of the banks of rivers
Government quick evacuation response
Source: HRNA Community Consultation and Verification Survey 2012.
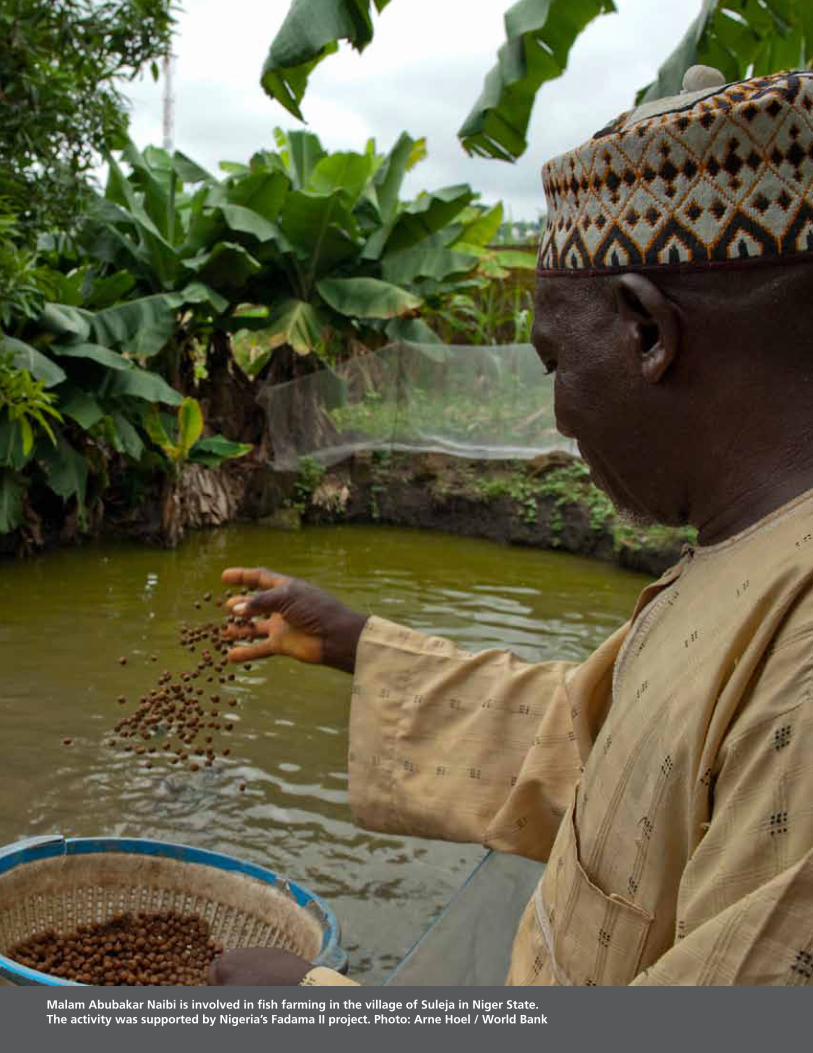
Malam Abubakar Naibi is involved in fish farming in the village of Suleja in Niger State. The activity was supported by Nigeria’s Fadama II project. Photo: Arne Hoel / World Bank
67CHAPTER 5: RECOVERY AND RECONSTRUCTION
5.1. Introduction
To ensure full recovery from the negative impact of the disaster, below are a number of recommended pro-gram interventions and their corresponding financial needs. Financial needs for the recovery and reconstruc-tion program have been estimated based on the as-sessment of damage and loss caused by the floods. These needs are expressed in a disaggregated manner, taking into consideration breakdowns by subsector as well as regional needs.
Economic Recovery Needs are defined on the basis of the estimated value of losses in economic flows and are organized according to three main sub-programs: (i) recovery of personal or household income; (ii) reha-bilitation of basic services to the population; and (iii) recovery of production. They are grouped under the major sector classification of social, productive, and in-frastructure.
Reconstruction Needs are defined on the basis of the estimated value of damage while adopting a strat-egy that seeks to introduce disaster-resilient standards, depending on the availability of funding. A “building-back-better” strategy requires quality and technologi-cal improvement, relocation of selected activities to safer areas, improved design and construction stan-dards, structural retrofitting, and adequate flood-con-trol measures and schemes.
5.2 Social Sector
5.2.1 Personal Income Recovery
A “cash-for-work” sub-program in combination with basic services rehabilitation that makes extensive use of unskilled labor are envisaged as a means of enabling the population that has seen their income decline and/
or their food stocks destroyed by the floods to at least secure a minimum income over the time required to re-store production activities and household revenue. The duration of this temporary program could range from three to six months, or until the next crop can be har-vested. Based on the value of personal income decline, as described in the section of this report that deals with such subjects, it has been estimated that total needs for this sub-program are N69 billion. If “food-for-work” or food donation sub-programs are introduced separate-ly, requirements for the “cash-for-work” sub-program should be reduced accordingly. The importance and pri-ority of this sub-program cannot be over-emphasized, as these families’ survival depends on its implementation.
5.2.2 Housing
Recovery and Reconstruction Needs
Table 5.1 lists the estimated costs of recovery and re-construction. A total sum of over N42 billion will be needed for recovery efforts in the housing sector, while over N620 billion will be needed for reconstruction. A total of N662 billion is needed in the housing sector. This comprises N42 billion for recovery and over N619 billion for reconstruction needs.
Two types of recovery activities have been envisaged: demolition, cleanup, and the environmentally-safe dis-posal of mud and debris (N3,600 million); and the provi-sion of funding to cover the cost of temporary housing for affected families while their homes are under recon-struction and while standards for disaster-resilient hous-ing units are being developed, the duration of which has been estimated at six months (N38,800 million).
Under the reconstruction sub-program, an urgent tech-nical cooperation activity is required to define a new
CHAPTER 5: RECOVERY AND RECONSTRUCTION NEEDS
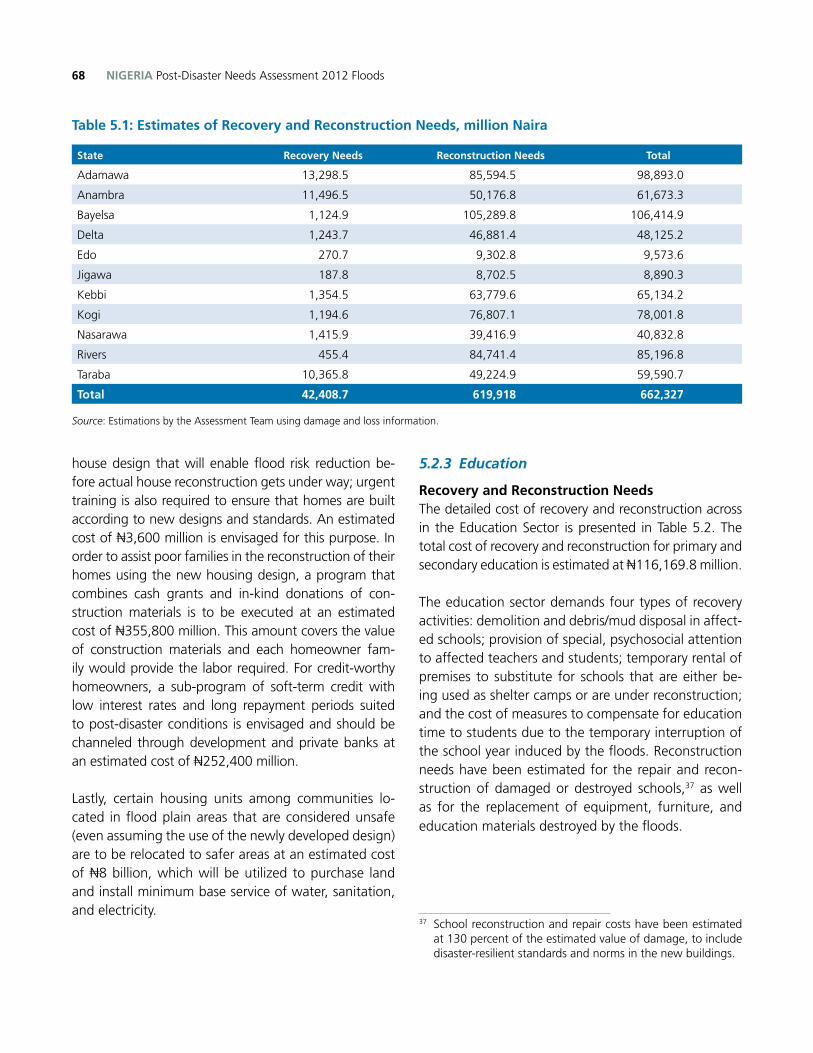
NIGERIA Post-Disaster Needs Assessment 2012 Floods68
house design that will enable flood risk reduction be-fore actual house reconstruction gets under way; urgent training is also required to ensure that homes are built according to new designs and standards. An estimated cost of N3,600 million is envisaged for this purpose. In order to assist poor families in the reconstruction of their homes using the new housing design, a program that combines cash grants and in-kind donations of con-struction materials is to be executed at an estimated cost of N355,800 million. This amount covers the value of construction materials and each homeowner fam-ily would provide the labor required. For credit-worthy homeowners, a sub-program of soft-term credit with low interest rates and long repayment periods suited to post-disaster conditions is envisaged and should be channeled through development and private banks at an estimated cost of N252,400 million.
Lastly, certain housing units among communities lo-cated in flood plain areas that are considered unsafe (even assuming the use of the newly developed design) are to be relocated to safer areas at an estimated cost of N8 billion, which will be utilized to purchase land and install minimum base service of water, sanitation, and electricity.
5.2.3 Education
Recovery and Reconstruction NeedsThe detailed cost of recovery and reconstruction across in the Education Sector is presented in Table 5.2. The total cost of recovery and reconstruction for primary and secondary education is estimated at N116,169.8 million.
The education sector demands four types of recovery activities: demolition and debris/mud disposal in affect-ed schools; provision of special, psychosocial attention to affected teachers and students; temporary rental of premises to substitute for schools that are either be-ing used as shelter camps or are under reconstruction; and the cost of measures to compensate for education time to students due to the temporary interruption of the school year induced by the floods. Reconstruction needs have been estimated for the repair and recon-struction of damaged or destroyed schools,37 as well as for the replacement of equipment, furniture, and education materials destroyed by the floods.
37 School reconstruction and repair costs have been estimated at 130 percent of the estimated value of damage, to include disaster-resilient standards and norms in the new buildings.
Table 5.1: Estimates of Recovery and Reconstruction Needs, million Naira
State Recovery Needs Reconstruction Needs Total
Adamawa 13,298.5 85,594.5 98,893.0
Anambra 11,496.5 50,176.8 61,673.3
Bayelsa 1,124.9 105,289.8 106,414.9
Delta 1,243.7 46,881.4 48,125.2
Edo 270.7 9,302.8 9,573.6
Jigawa 187.8 8,702.5 8,890.3
Kebbi 1,354.5 63,779.6 65,134.2
Kogi 1,194.6 76,807.1 78,001.8
Nasarawa 1,415.9 39,416.9 40,832.8
Rivers 455.4 84,741.4 85,196.8
Taraba 10,365.8 49,224.9 59,590.7
Total 42,408.7 619,918 662,327
Source: Estimations by the Assessment Team using damage and loss information.
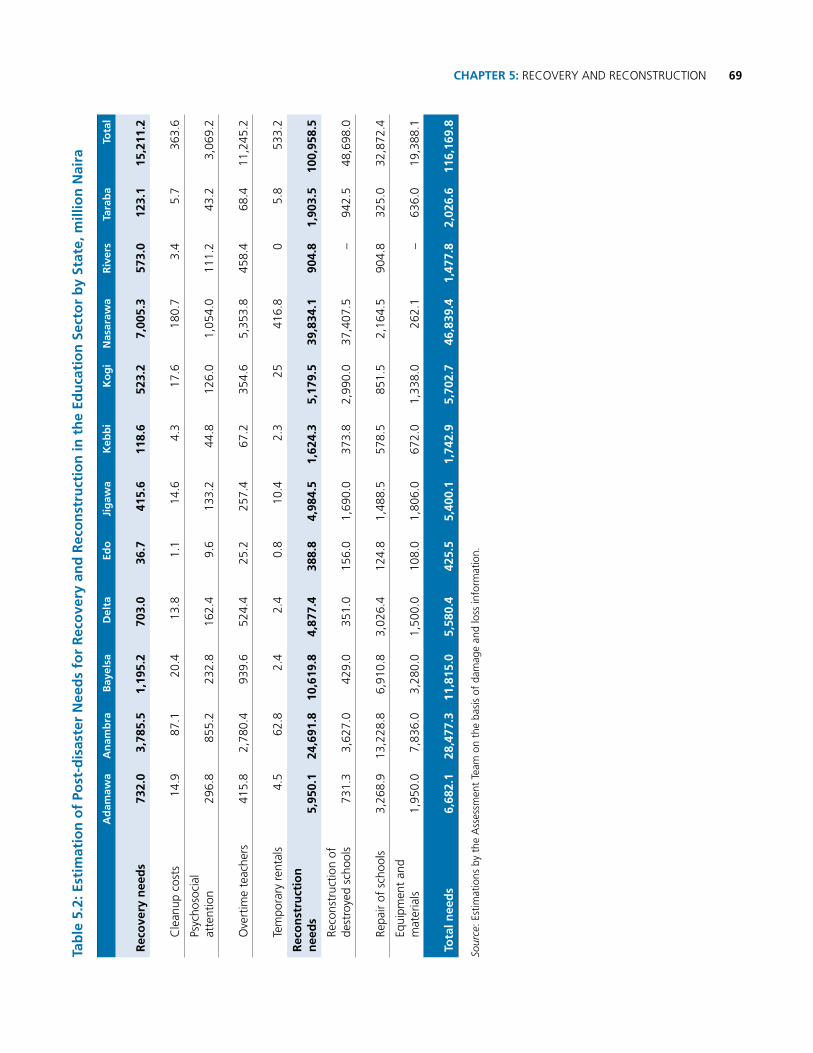
69CHAPTER 5: RECOVERY AND RECONSTRUCTIONTa
ble
5.2
: Est
imat
ion
of
Post
-dis
aste
r N
eed
s fo
r R
eco
very
an
d R
eco
nst
ruct
ion
in t
he
Edu
cati
on
Sec
tor
by
Stat
e, m
illio
n N
aira
A
dam
awa
An
amb
raB
ayel
saD
elta
Edo
Jig
awa
Keb
bi
Ko
gi
Nas
araw
aR
iver
sTa
rab
aTo
tal
Rec
ove
ry n
eed
s73
2.0
3,78
5.5
1,19
5.2
703.
0 36
.7
415.
6 11
8.6
523.
2 7,
005.
3 57
3.0
123.
1 15
,211
.2
Cle
anup
cos
ts14
.9
87.1
20
.4
13.8
1.
1 14
.6
4.3
17.6
18
0.7
3.4
5.7
363.
6
Psyc
hoso
cial
at
tent
ion
296.
8 85
5.2
232.
8 16
2.4
9.6
133.
2 44
.8
126.
0 1,
054.
0 11
1.2
43.2
3,
069.
2
Ove
rtim
e te
ache
rs41
5.8
2,78
0.4
939.
6 52
4.4
25.2
25
7.4
67.2
35
4.6
5,35
3.8
458.
4 68
.4
11,2
45.2
Tem
pora
ry r
enta
ls4.
562
.82.
42.
40.
810
.42.
325
416.
80
5.8
533.
2
Rec
on
stru
ctio
n
nee
ds
5,95
0.1
24,6
91.8
10
,619
.8
4,87
7.4
388.
8 4,
984.
5 1,
624.
3 5,
179.
5 39
,834
.1
904.
8 1,
903.
5 10
0,95
8.5
Reco
nstr
uctio
n of
de
stro
yed
scho
ols
731.
3 3,
627.
0 42
9.0
351.
0 15
6.0
1,69
0.0
373.
8 2,
990.
0 37
,407
.5
– 94
2.5
48,6
98.0
Repa
ir of
sch
ools
3,26
8.9
13,2
28.8
6,
910.
8 3,
026.
4 12
4.8
1,48
8.5
578.
5 85
1.5
2,16
4.5
904.
8 32
5.0
32,8
72.4
Equi
pmen
t an
d m
ater
ials
1,95
0.0
7,83
6.0
3,28
0.0
1,50
0.0
108.
0 1,
806.
0 67
2.0
1,33
8.0
262.
1 –
636.
0 19
,388
.1
Tota
l nee
ds
6,68
2.1
28,4
77.3
11
,815
.0
5,58
0.4
425.
5 5,
400.
1 1,
742.
9 5,
702.
7 46
,839
.4
1,47
7.8
2,02
6.6
116,
169.
8
Sour
ce: E
stim
atio
ns b
y th
e A
sses
smen
t Te
am o
n th
e ba
sis
of d
amag
e an
d lo
ss in
form
atio
n.
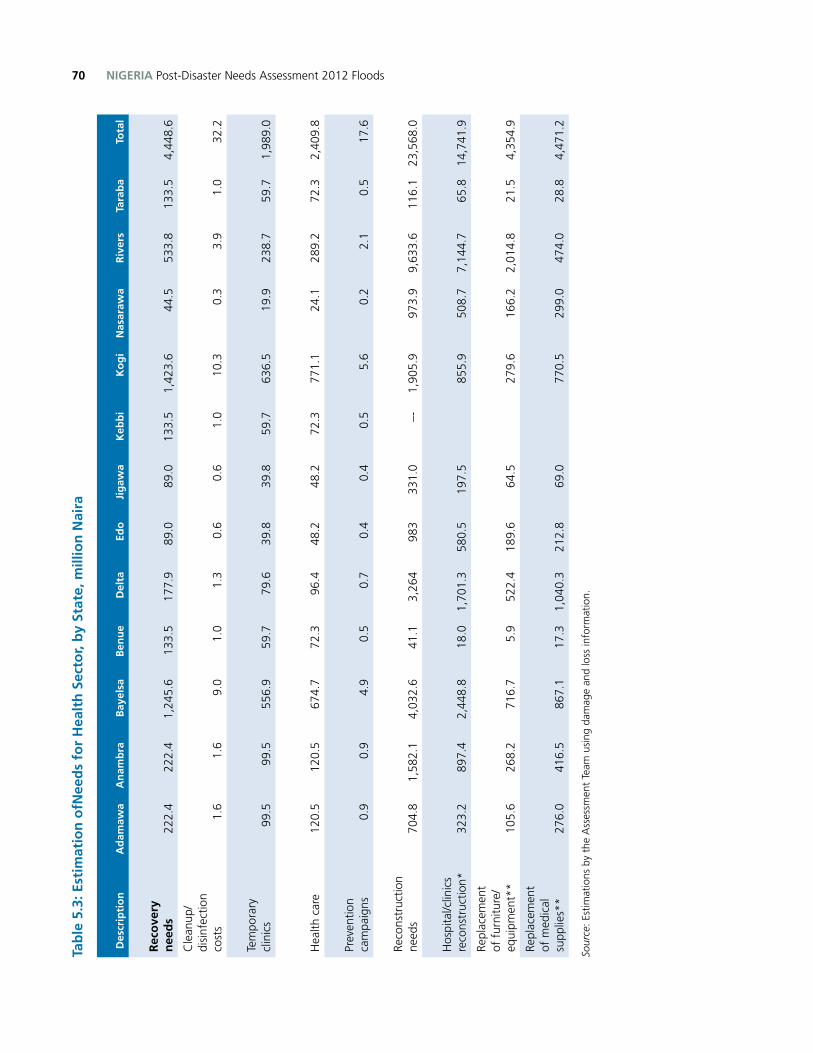
NIGERIA Post-Disaster Needs Assessment 2012 Floods70Ta
ble
5.3
: Est
imat
ion
ofN
eed
s fo
r H
ealt
h S
ecto
r, b
y St
ate,
mill
ion
Nai
ra
Des
crip
tio
nA
dam
awa
An
amb
raB
ayel
saB
enu
eD
elta
Edo
Jig
awa
Keb
bi
Ko
gi
Nas
araw
aR
iver
sTa
rab
aTo
tal
Rec
ove
ry
nee
ds
222.
4
22
2.4
1,
245.
6
13
3.5
177.
9
89.0
89.
0
133.
5 1
,423
.6
44.
5 53
3.8
133.
5 4,
448.
6
Cle
anup
/di
sinf
ectio
n co
sts
1.6
1
.6
9.
0
1.0
1.3
0.6
0.6
1.0
10.
3
0
.3
3.9
1.0
32.2
Tem
pora
ry
clin
ics
9
9.5
99.
5
556
.9
59.7
79
.6
39.8
39.
8
59.
7
636
.5
19.
9 23
8.7
59.7
1,
989.
0
Hea
lth c
are
120
.5
120.
5
674
.7
72
.3
96.4
48
.2
4
8.2
7
2.3
7
71.1
2
4.1
289.
2 72
.3
2,40
9.8
Prev
entio
n ca
mpa
igns
0.9
0
.9
4.
9
0.5
0.7
0.
4
0.
4
0.
5
5
.6
0.2
2.
1 0.
5 17
.6
Reco
nstr
uctio
n ne
eds
704
.8
1,
582.
1
4,03
2.6
41.1
3
,264
983
331
.0
–-
1,9
05.9
973
.9
9,63
3.6
116.
1 23
,568
.0
Hos
pita
l/clin
ics
reco
nstr
uctio
n* 3
23.2
89
7.4
2,
448.
8 18
.0
1,70
1.3
580.
5 1
97.5
8
55.9
508
.7
7,14
4.7
65.8
14
,741
.9
Repl
acem
ent
of f
urni
ture
/eq
uipm
ent*
*10
5.6
268.
2 71
6.7
5.9
522.
4 18
9.6
64.5
27
9.6
166.
2 2,
014.
8 21
.5
4,35
4.9
Repl
acem
ent
of m
edic
al
supp
lies*
* 2
76.0
41
6.5
8
67.1
17
.3
1,04
0.3
212.
8
69.
0
7
70.5
299
.0
474.
0 28
.8
4,47
1.2
Sour
ce: E
stim
atio
ns b
y th
e A
sses
smen
t Te
am u
sing
dam
age
and
loss
info
rmat
ion.
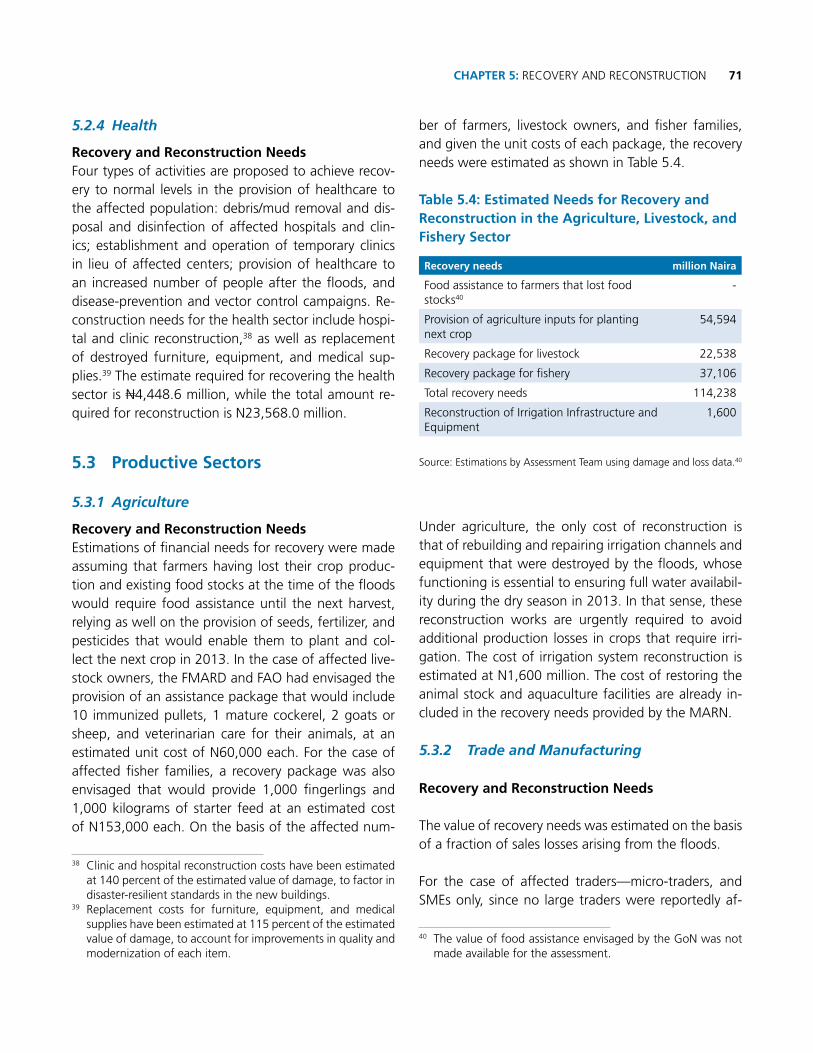
71CHAPTER 5: RECOVERY AND RECONSTRUCTION
5.2.4 Health
Recovery and Reconstruction Needs Four types of activities are proposed to achieve recov-ery to normal levels in the provision of healthcare to the affected population: debris/mud removal and dis-posal and disinfection of affected hospitals and clin-ics; establishment and operation of temporary clinics in lieu of affected centers; provision of healthcare to an increased number of people after the floods, and disease-prevention and vector control campaigns. Re-construction needs for the health sector include hospi-tal and clinic reconstruction,38 as well as replacement of destroyed furniture, equipment, and medical sup-plies.39 The estimate required for recovering the health sector is N4,448.6 million, while the total amount re-quired for reconstruction is N23,568.0 million.
5.3 Productive Sectors
5.3.1 Agriculture
Recovery and Reconstruction Needs Estimations of financial needs for recovery were made assuming that farmers having lost their crop produc-tion and existing food stocks at the time of the floods would require food assistance until the next harvest, relying as well on the provision of seeds, fertilizer, and pesticides that would enable them to plant and col-lect the next crop in 2013. In the case of affected live-stock owners, the FMARD and FAO had envisaged the provision of an assistance package that would include 10 immunized pullets, 1 mature cockerel, 2 goats or sheep, and veterinarian care for their animals, at an estimated unit cost of N60,000 each. For the case of affected fisher families, a recovery package was also envisaged that would provide 1,000 fingerlings and 1,000 kilograms of starter feed at an estimated cost of N153,000 each. On the basis of the affected num-
38 Clinic and hospital reconstruction costs have been estimated at 140 percent of the estimated value of damage, to factor in disaster-resilient standards in the new buildings.
39 Replacement costs for furniture, equipment, and medical supplies have been estimated at 115 percent of the estimated value of damage, to account for improvements in quality and modernization of each item.
ber of farmers, livestock owners, and fisher families, and given the unit costs of each package, the recovery needs were estimated as shown in Table 5.4.
Table 5.4: Estimated Needs for Recovery and Reconstruction in the Agriculture, Livestock, and Fishery Sector
Recovery needs million Naira
Food assistance to farmers that lost food stocks40
-
Provision of agriculture inputs for planting next crop
54,594
Recovery package for livestock 22,538
Recovery package for fishery 37,106
Total recovery needs 114,238
Reconstruction of Irrigation Infrastructure and Equipment
1,600
Source: Estimations by Assessment Team using damage and loss data.40
Under agriculture, the only cost of reconstruction is that of rebuilding and repairing irrigation channels and equipment that were destroyed by the floods, whose functioning is essential to ensuring full water availabil-ity during the dry season in 2013. In that sense, these reconstruction works are urgently required to avoid additional production losses in crops that require irri-gation. The cost of irrigation system reconstruction is estimated at N1,600 million. The cost of restoring the animal stock and aquaculture facilities are already in-cluded in the recovery needs provided by the MARN.
5.3.2 Trade and Manufacturing
Recovery and Reconstruction Needs
The value of recovery needs was estimated on the basis of a fraction of sales losses arising from the floods.
For the case of affected traders—micro-traders, and SMEs only, since no large traders were reportedly af-
40 The value of food assistance envisaged by the GoN was not made available for the assessment.
NIGERIA Post-Disaster Needs Assessment 2012 Floods72
fected—needs are also represented by working capital to acquire goods to sell and meet some operational requirements and to reschedule non-performing loans. The recovery needs include cash grants to micro-en-trepreneurs and soft-term credit lines for credit-worthy traders channeled through the private banks.41
For industries, the recovery needs refer to working capital requirements and non-performing loan re-scheduling to ensure the recovery of production for the affected small, medium and large industries. The funding is to be channeled through special, soft-term (in both interest rate and repayment terms) credit lines that should be made available through the develop-ment and private banks. The value of these recovery needs was estimated as a fraction of the estimated production losses caused by the floods.42 Reconstruc-tion needs were estimated on the basis of the value of damage and have been increased to provide disaster resilience through improved structure design to ensure flood-proofing and, in some cases, provide for storage of raw materials and produced goods in safer, elevated places, plus locating machinery and equipment in simi-lar spaces on the premises.
The estimated values of the recovery and reconstruc-tion needs for commerce and industry are N4,017 million and N33,415 million, respectively (Tables 5.5 and 5.6).
41 An analysis of the operational characteristics of affected traders obtained through sample interviews, the amount of working capital and loan rescheduling was estimated as 10 percent of the sales losses of micro-traders and as 25 percent of losses of SMEs.
42 After an analysis of the characteristics of industries that were affected and on the basis of interviews conducted with a sample of owners and managers of affected manufacturers, the amount of working capital and loan rescheduling was estimated as 35 percent of the production losses of SMEs and as 25 percent of the losses of large industries.
5.4 Infrastructure
5.4.1 Water and sanitation
Reconstruction Needs
Reconstruction requirements for destroyed or partially damaged water supply and sanitation systems result from increasing the value of damage by 30 percent in order to introduce flood-resilient design and construc-tion standards. No recovery needs were estimated, since no data on production losses were available.
The reconstruction needs for the water and sanitation sector are estimated at N18 billion (see Table 5.7).
5.4.2 Electricity
Recovery and Reconstruction Needs
The strategy for reconstruction and recovery is hinged on three imperatives: restoration of basic services, rehabilitatation of supporting infrastructure, and replacement of equipment that was completely de-stroyed. Considering that the effect of flooding on the electricity subsector was not too devastating, restora-tion of the electricity supply was almost immediately effected after the floods by the DISCOs. However, re-habilitation and replacement of installations in some cases is still ongoing. The financial needs for recon-struction efforts are estimated at N337.3 million, as presented in Table 5.8.
5.4.3 Transport Sector
Recovery and Reconstruction Needs
In the road transport sector, reconstruction require-ments include those of the federal government-owned primary roads, state-owned secondary roads, state-owned tertiary roads, and bridges and culverts. These amounts include slight increases with respect to the es-timated value of damage to factor in improved, flood-resilient standards, especially in the case of bridges and drainage structures.
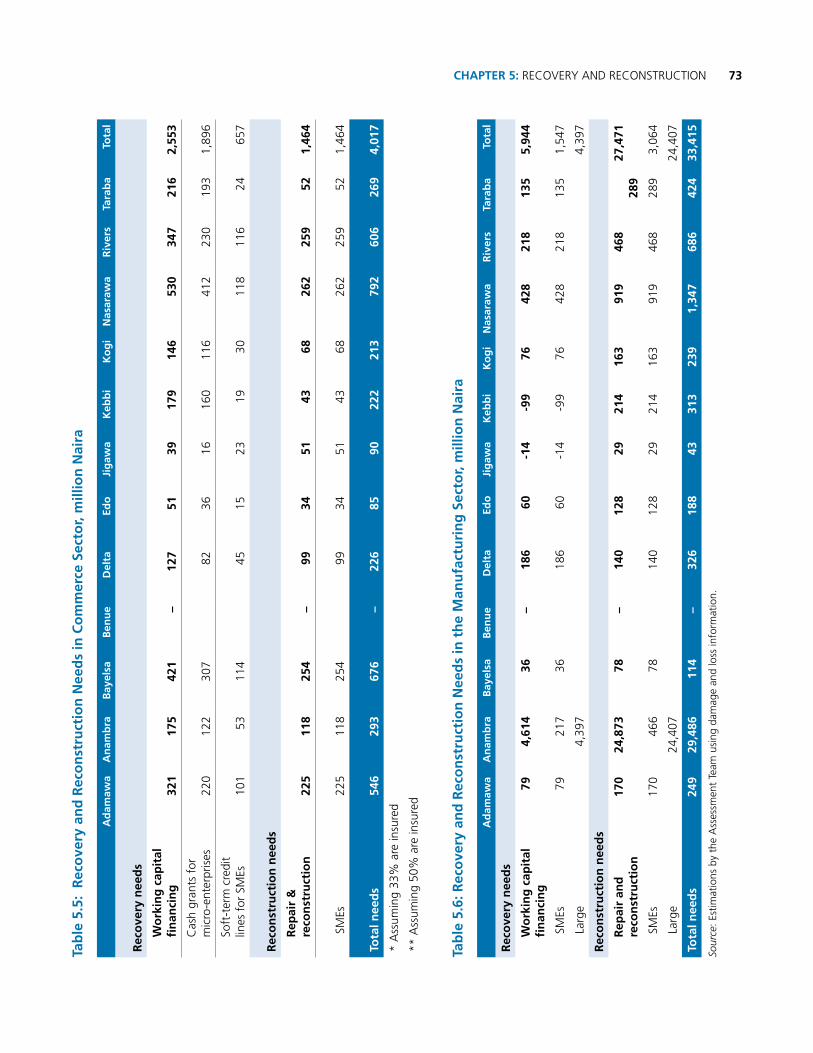
73CHAPTER 5: RECOVERY AND RECONSTRUCTIONTa
ble
5.5
: R
eco
very
an
d R
eco
nst
ruct
ion
Nee
ds
in C
om
mer
ce S
ecto
r, m
illio
n N
aira
A
dam
awa
An
amb
raB
ayel
saB
enu
eD
elta
Edo
Jig
awa
Keb
bi
Ko
gi
Nas
araw
aR
iver
sTa
rab
aTo
tal
Rec
ove
ry n
eed
s
Wo
rkin
g c
apit
al
fin
anci
ng
321
175
42
1
–
127
51
39
179
146
530
347
21
6 2,
553
Cas
h gr
ants
for
m
icro
-ent
erpr
ises
220
122
30
7
82
36
16
160
116
412
230
19
3 1,
896
Soft
-ter
m c
redi
t lin
es f
or S
MEs
101
53
11
4
45
15
23
19
30
118
116
24
657
Rec
on
stru
ctio
n n
eed
s
Rep
air
&
reco
nst
ruct
ion
225
118
25
4
–
99
34
51
43
68
262
259
52
1,46
4
SM
Es22
511
8
254
99
34
51
43
68
26
2 25
9
52
1,
464
Tota
l nee
ds
546
293
67
6
–
226
85
90
222
213
792
606
26
9 4,
017
* A
ssum
ing
33%
are
insu
red
** A
ssum
ing
50%
are
insu
red
Tab
le 5
.6: R
eco
very
an
d R
eco
nst
ruct
ion
Nee
ds
in t
he
Man
ufa
ctu
rin
g S
ecto
r, m
illio
n N
aira
A
dam
awa
An
amb
raB
ayel
saB
enu
eD
elta
Edo
Jig
awa
Keb
bi
Ko
gi
Nas
araw
aR
iver
sTa
rab
aTo
tal
Rec
ove
ry n
eed
s
Wo
rkin
g c
apit
al
fin
anci
ng
7
9 4,
614
3
6 –
186
60
-14
-99
76
428
21
8 13
5 5,
944
SM
Es
79
217
3
6
186
60
-14
-99
76
428
21
8 13
5 1,
547
Lar
ge
4,39
7
4,
397
Rec
on
stru
ctio
n n
eed
s
Rep
air
and
re
con
stru
ctio
n17
0 24
,873
78
–
140
128
29
214
163
919
46
8
289
27,4
71
SM
Es17
0 46
6
78
14
0 12
8 29
21
4 16
3
9
19
468
289
3,06
4
Lar
ge
2
4,40
7
24
,407
Tota
l nee
ds
24
9
29,
486
114
–
326
188
43
313
239
1
,347
68
6 42
4 33
,415
Sour
ce: E
stim
atio
ns b
y th
e A
sses
smen
t Te
am u
sing
dam
age
and
loss
info
rmat
ion.
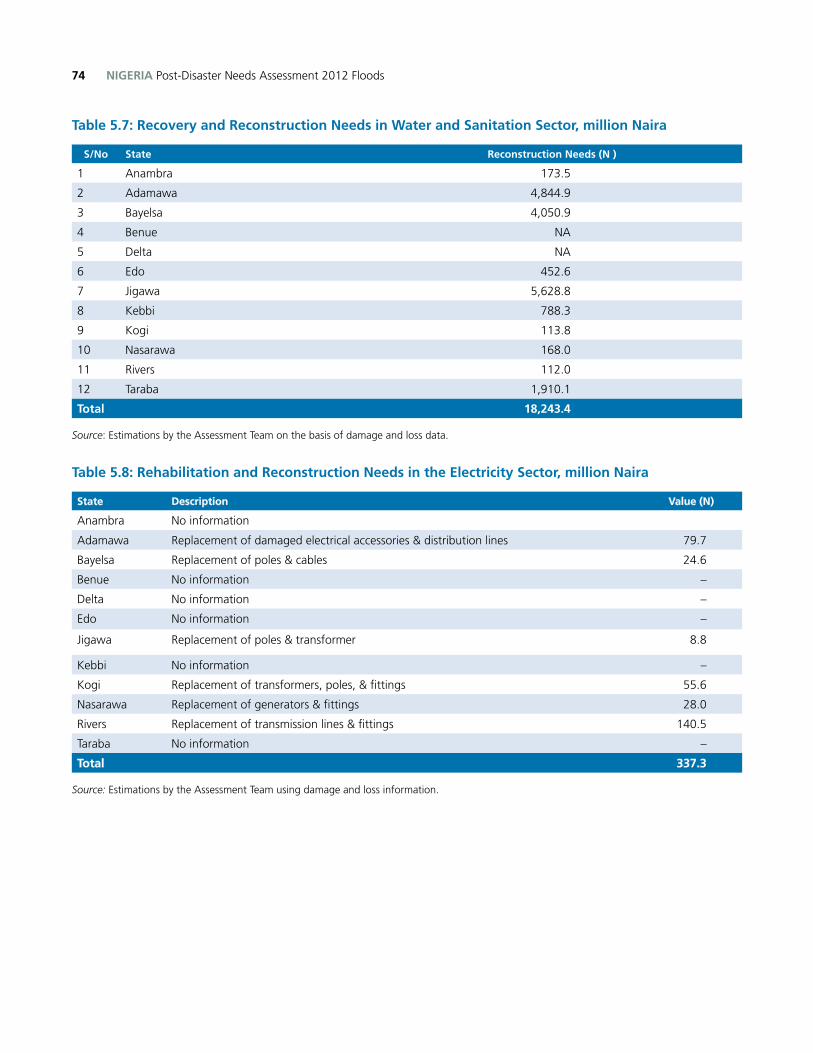
NIGERIA Post-Disaster Needs Assessment 2012 Floods74
Table 5.7: Recovery and Reconstruction Needs in Water and Sanitation Sector, million Naira
S/No State Reconstruction Needs (N )
1 Anambra 173.5
2 Adamawa 4,844.9
3 Bayelsa 4,050.9
4 Benue NA
5 Delta NA
6 Edo 452.6
7 Jigawa 5,628.8
8 Kebbi 788.3
9 Kogi 113.8
10 Nasarawa 168.0
11 Rivers 112.0
12 Taraba 1,910.1
Total 18,243.4
Source: Estimations by the Assessment Team on the basis of damage and loss data.
Table 5.8: Rehabilitation and Reconstruction Needs in the Electricity Sector, million Naira
State Description Value (N)
Anambra No information
Adamawa Replacement of damaged electrical accessories & distribution lines 79.7
Bayelsa Replacement of poles & cables 24.6
Benue No information –
Delta No information –
Edo No information –
Jigawa Replacement of poles & transformer 8.8
Kebbi No information –
Kogi Replacement of transformers, poles, & fittings 55.6
Nasarawa Replacement of generators & fittings 28.0
Rivers Replacement of transmission lines & fittings 140.5
Taraba No information –
Total 337.3
Source: Estimations by the Assessment Team using damage and loss information.
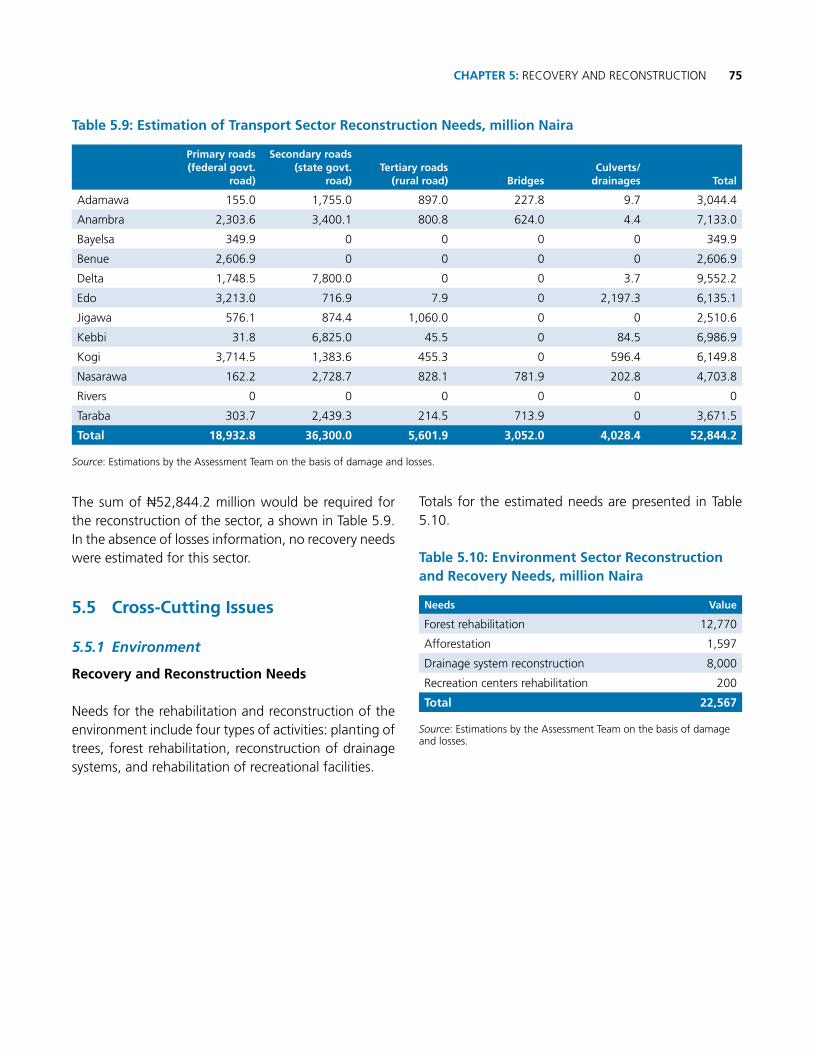
75CHAPTER 5: RECOVERY AND RECONSTRUCTION
The sum of N52,844.2 million would be required for the reconstruction of the sector, a shown in Table 5.9. In the absence of losses information, no recovery needs were estimated for this sector.
5.5 Cross-Cutting Issues
5.5.1 Environment
Recovery and Reconstruction Needs
Needs for the rehabilitation and reconstruction of the environment include four types of activities: planting of trees, forest rehabilitation, reconstruction of drainage systems, and rehabilitation of recreational facilities.
Totals for the estimated needs are presented in Table 5.10.
Table 5.10: Environment Sector Reconstruction and Recovery Needs, million Naira
Needs Value
Forest rehabilitation 12,770
Afforestation 1,597
Drainage system reconstruction 8,000
Recreation centers rehabilitation 200
Total 22,567
Source: Estimations by the Assessment Team on the basis of damage and losses.
Table 5.9: Estimation of Transport Sector Reconstruction Needs, million Naira
Primary roads (federal govt.
road)
Secondary roads (state govt.
road)Tertiary roads
(rural road) BridgesCulverts/
drainages Total
Adamawa 155.0 1,755.0 897.0 227.8 9.7 3,044.4
Anambra 2,303.6 3,400.1 800.8 624.0 4.4 7,133.0
Bayelsa 349.9 0 0 0 0 349.9
Benue 2,606.9 0 0 0 0 2,606.9
Delta 1,748.5 7,800.0 0 0 3.7 9,552.2
Edo 3,213.0 716.9 7.9 0 2,197.3 6,135.1
Jigawa 576.1 874.4 1,060.0 0 0 2,510.6
Kebbi 31.8 6,825.0 45.5 0 84.5 6,986.9
Kogi 3,714.5 1,383.6 455.3 0 596.4 6,149.8
Nasarawa 162.2 2,728.7 828.1 781.9 202.8 4,703.8
Rivers 0 0 0 0 0 0
Taraba 303.7 2,439.3 214.5 713.9 0 3,671.5
Total 18,932.8 36,300.0 5,601.9 3,052.0 4,028.4 52,844.2
Source: Estimations by the Assessment Team on the basis of damage and losses.

Photo: Thinkstock.com
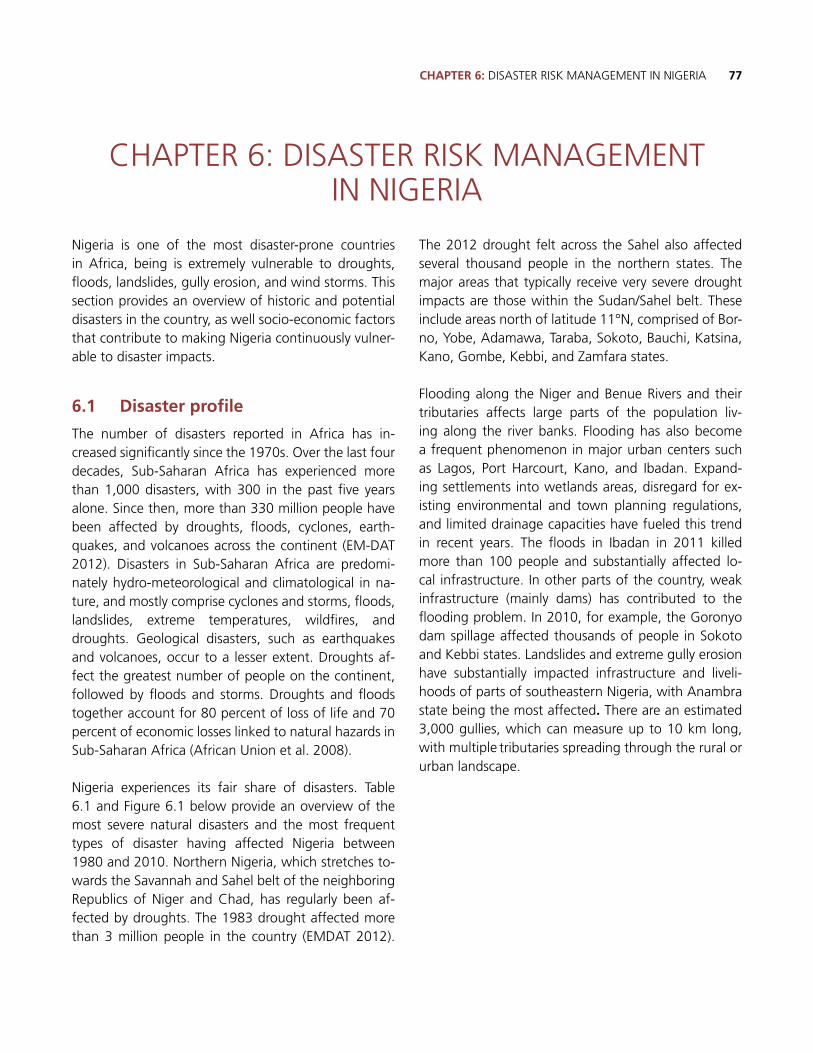
77CHAPTER 6: DISASTER RISK MANAGEMENT IN NIGERIA
Nigeria is one of the most disaster-prone countries in Africa, being is extremely vulnerable to droughts, floods, landslides, gully erosion, and wind storms. This section provides an overview of historic and potential disasters in the country, as well socio-economic factors that contribute to making Nigeria continuously vulner-able to disaster impacts.
6.1 Disaster profile
The number of disasters reported in Africa has in-creased significantly since the 1970s. Over the last four decades, Sub-Saharan Africa has experienced more than 1,000 disasters, with 300 in the past five years alone. Since then, more than 330 million people have been affected by droughts, floods, cyclones, earth-quakes, and volcanoes across the continent (EM-DAT 2012). Disasters in Sub-Saharan Africa are predomi-nately hydro-meteorological and climatological in na-ture, and mostly comprise cyclones and storms, floods, landslides, extreme temperatures, wildfires, and droughts. Geological disasters, such as earthquakes and volcanoes, occur to a lesser extent. Droughts af-fect the greatest number of people on the continent, followed by floods and storms. Droughts and floods together account for 80 percent of loss of life and 70 percent of economic losses linked to natural hazards in Sub-Saharan Africa (African Union et al. 2008).
Nigeria experiences its fair share of disasters. Table 6.1 and Figure 6.1 below provide an overview of the most severe natural disasters and the most frequent types of disaster having affected Nigeria between 1980 and 2010. Northern Nigeria, which stretches to-wards the Savannah and Sahel belt of the neighboring Republics of Niger and Chad, has regularly been af-fected by droughts. The 1983 drought affected more than 3 million people in the country (EMDAT 2012).
The 2012 drought felt across the Sahel also affected several thousand people in the northern states. The major areas that typically receive very severe drought impacts are those within the Sudan/Sahel belt. These include areas north of latitude 11°N, comprised of Bor-no, Yobe, Adamawa, Taraba, Sokoto, Bauchi, Katsina, Kano, Gombe, Kebbi, and Zamfara states.
Flooding along the Niger and Benue Rivers and their tributaries affects large parts of the population liv-ing along the river banks. Flooding has also become a frequent phenomenon in major urban centers such as Lagos, Port Harcourt, Kano, and Ibadan. Expand-ing settlements into wetlands areas, disregard for ex-isting environmental and town planning regulations, and limited drainage capacities have fueled this trend in recent years. The floods in Ibadan in 2011 killed more than 100 people and substantially affected lo-cal infrastructure. In other parts of the country, weak infrastructure (mainly dams) has contributed to the flooding problem. In 2010, for example, the Goronyo dam spillage affected thousands of people in Sokoto and Kebbi states. Landslides and extreme gully erosion have substantially impacted infrastructure and liveli-hoods of parts of southeastern Nigeria, with Anambra state being the most affected. There are an estimated 3,000 gullies, which can measure up to 10 km long, with multiple tributaries spreading through the rural or urban landscape.
CHAPTER 6: DISASTER RISK MANAGEMENT IN NIGERIA
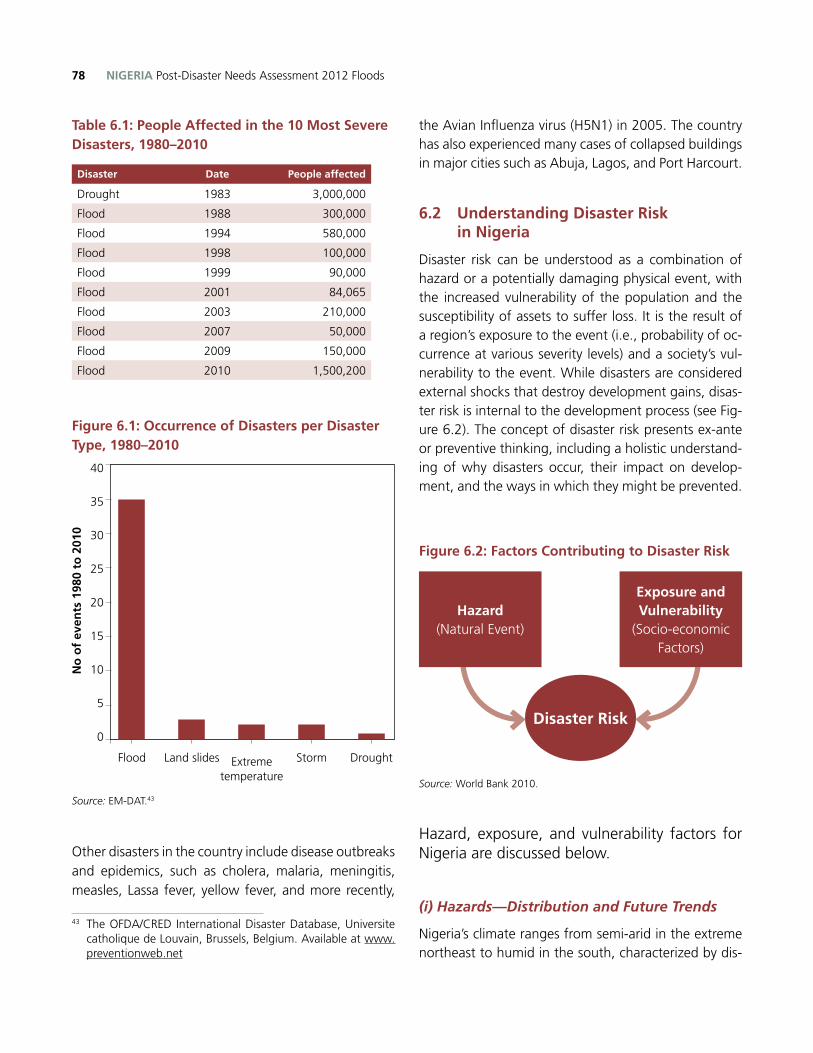
NIGERIA Post-Disaster Needs Assessment 2012 Floods78
Table 6.1: People Affected in the 10 Most Severe Disasters, 1980–2010
Disaster Date People affected
Drought 1983 3,000,000
Flood 1988 300,000
Flood 1994 580,000
Flood 1998 100,000
Flood 1999 90,000
Flood 2001 84,065
Flood 2003 210,000
Flood 2007 50,000
Flood 2009 150,000
Flood 2010 1,500,200
Figure 6.1: Occurrence of Disasters per Disaster Type, 1980–2010
Source: EM-DAT.43
Other disasters in the country include disease outbreaks and epidemics, such as cholera, malaria, meningitis, measles, Lassa fever, yellow fever, and more recently,
43 The OFDA/CRED International Disaster Database, Universite catholique de Louvain, Brussels, Belgium. Available at www.preventionweb.net
the Avian Influenza virus (H5N1) in 2005. The country has also experienced many cases of collapsed buildings in major cities such as Abuja, Lagos, and Port Harcourt.
6.2 Understanding Disaster Risk in Nigeria
Disaster risk can be understood as a combination of hazard or a potentially damaging physical event, with the increased vulnerability of the population and the susceptibility of assets to suffer loss. It is the result of a region’s exposure to the event (i.e., probability of oc-currence at various severity levels) and a society’s vul-nerability to the event. While disasters are considered external shocks that destroy development gains, disas-ter risk is internal to the development process (see Fig-ure 6.2). The concept of disaster risk presents ex-ante or preventive thinking, including a holistic understand-ing of why disasters occur, their impact on develop-ment, and the ways in which they might be prevented.
Figure 6.2: Factors Contributing to Disaster Risk
Source: World Bank 2010.
Hazard, exposure, and vulnerability factors for Nigeria are discussed below.
(i) Hazards—Distribution and Future Trends
Nigeria’s climate ranges from semi-arid in the extreme northeast to humid in the south, characterized by dis-
40
35
30
25
20
15
10
5
0
No
of
even
ts 1
980
to 2
010
Flood Land slides Extreme temperature
Storm Drought
Disaster Risk
Exposure and Vulnerability
(Socio-economic Factors)
Hazard(Natural Event)
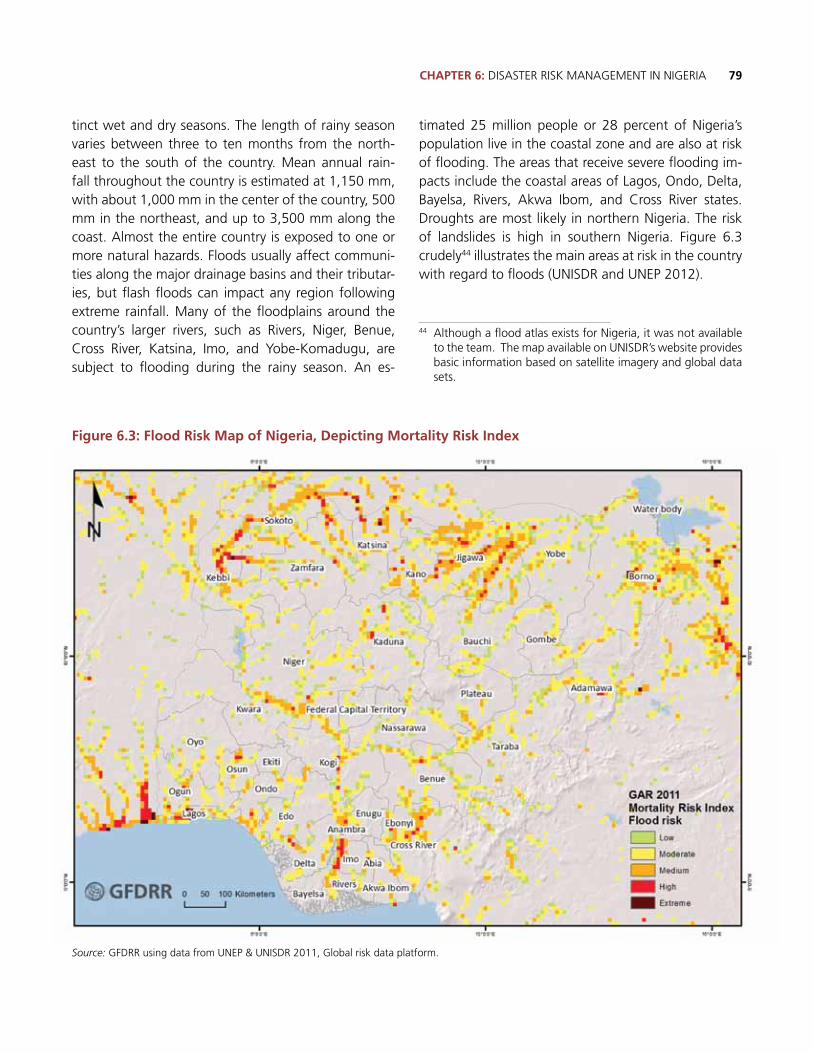
79CHAPTER 6: DISASTER RISK MANAGEMENT IN NIGERIA
tinct wet and dry seasons. The length of rainy season varies between three to ten months from the north-east to the south of the country. Mean annual rain-fall throughout the country is estimated at 1,150 mm, with about 1,000 mm in the center of the country, 500 mm in the northeast, and up to 3,500 mm along the coast. Almost the entire country is exposed to one or more natural hazards. Floods usually affect communi-ties along the major drainage basins and their tributar-ies, but flash floods can impact any region following extreme rainfall. Many of the floodplains around the country’s larger rivers, such as Rivers, Niger, Benue, Cross River, Katsina, Imo, and Yobe-Komadugu, are subject to flooding during the rainy season. An es-
timated 25 million people or 28 percent of Nigeria’s population live in the coastal zone and are also at risk of flooding. The areas that receive severe flooding im-pacts include the coastal areas of Lagos, Ondo, Delta, Bayelsa, Rivers, Akwa Ibom, and Cross River states. Droughts are most likely in northern Nigeria. The risk of landslides is high in southern Nigeria. Figure 6.3 crudely44 illustrates the main areas at risk in the country with regard to floods (UNISDR and UNEP 2012).
44 Although a flood atlas exists for Nigeria, it was not available to the team. The map available on UNISDR’s website provides basic information based on satellite imagery and global data sets.
Figure 6.3: Flood Risk Map of Nigeria, Depicting Mortality Risk Index
Source: GFDRR using data from UNEP & UNISDR 2011, Global risk data platform.
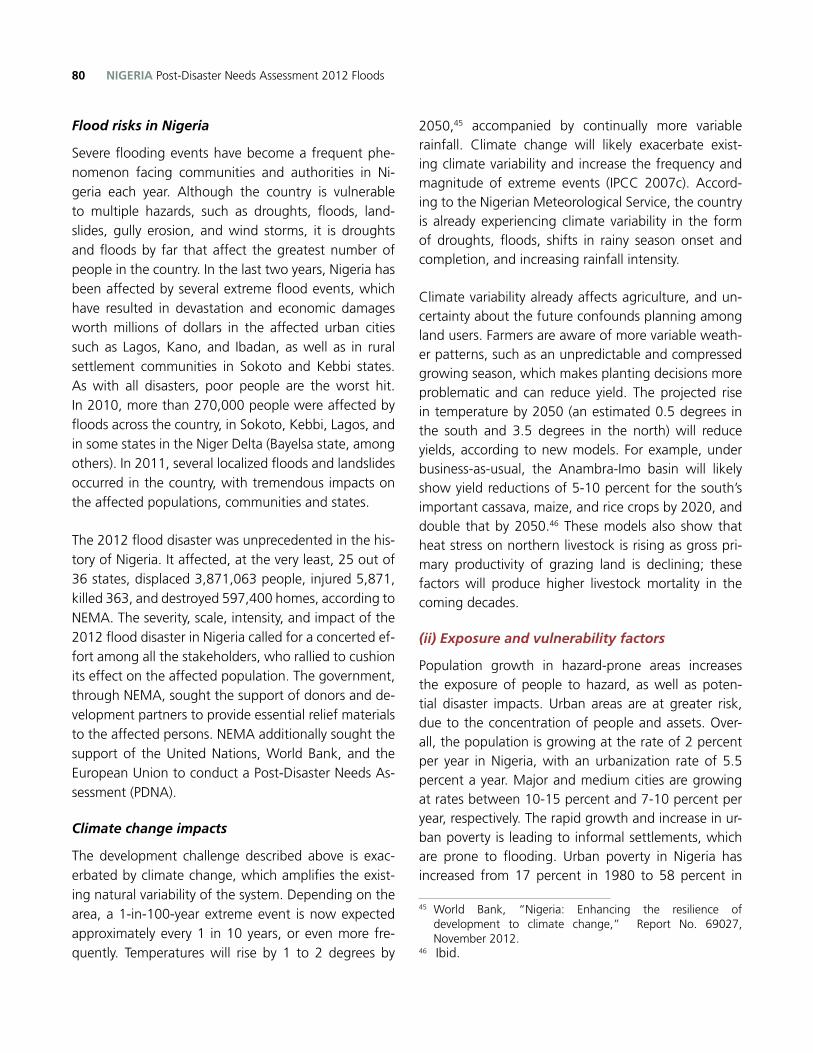
NIGERIA Post-Disaster Needs Assessment 2012 Floods80
Flood risks in Nigeria
Severe flooding events have become a frequent phe-nomenon facing communities and authorities in Ni-geria each year. Although the country is vulnerable to multiple hazards, such as droughts, floods, land-slides, gully erosion, and wind storms, it is droughts and floods by far that affect the greatest number of people in the country. In the last two years, Nigeria has been affected by several extreme flood events, which have resulted in devastation and economic damages worth millions of dollars in the affected urban cities such as Lagos, Kano, and Ibadan, as well as in rural settlement communities in Sokoto and Kebbi states. As with all disasters, poor people are the worst hit. In 2010, more than 270,000 people were affected by floods across the country, in Sokoto, Kebbi, Lagos, and in some states in the Niger Delta (Bayelsa state, among others). In 2011, several localized floods and landslides occurred in the country, with tremendous impacts on the affected populations, communities and states.
The 2012 flood disaster was unprecedented in the his-tory of Nigeria. It affected, at the very least, 25 out of 36 states, displaced 3,871,063 people, injured 5,871, killed 363, and destroyed 597,400 homes, according to NEMA. The severity, scale, intensity, and impact of the 2012 flood disaster in Nigeria called for a concerted ef-fort among all the stakeholders, who rallied to cushion its effect on the affected population. The government, through NEMA, sought the support of donors and de-velopment partners to provide essential relief materials to the affected persons. NEMA additionally sought the support of the United Nations, World Bank, and the European Union to conduct a Post-Disaster Needs As-sessment (PDNA).
Climate change impacts
The development challenge described above is exac-erbated by climate change, which amplifies the exist-ing natural variability of the system. Depending on the area, a 1-in-100-year extreme event is now expected approximately every 1 in 10 years, or even more fre-quently. Temperatures will rise by 1 to 2 degrees by
2050,45 accompanied by continually more variable rainfall. Climate change will likely exacerbate exist-ing climate variability and increase the frequency and magnitude of extreme events (IPCC 2007c). Accord-ing to the Nigerian Meteorological Service, the country is already experiencing climate variability in the form of droughts, floods, shifts in rainy season onset and completion, and increasing rainfall intensity.
Climate variability already affects agriculture, and un-certainty about the future confounds planning among land users. Farmers are aware of more variable weath-er patterns, such as an unpredictable and compressed growing season, which makes planting decisions more problematic and can reduce yield. The projected rise in temperature by 2050 (an estimated 0.5 degrees in the south and 3.5 degrees in the north) will reduce yields, according to new models. For example, under business-as-usual, the Anambra-Imo basin will likely show yield reductions of 5-10 percent for the south’s important cassava, maize, and rice crops by 2020, and double that by 2050.46 These models also show that heat stress on northern livestock is rising as gross pri-mary productivity of grazing land is declining; these factors will produce higher livestock mortality in the coming decades.
(ii) Exposure and vulnerability factors
Population growth in hazard-prone areas increases the exposure of people to hazard, as well as poten-tial disaster impacts. Urban areas are at greater risk, due to the concentration of people and assets. Over-all, the population is growing at the rate of 2 percent per year in Nigeria, with an urbanization rate of 5.5 percent a year. Major and medium cities are growing at rates between 10-15 percent and 7-10 percent per year, respectively. The rapid growth and increase in ur-ban poverty is leading to informal settlements, which are prone to flooding. Urban poverty in Nigeria has increased from 17 percent in 1980 to 58 percent in
45 World Bank, “Nigeria: Enhancing the resilience of development to climate change,” Report No. 69027, November 2012.
46 Ibid.
81CHAPTER 6: DISASTER RISK MANAGEMENT IN NIGERIA
1996, and the contribution of the severity of urban poverty to national poverty has increased from 22 per-cent to 48 percent between 1985 and 1996. At the same time, about 60 percent of GDP is generated in urban areas, indicating the increasing exposure of both populations and assets.
The causes of flooding, erosion, and gully formation dif-fer by location, but are largely human. These include: (a) improper building and infrastructure design, loca-tion, and construction, as well as inadequate drainage; (b) poor solid waste management in urban and peri-ur-ban areas that chokes the already inadequate drainage meant to prevent flooding and erosion; and (c) destruc-tive and unsustainable land-use practices that remove protective vegetation cover, including protective biodi-versity and carbon-rich areas, or disturb the fragile soil, such as overgrazing, deforestation, cultivation of mar-ginal lands, and uncontrolled mining for building mate-rial, which are linked to poverty. Rural areas face similar challenges, with reliance on rain-fed agriculture.
In summary, business as usual is not sustainable. The situation described above has contributed to upsetting the Niger/Benue basin’s ecological balance, and there-fore the ability of its ecosystems to provide services such as flood regulation, food production, freshwater, firewood and forest products. The environmental stress combines with sector and institutional barriers out-lined above to interfere with the country’s ambitions, as articulated in Vision 20:2020, to promote durable economic growth while reducing poverty and human vulnerability. Multiple sectors in this risk-prone yet eco-nomically important part of the country are affected by business as usual, hindering the country’s growth potential. A transformation is needed in the ways in which ecosystems and infrastructure are planned, fi-nanced, managed, and monitored, from a current isolated approach to an integrated approach with mul-tiple complementary benefits.
6.3. Disaster risk management in Nigeria
After the establishment of the National Emergency Management Agency (NEMA) in 1999, the country’s
flood response capacity and infrastructure have im-proved considerably. NEMA was established with the objective to “coordinate and facilitate disaster man-agement efforts aimed at reducing the loss of lives and property and protect lives from hazards by leading and supporting disaster management stakeholders in a comprehensive risk-based emergency management program of mitigation, preparedness, response and re-covery.” The 36 states of the federation were also en-couraged to establish State Emergency Management Agencies (SEMAs). Overall, 2247 out of 36 states have established SEMAs as the leading agencies for emer-gency management.
Even though the national response capacity has im-proved in recent years, risk reduction and mitigation capacity needs to be strengthened. Some of the chal-lenges in reducing and mitigating flood risk are related to inadequate flood control infrastructure, aging or weak dams, inadequate dam monitoring and mainte-nance, lack of flood risk awareness, along with inad-equate solid waste, sewage, drainage, and flood zone management. Urban areas require special consider-ation, with integrated flood risk management, plan-ning, and enforcement. Many cities or small towns are vulnerable to flood risk, and priority should be given to preparing and implementing structural and non-structural flood control strategies. Current initiatives and gaps under each of the five Hyogo Framework for Action (HFA) components are discussed below.
6.3.1 DRR as a development priority
The government of Nigeria is a signatory to the HFA and reports on progress made towards the implementation of the five HFA priorities. The country recently joined the Consultative Group of the World Bank Global Fa-cility for Disaster Risk Reduction and Recovery Board (GFDRR), which shows the high priority the Nigerian government accords to disaster risk management.
47 This number could not be confirmed at the time of finalizing this report.
NIGERIA Post-Disaster Needs Assessment 2012 Floods82
The enabling legislation for disaster management in Nigeria remains the National Emergency Management Agency Act No. 12 of 1999, as amended by Act 50, which established the National Emergency Manage-ment Agency (NEMA). Prior to this law, there was the National Emergency Relief Agency, established in 1990. However, the enabling Act No. 12 of 1999 redesigned and refocused the Agency; from a relief agency, it was transformed into a body that coordinates the manage-ment of disaster in all its ramifications. The National Disaster Management Framework (NDMF) provides a mechanism that serves as a regulatory guideline for ef-fective and efficient disaster management in Nigeria, whereas NEMA has a mandate to facilitate prevention and preparedness, and organize response at federal level. NEMA has six zonal offices, which facilitate coor-dination with the state level and coordinate response in case of disaster. NEMA coordinates its response fur-ther with federal-level agencies, the military, and in-ternational organizations and development partners. SEMAs have a similar function in the event of emer-gencies that can be handled at the state level.
Funding disaster management programs is presently a major responsibility of the federal government. The primary source of NEMA’s financing comes from an-nual allocations from the Ecological Fund, set aside to tackle environmental problems and emergencies. Ac-cording to Section 13 of the NEMA Act of 1999, 20 percent of the federal government’s share of Ecologi-cal Funds shall be allocated annually to NEMA.
National Development Strategies: Nigeria’s long-term national development vision and program is captured in The Nigeria Vision 20:2020, which was adopted in 2010. It outlines a vision to propel the country into the league of the world’s top 20 economies by 2020. Attain-ment of this vision would enable the country to achieve a high standard of living for its citizens. The NV20:2020 was developed by Nigerians for the Nigerian people and involved a process of thorough engagement with all stakeholders across all levels of government and soci-ety. NV20:2020 places emphasis on conservation of the environment, preventing loss of bio-diversity, restoring degraded areas, protecting ecologically sensitive sites,
and reducing the impact of climate change on socio-economic development. The measures will also combat desertification and mitigate the impact of droughts, re-duce the occurrence and impact of environmental haz-ards and disasters, and improve overall governance of the environment. High priority will be accorded to the use of natural resources and environmental protection.
Challenges related to institutions and incentives: Insti-tutional capacities for action need to be strengthened for sustainable and effective change. For example, planning and preparedness need to be carried out with good vertical (federal, state, local) and horizon-tal (across sectors) coordination. Clear responsibilities and mandates must be identified and various actors empowered to participate in multi-sector, multi-scale work, especially on long-term planning, policy, and public expenditure management. Regulatory devel-opment and enforcement need strengthening at all levels to transform planning processes into muscular tools that can deliver public goods and protect private benefits. Lastly, governance issues such as contract-ing irregularities and supervision challenges have been known to interfere with putting durable infrastructure in place. Specific deficiencies include:
■n No integrated water resources planning at national, state, or international transboundary levels, and weak integration of climate variability into planning;
■n Weak territorial and town/community planning and enforcement of plans, with few incentives in place to transform the status quo;
■n Inadequate disaster preparedness and responses, particularly at state and community levels;
■n Ineffective community land use bylaws, although there are some isolated good examples such as controlling bush burning or community forest management;
■n Need for improved public expenditure planning and execution for long-term, multi-sector, and multi-scale planning and investment;
The points above are becoming the norm, due to weak contracting, supervision, and regulatory development and enforcement.
83CHAPTER 6: DISASTER RISK MANAGEMENT IN NIGERIA
6.3.2 Risk identification, assessment and monitoring, and early warning
Risk Assessment: Nigeria has never conducted a com-prehensive national risk assessment nor engaged in systematic risk assessment activities. Overall, there is no clear guidance from federal and state governments on which methodologies should be used for risk and impact assessments, nor are tools provided to actually conduct these. Generally, the capacity for risk assessments varies from state to state. There is no continuous execution of state-based comprehensive risk assessments and little recognition of the importance of risk mapping. Many state agencies do not seem to conduct structured as-sessments of hazards, vulnerability, or capacity. Current steps towards risk assessment include: (i) The Vulner-ability and Capacity Analysis (VCA) conducted by NEMA in 2009 with the support of UNICEF in 21 Local Gov-ernment Areas (LGAs) in Nigeria, can be considered a first step towards stronger risk-management structures at the local level; (ii) the Ministry of Environment devel-oped a flood risk atlas, however, it does not include river basin and watershed level information and needs to be updated; and (iii) NASDRA has been developing a flood plain map for 2012 flood-affected areas.
A continuous and participatory M&E system based on the periodic risk assessment profile of disasters in the country would be very important for effective DRM. Such a system would need to develop a robust data-base, with data inputs from all the relevant agencies. NEMA, in collaboration with relevant MDAs, should also ensure the development of standard datasets for each potential disaster, as well as hazard vulnerabil-ity and risk models as ready tools for prevention and preparedness. The systematic inclusion of community members as primary data collectors is desirable.
Although many agencies and institutions have the re-quired technical skills to undertake risk assessment and identification, research institutions have been scattered and have not been systematically linked to inform na-tional disaster risk management agencies. At the federal level, NEMA has established within the Department of Planning a Geographic Information System Unit (GIS), which is already working on floods and landslide haz-
ard maps for isolated areas with techniques that can be used for wider assessments throughout the country. The government has tasked different academic agen-cies with conducting research and training relevant for risk management, such as in the areas of GIS, space science and technology, remote sensing, flood moni-toring, and assessment.
Early Warning: In Nigeria no systematic and automated process for developing and disseminating early warn-ing information has been established to date. Multiple agencies are making piecemeal efforts at trying to set up early warning systems. The Nigerian Meteorological Agency (NIMET) provides weather forecasts and sea-sonal rainfall predictions. The forecasts are based on soil moisture and historical data, which informs early warn-ing alerts for climate-related disaster threats across the country. Information management of existing risks and data is not distributed proactively as monitoring and early warning information to national disaster risk and emergency management stakeholders. Instead, infor-mation has to be requested by the user, which obstructs the flow of critical information which could be lifesaving if distributed in time to the appropriate recipients. For example, the impact of frequent floods in the South-West zone can be reduced thanks to rain forecasts from NIMET. However, state ministries do not receive these warnings directly from NIMET, but need to proactively look for early warning information from the NIMET pub-lic website or from the media.
While NEMA has engaged in establishing an early warn-ing system for epidemics, including the institutionaliza-tion of the National Influenza Sentinel Surveillance, there is no effective national early warning system in place for floods, either at the federal, state, or local/community levels. The majority of rivers in the country do not have functional water level gauges, while rivers that have stage and discharge stations are not coordinated into an integrated system. The status of hydrometeorology data collection and monitoring for flood warnings is inad-equate in the majority of river basins in Nigeria. Hence, overall, the national early warning system on floods is not systematic and there are no clear standard operating procedures in relation to the dissemination of alerts and
NIGERIA Post-Disaster Needs Assessment 2012 Floods84
how these alerts reach those communities most at risk. Generally, states and local governments have been slow or even reluctant to engage in early warning activities due to limited awareness, an absence of political will, and resource constraints.
In 2008, the Federal Ministry of Environment collabo-rated with UNDP to organize a National Workshop on Flood Early Warning Systems (FEWS) to create aware-ness of their importance and to work out modalities for the establishment and implementation of a FEWS.
Central database on past disasters: There is currently no central database on past disasters in place. Historic information on disaster incidents and losses is recorded in decentralized ways but records of previous disas-ters are not yet systematically stored by a government body. Interviews with NEMA during the PDNA indicate that first steps in that direction have been taken by the agency. The available data has not yet been aggre-gated, however, and no analysis has been done.
6.3.3 Disaster information, knowledge, and innovation
In Nigeria, there is insufficient evidence-based poli-cymaking and investment prioritization. Improving the evidence base and putting it into action requires working with multiple agencies at multiple levels and on different scales. This is critical to sustaining invest-ment and reducing and preventing risks. For example, data is weak, often fragmented in silos, and not readily shared. Participatory monitoring at local and commu-nity levels is rarely practiced, though it could certainly enhance policy and investment performance and help reduce long-term risks from disasters or natural re-source overreach. Information access and communica-tions outreach can help unlock greater participation, if strengthened. Specific needs include:
■n Development of effective early warning on floods and dam water releases;
■n Improvement in collecting, assessing, and sharing data for planning, policy and investment purposes. For example, improvements are needed to develop a
real-time early warning system;
■n Better coordination between agencies, both horizontally between agencies and vertically from federal to community levels;
■n Ensuring community participation in planning and implementation and monitoring of disaster preparedness activities.
Although much more needs to be done to raise the general public’s awareness of disaster risk, some impor-tant advocacy work is already under way. The National Orientation Agency and the Ministry of Information are involved in public awareness campaigns on the risks and dangers of hazards, as well as on the basic principles of disaster management. These campaigns are carried out via radio, national television, and print media. They are usually rendered in English and local languages. Fur-thermore, CSOs such as the Red Cross Society in Nigeria have been playing a key role in raising awareness of di-saster risk at the local and community levels.
The 2012 PDNA exercise indicated that there is wide understanding on this topic, but more needs to be done to increase public awareness on disaster risks, especially in relation to floods and building collapses. Although many ministries are already engaging the public to play its part in disaster risk reduction, mes-sages remain too general and do not target specific communities at risk. Community awareness on hazards and risks is low, and public authorities at all levels (with the exception of Lagos state and, to a lesser degree, Adamawa) have not conducted awareness campaigns for local households on the matter.
NEMA includes a Training Department with a mandate to conduct trainings within and outside the agency. One of the aims of NEMA’s training activities is to raise DRR awareness among its staff, at the national, state, and local levels and among communities. Since its es-tablishment, NEMA has made some effort to increase its staff capacity in DRR and it has sent some of its officers to attend international DRR courses. Gender is treated as an important aspect of DRR; gender as-pects are mainstreamed in DRR training manuals and women’s participation in trainings is encouraged.

85CHAPTER 6: DISASTER RISK MANAGEMENT IN NIGERIA
In light of its limited capacity, NEMA experiences difficul-ty in implementing its wide mandate, which also includes countrywide DRR training for state, local government, and community authorities. All of these stakeholders need significant DRR capacity building, particularly state and local governments, which seem to focus primarily on disaster response. Local governments have relatively limited administrative and program capacities, and they focus very little of their scant resources on disaster risk reduction. In 2008 and 2009, NEMA trained officers in the six geopolitical zones, with the help of Bournemouth Disaster Management Centre (a U.K. university center), including staff from the local, state, and federal levels on disaster risk management.
NEMA has also supported efforts to take disaster risk management to the community level by conducting community sensitization on flood risks and market fires in many Community Development Councils in the country’s six geopolitical zones. The Grassroots Emer-gency Volunteer Corps (GEVC) program is an effective tool for strengthening local DRR awareness and capac-ity. It was established in 2008 and so far is represented in 23 states, with a total of 6,408 registered volunteers. NEMA aims to train 200 GEVC volunteers in each local community across the country.
The National Youth Service Corps also participates in DRR mobilization. Moreover, CSOs—the Nigerian Red Cross Society in particular—have undertaken communi-ty awareness and DRR capacity development measures. In collaboration with the National Education Research and Development Council, NEMA is in the process of mainstreaming DRR into primary and secondary school curricula. DRR and risk-reduction activities are included in lesson plans, but much remains to be done to inte-grate these plans at the local level and to train teachers. It is envisaged that information, knowledge, and edu-cation on DRR will improve, particularly among youth, when these curricula become operational in schools. Other UN agencies—such as UNDP, FAO, and UNHCR—have also implemented awareness-raising activities.
NEMA has been providing substantive support to six uni-versities in Nigeria since 2009 with the aim of building
disaster risk management capacities. More specifically, NEMA collaborated with universities to train people in Disaster Risk Management (DRM) at the Post-Graduate level. Other Nigerian universities also have DRR-related faculties producing graduates in related areas. A sig-nificant achievement of NEMA’s Training Department has been the mainstreaming of Disaster Risk Reduction programs into administrative training schools, such as the Police Training College, Armed Forces Command and Staff College, the National Institute for Policy and Strategic Studies, the in-Service Trainings for Civil Ser-vants and National Security and Civil Defense Corps, and the National Youth Service Corps.
6.3.4 Key interventions to reduce underlying risk
Structural context: In Nigeria, major policies to reduce DRR underlying risks—such as National Environment Policy, Food Security, National Policy on Drought and Desertification, National Biodiversity Strategy and Ac-tion Plan, National Erosion and Flood Control Policy, Climate Change Adaptation, etc.—are in place, but enforcement and implementation has been weak. A major constraint is that the government has not been able to put in place a comprehensive implementation strategy that would enable these policies to translate into meaningful inter-sectoral activities for environ-mental management and disaster risk reduction, which could transform the existing policies into anticipatory adaptation and disaster prevention solutions for Nige-ria’s response to climate change and natural disasters.
Infrastructure and investment deficiencies: In Nigeria, it is critical for flood defense structures to be introduced, rehabilitated, expanded, and complemented by eco-logical infrastructure.48 Countries such as the United States and Netherlands are putting programs in place
48 An example from the U.S.: Following the Great Flood of 1993, U.S. researchers estimated that restoration of 13 million acres of wetlands in the upper portion of the Mississippi-Missouri watershed, at a cost of US$2-3 billion, would have absorbed enough floodwater to have substantially reduced the US$16 billion in flood damages. Wetlands are also important for livelihoods such as fishing, hunting, and agriculture.
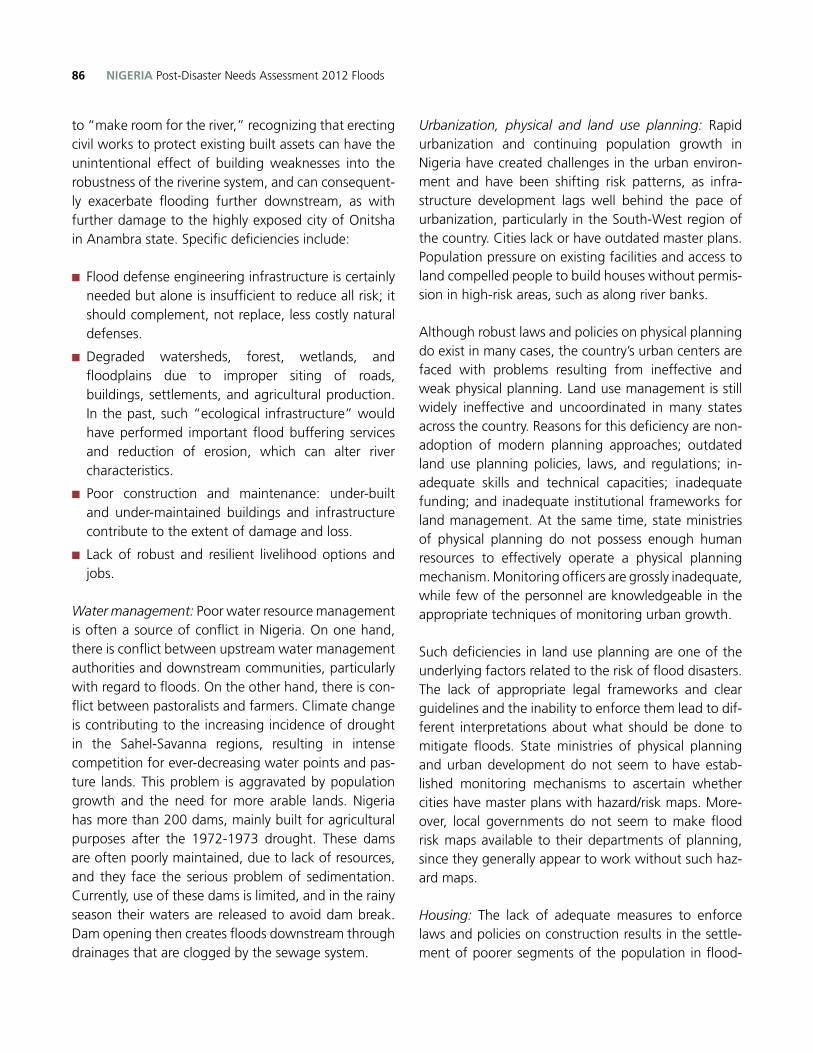
NIGERIA Post-Disaster Needs Assessment 2012 Floods86
to “make room for the river,” recognizing that erecting civil works to protect existing built assets can have the unintentional effect of building weaknesses into the robustness of the riverine system, and can consequent-ly exacerbate flooding further downstream, as with further damage to the highly exposed city of Onitsha in Anambra state. Specific deficiencies include:
■n Flood defense engineering infrastructure is certainly needed but alone is insufficient to reduce all risk; it should complement, not replace, less costly natural defenses.
■n Degraded watersheds, forest, wetlands, and floodplains due to improper siting of roads, buildings, settlements, and agricultural production. In the past, such “ecological infrastructure” would have performed important flood buffering services and reduction of erosion, which can alter river characteristics.
■n Poor construction and maintenance: under-built and under-maintained buildings and infrastructure contribute to the extent of damage and loss.
■n Lack of robust and resilient livelihood options and jobs.
Water management: Poor water resource management is often a source of conflict in Nigeria. On one hand, there is conflict between upstream water management authorities and downstream communities, particularly with regard to floods. On the other hand, there is con-flict between pastoralists and farmers. Climate change is contributing to the increasing incidence of drought in the Sahel-Savanna regions, resulting in intense competition for ever-decreasing water points and pas-ture lands. This problem is aggravated by population growth and the need for more arable lands. Nigeria has more than 200 dams, mainly built for agricultural purposes after the 1972-1973 drought. These dams are often poorly maintained, due to lack of resources, and they face the serious problem of sedimentation. Currently, use of these dams is limited, and in the rainy season their waters are released to avoid dam break. Dam opening then creates floods downstream through drainages that are clogged by the sewage system.
Urbanization, physical and land use planning: Rapid urbanization and continuing population growth in Nigeria have created challenges in the urban environ-ment and have been shifting risk patterns, as infra-structure development lags well behind the pace of urbanization, particularly in the South-West region of the country. Cities lack or have outdated master plans. Population pressure on existing facilities and access to land compelled people to build houses without permis-sion in high-risk areas, such as along river banks.
Although robust laws and policies on physical planning do exist in many cases, the country’s urban centers are faced with problems resulting from ineffective and weak physical planning. Land use management is still widely ineffective and uncoordinated in many states across the country. Reasons for this deficiency are non-adoption of modern planning approaches; outdated land use planning policies, laws, and regulations; in-adequate skills and technical capacities; inadequate funding; and inadequate institutional frameworks for land management. At the same time, state ministries of physical planning do not possess enough human resources to effectively operate a physical planning mechanism. Monitoring officers are grossly inadequate, while few of the personnel are knowledgeable in the appropriate techniques of monitoring urban growth.
Such deficiencies in land use planning are one of the underlying factors related to the risk of flood disasters. The lack of appropriate legal frameworks and clear guidelines and the inability to enforce them lead to dif-ferent interpretations about what should be done to mitigate floods. State ministries of physical planning and urban development do not seem to have estab-lished monitoring mechanisms to ascertain whether cities have master plans with hazard/risk maps. More-over, local governments do not seem to make flood risk maps available to their departments of planning, since they generally appear to work without such haz-ard maps.
Housing: The lack of adequate measures to enforce laws and policies on construction results in the settle-ment of poorer segments of the population in flood-
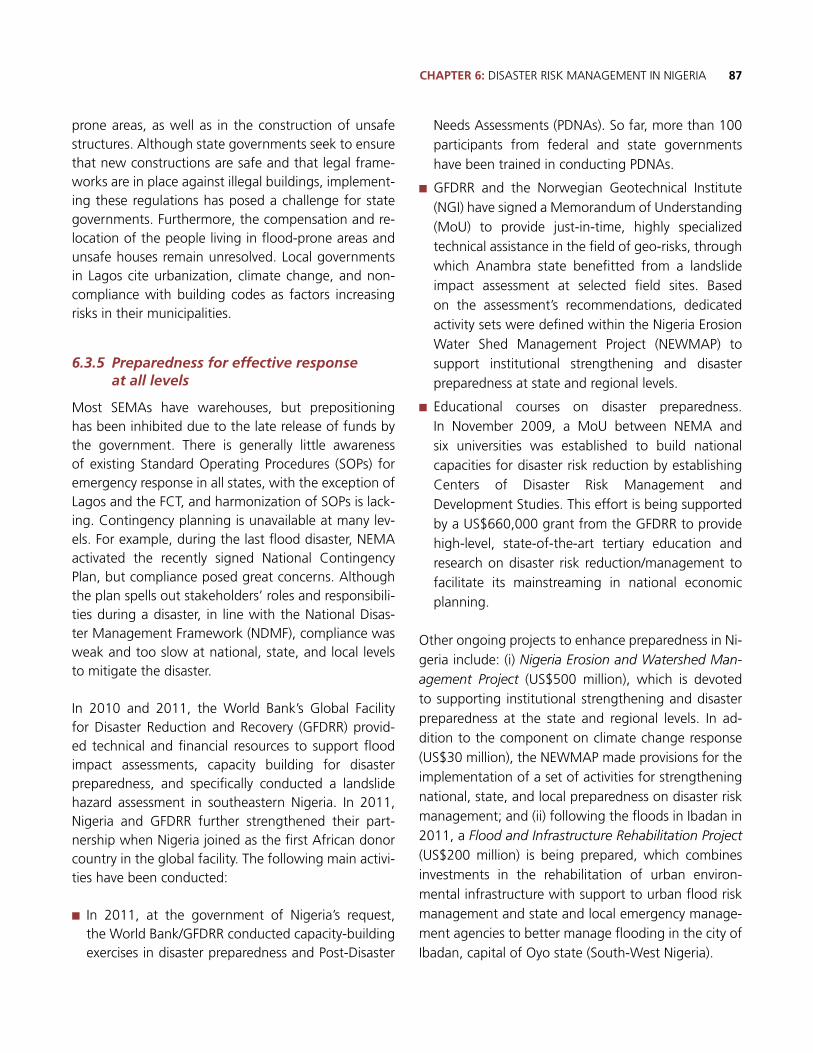
87CHAPTER 6: DISASTER RISK MANAGEMENT IN NIGERIA
prone areas, as well as in the construction of unsafe structures. Although state governments seek to ensure that new constructions are safe and that legal frame-works are in place against illegal buildings, implement-ing these regulations has posed a challenge for state governments. Furthermore, the compensation and re-location of the people living in flood-prone areas and unsafe houses remain unresolved. Local governments in Lagos cite urbanization, climate change, and non-compliance with building codes as factors increasing risks in their municipalities.
6.3.5 Preparedness for effective response at all levels
Most SEMAs have warehouses, but prepositioning has been inhibited due to the late release of funds by the government. There is generally little awareness of existing Standard Operating Procedures (SOPs) for emergency response in all states, with the exception of Lagos and the FCT, and harmonization of SOPs is lack-ing. Contingency planning is unavailable at many lev-els. For example, during the last flood disaster, NEMA activated the recently signed National Contingency Plan, but compliance posed great concerns. Although the plan spells out stakeholders’ roles and responsibili-ties during a disaster, in line with the National Disas-ter Management Framework (NDMF), compliance was weak and too slow at national, state, and local levels to mitigate the disaster.
In 2010 and 2011, the World Bank’s Global Facility for Disaster Reduction and Recovery (GFDRR) provid-ed technical and financial resources to support flood impact assessments, capacity building for disaster preparedness, and specifically conducted a landslide hazard assessment in southeastern Nigeria. In 2011, Nigeria and GFDRR further strengthened their part-nership when Nigeria joined as the first African donor country in the global facility. The following main activi-ties have been conducted:
■n In 2011, at the government of Nigeria’s request, the World Bank/GFDRR conducted capacity-building exercises in disaster preparedness and Post-Disaster
Needs Assessments (PDNAs). So far, more than 100 participants from federal and state governments have been trained in conducting PDNAs.
■n GFDRR and the Norwegian Geotechnical Institute (NGI) have signed a Memorandum of Understanding (MoU) to provide just-in-time, highly specialized technical assistance in the field of geo-risks, through which Anambra state benefitted from a landslide impact assessment at selected field sites. Based on the assessment’s recommendations, dedicated activity sets were defined within the Nigeria Erosion Water Shed Management Project (NEWMAP) to support institutional strengthening and disaster preparedness at state and regional levels.
■n Educational courses on disaster preparedness. In November 2009, a MoU between NEMA and six universities was established to build national capacities for disaster risk reduction by establishing Centers of Disaster Risk Management and Development Studies. This effort is being supported by a US$660,000 grant from the GFDRR to provide high-level, state-of-the-art tertiary education and research on disaster risk reduction/management to facilitate its mainstreaming in national economic planning.
Other ongoing projects to enhance preparedness in Ni-geria include: (i) Nigeria Erosion and Watershed Man-agement Project (US$500 million), which is devoted to supporting institutional strengthening and disaster preparedness at the state and regional levels. In ad-dition to the component on climate change response (US$30 million), the NEWMAP made provisions for the implementation of a set of activities for strengthening national, state, and local preparedness on disaster risk management; and (ii) following the floods in Ibadan in 2011, a Flood and Infrastructure Rehabilitation Project (US$200 million) is being prepared, which combines investments in the rehabilitation of urban environ-mental infrastructure with support to urban flood risk management and state and local emergency manage-ment agencies to better manage flooding in the city of Ibadan, capital of Oyo state (South-West Nigeria).
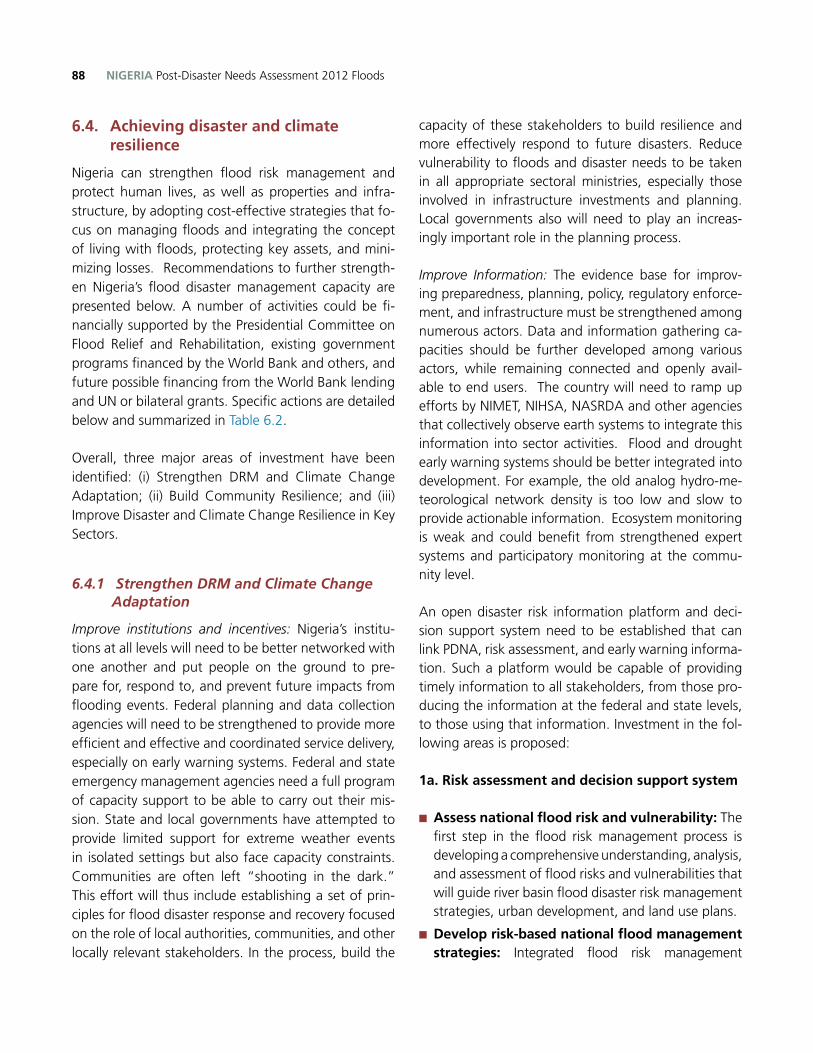
NIGERIA Post-Disaster Needs Assessment 2012 Floods88
6.4. Achieving disaster and climate resilience
Nigeria can strengthen flood risk management and protect human lives, as well as properties and infra-structure, by adopting cost-effective strategies that fo-cus on managing floods and integrating the concept of living with floods, protecting key assets, and mini-mizing losses. Recommendations to further strength-en Nigeria’s flood disaster management capacity are presented below. A number of activities could be fi-nancially supported by the Presidential Committee on Flood Relief and Rehabilitation, existing government programs financed by the World Bank and others, and future possible financing from the World Bank lending and UN or bilateral grants. Specific actions are detailed below and summarized in Table 6.2.
Overall, three major areas of investment have been identified: (i) Strengthen DRM and Climate Change Adaptation; (ii) Build Community Resilience; and (iii) Improve Disaster and Climate Change Resilience in Key Sectors.
6.4.1 Strengthen DRM and Climate Change Adaptation
Improve institutions and incentives: Nigeria’s institu-tions at all levels will need to be better networked with one another and put people on the ground to pre-pare for, respond to, and prevent future impacts from flooding events. Federal planning and data collection agencies will need to be strengthened to provide more efficient and effective and coordinated service delivery, especially on early warning systems. Federal and state emergency management agencies need a full program of capacity support to be able to carry out their mis-sion. State and local governments have attempted to provide limited support for extreme weather events in isolated settings but also face capacity constraints. Communities are often left “shooting in the dark.” This effort will thus include establishing a set of prin-ciples for flood disaster response and recovery focused on the role of local authorities, communities, and other locally relevant stakeholders. In the process, build the
capacity of these stakeholders to build resilience and more effectively respond to future disasters. Reduce vulnerability to floods and disaster needs to be taken in all appropriate sectoral ministries, especially those involved in infrastructure investments and planning. Local governments also will need to play an increas-ingly important role in the planning process.
Improve Information: The evidence base for improv-ing preparedness, planning, policy, regulatory enforce-ment, and infrastructure must be strengthened among numerous actors. Data and information gathering ca-pacities should be further developed among various actors, while remaining connected and openly avail-able to end users. The country will need to ramp up efforts by NIMET, NIHSA, NASRDA and other agencies that collectively observe earth systems to integrate this information into sector activities. Flood and drought early warning systems should be better integrated into development. For example, the old analog hydro-me-teorological network density is too low and slow to provide actionable information. Ecosystem monitoring is weak and could benefit from strengthened expert systems and participatory monitoring at the commu-nity level.
An open disaster risk information platform and deci-sion support system need to be established that can link PDNA, risk assessment, and early warning informa-tion. Such a platform would be capable of providing timely information to all stakeholders, from those pro-ducing the information at the federal and state levels, to those using that information. Investment in the fol-lowing areas is proposed:
1a. Risk assessment and decision support system
■n Assess national flood risk and vulnerability: The first step in the flood risk management process is developing a comprehensive understanding, analysis, and assessment of flood risks and vulnerabilities that will guide river basin flood disaster risk management strategies, urban development, and land use plans.
■n Develop risk-based national flood management strategies: Integrated flood risk management
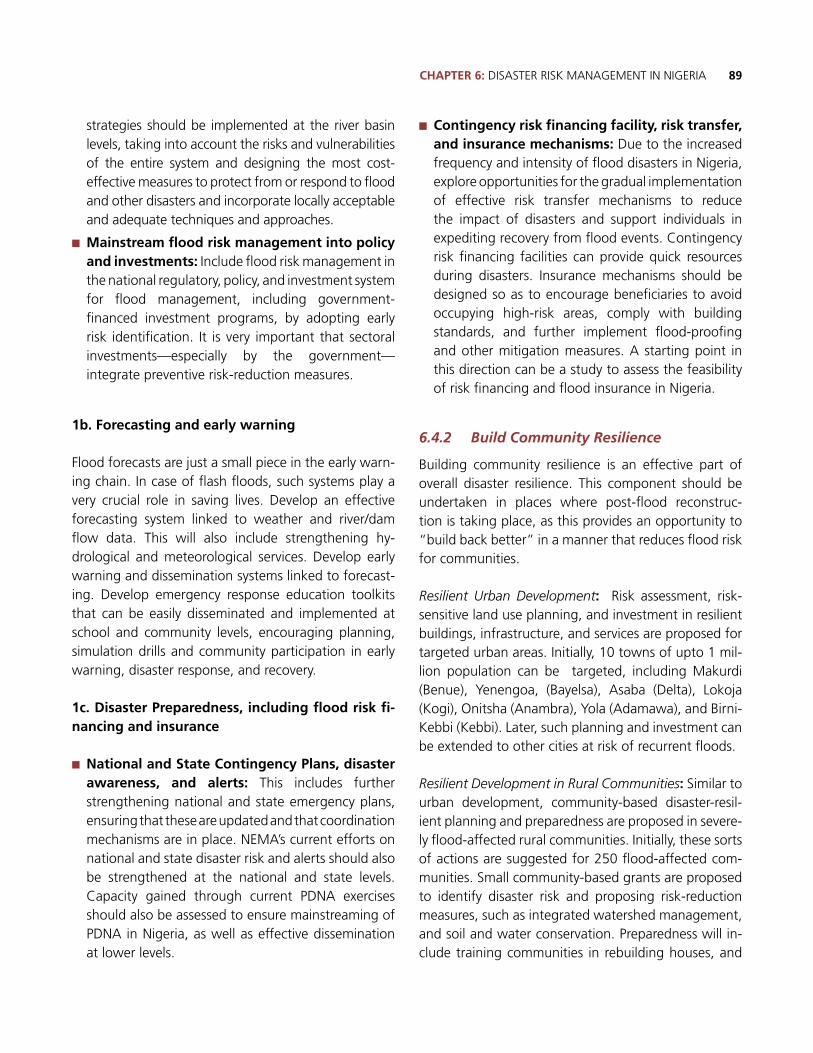
89CHAPTER 6: DISASTER RISK MANAGEMENT IN NIGERIA
strategies should be implemented at the river basin levels, taking into account the risks and vulnerabilities of the entire system and designing the most cost-effective measures to protect from or respond to flood and other disasters and incorporate locally acceptable and adequate techniques and approaches.
■n Mainstream flood risk management into policy and investments: Include flood risk management in the national regulatory, policy, and investment system for flood management, including government-financed investment programs, by adopting early risk identification. It is very important that sectoral investments—especially by the government—integrate preventive risk-reduction measures.
1b. Forecasting and early warning
Flood forecasts are just a small piece in the early warn-ing chain. In case of flash floods, such systems play a very crucial role in saving lives. Develop an effective forecasting system linked to weather and river/dam flow data. This will also include strengthening hy-drological and meteorological services. Develop early warning and dissemination systems linked to forecast-ing. Develop emergency response education toolkits that can be easily disseminated and implemented at school and community levels, encouraging planning, simulation drills and community participation in early warning, disaster response, and recovery.
1c. Disaster Preparedness, including flood risk fi-nancing and insurance
■n National and State Contingency Plans, disaster awareness, and alerts: This includes further strengthening national and state emergency plans, ensuring that these are updated and that coordination mechanisms are in place. NEMA’s current efforts on national and state disaster risk and alerts should also be strengthened at the national and state levels. Capacity gained through current PDNA exercises should also be assessed to ensure mainstreaming of PDNA in Nigeria, as well as effective dissemination at lower levels.
■n Contingency risk financing facility, risk transfer, and insurance mechanisms: Due to the increased frequency and intensity of flood disasters in Nigeria, explore opportunities for the gradual implementation of effective risk transfer mechanisms to reduce the impact of disasters and support individuals in expediting recovery from flood events. Contingency risk financing facilities can provide quick resources during disasters. Insurance mechanisms should be designed so as to encourage beneficiaries to avoid occupying high-risk areas, comply with building standards, and further implement flood-proofing and other mitigation measures. A starting point in this direction can be a study to assess the feasibility of risk financing and flood insurance in Nigeria.
6.4.2 Build Community Resilience
Building community resilience is an effective part of overall disaster resilience. This component should be undertaken in places where post-flood reconstruc-tion is taking place, as this provides an opportunity to “build back better” in a manner that reduces flood risk for communities.
Resilient Urban Development: Risk assessment, risk-sensitive land use planning, and investment in resilient buildings, infrastructure, and services are proposed for targeted urban areas. Initially, 10 towns of upto 1 mil-lion population can be targeted, including Makurdi (Benue), Yenengoa, (Bayelsa), Asaba (Delta), Lokoja (Kogi), Onitsha (Anambra), Yola (Adamawa), and Birni-Kebbi (Kebbi). Later, such planning and investment can be extended to other cities at risk of recurrent floods.
Resilient Development in Rural Communities: Similar to urban development, community-based disaster-resil-ient planning and preparedness are proposed in severe-ly flood-affected rural communities. Initially, these sorts of actions are suggested for 250 flood-affected com-munities. Small community-based grants are proposed to identify disaster risk and proposing risk-reduction measures, such as integrated watershed management, and soil and water conservation. Preparedness will in-clude training communities in rebuilding houses, and
NIGERIA Post-Disaster Needs Assessment 2012 Floods90
in navigating infrastructure, services, and actions dur-ing early warning periods and through actual disasters. The proposed actions can be undertaken through on-going community development projects, such as Fad-ama II AF.
6.4.3 Disaster and Climate Change Resilience in Key Sectors
Water resources management and structural flood management measures
A functioning and climate-resilient storm water drain-age network and solid waste management system is needed to mitigate floods. Investments in dam safety should be an integral part of water infrastructure plan-ning and should include thorough contingency plan-ning and risk management for possible dam failures. Proposed actions include constructing emergency flood defense structures and multi-purpose reservoirs (small irrigation, hydropower, water supply), along with complementary ecological infrastructure work, such as rehabilitation and protection of floodplains, wetlands, forests, and agricultural lands. Upgrade existing flood defense structures and infrastructure, including roads, drainage, and buildings, and promote permeable sur-faces. Provide alternative livelihoods to communities in vulnerable riparian zones. Undertaking river hydraulic studies, river dredging, and dam safety actions are also proposed.
Transportation
There is an undue bias towards new road construction and rehabilitation at the expense of maintenance by all levels of the government. This has led to the severe under-funding of road maintenance, which in turn re-sulted in a heavy road maintenance backlog. The lack of adequate routine maintenance has led to the silting of drainage and hydraulic structures; as such, when heavy rains are experienced, the roads are easily flood-ed because the channels for the water runoff have been blocked. Roads that are poorly maintained tend to have potholes, which allow the percolation of water. This leads to weakening of pavement structures and
makes the road more susceptible to washouts when floods are experienced. Edge scouring is also experi-enced due to the lack of maintenance, both routine and periodic.
The above issues are further compounded by irregu-lar releases of budgetary allocations and the absence of a strategic planning process, coupled with a poor road management information system. The need for a more sustainable funding mechanism for the road sector to enable the relevant actors under the main-tenance activities that would reduce the impact of the water and floods on the road is imperative. While most states in the country have developed their own road design standards directly from the federal level, there will nevertheless be need for effective supervision dur-ing the construction phase to ensure that standards are met and followed. Road design standards should be upgraded to safety levels, which take into account pre-cipitation levels, flood patterns, groundwater pressure, and climate change effects.
Risk Mapping: A common theme across the country is disjointed regional planning. Settlements develop in an almost uncoordinated and unregulated manner and are based on land availability; due to fragmented planning, development proposals precede infrastructure planning. These lead to people settling in areas prone to the haz-ards of flooding such as river banks and natural flood plains. There will be a need for greater sharing of in-formation regarding risk mapping between NEMA, the National Space Research and Development Agency (NASDRA), the private sector, and the various federal- and state-level actors to ensure that settlements are dis-couraged in areas that are most at risk; where this is not possible, higher building standards should be developed and enforced in order to make transport infrastructure more resilient to the effects of disasters.
Risk Management Approaches: The recommended risk management approaches for moderate flooding are: (i) Raising embankments to avoid frequent overrunning; (i) Providing adequate drainage structures; (iii) Upgrading selected roads to asphaltic concrete paved road stan-dards, and surfacing of other roads with non-slippery
91CHAPTER 6: DISASTER RISK MANAGEMENT IN NIGERIA
surface-dressed chippings of single or double coat, based on traffic analysis; (iv) Regular preventive mainte-nance (desilting of culverts/drainages, etc.). Prior to rais-ing roads affected by previous flooding, it is important to conduct hydraulic studies to determine the optimal number and size of the drainage, otherwise the road could raise water levels artificially upstream or act as le-vees when they run parallel to the river.
It is especially important to ensure safe road access to schools, clinics, markets and critical public infrastruc-ture and improve access to villages and homesteads vulnerable to flooding.
Urban stormwater management requires more com-prehensive planning. Rain water and over-spilling wa-ter from the outskirts of townships can be carried away by a stormwater system constructed as part of the ur-ban roads.
Roles of the federal government: Most of the critical transport infrastructure is owned by the federal gov-ernment (primary roads, which are the major trunk roads (trunk A)), while state governments have respon-sibility for the other roads. Other transport assets such as railways, airports, and ports are all owned by the government as well.
Hence there is a need for the government to take on a greater leadership and coordination role to ensure that all stakeholder efforts are in synergy with one another. In this regard, the federal government could play a fa-cilitating role in the following:
■n Vulnerability studies can be undertaken to map areas that are at risk and to grade these risks, taking into account climate change and its predicted impact into the future. Based on the studies above, new design standards can be developed that should make the infrastructure more resilient to future flooding.
■n Awareness should be raised at all levels about critical infrastructure issues regarding flooding as informed by studies and risk mapping, and more localized sectoral action plans should be championed and supported.
■n From the experience of this flood, the response of the relevant actors was usually slow, disjointed, and of varying quality. There is a need for a coordinated, targeted national measure, including research, training, and education, and promoting good practice. The objective of this initiative would be the institutionalization of responses, so that, in the event of emergency, all actors know what is expected of them, as well as when and how they should coordinate their own efforts.
Redundancy for vulnerability reduction: The Abuja–Lo-koja Road, a key trunk road, was overtopped with flood waters and motorists were stranded on it for about five days. Although there were alternative routes (Makur-di–Lafia–Akwanga–Abuja on the eastern flank, and Ilorin–Jebba–Mokwa Road on the western flank), the Ilorin–Jebba–Mokwa Road is in very bad shape and is almost un-motorable due to lack of maintenance. It is highly likely that this scenario occurred in other areas that experienced floods as well.
It is, of course, not feasible to build alternative routes for all roads in the country. However, from a risk-map-ping standpoint, areas and roads that are more sus-ceptible to floods can be identified, and provided that costs and location considerations are not problematic, then an alternative/redundant road can be built.
Electricity
Every disaster marks the nation, but it should addition-ally serve to alert the population to the probable recur-rence of such a devastating event and the possibility that it might next occur on an even larger scale.
It is gratifying that most electricity installations are long-term investments, especially transmission lines and, to some extent, distribution lines. This partly accounts for the fact that supply was immediately restored when the floods receded. It will be difficult to estimate any costs, because the entire subsector is undergoing repo-sitioning. Any costs therefore should be factored into the new arrangement. Disaster risk reduction in the subsector should consider the following:
NIGERIA Post-Disaster Needs Assessment 2012 Floods92
■n Replace wooden distribution poles with concrete ones.
■n Elevate transformers above possible flood levels in cases where they cannot simply be relocated.
■n Ensure safety standards and global best practices.
■n Mitigate losses in electricity supply. In electricity supply to final consumers, losses refer to the amounts of electricity injected into the transmission and distribution grids that are not paid for by users. Total losses have two components: technical and non-technical. Technical losses occur naturally and consist mainly of power dissipation in electricity system components, such as transmission and distribution lines, transformers, and measurement systems. Non-technical losses are caused by actions external to the power system and consist primarily of electricity theft, non-payment by customers, and errors in accounting and record-keeping. These three categories of losses are respectively sometimes referred to as commercial, non-payment, and administrative losses.
■n Meter and bill for electricity actually consumed by users, as this is integral to the commercial management of an electricity utility. Another critical task is the collection of the billed amounts.
■n Ensure the effective performance in both functions, which is critical to the financial viability of the company. From an operational point of view, metering-billing and collection are separate functions and they require distinct management approaches.
Health
■n Develop comprehensive national policies on increasing the safety and emergency preparedness of health facilities (HFs) and staff.
■n Draft comprehensive guidelines on how to implement a safe hospital program, including mechanisms on how to control and supervise health infrastructural projects, land-use planning, architectural design, and building codes standards for the development and maintenance of HFs.
■n Develop and coordinate multisectoral programs related to the safety of health facilities and
emergency preparedness.
■n Ensure that the development of proposals and plans for all new HFs include hazard and vulnerability assessments.
■n Assess existing HFs to identify the priorities for retrofitting and other actions, e.g. using the Hospital Safety Index.
• Developtrainingcoursesinsafetyandemergencypreparedness in undergraduate, graduate, and continuing professional courses for construction, health and other sectors.
• Initiateprogramstoreduceunderlyingriskfactors.
Education
Short Term■n At the national level, establish an Education in Emergencies Working Group to coordinate the education response and preparedness/disaster risk reduction in education. When the working group is up and running at the national level, roll out a similar system at the state level.
■n Building on the existing Education Management Information System, establish a user-friendly information management system that will allow collection, analysis, and sharing of information essential for partners to make coordinated, informed, evidence-based, and strategic decisions on: a) the education needs of affected populations; b) the prioritization of these needs; c) the key gaps in activities to meet prioritized needs; and d) what capacity (human, material, financial) is required in support of the identified prioritized response needs.
■n Preposition appropriate teaching and learning materials in areas with recurrent emergencies, including floods.
■n Organize hygiene education trainings for school communities, including cholera prevention and distribution of key health messages.
Medium Term■n Train ministry of education focal points at the federal and state level on education in emergencies:
93CHAPTER 6: DISASTER RISK MANAGEMENT IN NIGERIA
• Conductingassessments
• Coordinatingpreparedness
• Coordinatingaresponse
■n Revise the education portion of the national contingency plan in line with the Education in Emergencies Working Group’s strategy.
■n Develop guidelines on the use of schools as shelters, aimed at: a) avoiding the use of schools as shelters, and b) reducing the impact on education when schools are used as shelters.
■n Use the experiences with the provision of psychosocial support training to develop a standard training module for use in future emergencies.
Long Term■n Build Back Better in flood-prone areas:
• Assessthesitebeforereconstructingaschoolandconsider relocation when needed.
• Elevatethebuilding(onstiltsorearthfill).
• Create(earthenorconcrete)floodbarriers.
• Improvebuildingstopreventtheirdestructioninthe next floods (e.g., do not construct schools or teachers’ quarters in mud).
• Build good drainage systems (also to drainfloodwaters if they breach the barriers).
• Install all electrical, mechanical and plumbingsystems above the expected flood level.
• Ensure that school toilet facilities are locatedabove expected flood elevation and downstream and down slope of school facilities.
• Diverthightensionpowerlinesintheschoolarea.
• Advocatefortheenforcementofbuildingcodes.
• Revisetheministry’sbuildingcodetoensurethatconstruction is hazard-resilient.
■n Assess the extent to which DRR is included in (pre-service and in-service) teacher training and advocate for the necessary reforms.
■n Assess the extent to which DRR is included in the school curriculum in primary and secondary schools and advocate for the necessary reforms.
■n Assess the need to teach children in flood-prone areas to swim and take the appropriate initiatives.
■n Work with School-Based Management Committees and Parent-Teacher Associations to limit the impact of disasters on education in their communities by:
• Develop maintenance plans for the schools,engaging the community, pupils and local authorities.
• Prepareschool-basedpreparednessandresponseplans (including the identification of safe areas, evacuation plans and drills, safe storage of teaching and learning materials in case of an emergency, school response kits, etc.)
Gender
Train and retrain women, empower and involve them in the entire process.
Environmental Management
■n Conserve and restore vegetation and forests in mountainous areas, woodlands, etc..
■n Maintain and expand the forest population in the river basin by semi-natural reforestation, particularly in mountain and hilly ranges.
■n Conserve and restore degraded wetlands and floodplains, including reconnecting rivers with their floodplains. The maintenance of the vegetation edging a waterway is, however, necessary in a way that is both respectful of the wealth and biodiversity of these environments and effective against the risk of flood damage.
■n Improve land reclamation, including reducing the drainage of the landscape, reversing the straightening of watercourses and bank reinforcement, while ceasing the drainage of swamps, as it will be contrary to the objective of flood prevention.
■n Reclaim former floodplains and lakes by creating buffer zones, relocating dykes, and opening natural levees by creating inlets at the deepest terrain sections, in order to reincorporate these areas as natural retention areas into the discharge dynamic.
■n Ensure land uses are appropriate to areas prone to
NIGERIA Post-Disaster Needs Assessment 2012 Floods94
flooding and erosion, enhance soil conservation by avoiding excessive soil compaction and erosion.
■n Develop manageable flood polders, which should preferably be used as extensive grassland or to restore alluvial forests, at selected locations of former floodplains to lower flood peaks.
■n Increase the flood conveyance capacity of the flood bed in the middle and lower river sections where the natural slope of the river is too little by
making every possible effort to dismantle manmade obstacles of flow, by encouraging appropriate land uses, e.g. rehabilitation of pastures and mosaic-type floodplain forests in the floodway, by creating bypassing channels in the flood bed (where possible and if necessary), and by increasing the flow capacity of bridge sections.
■n Limit soil sealing as part of urbanization. Unsealing measures promote rainwater infiltration.
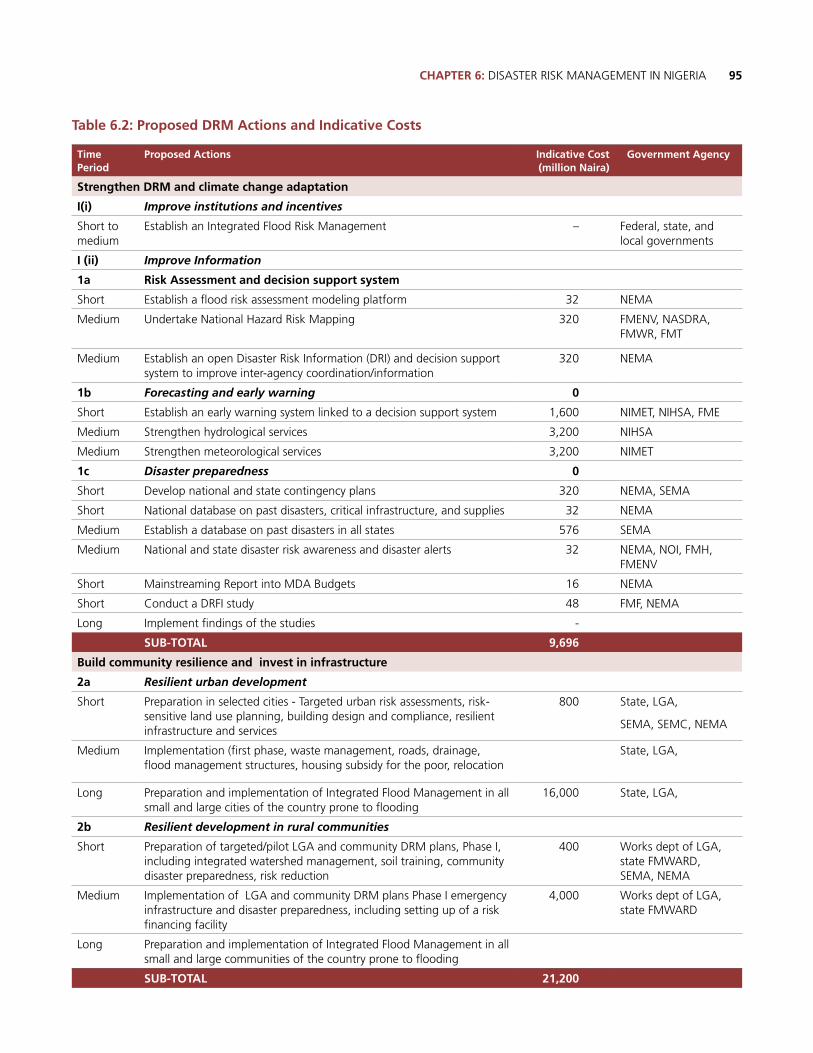
95CHAPTER 6: DISASTER RISK MANAGEMENT IN NIGERIA
Table 6.2: Proposed DRM Actions and Indicative Costs
Time Period
Proposed Actions Indicative Cost (million Naira)
Government Agency
Strengthen DRM and climate change adaptation
I(i) Improve institutions and incentives
Short to medium
Establish an Integrated Flood Risk Management – Federal, state, and local governments
I (ii) Improve Information
1a Risk Assessment and decision support system
Short Establish a flood risk assessment modeling platform 32 NEMA
Medium Undertake National Hazard Risk Mapping 320 FMENV, NASDRA, FMWR, FMT
Medium Establish an open Disaster Risk Information (DRI) and decision support system to improve inter-agency coordination/information
320 NEMA
1b Forecasting and early warning 0
Short Establish an early warning system linked to a decision support system 1,600 NIMET, NIHSA, FME
Medium Strengthen hydrological services 3,200 NIHSA
Medium Strengthen meteorological services 3,200 NIMET
1c Disaster preparedness 0
Short Develop national and state contingency plans 320 NEMA, SEMA
Short National database on past disasters, critical infrastructure, and supplies 32 NEMA
Medium Establish a database on past disasters in all states 576 SEMA
Medium National and state disaster risk awareness and disaster alerts 32 NEMA, NOI, FMH, FMENV
Short Mainstreaming Report into MDA Budgets 16 NEMA
Short Conduct a DRFI study 48 FMF, NEMA
Long Implement findings of the studies -
SUB-TOTAL 9,696
Build community resilience and invest in infrastructure
2a Resilient urban development
Short Preparation in selected cities - Targeted urban risk assessments, risk-sensitive land use planning, building design and compliance, resilient infrastructure and services
800 State, LGA,
SEMA, SEMC, NEMA
Medium Implementation (first phase, waste management, roads, drainage, flood management structures, housing subsidy for the poor, relocation
State, LGA,
Long Preparation and implementation of Integrated Flood Management in all small and large cities of the country prone to flooding
16,000 State, LGA,
2b Resilient development in rural communities
Short Preparation of targeted/pilot LGA and community DRM plans, Phase I, including integrated watershed management, soil training, community disaster preparedness, risk reduction
400 Works dept of LGA, state FMWARD, SEMA, NEMA
Medium Implementation of LGA and community DRM plans Phase I emergency infrastructure and disaster preparedness, including setting up of a risk financing facility
4,000 Works dept of LGA, state FMWARD
Long Preparation and implementation of Integrated Flood Management in all small and large communities of the country prone to flooding
SUB-TOTAL 21,200
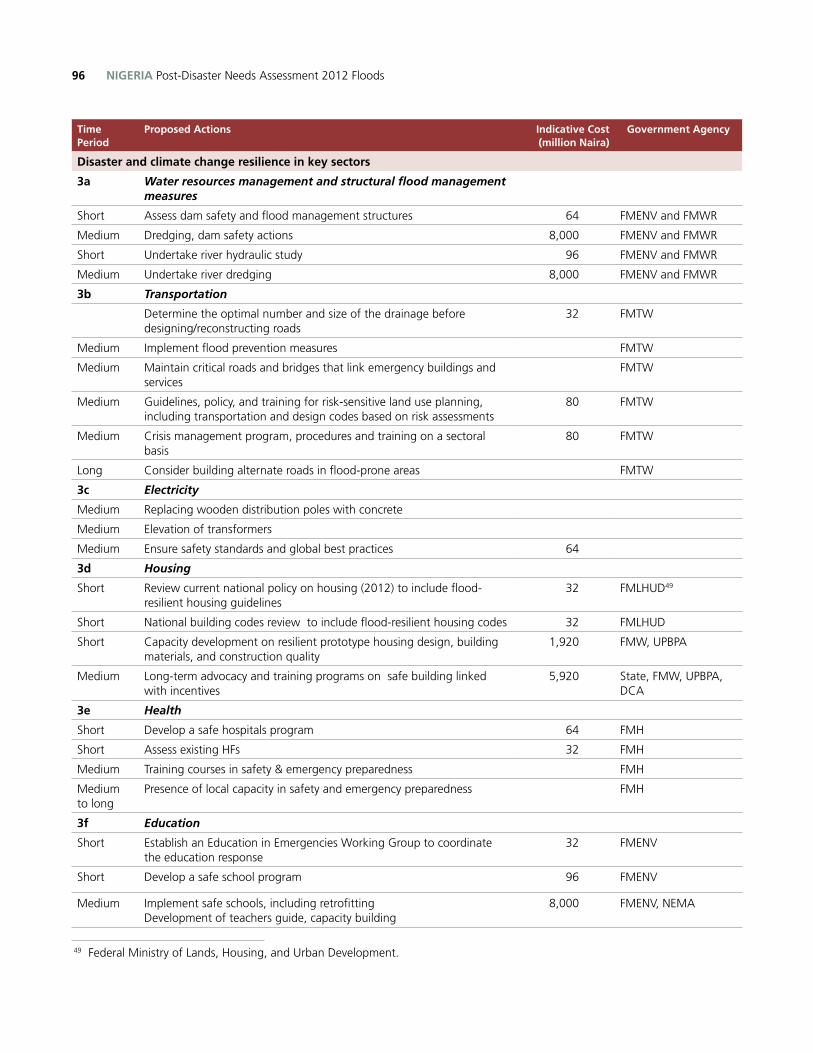
NIGERIA Post-Disaster Needs Assessment 2012 Floods96
Time Period
Proposed Actions Indicative Cost (million Naira)
Government Agency
Disaster and climate change resilience in key sectors
3a Water resources management and structural flood management measures
Short Assess dam safety and flood management structures 64 FMENV and FMWR
Medium Dredging, dam safety actions 8,000 FMENV and FMWR
Short Undertake river hydraulic study 96 FMENV and FMWR
Medium Undertake river dredging 8,000 FMENV and FMWR
3b Transportation
Determine the optimal number and size of the drainage before designing/reconstructing roads
32 FMTW
Medium Implement flood prevention measures FMTW
Medium Maintain critical roads and bridges that link emergency buildings and services
FMTW
Medium Guidelines, policy, and training for risk-sensitive land use planning, including transportation and design codes based on risk assessments
80 FMTW
Medium Crisis management program, procedures and training on a sectoral basis
80 FMTW
Long Consider building alternate roads in flood-prone areas FMTW
3c Electricity
Medium Replacing wooden distribution poles with concrete
Medium Elevation of transformers
Medium Ensure safety standards and global best practices 64
3d Housing
Short Review current national policy on housing (2012) to include flood-resilient housing guidelines
32 FMLHUD49
Short National building codes review to include flood-resilient housing codes 32 FMLHUD
Short Capacity development on resilient prototype housing design, building materials, and construction quality
1,920 FMW, UPBPA
Medium Long-term advocacy and training programs on safe building linked with incentives
5,920 State, FMW, UPBPA, DCA
3e Health
Short Develop a safe hospitals program 64 FMH
Short Assess existing HFs 32 FMH
Medium Training courses in safety & emergency preparedness FMH
Medium to long
Presence of local capacity in safety and emergency preparedness FMH
3f Education
Short Establish an Education in Emergencies Working Group to coordinate the education response
32 FMENV
Short Develop a safe school program 96 FMENV
Medium Implement safe schools, including retrofitting Development of teachers guide, capacity building
8,000 FMENV, NEMA
49 Federal Ministry of Lands, Housing, and Urban Development.
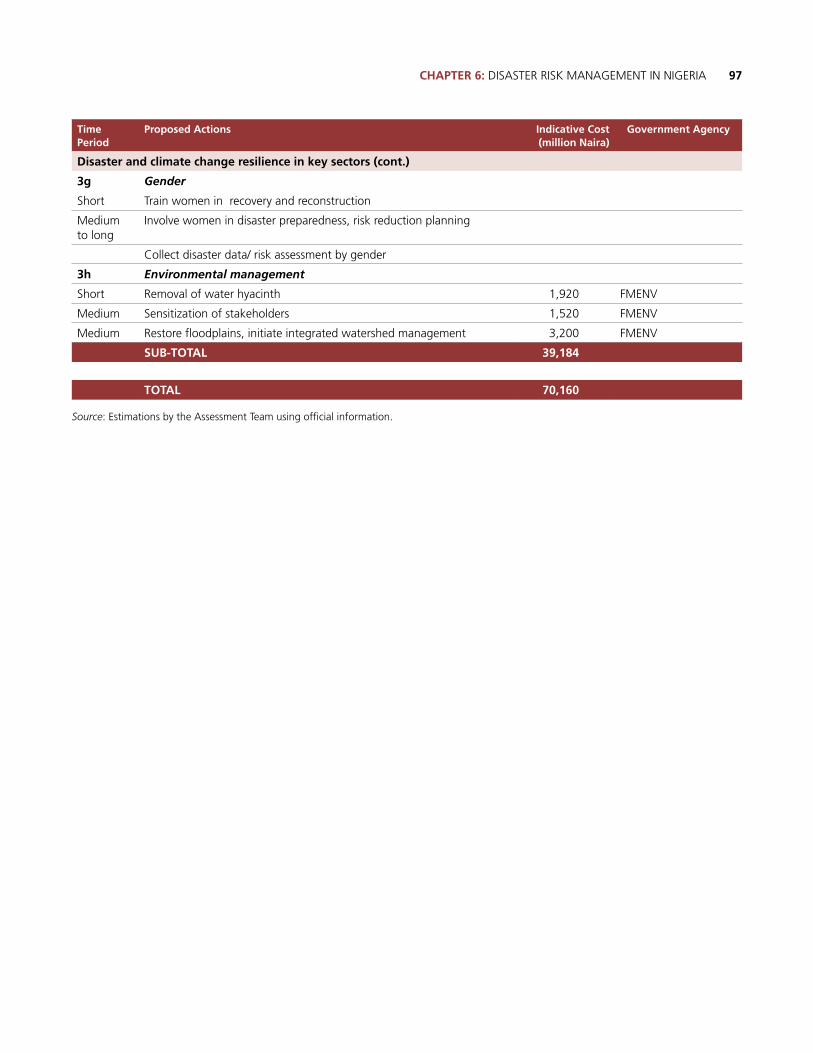
97CHAPTER 6: DISASTER RISK MANAGEMENT IN NIGERIA
Time Period
Proposed Actions Indicative Cost (million Naira)
Government Agency
Disaster and climate change resilience in key sectors (cont.)
3g Gender
Short Train women in recovery and reconstruction
Medium to long
Involve women in disaster preparedness, risk reduction planning
Collect disaster data/ risk assessment by gender
3h Environmental management
Short Removal of water hyacinth 1,920 FMENV
Medium Sensitization of stakeholders 1,520 FMENV
Medium Restore floodplains, initiate integrated watershed management 3,200 FMENV
SUB-TOTAL 39,184
TOTAL 70,160
Source: Estimations by the Assessment Team using official information.
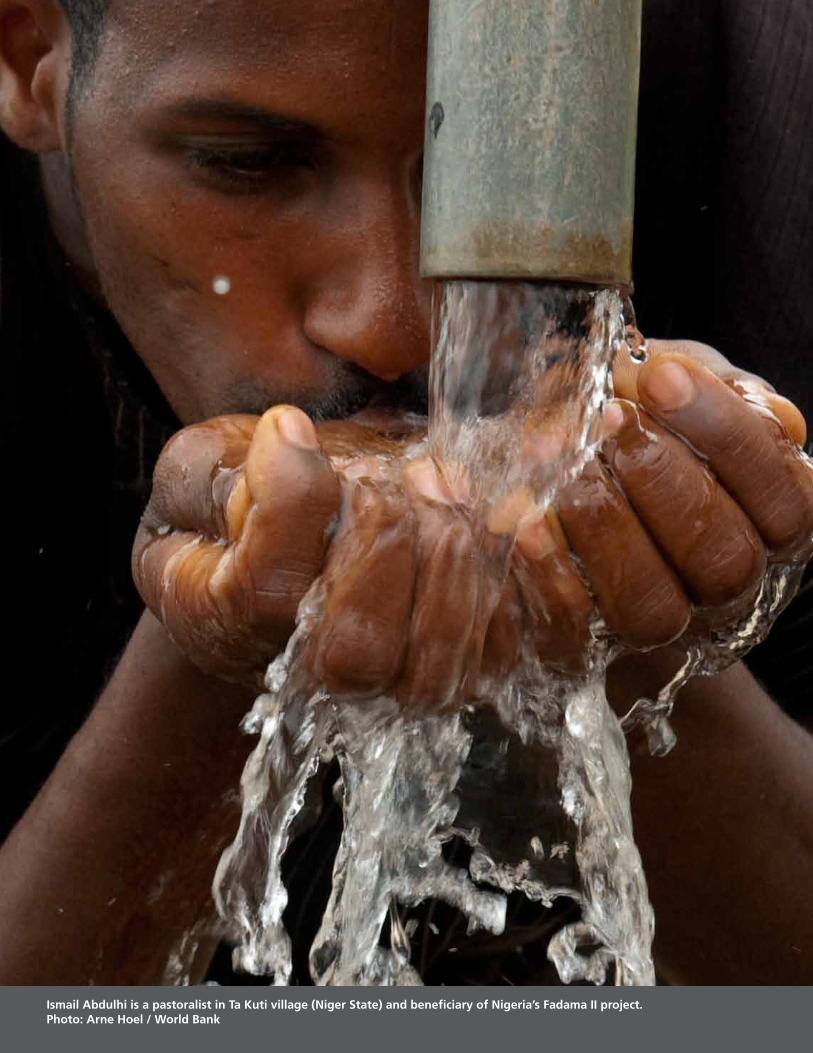
Ismail Abdulhi is a pastoralist in Ta Kuti village (Niger State) and beneficiary of Nigeria’s Fadama II project. Photo: Arne Hoel / World Bank
99CHAPTER 7: TRANSITIONAL RECOVERY, AND RECONSTRUCTION FRAMEWORK
7.1 Introduction
The calamities wrought by the 2012 floods offer an important window of opportunity to address difficult, long-standing development issues. The challenge now is to make full use of this opportunity. If Nigeria rises to the challenge, it will facilitate modernization of the country overall and the Niger and Benue river basins in particular, with improved living conditions for its popu-lation. If it does not rise to the challenge, the country will be increasingly at risk from the impacts of recur-rent floods, as well as the negative impacts of possible future climate change.
Instead of letting Nigeria’s vulnerability to floods in-crease, federal and state authorities and the private sector should together shore up Nigeria’s flood re-silience. With more extreme weather and devastat-ing floods likely in store in the decades ahead, public safety and economic security depend on strengthening vulnerable poor residents’ natural resource-based liveli-hoods and jobs.
A robust recovery and reconstruction framework pro-vides a sequenced, prioritized, programmatic, yet flexible (living) action plan to guide the recovery and reconstruction process that addresses the following questions:
■n Why is a recovery and reconstruction framework needed?
■n What are the goals of recovery and reconstruction? How to prioritize the identified needs? What is the timeline for implementing identified actions?
■n What implementation arrangements can ensure coordinated and efficient actions?
■n What are the monitoring and evaluation arrange-ments to track progress?
■n Why and how to ensure social equity, community participation, and public awareness throughout recovery and reconstruction?
When fully fleshed out and operationalized, such a framework could help governments, donors and other stakeholders to:
■n Maintain a cohesive and flexible structure for managing the overall recovery and reconstruction process, including communication flows and information feedback loops;
■n Clarify roles, responsibilities, and institutional arrangements to capitalize on the strengths of each stakeholder, and augment capacity where needed;
■n Effectively prioritize, sequence, and drive multi-sectoral and cross-cutting recovery decisions, activities, and allocation of resources;
■n Systematically integrate disaster risk reduction in reconstruction and recovery and formalize policy and strategic linkages across recovery and regular development processes;
■n Implement recommendations and strategies outlined in the PDNA;
■n Assist in establishing robust and criteria-based monitoring and evaluation systems for recovery;
■n Apply lessons learned from other countries and adapt them to national contexts.
This chapter starts by describing guiding principles for recovery and reconstruction, including a discus-sion on the “build-back-better” approach. Sectoral needs, current interventions, and institutional capaci-ties are presented in the next section. A potential ac-tion plan consisting of priorities, timeline, monitoring and evaluation arrangements, financing options, and technical support is presented in Section 7.4. Com-
CHAPTER 7: TRANSITIONAL RECOVERY, AND RECONSTRUCTION FRAMEWORK
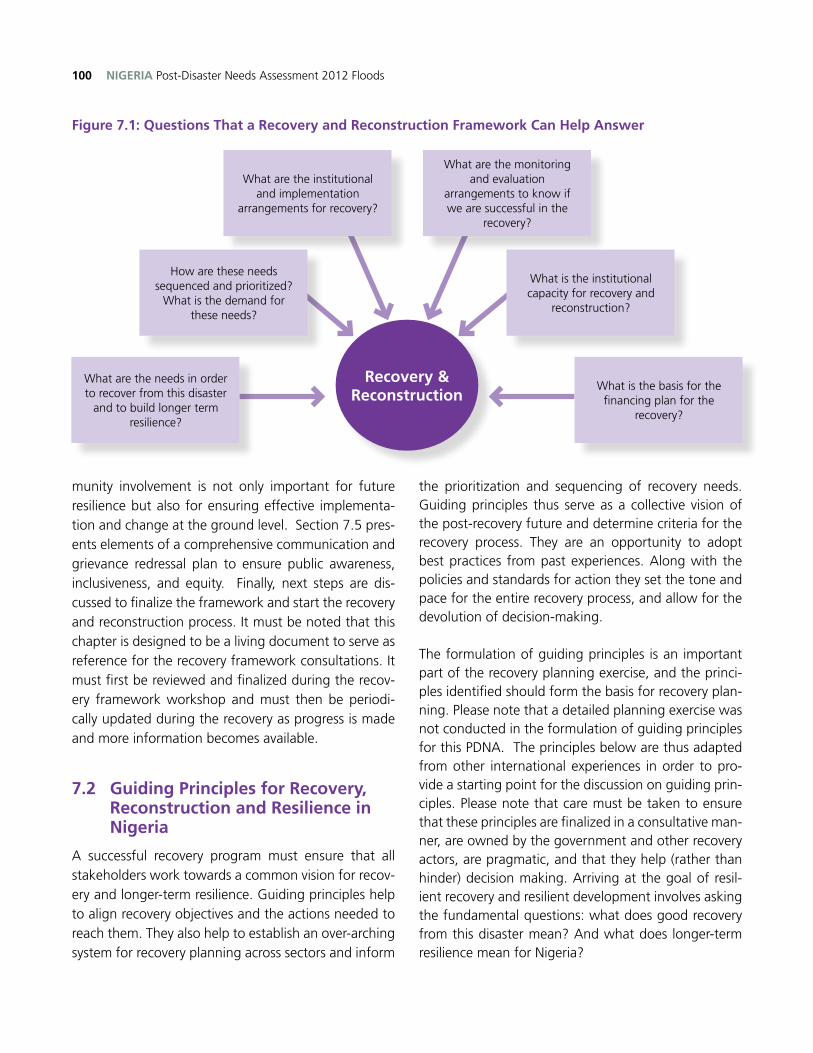
NIGERIA Post-Disaster Needs Assessment 2012 Floods100
munity involvement is not only important for future resilience but also for ensuring effective implementa-tion and change at the ground level. Section 7.5 pres-ents elements of a comprehensive communication and grievance redressal plan to ensure public awareness, inclusiveness, and equity. Finally, next steps are dis-cussed to finalize the framework and start the recovery and reconstruction process. It must be noted that this chapter is designed to be a living document to serve as reference for the recovery framework consultations. It must first be reviewed and finalized during the recov-ery framework workshop and must then be periodi-cally updated during the recovery as progress is made and more information becomes available.
7.2 Guiding Principles for Recovery, Reconstruction and Resilience in Nigeria
A successful recovery program must ensure that all stakeholders work towards a common vision for recov-ery and longer-term resilience. Guiding principles help to align recovery objectives and the actions needed to reach them. They also help to establish an over-arching system for recovery planning across sectors and inform
the prioritization and sequencing of recovery needs. Guiding principles thus serve as a collective vision of the post-recovery future and determine criteria for the recovery process. They are an opportunity to adopt best practices from past experiences. Along with the policies and standards for action they set the tone and pace for the entire recovery process, and allow for the devolution of decision-making.
The formulation of guiding principles is an important part of the recovery planning exercise, and the princi-ples identified should form the basis for recovery plan-ning. Please note that a detailed planning exercise was not conducted in the formulation of guiding principles for this PDNA. The principles below are thus adapted from other international experiences in order to pro-vide a starting point for the discussion on guiding prin-ciples. Please note that care must be taken to ensure that these principles are finalized in a consultative man-ner, are owned by the government and other recovery actors, are pragmatic, and that they help (rather than hinder) decision making. Arriving at the goal of resil-ient recovery and resilient development involves asking the fundamental questions: what does good recovery from this disaster mean? And what does longer-term resilience mean for Nigeria?
Figure 7.1: Questions That a Recovery and Reconstruction Framework Can Help Answer
Recovery &Reconstruction
What are the needs in order to recover from this disaster
and to build longer term resilience?
How are these needs sequenced and prioritized?
What is the demand for these needs?
What is the basis for the financing plan for the
recovery?
What is the institutional capacity for recovery and
reconstruction?
What are the institutional and implementation
arrangements for recovery?
What are the monitoring and evaluation
arrangements to know if we are successful in the
recovery?
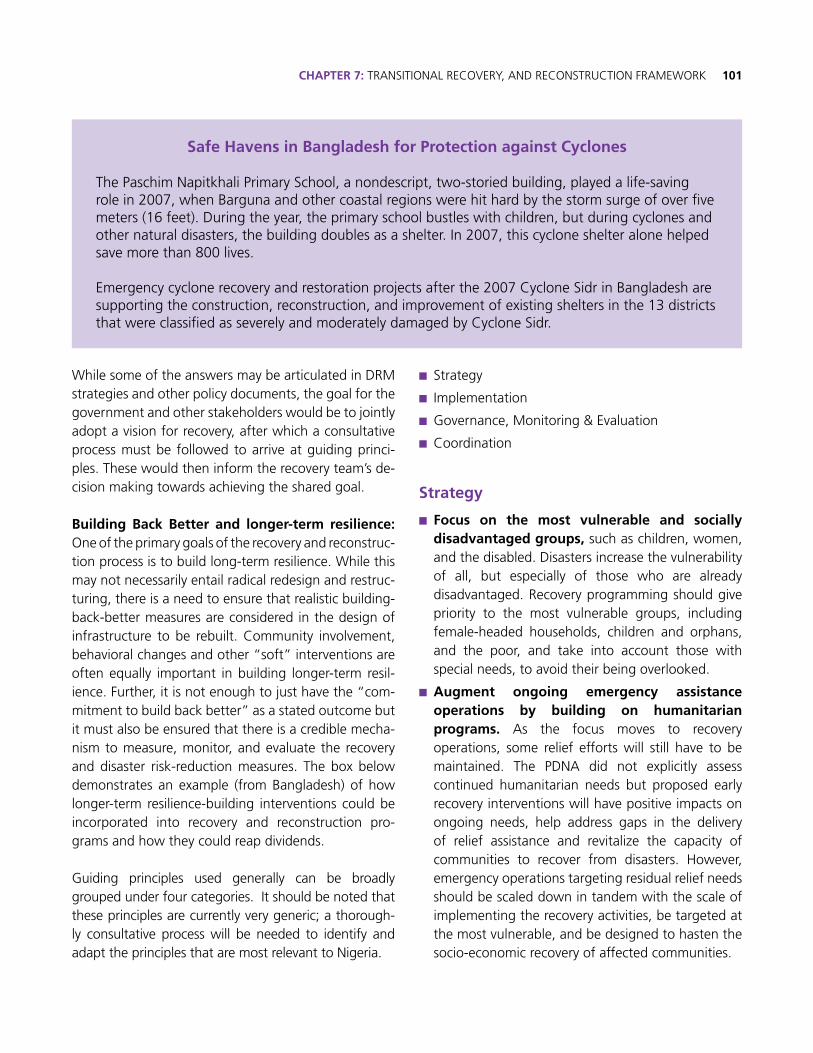
101CHAPTER 7: TRANSITIONAL RECOVERY, AND RECONSTRUCTION FRAMEWORK
While some of the answers may be articulated in DRM strategies and other policy documents, the goal for the government and other stakeholders would be to jointly adopt a vision for recovery, after which a consultative process must be followed to arrive at guiding princi-ples. These would then inform the recovery team’s de-cision making towards achieving the shared goal.
Building Back Better and longer-term resilience: One of the primary goals of the recovery and reconstruc-tion process is to build long-term resilience. While this may not necessarily entail radical redesign and restruc-turing, there is a need to ensure that realistic building-back-better measures are considered in the design of infrastructure to be rebuilt. Community involvement, behavioral changes and other “soft” interventions are often equally important in building longer-term resil-ience. Further, it is not enough to just have the “com-mitment to build back better” as a stated outcome but it must also be ensured that there is a credible mecha-nism to measure, monitor, and evaluate the recovery and disaster risk-reduction measures. The box below demonstrates an example (from Bangladesh) of how longer-term resilience-building interventions could be incorporated into recovery and reconstruction pro-grams and how they could reap dividends.
Guiding principles used generally can be broadly grouped under four categories. It should be noted that these principles are currently very generic; a thorough-ly consultative process will be needed to identify and adapt the principles that are most relevant to Nigeria.
■n Strategy
■n Implementation
■n Governance, Monitoring & Evaluation
■n Coordination
Strategy
■n Focus on the most vulnerable and socially disadvantaged groups, such as children, women, and the disabled. Disasters increase the vulnerability of all, but especially of those who are already disadvantaged. Recovery programming should give priority to the most vulnerable groups, including female-headed households, children and orphans, and the poor, and take into account those with special needs, to avoid their being overlooked.
■n Augment ongoing emergency assistance operations by building on humanitarian programs. As the focus moves to recovery operations, some relief efforts will still have to be maintained. The PDNA did not explicitly assess continued humanitarian needs but proposed early recovery interventions will have positive impacts on ongoing needs, help address gaps in the delivery of relief assistance and revitalize the capacity of communities to recover from disasters. However, emergency operations targeting residual relief needs should be scaled down in tandem with the scale of implementing the recovery activities, be targeted at the most vulnerable, and be designed to hasten the socio-economic recovery of affected communities.
Safe Havens in Bangladesh for Protection against Cyclones
The Paschim Napitkhali Primary School, a nondescript, two-storied building, played a life-saving role in 2007, when Barguna and other coastal regions were hit hard by the storm surge of over five meters (16 feet). During the year, the primary school bustles with children, but during cyclones and other natural disasters, the building doubles as a shelter. In 2007, this cyclone shelter alone helped save more than 800 lives.
Emergency cyclone recovery and restoration projects after the 2007 Cyclone Sidr in Bangladesh are supporting the construction, reconstruction, and improvement of existing shelters in the 13 districts that were classified as severely and moderately damaged by Cyclone Sidr.
NIGERIA Post-Disaster Needs Assessment 2012 Floods102
Align recovery interventions with key national DRM policies.
■n Move from a culture of response to one of long-term resilience to address long-term vulnerability and risks. To help prepare effectively to reduce future disaster risks, recovery interventions should be designed to promote resilience to future shocks by including utilizing this window of opportunity to bring attention to the importance of DRR and the need to integrate risk reduction at both policy and sector levels in national, state, and local development. As such, recommended recovery measures should also help catalyze dialogue between government, communities, and development partners to link ex-ante disaster prevention and climate change.
■n Leverage flood recovery to prepare for future and multiple hazard events. Effective recovery should reduce exposure to and impacts of future hazards, whether they occur as independent events due to climate change or as cascading effects of the current flood hazard. At the time of the PDNA, several communities were still underwater, while the flood waters had subsided in some. Communities expressed concern about further flooding in the 2013 rainy season, given the high level of residual soil moisture due to the 2012 flood and likely high rainfall in 2013. In view of the likelihood of these related future hazards, recovery interventions need to involve measures to reduce underlying vulnerabilities and exposure to multiple hazards. This requires that recommended recovery measures stimulate change and policy development to “build back better” and thus reduce future risks from major hazards (including drought).
■n Include the community and use local knowledge and skills. This ensures the optimal use of local initiatives, resources, and capacities. Planning and execution is based on local knowledge, skills, materials and methods, and enterprises, taking into account the need for affordable solutions. This principle further promotes community participation in all aspects of the recovery process and partnering with local institutions. This will allow post-flood assistance to support and build on spontaneous recovery
initiatives by affected communities. It encourages decision-making concerning planning, design, and implementation at the lowest level possible, to promote community ownership and empowerment, and to ensure solutions are locally appropriate.
■n Secure development gains while differentiating between regular development and disaster recovery. Recovery planning must attempt to re-establish and secure previous development gains, and areas not affected by the disaster should not lose out due to increased allocation of public resources to the disaster-affected areas. It must, however, be noted that while disaster recovery provides opportunities for improving the disaster-resilience of affected infrastructure and assets, it should not include improvements or enhancements that fall under the purview of regular development.
■n Adopt a phased approach to recovery involving immediate and longer-term interventions. The early recovery component of the assistance program should be based on a strategy of meeting immediate needs while providing the first opportunity for the affected population to rebuild the homes, lives, and living environment devastated by the flood. Meeting these priority early recovery needs requires a three-pronged approach, involving: (a) providing quick response to those in need immediately after the humanitarian phase; (b) supporting the repair of vital community infrastructure while providing temporary employment opportunities to restore lost income (this would be scaled down progressively as normal recovery ensues); and (c) facilitating local economic recovery and development to resume economic growth by helping to restore the normal productive livelihoods of affected communities. Longer-term effective recovery requires a comprehensive strategic approach that ensures hazard-resistant reconstruction, sustainable economic recovery, and reduced exposure and vulnerability to disaster risks, thereby ensuring resilience, through: (a) reconstruction and improvement of social and economic infrastructure; (b) livelihood recovery, economic regeneration, and social protection; (c) ecosystem protection and enhancement; and (d) disaster preparedness, response, and risk-reduction capacity development.
103CHAPTER 7: TRANSITIONAL RECOVERY, AND RECONSTRUCTION FRAMEWORK
■n Prioritize and sequence needs in the overall Recovery Framework. The prioritizing and sequencing of needs across sectors must be done after internal prioritizing is complete within each sector. This must then be done at a cross-sector level through a consultative process which includes representatives from all sectors, ensuring that the needs of every sector are given due priority. Furthermore, a distinction must be made between what is urgent (must be done immediately) versus what is important (must be done regardless of time).
■n Build on lessons of past experiences in disaster risk management. Planning and prioritization for recovery should be based on sound lessons of experience and practices while leveraging best practices in the region and worldwide.
■n Strengthen capacities to manage the recovery process. The capacity of local public administration, including infrastructure, must be strengthened. Along with local and national institutions, encourage and empower all levels of civil society to participate in and manage the recovery process. In this regard, the role of local governments needs to be given priority. It would also be important to mobilize private investment—both human and financial—by ensuring that the local private sector has incentives and technology to participate fully in reconstruction.
■n Further strengthen institutions and their ability to manage risks. Recovery efforts should strive to strengthen existing institutional structures and build long-term capacity to manage disasters, particularly floods, drought, and food crises.
Implementation
■n Prioritize service delivery support to local governments directly in the short term and implement a program of capacity building over the long term. Even prior to disasters, affected areas typically have limited capacity to implement development programs. Disasters usually only exacerbate this, and there is a need to assess and prioritize capacity development.
■n Maintain realistic recovery programming while exploring innovative and ambitious approach-
es for implementation. Planning strategically and conservatively to ensure that there is sufficient ca-pacity to undertake recovery tasks while developing innovative efficiency mechanisms.
■n Institutionalize urgency. Assessing current institutional arrangements, including processes and procedures for recovery interventions, and if necessary, review and streamline them or develop special dispensation for key recovery processes.
Governance, Monitoring & Evaluation
■n Develop a strong monitoring and evaluation (M&E) system to ensure that the course of recovery, reconstruction, and DRR activities get completed in a timely way. An M&E mechanism must be used as a tool that brings together all the recovery, reconstruction, and disaster risk-reduction initiatives that have been envisaged towards delivering results as a coherent whole. The users and target audience of the performance management tools should be the managers of these programs and the projects that make up the recovery programs going forward.
■n Employ a dedicated body within the govern-ment to own and implement the results agenda for recovery, reconstruction, and disaster risk reduction with adequate resources for its successful function-ing.
■n Leverage existing capacities. The capacity of existing M&E systems must be first assessed and any existing capacities and resources must be leveraged. Further, the capacities and resources of development partners’ M&E must be assessed in order to ensure a harmonized M&E framework for recovery and to leverage synergies.
■n Maximize credibility through independent oversight mechanisms, third-party monitoring, and community-based grievance redress mechanisms.
Coordination
■n Need for a coordinated effort. In order to create a lasting impact for affected communities, it is imperative that all actors work in concert to put in
NIGERIA Post-Disaster Needs Assessment 2012 Floods104
place and successfully execute interventions that are geared toward building long-term resilience. It will be important to ensure harmonization between all stakeholders involved in needs planning and execution. As seen in the next section, there are several institutional stakeholders in recovery and reconstruction, thus there is a critical need to bridge relief, recovery, reconstruction, and disaster risk reduction efforts.
7.3 Institutional Capacity Analysis
Flood recovery and reconstruction
A number of government agencies are likely to be involved in flood recovery and reconstruction at the federal level. These activities are currently conducted with limited intersectoral coordination among the in-stitutions involved. In addition, these institutions are under-funded and have limited technical capacity to address gully erosion in an integrated approach. Ca-pacity analysis of some of the key government agen-cies is discussed below.
Flood response and recovery: National Emergency Management Agency (NEMA)
Responding to communities affected by disasters such as floods, droughts, erosion, wind/rain storms, and hazards from such disasters as fires, epidemics, and the destruction of infrastructure is the responsibility of the Nigeria Emergency Management Agency (NEMA). NE-MA’s mandate includes educating the public in order to raise levels of awareness and preparedness, as well as detecting disasters and responding to them in a timely manner. It is an independent agency under the Presi-dency. The Governing Council, which oversees activi-ties of the Agency, is comprised of representatives from various MDAs.50 NEMA’s departments include training; search and rescue; relief and rehabilitation; planning, research and forecasting for disaster management;
50 Members of the Governing Council include the Federal Ministries of Aviation, Foreign Affairs, Health, Internal Affairs, Transport, Environment, Water Resources, Works and Housing, Nigeria Police Force, Nigeria Red Cross Society and is chaired by the Vice President of Nigeria.
and two non-technical departments, which are finance and administration. NEMA has six zonal offices, which in the last year have been strengthened by the recruit-ment of around 192 new staff.
The Mission Control Center
Nigeria’s Mission Control Center (MCC) is located in NEMA and is an aid to search and rescue operations, which are able to receive and process distress alerts from aircrafts, vessels, and land users. This is able to provide location information on distress victims to search and rescue teams and as such would be an important tool that can be used in erosion disasters for timely evacuation. The center has been decommis-sioned and relocated since NEMA’s headquarters be-gan renovations in 2009, however, the Spanish MCC is currently providing backup. In 2009, the MCC received 103 distress alert signals and only three were real while others were false alerts due to poor handling of the beacons. This tool would be useful in informing com-munities of erosion disasters.
State Emergency Management Agencies
NEMA depends heavily on the coordination and col-laboration of state and local governments to effectively implement its mandate, which has affected its effec-tiveness to respond to disasters in a timely manner. The Act establishing NEMA51 calls for state governments to establish their autonomous State Emergency Man-agement Agencies (SEMAs) to take charge of disaster management in the states while NEMA operates at the federal level and is only called upon to participate in disaster management operations that are beyond SEMAs’ capacity. Many SEMAs lack training from state government to prepare them for the task of manag-ing disasters in their individual states.52 This has led to NEMA functioning mostly in isolation.
NEMA Zonal Officers
In addition to the challenges faced by SEMAs, most zonal offices experience difficulties in responding effi-
51 Act 12 as amended by Act 150 of 1999.52 NEMA, Annual report 2009, July 2010.
105CHAPTER 7: TRANSITIONAL RECOVERY, AND RECONSTRUCTION FRAMEWORK
ciently to disasters. These include equipment with lim-ited functionality and a lack of funding due to delays in allocating funds from Headquarters. For example, some zonal offices lack the drivers and vehicles nec-essary for conducting operations.53 There have been delays in the procurement and delivery of relief ma-terials by contractors to zonal warehouses, which has affected logistical activities. In addition, the failure to carry out direct distribution of disaster relief materials to local governments has made delivery to disaster vic-tims very uncertain.
So far, limited activities have been conducted by NE-MA’s zonal office in the southeast regarding erosion. Rescue activities have focused mainly on flooding, fires, and rain/wind storms. Zonal offices mainly orga-nize sensitization workshops on disaster management for civil servants in relevant state MDAs and carry out assessment of disasters that have taken place, thereby providing recommendations for relief assistance to af-fected communities. For example, in Anambra, an as-sessment was carried out on erosion, while another was conducted in Ebonyi regarding wind storms.
Recovery and Reconstruction in Agriculture – Ministry of Agriculture
The Federal Ministry of Agriculture is the key Ministry responsible for sustainable land management issues. Its mandate includes the implementation of the national agriculture policy, technical support to land-use plan-ning, soil management, soil capacity evaluation, and soil resource management. The Ministry is divided into various technical departments and soil erosion and wa-tershed management activities fall under the Depart-ment of Agriculture and Land Resources. The mandate of the Department of Agriculture and Land Resources includes continuous inventory and assessment of land resources, for agriculture, rehabilitation of degraded land area affected by drought, desert encroachment, soil erosion, and flood.
The Department has four technical divisions dealing with erosion and watershed management: soil and fer-
53 Ibid.
tility testing, soil survey and land evaluation, soil fertility management, and land use conservation. In addition, there is a specialized GIS and remote sensing division under the Department. Each division comprises a desk officer and five to 10 support staff members. The unit on land use conservation is responsible for conduct-ing studies on erosion in agricultural land. Much of the work on erosion undertaken by this Department is in the form of studies on the causes of land degradation and types of mitigation measures in relation to agricul-tural land. Proposed projects include farmland erosion control projects focusing mainly on Anambra and Edo states. The department has limited funding of its own and depends largely on the Ecological Fund or other donors for financing.
Recovery, reconstruction and resilience in Water Resources: Federal Ministry of Water Resources
The key ministry at the federal level that is responsi-ble for all matters related to water resources and their management is the Federal Ministry of Water Resourc-es. The Federal Ministry of Water Resources is responsi-ble for policy formulation and coordination of activities relating to irrigation and drainage, conservation, as well as quality and quantity control of inland water bodies.54 The Ministry enforces the mandate through its component Departments & Inspectorates (e.g., 12 River Basins, Dept. of Dam & Reservoir Operations, Dept. of Irrigation & Drainage, Hydrological Services Agency (NIHSA)) and the Nigeria Integrated Water Re-sources Management Commission (NIWRMC). The 12 River Basin Development Authorities (RBDAs) have the mandate to implement projects on erosion control un-der the FMWR.
River Basin Development Authority (RBDA)
The 1979 River Basins Development Authorities Act es-tablishes and regulates 12 river basin authorities. These are Anambra-Imo, Chad Basin, Cross River, Benin Owe-na, Lower Benue, Lower Niger, Hadeja-Jama’are, Up-
54 Ropsin, Review of Public Irrigation Sector in Nigeria, Irrigation Institutions Volume III.
NIGERIA Post-Disaster Needs Assessment 2012 Floods106
per Benue, Upper Niger, Ogun-Osun and Sokoto-Rima. They are parastatals and major implementing arms of the FMWR and are funded by the FMWR. The Director of River Basin Operations and Inspectorate based in the FMWR in Abuja performs the coordination function for all RBDAs. This newly created coordinating secretariat for RBDAs at the federal level is not yet fully staffed.
Since their creation, the RBDAs have undergone some operational and structural changes to improve their relevance and efficiency as spelt out in Decree No 35 of 1986.55 The core mandate of the RBDAs is irriga-tion, drainage, and water supply. Apart from this, the RBDAs are implementation agencies for erosion con-trol projects financed directly by the Ecological Fund, which are within the catchment, as well as constitu-ency projects.56 RBDAs are also involved in collecting hydrological data from the basins and continue to do so, although the mandate is with NIHSA.
At present, RBDAs are undergoing an organizational transformation; their future recommended structure will include a division on Integrated Water Resource Management. It is not yet known how this division would explore the possibility of integrated water man-agement and coordinate its functions with the newly formalized Integrated Water Resources Management Commission (IWRMC).
Integrated Water Resources Management Commission (IWRMC)
A Bill is in its final stages (Senate deliberations are com-pleted and it now awaits the President’s signature) to establish the IWRMC for the regulation and coordina-tion of water resources development and manage-ment. The Commission aims to introduce regulations to ensure efficient water service delivery.
IWRMC will have representative offices within each of the basins, but these would report directly to the feder-
55 Commission for the European Communities, Support to the Federal Ministry of Water, Water Resource Management Policy, June 2006, page 10.
56 These projects are funded directly by the National Assembly to be implemented in the relevant constituent.
al-level IWRMC and are not governed by a cooperative arrangement of the states. Additionally, the Board of the IWRMC is comprised predominately of representatives from federal ministries and has no state-level represen-tation. The Bill does not refer to existing RBDAs or any succeeding organizations to be established under the draft Water Resources Bill. Relationships between the IWRMC and both existing and proposed organizations are not clearly defined. In addition, the IWRMC seems to focus mainly on regulating public and private water ser-vices, without specific attention to adverse basin-wide environmental impacts, such as: (i) the impact of large water diversions for further irrigation development on floodplain communities & fisheries, and (ii) basin-wide flooding caused by high spillway discharges.57
At the state and local government level, the IWRMC will carry out its functions by establishing a catchment management officer (CMO) in each of the eight hy-drological zones. The CMO will have multidisciplinary professional staff, headed by a water resources man-agement professional with a rank not lower than that of a civil service Deputy Director. CMOs for each hy-drological zone will be set up essentially as line depart-ments of the IWRMC. This approach conflicts with the concept of integrated water resources management and cooperative state governance of river basins. There is no clear definition of which functions will be del-egated to the eight CMOs. The advisory Catchment Committees are headed by a CMO with wide repre-sentation from federal water resource development and public water service provider agencies, NIHSA, the State Water Board, State Emergency Management Agency, and community organizations. These Catch-ment Committees will advise the CMO on the imple-mentation of the Commission’s functions.
National Hydrological Services Agency (NIHSA)
NIHSA is the custodian of all water resources data. The Agency was established by the Federal Executive
57 Aide Memoirs for the Irrigation and Water resources Management project, Joint World Bank and FAO Identification mission (28th February – 15th March, 2011)
107CHAPTER 7: TRANSITIONAL RECOVERY, AND RECONSTRUCTION FRAMEWORK
Council Approval EC 18 (07) 4 of May 16, 2007. Spe-cifically, it provides services required for assessment of the nation’s surface and groundwater resources in terms of quantity, quality, distribution and availability in time and space; for the efficient and sustainable management of water resources it operates and main-tains hydrological stations nationwide and carries out groundwater exploration; and finally it is responsible for monitoring, using various scientific techniques in order to provide hydrological data needed for plan-ning, design, execution and management of water re-sources and allied projects.
The Act establishing the Agency provides for a Board in order to allow NIHSA to carry out its mandate indepen-dently and maintain an autonomous budget. The Gov-erning Board includes a Chairman and representatives of FMAWR, NIMET, three public figures, and Director Gen-eral of Agency. The powers of the Board include, among other things, formulating policies and guidelines to super-vise management and draft regulations regarding data collection. However, the Board that has been named is yet to be inaugurated and the Agency is currently headed by an Acting Director General, which means NIHSA con-tinues to depend on the FMWR for its budget.
There are other agencies involved in collecting hydro-logical data, but for specific purposes, such as pow-er generation (PHCN), water transportation (NIWA), water supply (State Water Boards), irrigation (RBDA), and enforcement (NESREA). The Agency collects data through various means: direct field measurements of relevant parameters; secondary sources, such as other agencies involved in hydrological data collection; Proj-ect Reports, Dissertations and Publications; and collab-oration with international and local agencies on data collection activities.
There are six departments within the Agency, one for general services (Administration and Finance) and five technical departments: Hydrology, Hydro Geophysics, Hydrogeo Information, Operational Hydrology, and En-gineering Hydrology. There are various Units, such as Legal, Audit, Procurement, etc. that function directly under the office of the Director-General.
NIHSA’s activities and functions have a direct relation-ship to the management of watersheds. NIHSA pro-vides data to federal and state MDAs, such as the Ministry of Environment, RBDAs, and international or-ganizations, such as FAO and UNDP. For example, the agency has shared its study on special catchment ar-eas, program on gathering of sediment transport data, hydrological mapping, baseline data for all required floodplain mapping, etc. The agency additionally col-lects hydrological data on watersheds across the eight hydrological zones. EFCZM Department’s flood fore-casting, monitoring and control division uses hydrol-ogy information from NIHSA for flood forecasting and floodplain zoning.
National Water Resources Institute (NWRI) in Kaduna
The NWRI is a training institute, located in Kaduna. It is a parastatal organization under the FMWR, designated to provide capacity-building training and education, as well as data collection and dissemination services in the field of water resources development and man-agement. NWRI is currently conducting research on water quality for domestic use, sedimentation levels of selected dams/reservoirs and their downstream socio-economic impacts on communities and on causes of flooding. Core functions of the institute include pro-moting and developing training courses on Water Resources (Regular and Short Courses), carrying out capacity development assessments of sector organiza-tions, and providing skill-oriented training courses.
Flood resilience: Federal Ministry of Environment (FMENV), Department of Erosion, Flood and Coastal Zone Management (EFCZM)
Given the FMENV’s mandate to supervise all environ-mental activities in Nigeria, it is the central authority for activities related to flood resilience issues. The FMENV’s overall core functions include: (1) defining the policy, legal and regulatory framework for environmental management, including assisting in collaboration with sectoral ministries and stakeholders; (2) environmen-tal monitoring, data collection, and analysis; (3) EIA
NIGERIA Post-Disaster Needs Assessment 2012 Floods108
review, training, and clearances, including environ-mental education and public awareness; (4) managing ecosystems and promoting sustainable use of natural resources; and (5) setting and enforcing environmen-tal quality norms, standards and rules.58 The Ministry was created by incorporating environmentally relevant units from numerous sector ministries, such as Water Resources, Agriculture, and Works, and it comprises five technical departments. These include: (i) Forestry; (ii) Drought and Desertification; (iii) Erosion, Flood, and Coastal Zone Management; (iv) Environment Assess-ment; and (v) Pollution Control and Environmental Health. At first, the Department of Soil Erosion and Flood Control of the Federal Ministry of Water Re-sources was transferred to the now-defunct Federal Environmental Protection Agency (FEPA). Later, with the creation of the Federal Ministry of Environment, the Department merged with the Flood and Erosion Control Division of the Federal Ministry of Works to form the current Department of Erosion, Flood, and Coastal Zone Management (EFCZM) in the Federal Ministry of Environment in 1999.
The EFCZM Department consists of four divisions: Coastal Zone Management; Soil Erosion Monitoring
58 According to the 1999 Presidential Order.
& Control; Flood Forecasting, Monitoring, & Control; and Water Management & Harvesting. The EFCZM De-partment is involved in policy formulation, as well as implementation of erosion projects funded by the fed-eral government, Ecological Fund, and international donors.
The EFCZM Department receives funding from the federal budget, the Ecological Fund, and international donors. Ecological Funds has been the main source of funding for erosion projects. Funding is allocated ac-cording to project proposals approved by the Fund.
The federal budget allocations for environmental man-agement have often been limited, since what is ap-proved and what is disbursed do not often match. For example, a project is designed according to the allocat-ed funds, however once work on a project commences the allocated funds are not released or may be reallo-cated to another project. This has led to projects get-ting implemented at 50 percent or less in certain cases.
Long-term resilience
Cutting across all the points is the fact that institutional capacities for action need to be strengthened. For ex-ample, planning and preparedness need to be carried out with good coordination and participation both ver-
BOX 1: Ecological Fund
The Ecological Fund is a funding resource to support initiatives that promote improved environmental management. The fund is financed through an annual provision of 2 percent of the Federal Budget. The Secretariat of the Fund is located in the Presidency and is responsible for processing all requests for funds, documentation of all disbursements, monitoring and co-ordination and general administration of the funds. The fund allocation is decided by the National Committee on Ecological Problems, which is chaired by the Minister of Environment and includes representatives from various line ministries and the River Ba-sin Development Authorities (RBDAs). It has four technical subcommittees that include (1) Desertification, (2) Erosion, (3) Gas and Oil, and (4) General Environmental matters. Each of these subcommittees recom-mends projects to the National Committee for financing.
The subcommittee on Erosion included technical representatives (mostly permanent secretaries) from the various ministries at the federal and state levels (Environment, Agriculture, and Works), relevant agencies and the CEOs and Managing Directors of Operations of all the River Basin Development Authorities.
109CHAPTER 7: TRANSITIONAL RECOVERY, AND RECONSTRUCTION FRAMEWORK
tically (federal, state, local) and horizontally (across sec-tors). Clear responsibilities and mandates need to be identified and various actors empowered to participate in multi-sector, multi-scale work, especially on long-term planning, policy and public expenditure manage-ment. Regulatory development and enforcement need strengthening at all levels to transform planning pro-cesses into muscular tools that can deliver public goods and protect private benefits. Lastly, governance issues such as contracting irregularities and supervision chal-lenges have been known to interfere with putting dura-ble infrastructure in place. Specific deficiencies include:
■n No integrated water resources planning at national, state, or international transboundary levels, and weak integration of climate variability into planning;
■n Weak territorial and town/community planning, and enforcement of plans, with few incentives in place to transform the status quo;
■n Readiness and preparedness for flood and other disaster responses (i.e., erosion, drought) are weak at all levels, from the community level up to the federal level;
■n Weak community land use bylaws, although there are some isolated good examples in Nigeria of, for example, controlling bush burning or of community forest management;
■n Room for improvement in public expenditure planning and execution on long-term, multi-sector, and multi-scale planning and investment.
The points above are becoming the norm due to weak contracting, supervision, and regulatory development and enforcement;
For long-term resilience, Nigeria’s institutions at all lev-els will need to be better networked with one another and with people on the ground to be able to prepare for, respond to, and prevent impacts from flooding events. Federal planning and data collection agencies will need to be strengthened to provide more efficient, effective, and coordinated service delivery, especially on early warning systems. Federal and state emergency management agencies need a full program of capacity
support to be able to carry out their mission. State and local governments have attempted to provide limited support for extreme weather events in isolated settings but also face capacity constraints. Communities are left “shooting in the dark.”
7.4 Action Plan
With the majority of damages and losses coming from just two sectors, housing and agriculture (52 percent and 22 percent of total damages and losses, respec-tively), recovery of these sectors must be prioritized and properly sequenced while ensuring that other af-fected sectors are not left unaddressed, and that re-covery and reconstruction needs having multi-sectoral implications (such as the restoration of transport infra-structure) are given priority to ensure a robust recovery.
In order to address the most urgent needs of the hous-ing and agriculture sectors alongside those of other sectors, the tables below present the needs for re-covery and reconstruction in all sectors, prioritized in three tiers. It is important to note that the prioritization was carried out by the assessment team and should be vetted and possibly reordered during the follow-up recovery planning workshop. Implementation of Priority 1 needs should begin immediately, whether they are short- or long-term interventions; many will overlap with the implementation of tier 2 and 3 needs. The timeframes for these interventions are meant to be indicative only, as institutional arrangements, finan-cial support, and other factors will influence timetables and lengths of involvement. Following the tables, de-tails about each sectoral recovery plan provide guiding principles for each sector and can help in establishing goals and milestones while implementing recovery.
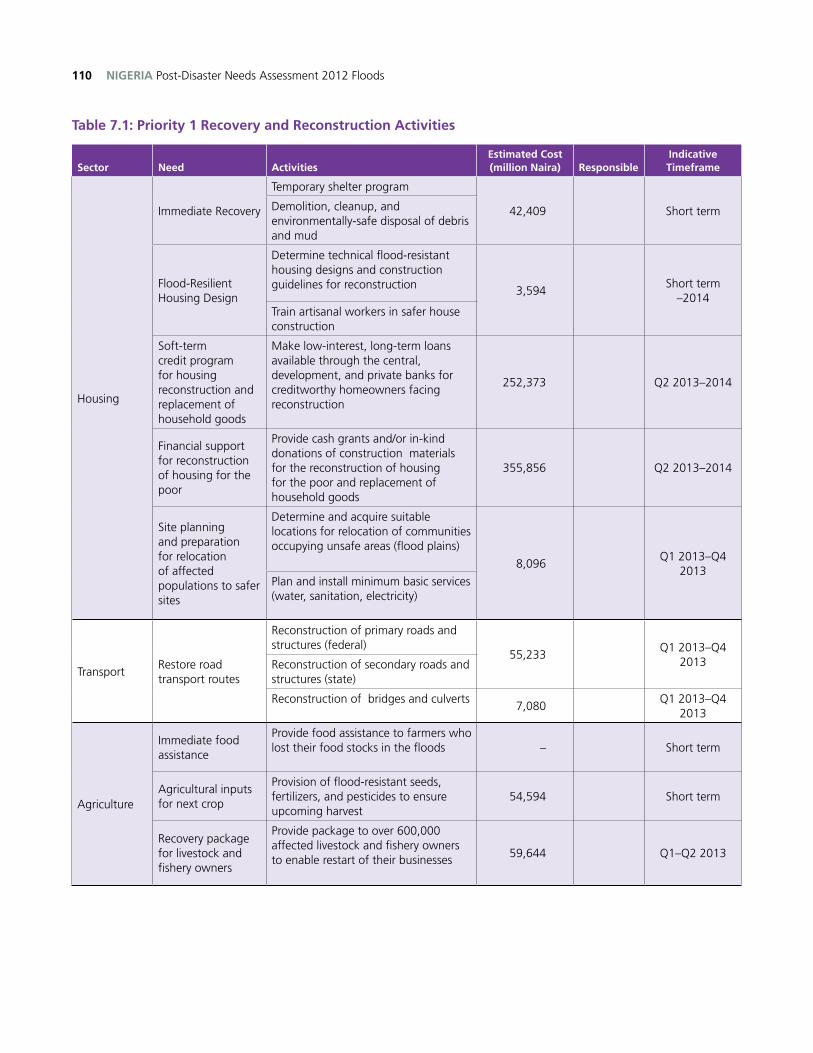
NIGERIA Post-Disaster Needs Assessment 2012 Floods110
Table 7.1: Priority 1 Recovery and Reconstruction Activities
Sector Need ActivitiesEstimated Cost (million Naira) Responsible
Indicative Timeframe
Housing
Immediate Recovery
Temporary shelter program
42,409 Short termDemolition, cleanup, and environmentally-safe disposal of debris and mud
Flood-Resilient Housing Design
Determine technical flood-resistant housing designs and construction guidelines for reconstruction 3,594
Short term –2014
Train artisanal workers in safer house construction
Soft-term credit program for housing reconstruction and replacement of household goods
Make low-interest, long-term loans available through the central, development, and private banks for creditworthy homeowners facing reconstruction
252,373 Q2 2013–2014
Financial support for reconstruction of housing for the poor
Provide cash grants and/or in-kind donations of construction materials for the reconstruction of housing for the poor and replacement of household goods
355,856 Q2 2013–2014
Site planning and preparation for relocation of affected populations to safer sites
Determine and acquire suitable locations for relocation of communities occupying unsafe areas (flood plains)
8,096Q1 2013–Q4
2013Plan and install minimum basic services (water, sanitation, electricity)
TransportRestore road transport routes
Reconstruction of primary roads and structures (federal)
55,233Q1 2013–Q4
2013Reconstruction of secondary roads and structures (state)
Reconstruction of bridges and culverts7,080
Q1 2013–Q4 2013
Agriculture
Immediate food assistance
Provide food assistance to farmers who lost their food stocks in the floods – Short term
Agricultural inputs for next crop
Provision of flood-resistant seeds, fertilizers, and pesticides to ensure upcoming harvest
54,594 Short term
Recovery package for livestock and fishery owners
Provide package to over 600,000 affected livestock and fishery owners to enable restart of their businesses
59,644 Q1–Q2 2013
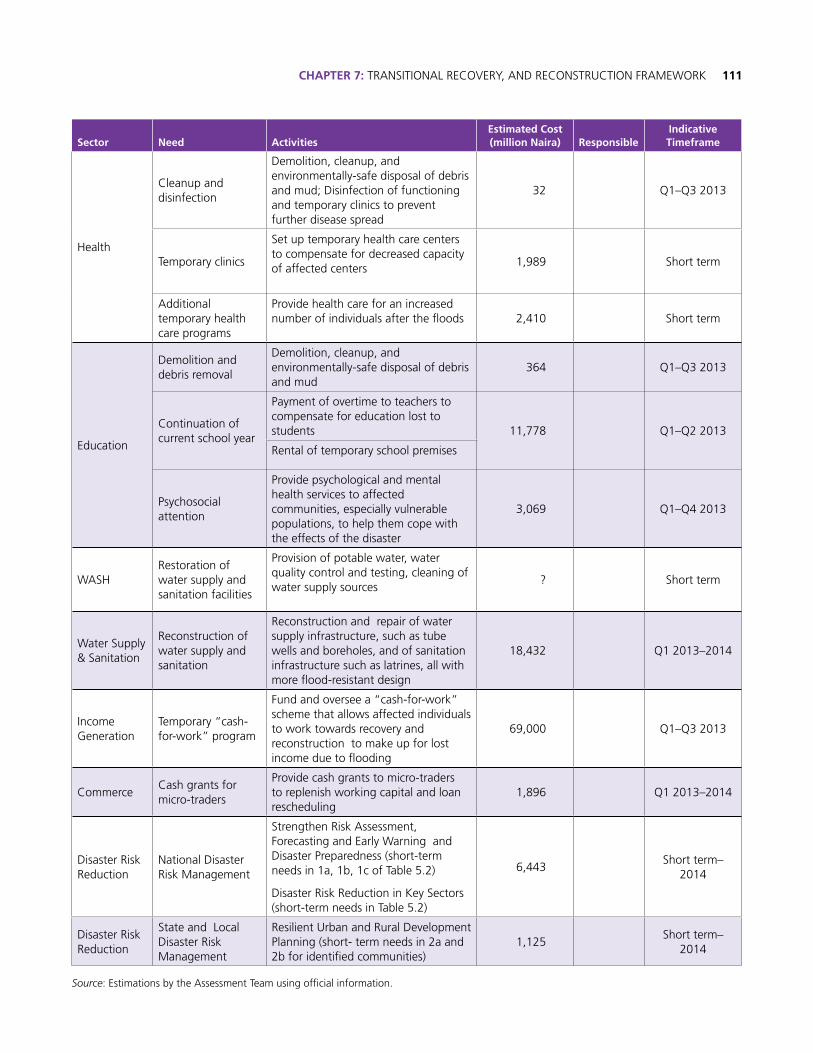
111CHAPTER 7: TRANSITIONAL RECOVERY, AND RECONSTRUCTION FRAMEWORK
Sector Need ActivitiesEstimated Cost (million Naira) Responsible
Indicative Timeframe
Health
Cleanup and disinfection
Demolition, cleanup, and environmentally-safe disposal of debris and mud; Disinfection of functioning and temporary clinics to prevent further disease spread
32 Q1–Q3 2013
Temporary clinics
Set up temporary health care centers to compensate for decreased capacity of affected centers
1,989 Short term
Additional temporary health care programs
Provide health care for an increased number of individuals after the floods 2,410 Short term
Education
Demolition and debris removal
Demolition, cleanup, and environmentally-safe disposal of debris and mud
364 Q1–Q3 2013
Continuation of current school year
Payment of overtime to teachers to compensate for education lost to students 11,778 Q1–Q2 2013
Rental of temporary school premises
Psychosocial attention
Provide psychological and mental health services to affected communities, especially vulnerable populations, to help them cope with the effects of the disaster
3,069 Q1–Q4 2013
WASHRestoration of water supply and sanitation facilities
Provision of potable water, water quality control and testing, cleaning of water supply sources
? Short term
Water Supply & Sanitation
Reconstruction of water supply and sanitation
Reconstruction and repair of water supply infrastructure, such as tube wells and boreholes, and of sanitation infrastructure such as latrines, all with more flood-resistant design
18,432 Q1 2013–2014
Income Generation
Temporary “cash-for-work” program
Fund and oversee a “cash-for-work” scheme that allows affected individuals to work towards recovery and reconstruction to make up for lost income due to flooding
69,000 Q1–Q3 2013
CommerceCash grants for micro-traders
Provide cash grants to micro-traders to replenish working capital and loan rescheduling
1,896 Q1 2013–2014
Disaster Risk Reduction
National Disaster Risk Management
Strengthen Risk Assessment, Forecasting and Early Warning and Disaster Preparedness (short-term needs in 1a, 1b, 1c of Table 5.2)
Disaster Risk Reduction in Key Sectors (short-term needs in Table 5.2)
6,443Short term–
2014
Disaster Risk Reduction
State and Local Disaster Risk Management
Resilient Urban and Rural Development Planning (short- term needs in 2a and 2b for identified communities)
1,125Short term–
2014
Source: Estimations by the Assessment Team using official information.
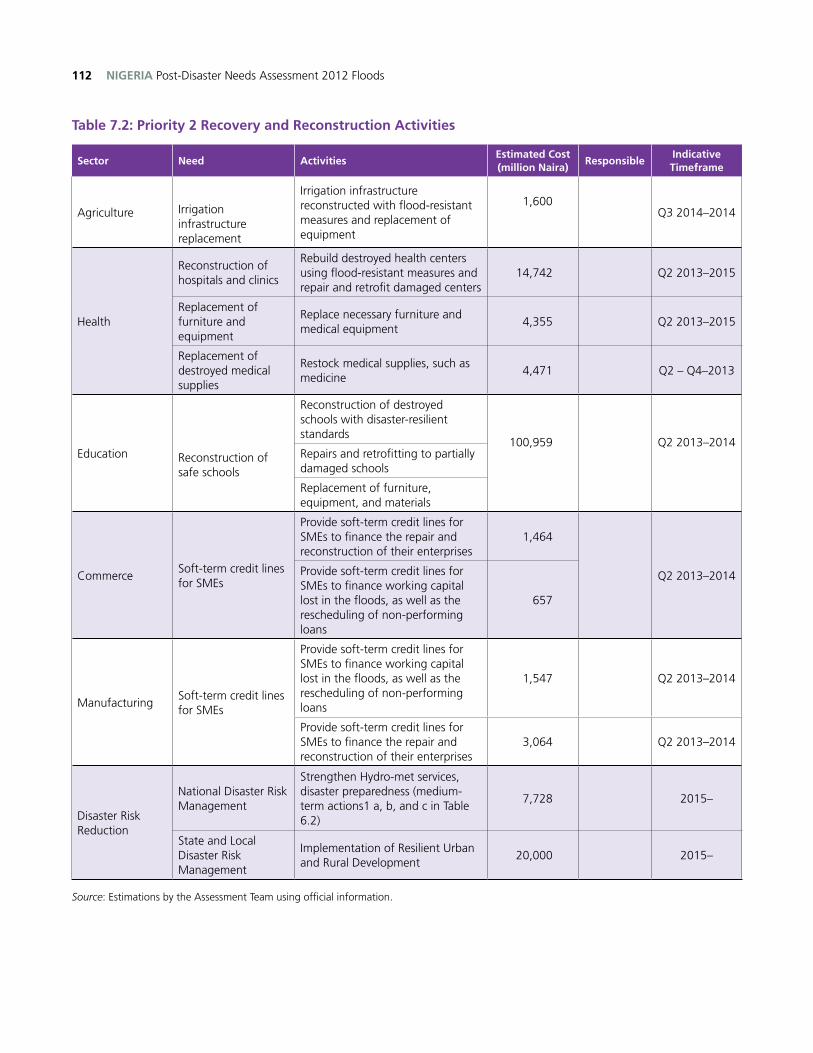
NIGERIA Post-Disaster Needs Assessment 2012 Floods112
Table 7.2: Priority 2 Recovery and Reconstruction Activities
Sector Need ActivitiesEstimated Cost (million Naira)
ResponsibleIndicative Timeframe
Agriculture Irrigation infrastructure replacement
Irrigation infrastructure reconstructed with flood-resistant measures and replacement of equipment
1,600Q3 2014–2014
Health
Reconstruction of hospitals and clinics
Rebuild destroyed health centers using flood-resistant measures and repair and retrofit damaged centers
14,742 Q2 2013–2015
Replacement of furniture and equipment
Replace necessary furniture and medical equipment
4,355 Q2 2013–2015
Replacement of destroyed medical supplies
Restock medical supplies, such as medicine
4,471 Q2 – Q4–2013
Education Reconstruction of safe schools
Reconstruction of destroyed schools with disaster-resilient standards
100,959 Q2 2013–2014Repairs and retrofitting to partially damaged schools
Replacement of furniture, equipment, and materials
CommerceSoft-term credit lines for SMEs
Provide soft-term credit lines for SMEs to finance the repair and reconstruction of their enterprises
1,464
Q2 2013–2014Provide soft-term credit lines for SMEs to finance working capital lost in the floods, as well as the rescheduling of non-performing loans
657
ManufacturingSoft-term credit lines for SMEs
Provide soft-term credit lines for SMEs to finance working capital lost in the floods, as well as the rescheduling of non-performing loans
1,547 Q2 2013–2014
Provide soft-term credit lines for SMEs to finance the repair and reconstruction of their enterprises
3,064 Q2 2013–2014
Disaster Risk Reduction
National Disaster Risk Management
Strengthen Hydro-met services, disaster preparedness (medium-term actions1 a, b, and c in Table 6.2)
7,728 2015–
State and Local Disaster Risk Management
Implementation of Resilient Urban and Rural Development
20,000 2015–
Source: Estimations by the Assessment Team using official information.
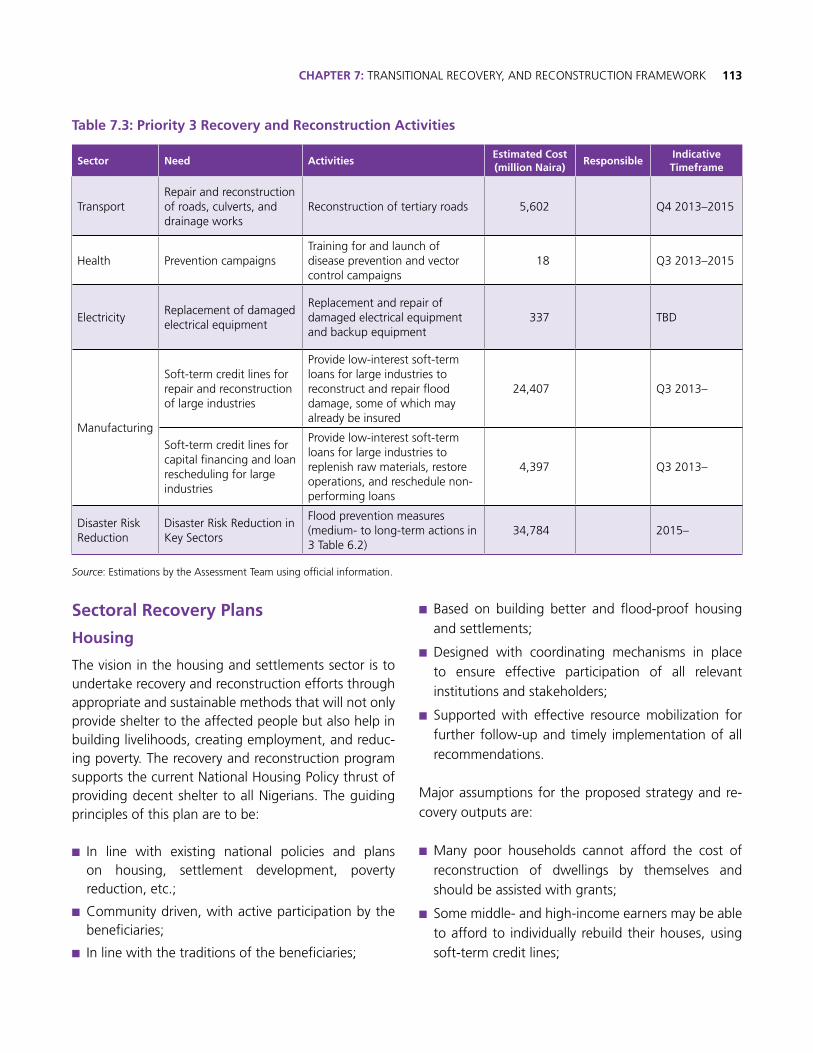
113CHAPTER 7: TRANSITIONAL RECOVERY, AND RECONSTRUCTION FRAMEWORK
Table 7.3: Priority 3 Recovery and Reconstruction Activities
Sector Need ActivitiesEstimated Cost (million Naira)
ResponsibleIndicative Timeframe
TransportRepair and reconstruction of roads, culverts, and drainage works
Reconstruction of tertiary roads 5,602 Q4 2013–2015
Health Prevention campaignsTraining for and launch of disease prevention and vector control campaigns
18 Q3 2013–2015
ElectricityReplacement of damaged electrical equipment
Replacement and repair of damaged electrical equipment and backup equipment
337 TBD
Manufacturing
Soft-term credit lines for repair and reconstruction of large industries
Provide low-interest soft-term loans for large industries to reconstruct and repair flood damage, some of which may already be insured
24,407 Q3 2013–
Soft-term credit lines for capital financing and loan rescheduling for large industries
Provide low-interest soft-term loans for large industries to replenish raw materials, restore operations, and reschedule non-performing loans
4,397 Q3 2013–
Disaster Risk Reduction
Disaster Risk Reduction in Key Sectors
Flood prevention measures (medium- to long-term actions in 3 Table 6.2)
34,784 2015–
Source: Estimations by the Assessment Team using official information.
Sectoral Recovery Plans
Housing
The vision in the housing and settlements sector is to undertake recovery and reconstruction efforts through appropriate and sustainable methods that will not only provide shelter to the affected people but also help in building livelihoods, creating employment, and reduc-ing poverty. The recovery and reconstruction program supports the current National Housing Policy thrust of providing decent shelter to all Nigerians. The guiding principles of this plan are to be:
■n In line with existing national policies and plans on housing, settlement development, poverty reduction, etc.;
■n Community driven, with active participation by the beneficiaries;
■n In line with the traditions of the beneficiaries;
■n Based on building better and flood-proof housing and settlements;
■n Designed with coordinating mechanisms in place to ensure effective participation of all relevant institutions and stakeholders;
■n Supported with effective resource mobilization for further follow-up and timely implementation of all recommendations.
Major assumptions for the proposed strategy and re-covery outputs are:
■n Many poor households cannot afford the cost of reconstruction of dwellings by themselves and should be assisted with grants;
■n Some middle- and high-income earners may be able to afford to individually rebuild their houses, using soft-term credit lines;
NIGERIA Post-Disaster Needs Assessment 2012 Floods114
■n Efforts must be made to ensure that all reconstructed and newly built houses are flood-proof;
■n Skills and knowledge of building are available in the communities; what is needed is to train more hands to meet the demand.
Education
The goal of the recovery process in the education sec-tor is to re-establish educational services in the flood-af-fected areas to a standard equal to or better than what existed before the disaster. The recovery and reconstruc-tion process in the education sector is affected by the strategies in a number of other sectors. These include:
■n The repair and reconstruction of schools has to be carried out in collaboration with the water and sani-tation sector, in order to make sure that schools are equipped with drainage facilities, adequate water supply, and latrines (separate for boys and girls, and accessible for people with disabilities).
■n Close collaboration with the nutrition sector should focus on developing strategies for the provision of sufficient food to families that have been adversely affected by the floods, resulting in little food at home, including for school-going children. The school feed-ing program that existed prior to the floods should be restored, and the introduction of similar program in states where they do not exist should be consid-ered, be it for the short- or long-term. Moreover, the provision of micronutrient supplements (such as vitamins, iron, and iodine), and de-worming to treat parasitic infections can be organized together with the nutrition sector.
■n In cases in which schools are still being used as shel-ters for internally displaced persons, the education sector should collaborate with the housing sector to find alternative housing for the families concerned, to restore educational activities, and to ensure that the facilities are returned in a useable state.
■n Also gender, disability and child protection concerns need to be raised with the appropriate authorities. This is especially true in cases where children are at-tending a different school after theirs was destroyed
by the floods, as this puts them—especially girls—at risk of dropping out. Special attention has to be paid to children with disabilities, as the post-flood situa-tion might make it more difficult for them to attend school. Lastly, the use of damaged buildings for class-es causes protection risks that must be addressed.
Health
Health sector recovery needs basically consist of treat-ing injured and displaced persons, both physically and psychosocially, conducting immunization campaigns, and monitoring/controlling disease outbreaks. Shoring up this sector also involves vector control and the provi-sion of special nutrition supplements to children. Recon-struction needs in this sector include the construction of hospitals and clinics and the refurbishment of damaged and/or procurement of new equipment. This vision for health sector recovery and reconstruction is meant to facilitate and fast-track the achievement of health devel-opment goals in the sector, in line with the national stra-tegic plans and vision, in such a way as to “build back better.” The guiding principles forming the foundation upon which this vision will be realized are as follows:
■n Rapid rebuilding of livelihoods: there is a need to rapidly jumpstart local economies and a critical need for the revitalization of production, trade, and creation of income and employment opportunities. As the need arises, innovative strategies and a conductive environment are critical to achieving early recovery. The direct and indirect effects of this will also form the backbone of recovery in many sectors, including health.
■n Community involvement and ownership: Recovery is faster when communities are involved and carried along. This principle encourages collaborative deci-sion making in planning, design, and implementa-tion, and promotes community ownership and em-powerment, while encouraging the implementation of locally appropriate and affordable solutions.
■n Focus on the most vulnerable and socially disadvan-taged groups: Disasters increase the vulnerability of all, but especially of those who are already dis-
115CHAPTER 7: TRANSITIONAL RECOVERY, AND RECONSTRUCTION FRAMEWORK
advantaged. Recovery programming needs to give priority to the most vulnerable groups, including female-headed households, children and orphans, and the poor, and take into account those with spe-cial needs, so that they are not overlooked.
■n Secure developmental gains: Recovery efforts must, as a rule, seek to re-establish and secure developmental gains without comprising development in non-affected areas. In the health sector, recovery should present an opportunity to incorporate resilience that otherwise would have been neglected. This principle also takes into consideration any major setbacks in pre-disaster progress achieved towards meeting sector MDGs and other national/regional targets, and proposes measures for bridging such gaps in the course of regular development.
■n Building back better and long-term disaster manage-ment: Recovery plans will take into consideration the need to build back in such a way that health infra-structure and assets are more resilient to future disas-ters to a large extent. In making the sector less vulner-able, employ the principles of practicability, simplicity, appropriateness, social acceptability of methods and technology, and affordability, while stressing the im-portance of participation by host communities in a spirit of self-reliance and self-determination.
■n Coordinated and coherent approaches to recov-ery: Health sector recovery and reconstruction will be built on the full and effective coordination and collaboration with other relevant sectors through information exchange, flexibility in administrative procedures, and uniformity in policies. This should be done in such a way that they complement one another and build upon their respective activities.
■n Restoring capacity to manage the recovery process: it is critical that the capacity of local public adminis-trations be rebuilt to manage the recovery process. In addition, local and national institutions, as well as civil society and the private sector, should be encour-aged to join in the recovery process by committing both human and financial resources.
■n Transparency and accountability: Achieve transparency through open processes and the wide dissemination of information on all aspects of the recovery process.
Agriculture
The 2012 flood caused losses to food crops amount-ing to N305,070.1 million and affected livelihoods. In-deed, large areas of agricultural land were inundated just before harvest time. Food prices in many flooded areas have risen by 30 to 70 percent, increasing food insecurity among the affected populations. To facilitate their recovery and ensure their food security, a number of actions must be taken in the short and medium/long term. These include immediate food assistance, provision of agricultural inputs, a recovery package for livestock, and a recovery package for fisheries.
To ensure the timely and effective planting of the next harvest, an estimated N54,600 million is required for the provision of flood-resistant seed varieties to farm-ers, together with fertilizers and pesticides.59 The Min-istry of Agriculture (MARN) has already begun assisting affected farmers and has been providing in-kind food assistance to those that sustained destruction of their food stocks due to the floods.60
In addition, an estimated N22,500 million is required to provide a recovery package to 375,000 affected livestock owners, which includes for each household 10 immunized pullets, a mature cockerel, two goats or sheep, and veterinary assistance for these animals.61
The fishery subsector will require an estimated N37,100 million to provide 240,000 affected fisher folk with of fingerlings and the fisher feed needed to restart their business.62
The only cost of reconstruction in this sector—esti-mated at N1,600 million—is that of rebuilding and re-
59 In the case of food crops, needs have been estimated at 18 percent of the value of production losses.
60 As indicated in the social sector recovery program, the value of food assistance should be deducted from the “cash-for-work” program in the case of the agriculture sector.
61 This so-called recovery package in fact includes the partial restoration of capital assets and animal health prevention needs.
62 This fishery “recovery” package in fact refers to restoring the capital assets of aquaculture, which explains why needs exceed the value of production losses in the sector.
NIGERIA Post-Disaster Needs Assessment 2012 Floods116
pairing irrigation channels and equipment that were destroyed by the floods, whose functioning is essen-tial to ensure full water availability during future dry seasons. In that sense, these reconstruction works are urgently required to avoid additional production losses in crops requiring irrigation.
Commerce and Manufacturing
In manufacturing, needs refer to working capital re-quirements and non-performing loan rescheduling to ensure recovery of production for the affected small, medium and large industries. The funding is to be chan-neled through special, soft-term (in both interest rate and repayment terms) credit lines that should be made available through the development and private banks.
In the case of affected traders, only micro-traders and SMEs are included, since no large traders were report-edly affected. Their immediate need is for working capi-tal to acquire goods to sell and meet some operational requirements, as well as to reschedule non-performing loans. Recovery needs in this sector include cash grants to micro-entrepreneurs and soft-term credit lines for cred-itworthy traders, channeled through the private banks.
The reconstruction needs of affected small- and medium-sized enterprises (SMEs) as well as those of large indus-tries have been estimated at N3,065 million and N24,400 million, respectively.63 These amounts should be chan-neled through special, soft-term credit lines to be opened via the development and private banking system.
In the case of the commerce sector, reconstruction needs have been estimated at N1,465 million, to en-able traders to rebuild their physical facilities using im-proved quality standards and flood-resilient features.64
63 To estimate these manufacturing reconstruction needs, the value of damage for SMEs has been increased by 35 percent, and the value of damage for large industries was increased by 25 percent, in order to allow for an improved technological design that involves modernization and the introduction of flood-resilient characteristics.
64 In this sector, reconstruction needs were estimated at 125 percent of the estimated value of damage to physical facilities, to allow for modernization and the introduction of flood-resilient standards.
Water and Sanitation
The vision of Water supply, Sanitation, and Hygiene (WASH) is to bring about success in related issues in Ni-geria. National policies on water supply, sanitation, and hygiene are in varying stages of implementation, with greater progress being made in water supply. Policy im-plementation remains a great challenge, while sector investment strategies are absent. There is little empha-sis on disaster risk reduction, or on standard operating procedures to enhance scope for timely, proportion-ate responses to emergencies. Development programs with external support is primarily project-focused, cov-ering both urban and rural needs. National programs to install filtration plans at local government levels have not succeeded, owing to poor planning, design, and maintenance. Overlapping mandates among govern-ment ministries and agencies pose serious challenges to WASH sector coordination.
The key principles for the proposed strategy include:
■n Re-establishing WASH services, not simply repairing or replacing infrastructure;
■n Ensuring that proper and skilled service manage-ment providers are available to operate and main-tain assets, deliver services, and recover costs;
■n Creating new models for rural and urban water sup-ply, sanitation, and hygiene service delivery that are customer-focused, performance-driven, and finan-cially sustainable;
■n Ensuring that experienced managers, skilled techni-cians, and sound operating systems are maintained and that private sector expertise is tapped into;
■n Providing hygiene education and ensuring water conservation; and
■n Encouraging better disaster preparedness; in the absence of new management structures, however, such knowledge is unlikely to be retained or used.
Electricity
The 2012 floods did not have devastating effects on the electricity subsector, however, considering the overall
117CHAPTER 7: TRANSITIONAL RECOVERY, AND RECONSTRUCTION FRAMEWORK
importance of the sector within the entire economy and the fact that the sector is currently undergoing privatiza-tion, efforts should be made not only to expand gener-ating, transmitting, and distribution infrastructures, but also to make existing installations functional and opti-mize their capacities. Meeting some conditions during the privatization process could be useful in achieving a stable electricity supply. These include:
■n Ensuring global competitiveness in the management of the subsector;
■n Making investments in the subsector very friendly;
■n Improving regulatory oversight; and
■n Demonstrating greater commitment by the government to expand and make the subsector truly functional.
It is self-evident that the dismal performance of the sector is a key factor in the overall economic environ-ment of the country.
Transport
The enormity of the damage on the road sector requires strategic planning in order to meet up with the recon-struction needs in the short, medium and long terms. Medium-term intervention would require bringing the roads to pre-flood levels through the reinstatement of washout road embankment/pavement layers and damaged hydraulic structures (bridges and culverts). It is also necessary that damaged sections of strategic roads at the federal, state and local government levels be repaired and made functional before the onset of the next rainy season, as a medium-term plan.
Long-term plans would need to incorporate innovative approaches to road construction through research and development for improved resilience of road pavement and hydraulic structures in the face of the challenge posed by climate change. This would bring about im-proved design as well as improved construction tech-niques. The rehabilitation of alternative routes is also necessary, especially with respect to the Ilorin-Jebba-Mokwa federal road. The construction of the proposed second Niger Bridge is a matter of utmost national pri-ority. The state and local governments need to adopt
similar measures in the construction of viable alterna-tive routes. In order to meet these construction needs, a thorough analysis of basic units of construction ma-terials and labor was taken into consideration.
Institutional and Implementation Arrangements
Presently, the National Emergency Management Agen-cy (NEMA) at the federal level and the State Emergen-cy Management Agencies (SEMAs) at the state level, along with relevant offices of the local governments, are mandated to manage relief, recovery, and recon-struction. However, considering the scale of the disas-ter and challenges related to such large-scale recovery and reconstruction efforts, drawing from certain guid-ing principles based on international experience could help to improve the effectiveness of the recovery pro-gram. These principles are summarized below.
Although the government is presently involved in relief efforts, international development partners will want to see a credible institutional mechanism in place for recovery and reconstruction as early as possible in or-der for them to consider mobilizing longer-term com-mitments of financial support. Therefore, it will be important for Nigeria’s federal government to articu-late its strategy for governing reconstruction efforts and to signal to donors its commitment to an effective, transparent, and accountable mechanism for the man-agement and implementation of these resources.
Disaster Risk Management
In order to ensure flood resilience, all recovery and re-construction efforts should be based on the principle of managing floods and integrating the concept of living with floods, protecting key assets, and minimiz-ing losses. Recommendations to further strengthen Nigeria’s flood disaster management capacity are pre-sented in an earlier chapter under three categories: (i) Strengthen DRM and Climate Change Adaptation; (ii) Build Community Resilience; and (iii) Develop disaster and Climate Change Resilience in Key Sectors. These will have to be considered when finalizing priorities for the recovery and reconstruction framework.
NIGERIA Post-Disaster Needs Assessment 2012 Floods118
Key Premises of Proposed Institutional Arrangements
1. Delivering a Recovery Program: Fast, Efficient, Transparent, and Accountable: Institutional ar-rangements for recovery must be founded on the principle of delivering a recovery program with greater flexibility and speed while maintaining ac-countability and transparency.
2. Institutionalizing lessons learned: Decisions on institutional arrangements should be based on sound lessons drawn from both national and inter-national experience.
3. Building capacity to manage future disasters: Flood recovery should work to develop the long-term capacity to manage and mitigate disasters in the future.
Core Structure of Proposed Institutional Framework
Central coordination and local implementation should be key features of whatever institutional frame-work is ultimately established:
1. A central coordinating agency is the backbone for:
a. Mobilizing a global fundraising campaign;b. Managing multi-source funding and coordinating
with donors;c. Developing an overarching policy framework,
standards, and principles;
d. Ensuring equity/quality across the country; and,e. Implementing federal projects.
2. Local governments are the key for actualizing recovery:
a. Implementing a recovery program: planning, designing, approving, and implementing;
b. Monitoring;c. Managing grievance redress.
Key Requirements
Implementation■n Prioritizing immediate implementation support to local governments directly in the short term and a program of capacity building over the long term.
■n Matching greater flexibility and speed of implemen-tation with greater ex-post accountability.
■n Maintaining realistic reconstruction policies and plans while exploring innovative and ambitious ap-proaches for implementation: Planning conserva-tively to ensure that sufficient time and funds exist to complete reconstruction while developing inno-vative efficiency mechanisms (i.e., in procurement/contracting).
■n Realize that no “one size fits all” approach will work: Develop sector- and geographic-specific ap-proaches.
Fiduciary governance & oversight■n Channeling funds into the hands of those with the strongest incentive to use them for the intended pur-poses: This includes direct transfers to recipients and community-driven implementation and oversight.
■n Maximizing credibility through an independent over-sight board, Ombudsman, third-party monitoring and a grievance redress mechanism: Involving prom-inent citizens and professionals.
■n Utilizing substantive real-time financial reporting/fiduciary arrangements to ensure transparency and accountability and maintain credibility for benefi-ciaries and donors, matching greater flexibility and speed in public financial management with greater ex-post accountability.
■n Utilizing both on-budget and off-budget support.
Coordination■n Managing multi-source funding and providing over-arching guidelines: Coordinating and prioritizing fund flows and developing overarching guidelines.
■n Overseeing public information and relations, includ-ing coordination, facilitation and harmonization with donors and the international community.
119CHAPTER 7: TRANSITIONAL RECOVERY, AND RECONSTRUCTION FRAMEWORK
Ten Steps in Designing, Building, and Sustaining Results-Based M&E Systems
Traditional results-based M&E systems can be built and sustained by following the ten steps outlined be-low. With some modifications, these steps can be applied to the Nigerian context to create strong M&E systems.
1. Conducting a readiness assessment2. Agreeing on outcomes to monitor and evaluate3. Selecting key indicators to monitor outcomes4. Determining baseline data on indicators – where are we today?5. Planning for improvements – selecting results targets6. Monitoring for results7. Defining the role of evaluations8. Reporting findings9. Using findings10. Sustaining the M&E system within the organization
Source: Kusek and Rist 2004.
Example of Grievance Redress Mechanism in the Pakistan Earthquake of 2005
The Earthquake Rehabilitation and Reconstruction Authority (ERRA) set up after the 2005 disaster in Paki-stan had a grievance redress mechanism from which useful lessons might be drawn. The mechanism was of a fast-track and informal nature, operating at the community (village) level and mostly run by partner organizations, which included local and national NGOs. On a formal level, various local government of-fices at the sub-province (district) level were put in charge of addressing and resolving complaints. To deal with complaints regarding registration, data errors, and payment records, the national-level government authority dealing with the registration of individuals and issuance of identity cards was given the appro-priate authority at the sub-provincial (district) level, as it already had “data registration offices” in these locations.
However, the system was not without its share of problems. Notably, most local-level records were kept manually, which led to significant delays at the time of complaint registration and to a sense among staff of being overwhelmed. However, the system itself was MIS-based at headquarters.
Source: ERRA.
NIGERIA Post-Disaster Needs Assessment 2012 Floods120
■n Bridging relief efforts, early recovery, and long-term reconstruction.
■n Coordinating reconstruction efforts throughout the country.
7.5 Next Steps
Once the PDNA findings are accepted, it will be impor-tant for the government to adopt a fairly consultative yet relatively speedy process for finalizing the recovery and reconstruction framework. This will include:
1. Finalizing guiding principles for recovery and reconstruction (see Section 7.2).
2. Agreeing on the priorities, timeline, and budget under the Action Plan (see Section 7.4).
3. Finalizing financing arrangements, including consultations with MDAs and development partners, such as the World Bank, to assess which actions can be supported by ongoing or new interventions and which actions will need new funding from the national government.
4. Adopting an effective implementation arrangement (see Section 7.4, Key Premises of Proposed Institutional Arrangements), including monitoring and evaluation systems).
5. Ensuring that recovery and reconstruction planning and implementation can lead to flood resilience (following recommendations from Chapter 6 on Disaster Risk Management).
Given the federal system of government in Nigeria, an action plan that supports national interventions related to strengthening disaster risk management, climate change adaptation, water resources management (for example, dam safety and river dredging), and other sectors, with matching local interventions by the states (see “build community resilience” and “invest in in-frastructure” in Chapter 6, Table 6.2) for recovery and reconstruction. The bulk of the intervention will be needed at the local level, involving communities, to en-sure that they are not only recovering from this flood but are prepared for similar future events.
Mainstreaming PDNAThis assessment is a first effort in Nigeria to conduct PDNA on such a large scale. The PDNA exercise has offered an opportunity to train federal and state of-ficers and to develop a national roster of PDNA ex-perts. To keep up the momentum and sustain these capacity-building efforts, it will be important for NEMA to develop a PDNA platform, in which baseline data, damage collection data templates, training materials, and the contact information of trained staff are stored. Some of these points are discussed in detail below:
■n Data readiness: NEMA will need an online platform to host all the baseline and damage data collected during the current PDNA exercise, so that it is available for all subsequent exercises, as well as for research purposes. More importantly, developing a current baseline will be important to enabling readiness for any future disaster response.
■n Team’s capacity-building and simulation exercises: To sustain the current capacity-building efforts, it will be important to follow up with routine training and simulation exercises. New DRM centers in universities can play a key role in this regard.
■n Roster of PDNA experts: The names and contact information of all trained PDNA experts in the country should be archived by NEMA to ensure that properly trained and experienced experts are available for any future disaster assessments.
■n Learning and feedback loops: It will be important to adapt the PDNA methodology to the Nigerian context. Thus, learning from the current PDNA, and receiving feedback from the team will be of the utmost importance to NEMA. Ideally, a session on lessons learned should be organized, and knowledge notes developed in order to learn from this exercise and plan for future ones.
■n Information flow and decision support system: Information flow before, during and after a disaster plays an important role in the resiliency of a country or a state. Thus, maintaining an efficient information and decision support system will be at the heart of mainstreaming PDNA methodology. Such a system will help the government to respond more quickly to
121CHAPTER 7: TRANSITIONAL RECOVERY, AND RECONSTRUCTION FRAMEWORK
a disaster, to make informed and efficient decisions, as well as to plan recovery and reconstruction efforts.
■n Dedicated resources for PDNA, and disaster response: The government of Nigeria has invested in disaster response over the last few years, as evidenced by the development of NEMA, SEMA, and local EMAs. However, to be more efficient in responding to disasters, effective assessment and response mechanisms are needed. A dedicated budget and credit line for undertaking national and state PDNAs, as well as for relief, recovery, and reconstruction, will be needed to sustain current capacity-building efforts.

Photo: Thinkstock.com.
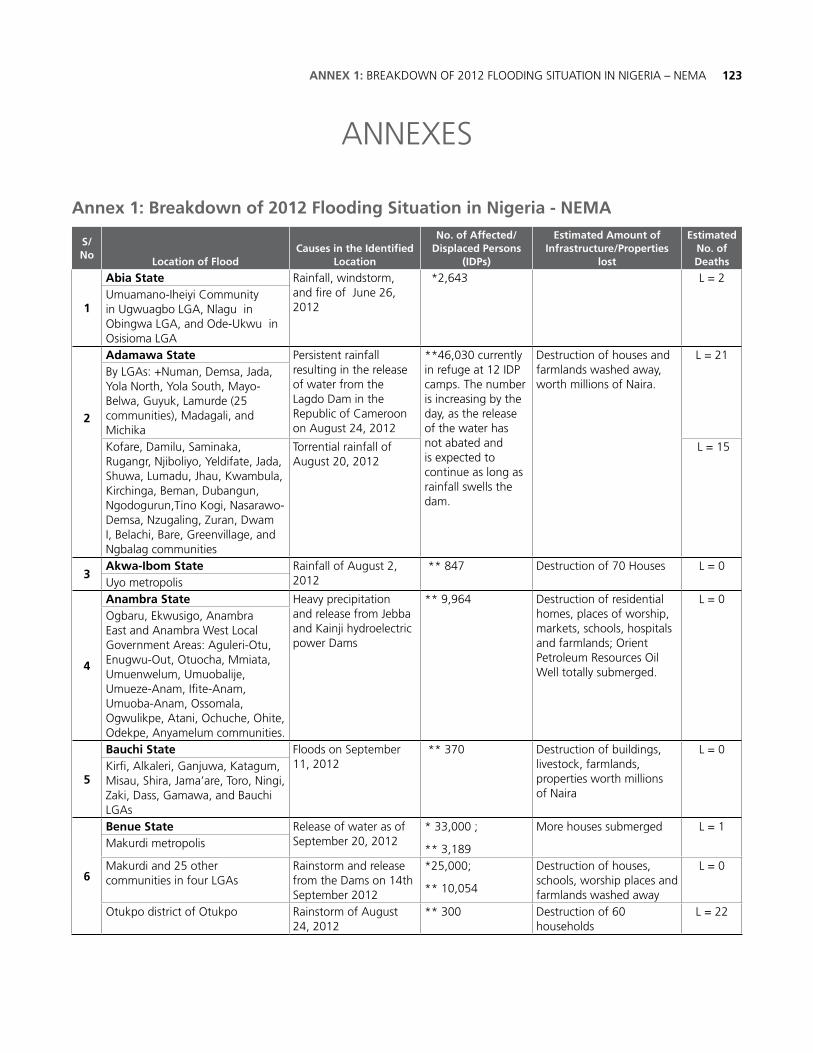
123ANNEX 1: BREAKDOWN OF 2012 FLOODING SITUATION IN NIGERIA – NEMA
ANNEXES
Annex 1: Breakdown of 2012 Flooding Situation in Nigeria - NEMA
S/No
Location of FloodCauses in the Identified
Location
No. of Affected/Displaced Persons
(IDPs)
Estimated Amount of Infrastructure/Properties
lost
Estimated No. of Deaths
1
Abia State Rainfall, windstorm, and fire of June 26, 2012
*2,643 L = 2Umuamano-Iheiyi Community in Ugwuagbo LGA, Nlagu in Obingwa LGA, and Ode-Ukwu in Osisioma LGA
2
Adamawa State Persistent rainfall resulting in the release of water from the Lagdo Dam in the Republic of Cameroon on August 24, 2012
**46,030 currently in refuge at 12 IDP camps. The number is increasing by the day, as the release of the water has not abated and is expected to continue as long as rainfall swells the dam.
Destruction of houses and farmlands washed away, worth millions of Naira.
L = 21 By LGAs: +Numan, Demsa, Jada, Yola North, Yola South, Mayo-Belwa, Guyuk, Lamurde (25 communities), Madagali, and Michika Kofare, Damilu, Saminaka, Rugangr, Njiboliyo, Yeldifate, Jada, Shuwa, Lumadu, Jhau, Kwambula, Kirchinga, Beman, Dubangun, Ngodogurun,Tino Kogi, Nasarawo-Demsa, Nzugaling, Zuran, Dwam I, Belachi, Bare, Greenvillage, and Ngbalag communities
Torrential rainfall of August 20, 2012
L = 15
3Akwa-Ibom State Rainfall of August 2,
2012 ** 847 Destruction of 70 Houses L = 0
Uyo metropolis
4
Anambra State Heavy precipitation and release from Jebba and Kainji hydroelectric power Dams
** 9,964 Destruction of residential homes, places of worship, markets, schools, hospitals and farmlands; Orient Petroleum Resources Oil Well totally submerged.
L = 0Ogbaru, Ekwusigo, Anambra East and Anambra West Local Government Areas: Aguleri-Otu, Enugwu-Out, Otuocha, Mmiata, Umuenwelum, Umuobalije, Umueze-Anam, Ifite-Anam, Umuoba-Anam, Ossomala, Ogwulikpe, Atani, Ochuche, Ohite, Odekpe, Anyamelum communities.
5
Bauchi State Floods on September 11, 2012
** 370 Destruction of buildings, livestock, farmlands, properties worth millions of Naira
L = 0Kirfi, Alkaleri, Ganjuwa, Katagum, Misau, Shira, Jama’are, Toro, Ningi, Zaki, Dass, Gamawa, and Bauchi LGAs
6
Benue State Release of water as of September 20, 2012
* 33,000 ;
** 3,189
More houses submerged L = 1Makurdi metropolis
Makurdi and 25 other communities in four LGAs
Rainstorm and release from the Dams on 14th September 2012
*25,000;
** 10,054
Destruction of houses, schools, worship places and farmlands washed away
L = 0
Otukpo district of Otukpo Rainstorm of August 24, 2012
** 300 Destruction of 60 households
L = 22
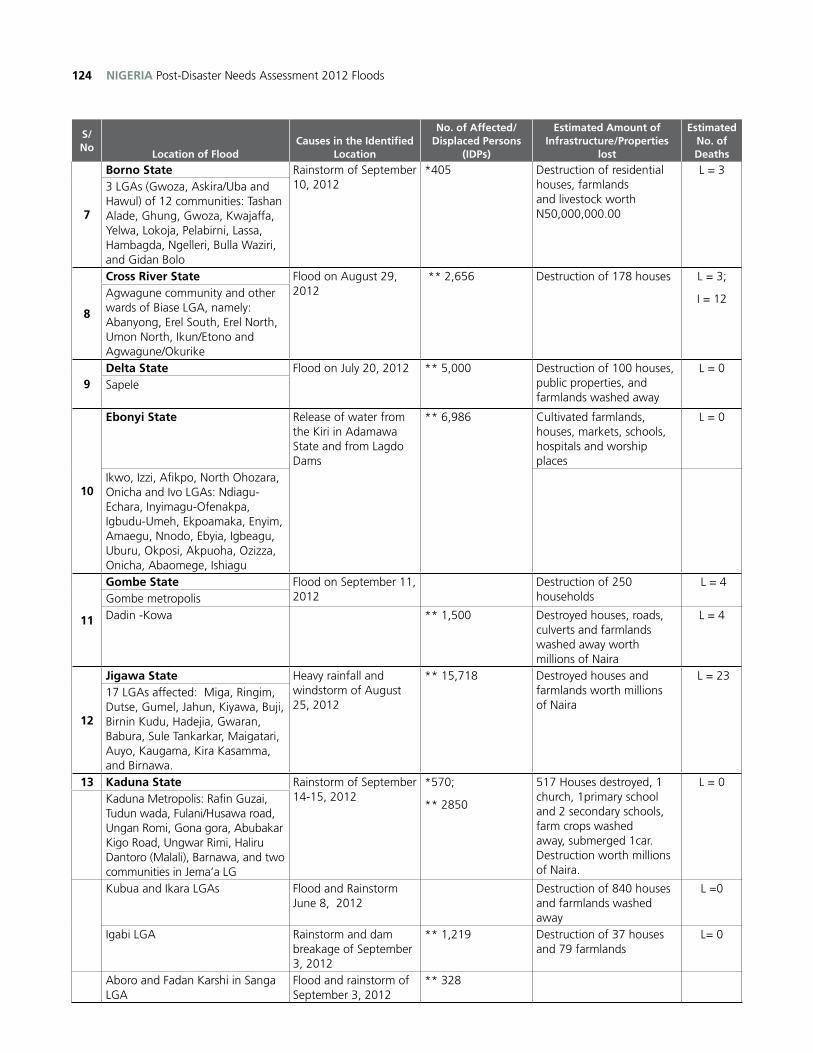
NIGERIA Post-Disaster Needs Assessment 2012 Floods124
S/No
Location of FloodCauses in the Identified
Location
No. of Affected/Displaced Persons
(IDPs)
Estimated Amount of Infrastructure/Properties
lost
Estimated No. of Deaths
7
Borno State Rainstorm of September 10, 2012
*405 Destruction of residential houses, farmlands and livestock worth N50,000,000.00
L = 33 LGAs (Gwoza, Askira/Uba and Hawul) of 12 communities: Tashan Alade, Ghung, Gwoza, Kwajaffa, Yelwa, Lokoja, Pelabirni, Lassa, Hambagda, Ngelleri, Bulla Waziri, and Gidan Bolo
8
Cross River State Flood on August 29, 2012
** 2,656 Destruction of 178 houses L = 3;
I = 12 Agwagune community and other wards of Biase LGA, namely: Abanyong, Erel South, Erel North, Umon North, Ikun/Etono and Agwagune/Okurike
9Delta State Flood on July 20, 2012 ** 5,000 Destruction of 100 houses,
public properties, and farmlands washed away
L = 0Sapele
10
Ebonyi State Release of water from the Kiri in Adamawa State and from Lagdo Dams
** 6,986 Cultivated farmlands, houses, markets, schools, hospitals and worship places
L = 0
Ikwo, Izzi, Afikpo, North Ohozara, Onicha and Ivo LGAs: Ndiagu-Echara, Inyimagu-Ofenakpa, Igbudu-Umeh, Ekpoamaka, Enyim, Amaegu, Nnodo, Ebyia, Igbeagu, Uburu, Okposi, Akpuoha, Ozizza, Onicha, Abaomege, Ishiagu
11
Gombe State Flood on September 11, 2012
Destruction of 250 households
L = 4 Gombe metropolisDadin -Kowa ** 1,500 Destroyed houses, roads,
culverts and farmlands washed away worth millions of Naira
L = 4
12
Jigawa State Heavy rainfall and windstorm of August 25, 2012
** 15,718 Destroyed houses and farmlands worth millions of Naira
L = 2317 LGAs affected: Miga, Ringim, Dutse, Gumel, Jahun, Kiyawa, Buji, Birnin Kudu, Hadejia, Gwaran, Babura, Sule Tankarkar, Maigatari, Auyo, Kaugama, Kira Kasamma, and Birnawa.
13 Kaduna State Rainstorm of September 14-15, 2012
*570;
** 2850
517 Houses destroyed, 1 church, 1primary school and 2 secondary schools, farm crops washed away, submerged 1car. Destruction worth millions of Naira.
L = 0Kaduna Metropolis: Rafin Guzai, Tudun wada, Fulani/Husawa road, Ungan Romi, Gona gora, Abubakar Kigo Road, Ungwar Rimi, Haliru Dantoro (Malali), Barnawa, and two communities in Jema’a LGKubua and Ikara LGAs Flood and Rainstorm
June 8, 2012Destruction of 840 houses and farmlands washed away
L =0
Igabi LGA Rainstorm and dam breakage of September 3, 2012
** 1,219 Destruction of 37 houses and 79 farmlands
L= 0
Aboro and Fadan Karshi in Sanga LGA
Flood and rainstorm of September 3, 2012
** 328
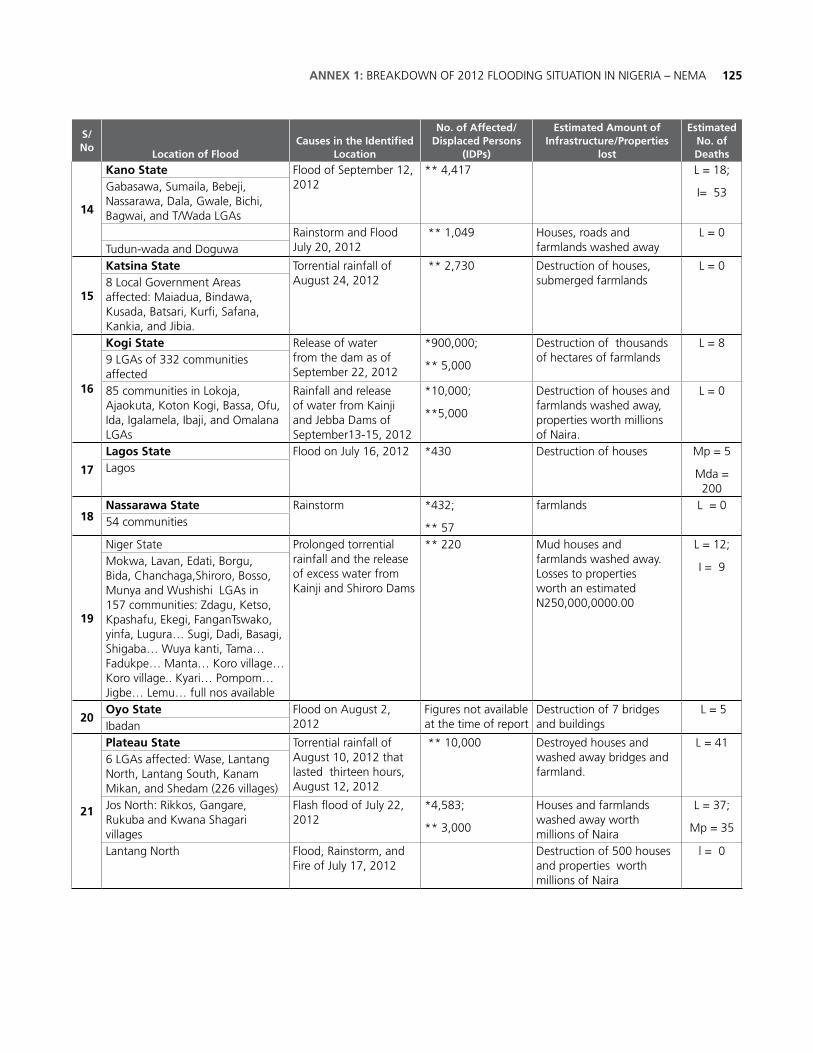
125ANNEX 1: BREAKDOWN OF 2012 FLOODING SITUATION IN NIGERIA – NEMA
S/No
Location of FloodCauses in the Identified
Location
No. of Affected/Displaced Persons
(IDPs)
Estimated Amount of Infrastructure/Properties
lost
Estimated No. of Deaths
14
Kano State Flood of September 12, 2012
** 4,417 L = 18;
I= 53 Gabasawa, Sumaila, Bebeji, Nassarawa, Dala, Gwale, Bichi, Bagwai, and T/Wada LGAs
Rainstorm and Flood July 20, 2012
** 1,049 Houses, roads and farmlands washed away
L = 0Tudun-wada and Doguwa
15
Katsina State Torrential rainfall of August 24, 2012
** 2,730 Destruction of houses, submerged farmlands
L = 08 Local Government Areas affected: Maiadua, Bindawa, Kusada, Batsari, Kurfi, Safana, Kankia, and Jibia.
16
Kogi State Release of water from the dam as of September 22, 2012
*900,000;
** 5,000
Destruction of thousands of hectares of farmlands
L = 89 LGAs of 332 communities affected85 communities in Lokoja, Ajaokuta, Koton Kogi, Bassa, Ofu, Ida, Igalamela, Ibaji, and Omalana LGAs
Rainfall and release of water from Kainji and Jebba Dams of September13-15, 2012
*10,000;
**5,000
Destruction of houses and farmlands washed away, properties worth millions of Naira.
L = 0
17
Lagos State Flood on July 16, 2012 *430 Destruction of houses Mp = 5
Mda = 200
Lagos
18Nassarawa State Rainstorm *432;
** 57
farmlands L = 054 communities
19
Niger State Prolonged torrential rainfall and the release of excess water from Kainji and Shiroro Dams
** 220 Mud houses and farmlands washed away. Losses to properties worth an estimated N250,000,0000.00
L = 12;
I = 9Mokwa, Lavan, Edati, Borgu, Bida, Chanchaga,Shiroro, Bosso, Munya and Wushishi LGAs in 157 communities: Zdagu, Ketso, Kpashafu, Ekegi, FanganTswako, yinfa, Lugura… Sugi, Dadi, Basagi, Shigaba… Wuya kanti, Tama… Fadukpe… Manta… Koro village… Koro village.. Kyari… Pompom… Jigbe… Lemu… full nos available
20Oyo State Flood on August 2,
2012Figures not available at the time of report
Destruction of 7 bridges and buildings
L = 5 Ibadan
21
Plateau State Torrential rainfall of August 10, 2012 that lasted thirteen hours, August 12, 2012
** 10,000 Destroyed houses and washed away bridges and farmland.
L = 41 6 LGAs affected: Wase, Lantang North, Lantang South, Kanam Mikan, and Shedam (226 villages)Jos North: Rikkos, Gangare, Rukuba and Kwana Shagari villages
Flash flood of July 22, 2012
*4,583;
** 3,000
Houses and farmlands washed away worth millions of Naira
L = 37;
Mp = 35
Lantang North Flood, Rainstorm, and Fire of July 17, 2012
Destruction of 500 houses and properties worth millions of Naira
l = 0
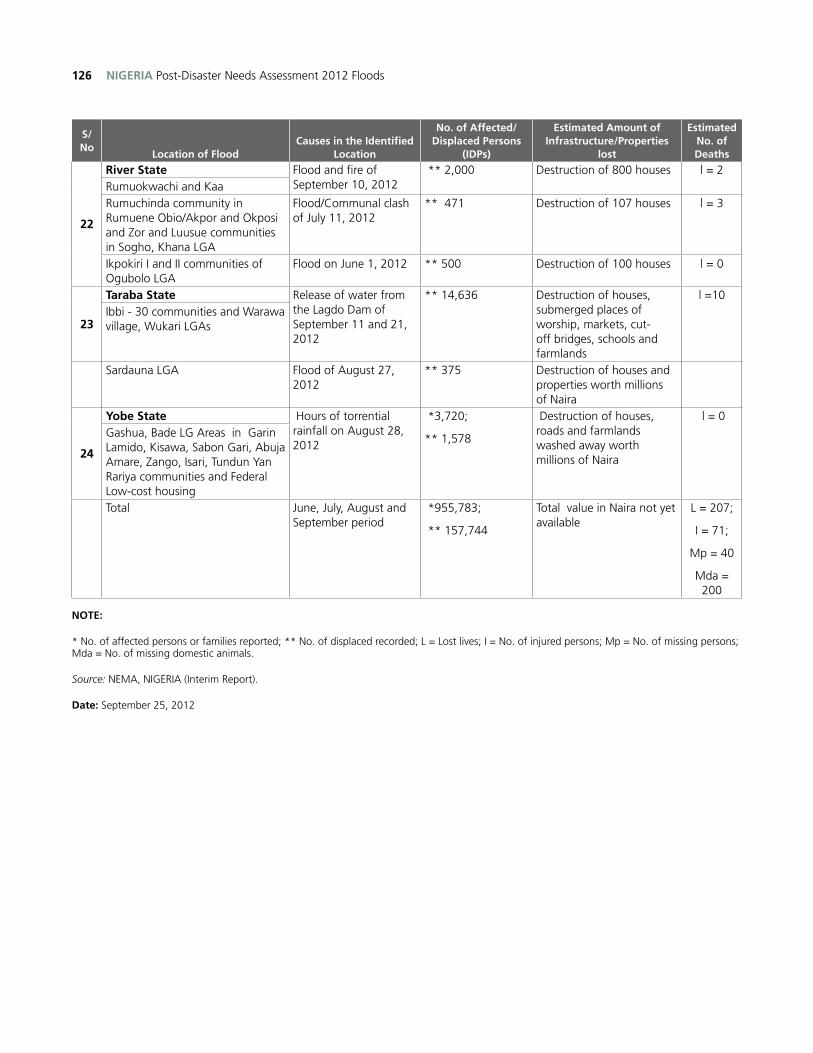
NIGERIA Post-Disaster Needs Assessment 2012 Floods126
S/No
Location of FloodCauses in the Identified
Location
No. of Affected/Displaced Persons
(IDPs)
Estimated Amount of Infrastructure/Properties
lost
Estimated No. of Deaths
22
River State Flood and fire of September 10, 2012
** 2,000 Destruction of 800 houses l = 2Rumuokwachi and KaaRumuchinda community in Rumuene Obio/Akpor and Okposi and Zor and Luusue communities in Sogho, Khana LGA
Flood/Communal clash of July 11, 2012
** 471 Destruction of 107 houses l = 3
Ikpokiri I and II communities of Ogubolo LGA
Flood on June 1, 2012 ** 500 Destruction of 100 houses l = 0
23
Taraba State Release of water from the Lagdo Dam of September 11 and 21, 2012
** 14,636 Destruction of houses, submerged places of worship, markets, cut-off bridges, schools and farmlands
l =10Ibbi - 30 communities and Warawa village, Wukari LGAs
Sardauna LGA Flood of August 27, 2012
** 375 Destruction of houses and properties worth millions of Naira
24
Yobe State Hours of torrential rainfall on August 28, 2012
*3,720;
** 1,578
Destruction of houses, roads and farmlands washed away worth millions of Naira
l = 0Gashua, Bade LG Areas in Garin Lamido, Kisawa, Sabon Gari, Abuja Amare, Zango, Isari, Tundun Yan Rariya communities and Federal Low-cost housing Total June, July, August and
September period *955,783;
** 157,744
Total value in Naira not yet available
L = 207;
I = 71;
Mp = 40
Mda = 200
NOTE:
* No. of affected persons or families reported; ** No. of displaced recorded; L = Lost lives; I = No. of injured persons; Mp = No. of missing persons; Mda = No. of missing domestic animals.
Source: NEMA, NIGERIA (Interim Report).
Date: September 25, 2012
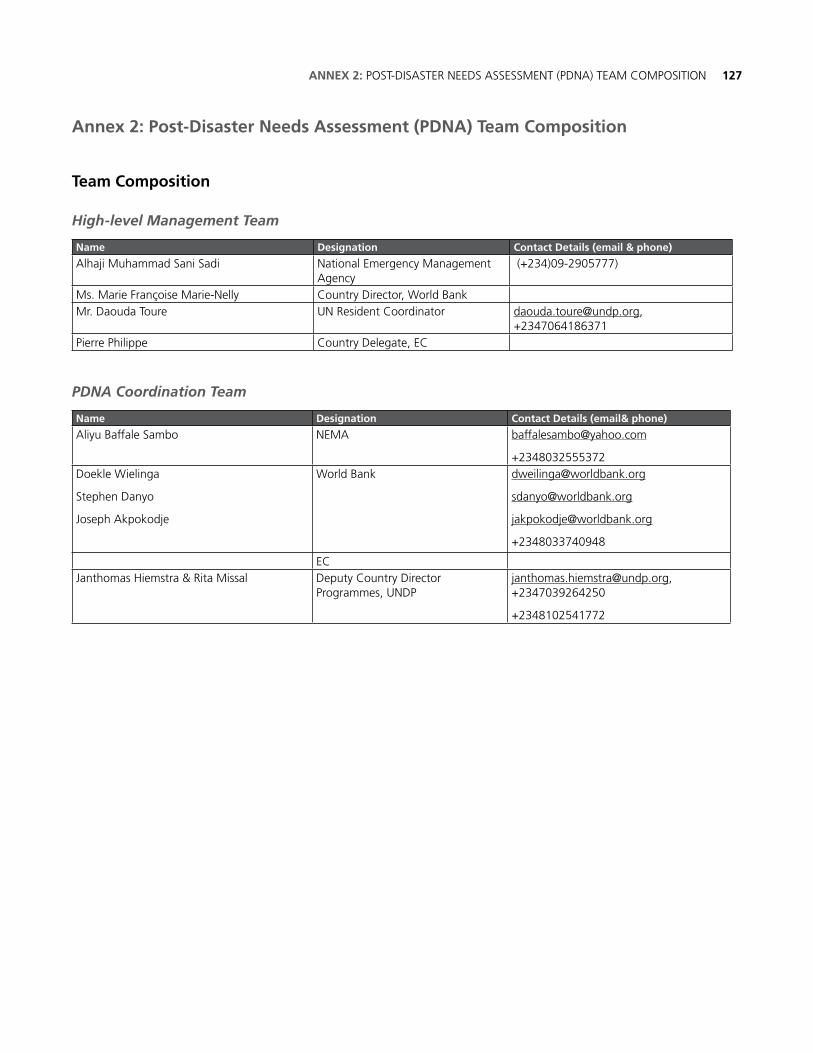
127ANNEX 2: POST-DISASTER NEEDS ASSESSMENT (PDNA) TEAM COMPOSITION
Annex 2: Post-Disaster Needs Assessment (PDNA) Team Composition
Team Composition
High-level Management Team
Name Designation Contact Details (email & phone)
Alhaji Muhammad Sani Sadi National Emergency Management Agency
(+234)09-2905777)
Ms. Marie Françoise Marie-Nelly Country Director, World Bank Mr. Daouda Toure UN Resident Coordinator [email protected],
+2347064186371Pierre Philippe Country Delegate, EC
PDNA Coordination Team
Name Designation Contact Details (email& phone)
Aliyu Baffale Sambo NEMA [email protected]
+2348032555372Doekle Wielinga
Stephen Danyo
Joseph Akpokodje
World Bank [email protected]
+2348033740948
EC Janthomas Hiemstra & Rita Missal Deputy Country Director
Programmes, [email protected], +2347039264250
+2348102541772
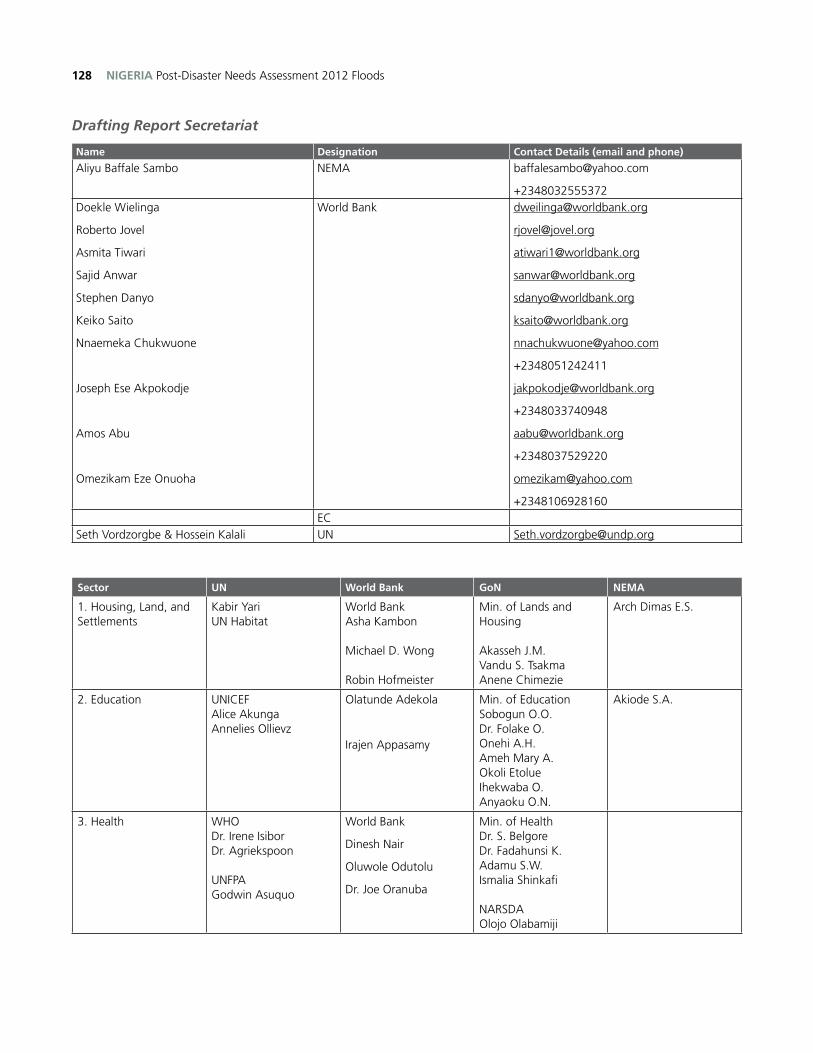
NIGERIA Post-Disaster Needs Assessment 2012 Floods128
Drafting Report Secretariat
Name Designation Contact Details (email and phone)
Aliyu Baffale Sambo NEMA [email protected]
+2348032555372Doekle Wielinga
Roberto Jovel
Asmita Tiwari
Sajid Anwar
Stephen Danyo
Keiko Saito
Nnaemeka Chukwuone
Joseph Ese Akpokodje
Amos Abu
Omezikam Eze Onuoha
World Bank [email protected]
+2348051242411
+2348033740948
+2348037529220
+2348106928160EC
Seth Vordzorgbe & Hossein Kalali UN [email protected]
Sector UN World Bank GoN NEMA
1. Housing, Land, and Settlements
Kabir Yari UN Habitat
World Bank Asha Kambon
Michael D. Wong
Robin Hofmeister
Min. of Lands and Housing
Akasseh J.M.Vandu S. TsakmaAnene Chimezie
Arch Dimas E.S.
2. Education UNICEFAlice AkungaAnnelies Ollievz
Olatunde Adekola
Irajen Appasamy
Min. of EducationSobogun O.O.Dr. Folake O.Onehi A.H.Ameh Mary A.Okoli EtolueIhekwaba O.Anyaoku O.N.
Akiode S.A.
3. Health WHODr. Irene Isibor Dr. Agriekspoon
UNFPAGodwin Asuquo
World Bank
Dinesh Nair
Oluwole Odutolu
Dr. Joe Oranuba
Min. of Health Dr. S. BelgoreDr. Fadahunsi K.Adamu S.W.Ismalia Shinkafi
NARSDAOlojo Olabamiji
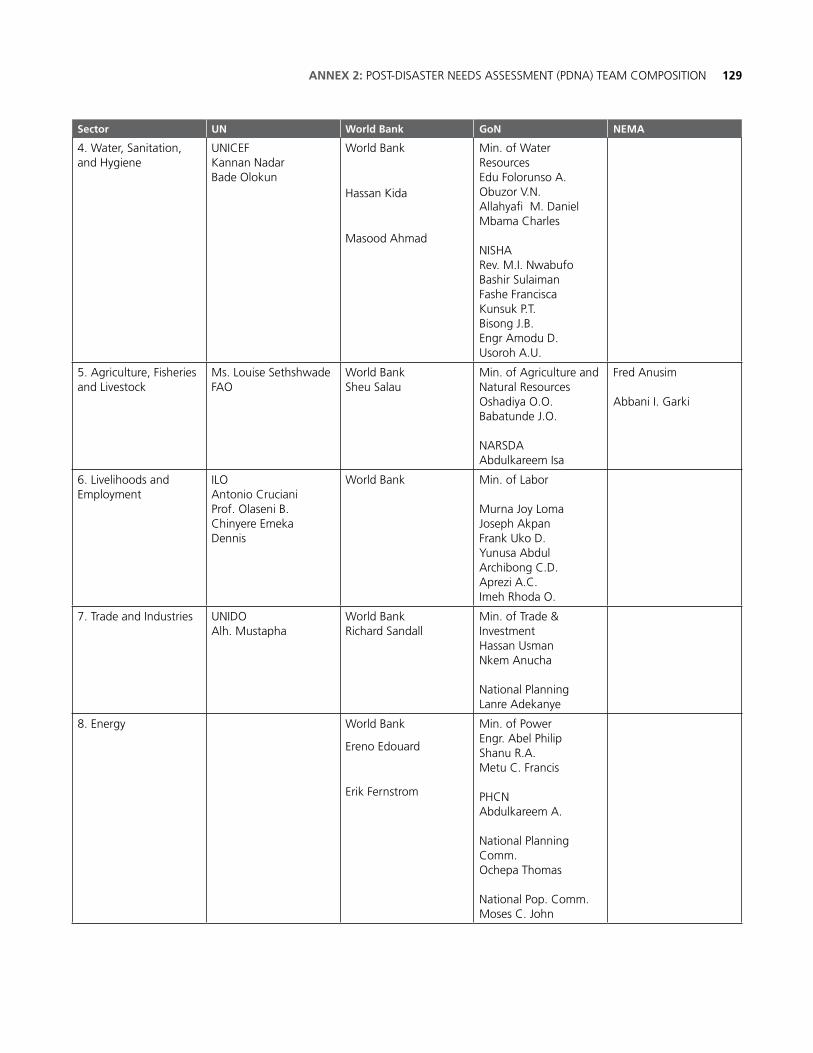
129ANNEX 2: POST-DISASTER NEEDS ASSESSMENT (PDNA) TEAM COMPOSITION
Sector UN World Bank GoN NEMA
4. Water, Sanitation, and Hygiene
UNICEFKannan Nadar Bade Olokun
World Bank
Hassan Kida
Masood Ahmad
Min. of Water ResourcesEdu Folorunso A.Obuzor V.N.Allahyafi M. Daniel Mbama Charles
NISHARev. M.I. NwabufoBashir SulaimanFashe FranciscaKunsuk P.T.Bisong J.B.Engr Amodu D.Usoroh A.U.
5. Agriculture, Fisheries and Livestock
Ms. Louise Sethshwade FAO
World Bank Sheu Salau
Min. of Agriculture and Natural ResourcesOshadiya O.O.Babatunde J.O.
NARSDAAbdulkareem Isa
Fred Anusim
Abbani I. Garki
6. Livelihoods and Employment
ILOAntonio Cruciani Prof. Olaseni B.Chinyere EmekaDennis
World Bank Min. of Labor
Murna Joy LomaJoseph AkpanFrank Uko D.Yunusa AbdulArchibong C.D.Aprezi A.C.Imeh Rhoda O.
7. Trade and Industries UNIDOAlh. Mustapha
World Bank Richard Sandall
Min. of Trade & InvestmentHassan UsmanNkem Anucha
National PlanningLanre Adekanye
8. Energy World Bank
Ereno Edouard
Erik Fernstrom
Min. of PowerEngr. Abel PhilipShanu R.A.Metu C. Francis
PHCNAbdulkareem A.
National Planning Comm.Ochepa Thomas
National Pop. Comm.Moses C. John
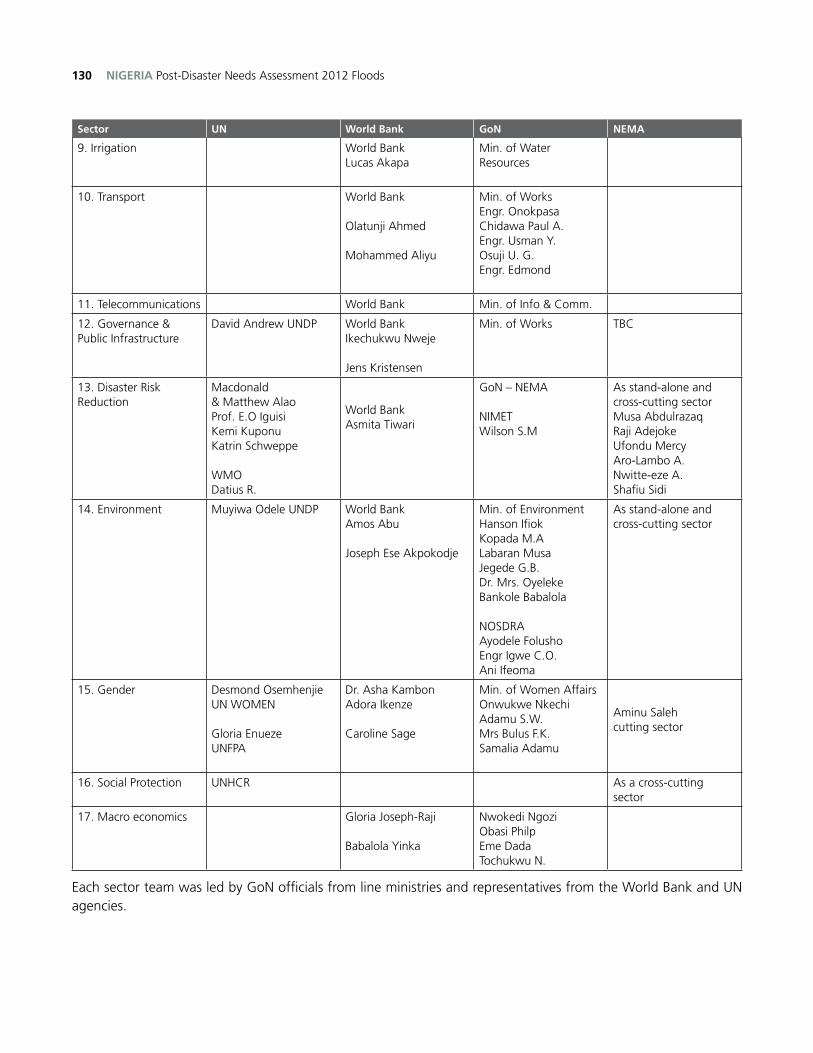
NIGERIA Post-Disaster Needs Assessment 2012 Floods130
Sector UN World Bank GoN NEMA
9. Irrigation World BankLucas Akapa
Min. of Water Resources
10. Transport World Bank Olatunji Ahmed
Mohammed Aliyu
Min. of WorksEngr. OnokpasaChidawa Paul A.Engr. Usman Y.Osuji U. G.Engr. Edmond
11. Telecommunications World Bank Min. of Info & Comm.
12. Governance & Public Infrastructure
David Andrew UNDP World Bank Ikechukwu Nweje
Jens Kristensen
Min. of Works TBC
13. Disaster Risk Reduction
Macdonald & Matthew Alao Prof. E.O IguisiKemi KuponuKatrin Schweppe
WMODatius R.
World BankAsmita Tiwari
GoN – NEMA
NIMETWilson S.M
As stand-alone and cross-cutting sector Musa AbdulrazaqRaji AdejokeUfondu MercyAro-Lambo A.Nwitte-eze A.Shafiu Sidi
14. Environment Muyiwa Odele UNDP World BankAmos Abu
Joseph Ese Akpokodje
Min. of Environment Hanson IfiokKopada M.ALabaran MusaJegede G.B.Dr. Mrs. OyelekeBankole Babalola
NOSDRAAyodele FolushoEngr Igwe C.O.Ani Ifeoma
As stand-alone and cross-cutting sector
15. Gender Desmond Osemhenjie UN WOMEN
Gloria EnuezeUNFPA
Dr. Asha KambonAdora Ikenze
Caroline Sage
Min. of Women Affairs Onwukwe NkechiAdamu S.W.Mrs Bulus F.K.Samalia Adamu
Aminu Saleh cutting sector
16. Social Protection UNHCR As a cross-cutting sector
17. Macro economics Gloria Joseph-Raji
Babalola Yinka
Nwokedi NgoziObasi PhilpEme DadaTochukwu N.
Each sector team was led by GoN officials from line ministries and representatives from the World Bank and UN agencies.
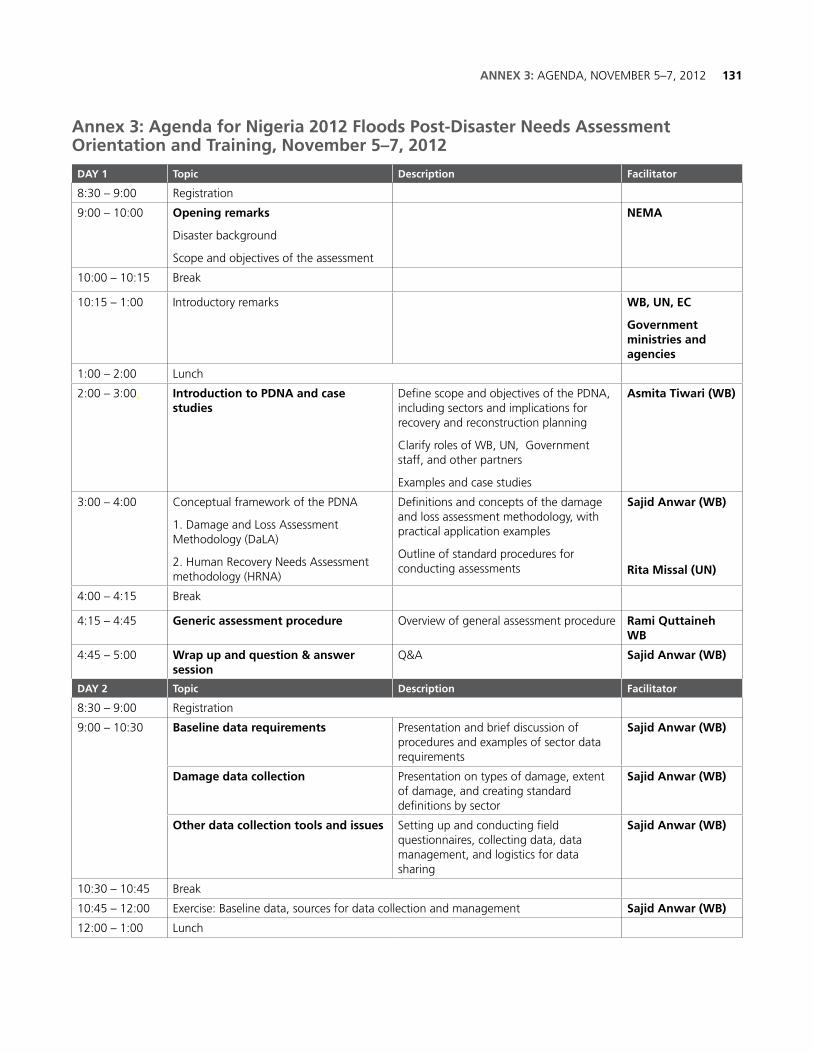
131ANNEX 3: AGENDA, NOVEMBER 5–7, 2012
Annex 3: Agenda for Nigeria 2012 Floods Post-Disaster Needs Assessment Orientation and Training, November 5–7, 2012
DAY 1 Topic Description Facilitator
8:30 – 9:00 Registration
9:00 – 10:00 Opening remarks
Disaster background
Scope and objectives of the assessment
NEMA
10:00 – 10:15 Break
10:15 – 1:00 Introductory remarks WB, UN, EC
Government ministries and agencies
1:00 – 2:00 Lunch
2:00 – 3:00. Introduction to PDNA and case studies
Define scope and objectives of the PDNA, including sectors and implications for recovery and reconstruction planning
Clarify roles of WB, UN, Government staff, and other partners
Examples and case studies
Asmita Tiwari (WB)
3:00 – 4:00 Conceptual framework of the PDNA
1. Damage and Loss Assessment Methodology (DaLA)
2. Human Recovery Needs Assessment methodology (HRNA)
Definitions and concepts of the damage and loss assessment methodology, with practical application examples
Outline of standard procedures for conducting assessments
Sajid Anwar (WB)
Rita Missal (UN)
4:00 – 4:15 Break
4:15 – 4:45 Generic assessment procedure Overview of general assessment procedure Rami Quttaineh WB
4:45 – 5:00 Wrap up and question & answer session
Q&A Sajid Anwar (WB)
DAY 2 Topic Description Facilitator
8:30 – 9:00 Registration
9:00 – 10:30 Baseline data requirements Presentation and brief discussion of procedures and examples of sector data requirements
Sajid Anwar (WB)
Damage data collection Presentation on types of damage, extent of damage, and creating standard definitions by sector
Sajid Anwar (WB)
Other data collection tools and issues Setting up and conducting field questionnaires, collecting data, data management, and logistics for data sharing
Sajid Anwar (WB)
10:30 – 10:45 Break
10:45 – 12:00 Exercise: Baseline data, sources for data collection and management Sajid Anwar (WB)
12:00 – 1:00 Lunch
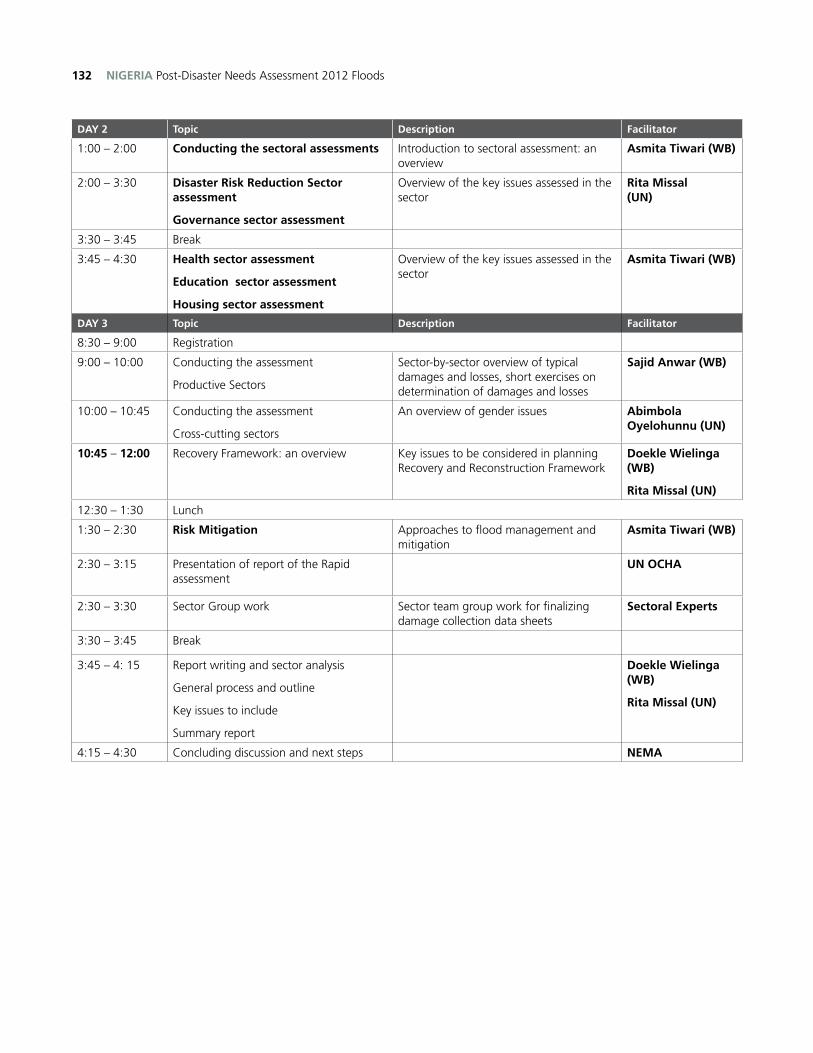
NIGERIA Post-Disaster Needs Assessment 2012 Floods132
DAY 2 Topic Description Facilitator
1:00 – 2:00 Conducting the sectoral assessments Introduction to sectoral assessment: an overview
Asmita Tiwari (WB)
2:00 – 3:30 Disaster Risk Reduction Sector assessment
Governance sector assessment
Overview of the key issues assessed in the sector
Rita Missal (UN)
3:30 – 3:45 Break
3:45 – 4:30 Health sector assessment
Education sector assessment
Housing sector assessment
Overview of the key issues assessed in the sector
Asmita Tiwari (WB)
DAY 3 Topic Description Facilitator
8:30 – 9:00 Registration
9:00 – 10:00 Conducting the assessment
Productive Sectors
Sector-by-sector overview of typical damages and losses, short exercises on determination of damages and losses
Sajid Anwar (WB)
10:00 – 10:45 Conducting the assessment
Cross-cutting sectors
An overview of gender issues Abimbola Oyelohunnu (UN)
10:45 – 12:00 Recovery Framework: an overview Key issues to be considered in planning Recovery and Reconstruction Framework
Doekle Wielinga (WB)
Rita Missal (UN)
12:30 – 1:30 Lunch
1:30 – 2:30 Risk Mitigation Approaches to flood management and mitigation
Asmita Tiwari (WB)
2:30 – 3:15 Presentation of report of the Rapid assessment
UN OCHA
2:30 – 3:30 Sector Group work Sector team group work for finalizing damage collection data sheets
Sectoral Experts
3:30 – 3:45 Break
3:45 – 4: 15 Report writing and sector analysis
General process and outline
Key issues to include
Summary report
Doekle Wielinga (WB)
Rita Missal (UN)
4:15 – 4:30 Concluding discussion and next steps NEMA

133ANNEX 2: AGENDA, NOVEMBER 5–7, 2012
Agenda for Nigeria 2012 Floods Post-Disaster Needs Assessment: Sectoral Assessment Training November 13, 2012
DAY 1 Topic Description Facilitator
10:00-10:15 Registration
10:15-10:30 Welcome remarks
Scope and objectives of the assessment
NEMA ,
WB
10:30-11:00 Overview of the Conceptual Framework of the PDNA – the Human Recovery Needs Assessment Methodology (HRNA)
Definitions and concepts of the damage and loss Human Recovery Needs Assessment methodology, with practical application examples
UNDP
11:00 -11:15 Questions and clarifications
11:15 – 12:30 Overview of the Conceptual framework of the PDNA/ Generic Assessment procedure: The Damage and Loss Assessment (DaLA) methodology
Definitions and concepts of the DaLA methodology, with practical application examples
Roberto Jovel, World Bank
12:30 – 1:00 Questions and clarifications
1:00 – 2:00pm Lunch
2:00 – 3:30 Group Work – Sectoral Teams Opportunity for Sector Teams to clarify data requirements for assessment
Roberto Jovel, Asha Kambon, Rami Quttaineh, WB
3:30 – 4:00pm Plenary to finalize logistics for Field Visits
NEMA,WB, UNDP
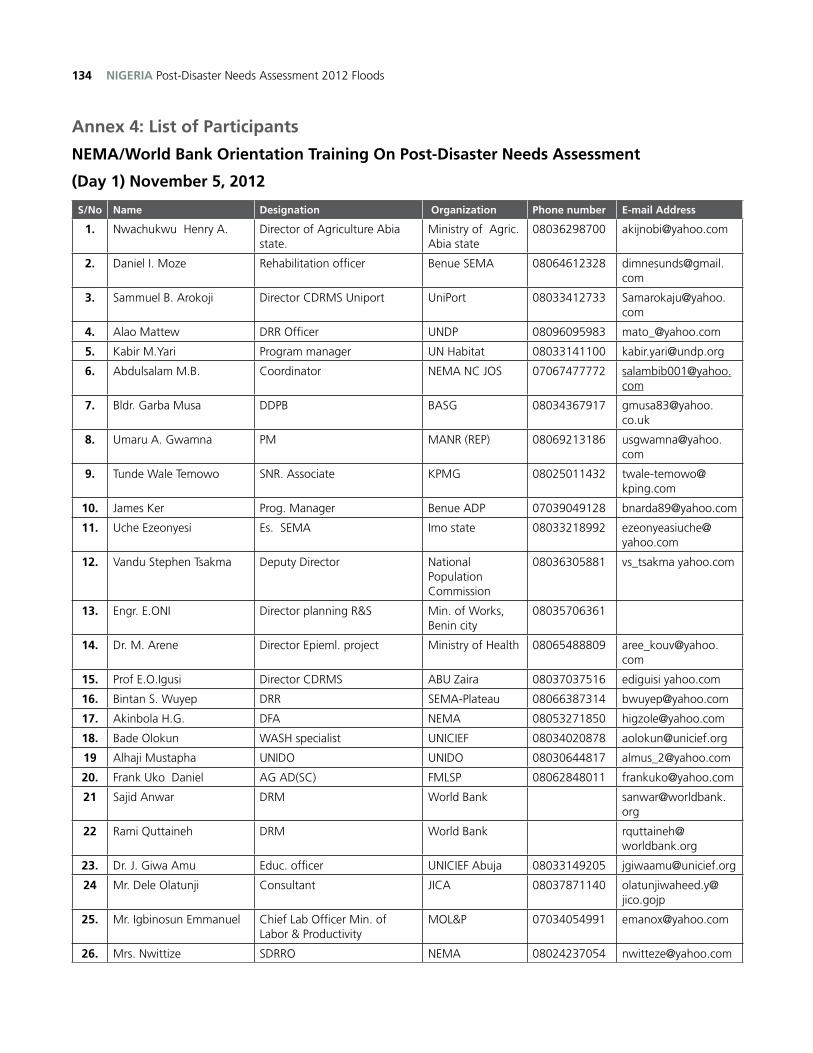
NIGERIA Post-Disaster Needs Assessment 2012 Floods134
Annex 4: List of Participants
NEMA/World Bank Orientation Training On Post-Disaster Needs Assessment
(Day 1) November 5, 2012
S/No Name Designation Organization Phone number E-mail Address
1. Nwachukwu Henry A. Director of Agriculture Abia state.
Ministry of Agric. Abia state
08036298700 [email protected]
2. Daniel I. Moze Rehabilitation officer Benue SEMA 08064612328 [email protected]
3. Sammuel B. Arokoji Director CDRMS Uniport UniPort 08033412733 [email protected]
4. Alao Mattew DRR Officer UNDP 08096095983 [email protected]
5. Kabir M.Yari Program manager UN Habitat 08033141100 [email protected]
6. Abdulsalam M.B. Coordinator NEMA NC JOS 07067477772 [email protected]
7. Bldr. Garba Musa DDPB BASG 08034367917 [email protected]
8. Umaru A. Gwamna PM MANR (REP) 08069213186 [email protected]
9. Tunde Wale Temowo SNR. Associate KPMG 08025011432 [email protected]
10. James Ker Prog. Manager Benue ADP 07039049128 [email protected]
11. Uche Ezeonyesi Es. SEMA Imo state 08033218992 [email protected]
12. Vandu Stephen Tsakma Deputy Director National Population Commission
08036305881 vs_tsakma yahoo.com
13. Engr. E.ONI Director planning R&S Min. of Works, Benin city
08035706361
14. Dr. M. Arene Director Epieml. project Ministry of Health 08065488809 [email protected]
15. Prof E.O.Igusi Director CDRMS ABU Zaira 08037037516 ediguisi yahoo.com
16. Bintan S. Wuyep DRR SEMA-Plateau 08066387314 [email protected]
17. Akinbola H.G. DFA NEMA 08053271850 [email protected]
18. Bade Olokun WASH specialist UNICIEF 08034020878 [email protected]
19 Alhaji Mustapha UNIDO UNIDO 08030644817 [email protected]
20. Frank Uko Daniel AG AD(SC) FMLSP 08062848011 [email protected]
21 Sajid Anwar DRM World Bank [email protected]
22 Rami Quttaineh DRM World Bank [email protected]
23. Dr. J. Giwa Amu Educ. officer UNICIEF Abuja 08033149205 [email protected]
24 Mr. Dele Olatunji Consultant JICA 08037871140 [email protected]
25. Mr. Igbinosun Emmanuel Chief Lab Officer Min. of Labor & Productivity
MOL&P 07034054991 [email protected]
26. Mrs. Nwittize SDRRO NEMA 08024237054 [email protected]
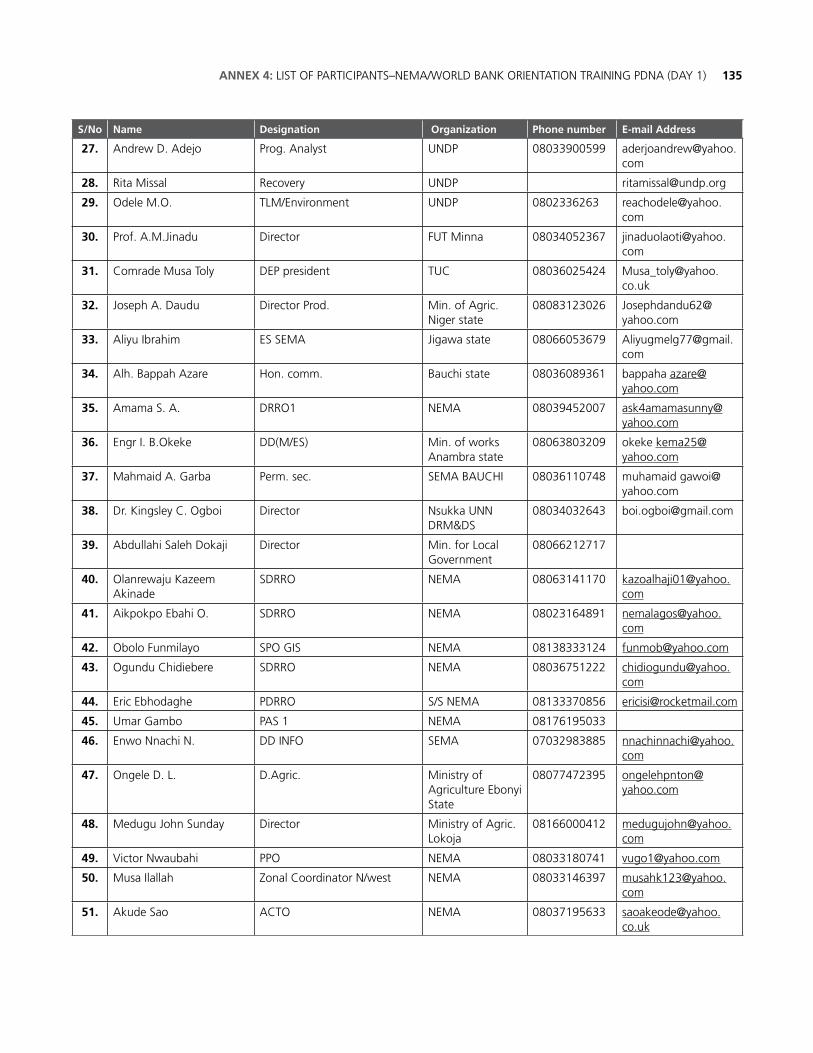
135ANNEX 4: LIST OF PARTICIPANTS–NEMA/WORLD BANK ORIENTATION TRAINING PDNA (DAY 1)
S/No Name Designation Organization Phone number E-mail Address
27. Andrew D. Adejo Prog. Analyst UNDP 08033900599 [email protected]
28. Rita Missal Recovery UNDP [email protected]
29. Odele M.O. TLM/Environment UNDP 0802336263 [email protected]
30. Prof. A.M.Jinadu Director FUT Minna 08034052367 [email protected]
31. Comrade Musa Toly DEP president TUC 08036025424 [email protected]
32. Joseph A. Daudu Director Prod. Min. of Agric. Niger state
08083123026 [email protected]
33. Aliyu Ibrahim ES SEMA Jigawa state 08066053679 [email protected]
34. Alh. Bappah Azare Hon. comm. Bauchi state 08036089361 bappaha [email protected]
35. Amama S. A. DRRO1 NEMA 08039452007 [email protected]
36. Engr I. B.Okeke DD(M/ES) Min. of works Anambra state
08063803209 okeke [email protected]
37. Mahmaid A. Garba Perm. sec. SEMA BAUCHI 08036110748 muhamaid [email protected]
38. Dr. Kingsley C. Ogboi Director Nsukka UNN DRM&DS
08034032643 [email protected]
39. Abdullahi Saleh Dokaji Director Min. for Local Government
08066212717
40. Olanrewaju Kazeem Akinade
SDRRO NEMA 08063141170 [email protected]
41. Aikpokpo Ebahi O. SDRRO NEMA 08023164891 [email protected]
42. Obolo Funmilayo SPO GIS NEMA 08138333124 [email protected]
43. Ogundu Chidiebere SDRRO NEMA 08036751222 [email protected]
44. Eric Ebhodaghe PDRRO S/S NEMA 08133370856 [email protected]
45. Umar Gambo PAS 1 NEMA 08176195033
46. Enwo Nnachi N. DD INFO SEMA 07032983885 [email protected]
47. Ongele D. L. D.Agric. Ministry of Agriculture Ebonyi State
08077472395 [email protected]
48. Medugu John Sunday Director Ministry of Agric. Lokoja
08166000412 [email protected]
49. Victor Nwaubahi PPO NEMA 08033180741 [email protected]
50. Musa Ilallah Zonal Coordinator N/west NEMA 08033146397 [email protected]
51. Akude Sao ACTO NEMA 08037195633 [email protected]
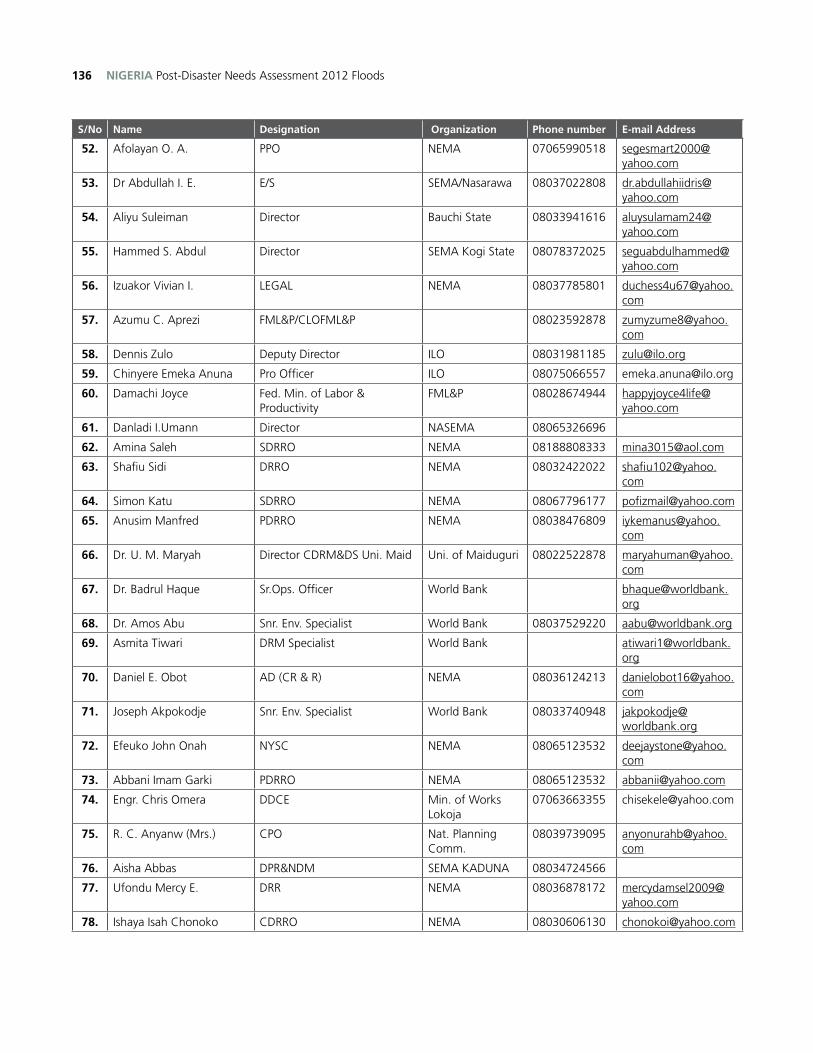
NIGERIA Post-Disaster Needs Assessment 2012 Floods136
S/No Name Designation Organization Phone number E-mail Address
52. Afolayan O. A. PPO NEMA 07065990518 [email protected]
53. Dr Abdullah I. E. E/S SEMA/Nasarawa 08037022808 [email protected]
54. Aliyu Suleiman Director Bauchi State 08033941616 [email protected]
55. Hammed S. Abdul Director SEMA Kogi State 08078372025 [email protected]
56. Izuakor Vivian I. LEGAL NEMA 08037785801 [email protected]
57. Azumu C. Aprezi FML&P/CLOFML&P 08023592878 [email protected]
58. Dennis Zulo Deputy Director ILO 08031981185 [email protected]
59. Chinyere Emeka Anuna Pro Officer ILO 08075066557 [email protected]
60. Damachi Joyce Fed. Min. of Labor & Productivity
FML&P 08028674944 [email protected]
61. Danladi I.Umann Director NASEMA 08065326696
62. Amina Saleh SDRRO NEMA 08188808333 [email protected]
63. Shafiu Sidi DRRO NEMA 08032422022 [email protected]
64. Simon Katu SDRRO NEMA 08067796177 [email protected]
65. Anusim Manfred PDRRO NEMA 08038476809 [email protected]
66. Dr. U. M. Maryah Director CDRM&DS Uni. Maid Uni. of Maiduguri 08022522878 [email protected]
67. Dr. Badrul Haque Sr.Ops. Officer World Bank [email protected]
68. Dr. Amos Abu Snr. Env. Specialist World Bank 08037529220 [email protected]
69. Asmita Tiwari DRM Specialist World Bank [email protected]
70. Daniel E. Obot AD (CR & R) NEMA 08036124213 [email protected]
71. Joseph Akpokodje Snr. Env. Specialist World Bank 08033740948 [email protected]
72. Efeuko John Onah NYSC NEMA 08065123532 [email protected]
73. Abbani Imam Garki PDRRO NEMA 08065123532 [email protected]
74. Engr. Chris Omera DDCE Min. of Works Lokoja
07063663355 [email protected]
75. R. C. Anyanw (Mrs.) CPO Nat. Planning Comm.
08039739095 [email protected]
76. Aisha Abbas DPR&NDM SEMA KADUNA 08034724566
77. Ufondu Mercy E. DRR NEMA 08036878172 [email protected]
78. Ishaya Isah Chonoko CDRRO NEMA 08030606130 [email protected]
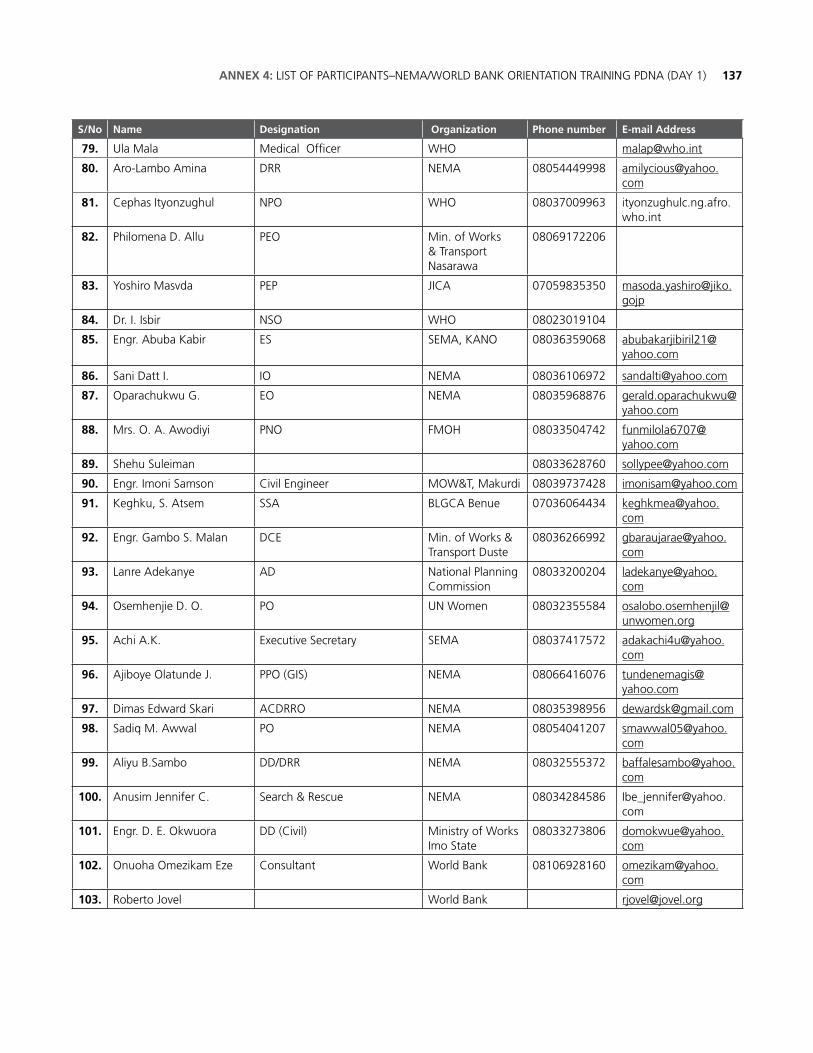
137ANNEX 4: LIST OF PARTICIPANTS–NEMA/WORLD BANK ORIENTATION TRAINING PDNA (DAY 1)
S/No Name Designation Organization Phone number E-mail Address
79. Ula Mala Medical Officer WHO [email protected]
80. Aro-Lambo Amina DRR NEMA 08054449998 [email protected]
81. Cephas Ityonzughul NPO WHO 08037009963 ityonzughulc.ng.afro.who.int
82. Philomena D. Allu PEO Min. of Works & Transport Nasarawa
08069172206
83. Yoshiro Masvda PEP JICA 07059835350 [email protected]
84. Dr. I. Isbir NSO WHO 08023019104
85. Engr. Abuba Kabir ES SEMA, KANO 08036359068 [email protected]
86. Sani Datt I. IO NEMA 08036106972 [email protected]
87. Oparachukwu G. EO NEMA 08035968876 [email protected]
88. Mrs. O. A. Awodiyi PNO FMOH 08033504742 [email protected]
89. Shehu Suleiman 08033628760 [email protected]
90. Engr. Imoni Samson Civil Engineer MOW&T, Makurdi 08039737428 [email protected]
91. Keghku, S. Atsem SSA BLGCA Benue 07036064434 [email protected]
92. Engr. Gambo S. Malan DCE Min. of Works & Transport Duste
08036266992 [email protected]
93. Lanre Adekanye AD National Planning Commission
08033200204 [email protected]
94. Osemhenjie D. O. PO UN Women 08032355584 [email protected]
95. Achi A.K. Executive Secretary SEMA 08037417572 [email protected]
96. Ajiboye Olatunde J. PPO (GIS) NEMA 08066416076 [email protected]
97. Dimas Edward Skari ACDRRO NEMA 08035398956 [email protected]
98. Sadiq M. Awwal PO NEMA 08054041207 [email protected]
99. Aliyu B.Sambo DD/DRR NEMA 08032555372 [email protected]
100. Anusim Jennifer C. Search & Rescue NEMA 08034284586 [email protected]
101. Engr. D. E. Okwuora DD (Civil) Ministry of Works Imo State
08033273806 [email protected]
102. Onuoha Omezikam Eze Consultant World Bank 08106928160 [email protected]
103. Roberto Jovel World Bank [email protected]
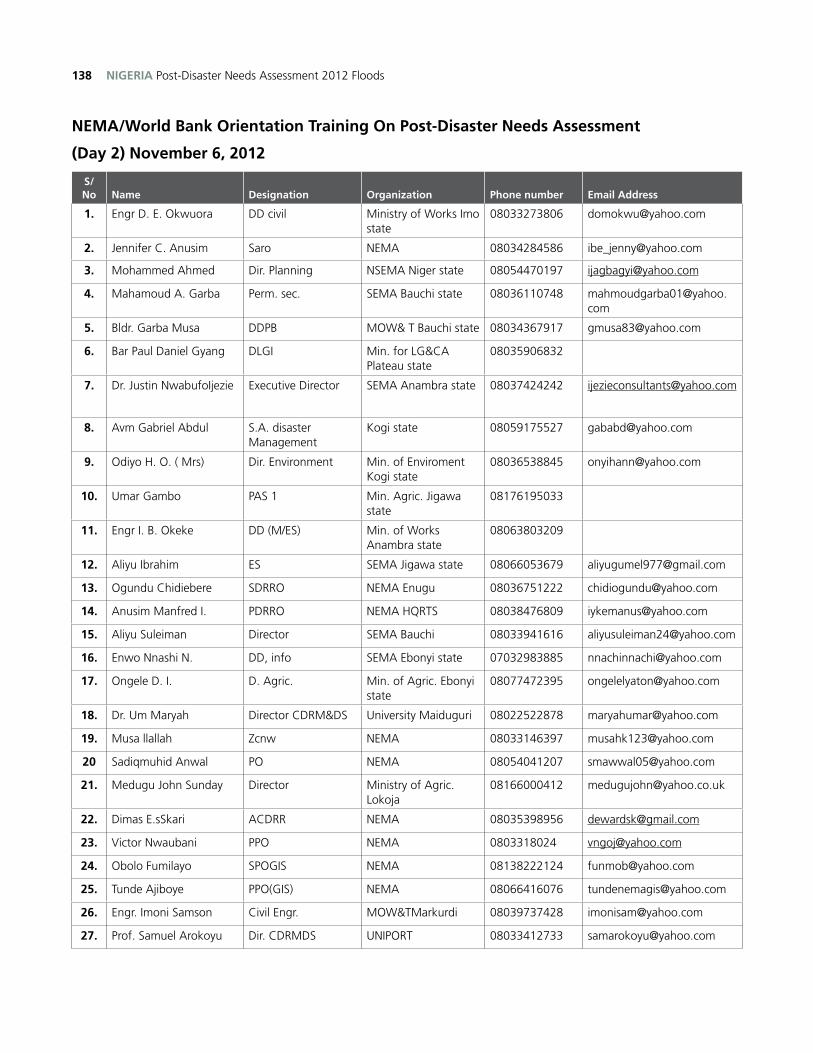
NIGERIA Post-Disaster Needs Assessment 2012 Floods138
NEMA/World Bank Orientation Training On Post-Disaster Needs Assessment
(Day 2) November 6, 2012
S/No Name Designation Organization Phone number Email Address
1. Engr D. E. Okwuora DD civil Ministry of Works Imo state
08033273806 [email protected]
2. Jennifer C. Anusim Saro NEMA 08034284586 [email protected]
3. Mohammed Ahmed Dir. Planning NSEMA Niger state 08054470197 [email protected]
4. Mahamoud A. Garba Perm. sec. SEMA Bauchi state 08036110748 [email protected]
5. Bldr. Garba Musa DDPB MOW& T Bauchi state 08034367917 [email protected]
6. Bar Paul Daniel Gyang DLGI Min. for LG&CA Plateau state
08035906832
7. Dr. Justin NwabufoIjezie Executive Director SEMA Anambra state 08037424242 [email protected]
8. Avm Gabriel Abdul S.A. disaster Management
Kogi state 08059175527 [email protected]
9. Odiyo H. O. ( Mrs) Dir. Environment Min. of Enviroment Kogi state
08036538845 [email protected]
10. Umar Gambo PAS 1 Min. Agric. Jigawa state
08176195033
11. Engr I. B. Okeke DD (M/ES) Min. of Works Anambra state
08063803209
12. Aliyu Ibrahim ES SEMA Jigawa state 08066053679 [email protected]
13. Ogundu Chidiebere SDRRO NEMA Enugu 08036751222 [email protected]
14. Anusim Manfred I. PDRRO NEMA HQRTS 08038476809 [email protected]
15. Aliyu Suleiman Director SEMA Bauchi 08033941616 [email protected]
16. Enwo Nnashi N. DD, info SEMA Ebonyi state 07032983885 [email protected]
17. Ongele D. I. D. Agric. Min. of Agric. Ebonyi state
08077472395 [email protected]
18. Dr. Um Maryah Director CDRM&DS University Maiduguri 08022522878 [email protected]
19. Musa llallah Zcnw NEMA 08033146397 [email protected]
20 Sadiqmuhid Anwal PO NEMA 08054041207 [email protected]
21. Medugu John Sunday Director Ministry of Agric. Lokoja
08166000412 [email protected]
22. Dimas E.sSkari ACDRR NEMA 08035398956 [email protected]
23. Victor Nwaubani PPO NEMA 0803318024 [email protected]
24. Obolo Fumilayo SPOGIS NEMA 08138222124 [email protected]
25. Tunde Ajiboye PPO(GIS) NEMA 08066416076 [email protected]
26. Engr. Imoni Samson Civil Engr. MOW&TMarkurdi 08039737428 [email protected]
27. Prof. Samuel Arokoyu Dir. CDRMDS UNIPORT 08033412733 [email protected]
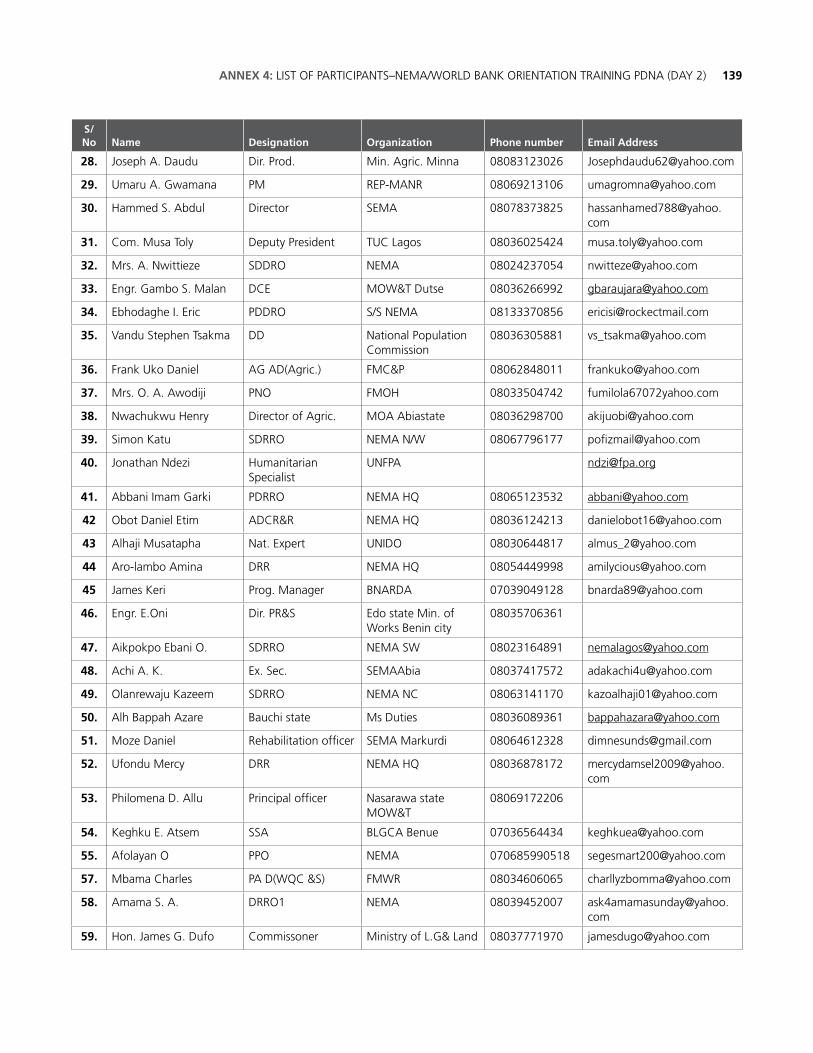
139ANNEX 4: LIST OF PARTICIPANTS–NEMA/WORLD BANK ORIENTATION TRAINING PDNA (DAY 2)
S/No Name Designation Organization Phone number Email Address
28. Joseph A. Daudu Dir. Prod. Min. Agric. Minna 08083123026 [email protected]
29. Umaru A. Gwamana PM REP-MANR 08069213106 [email protected]
30. Hammed S. Abdul Director SEMA 08078373825 [email protected]
31. Com. Musa Toly Deputy President TUC Lagos 08036025424 [email protected]
32. Mrs. A. Nwittieze SDDRO NEMA 08024237054 [email protected]
33. Engr. Gambo S. Malan DCE MOW&T Dutse 08036266992 [email protected]
34. Ebhodaghe I. Eric PDDRO S/S NEMA 08133370856 [email protected]
35. Vandu Stephen Tsakma DD National Population Commission
08036305881 [email protected]
36. Frank Uko Daniel AG AD(Agric.) FMC&P 08062848011 [email protected]
37. Mrs. O. A. Awodiji PNO FMOH 08033504742 fumilola67072yahoo.com
38. Nwachukwu Henry Director of Agric. MOA Abiastate 08036298700 [email protected]
39. Simon Katu SDRRO NEMA N/W 08067796177 [email protected]
40. Jonathan Ndezi Humanitarian Specialist
UNFPA [email protected]
41. Abbani Imam Garki PDRRO NEMA HQ 08065123532 [email protected]
42 Obot Daniel Etim ADCR&R NEMA HQ 08036124213 [email protected]
43 Alhaji Musatapha Nat. Expert UNIDO 08030644817 [email protected]
44 Aro-lambo Amina DRR NEMA HQ 08054449998 [email protected]
45 James Keri Prog. Manager BNARDA 07039049128 [email protected]
46. Engr. E.Oni Dir. PR&S Edo state Min. of Works Benin city
08035706361
47. Aikpokpo Ebani O. SDRRO NEMA SW 08023164891 [email protected]
48. Achi A. K. Ex. Sec. SEMAAbia 08037417572 [email protected]
49. Olanrewaju Kazeem SDRRO NEMA NC 08063141170 [email protected]
50. Alh Bappah Azare Bauchi state Ms Duties 08036089361 [email protected]
51. Moze Daniel Rehabilitation officer SEMA Markurdi 08064612328 [email protected]
52. Ufondu Mercy DRR NEMA HQ 08036878172 [email protected]
53. Philomena D. Allu Principal officer Nasarawa state MOW&T
08069172206
54. Keghku E. Atsem SSA BLGCA Benue 07036564434 [email protected]
55. Afolayan O PPO NEMA 070685990518 [email protected]
57. Mbama Charles PA D(WQC &S) FMWR 08034606065 [email protected]
58. Amama S. A. DRRO1 NEMA 08039452007 [email protected]
59. Hon. James G. Dufo Commissoner Ministry of L.G& Land 08037771970 [email protected]
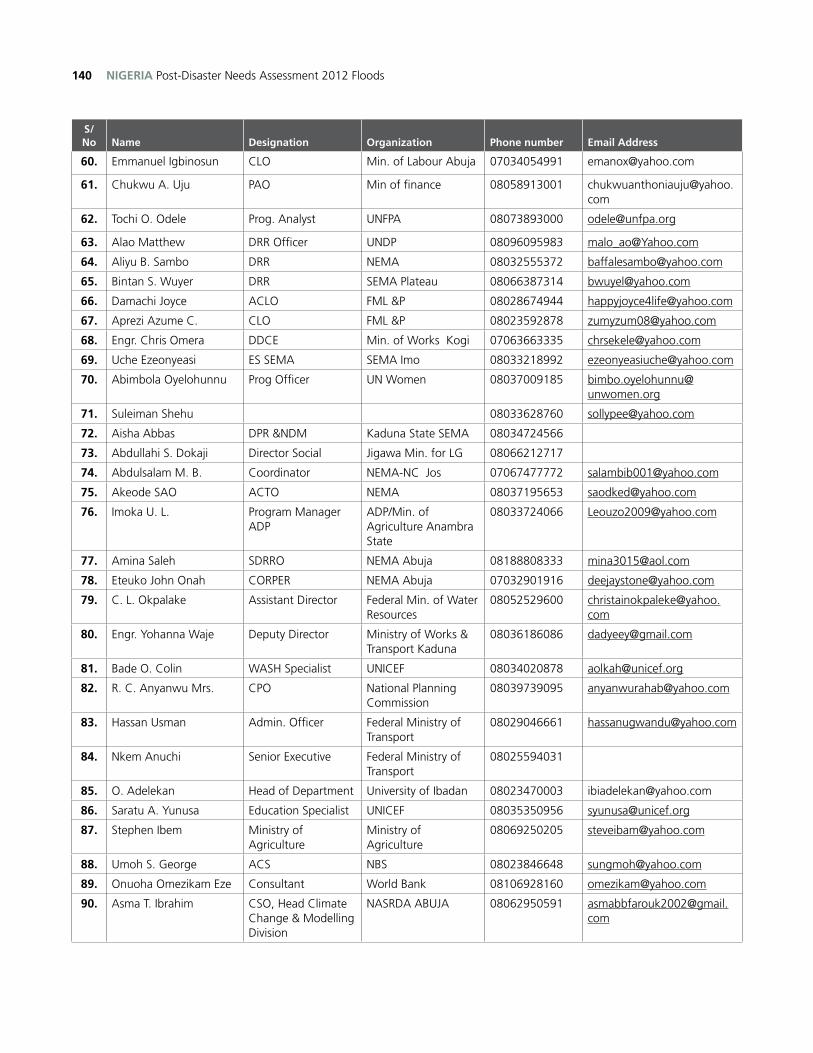
NIGERIA Post-Disaster Needs Assessment 2012 Floods140
S/No Name Designation Organization Phone number Email Address
60. Emmanuel Igbinosun CLO Min. of Labour Abuja 07034054991 [email protected]
61. Chukwu A. Uju PAO Min of finance 08058913001 [email protected]
62. Tochi O. Odele Prog. Analyst UNFPA 08073893000 [email protected]
63. Alao Matthew DRR Officer UNDP 08096095983 [email protected]
64. Aliyu B. Sambo DRR NEMA 08032555372 [email protected]
65. Bintan S. Wuyer DRR SEMA Plateau 08066387314 [email protected]
66. Damachi Joyce ACLO FML &P 08028674944 [email protected]
67. Aprezi Azume C. CLO FML &P 08023592878 [email protected]
68. Engr. Chris Omera DDCE Min. of Works Kogi 07063663335 [email protected]
69. Uche Ezeonyeasi ES SEMA SEMA Imo 08033218992 [email protected]
70. Abimbola Oyelohunnu Prog Officer UN Women 08037009185 [email protected]
71. Suleiman Shehu 08033628760 [email protected]
72. Aisha Abbas DPR &NDM Kaduna State SEMA 08034724566
73. Abdullahi S. Dokaji Director Social Jigawa Min. for LG 08066212717
74. Abdulsalam M. B. Coordinator NEMA-NC Jos 07067477772 [email protected]
75. Akeode SAO ACTO NEMA 08037195653 [email protected]
76. Imoka U. L. Program Manager ADP
ADP/Min. of Agriculture Anambra State
08033724066 [email protected]
77. Amina Saleh SDRRO NEMA Abuja 08188808333 [email protected]
78. Eteuko John Onah CORPER NEMA Abuja 07032901916 [email protected]
79. C. L. Okpalake Assistant Director Federal Min. of Water Resources
08052529600 [email protected]
80. Engr. Yohanna Waje Deputy Director Ministry of Works & Transport Kaduna
08036186086 [email protected]
81. Bade O. Colin WASH Specialist UNICEF 08034020878 [email protected]
82. R. C. Anyanwu Mrs. CPO National Planning Commission
08039739095 [email protected]
83. Hassan Usman Admin. Officer Federal Ministry of Transport
08029046661 [email protected]
84. Nkem Anuchi Senior Executive Federal Ministry of Transport
08025594031
85. O. Adelekan Head of Department University of Ibadan 08023470003 [email protected]
86. Saratu A. Yunusa Education Specialist UNICEF 08035350956 [email protected]
87. Stephen Ibem Ministry of Agriculture
Ministry of Agriculture
08069250205 [email protected]
88. Umoh S. George ACS NBS 08023846648 [email protected]
89. Onuoha Omezikam Eze Consultant World Bank 08106928160 [email protected]
90. Asma T. Ibrahim CSO, Head Climate Change & Modelling Division
NASRDA ABUJA 08062950591 [email protected]
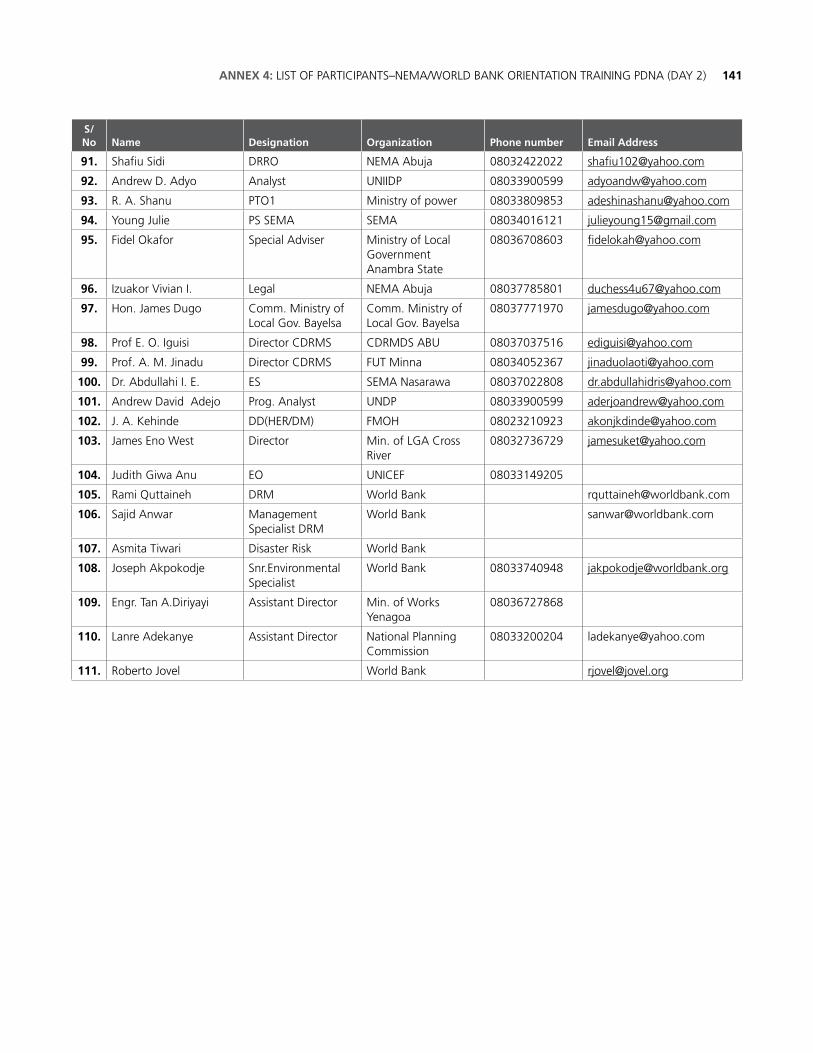
141ANNEX 4: LIST OF PARTICIPANTS–NEMA/WORLD BANK ORIENTATION TRAINING PDNA (DAY 2)
S/No Name Designation Organization Phone number Email Address
91. Shafiu Sidi DRRO NEMA Abuja 08032422022 [email protected]
92. Andrew D. Adyo Analyst UNIIDP 08033900599 [email protected]
93. R. A. Shanu PTO1 Ministry of power 08033809853 [email protected]
94. Young Julie PS SEMA SEMA 08034016121 [email protected]
95. Fidel Okafor Special Adviser Ministry of Local Government Anambra State
08036708603 [email protected]
96. Izuakor Vivian I. Legal NEMA Abuja 08037785801 [email protected]
97. Hon. James Dugo Comm. Ministry of Local Gov. Bayelsa
Comm. Ministry of Local Gov. Bayelsa
08037771970 [email protected]
98. Prof E. O. Iguisi Director CDRMS CDRMDS ABU 08037037516 [email protected]
99. Prof. A. M. Jinadu Director CDRMS FUT Minna 08034052367 [email protected]
100. Dr. Abdullahi I. E. ES SEMA Nasarawa 08037022808 [email protected]
101. Andrew David Adejo Prog. Analyst UNDP 08033900599 [email protected]
102. J. A. Kehinde DD(HER/DM) FMOH 08023210923 [email protected]
103. James Eno West Director Min. of LGA Cross River
08032736729 [email protected]
104. Judith Giwa Anu EO UNICEF 08033149205
105. Rami Quttaineh DRM World Bank [email protected]
106. Sajid Anwar Management Specialist DRM
World Bank [email protected]
107. Asmita Tiwari Disaster Risk World Bank
108. Joseph Akpokodje Snr.Environmental Specialist
World Bank 08033740948 [email protected]
109. Engr. Tan A.Diriyayi Assistant Director Min. of Works Yenagoa
08036727868
110. Lanre Adekanye Assistant Director National Planning Commission
08033200204 [email protected]
111. Roberto Jovel World Bank [email protected]
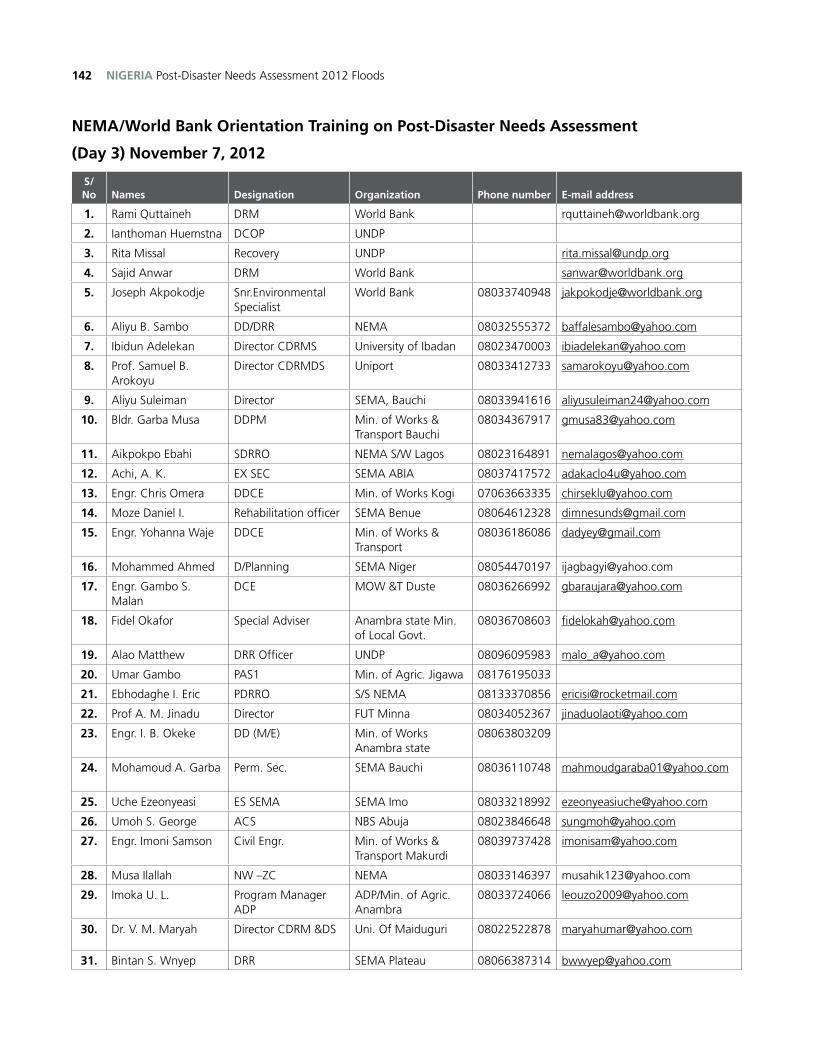
NIGERIA Post-Disaster Needs Assessment 2012 Floods142
NEMA/World Bank Orientation Training on Post-Disaster Needs Assessment
(Day 3) November 7, 2012
S/No Names Designation Organization Phone number E-mail address
1. Rami Quttaineh DRM World Bank [email protected]
2. Ianthoman Huemstna DCOP UNDP
3. Rita Missal Recovery UNDP [email protected]
4. Sajid Anwar DRM World Bank [email protected]
5. Joseph Akpokodje Snr.Environmental Specialist
World Bank 08033740948 [email protected]
6. Aliyu B. Sambo DD/DRR NEMA 08032555372 [email protected]
7. Ibidun Adelekan Director CDRMS University of Ibadan 08023470003 [email protected]
8. Prof. Samuel B. Arokoyu
Director CDRMDS Uniport 08033412733 [email protected]
9. Aliyu Suleiman Director SEMA, Bauchi 08033941616 [email protected]
10. Bldr. Garba Musa DDPM Min. of Works & Transport Bauchi
08034367917 [email protected]
11. Aikpokpo Ebahi SDRRO NEMA S/W Lagos 08023164891 [email protected]
12. Achi, A. K. EX SEC SEMA ABIA 08037417572 [email protected]
13. Engr. Chris Omera DDCE Min. of Works Kogi 07063663335 [email protected]
14. Moze Daniel I. Rehabilitation officer SEMA Benue 08064612328 [email protected]
15. Engr. Yohanna Waje DDCE Min. of Works & Transport
08036186086 [email protected]
16. Mohammed Ahmed D/Planning SEMA Niger 08054470197 [email protected]
17. Engr. Gambo S. Malan
DCE MOW &T Duste 08036266992 [email protected]
18. Fidel Okafor Special Adviser Anambra state Min. of Local Govt.
08036708603 [email protected]
19. Alao Matthew DRR Officer UNDP 08096095983 [email protected]
20. Umar Gambo PAS1 Min. of Agric. Jigawa 08176195033
21. Ebhodaghe I. Eric PDRRO S/S NEMA 08133370856 [email protected]
22. Prof A. M. Jinadu Director FUT Minna 08034052367 [email protected]
23. Engr. I. B. Okeke DD (M/E) Min. of Works Anambra state
08063803209
24. Mohamoud A. Garba Perm. Sec. SEMA Bauchi 08036110748 [email protected]
25. Uche Ezeonyeasi ES SEMA SEMA Imo 08033218992 [email protected]
26. Umoh S. George ACS NBS Abuja 08023846648 [email protected]
27. Engr. Imoni Samson Civil Engr. Min. of Works & Transport Makurdi
08039737428 [email protected]
28. Musa Ilallah NW –ZC NEMA 08033146397 [email protected]
29. Imoka U. L. Program Manager ADP
ADP/Min. of Agric. Anambra
08033724066 [email protected]
30. Dr. V. M. Maryah Director CDRM &DS Uni. Of Maiduguri 08022522878 [email protected]
31. Bintan S. Wnyep DRR SEMA Plateau 08066387314 [email protected]
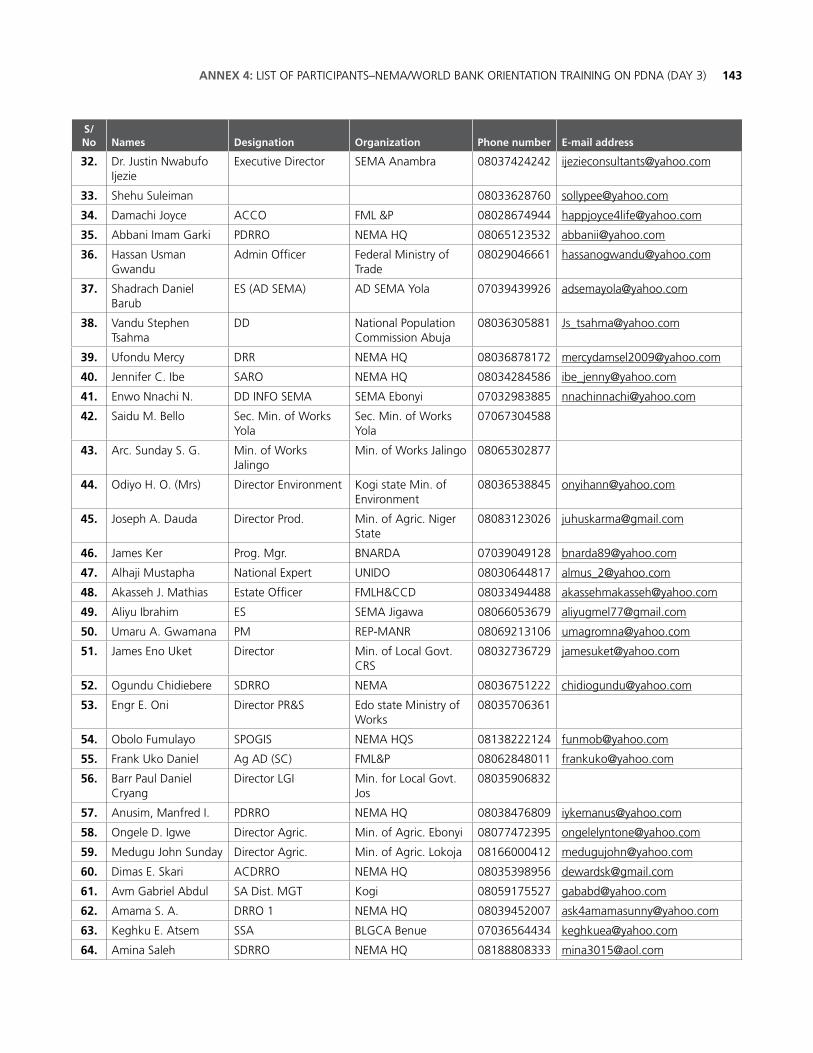
143ANNEX 4: LIST OF PARTICIPANTS–NEMA/WORLD BANK ORIENTATION TRAINING ON PDNA (DAY 3)
S/No Names Designation Organization Phone number E-mail address
32. Dr. Justin Nwabufo Ijezie
Executive Director SEMA Anambra 08037424242 [email protected]
33. Shehu Suleiman 08033628760 [email protected]
34. Damachi Joyce ACCO FML &P 08028674944 [email protected]
35. Abbani Imam Garki PDRRO NEMA HQ 08065123532 [email protected]
36. Hassan Usman Gwandu
Admin Officer Federal Ministry of Trade
08029046661 [email protected]
37. Shadrach Daniel Barub
ES (AD SEMA) AD SEMA Yola 07039439926 [email protected]
38. Vandu Stephen Tsahma
DD National Population Commission Abuja
08036305881 [email protected]
39. Ufondu Mercy DRR NEMA HQ 08036878172 [email protected]
40. Jennifer C. Ibe SARO NEMA HQ 08034284586 [email protected]
41. Enwo Nnachi N. DD INFO SEMA SEMA Ebonyi 07032983885 [email protected]
42. Saidu M. Bello Sec. Min. of Works Yola
Sec. Min. of Works Yola
07067304588
43. Arc. Sunday S. G. Min. of Works Jalingo
Min. of Works Jalingo 08065302877
44. Odiyo H. O. (Mrs) Director Environment Kogi state Min. of Environment
08036538845 [email protected]
45. Joseph A. Dauda Director Prod. Min. of Agric. Niger State
08083123026 [email protected]
46. James Ker Prog. Mgr. BNARDA 07039049128 [email protected]
47. Alhaji Mustapha National Expert UNIDO 08030644817 [email protected]
48. Akasseh J. Mathias Estate Officer FMLH&CCD 08033494488 [email protected]
49. Aliyu Ibrahim ES SEMA Jigawa 08066053679 [email protected]
50. Umaru A. Gwamana PM REP-MANR 08069213106 [email protected]
51. James Eno Uket Director Min. of Local Govt. CRS
08032736729 [email protected]
52. Ogundu Chidiebere SDRRO NEMA 08036751222 [email protected]
53. Engr E. Oni Director PR&S Edo state Ministry of Works
08035706361
54. Obolo Fumulayo SPOGIS NEMA HQS 08138222124 [email protected]
55. Frank Uko Daniel Ag AD (SC) FML&P 08062848011 [email protected]
56. Barr Paul Daniel Cryang
Director LGI Min. for Local Govt. Jos
08035906832
57. Anusim, Manfred I. PDRRO NEMA HQ 08038476809 [email protected]
58. Ongele D. Igwe Director Agric. Min. of Agric. Ebonyi 08077472395 [email protected]
59. Medugu John Sunday Director Agric. Min. of Agric. Lokoja 08166000412 [email protected]
60. Dimas E. Skari ACDRRO NEMA HQ 08035398956 [email protected]
61. Avm Gabriel Abdul SA Dist. MGT Kogi 08059175527 [email protected]
62. Amama S. A. DRRO 1 NEMA HQ 08039452007 [email protected]
63. Keghku E. Atsem SSA BLGCA Benue 07036564434 [email protected]
64. Amina Saleh SDRRO NEMA HQ 08188808333 [email protected]
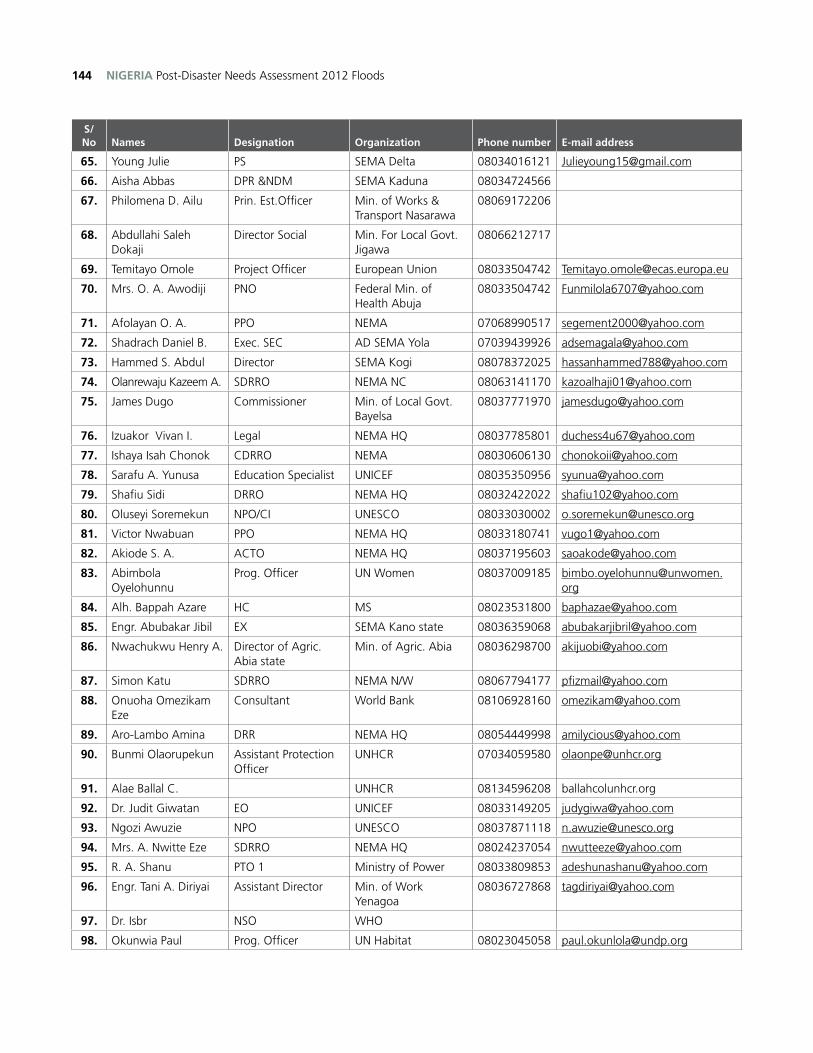
NIGERIA Post-Disaster Needs Assessment 2012 Floods144
S/No Names Designation Organization Phone number E-mail address
65. Young Julie PS SEMA Delta 08034016121 [email protected]
66. Aisha Abbas DPR &NDM SEMA Kaduna 08034724566
67. Philomena D. Ailu Prin. Est.Officer Min. of Works & Transport Nasarawa
08069172206
68. Abdullahi Saleh Dokaji
Director Social Min. For Local Govt. Jigawa
08066212717
69. Temitayo Omole Project Officer European Union 08033504742 [email protected]
70. Mrs. O. A. Awodiji PNO Federal Min. of Health Abuja
08033504742 [email protected]
71. Afolayan O. A. PPO NEMA 07068990517 [email protected]
72. Shadrach Daniel B. Exec. SEC AD SEMA Yola 07039439926 [email protected]
73. Hammed S. Abdul Director SEMA Kogi 08078372025 [email protected]
74. Olanrewaju Kazeem A. SDRRO NEMA NC 08063141170 [email protected]
75. James Dugo Commissioner Min. of Local Govt. Bayelsa
08037771970 [email protected]
76. Izuakor Vivan I. Legal NEMA HQ 08037785801 [email protected]
77. Ishaya Isah Chonok CDRRO NEMA 08030606130 [email protected]
78. Sarafu A. Yunusa Education Specialist UNICEF 08035350956 [email protected]
79. Shafiu Sidi DRRO NEMA HQ 08032422022 [email protected]
80. Oluseyi Soremekun NPO/CI UNESCO 08033030002 [email protected]
81. Victor Nwabuan PPO NEMA HQ 08033180741 [email protected]
82. Akiode S. A. ACTO NEMA HQ 08037195603 [email protected]
83. Abimbola Oyelohunnu
Prog. Officer UN Women 08037009185 [email protected]
84. Alh. Bappah Azare HC MS 08023531800 [email protected]
85. Engr. Abubakar Jibil EX SEMA Kano state 08036359068 [email protected]
86. Nwachukwu Henry A. Director of Agric. Abia state
Min. of Agric. Abia 08036298700 [email protected]
87. Simon Katu SDRRO NEMA N/W 08067794177 [email protected]
88. Onuoha Omezikam Eze
Consultant World Bank 08106928160 [email protected]
89. Aro-Lambo Amina DRR NEMA HQ 08054449998 [email protected]
90. Bunmi Olaorupekun Assistant Protection Officer
UNHCR 07034059580 [email protected]
91. Alae Ballal C. UNHCR 08134596208 ballahcolunhcr.org
92. Dr. Judit Giwatan EO UNICEF 08033149205 [email protected]
93. Ngozi Awuzie NPO UNESCO 08037871118 [email protected]
94. Mrs. A. Nwitte Eze SDRRO NEMA HQ 08024237054 [email protected]
95. R. A. Shanu PTO 1 Ministry of Power 08033809853 [email protected]
96. Engr. Tani A. Diriyai Assistant Director Min. of Work Yenagoa
08036727868 [email protected]
97. Dr. Isbr NSO WHO
98. Okunwia Paul Prog. Officer UN Habitat 08023045058 [email protected]
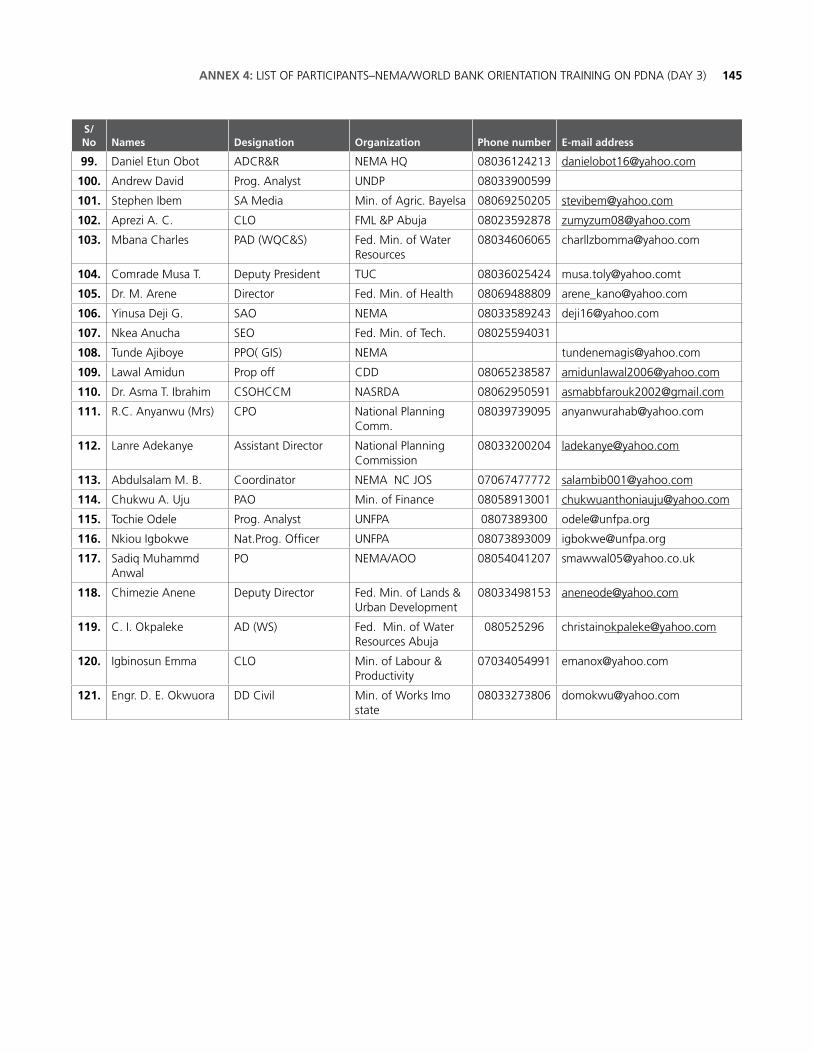
145ANNEX 4: LIST OF PARTICIPANTS–NEMA/WORLD BANK ORIENTATION TRAINING ON PDNA (DAY 3)
S/No Names Designation Organization Phone number E-mail address
99. Daniel Etun Obot ADCR&R NEMA HQ 08036124213 [email protected]
100. Andrew David Prog. Analyst UNDP 08033900599
101. Stephen Ibem SA Media Min. of Agric. Bayelsa 08069250205 [email protected]
102. Aprezi A. C. CLO FML &P Abuja 08023592878 [email protected]
103. Mbana Charles PAD (WQC&S) Fed. Min. of Water Resources
08034606065 [email protected]
104. Comrade Musa T. Deputy President TUC 08036025424 [email protected]
105. Dr. M. Arene Director Fed. Min. of Health 08069488809 [email protected]
106. Yinusa Deji G. SAO NEMA 08033589243 [email protected]
107. Nkea Anucha SEO Fed. Min. of Tech. 08025594031
108. Tunde Ajiboye PPO( GIS) NEMA [email protected]
109. Lawal Amidun Prop off CDD 08065238587 [email protected]
110. Dr. Asma T. Ibrahim CSOHCCM NASRDA 08062950591 [email protected]
111. R.C. Anyanwu (Mrs) CPO National Planning Comm.
08039739095 [email protected]
112. Lanre Adekanye Assistant Director National Planning Commission
08033200204 [email protected]
113. Abdulsalam M. B. Coordinator NEMA NC JOS 07067477772 [email protected]
114. Chukwu A. Uju PAO Min. of Finance 08058913001 [email protected]
115. Tochie Odele Prog. Analyst UNFPA 0807389300 [email protected]
116. Nkiou Igbokwe Nat.Prog. Officer UNFPA 08073893009 [email protected]
117. Sadiq Muhammd Anwal
PO NEMA/AOO 08054041207 [email protected]
118. Chimezie Anene Deputy Director Fed. Min. of Lands & Urban Development
08033498153 [email protected]
119. C. I. Okpaleke AD (WS) Fed. Min. of Water Resources Abuja
080525296 [email protected]
120. Igbinosun Emma CLO Min. of Labour & Productivity
07034054991 [email protected]
121. Engr. D. E. Okwuora DD Civil Min. of Works Imo state
08033273806 [email protected]
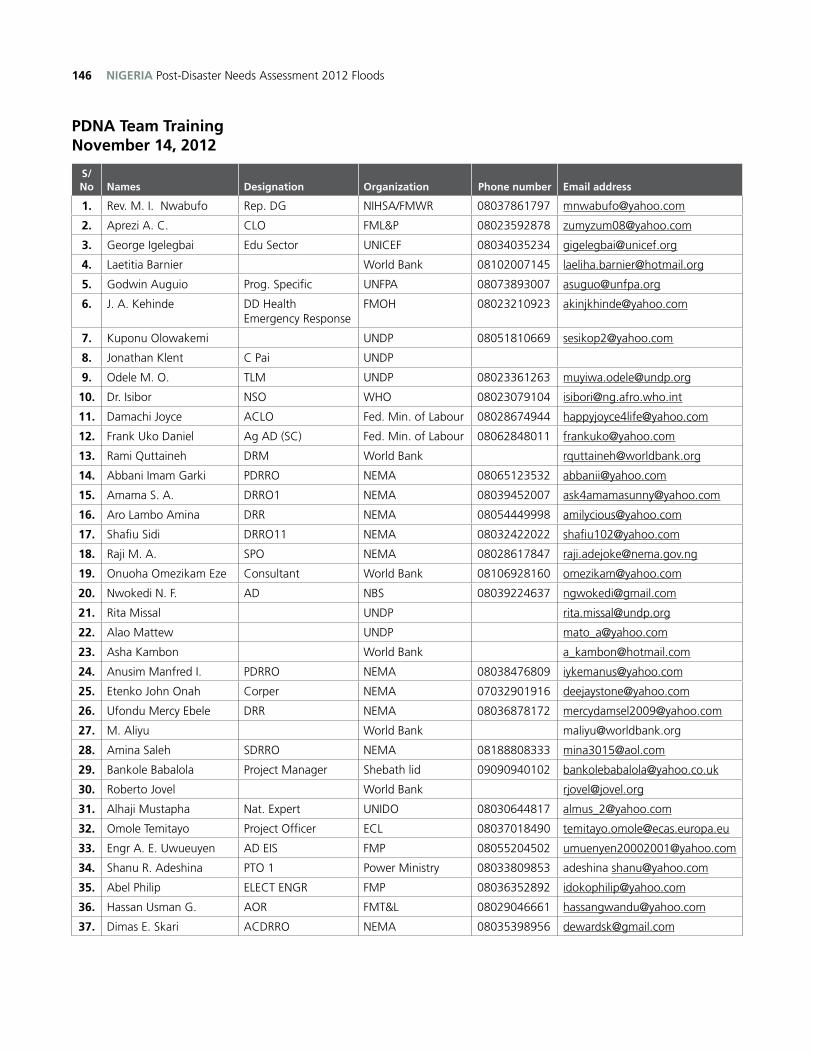
NIGERIA Post-Disaster Needs Assessment 2012 Floods146
PDNA Team Training November 14, 2012
S/No Names Designation Organization Phone number Email address
1. Rev. M. I. Nwabufo Rep. DG NIHSA/FMWR 08037861797 [email protected]
2. Aprezi A. C. CLO FML&P 08023592878 [email protected]
3. George Igelegbai Edu Sector UNICEF 08034035234 [email protected]
4. Laetitia Barnier World Bank 08102007145 [email protected]
5. Godwin Auguio Prog. Specific UNFPA 08073893007 [email protected]
6. J. A. Kehinde DD Health Emergency Response
FMOH 08023210923 [email protected]
7. Kuponu Olowakemi UNDP 08051810669 [email protected]
8. Jonathan Klent C Pai UNDP
9. Odele M. O. TLM UNDP 08023361263 [email protected]
10. Dr. Isibor NSO WHO 08023079104 [email protected]
11. Damachi Joyce ACLO Fed. Min. of Labour 08028674944 [email protected]
12. Frank Uko Daniel Ag AD (SC) Fed. Min. of Labour 08062848011 [email protected]
13. Rami Quttaineh DRM World Bank [email protected]
14. Abbani Imam Garki PDRRO NEMA 08065123532 [email protected]
15. Amama S. A. DRRO1 NEMA 08039452007 [email protected]
16. Aro Lambo Amina DRR NEMA 08054449998 [email protected]
17. Shafiu Sidi DRRO11 NEMA 08032422022 [email protected]
18. Raji M. A. SPO NEMA 08028617847 [email protected]
19. Onuoha Omezikam Eze Consultant World Bank 08106928160 [email protected]
20. Nwokedi N. F. AD NBS 08039224637 [email protected]
21. Rita Missal UNDP [email protected]
22. Alao Mattew UNDP [email protected]
23. Asha Kambon World Bank [email protected]
24. Anusim Manfred I. PDRRO NEMA 08038476809 [email protected]
25. Etenko John Onah Corper NEMA 07032901916 [email protected]
26. Ufondu Mercy Ebele DRR NEMA 08036878172 [email protected]
27. M. Aliyu World Bank [email protected]
28. Amina Saleh SDRRO NEMA 08188808333 [email protected]
29. Bankole Babalola Project Manager Shebath lid 09090940102 [email protected]
30. Roberto Jovel World Bank [email protected]
31. Alhaji Mustapha Nat. Expert UNIDO 08030644817 [email protected]
32. Omole Temitayo Project Officer ECL 08037018490 [email protected]
33. Engr A. E. Uwueuyen AD EIS FMP 08055204502 [email protected]
34. Shanu R. Adeshina PTO 1 Power Ministry 08033809853 adeshina [email protected]
35. Abel Philip ELECT ENGR FMP 08036352892 [email protected]
36. Hassan Usman G. AOR FMT&L 08029046661 [email protected]
37. Dimas E. Skari ACDRRO NEMA 08035398956 [email protected]
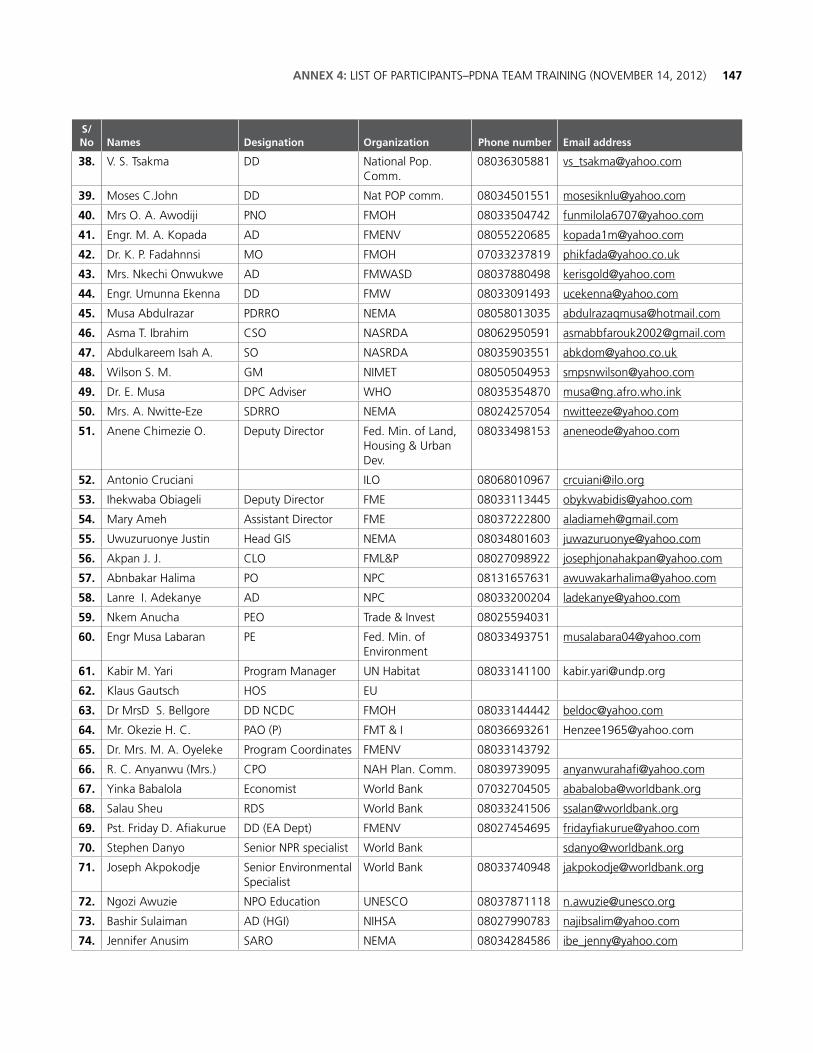
147ANNEX 4: LIST OF PARTICIPANTS–PDNA TEAM TRAINING (NOVEMBER 14, 2012)
S/No Names Designation Organization Phone number Email address
38. V. S. Tsakma DD National Pop. Comm.
08036305881 [email protected]
39. Moses C.John DD Nat POP comm. 08034501551 [email protected]
40. Mrs O. A. Awodiji PNO FMOH 08033504742 [email protected]
41. Engr. M. A. Kopada AD FMENV 08055220685 [email protected]
42. Dr. K. P. Fadahnnsi MO FMOH 07033237819 [email protected]
43. Mrs. Nkechi Onwukwe AD FMWASD 08037880498 [email protected]
44. Engr. Umunna Ekenna DD FMW 08033091493 [email protected]
45. Musa Abdulrazar PDRRO NEMA 08058013035 [email protected]
46. Asma T. Ibrahim CSO NASRDA 08062950591 [email protected]
47. Abdulkareem Isah A. SO NASRDA 08035903551 [email protected]
48. Wilson S. M. GM NIMET 08050504953 [email protected]
49. Dr. E. Musa DPC Adviser WHO 08035354870 [email protected]
50. Mrs. A. Nwitte-Eze SDRRO NEMA 08024257054 [email protected]
51. Anene Chimezie O. Deputy Director Fed. Min. of Land, Housing & Urban Dev.
08033498153 [email protected]
52. Antonio Cruciani ILO 08068010967 [email protected]
53. Ihekwaba Obiageli Deputy Director FME 08033113445 [email protected]
54. Mary Ameh Assistant Director FME 08037222800 [email protected]
55. Uwuzuruonye Justin Head GIS NEMA 08034801603 [email protected]
56. Akpan J. J. CLO FML&P 08027098922 [email protected]
57. Abnbakar Halima PO NPC 08131657631 [email protected]
58. Lanre I. Adekanye AD NPC 08033200204 [email protected]
59. Nkem Anucha PEO Trade & Invest 08025594031
60. Engr Musa Labaran PE Fed. Min. of Environment
08033493751 [email protected]
61. Kabir M. Yari Program Manager UN Habitat 08033141100 [email protected]
62. Klaus Gautsch HOS EU
63. Dr MrsD S. Bellgore DD NCDC FMOH 08033144442 [email protected]
64. Mr. Okezie H. C. PAO (P) FMT & I 08036693261 [email protected]
65. Dr. Mrs. M. A. Oyeleke Program Coordinates FMENV 08033143792
66. R. C. Anyanwu (Mrs.) CPO NAH Plan. Comm. 08039739095 [email protected]
67. Yinka Babalola Economist World Bank 07032704505 [email protected]
68. Salau Sheu RDS World Bank 08033241506 [email protected]
69. Pst. Friday D. Afiakurue DD (EA Dept) FMENV 08027454695 [email protected]
70. Stephen Danyo Senior NPR specialist World Bank [email protected]
71. Joseph Akpokodje Senior Environmental Specialist
World Bank 08033740948 [email protected]
72. Ngozi Awuzie NPO Education UNESCO 08037871118 [email protected]
73. Bashir Sulaiman AD (HGI) NIHSA 08027990783 [email protected]
74. Jennifer Anusim SARO NEMA 08034284586 [email protected]
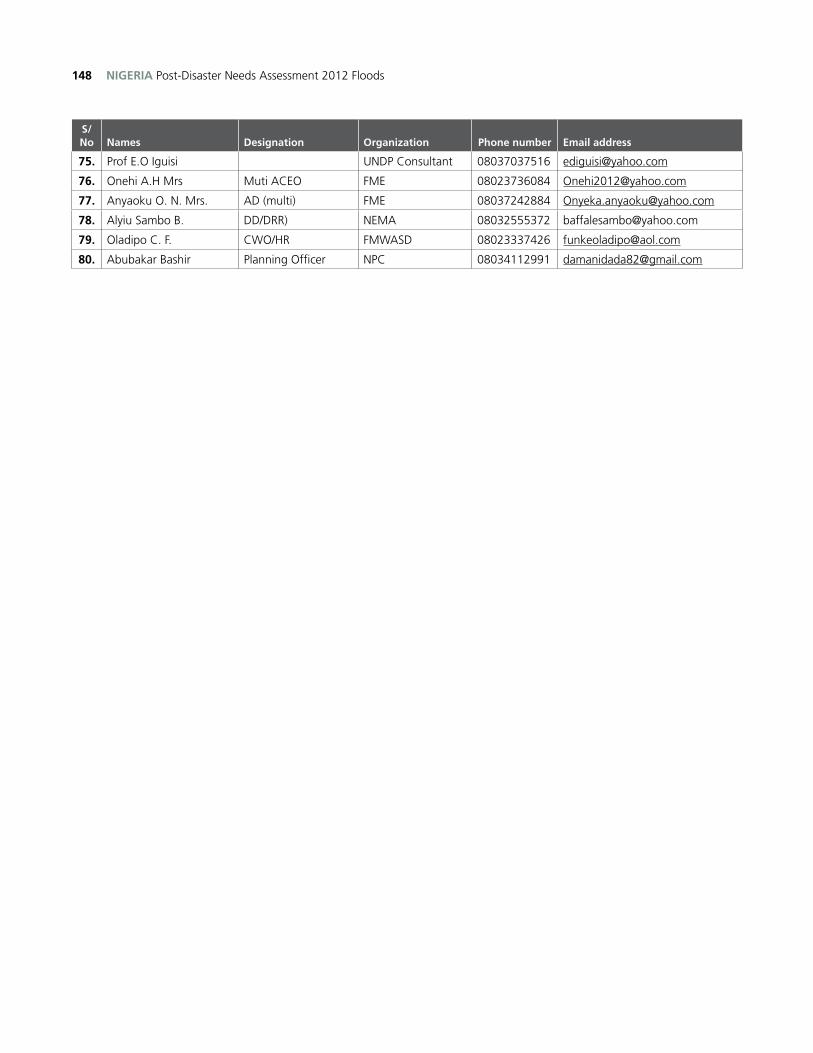
NIGERIA Post-Disaster Needs Assessment 2012 Floods148
S/No Names Designation Organization Phone number Email address
75. Prof E.O Iguisi UNDP Consultant 08037037516 [email protected]
76. Onehi A.H Mrs Muti ACEO FME 08023736084 [email protected]
77. Anyaoku O. N. Mrs. AD (multi) FME 08037242884 [email protected]
78. Alyiu Sambo B. DD/DRR) NEMA 08032555372 [email protected]
79. Oladipo C. F. CWO/HR FMWASD 08023337426 [email protected]
80. Abubakar Bashir Planning Officer NPC 08034112991 [email protected]
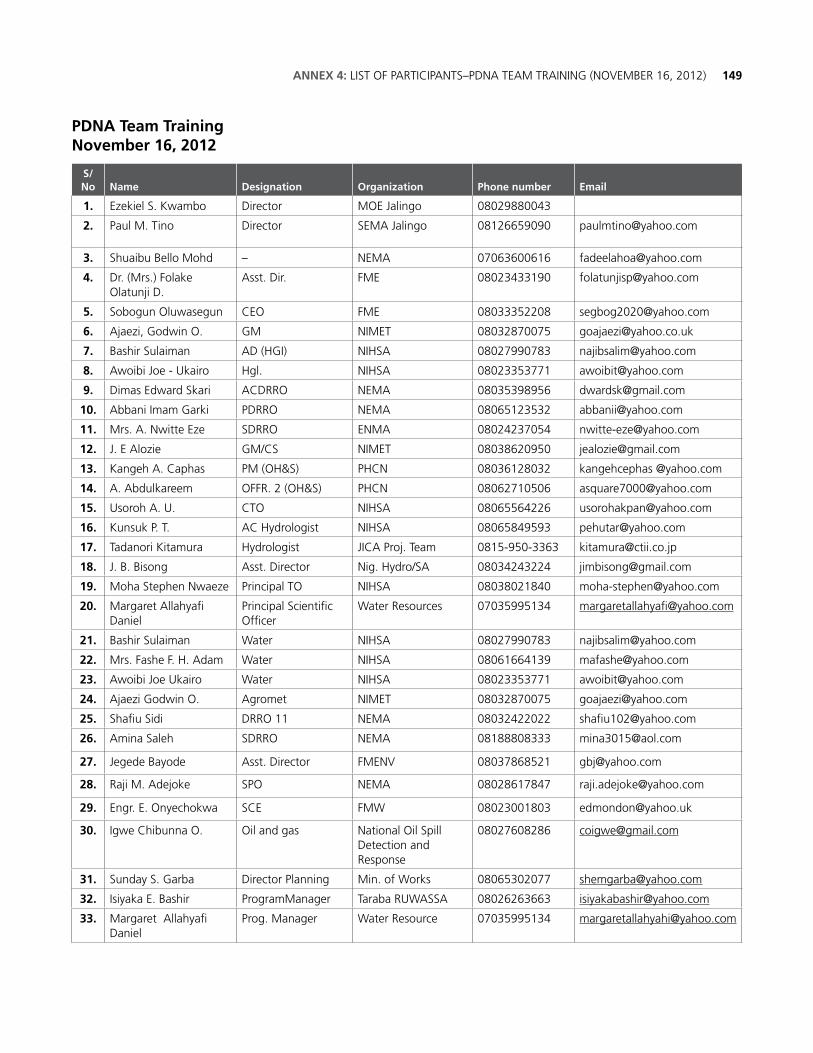
149ANNEX 4: LIST OF PARTICIPANTS–PDNA TEAM TRAINING (NOVEMBER 16, 2012)
PDNA Team Training November 16, 2012
S/No Name Designation Organization Phone number Email
1. Ezekiel S. Kwambo Director MOE Jalingo 08029880043
2. Paul M. Tino Director SEMA Jalingo 08126659090 [email protected]
3. Shuaibu Bello Mohd – NEMA 07063600616 [email protected]
4. Dr. (Mrs.) Folake Olatunji D.
Asst. Dir. FME 08023433190 [email protected]
5. Sobogun Oluwasegun CEO FME 08033352208 [email protected]
6. Ajaezi, Godwin O. GM NIMET 08032870075 [email protected]
7. Bashir Sulaiman AD (HGI) NIHSA 08027990783 [email protected]
8. Awoibi Joe - Ukairo Hgl. NIHSA 08023353771 [email protected]
9. Dimas Edward Skari ACDRRO NEMA 08035398956 [email protected]
10. Abbani Imam Garki PDRRO NEMA 08065123532 [email protected]
11. Mrs. A. Nwitte Eze SDRRO ENMA 08024237054 [email protected]
12. J. E Alozie GM/CS NIMET 08038620950 [email protected]
13. Kangeh A. Caphas PM (OH&S) PHCN 08036128032 kangehcephas @yahoo.com
14. A. Abdulkareem OFFR. 2 (OH&S) PHCN 08062710506 [email protected]
15. Usoroh A. U. CTO NIHSA 08065564226 [email protected]
16. Kunsuk P. T. AC Hydrologist NIHSA 08065849593 [email protected]
17. Tadanori Kitamura Hydrologist JICA Proj. Team 0815-950-3363 [email protected]
18. J. B. Bisong Asst. Director Nig. Hydro/SA 08034243224 [email protected]
19. Moha Stephen Nwaeze Principal TO NIHSA 08038021840 [email protected]
20. Margaret Allahyafi Daniel
Principal ScientificOfficer
Water Resources 07035995134 [email protected]
21. Bashir Sulaiman Water NIHSA 08027990783 [email protected]
22. Mrs. Fashe F. H. Adam Water NIHSA 08061664139 [email protected]
23. Awoibi Joe Ukairo Water NIHSA 08023353771 [email protected]
24. Ajaezi Godwin O. Agromet NIMET 08032870075 [email protected]
25. Shafiu Sidi DRRO 11 NEMA 08032422022 [email protected]
26. Amina Saleh SDRRO NEMA 08188808333 [email protected]
27. Jegede Bayode Asst. Director FMENV 08037868521 [email protected]
28. Raji M. Adejoke SPO NEMA 08028617847 [email protected]
29. Engr. E. Onyechokwa SCE FMW 08023001803 [email protected]
30. Igwe Chibunna O. Oil and gas National Oil Spill Detection and Response
08027608286 [email protected]
31. Sunday S. Garba Director Planning Min. of Works 08065302077 [email protected]
32. Isiyaka E. Bashir ProgramManager Taraba RUWASSA 08026263663 [email protected]
33. Margaret Allahyafi Daniel
Prog. Manager Water Resource 07035995134 [email protected]
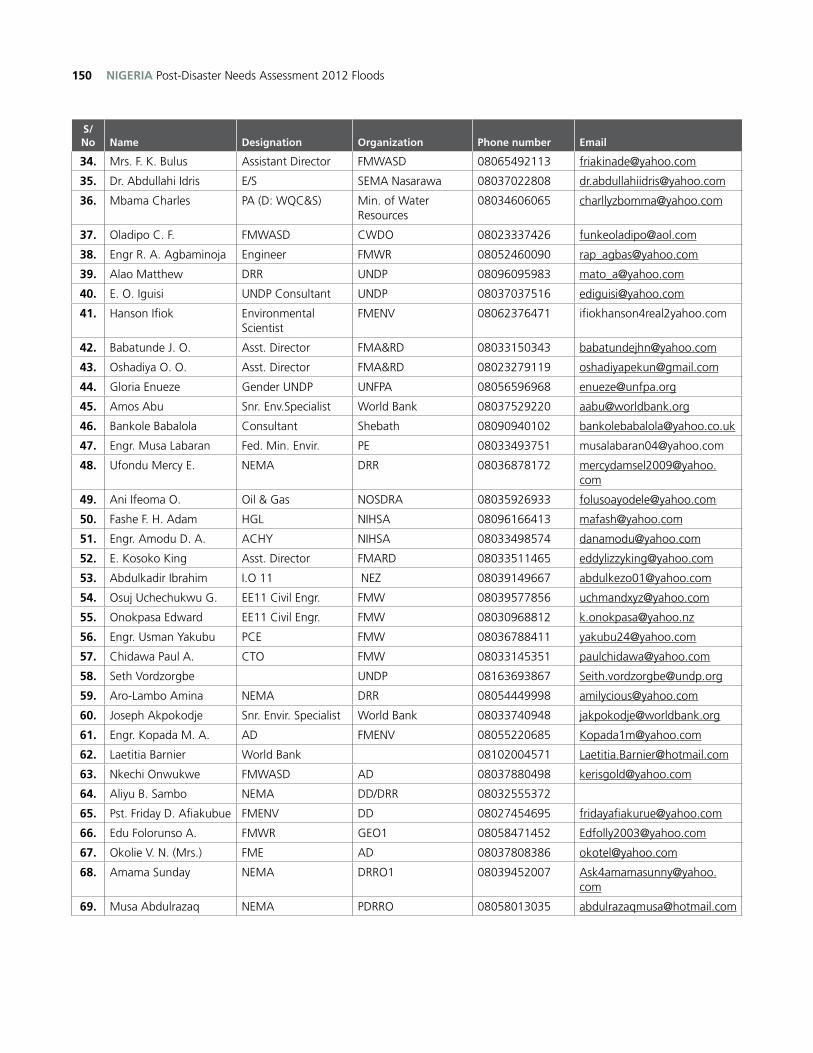
NIGERIA Post-Disaster Needs Assessment 2012 Floods150
S/No Name Designation Organization Phone number Email
34. Mrs. F. K. Bulus Assistant Director FMWASD 08065492113 [email protected]
35. Dr. Abdullahi Idris E/S SEMA Nasarawa 08037022808 [email protected]
36. Mbama Charles PA (D: WQC&S) Min. of Water Resources
08034606065 [email protected]
37. Oladipo C. F. FMWASD CWDO 08023337426 [email protected]
38. Engr R. A. Agbaminoja Engineer FMWR 08052460090 [email protected]
39. Alao Matthew DRR UNDP 08096095983 [email protected]
40. E. O. Iguisi UNDP Consultant UNDP 08037037516 [email protected]
41. Hanson Ifiok Environmental Scientist
FMENV 08062376471 ifiokhanson4real2yahoo.com
42. Babatunde J. O. Asst. Director FMA&RD 08033150343 [email protected]
43. Oshadiya O. O. Asst. Director FMA&RD 08023279119 [email protected]
44. Gloria Enueze Gender UNDP UNFPA 08056596968 [email protected]
45. Amos Abu Snr. Env.Specialist World Bank 08037529220 [email protected]
46. Bankole Babalola Consultant Shebath 08090940102 [email protected]
47. Engr. Musa Labaran Fed. Min. Envir. PE 08033493751 [email protected]
48. Ufondu Mercy E. NEMA DRR 08036878172 [email protected]
49. Ani Ifeoma O. Oil & Gas NOSDRA 08035926933 [email protected]
50. Fashe F. H. Adam HGL NIHSA 08096166413 [email protected]
51. Engr. Amodu D. A. ACHY NIHSA 08033498574 [email protected]
52. E. Kosoko King Asst. Director FMARD 08033511465 [email protected]
53. Abdulkadir Ibrahim I.O 11 NEZ 08039149667 [email protected]
54. Osuj Uchechukwu G. EE11 Civil Engr. FMW 08039577856 [email protected]
55. Onokpasa Edward EE11 Civil Engr. FMW 08030968812 [email protected]
56. Engr. Usman Yakubu PCE FMW 08036788411 [email protected]
57. Chidawa Paul A. CTO FMW 08033145351 [email protected]
58. Seth Vordzorgbe UNDP 08163693867 [email protected]
59. Aro-Lambo Amina NEMA DRR 08054449998 [email protected]
60. Joseph Akpokodje Snr. Envir. Specialist World Bank 08033740948 [email protected]
61. Engr. Kopada M. A. AD FMENV 08055220685 [email protected]
62. Laetitia Barnier World Bank 08102004571 [email protected]
63. Nkechi Onwukwe FMWASD AD 08037880498 [email protected]
64. Aliyu B. Sambo NEMA DD/DRR 08032555372
65. Pst. Friday D. Afiakubue FMENV DD 08027454695 [email protected]
66. Edu Folorunso A. FMWR GEO1 08058471452 [email protected]
67. Okolie V. N. (Mrs.) FME AD 08037808386 [email protected]
68. Amama Sunday NEMA DRRO1 08039452007 [email protected]
69. Musa Abdulrazaq NEMA PDRRO 08058013035 [email protected]
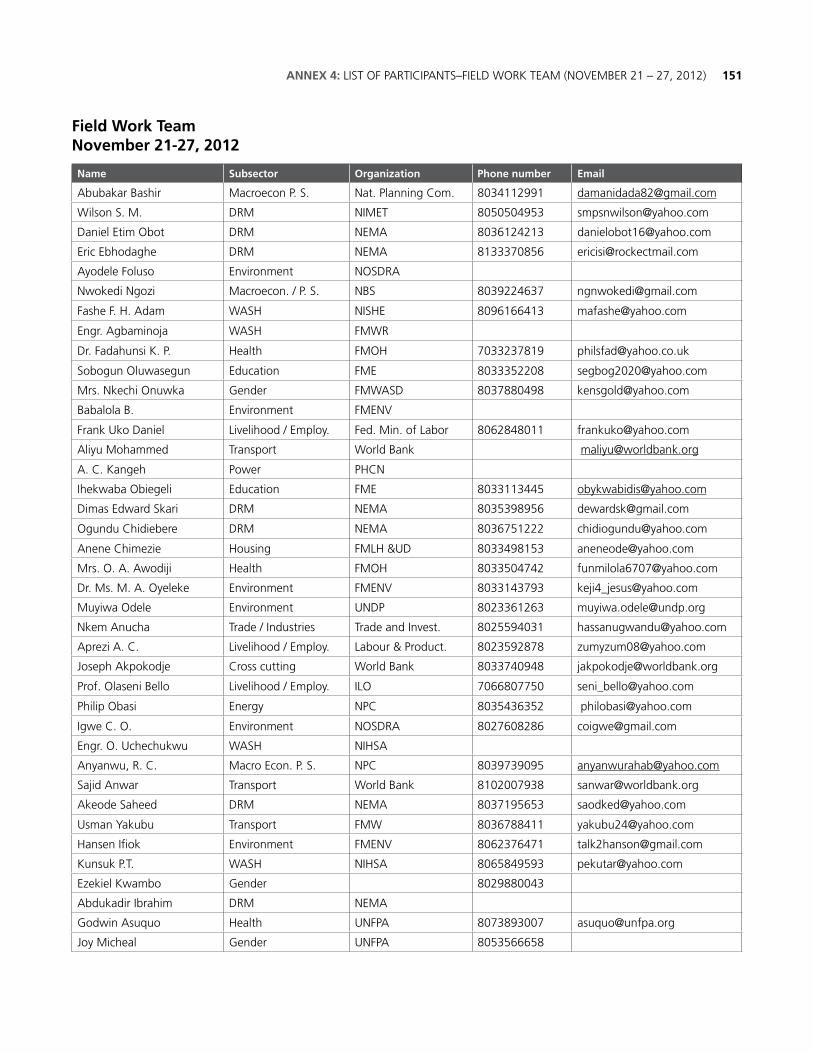
151ANNEX 4: LIST OF PARTICIPANTS–FIELD WORK TEAM (NOVEMBER 21 – 27, 2012)
Field Work Team November 21-27, 2012
Name Subsector Organization Phone number Email
Abubakar Bashir Macroecon P. S. Nat. Planning Com. 8034112991 [email protected]
Wilson S. M. DRM NIMET 8050504953 [email protected]
Daniel Etim Obot DRM NEMA 8036124213 [email protected]
Eric Ebhodaghe DRM NEMA 8133370856 [email protected]
Ayodele Foluso Environment NOSDRA
Nwokedi Ngozi Macroecon. / P. S. NBS 8039224637 [email protected]
Fashe F. H. Adam WASH NISHE 8096166413 [email protected]
Engr. Agbaminoja WASH FMWR
Dr. Fadahunsi K. P. Health FMOH 7033237819 [email protected]
Sobogun Oluwasegun Education FME 8033352208 [email protected]
Mrs. Nkechi Onuwka Gender FMWASD 8037880498 [email protected]
Babalola B. Environment FMENV
Frank Uko Daniel Livelihood / Employ. Fed. Min. of Labor 8062848011 [email protected]
Aliyu Mohammed Transport World Bank [email protected]
A. C. Kangeh Power PHCN
Ihekwaba Obiegeli Education FME 8033113445 [email protected]
Dimas Edward Skari DRM NEMA 8035398956 [email protected]
Ogundu Chidiebere DRM NEMA 8036751222 [email protected]
Anene Chimezie Housing FMLH &UD 8033498153 [email protected]
Mrs. O. A. Awodiji Health FMOH 8033504742 [email protected]
Dr. Ms. M. A. Oyeleke Environment FMENV 8033143793 [email protected]
Muyiwa Odele Environment UNDP 8023361263 [email protected]
Nkem Anucha Trade / Industries Trade and Invest. 8025594031 [email protected]
Aprezi A. C. Livelihood / Employ. Labour & Product. 8023592878 [email protected]
Joseph Akpokodje Cross cutting World Bank 8033740948 [email protected]
Prof. Olaseni Bello Livelihood / Employ. ILO 7066807750 [email protected]
Philip Obasi Energy NPC 8035436352 [email protected]
Igwe C. O. Environment NOSDRA 8027608286 [email protected]
Engr. O. Uchechukwu WASH NIHSA
Anyanwu, R. C. Macro Econ. P. S. NPC 8039739095 [email protected]
Sajid Anwar Transport World Bank 8102007938 [email protected]
Akeode Saheed DRM NEMA 8037195653 [email protected]
Usman Yakubu Transport FMW 8036788411 [email protected]
Hansen Ifiok Environment FMENV 8062376471 [email protected]
Kunsuk P.T. WASH NIHSA 8065849593 [email protected]
Ezekiel Kwambo Gender 8029880043
Abdukadir Ibrahim DRM NEMA
Godwin Asuquo Health UNFPA 8073893007 [email protected]
Joy Micheal Gender UNFPA 8053566658
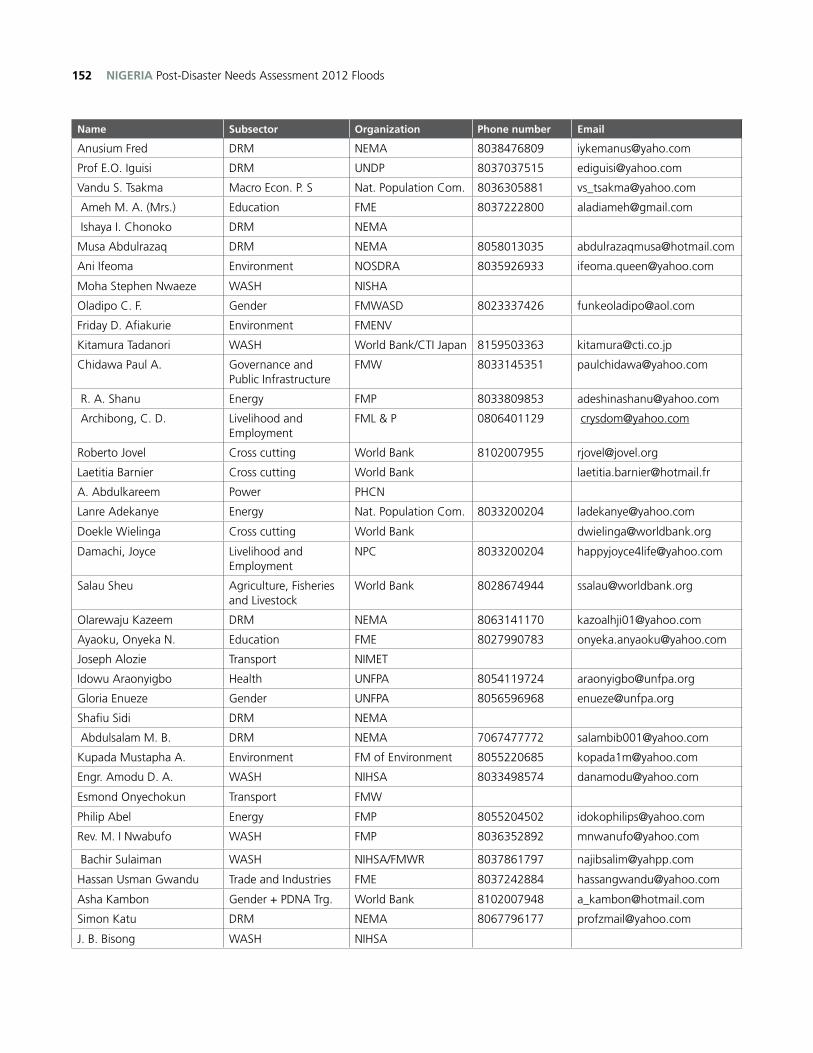
NIGERIA Post-Disaster Needs Assessment 2012 Floods152
Name Subsector Organization Phone number Email
Anusium Fred DRM NEMA 8038476809 [email protected]
Prof E.O. Iguisi DRM UNDP 8037037515 [email protected]
Vandu S. Tsakma Macro Econ. P. S Nat. Population Com. 8036305881 [email protected]
Ameh M. A. (Mrs.) Education FME 8037222800 [email protected]
Ishaya I. Chonoko DRM NEMA
Musa Abdulrazaq DRM NEMA 8058013035 [email protected]
Ani Ifeoma Environment NOSDRA 8035926933 [email protected]
Moha Stephen Nwaeze WASH NISHA
Oladipo C. F. Gender FMWASD 8023337426 [email protected]
Friday D. Afiakurie Environment FMENV
Kitamura Tadanori WASH World Bank/CTI Japan 8159503363 [email protected]
Chidawa Paul A. Governance and Public Infrastructure
FMW 8033145351 [email protected]
R. A. Shanu Energy FMP 8033809853 [email protected]
Archibong, C. D. Livelihood and Employment
FML & P 0806401129 [email protected]
Roberto Jovel Cross cutting World Bank 8102007955 [email protected]
Laetitia Barnier Cross cutting World Bank [email protected]
A. Abdulkareem Power PHCN
Lanre Adekanye Energy Nat. Population Com. 8033200204 [email protected]
Doekle Wielinga Cross cutting World Bank [email protected]
Damachi, Joyce Livelihood and Employment
NPC 8033200204 [email protected]
Salau Sheu Agriculture, Fisheries and Livestock
World Bank 8028674944 [email protected]
Olarewaju Kazeem DRM NEMA 8063141170 [email protected]
Ayaoku, Onyeka N. Education FME 8027990783 [email protected]
Joseph Alozie Transport NIMET
Idowu Araonyigbo Health UNFPA 8054119724 [email protected]
Gloria Enueze Gender UNFPA 8056596968 [email protected]
Shafiu Sidi DRM NEMA
Abdulsalam M. B. DRM NEMA 7067477772 [email protected]
Kupada Mustapha A. Environment FM of Environment 8055220685 [email protected]
Engr. Amodu D. A. WASH NIHSA 8033498574 [email protected]
Esmond Onyechokun Transport FMW
Philip Abel Energy FMP 8055204502 [email protected]
Rev. M. I Nwabufo WASH FMP 8036352892 [email protected]
Bachir Sulaiman WASH NIHSA/FMWR 8037861797 [email protected]
Hassan Usman Gwandu Trade and Industries FME 8037242884 [email protected]
Asha Kambon Gender + PDNA Trg. World Bank 8102007948 [email protected]
Simon Katu DRM NEMA 8067796177 [email protected]
J. B. Bisong WASH NIHSA
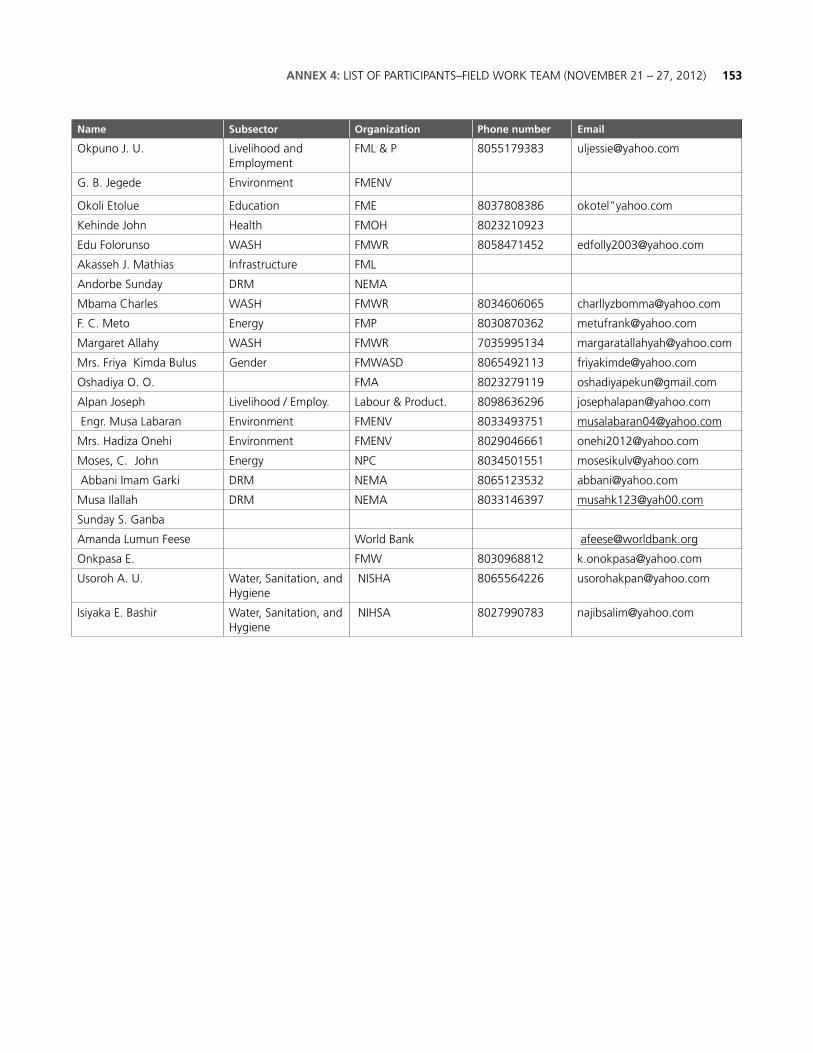
153ANNEX 4: LIST OF PARTICIPANTS–FIELD WORK TEAM (NOVEMBER 21 – 27, 2012)
Name Subsector Organization Phone number Email
Okpuno J. U. Livelihood and Employment
FML & P 8055179383 [email protected]
G. B. Jegede Environment FMENV
Okoli Etolue Education FME 8037808386 okotel”yahoo.com
Kehinde John Health FMOH 8023210923
Edu Folorunso WASH FMWR 8058471452 [email protected]
Akasseh J. Mathias Infrastructure FML
Andorbe Sunday DRM NEMA
Mbama Charles WASH FMWR 8034606065 [email protected]
F. C. Meto Energy FMP 8030870362 [email protected]
Margaret Allahy WASH FMWR 7035995134 [email protected]
Mrs. Friya Kimda Bulus Gender FMWASD 8065492113 [email protected]
Oshadiya O. O. FMA 8023279119 [email protected]
Alpan Joseph Livelihood / Employ. Labour & Product. 8098636296 [email protected]
Engr. Musa Labaran Environment FMENV 8033493751 [email protected]
Mrs. Hadiza Onehi Environment FMENV 8029046661 [email protected]
Moses, C. John Energy NPC 8034501551 [email protected]
Abbani Imam Garki DRM NEMA 8065123532 [email protected]
Musa Ilallah DRM NEMA 8033146397 [email protected]
Sunday S. Ganba
Amanda Lumun Feese World Bank [email protected]
Onkpasa E. FMW 8030968812 [email protected]
Usoroh A. U. Water, Sanitation, and Hygiene
NISHA 8065564226 [email protected]
Isiyaka E. Bashir Water, Sanitation, and Hygiene
NIHSA 8027990783 [email protected]
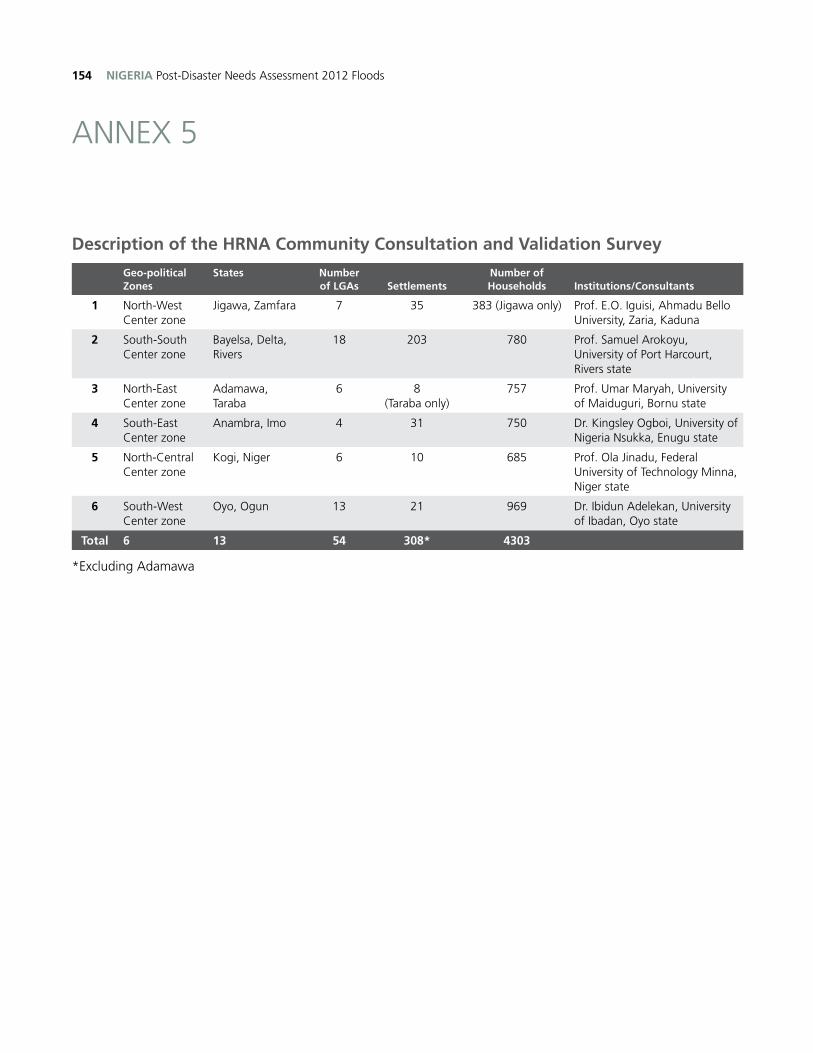
NIGERIA Post-Disaster Needs Assessment 2012 Floods154
ANNEX 5
Description of the HRNA Community Consultation and Validation Survey
Geo-politicalZones
States Number of LGAs Settlements
Number of Households Institutions/Consultants
1 North-West Center zone
Jigawa, Zamfara 7 35 383 (Jigawa only) Prof. E.O. Iguisi, Ahmadu Bello University, Zaria, Kaduna
2 South-South Center zone
Bayelsa, Delta, Rivers
18 203 780 Prof. Samuel Arokoyu, University of Port Harcourt, Rivers state
3 North-East Center zone
Adamawa, Taraba
6 8 (Taraba only)
757 Prof. Umar Maryah, University of Maiduguri, Bornu state
4 South-East Center zone
Anambra, Imo 4 31 750 Dr. Kingsley Ogboi, University of Nigeria Nsukka, Enugu state
5 North-Central Center zone
Kogi, Niger 6 10 685 Prof. Ola Jinadu, Federal University of Technology Minna, Niger state
6 South-West Center zone
Oyo, Ogun 13 21 969 Dr. Ibidun Adelekan, University of Ibadan, Oyo state
Total 6 13 54 308* 4303
*Excluding Adamawa

National Emergency Management AgencyAddress: Plot 439 (No. 8), Adetokunbo Ademola Crescent,
Maitama, Abuja, Nigeria
Telephone: (+234)09-2905777
Email: [email protected]
World Bank Nigeria Country Office Address: 102 Yakubu Gowon Crescent, Opposite ECOWAS Secretariat,
P.O. Box 2826, Garki, Abuja, Nigeria
Telephone: +234-703-583-0641
Email: [email protected]