
HOUSING AND HOMELESSNESS NEEDS ASSESSMENT ...
139
HOUSING AND HOMELESSNESS NEEDS ASSESSMENT FOR ST. THOMAS AND ELGIN COUNTY: Prepared by Tim Welch Consulting Inc., Lapointe Consulting and Deb Ballak Prepared for St. Thomas—E|gin Ontario Works Department, City of St. Thomas May, 2013
-
Upload
khangminh22 -
Category
Documents
-
view
0 -
download
0
Transcript of HOUSING AND HOMELESSNESS NEEDS ASSESSMENT ...

HOUSING AND HOMELESSNESS NEEDS ASSESSMENT FORST. THOMAS AND ELGIN COUNTY:
Prepared by Tim Welch Consulting Inc., Lapointe Consulting and Deb Ballak
Prepared for St. Thomas—E|ginOntario Works Department, City of St. Thomas
May, 2013

Table of ContentsPREFACE......................................................................................................................
......................1
1 INTRODUCTION...........................................................................................................
..17
2 POPULATION AND HOUSEHOLDCHARACTERISTICS........................................................192.1 Population Growth ............................................................................................................................202.2 Age Distribution ................................................................................................................................22
2.3 Household Growth ............................................................................................................................22
2.4 Household Sizes Declining .................................................................................................................232.5 Household Types ...............................................................................................................................26
3 EMPLOYMENTPROFILES...............................................................................................................283.1 Employment in Elgin and Place of Work ...........................................................................................28
3.2 Labour Force in St. Thomas and Elgin County ...................................................................................28
3.3 Household Growth ............................................................................................................................313.4 Household Sizes Declining .................................................................................................................32
4 HOUSING STOCK............................................................................................................................334.1 Housing Stock by Dwelling Type .......................................................................................................334.2 Ownership and Rental Rates .............................................................................................................374.3 Limited Purpose—Bui|t Rental Housing ..............................................................................................384.4 Rental Vacancy Rates in St. Thomas .................................................................................................394.5 Tenure by Age of Household Maintainer ..........................................................................................404.6 Condition of Housing Stock ...............................................................................................................42
5 PROJECTEDPOPULATION AND HOUSING REQUIREMENTS.........................................................425.1 Population Projections ......................................................................................................................425.2 Housing Projections ..........................................................................................................................435.3 Projected Distribution .......................................................................................................................44
6 HOUSEHOLDINCOME AND HOUSING AFFORDABILITY...............................................................45
6.1 Housing Income by Tenure ...............................................................................................................45
6.2 Rental Housing Costs .........................................................................................................................47
6.3 Ownership Housing Costs .................................................................................................................48
6.4 Affordable Housing ...........................................................................................................................51
6.4.1 Type chapter title (level 3) .........................................................................................................51
6.4.1 Type chapter title (level 3) .........................................................................................................536.5 Housing Ownership Housing .............................................................................................................56
6.6 Housing Affordability in St. Thomas — Elgin County ..........................................................................58
7 SOCIALAND AFFORDABLEHOUSING............................................................................................62
7.1 Social and Affordable Housing Stock ................................................................................................62
7.2 Housing Need and Waiting Lists .......................................................................................................66
7.3 Municipal Planning Supports for Social and Affordable Housing .....................................................68
8 OVERVIEW: DEFININGHOMELESSNESS........................................................................................738.1 Shelter Use ........................................................................................................................................748.2 Social Assistance Recipients ..............................................................................................................74
8.3 Households with Affordability Problems ..........................................................................................75
8.4 Youth .................................................................................................................................................778.5 Food Bank Usage ...............................................................................................................................778.6 Social Housing Waiting List ...............................................................................................................77
St. Thomas — Elgin County Housing and Homelessness Plan: Needs Assessment
Tim Welch Consulting in Association with Lapointe Consulting and Deb Ballak

9 HOMELESSNESSPROGRAMS, SUPPORTS AND SERVICES............................................................79
9.1 Existing Homeless Programs, Supports and Services ........................................................................80
9.2 Service Usage Indicators ...................................................................................................................83
9.3 Evolution of Services (Changes) ........................................................................................................86
9.4 Issues and Strengths Identified by Key Informants ...........................................................................92
10 EMERGENCYHOUSING..................................................................................................................99
10.1 Indicators of Usage ....................................................................................................................... 101
10.2 Evolution of Services ..................................................................................................................... 103
10.3 Issues Identified by Key Informants .............................................................................................. 104
11 TRANSITIONALAND SUPPORTIVE HOUSING.............................................................................. 106
9.1 Existing Homeless Programs, Supports and Services ...................................................................... 109
9.2 Service Usage Indicators ................................................................................................................. 1129.3 Evolution of Services (Changes) ...................................................................................................... 115
9.4 Issues and Strengths Identified by Key Informants ......................................................................... 118
12 ISSUESIDENTIFIEDIN STUDIESAND REPORTS FOR THE HOMELESSAND HOUSINGSERVICEDELIVERYSYSTEM......................................................................................................... 120
APPENDIX A: Glossary of Terms ............................................................................................................... 124
APPENDIX B: Data Tables ......................................................................................................................... 126
St. Thomas — Elgin County Housing and Homelessness Plan: Needs Assessment
Tim Welch Consulting in Association with Lapointe Consulting and Deb Ballak

List of TablesTable 2.1.1:Table 2.2.1:Table 2.2.2:Table 2.3.1:Table 2.4.1:Table 2.4.2:Table 2.4.3:
Table 2.5.1:
Table 3.2.1:
Table 3.2.2:Table 3.2.3:Table 3.2.4:
Table 3.3.1:
Table 4.1.1:
Table 4.1.2:Table 4.1.3:
Table 4.1.4:
Table 4.2.1:Table 4.2.2:
Table 4.3.1:
Table 4.4.1:
Table 4.5.1:
Table 4.6.1:Table 4.6.2:
Table 5.1.1:
Table 5.3.1:
Table 6.1.1:
Table 6.1.2:
Table 6.2.1:
Population Growth, St. Thomas and Elgin County, 1991 — 2011 ......................................19Age Distribution, St. Thomas/Elgin County, 1991 — 2011 and Ontario, 2011 ....................20Age Distribution in Municipalities across St. Thomas/Elgin County, 2011 ........................22Household Growth, St. Thomas, Elgin County and Area Municipalities, 1991 — 2011 .......23Change in Household Size, St. Thomas and Elgin County, 1991 — 2011 ............................24Distribution of Households by Size, St. Thomas/Elgin County, 1991 — 2011 .....................24Distribution of Households by Size, St. Thomas and municipalities within Elgin County,
2011 ...........................................................................................................................
..25Distribution of Household Types across St. Thomas/Elgin County, 2011 ..........................27
Employed Labour Force by Industry, 2006, Elgin County, St. Thomas and St. Thomas/Elgin County .....................................................................................................
.............29
List of Major Manufacturing Plant Closures in St. Thomas, 2006 — 2012 ..........................30List of New Manufacturing Facilities in St. Thomas, 2006 — 2012 ....................................30Unemployment Rate for London CMA, Elgin County/St. Thomas and Ontario,2000 — 2013 .....................................................................................................
.............30
Top Employers in the City of St. Thomas and Elgin County ..............................................32
Distribution of Housing Stock, St. Thomas/Elgin County, 1991 — 2011 ............................33Change in Housing Stock by Dwelling Type, 1991 — 2011 ................................................33Distribution of Housing Stock in Elgin County, St. Thomas andSt. Thomas/Elgin County, 2011 .................................................................................
.....34
Distribution of Housing by Type, Municipalities in Elgin County, 2011 .............................35Proportion of Households Who Own and Rent, 2001 and 2006 .......................................36Tenure by Dwelling Type, Elgin County, St. Thomas, St. Thomas/Elgin County andOntario, 2001 and 2006 .........................................................................................
........37
Distribution of Rental Units by Dwelling Type and Municipality inSt. Thomas/Elgin County, 2006 .................................................................................
.....38
Vacancy Rates in St. Thomas, 1996 — 2012 .....................................................................39Proportion of Household Maintainers Who Own and Rent in Elgin County
and St. Thomas, 2006 ..................................................................................................
..40Housing Condition of Rental Housing, in St. Thomas/CentralElgin, 2006 ........................40Housing Condition of Ownership Housing, in St. Thomas/CentralElgin, 2006 .................41
Alternative Population Projections, St. Thomas/Elgin County andHousing Requirements, 2011-2031 ............................................................................
...42
Projected Age Distribution, 2011-2026, CASEPopulation Projections .............................44
Household Income Distribution by Tenure, St. Thomas, Elgin County
and St. Thomas/Elgin County, 2005 ............................................................................
..45Median Income by Tenure, St. Thomas, Elgin County Municipalities,St. Thomas-Elgin County, 2005 ................................................................................
.....46
Rents for Apartments in St. Thomas, 2002 — 2012 ..........................................................48
St. Thomas — Elgin County Housing and Homelessness Plan: Needs Assessment
Tim Welch Consulting in Association with Lapointe Consulting and Deb Ballak
Table 6.3.1: Average resale house prices by dwelling type in Elgin County and St. Thomas,2011 — 2012 ....................................................................................................
.............49
Table 6.3.2: Average resale prices in St. Thomas and annual increases in inflation,2003 — 2009 ....................................................................................................
.............50
Table 6.3.3: Resale house price increases in the City of London, the City of St. Thomas andLSTARArea, 2002 — 2012 ......................................................................................
........50
Table 6.3.4: New house price in St. Thomas, Central Elgin and Southwold, 2011 — 2012 ....................51Table 6.4.1.1: Income Deciles for Owned and Rented Housing, St. Thomas, Elgin County and
St. Thomas/Elgin County, 2005 ...................................................................................
..53Table 6.4.2.1: Affordable Rents at Different Income Levels in St.Thomas/Elgin County, 2012 .............54Table 6.4.2.2: Seniors Guaranteed Income Rates, Monthly, Oct — Dec 2012 .......................................55Table 6.4.2.3: Social Assistance Rates, Monthly, 2012 ......................................................................55Table 6.4.2.4: Affordable Rents for Selected Households on Fixed Incomes .......................................56Table 6.5.1: Affordable Ownership Housing in St. Thomas/Elgin County at Different Income
Percentiles, 2012 .........................................................................................................
..58Table 6.6.1: Housing Affordability — Absolute Number of Owner and Renter Households, 2006 .........60Table 6.6.2: Housing Affordability by Proportion of Owner and Renter Households, 2006 .................60
Table 7.1.1: ESTHCNumbers of Units by Type and Location ..............................................................63Table 7.1.2: Other Non-Profit Housing Providers — Numbers of Units by Type and Location ...............63Table 7.1.3: Affordable Units - Numbers of Units by Type and Location ............................................64Table 7.1.4: Rent Supplements ..............................................................................................
...........65
Table 7.2.1: Annual Average of SPP and Senior Social Housing Applicants(January 2002 — 2012) ..........................................................................................
.........66
Table 7.2.2: Waiting List for Social Housing in the St. Thomas Service Area(January 2007 — 2012) ..........................................................................................
.........67
Table 7.2.3: Average Number of Households on Social Housing Wait Lists in theSt. Thomas — Elgin Service Area: 2002 — 2012 ................................................................67
Table 7.3.1: St. Thomas Affordable Housing Targets, 2006 — 2026 .....................................................71
Table 7.3.2: Adoption of Lapointe Report Recommendations in Local Official Plans ..........................72
Table 8.3.1: Monthly Income for Households on OW/ODSP, 2012 .....................................................76Table 8.3.2: Market Rental Affordability for Social Assistance Recipients ...........................................76
Table 9.1.1: Existing Homeless Programs, Supports and Services .......................................................80Table 9.1.2: Programs for Homeowners .....................................................................................
.......83
Table 9.3.1: 2013/14CHPI Investment Plan .....................................................................................
..87
Table 10.0.1: List of Emergency Housing Providers ............................................................................99
Table 11.1.1 List of Transitional and Supportive Housing Services ....................................................109Table 11.1.2: Canadian Mental Health Association- Elgin Branch—Supported Housing .....................112
St. Thomas — Elgin County Housing and Homelessness Plan: Needs Assessment
Tim Welch Consulting in Association with Lapointe Consulting and Deb Ballak

List of ChartsChart 1.0.1: Map of Service Manager Area ..................................................................................
......18
Chart 2.2.1: Age Distribution, St. Thomas/Elgin County, 1991 — 2011 ................................................21
Chart 3.2.1: Unemployment Rate for London CMA, Elgin County/St. Thomas and Ontario,2000 — 2013 ....................................................................................................
.............31
Chart 6.1.1: Median Household Income, St. Thomas/Elgin County, 2006 ............................................46Chart 6.3.2: Five — Year Residential Mortgage Rates, December 1959 — 2011 ....................................49Chart 6.6.1: Proportion of Households with Affordability Problems in Elgin County and St. Thomas,
2006 ..........................................................................................................................
..60Chart 6.6.2: Proportion of Households in St. Thomas — Elgin County Paying More Than 30% of Gross
Monthly Income on Housing Costs, 2006 .......................................................................61Chart 6.6.3: Affordability of Housing by Tenure and Age, St. Thomas — Elgin County, 2006 .................61
Chart 8.1.1: Average Emergency Shelter Bed Use, 2012 .....................................................................74
Chart 8.2.1: Average Yearly Ontario Works and Ontario Disability Support Program Caseloads,2005 — 2012 ....................................................................................................
.............75
Chart 9.0.1: Emergency Shelter, Transitional and Supportive Housing in St. Thomas — Elgin County ...79Chart 9.1.1: Homeless Programs, Supports and Services ....................................................................80Chart 9.2.1: Costs of City Delivered Homeless Programs (prior to Jan.1, 2013) ..................................84Chart 9.2.2: City Delivered Homeless Programs — Households Served Prior to Jan.1, 2013 ................85Chart 9.3.1: CHPI Funding Plan, 2013 — 2014 ...............................................................................
.....88
Chart 10.1.1: Average Emergency Bed Use Stats: 2011 — 2012 ........................................................101Chart 10.1.2: YMCA Emergency Usage: 2010 — 2013 ......................................................................102
Chart 11.2.1: YWCA Usage Statistics: 2010 — 2012 ...........................................................................112
St. Thomas — Elgin County Housing and Homelessness Plan: Needs Assessment
Tim Welch Consulting in Association with Lapointe Consulting and Deb Ballak

St. Thomas and Elgin County Housing and Homelessness
Needs Assessment
PrefaceThe City of St. Thomas in its role as the Service Manager for St. Thomas and Elgin County is responsible fo
rcommunity services throughout the City and the County. As part of its mandate, the St. Thomas/Elgin COI
administers and delivers a range of housing and homelessness programs including existing social housing, ne
rent supplements, housing allowances, funding for emergency shelters and transitional housing, and other hor
programs including the new Housing Linksfor People (HeLP) program.
The City, in its role as Service Manager has worked in collaboration with the County of Elgin and area munic
private sector and not for profit housing providers, with support services agencies and with many individual.
the community to help meet the housing needs and homelessness prevention needs and supports of its resider
St. Thomas has provided leadership in undertaking, often in collaboration with community partners, repoi
community housing and homeless needs and has worked with organizations to implement many of the key
studies. A result of the 2009 Homelessness Study, for example, the Inn Out of the Cold emergency shelter was
three—bed transitional residence for young men was opened in 2010, and a six unit supportive housing develcopens in the spring of 2013.
With passage of the provincial government's Housing Services Act, 2012, each Service Manager across the
prepare a local 10-year Housing and Homelessness Plan. These plans are to articulate the |ong—term vision
housing and homelessness services over the next ten years and should include:
0 An assessment of current and future housing needs in the Service Manager Area;
0 Objectives and targets related to housing needs;
0 A description of the measures proposed to meet the objectives and targets;
0 A description of how progress will be measured.
St. Thomas — Elgin County Housing and Homelessness Plan: Needs Assessment
Tim Welch Consulting in Association with Lapointe Consulting and Deb Ballak

The 10-year Housing and Homelessness Plan for St. Thomas and Elgin County and companion document "ITogether’ is based on the following Needs Assessment prepared as a foundation for and companion to
Assessment provides the background including up—to—datestatistical analysis as well as information gathered t
community organization interviews as well as people with lived experience.
The Needs Assessment builds upon and complements recent documents such as the 2012 Community Strateg
St. Thomas, the 2013 Homelessness Youth Study, the 2009 St. Thomas and Elgin Study on Homelessness and
and Elgin County Housing Strategy: Final Report.
The Needs Assessment highlights key issues:
0 The population continues to grow in Elgin County although more quickly in the City of St. Thomas; in
increasing number of older adults and single person households.
0 The recent recession had a considerable impact on St. Thomas/Elgin County although manufacturi
significant part of the economy. There are a considerable number of low to moderate income househc
Manager Area.
0 The housing stock is primarily single detached dwellings which are owned. While this shows the ma_
successfully housed, the lack of variation on housing built in the past 20 years has resulted in gzaccessible housing.
0 The existing 1,300 social housing homes in St. Thomas and Elgin County are a very important long tern
affordable housing needs of the community. St. Thomas has also been successful in accessing Feder
create 155 units of new affordable housing, but the needs for more affordable housing, especially one
remains high.
0 While ownership prices and rents in St. Thomas are lower than many of the urban areas of the provin
7,000 households with housing affordability issues. Seniors with basic pensions, persons earning minir
assistance recipients cannot afford the average rents and ownership prices in St. Thomas/Elgin County.
0 Projections show continuing growth of 360 to 595 households per year over the next twenty year
construction will need to be affordable to low and middle income residents and accessible to the ag2.4.2)
St. Thomas — Elgin County Housing and Homelessness Plan: Needs Assessment
Tim Welch Consulting in Association with Lapointe Consulting and Deb Ballak

0 There are dozens of people actually homeless in St. Thomas and Elgin County and many times that nu
housed with the potential to become homeless.
0 There is a strong network of outreach, supports and programs. Continued co—ordination and search
provision of services will be necessary to maintain and enhance service provision. Service and support
with undiagnosed mental heath issues, persons with addictions and homeless youth in need of basic life
0 The Inn Out of the Cold program is now established as an emergency shelter, operating in the evenings
year. Women can also access emergency shelter through the YWCA and Violence Against Women,
(VAWSEC). There is the challenge of linking people who stay at a shelter with the support services
successfully access permanent housing
0 Support and transitional housing options have been expanding in the past few years although gaps st
be continuing monitoring of the need for supportive housing and an examination of successful mnadapted in St. Thomas/Elgin County.
Changes in household composition and continuing lower incomes indicate the need to ensure there are
dwellings for smaller households in the future. Ongoing housing and homelessness challenges in the next 10
|ow—income rental housing needs and creating accessible housing for people who are aging. The aging of hou.demand mismatches as housing stock adapts to changing population needs also remain as challenges.
Emergency, transitional and supportive housing along with models of rapid re—housing, and targeted outreach
once housed continue to be key elements of an effective housing service support continuum. A Housing First |:
greater service coordination and collaboration across all providers. The existing housing service system in St.
to be monitored and reviewed to ensure this approach can be fully realized.
St. Thomas — Elgin County Housing and Homelessness Plan: Needs Assessment
Tim Welch Consulting in Association with Lapointe Consulting and Deb Ballak

Recommended Actions
Strategic Direction 1.0Increase housing supply options to meet projected need.
OBJECTIVE1.1: Increase the mix and supply of housing options, including the number of affqmarket rental units, condo units, and affordable homes in the City of St. Thomas and the Cou
. TimeActions Targets Measure Resp.
frame1.1.1 Encourage municipalities to work with private lncrease the Supplv 01‘ Number Ofnew 2014-24 City
and non—profitbuilders/developers to ensure the gff§"dab'e°”te'| _t °”e':’ed":°m, , , E room ren a U|'1|S. a ar men Sconstruction of a mix of new housing and/or erpeatedconversion of existing buildings with a focus on increase the Supply ofnew units in the areas of highest demand and for accessible rental Number of new
the types of housing in areas of highest demand. aF’a”'“e”t5- '°W'”-"9 market‘
This should include a portion of ownership Lfggtizartmentshousing priced below affordability levels and a lnereeee the Supply of
'
specific focus on building one bedroom units in affordable ownership Number of new
St Thomas_ condos, townhouses affordableand single family ownership condos,homes. townhouses and
single family homescreated.
....
establish municipal incentives that promote the 'e5'de”t'a' tax “ass County/development of mixed density neighbourhoods. Twps
Reduce or eliminatedevelopment feesand other charges foraffordable housing.
St. Thomas — Elgin County Housing and Homelessness Plan: Needs Assessment
Tim Welch Consulting in Association with Lapointe Consulting and Deb Ballak

Strategic Direction 1.0Increase housing supply options to meet projected need.
OBJECTIVE1.1: Increase the mix and supply of housing options, including the number of affqmarket rental units, condo units, and affordable homes in the City of St. Thomas and the Cou
. TimeActions Targets Measure Resp.
frame1.1.3 Permit secondary suites—a|| areas within St. A“ Citvand lower tier Number Of 2014-19 City/
Thomas and Elgin County should ensure their m‘t‘“r')°r_'F’r":"'t"r9_‘°‘_tmr‘r‘_“'r:'rFr’a"t'e5County/
, , , , , ES a IS 0 ICIES O W IC Z-IVEplanning policies permit secondary suites/garden
permit Segorrdaryestablished pO“creS_ Twps
suites in single detached and row houses in Suites Orgarden
.........................................
1.1.4 Allmunicipalities to include directions in their A“ upper and lower A“ municipalities 2014-19 City/Official Plans that support the development of _“erm““'°'p‘f"'_“e5 have e‘°‘tab"5he‘_j County/
, include provisions for affordable housingnew affordablerentalhousing to meet the needs the development of targets in their Twps
of the” C0mmUn't'e5- affordable housing in Official Plans.their Official Plans, to
comply with the 2008
housing affordability
........................................................................................................................................................................................................................................................................................1.1.5 Actively advocate for a commitment from Council/staff Examples Offlexible 2014-19 City/
municipal and provincial governments as well as ad"°_°at_e°r '°bbV t0 ”e‘’‘_’appr°a°he‘°‘ County/, provincial gov’t and achieved.
school boards for a more flexible approach to School board toTwps/
consider the use of publicly owned land consider this request Prov/(including surplus school sites) for affordable Fedhousing, even if affordable housing is only a part
of the redeveloped publicly owned sites.
1.1.6 Increase the number of rent supplements Expand R5 Program as Number 01‘new R5 2014-19 City/available to low and moderate income families. f“”fj‘°‘bewme “”'t‘°" As Prov/
available. ,funding Fed
Increase number of becomesportable RS. available.
St. Thomas — Elgin County Housing and Homelessness Plan: Needs Assessment
Tim Welch Consulting in Association with Lapointe Consulting and Deb Ballak

Strategic Direction 1.0Increase housing supply options to meet projected need.
OBJECTIVE1.1: Increase the mix and supply of housing options, including the number of affdmarket rental units, condo units, and affordable homes in the City of St. Thomas and the Coul
_ TActions Targets Measure
lmeResp.
frame1.1.7 Undertake strategic outreach to landlords to lncrease Number Ofnew RS 2014-19 City
encourage them to rent to |ow—income
households through the provision of Rent
Supplements and/orongoing tenant support
from community workers, building on the modelCM HA has developed for its clients. Wherepossible, accessible units should be a prioritywhen entering into rent supplementagreements.
collaboration withprivate sector
landlords, andnumber of RS inprivate sector.
landlords.
Number of newlandlordspartnering with theCity.
St. Thomas — Elgin County Housing and Homelessness Plan: Needs Assessment
Tim Welch Consulting in Association with Lapointe Consulting and Deb Ballak

Strategic Direction 2.0Provide supports to kee people in the sustainable housing they currently have.
OBJECTIVE2.1: Ensure that a coordinated system of supports is available to those currently ihousing.
. TimeActions Targets Measure
frameRe
2.1.1 Continue to fund existing programs that help people Continue to Offer CHP| Performance 2014-19 Ci1maintain housing, evaluating effectiveness, enhancing Hteh"P'r';EAPf‘”d '”d'°at°' 'ep°”5' Pr
. 0 er ome ESSHESSwhere needed,as funds become available (such as
prevention Client SatisfactionFOCUSFa'rV'eW)- programs currently surveys.
in place,monitoring,modifying andenhancing deliveryas required.
....
developed according to c|ient—centred (not system p9"Tt‘,’f,e””V];I
Strategies and, , , , m||'1|m|Z||'1 FE erra S
centred) principles, using strategies andto
Othersgurces”‘ea5“'e”‘e”t5- as
measurements devised by Ontario Municipal Social f|eXibj|ity and fundingServices Association (OMSSA). coordination among becomes
servicesproviders, availableusing measures
developed byOMSSA.
St. Thomas — Elgin County Housing and Homelessness Plan: Needs Assessment
Tim Welch Consulting in Association with Lapointe Consulting and Deb Ballak
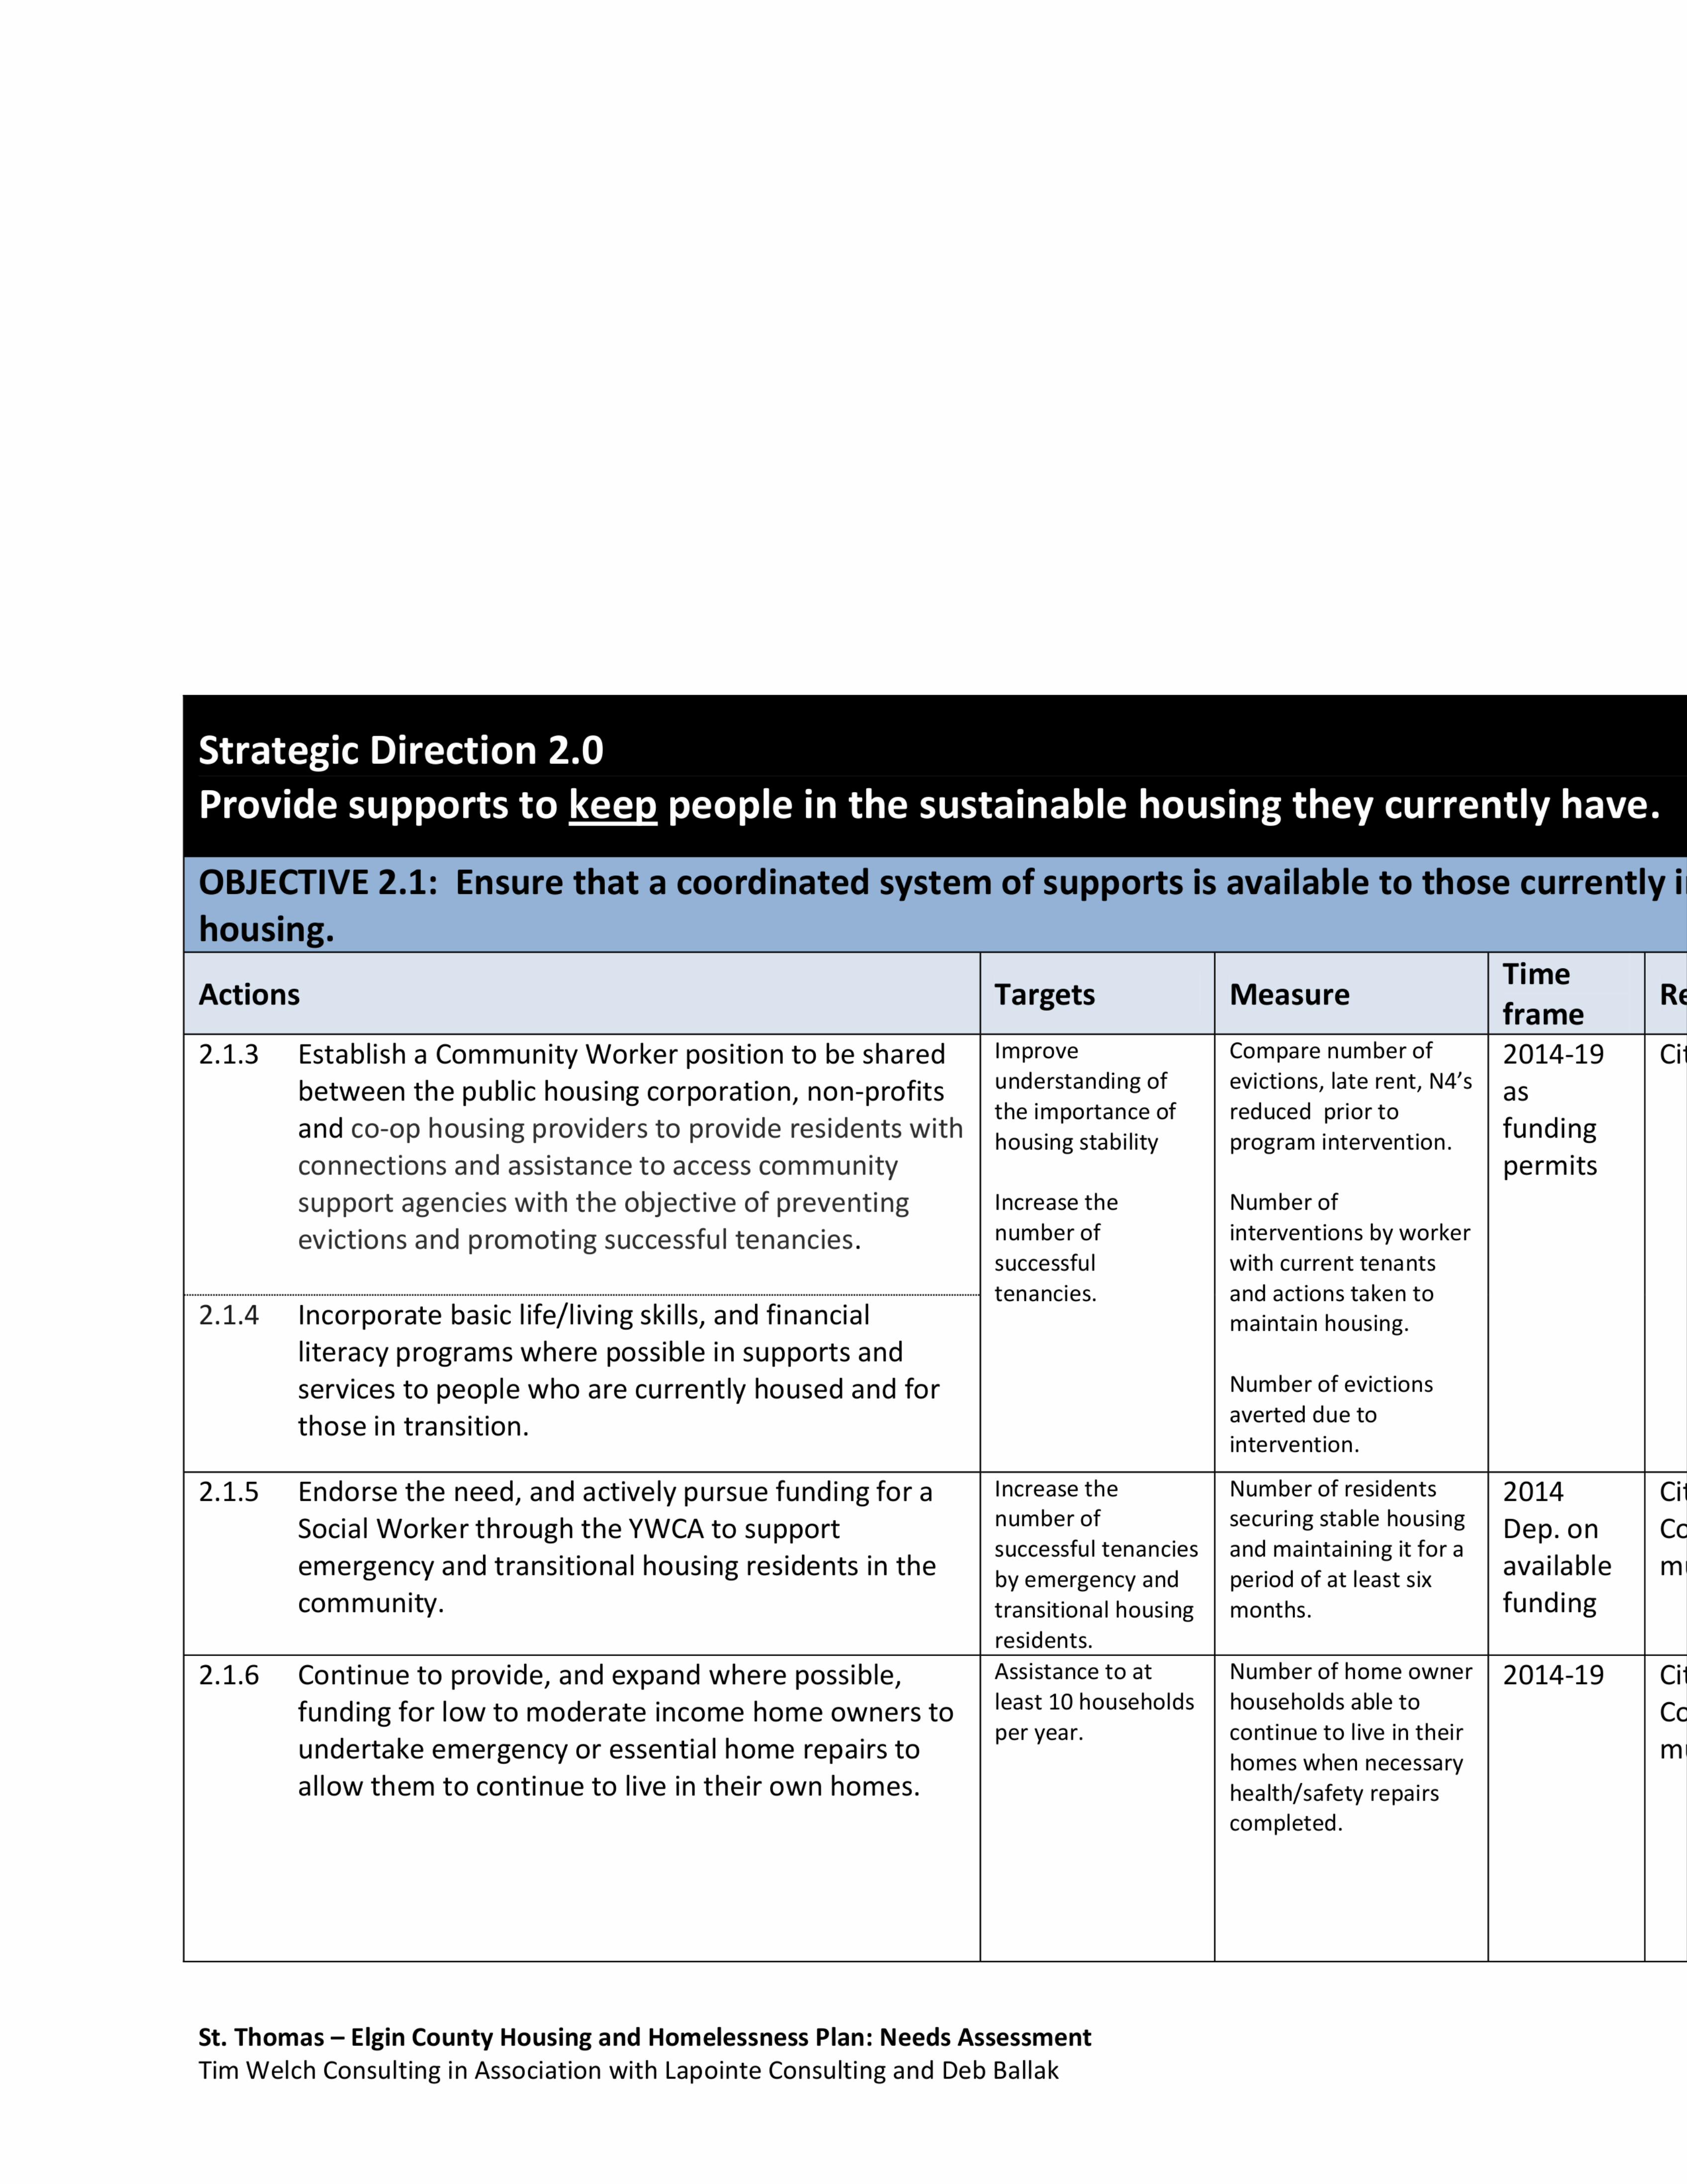
Strategic Direction 2.0Provide supports to kee people in the sustainable housing they currently have.
OBJECTIVE2.1: Ensure that a coordinated system of supports is available to those currently ihousing.
_ TimeActions Targets Measure R
eframe2.1.3 Establish a Community Worker position to be shared lmPr0Ve Compare number 01‘ 2014-19 Ci
1between the public housing corporation, non—profits “”d_e“ta“d'“g°f e"'°“°“‘°" Werem’ N4 5 as, , , , , the importance of reduced prior to ,
and co—ophousing providersto provide residentswith housing Stability program rrrrervermorr fundingconnections and assistance to access community permits
support agencies with the objective of preventing Increase the Number of
evictions and promoting successful tenancies. “umber °‘° ”“e'Ve““°“5 bVWorkersuccessful with current tenants
................................................................................................................... tenancieS_ and actions taken to2.1.4 Incorporate basic life/living skills, and financial maintain housing
literacy programs where possible in supports andservices to people who are currently housed and for Number °feVrCtr0n5
those in transition. r3n"t‘:tVe:n‘:r:‘:rt°2.1.5 Endorse the need, and actively pursue funding for a lnerease the Number Of residents 2014 Ci
1Social Worker through the YWCA to support “umber °f_
‘°‘e°““”_gStébleh_"“‘°"”gDep. on Cc, , , , , successful tenancies and maintaining it for a ,
emergency and transitional housing residents in the by emergency and period Ofar leasrsrx available mi
C0mmUrNtV- transitional housing months. fundingresidents.
2.1.6 Continue to provide, and expand where possible, Assistance t0 at Number 01‘n0me 0Wner 2014-19 Ci1funding for low to moderate income home owners to least 10 h°“‘°‘eh°'d5 h°“‘°jeh°'d5‘7b'e_t°
_ Cc, , per year. continue to live in their
undertake emergency or essential home repairs to mi
allow them to continue to live in their own homes.homes when necessaryhealth/safety repairscompleted.
St. Thomas — Elgin County Housing and Homelessness Plan: Needs Assessment
Tim Welch Consulting in Association with Lapointe Consulting and Deb Ballak

Strategic Direction 2.0Provide supports to kee people in the sustainable housing they currently have.
OBJECTIVE2.1: Ensure that a coordinated system of supports is available to those currently ihousing.
_ TimeActions Targets Measure R
eframe2.1.7 Evaluate the current St. Thomas Home Repair Evaluation 01‘ Number 01‘h0USeh0|dS 2014-15 Ci
1Program for its effectiveness prior to 2015. If effe°“"e”ess °f assisted and h°“si”g
program retaineddeemed effective in keeping these homeowners intheir homes, continue/expand the program as
federal/provincial funds become available.
St. Thomas — Elgin County Housing and Homelessness Plan: Needs Assessment
Tim Welch Consulting in Association with Lapointe Consulting and Deb Ballak

Strategic Direction 3.0Enhance the current service system to revent homelessness, and when homelesmove people into stable housing.OBJECTIVE3.1: Ensure that emergency and crisis services are accessible to persons experie
ncihomelessness, with a view to immediately setting goals, with supports, to move into stable,
Actions Targets MeasureTlme
Reframe
3.1.1 Ensure existing programs and services that help See 2-1-2 above See 2-1-2 above 2014-19 Ci1people maintain housing and prevent
homelessness continue, new programs andservices are developed according to client-centred (not system centred) principles,evaluating effectiveness, and enhancing whereneeded, as funds become available.Use strategies to measure outcomes
devised by OMSSA.
3.1.2 Evaluate how attendance at Inn Out of the Reduced use 01‘emergencv QUantitatiVe/ Spring CcCold, particularly for people regularly staying at 5h°”'te”“ h°“‘°‘i”g' quamative e"a'“a“°” _
2015 ml
the Inn Out of the Cold, is affected by theOccupancy
/Copening of the Second Story transitional Abmty to assess mentai
housing and examine the need for increased health and other issues
services for the population served, including an a”d CaF’aC”Vto assist
evaluation of daytime programming,extendingReview Where people
the season and the need for additional transition to, need fortransitional or supportive housing. supports to obtain
housing, etc.
St. Thomas — Elgin County Housing and Homelessness Plan: Needs Assessment
Tim Welch Consulting in Association with Lapointe Consulting and Deb Ballak

Strategic Direction 3.0Enhance the current service system to revent homelessness, and when homelesmove people into stable housing.OBJECTIVE3.1: Ensure that emergency and crisis services are accessible to persons experie
ncihomelessness, with a view to immediately setting goals, with supports, to move into stable,Time
Actions Targets Measure Reframe
3.1.3 Determine how Second Story is addressing the Reduction Otservice gaPS- Quantitative Spring Ci1transitional housing needs of men in the /q“a"tat"’e e"a'“at'°” 2015 Cc, , , FEE OCCU anc
community, and what service gaps continue top y
mi
exist for this Population Ability to assess mentalhealth and other issuesand capacity to assist
Review where peopletransition to, need forsupports to obtainhousing etc.
3.1.4 Endorse recent youth homelessness Y0utn PF0t0C0i EVaiuati0n 0tV0utn 2014-19 CCrecommendations. Implement Coordinated 'dmtp'em_e”tedapd
b_|_t / '”t‘:"age”°Vp'°t°°°' Cc, e ermine app ica I I y sys em.
Service Protocol to Respondto Youth’ revision for use with nOn_mi
Homelessness, evaluate implementation, and youth homeie55_ /Cdetermine how this protocol can be extended
to other populations.
St. Thomas — Elgin County Housing and Homelessness Plan: Needs Assessment
Tim Welch Consulting in Association with Lapointe Consulting and Deb Ballak
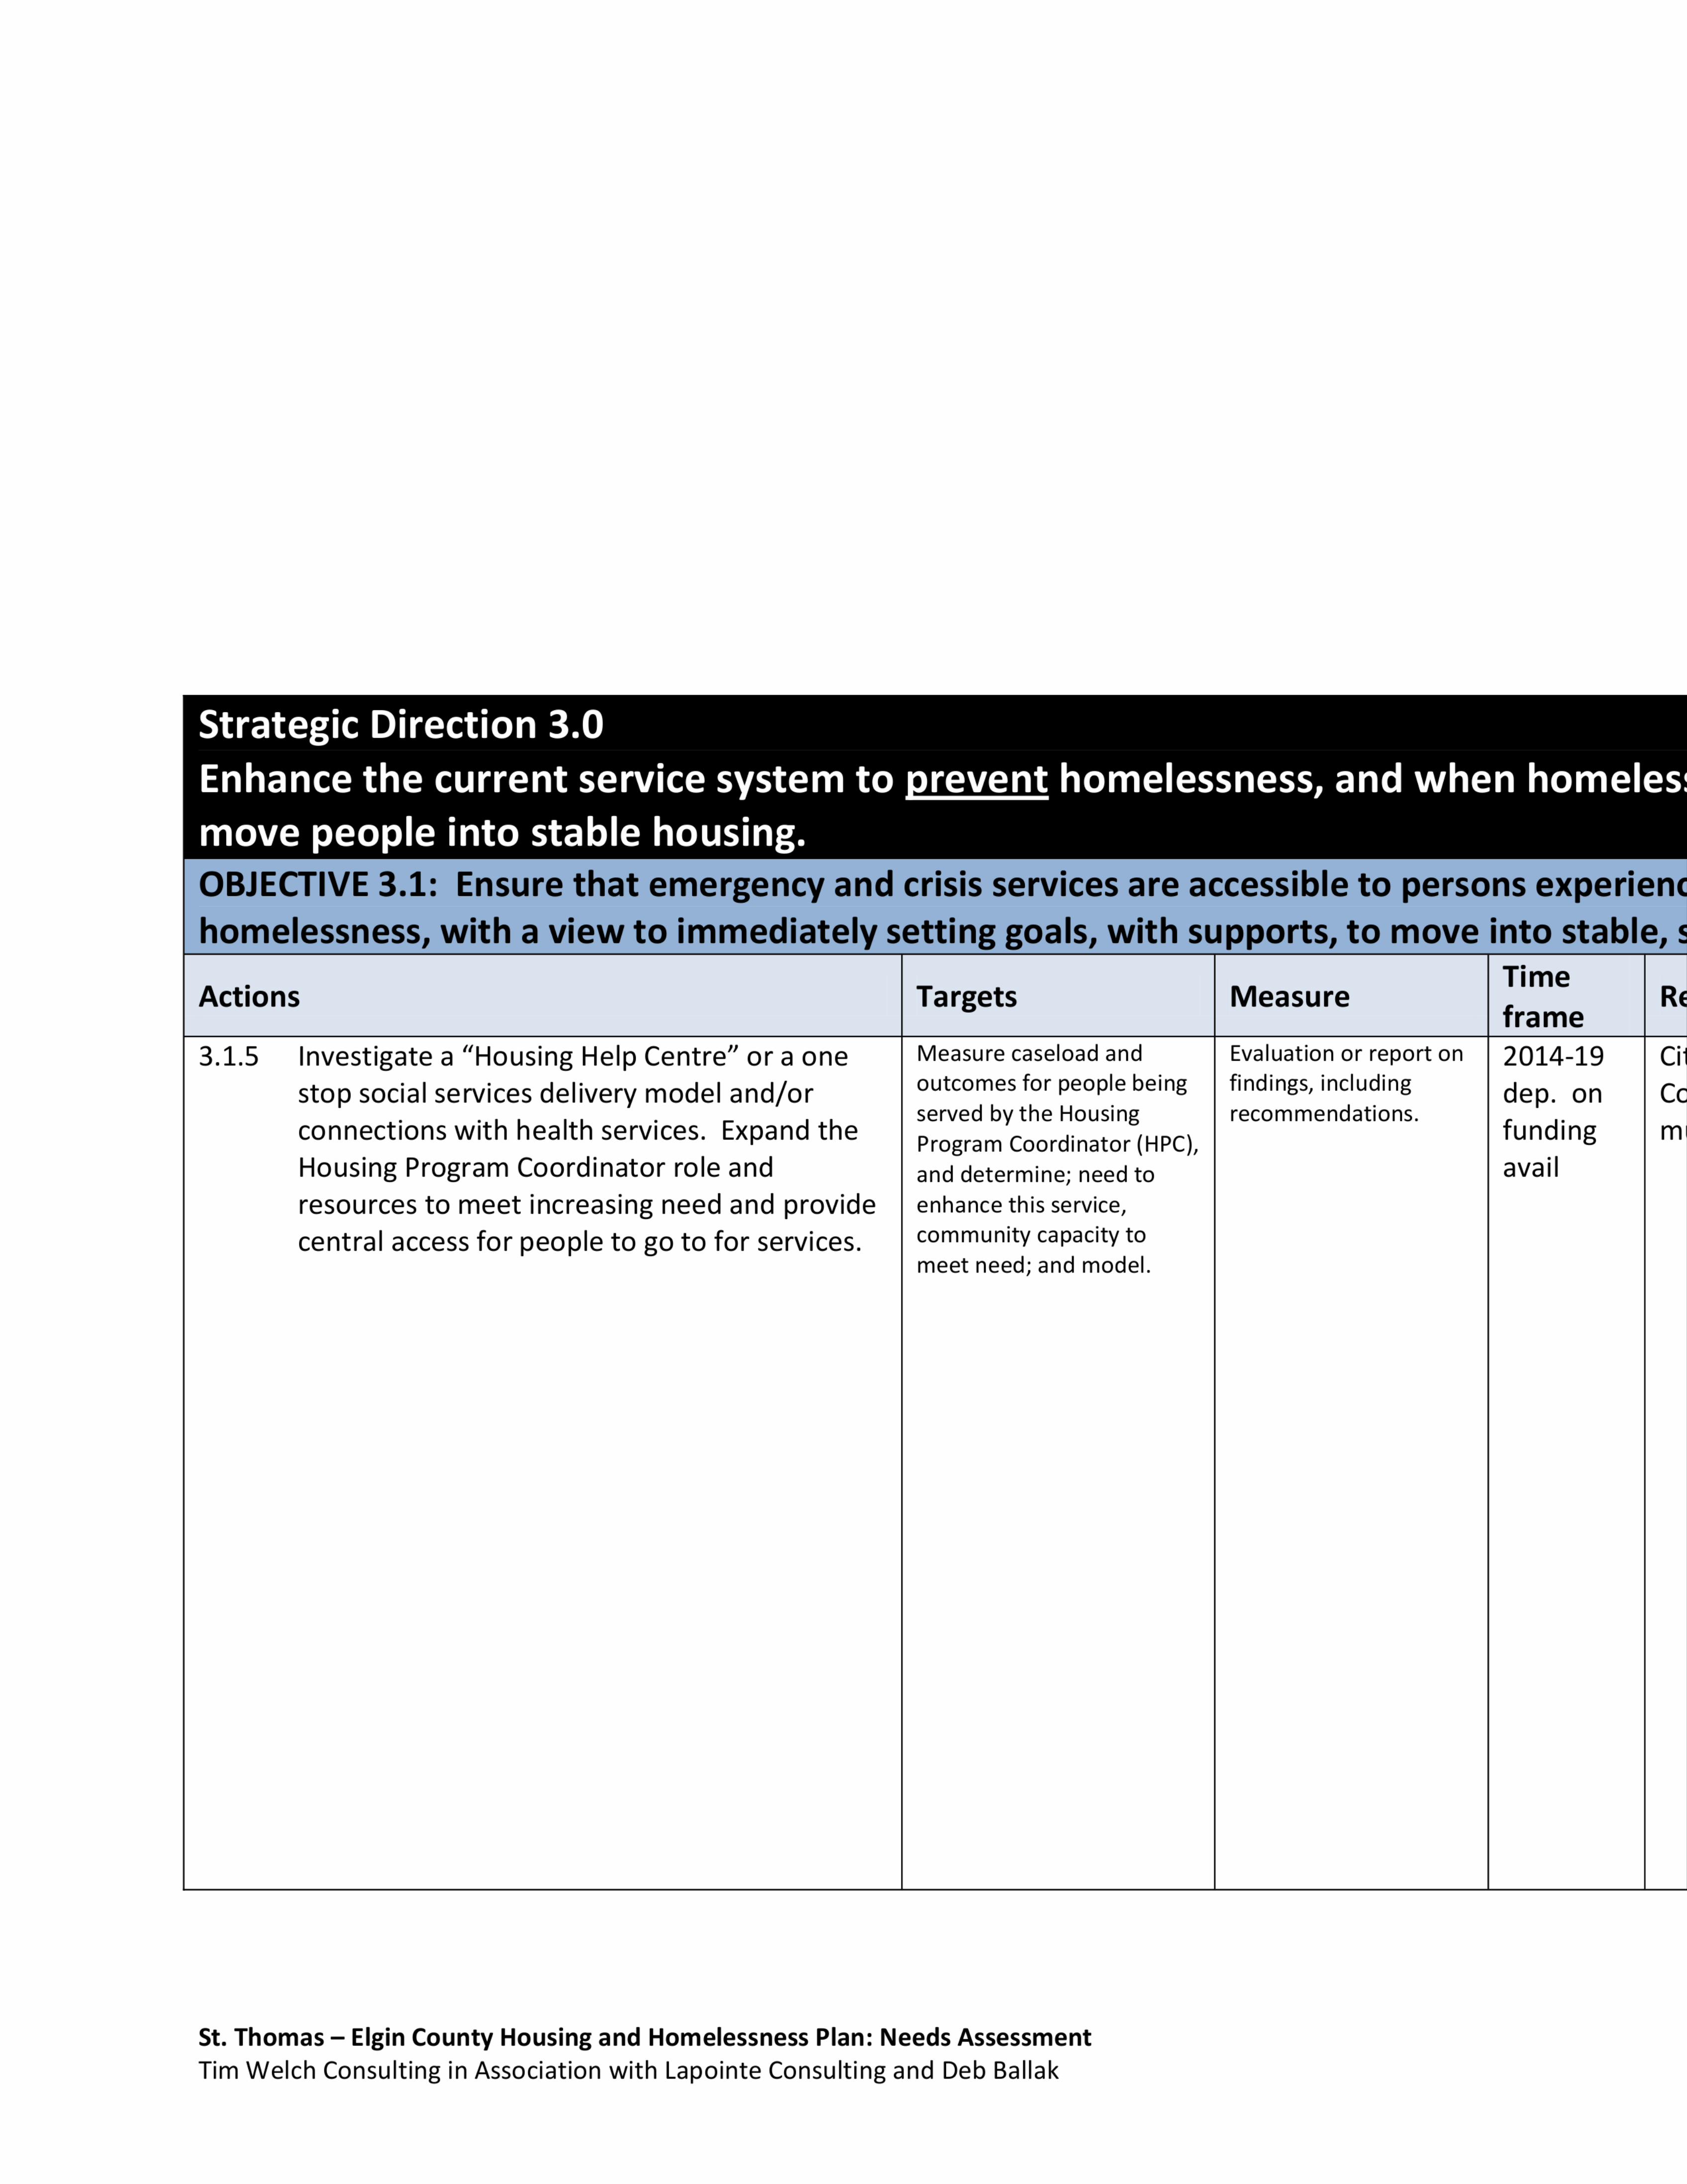
Strategic Direction 3.0Enhance the current service system to revent homelessness, and when homelesmove people into stable housing.OBJECTIVE3.1: Ensure that emergency and crisis services are accessible to persons experie
nclhomelessness, with a view to immediately setting goals, with supports, to move into stable,. Time
Actions Targets Measure Reframe
3.1.5 Investigate a "Housing Help Centre” or a one Measure Caseload and Evaluation or report On 2014-19 Ci1stop social services delivery model and/or °“t°°(;“t:35tf:1"|F:|e°p'_ebemg f'”d'”g5' '”(°j'“t‘_j'”gdep. on Cc, , , SEFVE y E OUS||'1g recommen a |O|'1S. ,
connections with health services. Expand theProgram Coordinator (HPC), funding mi
Housing Program Coordinator role and availresources to meet increasing need and providecentral access for people to go to for services.
and determine; need to
enhance this service,community capacity to
meet need; and model.
St. Thomas — Elgin County Housing and Homelessness Plan: Needs Assessment
Tim Welch Consulting in Association with Lapointe Consulting and Deb Ballak

Strategic Direction 4.0Pursue community partnerships and broaden community awareness while advoclevels of government to ensure stable housing and poverty reduction for all resid
OBJECTIVE:4.1 Increase community partnerships and collaborations and actively advocate fpoverty and increased housing stability for all residents of St. Thomas and Elgin County.
. TimeActions Target Measure
frameResp. Rela
t4.1.1 Examine opportunities for further service Housing and Action Group 2015-19 City/ St Th
iintegration of health and social services and H°'_“e'e55”e55 _e”gage5_"H'N'” Com— Home, , , , Action Group its meetings/ ,
support community agencies in pursuing (HHAG) Continues Workmanto meetmunity/ Creal
additional funding through the LHINto to Show progress community health LH|N/ Optic
address housing and support needs of on meetingthe and social Prov lmpri
persons with mental illness, addictions and 303's°‘° HHPI2009 5e'ViCe5 303'-°~ Coon
undiagnosed mental illness. Study and YouthHomi
_ _ _ _ Study. Annual Report4.1.2 Expand collaborative priority—setting Card to monitor
through the Housing and Homeless Action progress in Our
Group (HHAG). Effective planning of implementing 10- Ourhome|ess—re|ated mental health and Vear ma”
_ Comr_ _ _ _ recommendations
addiction services, and housing supports, Septe
will require enhanced collaborationbetween the LHIN,the City and other 1.4 C
Icommunity support organizations. provi:servii
4.1.3 Encourage and support community Determining the Supported Ongoing Com— St Thinitiatives for supportive housing. Seek Weedf°' h°“5'”g' h°“5'”g “eds 2014-19 munity/ f -
, , , intended assessment. ,eas'
capital funding through senior levels ofpopulation, number
City/gov’t, coordinate funding with partners such of units, mode; of Prov 1_4_2
as LHIN,CM HA etc. supgort,securel integiun S OF capi a
servi‘and operating.
St. Thomas — Elgin County Housing and Homelessness Plan: Needs Assessment
Tim Welch Consulting in Association with Lapointe Consulting and Deb Ballak
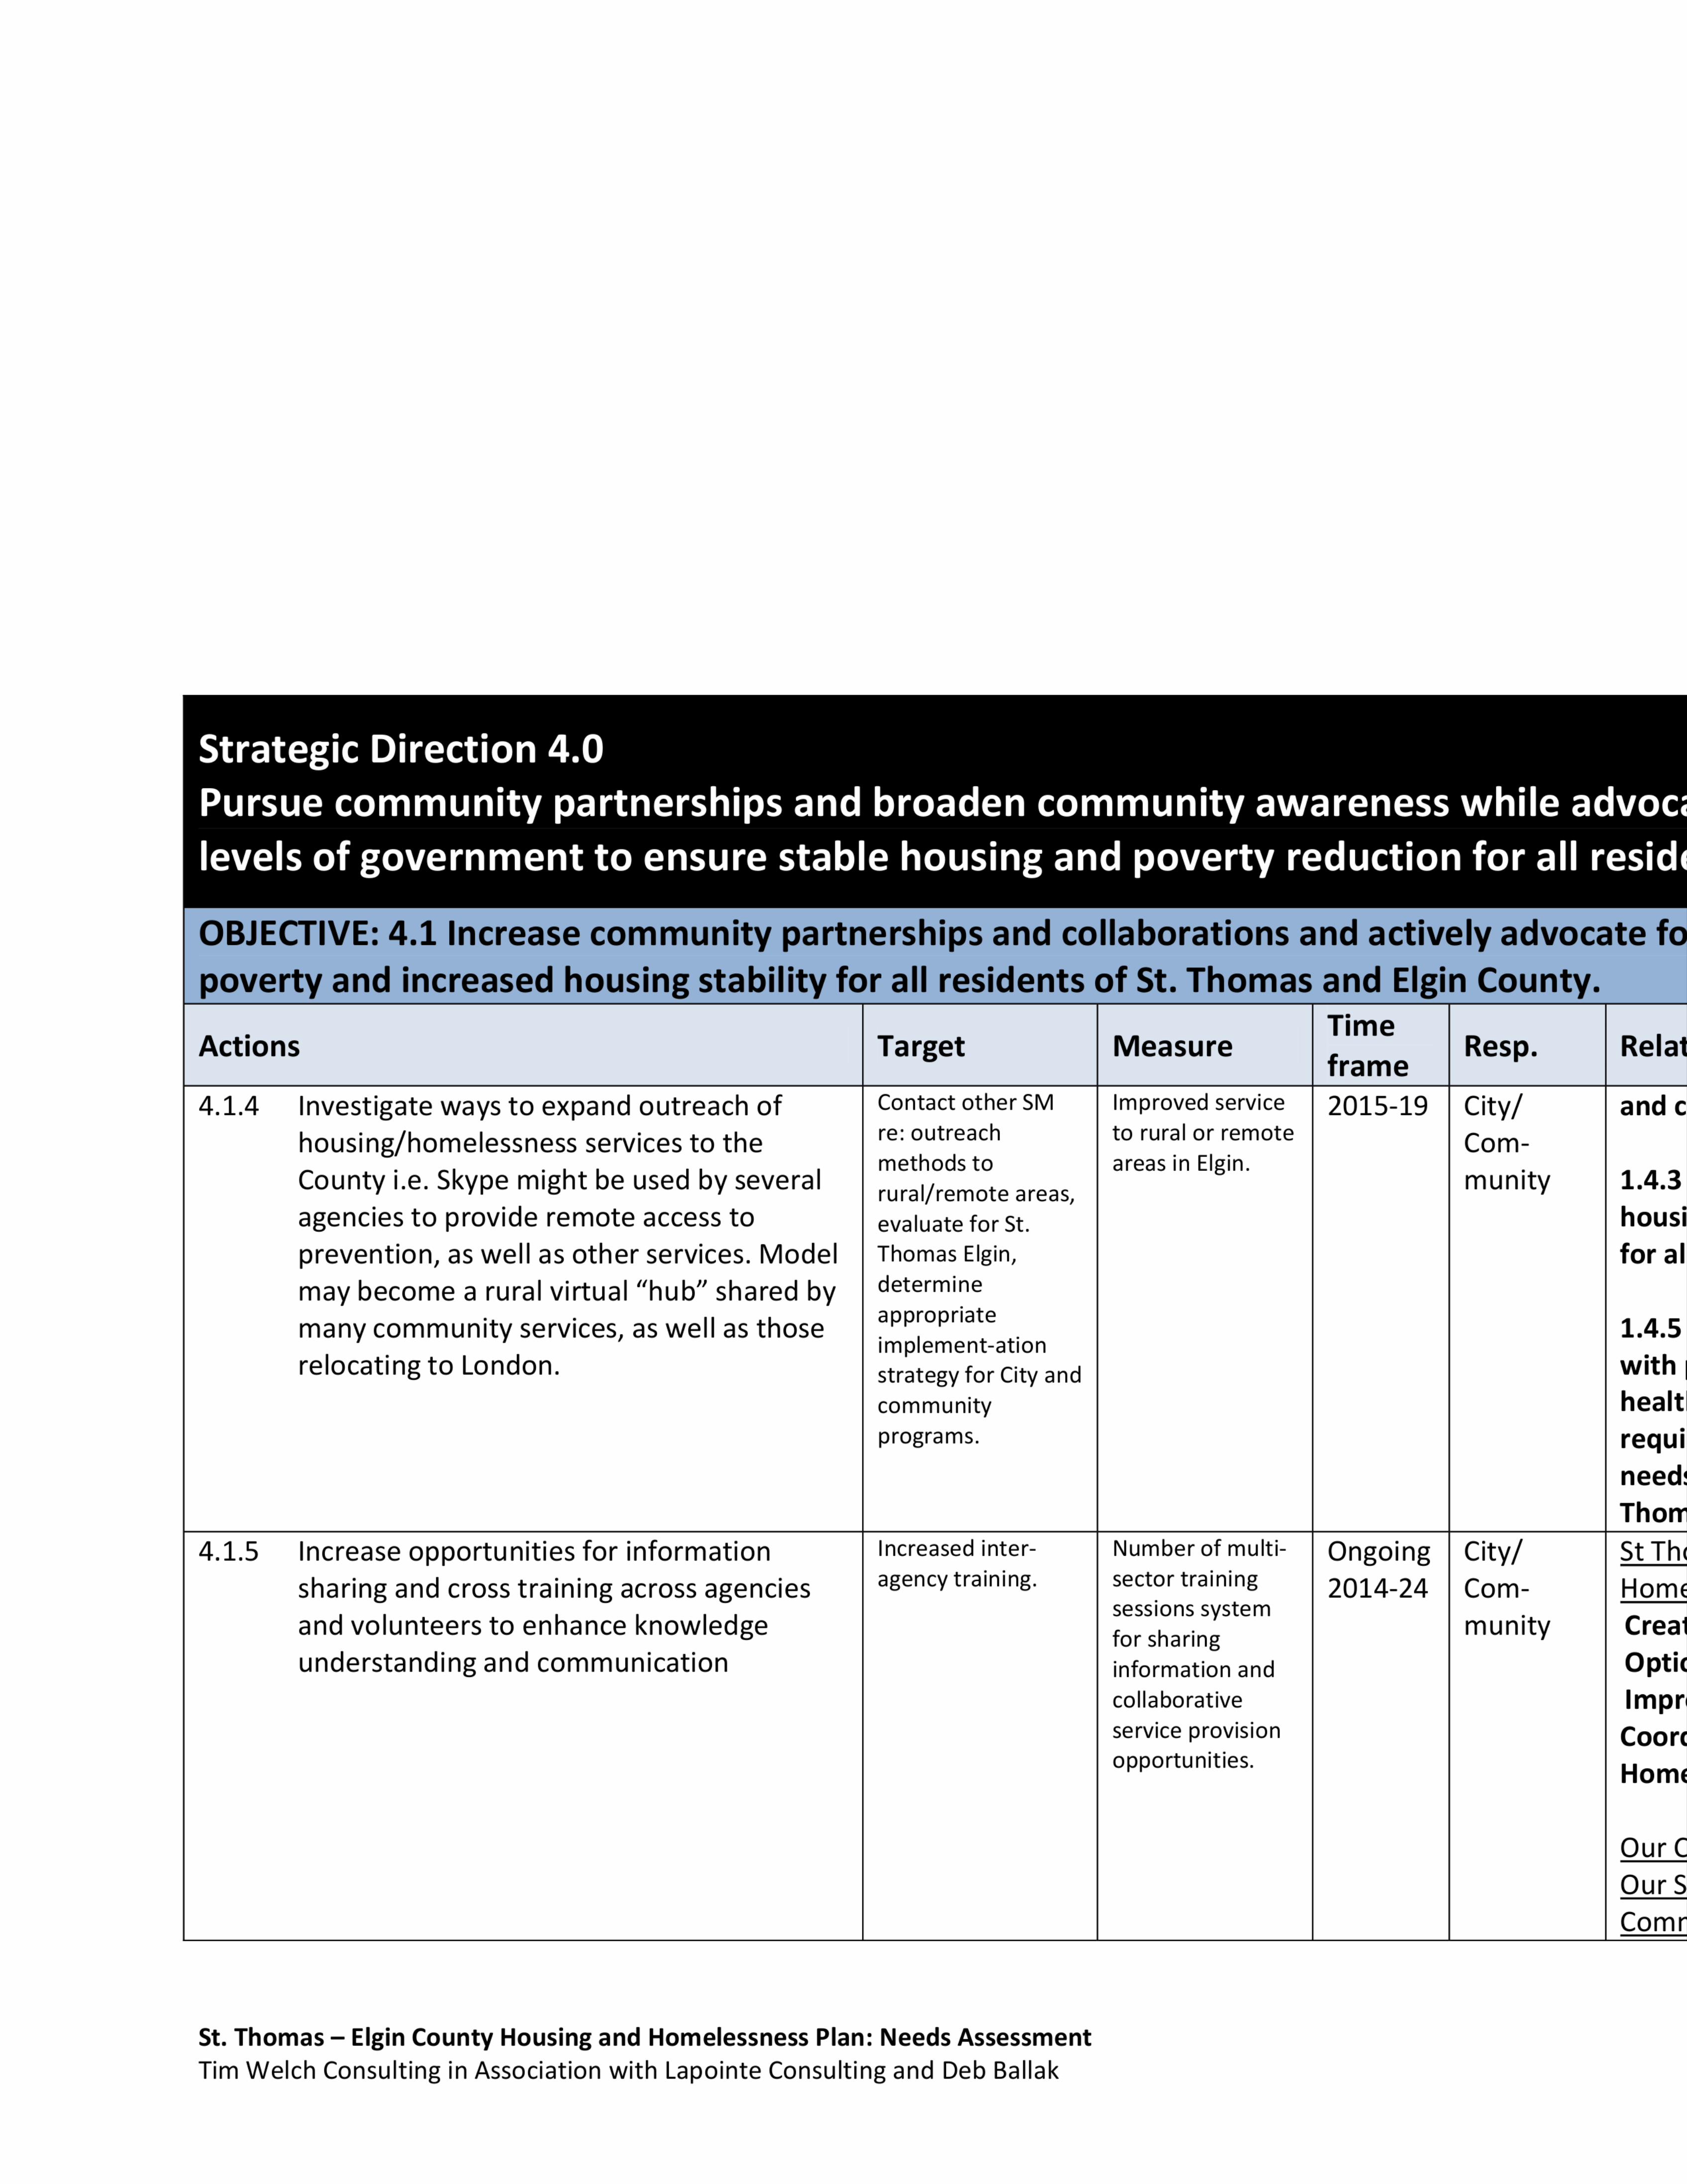
Strategic Direction 4.0Pursue community partnerships and broaden community awareness while advoclevels of government to ensure stable housing and poverty reduction for all resid
OBJECTIVE:4.1 Increase community partnerships and collaborations and actively advocate fpoverty and increased housing stability for all residents of St. Thomas and Elgin County.
TimeActions Target Measure
frameResp. Rela
t4.1.4 Investigate ways to expand outreach of Contact Other SM improved Service 2015-19 City/ and c
housing/homelessness services to the re: °“”ea°h t0 ”‘"f‘'°' '_em°te Com—, , methods to areas in Elgin. ,
Countyi.e. Skypemight be used by several rural/remoteareas, munity 1.4.3agencies to provide remote access to evaluate for St_ housiprevention, as well as other services. Model Thomas Elgin, for al
lmay become a rural virtual "hub” shared by determl?emany community services, as well as those fappropnate. 1.4.5
_ imp|ement—ation _relocating to London. Strategy for City and with
community healtlprograms. requi
need:Thom
4.1.5 Increase opportunities for information lnereased ir1ter- Number 01‘mU|ti- Ongoing City/ St Thisharing and cross training across agencies age”°V ”a'”'”g' Sect?’”a'”'t"g 2014-24 Com— Home
SeSS|O|'1S S S em ,and volunteers to enhance knowledge for Sharing munity Creaiunderstanding and communication information and Optic
collaborative Impr:service provision coo
nopportunities. Ham‘
Our
Our
Comr
St. Thomas — Elgin County Housing and Homelessness Plan: Needs Assessment
Tim Welch Consulting in Association with Lapointe Consulting and Deb Ballak

Strategic Direction 4.0Pursue community partnerships and broaden community awareness while advoclevels of government to ensure stable housing and poverty reduction for all resid
OBJECTIVE:4.1 Increase community partnerships and collaborations and actively advocate fpoverty and increased housing stability for all residents of St. Thomas and Elgin County.
. T'Actions Target Measure
lmeResp. Rela
tframe4.1.6 Advocate for policy change to build on the lncreésedfinancial Number and
_
2014- C0m_- Septe
approach of the Ontario Child Benefit by _5e°“"tVf°'_'°""' ‘V995°f '°bbV'”g 2024 ”T“”'tV' 1.4 CI, , income residents. actions. directly to
developing an expanded range of incomeprovincial provi:
and services to be available to all low— go‘/t serviiincome Ontarians. (lvicss, and St. T
h'V'°"'/LTC) feasil4.1.7 Advocate for the replacement of short—termusing
coverage in Ontario Works with more app,op_appropriate financial support outside of the riate and .
142
social assistance system for those who are effective integl
temporarily unemployed. methods‘ Semi‘
4.1.8 Support the advocacy campaign for a Sectorand
healthy food supplement of $100 monthly organiz-
to all adults receiving social assistance in ations and 1-4-3
Ontario Municipal housiCouncils for 3'(OMSSA/AMO/FCM)
1.4.5withhealtlrequineed:Thom
St. Thomas — Elgin County Housing and Homelessness Plan: Needs Assessment
Tim Welch Consulting in Association with Lapointe Consulting and Deb Ballak

Strategic Direction 4.0Pursue community partnerships and broaden community awareness while advoclevels of government to ensure stable housing and poverty reduction for all resid
OBJECTIVE:4.1 Increase community partnerships and collaborations and actively advocate fpoverty and increased housing stability for all residents of St. Thomas and Elgin County.
. T'Actions Target Measure fr'::eResp. Rela
t4.1.9 Advocate for increased and stable funding Lobbvthrough Number Ofnew 2014- Citv/
.Our
from the Federal and Provincial sectororganiz— affordablerental2024 Com—munity our,
d ,de newations and housing units.
Comrgovernments in or er provi Municipal Councilsaffordable rental housing units in the City (OMSSA/ONPHN Examine change Septe
and County. AMO/FCM/CHRA) in federal funding 1.4.34.1.10 Advocate for Federal and Provincial and ‘_“"?°|“Vt‘jtfor 5°C‘a' h°“5”‘3- housi
. . . . . FOV||'1C|a OV
governmentfundingitomaintainexisting (pmcsslME/‘AHand # of new rentfor pt
social housing stock in the City and County. MOH/LTC)using Supplement umtS_
4.1.11 Advocate for increased Federal and approp—riate and St ThiProvincial funding for portable rent e‘°‘°eC“Ve '“e”‘°d5- _EXam”‘eCha“8e H0m€
supplements, especially to meet the needs m rent "NP". supplementEof the working poor. funding XP5
"Hou?Oppo
RespcHome
andServiiServiiEmerTerm
St. Thomas — Elgin County Housing and Homelessness Plan: Needs Assessment
Tim Welch Consulting in Association with Lapointe Consulting and Deb Ballak

1 INTRODUCTION
The City of St. Thomas is the designated Consolidated Municipal Service Manager (CMSM) for
St. Thomas and Elgin County and is responsible for delivering social and community services
throughout the City and the County. As part of its mandate, the St. Thomas/Elgin County
Service Manager administers and delivers a range of housing and homelessness programs
including existing social housing, new affordable housing, rent supplements, housing
allowances, funding for emergency shelters and transitional housing, and other homelessness
prevention programs including the new Housing Linksfor People (HeLP) program.
The St. Thomas/Elgin County service area includes the separated City of St. Thomas and Elgin
County which includes seven local municipalities: the Municipality of Bayham, the Town of
Aylmer, the Township of Malahide, the Municipality of Central Elgin, the Municipality of
Southwold, the Municipality of Dutton—Dunwich and the Municipality of West Elgin. (See Figure
1.0.1 on the following page).
As a result of the provincial Housing Services Act, 2012, each Service Manager across the
Province is required to prepare a local 10-year Housing and Homelessness Plan. These plans are
to articulate the |ong—term vision for the provision of housing and homelessness services over
the next ten years and are required to include:
0 An assessment of current and future housing needs in the Service Manager Area;
0 Objectives and targets related to housing needs;
0 A description of the measures proposed to meet the objectives and targets;
0 A description of how progress will be measured.
This report begins with an assessment of current and future housing and homelessness needs
for St. Thomas/Elgin County.
St. Thomas — Elgin County Housing and Homelessness Plan: Needs Assessment 17Tim Welch Consulting in Association with Lapointe Consulting and Deb Ballak

Chart 1.0.1 — Map of Service Manager Area
COUNTY OF MIDDLESEXin
MALAH|DEAVON me
SOUTHWOLD
W:/amnW§‘id‘ oDUTTONIDUNWICH (-/ __ " O’
‘
Lawrunz::.S—;:uonQ’
’./
I
,1 v.
_.wows1»
LY“...V‘?
’
1
'
V
Kinnsmlilcomics. _
4. .Middlemarch _
V
7 ;.*«.
St. Thomas/Elgin County Housing and Homelessness PlanTim Welch Consulting in association with Lapointe Consulting and Deb Ballak

Housing Needs Assessment
2 POPULATION AND HOUSEHOLDCHARACTERISTICS
2.1 Population Growth
In 2011, the City of St. Thomas’s population was 37,095 representing 43.3% of the population in
the St. Thomas/Elgin County area, while Elgin County's population was 49,556 accounting for
56.7% of the population. Over time, the City's share of the St. Thomas/Elgin County area has
been increasing.
Despite some challenging economic times, St. Thomas’ population grew by 5.0% between 2006
and 2011, close to the Provincial growth rate while the population in the County increased by
0.6%. Within the County, the highest growth levels between 2006 and 2011 were in the
Municipality of Bayham (3.9% growth) and the Township of Malahide (3.6%). Other
municipalities had low or negative growth rates. For example, the Town of Aylmer increased by
1.2%, the Municipality of Central Elgin by .2% and the Municipality of Dutton—Dunwich by 1.4%.
The Township of Southwold decreased by 4.9% — a reflection of the declining workforce at the
Ford plant in Southwold. The Municipality of West Elgin located at the western edge of the
County decreased by 3.6%. As a whole, St.Thomas/Elgin County's population grew by 2.5%.
Table 2.1.1: Population Growth, St. Thomas and Elgin County, 1991-20111991 1996 2001 2006 2011 5-Yr. Change 06-11 10-Yr. Change 01-11
Municipality # % # %
City of St. Thomas 30,332 31,407 33,236 36, 110 37,905 1,795 5.0% 4,669 14.0%
% of Total 40.2% 39. 7% 40.8% 42.3% 43.3% 85.1% 79.0%
Municipality of Bayham 5,673 6,234 6,375 6,727 6,989 262 3.9% 614 9.6%
% of Total 7.5% 7.9% 7.8% 7.9% 8.0% 12.4% 10.4%
Township of Malahide 8,514 8,891 8,809 8,828 9,146 318 3.6% 337 3.8%
% of Total 11.3% 11.2% 10.8% 10.3% 10.5% 15.1% 5. 7%
Town of Aylmer 6,244 7,022 7,126 7,069 7,151 82 1.2% 25 0.4%
% of Total 8.3% 8.9% 8. 7% 8.3% 8.2% 3.9% 0.4%
Municipality of Central Elgin 11,447 12,156 12,360 12,723 12,743 20 0.2% 383 3.1%
% of Total 15.2% 15.4% 15.2% 14.9% 14.6% 0.9% 6.5%
Township Southwol CI 4,351 4,273 4,487 4,724 4,494 -230 -4.9% 7 0.2%
% of Total 5.8% 5.4% 5.5% 5.5% 5.1% -10. 9% 0.1%
Municipality Dutton—Dunwich 3,536 3,603 3,696 3,821 3,876 55 1.4% 180 4.9%
% of Total 4. 7% 4. 6% 4.5% 4.5% 4.4% 2.6% 3.0%
Municipality of West Elgin 5,366 5,573 5,464 5,349 5,157 -192 -3.6% -307 -5.6%
% of Total 7.1% 7.0% 6. 7% 6.3% 5.9% -9. 1% -5. 2%
Elgin County 45,131 47,752 48,317 49,241 49, 556 315 0.6% 1,239 2.6%
% of Total 59.8% 60.3% 59.2% 57. 7% 56. 7% 14.9% 21.0%
St. Thomas/Elgin County 75,463 79,159 81,553 85,351 87,461 2,110 2.5% 5,908 7.2%
% of Total 100.0% 100. 0% 100. 0% 100. 0% 100. 0% 100. 0% 100. 0%
ONTARIO 10,085,000 10,753,573 11,410,046 12,160,282 12,851,821 691,539 5.7% 1,441,775 12.6%
Source: Statistics Canada, various census years.
St. Thomas/Elgin County Housing and Homelessness Plan 19
Tim Welch Consulting in association with Lapointe Consulting and Deb Ballak
Over the 10-year period, 2001-2011, St. Thomas also grew at a faster rate than the County and
at a higher rate that the Province as a whole — 14.0% in St. Thomas compared to 2.6% in the
County and 12.6% in Ontario. Within the County, Bayham and Dutton—Dunwich had the highest
growth rates — 9.6% in Bayham and 4.9% in Dutton—Dunwich. The combined St. Thomas/Elgin
County area grew by 7.2% between 2001 and 2011.
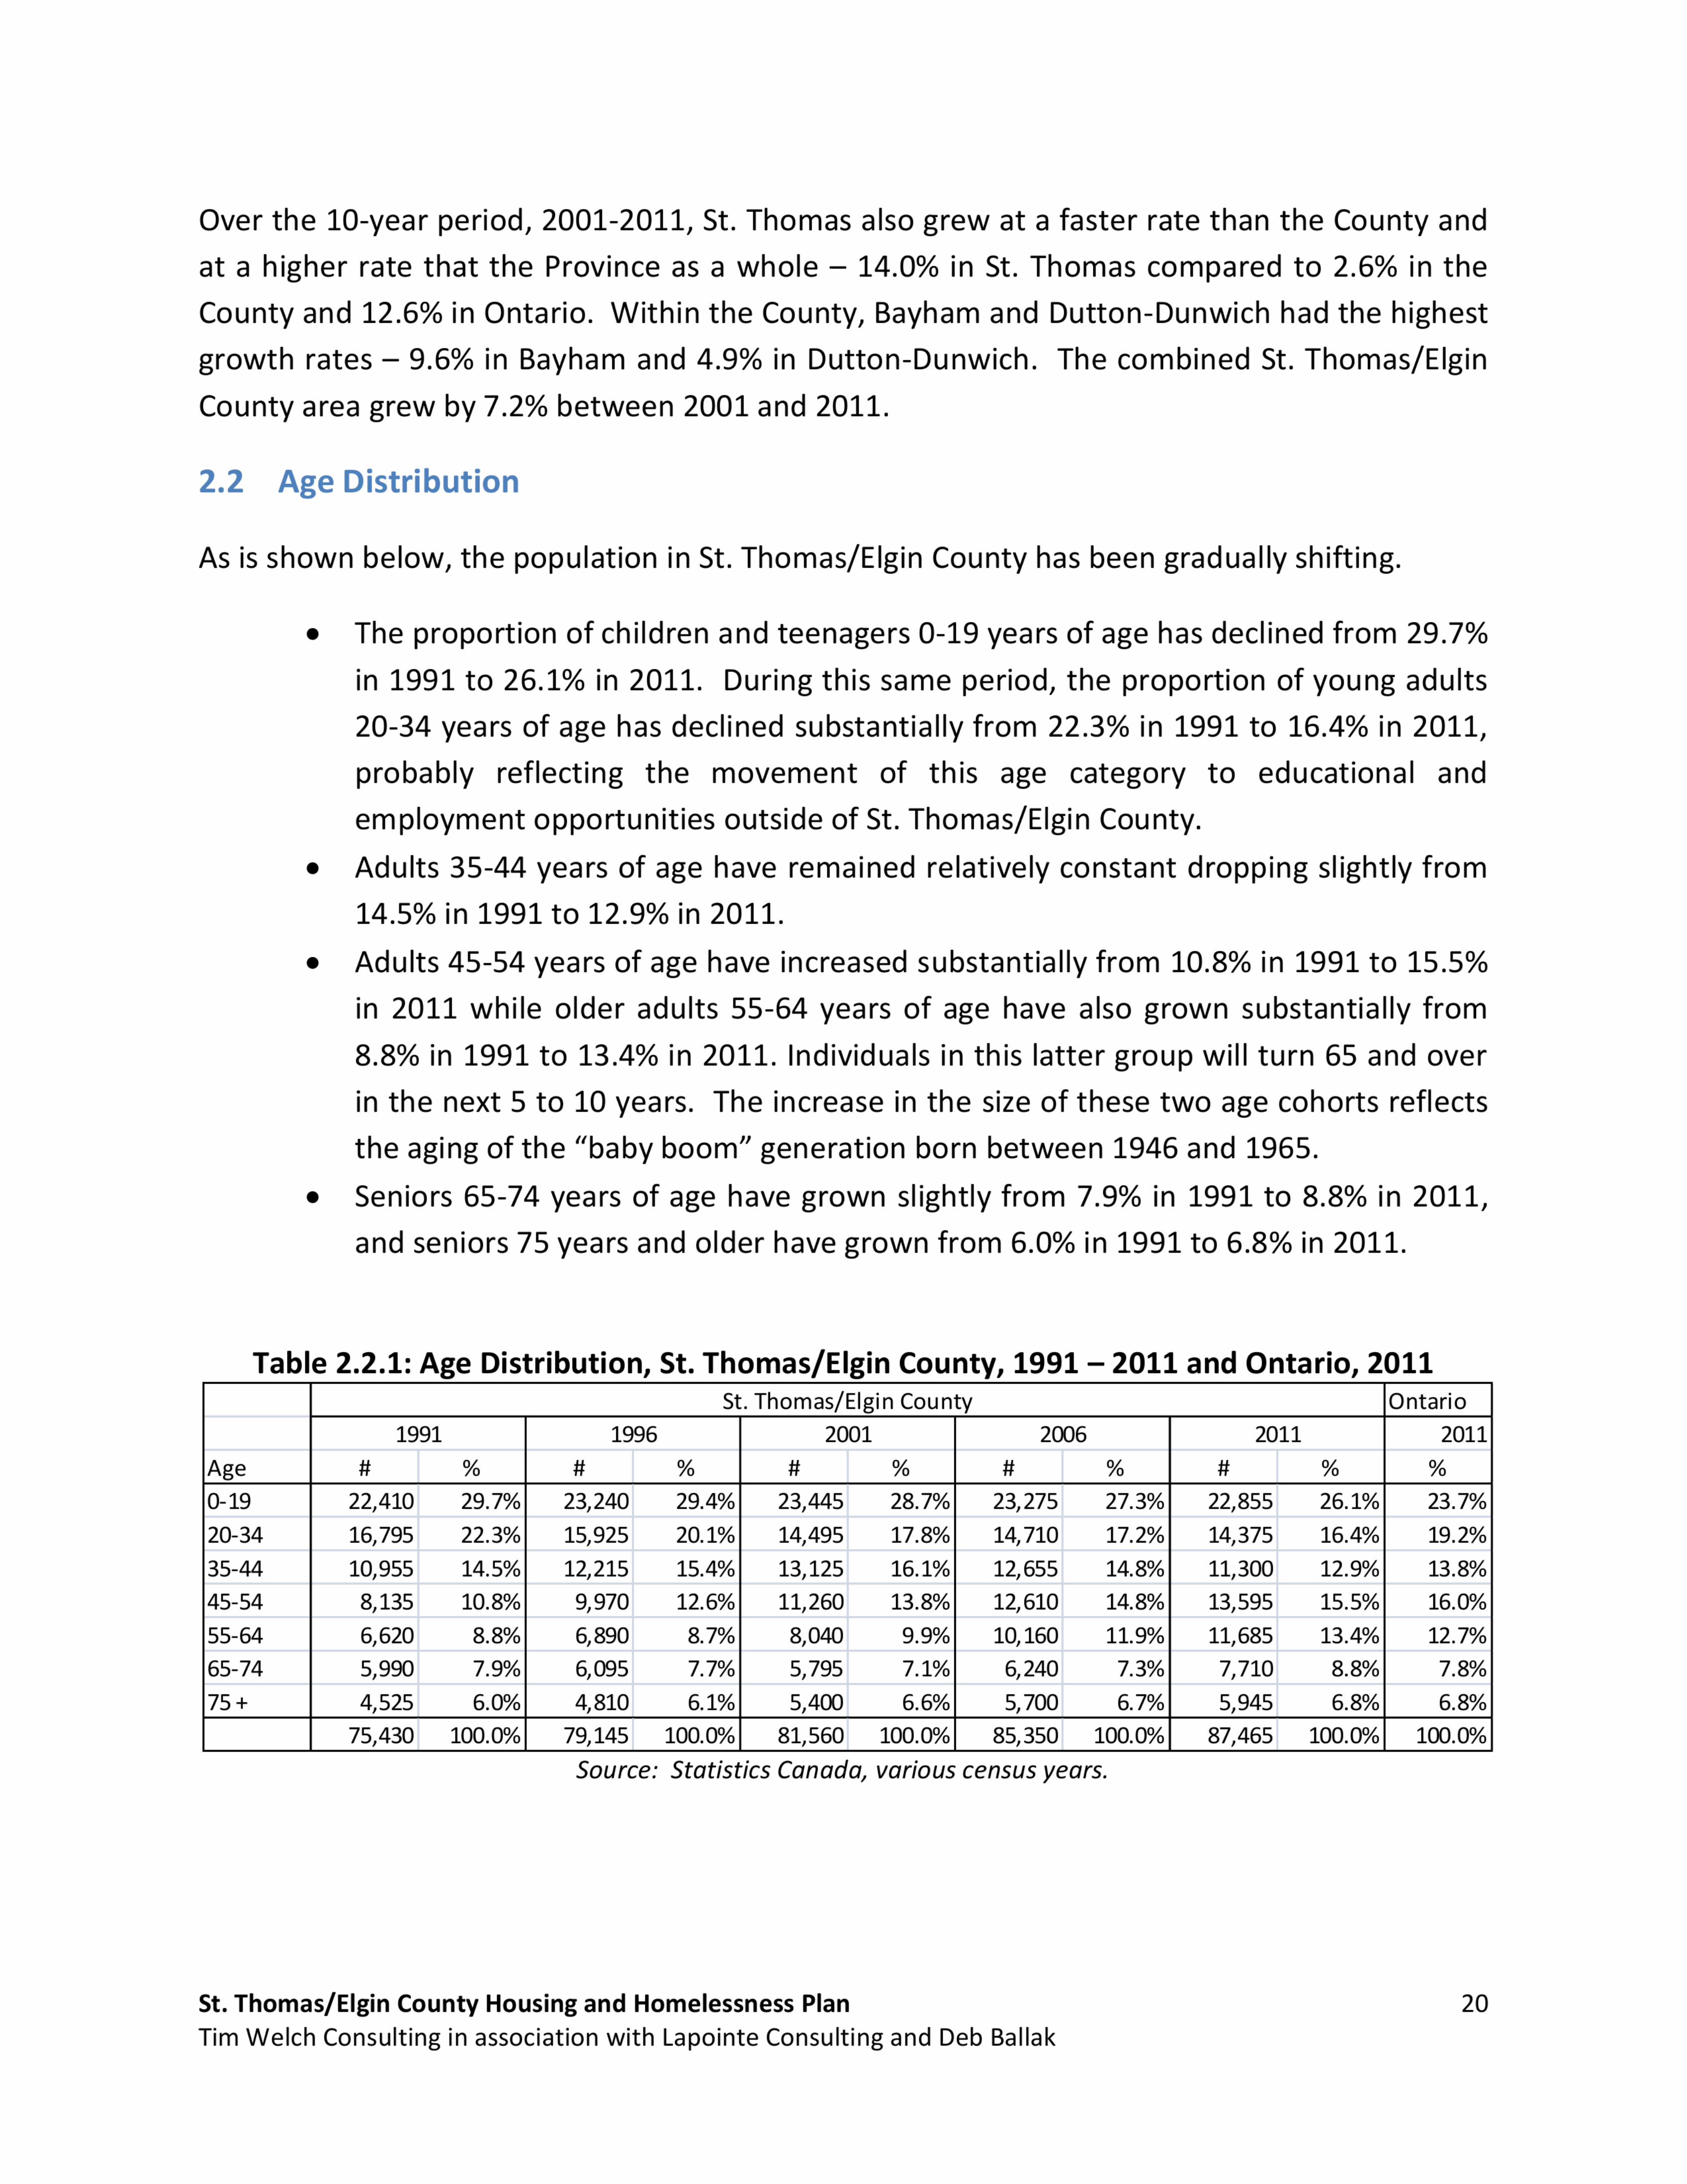
2.2 Age Distribution
As is shown below, the population in St. Thomas/Elgin County has been gradually shifting.
0 The proportion of children and teenagers 0-19 years of age has declined from 29.7%
in 1991 to 26.1% in 2011. During this same period, the proportion of young adults
20-34 years of age has declined substantially from 22.3% in 1991 to 16.4% in 2011,
probably reflecting the movement of this age category to educational and
employment opportunities outside of St. Thomas/Elgin County.
0 Adults 35-44 years of age have remained relatively constant dropping slightly from
14.5% in 1991 to 12.9% in 2011.
0 Adults 45-54 years of age have increased substantially from 10.8% in 1991 to 15.5%
in 2011 while older adults 55-64 years of age have also grown substantially from
8.8% in 1991 to 13.4% in 2011. Individuals in this latter group will turn 65 and over
in the next 5 to 10 years. The increase in the size of these two age cohorts reflects
the aging of the ”baby boom” generation born between 1946 and 1965.
0 Seniors 65-74 years of age have grown slightly from 7.9% in 1991 to 8.8% in 2011,
and seniors 75 years and older have grown from 6.0% in 1991 to 6.8% in 2011.
Table 2.2.1: Age Distribution, St. Thomas/Elgin County, 1991 — 2011 and Ontario, 2011St. Thomas/Elgin County Ontario
1991 1996 2001 2006 2011 2011
Age it % it % it % it % it % %
0- 19 22,410 29.7% 23,240 29.4% 23,445 28.7% 23,275 27.3% 22,855 26.1% 23.7%
20-34 16,795 22.3% 15,925 20.1% 14,495 17.8% 14,710 17.2% 14,375 16.4% 19.2%
35-44 10,955 14.5% 12,215 15.4% 13,125 16.1% 12,655 14.8% 11,300 12.9% 13.8%
45-54 8,135 10.8% 9,970 12.6% 11,260 13.8% 12,610 14.8% 13,595 15.5% 16.0%
55-64 6,620 8.8% 6,890 8.7% 8,040 9.9% 10, 160 11.9% 11,685 13.4% 12.7%
65-74 5,990 7.9% 6,095 7.7% 5,795 7.1% 6,240 7.3% 7,710 8.8% 7.8%
75 + 4,525 6.0% 4,810 6.1% 5,400 6.6% 5,700 6.7% 5,945 6.8% 6.8%
75,430 100.0% 79, 145 100.0% 81, 560 100.0% 85, 350 100.0% 87,465 100.0% 100.0%
Source: Statistics Canada, various census years.
St. Thomas/Elgin County Housing and Homelessness Plan 20
Tim Welch Consulting in association with Lapointe Consulting and Deb Ballak

Chart 2.2.1 Age Distribution, St. Thomas/Elgin County, 1991 — 201135.0%
30.0%‘
25.0% £1199:
2o.o°/9 I 1996
15.0%F
2°01
10.0% E T _
'2°°5
50% : g N ‘J I
I2011
l [Io.o%
lo-19 20-3.: 35-44 45-5.: 55-64 65-74 75 ~
Source: Statistics Canada, various census years.
In 2011 the age distribution in St. Thomas/Elgin County was similar to that of Ontario's except
that Ontario had a smaller proportion of the under 19 years of age category and a higher
proportion of young adults 20-34 years of age. A comparison of the distribution of the
population by age in St. Thomas and Elgin County in Table 2.2.2 below shows that the age
distributions are relatively similar though there are some noticeable differences:
0 Elgin County as a whole has a higher proportion of its population who are 0-19 years
of age (27.4%) compared to the City of St. Thomas (24.5%), though there is
considerable variation amongst area municipalities. The highest proportions of
children and youth are in Bayham and Malahide.
0 The City of St. Thomas has a higher proportion of its population who are 20-34 years
of age (17.6%) compared to the County as a whole (15.5%) perhaps reflecting
greater employment and educational opportunities in St. Thomas. Bayham,
Malahide and Aylmer have similar proportions as St. Thomas.
0 The City of St. Thomas has a slightly higher proportion of its population who are 35-
44 years of age (13.7%) compared to the County (12.3%) — though several
municipalities have similar proportions as the City (Southwold — 13.5% and Dutton-
Dunwich — 13.1%.
0 The City of St. Thomas has a similar proportion of its population who are 45-54
years of age (15.1%) compared to the County (15.9%) but a lower proportion who
are 55-64 years of age (12.7%) compared to the County (13.9%). Within the County,
Central Elgin, Southwold and West Elgin all have relatively high proportions of
individuals 55-64 years of age.
0 There is a similar proportion of the population who are 65-74 in the City (9.0%) and
the County (8.7%) but the City of St. Thomas has a higher share of its population
who are 75+ years (7.5%) compared to the County (6.3%) — though Aylmer, Dutton-
St. Thomas/Elgin County Housing and Homelessness Plan 21Tim Welch Consulting in association with Lapointe Consulting and Deb Ballak
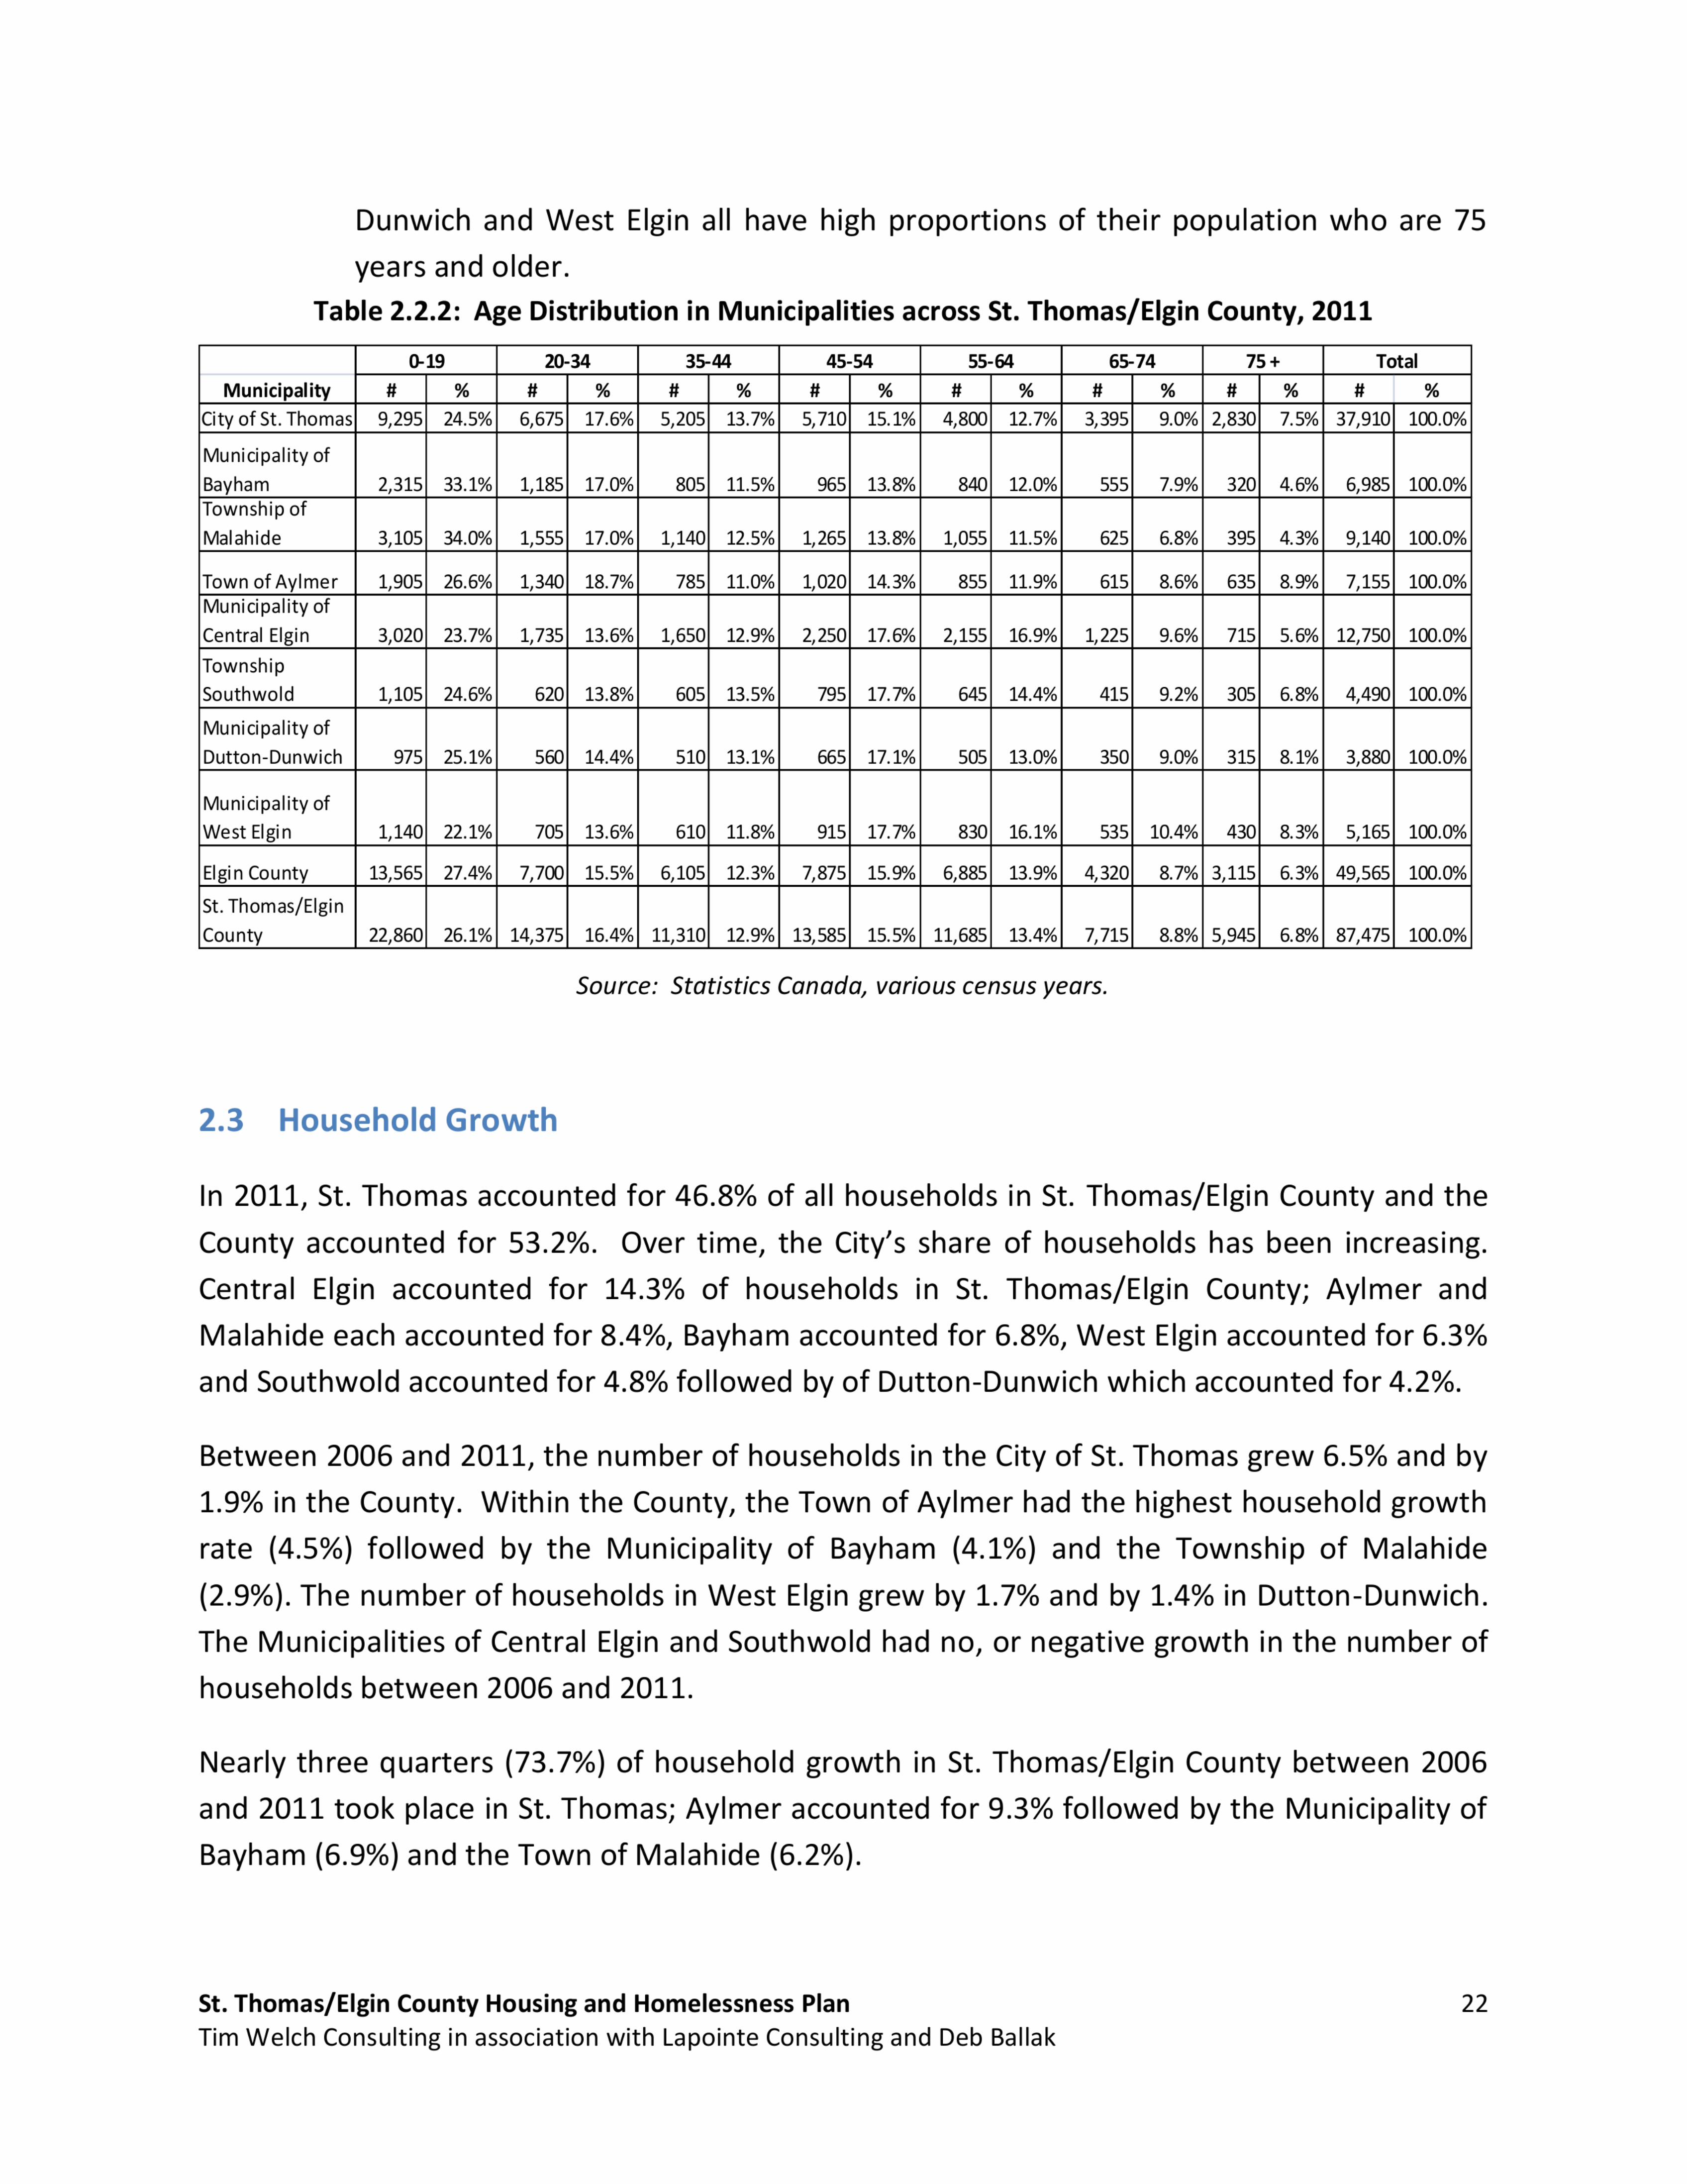
Dunwich and West Elgin all have high proportions of their population who are 75
years and older.
Table 2.2.2: Age Distribution in Municipalities across St. Thomas/Elgin County, 2011
0-19 20-34 35-44 45-54 55-64 65-74 75 + Total
Municipality ll % ll % # % # % # % ll % # % # %
City of St. Thomas 9,295 24.5% 6,675 17.6% 5,205 13.7% 5,710 15.1% 4,800 12.7% 3,395 9.0% 2,830 7.5% 37,910 100.0%
Municipality of
Bayham 2,315 33.1% 1,185 17.0% 805 11.5% 965 13.8% 840 12.0% 555 7.9% 320 4.6% 6,985 100.0%Township of
Malahide 3,105 34.0% 1,555 17.0% 1,140 12.5% 1,265 13.8% 1,055 11.5% 625 6.8% 395 4.3% 9,140 100.0%
Town ofAy|mer 1,905 26.6% 1,340 18.7% 785 11.0% 1,020 14.3% 855 11.9% 615 8.6% 635 8.9% 7,155 100.0%Municipalityof
Centra|E|gin 3,020 23.7% 1,735 13.6% 1,650 12.9% 2,250 17.6% 2,155 16.9% 1,225 9.6% 715 5.6% 12,750 100.0%
Township
Southwold 1,105 24.6% 620 13.8% 605 13.5% 795 17.7% 645 14.4% 415 9.2% 305 6.8% 4,490 100.0%
Municipalityof
Dutton—Dunwich 975 25.1% 560 14.4% 510 13.1% 665 17.1% 505 13.0% 350 9.0% 315 8.1% 3,880 100.0%
Municipalityof
West Elgin 1,140 22.1% 705 13.6% 610 11.8% 915 17.7% 830 16.1% 535 10.4% 430 8.3% 5,165 100.0%
Elgincounty 13,565 27.4% 7,700 15.5% 6,105 12.3% 7,875 15.9% 6,885 13.9% 4,320 8.7% 3,115 6.3% 49,565 100.0%
St.Thomas/Elgin
County 22,860 26.1% 14,375 16.4% 11,310 12.9% 13,585 15.5% 11,685 13.4% 7,715 8.8% 5,945 6.8% 87,475 100.0%
Source: Statistics Canada, various census years.
2.3 Household Growth
In 2011, St. Thomas accounted for 46.8% of all households in St. Thomas/Elgin County and the
County accounted for 53.2%. Over time, the City's share of households has been increasing.
Central Elgin accounted for 14.3% of households in St. Thomas/Elgin County; Aylmer and
Malahide each accounted for 8.4%, Bayham accounted for 6.8%, West Elgin accounted for 6.3%
and Southwold accounted for 4.8% followed by of Dutton—Dunwich which accounted for 4.2%.
Between 2006 and 2011, the number of households in the City of St. Thomas grew 6.5% and by
1.9% in the County. Within the County, the Town of Aylmer had the highest household growth
rate (4.5%) followed by the Municipality of Bayham (4.1%) and the Township of Malahide
(2.9%). The number of households in West Elgin grew by 1.7% and by 1.4% in Dutton—Dunwich.
The Municipalities of Central Elgin and Southwold had no, or negative growth in the number of
households between 2006 and 2011.
Nearly three quarters (73.7%) of household growth in St. Thomas/Elgin County between 2006
and 2011 took place in St. Thomas; Aylmer accounted for 9.3% followed by the Municipality of
Bayham (6.9%) and the Town of Malahide (6.2%).
St. Thomas/Elgin County Housing and Homelessness Plan 22Tim Welch Consulting in association with Lapointe Consulting and Deb Ballak

Over the 10-year period, 2001-2011, St. Thomas had the highest growth rate (17.8%), almost
three times the growth rate in the County (5.6%). Within the County, the highest growth rates
were in Bayham (8.3%), Central Elgin (6.8%) and Aylmer (6.2%).
Table 2.3.1: Household Growth, St. Thomas, Elgin County and Area Municipalities, 1991-20115-Yr. Change 06-11 10-Yr. Change 01-11 10 yr
Municipality 1991 1996 2001 2006 2011 # % # % Annual
City of St. Thomas 11,535 12,690 13,315 14,735 15,690 955 6.5% 2,375 17.8% 238
% of Total 43.3% 44.4% 44.1% 45.8% 46.8% 73.7% 71.5%
Municipality of Bayham 1,830 2,055 2,110 2,195 2,285 90 4.1% 175 8.3% 18
% of Total 6.9% 7.2% 7.0% 6.8% 6.8% 6.9% 5.3%
Township of Malahide 2,455 2,610 2,665 2,730 2,810 80 2.9% 145 5.4% 15
% of Total 9.2% 9.1% 8.8% 8.5% 8.4% 6.2% 4.4%
Town of Aylmer 2,315 2,570 2,650 2,695 2,815 120 4.5% 165 6.2% 17
% of Total 8. 7% 9.0% 8.8% 8.4% 8.4% 9.3% 5.0%
Municipality of Central Elgin 3,940 3,955 4,475 4,775 4,780 5 0.1% 305 6.8% 31
% of Total 14.8% 13.8% 14.8% 14.8% 14.3% 0.4% 9.2%
Township of Southwold 1,435 1,405 1,535 1,605 1,595 -10 -0.6% 60 3.9% 6
% of Total 5.4% 4.9% 5.1% 5.0% 4.8% -0.8% 1.8%
Municipality Dutton-Dunwich 1,195 1,275 1,365 1,390 1,410 20 1.4% 45 3.3% 5
% of Total 4.5% 4.5% 4.5% 4.3% 4.2% 1.5% 1.4%
Municipality of West Elgin 1,945 2,045 2,060 2,075 2,110 35 1.7% 50 2.4% 5
% of Total 7.3% 7.1% 6.8% 6.4% 6.3% 2.7% 1.5%
Elgin County 15,115 15,915 16,860 17,465 17,805 340 1.9% 945 5.6% 95
% of Total 56. 7% 55.6% 55.9% 54.2% 53.2% 26.3% 28.5%
St. Thomas/Elgin County 26,650 28,605 30,175 32,200 33,495 1,295 4.0% 3,320 11.0% 332
% of Total 100.0% 100.0% 100.0% 100.0% 100.0% 100.0% 100.0%
Ontario 3,638,360 3,924,515 4,219,410 4,555,025 4,887,510 332,485 7.3% 668,100 15.8%
Source: Statistics Canada, census for various years.
2.4 Household Sizes Declining
For a variety of reasons, household sizes have been falling in Ontario and in the St.
Thomas/Elgin County area. These reasons include lower birth rates, women having children at
a later stage in their life, and higher life expectancies. As Table 2.4.1 below shows, in 2011, the
average household size in St. Thomas was 2.36 persons per household (pph) well below the
2.74 persons per household in Elgin County. The highest household sizes are found in the
Municipality of Bayham (3.04 pph) and Malahide (3.20 pph). The greatest declines in
household sizes over the past 20 years have been in several of the municipalities in the County.
As the population ages, these household sizes are expected to continue to decline.
As shown in Table 2.4.1 below, in 2011, one-person households in St. Thomas/Elgin County
represent 23.4% of all households and two-person households account for 36.9% of
households. Thus, in 2011, one and two-person households account for approximately 60% of
households in St. Thomas/Elgin County — up from 57% in 2001 and 53% in 1991.
St. Thomas/Elgin County Housing and Homelessness Plan 23
Tim Welch Consulting in association with Lapointe Consulting and Deb Ballak

Table 2.4.1: Change in Household Size, St. Thomas and Elgin County, 1991-2011
Source: Statistics Canada, census for various years.
Table 2.4.2: Distribution of Households by Size, St. Thomas/Elgin County, 1991 — 2011
HouseholdSize
1 person
2 persons
3 persons
4 — 5 persons
6+ persons
20.2%
32.9%
16.9%
26.2%
3.9%
22.4%
34.8%
15.7%
23.4%
3.7%
23.4%
36.9%
15.7%
20.4%
3.6%
100.0% 100.0%Source: Statistics Canada, census for various years.
Over the past twenty years there has been a steady increase in the number of single person
100.0%
HHSize Decline 1991- HHSize Decline
2011 2001 - 2011
Municipality 1991 1996 2001 2006 2011 # % # %
City of St. Thomas 2.53 2.48 2.43 2.40 2.36 -0.17 -6.6% -0.07 -2.8%
Municipality of Bayham 3.07 3.03 3.00 3.05 3.04 -0.03 -1.0% 0.04 1.3%
Township of Malahide 3.39 3.35 3.24 3.18 3.20 -0.19 -5.6% -0.04 -1.2%
Town of Aylmer 2.65 2.70 2.66 2.59 2.51 -0.14 -5.2% -0.15 -5.6%
Municipality of Central Elgin 2.85 2.79 2.71 2.63 2.63 -0.22 -7.8% -0.08 -3.1%
Township of Southwold 3.04 2.97 2.87 2.84 2.75 -0.29 -9.5% -0.12 -4.1%
Municipality Dutton-Dunwich 2.89 2.78 2.66 2.69 2.65 -0.24 -8.5% -0.01 -0.5%
Municipality of West Elgin 2.70 2.69 2.62 2.55 2.42 -0.28 -10.2% -0.20 -7.5%
Elgin County 2.94 2.9 2.82 2.78 2.74 -0.20 -6.8% -0.08 -2.8%
St. Thomas/Elgin County 2.76 2.71 2.65 2.60 2.56 -0.20 -7.1% -0.09 -3.2%
ONTARIO 2.72 2.71 2.70 2.63 2.59 -0. 13 -4.8% -0.11 -4. 1%
households which have grown by 45.7% while the number of two—person households has
increased by 41.0%. During this same period, the proportion of three—person households has
remained relatively constant around 16%. Larger households with four or more persons
account for just under a quarter of households (24.0%) in 2011 compared to around 30.1% in
1991. These changes in the household composition indicate the need to ensure there are
sufficient dwellings for smaller households in the future.
Table 2.4.3 below shows that there is considerable variation in the distribution of households
by size:
0 The City of St. Thomas along with the Town of Aylmer and the Municipality of West Elgin
have the largest share of single person households. Single persons are more likely to be
either younger or older adults and may choose to live in more urban locations where
they can find housing that is suitable to their household size and where they are closer
to amenities.
St. Thomas/Elgin County Housing and Homelessness PlanTim Welch Consulting in association with Lapointe Consulting and Deb Ballak
24

Table 2.4.3: Distribution of Households by Size, St. Thomas and municipalities within Elgin Cour
1 person 2 persons 3 persons 4 persons 5 persons 6+ pers«
Municipality # % # % # % # % # % #
City of St. Thomas 4,415 28.1% 5,660 36.1% 2,495 15.9% 2,125 13.5% 700 4.5% 290
Municipality of Bayham 410 18.0% 815 35.7% 315 13.8% 330 14.5% 190 8.3% 220
Township of Malahide 385 13.8% 995 35.5% 435 15.5% 410 14.6% 245 8.8% 330
Town of Aylme r 745 26.5% 980 34.8% 425 15.1% 395 14.0% 175 6.2% 95
Municipality of Central Elgin 830 17.4% 1,940 40.6% 780 16.3% 810 16.9% 305 6.4% 115
Township of Southwold 240 15.1% 610 38.4% 280 17.6% 290 18.2% 125 7.9% 45
Municipality Dutton-Dunwich 280 19.9% 545 38.7% 205 14.5% 240 17.0% 90 6.4% 50
Municipality of West Elgin 540 25.7% 810 38.5% 305 14.5% 285 13.5% 115 5.5% 50
ElginCounty 3,430 19.3% 6,695 37.7% 2,745 15.4% 2,760 15.5% 1,245 7.0% 905
St. Thomas/Elgin County 7,845 23.4% 12,355 36.9% 5,240 15.7% 4,885 14.6% 1,945 5.8% 1,195
ONTARIO 1,230,975 25.2% 1,584,415 32.4% 803,030 16.4% 783,925 16.0% 310,860 6.4% 174,305
Source: 2011 Census, Community Profiles
St. Thomas/Elgin County Housing and Homelessness Plan 25
Tim Welch Consulting in association with Lapointe Consulting and Deb Ballak

0 Two—person households account for the largest share of households in various
municipalities ranging from 34.8% in Aylmer to a high of 40.6% in Central Elgin.
0 There is not a major difference in the proportion of households that are three and four-
person households across St. Thomas/CentralElgin. The highest proportion of four-
person households is found in Central Elgin, Southwold and Dutton—Dunwich.
0 St. Thomas has the smallest proportion of five—person households (4.5%) compared to
other municipalities such as Bayham, Malahide and Southwold. Larger households
reflect a higher proportion of families with children.
0 The Township of Malahide stands out for its high proportion of households who have six
or more persons — almost 12% (11.8%) of households. Bayham also has a larger share of
households with six or more persons — 9.6%. By contrast, in St. Thomas, only 1.8% of
households are represented by households with six or more persons.
2.5 HOUSEHOLD TYPES
There is a considerable difference in the proportion of family and non—fami|y households in St.
Thomas and Elgin County. In 2011, just under a third (31.2%) of households in St. Thomas were
non—fami|y households, mainly single persons living alone. Aylmer also had a relatively large
share of non—fami|y households — 28.7%. By contrast, in most municipalities in the County
(excluding Aylmer and West Elgin) a large majority of households (79% — 85%) were family
households. Family households include childless couples as well as families with children. In
the City of St. Thomas about two—thirds of households were family households (68.8%); in
Aylmer 71.3% were family households; and in West Elgin 72.2% were family households.
Couples with children account for a larger share of family households in most municipalities in
the County compared to the City of St. Thomas. Just over a quarter (26.1%) of households in St.
Thomas are families with children while the proportion in the County is much higher — e.g.,
Bayham (38.0%), Malahide (43.4.0%), Central Elgin (34.8%), Southwold (39.2%) and Dutton-
Dunwich (32.6%). West Elgin and Aylmer have lower proportions (28.3% in West Elgin and
30.3% in Aylmer). The proportion of single parents is highest in St. Thomas and Aylmer where
almost a tenth of households are single parent led. The proportion of individuals living alone is
highest in St. Thomas (28.2% of households) and Aylmer (26.4%).
St. Thomas/Elgin County Housing and Homelessness Plan 26
Tim Welch Consulting in association with Lapointe Consulting and Deb Ballak

Table 2.5.1: Distribution of Household Types Across St. Thomas/Elgin County, 2011Two or
More
Couples no Couples with Single Other Total Unrelated Total Non- Total
children children Parents Families Families Single Persons persons Families Households
St.Thomas 4,275 4,100 1,690 730 10,795 4,415 470 4,885 15,680
27.3% 26.1% 10.8% 4. 7% 68.8% 28.2% 3.0% 31.2% 100.0%
Bayham 710 870 120 140 1,840 410 40 450 2,290
31.0% 38.0% 5.2% 6.1% 80.3% 17.9% 1.7% 19. 7% 100.0%
Malahi de 885 1,220 125 150 2,380 390 40 430 2,810
31.5% 43.4% 4.4% 5. 3% 84. 7% 13. 9% 1.4% 15.3% 100. 0%
Aylme r 775 850 260 115 2,000 740 65 805 2,805
27.6% 30.3% 9.3% 4.1% 71.3% 26.4% 2.3% 28. 7% 100.0%
Central Elgin 1,705 1,665 280 215 3,865 830 85 915 4,780
35. 7% 34. 8% 5.9% 4.5% 80. 9% 17.4% 1.8% 19.1% 100. 0%
Southwold 525 625 90 80 1,320 240 35 275 1,595
32.9% 39. 2% 5. 6% 5. 0% 82. 8% 15. 0% 2.2% 17.2% 100. 0%
Dutton—Dunwich 470 460 115 65 1,110 280 20 300 1,410
33.3% 32. 6% 8.2% 4. 6% 78. 7% 19.9% 1.4% 21.3% 100. 0%
West Elgin 680 595 150 95 1,520 540 45 585 2,105
32.3% 28.3% 7.1% 4.5% 72.2% 25. 7% 2.1% 27.8% 100. 0%
Elgin County 5,750 6,285 1,140 860 14,035 3,430 330 3,760 17,795
32.3% 35.3% 6.4% 4.8% 78.9% 19.3% 1.9% 21.1% 100.0%
St.Thomas/Elgin
County 10,025 10,385 2,830 1,590 24,830 7,845 800 8,645 33,475
29.9% 31. 0% 8.5% 4. 7% 74.2% 23.4% 2.4% 25.8% 100. 0%
Ontario 1,171,505 1,471,175 460,840 371,515 3,475,035 1,230,980 181,500 1,412,480 4,887,515
24.0% 30.1% 9.4% 7.6% 71.1% 25.2% 3. 7% 28.9% 100. 0%
Source: Statistics Canada, 2011 Census Pro?les
St. Thomas/Elgin County Housing and Homelessness Plan 27Tim Welch Consulting in association with Lapointe Consulting and Deb Ballak

3 EMPLOYMENT PROFILES
3.1 Employment in Elgin and Place of Work
According to the County ofElgin OfficialPlan (2012), there was a total of 34,805 jobs in the St.
Thomas/Elgin area in 2006 of which 18,885 (54%) were in St. Thomas. Of these 34,805 jobs,
2,770 were in agriculture (7.9%), 11,620 (33.4%) were in manufacturing and 20,415 (58.7%)
were in other industries.1
Research prepared for the Official Plan examined the place of work of residents in St.
Thomas/Elgin County. The report, Population, Employment and Housing Research Paper, found
that 65.0% of St. Thomas/Elgin residents worked within St. Thomas/Elgin, 24.4% worked in
London and 10.6% worked elsewhere. 2 Similarly, of the 15,610 residents of St. Thomas, 71.2%
worked within St. Thomas/Elgin, 24.3% worked in London and 4.5% worked elsewhere.
The report concluded that there is a very high degree of economic interdependence between
St. Thomas/Elgin County residents and the City of London. The exceptions are the municipalities
to the east and west — those outside of the London CMA. Furthermore, the report also noted
that there was a significant amount of in—commuting into St. Thomas/Elgin County (16,305
persons) and an almost identical amount of out—commuting (16,950) from St. Thomas/Elgin
County.
3.2 Labour Force in St. Thomas and Elgin County
A profile of the employed labour force in St. Thomas/Elgin County in 2006 shows that the
highest source of employment in St. Thomas/Elgin County was manufacturing followed by
health and social services, primary industries (mainly agriculture) and retail trade. (See Table
3.2.1 below.) These figures reflect the employment category of residents who find jobs within
St. Thomas/Elgin County but also those who commute to other nearby communities such as
London to the north and Tillsonburg north—east of Bayham. The top industry classifications for
the employed labour force in St. Thomas/Elgin County in 2006 were:
0 Manufacturing (33.4%),
0 Health and social assistance (10.5%),
0 Retail trade (9.6%), and
0 Agriculture and fishing (8.0%).
1 Offical Plan of the County of Elgin, July, 2012, page 272 Population, Employment and Housing Research Paper, Prepared by Elgin County and C4SE, the Centre for Spatial
Economics, May 2011, page 21St. Thomas/Elgin County Housing and Homelessness Plan 28
Tim Welch Consulting in association with Lapointe Consulting and Deb Ballak

The data in Table 3.2.1 preceded the economic downturn in 2008-2009 as well as the closure of
the Talbotville Ford plant in Southwold and the Sterling Truck plant. As is shown in Table 3.2.2,
the recession had a considerable impact on local employment trends with at least 4,000
manufacturing jobs being lost according to local sources. Despite the recent losses there have
been modest improvements in manufacturing employment opportunities in St. Thomas as a
result of economic diversification strategies and growing demand for automotive parts both in
Canada and in the U.S. (Tab|e3.2.3)
Table 3.2.1: Employed Labour Force by Industry, 2006, Elgin County, St. Thomas and St.Thomas/ElginCounty
City of St. Thomas/Elgin County St. Thomas Elgin County Ontario
Industry # % # % # % # %Agriculture, forestry, fishing and hunting 2,680 17.0% 85 0.4% 2,770 8.0% 99,825 1.8%
Mining and oil and gas extraction 10 0.1% 0 0.0% 15 0.0% 21,490 0.4%
Utilities 35 0.2% 60 0.3% 100 0.3% 43,900 0.8%
Construction 400 2.5% 300 1.6% 705 2.0% 176,115 3.2%
Manufacturing 4,470 28.3% 7,140 37.8% 11,620 33.4% 826,445 14.8%
Wholesale trade 435 2.8% 540 2.9% 975 2.8% 273,795 4.9%
Retail trade 1,340 8.5% 2,005 10.6% 3,345 9.6% 656,575 11.8%
Transportation and warehousing 730 4.6% 795 4.2% 1,535 4.4% 225,505 4.0%
Information and cultural industries 145 0.9% 150 0.8% 290 0.8% 152,225 2.7%
Finance and insurance 190 1.2% 275 1.5% 475 1.4% 300,920 5.4%
Real estate and rental and leasing 100 0.6% 175 0.9% 285 0.8% 114,450 2.1%
Professional, scientific and technical services 425 2.7% 530 2.8% 965 2.8% 416,400 7.5%
Management of companies and enterprises 10 0.1% 10 0.1% 10 0.0% 7,705 0.1%
Admin. and support, waste management 370 2.3% 775 4.1% 1,155 3.3% 219,765 3.9%
Educational services 770 4.9% 825 4.4% 1,600 4.6% 388,370 7.0%
Health care and social assistance 1,350 8.5% 2,300 12.2% 3,660 10.5% 563,260 10.1%
Arts, entertainment and recreation 320 2.0% 180 1.0% 500 1.4% 117,075 2.1%
Accommodation and food services 860 5.4% 1,365 7.2% 2,235 6.4% 367,640 6.6%
Other services (except public administration) 720 4.6% 900 4.8% 1,630 4.7% 265,735 4.8%
Public administration 450 2.8% 480 2.5% 935 2.7% 333,675 6.0%
Total — Industry — NACS System 2002 15,810 100.0% 18,890 100.0% 34,805 100.0% 5,570,870 1669.5%
Source: Statistics Canada, 2006 Census, Catalogue no. 97-561-XCB2006007
St. Thomas/Elgin County Housing and Homelessness Plan 29
Tim Welch Consulting in association with Lapointe Consulting and Deb Ballak

Table 3.2.2: List of Major Manufacturing Plant Table 3.2.3: List of New Manufacturing FacilitiesClosures in St. Thomas, 2006 — 2012 in St. Thomas, 2006 — 2012
Company Jobs Lost Company Employees
A. Schulman 120 Catfish Creek TropicalAccurate Millwork N/A Fish Hatchery 2Alcoa Manufacturing 150 CH“AM“ Memo“ N/A DMAC Automation 13C0” Met Ca ”ada '”C' N/A Forest City Castings 70Contran Mfg. 90 . .
Emerson Network Power 220 2/Ijtsscz(?fladaLlmlted 45:Flexalloy N/A Pickard Contstruction 10
E:;i2ff’?:.:,E.:T‘““’1:3:Company 7
L.E. Walker Transport 30Sidana Inc. 9
Mutt & CO. N/ATakumi Stamping Canada 150
Parker Hannifin N/A _
Potters Canada Partnership N/Anmken Ca“ Centre 13
Rite Form Tool & Die N/AZimmerpdr Services 3
Sterling Truck 1,400T°ta| 746
Therm_O_DisC 280Source: St. Thomas EDC
Wolseley |.P.G. N/AZF Lenksysteme 57
Total 4,107Source: St. Thomas EDC,St. Thomas Times Journal
Reflecting in part the loss of manufacturing employment opportunities, Table 3.2.4 shows that
the unemployment rate in the London CMA (which includes St. Thomas, Central Elgin and
Southwold) and Elgin County have remained, for the most part, above the provincial average in
recent years. For instance, the highest unemployment rate in the London CMA and Elgin County
were 9.7% (2009) and 13% (2009) respectively. In contrast, the Ontario's higher unemployment
rate was 8.7% (2010). In 2012, the unemployment rate in both the London CMA and Elgin
County remained higher than the Provincial average.
Table 3.2.4: Unemployment Rate for London CMA, Elgin County/St. Thomas and Ontario,2000 - 2013
2000 2001 2002 2003 2004 2005 2006 2007 2008 2009 2010 2011 2012
London CMA 5.9 6.3 7 6.9 6.7 6.5 6 6 6.9 9.7 8.6 8.6 8.5
“El” c°""tV/ 5.1 6.2 6.4 6.8 8.1 7.3 5.7 9.7 13 12.2* 11* 9.5*St. Thomas*Ontario 5.7 6.2 7.1 7 6.8 6.2 6.3 6.4 6.5 6.5 8.7 7.8 7.6
Source: St. Thomas EDC,2010 Community Health Status Report, Elgin St. Thomas Public HealthNote: *Figures are for December of the same year as opposed to yearly averages.
St. Thomas/Elgin County Housing and Homelessness Plan 30
Tim Welch Consulting in association with Lapointe Consulting and Deb Ballak

Chart 3.2.1: Unemployment Rate for London CMA, Elgin County/St. Thomas and Ontario:2000-2013
14
12G)
‘is’10n:
31-:8 -O—LondonCMAE3 6E -I-Elgin County/
tv St.Thomas*5 4
2-I-Ontario
O I I I I I I I I I I I I I
O \-l N (Y) <I' L? K0 I\ O0 0'‘: O \-l No o o o o o o o o o \-l .—u .—uo o o o o o o o o o o o oN N N N N N N N N N N N N
Year
Source: St. Thomas EDC,2010 Community Health Status Report, Elgin St. Thomas Public HealthNote: *Figures are for December of the same year as opposed to yearly averages
3.3 Labour Force in City of St. Thomas and Major Employers
Within the City of St. Thomas, manufacturing employment continues to be the dominant source
of employment accounting for 37.8% of the employed labour force in 2006. Employment in
health and social assistance accounted for 12.2%; retail trade 10.6%; and, accommodation and
food services 7.2%. Even with the closure of the Sterling Truck Plant which employed over
1,000 persons and the recent closure of the Ford Motor Company (in Southwold), which at one
time employed close to 3,000 employees, manufacturing will continue to be the main source of
employment for residents in St. Thomas.
Below is a list of major private sector employers in the City of St. Thomas and in Elgin County —
all of which are located in St. Thomas except for Steelway Building Systems.
St. Thomas/Elgin County Housing and Homelessness Plan 31
Tim Welch Consulting in association with Lapointe Consulting and Deb Ballak

Table 3.3.1: Top Employers in the City of St. Thomas and Elgin County
Company Name Location Employees Type of Product
Formet Industries St. Thomas 1,150 Automated frame assembly- automotive
sector.
Presstan industries St. Thomas 540 Heavy automotive stamping and weldedassemblies.
Starwood Worldwide Hotels St. Thomas 600 Hotel reservation.and Resorts Inc.
Steelway Building Systems Central Elgin 175 Pre—engineered metal building systems —
steel roof systems, structural steelcomponents, steel siding and wallcladding.
Unimotor St. Thomas 130 Fractional horsepower DC motors.
GKN Sinter Metals St. Thomas 147 Powder metal and powder forge
components.
Masco Canada St. Thomas 417 Brass plumbing and industrial fittings.
BFICanada Inc. St. Thomas 100 Waste, Recycling and organic collection.Takumi Stamping Canada Inc. St. Thomas 150 Automotive stamped parts.
Timken Canada St. Thomas 170 Tapered roller bearings and relatedproducts.
Forest City Castings St. Thomas 70 Permanent graphite mould technology —
mould making, aluminum and zinccastings.
Buckland Customs Broker St. Thomas 65 Customs brokerage, warehousing.
Yarmouth Metal Fabricators Central Elgin 60 Metal fabrication and crane services.
Source: St. Thomas Economic Development Commission web site, Jan. 2013
3.4 Labour Force in Elgin County
Elgin County has a strong agricultural base, a growing alternative energy sector and a
manufacturing base. In 2006, there were 15,810 residents in the County's employed labour
force working in Elgin County, St. Thomas and nearby communities. In 2006, the main types of
industries in which the resident labour force was employed were:
0 manufacturing (28.3%),0 primary industries (mainly agriculture and fishing) (17.0%),
0 health care and social assistance (8.5%), and
0 retail trade (8.5%).
As described earlier, these numbers will change once new data is released reflecting both
recent plant closures as well as additions to the employment base. There is considerable
variation among area municipalities — see Table A1 in Appendix 1.
St. Thomas/Elgin County Housing and Homelessness Plan 32
Tim Welch Consulting in association with Lapointe Consulting and Deb Ballak
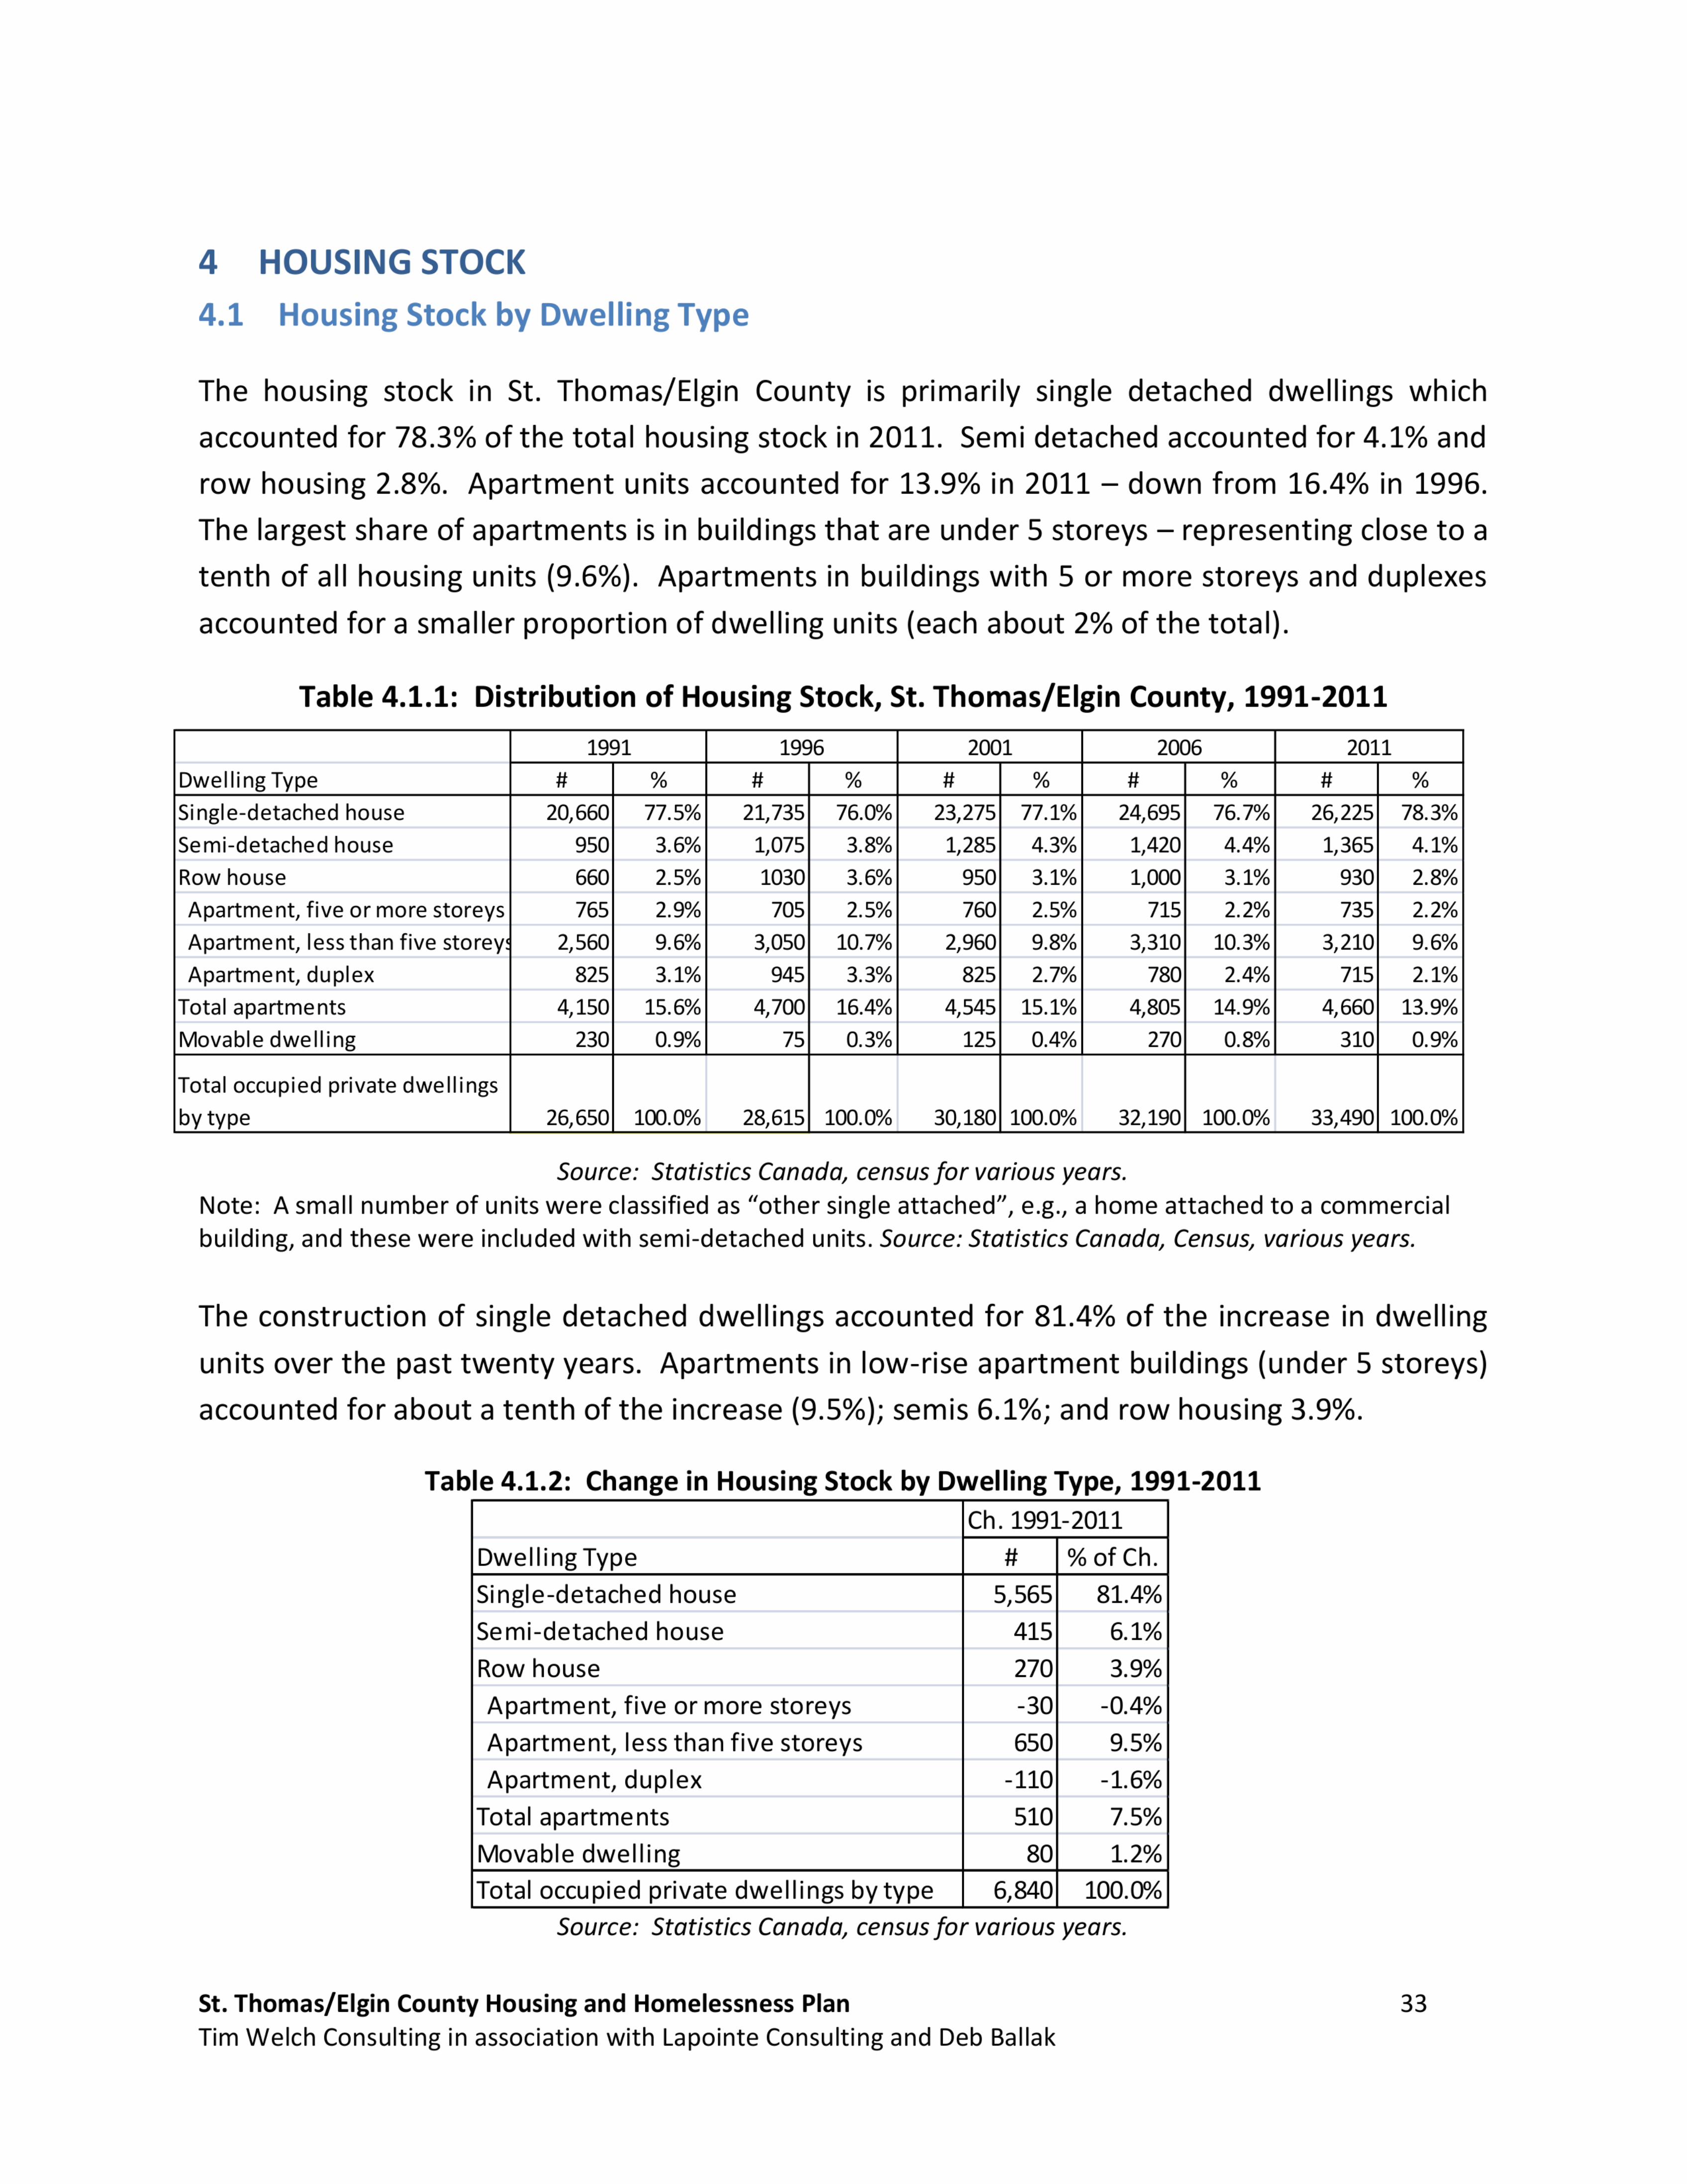
4 HOUSING STOCK
4.1 Housing Stock by Dwelling Type
The housing stock in St. Thomas/Elgin County is primarily single detached dwellings which
accounted for 78.3% ofthe total housing stock in 2011. Semi detached accounted for 4.1% and
row housing 2.8%. Apartment units accounted for 13.9% in 2011 — down from 16.4% in 1996.
The largest share of apartments is in buildings that are under 5 storeys — representing close to a
tenth of all housing units (9.6%). Apartments in buildings with 5 or more storeys and duplexes
accounted for a smaller proportion of dwelling units (each about 2% of the total).
Table 4.1.1: Distribution of Housing Stock, St. Thomas/Elgin County, 1991-2011
1991 1996 2001 2006 2011
Dwelling Type # % # % # % # % # %
Sing|e—detached house 20,660 77.5% 21,735 76.0% 23,275 77.1% 24,695 76.7% 26,225 78.3%
Se mi—detached house 950 3.6% 1,075 3.8% 1,285 4.3% 1,420 4.4% 1,365 4.1%
Row house 660 2.5% 1030 3.6% 950 3.1% 1,000 3.1% 930 2.8%
Apartment, five or more storeys 765 2.9% 705 2.5% 760 2.5% 715 2.2% 735 2.2%
Apartment, less than five storey 2,560 9.6% 3,050 10.7% 2,960 9.8% 3,310 10.3% 3,210 9.6%
Apartme nt, duplex 825 3.1% 945 3.3% 825 2.7% 780 2.4% 715 2.1%
Total apartme nts 4,150 15.6% 4,700 16.4% 4,545 15.1% 4,805 14.9% 4,660 13.9%
Movable dwelling 230 0.9% 75 0.3% 125 0.4% 270 0.8% 310 0.9%
Total occupied private dwellings
by type 26,650 100.0% 28,615 100.0% 30,180 100.0% 32,190 100.0% 33,490 100.0%
Source: Statistics Canada, census for various years.
Note: A small number of units were classified as ”other single attached”, e.g., a home attached to a commercialbuilding, and these were included with semi-detached units. Source: Statistics Canada, Census, various years.
The construction of single detached dwellings accounted for 81.4% of the increase in dwelling
units over the past twenty years. Apartments in |ow—rise apartment buildings (under 5 storeys)
accounted for about a tenth of the increase (9.5%); semis 6.1%; and row housing 3.9%.
Table 4.1.2: Change in Housing Stock by Dwelling Type, 1991-2011Ch. 1991-2011
Dwe||ingType # %of Ch.
Sing|e—detached house 5,565 81.4%
Semi—detached house 415 6.1%
Row house 270 3.9%
Apartment, five or more storeys -30 -0.4%
Apartment, less than five storeys 650 9.5%
Apartment, duplex -110 -1.6%
Total apartments 510 7.5%
Movable dwelling 80 1.2%
Total occupied private dwellings by type 6,840 100.0%
Source: Statistics Canada, census for various years.
St. Thomas/Elgin County Housing and Homelessness Plan 33
Tim Welch Consulting in association with Lapointe Consulting and Deb Ballak

It is worth noting that most of the growth in row housing and apartments occurred in the
period 1991 to 1996 when there were significant government programs supporting the creation
of new non—profit and co—operative housing, generally in the form of row housing and
apartments. In the more recent decade, established homebuilders and developers in St.
Thomas and Elgin County have focused on single family home development as that has been
their ”comfort zone” and there have not been significant financial incentives or requirements to
consider developing alternative forms of housing. Interviews with builders conducted as part of
this report indicate that there may be interest by some of the builders who have focused on
single family home development to consider mu|ti—residentia| market homes, (with a focus on
older adults wanting less yard/home maintenance, as well as homes that are accessible) and
potentially affordable mu|ti—residentia| homes if there were significant financial incentives for
the creation of affordable housing.
In Elgin County single detached dwellings account for 89.0% of all housing units. Semi—detached
and row houses each account for about 2% with apartments accounting for 5.3%. The
composition of the housing stock in Elgin County is very different from the City of St. Thomas
where single detached homes represent about two—thirds of all housing (66.2%); semi’s 6.6%;
row housing 3.6% and apartments just under a quarter (23.7%).
Table 4.1.3: Distribution of Housing Stock in Elgin County, St. Thomas and St. Thomas/ElginCounty, 2011
City of St. Thomas/Elgin County St. Thomas Elgin County
Dwelling Type # % # % # %
Sing|e—detached house 15,835 89.0% 10,385 66.2% 26,225 78.3%
Semi—detached house 330 1.9% 1,030 6.6% 1,365 4.1%
Row house 370 2.1% 560 3.6% 930 2.8%
Apartment, five or more storeys 0 0.0% 730 4.7% 735 2.2%
Apartment, less than five storeys 785 4.4% 2,435 15.5% 3,210 9.6%
Apartment, duplex 160 0.9% 550 3.5% 715 2.1%
Total Apartments 945 5.3% 3,715 23.7% 4,660 13.9%
Movable dwelling 315 1.8% 0 0.0% 310 0.9%
Total 17,795 100.0% 15,690 100.0% 33,490 100.0%Source: Statistics Canada, 2011 census, community profiles.
Note: A small number of units were classified as ”other single attached”, e.g., a home attached to a commercialbuilding, and these were included with semi-detached units.
Within Elgin County there is considerable variation in the composition of the housing stock. For
example
0 In Southwold, almost all (99.1%) housing units are single detached dwellings.
St. Thomas/Elgin County Housing and Homelessness Plan 34
Tim Welch Consulting in association with Lapointe Consulting and Deb Ballak
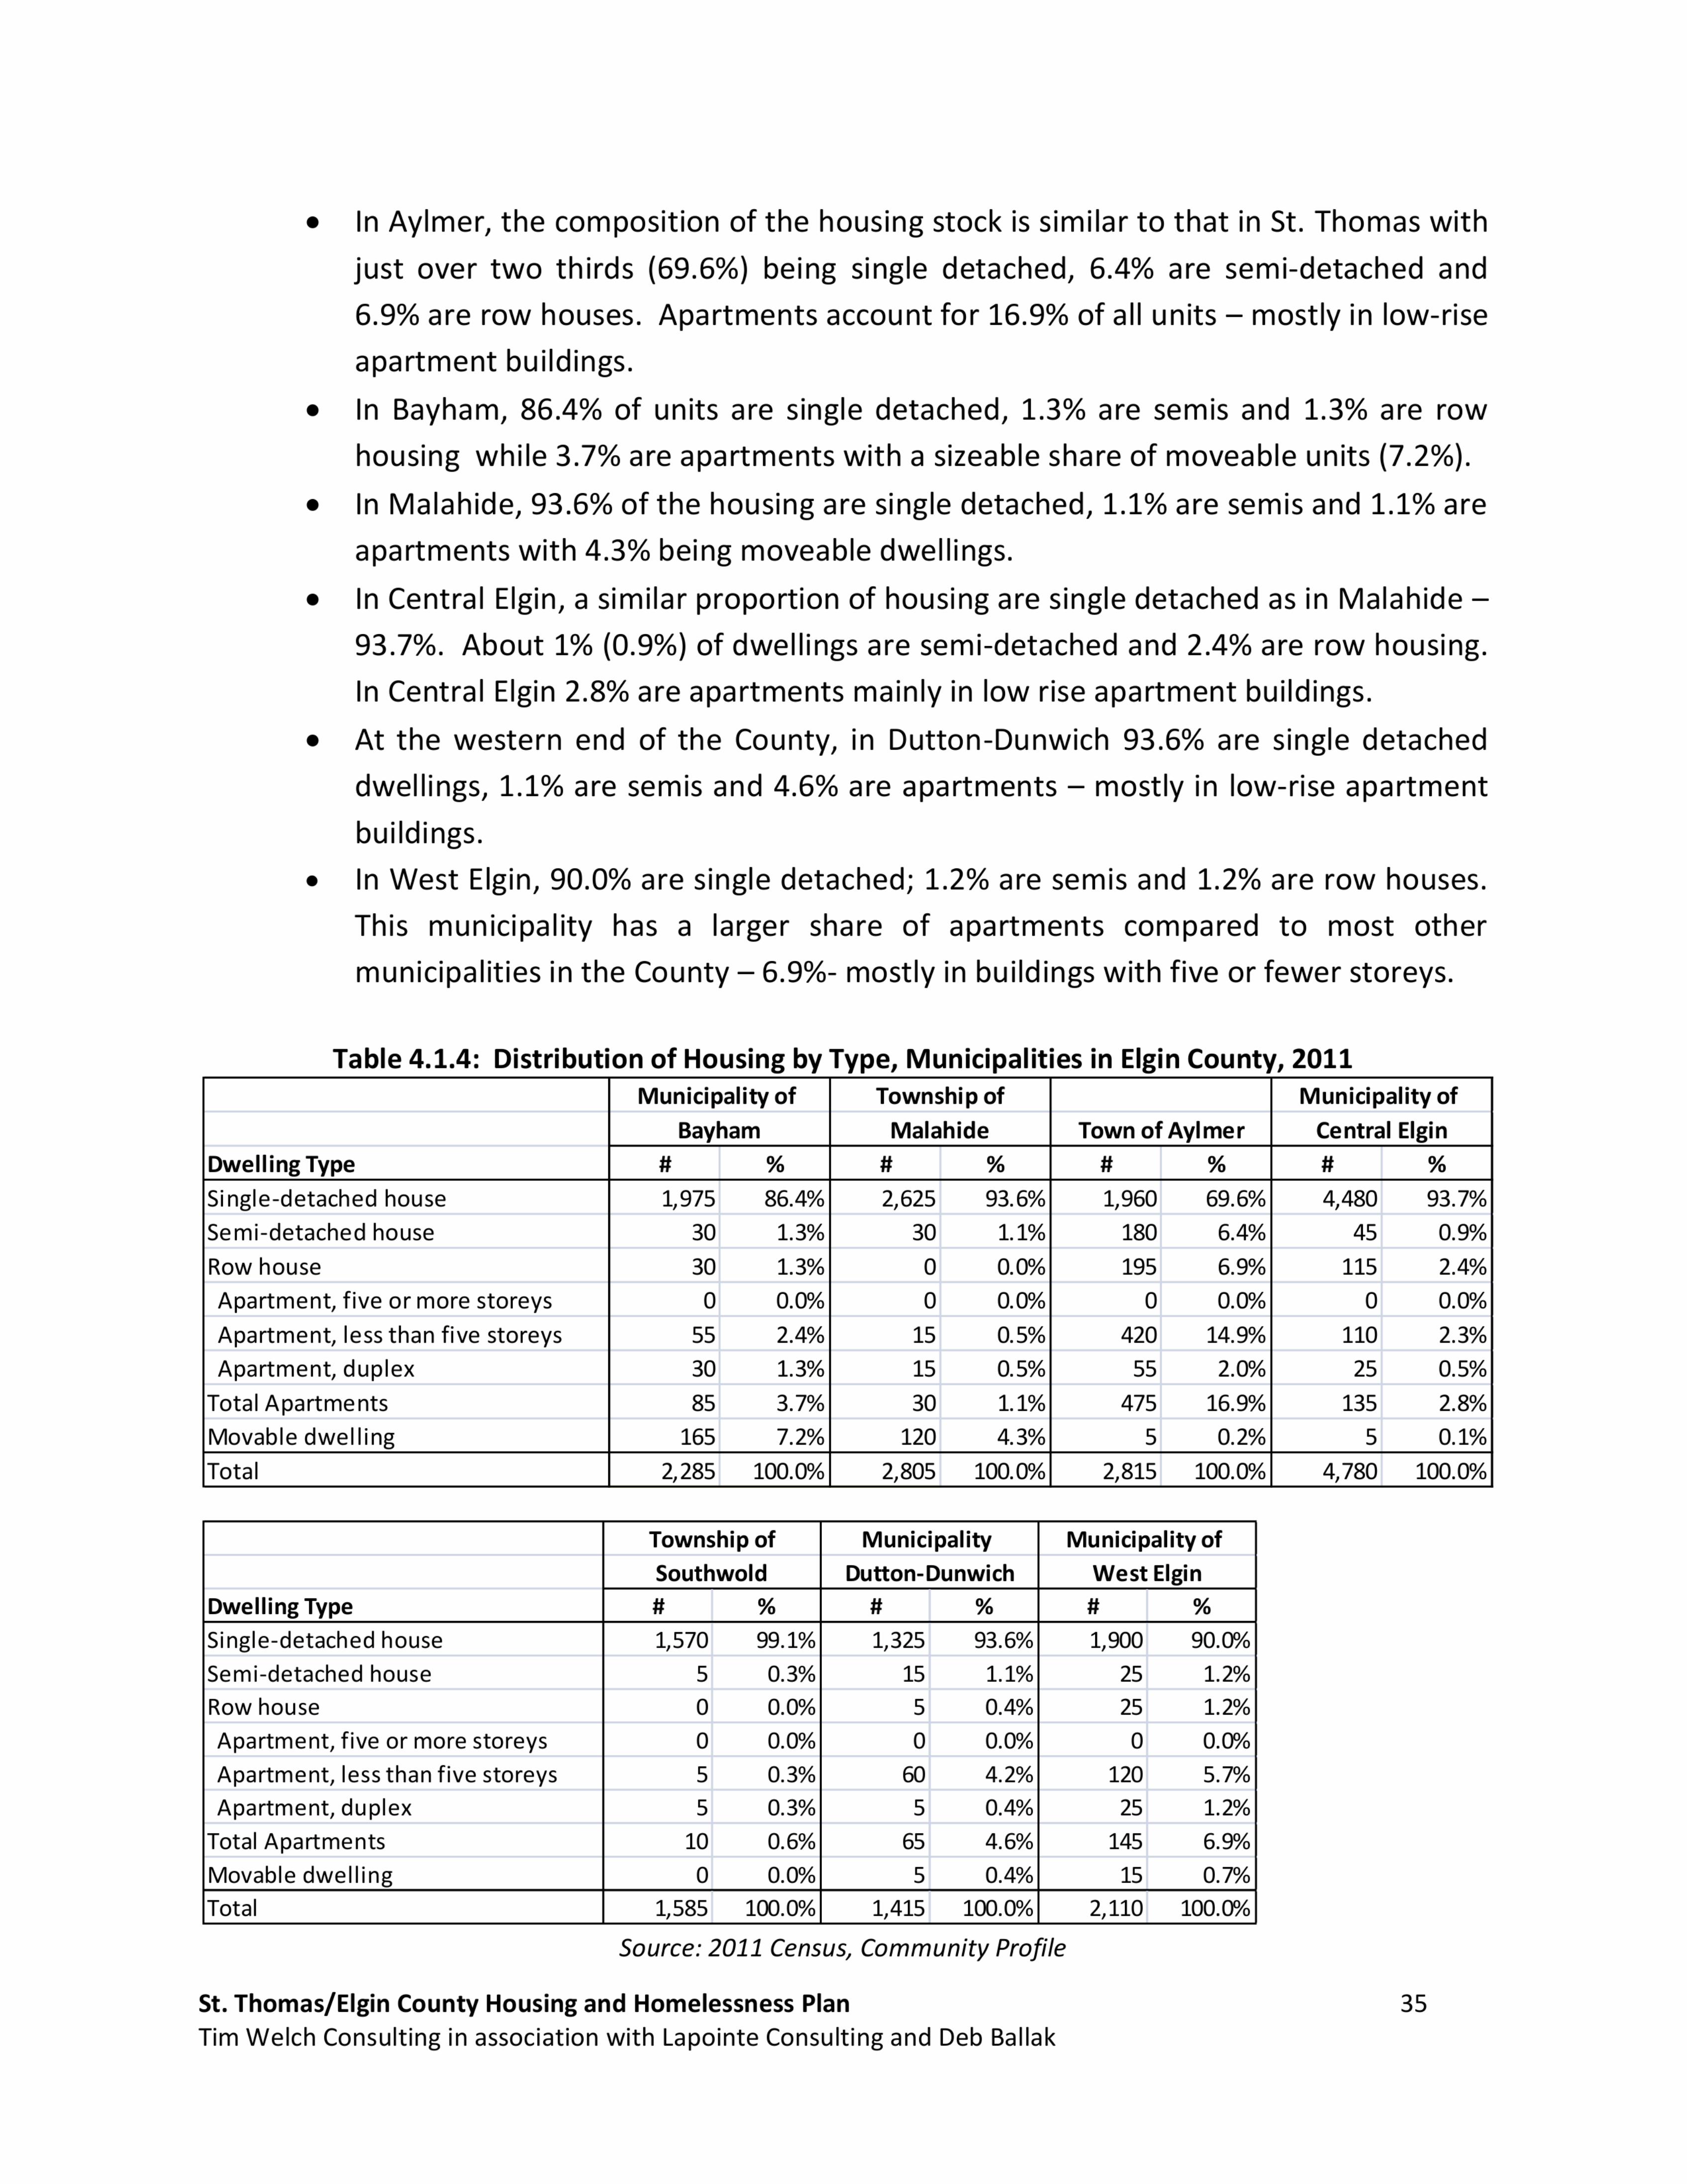
In Aylmer, the composition of the housing stock is similar to that in St. Thomas with
just over two thirds (69.6%) being single detached, 6.4% are semi—detached and
6.9% are row houses. Apartments account for 16.9% of all units — mostly in |ow—rise
apartment buildings.
In Bayham, 86.4% of units are single detached, 1.3% are semis and 1.3% are row
housing while 3.7% are apartments with a sizeable share of moveable units (7.2%).
In Malahide, 93.6% of the housing are single detached, 1.1% are semis and 1.1% are
apartments with 4.3% being moveable dwellings.
In Central Elgin, a similar proportion of housing are single detached as in Malahide —
93.7%. About 1% (0.9%) of dwellings are semi—detached and 2.4% are row housing.
In Central Elgin 2.8% are apartments mainly in low rise apartment buildings.
At the western end of the County, in Dutton—Dunwich 93.6% are single detached
dwellings, 1.1% are semis and 4.6% are apartments — mostly in |ow—rise apartment
buildings.
In West Elgin, 90.0% are single detached; 1.2% are semis and 1.2% are row houses.
This municipality has a larger share of apartments compared to most other
municipalities in the County — 6.9%—mostly in buildings with five or fewer storeys.
Table 4.1.4: Distribution of Housing by Type, Municipalities in Elgin County, 2011Municipality of Township of Municipality of
Bayham Malahide Town of Aylmer Central Elgin
Dwelling Type # % # % # % # %
Single-detached house 1,975 86.4% 2,625 93.6% 1,960 69.6% 4,480 93.7%
Semi-detached house 30 1.3% 30 1.1% 180 6.4% 45 0.9%
Row house 30 1.3% 0 0.0% 195 6.9% 115 2.4%
Apartment, five or more storeys 0 0.0% 0 0.0% 0 0.0% 0 0.0%
Apartment, less than five storeys 55 2.4% 15 0.5% 420 14.9% 110 2.3%
Apartment, duplex 30 1.3% 15 0.5% 55 2.0% 25 0.5%
Total Apartments 85 3.7% 30 1.1% 475 16.9% 135 2.8%
Movable dwelling 165 7.2% 120 4.3% 5 0.2% 5 0.1%
Total 2,285 100.0% 2,805 100.0% 2,815 100.0% 4,780 100.0%
Township of Municipality Municipality of
Southwold Dutton—Dunwich West Elgin
Dwelling Type # % # % # %
Single-detached house 1,570 99.1% 1,325 93.6% 1,900 90.0%
Semi-detached house 5 0.3% 15 1.1% 25 1.2%
Row house 0 0.0% 5 0.4% 25 1.2%
Apartment, five or more storeys 0 0.0% 0 0.0% 0 0.0%
Apartment, less than five storeys 5 0.3% 60 4.2% 120 5.7%
Apartment, duplex 5 0.3% 5 0.4% 25 1.2%
Total Apartments 10 0.6% 65 4.6% 145 6.9%
Movable dwelling 0 0.0% 5 0.4% 15 0.7%
Total 1,585 100.0% 1,415 100.0% 2,110 100.0%
Source: 2011 Census, Community Pro?le
St. Thomas/Elgin County Housing and Homelessness Plan 35
Tim Welch Consulting in association with Lapointe Consulting and Deb Ballak
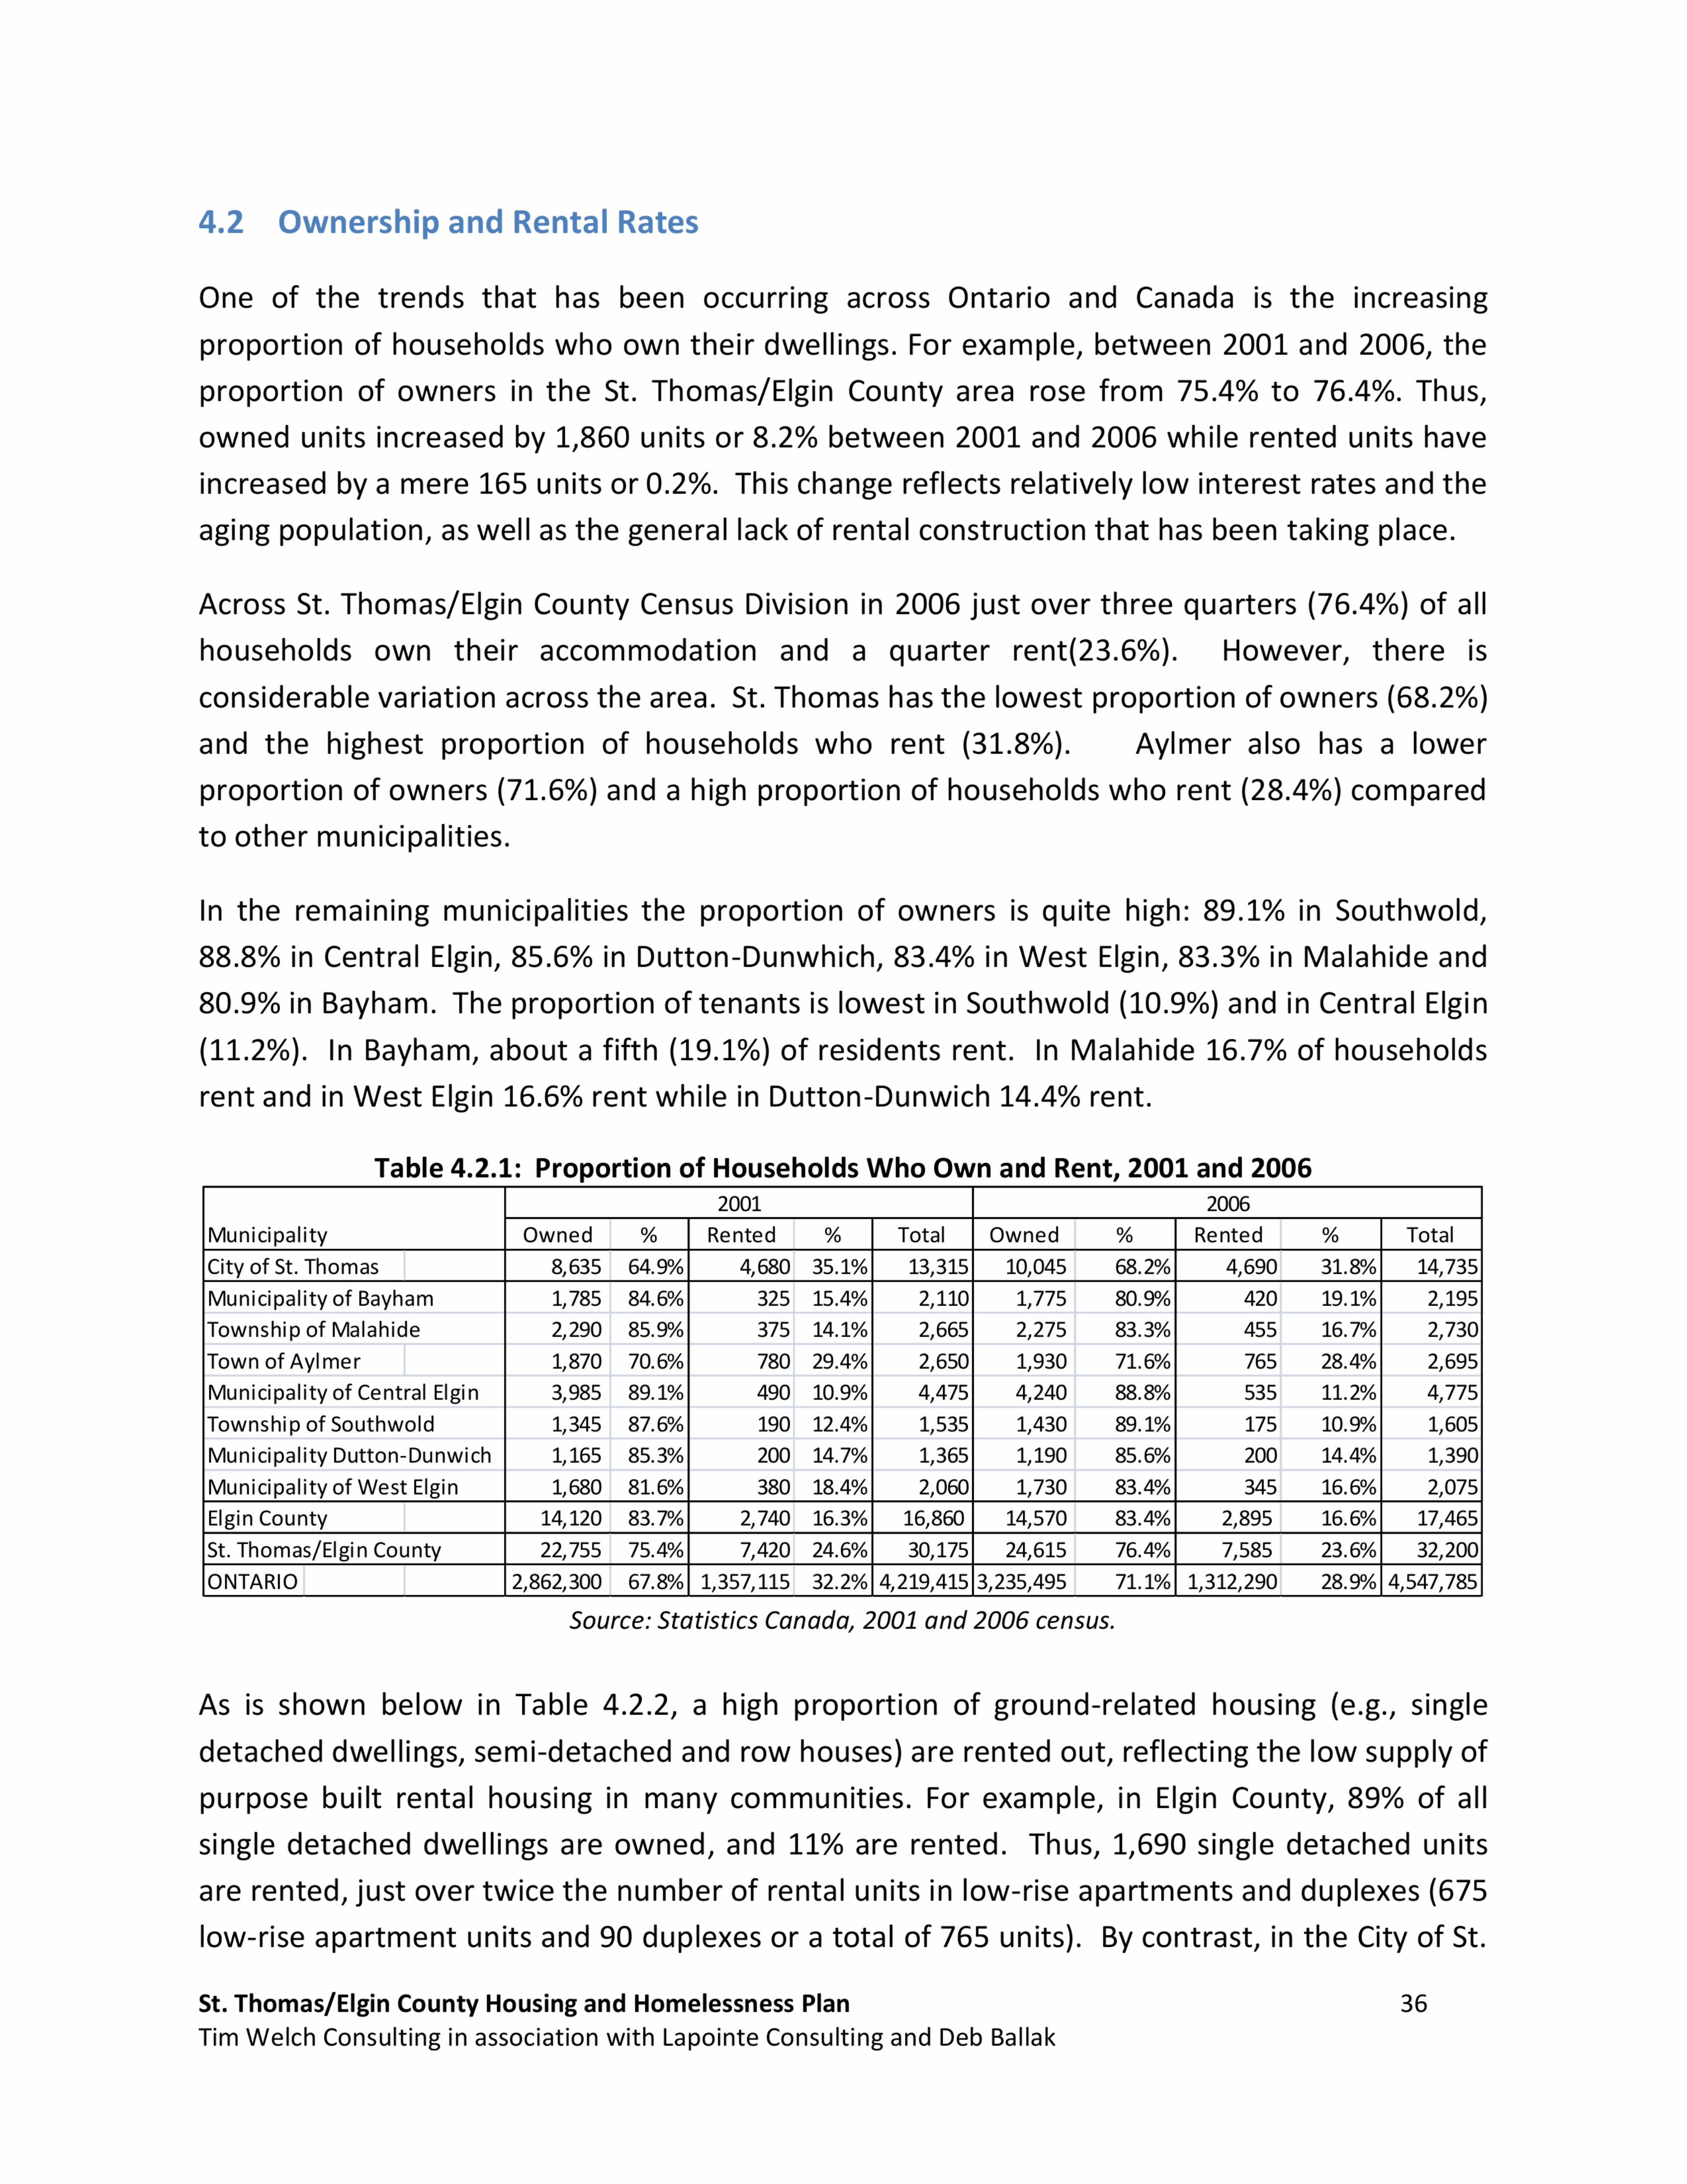
4.2 Ownership and Rental Rates
One of the trends that has been occurring across Ontario and Canada is the increasing
proportion of households who own their dwellings. For example, between 2001 and 2006, the
proportion of owners in the St. Thomas/Elgin County area rose from 75.4% to 76.4%. Thus,
owned units increased by 1,860 units or 8.2% between 2001 and 2006 while rented units have
increased by a mere 165 units or 0.2%. This change reflects relatively low interest rates and the
aging population, as well as the general lack of rental construction that has been taking place.
Across St. Thomas/Elgin County Census Division in 2006 just over three quarters (76.4%) of all
households own their accommodation and a quarter rent(23.6%). However, there is
considerable variation across the area. St. Thomas has the lowest proportion of owners (68.2%)
and the highest proportion of households who rent (31.8%). Aylmer also has a lower
proportion of owners (71.6%) and a high proportion of households who rent (28.4%) compared
to other municipalities.
In the remaining municipalities the proportion of owners is quite high: 89.1% in Southwold,
88.8% in Central Elgin, 85.6% in Dutton—Dunwhich,83.4% in West Elgin, 83.3% in Malahide and
80.9% in Bayham. The proportion of tenants is lowest in Southwold (10.9%) and in Central Elgin
(11.2%). In Bayham, about a fifth (19.1%) of residents rent. In Malahide 16.7% of households
rent and in West Elgin 16.6% rent while in Dutton—Dunwich 14.4% rent.
Table 4.2.1: Proportion of Households Who Own and Rent, 2001 and 20062001 2006
Municipality Owned % Rented % Total Owned % Rented % Total
City of St. Thomas 8,635 64.9% 4,680 35.1% 13,315 10,045 68.2% 4,690 31.8% 14,735
Municipality of Bayham 1,785 84.6% 325 15.4% 2,110 1,775 80.9% 420 19.1% 2,195
Township of Malahide 2,290 85.9% 375 14.1% 2,665 2,275 83.3% 455 16.7% 2,730
Town of Aylmer 1,870 70.6% 780 29.4% 2,650 1,930 71.6% 765 28.4% 2,695
Municipality of Central Elgin 3,985 89.1% 490 10.9% 4,475 4,240 88.8% 535 11.2% 4,775
Township of Southwold 1,345 87.6% 190 12.4% 1,535 1,430 89.1% 175 10.9% 1,605
Municipality Dutton—Dunwich 1,165 85.3% 200 14.7% 1,365 1,190 85.6% 200 14.4% 1,390
Municipality of West Elgin 1,680 81.6% 380 18.4% 2,060 1,730 83.4% 345 16.6% 2,075
Elgin County 14,120 83.7% 2,740 16.3% 16,860 14,570 83.4% 2,895 16.6% 17,465
St. Thomas/Elgin County 22,755 75.4% 7,420 24.6% 30,175 24,615 76.4% 7,585 23.6% 32,200
ONTARIO 2,862,300 67.8% 1,357,115 32.2% 4,219,415 3,235,495 71.1% 1,312,290 28.9% 4,547,785
Source: Statistics Canada, 2001 and 2006 census.
As is shown below in Table 4.2.2, a high proportion of ground—re|ated housing (e.g., single
detached dwellings, semi—detached and row houses) are rented out, reflecting the low supply of
purpose built rental housing in many communities. For example, in Elgin County, 89% of all
single detached dwellings are owned, and 11% are rented. Thus, 1,690 single detached units
are rented, just over twice the number of rental units in |ow—rise apartments and duplexes (675
|ow—rise apartment units and 90 duplexes or a total of 765 units). By contrast, in the City of St.
St. Thomas/Elgin County Housing and Homelessness Plan 36
Tim Welch Consulting in association with Lapointe Consulting and Deb Ballak

Thomas where there is a relatively large stock of rental housing, only 5.8% of single detached
dwellings are rented.
Table 4.2.2: Tenure by Dwelling Type, Elgin County, St. Thomas, St. Thomas/Elgin County and Ontario:
Source: Statistics Canada 2006 Census Table 97-554-XCB2006034
4.3 Limited Purpose-Built Rental Housing
2001 and 2006City of
Elgin County St.Thomas
Dwelling Type Owned % Rented % Total Owned % Rented % Total
Single-detached house 13,735 89.0% 1,690 11.0% 15,425 8,735 94.2% 540 5.8% 9,275
Se mi-detached house 210 59.2% 145 40.8% 355 770 74.0% 270 26.0% 1,040Row house 170 39.1% 265 60.9% 435 80 13.9% 495 86.1% 575
Apartment, five +storeys 0 - 0 - 0 15 2.1% 705 97.9% 720
Apartment, less than five storeys 115 14.6% 675 85.4% 790 230 9.1% 2,285 90.9% 2,515
Apartme nt, duplex 85 48.6% 90 51.4% 175 205 34.7% 385 65.3% 590
Movable dwelling 230 93.9% 15 6.1% 245 10 50.0% 10 50.0% 20
Total 14,545 83.5% 2,880 16.5% 17,425 10,045 68.2% 4,690 31.8% 14,735
St.Thomas/Elgin County ONTARIO
Dwelling Type Owned % Rented % Total Owned % Rented % Total
Single-detached house 22,465 91.0% 2,230 9.0% 24,695 2,393,060 93.9% 154,410 6.1% 2,547,470
Semi-detached house 990 69.7% 430 30.3% 1,420 222,930 81.6% 50,435 18.4% 273,365
Row house 245 24.5% 755 75.5% 1,000 239665 66.4% 121240 33.6% 360,905Apartment, five + storeys 10 1.4% 705 98.6% 715 180,230 25.4% 529,465 74.6% 709,695
Apartment, less than five storeys 350 10.6% 2,960 89.4% 3,310 104,640 21.4% 384,975 78.6% 489,615
Apartment, duplex 295 37.8% 485 62.2% 780 84,670 54.7% 70,030 45.3% 154,700
Movable dwelling 245 90.7% 25 9.3% 270 10,305 85.6% 1,735 14.4% 12,040
Total 24,600 76.4% 7,590 23.6% 32,190 3,235,500 71.1% 1,312,290 28.9% 4,547,790
Both St. Thomas and to a lesser extent Aylmer, have a relatively large share of rented units that
can be considered to be purpose—bui|t rental units, that is, they were built to provide rental
housing. For example, 72.0% of the rental units in St. Thomas are in |ow—rise, high—riseor
duplex structures, and in Aylmer 48.7% of units are in these types of buildings. However, in
most of the more rural communities, there are much smaller proportions of purpose—bui|t
rental housing — 12.0% in Bayham, 5.6% in Malahide, and 11.8% in Southwold. Nevertheless, in
some of the rural municipalities there is a more substantial proportion of purpose—bui|t rental
units: 25.7% in Central Elgin and 36.2% in West Elgin, with some of these municipalities having
a significant portion of their mu|ti—residentia| stock consisting of social or affordable housing.
St. Thomas/Elgin County Housing and Homelessness PlanTim Welch Consulting in association with Lapointe Consulting and Deb Ballak
37
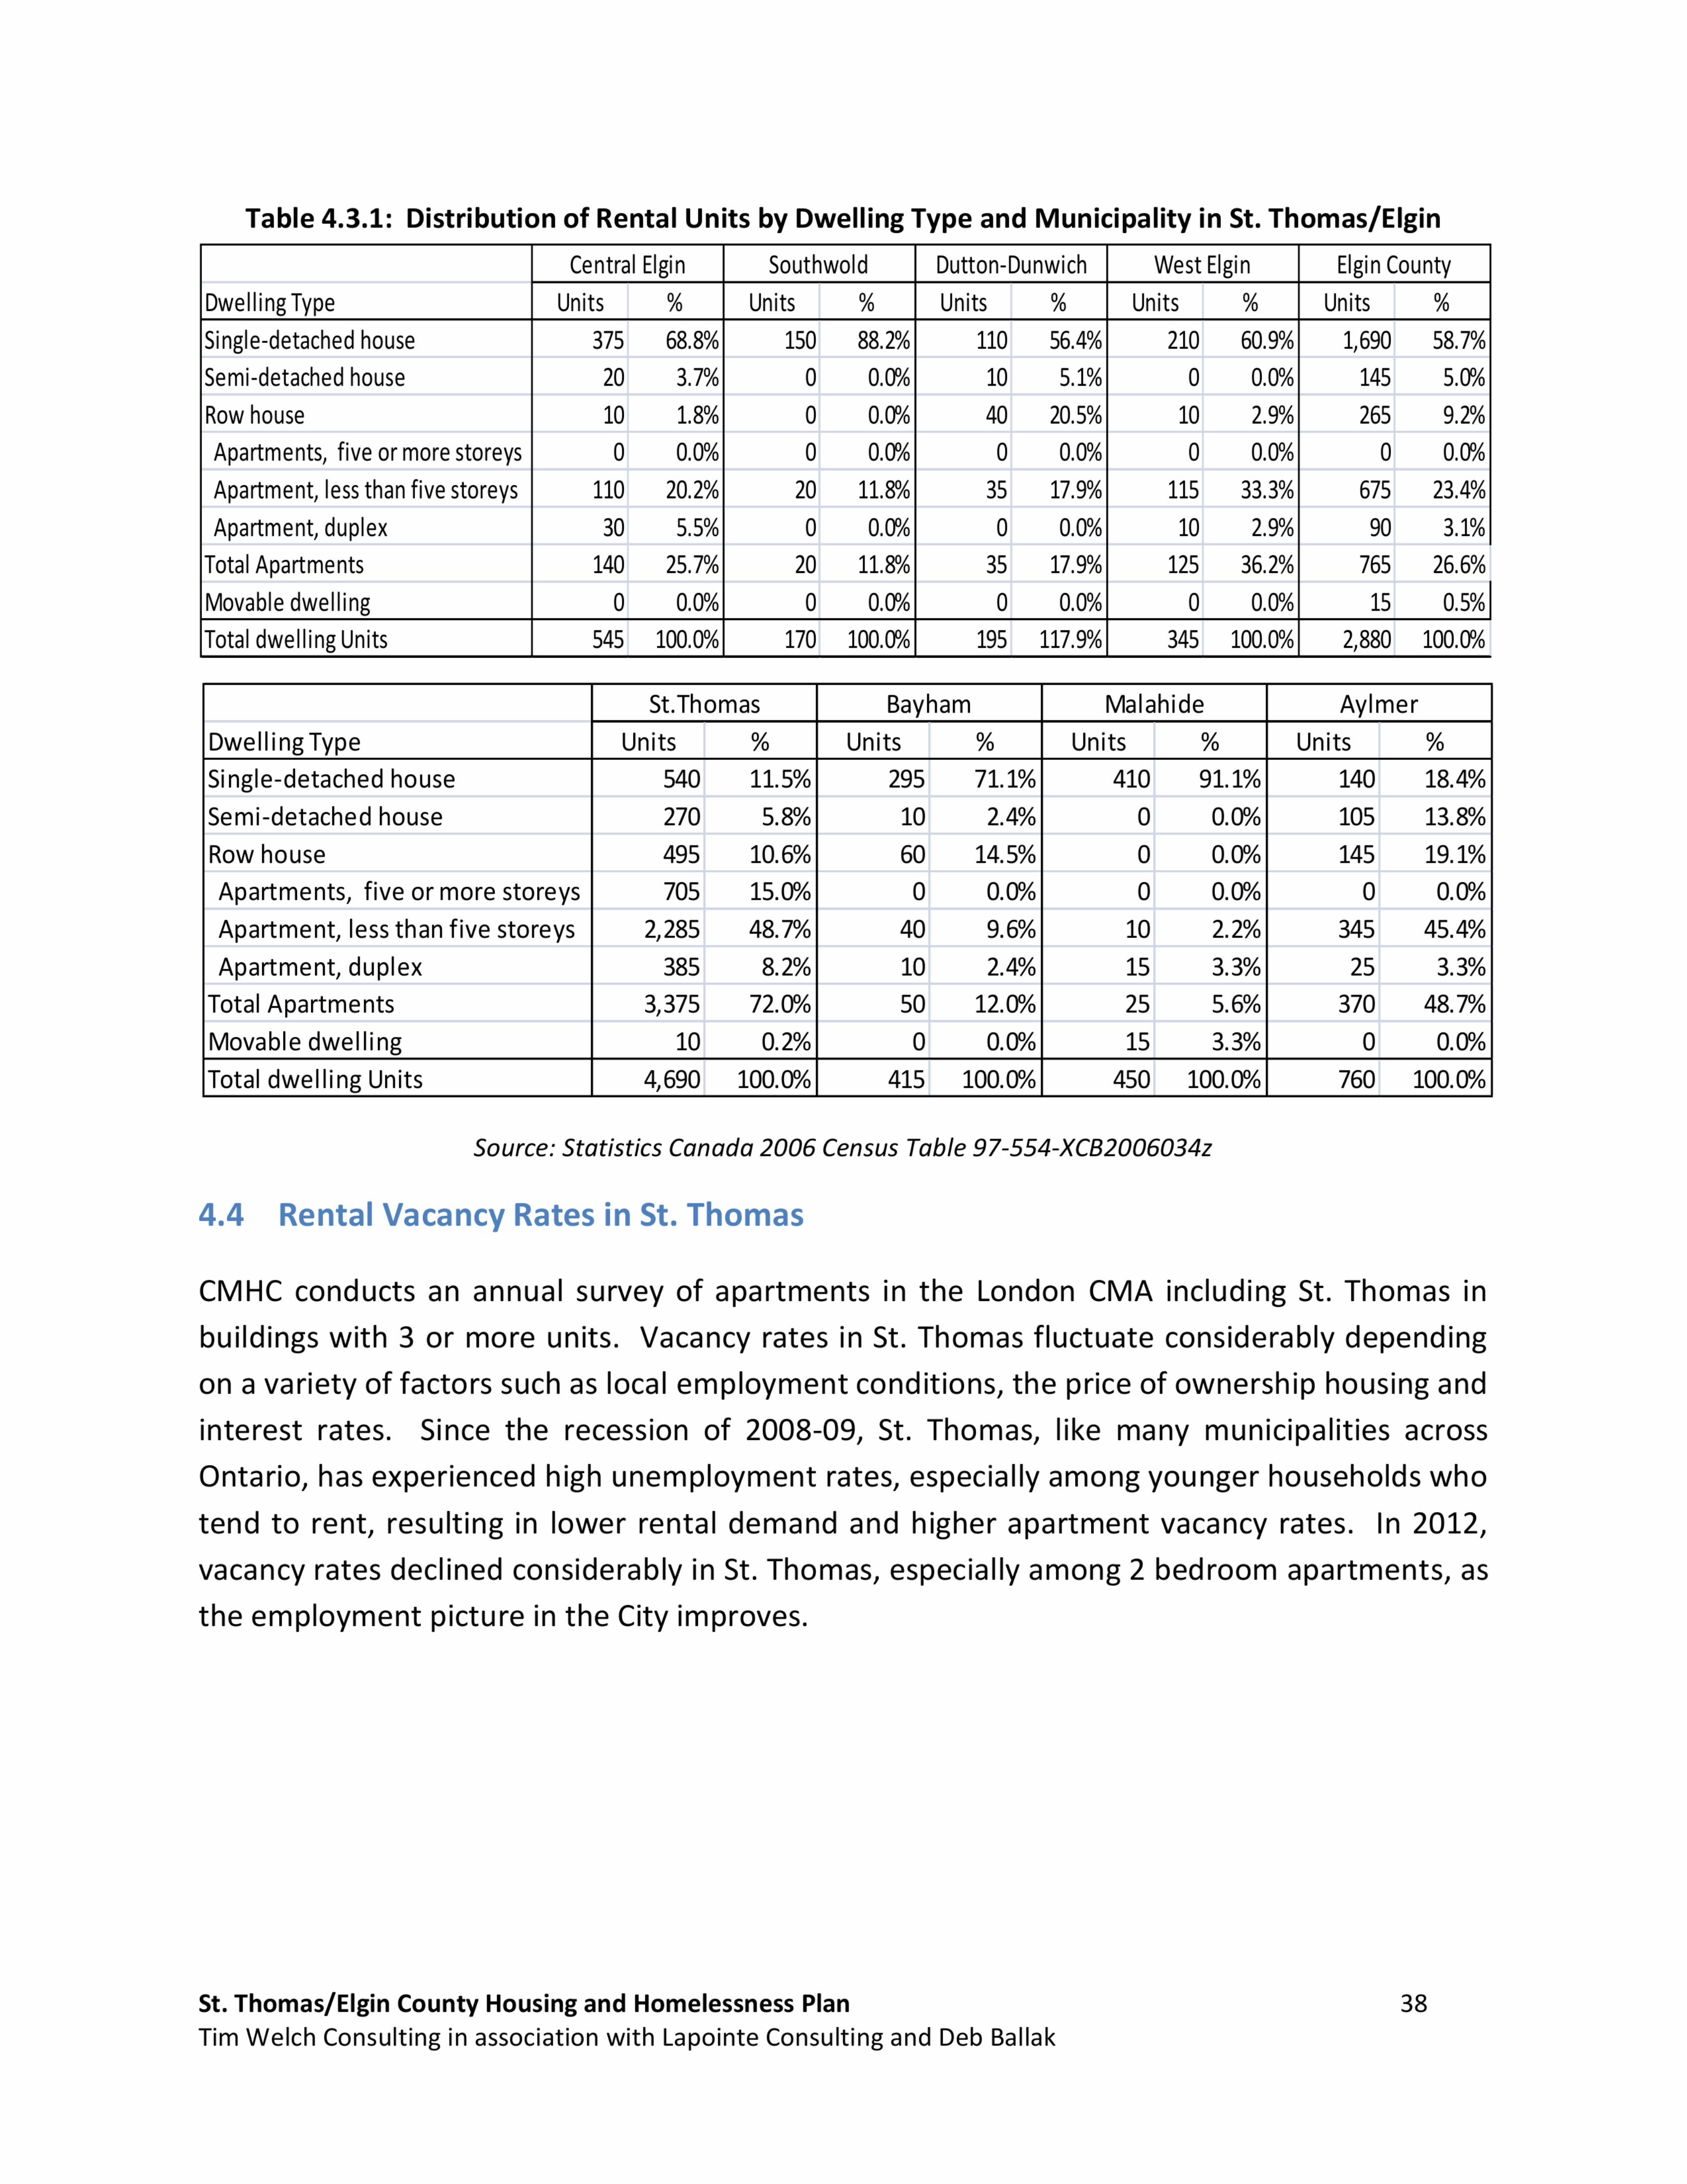
Table 4.3.1: Distribution of Rental Units by Dwelling Type and Municipality in St. Thomas/Elgin
Source: Statistics Canada 2006 Census Table 97-554-XCB2006034z
4.4 Rental Vacancy Rates in St. Thomas
CentralElgin Southwold Dutton—Dunwich West Elgin ElginCounty
DwellingType Units % Units % Units % Units % Units %
Single—detachedhouse 375 68.8% 150 88.2% 110 56.4% 210 60.9% 1,690 58.7%
Semi-detachedhouse 20 3.7% 0 0.0% 10 5.1% 0 0.0% 145 5.0%
Rowhouse 10 1.8% 0 0.0% 40 20.5% 10 2.9% 265 9.2%
Apartments,fiveor more storeys 0 0.0% 0 0.0% 0 0.0% 0 0.0% 0 0.0%
Apartment,lessthanfivestoreys 110 20.2% 20 11.8% 35 17.9% 115 33.3% 675 23.4%
Apartment,duplex 30 5.5% 0 0.0% 0 0.0% 10 2.9% 90 3.1%
TotalApartments 140 25.7% 20 11.8% 35 17.9% 125 36.2% 765 26.6%
Movabledwelling 0 0.0% 0 0.0% 0 0.0% 0 0.0% 15 0.5%
TotaldwellingUnits 545 100.0% 170 100.0% 195 117.9% 345 100.0% 2,880 100.0%
St.Thomas Bayham Malahide Aylmer
Dwelling Type Units % Units % Units % Units %
Single—detachedhouse 540 11.5% 295 71.1% 410 91.1% 140 18.4%
Semi-detached house 270 5.8% 10 2.4% 0 0.0% 105 13.8%
Row house 495 10.6% 60 14.5% 0 0.0% 145 19.1%
Apartments, five or more storeys 705 15.0% 0 0.0% 0 0.0% 0 0.0%
Apartment, less than five storeys 2,285 48.7% 40 9.6% 10 2.2% 345 45.4%
Apartment, duplex 385 8.2% 10 2.4% 15 3.3% 25 3.3%
Total Apartments 3,375 72.0% 50 12.0% 25 5.6% 370 48.7%
Movable dwelling 10 0.2% 0 0.0% 15 3.3% 0 0.0%
Total dwelling Units 4,690 100.0% 415 100.0% 450 100.0% 760 100.0%
CMHC conducts an annual survey of apartments in the London CMA including St. Thomas in
buildings with 3 or more units. Vacancy rates in St. Thomas fluctuate considerably depending
on a variety of factors such as local employment conditions, the price of ownership housing and
interest rates. Since the recession of 2008-09, St. Thomas, like many municipalities across
Ontario, has experienced high unemployment rates, especially among younger households who
tend to rent, resulting in lower rental demand and higher apartment vacancy rates. In 2012,
vacancy rates declined considerably in St. Thomas, especially among 2 bedroom apartments, as
the employment picture in the City improves.
St. Thomas/Elgin County Housing and Homelessness PlanTim Welch Consulting in association with Lapointe Consulting and Deb Ballak
38

Table 4.4.1: Vacancy Rates in St. Thomas, 1996-2012
Year
1996 8.2 6.4 4.2 6.6 5.1
1997 9.4 6.4 6.7 6.6 6.7
1998 8.5 5.8 4.2 ** 4.8
1999 ** 5.1 2.9 ** 3.7
2000 ** 3.8 2.6 ** 3
2001 ** 4.2 2.7 ** 3.3
2002 ** 3.7 2.9 ** 3.4
2003 1.4 4.0 1.1 ** 2.0
2004 ** 4.0 5.7 ** 4.8
2005 ** 5.4 3.0 ** 4.3
2006 ** 2.6 2.1 ** 2.5
2007 ** 4.2 2.7 ** 3.4
2008 ** 4.9 5.4 ** 5.2
2009 ** 7.5 5.4 ** 6.1
2010 ** 5.8 7.5 ** 6.8
2011 ** 4 5.9 0.0 5.3
2012 ** 3.7 2.6 ** 2.9
Source: CMHC Rental Market Reports, various years.
4.5 Tenure by Age of Household Maintainer
As shown below, in both Elgin County and the City of St. Thomas, younger households have
lower rates of ownership which rises with age and then starts to decline again for households
who are 65 and over. In Elgin County a relatively high proportion of households where the
household maintainer is 15-24 years of age rent (40.5%). This number however decreases with
each age category until 65-74 and 75+ years of age when ownership starts to decline and rental
rates increase.
The pattern is more pronounced in the City of St. Thomas where only 16.4% of those where
household maintainers 15-24 years of age own; however, for those household maintainers 25-
34, the proportion of owners rises to 63.3% and continues to rise until it peaks at 76.2% for
households where the maintainer 55-64 years of age. Ownership rates decline for those 65-74
year age group and older while rental rates climb for those who are 65-74 years of age and rises
to over a third — 35.4% - for those where the maintainer is 75 years and older. With the aging
of the baby boom population, there is likely to be a stronger need for rental housing over the
next ten year period, though many seniors will opt for ownership housing alternatives — such as
low-rise apartment condominiums and smaller single family and row houses.
St. Thomas/Elgin County Housing and Homelessness Plan 39
Tim Welch Consulting in association with Lapointe Consulting and Deb Ballak

Table 4.5.1: Proportion of Household Maintainers Who Own and Rent inElgin County and St. Thomas, 2006
Age of Household Elgin County City of St. Thomas
Maintainer Owned
15-24 150
25-34 1,485
35-44 3,065
45-54 3,425
55-64 3,035
65-74 1,915
75+ 1,480
Total Tenure by Age 14,555
Source: Statistics Canada 2006 Census Table 97-554-XCB2006034
4.6 Condition of Housing Stock
As is shown below in Table 4.6.1, the majority of rental housing in St. Thomas/Elgin County
needs only regular maintenance or minor repairs. About a tenth (11.7%) of housing that is
rented is in need of major repair. This is slightly higher than the Provincial average. Southwold
and West Elgin have higher proportions of rented units in need of major repair while other
municipalities have lower levels of rental housing that needs major repairs — e.g., Bayham and
Malahide.
Housing that is owned tends to be in better repair. In St. Thomas/Elgin County about two-
thirds (67.4%) only needs regular maintenance and 26.3% needs minor repair. A relatively
small proportion of ownership units need major repair—6.4% in St. Thomas/Elgin County. The
highest levels of need for major repair are in Bayham (8.7%) and West Elgin (8.4%).
Table 4.6.1: Housing Condition of Rental Housing, St. Thomas/CentralElgin, 2006
Regular Maintenance Minor Repairs Major Repairs Total Condition
Municipality # % # % # % # %
City of St. Thomas 2,955 62.9% 1,145 24.4% 595 12.7% 4,695 100.0%|Municipality of Bayham 275 66.3% 115 27.7% 25 6.0% 415 100.0%
Township of Malahide 240 53.3% 185 41.1% 25 5.6% 450 100.0%
Town of Aylmer 485 63.0% 195 25.3% 90 11.7% 770 100.0%
Municipality of Central Elgin 290 54.2% 195 36.4% 50 9.3% 535 100.0%
Township of Southwold 105 60.0% 45 25.7% 25 14.3% 175 100.0%
Municipality Dutton-Dunwich 125 62.5% 55 27.5% 20 10.0% 200 100.0%
Municipality of West Elgin 165 47.8% 125 36.2% 55 15.9% 345 100.0%
Elgin County 1,685 58.3% 915 31.7% 290 10.0% 2,890 100.0%
St. Thomas/Elgin County 4,640 61.2% 27.2% 11.7% 7,585 100.0%
ONTARIO 839,410 64.0% 341,985 26.1% 130,895 10.0% 1,312,290 100.0%
Source: Statistics Canada — 2006 Census. Catalogue Number 97-554—XCB2006023.
St. Thomas/Elgin County Housing and Homelessness Plan 40
Tim Welch Consulting in association with Lapointe Consulting and Deb Ballak

Table 4.6.2: Housing Condition of Ownership Housing, St. Thomas/CentralElgin, 2006Regular Maintenance Minor Repairs Major Repairs
Municipality # %
City of St. Thomas 10,045 . 00.0%
Municipality of Bayham 1,205 67.9% 415 23.4% 155 8.7% 1,775 .00.0%
Township of Malahide 1,395 61.3% 775 34.1% 105 4.6% 2,275 .00.0%
Town of Aylmer 1,255 65.0% 595 30.8% 80 4.1% 1,930 .00.0%
Municipality of Central Elgin 2,930 69.2% 1,065 25.1% 240 5.7% 4,235 .00.0%
Township of Southwold 895 62.8% 430 30.2% 100 7.0% 1,425 .00.0%
Municipality Dutton—Dunwich 785 66.2% 320 27.0% 80 6.8% 1,185 . 00.0%
Municipality of We st Elgin 1,030 59.5% 555 32.1% 145 8.4% 1,730 .00.0%
Elgin County 9,495 65.2% 4,155 28.5% 905 6.2% 14,555 .00.0%
St. Thomas/Elgin Cou nty 16,590 67.4% 6,465 26.3% 1,565 6.4% 24,620 .00.0%
Ontario 2,251,545 818,060 25.3% 165,890 5.1% 3,235,495 .00.0%
Source: Statistics Canada — 2006 Census. Catalogue Number 97-554—XCB2006023.
St. Thomas/Elgin County Housing and Homelessness Plan 41
Tim Welch Consulting in association with Lapointe Consulting and Deb Ballak

5 PROJECTEDPOPULATION AND HOUSING REQUIREMENTS
5.1 Population Projections
Three population projections are shown below — one is from the Population, Employment and
Housing Paper prepared by Elgin County in association with C4SE the Centre for Spatial
Economics as a background paper to the County's OfficialPlan, and the other is based on
population projections in various Official Plans in St. Thomas and Elgin County. The third
projection was prepared by the Ontario Ministry of Finance in the spring of 2012. None of the
projections use 2011 census population figures as the base and most are based on either 2006
census or the 2006 census and recent post—censa| estimates for 2011 that take into account the
census undercount in 2006.
The projections range from a 2031 population of 104,190 (C4SE), to 105,700 persons in the
Ministry of Finance projections to 114,787 by combining all of the Official Plans.
Table 5.1.1: Alternative Population Projections, St. Thomas/Elgin County and HousingRequirements, 2011-2031
2011- Change
C4SE 104,190 603 13,630 682
Household Size 2.40 -6.30%
Housing units 43,435 360 8,060 403
Ministry of Finance 105,700 730 14,300 715
Housing units 44,064 413 8,361 418
Official Plans 92,770 104,557 114,787 11,787 1,179 22,017 1,101
Housing Units 36,238 42,193 47,852 5,954 595 11,614 581
Source: Elgin County OfficialPlan, July 2012; Population, Employment and Housing Research Paper,
Elgin County in association with C4SE The Centre for Spatial Economics, May 2011; and, Ontario Ministry
ofFinance, Ontario Population Projections Update, 2011-2036, Spring 2012.
In Table 5.1.1 above it was assumed that household sizes would decline between 2011-2021 at
the same rate as they declined in the previous 10 year period, 2001-2011 and at a similar rate in
the following 10 years from 2021-2031. A sharper decline due to the aging of the population
would result in a higher number of housing units being required.
Projections in the various Official Plans show St. Thomas/Elgin County growing from 92,770
persons in 2011 to 104,557 persons in 2021 — a growth of 11,787 persons or about 1,180
persons annually. This would require a higher level of growth than occurred in the past 10 year
or 20 year period. For example, over the past 10-year period, the population of St.
St. Thomas/Elgin County Housing and Homelessness Plan 42Tim Welch Consulting in association with Lapointe Consulting and Deb Ballak

Thomas/Elgin County grew by 5,908 persons or 590 persons annually and the 20-year growth
level was similar.
Under the C4SE base projection, the annual increase between 2011 and 2021 would be around
6,000 persons or about 600 persons annually — almost identical to recent growth trends.
However, it should be pointed out that the recent 2001-2011 period included a very serious
recession which certainly impacted on population growth in the St. Thomas/Elgin County area.
The 20-year projections by C4SE resulted in a higher annual growth level of 680 persons. C4SE
had a low projection of 98,450 for 2031 to a high of 110,330 persons in 2031.
Under the Ministry of Finance reference scenario projections, the 10-year population growth
would be in the range of 730 persons and a similar number for the 20-year projections. Thus,
C4SE’s base projection and the Ministry of Finance 20-year reference scenario forecasts are
very similar.
5.2 Housing Projections
Table 5.1.1 provides a rough estimate of the number of new dwelling units required over the
next ten and twenty year period, under each of the three projections. (These are considered
rough estimates because they do not take into account the fact that some of the population do
not live in their own dwellings but rather live in institutions.) The household size for St.
Thomas/Elgin County is assumed to decline at the same rate it declined in the 2001-2011 period
(refer to Table 2.3.1) which shows that the average household size declined by 3.2% between
2001 and 2011. Applying these decreasing household sizes under the various projections shows
that under the C4SE projection, there is a requirement of 360 units annually between 2011 and
2021 but 403 units annually over the longer period, 2011 to 2031. Under the Ministry of
Finance projections, an average of 413 units are required annually for the period 2011-2021
and a similar number for the twenty—year period. Under the combined Official Plans, 595
additional housing units are required annually for the period 2011-2021 and a similar number,
581 for the longer term 2011-2031.
It is beyond the scope of this study to prepare separate population and housing projections. It
seems prudent to monitor housing development especially as the economy improves. However,
given these projections, there will be increasing numbers of residential units required, likely
400 and 600 units per year over the next 20 years. A portion of those units will be required for
low and moderate income households as well as for seniors aged 65 and over (see below).
5.3 Projected Distribution
As is shown below in Table 5.3.1, St. Thomas/Elgin County has a large share of its population in
younger age groups (0-14 years). Over time, one of the most striking changes that will occur in
St. Thomas/Elgin County Housing and Homelessness Plan 43
Tim Welch Consulting in association with Lapointe Consulting and Deb Ballak

St. Thomas/Elgin County is the growing share ofthe population who are 65 years and older. For
example, by 2021 the population who are 65 years and older will increase to 18.1% and by 2026
to 19.6% - up from 14.5% in 2011. Over the fifteen year period, 2001-2026, 18.3% of the
population increase will be amongst younger children 0-14 years of age, those 25-34 years of
age will account for 10.2% of the change, while those who are 55-64 will account for 12.9% of
the change; those 65-75 will account for 39.3% of the change and those 75+ will account for a
quarter of the population change. Planning for an older population will require increased
housing options and increased levels of services so people can live independently in their own
dwellings as long as possible.
Table 5.3.1: Projected Age Distribution, 2011-2026, CASEPopulation Projections
2011 2021 Ch. 2011-21 2026 Ch. 2001-26
Age
Group # % # % # % # % # %
1,860 18.3%- 280 -2.8%- 370 -3.6%
1,040 10.2%
940 9.3%- 920 -9.1%
1,310 12.9%
3,990 39.3%
2,580 25.4%
Total 90,560 100.0% 96,590 100.0% 6,030 100.0% 100,710 100.0% 10,150 100.0%
65+ 13,170 14.5% 17,460 18.1% 4,290 71.1% 19,740 19.6% 6,570 64.7%
Source: Population,Employment and Housing Research Paper, Elgin County in association with C4$E The Centre forSpatial Economics, May 2011;
St. Thomas/Elgin County Housing and Homelessness Plan 44
Tim Welch Consulting in association with Lapointe Consulting and Deb Ballak

6 HOUSEHOLD INCOME AND HOUSING AFFORDABILITY
6.1 Housing Income by Tenure
Table 6.1.1 below provides the distribution of income in 2005 for owners and tenants in St.
Thomas/Elgin County from the 2006 census. Tenant household incomes in St. Thomas/Elgin
County tend to be concentrated in the lower income groups with 47.7% having incomes under
$30,000 compared to 13.7% of owner households in this income category. By contrast, 57.3%
of homeowners in St. Thomas/Elgin County had household incomes of $60,000 or more
compared to 18.1% of tenant households
A higher proportion of tenant households had incomes of less than $30,000 in 2005 in St.
Thomas (51.4%) compared to Elgin County (41.9%). On the other hand, in St Thomas a slightly
higher proportion of owner households (58.5%) had incomes over $60,000 compared to Elgin
County (56.4%).
Table 6.1.1: Household Income Distribution by Tenure, St. Thomas, Elgin County andSt. Thomas/Elgin County, 2005
St. Thomas/Elgin County
Owned Re nted Total
Income Levels # % # % # %
Under $10,000 390 1.6% 565 7.4% 955 3.0%
$10,000-$19,999 1,270 5.2% 1,695 22.3% 2,965 9.2%
$20,000-$29,999 1,720 7.0% 1,355 17.9% 3,075 9.5%
$30,000-$39,999 2,110 8.6% 1,135 15.0% 3,245 10.1%
$40,000-$49,999 2,535 10.3% 880 11.6% 3,415 10.6%
$50,000-$59,999 2,485 10.1% 585 7.7% 3,070 9.5%
$60,000-$69,999 2,550 10.4% 505 6.7% 3,055 9.5%
$70,000-$79,999 2,140 8.7% 235 3.1% 2,375 7.4%
$80,000+ 9,425 38.3% 630 8.3% 10,055 31.2%
Total 24,625 100.0% 7,585 100.0% 32,210 100.0%
Median $66,981 $30,843 $57,839
Average $75,143 $38,218 $66,442
St. Thomas Elgin County
Owned Rented Total Owned Rented Total
Income Levels # % # % # % # % # % # %
Unde r $10,000 105 1.0% 400 8.5% 505 3.4% 290 2.0% 175 6. 1% 465 2.7%
$10,000 — $19,999 450 4.5% 1,095 23.3% 1,545 10.5% 825 5.7% 595 20.6% 14,200 8.1%
$20,000 — $29,999 595 5.9% 915 19.5% 1,510 10.2% 1,115 7.7% 440 15.2% 1,555 8.9%
$30,000 — $39,999 835 8.3% 740 15.8% 1,575 10.7% 1,280 8.8% 395 13.7% 1,675 9.6%
$40,000 — $49,999 1,060 10.5% 485 10.3% 1,545 10. 5% 1,475 10. 1% 395 13.7% 1,870 10.7%
$50,000 — $59,999 1,125 11.2% 355 7.6% 1,480 10.0% 1,365 9.4% 235 8. 1% 1,600 9.2%
$60,000 — $69,999 1,180 11.7% 295 6.3% 1,475 10.0% 1,370 9.4% 210 7.3% 1,580 9.0%
$70,000 — $79,999 965 9.6% 125 2.7% 1,090 7.4% 1,165 8.0% 100 3.5% 1,265 7.2%
$80,000+ 3,735 37.2% 280 6.0% 4,015 27.2% 5,685 39.0% 345 11.9% 6,030 34.5%
Total 10,050 100.0% 4,690 100.0% 14,740 100. 0% 14,570 100. 0% 2,890 100. 0% 17,460 100. 0%
Median $67,077 $28,983 $54,786 $66,858 36,003 $60,724Average $74,854 $35,265 $62,064 $75,529 $43,002 $70,134
Source: Statistics Canada,2006 Census Custom Tabulation
St. Thomas/Elgin County Housing and Homelessness Plan 45
Tim Welch Consulting in association with Lapointe Consulting and Deb Ballak

The median tenant household income for tenants in the St. Thomas/Elgin County area was
$30,843 or almost half (46%) of the median income of homeowners — $66,981.
The median homeowner income was virtually the same in St. Thomas, Elgin County and St.
Thomas — around $67,000. On the other hand, median tenant incomes were much higher in
the County (approximately $36,000) compared to the St. Thomas (approximately $29,000).
Chart 6.1.1: Median Household Income, St. Thomas/Elgin County, 2006$80,000 ‘
$66,858$70,000
66,981 $60,72§57339$60,000 -
$54376
sso,ooo -
$40,000 - $36,003
528.983 530343530.000 »
$20,000 ~
$10,000 -
so ~ -
AllOwners Renters
I St. Thomas I ElginCounty I St. Thomas/Elgin County
Source: Statistics Canada, 2006 Census
Table 6.1.2: Median Income by Tenure, St. Thomas, Elgin County Municipalities, St.Thomas-Elgin County, 2005
City of St. Thomas $67,077 $28,983
Municipality of Bayham $55,799 $37,487
Township of Malahide $66,583 $45,192
Town of Aylmer $63,955 $26,960
Municipality of Centra|Elgin
Municipality of Southwold $75,717 $55,713
Municipality of Dutton-
Dunwich $65,097 $33,517
Municipality of West Elgin $54,730 $27,661
ElginCounty $66,858 $36,003St.Thomas/Elgin County $66,981 $30,843
Source: Statistics Canada, 2006 Census, Custom Tabulation
St. Thomas/Elgin County Housing and Homelessness Plan 46
Tim Welch Consulting in association with Lapointe Consulting and Deb Ballak

As is shown above in Table 6.1.2, there is considerable variation in the median incomes of
households across Elgin County and the City of St. Thomas. For example, the highest overall
median incomes are found in Central Elgin ($71,300) and Southwold ($71,189). The next
highest median incomes are found in the Township of Malahide where the median income was
$61,530, followed by the City of St. Thomas ($54,876), Bayham ($51,191) Aylmer ($50,957) and
West Elgin ($49,415). These differences in median incomes reflect a variety of factors such as
household size, age of the household maintainer and stage in the life cycle as well as
differences in employment status and category.
There is also considerable variation in the median ownership and tenant incomes among
municipalities in Elgin County. Among tenants the lowest incomes were in West Elgin
($27,661), Aylmer ($26,960) and St. Thomas ($28,983) while the highest incomes were in
Southwold ($55,713), Malahide ($45,192) and Central Elgin ($45,749). The median tenant
income in Bayham was $37,487 and in Dutton—Dunwich it was $33,517.
Among owners, the highest incomes were found in Central Elgin ($76,391) and Southwold
($75,717) followed by the City of St. Thomas ($67,077), Malahide ($66,583), Dutton—Dunwich
($65,097) and Aylmer ($63,583). The lowest median owner household incomes were in
Bayham ($55,789) and West Elgin ($54.730).
6.2 Rental Housing Costs
The average rents in St. Thomas for apartments in structures with 3 or more rental units are
shown below in Table 6.2.1. In 2012, the average rents for various sized units were: $485 for a
bachelor unit; $630 for a one—bedroom apartment; $765 for a two—bedroom apartment and
$847 for an apartment with three or more bedrooms.
Generally speaking rents are lower in St. Thomas than in a number of other southern and
south—western municipalities. For example, in 2012, a bachelor apartment rented for $485 in
St. Thomas while the average rent for a bachelor apartment in the City of London was $581.
The average rent for a one—bedroom apartment in St. Thomas in 2012 was $630 compared to
$754 in the City of London. There was an even larger gap between rents for two—bedroom units
in St. Thomas and the City of London as the average rent for a two—bedroom apartment in St.
Thomas in 2012 was $765 compared to an average rent of $932 in the City of London.
Rent increases have generally kept up with or exceeded inflation. The rent for a bachelor
apartment increased by 27.0% between 2003-2012 compared to a change in the Consumer
Price Index (CPI) of 18.0%. Rents for a one—bedroom apartment increased by 20.0% during this
period or just above the rate of inflation. However, rents for two—bedroom apartments have
not kept pace with inflation. This may be because those who would typically rent a two-
St. Thomas/Elgin County Housing and Homelessness Plan 47
Tim Welch Consulting in association with Lapointe Consulting and Deb Ballak

bedroom apartment (such as young couples) are taking advantage of the lower cost of
purchasing due to historically low mortgage interest rates and are opting to purchase a home.
Nevertheless, the declining vacancy rates among two—bedroom apartments noted above in
Table 4.4.1 on page 23 indicates that rents for these units may increase in the future.
Unfortunately, rental data for other communities in Elgin County does not exist at this time.
Table 6.2.1: Rents for Apartments in St. Thomas, 2002-2012
mN/A**
**
**
**
**
Change 2003-
2012
Ch. ln CPI Ontario 2003-12
Source: CMHC Rental Market Reports: London CMA, various years.
Note: Inflation for 2012 based on Dec. Figure seasonally unadjusted.
6.3 Ownership Housing Costs
One of the major factors behind the high level of ownership housing development across
Ontario and in St. Thomas/Elgin County has been low interest rates. Since 2002, interest rates
have been at historically low levels not seen since the 1950's. As governments continue to
keep bank rates low in order to stimulate the economy, mortgage rates have continued to
drop. As well, five—year mortgage rates follow the pattern of 5-year Canada Bond yields which
have been low in recent years. At the end of 2011, the average 5-year mortgage rate was under
5% — 4.36%. Currently, the 5-year mortgage rate for a 25-year closed mortgage at most major
banks is between 4.99% and 5.24% but lower mortgage rates are available from credit unions
and other financial institutions and through negotiated rates with banks. While there has been
considerable talk about mortgage rates increasing, it is not likely to happen in the near future
until the global economy is more secure. Current mortgage rates are still well below interest
rates of recent years and will help to continue to fuel demand for ownership housing.
St. Thomas/Elgin County Housing and Homelessness Plan 48
Tim Welch Consulting in association with Lapointe Consulting and Deb Ballak
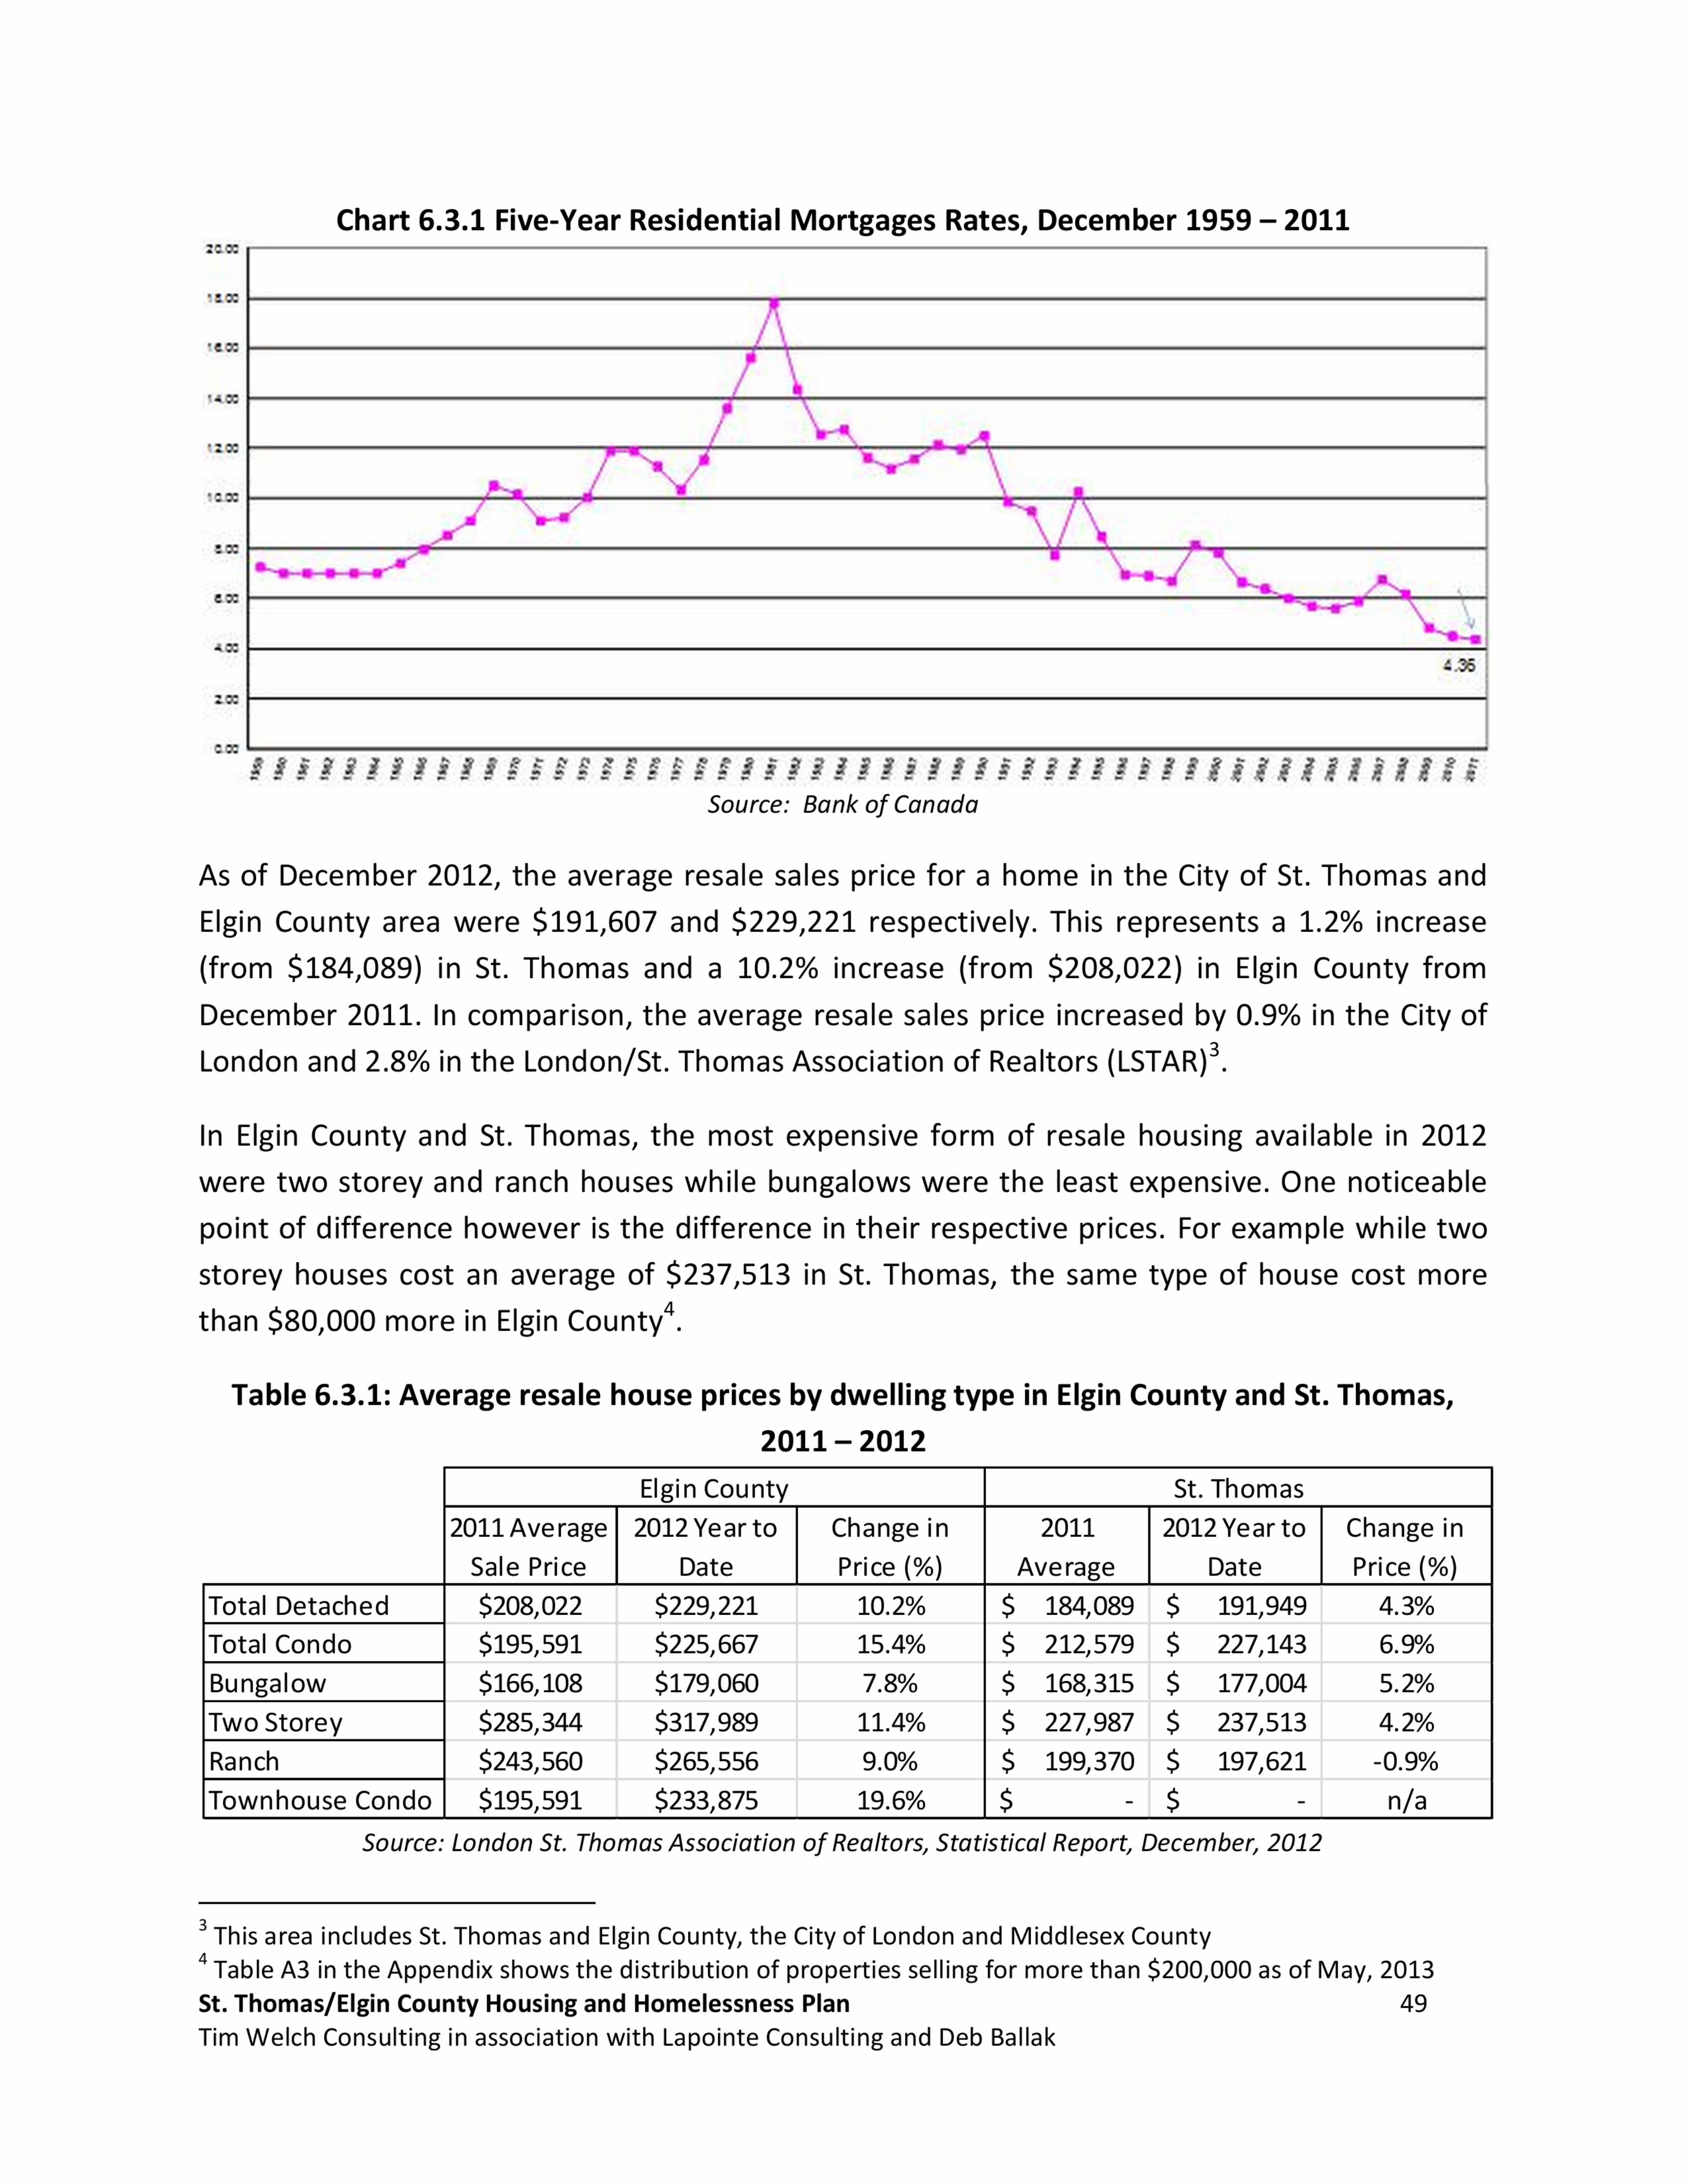
Chart 6.3.1 Five-Year Residential Mortgages Rates, December 1959 — 2011
nu3
Source: Bank ofCanada
As of December 2012, the average resale sales price for a home in the City of St. Thomas and
Elgin County area were $191,607 and $229,221 respectively. This represents a 1.2% increase
(from $184,089) in St. Thomas and a 10.2% increase (from $208,022) in Elgin County from
December 2011. In comparison, the average resale sales price increased by 0.9% in the City of
London and 2.8% in the London/St.Thomas Association of Realtors (LSTAR)3.
In Elgin County and St. Thomas, the most expensive form of resale housing available in 2012
were two storey and ranch houses while bungalows were the least expensive. One noticeable
point of difference however is the difference in their respective prices. For example while two
storey houses cost an average of $237,513 in St. Thomas, the same type of house cost more
than $80,000 more in ElginCounty4.
Table 6.3.1: Average resale house prices by dwelling type in Elgin County and St. Thomas,
2011 — 2012
Elgin County St. Thomas
2011 Average Change in 2011 Change in
Sale Price Date Price (%) Average Date Price (%)
Total Detached $208,022 $229,221 184,089 191,949 4.3%
Total Condo $195,591 $225,667 212,579 227,143 6.9%
Bungalow $166,108 $179,060 168,315 177,004 5.2%
Two Storey $285,344 $317,989 227,987 237,513 4.2%
$243,560 $265,556 199,370 197,621 -0.9%
Townhouse Condo $195,591 $233,875 — — n/aSource: London St. Thomas Association ofRealtors, Statistical Report, December, 2012
3 This area includes St. Thomas and Elgin County, the City of London and Middlesex County4 Table A3 in the Appendix shows the distribution of properties selling for more than $200,000 as of May, 2013
St. Thomas/Elgin County Housing and Homelessness Plan 49
Tim Welch Consulting in association with Lapointe Consulting and Deb Ballak

As shown in Table 6.3.2, resale house prices in St. Thomas rose considerably faster (almost 2.4
times) than the rate of inflation in Ontario between 2003 and 2012. In fact there were only two
years during this period (2009 and 2010) where the increase in housing prices was below the
rate of inflation. It should be noted since the economic downturn of 2008 — 2009, the rate at
which housing prices have increased in St. Thomas have slowed considerably. Historical data for
Elgin County was not available.
Table 6.3.2: Average resale prices in St. Thomas and annual increases in inflation,2003 — 2009
Total Average
Year 2003 2004 2005 2006 2007 2008 2009 2010 2011 2012 (%) (%)
ResalePrices(%) 6.5 9.8 9.6 4.3 6.3 8.6 -2.6 0.1 3.7 1.2 47.4 19.4
Increase in Inflation(%) 2.7 1.9 2.2 1.8 1.8 2.3 0.4 2.5 3.1 0.9 8.6 1.9
Source: London St. Thomas Association ofRealtors, Statistical Report, December, 2012
Note: Inflation for 2012 based on Dec. Figure seasonally unadjusted.
Nevertheless, house prices in St. Thomas and Elgin County continued to be significantly less
than in the City of London or the LSTAR area. In 2012, resale house prices in St. Thomas and
Elgin County were 25% lower ($48,763) than those in the City of London and 19% lower
($47,215) than resale prices in the LSTARarea.
Table 6.3.3: Resale house price increases in the City of London, the City of St. Thomas andLSTARArea, 2002 — 2012
City of Increase City of St. Increase (LSTAR Increase
London (%) Thomas (%) Area) (%)
2002 143,007 121,470 142,106
2003 155,148 8.5% 129,349 6.5% 152,586 7.4%
2004 169,022 8.9% 141,989 9.8% 166,138 8.9%
2005 178,899 5.8°o 155,595 9.6% 178,058 7.2%
2006 193,087 7.9% 162,250 4.3% 188,942 6.1%
2007 208,865 8. 2% 172,550 6.3% 202,526 7.2%
2008 211,323 1.2% 187,361 8.6% 210,888 4.1%
2009 214,769 1.6°o 182,450 -2.6% 213,402 1.2%
2010 231,020 7.6°o 182,719 0.1% 227,056 6.4%
2011 238,238 3.1% 189,413 3.7% 232,372 2.3%
2012 240,370 0.9% 191,607 1.2% 238,822 2.8%
Average 5.4% Average 4.7% Average 5.4%Source: London St. Thomas Association ofRealtors, Statistical Report, December, 2012
With regard to new housing sales prices, the CMHC Housing Now Report (4thQuarter, 2012) for
the London CMA noted that the average and median price in the St. Thomas area (includes St.
St. Thomas/Elgin County Housing and Homelessness Plan 50
Tim Welch Consulting in association with Lapointe Consulting and Deb Ballak

Thomas, Central Elgin and Southwold) was $276,500 and $288,851 respectively. Compared to
2011 figures this represents an increase of $11,500 (4.3%) in the median house price and
$70,772 (32.4%) in the average house price. The significant increase in average house price in
part reflects the reality that the number of houses sold for under $250,000 decreased while the
number of houses sold between $250,000 and $299,999 increased.
Table 6.3.4: New house price in St. Thomas, Central Elgin and Southwold, 2011 — 2012250,000 - 300,000 - 350,000 -
'
< $250,0005 5 5
$400,000 + Total Mfma"A"i°""g°$299,999 $349,999 $399,999 PrIce($) PrIce($)
UnitsShare
UnitsShare
UnitsShare
UnitsShare
UnitsShare
(%) (%) (%) (%) (%)
2011 45 38.5 36 30.8 17 14.5 14 12 5 4.3 117 265,000 218,079
2012 25 22.9 49 45 18 16.5 11 10.1 6 5.5 109 276,500 288,851
Source: CMHC, Housing Now, London CMA, Fourth Quarter 2012
According to local home builders, a key factor explaining the rising cost of new homeownershipare the increased costs associated with building new homes. These costs included:
0 The price for un—serviced or raw agricultural land has doubled in the past decade,
0 New building code regulations drive up building costs (it was noted that new code
regulations increased costs by as much as $5,000 effective Jan. 1, 2012), and
0 Higher construction standards and costs have increased the total cost of developing
and servicing new land.
As a result ofthese and other costs, one builder noted that a semi—detached house which sold
for $136,800 in 2005 now sells for $190,000.
6.4 Affordable Housing
6.4.1 Defining Affordable Housing
In this section we identify what is considered to be affordable rental and affordable ownership
housing. The definition for affordable rents and house prices is provided through the Ontario
Provincial Policy Statement (PPS) (2005) as well as through various federal/provincial
Affordable Housing Initiatives. In this section, we will be using the Provincial Policy Statement
to define affordable housing.
The PPS is a policy statement issued under the Planning Act and is an overriding planning
document which identifies a range of policies regarding development in local and
regional/county jurisdictions. The PPS contains policies addressing the need for a range of
housing that is affordable to different income levels. Planning authorities are required to
provide for an appropriate range of housing types and densities to meet projected
St. Thomas/Elgin County Housing and Homelessness Plan 51
Tim Welch Consulting in association with Lapointe Consulting and Deb Ballak

requirements of current and future residents. Municipalities are required to establish and
implement minimum targets for the provision of housing which is affordable to low and
moderate income households as well as meeting special needs housing requirements.
The term ’’affordable housing” includes both market and government assisted housing which is
affordable to low and moderate income households. The PPS defines affordable rental and
ownership housing as:
Rental Housing:
The lower of:
a) housing for which the rent does not exceed 30 percent of gross annual income fortenants with incomes at or below the 60”‘income percentile for tenants in the regionalmarket area; or
b) the average market rent of a unit in the regional market area.
Ownership Housing:
The lower of:
a) housing for which the purchase price results in annual accommodation costs that do not
exceed 30 percent of gross annual household income for the lowest 60 percent of allhouseholds in the regional market area; or,
b) housing for which the purchase price is at least 10 percent below the average purchaseprice of a resale unit in the regional market area.
The definition provided through the PPS is different from those used through various
Affordable Housing Programs. For example, under the 2003 pilot phase of
FederaI/Provincial/Municipal Affordable Housing Program (AHP) affordable rent was defined as
”market rents in the regional market area and below” and in the more recent phase of the
Canada—Ontario Affordable Housing Program and the Investment in Affordable Housing for
Ontario (IAH)program, affordable rents are set at 80% of the regional market rent or below.
The following table provides income deciles for owners and tenants in 2005 for the City of St.
Thomas, Elgin County and St. Thomas/Elgin County. For the purposes of this study, it is
proposed that the ”market area” be defined as the St. Thomas/Elgin County area which
encompasses both the City of St. Thomas and Elgin County. In the analysis of affordable
housing below, we will adjust the 2005 incomes to 2012. In the absence of a better method of
updating incomes, the incomes will be adjusted using the CPI index even though some income
levels may not increase at this level — especially those at the very bottom end of the income
spectrum.
St. Thomas/Elgin County Housing and Homelessness Plan 52
Tim Welch Consulting in association with Lapointe Consulting and Deb Ballak

Table 6.4.1.1: Income Deciles for Owned and Rented Housing,St. Thomas, Elgin County and St. Thomas/Elgin County, 2005
Income Levels
10th Percentile
20th Percentile
30th Percentile
40th Percentile
50th Percentile
60th Percentile
City of St. Thomas Elgin County
St. Thomas!
Elgin County
$27,614
$40,294
$49,690
$ 59,033
$67,077
$ 77,127
$11,398
$14,574
$19,096
$23,517
$28,983
$35,065
$16,296
$25,962
$ 35,248
$44,973
$ 54,876
$64,638
$ 24,119 $ 13,431
$ 35,834 $ 17,020
$ 45,971 $ 23,269
$ 55,382 $ 28,610
$ 66,858 $ 36,003
$ 78,708 $ 42,661
Total
$ 19,398
$ 30,361
$ 41,000
$ 50,079
$ 60,724
$ 72,369
$ 25,612 $ 11,746
$ 37,607 $ 15,532
$ 47,801 $ 20,078
$ 57,153 $ 25,461
$ 66,981 $ 30,843
$ 77,929 $ 38,116
$ 18,054
$ 28,251
$ 38,338
$ 47,862
$ 57,839
$ 68,499
Source: Statistics Canada, 2006 Census, Custom Tabulation
6.4.2 Affordable Rental Housing
Table 6.4.2.1 below shows rents that are affordable at different income levels for tenant
households in St. Thomas/Elgin County without tenants paying more than 30% of their income
on housing. These rent levels are then compared to the average rent in the market area. As
can be seen from this analysis:
The lowest 10% of all tenant households with the upper income threshold of
$13,320 can only afford a rent of $333/month or below, and there are no private
rental units that rent at this level.
The lowest 20”‘percentile of tenant households with the upper limit of $17,613 can
afford rent that is $440/month and can barely afford a bachelor apartment but
cannot afford any other rental housing.
The lowest 30”‘percentile of tenant households with the upper limit of $22,768 can
afford rent of $569 and therefore can only afford a bachelor apartment without
paying more than 30% oftheir income on housing.
The lowest 40”‘percentile of tenant households with the upper limit of $28,873 can
afford rent of $722 and therefore can afford the average rent for bachelor, one
bedroom and some below average rent two bedroom apartments.
Tenants at the 50”‘income percentile ($34,976) can afford to pay $874 and
therefore can afford the rent for units of different bedroom counts as can tenants
at the 60”‘income percentile ($43,224) who can afford rents of up to $1,081.
St. Thomas/Elgin County Housing and Homelessness Plan 53
Tim Welch Consulting in association with Lapointe Consulting and Deb Ballak

Table 6.4.2.1: Affordable Rents at Different Income Levels in St.Thomas/Elgin County, 20122012 Affordable Bachelor 1 Bedroom 2-Bedroo 3+ Bedroom All
Income Levels Incomes Rents $485 $53010th Percentile $13,320 $333 X X
20th Percentile $17,613 $440 X X
30th Percentile $22,768 $569 X X
40th Percentile $28,873 $722 X X
50th Percentile $34,976 $874 V V
60th Percentile $43,224 $1,081 V V
Source: Custom Tabulation and calculations by Lapointe ConsultingNote: 2005 income levels were increased by the change in the CPI in Ontario between 2005 and 2012.
Based on the above analysis, affordable rent is defined as the average market rent and below
which is $717 or $720/month and below (since this level is lower than the rent that is
affordable at the 60”‘income percentile for tenants). However, it is important that rental
housing be provided in the future at levels that are affordable to those at the lower income
levels not just at the average rent (which is roughly affordable to those at the 40”‘income
percentile for tenants).
Based on the most recent average market rents in St. Thomas—E|gin County, housing
affordability is a problem for many households in |ow—wage employment or dependent on
government transfers. The following tables show rates for social assistance and for seniors
government pensions (OAS, GIS, GAINS). Ontario Child Benefit is also shown for families with
children. In round terms:
0 A typical family reliant only on Ontario Works and Ontario Child Benefit has an
annual income of $12,000 to $14,000, depending on family size; it has $19,000 to
$21,000 if receiving ODSP.
0 A couple reliant only on OW has an annual income of about $12,000; or $19,000 if
receiving ODSP.
0 A single person has just over $7,000 annually if receiving OW or just under $13,000
if receiving ODSP.
0 The guaranteed seniors income is about $16,000 annually for a single person and
$27,000 for a couple.
There are also many |ow—wage workers at low income. A single minimum wage earner at
$10.25/hour working a fu||—time job of 2,000 hours annually (38 hours/week, 52 weeks
including vacation pay) has an income of $20,500 before tax and transfers (or $1,700 per
|IImonth). A ”typica couple with 1.6 earners at minimum wage has an income of about $33,000
(or $2,750 per month).
St. Thomas/Elgin County Housing and Homelessness Plan 54
Tim Welch Consulting in association with Lapointe Consulting and Deb Ballak

The significance of these facts is that the incomes in the lower 20 percent or so of the income
spectrum is strongly shaped by the level of minimum wages, government pensions, and other
transfer payments.
Table 6.4.2.2: Seniors Guaranteed Income Rates, Monthly, Oct. — Dec 2012Si_ngl_e Couple
per person combined
OAS — Old Age Security $545 $545 $1,090GIS — Guaranteed Income Supplement $739 $490 $980GAINS — Guaranteed Annual Income System $83 $83 $166Total $1,367 $1,118 $2,236
Source: Ontario Ministry ofFinance website. Data rounded to nearest dollar
Table 6.4.2.3: Social Assistance Rates, Monthly, 2012
Maximum __ Max Ontario
Basic Needs Shelter _ _ Total_ Child Benefit
Monthly Benefit
Ontario Works (OW)
Single $227 $372 $0 $599Couple $448 $584 $0 $1,032Single Parent + 1 child $347 $584 $92 $1,023Single Parent + 2 children $347 $634 $184 $1,165Couple + 1 child $448 $634 $92 $1,174
Ontario Disability Support Program (ODSP)
Single $590 $474 $0 $1,064
Couple $873 $745 $0 $1,618Single Parent + 1 child $733 $745 $92 $1,570Single Parent + 2 children $751 $807 $184 $1,742Couple + 1 child $873 $807 $92 $1,772Age of children in rates shown = under 18 for OW, under 13 for ODSP with 1—chi|d, one each >13 and 13+
for ODSP and with 2 children.
Source: Income Security Advocacy Centre
The rent levels these households can afford (using either the max shelter allowance for persons
receiving shelter assistance or calculating 30% of income for minimum wage earners of seniors
receieving basic pernsions are well below average rents in St. Thomas.
St. Thomas/Elgin County Housing and Homelessness Plan 55
Tim Welch Consulting in association with Lapointe Consulting and Deb Ballak

Table 6.4.2.4: Affordable Rents for Selected Households on Fixed IncomesGross
Source of Income MonthlyAffordable
RentsIncome
SeniorSing|e-OAS+Supp.+GA|NS $1,370 $411Senior Couple -OAS+Supp.+GA|NS $2,240 $672OW - Single $606 $182OW - Single with 1 Child $683 $205OW- Couple $829 $249OW - Couple with 1 child $829 $249ODSP - Single $1,075 $323ODSP - Single with 1 Child $1,510 $453
Source: Ontario Ministry ofFinance Website, 2013
Note: Affordable rents are 30% of gross monthly income based. Gross monthly income figures provided byMinistry of Finance only.
6.5 Affordable Ownership Housing
Table 6.4.3.1 below shows the price of housing that is affordable to different income
percentiles (for all households) in 2012 based on different mortgage rates for 5-year fixed
mortgages and based on 5 and 10% down payments. While making a down payment of 25% is
the norm, lower down payments are possible if mortgage insurance is obtained. The affordable
housing prices shown in Table 6.4.3.1 below include monthly payment of principal and
interests, municipal taxes (including County taxes where applicable and education taxes) and
mortgage insurance.
The PPS states that affordable housing is defined as the lower of that which is affordable to
households at the 60”‘income percentile and below or 10% below resale prices. (The 60”‘income percentile estimated at $78,000 in 2012 represents the top 60 percent of all households
in St. Thomas/Elgin County.) Data was obtained on all house sales in St. Thomas, Elgin County,
St. Thomas/Elgin County and the London CMA — most of these sales are re—sa|es though a very
few new houses are also included.
This analysis shows that using the PPS definition, 10% below the average price of a home
should be used to define ”affordab|e ownership housing”. If the combined St. Thomas/Elgin
County average 2012 home sale price of $209,100 is used, this would result in an affordable
house price of $188,200. Since the PPS is designed to apply to new housing, three developers
were asked if they could produce housing in this price range. One developer noted that he was
able to build semi—detached houses for $190,000 in 2012 while the remainder of the homes
were detached and were priced beginning at $250,000. However, as shown earlier on Table
6.3.4, only 25 new houses were built for less than $250,000 in 2012. While it is unclear of what
the exact costs of each house was, many were most likely above the $200,000 figure. In
St. Thomas/Elgin County Housing and Homelessness Plan 56
Tim Welch Consulting in association with Lapointe Consulting and Deb Ballak

addition, to the factors discussed earlier in Section 6.3, the ability to purchase new housing for
households in the 40”‘percentile will continue to diminish.
It could be argued that there should be a separate benchmark affordable house price for St.
Thomas, Southwold and Central Elgin all of which are in the London CMA — using the average
London CMA price of $241,200 or benchmark affordable house price of $217,000. Such housing
would be affordable to households between the 40”‘income percentile and the median
Income.
In other municipalities in the County, the average house price for the County ($229,000) could
be used to define affordable housing with a benchmark affordable house price of $206,1005.Incomparison, the average house price in the City of St. Thomas was $191,949.
In a recent publication by the Ontario Ministry of Municipal Affairs and Housing posted on the
Ministry's web site; the average resale price for the third quarter, 2012 for the City of St.
Thomas was identified as $238,407 a figure which represents the entire London CMA shown in
Table 6.4.3.1 below. Under the Canada—Ontario Affordable Housing Program, the average
market selling price for the area is used to set the upper limit of housing that can be purchased
in the local market (or what is affordable at the 50”‘percentile of incomes in the Service
Manager Area).5
Therefore the definition of affordable housing for ownership purposes in 2012 for St. Thomas
and Elgin County should be $188,156 or |ess7. The municipalities within the St. Thomas/Elgin
County Service Manager Area should be working with builders/developers to ensure a portion
of the ownership housing to be built would be priced at or below this figure. Interviews with
current area builders/developers revealed that they felt that achieving price points at or below
this figure was possible for semi—detached houses. Ownership housing sold at or below this
price point would be affordable to the 40”‘to 60”‘income percentile households.
5 MLS listings for more than $200,000 in Elgin County can be found in Table A3 in the Appendix.6
From Canada—Ontario AffordableHousing Program: A?ordable Homeownership Component Guidelines.7 This figure represents 10% below of the combined house prices from St. Thomas and Elgin County. For more
information on prices please refer to Table 6.4.3.1
St. Thomas/Elgin County Housing and Homelessness Plan 57
Tim Welch Consulting in association with Lapointe Consulting and Deb Ballak

Table 6.5.1: Affordable Ownership Housing in St. Thomas/Elgin County at Different Income
Percentiles, 2012
Affordable Ownership Housing Thresholds at Different Mortgage Rates:St. Thomas/Elgin County
2012 5% Mortgage Rate 5.5% Mortgage Rate 6% Mortgage Rate
Household Affordable
Income Incomes (All Carrying
Percentile households) Costs 5% down 10% down 5% down 10% down 5% down 10% down
10th Percentile $20,587 $515 $76,400 $80,200 $73,400 $77,100 $70,600 $74,200
20th Percentile $32,215 $805 $119,600 $125,500 $114,900 $120,600 $110,500 $116,000
30th Percentile $43,718 $1,093 $162,300 $170,300 $155,900 $163,600 $150,000 $157,500
40th Percentile $54,578 $1,364 $202,600 $212,600 $194,600 $204,300 $187,300 $196,600
50th Percentile $65,955 $1,649 $244,800 $256,900 $235,200 $246,900 $226,300 $237,600
60th Percentile $78,111 $1,953 $290,000 $304,200 $278,600 $292,400 $268,000 $281,400
Average Sale 10%
Pricein2012in Below
Elgin County $228,965 Ave. $206,069
Ave rage Sale
Price in 2012 in St. 10%
Thomas/Elgin Below
County $209,062 Ave. $188,156
Average Sale 10%
Pricein St. Below
Thomas $191,949 Ave. $172,754
Average Housing 10%
Price in London Below
CMA $241,160 Ave. $217,044
Source: Real Estate Prices for St. Thomas and Elgin/$t.Thomas provided by the London St. ThomasAssociation ofRealtors; London CMA average home sales from CMHC’s Housing Now — London CMA First
Quarter report.
Notes: To calculate municipal taxes, the average mill rate of 1.48 was used (the average across all 7municipalities in the County and the City of St. Thomas).2005 incomes were updated using the change in the Consumer Price Index in the absence of incomesfrom the 2011 census. This approach may have resulted in higher incomes than occurred, especiallyfor lower income groups. We do know that Ontario hourly wages have outpaced inflation between2005 and 2011 so some incomes will have increased at the rate of inflation between 2005 and 2011.
6.6 Housing Affordability in St. Thomas - Elgin County
According to 2006 Census data, almost 7,000 households (22%) in St. Thomas and Elgin County
are living in housing that is not affordable (paying more than 30% oftheir gross monthly income
on housing expenditures). While the number of households experiencing housing affordability
problems are similar in both the City and County (3,580 vs. 3,435), the proportion of
households experiencing this problem is slightly higher in St. Thomas than Elgin County (24.3%
vs. 20.4%). Within Elgin County, the municipalities of West Elgin and Bayham had the highest
incidence of housing affordability problems (26.0% and 24.3% respectively) while Central Elgin
and Dutton—Dunwich had the fewest (17.1% and 17.5% respectively).St. Thomas/Elgin County Housing and Homelessness Plan 58
Tim Welch Consulting in association with Lapointe Consulting and Deb Ballak

Mirroring trends in other communities, homeowners generally have a lower incidence of
affordability problems than renters. This trend not only reflects the higher incomes needed to
purchase housing, but the reality that some homeowners have already paid—offtheir mortgage.
As a result only 17.0% of homeowners in E|gin—St.Thomas faced an affordability problem. In
comparison almost 40.0% of renter households experienced this problem. Of particular note is
the higher number of homeowners with affordability problems in Elgin County than St. Thomas
(2,515 or 18.0% of households vs. 1,550 or 15.0%).
Among renters, 39% were having affordability problems in St. Thomas and Elgin County. More
than 14% of renter households were experiencing severe affordability problems (paying at least
50% of income on housing costs) while 10.7% were experiencing moderate affordability
problems (paying at least 40% of income on housing costs).
In St. Thomas, approximately 43.3% of renting households had an affordability problem
compared to nearly a third (32.3%) of all renter households in Elgin County. Similarly, the
prevalence of moderate— and severe —affordabi|ity problems is greater in St. Thomas than in
Elgin County. In 2006, almost 27% of renter households in St. Thomas were paying at least 40%
of their monthly income on housing costs compared to 18% in Elgin County. The prevalence and
severity of these trends reflect in large part the higher number of renter households and
properties in St. Thomas compared to elsewhere in the Service Manager Area.
Households susceptible to affordability problems tended to be comprised of single parent and
one person households. As shown on Chart 6.5.2, 38.4% of |one—parent households and 40.7%
of one person households experienced some form of affordability problem. In contrast, the
least likely to experience these problems were other households and couples without children.
With regard to age, approximately 25% of households under the age of 25, between the ages of
55 and 64, and 75 years and older experienced some affordability problems. Of particular
concern are renters aged 65 and over. According to the 2006 Census data more than 51% of
these households had affordability problems with more than 26% paying at least 40% of their
monthly income on housing.
St. Thomas/Elgin County Housing and Homelessness Plan 59
Tim Welch Consulting in association with Lapointe Consulting and Deb Ballak
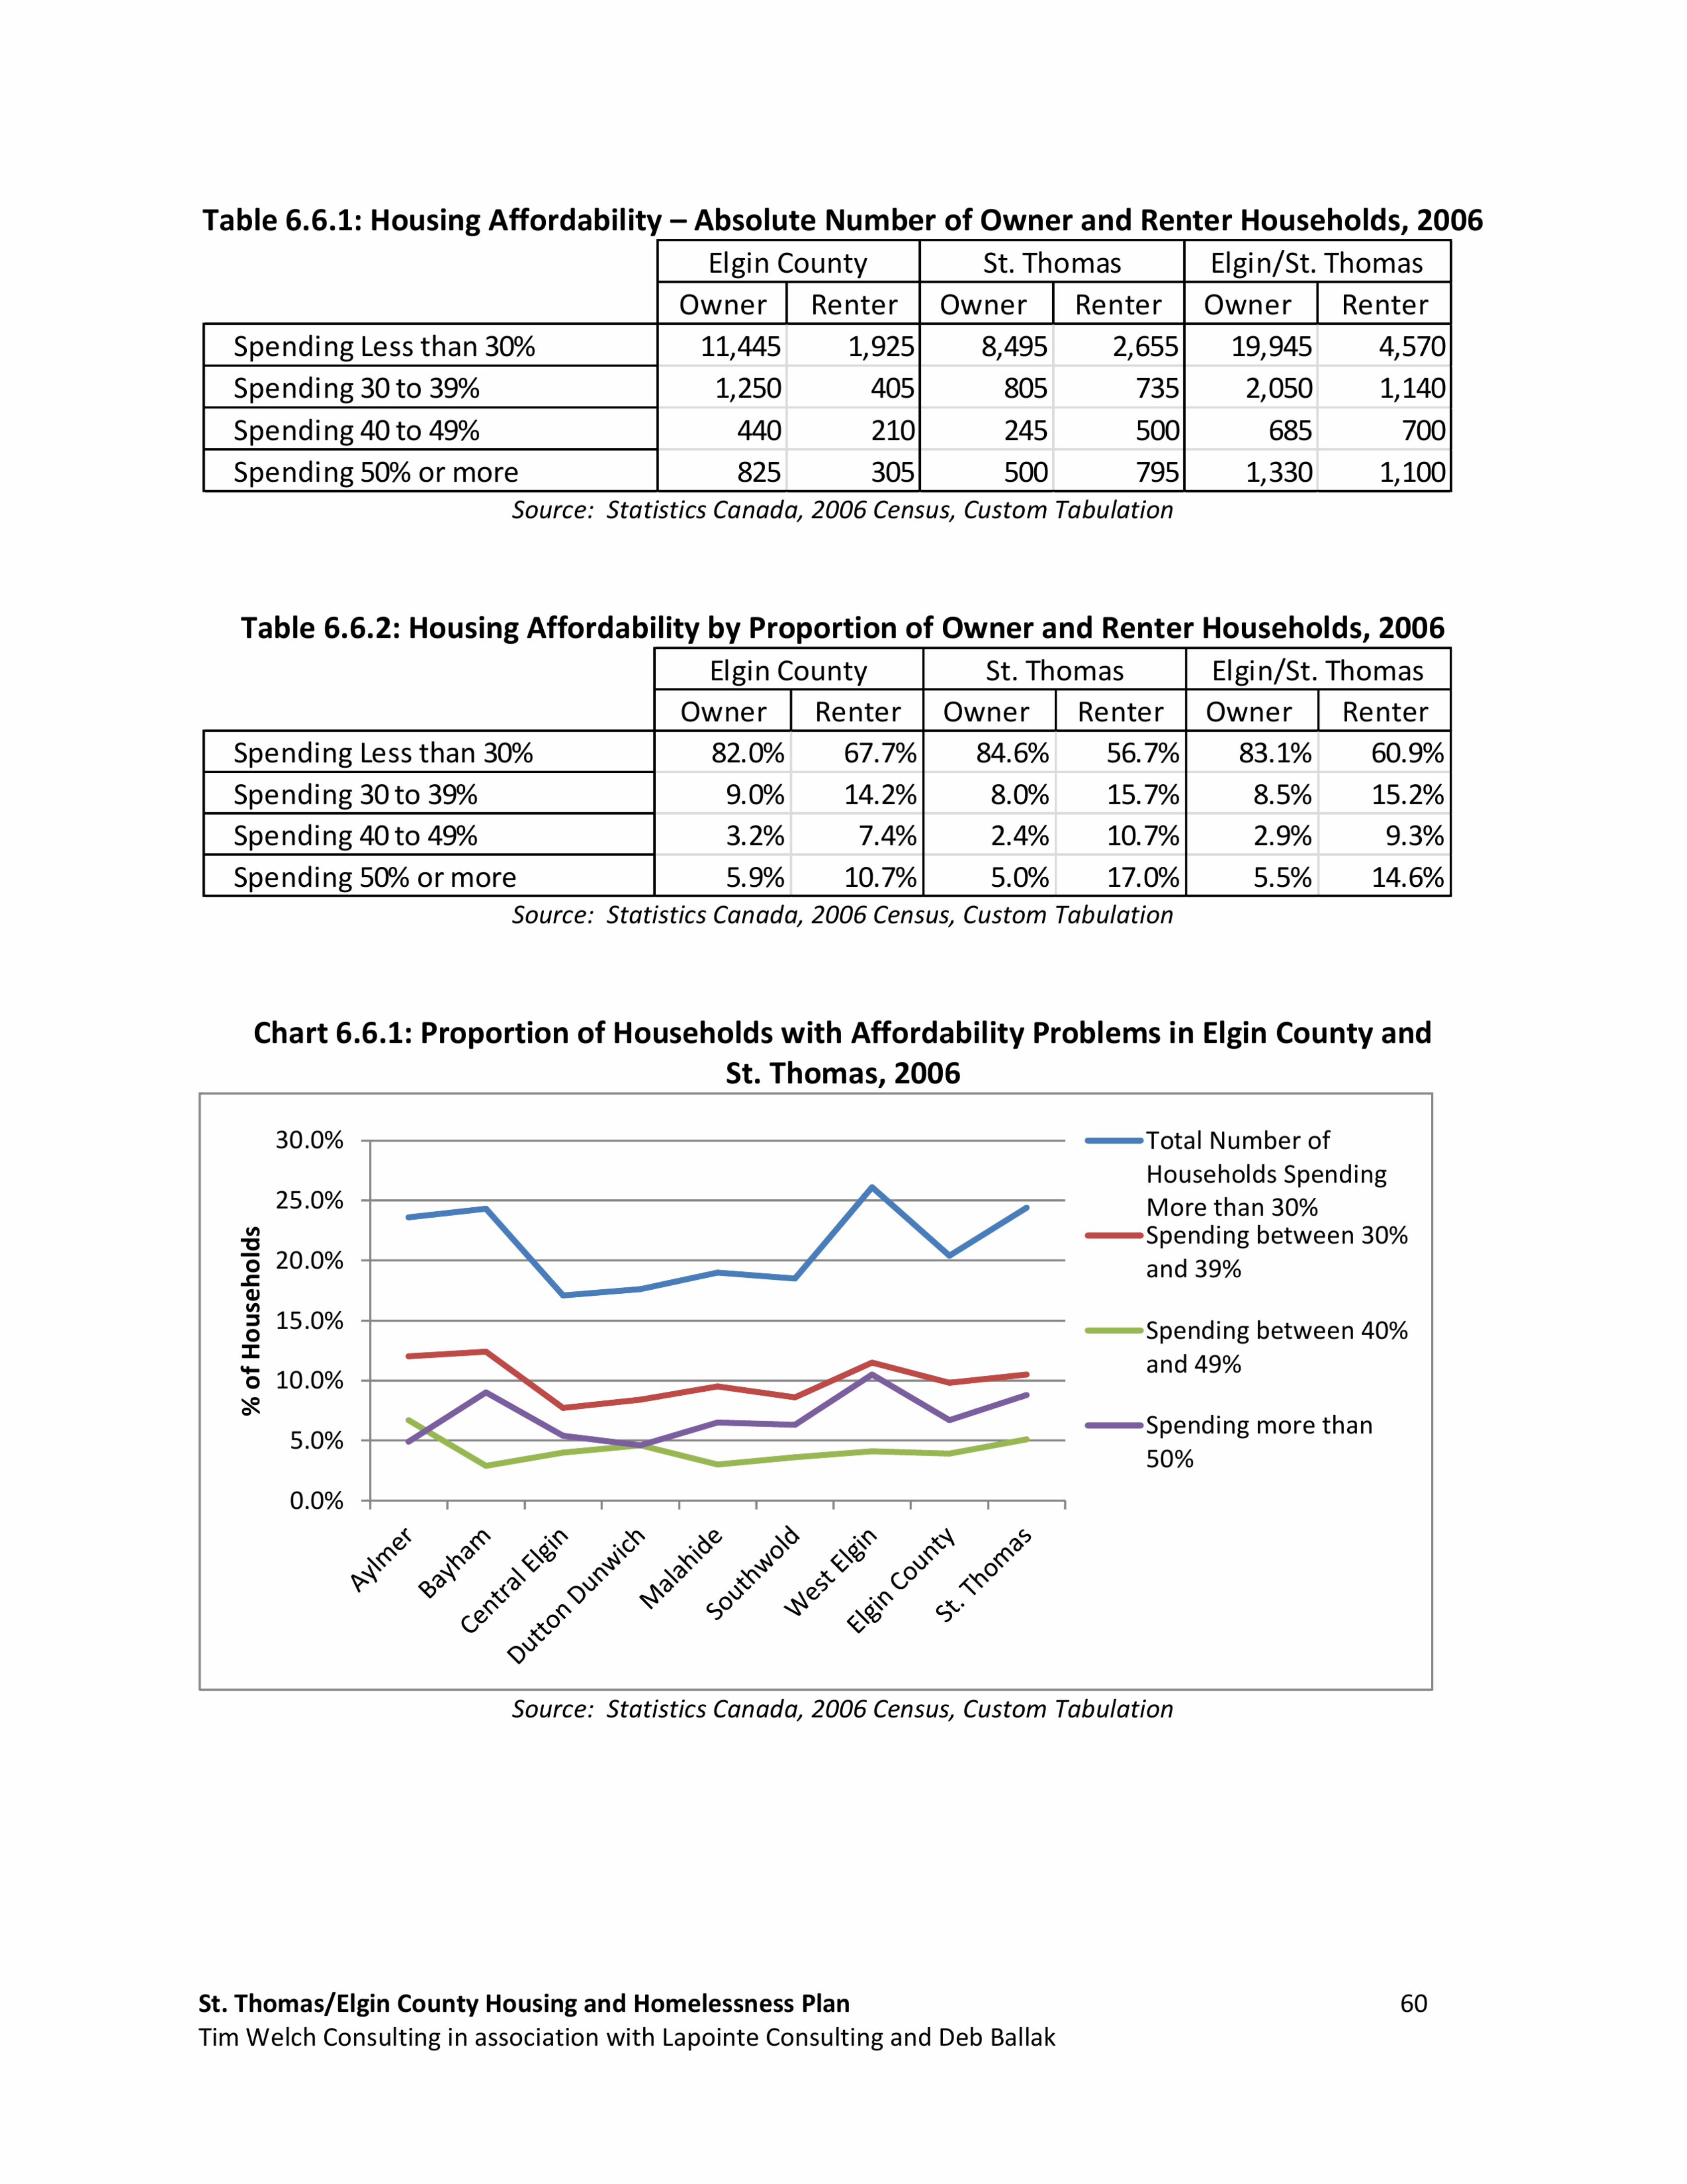
Table 6.6.1: Housing Affordability — Absolute Number of Owner and Renter Households, 2006
Elgin County St. Thomas Elgin/St. Thomas
Spending Less than 30% 11,445 1,925 8,495 2,655
Spending 30 to 39% 1,250 405 805 735
Spending 40 to 49% 440 210 245 500
Spending 50% or more 825 305 500 795Source: Statistics Canada, 2006 Census, Custom Tabulation
Table 6.6.2: Housing Affordability by Proportion of Owner and Renter Households, 2006Elgin County St. Thomas Elgin/St. Thomas
Renter
Spending Less than 30%
Spending 30 to 39%
Spending 40 to 49%
Spending 50% or more
Source: Statistics Canada, 2006 Census, Custom Tabulation
8.5% 15.2%
2.9% 9.3%
5.5% 14.6%
Chart 6.6.1: Proportion of Households with Affordability Problems in Elgin County andSt. Thomas, 2006
30.0% jTotal Number ofHouseholds Spending
250% More than 30%
§0
—Spending between 30%
-2 20.0%: and 39%0)
§ 15.0% jspending between 40%:|:
“5 10.0%"”d 49%
=.\° .5 (W
—Spending more than. O —
50%
0.0% I I I I I I I I I
« .0 _ xx’
o 6 0 ~\ 9
\<°°’x~°‘°<a°3 9° x-° .«°‘ <83 o°‘ 5’~\ Q3 \ 0 \’?> ~<\ x (,0 ~00V <2; <3’ 0° ge O6“\$<25".0
’\(P0 K90 L) 5‘.
‘K.00
Source: Statistics Canada, 2006 Census, Custom Tabulation
St. Thomas/Elgin County Housing and Homelessness Plan 60
Tim Welch Consulting in association with Lapointe Consulting and Deb Ballak

Chart 6.6.2: Proportion of Households in St. Thomas - Elgin County Paying More Than 30% ofGross Monthly Income on Housing Costs, 2006
Married and
Non-family: C0mm0n"3W
Two or more COUPIESWlth0Ut
person children
households 10%
12‘V Married andcom mon—|aw
couples withchildren
10%
Allother familyhouseholds
9%
Source: Statistics Canada, 2006 Census, Custom Tabulation
Chart 6.6.3: Affordability of Housing by Tenure and Age, St. Thomas — Elgin County, 2006
100.0%
E 9o_o% 4 Owners Spendingcu \j—__.jj Less than 30%3? 80.0%.: -jowners Spending§ g_
700%— - " ~ -
‘More than 30%
'5 § 600% ‘\ jowners spending'5
E3 50.0% : > C 2 :3 More than 50%ca : /
§ E.40-0%’
, “' - —-Renters Spending
E 300%' ‘ ‘ ’ Less than 30%
o‘E 20.0% — —-Renters Spending
§ — — "' ‘—
_ _. More than 30%
E 10.0%jj-
— —o Renters Spending00% 1 ' ' ' ' ' ' More than 50%
<35 35-44 45-54 55-64 65-74 75 +
Source: Statistics Canada, 2006 Census, Custom Tabulation
St. Thomas/Elgin County Housing and Homelessness Plan 61Tim Welch Consulting in association with Lapointe Consulting and Deb Ballak
7 SOCIALAND AFFORDABLEHOUSING STOCK
7.1 Social and Affordable Housing Stock
A significant portion of the existing rental housing stock in the City of St. Thomas and Elgin
County is described as financially assisted, or social, or affordable housing stock. From the
1950's to the early 1990's, there were a number of initiatives and programs implemented by
both Federal and Provincial governments which resulted in the creation of housing affordable
to low and moderate income households. The housing was, and still is, owned and operated by
governments directly, by community based non—profits and by private sector bui|ders/
developers.
The City of St. Thomas is the Municipal Service Manager responsible for the administration of
1,294 units of social housing rental units consisting of non—profit, co—op and public housing
units. These units are located within the City St. Thomas as well as in the communities Aylmer,
Belmont, Dutton, Port Burwell, Rodney and West Lorne within the County. The social housing
available throughout the St. Thomas Service Area consists of low—and medium—riseapartment
buildings, townhouse, semi—detached and single unit (scattered) dwellings. While housing for
seniors, families and single persons is provided, not every type of housing is available in every
community within the Service Manager area.
The Elgin and St. Thomas Housing Corporation is the Local Housing Corporation (LHC)under the
Housing Services Act (HSA). The Housing Corporation owns 530 units including 415 in St.
Thomas and 115 in Elgin County (See Table 7.1.1).
In addition to administering the rental stock owned and operated by ESTHC, the City of St.
Thomas has administrative and financial responsibilities for:
0 Private non—profitor co—op housing owned and operated by community—based non-
profit organizations such as the Port Burwell Non—Profit Housing Corporation, and
the Meadowdale Community Housing Co—operative in St. Thomas.
0 Private rent supplements, where a private or non—profit landlord sets aside units for
households requiring rent—to—geared—income; the City pays the landlord the
difference between geared to income rent and the market rent for the unit. There
are 49 rent supplement units scattered throughout the service area. See table 7.1.4
for details of both rent supplement funding as well as housing allowance funding
administered by St. Thomas which provides a set monthly financial payment of $140
to 30 low income households who are paying a high percentage of their income on
rent.
St. Thomas/Elgin County Housing and Homelessness Plan 62
Tim Welch Consulting in association with Lapointe Consulting and Deb Ballak

In discussions with existing social housing providers, one of the strongest messages conveyed
was the need for a social worker or community support worker to help some of their existing
residents with basic |ife—ski||s as well as connecting successfully with other support service
agencies in the community. It was noted that in many other similar sized service manager
areas, a community support worker (or workers) are funded.
Table 7.1.1: ESTHCNumbers of Units by Type and Location
Type Apartments Townhouses
No. of
bedroomsBach
Community:
St. Thomas
Aylmer
Rodney
TotalSource: City ofSt. Thomas, 2013
Table 7.1.2: Other Non-Profit Housing Providers — Numbers of Units by Type and LocationType Apartments Townhouses Detached Semi-Detached Totals IN0‘ of
B h 1 2 1 2 3 4 5+ 2 3 4 2 3 4acbedrooms
Community:
St. Thomas 60
Ay|mer*** 46
Belmont 18 IDutton 17 IPort Burwell 16 4 8 6 14 7 55 |Port Stanley** 18 12 30 |Rodney 17 7 24 |Totals 192 66 42 152 236 57 19 764 I
Source: City ofSt. Thomas, 2013** Mortgage discharged in August 2011*** 4 one bedroom and two bedroom units in detached dwellings have had mortgages discharged
In the past decade, newer affordable housing initiatives have been supported by the City and
the Federal and Provincial governments for low to moderate income households. These
programs, delivered and administered by the City, have been generally known as the Affordable
Housing Program (rental component) or AHP. Under this initiative (most recently re—named the
Investment in Affordable Housing Program) rents have been set at a minimum of 80 percent of
the average market rent although some units from the earliest phase of the AHP have rents at
100% of average market rents. Within these units, however, the City has entered into Rent
Supplement Agreements with the landlords so that 10 supported units may be rented on a rent
St. Thomas/Elgin County Housing and Homelessness Plan 63
Tim Welch Consulting in association with Lapointe Consulting and Deb Ballak

geared to income (RGI) basis. Under the AHP, 155 units of affordable housing have been
created including:
0 84 units in St. Thomas for singles, seniors and families including persons with special
needs,
0 25 units in Aylmer for singles, seniors and families,
0 30 units in Dutton for seniors, and
0 16 units in West Lorne for seniors and persons with special needs.
Table 7.1.3: Affordable Units - Numbers of Units by Type and LocationApartments Townhouses Detached Semi—Detached Totals
No. of
bedrooms
Community:
Aylmer
Dutton
Totals 7 80 66 2 155Source: City of$t. Thomas, 2013
St. Thomas/Elgin County Housing and Homelessness Plan 64
Tim Welch Consulting in association with Lapointe Consulting and Deb Ballak

Table 7.1.4: Rent SupplementsProgram Name Purpose Source of
FundingStart and EndDates
Delivered by # Households Assisted
Rent Supplement Programs (RS) Currently Running
“Commercial” RGI |eve|—private|y owned or City/County 2002-2023 City 10/monthprivate landlord market rent units (sufficient to —withinsocial
achieve rent at 30% of tenant housing fundingincome) budget
IAH —Housing Flat rate (non RGI)for low Provincia|/ 2013-2015 City 30/monthAllowance income households Federal 2013/14-38 (1 year)
Gov’t 2014/15-20(1 year)
Strong RGI level for low-income Province 2002-2023 City/LHC 39/monthavg., includinCommunities RS households (sufficient to supportive (Elgin
achieve rent at 30% of tenant Association for Commuincome) Living and Violence Aga
Women Services Elgin),regular
Rent Supplement Programs (RS) Closed
AHP Housing Rent Subsidy for low-income Provincia|/ 2006-2010 City 32/monthavg.Allowance] Rent households FederalSupplement Gov’t(HARS) (total allocation
= $270,000)
Short Term Rent Subsidy for low-income Province 2011-2012 City 45/monthavg.
Support Program households (total allocation= $162,060)
St. Thomas/Elgin County Housing and Homelessness PlanTim Welch Consulting in association with Lapointe Consulting and Deb Ballak
65
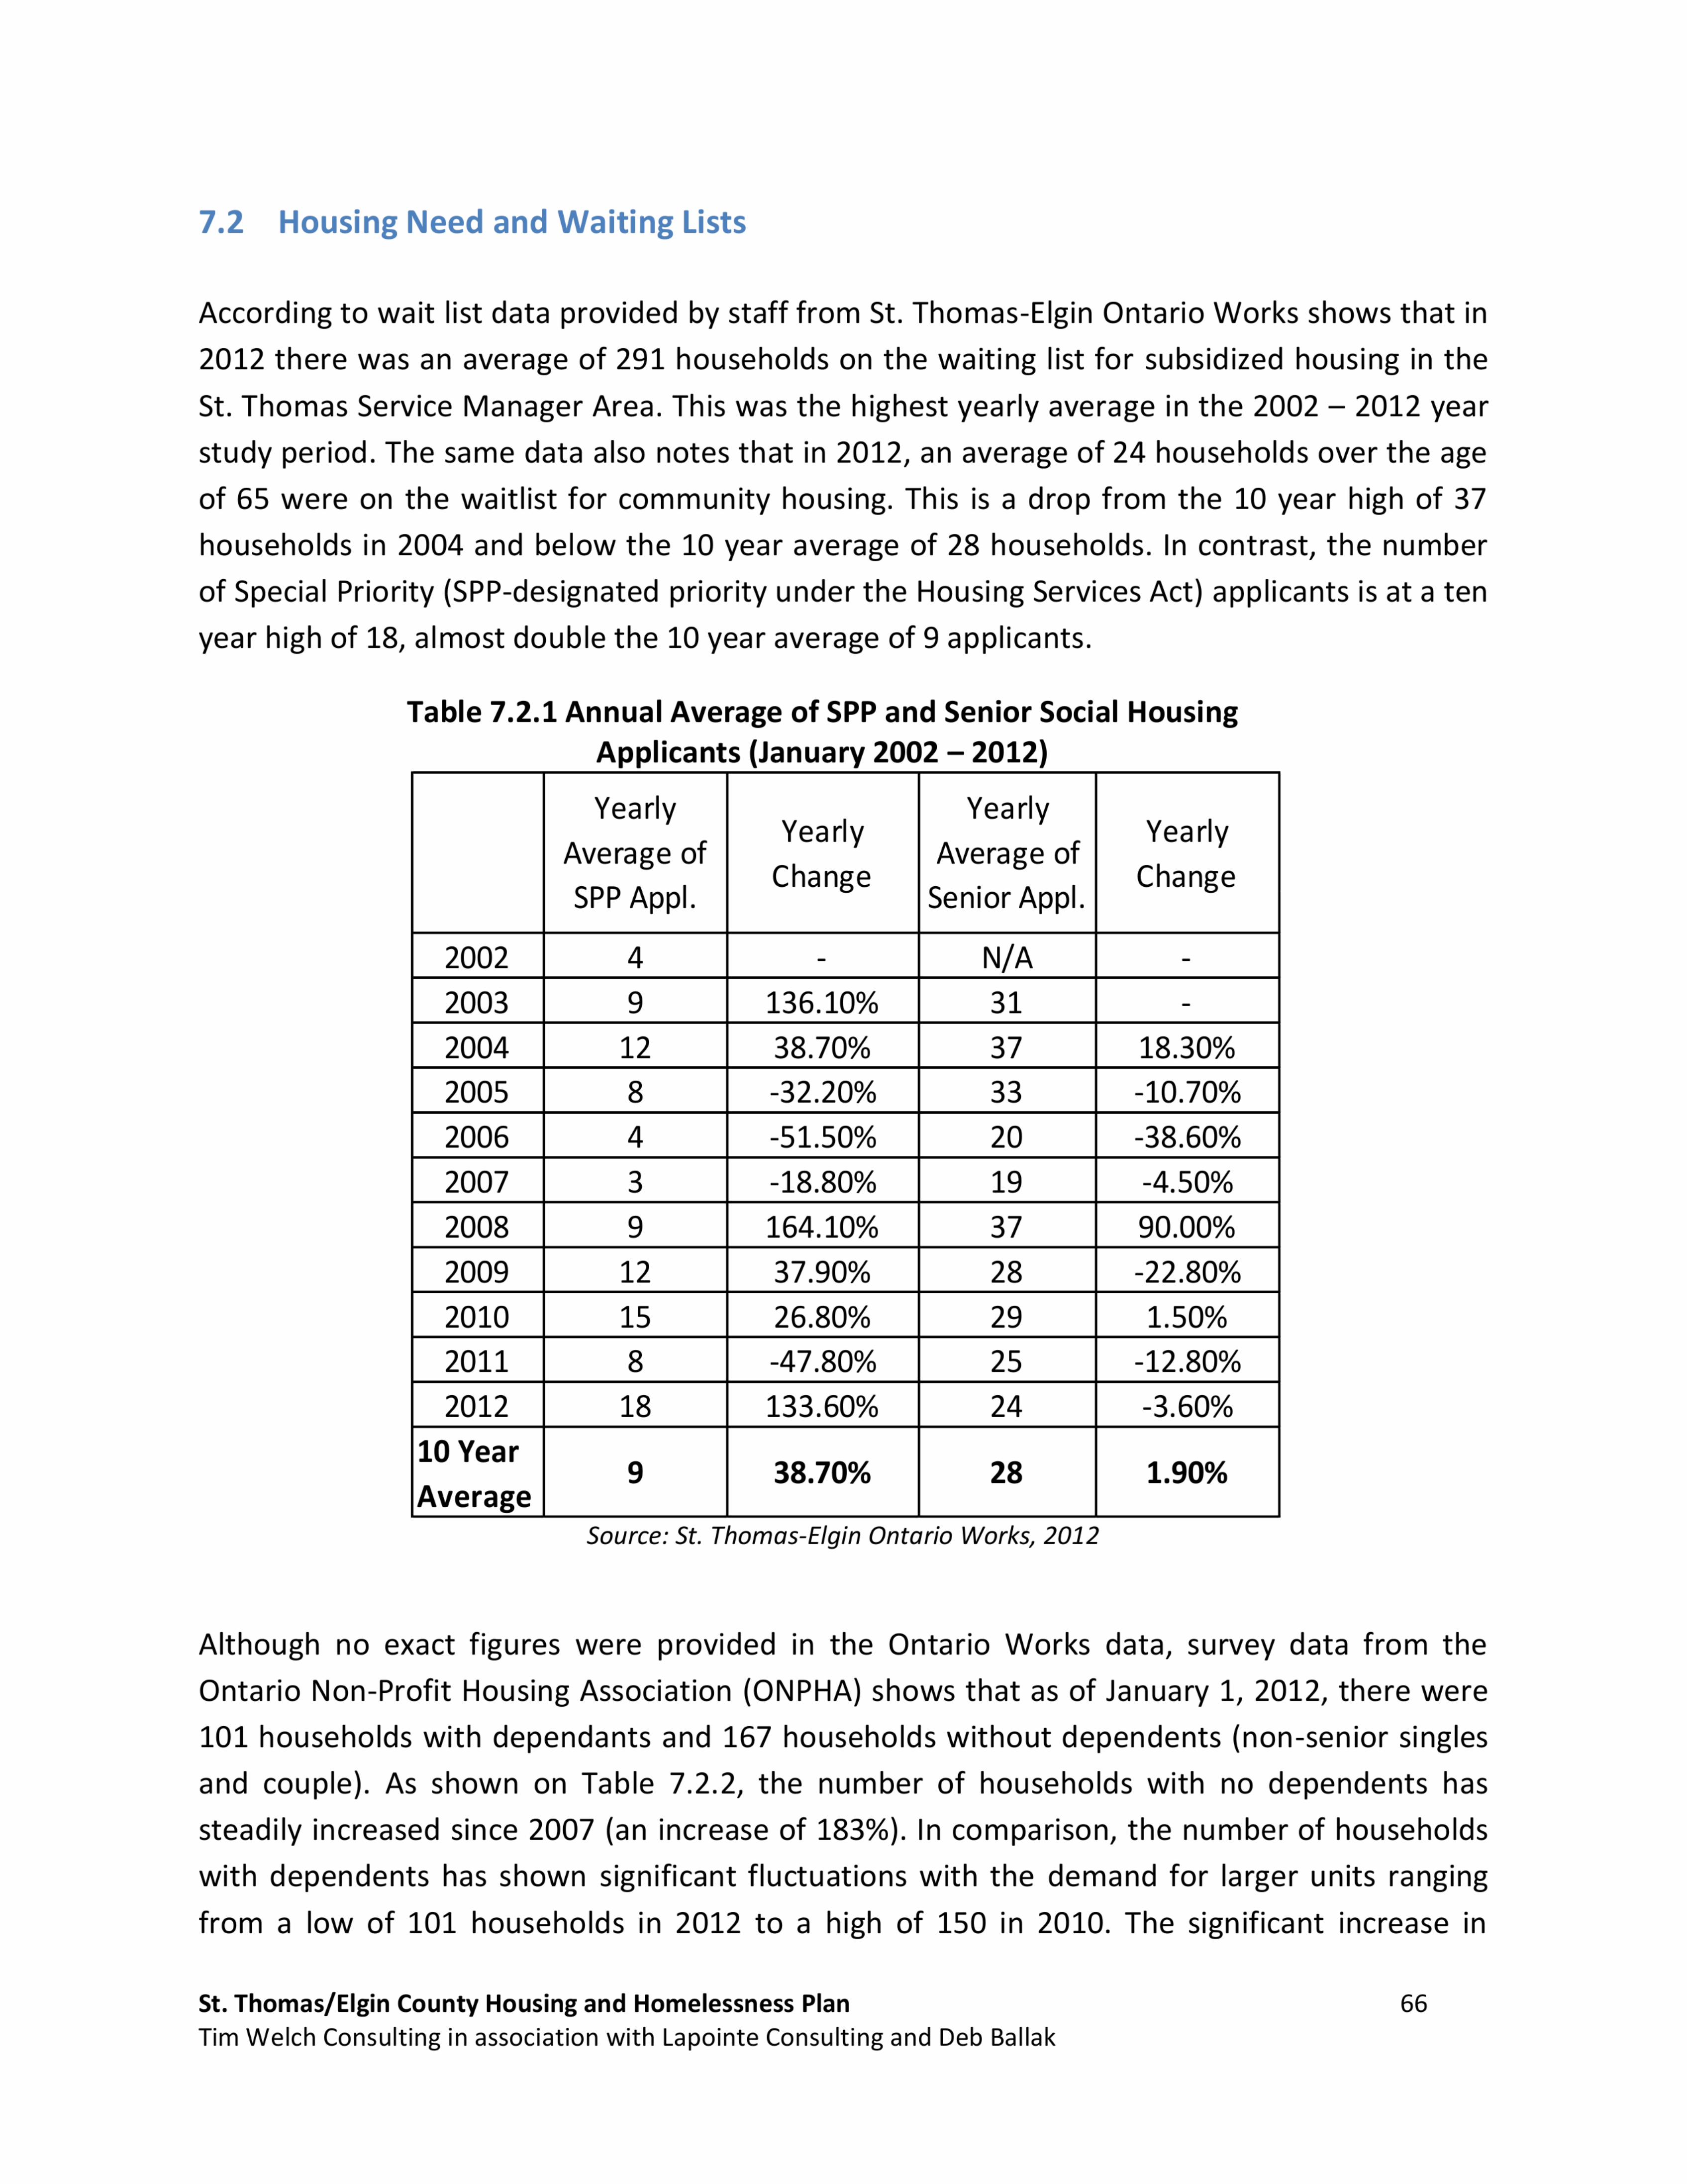
7.2 Housing Need and Waiting Lists
According to wait list data provided by staff from St. Thomas—E|ginOntario Works shows that in
2012 there was an average of 291 households on the waiting list for subsidized housing in the
St. Thomas Service Manager Area. This was the highest yearly average in the 2002 — 2012 year
study period. The same data also notes that in 2012, an average of 24 households over the age
of 65 were on the waitlist for community housing. This is a drop from the 10 year high of 37
households in 2004 and below the 10 year average of 28 households. In contrast, the number
of Special Priority (SPP—designated priority under the Housing Services Act) applicants is at a ten
year high of 18, almost double the 10 year average of 9 applicants.
Table 7.2.1 Annual Average of SPP and Senior Social HousingApplicants (January 2002 — 2012)
Yearly YearlyYearly Yearly
Average ofCh
Average ofChan e an e
SPP Appl.g
Senior Appl.g
4 — N/A —
136.10% 31 —
2007
2008
2009
1137 18-30%
11 33 -10-70%
20 -38-60%
3 -18.80% 19 -4.50%
9 164.10% 37 90.00%
12 37.90% 28 -22.80%
29 1-50%
11 25 -12-80%
24 360%
10 Year9 38.70% 28 1.90%
AverageSource: St. Thomas—ElginOntario Works, 2012
Although no exact figures were provided in the Ontario Works data, survey data from the
Ontario Non—ProfitHousing Association (ONPHA) shows that as of January 1, 2012, there were
101 households with dependants and 167 households without dependents (non—senior singles
and couple). As shown on Table 7.2.2, the number of households with no dependents has
steadily increased since 2007 (an increase of 183%). In comparison, the number of households
with dependents has shown significant fluctuations with the demand for larger units ranging
from a low of 101 households in 2012 to a high of 150 in 2010. The significant increase in
St. Thomas/Elgin County Housing and Homelessness Plan 66
Tim Welch Consulting in association with Lapointe Consulting and Deb Ballak

households with dependents in 2009 and 2010 may be attributed in part to the lingering effects
of the economic recession of 2008-2009.
Table 7.2.2 Waiting List for Social Housing in the St. Thomas Service Area(January 2007 — 2012)
Households Households
withAnnual
WithoutAnnual
Change ChangeDependents Dependents
2007
2008 . 42.40%
2009 128 20.80% 2.40%
2010 150 17.10% 10.50%
2011 131 -12.60% 9.50%
2012 — . 0% 60.60%
Six Year
Average E 0.00% 00.00%
Source: Ontario Non—ProfitHousing Association, 2012
In 2011, the average wait time for a social housing unit was 1.4 years. Households without
dependents waited an average of 1.0 years for a social housing unit while households with
dependents waited an average of 0.9 years. In comparison, households comprised of seniors
had to wait approximately 2.2 years to access social housing. It is important to note that there
are many more households’ that are not on waiting lists, but require affordable housing. For
instance, the 2009 Homeless Study noted that some applicants did not complete a social
housing application due to the long wait times despite their need for affordable housing.
Table 7.2.3 Average Number of Households on Social Housing Wait Lists in the St. Thomas —
Elgin Service Area: 2002 — 2012Average
Number of
Households
2010 260 -5.8%
250 -3.8%
291 16.4% |Source: St. Thomas—ElginOntario Works, 2012
St. Thomas/Elgin County Housing and Homelessness Plan 67
Tim Welch Consulting in association with Lapointe Consulting and Deb Ballak

Local waitlist data was also provided for unit sizes from 2002 — 2012. Overall, one—bedroom
apartments have the highest demand in the area with 45.6% of applicants applying for these
units in 2012. This is significantly higher than the demand for the second and third most
popular choice of three and two bedroom units which represented 23.2% and 19.5% of all filed
applications. The units in least demand were four bedroom, bachelor and five bedroom units
which represented 5.8%, 5.5% and 0.4% of the total applications for social housing in 2012.
Despite variations in the demand during the past ten years, demand for bachelor, one—, four-
and five—bedroom units has remained fairly stable when examining 2012 applications verses the
2002 — 2012 average. In comparison, demand in 2012 for two bedroom units was 7.6% lower
than the ten year average while the demand for three bedroom’s was 6.4% higher. Based on
the demographic trends discussed earlier, the strong demand for smaller units will continue
into the foreseeable future.
Within the Service Manager Area there is a relatively higher demand for units in the City of St.
Thomas than in other areas of the County. Some non—profit housing providers in the outlying
parts of Elgin County (Rodney, West Lorne, and Port Burwell) are finding it more challenging to
fill their social and affordable housing units as modest income residents seek to be close to
health, retail and various community services.
7.3 Municipal Planning Supports for Social and Affordable Housing
Lapointe Housing Targets and Condominium Conversion Report
The ability to maintain and expand a community's stock of affordable housing depends in part
on the direction and content of its planning documents including Official Plans and zoning by-
laws. In 2005, the Ontario government updated its Provincial Policy Statement (PPS) to provide
direction on a number of new land use and other municipal areas. Among these changes was
the requirement that all municipal Official Plans create specific targets for the provision of
affordable housing.
To conform to the PPS, the City of St. Thomas undertook a number of background studies and
reports. Among these was the AffordableHousing Targets and Condominium Conversion Policy
report written in 2008 by Lapointe Consulting Inc. The Lapointe Consulting report provided a
detailed definition of affordable housing, population and household projections and a set of
recommendations on how to increase the affordable housing stock, targets for the provision of
new affordable housing (as a % of new housing units) and recommendations for revising the
City's condominium conversion policy. The recommendations and targets contained in the
report include (verbatim)8:
8 Full recommendations from the report can be found in the AppendixSt. Thomas/Elgin County Housing and Homelessness Plan 68
Tim Welch Consulting in association with Lapointe Consulting and Deb Ballak

0 Adopt the 2005 Provincial Policy Statement’s definition of affordable housing andamend it as per new definitions in federal/provincial affordable housing programs.
0 Update household income, average market rent and purchase prices on an annualbasis.
0 Adopt 20-year annual affordable housing targets (23% of new housing should beaffordable; 15% of it affordable ownership; and 8% of the new housing should beaffordable rental housing).
0 Monitor the provision and production of affordable housing.
0 Continue to participate in federal/provincial affordable housing programs.
0 Advocate senior governments for a stable funding base for affordable housing.
0 Undertake information sessions on housing (i.e. housing affordability, benefits ofaffordable housing etc.).
0 Encourage affordable housing projects through a variety of means (i.e. financialincentives).
With regard to the existing condominium conversion, the report also recommended that the
City rescind its existing policy and institute the following (verbatim of high|ights)9:
0 Prohibit the conversion of an existing rental building to a condominium unless theCity has had a vacancy rate above 3% for more than four years.
0 Prohibit the conversion of a rental building when it will have a negative effect onthe supply of rental housing, especially that which is affordable to the lowest 60”‘percentile.
0 A new set of requirements for the submission of a condominium conversionapplication.
0 Public meeting with affected tenants to inform them of their rights under relevantlegislation.
Implementation of Lapointe Report Recommendations
As shown on Table 7.3.2 the implementation of the Lapointe report recommendations vary in
each of the communities. Of the nine Official Plans in the St. Thomas — Elgin County area only
three incorporated all of the report's recommendations. The remaining Official Plans
incorporated a portion of the recommendations with the municipalities of Dutton—Dunwich and
Malahide each implementing one. The most widely used recommendations were ”promoting a
mixture of housing types” and ’’affordable housing targets” while the least used were
9 Full recommendations from the report can be found in the AppendixSt. Thomas/Elgin County Housing and Homelessness Plan 69
Tim Welch Consulting in association with Lapointe Consulting and Deb Ballak

”monitoring average market home purchase prices and rents” and ”monitoring affordable
housing trends.”
It should be noted that the targets for new affordable housing vary slightly among the Official
Plans. The target in Central Elgin for instance was 21.4% while the Town of Aylmer created a
target of 25%, 15% of which will be targeted to renter households. In the case of St. Thomas,
their Official Plan noted that the City would adopt the targets as outlined in the 2008 Lapointe
report, but did not give a specified timeline for its adoption. There was no distinction of rental
and ownership affordable housing in Central Elgin. Likewise, while Aylmer created a target to
specify the composition and tenure of new housing, most municipalities did not and preferred
to provide a statement issuing their support for a greater diversity of housing.
Condominium Conversion Policy
To help preserve the existing affordable rental housing stock in St. Thomas, the City's OfficialPlan Amendment No. 66 amended its existing condominium conversion policy by incorporating
all of the recommendations found in the 2008 Lapointe Consulting Report.
Due to the composition of the rental stock in Elgin County, these recommendations were not
found in the County's Official Plan. Nevertheless the Town of Ay|mer’s Official Plan notes that it
will examine the potential impacts of converting rental dwelling units into condominiums on
the availability of affordable housing when such applications are made.
Secondary Units and Group Homes
In 2011, the Province passed the Strong Communities through AffordableHousing Act, 2011
which required municipalities to establish Official Plan policies and zoning by—|awprovisions to
allow secondary units in detached, semi—detached and row houses and in ancillary structures.
To this effect, the Elgin County OfficialPlan requires that local Official Plans permit their
construction:
Local municipalities are also required to establish local Official Planpolicies and Zoning By—|aw provisions to allow second units indetached, semi—detached, row houses and ancillary structures. Localmunicipalities are also encouraged to include local Official Planpolicies with respect to garden suites. Encouraging the establishmentof second units and garden suites will also assist in meetingresidential intensification targets and the provision of affordablehousing.1°
10 Official Plan of the County of Elgin, C1.3.2 General Provisions, p. 39 (2012)St. Thomas/Elgin County Housing and Homelessness Plan 70
Tim Welch Consulting in association with Lapointe Consulting and Deb Ballak

Currently only one Official Plan in the St. Thomas — Elgin County area (Central Elgin) permits the
construction of secondary or accessory units in residential buildings. The remaining
municipalities are in the midst of creating new Plans or reviewing existing Plans to permit
second units through changes to their Official Plans and in the zoning by—|awsthat complement
the Official Plans. The County Official Plan with the provision to allow second units was adopted
by County Council in July 2012 and is currently being reviewed by the Province.
With regard to group homes, four communities have instituted minimum separation distances
in their Official Plans (Aylmer, Bayham, Central Elgin and Dutton—Dunwich). The remaining five
do not have this requirement and in the case of St. Thomas, permit group homes in all areas
that are zoned as residential.
Table 7.3.1: St. Thomas Affordable Housing Targets, 2006 — 2026Share Affordable
Total Housing Affordable Units Annual PercentOwned HousingSingles 3,904 10% 390 20Semis 408 25% 102 5
Townhouses 346 60% 207 10Apartments 159 100% 159 8
Total Owned 4,817 81% 859 43 63%
Rental HousingApartments 474 80% 379 19Townhouses 148 80% 119 6
Other 514 0% 0 0
Total Rented 1,136 19% 19% 25 37%
Total Housing Units 5,953 100% 100% 38 100%
Percent Affordable 22.8%
Source: Housing Targets and Condominium Conversion Report, Lapointe Consulting, 2008
St. Thomas/Elgin County Housing and Homelessness Plan 71
Tim Welch Consulting in association with Lapointe Consulting and Deb Ballak

Table 7.3.2: Adoption of Lapointe Report Recommendations in Local Official PlansM ' M ' T I '
. . Promote Defineomtor
Affordableomtor 00 S/Strategles
LocalOfficial . average market . Affordable to encourageMixture of Affordable Housing .
Plans . . rent and Housing affordableHousing Housing . Targets .
purchase prices trends housingSt. Thomas X X X X X X
Elgin County X X X X X
Aylmer X X X X X X
Bayham X X X X
Central Elgin X X X X X X
Dutton—X
DunwichMalahide X
Southwold X X X X
West Elgin X X X XSource: O?icialPlans fromService Manager Area
St. Thomas/Elgin County Housing and Homelessness Plan 72Tim Welch Consulting in association with Lapointe Consulting and Deb Ballak

8 Overview: Defining Homelessness
St. Thomas and Elgin County face significant challenges for current and future affordable
housing needs. There are a large number of households with affordability issues but there are
also a significant number of those households who have additional challenges for supports or
other services/assistanceto remain stably housed to prevent homelessness.
In assessing the need for supports and services to persons who might become homeless, and to
understand the context of providing support services to persons who actually are homeless, it is
important to provide a definition of homelessness.
From discussions with City staff and community stakeholders, the term homeless is commonly
meant to include persons who are absolutely homeless — without a regular night time residence,
those who are precariously housed such as living in unsafe and unstable conditions, as well as
those who have housing but are ”at risk” of losing their residence.
The definition from the St. Thomas and Elgin County Study on Homelessness (2009) provides a
useable and inclusive definition that is based on the Service Canada definition. It reflects what
the community commonly refers to as homelessness. This definition has been slightly modified
for this Needs Assessment.
Homelessness is definedas persons/families who are living on the street, who are accessing
emergency or transitional housing, the hidden homeless (who are residing with friends/family,
often referred to as ‘couch surfing’, or in abandoned buildings etc.), and those at risk ofhomelessness.
At—riskof becoming homeless are persons/families at imminent risk of eviction, who pay too
high a proportion of their income on housing, or who live in unacceptable housing or housing
circumstances.
The ”Responding to Youth Home|essness”11 study states that despite other factors ‘the absence
of housing is the definition of homelessness’. The above definition concurs with the youth
study with one addition ‘the absence of ’’stable’’ housing is the definition of homelessness’.
11 Community Council for Children and Youth in Elgin: Responding to Youth Homelessness in St. Thomas and ElginCounty. Prepared by OrgCode Consulting Inc. January 10, 2013.
St. Thomas/Elgin County Housing and Homelessness Plan 73
Tim Welch Consulting in association with Lapointe Consulting and Deb Ballak

How Many People are Homeless, or At Risk of Homelessness?
This section looks at some of the indicators that lead to homelessness, or risk of becoming
homeless. It should be noted that some of these population groups will overlap:
8.1 Shelter Use
The peak average combined usage at the Inn out of the Cold and the YWCA shelter was 12
households. When emergency shelters are full, or non—existent for the type of person, or the
individual or family cannot physically get to the shelter, OW staff pay for motel accommodation
on a short—term basis. In 2012, 8 different single persons, 1 family and 2 couples stayed at
motels for a combined total of 19 nights.
Chart 8.1.1: Average Emergency Shelter Bed use 2012
1210
8-O—|nn Out of the Cold av.
6 .4
beds/night
2 -I-YWCA av. beds/night
O _
o~o~o'%te\~\\'~‘&~\c{O <8’W15’$5‘V9 \‘’'° 30 w>s’°’5%‘:0° %° 0°’
Source: City ofSt. Thomas, Ontario Works Department
NOTE: Inn Out of the Cold is closed May 1 to Sept. 30YWCA has 3 beds designated as emergency shelter beds
8.2 Social Assistance Recipients
0 The caseload numbers from the OW and ODSP caseloads provide an indicator of thenumber of households on very limited incomes who cannot afford market rents and maybe ”at risk” of homelessness.
0 As stated earlier in this report, there are no market rental options for those in the lowestincome bracket which includes those receiving social assistance.
0 The chart below shows that the average number of households receiving OW and ODSPhas increased by 158.8% since 2005.
o In January and February 2013 there were 19 and 14 people (respectively) who receivedOntario Works and who had ”No Fixed Address”.
St. Thomas/Elgin County Housing and Homelessness Plan 74
Tim Welch Consulting in association with Lapointe Consulting and Deb Ballak

Chart 8.2.1: Average Yearly Ontario Works and Ontario Disability Support Program Caseloads,
2005-2012
4500
4000
3500
3000
2500 _
11752000 -I-ODSP
2224
1500 1649 _._oW
1000 123
500
2005 2006 2007 2008 2009 2010 2011 2012
Source: City of St. Thomas Ontario Works Department
NOTE: Records for Q4 2006 damaged, average is to 03 only,Average caseload for 2012 is average of Q3 and QSonly.
8.3 Households with Affordability Problems
Affordability problems are described here as paying more than 30 percent of income on
housing costs.” People in receipt of either Ontario Works (OW) or Ontario Disability Support
Program (ODSP), are not the only people who have affordability problems, however the second
table below 8.0.2 notes that most social assistance recipients do have serious to severe
affordability problems in meeting shelter costs.
12 See also section 6.4 for the definition of affordable rental and affordable ownership housing, as per theProvincial Policy Statement
St. Thomas/Elgin County Housing and Homelessness Plan 75
Tim Welch Consulting in association with Lapointe Consulting and Deb Ballak

Table 8.3.1: Monthly Income for Households on OW/ODSP, 2012
Maximum _
Monthly Basic Needs Shelter Mixonta”_° Total_ Child Benefit
Benefit
Ontario Works (OW)
Single $277 $372 $0 $599Couple $448 $584 $0 $1,032Single Parent + 1 child $347 $584 $92 $1,023Single Parent + 2 children $347 $634 $184 $1,165Couple + 1 child $448 $634 $92 $1,174
Ontario Disability Support Program (ODSP)
Single $590 $474 $0 $1,064Couple $873 $745 $0 $1,618Single Parent + 1 child $733 $745 $92 $1,570Single Parent + 2 children $751 $807 $184 $1,742Couple + 1 child $873 $807 $92 $1,772
Age of children in rates shown = under 18 for OW, under 13 for ODSP with 1—chi|d,one each <13
and 13+ for ODSP with 2 children.Source: Income Security Advocacy Centre
The table below shows that the maximum shelter benefit allowed under both the OW and
ODSP programs does not meet the Provincial Policy Statement definition of affordability (30%)
even though the market rents for some social assistance participants is within the ”maximum
shelter benefit”.
Table 8.3.2: Market Rental Affordability for Social Assistance RecipientsHousehold size 1 bed $630* 2 bed $765* 3 bed $847*
OW Single Can't afford Can't afford Can't afford
OW Couple Can't afford Can't afford Can't afford
OW Single parent + 1 child Can't afford Can't afford Can't afford
OW Single parent + 2 children Can't afford Can't afford Can't afford
OW Couple + 1 child Can't afford Can't afford Can't afford
ODSP single Can't afford Can't afford Can't afford
ODSP Couple Can't afford Can't afford Can't afford
ODSP Single parent + 1 child Can't afford Can't afford Can't afford
ODSP Single parent + 2 30%: $627 Can't afford Can't afford
children
ODSP Couple + 1 child 30%: $637 Can't afford Can't afford
*Average market rent Dec 2012 (CMHC)
St. Thomas/Elgin County Housing and Homelessness Plan 76
Tim Welch Consulting in association with Lapointe Consulting and Deb Ballak
8.4 Youth
The Youth Homelessness Report (January 2013) estimates that there are between 100 and
300 youth who are homeless at a time, with a significant portion of these youth staying
with friends for the short term. Further, that about 10% are high risk of becoming
homeless for a longer term and 10% can be considered medium risk”.
The following two indicators are cited cautiously as they are generally regarded as
measures ofdeep poverty rather than ofhigh risk ofbecoming homeless.
8.5 Food Bank usage
In St. Thomas, the Caring Cupboard Food Bank assists approximately 35014families or 800
individuals a month — approximately 37% of those are children. In 2012 the Caring
Cupboard served approximately 9,600 households.”The Caring Cupboard is one of the
main Food Banks, but not the only food bank and many meal programs operate in the
area.
The 2012 Hunger Report published by the Ontario Association of Foodbanks reports that
412,998 households received food bank assistance in the province, in March 2012,
surpassing the record number served during the recession of 2008 of 374,000
households.”The report notes that households in rural areas often use food banks
because they are isolated and have limited access to community services. Also many rural
seniors live alone and struggle physically, emotionally, and financially.
8.6 Social Housing Waiting list
The centralized waiting list for households requesting rent—geared—to—income(RGI)
housing in Dec. 2012 was approximately 291 households, with single persons waiting up to
2 years for social housing. Waiting list numbers are an incomplete indication of
homelessness or at risk, as many homeless people are discouraged by the wait, their need
is urgent and they do not apply, or do not keep their applications active. Also many
seniors are on this waiting list for reasons other than being at risk of homelessness.
13 Responding to Youth Homelessness in St. Thomas and Elgin County. Community Council for Children and Youthin Elgin (CCCYE).January 10, 2013.14 Data references www.caringcupboard.ca and Brian Burley15 www.caringcupboard.ca16 www.oafb.caSt. Thomas/Elgin County Housing and Homelessness Plan 77
Tim Welch Consulting in association with Lapointe Consulting and Deb Ballak

Trends in the Homeless PopulationKey Informants were asked to describe recent trends, requests for programs or funding, and
client characteristics. Their comments are listed as:
0 There are greater numbers of people with diagnosed and undiagnosed mental
health and addictions issues, and there is a trend toward these people being
youngen
0 Employment destabilization was cited as a primary cause in the increase in mental
health and addiction issues. When a person's economic value is taken away it leads
to loss of hope, other issues are compounded, and these are also often reflected in
the health of other family members.
0 Concern about psychiatric supports moving out of the community, closing beds and
the perception that people will be left without the supports they need,
transportation (to London) is often a barrier.
0 Former patients of the Regional Mental Health Centre in St. Thomas put down roots
in this area to be close to supports and treatment.
0 Higher percentage (than Ontario) of teenaged pregnancies and unwed mothers, and
their associated needs for supports and affordable housing.
0 Increase in the number of homeless youth and a perception that they are
presenting at a younger age, and with more complex problems. More instances of
male sexual abuse have been seen.
St. Thomas/Elgin County Housing and Homelessness Plan 78
Tim Welch Consulting in association with Lapointe Consulting and Deb Ballak

9 HOMELESSNESSPROGRAMS, SUPPORTS AND SERVICESExisting Homeless Programs, Supports, and Services
The number of reasons that people find themselves without a home can be as varied as the
individuals and families themselves. As a Service Manager for a smaller and geographically vast
Service Area, the City is challenged to address many diverse issues, which are often
compounded by social, economic and health problems, and limited resources.
Homeless Programs Supports and Service System
The system of services for those who are homeless or at risk/precariously housed, consists of a
number of interrelated programs supports and services: outreach to prevent loss of housing,
housing retention programs such as rent and utility banks, referrals for financial, legal,
educational/vocationalservices, physical and mental health issues, supports such as food
banks and meal programs, help to find appropriate housing such as emergency, market or
subsidized housing, transitional or supportive housing, and supports to maintain that housing.
To meet these complex challenges the City and community partners often ”qui|t together”
funds and volunteer resources, to provide the system of services needed in the community.
Chart 9.0.1: Emergency Shelter, Transitional and Supportive Housing inSt. Thomas — Elgin County
emergency shelter transitional supportiveInn Out of CMHA VAWSEC ASH Victoria‘sthe BfanCh beds for women Home
women and men‘s 6 crisis beds and cnndren Victims 4 beds 20 bed domiciliaryShelter group homes of domennc addictions hostelOct-Mar supportive housing Violence focus Fresh start
YWCA YWCA St. Thomas group home and
3 enmgency beds Second Storey Elgin Second support housing
20 bed residence °" Ta'b°t Stage H°“5i"9 Womenand
transitional long. 6 bed transitional longer term needs Children
term supportive h0U5l”QPloglam R?’Womfarland Wallis
YWCAfor men ghlldrenvlctlnwsof Residential
CMHA YWCAomestic VIO ence Homes‘
I
_
city Fair winds YWCA 38 beidotmllciliary4 bedroom house 3 bed transitional Tar:SHea"for emergency or
transitional housingfor family
housing programfor young men 3 bed transitional
housing programfor young women
3 mos. transitionalfunding for 36 beddomiciliary hostel
St. Thomas/Elgin County Housing and Homelessness PlanTim Welch Consulting in association with Lapointe Consulting and Deb Ballak
79

9.1 Existing Homeless Programs, Supports, and Services 17
Table 9.1.1: Homeless Programs, Supports and ServicesProgram Delivered by Annual Description
AllocationHeLP (Housing Links for City of St. Thomas $642,690 Immediate financial assistance to low-incomePeop|e)* allocated households to prevent homelessness. Items covered
for April 1, include; rent and utility arrears, (replaces former rent
(New program under 2103 to and utility bank) max. 5 days in motel, costs to
CHPI-100% Provincially March 31, establish permanent/sustainable residence, dailyfunded) 2014 living costs i.e. food vouchers, etc. This program
covers similar expenses as were covered under theformer Community Start Up and MaintenanceBenefit (CSUMB),differing in that HeLP is a
discretionary benefit.Applicants must be: homeless, in immediate dangerof losing housing/at risk of homelessness. RGI
tenants are not eligible for HeLP for rent arrears.
Maximum household income limits pertain.Annual maximum assistance is $650 for householdswith no children, $1,250 for households withchildren.
LEAP (Low-Income Housing Dept $6,775 Helps low income households with hydro costs
Energy Assistance administers on paid twice where there is shut-off or risk of shut-off. Max. grant
Program) behalf of St per year $500 per year or $600 for hydro customers. Cases
St. Thomas Energy Thomas Energy to City reviewed by the Housing Programs Coordinator.
Customers
LEAP - Erie ThamesPowerlines Energy
Customers (County)
Salvation Army Helps low income households with energy costs
where there is shut-off or risk of shut-off. Max. grant
$500 per year or $600 for hydro customers. Cases
reviewed and paid through Salvation Army.
LEAP - Hydro One
Customers (County)United Way ofGreater Simcoe
Intake—St. Thomas
Utility arrears only once per year for Hydro One, lowincome households, where there has been shut off or
threat of shut off. Intake and verification done byHPC and sent to United Way.
Salvation Army FamilyAssistance Program
(County)
Funded anddelivered bySalvation Army
Covers utility arrears and other fuel sources (notUnion Gas) that have been disconnected or are
under threat of disconnection. Maximum grant is$350 per household.
Winter Warmth Program- Union Gas and other gas
Union Gas inpartnership with
Red Cross assesses applications for arrears anddisconnects for Union Gas only. For low income
17 For a complete inventory of Homelessness and I-ousing related services see Responding to Youth Homelessnessin St. Thomas and Elgin County. Community Council for Children and Youth in Elgin (CCCYE).Prepared by OrgCodeConsulting Inc. January 10, 2013.
St. Thomas/Elgin County Housing and Homelessness PlanTim Welch Consulting in association with Lapointe Consulting and Deb Ballak
80

Program Delivered by Annual DescriptionAllocation
Companies i.e. NRG local United Way households in Elgin County. Access is limited to once(County) a year. Payment is made directly to Union Gas,
maximum $500 per year per family.
Hydro Settlement Fund City of St. Thomas $30,000 Helps low income households with electricity costs-
used as a last resort for emergencies.
Local Home Repair City of St. Thomas $100,940/ To help low income households with essentialProgram 3 yrs. emergency repairs such as roofs, furnaces, windows,(New program) leaky basements, hand rails, etc.
Housing Allowances City of St Thomas $77,226 Housing Allowances assist social assistance recipients(100% Provincial/Federal) (2012) and the working poor to afford market rent, average
$140 per month.Strong Communities Rent City of St. $226,444 Full rent-geared-to—income subsidies are paid to
Supplement Program Thomas/Elgin and (2012) private and non—profit landlords to assist low-income(100% provincial) St. Thomas households with the cost of rent.
Housing
Corporation
CMHA Crisis Phone Line CMHA Crisis phone line operating 24/7open to anyone.
Violence Against Women, VAWSEC VAWSEC runs several programs in addition to theServices Elgin County shelter, such as the Sexual Assault Centre, Child
Witness, Prevention through Education, 24 hour HelpLine, the Coordinated Response Program,
Transitional Housing Support Advocacy, and Legalprograms.
Focus Fairview Elgin and St. This is a community development project initiated byThomas HousingCorp. (ESTHC)andmany community
agencies andorganizations
ESTHCin 2009 to recognize the impact of poverty onthe families in the housing community and to provideeducation and needed services, while promoting
resident and community involvement andcommitment. (See Section 9.3).
Community HealthCentres
Ministry of Healthand Long Term
Care
Two centres; the Central CHC in St Thomas and West
Elgin CHC in West Lorne, provide primary health care
and health promotion to individuals and families to
strengthen their capacity to take more responsibilityfor their health and well-being. Many people whovisit these centres are low income and/orhavemental health and addiction issues that present
challenges to finding and keeping housing.* See page 71 re: the changes to homelessness funding.** See Table 9.3.1 for funding and funding changes effective January 2013.
Housing Retention Programs for Low Income Renters
Housing Allowances and Rent Supplements
As stated earlier in this report, over 40% of renters in St. Thomas—E|ginCounty spend more than
30% of their income on housing costs resulting in a housing affordability situation, routinely
making the choice between paying rent and food. In addition, for those in rural areas, the
minimum delivery for heating oil is $600, and for propane $400-$600. Housing Allowances and
St. Thomas/Elgin County Housing and Homelessness PlanTim Welch Consulting in association with Lapointe Consulting and Deb Ballak
81

Rent Supplements are seen to be one of the most effective ways to assist low income renters to
maintain their current (sustainable) housing, while allowing them to continue to live in the
community of their choice.
The Investment in Affordable Housing Program (IAH) is part of the province's multilateral
Affordable Housing Framework: Building Foundations: Building Futures, Ontario's Long—Term
AffordableHousing Strategy that was announced on August 10, 2011. IAH provides a notional
funding allocation to service managers to deliver five housing program components18inaccordance with identified community needs.
The City of St Thomas extended their current Rent Supplement and Housing Allowance
programs through the IAH by allocating $100,000 to extend the 2009 Extension HARS program
and the Short—Term Rent Support Program (STRSP)when the funding ended on March 31, 2013.
Through the Housing Allowance program, at least 28 households will be able to continue
receiving rent supports while waiting for subsidized housing. Housing Allowance funding has
proven to be an effective homelessness prevention program; although full rent geared to
income (RGI) housing through either a rent supplement or moving into an RGI unit in social
non—profithousing does provide the best level of ongoing affordability.
Housing Retention Programs for Low Income Home Owners
St. Thomas—ElginHome Repair Program
The Housing Needs Assessment identified that there are about 4,000 home owner households
with affordability problems. Many of these homeowners often live in older homes that require
necessary life and safety repairs, or modifications for physical mobility. Funding from
IAH administration dollars, in the amount of $100,940 has been allocated to fund the St.
Thomas—ElginHome Repair Program.
The objectives ofthe St. Thomas—ElginHome Repair Program are:
0 To improve the living conditions of households in need through financial assistance to
repair essential deficiencies for |ow—income home owners. Emergency repairs related to
life and safety issues are considered a top priority.
0 To foster independent living of seniors and persons with disabilities by providingfinancial assistance to support modifications and renovations to increase accessibility ofaffordable ownership properties.
The type of work approved includes new roofs, major bathroom repairs, basement drainage
repairs, hand rails and other modifications for a physical disability, new windows, new furnaces,
18 The five components of the IAH program are: Rental Housing (new construction), Homeownership, Ontario
Renovates (formerly RRAP)Rent Supplements, and Housing Allowances.St. Thomas/Elgin County Housing and Homelessness Plan 82
Tim Welch Consulting in association with Lapointe Consulting and Deb Ballak

insulation, major kitchen repairs, etc. Applicants who are Union Gas customers are referred to
the new Union Gas Helping Homes Conserve program for sing|e—fami|y homeowners. This
energy saving incentive program covers insulation, new windows, |ow—f|ow showerheads,
programmable thermostats, etc. St. Thomas Energy also has an energy conservation program
for homeowners with similar incentives.
Previous to the St. Thomas—E|gin Home Repair Program (2012) these types of repairs were
completed through the Residential Rehabilitation Assistance Program (RRAP), delivered and
funded through the Canadian Mortgage and Housing Corporation (CMHC). The average cost
per home under that program was approximately $10,000.
The criteria for the St. Thomas—E|gin Home Repair Program is different than the criteria for
RRAP, although many ofthe repairs are similar to those under RRAP. As of the end of February
2013 work has been approved for 8 homeowners totalling $43,767 (averaging $5,471 per
household). Should this average cost per household continue, approximately 18 households
will be assisted through this program to March 31, 2015.
Table 9.1.2: Programs for HomeownersCMHC RRAP St. Thomas — Elgin Home Repair
Delivered by CMHC* Proposed # of Homes
# of Homes/totalcost (Provincial funding)
(Federal funding)
2008/09 10 homes — cost $91,808 n/a2009/10 13 homes — cost $130,034 n/a2010/11 20 homes — cost $198,195 n/a2011/12 n/a n/a2012/13 n/a2013/14 n/a approx. 18 homes — cost $100,940
2014/15 n/a over 3 years
Source: City ofst. Thomas and CMHC *Not including rental or garden suites
9.2 Service Usage Indicators
Homelessness Programs, Supports, and Services
The ability to determine whether funding and staff levels are adequate to address the needs of
the homeless and at risk populations is limited by several factors:
0 The number of people served/supported in a program is often determined by availablehuman and fiscal resources/budget allocations, and not determined by community need.
St. Thomas/Elgin County Housing and Homelessness Plan 83
Tim Welch Consulting in association with Lapointe Consulting and Deb Ballak

0 Waiting lists for services are not always kept, so it is not possible to determine thosewho have n_o’c been able to access timely services. Waiting lists are often not
appropriate or helpful for services geared to immediately meeting the urgent needs ofpeople, and are therefore not part of all services.
0 In the case of shelters the number and ‘mix’ of resident needs greatly impacts the abilityof staff and support service agency staff and/orvolunteers to provide support.
Chart 9.2.1 Costs of City Delivered Homeless Programs (prior to Jan. 1, 2013)
$350,000
$300,000
2 $250,000'87;,$200,000<
é$150,000
.2 $100,000
$0-_ _ 1
HomelessEmergenc Leap . Rent
nessEner Ener Rent Bank
HousmgSuppleme
Initiativey gy gy
AllowanceFund Fund nt
Fund
l2010 $73,280 $26,490 $0 $26,643 $97,193 $295,644
l2011 $81,656 $13,990 $5,759 $36,859 $77,226 $272,736
Source: City ofSt. Thomas Ontario Works Department
St. Thomas/Elgin County Housing and Homelessness Plan 84Tim Welch Consulting in association with Lapointe Consulting and Deb Ballak

Chart 9.2.2: City Delivered Homeless Programs — Households Served Prior to Jan. 1, 2013
600904
500 . 455
400
300
200
100 F“2° O 22 36 41
4 455 4%
-2010O ‘ 1
_‘
I 2011
Q36 Q§© Q§© Q¢§ 6&9 $¢§.\,e .9 A 6» 0*‘ \0ve K «°0 e \\ Q
.12, ® Q; Q‘ V Q. \ 0 0 0gs <9 <<, .000 ,5\ 6 $2 9* 0.59 0 <0 0 0
Q, Q1 \, 0 Q‘
64;‘ <°Q}°o *2‘\ <9<00
$0
Source: City ofSt. Thomas Ontario Works Department
Food Security: Food Banks and Meal Programs
As noted previously, food bank and meal program usage are not direct indicators of
homelessness or ‘at risk’for individuals and families, however they are regarded as measures of
deep poverty. The Healthy Communities Report (March 2011) notes that ”there is a strong
interplay between healthy eating and stable housing for the communities’ low income
population”.
The Food Security system in St. Thomas and Elgin County consists of:
0 Student Nutrition Programs operating in 34 elementary and secondary schools in Elgin
and St. Thomas. Approximately 12,800 students participate on a daily basis.
0 Seven formal food banks in the City and County with many informal acts of charity from
institutions and individuals. The Caring Cupboard (food bank) in St. Thomas indicated a
9% increase in numbers from March 2010 to March 2011, although other food banks
report their numbers are status quo.19
19 Nutritious Food Basket Report: the Cost of Eating in St. Thomas and Elgin County. Elgin St. Thomas Public Health,2011
St. Thomas/Elgin County Housing and Homelessness Plan 85
Tim Welch Consulting in association with Lapointe Consulting and Deb Ballak

Family and Children's Services (FSC)
FCS has reported seeing a 16% increase in the number of families served by their agency since
2008. Thirty—seven percent of these families have children 18 years and under. They suspect
that not all homeless people se|f—identify and usually disclose that they are staying with friends
or couch surfing.
Violence Against Women, Services Elgin County (VAWSEC)Staff report that they help 170 families annually in the Transitional Housing program that
provides support to women and their children in the community to help them maintain their
housing and stay safe. This includes advocacy with landlords and housing providers.
CMHA Crisis Phone LineCMHA receives approximately 1,100 calls per month, and reports that of these calls 33% are
from people with issues regarding shelter or permanent housing.
9.3 Evolution of Services (Changes)
Homelessness Programs, Supports, and Services
Consolidated Homelessness Prevention Initiative (CHPI)
The CHPI program took effect January 2013. CHPI combines five previously existing
homelessness prevention programszo,as well as half of the former Ontario Works and Ontario
Disability Support Program, CSUMB, into one consolidated funding envelope. CHPI is intended
to provide better coordinated and integrated service delivery to prevent, reduce, and address
homelessness with a focus on two key outcomes:
1. Helping people experiencing homelessness obtain and retain housing, and
2. Ensuring people at risk of homelessness remain housed.
The City is required to submit a Counci|—approved Investment Plan to the Province in each of
the first three years of the CHPI program, outlining how the funds will be used to address
homelessness in the community. After the third year, the annual funding allocation will be
rolled into a three—year reconciliation cycle.
Within the broad provincially prescribed parameters, the City has used the flexibility for funding
in the following categories and amounts for the 2013/14fiscal year. Given that this is the first
20 The five previously existing programs include: the domiciliary hostel program, emergency hostel services, rent
bank, energy bank, and homeless prevention fund.
St. Thomas/Elgin County Housing and Homelessness Plan 86
Tim Welch Consulting in association with Lapointe Consulting and Deb Ballak

year of the new program, spending plans in future years may be adjusted depending on usage
and need.
Table 9.3.1: 2013/14CHPI Investment Plan
”Emergency Shelter Solutions” and ”Housing with Related Supports”
Emergency Shelter Solutions 54,250(i.e. emergency homeless shelters and safe beds)
Housing with Related Supports 151,500(i.e. supported permanent housing, transitional housing)Other Services and Supports 42,690(i.e. street and housing outreach, food banks, housingsearches)
Homelessness Prevention 600,000(i.e. payment of rent or utility arrears)
Program Administration 44,654
Total CHPI 2013/14Investment Plan $893,094
Financial support for operational costs will be made available to existing community agencies
which currently provide services that meet the two CHPI outcomes. Financial assistance will be
based on an equitable funding formula of $3,000 per bed or $3,500 for room and board,
annually. The following agencies will receive total funding in the amount of $205,750:
1. Inn Out ofthe Cold — a shelter operating between October and March offering a warm
place to sleep, a hot supper, and breakfast for homeless men and women.
(See Section 10.0 for program description).
2. YWCASt. Thomas — offers the following housing services:
a. A 20—bedresidence for women including transitional, |ong—term supported housing,and 3 emergency beds, (Sections 10.0 and 11.1).
b. Harmony House — a 3—bedtransitional housing program for young women (Section10.0),
F‘
Fair Winds — a 3—bedtransitional housing program for young men (Section 9.0),d. Second Storey on Talbot — a 6—bedtransitional housing program for men opening
June 2013 (Section 11.1),e. A 4-bedroom house for emergency or transitional housing for a family. (Section 9.1
and 10)
St. Thomas/Elgin County Housing and Homelessness PlanTim Welch Consulting in association with Lapointe Consulting and Deb Ballak
87

3. Fresh Start Maternity Supports — transitional housing with supports for pregnant
women or women with newborn children (5 group home units and 3 se|f—contained
apartments with supports. (Section 11.1)
4. Tara Hall — transitional funding for three months for a 36—beddomiciliary hostel.
(Section 11.1)
”HomeIessness Prevention” and "Services and Supports” HeLP
The balance of the CHPI allocation, net of 5% for program administration fees, in the amount of
$642,690 will be rolled into a new Ontario Works Department program called HeLP (Housing
Linksfor People) to provide immediate financial assistance to |ow—income households to
prevent homelessness (See Table 9.1.1 for program description).
Chart 9.3.1: CHPI Funding Plan, 2013/14
,25 .00 , 6%44,654.00,
I Emergency Shelter Sol/ns
I Housing w Supports
A50/" I Services & Supports
I Hmlss Prevention
I Admin
Source: City ofSt. Thomas Report No. OW-04-13NOTE: On Dec 27, 2012 MCSS announced additional funding for service managers to support
the transition to CHPI. One-time funding in the amount of $305,513 was allocated to the City
of St. Thomas to complement the CHPI funding. It is anticipated that this funding will be usedto cushion funding short falls in any of the service categories during the start—up year.
Community Start Up and Maintenance Benefit (CSUMB)
One of the most contentious aspects of the changes brought about by the implementation of
CHPI in January 2013 was the termination of CSUMB for both OW and ODSP recipients. This
benefit, which was available every two years for recipients, was considered part of their social
assistance entitlement benefits by many recipients who used CSUMB for last month's rent
St. Thomas/Elgin County Housing and Homelessness Plan 88Tim Welch Consulting in association with Lapointe Consulting and Deb Ballak

deposits, essential furnishings (when discharged from an institution, or in cases of bed bugs),
moving costs, hook—upexpenses, etc.
In 2011 a total of $899,725 was issued to OW and ODSP recipients for CSUMB items (including
the City portion of $80,971). The total CHPI allocation for 2013-14 is $893,094. The loss to the
community in provincial dollars is $305,513. One—time provincial funding in the amount of
$305,513 has been provided to the City to compensate for the change in total funding due to
the new CHPI program. The additional one—time funding must be used in the first year of the
new program (by March 31, 2014).
Youth
The newly released report, Responding to Youth Homelessness in St. Thomas and Elgin County,
calls for the development of a coordinated service response protocol by clarifying roles,
responsibilities, and obligations of each service provider within the service area that deals with
youth who are homeless.
Family and Children Services are collaborating with churches to develop foster—type homes, or
Host Homes for short periods of time that would help with short term supportive housing for
homeless youth. In this proposed model, Family and Children's Services staff will screen
potential families and youth, and train foster families in line with their mandate to recruit and
train foster families for their regular program stream. The Report is briefly outlined in Section
12.0.
Food Security Network
Examples of how the traditional ”soup kitchen” model is evolving are:
Destination Church has changed its focus to provide advocacy services to its
guests. The open drop—intimes provide housing help and offer broader food
and mail assistance on an emergency basis. Approaches build on life skills and
creating opportunities based on the individua|’s strengths and skills. A full time
coordinator has been hired for this role. Its meal program (Thursday evenings)
relies on the ”Stone Soup” story, requiring everyone to contribute to the meal.
If someone doesn't have a food contribution, they are expected to contribute
with their hands and feet—preparing the meal or setting up and clearing up.
Trinity Anglican Church collective kitchen assists people with their cooking skills. The eight
week programs teach participants how to healthy cook meals.
Free community fellowship meals are available twice a month year—round at Trinity Anglican
St. Thomas/Elgin County Housing and Homelessness Plan 89
Tim Welch Consulting in association with Lapointe Consulting and Deb Ballak

Church for families or individuals who are experiencing difficulty making ends meet, who are on
a limited or fixed income, are alone or feel isolated. The community service is offered
collaboratively by Trinity Anglican, Grace United, Knox Presbyterian, Central United, Centre
Street Baptist, St. Andrews United, Holy Angels Roman Catholic, St. Anne's Roman Catholic,
First United, shrine Club, E|gin—St.Thomas Health Unit and many volunteer citizens.
Social Worker at the YWCA
At the time of this report, and funding permitting, the YWCA is planning on adding a Social
Worker to their staff compliment. The goal is for all individuals and families accessing
emergency and/or transitional housing to be supported by the social worker while navigating
from emergency housing and supportive housing to safe, affordable non—supported housing.
Based on previous discussions, this support would also be extended to those accessing Inn Out
of the Cold or other services as appropriate.
Salvation Army
Salvation Army staff report an increase in the number of people that are coming to them for
assistance, especially for medication, and prescribed medical equipment such as hearing aids.
As a result of the increased demand, the Salvation Army has increased the availability of
emergency services through extended hours, and outreach to other agencies in the community.
Housing Program Coordinator
St. Thomas Ontario Works division introduced a permanent full time Housing Program
Coordinator (HPC) position to deliver housing support programs in an integrated model. The
HPC position supports the coordination and management of social/affordablehousing
programs and initiatives to qualifying low income families in St. Thomas and Elgin County.
Specifically, the HPC manages the Housing Allowance Program, the HeLP program (for ODSP
recipients and the general public), the LEAP program as well as new homelessness
prevention program(s) from time to time (Section 9.1).
This position was created in order to consolidate homelessness prevention administration
within one staff position for better ”one—stop” service for the public. The position is a result of
a recommendation from the 2009 Homelessness Study (See Section 12.0). The HPC was
approved by City Council as a permanent position effective April 8, 2011.
Bridges Out of Poverty
In the spring of 2010, the United Way and the E|gin—St.Thomas Public Health Unit partnered in
bringing presenter Gayle Montgomery to St. Thomas to speak about the Bridges out of Poverty
St. Thomas/Elgin County Housing and Homelessness Plan 90
Tim Welch Consulting in association with Lapointe Consulting and Deb Ballak

philosophy and her experiences in establishing the Bridges Out Of Poverty/ Circles chapter in
Lambton County.
This presentation brought numerous local organizations together to find a way to incorporate
this philosophy into this community and to also bring the ”Getting Ahead” Workshops and the”Circ|es” programs to the City of St. Thomas and County of Elgin. Over the past two (2) years,
this large group has continued to meet, and a Focus Committee was established for funding,
program development and implementation.
Bridges Out of Poverty is an approach that helps employers, community organizations, social-
service agencies, and individuals address and reduce poverty in a comprehensive way. People
from all economic classes come together to improve job retention rates, build resources,
improve outcomes, and support those who are moving out of poverty“. The Bridges Out of
Poverty/Circles Program has proven effective at addressing the root causes of poverty with the
emphasis on achieving meaningful individual, systemic and regulatory change. It is driven by
people in poverty who are motivated to make the changes needed to reach se|f—sufficiency.
This group recently received a 3-year Trillium Grant that combines matching dollars through
various partnerships to allow this program to begin.
Housing and Homelessness Action Group
This group of community service providers was formed and through creative and collaborative
community partnerships, the group has successfully implemented several recommendations
from the 2009 Homelessness Study. This group reviews the 2009 recommendations annually,
monitoring progress. Newly identified needs are discussed and actions taken as
appropriate/feasible.
Staff Training
Two OW staff, two YWCA staff, and one Central Community Health Centre staff are qualified
Financial Literacy Trainers. These staff increase the community's capacity to provide life skills,
life coaching, and financial literacy training.
Focus Fairview
The ”Focus Fairview” community unit is one of 530 units that the Elgin and St. Thomas Housing
Corporation (ESTHC) manages. In 2009, a Steering Committee consisting of most social
agencies in the City of St. Thomas was formed, and a unit was allocated for dedicated use by
residents and, of course, for the social agencies that bring much needed services and education
to the residents. The social agencies were eager to get started and, with the help of Elgin
21 www.BridgesOutofPoverty.comSt. Thomas/Elgin County Housing and Homelessness Plan 91
Tim Welch Consulting in association with Lapointe Consulting and Deb Ballak

Counselling and Mediation Centre staff and their MSW students, programs, counselling and
education were soon being offered to the residents, and their children.
It soon became obvious, that the many and varied needs exhibited by the residents (life skills,
parenting skills, budget and finance skills, and coping skills, etc.) warranted a dedicated person
to provide more consistency and co—ordination of the social programs and education required.
The Ontario Trillium Foundation has provided a 2-year grant allowing the Steering Committee
to hire a part—time Co—ordinator (20-25 hours per week) and to purchase much needed
equipment and supplies for programming. This grant will conclude at the end of 2013.
The Co—ordinator utilizes a technique that promotes community and resident involvement and
commitment. Community involvement is evidenced by a nearby church that not only offers
their space for meetings and larger activities such as ”pot—|uck”dinners, but also contributes to
the Focus Fairview initiative with donations of clothing and food for the resident—run ”Food and
Clothing Cupboard”. The church has also made arrangements with Elgin St. Thomas Public
Health to be host to the Community Kitchen proposal. The residents are ”giving back” by
assisting the church with such things as church garden c|ean—ups, church bake sales, etc. An
initiative is currently underway to determine if the ESTHC Elm St. development would benefit
from a toddler program to be conducted at the Salvation Army church located directly across
the street.
As funding may come to an end in December 2013, planning sessions are underway with the
residents and others to ”brain—storm” ideas to raise money. The residents are acutely aware of
the benefits that the Focus Fairview initiative has brought to them and desperately want to
continue improving their life styles and life circumstances.
Central Community Health Centre
In 2010 this CHC opened in St. Thomas see Table 9.1.1 for description of services. This is the
second CHC in the area, with West Elgin CHC operating out of West Lorne.
211
211 is a province—wide information and referral service accessible by telephone or on—|ine. It is
now available to residents of St. Thomas and Elgin County.
9.4 Issues and Strengths Identified by Key lnformants
Homelessness Programs, Supports, and Services
This section looks at the issues and strengths that directly relate to the provision of homeless
programs and services in the St. Thomas—E|gin community. The comments from community
stakeholders have been grouped to provide a more robust description of each issue. It is
St. Thomas/Elgin County Housing and Homelessness Plan 92
Tim Welch Consulting in association with Lapointe Consulting and Deb Ballak

important to note that these issues are interrelated and directly impact each other, and cannot
be examined independently. The following points are paraphrased and amalgamated from
actual interviews.
1. Effects of Employment Destabilization
0 There is a lot of resilience in the community as this is the third or fourth downturn it hasexperienced economically in the past 30 years, however this one has been by far themost lengthy and it is reflected in the lack of retail downtown. This community is indirect competition with London who is aggressively developing the 401 corridor.
0 United Way fundraising is suffering as a result of the loss of jobs (9000 jobs in 70
workplaces since 2006). In 2012, $605,000 was raised, a few years earlier $1.2M wasraised.
0 The termination of jobs at Ford paying $33.90 per hour, and at Sterling paying $29.16per hour, have resulted in an influx of clients requesting help from the social service
sector, i.e. homeless issues as a result of bankruptcy, and under employment.
0 It is expected that more of the impact of the Ford plant closing will be felt this summer,it is commonly held that there is a 2 year period before the community really feels theimpact of a closure.
2. People-Centered Service Provision
Service Capacity
0 Capacity is evolving with service providers but the complexity of the issues peopleare presenting is much greater than it's ever been in the community. No longer cana single provider do it — collaborative models are necessary to be able to workthrough issues of complex mental illnesses, and addiction abuse cases. Services
have to come together to provide comprehensive care plans of action. This requiresall of us to sit down and talk.
Service Centralization
0 Concern with centralizing services out of London i.e. hospitals, ODSP, Red Cross,
MS, Cancer Society, school board regionalized in London, children's mental health,and the effect on this community and organizations. Concern that the further awayfrom the hub or the service centre, the less priority is given to your needs. Whenthere is limited funding the people on the periphery tend to get less and less, andthey expect people to travel — key issue! Crises will become more acute.
0 Can't (afford to) lose the presence of services in Elgin County.
0 Vulnerable populations can't get to London — this is not acceptable.
0 We should come together around needs of community (social planning councilmodel), rather than independent mandates of agencies.
St. Thomas/Elgin County Housing and Homelessness Plan 93
Tim Welch Consulting in association with Lapointe Consulting and Deb Ballak

0 Chi|dren—youth example of working with centralized services; CPRI (Child andParents Resource Institute) provides highly specialized treatment services forchildren and their families. CPRI is going through deinstitutionalization andreducing bed capacity. Their strategic plan is to continue to offer services in localcommunities through a protocol involving a team (family/parent mentor/ system
facilitator) prior to admission to CPRI. This team supports family/child while in CPRI
and continues to support them when discharged. This is a type of wraparoundapproach for these children and families.
0 Intent is to make best use of intensive treatment — transfer of knowledge for bestsupports when they get back.
Service Integration
0 We do come together to talk about these complex cases — but we run into theresourcing issues, plans are easy to develop, but we need the resources to makethem happen. These are more challenging times and the resources are not alwaysthere — some integrated models cost more money.
0 Specialized services are in silos, everyone works independently. We need a focus, aplanning table on homelessness — hopefully the report will recommend this.
0 We need to incorporate youth homelessness info into the 10 Year Plan. There areobvious parallels with coordination and integration issues.
0 Need a homeless system with multiple entry points, followed by a we||—structured
protocol of services. The homeless person triggers that protocol, then wraparoundteam of supports, with the expectation from service providers that all domain needswould be met. It is the only way to reduce homelessness.
0 Protocol pulls together services to make commitments to providing services, bysigning the protocol services are held accountable for service provision.
Technology
0 Look at modern technology around databases i.e. 211. We need long term ideasaround collecting information and follow up.
0 Need more sophistication around technology information databases,— access to
information for youth re: services — Google maps, service directories, etc.
3. Information Sharing
0 There is difficulty with community workers always knowing what programs are beingoffered and where. Perhaps 211 could be the ”go to” place for service providers to keepup on info so appropriate referrals can be made.
0 All agencies need to get their information out to the community. There are a lot offamilies working for minimum wage who have no idea of the programs/services that are
in the community to help them ‘get by’.
St. Thomas/Elgin County Housing and Homelessness Plan 94
Tim Welch Consulting in association with Lapointe Consulting and Deb Ballak

4. Mental Health and Addictions Issues
High percentage of mental health needs — because of hospital — many don't go back to
their communities because they need ready access/treatmentat the facility — so put
down roots here, consider Elgin their community. They will require supports whenhospital leaves.
Lots of people with undiagnosed and diagnosed addiction issues are treating
themselves, leading to more serious problems.
Lack of access to addictions treatment — Addictions Services of Thames Valley offerssome beds.
Big gaps exist in addictions services. In Oxford County they opened up a centre to treat
people with addiction issues and it would be good if we had something comparable hereso that people who reside here wouldn't have to go elsewhere.
OW has acknowledged addictions as a barrier. There have been great strides to look at
the person in a holistic way.
People with undiagnosed mental issues are not supported by some of the existingmental agencies.
Without intensive programs our clients get lost.
There is no easy transition from detox to residential care. The person must be readyand willing to make steps, there are no supports for them.
Core treatment timeliness have been cut back, this has more to do with budgets thanclient need.
Feeding people and offering them a bed for the night is lovely but it's a band aid. Weneed real solutions, like access to mental health care most importantly.
5. Supports to Find and Keep Housing
No real housing help centre, but agencies are doing this work.
Transportation issues from isolated rural areas present challenges to access services,and for services to access pockets that are rurally isolated.
Libraries can play a crucial piece around a drop—inservice.
Lot of agencies moving to meet just the high end needs, what happens to the rest?Need to be proactive so people won't become high needs.
The services need to go to where the person is. It needs to be recognized thatsometimes there is a stigma with services offered from a Church. Providers need to goto the people i.e. under a bridge if necessary.
St. Thomas/Elgin County Housing and Homelessness Plan 95
Tim Welch Consulting in association with Lapointe Consulting and Deb Ballak

Education and support re: housing rights and responsibilities, tenants don't have to put
up with substandard housing, and also they need to be held accountable, they needsupport and help with living skills. Landlords need to keep up property standards.
6. Advocacy
Haven't done much advocacy with private landlords (housing retention).
There are issues with some derelict landlords. Some of these tenants are paying out
ridiculous amounts for rent for places that no one should be living in, and buildingsshould be torn down or condemned.
How do we make landlords more responsible for their buildings? Need checks andbalances.
Great working relationship with Elgin Housing Corp. it's a mutual relationship. Theydon't want to see the tenant de—housed so we collaborate as much as we can to see thetenant's needs are met.
Need to have a worker who works with social housing tenants on a full time basis(Community Support Worker).
7. Special Populations
Single Men
St. Thomas/Elgin County Housing and Homelessness Plan
Youth
Men 30-55 are the most vulnerable population.
The support network for men is horrible, some of them would love their own placebut can't find/affordthem so they are living in shared accommodation/grouphomes i.e. Tara Hall — pretty transient stop gap.
This group presents an ‘emerging need’.
Needs to be a lot more affordable housing for young people.
Challenging to find decent housing for 18-21 yr. olds at OW rates, as a result theytend to share the places and get kicked out for partying, etc.
Youth homelessness is hidden, couch surfing or sleeping out in the summer.
Youth in the County don't have access to any services.
Youth don't feel safe using Inn Out of the Cold, due to the number of people usingthe shelter that have mental health and addictions issues. There needs to be ashelter geared toward youth only, like Fairwinds.
No local support for male sexual abuse survivors, not sure if supports exist inLondon.
96
Tim Welch Consulting in association with Lapointe Consulting and Deb Ballak
0 Need young people to stay in school: the rates of drop out and teen pregnancy aredeplorable. Young people need to be part ofthe solutions.
Low German Population
0 This population is isolated from mainstream systems and services.
0 This population skews the education statistics as young men go to work on farmsafter grade 8 (16 yrs.) and girls get married. Their education levels have stayedstagnant, see this as an issue in the near future.
0 Often male dominated culture does not fit in with North American culture.
0 These families are not usually homeless but due to the shortage of large homes inthe country, several families may live in one house. This is not part of their cultureand can be extremely stressful.
0 Families cannot afford the rent plus high heating bills for a large country home, sosome migrate to Mexico over the winter and return in the spring for jobs inagriculture. Example given of a family of six arriving with two dollars and no place to
stay. In these cases churches put them up in motels and assist them to settle.
Issues expressed by people with Lived Experience
Guests at the Inn Out ofthe Cold and Stone Soup dinner were interviewed and
students of the Adult Basic Skills Class at the YWCA completed surveys. See
Appendix C for the results of this survey.
0 Biggest challenges to finding a place to live:I No income, no support,
I Can't find decent place, can't afford a decent placeI Need help to find a place, need more help to find placesI Landlords discriminate because I'm young
I Hard to find a compatible roommate
I Don't know of any places to help find a place to liveI Poor or no credit rating
I Subsidized waiting list is too longI Poor landlord reference or no reference
0 Biggest Challenges keeping a place:
IAnger issues
I Addiction/mentalhealth issues
I Utilities cost too muchI Landlord and other tenants
St. Thomas/Elgin County Housing and Homelessness Plan 97
Tim Welch Consulting in association with Lapointe Consulting and Deb Ballak

0 Helpful Services:
I Case managers, YWCA,ACT, OW, Inn Out ofthe Cold
IA number of participants stated that they didn't know of any services to
help them
0 AdviceI Build a homeless shelter, more Inn Out of the Co|d—year round, programs
for those who are homelessI More subsidized housing—|ower rents, safe, affordable housingI OW to pay first and last month's rent——
I City needs to set guidelines for landlordsI Open family residence to help people manage their money and pay bills
St. Thomas/Elgin County Housing and Homelessness Plan 98
Tim Welch Consulting in association with Lapointe Consulting and Deb Ballak
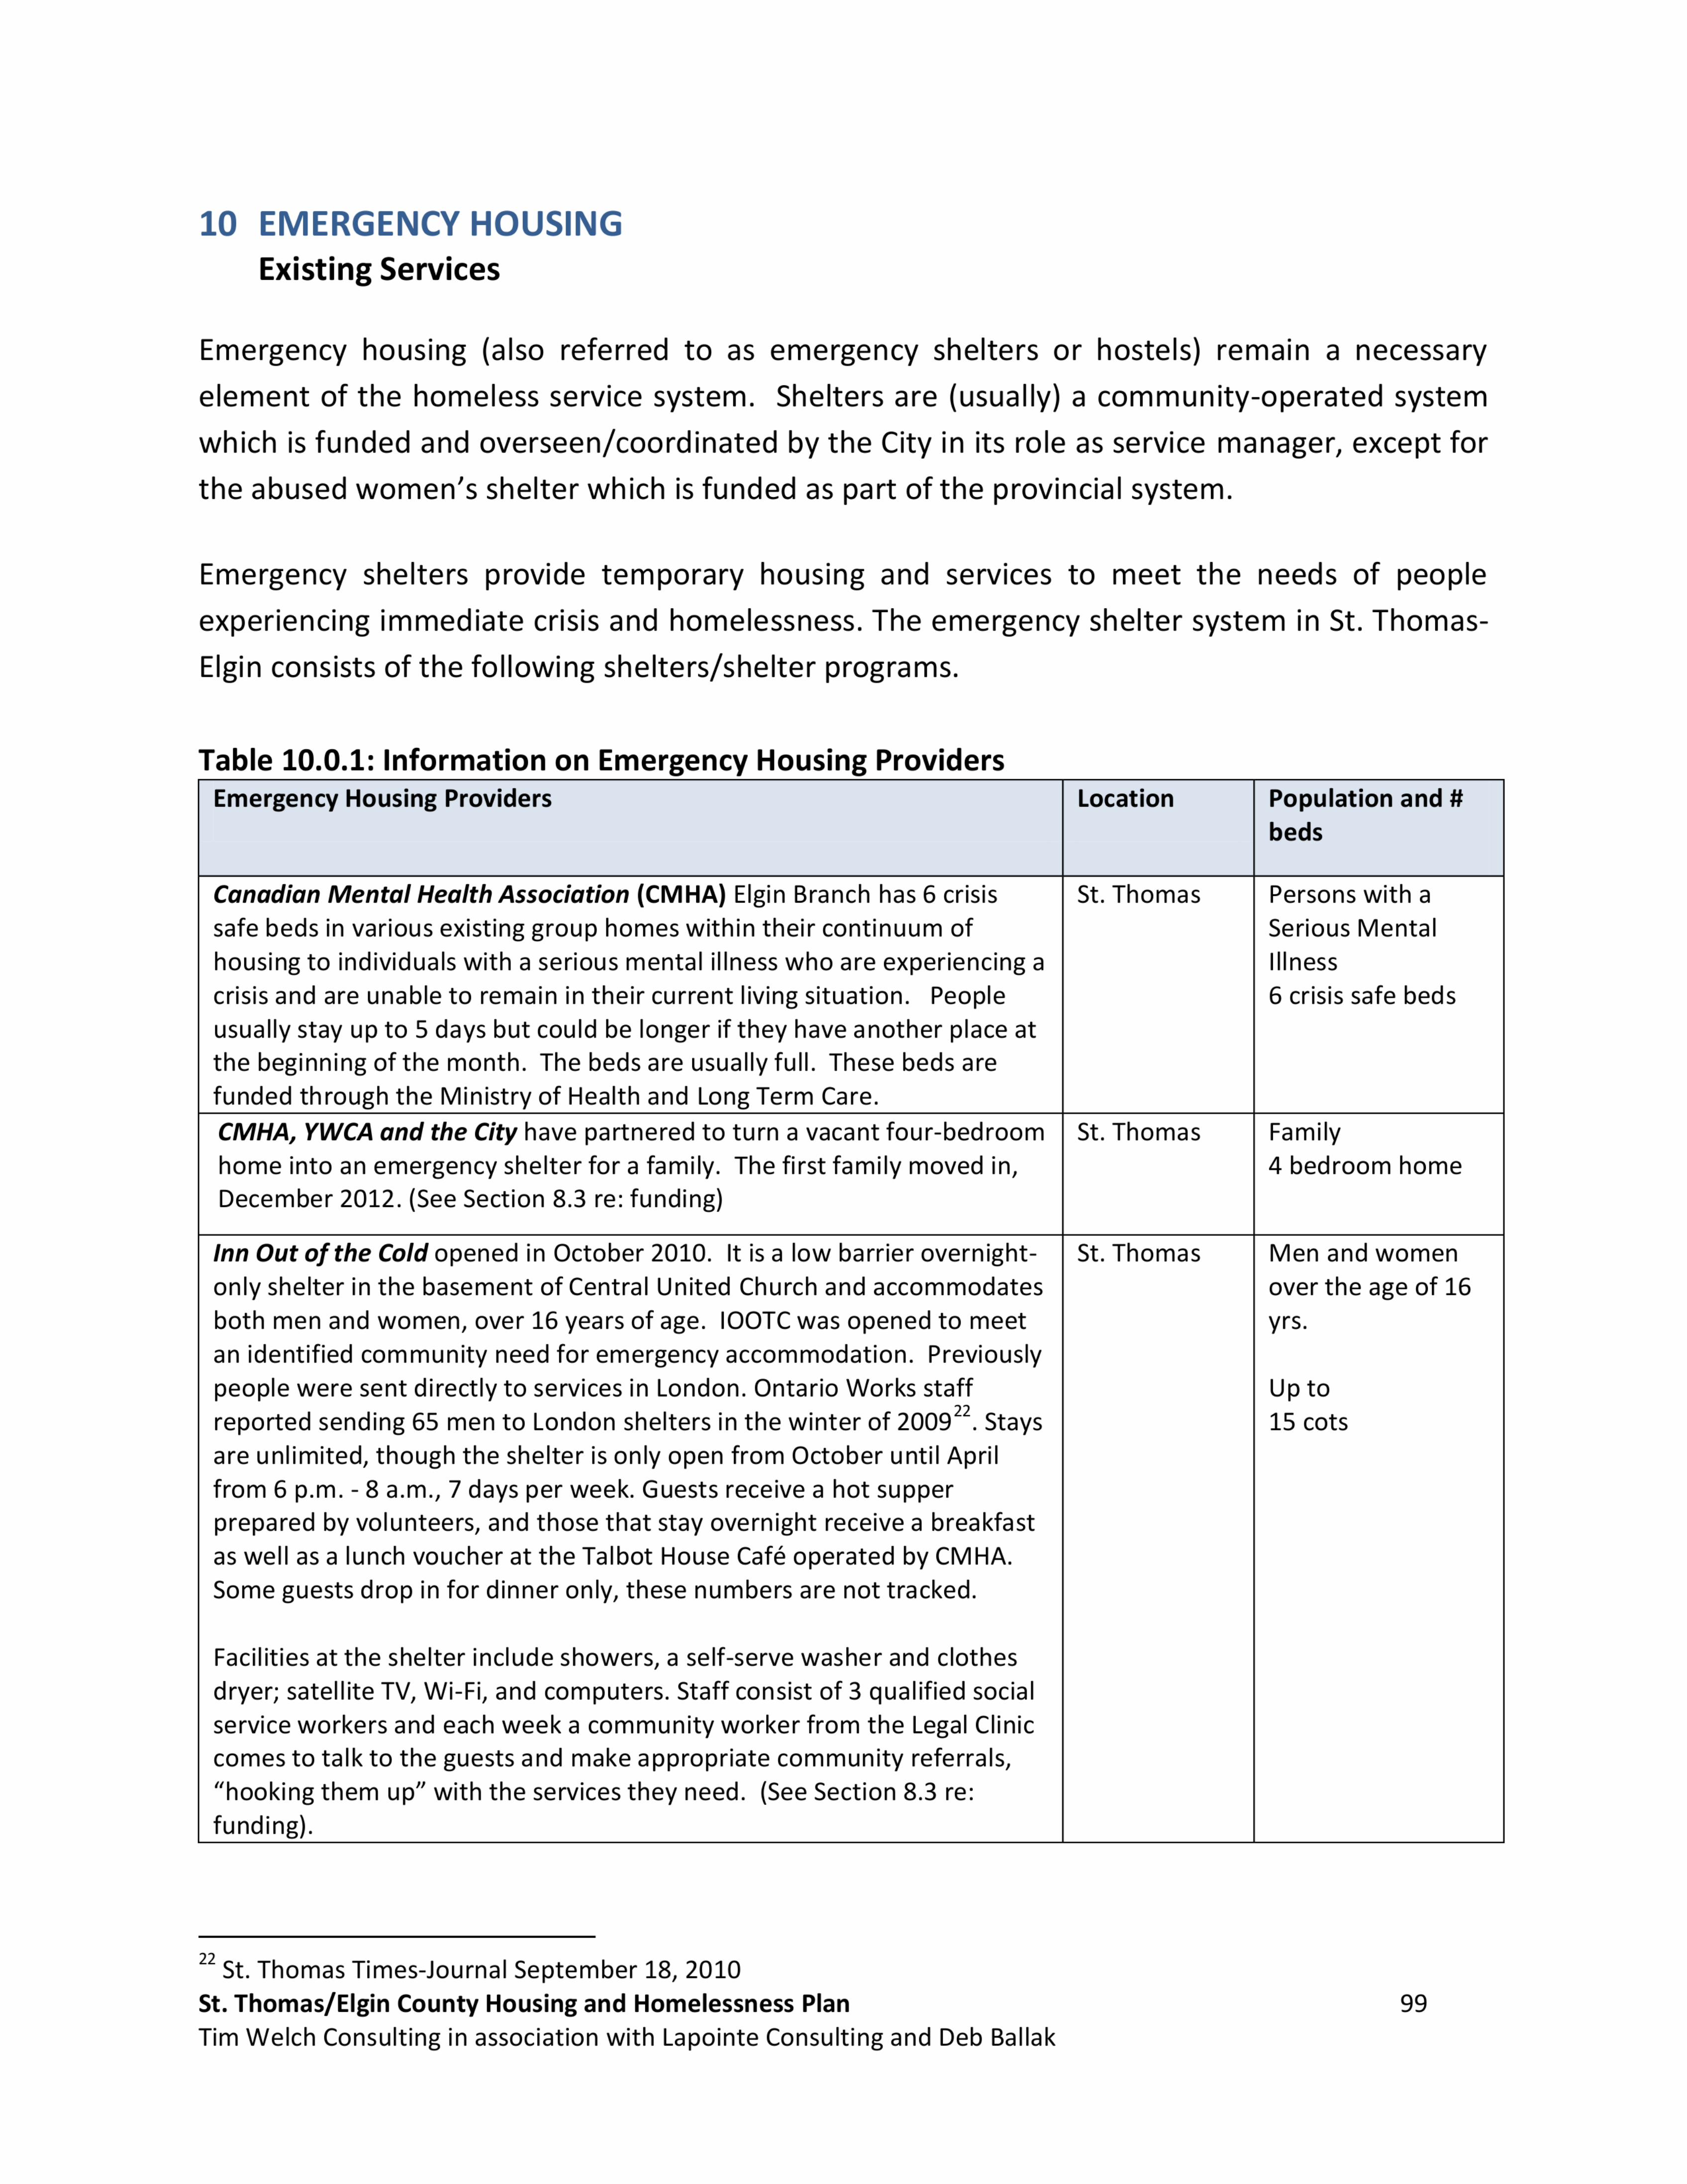
10 EMERGENCYHOUSINGExisting Services
Emergency housing (also referred to as emergency shelters or hostels) remain a necessary
element of the homeless service system. Shelters are (usually) a community—operated system
which is funded and overseen/coordinatedby the City in its role as service manager, except for
the abused women's shelter which is funded as part of the provincial system.
Emergency shelters provide temporary housing and services to meet the needs of people
experiencing immediate crisis and homelessness. The emergency shelter system in St. Thomas-
Elgin consists of the following shelters/shelterprograms.
Table 10.0.1: Information on Emergency Housing Providers
only shelter in the basement of Central United Church and accommodatesboth men and women, over 16 years of age. IOOTC was opened to meet
an identified community need for emergency accommodation. Previouslypeople were sent directly to services in London. Ontario Works staffreported sending 65 men to London shelters in the winter of 200922.Stays
are unlimited, though the shelter is only open from October until Aprilfrom 6 p.m. — 8 a.m., 7 days per week. Guests receive a hot supperprepared by volunteers, and those that stay overnight receive a breakfastas well as a lunch voucher at the Talbot House Café operated by CMHA.
Some guests drop in for dinner only, these numbers are not tracked.
Facilities at the shelter include showers, a se|f—serve washer and clothesdryer; satellite TV, Wi—Fi,and computers. Staff consist of 3 qualified socialservice workers and each week a community worker from the Legal Cliniccomes to talk to the guests and make appropriate community referrals,”hooking them up” with the services they need. (See Section 8.3 re:funding).
Emergency Housing Providers Location Population and #
beds
Canadian Mental Health Association (CMHA) Elgin Branch has 6 crisis St. Thomas Persons with a
safe beds in various existing group homes within their continuum of Serious Mentalhousing to individuals with a serious mental illness who are experiencing a Illnesscrisis and are unable to remain in their current living situation. People 6 crisis safe bedsusually stay up to 5 days but could be longer if they have another place at
the beginning of the month. The beds are usually full. These beds are
funded through the Ministry of Health and Long Term Care.
CMHA, YWCAand the City have partnered to turn a vacant four-bedroom St. Thomas Familyhome into an emergency shelter for a family. The first family moved in, 4 bedroom homeDecember 2012. (See Section 8.3 re: funding)
Inn Out of the Cold opened in October 2010. It is a low barrier overnight— St. Thomas Men and women
over the age of 16
yrs.
Up to
15 cots
22 St. Thomas Times—Journal September 18, 2010
St. Thomas/Elgin County Housing and Homelessness PlanTim Welch Consulting in association with Lapointe Consulting and Deb Ballak
99
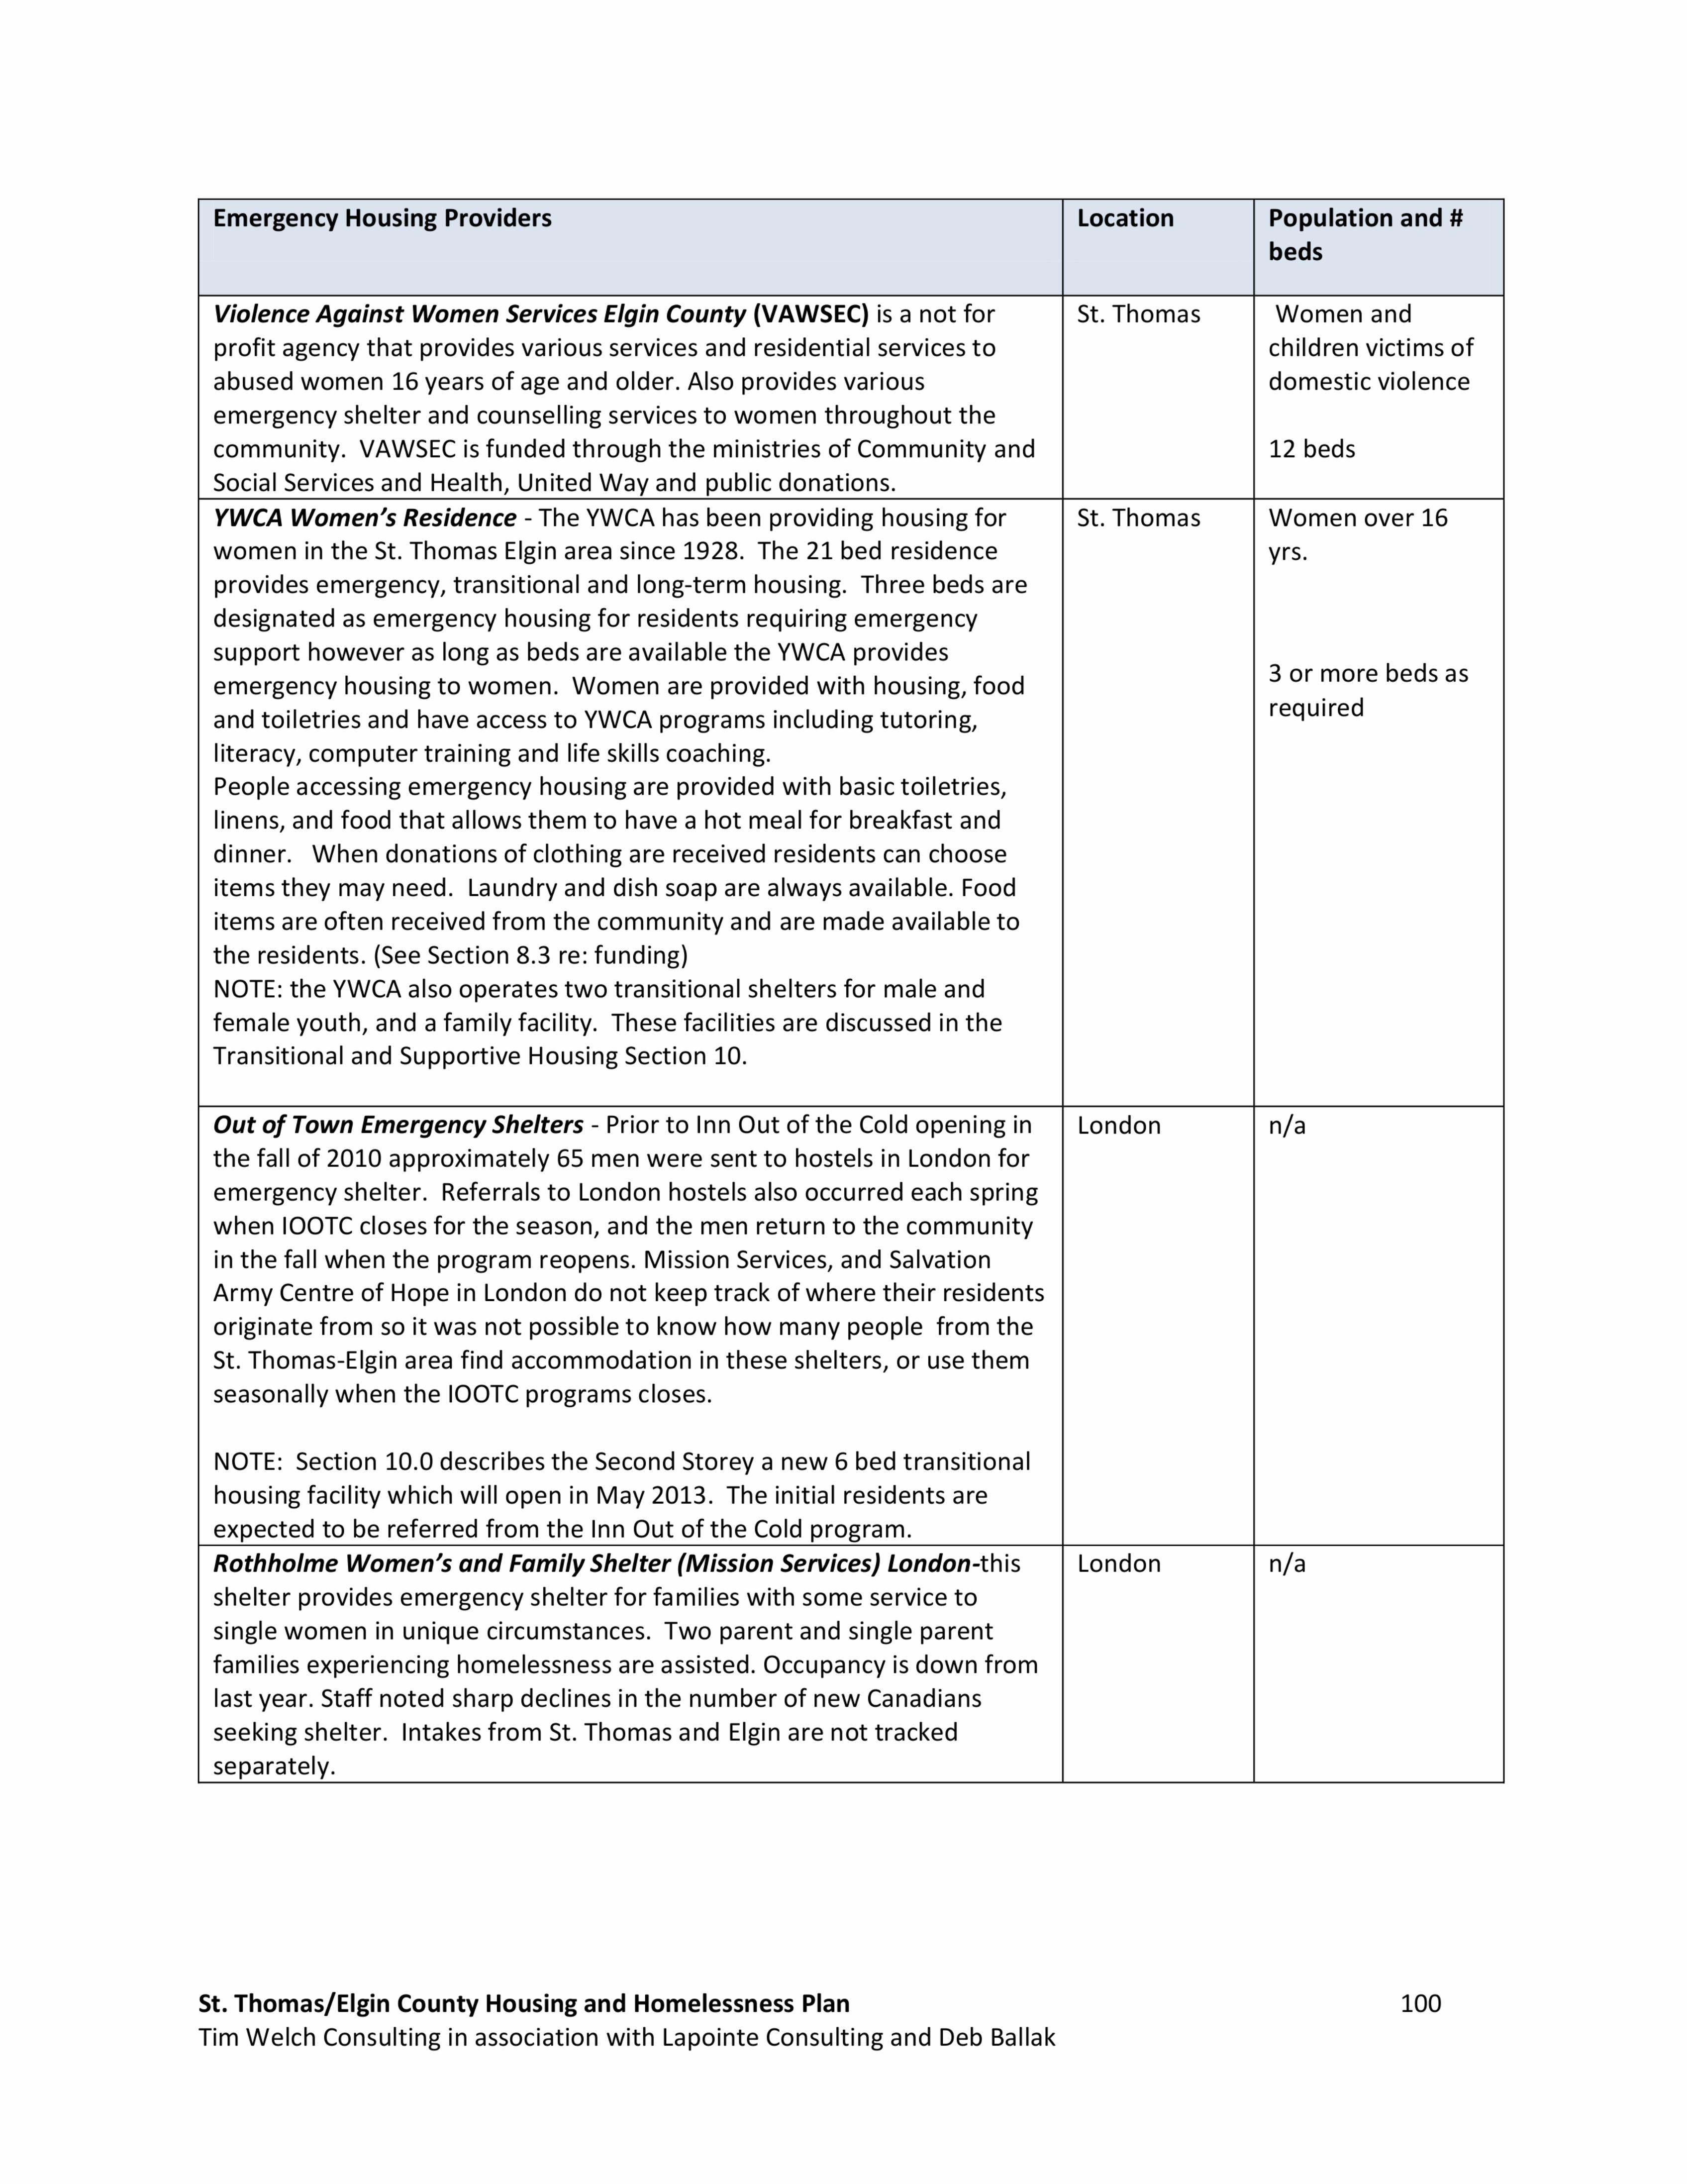
Emergency Housing Providers Location Population and #
beds
Violence Against Women Services Elgin County (VAWSEC) is a not forprofit agency that provides various services and residential services to
abused women 16 years of age and older. Also provides variousemergency shelter and counselling services to women throughout thecommunity. VAWSEC is funded through the ministries of Community andSocial Services and Health, United Way and public donations.
St. Thomas Women andchildren victims ofdomestic violence
12 beds
YWCA Women's Residence — The YWCA has been providing housing forwomen in the St. Thomas Elgin area since 1928. The 21 bed residenceprovides emergency, transitional and long—term housing. Three beds are
designated as emergency housing for residents requiring emergency
support however as long as beds are available the YWCA providesemergency housing to women. Women are provided with housing, foodand toiletries and have access to YWCAprograms including tutoring,
literacy, computer training and life skills coaching.People accessing emergency housing are provided with basic toiletries,linens, and food that allows them to have a hot meal for breakfast anddinner. When donations of clothing are received residents can chooseitems they may need. Laundry and dish soap are always available. Fooditems are often received from the community and are made available to
the residents. (See Section 8.3 re: funding)NOTE: the YWCAalso operates two transitional shelters for male andfemale youth, and a family facility. These facilities are discussed in theTransitional and Supportive Housing Section 10.
St. Thomas Women over 16
yrs.
3 or more beds as
required
Out of Town Emergency Shelters — Prior to Inn Out of the Cold opening inthe fall of 2010 approximately 65 men were sent to hostels in London foremergency shelter. Referrals to London hostels also occurred each spring
when IOOTC closes for the season, and the men return to the community
in the fall when the program reopens. Mission Services, and SalvationArmy Centre of Hope in London do not keep track of where their residentsoriginate from so it was not possible to know how many people from theSt. Thomas-Elgin area find accommodation in these shelters, or use themseasonally when the IOOTC programs closes.
NOTE: Section 10.0 describes the Second Storey a new 6 bed transitionalhousing facility which will open in May 2013. The initial residents are
expected to be referred from the Inn Out of the Cold program.
London n/a
Rothholme Women's and Family Shelter (Mission Services) London-thisshelter provides emergency shelter for families with some service to
single women in unique circumstances. Two parent and single parent
families experiencing homelessness are assisted. Occupancy is down fromlast year. Staff noted sharp declines in the number of new Canadiansseeking shelter. Intakes from St. Thomas and Elgin are not trackedseparately.
London n/a
St. Thomas/Elgin County Housing and Homelessness PlanTim Welch Consulting in association with Lapointe Consulting and Deb Ballak
100

10.1 Indicators of Usage
Emergency Housing
Inn Out of the Cold
In October 2012, the Inn Out of the Cold reported that their numbers fluctuated during the
2011/12season from a low of 2-5 people per night to up to 16 people. Ninety—eight unique
individuals used IOOTC during the 2011/12.Staff report that 7 people have been coming to the
program since it opened three years ago, indicating a need for long term stable housing. The
overnight capacity at IOOTC is 15 people.
Chart 10.1.1: Average Emergency Bed Use Stats: 2011-2012
12
ll10
8
59 -0—|nn Out of the Cold av.
5 beds/night
-I-YWCA av. beds/night4 4
2
' ' WI 0.6O I I I I
Jan Feb March April
Source: Ontario Works Department, Inn Out of the Cold and YWCA
YWCA Emergency Housing
For women who are accessing housing unexpectedly, or not by their choice, the average length
of stay is 3 to 9 months. These are women who have been evicted or going through a
relationship breakdown. They often move back with their partner or move in with a friend or
other family member. Twenty—five percent of these women will reappear at the YWCAwithin a
year or two.
Women who are transient because they are re—|ocating, leaving a bad situation, or suffering
from mental health or addiction issues typically stay for 0 — 3 months. These women will often
move on to another city or end up living with a new partner that provides them with housing.
Again about 25% of these women will return for housing at some point.
St. Thomas/Elgin County Housing and Homelessness Plan 101
Tim Welch Consulting in association with Lapointe Consulting and Deb Ballak
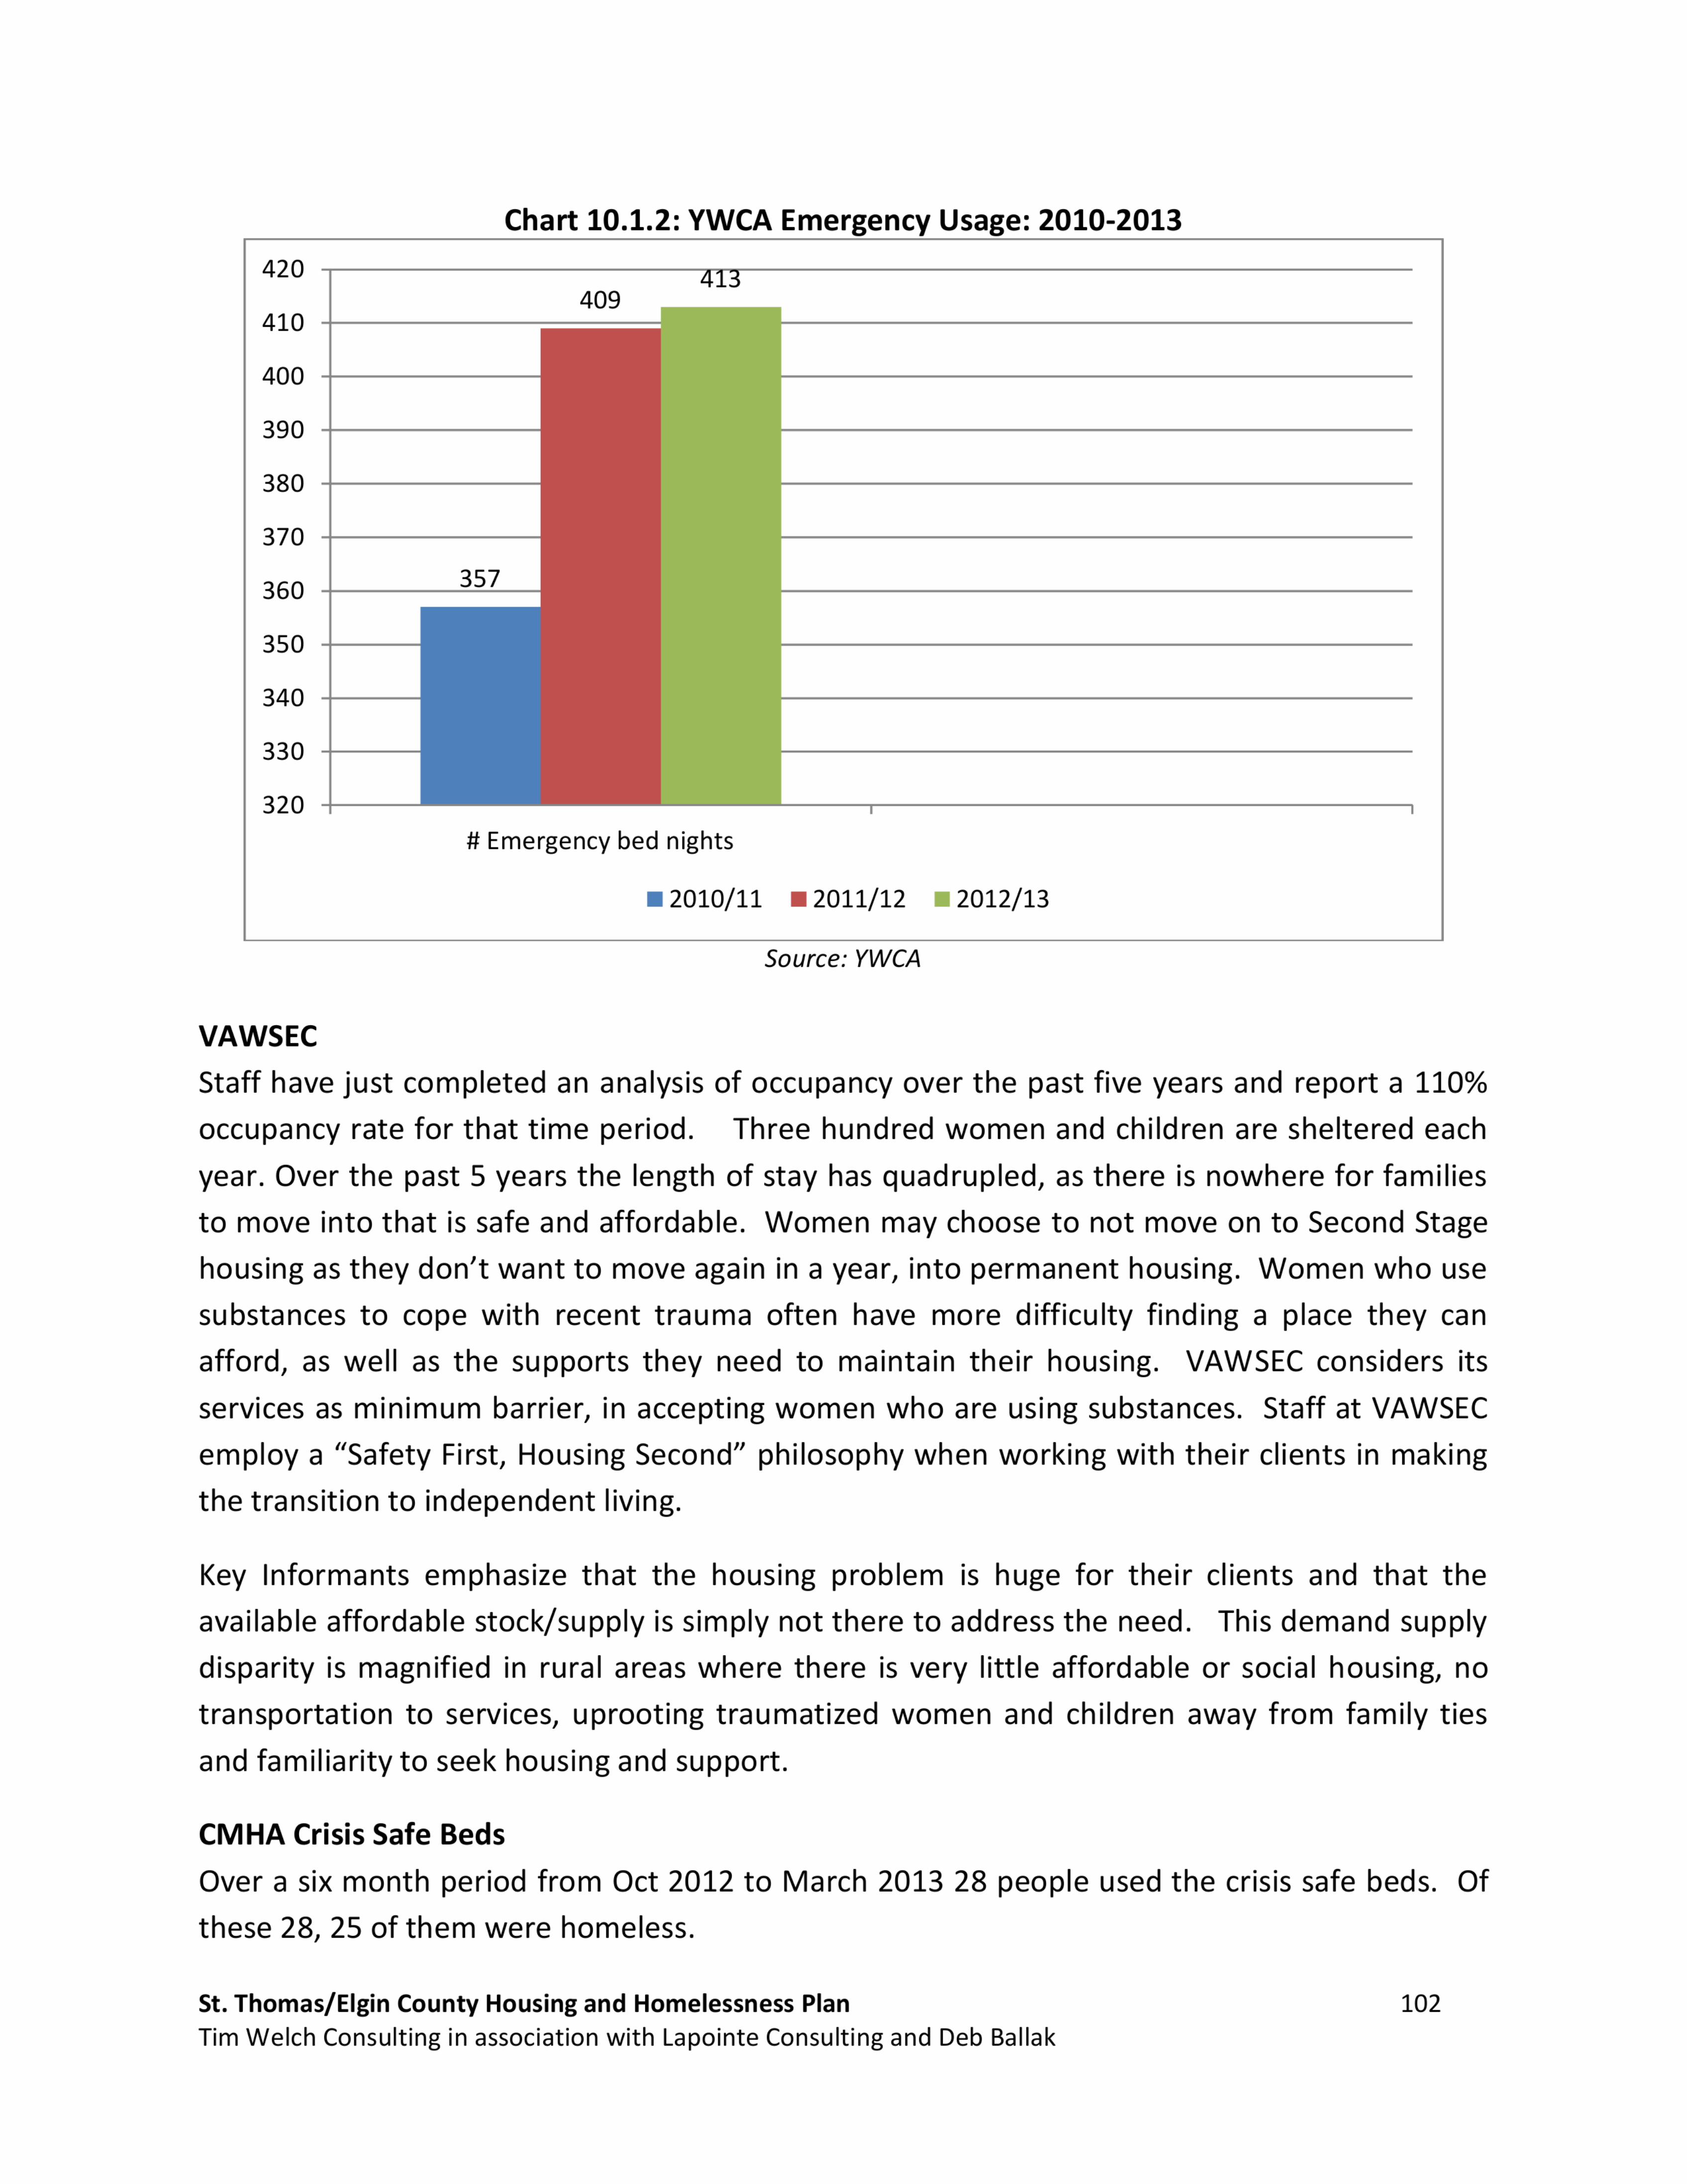
Chart 10.1.2: YWCA Emergency Usage: 2010-2013
409410
400 -
390 -
380 -
370 -
360 -
350 -
340 -
330 -
320 -
# Emergency bed nights
I 2010/11 I 2011/12 I 2012/13
Source: YWCA
VAWSEC
Staff have just completed an analysis of occupancy over the past five years and report a 110%
occupancy rate for that time period. Three hundred women and children are sheltered each
year. Over the past 5 years the length of stay has quadrupled, as there is nowhere for families
to move into that is safe and affordable. Women may choose to not move on to Second Stage
housing as they don't want to move again in a year, into permanent housing. Women who use
substances to cope with recent trauma often have more difficulty finding a place they can
afford, as well as the supports they need to maintain their housing. VAWSEC considers its
services as minimum barrier, in accepting women who are using substances. Staff at VAWSEC
employ a ”Safety First, Housing Second” philosophy when working with their clients in making
the transition to independent living.
Key Informants emphasize that the housing problem is huge for their clients and that the
available affordable stock/supply is simply not there to address the need. This demand supply
disparity is magnified in rural areas where there is very little affordable or social housing, no
transportation to services, uprooting traumatized women and children away from family ties
and familiarity to seek housing and support.
CMHA Crisis Safe Beds
Over a six month period from Oct 2012 to March 2013 28 people used the crisis safe beds. Of
these 28, 25 of them were homeless.
St. Thomas/Elgin County Housing and Homelessness Plan 102Tim Welch Consulting in association with Lapointe Consulting and Deb Ballak

10.2 Evolution of Services (Changes)
Emergency Housing
The City has recognized the need for funding stability for emergency housing and has ensured
these funds will flow to providers through the CHPI program (See Section 9.3 ”Emergency
Shelter Solutions” and ”Housing with Related Supports”).
Inn Out of the Cold
The need for an emergency shelter program was identified as a priority in the 2009 St. Thomas
and Elgin County Study on Homelessness. Elgin Oxford legal Clinic and CMHA took the lead in
establishing the shelter at a local church.
The program started in 2010 with 5 cots and can expand to 10-15 cots. Inn Out of the Cold is
open seven nights per week from October to April. In 2011 the City began to fund emergency
shelter beds issuing $39,752.00 to the program in per diem funding under the former Ontario
Works Emergency Hostel Services program. Funding will continue to be provided through the
CHPI program in 2013 (See Section 9.3).
YWCA
In 2011 the City began to fund emergency shelter beds, and issued $20,386 in 2012 for the
three emergency shelter beds at the YWCA under the former Ontario Works Emergency Hostel
Services program. Funding will continue to be provided through the CHPI program in 2013. (See
Section 8.3).
Emergency Housing for Families
CMHA has offered a single family home in St. Thomas to be used as an emergency/transitional
family shelter. The YWCA will manage the shelter, and the City will fund it at $3,000 per year
through CHPI.
VAWSEC
Staff are planning for an expansion of their services through a purpose built building that will
provide privacy and dignity for their current resident population, and ability to serve those who
are homeless and abused, as well as those suffering from substance abuse that compromises
their ability to cope. Their programs will also operate from this new facility and they hope to
”bring the community in” for services. Staff cited Centennial Crescent in Peterborough as an
ideal model for VAWSEC. This model consists of an emergency shelter as well as an apartment
complex where on site supports are offered to families on a long term basis.
St. Thomas/Elgin County Housing and Homelessness Plan 103
Tim Welch Consulting in association with Lapointe Consulting and Deb Ballak

Social Worker at the YWCA
(See Section 9.3)
10.3 Issues Identified by Key lnformants
Emergency Housing
This section looks at the issues and strengths that directly relate to the provision of emergency
housing in the St. Thomas—E|gin community. As in the previous section, the comments from
community stakeholders have been grouped to provide a more robust description of each
issue, and the following points are paraphrased and amalgamated from actual interviews.
Inn Out of the Cold
St. Thomas/Elgin County Housing and Homelessness Plan
A community worker from the Legal Clinic does ”triage” each week with guests
making referrals to programs and services that guest's request/need. It is difficult to
follow up with guests on these referrals as agencies are closed in the evening when
they meet with the worker and staff, and motivation to follow through, or other
personal challenges i.e. literacy, interferes with the referrals the next day when
IOOTC is closed.
Difficult to discharge in the morning when cold (and heat) alerts exist.
Seven people have regularly used the Inn Out of the Cold program each year since it
began 3 years ago. In the spring they are referred to London shelters and lose their
connection to the community. The guests feel safer in a smaller environment, where
they have a feeling of belonging. A 24 hour shelter is needed, especially for men.
When younger guests are sent to London they are out of their element.
There is a definite lack of affordable housing in the area. The centralized waiting list
for a one bedroom unit is two years long.
Some private rooming houses, the only affordable option for singles, reportedly take
advantage of their tenants especially those with mental health issues.
When (IOOTC)set up there were more employment issues, now they see more issues
with mental health and addictions, people are younger.
IOOTC staff are seeing a ”sense of entitlement” among a certain group of their
guests. This has led to some behavioural problems and necessitated developing
some ’’Rules’’for the shelter.
Income doesn't allow for independence—rents too high, no transitional housing,
need more RGI.
104
Tim Welch Consulting in association with Lapointe Consulting and Deb Ballak

0 IOOTC is fairly new; staff need some cross training with other services to inform them
about IOOTC and find out about their services and supports—better referrals.
0 Very difficult to measure the number of marginalized people, especially men. May
get a better handle on these numbers when Second Storey is operating.
Emergency Shelter System
0 Important not to concentrate only on gaps in service. Other programs need support
and we need to address gaps and enhance the services that we have.
0 One—stop shopping isn't the answer, agencies need to work together.
0 Acknowledge the continuum of housing services and continue to meet the needs
along it.
0 Need to leverage dollars, need political will, raise awareness of issues.
0 We can't focus on short term remedies if we are going to reduce homelessness.
St. Thomas/Elgin County Housing and Homelessness Plan 105
Tim Welch Consulting in association with Lapointe Consulting and Deb Ballak
11 TRANSITIONALAND SUPPORTIVE HOUSING
Introduction and Context
What are Transitional and Supportive Housing?
”Transitiona| housing” may involve a more time—|imited residency, without full tenancy rights.
It may involve an expectation or requirement that a resident will work toward certain goals that
help resolve issues that contributed to homelessness, or are steps toward moving on to
permanent housing. However, transitional housing in Ontario does not in all cases have such
specific requirements. In the absence of available subsidized or other |ow—rent housing to
move on to, transitional housing may also house a person for the longer term. For this needs
assessment, ’’transitional housing” is treated as one ofthe varied supportive housing models.
”Supported” housing refers to arrangements where targeted supports are provided to qualified
clients wherever they may live in the housing market.
Supportive housing is a combination of housing plus support services provided by staff of
service providers/agencies. ”Housing” refers to residential accommodation, sometimes rooms
and often apartments or occasionally houses. Supportive housing does not include institutional
forms of accommodation such as Long Term Care (nursing homes), and it does not include
emergency shelters.
For people who may not be able to live fully independently, supportive housing is often a better
alternative than institutional living, dependence on family and relatives, or homelessness.
Supportive housing is less expensive than institutions or emergency care, provides autonomy
and dignity for the residents, ensures adequate support, and integrates people into the
community.
Supportive and transitional housing are among the main building blocks of the Housing First
approach. This refers to an approach to homelessness which starts with the principle that
housing is everyone’s right, and is essential to everyone’s we||—being. For a homeless client for
whom drug/alcohol abuse, mental illness, violent behaviour, or other problematic factors are
contributing to homelessness, housing should not be conditional on first dealing with or being
treated for such issues. Instead stable housing comes first, and it serves a route to personal
stability, a context to provide dependable and adaptable supports, a place to be re—integrated
into society, and a platform to address other life issues.
St. Thomas/Elgin County Housing and Homelessness Plan 106
Tim Welch Consulting in association with Lapointe Consulting and Deb Ballak

There are many different models of supportive housing — that is, of types of housing and
arrangements for support services. In principle and (with rare exceptions) in practice,
supportive housing is a residential land use where people with special needs live integrated
with others in neighbourhoods in the community. It is not an institutional land use or facility.
While room—units are less expensive to build than apartments, for many client groups (except
seniors) they more often give rise to conflicts among residents who must share the congregate
living spaces. This may entail higher support and management costs. As well, there is often
higher turnover as residents gradually find other housing options. For those needing
supportive/transitional housing for the long term, independent apartments — even if units are
small — are a more fully stable and integrated form of living in the community.
Diverse Clients
The population groups that need or live in supportive housing are diverse. This needs
assessment is concerned significantly with supportive housing that is most related to
homelessness or risk of homelessness.
For some types of clients, homelessness is a high risk if supportive housing is not available. For
others the alternative to supportive housing may be dependency on family members or living in
an institution. The latter tends to be the case for many intellectually disabled people. For
seniors with high support needs relating to age, frailty, or dementia, the alternative may be a
Long Term Care home or a hospital, which has much higher costs and can mean less
independence, private space, and dignity.
For people with physical disabilities, supportive housing does not include any and all”accessib|e” apartments modified for wheelchair access or in other ways. It refers only to
homes where a resident receives support services for activities of daily living, such as dressing,
bathing, outings, and meals. The housing needs component of this housing and homelessness
plan deals with accessible units, in the section on social housing Section 7.1.
Diverse Housing and Support Resources Related to this Needs Assessment
The resources that support existing transitional and supportive housing are perhaps as diverse
as the clients’ needs. These correspond loosely, not exactly, to the main client populations just
noted.
0 Housing funded by Ministry of Health and Long Term Care through the Local HealthIntegration Network (LHIN),in four program categories:
o Assisted Living for high—needs seniors (in their own home, often in socialhou?ngy
St. Thomas/Elgin County Housing and Homelessness Plan 107
Tim Welch Consulting in association with Lapointe Consulting and Deb Ballak

o Assisted Living for others with high needs (usually in clustered social housingunits) e.g. severe physically disabilities, acquired brain injury, advanced
HIV/AIDS.o Mental Health Supportive Housing.
o Supportive Housing for people with addictions.
0 Community Living for people with intellectual disabilities, funded by the Ministry ofCommunity and Social Services as well as by community fundraising.
0 Housing funded through the provincial/municipal homeless programs in long-established programs: Homes for Special Care and Domiciliary Hostels.
0 Transitional housing for former homeless people, or for youth, supported by variedresources, mainly federal homelessness funding, and provincial/municipal homelessnessprograms.
0 Retirement homes.
0 Second Stage housing for abused women (victims of domestic violence).
0 Other supportive units within social housing projects or within new affordable housingprojects.
Mental Health Supportive Housing combines subsidized housing and support services to
enable people with serious mental illness to live independently in the community. ”The
supports provided can include social supports (... such as homemaking and personal care; life
skills; peer support; and employment support), and more clinical mental health supports (i.e.
case management; outreach nursing, and assertive community treatment).” The same
organization is usually service provider and landlord. Housing subsidies are provided via the
LHIN(not via the social housing system funded and overseen by municipalities such as the City
of St Thomas). All residents/clientsmust have a diagnosed serious mental illness. Although this
category includes ”dedicated” supportive housing, the Ministry tends to favour ”integrated”
units rented in ordinary private—sector apartments, for reasons of community integration, cost-
efficiency, and ability to put them in place quickly.
Supportive Housing for People with Problematic Substance Use — Clients are mostly people
who are homeless or at high risk, are high users of addiction services, or have complex
addictions — if they are assessed as likely to have stable lives in this housing. Support services
vary by individual needs.
Domiciliary Hostels are private or non—profit residences that assist adults to live in a safe and
supportive community environment. Residents are typically living with psychiatric,
developmental or physical illness and/ordisability. For most residents, the domiciliary hostel is
their permanent housing. These hostels offer a community alternative to institutional care.
St. Thomas/Elgin County Housing and Homelessness Plan 108
Tim Welch Consulting in association with Lapointe Consulting and Deb Ballak

Domiciliary hostels can be one part of a broad system of housing and supports services for
people who are vulnerable, homeless or at risk of homelessness.
11.1 Existing Services
Transitional and Supportive Housing
Table 11.1.1: Transitional and Supportive Housing in St. Thomas/Elgin County
Transitional and Supportive Housing Location Beds] units
ASH (Addiction Supportive Housing) 4 beds are available in St. Thomas at unitsowned by Elgin and St. Thomas Housing Corporation. Operated by AddictionsServices Thames Valley (ASTV)in conjunction with Canadian Mental HealthAssociation Elgin Branch the beds are for stays up to one year. ASTV is also in thepreliminary stages of rolling out their Tele Withdrawal Crisis Support Program — avirtual model that will provide enhanced and crisis supports for Community
Withdrawal Management across St. Thomas-Elgin.
St. Thomas See Table11.1.2below
CMHA-Elgin Branch provides housing, wraparound supports and crisis support to
person with a diagnosed serious mental illness.St. Thomas See Table
11.1.2below
Community Living —E|ginprovides various housing options across Elgin County
including group living, supported Independent living, family home program andrespite services for persons with intellectual disabilities. Staff assist the peoplethey support to develop life skills, encouraging them to speak up for their rightsand responsibilities within their homes and communities.
St. Thomas
Dutton and District Lions Non-Profit Housing-Caledonia Gardens —non-profit(RGI)seniors only assisted living program joined by hallway to Bobier Villa Home
for the Aged.
Dutton
Fresh Start (formerly Rehoboth Homes) serves an average of 20 moms and 20
babies per year through their residential program. There are 2 residential servicesunder 1 roof at Fresh Start: Group Home and Support Housing. The group homehas capacity for 5 moms and 5 babies at a time and Supportive Housing hascapacity for 3 moms and 5 babies at a time. The women in both programs receiveaccess to 24 hour support, a case worker and daily programs. Room and Board isprovided in the group home portion. The only difference is that in Supportive
Housing women live more independently in their own apartment; it is thetransition to community living.Women may reside at Fresh Start from a few days up to 364 days in the group
home and then an additional 364 days in Support Housing.
St. Thomas
Kettle Creek Residence provides daily living assistance and supports to personswith cognitive difficulties, impairments or psychiatric diagnosis.
St. Thomas 56 beds
Pine Hill Rest Home-assisted living services for adults 18 yrs and over with longterm care needs, generally with a mental illness.
St. Thomas 43 beds
St. Thomas/Elgin County Housing and Homelessness PlanTim Welch Consulting in association with Lapointe Consulting and Deb Ballak
109

Transitional and Supportive Housing Location Beds] units
Port Bruce Manor provides housekeeping, assistance with activities of daily living,cooking laundry and transportation for adults 18 yrs and over with an intellectualdisability if capable of directing their own care. (Home for Special Care)
Port Bruce 36 beds
St. Thomas-Elgin Second Stage Housing is focused on the longer term needs ofvictims of domestic violence. Second Stage Housing’s purpose is to meets theneeds of women and children who have survived abuse, including physical,sexual, emotional and/orverbal abuse. In addition to residential services, theyprovide supports and counselling including intense psycho social programs withan educational focus. A fo||ow—up transition worker does the initial interview, andmeets with them until they are admitted, helping with legal and community
support referrals, and housing applications. When they are discharged theworker assists with a safety inspection and plan, and the shelter reports that theyhave followed up with their residents up to 12 years.
Funding for accommodation and programming comes from the Ministry ofCommunity and Social Services, OW shelter component, and United Way for thechildren's program.
The apartment complex is comprised of five 3 bedroom units, four 2-bedroomunits, one 1-bedroom unit and one modified single bedroom unit. They have a
head lease agreement with a private landlord for a two bedroom unit downtown.
St. Thomas Women andchildren——victims ofdomesticabuse
12 units
Second Storey Transitional/supportive housing for men has been a longstandingcommunity concern and it will be addressed with the opening of Second Storey inJune 2013. Six transitional housing units will allow men to transition fromhomelessness or the Inn Out of the Cold program to permanent housing. CMHA
owns the building and the YWCAwill deliver the programming with a modelsimilar to the Harmony and Fairwinds programs (described below). (See alsoSection 8.3 Social Worker).
St. Thomas 6 units
Tara Hall is the only domiciliary hostel operating in the service area. It is a 36 beddomiciliary hostel that provides long-term stays for persons with special medicalneeds, including person with severe or mild mental illness, persons withdevelopmental delays and seniors. Tara Hall has been in operation since the mid1980s, and until 2013, was funded by both the Ministry of Community and SocialServices and by the City of St. Thomas. On average 32 beds are occupied andfunded. (See Section 10.3).
St. Thomas Avg. 32
bedsoccupied
Transitional /Emergency Housing for Families The same partnership that was
involved in developing Second Storey has opened a Family Shelter in December2012 with the same supports regarding life skills, life coaching and comprehensivereferrals to other YWCA programming as well as other community services.
St. Thomas Families
Victoria's Home provides support with the activities of daily living for primarilyadults with a psychiatric illness, or children in the care of CAS (no agerestrictions).
St. Thomas 20 beds
Wallis Residential Homes provides daily living assistance and support for personswith mental illness and adults with disabilities, Housing Allowances help peoplewith affordable rents. (Homes for Special Care)
St. Thomas 17 apts.
10 semi-indep. units
St. Thomas/Elgin County Housing and Homelessness PlanTim Welch Consulting in association with Lapointe Consulting and Deb Ballak
110

women accessing the YWCA residence. Many of these young women were
between the ages of 16 — 24 and were either leaving dysfunctional homes or hadfound themselves returning to the YWCAfrequently for housing due to a lack oflife skills and poor life choices. While the YWCA residence was able to providehousing for these young women, due to the wide mix of ages and issues, it was
determined that these young women would be better served in a smaller, more
age specific housing program that included some rules around curfew, life skillsand life coaching.In 2008 the YWCAentered into a head lease agreement with Eastwood Baptist
(non-profit housing provider), for a four bedroom centrally located townhouse.Three of the bedrooms are rented out to young women who require supports intheir plans to transition to independent living. A Resident Advisor lives in thebasement and works outside of the home during the day.The young women receive OW or wages, are expected to pay rent and buygroceries, as well as follow through on their plans i.e. going to school, looking forwork etc. The supports that are available to them are the Resident Advisor whofacilitates the house routines, a Social Work Student who assists in organizing lifeskills workshops, on topics such as nutrition, sexual health, budget planning etc., a
Life Coach who works with them on achieving their individual goals, and theHousing Manager who meets with them weekly to go over any issues, concerns,advocacy and additional support. An MSW is available to youth who may need
and/orwant clinical counselling. The coordinator for Harmony House reports thatthis is a way to provide supportive transitional housing to a small group of peoplewith low financial overhead. Services are client—directed and are based on
individual need.
Transitional and Supportive Housing Location Beds/units
38 beds
YWCA - Women's Residence (1902) is a 21 bed facility that provides 3 beds as St. Thomas Women
emergency accommodation and approximately 6 beds for supportive transitional over 16 yrs.
housing for women. The remaining beds at the residence are allocated for long 6
term housing. This allows women to receive consistent supports at the same transitionallocation as they transition from homelessness to independent living. As supports bedsare provided on site to all of the residents, the 6 transitional beds and the 12 long-remaining approximately 12 beds will be considered supportive housing for the term
purpose of this needs assessment. (See also Section 9.1). supportivebeds
YWCA - Fairwinds A partnership of community organizations concerned about St. Thomas Young men
services for the homeless, organized to discuss ways of closing the gaps in age 16-24
services they dealt with daily. A transitional home for young men was identifiedas a gap. Building on the positive experience of the Harmony Homes model foryoung women (see below), the YWCAentered into a head lease agreement withElgin St. Thomas Housing Corp. for a four bedroom house in 2010. Fairwinds is 3 beds
for young men 16-24 who find themselves without the supports necessary to
make a healthy transition from youth to adulthood. Referrals often come fromthe Inn Out of the Cold program. Program supports are the same as for Harmony
House.
YWCA - Harmony House Over the last decade the YWCAstaff noticed more young St. Thomas Young
women age
16-24
3 beds
Source: Key Informant Interviews; 2009 Study on Homelessness; organization websites; http://thehealthline.ca
St. Thomas/Elgin County Housing and Homelessness PlanTim Welch Consulting in association with Lapointe Consulting and Deb Ballak
111

Table 11.1.2: Canadian Mental Health Association- Elgin Branch—Supported Housing(For persons with a diagnosed serious mental illness.)
Location Tenancy
Occupancy Comments
282 Highview Drive 12 Units 0 Supported housing units
50/52 Steele Street 8 Units 0 Supported housing units67 Hiawatha Street 4 Units 0 Supported housing units35 Metcalfe Street 1 0 Supported housing for family
37 Steele Street 10 0 Mental Health Treatment bedsHead Lease Units 44 o Geared to income supported housingSupportive Housing — Addictions 4 o Addiction treatment units661 Talbot Street 1 0 Independent apartment
8 Elizabeth Street 1 0 Emergency family housing (Section 9.0)
6 crisis beds in various existing group homes (see Section 9.0)
Source: CMHA Elgin Branch: Currency March 19, 2013
11.2 Indicators of usage
Transitional and Supportive Housing
YWCATransitional and Supportive Housing Programs (3 locations)
Chart 11.2.1: YWCA Usage Statistics: 2010 — 2012
50
45
40 > 3935
30
25 -O—# women in residence
20 -I-# youth in residence
15 1:5
10
2010/11 2010/11 2011/12
Source: YWCA
NOTE: Fairwinds opened fall 2010
YWCA Average Length of Stay
For women accessing transitional housing the average length to get into affordable housing is
approximately 6 years. For those women that function in a communal living environment, they
will generally try and stay at the Y until such time as they get called for an apartment. Because
St. Thomas/Elgin County Housing and Homelessness Plan 112Tim Welch Consulting in association with Lapointe Consulting and Deb Ballak

the wait time is so long many do not bother to apply to the centralized list for RGI housing.
These are typically older women who have suffered a job loss, poor housing, or break down in
the family structure. Mental health issues are often present for these women.
Women looking for long term options who do not prefer communal living generally move out in
about 9 — 12 months. However, about 50% return within a year or two, needing housing again.
YWCA Patterns and Trends
Women
There has been an increase in the number of women accessing housing due to addiction issues
that result in evictions, relationships disintegrating, and/orfamily supports no longer available.
For those with addiction issues there are more mental health issues as well.
For many of the women accessing housing, it is not just about needing housing but all round
supports as well. With difficult economic times, the women that were in lower paying jobs are
being bumped by individuals that may have a high school or higher diploma. The marginalized
are getting squeezed by the middle class that have lost their jobs.
About 20% of the women need to stay in this community even without opportunities or
supports because their children are in foster care and they need to be close by in order to have
access and regular visits. Approximately 35-45% of the women come to the YWCA because they
feel unsafe living alone, especially in housing they cannot afford.
Youth
Youth are accessing housing due to break—downs in their family structures. This could be a
single parent household where the parent is struggling with their own addictions or mental
health issues, or where the parent has now become involved with someone else and the child is
not wanted in the new family structure, or where parents have to re—|ocate and the youth
refuses to leave due to school and other ties. The youth are being asked to leave because the
parents can't cope with an adolescent who is acting out. Social Workers have requested
housing for the youth because they are being ”dragged down” by dysfunctional or unhealthy
family relationships. Mental health and addiction issues are also often present.
YWCAWait Lists
The Women's Residence is full about 95% of the time and when there is a vacancy it is often
filled quite quickly. The YWCA generally has 5 to 10 names on their waiting list. There have
been times when it has gotten as high as 20. However it is important to note that often once
they go on the wait list they move on to another location, as determined when they are
St. Thomas/Elgin County Housing and Homelessness Plan 113
Tim Welch Consulting in association with Lapointe Consulting and Deb Ballak

contacted and no longer need housing. It is hard to state the average wait time because timing
is everything. Sometimes it can be very quick and other times it can take months.
The Youth Homes are full about 75-80% of the time. In general throughout the last two
decades youth accessing the Y's housing services seem to come in groups.
Other Services Provided by the YWCA
Access to other YWCA programs such as employment training, literacy, life skills/lifecoaching,
and computer classes are available. Youth can access MSW clinical services as well as life
coaching. Those in high school have access to the ”Get Gorgeous for Grad” boutique.
Short term crisis intervention is provided that allows for comprehensive referrals to be made as
well as supportive listening. Computer access and internet are available. In 2013, a full time
social worker within the housing programs is planned (See Section 9.3).
CMHA —E|ginTransitional and Supportive Housing Programs
Patterns and Trends
Staff note that many of their clients have poor se|f—worth and tend to ‘sabotage’ their
tenancies, believing that they don't ‘deserve’ an apartment of their own. This involves a great
deal of trust building, and enhancing se|f—worth with the tenant. Often tenants will cycle in and
out of the program several times before becoming permanently housed. They have also
noticed an increase in hoarding behaviour in individuals who previously had very few
possessions, and now can't let go of anything. These individuals require intense support to
reduce the hazards of hoarding.
Wait Lists
Fortunately there are no wait lists for CMHA’s supportive housing. When a vacancy occurs it is
usually filled quickly. It is believed that there are adequate resources for people with a
diagnosed Serious Mental Illness (SMI) who require supportive housing in the area.
Family Home
A four bedroom family home (not restricted to persons with a serious mental illness) is new to
the services provided, and at this point it is not known if one home is adequate, and if not how
many similar homes or units might be needed. The home is owned by CMHA, beds are funded
by the City, and the YWCA provides the supports. This partnership is currently developing the
structure for this home. CMHA runs another family home for a family where one person has a
diagnosed serious mental illness.
St. Thomas/Elgin County Housing and Homelessness Plan 114
Tim Welch Consulting in association with Lapointe Consulting and Deb Ballak

Staff at CMHA note that while there are adequate supportive units for people with a Serious
Mental Illness, the resources for those who are marginalized, and do not have a mental illness
are lacking, and that the full impact of the plant closures are still to be felt by the community.
There are lower rental units in the private market, however many are not in adequate physical
condition.
11.3 Evolution of Services (Changes)
Transitional and Supportive Housing
CMHA —E|ginTransitional and Supportive Housing Programs
In the last five years CMHA has doubled its supportive housing units throughout the area by
expanding head leases in the private sector. This change in service model resulted from the
Ministry of Health and Long Term Care's move away from the group home model. Now their
clients are housed independently, where ?r want to live with wrap around supports, geared
to their needs. Lifeskills training and recreational activities are available to them as well as a 24
crisis line, with the latter also available to the public. This allows the tenant to increase their
independence, while decreasing wrap around services, but also be able to call on support in a
crisis, i.e. a neighbor dispute, and receive support/coping strategies to deal with the issue
before it jeopardizes their we||—being and/ortheir tenancy.
Rent Supplement agreements with private landlords have allowed tenants to live in the areas of
their choice. Funding from the MoH and LTC has allowed CMHA to enter into head leases for
several units in the private sector. Relationships with these landlords have been developed.
CMHA has a handy—man on staff to do repairs in these apartments, and in one case fixed up the
apartment prior to move in, and negotiated a lower rent for the tenant. CMHA finds that
paying the utilities allows the tenant more housing security.
Family Home
(See Section 11.2)
Funding to Transitional and Supportive Housing
The City has recognized the need for funding stability for transitional housing and has ensured
these funds will flow to providers through the CHPI program. Transitional and supportive
housing providers that will receive CHPI funding are listed in Section 8.3 ”Emergency Shelter
Solutions” and ”Housing with Related Supports”.
St. Thomas-Elgin General Hospital (STEGH)
The St. Joseph's Health Care's Regional Mental Health Care (RMHC) St. Thomas is constructing
a new 89—bedforensic unit that is scheduled to open in June 2013. Fifteen of these acute beds
St. Thomas/Elgin County Housing and Homelessness Plan 115
Tim Welch Consulting in association with Lapointe Consulting and Deb Ballak

are moving to STEGH as St. Joseph's is divesting mental health care beds to regional hospitals as
part of an overall regional strategy directed by the Health Service Restructuring Commission23.
While beds were to be temporarily accommodated at STEGH during construction, in—patients
are being moved to London on a temporary basis until STEGH can take them. Construction at
STEGH as a permanent site for the 15 acute beds has started and it is anticipated that they will
be completed in 2017. Overall however, there will be a reduction of specialized mental health
care inpatient beds in the system.
Seniors
As the aged population is rapidly growing, those who offer supportive housing for seniors are
experiencing new challenges that they are struggling to deal with. Homes for the Aged are now
becoming more like Long Term Care (LTC)facilities. With the Ministry of Health and Long Term
Care's emphasis on keeping people out of hospital, Homes for the Aged are now expected to
offer more intensive medical treatment such as tube feeding and intravenous administrations.
The populations they are serving are diverse, and this diversity is often the cause of extreme
stress to some residents.
A local Behavioural Support Committee discusses local issues with the LHIN (Local Health
Integration Network), with the goal of keeping residents out of hospital whenever possible.
LTC has become a melting pot for seniors with diverse diagnoses, i.e. housing a person who has
been in the psychiatric hospital all their life, alongside the frail elderly. LTC facilities need to
have separate areas to segregate residents according to their diagnoses. The Ministry of Health
and Long Term Care has provided minimal funding in response to these issues for staffing and
training, to help manage behavioural issues before hospitalization becomes the only option.
Some active seniors feel forced to accept a bed in a Home or LTC when it becomes available,
even though they may not be ready for this facility, and could continue to live in their homes
with proper supports. Key Informants report that approximately 10% of their residents fit this
category and could live in their own homes with support. Others come to the Home or LTCdue
to an accident or illness and continue to live in LTC after they are well, and don't require the
level of service offered in LTC. The Ontario model was compared to the US model where LTC is
either for rehabilitation or palliative care. If the senior requires rehab after a stroke or other
illness, accommodation is provided that includes a kitchen and washroom, and supports to help
the senior relearn the skills they need to be placed back in their home that has been retrofitted
to their needs.
23 St. Joseph's Health Care, Community and Protective Service Committee, City Council of LondonSt. Thomas/Elgin County Housing and Homelessness Plan 116
Tim Welch Consulting in association with Lapointe Consulting and Deb Ballak

Social Worker at the YWCA
(See Section 9.3)
Persons with a Developmental Disability
In keeping with Goal #2 in the 2009 Homeless Study; six units developed under the AHP
program are rented out to people supported by the Elgin Association for Community Living,
with supports provided by the agency.
Tara Hall
This 36 bed domiciliary hostel received per diem funding through the domiciliary hostel
program. With the introduction of the new CHPI program effective January 2013; future
funding for the domiciliary program is under review.
YWCA Fairwinds
(Section 11.1)
Transitional Housing for Men
(Section 11.1)
Supportive Housing for People with Addictions
Four supported units for people with mental health and addictions are available in St. Thomas
for a period of up to one year. The units are owned by Elgin and St Thomas Housing Corp., are
rented by CMHA, and supports are provided by Addiction Services Thames Valley (ASTV).ASTV
is also in the preliminary stages of rolling out their Tele Withdrawal Crisis Support Program — a
virtual model that will provide enhanced and crisis supports for Community Withdrawal
Management across St. Thomas—E|gin(Section 11.1). The closest Residential Withdrawal Centres
are located in Waterloo, Simcoe and Chatham.
New Supportive Housing
A number of faith organizations have been meeting in 2013 to focus on the possibility of
creating se|f—contained, affordable and supportive housing for single people who may not be
diagnosed with a serious mental illness but still require supports in order to stay successfully
housed. This group is still in the early stages of planning, they are examining other successful
models of supportive housing in Ontario.
St. Thomas/Elgin County Housing and Homelessness Plan 117
Tim Welch Consulting in association with Lapointe Consulting and Deb Ballak

11.4 Issues Identified with Key lnformants
Transitional and Supportive Housing
0 There is a great deal of willingness to work together in this community, and the City
is engaged with service providers, there is little duplication of services and there arenot enough services to meet the need.
0 Partnerships have resulted in a number of ‘cool initiatives’ i.e. Inn Out of the Coldand Second Storey, the downside is we need twice as many resources as we havenow.
0 There are not enough options for people who don't fit a ‘funding stream’ i.e. laid offworkers, working poor, undiagnosed mental health, etc.
0 Need more life skills programming especially for persons in supportive housing, as
well as persons living in the public and private rental housing markets. Some lifeskills training is all that is required for some persons to maintain their housing.
0 Supported housing must address the cross—sectora| needs of people.
0 Housing First principle — need social housing models with support network to start
to address dependency issues, literacy, employment, etc. that have kept people insocial housing — break the cycle/lifestyle.
0 The challenges don't go away after you put a roof over their heads.
0 Need dedicated year round men's shelter with services and supports.
0 CMHA/ACTprovide great community supports, crisis beds are very useful to providesome alternative. Need more CMHA/ACTbeds—more intensive supports.
0 In the spectrum of homelessness we need more transitional housing for men; thiswill be the emerging group over the next few years.
0 Transitional workers are needed to help people maintain their tenancies—need acommitment to support people; the priority must be to reduce homelessness.
0 Build more housing that has supports attached and lobby, lobby, lobby for morefunding; this (geographic) area needs help.
0 Build on the base that has been developed in this community.
Seniors
0 Need places where seniors can age in place, having appropriate supports when theyneed them, not LTC.
0 Supportive housing for seniors that an average person can afford — nothing outsidethe city.
St. Thomas/Elgin County Housing and Homelessness Plan 118
Tim Welch Consulting in association with Lapointe Consulting and Deb Ballak

0 No specific palliative care beds —|acking affordable longer term care services forseniors.
0 CCAC will only be serving high needs; those with middle level needs drop off theirlist and are downloaded to community health centre. This is a huge issue that iscoming — who will meet those needs?
0 Accessibility is a big issue, some emergency, transitional and supportive housinghave stairs.
St. Thomas/Elgin County Housing and Homelessness Plan 119
Tim Welch Consulting in association with Lapointe Consulting and Deb Ballak

12 ISSUESIDENTIFIEDIN STUDIESAND REPORTS FOR THE HOMELESSNESSAND
HOUSING SERVICEDELIVERYSYSTEM
St. Thomas and Elgin County Study on Homelessness - Final Report August 200924
This study identified three priority areas or housing directions:
1. Creating Improved Housing Options - Issues/Needsidentified
0 Emergency housing that is flexible toward the unique needs of persons who are
homeless, particularly for those with mental illness and addictions.
0 Lack of shelter for men and youth. Reported that often men do not want to leave
their home community, or in some cases theirjobs, even when transportation is
provided, and chose not to go to out of town shelters.
0 The Teen Youth Centre reported that youth often had no supports from services or
family. Ifthey were in school they often refused a referral out of town.
0 25% (on the social housing waiting list) stated that they were at risk of losing their
housing, or a safe place to live.
2. Improving Support Services - Issues/Needsidentified
0 More life skills programming especially for persons in supportive housing as well as
persons living in the public and private rental housing markets. In some cases some
life skills training is all that is required for some persons to maintain their housing.
0 There continues to be a need for housing and supports for persons with a mental
illness and more supports for those with addictions.
3. Coordinating Approach to Homelessness
0 There is a need to further pursue community partnerships and increase public
awareness of homelessness issues in order to reduce barriers to accessing services
by increasing awareness or the services.
24 St. Thomas and Elgin County Study on Homelessness — Final Report, August 2009. Prepared by SHS Consulting.St. Thomas/Elgin County Housing and Homelessness Plan 120
Tim Welch Consulting in association with Lapointe Consulting and Deb Ballak

Our Community Our Future Our St. Thomas: Community Strategic Plan (draft September
2012)
This Strategic Plan is ‘based on examining the |ong—term sustainability and management of the
City's societal, cultural, economic and environmental assets’.
In the SWOT analysis homelessness, and available and affordable homes are listed under the
Weaknesses or Limitations headings.
A section of the report devoted to housing notes that; from 2007-2009 there was a 73%
increase in the social housing waiting list, which corresponded to the rising unemployment rate.
The following Goals, Objectives and Actions pertain to this Needs Assessment:
Goal 1: Provide a Safe, Healthy and Vibrant Community
Objective 1.4: Continue to support the provision of health and social services for the
residents of St. Thomas where financially feasible.
Action 1.4.2: Investigate ways to integrate health and social services to improve
linkages and collaborative efforts.
Action 1.4.3: ‘Plan for a range and variety of housing options for residents
including affordable housing, will help maintain a high quality of life’.
Action 1.4.5: Work cooperatively with partners to promote health and wellness
and required services to meet the needs of the residents of St. Thomas.
Res ondin to Youth Homelessness In St Thomas and El in Count Januar 2013
This report was commissioned by the Community Council for Children and Youth of Elgin
(CCCYE)to ‘understand the nature and scope of youth homelessness’ and identify community
actions and recommendations. The report extensively details the types of youth homelessness,
and the issues homeless youth face.
It identifies factors of homelessness that impact rural youth differently than urban youth. It also
identifies how homelessness impacts youth differently than adults.
IdentifiedHomelessness Programs, Supports and Services Issues;0 The need for life skills to help youth obtain an apartment and to maintain it.
0 The importance of homelessness prevention for youth, ‘Assisting youth to find housingand supports not only reduces youth homelessness now, but it also reduces chronichomelessness in the future’. These services ‘ensure that youth have a true support
system in place’ including; immediate counseling forfamilies in crisis, mentoring, familycounseling— |onger—term approach to prevent homeless recurrence.
St. Thomas/Elgin County Housing and Homelessness Plan 121Tim Welch Consulting in association with Lapointe Consulting and Deb Ballak

0 A ‘Community Protocol’ to develop a coordinated service response by clarifying theroles, responsibilities, and obligations of each service provider that deals with youthwho are homeless/25
0 Service Coordination—mode|s of data collection that ‘contribute to understandingrelevant issues, collaborate with other agencies...and work within the community withall stakeholders’;
0 Prevention initiatives including all sectors of the community;
0 Ensuring’ that youth have access to specific services for youth...before they becomeentrenched in street life’.
IdentifiedEmergency Housing Issues:
0 Emergency Response to provide basic needs before process oftransitioning from thestreets;
0 She|ter—’accessib|e, age appropriate emergency accommodation, as well as emergency
housing options for those being discharged from correctional and medical facilities’.Shelter options include: youth—specific shelter,
o Youth—specificshelter
o 24-hour crash beds Respite She|ter—’time—out place where youth can stay
temporarily
o Host Home program
0 Emergency services— ’youth—responsive health, mental health, addiction and concurrent
disorder services and counselling’
o Mental health crisis response
o Harm reduction services
o Treatment for co—ocurring problems
o Food programs
IdentifiedTransitional and Supportive Housing Issues:
0 Long term accommodation solutions
o Housing access services
o Rent—geared—to—incomehousing for youth
o Supported and supportive housing for youth
o Family reunification
25 Youth Homeless Study. Report to the Community Council for Children and Youth of Elgin. Presentation madeJanuary 8, 2013 by Dr. John Whitesell, OrgCode Consulting, Inc.
St. Thomas/Elgin County Housing and Homelessness Plan 122Tim Welch Consulting in association with Lapointe Consulting and Deb Ballak

Community Matters "Looking Ahead” Report 2008
In 2005 and 2006, the United Way engaged interested citizens in community building exercises.
Community Consultations and Town Hall Meetings were hosted by United Way across Elgin and
St. Thomas, community by community. Using an asset—based approach, meeting facilitators
sought input on participants’ views of their areas—what people viewed as Assets or Resources,
Needs or Gaps, possible Solutions and what they rated as highest Priorities.
The report found that, based on their community consultations in 2006, the top three priorities
emerging in St. Thomas and Elgin County were:
1. Youth
2. Medical and mental health issues
3. Poverty and employment.
Healthy Communities: Community Picture (March 2011)
This report is a part ofthe Ministry of Health's Promotion and Sport, to fund community
programs that improve the health of Ontarians. It is a ‘comprehensive profile ofthe community
showing the demographic make—up,health status data, current initiatives and policies that
impact on health and we||—being.’ Although housing is not one of the identified risk factors,
healthy eating is, and there is a strong interplay between healthy eating and stable housing for
the communities’ |ow—income population.
The report notes that ‘availability of housing choices: affordable housing is part of the
framework for a culture of health and we||—being’.The report also states that ‘there are people
in Elgin County and St. Thomas who cannot afford a nutritious diet. According to the Canadian
Community Health Survey 2007/08, nearly 10% ofthe population of Elgin is food insecure
(Nutritious Food Basket).’
St. Thomas/Elgin County Housing and Homelessness Plan 123
Tim Welch Consulting in association with Lapointe Consulting and Deb Ballak
Appendix A: Glossary of Terms
AHP Referred to as the Canada—Ontario Affordable Housing Program, jointlyfunded through the federal and provincial governments to build new
affordable rental housing.CMA Statistics Canada's term for Census Metropolitan Area (CMA)consisting
of one or more neighbouring municipalities situated around a core.
CMA must have apopulation of at least 100,000 of which 50,000 or
more live in the core.
CMHA Canadian Mental Health Association.
CMHC Canada Mortgage and Housing Corporation.
Community Start UP &
Maintenance Benefit(CSUMB)
Issued to recipients of OW and ODSP to help establish, or re—estab|ish
them in the community. Discontinued January 1, 2013.
Consolidated HomelessPrevention Initiative (CHPI)
Replaced Consolidated Homelessness Prevention Program (CHPP),January 1, 2013. Service Managers have flexibility to allocate fundingwhere most needed.
Consolidated HomelessnessPrevention Program (CHPP)
Consolidated a number of provincial MCSS homelessness programs intoone funding envelope in 2005. Programs retained their individualcriteria. Replaced by Consolidated Homeless Prevention InitiativeJanuary 1, 2013.
Consolidated MunicipalService Manager (CMSM)
Provincially appointed governments, usually municipalities that deliverOntario Works, Housing and Child Care Programs
Domiciliary Hostel Provincially designated longer term shelter, usually for persons with a
physical or intellectual disability, or the aged.Emergency
hostel/shelter/housingAccommodation provided on a short—term basis when no otheraccommodation is available. Usually operated by a non—profit&subsidized by the Service Manager/province.
HeLP (Housing Links forPeople)
Immediate financial assistance for low income people to prevent
homelessness, delivered by the Service Manager.
Homelessness Defined in this document to include people who are absolutelyhomeless, as well as those who are at risk of becoming homeless.
Housing AllowanceProgram
Designed to subsidize rent for low income households, usually a fixedmonthly amount for a fixed period of time, in order to increase thestock of affordable housing.
Housing First Involves providing immediate housing along with supports to helppeople retain housing and deal with issues that have in the past lead to
homelessness.Housing Services Act Provincial legislation that replaced the Social Housing Reform Act
January 1, 2012
Investment in AffordableHousing (IAH)
A provincial housing program that allows Service Managers theflexibility to allocate funding consistent with identified communityneed.
Low—Income Energy
Assistance Program (LEAP)Programs delivered by the Service Manager, or non—profits to assistwith utility costs where there is a shut off notice or risk of shut off.
LHIN Local Health Integration Network are the health authority responsiblefor the regional administration of public healthcare services in Ontario.
St. Thomas/Elgin County Housing and Homelessness Plan 124Tim Welch Consulting in association with Lapointe Consulting and Deb Ballak

Market Housing Refers to housing operated by the private market (rental or ownership).Prices are set in the open market.
Ministry of Community &
Social Services (MCSS)Primary provincial ministry responsible for OW, ODSP andhomelessness initiatives (the latter prior to January 1, 2013).
Ministry of MunicipalAffairs & Housing (MMAH)
Primary provincial ministry responsible for social housing, and effectiveJanuary 1, 2013 for homelessness programs.
ODSP Ontario Disability Support Program— social assistance program forpersons with a disability delivered by the province
Official Plan A municipal document that outlines a community's vision for the futureby establishing goals and objectives to manage and direct its social,economic and natural environment.
OW Ontario Works—socia| assistance program delivered by Service
Managers
Rent Bank A program designed to assist with rental arrears to prevent
homelessness. Eligibility criteria and maximums apply.Rent Supplement Program Designed to subsidize rent for low income households, in order to
increase the stock of affordable housing.RRAP Residential Rehabilitation Assistance Program, helped low to moderate
home owners with essential repairs, and modifications for physicaldisabilities. Expired December 2012.
Second Stage Housing Longer term transitional housing for survivors of domestic abuse.Service Area The geographic area of responsibility for the Service Manager, as
designated by the province
Service Managers Provincially appointed governments, usually municipalities, that deliverOntario Works, Housing and Child Care Programs
Social Housing Permanent housing subsidized, usually through the Service Manager
(some social housing is subsidized directly through senior levels ofgovernment). Social Housing is operated by government or non—profitsgroups and is governed by the Housing Services Act. Access to socialhousing is through the Centralized Waiting List operated by the Elginand St. Thomas Housing Corporation.
Supportive Housing Usually longer term housing providing a range of services and supports
either by on site staff, regular visits, or on call support.
Transitional Accommodation targeted to people who require structure and support
Housing/Shelter to move to more independent living. Can be short or long term.
VAWSEC Violence Against Women Services Elgin County, a shelter for women
and their children who have been victims/orwitnessed domesticviolence.
YWCA Young Women's Christian Association provides a number of services to
individuals and families throughout St. Thomas and Elgin County.
St. Thomas/Elgin County Housing and Homelessness Plan 125
Tim Welch Consulting in association with Lapointe Consulting and Deb Ballak

Appendix B: Data Tables
Table A1: Employed Labour Force in Individual Municipalities in Elgin County, 2006By Industry Category
Municipality of Township of Town ofAy|mer Municipality of Township of Municipality Munici|
Bayham Malahide Central Elgin Southwold Dutton—Dunwich Wesl
Industry # % # % # % # % # % # % #
Agriculture, forestry, fishing and hunting 410 27.0% 560 45.3% 295 9.4% 460 14.4% 405 10.4% 200 23.4% 35CMining and oil and gas extraction 0 0.0% 0 0.0% 0 0.0% 0 0.0% 0 0.0% 0 0.0% 1
CUtilities 0 0.0% 0 0.0% 10 0.3% 25 0.8% 0 0.0% 0 0.0%
Construction 45 3.0% 10 0.8% 75 2.4% 135 4.2% 60 1.5% 15 1.8% 6CManufacturing 465 30.6% 45 3.6% 490 15.7% 320 10.0% 2,570 66.0% 0 0.0% 58
CWholesale trade 40 2.6% 35 2.8% 105 3.4% 135 4.2% 85 2.2% 0 0.0% 35Retail trade 125 8.2% 75 6.1% 475 15.2% 280 8.7% 80 2.1% 120 14.0% 18
5Transportation and warehousing 50 3.3% 110 8.9% 200 6.4% 150 4.7% 100 2.6% 30 3.5% 9CInformation and cultural industries 30 2.0% 10 0.8% 70 2.2% 15 0.5% 10 0.3% 10 1.2%
Finance and insurance 0 0.0% 0 0.0% 95 3.0% 25 0.8% 0 0.0% 20 2.3% 5CReal estate and rental and leasing 10 0.7% 20 1.6% 25 0.8% 30 0.9% 0 0.0% 0 0.0% 15
Professional, scientific and technical services 30 2.0% 25 2.0% 90 2.9% 135 4.2% 50 1.3% 35 4.1% 6CManagement of companies and enterprises 0 0.0% 0 0.0% 0 0.0% 0 0.0% 10 0.3% 0 0.0%
Admin. and support, waste management 35 2.3% 15 1.2% 100 3.2% 80 2.5% 90 2.3% 15 1.8% 35Educational services 45 3.0% 75 6.1% 225 7.2% 150 4.7% 115 3.0% 45 5.3% 11
5Health care and social assistance 35 2.3% 95 7.7% 210 6.7% 625 19.5% 140 3.6% 165 19.3% 8
CArts, entertainment and recreation 50 3.3% 10 0.8% 20 0.6% 165 5.1% 20 0.5% 30 3.5% 2
5Accommodation and food services 80 5.3% 45 3.6% 210 6.7% 245 7.6% 75 1.9% 115 13.5% 9COther services (except public administration) 60 3.9% 70 5.7% 230 7.4% 100 3.1% 60 1.5% 45 5.3% 15
5Public administration 10 0.7% 35 2.8% 200 6.4% 130 4.1% 25 0.6% 10 1.2% 4
CTotal — Industry — NACS System 2002 1,520 100.0% 1,235 100.0% 3,125 100.0% 3,205 100.0% 3,895 100.0% 855 100.0% 1,975
Source: Statistics Canada, 2006 Census, Catalogue no. 97—561—XCB2006007
St. Thomas/Elgin County Housing and Homelessness Plan 126
Tim Welch Consulting in association with Lapointe Consulting and Deb Ballak

Municipality of Township of
Bayham Malahide
Dwelling Type Owned % Rented % Total Owned % Rented % Total Owned %
Single-detached house 1,640 84.8% 295 15.2% 1,935 2,115 83.8% 410 16.2% 2,525 1,740 92.6%
Semi-detached house 30 75.0% 10 25.0% 40 25 100.0% 0 0.0% 25 75 41.7%
Row house 10 14.3% 60 85.7% 70 0 - 0 - 0 20 12.1%
Apartment, building five or more 0 - 0 - 0 0 - 0 - 0 0 -
Apartment, building less than five 10 20.0% 40 80.0% 50 10 50.0% 10 50.0% 20 55 13.8%
Apartment, duplex 10 50.0% 10 50.0% 20 10 40.0% 15 60.0% 25 25 50.0%
Movable dwelling 75 100.0% 0 0.0% 75 110 88.0% 15 12.0% 125 10 100.0%
Total occupied private dwellings l: 1,775 81.1% 415 18.9% 2,190 2,270 83.5% 450 16.5% 2,720 1,925 71.7%
Township of Municipality of MLSouthwold Dutton-Dunwich
Dwelling Type Owned % Rented % Total Owned % Rented % Total Owned %
Single-detached house 1,415 90.4% 150 9.6% 1,565 1,160 91.3% 110 8.7% 1,270 1,655 88.7%
Semi-detached house 0 - 0 - 0 15 60.0% 10 40.0% 25 15 100.0%
Row house 0 - 0 - 0 0 0.0% 40 100.0% 40 20 66.7%
Apartment, building five or more 0 - 0 - 0 0 - 0 - 0 0 -
Apartment, building less than five 0 0.0% 20 100.0% 20 0 0.0% 35 100.0% 35 10 8.0%
Apartment, duplex 10 100.0% 0 0.0% 10 10 100.0% 0 0.0% 10 0 0.0%
Movable dwelling 0 - 0 - 0 0 - 0 - 0 35 100.0%
Total occupied private dwellings l: 1,425 89.3% 170 10.7% 1,595 1,185 85.9% 195 14.1% 1,380 1,735 83.4%
Municipality of
Central Elgin
Dwelling Type Owned % Rented % Total
Single-detached house 4,010 91.4% 375 8.6% 4,385
Semi-detached house 50 71.4% 20 28.6% 70
Row house 120 92.3% 10 7.7% 130
Apartment, buildingfive or more 0 — 0 — 0
Apartment, building less than five 30 21.4% 110 78.6% 140
Apartment, duplex 20 40.0% 30 60.0% 50
Movable dwelling 0 — 0 — 0
Total occupied private dwellings l: 4,230 88.6% 545 11.4% 4,775
St. Thomas/Elgin County Housing and Homelessness Plan 127Tim Welch Consulting in association with Lapointe Consulting and Deb Ballak

Table A2: Housing Affordability Data by Municipality
Aylmer
Gross Housing Costs as %
of 2006 HouseholdIncome
Less than 15%
15 to 19%
20 to 24%
25 to 29%
30 to 34%
35 to 39%
40 to 44%
45 to 49%
50% or more
Total
Tenant Households
755 100. 0%
Owner Households
1945 100.0%
Less than 30%
30%+
40%+
50%+
Gross Housing Costs as
% of 2006 HouseholdIncome
Less than 15%
15 to 19%
20 to 24%
25 to 29%
30 to 34%
35 to 39%
40 to 44%
45 to 49%
50% or more
475 62.9%
280 29.0%
135 14.0%
7 7.8%5 5
Tenant Households
1610 82. 8%
335 15.3%
155 7.1%
8 3.9%
Owner Households
Total
Less than 30%
30%+
40%+
50%+
Total 113.9%
St. Thomas/Elgin County Housing and Homelessness PlanTim Welch Consulting in association with Lapointe Consulting and Deb Ballak
112.9%
128

Central Elgin
Gross Housing Costs as %
of 2006 HouseholdTenant Households Owner Households
Income
Less than 15% 28.8% 43.9%
15 to 19% 12.5% 21.3%
20 to 24% 7.7% 13.9%
25 to 29% 11.5% 6.7%
30 to 34% 4.8% 5.0%
35 to 39% 3.8% 2.7%
40 to 44% 6.7% 1.2%
45 to 49% 7.7% 1.5%
50% or more 16.3% 4.0%
Total 100.0% 100.0%
Less than 30% 60.6% 85.7%
30%+ 26.8% 12.9%
40%+ 20.9% 6.0%
50%+ 11.1% 3.6%
Total 119.4% 108.2%
Dutton/Dunwich
Gross Housing Costs as
% of 2006 HouseholdTenant Households Owner Households
Income
Less than 15%
15 to 19%
20 to 24%
25 to 29%
30 to 34%
35 to 39%
40 to 44%
45 to 49%
50% or more
100.0% 1115 100.0%
Less than 30% 135
30%+ 65
40%+ 35
50%+ 10
Total 112.4% 109.2%
St. Thomas/Elgin County Housing and Homelessness Plan 129
Tim Welch Consulting in association with Lapointe Consulting and Deb Ballak

Malahide
Gross Housing Costs as %
of 2006 HouseholdTenant Households
Income
39.8%
19.3%
13.3%
Less than 15%
15 to 19%
20 to 24%
25 to 29% 9.6%
30 to 34% 4.8%
35 to 39% 6.0%
40 to 44% 2.4%
45 to 49% 0.0%
50% or more 4.8%
Owner Households
39.1%
19.2%
14.2%
8.3%
4. 7%
4. 5%
1.7%
1.4%
6.9%
Total 100. 0%
Less than 30% 81.9%
30%+ 18.1%
40%+ 7.2%
50%+ 4.8%
100. 0%
80. 8%
19.2%
10.0%
6.9%
Total 112.0%
Southwold
Gross Housing Costs as
%of2006HouseholdT tH h Idenan ouse o s
116. 8%
Owner HouseholdsIncome
Less than 15%
15 to 19%
20 to 24%
25 to 29%
30 to 34%
35 to 39%
40 to 44%
45 to 49%
50% or more
Less than 30%
30%+
40%+
50%+
Total
1340 100.0%
118.3%
St. Thomas/Elgin County Housing and Homelessness PlanTim Welch Consulting in association with Lapointe Consulting and Deb Ballak
130

St. Thomas
Gross Housing Costs as %
of 2006 HouseholdTenant Households Owner Households
Income
Less than 15%
15 to 19%
20 to 24%
25 to 29%
30 to 34%
35 to 39%
40 to 44%
45 to 49%
50% or more
19.2%
13.1%
12.0%
12.4%
9.2%
6.5%
6.1%
4.6%
17.0%
41.4%
20.0%
15.4%
7.8%
5.4%
2.6%
1.0%
1.4%
5.0%
Total
Less than 30%
30%+
40%+
50%+
100. 0%
56.7%
43.3%
27.6%
17.0%
100.0%
84. 6%
15.4%
7.4%
5.0%
Total
West Elgin
Gross Housing Costs as
% of 2006 HouseholdIncome
Less than 15%
15 to 19%
20 to 24%
25 to 29%
30 to 34%
35 to 39%
40 to 44%
45 to 49%
50% or more
Tenant Households
144. 6% 112.4%
Owner Households
Total
Less than 30%
30%+
40%+
50%+
Total
St. Thomas/Elgin County Housing and Homelessness Plan
144.3% 120.8%
Tim Welch Consulting in association with Lapointe Consulting and Deb Ballak131
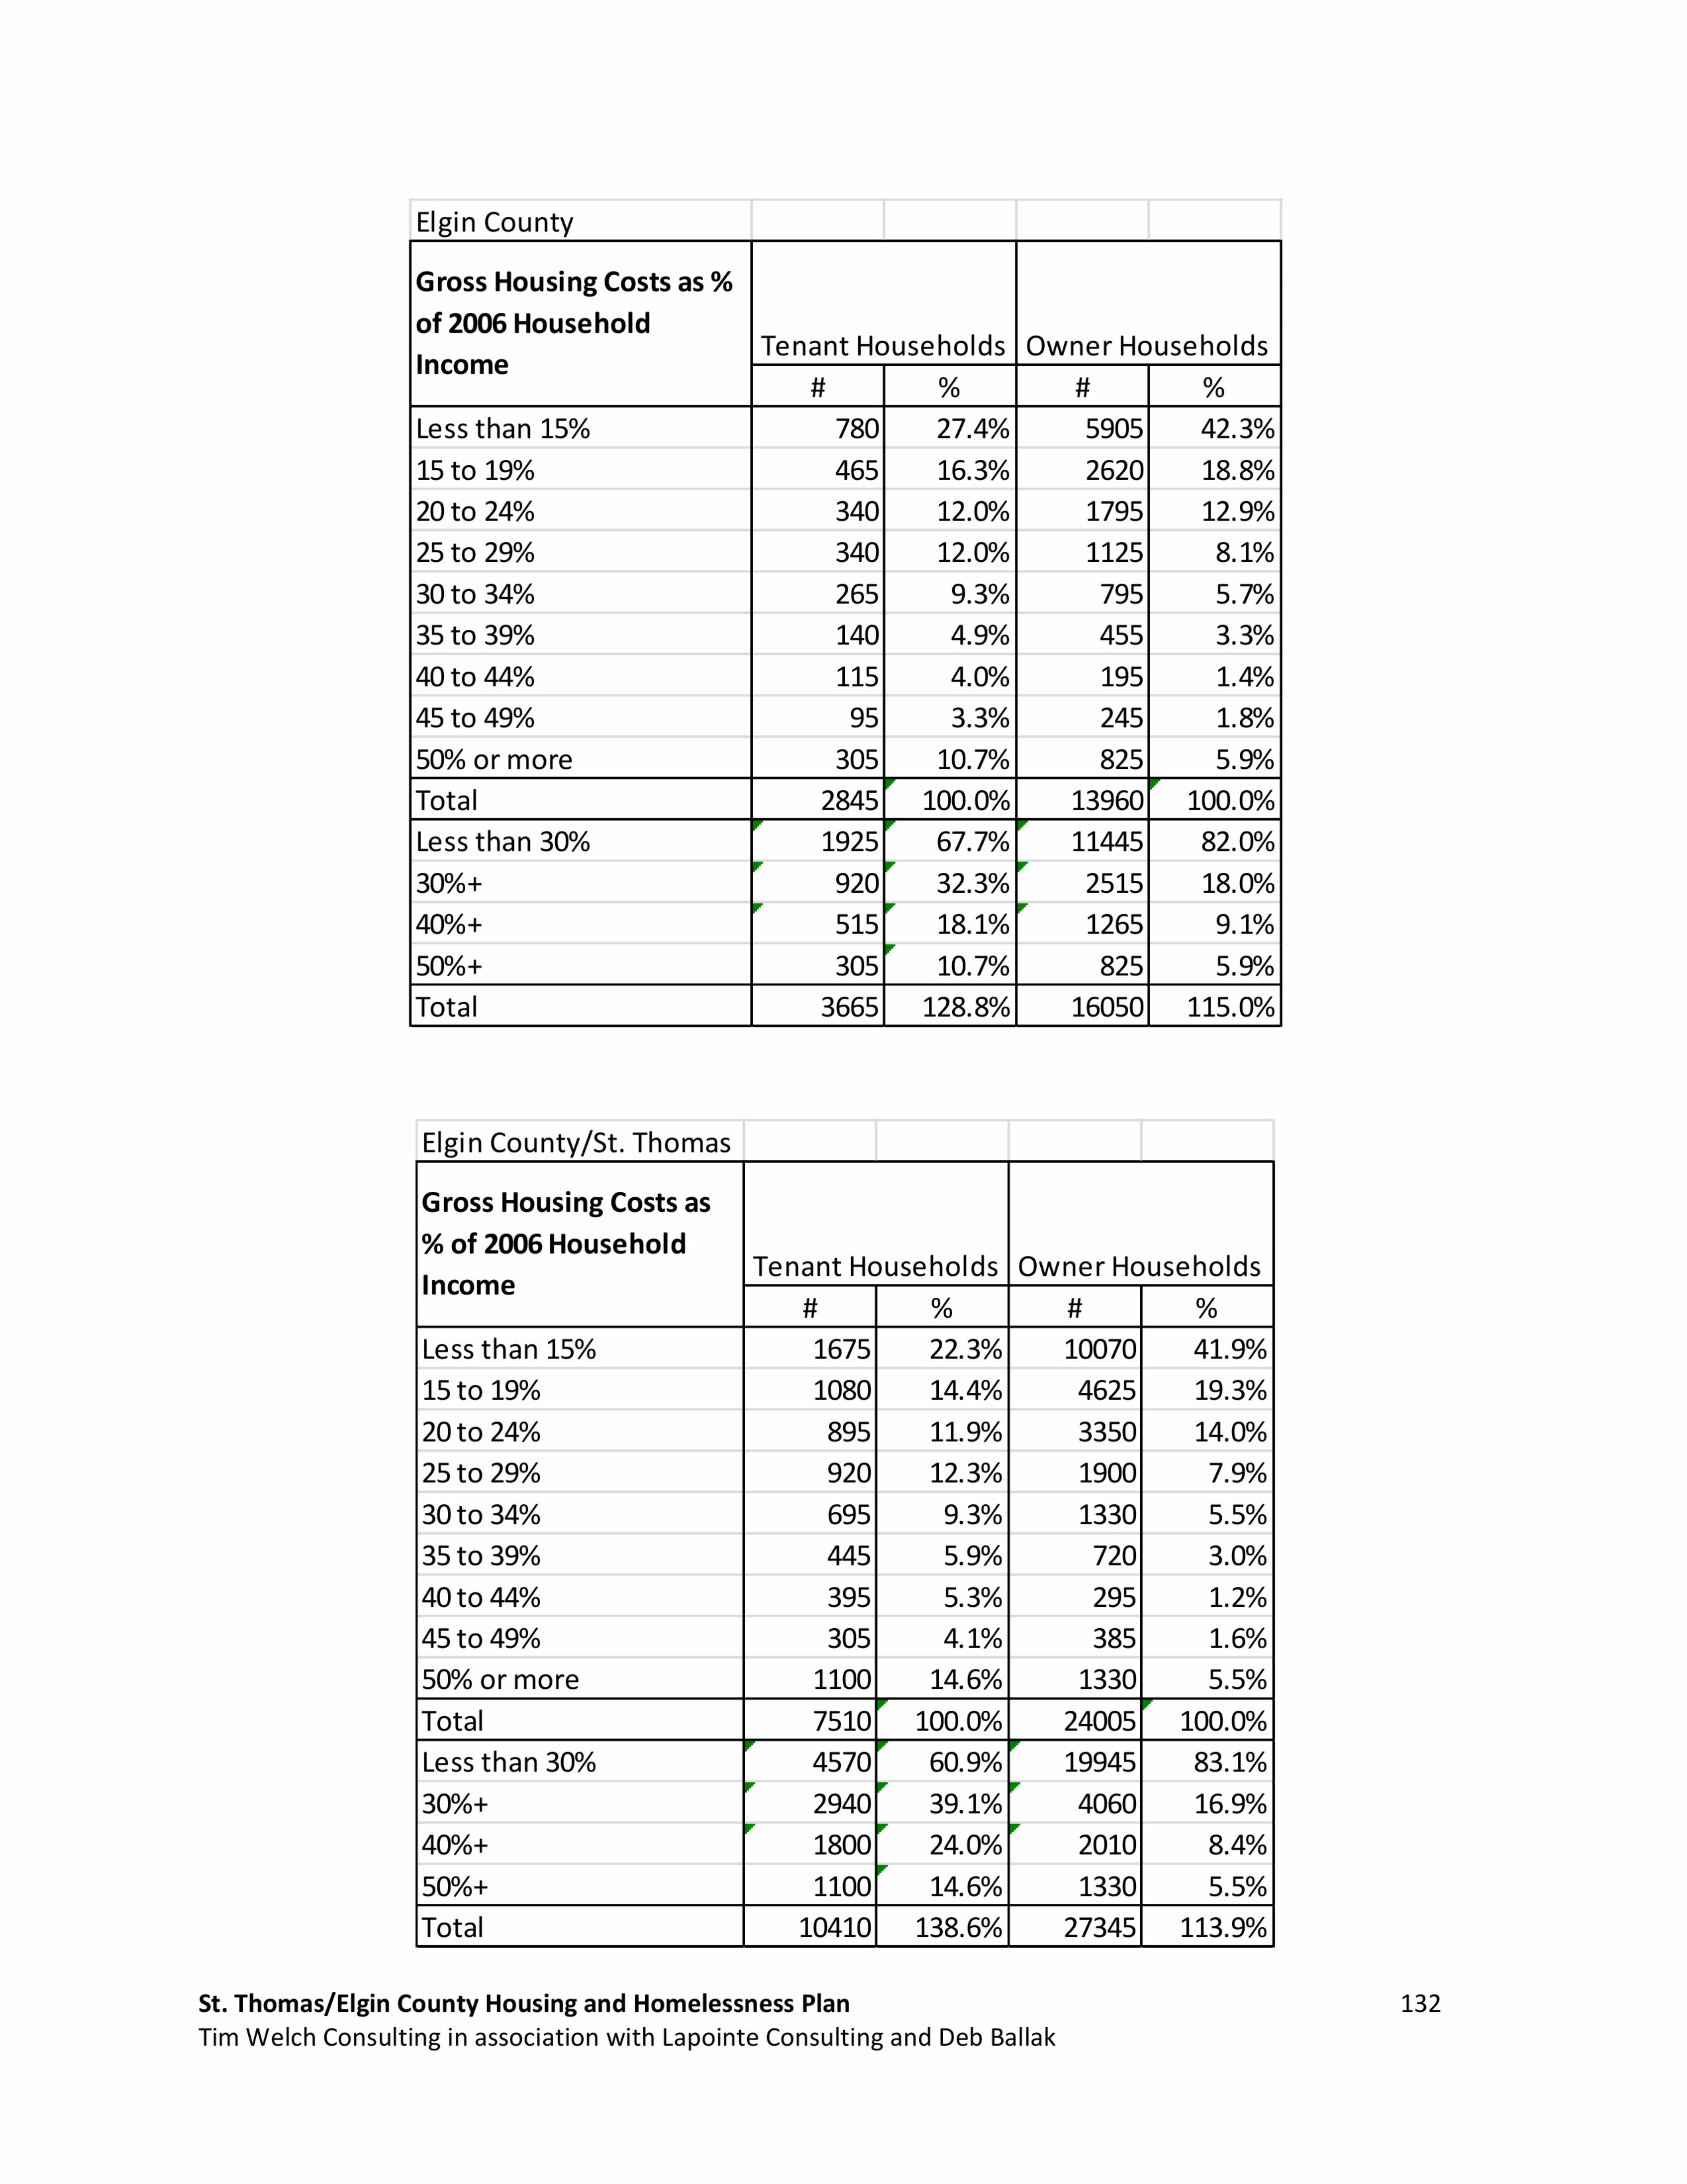
Elgin County
Gross Housing Costs as %
of 2006 HouseholdTenant Households Owner Households
Income
Less than 15% 27.4% 42.3%
15 to 19% 16.3% 18.8%
20 to 24% 12.0% 12.9%
25 to 29% 12.0% 8.1%
30 to 34% 9.3% 5.7%
35 to 39% 4.9% 3.3%
40 to 44% 4.0% 1.4%
45 to 49% 3.3% 1.8%
50% or more 10.7% 5.9%
Total 100.0% 100.0%
Less than 30% 67.7% 82.0%
30%+ 32.3% 18.0%
40%+ 18.1% 9.1%
50%+ 10.7% 5.9%
Total 128.8% 115.0%
Elgin County/St. Thomas
Gross Housing Costs as
% of 2006 HouseholdTenant Households Owner Households
Income
Less than 15%
15 to 19%
20 to 24%
25 to 29%
30 to 34%
35 to 39%
40 to 44%
45 to 49%
50% or more
Total
Less than 30%
30%+
40%+
50%+
Total 138.6% 113.9%
St. Thomas/Elgin County Housing and Homelessness Plan 132
Tim Welch Consulting in association with Lapointe Consulting and Deb Ballak

Table A3: MLS Listings Above $200,000 in Elgin County, May 2013
Central Dutton/ _
$200,000 - 249,999 7
$250,000 - 299,999
$300,000 - 349,999
$350,000 - 399,999
$400,000 - 499,999
$500,000 +
Total
6
10
2
3
1
2
24
St. Thomas/Elgin County Housing and Homelessness Plan 133
Tim Welch Consulting in association with Lapointe Consulting and Deb Ballak