Comprehensive Housing Needs Update City of Cedar Rapids ...
113
Comprehensive Housing Needs Update City of Cedar Rapids, Iowa Prepared For: City of Cedar Rapids October 2016 7575 Golden Valley Road Suite 385 Minneapolis, MN 55427 612.338.0012 www.maxfieldresearch.com
-
Upload
khangminh22 -
Category
Documents
-
view
2 -
download
0
Transcript of Comprehensive Housing Needs Update City of Cedar Rapids ...
Comprehensive Housing Needs Update City of Cedar Rapids, Iowa
Prepared For:
City of Cedar Rapids
October 2016
7575 Golden Valley Road Suite 385 Minneapolis, MN 55427 612.338.0012 www.maxfieldresearch.com
(612) 338‐0012 fax (612) 904‐7979 7575 Golden Valley Road, Suite 385, Golden Valley, MN 55427 www.maxfieldresearch.com
October 28, 2016 Ms. Paula Mitchell Housing Services Division City of Cedar Rapids 101 1st Street SE Cedar Rapids, IA 52401 Dear Ms. Mitchell: Attached is the Update Comprehensive Housing Market Analysis for Cedar Rapids, Iowa con‐ducted by Maxfield Research and Consulting, LLC. The study updates housing demand from 2016 to 2025, and suggests housing product types and amounts that could be built in Cedar Rapids to satisfy demand from current and future residents over the remainder of the decade. The study identifies a potential demand for 2,936 new housing units in Cedar Rapids over the remainder of the decade (2016 to 2020) and includes a variety of housing options. Demand is anticipated for another 4,651 units between 2020 and 2025. The majority of the demand is projected to be for owned housing and the rental market continues to experience a modest rental vacancy rate of 2.4% at this time. Detailed information regarding recommended housing concepts can be found in the Conclusions and Recommendations section at the end of the report. We have enjoyed performing this update for you and are available should you have any ques‐tions or need additional information. Sincerely, MAXFIELD RESEARCH AND CONSULTING LLC
Mary C. Bujold President Attachment
TABLE OF CONTENTS Page EXECUTIVE SUMMARY ........................................................................................................ 1 DEMOGRAPHIC ANALYSIS ................................................................................................... 8 Introduction .................................................................................................................... 8 Market Area Definition ................................................................................................... 8 Population and Household Growth ................................................................................ 10 Population and Household Estimates and Projections ................................................... 14 Household Size Trends .................................................................................................... 16 Age Distribution Trends .................................................................................................. 17 Household Income by Age of Householder .................................................................... 20 Tenure by Age of Householder ....................................................................................... 28 Household Type .............................................................................................................. 31 Employment Trends ........................................................................................................ 33 Commuting Patterns ....................................................................................................... 39 HOUSING CHARACTERISTICS ............................................................................................... 42 Introduction .................................................................................................................... 42 Residential Construction Trends 2010 through September 2016 .................................. 42 American Community Survey .......................................................................................... 44 Cost Burden ..................................................................................................................... 45 Age of Housing Stock....................................................................................................... 46 Housing Units by Structure and Occupancy .................................................................... 48 Owner‐Occupied Housing Units by Value ....................................................................... 49 RENTAL MARKET ANALYSIS ................................................................................................ 51 Introduction .................................................................................................................... 51 General Occupancy Rental Projects ................................................................................ 51 Pending Rental Developments ........................................................................................ 59 SENIOR HOUSING ANALYSIS ............................................................................................... 61 Senior Housing Defined ................................................................................................... 61 Senior Housing in Cedar Rapids and Surrounding Area ................................................... 62 Pending Senior Housing Developments ........................................................................... 67

TABLE OF CONTENTS (continued)
Page FOR‐SALE HOUSING ANALYSIS ............................................................................................ 69 Introduction .................................................................................................................... 69 Overview of For‐Sale Housing Market Conditions .......................................................... 69 Current Supply of Homes on the Market ......................................................................... 70 Lot Inventory .................................................................................................................... 73 Pending For‐Sale Developments ...................................................................................... 74 Presumption of Affordability ........................................................................................... 75 HOUSING DEMAND ANALYSIS ............................................................................................ 77 Introduction ..................................................................................................................... 77 Demographic Profile and Housing Demand .................................................................... 77 Estimated Demand for For‐Sale Housing ......................................................................... 78 Estimated Demand for General Occupancy Rental Housing ........................................... 81 Estimated Demand for Independent Adult Few Services Age‐Restricted Housing ......... 85 Estimated Demand for Shallow‐Subsidy Independent Age‐Restricted Housing ............. 87 Estimated Demand for Deep‐Subsidy Age‐Restricted Housing ....................................... 89 Estimated Demand for Congregate Age‐Restricted Housing .......................................... 90 Demand Estimate for Assisted Living Housing ................................................................ 92 Estimated Demand for Memory Care Housing ................................................................ 95 RECOMMENDATIONS AND CONCLUSIONS ........................................................................ 98 Introduction/Overall Housing Recommendations .......................................................... 98 For‐Sale Housing ............................................................................................................. 101 General Occupancy Rental Housing ................................................................................ 101 Senior Housing ................................................................................................................ 102 Challenges and Opportunities ......................................................................................... 105
LIST OF TABLES Table Number and Title Page 1. Population Growth Trends and Projections, Cedar Rapids Area, 2000 to 2025 .......... 12 2. Household Growth Trends and Projections, Cedar Rapids Area, 2000 to 2025 ........... 13 3. Household Size, Cedar Rapids Area, 2000 to 2025 ....................................................... 16 4. Age Distribution Trends, Flood Impact Area, Cedar Rapids and Surrounding Area, 2000 to
2021 .............................................................................................................................. 19 5. Estimated Household Income by Age of Householder, Cedar Rapids City, 2016/2021 23 6. Estimated Household Income by Age of Householder, Flood Impact Area, 2016/2021 25 7. Estimated Household Income by Age of Householder, Linn County, 2016/2021 ........ 27 8. Tenure by Age of Householder, Cedar Rapids and Surrounding Area, 2010 and 2016 30 9. Household Type, Cedar Rapids and Surrounding Area, 2000, 2010 and 2016 ............. 32 10. Annual Average Resident Employment, Cedar Rapids Metro and Linn County ........... 34 11. Covered Employment Trends, Cedar Rapids MSA, 2001, 2005, 2010‐2016 ................ 37 12. Cedar Rapids Commuting Patterns, 2014 ..................................................................... 40 13. Commuting Patterns – Inflow and Outlow, Cedar Rapids, 2014 .................................. 41 14. Residential Construction, City of Cedar Rapids, 2010 through September 2016......... 43 15. Renter Cost Burden, City of Cedar Rapids, 2016 .......................................................... 45 16. Owner Cost Burden, City of Cedar Rapids, 2016 .......................................................... 46 17. Age of Housing Stock, Cedar Rapids and Adjacent Cities, 2016 ................................... 47 18. Housing Units by Structure and Tenure, Cedar Rapids and Adjacent Communities .... 48 19. Owner‐Occupied Units by Value, Cedar Rapids and Adjacent Communities ............... 49 20. Summary of Market Rate Rental Units in Survey, Cedar Rapids and Marion, 2016 .... 51 21. Rent Summary for Shallow‐Subsidy, Cedar Rapids/Marion, September 2016 ............ 54 22. Iowa Housing Authority Income Limits, Linn County, 2016 ......................................... 56 23. Deep‐Subsidy General Occupancy Rental Housing, Cedar Rapids, September 2016 ... 57 24. HUD Income Limits, 2016, Cedar Rapids MSA .............................................................. 59 25. Summary of Market Rate Senior Units in Survey, Cedar Rapids, September 2016 ..... 64 26. Shallow‐Subsidy Senior Properties, Cedar Rapids, September 2016 ........................... 65 27. Deep‐Subsidy Senior Rental Projects, Cedar Rapids, September 2015 ........................ 66 28. Home Resales Cedar Rapids and Surrounding Area, 2013‐2016 YTD .......................... 69 29. Active Listings by Submarket, Cedar Rapids and Marion, September 20165 .............. 72 29A. No. of Active Home Listings, Core Neighborhoods, Cedar Rapids, Iowa, Dec. 2016 ... 73 30. Active Lot Listings by Submarket, October 2016 .......................................................... 74 31. For‐Sale Housing Demand, City of Cedar Rapids, 2015 to 2020 ................................... 79 32. For‐Sale Housing Demand, City of Cedar Rapids, 2020 to 2025 ................................... 80 33. Rental Housing Demand, City of Cedar Rapids, 2015 to 2020...................................... 82 34. Rental Housing Demand, City of Cedar Rapids, 2020 to 2025...................................... 83 35. Market Rate/Active Adult Housing Demand, Cedar Rapids, 2016 & 2021................... 86 36. Shallow Subsidy Independent Senior Housing Demand, Cedar Rapids, 2016 & 2021 . 88 37. Deep‐Subsidy Independent Senior Housing Demand, Cedar Rapids, 2016 & 2021 ..... 90 38. Market Rate Congregate Housing Demand, Cedar Rapids, 2016 & 2021 .................... 91 39. Market Rate Assisted Living Housing Demand, Cedar Rapids, 2016 & 2021 ............... 93 40. Memory Care Demand, Cedar Rapids, 2016 & 2021 .................................................... 96 41. Summary of Housing Demand, City of Cedar Rapids, October 2016 ........................... 98 42. Recommended Housing Development, City of Cedar Rapids, 2016 to 2020 ............... 100

EXECUTIVE SUMMARY
MAXFIELD RESEARCH AND CONSULTING, LLC 1
Purpose and Scope of Study Maxfield Research and Consulting, LLC was engaged by the City of Cedar Rapids to complete an update of the Comprehensive Housing Needs Analysis for the City. The Housing Needs Analysis provides recommendations on current and projected housing conditions and the amount and types of housing that should be developed in order to meet the needs of current and future households who choose to reside in the City. This document, October 2016, updates infor‐mation that was provided to the City in October 2015. The scope of this study includes: an analysis of the demographic and economic characteristics of the City; a review of the characteristics of the existing housing stock and building permit trends; an analysis of the market condition for a variety of rental and for‐sale housing products; and an assessment of the need for housing by product type in the City. Recommendations on the number and types of housing products that should be considered in the City are also supplied. Demographic Analysis
As of the 2010 Census, the City of Cedar Rapids had 126,326 people and 53,236 households. The tri‐city area, including the Cities of Cedar Rapids, Marion and Hiawatha, had 168,118 people and 70,415 households. Between 2000 and 2010, the flood impact area in the City of Cedar Rapids lost population and households. As of 2010, the flood impact area had 16,955 people and 6,888 households. The decrease in population and households in the flood impact area over the period was ‐11.3% for population and ‐22.1% for households.
Despite population and household decreases in the flood impact areas, Cedar Rapids and the surrounding tri‐city area grew during the 2000s by 5,558 people and 14,586 people, re‐spectively. These increases reflect growth rates of 4.6% and 9.5%, respectively. By compar‐ison, Linn County increased its population by 13.6% during this same period to 211,226 people.
A similar situation occurred with household growth. The City of Cedar Rapids experienced a net increase of 3,416 households (6.9%) while the tri‐city area grew by 7,278 households (11.5%). Linn County increased its household base by 10.1% between 2000 and 2010.
Most recent estimates (2016) shows that Cedar Rapids’ population is estimated at 132,161 people and 55,361 households.
Growth in population and households is expected to continue, but slow modestly in Cedar Rapids and in the tri‐city area. By 2020, Cedar Rapids is projected to have 137,497 people and 56,923 households. Higher population growth rates are anticipated for the Flood Im‐pact Area versus the outlying neighborhoods due to increases in high‐density housing in and near the Downtown. A similar situation is projected for household growth in the Downtown versus the outlying areas.

EXECUTIVE SUMMARY
MAXFIELD RESEARCH AND CONSULTING, LLC 2
Smaller household sizes reflect an overall aging population base, households having fewer children, on average, and many households choosing to live alone. These trends are dis‐cussed further in the data on age distribution and household type.
Growth in the flood impact area is expected to occur out to at least 2025. The amount of growth however, that occurs in the area depends on higher land utilization with increased housing densities, continued replacement of housing that was lost and other development initiatives. This has been occurring with several new multifamily developments located in and near the Downtown. The projected growth rates for the flood impact area continue to anticipate a proactive approach to residential development in these areas.
The population in Cedar Rapids and the tri‐city area is aging. Although Cedar Rapids contin‐ues to attract a healthy share of people in their 20s and 30s, people over the age of 45 ac‐counted for a higher proportion of the total population in 2010 than in 2000 and this trend is expected to continue over the next several (2020). From 2016 to 2021, the population age 65 to 74 is estimated to have the highest growth numerically and by percent (5,232 people, or 65.1%). This age group is the largest in the community although Millennials (those born between 1980 and 2000) account for only slightly less than those ages 49 to 67.
In 2016, the City of Cedar Rapids had an estimated median household income of $54,760. The median household income of non‐senior households was $60,509 compared to senior households with a median household income of $41,559. A majority of seniors are typically retired utilizing retirement savings, pension and social security as income; some remain employed. Most non‐senior households are likely to have two incomes through full‐time employment.
Between 2010 and 2016, the homeownership rate in Cedar Rapids rose slightly from 68.2%
to 69.3%. Similarly, the homeownership rate in Linn County rose from 72.7% to 73.5%. Approximately 32% of all households in Cedar Rapids lived alone in 2016. In the Remainder
of the County, 25% of all households lived alone. Married households without children in Cedar Rapids and in the Remainder of the County accounted for the second highest per‐centages at 25.3% and 31.1, respectively.
The unemployment rate for Linn County was 4.3% as of August 2016, which was slightly
higher than for the State of Iowa (4.2%), but lower than the Nation (4.9%). The unemploy‐ment rate for the City of Cedar Rapids was 4.4%, higher than the County and the State. Since last year at this time, there has been a softening in the employment market in Cedar Rapids.
According to data published for 2014 by the US Census Bureau’s Local Employment House‐
hold Dynamics, the City of Cedar Rapids is a net importer of workers. Fully, 60,559 workers enter the City for work while 23,587 workers leave the City for employment. An estimated 37,749 (38.6%) of workers live and work in Cedar Rapids. The largest numbers of workers

EXECUTIVE SUMMARY
MAXFIELD RESEARCH AND CONSULTING, LLC 3
that leave the City for employment commute to nearby communities including Marion, Hi‐awatha, Iowa City, Coralville, Des Moines, Davenport, Waterloo, and North Liberty.
The highest proportion of workers lives in Cedar Rapids (38.4%) and the second highest
proportion lives in Marion (10.0%). Smaller proportions live in Hiawatha (2.1%) and Iowa City (2.1%).
Housing Characteristics
The City of Cedar Rapids issued permits for the construction of 3,000 new residential units
from 2010 through September 2016. The majority of new construction has been single‐family homes and development has focused in the Northwest and Southwest, although re‐cently development has increased in some subdivisions in the Northeast. The number of residential permits decreased in each year since 2010 from 498 to 316 in 2012, but then rose again in 2013 to 541 and has been steady since then. Gradually, new residential con‐struction is increasing in the core neighborhoods that had affected by the 2008 Flood.
As of 2016, the City of Cedar Rapids is estimated to have a total of 55,361 housing units, of which about 70% are owner‐occupied and 30% are renter‐occupied.
Most of the homes in Cedar Rapids were built between 1950 and 1980 (42%). An estimated 20% of homes in Cedar Rapids were built pre‐1950 and the remaining 38% were built in 1980 or later. The shifts in the overall age of the housing stock indicate that the proportion of new housing is gradually increasing in Cedar Rapids.
According to the Cedar Rapids Area Association of Realtors, the median value of homes in the Cedar Rapids Metro Area was $143,000 as of September 2016. The average price was $169,972, indicating that there were more high‐priced homes sold than low‐priced homes, causing the average to be somewhat higher than the median. Market activity indicators such as number of homes sold, average sold price and days on market are all trending in positive directions indicating that the for‐sale market is doing well. Home sales increased in Cedar Rapids city in 2015 and in 2016. Market times have continued to decrease signaling a strengthening market and increased buyer activity.
The median contract rent was estimated at $581 in Cedar Rapids as of 2014. An estimated 52% of renters in Cedar Rapids were paying monthly rents ranging from $400 to $699 as of 2013. Approximately 28% of renters in Cedar Rapids were estimated to be paying monthly rents of $700 or more including service‐enriched age‐restricted housing. Approximately 2.8% of households were estimated to pay no cash rent and may be renting their housing from family or friends or may be caretakers of property whereby they have housing provid‐ed to them as a benefit of their employment.

EXECUTIVE SUMMARY
MAXFIELD RESEARCH AND CONSULTING, LLC 4
Rental Housing Market Analysis
In order to assess the current market conditions for rental housing in Cedar Rapids and the surrounding area, Maxfield Research completed a survey of rental housing that includes deep‐subsidy units (i.e. housing that is income‐restricted to households earning at or below 50% of the Area Median Income), shallow‐subsidy (i.e. housing that is income‐restricted be‐tween 40% and 80% of the Area Median Income) and market rate (i.e. housing that is not income‐restricted); properties surveyed include those located in Cedar Rapids and Marion, with a few properties located outside of these two communities. Cedar Rapids and Marion contain the majority of general market rental units in the area.
Since undertaking the original analysis back in the late 2000s, Maxfield Research has con‐sistently inventoried an increasing number of rental units throughout the area. In Septem‐ber 2016, a total of 6,433 general occupancy market rate rental units were surveyed in the City of Cedar Rapids spread across 76 properties. At the time of the survey, there were 145 vacant units resulting in an overall vacancy rate of 2.3%. Typically, a healthy rental market maintains a vacancy rate of roughly 5%, which promotes competitive rates, ensures ade‐quate consumer choice, and allows for unit turnover. While the current vacancy rate re‐mains below 5%, conversations with leasing agents and rental property managers indicated that it seemed as though the market had softened somewhat over the past 12 months, alt‐hough vacancy counts seem to have remained about the same. Some properties had de‐creased rents slightly on two‐bedroom units.
Maxfield also surveyed workforce housing properties, a majority of which have been typically financed through the Low Income Housing Tax Credit program (LIHTC) adminis‐tered by the Iowa Housing Finance Agency. Properties financed through the LIHTC program usually provide housing to households that have median household incomes ranging from about 40% to 60% of median. As of September 2016, about 1,800 units were surveyed. The overall vacancy rates for these properties remain relatively low, although some properties tend to consistently have a few units available. Properties that provide housing to those with the lowest household incomes typically have lengthy waiting lists.
The City of Cedar Rapids currently manages 1,110 active Housing Choice Vouchers. The waiting list closed in November 2016 with 1,300 applicant families. The Housing Depart‐ment estimates it will reopen the wait list within the next two years.
Senior Housing Market Analysis
There are more than 19 age‐restricted housing facilities located in Cedar Rapids with more than 1,600 units. Nearly 600 of those units are deep‐subsidy age‐restricted units and the remainder is shallow‐subsidy and market rate. Combined, the overall vacancy for senior properties was an estimated 3.0% as of September/October 2016. Our conversations with senior marketing directors indicated that all senior housing products appear to be doing well, except perhaps for very small size units with fewer amenities. At this time, we believe

EXECUTIVE SUMMARY
MAXFIELD RESEARCH AND CONSULTING, LLC 5
that higher vacancies among specific properties may be a result of product types that are not meeting the needs of the market.
Adult/few services buildings in the Cedar Rapids/Marion area include: Village Cooperative (65 units‐complete and occupied), Cedar Crest (36 shallow‐subsidy units – 1BR and 2BR) and Legacy Manor (60 units – 1BR/2BR – shallow‐subsidy). Cedar Crest is located in the Time Check neighborhood and opened a couple of years ago. Legacy Manor recently opened (2014) and Village Cooperative opened in 2015. Village Cooperative is an ownership format while Cedar Crest and Legacy Manor are rental. A new development, Commonwealth, is now open and is marketing units (84 age‐restricted, shallow‐subsidy).
There are a number of properties in Cedar Rapids that provide assisted living care and services. These properties combine for a total of 323 assisted living units. Some of the as‐sisted living facilities also offer memory care. The survey includes 113 memory care units. The newest facility is in the area is Irving Pointe, which opened in 2008. Located near Mer‐cy Hospital, Irving Pointe is the area’s first affordable assisted living.
For‐Sale Housing Market Analysis
The average resale price of homes in the Cedar Rapids Metro Area was $169,972. Sales prices have gradually increased as have the number of home sales in the area. The year 2015 was a banner sales year, similar to other areas of the Upper Midwest. Time on market has strengthened however, and as of 2016 YTD was at 65 days.
In 2015, 3,165 homes sold. Year to date home sales for Cedar Rapids as of September 2016 were 2,622.
The median sales price of homes in Cedar Rapids was $134,550 as of year to date 2016 and the average price was $158,074. Based on the median sales price, a household would need an annual income of between $40,000 to $45,000 based on an industry standard of 3.0 to 3.5 times income at today’s interest rates. An estimated 65% of Cedar Rapids households have annual incomes at or above $40,000.
Housing Needs Analysis
Based on our calculations, demand exists for the following general occupancy product types between 2016 and 2025:
o Market rate rental 1,013 units o Shallow‐Subsidy rental 561 units o Deep‐subsidy rental 193 units o For‐sale single‐family 1,920 units o For‐sale multifamily 630 units

EXECUTIVE SUMMARY
MAXFIELD RESEARCH AND CONSULTING, LLC 6
In addition, we find demand for multiple age‐restricted (55+) and/or service‐enriched housing product types. As of 2016, demand for age‐restricted and/or service‐enriched housing is forecast for the following:
o Active adult ownership 251 units o Active adult market rate rental 238 units o Active adult shallow‐subsidy ‐25 units o Active adult deep‐subsidy 452 units o Congregate (IL w/some services) 179 units o Assisted living 244 units o Memory care 141 units
Conclusions and Recommendations
Based on the findings of the analysis and the updated demand calculations, the chart shown on the next page provides a summary of the recommended housing product types for the City of Cedar Rapids to 2020. Detailed findings are described in the Conclusions and Rec‐ommendations section of the report.

EXECUTIVE SUMMARY
MAXFIELD RESEARCH AND CONSULTING, LLC 7
Purchase Price/ Development
Monthly Rent Range¹ Timing
General Occupancy Rental Housing
Market Rate Rental Housing2
Apartment‐style $850/1BR ‐ $1,200/2BR 200 ‐ 300 2016+
Affordable Rental Housing
Shallow‐Subsidy Moderate Income3
125 ‐ 175 2016+
Deep‐Subsidy Low Income 80 ‐ 100 2016+
Market Rate Single‐Family Entry‐Level (Core Neighbor.) 300 ‐ 500 2016+
Market Rate Multifamily Owned Entry‐Level/Move‐Up (Core) 100 ‐ 200 2016+
Senior Housing (i.e. Age Restricted)
Active Adult Market Rate Rental4
$800/1BR ‐ $1,100/2BR 100 ‐ 120 2016+
Active Adult Market Rate Owner $150,000/1BR‐$200,000/2BR 50 ‐ 65 2017+
Active Adult Shallow Rental4
Moderate Income3
0 ‐ 100 2017+
Congregate $2,200/1BR ‐ $3,000/2BR 120 ‐ 150 2016+
Deep‐Subsidy Senior5
30% of Income 100 ‐ 150 2016+
Market Rate Assisted Living $3,200/1BR ‐ $4,000/2BR 65 ‐ 70 2017+
Market Rate Memory Care $4,500/Std. ‐ $5,500/1BR 40 ‐ 40 2016+
Total 475 ‐ 695
Note ‐ Recommended development does not coincide with total demand.
Source: Maxfield Research and Consulting, LLC
¹ Pricing in 2016 dol lars . Pricing can be adjusted to account for inflation.2 The development of these products can occur a fter the vacancy rate i s a t or below 5%. Additiona l renta l
development could occur a fter new development has been absorbed and phased into the market.
3 Affordabl i ty subject to income guidel ines per Iowa Hous ing Authori ty.
4 Al ternative development concept i s to combine active adult shal low‐subs idy and market rate active adult into
one mixed‐income senior community
5. Deep‐subs idy senior wi l l be di fficul t to develop financia l ly; some overlap between sha l low‐/deep‐subs idy
RECOMMENDED HOUSING DEVELOPMENT
CITY OF CEDAR RAPIDS
2016 to 2020
No. of
Units

DEMOGRAPHIC ANALYSIS
MAXFIELD RESEARCH AND CONSULTING, LLC 8
Introduction This section of the report examines factors related to the current and future demand for owner‐ and renter‐occupied housing in Cedar Rapids, Iowa. It includes an analysis of popula‐tion and household growth trends and projections, projected age distribution, household income, household types, household tenure, employment growth trends and characteristics, age of housing stock, and recent residential building permit trends for the Cedar Rapids Market Area, which includes the Cities of Cedar Rapids, Marion and Hiawatha. A review of these characteristics provides insight into the demand for various types of housing in the Market Area. This information is updated including estimates for 2016 and projections to 2025.
Market Area Definition The primary draw area (Market Area) for housing in Cedar Rapids was defined based on traffic patterns, community and school district boundaries, and geographic and our general knowledge of housing draw areas and specifically, draw areas for Cedar Rapids. The Market Area includes the three communities of Cedar Rapids, Marion and Hiawatha. Marion and Hiawatha, which are adjacent to Cedar Rapids, serve as "bedroom communities" for the City, but most commuters who work in Cedar Rapids and live outside of the City do so by choice. Some people prefer a more suburban or rural atmosphere while others have attachments to the communities where they currently live or a spouse working in that community. The Housing Market Area is expected to account for an estimated 75% of the total demand for housing for most product types in the City of Cedar Rapids. Additional demand (25%) will come from individuals moving from outside the area, those who return from other locations (particu‐larly young households returning after pursuing their degrees or elderly returning from retire‐ment locations), and seniors who move to be near the adult children living in the Market Area. Demand generated from in and outside of the Market Area is considered in the demand calcu‐lations presented later in this analysis. The Housing Market Area remains the same from previous analyses and figures included in those can be compared to updated information provided in this report. The map on the following page shows the Cedar Rapids Housing Market Area. Due to the overall expansion of the Tri‐City area of Cedar Rapids, this update report expands the proportion of households from 20% to 25% that may relocate to Cedar Rapids from outside of the immediate Market Area. Strong employers and growth of the region indicate that Cedar Rapids is attracting this propor‐tion now from outside of the immediate area.

DEMOGRAPHIC ANALYSIS
MAXFIELD RESEARCH AND CONSULTING, LLC 9
Cedar Rapids Housing Market Area
DEMOGRAPHIC ANALYSIS
MAXFIELD RESEARCH AND CONSULTING, LLC 10
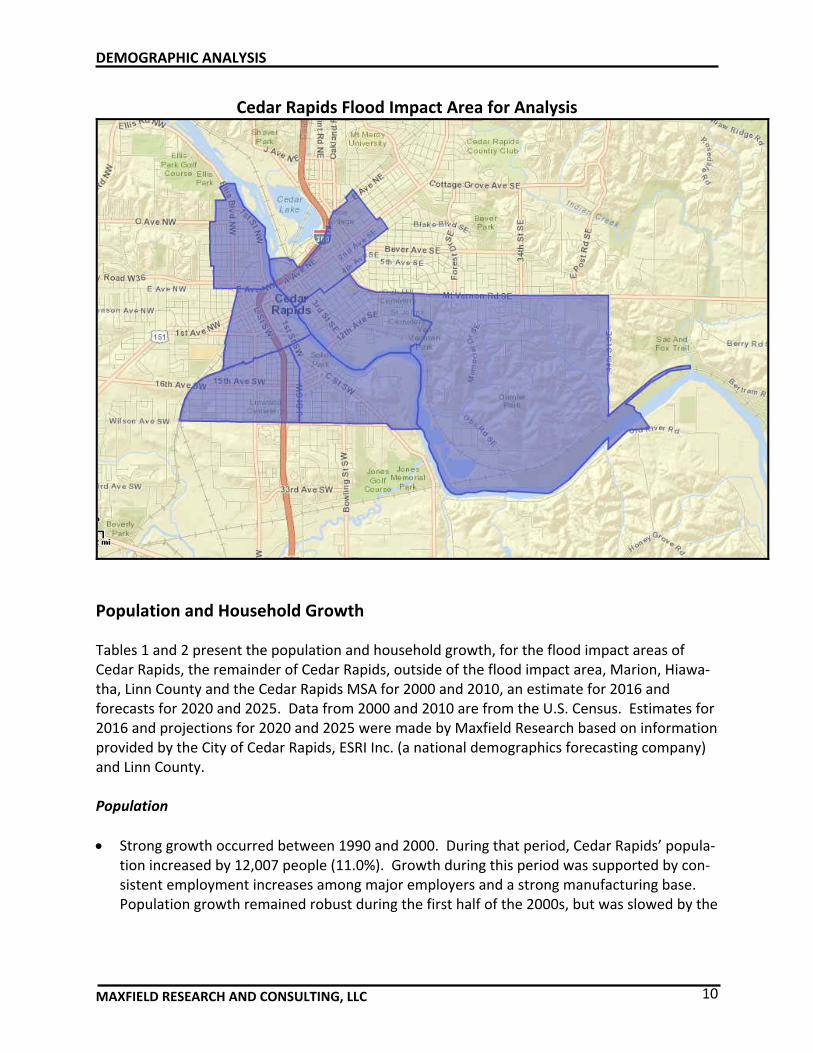
Cedar Rapids Flood Impact Area for Analysis
Population and Household Growth Tables 1 and 2 present the population and household growth, for the flood impact areas of Cedar Rapids, the remainder of Cedar Rapids, outside of the flood impact area, Marion, Hiawa‐tha, Linn County and the Cedar Rapids MSA for 2000 and 2010, an estimate for 2016 and forecasts for 2020 and 2025. Data from 2000 and 2010 are from the U.S. Census. Estimates for 2016 and projections for 2020 and 2025 were made by Maxfield Research based on information provided by the City of Cedar Rapids, ESRI Inc. (a national demographics forecasting company) and Linn County. Population
Strong growth occurred between 1990 and 2000. During that period, Cedar Rapids’ popula‐tion increased by 12,007 people (11.0%). Growth during this period was supported by con‐sistent employment increases among major employers and a strong manufacturing base. Population growth remained robust during the first half of the 2000s, but was slowed by the
DEMOGRAPHIC ANALYSIS
MAXFIELD RESEARCH AND CONSULTING, LLC 11
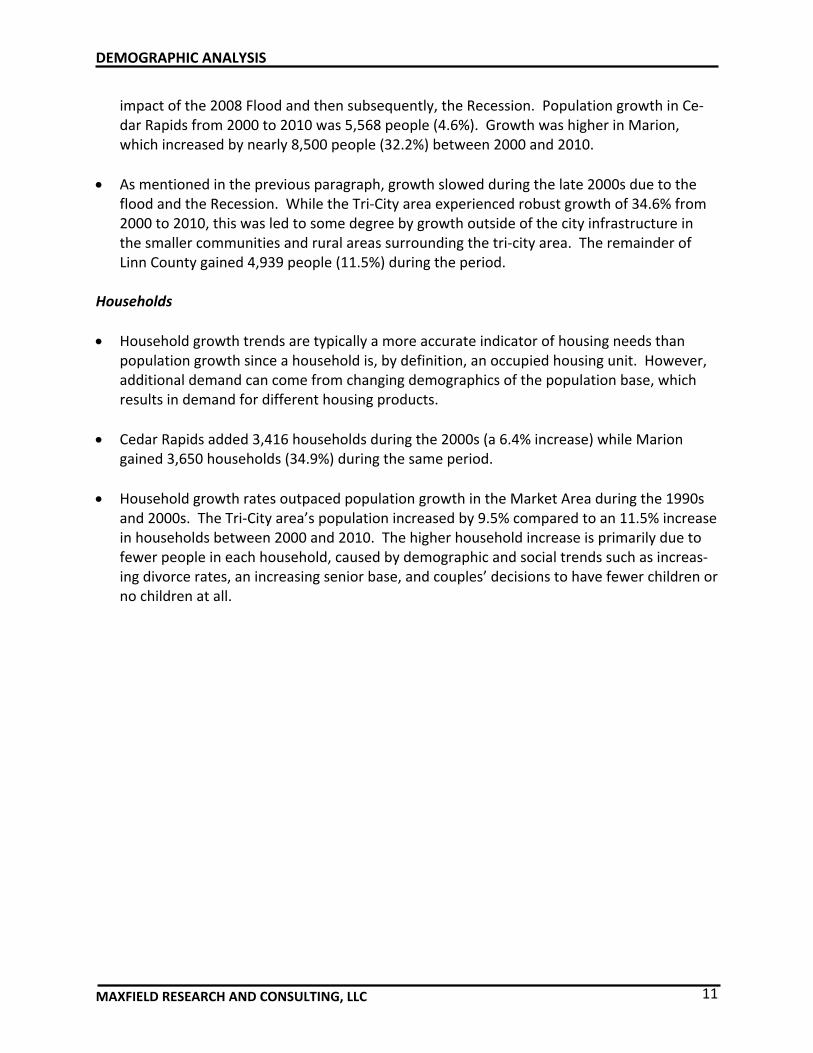
impact of the 2008 Flood and then subsequently, the Recession. Population growth in Ce‐dar Rapids from 2000 to 2010 was 5,568 people (4.6%). Growth was higher in Marion, which increased by nearly 8,500 people (32.2%) between 2000 and 2010.
As mentioned in the previous paragraph, growth slowed during the late 2000s due to the flood and the Recession. While the Tri‐City area experienced robust growth of 34.6% from 2000 to 2010, this was led to some degree by growth outside of the city infrastructure in the smaller communities and rural areas surrounding the tri‐city area. The remainder of Linn County gained 4,939 people (11.5%) during the period.
Households
Household growth trends are typically a more accurate indicator of housing needs than population growth since a household is, by definition, an occupied housing unit. However, additional demand can come from changing demographics of the population base, which results in demand for different housing products.
Cedar Rapids added 3,416 households during the 2000s (a 6.4% increase) while Marion gained 3,650 households (34.9%) during the same period.
Household growth rates outpaced population growth in the Market Area during the 1990s and 2000s. The Tri‐City area’s population increased by 9.5% compared to an 11.5% increase in households between 2000 and 2010. The higher household increase is primarily due to fewer people in each household, caused by demographic and social trends such as increas‐ing divorce rates, an increasing senior base, and couples’ decisions to have fewer children or no children at all.

DEMOGRAPHIC ANALYSIS
MAXFIELD RESEARCH AND CONSULTING, LLC 12
Estimate Projection Projection
2000 2010 2016 2020 2025 No. Pct. No. Pct. No. Pct.
Flood Impact Areas** 19,338 16,955 17,934 18,561 19,061 ‐2,383 ‐12.3 1,606 9.5 1,127 6.6
Remainder of Cedar Rapids 101,420 109,371 114,227 118,936 123,645 7,951 7.8 9,565 8.7 9,418 8.6
Marion 26,294 34,768 37,277 38,759 40,239 8,474 32.2 3,991 11.5 2,962 8.5
Hiawatha 6,480 7,024 7,080 7,205 7,330 544 8.4 181 2.6 250 3.6
Total Cedar Rapids Area 153,532 168,118 176,518 183,461 190,275 14,586 9.5 15,343 9.1 13,757 8.2
Remainder of Linn County 38,169 43,108 45,629 46,208 48,794 4,939 12.9 3,100 6.8 3,165 7.3
Linn County 191,701 211,226 222,147 229,669 239,069 19,525 10.2 18,443 8.7 16,922 8.0
Cedar Rapids MSA 191,701 257,940 269,269 276,954 286,334 66,239 34.6 19,014 7.4 17,065 6.6
Note: In 2005, Benton and Jones Counties were added to the Cedar Rapids MSA.
Flood Impact Areas include the following Census Tracts: 12, 19, 22, 25, 26, 27, 28;
* estimate and projection of population compiled by Maxfield Research
TABLE 1
POPULATION GROWTH TRENDS AND PROJECTIONS
CEDAR RAPIDS AREA
2000 to 2025
U.S. Census
Maxfield Research
Sources: U.S. Census (2000, 2010); American Community Survey; ESRI Inc.; Woods and Poole; Maxfield Research and Consulting, LLC
Change
2010‐20202000‐2010 2020‐2025
DEMOGRAPHIC ANALYSIS
MAXFIELD RESEARCH AND CONSULTING, LLC 13
Estimate Projection Projection
2000 2010 2016 2020 2025 No. Pct. No. Pct. No. Pct.
Flood Impact Areas** 8,838 6,888 7,315 7,597 7,947 ‐1,950 ‐22.1 709 10.3 632 9.2Remainder of Cedar Rapids 40,982 46,348 48,046 49,326 50,931 5,366 13.1 2,978 6.4 2,885 6.2Marion 10,458 14,108 14,944 15,460 16,105 3,650 34.9 1,352 9.6 1,161 8.2Hiawatha 2,859 3,071 3,076 3,123 3,183 735 34.6 52 1.8 107 3.7
Total Cedar Rapids Area 63,137 70,415 73,381 75,506 78,166 7,801 12.4 5,091 7.2 4,785 6.8
Remainder of Linn County 13,616 14,120 16,578 17,256 18,096 504 3.7 3,136 22.2 1,518 10.8
Linn County 76,753 84,535 89,959 92,762 96,262 7,782 10.1 8,227 9.7 6,303 7.5
Cedar Rapids MSA 76,753 104,617 108,695 111,539 115,094 27,864 36.3 6,922 6.6 6,399 6.1
Note: In 2005, Benton and Jones Counties were added to the Cedar Rapids MSA.
Flood Impact Areas include the following Census Tracts: 12, 19, 22, 25, 26, 27, 28
* Estimates of occupied housing units pre‐flood
** Estimate of occupied housing units based on 2010 Census counts
American Community Survey; ESRI Inc.; Maxfield Research and Consulting, LLC
2020 to 2025U.S. Census
Maxfield Research
Sources: U.S. Census (2000, 2010);
TABLE 2
HOUSEHOLD GROWTH TRENDS AND PROJECTIONS
CEDAR RAPIDS AREA
2000 to 2025
Change
2000 to 2010 2010 to 2020
DEMOGRAPHIC ANALYSIS
MAXFIELD RESEARCH AND CONSULTING, LLC 14
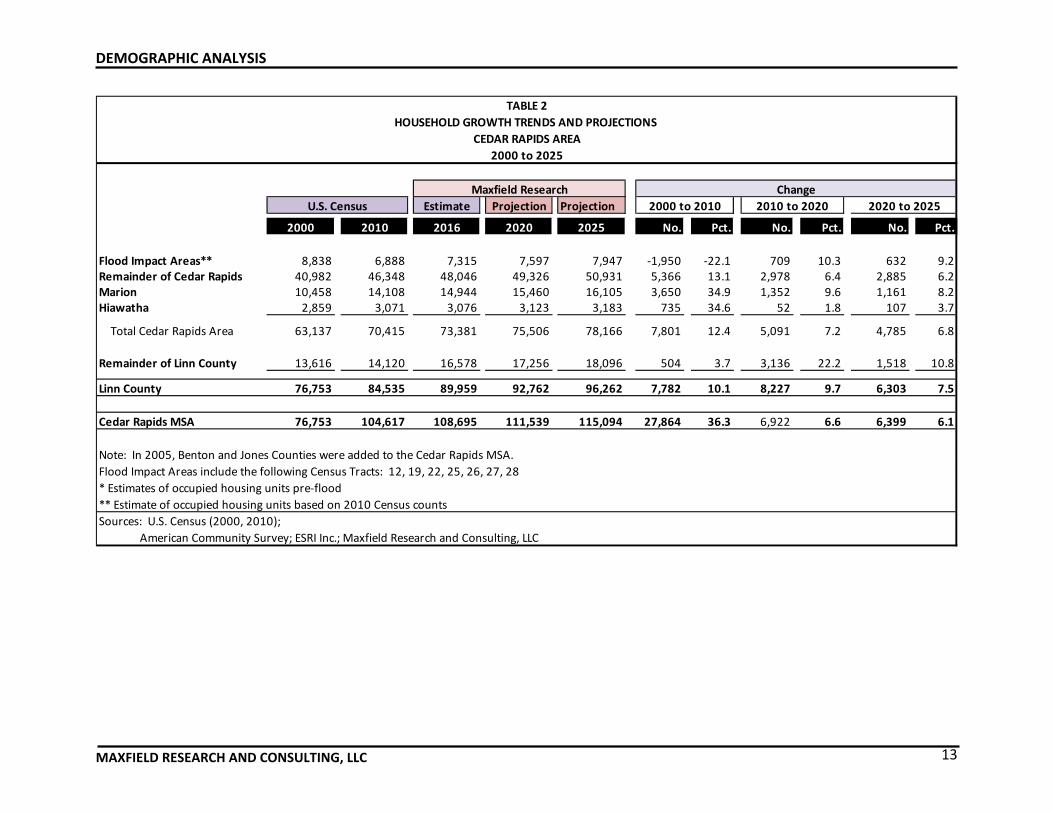
Population and Household Estimates and Projections Tables 1 and 2 present population and household growth estimates and projections for the Market Area to 2020. Estimates for 2016 and projections for 2020 and 2025 are based on information from ESRI (a national demographics service provider), the City of Cedar Rapids and Linn County with adjustments calculated by Maxfield Research. The adjustments are intended to reflect growth that is likely to be realized in each of the cities and in the Region as a whole considering recent demographic and economic trends.
Although residential construction has slowed modestly in the Cedar Rapids area, the long‐term impacts of the flood (housing removal), along with strong employment growth and new residential construction is expected to remain consistent between now and the end of the decade, barring another downturn in the economy. The 2020 projections estimate that the City of Cedar Rapids is on track to add 5,336 new people and 1,562 new households be‐tween 2016 and 2020. General housing growth and expansion in the Cedar Rapids area be‐cause of the economic recovery has led to increased household growth thus far this decade.
Since households represent occupied housing units, the projected growth of 1,562 new households over the next four years would require the addition of at least 1,600 new hous‐ing units and/or a combination of a decrease in vacancy rates combined with new construc‐tion to accommodate the projected household growth. There will also be some demand for new housing due to replacement need and housing obsolescence.
Between 2000 and 2010, the population in the combined communities of Marion and Hiawatha increased by 9,018 people (27.5%). Population in these two communities is pro‐jected to increase between 2010 and 2020 by 4,172 people (9.9%). The number of house‐holds is also projected to increase by 1,404 households (8.2%). The 2020 projections were revised downward slightly to reflect current estimates and forecasts.
Overall, the Market Area population is projected to increase at a slightly slower rate be‐tween 2010 and 2020 than it did during the 2000s. The Market Area is expected to increase by 15,343 people (9.1%) by 2020, for a total of 183,461 people. Households are projected to increase by 5,091 (7.2%) by 2020, slower than the growth rate during the 2000s (12.4%).

DEMOGRAPHIC ANALYSIS
MAXFIELD RESEARCH AND CONSULTING, LLC 15
0
50,000
100,000
150,000
200,000
250,000
300,000
2000 2010 2020 2025
Number o
f People
Population TrendsCedar Rapids Market Area
2000‐2025
Cedar Rapids Marion Remainder of Linn County
0
10,000
20,000
30,000
40,000
50,000
60,000
70,000
80,000
90,000
100,000
2000 2010 2020 2025
Number of Households
Household Growth TrendsCedar Rapids Market Area
2000‐2025
Cedar Rapids Marion Remainder of Linn County

DEMOGRAPHIC ANALYSIS
MAXFIELD RESEARCH AND CONSULTING, LLC 16
Household Size Trends Table 3 shows historical and projected household size trends for the flood impact areas, the Cities of Cedar Rapids, Marion and Hiawatha, Linn County and the MSA. This information was compiled from Census data along with the estimates and projections for each of the jurisdic‐tions. The information shows that household sizes have been decreasing since 1990 and are projected to either remain stable in some areas for a time, but eventually continue to decrease as the population ages and as there are fewer births. The City of Cedar Rapids and Hiawatha are projected to have the smallest household sizes by 2025, roughly 2.28 and 2.17 people per household, respectively. Cedar Rapids is expected to have higher concentrations of smaller size households including seniors and young singles living alone. Household sizes are expected to be the largest in Marion and in the MSA, areas which generally tend to attract higher proportions of families with children.
Estimate
2000 2010 2016 2020 2025
Flood Impact Areas 2.19 2.46 2.46 2.46 2.40
City of Cedar Rapids 2.42 2.38 2.38 2.34 2.28
Marion 2.51 2.46 2.46 2.41 2.34
Hiawatha 2.27 2.29 2.29 2.23 2.17
Linn County 2.50 2.50 2.50 2.47 2.34
Cedar Rapids MSA 2.50 2.47 2.47 2.44 2.45
Note: In 2005, Benton and Jones Counties were added to the Cedar Rapids MSA.
TABLE 3
HOUSEHOLD SIZE
CEDAR RAPIDS AREA
2000 to 2025
Sources: US Census; American Community Survey; ESRI Inc.; Maxfield Research;
US Census Projections

DEMOGRAPHIC ANALYSIS
MAXFIELD RESEARCH AND CONSULTING, LLC 17
Age Distribution Trends
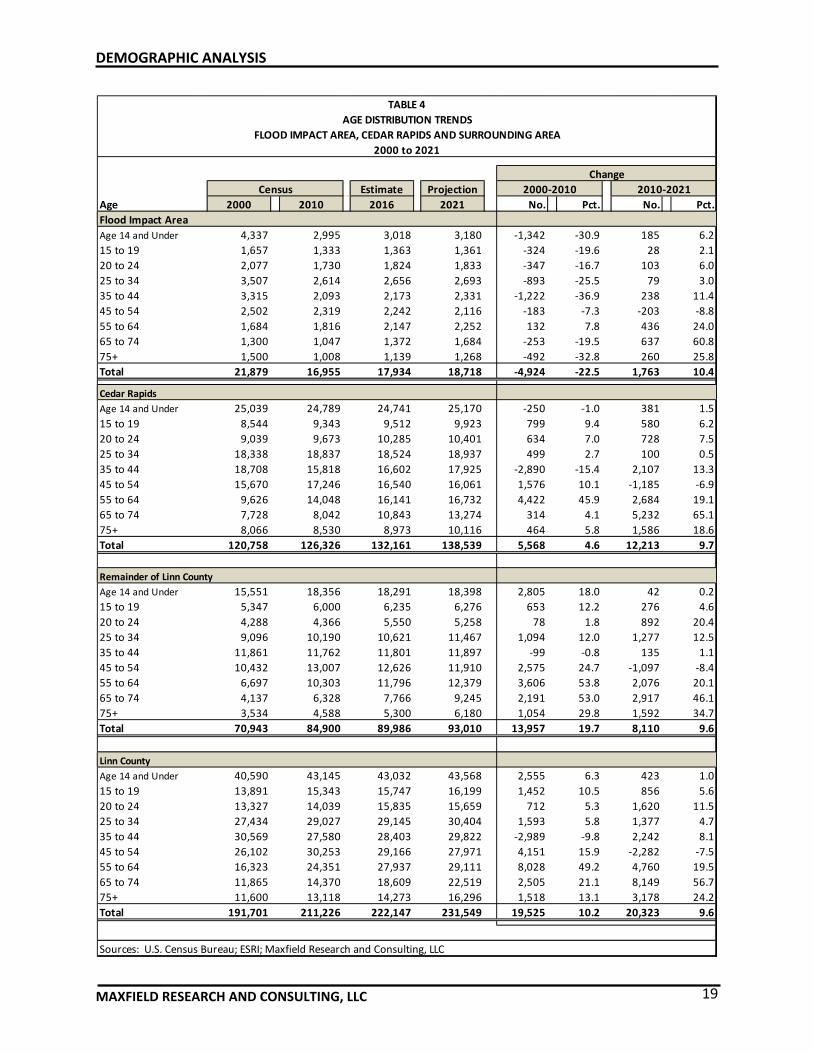
Age distribution affects demand for different types of housing since needs and desires change at different stages of the life cycle. Table 4 shows the distribution of persons in nine age cohorts for the Flood Impact Area and Cedar Rapids city in 2000 and 2010 with updated esti‐mates for 2016 and projections for 2021. The 2000 and 2010 age distributions are from the U.S. Census Bureau; the 2016 figures are based updated estimates and projections from data obtained by ESRI Inc., a national demographics forecasting company. The following are key points from the table.
In Cedar Rapids, growth from 2000 to 2010 occurred primarily among mid‐age and older adults. The age 45 to 54 and age 55 to 64 cohorts increased by 1,576 and 4,422 people, re‐spectively. Also showing relatively strong growth were the cohorts ages 15 to 19 and ages 20 to 24, which increased by 799 and 634 people, respectively. Between 2000 and 2010, the cohort, age 14 and under, lost ‐250 people.
In the Flood Impact Area, all cohorts, except those age 55 to 64, experienced losses as the 2008 flood, caused many households to relocate out of the core neighborhoods. The popu‐lation of the Flood Impact Area decreased from 21,879 people to 16,755 people, a decrease of 4,924 people or 22.5%. The current 2016 estimates reveal a gain of 979 people with an estimated 2016 population in the Flood Impact Area of 17,934.
In Cedar Rapids, growth is anticipated to be greatest among those over the age of 55 (9,502 people) between 2010 and 2021. Also expected to exhibit relatively strong growth are peo‐ple ages 25 to 44 (317). The projected population increase in the younger age cohorts, who are primarily renters and first‐time homebuyers, indicates potential demand for new hous‐ing that could be developed in the core neighborhoods. Many younger households are at‐tracted to an urban lifestyle.
In the Flood Impact Area, similar trends are anticipated, but growth is expected to be limited. Growth is shown among people age 14 and under, those age 55+ and those ages 25 to 34. The projected growth trends indicate a mix of housing product types to satisfy fami‐lies with children, young singles and couples and older adults and seniors. Encouraging housing near to goods and services in the core neighborhoods and in the Downtown can increase the ability to draw people back to the core neighborhoods.

DEMOGRAPHIC ANALYSIS
MAXFIELD RESEARCH AND CONSULTING, LLC 18
0
500
1,000
1,500
2,000
2,500
3,000
3,500
Age 14 andUnder
15 to 19 20 to 24 25 to 34 35 to 44 45 to 54 55 to 64 65 to 74 75+
Number of People
Age Distribution
Flood Impact Area2010, 2016 & 2021
2010 2016 2021
0
5,000
10,000
15,000
20,000
25,000
30,000
Age 14 and
Under
15 to 19 20 to 24 25 to 34 35 to 44 45 to 54 55 to 64 65 to 74 75+
Age DistributionCedar Rapids
2010, 2016, & 2021
2010 2016 2021
No. of People
DEMOGRAPHIC ANALYSIS
MAXFIELD RESEARCH AND CONSULTING, LLC 19
Estimate Projection
Age 2000 2010 2016 2021 No. Pct. No. Pct.
Flood Impact Area
Age 14 and Under 4,337 2,995 3,018 3,180 ‐1,342 ‐30.9 185 6.2
15 to 19 1,657 1,333 1,363 1,361 ‐324 ‐19.6 28 2.1
20 to 24 2,077 1,730 1,824 1,833 ‐347 ‐16.7 103 6.0
25 to 34 3,507 2,614 2,656 2,693 ‐893 ‐25.5 79 3.0
35 to 44 3,315 2,093 2,173 2,331 ‐1,222 ‐36.9 238 11.4
45 to 54 2,502 2,319 2,242 2,116 ‐183 ‐7.3 ‐203 ‐8.8
55 to 64 1,684 1,816 2,147 2,252 132 7.8 436 24.0
65 to 74 1,300 1,047 1,372 1,684 ‐253 ‐19.5 637 60.8
75+ 1,500 1,008 1,139 1,268 ‐492 ‐32.8 260 25.8
Total 21,879 16,955 17,934 18,718 ‐4,924 ‐22.5 1,763 10.4
Cedar Rapids
Age 14 and Under 25,039 24,789 24,741 25,170 ‐250 ‐1.0 381 1.5
15 to 19 8,544 9,343 9,512 9,923 799 9.4 580 6.2
20 to 24 9,039 9,673 10,285 10,401 634 7.0 728 7.5
25 to 34 18,338 18,837 18,524 18,937 499 2.7 100 0.5
35 to 44 18,708 15,818 16,602 17,925 ‐2,890 ‐15.4 2,107 13.3
45 to 54 15,670 17,246 16,540 16,061 1,576 10.1 ‐1,185 ‐6.9
55 to 64 9,626 14,048 16,141 16,732 4,422 45.9 2,684 19.1
65 to 74 7,728 8,042 10,843 13,274 314 4.1 5,232 65.1
75+ 8,066 8,530 8,973 10,116 464 5.8 1,586 18.6
Total 120,758 126,326 132,161 138,539 5,568 4.6 12,213 9.7
Remainder of Linn County
Age 14 and Under 15,551 18,356 18,291 18,398 2,805 18.0 42 0.2
15 to 19 5,347 6,000 6,235 6,276 653 12.2 276 4.6
20 to 24 4,288 4,366 5,550 5,258 78 1.8 892 20.4
25 to 34 9,096 10,190 10,621 11,467 1,094 12.0 1,277 12.5
35 to 44 11,861 11,762 11,801 11,897 ‐99 ‐0.8 135 1.1
45 to 54 10,432 13,007 12,626 11,910 2,575 24.7 ‐1,097 ‐8.4
55 to 64 6,697 10,303 11,796 12,379 3,606 53.8 2,076 20.1
65 to 74 4,137 6,328 7,766 9,245 2,191 53.0 2,917 46.1
75+ 3,534 4,588 5,300 6,180 1,054 29.8 1,592 34.7
Total 70,943 84,900 89,986 93,010 13,957 19.7 8,110 9.6
Linn County
Age 14 and Under 40,590 43,145 43,032 43,568 2,555 6.3 423 1.0
15 to 19 13,891 15,343 15,747 16,199 1,452 10.5 856 5.6
20 to 24 13,327 14,039 15,835 15,659 712 5.3 1,620 11.5
25 to 34 27,434 29,027 29,145 30,404 1,593 5.8 1,377 4.7
35 to 44 30,569 27,580 28,403 29,822 ‐2,989 ‐9.8 2,242 8.1
45 to 54 26,102 30,253 29,166 27,971 4,151 15.9 ‐2,282 ‐7.5
55 to 64 16,323 24,351 27,937 29,111 8,028 49.2 4,760 19.5
65 to 74 11,865 14,370 18,609 22,519 2,505 21.1 8,149 56.7
75+ 11,600 13,118 14,273 16,296 1,518 13.1 3,178 24.2
Total 191,701 211,226 222,147 231,549 19,525 10.2 20,323 9.6
Sources: U.S. Census Bureau; ESRI; Maxfield Research and Consulting, LLC
TABLE 4
AGE DISTRIBUTION TRENDS
FLOOD IMPACT AREA, CEDAR RAPIDS AND SURROUNDING AREA
2000 to 2021
Change
2000‐2010 2010‐2021Census

DEMOGRAPHIC ANALYSIS
MAXFIELD RESEARCH AND CONSULTING, LLC 20
Mirroring trends observed across the Nation, the aging baby boom generation continues to impact the composition of the Cedar Rapids’ population. Born between 1946 and 1964, these individuals are between the ages of 52 and 70. As of 2016, baby boomers are esti‐mated to account for approximately 20% of Cedar Rapids’ population. In the Flood Impact Area, the estimate is 19.5% of the area’s population.
The 65 to 74 age cohort is projected to have the greatest growth (by percentage and numerically) across all jurisdictions between 2010 and 2021. As shown on Table 4, the 65 to 74 age cohort is projected to increase by 637 people (35.8%) in the Flood Impact Area, 5,232 people (65.1%) in Cedar Rapids and 8,149 (56.7%) in Linn County. The growth in this age cohort is attributed primarily to the baby boom generation aging into their young senior years. The older senior cohort (75+) also continues to grow.
The social changes that occurred with the aging of the baby boom generation, such as higher divorce rates, higher levels of education, and lower birth rates has led to a greater variety of lifestyles than existed in the past – not only among baby boomers, but also among their parents and children. The increased diversity of lifestyles has fueled demand for alternative housing products to single‐family homes. Seniors, in particular, and mid‐age people now tend to travel more and participate in more activities than previous genera‐tions; they increasingly prefer lower maintenance housing options that enable them to spend more time on activities outside the home.
People age 14 and Under are projected to continue to show relatively strong increases. This also suggests that Cedar Rapids and Linn County will continue to have a somewhat higher proportion of families with children than some other areas of the country. As shown on Ta‐ble 4, children under 14 are expected to increase by 6.2% and 1.5%, respectively in the Flood Impact Area and Cedar Rapids, but by nearly 0.2% in the remainder of Linn County.
Household Income by Age of Householder The estimated distribution of household incomes in Cedar Rapids, the Flood Impact Area and Linn County for 2016 and 2021 are shown in Tables 5 to 7. The data was estimated by Maxfield Research based on income trends provided by ESRI. The data helps ascertain the demand for different housing products based on the size of the market at specific cost levels. The Department of Housing and Urban Development defines housing costs as affordable when a household allocates no more than 30% of its adjusted gross income for housing. For example, a household with an income of $40,000 per year would be able to afford a monthly housing cost of about $1,000. Maxfield Research uses a figure of 30% for younger households and 40% or more for seniors, since seniors generally have lower living expenses and can often sell their homes and use the proceeds toward rent payments.
DEMOGRAPHIC ANALYSIS
MAXFIELD RESEARCH AND CONSULTING, LLC 21
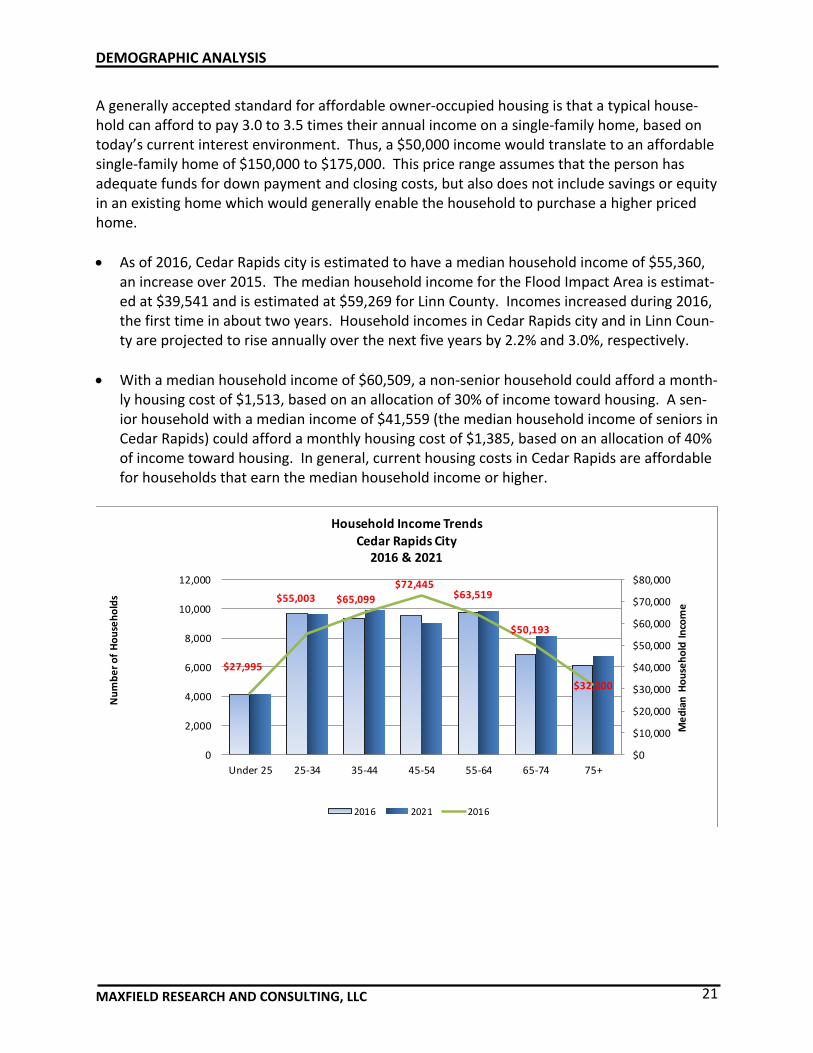
A generally accepted standard for affordable owner‐occupied housing is that a typical house‐hold can afford to pay 3.0 to 3.5 times their annual income on a single‐family home, based on today’s current interest environment. Thus, a $50,000 income would translate to an affordable single‐family home of $150,000 to $175,000. This price range assumes that the person has adequate funds for down payment and closing costs, but also does not include savings or equity in an existing home which would generally enable the household to purchase a higher priced home.
As of 2016, Cedar Rapids city is estimated to have a median household income of $55,360, an increase over 2015. The median household income for the Flood Impact Area is estimat‐ed at $39,541 and is estimated at $59,269 for Linn County. Incomes increased during 2016, the first time in about two years. Household incomes in Cedar Rapids city and in Linn Coun‐ty are projected to rise annually over the next five years by 2.2% and 3.0%, respectively.
With a median household income of $60,509, a non‐senior household could afford a month‐ly housing cost of $1,513, based on an allocation of 30% of income toward housing. A sen‐ior household with a median income of $41,559 (the median household income of seniors in Cedar Rapids) could afford a monthly housing cost of $1,385, based on an allocation of 40% of income toward housing. In general, current housing costs in Cedar Rapids are affordable for households that earn the median household income or higher.
$27,995
$55,003 $65,099
$72,445$63,519
$50,193
$32,000
$0
$10,000
$20,000
$30,000
$40,000
$50,000
$60,000
$70,000
$80,000
0
2,000
4,000
6,000
8,000
10,000
12,000
Under 25 25‐34 35‐44 45‐54 55‐64 65‐74 75+
Median H
ousehold Income
Number of Households
Household Income Trends
Cedar Rapids City2016 & 2021
2016 2021 2016

DEMOGRAPHIC ANALYSIS
MAXFIELD RESEARCH AND CONSULTING, LLC 22
Non‐Senior Households
In 2016, 11.2% of the non‐senior (under age 65) households in Cedar Rapids had incomes under $15,000 (4,434 households). Virtually all of these households would be eligible for deep‐subsidy rental housing. Another 8.3% of the Cedar Rapids’ non‐senior households had incomes between $15,000 and $25,000 (3,522 households). Many of these households would qualify for deep‐subsidy housing, but many could also qualify for shallow‐subsidy or older market rate rentals. If housing costs absorb 30% of income, households with incomes of $15,000 to $25,000 could afford to pay between $375 and $625 per month. Average monthly rents for one‐bedroom units in Cedar Rapids range from $385 to $850 with many rentals priced between $550 and $700.
Median incomes for households in Cedar Rapids peak at $72,445 for the 45 to 54 age group as of 2016. Households in this age group are in their peak earning years. The majority of the households (78%) in this age group are homeowners. By 2021, the median income for the 45 to 54 age group is projected to increase to $80,461, a 11.2% increase.
The average resale price of homes in Cedar Rapids Metro Area as of October 2016 was $169,972. The income required to afford a home at this price would be between $48,563 and $56,658, based on the standard of 3.0 to 3.5 times the median income (and assuming households do not have a high level of debt). In 2016, 61.0% (26,002 households) of Cedar Rapids’ non‐senior households had incomes greater than $48,500.
The median household income for non‐senior households in Cedar Rapids is expected to increase by 20.1% between 2016 and 2021 in Cedar Rapids for a median income of $68,596 by 2021. This equates to an average annual increase of 2.7% over the period.
Senior Households
The oldest householders (75+) are estimated to have a collective median household income of $32,000 as of 2016. In Cedar Rapids, 8.6% of households ages 65 to 74 had incomes be‐low $15,000, compared to 15.7% of households ages 75 and over. Many low‐income older senior households rely solely on social security benefits. Typically, younger seniors have higher incomes because they are still able to work or may still be married and have two pensions or higher social security benefits. The 2016 median incomes for Cedar Rapids householders age 65 to 74 and 75+ are $50,193, and $32,000, respectively. However, the proportion of households 65+ with incomes of less than $15,000 has been decreasing.
Generally, older adult households with incomes of at least $35,000 can afford market rate senior housing. Based on a 40% allocation of income for housing, this translates to monthly rents of at least $1,166. An estimated 7,479 older adult households (65+) in Cedar Rapids (57.6% of senior households) have incomes of $35,000 or more in 2016. Another 5,153 old‐er adults in the remainder of Linn County have household incomes of $35,000 or more in

DEMOGRAPHIC ANALYSIS
MAXFIELD RESEARCH AND CONSULTING, LLC 23
2015. Older adults (65+) will often move from rural areas to regional centers to receive medical care and other services.
Total Under 25 25‐34 35‐44 45‐54 55‐64 65 ‐74 75+
Less than $15,000 5,990 1,100 960 705 726 943 587 969
$15,000 to $24,999 5,622 669 833 662 564 794 780 1,320
$25,000 to $34,999 5,651 721 993 745 645 705 807 1,035
$35,000 to $49,999 7,415 481 1,350 1,197 932 1,169 1,217 1,069
$50,000 to $74,999 11,298 565 2,391 1,975 2,037 2,000 1,488 842
$75,000 to $99,999 7,619 247 1,366 1,510 1,672 1,619 799 406
$100,000 or more 11,765 301 1,759 2,568 2,939 2,540 1,141 517
Total 55,360 4,084 9,652 9,362 9,515 9,770 6,819 6,158
Median Income $54,760 $27,995 $55,003 $65,099 $72,445 $63,519 $50,193 $32,000
Cedar Rapids Metro $58,772 $30,803 $58,237 $72,818 $77,758 $68,283 $51,967 $32,049
Less than $15,000 6,326 1,167 987 743 687 918 754 1,070
$15,000 to $24,999 5,461 632 750 626 468 732 878 1,375
$25,000 to $34,999 7,433 899 1,223 976 732 883 1,238 1,482
$35,000 to $49,999 4,194 291 749 659 483 635 778 599
$50,000 to $74,999 10,093 499 2,046 1,827 1,620 1,715 1,554 832
$75,000 to $99,999 9,122 296 1,622 1,824 1,786 1,865 1,161 568
$100,000 or more 14,684 374 2,212 3,236 3,227 3,093 1,738 804
Total 57,313 4,158 9,589 9,891 9,003 9,841 8,101 6,730
Median Income $60,630 $27,316 $60,675 $76,113 $80,461 $75,348 $54,681 $30,280
Cedar Rapids Metro $67,228 $29,257 $66,436 $81,802 $85,942 $79,250 $57,980 $30,647
Less than $15,000 336 67 27 38 ‐39 ‐25 167 101
$15,000 to $24,999 ‐161 ‐37 ‐83 ‐36 ‐96 ‐62 98 55
$25,000 to $34,999 1,782 178 230 231 87 178 431 447
$35,000 to $49,999 ‐3,221 ‐190 ‐601 ‐538 ‐449 ‐534 ‐439 ‐470
$50,000 to $74,999 ‐1,205 ‐66 ‐345 ‐148 ‐417 ‐285 66 ‐10
$75,000 to $99,999 1,503 49 256 314 114 246 362 162
$100,000 or more 2,919 73 453 668 288 553 597 287
Total 1,953 74 ‐63 529 ‐512 71 1,282 572
Median Income $5,870 ‐$679 $5,672 $11,014 $8,016 $11,829 $4,488 ‐$1,720
Sources: ESRI; Maxfield Research and Consulting, LLC
TABLE 5
HOUSEHOLD INCOME BY AGE OF HOUSEHOLDER
CEDAR RAPIDS CITY
Change 2016 ‐ 2021
2016 & 2021
Age of Householder
2016
2021

DEMOGRAPHIC ANALYSIS
MAXFIELD RESEARCH AND CONSULTING, LLC 24
Seniors who are able and willing to pay 80% or more of their income on assisted living housing would likely need an annual income of $40,000 or higher to afford monthly rents of $2,700, which is about the beginning monthly rent for assisted living projects in the Cedar Rapids area. There are an estimated 2,471 older senior (ages 75 and over) households with incomes greater than $40,000 in 2016 in Cedar Rapids city. In the remainder of Linn Coun‐ty, there are another 1,494 older seniors with incomes greater than $40,000. Seniors age 75 and over are the primary market for senior housing with support services including con‐gregate, assisted living and memory care housing.
The median income for older adults age 65+ in Cedar Rapids is $41,559 in 2016. It is pro‐jected to increase by $2,049 (4.9%) to $43,608 by 2021.
Flood Impact Area Table 6 shows household incomes by age of householder for the Flood Impact Area in 2016 and 2021. The table shows that while the overall median income for the Flood Impact Area is lower than for Cedar Rapids or Linn County, the median income for households age 25 to 44 is pro‐portionally higher in the Flood Impact Area. Incomes in the two youngest age cohorts exhibited strong increases between 2015 and 2016 compared to the other age cohorts in this area. We believe that this situation accounts for a trend among young professionals to seek an active, urban environment within walking distance of entertainment and employment. The higher incomes among these age groups attest to this. Overall, there is a higher proportion of households with low incomes that resides in the core neighborhoods. These individuals may reside in older housing or may live in affordable hous‐ing, some of which is located in the Downtown area. Owner‐occupied homes in the Flood Impact Area tend to be more affordable. Many of those that survived the flood have been renovation and rehabilitated. In addition, new housing has also been built in the Flood Impact Area. Older adult households in the Flood Impact Area have low incomes. The median income for all householders age 75+ is estimated at $22,632. Households age 75+ tend to have household incomes about one‐third lower than households age 65 to 74. This is because there are more single person households after age 75.

DEMOGRAPHIC ANALYSIS
MAXFIELD RESEARCH AND CONSULTING, LLC 25
Total Under 25 25‐34 35‐44 45‐54 55‐64 65 ‐74 75+
Less than $15,000 1,326 131 210 171 206 257 141 210
$15,000 to $24,999 1,016 78 140 132 130 170 167 199
$25,000 to $34,999 934 99 173 141 138 127 148 108
$35,000 to $49,999 1,017 54 186 178 158 175 177 89
$50,000 to $74,999 1,353 51 303 250 281 260 143 65
$75,000 to $99,999 880 24 170 167 202 189 74 54
$100,000 or more 789 17 141 185 186 163 68 29
Total 7,315 454 1,323 1,224 1,301 1,341 918 754
Median Income $39,541 $26,271 $45,222 $48,879 $51,055 $43,928 $35,169 $22,632
Cedar Rapids Metro $58,772 $30,803 $58,237 $72,818 $77,758 $68,283 $51,967 $32,049
Less than $15,000 1,455 136 224 194 195 280 193 233
$15,000 to $24,999 990 71 125 117 109 158 197 213
$25,000 to $34,999 1,208 116 212 179 150 162 231 158
$35,000 to $49,999 687 34 121 122 98 115 140 57
$50,000 to $74,999 1,334 46 284 267 250 261 163 63
$75,000 to $99,999 1,027 24 203 199 213 217 102 69
$100,000 or more 965 18 167 231 203 205 96 45
Total 7,666 445 1,336 1,309 1,218 1,398 1,122 838
Median Income $38,198 $25,862 $47,824 $52,712 $54,007 $47,415 $31,657 $23,148
Cedar Rapids Metro $67,228 $29,257 $66,436 $81,802 $85,942 $79,250 $57,980 $30,647
Less than $15,000 129 5 14 23 ‐11 23 52 23
$15,000 to $24,999 ‐26 ‐7 ‐15 ‐15 ‐21 ‐12 30 14
$25,000 to $34,999 274 17 39 38 12 35 83 50
$35,000 to $49,999 ‐330 ‐20 ‐65 ‐56 ‐60 ‐60 ‐37 ‐32
$50,000 to $74,999 ‐19 ‐5 ‐19 17 ‐31 1 20 ‐2
$75,000 to $99,999 147 0 33 32 11 28 28 15
$100,000 or more 176 1 26 46 17 42 28 16
Total 351 ‐9 13 85 ‐83 57 204 84
Median Income ‐$1,343 ‐$409 $2,602 $3,833 $2,952 $3,487 ‐$3,512 $516
Sources: ESRI; Maxfield Research and Consulting, LLC
TABLE 6
HOUSEHOLD INCOME BY AGE OF HOUSEHOLDER
FLOOD IMPACT AREA
2016
2021
Change 2016 ‐ 2021
2016 & 2021
Age of Householder

DEMOGRAPHIC ANALYSIS
MAXFIELD RESEARCH AND CONSULTING, LLC 26
$26,271
$45,222 $48,879 $51,055$43,928
$35,169
$22,632
$0
$10,000
$20,000
$30,000
$40,000
$50,000
$60,000
0
200
400
600
800
1,000
1,200
1,400
1,600
Under 25 25‐34 35‐44 45‐54 55‐64 65‐74 75+
Median H
ousehold Income
Number of Households
Household Income Trends
Flood Impact Area2016 & 2021
2016 2021 2016
Linn County Table 7 shows household incomes by age of householder for Linn County.
$29,845
$58,262$73,514
$78,873$69,692
$52,466
$32,804
$0
$10,000
$20,000
$30,000
$40,000
$50,000
$60,000
$70,000
$80,000
$90,000
0
5,000
10,000
15,000
20,000
25,000
Under 25 25‐34 35‐44 45‐54 55‐64 65‐74 75+
Median H
ousehold Income
Number of Households
Household Income TrendsLinn County2016 & 2021
2016 2021 2016

DEMOGRAPHIC ANALYSIS
MAXFIELD RESEARCH AND CONSULTING, LLC 27
Total Under 25 25‐34 35‐44 45‐54 55‐64 65 ‐74 75+
Less than $15,000 8,243 1,337 1,266 952 1,013 1,345 899 1,431
$15,000 to $24,999 8,117 855 1,143 949 818 1,173 1,206 1,973
$25,000 to $34,999 8,690 979 1,443 1,135 1,006 1,132 1,283 1,712
$35,000 to $49,999 11,552 685 2,007 1,852 1,484 1,862 1,975 1,687
$50,000 to $74,999 17,848 804 3,583 3,042 3,261 3,224 2,540 1,394
$75,000 to $99,999 13,152 352 2,226 2,622 2,996 2,895 1,441 620
$100,000 or more 22,357 488 3,187 5,053 5,822 4,832 2,137 838
Total 89,959 5,500 14,855 15,605 16,400 16,463 11,481 9,655
Median Income $59,269 $29,845 $58,262 $73,514 $78,873 $69,682 $52,466 $32,804
Cedar Rapids Metro $58,772 $30,803 $58,237 $72,818 $77,758 $68,283 $51,967 $32,049
Less than $15,000 10,128 1,495 1,486 1,114 1,076 1,521 1,385 2,051
$15,000 to $24,999 7,163 889 1,202 1,019 802 1,349 1,633 269
$25,000 to $34,999 13,893 1,312 2,051 1,715 1,376 1,793 2,456 3,190
$35,000 to $49,999 7,967 463 1,317 1,173 938 1,274 1,581 1,221
$50,000 to $74,999 19,163 818 3,627 3,249 3,118 3,449 3,211 1,691
$75,000 to $99,999 18,663 476 3,072 3,596 3,775 4,094 2,519 1,131
$100,000 or more 32,873 682 4,724 7,160 7,493 7,160 3,974 1,680
Total 109,850 6,135 17,479 19,026 18,578 20,640 16,759 11,233
Median Income $68,329 $28,775 $66,893 $82,260 $87,141 $80,356 $59,316 $31,289
Cedar Rapids Metro $67,228 $29,257 $66,436 $81,802 $85,942 $79,250 $57,980 $30,647
Less than $15,000 1,885 158 220 162 63 176 486 620
$15,000 to $24,999 ‐954 34 59 70 ‐16 176 427 ‐1,704
$25,000 to $34,999 5,203 333 608 580 370 661 1,173 1,478
$35,000 to $49,999 ‐3,585 ‐222 ‐690 ‐679 ‐546 ‐588 ‐394 ‐466
$50,000 to $74,999 1,315 14 44 207 ‐143 225 671 297
$75,000 to $99,999 5,511 124 846 974 779 1,199 1,078 511
$100,000 or more 10,516 194 1,537 2,107 1,671 2,328 1,837 842
Total 19,891 635 2,624 3,421 2,178 4,177 5,278 1,578
Median Income $9,060 ‐$1,070 $8,631 $8,746 $8,268 $10,674 $6,850 ‐$1,515
Sources: ESRI; Maxfield Research and Consulting LLC
TABLE 7
HOUSEHOLD INCOME BY AGE OF HOUSEHOLDER
LINN COUNTY
2016
2021
Change 2016 ‐ 2021
2016 & 2021
Age of Householder
DEMOGRAPHIC ANALYSIS
MAXFIELD RESEARCH AND CONSULTING, LLC 28
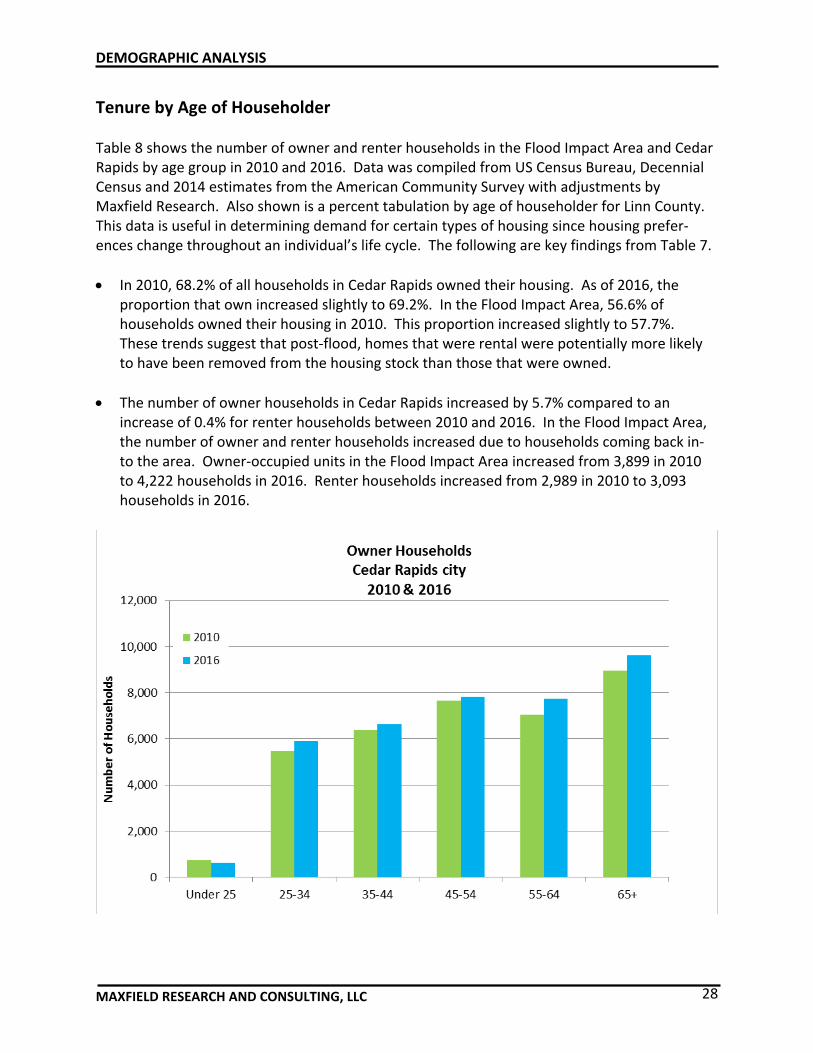
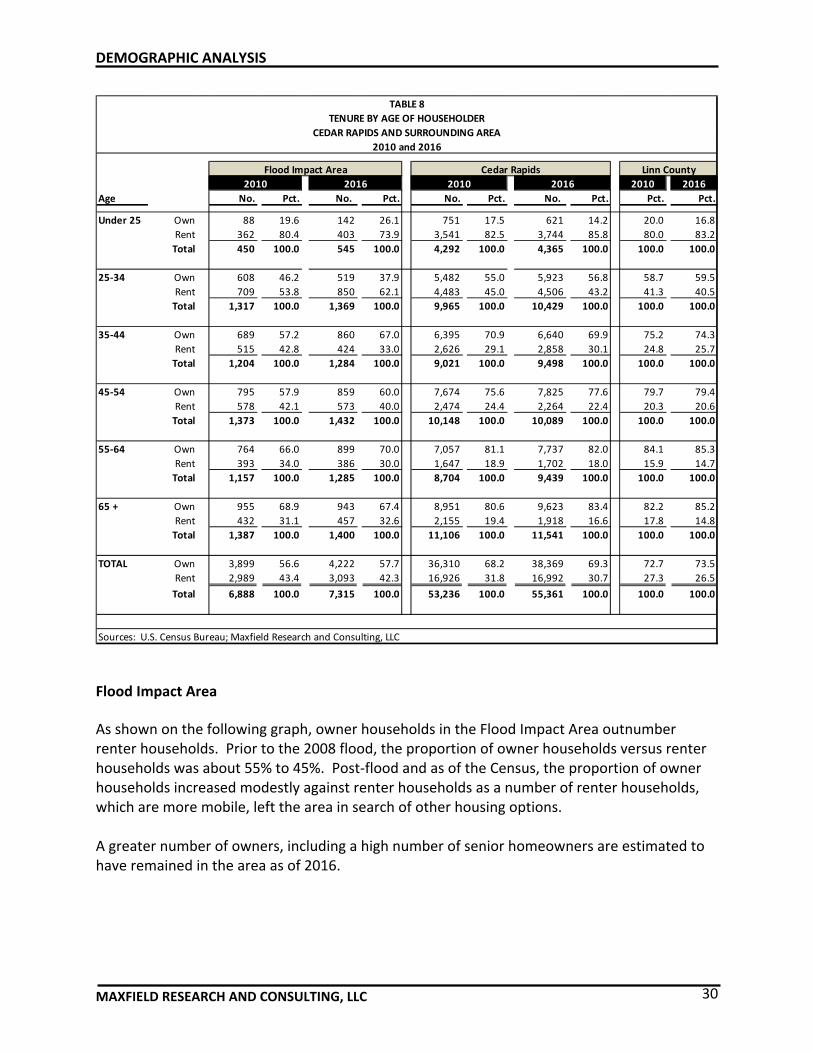
Tenure by Age of Householder Table 8 shows the number of owner and renter households in the Flood Impact Area and Cedar Rapids by age group in 2010 and 2016. Data was compiled from US Census Bureau, Decennial Census and 2014 estimates from the American Community Survey with adjustments by Maxfield Research. Also shown is a percent tabulation by age of householder for Linn County. This data is useful in determining demand for certain types of housing since housing prefer‐ences change throughout an individual’s life cycle. The following are key findings from Table 7.
In 2010, 68.2% of all households in Cedar Rapids owned their housing. As of 2016, the proportion that own increased slightly to 69.2%. In the Flood Impact Area, 56.6% of households owned their housing in 2010. This proportion increased slightly to 57.7%. These trends suggest that post‐flood, homes that were rental were potentially more likely to have been removed from the housing stock than those that were owned.
The number of owner households in Cedar Rapids increased by 5.7% compared to an increase of 0.4% for renter households between 2010 and 2016. In the Flood Impact Area, the number of owner and renter households increased due to households coming back in‐to the area. Owner‐occupied units in the Flood Impact Area increased from 3,899 in 2010 to 4,222 households in 2016. Renter households increased from 2,989 in 2010 to 3,093 households in 2016.

DEMOGRAPHIC ANALYSIS
MAXFIELD RESEARCH INC. 29
0
500
1,000
1,500
2,000
2,500
3,000
3,500
4,000
4,500
5,000
15‐24 25‐34 35‐44 45‐54 55‐64 65+
Number of Households
Renter Households
Cedar Rapids city2010 & 2016
2010
2016
As households progress through their life cycle, housing needs change. The proportion of renter households typically decreases as households age out of their young‐adult years. By the time households reach their senior years however, rental housing often becomes a more viable option than homeownership, as households prefer to reduce their responsibil‐ities for maintenance and the large financial commitment.
In 2016, 86.6% of Cedar Rapids’ households between the ages of 15 and 24 rented their
housing, compared to 43.2% of households between the ages of 25 and 34. Householders between 35 and 64 are predominantly homeowners, with no more than 30% of the house‐holders in each 10‐year age cohort renting their housing and in the older age groups, it is much less.
Overall, the proportion of owner households in each age category is higher than in Cedar Rapids or the Flood Impact Area. Most of the rental housing is located in the central city with fewer rental options available in the outlying areas of the County. Higher owner pro‐portions reflect the more rural character of the area, where traditional agricultural land use and lack of infrastructure does not readily support high‐density rental housing. Rental demand is generally less in rural areas because a greater percentage of younger house‐holds, who are primarily renters, migrate to urban areas, such as Cedar Rapids.
DEMOGRAPHIC ANALYSIS
MAXFIELD RESEARCH AND CONSULTING, LLC 30
2010 2016
Age No. Pct. No. Pct. No. Pct. No. Pct. Pct. Pct.
Under 25 Own 88 19.6 142 26.1 751 17.5 621 14.2 20.0 16.8
Rent 362 80.4 403 73.9 3,541 82.5 3,744 85.8 80.0 83.2
Total 450 100.0 545 100.0 4,292 100.0 4,365 100.0 100.0 100.0
25‐34 Own 608 46.2 519 37.9 5,482 55.0 5,923 56.8 58.7 59.5
Rent 709 53.8 850 62.1 4,483 45.0 4,506 43.2 41.3 40.5
Total 1,317 100.0 1,369 100.0 9,965 100.0 10,429 100.0 100.0 100.0
35‐44 Own 689 57.2 860 67.0 6,395 70.9 6,640 69.9 75.2 74.3
Rent 515 42.8 424 33.0 2,626 29.1 2,858 30.1 24.8 25.7
Total 1,204 100.0 1,284 100.0 9,021 100.0 9,498 100.0 100.0 100.0
45‐54 Own 795 57.9 859 60.0 7,674 75.6 7,825 77.6 79.7 79.4
Rent 578 42.1 573 40.0 2,474 24.4 2,264 22.4 20.3 20.6
Total 1,373 100.0 1,432 100.0 10,148 100.0 10,089 100.0 100.0 100.0
55‐64 Own 764 66.0 899 70.0 7,057 81.1 7,737 82.0 84.1 85.3
Rent 393 34.0 386 30.0 1,647 18.9 1,702 18.0 15.9 14.7
Total 1,157 100.0 1,285 100.0 8,704 100.0 9,439 100.0 100.0 100.0
65 + Own 955 68.9 943 67.4 8,951 80.6 9,623 83.4 82.2 85.2
Rent 432 31.1 457 32.6 2,155 19.4 1,918 16.6 17.8 14.8
Total 1,387 100.0 1,400 100.0 11,106 100.0 11,541 100.0 100.0 100.0
TOTAL Own 3,899 56.6 4,222 57.7 36,310 68.2 38,369 69.3 72.7 73.5
Rent 2,989 43.4 3,093 42.3 16,926 31.8 16,992 30.7 27.3 26.5
Total 6,888 100.0 7,315 100.0 53,236 100.0 55,361 100.0 100.0 100.0
Sources: U.S. Census Bureau; Maxfield Research and Consulting, LLC
TABLE 8
TENURE BY AGE OF HOUSEHOLDER
CEDAR RAPIDS AND SURROUNDING AREA
2010 and 2016
Flood Impact Area Cedar Rapids Linn County
2016 20162010 2010
Flood Impact Area As shown on the following graph, owner households in the Flood Impact Area outnumber renter households. Prior to the 2008 flood, the proportion of owner households versus renter households was about 55% to 45%. Post‐flood and as of the Census, the proportion of owner households increased modestly against renter households as a number of renter households, which are more mobile, left the area in search of other housing options. A greater number of owners, including a high number of senior homeowners are estimated to have remained in the area as of 2016.

DEMOGRAPHIC ANALYSIS
MAXFIELD RESEARCH AND CONSULTING, LLC 31
0
100
200
300
400
500
600
700
800
900
1,000
15‐24 25‐34 35‐44 45‐54 55‐64 65+
Number of Households
Owner and Renter HouseholdsFlood Impact Area
2016
Own Rent
Household Type Table 9 shows a breakdown of the type of households present in the Flood Impact Area, Cedar Rapids and Linn County in 2010 and 2016. The data is useful in assessing the potential demand for different types of housing products because household composition often determines the type of housing that is preferred.
Between 2010 and 2016, Cedar Rapids experienced an increase in all types of households except families that are married without children (‐1.3%) and roommate households. Mar‐ried couple families with children experienced the largest numerical increase during this pe‐riod, (909 households or 9.7%).
Married couple families with children also experienced the highest percentage increase at
9.7% among the household categories. This may indicate that Millennials are beginning to have families.
The Market Area had a relatively strong increase in other family households (a gain of 360 households, or 4.4%). Other families include single‐parents and unmarried couples with children. With only one income, these families are most likely to need affordable or modest housing, both rental and for‐sale.
Married couples without children experienced the second highest increase during the period, 559 households or 4.2%. The increase in this category is most likely due to empty‐nesters and young seniors whose children have grown and now left home.

DEMOGRAPHIC ANALYSIS
MAXFIELD RESEARCH AND CONSULTING, LLC 32
2000 2010 2016 2000 2010 2016 2000 2010 2016 2000 2010 2016 2000 2010 2016 2000 2010 2016
No. of Households
Flood Impact Area 9,078 6,888 7,315 1,454 832 985 1,781 1,341 1,427 1,576 1,301 1,350 3,506 2,756 2,897 761 658 656
Cedar Rapids 49,820 53,236 55,361 10,570 9,357 10,266 13,557 13,433 13,992 6,697 8,141 8,501 15,047 17,317 17,887 3,949 4,988 4,715
Remainder of Cty. 26,933 32,898 34,598 7,725 8,377 9,045 8,976 10,904 10,768 2,810 3,957 4,282 6,045 7,871 8,558 1,377 1,789 1,945
Linn County 76,753 86,134 89,959 18,295 17,734 19,311 22,533 24,337 24,760 9,507 12,098 12,783 21,092 25,188 26,445 5,326 6,777 6,660
Percent of Total
Flood Impact Area 100.0 100.0 100.0 16.0 12.1 13.5 19.6 19.5 19.5 17.4 18.9 18.5 38.6 40.0 39.6 8.4 9.6 9.0
Cedar Rapids 100.0 100.0 100.0 21.2 17.6 18.5 27.2 25.2 25.3 13.4 15.3 15.4 30.2 32.5 32.3 7.9 9.4 8.5
Remainder of Cty. 100.0 100.0 100.0 28.7 25.5 26.1 33.3 33.1 31.1 10.4 12.0 12.4 22.4 23.9 24.7 5.1 5.4 5.6
Linn County 100.0 100.0 100.0 23.8 20.6 21.5 29.4 28.3 27.5 12.4 14.0 14.2 27.5 29.2 29.4 6.9 7.9 7.4
No. Pct. No. Pct. No. Pct. No. Pct. No. Pct. No. Pct.
Flood Impact Area 427 6.2% 153 18.4% 86 6.4% 49 3.8% 141 5.1% ‐2 ‐0.3%
Cedar Rapids 2,125 4.0% 909 9.7% 559 4.2% 360 4.4% 570 3.3% ‐273 ‐5.5%
Remainder of Area 1,700 5.2% 668 8.0% ‐136 ‐1.2% 325 8.2% 687 8.7% 156 8.7%
Linn County 9,381 12.2% ‐561 ‐3.1% 1,804 8.0% 2,591 27.3% 4,096 19.4% 1,451 27.2%
* Single‐parents and unmarried couples with children
** Includes unmarried couples without children
Sources: U. S. Census; Maxfield Research and Consulting, LLC
TABLE 9
HOUSEHOLD TYPE
CEDAR RAPIDS AND SURROUNDING AREA
2000, 2010 & 2016
Family Households Non‐Family Households
Change 2010‐2016
Total HH's Married w/ Child Married w/o Child Other * Living Alone Roommates **
DEMOGRAPHIC ANALYSIS
MAXFIELD RESEARCH AND CONSULTING, LLC 33
To some extent, differences between Cedar Rapids and the Remainder of the County reflect the availability of a wider range of housing options in Cedar Rapids compared to more rural areas outside of the larger cities. For example, non‐family householders tend to rent their housing more so than the other categories. This category includes elderly widows as well as young people that are single and may also include people that have been divorced and are living alone. Young people typically do not have sufficient incomes to purchase housing; single seniors are more likely to move to multifamily housing to shed the burden of home maintenance and to have more opportunities for socialization. As of 2013, an estimated 42% of households in Cedar Rapids were non‐family households, while 30% in the Remain‐der of the County were non‐family. This reflects a higher proportion of multifamily rental housing in Cedar Rapids.
Employment Trends Since employment growth generally fuels household growth, employment trends are a reliable indicator of housing demand. Typically, households prefer to live near work for convenience. However, housing is often less expensive in smaller towns, making commuting from outlying communities to work in larger employment centers attractive for households concerned about housing affordability. Recent employment growth trends for Cedar Rapids are shown in Tables 10 and 11. Table 10 presents resident employment data for Cedar Rapids from 2000 through August 2016. Resident employment data is calculated as an annual average and reveals the work force and number of employed persons living in the City. It is important to note that not all of these individuals necessarily work in the City. Table 11 presents covered employment in the Cedar Rapids Metro Area from 2000 through August 2016. Covered employment data is calculated as an annual average and reveals the number of jobs in the City, which are covered by unemployment insurance. Most farm jobs, self‐employed persons, and some other types of jobs are not covered by unemployment insurance and are not included in the table. The data in both tables is from the Iowa Workforce Information Network (IWIN). The following are key trends derived from the employment data: Resident Labor Force
Resident employment in the Cedar Rapids Metro Area decreased by an estimated 5,600 people from 2008 through 2011 (‐4.0%). During this same period, the number of individuals in the labor market also decreased (although fluctuated some), still resulting in an increase in unemployment from 3.9% (2008) to 6.0% (2011).

DEMOGRAPHIC ANALYSIS
MAXFIELD RESEARCH AND CONSULTING, LLC 34
The unemployment rate in Cedar Rapids Metro Area has been slightly higher than the State’s for most of the years shown on the table. As of August 2016, the unemployment rate in Cedar Rapids rose to 4.4%, above that of the County (4.3%) and the State (4.2%).
TABLE 10
ANNUAL AVERAGE RESIDENT EMPLOYMENT
CEDAR RAPIDS CITY AND LINN COUNTY
2005 through August 2016
Cedar Rapids Metro Area
Comparative Unemployment Rates
Year Labor Force Employment Unemployment CR County State
2005 69,400 66,500 2,900 4.1% 4.5% 4.3%
2006 71,100 68,600 2,500 3.6% 4.8% 3.7%
2007 72,000 69,600 2,400 3.3% 3.7% 3.8%
2008 74,700 71,000 3,700 5.0% 4.2% 4.4%
2009 73,800 69,400 4,400 6.0% 5.3% 5.6%
2010 72,500 68,300 4,200 5.7% 6.1% 6.1%
2011 71,500 67,600 3,900 5.6% 6.0% 5.6%
2012 71,000 67,300 3,700 5.2% 5.1% 5.1%
2013 71,800 68,400 3,400 4.7% 4.9% 4.9%
2014 72,500 69,500 3,000 4.1% 4.6% 4.9%
2015 71,400 68,900 2,500 3.5% 3.5% 3.3%
*2016 71,600 68,500 3,100 4.4% 4.3% 4.2%
Change, 2005 through August 2016
No. 2,200 2,000 200 N/A N/A N/A
Pct. 3.2% 3.0% 6.9% N/A N/A N/A
Linn County
Comparative Unemployment Rates
Year Labor Force Employment Unemployment County State
2005 113,700 108,800 4,900 4.3% 4.3%
2006 117,100 112,700 4,400 3.8% 3.7%
2007 119,100 114,800 4,300 3.6% 3.8%
2008 123,200 117,000 6,200 5.0% 4.4%
2009 122,700 115,200 7,500 6.1% 5.6%
2010 120,600 113,600 7,000 5.8% 6.1%
2011 119,100 112,400 6,700 5.6% 5.6%
2012 118,600 112,400 6,200 5.2% 5.1%
2013 120,200 114,700 5,500 4.6% 4.9%
2014 121,500 116,500 5,000 4.1% 4.9%
2015 119,700 115,500 4,200 3.5% 3.3%
2016 119,800 114,700 5,100 4.3% 4.2%
Change, 2005 through August 2016
No. 6,100 5,900 200 N/A N/A N/A
Pct. 5.4% 5.4% 4.1% N/A N/A N/A
* 2016 data current through August.
Sources: Iowa Workforce Information Network; Maxfield Research and Consulting, LLC

DEMOGRAPHIC ANALYSIS
MAXFIELD RESEARCH AND CONSULTING, LLC 35
4.33.8
5.6 5.64.9
4.9
4.6
5.8
9.6
8.1
6.2
0.0
2.0
4.0
6.0
8.0
10.0
12.0
2005 2006 2007 2008 2009 2010 2011 2012 2013 2014 2015 2016
Percent Unemploye
d
Unemployment Rates
City of Cedar Rapids2005 through 2016 (AUG)
Cedar Rapids Iowa US

DEMOGRAPHIC ANALYSIS
MAXFIELD RESEARCH AND CONSULTING, LLC 36
As of August 2016, the unemployment rate was 4.4%, the highest it has been since 2013 when it was 4.7%.
The rise in the unemployment rate for Cedar Rapids followed a rise in the labor force along with a decrease in employment.
Covered Employment by Industry
Table 11 shows covered employment by industry for the Cedar Rapids MSA in 2001, 2005, and 2009 through August 2016.
The Manufacturing Sector accounted for 14% of the City’s jobs in 2016, equal to the per‐centage in 2014, which is a far higher percentage than most cities in the State. Education & Health Services and Professional and Business Services Sectors accounted for 13.9% and 10.0% of the all jobs in the Cedar Rapids MSA, respectively.
Between 2001 and 2016, the number of jobs increased by 10,700, an 8.0% increase. Manu‐facturing lost ‐1,200 jobs between 2001 and 2016, or ‐5.6%. Information lost ‐2,800 jobs or ‐40.0%. The largest gain was in Education and Health Services, which increased by 4,600 jobs, an increase of 30.5%.
Other sectors that experienced growth were Transportation/Utilities, 4,500 jobs (61.6%), Financial Services, 2,200 jobs (24.7%), Leisure and Hospitality, 2,800 jobs (28.0%) and Pro‐fessional and Business Services, 2,800 jobs (28.0%).
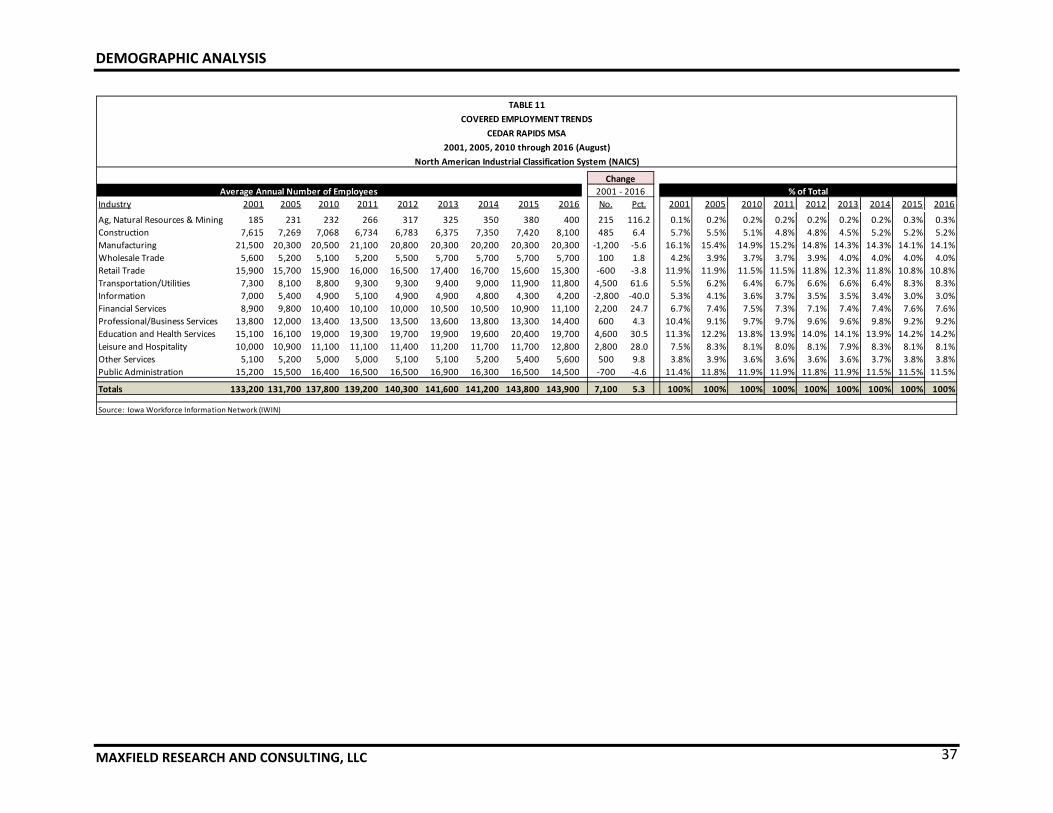
DEMOGRAPHIC ANALYSIS
MAXFIELD RESEARCH AND CONSULTING, LLC 37
Industry 2001 2005 2010 2011 2012 2013 2014 2015 2016 No. Pct. 2001 2005 2010 2011 2012 2013 2014 2015 2016
Ag, Natural Resources & Mining 185 231 232 266 317 325 350 380 400 215 116.2 0.1% 0.2% 0.2% 0.2% 0.2% 0.2% 0.2% 0.3% 0.3%
Construction 7,615 7,269 7,068 6,734 6,783 6,375 7,350 7,420 8,100 485 6.4 5.7% 5.5% 5.1% 4.8% 4.8% 4.5% 5.2% 5.2% 5.2%
Manufacturing 21,500 20,300 20,500 21,100 20,800 20,300 20,200 20,300 20,300 ‐1,200 ‐5.6 16.1% 15.4% 14.9% 15.2% 14.8% 14.3% 14.3% 14.1% 14.1%
Wholesale Trade 5,600 5,200 5,100 5,200 5,500 5,700 5,700 5,700 5,700 100 1.8 4.2% 3.9% 3.7% 3.7% 3.9% 4.0% 4.0% 4.0% 4.0%
Retail Trade 15,900 15,700 15,900 16,000 16,500 17,400 16,700 15,600 15,300 ‐600 ‐3.8 11.9% 11.9% 11.5% 11.5% 11.8% 12.3% 11.8% 10.8% 10.8%
Transportation/Utilities 7,300 8,100 8,800 9,300 9,300 9,400 9,000 11,900 11,800 4,500 61.6 5.5% 6.2% 6.4% 6.7% 6.6% 6.6% 6.4% 8.3% 8.3%
Information 7,000 5,400 4,900 5,100 4,900 4,900 4,800 4,300 4,200 ‐2,800 ‐40.0 5.3% 4.1% 3.6% 3.7% 3.5% 3.5% 3.4% 3.0% 3.0%
Financial Services 8,900 9,800 10,400 10,100 10,000 10,500 10,500 10,900 11,100 2,200 24.7 6.7% 7.4% 7.5% 7.3% 7.1% 7.4% 7.4% 7.6% 7.6%
Professional/Business Services 13,800 12,000 13,400 13,500 13,500 13,600 13,800 13,300 14,400 600 4.3 10.4% 9.1% 9.7% 9.7% 9.6% 9.6% 9.8% 9.2% 9.2%
Education and Health Services 15,100 16,100 19,000 19,300 19,700 19,900 19,600 20,400 19,700 4,600 30.5 11.3% 12.2% 13.8% 13.9% 14.0% 14.1% 13.9% 14.2% 14.2%
Leisure and Hospitality 10,000 10,900 11,100 11,100 11,400 11,200 11,700 11,700 12,800 2,800 28.0 7.5% 8.3% 8.1% 8.0% 8.1% 7.9% 8.3% 8.1% 8.1%
Other Services 5,100 5,200 5,000 5,000 5,100 5,100 5,200 5,400 5,600 500 9.8 3.8% 3.9% 3.6% 3.6% 3.6% 3.6% 3.7% 3.8% 3.8%
Public Administration 15,200 15,500 16,400 16,500 16,500 16,900 16,300 16,500 14,500 ‐700 ‐4.6 11.4% 11.8% 11.9% 11.9% 11.8% 11.9% 11.5% 11.5% 11.5%
Totals 133,200 131,700 137,800 139,200 140,300 141,600 141,200 143,800 143,900 7,100 5.3 100% 100% 100% 100% 100% 100% 100% 100% 100%
Source: Iowa Workforce Information Network (IWIN)
TABLE 11
Change
2001 ‐ 2016
North American Industrial Classification System (NAICS)
% of Total
2001, 2005, 2010 through 2016 (August)
CEDAR RAPIDS MSA
COVERED EMPLOYMENT TRENDS
Average Annual Number of Employees

DEMOGRAPHIC ANALYSIS
MAXFIELD RESEARCH AND CONSULTING, LLC 38
133,200
130,900
128,800
130,000
132,000
134,900
137,800
140,100
137,800
140,100 139,100
140,400
140,800
141,300
142,100
143,900
0
20,000
40,000
60,000
80,000
100,000
120,000
140,000
160,000
2001 2002 2003 2004 2005 2006 2007 2008 2009 2010 2011 2012 2013 2014 2015 2016
No. of Co
vered Jobs
Year
Covered Employment TrendsCedar Rapids MSA
2001 through 2016 (August)

DEMOGRAPHIC ANALYSIS
MAXFIELD RESEARCH AND CONSULTING, LLC 39
Commuting Patterns Proximity to employment is often a primary consideration when choosing where to live, since transportation costs often accounts for a large proportion of households’ budgets. Table 12 highlights the commuting patterns of workers in the City of Cedar Rapids in 2014 (the most recent data available), based on Employer‐Household Dynamics data from the U.S. Census Bureau. The City of Cedar Rapids is a net importer of jobs from the MSA. The table and following
graphic show the number of people that travel into the City of Cedar Rapids for employ‐ment, those that exit the City for employment and residents that live and work in the City. There were an estimated 98,308 primary jobs in Cedar Rapids as of 2014. Of those that hold these jobs, 37,749 (61.5%) of them live and work in Cedar Rapids. The remaining jobs are held by individuals commuting to Cedar Rapids from other locations (60,559 individu‐als). The top commuting locations from outside of Cedar Rapids are Marion (4.6%), Hiawa‐tha city (4.4%), Iowa City (4.1%), Coralville (2.2%), Des Moines (1.4%) and Davenport (1.2%). All other communities were represented by 1.1% or less.
As shown on the graphic, 23,587 individuals that live in Cedar Rapids work outside of the city in other communities.
Inflow and Outflow of Workers in Cedar Rapids
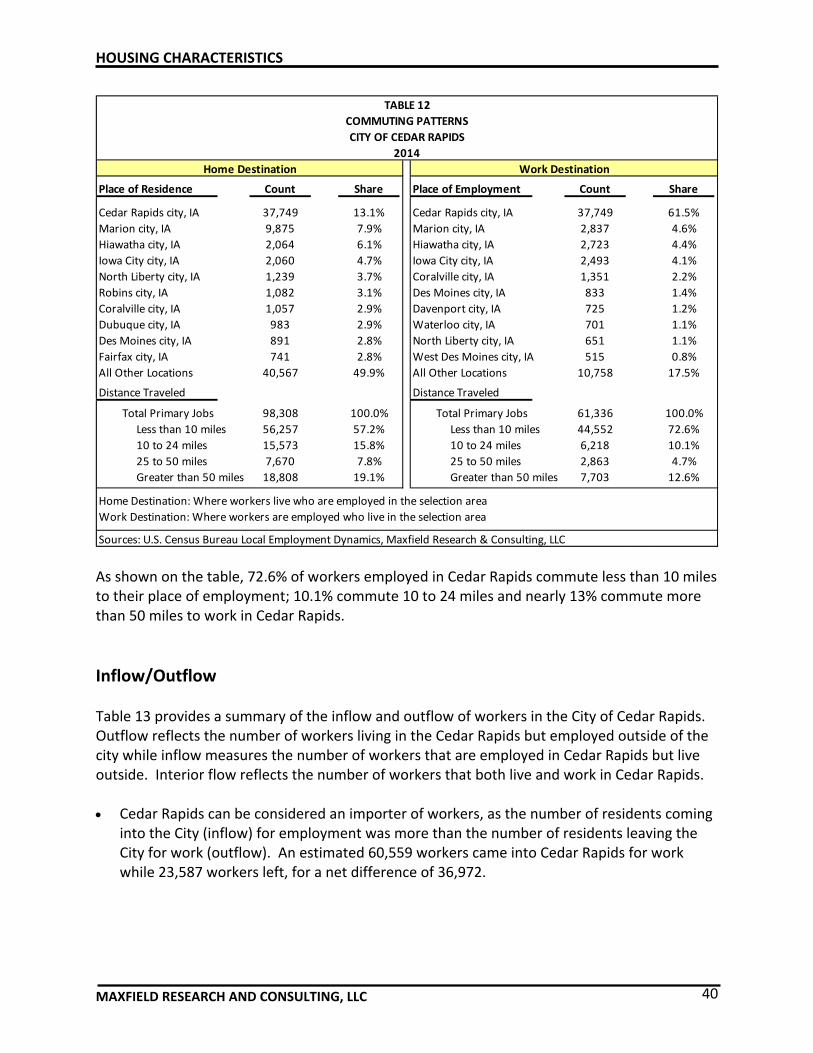
HOUSING CHARACTERISTICS
MAXFIELD RESEARCH AND CONSULTING, LLC 40
Place of Residence Count Share Place of Employment Count Share
Cedar Rapids city, IA 37,749 13.1% Cedar Rapids city, IA 37,749 61.5%
Marion city, IA 9,875 7.9% Marion city, IA 2,837 4.6%
Hiawatha city, IA 2,064 6.1% Hiawatha city, IA 2,723 4.4%
Iowa City city, IA 2,060 4.7% Iowa City city, IA 2,493 4.1%
North Liberty city, IA 1,239 3.7% Coralville city, IA 1,351 2.2%
Robins city, IA 1,082 3.1% Des Moines city, IA 833 1.4%
Coralville city, IA 1,057 2.9% Davenport city, IA 725 1.2%
Dubuque city, IA 983 2.9% Waterloo city, IA 701 1.1%
Des Moines city, IA 891 2.8% North Liberty city, IA 651 1.1%
Fairfax city, IA 741 2.8% West Des Moines city, IA 515 0.8%
All Other Locations 40,567 49.9% All Other Locations 10,758 17.5%
Distance Traveled Distance Traveled
Total Primary Jobs 98,308 100.0% Total Primary Jobs 61,336 100.0%
Less than 10 miles 56,257 57.2% Less than 10 miles 44,552 72.6%
10 to 24 miles 15,573 15.8% 10 to 24 miles 6,218 10.1%
25 to 50 miles 7,670 7.8% 25 to 50 miles 2,863 4.7%
Greater than 50 miles 18,808 19.1% Greater than 50 miles 7,703 12.6%
Home Destination: Where workers live who are employed in the selection area
Work Destination: Where workers are employed who live in the selection area
Sources: U.S. Census Bureau Local Employment Dynamics, Maxfield Research & Consulting, LLC
TABLE 12
COMMUTING PATTERNS
CITY OF CEDAR RAPIDS
2014
Home Destination Work Destination
As shown on the table, 72.6% of workers employed in Cedar Rapids commute less than 10 miles to their place of employment; 10.1% commute 10 to 24 miles and nearly 13% commute more than 50 miles to work in Cedar Rapids.
Inflow/Outflow Table 13 provides a summary of the inflow and outflow of workers in the City of Cedar Rapids. Outflow reflects the number of workers living in the Cedar Rapids but employed outside of the city while inflow measures the number of workers that are employed in Cedar Rapids but live outside. Interior flow reflects the number of workers that both live and work in Cedar Rapids. Cedar Rapids can be considered an importer of workers, as the number of residents coming
into the City (inflow) for employment was more than the number of residents leaving the City for work (outflow). An estimated 60,559 workers came into Cedar Rapids for work while 23,587 workers left, for a net difference of 36,972.

HOUSING CHARACTERISTICS
MAXFIELD RESEARCH AND CONSULTING, LLC 41
The largest proportion of workers in Cedar Rapids, earn more than $3,333 per month, are within the prime working ages of 30 to 54 and are employed in the “other services” indus‐tries.
City Total 23,587 100.0% 60,559 100.0% 37,749 100.0%
By Age
Workers Age 29 or younger 6,578 27.9% 13,961 23.1% 8,564 22.7%
Workers Age 30 to 54 12,600 53.4% 34,319 56.7% 20,993 55.6%
Workers Age 55 or older 4,409 18.7% 12,279 20.3% 8,192 21.7%
By Monthly Wage
Workers Earning $1,250 per month or less 5,035 21.3% 11,657 19.2% 6,888 18.2%
Workers Earning $1,251 to $3,333 per month 8,962 38.0% 18,363 30.3% 12,522 33.2%
Workers Earning More than $3,333 per month 9,590 40.7% 30,539 50.4% 18,339 48.6%
By Industry
Workers in the "Goods Producing" Industry Class 5,061 21.5% 13,248 21.9% 8,263 21.9%
Workers in the "Trade, Transportation, and Utilities" Industry Class 6,112 25.9% 15,073 24.9% 5,918 15.7%
Workers in the "All Other Services" Industry Class 12,414 52.6% 32,238 53.2% 23,568 62.4%
Sources: U.S. Census Bureau, Maxfield Research & Consulting, LLC
Outflow Inflow
TABLE 13
COMMUTING INFLOW/OUTFLOW CHARACTERISTICS
CITY OF CEDAR RAPIDS
2014
Interior Flow

HOUSING CHARACTERISTICS
MAXFIELD RESEARCH AND CONSULTING, LLC 42
Introduction The variety and condition of the housing stock in a community provides the basis for an attrac‐tive living environment. Housing functions as a building block for neighborhoods and goods and services. An analysis of the housing market in Cedar Rapids and the surrounding area was completed by reviewing data on the age of the existing housing supply; updating residential building permits in Cedar Rapids as a whole and by quadrant of the City including the core neighborhoods that comprise the Flood Impact Area, surveys of multifamily properties, analysis of home sales data in the Cedar Rapids area and other information. Residential Construction Trends 2010 through 2016 (September) Maxfield Research obtained data from the City of Cedar Rapids on the number of building permits issued for new housing units in Cedar Rapids from 2010 through September 2016. From this data, Maxfield Research identified the number of new residential units from building permits issued for structures in the Flood Impact Area by quadrant of the City and in the City of Cedar Rapids overall. Table 14 displays permits issued for single‐family homes, town‐homes/twinhomes, condominiums, and multifamily buildings of five or more units. Multifamily buildings typically include larger apartment buildings and some senior housing properties. New construction was also segmented by quadrant (NW, NE, SW and SE) and location in the central core of the City (NW, NE, SW and SE) to see the level of development that has occurred in each sector of the City. The following are key points about housing development since 2010.
Cedar Rapids issued permits for the construction of 498 new residential units in 2010, 374 units in 2011, 316 units in 2012, 541 units in 2013, 449 units in 2014, 456 units in 2015 and 366 units year‐to‐date through September 2016. These figures equate to an average of 439 units per year for the past six full years and 482 units per year over the past three years.
The number of permitted units was highest in 2013, signaling the recovery and because public funds were available to incent builders to construct new housing units. With the de‐crease in additional funding, construction increased for single‐family homes, but decreased for multifamily over the past two years. The vast majority of permits were issued for single‐family homes. A portion of the permits issued have been for townhomes, condominiums and apartments.
The number of new units constructed from permits issued in the Flood Impact Area de‐creased each year from a high in 2011 when 103 units were permitted. However, over the past two years, more new housing units have been constructed in the Flood Impact Area causing the number of permits to rise again. Through September 2016, 98 units have been permitted. New residential development continues to be focused in the SW, but the NE has also had a substantial amount of new development. The breakdown of new units by quad‐rant is also shown on Table 14.

HOUSING CHARACTERISTICS
MAXFIELD RESEARCH AND CONSULTING, LLC 43
Townhome/
Twinhome
2010 333 30 77 58 498
2011 215 32 57 70 374
2012 215 60 41 0 316
2013 236 32 42 231 541
2014 325 28 42 54 449
2015 254 23 35 144 456
2016* 163 32 68 103 366
Total 1,741 237 362 660 3,000
NW SW NE SE Total
2010 119 201 146 32 498
2011 68 118 157 31 374
2012 52 184 74 6 316
2013 165 116 252 8 541
2014 138 162 98 51 449
2015 90 203 93 70 456
2016* 58 120 140 48 366
Total 690 1,104 960 246 3,000
NW SW NE SE Total
2010 20 1 2 56 79
2011 22 6 4 71 103
2012 33 20 3 22 78
2013 33 23 5 3 64
2014 25 42 0 5 72
2015 25 48 0 39 112
2016* 35 27 22 14 98
Total 193 167 36 210 606
* Permits Issued through 09/30/2016
Sources : Ci ty of Cedar Rapids (Bui lding Department); Maxfield Research
TABLE 14
RESIDENTIAL CONSTRUCTION
RESIDENTIAL UNITS FROM BUILDING PERMITS ISSUED
CITY OF CEDAR RAPIDS
Number of New Units by Quadrant
Number of New Units by Quadrant for Central Core
Single‐
Family
2010 through September 2016
Total
Housing
Condo
(4+ Units)
Number of New Housing Units
Multifamily
(5+ units)

HOUSING CHARACTERISTICS
MAXFIELD RESEARCH AND CONSULTING, LLC 44
0
100
200
300
400
500
2010 2011 2012 2013 2014 2015 2016*
# of Units from Permits
Issu
ed
Year
Residential New Construction (Total Units)City of Cedar Rapids
2010 through September 2016
Multifamily (5+ units)
Condo (4+ Units)
Townhome/ Twinhome
Single‐Family Homes
American Community Survey The American Community Survey (“ACS”) is an ongoing statistical survey administered by the U.S. Census Bureau that is sent to approximately 3 million addresses annually. The survey gathers data previously contained only in the long form of the decennial census. As a result, the survey is ongoing and provides a more “up‐to‐date” portrait of demographic, economic, social, and household characteristics every year, not just every ten years. The most recent ACS highlights data collected for a one‐year period (2015), although the most complete data from the ACS is the 2014 five‐year average estimate. Tables 15 through 20 show key data for Cedar Rapids. Tables 18 and 19 show data that was compiled by ESRI, a national demographics forecasting company, but was derived from American Community Survey tabulations.

HOUSING CHARACTERISTICS
MAXFIELD RESEARCH AND CONSULTING, LLC 45
Cost Burden Tables 15 and 16 show the numbers of renters and homeowners, respectively, that are esti‐mated to be cost‐burdened in Cedar Rapids. This information can assist in assessing the poten‐tial demand for additional affordable housing depending on the number and proportion of households that currently pay more than 30% of their household income for housing costs.
% of Income on Rent Total Percent
Less than 10% 760 4.7%
10% to 14.9% 1,607 9.9%
15% to 19.9% 2,299 14.1%
20% to 24.9% 2,026 12.4%
25% to 29.9% 2,008 12.3%
30% to 34.9% 1,528 9.4%
35% to 39.9% 789 4.8%
40% to 49.9% 1,151 7.1%
50% or more 3,424 21.0%
Not Computed 714 4.4%
Total 16,306 100.0%
Sources: American Community Survey
Maxfield Research and Consulting LLC
Renter Households
TABLE 15
RENTER COST BURDEN
CITY OF CEDAR RAPIDS
2014
Table 15 shows that 21.0% of all renter households or 3,424 households in Cedar Rapids are severely cost‐burdened, meaning they pay 50% or more of their household income on housing. Another 11.9% are moderately cost‐burdened meaning they pay between 35% and 49.9% of their incomes on housing costs. Among all renter households, 33% in Cedar Rapids are consid‐ered cost‐burdened, a slight increase from 2013 figures. Table 16 shows owner households that are cost‐burdened in Cedar Rapids. Fewer owner households are cost‐burdened as household income rises. With household incomes that are equal to or less than $35,000, much higher proportions of households are cost‐burdened or pay 30% or more of their income on housing costs, 11.9%. For households that earn incomes of $75,000 or higher, only 0.3% of households were identified as cost‐burdened. Compared to renter households, owner households have a lower overall proportion of house‐holds that are cost‐burdened. The total proportion of owner households that is cost‐burdened was identified as 19.4% versus 33% for renter households.
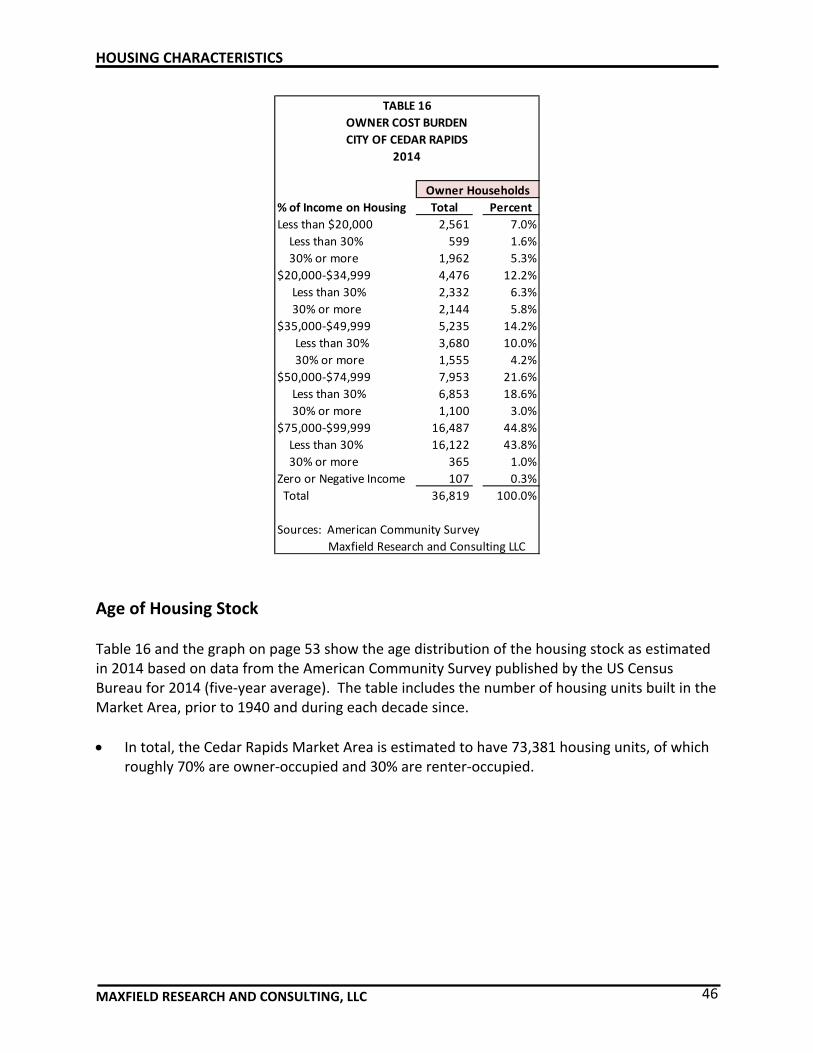
HOUSING CHARACTERISTICS
MAXFIELD RESEARCH AND CONSULTING, LLC 46
% of Income on Housing Total Percent
Less than $20,000 2,561 7.0%
Less than 30% 599 1.6%
30% or more 1,962 5.3%
$20,000‐$34,999 4,476 12.2%
Less than 30% 2,332 6.3%
30% or more 2,144 5.8%
$35,000‐$49,999 5,235 14.2%
Less than 30% 3,680 10.0%
30% or more 1,555 4.2%
$50,000‐$74,999 7,953 21.6%
Less than 30% 6,853 18.6%
30% or more 1,100 3.0%
$75,000‐$99,999 16,487 44.8%
Less than 30% 16,122 43.8%
30% or more 365 1.0%
Zero or Negative Income 107 0.3%
Total 36,819 100.0%
Sources: American Community Survey
Maxfield Research and Consulting LLC
TABLE 16
OWNER COST BURDEN
CITY OF CEDAR RAPIDS
2014
Owner Households
Age of Housing Stock Table 16 and the graph on page 53 show the age distribution of the housing stock as estimated in 2014 based on data from the American Community Survey published by the US Census Bureau for 2014 (five‐year average). The table includes the number of housing units built in the Market Area, prior to 1940 and during each decade since.
In total, the Cedar Rapids Market Area is estimated to have 73,381 housing units, of which roughly 70% are owner‐occupied and 30% are renter‐occupied.
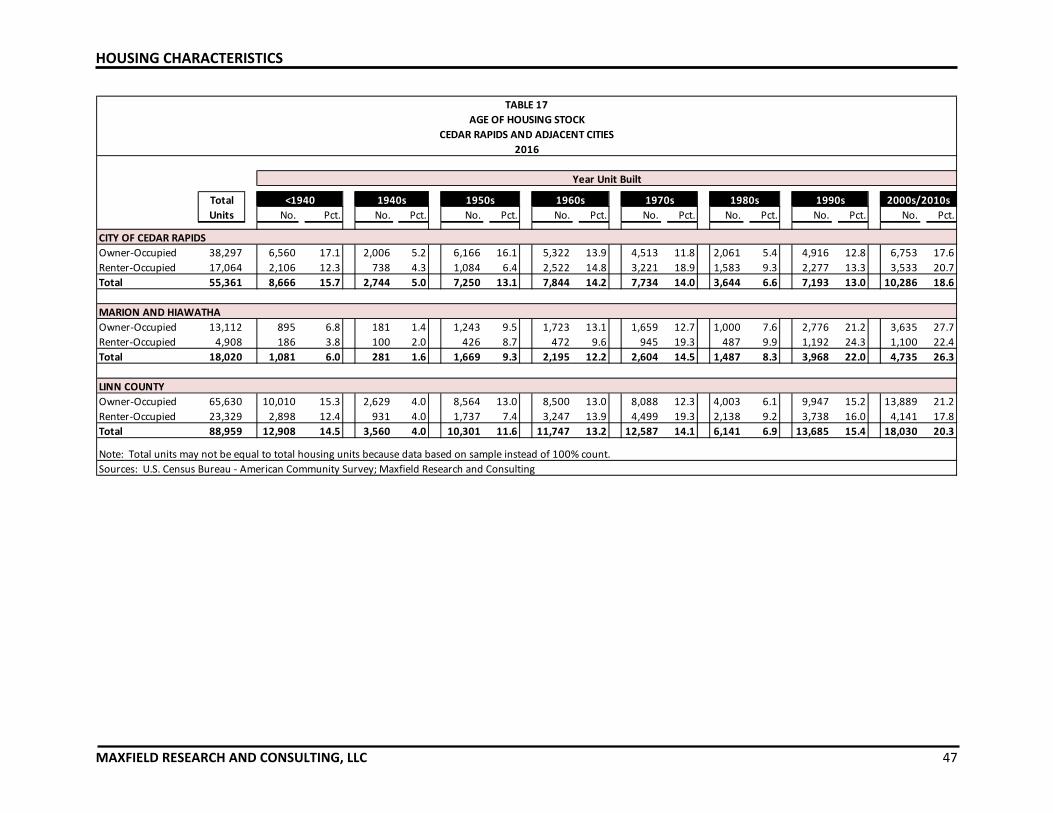
HOUSING CHARACTERISTICS
MAXFIELD RESEARCH AND CONSULTING, LLC 47
Total
Units No. Pct. No. Pct. No. Pct. No. Pct. No. Pct. No. Pct. No. Pct. No. Pct.
Owner‐Occupied 38,297 6,560 17.1 2,006 5.2 6,166 16.1 5,322 13.9 4,513 11.8 2,061 5.4 4,916 12.8 6,753 17.6
Renter‐Occupied 17,064 2,106 12.3 738 4.3 1,084 6.4 2,522 14.8 3,221 18.9 1,583 9.3 2,277 13.3 3,533 20.7
Total 55,361 8,666 15.7 2,744 5.0 7,250 13.1 7,844 14.2 7,734 14.0 3,644 6.6 7,193 13.0 10,286 18.6
Owner‐Occupied 13,112 895 6.8 181 1.4 1,243 9.5 1,723 13.1 1,659 12.7 1,000 7.6 2,776 21.2 3,635 27.7
Renter‐Occupied 4,908 186 3.8 100 2.0 426 8.7 472 9.6 945 19.3 487 9.9 1,192 24.3 1,100 22.4
Total 18,020 1,081 6.0 281 1.6 1,669 9.3 2,195 12.2 2,604 14.5 1,487 8.3 3,968 22.0 4,735 26.3
Owner‐Occupied 65,630 10,010 15.3 2,629 4.0 8,564 13.0 8,500 13.0 8,088 12.3 4,003 6.1 9,947 15.2 13,889 21.2
Renter‐Occupied 23,329 2,898 12.4 931 4.0 1,737 7.4 3,247 13.9 4,499 19.3 2,138 9.2 3,738 16.0 4,141 17.8
Total 88,959 12,908 14.5 3,560 4.0 10,301 11.6 11,747 13.2 12,587 14.1 6,141 6.9 13,685 15.4 18,030 20.3
Sources: U.S. Census Bureau ‐ American Community Survey; Maxfield Research and Consulting
1980s<1940 1940s
LINN COUNTY
CITY OF CEDAR RAPIDS
MARION AND HIAWATHA
1990s
Note: Total units may not be equal to total housing units because data based on sample instead of 100% count.
TABLE 17
AGE OF HOUSING STOCK
CEDAR RAPIDS AND ADJACENT CITIES
2016
1950s 1960s 2000s/2010s
Year Unit Built
1970s

HOUSING CHARACTERISTICS
MAXFIELD RESEARCH AND CONSULTING, LLC 48
0
1,000
2,000
3,000
4,000
5,000
6,000
7,000
8,000
9,000
10,000
11,000
<1940s 1940s 1950s 1960s 1970s 1980s 1990s 2000s/2010s
Housing Units Built by DecadeCity of Cedar Rapids and Adjacent Cities
2016
City of Cedar Rapids Marion and Hiawatha
Homes in Marion and Hiawatha are newer than homes in Cedar Rapids. The highest number of homes in Cedar Rapids was built in 1940s or earlier compared to the 2000s for Marion and Hiawatha. The least number of homes was built in the 1940s and in the 1980s. These were periods of economic turmoil in the United States with WWII in the 1940s and a Recession in the early 1980s.
Proportionally, an estimated 13% of housing units were built prior to the 1940s while 14% were built in the 1960s and 12% were built during the 1950s. Approximately 21.4% of housing units in Cedar Rapids were built in the 2000s or later. More housing units have been built to replace units that were removed in the core neighborhoods as a result of the 2008 flood.
Housing Units by Structure and Occupancy or (Housing Stock by Structure Type) Table 18 shows the estimated housing stock in Cedar Rapids by type of structure and tenure estimated as of 2016.
The dominant housing type in Cedar Rapids and in the adjacent communities remains the single‐family detached home, representing 83% of all owner‐occupied housing units in the Metropolitan Area as of 2016. In Cedar Rapids, the single‐family detached home accounts for an estimated 85% of all owner‐occupied units.

HOUSING CHARACTERISTICS
MAXFIELD RESEARCH AND CONSULTING, LLC 49
Housing units with 50 or more units are predominantly renter‐occupied but not entirely. Approximately 2.1% of housing units in the Metro Area have 50 or more units. In Cedar Rapids, there is a high proportion of rentals where there are many buildings at a single property, but all of the buildings have 24 units or fewer in each of the buildings. This is prevalent in Cedar Rapids and in the surrounding area.
Mobile homes account for 4.5% of all housing units in the Metro Area, but nearly 8% of the homes in Marion and Hiawatha combined.
Owner‐ Renter‐ Owner‐ Renter‐ Owner‐ Renter‐
Units in Structure Occupied Pct. Occupied Pct. Occupied Pct. Occupied Pct. Occupied Pct. Occupied Pct.
1, detached 32,495 84.9% 3,843 22.6% 10,201 77.7% 578 12% 42,696 83.0% 4,421 20.2%
1, attached 2,013 5.3% 310 1.8% 1,331 10.1% 261 5% 3,344 6.5% 571 2.6%
2 305 0.8% 809 4.8% 84 0.6% 149 3% 389 0.8% 958 4.4%
3 to 4 704 1.8% 1,720 10.1% 156 1.2% 873 18% 860 1.7% 2,593 11.9%
5 to 9 328 0.9% 2,763 16.3% 33 0.3% 799 16% 361 0.7% 3,562 16.3%
10 to 19 564 1.5% 4,189 24.7% 35 0.3% 928 19% 599 1.2% 5,117 23.4%
20 to 49 216 0.6% 2,114 12.4% 62 0.5% 881 18% 278 0.5% 2,995 13.7%
50 or more 238 0.6% 1,006 5.9% 0 0.0% 261 5% 238 0.5% 1,267 5.8%
Mobile home 1,425 3.7% 239 1.4% 1,234 9.4% 153 3% 2,659 5.2% 392 1.8%
Boat, RV, van, etc. 0 0.0% 0 0.0% 0 0.0% 0 0% 0 0.0% 0 0.0%
Total 38,288 100% 16,993 100% 13,136 100% 4,883 100% 51,424 100% 21,876 100%
Sources: U.S. Census Bureau ‐ American Community Survey; Maxfield Research and Consulting, LLC
CEDAR RAPIDS METRO AREA TOTALMARION AND HIAWATHA
TABLE 18
HOUSING UNITS BY STRUCTURE & TENURE
CITY OF CEDAR RAPIDS AND ADJACENT COMMUNITIES
2016
Owner‐Occupied Housing Units by Value Table 19 presents data on housing values summarized by nine price ranges. Housing value refers to the estimated sales price of the property if it was sold. For single‐family and town‐home properties, value includes the land and the structure. For condominium units, value refers to only the unit.
The majority of the owner‐occupied housing stock in Cedar Rapids is estimated to be valued between $100,000 and $149,999 (36.7%).
The median owner‐occupied home in Cedar Rapids is estimated at $133,900, or $3,900 less than the median for Marion and Hiawatha combined ($137,800). Overall, Marion and Hia‐watha have newer housing stocks so it is likely that homes in those areas would be valued moderately higher than in Cedar Rapids. However, Cedar Rapids has a lower proportion of homes valued at Less than $50,000 (about 6.2% versus 11.8% for Marion and Hiawatha).

HOUSING CHARACTERISTICS
MAXFIELD RESEARCH AND CONSULTING, LLC 50
Home Value No. Pct. No. Pct. Pct. Pct.
Less than $50,000 2,194 6.0 1,511 11.8 3,235 5.1$50,000‐$99,999 6,960 18.9 1,208 9.4 9,557 15.2$100,000‐$149,999 13,297 36.1 3,998 31.1 19,788 31.5
$150,000‐$199,999 6,961 18.9 2,840 22.1 12,900 20.5
$200,000‐$299,999 5,243 14.2 2,379 18.5 11,459 18.2
$300,000‐$499,999 1,789 4.9 807 6.3 4,660 7.4
Greater than $500,000 375 1.0 105 0.8 1,281 2.0
Total 36,819 100.0 12,848 100.0 62,880 100.0
Median Home Value
Sources: U.S. Census Bureau ‐ American Community Survey; Maxfield Research Inc.
TABLE 19
OWNER‐OCCUPIED UNITS BY VALUE
CEDAR RAPIDS AND ADJACENT COMMUNITIES
2016
$134,600 $145,700$144,100
LINN COUNTYMARION/HIAWATHACEDAR RAPIDS
0
2,000
4,000
6,000
8,000
10,000
12,000
14,000
< $50K $50K‐$99.9K $100K‐
$149.9K
$150K‐
$199.9K
$200K‐
$249.9K
$300K‐
$399.9K
>$500K
Units
Home Value
Owner‐Occupied Units by Value
City of Cedar Rapids and Adjacent Communities2016
City of Cedar Rapids
Adjacent Communities

RENTAL MARKET ANALYSIS
MAXFIELD RESEARCH AND CONSULTING, LLC 51
Introduction Maxfield Research surveyed larger rental properties of 12 or more units in Cedar Rapids, Marion and Hiawatha. Information was gathered on year built, total number of units, unit mix, size of units by unit type, current rents and vacancies. General occupancy properties were segmented by market rate (private market units, no income restrictions), shallow‐subsidy (fixed rent, typically financed through Low Income Housing Tax Credits) to households earning be‐tween 40% and 60% of Area Median Household Income (AMHI) and deep‐subsidy (households pay 30% of their adjusted gross income toward the monthly rent), which typically receive project‐based housing assistance payments that remain with the housing unit (i.e. Section 8). A separate section of the report discusses senior properties, which are age‐restricted. The analysis of senior properties is included in the Senior Housing Analysis section of this report.
General‐Occupancy Rental Projects Market Rate The analysis of Cedar Rapids’ general occupancy rental market includes a survey of more than 66 market rate apartment properties (4 units and larger) in September and October 2016. These projects represent a combined total of 7,558 units. At the time of the survey, 145 market rate units were vacant, resulting in an overall vacancy rate of 2.3% for market rate units, which excludes properties that are in their initial lease‐up periods. The overall market rate vacancy rate of 2.3% remains lower than the industry standard of 5% vacancy for a stabilized rental market, which promotes competitive rates, ensures ade‐quate choice, and allows for unit turnover. Table 20 summarizes the unit mix, sizes and rents for the market rate projects. Market Rate
The newest market rate rentals available in Cedar Rapids include several properties located in the Downtown area. There are a total of nine properties that opened in late 2015 and during 2016 and are currently leasing units. Some properties are already fully leased. The following properties include some income‐restricted units; nearly all properties that have been developed in the Downtown core have received some type of assistance, either histor‐ic tax credits, low‐income housing tax credits, or local assistance.

RENTAL MARKET ANALYSIS
MAXFIELD RESEARCH AND CONSULTING, LLC 52
Properties included in the rental survey were built from 1951 to 2016. Many properties were built in the 1990s and 2000s (47% of the total). The median year built of properties surveyed is 1994. About 40% of the market rate units surveyed were constructed in 2000 or later.
A total of 149 vacancies were found, resulting in a vacancy rate of 2.3% as of October 2016. This compares to a vacancy rate of 2.4% in the September 2015 survey.
Avg. Rent/
Unit Type # of Units Avg. Size Avg. Rent Sq. Ft.
Studio 68 444 $454 $1.02
1BR 2,338 529 $513 $0.97
2BR 3,859 762 $612 $0.80
3BR 168 1,123 $980 $0.87
4BR 0 0 0 $0.00
Total 6,433 690 $583 $0.84
Source: Maxfield Research and Consulting, LLC
TABLE 20
SUMMARY OF MARKET RATE PROPERTIES IN SURVEY
CEDAR RAPIDS/MARION/HIAWATHA
September/October 2016
0
5
10
15
20
25
30
35
0
500
1,000
1,500
2,000
2,500
3,000
Up to 1980 1980 to 1999 2000 or later
Number of Properties
Number of Units
Number of Market Rate Units by Year BuiltCedar Rapids, Marion and Hiawatha
October 2016
# of Properties # of Units
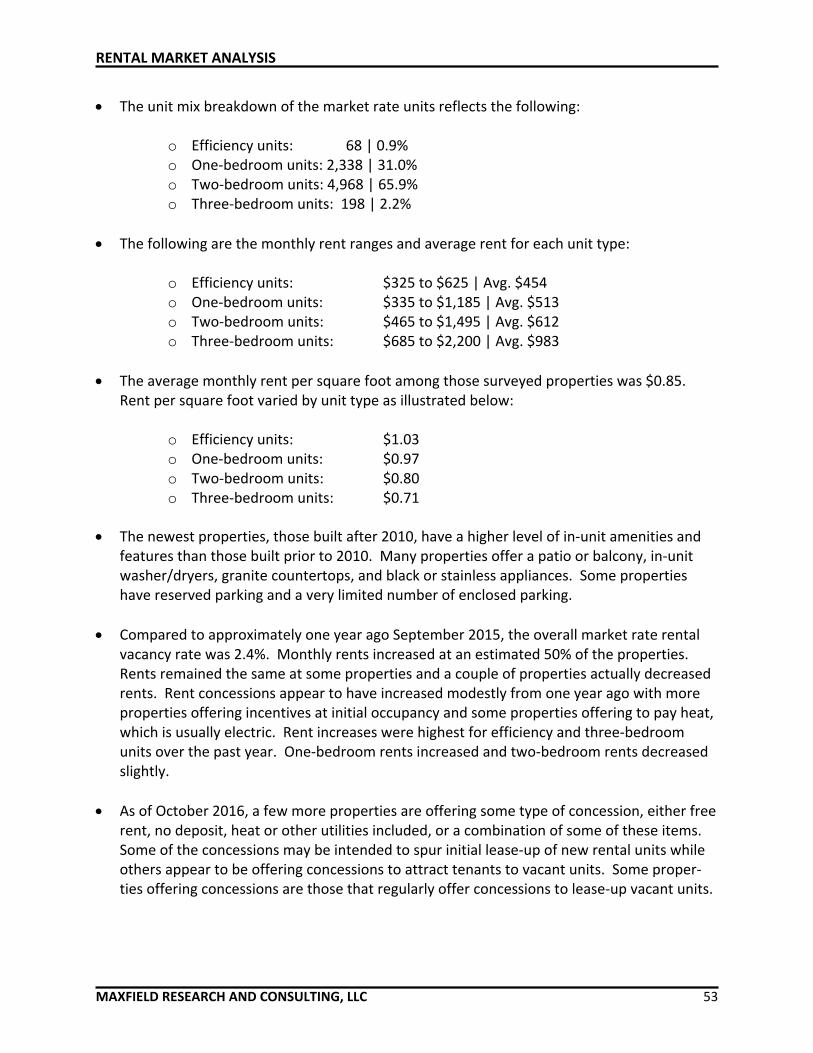
RENTAL MARKET ANALYSIS
MAXFIELD RESEARCH AND CONSULTING, LLC 53
The unit mix breakdown of the market rate units reflects the following:
o Efficiency units: 68 | 0.9% o One‐bedroom units: 2,338 | 31.0% o Two‐bedroom units: 4,968 | 65.9% o Three‐bedroom units: 198 | 2.2%
The following are the monthly rent ranges and average rent for each unit type:
o Efficiency units: $325 to $625 | Avg. $454 o One‐bedroom units: $335 to $1,185 | Avg. $513 o Two‐bedroom units: $465 to $1,495 | Avg. $612 o Three‐bedroom units: $685 to $2,200 | Avg. $983
The average monthly rent per square foot among those surveyed properties was $0.85. Rent per square foot varied by unit type as illustrated below:
o Efficiency units: $1.03 o One‐bedroom units: $0.97 o Two‐bedroom units: $0.80 o Three‐bedroom units: $0.71
The newest properties, those built after 2010, have a higher level of in‐unit amenities and
features than those built prior to 2010. Many properties offer a patio or balcony, in‐unit washer/dryers, granite countertops, and black or stainless appliances. Some properties have reserved parking and a very limited number of enclosed parking.
Compared to approximately one year ago September 2015, the overall market rate rental vacancy rate was 2.4%. Monthly rents increased at an estimated 50% of the properties. Rents remained the same at some properties and a couple of properties actually decreased rents. Rent concessions appear to have increased modestly from one year ago with more properties offering incentives at initial occupancy and some properties offering to pay heat, which is usually electric. Rent increases were highest for efficiency and three‐bedroom units over the past year. One‐bedroom rents increased and two‐bedroom rents decreased slightly.
As of October 2016, a few more properties are offering some type of concession, either free rent, no deposit, heat or other utilities included, or a combination of some of these items. Some of the concessions may be intended to spur initial lease‐up of new rental units while others appear to be offering concessions to attract tenants to vacant units. Some proper‐ties offering concessions are those that regularly offer concessions to lease‐up vacant units.
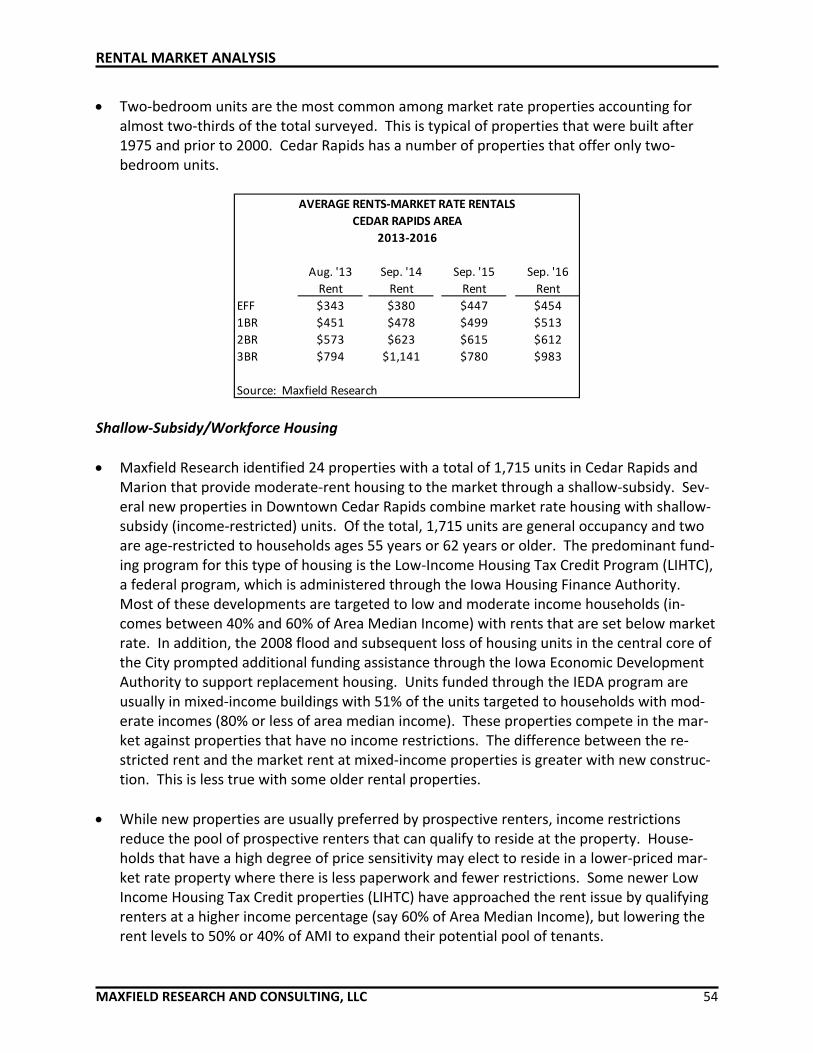
RENTAL MARKET ANALYSIS
MAXFIELD RESEARCH AND CONSULTING, LLC 54
Two‐bedroom units are the most common among market rate properties accounting for almost two‐thirds of the total surveyed. This is typical of properties that were built after 1975 and prior to 2000. Cedar Rapids has a number of properties that offer only two‐bedroom units.
Aug. '13 Sep. '14 Sep. '15 Sep. '16
Rent Rent Rent Rent
EFF $343 $380 $447 $454
1BR $451 $478 $499 $513
2BR $573 $623 $615 $612
3BR $794 $1,141 $780 $983
Source: Maxfield Research
AVERAGE RENTS‐MARKET RATE RENTALS
CEDAR RAPIDS AREA
2013‐2016
Shallow‐Subsidy/Workforce Housing
Maxfield Research identified 24 properties with a total of 1,715 units in Cedar Rapids and Marion that provide moderate‐rent housing to the market through a shallow‐subsidy. Sev‐eral new properties in Downtown Cedar Rapids combine market rate housing with shallow‐subsidy (income‐restricted) units. Of the total, 1,715 units are general occupancy and two are age‐restricted to households ages 55 years or 62 years or older. The predominant fund‐ing program for this type of housing is the Low‐Income Housing Tax Credit Program (LIHTC), a federal program, which is administered through the Iowa Housing Finance Authority. Most of these developments are targeted to low and moderate income households (in‐comes between 40% and 60% of Area Median Income) with rents that are set below market rate. In addition, the 2008 flood and subsequent loss of housing units in the central core of the City prompted additional funding assistance through the Iowa Economic Development Authority to support replacement housing. Units funded through the IEDA program are usually in mixed‐income buildings with 51% of the units targeted to households with mod‐erate incomes (80% or less of area median income). These properties compete in the mar‐ket against properties that have no income restrictions. The difference between the re‐stricted rent and the market rent at mixed‐income properties is greater with new construc‐tion. This is less true with some older rental properties.
While new properties are usually preferred by prospective renters, income restrictions reduce the pool of prospective renters that can qualify to reside at the property. House‐holds that have a high degree of price sensitivity may elect to reside in a lower‐priced mar‐ket rate property where there is less paperwork and fewer restrictions. Some newer Low Income Housing Tax Credit properties (LIHTC) have approached the rent issue by qualifying renters at a higher income percentage (say 60% of Area Median Income), but lowering the rent levels to 50% or 40% of AMI to expand their potential pool of tenants.

RENTAL MARKET ANALYSIS
MAXFIELD RESEARCH AND CONSULTING, LLC 55
Table 21 shows a summary of rental units with a shallow subsidy by unit type with average rents, average sizes and the proportion of units surveyed of a particular unit type. As shown on the table, the average rent for these properties was $642 per month with an average unit size of 860 square feet, or an average rent per square foot of $.75. The highest propor‐tions of units are two‐ and three‐bedroom units with 48% and 30%, respectively of the to‐tal. As of the survey, the overall vacancy rate was 2.5% with 43 units vacant. The estimated current vacancy rate is below the 5% level considered to be market equilibrium where the market would be in balance between supply and demand. With a level below the 5% rate, there appears to be some pent‐up demand for additional shallow‐subsidy units. As men‐tioned previously, there is typically some overlap between market rate rental units with low rent levels (naturally occurring affordable housing) and shallow‐subsidy (income‐restricted) rental housing in Cedar Rapids.
Unit Type No. of Units % of Units Avg. Rent Avg. SF Avg. R/SF
EFF 39 2.8% $380 429 $0.89
1BR 325 16.6% $557 670 $0.83
2BR 744 48.0% $634 846 $0.75
3BR 330 30.3% $772 1,172 $0.66
4BR 24 2.4% $881 1,329 $0.66
TOTAL 1,462 100.0% $645 877 $0.74
Sources: Iowa Housing Authority; Maxfield Research and Consulting, LLC
TABLE 21
RENT SUMMARY FOR SHALLOW‐SUBSIDY UNITS
CEDAR RAPIDS/MARION
September 2016
0
2
4
6
8
10
12
14
16
18
0
100
200
300
400
500
600
700
800
900
Up to 1980 1980‐2000 2000 or later
Number of Properties
Number of Units
Number of General Occupancy Shallow‐Subsidy Units
and Properties by Year BuiltCity of Cedar Rapids
September 2016
RENTAL MARKET ANALYSIS
MAXFIELD RESEARCH AND CONSULTING, LLC 56
Only one of the 25 properties was built prior to 1980, seven of the properties were built between 1990 and 2000 and the remaining 17 (65%) were built in 2000 or later.
The newest shallow‐subsidy developments are Kingston Village, Kingston Pointe, Village West and Breyer Street Apartments. Kingston Village is a mixed income (LIHTC) develop‐ment while Village West, Kingston Pointe and Breyer Street are part of the Multifamily New Construction Program where 51% of the units must be rented to households at or below 80% of the Area Median Income. These properties did not receive historic tax credits. King‐ston Village and Breyer Street Apartments have reached stabilized occupancy. Kingston Pointe is under construction. Several other properties are under construction that are part of the Multifamily New Construction Program including Center Point, Creekside and Corner‐stone Place. Cornerstone Place is receiving historic tax credits. Many of the newer rental properties that are located in neighborhoods in the Downtown core have received some type of assistance to encourage residency in the Downtown.
New construction rental and owner‐occupied units are currently under construction in Cedar Rapids in the Flood Impact area. These new properties, several of which have re‐ceived either low‐income or historic tax credit assistance provide more amenities and up‐scale unit finishes. Rents at these properties are targeted to households usually earning be‐tween 40% and 80% of the Area Median Income. Amenities include central heat and air, high ceilings, kitchen islands, dishwasher with garbage disposal, reserved and secure park‐ing, among other amenities.
Table 22 below shows the maximum allowable incomes by household size to qualify for the shallow‐subsidy program along with the maximum gross rents that can be charged by bed‐room size in Linn County. These income qualifications are utilized for housing develop‐ments that are financed through the Section 42 or Low‐Income Housing Tax Credit Program (LIHTC).

RENTAL MARKET ANALYSIS
MAXFIELD RESEARCH AND CONSULTING, LLC 57
1 phh 2 phh 3 phh 4 phh 5phh 6phh
30% of median $17,610 $20,130 $22,650 $25,140 $27,180 $29,190
40% of median $23,480 $26,840 $30,200 $33,520 $36,240 $38,920
50% of median $29,350 $33,550 $37,750 $41,900 $45,300 $48,650
60% of median $35,220 $40,260 $45,300 $50,280 $54,360 $58,380
0 BR 1BR 2BR 3BR 4BR
30% of median $440 $471 $566 $654 $729
40% of median $587 $629 $755 $872 $973
50% of median $733 $786 $943 $1,090 $1,216
60% of median $880 $943 $1,132 $1,308 $1,459
Source: Iowa Housing Finance Authority
TABLE 22
2016 IOWA HOUSING FINANCE INCOME LIMITS
LINN COUNTY
Income Limits by Houshold Size
Maximum Gross Rents by Bedroom Size
Deep‐Subsidy Housing/Project‐Based Assistance The US Housing and Redevelopment Authority (HUD) administers and supports the Section 8 housing program. This program was originally developed by HUD and substantial numbers of buildings were constructed in the 1960s and 1970s. HUD eventually transitioned the project‐based Section 8 program to a portable voucher system where the housing subsidy stays with the household and not with the unit. Maxfield Research identified three family housing properties in Cedar Rapids that have project‐based subsidies. These developments are shown on Table 24. There are a total of 318 units among three projects with no vacancies. Typically, vacant units in these types of properties reflect usual turnover of units and the additional time required to qualify and move a new tenant into the unit. Residents pay 30% of their adjusted gross income for rent based on household size and incomes are restricted to a maximum of 50% of the Area Median Income adjusted for family size. The unit mix among these three properties is skewed toward smaller size units. Usually, there is a greater need for larger size unit types such as three‐bedroom and four‐bedroom units, but the survey identified very few of these under this program.

RENTAL MARKET ANALYSIS
MAXFIELD RESEARCH AND CONSULTING, LLC 58
Project Name/Location Year Built No. Vacant Monthly Rent
Glenbrook Apartments 1981 100 56 ‐ 1BR 0 30% of AGI
4815 1st Avenue SW 4 ‐ 2BR 0 30% of AGI
20 ‐ 3BR 0 30% of AGI
20 ‐ 4BR 0 30% of AGI
Hawthorne Hills 1969 202 120 ‐ EFF 0 30% of AGI
2247 C Street SW 32 ‐ 1BR 0 30% of AGI
32 ‐ 2BR 0 30% of AGI
18 ‐ 3BR 0 30% of AGI
Oak Park Village 1982 16 12 ‐ 2BR 0 30% of AGI
1350 15th Street SE 4 ‐ 3BR 0 30% of AGI
Total 318 0
Vacancy Rate 0.00%
Sources: City of Cedar Rapids; Maxfield Research and Consulting, LLC
Mix
TABLE 23
DEEP‐SUBSIDY GENERAL OCCUPANCY RENTAL HOUSING
CITY OF CEDAR RAPIDS
September 2016
Units
Deep‐Subsidy Housing Assistance Program (Choice Vouchers) The City of Cedar Rapids administers a “tenant‐based” subsidy called the Housing Choice Voucher Program that assists low‐income households in finding affordable housing in the private market. The tenant‐based subsidy is funded by the Department of Housing and Urban Development’s (HUD). Under the Housing Choice Voucher program (formerly Section 8 Certifi‐cates and Vouchers) qualified households are issued a voucher that the household can take to an apartment in the private market. The amount of the rental assistance that is provided to the household is based on the household’s adjusted gross income and the maximum fair market rent level that has been identified by HUD. The household’s contribution to the monthly rental amount is 30% of their adjusted gross income for rent and utilities. Applicants in the City of Cedar Rapids may be eligible for the program if their income is below the current limits shown on Table 24, which are set by HUD annually As of 2016, the Cedar Rapids Housing Department serves a total of 1,110 families in the Hous‐ing Choice Voucher Program. Although there is a maximum available limit of 1,265, funding to the program has been reduced, thereby limiting the number of families that can be served. The program keeps a waiting list, which was closed in November 2016 with 1,300 applicant families. The Housing Department plans to open the wait list for vouchers within the next two years. There are 49 vouchers ported into the City, of which 20 are VASH vouchers (used by Veterans) and are funded by the Iowa City Housing Authority. A total of 42 vouchers have ported out of the City and 11 of those were not absorbed and are included in the Cedar Rapids program. The waiting list opened sooner than was originally anticipated one year ago and annual turnover has risen modestly.

RENTAL MARKET ANALYSIS
MAXFIELD RESEARCH AND CONSULTING, LLC 59
1PP 2PP 3PP 4PP 5PP 6PP 7PP 8PP
30% of HAMFI $16,000 $18,300 $20,600 $24,300 $28,440 $32,580 $36,730 $40,890
50% of HAMFI $26,700 $30,500 $34,300 $38,100 $41,150 $44,200 $47,250 $50,300
80% of HAMFI $42,700 $48,800 $54,900 $60,950 $65,850 $70,750 $75,600 $80,500
2017 0BR 1BR 2BR 3BR 4BR
Fair Market Rents $485 $575 $764 $1,088 $1,168
Source: Dept. of Housing and Urban Development
TABLE 24
HUD INCOME LIMITS
CEDAR RAPIDS
2016
Pending Rental Developments Maxfield Research obtained information on pending and planned rental developments in Cedar Rapids. As of September 2016, there are 11 rental developments either under construction or planned in Cedar Rapids. Most of these properties are located in the Downtown core. Cedar Rapids‐Outside of Downtown Creekside Apartments has a total of 30 units and is under construction in Northeast Cedar Rapids at 1427 Center Point Road NE. The property will offer one‐ and two‐bedroom units. A second property adjacent, Center Point, also has 30 units and is under construction at 1415 Center Point Road NE. Crestwood Ridge, by Common Bond Communities was approved for development and will feature four market rate units, 36 shallow‐subsidy units affordable to households with incomes at 60% or less of AMI and five units of supportive housing for long‐term homeless. Monthly rents for the assisted units are projected to range from $453 to $950 per month. Construction is anticipated to begin Spring 2017 with occupancy by Spring 2018. Monroe School, located at 3200 Pioneer Avenue SE will be converted to 43 units of affordable rental housing. Tax credits were awarded for this development.

RENTAL MARKET ANALYSIS
MAXFIELD RESEARCH AND CONSULTING, LLC 60
Cedar Rapids – Downtown Core General Occupancy Market Rate Properties The Metropolitan is under construction at 450 1st Street SW. The property features a total of 27 rental units including studio, one‐ and two‐bedroom apartments. Unit sizes range from 598 to 993 square feet and will rent from $840 to $1,390 per month. The property includes 6 studios, 12, one‐bedroom and 4, two‐bedroom units. The Depot is under construction behind the NewBo market in the Downtown. The property features studio, one‐ and two‐bedroom units and a portion of the units will be made available to households with moderate incomes. Rent levels will range from $550 to $1,000 square feet. Smulekoff Building is under construction to be converted to rental apartments. The property will feature 32, studio, one‐ and two‐bedroom units. Unit sizes are proposed to range from 472 to 885 square feet with rents of between $400 and $500 per month. Kingston Pointe is located at 210 5th Street SW and will be income‐restricted. The building is under construction and will feature two‐bedroom and three‐bedroom units. Unit sizes are proposed to range from 1,044 to 2,485 square feet with rents ranging from $848 to $1,047 per month. Kingston Landing is under construction and located at 346 2nd Avenue SW. The building features a mix of studio to two‐bedroom units with unit sizes ranging from 756 to 1,512 square feet and rent levels that will range from $810 to $1,080 per month. Cornerstone Place is located at 323 3rd Street SE and will feature 32 residential units with first floor commercial space. Rental units would be located on floors 2 and above and include studio to three‐bedroom units. Building is currently listed as under construction. Unit square footag‐es are proposed to range from 602 to 1,835 square feet with rents proposed to range from $672 to $1,394 per month. Village West Apartments and Shops has received approval from the City and is located at 100 16th Avenue SW. Village West will feature one‐ and two‐bedroom apartments ranging in size from 725 to 1,000 square feet with rents proposed at between $720 to $950 per month. Construction will likely begin in 2017. 6th Street Commons received approval from the City and is likely to start construction sometime Spring 2017. The property is located at 5th Avenue and 6th Street Southwest. Unit sizes will range from 650 to 1,000 square feet. Rent levels for the property have not yet been deter‐mined. Shamrock Villages, located on 2nd Avenue SW is under construction and planned to have ten rental units.
SENIOR HOUSING ANALYSIS
MAXFIELD RESEARCH AND CONSULTING, LLC 61
Senior Housing Defined The term “senior housing” refers to any housing development that is restricted to people age 55 or older. Today, senior housing includes an entire spectrum of housing alternatives, which occasionally overlap, thus making the differences somewhat ambiguous. However, the level of support services offered best distinguishes them. Maxfield Research Inc. classifies senior housing projects into five categories based on the level of support services offered: Adult/Few Services; where few, if any, support services are provided, and rents tend to be modest as a result; Congregate/Optional‐Services; where support services such as meals and light housekeeping are available for an additional fee; Congregate/Service‐Intensive; where support services such as meals and light housekeeping are included in the monthly rents; Assisted Living; where two or three daily meals as well as basic support services such as trans‐portation, housekeeping and/or linen changes are included in the fees. Personal care services such as assistance with bathing, grooming and dressing is included in the fees or is available either for an additional fee or included in the rents. Memory Care; where more rigorous and service‐intensive personal care is required for people with dementia and Alzheimer’s disease. Typically, support services and meal plans are similar to those found at assisted living facilities, but the heightened levels of personalized care de‐mand more staffing and higher rental fees. These five senior housing products tend to share several characteristics. First, they usually offer individual living apartments with living areas, bathrooms, and kitchens or kitchenettes. Second, they generally have an emergency response system with pull‐cords or pendants to promote security. Third, they often have a community room and other common space to encourage socialization. Finally, they are age‐restricted and offer conveniences desired by seniors, alt‐hough assisted living projects sometimes serve non‐elderly people with special health consider‐ations. The five senior housing products offered today form a continuum of care (see Figure 1 on the following page), from a low level to a fairly intensive one; often the service offerings at one type overlap with those at another. In general, however, adult/few services projects tend to attract younger, more independent seniors, while assisted living and memory care projects tend to attract older, frailer seniors.
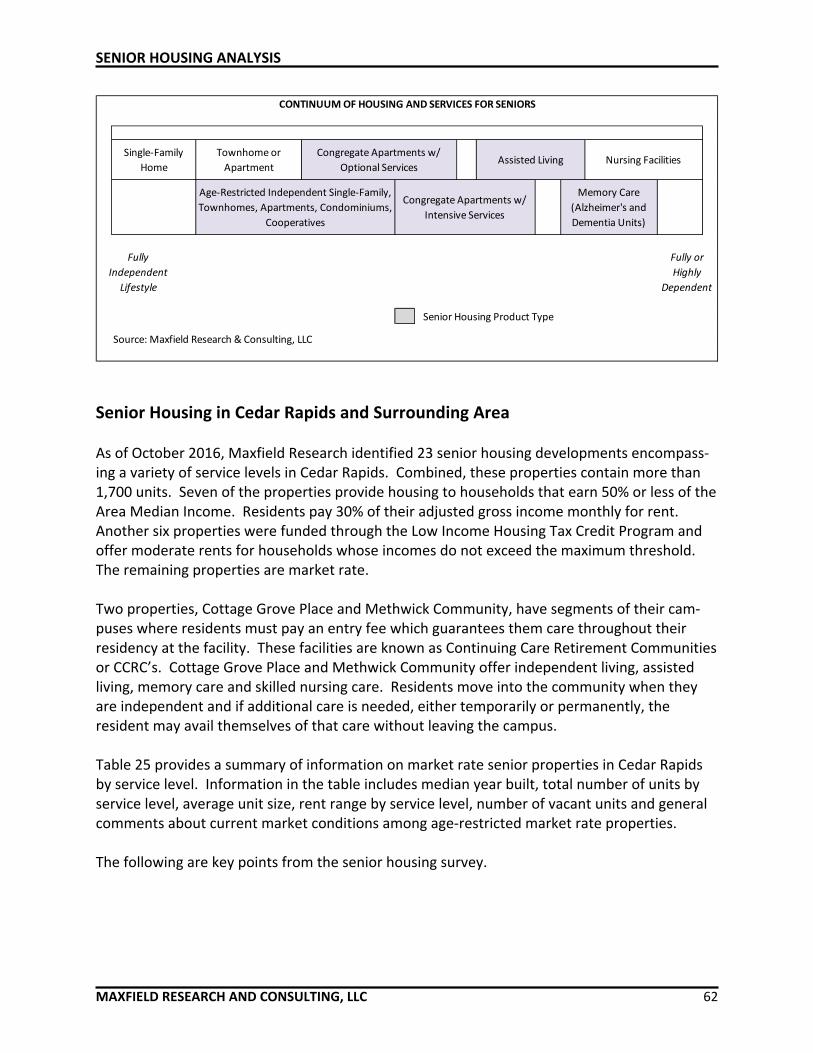
SENIOR HOUSING ANALYSIS
MAXFIELD RESEARCH AND CONSULTING, LLC 62
Townhome or
Apartment
Congregate Apartments w/
Intensive Services
Memory Care
(Alzheimer's and
Dementia Units)
Fully
Independent
Lifestyle
Fully or
Highly
Dependent
Senior Housing Product Type
Source: Maxfield Research & Consulting, LLC
CONTINUUM OF HOUSING AND SERVICES FOR SENIORS
Single‐Family
Home
Congregate Apartments w/
Optional ServicesAssisted Living Nursing Facilities
Age‐Restricted Independent Single‐Family,
Townhomes, Apartments, Condominiums,
Cooperatives
Senior Housing in Cedar Rapids and Surrounding Area As of October 2016, Maxfield Research identified 23 senior housing developments encompass‐ing a variety of service levels in Cedar Rapids. Combined, these properties contain more than 1,700 units. Seven of the properties provide housing to households that earn 50% or less of the Area Median Income. Residents pay 30% of their adjusted gross income monthly for rent. Another six properties were funded through the Low Income Housing Tax Credit Program and offer moderate rents for households whose incomes do not exceed the maximum threshold. The remaining properties are market rate. Two properties, Cottage Grove Place and Methwick Community, have segments of their cam‐puses where residents must pay an entry fee which guarantees them care throughout their residency at the facility. These facilities are known as Continuing Care Retirement Communities or CCRC’s. Cottage Grove Place and Methwick Community offer independent living, assisted living, memory care and skilled nursing care. Residents move into the community when they are independent and if additional care is needed, either temporarily or permanently, the resident may avail themselves of that care without leaving the campus. Table 25 provides a summary of information on market rate senior properties in Cedar Rapids by service level. Information in the table includes median year built, total number of units by service level, average unit size, rent range by service level, number of vacant units and general comments about current market conditions among age‐restricted market rate properties. The following are key points from the senior housing survey.

RENTAL HOUSING ANALYSIS
MAXFIELD RESEARCH AND CONSULTING, LLC 63
Market Rate Senior Housing Properties There are a variety of market rate housing options for seniors in Cedar Rapids including active adult living (ownership and rental formats), independent living with optional or included services, assisted living (personal care), memory care (Alzheimer’s/dementias) and skilled nursing. Most recently, there have been several new properties constructed, active adult units, targeted to moderate‐income senior households and developed through the Low‐Income Housing Tax Credit Program. For 2015 funding, two properties were awarded tax credits in Marion and one in Cedar Rapids. The survey includes primarily larger facilities with 15 units or more. All of the units at Village Cooperative have been sold and the building opened in 2015. This property experienced strong absorption during its pre‐sales period. The largest number of independent living units is currently located within the two Continuing Care Retirement Communities in Cedar Rapids, Cottage Grove Place and Methwick Community. These two campuses contain approximately 40% of all of age‐restricted market rate senior housing units in Cedar Rapids. The average size of units varies by service level. Unit sizes typically decrease the higher the level of care being received by the resident. The survey includes 947 market rate age‐restricted senior units among varying service levels. Average size of all units was 808 square feet with an average monthly fee of $3,274, which equates to an average per square foot rent of $4.05. The higher per square foot rents for senior properties is due to the high level of care that is provided at most of these facilities including three meals per day, transportation, housekeeping, and general oversight. For higher levels of care such as assisted living and memory care, additional services include bathing, dressing, grooming, personal laundry and linens, medication administration and oversight, escorts to meals, and other personal cares.

RENTAL HOUSING ANALYSIS
MAXFIELD RESEARCH AND CONSULTING, LLC 64
Service Level # of Units Avg. Size
Active Adult‐Owned 65 1,095 $875 ‐ $1,440 $0.80 ‐ $1.32
Active Adult‐Rental 86 852 $825 ‐ $2,450 $0.97 ‐ $2.88
Independent‐CCRC 385 1,010 $2,100 ‐ $5,000 $2.08 ‐ $4.95
Independent‐Congregate 139 718 $2,500 ‐ $4,560 $3.48 ‐ $6.35
Assisted Living 329 571 $3,580 ‐ $5,300 $6.27 ‐ $9.28
Memory Care 113 427 $4,945 ‐ $6,700 $11.58 ‐ $15.69
Total 1,117 808
Note: Owned housing includes cooperative units where owner must first purchase a share.
Source: Maxfield Research and Consulting, llc
$3,356 $4.05
TABLE 25
SUMMARY OF MARKET RATE SENIOR UNITS IN SURVEY
CITY OF CEDAR RAPIDS
September 2016
Average Rent/Fee Range Avg. Rent/Sq. Ft.
0
50
100
150
200
250
300
350
400
450
Number of Units
No. of Market Rate Senior Units by Service LevelCity of Cedar Rapids
The survey of market rate age‐restricted properties identified low vacancy rates overall. The CCRCs have somewhat higher vacancy rates than the non‐CCRC properties, primarily due to the higher entry fees required by these properties. Vacancies among all service levels including independent living, assisted living and memory care were all low. Many properties had only one or two units available and some properties had waiting lists for specific types of units. The survey identified an overall vacancy rate among all market rate, age‐restricted units of 24 units for an overall vacancy rate of 2.2%, which is considered low. Among some of the independent

RENTAL HOUSING ANALYSIS
MAXFIELD RESEARCH AND CONSULTING, LLC 65
living properties, it is typical to have a waiting list for two‐bedroom units, of which there are fewer in the market. Several senior properties have higher proportions of one‐bedroom units. Shallow‐Subsidy Senior Properties Table 26 shows three shallow subsidy independent senior properties located in Cedar Rapids. A third property, Irving Pointe assisted living, is also affordable and is included in the survey of enhanced service facilities. As shown on the table, there are very few units vacant among the shallow‐subsidy senior properties. This indicates pent‐up demand for additional shallow‐subsidy senior units in the Cedar Rapids market. Three additional senior developments were recently awarded tax credits. Arbor at Lindale Trail in Marion (70 units), Blairs Ferry Senior in Marion (60 units) and Com‐monwealth Senior in Cedar Rapids (84 units). Commonwealth has some units completed and is currently leasing available units.
Project Name/Location Year Built No. Vacant Monthly Rent
Cedar Crest 2010 36 23 ‐ 1BR 0 $495‐$605
1100 O Ave. NW 13 ‐ 2BR
Cedar Rapids
Commonwealth** 2016 84 15 ‐ Studio n/a $410‐$435
1400 2nd Avenue SE 58 ‐ 1BR $560‐$635
Cedar Rapids 11 ‐ 2BR $660‐$710
Legacy Manor 2013 60 30 ‐ 1BR 0 $453‐$565
1350 A'Hearn Dr. 30 ‐ 2BR
Cedar Rapids
** In Initial Lease‐up
Total 180 0
Vacancy Rate 0.00%
Sources: City of Cedar Rapids; Maxfield Research and Consulting, LLC
Mix
TABLE 26
SHALLOW‐SUBSIDY SENIOR PROPERTIES
CEDAR RAPIDS/MARION
September 2016
Units
Deep‐Subsidy Senior Properties
Deep‐subsidy senior housing offers rents affordable to qualified senior households and individuals that have physical or cognitive limitations. Rents are typically based on 30% of a resident’s adjusted gross income or a rent that is below the fair market rent. For those households meeting the age and income qualifications, deep‐subsidy senior housing is usu‐ally the most affordable rental option available. These properties are typically limited to

RENTAL HOUSING ANALYSIS
MAXFIELD RESEARCH AND CONSULTING, LLC 66
households earning 50% or less of Linn County’s area median income after adjusting for household size and medical expenses.
As of September 2016, Cedar Rapids had 594 units in seven deep‐subsidy properties desig‐nated for people ages 62 years or older. Eight units were vacant for an overall vacancy rate of 1.3%, indicating pent‐up demand for these units. However, previous programs that had been available to fund these types of projects are now very limited and highly competitive. It is unlikely that any housing units would be developed in the near future through either the 202 program or the Section 8 program. Funding is still available for through the 811 program for special needs housing.
The unit mix among these properties is split between one‐bedroom and efficiency units. Unit sizes at deep‐subsidy senior properties are smaller than many of the market rate senior rental projects. One‐bedroom units usually range from about 500 to 600 square feet.
Project Name/Location Year Built No. Vacant Monthly Rent
Linwood 1979 100 100 ‐ 1BR 0 30% of AGI
4845 Johnson Ave. NW
Cedar Village 1977 48 48 ‐ 1BR 1 30% of AGI
193 Jocolyn Dr. NW
Five Seasons 1994 54 54 ‐ 1BR 1 30% of AGI
1225 42nd Street SE
Geneva Tower 1969 190 130 ‐ EFF 2 30% of AGI
310 5th Street SE 60 ‐ 1BR 0 30% of AGI
Oak Hill Manor 1974 96 96 ‐ 1BR 0 30% of AGI
1301 15th Street SE
Westover Manor 1989 40 10 ‐ EFF 0 30% of AGI
204 40th Street DR. SE 30 ‐ 1BR 0 30% of AGI
The Meadows 1980 66 66 ‐ 1BR 0 30% of AGI
1030 Memorial Drive SE
Total 594 4
Vacancy Rate 0.70%
Sources: City of Cedar Rapids; Maxfield Research and Consulting, LLC
Mix
TABLE 27
DEEP‐SUBSIDY SENIOR RENTAL HOUSING
CITY OF CEDAR RAPIDS
September 2016
Units
RENTAL HOUSING ANALYSIS
MAXFIELD RESEARCH AND CONSULTING, LLC 67
Pending Senior Housing Developments Age‐Restricted Properties Commonwealth Senior, an 84‐unit mixed‐income age‐restricted rental property received approval from the Iowa Housing Finance Authority for tax credits. The property will be located in SW Cedar Rapids in one of the core neighborhoods and will feature one‐ and two‐bedroom units. There will be 77 shallow‐subsidy and 7 market rate units. This property is scheduled for occupancy by Monthly rents range from $376 for an efficiency unit to $710 per month for a two‐bedroom unit. Residents must meet maximum income restrictions. Square footages for the units range from 418 square feet for an efficiency to 1,017 square feet for a two‐bedroom. This property is currently in initial lease‐up. Stoney Point Assisted Living and Memory Care, an 84‐unit assisted living and memory care facility is planned to be constructed in Southwest Cedar Rapids at the intersection of 16th Avenue and Stony Point Road SW. The property is awaiting HUD commitment letter for financ‐ing. Construction is anticipated to begin Spring 2017 with completion by Spring 2018. These units are planned to be market rate. Grand Living of Indian Creek is proposed to be developed by Ryan Companies of Minneapolis and would feature 164 units of market rate independent living (congregate), assisted living and memory care and would be constructed at Collins Road and 1st Avenue. The property will feature units ranging from studio apartments to two‐bedroom units. Services will be provided to those that require them. Construction is anticipated to begin Fall 2016 with occupancy scheduled for Fall 2017. The Gardens is an 80‐unit campus that is proposed to be developed at 5710 Dean Road SW with 40 skilled nursing units, 30 assisted living units and 12 memory care units. The develop‐ment could open as soon as July 2017. Hart‐Frederick Consultants and Sharp Investments are proposing a mini‐continuum of care senior complex near The Gardens in Southwest Cedar Rapids. The initial proposal calls for 24 units of memory care and 60 units of assisted living with another 18 units of assisted living in a future phase. This project is in the planning stages. Marion The Views is a proposed 100 beds of skilled nursing, assisted living and memory care that would be located behind One Research Center in Marion. This facility is proposed. Arbor at Lindal Trail – 70 units of active adult independent senior housing that would be located at 1362 Blairs Ferry Road in Marion. The property is under construction and occupancy is slated for occupancy in later 2016 or early 2017.

RENTAL HOUSING ANALYSIS
MAXFIELD RESEARCH AND CONSULTING, LLC 68
Blairs Ferry Senior Housing – 60 units of active adult independent senior housing that would be located at 830 Blairs Ferry Road and being co‐developed by Landover Corporation and TWG Development, LLC. Project was scheduled for completion in September 2016.

FOR‐SALE MARKET ANALYSIS
MAXFIELD RESEARCH AND CONSULTING, LLC 69
Introduction Maxfield Research analyzed the for‐sale housing market in Cedar Rapids through an analysis of home sales and active listings, identifying active subdivisions and pending developments.
Overview of For‐Sale Housing Market Conditions Table 28 presents date on home resales in Cedar Rapids city and in the Cedar Rapids Metro Area (Cedar Rapids, Marion, Hiawatha) for calendar years 2013, 2014, 2015 and year‐to‐date 2016 (through September 2016). Data was obtained from the Cedar Rapids Area Association of Realtors. Data shows market activity, average and median sales prices and the number of days on market. The data represents all residential sales.
The table shows that the average sales price in the Cedar Rapids Metro Area year‐to‐date 2016 is $169,972. This is a 1.2% increase over 2015. The median sales price rose by $1,000 between year‐end 2015 and year‐to‐date 2016, an increase of 0.7%. A total of 3,165 homes were sold in Cedar Rapids in 2015. Year‐to‐date 2016, 2,560 homes have been sold in 2016, slightly slower than the same time last year in 2015. The average days on market dropped from 72 in 2015 to 65 year‐to‐date 2016. According to Cedar Rapids Association of Realtors, home inventory is down, a situation that is present in many metropolitan areas across the country. New construction homebuilding has not kept pace with demand and existing home inventory continues to remain low. Average days on market dropped quite signifi‐cantly this past year. Most of the demand for new construction has been for move‐up homes. First‐time homebuyers are in the market, but there is limited inventory to show them.
No. Sold Avg. Sold Price Median Sold Price Avg. DOM
Cedar Rapids city ‐ 2013 2,082 $151,201 $128,500 82
Cedar Rapids city ‐ 2014 2,098 $147,446 $128,700 81
Cedar Rapids city ‐ 2015 2,248 $156,592 $134,000 73
Cedar Rapids city ‐ 2016 1,843 $158,074 $134,550 67
Cedar Rapids Metro ‐ 2013 2,909 $162,601 $138,000 83
Cedar Rapids Metro ‐ 2014 2,902 $160,214 $139,311 77
Cedar Rapids Metro ‐ 2015 3,165 $167,844 $142,000 72
Cedar Rapids Metro ‐ 2016 2,560 $169,972 $143,000 65
* YTD as of September 30, 2016
Source: CR Area Realtor's Association
TABLE 28
HOME RESALES
CEDAR RAPIDS AND SURROUNDING AREA
2013‐2016 YTD*

FOR‐SALE MARKET ANALYSIS
MAXFIELD RESEARCH AND CONSULTING, LLC 70
$0
$20,000
$40,000
$60,000
$80,000
$100,000
$120,000
$140,000
$160,000
$180,000
2003 2004 2005 2006 2007 2008 2009 2010 2011 2012 2013 2014 2015 2016
Home Sales Price
Cedar Rapids Metro Area Home Sales Prices
2003 through September 2016
Median Sold Price Average Sold Price
Current Supply of Homes on the Market Maxfield Research reviewed the current market for available owner‐occupied homes in Cedar Rapids and Marion on the market (listed for sale). Table 29 shows the number of homes and price ranges currently listed for sale in Cedar Rapids and Marion by quadrant. The data was gathered from the Multiple Listing Service from Iowa Realty Cedar Rapids and is based on listings active as of October 2016. MLS listings generally account for the vast majority of all residential sale listings in a given area. Table 29 shows listings for single‐family and multifamily (condominium, townhome, zero‐lot line and detached townhome or condominium). Table 29A shows data on active MLS listings for single‐family and multifamily homes in the Flood Impact Area (core neighborhoods) of Cedar Rapids. Data is presented by quadrant and shows the high price, low price and median price of active listings as of December 2016.
As of October 2016, there were 614 homes listed for‐sale in Cedar Rapids, 191 homes in Marion and 32 homes in Hiawatha/Robins listed for sale (previously owned and new con‐struction). Of the totals listed above, there were 81 new construction homes in Cedar Rap‐ids, 64 new construction homes in Marion and 10 new construction homes in Hiawatha.
Resale pricing for existing homes spans a broad range with homes available for a low of $59,995 to a high of $1.6 million. Many of the homes that are listed for less than $100,000 are located in the core neighborhoods in Cedar Rapids. Short sales and foreclosures have decreased over time since the recovery has ensued.

FOR SALE MARKET ANALYSIS
MAXFIELD RESEARCH AND CONSULTING, LLC 71
New construction homes currently listed for sale also span a broad price range although not as significant as existing homes. Lowest price for new construction was $142,700 for an at‐tached townhome up to $514,310 for a new executive single‐family home in Cedar Rapids. The highest prices are in the SE quadrant of the City, a shift from two years ago, when the highest prices were in the NW quadrant. Home prices in Marion range from $55,000 to $3.5 million.
Based on an estimated median list price in Cedar Rapids area of $152,000, the income required to afford a home at this price would be about $43,500 to $50,700, based on the standard of 3.0 to 3.5 times the median income (and assuming these households do not have a high level of debt). A household with significantly more equity (in an existing home and/or savings) could afford a higher priced home. According to updated income data for 2016, an estimated 58.9% of households in Cedar Rapids have annual incomes at or above $43,500.
Single‐family homes account for 79.0% of all active listings. The remaining listings are multifamily homes (21%).
0
20
40
60
80
100
120
140
160
180
NE SE NW SW Marion Hiawatha
Number of Listings
Active Home Listings
Cedar Rapids/Marion/HiawathaOctober 2016
Single‐Family Multifamily

FOR SALE MARKET ANALYSIS
MAXFIELD RESEARCH AND CONSULTING, LLC 72
Avg. List Price
Property Type Listings Pct.
NE 167 25.2% $32,500 ‐ $960,000
SE 117 17.7% $19,000 ‐ $1,595,000
NW 89 13.4% $49,500 ‐ $1,499,000
SW 114 17.2% $45,000 ‐ $610,000
Marion 146 22.1% $55,000 ‐ $3,500,000
Hiawatha 29 4.4% $72,950 $939,000
Total/Average 662 100.0% $45,658 ‐ $1,517,167
NE 33 18.9% $85,000 ‐ $450,000
SE 33 18.9% $59,995 ‐ $345,000
NW 8 4.6% $89,900 ‐ $269,900
SW 53 30.3% $66,900 ‐ $610,000
Marion 45 25.7% $78,000 ‐ $569,927
Hiawatha 3 1.7% $72,950 ‐ $238,900
Total/Average 175 100.0% $75,458 ‐ $413,955
NE 24 15.5% $166,500 ‐ $514,310
SE 6 3.9% $155,000 ‐ $360,000
NW 10 6.5% $209,900 ‐ $325,000
SW 41 26.5% $95,900 ‐ $384,132
Marion 64 41.3% $160,500 ‐ $569,927
Hiawatha 10 6.5% $238,900 ‐ $504,950
Total/Average 155 100.0% $171,117 ‐ $443,053
Sources: Multiple Listing Service‐Cedar Rapids Area; Maxfield Research
TABLE 29
New Construction (included in above totals)
ACTIVE LISTINGS BY SUBMARKET
October 2016
Single‐Family
Multifamily
Price Range
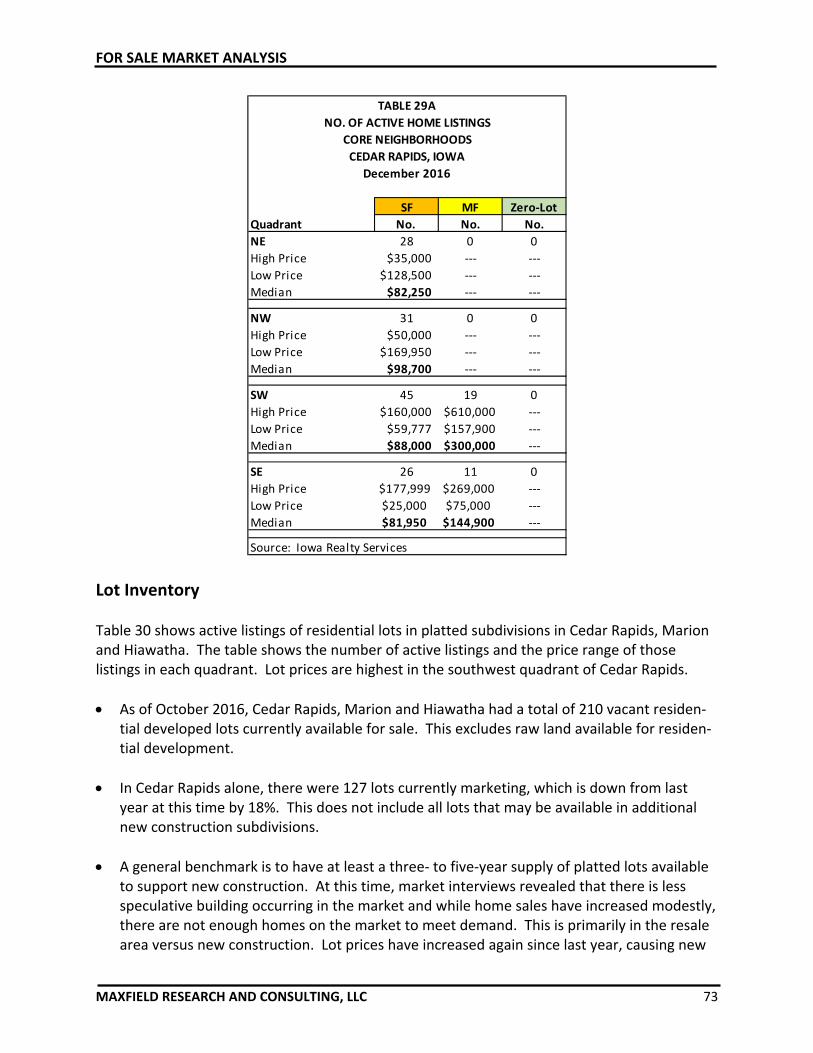
FOR SALE MARKET ANALYSIS
MAXFIELD RESEARCH AND CONSULTING, LLC 73
SF MF Zero‐Lot
Quadrant No. No. No.
NE 28 0 0
High Price $35,000 ‐‐‐ ‐‐‐
Low Price $128,500 ‐‐‐ ‐‐‐
Median $82,250 ‐‐‐ ‐‐‐
NW 31 0 0
High Price $50,000 ‐‐‐ ‐‐‐
Low Price $169,950 ‐‐‐ ‐‐‐
Median $98,700 ‐‐‐ ‐‐‐
SW 45 19 0
High Price $160,000 $610,000 ‐‐‐
Low Price $59,777 $157,900 ‐‐‐
Median $88,000 $300,000 ‐‐‐
SE 26 11 0
High Price $177,999 $269,000 ‐‐‐
Low Price $25,000 $75,000 ‐‐‐
Median $81,950 $144,900 ‐‐‐
Source: Iowa Realty Services
NO. OF ACTIVE HOME LISTINGS
CORE NEIGHBORHOODS
CEDAR RAPIDS, IOWA
December 2016
TABLE 29A
Lot Inventory Table 30 shows active listings of residential lots in platted subdivisions in Cedar Rapids, Marion and Hiawatha. The table shows the number of active listings and the price range of those listings in each quadrant. Lot prices are highest in the southwest quadrant of Cedar Rapids.
As of October 2016, Cedar Rapids, Marion and Hiawatha had a total of 210 vacant residen‐tial developed lots currently available for sale. This excludes raw land available for residen‐tial development.
In Cedar Rapids alone, there were 127 lots currently marketing, which is down from last year at this time by 18%. This does not include all lots that may be available in additional new construction subdivisions.
A general benchmark is to have at least a three‐ to five‐year supply of platted lots available to support new construction. At this time, market interviews revealed that there is less speculative building occurring in the market and while home sales have increased modestly, there are not enough homes on the market to meet demand. This is primarily in the resale area versus new construction. Lot prices have increased again since last year, causing new
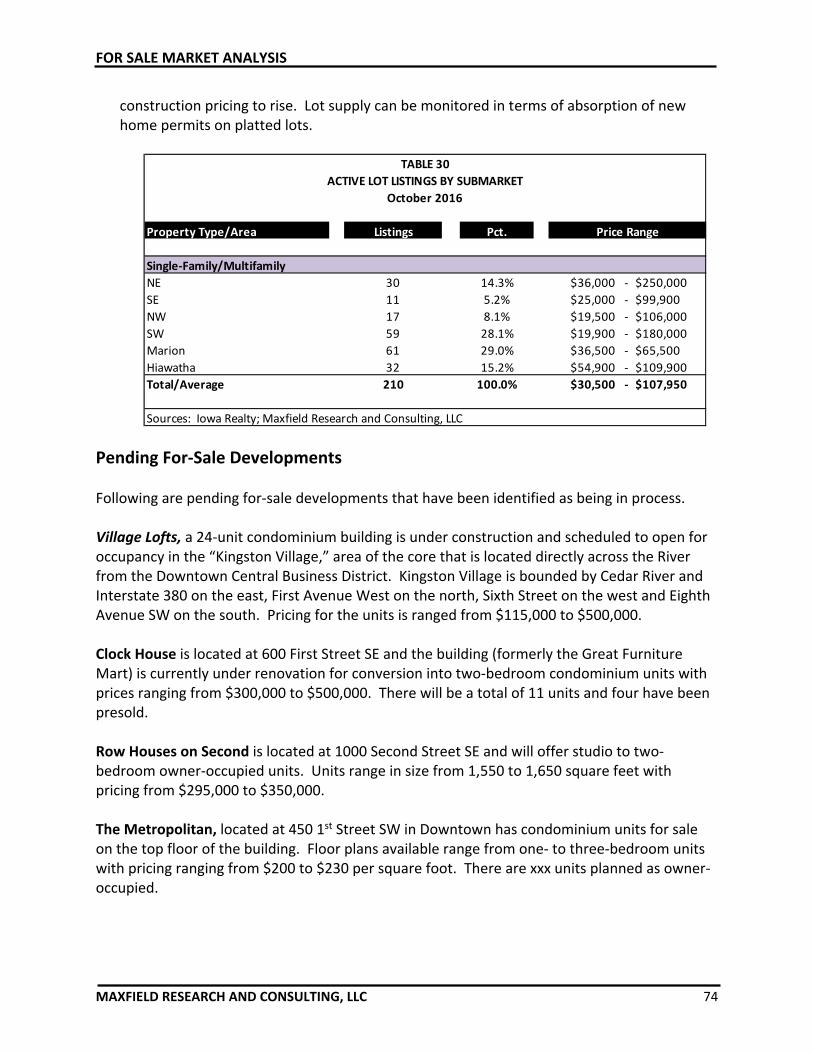
FOR SALE MARKET ANALYSIS
MAXFIELD RESEARCH AND CONSULTING, LLC 74
construction pricing to rise. Lot supply can be monitored in terms of absorption of new home permits on platted lots.
Property Type/Area Listings Pct.
Single‐Family/Multifamily
NE 30 14.3% $36,000 ‐ $250,000
SE 11 5.2% $25,000 ‐ $99,900
NW 17 8.1% $19,500 ‐ $106,000
SW 59 28.1% $19,900 ‐ $180,000
Marion 61 29.0% $36,500 ‐ $65,500
Hiawatha 32 15.2% $54,900 ‐ $109,900
Total/Average 210 100.0% $30,500 ‐ $107,950
Sources: Iowa Realty; Maxfield Research and Consulting, LLC
Price Range
TABLE 30
ACTIVE LOT LISTINGS BY SUBMARKET
October 2016
Pending For‐Sale Developments Following are pending for‐sale developments that have been identified as being in process. Village Lofts, a 24‐unit condominium building is under construction and scheduled to open for occupancy in the “Kingston Village,” area of the core that is located directly across the River from the Downtown Central Business District. Kingston Village is bounded by Cedar River and Interstate 380 on the east, First Avenue West on the north, Sixth Street on the west and Eighth Avenue SW on the south. Pricing for the units is ranged from $115,000 to $500,000. Clock House is located at 600 First Street SE and the building (formerly the Great Furniture Mart) is currently under renovation for conversion into two‐bedroom condominium units with prices ranging from $300,000 to $500,000. There will be a total of 11 units and four have been presold. Row Houses on Second is located at 1000 Second Street SE and will offer studio to two‐bedroom owner‐occupied units. Units range in size from 1,550 to 1,650 square feet with pricing from $295,000 to $350,000. The Metropolitan, located at 450 1st Street SW in Downtown has condominium units for sale on the top floor of the building. Floor plans available range from one‐ to three‐bedroom units with pricing ranging from $200 to $230 per square foot. There are xxx units planned as owner‐occupied.

FOR SALE MARKET ANALYSIS
MAXFIELD RESEARCH AND CONSULTING, LLC 75
Kingston Quarters is located at 353 2nd Avenue SW and is proposed to have all two‐bedroom units for‐sale. No additional information is available at this time regarding pricing or unit sizes. The Sanctuary is located in the Ellis Park neighborhood and would consist of 28 housing units, a mix of single‐family, duplex and townhome units. The developer is also partnering with the ROOTs program in Cedar Rapids to provide affordable ownership units. Newbo Development Group is the preferred developer and the property was recently rezoned to accommodate the mix of housing product types. One Park Place is a proposed high‐rise tower that would be located in Downtown Cedar Rapids with a total of 90 units, all of which would be owner‐occupied. This development is located at 101 3rd Avenue SE and is still in the planning stages.
Presumption of Affordability The City of Cedar Rapids has been involved for the past several years in a revitalization program for its Downtown core neighborhoods, specifically those that experienced the greatest impact from the 2008 flood. Prior to the 2008 flood, much of the housing stock in the core neighbor‐hoods was older and less well‐maintained than other areas of the City. The 2008 flood caused a substantial amount of rehabilitation work to be completed to many units in these neighbor‐hoods just to make them livable once again. In addition, the City has focused efforts on devel‐oping more housing in its Downtown through the conversion of existing under‐utilized ware‐house buildings and through new construction. Approximately half of the new construction rental units built and located in the Downtown are affordable to households that earn between 40% and 80% of the area median household income. This has enabled some households to remain in the Downtown area and others to relocate to the Downtown because housing is available there to meet their needs. Regarding demographics and market conditions for the Flood Impact Area which comprises most of the geographic area of the City’s core neighborhoods, we find the following in 2016 as compared to 2010: 2010 2016 Population 16,955 17,934 Households 6,888 7,315 Age Distribution 31% growth 65‐74 23% growth 65‐74 Median HH Income $33,907 $39,541 Household Tenure 56.6% (owner) 57.7% (owner) Age of Housing (Median) Owner 1942 1942 Renter 1956 1960 Median Home Value (Census) $88,958 $97,400 Median List Price (Iowa Realty) N/A $87,725

FOR SALE MARKET ANALYSIS
MAXFIELD RESEARCH AND CONSULTING, LLC 76
Incomes Needed to Qualify 65% $44,500 $49,500 80% $54,700 $60,950 Maximum Mortgage Costs 65% $1,150/mo. $1,279/mo. 80% $1,413/mo. $1,575/mo. Maximum Mo. Payment (Median Home Value) $410/mo. $450/mo. Minimum Income Needed to Qualify $16,000/yr. $18,000/yr. (Assumes no debt load) No. of Income‐Qualified HHs 2,700 3,470 (Flood Impact Area) Typical size of SF homes in the core 1,081 SF 1,117 SF Based on the above analysis, the median home values in the core neighborhoods are affordable to a substantial portion of the population currently residing in the Flood Impact Area. In addition, these homes would be affordable to an even higher proportion of low and moderate income households living in the Cedar Rapids Metro Area.

HOUSING DEMAND ANALYSIS
MAXFIELD RESEARCH AND CONSULTING, LLC 77
Introduction Previous sections of this study analyzed the existing housing supply and the growth and demo‐graphic characteristics of the population and household base in Cedar Rapids. This section of the report presents our estimates of housing demand in Cedar Rapids from 2013 through 2020.
Demographic Profile and Housing Demand The demographic profile of a community affects housing demand and the types of housing that are needed. The housing life‐cycle stages are:
1. Entry‐level householders
Often prefer to rent basic, inexpensive apartments
Usually singles or couples in their early 20’s without children
Will often “double‐up” with roommates in apartment setting 2. First‐time homebuyers and move‐up renters
Often prefer to purchase modestly‐priced single‐family homes or rent more upscale apartments
Usually married or cohabiting couples, in their mid‐20's or 30's, some with children, but most are without children
3. Move‐up homebuyers
Typically prefer to purchase newer, larger, and therefore more ex‐pensive single‐family homes
Typically families with children where householders are in their late 30's to 40's
4. Empty‐nesters (persons whose children have grown and left home) and nev‐
er‐nesters (persons who never have children)
Prefer owning but will consider renting their housing
Some will move to alternative lower‐maintenance housing products
Generally couples in their 50's or 60's 5. Younger independent seniors
Prefer owning but will consider renting their housing
Will often move (at least part of the year) to retirement havens in the Sunbelt and desire to reduce their responsibilities for upkeep and maintenance
Generally in their late 60's or 70's
HOUSING DEMAND ANALYSIS
MAXFIELD RESEARCH AND CONSULTING, LLC 78
6. Older seniors
May need to move out of their single‐family home due to physical and/or health constraints or a desire to reduce their responsibilities for upkeep and maintenance
Generally single females (widows) in their mid‐70's or older
Cedar Rapids tends to have a somewhat higher proportion of younger households owning their housing at an earlier age. This may be a result of relatively modest home prices for entry‐level homes and a higher proportion of jobs in the community that pay living wage and professional salaries. This enables younger households to move into the for‐sale market at a younger age that would be true in other larger metropolitan areas where housing prices are higher. In general, it appears as though seniors are moving to alternate housing when they are about in their mid‐ to late 70s, which is typical of most areas. Those moving to assisted living tend to do so in their early to mid‐80s or older, depending on their health conditions. The baby boom generation is anticipated to continue to have the largest effect on the housing market in Cedar Rapids as their life cycle continues. Baby boomers are currently ages 51 to 69 and as they age over this decade, they will increase the population in the age groups 55 to 64, and 65 to 74. The 55 to 64 and 65 to 74 age groups in the Cedar Rapids Area are expected to see increases of 2,610 and 3,428 people, respectively, between 2010 and 2020. Some of these baby boomers will prefer more expensive single‐family homes, while others who become empty nesters may prefer to downsize or desire maintenance‐free alternatives. With the baby busters following in the baby boomers’ wake, the age group 35 to 54 is anticipated to decline, somewhat decreasing the overall demand for move‐up housing. This may result in homeown‐ers deciding to remain in their homes longer and is likely to increase the demand for remodel‐ing. Estimated Demand for For‐Sale Housing Tables 31 and 32 present our demand calculations for general occupancy for‐sale housing in Cedar Rapids between 2016 and 2020 and from 2020 to 2025, respectively. Between 2016 and 2020, the City of Cedar Rapids is projected to add 1,562 new households and the Tri‐City Area (Housing Market Area) is projected to add 2,125 new households. Be‐tween 2020 and 2025, Cedar Rapids city is forecast to add 3,517 new households and the Tri‐City area is forecast to add 4,785 new households. Based on the analysis of household growth forecasts in specific age cohorts and projected income levels, it is estimated that 85% of these households will support demand for general occupancy housing products (versus senior hous‐ing), generating total demand for 1,327 new general occupancy housing units from 2016 to 2020 in Cedar Rapids and approximately 1,806 new housing units the Tri‐City Area.

HOUSING DEMAND ANALYSIS
MAXFIELD RESEARCH AND CONSULTING, LLC 79
Demand for housing is apportioned between ownership and rental housing products. According to 2016 estimates derived from the US Census American Community Survey, an estimated 66% of households under age 65 owned their housing in Cedar Rapids. Because areas outside of the City of Cedar Rapids generally have a somewhat higher ownership rate, this proportion is estimated to be slightly higher for the Cedar Rapids Metro Area. Applying a ratio of 66% for the City of Cedar Rapids yields demand for 876 new general occupancy for‐sale units between 2016 and 2020 or an estimated average of 219 units per year from new household growth.
Projected household growth in the Cedar Rapids city 2016 to 2020¹
(times) Pct. of HH growth for general occupancy housing2
x
(equals) Projected demand for general occupancy units =
(times) Propensity to Own3
x
(equals) Total demand potential for ownership housing (2016 to 2020) =
Number of owner households (age 64 and younger) in PMA, 2016
(times) Estimated percent of owner turnover4
x
(equals) Total existing households projected to turnover =
(times) Estimated percent desiring new housing x
(equals) Demand from existing households
(equals) Total demand from household growth and existing households, 2016 to 2020 =
(times) Demand from outside Cedar Rapids
(equals) Total demand potential for ownership housing, 2016‐2020
(times) Percent desiring for‐sale single‐family vs. multifamily5
x 75% 25%
(equals) Total demand potential for new single‐family & multifamily for‐sale housing = 907 302
(minus) Units under construction6
‐ 64 34
(equals) Excess demand for new general occupancy for‐sale housing = 843 268
(times) Percent capturable by Cedar Rapids x 75% 75%
(equals) number of units supportable in Cedar Rapids 633 201
2 Pct. of household growth age 65 and younger (U.S. Census ‐ 2010, ESRI, Maxfield Research).
3 Pct. Owner households age 65 and younger in the PMA (2016)
4 Based on on turnover from 2014 American Community Survey for households moving after 2010.
5 Based on preference for housing type and land availability
* Multi‐family demand includes demand for townhomes, twinhomes, and condominium units.
Source: Maxfield Research and Consulting LLC
Demand from Existing Owner Households
28,746
20%
6 Units under construction.
1,031
66%
680
1 Estimated household growth based on data data from the US Census, ESRI, CR Building Permits, and Maxfield Research
287
Single
Family
Multi‐
family*
20%
1,210
5,749
5%
968
TABLE 31
FOR‐SALE HOUSING DEMAND
CITY OF CEDAR RAPIDS
2016 to 2020
66%
Demand from Projected Household Growth
1,562

HOUSING DEMAND ANALYSIS
MAXFIELD RESEARCH AND CONSULTING, LLC 80
Projected household growth in the Cedar Rapids city 2020 to 2025¹
(times) Pct. of HH growth for general occupancy housing2
x
(equals) Projected demand for general occupancy units =
(times) Propensity to Own3
x
(equals) Total demand potential for ownership housing (2020 to 2025) =
Number of owner households (age 64 and younger) in PMA, 2025
(times) Estimated percent of owner turnover4
x
(equals) Total existing households projected to turnover =
(times) Estimated percent desiring new housing x
(equals) Demand from existing households
(equals) Total demand from household growth and existing households, 2020 to 2025 =
(times) Demand from outside Cedar Rapids
(equals) Total demand potential for ownership housing, 2020‐2025
(times) Percent desiring for‐sale single‐family vs. multifamily5
x 75% 25%
(equals) Total demand potential for new single‐family & multifamily for‐sale housing = 1,715 572
(minus) Units under construction6
‐ 0 0
(equals) Excess demand for new general occupancy for‐sale housing = 1,715 572
(times) Percent capturable by Cedar Rapids x 75% 75%
(equals) number of units supportable by in Cedar Rapids 1,287 429
2 Pct. of household growth age 65 and younger (U.S. Census ‐ 2010, ESRI, Maxfield Research).
3 Pct. Owner households age 65 and younger in the PMA (2010)
4 Based on on turnover from 2014 American Community Survey for households moving after 2010.
5 Based on preference for housing type and land availability
* Multi‐family demand includes demand for townhomes, twinhomes, and condominium units.
Source: Maxfield Research and Consulting LLC
TABLE 32
FOR‐SALE HOUSING DEMAND
CITY OF CEDAR RAPIDS
2020 to 2025
Demand from Projected Household Growth
3,517
20%
66%
2,321
66%
1,532
Demand from Existing Owner Households
29,777
2,287
Single
Family
Multi‐
family*
1 Estimated household growth based on data data from the US Census, ESRI, CR Building Permits, and Maxfield Research
6 Units under construction.
20%
5,955
5%
298
1,830
Demand is also forecast to come from existing Market Area householders through turnover. As of 2016, an estimated 38,400 owner‐occupied households are located in Cedar Rapids. Based on updated and revised mobility data from the Census Bureau, an estimated 20% of owner households will turnover in a five‐year period, resulting in 7,680 existing households projected to turnover. Finally, we estimate 5% of the existing owner households will seek new for‐sale housing, resulting in demand for 384 for‐sale units to 2020 or approximately 96 units annually.
HOUSING DEMAND ANALYSIS
MAXFIELD RESEARCH AND CONSULTING, LLC 81
Next, we estimate that 20% of the total demand for new for‐sale units in Cedar Rapids will come from people currently living outside of the City. Adding demand from outside Cedar Rapids to the existing demand potential, results in a total estimated demand for 480 for‐sale housing units to 2020 or 120 units annually. Based on land available, building trends, and demographic shifts (increasing older adult popula‐tion), we project 80% of the for‐sale owners will prefer traditional single‐family product types while the remaining 20% will prefer maintenance‐free multifamily products such as twinhomes, detached townhomes/condominiums or traditional condominiums. Of these totals, Cedar Rapids is estimated to capture roughly 75% of the estimated total de‐mand in this segment resulting in for‐sale demand for 633 single‐family and 201 multifamily units over the next four years. Similar calculations compiled for the period 2020 to 2025 revealed a projected demand for general occupancy for‐sale housing of 1,287 single‐family and 429 multifamily (owned) units over the five‐year period.
Estimated Demand for General‐Occupancy Rental Housing Tables 33 and 34 present calculations of general‐occupancy rental housing demand in Cedar Rapids from 2016 to 2020 and from 2020 to 2025. The analysis identifies potential demand for rental housing that is generated from both new households and turnover households. A portion of the demand will be drawn from existing households in Cedar Rapids that want to upgrade their housing situations. First, potential demand from new household growth by age group is calculated based on the propensity of households to rent their housing. For purposes of the analysis, there is a focus on households between the ages of 18 and 64 that will account for the vast majority of general‐occupancy rental demand. Based on an analysis of household growth forecast in specific age cohorts, household growth is projected in every cohort except for the youngest cohort (under age 25). Next, the percentage of households that will likely rent their housing is calculated. In 2016, the percentage of renters ranged from 86% among the under 25 age cohort to 18% among the 55 to 64 age cohort and 16% for those age 65 years or older.

HOUSING DEMAND ANALYSIS
MAXFIELD RESEARCH INC. 82
Demand From Household Growth
Projected Growth in Household Base by 2020
(times) Proportion Estimated to Be Renting Their Housing1
x
(equals) Projected Demand for Rental Housing Units = 52 ‐22 127 ‐71 237
Demand From Existing Households
Number of renter households in 2016
(times) Estimated % of renter turnover between 2016 & 20202
x(equals) Total Existing Renter Households Projected to Turnover = 3,463 3,776 1,606 1,364 994
(times) Estimated % Desiring New Rental Housing x 5% 10% 10% 5% 5%
(equals) Demand From Existing Households = 173 378 161 68 50
Total Demand From Household Growth and Existing Households 173 355 288 ‐2 287
Total Demand from Household Growth and Existing Households
(plus) Demand from outside Market Area (25%)
(equals) Total Demand for Rental Housing in Cedar Rapids
(times) Percent of rental demand by product type3
x
(equals) Total demand for new general occupancy rental housing units =
(minus) Units under construction or pending* ‐
(equals) Excess demand for new general occupancy rental housing =
(times) Percent of Market Area demand capturable by Cedar Rapids x
(equals) number of units supportable by the City of Cedar Rapids =
¹ Based on 2014 Census data.
² Based on Turnover from 2014 American Community Survey for households moving after 2010.3 Based on the combination of current rental product and household incomes of area renters (non‐senior households)
*Pending/proposed competitive units at 95% occupancy.
Source: Maxfield Research and Consulting, LLC
83.8% 56.2%
4
35%10%
60 ‐52 423 ‐353
Market Rate
34.4% 51.8%
1,085
92.5%
104
Affordable
86.0% 43.0%
3,744 4,506
108
814
271
2,858
30.0% 20.0% 16.0%
3,966
TABLE 33
RENTAL HOUSING DEMAND
CITY OF CEDAR RAPIDS
2016‐2020
1,483
1,918
55%
597
201
‐‐‐‐‐‐‐‐ Number of Households ‐‐‐‐‐‐‐‐ Under 25 Age 25 to 34
Subsidized
Age 35 to 44 Age 45 to 64 Age 65 & Over
80%
84 233 316
380
88
80% 80%
396292

HOUSING DEMAND ANALYSIS
MAXFIELD RESEARCH INC. 83
Demand From Household Growth
Projected Growth in Household Base by 2025
(times) Proportion Estimated to Be Renting Their Housing1
x
(equals) Projected Demand for Rental Housing Units = 170 70 191 103 334
Demand From Existing Households
Number of renter households in 2020
(times) Estimated % of renter turnover between 2016 & 20202
x(equals) Total Existing Renter Households Projected to Turnover = 3,295 3,437 1,650 1,120 1,199
(times) Estimated % Desiring New Rental Housing x 5% 10% 10% 5% 5%
(equals) Demand From Existing Households = 165 344 165 56 60
Total Demand From Household Growth and Existing Households 165 414 356 159 394
Total Demand from Household Growth and Existing Households
(plus) Demand from outside Market Area (20%)
(equals) Total Demand for Rental Housing in Cedar Rapids
(times) Percent of rental demand by product type3
x
(equals) Total demand for new general occupancy rental housing units =
(minus) Units under construction or pending* ‐
(equals) Excess demand for new general occupancy rental housing =
(times) Percent of Market Area demand capturable by Cedar Rapids x
(equals) number of units supportable by the City of Cedar Rapids =
¹ Based on 2014 Census data.
² Based on Turnover from 2014 American Community Survey for households moving after 2010.3 Based on the combination of current rental product and household incomes of area renters (non‐senior households)
*Pending/proposed competitive units at 95% occupancy.
Source: Maxfield Research and Consulting, LLC
80% 80% 85%
109 328 697
0 0 0
137 410 821
10% 30% 60%
137 410 821
1,094
274
1,368
Subsidized Affordable Market Rate
3,562 4,101 2,936 3,256 2,314
92.5% 83.8% 56.2% 34.4% 51.8%
205 162 623 488 2,039
83.1% 43.5% 30.7% 21.1% 16.4%
TABLE 34
RENTAL HOUSING DEMAND
CITY OF CEDAR RAPIDS
2020‐2025
‐‐‐‐‐‐‐‐ Number of Households ‐‐‐‐‐‐‐‐ Under 25 Age 25 to 34 Age 35 to 44 Age 45 to 64 Age 65 & Over
HOUSING DEMAND ANALYSIS
MAXFIELD RESEARCH AND CONSULTING, LLC 84
The second part of the analysis calculates demand from existing households, or turnover demand. Younger households tend to be highly mobile, relative to older households. Mobility rates were calculated for the renter population based on Census data and were applied to the existing renter household base. Finally, the percentage of the existing renter households that will seek new rental housing by age cohort is applied resulting in demand for 814 units over the next four years. We estimate that 25% of the total demand for new rental housing units in Cedar Rapids will come from people currently living outside of the City as Cedar Rapids is often a draw for house‐holds that may be relocating for the short‐term. As a result, we find demand for 1,085 renter households based on household growth and existing households alone between 2016 and 2020. Based on a review of household incomes and sizes and monthly rents at existing projects, we estimate that approximately 15% of the total demand will be for deep‐subsidy housing, 35% will be for shallow‐subsidy (workforce‐40% to 60% of AMHFI) housing, and 55% will be for market rate housing. Next we subtract housing projects that are under construction or pending at this time, since these projects will satisfy some of the calculated demand for general occupancy rental housing. The analysis identifies 383 rental housing units either pending or under construction in Cedar Rapids. Therefore, demand would remain for 104 deep‐subsidy units, 292 shallow‐subsidy units and 306 market rate units to 2020. Finally, we estimate various sites in Cedar Rapids could capture 80% of the total demand, resulting in demand for 84 deep subsidy units, 233 shallow‐subsidy units and 244 market rate units in Cedar Rapids over the next four years. Demand, especially for rental units that are deep‐subsidy, would be higher to account for pent‐up demand. With pent‐up demand (a shortage of units), people who would normally form their own rental households instead room with other persons in a housing unit, live with their parents, or live in housing outside of the area and commute to jobs. A healthy rental market is expected to have a vacancy rate of about 5% to allow for sufficient consumer choice and unit turnover. In Cedar Rapids, we found that the overall vacancy rate was 2.4% among the general‐occupancy rental supply – below the 5% level indicating market equilibrium. In addition, vacancies for shallow‐subsidy and deep‐subsidy units indicate higher levels of pent‐up demand in these categories.
HOUSING DEMAND ANALYSIS
MAXFIELD RESEARCH AND CONSULTING, LLC 85
Estimated Demand for Independent Adult/Few Service Age‐Restricted Housing Table 35 presents our demand calculations for market rate independent age‐restricted housing in Cedar Rapids in 2016 and 2021. In order to determine demand for independent age‐restricted housing, the potential market is reduced to households that are both age‐ and income‐qualified. The age‐qualified market is defined as older adults age 55 and older, although active adult/few services properties primari‐ly attract older adults age 65 and older. Based on estimated market rate rents, the minimum income needed to afford monthly rents for market rate active adult/few services building would be $25,000, since older adults with this income could afford a monthly rent of $835 based on spending 40% of their income. We also add in households with incomes between $20,000 and $24,999 who would be able to supple‐ment their incomes with the proceeds from a home sale. We estimate the number of age/income‐qualified older adult households (55+) in Cedar Rapids in 2016 at 15,308 house‐holds. Adjusting to include appropriate long‐term capture rates for each age cohort (0.5% of house‐holds age 55 to 64, about 3.5% of households age 65 to 74, and 11.0% of households age 75 and over) results in a market rate demand potential for 599 independent age‐restricted rental units in 2016. Some additional demand will come from outside Cedar Rapids. We estimate that 25% of the long‐term demand for independent age‐restricted housing will be generated by older adults currently residing outside Cedar Rapids. This demand will consist primarily of parents of adult children living in the Cedar Rapids area, individuals who live just outside of Cedar Rapids and have an orientation to the area, as well as former residents who desire to return. Together, the demand from Cedar Rapids seniors and demand from older adults who would relocate to Cedar Rapids results in a demand for 798 active adult units in 2016. Independent demand in Cedar Rapids is apportioned between ownership and rental housing. Based on the age distribution, homeownership rates and current product available in Cedar Rapids, we project that 50% of the demand will be for adult ownership housing (399 units) and 50% will be for rental housing (399 units). Next, we subtract existing competitive market rate units (minus a vacancy factor of 5% to allow for sufficient consumer choice and turnover) from the owner and rental demand. Subtracting the existing competitive market rate units results in total demand potential for 335 adult owner‐occupied units and 317 adult rental units in 2016.
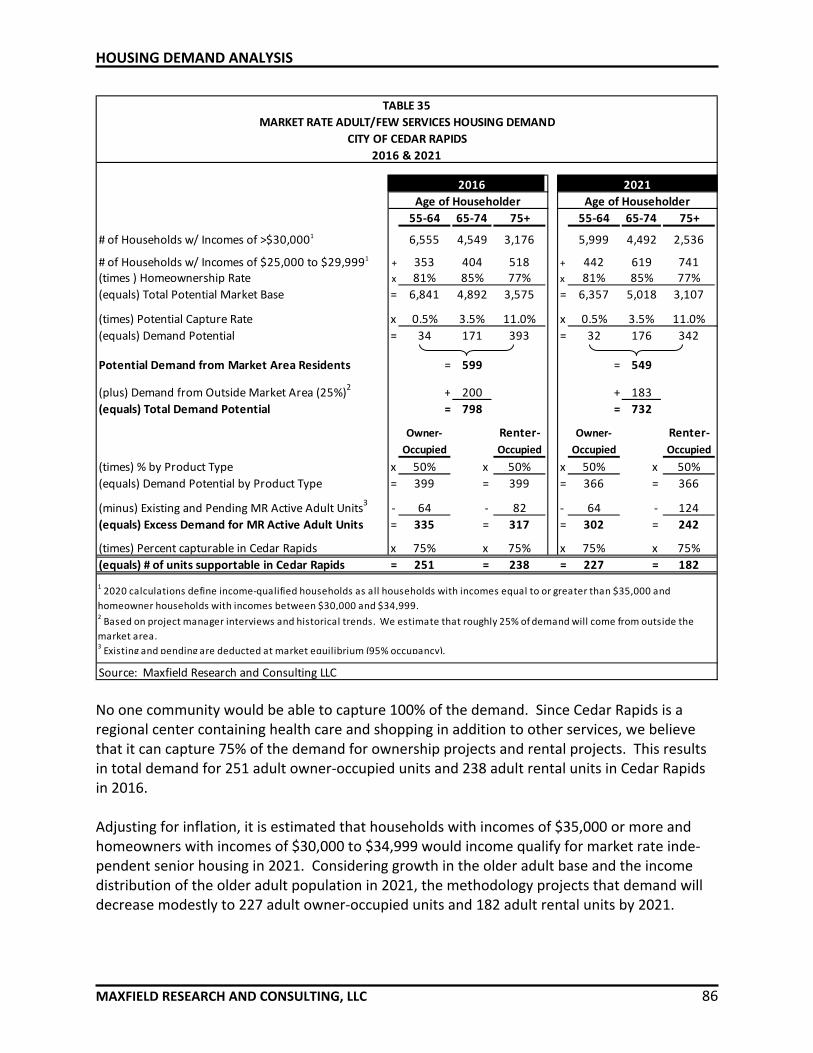
HOUSING DEMAND ANALYSIS
MAXFIELD RESEARCH AND CONSULTING, LLC 86
55‐64 65‐74 75+ 55‐64 65‐74 75+
# of Households w/ Incomes of >$30,0001 6,555 4,549 3,176 5,999 4,492 2,536
# of Households w/ Incomes of $25,000 to $29,9991 + 353 404 518 + 442 619 741
(times ) Homeownership Rate x 81% 85% 77% x 81% 85% 77%
(equals) Total Potential Market Base = 6,841 4,892 3,575 = 6,357 5,018 3,107
(times) Potential Capture Rate x 0.5% 3.5% 11.0% x 0.5% 3.5% 11.0%
(equals) Demand Potential = 34 171 393 = 32 176 342
Potential Demand from Market Area Residents = 599 = 549
(plus) Demand from Outside Market Area (25%)2
+ 200 + 183
(equals) Total Demand Potential = 798 = 732
Owner‐ Renter‐ Owner‐ Renter‐
Occupied Occupied Occupied Occupied
(times) % by Product Type x 50% x 50% x 50% x 50%
(equals) Demand Potential by Product Type = 399 = 399 = 366 = 366
(minus) Existing and Pending MR Active Adult Units3
‐ 64 ‐ 82 ‐ 64 ‐ 124
(equals) Excess Demand for MR Active Adult Units = 335 = 317 = 302 = 242
(times) Percent capturable in Cedar Rapids x 75% x 75% x 75% x 75%
(equals) # of units supportable in Cedar Rapids = 251 = 238 = 227 = 182
Source: Maxfield Research and Consulting LLC
3 Existing and pending are deducted at market equilibrium (95% occupancy).
2016 2021
Age of Householder Age of Householder
2 Based on project manager interviews and historical trends. We estimate that roughly 25% of demand will come from outside the
market area.
TABLE 35
MARKET RATE ADULT/FEW SERVICES HOUSING DEMAND
CITY OF CEDAR RAPIDS
2016 & 2021
1 2020 calculations define income‐qualified households as all households with incomes equal to or greater than $35,000 and
homeowner households with incomes between $30,000 and $34,999.
No one community would be able to capture 100% of the demand. Since Cedar Rapids is a regional center containing health care and shopping in addition to other services, we believe that it can capture 75% of the demand for ownership projects and rental projects. This results in total demand for 251 adult owner‐occupied units and 238 adult rental units in Cedar Rapids in 2016. Adjusting for inflation, it is estimated that households with incomes of $35,000 or more and homeowners with incomes of $30,000 to $34,999 would income qualify for market rate inde‐pendent senior housing in 2021. Considering growth in the older adult base and the income distribution of the older adult population in 2021, the methodology projects that demand will decrease modestly to 227 adult owner‐occupied units and 182 adult rental units by 2021.

HOUSING DEMAND ANALYSIS
MAXFIELD RESEARCH AND CONSULTING, LLC 87
Because of the current income qualification range for LIHTC units, a portion of the demand shown for active adult market rate housing would overlap with the demand for shallow‐subsidy housing.
Estimated Demand for Affordable Independent Age‐Restricted Housing Table 36 presents our demand calculations for affordable independent age‐restricted (55+) housing in the Cedar Rapids in 2016 and 2021. While the methodology used to calculate demand for shallow‐subsidy housing closely mirrors the methodology used to calculate demand for market rate housing, we make several adjust‐ments to more precisely quantify demand among this market segment. The following points summarize these adjustments: Income‐Qualifications: In order to arrive at the potential age and income‐qualified base for
low‐income and affordable housing, we include all senior households age 55+ that qualify for the income guidelines for two‐person households in 2016 between 40% and 60% of AMI. The income‐restriction for a one‐person household at 40% AMI is $23,480 and the in‐come‐restriction for a two‐person household at 60% AMI is $35,220.
Capture Rates: Households in a need‐based situation (either requiring services or financial
assistance) more readily move to housing alternatives than those in non‐need based situa‐tions. Hence, the capture rate among each age group is higher than for market rate hous‐ing. Capture rates are employed at 1.5% for households age 55 to 64, 10.0% for house‐holds age 65 to 74 and 20.0% for households age 75 and older.
Potential Demand Capture: Seniors in need‐based situations are less selective when
securing housing than those in non‐need based situations. We estimate that a high‐quality site would capture a greater proportion of total demand for financially‐assisted housing than for market rate housing; hence, the potential capture rate increases to 65% for shal‐low‐subsidy active adult housing.
Using the methodology described above results in a demand potential for 149 shallow‐subsidy active adult housing units in 2016. We estimate that older adults currently residing outside Cedar Rapids will generate 25% of the demand for shallow‐subsidy active adult housing – increasing demand to 198 units with shallow subsidy. Demand from those outside Cedar Rapids includes parents of adult children living in Cedar Rapids, individuals who live just outside Cedar Rapids and have an orientation to the area and former residents who desire to return upon retirement. Next we subtract existing competitive units. There are two shallow subsidy independent projects in Cedar Rapids; Cedar Crest features 36 units and Legacy Manor has 60 units. A third development, Commonwealth received an award for tax credits and will have 77 units of
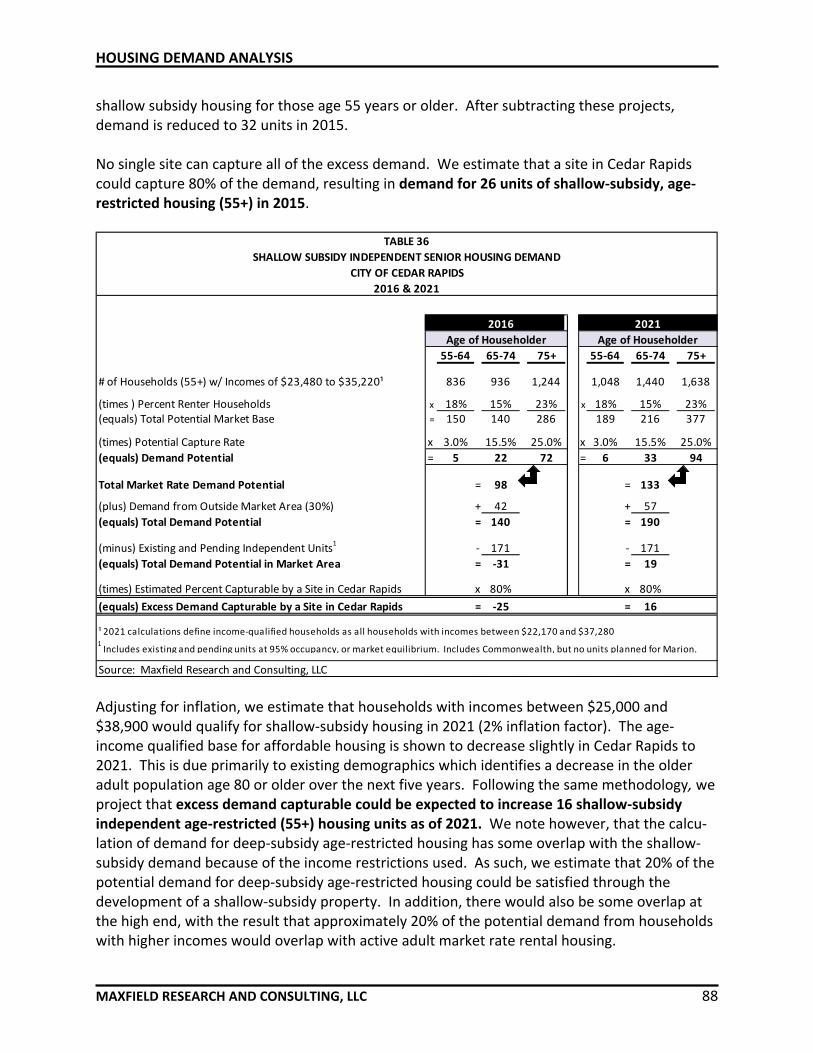
HOUSING DEMAND ANALYSIS
MAXFIELD RESEARCH AND CONSULTING, LLC 88
shallow subsidy housing for those age 55 years or older. After subtracting these projects, demand is reduced to 32 units in 2015. No single site can capture all of the excess demand. We estimate that a site in Cedar Rapids could capture 80% of the demand, resulting in demand for 26 units of shallow‐subsidy, age‐restricted housing (55+) in 2015.
55‐64 65‐74 75+ 55‐64 65‐74 75+
# of Households (55+) w/ Incomes of $23,480 to $35,220¹ 836 936 1,244 1,048 1,440 1,638
(times ) Percent Renter Households x 18% 15% 23% x 18% 15% 23%(equals) Total Potential Market Base = 150 140 286 189 216 377
(times) Potential Capture Rate x 3.0% 15.5% 25.0% x 3.0% 15.5% 25.0%
(equals) Demand Potential = 5 22 72 = 6 33 94
Total Market Rate Demand Potential = 98 = 133
(plus) Demand from Outside Market Area (30%) + 42 + 57
(equals) Total Demand Potential = 140 = 190
(minus) Existing and Pending Independent Units1
‐ 171 ‐ 171
(equals) Total Demand Potential in Market Area = ‐31 = 19
(times) Estimated Percent Capturable by a Site in Cedar Rapids x 80% x 80%
(equals) Excess Demand Capturable by a Site in Cedar Rapids = ‐25 = 16
¹ 2021 calculations define income‐qualified households as all households with incomes between $22,170 and $37,280
Source: Maxfield Research and Consulting, LLC
1 Includes existing and pending units at 95% occupancy, or market equilibrium. Includes Commonwealth, but no units planned for Marion.
2016
Age of Householder
2021
Age of Householder
TABLE 36
SHALLOW SUBSIDY INDEPENDENT SENIOR HOUSING DEMAND
CITY OF CEDAR RAPIDS
2016 & 2021
Adjusting for inflation, we estimate that households with incomes between $25,000 and $38,900 would qualify for shallow‐subsidy housing in 2021 (2% inflation factor). The age‐income qualified base for affordable housing is shown to decrease slightly in Cedar Rapids to 2021. This is due primarily to existing demographics which identifies a decrease in the older adult population age 80 or older over the next five years. Following the same methodology, we project that excess demand capturable could be expected to increase 16 shallow‐subsidy independent age‐restricted (55+) housing units as of 2021. We note however, that the calcu‐lation of demand for deep‐subsidy age‐restricted housing has some overlap with the shallow‐subsidy demand because of the income restrictions used. As such, we estimate that 20% of the potential demand for deep‐subsidy age‐restricted housing could be satisfied through the development of a shallow‐subsidy property. In addition, there would also be some overlap at the high end, with the result that approximately 20% of the potential demand from households with higher incomes would overlap with active adult market rate rental housing.

HOUSING DEMAND ANALYSIS
MAXFIELD RESEARCH AND CONSULTING, LLC 89
Estimated Demand for Deep‐Subsidy Age‐Restricted Housing Table 37 presents our demand calculations for deep‐subsidy age‐restricted housing in Cedar Rapids in 2016 and 2021. The target market for deep‐subsidy age‐restricted housing is older adult households with incomes below 50% AMI. The 2016 income qualification for a two‐person household earning 50% AMI or less in Cedar Rapids is $31,250. Two Federal government agencies, HUD and the United State Department of Agriculture’s Rural Development, provide funding for the vast majority of deep‐subsidy age‐restricted housing developments. The age restrictions are typical‐ly age 62+, therefore we only include households age 62+ with incomes at or less than 50% AMI. We deduct older adult homeowners that earn between $20,000 and $28,000 from the potential market since these seniors will likely have home equity that may cause them to be disqualified for deep‐subsidy age‐restricted housing. In total, we estimate the number of age/income‐qualified older adult households in Cedar Rapids in 2015 totals 3,107 households. A portion of seniors who are age‐ and income‐qualified for deep‐subsidy age‐restricted housing will choose other housing options (i.e. market rate projects with the financial assistance of family members) or will delay moving to age‐restricted housing alternatives until they need greater levels of care. Therefore, only a portion of the age‐ and income‐qualified market will choose to reside at a deep‐subsidy age‐restricted housing community. We estimate that approximately 30% of the total age/income‐qualified market would both need and desire deep‐subsidy senior housing. Applying a 30% capture rate, results in an estimated potential demand for 1,053 deep‐subsidy age‐restricted housing units in Cedar Rapids in 2015. We anticipate that 25% of the demand for deep‐subsidy senior housing in will be generated by seniors currently residing outside Cedar Rapids. This additional demand includes seniors residing in just outside Cedar Rapids, seniors who have an orientation to the area (i.e. church, doctor, etc.), seniors who previously lived in the area and desire to move back, or seniors who desire to move near their adult children who already live in the area. Including demand from outside of Cedar Rapids increases total demand potential to 1,057 units in 2015.

HOUSING DEMAND ANALYSIS
MAXFIELD RESEARCH AND CONSULTING, LLC 90
62‐64* 65‐74 75+ 62‐64* 65‐74 75+
Households w/Incomes < $30,500¹ 627 1,696 2,807 646 2,684 3,705
(Subtract) Households w/Incomes of $20,000 and $30,500 105 404 518 180 686 880
(times) Homeownership Rate x 81% 85% 77% x 81% 85% 77%
(equals) Disqualfied Homeowner Households = 85 343 399 = 146 583 678
Potential Income‐Qualified Market by Age 542 1,353 2,408 500 2,101 3,027
Potential Market Total in the PMA
(times) Percent Needing/Desiring Deep‐Subsidy Age‐Restricted Housing x 20% x 20%
(equals) Demand Potenital from Market Area residents = 861 = 1,126
(plus) Demand From Ouside the Market Area (25%) + 287 + 375
(equals) Total Demand Potential for Subsidized Senior Housing in Market Area 1,147 1,501
(minus) Existing & Pending Subsidized Senior Units in Market Area² ‐ 582 ‐ 582
(equals) Total Market Area Subsidized Senior Housing Demand Potential = 565 = 919
Percent Capturable on a Site in Cedar Rapids x 80% 80%
Total number of units supportable in Cedar Rapids = 452 = 735
¹ 2021 calculations define income‐qualified households as all households with incomes less than $33,500
² Competitive subsidized units, minus a 2% vacancy rate.
* Estimated number of the 55 to 64 age cohort.
Source: Maxfield Research and Consulting, LLC
TABLE 37
DEEP SUBSIDY INDEPENDENT AGE‐RESTRICTED HOUSING DEMAND
CITY OF CEDAR RAPIDS
2016 & 2021
5,629
Age of Householder
2021
Age of Householder
4,303
2016
From this potential demand, we subtract the existing number of competitive housing units in Cedar Rapids. Currently, there are 594 deep‐subsidy senior units in Cedar Rapids with very few vacant units. Subtracting these units, minus a 2% vacancy factor, results in excess demand from local older adult households for 565 units in 2016. We estimate that Cedar Rapids could capture 80% of the excess demand or 452 units in 2016 considering different locations for this type of housing. To calculate demand in 2021, we increase the income‐qualifications to account for inflation. Following the same methodology and holding constant the number of competitive units (we did not identify any new product proposed to come online); demand is forecast to increase over the next five years to 735 units in 2021.
Estimated Demand for Congregate Age‐Restricted Housing Table 39 presents our demand calculations for congregate housing in Cedar Rapids in 2016 and 2021.

HOUSING DEMAND ANALYSIS
MAXFIELD RESEARCH AND CONSULTING, LLC 91
# of Households w/ Incomes of >$35,000¹
# of Households w/ Incomes of $30,000 to $34,999¹ + +
(times) Homeownership Rate x x
(equals) Potential Market = =
(equals) Total Potential Market Base = =
(times) Potential Capture Rate² x x
(equals) Demand Potential = + = +
Potential Demand from Market Area Residents = =
(plus) Demand from Outside Market Area (20%) + +
(equals) Total Demand Potential = =
(minus) Existing and Pending Congregate Units3
‐ ‐
(equals) Excess Demand for Congregate Units = =
(times) Percent capturable in Cedar Rapids
(equals) # of units supportable in Cedar Rapids
Source: Maxfield Research and Consulting, LLC
50% 50%
¹ 2021 calculations define income‐qualified households as all households with incomes greater than $40,000 and
homeowner households with incomes between $35,000 and $39,999.
²The potential capture rate is derived from data from the Summary Health Statistics for the U.S. Population:
National Health Interview Survey, 2007 by the U.S. Department of Health and Human Services. The capture rate
used is the percentage of seniors needing assistance with IADLs, but not ADLs (seniors needing assistance with
ADLs typcially need assistance with multiple IADLs and are primary candidates for assisted living.).
212179
358 425
116 130
581 648
223 223
67 397 86 432
465 518
4,488 3,057 5,723 3,326
1.5% 13.0% 1.5% 13.0%
3,174
343 399 218 152
85% 77% 85% 77%
75+ 65‐74 75+
404 518 257 198
4,145 2,658 5,505
3 Existing and pending are deducted at market equilibrium (95% occupancy).
2016 2021
TABLE 39
MARKET RATE CONGREGATE HOUSING DEMAND
CEDAR RAPIDS
2016 & 2021
Age of
Householder
Age of
Householder
65‐74
The potential age‐ and income‐qualified base for congregate age‐restricted housing includes all senior (65+) households with incomes of $35,000 as well as homeowner households with incomes between $30,000 and $35,000 who would qualify with the proceeds from the sales of their homes. The proportion of eligible homeowners is based on the 2016 estimated home‐ownership rates for Cedar Rapids seniors. The number of age, income, and asset‐qualified households in Cedar Rapids is estimated to be 7,545 households in 2016.

HOUSING DEMAND ANALYSIS
MAXFIELD RESEARCH AND CONSULTING, LLC 92
Demand for congregate housing is need‐drive, which reduces the qualified market to only the portion of older adults who need some assistance. Adjusting to include appropriate capture rates for each age cohort (1.5% of households age 65 to 74 and 13.0% of households age 75 and older) results in a local demand potential for 465 congregate units in 2016. We estimate that seniors currently residing outside of Cedar Rapids will generate 20% of the demand for congregate senior housing. Together, the demand from Cedar Rapids older adults and demand from older adults who are willing to locate to Cedar Rapids totals 581 congregate units in 2016. Next we subtract existing competitive units from the overall demand. There are a total of 139 congregate units and we include 25% of independent CCRC units in this category. After sub‐tracting existing congregate units, the total demand is reduced to 358 units. No single location can capture all of the demand in a market area. We estimate that 50% of total demand in Cedar Rapids can be captured on a site. Demand is calculated for 179 congregate units in 2016. Adjusting for inflation, we estimate that households with incomes of $40,000 or more and senior homeowners with incomes between $35,000 and $39,999 would qualify for congregate housing in 2021. Following the same methodology, demand is calculated to increase to 212 units to 2021.
Demand Estimate for Assisted Living Housing Table 40 presents our demand calculations for assisted living housing in Cedar Rapids in 2016 and 2021. This analysis focuses on the potential private pay/market rate demand for assisted living units. The availability of more intensive support services such as meals, housekeeping and personal care at assisted living facilities usually attracts older, frailer older adults. According to the 2009 Overview of Assisted Living (which is a collaborative research project by the American Association of Homes and Services for the Aging, the American Seniors Housing Association, National Center for Assisted Living, and National Investment Center for the Seniors Housing and Care Industry), the average age of residents in freestanding assisted living facilities was 87 years in 2008. Hence, the age‐qualified market for assisted living is defined as seniors ages 75 and over, as we estimate that of the half of demand from seniors under age 87, almost all would be from seniors over age 75. In 2016, there were an estimated 8,973 seniors age 75 and older in Cedar Rapids. Demand for assisted living housing is need‐driven, which reduces the qualified market to only the portion of seniors who need assistance. According to a study completed by the U.S. Census Bureau (1999 panels of the Survey of Income and Program Participation (SIPP) files), 30% of seniors needed assistance with everyday activities (from 19.5% of 75‐to‐79‐year‐olds, to 31.2%
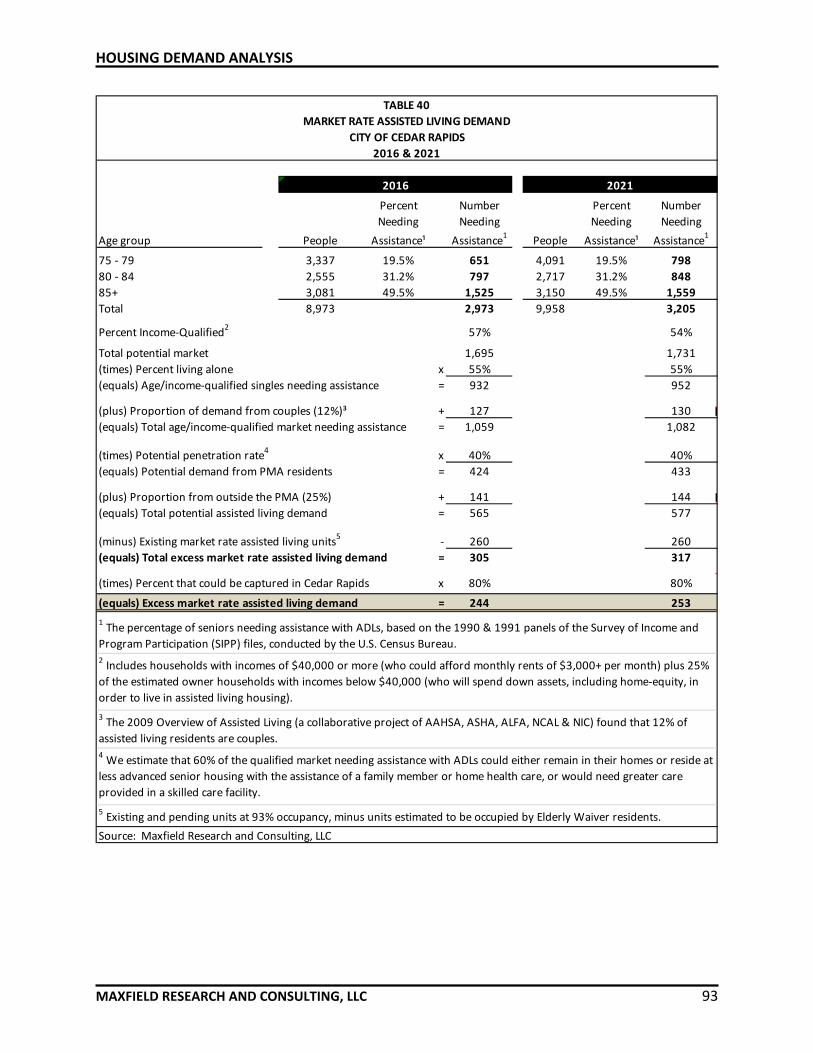
HOUSING DEMAND ANALYSIS
MAXFIELD RESEARCH AND CONSULTING, LLC 93
Percent Percent
Needing Needing
Age group People Assistance¹ People Assistance¹
75 ‐ 79 3,337 19.5% 4,091 19.5%
80 ‐ 84 2,555 31.2% 2,717 31.2%
85+ 3,081 49.5% 3,150 49.5%
Total 8,973 9,958
Percent Income‐Qualified2
Total potential market
(times) Percent living alone x
(equals) Age/income‐qualified singles needing assistance =
(plus) Proportion of demand from couples (12%)³ +
(equals) Total age/income‐qualified market needing assistance =
(times) Potential penetration rate4
x
(equals) Potential demand from PMA residents =
(plus) Proportion from outside the PMA (25%) +
(equals) Total potential assisted living demand =
(minus) Existing market rate assisted living units5
‐
(equals) Total excess market rate assisted living demand =
(times) Percent that could be captured in Cedar Rapids x
(equals) Excess market rate assisted living demand =
Source: Maxfield Research and Consulting, LLC
4 We estimate that 60% of the qualified market needing assistance with ADLs could either remain in their homes or reside at
less advanced senior housing with the assistance of a family member or home health care, or would need greater care
provided in a skilled care facility.
5 Existing and pending units at 93% occupancy, minus units estimated to be occupied by Elderly Waiver residents.
80%
244
80%
253
1 The percentage of seniors needing assistance with ADLs, based on the 1990 & 1991 panels of the Survey of Income and
Program Participation (SIPP) files, conducted by the U.S. Census Bureau.2 Includes households with incomes of $40,000 or more (who could afford monthly rents of $3,000+ per month) plus 25%
of the estimated owner households with incomes below $40,000 (who will spend down assets, including home‐equity, in
order to live in assisted living housing).
3 The 2009 Overview of Assisted Living (a collaborative project of AAHSA, ASHA, ALFA, NCAL & NIC) found that 12% of
assisted living residents are couples.
141 144
565 577
260 260
305 317
40% 40%
424 433
127 130
1,059 1,082
2,973 3,205
1,695 1,731
57% 54%
55% 55%
932 952
TABLE 40
MARKET RATE ASSISTED LIVING DEMAND
CITY OF CEDAR RAPIDS
2016 & 2021
2016 2021
1,525 1,559
Number Number
Needing Needing
797 848
Assistance1
Assistance1
651 798

HOUSING DEMAND ANALYSIS
MAXFIELD RESEARCH AND CONSULTING, LLC 94
of 80‐to‐84‐year‐olds and 49.5% of 85+ year olds). Applying these percentages to the senior population yields a potential assisted living market of 2,973 seniors in Cedar Rapids. Due to the supportive nature of assisted living housing, most daily essentials are included in monthly rental fees, which allow seniors to spend a higher proportion of their incomes on housing with basic services. Therefore, the second step in determining the potential demand for assisted living housing in Cedar Rapids is to identify the income‐qualified market based on a senior’s ability to pay the monthly rent. We consider seniors in households with incomes of $40,000 or greater to be income‐qualified for assisted living senior housing. Households with incomes of $40,000 could afford monthly assisted living fees of $3,000 by allocating 90% of their income toward the fees. According to the 2009 Overview of Assisted Living, the average arrival income of assisted living residents in 2008 was $27,260, while the average annual assisted living fee was $37,281 ($3,107/month). This data highlights that seniors are spending down assets to live in assisted living and avoid institutional care. Thus, in addition to households with incomes of $30,000 or greater, there is a substantial base of senior households with lower incomes who income‐qualify based on assets – their homes, in particular. Seventy‐seven (77%) percent of the age 75+ households in Cedar Rapids are homeowners, and the median resale price of existing homes in 2016 in the community was $143,000. Seniors selling their homes for the median resale price would generate about $134,420 in proceeds after selling costs. With an average monthly assisted living fee of $3,500, these proceeds would last 38 months or a little more than three years in an assisted living facility, which is modestly above the average length of stay in assisted living (27 months according to the 2009 Overview of Assisted Living). For each age group in Table 37, we estimate the income‐qualified percent‐age to be all seniors in households with incomes above $40,000 (who could afford monthly rents of $3,500+ per month) plus a portion of seniors in homeowner households with incomes below $40,000 (who will spend down assets, including home‐equity, in order to live in assisted living housing). This results in a total potential market of 1,695 units from Cedar Rapids in 2016. Because the vast majority of assisted living residents are single (88% according to the 2009 Overview of Assisted Living), our demand methodology multiplies the total potential market by the percentage of seniors age 75+ living alone. Based on 2014 Census data, 55% of age 75+ households in Cedar Rapids lived alone. Applying this percentage results in a total base of 932 age/income‐qualified singles. The 2009 Overview of Assisted Living found that 12% of residents in assisted living were couples. There are a total of 1,059 age/income‐qualified seniors needing assistance including both couples and singles. We estimate that roughly 60% of the qualified market needing significant assistance with Activities of Daily Living (“ADLs”) would either remain in their homes or less service‐intensive senior housing with the assistance of a family member or home health care, or would need greater care provided in a skilled care facility. The remaining 40% could be served by assisted

HOUSING DEMAND ANALYSIS
MAXFIELD RESEARCH AND CONSULTING, LLC 95
living housing. Applying this potential market penetration rate of 40% results in demand for 424 assisted living units in 2016. We estimate that a portion of demand for assisted living units (25%) will come from outside of Cedar Rapids. Applying this figure results in total potential demand for 565 market rate assisted living units. There are a total of 323 units. However, a portion of these units are occupied by residents with financial assistance, estimated to account for 15% of the total units in the Market Area. After deducting these competitive units (minus a 93% occupancy rate) from the total demand potential, we calculate the excess supply of assisted living units at 260. Subtracting the 260 units from the potential demand results in excess assisted living demand in 2016 of 305 units. At an 80% capture rate for Cedar Rapids, this results in potential excess demand of 244 units as of 2016. The same calculations are applied to the age/income‐qualified base in 2021. With the existing supply of assisted living product in Cedar Rapids, excess demand is calculated for 253 units in 2016. This does not include potential units that would be developed in the following properties: Grand Living, The Gardens and The Views. The addition of assisted living units from these properties would reduce demand for 2021. Most assisted living developments require residents to have lived in their facility for a certain amount of time before they can use a waiver, and many try to limit the amount of waivers accepted within the community to around roughly 10% to 15%. Some facilities accept higher amounts of residents on waivers and many newer facilities do not accept any waivers.
Estimated Demand for Memory Care Housing Table 41 presents our demand calculations for market rate memory care senior housing in Cedar Rapids in 2016 and 2021. Demand is calculated by starting with the estimated senior (age 65+) population in 2016 and multiplying by the incidence rate of Alzheimer’s/dementia among this population’s age cohorts. According to the Alzheimer’s Association (Alzheimer’s Disease Facts and Figures, 2007), 2% of seniors ages 65 to 74, 19% of seniors ages 75 to 84, and 42% of seniors ages 85+ are inflicted with Alzheimer’s Disease. This yields a potential market of 2,630 seniors in Cedar Rapids.
Because of the staff‐intensive nature of dementia care, typical monthly fees for this type of housing are at least $4,000 and may range up to more than $6,000 when including service packages. Based on our review of senior household incomes in Cedar Rapids, homeownership rates and home sale data, we estimate that 37% of seniors in Cedar Rapids would have incomes and/or assets to sufficiently cover the costs of memory care housing. This figure takes into account married couple households where one spouse may have memory care needs and

HOUSING DEMAND ANALYSIS
MAXFIELD RESEARCH AND CONSULTING, LLC 96
allows for a sufficient income for the other spouse to live independently. Multiplying the number of seniors
65 to 74 Population 10,843 13,116
(times) Dementia Incidence Rate¹ x 2% x 2%
(equals) Estimated Age 65 to 74 Pop. with Dementia = 217 = 262
75 to 84 Population 5,892 6,808
(times) Dementia Incidence Rate¹ x 19% x 19%
(equals) Estimated Age 75 to 84 Pop. with Dementia = 1,119 = 1,294
85+ Population 3,081 3,150
(times) Dementia Incidence Rate¹ x 42% x 42%
(equals) Estimated Age 85+ Pop. with Dementia = 1,294 = 1,323
(equals) Total Senior Population with Dementia = 2,630 = 2,879
(times) Percent Income/Asset‐Qualified² x 37% x 38%
(equals) Total Income‐Qualified Market Base = 973 = 1,094
(times) Percent Needing Specialized Memory Care Assistance x 25% x 25%
(equals) Total Need for Dementia Care = 243 = 273
(plus) Demand from Outside Market Area (25%) + 81 + 91
Total Demand Potential = 324 365
(minus) Existing and Pending Memory Care Units³ ‐ 89 ‐ 89
(equals) Excess Demand for Memory Care Units = 235 = 276
(times) Percent capturable in Cedar Rapids x 60% x 60%
(equals) # of units supportable in Cedar Rapids = 141 = 165
Source: Maxfield Research and Consulting, LLC
TABLE 41
MEMORY CARE DEMAND
CITY OF CEDAR RAPIDS
2016 and 2021
2021
¹ Alzheimer's Association: Alzheimer's Disease Facts & Figures (2007)
² Income‐qualified households consider those with incomes greater than $65,000 in 2016 plus 20% of
homeowners with incomes below this threshold.
2016
³ Existing memory care units less units occupied by public pay residents and a 7% vacancy rate.
with Alzheimer’s/dementia (2,630 seniors) by the income‐qualified percentage results in a total of 973 age/income‐qualified seniors in 2016. According to data from the National Institute of Aging, about 25% of all individuals with memory care impairments comprise the market for memory care housing units. This figure considers that seniors in the early stages of dementia will be able to live independently with the care of a spouse or other family member, while those in the later stages of dementia will require intensive medical care that would only be available in skilled care facilities. Applying
HOUSING DEMAND ANALYSIS
MAXFIELD RESEARCH AND CONSULTING, LLC 97
this figure to the estimated population with memory impairments yields a potential market of about 243 seniors. We estimate that 25% of the overall demand for memory care housing would come from outside of Cedar Rapids. Together, demand totals 324 memory care units in 2016. We reduce the demand potential by accounting for the existing memory care product. There are 113 units and we reduce the competitive units to include only the private pay units (esti‐mated at 96 units). Subtracting these competitive units at a 93% occupancy rate results in excess demand for 141 memory care units in 2016. Following the same methodology, demand is calculated to increase to 165 units by 2021.

RECOMMENDATIONS AND CONCLUSIONS
MAXFIELD RESEARCH AND CONSULTING, LLC 98
Introduction/Overall Housing Recommendations This section summarizes demand calculated for specific housing products in Cedar Rapids and recommends development concepts to meet the housing needs forecast for the City. All recommendations are based on findings of the Comprehensive Housing Market Analysis. The following table and charts illustrate calculated demand by product type. It is important to recognize that housing demand is highly contingent on projected household growth; household growth could be higher should increased job growth ensue and the overall economy improves.
Type of Use
General‐Occupancy
Rental Units ‐ Market Rate
Rental Units ‐ Shallow‐Subsidy
Rental Units ‐ Deep‐Subsidy
For‐Sale Units ‐ Single‐family
For‐Sale Units ‐ Multifamily
Total General Occupancy Supportable
2016 2021
Age‐Restricted (Senior)
Market Rate
Adult Few Services (Active Adult) 489 409
Ownership 251 227
Rental 238 182
Congregate 179 212
Assisted Living 244 253
Memory Care 141 165
Total Market Rate Senior Supportable 1,053 1,039
Shallow‐Subsidy/Deep‐Subsidy
Active Adult ‐ Deep Subsidy 452 735
Active Adult ‐ Shallow‐Subsidy ‐25 16
Total Affordable Senior Supportable 427 751
Note: Some overlap exists between active adult deep‐ and shallow‐subsidy
Source: Maxfield Research and Consulting, LLC
1,920
193
561
1,013
630
4,317
TABLE 42
SUMMARY OF HOUSING DEMAND
CITY OF CEDAR RAPIDS
October 2016
2016‐2025

RECOMMENDATIONS AND CONCLUSIONS
MAXFIELD RESEARCH AND CONSULTING, LLC 99
1,013
561
193
1,920
630
0 500 1,000 1,500 2,000 2,500
Rental Units ‐ Market Rate
Rental Units ‐ Shallow‐Subsidy
Rental Units ‐ Deep‐Subsidy
For‐Sale Units ‐ Single‐family
For‐Sale Units ‐ Multifamily
Units
General‐Occupancy Demand by Type2016 to 2025
735
16
165
253
212
182
227
452
‐25
141
244
179
238
251
‐200 0 200 400 600 800
Deep‐Subsidy
Shallow‐Subsidy
Memory Care
Assisted Living
Congregate
Adult ‐ Rental
Adult ‐ Owner
Units
Senior Housing Demand by Type 2016 & 2021
2016 2020

RECOMMENDATIONS AND CONCLUSIONS
MAXFIELD RESEARCH AND CONSULTING, LLC 100
Based on the finding of our analysis and demand calculations, Table 43 provides a summary of the suggested development concepts by product type for the City. It is important to note that these proposed concepts are intended to act as a development guide for the City regarding the types of housing products that the City should encourage. The suggested development types in Table 43 do not directly coincide with total demand for the other demand tables due primarily to a continued housing market recovery and to an adjustment made for properties that are already proposed and/or under construction.
Purchase Price/ Development
Monthly Rent Range¹ Timing
General Occupancy Rental Housing
Market Rate Rental Housing2
Apartment‐style $850/1BR ‐ $1,200/2BR 200 ‐ 300 2016+
Affordable Rental Housing
Shallow‐Subsidy Moderate Income3
125 ‐ 175 2016+
Deep‐Subsidy Low Income 80 ‐ 100 2016+
Market Rate Single‐Family Entry‐Level (Core Neighbor.) 300 ‐ 500 2016+
Market Rate Multifamily Owned Entry‐Level/Move‐Up (Core) 100 ‐ 200 2016+
Senior Housing (i.e. Age Restricted)
Active Adult Market Rate Rental4
$800/1BR ‐ $1,100/2BR 100 ‐ 120 2016+
Active Adult Market Rate Owner $150,000/1BR‐$200,000/2BR 50 ‐ 65 2017+
Active Adult Shallow Rental4
Moderate Income3
0 ‐ 100 2017+
Congregate $2,200/1BR ‐ $3,000/2BR 120 ‐ 150 2016+
Deep‐Subsidy Senior5
30% of Income 100 ‐ 150 2016+
Market Rate Assisted Living $3,200/1BR ‐ $4,000/2BR 65 ‐ 70 2017+
Market Rate Memory Care $4,500/Std. ‐ $5,500/1BR 40 ‐ 40 2016+
Total 475 ‐ 695
Note ‐ Recommended development does not coincide with total demand.
Source: Maxfield Research and Consulting, LLC
Units
TABLE 43
¹ Pricing in 2016 dol lars . Pricing can be adjusted to account for inflation.2 The development of these products can occur a fter the vacancy rate i s a t or below 5%. Additiona l renta l
development could occur a fter new development has been absorbed and phased into the market.
3 Affordabl i ty subject to income guidel ines per Iowa Hous ing Authori ty.
4 Al ternative development concept i s to combine active adult shal low‐subs idy and market rate active adult into
one mixed‐income senior community
5. Deep‐subs idy senior wi l l be di fficul t to develop financia l ly; some overlap between sha l low‐/deep‐subs idy
RECOMMENDED HOUSING DEVELOPMENT
CITY OF CEDAR RAPIDS
2016 to 2020
No. of

RECOMMENDATIONS AND CONCLUSIONS
MAXFIELD RESEARCH AND CONSULTING, LLC 101
For‐Sale Housing Demand for for‐sale housing remains strong, but there is limited inventory to meet demand. Home pricing is anticipated to increase again in 2017 because of fewer homes on the market and less speculative new construction. Most of the new development appears to be targeted toward move‐up buyers. With low inventory among existing homes, townhome and condo development may be a way to assist first‐time homebuyers in moving into that first home. Special programs for affordable for‐sale housing have been successful in bringing new housing product into the core. While the housing market is still recovering, some caution should be exercised as land prices are increasing rapidly. This is pushing the price of new construction homes higher. We see continued demand for new owner‐occupied single‐family homes. Developing new housing products that would target first time homebuyers and would be in locations in close proximity to schools would be likely to be highly successful.
General Occupancy Rental Housing Our competitive inventory identified that the vacancy rates for all types of general occupancy have remained essentially stable as of September 2016 at 2.4% although concessions appear to be increasing modestly from one year ago. Due to the older age and positioning of most of the existing rental supply, many older units are priced at or below guidelines for shallow‐subsidy/workforce housing, which indirectly satisfies demand from households that income‐qualify for financially assisted housing. However, the growing renter base is seeking newer rental properties with additional and updated amenities that are not offered in older develop‐ments. Although ownership housing in Cedar Rapids is very affordable for first‐time home buyers, some are choosing to rent due to fears of past housing market performance or the need for more lifestyle flexibility and mobility. Maxfield Research calculated demand for 316 market rate, 233 shallow‐subsidy, and 84 deep‐subsidy rental housing units in the City to 2025. Based on our analysis, the City should be able to accommodate another 300 new market rate rental units across the City over the next three to four years as well as 200 shallow‐subsidy units.
Market Rate Rental – The existing market rate rental supply in Cedar Rapids is somewhat older. New market rate units have recently been brought on‐line in the Downtown core and a limited number outside of the core. Housing units within the core should continue to focus on providing smaller unit types while housing in the suburban locations should have a broader mix that would include one‐, two‐ and three‐bedroom units.

HOUSING PROGRAMS
MAXFIELD RESEARCH AND CONSULTING, LLC 102
Monthly rents (in 2016 dollars) should range from $895 for a one‐bedroom unit to $1,200 for a two‐bedroom unit in the Downtown core, but should be less than this outside of the Downtown. Average rents in Cedar Rapids remain at $0.84 per square foot, however monthly rents for new product should range from $1.10 to $1.20 per square foot to be fi‐nancially feasible. Monthly rents can be trended up by 1.5% annually prior to occupancy to account for inflation depending on overall market conditions. We are somewhat concerned that new properties appear to have lowered rents to some degree to fill new units. Because of construction and development costs, it may be difficult for a market rate apartment to be financially feasible with rents lower than the suggested per square foot price. Thus, for this type of project to become a reality, there may need to be a public – private partnership to reduce development costs and bring down the rents or the developer will need to provide smaller unit sizes. In order to make these projects feasible, developers have used special funding in the past through a program offered by the State to create a mixed‐income devel‐opment whereby 51% of the units are income‐restricted. It is likely that this program will no longer be available.
New market rate rental units should be designed with contemporary amenities that include open floor plans, high ceilings, in‐unit washer and dryer, full appliance package, central air‐conditioning, high‐speed internet, cable TV and Wi‐Fi connections in addition to garage parking.
Shallow‐Subsidy General Occupancy Rental– We find that demand exists for233 shallow‐subsidy units up to 2020. New tax credit units have been approved for Cedar Rapids and developers continue to submit proposals for tax credit financed units. Thus far, most of these units have been absorbed into the market. Units in the Downtown core have ab‐sorbed rapidly.
We recommend a project with one‐, two‐ and three‐bedroom units. Units should feature central air conditioning, full appliance package, in‐unit washer/dryer, an attached one/two car garage. Such development could assist in drawing more families to the community that cannot find affordable housing options through ownership or market rate rental in the sur‐rounding area; rental townhomes could serve this type of segment.
We believe the addition of the rental developments suggested above will further provide sufficient housing choices in the City and will continue to serve the needs of households that live and/or currently work in Cedar Rapids.
Senior Housing As illustrated in Table 43, demand exists for all service levels of senior housing in the City of Cedar Rapids. New senior housing developments are planned to break ground in the near future. Most of the units planned are focused toward service‐enriched senior housing. We believe that there is strong demand for independent living and that this category is likely to

HOUSING PROGRAMS
MAXFIELD RESEARCH AND CONSULTING, LLC 103
take center stage over the next few years. Developers in other communities have been reduc‐ing the amount of separation between assisted living and independent living and allowing the resident to elect to receive services in their independent living unit as they age in place.
Active Adult Rental – Demand is projected for 182 market rate active adult rental units in Cedar Rapids to 2020. Currently, there are almost no active adult rental products in the community; most of the entire product in this format is located in Continuing Care Retire‐ment Communities which require a substantial entry fee or in tax credit developments with income restrictions. It is very likely there are seniors who currently reside in general‐occupancy housing that would consider a newer active adult rental product. The consider‐able success of LIHTC developments that are age‐restricted indicates that a portion of the market is being satisfied by this product. Development of this product could be in a separate stand‐alone facility or in a mixed‐income project. A mixed‐income building could include a portion of units that would be af‐fordable to seniors with incomes established by the Iowa Housing Authority, such as Cedar Crest. During the Recession, many older adults delayed making a move to age‐restricted housing because of the low sale prices in the for‐sale market. This is changing as prices are again increasing, albeit somewhat slowly.
Shallow‐Subsidy and Deep‐Subsidy Age‐Restricted Rental – We find limited demand for shallow‐subsidy age‐restricted (55+) older adult and strong demand for deep‐subsidy age‐restricted rentals over the next five years. There is some overlap among households quali‐fied for a shallow‐subsidy development, those that would qualify for a deep‐subsidy devel‐opment and those that qualify for market rate housing. Typically, the income overlap would be between $26,100 and $35,000 in annual income. This overlap could add about 20% to 30% more units to the demand for shallow‐subsidy age‐restricted rental from either side of the income spectrum. On the high end of the spectrum, there would also be some overlap between shallow‐subsidy and market rate active adult rental housing. Financing deep‐subsidy age‐restricted housing is difficult as federal funds have been shrink‐ing. Therefore, a new subsidized development would likely rely on a number of funding sources; from low‐income tax credits (LIHTC), tax‐exempt bonds, USDA 515 program, among others.
Congregate – Demand was calculated for 179 to 212 congregate units over the next five years. Based on this demand, we recommend 80 independent living with some services with a mix of one‐bedroom, one‐bedroom plus den, and two‐bedroom units. Base monthly rents should range from $2,000 for one‐bedroom units to $3,000 for two‐bedroom units. The monthly fees should include all utilities (except telephone and basic cable/satellite tele‐vision) and the following services:
HOUSING PROGRAMS
MAXFIELD RESEARCH AND CONSULTING, LLC 104
I’m OK program;
Up to two meals per day;
Regularly scheduled van transportation;
Social, health, wellness and educational programs;
24‐hour emergency call system; and
Complimentary use of laundry facilities. In addition, meals and other support and personal care services will be available to congre‐gate residents on a fee‐for‐service basis, such as laundry, housekeeping, etc. When their care needs increase, residents also have the option of receiving assisted living packages in their existing units.
Assisted Living – Demand was calculated for 244 assisted living units over the next five years. We recommend between 50 and 70 assisted living units with a mix of studio and one‐bedroom units and a limited number of two‐bedroom units. Base monthly rents should range from $3,000 for studio units to $4,000 for two‐bedroom units. The monthly fees should include all utilities (except telephone and basic cable/satellite television) and the fol‐lowing services:
I’m OK program;
Three meals per day plus snacks;
Weekly housekeeping;
Medication oversight;
Laundering of Linens;
Regularly scheduled van transportation;
Social, health, wellness and educational programs;
24‐hour emergency call system; and
Complimentary use of laundry facilities.
In addition, other support and personal care services will be available to assisted living resi‐dents on a fee‐for‐service basis, such as personal laundry, and other personal cares.
Memory Care – Demand was calculated for 141 memory care units in 2016. Based on this demand, we recommend development of about 50 units of memory care associated with either a continuum of care campus or combined with assisted living. Unit types offered should include studio and one‐bedroom units. Base monthly rents should range from $4,500 for studio units to $4,900 for one‐bedroom units. The monthly fees should include all utilities (except telephone and basic cable/satellite television) and the following services:
Daily check program;
Three meals per day plus snacks;
Daily housekeeping;
Transportation to doctor’s appointments;

HOUSING PROGRAMS
MAXFIELD RESEARCH AND CONSULTING, LLC 105
Social, health, wellness and educational programs;
24‐hour emergency call system; and
Linens and personal laundry.
Medication administration and oversight.
Personal grooming, bathing dressing as needed.
In addition, other care services would be available to residents on a fee‐for‐service basis.
Challenges and Opportunities Table 43 identifies and suggests housing types that would satisfy the housing needs in Cedar Rapids up to 2020. The following were identified as challenges and opportunities for develop‐ing the recommended housing types (in no particular order).
Affordability. Based on current home prices, the majority of Cedar Rapids’ householders could afford to purchase an entry‐level home given today’s pricing (see following page). Similarly, most householders can also afford the average market rate rent of Cedar Rapids rental developments which remains rather low. Because of this condition, some house‐holders who would not consider purchasing may do so earlier since the cost to own an en‐try‐level home is on‐par with rental housing costs. In fact, there are a few cases where owning a home may be more affordable than renting. Furthermore, investors may pur‐chase single‐family homes at reduced prices and convert the properties to single‐family rentals that currently compete with traditional apartment units. Cedar Rapids has a rela‐tively large base of single‐family rentals. The following chart compares the costs of home‐ownership to rentals given today’s housing costs based on a 30% allocation of income to housing. Not all householders however, have the credit scores and down payment that would qualify them to purchase for‐sale housing.
Shadow Rental Inventory. Shadow rentals are generally considered nontraditional rentals that were previously owner‐occupied single‐family homes, townhomes, or condominiums. The shadow market has been particularly fueled by homeowners who lost their home to foreclosure who opt to not rent in a traditional rental complex. Typically, short sales and foreclosures have resulted in substantial price reductions which have allowed buyers or in‐vestors to charge rents below market while still maintaining a profit. Although the shadow market rentals tend to be at lower costs, renters run the risk of evictions if the owner does not pay the mortgage.
We know that the City of Cedar Rapids has a rental registration program that was initiated several years ago. Therefore, the City has the ability to monitor the number of non‐traditional rental units in the community. Many communities do not license single‐family rentals and do not accurately inventory the shadow market. Cedar Rapids should continue

HOUSING PROGRAMS
MAXFIELD RESEARCH AND CONSULTING, LLC 106
to monitor the number of units in this program in order to mitigate problem properties and improve the overall rental housing stock.
For‐Sale (Assumes 10% down payment and good credit)
Entry‐Level Move‐Up Executive Entry‐Level Move‐Up Exec/Det.
Price of House $100,000 $180,000 $300,000 $100,000 $180,000 $240,000
Pct. Down Payment 10.0% 10.0% 10.0% 10.0% 10.0% 10.0%
Total Down Payment Amt. $10,000 $18,000 $30,000 $10,000 $18,000 $24,000
Cost of Loan $90,000 $162,000 $270,000 $90,000 $162,000 $216,000
Interest Rate 3.750% 3.750% 3.750% 3.750% 3.750% 3.750%
Number of Pmts. 360 360 360 360 360 360
Monthly Payment (P & I) ‐$417 ‐$750 ‐$1,250 ‐$417 ‐$750 ‐$1,000
(plus) Prop. Tax ‐$150 ‐$270 ‐$450 ‐$150 ‐$270 ‐$360
(plus) Homeowner's Ins./Assoc. Fee for TH ‐$33 ‐$60 ‐$100 ‐$125 ‐$125 ‐$125
(plus) PMI/MIP (less than 20%) ‐$39 ‐$70 ‐$117 ‐$39 ‐$70 ‐$94
Subtotal monthly costs ‐$639 ‐$1,150 ‐$1,917 ‐$731 ‐$1,215 ‐$1,579
Housing Costs as % of Income 30% 30% 30% 30% 30% 30%
Minimum Income Required $25,565 $46,018 $76,696 $29,232 $48,618 $63,157
Pct. Of Cedar Rapids Housholds 80.3% 61.2% 37.2% 76.2% 63.3% 50.6%
Rental
1BR 2BR 3BR 1BR 2BR 3BR
Monthly Rent $451 $573 $794 $725 $950 $1,150
Annual Rent $5,412 $6,876 $9,528 $8,700 $11,400 $13,800
Housing Costs as % of Income 30% 30% 30% 30% 30% 30%
Minimum Income Required $18,040 $22,920 $31,760 $29,000 $38,000 $46,000
Pct. Of Cedar Rapids Households 84.4% 75.7% 68.6% 73.3% 61.6% 52.3%
CEDAR RAPIDS HOUSING AFFORDABILITY ‐ BASED ON HOUSEHOLD INCOME
Single‐Family Townhome
Existing Rental New Rental
Job Growth/Employment. Historically, low unemployment rates have driven both existing home purchases and new‐home purchases. Cedar Rapids’ unemployment rate recently in‐creased against unemployment rates that remain low for Iowa overall. We are aware how‐ever, of new companies that have announced they are bringing new jobs to Cedar Rapids which should continue to support the labor force and therefore, the housing market. Addi‐tional job creation in Cedar Rapids and especially in the Downtown will continue to support household growth, there may be a temporarily lull in demand due to lower employment.
Housing Programs. There are some housing programs that the City could consider to aid and improve the City’s housing stock. The following is a list of potential programs that could be explored. o Remodeling Advisor – Partner with local architects and/or builders to provide ideas and
general cost estimates for property owners. o Construction Management Services – Assist homeowners regarding local building codes,
reviewing contractor bids, etc. Typically provided as a service by the building depart‐ment.

HOUSING PROGRAMS
MAXFIELD RESEARCH AND CONSULTING, LLC 107
o Historic Preservation – Encourage residents to preserve historic housing stock in neigh‐borhoods with homes with character through restoring and preserving architectural and building characteristics. Typically funded with low interest rates on loans for preserva‐tion construction costs.
o Foreclosure Home Improvement Program – Low‐interest loans to buyers of foreclosed homes to assist home owners with needed home improvements while stabilizing owner‐occupied properties. A portion of the loan could be forgivable if the occupant resides in home at least five years. Eligible participants should be based on income‐guidelines (typically 80% AMI or lower).
o Rent to Own ‐ Income‐eligible families rent for a specified length of time with the end‐goal of buying a home. The HRA saves a portion of the monthly rent that will be allocat‐ed for a down payment on a future house.
o Rental Collaboration – Host meetings on a regular basis (quarterly, bi‐annually, or annu‐ally) with rental property owners, property management companies, Realtors, etc. to discuss key issues and topics related to the rental housing industry in Cedar Rapids.
o Home Fair – Provide residents with information and resources to promote improve‐ments to the housing stock. Typically offered on a weekend in early spring where home owners can meet and ask questions to architects, landscapers, building contractors, lenders, building inspectors, etc.
Age of Rental Housing Stock. As illustrated in the Rental Market Analysis section of the report, development in the Downtown core has recently been robust. Additional owned and rental construction is occurring and Downtown is also attracting new retail and em‐ployment. New developments are focusing on providing upgraded features and amenities and renters have been attracted to this new product.
Multifamily Development Costs. It may be difficult to construct new multifamily product with amenities today’s renter’s desire given achievable rents and development costs. Maxfield Research tracks development and construction costs for new rental housing across the upper Midwest. In the Twin Cities, the average cost per unit ranges from about $150,000 to $250,000; whereas in Sioux Falls South Dakota, many market rate rental pro‐jects average only just over $100,000 per unit. The average rent per square foot overall is currently at $0.84 per square foot; most new rental projects will need about $1.05 or more per square foot to be financially feasible. Based on these costs, it may be difficult to devel‐op stand‐alone multifamily housing structures by the private sector based on achievable rents. As a result, a private‐public partnership or other financing programs may be required to spur development.
For‐Sale Housing. It may be difficult to construct new multifamily product with amenities today’s renter’s desire given achievable rents and development costs. Maxfield Research tracks development and construction costs for new rental housing across the upper Mid‐west. In the Twin Cities, the average cost per unit ranges from about $150,000 to $250,000; whereas in Sioux Falls South Dakota, many market rate rental projects average only just over $100,000 per unit. The average rent per square foot overall is currently at $0.84 per

HOUSING PROGRAMS
MAXFIELD RESEARCH AND CONSULTING, LLC 108
square foot; most new rental projects will need about $1.05 or more per square foot to be financially feasible. Based on these costs, it may be difficult to develop stand‐alone multi‐family housing structures by the private sector based on achievable rents. As a result, a pri‐vate‐public partnership or other financing programs may be required to spur development.