“Everything We Do, It's Cedar”: First Nation and Ecologically ...
Upload
khangminh22Category
view
0download
0
Cesar E. Valladares
LISN observations over the American continent
1
University of Texas at Dallas

2
Outline
The tropical Ionization Anomaly, TEC anomaly observed with a large network of GPSs.
Observations of TIDs with GPS receivers and VIPIR ionosondes.

LISN GPS receivers and basic measurements
3

The tropical Ionization Anomaly. TEC values for July 12, 2011
Abrupt termination of TEC enhancement where declination changes. Occurs during afternoon hours.
Valladares and Eccles, 20154

TEC values for December 12, 2011

Hour-by-hour variability of the TEC tropical ionization anomaly

Operates during the June Solstice
Operates during the December Solstice
Both the westward & North-south wind move plasma up the field lines.
Wind system associated with tropical TEC enhancement

TEC results of the numerical model LLIONS using 90 planes along parallel field lines. One every degree between 120° W and 30° W.

LISN VIPIR ionosondes and basic measurements
9
Tupiza: vertical sounding
Tucuman: oblique sounding
LISN magnetometers LISN Ionosondes

Due to passage of GW over field-of-view of VIPIR ionosonde.
TEC perturbations associated with TIDs are detrended to study AGWs.

Tropical Storm Irene observed on August 21, 2011, at 00 UT
Convective plumes

TIDs (dTEC traces) observed at 8stations in the Caribbean region onAugust 21, 2011 between 00 and 05 UT.
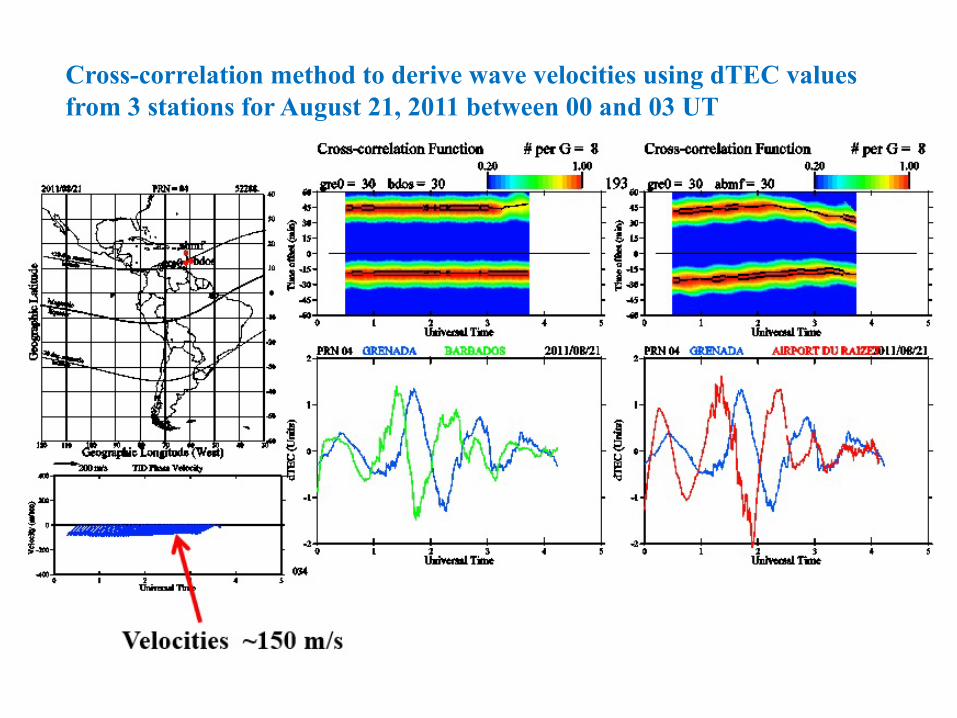
Cross-correlation method to derive wave velocities using dTEC values from 3 stations for August 21, 2011 between 00 and 03 UT

TIDs (dTEC traces) observed at 8stations in Northern Colombia onAugust 21, 2011 between 03 and 09 UT.

Cross-correlation method to derive wave velocities using dTEC values from 3 stations

Vadas and Crowley (2010) JGR Sources of the traveling ionosphericdisturbances observed by the ionospheric TIDDBIT sounder near Wallops Islandon 30 October 2007.
ConvectivePlume
Z=15 kmTropopause
Bottomside F region
Z=90 km mesosphere body forces
Primary TIDs have velocities less than 200 m/s and small periods .
Secondary MSTIDs have scale sizes between 1000 and 2000 km, horizontal velocity ~500 m/s and periods ~80 min
Z=140 km thermosphericbody forces

TIDs associated with Tropical storm Irene (August 20-21, 2011)
GOES 12 image showing Tropical storm Irene.

TIDs associated with Tropical storm Irene (August 20-21, 2011)
GOES 12 image showing Tropical storm Irene.

Summary
LISN is providing regional maps of TEC and TIDs over South andCentral America and the Caribbean region.
The LISN network together with other networks of GPS receivers wereused to obtain the characteristics of TEC enhancements that developover Central America and the southern part of South America duringthe June and December Solstices.
We detected and analyzed TIDs signature associated with the tropicalstorm Irene that was observed in the Caribbean region on August 20-21,2011. Our analysis suggest the detection of primary and secondarygravity waves.
19

20

21
Copyright © 2022 FDOKUMEN