Mobilising pension assets for housing finance needs in Africa
54
Mobilising pension assets for housing finance needs in Africa – Experiences and prospects in East Africa Matrix Development Consultants Dr James Mutero with Mwijage Bishota Dr William Kalema (UMACIS Consultants) Duncan Kayiira (UMACIS Consultants) December 2010
-
Upload
khangminh22 -
Category
Documents
-
view
1 -
download
0
Transcript of Mobilising pension assets for housing finance needs in Africa

Mobilising pension assets for housing finance needs in Africa – Experiences and prospects in East Africa
Matrix Development Consultants
Dr James Mutero
with
Mwijage Bishota
Dr William Kalema (UMACIS Consultants)
Duncan Kayiira (UMACIS Consultants)
December 2010

Mobilising Pension Assets for Housing Finance Needs in East Africa Report to the FinMark Trust (December 2010)
ii
Abbreviations and Acronyms
ABS Asset Backed Security BCR Commercial Bank of Rwanda BHR Rwanda Housing Finance Bank BNR National Bank of Rwanda BOU Bank of Uganda BOURBS Bank of Uganda Retirement Benefits Scheme BRD Rwanda Development Bank CAA Civil Aviation CMA Capital Markets Authority CSR Caisse Sociale du Rwanda DB Defined Benefit DC Defined Contribution GDP Gross Domestic Product GDP Gross Domestic Product HF Housing Finance HFB Housing Finance Bank IFC International Finance Corporation ILO International Labour Organisation IMF International Monetary Fund IPO Initial Public Offering KCB Kenya Commercial Bank KES Kenyan shilling MLF Mortgage Liquidity Facility MoFPED Ministry of Finance Planning and Economic Development NBI Non-‐Banking Institutions NGOs Non Governmental Organisations NSE Nairobi Stock Exchange NSSF National Social Security Fund NSSF National Social Security Fund OECD Organization for Economic Cooperation and Development PSPS Public Sector Pension Scheme RBA Retirement Benefits Authority REIT Real Estate Investment Trust RSSB Rwanda Social Security Board RVR Rift Valley Railways RWF Rwandan franc Rwf Rwandan Francs TZS Tanzania shilling UBOS Uganda Bureau of Statistics UGX Ugandan shilling USD United States dollar
Currencies 1 USD = 75 KES (Kenyan shillings) 1 USD = 1327 TZS (Tanzanian shillings) 1 USD = 2044 UGX (Ugandan shillings) 1 USD = 560 RWG (Rwandan Francs)

Mobilising Pension Assets for Housing Finance Needs in East Africa Report to the FinMark Trust (December 2010)
iii
Contents
1 Introduction ............................................................................................................................ 1
2 Economic and Financial Setting ................................................................................................ 3
2.1 Overview .................................................................................................................................. 3
2.2 Growing Informalisation of Regional Economies ..................................................................... 7
3 The Pension Landscape: Institutions and their Coverage .......................................................... 8
3.1 Institutions ............................................................................................................................... 8
3.2 Coverage and profiles of contributors ................................................................................... 13
4 Regulation, Investment Opportunities and Pension Fund Behaviour ...................................... 14
4.1 Regulation .............................................................................................................................. 14
4.2 Investment Opportunities and Pension Fund Behaviour ....................................................... 16
5 Mobilising pension assets for housing .................................................................................... 24
5.1 End-‐user models .................................................................................................................... 24
5.1.1 Direct loans ...................................................................................................................... 24
5.1.2 Loans secured by retirement benefits .............................................................................. 25
5.1.3 Pension schemes as issuers of debt ................................................................................. 26
5.2 Investment Models ................................................................................................................ 26
5.2.1 Direct investments in housing developments .................................................................. 26
5.2.2 Loans and deposits by pension schemes ........................................................................ 28
5.2.3 Purchase of debt issued by housing finance institutions ................................................. 29
5.2.4 Acquiring equity in a housing finance institution ............................................................ 29
6 Main Findings and Recommendations ................................................................................... 32
6.1 Missing institutions ................................................................................................................ 33
6.1.1 Real Estate Investment Trusts ......................................................................................... 33
6.1.2 Mortgage Liquidity Facility .............................................................................................. 34
6.2 Recommendations ................................................................................................................. 35

Mobilising Pension Assets for Housing Finance Needs in East Africa Report to the FinMark Trust (December 2010)
iv
Tables
Table 1: Pension system in Kenya Table 2: Pension Fund Breakdown – Tanzania Mainland Table 3: Main features of pension funds Table 4: Kenya: Investment maxima set by the Retirement Benefits Authority Table 5: Comparison between NSSF interest rate and other benchmarks Table 6: Asset Allocation of a typical single-‐employer scheme Table 7: Summary: Different models of mobilising pension assets for housing
Boxes
Box: 1 Defined Benefit and Defined Contribution Funds Box 2: Corporate profile of NSSF Kenya Box 3: Rwanda: Progress towards reforms Box 4: Bank of Uganda Retirement Benefits Scheme – a Defined Benefit Scheme Box 5: Uganda: Direct housing loans to members Figures Fig. 1: Kenya: yield curve Fig. 2: Comparative GDP Growth Rates in 2008 Fig. 3: Retirement Benefits Scheme Assets Fig 4: Proportion of Defined Benefit and Defined Contribution Schemes, 2007 Fig. 5: Tanzania: Distribution of membership by pension fund Fig. 6: Kenya: Exposure of Private Pension Schemes to Property (June 2009) Fig. 7: Kenya: Relative Performance of Property and Equities Fig. 8: Tanzania: Asset Composition of Public Pension Funds Fig. 9: Distribution of NSSF Investments at 30th June 2006 Fig. 10: Age Analysis of a Typical Private Scheme Fig. 11: Distribution of CSR investments in 2007 Fig.12: Structure of a REIT Fig. 13: Structure of a Liquidity Facility Annexes Annex 1: Key Country Data Annex 2: Other Data and Information Annex 3: Brief Issued by the Retirement Benefits Authority Kenya on the Retirement Benefits
(Mortgage Loans) Regulations 2009 Annex 4: List of Interviewees References

Mobilising Pension Assets for Housing Finance Needs in East Africa Report to the FinMark Trust (December 2010)
1
1 Introduction
In their terms of reference for this study, FinMark Trust observed that the role of pension fund
assets1 in supporting access to housing is hugely attractive to housing development advocates:
pension funds often represent the most significant proportion of domestic savings and therefore offer a substantial source of capital that could be used as end finance for housing in addition to funding the housing development industry in general. Pension funds, unlike commercial banks, fall into that small group of asset holders with long-‐term horizons, which housing advocates see as a natural source of the needs of borrowers for housing, who seek long-‐term finance. For their part, the trustees and managers of pension funds, especially those in the private domain, are not so sure: they tend to be conservative in their approach to fund investment, protecting member assets in support of their retirement. Recent turmoil in the global markets has created additional anxiety about the security of housing investments. Further, in many jurisdictions, there are regulatory constraints to pension funds investing in the housing sector. Trustees nevertheless are increasingly recognizing the need to continue seeking appropriate and profitable investment opportunities in new areas that often include property in general, and housing in particular. Opportunities also exist for pension schemes to issue debt and in this way mobilize capital to finance housing for their members. In the four East African countries of Kenya, Tanzania, Uganda and Rwanda, the geographic focus of this study2, pension assets constitute a large pool of funds, equivalent to a significant part of GDP.3 In spite of their suitability for financing housing4, pension funds have seen limited use in the housing sector for a number of reasons:
• Trustees and their fund managers have inadequate knowledge of housing markets, especially low-‐income sub-‐markets, and are unfamiliar with the associated investment risks. Indeed, the pension fund community has scanty knowledge of housing micro-‐finance and the incremental construction process that is commonly used by the vast majority of households to improve their housing;
• the capital markets in the region are under-‐developed, limiting the investment options open to pension schemes;
• some pension funds are too small to set aside funds for the lumpy investments required to acquire housing and property assets;
• a number of private schemes face substantial liabilities in respect of members nearing retirement and cannot therefore tie up their funds in illiquid investments;
• pricing of pension funds often makes them unattractive for mortgage lending particularly in settings where government paper offers highly attractive yields;
• the institutional capacity is lacking to utilise pension funds for housing especially for purposes of addressing the needs of low-‐income groups; and,
• the low coverage of pension schemes, ranging from 2 to 15 per cent of the labour force, severely limits their reach.
In spite of these bottlenecks, stakeholders acknowledge that immovable property, including housing, would be an attractive asset class if the associated concerns were adequately addressed. A particular benefit, exemplified by Kenya (Fig. 7), is that investments in property show limited volatility in addition to acting as a robust hedge against inflation.
1 Pension funds and retirement benefit schemes have been used to mean one and the same thing in this report. 2 See the key country data at Annex 1 3 20 per cent in Kenya, 4 per cent in Uganda, and nearly 2 per cent in Rwanda. 4 For instance, they adequately address the asset-‐liability mismatch that usually suppresses mortgage lending.

Mobilising Pension Assets for Housing Finance Needs in East Africa Report to the FinMark Trust (December 2010)
2
In varying degrees, all four countries face severe housing shortages especially in their urban centres where shelter conditions are dire. In Kenya, government has estimated an urban housing need of 150,000 dwellings a year, yet formal production is only 30,000 units, giving an annual deficit of 120,000 houses5. In the other countries, there is only a limited supply of good quality housing and the vast majority of dwellings are built informally. Several factors account for this pressing housing challenge: high urban growth rates, as a result of both rural-‐urban migration and natural population growth; low-‐incomes making it difficult, if not impossible, for the vast majority to afford the housing finance products typically on offer; and weak housing markets that lack the capacity and capital to: (a) expand the supply of affordable housing; and (b) provide appropriate housing finance products. In particular, there is a growing demand for mortgage lending to middle and high income groups, requiring loans of maturities of up to 20 years. Yet there is an extremely limited supply of term funds: in Uganda, for instance, more than a half of the liabilities in the banking sector (68 per cent) are short term and do not exceed 30 days in maturity, while liabilities with the longest maturity (i.e. greater than 12 months) only account for 16 per cent6. The housing finance market is most developed in Kenya, but the other three countries have the potential to grow their currently small loan portfolios. At the lower levels of the income pyramid, the demand is for loans of shorter tenor – generally not more than 5 years – to support housing microfinance. An additional requirement in all four countries is for developer finance to boost housing supply in view of the low levels of formal housing production and the pressure that would come to bear on house prices if there were an expanded utilisation of pension funds for housing. Our investigations sought to:
• Scope and summarise the literature with regard to the use of pension assets in financing housing in the region;
• Describe the pension industry in the economy including the total size of pension assets in comparison to the economy, number and broad profiles of contributors including their income bands and size of contributions, the level of penetration and coverage of pension savings within the general and working population, and the number and type of pension funds;
• Describe the policy and regulatory environment in each jurisdiction that governs the practice of pension assets, more particularly on their role in housing sector investment;
• Identify in detail the practice of mobilizing pension assets for housing purposes; • Set out the debates regarding the use of pension assets for housing purposes in these countries,
describing opportunities for change and development; and, • Make recommendations on how to better mobilise pension assets for housing in specific
countries, or across the region, possibly drawing on experience and practice from other countries and regions
The report is based on field interviews with the key stakeholders in the four countries and on secondary material, published and unpublished. The rest of the report is organized as follows: Section 2 gives an overview of the economic and financial setting in the four jurisdictions, highlighting the implications for pension fund investments; Section 3 describes pension schemes and their coverage; Section 4 looks at regulation, the investment opportunities open to pension schemes, and the consequent pension fund behaviour; Section 5 focuses on the mobilization of pension assets to meet housing needs whilst Section 6 draws out the main findings and sets out the
5 See estimate at http://www.housing.go.ke/kensup.html 6 Genesis (2009a)

Mobilising Pension Assets for Housing Finance Needs in East Africa Report to the FinMark Trust (December 2010)
3
key recommendations. Annexes with detailed data and other information are at the end of the report.
2 Economic and Financial Setting
2.1 Overview
Although the four jurisdictions are classified as low-‐income countries they show substantial diversity in their economic and financial characteristics. Kenya has the most developed financial sector, broadening investment options for pension funds and thus raising the prospects for channelling resources into the housing industry: it has the highest market capitalization of listed companies as a percentage of GDP (31.6 % in 2008), followed by Tanzania (6.3 %) and Uganda (1.1 % in 2005)7. Pension funds in Tanzania, Uganda and Rwanda have more limited choices but the trend towards integrating capital markets in the region should widen investment opportunities. This section seeks to draw out the main economic and financial features in the region to provide a broad basis for examining the investment options available to retirement benefit schemes. Two aspects have been given special attention because of their implications for utilizing pension funds for housing: the state of the capital markets in the four countries; and the rapid informalisation of the respective economies. In particular, informalisation works against workers seeking housing in three ways. First, with little exception, informal workers are not members of retirement benefit schemes and therefore do not have access to the end-‐user finance offered by such schemes. Second, pension investments in housing finance are usually routed through financial institutions that act as mortgage lenders. Yet these are the channels that typically exclude all but a minority – far fewer than 10 per cent of households in some countries -‐-‐ from accessing housing finance. Third, even where retirement benefit schemes invest directly in property development, informal workers often do not qualify for the housing on offer.
a. Kenya After two decades of poor growth, the Kenyan economy8 finally started to expand in 2002. From 2003-‐04, economic outcomes began to change for the better with the implementation of the Economic Strategy for Wealth and Employment Creation. Real GDP grew at a rate of 5.8 per cent in 2005, 6.1 percent in 2006 and nearly 7 per cent in 2007, a steep recovery from the earlier period of economic stagnation.
This economic turnaround resulted in significant reductions in rates of income poverty, higher flows of external assistance, declining interest rates, greater investor confidence, and improvement in growth and welfare prospects. These positive trends were driven by three main factors: the lagged effects of price, trade, exchange rate, and interest rate liberalization; macroeconomic stability based on reduced indebtedness, and efficient domestic revenue mobilization; and the perception that political stability had improved after the 2002 elections. The reduction in political risk fueled an improvement in sovereign creditworthiness and the private investment climate.
Contested elections at the end of 2007 violently disrupted the economy resulting in loss of confidence among investors and the tourism industry. Inflation soared, reaching 26.6 percent year-‐on-‐year in April 2008—the highest rate since 1994. Potential damage to agriculture, a slowdown in the growth rate of private consumption, rising oil prices, and a global slowdown, piled additional pressure on the economy.
7 World Bank (2009). Market capitalization in Rwanda is insignificant. 8 Adapted from World Bank (2008)

Mobilising Pension Assets for Housing Finance Needs in East Africa Report to the FinMark Trust (December 2010)
4
Following the formation of a coalition government early in 2008 the economy started to show signs of recovery but the growth rates of the 2005-‐07 period are yet to be attained. Future economic prospects hinge on the adoption of a new constitution and the political stability that is expected to follow.
In spite of occasional setbacks, the capital market has continued to offer a variety of Treasury and corporate bonds as well as other fixed income securities issued by inter-‐governmental bodies such as Shelter Afrique and the East African Development Bank. A recent rights issue by Housing Finance, the leading mortgage lender, was successful and the Cooperative Bank, in an initial public offering (IPO) in 2009, was able to raise capital to support its entry into mortgage lending. Although the bond market is still small it has expanded substantially over the last five years: corporate bond issues rose from less than five in 2004 to 13 by the end of 2009 and unredeemed bonds that year were worth KES 33.5 billion (USD 446.6 million). The outstanding stock of Treasury bonds rose, in nominal terms, from KES 80 billion (USD 1.1 billion) in June 2001 to KES 390 billion (USD 5.2 billion) by the end of 2009.9 There have also been issues of infrastructure bonds, and Barclays Bank has ventured into the bond market to support its mortgage business10. Trading maturities for bonds extend to 20 years, up from a maximum tenor of 10 years in 2004 with the result that Kenya now has a well-‐shaped yield curve (Fig. 1).11 This is beneficial to the housing sector as the curve provides pricing benchmarks that, after adjusting for risk, could be used in mortgage lending. Fig 1: Kenya: yield curve12
Source: Stanbic Investments (2009)13
Regulations for issuing asset backed securities exist, providing a framework for securitization. So far, no mortgage-‐backed securities have been issued and a number of problems will need to be resolved before this becomes possible: mortgage lenders do not yet have a pool of standardized mortgages that readily lend themselves to securitization; the land registry is inefficient and this casts doubt on the integrity of some mortgage assets; and the balance sheets of some mortgage lenders are still weak14. Regulations for Real Estate Investment Trusts (REITS) have been ready since 2009 but they are yet to be gazetted. There are least two firms which have shown keen interest in establishing REITS as soon as the new regulations come into force15. But it might be a 9 Mbaru, J. (2010). Special Report in the Daily Nation newspaper, January 5, 2010. 10 Interview with Capital Markets Authority. 11 Mbaru op. cit. A yield curve, as defined by www.investopedia.com is “A line that plots the interest rates, at a set point in time, of bonds having equal credit quality, but differing maturity dates. The most frequently reported yield curve compares the three-‐month, two-‐year, five-‐year and 30-‐year U.S. Treasury debt. This yield curve is used as a benchmark for other debt in the market, such as mortgage rates or bank lending rates”. 12 Horizontal axis is in years 13 Stanbic Investments (2009) 14 Interview with Capital Markets Authority” 15 Interview with Capital Markets Authority.

Mobilising Pension Assets for Housing Finance Needs in East Africa Report to the FinMark Trust (December 2010)
5
few years, according to pension fund managers, before REITS acquire the reputation to attract pension fund investments.
b. Tanzania The Tanzanian economy was in severe distress in the mid-‐1980s but has since been radically transformed. The International Monetary Fund (IMF) distinguishes three broad phases of this transformation: 1970-‐1985 which was characterised by Ujamaa (socialism) and economic decline; 1986-‐1995, a period of liberalization and partial reforms; and 1996-‐2006, marked by macroeconomic stabilization and structural reforms. These reforms have continued to the present. Following fifteen years of Ujamaa policy, the economy was gradually liberalized from 1986 to 1995 to remove state domination in production and promote private enterprise. Thus, prices were allowed to adjust to market levels, interest rates and the exchange rate were freed and restrictions on economic activities were phased out. Specific reforms included: (a) restructuring the financial sector and licensing foreign banks thus expanding private access to finance for investment; (b) liberalizing trade, a move that triggered an export boom and restored the country’s foreign exchange reserves; and (c) denying credit to poorly performing public corporations and subjecting public finance to greater scrutiny and discipline. Reforms within the housing sector saw the winding up of a bankrupt housing bank in 1995, which had been created in 1972 as a part of government’s interventionist economic policy. The IMF points out that a committed ownership of the reform process has been key to success, symbolized by Mkukuta, mainland Tanzania’s own growth and poverty reduction strategy16.
Before the reforms, Tanzania had one of the smallest banking systems in Africa, dominated by a single commercial bank and other state-‐owned financial institutions. After two decades of liberalization, two dozen commercial banks and many other private financial institutions were in operation, offering a broad range of financial services. Since 2000, credit to the private sector has expanded at 30-‐40 per cent a year, supported by growing customer deposits, and bank performance has improved17. In spite of these reforms, household access to credit is appallingly low with a mere 9 per cent of the population reported as having access to financial services from the formal sector in 200618. The second generation of financial reforms, now underway, seeks to broaden the reach of financial services.
The capital market is in its early stages of development and there is a limited range of financial instruments and securities. The market is regulated by the Capital Markets and Securities Authority, established under the Capital Markets and Securities Act of 1994. Securities are traded on the Dar es Salaam Stock Exchange, established in 1996 as a company limited by guarantee. The exchange has an Automated Trading Electronic System. There are 15 listed companies out of which four are commercial banks and market capitalization is TZS 5,024.45 billion (US$ 3.8 billion).
Only seven corporate bonds are listed, six of them issued by commercial and development banks. Government bonds listed at the exchange have a tenor of 2 to 10 years. Otherwise, investments are primarily short-‐term given that instruments for long-‐term investment are rare. Retirement benefit schemes usually invest in the money market, typically for not more than 365 days, with yields benchmarked against inflation or Treasury Bill rates. On average, the various funds seek a return of at least 200 basis points above headline inflation.
16 IMF (2009) 17 IMF (2009) 18 Financial Sector Deepening Trust (2007) Finscope E-‐book Tanzania

Mobilising Pension Assets for Housing Finance Needs in East Africa Report to the FinMark Trust (December 2010)
6
c. Uganda Through sound economic management and efficiency-‐enhancing reforms since the early 1990s, Uganda has achieved commendable sustained economic growth rates, averaging 7.7 per cent between 2002/3 and 2007/8. In 2008/9, GDP grew by 6.6 per cent, increasing from UGX 28.2 trillion (USD 13.8 billion) in 2008 to UGX 33.0 trillion (USD 16.1 billion)19. The 2008/9 growth rate was strong by regional and international standards, despite the global financial crisis, and among the fastest in the world, mainly as a result of prudent economic management and strong fundamentals20. Uganda’s strong economic growth has mainly been driven by: (a) a diversified services sector21, which has over the last 18 years replaced agriculture as the largest contributor to GDP, followed by the industrial sector. Nonetheless, the structure of the economy remains rural and agrarian, with over 75 per cent of the population primarily in agriculture. During the last two decades, the governemnt has maintained low inflation rates, averaging 5.0 percent per annum. More recently, however, the general price level has increased at a rate of 14.2 per cent a year, driven by soaring food prices. The real interest rate has fallen, dropping from 14.1 per cent per annum in May 2007 to 4.5 per cent in January 2009, before rising again to 6.9 per cent in March 200922. This upswing can be traced to growing corporate demand for locally available loanable funds as companies which previously borrowed abroad switched to domestic bank resources. This shift was driven by the global financial crisis which made access to credit in the advanced countries difficult. The banking sector remains competitive and local banks are adequately capitalized. Uganda’s capital market is in its early stages of development but it has provided a good medium of investment for pension schemes. Over the last decade, 10 companies have listed on the Uganda Securities Exchange, including Stanbic Bank, in which the NSSF and the Bank of Uganda Retirement Benefits Scheme are among the top ten shareholders. Indeed, NSSF controls 80 per cent of the Uganda stock market, with a share worth between UGX 150 billion (USD 73.4 million) and180 billion (USD 88.1 million).
d. Rwanda Rwanda’s remarkable macroeconomic stability and sustained robust growth have been well documented and widely acclaimed. The country has grown at an average real rate of 8.8 per cent per annum since 200423. In 2008, the economy registered its first double-‐digit growth (11.2 per cent) since 2002, the highest among all East African Countries, mainly as result of prudent economic and social policies, and structural reforms (Fig. 2).
19 Source: Uganda Bureau of Statistics, 2010 20 IMF (2010) 21 Between 2002/3 and 2008/9, the services sector registered an average growth of 24.4% per annum, thus achieving the fastest steady growth over the period relative to other sectors of the economy (UBOS, 2009) 22 UBOS (2010). 23 Rwanda Development Board (2009)

Mobilising Pension Assets for Housing Finance Needs in East Africa Report to the FinMark Trust (December 2010)
7
Fig. 2: Comparative GDP Growth Rates in 200824
Source: CIA, the World Fact Book
The Rwandan economy is however small, with real GDP at about USD 3.5 billion, and is dominated by services (48 percent) and agriculture (36 percent). Inflation has been moderate, maintained at single digits during the last decade except for 2003 and 2004, and more recently in 2008. That year, inflation increased to 15.4 per cent -‐-‐ from 9.1 per cent in 2007—mainly as a result of increased food and fuel prices and monetization of the economy. The target inflation rate is 5 per cent in 2010 but this will require prudent monetary management to achieve. Lending rates have also remained stable, averaging 16 percent since 200225. The capital market is not well developed and is dominated by government paper.
2.2 Growing Informalisation of Regional Economies
Pension schemes in the four countries, and indeed in most developing countries, have traditionally not addressed the needs of informal sector workers. Yet the informal sector is large and expanding. In Kenya, the proportion of informal sector workers nearly quadrupled between 1988 and 2006, growing from 20 to 78 per cent of the overall labour force (Annex 2, Table A.1). In Uganda, the informal economy is the source of employment for 40 per cent of the working population and, as the International Labour Organization (ILO) points out, is “by far the most important employer in the country” 26. By the end of the 1990’s it was estimated that there were more than 800,000 informal micro and small enterprises (MSEs) operating in the country, employing approximately 1.5 million people (including 90 per cent of total non-‐farm private sector workers), with a contribution to GDP of more than 20 per cent27. The ILO predicted in 1999 that informal sector employment would expand at more than 20 per cent per year. Informal businesses are generally small, with 1.6 persons on average. This means that they are not required to save with the National Social Security Fund (NSSF) – the national provident fund – because the NSSF Act limits the Fund’s scope to firms with 5 or more employees. Kenya, which has traditionally had a similar rule, has widened the net and now requires establishments of 1-‐4 employees to make pension contributions. The NSSF Acts in both Uganda and Kenya allow individuals (as opposed to firms) to voluntarily register and save with the respective Funds, providing a window for informal workers to become members. However, the informal sector is generally not aware of the benefits of social security protection and has largely failed to take advantage of this opportunity.
24 Vertical axis in %. 25 Source: Oyier, T., Ketley, R. and Davis, B. (2008). “Access to Housing Finance in Africa: Exploring the Issues in Rwanda” 26 Christiaan H. (2002), Informal Economy Series: Training for Work in the Informal Sector: New Evidence from Kenya, Tanzania and Uganda, ILO http://www.ilo.org/public/english/employment/infeco/download/haan.pdf 27 PSD/MSEPU (1999)
0 2 4 6 8 10 12
Rwanda Kenya Uganda Tanzania Burundi

Mobilising Pension Assets for Housing Finance Needs in East Africa Report to the FinMark Trust (December 2010)
8
The informal sector in Tanzania is also large with decade-‐old estimates showing that the sector accounted for 53 per cent of urban employment.28 More recent data show that formal sector employees comprise a mere 6.5 per cent of the total labour force, with the remainder (93.5 per cent) in the informal sector.
Much of Rwanda’s economic base is in the process of recovery but there is a high level of informality. The vast majority of the working population (4.16 million people or about 93 per cent) is employed in the informal sector (including agriculture). Only around 290,000 salaried Rwandese are employed in the formal sector, up from 271,000 at the end of 2008. This high level of informality has significantly limited the coverage and scope of the pension industry. The Social Security law requires salaried workers to contribute to the Caise Sociale du Rwanda (CSR) – the National Social Security Fund. CSR also encourages informal sector workers to save with the Fund29. For all four countries, these data provide compelling evidence of the important scope of the informal sector and are consistent with the extremely low pension coverage in the region. To be sure, the pension industry has started to cater for informal sector workers but the number of active members is still small. The inevitable conclusion is that exclusion is the norm, meaning that for many years to come informal workers, constituting the majority of the work force, will not be able to benefit directly from pension-‐backed housing finance products. However, a general expansion of non-‐member based housing finance, supported by pension assets, would benefit some of those in the informal sector.
3 The Pension Landscape: Institutions and their Coverage
3.1 Institutions
Public schemes hold the bulk of pension funds in Tanzania, Uganda and Rwanda but this dominance is less pronounced in Kenya where a large number of occupational schemes have been established by the private sector. As in the rest of the world, there has been a steady shift in Kenya from Defined Benefit (DB) to Defined Contribution (DC) schemes. DC schemes also predominate in Uganda. Even though DC schemes, unlike DB schemes, transfer the investment risk to the member, their stance towards risk is not any less conservative because of the monitoring role played by members who take an active interest in the performance of their individual accounts30. Box: 1 Defined Benefit and Defined Contribution Funds Defined Benefit Fund (DB) A defined benefit fund is one that specifies the benefits a member will receive on retirement. The investment risk falls on the fund, which commits to pay a certain benefit, usually a proportion of salary at retirement, regardless of the performance of the fund’s investments. Members’ contributions are pooled and invested by the fund in a way that ensures it is able to meet the defined benefit liabilities. The additional gains or losses that the fund makes accrue to the fund. Defined Contribution Fund (DC) In a defined contribution fund the members’ contributions are set at a specific rate (usually a percentage of salary) and these are ring-‐fenced and invested – the member is able to assess the performance of his or her individual contributions. On retirement, the individual member’s benefit is the amount that he / she has contributed plus any investment return earned. The investment risk therefore rests with the member. Source: Genesis (2009a)31
28 Liimatainen, M-‐R (2000) “training and Skills Acquisition in the Informal Sector: a Literature Review”. Informal Sector Series. International Labour Office, Geneva 29Caisse Sociale du Rwanda Annual Report (2007) 30 Interview with investment managers. 31 Genesis (2009) “Mobilising Pension Assets for Housing Needs – Experiences in Southern Africa” Report for FinMark Trust

Mobilising Pension Assets for Housing Finance Needs in East Africa Report to the FinMark Trust (December 2010)
9
a. Kenya
Kenya’s pension assets amount to about 20 per cent of GDP, the fourth highest such share in Africa after South Africa, Egypt and Mauritius32. The retirement benefits sector is composed of the civil service scheme, the National Social Security Fund (NSSF), occupational schemes and individual pension schemes, with a coverage rate of around than 15 per cent of the workforce (10 per cent or 800,00033 members of the NSSF, 3 per cent in the civil service scheme, 1.5 per cent in private and public occupational schemes and 0.5 per cent in individual retirement benefit schemes)34. The civil service pension scheme is unfunded, with pensions paid out from general taxation and, for this reason, is not directly relevant to this study. The main features of Kenyan pension schemes are summarized in Table 1. Raichura (2008) reports that the NSSF introduced voluntary (as opposed to statutory) membership in 2006 and embarked on a marketing campaign to attract such membership, particularly from the informal sector. He adds that “The success or otherwise of this campaign to date is difficult to establish, although the number of such voluntary members is indicated at 13,000. No data is available to assess the frequency and amount of such voluntary contributions and the costs of collecting from and administering such members relative to the voluntary contributions.”
Table 1: Pension system in Kenya35
Source: Raichura (2008) based on RBA website
NSSF, described in Box 2, is the single largest scheme, accounting for one-‐third of the entire assets of the funded pension industry (Fig. 3). Box 2: Corporate profile of NSSF Kenya The National Social Security Fund was established in 1965 through an Act of Parliament Cap 258 of the Laws of Kenya. The Fund initially operated as a Department of the Ministry of Labour until 1987 when the NSSF Act was amended transforming the Fund into a State Corporation under the management of a Board of Trustees. Plans are underway to further amend the NSSF Act in order to convert the Fund into a mandatory National
32 Interview of Retirement Benefits Authority 33 The current estimate, by RBA is higher at 1 million members. 34 Stewart, F. and Yermo, J. (2008) “Pensions in Africa” 35 Establishments with one to four employees are now required to contribute to the NSSF.

Mobilising Pension Assets for Housing Finance Needs in East Africa Report to the FinMark Trust (December 2010)
10
Social Insurance Pension Scheme to which every Kenyan with an income shall contribute a percentage of his/her gross earnings so as to be guaranteed basic compensation in case of permanent disability, basic assistance to needy dependants in case of death and a monthly life pension upon retirement. Source: NSSF website
Fig. 3: Retirement Benefits Scheme Assets (KES Billion)
Source: RBA Annual Report
In 2007, DC schemes accounted for nearly 90 per cent of all occupational schemes (Fig. 4). Still, DB schemes tend to be larger and older and hold more assets than DB schemes. Interviews indicated that the structural change from DB to DC schemes has been driven by two factors: (a) the desire to shift the investment risk from the pension fund to members; and (b) changes in accounting standards which now require balance sheet disclosure of funding shortfalls36 by the sponsoring firm37. Firms have been apprehensive that this disclosure would impact negatively on the valuation of their stock, by the market where the firm is listed. This is a disincentive to retaining DB schemes.
Yet another change has been an increasing shift away from pension to provident funds, driven by the preferences of members 38. This means that members would not enjoy the periodic payments of pension schemes unless they purchase an annuity upon retirement, a financial product available from local insurance companies.
Fig 4: Proportion of Defined Benefit and Defined Contribution Schemes, 2007
Source: RBA Annual Report 2006/07
36 Actuarial valuations, which are carried out on a regular basis, would show instances where pension funds are not able to meet their liabilities. 37 Notwithstanding that the sponsor and its pension fund are different legal entities. 38 RBA (2007) “Annual Report and Accounts 2006/2007”

Mobilising Pension Assets for Housing Finance Needs in East Africa Report to the FinMark Trust (December 2010)
11
b. Tanzania
There are five39 public pension schemes on the Tanzania Mainland40 and an additional pension scheme in Zanzibar, the Zanzibar Social Security Fund (ZSSF). But there are no private occupational schemes, unlike in the other countries, as liberalization of the pension industry is yet to start. The public schemes draw their membership from different occupational groups and generally permit full or partial withdrawal of accrued pension entitlements in the event of unemployment. There is no portability of benefits between the pension funds and scheme benefits vary from one pension fund to another. The relative size of the mainland schemes by membership is shown in Fig. 5 and other attributes in Table 2.
Fig. 5: Tanzania: Distribution of membership by pension fund
Table 2: Pension Fund Breakdown – Tanzania Mainland
Fund name Active Members (Approx.)
Rate (%)
Contribution (% of salary)
Coverage Year Started
Regulator
Employee Employer
National Social Security Fund (NSSF)
460,000 20 10 10
Private sector workers
1964 Ministry of Labour
Parastatal Pension Fund (PPF)
100,000 20 5 15
Parastatal & private sector workers
1978 Ministry of Finance
Public Service Pension Fund (PSPF)
250,000 20 5 15
Central government employees
1999 Ministry of Finance
39 These are the National Social Security Fund (NSSF), the Local Authorities Pension Fund (LAPF), the Parastatal Pension Fund (PPF), the Public Service Pension Fund (PSPF) and the Government Employees Provident Fund (GEPF). 40 While the union between Tanzania Mainland and Zanzibar is referred to as the United Republic of Tanzania, each of the two geographic entities has its own pension schemes. For instance, the Zanzibar Social Security Fund (ZSSF) is entirely operated and regulated within the framework of the Zanzibar Government with limited involvement of the Tanzania Mainland government.
50%
11%
27%
8% 4%
NaTonal Social Security Fund (NSSF)
Parastatal Pension Fund (PPF)
Public Service Pension Fund (PSPF)
Local AuthoriTes Pension Fund (LAPF)
Government Employees Provident Fund (GEPF)

Mobilising Pension Assets for Housing Finance Needs in East Africa Report to the FinMark Trust (December 2010)
12
Fund name Active Members (Approx.)
Rate (%)
Contribution (% of salary)
Coverage Year Started
Regulator
Local Authorities Pension Fund (LAPF)
70,000 20 5 15
Only local government employees
1944 Prime Minister's Office -‐ Regional Administration & Local Government
Government Employees Provident Fund (GEPF)
35,000 25 10 15
Non-‐pensionable civil servants
1942 Ministry of Finance
c. Uganda
Uganda’s pension industry is limited both in coverage and scope, with less than 2 per cent of the labour force covered by pension schemes. The industry is monopolized by the National Social Security Fund (NSSF) and the Public Service Pension Scheme (PSPS). There are also several private occupational schemes and unfunded public sector schemes. • NSSF: NSSF is a defined contribution scheme financed by mandatory contributions at a rate of
15 per cent of gross employee wages, 5 per cent of which is deducted from employees and 10 per cent from their employers. The money collected is maintained in individual member accounts which earn an annual return that depends on the type of investment. NSSF assets are centrally managed without the help of external professional fund managers.
By the end of 2008, the number of registered members with the Fund was just over 215,000, a very small part of the workforce in a nation of 31 million people.
• Private Occupational Schemes: There are no reliable statistics on the number of private sector
occupational schemes but some reports estimate that there are more than 5041. Most respondents reported that these schemes had grown and now ranged between 80 and 100, pointing to the demand for private pension schemes as an alternative to NSSF. This study estimated that nearly all of the private schemes are operated on a defined contribution basis, like the NSSF, while the rest are defined benefit schemes. Annex 3 (Table C.2) lists selected schemes, their total portfolio, and the asset managers/advisors. • Private Defined Contribution Schemes: Uganda’s private DC funds comprise one multi-‐
employer scheme42 – the Alexander Forbes umbrella fund -‐-‐ and several single-‐employer schemes. The Alexander Forbes fund consists of four employers: Fina Bank, Kenya Commercial Bank (KCB), Alexander Forbes, and Rift Valley Railways (RVR). For most single-‐employer schemes, management is internal, mainly because of the small size of their portfolios. In some cases, however, single-‐employer schemes with relatively large portfolios have outsourced management functions to: o Administrators, who ensure that the scheme operates effectively on a day-‐to-‐day
basis; o Investment managers who are charged with fund management, providing
consultancy services on the investment of scheme funds, and disseminating investment information; and,
41Okoboi, C. W. (2005) 42 The multi-‐employer model minimizes administrative challenges in managing the funds in-‐house, given their young age and small size of portfolios

Mobilising Pension Assets for Housing Finance Needs in East Africa Report to the FinMark Trust (December 2010)
13
o Custodians, who handle all financial transactions.
The schemes are operated as segregated funds (i.e. funds of different schemes do not commingle) under the supervision of an appointed board of trustees that ensures that members’ contributions are prudently invested to earn a competitive return.
• Private Defined Benefit Schemes: There are less than 10 private sector schemes that are
managed as defined benefit funds. Examples include the Makerere University Staff Pension Fund, the Civil Aviation Authority Fund, and the Bank of Uganda retirement benefits scheme. The governance structure for DB schemes is similar to that of DC schemes.
d. Rwanda
Rwanda’s pension industry comprises one public pension fund the Caisse Sociale du Rwanda, already referred to, and about 40 nascent private pension schemes. There are, however, no readily available statistics on the different private firms that operate in-‐house pension schemes and their total portfolios.
The National Bank of Rwanda, whose mandate includes the supervision of non-‐bank financial institutions, has commissioned a study to identify and profile all private pension schemes in the country. The study findings -‐-‐ expected towards the end of 2010 -‐-‐ will document the different types of private pension schemes in the country, their governance, membership and portfolios.
CSR is financed by contributions equivalent to 8 per cent of the employee’s gross salary, of which 5 per cent is paid by the employer and 3 per cent by the employee. Out of the 5 per cent paid by the employer, 2 per cent goes to occupational hazards. Close to RWF 4 billion was paid out to about 30,000 beneficiaries in 200843. Key data on CSR are given in Annex 3 (Table D.1).
3.2 Coverage and profiles of contributors
The majority of pension scheme members in all four countries are formal sector workers. Pension coverage is roughly 15 per cent in Kenya and a mere 6.5 per cent in Tanzania, 1.7 per cent in Uganda and 7.5 per cent in Rwanda44. These figures are approximate, especially for the last three countries where there are no systematic sector-‐wide data. The membership of private pension schemes tends to have higher incomes than members of public schemes such as the NSSFs in Kenya, Tanzania and Uganda. Uganda and Rwanda provide good examples of the salary profiles of members of a public pension scheme: in Uganda, around 60 per cent earn salaries less than UGX 400,000 (USD 196) per month and nearly 85 per cent less than UDX 1 million (USD 490)45, the minimum income typically required by banks to obtain mortgage finance; in Rwanda, slightly above 72 per cent of CSR members have salaries less than RWF 100,000 (USD 179), not enough to qualify for a mortgage loan46. Table 3 summarises the main features of pension funds in the four countries.
43 Source: Caisse Sociale Du Rwanda Annual Report, 2007 44 Ratio of pension scheme members to the labour force. 45 See Annex 3 Table C.1 for the salary distribution. 46 See Annex 3 Table D.2 for the salary distribution.

Mobilising Pension Assets for Housing Finance Needs in East Africa Report to the FinMark Trust (December 2010)
14
Table 3: Main features of pension funds Kenya Tanzania Uganda Rwanda Pension assets/GDP (%) 20 App. 2.7 4.247 1.6 Pension fund members 1.4 million48 App. 915,000 >500,000 290,281 No. of funds App. 1,500 6 >100 App. 40 Members as a % of working age population App. 15 6.5 App. 1.7 7.5
4 Regulation, Investment Opportunities and Pension Fund Behaviour
4.1 Regulation
The regulatory framework is most developed in Kenya where a statute to regulate the pension industry exists as does a formal regulator. Formal regulation has created a uniform approach to influencing the behavior of the main players in the sector. An important requirement is for pension schemes to submit annual accounts to the Retirement Benefits Authority (RBA), investment returns every quarter and investment policies at least once every three years49. Besides seeking to ensure compliance with statutory requirements, the regulator has been able to publish information on a wide range of subjects: regulations on the governance of pension funds; investment guidelines; and portfolio performance. In addition, the regulator maintains and publishes a register of approved administrators, fund managers, and custodians. Yet another important service it that the regulator conducts research on the pension industry, an area neglected by individual pension schemes and other players as they consider it to fall within the rubric of public goods50. In the other countries there is no formal regulator and a uniform approach to regulation is therefore lacking as are sector-‐wide data and other information on pension schemes. Moreover, the lack of regulation exposes the pension industry to such risks as:
• Fiscal risk: in the absence of legally binding guidelines, pension funds are exposed to the danger of not being able to meet payouts as a result of poor investment decisions by trustees and fund managers;
• Fiduciary risk whereby trustees and fund managers, as agents, fail to make optimal investment decisions and, therefore, erode the value of scheme funds. Moreover, in an inadequately regulated pension sector, the lack of disclosure requirements makes it difficult for stakeholders to know what is actually going on.
a. Kenya
The Retirement Benefits Authority was established in 1997 to regulate the pension industry. RBA supervises retirement benefits schemes primarily through the Retirement Benefits Act of 1997 and the Retirement Benefit Regulations of 2000. The regulator provides investment guidelines, setting the maximum exposure for each asset class but does not dictate the investment mix for schemes. To ensure transparency and good practice, regulations generally require the appointment of a trustee, an administrator, a fund manager, and a custodian. Until recently, the Retirement Benefits Act did not allow pension schemes to use funds to enable individual members to acquire housing, to make direct or indirect loans to any person and to invest
47 Genesis (2009a) 48 Consists of 1 million NSSF members and 400,000 members of the civil service. NSSF membership includes about 350,000 members of occupational schemes. 49 Mutuku, N. (2007) 50 A notable exception is Alexander Forbes which conducts a periodic survey of the pension industry and publishes the results.

Mobilising Pension Assets for Housing Finance Needs in East Africa Report to the FinMark Trust (December 2010)
15
with a financial institution with a view to securing mortgage loans. Further, the Retirement Benefits (Occupational Retirement Benefits Schemes) Regulations forbid the assignment of benefits for whatever purpose51. This blanket restriction has been modified somewhat in that the Retirement Benefits (Mortgage Loans) Regulations, gazetted in 2009 subsequent to an amendment of the RBA Act, permit the use of pension funds to guarantee housing loans taken out by members from an authorized lender. We return to these regulations in Section 5. Although the NSSF is governed by its own statute it also falls within the remit of the regulator. However, interviews pointed to limited compliance with the provisions of the RBA Act although some progress has been made: for instance, investment in immovable property is now 32 per cent, just over the statutory limit of 30 per cent, having fallen from 80 per cent about a decade ago52.
b. Tanzania
Although government has sought to establish a regulatory framework, following the enactment of the Social Security Regulatory Authority Act of 2008, a formal regulator does not exist. This rules out a uniform approach to pension fund regulation and fund management practices differ across the ministries responsible for the respective pension Funds. The National Social Security Fund (NSSF) is overseen by the Ministry of Labour, Employment and Youth Development; the Local Authorities Pension Fund (LAPF) by the Prime Minister’s Office, Regional Administration and Local Government; and the Parastatal Pension Fund (PPF), the Public Service Pension Fund (PSPF), and the Government Employees Provident Fund (GEPF) by the Ministry of Finance and Economic Affairs. Zanzibar Social Security Fund falls under the Minister of State in the President’s Office responsible for Finance and Economic Affairs.
This fragmentation of responsibilities, besides frustrating systematic regulation, makes it difficult to maintain a coherent body of data and information on the pension industry.
c. Uganda Uganda does not have an independent regulator and the different pension schemes are regulated through separate laws. The NSSF is regulated by the NSSF Act, while the Public Sector Pension Scheme (PSPS) is governed by the Pensions Act and Article 245 paragraphs (1), (2) and (3) of the Constitution. Private occupational schemes managed by fund managers are licensed and supervised by the Capital Markets Authority. The lack of an independent regulator has over the years exposed the pension industry to fiscal and fiduciary risks, already referred to. In February 2008, Cabinet approved the reform of the sector and asked for the establishment of a regulatory authority. An important goal is to liberalize the pension industry to bring to an end the monopoly of NSSF and PSPS. Members of private pension schemes will be able to opt out of the NSSF by making statutory contributions to their in-‐house private pension schemes
51 Chirchir (2006) 52 Interview with NSSF. Raichura (2008) supports this finding, pointing out that land and property assets decreased from a peak of 78 per cent in 2000 to 34.6 per cent in 2007

Mobilising Pension Assets for Housing Finance Needs in East Africa Report to the FinMark Trust (December 2010)
16
A draft Pensions Regulatory Authority Bill has been drafted and is expected to be passed into law by the end of the year. It is envisaged that pension reform will foster the growth of the pension industry, creating a larger source of term funding that could be tapped for housing finance.
d. Rwanda Rwanda does not have a formal regulator but ongoing reforms include the establishment of the Rwanda Social Security Board that will regulate and supervise the pension industry. Reforms also aim to liberalize the sector by authorizing the establishment of private pension schemes to be operated by both local citizens and foreigners within a legal framework set by the National Bank of Rwanda. Progress towards reforms is described in Box 3. The Board of CSR has an investment committee that oversees investments decisions. The committee is charged with assessing the investment plan and budget, monitoring performance of the Fund’s investments and developing investment strategies, based on the returns in the financial market. The Fund’s investments are centrally managed without the help of external professional fund managers. Box 3: Rwanda: Progress towards reforms • The draft law governing social security in Rwanda is currently in place; • The draft law establishing Rwanda Social Security Board (RSSB) and the draft law governing the activities
of pension schemes are being discussed. The latter will merge the CSR and Medical Insurance Scheme to pool more funds for investment. Both laws will work in combination to establish, regulate and supervise pension sector activities in Rwanda;
• A policy is being developed to authorize CSR to provide long-‐term funds to banks to enable them to provide mortgage finance to their clients.
• A provident fund will be introduced, made up of two branches, namely, complementary pension and special savings:
Complementary pension is a branch that has been introduced to complement the basic pension pillar. Special savings is intended to provide pre-‐retirement benefits such as housing, children’s education, and this will be managed under the defined contribution principle.
4.2 Investment Opportunities and Pension Fund Behaviour
There is little analysis in the literature of the merits or otherwise of pension funds investing directly in housing or indirectly via capital markets. One source, in reference to infrastructure, lays out the pros and cons of direct investments53. It points out that direct investment gives direct ownership and control over the investments, but requires much stronger in-‐house resources in the process of building, acquiring, managing and disposing of assets. Transaction costs and investment sizes are relatively high. Indirect investment, via the capital market, allows investment in smaller sizes and a higher degree of diversification. But, there is more limited control over assets, it is argued, and substantial fees need to be paid to external specialist firms. The lack of adequately developed capital markets in the region, with the exception of Kenya, substantially narrows the indirect investment opportunities available to pension funds. As already noted, cross-‐listing of securities among the exchanges has started, broadening investment options.
53 Inderst, G. (2008)

Mobilising Pension Assets for Housing Finance Needs in East Africa Report to the FinMark Trust (December 2010)
17
Cross-‐listing became possible upon the signing of a memorandum of understanding between the stock exchanges in Kenya, Uganda and Rwanda. The exchanges in Kenya, Tanzania and Uganda have also set up a communications support system54. In the four countries, several factors influence the investment behaviour of pension schemes:
• The investment guidelines of the regulator, where one exists, or of the board of trustees acting within its legal mandate;
• Whether the scheme is in the public or private domain, as this determines the monitoring environment within which the scheme operates: monitoring is more stringent for private schemes, as trustees are individually liable. Monitoring and regulation of public funds tends to be lax and politically driven;
• Whether or not there is a well-‐developed capital market; • Age profile of members: schemes dominated by younger members are able to tolerate higher
risks as payouts are in the distant future, whilst those with older members tend to be more conservative; and
• Anticipated staff turnover: schemes of firms with a low turnover, e.g the Central Bank in Kenya, have a smaller exposure to liquidity risk and can therefore invest in more illiquid asset classes, unlike firms with a higher turnover.
As already noted, even though DC schemes, unlike DB schemes, transfer the investment risk to the member, their stance towards risk is not necessarily any different because of the monitoring role played by individual members. Because of poor regulation and politically driven investment decisions, public pension schemes have had a chequered investment record, failing to achieve the returns common to private schemes. With regard to the Kenyan NSSF, Raichura (2008) notes that the rate of interest credited to members falls well short of the returns allocated by other retirement schemes. He adds that this creates a disincentive to join the Fund and encourages non-‐compliance. In apparent reference to the NSSF in Kenya, Chirchir (2006) confirms that its investment decisions have historically been poor. Field investigations revealed similar investment behaviour at the Ugandan NSSF. CSR in Rwanda appears to be the exception to the rule as its return, at 12.8 per cent, is comparatively high. The pricing of pension funds is an area that forms an important part of the debate surrounding the use of pension funds for housing. In all four countries, pension funds strive to obtain the best risk-‐adjusted return. Generally, the purchase of risk-‐free government paper is often the best choice, an option that could crowd out the use of pension funds to support the housing sector. In the context of mortgage lending in Uganda, Genesis (2009b) point out that “investors can purchase a two year Treasury Bill at a rate of 18.6 per cent in the primary market, almost exactly the same as the average lending rate. With the current mortgage lending rates offering only a slight margin (if at all) over the shorter term zero risk rated government bonds and there being an adequate supply of government paper in the system, there is little motive for banks to lend. Supply of mortgage finance is thus likely to remain depressed until the proposition for banks to lend has improved”. This argument applies equally to pension funds: if they can buy government paper at such attractive yields why would they want to place their money with housing finance lenders? Yet these lenders cannot offer better returns than government paper since their loans would then become unaffordable to house buyers. This concern was also raised in Kenya where the yield on long-‐term bonds is between 12 and 14 per cent (Fig. 1), only somewhat lower than the mortgage lending rate. Pension funds priced at this level, and indeed higher to take account of risk, would not be attractive to mortgage lenders. But they would be suitable for housing micro-‐finance which generally accommodates higher lending rates.
54 Mbaru, J. (2010)

Mobilising Pension Assets for Housing Finance Needs in East Africa Report to the FinMark Trust (December 2010)
18
a. Kenya In regulating the sector, the Retirement Benefits Authority sets parameters that determine the maxima for each type of asset class (Table 4). The current exposure of private pension schemes to property is a mere 5 per cent (Fig. 6), way below the permitted 30 per cent. Table 4: Kenya: Investment maxima set by the Retirement Benefits Authority Asset class Maximum (%) Cash 5 Fixed deposits 30 Fixed income securities 30 Government securities 70 Quoted equities 70 Unquoted equities 5 Offshore investments 15 Immovable property 30 Guaranteed funds55 100 Other investments 10
Source: RBA Fig. 6: Kenya: Exposure of Private Pension Schemes to Property (June 2009).
Source: Stanbic (2009)56
The recent slump in the performance of other asset classes (especially equities and off-‐shore investments, following the global financial crisis), and the positive performance of property relative to equities (Fig. 7), has generated keen interest in property investment. But there is a counterweight to this interest57:
• Investments in property are lumpy and illiquid. Because of the large capital outlay required, only the large pension schemes are able to acquire high quality properties, especially commercial buildings;
• Commercial buildings, such as office blocks, tend to become technologically obsolescent after 15-‐20 years as other more modern buildings come into the market. In a typical case, the premier tenants leave and are progressively replaced by less desirable clients. As a result, management
55 These guarantee a certain return and are typically managed by insurance companies. 56 Based on RBA (2009) Investment Report 57 Interviews with fund manangers.

Mobilising Pension Assets for Housing Finance Needs in East Africa Report to the FinMark Trust (December 2010)
19
costs go up. At any rate, management costs and the demand on management time are higher than for other asset classes, even where estate management is outsourced58.
Fund managers consider equities to be the most risky asset class especially because of the recent poor performance of the local stock market. Still, as pension schemes focus on long-‐term investment horizons, temporary downturns are, in strategic terms, not seen to be an overriding concern. Managers seek to outperform different benchmarks for different asset classes e.g. the Nairobi Stock market index for equities and the Treasury bond rate for fixed income securities. An overriding concern is for the aggregate return to surpass headline inflation. Fig. 7: Kenya: Relative Performance of Property and Equities
Source: Stanbic (2009)59
b. Tanzania
Given that there is no pension regulator to establish broad investment guidelines, investment policies are established within each individual institution by the respective Board of Trustees. The membership of the board and its understanding of investments influence a great deal the investment parameters, including the acceptable risk tolerance levels. Whilst the overriding concern is the preservation and appreciation of capital, with minimum risk, there are other factors that impact investment decisions:
• Interference: Government influences investment decisions, as in Kenya and Uganda, increasing
the potential for poor investment decisions; • Limitation of investment options: The lack of a well-‐developed capital market constrains
investment decisions; in the event, Funds often adopt short term investment strategies, with a preference for Treasury bills;
• Early withdrawals: In the case of NSSF and Parastatal Pension Fund (PPF), early withdrawals are common as a result of unemployment, and Fund investments must take this into account;
• Potential and substantial unfunded liability: Public Service Pension Fund (PSPF) has a substantial unfunded liability and has to tread cautiously in crafting its overall investment strategy;
• Commercial property is preferred to low-‐income housing: Commercial property constitutes the bulk of the real estate portfolio held by the pension funds. This is because commercial property is in high demand, is secure and yields high returns. Although pressure from scheme
58 Discussion with an official of Shell BP 59 The Hass Consult Property Index is the first such index in Kenya. NSE is short for Nairobi Stock Exchange.

Mobilising Pension Assets for Housing Finance Needs in East Africa Report to the FinMark Trust (December 2010)
20
members is changing attitudes towards low-‐income housing, trustees believe that direct investments in housing projects should be avoided, as the expertise for this type of investment is lacking. Instead, trustees advocate for investments in housing through third parties.
• Direct lending to Government: Direct lending to government for institutional housing and infrastructure is a favoured channel, involving direct loans of 5-‐10 years. There has also been lending, on a syndicated basis with other financial institutions, to government institutions as in the case of Tanzania Electricity Supply Company (Tanesco) with the government providing a guarantee.
On the whole, retirement benefit schemes invest mainly in government securities, real estate and equities, in addition to fixed deposits and loans to other parties (Fig. 8)
Fig. 8: Tanzania: Asset Composition of Public Pension Funds
Source: Fund reports
c. Uganda NSSF The NSSF collects up to UGX 180 billion (USD 88.1 million) in subscriptions per annum and pays out an average of UGX 28 billion (USD 13.7 million) per year in mature claims. The balance is invested in shares, bonds, and real estate in accordance with its five-‐year strategic plan. As shown in Fig. 9, investment in bonds and real estate constitute the largest percentage shares: 36 and 20 percent, respectively. Equities, corporate loans and mortgage securities constitute the lowest share. As of December 2009, the total assets under the Fund’s management were valued at UGX 1.5 trillion (USD 733.9 million), representing approximately 4 percent of GDP.
0
10
20
30
40
50
60
NSSF PSPF LAPF GEPF ZSSF
Govt Sec.
Real Estate
Loans
Fixed Dep.
Equity

Mobilising Pension Assets for Housing Finance Needs in East Africa Report to the FinMark Trust (December 2010)
21
Fig. 9: Distribution of NSSF Investments at 30th June 2006
Source: NSSF In principle, the Fund’s investment decisions are guided by two principles: (a) security – the investments should assist the Fund to meet its commitments in a cost-‐effective way; and (b) profitability – the investments should achieve maximum returns, subject to acceptable risk. But NSSF has not paid any real interest to its members in the last ten years except for the financial years 2001/02 and 2007/08 (Table 5)60, mainly because of the poor return on investment and high operating costs. Table 5: Comparison between NSSF interest rate and other benchmarks Year 2000/1 2001/2 2002/3 2003/4 2004/5 2005/6 2006/7 2007/8 2008/9 Inflation Rate 4.5 -‐2 5.7 5 8 6.6 7.4 7.4 14.1 NSSF Interest 4 4 6 7 7 7 7 14 2.5 Real Interest -‐0.5 6 0.3 2 -‐1 0.4 -‐0.6 6.7 -‐9.5 Treasury Bill (TB) rates 32 15 17.5 25 12 9.1 12.4 13 12.3 Real Return on TBs 27.5 17 11.8 20 4 2.5 5 6.6 -‐1.8 Source: The Independent Publications, 2009 The largely negative returns on investment are mainly attributed to illiquid investments that are poorly selected. As in Kenya, this depressed portfolio performance is a consequence of poor governance, mainly the result of rent seeking by political elites. This has led to dissatisfaction among several corporate businesses, triggering the setting up of private occupational schemes. Private pension schemes Before accrued funds are invested, a key factor that is critically studied by the board of trustees is the age liability of members. Age liability analysis has implications for which instruments to invest in (Fig10). The figure shows that the largest liability of this particular Fund lies within the 46–50 years band, representing 20 per cent of the Scheme’s total liability. Moreover, the liability in respect of those aged 50 years and above constitutes 17 per cent of the scheme’s total liability. As these age cohorts account for a sizeable share of liabilities and are approaching retirement, a conservative investment strategy would be favoured over a more aggressive approach.
60 The Independent Publications, August, 2009
Tresury Bills 16%
Bank Deposits 16%
Bonds 36%
Mortgage SecuriTes
2%
Corporate Loans 4%
EquiTes 6%
Real Estate 20%

Mobilising Pension Assets for Housing Finance Needs in East Africa Report to the FinMark Trust (December 2010)
22
Fig. 10: Age Analysis of a Typical Private Scheme
Source: interviews Age analysis allows minimum and maximum asset allocation thresholds to be set for different instruments, depending on the risk they carry. Table 6 shows the asset allocation for a typical single-‐employer scheme – priority is given to local and East African equities because they are short-‐term and carry less risk. In contrast, investing in property, although not risky, is discouraged as it is long-‐term and requires a significant amount of resources. Table 6: Asset Allocation of a Typical Single-‐Employer Scheme No. Asset Minimum % Allocation Maximum % Allocation 1. Local Equity 30 70 2. Local Corporate Bond 0 30 3. East Africa Equity 10 40 4. Off-‐shore Equity 0 20 5. Off-‐shore Bond/Foreign FDR 10 40 6. Local Cash/ Term Deposits 0 10 7. Property 0 10
Source: Interviews
The total portfolio of private sector defined contribution schemes is estimated at between UGX 300 and 350 billion (USD 146.8 -‐ USD 171.2 million). Contributions from employees range between 2.5 and 7.5 per cent of salaries, while employers contribute above 7 per cent. Members are paid interest on accrued savings, with the amount due pegged to their salary scales and the return on investments. Investment returns for most private sector schemes have been relatively low (below 5 per cent) mainly as a result of low trading on the Uganda Security Exchange and the global financial crisis. Box 4: Bank of Uganda Retirement Benefits Scheme – a Defined Benefit Scheme The Bank of Uganda Retirement Benefit Scheme was established under an irrevocable trust in 1995. The Scheme is governed by the board’s appointed trustees. Each employee contributes 2 per cent of the total pensionable pay and the Bank (employer) the balance required to reach the level recommended by the actuary for the fund. Currently, the Bank contributes 25.8 per cent of the employee’s total pensionable pay. The scheme provides pension benefits to eligible members based on the number of years of service and final pensionable pay. The scheme’s assets are held and managed in a separate fund administered by trustees. Stanbic Investments and AIG, Uganda, are the fund managers of the Scheme, while Barclays Bank is the Scheme’s custodian.
0 50 100 150 200 250
21 to 25
26 to 35
31 to 35
36 to 40
41 to 45
46 to 50
51 to 55
56 to 60
61 to 65
66 to 70
78.2m 226.4m 300.8m 384.5m 367.7m 507.6m 289.9m 142.8m 39.5m 2.5m
Num
ber of M
embe
rs
Age/Liability
Mobilising Pension Assets for Housing Finance Needs in East Africa Report to the FinMark Trust (December 2010)
23
Members’ contributions are charged to the income and expenditure statement so as to spread the cost of pensions over employees’ working lives in the Bank. Presently, the Retirement Benefit Scheme has 650 active members, with a total portfolio of UGX 62 billion (USD 30.3 million). Ninety percent of the members are aged between 25 and 45 years, and earn between UGX 700,000 and UGX 10 million per month (USD 342-‐4,890). Asset Allocation for 2008 was as follows: (i) Cash – 1%, (ii) Equity (Kenya) – 11%, (iii) Equity (Uganda) – 5%, (iv) Treasury Bills – 17%, (v) Treasury Bonds – 33%, and (vi) Fixed Deposits – 33% The Return on investment over the last three years has been low at 2.55 percent per annum partly because of the global economic crisis which has negatively impacted equity markets. Source: Bank of Uganda
d. Rwanda
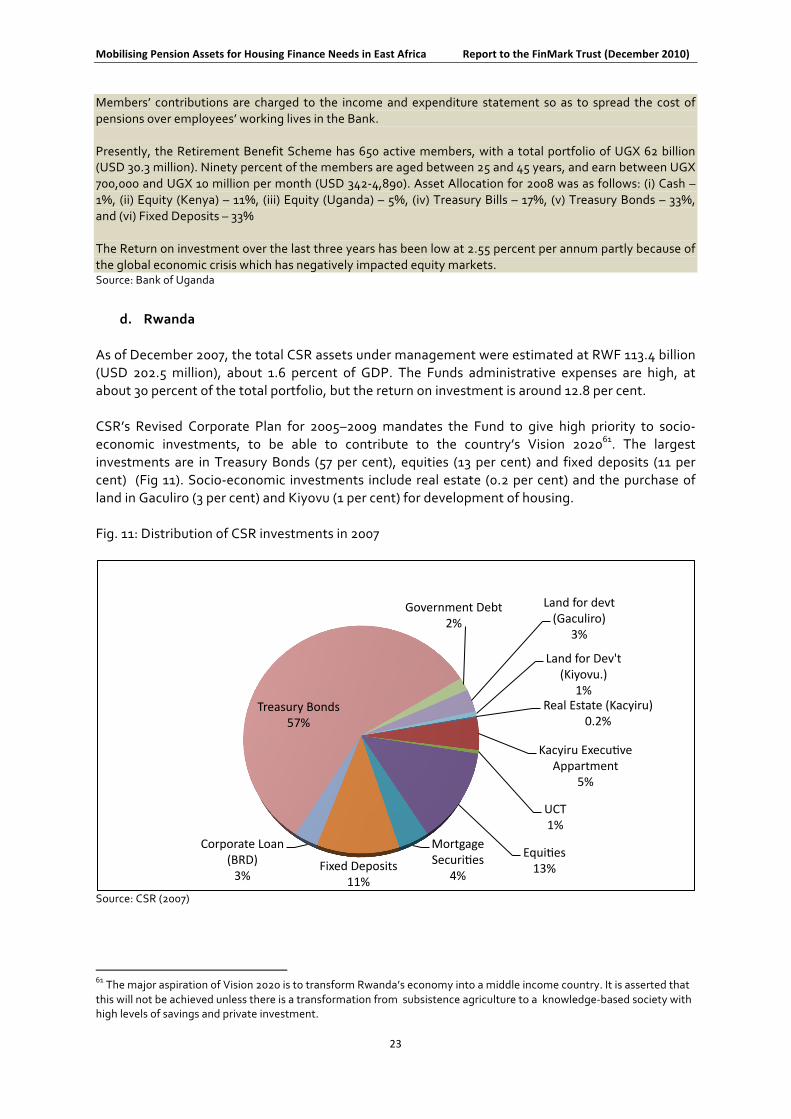
As of December 2007, the total CSR assets under management were estimated at RWF 113.4 billion (USD 202.5 million), about 1.6 percent of GDP. The Funds administrative expenses are high, at about 30 percent of the total portfolio, but the return on investment is around 12.8 per cent. CSR’s Revised Corporate Plan for 2005–2009 mandates the Fund to give high priority to socio-‐economic investments, to be able to contribute to the country’s Vision 202061. The largest investments are in Treasury Bonds (57 per cent), equities (13 per cent) and fixed deposits (11 per cent) (Fig 11). Socio-‐economic investments include real estate (0.2 per cent) and the purchase of land in Gaculiro (3 per cent) and Kiyovu (1 per cent) for development of housing. Fig. 11: Distribution of CSR investments in 2007
Source: CSR (2007)
61 The major aspiration of Vision 2020 is to transform Rwanda’s economy into a middle income country. It is asserted that this will not be achieved unless there is a transformation from subsistence agriculture to a knowledge-‐based society with high levels of savings and private investment.
Real Estate (Kacyiru) 0.2%
Kacyiru ExecuTve Appartment
5%
UCT 1%
EquiTes 13%
Mortgage SecuriTes
4% Fixed Deposits
11%
Corporate Loan (BRD) 3%
Treasury Bonds 57%
Government Debt 2%
Land for devt (Gaculiro)
3%
Land for Dev't (Kiyovu.)
1%

Mobilising Pension Assets for Housing Finance Needs in East Africa Report to the FinMark Trust (December 2010)
24
5 Mobilising pension assets for housing
To structure our review of how pension schemes in the four countries use or could use their assets to finance housing, we follow Genesis (2009a) who identify two general models:
• End-‐user models: These assist a pension fund member to obtain finance for the purchase or construction of a home; and
• Investment models: these provide a channel for pension funds to boost the supply of housing finance either through direct investment in housing development, or using debt and equity.
The end-‐user model has two variants: the first has the fund making direct loans to members whilst in the second the fund provides guarantees for members to take out loans from a third party. We have added a third variant, the debt issuer sub-‐model, since pension funds can use asset-‐backed securities and other debt instruments to mobilize capital to finance housing for their members. In this capacity, pension funds would be intervening, not as investors, but as mobilisers of capital. Most of the literature and related debate appear to have given limited attention to this variant. But Chirchir (2006)62 makes reference to it, noting that “In South Africa, pension administrators raise housing finance through the capital markets by issuing pension-‐backed securities to enable members to acquire home ownership”.
5.1 End-‐user models
5.1.1 Direct loans We could not find evidence of direct loans in Kenya, Tanzania and Rwanda, not surprisingly as the law does not allow such lending.
In Uganda, some retirement benefit schemes allow members to borrow to finance their housing. One scheme that lends to members is described in Box 5. Box 5: Uganda: Direct housing loans to members The scheme is operated on a Defined Contribution basis (both the employee and the employer contribute 7.5 percent), and managed by a Board of Trustees, comprising staff, management and two non-‐executive members. The scheme’s total portfolio is UGX 4 billion (USD 1.9 million), and has over the last three years invested mainly in fixed income assets (over 90 percent), earning members an average annual interest of 13 per cent after tax. The scheme only allows members who have saved for a minimum of 4 years to use a portion of their savings to facilitate homeownership. Eligible members should have started building their homes. No interest is charged on the loan; however, the scheme retains 1 percent of the loan amount to help verify the ownership of the land on which the house is being built and to meet monitoring costs of ensuring that loans are used for housing. A total of 50 members have drawn loans from their savings over the last three years to meet their housing needs. The minimum of 4 years to obtain a loan was set as it is only then that a member qualifies for the whole amount contributed by both employer and employee. Members who have worked for three years can access only 75 per cent of the employer’s contribution and their own contribution. At 2 years, they qualify for 50 per cent of the employer’s contribution, and below 2 years, only their contribution is due.
62 Chirchir, S. K. (2006)

Mobilising Pension Assets for Housing Finance Needs in East Africa Report to the FinMark Trust (December 2010)
25
5.1.2 Loans secured by retirement benefits In Kenya, the Retirement Benefits (Mortgage Loans) Regulations 200963 allow a retirement benefit scheme to assign up to sixty per cent (60 per cent) of a member’s accumulated benefits to guarantee a similar amount to an approved lender, including microfinance institutions. This new financial scheme has apparently been based on a similar one in South Africa whose implementation has been mixed: more than 30 per cent of loans have been diverted into non-‐housing activities; and loans have generally been taken up by rural households64. In Tanzania, the Public Service Pension Fund can now arrange for members to take out guaranteed loans from Azania Bank in which the Fund owns shares. The Board of Trustees approved this facility after members complained and criticized the Fund for investing in high rise buildings that contributed little towards improving the livelihoods of members. This pressure eventually led to an amendment of the Fund’s governing legislation. We could not find evidence of similar loan guarantees in Uganda and Rwanda.
The guaranteed loans in Kenya can be used for four purposes: • Acquiring a property outright; • Constructing a home; • Carrying out repairs, alterations and improvements; and, • Securing financing for deposits and closing costs -‐-‐ stamp duty, valuation and legal fees-‐-‐
associated with home ownership (excluding arrangement fees, commitment fees etc.)
Whilst it is too early to judge how this product will fare in the market, interviews suggested that it will take time for trustees to understand how the regulations can be operationalised without exposing their funds to higher risk. An area of concern, given that trustees have extremely limited market knowledge of low cost housing, is whether “carrying out repairs, alterations and improvements” will be interpreted to include incremental construction by low-‐income households. Our view, on the basis of interviews and the complexity of incremental building, is that trustees will not stretch the scope of their lending to include such housing. The change in the law has generated substantial interest within the pension community although there is a measure of skepticism on issues of viability. On the strength of the published regulations, the leading mortgage lender, Housing Finance, has introduced a new mortgage product in collaboration with British American Insurance Company (BRITAK), one of its main shareholders. These two firms expect to enjoy business synergy as BRITAK will provide life cover to mortgagors, and there might be other first-‐mover advantages, according to the officials interviewed. To the borrower, the main advantage will be: (a) that HF, and presumably other lenders, will advance a loan equivalent to the house value, making a down payment unnecessary; and (b) that closing costs will be financed. Interviews suggested that the guarantee is unlikely to lead to lower lending rates as the cost of funds to mortgage lenders will not have changed. In voicing their concerns, investment managers pointed out that, in principle, trustees would need to adjust their investment strategy to ensure that their funds are not exposed to additional risk as a result of mortgage defaulting. If the mortgagor defaulted and the forced sale value failed to meet the outstanding debt65, the guarantee would be called triggering a withdrawal from the pension fund to meet any outstanding financial liability. Fund managers and their actuaries are yet to work out the probability of loss in the event of defaulting.
63 See Annex 3 for a brief issued by RBA on the rules for mortgage loans backed by retirement benefits. 64 Sing (2009) 65 i.e. principal, accrued interest and the transaction costs of foreclosure.

Mobilising Pension Assets for Housing Finance Needs in East Africa Report to the FinMark Trust (December 2010)
26
One commentator worried about the tax treatment of such a withdrawal, pointing out that it was not clear whether the amount so withdrawn would attract tax. Another fear was that administrators, who track financial and other transactions for pension schemes, might not have the capacity to maintain proper records of loan guarantee transactions. Yet another concern was that housing prices might come under pressure because of the increased demand arising from this new facility in a market with strong supply-‐side rigidities66. In practice, outcomes will depend on: (a) whether the scheme will be operationalised quickly, giving the housing market limited time to respond to demand and thus driving up prices; and (b) the numbers of first-‐time buyers who will come into the market. Some respondents argued that many of those who meet the income criterion set by mortgage lenders probably own homes and will therefore not qualify for pension-‐backed mortgages; and that “operationalisation” hurdles, including the conservative stance of trustees, will slow the scheme down67. At any rate, pension coverage is very low. These factors will likely ease the pressure on house prices.
5.1.3 Pension schemes as issuers of debt In Kenya, the Capital Markets Authority argues that pension schemes should consider issuing asset backed securities to raise the funds needed to finance housing for their members. Regulations for this type of capital mobilization already exist but schemes would need to amend their trust deeds to pave the way for capital raising. It is not clear to what extent this option would be adopted by pension schemes nor what methods they would use to extend financing to their members. Regulations for asset backed securities do not exist in the other countries.
5.2 Investment Models
5.2.1 Direct investments in housing developments
a. Kenya NSSF has in the past directly financed a mix of up-‐market and middle income housing but it has now shifted away from the higher end of the market68. The Fund’s stock of housing assets is valued at KES 4.4 billion (USD 58.7 million) or 5.5 per cent of the Fund’s entire portfolio, made up of the outstanding principal on tenant purchase loans69. These assets will increase as it expands its tenant purchase programme. There are no industry-‐wide data on private pension fund investments in housing but interviews clearly indicated that such investments are limited. As already pointed out the entire property portfolio, largely made up of commercial property such as office blocks, currently accounts for a mere 5 per cent of total assets. Another source, using a sample survey, shows that exposure to property is even lower, at 2.4 per cent70. When data are disaggregated by the size of the pension fund, a more nuanced picture emerges: small schemes do not invest in property whilst the asset allocation for medium and large schemes is 2.4 per cent and 4.4 per cent, respectively71. Small
66 Housing markets are inefficient and they take long to expand supply to meet rising demand. 67 There are other important operationalisation hurdles. First, direct construction by members, which is allowed by the regulations, is not only a complex task, as the South African experience has shown, but it also leads to a substantial diversion of loans to non-‐housing expenditures (Sing, 2009). Second, the microfinance channel will be constrained by its limited capacity to originate and manage housing micro loans. 68 Interview with NSSF 69 Interview with NSSF 70 Alexander Forbes Consulting Actuaries (2009) 71 Small schemes have assets less than KES 100 million (USD 1.3 million), medium schemes over KES 100 million but less than KES 500 million (USD 6.6 million) and large schemes over KES 500 million.

Mobilising Pension Assets for Housing Finance Needs in East Africa Report to the FinMark Trust (December 2010)
27
schemes have no exposure to property because they have limited funds. Moreover, there is a general aversion towards investment in property, and in housing in particular, by most pension schemes irrespective of size72. Still, some schemes have invested directly in housing projects (Annex 2, Table A.2). Interviews of private funds revealed particular wariness towards lower income housing for two reasons: • Trustees and their fund managers do not understand the workings of the lower-‐income housing
market; and, • Rent collection is seen as difficult, making estate management problematic and expensive.
b. Tanzania,
Some of the public pension funds have invested directly in housing. In 2003, NSSF developed 194 houses in Kinyerezi, Dar es Salaam and has started to develop another project of 300 houses in the same city. Loans for houses in the latter project will be repaid over 15 years. The Public Service Pension Fund, starting this year, plans to acquire plots in Dar es Salaam and other regions. These plots will be sold to members either through direct purchase agreements or through guaranteed loans from Azania Bank. Loan deductions would be spread over 5 years. Initially 200 houses are planned for Dar es Salaam and 50 each for Morogoro, Mtwara, Shinyanga and Tabora regions. Investment in low income housing is viewed as low risk as outright purchase will be required and where loans are granted, there will be substantial cash cover from pension savings accumulated by the borrowing member; this cover will meet liabilities in the event of default.
The Parastatal Pension Fund PPF has also ventured into low cost housing and in 2007 developed a project in Kiseke, Mwanza, comprising 580 houses. Members of the Fund bought 365 of these houses after bidding for them. The remainder were reserved for the general public but the uptake has been slower than expected primarily because the Fund raised the selling prices to take account of higher construction costs.
c. Uganda
NSSF is the only fund that has been able to invest directly in real estate, mainly because of its large portfolio (UGX 1.5 trillion (USD 733.8 million)) and the low age liability of most of its members (normal retirement age is 60 years but the average age of members is about 30 years). As for the private schemes, investing in real estate is viewed as a challenge because of: (a) the small size of portfolios; and (b) a large portion of liabilities lie within the retirement age of 55 to 60 years, an age cohort that will retire in the near term.
In 2005/6, NSSF’s investment in real estate constituted about 20 per cent of its portfolio (Fig. 9). According to the Fund’s five-‐year strategic plan, this type of investment is expected to increase three-‐fold by 2012. Box C.1 (Annex 2) lists properties the Fund has been able to invest in during the last decade, some of which include housing for low income earners73. As NSSF’s property portfolio gets larger, the Fund will likely become a major landlord. In the event, it will need to be careful to ensure that its housing investments in rental housing yield a market return74.
72 Field interviews. 73 Data on NSSF’s investment in property was sourced from the NSSF website and the Independent Publication. 74 Genesis (2009a)

Mobilising Pension Assets for Housing Finance Needs in East Africa Report to the FinMark Trust (December 2010)
28
d. Rwanda
In 2007, the CSR undertook eight projects in real estate. Three of these projects were housing developments (representing 35 percent of the total investments in real estate) which sought to reduce the annual housing deficit in the country, estimated at about 10,000 units. Of the three housing projects, the largest is the Gaculiro project whose first phase of 234 dwellings has already been completed. The houses were targeted at high income households and sold at between RWF 23 million and 27 million (USD 41070 and 48,200). Mortgage finance of up to 20 years was provided through the Rwanda Housing Bank. In the second phase, to be completed in 2010, 280 condominium75 apartments for sale to middle and high income households will be constructed. In the last phase, about 2,600 units will be built by the end of 2013. In all, the project will have a mix of houses for all income groups, with prices ranging between RWF 3.5 and 27 million (USD 6,250 and 48,200). Other housing development projects undertaken by the CSR include the construction of 250 houses in Batsinda and 150 residential houses in Nyagatare. The projects will have a mix of condominium apartments and bungalows, targeted at low and middle income households. Table D.2 (Annex 2) lists CSR’s real estate investments in 2007.
5.2.2 Loans and deposits by pension schemes
Interviews suggested that retirement benefit schemes do not commonly lend to mortgage lenders or place long-‐term deposits with them. The Kenyan NSSF, however, recalled having placed a deposit with HF some years back to support the latter’s development of a housing project in eastern Nairobi. In Tanzania, NSSF and other pension funds have provided Azania Bank, the pioneer mortgage lender, with a revolving line of credit of TZS 2 billion (USD 1.5 million). This credit has a four-‐year tenor that has enabled the bank to boost its mortgage portfolio. In Uganda, several studies have documented the lack of long-‐term funding within the domestic banking system as a major hindrance to the growth of Uganda’s housing finance sector76. Yet, until recently, NSSF had been reluctant to place long term deposits (above 10 years) with banks, preferring to invest directly in property as discussed earlier. In 2009, the Fund offered a loan facility to a local bank seeking to extend mortgage lending. The total loan amount was UGX 15 billion (USD 7.3 million), with options of variable or fixed interest. The terms offered will likely enable the bank to lend at rates comparable to the market rates of between 17 and 19 per cent. The loan tenor is 10 years, with a 12 months grace period on the principal amount. The loan facility will be used to finance the purchase and construction of residential houses only. Taking an average cost of UGX 65 million (USD 31,800)77, affordable by a middle income household, this project will be able to reach about 230 purchasers. This number represents about half of the mortgages the bank has issued over the past five years. But the number is small (about 0.1 percent) in comparison to the total number of mortgages issued by all the banks that offer housing finance.
75 Rwanda passed the Condominium Law in 2006. 76 Kalema, W. and Kayiira, D. (2008) 77 Today, a house that can comfortably accommodate a middle income earner costs about UGX 80 million (USD 39,000) in Akright’s Kakungulu Housing Project. If an individual was to construct the same house on his/her own, it could cost about UGX 50 million (USD 24,500).

Mobilising Pension Assets for Housing Finance Needs in East Africa Report to the FinMark Trust (December 2010)
29
Another case to note, though unsuccessful, was the credit guarantee scheme in which the International Finance Corporation (IFC) had envisaged to partially guarantee loans by NSSF to three banks that participated in the Uganda Primary Mortgage Market Initiative (UPMMI) (Box 6). Box 6: Uganda Primary Mortgage Market Credit Scheme In 2007, the IFC partnered with three banks (DFCU Limited, Orient Bank and Stanbic Bank) to launch UPMMI. The overall goals of the project were to create more opportunities for Ugandans to own homes, and improve the regulatory environment for the provision of mortgage finance. Under the UPMMI, IFC signed agreements with the banks and advised them on developing and implementing standard mortgage products, origination and servicing policies, and industry guidelines. Other banks were expected to join later. IFC also worked with key stakeholders in the financial sector to address legal and regulatory constraints to the growth of mortgage lending and investing. Efforts included implementing tax incentives to promote home ownership, helping increase securitization of mortgages in the secondary market, and raising the standards that banks use to appraise homes. Lastly, IFC had envisaged to partially guarantee loans made by NSSF to the three banks, to help them increase mortgage lending. NSSF was expected to lend the banks a total of USD 40 million, with IFC guaranteeing USD 10 million of the amount. Unfortunately, the credit guarantee scheme was not successful because the pricing was unattractive. Source: IFC
5.2.3 Purchase of debt issued by housing finance institutions Private sector pension schemes have invested in corporate bonds issued by housing finance institutions. In Kenya, corporate bonds of financial institutions, such as mortgage lenders and housing finance bodies such as Shelter Afrique, offer a channel for pension fund investments. Interviews indicated that pension schemes had subscribed to Shelter Afrique bonds but no data were given on the quantum of bonds bought. Barclays Bank, as already noted, has also issued a bond to support its mortgage lending, attracting funding from some pension funds78. In Uganda, it is estimated that about 3 per cent of a UGX 30 billion (USD 14.7 million) corporate bond issued by Housing Finance Bank was bought by private sector occupational schemes. The amount invested could have been higher but some schemes considered the bond tenor to be unfavourable, while others thought that the rate of return (capped at the 182 day Treasury bill rate plus 2.2 per cent) was not competitive compared to other instruments. Stanbic Bank has also issued a UGX 27 billion (USD 13.2 million) bond in which some pension schemes invested. In Rwanda, CSR bought about 1 percent of a corporate bond issued by the Commercial Bank of Rwanda (BCR) thus supporting housing finance. BCR is the pioneer of mortgage lending in Rwanda and holds above 40 percent of the total mortgage portfolio.
5.2.4 Acquiring equity in a housing finance institution In the four countries, there are examples of retirement benefit schemes acquiring an equity stake in a mortgage lender. In Kenya, NSSF owns substantial equity in Housing Finance, the leading housing finance institution.
78 Reported by Capital Markets Authority

Mobilising Pension Assets for Housing Finance Needs in East Africa Report to the FinMark Trust (December 2010)
30
In Tanzania, the public pension funds are allowed to acquire equity in financial institutions that specialize in housing finance products or housing development. NSSF has a 40 per cent stake in Azania Bank and two of the other Funds own 35 per cent (PPF) and 14 per cent (PSPF). In Uganda, NSSF79 and the Bank of Uganda Retirement Benefits Scheme (BoURBS) are among the top ten shareholders of Stanbic Bank; this is one of the five banks which offer mortgage loans, with a share of about 14 per cent of the mortgage portfolio. NSSF has an equity stake of 11 and 55 percent, respectively, in Development Finance Company of Uganda (DFCU) Bank, and Housing Finance Bank (HFB). DFCU Bank holds about 12 per cent of the total mortgage portfolio and HFB over 50 per cent. These statistics point to the important role pension funds play in supporting mortgage lending. The CSR holds shares in 11 companies two of which -‐-‐ the Rwanda Housing Finance Bank (BHR) and Rwanda Development Bank (BRD) – provide mortgage loans. CSR holds 30 per cent and 3.3 percent stakes in BHR and BRD, respectively. Both BHR and BRD hold about 10 per cent of the total mortgage portfolio in the country. Beneficiaries are mainly middle and high income households. 5.3 Summing up Table 7, on the next page, summarises the various direct and indirect channels used by pension funds to finance housing.
79 NSSF controls 80 per cent of the Uganda Stock Exchange, with a market share worth between UGX 150-‐180 billion (USD 73.4 – 88.1 million)

Mobilising Pension Assets for Housing Finance Needs in East Africa Report to the FinMark Trust (December 2010)
31
Table 7: Summary: Different models of mobilising pension assets for housing Kenya Tanzania Uganda Rwanda
End Use
r Mod
els
Direct access to funds via partial or full withdrawal which could in principle be used to finance housing
Permitted? No Yes & No80 No No
Done? No Yes & No No No
Loan from fund Permitted? No Yes & No Yes & No No Done? No Yes & No Yes & No No
Loans secured by retirement benefits
Permitted? Yes No No No Done? In the pipeline No No No
Act as issuer of debt (e.g. through a bond issue) to mobilize capital to support housing finance for members
Permitted? Yes but would require amendment of trust deed
No No No
Done? No No No No
Inve
stmen
t Mod
els
Invest in housing projects Permitted? Yes Yes & No Yes81 Yes
Done? Yes Yes & No Yes Yes
Invest in housing development companies
Permitted? ?82 No No No
Done? ? No No No
Invest in equity of mortgage lenders
Permitted? Yes Yes & No Yes Yes Done? Yes Yes & No Yes Yes
Purchase of debt instruments (e.g. bonds) of mortgage lenders (e.g. commercial banks) or financiers of housing developers (e.g. Shelter Afrique)
Permitted? Yes Yes Yes Yes
Done? Yes Yes Yes Yes
Invest in asset backed securities (ABS)
Permitted? Yes No legislation for (ABS)
No legislation for (ABS)
No legislation for (ABS)
Done? Not yet n/a n/a n/a Invest in Real Estate Investment Trusts (REITS)
Permitted? Yes (once REITS established)
No legislation for REITS
No legislation for REITS
No legislation for REITS
Done? Not yet n/a n/a n/a
80 Where Yes and No both appear, some funds permit and others do not 81 All private schemes permit investments in housing but only one has actually done so. 82 No information on whether this can be done

Mobilising Pension Assets for Housing Finance Needs in East Africa Report to the FinMark Trust (December 2010)
32
6 Main Findings and Recommendations
There is a large body of general research material on pension funds but very limited literature on the use of pension assets to meet housing needs. The following are the main findings of this report: • Pension coverage: In all four countries, pension coverage is small, ranging from 15 per cent of
the labour force in Kenya to a mere 1.6 per cent in Uganda. But the stock of pension fund assets is significant, especially in Kenya where it is equivalent to 20 per cent of GDP; in the other countries it is much smaller, and is only 1.6 per cent of GDP in Rwanda; o The growing informalisation of the regional economies substantially reduces the reach
of pension funds as informal sector workers have historically been denied membership. With the passage of time, the recent measures taken to include informal workers will likely increase coverage;
• Capital markets are relatively underdeveloped, except in Kenya, narrowing the investment options open to pension schemes. In particular, the lack of REITS and mortgage liquidity facilities is an important blockage, denying pension schemes the opportunity to contain the risks of investing in real estate. The establishment of REITS in Kenya is imminent as is the creation of a mortgage liquidity facility in Tanzania. Such a facility is also being actively considered in Uganda and Rwanda;
• Regulations: Kenya has an industry-‐wide regulator and whilst the other countries do not there are advanced plans to establish one. The presence of a regulator has streamlined the management of the pension industry in Kenya, unbundling the functions of the different players, specifying their fiduciary responsibilities, and setting investment guidelines;
• Public vs. private schemes: In Uganda and Rwanda the public pension funds hold a vastly larger share of pension assets than private schemes. This dominance is less pronounced in Kenya where the public pension fund, NSSF, held around one third of total assets in 2007. In Tanzania, in contrast to the other countries, there are no private occupational schemes.
• Investment decisions: Several factors influence the investment decisions of pension schemes:
o The guidelines of the regulator, where one exists, or of the board of trustees acting within its legal mandate;
o Whether the scheme is in the public or private domain, as this determines the monitoring environment within which the scheme operates: monitoring is more stringent for private schemes, as trustees are individually liable and appear to take their fiduciary responsibilities more seriously than in public schemes;
o Age profile of members: schemes dominated by younger members are able to tolerate higher risks as payouts are in the distant future; whilst those with older members tend to be more conservative;
o Anticipated staff turnover: schemes of firms with a low turnover, e.g the Central Bank in Kenya, have a smaller exposure to liquidity risk and can therefore invest in more illiquid asset classes, unlike firms with a higher turnover;
• DC vs. DB: Even though Defined Contribution (DC) schemes, unlike Defined Benefit (DB) schemes, transfer the investment risk to the member, their stance towards risk is not necessarily any different because of the monitoring role played by individual members – individual member accounts are maintained and members take an active interest in the performance of their accounts;

Mobilising Pension Assets for Housing Finance Needs in East Africa Report to the FinMark Trust (December 2010)
33
o In terms of numbers, DB schemes have fallen substantially, mirroring a world-‐wide trend.
• Use of pensions for housing purposes
o Private occupational schemes generally prefer investments in commercial property over housing but, on the whole, consider investing in real estate risky as it is illiquid and requires substantial capital;
o In all four countries, pension schemes have used their assets to meet housing needs using a range of mechanisms, which include supplying end-‐user finance and investing in housing finance in a variety of ways. But there is no evidence of schemes using their accounts receivable to support the issuing of debt to finance housing;
o Both public and private pension schemes have invested directly in housing development. However, trustees have limited understanding of housing markets and are especially wary of investing in low-‐income housing arguing that its risks might be difficult to contain;
o Kenya has recently issued regulations to govern pension backed lending which will enable scheme members to take out loans from approved lenders for purposes of purchasing or building a house or refurbishing an existing dwelling. However, there is a measure of skepticism among trustees and their advisers about the viability of this scheme and the capacity to support its implementation has been questioned;
o The pension backed scheme will likely reach a limited number of workers since many of those who meet the income criterion set by mortgage lenders probably own homes and will therefore not qualify for pension-‐backed mortgages; and “operationalisation” hurdles, including the conservative stance of trustees, will slow the scheme down. Besides, pension coverage is very low.
o Because of their attractive yields, government securities have the potential to crowd out the channelling of pension funds to mortgage lenders;
6.1 Missing institutions
Most private sector occupational schemes interviewed noted that investing in real estate was very risky, and required a significant amount of resources. Although the schemes were open to investing in real estate, many have been in existence for less than 15 years, and have not built up substantial portfolios to be able to invest in property. Two institutional vehicles, if established, would provide channels for attracting pension fund investments in housing: Real Estate Investment Trusts (REIT) and mortgage liquidity facilities.
6.1.1 Real Estate Investment Trusts The creation of REITS could encourage and minimize the risk many private sector occupational schemes face when directly investing in real estate. A REIT is a collective investment company that owns, manages and develops real properties83. The private sector occupational schemes could buy units/equity in REITS, which would be listed on the stock exchange, instead of investing directly in real estate. REITS invest in different kinds of real estate or real estate related assets, including shopping centres, office buildings, hotels, and mortgages secured by real estate. There are three types of REITS:
83 Source: http://www.co-‐opbank.co.ke/public_site/webroot/cache/article/file/Real_Estate_Investment_Trust.pdf

Mobilising Pension Assets for Housing Finance Needs in East Africa Report to the FinMark Trust (December 2010)
34
• Equity REITS, which invest in or own real estate and make money for investors from the rent they collect;
• Mortgage REITS, which lend money to owners and developers or invest in financial instruments secured by mortgages on real estate;
• Hybrid REITS, which are a combination of equity and mortgage REITS. Fig. 12 depicts the structure of a REIT using a Kenyan example. Fig. 12: Structure of a REIT
Source: Stanbic (2009)
In Kenya, unlike in the other countries, regulations for REITS have already been prepared and are awaiting to be gazetted to come into force.
6.1.2 Mortgage Liquidity Facility
A mortgage liquidity facility (MLF) is the other institutional mechanism that could facilitate pension fund investments in housing. The main function of a MLF is to act as an intermediary between primary mortgage lenders and the bond market, with the objective of providing long term funds on better terms than primary lenders might be able to obtain if acting alone. A liquidity facility is less complex than mortgage securitization as the latter requires a detailed legal and accounting framework as well as a substantial mortgage portfolio in order to make the operation economically viable84. Fig. 13 depicts how a liquidity facility fits into the mortgage market.
84 World Bank concept paper and Genesis (2009b)

Mobilising Pension Assets for Housing Finance Needs in East Africa Report to the FinMark Trust (December 2010)
35
Fig. 13: Structure of a Liquidity Facility
Source: Genesis (2008) As shown above (fourth column on long-‐term funding providers), bonds issued by the mortgage liquidity facility can be bought by pension schemes (public schemes and private sector occupational schemes) to provide the term capital required by banks that offer mortgage finance. This type of facility is being established in Tanzania by the central bank and commercial banks in collaboration with the World Bank; and in Uganda and Rwanda it is receiving active consideration. In Kenya, the Capital Markets Authority has not been keen to approve a similar facility apparently because its legal form could not be agreed upon with the potential sponsors85.
6.2 Recommendations
The following recommendations focus on the actions needed to accelerate the use of pension assets to meet housing needs and are not meant to address the wider scope of pension reform. For all countries:
• Mobilize the informal sector to join pension schemes to enable them to qualify for housing finance products supported by pension assets;
For Kenya:
• Formulate detailed procedures for implementing the pension backed mortgage scheme recently introduced;
• Promote debate among trustees and their advisers about the operationalisation of the pension backed mortgage scheme;
85 Discussion with Capital Market Authority
Bank A
Long-term funding providers
Bank N LT Funding
Loan
Loan
Liquidity Facility (LF)
1. Borrowers cede their property as security for a long-term mortgage loan
1. Bank provides loan from its balance sheet
2. When necessary, the bank sources funding from the liquidity facility, using the mortgages as collateral
3. Either receives wholesale loan from the LF (using mortgages as collateral) or “sells” the mortgage portfolio (but the default risk remains with the bank/lender so as to avoid moral hazard issues)
1. LF then issues bonds – the bonds are not directly linked to the underlying mortgages. Unlike with securitisation the bonds can be issued at any time as there is no need for an existing portfolio of mortgages waiting to be funded
2. A key difference to securitisation is that the risk of default remains with the bank/lender
Bond
1. Institutions with medium to long term liabilities would buy the bonds issued by the LF
2. The LF may initially carry a guarantee (potentially government funded) in order to stimulate demand
3. The bond would typically carry a small margin above government securities

Mobilising Pension Assets for Housing Finance Needs in East Africa Report to the FinMark Trust (December 2010)
36
• Reconsider the decision not to create a mortgage liquidity facility; • Gazette regulations governing REITS
For Tanzania, Uganda and Rwanda
• Fast track the establishment of a regulator; • Fast track the creation of REITS and mortgage liquidity facilities; • Introduce pension backed mortgage lending along the lines of Kenya
For FinMark Trust
• Sponsor further comparative research on the use of pension assets to meet housing needs; • Promote debate within the pension fund community to foster a better understanding of the
need to utilize pension assets for housing; • Support advocacy that seeks to improve market knowledge within the pension fund
community of low-‐income housing and housing micro-‐finance.

Mobilising Pension Assets for Housing Finance Needs in East Africa Report to the FinMark Trust (December 2010)
37
Annex 1: Key Country Data
Kenya 2000 2005 2007 2008 Population, total (millions) 31.25 35.60 37.53 38.53 Population growth (annual %) 2.6 2.6 2.6 2.6 Surface area (sq. km) (thousands) 580.4 580.4 580.4 580.4 GNI per capita, PPP (current international $) 1,130 1,350 1,550 1,580 GDP (current US$) (billions) 12.69 18.77 26.95 34.51 GDP growth (annual %) 0.6 5.8 7.0 3.6 Inflation, GDP deflator (annual %) 6.1 5.2 4.7 27.0 Agriculture, value added (% of GDP) 32 27 26 21 Industry, value added (% of GDP) 17 19 18 13 Services, etc., value added (% of GDP) 51 54 56 65 Exports of goods and services (% of GDP) 22 28 26 25 Imports of goods and services (% of GDP) 32 36 37 39 Gross capital formation (% of GDP) 17 17 20 25 Market capitalization of listed companies (% of GDP) 10.1 34.0 49.7 31.6
Tanzania 2000 2005 2007 2008 Population, total (millions) 34.13 39.01 41.28 42.48 Population growth (annual %) 2.5 2.8 2.8 2.9 Surface area (sq. km) (thousands) 947.3 947.3 947.3 947.3 GNI per capita, PPP (current international $) 750 1,020 1,130 1,230 GDP (current US$) (billions) 9.08 14.14 16.83 20.49 GDP growth (annual %) 5.1 7.4 7.1 7.5 Inflation, GDP deflator (annual %) 7.5 20.2 9.0 8.9 Agriculture, value added (% of GDP) 45 46 .. .. Industry, value added (% of GDP) 16 17 .. .. Services, etc., value added (% of GDP) 39 37 .. .. Exports of goods and services (% of GDP) 17 21 .. .. Imports of goods and services (% of GDP) 24 27 .. .. Gross capital formation (% of GDP) 18 16 .. .. Market capitalization of listed companies (% of GDP) 2.6 4.2 .. 6.3
Uganda 2000 2005 2007 2008 Population, total (millions) 24.43 28.70 30.64 31.66 Population growth (annual %) 3.1 3.3 3.3 3.3 Surface area (sq. km) (thousands) 241.0 241.0 241.0 241.0 GNI per capita, PPP (current international $) 680 880 1,050 1,140 GDP (current US$) (billions) 6.19 9.23 11.89 14.53 GDP growth (annual %) 5.6 6.3 8.6 9.5 Inflation, GDP deflator (annual %) 8.5 -‐1.7 7.3 6.3 Agriculture, value added (% of GDP) 30 27 24 23 Industry, value added (% of GDP) 23 25 26 26 Services, etc., value added (% of GDP) 47 48 50 52 Exports of goods and services (% of GDP) 11 14 17 16 Imports of goods and services (% of GDP) 22 25 31 33 Gross capital formation (% of GDP) 19 22 22 24 Market capitalization of listed companies (% of GDP) .. 1.1 .. ..

Mobilising Pension Assets for Housing Finance Needs in East Africa Report to the FinMark Trust (December 2010)
38
Rwanda 2000 2005 2007 2008 Population, total (millions) 7.96 8.99 9.45 9.72 Population growth (annual %) 6.7 1.9 2.6 2.8 Surface area (sq. km) (thousands) 26.3 26.3 26.3 26.3 GNI per capita, PPP (current international $) 580 780 920 1,010 GDP (current US$) (billions) 1.73 2.38 3.41 4.46 GDP growth (annual %) 8.1 7.1 7.9 11.2 Inflation, GDP deflator (annual %) -‐3.0 8.9 10.5 17.4 Agriculture, value added (% of GDP) 37 39 39 35 Industry, value added (% of GDP) 14 14 14 12 Services, etc., value added (% of GDP) 49 47 47 53 Exports of goods and services (% of GDP) 9 10 10 8 Imports of goods and services (% of GDP) 26 27 28 28 Gross capital formation (% of GDP) 18 22 21 21 Market capitalization of listed companies (% of GDP) .. .. .. .. Source: World Development Indicators database, September 2009

Mobilising Pension Assets for Housing Finance Needs in East Africa Report to the FinMark Trust (December 2010)
39
Annex 2: Other Data and Information A. Kenya
Table A.1: Relative growth of the number of employees in the informal sector 1988-‐2006
Source: Raichura (2008) based on various Economic Surveys Table A.2: Residential estates directly financed by retirement benefits schemes86
Location/Name Cost in KES87 Location/Name Cost in KES Karen Residential 591,691,000.00 Kilimani 44,500,000.00 Muthaiga 83,563,165.00 Bendara lane 8,000,000.00 Ridgeways 72,000,000.00 Langata 40,195,000.00 Hurlingham 128,248,497.18 Loresho 62,500,000.00 Eldama Flats 26,500,000.00 Lower Kabete 145,000,000.00 Hatheru 72,000,000.00 Milimani Flats 103,562,000.00 Hazina Estate 1,105,164,000.00 Mountain View 20,167,000.00 Hospital Development 132,174,000.00 Nyali Estate 31,222,000.00 Kangemi Development 680,384,000.00 Ojijo Road 181,081,000.00 Kapsoya Estate 6,158,000.00 Rivatex Estate 28,411,115.00 Kileleshwa 33,200,000.00 Runda 3,600,000.00
Source: Chirchir (2006)
B. Tanzania Table B.1: PPF Investment policy limits Investment Category % age of total investments Fixed Income Assets 36 -‐ 54 Equities 12 -‐ 18 Properties 32 -‐48
86 With a few exceptions, these schemes are in Nairobi. 87 Costs are historical costs

Mobilising Pension Assets for Housing Finance Needs in East Africa Report to the FinMark Trust (December 2010)
40
C. Uganda Table C.1 Distribution of NSSF’s members by monthly salary in 2008
No. Monthly Salary (millions) Number of Employees Percentage 1. <0.2 84,374 39.2 2. 0.2 -‐ 0.4 45,347 21.1 3. 0.41-‐0.6 24,989 11.6 4. 0.61 – 1 24,883 11.6 5. 1.1 – 2 20,909 9.7 6. 2.1 – 3 6,873 3.2 7. 3.1 – 4 3,226 1.5 8. 4.1 – 5 1,762 0.8 9. 5.1 – 6 1,021 0.5 10. 6.1 – 7 640 0.3 11. >7.1 1,190 0.6 Total Number of Members 215,214 100 Source: NSSF, 2008
Table C.2 Selected Private Sector Occupational Schemes Name of Scheme Scheme Type Asset Management Est Asset UGX billion AIG DC ICEA 0.5 Bank of Uganda DB BOU Trustees, Stanbic
Investments and AIG 60
British American Tobacco
DC Trustees (60% abroad) 2.5
Barclays Bank DC Barclays Bank 4.0 Church of Uganda DC Jubilee Insurance 0.2 Civil Aviation Authority DB CAA Trustees 0.6 DFCU Bank DC DFCU Trustees 4 East Africa Development Bank
DC Crown Agents 5.5
Kanisa Procurement DC Jubilee Insurance 0.1 Makerere University Staff Pension Scheme
DB National Insurance Corporation 12.2
MTN Uganda DC Stanbic Investment 2 P&O Nedloyd DC Jubilee Insurance 0.2 Stanbic Bank Limited DC Stanbic Investment 11 Standard Chartered Bank
DC Standard Chartered Bank Trustees 7.5
Uganda Breweries Limited
DC AIG, Uganda 2.0
Source: Carmichael Consulting Pty Ltd, 2005 and Interviews Box C.1: List of NSSF investments in property including housing 1. Workers House, which is rented out to several government institutions and private
organizations. 2. Social Security House, which is also rented out to several government institutions and private
organizations. 3. Construction of Pension Towers on Lumumba Avenue, a 24 storey-‐3 tower building. 4. Bought land in Temangalo in which it intends to build 5,000 housing units. 5. In Lubowa, NSSF embarked on a 3,000 housing project which, however, has stalled since 2007
for several reasons including inadequate management 6. In 2007, NSSF entered into an arrangement with MTN Uganda to build them a head office along
Yusuf Lule Road. The project is worth USD 40m. 7. The Farmers House project worth US$ 15m which has, however, stalled since 2007 due to
inadequate management

Mobilising Pension Assets for Housing Finance Needs in East Africa Report to the FinMark Trust (December 2010)
41
8. A planned 16-‐storey Church House near Crane Bank on Kampala Road. 9. Bought land in Mbuya and Naguru. The land will be used for housing developments.
D. Rwanda Table D.1 CSR: Key socio-‐security indicators
Period 2004 2005 2006 2007 2008
Average Salary 36,557 43,923 54,206 73,866 73,005
Average pension 19.127 23,581 29,635 40,684 36,180 Gross replacement rate 52.3 53.7 54.7 55.1 49.6
Pensioners 25,023 26,833 23,547 24,258 27,883
Active contributors 207,010 194,230 203,139 210,671 280,891
Dependence rate 12.1 13.8 11.6 11.5 9.9
Reserves 44,593,717,597 48,773,270,009 53,784,508,198 66,967,878,895 98,566,256,132 CSR annual expenditures 5,204,766,397 5,294,031,908 5,722,835,127 7,930,350,599 9,795,781,446
Reserve ratio 8.6 9.2 9.4 8.4 10.1 Administrative expenses 2,156,402,025 1,919,706,407 2,172,321,067 4,251,414,677 5,573,901,549
Contributions 7770,145,487 165,855,618 10,066,293,107 15,834,735,272 20,737,731,663
Efficiency rate 27.8 20.9 21.6 26.8 20.9
Investment revenue 3,420,712,539 4,027,783,991 2,754,700,123 8,882,546,229 7,586,830,863
Other revenues 268,464,868 20,664,834 22,206,400 40,618,351 91,356,871
CRS Total revenues 11,459,322,894 13,214,304,443 12,843,199,630 24,757,899,852 28,415,919,397 CSR revenues/National /Financial assets 24.6 23.6 17.1 42.6 28.3
CSR Revenues/GDP 1 1 0.8 1.6 1.1 Source: CSR, 2009 Table D.2: CSR Investments in Real Estate in 2007 Project Progress Construction of CSR District Branch The evaluation of bids was finalized Insurance Plaza Building Construction works are underway Gaculiro Shopping Mall The final design report is under review Construction of residential houses in Gaculiro Phase One: 234 houses completed
Phase Two: 280 houses, comprising condominium apartments will be constructed Phase Three: 2,600 units, comprising condominium apartments, bungalows and maisonettes will be constructed
Batsinda Project (250 houses) Phase one: construction activities for the first phase of 250 houses Phase Two and Three will build 750 houses
Construction of Hostels Landscaping for hostel in Butare has been finalized Construction of 150 residential houses and a guest house at Nyagatare
Under study
Rehabilitation and extension of CSR Headquarters Completed Source: CSR Annual Report 2007

Mobilising Pension Assets for Housing Finance Needs in East Africa Report to the FinMark Trust (December 2010)
42
Table D.2 Rwanda: Distribution of CSR’s members by monthly salary in 2008
Income group (RWF) Number of contributors Percentage (%)
0-‐49,999 163,198 58.1
50,000-‐99,999 40,167 14.3
100,000-‐149,999 27,527 9.8
150,000-‐199,999 11,235 4.0
200,000-‐249,999 7,584 2.7
250,000-‐299,999 6,460 2.3
300,000-‐349,999 3,933 1.4
350,000-‐399,999 3,651 1.3
400,000-‐449,999 3,090 1.1
450,000-‐499,999 2,247 0.8
500,000-‐549,999 1,966 0.7
550,000-‐599,999 1,405 0.5
600,000-‐649,999 1,405 0.5
650,000-‐699,999 1,124 0.4
700,000-‐749,999 843 0.3
750,000-‐799,999 843 0.3
800,000-‐849,999 561 0.2
850,000-‐899,999 281 0.1
900,000-‐949,999 281 0.1
950,000-‐999,999 281 0.1
≥1,000,000 2,809 1.0
Total 280,891 100.0 Source: CSR, 2008

Mobilising Pension Assets for Housing Finance Needs in East Africa Report to the FinMark Trust (December 2010)
43
Annex 3: Brief Issued by the Retirement Benefits Authority Kenya on the Retirement Benefits (Mortgage Loans) Regulations 2009
“Following the gazettement of the Retirement Benefits (Mortgage Loans) Regulations, 2009 by the Honourable Deputy Prime Minister and Minister for Finance, through Legal Notice No. 85 of 2009 on 11th June 2009, the Retirement Benefits Authority would like to highlight and clarify to the public some of the important issues contained in the new regulations. 1. The regulations are made pursuant to Section 38 of the Retirement Benefits Act which specifically prohibits the use of scheme funds to make direct or indirect loans to any person or invested with a bank, non-‐banking financial institution, insurance company, building society or other similar institution with a view to securing loans. However, a prescribed proportion of the benefits accruing to a member in a scheme may be assigned and used by the member to secure a mortgage loan from such institutions and on such terms as may be prescribed in regulations made by the Minister. The regulations have prescribed a proportion of sixty percent (60%) of accrued benefits. (Sec 38, RBA and Reg. 8(1)) 2. A member of a retirement benefit scheme can assign up to sixty percent (60%) of his accumulated benefits to the scheme which in turn will issue a guarantee for a similar amount to the financial institution. If the member remains in employment, the accumulated savings continue to grow through contributions and investment, and so the member can, at three-‐year intervals, revalue the amount assigned so as to allow re-‐financing or borrowing for home improvements and extensions. (Reg. 8(2)) 3. No funds will be transferred from the scheme, but trustees, upon receiving instructions from a member, will issue a guarantee to the financial institution for the amount being secured. It must be noted that the house being purchased or constructed (unless it is rural housing) will remain the primary security for such lending and that the role of such a guarantee is merely credit enhancement to enable the member access the mortgage loan. Guarantees are transferable from one scheme to another. (Reg. 7(1) & Reg. 9) 4. Care must be taken to ensure that access to the member’s benefits while he or she is in employment is only as a last resort in the event of default AND if the accumulated benefits will make good the balanceif the realizable value of the collateral property securing the mortgage is insufficient to repay in full the borrowers’ outstanding debt. The double jeopardy of a member losing both the benefits and the house should be avoided as much as possible. The scheme member should be allowed to continue building their fund for the future. This would allow for optimal investments of the funds and optimal accumulation. (Reg. 7(1)(a)) 5. The regulations provide for guarantees for loans for 4 specific purposes (Reg. 4(1)):-‐ a) Acquire a property outright; b) Construct a home; c) Cary out repairs, alterations and improvements; and d) Secure financing for deposits, stamp duty, valuation fees and other incidentals associated with home ownership (excluding arrangement fees, commitment fees etc.) 6. The Authority appreciates that a big barrier to home ownership is the initial 15-‐20% of the purchase price that must be available in cash before any lender will advance a mortgage loan. Many Kenyans are unable to build up the level of savings required to pay the deposit and various transaction fees, and so they normally borrow the money. With the provision of a guarantee by the scheme, lenders should be able to lend 100-‐115%% of the purchase price thus enlarging access for

Mobilising Pension Assets for Housing Finance Needs in East Africa Report to the FinMark Trust (December 2010)
44
lower income Kenyans. This is an important policy objective of the regulations i.e. to encourage lenders to provide credit to Kenyans who are unable to accumulate the substantial cash savings required to access mortgage loans. This will lead to expanding homeownership via lower down-‐payment financing, including to households of limited means while developing the mortgage and capital markets by building investor confidence. 7. It is hoped that members of schemes will be able to put up houses in rural areas if they so chose. This is especially relevant for lower income members whose emoluments may be too low to service a mortgage in an urban area or their accumulated benefits are equally too small to guarantee borrowing to buy or build in an urban area. (Reg. 7(1)(a)) 8. Married couples should be able to pool their retirement savings for this purpose in order to buy a family property. Although not specifically, addressed in the regulations, lenders are expected to look at the practical modalities of effecting this pooling. 9. Trustees of retirement benefit schemes will be required to amend their trust deeds to allow for such assignment and thereafter negotiate with institutions licensed by the Central Bank of Kenya to issue mortgage loans (including approved microfinance institutions) so as to establish facilities for their members. (Reg. 3) 10. Other institutions that wish to provide home purchase financing, or tenant purchase arrangements will have to apply specifically to the Authority for approval to provide such services to retirement benefit schemes. (Reg. 6) Stakeholders are advised to obtain full details of the regulations from Legal Notice No.85 of June 11, 2009”
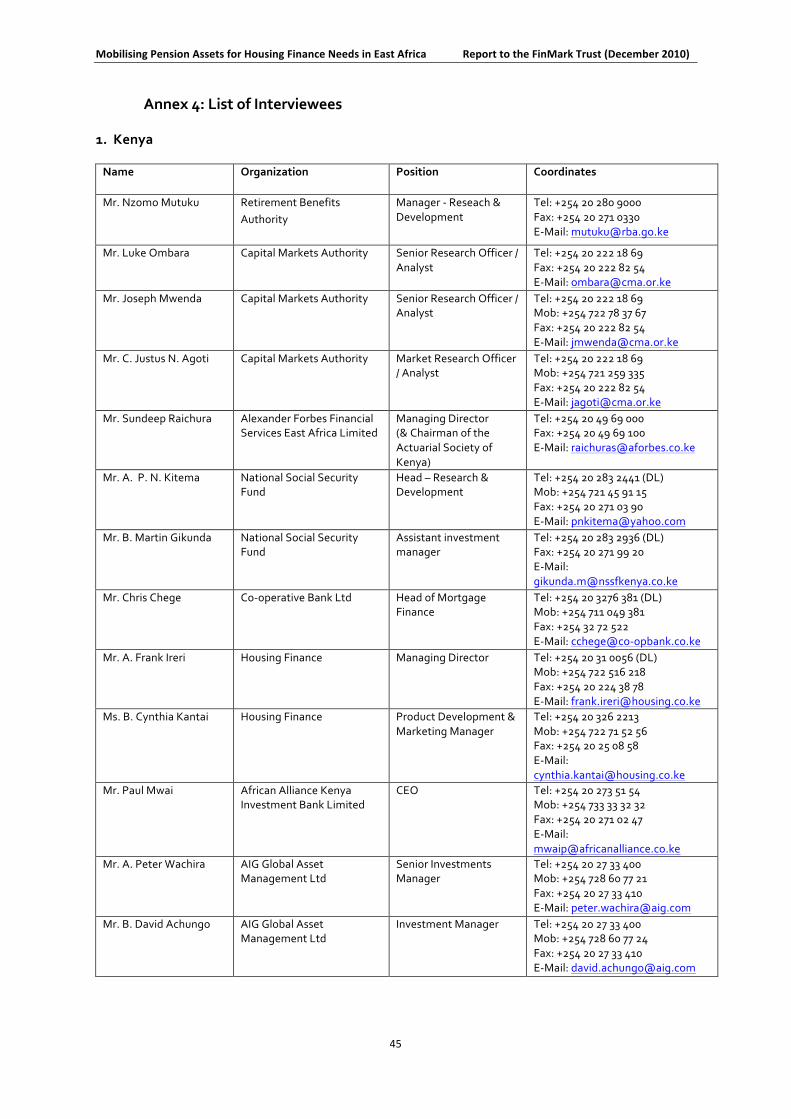
Mobilising Pension Assets for Housing Finance Needs in East Africa Report to the FinMark Trust (December 2010)
45
Annex 4: List of Interviewees
1. Kenya
Name Organization Position Coordinates
Mr. Nzomo Mutuku
Retirement Benefits Authority
Manager -‐ Reseach & Development
Tel: +254 20 280 9000 Fax: +254 20 271 0330 E-‐Mail: [email protected]
Mr. Luke Ombara
Capital Markets Authority
Senior Research Officer / Analyst
Tel: +254 20 222 18 69 Fax: +254 20 222 82 54 E-‐Mail: [email protected]
Mr. Joseph Mwenda
Capital Markets Authority
Senior Research Officer / Analyst
Tel: +254 20 222 18 69 Mob: +254 722 78 37 67 Fax: +254 20 222 82 54 E-‐Mail: [email protected]
Mr. C. Justus N. Agoti
Capital Markets Authority
Market Research Officer / Analyst
Tel: +254 20 222 18 69 Mob: +254 721 259 335 Fax: +254 20 222 82 54 E-‐Mail: [email protected]
Mr. Sundeep Raichura
Alexander Forbes Financial Services East Africa Limited
Managing Director (& Chairman of the Actuarial Society of Kenya)
Tel: +254 20 49 69 000 Fax: +254 20 49 69 100 E-‐Mail: [email protected]
Mr. A. P. N. Kitema
National Social Security Fund
Head – Research & Development
Tel: +254 20 283 2441 (DL) Mob: +254 721 45 91 15 Fax: +254 20 271 03 90 E-‐Mail: [email protected]
Mr. B. Martin Gikunda
National Social Security Fund
Assistant investment manager
Tel: +254 20 283 2936 (DL) Fax: +254 20 271 99 20 E-‐Mail: [email protected]
Mr. Chris Chege
Co-‐operative Bank Ltd
Head of Mortgage Finance
Tel: +254 20 3276 381 (DL) Mob: +254 711 049 381 Fax: +254 32 72 522 E-‐Mail: cchege@co-‐opbank.co.ke
Mr. A. Frank Ireri
Housing Finance Managing Director
Tel: +254 20 31 0056 (DL) Mob: +254 722 516 218 Fax: +254 20 224 38 78 E-‐Mail: [email protected]
Ms. B. Cynthia Kantai
Housing Finance Product Development & Marketing Manager
Tel: +254 20 326 2213 Mob: +254 722 71 52 56 Fax: +254 20 25 08 58 E-‐Mail: [email protected]
Mr. Paul Mwai
African Alliance Kenya Investment Bank Limited
CEO
Tel: +254 20 273 51 54 Mob: +254 733 33 32 32 Fax: +254 20 271 02 47 E-‐Mail: [email protected]
Mr. A. Peter Wachira
AIG Global Asset Management Ltd
Senior Investments Manager
Tel: +254 20 27 33 400 Mob: +254 728 60 77 21 Fax: +254 20 27 33 410 E-‐Mail: [email protected]
Mr. B. David Achungo
AIG Global Asset Management Ltd
Investment Manager Tel: +254 20 27 33 400 Mob: +254 728 60 77 24 Fax: +254 20 27 33 410 E-‐Mail: [email protected]

Mobilising Pension Assets for Housing Finance Needs in East Africa Report to the FinMark Trust (December 2010)
46
Name Organization Position Coordinates
Mr. Onchera Maiko
British-‐American Asset Managers Limited
General Manager -‐ Investments
Tel: +254 20 28 33 824 (DL) Mob: +254 724 50 69 87 Fax: +254 20 27 22 157 E-‐Mail:omaiko@british-‐american.co.ke
Mr. Justus Mutiga
ICEA Asset Management Ltd
General Manager -‐ Life & Pensions Division
Tel: +254 20 222 47 66 Fax: +254 20 244 258 E-‐Mail: [email protected]
Mr. B. Fred Mburu
Old Mutual Asset Managers (Kenya) Ltd
Head -‐ Portfolio Management
Tel: +254 20 28 29 457 (DL) Mob: +254 711 010 457 Fax: +254 20 27 11 066 E-‐Mail: [email protected]
Mr. A. Peter Anderson Old Mutual Asset Managers (Kenya) Ltd
Senior Investment Portfolio Manager
Tel: +254 20 28 29 466 (DL) Mob: +254 711 010 466 Fax: +254 20 27 11 066 E-‐Mail: [email protected]
Mr. Stephen Gugu
Stanbic Investment Services (E.A.) Ltd
Investment Analyst
Tel: +254 20 326 85 11 (DL) Mob: +254 733 423 715 Fax: +254 20 22 472 85 E-‐Mail: [email protected]
Mr. Sammy Muvelah
Zimele Asset Management Company Limited
Managing Director
Tel: +254 20 224 62 67 Mob: +254 722 207 662 Fax: +254 20 221 65 07 E-‐Mail: [email protected]
Mr. A. Roger Urion
Kingsland Court Trusts & Benefits Services Ltd and Association of Retirement Benefits Schemes Secretariat
Managing Director (Kingsland Court Trusts & Benefits Services Ltd)
Tel: +254 20 27 11 461 Mob: +254 722 77 15 79 Fax: +254 20 27 11 446 E-‐Mail: [email protected]
Mr. B. Lazarus L. Muema
Shell Africa
Policy Adviser (Shell Africa) and Chairman – Association of Retirement Benefit Schemes & Pensions Investment
Tel: +254 20 320 55 55 Mob: +254 721 73 42 79 Fax: +254 20 271 45 75 E-‐Mail: [email protected]
2. Tanzania
Name Position Organisation Coordinates
Mr. Yacoub Kidula Director –Planning & Investment
National Social Security Fund
2163400
Mr. Abdallah Mseli Manager -‐ Investments National Social Security Fund
2163400
Mr. Elias Baruti Manager -‐ Investments/Secretary General (Tanzania Social Security Association)
Local Authorities Pension Funds
+255756770037
Mr Godbless Robiam Senior Investment Officer Parastatal Pensions Fund 2113919
Mr. Festo Fute Director –Planning & Investment
Government Employees Provident Fund
2461232
Mr. Abdul H. Hafidh Managing Director Zanzibar Social Security Fund
024-‐2230242

Mobilising Pension Assets for Housing Finance Needs in East Africa Report to the FinMark Trust (December 2010)
47
Name Position Organisation Coordinates
Mr. Ramadhan Khijjah Chairman – Board of Trustees/Permanent Secretary, Ministry of Finance
Parastatal Pensions Funds
2112856
Mr. Musa Assad Member-‐ Board of Trustees National Social Security Fund
2410510 /0754809843
Mr. Nicholas H. Mbwanji Member-‐ Board of Trustees National Social Security Fund
2130387/0754612969
Mr. Gabriel Silayo Director-‐Planning & Investment
Public Service Pensions Fund
2120912
Mr. Anthony Komba Director General National Housing Cooperation
2851135
Mrs. Esther Kileo Kitoka Director of Risk CRDB 2112113
Mr. Dyamo Samuel Head of Treasury Azania Bancorp 2121911
Mr. Julius Mcharo Head of Treasury CBA 2130113
3. Uganda
Name Organization Position Coordinates Mr. Grace Isabirye NSSF Ag. Managing
Director/CEO 0414 341 137
Ms. Maris Wanyera MoFPED Ag. Commissioner 0414 707 217/ 0772 426 456
Mr. Solomon Okecho Bank of Uganda Head of Establishment Division
0414 258 441/6 or 0414 258 060/9
Ms. Gertrude Wamala Karugaba
Stanbic Bank Chairman Board, Staff Pension Fund
0312 224 336
Mr. Martin Owiny Stanbic Investment Management Services (EA) Limited
The General Manager 0312 224 22/600
Mr. Sam Lukooya National Insurance Corporation
Senior Manager, Pensions 0752 522 505
Mr. Lawrence Nsubuga Standard Chartered Bank Pension’s Manager 0772 620 264
Mr. Miriam Musaali Capital Markets Authority Senior Legal Officer 0312 264 950 Mr. Duncan Sentamu Barclays Bank Human Resource Manager 0312 218 326 Mr. Michael Sekadde MTN Uganda Human Resource Manager 0312 212 066 Mr. Chris Sserunkuma DFCU Bank Chairperson Board, Staff
Pension Fund 0772 760 203
Mr. Gerald Semivule Ms. Rosemary Nantambi
Alexander Forbes Chief Finance Officer 0414 222 217/ 0772 542 251/ 0772 496 569
4. Rwanda
Name Organisation Position Coordinates Mr. Kamasa R. Emmanuel
National Bank of Rwanda Human Resource Manager +250 07502 43686/+250 07886 49665
Mr. Kayitare Emmanuel Social Security Fund of Rwanda
Director Planning, Research and Statistics
+250 5510 5972/+250 0830 3554
Mr. Ramba Afrique Social Security Fund of Rwanda
Director Investments +250 2529 8400/+250 7883 03307
Mr. Nuwagira Rogers Bukoni
National Bank of Rwanda Head of Pension Fund Division
+250 5914 2261/+250 0885 5338
Mr. Kayonga Nkusi Jack Rwanda Development Bank
Managing Director +252 577 021/+250 575 079
Mr. Sackey Daniel EcoBank Rwanda Managing Director +250 503 580/+250 0830 6775

Mobilising Pension Assets for Housing Finance Needs in East Africa Report to the FinMark Trust (December 2010)
48
List of references
Alexander Forbes Consulting Actuaries (2009) “Schemes Survey” Report for Kenya RBA (2009) “Investment Report” Bishota, M. (2010) “Mobilising Pension Assets For Housing Finance Needs in Africa Caisse Sociale du Rwanda Annual Report, 2007 Carmichael Consulting Pty Ltd (2005) “Uganda: Advising on Establishing a Supervisor for Chirchir, S. K. (2006) “Promoting home ownership usingretirement benenfits” Research Paper series 01/2006. See www.rba.go.ke Christiaan H. (2002), Informal Economy Series: Training for Work in the Informal Sector: New Evidence from Kenya, Tanzania and Uganda, ILO. See http://www.ilo.org/public/english/employment/infeco/download/haan.pdf Christian Hann. H (2002), Informal Economy series: Training for work in the informal sector. New Evidence from Kenya, Tanzania and Uganda, ILO NSSF Act of Parliament David B Nyakundi (2009), A Description of the Pension System in Uganda: Need for Reform Dyamo (2010) “Experiences and Prospects in East Africa: Tanzania Case Study” Financial Sector Deepening Trust (2007) Finscope E-‐book Tanzania Genesis (2009a) “Mobilising Pension Assets for Housing Needs – Experiences in Southern Africa” Report for FinMark Trust Genesis (2009b) “Study to Examine the Use of Retail Funds for Mortgage Lending”. Report for the Urban Institute, FIRST Initiative in Uganda, April 2009. Genesis (2008) “Access to Housing Finance in Africa: Exploring the Issues in Rwanda” Report for FinMark Trust. GEPF Website. (2010, March). “Home: Government Employee Provident Fund”. See GEPF http://www.gepf.or.tz Government Employee Provident Fund. (2007/08). Annual Report. Dar es Salaam, Tanzania. Government of Uganda, Ministry of Finance Planning and Economic Development (2007) “Background to the Budget for Financial Year 2009/10”, Kampala. IMF (2008), “Rwanda – Assessing the Macroeconomic Impact of an Increase in Aid under the Gleneagles Scenario,” mimeo. IMF (2009) “Tanzania: The Story of an African Transition” African Department, IMF: Washington DC Inderst, G. (2008) “Pension Fund Investment in Infrastructure” Pension Development in Africa – Conference Proceedings of the OECD/IOPS Global Forum on Private Pensions, Mombasa October 2008. International Labour Office, Social Security Department. (2008). “Tanzania Mainland, Social Protection, Expenditure and Performance Review and Social Budget”. Geneva: ILO.

Mobilising Pension Assets for Housing Finance Needs in East Africa Report to the FinMark Trust (December 2010)
49
Kalema, W. and Kayiira, D. (2008): Access to Housing Finance in Africa: Exploring the issues, No.4 Uganda. A FinMark publication. Kalema, W. and Kayiira, D. (2010) “Mobilising Pension Assets For Housing Finance Needs in Africa -‐-‐ Experiences and Prospects in East Africa: Uganda Case Study” Kalema, W. and Kayiira, D. (2010) “Mobilising Pension Assets For Housing Finance Needs in Africa -‐-‐ Experiences and Prospects in East Africa: Rwanda Case Study” Liimatainen, M-‐R (2000) “Training and Skills Acquisition in the Informal Sector: a Literature Review”. Informal Sector Series. International Labour Office, Geneva. Local Authorities Pensions Fund. (2008). Annual Report and Audited Accounts 2007/08. Dar es Salaam. Mbaru, J. (2010). Special Report in the Daily Nation newspaper, January 5, 2010. Ministry of Finance & Economic Affairs. (2008, October 28). “National Social Protection Framework” . Dar es Salaam, Tanzania. Mutuku, N. (2007) “The Kenyan Pension Fund Market”. A presentation at an international investors seminar, Nairobi, January 29, 2007. National Social Security Fund. (2008). Annual Report 2007/08 . Dar es Salaam, Tanzania. NBFIs NSSF Annual Report 2005/6 OECD (1998). “Maintaining Prosperity In An Ageing Society: the OECD study on the policy implications of ageing; The Chilean Pension System” Okoboi, C. W. (2005) “A case of Uganda: Balancing the Pressures of Different Stakeholders”. World Bank Conference on Aligning Supervisory Structures with Country Needs”. CMA Uganda Parastatal Pensions Fund. (2008). Annual Report 2007/08 . Dar es Salaam, Tanzania. Planning, July. PSD/MSEPU (1999) ??? Raichura, S. K. (2008) “Analytical Review of the Pensions System in Kenya” RBA (2007) Annual Report and Accounts 2006/2007 Republic of Rwanda (2000), “Rwanda Vision 2020”, Ministry of Finance and Economic Republic of Rwanda, “The National Budget (2009)” Ministry of Finance and Economic Development and National Institute of Statistics of Rwanda. Republic of Rwanda, Rwanda Development Board (2009). Investing in Rwanda Silayo, G. (2010). “On mobilizing pension assets for low cost income housing”. Sing, L. (2009) “Pension-‐secured loans; Facilitating access to housing in South Africa?” Report prepared for the FinMark Trust Stanbic Investments (2009) “Economic Report and Investor Outlook” Second Quarter 2009

Mobilising Pension Assets for Housing Finance Needs in East Africa Report to the FinMark Trust (December 2010)
50
Stewart, F. and Yermo, J. (2008) “Pensions in Africa” Paper presented at Conference on Pension in Africa, Mombasa 2008. The Caisse Sociale du Rwanda, 2005-‐9; “CSR Revised Corporate Plan” The Caisse Sociale du Rwanda, 2007/8; “CSR Annual Report” The Central Intelligence Agency (2009); “The World Fact Book” The Independent Publications, August, 2009. Uganda The Independent Publications, Tuesday 25th August, 2009. Uganda The National Social Security Fund, 2005/6; “NSSF Annual Report” The Newvision, Thursday September 16th, 2004 Uganda Bureau of Statistics (2010), Statistical Abstract. Uganda Bureau of Statistics, (2006), Uganda National Household Survey (2005/06) Report on the Socio-‐Economic module. World Bank (2009) “Making Finance work for Uganda” World Bank (2008) “World Development Indicators” Zanzibar Social Security Fund. (n.d.) “Investment Management Policy”. Websites
1. www.rba.go.ke 2. www.coopbank.co.ke/public/site/webroot/cache/article/file/realestateinvestmenttrust.pdf 3. www.housing.go.ke/kensup.html 4. www.ilo.org/public/english/employement/infeco/download/haan.pdf 5. www.investopedia.com 6. www.nssf.co.ug 7. www.ubos.org