
Pension investments in employer stock
49
IZA DP No. 2376 Pension Investments in Employer Stock William E. Even David A. Macpherson DISCUSSION PAPER SERIES Forschungsinstitut zur Zukunft der Arbeit Institute for the Study of Labor October 2006
-
Upload
independent -
Category
Documents
-
view
0 -
download
0
Transcript of Pension investments in employer stock
IZA DP No. 2376
Pension Investments in Employer Stock
William E. EvenDavid A. Macpherson
DI
SC
US
SI
ON
PA
PE
R S
ER
IE
S
Forschungsinstitutzur Zukunft der ArbeitInstitute for the Studyof Labor
October 2006

Pension Investments in Employer Stock
William E. Even Miami University
and IZA Bonn
David A. Macpherson Florida State University
and IZA Bonn
Discussion Paper No. 2376 October 2006
IZA
P.O. Box 7240 53072 Bonn
Germany
Phone: +49-228-3894-0 Fax: +49-228-3894-180
Email: [email protected]
Any opinions expressed here are those of the author(s) and not those of the institute. Research disseminated by IZA may include views on policy, but the institute itself takes no institutional policy positions. The Institute for the Study of Labor (IZA) in Bonn is a local and virtual international research center and a place of communication between science, politics and business. IZA is an independent nonprofit company supported by Deutsche Post World Net. The center is associated with the University of Bonn and offers a stimulating research environment through its research networks, research support, and visitors and doctoral programs. IZA engages in (i) original and internationally competitive research in all fields of labor economics, (ii) development of policy concepts, and (iii) dissemination of research results and concepts to the interested public. IZA Discussion Papers often represent preliminary work and are circulated to encourage discussion. Citation of such a paper should account for its provisional character. A revised version may be available directly from the author.

IZA Discussion Paper No. 2376 October 2006
ABSTRACT
Pension Investments in Employer Stock*
This study examines the consequences of a pension fund investing in the stock of the sponsoring firm. Using a merger of data on pension asset holdings from IRS Form 5500 filings and financial data on the company’s stock from CRSP, two broad questions are addressed: First, what factors influence the extent of a pension fund’s investments in the employer’s stock? Second, when a pension invests in the employer’s stock, how much is lost as a result of poor diversification? The empirical results suggest that investments in employer stock are responsive to non-diversification costs, tax consequences, and employee ability to diversify the risk. There is also evidence that employers and employees weight these factors differentially in their decision of how much employer stock to include in the pension. Using actual return data on pension plans, we also find that concentrated investments in employer stock substantially reduce risk-adjusted return performance. JEL Classification: J30, G20 Keywords: defined contribution pension, employer stock Corresponding author: David A. Macpherson Department of Economics Florida State University Tallahassee, FL 32306-2180 USA E-mail: [email protected]
* The authors thank Jeff Brown, Mike Curme, Julia Coronado, Frank Heiland, Barry Hirsch, Dick Ippolito, Karen Pence, David McCarthy, David Shrider and seminar participants at the Federal Reserve Bank of Atlanta, University of Iowa, University of Kentucky, University of Oklahoma, and West Virginia University for comments on an earlier version of this paper.

3
PENSION INVESTMENTS IN EMPLOYER STOCK
Some pension plans invest heavily in the stock of the employer. This is a very risky
investment strategy that sometimes results in catastrophic losses. For example, Enron had over
40 percent of its assets invested in company stock in 2000 and it lost 99.6 of its market value by
the end of 2001.1 Legislators in the 107th Congress responded to the spate of catastrophic
losses in pension plans by proposing limits on pension fund holdings of employer securities and
mandating that employees be allowed to sell off their employer stock holdings within a certain
period of time. As of this writing, no significant legislation on pension investments in employer
stock has been enacted.2
The debate over the merits of pension plans holding investments in employer stock is
ongoing. One of the most important issues in the debate is the “cost” to employees of holding
large shares of their retirement wealth in their employer stock. While several studies provide
evidence on this point, our study adds to the literature in a few ways. First, it provides an in-
depth examination of the factors that influence the amount of employer stock held in defined
contribution plans at publicly traded firms. We find that employer stock holdings are sensitive
to the underlying risk characteristics of the security, as well as the ability of workers to absorb
such risks. We also provide evidence that giving workers control over asset allocation in
pension plans reduces investments in employer stock and alters the sensitivity of stock holdings
to risk characteristics. Second, unlike earlier studies that rely primarily on simulation
approaches or asset pricing models to evaluate the cost of holding employer stock using
1Munnell and Sunden (2002). 2Purcell (2002) summarizes numerous bills that were proposed in the 107th Congress regulating pension plan investments in employer stock. As of this writing, no significant legislation regulating pension holdings of employer stock holdings have been enacted, but some of the same provisions enabling workers to divest themselves of employer stock are under consideration in Senate Bill 1783 (The Pension Security and Transparency Act of 2005) and House bill 2830 (The Pension Protection Act of 2005) in the 109th Congress.

4
hypothetical portfolios, we use actual pension return data from IRS Form 5500 filings to estimate
the effect of employer stock holdings on portfolio efficiency. The results imply that investments
in employer stock generate significant reductions in risk-adjusted return performance. However,
the costs are significantly lower than an asset pricing model might suggest. We also find that
simulations using returns on broad asset categories provide a remarkably accurate picture of
actual return performance.
Background
Holding a large share of pension assets in a single stock is contrary to the basic principles
of diversification and may expose workers to risk without a commensurate increase in expected
returns. Nevertheless, among 401(k) plans with some employer stock in the portfolio, an
average of 38 percent of assets is invested in employer stock (Holden and VanDerhei, 2001).
The obvious question is why employers (and sometimes the employees themselves) invest in
employer stock when it leads to unnecessary risk.
There are two ways that employer stock can be included in a pension fund. First, the
firm could include company stock as one of several investment options and allow employees to
decide how much stock to purchase. Second, the firm could mandate that some or all of the
contributions be invested in employer stock. For example, it is estimated that slightly less than
one-half of employers who offer company stock as an investment option make matching
contributions exclusively in employer stock.3
In deciding whether to invest in employer stock or make it available as an option to the
employee, the employer has to consider several benefits and costs. One benefit of pension fund
investments in employer stock is that it could improve firm profitability by aligning worker
3Hewitt Associates (2001) and Brown et al. (2004).

5
interests with the firm's.4 The empirical evidence on this hypothesis is mixed, however.5
Another benefit to pension fund investments in employer stock is the potential to reduce
corporate income tax liabilities. If employer stock is held inside an Employee Stock Ownership
Plan (ESOP), any dividends paid on that stock is tax deductible to the corporation.6
Pension investments in employer stock may also allow firms to avoid investment
management and brokerage costs. Also, employee ownership may deter hostile takeovers if
employees are reluctant to sell stock to a third party since it may result in restructuring that could
cost the workers their jobs [Chaplinsky and Niehaus (1994), Beatty (1994), and Rauh (2003)].
Potentially offsetting the above benefits of investing in company stock are several costs.
First and foremost, investing a large share of pension assets in a single stock is counter to
principles of optimal portfolio management. Second, an employer increases exposure to
fiduciary liability if the stock performs poorly when there is mandatory investment in employer
stock. Without mandatory investments in employer stock, a company is eligible for a safe harbor
provision offered in section 404(c) of ERISA exempting them from fiduciary liability.7
4The U.S. General Accounting Office found that 70 percent of employers indicate that improving productivity is a major motivation for formation of an ESOP plan. 5For example, Jones and Kato (1993, 1995) find that employee stock ownership can increase worker productivity by 4 to 7 percentage points. In contrast, Pugh, Oswald and Jahera (2000) report that employee stock ownership provides only a short-term boost to corporate performance. Other studies suggest that the impact of employee stock ownership differs depending upon the firm’s motivation for introducing the ownership plan (Gamble 1999 and Gordon and Pound 1990). Kruse and Blasi (1997) review thirty-one studies and conclude there is a positive but weak effect of employee ownership on productivity. 6Brown et al. (forthcoming)] find mixed evidence on this point noting that the high correlation between dividend payments and firm risk attributes makes it difficult to precisely estimate the effect of dividend policy on a firm’s decision of whether to make the matching contribution to a 401(k) plan as employer stock.. 7See Purcell (2002) for a good discussion of section 404(c) compliance and protections. Munnell and Sunden (2004, chapter 5) describe several lawsuits pending over the alleged mismanagement of pension assets associated with investments in employer stock.

6
Employers may even be deemed liable for losses if the plan is an ESOP or if the employer
merely makes the stock an investment option.8
By investing heavily in a single stock, the worker is likely to receive less than the
maximum possible expected rate of return given the level of risk exposure. If workers are aware
of this inefficiency, they will discount the value of pension contributions and competition in the
labor market will shift the cost of this discounting to the firm. For example, if a worker places
only $.80 of value on $1 of employer stock, the firm will have to provide a compensating
difference of $.20 to compete with firms that provide unconstrained pension contributions.
The size of the compensating differential required for mandating investments in employer
stock will depend upon two factors: (i) the risk and return characteristics of the employer stock;
and (ii) the risk tolerance of the workers. If allowed to freely allocate pension contributions,
rational investors would choose a portfolio matching their risk preferences with a portfolio
chosen along the efficient frontier that maximizes return for any given level of risk.
This study is interested in two broad questions relevant to the issue of pension
investments in employer stock. First, do pension investments in employer stock reflect the costs
and benefits described above? Also, do employees and employers place different weights on
these costs and benefits when making asset allocation decisions? Second, how costly are
investments in employer stock in terms of portfolio performance? While other studies have
addressed similar issues, as discussed below, our study adds to the literature in several ways.
While several studies provide descriptive evidence on the extent of pension investments
in employer stock, relatively few provide much evidence on the factors influencing the extent of
8Since ERISA does provide some special protections to the fiduciary of an ESOP, some legal experts (e.g., Jenkins and Gilchrist 2003, Reish 2003) suggest that offering a combination of an ESOP and 401(k) plan (referred to as a KSOP) may be wise if an employer wants to mandate investments in employer stock. If a KSOP is offered, the

7
such holdings. Purcell (2002) examines 11-k filings with the Securities and Exchange
Commission and finds that the share of assets invested in employer stock are greater when the
employer also offers a defined benefit plan, at larger firms, and when the company matches
employee contributions with employer stock. He also finds that holdings are lower for stocks
with a high beta coefficient. Since the data are drawn from 11-k filings, the sample includes
only those plans that make employer stock an investment option and the decision of whether to
make employer stock an option cannot be examined.
Brown et al (2005) also use 11-k filings to investigate the causes and consequences of the
employer’s decision of whether to match employee contributions to a 401(k) plan in company
stock. Their study shows that matching in employer stock is more likely when the security has
lower risk and when the employees are also covered by a defined benefit plan. They find little
support for the hypothesis that sheltering dividend payments from taxation increases employer
stock holdings.
Our study provides a much broader analysis of the decision of how much to invest in
employer stock by examining the defined contribution pensions of publicly traded corporations
without restricting to the subset of plans that make employer stock an option. Our study allows
us to examine the effect of a wide range of variables on employer stock holdings. This includes
such decisions as whether to make the plan an ESOP, a stock-bonus plan, provide matching
contributions as employer stock, or whether to give the employees control over asset allocation
decisions. Our study is also unique in that it sheds light on whether employees and employers
are equally responsive to the costs and benefits of investing in employer stock.
employer would contribute employer stock to the ESOP portion of the plan and allow the employee to choose between a diversified mix of assets in the 401(k) portion of the plan.
8
Our study also provides new insights into the inefficiencies caused by pension
investments in employer stock. Existing work on this topic has attacked the problem in a variety
of ways. One group of studies uses asset pricing models to derive an estimate of the
inefficiency. For example, Meulbroek (2005) uses the capital asset pricing model (CAPM) to
estimate the value of company stock to an undiversified investor. For a 5 year holding period,
she estimates that between one-half and one-third a typical stock’s value is lost due to the costs
of nondiversification. Ramaswamy (2002) uses option pricing methods and estimates that the
premium for an option contract guaranteeing the better of the rate of return on a typical stock or
the rate of return on a well-diversified portfolio would be about $178 per year for each $1000 of
stock held.
Simulation methods have also been used to estimate the inefficiency of investing in
employer stock. The typical simulation study makes an assumption regarding worker risk
preferences to compare a portfolio heavily concentrated with employer stock to some other
hypothetical portfolio. Variants of the simulation approach are used by Brennan and Torous
(1999), Poterba (2003, 2004) and Brown et al. (forthcoming). These studies differ in terms of
the specific stocks used for the simulations, the type of assets that are mixed with the stock, and
the holding or accumulation periods. Nevertheless, all of these studies find that the cost of
holding heavy concentrations of employer stock can be quite high, especially for workers that
have few assets outside of their pension. For example, for a person that holds all wealth as a
single stock, Brennan and Torous (1999) estimate that the certainty equivalent of holding one
dollar of a typical stock over a 10 year period is only 36 cents. Poterba (2003) estimates that the
certainty equivalent of investing in the typical stock held in large DC plans over a 35 year work

9
career is only 27 cents.9 Both studies also reveal, however, that the cost of holding a single
stock drops sharply as other assets are added to the portfolio.
Brown et al (forthcoming) examine the consequences of the employer providing
matching contributions as employer stock on portfolio performance. While their work finds that
workers would be better off with a match in a diversified portfolio than employer stock, they also
report that naive investors who follow a “1/n” investment strategy would frequently be better off
with matching contributions in employer stock.10
Our study extends the work on the efficiency effects of pension investments in employer
stock by using actual return data on plan performance. While the simulation approach has
several advantages (such as a long history of returns to base the simulations upon), one
shortcoming is that the results hinge on assumptions about how investments in employer stock
alter the mix of other assets held in the portfolio. Rather than simulate the distribution of returns
that would emerge if employer stock is mixed with some mixture of broad asset categories, we
use actual data on pension returns from 1990-1998 to compare the performance of pension plans
with and without holdings of employer stock. This approach has two advantages. First, it does
not require any assumptions regarding how investors would behave if employer stock was not
included in the portfolio. As discussed above, a naive investor following a 1/n approach could
benefit from mandatory investments in employer stock, whereas a financially sophisticated
investor would be made worse off by such investments. Second, using actual portfolios allows
for the possibility that, when pensions invest in employer stock, the remainder of the portfolio is
chosen to help offset that risk. For example, the person selecting the pension allocations could
9Both of these estimates assume that the typical person has a coefficient of relative risk aversion equal to two. 10Benartzi and Thaler (2001) find evidence of 1/n investment behavior where an employee who is given n investment options invests the fraction 1/n of assets in each option. Several subsequent studies have found conflicting evidence on whether such behavior is common.

10
invest in other equities with returns that are negatively correlated with employer stock returns.
Because the simulation approach mixes employer stock with broad asset categories, the effect of
such offsetting behavior in the remainder of the portfolio would be missed and the inefficiency
caused by investments in employer stock could be overestimated.11 We evaluate this possibility
by examining whether the results are sensitive to substituting simulated pension returns for
actual returns.
Data
Our empirical analysis relies on a merger of three data sources. First, Internal Revenue
Service (IRS) Form 5500 filings for the years 1990 through 1998 provide information about
pension plan assets and returns. We use the research data base constructed by the Employee
Benefits Security Administration.12 Second, financial data on stocks are drawn from the Center
for Research in Security Prices (CRSP) and merged to pension plans using identifiers issued by
the Committee on Uniform Security Identification Procedures (CUSIP).13 Finally, industry-
specific estimates of the age distribution and average incomes of private-sector pension covered
workers are drawn from the 1989 through 1999 March Current Population Surveys and merged
to pension plans on the basis of 3-digit industry.
Table 1 summarizes the effect of sample restrictions on the data. Over the sample period
of 1990 through 1998, there are 50,634 plan-year observations for publicly traded firms with 100
11There is little empirical evidence relevant to the question of whether pension plans adjust the mix of assets to minimize the risk of holding employer stock, or how effective such strategies are. Holden and VanDerhei (2002) report that increases in employer stock are offset primarily by decreasing equity and balanced fund holdings. On the other hand, Benartzi and Thaler (2001) find that regardless of how much employer stock is held people split the remainder of their assets almost equally between bonds and other equities. Neither of these studies is able to investigate whether pensions alter the mix of assets within these broad categories. 12The research samples provide additional editing to correct inaccuracies in the data and a 10 percent sample of plans with less than 100 participants. 13A detailed description of CRSP data is available at http://gsbwww.uchicago.edu/research/crsp/. A description of the CUSIP numbering system is available at http://www.cusip.com/. Since the CUSIP for a corporation may

11
or more participants in the Form 5500 data. Plans with less than 100 participants are dropped
from the sample because insufficient information on asset allocation is collected for the small
plans. There are some plans that report holding employer stock but do not provide a CUSIP
because the stock is not publicly traded and thus no CUSIP is assigned. Since we cannot obtain
financial data on the stocks for these companies, they are also excluded. The sample is further
restricted by eliminating 6,568 plan-year observations whose assets are held in a master trust
since they provide no breakdown on asset holdings and may have employer stock inside of the
master trust.14 We also eliminate multi-employer plans, filings that are interim reports, or where
there are inconsistencies in the asset values reported. The combination of these restrictions
reduces the original sample of 50,634 to 42,348. An additional 18,560 observations are dropped
because the CUSIP provided on the Form 5500 is not in the CRSP data.15 Another 738 plans are
dropped because the CRSP data on the relevant stocks are incomplete. This yields a total sample
of 5,558 plans and 22,050 plan-year observations.
While 34 percent of employers with a DC plan in the Form 5500 data have more than one
DC plan, it is impossible to determine whether the DC plans cover the same or different groups
of workers within the firm. If each plan covers a separate group of workers, the concentration of
employer stock holdings would be best measured by treating each plan as a separate observation.
On the other hand, if an employer has several plans that cover the same employees, it would be
more appropriate to pool pension assets by employer. We examined the sensitivity of our results
change over time, we use the CRSP data to determine the CUSIP for a corporation during the month and year of the Form 5500 filing. The PERMNO of that corporation is then used to access data on prior returns and prices. 14We do not exclude plans who have assets in common, pooled, 103-12, or registered investment company trusts. Using data provided by the Employee Benefits Security Administration that calculated the asset allocations for trusts in selected years, we estimated that only master trusts have a significant share of assets invested in employer stock. For pensions that have a master trust, the employer stock in master trusts represents an average of 3.2 percent of all assets. For pensions with the other trusts, employer stock represents less than 0.2% of pension assets.

12
to the pooling of assets across an employer's pensions and found very small changes. This is not
entirely surprising because the majority of firms have only one DC plan. For the sake of brevity,
we focus on the results without pooling plans by employer.
Table 2 describes the DC plans in our sample and the level of stock holdings. Among the
DC plans of publicly traded firms in the Form 5500 data, 44.1 percent of plans have some
investments in employer stock. Among the plans with some employer stock, the average plan
has 45.6 percent of assets invested in employer stock and 26.6 percent of plans have over 80
percent of their assets in employer stock.
The DC plans in our sample contain a wide variety of plan features, some of which are
endogenous to the employer’s choice of whether to mandate or offer investments in employer
stock. For example, approximately one-fifth of the DC plans include an employee stock
ownership plan (ESOP) that is required by law to invest primarily in employer stock. ESOPs are
frequently combined with a 401(k) plan to hold employer contributions of stock (frequently
referred to as KSOPs). Consequently, 401(k) plans with ESOP features frequently hold
significant shares of other assets. For example, in our sample, 6.4 percent of the pension plans
are KSOPs that have an average of 41.1 percent of assets invested in employer stock.
Ten percent of the plans have a stock-bonus feature where the employer contributes
company stock to the pension plan. Nearly three-fourths of the DC plans have a 401(k) feature
allowing employees to make their own contributions to the plan. Four-fifths of the plans have a
profit-sharing feature where employer contributions may vary with the profitability of the firm.
Slightly over one-half of the plans allow the participant to direct at least some of the assets and,
in some cases, may choose to invest their own contributions in employer stock. Unfortunately,
15We examined a random subset of plans who provided a CUSIP that are not found in the CRSP data and determined that the primary reasons for a failure to match is that the Form 5500 CUSIP number was improperly

13
the form 5500 data does not make it possible to determine precisely who is making the decision
to invest in employer stock. We will return to this point later.
To examine whether pension fund investments in employer stock reflect the costs and
benefits outlined earlier, we examine the predictive power of several variables that should be
related to either the costs or benefits. First, we calculate variables reflecting the risk and return
features of each company's stock using data merged from CRSP. Following Meulbroek (2005),
we estimate a measure of the nondiversification cost of holding employer stock that relies on the
CAPM to estimate the increase in expected return that a worker could realize by switching from
a portfolio consisting entirely of employer stock to a portfolio located on the efficient frontier.
The estimate of nondiversification cost is:
jm − j (rm − rf)(1) NDCj =
where 9j and 9m represent the standard deviation of returns on stock j and the market portfolio;
j is the beta coefficient corresponding to stock j; and rm and rj represent the expected return on
the market portfolio and the risk free asset respectively.16
An alternative measure of the cost of investing in a single stock is the potential decrease
in the standard deviation of returns that a person could achieve with no reduction in the expected
return. Comparing the security market line with the efficient frontier, this potential reduction in
risk (PRR) can be shown to be equal to:
(2) PRRj = j(1 − jm) if jm 0
recorded or that the stock is traded over the counter and thus not included in CRSP. 16 j=8jm (9j /9m) where 8jm is the correlation coefficient between the daily returns on stock j and the daily returns on the market portfolio. The derivation of the nondiversification cost relies upon two results from the CAPM. First, the set of efficient portfolios is a mix of the risk free asset and the market portfolio. The expected return for an efficient portfolio with standard deviation of returns 9j can be written as rj*=r + (9f j/9m)(rm-rf). Second, the security market line reveals the expected return for a given stock as: rj = r + f j(rm-rf). The difference between rj* and rj is the measure of nondiversification cost for a stock with standard deviation of returns given by 9j. See Meulbroek (2005) for details on the derivation.

14
where 8jm is the correlation between the stock’s return and the return on the market portfolio.
This expression holds only for non-negative 8jm since stocks with a negative correlation with
the market return will have an expected return below the risk free rate. For such stocks, a switch
to the risk free asset would eliminate all of the risk and simultaneously increase the expected rate
of return.
While there is considerable evidence that the CAPM has shortcomings and is not a
perfect predictor of expected returns (Fama and French 2004), there is great value in its
parsimony. In particular, the more advanced methods (e.g., the Fama-French three- or four-
factor model) require high frequency data (e.g., monthly or daily) for practical implementation.
Pension returns are available only on an annual basis. Moreover, while the CAPM has
shortcomings, it provides us with a benchmark for gauging return performance that is not
obviously biased in favor or against pensions that invest in employer stock.
To estimate the required components for nondiversification cost, daily stock returns are
used for the year prior to the Form 5500 filing;17 the CRSP value-weighted index is used to
measure returns on the market portfolio, and a risk premium of 7.9 percent is assumed.18
Holding nondiversification costs constant, a stock with a higher beta represents a stock
with a higher return and a higher level of systematic risk. If high beta stocks are inconsistent
with a risk averse worker's unconstrained portfolio choice, the size of the necessary
compensating difference for mandatory investments in employer stock would be greater.
Consequently, a higher beta could make it less likely that employer stock is held in the pension.
Since there is evidence that employee purchases of employer stock are especially
17 Since the plan year in the Form 5500 can end in any month of the year, we merge a year of financial data that ends on the month and year corresponding to the beginning of the pension plan year. 18The risk premium is based upon an update of the data in Fama and French (1993) for the period 1927 to 1998 available from Kenneth French at http://mba.tuck.dartmouth.edu/pages/faculty/ken.french/index.html.

15
sensitive to recent stock performance and that workers rarely rebalance their portfolio [Benartzi
(2001) and Sengmuller (2002)], we include controls for the average returns on the company’s
stock over the three prior years. Also, since stocks that pay dividends create a greater tax
incentive to include employer stock in an ESOP, we include controls for the three previous years
of dividend yields (annual dividends expressed as a percentage of stock price).
Workers with assets outside of their DC plan are more able to diversify the risk of
holding employer stock. Hence, because workers with higher incomes are more likely to have
financial assets outside of their pension, a work force with higher average income should make
employer stock holdings more likely. Also, we expect that coverage by a DB plan or the
presence of another DC plan would increase the chance that a worker has employer stock in the
DC. Unfortunately, the data in the Form 5500 do not allow us to determine whether additional
plans at a given firm cover the same or different workers.
Economic theory suggests that workers should reduce their holdings of equities as they
approach retirement since the proportion of total wealth held as relatively safe human capital
declines as workers age.19 Also, in ESOP plans, federal regulations require that workers be
allowed to begin diversification of their employer stock when they reach age 55. Consequently,
employer stock holdings should be lower among firms with a larger fraction of older workers.
We also control for the effect of the plan's size (number of participants) and whether the
plan is collectively bargained on employee stock holdings. Brown et al. (forthcoming) suggest
that larger firms (proxied by a larger number of participants) may be faced with greater
monitoring costs and thus realize greater benefits from the incentives created by employee stock
ownership. Cohen (2004) argues that self-selection will result in unionized workers being less
19See, for example, chapter 7 of Campbell and Viceira (2002).

16
loyal to the firm and therefore less willing to invest in employer stock. Potentially offsetting
this, however, is the fact that unionized workers are more likely to receive assistance in the event
of job loss. This reduces the positive correlation between employer stock returns and labor
income and reduces the nondiversification cost to holding employer stock.
The Form 5500 data does not provide information on two factors that could be important
in determining employer stock holdings. First, there is no information on whether the employer
provides a match in the form of employer stock. Brown et al (forthcoming) use data gathered
from 11-k filings by 401(k) plans with the SEC to examine the employer’s decision to provide
matching contributions in the form of employer stock. Second, while it is possible to determine
whether the employee has control over some of the asset allocation in the pension, the form 5500
does not reveal what fraction of assets are under the control of the employee. We recognize that
these variables could have important effects on the level of stock holdings. At the same time,
however, these variables are likely to be endogenous to the decision to hold employer stock.
Table 3 provides means for the control variables with the sample stratified according to
whether the pension holds any employer stock. Consistent with expectations, plans holding
employer stock have stocks with a lower beta and nondiversification cost, and both higher
dividend yields and returns over the prior three years. Plans that hold employer stock are also
more likely to be located at firms that offer a DB or another DC plan, have more participants
with higher average incomes, but are less likely to be collectively bargained plans.
The estimate of nondiversification cost for the stocks that are held in pension plans
averages 23.9 percent annually.20 This implies that, if the average plan had 100 percent of its
assets invested in employer stock, it could earn an expected return that is 23.9 percent higher
20The daily rate is converted to an annual rate by assuming 252 trading days per year -- the average number of trading days per year between 1990 and 1998.

17
without any increase in risk if it diversified and held a mean-variance efficient portfolio. Since
most plans do not have 100 percent of assets invested in employer stock, the actual cost of
holding employer stock will be lower than these estimates. Consistent with the hypothesis that
high nondiversification costs are undesirable to workers and should deter investments in the
employer stock, nondiversification costs are lower for the stocks that pension funds invest in.21
The alternative measure of the cost of holding employer stock is the “potential reduction
in risk” (PRR) described in equation (2) above. In the CAPM, stocks with a negative beta could
switch to the risk free asset and earn a higher rate of return with no risk. Consequently, we
impute a lower bound estimate of the cost of holding such stocks equal to the standard deviation
of the stock’s daily returns.
The daily PRR for stocks that are held in pension plans is .0191. This is nearly three
times the standard deviation of daily returns for the CRSP value weighted portfolio and suggests
that a plan invested entirely in employer stock could achieve significant reductions in risk
without any loss in expected return by diversifying the portfolio. The fact that the PRR is lower
for the employer stocks that are held in pension plans is consistent with the hypothesis that
pension plans will avoid stocks where the resulting inefficiencies are greatest.
Determinants of Investments in Employer Stock.
Given the potential correlation between the various explanatory variables, multivariate
analysis is necessary to sort out the separate effects of the control variables on employer stock
21Our estimates of nondiversification cost are higher than the industry averages of 8 to 14 percent estimated by in Meulbroek (2002). Meulbroek (2005) does not provide a comparable statistic. There are two explanations for our larger estimate. First, the sample in Meulbroek (2002) consists primarily of large firms tracked by Value Line. Among stocks that have market capitalization in the top one-third of our sample, the mean value of nondiversification cost is 13.5 percent annually. Second, Meulbroek's sample uses stock return data for 1998 only. Our estimates of nondiversification cost are below average in 1998. Restricting the sample to firms in the top one-third of market capitalization and using 1998 data only reduces the mean value of nondiversification cost to 8.5 percent. 1

18
holdings. We examine two measures of employer stock holdings. First, a probit model is used
to examine the effect of variables on the probability that a pension plan holds any employee
stock. Second, a tobit model is used to examine the effect of variables on the percentage of
assets held as employer stock (the "employer stock share"). The tobit model is used instead of
linear regression because of the significant share of plans with zero stock holdings.
Table 4 presents the results of the probit and tobit models of employer stock holdings.
Both models adjust standard errors for within plan clustering of residuals. The reported probit
coefficients represent the estimated effect of a one unit change in the explanatory variable on the
probability that the pension fund holds any company stock. The tobit results represent the
marginal effect of a one unit change in the explanatory variable on the expected share of assets
held in employer stock. All of the models include the control variables described in table 3 plus
year dummies.22
We deliberately exclude plan features such as ESOP status and stock-bonus features as
control variables since they are likely to be endogenous to the choice of whether to include
employer stock in the pension. For example, ESOPs are required to invest the majority of their
assets in employer stock and thus ESOP status is endogenous to the employer's decision to
mandate holdings of employer stock. Stock-bonus plans allow employers to give employer stock
as bonus payments to workers.
The variables describing the financial characteristics of the employer’s stock have
statistically significant effects on employer stock holdings that are consistent with expectations.
An increase in nondiversification cost by two standard deviations (an increase of 1.32) is
2 22The marginal effects are evaluated at the sample mean for all of the control variables. For explanatory variables that are dichotomous, the marginal effects are calculated by estimating the change in the relevant prediction created by switching the dummy variables from a value of zero to one.

19
estimated to reduce the probability of holding employer stock by 23.2 percentage points and the
level of holdings by 14.8 percentage points.
Consistent with the premise that employees will be averse to holding stocks with a high
risk and return, employer stock holdings also decline with the stock's beta coefficient. A two
standard deviation increase in beta (an increase of 1.35) reduces the probability of holding
employer stock by 9.2 percentage points and the expected level of holdings by 5.7 percentage
points.
The regression estimates also imply that the share of assets in employer stock increases
when a company's stock has recently performed well or had a high dividend yield. This positive
effect of higher returns is consistent with either infrequent portfolio rebalancing or employees
increasing stock purchases after it has outperformed the market. The tax deductibility of
dividends on stock held in an ESOP could explain the positive impact of a higher dividend yield
on stock holdings, though it may simply indicate that employees are more willing to invest in
stocks that are paying dividends.
Consistent with the prediction in Cohen (2004) that unions reduce employee loyalty,
collectively bargained plans are less likely to invest in employer stock. Alternatively, unions
could reduce investments in employer stock through their agency function whereby union leaders
advise workers to diversify and avoid heavy concentrations of employer stock.
Supporting the hypothesis that workers with assets outside of the DC plan (either as
another pension or as non-pension saving) are more able to diversify the risk, employer stock
holdings are greater when the firm offers another DB or DC plan and when workers in the
corresponding 3-digit industry have higher incomes. The estimated effect of average income,
however, is statistically insignificant at the .10 level.

20
Supporting the premise that workers should move out of equities as they approach
retirement, the fraction of workers in the industry over age 55 has a significant negative effect on
employer stock holdings. A 10 percentage point increase in the share of workers in the industry
that are over age 55 reduces the probability of holding any employer stock by 18.9 percentage
points and reduces the share of assets invested in employer stock by 13.1 percentage points. The
age effect could also be the result of federal law mandating that workers in ESOP plans be
allowed to diversify and reduce their holdings of company stock after they reach age 55 and have
10 years of service.
In general, the results suggest that the pension investments in employer stock reflect
several of the costs and benefits described earlier. Investments are lower when the stock
increases the risk of the portfolio without a commensurate increase in expected return (i.e., when
nondiversification cost is high); when workers are less able to diversify away the risk because
they have no other pension plan; and when workers are older and should be shifting out of
equities and into bonds. Consistent with prior evidence suggesting that workers overweight
recent performance when making investment decisions and a failure to rebalance portfolios, the
level of employer stock holdings also responds positively to recent stock performance. Finally,
the positive effect of dividend yields on employer stock holdings suggests that firms are
responsive to the tax deductibility of dividends paid to stock held inside an ESOP. Alternatively,
employees may be more willing to invest in employer stocks that pay dividends.
Up to this point, we have not considered the possibility that employers and employees
weight the costs and benefits of investing in employer stock differentially. In theory, if
employees substantially discount the stock, the employer should be less willing to force
investments in the stock since the worker will value the stock at less than market value.

21
Consequently, if employees discount the stock, the employer would be providing an inefficient
form of compensation that may require a compensating difference. On the other hand,
employers may be willing to force investments in employer stock even if a compensating
difference is required if productivity, tax, or anti-takeover effects are sufficient to offset the
employee discount. In fact, one might argue that if employees have complete control over asset
allocation decisions, they would be unwise to invest in employer stock because of its
nondiversification costs. Some have argued, however, that employees are either irrational or
believe they have private information about the employer stock causing them to voluntarily
invest in employer stock.
To determine whether employers and employees place different weights on the costs and
benefits of investing in employer stock, we stratify the sample according to whether it is
participant directed. A participant directed plan is one where the employee controls asset
allocation. One disadvantage of the form 5500 data on participant direction through 1998 is that
it is impossible to determine what fraction of assets the participant directs. For example, a
pension plan might report that it is a participant directed 401(k) plan with an ESOP option
(KSOP). This KSOP has become increasingly common and typically represents a plan where the
employee directs his own contributions to the 401(k), but the employer contributions are in the
form of employer stock. Similarly, a participant directed 401(k) with a stock-bonus option is a
401(k) plan where the employee directs some of the assets, but the employer contributes stock as
part of a bonus plan.
While it is impossible to perfectly segregate the plans according to the extent of control
over assets, the combination of information on participant direction, ESOP and stock-bonus
features allow for a reasonable stratification of the sample in terms of the extent to which the
22
employer mandates investments in employer stock. For example, participant directed plans
without an ESOP or stock-bonus feature are likely to give employees the most control over how
much to invest in employer stock. Plans without any participant direction give employees the
least control.
Table 5 provides tobit estimates of the determinants of the employer stock share for
samples stratified by the level of participant direction.23 T-statistics testing the null hypothesis
that the tobit coefficients are identical across stratifications of the sample are also presented. The
three specifications are based upon 3 subsamples of the earlier data. The first specification
includes all plans without participant direction where the employer decides how all assets are
invested. The second specification includes all plans that have participant direction. Since some
of these plans also include ESOP or stock-bonus features, the employer may direct some of the
assets in these plans into employer stock. The third specification includes only participant
directed plans that have no ESOP or stock-bonus features. The first and third specifications
represent the greatest contrast in terms of employee control over investments in employer stock.
The t-statistics presented in the last two columns provide a test of equal tobit coefficients across
the subsamples.
The results in table 5 establish several interesting points about the weights that employers
and employees place on the costs and benefits of investing in employer stock. First, employees
are more averse to nondiversification than employers. The estimated effect of nondiversification
cost on the employer stock share is nearly four times as large in the restricted sample of
participant directed plans (i.e. no ESOP or stock-bonus features) than in plans controlled by the
23The estimates represent marginal effects on the expected value of the employer stock share evaluated at the sample mean. Standard errors are corrected for clustering of residuals at the plan level.

23
employer. The difference is statistically significant at the .01 level. Employee control of asset
allocation also reduces the rapid increase in employer stock share prior to age 50 that is then
followed by a rapid decrease after age 50.
The negative effect of collective bargaining on employer stock share is significantly
reduced when workers are given control over asset allocation. One might interpret this to mean
that unions are unwilling to allow the employer to force investments in employer stock, but
membership in a union does not reduce worker willingness to voluntarily purchase the stock.
Another notable difference between the employer and employee directed accounts is the
time trend in employer stock share. Whereas the employer directed accounts illustrate a marked
increase in employer stock share over time, the participant directed accounts show virtually no
growth over time. One explanation for this trend is that many plans are adding participant
directed features over time, and separate analysis reveals that the plans with the smallest
holdings of employer stock are the most likely to shift to participant direction.24 Over time, this
increases the employer stock share of the remaining employer directed accounts.
The Effect of Employer Stock Holdings on Risk and Return.
The above analysis provides compelling evidence that the inherent risk exposure
associated with investments in employer stock affects the extent of pension plan investments in
employer stock, and that employees are more sensitive to nondiversification costs than
employers. Nevertheless, investments in employer stock may still result in significant effects on
the efficiency of the portfolio. Our estimates of nondiversification cost for the typical stock held
1 24The percentage of plans in our sample with participant direction rose from 28.1 to 70.4 percent between 1990 and 1998. For plans that did not have participant direction in the prior year, we estimated a probit model of the decision to switch to participant direction as a function of employer stock share and found that a 10 percentage point increase in the share of assets held in employer stock is associated with a 1.2 percentage point reduction in the probability of switching to participant direction. The effect is statistically significant at the .001 level.

24
in pension plans suggest that, if forced to invest 100 percent of assets in employer stock, the
worker would need an increase in annual returns of 23.9 percent to match what could be earned
with an efficiently managed diversified portfolio with the same risk exposure. Alternatively, the
worker could reduce rate of return risk by nearly three times that of the CRSP value weighted
index by switching to an efficiently managed portfolio with no reduction in the expected rate of
return. These estimates, however, are based upon the validity of the CAPM and the assumption
that all assets are invested in employer stock. The estimates would overstate the inefficiency if
employees hold assets other than the employer stock that offset the risk of holding employer
stock.
To determine whether investors adjust the remainder of the pension portfolio to the level
of employer stock holdings, we group the other assets into six broad categories: other stock (i.e.,
stock other than employer stock); government bonds; corporate bonds; receivables; trusts and
pooled accounts; and other assets.25 We then estimate a series of linear regressions with the
dependent variable representing the share of non-employer stock assets invested in a particular
category. The right hand side of the regression equation includes plan fixed effects and the share
of assets invested in employer stock. In all six share equations, the fixed effects are statistically
significant at the .01 level. The models are also estimated with the sample stratified according to
participant directed status to determine whether employees and employers have different
responses increased investments in employer stock. Since the four asset shares must sum to 100
percent, the coefficients on the employer stock share variable sum to zero across the six
regressions. If employer stock holdings have no impact on how the remainder of the portfolio is
25The corresponding asset shares for the six categories average 9.9, 16.3 2.6, 46.3, 7.6 and 17.3 percent. As noted earlier, funds with master trusts are excluded from the sample because they frequently hold significant shares of assets in employer stock.

25
allocated, the coefficients on the employer stock share variable should be zero in all six
regressions.
The results of the share equations, presented in table 6, imply that in the sample of all
pension plans, as the share of assets invested in employer stock rises, the remainder of the
portfolio experiences a reduced share of assets invested in other stock, but increases in the share
invested in corporate bonds, trusts and pooled and accounts, and receivables. Given that trusts
and pooled accounts can contain a wide range of asset types, it is difficult to ascertain what the
net impact on the mix of stocks and bonds in the portfolio. Nevertheless, the evidence does
suggest that the mix of assets in the remainder of the portfolio is sensitive to the level of
investments in employer stock.
Stratification of the sample by participant directed status reveals that participant direction
alters the nature of the response to an increase in employer stock, though in both types of plans,
there are significant reductions in the holding of other types of stock. One notable difference is
that, when the employer stock share rises, the employer directed accounts tend to increase the
weight on corporate bonds much more than the employee directed accounts. Employee directed
accounts respond with a much larger increase in the share of assets held in trusts or pooled
accounts.
Overall, given the broad nature of the asset categories, it is impossible to determine
whether pension funds are adjusting their mix of investments to help offset the risk of large
holdings of employer stock. It is clear, however, that both employer and employee directed
plans adjust the mix of assets in response to changes in the employer stock share. This fact is
counter to the assumption in some of the earlier work (e.g. Meulbroek 2005) which estimates the

26
costs of employer stock by assuming that the portfolio consists entirely of employer stock and
the market portfolio.
As an alternative to simulation methods or asset pricing models, we examine the
relationship between employer stock holdings and the risk and return of the pension portfolio
using actual pension returns over the sample period of 1990 through 1998. We track plans
across time and estimate the mean and standard deviation of returns for each plan over the
sample period. To be included in the sample, a plan must appear in the sample at least four of
the 9 years.26
To construct estimates of the rate of return on pension assets from the Form 5500 data,
we use the approach described in McCarthy and Turner (1989).27 The mean and standard
deviation of real returns for plans according to their stock holdings are presented in table 7. The
standard deviation of returns reported in table 7 is calculated by first calculating the standard
deviation of returns across time for each pension, and then averaging this across plans.
Plans are stratified into six groups according to their average share of assets invested in
employer stock over the sample period. One group contains the set of plans with no employer
stock over the entire sample period. The remaining sample is broken into five quintiles
according to their average share of stock holdings over the sample period.
A mean and standard deviation are also presented for a benchmark portfolio consisting of
a mix of stocks, corporate and government bonds, interest bearing cash, and non-interest bearing
26To create a panel of pension plans, we use the employer identification number and plan number. To verify the validity of these matches, we compare the end of year asset balance for year t with the beginning of the year asset balance in (t+1). In cases where asset balances are not in alignment, we drop the plan. 27The annual rate of return is calculated as net income from assets divided by invested assets. The net income from invested assets is defined as the sum of interest, dividends, rents, royalties, net realized gain or loss on sale or exchange of assets, other income, unrealized appreciation or depreciation of assets, and net investment gain from trusts minus unrealized appreciation or depreciation of buildings and depreciable property used in plan operations.

27
cash that matches the allocation for the average pension that did not hold employer stock over
the sample period. The returns for these asset categories over the 1990-98 sample period are
drawn from Ibbotson Associates (2004).28
The estimates in table 7 reveal that the average pension plan without any employer stock
had a slightly lower rate of return and slightly lower risk than the benchmark pension. It
experienced an average rate of return that is 0.5 percentage points lower (8.1 versus 8.6 percent)
and a standard deviation of returns that is 0.1 percentage points lower (8.6 versus 8.7 percent).
The slightly superior performance of the benchmark portfolio could be due to the fact that we do
not make any adjustment to the benchmark return for administrative costs, or transaction costs
associated with the purchase and sale of assets. Nevertheless, the fact that the mean and standard
deviation of returns for the benchmark pension and plans without employer stock are fairly
similar provides us with some confidence in our estimates of the rate of return.
An examination of the data by the level of employer stock holdings reveals that pension
investments in employer stock are associated with increases in both risk and return, particularly
when stock holdings reach into the top two quintiles of the distribution. Compared to plans that
hold no employer stock, those in the top quintile of stock holdings have an average real return
that is 0.1 percentage points higher, but the average standard deviation of returns is nearly four
times as high. In general, the plans with the heavier concentrations of employer stock are
achieving a slightly higher average return at the expense of much higher risk.
Investible assets are defined to reflect assets at the beginning of the year plus additional purchases of assets through the year with the assumption that all purchases are made midyear. 28The benchmark pension portfolio includes 8.3 percent corporate bonds, 9.9 percent government bonds, 56.7 stocks, 23.0 percent interest bearing cash and certificates of deposit, and 2.1 percent non-interest bearing cash. The real continuous time returns assigned to these respective asset categories are those realized by long-term corporate bonds, a weighted average of long-term and intermediate government bonds, large-company stocks, and T-bills. Non-interest bearing cash was given a zero nominal rate of return.

28
An obvious question is whether the higher return justifies the higher risk. The CAPM
model implies that the expected real return for a mean-variance efficient portfolio will be29
(2) ri = rf + ( i/ m)(rm − rf)
where ri represents the expected real return on a mean-variance efficient portfolio with standard
deviation of real returns 9i (henceforth the "predicted efficient return"); rm represents the
expected real return on the market portfolio which has a standard deviation of returns 9m; and rf
is the real rate of return on the risk-free asset. The result implies that a mean-variance efficient
portfolio has an expected real return that equals the risk free rate plus a multiple of the risk
premium earned by the market portfolio. For example, an efficient portfolio with a standard
deviation of returns that is twice as high as the market portfolio should earn a risk premium that
is twice as high.
To compute a measure of risk-adjusted return performance (RARP), we compute the
difference between the pension’s actual return and the predicted return for an efficient portfolio
with the same risk (standard deviation). To be precise,
(3) RARPi = ri − ri
where is the average return realized by pension i over the sample period, and ri ri is the
predicted return for an efficient portfolio with the same risk (standard deviation of returns) as
experienced by pension i over the sample period. The standard deviation of real returns for the
pension is based upon the pension returns observed between 1990 and 1998. The predicted
efficient return requires estimates of the historical risk-return tradeoff described in (2). To check
robustness, we use three different time periods for calculating the risk free rate and the mean and
29A mean-variance efficient portfolio is any portfolio that maximizes the expected rate of return holding the variance of returns constant. One result of the CAPM is that the market portfolio is always a mean-variance efficient portfolio.

29
standard deviation of market returns, all ending in 1998 but with starting dates of 1927 (the
earliest date with the necessary data), 1946 (post World War II), or 1960. The three different
time periods yield slightly different estimates of the key parameters.30
If employer stock holdings result in an inefficient mix of assets, the RARP of pension
plans should fall as employer stock holdings increase. Potentially mitigating this effect is our
finding that employer stock holdings are less common when the stock has a higher
nondiversification cost.
Evidence on the relationship between RARP and employer stock holdings is reported in
the middle three columns table 7 with each column corresponding to one of the three historical
periods for estimating the risk/return tradeoff. Given the strong performance of the stock market
during the 1990s, it is not surprising that pension plans performed above historical expectations.
31 Depending upon the historical period chosen for evaluating risk-adjusted return
performance, the benchmark portfolio outperformed predictions by 3.8 to 4.3 percentage points.
Performance for all pension plans as a group exceeds predictions by 1.6 to 2.5 percentage
points.
Heavy concentrations of employer stock significantly reduce plan performance. Whereas
pensions in the top quintile of employer stock holdings earned between 3.8 and 7.2 percentage
points below the predicted return for an efficiently managed portfolio with the same risk, plans
without any employer stock performed between 3.4 and 3.8 percentage points above predictions.
30For the three time periods starting with 1927, 1946, and 1960, estimates of the real risk free rate of return are 0.6, 0.5 and 1.4 percent; the standard deviations of the real return on the market portfolio are 18.6, 14.6 and 15.2 percent; and the risk premia for the market portfolio are 7.9, 7.1 and 5.3. All statistics are from an update of Fama and French (1993) made available by Kenneth French. All three estimates measure returns in continuous time. 31The real rate of return for the market portfolio from 1990 through 1998 averaged 14.5 percent, whereas it averaged only 8.9 percent between 1927 and 1998.

30
Consequently, based upon the historical tradeoff between risk and return, pension plans with the
heaviest concentrations of employer stock have returns that are too low given the level of risk.
Pension plans with modest holdings of employer stock compare favorably to plans
without employer stock. Comparing the return efficiency of pension plans in the bottom three
quintiles of employer stock holdings to those with no employer stock reveals a reduction in
performance of no more than 1.0 percentage points, and sometimes superior performance to
plans without employer stock. Consequently, modest holdings of employer stock result in
relatively modest reductions in performance. In fact, it is conceivable that the lower transaction
costs associated with purchases of employer stock may improve pension performance for those
with modest holdings.
To provide a summary measure of the relationship between rate of return performance
and employer stock holdings, we employ a simple regression approach. Using OLS, we
estimate a regression of risk-adjusted return performance as a quadratic of the employer stock
share. Higher order terms of stock share did not add statistically significant explanatory power.
We use the coefficient estimates to measure the effect of employer stock share on RARP as it
rises from 0 to 100 percent. For the sake of brevity, we present the results relying on the 1927-
1998 period for estimating the risk-return tradeoff. The results change only slightly when either
the 1947-98 or 1960-98 tradeoffs are used instead.
Table 8 summarizes the effect of employer stock share on RARP as it increases in 25
percentage point increments for the 1990-1998 sample of plans. The analysis is repeated with
several different samples of pension plans with alternative methods of calculating returns to
check for sensitivity of results.

31
Using the 2550 plans with at least 4 years of data in the 1990-98 Form 5500 data (row 1),
our estimates suggest that increasing the employer stock share from 0 to 100 percent reduces
RARP by 9.9 percentage points. The negative effect on RARP rises sharply with employer stock
share. Whereas increasing employer stock share from 0 to 50 percent reduces RARP by 2.0
percentage points; an increase from 50 to 100 percent reduces performance by 7.0 percentage
points.
To perform sensitivity analysis, we extend the time period and add more plans. This
requires that we simulate returns for pension portfolios by using information on their asset
allocation. To determine whether the simulations generate reasonable results, we first use the
same 2550 plans that have actual return data for the pension portfolio. Returns for these plans
are simulated by computing a weighted average of real returns on employer stock with the
remainder of the portfolio split equally between the CRSP value weighted index and bonds. The
bond portion of the portfolio was assumed to match the average mix of government and
corporate bonds reported in the Form 5500 data.32 The simulated returns on the pension
portfolios are highly correlated with the actual returns observed in the data (correlation
coefficient of .84) .
The estimated effects of employer stock share on RARP using actual and simulated
portfolio returns (rows 1 and 2 of table 8) are very similar. The similarity of results gives us
some confidence in using simulated returns for analysis of other time periods and portfolios to
examine the robustness of results.
One possible concern with the analysis is that it is based upon a relatively strong period
of stock market performance. The average real rate of return on the CRSP value weighted index
32This includes 45.6% for government bonds and 54.4% for corporate bonds

32
was 12.6 percent between 1990 and 1998. On the other hand, the market performed quite poorly
from 2000 to 2002, and the average real rate of return over the 1999-2003 period was -1.5
percent.
To determine the sensitivity of our results to the use of the 1990-1998 time period, we
compute simulated returns up through 2003. Also, we use delisting returns from CRSP to allow
for the possibility that a company’s stock becomes worthless or the stock ceases to exist as a
result of a merger.33
Comparing rows (2) and (3) of table 8 reveals that expanding the time period for returns
from 1990-98 to 1990-2004 slightly amplifies (by approximately one-fifth) the estimated effect
of employer stock holdings on RARP.
By using returns for simulated portfolios and extending the time period, the number of
plans with at least 4 years of data for calculating returns and risk nearly doubles (from 2,550 to
4,285). Despite the large increase in the sample size, the results are altered only slightly (row 4
of table 8).
Another potential issue with our analysis is that plans with master trusts were excluded
from the sample because of the lack of information on how funds are invested. To examine
whether this exclusion has an important effect, we use a special version of the 1996 Form 5500
data obtained from the Employee Benefits Security Administration that relied on ancillary
information to spread the master trust assets into the Form 5500 asset categories. As with the
earlier analysis, we simulate returns for each plan by dividing the portfolio into employer stock
and the remainder into the CRSP value-weighted index and bonds using the asset shares found in
the 1996 spread data.
33Delisting returns from CRSP impute returns for firms whose stocks cease trading either because of too little trading activity or a merger.

33
Using the 1990-98 time period for estimating returns for the plans in the 1996 spread data
results (row 5 of table 8) results in estimates very similar to those for the plans in the 1990-1998
Form 5500 sample that excluded plans with master trusts. Moreover, similar to the results
obtained for the earlier sample of plans, if the time period is extended to 2003 to include the
weaker years of stock market performance, the estimated effect of employer stock on RARP
increases by about one-fifth.
Overall, the estimated effects of employer stock holdings on RARP are quite robust to a
variety of changes in the methodology. Extension of the time period, including plans with
master trusts, using actual pension portfolio returns or simulated returns based on imputations of
returns on broad asset categories. All of the above variations support two main conclusions:
First, compared to plans with no investments in employer stock, those with 100 percent of assets
invested in employer stock have a shortfall of 10 to 14 percentage in RARP. This is substantially
lower than the estimates drawn directly from the CAPM model that averaged approximately 24%
for the stocks that are held in pension plans. Second, the adverse effect of employer stock on
pension plan performance rises sharply with the level of concentration. Compared to plans with
no employer stock, plans with one-half of their assets invested in employer stock have a
relatively small shortfall of approximately 2 percentage points in RARP. Doubling the share
from 50 to 100 percent reduces the RARP by approximately 9 to 11 percentage points.
Summary and Conclusions.
This study addresses two broad questions relevant to the wisdom of pension investments
in employer stock. First, what influences the extent to which firms and/or their employees invest
pension assets in employer stock? Second, when pension assets are invested in employer stock,
how much does it “cost” in terms of receiving too little return given the risk exposure?

34
The empirical analysis finds several patterns suggesting that the decision to invest in
employer stock reflects risk and return considerations. First, investments in employer stock are
more common when workers have other pension coverage that allows them to diversify away
some of the risk of holding employer stock. Second, consistent with optimizing the portfolio
over the life-cycle, firms with an older work force tend to invest less in employer stock. Finally,
pensions are less likely to hold heavy concentrations of employer stock when they have a high
nondiversification cost since these stocks would result in particularly large increases in risk
without a commensurate improvement in expected returns.
Our study also shows that employees and employers weight some of the costs and
benefits of investing in employer stock differentially. For example, employers place less weight
on the nondiversification of investments in stock. We also find evidence suggesting that unions
reduce investments in employer stock when the employer is managing the assets, but have a
much smaller effect on such investments when the employees are managing the assets and
making voluntary purchases of the stock.
Rather than rely entirely on simulations of pension performance which requires
assumptions about portfolio allocation, our study uses actual pension return data to estimate the
efficiency effects of investments in employer stock. Our estimates illustrate that pension plans
that hold employer stock have lower risk-adjusted return performance. While modest holdings
of employer stock (i.e., under 50 percent) have relatively small effects on performance, the
effects are quite dramatic when the asset share rises from 50 to 100 percent. Moreover, the
actual return data result in substantially lower estimates of the efficiency affects than suggested
by the CAPM model.

35
Several points should be made regarding these results. First, the fact that the inefficiency
of holding employer stock is relatively modest for low concentrations of stock suggests that if
workers have other assets to supplement their pensions (either other pensions or private saving),
we would be overestimating the negative consequences of employer stock holdings. At the same
time, this point underscores the fact that heavy investments in employer stock are particularly
troublesome for workers who have little in the form of other savings. Our analysis suggests that
firms internalize this fact to some degree by their tendency to avoid investments in employer
stock when the average worker has low income and when there are no other pension plans
provided by the firm.
A second point to emphasize is that the negative effect of employer stock holdings on
RARP could potentially be offset by gains in other areas of the employment relationship. The
incentive and tax effects of holding employer stock may be sufficient to offset the return
inefficiencies. Moreover, it is possible that firms pay workers a compensating difference for the
loss in performance when heavy investments in employer stock are mandated. We have no
evidence on this point.
Finally, given the structure of our data, our study was forced to examine asset allocation
and efficiency effects at the plan level. It is entirely possible that the efficiency effects are much
greater than we estimate because aggregation to the plan level may lead to an understatement of
the frequency with which there are extreme concentrations of employer stock. For example, it is
possible that a plan holding 25 percent of its assets in employer stock is the result of 25% of its
working investing everything in employer stock and 75 percent investing nothing. Data on
individual behavior supplemented with information on their non-pension assets would provide an
improved picture of the cost of pension investments in employer stock.

36
References.
Ameriks, John, and Zeldes, Stephen P. “How Do Household Portfolio Shares Vary With Age?”
Working Paper, Columbia University, December 2001.

37
Beatty, Anne. “An Empirical Analysis of the Corporate Control, Tax and Incentive Motivations
for Adopting Leveraged Employee Stock Ownership Plans.” Managerial and Decision Economics 15 (July-August 1994): 299-315.
Benartzi, Shlomo. “Excessive Extrapolation and the Allocation of 401(k) Accounts to Company
Stock.” Journal of Finance 56 (October 2001): 1747-1764. Benartzi, Shlomo, and Thaler, Richard H. “Naive Diversification Strategies in Defined
Contribution Savings Plans.” American Economic Review 91 (March 2001): 79-98.
Brennan, Michael, and Torous, Walter N. “Individual Decision-Making and Investor Welfare,”
Economic Notes 28 (July 1999): 119-143.. Brown, Jeffrey R; Liang, Nellie; and Weisbenner, Scott. “401(k) Matching Contributions in
Company Stock: Costs and Benefits for Firms and Workers.” Forthcoming Journal of Public Economics.
Campbell, John Y. and Viceira, Luis M. Strategic Asset Allocation: Portfolio Choice for Long-
Term Investors, with Luis M. Viceira, Oxford: Oxford University Press, 2002.
Chaplinsky, Susan, and Niehaus, Greg. "The Role of ESOPs in Takeover Contests." Journal of Finance 49 (September 1994): 1451-70.
Cohen, Lauren. "Loyalty Based Portfolio Choice." University of Chicago Working Paper,
March 2004. Davis, Steven and Willen, Paul. “Occupation Level Income Shocks and Asset Returns: Their
Covariance and Implications for Portfolio Choice.” Cambridge, MA: National Bureau of Economic Research Working Paper Number 7905, September 2000.
Even, William and Macpherson, David. “Company Stock in Pension Funds.” National Tax
Journal 57 (June 2004): 299-313. Fama, Eugene F., and French, Kenneth R., “Common Risk Factors in the Returns on Stocks and
Bonds," Journal of Financial Economics 33 (February 1993): 3-56. _______________. “The Capital Asset Pricing Model: Theory and Evidence.” Journal of
Economic Perspectives (Summer 2004): 25-46.

38
Gamble, John E. "ESOPs" Financial Performance and Federal Tax Incentives." Journal of Labor Research 19 (Summer 1998): 529-41.
Gordon, Lilli A., and Pound, John. “ESOPs and Corporate Control.” Journal of Financial
Economics 7 (October 1990): 525-55. John Hancock Financial Services. Insight into Participant Investment Knowledge and Behavior,
Seventh Defined Contribution Plan Survey, 2001. Hewitt Associates. Trends and Experiences in 401(k) Plans. Lincolnshire, Ill: Hewitt Associates,
2001.
Holden, Sarah, and VanDerhei, Jack. “401(k) Plan Asset Allocation, Account Balances, and Loan Activity in 2000,” EBRI Issue Brief Number 239, Employee Benefit Research Institute, Washington DC, November 2001.
Huberman, Gur, and Jiang,Wei. "The 1/N Heuristic in 401(k) Plans." Columbia University
Business School Working Paper, April 2004. Ibbotson Associates. Stocks, Bonds, Bills and Inflation: 2004 Yearbook: Market Results for
1926-2003. Chicago: Ibbotson Associates, 2004. Institute of Management and Administration. DC Plan Investing, December 2001.
Jenkins and Gilchrist ESOP Solutions Group. “ESOP Fiduciaries Continuing to Invest And Hold Company Stock in the Wake of a Declining Stock Value.” ESOPtions 3 (81), April-May 2003.
Jones, Derek C. and Kato, Takao. "The Productivity Effects of Employee Stock-Ownership
Plans and Bonuses: Evidence from Japanese Panel Data. American Economic Review 85 (June 1995): 391-414.
__________. "Employee Stock Ownership Plans and Productivity in Japanese Manufacturing
Firms." British Journal of Industrial Relations 31 (September 1993): 331-46. Kruse, Douglas, and Blasi, Joseph. "Employee Ownership, Employee Attitudes, and Firm
Performance: A Review of the Evidence." In Human Resources Management Handbook, Part 1, edited by David Lewin, Daniel J.B. Mitchell, and Mahmood Zaidi, pp. 113-51. Greenwich, CT: JAI Press, 1997.
Liang, Nellie, and Weisbenner, Scott. “Investor Behavior and the Purchase of Company Stock in
401(k) Plans - The Importance of Plan Design.” Cambridge, MA: National Bureau of Economic Research Working Paper Number 9131, August 2002.

39
McCarthy, David D., and Turner, John A. "Pension Rates of Return in Large and Small Plans." In Trends in Pensions, edited by John A. Turner and Daniel J. Beller. Washington, D.C.: U.S. Department of Labor, Pension and Welfare Benefits Administration, 1989, pp. 235-286.
Meulbroek, Lisa K. “Company Stock in Pension Plans: How Costly Is It?” Harvard Business
School Working Paper 02-058. March 2002. ________. “Company Stock in Pension Plans: How Costly Is It?” Journal of Law and
Economics 48, October 2005: 443-474. Mitchell, Olivia S., and Utkus, Stephen P.. “Company Stock and Retirement Plan
Diversification.” Pension Research Council. University of Pennsylvania. Working Paper 2002-4, April 2002.
Munnell, Alicia; and Sunden, Annika E. “401(k)s and Company Stock: How Can We
Encourage Diversification?” Center for Retirement Research Issue Brief No. 9, Boston College, July 2002.
________ . Coming Up Short: The Challenge of 401(k) Plans. Washington, D.C. : Brookings
Institution Press, 2004 Pension and Welfare Benefits Administration Advisory Council on Employee Welfare and
Pension Benefits Plans, Report of the Working Group on Employer Assets in ERISA Employer-Sponsored Plans, November 13, 1997.
Poterba, James M. “Employer stock and 401(k) plans.” American Economic Review 93, May
2003: 398-404. ________ . “Portfolio risk and self-directed retirement saving programmes.” Economic Journal
114 (March 2004): C26-51. Pugh, William N.; Oswald, Sharon L.; Jahera, John S. Jr. "The Effect of ESOP Adoptions on
Corporate Performance: Are There Really Performance Changes?" Managerial and Decision Economics, July-Aug. 2000, v. 21, iss. 5, pp. 167-80.
Purcell, Patrick J. “Company stock in Retirement Plans: Investment Risk and Retirement
Security,” Congressional Research Service Report, June 2002. Ramaswamy, Krishna. “Company Stock and DC Plan Diversification.” Pension Research
Council Working Paper, University of Pennsylvania, April 2002 Rauh, Joshua. "Own Company Stock in Defined Contribution Pension Plans: A Takeover
Defense?" Massachusetts Institute of Technology Working Paper, May 2003.
40
Reish, Fred. “Taking Stock: Managing the Risk of Company Stock.” available at http://www.reish.com. June 2003.
Samuelson, William, and Zeckhauser, Richard. “Status Quo Bias in Decision Making,” Journal
of Risk and Uncertainty 1 (March 1988): 7–59. Sengmuller, Paul. “Performance Predicts Asset Allocation: Company Stock in 401(k) Plans.”
Columbia University, Department of Economics. April 2002. Vanguard Group. “Expecting Lower Returns in the Short Run.” Vanguard Participant Monitor.
Vanguard Center for Retirement Research. November 2001.

41
Table 1: Sample Sizes and Deletions for Data Sets
Sample Size Deletions Number of DC plans with 100 or more participants at publicly traded companies 50,634 Master Trust Assets Greater than Zero 6,568 Multi-employer plan 583 Interim reports 478 Missing Industry Code 397 Sum of Asset Parts Not Within 2% of Reported Asset Total 164 Individual Asset Value Exceeds Reported Total of Assets 96 Total Deletions 8,286 Sample Size in Form 5500 DC Data Set 42,348 No match in CRSP 18,560 Missing financial data in CRSP. 738 Number of plan-year observations 23,050 Number of plans in sample 5,558 Note: The mean number of plans per EIN in a given year is 1.91 and 53 percent of employers have only one DC plan.

42
Table 2: Sample Characteristics of Defined Contribution Plans.
Employer stock holdings.
Percent of plans with some employer stock
44.1%
Among plans with some employer stock, average share of assets invested in employer stock.
45.6%
Among plans with some employer stock, percent with more than 50 percent of assets invested in employer stock
40.8%
Among plans with some employer stock, percent with more than 80 percent of assets invested in employer stock
26.6%
Plan Features
401(k) plan 71.2%
ESOP or Leveraged ESOP 21.1%
Stock Bonus Plan 10.0%
Profit sharing plan 78.9%
Participant directed plan 54.0%
Stock bonus plan 10.0%
Sample Size
23,050
The sample includes defined contribution plans with 100 or more participants at publicly traded companies in the matched Form 5500/CRSP data for the years 1990 through 1998.
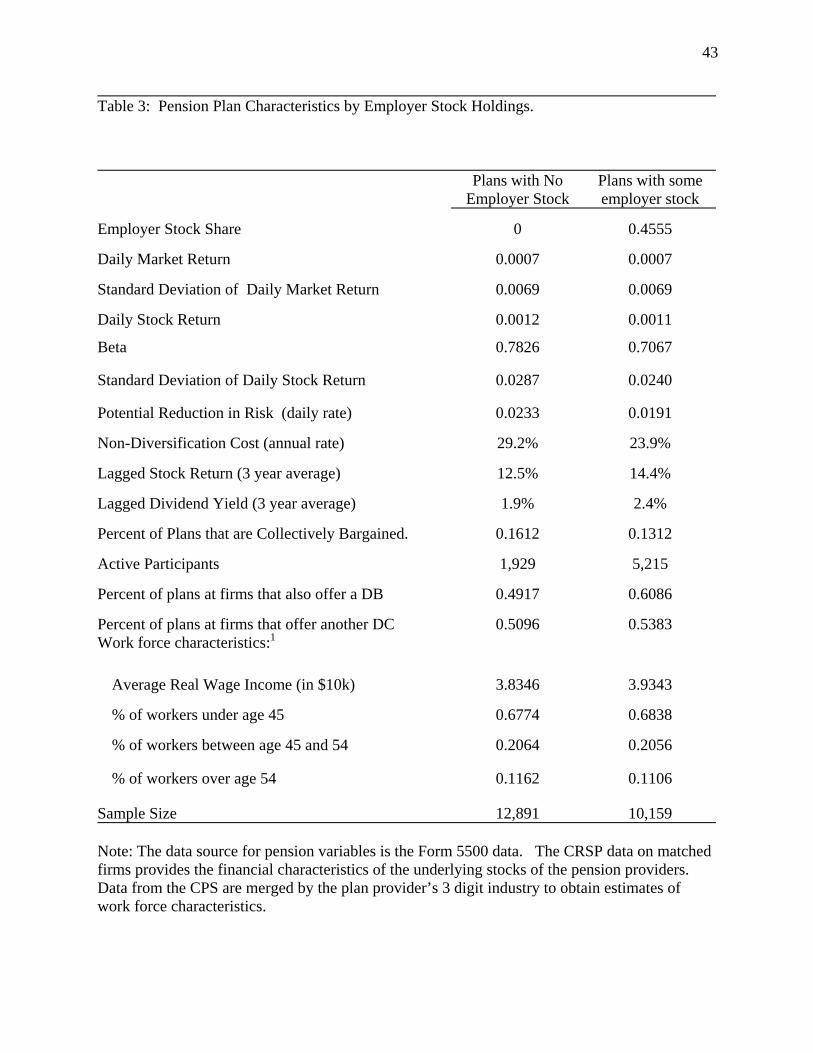
43
Table 3: Pension Plan Characteristics by Employer Stock Holdings.
Plans with No Employer Stock
Plans with some employer stock
Employer Stock Share 0 0.4555
Daily Market Return 0.0007 0.0007
Standard Deviation of Daily Market Return 0.0069 0.0069
Daily Stock Return 0.0012 0.0011
Beta 0.7826 0.7067
Standard Deviation of Daily Stock Return 0.0287 0.0240
Potential Reduction in Risk (daily rate) 0.0233 0.0191
Non-Diversification Cost (annual rate) 29.2% 23.9%
Lagged Stock Return (3 year average) 12.5% 14.4%
Lagged Dividend Yield (3 year average) 1.9% 2.4%
Percent of Plans that are Collectively Bargained. 0.1612 0.1312
Active Participants 1,929 5,215
Percent of plans at firms that also offer a DB 0.4917 0.6086
Percent of plans at firms that offer another DC 0.5096 0.5383 Work force characteristics:1
Average Real Wage Income (in $10k) 3.8346 3.9343
% of workers under age 45 0.6774 0.6838
% of workers between age 45 and 54 0.2064 0.2056
% of workers over age 54 0.1162 0.1106
Sample Size 12,891 10,159 Note: The data source for pension variables is the Form 5500 data. The CRSP data on matched firms provides the financial characteristics of the underlying stocks of the pension providers. Data from the CPS are merged by the plan provider’s 3 digit industry to obtain estimates of work force characteristics.

44
Table 4: Determinants of Employer Stock Holdings.
Probit model
Tobit model
Marginal probability
effect t-statistic
Marginal effect on employer
stock share t-statistic Non-diversification cost -0.176 5.31 -0.112 5.39 Beta -0.068 6.54 -0.042 6.82 Lagged Return (3 year average) 0.030 1.56 0.058 5.26 Lagged Dividend Yield (3 year average) 0.899 3.29 0.618 4.16 1Missing Return 0.035 0.54 0.037 0.99 Missing Yield -0.083 1.30 -0.047 1.41 Age 45 to 54 0.402 1.75 0.147 1.15 Age 55 and up -1.888 5.69 -1.313 7.35 Real Wage Income (in $10k) 0.006 0.68 0.003 0.58 Collective Bargaining -0.125 5.87 -0.077 6.73 Active Participants in 1,000s 0.008 3.88 0.002 5.40 Other DB 0.089 5.51 0.052 5.57 Other DC -0.0003 0.02 0.057 6.57 Year: 1991 0.026 2.64 0.020 3.55 1992 0.043 3.71 0.033 4.84 1993 0.071 5.16 0.040 4.88 1994 0.095 6.68 0.059 6.92 1995 0.086 6.14 0.046 5.51 1996 0.099 6.73 0.054 6.09 1997 0.095 6.45 0.039 4.56 1998 0.087 5.71 0.031 3.43 1999 0.104 3.22 0.055 2.62 Sample Size 23,050 23,050 Note: The data source is the matched Form 5500/CRSP data set. Marginal effects are estimated at the sample mean. T-statistics are based upon robust standard errors allowing for within-plan clustering of residuals.

45
Table 5: Determinants of Employer Stock Holdings by Participant Directed Status.
(1) Not
participant directed
(2)
Participant directed
(3) Participant directed, excluding ESOPs &
Stock-bonus
(1) vs. (2) t-stat for
equal effects
(1) vs. (3) t-stat for
equal effectsNon-diversification cost -0.025
(0.69) -0.133 (7.79)
-0.103 (7.10)
4.62 4.13
Beta -0.050 (4.20)
-0.020 (4.31)
-0.017 (4.47)
0.90 0.80
Lagged Return (3 year average) 0.071 (3.21)
0.048 (5.41)
0.039 (5.43)
0.19 0.33
Lagged Dividend Yield (3 year average) 0.527 (2.11)
0.566 (4.47)
0.495 (4.26)
1.38 1.41
Age 45 to 54 0.449 (1.90)
0.113 (1.13)
0.057 (0.65)
0.87 1.09
Age 55 and up -1.946 (5.92)
-0.711 (5.12)
-0.551 (4.52)
1.82 2.00
Real Wage Income (in $10k) 0.009 (1.00)
0.001 (0.19)
0.002 (0.47)
0.72 0.57
Collective Bargaining -0.140 (6.43)
-0.024 (2.65)
-0.015 (1.81)
3.84 4.01
Active Participants in 1,000s 0.003 (3.23)
0.001 (3.91)
0.001 (2.91)
0.54 0.84
Other DB 0.058 (3.38)
0.046 (6.34)
0.038 (6.01)
1.22 1.16
Other DC 0.105 (6.84)
-0.021 (3.26)
-0.015 (2.58)
8.33 7.79
Year: 1991 0.047
(4.76) -0.005 (0.70)
-0.002 (0.36)
3.43 3.15
1992 0.070 (5.74)
0.010 (1.33)
0.009 (1.33)
2.91 2.85
1993 0.073 (4.92)
0.024 (2.86)
0.017 (2.31)
1.48 1.74
1994 0.118 (7.73)
0.033 (3.87)
0.021 (2.78)
2.76 3.30
1995 0.130 (8.07)
0.019 (2.39)
0.009 (1.31)
4.27 4.76
1996 0.153 (8.75)
0.027 (3.18)
0.015 (2.08)
4.35 4.81
1997 0.152 (8.10)
0.018 (2.24)
0.010 (1.45)
4.69 4.96
1998 0.177 (8.77)
0.004 (0.46)
0.000 (0.05)
6.37 6.40
1999 0.218 (4.91)
-0.009 (0.58)
-0.011 (0.93)
4.17 4.28
Sample Size 10,600 12,450 111,239 Note: Marginal effects are from tobit models and are estimated at the sample mean. T-statistics are based upon robust standard errors allowing for within-plan clustering of residuals. The t-statistics for equal effects test the null hypothesis that the tobit coefficients are independent of participant directed status. Models also include dummy variables for missing returns and missing dividend yields.

46
Table 6: Estimated Effect of Employer Stock Holdings on Allocation of Other Assets.
All Plans Not participant directed
Participant directed,
excluding ESOP and Stock Bonus
Plans Effect of increase in employer stock share on share of other assets invested in:
Other stock -0.617 (87.35)
-.713 (75.88)
-.406 (28.99)
Government bonds 0.004 (0.88)
.014 (2.40)
-.015 (2.35)
Corporate bonds 0.247 (22.68)
.325 (20.49)
.030 (1.60)
Trusts and pooled accounts 0.147 (9.26)
0.088 (5.40)
0.444 (11.82)
Receivables 0.168 (22.23)
0.190 (15.26)
0.008 (0.84)
Other assets 0.051 (4.16)
0.095 (6.57)
-0.061 (2.16)
Sample Size 22,909 10,460 111,517 Note: Estimates are based upon linear models with plan fixed effects. The dependent variable is defined as the value of a particular asset expressed as a percentage of all assets other than employer stock. The right hand side variables for each regression are the percentage of pension assets invested in employer stock and an intercept.

47
Table 7: Risk Adjusted Return Performance and Employer Stock Holdings: 1990 - 1998.a
Average Real Return on
Assets
Average Std. Deviation of
Real Return on Pension Assets
Risk-Adjusted Return Performanceb
Average Share of assets
invested in employer stock
Number of Pension Plans
Historical period used for risk adjustment
1927-1998 1946-1998 1960-1998
Benchmark pension portfolioc 8.6% 8.7% 4.3% 3.8% 4.2% -- --
All Plans 8.5%
13.1% 2.3% 1.6% 2.5% 21.9% 2,550
Plans with no employer stock 8.1% 8.6% 3.8% 3.4% 3.7% 0.0% 1,133
Plans with some employer stock Bottom quintile 8.1% 7.4% 4.4% 4.0% 4.2% 2.0% 283
2nd quintile 8.4% 9.2% 3.8% 3.4% 3.8% 10.7% 283
3rd quintile 9.4% 13.3% 3.1% 2.4% 3.4% 27.1% 284
4th quintile 9.9% 22.0% -0.1% -1.3% 0.8% 58.7% 283
Top quintile 8.2% 30.6% -5.4% -7.2% -3.8% 95.0% 284
a The data source is the matched Form 5500/CRSP data set. The sample is restricted to plans with non-missing rates of return that appear in the Form 5500 data simulation sample for at least 4 years. b Risk-adjusted return performance is the difference between the average return realized and the predicted return for an efficiently managed portfolio with the same level of risk. See text for details on the calculation. Three different time-periods are used to construct estimates of the risk free rate and the mean and standard deviation of returns for the market portfolio. C The benchmark pension portfolio includes 8.3 percent corporate bonds, 9.9 percent government bonds, 56.7 stocks, 2.1 percent non-interest bearing cash, and 23.0 percent interest bearing cash and certificates of deposit.
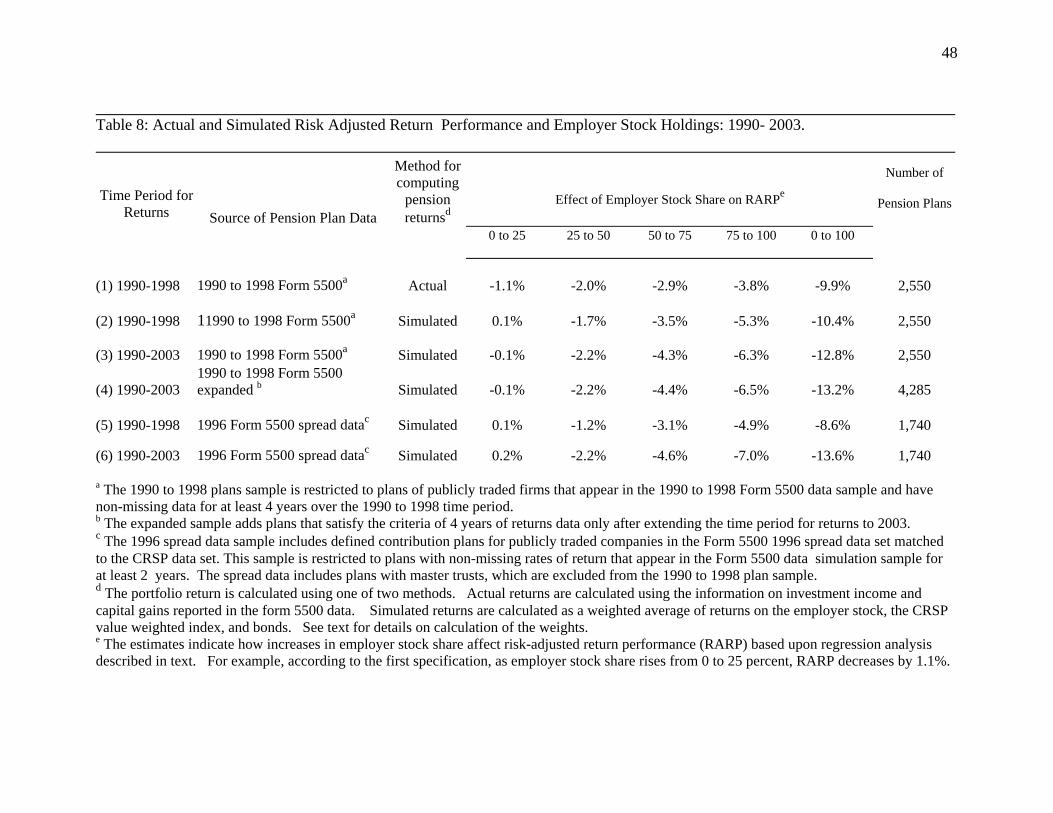
48
Table 8: Actual and Simulated Risk Adjusted Return Performance and Employer Stock Holdings: 1990- 2003.
Time Period for Returns Source of Pension Plan Data
Method for computing
pension returnsd
Effect of Employer Stock Share on RARPe
Number of
Pension Plans
0 to 25 25 to 50 50 to 75 75 to 100 0 to 100
(1) 1990-1998 1990 to 1998 Form 5500a Actual -1.1% -2.0% -2.9% -3.8% -9.9% 2,550
(2) 1990-1998 11990 to 1998 Form 5500a Simulated 0.1% -1.7% -3.5% -5.3% -10.4% 2,550
(3) 1990-2003 1990 to 1998 Form 5500a Simulated -0.1% -2.2% -4.3% -6.3% -12.8% 2,550
(4) 1990-2003 1990 to 1998 Form 5500 expanded b Simulated -0.1% -2.2% -4.4% -6.5% -13.2% 4,285
(5) 1990-1998 1996 Form 5500 spread datac Simulated 0.1% -1.2% -3.1% -4.9% -8.6% 1,740
(6) 1990-2003 1996 Form 5500 spread datac Simulated 0.2% -2.2% -4.6% -7.0% -13.6% 1,740
a The 1990 to 1998 plans sample is restricted to plans of publicly traded firms that appear in the 1990 to 1998 Form 5500 data sample and have non-missing data for at least 4 years over the 1990 to 1998 time period. b The expanded sample adds plans that satisfy the criteria of 4 years of returns data only after extending the time period for returns to 2003. c The 1996 spread data sample includes defined contribution plans for publicly traded companies in the Form 5500 1996 spread data set matched to the CRSP data set. This sample is restricted to plans with non-missing rates of return that appear in the Form 5500 data simulation sample for at least 2 years. The spread data includes plans with master trusts, which are excluded from the 1990 to 1998 plan sample. d The portfolio return is calculated using one of two methods. Actual returns are calculated using the information on investment income and capital gains reported in the form 5500 data. Simulated returns are calculated as a weighted average of returns on the employer stock, the CRSP value weighted index, and bonds. See text for details on calculation of the weights. e The estimates indicate how increases in employer stock share affect risk-adjusted return performance (RARP) based upon regression analysis described in text. For example, according to the first specification, as employer stock share rises from 0 to 25 percent, RARP decreases by 1.1%.