Longevity Adjustment of Pension Benefits
25
econstor www.econstor.eu Der Open-Access-Publikationsserver der ZBW – Leibniz-Informationszentrum Wirtschaft The Open Access Publication Server of the ZBW – Leibniz Information Centre for Economics Nutzungsbedingungen: Die ZBW räumt Ihnen als Nutzerin/Nutzer das unentgeltliche, räumlich unbeschränkte und zeitlich auf die Dauer des Schutzrechts beschränkte einfache Recht ein, das ausgewählte Werk im Rahmen der unter → http://www.econstor.eu/dspace/Nutzungsbedingungen nachzulesenden vollständigen Nutzungsbedingungen zu vervielfältigen, mit denen die Nutzerin/der Nutzer sich durch die erste Nutzung einverstanden erklärt. Terms of use: The ZBW grants you, the user, the non-exclusive right to use the selected work free of charge, territorially unrestricted and within the time limit of the term of the property rights according to the terms specified at → http://www.econstor.eu/dspace/Nutzungsbedingungen By the first use of the selected work the user agrees and declares to comply with these terms of use. zbw Leibniz-Informationszentrum Wirtschaft Leibniz Information Centre for Economics Lassila, Jukka Working Paper Longevity adjustment of pension benefits ETLA Discussion Papers, The Research Institute of the Finnish Economy (ETLA), No. 1073 Provided in Cooperation with: Research Institute of the Finnish Economy (ETLA), Helsinki Suggested Citation: Lassila, Jukka (2007) : Longevity adjustment of pension benefits, ETLA Discussion Papers, The Research Institute of the Finnish Economy (ETLA), No. 1073, http:// hdl.handle.net/10419/63859
-
Upload
independent -
Category
Documents
-
view
1 -
download
0
Transcript of Longevity Adjustment of Pension Benefits

econstor www.econstor.eu
Der Open-Access-Publikationsserver der ZBW – Leibniz-Informationszentrum WirtschaftThe Open Access Publication Server of the ZBW – Leibniz Information Centre for Economics
Nutzungsbedingungen:Die ZBW räumt Ihnen als Nutzerin/Nutzer das unentgeltliche,räumlich unbeschränkte und zeitlich auf die Dauer des Schutzrechtsbeschränkte einfache Recht ein, das ausgewählte Werk im Rahmender unter→ http://www.econstor.eu/dspace/Nutzungsbedingungennachzulesenden vollständigen Nutzungsbedingungen zuvervielfältigen, mit denen die Nutzerin/der Nutzer sich durch dieerste Nutzung einverstanden erklärt.
Terms of use:The ZBW grants you, the user, the non-exclusive right to usethe selected work free of charge, territorially unrestricted andwithin the time limit of the term of the property rights accordingto the terms specified at→ http://www.econstor.eu/dspace/NutzungsbedingungenBy the first use of the selected work the user agrees anddeclares to comply with these terms of use.
zbw Leibniz-Informationszentrum WirtschaftLeibniz Information Centre for Economics
Lassila, Jukka
Working Paper
Longevity adjustment of pension benefits
ETLA Discussion Papers, The Research Institute of the Finnish Economy (ETLA), No. 1073
Provided in Cooperation with:Research Institute of the Finnish Economy (ETLA), Helsinki
Suggested Citation: Lassila, Jukka (2007) : Longevity adjustment of pension benefits, ETLADiscussion Papers, The Research Institute of the Finnish Economy (ETLA), No. 1073, http://hdl.handle.net/10419/63859

Keskusteluaiheita – Discussion papers
No. 1073
Jukka Lassila – Tarmo Valkonen
LONGEVITY ADJUSTMENT OF
PENSION BENEFITS
We thank Peter Broer for fruitful comments, Juha Alho for providing us with his stochastic population simulations and Eija Kauppi for model programming. We acknowledge the financial support from the Ministry of Social Affairs and Health in Finland and the European Commission. The article is forthcoming in Alho, J.M., Jensen, S.E.H. and Lassila, J. (eds.): Uncertain Demographics and Fiscal Sustainability, Cambridge University Press.
ISSN 0781-6847 12.02.2007
ETLA ELINKEINOELÄMÄN TUTKIMUSLAITOS THE RESEARCH INSTITUTE OF THE FINNISH ECONOMY Lönnrotinkatu 4 B 00120 Helsinki Finland Tel. 358-9-609 900 Telefax 358-9-601 753 World Wide Web: http://www.etla.fi/

LASSILA, Jukka – VALKONEN, Tarmo, LONGEVITY ADJUSTMENT OF PENSION BENE-FITS. Helsinki: ETLA, Elinkeinoelämän Tutkimuslaitos, The Research Institute of the Finnish Economy, 2007, 20 p. (Keskusteluaiheita, Discussion Papers ISSN 0781-6847; No. 1073). ABSTRACT: In anticipation of future gains in life expectancy, several countries have passed laws that automatically adjust pensions, if life expectancy changes. In this paper we study the effects of longevity adjustment under demographic uncertainty in Finland. If longevity increases, the adjustment decreases the contribution rate, and the reduction is bigger the higher the rate would have been without the reform. On the other hand, longevity adjustment increases the uncertainty in replacement rates. The current middle-aged generations, whose pensions are reduced more than contributions, are likely to experience the largest losses. The full gains are observed far in future. The quantitative results de-pend on, besides demographic realisations, the specifics of the pension system. Longevity adjustment significantly weakens the defined-benefit nature of the Finnish pension system and brings in a strong defined-contribution flavour. Key words: pensions, longevity, demographic uncertainty JEL: H55, J11 LASSILA, Jukka – VALKONEN, Tarmo, ELÄKKEIDEN SOPEUTTAMINEN ELINAJAN MUUTOKSIIN. Helsinki: ETLA, Elinkeinoelämän Tutkimuslaitos, The Research Institute of the Finnish Economy, 2007, 20 s. (Keskusteluaiheita, Discussion Papers ISSN 0781-6847; No. 1073). TIIVISTELMÄ: Eliniän piteneminen aiheuttaa ongelmia eläkejärjestelmien rahoitukselle. Tästä syystä on useissa maissa otettu käyttöön mekanismeja, joiden avulla työeläkkeen suuruutta muutetaan elinajan odotteen muuttuessa. Jos elinikä pitenee Suomessa, elinaikakerroin hillitsee työeläkemaksujen nousua. Tutkimme kertoimen vaikutuksia väestöepävarmuuden vallitessa. Elinaikakerroin alentaa maksua sitä enemmän, mitä korkeampi maksu olisi ollut ilman kerrointa. Toisaalta elinaikakerroin lisää eläkkeiden korvausasteen suuruuteen liittyvää riskiä. Sen käyttöönotto heikentää todennäköisesti nykyisten keski-ikäisten kohorttien hyvinvointia, koska heidän elinaikanaan saamansa eläkkeet pie-nenevät enemmän kuin heidän maksamansa maksut. Tulevat sukupolvet hyötyvät hieman kertoimesta. Täsmälliset vaikutukset riippuvat tulevasta väestökehityksestä ja työeläkejärjestelmän säännöistä. Elinaikakerroin vähentää joka tapauksessa merkittävästi Suomen työeläkejärjestelmään etuusperustei-suutta ja tuo mukanaan maksuperusteisia piirteitä. Avainsanat: työeläkkeeet, elinaikakerroin, väestöepävarmuus

1 Introduction An increase in the life expectancy of elderly individuals can put a strain on the finances of a defined-benefit pension system if it means there are more retired people receiving benefits. In a PAYG system this increases the contribution levels. In anticipation of future gains in life expectancy, several countries have passed laws that automatically adjust pensions, if life ex-pectancy changes. The aim is to preserve the expected present value of future pensions. If benefits are received for more years, pensions per year will be lower. The popularity of this type of adjustment among policy planners is easy to understand – it is likely to cut pension expenditure significantly if current trends in mortalities continue. In the eyes of the public it can also be defended with an intergenerational fairness argument, because changes in life expectancies would have smaller effects on the present values of future pen-sions of different cohorts. In countries that have applied longevity adjustment or are considering doing so, its expected effects have been investigated to some degree. However, the fact that future mortality devel-opments are uncertain has not received much attention. For pension contribution rates this is not a serious deficiency; the adjustment itself takes care most of this uncertainty. But this un-certainty does exist for monthly pension benefits and replacement rates. Although the size of the adjustment will usually evolve slowly over time, it is worthwhile trying to form a picture of the effects well in advance. What has been missing thus far is an analysis that explicitly aims at both the expected implications and the risk-sharing properties of longevity adjustment when it is applied to actual populations and actual pension systems, at the same time consider-ing the interaction between the economy, demography and the pension system rules. We study the economic effects of longevity adjustment under demographic uncertainty, using as an example the recently reformed Finnish earnings related pension system, where, from 2010 onwards, new old-age pensions will be affected by longevity adjustment. First we describe the practical applications of longevity adjustment in other countries and re-view previous research. Then we depict the Finnish pension system and the simulation model. After that we consider the economic effects of longevity adjustment and draw conclusions. 2 How to adjust pensions to changes in longevity? Details of longevity adjustment define the risk sharing properties Increased longevity is by itself a positive phenomenon. Besides being an indication of higher healthy life expectancy, the increased number of potential working years allows extended use of accumulated human capital. However, an increase in longevity weakens the sustainability of defined benefit pension systems by adding to the number of pensioners and pension expen-diture. The pressure to raise contribution rates may be alleviated by several policy measures. Each has different intergenerational risk-sharing properties. Auerbach and Hasset (2001) suggest prefunding or precautionary saving as the optimal policy against longevity risks. Due to demographic uncertainty, the precision of such up-front meas-ures is, however, limited. In general, the desirability of waiting before policy action depends

2
on whether the future brings a resolution of uncertainty or whether simply new shocks replace the old (Auerbach and Hasset, 2002). In PAYG-financed pension systems the most often-used reform option is to discretionarily raise the eligibility ages for pension benefits. This necessitates unpopular political decisions, which may have to be repeated since future longevity is uncertain. Political dispute can be avoided by linking the set retirement age to longevity, but this may even increase the welfare losses if the optimal retirement age varies a lot between individuals e.g., due to health, wealth or productivity differences (see Diamond, 2001). Andersen (2005) suggests that optimal risk sharing requires an actuarial scheme in which pen-sions are proportional to the expected lifetime, but the present value of pension entitlements is independent of the actual retirement age. Diamond and Orszag (2003) claim that this type of full longevity adjustment would harm the pensioners too much and propose dividing the costs of longer life times equally between benefits and contribution. The exact details of the longevity adjustment are important for the risk-sharing properties. Adjustment of currently paid pensions with continuously updated life expectancy estimates would be problematic for the retirees; the ‘demographic factor’ suggested in the German Pen-sion Act of 1999 is such a measure. Another policy option is to let people decide when to retire (with actuarial determination of pensions), but at the same time improve the financial sustainability of the system by adjusting pensions to the expected longevity of the cohort at the time of retirement. This allows reacting to surprises by adjusting the labour supply. There are two alternatives for the indicator of fu-ture longevity. The first is to use official cohort projections and the second is to use known ex-post cross-sectional survival data. Cohort projections are in use in Latvia. The process of creating projections should be trans-parent in order to avoid political interventions (see Palmer, 2005). Lindell (2003) notes that it is not fair to adjust pensions following possibly erroneous longevity forecasts. Use of observed data provides stronger protection from political intervention and is therefore preferred in the current Finnish and Swedish first-pillar pension systems. The obvious prob-lem is the lagging realization of adjustments if longevity continues to increase. This slow re-action is most evident in DC or NDC systems, where the pension capital is divided by life ex-pectancy. However, in the case of defined benefit systems, this approach may still be preferable since it generates larger expected cuts to the future pensions than the adjustments based on forecasted longevity. The reason is that the increase in longevity has already taken place in the base pe-riod’s forecasts, but not in the observed mortality rates (see Lassila and Valkonen, 2003). Longevity adjustment in Sweden The Swedish pension reform of the 1990s has brought longevity adjustment to general knowl-edge in international pension circles. However, the instrument is just one part of a larger con-cept, the notional defined contribution (NDC) system, which contains other automatic adjust-ment mechanisms as well. Although we are concentrating on longevity adjustment, its role and effects cannot fully be understood separately from the whole system.

3
In the Swedish pension system, the NDC part includes explicit rules that state how the mortal-ity risk and the overall sustainability risk due to unfavourable population trends are distributed between benefits and contributions and time. Longevity adjustment together with a flexible retirement age is an essential part of the pen-sion strategy. This adjustment is applied to the cumulative balance of the nominal account of an employee at the time of retirement. The balance is changed to an annuity, using the aver-age life expectancy of the cohort and an imputed real rate of growth of 1.6 percent. This im-puted growth makes the annuity front-loaded: part of the expected value of the benefit stream, given the life expectancy and the 1.6 % growth factor, is shifted from the future to the present. The growth factor represents assumed real earned income growth. If the actual growth of real incomes is higher (lower) than 1,6 %, the benefit is adjusted upwards (downwards). In addi-tion, the annuity is indexed to consumer prices, so that over the lifetime the indexation actu-ally produces a result similar to full wage indexation. The adjustment is likely to cut pension expenditures markedly and to eliminate a major part of the variation in the contribution rate due to changes in mortality rates. The longevity adjustment and the indexation rule leave some demographic risks to be carried by the contribution rate. Since variation in the contribution rate would be problematic in a de-fined contribution system, an additional automatic balancing mechanism was created. Nor-mally the balance in the individual account is indexed to per capita income growth. The automatic adjustment mechanism will lower the indexation as long as the financial sustain-ability of the system is in danger. The Swedish Social Insurance Agency (Settergren, 2000) created a large number of scenarios (72) for the future of the pension system before the automatic balancing was decided. Uncer-tainty in these scenarios was related to demographics, economic growth, participation ratio and the yield of the buffer fund. Many of the studied scenarios led to the use of the balancing mechanism. The problem with this type of scenario approach is that it does not allow attach-ing any probability assessments to the results. Other countries that are applying the adjustment include Latvia, Poland, Italy and Finland. Switzerland is planning to adopt it, and a proposal to adopt it in a defined-benefit pension scheme has been made by a pension committee in Norway. Previous economic analysis of longevity adjustment Previous analysis of the economic impacts of longevity adjustment has mostly been based on actuarial models, with arbitrarily chosen demographic variants. However, some exceptions are discussed below. Lassila and Valkonen (2002) analysed the economic effects of longevity adjustment with a numerical overlapping model describing the pension system and economy of Lithuania. Fu-ture population paths were extracted from a stochastic population forecast. Thereby, the study aimed at both the expected outcomes and the risk-sharing properties of the measure. It turned out that both the expected welfare losses and the changes in risks are small compared with individuals’ lifetime resources. Future generations are expected to gain even though pension benefits are cut, since the lower contributions more than compensate for this. Cohorts near retirement will suffer the biggest expected welfare losses and the uncertainty of the scale of losses due to demographic uncertainty is also the largest for those generations. Lassila and

4
Valkonen (2007) analysed the Finnish pension reform of 2005 with the same approach, but did not isolate the effects of longevity adjustment. Fehr and Habermann (2006) used a similar method to analyse continuous adjustment of pen-sions for longevity (‘demographic factor’) by changing indexation. If ever implemented, this measure would allow extending the incidence to the currently retired generations. Still the main welfare losses and largest variation in welfare are again allocated to the middle-aged generations. The smallness of the welfare changes was also evident in these results. Other simulations based on just one population projection suggest a similar timing of expected wel-fare changes (see Hirte, 2002 and Bonin and Feist, 2003). The issue of adjusting pensions for longevity has also been raised in the United States. Dia-mond and Orszag (2003) present a reform package that proposes that impacts of longevity should be divided in half between benefits and contributions. The economic outcomes of the proposal have been simulated with an actuarial model by the US Congressional Budget Office (CBO 2004). These simulations are based on a probability distribution of possible future out-comes for the various demographic and economic assumptions used in the projections. It is impossible to isolate the impact of longevity adjustment of benefits, but it is likely to contrib-ute markedly to the observed reduction in uncertainty. Harris and Simpson (2005) simulated intra- and intergenerational redistribution outcomes of three pension policy measures, one of them being full longevity adjustment. These simula-tions utilized deterministic population forecasts. Progressive longevity indexing, which uses life expectancies by economic groups, has also been discussed in the United States. 3 Methodology The Finnish earnings-related pension system The earnings-related pension system aims to provide sufficient retirement income to cover consumption comparable to levels enjoyed during working years and to current workers’ con-sumption. It covers risks related to old age, disability and death of family earners. In cases where the earnings-related pension is absent or insufficient, the national pension guarantees a minimum income. Both of these first-pillar systems are mandatory. Voluntary pensions are still of minor importance in Finland but are becoming more common. Below we describe the private sector earnings-related system. Public sector pension systems are becoming similar, except that funding is different and there are long transition periods from old benefit rules. A more detailed presentation of the Finnish pension system can be found in Hietaniemi and Vid-lund (2003). Benefits The pensions can be thought of as consisting of both disability pensions and old-age pensions. Every year’s earnings and accrual rates directly affect the future pension. The accrual rate is 1.5 % per year between the ages of 18 and 53 and 1.9 % between the ages 53 and 62. Between the ages 63 and 68 the accrual is 4.5 % per year, aiming to reward later retirement in a cost-neutral way.

5
Both pension rights and benefits are index linked, with 80-20 weights on wages and consumer prices respectively during working years and 20-80 weights after retirement, irrespective of retirement age. In the model, function ( , , )I t u λ states that the change in wages w from period t to period u is weighted by λ and the change in consumer prices p is weighted by 1-λ . Em-ployee’s contributions e are deducted from wages in this calculation.
(1) ( )( )1
1
1( ) ( ) ( )( , , )( ) ( ) ( )
w u e u p uI t uw t e t p t
λ λλ
−
−
−⎛ ⎞ ⎛ ⎞= ⎜ ⎟ ⎜ ⎟
⎝ ⎠⎝ ⎠
We denote the accruals with k(x) where x refers to age. If retirement occurs due to disability, the pensioner is compensated for lost future accruals. The compensation depends on the age at the time of the disability event; we denote it by f(z) where z refers to the age during the last working period. After receiving the disability pension for five years there is a one-time level increase in the pension. This increase is 21 % for a person aged 26 or less, and smaller for older persons, so that those aged 56 or more get no increase. This feature is denoted by a(x,z). Thus the pension benefit b, without longevity adjustment, for an individual i in age group x who retired at age z + 1 and had earned wage incomes denoted by y is as follows.
(2) ( )
( )1
1
1
( , , ) ( , ) ( ) ( ) ( ) ( , ,0.8) ( , ,0.2)
( , ) ( ) ( ) ( ) ( , ,0.2)
z
i is
i
b t x z a x z k s y t s e t s I t s t x z I t x z t
a x z f z y t x z e t x z I t x z t=
−
−
= − − − − + − +
+ − + − + − +
∑
where x > z. Longevity adjustment The pensions are adjusted for increasing life expectancy simply by taking the increasing lon-gevity into account in the value of the annuity. The adjustment coefficient is a ratio of two present values of a unit pension, calculated at two different periods. The present value of a unit pension, which begins in period t and is calculated forward from age 62, is as follows.
(3) 100
62
63( ,62) ( 1,62, ) /(1.02)s
sA t S t s −
=
= −∑
The present value of a unit pension is a discounted sum of terms generated during various re-tirement years. The terms have two parts. The first term, S, expresses the survival probability from age 62 to age s, and the first subscript of the term demonstrates that the probability is evaluated using information available in period t, when the latest the observed mortalities are from period t-1. The survival probabilities are actually five-year moving averages. The second term is the discount factor where the discount rate is 2 % per year. In the model individuals die at the age of 100 at the latest. The pension of a person born in period t – 62 is multiplied by the longevity adjustment coeffi-cient E(t,62) after age 62. The coefficient is a ratio of two A-terms as follows. (4) ( ,62) (2009,62) / ( ,62)E t A A t=

6
The median Md, the first and third quartiles Q, and the first and ninth deciles d for the predic-tive distribution of the adjustment factors in 2030 and 2050, calculated from the 500 popula-tion paths in this study, are as follows. year d1 Q1 Md Q3 d9 2030 0.86 0.89 0.91 0.95 0.98 2050 0.79 0.82 0.87 0.91 0.97 Due to a shorter forecast horizon, the distribution is slightly narrower than that in Alho (2003). We expect the adjustment coefficient to decline to about 0.87 in 2050, with an 80% prediction interval [0.79, 0.97]. These intervals are valid providing the volatility of the trends of mortality during the next 50 years does not exceed the volatility of mortality during 1900-1994. Prefunding on the individual level The Finnish earnings-related system has collected substantial funds to smoothen the contribu-tion increases due to population ageing in the future. Funding is collective but based on indi-vidual pension rights. Individual pension benefits do not depend on the existence or yield of funds. Funds only affect contributions. When a person receives a pension after the age of 65, his/her funds are used to pay that part of the pension benefit that was prefunded. The rest comes from the PAYG part, the so-called pooled component in the contribution rate. Equation (5) describes new funding for an individual i. A share g of the present value of the pension right accruing in period t to workers in the age range 18 - 54 is put in the funds. The present value includes all old-age pension years, from 65 to a maximum age assumed to be 100. The labour income y creates a pension right for each year in old age. Discounting in-cludes both the so-called fund rate of interest q, which is administratively set, and survival probabilities S. For prefunding purposes, the magnitude of the pension right is evaluated ig-noring all future changes due to wage or price developments. Thus the value of the right is simply k times the labour income, without the employee contribution part, for each retirement year.
(5) 100
65( , ) ( ) ( )(1 ( )) ( 1, , ) /(1 )s x
i is
h t x g k x y t e t S t x s q −
=
= − − +∑
where x = 18,…, 54. Equation (6) states that for a retired person the amounts prefunded earlier (when the current pensioner was between the ages of 18 and 54) for period t's pension, with the interest accrued to them with rate r and leading to a total amount v, is used to pay a part of the person's pen-sion. The interest accrued is assumed here to be constant for a simpler exposition. In practice it follows approximately the average market yield plus a margin, and must not be lower than the fund rate in equation (5).
(6) 54
18( , ) ( ) ( )(1 ( )) ( 1, , )(1 ) (1 )s x x s
i is
v t x gk s y t x s e t x s S t x s x s x q r− −
=
= − + − − + − + − − + +∑
where x = 65,…, 100.

7
Contribution and replacement rates The equations (5) and (6) are important for the aggregate dynamics of the pension system, especially for the level and time path of the contribution rates. Let n(t,x) be the number of workers and ( , )h t x the average amount of new funding per worker in age x in period t. The total amount of new funding in period t is obtained by multi-plying the average individual funding in age group x by the number of workers in the age group, and summing over all age groups where funding takes place. Analogously, m(t,x) is the number of retired persons and ( , )v t x is the average amount withdrawn from the funds per re-tiree in each age group, and the total amount withdrawn from the funds is obtained by multi-plying the average withdrawals by the number of retirees and summing over relevant age groups. Three other aggregates are defined in a similar fashion: the total wage bill from which the pension contributions are collected, denoting the average wage income at age x by ( , )y t x , the total amount of earnings-related pension expenditure, denoting the average pension of re-tired persons by ( , )b t x and the total amount of other transfers from the pension sector, denot-ing the average transfer per person by ( , )s t x . The time path of the contribution rates is given by equation (7). Besides employees, employ-ers must also pay contributions, which we denote by c(t), based on the wage bill. The left-hand side of the equation is the total amount of contributions. That must be sufficient to cover that part of the pension expenditure (first term on the right-hand side) that does not come from withdrawals from the funds (second term), plus new funding (third term), plus transfers (the final term).
(7) [ ]
[ ]
64 100 100
18 18 65
54 100
18 18
( ) ( ) ( , ) ( , ) ( , ) ( , ) ( , ) ( , )
( , ) ( , ) ( , ) ( , ) ( , )
x x x
x x
c t e t n t x y t x m t x b t x m t x v t x
n t x h t x n t x m t x s t x
= = =
= =
+ = −
+ + +
∑ ∑ ∑
∑ ∑
Employer contributions were on average 16.8 % and employee contributions 4.6 % of wages in 2004. Future changes have been agreed to be shared 50-50 between employers and em-ployees. Since 2005, employees aged 53 and over pay contributions that are about 1.27 times that of younger employees, reflecting their higher accrual. From this point on, when we speak about the contribution rate we mean the sum of employer and employee contribution rates, where the latter is weighted from the age-dependent rates with corresponding revenue shares. By the replacement rate in age group x we mean the ratio of the average pension of retired persons ( , )b t x to the average wage income ( )y t of all work-ers. As an intergenerational measure of the connection between benefits and contributions, we de-fine the following. The actuarity rate is the ratio of a cohort’s discounted benefits from the pension system to its discounted sum of payments to the pension system. The benefits include all pensions and transfers from the earnings-related pension system. Denoting the interest rate by r, the actuarity rate AR for the cohort born in period t is the following.

8
(8) [ ]
[ ]
100 100
18 1864
18
( , ) ( , )(1 ) ( , ) ( , ) ( , )(1 )( )
( ) ( ) ( , ) ( , )(1 )
x x
x x
x
x
m t x x b t x x r n t x x m t x x s t x x rAR t
c t x e t x n t x x y t x x r
− −
= =
−
=
+ + + + + + + + +=
+ + + + + +
∑ ∑
∑
The economic model We simulate the economic impacts of introducing longevity adjustment using a perfect fore-sight numerical overlapping generations model of the type originated by Auerbach and Kot-likoff (1987). There are five sectors: households, enterprises, a government, a pension fund and a foreign sector. The labour, goods and capital markets are competitive and prices balance supply and demand period-by-period. There is no money or inflation in the model. House-holds and firms are forward-looking decision-makers. The unit period is five years, and the model has 16 adult generations living in each period. The model is adjusted to imitate the Finnish economy by a process of calibration. First, pa-rameters for household behaviour (e.g. preference for leisure) and production technology (e.g. substitutability of capital and labour) are extracted from the economic literature and used to generate numerical versions of those model equations describing the dynamics of the econ-omy. The current and future household cohorts are then aggregated using population statistics and forecasts. Finally, the model is scaled so that the outcomes resemble the key macroeco-nomic, public sector and household statistics for recent years. The earnings-related pension system is gradually brought into the model starting from the 1960s. Household behaviour Individuals make economic decisions according to the life-cycle hypothesis. They maximise the utility from consumption and leisure in different periods and the bequest that they give. The lifetime budget constraint says that discounted lifetime wage and pension income and discounted received bequest and transfers equal discounted consumption expenditure and the given bequest. Households consider the possibility of early death by discounting future con-sumption and incomes by a factor that includes both the interest rate and the age-specific sur-vival probability. Retirement occurs at the age of 65 at the latest. At ages below 60 an exogenous share, increas-ing with age, of persons retire due to disability. There is also an endogenous retirement deci-sion in the 60 – 64 age group. In that group the price of leisure, besides lost wage income and discounted effects on future pensions, also includes the amount of pension one can have if retiring then. Part of the leisure so decided is interpreted as a decline in the share of people working, and the share of those retiring at the age of 65 is reduced correspondingly. The elas-ticity of retirement to early pensions (and resulting changes in future pensions) is calibrated to observed behaviour in Finland between 1970 and 2004, taking into account the developments in the unemployment rate at ages 60 – 64 and changes in the eligibility and other rules of un-employment pensions and early old-age pensions. Decision problem for firms Firms choose the optimal amount of investment and use of labour to maximise the price of their shares. The market value of the firm is determined as a discounted sum of future divi-

9
dends. The problem can be presented as maximising at the beginning of the period the divi-dends distributed during the period plus the value of the firm at the end of the period, subject to the amount of initial capital stock, the cash-flow equation of the firm, the CES production function, the accumulation condition of the capital stock, the determination of the firm's debt and the investment adjustment costs. Markets The model includes four markets, which clear every period. In the labour market, firms de-mand labour according to the marginal productivity of labour rule. Households' aggregate la-bour supply is divided between public and private employment. The wage rate is determined by equating supply and demand in the labour market. Firms are the sole suppliers of the domestic good in the market. The product is used by other firms as part of the composite intermediate and investment goods, by households as part of the composite consumption good and by foreign agents. The domestic agents demand and the prices of the composite goods are determined by a cost minimising procedure. Domestic de-mand for fixed-price imported goods is also determined by minimising the costs of the com-posite goods. The perfectly elastic supply adjusts to demand in this market. The fourth market is the capital market, in which saving and investment are balanced by the domestic interest rate. In the simulations we use a model version in which the interest rate is set equal to the rate in international capital markets. In this case total saving is the sum of domestic saving and foreign portfolio investments. The presentation above only describes the most relevant parts of the model. The actual model includes a local and a central government, both with intertemporal budget constraints, and trade and capital flows with the rest of the world. The role of demographics Demographic information appears in several parts of the economic model. The most impor-tant areas are cohorts and age structures, survival probabilities, and aggregation over cohorts. The model keeps track of different cohorts of population throughout their adult ages. Survival probabilities are also important. The household variables, such as consumption, labour supply and wealth, are aggregated using population weights by age to obtain aggregate consumption, labour supply and household wealth. Similarly, aggregate wage bill, pensions, various taxes and transfers are obtained by analogous aggregation. Demographics also affect the labour markets indirectly. Part of the labour input is used to provide health and long-term care services. This share depends on the number of elderly peo-ple, weighted by per capita need of these services in different age groups. Similarly, part of the labour input is used for education work, whose demand depends on the sizes of young co-horts. These parts of the labour input, which vary from one population path to another, reduce the labour available for private production and affect the wages that balance the demand and supply of labour. Real wage growth varies between population paths, even though there is a common trend growth in total factor productivity. Due to only partial indexation of pension accruals and benefits, this directly affects the replacement rates. Thus there is considerable variation in all pension outcomes even without longevity adjustment.
10
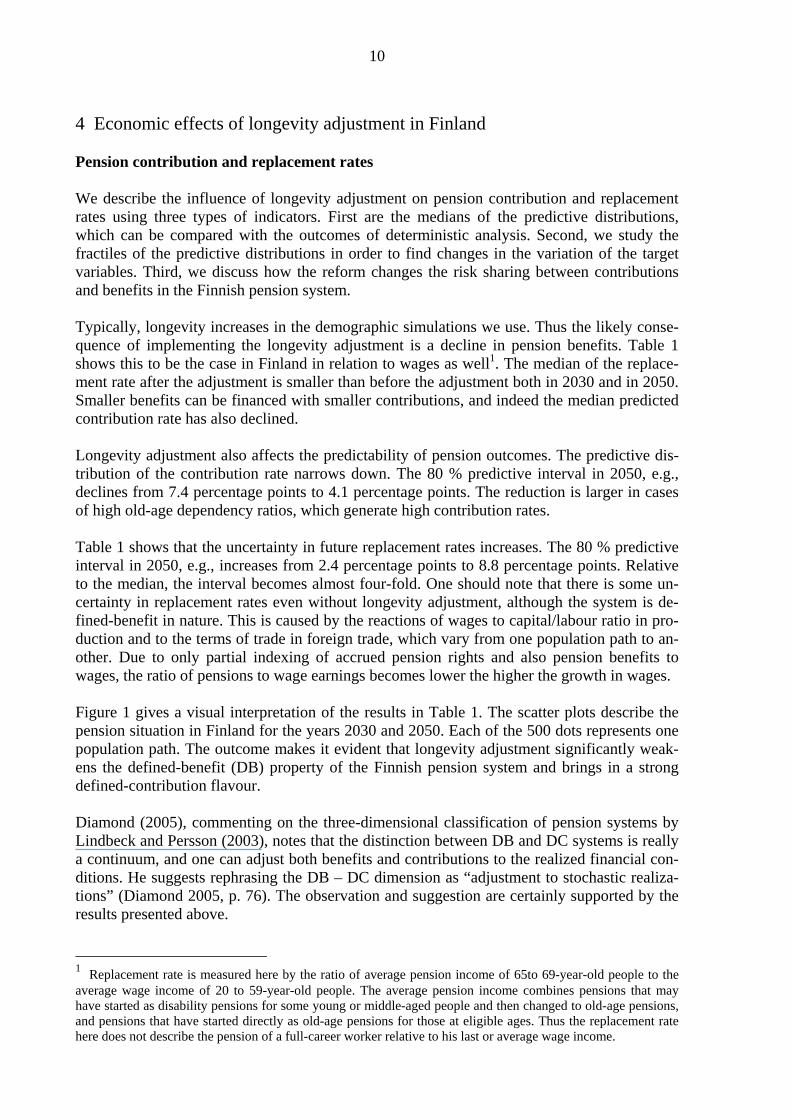
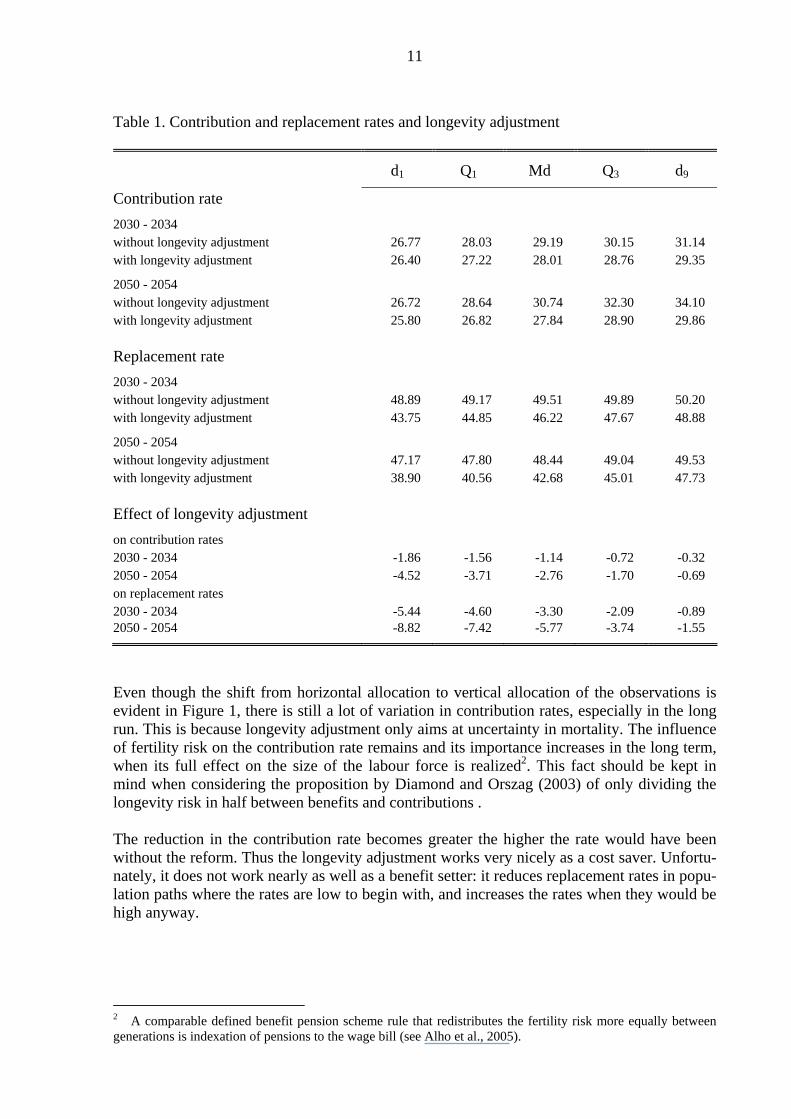
4 Economic effects of longevity adjustment in Finland Pension contribution and replacement rates We describe the influence of longevity adjustment on pension contribution and replacement rates using three types of indicators. First are the medians of the predictive distributions, which can be compared with the outcomes of deterministic analysis. Second, we study the fractiles of the predictive distributions in order to find changes in the variation of the target variables. Third, we discuss how the reform changes the risk sharing between contributions and benefits in the Finnish pension system. Typically, longevity increases in the demographic simulations we use. Thus the likely conse-quence of implementing the longevity adjustment is a decline in pension benefits. Table 1 shows this to be the case in Finland in relation to wages as well1. The median of the replace-ment rate after the adjustment is smaller than before the adjustment both in 2030 and in 2050. Smaller benefits can be financed with smaller contributions, and indeed the median predicted contribution rate has also declined. Longevity adjustment also affects the predictability of pension outcomes. The predictive dis-tribution of the contribution rate narrows down. The 80 % predictive interval in 2050, e.g., declines from 7.4 percentage points to 4.1 percentage points. The reduction is larger in cases of high old-age dependency ratios, which generate high contribution rates. Table 1 shows that the uncertainty in future replacement rates increases. The 80 % predictive interval in 2050, e.g., increases from 2.4 percentage points to 8.8 percentage points. Relative to the median, the interval becomes almost four-fold. One should note that there is some un-certainty in replacement rates even without longevity adjustment, although the system is de-fined-benefit in nature. This is caused by the reactions of wages to capital/labour ratio in pro-duction and to the terms of trade in foreign trade, which vary from one population path to an-other. Due to only partial indexing of accrued pension rights and also pension benefits to wages, the ratio of pensions to wage earnings becomes lower the higher the growth in wages. Figure 1 gives a visual interpretation of the results in Table 1. The scatter plots describe the pension situation in Finland for the years 2030 and 2050. Each of the 500 dots represents one population path. The outcome makes it evident that longevity adjustment significantly weak-ens the defined-benefit (DB) property of the Finnish pension system and brings in a strong defined-contribution flavour. Diamond (2005), commenting on the three-dimensional classification of pension systems by Lindbeck and Persson (2003), notes that the distinction between DB and DC systems is really a continuum, and one can adjust both benefits and contributions to the realized financial con-ditions. He suggests rephrasing the DB – DC dimension as “adjustment to stochastic realiza-tions” (Diamond 2005, p. 76). The observation and suggestion are certainly supported by the results presented above. 1 Replacement rate is measured here by the ratio of average pension income of 65to 69-year-old people to the average wage income of 20 to 59-year-old people. The average pension income combines pensions that may have started as disability pensions for some young or middle-aged people and then changed to old-age pensions, and pensions that have started directly as old-age pensions for those at eligible ages. Thus the replacement rate here does not describe the pension of a full-career worker relative to his last or average wage income.
11
Table 1. Contribution and replacement rates and longevity adjustment
d1 Q1 Md Q3 d9
Contribution rate
2030 - 2034 without longevity adjustment 26.77 28.03 29.19 30.15 31.14 with longevity adjustment 26.40 27.22 28.01 28.76 29.35
2050 - 2054 without longevity adjustment 26.72 28.64 30.74 32.30 34.10 with longevity adjustment 25.80 26.82 27.84 28.90 29.86 Replacement rate
2030 - 2034 without longevity adjustment 48.89 49.17 49.51 49.89 50.20 with longevity adjustment 43.75 44.85 46.22 47.67 48.88
2050 - 2054 without longevity adjustment 47.17 47.80 48.44 49.04 49.53 with longevity adjustment 38.90 40.56 42.68 45.01 47.73 Effect of longevity adjustment
on contribution rates 2030 - 2034 -1.86 -1.56 -1.14 -0.72 -0.32 2050 - 2054 -4.52 -3.71 -2.76 -1.70 -0.69 on replacement rates 2030 - 2034 -5.44 -4.60 -3.30 -2.09 -0.89 2050 - 2054 -8.82 -7.42 -5.77 -3.74 -1.55
Even though the shift from horizontal allocation to vertical allocation of the observations is evident in Figure 1, there is still a lot of variation in contribution rates, especially in the long run. This is because longevity adjustment only aims at uncertainty in mortality. The influence of fertility risk on the contribution rate remains and its importance increases in the long term, when its full effect on the size of the labour force is realized2. This fact should be kept in mind when considering the proposition by Diamond and Orszag (2003) of only dividing the longevity risk in half between benefits and contributions . The reduction in the contribution rate becomes greater the higher the rate would have been without the reform. Thus the longevity adjustment works very nicely as a cost saver. Unfortu-nately, it does not work nearly as well as a benefit setter: it reduces replacement rates in popu-lation paths where the rates are low to begin with, and increases the rates when they would be high anyway.
2 A comparable defined benefit pension scheme rule that redistributes the fertility risk more equally between generations is indexation of pensions to the wage bill (see Alho et al., 2005).

12
Figure1. Pension contribution and replacement rates in Finland in 2030 and 2050
20 25 30 contributionrate, %
30
35
40
45
50
55
replace-ment
rate, %
2030
Without longevity adjustment
20 25 30 contributionrate, %
30
35
40
45
50
55
replace-mentrate, %
2050
20 25 30 contributionrate, %
30
35
40
45
50
55
replace-ment
rate, %2030
With longevity adjustment
20 25 30 contributionrate, %
30
35
40
45
50
55
replace-mentrate, %
2050
ETLA
We have looked at sustainability by reporting contribution rates in some specific periods. Likewise, adequacy has been considered by showing replacement rates for some specific groups in some specific periods. Clearly, this is not sufficient for analysing the effects of poli-cies. On the other hand, increasing the number of groups, periods and cohorts in a similar fashion to the above is probably not the answer – there is simply too much data. Thus we need summary measures. There is a simple measure for sustainability, the sustainability gap. It expresses a once-and-for-all change in the contribution rate that is needed to balance the pension system. The new contribution rate is calculated by dividing the present value of future contribution revenues by the present value of future wage bills. For adequacy, we calculate a measure that uses the replacement rates in a base case scenario. Fixing the replacement rates from that scenario, we calculate the present value of pension ex-penditure in each population path and compare it with the actual present value for that path. We call the difference between the actual and hypothetical present values the adequacy gap, and express it as percentage of the present value of the contribution base. Thus the gap gives the immediate and permanent change in contributions that is needed to finance replacement rates equal to those in the base case. With this definition, the adequacy gap is directly compa-rable to the sustainability gap.

13
Figure 2. Sustainability and adequacy
0.7 0.8 0.9 1 1.10
5
10
Sustainabilitygap
longevityadjustment factor
Without longevity adjustment
0.7 0.8 0.9 1 1.1-5
0
Adequacygap
longevityadjustment factor
0 5 10-5
0
Adequacygap
Sustainabilitygap
0.7 0.8 0.9 1 1.10
5
10
Sustainabilitygap
longevityadjustment factor
With longevity adjustment
0.7 0.8 0.9 1 1.1-5
0
Adequacygap
longevityadjustment factor
0 5 10-5
0
Adequacygap
Sustainabilitygap
Figure 2 shows how the measures correlate with life expectancy, measured by the size of the longevity adjustment factor in 2050. The lower the factor, the higher the life expectancy. Without longevity adjustment the adequacy gap is not correlated with life expectancy, whereas the sustainability gap is strongly correlated with it. With longevity adjustment, the adequacy gap increases with increasing life expectancy because monthly pensions are cut and replacement rates thus fall. This eases the effect of life expectancy on the sustainability gap considerably, but it does not remove it. The lowest part of Figure 2 shows how the measures correlate with each other. Introducing longevity adjustment increases the variability of the adequacy gap and reduces the variability of the sustainability gap. In fact, comparing the ranges of the predictive distributions, we may conclude that in the Finnish system benefits take more than half and contributions less than half of adjustment to demographic realizations, when measured by contribution equivalents.

14
Without longevity adjustment the benefits would take about 5 % of adjustment as a conse-quence of less than full indexing to earnings, and contributions about 95%. This striking result shows that it is important to quantitatively analyse the dynamic properties of pension systems under a wide range of demographic developments. Table 2. Sustainability and adequacy gaps and longevity adjustment
d1 Q1 Md Q3 d9
Sustainability gap
2005 – 2050 without longevity adjustment 4.31 5.12 5.90 6.57 7.15 with longevity adjustment 4.05 4.46 4.96 5.40 5.75
2005 – 2100 without longevity adjustment 5.06 6.24 7.28 8.34 9.50 with longevity adjustment 4.28 4.95 5.59 6.18 6.73
2005-2150 without longevity adjustment 5.42 6.63 7.74 8.76 9.90 with longevity adjustment 4.57 5.15 5.73 6.30 6.78 Adequacy gap
2005 – 2050 without longevity adjustment -0.71 -0.67 -0.63 -0.59 -0.54 with longevity adjustment -0.30 0.03 0.40 0.77 1.07
2005 - 2100 without longevity adjustment -1.49 -1.45 -1.41 -1.36 -1.31 with longevity adjustment -0.80 0.03 0.79 1.53 2.29
2005 - 2150 without longevity adjustment -1.73 -1.68 -1.62 -1.55 -1.49 with longevity adjustment -0.93 0.05 0.92 1.81 2.61 Effect of longevity adjustment
on sustainability gap 2005 - 2050 -1.46 -1.19 -0.89 -0.56 -0.23 2005 - 2100 -2.91 -2.35 -1.76 -1.15 -0.41 2005 - 2150 -3.32 -2.72 -2.00 -1.30 -0.48 on adequacy gap 2005 - 2050 0.28 0.65 1.03 1.39 1.71 2005 - 2100 0.52 1.45 2.22 2.98 3.70 2005 - 2150 0.60 1.66 2.56 3.48 4.26
There is one usually less discussed, but important, detail in the gap calculations. Most popula-tion forecasts extend to the year 2050. They describe a large change in population structure, ending in much higher old age ratios. Assuming the change in the age ratio is permanent, the choice of the time horizon used in the gap calculations markedly influences the outcome. We have measured the gaps using the 95 years range. Limiting the end of horizon to the year 2050 would have reduced the adequacy gap to approximately half (see Table 2).

15
Intergenerational fairness The Finnish earnings-related pension system was started in 1962, and the first participants get more out than they have paid in, as is usual in (partly) PAYG arrangements. Their actuarity ratios are greater than 1 under all demographic futures considered. All further cohorts are likely to have actuarity ratios below 1 and thus pay more than they will get back.
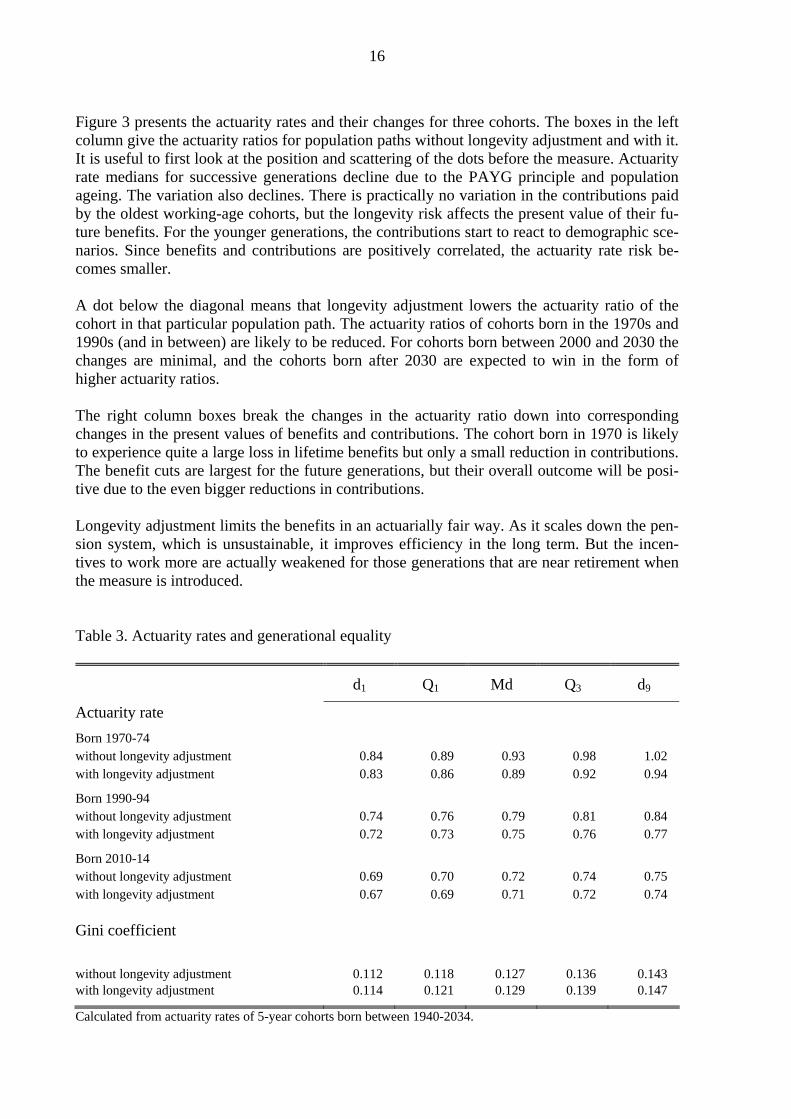
Figure 3. The effect of longevity adjustment on the actuarity rates of three cohorts
0.6 0.8 10.6
0.8
1
1.2
withlongevity
adjustment
withoutlongevity adjustment
Born 1970-74
Actuarity rate
0.6 0.8 10.6
0.8
1
1.2
withlongevity
adjustment
withoutlongevity adjustment
Born 1990-94
0.6 0.8 10.6
0.8
1
1.2
withlongevity
adjustment
withoutlongevity adjustment
Born 2010-2014
-20 -15 -10 -5 0 5 10-20
-15
-10
-5
0
5
10
benefits
contributions
Born 1970-74
Changes in present value of benefitsand contribution, per cent
-20 -15 -10 -5 0 5 10-20
-15
-10
-5
0
5
10
benefits
contributions
Born 1990-94
-20 -15 -10 -5 0 5 10-20
-15
-10
-5
0
5
10
benefits
contributions
Born 2010-2014
ETLA
16
Figure 3 presents the actuarity rates and their changes for three cohorts. The boxes in the left column give the actuarity ratios for population paths without longevity adjustment and with it. It is useful to first look at the position and scattering of the dots before the measure. Actuarity rate medians for successive generations decline due to the PAYG principle and population ageing. The variation also declines. There is practically no variation in the contributions paid by the oldest working-age cohorts, but the longevity risk affects the present value of their fu-ture benefits. For the younger generations, the contributions start to react to demographic sce-narios. Since benefits and contributions are positively correlated, the actuarity rate risk be-comes smaller. A dot below the diagonal means that longevity adjustment lowers the actuarity ratio of the cohort in that particular population path. The actuarity ratios of cohorts born in the 1970s and 1990s (and in between) are likely to be reduced. For cohorts born between 2000 and 2030 the changes are minimal, and the cohorts born after 2030 are expected to win in the form of higher actuarity ratios. The right column boxes break the changes in the actuarity ratio down into corresponding changes in the present values of benefits and contributions. The cohort born in 1970 is likely to experience quite a large loss in lifetime benefits but only a small reduction in contributions. The benefit cuts are largest for the future generations, but their overall outcome will be posi-tive due to the even bigger reductions in contributions. Longevity adjustment limits the benefits in an actuarially fair way. As it scales down the pen-sion system, which is unsustainable, it improves efficiency in the long term. But the incen-tives to work more are actually weakened for those generations that are near retirement when the measure is introduced. Table 3. Actuarity rates and generational equality
d1 Q1 Md Q3 d9
Actuarity rate
Born 1970-74 without longevity adjustment 0.84 0.89 0.93 0.98 1.02 with longevity adjustment 0.83 0.86 0.89 0.92 0.94
Born 1990-94 without longevity adjustment 0.74 0.76 0.79 0.81 0.84 with longevity adjustment 0.72 0.73 0.75 0.76 0.77
Born 2010-14 without longevity adjustment 0.69 0.70 0.72 0.74 0.75 with longevity adjustment 0.67 0.69 0.71 0.72 0.74 Gini coefficient
without longevity adjustment 0.112 0.118 0.127 0.136 0.143 with longevity adjustment 0.114 0.121 0.129 0.139 0.147
Calculated from actuarity rates of 5-year cohorts born between 1940-2034.

17
As a summary measure for intergenerational equality we use a standard inequality measure, the Gini coefficient. We calculate it using cohort-wise actuarity rates as data. The results are in Table 3. Longevity adjustment has an extremely small effect on that measure. If we were to include more future cohorts in the calculation, it is likely that the Gini coefficients would be-come smaller on average. That would mean, however, using population forecasts well beyond year the 2135, which in itself already far exceeds the horizon of genuine stochastic population forecasts. Saving and labour supply The most important economic reaction to the implementation of the reform is the increase in saving, which initially lowers consumption. The main reason for extra saving is the need for old-age consumption, but for future generations in particular the role of larger net wage gen-erated by lower pension contributions is also evident. Changes in the aggregate labour supply are, by contrast, quite small. Implementation of the reform reduces the additional pension benefit gained by a marginal increase in the labour sup-ply, but it also provides a higher net wage due to lower contributions. The divergent income and substitution effects just about cancel each other out. At least in Finland, Norway and Sweden, longevity adjustment has been described in terms of the number of extra months each cohort needs to work in order to cancel the adjustment effect on pension. From a theoretical point of view there is no reason why a rational person would like to ‘cancel’ one element among the many that affect the benefit level. In practice, how-ever, marketing the issue may have a bearing on behaviour. In any case, it is important to as-sess what effect longevity adjustment has on effective retirement age. In our model, retire-ment is endogenous in the 60 – 64 age group, which facilitates analyzing how retirement changes. Lassila and Valkonen (2005) analysed the Finnish pension reform of 2005, which included several elements. The marginal effect of longevity adjustment on retirement age varied, de-pending on the base case. If the comparison was with the old system, which broadly speaking had poor incentives for remaining at work in old age, longevity adjustment raised the effective retirement age slightly. But when the comparison was done with the new system (without longevity adjustment), adding longevity adjustment lowered the retirement age a little. The new system improved incentives to continue working, and cutting benefits by longevity ad-justment reduces this reward. The analysis in Lassila and Valkonen (2005) was done with just one demographic projec-tion. Repeating the exercise using 500 population paths gives similar results. The retirement age declines more when the adjustment is larger. In the model people do not compensate for the cut by postponing retirement, they react by retiring earlier. But they work more when young, and the overall labour supply effects are minimal. Retirement age effects concern the timing of the work more than the amount of work over the lifecycle. The changes in retire-ment age are usually less than 0.1 years, in practice one month or less. Note that this analy-sis ignores the possibility that increasing life expectancy may well be linked to factors that also increase work efficiency at older ages, thus making potential wages higher and post-poning retirement.

18
5 Conclusions We have analyzed the effects of longevity adjustment using the Finnish earnings-related pen-sion system as an example. The analysis has been carried out by simulations under uncertain future demographics. Our results confirm the earlier results of the expected effects of longevity adjustment: it cuts future benefits and thus facilitates a decrease in future contributions. The current middle-aged generations, whose pensions are reduced more than contributions experience the largest wel-fare losses. The full gains are observed far in the future. Besides demographic realisations, the quantitative results depend on the specifics of the pen-sion system. They also depend on the assumptions and features of the model, especially how the agents react to changes in pension policies and how the labour markets behave. Longevity adjustment usually reduces the contribution rates, and the reduction is bigger the higher the rate would have been without the reform. Thus longevity adjustment works very nicely as a cost saver. On the other hand, contribution rates are higher in demographic worlds where labour is scarce, wages higher and replacement rates lower. Thus longevity adjustment increases the uncertainty in replacement rates. In the long run, the ratio of discounted benefits and contributions is not much affected by the measure since the induced changes in benefits and contributions are highly correlated. Longevity adjustment significantly weakens the defined-benefit nature of the Finnish pension system and brings in a strong defined-contribution flavour. But it is important to note that demographic uncertainty in itself reduces the defined-benefit feature. Fertility risks, and other risks that may cause changes in wage trends, are important here; without them, and without longevity adjustment, the Finnish system would be very close to DB, and adopting longevity adjustment then would make the system very close to DC. But because fertility risks are sig-nificant, adopting longevity adjustment means a shift towards DC while keeping within a mixed state. The relative timing of longevity and fertility risks is also important. For the next 20 – 30 years the effects of future fertility changes on pension outcomes are small. Longevity adjustment then narrows down the dominant uncertainty effect of demographics. After 30 years future fertility starts to affect the labour supply more, and longevity adjustment alone is inadequate in controlling the effects of demographic risks. In countries where migration risks are large, the practical significance of this timing feature is reduced.

19
References: Alho, J.M. (2003). Predictive Distribution of adjustment for Life Expectancy Change. Finnish Centre for Pensions, Working Papers 3, Helsinki. Alho, J.M., Jensen, S.E.H., Lassila, J. and Valkonen, T. (2005). Controlling the Effects of Demographic Risks: The Role of Pension Indexation Schemes. Journal of Pension Economics and Finance, 4 (2): 139-153. Andersen, T. (2005). Social Security and Longevity, CESifo Working Paper No. 1577. Auerbach, A.J. and Hassett, K. (2001). Uncertainty and the Design of Long-Run Fiscal Pol-icy. In A.J. Auerbach and R.D. Lee (eds.) “Demographic Change and Fiscal Policy”, Cam-bridge University Press. Cambridge. Auerbach, A.J. and Hassett, K. (2002). Optimal Long-Run Fiscal Policy: Constraints, Prefer-ences and the Resolution of Uncertainty, (August 1, 2002). Robert D. Burch Center for Tax Policy and Public Finance. Burch Center Working Papers: Paper B02-10. Auerbach, A.J. and Kotlikoff, L.J. (1987). Dynamic Fiscal Policy, Cambridge: Cambridge University Press, UK. Bonin, H. and Feist, K. (2003). Measuring Redistribution Between Living Generations: The Case of German Pension Reform. In M. Weale (ed.): “Social Security and Pension Reform”. NIESR, Occasional paper, No. 56. CBO (2004). Long-Term Analysis of the Diamond-Orszag Social Security Plan, Congres-sional Budget Office, December 22, 2004. Diamond P.A. (2001). Comment. In A.J. Auerbach and R.D. Lee (eds.) “Demographic Change and Fiscal Policy”, Cambridge University Press. Cambridge. Diamond, P. (2005). Conceptualization of “Non-Financial Defined Contribution Systems. In Holzmann, R. and E. Palmer (eds., 2005): Pension Reform: Issues and Prospects for Non-Financial Defined Contribution (NDC) Schemes”. The World Bank, Washington, D.C. Diamond, P.A. and Orszag, P.R. (2003). “Saving Social Security, A Balanced Approach” Brookings Institution Press 2003. Fehr, H. and Habermann, C. (2006). Pension Reform and Demographic Uncertainty: The Case of Germany, Journal of Pension Economics and Finance, 5:69-90. Harris, A. R. and Simpson, M. (2005). “Winners and Losers under Various Approaches to Slowing Social Security Benefit Growth”. National Tax Journal, 58: 523-43. Hietaniemi, M. and Vidlund, M. (eds., 2003). The Finnish Pension System, The Finnish Cen-tre for Pensions, http://www.etk.fi. Hirte, G. (2002). Welfare and Macroeconomic Effects of the German Pension Act of 1992 and 1999 - A Dynamic CGE Study, German Economic Review, 3: 81-106.

20
Lassila, J. and Valkonen, T. (2002). Ageing Policies and Demographic Uncertainty in Lithua-nia: A Dynamic CGE Analysis. Available at www.etla.fi/lithuania Lassila, J. and Valkonen, T. (2003). Ageing, demographic risks and pension reform, in M. Weale (ed.): “Social Security and Pension Reform”. NIESR, Occasional paper, No. 56. Lassila, J. and Valkonen, T. (2005). Yksityisalojen eläkeuudistuksen taloudelliset vaikutukset (in Finnish). ETLA B 211. Lassila, J. and Valkonen, T. (2007). The Finnish pension reform of 2005. Geneva Papers on Risk and Insurance – Issues and Practice, 32: 75-94. Lindbeck, A. and Persson, M. (2003). The Gains from Pension Reform. Journal of Economic Literature, 41: 74-112. Lindell, K. (2003). Longevity is increasing – what about the retirement age? Working Papers 6, Finnish Centre for Pensions. Palmer, E. (2005). What is NDC? In Holzmann, R. and E. Palmer (eds.), “Pension Reform: Issues and Prospects for Non-Financial Defined Contribution (NDC) Schemes”, World Bank. Settergren, O. (2000). Automatisk balansering av ålderspensionssystemet. Redovisning av regeringens beräkningsuppdrag, RFV Analyserar 2000:1. National Social Insurance Board, Stockholm. .

E L I N K E I N O E L Ä M Ä N T U T K I M U S L A I T O S (ETLA) THE RESEARCH INSTITUTE OF THE FINNISH ECONOMY LÖNNROTINKATU 4 B, FIN-00120 HELSINKI ____________________________________________________________________________ Puh./Tel. (09) 609 900 Telefax (09) 601753 Int. 358-9-609 900 Int. 358-9-601 753 http://www.etla.fi KESKUSTELUAIHEITA - DISCUSSION PAPERS ISSN 0781-6847 Julkaisut ovat saatavissa elektronisessa muodossa internet-osoitteessa: http://www.etla.fi/finnish/research/publications/searchengine
No 1040 MARKKU KOTILAINEN, Finland’s Experiences and Challenges in the Euro Zone. 20.09.2006. 34 p. No 1041 HANNU PIEKKOLA, Tax Cuts and Employment: Evidence from Finnish Linked Employer-
Employee Data. 23.10.2006. 32 p. No 1042 ELAD HARISON – HELI KOSKI, Innovative Software Business Strategies: Evidence from Finnish
Firms. 02.10.2006. 28 p. No 1043 VILLE KAITILA – REIJO MANKINEN – NUUTTI NIKULA, Yksityisten palvelualojen kansainvä-
linen tuottavuusvertailu. 13.10.2006. 50 s. No 1044 SAMI NAPARI, Perhevapaiden palkkavaikutukset: Katsaus kirjallisuuteen. 09.10.2006. 18 s. No 1045 MIKA PAJARINEN – PETRI ROUVINEN – PEKKA YLÄ-ANTTILA, T&K:n verokannustimien
mahdollisia vaikutuksia suomalaisten yrityskyselyjen valossa. 13.10.2006. 29 s. No 1046 LAURA VALKONEN, Verokannustimet innovaatiopolitiikan välineenä – Katsaus verokannustimien
käyttöön OECD-maissa. 13.10.2006. 26 s. No 1047 ALBERTO DI MININ – CHRISTOPHER PALMBERG, A Case for Non-Globalisation? – The Or-
ganisation of R&D in the Wireless Telecommunications Industry. 23.10.2006. 28 p. No 1048 TUOMO NIKULAINEN – RAINE HERMANS – MARTTI KULVIK, Patent Citations Indicating
Present Value of the Biotechnology Business. 25.10.2006. 21 p. No 1049 TOMI KYYRÄ – MIKA MALIRANTA, The Micro-Level Dynamics of Declining Labour Share:
Lessons from the Finnish Great Leap. 02.11.2006. 35 p. No 1050 KARI E.O. ALHO, Structural Reforms in the EU and The Political Myopia in Economic Policies.
03.11.2006. 30 p. No 1051 MIKKO KETOKIVI, When Does Co-Location of Manufacturing and R&D Matter? 03.11.2006.
22 p.
No 1052 MIKA PAJARINEN – PETRI ROUVINEN – PEKKA YLÄ-ANTTILA, Uusyrittäjien kasvuhakui-suus. 03.11.2006. 77 s.
No 1053 RAIMO LOVIO, Sijainti seuraa strategiaa: Kokonaiskuva suomalaisten monikansallisten yritysten
globaalien karttojen muutoksista 2000 – 2005. 03.11.2006. 30 s. No 1054 KARI E.O. ALHO – NUUTTI NIKULA, Productivity, Employment and Taxes – Evidence on the
Potential Trade-offs and Impacts in the EU. 10.11.2006. 24 p. No 1055 JUSTIN BYMA – AIJA LEIPONEN, Can’t Block, Must Run: Small Firms and Appropriability.
11.11.2006. 30 p.

No 1056 AIJA LEIPONEN, Competing Through Cooperation: Standard Setting in Wireless Telecommunica-tions. 11.11.2006. 30 p.
No 1057 TERTTU LUUKKONEN – MARI MAUNULA, Riskirahoituksen merkitys biotekniikka-alalla –
Pääomasijoittajien vertailu yritysten näkökulmasta. 14.11.2006. 50 s. No 1058 VESA KANNIAINEN, Yrittäjyyden ja yritysten verokannustimet. 08.12.2006. 28 s. No 1059 JYRKI ALI-YRKKÖ, Ulkoistus ja toimintojen siirrot Suomesta ulkomaille – Katsaus 2000-luvun alun
tilanteesta. 11.12.2006. 24 s. No 1060 OLLI-PEKKA RUUSKANEN, Time Use during the Parental Leave and the Return to Em-
ployment. 30.12.2006. 32 p.
No 1061 VILLE KAITILA – NUUTTI NIKULA – JUDIT KARSAI, Suomalaiset yritykset Tšekin, Slova-kian, Unkarin ja Slovenian markkinoilla. 18.12.2006. 90 s.
No 1062 NIKU MÄÄTTÄNEN – PANU POUTVAARA, Should Old-age Benefits be Earnings Tested?
18.12.2006. 24 p. No 1063 AIJA LEIPONEN – CONSTANCE E. HELFAT, When Does Distributed Innovation Activity
Make Sense? Location, Decentralization, and Innovation Success, 20.12.2006. 32 p. No 1064 CHRISTOPHER PALMBERG – MIKA PAJARINEN – TUOMO NIKULAINEN, Transferring
Science-Based Technologies to Industry – Does Nanotechnology make a Difference? 04.01.2007. 64 p.
No 1065 NIKU MÄÄTTÄNEN – MIKA MALIRANTA, T&K-toiminnan verokannustimet ja yritysdy-
namiikka. 04.01.2007. 23 s. No 1066 TARMO VALKONEN, Tutkimus- ja tuotekehitysinvestointien verotuki. 11.01.2007. 24 s. No 1067 TERTTU LUUKKONEN – MARI MAUNULA, Non-financial Value-added of Venture Capi-
tal: A Comparative Study of Different Venture Capital Investors. 18.01.2007. 26 p. No 1068 MARKKU MAULA, Verokannustimet yksityishenkilöiden riskipääomasijoitusten aktivoinnis-
sa. 22.01.2007. 40 s. No 1069 OLAVI RANTALA, Palvelualojen kilpailu ja hinnanmuodostus kansainvälisessä vertailussa.
22.01.2007. 40 s. No 1070 JYRKI ALI-YRKKÖ, Ulkoistukset Suomen teollisuusyrityksissä – onko toimialalla merkitystä?
12.02.2007. 15 s. No 1071 JYRKI ALI-YRKKÖ, Tuotannon ja T&K-toiminnan ulkoistaminen – motiivit ja onnistuminen.
12.02.2007. 16 s. No 1072 CHRISTOPHER PALMBERG, Nanoteknologiastako seuraava yleiskäyttöinen teknologia? –
Havaintoja Suomen näkökulmasta. 08.02.2007. 25 s. No 1073 JUKKA LASSILA – TARMO VALKONEN, Longevity Adjustment of Pension Benefits.
12.02.2007. 20 p.
Elinkeinoelämän Tutkimuslaitoksen julkaisemat "Keskusteluaiheet" ovat raportteja alustavista tutkimustuloksista ja väliraportteja tekeillä olevista tutkimuksista. Tässä sarjassa julkaistuja mo-nisteita on mahdollista ostaa Taloustieto Oy:stä kopiointi- ja toimituskuluja vastaavaan hintaan.
Papers in this series are reports on preliminary research results and on studies in progress. They are sold by Taloustieto Oy for a nominal fee covering copying and postage costs.