Energetics and longevity in birds
13
Energetics and longevity in birds L. J. Furness & J. R. Speakman Received: 8 April 2008 / Accepted: 14 April 2008 # American Aging Association 2008 Abstract The links between energy expenditure and ageing are different at different levels of enquiry. When studies have examined the relationships between different species within a given class the association is generally negative—animals with greater metabo- lism per gram of tissue live shorter lives. Within species, or between classes (e.g. between birds and mammals) the association is the opposite—animals with higher metabolic rates live longer. We have previously shown in mammals that the negative association between lifespan and metabolic rate is in fact an artefact of using resting rather than daily energy expenditure, and of failing to adequately take into account the confounding effects of body size and the lack of phylogenetic independence of species data. When these factors are accounted for, across species of mammals, the ones with higher metabolism also have the largest lifetime expenditures of energy—consistent with the inter-class and intra-specific data. A previous analysis in birds did not yield the same pattern, but this may have been due to a lack of sufficient power in the analysis. Here we present an analysis of a much enlarged data set (>300 species) for metabolic and longevity traits in birds. These data show very similar patterns to those in mammals. Larger individuals have longer lives and lower per-gram resting and daily energy expenditures, hence there is a strong negative relationship between longevity and mass-specific metabolism. This relationship disappears when the confounding effects of body mass and phylogeny are accounted for. Across species of birds, lifetime expenditure of energy per gram of tissue based on both daily and resting energy expenditure is positively related to metabolic intensity, mirroring these statisti- cal relationships in mammals and synergising with the positive associations of metabolism with lifespan within species and between vertebrate classes. Keywords Birds . Dailyenergyexpenditure . Lifespan . Phylogeny . Rate of living theory . Metabolic rate Abbreviations DEE Daily energy expenditure RMR Resting metabolic rate ETC Electron transport chain LEE Lifetime energy expenditure ATP Adenosine Tri-phosphate MLSP Maximum lifespan potential DNA Deoxyribonucleic acid UCPn Uncoupling protein where n =1, 2 or 3 Introduction This year marks the 100th anniversary of the publica- tion of Rubner ’ s seminal work noting the duration of AGE DOI 10.1007/s11357-008-9054-3 L. J. Furness : J. R. Speakman (*) Institute of Biological and Environmental Sciences, University of Aberdeen, Aberdeen AB24 2TZ Scotland, UK e-mail: [email protected]
Transcript of Energetics and longevity in birds
Energetics and longevity in birds
L. J. Furness & J. R. Speakman
Received: 8 April 2008 /Accepted: 14 April 2008# American Aging Association 2008
Abstract The links between energy expenditure andageing are different at different levels of enquiry. Whenstudies have examined the relationships betweendifferent species within a given class the associationis generally negative—animals with greater metabo-lism per gram of tissue live shorter lives. Withinspecies, or between classes (e.g. between birds andmammals) the association is the opposite—animalswith higher metabolic rates live longer. We havepreviously shown in mammals that the negativeassociation between lifespan and metabolic rate is infact an artefact of using resting rather than daily energyexpenditure, and of failing to adequately take intoaccount the confounding effects of body size and thelack of phylogenetic independence of species data.When these factors are accounted for, across species ofmammals, the ones with higher metabolism also havethe largest lifetime expenditures of energy—consistentwith the inter-class and intra-specific data. A previousanalysis in birds did not yield the same pattern, but thismay have been due to a lack of sufficient power in theanalysis. Here we present an analysis of a muchenlarged data set (>300 species) for metabolic andlongevity traits in birds. These data show very similarpatterns to those in mammals. Larger individuals have
longer lives and lower per-gram resting and dailyenergy expenditures, hence there is a strong negativerelationship between longevity and mass-specificmetabolism. This relationship disappears when theconfounding effects of body mass and phylogeny areaccounted for. Across species of birds, lifetimeexpenditure of energy per gram of tissue based onboth daily and resting energy expenditure is positivelyrelated to metabolic intensity, mirroring these statisti-cal relationships in mammals and synergising with thepositive associations of metabolism with lifespanwithin species and between vertebrate classes.
Keywords Birds . Dailyenergyexpenditure . Lifespan .
Phylogeny. Rate of living theory .Metabolic rate
AbbreviationsDEE Daily energy expenditureRMR Resting metabolic rateETC Electron transport chainLEE Lifetime energy expenditureATP Adenosine Tri-phosphateMLSP Maximum lifespan potentialDNA Deoxyribonucleic acidUCPn Uncoupling protein where n=1, 2 or 3
Introduction
This year marks the 100th anniversary of the publica-tion of Rubner’s seminal work noting the duration of
AGEDOI 10.1007/s11357-008-9054-3
L. J. Furness : J. R. Speakman (*)Institute of Biological and Environmental Sciences,University of Aberdeen,Aberdeen AB24 2TZ Scotland, UKe-mail: [email protected]
animal lifespan and its relationship to energy expen-diture (Rubner 1908). Rubner observed that largeranimals live longer and also have lower mass-specificrates of resting metabolic rate (RMR) as measured byindirect calorimetry. Perhaps his key observation,however, was that the product of these two parame-ters, the lifetime expenditure of energy per gram oftissue, is approximately constant. Tissues appear toburn the same amount of energy during an animal’slife, regardless of species. Some animals, like mice(Mus musculus), appear to burn through this alloca-tion rapidly, and consequently die fast, while others,such as elephants (Loxodonta africana), seem to burnenergy more slowly and in consequence to live muchlonger. Rubner’s observations were probably veryimportant in the subsequent formulation of the ‘rate ofliving’ theory. Published 20 years later by Pearl(1928), this was the first scientific theory of ageing.
The rate of living theory—the idea that animalsand humans die sooner if they live faster—received aboost in the 1950s with the advent of the free radicaltheory of ageing. The free radical theory of ageingwas developed by Gerschman et al. (1954) andHarman (1956), who were concerned primarily withthe impacts of radiation on tissue damage. Animalsexposed to ionising radiation experience variousforms of tissue damage and also live much shorterlives than non-irradiated animals. It was argued thatthese effects provide a model for understanding hownatural tissue functions decline with age and ulti-mately constrain lifespan. These authors argued thatnumerous endogenous processes generate free radi-cals (notably oxygen free radicals) and continuouslydamage macromolecular components of tissue(Gerschman et al. 1954). Probably the most importantof these processes is the electron transport chain(ETC), located on the inner membrane of themitochondria and responsible for generating largequantities of radical oxygen species (Barja 1999). TheETC is also the source of cellular ATP generation thatunderpins whole-animal metabolic rate. Hence thefree radical theory of ageing provides a mechanisticbasis for the rate of living theory. In summary, thistheory posits that energy metabolism requires con-sumption of oxygen and generation of ATP via theETC, which generates radical oxygen species thatcause macromolecular damage, the unrepaired accu-mulation of which ultimately leads to disruption oftissue physiology and death.
This conceptual framework has received substan-tial support by comparative analyses showing statis-tical relationships of various additional parameters toobserved maximum lifespans of animals. For exam-ple, mammals that live longer have lower urinaryexcretion rates of DNA excision-repair products (8-oxoGua and 8-oxodG) (Foksinski et al. 2004), loweroxidative damage to mitochondria (8-oxodG in mito-chondrial DNA) (Barja and Herrero 2000; Barja 2002),lower levels of fatty acid desaturation in heartphospholipids, and lower levels of dehydroepiandros-terone (DHEA) in heart phospholipids (Pamplona et al.1999). Moreover, since Rubner’s time, the database ofspecies for which both maximum lifespan and restingmetabolism are available has increased enormously,and the fundamental observation that the product ofthese traits is independent of body size has, untilrecently, been repeatedly supported (Calder 1984;Prinzinger 2005).
Despite a broad consensus, there are many prob-lems with current understanding of the relationshipbetween metabolic rates and lifespan and the data thatsupport them. We and others have highlighted themain difficulties with the typical “comparative”approach to these issues (Promislow 1991, 1993, 1994;Le Bourg 1996; Speakman et al. 2004; Speakman2005a, b). One problem is that maximum lifespan dataare themselves a poor measure of ageing, principallybecause they reflect the duration of life of only a singleindividual. These data in turn depend on how exten-sively the population of a given species is studied. Themore individuals that are measured the greater will bethe maximum reported lifespan. Yet data on the size ofthe monitored population to correct for this effect areseldom available. A second key problem with compara-tive interspecific analyses of the relationships betweenvarious physiological parameters and lifespan is theirsmall sample size and the potentially confoundingeffect of body size. Because, within vertebrate classes,lifespan is correlated with body size, any otherparameter related to body size will also be related tolifespan. Statistical approaches are available to partitionthe effects of body size and any other trait on lifespan;generally when these are employed the relationshipsbetween traits related to energy metabolism, free radicalproduction and lifespan either disappear or are substan-tially weakened (Speakman 2005a, b; Lambert et al.2007). A second problem is that the relationshipderived by Rubner is based on measures of resting
AGE
energy metabolism; RMR, however, is only a fraction(normally 15–50%) of the total daily consumption ofenergy (Nagy et al. 1999; Speakman 2000). Techniquessuch as the doubly labelled method are now available toquantify total daily energy expenditure (DEE) (Nagy1983; Speakman 1998), and when these are used incomparative analyses rather than RMR, the supposedconstancy of lifetime mass-specific energy expenditurein relation to body size disappears. In other words,when DEE is substituted for RMR data, our analyseshave shown that smaller mammals actually burn moreenergy per gram of tissue during their lives than largeranimals (Speakman 2005a).
The final problem is that statistical relationshipsgenerated by inter-specific comparisons seem to be atodds with variation observed within some species—which ultimately is a key focus for understandingageing phenomena. Interspecific comparisons ofenergy metabolism and lifespan have now been madeon several species, and these tend to show thatlifespan is actually longer in those individuals thathave higher rates of metabolism—both daily andresting (mice: Speakman et al. 2004; dogs: Speakmanet al. 2003; hamsters: Oklejewicz and Daan 2002;yeast: Lin et al. 2002; nematodes: van Voorhies andWard 1999), or that lifespan and metabolic rate areindependent (mice: Selman et al. 2007; Drosophila:Hulbert et al. 2004a; Marden et al. 2003; blowflies:Hulbert et al. 2004b; nematodes: van Voorhies 2002;Braeckman et al. 2001). For humans, we haveabundant evidence that exercise increases energymetabolism while at the same time decreasing all-riskmortality (Blair et al. 1989, 1996). Finally, a fewexperimental manipulations have been made ofenergy expenditure with minimal or non-significanteffects on lifespan (Holloszy and Smith 1986; Selmanet al. 2008). To add confusion to the picture, however,some manipulations of energy expenditure havesupported the negative association between dailyenergy expenditure and lifespan predicted by therate-of-living model (Lemon and Barth 1992; Daan etal. 1990; Wolf and Schmid-Hempel 1989).
In our previous analyses of interspecific relation-ships among energy metabolism, body size and life-span we focussed primarily on mammals (Speakman2005b). While an analysis of similar data for birds didnot generate exactly the same patterns, this may havebeen a statistical power issue, since a smaller samplesize was involved in that analysis (Speakman 2005b).
Birds show a wide diversity of life history patterns,lifespans and variation in energy metabolism (Holmesand Austad 1995a, b; Holmes et al. 2001) and similarvariability in levels of basal (Bennet and Harvey1985) and daily (Nagy et al. 1999) energy demands.In the current paper we report an analysis of a muchlarger database on avian energy expenditure andlifespans.
Materials and methods
Body mass, DEE measured by the doubly labelledwater technique, RMR and maximum lifespan poten-tial (MLSP) of birds were collected from the litera-ture. Four main sources were consulted for values ofMLSP; Staav (1998), Carey and Judge (2000), theUSGS Longevity Records [Patuxent Wildlife ResearchCenter (ND) USGS Longevity Records. Retrieved fromhttp://www.pwrc.usgs.gov/bbl/homepage/longvlst.htmNovember 2006] and the AnAge database (HumanAgeing Genomic Resources 2006; AnAge database.Retrieved from http://genomics.senescence.info/species/June 2007). Multiple values for a single species wereaveraged.
A phylogenetic supertree of all the bird specieswas created in PDTREE (Garland et al. 1993) basedmainly on the avian phylogeny of Sibley and Ahlquist(1990). A phylogenetic tree consists of branches,nodes and tips (or end nodes). The lengths of thebranches correspond to evolutionary time, nodes areevolutionary divergences between two or morespecies and the tips represent either species or genus.Two trait values (such as body mass and DEE) can beentered into each tip using PDTREE. Not all birdshad values for all life-history traits (DEE, RMR andMLSP), therefore the tips with missing values wereremoved from the tree and separate trees were createdfor each combination of residual life-history traits.Since tips (or species) cannot be regarded asstatistically independent, Felsenstein (1985) recom-mended calculating “phylogenetic contrasts” betweeneach one. The number of un-standardised contrasts isone less than the total number of tips in the tree;standard contrasts (SC) are calculated by dividingeach unstandardised contrast by its standard devia-tion. Hence SC can be regarded as independent valuesand used in standard statistical procedures (Garlandet al. 1993). Phylogenetic independent contrast (PIC)
AGE
analysis was conducted using the Phenotypic Diver-sity Analysis Program (PDAP) (Garland et al. 1993).
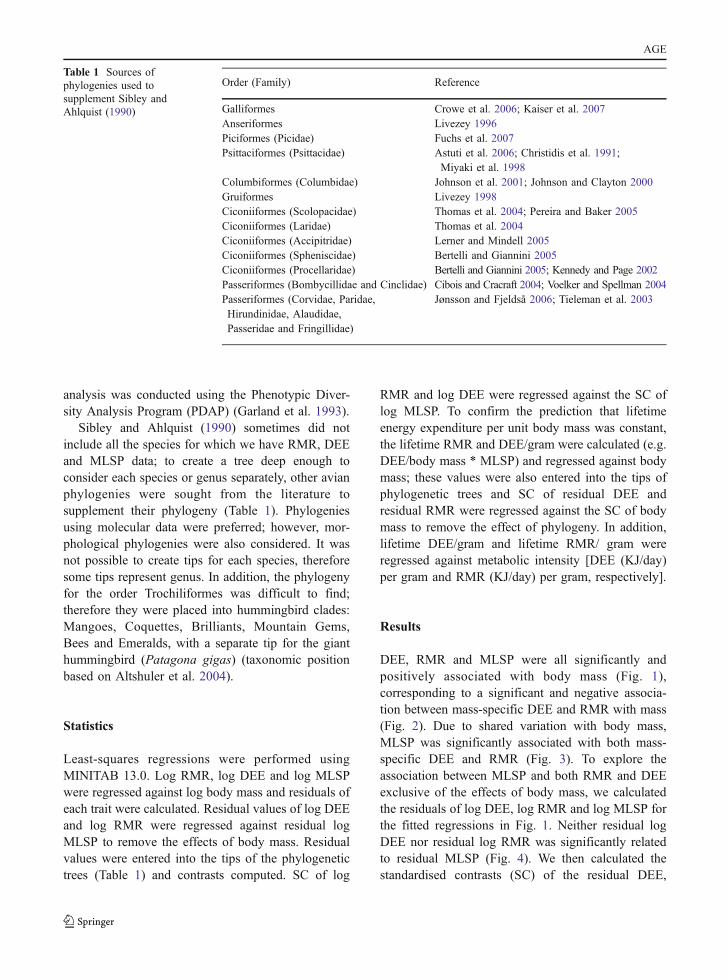
Sibley and Ahlquist (1990) sometimes did notinclude all the species for which we have RMR, DEEand MLSP data; to create a tree deep enough toconsider each species or genus separately, other avianphylogenies were sought from the literature tosupplement their phylogeny (Table 1). Phylogeniesusing molecular data were preferred; however, mor-phological phylogenies were also considered. It wasnot possible to create tips for each species, thereforesome tips represent genus. In addition, the phylogenyfor the order Trochiliformes was difficult to find;therefore they were placed into hummingbird clades:Mangoes, Coquettes, Brilliants, Mountain Gems,Bees and Emeralds, with a separate tip for the gianthummingbird (Patagona gigas) (taxonomic positionbased on Altshuler et al. 2004).
Statistics
Least-squares regressions were performed usingMINITAB 13.0. Log RMR, log DEE and log MLSPwere regressed against log body mass and residuals ofeach trait were calculated. Residual values of log DEEand log RMR were regressed against residual logMLSP to remove the effects of body mass. Residualvalues were entered into the tips of the phylogenetictrees (Table 1) and contrasts computed. SC of log
RMR and log DEE were regressed against the SC oflog MLSP. To confirm the prediction that lifetimeenergy expenditure per unit body mass was constant,the lifetime RMR and DEE/gram were calculated (e.g.DEE/body mass * MLSP) and regressed against bodymass; these values were also entered into the tips ofphylogenetic trees and SC of residual DEE andresidual RMR were regressed against the SC of bodymass to remove the effect of phylogeny. In addition,lifetime DEE/gram and lifetime RMR/ gram wereregressed against metabolic intensity [DEE (KJ/day)per gram and RMR (KJ/day) per gram, respectively].
Results
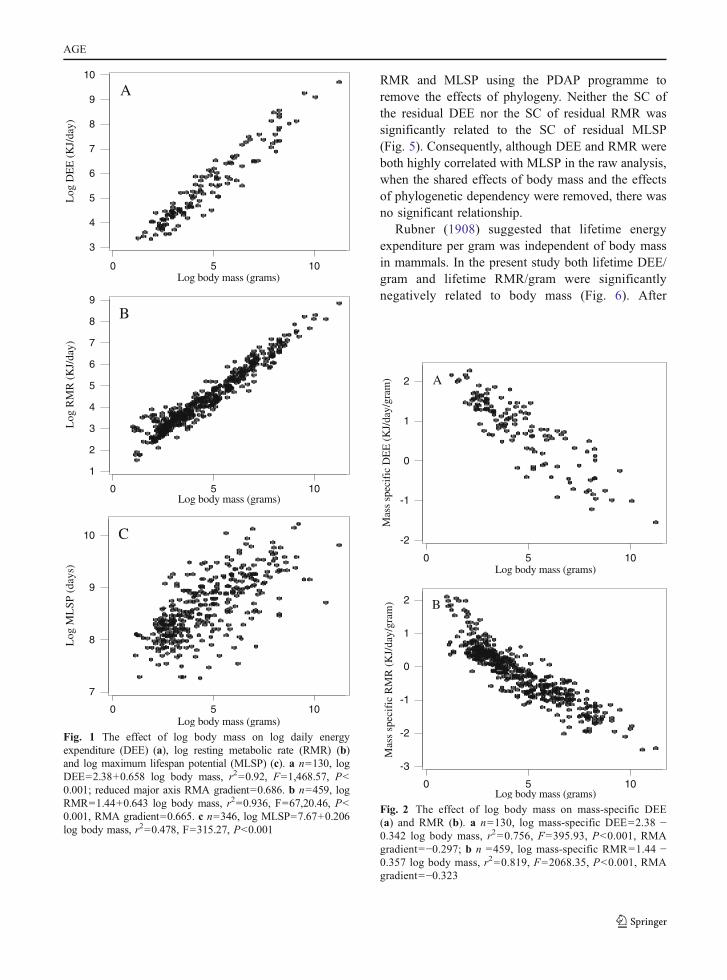
DEE, RMR and MLSP were all significantly andpositively associated with body mass (Fig. 1),corresponding to a significant and negative associa-tion between mass-specific DEE and RMR with mass(Fig. 2). Due to shared variation with body mass,MLSP was significantly associated with both mass-specific DEE and RMR (Fig. 3). To explore theassociation between MLSP and both RMR and DEEexclusive of the effects of body mass, we calculatedthe residuals of log DEE, log RMR and log MLSP forthe fitted regressions in Fig. 1. Neither residual logDEE nor residual log RMR was significantly relatedto residual MLSP (Fig. 4). We then calculated thestandardised contrasts (SC) of the residual DEE,
Order (Family) Reference
Galliformes Crowe et al. 2006; Kaiser et al. 2007Anseriformes Livezey 1996Piciformes (Picidae) Fuchs et al. 2007Psittaciformes (Psittacidae) Astuti et al. 2006; Christidis et al. 1991;
Miyaki et al. 1998Columbiformes (Columbidae) Johnson et al. 2001; Johnson and Clayton 2000Gruiformes Livezey 1998Ciconiiformes (Scolopacidae) Thomas et al. 2004; Pereira and Baker 2005Ciconiiformes (Laridae) Thomas et al. 2004Ciconiiformes (Accipitridae) Lerner and Mindell 2005Ciconiiformes (Spheniscidae) Bertelli and Giannini 2005Ciconiiformes (Procellaridae) Bertelli and Giannini 2005; Kennedy and Page 2002Passeriformes (Bombycillidae and Cinclidae) Cibois and Cracraft 2004; Voelker and Spellman 2004Passeriformes (Corvidae, Paridae,Hirundinidae, Alaudidae,Passeridae and Fringillidae)
Jønsson and Fjeldså 2006; Tieleman et al. 2003
Table 1 Sources ofphylogenies used tosupplement Sibley andAhlquist (1990)
AGE
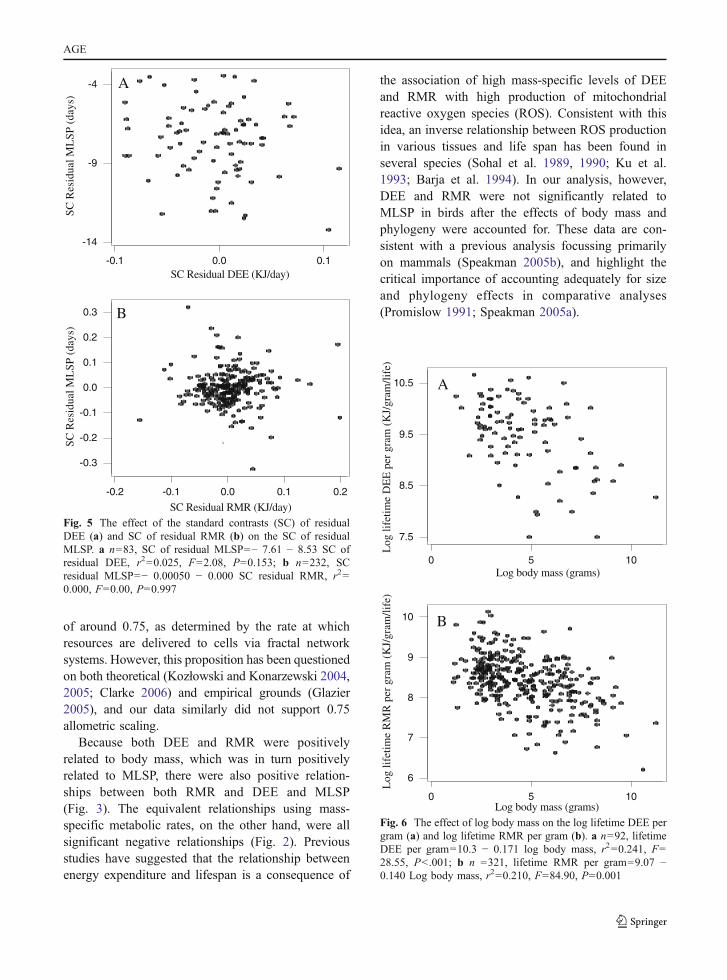
RMR and MLSP using the PDAP programme toremove the effects of phylogeny. Neither the SC ofthe residual DEE nor the SC of residual RMR wassignificantly related to the SC of residual MLSP(Fig. 5). Consequently, although DEE and RMR wereboth highly correlated with MLSP in the raw analysis,when the shared effects of body mass and the effectsof phylogenetic dependency were removed, there wasno significant relationship.
Rubner (1908) suggested that lifetime energyexpenditure per gram was independent of body massin mammals. In the present study both lifetime DEE/gram and lifetime RMR/gram were significantlynegatively related to body mass (Fig. 6). After
1050
10
9
8
7
6
5
4
3
Log
DE
E (
KJ/
day)
A
Log body mass (grams)
1050
9
8
7
6
5
4
3
2
1
Log
RM
R (
KJ/
day)
B
Log body mass (grams)
1050
10
9
8
7
Log
ML
SP
(da
ys)
Log body mass (grams)
C
Fig. 1 The effect of log body mass on log daily energyexpenditure (DEE) (a), log resting metabolic rate (RMR) (b)and log maximum lifespan potential (MLSP) (c). a n=130, logDEE=2.38+0.658 log body mass, r2=0.92, F=1,468.57, P<0.001; reduced major axis RMA gradient=0.686. b n=459, logRMR=1.44+0.643 log body mass, r2=0.936, F=67,20.46, P<0.001, RMA gradient=0.665. c n=346, log MLSP=7.67+0.206log body mass, r2=0.478, F=315.27, P<0.001
1050
2
1
0
-1
-2
Log body mass (grams)
Mas
s sp
ecif
ic D
EE
(K
J/da
y/gr
am) A
1050
2
1
0
-1
-2
-3
Log body mass (grams)
Mas
s sp
ecif
ic R
MR
(K
J/da
y/gr
am) B
Fig. 2 The effect of log body mass on mass-specific DEE(a) and RMR (b). a n=130, log mass-specific DEE=2.38 −0.342 log body mass, r2=0.756, F=395.93, P<0.001, RMAgradient=−0.297; b n =459, log mass-specific RMR=1.44 −0.357 log body mass, r2=0.819, F=2068.35, P<0.001, RMAgradient=−0.323
AGE
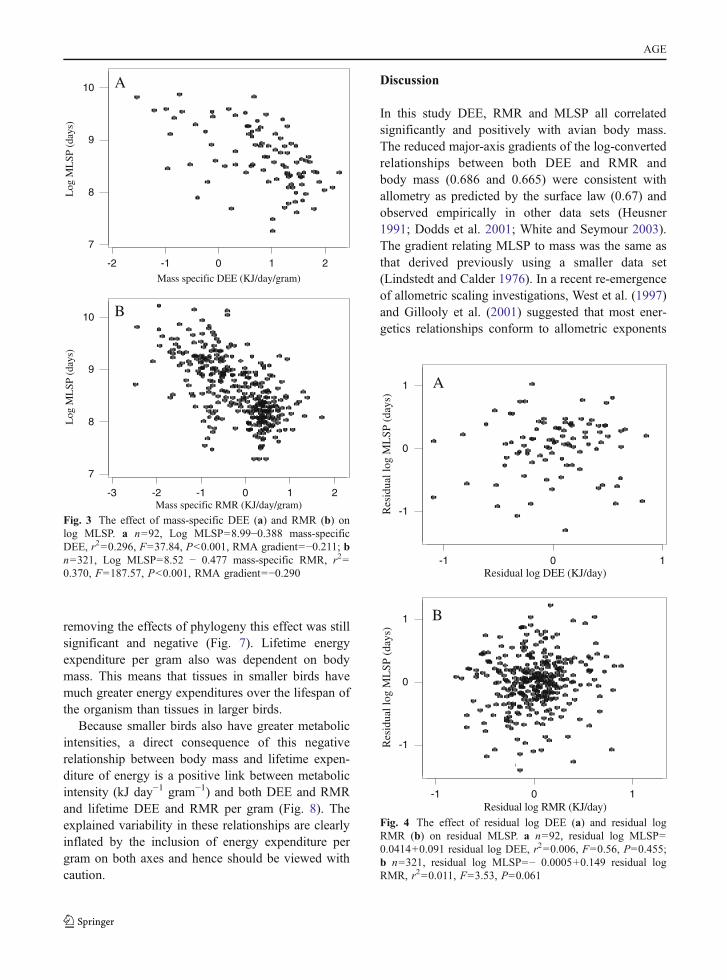
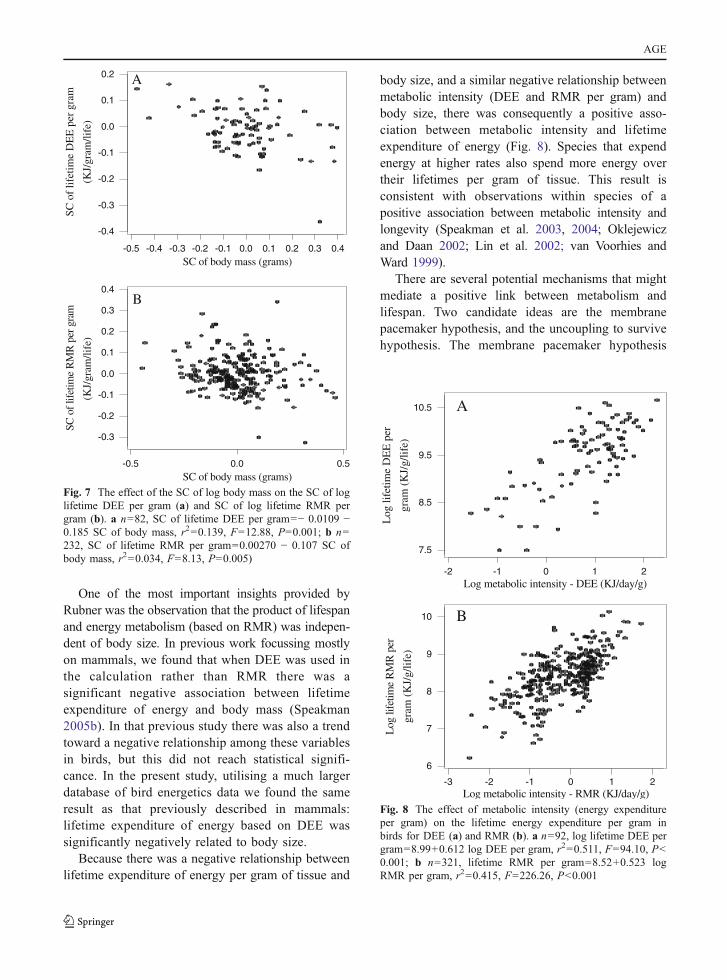
removing the effects of phylogeny this effect was stillsignificant and negative (Fig. 7). Lifetime energyexpenditure per gram also was dependent on bodymass. This means that tissues in smaller birds havemuch greater energy expenditures over the lifespan ofthe organism than tissues in larger birds.
Because smaller birds also have greater metabolicintensities, a direct consequence of this negativerelationship between body mass and lifetime expen-diture of energy is a positive link between metabolicintensity (kJ day−1 gram−1) and both DEE and RMRand lifetime DEE and RMR per gram (Fig. 8). Theexplained variability in these relationships are clearlyinflated by the inclusion of energy expenditure pergram on both axes and hence should be viewed withcaution.
Discussion
In this study DEE, RMR and MLSP all correlatedsignificantly and positively with avian body mass.The reduced major-axis gradients of the log-convertedrelationships between both DEE and RMR andbody mass (0.686 and 0.665) were consistent withallometry as predicted by the surface law (0.67) andobserved empirically in other data sets (Heusner1991; Dodds et al. 2001; White and Seymour 2003).The gradient relating MLSP to mass was the same asthat derived previously using a smaller data set(Lindstedt and Calder 1976). In a recent re-emergenceof allometric scaling investigations, West et al. (1997)and Gillooly et al. (2001) suggested that most ener-getics relationships conform to allometric exponents
10-1
1
0
-1
Residual log DEE (KJ/day)
Res
idua
l log
ML
SP (
days
)A
10-1
1
0
-1
Residual log RMR (KJ/day)
Res
idua
l log
ML
SP (
days
)
B
Fig. 4 The effect of residual log DEE (a) and residual logRMR (b) on residual MLSP. a n=92, residual log MLSP=0.0414+0.091 residual log DEE, r2=0.006, F=0.56, P=0.455;b n=321, residual log MLSP=− 0.0005+0.149 residual logRMR, r2=0.011, F=3.53, P=0.061
-2 -1 0 1 2
7
8
9
10
Mass specific DEE (KJ/day/gram)
Log
ML
SP (
days
)
A
-3 -2 -1 0 1 2
7
8
9
10
Mass specific RMR (KJ/day/gram)
Log
ML
SP (
days
)
B
Fig. 3 The effect of mass-specific DEE (a) and RMR (b) onlog MLSP. a n=92, Log MLSP=8.99−0.388 mass-specificDEE, r2=0.296, F=37.84, P<0.001, RMA gradient=−0.211; bn=321, Log MLSP=8.52 − 0.477 mass-specific RMR, r2=0.370, F=187.57, P<0.001, RMA gradient=−0.290
AGE
of around 0.75, as determined by the rate at whichresources are delivered to cells via fractal networksystems. However, this proposition has been questionedon both theoretical (Kozłowski and Konarzewski 2004,2005; Clarke 2006) and empirical grounds (Glazier2005), and our data similarly did not support 0.75allometric scaling.
Because both DEE and RMR were positivelyrelated to body mass, which was in turn positivelyrelated to MLSP, there were also positive relation-ships between both RMR and DEE and MLSP(Fig. 3). The equivalent relationships using mass-specific metabolic rates, on the other hand, were allsignificant negative relationships (Fig. 2). Previousstudies have suggested that the relationship betweenenergy expenditure and lifespan is a consequence of
the association of high mass-specific levels of DEEand RMR with high production of mitochondrialreactive oxygen species (ROS). Consistent with thisidea, an inverse relationship between ROS productionin various tissues and life span has been found inseveral species (Sohal et al. 1989, 1990; Ku et al.1993; Barja et al. 1994). In our analysis, however,DEE and RMR were not significantly related toMLSP in birds after the effects of body mass andphylogeny were accounted for. These data are con-sistent with a previous analysis focussing primarilyon mammals (Speakman 2005b), and highlight thecritical importance of accounting adequately for sizeand phylogeny effects in comparative analyses(Promislow 1991; Speakman 2005a).
0.10.0-0.1
-4
-9
-14
SC Residual DEE (KJ/day)
SC
Res
idua
l ML
SP
(da
ys)
A
-0.2 -0.1 0.0 0.1 0.2
-0.3
-0.2
-0.1
0.0
0.1
0.2
0.3
SC Residual RMR (KJ/day)
SC
Res
idua
l ML
SP
(da
ys)
B
Fig. 5 The effect of the standard contrasts (SC) of residualDEE (a) and SC of residual RMR (b) on the SC of residualMLSP. a n=83, SC of residual MLSP=− 7.61 − 8.53 SC ofresidual DEE, r2=0.025, F=2.08, P=0.153; b n=232, SCresidual MLSP=− 0.00050 − 0.000 SC residual RMR, r2=0.000, F=0.00, P=0.997
0 5 10
7.5
8.5
9.5
10.5L
og li
fetim
e D
EE
per
gra
m (
KJ/
gram
/life
)A
Log body mass (grams)
1050
10
9
8
7
6
Log body mass (grams)
Log
life
time
RM
R p
er g
ram
(K
J/gr
am/li
fe)
B
Fig. 6 The effect of log body mass on the log lifetime DEE pergram (a) and log lifetime RMR per gram (b). a n=92, lifetimeDEE per gram=10.3 − 0.171 log body mass, r2=0.241, F=28.55, P<.001; b n =321, lifetime RMR per gram=9.07 −0.140 Log body mass, r2=0.210, F=84.90, P=0.001
AGE
One of the most important insights provided byRubner was the observation that the product of lifespanand energy metabolism (based on RMR) was indepen-dent of body size. In previous work focussing mostlyon mammals, we found that when DEE was used inthe calculation rather than RMR there was asignificant negative association between lifetimeexpenditure of energy and body mass (Speakman2005b). In that previous study there was also a trendtoward a negative relationship among these variablesin birds, but this did not reach statistical signifi-cance. In the present study, utilising a much largerdatabase of bird energetics data we found the sameresult as that previously described in mammals:lifetime expenditure of energy based on DEE wassignificantly negatively related to body size.
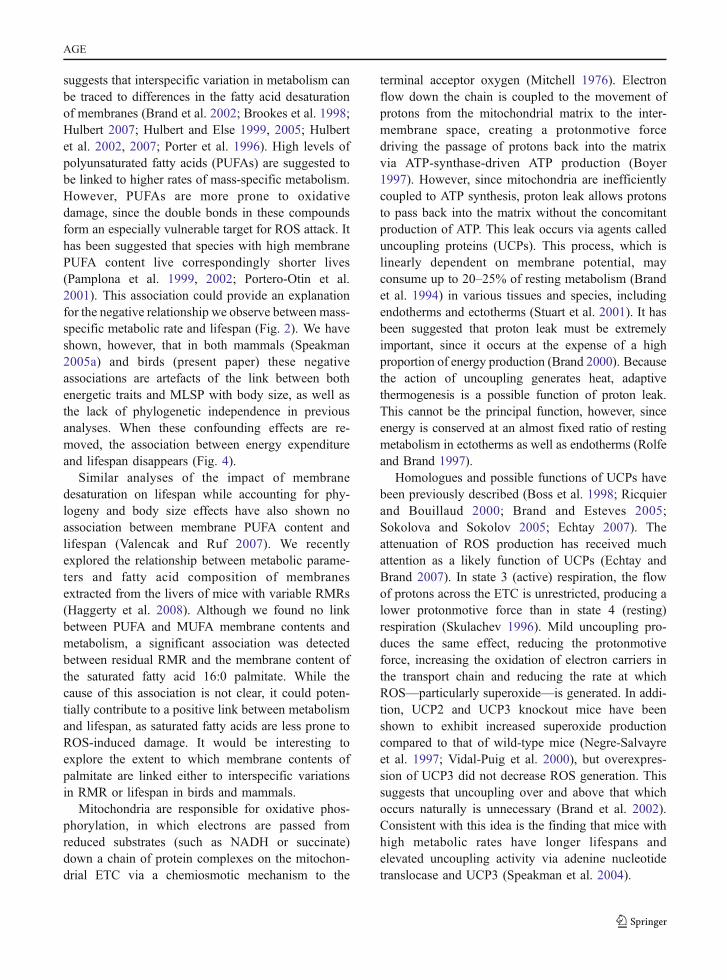
Because there was a negative relationship betweenlifetime expenditure of energy per gram of tissue and
body size, and a similar negative relationship betweenmetabolic intensity (DEE and RMR per gram) andbody size, there was consequently a positive asso-ciation between metabolic intensity and lifetimeexpenditure of energy (Fig. 8). Species that expendenergy at higher rates also spend more energy overtheir lifetimes per gram of tissue. This result isconsistent with observations within species of apositive association between metabolic intensity andlongevity (Speakman et al. 2003, 2004; Oklejewiczand Daan 2002; Lin et al. 2002; van Voorhies andWard 1999).
There are several potential mechanisms that mightmediate a positive link between metabolism andlifespan. Two candidate ideas are the membranepacemaker hypothesis, and the uncoupling to survivehypothesis. The membrane pacemaker hypothesis
0.40.30.20.10.0-0.1-0.2-0.3-0.4-0.5
0.2
0.1
0.0
-0.1
-0.2
-0.3
-0.4
SC of body mass (grams)
(KJ/
gram
/life
)
SC o
f lif
etim
e D
EE
per
gra
mA
-0.5 0.0 0.5
-0.3
-0.2
-0.1
0.0
0.1
0.2
0.3
0.4
SC of body mass (grams)
(KJ/
gram
/life
)
SC o
f life
time
RM
R p
er g
ram
B
Fig. 7 The effect of the SC of log body mass on the SC of loglifetime DEE per gram (a) and SC of log lifetime RMR pergram (b). a n=82, SC of lifetime DEE per gram=− 0.0109 −0.185 SC of body mass, r2=0.139, F=12.88, P=0.001; b n=232, SC of lifetime RMR per gram=0.00270 − 0.107 SC ofbody mass, r2=0.034, F=8.13, P=0.005)
210-1-2
10.5
9.5
8.5
7.5
Log metabolic intensity - DEE (KJ/day/g)
Log
life
time
DE
E p
er
gram
(K
J/g/
life)
-3 -2 -1 0 1 2
6
7
8
9
10
Log metabolic intensity - RMR (KJ/day/g)
gram
(K
J/g/
life)
Log
life
time
RM
R p
er
A
B
Fig. 8 The effect of metabolic intensity (energy expenditureper gram) on the lifetime energy expenditure per gram inbirds for DEE (a) and RMR (b). a n=92, log lifetime DEE pergram=8.99+0.612 log DEE per gram, r2=0.511, F=94.10, P<0.001; b n=321, lifetime RMR per gram=8.52+0.523 logRMR per gram, r2=0.415, F=226.26, P<0.001
AGE
suggests that interspecific variation in metabolism canbe traced to differences in the fatty acid desaturationof membranes (Brand et al. 2002; Brookes et al. 1998;Hulbert 2007; Hulbert and Else 1999, 2005; Hulbertet al. 2002, 2007; Porter et al. 1996). High levels ofpolyunsaturated fatty acids (PUFAs) are suggested tobe linked to higher rates of mass-specific metabolism.However, PUFAs are more prone to oxidativedamage, since the double bonds in these compoundsform an especially vulnerable target for ROS attack. Ithas been suggested that species with high membranePUFA content live correspondingly shorter lives(Pamplona et al. 1999, 2002; Portero-Otin et al.2001). This association could provide an explanationfor the negative relationship we observe between mass-specific metabolic rate and lifespan (Fig. 2). We haveshown, however, that in both mammals (Speakman2005a) and birds (present paper) these negativeassociations are artefacts of the link between bothenergetic traits and MLSP with body size, as well asthe lack of phylogenetic independence in previousanalyses. When these confounding effects are re-moved, the association between energy expenditureand lifespan disappears (Fig. 4).
Similar analyses of the impact of membranedesaturation on lifespan while accounting for phy-logeny and body size effects have also shown noassociation between membrane PUFA content andlifespan (Valencak and Ruf 2007). We recentlyexplored the relationship between metabolic parame-ters and fatty acid composition of membranesextracted from the livers of mice with variable RMRs(Haggerty et al. 2008). Although we found no linkbetween PUFA and MUFA membrane contents andmetabolism, a significant association was detectedbetween residual RMR and the membrane content ofthe saturated fatty acid 16:0 palmitate. While thecause of this association is not clear, it could poten-tially contribute to a positive link between metabolismand lifespan, as saturated fatty acids are less prone toROS-induced damage. It would be interesting toexplore the extent to which membrane contents ofpalmitate are linked either to interspecific variationsin RMR or lifespan in birds and mammals.
Mitochondria are responsible for oxidative phos-phorylation, in which electrons are passed fromreduced substrates (such as NADH or succinate)down a chain of protein complexes on the mitochon-drial ETC via a chemiosmotic mechanism to the
terminal acceptor oxygen (Mitchell 1976). Electronflow down the chain is coupled to the movement ofprotons from the mitochondrial matrix to the inter-membrane space, creating a protonmotive forcedriving the passage of protons back into the matrixvia ATP-synthase-driven ATP production (Boyer1997). However, since mitochondria are inefficientlycoupled to ATP synthesis, proton leak allows protonsto pass back into the matrix without the concomitantproduction of ATP. This leak occurs via agents calleduncoupling proteins (UCPs). This process, which islinearly dependent on membrane potential, mayconsume up to 20–25% of resting metabolism (Brandet al. 1994) in various tissues and species, includingendotherms and ectotherms (Stuart et al. 2001). It hasbeen suggested that proton leak must be extremelyimportant, since it occurs at the expense of a highproportion of energy production (Brand 2000). Becausethe action of uncoupling generates heat, adaptivethermogenesis is a possible function of proton leak.This cannot be the principal function, however, sinceenergy is conserved at an almost fixed ratio of restingmetabolism in ectotherms as well as endotherms (Rolfeand Brand 1997).
Homologues and possible functions of UCPs havebeen previously described (Boss et al. 1998; Ricquierand Bouillaud 2000; Brand and Esteves 2005;Sokolova and Sokolov 2005; Echtay 2007). Theattenuation of ROS production has received muchattention as a likely function of UCPs (Echtay andBrand 2007). In state 3 (active) respiration, the flowof protons across the ETC is unrestricted, producing alower protonmotive force than in state 4 (resting)respiration (Skulachev 1996). Mild uncoupling pro-duces the same effect, reducing the protonmotiveforce, increasing the oxidation of electron carriers inthe transport chain and reducing the rate at whichROS—particularly superoxide—is generated. In addi-tion, UCP2 and UCP3 knockout mice have beenshown to exhibit increased superoxide productioncompared to that of wild-type mice (Negre-Salvayreet al. 1997; Vidal-Puig et al. 2000), but overexpres-sion of UCP3 did not decrease ROS generation. Thissuggests that uncoupling over and above that whichoccurs naturally is unnecessary (Brand et al. 2002).Consistent with this idea is the finding that mice withhigh metabolic rates have longer lifespans andelevated uncoupling activity via adenine nucleotidetranslocase and UCP3 (Speakman et al. 2004).
AGE
Given that mild uncoupling generates an inefficientflow of electrons along the ETC, lowering theprotonmotive force across the inner mitochondrialmembrane and reducing ROS production, and thatUCPs are correlated with longer life in mice,uncoupling activity in birds could be the mechanismby which they can achieve high tissue metabolic ratesand extended lifetime energy expenditures. In 2001, aUCP homolog was identified in hummingbirds (Viannaet al. 2001), chickens and ducklings (Raimbault et al.2001), and king penguins (Talbot et al. 2004). Emreet al. (2007) presented evidence that birds have onlyone UCP and that its function is likely to be varied;one such function could be to decrease ROS produc-tion. Consistent with this idea, avian UCP expressionhas been shown to attenuate ROS production in yeast(Criscuolo et al. 2005).
In conclusion, the associations between DEE, RMRand MLSP and body mass are all significantly positivein birds. After removing potential covariance in bodymass and the effects of phylogeny, DEE and RMRwere not significantly associated with MLSP; lifetimeDEE and RMR per gram, moreover, was significantlyand negatively associated with body mass.
Acknowledgements We thank Ted Garland for the PDAPpackage and his help on the PIC analysis.
References
Altshuler DL, Dudley R, McGuire JA (2004) Resolution of aparadox: hummingbird flight at high elevation does comewithout a cost. Proc Natl Acad Sci USA 101:17731–17736
Astuti D, Azuma N, Suzuki H, Higashi S (2006) Phylogeneticrelationships within parrots (Psittacidae) inferred frommitochondrial cytochrome-b gene sequences. Zool Sci23:191–198
Barja G (1999) Mitochondrial oxygen radical generation and leak:sites of production in state 4 and 3, organ specificity, andrelation to aging and longevity. J Bioener Biomembranes31:347–366
Barja G (2002) Rate of generation of oxidative stress-relateddamage and animal longevity. Free Rad Biol Med33:1167–1172
Barja G, Herrero A (2000) Oxidative damage to mitochondrialDNA is inversely related to maximum life span in theheart and brain of mammals. FASEB J 14:312–318
Barja G, Cadenas S, Rojas C, Lopez-Torres M, Perez-Campo R(1994) A decrease of free radical production near criticaltargets as a cause of maximum longevity in animals.Comp Biochem Physiol Part B Biochem Mol Biol 108:501–512
Bennett PM, Harvey PH (1985) Active and resting metabolismin birds: allometry, phylogeny and ecology. J Zool213:327–363
Bertelli S, Giannini NP (2005) A phylogeny of extant penguins(Aves: Sphenisciformes) combining morphology andmitochondrial sequences. Cladistics 21:209–239
Blair SN, Kohl HW 3rd, Paffenbarger RS Jr, Clark DG, CooperKH, Gibbons LW (1989) Physical fitness and all-causemortality. A prospective study of healthy men and women.JAMA 262:2395–2401
Blair SN, Kampert JB, Kohl HW 3rd, Barlow CE, Macera CA,Paffenbarger RS Jr, Gibbons LW (1996) Influences ofcardiorespiratory fitness and other precursors on cardio-vascular disease and all-cause mortality in men andwomen. JAMA 276:205–210
Boss O, Samec S, Kuhne F, Bijlenga P, Assimacopoulos-Jeannet F, Seydoux J, Giacobino JP (1998) Uncouplingprotein-3 expression in rodent skeletal muscle is modulat-ed by food intake but not by changes in environmentaltemperature. J Biol Chem 273:5–8
Boyer PD (1997) The ATP synthase—a splendid molecularmachine. Annu Rev Biochem 66:717–749
Braeckman BP, Houthoofd K, Vanfleteren JR (2001) Insulin-like signaling, metabolism, stress resistance and aging inCaenorhabditis elegans. Mech Ageing Develop 122:673–693
Brand MD (2000) Uncoupling to survive? The role of mitochon-drial inefficiency in ageing. Exp Gerontol 35:811–820
Brand MD, Esteves TC (2005) Physiological functions of themitochondrial uncoupling proteins UCP2 and UCP3. CellMetab 2:85–93
Brand MD, Chien L-F, Ainscow EK, Rolfe DFS, Porter RK(1994) The causes and functions of mitochondrial protonleak. Biochim Biophys Acta 1187:132–139
Brand MD, Pamplona R, Portero-Otin M, Requena JR,Roebuck SJ, Buckingham JA, Clapham JC, Cadenas S(2002) Oxidative damage and phospholipids fatty acylcomposition in skeletal muscle mitochondria from miceunderexpressing or overexpressing uncoupling protein 3.Biochem J 368:597–603
Brookes PS, Buckingham JA, Tenreiro AM, Hulbert AJ, BrandMD (1998) The proton permeability of the inner mem-brane of liver mitochondria from ectothermic and endo-thermic vertebrates and from obese rats: correlations withstandard metabolic rate and phospholipid fatty acidcomposition. Comp Biochem Phys B 119:325–334
Calder WA (1984) Size, function, and life history. HarvardUniversity Press, Cambridge
Carey JR, Judge DS (2000) Longevity Records: Life spans ofmammals, birds, amphibians, reptiles and fish. OdenseUniversity Press, Odense
Christidis L, Scodde R, Shaw DD, Maynes SF (1991) Relation-ships among the australo-papuan parrots, lorikeets, andcockatoos (Aves: Psittaciformes): protein evidence. Condor93:302–317
Cibois A, Cracraft J (2004) Assessing the passerine “Tapestry”:phylogenetic relationships of theMuscicapoidea inferred fromnuclear DNA sequences. Mol Phylogenet Evol 32:264–273
Clarke A (2006) Temperature and the metabolic theory ofecology. Func Ecol 20:405–412
AGE
Criscuolo F, del Mar Gonzalez-Barroso M, Le Maho Y,Ricquier D, Bouillaud F (2005) Avian uncoupling proteinexpressed in yeast mitochondria prevents endogenous freeradical damage. Proc R Soc 272:803–810
Crowe TM, Bloomer P, Randi E, Lucchini V, Kimball R, BraunE, Groth JG (2006) Supra-generic cladistics of landfowl(Order Galliformes). Acta Zool Sinica 52(supplement):358–361
Daan S, Deerenberg C, Dijkstra C (1990) Increased daily workprecipitates natural death in the kestrel. J Anim Ecol65:539–544
Dodds PS, Rothman DH, Weitz JS (2001) Re-examination ofthe “3/4-law” of metabolism. J Theor Biol 209:9–27
Echtay KS (2007) Mitochondrial uncoupling proteins—what istheir physiological role? Free Radic Biol Med 43:1351–1371
Echtay KS, Brand MD (2007) 4-Hydroxy-2-nonenal anduncoupling proteins: an approach for regulation ofmitochondrial ROS production. Redox Rep 12:26–29
Emre Y, Hurtaud C, Ricquier D, Bouillaud F, Hughes J,Criscuolo F (2007) Avian UCP: the killjoy in the evolutionof the mitochondrial uncoupling proteins. J Mol Evol65:392–402
Felsenstein J (1985) Phylogenies and the comparative method.Am Nat 125:1–15
Foksinski M, Rozalski R, Guz J, Ruszkowska B, Sztukowska P,Piwowarski M, Klungland A, Olinski R (2004) Urinaryexcretion of DNA repair products correlates with meta-bolic rates as well as with maximum life spans of differentmammalian species. Free Radic Biol Med 37:1449–1454
Fuchs J, Ohlson JI, Ericson PGP, Pasquet E (2007) Synchronousintercontinental splits between assemblages of woodpeckerssuggested by molecular data. Zool Scripta 36:11–25
Garland T Jr, Dickerman AW, Janis CM, Jones JA (1993)Phylogenetic analysis of covariance by computer simula-tion. Syst Biol 42:265–292
Gerschman R, Gilbert DL, Nye SW, Dwyer P, Fenn WO (1954)Oxygen poisoning and X-irradiation: a mechanism incommon. Science 119:623–626
Gillooly JF, Brown JH, West GB (2001) Effects of size andtemperature on metabolic rate. Science 293:2248–2251
Glazier DS (2005) Beyond the ‘3/4-power law’: variation in theintra- and interspecific scaling of metabolic rate inanimals. Biol Rev 80:611–662
Haggerty C, Hoggard N, Brown DS, Clapham JC, Speakman JR(2008) Intra-specific variation in resting metabolic rate inMF1 mice is not associated with membrane lipid desatura-tion in the liver. Mech Age Develop 129(3):129–137
Harman D (1956) Aging: a theory based on free radical andradiation biology. J Gerontol 11:298–300
Heusner AA (1991) Size and power in mammals. J Exp Biol160:25–54
Holloszy JO, Smith EK (1986) Longevity of cold exposed rats:a re-evaluation of the rate of living theory. J Appl Physiol61:1656–1660
Holmes DJ, Austad SN (1995a) The evolution of aviansenescence patterns—implications for understanding pri-mary aging processes. Am Zool 35:307–317
Holmes DJ, Austad SN (1995b) Birds as animal-models for thecomparative biology of aging—a prospectus. J Gerontol50:B59–B66
Holmes DJ, Fluckiger R, Austad SN (2001) Comparativebiology of aging in birds: an update. Exp Gerontol36:869–883
Hulbert AJ (2007) Membrane fatty acids as pacemakers ofanimal metabolism. Lipids 42(9):811–819
Hulbert AJ, Else PL (1999) Membranes as possible pacemakersof metabolism. J Theor Biol 199:257–274
Hulbert AJ, Else PL (2005) Membranes and the setting ofenergy demand. J Exp Biol 208:1593–1599
Hulbert AJ, Faulks S, Buttemer WA, Else PL (2002) Acylcomposition of muscle membranes varies with body sizein birds. J Exp Biol 205:3561–3569
Hulbert AJ, Clancy DJ, Mair W, Braekman BP, Gems DPartridge L (2004a) Metabolic rate is not reduced bydietary restriction or by lowered insulin/IGF-1 signallingand is not correlated with individual lifespan in Dro-sophila melanogaster. Exp Gerontol 39:1137–1143
Hulbert AJ, Usher MJ, Wallman JF (2004b) Food consump-tion and individual lifespan of adults of the blowfly,Calliphora stygia: a test of the ‘rate of living’ theory ofageing. Exp Gerontol 39:1485–1490
Hulbert AJ, Pamplona R, Buffenstein R, Buttemer WA (2007)Life and death: metabolic rate, membrane composition,and life span of animals. Physiol Rev 87:1175–1213
Johnson KP, Clayton DH (2000) Nuclear and mitochondrialgenes contain similar phylogenetic signal for pigeons anddoves (Aves: Columbiformes). Mol Biol Evol 14:141–151
Johnson KP, de Kort S, Dinwoodey K, Mateman AC, Cate CT,Lessells CM, Clayton DH (2001) A molecular phylogenyof the dove genera Streptopelia and Columba. Auk118:874–887
Jønsson KA, Fjeldså J (2006) A phylogenetic supertree ofoscine passerine birds (Aves: Passeri). Zool Scripta35:149–186
Kaiser VB, van Tuinen M, Ellegren H (2007) Insertion eventsof CR1 retrotransposable elements elucidate the phylo-genetic branching Order in Galliform birds. Mol BiolEvol 24:338–347
Kennedy M, Page RDM (2002) Seabird supertrees: combiningpartial estimates of Procellariiformes phylogeny. Auk119:88–108
Kozłowski J, Konarzewski M (2004) Is West, Brown andEnquist’s model of allometric scaling mathematicallycorrect and biologically relevant? Func Ecol 18:283–289
Kozłowski J, Konarzewski M (2005) West, Brown andEnquist’s model of allometric scaling again: the samequestions remain. Func Ecol 19:739–743
Ku HH, Brunk UT, Sohal RS (1993) Relationship betweenmitochondrial superoxide and hydrogen peroxide produc-tion and longevity of mammalian species. Free Radic BiolMed 15:621–627
Lambert AJ, Boysen HM, Buckingham JA, Yang T, PodlutskyA, Austad SN, Kunz TH, Buffenstein R, Brand MD(2007) Low rates of hydrogen peroxide production byisolated heart mitochondria associate with long maxi-mum lifespan in vertebrate homeotherms. Aging Cell6:607–618
Le Bourg E (1996) Correlational analysis in comparativegerontology: an examination of some problems. ExpGerontol 31:645–653
AGE
Lemon WC, Barth RH Jr (1992) The effects of feeding rate onreproductive success in the zebra finch, Taeniopygiaguttata. Anim Behav 44:851–857
Lerner HR, Mindell DP (2005) Phylogeny of eagles, old worldvultures and other Accipitridae based on nuclear andmitochondrial DNA. Mol Phylogenet Evol 37:327–346
Lin SJ, Kaeberlein M, Andalis AA, Sturtz LA, Defossez P-A,Culotta VC, Fink GR, Guarente L (2002) Calorierestriction extends Saccharomyces cerevisiae lifespan byincreasing respiration. Nature 418:344–348
Lindstedt SL, Calder WA (1976) Body size and longevity inbirds. Condor 78:91–145
Livezey BC (1996) A phylogenetic analysis of geese and swans(Anseriformes: Anserinae) including selected fossil species.Sys Biol 45:415–450
Livezey BC (1998) A phylogenetic analysis of the Gruiformes(Aves) based on morphological characters, with anemphasis on rails (Rallidae). Philos Trans R Soc Lond BBiol Sci 353:2077–2151
Marden JH, Rogina B, Montooth KL, Helfand SL (2003)Conditional tradeoffs between aging and organismalperformance of Indy long-lived mutant flies. Proc NatlAcad Sci USA 100:3369–3373
Mitchell P (1976) Vectorial chemistry and the molecularmechanisms of chemiosmotic coupling. Biochem SocTrans 4:399–430
Miyaki CY, Matioli SR, Burke T, Wajntal A (1998) Parrotevolution and paleogeographical events: mitochondrialDNA evidence. Mol Biol Evol 15:544–551
Nagy KA (1983) Ecological energetics. In: Huey RB, PiankaER, Schoener TW (eds) Lizard ecology: studies of amodel organism. Harvard University Press, Cambridge
NagyKA, Girard IA, Brown TK (1999) Energetics of free-rangingmammals, reptiles and birds. Ann Rev Nutr 19:247–277
Negre-Salvayre A, Hirtz C, Carrera G, Cazenave G, Troly M,Salvayre R, Penicaud L, Casteilla L (1997) A role foruncoupling protein-2 as a regulator of mitochondrialhydrogen peroxide generation. FASEB J 11:809–815
Oklejewicz M, Daan S (2002) Enhanced longevity in taumutant Syrian hamsters, Mesocricetus auratus. J BiolRhyt 17:210–216
Pamplona R, Portero-Otin M, Ruiz C, Gredilla R, Herrero A,Barja G (1999) Double bond content of phospholipids andlipid peroxidation negatively correlate with maximumlongevity in the heart of mammals. Mech Age Develop112:169–183
Pamplona R, Barja G, Portero-Otin M (2002) Membrane fattyacid unsaturation, protection against oxidative stress, andmaximum life span—a homeoviscous-longevity adapta-tion? Ann N Y Acad Sci 959:475–490
Pearl R (1928) The rate of living. University of London Press, UKPereira SL, Baker AJ (2005) Multiple gene evidence for
parallel evolution and retention of ancestral morphologicalstates in the shanks (Charadriiformes: Scolopacidae).Condor 107:514–526
Porter RK, Hulbert AJ, Brand MD (1996) Allometry ofmitochondrial proton leak: influence of membrane surfacearea and fatty acid composition. Am J Physiol 271:R1550–R1560
Portero-Otin M, Bellmunt MJ, Ruiz MC, Barja G, Pamplona R(2001) Correlation of fatty acid unsaturation of the liver
mitochondrial phospholipids classes in mammals to theirmaximum life span potential. Lipids 36:491–498
Prinzinger R (2005) Programmed ageing: the theory ofmaximal metabolic scope. EMBO Rep 6:S14–S19
Promislow DEL (1991) Senescence in natural-populations ofmammals—a comparative study. Evol 45:1869–1887
PromislowDEL (1993) On size and survival—progress and pitfallsin the allometry of life-span. J Gerontol 48:B115–B123
Promislow DEL (1994) DNA-repair and the evolution oflongevity—a critical analysis. J Theor Biol 170:291–300
Raimbault S, Dridi S, Denjean F, Lachuer J, Couplan E,Bouillaud F, Bordas A, Duchamp C, Taouis M, Riquier D(2001) An uncoupling protein homologue putativelyinvolved in facultative muscle thermogenesis in birds.Biochem J 353:441–444
Ricquier D, Bouillaud F (2000) The uncoupling proteinhomologues: UCP1, UCP2, UCP3, StUCP and AtUCP.Biochem J 345:161–179
Rolfe DFS, Brand MD (1997) The physiological significance ofmitochondrial proton leak in animal cells and tissues.Biosci Rep 17:9–16
Rubner M (1908) Das Problem Der Lebensdauer Und SeineBeziehunger Zum Wachstum Und Ernarhnung. Oldenberg,Munich
Selman C, Lingard S, Choudhury AI, Batterham RL, Claret M,Clements M, Ramadani F, Okkenhaug K, Schuster E,Blanc E, Piper MD, Al-Qassab H, Speakman JR,Carmignac D, Robinson ICA, Thornton JM, Gems D,Partridge L, Withers DJ (2007) Evidence for lifespanextension and delayed age-related biomarkers in insulinreceptor substrate 1 null mice. FASEB J 22:807–818
Selman C, McLaren JS, Collins AR, Duthie GG, Speakman JR(2008) Experimentally elevating energy expenditure doesnot increase oxidative stress or reduce lifespan in the short-tailed field vole Microtus agrestis. Proc R Soc B, doi:10.1098/rspb.2008.0355
Sibley CG, Ahlquist JE (1990) Phylogeny and classification ofbirds. Yale University Press, New Haven
Skulachev VP (1996) Role of uncoupled and non-coupledoxidations in maintenance of safety low levels of oxygenand its one-electron reductants. Q Rev Biophys 29:169–202
Sohal RS, Svensson I, Sohal BH, Brunk UT (1989) Superoxideanion radical production in different species. Mech AgeingDev 49:129–135
Sohal RS, Svensson I, Brunk UT (1990) Hydrogen peroxideproduction by liver mitochondria in different species.Mech Ageing Dev 53:209–215
Sokolova IM, Sokolov EP (2005) Evolution of mitochondrialuncoupling proteins: novel invertebrate UCP homologuessuggest early evolutionary divergence of the UCP family.FEBS lett 579:313–317
Speakman JR (1998) The history and theory of the doublylabelled water technique. Am J Clin Nutr 68:927S–979S
Speakman JR (2000) The cost of living: field metabolic rates ofsmall mammals. Adv Ecol Res 30:177–297
Speakman JR (2005a) Body size, metabolism and lifespan. JExp Biol 208:1717–1730
Speakman JR (2005b) Correlations between physiology andlifespan—two widely ignored problems with comparativestudies. Aging Cell 4:167–175
AGE
Speakman JR, van Acker A, Harper EJ (2003) Age-relatedchanges in the metabolism and body composition of threedog breeds and their relationship to life expectancy. AgingCell 2:265–275
Speakman JR, Talbot DA, Selman C, Snart S, McLaren JS,Redman P, Krol E, Jackson DM, Johnson MS, Brand MD(2004) Uncoupled and surviving: individual mice withhigh metabolism have greater mitochondrial uncouplingand live longer. Aging Cell 3:87–95
Staav R (1998) Longevity list of birds ringed in Europe.EURING news lett 2
Stuart JA, Cadenas S, Jekabsons MB, Roussel D, Brand MD(2001) Mitochondrial proton leak and the uncoupling protein1 homologues. Biochim Biophys Acta 1504:144–158
Talbot DA, Duchamp C, Rey B, Hanuise N, Rouanet JL,Sibille B, Brand MD (2004) Uncoupling protein and ATP/ADP carrier increase mitochondrial proton conductanceafter cold adaptation of king penguins. J Physiol 558:123–135
Thomas GH, Wills MA, Székely T (2004) A supertreeapproach to shorebird phylogeny. BMC Evol Biol 4:28
Tieleman BI, Williams JB, Bloomer P (2003) Adaptation ofmetabolism and evaporative water loss along an ariditygradient. Proc Biol Sci 270:207–214
Valencak TG, Ruf T (2007) N-3 polyunsaturated fatty acidsimpair lifespan but have no role for metabolism. AgingCell 6:15–25
Van Voorhies WA (2002) The influence of metabolic rate onlongevity in the nematode Caenorhabditis elegans. AgingCell 1:91–101
Van Voorhies WA, Ward S (1999) Genetic and environmentalconditions that increase longevity in Caenorhabditiselegans decrease metabolic rate. Proc Natl Acad SciUSA 96:11399–11403
Vianna CR, Hagen T, Zhang C-Y, Bachman E, Boss O,Gereben B, Moriscot AS, Lowell BB, Bicudo JEPW,Bianco AC (2001) Cloning and functional characterizationof an uncoupling protein homolog in hummingbirds.Physiol Genom 5:137–145
Vidal-Puig AJ, Grujic D, Zhang CY, Hagen T, Boss O, Ido Y,Szczepanik A, Wade J, Mootha V, Cortright R, Muoio DM,Lowell BB (2000) Energy metabolism in uncoupling protein3 gene knockout mice. J Biol Chem 275:16258–16266
Voelker G, Spellman GM (2004) Nuclear and mitochondrialDNA evidence of polyphyly in the avian superfamilyMuscicapoidea. Mol Phylogenet Evol 30:386–394
West GB, Brown JH, Enquist BJ (1997) A general model forthe origin of allometric scaling laws in biology. Science276:122–126
White CR, Seymour RS (2003) Mammalian basal metabolicrate is proportional to body mass2/3. Proc Natl Acad SciUSA 100:4046–4049
Wolf TJ, Schmid-Hempel P (1989) Extra loads and foraginglifespan in honeybee workers. J Anim Ecol 58:943–954
AGE