
Nanocrystal energetics via quantum similarity measures
15
This content has been downloaded from IOPscience. Please scroll down to see the full text. Download details: IP Address: 193.140.134.75 This content was downloaded on 12/08/2014 at 14:26 Please note that terms and conditions apply. Nanocrystal energetics via quantum similarity measures View the table of contents for this issue, or go to the journal homepage for more 2014 Modelling Simul. Mater. Sci. Eng. 22 025009 (http://iopscience.iop.org/0965-0393/22/2/025009) Home Search Collections Journals About Contact us My IOPscience
Transcript of Nanocrystal energetics via quantum similarity measures

This content has been downloaded from IOPscience. Please scroll down to see the full text.
Download details:
IP Address: 193.140.134.75
This content was downloaded on 12/08/2014 at 14:26
Please note that terms and conditions apply.
Nanocrystal energetics via quantum similarity measures
View the table of contents for this issue, or go to the journal homepage for more
2014 Modelling Simul. Mater. Sci. Eng. 22 025009
(http://iopscience.iop.org/0965-0393/22/2/025009)
Home Search Collections Journals About Contact us My IOPscience
Modelling and Simulation in Materials Science and Engineering
Modelling Simul. Mater. Sci. Eng. 22 (2014) 025009 (14pp) doi:10.1088/0965-0393/22/2/025009
Nanocrystal energetics via quantumsimilarity measures
M I Torehan Balta and Cetin Kılıc1
Department of Physics, Gebze Institute of Technology, Gebze, Kocaeli 41400, Turkey
E-mail: cetin [email protected]
Received 15 August 2013, revised 13 November 2013Accepted for publication 11 December 2013Published 17 January 2014
AbstractWe first develop a descriptor-based representation of atomic environments bydevising two local similarity indices defined from an atom-partitioned quantum-chemical descriptor. Then, we employ this representation to explore the size-,shape- and composition-dependent nanocrystal energetics. For this purpose,we utilize an energy difference µ that is related to the atomic chemical poten-tial, which enables one to characterize energetic heterogeneities. Employingfirst-principles calculations based on the density functional theory for a set ofdatabase systems, namely unary atomic clusters in the shape of regular polyhe-dra and the bulk solids of C, Si, Pd and Pt, we explore the correlations betweenthe energy difference µ and similarity indices. We find that there exists aninterconnection between nanocrystal energetics and quantum similarity mea-sures. Accordingly, we develop a means for computing total energy differencesfrom the similarity indices via interpolation, and utilize a test set comprising avariety of unary nanocrystals and binary nanoalloys/nanocompounds for vali-dation. Our findings indicate that the similarity-based energies could be utilizedin computer-aided design of nanoparticles.
Keywords: nanocrystal energetics, quantum similarity, nanoalloys/ nanocom-pounds, density functional calculations, computational materials design
S Online supplementary data available from stacks.iop.org/MSMSE/22/025009/mmedia
(Some figures may appear in colour only in the online journal)
1 Author to whom any correspondence should be addressed.
0965-0393/14/025009+14$33.00 © 2014 IOP Publishing Ltd Printed in the UK 1
Modelling Simul. Mater. Sci. Eng. 22 (2014) 025009 M I Torehan Balta and C Kılıc
1. Introduction
Nanoparticles exhibit chemical and structural inhomogeneities insomuch as they appearin various morphologies, regardless of the production method used [1–3]. Even awell-crystallized nanoparticle with a well-defined polyhedral shape consists of low-coordinatedsurface atoms that are obviously dissimilar to high-coordinated (bulk-like) atoms. Onerecognizes immediately, by inspection, that the bulk-like atoms have indeed a local (bonding)environment that resembles the bulk solid, whereas the surface atoms along the edges or atthe corners have similarities with the atoms of atomic clusters with regard to bonding andlocal coordination. Utilizing these similarities (or dissimilarities) in elucidating the propertiesof nanoparticles would be rewarding since one could then employ similarity search methods[4–6] in computer-aided design of nanoparticles with customized properties. We should liketo complement this consideration by noting that similarity measures/indices [7–9] based onquantum-chemical descriptors [10–12] have long been available, which have proved to bepromising in carrying out various tasks related to a multitude of physicochemical phenomena,such as comparing properties and reactivities of different molecular systems [13], derivingquantitative structure-activity or -property relationships [14, 15], and identification of the activemolecular sites [16]. Clearly, these efforts demonstrate the utility of similarity-based analysisin molecular design [17]. On the other hand, the structure and/or properties of nanoparticleshave never been explored via the notion of the (quantum) similarity. This is, in our opinion, dueto the lack of a complete [18] similarity-based representation of atomic environments, whichfurnishes an adequate description for the nanoparticle atoms. This study is, thus, devotedto fulfill an objective along this line. First, we develop a descriptor-based representation ofatomic environments by devising two local similarity indices that are defined from the atom-partitioned [19, 20] shape function [21–23] σ(r) = ρ(r)/Ne, where ρ(r) and Ne denotethe electronic density function and number of electrons, respectively. Then, we employ thisrepresentation to explore the size-, shape-, and composition-dependent nanocrystal energeticsvia the notion of quantum similarity. We focus on an energy difference µ, which is relatedto the atomic chemical potential, because of its utility in the modelling and simulation ofnanoparticles [24, 25]. This energy difference and the local similarity indices were obtainedby performing first-principles calculations based on the density functional theory (DFT) for:(i) a set of database systems, including unary atomic clusters in the shape of regular polyhedraand the bulk solids of C, Si, Pd and Pt; and, (ii) a test set for validation, which includes avariety of unary nanocrystals as well as binary Pt–Pt nanoalloys and Pt–C nanocompounds.Regarding the energy difference µ as a ‘property’, and exploring its correlations with the localsimilarity indices, we find that there exists an interconnection between nanocrystal energeticsand quantum similarity measures. Furthermore, we introduce an interpolation procedure inorder to obtain total energies and energy differences from the two similarity indices. The latterenables us to demonstrate that the similarity-based energies could be utilized in computer-aideddesign of nanoparticles.
Although one of the similarity indices (denoted by Ziα below) employed in this studyis of the same form as the local Carbo index [7, 8, 12], we find it necessary to introduce asecond similarity index (denoted by Siα below) in order to achieve an adequate chemicalrepresentation. Our findings reveal that using a single similarity index, namely Ziα , leadsto a bijection between Ziα and µ if and only if the set of systems are restricted to includeequilibrium structures. This has an obvious drawback in that it requires a priori knowledge ofthe equilibrium geometries. Thus, we find the introduction of a second similarity index to benecessary, which enables us to extend the aforementioned bijection to cover a generalized set ofsystems, including strained (compressed or dilated) systems. Hence, the foregoing drawback
2
Modelling Simul. Mater. Sci. Eng. 22 (2014) 025009 M I Torehan Balta and C Kılıc
is overcome by using two similarity indices with adequately tailored functional forms givenbelow. It should be emphasized that this approach makes a similarity-based representation ofthe potential energy surfaces [26] accessible thanks to the inclusion of the strained systems,which facilitates an adequate description of physicochemical processes.
The rest of this paper is organized as follows. The next section is devoted to themethodological aspects, which also summarizes the computational details. This is followedby a discussion of the calculation results, before our concluding remarks are given in the lastsection.
2. Methodology
In this section, we first define the energy difference µ and the similarity indices that constitutethe employed chemical representation. We then describe: (i) the set of database systems thatare used to construct a database for the purpose of exploring correlations between energydifferences and local similarity indices; and, (ii) the test set employed for validation. Next,we introduce an ad hoc interpolation procedure that enables one to compute the similarity-based energy differences and total energies. We finalize this section with a description of ourcomputational modelling framework.
2.1. Energy differences
The aforementioned energy difference is defined by
µ(N, d) = �Ha + [EN(d) − Eb(db)] , (1)
where N is the number of atoms in the system under consideration, EN(d) is the DFT-calculatedenergy per atom for the system with the nearest-neighbor distance d, Eb(db) is the DFT-calculated energy per atom for the bulk solid with the equilibrium nearest-neighbor distancedb corresponding to the minimum of the total energy, and �Ha denotes the negative of themeasured [27] heat of atomization for the bulk solid. It is useful to define µe(N) = µ(N, de)
for the equilibrium value de of the nearest-neighbor distance. Note that µe(N) would be equalto the atomic chemical potential at zero temperature (T = 0 K) for a unary system if the zeroof energy is set to the energy of the atom; that is, µatom = 0. Recent investigations [24, 25]by one of the present authors have indicated that the energy difference µ could be utilized tointroduce a scale of energy on which small (less stable, more reactive) and large (more stable,less reactive) nanocrystals are naturally ordered near the higher (µatom) and lower (µbulk) endsof the scale, respectively.
2.2. Local similarity indices
In this study, the isolated (free) atom is employed as a reference system for each atomic species;namely, the free C, Si, Pd or Pt atoms are used as a reference for the C, Si, Pd or Pt atoms in anysystem, namely atomic clusters, bulk solids or nanocrystals, respectively. This is advantageousfor computational efficiency and avoids the need for an alignment [28–30] procedure. It alsoimplies that the similarity of an atom of a certain type in a system is measured with respect tothe free atom of the same type, regardless of the type of the system (atomic cluster, bulk solidor nanocrystal). The local (atom-partitioned) Carbo index, which here serves as an indicatorof similarity of an atom i, located at Ri , of type α in the system under consideration to the
3
Modelling Simul. Mater. Sci. Eng. 22 (2014) 025009 M I Torehan Balta and C Kılıc
free α atom, could then be expressed as
Ziα =∫
σ(r)wi(r − Ri )σα(r) dr√∫σ 2(r)wi(r − Ri ) dr
√∫σ 2
α (r) dr, (2)
where σ(r) and σα(r) denote the shape function of the system under consideration and freeα atom, respectively. The use of the Hirsfeld partitioning [19, 20] function wα(r − Rα) =ρα(r − Rα)/ρm(r) in equation (2) is encouraged [12] by the holographic electron densitytheorem [8]. Here, ρα(r − Rα) denotes the electron density of the isolated atom α locatedat point Rα , and ρm(r) = ∑
α ρα(r − Rα) is the promolecular electron density. Asexplained above, using Ziα does not suffice for obtaining a full-fledged representation ofatomic environments. Thus, we introduce a second indicator of local similarity given by
Siα =∫
r2σ(r)wi(r − Ri )σα(r)dr√∫r2σ 2(r)wi(r − Ri )dr
√∫r2σ 2
α (r)dr. (3)
As explained below, the introduction of Siα enables one to treat energetic trends when thevariations with the interatomic distance d are taken into account. Note that, Siα = Ziα = 1 ifthe system itself is the free α atom.
2.3. The set of database systems
In this study, first-principles calculations are employed to build a database that comprises µ and(Ziα , Siα) values for the unary atomic clusters in the shape of Platonic or Archimedean solids.In addition to these regular polyhedra, dimers C2, Si2, Pd2 and Pt2, and the bulk solids of C,Si, Pd and Pt are included in this database. It should be emphasized that not only equilibriumsystems (d = de) but also compressed or dilated systems (d < de or d > de) are included inthis set. The systems in this set are called here database systems for ease of speech, and theyare thoroughly used for the purpose of exploring the correlations between the µ and Ziα orSiα values. Since the set of database systems comprise only equivalent atoms, this makes itpossible to set EN = EDFT/N in equation (1), where EDFT denotes the DFT-calculated totalenergy. For each database system, plotting µ values as a function of Ziα yields a convexcurve that can accurately be parameterized, as demonstrated below. Accordingly, for a givendatabase system i, the energy difference defined in equation (1) is represented by µ = µi(Ziα),where µi denotes a polynomial function of forth order (whose coefficients are determined byfitting to the DFT-calculated values). It is found that one must employ a distinct functionµi with a unique set of polynomial coefficients for each system. Thus, the µ = µi(Ziα)
relationships are tabulated for all database systems with α = C, Si, Pd, Pt in tables 1–4 in theonline supplementary data (stacks.iop.org/MSMSE/22/025009/mmedia).
2.4. Test set
As mentioned above, a variety of nanocrystals are utilized as test systems for the purposeof validation, which exhibit structural inhomogeneity owing to the presence of a numberof inequivalent atoms. This test set is designed to cover a variety of nanocrystal sizes andshapes, as well as a range of nanoalloy compositions with various mixing patterns. Thus,a number of unary C, Si, Pd, or Pt nanocrystals (see the online supplementary data, table 5(stacks.iop.org/MSMSE/22/025009/mmedia)), uniformly mixed (see the online supplementarydata, table 6 (stacks.iop.org/MSMSE/22/025009/mmedia)), core-shell segregated (see theonline supplementary data, table 7 (stacks.iop.org/MSMSE/22/025009/mmedia)) and phase
4

Modelling Simul. Mater. Sci. Eng. 22 (2014) 025009 M I Torehan Balta and C Kılıc
separated (see the online supplementary data, table 8 (stacks.iop.org/MSMSE/22/025009/mmedia)) Pt–Pd nanoalloys and Pt–C nanocompounds (see the online supplementary data,table 9 (stacks.iop.org/MSMSE/22/025009/mmedia)) are contained in the test set. In practice,the atoms of the test systems were constrained to occupy the diamond (C and Si nanocrystals),fcc (Pd and Pt nanocrystals and Pt–Pd nanoalloys) and zinc-blende (Pt–C nanocompounds)lattice sites. It should be mentioned that platinum carbide nanocrystals are considered hereonly for the purpose of studying some challenging systems since the bonding characteristicsof platinum carbide, which was synthesized [31] for the first time in 2005 under extremeconditions via a high-pressure and high-temperature method in a diamond anvil cell with laserheating, is peculiar owing to the mixed covalent–ionic–metallic [32] interatomic interactions.
2.5. Interpolation procedure
With the aid of tabulated µ = µi(Ziα) relationships (see the online supplementary data,tables 1–4 (stacks.iop.org/MSMSE/22/025009/mmedia)), the energies of the test systems areobtained according to the following procedure. The contribution δEI to the energy by the I
atom of a test system is obtained, via interpolation, by
δEI =∑
i
ωIi µi(Ziα), (4)
ωIi = (SIα − Siα)−2
∑i (SIα − Siα)−2
, (5)
whereωIi denotes the interpolation coefficients, and i is the label for database systems (whereasI denotes atoms of the test system under consideration). Performing a sum over I yields asimilarity-based total energy difference
�Esim =∑
I
δEI . (6)
Note that, �Esim should be compared to a DFT-calculated total energy difference given by
�EDFT = m�H Aa + n�H B
a +[EDFT(AmBn) − mEA
b − nEBb
], (7)
for a nanoalloy/nanocompound made of m A and n B atoms, owing to the inclusion of �Ha andEb in the definition of µ, see equation (1). One obviously needs to set n = 0 in equation (7)for a unary nanocrystal made of m A atoms.
2.6. Computational details
The DFT-calculated energies employed in equations (1) and (7), as well as shape functionsemployed in equations (2) and (3), were obtained within the generalized gradient approximation(GGA) using the PBE exchange correlation potential [33], and employing the projectoraugmented-wave (PAW) method [34], as implemented in VASP code [35–37]. Spin-polarization was taken into account and scalar relativistic effects were included in allcalculations. The 2s and 2p, 3s and 3p, 4d and 5s, and 5d and 6s states are treated as valencestates for carbon, silicon, palladium, and platinum, respectively. Plane wave basis sets wereused to represent the electronic states, which were determined by imposing a kinetic energycutoff of 400 eV, 245 eV, 250 eV and 230 eV for C, Si, Pd and Pt, respectively. Primitiveand/or conventional unit cells were used in the calculations for the bulk solids, namely C andSi in the diamond structure and Pd and Pt in the face-centered-cubic (fcc) structure, whoseBrillouin zones were sampled by fine k-point meshes generated according to Monkhorst–Packscheme [38], ensuring convergence with respect to the number of k-points. A variety of
5
Modelling Simul. Mater. Sci. Eng. 22 (2014) 025009 M I Torehan Balta and C Kılıc
cubic supercells with a side length in the range 15–30 Å were used for the atomic clusters andnanocrystals, which included a vacuum region that put at least 10 Å distance between nearestatoms of two systems in neighboring supercells. Only �-point was used for Brillouin-zonesampling in the case of the cluster or nanocrystal supercells. The error bar for the energyconvergence was on the order of 1 meV/atom in all calculations.
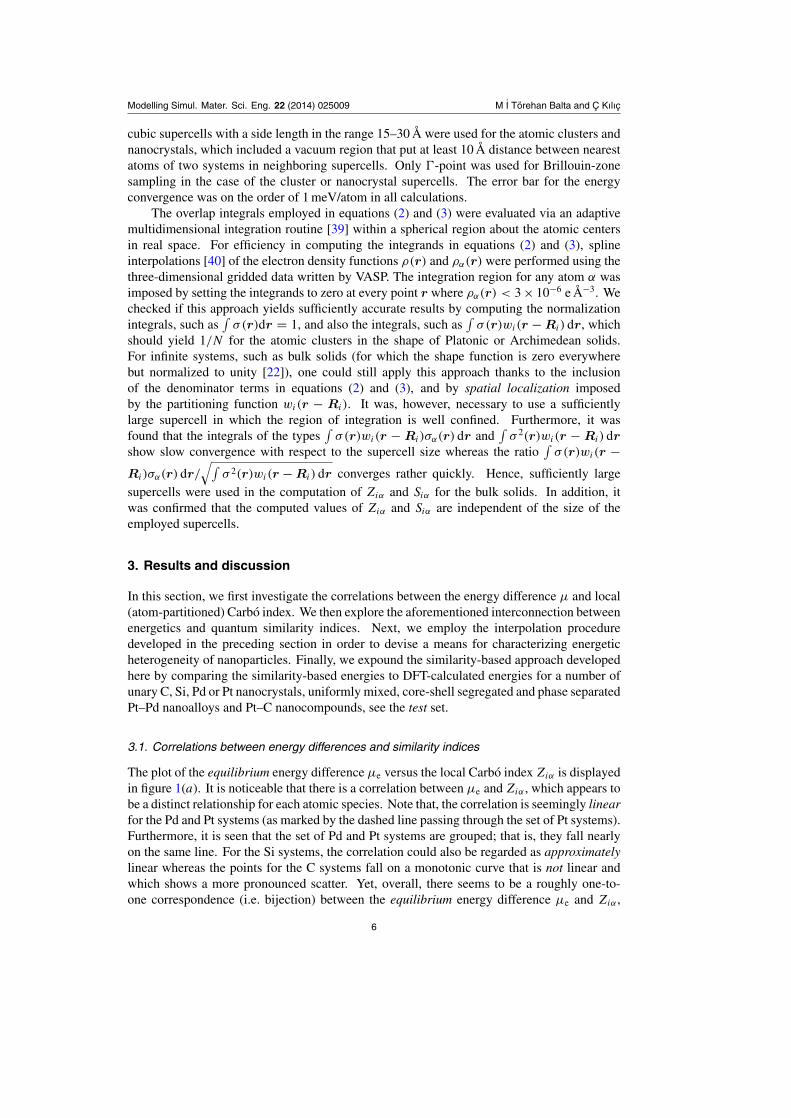
The overlap integrals employed in equations (2) and (3) were evaluated via an adaptivemultidimensional integration routine [39] within a spherical region about the atomic centersin real space. For efficiency in computing the integrands in equations (2) and (3), splineinterpolations [40] of the electron density functions ρ(r) and ρα(r) were performed using thethree-dimensional gridded data written by VASP. The integration region for any atom α wasimposed by setting the integrands to zero at every point r where ρα(r) < 3 × 10⁻⁶ e Å−3. Wechecked if this approach yields sufficiently accurate results by computing the normalizationintegrals, such as
∫σ(r)dr = 1, and also the integrals, such as
∫σ(r)wi(r − Ri ) dr, which
should yield 1/N for the atomic clusters in the shape of Platonic or Archimedean solids.For infinite systems, such as bulk solids (for which the shape function is zero everywherebut normalized to unity [22]), one could still apply this approach thanks to the inclusionof the denominator terms in equations (2) and (3), and by spatial localization imposedby the partitioning function wi(r − Ri ). It was, however, necessary to use a sufficientlylarge supercell in which the region of integration is well confined. Furthermore, it wasfound that the integrals of the types
∫σ(r)wi(r − Ri )σα(r) dr and
∫σ 2(r)wi(r − Ri ) dr
show slow convergence with respect to the supercell size whereas the ratio∫
σ(r)wi(r −Ri )σα(r) dr/
√∫σ 2(r)wi(r − Ri ) dr converges rather quickly. Hence, sufficiently large
supercells were used in the computation of Ziα and Siα for the bulk solids. In addition, itwas confirmed that the computed values of Ziα and Siα are independent of the size of theemployed supercells.
3. Results and discussion
In this section, we first investigate the correlations between the energy difference µ and local(atom-partitioned) Carbo index. We then explore the aforementioned interconnection betweenenergetics and quantum similarity indices. Next, we employ the interpolation proceduredeveloped in the preceding section in order to devise a means for characterizing energeticheterogeneity of nanoparticles. Finally, we expound the similarity-based approach developedhere by comparing the similarity-based energies to DFT-calculated energies for a number ofunary C, Si, Pd or Pt nanocrystals, uniformly mixed, core-shell segregated and phase separatedPt–Pd nanoalloys and Pt–C nanocompounds, see the test set.
3.1. Correlations between energy differences and similarity indices
The plot of the equilibrium energy difference µe versus the local Carbo index Ziα is displayedin figure 1(a). It is noticeable that there is a correlation between µe and Ziα , which appears tobe a distinct relationship for each atomic species. Note that, the correlation is seemingly linearfor the Pd and Pt systems (as marked by the dashed line passing through the set of Pt systems).Furthermore, it is seen that the set of Pd and Pt systems are grouped; that is, they fall nearlyon the same line. For the Si systems, the correlation could also be regarded as approximatelylinear whereas the points for the C systems fall on a monotonic curve that is not linear andwhich shows a more pronounced scatter. Yet, overall, there seems to be a roughly one-to-one correspondence (i.e. bijection) between the equilibrium energy difference µe and Ziα ,
6
Modelling Simul. Mater. Sci. Eng. 22 (2014) 025009 M I Torehan Balta and C Kılıc
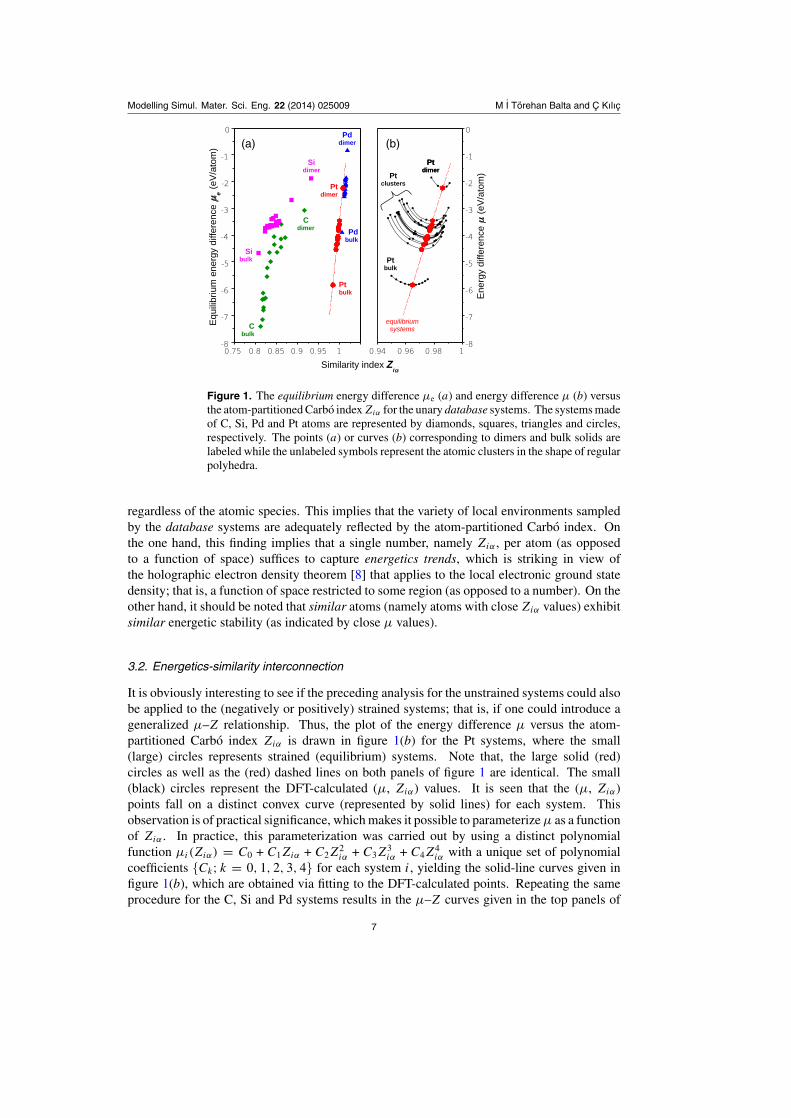
(a) (b)
Figure 1. The equilibrium energy difference µe (a) and energy difference µ (b) versusthe atom-partitioned Carbo index Ziα for the unary database systems. The systems madeof C, Si, Pd and Pt atoms are represented by diamonds, squares, triangles and circles,respectively. The points (a) or curves (b) corresponding to dimers and bulk solids arelabeled while the unlabeled symbols represent the atomic clusters in the shape of regularpolyhedra.
regardless of the atomic species. This implies that the variety of local environments sampledby the database systems are adequately reflected by the atom-partitioned Carbo index. Onthe one hand, this finding implies that a single number, namely Ziα , per atom (as opposedto a function of space) suffices to capture energetics trends, which is striking in view ofthe holographic electron density theorem [8] that applies to the local electronic ground statedensity; that is, a function of space restricted to some region (as opposed to a number). On theother hand, it should be noted that similar atoms (namely atoms with close Ziα values) exhibitsimilar energetic stability (as indicated by close µ values).
3.2. Energetics-similarity interconnection
It is obviously interesting to see if the preceding analysis for the unstrained systems could alsobe applied to the (negatively or positively) strained systems; that is, if one could introduce ageneralized µ–Z relationship. Thus, the plot of the energy difference µ versus the atom-partitioned Carbo index Ziα is drawn in figure 1(b) for the Pt systems, where the small(large) circles represents strained (equilibrium) systems. Note that, the large solid (red)circles as well as the (red) dashed lines on both panels of figure 1 are identical. The small(black) circles represent the DFT-calculated (µ, Ziα) values. It is seen that the (µ, Ziα)points fall on a distinct convex curve (represented by solid lines) for each system. Thisobservation is of practical significance, which makes it possible to parameterize µ as a functionof Ziα . In practice, this parameterization was carried out by using a distinct polynomialfunction µi(Ziα) = C0 + C1Ziα + C2Z
2iα + C3Z
3iα + C4Z
4iα with a unique set of polynomial
coefficients {Ck; k = 0, 1, 2, 3, 4} for each system i, yielding the solid-line curves given infigure 1(b), which are obtained via fitting to the DFT-calculated points. Repeating the sameprocedure for the C, Si and Pd systems results in the µ–Z curves given in the top panels of
7
Modelling Simul. Mater. Sci. Eng. 22 (2014) 025009 M I Torehan Balta and C Kılıc
(a)
(e) (f) (g) (h)
(b) (c) (d)
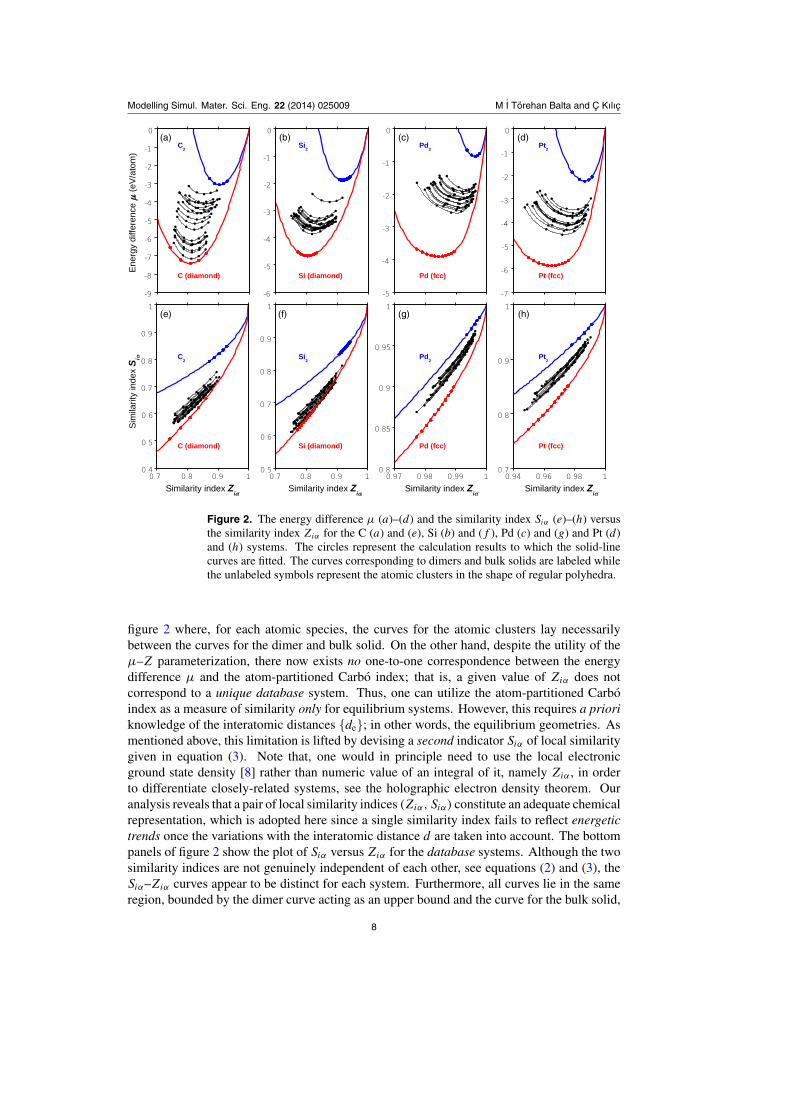
Figure 2. The energy difference µ (a)–(d) and the similarity index Siα (e)–(h) versusthe similarity index Ziα for the C (a) and (e), Si (b) and (f ), Pd (c) and (g) and Pt (d)and (h) systems. The circles represent the calculation results to which the solid-linecurves are fitted. The curves corresponding to dimers and bulk solids are labeled whilethe unlabeled symbols represent the atomic clusters in the shape of regular polyhedra.
figure 2 where, for each atomic species, the curves for the atomic clusters lay necessarilybetween the curves for the dimer and bulk solid. On the other hand, despite the utility of theµ–Z parameterization, there now exists no one-to-one correspondence between the energydifference µ and the atom-partitioned Carbo index; that is, a given value of Ziα does notcorrespond to a unique database system. Thus, one can utilize the atom-partitioned Carboindex as a measure of similarity only for equilibrium systems. However, this requires a prioriknowledge of the interatomic distances {de}; in other words, the equilibrium geometries. Asmentioned above, this limitation is lifted by devising a second indicator Siα of local similaritygiven in equation (3). Note that, one would in principle need to use the local electronicground state density [8] rather than numeric value of an integral of it, namely Ziα , in orderto differentiate closely-related systems, see the holographic electron density theorem. Ouranalysis reveals that a pair of local similarity indices (Ziα, Siα) constitute an adequate chemicalrepresentation, which is adopted here since a single similarity index fails to reflect energetictrends once the variations with the interatomic distance d are taken into account. The bottompanels of figure 2 show the plot of Siα versus Ziα for the database systems. Although the twosimilarity indices are not genuinely independent of each other, see equations (2) and (3), theSiα–Ziα curves appear to be distinct for each system. Furthermore, all curves lie in the sameregion, bounded by the dimer curve acting as an upper bound and the curve for the bulk solid,
8
Modelling Simul. Mater. Sci. Eng. 22 (2014) 025009 M I Torehan Balta and C Kılıc
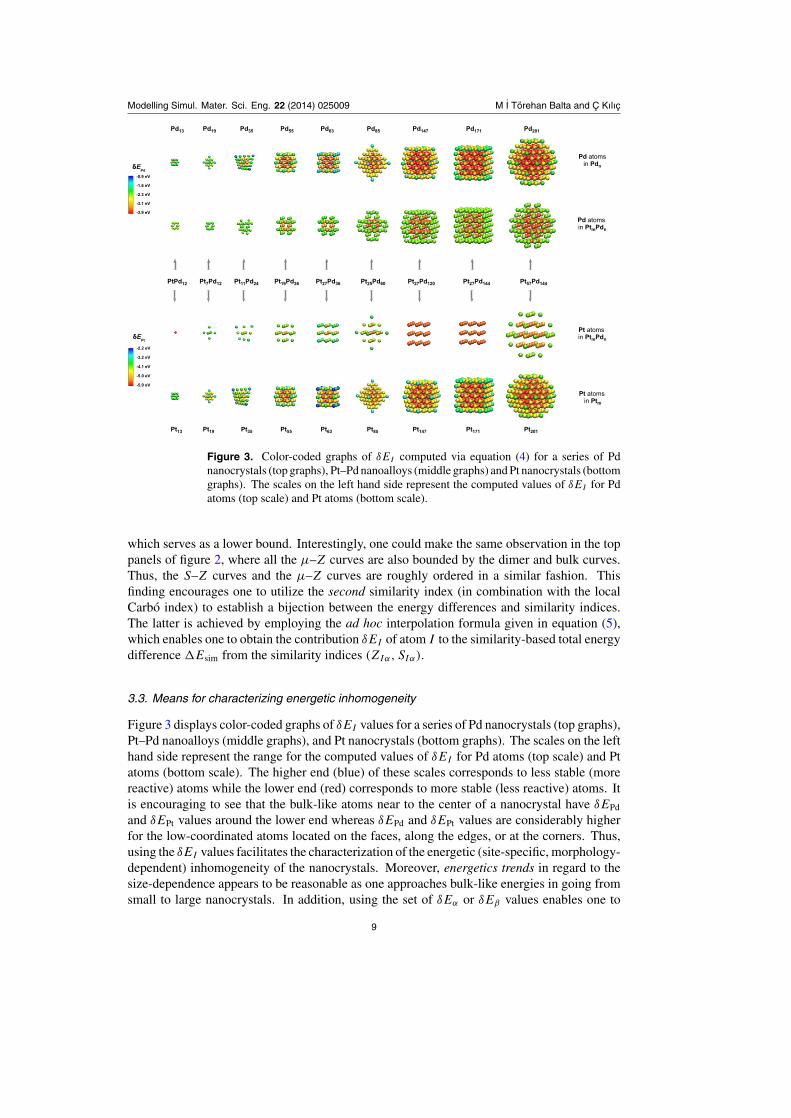
Figure 3. Color-coded graphs of δEI computed via equation (4) for a series of Pdnanocrystals (top graphs), Pt–Pd nanoalloys (middle graphs) and Pt nanocrystals (bottomgraphs). The scales on the left hand side represent the computed values of δEI for Pdatoms (top scale) and Pt atoms (bottom scale).
which serves as a lower bound. Interestingly, one could make the same observation in the toppanels of figure 2, where all the µ–Z curves are also bounded by the dimer and bulk curves.Thus, the S–Z curves and the µ–Z curves are roughly ordered in a similar fashion. Thisfinding encourages one to utilize the second similarity index (in combination with the localCarbo index) to establish a bijection between the energy differences and similarity indices.The latter is achieved by employing the ad hoc interpolation formula given in equation (5),which enables one to obtain the contribution δEI of atom I to the similarity-based total energydifference �Esim from the similarity indices (ZIα, SIα).
3.3. Means for characterizing energetic inhomogeneity
Figure 3 displays color-coded graphs of δEI values for a series of Pd nanocrystals (top graphs),Pt–Pd nanoalloys (middle graphs), and Pt nanocrystals (bottom graphs). The scales on the lefthand side represent the range for the computed values of δEI for Pd atoms (top scale) and Ptatoms (bottom scale). The higher end (blue) of these scales corresponds to less stable (morereactive) atoms while the lower end (red) corresponds to more stable (less reactive) atoms. Itis encouraging to see that the bulk-like atoms near to the center of a nanocrystal have δEPd
and δEPt values around the lower end whereas δEPd and δEPt values are considerably higherfor the low-coordinated atoms located on the faces, along the edges, or at the corners. Thus,using the δEI values facilitates the characterization of the energetic (site-specific, morphology-dependent) inhomogeneity of the nanocrystals. Moreover, energetics trends in regard to thesize-dependence appears to be reasonable as one approaches bulk-like energies in going fromsmall to large nanocrystals. In addition, using the set of δEα or δEβ values enables one to
9
Modelling Simul. Mater. Sci. Eng. 22 (2014) 025009 M I Torehan Balta and C Kılıc
look into local (e.g., site-specific) mixing of α- and β-type atoms in a binary alloy formation.For example, comparative inspection of Pt35, Pt11Pd24 and Pd35 in figure 3 shows that the Ptatoms at the corners of Pt11Pd24 are less energetic in comparison with those of Pt35, indicatingthat alloying Pt nanocrystal with Pd increases the energetic stability of the corner (Pt) atoms.Since a similar analysis could be applied to any nanocrystal in a site-specific manner, usingthe set of δEI values would clearly be useful in elucidating trends in the size-, shape- andcomposition-dependent nanocrystal energetics.
3.4. Similarity-based energies
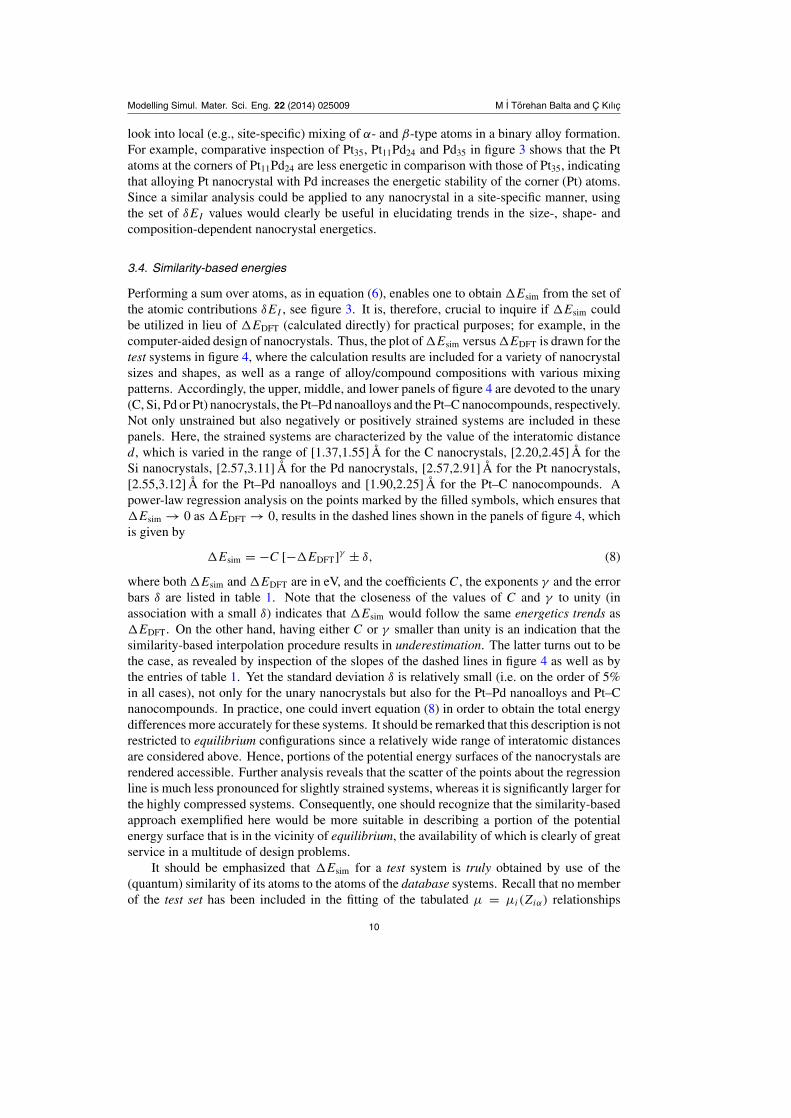
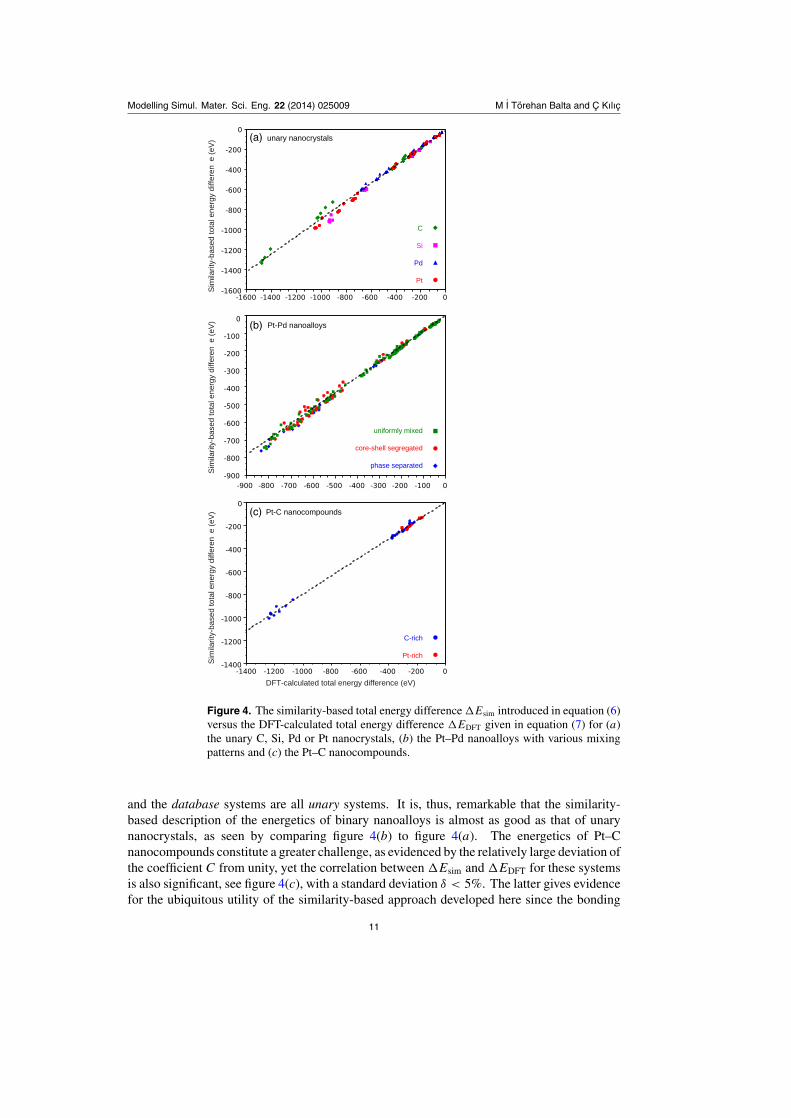
Performing a sum over atoms, as in equation (6), enables one to obtain �Esim from the set ofthe atomic contributions δEI , see figure 3. It is, therefore, crucial to inquire if �Esim couldbe utilized in lieu of �EDFT (calculated directly) for practical purposes; for example, in thecomputer-aided design of nanocrystals. Thus, the plot of �Esim versus �EDFT is drawn for thetest systems in figure 4, where the calculation results are included for a variety of nanocrystalsizes and shapes, as well as a range of alloy/compound compositions with various mixingpatterns. Accordingly, the upper, middle, and lower panels of figure 4 are devoted to the unary(C, Si, Pd or Pt) nanocrystals, the Pt–Pd nanoalloys and the Pt–C nanocompounds, respectively.Not only unstrained but also negatively or positively strained systems are included in thesepanels. Here, the strained systems are characterized by the value of the interatomic distanced, which is varied in the range of [1.37,1.55] Å for the C nanocrystals, [2.20,2.45] Å for theSi nanocrystals, [2.57,3.11] Å for the Pd nanocrystals, [2.57,2.91] Å for the Pt nanocrystals,[2.55,3.12] Å for the Pt–Pd nanoalloys and [1.90,2.25] Å for the Pt–C nanocompounds. Apower-law regression analysis on the points marked by the filled symbols, which ensures that�Esim → 0 as �EDFT → 0, results in the dashed lines shown in the panels of figure 4, whichis given by
�Esim = −C [−�EDFT]γ ± δ, (8)
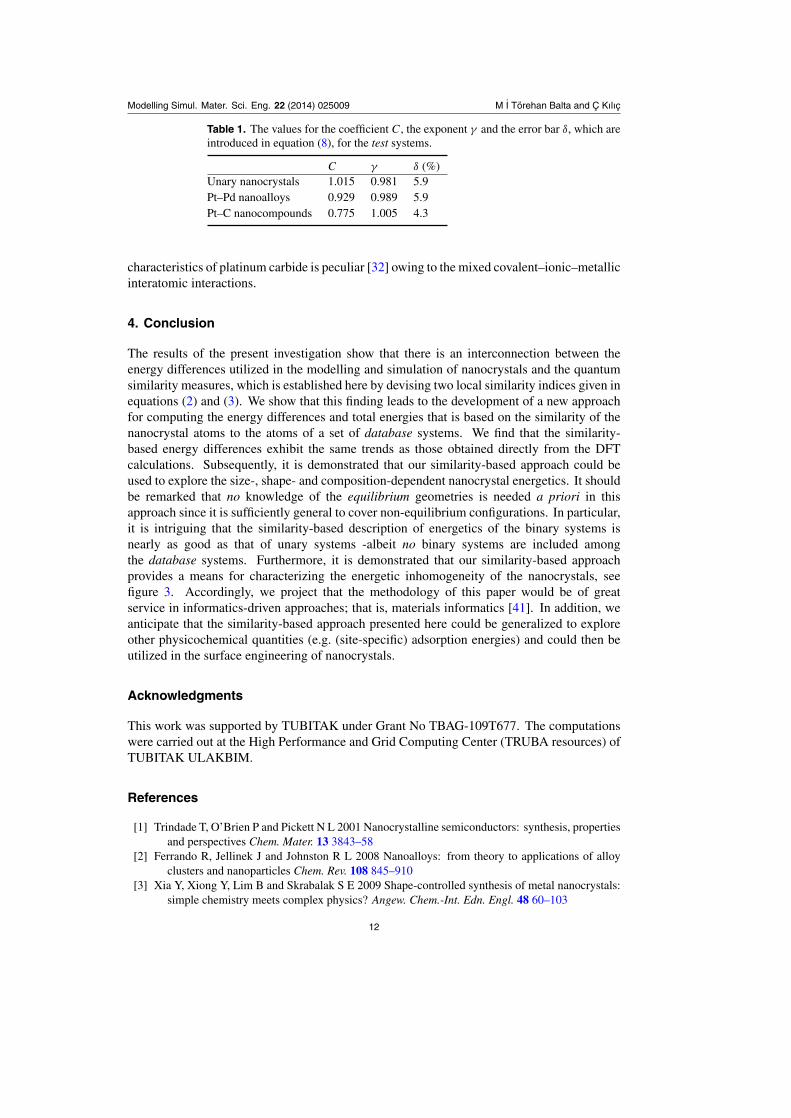
where both �Esim and �EDFT are in eV, and the coefficients C, the exponents γ and the errorbars δ are listed in table 1. Note that the closeness of the values of C and γ to unity (inassociation with a small δ) indicates that �Esim would follow the same energetics trends as�EDFT. On the other hand, having either C or γ smaller than unity is an indication that thesimilarity-based interpolation procedure results in underestimation. The latter turns out to bethe case, as revealed by inspection of the slopes of the dashed lines in figure 4 as well as bythe entries of table 1. Yet the standard deviation δ is relatively small (i.e. on the order of 5%in all cases), not only for the unary nanocrystals but also for the Pt–Pd nanoalloys and Pt–Cnanocompounds. In practice, one could invert equation (8) in order to obtain the total energydifferences more accurately for these systems. It should be remarked that this description is notrestricted to equilibrium configurations since a relatively wide range of interatomic distancesare considered above. Hence, portions of the potential energy surfaces of the nanocrystals arerendered accessible. Further analysis reveals that the scatter of the points about the regressionline is much less pronounced for slightly strained systems, whereas it is significantly larger forthe highly compressed systems. Consequently, one should recognize that the similarity-basedapproach exemplified here would be more suitable in describing a portion of the potentialenergy surface that is in the vicinity of equilibrium, the availability of which is clearly of greatservice in a multitude of design problems.
It should be emphasized that �Esim for a test system is truly obtained by use of the(quantum) similarity of its atoms to the atoms of the database systems. Recall that no memberof the test set has been included in the fitting of the tabulated µ = µi(Ziα) relationships
10
Modelling Simul. Mater. Sci. Eng. 22 (2014) 025009 M I Torehan Balta and C Kılıc
(a)
(b)
(c)
Figure 4. The similarity-based total energy difference �Esim introduced in equation (6)versus the DFT-calculated total energy difference �EDFT given in equation (7) for (a)the unary C, Si, Pd or Pt nanocrystals, (b) the Pt–Pd nanoalloys with various mixingpatterns and (c) the Pt–C nanocompounds.
and the database systems are all unary systems. It is, thus, remarkable that the similarity-based description of the energetics of binary nanoalloys is almost as good as that of unarynanocrystals, as seen by comparing figure 4(b) to figure 4(a). The energetics of Pt–Cnanocompounds constitute a greater challenge, as evidenced by the relatively large deviation ofthe coefficient C from unity, yet the correlation between �Esim and �EDFT for these systemsis also significant, see figure 4(c), with a standard deviation δ < 5%. The latter gives evidencefor the ubiquitous utility of the similarity-based approach developed here since the bonding
11
Modelling Simul. Mater. Sci. Eng. 22 (2014) 025009 M I Torehan Balta and C Kılıc
Table 1. The values for the coefficient C, the exponent γ and the error bar δ, which areintroduced in equation (8), for the test systems.
C γ δ (%)Unary nanocrystals 1.015 0.981 5.9Pt–Pd nanoalloys 0.929 0.989 5.9Pt–C nanocompounds 0.775 1.005 4.3
characteristics of platinum carbide is peculiar [32] owing to the mixed covalent–ionic–metallicinteratomic interactions.
4. Conclusion
The results of the present investigation show that there is an interconnection between theenergy differences utilized in the modelling and simulation of nanocrystals and the quantumsimilarity measures, which is established here by devising two local similarity indices given inequations (2) and (3). We show that this finding leads to the development of a new approachfor computing the energy differences and total energies that is based on the similarity of thenanocrystal atoms to the atoms of a set of database systems. We find that the similarity-based energy differences exhibit the same trends as those obtained directly from the DFTcalculations. Subsequently, it is demonstrated that our similarity-based approach could beused to explore the size-, shape- and composition-dependent nanocrystal energetics. It shouldbe remarked that no knowledge of the equilibrium geometries is needed a priori in thisapproach since it is sufficiently general to cover non-equilibrium configurations. In particular,it is intriguing that the similarity-based description of energetics of the binary systems isnearly as good as that of unary systems -albeit no binary systems are included amongthe database systems. Furthermore, it is demonstrated that our similarity-based approachprovides a means for characterizing the energetic inhomogeneity of the nanocrystals, seefigure 3. Accordingly, we project that the methodology of this paper would be of greatservice in informatics-driven approaches; that is, materials informatics [41]. In addition, weanticipate that the similarity-based approach presented here could be generalized to exploreother physicochemical quantities (e.g. (site-specific) adsorption energies) and could then beutilized in the surface engineering of nanocrystals.
Acknowledgments
This work was supported by TUBITAK under Grant No TBAG-109T677. The computationswere carried out at the High Performance and Grid Computing Center (TRUBA resources) ofTUBITAK ULAKBIM.
References
[1] Trindade T, O’Brien P and Pickett N L 2001 Nanocrystalline semiconductors: synthesis, propertiesand perspectives Chem. Mater. 13 3843–58
[2] Ferrando R, Jellinek J and Johnston R L 2008 Nanoalloys: from theory to applications of alloyclusters and nanoparticles Chem. Rev. 108 845–910
[3] Xia Y, Xiong Y, Lim B and Skrabalak S E 2009 Shape-controlled synthesis of metal nanocrystals:simple chemistry meets complex physics? Angew. Chem.-Int. Edn. Engl. 48 60–103
12
Modelling Simul. Mater. Sci. Eng. 22 (2014) 025009 M I Torehan Balta and C Kılıc
[4] Willett P, Barnard J M and Downs G M 1998 Chemical similarity searching J. Chem. Inf. Comput.Sci. 38 983–96
[5] Sheridan R P and Kearsley S K 2002 Why do we need so many chemical similarity search methods?Drug Discov. Today 7 903–11
[6] Engel T 2006 Basic overview of chemoinformatics J. Chem. Inform. Modelling. 46 2267–77[7] Carbo R, Leyda L and Arnau M 1980 How similar is a molecule to another–an electron-density
measure of similarity between 2 molecular-structures Int. J. Quant. Chem. 17 1185–9[8] Mezey P G 1999 The holographic electron density theorem and quantum similarity measures Mol.
Phys. 96 169–78[9] Chermette H 1999 Chemical reactivity indexes in density functional theory J. Comput. Chem.
20 129–54[10] Karelson M, Lobanov V S and Katritzky A R 1996 Quantum-chemical descriptors in QSAR/QSPR
studies Chem. Rev. 96 1027–43[11] Bultinck P and Carbo-Dorca R 2005 Molecular quantum similarity using conceptual DFT
descriptors J. Chem. Sci. 117 425–35[12] Geerlings P, Boon G, Van Alsenoy C and De Proft F 2005 Density functional theory and quantum
similarity Int. J. Quant. Chem. 101 722–32[13] Boon G, Langenaeker W, De Proft F, De Winter H, Tollenaere J P and Geerlings P 2001 Systematic
study of the quality of various quantum similarity descriptors. Use of the autocorrelation functionand principal component analysis J. Phys. Chem. A 105 8805–14
[14] Good A C, Peterson S J and Richards W G 1993 QSARs from similarity-matrices–techniquevalidation and application in the comparison of different similarity evaluation methods J. Med.Chem. 36 2929–37
[15] Besalu E, Girones X, Amat L and Carbo-Dorca R 2002 Molecular quantum similarity and thefundamentals of QSAR Acc. Chem. Res. 35 289–95
[16] Amat L, Besalu E, Carbo-Dorca R and Ponec R 2001 Identification of active molecular sites usingquantum-self-similarity measures J. Chem. Inf. Comput. Sci. 41 978–91
[17] Rouvray D H 1992 Definition and role of similarity concepts in the chemical and physical sciencesJ. Chem. Inf. Comput. Sci. 32 580–6
[18] Bartok A P, Kondor R and Csanyi G 2013 On representing chemical environments Phys. Rev. B 87184115
[19] Hirshfeld F L 1977 Bonded-atom fragments for describing molecular charge-densities Theor. Chem.Acc. 44 129–38
[20] De Proft F, Vivas-Reyes R, Peeters A, Van Alsenoy C and Geerlings P 2003 Hirshfeld partitioningof the electron density: atomic dipoles and their relation with functional group properties J.Comput. Chem. 24 463–9
[21] Parr R G and Bartolotti L J 1983 Some remarks on the density functional theory of few-electronsystems J. Phys. Chem. 87 2810–5
[22] Ayers P W 2000 Density per particle as a descriptor of Coulombic systems Proc. Natl Acad. Sci.USA 97 1959–64
[23] De Proft F, Ayers P W, Sen K D and Geerlings P 2004 On the importance of the ‘density per particle’(shape function) in the density functional theory J. Chem. Phys. 120 9969–73
[24] Kılıc C 2010 Size- and shape-dependent energetics of transition-metal nanocrystals Solid StateCommun. 150 2333–6
[25] Kılıc C 2011 Energy-distance relation for fcc transition metal nanocrystals Europhys. Lett.93 26004
[26] Behler J 2011 Neural network potential-energy surfaces in chemistry: a tool for large-scalesimulations Phys. Chem. Chem. Phys. 13 17930–55
[27] Lide D 2008 CRC Handbook of Chemistry and Physics: A Ready-Reference Book of Chemical andPhysical Data (Boca Raton, FL: CRC Press)
[28] Parretti M F, Kroemer R T, Rothman J H and Richards W G 1997 Alignment of moleculesby the monte carlo optimization of molecular similarity indices J. Comput. Chem.18 1344–53
13
Modelling Simul. Mater. Sci. Eng. 22 (2014) 025009 M I Torehan Balta and C Kılıc
[29] Bultinck P, Kuppens T, Girones X and Carbo-Dorca R 2003 Quantum similarity superpositionalgorithm (QSSA): a consistent scheme for molecular alignment and molecular similarity basedon quantum chemistry J. Chem. Inf. Comput. Sci. 43 1143–50
[30] Bultinck P, Carbo-Dorca R and Van Alsenoy C 2003 Quality of approximate electron densitiesand internal consistency of molecular alignment algorithms in molecular quantum similarity J.Chem. Inf. Comput. Sci. 43 1208–17
[31] Ono S, Kikegawa T and Ohishi Y 2005 A high-pressure and high-temperature synthesis of platinumcarbide Solid State Commun. 133 55–9
[32] Ivanovskii A L 2009 Platinum group metal nitrides and carbides: synthesis, properties andsimulation Russ. Chem. Rev. 78 303–18
[33] Perdew J P, Burke K and Ernzerhof M 1996 Generalized gradient approximation made simple Phys.Rev. Lett. 77 3865–8
[34] Blochl P E 1994 Projector augmented-wave method Phys. Rev. B 50 17953–79[35] Kresse G and Furthmuller J 1996 Efficiency of ab-initio total energy calculations for metals and
semiconductors using a plane-wave basis set Comput. Mater. Sci. 6 15–50[36] Kresse G and Joubert D 1999 From ultrasoft pseudopotentials to the projector augmented-wave
method Phys. Rev. B 59 1758–75[37] Sun G Y, Kurti J, Rajczy P, Kertesz M, Hafner J and Kresse G 2003 Performance of the Vienna
ab initio simulation package (VASP) in chemical applications J. Mol. Struct.—THEOCHEM624 37–45
[38] Monkhorst H J and Pack J D 1976 Special points for brillouin-zone integrations Phys. Rev. B13 5188–92
[39] Berntsen J, Espelid T O and Genz A 1991 Algorithm 698: Dcuhre: an adaptive multidemensionalintegration routine for a vector of integrals ACM Trans. Math. Softw. 17 452–6
[40] Boor C 2001 A Practical Guide to Splines (New York: Springer)[41] Rajan K 2005 Materials informatics Mater. Today 8 38–45
14