Epitaxial CdSe-Au Nanocrystal Heterostructures by Thermal Annealing
Upload
khangminh22Category
view
0download
0
Chemistry Publications Chemistry
2017
Building Materials from Colloidal NanocrystalAssemblies: Molecular Control of Solid/SolidInterfaces in Nanostructured Tetragonal ZrO2Santosh ShawIowa State University
Tiago F. SilvaUniversidade de Sao Paulo
Jonathan M. BobbittIowa State University and Ames Laboratory
Fabian NaabUniversity of Michigan
Cleber L. RodriguesUniversidade de Sao Paulo
See next page for additional authors
Follow this and additional works at: https://lib.dr.iastate.edu/chem_pubs
Part of the Materials Chemistry Commons, Materials Science and Engineering Commons, andthe Nanoscience and Nanotechnology Commons
The complete bibliographic information for this item can be found at https://lib.dr.iastate.edu/chem_pubs/1088. For information on how to cite this item, please visit http://lib.dr.iastate.edu/howtocite.html.
This Article is brought to you for free and open access by the Chemistry at Iowa State University Digital Repository. It has been accepted for inclusionin Chemistry Publications by an authorized administrator of Iowa State University Digital Repository. For more information, please [email protected].

Building Materials from Colloidal Nanocrystal Assemblies: MolecularControl of Solid/Solid Interfaces in Nanostructured Tetragonal ZrO2
AbstractWe here describe a bottom-up approach to control the composition of solid/solid interfaces innanostructured materials, and we test its effectiveness on tetragonal ZrO2, an inorganic phase of greattechnological significance. Colloidal nanocrystals capped with trioctylphosphine oxide (TOPO) or oleic acid(OA) are deposited, and the organic fraction of the ligands is selectively etched with O2 plasma. Theinterfaces in the resulting all-inorganic colloidal nanocrystal assemblies are either nearly bare (for OA-cappednanocrystals) or terminated with phosphate groups (for TOPO-capped nanocrystals) resulting from thereaction of phosphine oxide groups with plasma species. The chemical modification of the interfaces hasextensive effects on the thermodynamics and kinetics of the material. Different growth kinetics indicatedifferent rate limiting processes of growth (surface diffusion for the phosphate-terminated surfaces anddissolution for the “bare” surfaces). Phosphate termination led to a higher activation energy of growth, and a3-fold reduction in interfacial energy, and facilitated significantly the conversion of the tetragonal phase intothe monoclinic phase. Films devoid of residual ligands persisted in the tetragonal phase at temperatures ashigh as 900 °C for 24 h.
DisciplinesMaterials Chemistry | Materials Science and Engineering | Nanoscience and Nanotechnology
CommentsThis document is the unedited Author’s version of a Submitted Work that was subsequently accepted forpublication in Chemistry of Materials, copyright © American Chemical Society after peer review. To access thefinal edited and published work see DOI: 10.1021/acs.chemmater.7b02769. Posted with permission.
AuthorsSantosh Shaw, Tiago F. Silva, Jonathan M. Bobbitt, Fabian Naab, Cleber L. Rodrigues, Bin Yuan, Julia J.Chang, Xinchun Tian, Emily A. Smith, and Ludovico Cademartiri
This article is available at Iowa State University Digital Repository: https://lib.dr.iastate.edu/chem_pubs/1088

1
BUILDING MATERIALS FROM COLLOIDAL NANOCRYSTAL ARRAYS: MOLECULAR CONTROL OF SOLID/SOLID INTERFACES IN
NANOSTRUCTURED TETRAGONAL ZRO2 SA N TO S H S HA W 1 , TIA G O F . SI L VA 2 , JONATHAN M. BOBBITT3,6, FA B IA N NA A B 4 , C LEB ER L . R OD R IG U E S 2 , B I N Y U A N 5 , JU LIA J . C HA NG 1 , X INC H U N T IA N 1 , E MI LY A . S MI T H 3 , 6 , LU D OV I CO CA D E MA R T IR I 1 , 5 , 6 *
1 Department of Materials Science & Engineering, Iowa State University of Science and Technology, 2220 Hoover Hall, Ames, IA, 50011 2 Instituto de Física da Universidade de São Paulo, Rua do Matão, trav. R 187, 05508-090 São Paulo, Brazil 3 Department of Chemistry, Iowa State University of Science and Technology, Gilman Hall, Ames, IA, 50011
4Michigan Ion Beam Laboratory, University of Michigan, Draper Road, Ann Arbor, MI 48109, USA 5 Department of Chemical & Biological Engineering, Iowa State University of Science and Technology, Sweeney Hall, Ames, IA, 50011
6 Ames Laboratory, U.S. Department of Energy, Ames, IA, 50011 * Author to whom correspondence should be addressed: [email protected]
Page 1 of 39
ACS Paragon Plus Environment
Journal of the American Chemical Society
123456789101112131415161718192021222324252627282930313233343536373839404142434445464748495051525354555657585960

2
ABSTRACT
We here describe a bottom-up approach to control the composition of solid/solid interfaces in nanostructured materials and we test its effectiveness on tetragonal ZrO2, an inorganic phase of great technological significance. Colloidal nanocrystals capped with trioctylphosphine oxide (TOPO) or oleic acid (OA) are deposited and the organic fraction of the ligands is selectively etched with O2 plasma. The interfaces in the resulting all-inorganic colloidal nanocrystal assemblies (CNAs) are either bare (for OA-capped nanocrystals) or terminated with phosphate groups (for TOPO-capped nanocrystals) resulting from the reaction of phosphine oxide groups with plasma species. The chemical modification of the interfaces has extensive effects on the thermodynamics and kinetics of the material. Different growth kinetics indicate different rate limiting processes of growth for the phosphate-terminated surfaces (surface diffusion) and the bare surfaces (dissolution). Phosphate termination led to a higher activation energy of growth, and a three-fold reduction in interfacial energy, while bare interfaces prevented the conversion of the tetragonal phase into the monoclinic phase at temperatures of 900C. The hardness of these nanostructured polycrystals was found to increase linearly with the decrease in porosity until a density of 85-90%, after which it decreased with decreasing porosity. The data suggest that the inverted trend could be justified by the growth of the size of the grains at high densities, thereby suggesting that a Hall-Petch-type behavior for hardness in ZrO2 ceramics might be conserved at particle sizes smaller than 10nm.
Page 2 of 39
ACS Paragon Plus Environment
Journal of the American Chemical Society
123456789101112131415161718192021222324252627282930313233343536373839404142434445464748495051525354555657585960

3
INTRODUCTION
Surfaces and interfaces represent an increasingly important opportunity and challenge. Some of the most exciting recent discoveries in solid state science involve interfaces (or materials that are effectively interfaces): e.g., topological insulators1-3, interface superconductivity4-7, graphene 8,9.
By increasing the fraction of atoms that are at the boundary of a crystal, one can leverage and amplify their unique properties in materials design. As the characteristic length scales of devices approach the atomic scale, the influence of surfaces on their properties becomes increasingly dominant: for most crystals, a radius of curvature of ~1-2 nm indicates the threshold at which the majority of the atoms are at the surface10,11.
Solid/air interfaces have been a subject of intense interest in the past decades. They control the interaction of the material with its environment, with exceptional consequences on its wetting12-15, catalytic16-20, optical21-24, chemical25,26, tribological27,28, and electrical1-7,29 properties.
Solid/solid interfaces within a material (e.g., the grain boundaries in a polycrystal) are just as important. They can dominate thermal30,31, mechanical32,33, and bulk transport34-36 properties, especially in nanostructured materials. They can make thermodynamically unstable phases stable37,38, soft metals hard39,40, brittle ceramics ductile41,42, weak composites tough43, and metallic conductors insulating29. Nonetheless, compared to solid/air interfaces, they are much more difficult to modify, control, and characterize.
The formation of solid/solid interfaces in a material is usually a direct consequence of the synthesis and processing of the material44, after which they are typically inaccessible for modification. Their out-of-equilibrium nature makes them exquisitely sensitive to the exact processing history (e.g., temperature fluctuations leading to diffusion45), and composition of the material (e.g., trace elements which segregate to the grain boundaries46). Any processing (e.g., high temperatures) that
Page 3 of 39
ACS Paragon Plus Environment
Journal of the American Chemical Society
123456789101112131415161718192021222324252627282930313233343536373839404142434445464748495051525354555657585960

4
facilitates the evolution of the material towards its thermodynamic ground state tends to compromise the control and design of these interfaces47.
To circumvent these difficulties, we have been developing a materials chemistry approach that combines bottom-up solution-based chemistry with top-down physical processing to yield materials with controlled nanostructure (cf. Figure 1). Colloidal nanocrystal synthesis can produce a large number of functional nanocrystalline phases (oxides48-55, chalcogenides56-68, pnictides69-78, metals79-89) at relatively low temperatures, with remarkable control over crystal size, shape, and surface chemistry. The nanoparticles can be deposited as solids (colloidal nanocrystal assemblies, CNAs90-92) constituted of inorganic cores separated by the organic ligands. We have previously shown that the ligands can be completely, and selectively removed from thin films of colloidal nanocrystal assemblies by plasma processing93-96. While the accompanying volume loss is significant (easily above 40%), we also showed that the structure of the nanoparticle assembly can prevent its cracking, resulting in all-inorganic solid state films97: each nanoparticle building block becomes a grain of the resulting nanostructured polycrystal.
We here show that, by combining the control of the ligand shells with the remarkable etch selectivity of O2 plasma for organics, we can produce all-inorganic solids with monolayer-level control over their solid/solid interfaces. Inorganic elements can react with the O2 plasma species, but are not etched away since they do not form volatile species, and leave behind a monolayer coating of inorganic phase. Specifically, the O2 plasma processing of assemblies of nanoparticles of ZrO2 capped with oleic acid or trioctylphosphine oxide result in ZrO2 films in which the solid/solid interfaces are respectively ZrO2//ZrO2 and ZrO2/phosphate//phosphate/ZrO2. In contrast to high temperature processing strategies, the plasma we use is dilute and at low pressure and is near room temperature: the processing does not coarsen the particles or damage the interfaces.
Page 4 of 39
ACS Paragon Plus Environment
Journal of the American Chemical Society
123456789101112131415161718192021222324252627282930313233343536373839404142434445464748495051525354555657585960

5
This molecularly designed tuning of the interface composition results in significant changes in the macroscopic properties of the material, including grain growth kinetics, phase stability, surface energy, and mechanical properties. Importantly, we show that controlling the solid/solid interfaces allows the stabilization of the tetragonal phase of ZrO2 to an extent comparable to doping with Y.
Figure 1Figure 1Figure 1Figure 1. Schematic of bottomSchematic of bottomSchematic of bottomSchematic of bottom----up approach to up approach to up approach to up approach to the the the the controlcontrolcontrolcontrol of solidof solidof solidof solid----solid interfaces in solid interfaces in solid interfaces in solid interfaces in nanostructured materials obtained frnanostructured materials obtained frnanostructured materials obtained frnanostructured materials obtained from colloidal nanoparticlesom colloidal nanoparticlesom colloidal nanoparticlesom colloidal nanoparticles. Two scenarios (left and right) are shown. On the left is the case of nanoparticles capped with purely organic ligands. Upon deposition and plasma processing by O2 plasma the entirety of the ligand is etched leaving behind bare surfaces that, upon consolidation, will form bare interfaces. On the right is the case of nanoparticles capped with ligands
Page 5 of 39
ACS Paragon Plus Environment
Journal of the American Chemical Society
123456789101112131415161718192021222324252627282930313233343536373839404142434445464748495051525354555657585960

6
featuring an inorganic head group. Upon plasma processing with O2 plasma the organic tail is removed but the inorganic head group reacts with the plasma forming non-volatile groups that are located at the particle surface. Consolidation of the assembly leads to the formation of solids with an engineered solid/solid interface.
There are other approaches that attempt to control interface composition from the bottom-up. Outer shells can be grown on the nanoparticles as a post-synthesis process, leading to core-shell architectures61,98-103. These shells are usually thick (several monolayers), they represent a separate phase in the material, and can dominate the properties of the core104, especially when particle size are <5nm. The generation of monolayer/submonolayer shells that are uniformly distributed on the surface of the core is not trivial100, and is a problem that must be solved on a case-by-case basis. Another elegant approach uses inorganic ligands to stabilize nanoparticles105: after post-processing, these ligands can form a matrix106.
Homogeneous control of the solid/solid interfaces after consolidation of the materials is a complex problem. Techniques like atomic layer deposition (ALD) can deposit/coat exposed surfaces, thereby filling up the accessible pores. Uniform coating of the surfaces can become more complicated when the pore sizes are <5nm, which is usually the case for colloidal nanoparticle assemblies. Furthermore, the use of ALD requires one additional step in the processing, while our approach combines the ligand removal with the creation of a designed interface composition.
Most of the above approaches, differently from the one reported here, create a separate phase rather than a pure chemical modification of the interfaces within a single phase material.
RESULTS AND DISCUSSION
Nanoparticle synthesis and ligand exchangeNanoparticle synthesis and ligand exchangeNanoparticle synthesis and ligand exchangeNanoparticle synthesis and ligand exchange
Page 6 of 39
ACS Paragon Plus Environment
Journal of the American Chemical Society
123456789101112131415161718192021222324252627282930313233343536373839404142434445464748495051525354555657585960

7
We chose ZrO2 nanoparticles as our starting inorganic core building block. Zirconia is a highly studied and technologically important ceramic for its mechanical, thermal, catalytic properties, and ionic conductivity. It exists in three crystalline phases: monoclinic, tetragonal, and cubic. The room temperature phase is monoclinic but tetragonal and cubic phases have superior mechanical, thermal, and catalytic properties, and are highly sought for high temperature applications. These phases can be stabilized either by doping107 or by decreasing crystal size38,108.
We synthesized highly crystalline, t-ZrO2 nanocrystals by an established colloidal synthetic route55. Two different ligand shells were produced. The as-synthesized nanocrystals are capped with trioctylphosphine oxide – TOPO (C24H51PO). The processing by O2 plasma should etch the octyl chains, and leave behind the phosphorus, attached to the surface of the nanoparticles. Oleic acid (OA) was chosen as a comparison. It is an established ligand for nanoparticles, and it is fully organic: its etching by O2 plasma should yield a bare ZrO2 surface. TOPO was replaced by OA following a simple ligand replacement protocol. For convenience in comparing data we will refer to the particles before ligand exchange with the shorthand “TOPO”, and to the particles after ligand exchange with “OA”.
Page 7 of 39
ACS Paragon Plus Environment
Journal of the American Chemical Society
123456789101112131415161718192021222324252627282930313233343536373839404142434445464748495051525354555657585960

8
Figure 2Figure 2Figure 2Figure 2. Morphological and chemical characterization of the effect of ligand Morphological and chemical characterization of the effect of ligand Morphological and chemical characterization of the effect of ligand Morphological and chemical characterization of the effect of ligand repreprepreplacement and plasma processing. lacement and plasma processing. lacement and plasma processing. lacement and plasma processing. ((((aaaa)))) TEM micrographs of t-ZrO2 nanoparticles before and after ligand exchange with OA. On the right is shown the size distribution statistics as a box plot showing no change in the average particle size upon ligand exchange. ((((bbbb) ) ) ) FT-IR characterization of films obtained from nanoparticles before and after ligand exchange with OA, showing the disappearance of P=O groups. ((((cccc) ) ) ) Powder XRD characterization of films obtained from nanoparticles before and after
Page 8 of 39
ACS Paragon Plus Environment
Journal of the American Chemical Society
123456789101112131415161718192021222324252627282930313233343536373839404142434445464748495051525354555657585960

9
ligand exchange with OA, showing the presence of a single t-ZrO2 phase. Only trace amounts of monoclinic phase might be observed. ((((dddd)))) Compositional profile of the TOPO and OA samples before and after O2 plasma processing. The plot shows the homogeneous removal of carbon and preservation of P in the TOPO samples. ((((eeee)))) Raman characterization of TOPO and OA samples before and after O2 plasma processing confirming the removal of organic fraction of the ligands. ((((ffff) ) ) ) XPS characterization of the P 2p3/2 orbital in TOPO samples before and after plasma processing showing oxidation of phosphine oxide to likely phosphate groups.
The morphology, size, and crystallinity of the nanoparticles is not affected by the ligand exchange procedure. Figure 2a shows the Transmission Electron Microscopy (TEM) characterization of TOPO and OA samples, as well as their size distribution. While ligand exchange appears to slightly increase the polydispersity (6% vs 8%), the spherical morphology and average size are not significantly affected (2.87±0.07 nm vs 2.86±0.09 nm, where the error is the 95% confidence interval on the average). FT-IR characterization of solid films of TOPO and OA nanoparticles (cf. Figure 2b) shows what appears to be a nearly complete removal of the TOPO ligands after ligand exchange: the absorption peak at 1110 cm-1 can be attributed to the P=O bond in TOPO molecules and vanishes after ligand exchange. Figure 2c shows that the crystallinity of the material is also unaffected: the dominant phase is probably tetragonal109 before and after ligand exchange, with possible evidence of some trace amounts of monoclinic phase (indicated by possible peaks at ~24°, ~41°, and ~45°).
The average distance between TOPO-capped particles calculated from TEM images is ~0.9nm whereas the distance between particles after ligand exchange with oleic acid is ~2nm. Both distances are consistent with TOPO and OA ligand shells that are fully interdigitated. The complete
Page 9 of 39
ACS Paragon Plus Environment
Journal of the American Chemical Society
123456789101112131415161718192021222324252627282930313233343536373839404142434445464748495051525354555657585960

10
interdigitation of ligands deposited from ZrO2 nanoparticles dispersions in hexane has been explained elsewhere110.
Both TOPO and OA particles were extensively washed with pure solvent (4 times) to avoid unnecessary amounts of free ligands. This is an important factor for the success of the plasma processing since free ligand can reduce the porosity of the colloidal nanoparticle assemblies, and amplify the destructive effects of volume loss on the film integrity.
Particle deposition and plasma processingParticle deposition and plasma processingParticle deposition and plasma processingParticle deposition and plasma processing
Films of TOPO and OA nanoparticles were obtained on Si substrates by spin-coating from hexane dispersions. The concentration of the dispersion and the deposition parameters were controlled to produce 300-400 nm thick films. In both cases, as we described before97, this choice of solvent yielded disordered CNAs which resisted cracking upon ligand removal and sintering.
Exposure of ZrO2 nanocrystals films to plasma serves two purposes: (i) the conversion of CNAs (inorganic cores + organic ligands shells) into all-inorganic solids, and (ii) “programming” the interface composition of the nanocrystals by reaction with the inorganic components of the ligand shell.
Plasma processing was conducted in an inductively coupled plasma chamber at 30W of power, pressure of 500mTorr, and for 48hrs, using ultrapure O2 as feed gas. The effect of this processing on the chemical makeup of the films was determined by Ion Beam Analysis (IBA). Modeling of the IBA characterization allows for the determination of the concentration of individual elements across the sample thickness. Figure 2d shows the concentration of carbon (black scatters) and phosphorus (green scatters) in units of at%, as a function of the equivalent thickness in thin film units (TFU, 1015 atoms/cm2). The zero value of equivalent thickness in the plot represents the position of the
Page 10 of 39
ACS Paragon Plus Environment
Journal of the American Chemical Society
123456789101112131415161718192021222324252627282930313233343536373839404142434445464748495051525354555657585960
11
substrate, but, since IBA does not obtain signal from voids in the sample, the equivalent thickness is only a monotonic function of the physical thickness.
In both the TOPO (black line) and OA (red line) samples, the homogeneous ~25 at% concentration of carbon in the as-deposited films (filled scatters) is reduced to ~1 at% after plasma processing (empty scatters) throughout the thickness of the CNA. This loss of ligands is accompanied by a shrinkage of the CNA perpendicularly to the substrate by 36% and 45% for TOPO and OA samples respectively. We have not been able so far to reduce the concentration of carbon much below this value under any processing conditions or times, which leads us to postulate that this residual carbon can be attributed to adventitious contamination111 that occurs between the plasma processing and the IBA characterization: a 1% volume fraction accounts for much less than a monolayer coverage of the CNA surfaces and some contamination is plausible, especially considering the expectedly high surface energies of these surfaces (γ=1.02 J/m2). The decrease in the carbon concentration was supported by Raman scattering (cf. Figure 2e), which shows the disappearance of the main C-H band at 2800-3000 cm-1 after plasma processing.
The phosphorus concentration in the TOPO samples remains homogeneous throughout the thickness of the film after plasma processing (cf. Figure 2d), indicating that phosphorus species have not been displaced over hundreds of nanometers. The overall amount of phosphorus is largely unaffected (2.279·1016 atoms/cm2 before plasma vs 2.184·1016 atoms/cm2 after plasma), but its chemical state is significantly modified, as shown by X-ray photoelectron spectroscopy (XPS) in Figure 2f. The P 2p3/2 peak at 132.5eV in the TOPO CNAs before plasma processing is comparable to the peak position of Ph3PO112 (132.5±0.2 eV from the NIST XPS Database: the valueis the average over all entries in the database). Plasma processing causes the peak to shift significantly to higher binding energies (~133.9 eV), consistently with the oxidation expected in a O2 plasma environment. The peak position is consistent with a complete oxidation of the phosphine oxide group to
Page 11 of 39
ACS Paragon Plus Environment
Journal of the American Chemical Society
123456789101112131415161718192021222324252627282930313233343536373839404142434445464748495051525354555657585960

12
phosphate (133.4±0.5 eV for zirconium hydrogen phosphate Zr(HPO4)2 according to the NIST XPS Database: again the value is averaged over the multiple entries in the database)112.
Comparisons of the Zr 3d core-line of the TOPO and OA CNAs after plasma processing (see Supporting Information) are consistent with the above attributions. The binding energies of the TOPO samples are 0.5 eV higher than in the OA sample (182.9 eV vs 182.4 eV), consistently with the trend observed in the literature (183.9±0.9 eV for Zr(HPO4)2 vs 183.1±0.7 eV for ZrO2). The full width at half maximum (FWHM) of the XPS peaks for oxides like ZrO2 are influenced by the metal-oxygen bond length or the metal-oxygen coordination number113. The FWHM of the Zr 3d5/2 peak in TOPO samples is ~0.2eV narrower than in the OA samples, consistently with the difference reported between Zr(HPO4)2 and yttria stabilized zirconia (YSZ) 113.
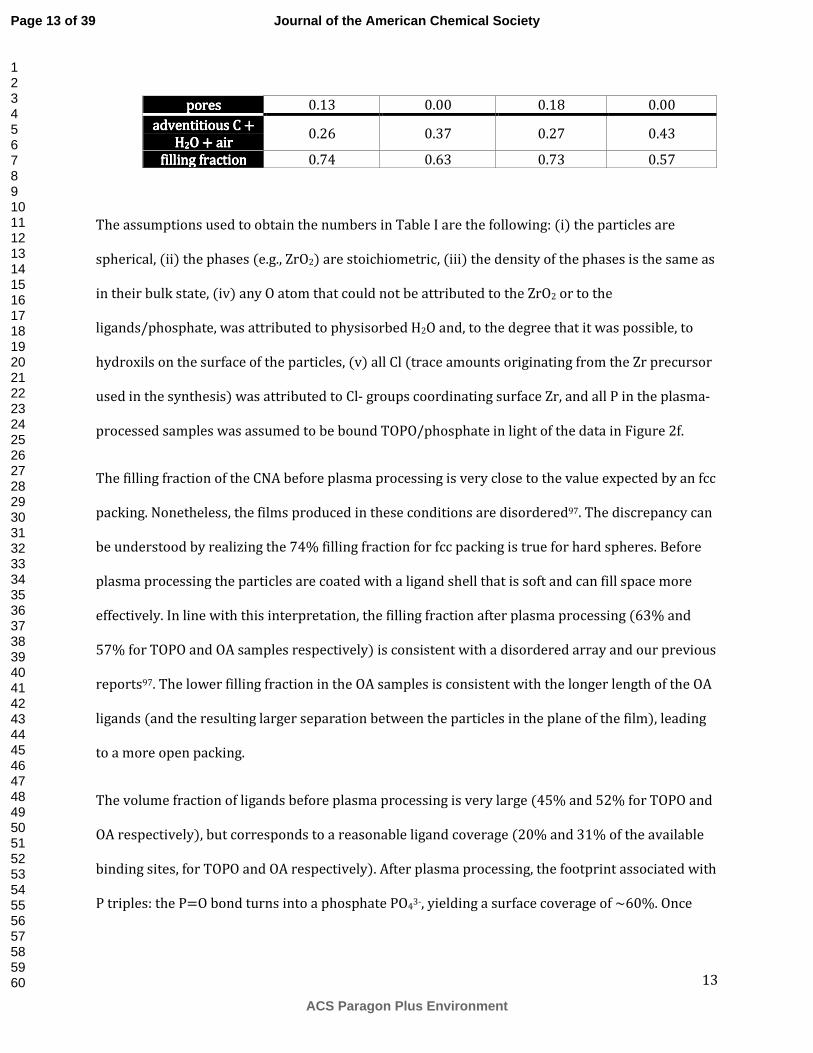
Combining the complete and extremely accurate elemental analysis provided by IBA characterization, the knowledge of the particle sizes, the identity of the phases, and the film thickness allows, with few assemptions, to determine the volume fractions of all phases in the CNA. The results of this analysis for the TOPO and OA samples, before and after plasma processing, are listed in Table I and provide important information about the structure of the films and how it is affected by plasma processing. The bottom two rows provide binned volume fractions of the solid (i.e., the filling fraction) and of everything else (i.e., adsorbed water, contaminants, and pore space).
Table ITable ITable ITable I. Vol. Vol. Vol. Volume fractions of different phases in the different types of colloidal ume fractions of different phases in the different types of colloidal ume fractions of different phases in the different types of colloidal ume fractions of different phases in the different types of colloidal nanoparticle assemblies, before and after Onanoparticle assemblies, before and after Onanoparticle assemblies, before and after Onanoparticle assemblies, before and after O2222 plasma processing.plasma processing.plasma processing.plasma processing.
TOPO before plasma TOPO after plasma OA before plasma OA after plasma ZrOZrOZrOZrO2222 0.26 0.43 0.21 0.44 ligandsligandsligandsligands 0.45 0.00 0.52 0.00 phosphatephosphatephosphatephosphate 0.00 0.15 0.00 0.05 chloridechloridechloridechloride 0.02 0.03 0.01 0.03 aaaadventitious dventitious dventitious dventitious CCCC 0.03 0.02 0.00 0.03 HHHH2222OOOO 0.10 0.35 0.09 0.40
Page 12 of 39
ACS Paragon Plus Environment
Journal of the American Chemical Society
123456789101112131415161718192021222324252627282930313233343536373839404142434445464748495051525354555657585960
13
poresporesporespores 0.13 0.00 0.18 0.00 aaaadventitious C + dventitious C + dventitious C + dventitious C + HHHH2222O + airO + airO + airO + air 0.26 0.37 0.27 0.43
filling fractionfilling fractionfilling fractionfilling fraction 0.74 0.63 0.73 0.57
The assumptions used to obtain the numbers in Table I are the following: (i) the particles are spherical, (ii) the phases (e.g., ZrO2) are stoichiometric, (iii) the density of the phases is the same as in their bulk state, (iv) any O atom that could not be attributed to the ZrO2 or to the ligands/phosphate, was attributed to physisorbed H2O and, to the degree that it was possible, to hydroxils on the surface of the particles, (v) all Cl (trace amounts originating from the Zr precursor used in the synthesis) was attributed to Cl- groups coordinating surface Zr, and all P in the plasma-processed samples was assumed to be bound TOPO/phosphate in light of the data in Figure 2f.
The filling fraction of the CNA before plasma processing is very close to the value expected by an fcc packing. Nonetheless, the films produced in these conditions are disordered97. The discrepancy can be understood by realizing the 74% filling fraction for fcc packing is true for hard spheres. Before plasma processing the particles are coated with a ligand shell that is soft and can fill space more effectively. In line with this interpretation, the filling fraction after plasma processing (63% and 57% for TOPO and OA samples respectively) is consistent with a disordered array and our previous reports97. The lower filling fraction in the OA samples is consistent with the longer length of the OA ligands (and the resulting larger separation between the particles in the plane of the film), leading to a more open packing.
The volume fraction of ligands before plasma processing is very large (45% and 52% for TOPO and OA respectively), but corresponds to a reasonable ligand coverage (20% and 31% of the available binding sites, for TOPO and OA respectively). After plasma processing, the footprint associated with P triples: the P=O bond turns into a phosphate PO43-, yielding a surface coverage of ~60%. Once
Page 13 of 39
ACS Paragon Plus Environment
Journal of the American Chemical Society
123456789101112131415161718192021222324252627282930313233343536373839404142434445464748495051525354555657585960

14
two opposing surfaces face each other upon ligand etching, the phosphate layers are expected to form a nearly continuous monolayer.
The volume fraction of H2O in the ligand-free samples is remarkably large and precisely the amount needed to completely fill the pores. While we do not have analytical information about the size of the pores, simple geometric arguments indicate that they should be, on average, on the order of 2 nm or less. In normal humidity conditions, capillary condensation of water would occur in such micropores. While the amount of water might seem implausible at first glance, it corresponds to a 0.36 to 0.39 nm layer of water on each nanoparticle, which is approximately 1 monolayer (~0.31 nm for a H2O molecule lying flat). The observation of water in IBA characterization (which is conducted in high vacuum) suggest that this physisorbed water is very strongly bound to the surface and might persist in atmospheric pressure conditions at high temperatures. An order of magnitude estimate of the thermodynamic driving force to desorption shows that the ΔG of evaporation of water at 900C should be approximately -155kJ/mol. On the other hand, if the adsorbed water is capable of decreasing surface energy even by 0.01J/m2, the ΔG opposing desorption would be still three orders of magnitude larger (580MJ/mol).
The amount of water that we extrapolate from the data from the samples before plasma processing (10% and 9% respectively for the TOPO and OA samples) is also noteworthy. This result is consistent with our previous characterizations96 and with other reports114: nevertheless the apparently ubiquitous presence of water in ligand shells of CNAs, most likely located at the core’s surface where the polar groups of the ligands are found, is not quite widely recognized.
Interestingly, the data shows that phosphorus is also observed in the OA samples indicating that, in spite of the FT-IR results in Figure 2b that suggest complete removal of the TOPO ligands, a small amount of TOPO is still bound to the particles.
Page 14 of 39
ACS Paragon Plus Environment
Journal of the American Chemical Society
123456789101112131415161718192021222324252627282930313233343536373839404142434445464748495051525354555657585960

15
To summarize this section, particles capped with TOPO and OA lead to remarkably similar CNAs, from which the organic elements of the ligands can be effectively removed by O2 plasma processing. Trace amounts of inorganic compounds (e.g., the P in the ligands) are preserved and control the interfaces in between the crystalline cores in the CNA. Specifically, the TOPO-capped particles become capped by a phosphate-like shell. The CNAs after ligand removal are saturated with water, consistently with the increased pore space, the increased surface energy, and the small pore size (~2nm or less).
Growth kinetics and thermal stabilizationGrowth kinetics and thermal stabilizationGrowth kinetics and thermal stabilizationGrowth kinetics and thermal stabilization
Zirconium oxide is a high temperature ceramic widely used as a thermal barrier coating in gas turbines and jet engines due to its low thermal conductivity and as solid electrolyte in solid oxide fuel cell and as oxygen sensors due to its excellent oxygen ion conduction.
To stabilize ZrO2 at high temperatures and prevent its phase transition to the monoclinic phase, the tetragonal phase is stabilized at room temperature by doping (e.g., with Y). Another approach to stabilization involves the reduction in size of the crystals in order to increase the surface area. The tetragonal phase has a significantly lower surface energy (1.02 J/m2) than the monoclinic phase (1.52 J/m2): as the crystal size decreases, the surface area per unit volume increases, leading to a relative stabilization of the tetragonal phase with respect to the monoclinic phase. Using basic thermodynamics and the tabulated thermochemical values for ZrO2, it is possible to calculate that, at room temperature, ZrO2 crystals smaller than 8.8nm will be thermodynamically stable in the tetragonal phase (see Supporting Information). The challenge of stabilizing ZrO2 by size is to reduce crystal growth kinetics so that the high area of the interfaces is preserved throughout the operation of the material.
To understand the effect of the surface modification on the growth kinetic we sintered plasma processed TOPO and OA samples and monitor the grain size as a function of time and temperature
Page 15 of 39
ACS Paragon Plus Environment
Journal of the American Chemical Society
123456789101112131415161718192021222324252627282930313233343536373839404142434445464748495051525354555657585960

16
(Figure 3a). The particle sizes were determined by Sherrer analysis of the XRD spectrum, fitting the most intense and isolated reflection in the spectrum ((111) reflection at 30.2°) with a Gaussian curve (R2 ranged between 0.98 and 0.99). The FWHM of the peak was then used as the measure of peak breadth. We assumed the particles to be spherical and used the appropriate Sherrer constant (K=0.829)115. The obtained crystallite size was further corrected to account for the spherical shape of the crystals, as described previously116. The average error in the average size determination (i.e., 95% confidence interval, delimited by shaded areas in Figure 3a) was 7% but was slightly higher for the smallest and largest particles due to the decreased accuracy of the fit.
The growth curves show a phenomenologically common trend with a rather steep increase in particle size in the first hour of sintering followed by a quite sudden plateau. Qualitatively, the curves suggest that TOPO samples exhibit a rather slower growth, overall, while, on the other hand they display a slightly faster growth at long sintering times. The data was quite accurately described (R2=0.99 and 0.98 for TOPO and OA datasets respectively) by an Ostwald ripening growth model117-122 of the form Z([) = Z([ = 0) + \[]
^, where D is the diameter of the particles, k is the rate constant that should display an Arrhenius dependence on temperature, and n is the growth exponent ranging from 2 to 4 that depends on the rate limiting process of growth (n=2 indicates control by diffusion of ions at the matrix/particle interface, n=3 indicates control by volume diffusion through the matrix, and n=4 indicates control by dissolution kinetics117).
The model describes the experimental data significantly better than other models we used (e.g., growth models with variable exponents123, models accounting impeded growth124, and models considering non-classical crystallization processes117), and has fewer fitting parameters than most.
The fit of the growth kinetic curves was performed by constraining n to be dependent only on the surface chemistry of the particles. The samples exhibited a growth parameter of 2.28±0.27 for TOPO samples, and 3.8±1.2 for OA samples (in both cases the error is the 95% confidence interval).
Page 16 of 39
ACS Paragon Plus Environment
Journal of the American Chemical Society
123456789101112131415161718192021222324252627282930313233343536373839404142434445464748495051525354555657585960

17
According to the standard interpretation of the Ostwald ripening model117, these significantly different exponents would indicate that the rate limiting process in TOPO samples is diffusion of ions on the particle surface, while in OA samples is the rate at which surface atoms become mobile. Both of these interpretations would be consistent with the presence of a phosphate layer in the TOPO samples that could hinder surface diffusion. On the other hand, caution in the interpretation is imperative for the following reasons: (i) Ostwald ripening is better suited and was originally formulated to describe ripening of particles in dilute solutions125, as the description by mean field theory of high filling fractions is analytically intractable and diffusion in highly confined systems is often anomalous; (ii) the molar excess Gibbs free energy of the surface changes significantly with size at these particle sizes and is expected to affect activation energies of growth. Nonetheless, the rate constants do obey an Arrhenius dependence on temperature (cf. Figure 3b). Qualitatively, the data suggest that the activation energy for growth of the TOPO samples is significantly larger than for the OA samples. The fit yields activation energies that are significantly different (111±13 kJ/mol for TOPO and 48±26 kJ/mol for OA) and yet much smaller than commonly reported values for microcrystalline ZrO2 (289-340 kJ/mol)126,127 and is closer to the values reported on nanocrystalline ZrO2 (188-226kJ/mol)124. While these works reported nanocrystalline doped ZrO2, the average sizes of their nanocrystals were >20nm, while all our nanocrystals are approximately one order of magnitude smaller. It is well understood that grain growth activation energies should decrease with decreasing grain size124.
The more rapid growth rate in OA samples is manifested in a different dependence of the porosity on the grain size and the sintering temperature (cf Figure 3c – the data shown is for sintering times of 24 hrs). The porosity was estimated by assuming that the density of the solid phases in the CNAs remains constant, that the CNAs do not crack, and that none of the solid phases evaporates during sintering. Under such assumptions, the porosity of the films could be calculated from the knowledge
Page 17 of 39
ACS Paragon Plus Environment
Journal of the American Chemical Society
123456789101112131415161718192021222324252627282930313233343536373839404142434445464748495051525354555657585960

18
of the porosity of the plasma processed films, and the shrinkage of the CNAs in the vertical direction.
Qualitatively, the dependence of porosity on grain size is significantly different for the TOPO and OA samples, showing a faster increase in grain size for the same degree of compaction. The relation between porosity and grain size in ceramics in which consolidation is accompanied by pore-mediated growth typically follows a power law of the form a ∝ Zcd where P is the pore fraction and α is an exponent ranging between 0.2 and 0.3123. Both datasets for TOPO samples and OA samples could be described by the above power law (R2=0.94 for TOPO and 0.75 for OA) obtaining exponents of α=0.26 and 0.33 for TOPO and OA respectively. The dependence of porosity on sintering temperatures also shows that TOPO samples compact less with temperature than OA samples.
The remarkable reduction in growth kinetics obtained by controlling the interface chemistry of the particles resulted in a growth stabilization of the t-ZrO2 phase that is comparable to that obtained by doping. Figure 3d shows the normalized grain size as a function of the sintering temperature for different types of nanocrystalline samples. The blue empty triangles show data from nanoparticles of Y-stabilized ZrO2 (D=3.7 nm) and their growth after 1h of exposure to different sintering temperatures128. The black squares and red circles show respectively the data from the TOPO and OA samples after 2hrs of exposure to the same range of temperatures. The OA samples show some initial grain growth at a temperature of 500C, while the TOPO samples remain essentially unchanged until 700C. Even though our samples had been sintered for an extra hour, the grain growth observed in our TOPO samples is significantly smaller than that shown by YSZ nanoparticles. Goto et al. also looked at the grain growth of t-ZrO2 particles synthesized by a reaction analogous to the one used here but using oleylamine as a ligand rather than TOPO128. The particle size they obtain was similar. The grain growth of those particles as a function of sintering
Page 18 of 39
ACS Paragon Plus Environment
Journal of the American Chemical Society
123456789101112131415161718192021222324252627282930313233343536373839404142434445464748495051525354555657585960

19
temperature is shown in Figure 3d in the open orange rhombi. The faster growth, especially compared to our OA samples (whose surface should be comparably similar), is striking. We speculate that the increased growth rate resulted from the sintering of the samples prior to the removal of the ligands. As will be shown in a separate publication, the calcination of nanostructured materials in O2 atmospheres does not come close to removing the carbon, which instead is left behind as amorphous carbon129. It is conceivable that the carbon matrix formed by the carbonization of the ligands could have facilitated the growth of the nanoparticles.
Figure 3Figure 3Figure 3Figure 3. Impact of interface composition on grain growth kinetics. Impact of interface composition on grain growth kinetics. Impact of interface composition on grain growth kinetics. Impact of interface composition on grain growth kinetics. ((((a) a) a) a) Plots of grain size as a function of time and temperature for TOPO (left) and OA (right) samples. The lines are fits obtained from an Ostwald ripening model. ((((bbbb) ) ) ) Arrhenius plot for TOPO and OA samples obtained from rate constants obtained from the fits in panel a. ((((c) c) c) c) Plot of the relation between porosity on diameter (left) and sintering
Page 19 of 39
ACS Paragon Plus Environment
Journal of the American Chemical Society
123456789101112131415161718192021222324252627282930313233343536373839404142434445464748495051525354555657585960

20
temperature (right) for both the TOPO and OA samples. The curves show fits of the data to a power law expected for pore coalescence-driven growth. ((((d) d) d) d) Coarsening at various temperatures. The graph compares our TOPO and OA samples for two or more hours, with YSZ and t-ZrO2 samples previously reported128. In all the above panels, shaded areas behind data points identify the 95% confidence interval on the average value.
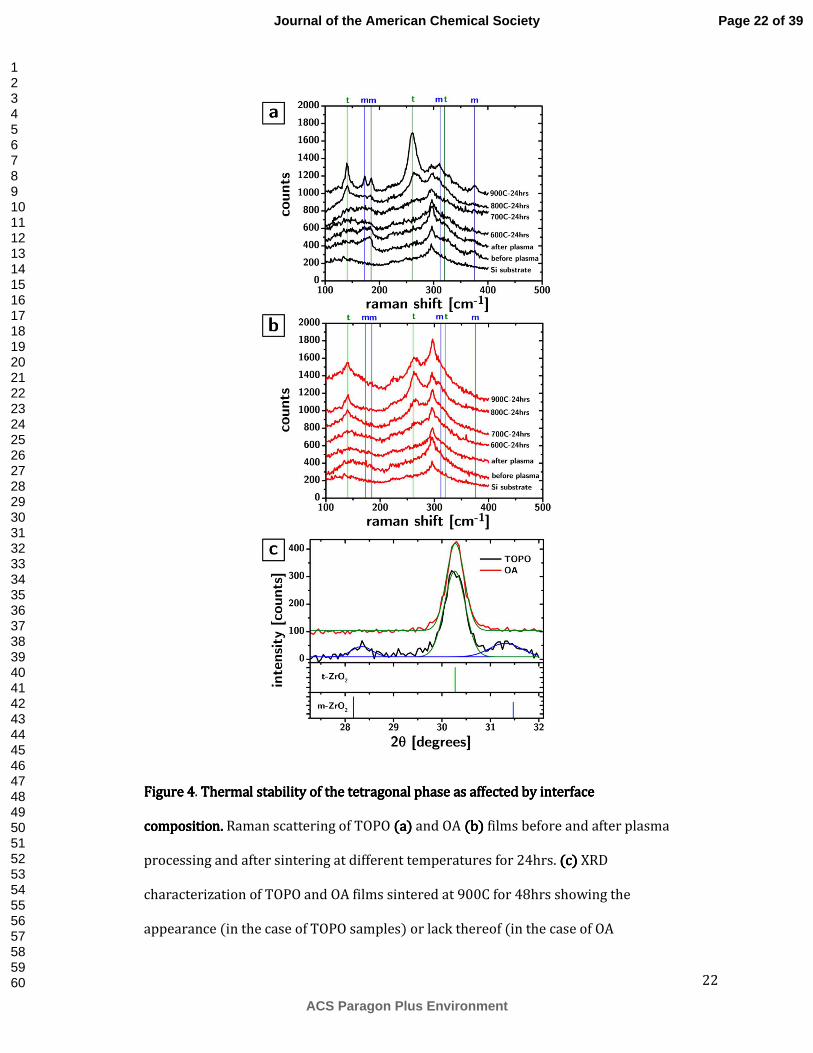
The remarkable effect of such a minute change of the grain boundary composition on the growth kinetics is further accompanied by a very significant effect on the stabilization of the tetragonal phase. Figure 4a and 4b show the Raman scattering from the CNAs of TOPO and OA samples at different stages of their processing and different sintering temperatures. For convenience we have marked the frequencies of the vibrational modes of the tetragonal and monoclinic phases of ZrO2 with green and blue vertical lines, respectively. The plots show quite clearly that the monoclinic phase appears in TOPO samples certainly when exposed to 900C (and maybe even at 800C). On the other hand, the OA samples show no obvious evidence of monoclinic phase at any temperature we tested. The difference in phase stabilization is noticeable even in the XRD characterization, at least in the samples sintered at 900C for 48hrs (cf. Figure 4c): the TOPO samples show clear evidence of peaks at 28.2° and 31.5°, which are indicative of the monoclinic phase. The difference in thermal stability is not easily attributable to anything other than grain boundary composition. As previously discussed, the major factor in controlling the relative thermodynamic stability of the two phases is the surface area per unit volume and the molar surface energy. The surface area is expected to be similar since the average particle size for the samples sintered at 900C for 48hrs was 21.10±1.81 nm and 23.29 ±0.61 nm for the TOPO and OA samples respectively. The error indicates the 95% confidence interval on the value of the average size, but we expect that the polydispersity to be at least as large as the one found in the starting nanoparticles (6% and 8% or 1.3 nm and 1.9 nm). Therefore the size distributions overlap very significantly.
Page 20 of 39
ACS Paragon Plus Environment
Journal of the American Chemical Society
123456789101112131415161718192021222324252627282930313233343536373839404142434445464748495051525354555657585960
21
In summary, while the phosphate groups at the grain boundary appear to significantly slow down grain growth, they might facilitate the phase transition to the monoclinic phase. (It is important to notice that all the sintered samples that showed t-ZrO2 grain sizes larger than 10nm are most likely not thermodynamically stable at room temperature and therefore that the stabilization of the tetragonal phase in those samples is most likely due to kinetic factors rather than thermodynamic, e.g., surface energy).
Page 21 of 39
ACS Paragon Plus Environment
Journal of the American Chemical Society
123456789101112131415161718192021222324252627282930313233343536373839404142434445464748495051525354555657585960
22
Figure 4Figure 4Figure 4Figure 4. Thermal stability of the tetragonal phase as affected by interface Thermal stability of the tetragonal phase as affected by interface Thermal stability of the tetragonal phase as affected by interface Thermal stability of the tetragonal phase as affected by interface composition. composition. composition. composition. Raman scattering of TOPO (a)(a)(a)(a) and OA (b) (b) (b) (b) films before and after plasma processing and after sintering at different temperatures for 24hrs. ((((c) c) c) c) XRD characterization of TOPO and OA films sintered at 900C for 48hrs showing the appearance (in the case of TOPO samples) or lack thereof (in the case of OA
Page 22 of 39
ACS Paragon Plus Environment
Journal of the American Chemical Society
123456789101112131415161718192021222324252627282930313233343536373839404142434445464748495051525354555657585960

23
samples) of the monoclinic phase. The curves show Gaussian fits of the diffraction peaks.
Interfacial energies and mechanical properties Interfacial energies and mechanical properties Interfacial energies and mechanical properties Interfacial energies and mechanical properties
The slower growth kinetic in TOPO samples can be hypothesized to originate from a decrease in the interfacial energy (γ=1.02 J/m2 for t-ZrO2 and ranges between 0.15 and 0.35 J/m2 for reported phosphates), as well as by a reduction on grain boundary mobility caused by the phosphate groups. We therefore used nanoindentation to measure the Young’s modulus and hardness of the CNA before and after sintering. The mechanical properties in polycrystalline ceramics as well as granular materials are heavily influenced by the composition of the grain boundary.
The modulus of the films, corrected for the influence of the substrate130, was found to be strongly dependent on the sintering temperatures. Our previous work96 has shown that the modulus of as prepared as well as ligand-free CNAs can be quantitatively predicted by the granular model by Kendall et al.131 that accounts for the effects of porosity φ, grain size D, bulk modulus Eb and interface energy Γ according to the following equation
g = 17.1hi jΓgklZ m]n
To understand whether the same model could be applied in sintered CNAs we plotted the experimental moduli against o = pq
r]n. If the model is valid, assuming that the interfacial energy is
independent of temperature, the plot of E(ζ) (cf. Figure 5a) should be describable by a straight line through the origin E(ζ)=β·ζ, whose slope β is equal to 17.1gk
unΓ]
n. The linear fit is adequate (R2=0.98 and 0.99), especially considering the associated experimental errors. The fit is especially good for the OA samples, which is interesting and unexpected. The data originates from samples that have
Page 23 of 39
ACS Paragon Plus Environment
Journal of the American Chemical Society
123456789101112131415161718192021222324252627282930313233343536373839404142434445464748495051525354555657585960

24
undergone, especially at high temperature, significant grain growth. It is not intuitive to describe the material as a granular system. On the other hand, the mechanical properties were determined by substrate corrected indentation, using a Berkovich indenter. It is assumed that in these conditions the deformation of the material is plastic. It is conceivable that in these conditions, the grains in the polycrystal could still be described as grains in a granular system. What is further surprising is the extent of agreement with the model, considering that it was developed under the assumption of spherical grains.
From the slope we can calculate the values of interfacial energy (and therefore the values of surface energy assuming that Γ=2·γ, which is fair since we are dealing with a homogeneous unary system), if we assume that the bulk energy is constant throughout the dataset. This assumption is valid for all samples sintered at temperatures lower than 900C, and even for those sintered at 900C the conversion of the TOPO samples to monoclinic is small. The values of surface energy are 0.04±0.01 and 0.11±0.02 J/m2 for the TOPO and OA samples respectively. These values are not consistent with the expected surface energies of the bare solid phases (0.1-0.3 for phosphates and 1.02 J/m2 for t-ZrO2), but they are consistent with the presence of water in between the grains due to adsorption from the atmosphere and capillary condensation, as already observed by Kendall131.
Using the fitted values of surface energy from Figure 5a, the modulus data as a function of temperature for both TOPO and OA samples can be qualitatively reproduced by the Kendall model (Figure 5b). Using the same assumptions used in our previous work96, the model allows to also to predict the modulus of the as-deposited (data shown for comparison in Figure 5b at T=0C) and plasma treated samples (data shown, for comparison in Figure 5b at T=25C). In summary these assumptions are that the bulk modulus and surface energy of the unprocessed CNA should be equal to that of the ligands.
Page 24 of 39
ACS Paragon Plus Environment
Journal of the American Chemical Society
123456789101112131415161718192021222324252627282930313233343536373839404142434445464748495051525354555657585960

25
The modulus of the TOPO samples before sintering are 53GPa, which is similar to the values we previously reported for similar samples96 (45GPa), while for OA samples the modulus is significantly smaller at 35GPa. According to the model, the difference in modulus can be completely accounted for by the higher porosity of the plasma processed OA samples, which we discussed before. Due to their higher growth rate, the porosity of the OA samples decreases faster than that of the TOPO samples and become similar at high sintering temperatures, resulting in similar maximum moduli.
The data in Figure 5b shows that the maximum modulus achieved (92±9 and 91±5 GPa for TOPO and OA samples) is nearly half of the single crystal bulk modulus of 200GPa and occurs at the intermediate sintering temperature of 700C. The drop in modulus at higher sintering temperatures results from the fact that the relatively large growth in the grain size outweighs the rather small decrease in porosity, thereby creating a maximum.
The hardness of the CNAs is also significantly improved by sintering. The plasma processed TOPO samples show a hardness of 1.92 GPa, which is consistent with the value reported in our previous work for similar samples (2.2 GPa). Sintering causes the hardness to increase up to 6.36 GPa at 700C and then decrease at higher temperatures. This hardness is quite remarkable as it is within a factor of 2 of the single crystal hardness (10GPa). The OA samples instead show a significantly smaller hardness throughout the sintering range, in spite of similar porosity at high sintering temperatures (Figure 5c).
It is important to try and detangle the role of particle size, porosity, and surface chemistry on the hardness of these nanocrystalline ceramics. While it might appear difficult to do so for a sintering series like this in which all parameters are dependent on each other, an analysis of the individual dependencies is possible and instructive. The dependence of hardness on porosity for TOPO and OA sintered samples is shown in Figure 5d. At higher porosities the samples follow what appears to be
Page 25 of 39
ACS Paragon Plus Environment
Journal of the American Chemical Society
123456789101112131415161718192021222324252627282930313233343536373839404142434445464748495051525354555657585960

26
a linear increase in hardness with decreasing porosity. The slope is similar for both the TOPO and OA samples (-13.7±2.1 vs 12.3±0.5 GPa). The intercepts are nonetheless are significantly different (8.1±0.4 vs 6.7±0.1 GPa) indicating that, for equal porosity, the TOPO samples are harder than the OA samples. At low porosities the TOPO samples shows a surprising and counterintuitive decrease in hardness with a decrease in porosity, suggestive that particle size – specifically a decrease in hardness with increasing particle size – might be responsible for the trend.
As shown in Figure 5d, the hardness of the TOPO sample does appear to decrease with particle size for particle sizes above 5nm while OA samples keep increasing in hardness with increasing particle size throughout the range. This difference in behaviour indicates that the switch in the behaviour of hardness is more likely to be associated with different porosities and that below a 10-15% porosity the influence of particle size on hardness becomes dominant and following a “Hall-Petch”-type trend of increasing mechanical properties with decreasing size132,133. This observation is interesting and might help shed light on the dependence of grain size on mechanical properties in ceramics, which has been complicated by the difficulty of creating phase pure materials with genuinely controlled grain size and grain boundary composition.
Page 26 of 39
ACS Paragon Plus Environment
Journal of the American Chemical Society
123456789101112131415161718192021222324252627282930313233343536373839404142434445464748495051525354555657585960
27
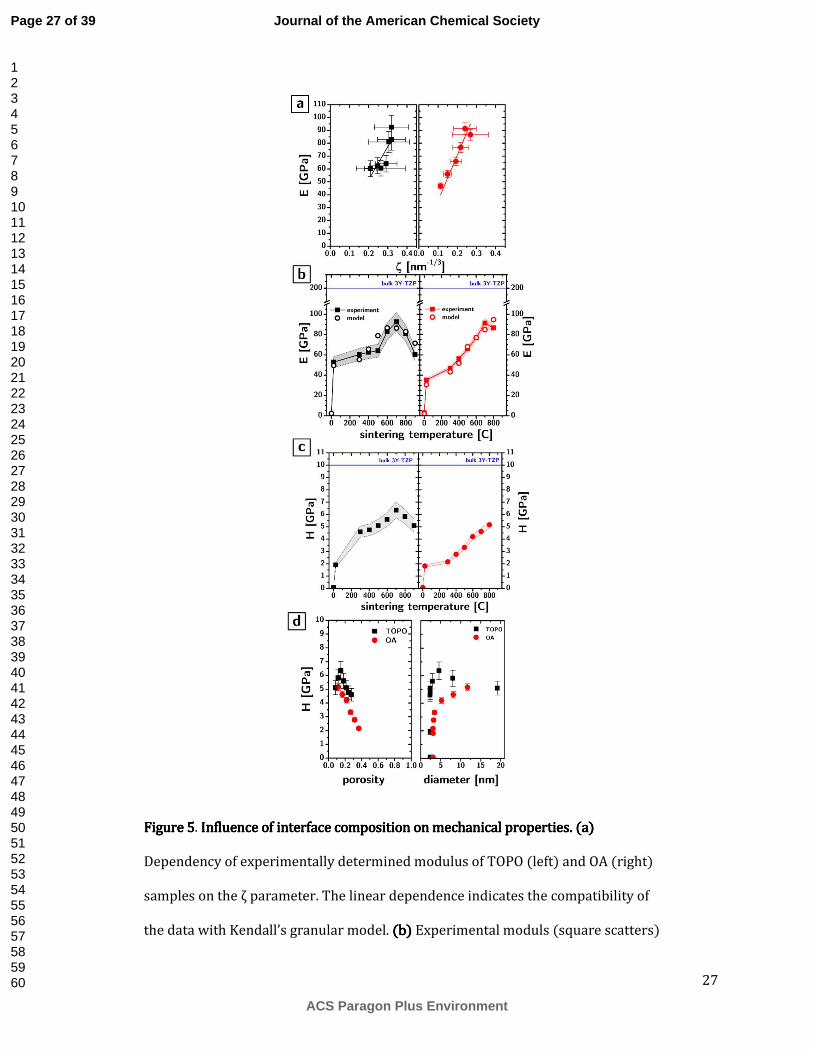
Figure 5Figure 5Figure 5Figure 5. Influence of interface composition on mechanical properties. (a) Influence of interface composition on mechanical properties. (a) Influence of interface composition on mechanical properties. (a) Influence of interface composition on mechanical properties. (a) Dependency of experimentally determined modulus of TOPO (left) and OA (right) samples on the ζ parameter. The linear dependence indicates the compatibility of the data with Kendall’s granular model. (b(b(b(b)))) Experimental moduls (square scatters)
Page 27 of 39
ACS Paragon Plus Environment
Journal of the American Chemical Society
123456789101112131415161718192021222324252627282930313233343536373839404142434445464748495051525354555657585960

28
for TOPO (left) and OA (right) samples as a function of the sintering temperature. The open scatters indicate the prediction of the Kendall model based on the interfacial energies determined from the slopes in panel a. (c)(c)(c)(c) Hardness as a function of sintering temperature for TOPO (left) and OA (right) samples. (d)(d)(d)(d) Hardness as a function of porosity (left) and grain size (right) for TOPO (black squares) and OA (red circles) samples. In all the above panels, shaded areas behind data points identify the 95% confidence interval on the average value.
CONCLUSIONS
In this work we have described a methodology to create nanostructured, all-inorganic materials with a selective control of the composition of the solid/solid interfaces inside them. The approach takes colloidal nanocrystals capped with ligands, deposits them as a solid composed of inorganic cores and ligands, and then uses plasma processing to selectively react with the ligands. We demonstrate here that this materials synthesis approach allows to control the composition of the interfaces by controlling the composition of the ligand shell. Specifically, by using ligands containing inorganic elements and using feed gases that do not yield volatile compounds with those elements (e.g., O2 plasma on P-containing ligands) allows to leave behind groups (e.g., phosphate) that modify the chemical composition of the surfaces the ligands were bound to. The advantage of this approach is that by controlling the composition and structure of the ligand, or by using mixtures of ligands one could envision developing extremely sophisticated control of the solid/solid interface conpositioons inside ligand-free nanocrystal superlattices, with potentially important effects on mechanical, transport, magnetic, and optical properties.
This work focused on t-ZrO2 nanoparticles capped with oleic acid and trioctylphosphine oxide. The particles were deposited as films and the organic components of their ligands was removed by
Page 28 of 39
ACS Paragon Plus Environment
Journal of the American Chemical Society
123456789101112131415161718192021222324252627282930313233343536373839404142434445464748495051525354555657585960
29
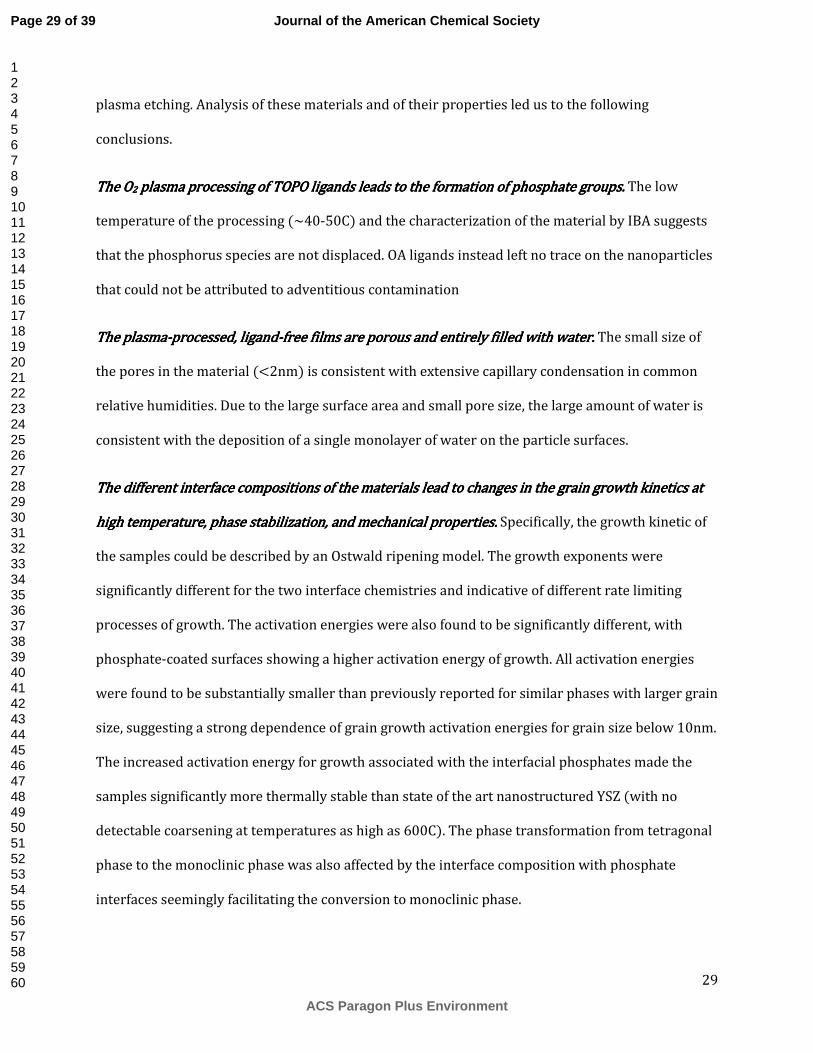
plasma etching. Analysis of these materials and of their properties led us to the following conclusions.
The OThe OThe OThe O2222 plasma processing of TOPO ligands leads to the formation of phosphate groups.plasma processing of TOPO ligands leads to the formation of phosphate groups.plasma processing of TOPO ligands leads to the formation of phosphate groups.plasma processing of TOPO ligands leads to the formation of phosphate groups. The low temperature of the processing (~40-50C) and the characterization of the material by IBA suggests that the phosphorus species are not displaced. OA ligands instead left no trace on the nanoparticles that could not be attributed to adventitious contamination
The plasmaThe plasmaThe plasmaThe plasma----processedprocessedprocessedprocessed, ligand, ligand, ligand, ligand----freefreefreefree films are porous and entirely filled with water.films are porous and entirely filled with water.films are porous and entirely filled with water.films are porous and entirely filled with water. The small size of the pores in the material (<2nm) is consistent with extensive capillary condensation in common relative humidities. Due to the large surface area and small pore size, the large amount of water is consistent with the deposition of a single monolayer of water on the particle surfaces.
The different interface compositions ofThe different interface compositions ofThe different interface compositions ofThe different interface compositions of the materials lead to changes in the grain growth kinetics at the materials lead to changes in the grain growth kinetics at the materials lead to changes in the grain growth kinetics at the materials lead to changes in the grain growth kinetics at high temperature, phase stabilization, and mechanical properties.high temperature, phase stabilization, and mechanical properties.high temperature, phase stabilization, and mechanical properties.high temperature, phase stabilization, and mechanical properties. Specifically, the growth kinetic of the samples could be described by an Ostwald ripening model. The growth exponents were significantly different for the two interface chemistries and indicative of different rate limiting processes of growth. The activation energies were also found to be significantly different, with phosphate-coated surfaces showing a higher activation energy of growth. All activation energies were found to be substantially smaller than previously reported for similar phases with larger grain size, suggesting a strong dependence of grain growth activation energies for grain size below 10nm. The increased activation energy for growth associated with the interfacial phosphates made the samples significantly more thermally stable than state of the art nanostructured YSZ (with no detectable coarsening at temperatures as high as 600C). The phase transformation from tetragonal phase to the monoclinic phase was also affected by the interface composition with phosphate interfaces seemingly facilitating the conversion to monoclinic phase.
Page 29 of 39
ACS Paragon Plus Environment
Journal of the American Chemical Society
123456789101112131415161718192021222324252627282930313233343536373839404142434445464748495051525354555657585960

30
The modulus of the films could be described in all cases with a granular model.The modulus of the films could be described in all cases with a granular model.The modulus of the films could be described in all cases with a granular model.The modulus of the films could be described in all cases with a granular model. The surface energies extracted from the model indicate that interfacial phosphate significantly reduces the interfacial energy, consistently with the slower grain growth kinetic. The hardness was found to increase linearly with a decrease in porosity during sintering until 85-90% density, after which the hardness appeared to decrease with increasing density. The counterintuitive trend appears to be explainable by the growth of the size of the grains at high densities, thereby suggesting that a Hall-Petch-type behavior for hardness in ZrO2 ceramics might be conserved at particle sizes smaller than 10nm.
ACKNOWLEDGMENTS
The work described in this paper has been supported by the Member-Specific-Research-Intel program of Semiconductor Research Corporation under Award No. 2015-IN-2582. The authors thank Dapeng Jing for his assistance with X-ray photoelectron spectroscopy. The Raman measurements were supported by the U.S. Department of Energy, Office of Basic Energy Sciences, Division of Chemical Sciences, Geosciences, and Biosciences through the Ames Laboratory. The Ames Laboratory is operated for the U.S. Department of Energy by Iowa State University under Contract No. DE-AC02-07CH11358.
Page 30 of 39
ACS Paragon Plus Environment
Journal of the American Chemical Society
123456789101112131415161718192021222324252627282930313233343536373839404142434445464748495051525354555657585960

31
REFERENCES
(1) Bernevig, B. A.; Hughes, T. L.; Zhang, S. C. Science 2006200620062006, 314, 1757-1761. (2) Hasan, M. Z.; Kane, C. L. Rev. Mod. Phys. 2010201020102010, 82, 3045-3067. (3) Zhang, H. J.; Liu, C. X.; Qi, X. L.; Dai, X.; Fang, Z.; Zhang, S. C. Nat. Phys. 2009200920092009, 5, 438-442. (4) Bert, J. A.; Kalisky, B.; Bell, C.; Kim, M.; Hikita, Y.; Hwang, H. Y.; Moler, K. A. Nat. Phys. 2011201120112011, 7, 767-771. (5) Hwang, H. Y.; Iwasa, Y.; Kawasaki, M.; Keimer, B.; Nagaosa, N.; Tokura, Y. Nat. Mater. 2012201220122012, 11, 103-113. (6) Mannhart, J.; Schlom, D. G. Science 2010201020102010, 327, 1607-1611. (7) Reyren, N.; Thiel, S.; Caviglia, A. D.; Kourkoutis, L. F.; Hammerl, G.; Richter, C.; Schneider, C. W.; Kopp, T.; Ruetschi, A. S.; Jaccard, D.et al. Science 2007200720072007, 317, 1196-1199. (8) Geim, A. K.; Novoselov, K. S. Nat. Mater. 2007200720072007, 6, 183-191. (9) Novoselov, K. S.; Geim, A. K.; Morozov, S. V.; Jiang, D.; Zhang, Y.; Dubonos, S. V.; Grigorieva, I. V.; Firsov, A. A. Science 2004200420042004, 306, 666-669. (10) Roduner, E. Nanoscopic Materials: Size Dependent Phenomena; Royal Society of Chemistry, 2006. (11) Cademartiri, L.; Ozin, G. A. Concepts of Nanochemistry; Wiley-VCH: Weinheim, 2009. (12) Wenzel, R. N. Ind. Eng. Chem. 1936193619361936, 28, 988-994. (13) Lafuma, A.; Quere, D. Nat. Mater. 2003200320032003, 2, 457-460. (14) Tuteja, A.; Choi, W.; Ma, M. L.; Mabry, J. M.; Mazzella, S. A.; Rutledge, G. C.; McKinley, G. H.; Cohen, R. E. Science 2007200720072007, 318, 1618-1622. (15) Wong, T. S.; Kang, S. H.; Tang, S. K. Y.; Smythe, E. J.; Hatton, B. D.; Grinthal, A.; Aizenberg, J. Nature 2012012012011111, 477, 443-447. (16) Diebold, U. Surf. Sci. Rep. 2003200320032003, 48, 53-229. (17) Fujishima, A.; Zhang, X. T.; Tryk, D. A. Surf. Sci. Rep. 2008200820082008, 63, 515-582. (18) Somorjai, G. A.; Frei, H.; Park, J. Y. J. Am. Chem. Soc. 2009200920092009, 131, 16589-16605. (19) Somorjai, G. A.; Park, J. Y. Angew. Chem. Int. Edit. 2008200820082008, 47, 9212-9228. (20) Yamada, Y.; Tsung, C. K.; Huang, W.; Huo, Z. Y.; Habas, S. E.; Soejima, T.; Aliaga, C. E.; Somorjai, G. A.; Yang, P. D. Nat. Chem. 2011201120112011, 3, 372-376. (21) Atwater, H. A.; Polman, A. Nat. Mater. 2010201020102010, 9, 205-213. (22) Ozbay, E. Science 2006200620062006, 311, 189-193. (23) Schuller, J. A.; Barnard, E. S.; Cai, W. S.; Jun, Y. C.; White, J. S.; Brongersma, M. L. Nat. Mater. 2010201020102010, 9, 193-204. (24) Stiles, P. L.; Dieringer, J. A.; Shah, N. C.; Van Duyne, R. R. Annu. Rev. Anal. Chem. 2008200820082008, 1, 601-626. (25) Love, J. C.; Estroff, L. A.; Kriebel, J. K.; Nuzzo, R. G.; Whitesides, G. M. Chem. Rev. 2005200520052005, 105, 1103-1169. (26) Ulman, A. Chem. Rev. 1996199619961996, 96, 1533-1554. (27) Bhushan, B.; Israelachvili, J. N.; Landman, U. Nature 1995199519951995, 374, 607-616. (28) Urbakh, M.; Klafter, J.; Gourdon, D.; Israelachvili, J. Nature 2004200420042004, 430, 525-528. (29) Wang, C.; Hu, Y.; Lieber, C. M.; Sun, S. J. Am. Chem. Soc. 2008200820082008, 130, 8902-8903. (30) Dresselhaus, M. S.; Dresselhaus, G.; Sun, X.; Zhang, Z.; Cronin, S. B.; Koga, T.; Ying, J. Y.; Chen, G. Microscale Thermophys. Eng. 1999199919991999, 3, 89-100. (31) Minnich, A. J.; Dresselhaus, M. S.; Ren, Z. F.; Chen, G. Energ. Environ. Sci. 2009200920092009, 2, 466-479. (32) Kumar, K. S.; Van Swygenhoven, H.; Suresh, S. Acta Mater. 2003200320032003, 51, 5743-5774. (33) Meyers, M. A.; Mishra, A.; Benson, D. J. Prog. Mater. Sci. 2006200620062006, 51, 427-556. (34) Kahn, A.; Koch, N.; Gao, W. Y. J. Polym. Sci. Pol. Phys. 2003200320032003, 41, 2529-2548.
Page 31 of 39
ACS Paragon Plus Environment
Journal of the American Chemical Society
123456789101112131415161718192021222324252627282930313233343536373839404142434445464748495051525354555657585960

32
(35) Rashba, E. I. Phys. Rev. B 2000200020002000, 62, R16267-R16270. (36) Wang, Q.; Moser, J. E.; Gratzel, M. J. Phys. Chem. B 2005200520052005, 109, 14945-14953. (37) Dinega, D. P.; Bawendi, M. G. Angew. Chem. Int. Edit. 1999199919991999, 38, 1788-1791. (38) Joo, J.; Yu, T.; Kim, Y. W.; Park, H. M.; Wu, F. X.; Zhang, J. Z.; Hyeon, T. J. Am. Chem. Soc. 2003200320032003, 125, 6553-6557. (39) Hall, E. O. Proc. Phys. Soc., London, Sect. B 1951195119511951, 64, 747. (40) Petch, N. J. J. Iron Steel Inst. London 1953195319531953, 173, 25-28. (41) Karch, J.; Birringer, R.; Gleiter, H. Nature 1987198719871987, 330, 556-558. (42) Waku, Y.; Nakagawa, N.; Wakamoto, T.; Ohtsubo, H.; Shimizu, K.; Kohtoku, Y. Nature 1997199719971997, 389, 49-52. (43) Kim, J. K.; Mai, Y. W. Compos. Sci. Technol. 1991199119911991, 41, 333-378. (44) Valiev, R. Z.; Estrin, Y.; Horita, Z.; Langdon, T. G.; Zehetbauer, M. J.; Zhu, Y. T. Jom 2006200620062006, 58, 33-39. (45) Balluffi, R. W.; Allen, S.; Carter, W. C. Kinetics of materials; John Wiley & Sons, 2005. (46) Kirchheim, R. Acta Mater. 2007200720072007, 55, 5129-5138. (47) Chookajorn, T.; Murdoch, H. A.; Schuh, C. A. Science 2012201220122012, 337, 951-954. (48) Sun, S. H.; Zeng, H.; Robinson, D. B.; Raoux, S.; Rice, P. M.; Wang, S. X.; Li, G. X. J. Am. Chem. Soc. 2004200420042004, 126, 273-279. (49) Hyeon, T. Chem. Comm. 2003200320032003, 927-934. (50) Kwon, S. G.; Piao, Y.; Park, J.; Angappane, S.; Jo, Y.; Hwang, N. M.; Park, J. G.; Hyeon, T. J. Am. Chem. Soc. 2007200720072007, 129, 12571-12584. (51) Choi, S. H.; Bin Na, H.; Il Park, Y.; An, K.; Kwon, S. G.; Jang, Y.; Park, M.; Moon, J.; Son, J. S.; Song, I. C.et al. J. Am. Chem. Soc. 2008200820082008, 130, 15573-15580. (52) Yu, T.; Joo, J.; Park, Y. I.; Hyeon, T. J. Am. Chem. Soc. 2006200620062006, 128, 1786-1787. (53) Yu, T. Y.; Joo, J.; Park, Y. I.; Hyeon, T. Angew. Chem. Int. Edit. 2005200520052005, 44, 7411-7414. (54) Tang, J.; Fabbri, J.; Robinson, R. D.; Zhu, Y.; Herman, I. P.; Steigerwald, M. L.; Brus, L. E. Chem. Mater. 2004200420042004, 16, 1336-1342. (55) Joo, J.; Yu, T.; Kim, Y. W.; Park, H. M.; Wu, F.; Zhang, J. Z.; Hyeon, T. Journal of the American Chemical Society 2003200320032003, 125, 6553-6557. (56) Murray, C. B.; Norris, D. J.; Bawendi, M. G. J. Am. Chem. Soc. 1993199319931993, 115, 8706-8715. (57) Hines, M. A.; Scholes, G. D. Adv. Mater. 2003200320032003, 15, 1844-1849. (58) Bakueva, L.; Musikhin, S.; Hines, M. A.; Chang, T. W. F.; Tzolov, M.; Scholes, G. D.; Sargent, E. H. Appl. Phys. Lett. 2003200320032003, 82, 2895-2897. (59) Hines, M. A.; Guyot-Sionnest, P. J. Phys. Chem. B 1998199819981998, 102, 3655-3657. (60) Peng, X. G.; Schlamp, M. C.; Kadavanich, A. V.; Alivisatos, A. P. J. Am. Chem. Soc. 1997199719971997, 119, 7019-7029. (61) Hines, M. A.; Guyot-Sionnest, P. J. Phys. Chem. B 1996199619961996, 100, 468–471. (62) Gaschler, W. L.; Murray, C. B.; Stokes, K. L. Abstr. Pap. Am. Chem. S. 2000200020002000, 219, U582-U582. (63) Cademartiri, L.; Guerin, G.; Bishop, K. J. M.; Winnik, M. A.; Ozin, G. A. J. Am. Chem. Soc. 2012201220122012, 134, 9327-9334. (64) Cademartiri, L.; Ozin, G. A. Philos. T. Roy. Soc. A 2010201020102010, 368, 4229-4248. (65) Cademartiri, L.; Malakooti, R.; O'Brien, P. G.; Migliori, A.; Petrov, S.; Kherani, N. P.; Ozin, G. A. Angew. Chem. Int. Edit. 2008200820082008, 47, 3814-3817. (66) Cademartiri, L.; Bertolotti, J.; Sapienza, R.; Wiersma, D. S.; Kitaev, V.; Ozin, G. A. J. Phys. Chem. B 2006200620062006, 110, 671-673. (67) Moreels, I.; Lambert, K.; Smeets, D.; De Muynck, D.; Nollet, T.; Martins, J. C.; Vanhaecke, F.; Vantomme, A.; Delerue, C.; Allan, G.et al. ACS Nano 2009200920092009, 3, 3023-3030. (68) Moreels, I.; Lambert, K.; De Muynck, D.; Vanhaecke, F.; Poelman, D.; Martins, J. C.; Allan, G.; Hens, Z. Chem. Mater. 2007200720072007, 19, 6101-6106. (69) Battaglia, D.; Peng, X. Nano Lett. 2002200220022002, 2, 1027-1030.
Page 32 of 39
ACS Paragon Plus Environment
Journal of the American Chemical Society
123456789101112131415161718192021222324252627282930313233343536373839404142434445464748495051525354555657585960

33
(70) Tang, C.; Fan, S.; De La Chapelle, M. L.; Dang, H.; Li, P. Adv. Mater. 2000200020002000, 12, 1346-1348. (71) Cao, Y.-W.; Aksenton, J.; Soloviev, V.; Banin, U. Mater. Res. Soc. Symp. Proc. 2000200020002000, 571, 75-80. (72) Henkes, A. E.; Schaak, R. E. Chem. Mater. 2007200720072007, 19, 4234-4242. (73) Henkes, A. E.; Vasquez, Y.; Schaak, R. E. J. Am. Chem. Soc. 2007200720072007, 129, 1896-+. (74) Xu, S.; Ziegler, J.; Nann, T. J. Mater. Chem. 2008200820082008, 18, 2653-2656. (75) Liu, W. Y.; Chang, A. Y.; Schaller, R. D.; Talapin, D. V. J. Am. Chem. Soc. 2012201220122012, 134, 20258-20261. (76) Srivastava, V.; Liu, W. Y.; Janke, E. M.; Kamysbayev, V.; Filatov, A. S.; Sun, C. J.; Lee, B.; Rajh, T.; Schaller, R. D.; Talapin, D. V. Nano Lett. 2017201720172017, 17, 2094-2101. (77) Andaraarachchi, H. P.; Thompson, M. J.; White, M. A.; Fan, H. J.; Vela, J. Chem. Mater. 2015201520152015, 27, 8021-8031. (78) White, M. A.; Thompson, M. J.; Miller, G. J.; Vela, J. Chem. Comm. 2016201620162016, 52, 3497-3499. (79) Qian, H.; Zhu, M.; Wu, Z.; Jin, R. Acc. Chem. Res. 2012201220122012. (80) Halder, A.; Ravishankar, N. Adv. Mater. 2007200720072007, 19, 1854-1858. (81) Jones, M. R.; Osberg, K. D.; Macfarlane, R. J.; Langille, M. R.; Mirkin, C. A. Chem. Rev. 2011201120112011, 111, 3736-3827. (82) Langille, M. R.; Personick, M. L.; Zhang, J.; Mirkin, C. A. J. Am. Chem. Soc. 2012201220122012, 134, 14542-14554. (83) Millstone, J. E.; Hurst, S. J.; Metraux, G. S.; Cutler, J. I.; Mirkin, C. A. Small 2009200920092009, 5, 646-664. (84) Pietrobon, B.; Kitaev, V. Chem. Mater. 2008200820082008, 20, 5186-5190. (85) Skrabalak, S. E.; Au, L.; Li, X. D.; Xia, Y. N. Nat. Protoc. 2007200720072007, 2, 2182-2190. (86) Skrabalak, S. E.; Chen, J. Y.; Sun, Y. G.; Lu, X. M.; Au, L.; Cobley, C. M.; Xia, Y. N. Acc. Chem. Res. 2008200820082008, 41, 1587-1595. (87) Wiley, B. J.; Im, S. H.; Li, Z. Y.; McLellan, J.; Siekkinen, A.; Xia, Y. N. J. Phys. Chem. B 2006200620062006, 110, 15666-15675. (88) Xia, Y. N.; Xiong, Y. J.; Lim, B.; Skrabalak, S. E. Angew. Chem. Int. Edit. 2009200920092009, 48, 60-103. (89) Xiong, Y. J.; Xia, Y. N. Adv. Mater. 2007200720072007, 19, 3385-3391. (90) Whetten, R. L.; Shafigullin, M. N.; Khoury, J. T.; Schaaff, T. G.; Vezmar, I.; Alvarez, M. M.; Wilkinson, A. Acc. Chem. Res. 1999199919991999, 32, 397-406. (91) Murray, C. B.; Kagan, C. R.; Bawendi, M. G. Science 1995199519951995, 270, 1335-1338. (92) Bentzon, M. D.; Vanwonterghem, J.; Morup, S.; Tholen, A. Philos. Mag. B 1989198919891989, 60, 169-178. (93) Cademartiri, L.; Ghadimi, A.; Ozin, G. A. Acc. Chem. Res. 2008200820082008, 41, 1820-1830. (94) Malakooti, R.; Cademartiri, L.; Akcakir, Y.; Petrov, S.; Migliori, A.; Ozin, G. A. Adv. Mater. 2006200620062006, 18, 2189-2194. (95) Cademartiri, L.; von Freymann, G.; Arsenault, A. C.; Bertolotti, J.; Wiersma, D. S.; Kitaev, V.; Ozin, G. A. Small 2005200520052005, 1, 1184-1187. (96) Shaw, S.; Colaux, J. L.; Hay, J. L.; Peiris, F. C.; Cademartiri, L. Adv. Mater. 2016201620162016, 28, 8900-8905. (97) Shaw, S.; Yuan, B.; Tian, X. C. M., K. J.; Cote, B. M.; Colaux, J. L. M., A.; Panthani, M. G.; Cademartiri, L. Adv. Mater. 2016201620162016, 28, 8892-8899. (98) Talapin, D. V.; Yu, H.; Shevchenko, E. V.; Lobo, A.; Murray, C. B. J. Phys. Chem. C 2007200720072007, 111, 14049-14054. (99) Carbone, L.; Nobile, C.; De Giorgi, M.; Sala, F. D.; Morello, G.; Pompa, P.; Hytch, M.; Snoeck, E.; Fiore, A.; Franchini, I. R.et al. Nano Lett. 2007200720072007, 7, 2942-2950. (100) Li, J. J.; Wang, Y. A.; Guo, W.; Keay, J. C.; Mishima, T. D.; Johnson, M. B.; Peng, X. J. Am. Chem. Soc. 2003200320032003, 125, 12567-12575. (101) Rakovich, Y. P.; Donegan, J. F.; Filonovich, S. A.; Gomes, M. J. M.; Talapin, D. V.; Rogach, A. L.; Eychmuller, A. Phys. E (Amsterdam, Neth.) 2003200320032003, 17, 99-100. (102) Lu, Y.; Yin, Y.; Li, Z.-Y.; Xia, Y. Nano Lett. 2002200220022002, 2, 785-788. (103) Dabbousi, B. O.; Rodriguez-Viejo, J.; Mikulec, F. V.; Heine, J. R.; Mattoussi, H.; Ober, R.; Jensen, K. F.; Bawendi, M. G. J. Phys. Chem. B 1997199719971997, 101, 9463-9475.
Page 33 of 39
ACS Paragon Plus Environment
Journal of the American Chemical Society
123456789101112131415161718192021222324252627282930313233343536373839404142434445464748495051525354555657585960

34
(104) Chen, Y.; Vela, J.; Htoon, H.; Casson, J. L.; Werder, D. J.; Bussian, D. A.; Klimov, V. I.; Hollingsworth, J. A. J. Am. Chem. Soc. 2008200820082008, 130, 5026-5027. (105) Kovalenko, M. V.; Scheele, M.; Talapin, D. V. Science 2009200920092009, 324, 1417-1420. (106) Dolzhnikov, D. S.; Zhang, H.; Jang, J.; Son, J. S.; Panthani, M. G.; Shibata, T.; Chattopadhyay, S.; Talapin, D. V. Science 2015201520152015, 347, 425-428. (107) Evans, A. G.; Cannon, R. M. Acta Metall. Mater. 1986198619861986, 34, 761-800. (108) Garvie, R. C. J. Phys. Chem. 1978197819781978, 82, 218-224. (109) XRD characterization does not univocally allow for the distinction of tetragonal and cubic phase in nanocrystalline ZrO2 due to the similarity of the two structures and peak broadening. Nonetheless, the tetragonal phase is more thermodynamically stable than the cubic phase at room temperature. (110) Shaw, S.; Yuan, B.; Tian, X. C.; Miller, K. J.; Cote, B. M.; Colaux, J. L.; Migliori, A.; Panthani, M. G.; Cademartiri, L. Advanced Materials 2016201620162016, 28, 8892-8899. (111) Barr, T. L.; Seal, S. J. Vac. Sci. Technol., A 1995199519951995, 13, 1239-1246. (112) Chastain, J.; King, R. C.; Moulder, J. Handbook of X-ray photoelectron spectroscopy: a reference book of standard spectra for identification and interpretation of XPS data; Physical Electronics Eden Prairie, MN, 1995. (113) Parmigiani, F.; Depero, L. E.; Sangaletti, L.; Samoggia, G. J. Electron Spectrosc. Relat. Phenom. 1993199319931993, 63, 1-10. (114) Dengo, N.; Vittadini, A.; Natile, M. M.; Gross, S. In E-MRS Lille, 2016 (115) Langford, J. I.; Wilson, A. J. C. J. Appl. Crystallogr. 1978197819781978, 11, 102-113. (116) Cademartiri, L.; Montanari, E.; Calestani, G.; Migliori, A.; Guagliardi, A.; Ozin, G. A. J. Am. Chem. Soc. 2006200620062006, 128, 10337-10346. (117) Huang, F.; Zhang, H. Z.; Banfield, J. F. Nano Lett. 2003200320032003, 3, 373-378. (118) Talapin, D. V.; Rogach, A. L.; Haase, M.; Weller, H. J. Phys. Chem. B 2001200120012001, 105, 12278-12285. (119) Voorhees, P. W. J. Stat. Phys. 1985198519851985, 38, 231-252. (120) Volmer, M.; Weber, A. Z. Phys. Chem.-Stoch. Ve. 1926192619261926, 119, 277-301. (121) Ostwald, W. Z. Phys. Chem. 1901190119011901, 37, 385. (122) Ostwald, W. Lehrbuch der Allgemeinen Chemie Leipzig, Germany, 1896; Vol. 2. (123) Veshchunov, M. S. Materials 2009200920092009, 2, 1252-1287. (124) Quach, D. V.; Avila-Paredes, H.; Kim, S.; Martin, M.; Munir, Z. A. Acta Mater. 2010201020102010, 58, 5022-5030. (125) Baldan, A. J. Mater. Sci. 2002200220022002, 37, 2171-2202. (126) Chokshi, A. H. Scr. Mater. 2003200320032003, 48, 791-796. (127) Tekeli, S.; Erdogan, M.; Aktas, B. Ceram. Int. 2004200420042004, 30, 2203-2209. (128) Goto, Y.; Omata, T.; Otsuka-Yao-Matsuo, S. J. Electrochem. Soc. 2009200920092009, 156, K4-K9. (129) Mohapatra, P.; Cademartiri, L. 2017201720172017, in preparation. (130) Hay, J.; Crawford, B. J. Mater. Res. 2011201120112011, 26, 727-738. (131) Kendall, K.; Alford, N. M.; Birchall, J. D. Nature 1987198719871987, 325, 794-796. (132) Wollmershauser, J. A.; Feigelson, B. N.; Gorzkowski, E. P.; Ellis, C. T.; Goswami, R.; Qadri, S. B.; Nguyen, D. D.; Tischler, J. G.; Kub, F. J.; Everett, R. K. Scr. Mater. 2014201420142014, 92, 65-68. (133) Wollmershauser, J. A.; Feigelson, B. N.; Gorzkowski, E. P.; Ellis, C. T.; Goswami, R.; Qadri, S. B.; Tischler, J. G.; Kub, F. J.; Everett, R. K. Acta Mater. 2014201420142014, 69, 9-16.
Page 34 of 39
ACS Paragon Plus Environment
Journal of the American Chemical Society
123456789101112131415161718192021222324252627282930313233343536373839404142434445464748495051525354555657585960
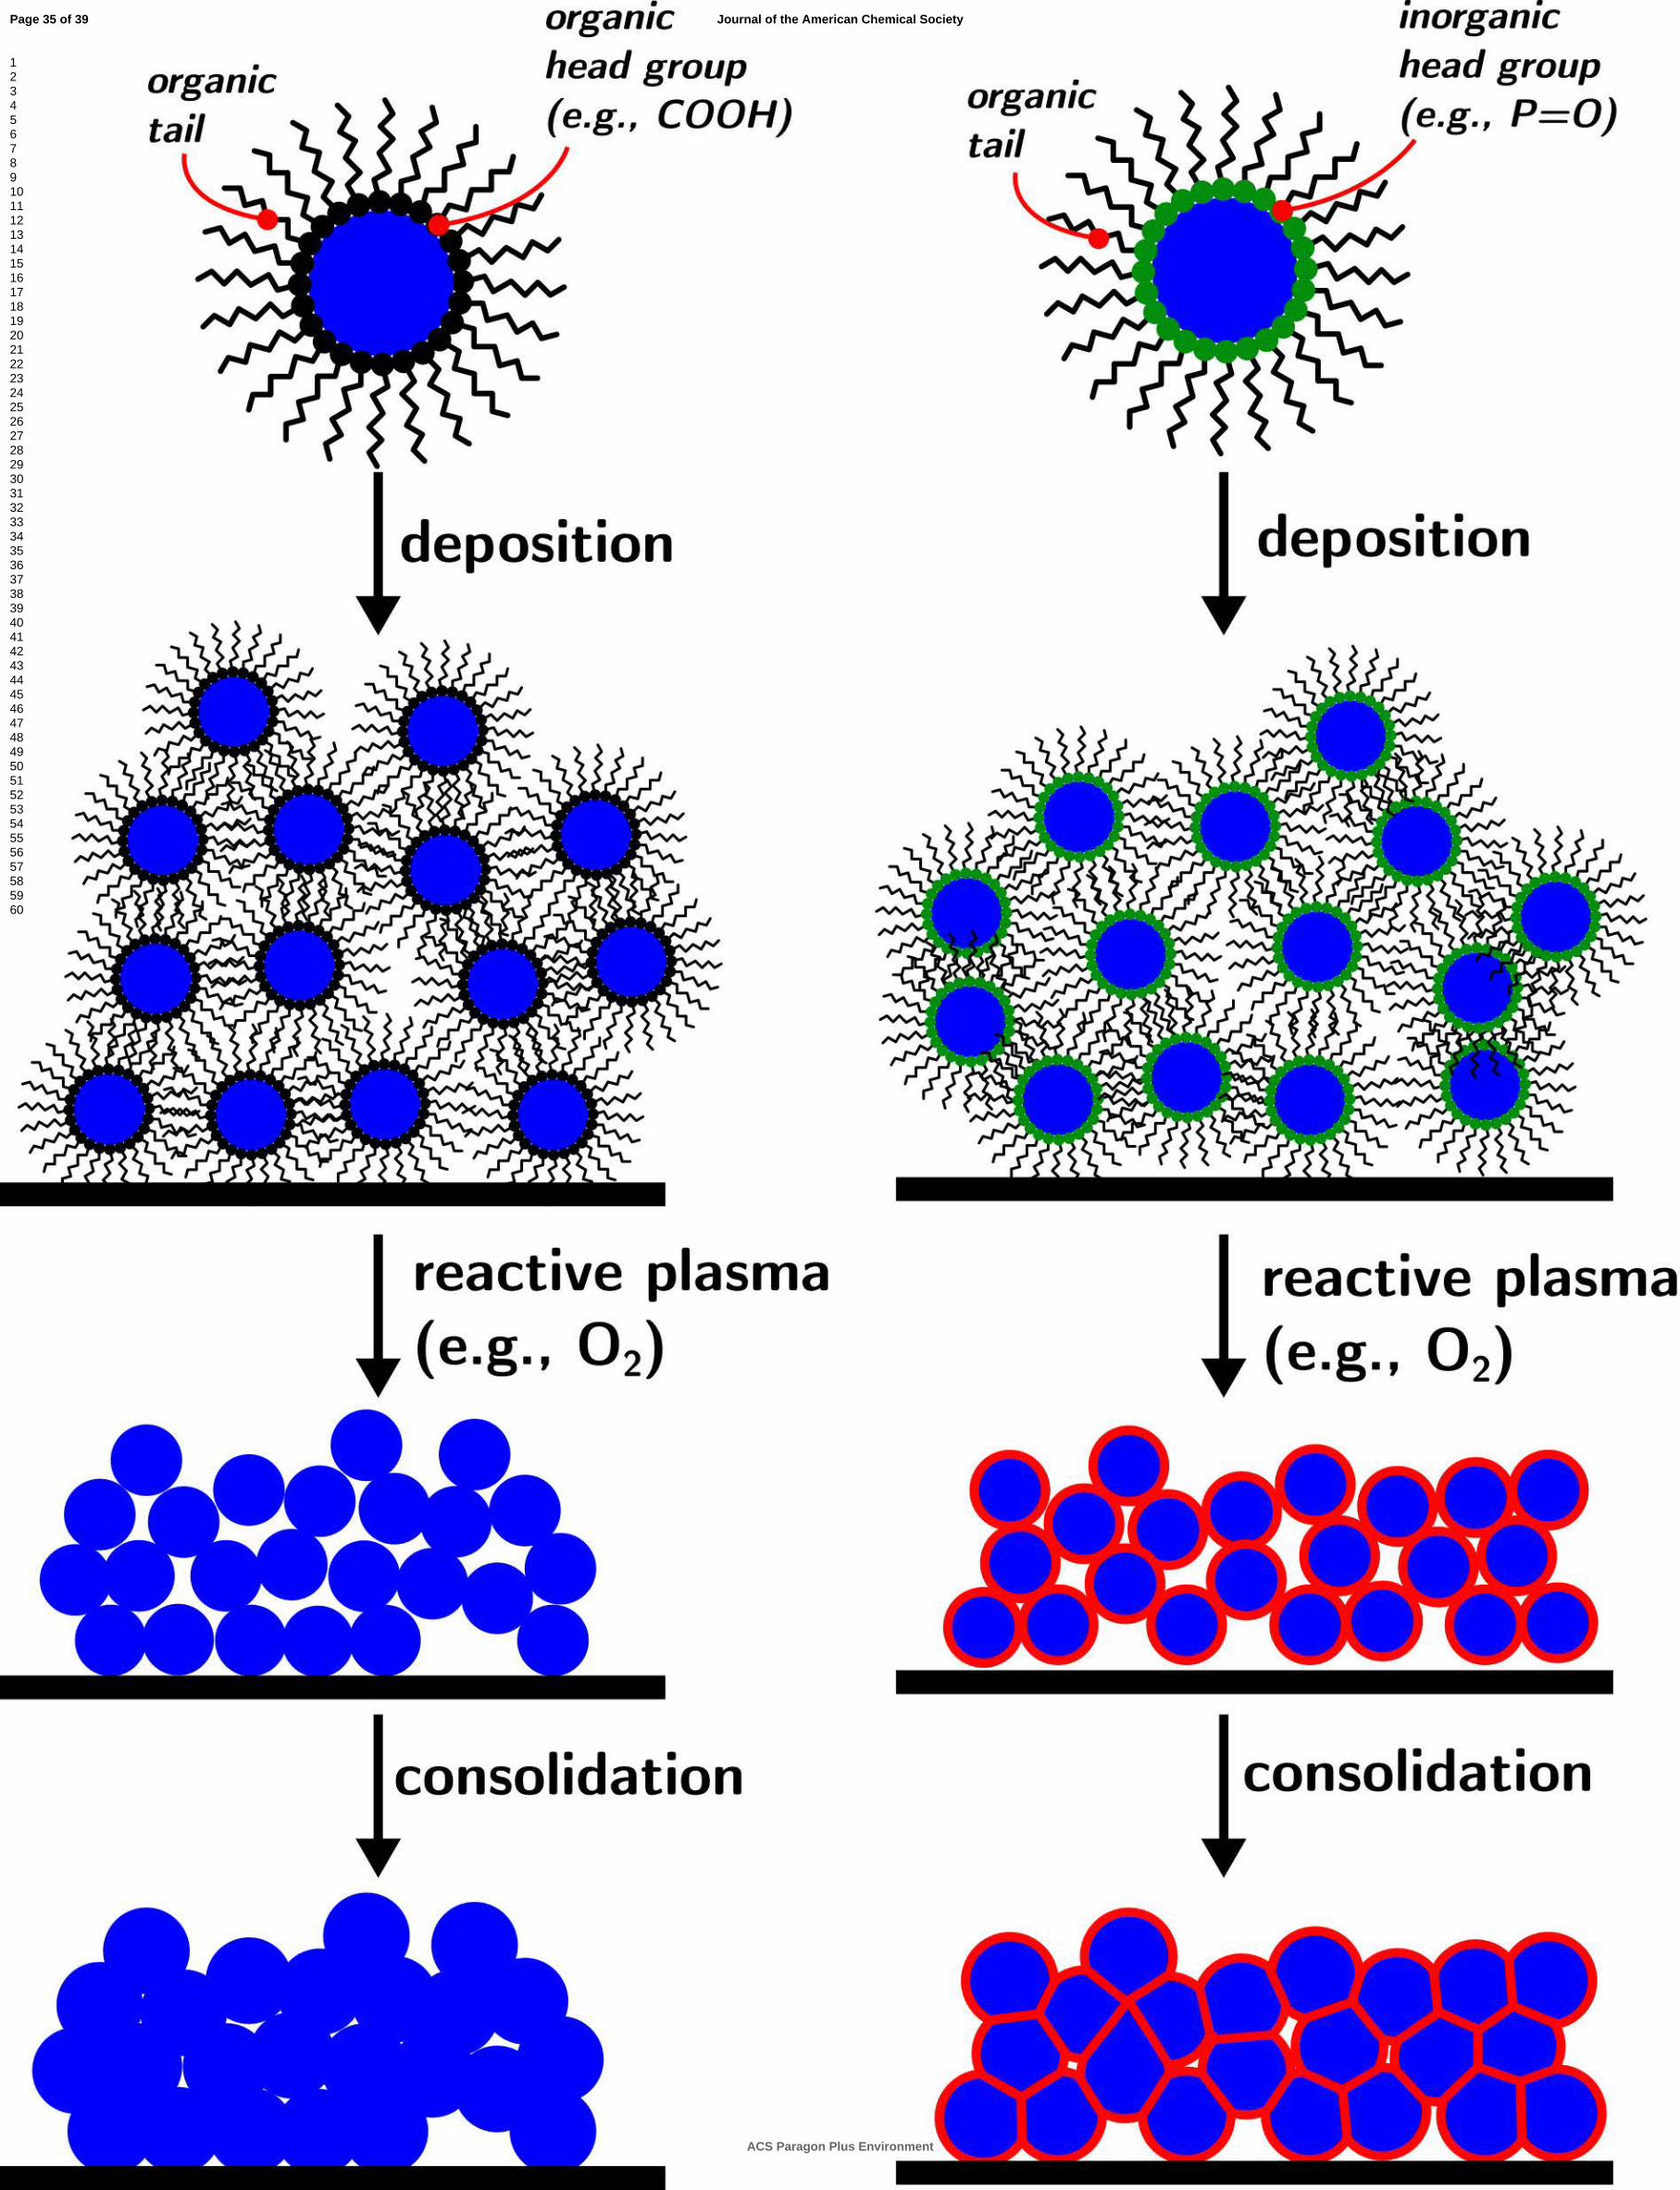
Page 35 of 39
ACS Paragon Plus Environment
Journal of the American Chemical Society
123456789101112131415161718192021222324252627282930313233343536373839404142434445464748495051525354555657585960

Page 36 of 39
ACS Paragon Plus Environment
Journal of the American Chemical Society
123456789101112131415161718192021222324252627282930313233343536373839404142434445464748495051525354555657585960

Page 37 of 39
ACS Paragon Plus Environment
Journal of the American Chemical Society
123456789101112131415161718192021222324252627282930313233343536373839404142434445464748495051525354555657585960

Page 38 of 39
ACS Paragon Plus Environment
Journal of the American Chemical Society
123456789101112131415161718192021222324252627282930313233343536373839404142434445464748495051525354555657585960

Page 39 of 39
ACS Paragon Plus Environment
Journal of the American Chemical Society
123456789101112131415161718192021222324252627282930313233343536373839404142434445464748495051525354555657585960
Copyright © 2022 FDOKUMEN