Web-based semantic similarity: An evaluation in the biomedical domain
Review
Semantic Similarity in Biomedical OntologiesCatia Pesquita1*, Daniel Faria1, Andre O. Falcao1, Phillip Lord2, Francisco M. Couto1
1 LaSIGE, Faculty of Sciences, University of Lisboa, Lisboa, Portugal, 2 School of Computing Science, Newcastle University, Newcastle-upon-Tyne, United Kingdom
Abstract: In recent years, ontologies have become amainstream topic in biomedical research. When biologicalentities are described using a common schema, such as anontology, they can be compared by means of theirannotations. This type of comparison is called semanticsimilarity, since it assesses the degree of relatednessbetween two entities by the similarity in meaning of theirannotations. The application of semantic similarity tobiomedical ontologies is recent; nevertheless, severalstudies have been published in the last few yearsdescribing and evaluating diverse approaches. Semanticsimilarity has become a valuable tool for validating theresults drawn from biomedical studies such as geneclustering, gene expression data analysis, prediction andvalidation of molecular interactions, and disease geneprioritization. We review semantic similarity measuresapplied to biomedical ontologies and propose theirclassification according to the strategies they employ:node-based versus edge-based and pairwise versusgroupwise. We also present comparative assessmentstudies and discuss the implications of their results. Wesurvey the existing implementations of semantic similaritymeasures, and we describe examples of applications tobiomedical research. This will clarify how biomedicalresearchers can benefit from semantic similarity measuresand help them choose the approach most suitable fortheir studies. Biomedical ontologies are evolving towardincreased coverage, formality, and integration, and theiruse for annotation is increasingly becoming a focus ofboth effort by biomedical experts and application ofautomated annotation procedures to create corpora ofhigher quality and completeness than are currentlyavailable. Given that semantic similarity measures aredirectly dependent on these evolutions, we can expect tosee them gaining more relevance and even becoming asessential as sequence similarity is today in biomedicalresearch.
Introduction
Comparison and classification have been central pillars of
biology since Linnaeus proposed his taxonomy and Darwin
observed the mockingbirds on the Galapagos Islands. Like most
scientific knowledge, biological laws and models are derived from
comparing entities (such as genes, cells, organisms, populations,
species) and finding their similarities and differences. However,
biology is unlike other sciences in that its knowledge can seldom be
reduced to mathematical form. Thus, biologists either record their
knowledge in natural language—for example, in scientific
publications—or they must seek other forms of representation to
organize it, such as classification schemes. When new entities arise,
biologists approach them by comparing them to known entities
and making inferences according to their degree of similarity.
Comparing entities is not always trivial. For instance, while the
sequences or structures of two gene products can be compared
directly (through alignment algorithms), the same is not true of
their functional aspects. The difference is that sequences and
structures have an objective representation and measurable
properties, whereas functional aspects have neither. This does
not mean that it is impossible to compare functional aspects, but
that to be compared they must be expressed in a common and
objective form.
The advent of automated sequencing has had deep repercus-
sions on knowledge representation in biology. As experimental
methods shift in scope from the gene level to the genomic level,
computational analysis is proving essential in handling the
increasing amount of data. Thus it has become crucial to adopt
common and objective knowledge representations to help
knowledge sharing and computer reasoning. This need led to
the development of ontologies for goals such as annotating gene
products (Gene Ontology), annotating sequences (Sequence
Ontology), and annotating experimental assays (Microarray and
Gene Expression Data Ontology).
The adoption of ontologies for annotation provides a means to
compare entities on aspects that would otherwise not be
comparable. For instance, if two gene products are annotated
within the same schema, we can compare them by comparing the
terms with which they are annotated. While this comparison is
often done implicitly (for instance, by finding the common terms in
a set of interacting gene products), it is possible to do an explicit
comparison with semantic similarity measures. Within the context
of this article, we define a semantic similarity measure as a
function that, given two ontology terms or two sets of terms
annotating two entities, returns a numerical value reflecting the
closeness in meaning between them.
The Gene Ontology (GO) [1] is the main focus of investigation
of semantic similarity in molecular biology, not only because it is
the ontology most widely adopted by the life sciences community,
but also because comparing gene products at the functional level is
crucial for a variety of applications. Semantic similarity applied to
the GO annotations of gene products provides a measure of their
functional similarity. From this point forward, we will use the term
Citation: Pesquita C, Faria D, Falcao AO, Lord P, Couto FM (2009) SemanticSimilarity in Biomedical Ontologies. PLoS Comput Biol 5(7): e1000443.doi:10.1371/journal.pcbi.1000443
Editor: Philip E. Bourne, University of California San Diego, United States ofAmerica
Published July 31, 2009
Copyright: � 2009 Pesquita et al. This is an open-access article distributedunder the terms of the Creative Commons Attribution License, which permitsunrestricted use, distribution, and reproduction in any medium, provided theoriginal author and source are credited.
Funding: This work was supported by the Portuguese Fundacao para a Ciencia eTecnologia through the Multiannual Funding Programme, and the PhD grantsSFRH/BD/42481/2007 and SFRH/BD/29797/2006. The funder approved the PhDplans of the two students. The funders had no role in study design, datacollection and analysis, decision to publish, or preparation of the manuscript.
Competing Interests: The authors have declared that no competing interestsexist.
* E-mail: [email protected]
PLoS Computational Biology | www.ploscompbiol.org 1 July 2009 | Volume 5 | Issue 7 | e1000443
‘‘functional similarity’’ when referring to the similarity between
two gene products given by the semantic similarity between the
sets of GO terms with which they are annotated. As such, the
semantic similarity measures and the studies reviewed in this
article are presented in the context of GO, notwithstanding the
fact that they are applicable to other biological ontologies.
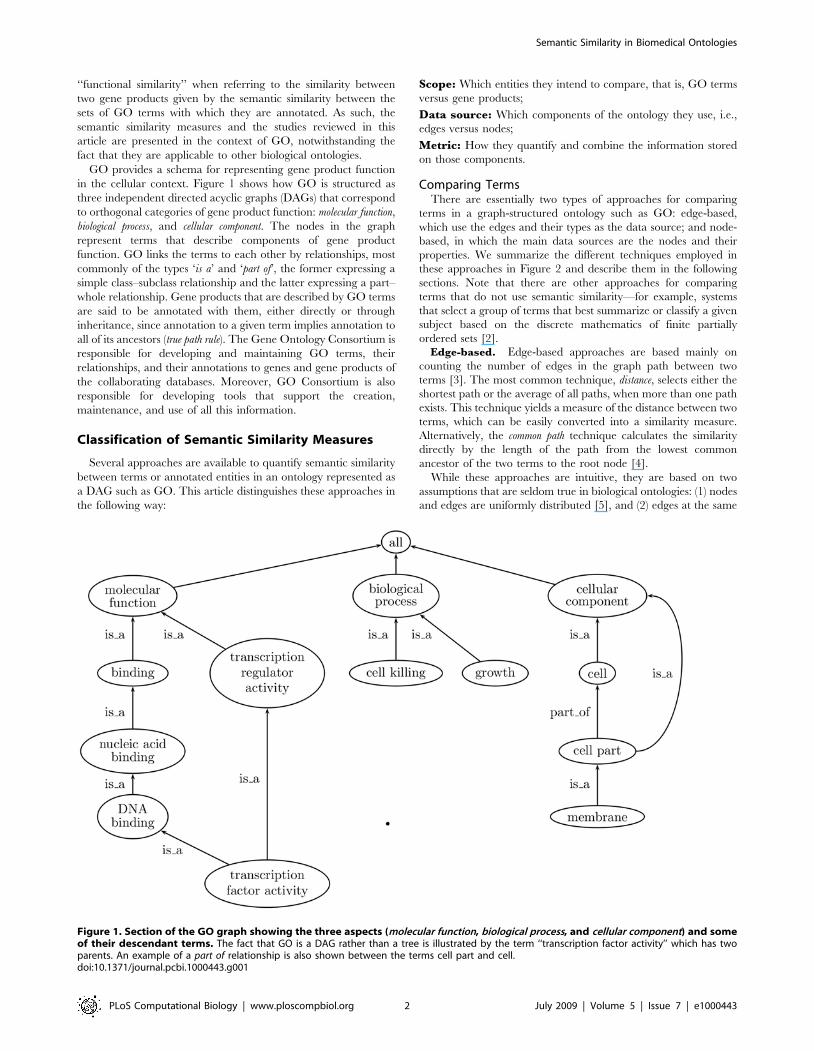
GO provides a schema for representing gene product function
in the cellular context. Figure 1 shows how GO is structured as
three independent directed acyclic graphs (DAGs) that correspond
to orthogonal categories of gene product function: molecular function,
biological process, and cellular component. The nodes in the graph
represent terms that describe components of gene product
function. GO links the terms to each other by relationships, most
commonly of the types ‘is a’ and ‘part of’, the former expressing a
simple class–subclass relationship and the latter expressing a part–
whole relationship. Gene products that are described by GO terms
are said to be annotated with them, either directly or through
inheritance, since annotation to a given term implies annotation to
all of its ancestors (true path rule). The Gene Ontology Consortium is
responsible for developing and maintaining GO terms, their
relationships, and their annotations to genes and gene products of
the collaborating databases. Moreover, GO Consortium is also
responsible for developing tools that support the creation,
maintenance, and use of all this information.
Classification of Semantic Similarity Measures
Several approaches are available to quantify semantic similarity
between terms or annotated entities in an ontology represented as
a DAG such as GO. This article distinguishes these approaches in
the following way:
Scope: Which entities they intend to compare, that is, GO terms
versus gene products;
Data source: Which components of the ontology they use, i.e.,
edges versus nodes;
Metric: How they quantify and combine the information stored
on those components.
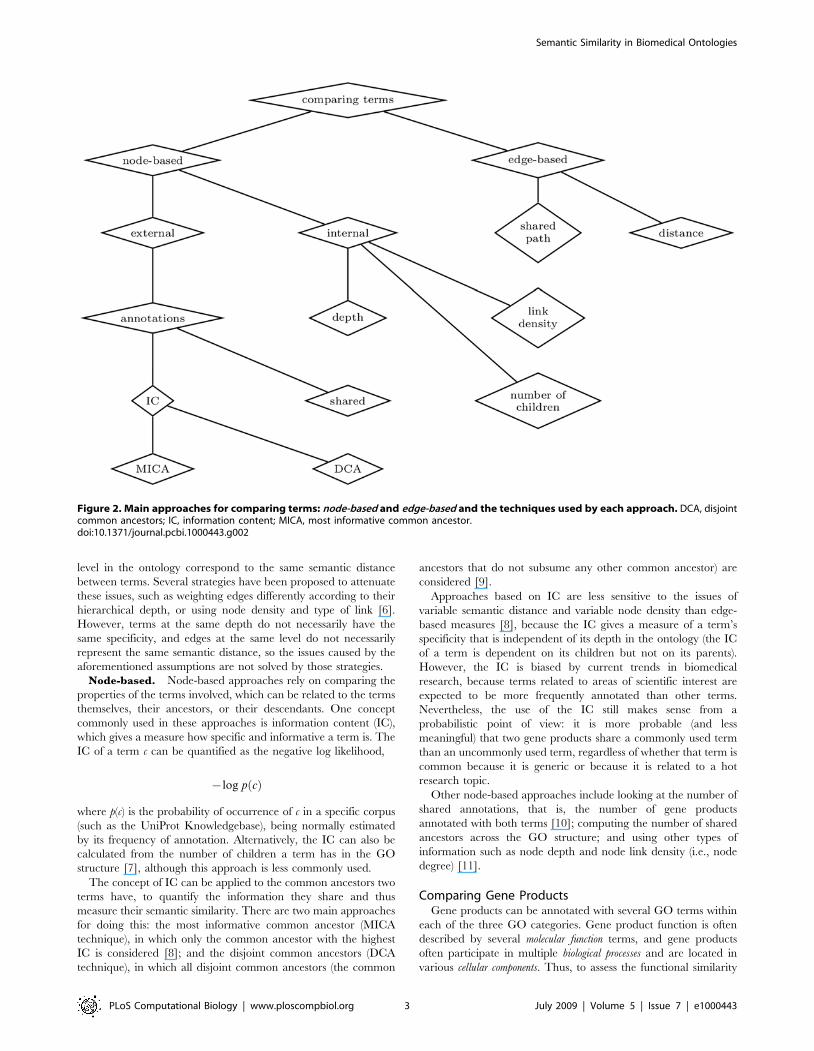
Comparing TermsThere are essentially two types of approaches for comparing
terms in a graph-structured ontology such as GO: edge-based,
which use the edges and their types as the data source; and node-
based, in which the main data sources are the nodes and their
properties. We summarize the different techniques employed in
these approaches in Figure 2 and describe them in the following
sections. Note that there are other approaches for comparing
terms that do not use semantic similarity—for example, systems
that select a group of terms that best summarize or classify a given
subject based on the discrete mathematics of finite partially
ordered sets [2].Edge-based. Edge-based approaches are based mainly on
counting the number of edges in the graph path between two
terms [3]. The most common technique, distance, selects either the
shortest path or the average of all paths, when more than one path
exists. This technique yields a measure of the distance between two
terms, which can be easily converted into a similarity measure.
Alternatively, the common path technique calculates the similarity
directly by the length of the path from the lowest common
ancestor of the two terms to the root node [4].
While these approaches are intuitive, they are based on two
assumptions that are seldom true in biological ontologies: (1) nodes
and edges are uniformly distributed [5], and (2) edges at the same
Figure 1. Section of the GO graph showing the three aspects (molecular function, biological process, and cellular component) and someof their descendant terms. The fact that GO is a DAG rather than a tree is illustrated by the term ‘‘transcription factor activity’’ which has twoparents. An example of a part of relationship is also shown between the terms cell part and cell.doi:10.1371/journal.pcbi.1000443.g001
Semantic Similarity in Biomedical Ontologies
PLoS Computational Biology | www.ploscompbiol.org 2 July 2009 | Volume 5 | Issue 7 | e1000443
level in the ontology correspond to the same semantic distance
between terms. Several strategies have been proposed to attenuate
these issues, such as weighting edges differently according to their
hierarchical depth, or using node density and type of link [6].
However, terms at the same depth do not necessarily have the
same specificity, and edges at the same level do not necessarily
represent the same semantic distance, so the issues caused by the
aforementioned assumptions are not solved by those strategies.
Node-based. Node-based approaches rely on comparing the
properties of the terms involved, which can be related to the terms
themselves, their ancestors, or their descendants. One concept
commonly used in these approaches is information content (IC),
which gives a measure how specific and informative a term is. The
IC of a term c can be quantified as the negative log likelihood,
{log p cð Þ
where p(c) is the probability of occurrence of c in a specific corpus
(such as the UniProt Knowledgebase), being normally estimated
by its frequency of annotation. Alternatively, the IC can also be
calculated from the number of children a term has in the GO
structure [7], although this approach is less commonly used.
The concept of IC can be applied to the common ancestors two
terms have, to quantify the information they share and thus
measure their semantic similarity. There are two main approaches
for doing this: the most informative common ancestor (MICA
technique), in which only the common ancestor with the highest
IC is considered [8]; and the disjoint common ancestors (DCA
technique), in which all disjoint common ancestors (the common
ancestors that do not subsume any other common ancestor) are
considered [9].
Approaches based on IC are less sensitive to the issues of
variable semantic distance and variable node density than edge-
based measures [8], because the IC gives a measure of a term’s
specificity that is independent of its depth in the ontology (the IC
of a term is dependent on its children but not on its parents).
However, the IC is biased by current trends in biomedical
research, because terms related to areas of scientific interest are
expected to be more frequently annotated than other terms.
Nevertheless, the use of the IC still makes sense from a
probabilistic point of view: it is more probable (and less
meaningful) that two gene products share a commonly used term
than an uncommonly used term, regardless of whether that term is
common because it is generic or because it is related to a hot
research topic.
Other node-based approaches include looking at the number of
shared annotations, that is, the number of gene products
annotated with both terms [10]; computing the number of shared
ancestors across the GO structure; and using other types of
information such as node depth and node link density (i.e., node
degree) [11].
Comparing Gene ProductsGene products can be annotated with several GO terms within
each of the three GO categories. Gene product function is often
described by several molecular function terms, and gene products
often participate in multiple biological processes and are located in
various cellular components. Thus, to assess the functional similarity
Figure 2. Main approaches for comparing terms: node-based and edge-based and the techniques used by each approach. DCA, disjointcommon ancestors; IC, information content; MICA, most informative common ancestor.doi:10.1371/journal.pcbi.1000443.g002
Semantic Similarity in Biomedical Ontologies
PLoS Computational Biology | www.ploscompbiol.org 3 July 2009 | Volume 5 | Issue 7 | e1000443
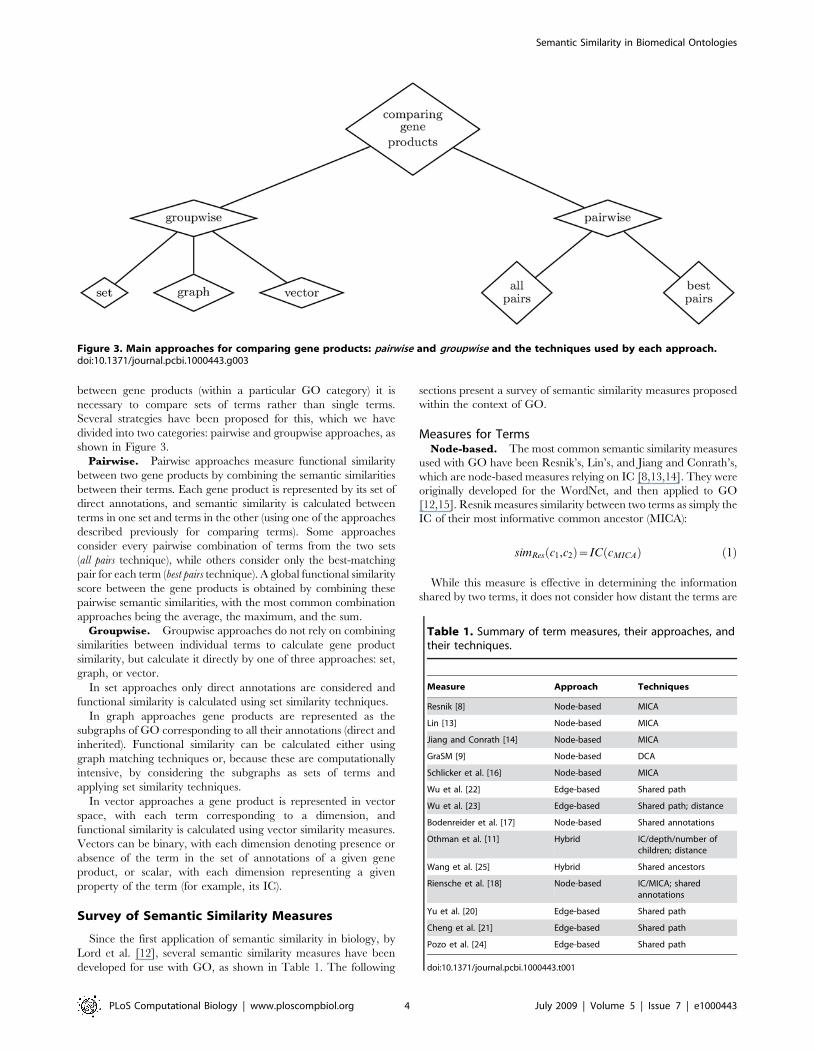
between gene products (within a particular GO category) it is
necessary to compare sets of terms rather than single terms.
Several strategies have been proposed for this, which we have
divided into two categories: pairwise and groupwise approaches, as
shown in Figure 3.
Pairwise. Pairwise approaches measure functional similarity
between two gene products by combining the semantic similarities
between their terms. Each gene product is represented by its set of
direct annotations, and semantic similarity is calculated between
terms in one set and terms in the other (using one of the approaches
described previously for comparing terms). Some approaches
consider every pairwise combination of terms from the two sets
(all pairs technique), while others consider only the best-matching
pair for each term (best pairs technique). A global functional similarity
score between the gene products is obtained by combining these
pairwise semantic similarities, with the most common combination
approaches being the average, the maximum, and the sum.
Groupwise. Groupwise approaches do not rely on combining
similarities between individual terms to calculate gene product
similarity, but calculate it directly by one of three approaches: set,
graph, or vector.
In set approaches only direct annotations are considered and
functional similarity is calculated using set similarity techniques.
In graph approaches gene products are represented as the
subgraphs of GO corresponding to all their annotations (direct and
inherited). Functional similarity can be calculated either using
graph matching techniques or, because these are computationally
intensive, by considering the subgraphs as sets of terms and
applying set similarity techniques.
In vector approaches a gene product is represented in vector
space, with each term corresponding to a dimension, and
functional similarity is calculated using vector similarity measures.
Vectors can be binary, with each dimension denoting presence or
absence of the term in the set of annotations of a given gene
product, or scalar, with each dimension representing a given
property of the term (for example, its IC).
Survey of Semantic Similarity Measures
Since the first application of semantic similarity in biology, by
Lord et al. [12], several semantic similarity measures have been
developed for use with GO, as shown in Table 1. The following
sections present a survey of semantic similarity measures proposed
within the context of GO.
Measures for TermsNode-based. The most common semantic similarity measures
used with GO have been Resnik’s, Lin’s, and Jiang and Conrath’s,
which are node-based measures relying on IC [8,13,14]. They were
originally developed for the WordNet, and then applied to GO
[12,15]. Resnik measures similarity between two terms as simply the
IC of their most informative common ancestor (MICA):
simRes c1,c2ð Þ~IC cMICAð Þ ð1Þ
While this measure is effective in determining the information
shared by two terms, it does not consider how distant the terms are
Figure 3. Main approaches for comparing gene products: pairwise and groupwise and the techniques used by each approach.doi:10.1371/journal.pcbi.1000443.g003
Table 1. Summary of term measures, their approaches, andtheir techniques.
Measure Approach Techniques
Resnik [8] Node-based MICA
Lin [13] Node-based MICA
Jiang and Conrath [14] Node-based MICA
GraSM [9] Node-based DCA
Schlicker et al. [16] Node-based MICA
Wu et al. [22] Edge-based Shared path
Wu et al. [23] Edge-based Shared path; distance
Bodenreider et al. [17] Node-based Shared annotations
Othman et al. [11] Hybrid IC/depth/number ofchildren; distance
Wang et al. [25] Hybrid Shared ancestors
Riensche et al. [18] Node-based IC/MICA; sharedannotations
Yu et al. [20] Edge-based Shared path
Cheng et al. [21] Edge-based Shared path
Pozo et al. [24] Edge-based Shared path
doi:10.1371/journal.pcbi.1000443.t001
Semantic Similarity in Biomedical Ontologies
PLoS Computational Biology | www.ploscompbiol.org 4 July 2009 | Volume 5 | Issue 7 | e1000443
from their common ancestor. To take that distance into account,
Lin’s and Jiang and Conrath’s measures relate the IC of the MICA
to the IC of the terms being compared:
simLin c1,c2ð Þ~ 2|IC cMICAð ÞIC c1ð ÞzIC c2ð Þ
ð2Þ
simJC c1,c2ð Þ~1{IC c1ð ÞzIC c2ð Þ{2|IC cMICAð Þ ð3Þ
However, being relative measures, simLin and simJC are
displaced from the graph. This means that these measures are
proportional to the IC differences between the terms and their
common ancestor, independently of the absolute IC of the
ancestor.
To overcome this limitation, Schlicker et al. [16] have proposed
the relevance similarity measure, which is based on Lin’s measure,
but uses the probability of annotation of the MICA as a weighting
factor to provide graph placement.
simRel c1,c2ð Þ~simLin c1,c2ð Þ| 1{p cAð Þð Þ ð4Þ
A constraint all of these measures share is that they look only at
a single common ancestor (the MICA) despite the fact that GO
terms can have several DCA. To avoid this, Couto et al. [9]
proposed the GraSM approach, which can be applied to any of
the measures previously described, and where the IC of the MICA
is replaced by the average IC of all DCA.
Bodenreider et al. [17] developed a node-based measure that
also uses annotation data but does not rely on information theory.
It represents each GO term as a vector of all gene products
annotated with it, and measures similarity between two terms by
computing the scalar product of their vectors.
Riensche et al. used coannotation data to map terms between
different GO categories and calculate a weighting factor, which
can then be applied to a standard node-based semantic similarity
measure [18].
Edge-based. Within the edge-based approaches, Pekar and
Staab proposed a measure based on the length of the longest path
between two terms’ lowest common ancestor and the root
(maximum common ancestor depth), and on the length of the
longest path between each of the terms and that common ancestor
[19]. It is given by the expression
simPS c1,c2ð Þ~ d ca,rootð Þd ca,rootð Þzd c1,cað Þzd c2,cað Þ ð5Þ
where d(c1,c2) is the length in number of edges of the longest
distance between term c1 and term c2. This measure was first
applied to GO by Yu et al. [20].
Cheng et al. also proposed a maximum common ancestor depth
measure, but weighted each edge to reflect depth [21]. Wu et al.
proposed a nonweighted maximum common ancestor depth
measure [22]. An adjustment of this measure was proposed by Wu
et al., introducing the distance to the nearest leaf node and the
distance to the lowest common ancestor to take term specificity
into account [23].
A distinct approach was proposed by Pozo et al. [24], where a
‘‘Functional Tree’’ for molecular function terms is first derived from
their co-occurrence in the same set of Interpro entries, and
semantic similarity between two terms is calculated from the
height of their lowest common ancestor in this ‘‘Functional Tree’’
rather than in the GO graph. With this approach, the authors
intend to reveal natural biological links between the terms.
Hybrid. Wang et al. [25] developed a hybrid measure in
which each edge is given a weight according to the type of
relationship. For a given term c1 and its ancestor ca, the authors
define the semantic contribution of ca to c1, as the product of all
edge weights in the ‘‘best’’ path from ca to c1, where the ‘‘best’’
path is the one that maximizes the product. Semantic similarity
between two terms is then calculated by summing the semantic
contributions of all common ancestors to each of the terms and
dividing by the total semantic contribution of each term’s
ancestors to that term. Othman et al. proposed a hybrid
distance measure in which each edge is weighted by node depth,
node link density, and difference in IC between the nodes linked
by that edge [11].
Measures for Gene ProductsSeveral measures for calculating the functional similarity
between gene products have also been developed, as shown in
Tables 2 and 3.
Pairwise. The most common methods of measuring gene
product functional similarity have been pairwise approaches based
on node-based term measures, namely, Resnik’s, Lin’s, and Jiang
and Conrath’s. Lord et al. were the first to apply these measures,
using the average of all pairwise similarities as the combination
strategy [12]; Sevilla et al. applied them using the maximum of the
pairwise similarities instead [26]; while Couto et al. and Azuaje et
al. opted for a composite average in which only the best-matching
term pairs are considered (best-match average) [9,27]. Schlicker et
al. all proposed a variation of the best-match average, by
combining semantic similarities for both molecular function and
biological process aspects of GO [16]; while Tao et al. used a
threshold of minimum similarity for selecting best-matching term
pairs, and considered only reciprocal pairs to reduce the noise
[28]. Riensche et al. also employed the maximum combination
strategy, but introduced a variation to allow comparison of terms
from different aspects of GO (see node-based term measures) [18].
Pairwise approaches have also been applied to edge-based
measures: Wang et al. and Pozo et al. used a best-match average
combination strategy with their measures [24,25], and Lei et al.
Table 2. Summary of pairwise approaches.
Measure Approach Techniques Term Comparison
Lord et al. [12] All pairs Average Resnik/Lin/Jiang
Sevillla et al. [26] All pairs Maximum Resnik/Lin/Jiang
Riensche et al. [18] (XOA) All pairs Maximum XOA
Azuaje et al. [27] Best pairs Average Resnik/Lin/Jiang
Couto et al. [9] Best pairs Average GraSM+(Resnik/Lin/Jiang)
Schlicker et al. [16] (funSim) Best pairs Average simRel
Wang et al. [25] Best pairs Average Wang
Tao et al. [61] (ITSS) Best pairs AverageMin. threshold
Lin
Pozo et al. [24] Best pairs Average Pozo
Lei et al. [29] All pairsBest pairsa
AverageMax, Sum
Depth of LCA
aLei et. al also consider exact matches only.doi:10.1371/journal.pcbi.1000443.t002
Semantic Similarity in Biomedical Ontologies
PLoS Computational Biology | www.ploscompbiol.org 5 July 2009 | Volume 5 | Issue 7 | e1000443
tested a number of different combination approaches, including
the average, maximum, and sum for all pairs, best pairs, and only
exact matches [29].
Of the several combination strategies employed in pairwise
measures, the best-match average variants are the best overall.
The maximum approach can answer the question of whether two
gene products share a functional aspect, but is unsuitable to assess
their global similarity, as it is indifferent to the number of
functional aspects they share and to the number of functional
aspects in which they differ. For instance, a gene product A with
terms t1 and t2 will be considered 100% similar to a gene product
B with terms t1 and t3 under the maximum approach, which
obviously does not reflect the differences between the gene
products. As for the average approach, because it makes an all-
against-all comparison of the terms of two gene products, it will
produce counterintuitive results for gene products that have
several distinct functional aspects. For instance, two gene products,
A and B, that share the same two unrelated terms, t1 and t2, will be
50% similar under the average approach, because similarity will
be calculated between both the matching and the opposite terms
of the two gene products. The best-match average approach
provides a good balance between the maximum and average
approaches by considering all terms but only the most significant
matching.
Groupwise. Purely set-based approaches are not common,
because few measures consider only direct annotations, but many
graph-based approaches use set similarity techniques to simplify
the problem of graph matching. The first graph-based measure to
be applied to GO was that of Lee et al. [30], in which the
similarity between gene products is defined by the number of
terms they share (term overlap [TO]). More recently, Mistry et al.
[31] proposed a normalized version of Lee’s measure (NTO), in
which the number of overlapping terms is divided by the
annotation set size for the gene with the lower number of
annotations. GOToolBox also implements some set similarity
techniques applied to GO graphs, namely Czekanowski-Dice and
Jaccard [32]. Gentleman’s simLP and simUI measures were also
among the first graph-based measures to be applied to GO [33]:
simLP extends the maximum common ancestor depth concept to
gene products, so two gene products are as similar as the depth of
the term that is the lowest common ancestor to all the terms’ direct
annotations; whereas simUI considers gene products as the set of
terms in their annotation subgraphs, and uses the Jaccard index to
calculate the similarity between them:
J(A,B)~jA\BjjA|Bj ð6Þ
Based also on the Jaccard index, Pesquita et al. have proposed
the simGIC measure, in which each GO term is weighted by its IC
[34].
Ye et al. proposed a normalized version of simLP that takes into
account the minimum and maximum depths within each GO
category [35].
Cho et al. developed a simpler groupwise approach, in which the
semantic similarity between two gene products is given by the
information content of the most informative term they share [36].
This produces the same result as Resnik’s measure with the
maximum combination strategy, but is simpler to apply to gene
products, as it does not require computing pairwise term similarities.
Other graph-based measures consider the probability of a gene
product being annotated with a particular set of terms (annotation
set probability). Lin et al. calculate the similarity between two gene
product subgraphs as the frequency of occurrence of the graph
resulting from the intersection of both subgraphs, that is, the
frequency of gene products whose annotation subgraph contains
the intersect graph [37]. Yu et al. proposed the ‘‘total ancestry
similarity’’ measure, a probabilistic approach in which similarity is
given by the probability that any two gene products have exactly
the same set of lowest common ancestors as the two gene products
being compared [38]. The SSA algorithm by Sheehan et al. is
based on the probability of any given gene product being
annotated with the nearest common ancestors of two gene
products. This probability is then transformed into an IC measure
that the authors use to compute Resnik’s and Lin’s measures to
obtain a final gene product similarity value [39]. This algorithm
also considers the types of relations between the terms in the
subgraphs and corrects the number of annotations for the parent
term in a part_of relation, if its number of annotations is smaller
than its child’s, to comply with the logic that if the part exists,
necessarily the whole does too.
Table 3. Summary of groupwise approaches.
Measure Approach Techniques Weighting
Lee et al. [30] (TO) Graph-based Term overlap None
Mistry et al. [31] (NTO) Graph-based Term overlap, Normalized None
Gentleman [33] (simLP) Graph-based Shared-path None
Gentleman [33] (simUI) Graph-based Jaccard None
Martin et al. [32] (GOToolBox) Graph-based Czekanowski-Dice, Jaccard None
Pesquita et al. [44] (simUI) Graph-based Jaccard IC
Ye et al. [35] Graph-based LCA, Normalized None
Cho et al. [36] Graph-based LCA IC
Lin et al. [37] Graph-based Intersection Annotation set probability
Yu et al. [38] Graph-based LCA Annotation set probability
Sheehan et al. [39] (SSA) Graph-based Resnik, Lin Annotation set probability
Huang et al. [40] Vector-based Kappa-statistic None
Chabalier et al. [41] Vector-based Cosine IC
doi:10.1371/journal.pcbi.1000443.t003
Semantic Similarity in Biomedical Ontologies
PLoS Computational Biology | www.ploscompbiol.org 6 July 2009 | Volume 5 | Issue 7 | e1000443
As for vector-based approaches, Huang et al. developed a gene
product similarity measure based on annotation profiles that
includes GO terms as well as many other derived from varied
sources for the tool DAVID [40]. Each gene product is
represented as a binary vector with each term having the value
1 if it is annotated to the gene product or 0 otherwise. Similarity is
calculated through kappa-statistics, which are a co-occurrence
probability measure corrected for chance.
Chabalier et al. also consider gene products as a vector of all
GO terms, but weight them according to their IC. Semantic
similarity is then calculated through the cosine similarity
algorithm, which is commonly used to measure document
similarity in information retrieval [41]:
CoSim A,Bð Þ~A:B
Aj j2z Bj j2{A:Bð7Þ
Evaluation of Semantic Similarity Measures
Given the variety of approaches and measures for semantic
similarity, a fundamental question arises: How well does each
measure capture the similarity in function between two gene
products?
Addressing this question is not trivial, because there is no direct
way to ascertain the true functional similarity between two gene
products. If there were, there would be no need to apply semantic
similarity in the first place. However, there are independent
properties, such as sequence similarity or coexpression data, that
can be used as measures of similarity at different levels, and by
correlating semantic similarity with such properties it is feasible to
assess how well a given measure captures the similarity between
gene products.
The choice of how to evaluate measures is still a subject of
debate, because no gold standard and few global comparative
studies exist. Furthermore, most authors test only a few measures
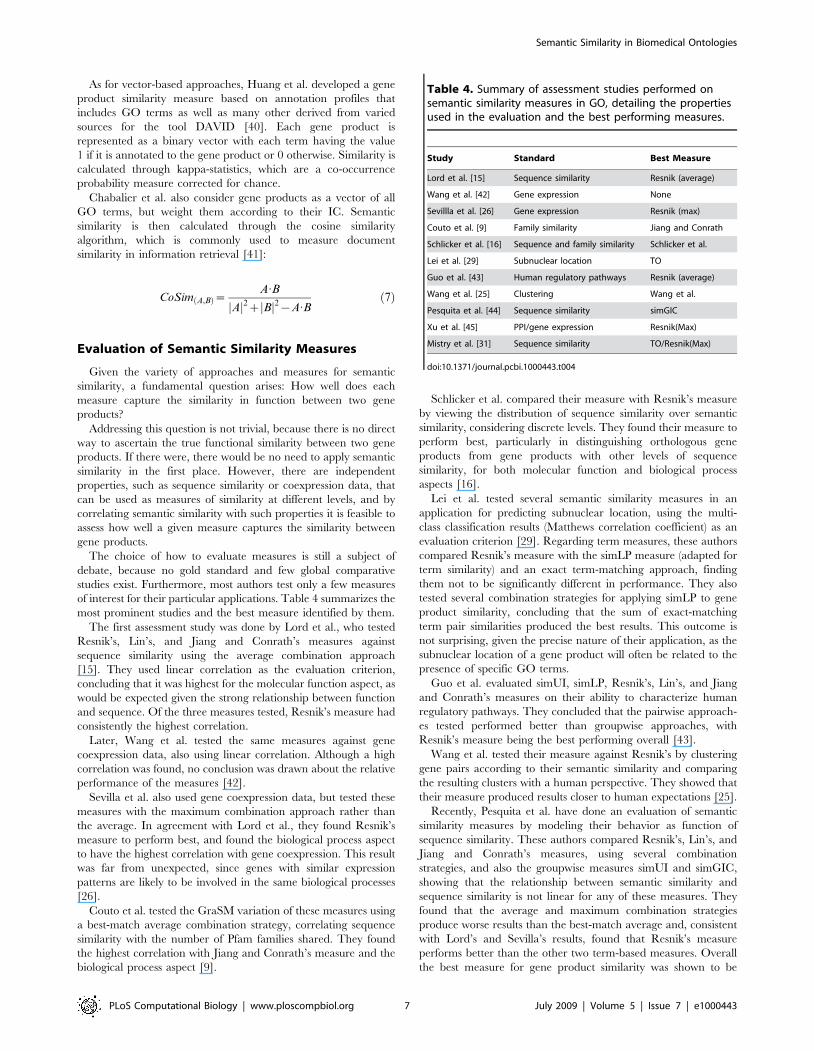
of interest for their particular applications. Table 4 summarizes the
most prominent studies and the best measure identified by them.
The first assessment study was done by Lord et al., who tested
Resnik’s, Lin’s, and Jiang and Conrath’s measures against
sequence similarity using the average combination approach
[15]. They used linear correlation as the evaluation criterion,
concluding that it was highest for the molecular function aspect, as
would be expected given the strong relationship between function
and sequence. Of the three measures tested, Resnik’s measure had
consistently the highest correlation.
Later, Wang et al. tested the same measures against gene
coexpression data, also using linear correlation. Although a high
correlation was found, no conclusion was drawn about the relative
performance of the measures [42].
Sevilla et al. also used gene coexpression data, but tested these
measures with the maximum combination approach rather than
the average. In agreement with Lord et al., they found Resnik’s
measure to perform best, and found the biological process aspect
to have the highest correlation with gene coexpression. This result
was far from unexpected, since genes with similar expression
patterns are likely to be involved in the same biological processes
[26].
Couto et al. tested the GraSM variation of these measures using
a best-match average combination strategy, correlating sequence
similarity with the number of Pfam families shared. They found
the highest correlation with Jiang and Conrath’s measure and the
biological process aspect [9].
Schlicker et al. compared their measure with Resnik’s measure
by viewing the distribution of sequence similarity over semantic
similarity, considering discrete levels. They found their measure to
perform best, particularly in distinguishing orthologous gene
products from gene products with other levels of sequence
similarity, for both molecular function and biological process
aspects [16].
Lei et al. tested several semantic similarity measures in an
application for predicting subnuclear location, using the multi-
class classification results (Matthews correlation coefficient) as an
evaluation criterion [29]. Regarding term measures, these authors
compared Resnik’s measure with the simLP measure (adapted for
term similarity) and an exact term-matching approach, finding
them not to be significantly different in performance. They also
tested several combination strategies for applying simLP to gene
product similarity, concluding that the sum of exact-matching
term pair similarities produced the best results. This outcome is
not surprising, given the precise nature of their application, as the
subnuclear location of a gene product will often be related to the
presence of specific GO terms.
Guo et al. evaluated simUI, simLP, Resnik’s, Lin’s, and Jiang
and Conrath’s measures on their ability to characterize human
regulatory pathways. They concluded that the pairwise approach-
es tested performed better than groupwise approaches, with
Resnik’s measure being the best performing overall [43].
Wang et al. tested their measure against Resnik’s by clustering
gene pairs according to their semantic similarity and comparing
the resulting clusters with a human perspective. They showed that
their measure produced results closer to human expectations [25].
Recently, Pesquita et al. have done an evaluation of semantic
similarity measures by modeling their behavior as function of
sequence similarity. These authors compared Resnik’s, Lin’s, and
Jiang and Conrath’s measures, using several combination
strategies, and also the groupwise measures simUI and simGIC,
showing that the relationship between semantic similarity and
sequence similarity is not linear for any of these measures. They
found that the average and maximum combination strategies
produce worse results than the best-match average and, consistent
with Lord’s and Sevilla’s results, found that Resnik’s measure
performs better than the other two term-based measures. Overall
the best measure for gene product similarity was shown to be
Table 4. Summary of assessment studies performed onsemantic similarity measures in GO, detailing the propertiesused in the evaluation and the best performing measures.
Study Standard Best Measure
Lord et al. [15] Sequence similarity Resnik (average)
Wang et al. [42] Gene expression None
Sevillla et al. [26] Gene expression Resnik (max)
Couto et al. [9] Family similarity Jiang and Conrath
Schlicker et al. [16] Sequence and family similarity Schlicker et al.
Lei et al. [29] Subnuclear location TO
Guo et al. [43] Human regulatory pathways Resnik (average)
Wang et al. [25] Clustering Wang et al.
Pesquita et al. [44] Sequence similarity simGIC
Xu et al. [45] PPI/gene expression Resnik(Max)
Mistry et al. [31] Sequence similarity TO/Resnik(Max)
doi:10.1371/journal.pcbi.1000443.t004
Semantic Similarity in Biomedical Ontologies
PLoS Computational Biology | www.ploscompbiol.org 7 July 2009 | Volume 5 | Issue 7 | e1000443
simGIC, slightly surpassing Resnik’s measure using the ‘‘pairwise-
best pairs-average’’ approach in resolution [44].
Xu et. al have also conducted an evaluation study using
protein–protein interactions and gene expression datasets of
Saccharomyces cerevisiae as the standard [45]. They tested the
maximum and average techniques with Resnik’s term similarity,
and also Tao’s, Schlicker’s, and Wang’s measures with receiver
operator characteristic (ROC) analysis. The maximum approach
was found to be the best performer in all GO categories. A positive
influence of the number of annotations per gene product was also
found.
Mistry et al. evaluated eleven measures: Resnik, Lin, and Jiang
and Conrath with both the average and maximum approaches;
three vector-based measures (cosine, weighted cosine, and kappa);
and TO and NTO. They investigated the correlation between
measures and the correlation with sequence similarity. They found
a good correlation between TO and Resnik’s maximum and
average. These three measures also correlated well to sequence
similarity, with TO presenting the highest correlation.
What we can draw from these studies is that there is no clear best
measure for comparing terms or gene products. Different measures
have performed differently under different circumstances, and a
given measure can be well suited for a specific task but perform
poorly in another. For instance, simUI was found by Guo et al. to be
the weakest measure when evaluated for its ability to characterize
human regulatory pathways, while Pesquita et al. found it to be
fairly good when evaluated against sequence similarity. However,
one result has been obtained consistently: pairwise measures using
Resnik’s term similarity outperform Lin’s and Jiang & Conrath’s
methods in all studies except family similarity.
There is also no clear best strategy for evaluating GO-based
semantic similarity measures; there are arguments for and against
most of the strategies employed. For instance, sequence similarity
is well known to be related to functional similarity, but it is just as
well known that there are gene products with similar sequences but
distinct functions and vice-versa. Another example are Pfam
families, which are related to global functional aspects of gene
products, but will likely not be suitable to compare with detailed
GO annotations.
Semantic Similarity Implementations
The rise in number of semantic similarity measures was
accompanied by the development of tools to calculate them.
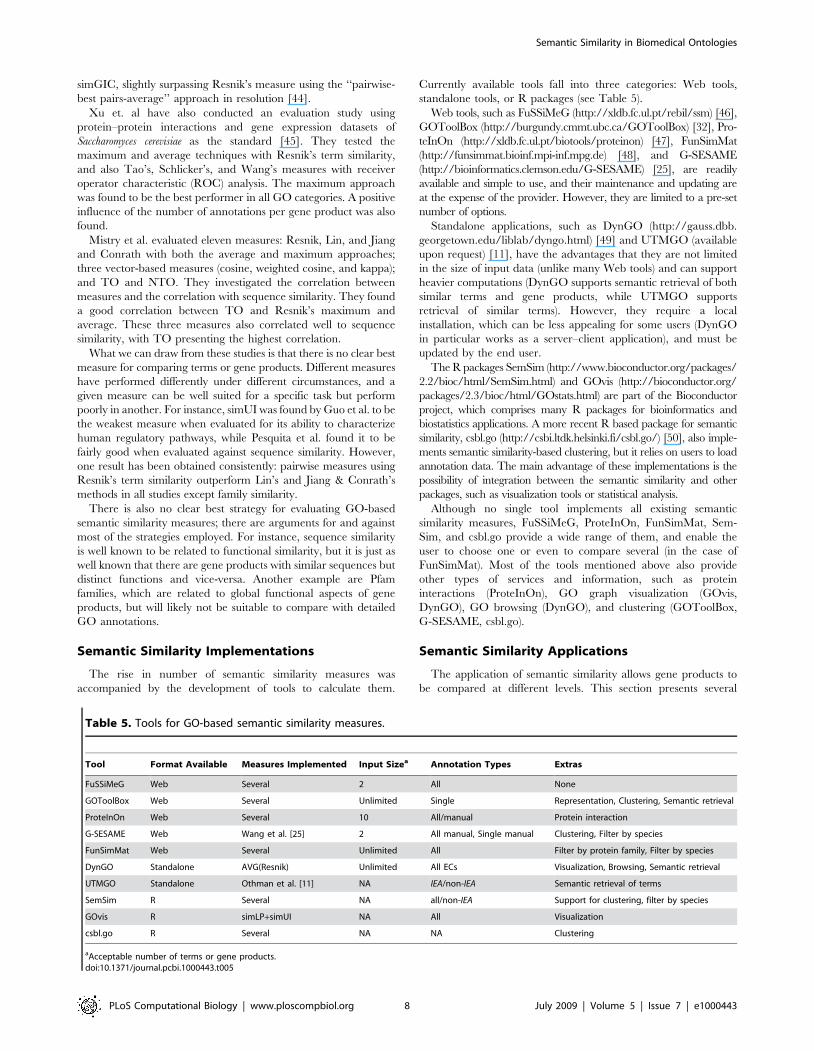
Currently available tools fall into three categories: Web tools,
standalone tools, or R packages (see Table 5).
Web tools, such as FuSSiMeG (http://xldb.fc.ul.pt/rebil/ssm) [46],
GOToolBox (http://burgundy.cmmt.ubc.ca/GOToolBox) [32], Pro-
teInOn (http://xldb.fc.ul.pt/biotools/proteinon) [47], FunSimMat
(http://funsimmat.bioinf.mpi-inf.mpg.de) [48], and G-SESAME
(http://bioinformatics.clemson.edu/G-SESAME) [25], are readily
available and simple to use, and their maintenance and updating are
at the expense of the provider. However, they are limited to a pre-set
number of options.
Standalone applications, such as DynGO (http://gauss.dbb.
georgetown.edu/liblab/dyngo.html) [49] and UTMGO (available
upon request) [11], have the advantages that they are not limited
in the size of input data (unlike many Web tools) and can support
heavier computations (DynGO supports semantic retrieval of both
similar terms and gene products, while UTMGO supports
retrieval of similar terms). However, they require a local
installation, which can be less appealing for some users (DynGO
in particular works as a server–client application), and must be
updated by the end user.
The R packages SemSim (http://www.bioconductor.org/packages/
2.2/bioc/html/SemSim.html) and GOvis (http://bioconductor.org/
packages/2.3/bioc/html/GOstats.html) are part of the Bioconductor
project, which comprises many R packages for bioinformatics and
biostatistics applications. A more recent R based package for semantic
similarity, csbl.go (http://csbi.ltdk.helsinki.fi/csbl.go/) [50], also imple-
ments semantic similarity-based clustering, but it relies on users to load
annotation data. The main advantage of these implementations is the
possibility of integration between the semantic similarity and other
packages, such as visualization tools or statistical analysis.
Although no single tool implements all existing semantic
similarity measures, FuSSiMeG, ProteInOn, FunSimMat, Sem-
Sim, and csbl.go provide a wide range of them, and enable the
user to choose one or even to compare several (in the case of
FunSimMat). Most of the tools mentioned above also provide
other types of services and information, such as protein
interactions (ProteInOn), GO graph visualization (GOvis,
DynGO), GO browsing (DynGO), and clustering (GOToolBox,
G-SESAME, csbl.go).
Semantic Similarity Applications
The application of semantic similarity allows gene products to
be compared at different levels. This section presents several
Table 5. Tools for GO-based semantic similarity measures.
Tool Format Available Measures Implemented Input Sizea Annotation Types Extras
FuSSiMeG Web Several 2 All None
GOToolBox Web Several Unlimited Single Representation, Clustering, Semantic retrieval
ProteInOn Web Several 10 All/manual Protein interaction
G-SESAME Web Wang et al. [25] 2 All manual, Single manual Clustering, Filter by species
FunSimMat Web Several Unlimited All Filter by protein family, Filter by species
DynGO Standalone AVG(Resnik) Unlimited All ECs Visualization, Browsing, Semantic retrieval
UTMGO Standalone Othman et al. [11] NA IEA/non-IEA Semantic retrieval of terms
SemSim R Several NA all/non-IEA Support for clustering, filter by species
GOvis R simLP+simUI NA All Visualization
csbl.go R Several NA NA Clustering
aAcceptable number of terms or gene products.doi:10.1371/journal.pcbi.1000443.t005
Semantic Similarity in Biomedical Ontologies
PLoS Computational Biology | www.ploscompbiol.org 8 July 2009 | Volume 5 | Issue 7 | e1000443
scenarios in which GO-based semantic similarity measures have
been successfully applied.
For instance, GO-based semantic similarity can be used to
compare gene products by their biochemical function (molecular
function), the cellular and supracellular processes in which they are
involved (biological process), and their cellular or extracellular location
(cellular component). Comparing the molecular function aspect, we can
measure the functional similarity between gene products and gain
insight into function-related characteristics such as domains and
active sites. The biological process aspect can be related to protein
interaction, both physical and indirect (involved in the same process
network), and thus can be used to predict them and to analyze
coexpression data. The cellular component aspect can be linked to
colocalization and in that context be used to validate physical
interaction and localization-dependent functions and processes.
Overall, GO-based semantic similarity measures have been applied
mainly for validating and predicting functions and interactions, and
for analyzing transcriptomics and proteomics data.
Automated prediction of gene product function has been a
cornerstone of genome annotation, because experimental methods
are too costly and time consuming to be able to cope with the size and
continuous growth of genetic data [51]. Semantic similarity can be
used to assess the performance of automated function prediction
methods (as was used in the Automated Function Prediction 2005
Special Interest Group meeting of ISMB 2005 in Detroit, USA) and to
validate their results [52,53]. It has also been used as a component of
several function prediction systems, based on protein–protein
interactions [54], on structural similarity of protein surface [55], and
on clustering using semantic similarity [56]; and to validate automatic
annotations [57]. Tao et al. have developed a function prediction
system in which annotations are transferred between proteins with the
only criterion being their semantic similarity [28].
Semantic similarity can also play an important role in both
predicting and validating gene product interactions and interac-
tion networks. Regarding prediction, some authors developed
methods based solely on semantic similarity [23,41], whereas
others combined semantic similarity with gene expression data
[43,58,59]. As for validation of interactions, semantic similarity
has been used to select a negative dataset of noninteracting
proteins to assess prediction methods [60], to improve the
performance of predictions by excluding false positives [61], and
to assess the quality of predicted interaction networks by
comparing them to experimentally verified interactions [48]. Also
in the context of interactions, semantic similarity has been used to
extract functional modules from interaction networks [62], to align
biological pathways [63] to generate functionally meaningful
network subsets [64], and to characterize protein interaction
networks to support breast cancer outcome prediction [65].
In the analysis of transcriptomics and proteomics data, the main
role of semantic similarity has been to improve the clustering of
coexpressed gene products by taking into account their functional
similarity [56,66–69]. However, it can also be used to link and
compare results from different assays [30], to improve data quality
[70], and to validate gene selection for biomedical purposes [71].
Other biological applications of semantic similarity include
determining interfold similarity based on sequence/structure
fragments [72], evaluating the biological significance of coex-
pressed chromosome domains [73], predicting domain distances
[2], and predicting cellular localization [29]. There are also other
applications such as integration of semantic search [75,76].
Unfortunately, most application studies use only one measure and
results are not comparable across studies, making it difficult to assess
which measure is best for which purpose. However, based on the few
comparative studies that exist, we can identify the most successful
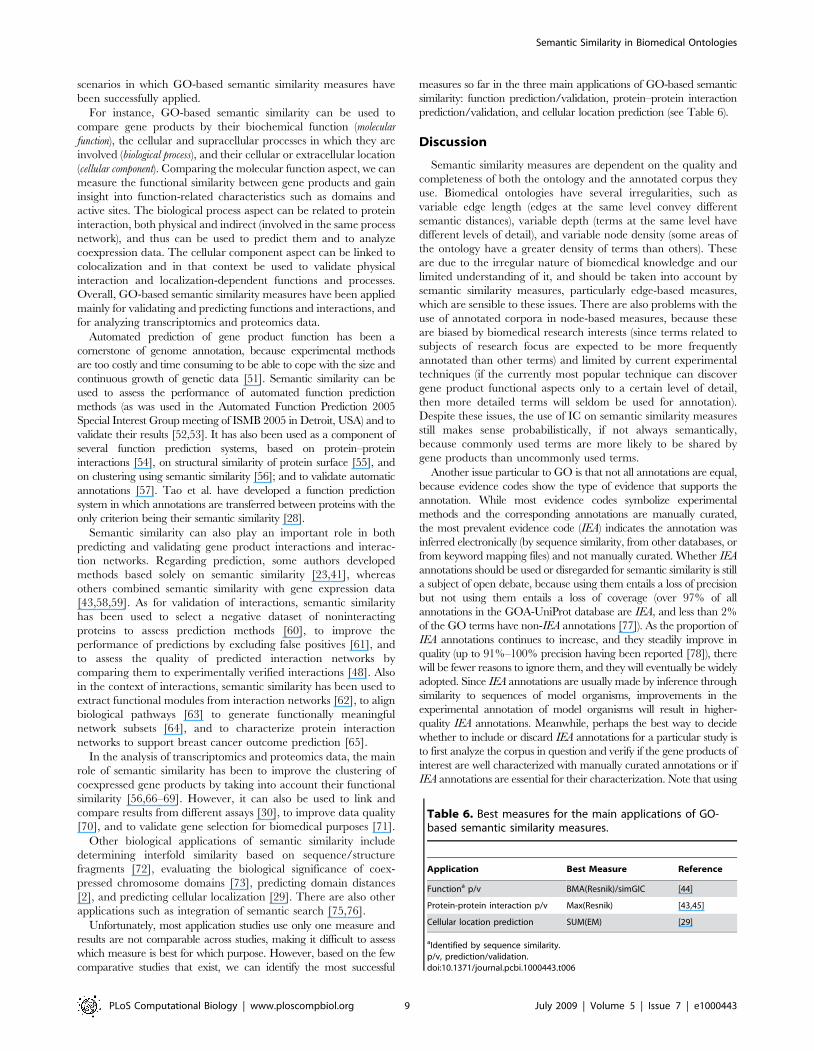
measures so far in the three main applications of GO-based semantic
similarity: function prediction/validation, protein–protein interaction
prediction/validation, and cellular location prediction (see Table 6).
Discussion
Semantic similarity measures are dependent on the quality and
completeness of both the ontology and the annotated corpus they
use. Biomedical ontologies have several irregularities, such as
variable edge length (edges at the same level convey different
semantic distances), variable depth (terms at the same level have
different levels of detail), and variable node density (some areas of
the ontology have a greater density of terms than others). These
are due to the irregular nature of biomedical knowledge and our
limited understanding of it, and should be taken into account by
semantic similarity measures, particularly edge-based measures,
which are sensible to these issues. There are also problems with the
use of annotated corpora in node-based measures, because these
are biased by biomedical research interests (since terms related to
subjects of research focus are expected to be more frequently
annotated than other terms) and limited by current experimental
techniques (if the currently most popular technique can discover
gene product functional aspects only to a certain level of detail,
then more detailed terms will seldom be used for annotation).
Despite these issues, the use of IC on semantic similarity measures
still makes sense probabilistically, if not always semantically,
because commonly used terms are more likely to be shared by
gene products than uncommonly used terms.
Another issue particular to GO is that not all annotations are equal,
because evidence codes show the type of evidence that supports the
annotation. While most evidence codes symbolize experimental
methods and the corresponding annotations are manually curated,
the most prevalent evidence code (IEA) indicates the annotation was
inferred electronically (by sequence similarity, from other databases, or
from keyword mapping files) and not manually curated. Whether IEA
annotations should be used or disregarded for semantic similarity is still
a subject of open debate, because using them entails a loss of precision
but not using them entails a loss of coverage (over 97% of all
annotations in the GOA-UniProt database are IEA, and less than 2%
of the GO terms have non-IEA annotations [77]). As the proportion of
IEA annotations continues to increase, and they steadily improve in
quality (up to 91%–100% precision having been reported [78]), there
will be fewer reasons to ignore them, and they will eventually be widely
adopted. Since IEA annotations are usually made by inference through
similarity to sequences of model organisms, improvements in the
experimental annotation of model organisms will result in higher-
quality IEA annotations. Meanwhile, perhaps the best way to decide
whether to include or discard IEA annotations for a particular study is
to first analyze the corpus in question and verify if the gene products of
interest are well characterized with manually curated annotations or if
IEA annotations are essential for their characterization. Note that using
Table 6. Best measures for the main applications of GO-based semantic similarity measures.
Application Best Measure Reference
Functiona p/v BMA(Resnik)/simGIC [44]
Protein-protein interaction p/v Max(Resnik) [43,45]
Cellular location prediction SUM(EM) [29]
aIdentified by sequence similarity.p/v, prediction/validation.doi:10.1371/journal.pcbi.1000443.t006
Semantic Similarity in Biomedical Ontologies
PLoS Computational Biology | www.ploscompbiol.org 9 July 2009 | Volume 5 | Issue 7 | e1000443
different sets of annotations (such as all, or just the manually curated
ones, etc.) will have an impact in the IC values calculated for the terms,
preventing their comparison. It is also important to stress that only
results obtained with the same versions of GO’s ontology and
annotation data are comparable, since changes to both the ontologies
and the annotations made with them affects semantic similarity .
An important issue in the evaluation of semantic similarity measures
based on the IC is that of data circularity between the data used to
evaluate the measures and the GO annotations. For instance, if a given
measure is evaluated by correlation with sequence similarity, then using
annotations based on sequence similarity (those with evidence codes
ISS and IEA) to calculate the IC leads to data circularity, as there is
direct dependency between both data sources. The same is true for the
use of annotations inferred by physical interaction (IPI) when a
measure is evaluated by correlation with protein-protein interactions,
and other similar cases. To minimize the effect of data circularity,
evaluation studies should (and usually do) remove annotations based on
evidence of the same nature as the data used to evaluate the measures.
Data circularity is not the only problem in evaluating GO-based
semantic similarity measures. The lack of a gold standard for
evaluating semantic similarity makes it hard to assess the quality of
the different measures and to find out which are best for which
goals. One of the reasons for the continued lack of a gold standard
is that measures are often developed for specific goals and
evaluated only in that context. Furthermore, there are pros and
cons to all data sources used to evaluate semantic similarity. The
best solution is likely that a gold standard be designed by experts to
cover most applications of semantic similarity, not based on
proxies for true functional similarity, such as sequence similarity or
gene coexpression.
How to Choose a Semantic Similarity MeasureResearchers who wish to employ semantic similarity in their
work need to spend some time defining their requirements to
choose an adequate measure. Since different measures interpret
ontology and annotation information in different ways, researchers
need to understand the differences and decide which interpreta-
tion is best suited to their needs. Below, we outline some of the
steps that should be taken before choosing a semantic similarity
measure.
1. Identify your scope: Comparing one aspect versus comparing
multiple aspects of gene products;
2. Identify your level of detail: Comparing gene products in
specific functions or overall similarity; and
3. Analyze the annotations of your dataset: Determining the
number of annotations per gene product, including and
excluding IEA annotations and annotation depth.
When wishing to compare single aspects of gene products,
researchers should opt for maximum approaches (‘‘pairwise–all
pairs–maximum’’). These will give a measure of how similar two
gene products are at their most similar aspect. For comparing
multiple aspects, the best measures are ‘‘pairwise–best pairs–
average’’ or groupwise approaches, since they allow for the
comparison of several terms. However, depending on the level of
detail desired, ‘‘pairwise–best pairs–average’’ or ‘‘groupwise–set’’
should be used for a higher degree of specificity (since only direct
annotations are used) and ‘‘groupwise–vector’’ or graph for a more
generalized similarity (since all annotations are used). To further
minimize the relevance of specificity, unweighted graph or vector
measures can be employed, so that high-level GO terms are not
considered less relevant.
However, having to analyze the dataset before deciding which
measure to use can be cumbersome to researchers who just need a
‘‘quick and dirty’’ semantic similarity calculation. In this case,
researchers should resort to one of the several semantic similarity
tools available and use their good judgment in analyzing the
results. Most semantic similarity measures proposed so far have
shown fair if not good results, and for less detailed analyses any
one of them can give a good overview of the similarities between
gene products.
ConclusionsOver the last decade, ontologies have become an increasingly
important component of biomedical research studies, because they
provide the formalism, objectivity, and common terminology
necessary for researchers to describe their results in a way that can
be easily shared and reused by both humans and computers. One
benefit of the use of ontologies is that concepts, and entities
annotated with those concepts, can be objectively compared
through the use of semantic similarity measures. Although the use
of semantic similarity in the biomedical field is recent, there is
already a wide variety of measures available that can be classified
according to the approach they use.
There are two main semantic similarity approaches for
comparing concepts: edge-based, which rely on the structure of
the ontology; and node-based, which rely on the terms themselves,
using information content to quantify their semantic meaning.
Node-based measures are typically more reliable in the biomedical
field because most edge-based measures assume that all relation-
ships in an ontology are either equidistant or have a distance as
function of the depth, neither of which is true for existing
biomedical ontologies.
Because biomedical entities are often annotated with several
concepts, semantic similarity measures for comparing entities need
to rely on sets of concepts rather than single concepts. There are
two main approaches for this comparison: pairwise, in which
entities are represented as lists of concepts that are then compared
individually; and groupwise, in which the annotation graphs of
each entity are compared as a whole.
Several studies have been conducted to assess the performance
of different similarity measures, by correlating semantic similarity
with biological properties such as sequence similarity, or other
classification schemas such as Pfam. Most measures were shown to
perform well, but as few comprehensive studies have been
conducted, it is difficult to draw any conclusion about which
measure is best for any given goal.
Until now, most research efforts in this area developed novel
measures or adapted preexisting ones to biomedical ontologies,
with most novel measures sporting an increased complexity
compared to previous ones. This increased complexity is mainly
a result of more recent measures combining several strategies to
arrive at a final score. Although the need for improved measures is
unquestionable, this trend fails to answer the most pressing
community needs: (1) easy application to both small and large
datasets, which would be best achieved by developing tools that
are at once easy to use and powerful; and (2) elucidation of which
measure is better fitted to the researcher’s needs, which would
imply comparative studies of all existing measures and approaches.
Although important efforts in these two areas have already been
made, semantic similarity is still far from reaching the status of
other gene product similarities, such as sequence-based ones, in
which fast and reliable algorithms coupled with the development
of ever-growing databases has made them the cornerstone of
present day molecular biology. One important step forward would
be the development of a gold standard for gene product function
Semantic Similarity in Biomedical Ontologies
PLoS Computational Biology | www.ploscompbiol.org 10 July 2009 | Volume 5 | Issue 7 | e1000443
that would allow the effective comparison of semantic similarity
measures. Nevertheless, semantic similarity is not restricted to gene
products and it can be expected that, as more biomedical
ontologies are developed and used, these measures will soon be
applied to different scenarios. It is then crucial that bioinforma-
ticians focus on strategies to make semantic similarity a practical,
useful, and meaningful approach to biological questions.
References
1. GO-Consortium (2004) The Gene Ontology (GO) database and informatics
resource. Nucleic Acids Research 32: D258–D261.
2. Joslyn C, Mniszewski S, Fulmer A, Heaton G (2004) The gene ontology
categorizer. Bioinformatics 20: i169–177.
3. Rada R, Mili H, Bicknell E, Blettner M (1989) Development and application of a
metric on semantic nets. In: IEEE Transaction on Systems, Man, and
Cybernetics. 19. pp 17–30.
4. Wu Z, Palmer MS (1994) Verb semantics and lexical selection. In: Proceedings
of the 32nd. Annual Meeting of the Association for Computational Linguistics
(ACL 1994). pp 133–138. URL http://dblp.uni-trier. de/db/conf/acl/acl94.
html#WuP94.
5. Budanitsky A (1999) Lexical semantic relatedness and its application in natural
language processing. URL http://citeseer.ist.psu.edu/budanitsky99lexical.html.
6. Richardson R, Smeaton AF, Murphy J (1994) Using WordNet as a knowledge
base for measuring semantic similarity between words. Technical Report CA-
1294, Dublin, Ireland. URL citeseer.ist.psu.edu/richardson94using.html.
7. Seco N, Veale T, Hayes J (2004) An intrinsic information content metric for
semantic similarity in wordnet. In: ECAI. pp 1089–1090.
8. Resnik P (1995) Using information content to evaluate semantic similarity in a
taxonomy. In: Proc. of the 14th International Joint Conference on Artificial
Intelligence. pp 448–453.
9. Couto FM, Silva MJ, Coutinho PM (2005) Semantic similarity over the gene
ontology: Family correlation and selecting disjunctive ancestors. In: Proc. of the
ACM Conference in Information and Knowledge Management as a short
paper.
10. Budanitsky A (2001) Semantic distance in wordnet: An experimental,
application-oriented evaluation of five measures. URL citeseer.ist.psu.edu/
budanitsky01semantic.html.
11. Othman R, Deris S, Illias R (2007) A genetic similarity algorithm for searching
the gene ontology terms and annotating anonymous protein sequences. J Biomed
Inform 23: 529–38.
12. Lord P, Stevens R, Brass A, Goble C (2003) Investigating semantic similarity
measures across the Gene Ontology: the relationship between sequence and
annotation. Bioinformatics 19: 1275–1283.
13. Lin D (1998) An information-theoretic definition of similarity. In: Proc. of the
15th International Conference on Machine Learning. San Francisco, CA:
Morgan Kaufmann. pp 296–304.
14. Jiang J, Conrath D (1997) Semantic similarity based on corpus statistics and
lexical taxonomy. In: Proc. of the 10th International Conference on Research on
Computational Linguistics, Taiwan.
15. Lord P, Stevens R, Brass A, Goble C (2003) Semantic similarity measures as
tools for exploring the gene ontology. In: Proc. of the 8th Pacific Symposium on
Biocomputing. pp 601–612.
16. Schlicker A, Domingues FS, Rahnenfuhrer J, Lengauer T (2006) A new measure
for functional similarity of gene products based on gene ontology. BMC
Bioinformatics 7.
17. Bodenreider O, Aubry M, Burgun A (2005) Non-lexical approaches to
identifying associative relations in the gene ontology. Pac Symp Biocomput.
pp 91–102. URL http://view.ncbi.nlm.nih.gov/pubmed/15759617.
18. Riensche RM, Baddeley BL, Sanfilippo AP, Posse C, Gopalan B (2007) Xoa:
Web-enabled cross-ontological analytics. In: Services, 2007 IEEE Congress on.
pp 99–105.
19. Pekar V, Staab S (2002) Taxonomy learning: factoring the structure of a
taxonomy into a semantic classification decision. In: Proceedings of the 19th
international conference on Computational linguistics. Morristown, NJ, USA:
Association for Computational Linguistics. pp 1–7. doi:http: //dx.doi.org/10.
3115/1072228.1072318.
20. Yu H, Gao L, Tu K, Guo Z (2005) Broadly predicting specific gene functions
with expression similarity and taxonomy similarity. Gene 352: 75–81.
21. Cheng J, Cline M, Martin J, Finkelstein D, Awad T, et al. (2004) A knowledge-
based clustering algorithm driven by gene ontology. Journal of Biopharmaceu-
tical Statistics 14: 687–700.
22. Wu H, Su Z, Mao F, Olman V, Xu Y (2005) Prediction of functional modules
based on comparative genome analysis and gene ontology application. Nucleic
Acids Res 33: 2822–2837. URL http://view.ncbi.nlm.nih.gov/pubmed/
15901854.
23. Wu X, Zhu L, Guo J, Zhang DY, Lin K (2006) Prediction of yeast
proteinprotein interaction network: insights from the gene ontology and
annotations. Nucleic Acids Research 34: 2137–2150.
24. Pozo AD, Pazos F, Valencia A (2008) Defining functional distances over gene
ontology. BMC Bioinformatics 9: doi:http://dx.doi.org/10.1186/1471-2105-9-50.
25. Wang JZZ, Du Z, Payattakool R, Yu PSS, Chen CFF (2007) A new method to
measure the semantic similarity of go terms. Bioinformatics; doi:http://dx.doi.
org/10.1093/bioinformatics/btm087.
26. Sevilla JL, Segura V, Podhorski A, Guruceaga E, Mato JM, et al. (2005)
Correlation between gene expression and go semantic similarity. In: IEEE/
ACM Transactions on Computational Biology and Bioinformatics.
27. Azuaje F, Wang H, Bodenreider O (2005) Ontology-driven similarity
approaches to supporting gene functional assessment. In: Proceedings of the
ISMB 2005 SIG meeting on Bio-ontologies.
28. Tao Y, Sam L, Li J, Friedman C, Lussier Y (2007) Information theory applied to
the sparse gene ontology annotation network to predict novel gene function.
Bioinformatics 23: 529–38.
29. Lei Z, Dai Y (2006) Assessing protein similarity with gene ontology and its use in
subnuclear localization prediction. BMC Bioinformatics 7.
30. Lee HK, Hsu AK, Sajdak J, Qin J, Pavlidis P (2004) Coexpression analysis of
human genes across many microarray data sets. Genome Res 14: 1085–1094.
doi:http://dx.doi.org/10.1101/gr.1910904.
31. Mistry M, Pavlidis P (2008) Gene ontology term overlap as a measure of gene
functional similarity. BMC Bioinformatics 9: URL http://www.biomedcentral.
com/1471-2105/9/327.
32. Martin D, Brun C, Remy E, Mouren P, Thieffry D, et al. (2004) Gotoolbox:
functional analysis of gene datasets based on gene ontology. Genome Biol 5:
doi:http://dx.doi.org/10.1186/gb-2004-5-12-r101.
33. Gentleman R (2005) Visualizing and Distances Using GO. URL http://www.
bioconductor.org/docs/vignettes.html.
34. Pesquita C, Faria D, Bastos H, Falcao AO, Couto F (2007) Evaluating gobased
semantic similarity measures. In: ISMB/ECCB 2007 SIG Meeting Program
Materials. International Society for Computational Biology.
35. Ye P, Peyser BD, Pan X, Boeke JD, Spencer FA, et al. (2005) Gene function
prediction from congruent synthetic lethal interactions in yeast. Molecular
Systems Biology 1: msb4100034–E1–msb4100034–E12. doi: http://dx.doi.org/
10.1038/msb4100034.
36. Cho YR, Hwang W, Ramanathan M, Zhang A (2007) Semantic integration to
identify overlapping functional modules in protein interaction networks. BMC
Bioinformatics 8: 265+. doi:http://dx.doi.org/10.1186/1471-2105-8-265.
37. Lin N, Wu B, Jansen R, Gerstein M, Zhao H (2004) Information assessment on
predicting protein-protein interactions. BMC Bioinformatics 5: doi:http://dx.
doi.org/10.1186/1471-2105-5-154.
38. Yu H, Jansen R, Gerstein M (2007) Developing a similarity measure in
biological function space. Bioinformatics, URL http://view.ncbi.nlm.nih.gov/
pubmed/17540677.
39. Sheehan B, Quigley A, Gaudin B, Dobson S (2008) A relation based measure of
semantic similarity for gene ontology annotations. BMC Bioinformatics 9:
doi:http://dx.doi.org/10.1186/1471-2105-9-468.
40. Huang DW, Sherman BT, Tan Q, Collins JR, Alvord GW, et al. (2007) David
gene functional classification tool: A novel biological modulecentric algorithm to
functionally analyze large gene list. Genome Biology 8: R183+. doi:http://dx.
doi.org/10.1186/gb-2007-8-9-r183.
41. Chabalier J, Mosser J, Burgun A (2007) A transversal approach to predict gene
product networks from ontology-based similarity. BMC Bioinformatics 2: 235.
42. Wang H, Azuaje F, Bodenreider O, Dopazo J (2004) Gene expression correlation
and gene ontology-based similarity: an assessment of quantitative relationships. In:
Computational Intelligence in Bioinformatics and Computational Biology, 2004.
CIBCB ’04. Proceedings of the 2004 IEEE Symposium on. pp 25–31. URL
http://ieeexplore.ieee.org/xpls/abs all.jsp?arnumber = 1393927.
43. Guo X, Liu R, Shriver CD, Hu H, Liebman MN (2006) Assessing semantic similarity
measures for the characterization of human regulatory pathways. Bioinformatics 22:
967–973. doi:10.1093/bioinformatics/btl042. URL http://www.ncbi.nlm.nih.gov/
entrez/query.fcgi?cmd = Retrieven&db = pubmedn&dopt = Abstractn&list
uids = 16492685.
44. Pesquita C, Faria D, Bastos H, Falcao AO, Couto F (2008) Metrics for go based
protein semantic similarity: a systematic evaluation. BMC Bioinformatics 9.
45. Xu T, Du L, Zhou Y (2008) Evaluation of go-based functional similarity
measures using s. cerevisiae protein interaction and expression profile data.
BMC Bioinformatics 9: doi:http://dx.doi.org/10.1186/1471-2105-9-472.
46. Couto F, Silva MJ (2003) Implementation of a functional semantic similarity
measure between gene-products. Technical Report DI/FCUL TR 3-29, FCUL.
URL http://www.di.fc.ul.pt/tech-reports/03-29.pdf.
47. Faria D, Pesquita C, Couto F, Falcao A (2007) Proteinon: A web tool for protein
semantic similarity. DI/FCUL TR 07–6, Department of Informatics, University
of Lisbon. URL http://www.di.fc.ul.pt/tech-reports/07-6.pdf.
48. Schlicker A, Albrecht M (2007) Funsimmat: a comprehensive functional
similarity database. Nucl Acids Res. gkm806+. doi:http://dx.doi.org/10.1093/
nar/gkm806.
49. Liu H, Hu ZZ, Wu CH (2005) Dyngo: a tool for visualizing and mining of gene
ontology and its associations. BMC bioinformatics 6: doi:http://dx.doi.org/10.
1186/1471-2105-6-201.
Semantic Similarity in Biomedical Ontologies
PLoS Computational Biology | www.ploscompbiol.org 11 July 2009 | Volume 5 | Issue 7 | e1000443
50. Ovaska K, Laakso M, Hautaniemi S (2008) Fast gene ontology based clustering
for microarray experiments. BioData mining 1: doi:http://dx.doi.org/10.1186/1756-0381-1-11.
51. Friedberg I (2006) Automated protein function prediction-the genomic
challenge. Briefings in Bioinformatics 7: 225–242.52. Duan ZH, Hughes B, Reichel L, Shi T (2006) The relationship between protein
sequences and their gene ontology functions. In: IMSCCS ’06: Proceedings ofthe First International Multi-Symposiums on Computer and Computational
Sciences - Volume 1 (IMSCCS’06). Washington, DC, USA: IEEE Computer
Society. pp 76–83. doi:http://dx.doi.org/10.1109/IMSCCS.2006.133.53. Ye P, Peyser BD, Pan X, Boeke JD, Spencer FA, et al. (2005) Gene function
prediction from congruent synthetic lethal interactions in yeast. MolecularSystems Biology 1: msb4100034–E1–msb4100034–E12. doi: http://dx.doi.org/
10.1038/msb4100034.54. Zhu M, Gao L, Guo Z, Li Y, Wang D, et al. (2007) Globally predicting protein
functions based on co-expressed protein-protein interaction networks and
ontology taxonomy similarities. Gene 391: 113–119.55. Liu ZP, Wu LY, Wang Y, Chen L, Zhang XS (2007) Predicting gene ontology
functions from protein’s regional surface structures. BMC Bioinformatics 8:doi:http://dx.doi.org/10.1186/1471-2105-8-475.
56. Chen JL, Liu Y, Sam LT, Li J, Lussier YA (2007) Evaluation of highthroughput
functional categorization of human disease genes. BMC Bioinformatics 8 Suppl3: doi:http://dx.doi.org/10.1186/1471-2105-8-S3-S7.
57. Couto F, Silva M, Lee V, Dimmer E, Camon E, et al. (2006) Goannotator:linking protein go annotations to evidence text. Journal of Biomedical Discovery
and Collaboration 1: 19. doi:10.1186/1747-5333-1-19. URL http://www.biomedcentral.com/1747-5333/1/19.
58. Lee PH, Lee D (2005) Modularized learning of genetic interaction networks from
biological annotations and mrna expression data. Bioinformatics 21: 2739–2747.URL http://www.ncbi.nlm.nih.gov/entrez/query.fcgi?cmd = Retrieven&db
= pubmedn&dopt = Abstractn&list uids = 15797909.59. Brown KR, Jurisica I (2005) Online predicted human interaction database.
Bioinformatics 21: 2076–2082. URL http://view.ncbi.nlm.nih.gov/pubmed/
15657099.60. Hur AB, Noble W (2006) Choosing negative examples for the prediction of
protein-protein interactions. BMC Bioinformatics 7: doi:http://dx.doi.org/10.1186/1471-2105-7-S1-S2.
61. Mahdavi MA, Lin YH (2007) False positive reduction in protein-proteininteraction predictions using gene ontology annotations. BMC Bioinformatics 8:
262+. doi:http://dx.doi.org/10.1186/1471-2105-8-262.
62. Zheng H, Wang H, Glass DH (2008) Integration of genomic data for inferringprotein complexes from global protein-protein interaction networks. IEEE Trans
Syst Man Cybern B Cybern 38: 5–16. doi:http://dx.doi.org/10.1109/TSMCB.2007.908912.
63. Gamalielsson J, Olsson B (2005) B.: Gosap: Gene ontology based semantic
alignment of biological pathways. Technical report, Skovde University.64. Lubovac Z, Gamalielsson J, Olsson B (2006) Combining functional and
topological properties to identify core modules in protein interaction networks.
Proteins: Structure, Function, and Bioinformatics 64: 948–959. doi:http://dx.
doi.org/10.1002/prot.21071.
65. Taylor IWW, Linding R, Warde-Farley D, Liu Y, Pesquita C, et al. (2009)
Dynamic modularity in protein interaction networks predicts breast cancer
outcome. Nature biotechnology, doi:http://dx.doi.org/10.1038/nbt. 1522.
66. Speer N, Spieth C, Zell A (2004) A memetic clustering algorithm for the
functional partition of genes based on the gene ontology. In: Computational
Intelligence in Bioinformatics and Computational Biology, 2004. CIBCB
apos;04. Proceedings of the 2004 IEEE Symposium on. pp 252–259.
67. Wang H, Azuaje O Fand Bodenreider (2005) An ontology-driven clustering
method for supporting gene expression analysis. In: Computer-Based Medical
Systems, 2005. Proceedings. 18th IEEE Symposium on. pp 389–394.
68. Kustra R, Zagdanski A (2006) Incorporating gene ontology in clustering gene
expression data. In: CBMS IEEE Computer Society. pp 555–563.
69. Wolting C, Mcglade JC, Tritchler D (2006) Cluster analysis of protein array
results via similarity of gene ontology annotation. BMC Bioinformatics 7: 338+.
doi:http://dx.doi.org/10.1186/1471-2105-7-338.
70. Tuikkala J, Elo L, Nevalainen O, Aittokallio T (2006) Improving missing value
estimation in microarray data with gene ontology. Bioinformatics 22: 566–572.
URL http://n.uni-trier.de/db/journals/bioinformatics/bioinformatics22.
html#TuikkalaENA06.
71. Duan KB, Rajapakse JC, Wang H, Azuaje F (2005) Multiple svm-rfe for gene
selection in cancer classification with expression data. IEEE Trans Nano-
bioscience 4: 228–234. URL http://view.ncbi.nlm.nih.gov/pubmed/16220686.
72. Friedberg I, Godzik A (2005) Connecting the protein structure universe by using
sparse recurring fragments. Structure 13: 1213–1224. doi:http://dx.doi.org/10.
1016/j.str.2005.05.009.
73. Li H, Liu Y, Shin S, Sun Y, Loring JF, et al. (2006) Transcriptome coexpression
map of human embryonic stem cells. BMC Genomics 7: 103. URL http://www.
citebase.org/abstract?id = oai:biomedcentral.com:1471-2164-7-103.
74. Bjorklund AK, Ekman D, Light S, Frey-Skott J, Elofsson A (2005) Domain
rearrangements in protein evolution. Journal of Molecular Biology 353:
911–923. doi:http://dx.doi.org/10.1016/j.jmb.2005.08.067.
75. Cao S, Qin L, He W, Zhong Y, Zhu Y, et al. (2004) Semantic search among
heterogeneous biological databases based on gene ontology. Acta Biochim
Biophys Sin (Shanghai) 36: 365–70.
76. Vanteru B, Shaik J, Yeasin M (2008) Semantically linking and browsing pubmed
abstracts with gene ontology. BMC Genomics 9: doi:http://dx. doi.org/
10.1186/1471-2164-9-S1-S10.
77. Camon E, Magrane M, Barrell D, Lee V, Dimmer E, et al. (2004) The gene
ontology annotation (goa) database: sharing knowledge in uniprot with gene
ontology. Nucleic Acids Research 32: D262. URL http://www. citebase.org/
abstract?id = oai:pubmedcentral.gov:308756.
78. Camon EB, Barrell DG, Dimmer EC, Lee V, Magrane M, et al. (2005) An
evaluation of go annotation retrieval for biocreative and goa. BMC Bioinfor-
matics 6 Suppl 1: doi:10.1186/1471-2105-6-S1-S17.
Semantic Similarity in Biomedical Ontologies
PLoS Computational Biology | www.ploscompbiol.org 12 July 2009 | Volume 5 | Issue 7 | e1000443
Copyright © 2022 FDOKUMEN